Canton OH 1955 - Main Report - Berman Jewish DataBank
124
Ben &eyer, president of the Federation Dr. Cyril Gross, Chairman Robert Luntz, Co-chainnan Irving Adelman -. Irving Bloom Robert Erlanger Isadore Freed Mrs. Lena Gensheft Mrs. Joseph Glazer Leonard Jaopold Mrs. H. H. hck Raymond WiUcof Hymie Williams Leonard Sebrens, BSrecutive Director CANTON SECTION, WION.4L COUNCIL OF JEWISH WOMEN: Mrs. bps. Mrs. Mrs. Mrs. Mrs. Mrs. Mrs. Mrs. Mrs. Mrs. Mrs. Mrs. . Mrs. ms. Mrs. Mrs. Mrs. Miss Mrs. Mrs. Allan Caghan, President of the Hati- Council of Jewish Women Ben Lavin, Chairmas Fred Lavin, Co-chairman Max Adelman Sheldon Fantle Herbert Fisher ~rthur Genshaft Cyril Gross Eldy Gmss William Kaven James LockshXn Earl Zellinger Pmqm COMMITTEE Ben Lavin---Sumey Chairman Fred Lavin---Coordinating Chairman William Kaven---Planning Chairman Max AdeLnan---Visual Aids Sheldon Fantle---Personnel Cyril Gross---Master List & Zoxing Revella Kopstein---Master List & Zoning James Lockshin---Printing Earl Zellinger---Publicity Mrs. Herbert Msher ) Mrs. Arthur Genshaft) Mrs. Eldy Gross SUPERVISORS OF THE SWAQX Mrs. William Kaven \ ms. Herbert aaaPh j s. Derwin Wilkof )
-
Upload
khangminh22 -
Category
Documents
-
view
0 -
download
0
Transcript of Canton OH 1955 - Main Report - Berman Jewish DataBank

Ben &eyer, president of the Federation Dr. Cyril Gross, Chairman Robert Luntz, Co-chainnan Irving Adelman
-. Irving Bloom Robert Erlanger Isadore Freed Mrs. Lena Gensheft Mrs. Joseph Glazer Leonard Jaopold Mrs. H. H. hck Raymond WiUcof Hymie Williams Leonard Sebrens, BSrecutive Director
CANTON SECTION, WION.4L COUNCIL OF JEWISH WOMEN:
Mrs. bps. Mrs. Mrs. Mrs. Mrs. Mrs. Mrs. Mrs. Mrs. Mrs. Mrs.
Mrs. . Mrs. ms. Mrs. Mrs. Mrs. Miss Mrs. Mrs.
Allan Caghan, President of the Hati- Council of Jewish Women Ben Lavin, Chairmas Fred Lavin, Co-chairman Max Adelman Sheldon Fant le Herbert Fisher ~rthur Genshaft Cyril Gross Eldy Gmss William Kaven James LockshXn Earl Zellinger
P m q m COMMITTEE
Ben Lavin---Sumey Chairman Fred Lavin---Coordinating Chairman William Kaven---Planning Chairman Max AdeLnan---Visual Aids Sheldon Fantle---Personnel Cyril Gross---Master List & Zoxing Revella Kopstein---Master List & Zoning James Lockshin---Printing Earl Zellinger---Publicity
Mrs. Herbert Msher ) Mrs. Arthur Genshaft) Mrs. Eldy Gross
SUPERVISORS OF THE SWAQX Mrs. William Kaven \ ms. Herbert aaaPh j s . Derwin Wilkof )

Table of Contents
Introduction
Text
Number Geographic Distribution Age Distribution Sex Ratio Fe r t i l i t y Ratio
Marital Status Size of Household Country of Origin of Foreign Born Area i n Which Canton's Native Born Jews Originated and
Time of Arrival Plans fo r Staying i n Canton
maturslization Status rnployment secular Education Religious Education Participation i n Center Sponsored Activities
Participation i n Activities Taking Place i n Center (But Not Center-Sponsored j
Military S e d c e
Appendix A: Major Tables (For detailed l i s t i ng see following page)
Appendix B: Background Elaterial B-1
Technical Note B-1 Study Questionnaire Fallovs B-1 Instructions fo r Interviewers Fol lms Above Control Sheet fo r InteMewers Follows Above Introductory Letter Mailed t o Residents Follows Above Letter of Appreciation t o Residents Follows Above Idst of Volunteer Intersriewers Inside of Back Cover
:
IiLst of Sunrmary Tables and Figures in Text
Figure 1 Age-Sex Pyramids 3 Table A Canton Jewish Population 1955 And 1950 PIhite Population of
Cantan Urban Area 1 B Geographical Distribution of Canton's Jewish Population 2 C Percentage Mstribution of Canton Jewish Population (1955)
and General t h i t e Population (1950) 4 D Median Ages: Jewish Population of Canton and Selected
Sections (1955); General $k i t e Population of Canton (1950) 5

Iist of Su!mnary Tables and Mgurea i n Text a
Table E Cant- Sex Ratios F Sax-Ratios of Canton Jewish Population and Three Other
Jewish Cc&miunities by ~ g e Groups 11 t o 50 G Fer t i l i ty Ratios H Percentage Mstribution by Marital Status I Cumulated Percentages of Married Udividuals for Five
Year Age Groups After 13 J Average Size of Jewish h s e h o l d e K Percentage Mstribution of Jewish Hameholds by Size for
Canton and Sections N, V, and V I L Number and Percentage Metributiaa of Canton Jswish
Population by Size of Howehold M Geographical Mstribution of Canton's Forei@ln Born Population N Country of Origin for Cantonis Foreign Born, Jewish (1955)
and Urt;an General White (1950) 0 Proportion of Total Jewish Populatiaa Native Bon, P The Jewirrh Foreign. Barn of Canton, New Orleans, a d
Des Moines Distributed by Year of Arrival i n United Statee Q Geographical Origin of Canton Jewish Community R Proportion of Each Age Group of Cantonis Jewieh Population
Reporting Plans t o Move from Canton S Per Cent of Foreign Born with Alien Status i n Various
Jewish Communities Ta Labor Force - Jewish Populetion of Canton Aged 14 and Over Tb Ccanparleon of La3or Force Distributions of Canton Jewish
Population (1955) and Canton Urban Area General Population (1950)
Tc Proportion Iiqloyed in &ah Age Group, Csaton Jewish Population (1955) and Canton City General Population (1950)
U Proportion of Jewish Popuhtions i n the Labor Force Va Percentage Distribution of Canton's Jewish Dnplaged by
Industrial Groupings and by Zhployment Status Vb Proportion Self-Bqloyed and Salaried by Broad Age Groups
Canton Jewish Population Vc Percentage Mstribution of Wployed by Industrial Groupings
for Canton Jewish Population (1955) an8 Urbebn Area General Population (1950)
Vd Corqpsrisaa of Industrial Distribution of Jewish mplayed i n Several Camunities Recently Surveyed
Ve Proportion Fareign Born in Bsch Industrial Classification of J&sh -logod, By Sex
Vf Mstribution of %nployed by mdwtrial Group, by Nativity Vg Percentage Distribution of Canton Jewish Iabor Force by
Vocatianal and Industrial Groupings V h Percentage Mstribution of Cantanis Jewish Bnploged (1955)
and C~nton City Xkperieaced Iabor Force (1950) by Vocational Groups
Vi Mstribution of Jewish Tnployed by Vocatianal Groupings in Cormnunities Recently Studied
Wa Percentage Distribution of SecuLar Education Levels of Canton Jewish Population Over Lge of 5 by Mador Age Groups
Wb Proportion College Educated i n Age Group 26-50 i n Sections V, , and V I I Canton Jewish Papulation
Wc Conwrative School Iavel Attained, Canton Urban Area General Pcpulation (Age 25 and Over in 1950) and Jswish Population (Age 26 and Over i n 1955)

l s t of Sumnary Tables end Figures i n Text
Table Wd Proportione of Population with College Education by Sex for Canton JEiwish Popula t ia ( ~ g e 26 and Over i n 1955 and Canton Urban Area General Population (Age 25 and Over i n 1950) 25
We Educational W e 1 of Jews Aged 25 and Over i n Communities Recently Surveyed and Total White Population Aged 25 & Over 26
Xa Percentege Mstribution of Canton Jewish Population by Type of Jewish Education and ~ g e (p.ge 4 and Over) 27
Xb Proportions of Population Over Three Years of Age by R d i g i m s School Types and Iargest Sections in Canton 26
Ya h p o r t i o n i n Bch of Canton's Jewish ,Ige Groups Participating i n Center Sponsored Activities 29
Yb Percentage Distributions by Age of Total Participants and Total Non-Participants in Center Sponsored Activities 29
Za Percentage i n Ebch Age Group of Canton's Jewish Population Participating i n Activities Located i n Center (But Not Center Sponsored ) 30
Zb Percentage Distributions by Age of participants and of Non-Participants i n Activities Taking place i n Center (But Not Center sponsored) 31
List of Major Tables i n Appendix A
Table I ~ g e Distribution by Sex, Nativity and Section A- 1 I1 Marital Status by Sex and ~ g e A- 9
111 Nruaber of Households by Size and Section A-10 IV Last Permanent Residence of Native Bon. by Age and Sex A- ll V Country of Origin, Foreign Born, by Age and Section A-13
VI Year of Arrival i n Ihited States, Foreign Born, by Age and Section A-20
VII h t e of Arrival, Native Born, By Region of Iast Residence A-24 VIII Plans fo r Staying i n Canton by Age and Sectian A-25
TX Naturalization Statue, Foreign Born by Sex and a t e of Arrival i n Wnited Sta%es A-26
X ' Labor Force by Sex and Section A-27
X I lihployment by InBustry, &ployment Status, Age and Section A-28 X I 1 O c c u p a t i d Groupings, by Sex, Wustry and Section A-36
X I 1 1 lbployed by Sex, Nativity and Section A-44 X I V Secular Education, Age Six and Over by Age, Sex and Section A-47 XV Jewish Education, Four Years and Over, by Age and Section A-59
XVI Use of JEiwish Center Programs or Activities by Age, Sex, and Sect ion A-67
XQII Participation i n Center Located Activities by Age, Sex, . and Section A- 71
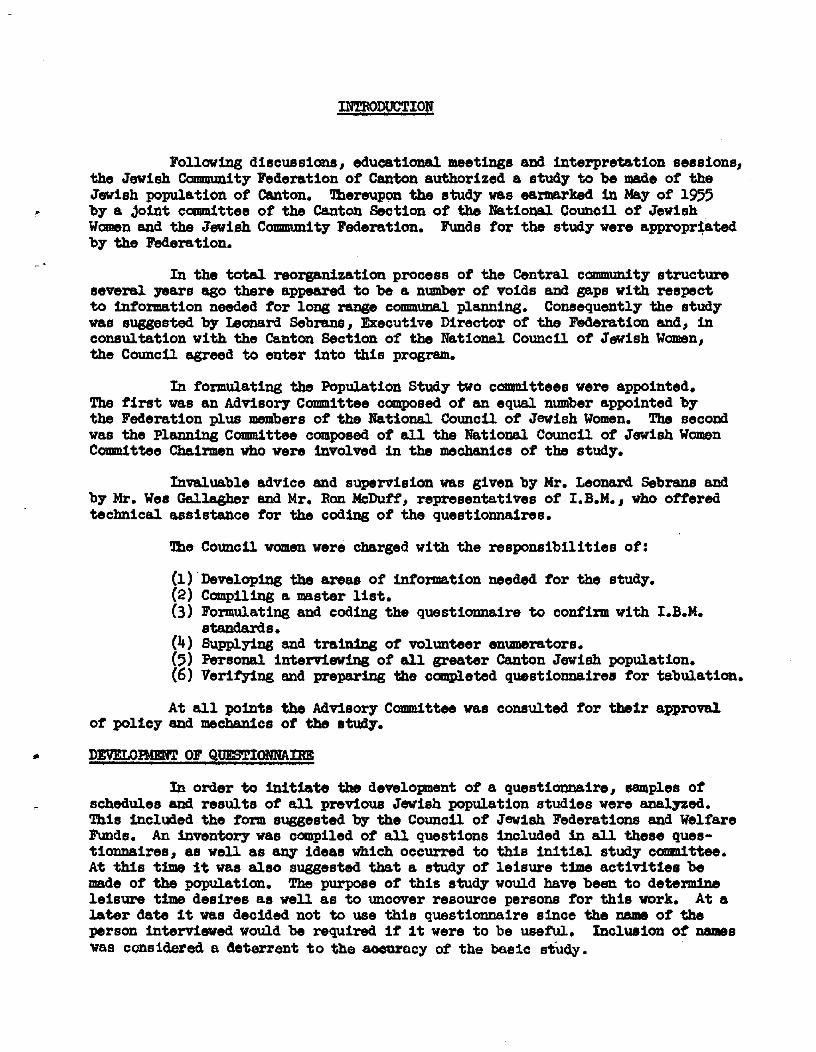
Following discuesions, eduoationnl meetings and interpretation sessions, the Jewish Campamity Feaeration of Canton authorized a study to be made of the Jswish population of Canton. Thereupon the stuay was earmarked in May of 1955 - by a joint ctmnnittee of the Canton Section of the National Council of Jewish Women and the Jeviab Cammuaity Federation. Funds for tho study were appropriated by the Federation.
- In the total reorganization process of the Central ccmununity structure
several yeare ago there appeared to be a number of voids and gaps with respect to infomation needed for long range communal planning. Consequsntly the study m e suggested by Leanard Sebrsne, Executive Mrector of the Federation ad, In consultation with the Canton Section of the National Council of Jewish Women, the Council agreed to enter into this program.
In formulating the Population Study two committees were appointed, The firrrt was aa Advisory Conunittee com~~sed of an equal mrmber appointed by the Federation plus members of the National Council of Jewish Women. The second was the Planaing Ccmnnlttee composed of all the &tional Council of Jewish Women Ccmnnlttee Chairmen who were involved In the mschanics of the study.
Invaluable advice and suparvision was given by Mr. Leonard Sebrane end by Mr. Wes Gallsgber and Mr. Ron kDuff, representatives of I.B.M., who offered technical assistance for the c o d a of the queationnalres.
The Council women were charged with the responsibilities of:
(1) .Developing ths areae of infomation needed for the study. (2) Compiling a master list. (3) Formulating and coding the questionnaire to confirm with I.B.M.
etandards. (4) 8upplying and training of volunteer enumerators. (5 ) Personal interviewing of all greeter Canton Jewish population. (6) Verifying and prepsriag the caarpleted questionnaires for tabulation.
At all points the Advisory Ccmnnlttee was consulted for thbir approval of policy sad mechanics of the study.
In order to initiate the developant of a questionnaire, samples of schedules and results of all previous Jewish population studies were analyzed. This included the form suggested by the Council of Jeviah Federations and Welfare Funds. An Inventory was compiled of all questions included In all these ques- tionnaires, as well as any ideas which occurred to thia initial study comittee. At this time it was also suggested that a study of leieure tims activltiee be m d e of the population. The purpose of this study would have been to detsrmins leisure time desires as well as to uncover reaource persons for this work. At a later date it vas decided not to use this questio~aire since the naim of the person interviewed would be required if it were to be useful. Inclmian of mums waa considered a deterrent to the aoouracy of the baeic study.

After eemral meet- of the Advisory C o m m i t f e e , certain questions not considered significant to Canton were dropped. Bueetioas wsre added tbat appeared on no other sample. These include% the individuals' plan8 for remining in Canton; their veteran service; and the use of thb Jewish Comunity Center.
After the Advisory Cdmmittee had approved the baeio questions, these had t o be put in a form that could be coded for use by I.B.M. Thie proved to
- be a most d i f f i c u l t procdure but one thst in the long run made the schedule of questions both mare wable and more objective. Thie elmpliZied the work of the interviewing and of v e r i w g .
A t this point, the Council of Jdvlsh Federations and Welfare -6, who had been encouraging the study from its inception, wee asked t o eoslwite an8 publish the reeulte of this population study. Mr. Alvin Cbenkia, who vae t o evaluate the study, approved the queetlormaire ae completed.
THE MASTER LIST
During this tima, a master l ist of all the Jewish hauseholds in Greater Canton was compiled. Initially, all of the names were taken from the l i s t of the Jewish Welfare Fund. Then this l i s t of names was checked w i t h the member- ship l i e t s of the Jewish Ccaimnity Center and the three houees of vorship. In- cluded i n this l i s t were persons unsOiiliated with any Jewish p u p , but known by gemral knowledge to be Jewish. The interpiewing of this non-affiliated group was handled in a spscial maMer to be diecuseed later.
In i ts final form, the laator l i s t included all howeholds where one adult member was Jewish. In the survey, a houeehold wae deflned as all members of a family unity living together. Information was obtained concerning the com- plete unit regardlee6 of any umber's present religious faith.
During the period when interpiewe were conpletsd, any new residents vere added to the meter list. A t the same the, anyone moving out or deceased, not previouely interviewed, were deleted from the list. Before the interviews vere terminated, the l i s t was again checked against ]met recent umberahip l i e t s of the previauely mentioned or&zatiom.
Duplicate index card8 vere made up of the maeter l i e t . One set of cards was fi led alphabetlaally and kept intact for a flnal check l ie t . The other set of cards was grouped f l r s t into major geographiaal areas. Then these were divided into individual packets t o be given to each interviewer. Those cards who were known to present special problems were given t o espscbl ly skilled interviewers.
To faci l i ta te the final check, the cards kept on f i l e were nunbered. Ae the ccrmpleted questionnaires were returned, the f i l e number was added t o ths questionnaire in the space marked "code number". This card wae then mooed t o an adjoining f i l e of completed households. T h ~ j w i t h one set of car(ls we wen, able t o tell at any tima the number of householde which had been interviewed and the ones that vere l e f t to do. The cards were kept in alphabetical amber at a l l timas, and the questionnaires in order by their f i l e number so any doubt- ful coverage of a household could be checked. The nrrme of the enmerator of any household appeared not only on the questionmire but also an the household f l l e card.
iii
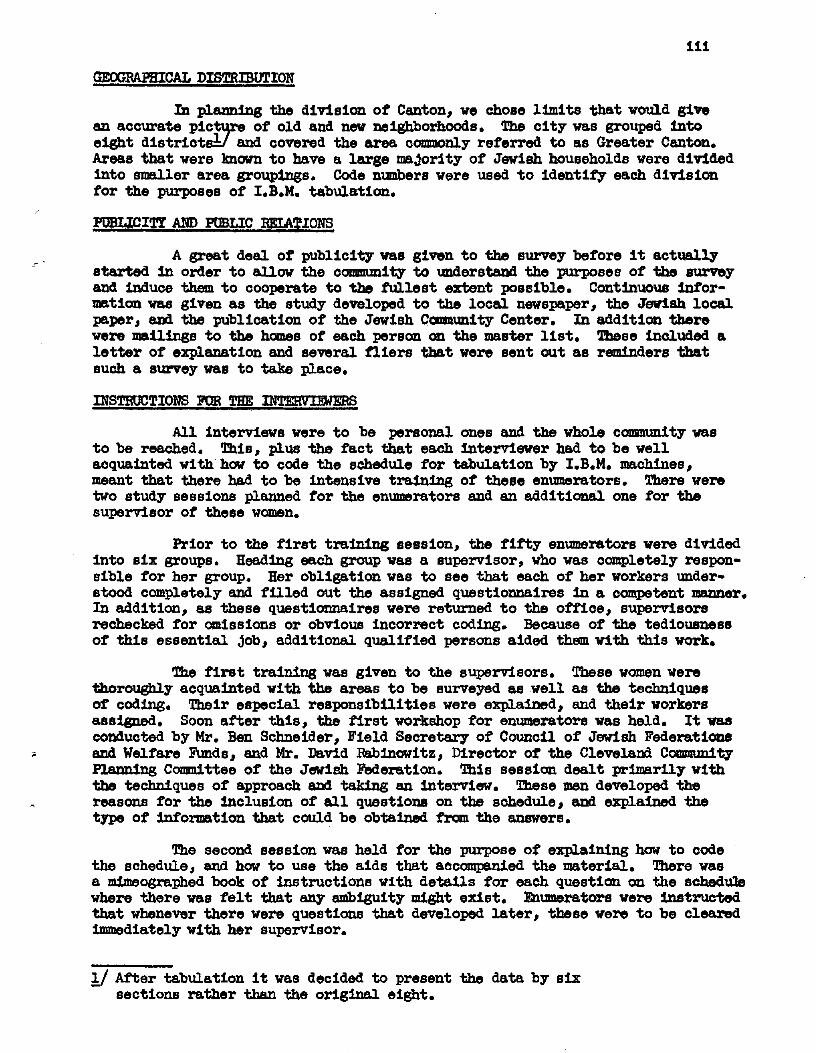
GEOGRAP3ICAL DISTRIBUTION
In flaming the division of Canton, we chose limits that w a d give an accurate pic P of old and nev nei&borhoade. lZle c i ty was grouped into eight d i s t r ia t and covered the area commonly referred to as Greater Canton. Areas that were ham t o have a large majority of Jewieh houeeholds were divided into smaller area groupings. Code nunbere were used t o identify each division for the purposes of I.B.M. tabulation.
PVBfJ%ITx AraD PUBLIC RELATIrn
A great deal o r publicitywas given t o the survey before it actually started in order t o allow the comnnmity to understand the purposes of the m y and induce them t o cooperate to the ful les t extent possible. Continuoue W o r - mstion ww ggien as the study developed t o the local newspaper, the Jewish local paper, srd the publication of the Jewieh Ccmmunity Center. In addition there were mailings t o the horns6 of each person a the master list. These included a l e t t e r of explanation and several f l i e re that were sent out as remlndere tbst such a survey wae t o take place.
A l l interviews were t o be personal ones and the whole canmnmity was t o be reached. This, flus the fact that each interviewer had t o be well aoquainted w i t h how to code the schedule for tabulation by I.B.M. machines, meant that there had t o be intensive training of theee enumerators. There were two study sessiona planned for the enumerators and an additional one for the supervisor of these women,
Prior t o the first training session, the f i f t y enumerators were divided into s ix groups. Heading each group waa a supervisor, who was completely respon- sible for her group. Her obligation was to see that each of her workers under- stood completely and f i l led out ths assigned questionnaires in a competent mannsr. In addition, aa these questionnaires were returned t o the office, superviso~l rechecked for omissions or obvious incorrect coding. Because of the tediousmas of this essential job, additional quslified persons aided thesn v i th t h l a work.
The first training was given to the supervisors. These women were thoroughly acquainted v i th the areas t o be surveyed aa well as the techniques of coding. Their eapecial responsibilities were explained, and their workera assiepled. Soon af ter this, the first work&op for enurnerstore was held. It was conducted by M r . Ben Schneider, Field Seoretary of Council of Jewish Federatione and Welfare Funds, and M r . David Rabincrwitz, Director or the Cleveland Communitp PUmhg Conunittee of the Jewish Federation, This session dea l t primarilywith the techniques of approach and taking an interview. These men developed the reasons for the inclueion of a l l questions on the schedule, end explained the type of information that could be obtahad from the anawers.
The second seesion was held for the purpose of explaining haw t o code the schedule, and haw t o use the aids that accompanied the material. There was a minmeographed book of instructions with detai ls for each question on the achedub where there was f e l t fhat m y ambiguity might exist. Enurn to r s were instructed that whenever there were question8 that developed later , these were to be cleared inmmdiately w i t h her supervisor.
1/ After tabulation it was decided t o present the data by six - sections rather than the original eight.
Following these sessions, the enumerators received their kits. All materials were distributed in heavy manila envelopes, strong enough on which to write. Included in each kit were the cards of prospects to be interviewed, the proper nuaber of questionnaires, a booklet of instructions, a map of the geograph- ical districts according to this survey, a pencil, scratch paper for personal questions, and a carbon copy of a control sheet with the names of prospects on it, which was to be turned in marked with the dates on which each interview wae completed.
THE SURVEY
Each enmerator was given fourteen persons to interview and her own household. It was decided that she would complete three of these and return them to her supervisor to be checked prior to doing the remaining schedules. This was found to work very satisfactorily insofar ar correcting any errors or mistakes in interpretation. During the major part of the survey, an office was maintained at the Jewish Cormunity Center where scl~alules were turned in, and checked at the time they w5re returned. The office as staffed by the Supervisors, key personnel, and a special group that could check these questionnaires. Only two persons were permittee? to do the filing of the schedules, which meant that a careful system was ~;laini~ii:ed throughout. Everj schedule was initialed when it had been rechecked for eri-grs or omissions, and then carefully checked against the file card before it was stored to be sent to I.B.M. offices. After the 1.B.M. punching and card running procedures were completed, the data sheets were sent to Alvtn Chenkln who prepared the analysis following.

Canton's Jewish population a t the time the interviewing for this study was completed (October 1 s 5 ) was 2,772a; &most equally divided between males (1,373) and females (1,399). No figures are currently available on the white population of Canton so Table A below u t i l i zes 1950 census data.
TABLE A 1955 CANMN JEWISH PO,DULTION AISD 1950 WHITE FOPULWI"l!ON OF CANTON UHBAN AFW
Jewish General White Sex - Population Population - Urban Area
Male 1 ,373 Female xi52
Total 2,772 164,501
Source: United States Census Report 1950 P-c35, Table 53, p.210.
The Canton Jewish population i n 1955 was 1.7 per cent of the Canton urban area's general white population i n 1950. Allowtng for a moderate increase i n Canton's white population between 1 s 0 and 1955 iihe proportion i n 1 s 5 would probably be closer t o 1.5 per cent. (The overall proportion of Jews nationally t o the total United States population i n 1955 was 3.1 per cent. Adjusting t h i s figure by the 1950 proportion of urban white population we get an estimsted seven per cent of the U.S. urban white population t o be Jews).
Geo~rauhic Distribution
Canton's Jewish population was largely centered i n three areas; Sections IV, V, and VI accounting together for 86 per cent of the totaJ.. Sections IV and V a re the central portions within Canton running eas t t o west; Section VI: runs northerly and extends beyond the c i t y limits proper.
The bulk of the Jewish population i n Canton i s therefore located i n contigiious areas. (See Table B on following page) Characteristics of the Jews residing i n these sections discussed i n de ta i l below reveal tha t Sections IB and V are older and.siniilar in nature, Section V I has a younger element with a greater emphasis on newer families than the other areas.
- a - The Study design called fo r obtaining data from a11 households in which a t
leas t one Jew resided. Approximately 0.8 per cent of t he 2,772 were non- Jewish and are 'included i n a l l of the tables following. In addition, some 11 families (an estimated 20 t o 30 individuals) cculd not be reached.

TABLE B GMXIrUllPHICRL DISTRIBUTION OF CAmTOX'S JEWISH POPUTATION, 1955
Number Proportion of of
Sectiaii Jews Total Area Description - 78 2.8 Southwest (west of Market, South of Tuscarawae)
and Southeast (east of Market, South of Tuscarawas ) .
153 5.5 East of Market t o outskirts, North of Tuscarawas t o 12 Street.
1 4 5 5.2 West of Market t o outskirts, North of Tuscarawas t o 12 Street.
665 23.9 West of Market t o outskirts, north of 12 Street t o 30 Street.
887 32.0 East of Market t o outskirts, North of 12 Street t o 30 Street.
839 30.3 West of Market, North of 30 Street (Includes Market Hills] and East of Market, North of 30 Street (Includes Plain Center Road).
Total 2,772 100.0
-. -.
9-s than 0.5 of 1 per cent.
Me Mstribution -. . . .. .
Certain salient features of Centon1s Jewish population are similar t o those noted i n other Jewish studies: A population older on the average than the general white population; a dearth of numbers i n those whose b i r th years coincided with the depression years; a sharp increase i n the proportion of children under 10.
Figure 1 i l lus t ra tes these characteristics very clearly. (The "age- sex pyramid" i s constructed by taking each f ive year grouping for male and for female, and coruputing the proportion of each t o the t o t a l population. It i s then drawn from the ear l ies t age group up t o the oldest. Very young populaticms show a characteristic broad base and nar rm top. Events which have had a negative aspect upon the birth-rate in certain years are also evident by the narrowing of specific age bars.) The "pinched in" bar for the age group 21-25 shm the extreme effect of the depression years 193C-34 upon the Jewish birth- rate. Although the same trend is evident for the general white population ( for age group 15-19 since the Census data are f ive years ear l ier ) it is not so striking. Similarly, the Jewish age-sex pyramid shared the largest %ge group (except fo r the post war Sumper crop of s ix t o ten year olds) t o be 41-45 compared d t h tha t of 30-34 for the general white population (projected from ages 25-29 based upon Census data of 1950).
-. In pi id, these differences are reflective of the greater proportion
of foreign born i n the Jewishcompared with the genera.1 white population. Table C below gives the percentages on which Figure 1 was based.


TPBIX C - PERCENTAGE DISTRIBUTION OF CANTON JEWISH POPULATION (1955) AND GENERAL WHITE POPULATION (1950)
Jewish Male Female
Native Native A&?L and Foreign Foreign and Foreign Foreign Age
General White* Male Female
Native Native and Foreign o r e and Foreign Foreign
51-55 3.0 1.5 3.0 1.6 '50-54 3-1 0.6 2.9 0.4 56-60 3.1 1-7 2.7 1.4 55-59 3.0 0.7 2.7 0.5 61-65 2.3 1.6 2.2 1.6 60-64 2.3 0.6 2.2 0.4 66-70 1-9 1.6 1.8 1.4 65-69 1.7 0.5 1.8 0.3 71-75 1.0 0.9 0.9 0.8 70-74 1.1 0.3 1 .4 0.2
76 ma over 1.2 1.1 1.1 0.9 75andOrrer 1.1 0.2 1.5 0.2
Total 49.5 11. 9 50.5 11.1 ~ o t d . 49.1 4.0 , 50.9 3.2
#bss than 0.5 of 1 per cent.
*Derived from U.S. Census Report P-B35, p. 75 covering Canton Urban Area. Percentage of foreign born estimated from data on Canton City, U.S. Census Report PaC35, p. 210.
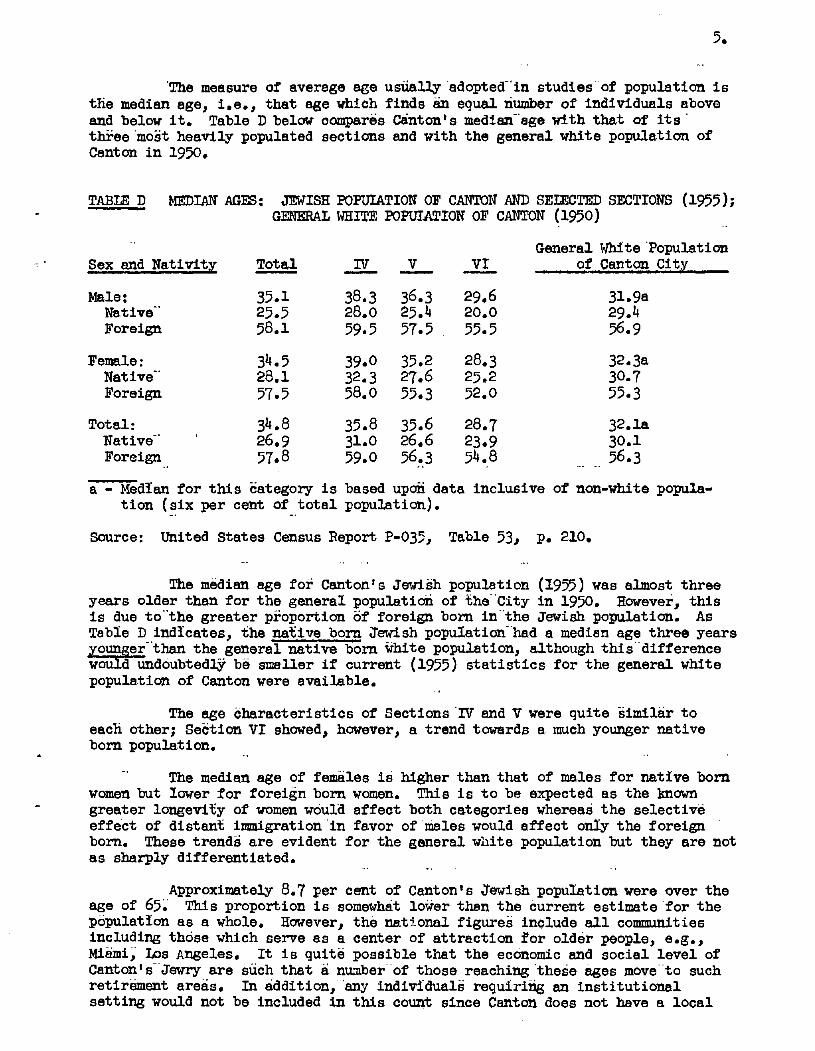
The measure of average a@e usliaUy adopted-'in studies of population i s the median age, i.e., that age which finds an equal number of individuals above and below it. Table D be lw oampares Canton's median-age with that of i t s three most heavily populated sections and with the general white population of Canton i n 1950.
TABLE D MEDIAN AGES: JEWISH IIOPJIATION OF CANTON AND SEIECTED SECTIONS (1955); GENERAL WHITE IIOFUTATIOW OF CANTON (1950)
General White 'Populaticm Sex and Nativity - Total IU V - - V I - of Canton C i t y
Male: 35.1 38.3 36.3 29.6 Native-' 25.5 28.0 25.4 20.0 Foreign 58.1 59.5 57.5 55.5
Female : 34.5 39.0 35.2 28.3 Native" 28.1 32.3 27.6 25.2 Foreign 57.5 58.0 55.3 52.0
Total: 34.8 35.8 35.6 28.7 32. l a Native-' 26.9 31.0 26.6 23.9 30.1 Foreign 57.8 59.0 56.3 -. 54.8 .. .. 56.3 -
a - Medfan for t h i s category i s based upoii data inclusive of non-white popula- t ion (s ix per cent of to ta l population). -. -.
Source: United States Census Report P-035, Table 53, p. 210.
The median age for Canton's Jewish population ( 1 9 5 ) was almost three years older than for the general. population of the City in 1950. Hmver, th i s i s due to- the greater proportion of foreign born in the Jewish population. A s Table D indxcates, the na%ive born Jewish popuIation had a median age three years
er-'than the general native born white population, although this difference SF d undoubtedlj; be smeller i f current (1955) s t a t i s t i c s for the general white population of Canton were available.
The age characteristics of Sections'IU and V were quite similar t o eack other; Section V I showed, however, a trend towards a much younger native born population.
-. The median age of females i d higher than that of males for natrve born
women but lower for foreign born women. This i s t o be expected as the known greater 1ongevit;y of women woula affect both categories whereas the selective effect of distant imigrat ion ' in fa.vor of 'males would affect only the foreign born. These trends are evident fo r the general white population but they are not as sharply differentiated.
-. . -.
Approximately 8.7 per cent of Canton's &wish population were over the age of 65. This proportion i s somewhat lower than the current estimate for the populatfon as a whole. Hawever, the national figures include all communities including those which serve as a center of attraction fo r older people, e.g., Miami, IDS Angeles. It i s quite possible that the economic and social level of Canton's-Jewry are such that a number of those reaching these ages move to such retirement areasa In addition, any individuals requiring an inst i tut ional setting would not be included in this count since Canton does not have a local

Jewish Home fo r the Aged. I n 1950 8.7 per cent of Canton'e white urban population were 65 or over. From theee figures it i s evident tha t the median age of Canton'e Jewish population is higher than tha t of the general Canton white population for another reason than an overweighting of those 65 and over. Reference t o Figure 1 w i l l show tha t the greater median age of the Jewish population was due t o the proportionately heavier weighting of the Jewish population i n the 40-65 age groups and the sharper r e l a t ive decreases i n the younger age-deficient groups.
Sex Ratio . A useful indicator of trends i n population development are "sex-ratios".
This r a t i o i s the number of males for every 100 females. A wide divergence away from 100 signifying an imbalance between males and females would have negative implications for the a b i l i t y of the Jewish group t o reproduce i t s e l f . Par t icular- l y i n the years when most marriages take place, a sex-ratio well below 100 would indicate delayed marriages and a pressure t o narry outside of the group.
Table E below gives the eex-ratios f o r the Canton Jewish population of 1955 by t en year age groups and the comparable figures for the general white population of the Canton Urban Area i n 1950.
CLWON SEX RATIOS
Jewi sh General White* Age 1955 Age 19 50
41-50 99 40-49 95 51-60 109 50- 59 108 61-70 106 60-69 loo
71 and Gver 107 70 and Over 78
Total 98 97
eource : U .S . Census Report P-B35, p .75 (Urban Area of canton)
While the aex-ratio for Canton's t o t a l Jewish population was very close t o 100, the age period when most marriages take place showed a strong de f i c i t i n males. It is qui te possible tha t t h i s r e f l ec t s the problems of a small c i t y i n keeping the young men who go i n for professional vocations. The general white population shows the same s i tua t ion except t h a t the deviations from equality a re not so dras t ic as for the Jewish population. Thie is not inconsistent with the hypothesis suggested above a s it is l ike ly tha t a larger proportion of the Jewish youth are following professional careers than i s the caee fo r the general white population. The higher sex-ratios i n the older age groups fo r the Jewish population compared with the general population are a t l ea s t pa r t i a l ly explained by the re la t ive ly heavier foreign born component of the farmer. A s indicated above males tend t o outnumber females i n migration from dietant points.
Although e a r l i e r Jewish studies revealed many instances where the sex-ratios i n the e a r l i e r age groups were above 100, a group of three studies conducted moat recently among comunit ies of under 10,000 Jewish population were not too diss imilar from Canton's data.

TABU F SEX-RATIOS OF CWlBB JEWTSH POPULA!KaBB IMD TEE33 OTIER JEWISH COMHMTZES BY J%GE GROUP6 Ll t o 50
New De s Canton Orleans m* Moine s*
Ae;e (19551 1 9 5 3 t1955) (1956)
- + - Age groups begin with 10-19, then by ten year groups t o 40-49.
F e r t i l i t y Ratio
One of the most d i f f i c u l t of tasks is to venture a judgement on the f e r t i l i t y of the Jewish population. And yet without t h i s knowledge we can not know whether the Jewish population is increasing, decreasing, or reminine; e t a t i c . Population change over a given time span i s based upon the excess (or d e f i c i t ) of b i r ths over deaths plus i&gration minus emigration. For groups within the population euch as the Jews, there is an added factor: lo@& through in ter - marriage or disassociation. For the population a s a whole the death r a t e has reached record lows; it i s unlikely t o go further below i t e present level t o any signif icant degree i n the next decede. Immigration can not contribute much more than a t r i ck le t o the Jewish t o t a l although emigration is also v i r tua l ly non- exis tent . In te r marriage may occur i n f ive t o ten per cent of Jewish households. The one basic factor remaining before we could assesa the long-tern trends i n J e d s h population growth is the present J e d s h f e r t i l i t y , i .e ., how many children on the average w i l l a Jewish mother 'nave during the years trhen she is biologically capable of reproducing? Unfortunately, these data are t o t a l l y lacking; indeed even Jewish b i r t h ra tes (number of children born i n a given year t o females i n varioua age brackets) are unavailable.
I n l i eu of t h i s type of information, another s t a t i s t i c a l measure has been ut i l ized, the " f e r t i l i t y rat io ." This i s the number of children under f ive related to the number of females from 20 t o 44. The chief d i f f icu l ty with this measure has been tha t it i e usually limited t o Census years so f a r as the general population is concerned.
Canton's Jewish f e r t i l i t y r a t i o i e given below as well as the one for the Canton urban area white population i n 1950. Also s h m are the r a t ios for the other small Jewish communities studied recently.
TABLE G FERTILITX RATIOS
Community Year - Ratio
Canton Jewish 1955 468.9 Canton Urban Area-Vhite 519 -8
New Orleans lg50 1953 496.5 Des Moines 1956 596 3 L ~ a n 1955 527 *8
It i s evident from these data that Canton i s behind not only i t s cnin general cowinunity but that of other Jewish communities recently studied as well . While this does not necessarily mean that Canton's Jewish population i s not replenishing i t se l f or better, it does indicate that the *easing f e r t i l i t y trend does not necessarily apply t o the Jevlsh population t o the same degree that it relates t o the general population.
Marital Status
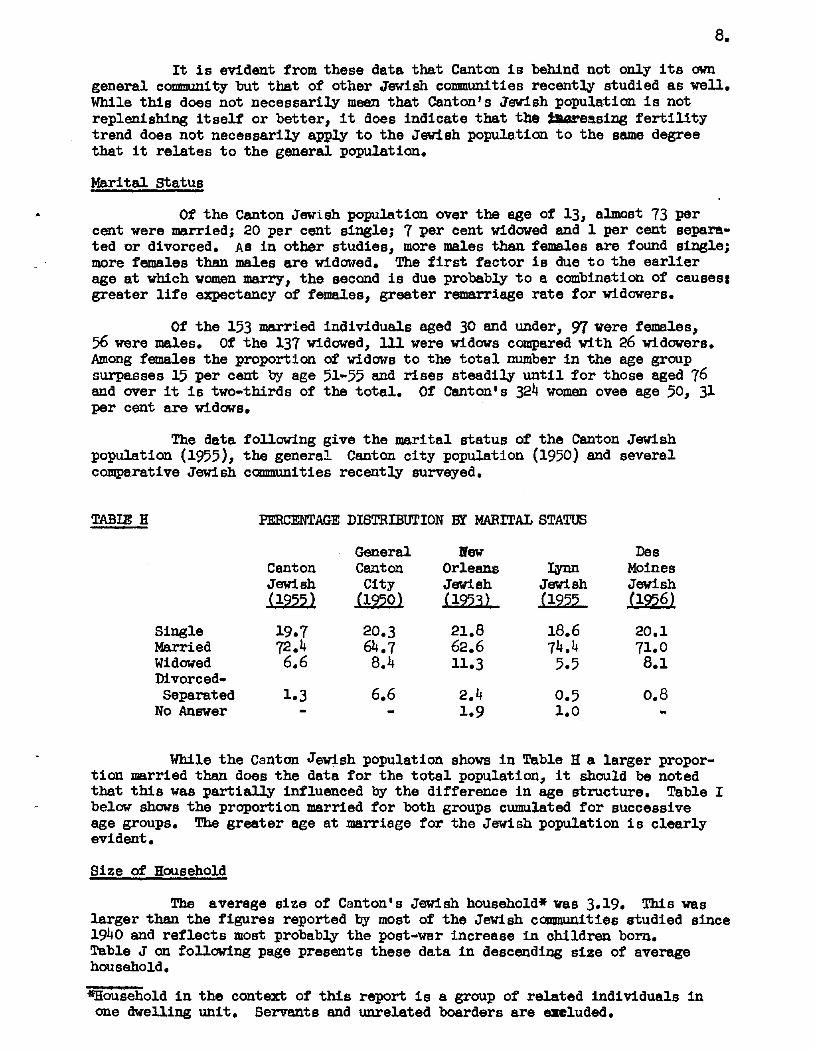
Of the Canton Jewish population aver the ege of 13, almost 73 per cent were married; 20 per cent single; 7 per cent widowed and 1 per cent separa- ted or divorced. AS i n other studies, more males than females are found single; more females than males are widowed. The f i r s t factor i s due t o the earl ier age a t which women marrg, the second is due probably t o a combination of causes: greater l i f e expectancy of females, greater remarriage ra te fo r widowers.
Of the 153 married individuals aged 30 and under, 97 were females, 56 were males. Of the 137 widwed, 111 were widows compared with 26 widowers. Among females the proportion of widows t o the t o t a l number in the age group surpasses 15 per cent by age 51-55 and rises steadily un t i l f o r those aged 76 and over it i s two-thirds of the total. Of Canton's 324 women ovee age 50, 31 per cent are widaus.
The data following give the marital status of the Canton Jewish population (1955), the general Canton c i ty population (1950) and several comparative Jewish ccmunities recently surveyed.
TAB= H PERCENTAGE DISTRIBUTION BY MARITAL STATUS
General lPew Des Canton Cant on Orleans rn Moines Jewi ah C i t y Jewish Jewish Jewish (1955) (1950) (1953) 11955 j1956)
Single 19.7 20.3 21.8 18.6 20.1 Married 72.4 64.7 62.6 74.4 71.0 Widowed 6.6 8.4 11.3 5.5 8.1 Mvorced- Separated 1.3 6.6 2.4 0.5 0.8
NO Answer - - 1.9 1.0 -
While the Canton Jewish population shows i n Table H a larger propor- tion married than does the data fo r the t o t a l population, it should be noted that this was part ial ly influenced by the difference i n age etmcture. Table I below shows the proportion married for both groups cumulated fo r successive age groups. The greater age a t marriage for the Jewish population i s clearly evident.
Size of Household
The average size of Canton's Jewish household* was 3.19. This was larger than the figures reported by most of the Jewish canarmnities studied since 1940 and reflects most probably the post-war increase in children born. Table J on following page presents these data in descending s ise of average household. - qousehold i n the context of this report i s a group of related individuals in one dwelling unit. Servants and unrelated boarders are excluded.

TABLE I czJMUuTED PERCENTAGES OF MARRIED I N D r n I D U A E FOR FIVE YEAH AGE GEOUPS AFTER 13
Age More Than 13 But Less Than
Csntoa Jewish (1955 )
Age More Than 13 But Lees Than
Canton City
General Popu1a.t i on
(1950 )
Tot a1 72.4 Total 64.7
Community
Jacksonville Grand Rapids rsnn Pittsburgh
Canton
Indianapolis Ces Mines Camden Gary Nashville Trenton
AVHiAGE SIZE OF JEWISH HOUSEHOZE
Date of
Study
194 5 1944 1955 1953
1955
194 8 1956 194 8 1940 194 9 194 9
Size - 3.50 3.43 3-30 3.23
3.19
3.13 3.11 3.10 3.10 3.08 3.m
Community
Erie Worcester Passaic Port Chester Elmira Los Angeles Toledo Ut ica New Orleans Tucson Miami Sal t Lake C i t y
Date of
Study
1940 1942 1949 1950 194 9 1950 194 4 1948 1953 1948 1949 1949
Size - 3-07 3-05 3.04 3.04 3.01 3.00 2.98 2.98 2.83 2.70 2.63 2.62
The only one of the three large sections t o d i f fe r significantly from the wer -a l l average size of household of 3.1 was Section VI. Comparative figures of the distribution of households by size fo r these Sections are shown i n Table K on the following page.
It is clear from Table K tha t proportionately few individuals l ive alone i n Section V I while conversely the four person household i s much more i n evidence than in other areas i n Canton. Although direct information on t h i s point was not secured, the lower median age and few foreign born i n Section V I make plausible the supposition tha t the larger size hot~seholds i n t h i s Section are a resul t of young families with growing children.

TABLE K PERCENTAGE DISTRIBUTION OF JEWISH H01fijEHOLD6 BY SIZE FOR CANTON AND SEXTION'S IV, V, AND V I
Household Size
7 8
Average Size
Jewish Population A l l Sections
Cant on - N - v - VI -
The average s ize of household* f o r Canton's c i ty population i n 1950 was 3.34. This figure i s not qui te comparable with tha t derived above f o r the Canton Jewish population a s i t i n c l ~ ~ d e s unrelated lodgers and employees. Excluding these l a t t e r t o bring the definition closer t o the one adopted f o r the Jewish population would bring the average t o approxilmtely 3.0. It i s obvious tha t the assumed increase i n the number of children since the United States lensus was taken i n Canton would ra ise t h i s average i f t h e figures were available fo r 1955 but it would appear tha t the average s i ze 09 household f o r the Canton City General population and the Jewish population is not too divergent from each other.
Almost 55 per cent of Canton's Jewish population were members 09 households with four or f ive members, almost three quarters i n households of from three t o f ive members. Only three per cent of Canton's Jewish population lived apart from relatives; only seven per cent lived i n households with more than f i v e members. The de ta i l s follow i n Table L.
TABLE L NUMBER AND PERCENTAGE DISTRIBUTION OF CAWTON JEWISH POPUIATION BY SIZE OF HOUSEKOLD, 1955
Size of Household
Total
Number - Per Cent -
- *Bcludes f ive f o r whom no section was indicated.
- %ource: Derived from U.S. Censce Report P-C35, Table 59, p. 231 (Canton City)
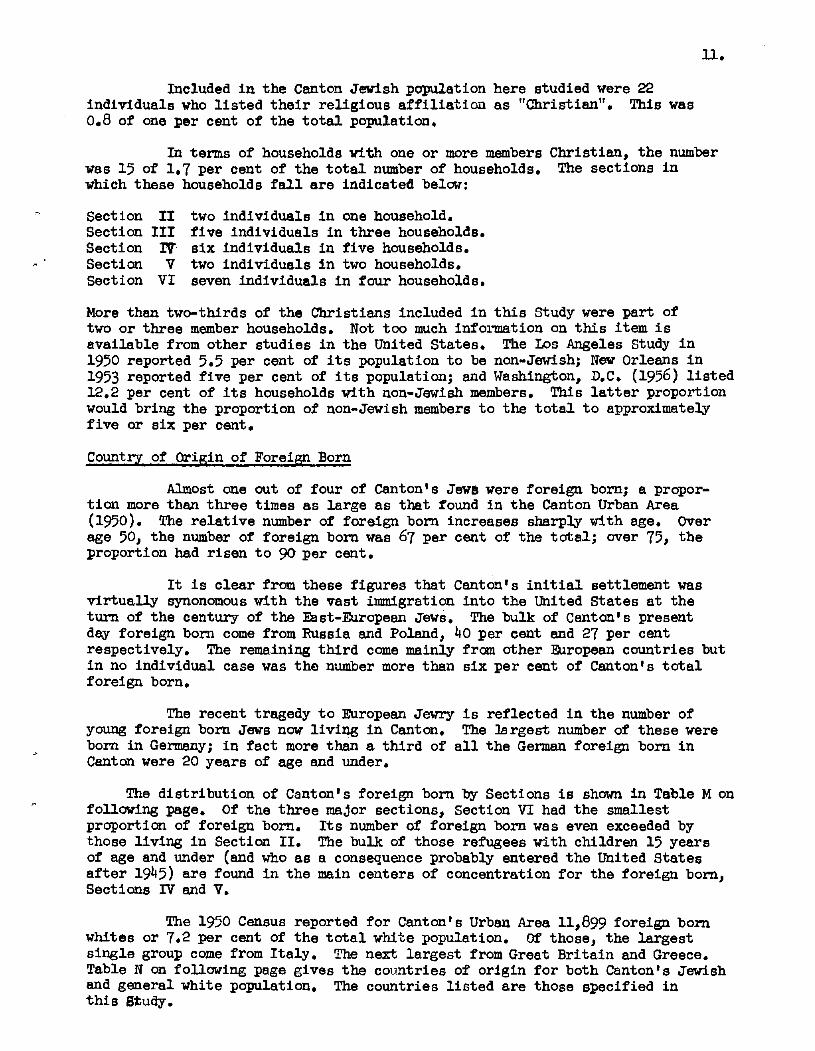
Included i n the Canton Jewish papuletion here studied were 22 individuals who l i s t e d t h e i r religious a f f i l i a t ion a s "Christian". This was 0.8 of one per cent of the t o t a l population.
In terms of households with one or more members Christian, the number was 15 of 1.7 per cent of the t o t a l number of households. The sections i n which these households f a l l are indicated below:
. Section I1 two individuals i n one household. Section I11 f ive individuals i n three househol0s. Section TF s i x individuals i n f ive households. Section V two individuals In two households. Section V I seven individuals i n four households.
More than two-thirds of the Christians included i n this Study were part of two or three member households. Not too much infollnation on this item i s available from other studies i n the United States. The Zos Angeles Study i n 1950 reported 5.5 per cent of i t s population t o be non-Jewish; N w Orleans i n 1953 reported f ive per cent of i t s population; and Washington, D.C. (1956) l i s t ed 12.2 per cent of i t s households with non-Jewish members. This l a t t e r proportion would bring the proportion of non-Jewish members t o the t o t a l t o approximately f ive or s ix per cent.
Country of Wigin of Foreign Born
Almost one out of four of Canton's Jew8 were foreign born; a propor- t ion more than three times a s large a s thet found i n the Canton Urban Area (1950). The re la t ive number of foreign born increases sharply with age. Over age 50, the number of foreign born was 67 per cent of the total; over 75, the proportion had r isen t o 90 per cent.
It i s clear f r m these figures tha t Canton's i n i t i a l settlement was vir tual ly synonomous with the vast immigration in to the United States a t the turn of the century of the East-European Jews. The bulk of Canton's present day foreign born come from Russia and Poland, 40 per cent end 27 per cent respectively. The remaining t h i r d come mainly from other &ropean countries but i n no individual case was tho number more than s i x per cent of Canton's t o t a l foreign born.
The recent tragedy t o European Jewry i s reflected i n the number of young foreign born Jews now l iving i n Canton. The largest number of these were born i n Germany; i n fac t more than a t h i r d of a l l t he German foreign born i n Canton were 20 years of age and under.
The dis tr ibut ion of Canton's foreign born by Sections is shown in Table M on following page. Of the three major sections, Section VI had the smallest proportion of foreign born. I t s number of foreign born was even exceeded by those l iving i n Section 11. The bulk of those refugees with children 15 years of age and under (and who a s a consequence probably entered the United States a f t e r 1945) a re found i n the main centers of concentration f o r the foreign born, Sections IV and V.
The 1950 Census reported fo r Canton's Urban Area 11,899 foreign born whites or 7.2 per cent of the t o t a l white population. Of those, the largest single group come from Italy. The next largest from Great Britain and Greece. Table N on following page gives the countries of origin f o r both Canton's Jewish and general white population. The countries l i s t ed a re those specified i n t h i s 82udy.

TABLE M -CAL DISTRIBVTION OF CANTON'S FOREIGN BORN POP~TION, 1955
Section
I I1
I11 IV v
V I Section Vhknown
Total
Foreign Born -
Per Cent Total
Foreign
Per Cent of! Total Population Each
Section
TABLE N COUNTXY OF ORIGIN FOR CANTON'S FOEIGN BORN JEWISH (1955) - AND URBAN G E N W WHITE (1950j
Country of Jewish (1955) General White (19501 Origin - Number Per Cent Idumber Per Cent
7
Russia 257 40.3 518 4.4 Poland 169 26.5 550 4.5 Germany 39 6.1 1,070 8.9 Austria 32 5. 0 525 4.4 H'-'ngary 35 5.5 653 5.4
Rumania 21 3.3 895 7.4 Czechoslovakia 25 3.9 485 4.1 Iatvia-Lithuania 21 3.3 39 0.3 -Land 9 1.4 979 8.2 fiance 5 0.8 127 1.1
Canada 18 2.8 318 2.7 Is rae l 3 0.5 - - Other 0.5 -2 - 5,790 46.6 Total 637 100.0 11,899 100.0
Studies of a group of Jewish ccmnmities conducted i n 1945 and l a t e r show that the proportion of native born t o t a t a l population was greater i n Canton than i n most of the other c m i t i e s . The date are &own below i n Table 0.
Since all the Jewish colrnnunities in Table 0 showed the same preponderance of foreign born i n the older age groups it i s not unexpected tha t the more recent studies report proportionately more native born.
The bulk of the foreign born now l iving i n Canton Came t o the United States i n the great pre-World War I wave of immigration. By 1920 sixty per cent of Canton's present foreign born had arrived a t these shores.

PROPORTION OF TOTAL JEWISH POPU?ATIOnJ NATIVE BORH
Date of Proportion Cotnmunity Study Native Born
Houston 1936 New Orleans 1953 Des Moines 1956
Canton 1955 77.0
Trent on 1949 Port Chester 1930 Newark 194 8 Passaic 19k 9 Los Angeles 1951 scranton 1945
While the foreign born who came t o Canton i n t h e years from 1945 on, a re relat ively small, 13.6 per cent, they comprise 71 per cent of a l l foreign born 35 years and yotmger. However, it i s not t o be expected tha t the foreign born w i l l be a significant factor i n Canton's growth. Whereas 55 foreign born n w i n Canton came t o the United States i n t h e period 1945-49, the number who arrived from 1950 on had dropped t o 32. Almost three-fourths of the foreign born now i n Canton who had entered the W t e d States within a ten year period of t h i s Study now reside i n Sections IV and V (61: out of a tcrtal of 87). Only two have settled i n Section VI, the t h i r d most populous section.
The dis tr ibut ion of the Cantm foreign born by year of a r r i v a l i n the United States i s f a i r l y close t o similar data compiled from studies of the New Orleans and Des bIoines Jewish populations. Table P does show a smaller proportion of Canton's foreign born arriving i n the period from 1950 on.
TABLE P TlIE JEWISH FOHEIGN BORN OF CARTON, NEW ORI;EANS, AND DElS NOINE5 DISTRIBUTED BY YEAR OF ARRIVAL IN THE UNITED STATES
Year
1950-Study Year 1945-49 1940-44 1930-39 Before 1930 Not Specified
Total
Canton (1955 )
New Orleans (1953
Des Moines (1956)
Area In Which Cantan's Native Born Jews Oriainafed - And Time of Arrival
The extent t o which Cantcmts Jewish population has been fed from outside sources i s evidenced i n data derived from Tables E arld V I I and mumnarized belou.

GEOGRAPHICAL ORIGIN OF CANTON JEWISH COMMUNITY, 1955
Native Born In Canton Outside Canton Foreim Barn
Number 1 172 963 637 Per Cent /2.3 34.7 23.0
. Of the 963 Jews native t o places in the United States other than
Canton, approximately 25 per cent had moved t o Canton prior t o 1935, 22 per cent during the period 1936 t o 1944, and another 50 per cent from 1945 an. Almost
+
90 per cent of these Jews came from within the =st Central or Central Atlantic States. The other areas i n the United States are sparsely represented i n Canton, the highest proportion from among the remaining regions being f ive per cent (west Central).
- The importance of in-migration t o the maintenance of Canton1 s Jewish population level may be gauged from the f ac t that i n 1955 more than 21 per cent of the current population had come from outside Canton during the period from 1945 on. Unfortunately, we have no direct evidence on those involved i n the reverse movement, i.e., out-migration from C~nton. Since they a re not present t o answer questions we can not h a w t h e i r age distribution, vocational skills, etc. We can surmise, hwever, t ha t the volume of out-migration was heavy; a t leas t a s large a s the movement in. In 1945 a survey of Canton's Jewish popula- t ion undertaken fo r the Community Center gave a f igure of 3,200 Jews. The wr i te r has no data on the method employed but it i s doubtful whether a correction f o r overstatement would reduce the figuse f o r tha t year t o a number below the current census of 2,772.
B Canton i s t o maintain i t s present population lfwel, certainly i f it i s t o increase, in-migration w i l l have t o supplement the proportionate increase i n the number of children boPn since the end of World War 11.
Table IV i n the Appendix gives the age dis tr ibut ion of Canton's native born Jewish population by region of l a s t pr ior residence. The East Central Region includes those who a r e native t o Canton i t s e l f . Table VII i n the Appendix gives the data on native born by region of Last residence and time period moved but the East Central Region is exclusive of those native t o Cant on.
Plans fo r Staying i n Canton -
Five per cent of Canton's Jewish population reported plans f o r moving outside of Canton. The age dis tr ibut ion of those planning t o move when compared with those remaining i s qui te similar, a t leas t when broad age classif icat ions a re util ized. However, 12.1 per cent of those planning t o move were i n the age group 21-30 compared with 8.1 per cent of those with no plans t o move.
It would require more refined data before we could defini tely assign a reason other than chance t o t h i s percentage difference. It may be suggestive, however, that these a r e the years when graduate students i n the professions - medicine, l a w , engineering - seek employment, the sources of which may not be found in Canton. These age groups a r e a t present relat ively deficient i n numbers fo r reasons discussed ea r l i e r i n the text.
The proportions of each age group plavring t o leave Canton a re shown below i n Table R. No age group shows a higher proportion than that of 26-30 and only two others exceed 21-25.

TABLE R PROPORTION OF MCE AGE GROiJP OF CANTON'S JEWISH r n ~ I 0 N REPOmIMI PfAMS To iY).m FROM CANTON
Age Groq Proportion Age Grouy, -.?P*oporti~m
41-45 46-50 51- 55 56-60 61-65 66-70 71-75 76 & Over Total
of the tbree largest sections, N and V reported 6.6 and 6.2 per cent respectively of t h e i r number planned t o move; Section V I on the other hand indicated only 2.9 per cent with such intentions.
Answers t o such a question a s whether the household plans t o stay or leave Canton are necessarily subjective. The magnitude of response i n a particular direction is related t o the time span which the respondent has i n mind among other factors. The New Orleans Study (1953) asked f o r "current household plans f o r moving" and the Des Moines Study (1956) asked f o r the family head's plans "for the coming year". In both communities the proportion indicating plans t o leave the community was f a r l e s s than reported i n Canton.
Naturalization Status
Eleven per cent of Canton's Jewish foreign born were aliens, of which four per cent had " f i r s t papers".
The desire f o r f u l l citizenship s tatus may be gauged by the data f o r the group entering the United States during the period 1945-49. Of t h i s group of 55, only 3 are s t i l l aliens, 9 have f i r s t papers, w h i l e 42 have already been naturalized.
The table following indicates the proportions of foreign born s t i l l not naturalized i n various Jewish comrmznities studied during recent years. It should be noted tha t the re la t ive number of foreign born ilmoigrating t o the United States within f ive years of the particular study has an effect on these proportions.
TAB12 S PER CENT OF FOREIGN BORN WITB ALIEN STATUS I N VARIOUS JEWISH COMMUNITIES
Year of conmaulity Study
Des ~ o i n e s ( a ) 1956 Canton 1955 Jacksonville 1954 New Orleans 1953 Port Chester 1950 Passaic Trent on
194 9 194 9
(a);reign born, eighteen and wer.
Per Cent Alien
Of the U,675 foreign born reported fo r the Canton urban area in the Vaited States Census of 1 9 0 , 1 4 per cent were l i s t ed as aliens; 7 per cent with s ta tus unlmown.
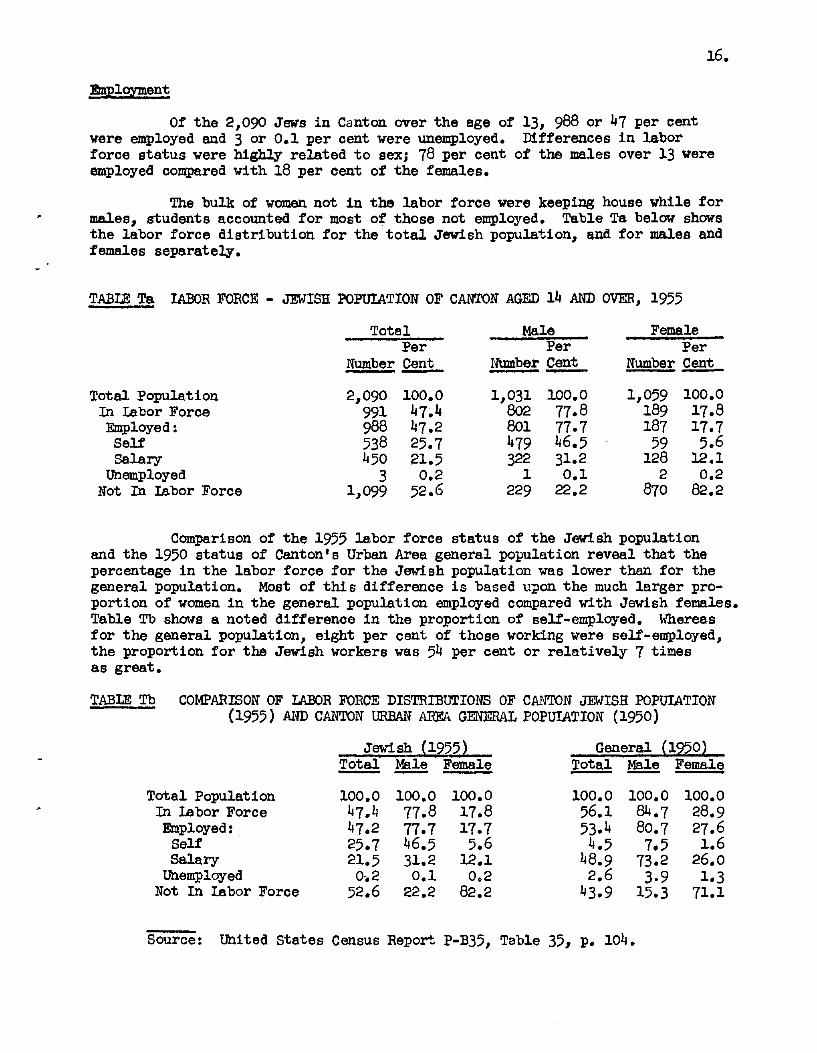
Of the 2,090 Jaws in Canton over the age of 13, 988 or 47 per cent were employed and 3 or 0.1 per cent were unemployed. Differences i n labor force status were highly related t o sex; 78 per cent of the males over 13 were employed compared with 18 per cent of the females.
The bulk of women not in the labor force were keeping house while for males, students accounted fo r most of those not employed. Table Ta below shows the labor force distribution fo r the t o t a l Jewish popula*ion, and for males and females separately.
TABLE Ta lABOR FORCE - JEWISH POPUIATION OF CANTON AGED 1 4 AND OVER, 1955
Total Male Female Per Per Per
Number Cent -- IJrrmber Cent -- Number C& -- Total Population 2,090 100.0 1,031 100.0 1,059 100.0
In Labor Force 991 47.4 802 77.8 189 17.8 Employed : 988 47.2 801 77.7 187 17.7 Self 538 25.7 479 46.5 59 5.6 Salary 450 21.5 322 31.2 128 12.1
Vnemployed 3 0.2 1 0.1 2 0.2 Not In Labor Force 1,099 52.6 229 22.2 870 82.2
Comparison of the 1955 labor force status of the Jewfsh population and the 1950 status of Canton's Urban Area general population reveal that the percentage i n the labor force for the Jewish population was lower than for the general population. Most of t h i s difference i s based upon the much larger pro- portion of women i n the general population employed compared with Jewish females. Table Tb shows a noted difference i n the proportion of self-employed. Whereas for the general population, eight per cent of those working were self-employed, the proportion for the Jewish workers was 54 per cent or relatively 7 times as great.
TABIZ Tb COMPARISON OF LABOR FORCZ DISTRIBUTIONS OF CANlON JEWISH POPULATION (1955) AID CANON URBAN AliEii GENERAL POPUIATION (1950)
Jewish (1955) Total Male Female --- General (1950)
Total Male Female --- Total Population 100.0 100.0 100.0 100.0 100.0 100.0
In h b o r Force 47.4 77.8 17.8 56.1 84.7 28.9 Employed : 47.2 77.7 17.7 53.4 80.7 27.6
Self 25.7 46.5 5.6 4.5 7.5 1.6 w a r y 21.5 31.2 12.1 48.9 73.2 26.0
Unemployed 0.2 0.1 0,2 2.6 3.9 1.3 Not In Labor Force 52.6 22.2 82.2 43.9 15.3 71.1
- Source: United States Census Report P-B35, Table 35, p. 104.

It i s apparent also from Table Tc tha t differences i n age structure does not i n i t s e l f contribute t o the differing proportions of employed i n the Jewish population and i n the general one. Cuily a f t e r age 40 does the Jewish - proportion employed i n the f ive years age grouping approach or exceed the general; before 21 only one-sixth a s many Jews are emplaged compared with the general population, end between 21 and 25 ha rdu more than one-half.
TABU Tc PROPORTION EMPIDYED I N EACE AGE GROUP, CANTON JEWISH POPUIATION (1955) AND CANTON CITY GFNWAL WPUlATION (1950)
Canton C i t y Jewish (1935) caner& ~opu l a t i& (1950)
Age Proportion Emplcyed . ~ e Proportion Bnployed
66-70 40.4 65-69 38.0 71-75 27.8 70-74 26.0 76 and Over 11.3 75 and Over 9.7 Total 47.4 Total 53.4 - Source: Derived from U.S. Census Report P-C35, Teble 66, p. 269.
Recent studies of Jewish populations providing labor force s t a t i s t i c s are noted below i n Table U.
TABLE U PROPORTION OF JENISH POmJLATIONS M THE LABOR FORCE
City and Year of Survey
Ins Angeles (1951) New Orleans (1953) Port Chester (1950) Des Moines (1955) Passaic (1949) Pittsburgh (194 9) Trenton (1949) Canton (1955
Over Per Cent In 4% Iabor Force
There i s a degree of non-camparability i n these s t a t i s t i c s because some of the studies d id not include age 14. The effect of t h i s is t o increase the labor force proportion i n cornpaison with those studies which did include age 14. Canton's labor force pro?ortion, for example, would be 48.9 per cent instead of 47.4 per cent i f age 14 had not been included. The proportions are, therefore, closer t o each other than the figures would indicate a t f i r s t inspection.

The t ex t above has already commented upon the re la t ive ly large proportion of self-emglaged i n the Jewish population when congared with the general population. Table Va following gives the proportians f o r each industr ial grouping by t o t a l employed, self-employed and salaried.
TABm Va PERCENTAGE DISTRIBUTION OF CANTON'S JEWISH X&PLOYED BY INDUSTRIAL ~ m w m AND BY ~ I D Y M E N T STATUS, 1955
Per C a t Employed Indue t ry Total Self -mployed Salaried -
Construction Manufacturing Finance Service
Professional 12.5 14.0 10.6 Recreational 0.7 0.6 . 0.9 Scrap Metal 8.6 10.3 6.4 Other Wholesale Trade 10.1 10.7 9.3
Retai l Trade: Food Druss Furniture Clothing
Other Not Reported
A l l Industries 100.0 100.0 100.0
A s would be assumed the older age groups have prosortionately more self-employed than the younger groups but even fo r those age groups 40 and under four out of every t en working a re self-employed. The de ta i l s a re shown i n Table Vb below.
TABIE Vb PROPORTION SET;F-EMPLOYED AND SAIARIED BY BROAD AGE GROUPS CANTON JEWISH POPUIATION, 1955
Per Cent hplqyed Self-
Total - Bnployed Salaried
40 and Under 100.0 42.7 57.3 Over 40 100.0 61.4 38.6 Total Over 13 100.0 54.4 45.6
The largest indus t r ia l concentration of Canton's employed (urban Area General Population-190) was i n manufacturing (47 per cent). The same per cent of the Jewish employed ( 1 9 5 ) was found i n the wholesale and r e t a i l trades. In additian the Jewish eqployed were more heavily concentrated i n business services and professional senrlces. The camgarative data fo r industri- a l groupings l i s t i n g specifically only those indus t r ia l groupings found i n the present study 1 follow in Table Vc.

TABU Vc PERCENTAGE DISTRIPILP1ION OF EMPUYED BY I:T%BTRJ-kJA GROUEWOS FOR CANToN JEWISE POPUIATION (1955) AND U W J AREA GEIVERAL POFUIATIODI ( 1 9 0 )
Industrial Grouping
Construction Manufacturing Finance Service Professional Recreation Wholesale Trade
(Scrap Metal) Reta i l Trade Other Not Reported Tom
Jewish Ge lle ral Urban Area
3 -9 47.4
a Reta i l Trade i n t h i s study included spec i f ica l ly Food, Drugs, Furniture and Clothing. Other r e t a i l trades are included i n Other.
The pa t te rn of indus t r ia l concentration fo r the Canton Jewish labor force was s imilar t o those found i n other s tudies of Jewish populations recent ly conducted. The wholesale and r e t a i l f i e l d s a r e predominant with the professional services group a l so const i tut ing an important aegmtit. The d e t a i l s f o l l a r i n Table Vd.
TABLE Vd COMPARISOI? OF INDUSTRIAL DISTRIBUTION OF JEWISH EMPlOYED I N SEVERAZ, COMMUNITIES m m m SURVEYED
Indus t r ia l Grouping
Construction Manufacturing - Wholssale-Retail Finance -Real Estate Business Services
. Professional Services Recreation
Canton (1955)
New Orleans (1953)
B s Moines 11956 1
Pittsburgh (1953)
Other 16.53 6.1 8.1 5 -4 Not Specif led - 0.1 - 0.2 - TUS AL 100 .O 100.0 100.0 100.0 100.0
3
N.B. - Personal Services reported separately and here included i n Business Services f o r Los Angeles, Des Moines and Pittsburgh. It was not coded separately f o r Canton and New Orleans.

The foreign born i n Canton's male labor force a re most important i n the industr ial f i e lds of scrap metal, other w~olesale trade, retail food and construction. Because few wonten are involved, the proportions for the t o t a l labor force are similar t o those observed fo r the male labor force elone. Table Ve shows the proportion of foreign born i n each industr ial grouping.
- TABIE Ve PROPOKTION FOmIGN BORN I N EACH INDUSTRIAL CIASSIFICATION OF JEWISH EMPLOYED, BY SEX, CANTON - 1955
- Industr ial Groupiq Construction Manufacturing Finance Service Professional Recreation Scrap Metal Wholesale Retail:
Food DruAs Furniture Clothing
Other
Proportion Foreign Born Male Fernale Total - 40.0
TOTAL 33 -3 20.5 30 -9
Comparing the dis tr ibut ion of the native and foreign born labor force a able Vf below) we note t h a t 14 per cent of the forsign born are i n scrap metal and 11 per cent i n other wholesale compared with proportions of 7 and 9 per cent f o r the native born. I n r e t a i l food, 13 per cent of the foreign born are employed cempared with seven per cent of the native born, but the reverse i s t rue fo r professional service, where 9 per cent of the foreign born are employed compared with 14 per cent of the native born.
TABIE V f DISTRIBUTION OF PlPLOYED BY INDUSTFUL GROUP, BY NATIVITY CANTON JEWISH POHJUTION - 1955
Industr ial Grouping
Construction Manufacturing Finance Service Professional Recreation Scrap Metal Wholesale Retai l
Food Drugs Furniture Clothing
Other TOTAL
Employed Native Foreign

21.
Table Vg following d is t r ibu tes occupational c lasses by the indus t r ia l grouping i n which employed. A s might be expected, the bulk of the professional vocational group a r e employed i n the pmfessional indus t r ia l grouping. Among the 88 i n t h i s category, there were 14 attorneys, 12 accountantl;, 28 physicians, 7 derrtists, 4 o p t o m t r i s t s and 4 chiropodists. The r e t a i l clothing industry is very important f o r the next s e t of vocational gmups: 25 per cent of the managers, 12 per cent of the proprietors, 13 per cent of the . c l e r i c a l employees, and 25 per cent of the sa les people a r e here employed.
The ski l led and semi-skilled a r e found predominantly i n the manu- facturing, business service and scrap mtal industries.
-AGE D I S T R ~ I O N OF CAImN JEWISH IABOR FORCE BY VOCATIONAL AM) ItDUSTRIAL GROUPINGS, 1955
V O C A T I O N A L G R O U P I N G TABLE Vg N o t
Profes- Man- r ropr i - Cler- Semi- Un- Swci - - Industry tiional .= e to r i c a l Sales Ski l led Ski l led S k i l l Other i i e d - Construction 0.7 1.9 2.8 1.9 - 15.9 5 -4 - - 16.7 Manufacturing 2.2 10.4 6.0 14.5 5.7 29.5 43.2 12.5 8.7 - Finance 5 -0 0.9 2.5 7.4 2.9 2.3 - - 4.3 16.7 Service 2 -9 9.4 7.8 14.8 4.3 25.0 8.1 25.0 8.7 - h.ofessiona1 80.6 - 0.3 7.4 - 4.5 - 4.2 2.2 - R e c m t ion Scrap Metal Wholesale Retail :
Foods Drugs Furniture Clothing
Other Not Reported
TOTAL 100.0 100.0 100 .O 100.0 100.0 100.0 100.0 100.0 100.0 l a 0
The difference between the vocational m t t e r n of the Jewish employed . and the non-Jewish i s c lear ly evident i n Table Vh on the following page.
Whereas proprietors account f o r 40 per cent of the t o t a l Jewish labor force, i n the general population the pmportion i s only 4 per cent. There a re proportion- a t e l y twice as many Jewish professionals and twice as many managers as i n the general population. While the c l e r i ca l and sa l e s f i e ld s account f o r 19.5 per cent of the Jewish employed compared with 21.0 per cent of t he general population, the proportions are qu i te dif ferent . There a re only 5 per cent of the Jewish employed as c l e r i ca l s compared with 14 per cent f o r sales people; i n the general population the proportions a r e reversed 13 per cent t o 8 per cent.
Almost 45 per cent of the general population's labor force are semi- sk i l l ed , unskilled, o r i n t he service t rades . Even allowing f o r cer ta in differences i n c lass i f ica t ion , the Jewish component i n these groups could not have exceeded 10 per cent.

TABIE Vh PERCENTAGE D I ~ ~ I O N OF CANTOBI'S n%?ITfSEI EMPiOYED (1955) AND CANTON C I T Y WPERIENCED LABOR FOXE 1950 BY VOCATIONAL GROUPS
Professional Manegers Proprietors Cler ica l Sales Skil led Semi -Skilled Service Workers Unskilled Other Not Specified
Canton Jewish Employed
M s Fenale Total
14.0 14.1 14.0 12.2 3.5 10.7 42.6 27.1 40.0 1.5 24.7 5.4
12.9 20.0 14.1 4.7 2.9 4 .I+ 4.1 1.8 3 97 a a a
2.7 1.2 2.4 4.6 4.7 4.6 0.7 - o .6
Experienced Canton Civ i l ian Labor Force Male Female Total
Source: U.S. Census Report (1950) V o l m P-C35, pp 306-311
a - Not reported separately but dis t r ibuted among other groups. Canton population f igums f o r t h i s category include domestic workers.
That the vocational pa t te rn of the Canton Jewish employed is not unique i s evident i n Table V i on the following page, where Canton i s compared with four other Jewish c o m n i t i e s recently surveyed. The la rger communities, Pittsburgh and Los Argeles, it is true, had roughly a t h i r d of t h e i r employed a s managers and proprietors coqpared with 40 t o 50 per cent f o r the slnaller c o m n i t i e s . But bas ica l ly the same conanents given above f o r the Canton vocational d i s t r ibu t ion could, with minor exception, be addressed t o these other cammunities.

TABLE V i DISTRIEITION OF JEWISH PIPIOYED BY VOCATIONAL GROUPINGS IN COMMUNITIES RECWTLY STUDIED
( 1955) ( 1953 1 (1956) ( 1953 1 (1950) Canton New Orleans Des Moines Pittsburgh Los Angeles
Vocation - Male Female Total Male Felnsle Total Male Female Total Male Fenmle T o t a l Male Fe~llale Total
Professional Managers Proprietors Cler ical Sales Skilled Semi -Skilled Service Unskilled Other Not Specified
TOTAL 100.0 100.0 100.0 100.0 100.0 100.0 100.0 100.0 100.0 100.0 100.0 l(iO.0 100.0 100.0 100.0
a - Not reported separately, but distributed amng the other groups.

SECUUlR EDUCATION
Almost a th i rd of Canton's Jewish population over the age of s ix had had sam~ college training. This proportion, however, understates the level t o which the Jewish population aspires i n educational matters because it includes those children who have not yet completed school and those older individuals who came t o the United States as immigrants. Table Wa below shows that f o r the age
1 group 26 through 50, 24 per cent of the Jews had attended college f o r some time without graduating, 12 per cent had graduated, and 14 per cent had done post- graduate work. Half therefore of a l l i n these age groups had proceeded beyond a high school diploms. Of t h i s same age group, only 12 per cent fa i led to f in i sh high school.
TABLE Wa PERCENTAGE DISTRIBUTION OF SECUIAR EDUCATION LEIS OF C m O N JEWISH FOWLATION OVER AGE OF 5 BY MAJOR AGE GROUPS - 1955
School Level A G E G R O U P S Reported 6 - 2 5 2 6 - 5 0 51 and Over Total
None 8.2 Elementary
Incomplete 45.6 Graduate 6.11
High School Incomplete 15 .O Graduate 7-5
College Incomplete 13.1 Graduate 2 -3 Post -Graduate 1.6
No Report 0.2
TOTAL 100.0
There was a marked difference between Section V I and the remaining two most heavily populated sections, IV and V. The proportion of college educated i n the age group 26 - 50 f o r these three sections is shown below i n Table Wb.
. TABU Wb PROFOKTION COLIEGE EDUCATED IN AGE GROUP 26-50 I N SECTIONS V, V I ,
AM) V I I CANTON JEWISH POPUTION 1955
College Level SECTIONS
N - v - V I - Incomplete 18.7 24.5 29 .O Graduated 12.1 7 -4 17.4 Post Graduate 15.6 10.3 17.1
Total A l l College Work 46.4 42.2 63 05

The general school level attained is mch higher f o r the Jewish population than f o r the general one. Table WC shows tha t over the age of 25, 18 per cent of the Jewish population had graduated college compared with 5 per cent for the gene- population (over the age of 24). Whereaa 21 per cent of the Jews reported no higher than an elemntary education (including 6 per cent who reported no education, although it is very l i ke ly tha t they received some secular education i n Europe before emigrating) 44 per cent of the general population were i n t h i s group.
TABLE Wc COMPARATIVE SCHOOL IEVEL A'ITAINED, CANTON URBAN AREA GENERAL POPULATION (AGE 25 AM) OVER I N 1950) AI'JD JEWISH POPUIATION
(AGE 26 AND OVER I N 1955)
School Level
None Elementary
Incomplete Graduate
High School Incomplete Graduate
College Incomplete Graduate Post Graduate
No Report
Canton Urban Area General Population
Canton Jewish PapuLat ion
6 -3
TUX'AL 100.0 100.0
Source: U.S. Census (1950) P-B35, Table 34, P- 92-
The differencesin educational attainments between the Jewish popu- l a t ion over 25 and the General Urban Area population over 24 remsine largely constant when the data are separated fo r the aexes. The most evident difference is the greater dispari ty i n favor of malea of those graduating college and going on t o post-gra.duate work. This ref lects the heavy concentration of the Jewish male population i n the professional vocations.
TABU Wd PROPOF?TIONS OF POPULATION WITH C0-E EDUCATION BY SEX FOR CAEJTON - JEWISH POHJIATION (AGE 26 AND OVER I N 1955) AND CANTON URBAN AREA GENERAL POPUIATION (AGE 25 AND OVER I N 1950)
. Jewish Population (1955) General Population (19501 College Level Ma& Female Ma& Fernale
Not Graduated 15 09 19.1 5 -2 5 *4 Graduated 10.1 6.4 Post Graduate 16 .0 5 -6
Source: U.S. Census Report (1950) P-B35, Table 34, p. 92
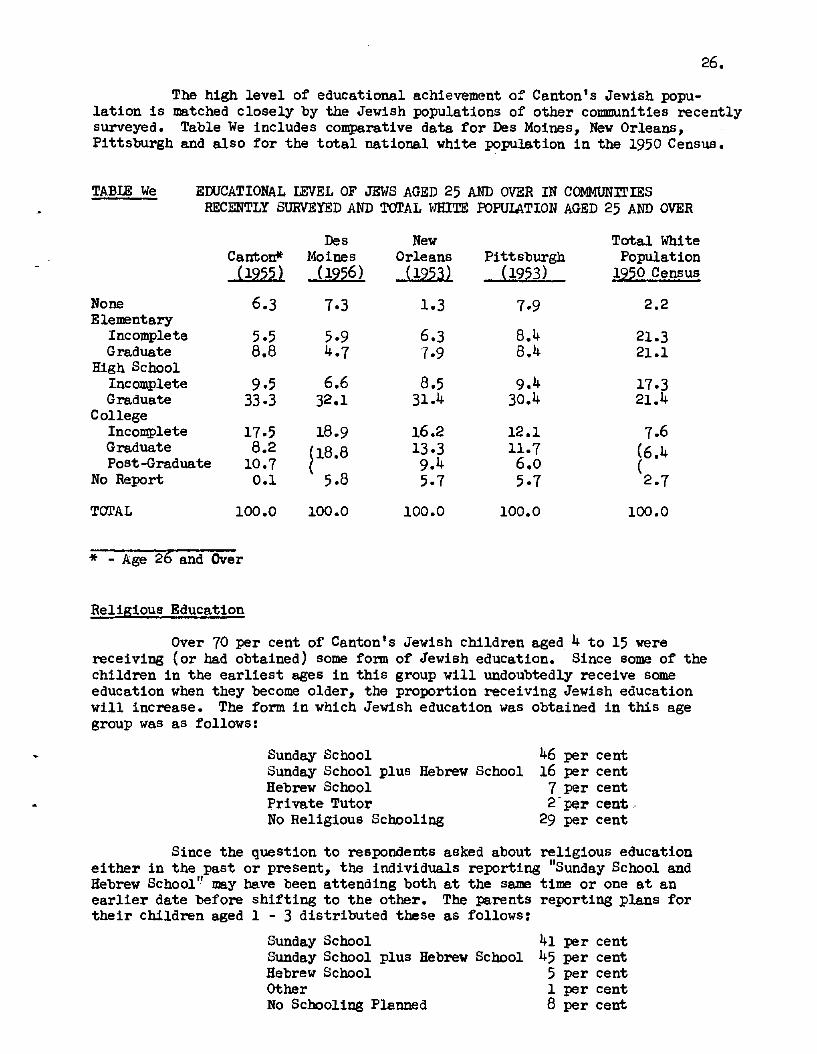
The high level of educational achievement ol" Canton's Jewish popu- l a t ion i s matched closely by the Jewish populations of other conmnities recently surveyed. Table We includes comparative data f o r Des Moines, New Orleans, Pittsburgh and a lso for the t o t a l national white population i n the 1950 Census.
TABU We EDUCATIONAL W E L OF JEWS AGED 25 AND OVER I N COMMUNTTIES RECENTLY SURVEYED AND TCITAL GIRITE POPUIATION AGED 25 AND OVER
None Elementary
Incomplete Graduate
High School Incomplete Graduate
College Incomplete Graduate Post Graduate
No Report
Cantos _11955_)
De s Moines
__( 1956
New
%z Pittsburgh (1953)
Total White Population
3 5 0 Census
* - Age 26 and h e r
Religious Education
Over 70 per cent of Canton's Jewish children aged 4 t o 15 were receiving (o r had obtained) some form of Jewish education. Since some of the children i n the ea r l i e s t ages i n t h i s group w i l l undoubtedly receive some education when they become older, the proportion receiving Jewish education w i l l increase. The form i n which Jewish education was obtained i n t h i s age group was as follows:
Sunday School 46 per cent Sunday School plus Hebrew School 16 per cent Hebrew School 7 per cent Private Tutor 2-per c e n t . No Religious Scboling 29 per cent
Since the question t o respondents asked about religious education e i the r i n the past o r present, the individuals reporting "Sunday School and Hebrew School'! may have been attending both a t the same time o r one a t an ea r l i e r date before sh i f t ing t o the other. The parents reporting plans for the i r children aged 1 - 3 distributed these as follows:
Sunday School 41 per cent Sunday School plus Hebrew School 45 per cent Hebrew School 5 per cent Other 1 per cent NO Schooling Planned 8 per cent

Plans f o r religious education reported by parents of children aged 4 - 12 a lso indicated a greater proportion f o r Hebrew School, and Sunday School plus Hebrew School, than was reported f o r actual experience. The most l ike ly explanation i s that parents send t h e i r young children f i r s t t o Sunday School and then i n l a t e r years su]?plement or subst i tute with Hebrew School.
Despite the indications toward greater use of the Hebrew School, = the data shown below i n Table Xa reveal quite clear ly tha t the Sunday School i s
the mre dominant form of Jewish education i n the younger age groups than i n the older. Comparable data from other co lmni t ies are d i f f i c u l t t o use because of differing kinds of information obtained but the swing towards the Sunday School i n the younger age groups seems comnon to most.
TABU Xa PERCENTAGE DISTRIBUTION OF CANTON JEWISH POPIJUTION (1955) BY TYPE OF JEWISH EWCATION AND AGE (AGE 4 AND OVER)
Type AGE
4-25 26-50 5 l o n Total
Sunday School 43.0 28.2 12 .O 29.3 Sunday School plus Hebrew School 19.5 15.6 5.9 14.5 Sunday School plus Tutor 2 -3 1.8 0.9 1.7 S.Schoo1 plus Hebrew School plus Tutor 1 .O 1 .O 0.3 0 .8 S.Schoo1 plus Hebr.Schoo1 plus All-Day School - 0.2 0.1 0.1 S .School plus Other 0.1 0.2 - S.Scho01 plus Hebrew School plus Other - 0.1 - Hebrew School g08 31.8 45.6 27.6 Hebr.Schoo1 plus All-Day School plus Tutor - 0.1 0.3 0.1 Hebr.Schoo1 plus All-Day School - 0.1 0.4 0.2 Hebr .School plus Tutor - 1.6 1.5 1.0 Hebr.Schoo1 plus Vther - 0.3 0.1 0 2
All-Day School All-Day School plus Tutor
Tutor Other None No Report
m
Total 100.0 100.0 100.0 100.0
. #Less than 0.5 of 1 per cent.
See variation i n Jewish religious education as between the three rnajor sections i n Canton i s evident. Section V I which has a larger young native born concentration reports 41 per cent of i t s t o t a l population 4 years of age and over t o have had Sunday School education alone compared with 33 per cent and 26 per cent i n Sections N and V. The data are summarized inlTable Xb, on the following page.
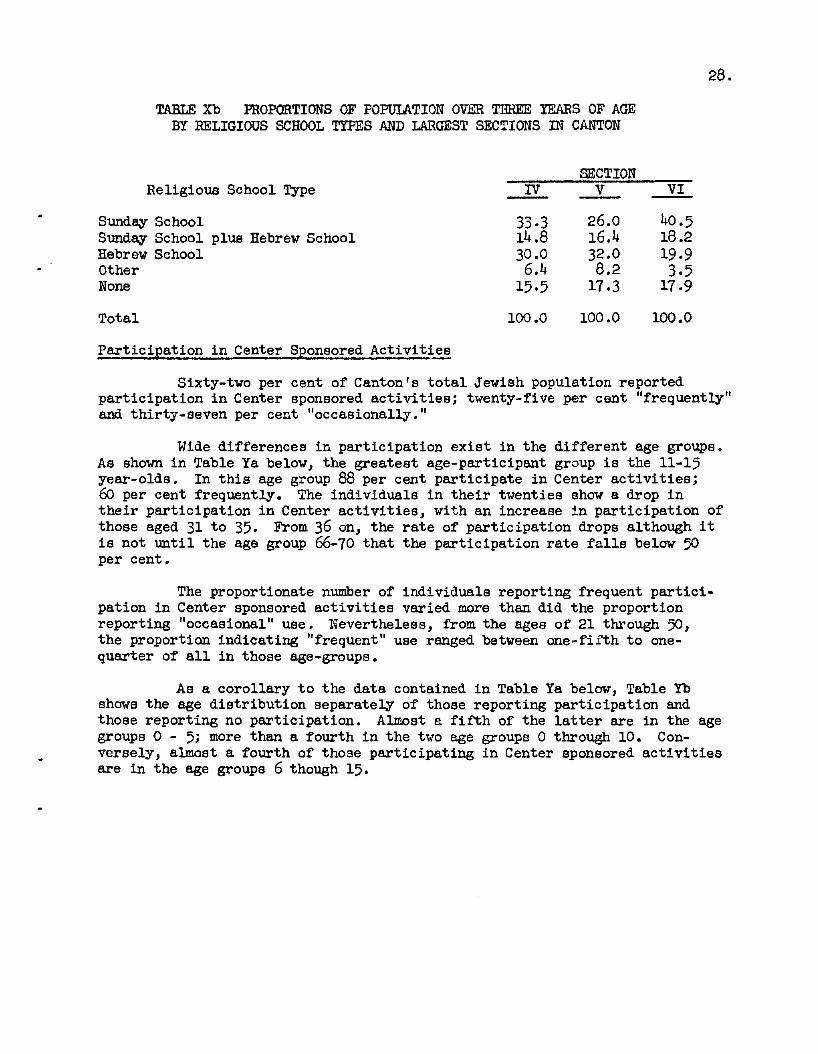
TAELE Xb PROPORTIONS OF POPULlTION OVER TrmEE YEARS OF AGE BY RELIGIOUS SCHOOL TYPES AND LARGEST SECTIONS I N CANTON
Religious School Type
Sunday School Sunday School plus Hebrew School Hebrew School Other None
SECTION IV - v - V I -
Total 100.0 100.0 100.0
Par t ic ipat ion i n Center Sponsored Act iv i t i es - Sixty-two per cent of Canton's t o t a l Jewish population reported
par t ic ipa t ion i n Center sponsored ac t iv i t i e s ; twenty-five per cent "frequentlytt and thirty-seven per cent "occasionally."
Wide differences i n par t ic ipat ion e x i s t i n the d i f f e r en t age groups. A s shown i n Table Ya below, the grea tes t age-participant group i s the 11-15 year-olds. In t h i s age group 88 per cent par t ic ipa te i n Center a c t i v i t i e s ; 69 per cent frequently. The individuals i n t h e i r twenties show a drop i n t h e i r par t ic ipa t ion i n Center a c t i v i t i e s , with an increase i n par t ic ipat ion of those aged 31 t o 35. From 36 on, the r a t e of par t ic ipa t ion drops although it i s not u n t i l the age group 66-70 t h a t the par t ic ipa t ion r a t e f a l l s be l a r 50 per cent.
The proportionate number of individuals reporting frequent pa r t i c i - pation i n Center sponsored a c t i v i t i e s varied more than did the proportion reporting " o ~ c a s i o n a l ' ~ use. Nevertheless, from the ages of 21 through 50, the proportion indicating "frequent" use ranged between one-f i f th t o one- quarter of a l l i n those age-groups.
A s a corollary t o the data contained i n Table Y a below, Table Yb shows the age d i s t r ibu t ion separately of those reporting par t ic ipat ion and those reporting no par t ic ipat ion. Almost a f i f t h of the l a t t e r are i n the age groups 0 - 5; more than a four th i n t he two age groups 0 through 10. Con- versely, a h s t a fourth of those par t ic ipat ing i n Center sponsored a c t i v i t i e s a re i n the age groups 6 though 15.

TABLE Ye PROPORTION I N EACH OF CANMN'S JX1,5SH AGE GROWS PARTICIPATING IN CENTER SPONSmD ACTIVITIES - 1955
Participates Frequent$ OccasionalQ - Not A t A l l Age Grouq
76 and Over 1.6 No Age Given - Total 24.8 36.8 38.4
TABU YD PERCENT' DIS!ElIBUTIONS BY ACE OF TOTAL PARTICIPANTS AND TOTAL WON-PARTICIPANTS Dl C m SPONSORED ACTIVITIES - 1955
Participants Non- Tot a1 - Frequently* Occaeionally* Participants Age Group
76 and Over 1 .0 0.1 No Age Given - - Total 100 .O 40.2 59.8 100 .0
* Percentages i n these columne re l a t e t o t o t a l participants (1,708 reporting ei ther "frequent" or "occasional" participation) as 100.0 per cent.

Part ic ipat ion i n Act iv i t i es Taking Place -- i n Center (But not center-sponsored)
Fif ty-f ive per cent of Canton's Jewish population par t ic ipated i n a c t i v i t i e s which were held i n the Center (but which were not center-sponsored). Thus a smaller proportion of Canton's Jewish population engaged i n a c t i v i t i e s held in , but not sponsored by, the Center than par t ic ipated d i r ec t ly i n Center- sponsored programs. The "teen-age" groups showed the greates t use of Center f a c i l i t i e s ; only 15 per cent of Canton's Jewish 11 t o 15 year-olds reported "no - participation" a t a l l . These data a r e summarized in Table Za following.
When par t ic ipat ion r a t e s were separately computed for males and e females, there was no s ignif icant differences although s l i gh t ly more males than
females reported "no par t ic ipat ion" (45.7 per cent t o 43.8 per cent) .
TABIE Za PERCENTAGE I N EACH AGE GROUP OF CANTON 'S JEI!ISH POPULATION
PAETICIPATING I N ACTIVITIES LOCAmD I N CENTER (BUT NOT CENTER SPONSORED) - 1952
Age Groue Participated
Frequently Occasionally No Par t ic ipat ion
76 and 0 ver - 17 -7 No Age Given - * 33.3
Total 21.2 34.2 44.6
Table Zb below shows the age dis t r ibu t ions separately of those re- porting par t ic ipat ion i n a c t i v i t i e s held i n the Center and those reporting none. Ful ly a t h i r d of a l l those reporting par t ic ipat ion were i n the age groups 6 through 20 and of these almost 20 per cent (of the t o t a l par t ic ipat ing) reported "frequent" use. After 20, the emphasis on "occasional" use of Center f a c i l i t i e s becomes much more marked with a concurrent decline i n those reporting "frequent" use.
It should be observed tha t the da ta i n Tables Y and Z a re not necessari ly re la ted, t ha t is , an individual may regort "no par t ic ipat ion" i n Center-eponsored programs and yet report "frequent" or "occasianal" use of the Centerfor other events. Because of t h i s , the proportion of the Canton Jewish community u t i l i z i n g the Center i n one form or another is undoubtedly higher

than the percentages shown in either of the two se t s of tables.
TABLE Zb F'ERC!ENTAC;E DISTRIBUTIONS BY AGE OF PARTICIPANTS AND OF NON-PARTICIPANTS I N ACTIVITIES TAKDTG PLACE CEN!lER
(BUT NOT CEN'IER SPONSORED) CANTON - 1955
Age GrouE Participating
Total* - F r e q u e n t v 0ccasionall.p Not Partic i p a t .
76 and Over 0 -7 - 0 -7 No Age Given 0.1 - Total 100 .O
* Percentages i n these columns relate t o t o t a l participants (1,532 reporti% ei ther "frequent" or "occasional" participation) as 100.0 per cent.
Military Service
Three hundred and forty-eight males and ten femalee reported military service. For the malee, th i s wae 37 per cent of the t o t a l male population (af ter exclusion of those 17 years and younger a t the t i m e of the study who would have been ineligible for service).

A P P E N D I X A
f k j o r Tables)

TAB= I ACE DISTRYBWPION OF CANPON JEWISH POPUIATION Bll SEX AND WIVTPII - 1955 -
M A L E F E M A L E T O T A L mtive Foreign T o t a l Per Cent Native Foreign Total Per Cent lktive Foreign Total Per Cent - - - - -

TABLE I (Continued) AGE DISTRlBTPTION OF CANTON JEMISH POPUIATION BY SEX AM) N4TIVITY - 1955 -
SECTION I
M A L E F E M A L E T O T A L
!32 Native Foreign Total Per Cent Native Foreign T o t d Per Cent - Native F o r e i ~ Total Per Cent
76 and over - 2 2 5.3 - 3 3 7.5 - 5 5 6.4 Age m o w n - - - - - - - - - - - - TOTAL 23 15 38 100.0 27 13 40 100.0 50 28 78 100.0 PW CENT 60.5 39.5 100.0 67.5 32.5 100.0 64.1 35.9 100.0
hEDIAN AGE 40.0 37-5 38:3

TABLE I (continued) AGE DISTRIBDTION 03' CARTON JEWISH P O ~ T I O N BY SEX AND MTIVITY - 1955 -
SECTION I1
M A L E F E M A L E T O T A L
922 Native Foreign Total Per Cent Native Foreian Total Per Cent Native F o r e i i Total 2~t:1. Cor?t -- - --.-
76 and Over 1 6 7 9.2 - 9 9 11-7 1 15 16 10.5 - Age TJnkmm - - - 1 - 1 1-3 1 - 1 0.7
TOTAL 37 39 76 ~00.0 33 44 77 ~00.0 70 83 153 100.0 PER CENT 48.7 51.3 100.0 42.9 57.1 100.0 45.8 54.2 lWo0
MEDIAN AGE 50.0 51.5 50.9

T A . I (continued) AGE DZSTRIBWl!ION OF CANTON JEWISH POPOPULATION BY SEX AM) NA!J!IYITY - 1955 -
SECTION 111
M A L E F E M A L E T O T A L .-----.-_- & IYiative e n Total Per Cent Native F o r e i q ;n ,Per Cent Native F o r e Tcsb~i i 23: -.-.a
76 and over - Ago llnkwm - TOTAL 43 m CENP 67.2
MEDIAN AGE 41.8 36.1 38.7

TABLE I (Continued) AGE DISTRDWION OF CANTON JEWISH POPUlATION BY SM AND NATIVITY - 1955 -
SECTION N
M A L E
Aae Native Foreign Total Per C a t -
76 and Over - 8 8 2.4 Age Unknown - - - -
F E M A L E Native Foreign j?er Cent - T O T A L
Native Foreign Total Per Cent
MEDIAN AG.E 38.5

TABLE I (continued) AGE DISTRIBUTION OF CANTON JEWISH POPUTATION BY SEX AND NATIVITY - 1955 -
SECTION V
M A L E F E M A L E T O T A L L E Native Foreign ~ o t & Per Cent Native Foreign T o t a l Per Cent Native Foreigg Total Per Cent - -
76 and Over - 9 9 2.1 1 5 6 1.3 1 1 4 AgeUnknoun - - - - - 15 1.7
1 1 0.2 1 - 1 0.1
TOTAL 316 120 436 100.0 341 u o 451 100.0 657 230 887 100.0 PER ClXC 72.5 27.5 100.0 75.6 24.4 100.0 74.1 25.9 100.0
MEDIAN AGE 35.9 35.3 35.6

TABU I (continued) AGE DISTRlBUl'ION OF CAWTON JEWISH POWmTION BY SEX AND N4TIVITP - 1955 -
SECTION VI
M A L E F E M k L E T O T A L
& Native Foreim Total Per Cent Native Fo re i~n Total Per Cent Native Foreign Total Per Cent
76 and Over - A g e U h k n m - TOTAL 377 PW CENC 88.3
MEDIAN AGE
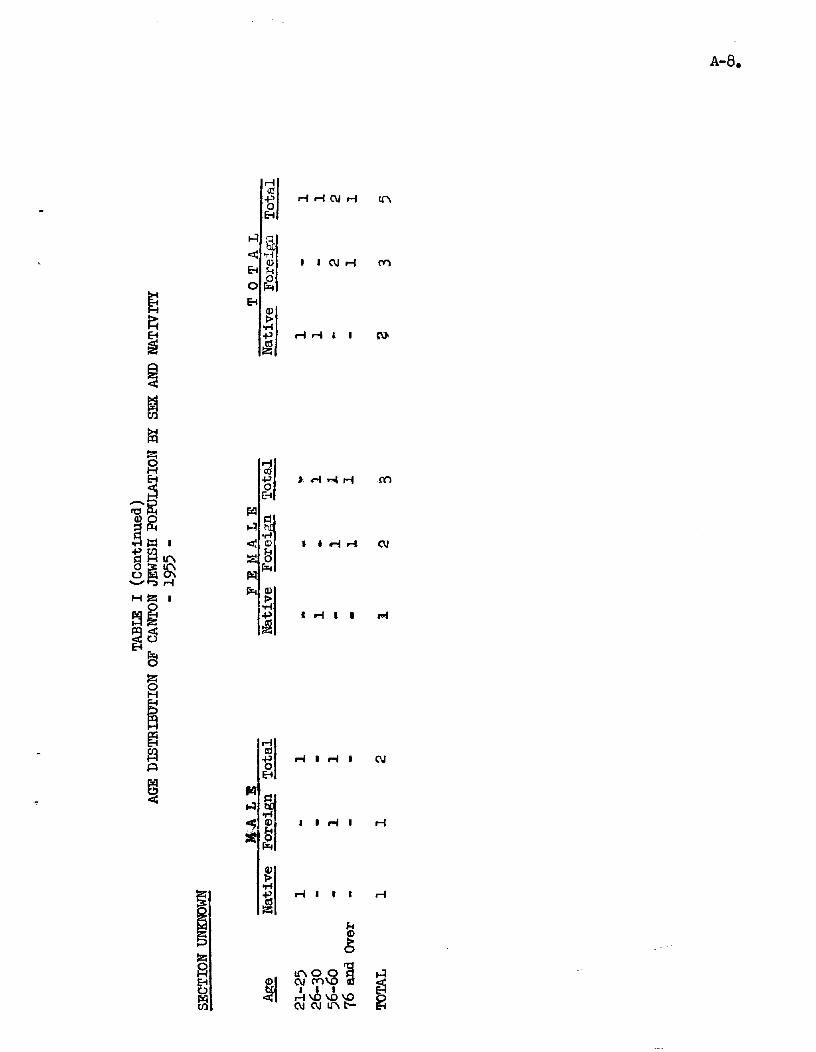

TAELE I1 MARITAL STATUS OF CANTON JEWISH POPUIATION, AGE 1 4 AND OVER, 1955 A- 9.
Single Married Widowed Bivorced !gG
Under 21 135 3 - - - - 138 21-25 46 4 - - 50 26-30 12 4 9 61 31-35 8 85 - - - 93 36-40 8 102 1 111
TOTAL 234 761 26 10 1,031 FER CENT 22.7 73.8 2.5 1.0 100.0
l?Emm - mder 21 128 5 - - - - 133 21-25 23 25 4 8 26-30 6 67 - - 73 31-35 1 113 1 6 121 36-40 5 1 L 129
66-70 - 28 20 2 - 50 7l.-75 11 1 4 1 26 76 and Over 1 9 20 - 30
TOTAL PER CEm
TOTAt - Under 21
66-70 2 71 27 4 104 71-75 - 35 18 1 76 and Over 2 30 30 - 62
54
TOTAL 412 1,513 137 28 2,090 (a ) PERCENT 19.7 72.4 6.6 1.3 100.0 m ~ h r e e Native born Females, ages unknown, are excluded from t h i s Table.

TABLE 111 NUMBFA OF HDUSEHOIDS I N CANTON JEWISH POmTlATION EY SIZE AND SECTION - 1955 - u SECTIONS(R~ SECTION I SECTION I1 SECTION I11
Number W r Cent HOlBEHOLD SIZE Number Pe rcen t - Number Per Cent Mrmber Per Cent
TOTAL 867 100.0 28 100.0 63 100.0 55 100.0
SECTION N SECTION V SECTION V I Number Per Cent HOUSEHOLD SIZE - Number Per Cent Nuuber Per Cent -
TOTAL 208 100.0 284 100.0 229 100.0
=ehold ( s ) total- five Indiv1dua;ls are excluded. These households are f rorn Sections Unknown.

A-11. TABLE IV
IAST PERMlWENT RESIDENCE: OF NATTVE BORN, CANTON JEWISH POPUIATION BY AGE AND SEX, 1955
M A L E New Central East West South- South- Not
England Atlantic Central Central East West lJest Specified -
TOTAL 14 129 824 27 10 3 9 28 PERCENT 1.3 12.4 78.9 2.6 1.0 0.3 0.9 2.7
(1,0448 100.0 per cent)
F E M A L E New ~ e n t ~ d . East West South- South- Not
4s Enaland Atlantic Central Central East West - West Specified
76 and Over - 1 3 - - - - - Age Unknown - - 3 - - - - - TOTAL ll 151 857 24 13 4 11 20 P E R c E ~ T 1.0 13.8 78.6 2.2 1.2 0.4 1.0 1.8
(1,091* 100.0 per cent) - For States included i n Regions, see follawlng page -

A-L2. WIE IV (continued)
fAST IERMQXP RESIDENCE OF IUTIVE BORN, CANTON JEGIISH POPUIATION BY AGE AMD SEX, 1955
T O T A L New Central East West South- South- Not
As!? England Atlantic Central Central East West West Specified
76 and over - 2 3 - - - - - Age Unknown - - 3 - - - - - TOTAL 25 280 1,681 51 23 7 20 48 m m 1.2 13.1 78.7 2.4 1.1 0.3 0.9 2.2
(2,1351 100.0 per cent)
N.B. States Included:
New England - Maim, New Hampshire, Vernont, Maesachusetts, mode Island, Connecticut.
Central ~ t l a n t i c - New York, Pennsylvania, Delaware, Maryland, New Jersey, District of Columbia.
East Central - Indiana, Michigan, Ohio, West Virginia, Kentucky. West Central - I l l inois , Colorado, Wisconsin, Ima, Kansas, Minnesota, Missouri,
Nebraska, North and South Dakota. South-East - Alabama, Tennessee, Florida, Virginia, Georgia, North and South
Carolina. South-West - Texas, Oklahoma, Arkansas, Louisiana, Mississippi. West - Arizona, California, Idaho, Montana, Glyoming, Nevada, New Mexico,
Oregon, Washington, Utah,

COUNTRY OF ORIGIN, FOREIGN BORN, C m O N JEWISH POPUIATION BY AGE AND SECTION, 1955 ALL CANMN
Czecho- Iatvia- & Russia Germam - Poland Austr ia Hun$a= Rumania Slovakia Lithuania JTngland - France Canada -- Israel Other
76 and Over 33 1 12 2 2 2 3 2 - - - - - TOTAL 257 39 169 32 35 21 25 21 9 5 18 3 3 PHI CENT 40.3 6.1 26.5 5.0 5.5 3.3 3.9 3.3 1.4 0.8 2.8 0.5 0.5
(637:. ~ 0 . 0 )

TABIE V (Continued) COUNTRY OF ORIGIN, FOT(E1GN BORN, CANTON JEWISH POPUIATION BY AGE AND SECTION, 1955
SECTION I Czecho- Iatvia-
A E Russia Germany Poland Austria Hungaw Rumania Slovakia Lithuania England France Canada I s rae l Other --

SECTION I1
TABLE V (Continued) COllNTFX OF ORIGIN. FOREIGN BORN. CANMN JEWISH POFWIATION BY AGE AND SECTION. 1955
Czecho- Latvia- --
Russia G e m ~ Poland Austria Hunaaqy Rumania Slovakia Lithuania England France Canada Israel Other
TOTAL 33 1 71 4 2 - 2 3 2 7 - 2 -

SECTION I11
TABLE V (Continued) COUNTfIlL OF ORIGIN, FOREIGN BORN, CANTON JEWISH POPUIATION BY AGE AND SECTION, 1955
Czecho- Latvia-
4 2 Russia Germany Poland Austria Hungary Rumania Slovakia Lithuania England France Canada Israel - Other
76 and &er 3 - 2 1 - - - - - - - - - TOTAL 16 1 13 4 2 2 2 - 2 - - - - PER CliWT 38.1 2.4 31.0 9.5 4.8 4.8 4.8 - 4.8 - - - -
(420 10070)

SECTION N
&
51-55 36-60 61-65 66-70 71-75
76 and Over
WLE V (continued) COUNTRY OF ORIGIN, FOREIGN BORN, CANTON JEWISH POPUTATION BY AGE AND SECTION, 1955
Czecho- Latvia- Russia Germany Poland Austria Hungary Rumania Slovakia Lithuania England France Canada Israel -
TOTAL 65 15 36 13 U 3 5 8 1 1 5 1 .. 39.2 9.0 21.7 7.9 7.9 1.8 3.0 4.8 0.6 0.6 3.0 0.6 -
(166= 100.0)

SECTION V
TABLE V (Continued) CO- OF ORIGIN, FOREIGN BORN, CANTON JEWISH POPUIATION BY AGE AND SECTION, 1955
Czecho- Latvia- & Ruseia Germany Poland Austria EIungary Rumania Slovakia ~ i t h u a n i a England France Canada I s r ae l Other
76 and Over 7 - 2 - 2 1 2 - - - - - - TOTAL 103 15 58 5 13 11 9 7 1 1 6 - 1 PER CENT 44.8 6.5 25.2 2.2 5.7 4.8 3.9 39 0 0.4 0.4 2.6 - 0.4
( 2 3 ~ 100.0)

TABLE V (continued) COUNTRY OF ORIGIN, FOREIGN BORN, CANTON JTNISH FOPIIIATION BY AGE AND SECTION, 1955
SECTIam VI Czecho- Latvia-
& Russia Germany Poland Austria Hungary Rumania Slovakia Lithuania England France Canada Israel Other ----
76 and Over - 1 - 1 - - 1 - - - - - - TOTAL 32 6 20 3 3 1 6 3 3 - 1 - 7
CENT 37.6 7.1 23.5 3.5 3.5 1.2 7.1 3.5 3.5 - 8.2 - 1.2 (85s io0.01
SECTION U N K N O ~ ~ Czecho- latvia-
& - Russia Germany Poland Austria Hungary Rumania Slovakia Lithuania England ---- France Canada Israel Other
. . . 76 and Over - - - - - 1 - - - - - - -

A-20. TABIE VI
YEAR OF ARRIVAL IN UNITED STATES, FOREIGN BORiJ, C P m M N JEWISH POrrmTATION EY AGE LW SECTION, 1955
A I L CANTON Before
& 1950-52 1945-49 1940-44 1930-2 1920-29 1910-19 1900-09 1900
76 and mer - 1 - 4 3 9 20 20
SECTION I Before
& 1950-35 19.45-49 1940-44 1930-39 1?10-12 1900-09 1900
76 and Over - - a - - 1 3 1
TOTAlL - 10 - - 2 8 7 1 PERCENT - 35.7 - - 7.1 28.6 25.0 3.6
(28. 100.0)

TABLE VI (Continued) A-21. YEAR OF ARRIVAL IN UIQITED STATES, FOREIGK BORN, CANTON JEWISH POPUIATION
SECTION 11 -- BY AGE AND SECTION, 1953
Before
76 and over - - - 2 2 4 4 3
TOTAL 3 3 - 9 ll 31 22 4 PER CENT 3.6 3.6 - 10.8 13.3 32.3 26.5 4.8
(839 100.0)
SECTION 111
76 and over - .. - - - 3 1
TOTAL 2 1 1 1 7 14 12 PERCENT 4.8 2.4 2.4 2.4 16.7 33-3 28.6
(42s 100.0)
Before 1900

TABLE V I (Continued) A-22.
PEAR OF ARRIVAL IN UHITED S T A m , FOREIGN BOIIM, CANMN JEWISH POPUIATION BX AGE AND SECTION, 1955
SECTION IV Before
76 and over - - - - o - 7 6
TOTAL 9 13 4 12 25 47 42 14 PERCENT 5.4 7.8 2.4 7.2 15.1 28.3 25.3 8.4
(166: 100.0)
76 and Over - g - 1 1 g 5 7
TOTAL 17 25 1 18 40 60 58 1.1 PERCENT 7.4 10.9 0.4 7.8 17.4 26.1 25.2 4.8
(23@ 100.0)
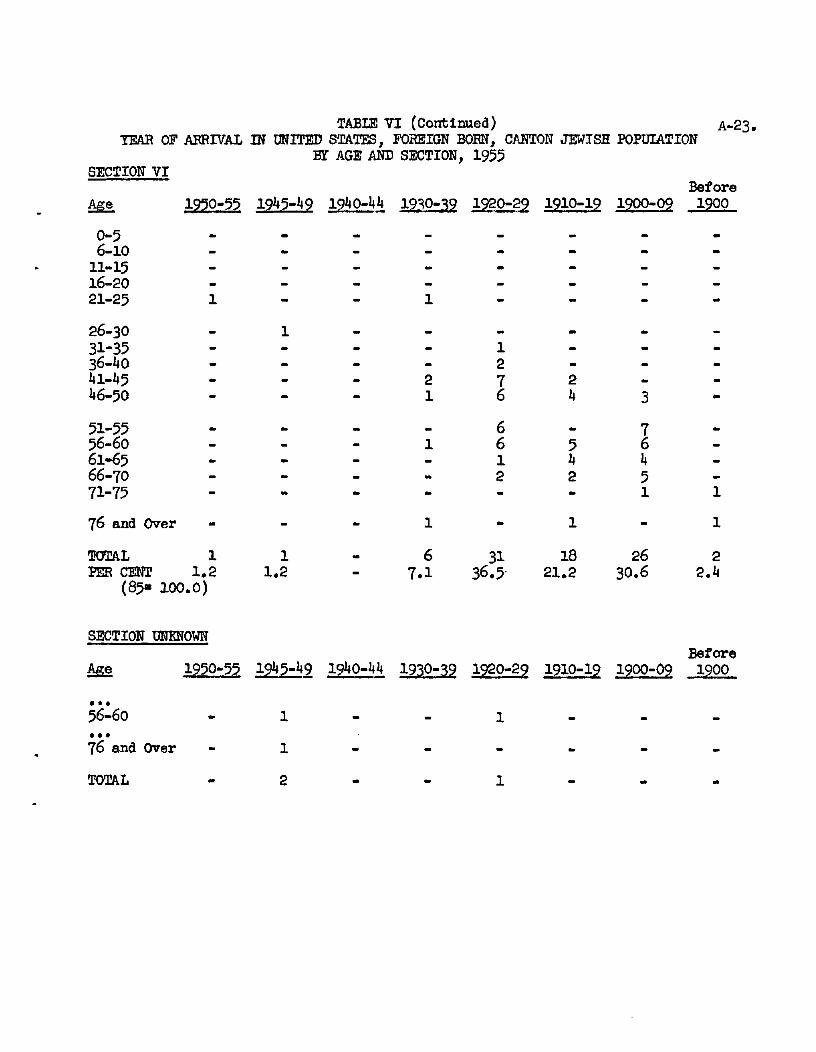
TABLE VI (Continued) A-23 YEAR OF AIIRIVAL IN UNITED S'IXTES, FOIiEIGN BORN, CANTON JXWSH POPUIATION
BY AGE AM] SECTION, 1955 SECTION VI
Before
76 and ~ v e r - - - 1 - 1 - 1
SECTION UNKNOWN Before
1950-55 1945-49 1940-44 1930-39 1920-29 1910-19 1900-Og 1900 - - 1 - - 1 - - - .
76 and Over - 1 - - - - - - - TOTAL - 2 9 - 1 - - 9

TABIX VII MTE OF ARRIVAL IN CAIJTOFI, OF WIVE BORN, CANMN JElJISH POPULATION, BY REGION OF IAST RESIDENCE, 1955
Central East West South- South- Per Dete of ~ r r i d New E o a h d Atlantic Cent& Central East West && Total Cent
5 70 128 22 10 6 9 250 26.0 7 65 1 4 9 4 1 - 9 235 24.4 - 43 56 8 3 - - l l 0 l l . 4
1935-39 2 20 75 9 1 - - 107 11.1 1934 and Before 7 71 1 4 9 8 2 1 2 24 0 24.9 Not Reported 4 XI. - - 6 - - 21 2.2
W.B. For States included i n these Regians, see footnote t o Table IV, page 12. Residents born in Canton have beon excluded from Bast Central Region and totals.

TABLE V I I I PUNS FClR STAYING I N CANTON, CANTON JEWISH POPULATION BY AGE AND SECTION, 1955
A I L SECTION SECTION SECTION SECTION SECTION SECTION CANM>N I I1 I11 N V V I NoY* 50 N g Y s RoYea EYo & a -
0-5 13 221 - 6 - 2 - 8 5 68 32 4 96
3 105 6-10 13 311 2 7 - 8 1 1 4 4 63 2 123
11-15 11 198 - 5 - 7 1 1 4 4 54 3 53 3 65 16-20 l o 168 - 3 1 9 - 4 2 38 5 58 2 56 21-25 6 92 - 4 1 5 - 3 2 25 3 29 - 25
26-30 K 119 1 4 - 2 - 2 3 24 8 38 - 48 31-35 11 202 2 3 - 4 - 13 2 33 5 58 2 91 36-40 10 n g - 3 - 4 3 11 3 54 1 8 0 41-45
3 77 21 232 4 7 - 15 1 9 5 65 8 70
46-30 8 197 - 5 1 15 1 9 2 31 2 81 2 56 3 66
51-55 9 158 1 7 - 16 - 4 2 46 4 55 56-60 6 154 - 1 1 10 - 1 4 1 52 2 45
2 30
61-65 2 30
7 118 - 3 - 1.2 - 10 5 39 2 40 - 14 66-70 6 98 - 4 - 9 1 6 4 311 1 31 - 1 4 71-75 2 52 - 1 - 1 4 1 5 1 1 4 - 1 4 - 4
76 and Over 4 57 2 3 - 16 1 5 - 15 1 1 4 - 3
TOTAL 149 2,607 K 66 4 149 l o 131 44 619 55 830 24 807 PER CENT 5.4 94.6 15.4 84.6 2.697.4 7.1 92.9 6.6 93.4 6.2 93.8 2.9 97.1
N.B. "No ~nsvers" excluded from t h i s table.
UNKNOWN No Yes - -

TABLE IX NA-TION STATUS OF FOREIGN BORN, CANTON JEWISH POPUIATION BY SEX AND MTE OF ARRIVAL IN UNITED STATES, 1955
lQATNE lbWURALIZED FIRST PAPERS ALIEhT TOTAL Cate of Arrival Male Female T o t a l Male Female Total Male Female Total Male Female Total Female T o t a l
L_-- --_I_ - 1950-56 1945-49 1940-44 Before 1940
TOTAL 4 2 6 302 259 561 9 17 26 1 4 30 44 329 308 637 PW CENT Male) I 1.2 91.8 2.7 4 .3 100.0 PER CENT Female) 0.6 84.1 5.5 9.7 100.0 PER CENT (Total) 0.9 88.1 4.1 6.9 100.0

TABU X A-27. IABOR FORCE, CAHIDN JEWISH POPUIATION, BY SEX AMI SECTION, 1955
Total Labor Force Total 3hplwed
m %lf-Bpluyed Salaried
Unemployed Not m Iabor Force
raap1aymsnt Statue
Total Labor Force Total Bployed Self -Emplayed Salaried
Vnemploged Not In Labor Force
A L L C A N T O N 5 b e r Per Cent -- - Male Female Total Male Female Total -
S E C T I O N I S E C T I O N I1 Male Female Total Per Cent --- Male Female Total Per Cent - -
TOTAL 29 30 59 100.0 68 71 139 100.0
~ l o y m e n t Status
S E C T I O N '111 S E C T I O N . I V Male Femele Total Per Cent --- Male Female Total Per Cent --
Total Labor Force 42 11 53 47.7 l* 64 262 49.8 Total Bhploged 42 10 52 46.8 197 63 260 49.4 Self-Employed 23 4 27 24.3 121 17 138 26.2 Salaried 19 6 25 22.5 76 46 122 23.2
Unemployed - 1 1 0.9 1 1 2 0.4 Not In Labor Force 12 46 58 52.3 56 208 264 50.2
TOTAL 54 57 I l l 100.0 254 272 526 100.0
Employment Status
S E C T I O N V S E C T I O N ' V I Male Female Total Per Cent --- Male Female Total Per Cent -- -
Total Iabor Force 263 59 322 47.3 228 33 261 45.9 " Total anplayed 263 59 322 47.3 228 33 261 45.9
self--played 132 21 153 22.5 165 12 180 31.6 Mjolaried 131 38 169 24.8 63 18 81 14.2 - Utlemployed - - - - - -
Not I n Labor Force 70 289 359 52.7 6; 24; 308 54.1
m l a ~ m e n t S E C T I O N U N K N O W N Status Male Female Total ---
Total Labor Force 2 2 4 Total Rqluyed 2 2 4 Self-Employed 1 - 1 Salaried 1 2 - - 3
Unemployed - Not In Labor Force - 1 TOTAL 2 3 $

Industry
TABLE XI EmmYMENT, CAMON JEWISH POPUIATXON, BY INDUSTRY, EMPIIOX@l?I' STATE,
AGE, AND SECTION, 1955
Construction . s e l f - ~ o g e a Sslarfed
Manufacturing Self -lBployed Salaried
Finance Self -5hployed Salaried
Servzlce Self-lBployed Salaried
Professional Self-Bnployed Salaried .
Recreational Self-Enploged Salaried
Scrap Metal Self-ESnployed Salaried
Wholeeale Self-Bnploged Salaried
Retail Foods Self-Rnployed Salaried
R e t a i l Drugs Self-Employed Salaried
Retail Furniture Self-Etnployed - Salaried -
Retail Clothing Self -Employed Salaried
Other Self-Ehploged Salaried
Not Reported Self-Flnployed Salaried
TOTAL Self-EZnployed Salaried
A G E 14- 21- 26- 31- 36- 41- 46- 51- 56- 61- 66- 71- 76 & Per 20 3 2 3 2 5 2 2 3 5 2 a Over Total Cent -

SECTION I
I n d u s t q
T A D X I (continued) ~ U ) ~ , CANTOIT JEWISH POPLmTION, BY INDUSTRY, EMPfDYElENT STATUS,
AGE, AND SECTION, 1955
Constmction Self-Employed Salaried
Manufacturing Self-&played Salaried
Finance Self -3Zuployed Salaried
Service Self-lhployed Salaried
Pmf essional Self-Ebployed Salaried
Recreational Self-Bnployed Salaried
Scrap Metal Self-Employed Salaried
Wholesale Self - w l o y e d Salaried
Retai l Foods Self -Bnplctyed Salaried
Retai l Drugs Self -hployed Salaried
Retai l Furniture Self-Employed
=
Salaried Retai l Clothing
Self -Emplayed Salaried
Other Self-lhplayed Salaried
Not Reported Self-Employed Salaried
TOTAL Self-Employed Salaried
A G E 14- 21- 26- 31- 36- 41- 46- 51- 56- 61- 66- 71- 76 & Per 20 25 40 45 50 2 60 over Total Cent - - - - - -
- ll. 1
- ll. 1

TABLE X I (Continued) EMPIOYMENP, CANTON JEWIS9 POPULATION, BY IIiDVSTRY, BII1PLOYME3W STATUS,
AGE, AM) SECTION, 1 9 3
SECTION I1
Industry
Construct ion Self-Eluployea ~ a l a r i e d
Manufacturing Self-E%plwed Salaried
Finance Self-Employed Salaried
Service Self-Bnployed Salaried
Profesaioml Self -E$lployed Salaried
Recreationel Self-Ibployed Salaried
Scrap Metal Sex-Bnployed Salaried
Wholesale Self-lbployed Salaried
Retai l Foods Self-Etnplwed Salaried
Retai l Drugs Self-Wloyed Salaried
Ret ci 1 Furniture - Self-Ebployed
Salaried Retai l Clothing Self-Employed Salaried
Other Self -Employed Salaried
Not Reported Self-lbployed Salaried
A G E 14- 21- 26- 31- 36- 41- 46- 51- 56- 61- 66- 71- 76 & Per 20 2 2 2 2 5 55 &I 5 2 75 over Total Cent - -
TOTAL Self-Employed - 1 1 3 5 4 3 2 4 2 3 2 8 1 ~ 0 . 0 Salaried - 2 1 3 8 3 6 4 3 1 1 3 2 1 0 0 . 0

TABLE X I (Continued) m-, C m N JEWISH POWIATION, BY IlDWl!RY, BMPLDPMEBP s'I?~TUS,
AGE, AND SECTION, 1955
SECTION I11 A G E 14- 21- 26- 31- 36- 41- k6- 51- 56- 61- 66- 71- 76 & Per
* Induatrg: - 20 2 !g 2 2 3 9 a Over T o t a l Cent
construction Self-mloyed . SdLaried
Manufacturing Self-Fauplager3 Salaried
Finance Self-Brployed Salaried
Semice Self-Bnplayed Salaried
Professional Self-%,played Salaried
Recreational Self-Ebgloged Salaried
Scrap Metal Self-B@loyed Salaried
Wholesale Self -Emplayed Salaried
Retail Foods Self-lbployed Salaried
Retail Drugs S e l f ~ ~ o y e d Salaried
Retail Furniture Self -E&ployed Salaried Retell Clothing
= Self-Phployed Salaried
Other Seu--6d Salaried
Not Repded Self-laplayed salluiea -
TOTAL Self-B@loyed - 2 6 4 3 1 6 4 - 1 2 7 1 0 0 . 0 Salaried 1 - 1 4 1 4 4 1 4 3 - 2 - 25100.0

SECTION N
TABI$ XI (~ont imed) WU)m, O N JEWISH POPUI&I'ION, BY INDTISTRY, EMPU)YMEW STATUS,
AGE, AID SECTION, 1955
A G E 14- 21- 26- 31- 36- 41- 46- 51- 56- 61- 66- 71- 76 & Per
Industry 20 2 3 3 5 9 2 @ 3 70 a Total C a t - 4 Construction
Self-kployed Salaried
Manuf acturlw Self-Employed Salaried
Finance Self-Employed Salaried
Semi ce Self-Emplayed Salaried
Professional Self -E$lploJred Salaried
Recreational SU-lhployed Salaried
sarap Mat& Self -E5nplayea Salaried
Wholesale Self-&played Salaried
Retail Foods Self -&ployed Salaried
R e t a i l Drugs Self-mlayed Salaried
Retail Furniture Self-Employed Salaried
Retail Clothing Self-Employed Salaried
Other Self-E$rplaged Salaried
lPot Reported Self -Bqlayed Salaried
TOTAL Self-mluyed - - 6 7 18 30 13 16 19 16 12 3 - 140100.0 Salaried 6 1 2 9 U . 1 3 2 0 1 2 1 7 1 0 8 4 - - 122 100.0

TABU X I ( ~ m i n u e d ) ~~, CAWMN JlWISH POPUIATION, BY INDtkS~, EMPIDPM@T STATUS
AGE, AND SECTION, 1955
SECTION V A G E 14- 21- 26- 31- 36- 346- 51- 56- 63,- 2-66.. 71- 76 & Per
Induetry 20 25 30 40 45 50 55 60 65 70 a Over Total C e n t - - - - - - - - - a construction
Self-Emplayed Salaried
Mmxeacturing Self-&plaged Salaried
F i m c e Self--1ayed Salaried
Service Se l f -mloyed Salaried
Professional Self -Wployed Salaried
Recreat ions1 Self-Bnployed Salaried
Scrap Metal Self-Dnplayed Salaried
Wholesale Self-PhploJred Salaried
R e t d l Foods Self-&played Salaried
R e t a i l Drugs Self -Employed Salaried
Re td l m m i t u r e Self -Emplayed
? Salaried Retail Clothing
Self-BPplayed Salaried
Other Self -Eqplaged Salaried
Not Reported Self - ~ l a y e d Salaried
r n A L Self-%played Salaried
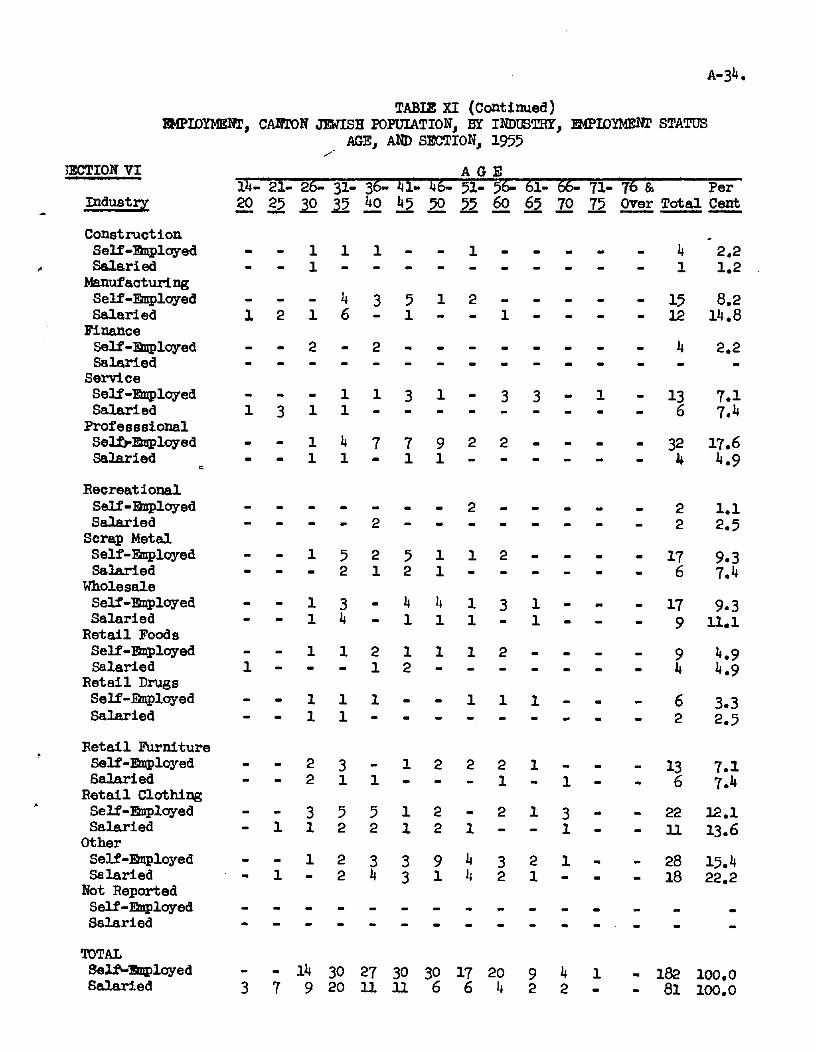
iECTION V I
- Industry
TABU X I (continued) m-, CAlOrOM JeWISH POPUIATION, BY INDUSW, WLOYME2?l' STATUS
/. AGE, SECTION, 1955
Construct ion Self-Ftnployed Selari ed
Manuf actull ng Self-Bnployed Salaried
Finance Self -Bnployed Salaried
Service Self -Employed SaLari ed
Profeaaaional SemEmployed Salaried
L
Recreational Self-Bnployed Salaried
Scrap Metal Self-Bnployed Salaried
Wholesale Self-lhployed Salaried
Retail Fooda Self-lhployed Salaried
Retail Drugs Self-mloyed Salaried
Retail Furniture Self-Bnployed Salaried
Retail Clothing Self-Baployed Salaried
Other Self-Jhployed Salaried Not Reported Self-lhployed Salaried
A G E 14- 21- 26- 31- 36- 41- 46- 51- 56- 61- 66- 71- 75 & Per
3 2 3 2 2 2 2 60 3 2 75 Over T d a l Cent
mTAL Sel;eZ@loyed - - 14 30 27 30 30 17 20 9 4 1 - 182 100.0 Salaried 3 7 9 2 0 U . 1 1 6 6 4 2 2 - - 81 100.0

TABU X I (continued) B D I P ~ ~ , CAi?lDN JEWISH POPUIATION, BY I-, EMPIDYMP:m ST-,
AGE, AND SICTION, 1955
SECTION UWRWOWN A G E - 21- 2 31- 3 1- d
Indust IT - 20 & OverTotal
construction - Self-mlaged - - - - - - - - - - - - - - .Salaried
Manufacturing Self-Wloyed Salaried
Finance Self -Employed SaLaried
Service Self-Piuplayed Salaried
Professional Self-Eblployed Salaried
Recreational Self-lbployed Salaried
Scrap Metal Self-lbployed Salaried
Wholeeale Self-Engloyed Salaried
Retail Foods Self -Employed Salaried
Retail Drugs Self-Bnployed Salaried
Retail Furniture Self-lhployed Salaried
Retail Clothixg Self -2hployed Salaried
Other S elf-lhployed Salaried
Not Reported self-Piuployea Salaried
TOTAL Self-Bnployed Sslaried

TABLE X I 1 A-36. OCCUPATIOW CROUF'IlGS, CAHIDN JEWISH POPUIATION, BY SEX AM) INDUSTRY, 1955
AU C r n N OmATIowlz a r a o t r P 1 ~
MALF - Pro- fes- Manl h-o- Not
Industrial sion- ag- pri- Cler- S d - Dl- Spec- Groupings a 1 er etor i c a l Sales Skilled Skilled Skilled Other i f ied Total -- -- - ---- construction 1 2 10 - - 7 2 - - 1 23 - Manufacturing 3 11 22 4 8 13 15 3 4 - - - 83 Finance 7 - 7 4 1 2 1 2 2 Service 4 10 28 2 5 7 1 5 3 - 65 bofessional 88 - 1 - - 2 - 1 1 - 93 Recreational - 2 2 - - - - - - - 4 Scrap Metal - 10 51 1 8 2 7 3 4 Wholesale - 3 48 2 29 4 2 2 2 - 9
3 89
Retai l Food - 9 4 1 1 10 2 4 2 - - - - - - - 69 Retail Drugs 2 3 12 1 - 18 Retail Furniture 2 6 31 - 6 1 - - 1 - 47 Retail Clothing 1 23 40 - 17 - - - 2 Other 7 21 58 2 18 - 3 4
- 83
- - - - - 19 Not Reported
1 133 --- - - 2 - 2 TOTAL 115 1 0 351 39 3'1 22 $ a = PER CElJT 14.0 12.2 42.6 1.9 12.9 4.7 4.1 2.7 4.6 0.7 IOO.O
mmLE - Construction - Manufacturing - Finance - Service - Professional 24 Recreational - Scrap Metal - Wholesale - R e t a i l Food - Retai l Drugs - R e t a i l Furniture - Retail Clothing - Other - Not Reported TOTAL 5c PER CEW 14 .1
TOTAL - Construction Manufacturing Finance Service Prof essioasl Recreational Scrap Metal Whole sale R e t a i l Food Retai l Drugs Retail Furniture Retai l Clothing Other N o t Reported TOTAL i$*$ PER CENT 14.0 10.7 40.0

TABU X I 1 (Continued) A-37 OCCUPATION4L CROUPIm, CANTON JEWISH P O ~ I O N , EE SEX AND IlW'STRY, 1955
SECTION I
MArn - OCCUPATIONAL GROUPINGS Pro- fes- Man- Pro- Not
Industrial sion- ag- pri- Cler- Semi- Vn- Spec- Groupiws a l e r etor ica l Sales Skilled Skilled Skilled Other if ied Tote1 ------- C a s t ruction Manufacturing - Finance Service Professional - Recreational Scrap Metal Wholesale Retail Food Retail Drugs Retail Furniture Retail Clothing Other kt Reported - - - - - - - - -- - - - - - - - -1
- - - W A L - - 10 2 2 3 2 1 1 22 PER CENT - - 45.5 9.1 9.1 13.6 9.1 4.5 4.5 4.5 100.0
FEMALE Construct ion w u f acturing Finance Service Professional Recreational Scrap Metal Wholesale Retail Food Retail Drugs Retai 1 FtwnZture Retail Clothing Other Not Reported TOTAL P E R m
= - TOTAL construction - Manufacturing Finance Service Prof esslonal Recreational Scrap Metal Wholesale Retail Food Retail Drugs R 9 t a i l Furniture Retail Clothing Other Not Reported - - TOTAL -

TM3LE ~ i i ( ~ o n t i n l ~ e d ) A-$. OCCUPATIONAL GROUPI%S, CANTON 9WK3 POPU'&?TO:OPI, BB Sm AM I&DUSTRY, 1955
smhw ir OCCUPATIO!?A L G?OTZPII%S
MAIE - Pro- fes- Man- Pro- Not
Industr ial sion- eg- pri- Cler- Semi- lb Spec- Groupings a 1 er e tor i c a l Salea Skilled Skilled Skilled Other i f i e d Total ------- construction Maaufacturing Nnance Service Professional . Recreational Scrap M e t a l Wholesale Retai l Food Retai l Drugs Retail Furniture R e t a i l Clothing Other Not Reported - - - - - - - - **5 T - - - - - - - TOTAL 5 2 7 1 7 1 50 PER CENr 12.0 12.0 26.0 4.0 10.0 4.0 14.0 2.0 14.0 2.0 100.0
Manufacturing Finance Service Professional RecreationaJ. Scrap Metal Wholesale Retai l Food Retai l Drugs Retai l Furniture Reta i l Clothing Other Not Reported TOTAL PER CENT
TOTAL - construction Manufacturing Finance Service Prof essioaal Recreatioml Scrap Metal Wholesale Retai l Food Reta i l Drugs Retai l Furniture Retai l Clothing Other N o t Reported TOTAL * * s PER CENT 10.0 lO.0 23.3

TABU x11 (continued) A-39. OCCUPATIONAL GROUPINGS, C A ~ M JEWISH mmION, BY SEX AND IIu3,USTRY, 1955
SECTION I11 OCCUPATIOXG GI?=;NGS
MALE - Pro- fes- Man- Pro- Not
Indust r i a l sion- ag- prig Cler- S d - Uh- Spec- Groupinas a1 e r etor i ca l Sales Skilled Skilled Skilled Other if ied Total ---- - construction - Manufacturing Fiaance Semice Professional - Recreational Scrap Metel Wholesale Retail Food R e t a i l Drugs Retail Furniture Retail Clothing Other - 3 5 Not Reported TOTAL +Ti6 PER CENT 9.3 14.0 44 . i
FEMALE - Construction - - - - 9 - - .. - - - Manufacturing Finance Semice Professional Recreational Scrap Metal Wholesale Retail Food Retail Drugs Retail Furniture Retail Clothing Other - -
Not Reported - - - - - o - - - - - - - - - - - - - TOT!& 1 - 4 2 3 1 - - - - - - - 11 PER C~!XC 9.1 - 36.3 U.2 27.3 9.1 - - 9 - 100.0
TOTAL - Construction Manufacturing Finance service Professional Recreational Scrap Metal Wholesale Retail Food Retail Drugs Retail f i r n i t w e Retail Clothing Other - ? 7 - Not Reported - TOTAL 7 T Z i

TABU XII (continued) A-40. OCCUF'ATIONAL GROUPINS, CANTON JEWISH POPUU!TION, BY SEX AND INDUSTBY, 1955
SECTION IV OCC~JPATIONAL GROUPIPGS
MAT3 - Pro- fee- Man- Pro- IPot
Industrial sion- ag- pri- Cler- Semi- Un- 'see- Grouping s al e r etor i ca l Sales Skilled Skilled Skilled Other ified Total ------- --- construction 1 - 2 - - - - - - - - 3 Mwufacturing 1 2 3 2 3 2 1 1 - 15 Finance 3 - 3 - 2 o - - 2 10 Service 1 1 7 - 2 3 - 2 - - 16 _ Professional 27 1 - - 1 - - 1 - 30 Recreational - 1 - - o - o - - - 1 Scrap Metal - 1 13 - 1 2 1 1 1 - 20 Wholesale - - I2 1 8 o 1 1 - - - - 23 Retail Food - 1 9 1 4 1 1 - 17 Retail Drugs - - 1 - - - - o - - 1 Retail Furniture 1 1 10 - 2 - - - - - 1 4 Retail Clothing - 5 7 - 2 - - - - - 1 4 Other 3 6 16 1 4 o 2 1 7 - 40 k t Reported - - - - - - - - - - 1 1 G i i i 3 27 G -- T(PTAL 7 7 I2 - 205 PERCEm 18.0 8.8 40.9 1.5 13.2 4.9 3.4 3.4 5.9 - 100.0
ction - Mhmf actnafing b
Pinam% - 6eTvice L.
Professional 10 R6ereatf ma1 - Scrap Metal - Wholesale - Retail Food - Retail Drugs - Retail Furniture - Retail Clothiag - Other - Not Reported - TOTAL 10
TOTAL - Construction 1 Manufacturing Finance
= Service Professional Recreational Scrap Metal Wholesale Retail Food Retail Drugs Retail Furniture Retail Clothing Other - Mot Reported TOTAL G

TABLE XI1 (Continued) A-41. OCCUPATION4L GROUPIW, CANTON JEWLW POPUIATION, BY SZX AND I-TRY, 1955
SECTION v . . O C C r X P A l ' I O ~ GROUP1m
M A D - Pro- fee- Mapt Pr* N o t
Industrial sion- ag- pri- Cler- S d - Un- Spec- Groupiws a l er etor ica l Sales Skilled Skilled Skilled Other ified Total ----- -7-
Construution - - 7 - - 2 1 - - 1 l l Manufacturing 1 2 4 1 4 5 8 2 2 - 29 Finance 1 - 3 - 2 .. - - - 1 - 7 Senrice 2 6 5 1 3 2 2 2 - 23 Professional 19 - - - - 1 - - - - 20 Recreational - - 1 - - - - - - - 1 Scrap k t a l - 5 17 1 4 3 - 1 - - 31 Wholesale - 19 - U. 3 1 1 1 - - - - 36 Retail Fadl - 4 13 4 1 2 - 24 Retail Drugs 1 2 6 - - - - - - - - - - - - 9 R e t a i l Furniture - 1 7 3 - 11 Rstail Clotbiag - 8 U. 9 - - - - 28 Other 1 6 16 1 6 - - 2 4 - 0
1 37 N o t Reported 1 - TOTAL a - j t i @ i G 5 lf i5 ii ~4 P E R C E m 9.3 32.7 40.7 1.5 17.2 4.9 5.2 3.7 3.7 1.1 100.0
-
M a c t u r l a g - Finaace - Servioe - Professional ll Recreatianal - Scrag Metal - Whole sale - Retail Food - Retail Drugs - Retail Furniture - R e t a l l Clothing - Other -
m r A L - Construction - - 8 - - 2 1 - - ~nufactur ing 1 2 4 1 4 3 8 2 2 Finance 1 1 5 2 2 - - - - service 2 6 7 3 4 2 - 3 2 Professional 30 - - - - 1 - - - Recreational - - 1 - - - - - - scrap mtal - 5 18 1 4 - 3 - 1 Wholesale - - 21 3 11 3 1 1 1 R e t a i l Food - 4 16 - 4 - 1 2 - Retall Drugs 1 2 7 - - - - - - Retail muniture - 1 9 - 3 - - - - Retail Cluthing - 8 1 4 2 1 4 - - . Other 1 7 18 2 9 - -
0 - 3 6 Not Reported - mAL f gne e 33 5 T i Ti! 6 FmcEm 1 . 2 21.2 39.6 4.3 17.0 4.0 4.3 3.7 3.7

TABLE XI1 (Continued) A- 42. OCCUPATIONAL GROUPIm, C m N JEWISH POPUIATIOX, BY SEX IrP,USTRY, 1955
SlZTION V I OCCUPfi.TIONfiL GROtJ3IIW
l&ux - Pro- fes- Man- Pro- Not
Industrial sion- ag- pri- Cler- Semi- Un- Spec- Groupings a 1 e r etor i c a l Sales Skilled Skilled Skilled Other if ied Total ----- ----- COn6tnlcti0n - 2 1
+ Manufacturing - 6 13 Maance 3 - - Service 1 2 1 1 Professional 34 - - - Recreational - 1 1 Scrap Metal - 4 15 Wholesale - 3 13 R e t a i l Food - 3 8 Retail Drugs 1 1 5 R e t a i l ~ n i t u n , 1 3 12 R e t a i l Clothi% - 5 17 Other 3 6 19 Not Reported TOTAL e $ e PERCEm s . 5 15.5 49.4
kufacturing - Finance - Servlce - Prof essioaal 2 Recreational - Scrap Metal - Wholesale - Retail Food - Retail Ihvgs - Retail Furniture - Retail Clothing - Other - - Rot Reported - TOTAL 2
= WPAL - construction - 2 1 - Manufacturing - 6 14 - 3 Finance 3 - - Service 1 2 1 1 1 Prof essionel 36 - - - Recreeti onal - 2 2 - Scrap Metal - 4 15 - Wholesale - 3 13 1 Retail Focd - 3 10 - Retail m g e 1 1 5 - Retail Furniture 1 3 12 g
Retail Clothing - 6 20 - Wher 3 6 21 Not Reported
3
WTAL e $Ei B PER* 17.2 14.6 47.5 3.1

TABLE XI1 (cant inued) A-43. OCCUPATIONAL GROUPINS, CAWION mISH POPUIATION, BY SEX AND INDUSTRY, 1955
SECTION UlWQWN
MAm - OCCUPATIONAL GROUPTNX Pro- fes- Man- fro- Not
Indust r ial sion- ag- pri- Cler- S d - Un- Spec- Groupings a1 er etor ical Sales Skilled Skilled Skilled Other ified Total --------- - construction Manufacturing
- Finance - Semite
Prof essioml Recreational Scrap Metal Wholesale Retail Food Retail Drugs Retail Furniture Retail Clothing Other

TABU XIII A-44. B@m, CANTON JEWISH POPUIATION, BY SEg, HATMTP, AND SRX"I'ON, 1955
M A L E F E M A L E AIL CAlPTON Per Per
Cent Induetrg Native Forelm Foreiun
Construction 13 10 43.5 b%snufacturing 54 29 34.9 - Finance 19 3 13.6 Service 44 21 32.3 Professional 7l 23 24.5 Recreational 3 1 25,O - Scrap Metal 46 43 48.3
Wholeeale 58 34 37.0 Retail Foods 39 31 44.3 Retail Druge 14 4 22.2 &tail Furniture 37 10 a.3 ~etail cloth- 59 24 28.9 Other 93 41 30.6
Cent Native Foreism FooreiRn
2 - - 7 1 12.5 8 1 11.1 16 3 15.8 28 4 12.5 3 - - 2 - - 7 1 12.5 8 10 - 55- 6 3 - 5 1 16.7 3 2 8 a.0 30 10 25.0
T O T A L Per Cent
Native Fore- Foreinn
15 10 40.0 61 30 33.0 27 4 12.9 60 24 28.6 99 27 P.4 6 1 14.3 48 43 47.3
65 35 35.0 47 41 46.6 17 4 19.0 42 11 20.8 91 32 26.0 123 51 29.3
SrnION I
Construction NIanufaaturing Flnance Service Professional Recreational Scrap Metal
Wholeeale Retail Foods Retail Drugs Retail Furniture Retail Clothing Other
SETION 11
Construction Manufacturing Finance Servlce Profeesional Recreational Scrap Metal
Wholeeale Retail Foods Retail Druge Retail Furniture Retail Clothing Other
TOTAL P 29 58.0 8 4 33.3 29 33 53.2

TABU XI11 (Continued) A-45. m W , C A & T O B JlWISH FQPUIATfON, BY SW, NATIVITY, AND SECTION, 1955
M A L E Per Cent
Industry Native Foreign Foreign - F E M A L E
Per T O T A L
Per Cent
Native Foreign Foreign - Cent Native Foreign Foreim
SECTION 111
Construction 1 - - mufacturing 1 2 66.7 Finmce - - - Service 2 - - Profeseional 2 1 - - 33.3 - Recreational - Scrap Metal 1 3 75.0
Wholesale 2 1 33,3 Retail Food6 3 2 - - 40.0 Retail Drugs - Retail Bhmiture 1 2 66.7 %tail clothing 6 2 25.0 Other 7 4 36.4
TOTAL 26 17 39.5 9 2 18.2 35 19 35.2
SECTION m Comtruction Manufacturing Finance Service Fmfeesional Recreational Scrap Metal
Wholesale Retail Foods Retail Drugs Retail muniture Retail Clothing Other
SECTION V
Conetruction Manufacturing Finance Service Professional Recreational Scrap Metal
Wholesale Retail Foods Retail Drugs Retail Furniture Retail Clothing Other

TABLE XIXI (Continued) A-46. -3 CAPEON JWISH POPULATION8 BY SEIT, NATXVITY, A D S%TION8 1955
Inaustrs
SECTION VI
. Coaetruction Manufacturing Finrtnce Service - Professional Recreational Scrap Metal
M A L E Per Cent
Native Foreim Foreie~l
Wholesale 19 6 24.0 Retail Foods 9 3 25.0 Retail Drugs 6 1 14.3 R e G a i l Furniture 16 3 15.8 Retail Clothing 19 5 a.8 Other 2'7 10 8.0
F E M A L E T O T A L Per Per Cent Cent
Native F m IporeiRn w~ -
Construction - - - - Manufacturing - - L
Finance - - - Service - - - Profeasio3lal - - - Recreational - - - Scrap Metal - - g
Wholeeale - - - - - - - - - Retail Foods - 1 100.0 1 1 ! n o 1 2 - - a - - - - - 66.7 Retail Druge - Retail Furniture - - - - - - - - o
Retail Clothing - - - - - - - - - Other 1 - - g - - 1 - - TOTAL 1 1 50.0 1 1 50.0 2 2 50.0
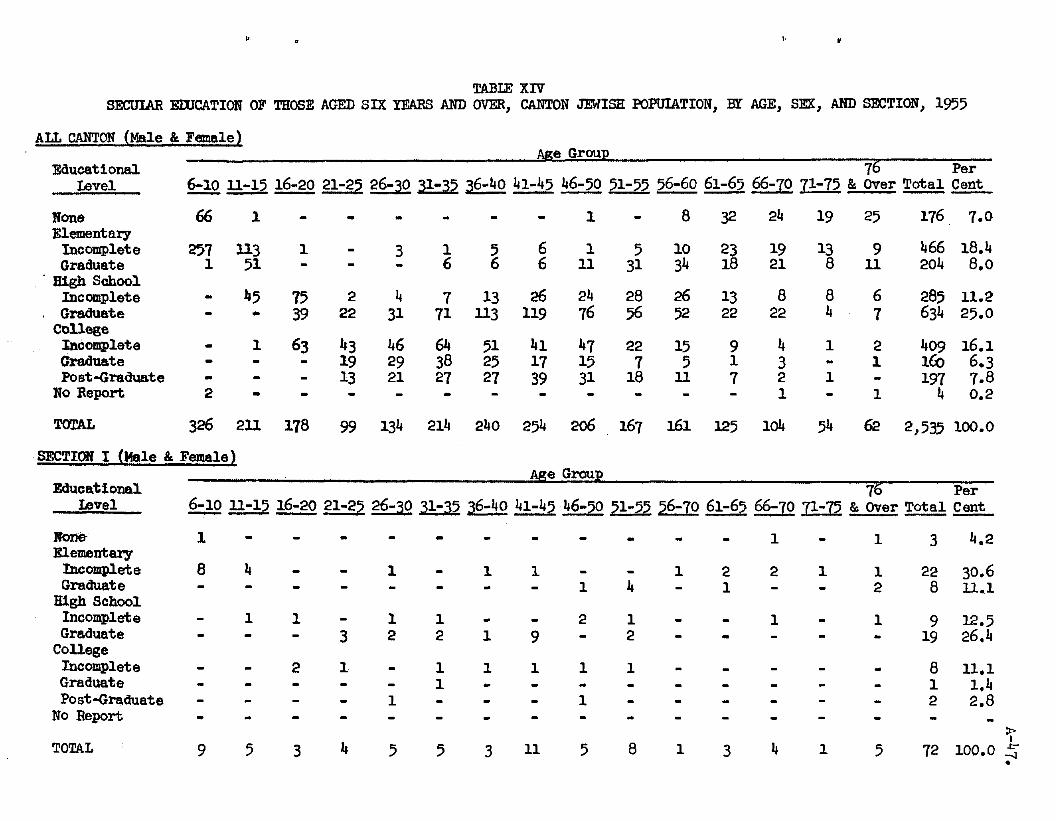
TABU XIV SECUIAR HXICATIOH OF THOSE AGED SIX YEARS AND OVER, CANTON JEWISH WPUIATION, BY AGE, SEX, AND SECTION, 1955
ALL CANTON (Male & Famale) Age Group
P
Educat tonal 76 Per h v e l --- 6-10 11-15 16-20 21-25 26-30 31-35 36-40 ----- 41-45 46-50 51-55 56-60 61-65 66-70 71-75 & Over Total Cent
None Elementary
Incomplete Graduate Bigh School
Incomplete Graduate College Incomplet a Graduate Post -Graduat e
No Report
TOTAL 326 ell 178 134 214 240 254 206 167 125 104 34 62 2,535 100.0
SECTION I (Elale & Female1 Age Group -
Educational 76 Per Iavel 6-10 11-15 16-20 21-25 26-30 31-35 36-40 41-45 46-50 51-55 56-70 61-65 66-70 71-75 & Over Total Cent - - - --
Ron6 Elementaq
Incomplete Graduate
High School Incomplete Graduate
College Incomplete Graduate Post -Graduate
No Report
TOTAL

TABU X I V (Continued) SECUIAR EDUCATION OF THOSE AGED SIX YEAE AND O W , CANTON JEWISH POPUIATIOFJ, BP AGE, SEX, AND SECTION, 1955
SXCTICN I1 ( ~ a . 1 ~ & Female1 Age Group
Educotional 76 Per Lnvel - 6-10 ll-15 16-20 21-25 26-30 31-35 96-40 41-45 46-50 51-55 -- 56-60 61-65 66-70 71-75 & ~ v e r ~otal cent
None Elenentary Incomplete Graduate High School Incomplete Graduate College Incomplete GraCuate Post-Graduate No Report
TOTAL 8 7 10 6 2 4 4 15 16 16 11 12 9 14 16 150 100.0
SECTION I11 (Malo & Fennsle) Age Group
Educational 76 Per Level 7
6 ~ 1 0 11-15 16-20 21-25 26-30 31-35 36-40 41-45 46-50 51-55 56-60 61-65 66-70 71-75 & Over Total Cent -- Pkrne 3 - - - - - - - - - - 2 3 3 Elementary Incomplete 13 8 - - - - - - - - 2 - 1 Graduate - 4 - - - - - - - - 3
3 1 2 - High School Incomplete . 3 3 - - - 2 1 3 - 5 1 - - Graduate - - 1 1 1 6 9 5 4 2 4 4 3 - College Incomplete - - - 1 - 1 2 4 1 - - 3 - - Qraduat e - - - 1 1 1 1 - - - - - - - hst-Graduat e - - - - . - 2 1 1 2 1 1 - - - NO Report - - - - - - - - - - - - - -
I C
TOTAL 16 15 4 3 2 13 15 ll 10 4 14 lo Y 6 6 136 100.0 a

TABLE XIV (continued) KECUIdIR EDUCATION OF TEOSE AGED SIX YEATCj AN0 OVER, CAFJTON JEWISH POPULBTION, BY AGE, SEX, AND SECTION, 1955
SECTION IV (Male & Female ) &e Group
Educational 76 Per Level 6-10 16-20 21-25 26-30 31-35 36-40 41-45 46-50 51-55 56-60 61-65 66-70 71-73 & Over Total Cent - - --
none 12 1 - - - - - - - 3 6 6 3 6 37 5.9 - Elementary
Incomplete 55 33 - - 1 - 1 2 - 2 2 7 6 2 1 112 17.8 Graduate - 16 - - - - - 2 2 2 9 9 9 3 4 56 8.9 High School Incomglet e - 6 15 - 1 - 4 5 3 8 6 9 2 3 - 62 9.9 Graduate - - 13 5 6 1 4 31 34 1 4 15 20 6 9 2 3 172 27.4
College Incomplete - 1 12 12 8 11 9 10 4 12 7 1 3 1 - 91 14.5 Graduate - - - 9 5 7 5 4 6 1 2 1 1 - 1 42 6.7 Post-Graduate - - - 1 7 4 7 13 4 8 4 5 2 1 - - - - - - - - - 56 8.9
No Report - - - - - - - - -
me, Group Educatloml 76 Per
k v e l 6-10 11-15 l6-20 21-25 26-30 31135 36-40 41-45 46-50 %-bo 61-65 66-70 & Over Total Cent - None Elementq
Incomplete Graduate
High School Incomplete Graduate
College Inccrmglete Graduate Post-Graduate
No Report
TOTAL

TABLE XIV (Continued) S E C ~ EDUCATION OF THOSE AGED SIX YEW AND m, CARKIN JEWISH POWIATION, BY AGE, SEX, AND SECTION, 1955
SECTION VI (Male & Female) ARe Grouu
Educational 76 Per Level - 6-10 - 16-20 21-25 26-30 31-35 36-40 41-45 46-50 51-55 56-60 61-65 66-70 n-75 & Over Total (&g&
N0m Elwntary
Incolqplete Graduate
a i a SC~OOI Incomplete Graduate
College Incomplete Gnatate Post -Graduete NO R e p o r t
. SECTIOB UVBMW (!&ale & Female1 Age Group
Educational Level
76 6-10 11-15 16-20 21-23 26-30 31-35 36-40 41-45 46-50 51-55 56-60 61-65 66-70 71-73 & Over Total - - -
h e Elementary
Incomplete Graduate High School Incomplete Graduate
College Incomplete Graduate Post-Graduate Ro Repa*

TABfE X N [continued) SECUylR EDUCATION OF THOSE AGED SIX YEARS AND OVER, CANTON JEWISH POPUTION, BY AGE, SEX, AND SECTION, 1955
ALL CABTON (Male) &e Group
Educational 76 Per Level
None Elementary
Incomplete Graduate High School
Incornplate Graduate
College Incmplete Graduate Past -Gmduat e
No Report
Educational Level
None Elementaw
Incarplet e Graduate
Eligh School Incamplet e Graduate
College Incmlete Graduate Post-Graduat e
NO Report
TOTAL
6-10 16-20 21-23 26-30 31-35 36-40 41-45 46-50 21-55 56-60 61-65 66-70 71-75 & &er Total cent - -- -- - --
76 Per 6-10 11-15 16-20 21-25 26-30 31-35 36-110 41-45 46-50 51-55 56-60 61-65 66-70 71-75 & Over Total Cent ---- - - --

-f ?? OO";? C-M C--f CbG0rl ;;I rl rlrl rl
\O m-f mrl w o a d rl rl rlrl
In rlrl 1 1 1 1 1 8
N d l I N l l lrl
m 4 1 1 4 1 1 1 1
4 4 1 N O I l l 1
I I I rlrl 1 rl-f I

TABU3 XI?? (continued) SECUIAR ElJUCATION OF THOSE AGED SIX PEAPS AND OVER, CANTON JZWISH POPULATION, BY AGE, SEX, AND SECTION, 1955
SECTION IV (Male) Age Group
Educational 76 Per Level - 6-10 11-15 16-20 21-25 26-30 31-35 36-40 41-45 46-50 51-55 56-60 61-65 66-70 71-75 & over Total Cent
None Blementary Incomplete Graduate
High School Incomplete Graduate
College Incomplete Graduate Post-Graduate
No Report
SBcTIOM V (Male 1 Age Group
Wucatiomi~ 76 Per Level 6-10 11-15 16-20 2 1 e 5 26-30 31-15 36-40 41-43 46-50 51-55 56-60 61-65 66-70 71-75 & Over Total Cent - -
None Elementary Incmplet e Graduate High School
Incomplete Graduate
College Inconrglet e Graduate Post-Graduate
NO Report
TOTAL

TABU XIV (Contirrued ) SECUIAR E~XTCATION OF THOSE AGED SIX YEARS AND m, cmom JEWISH POPULATIO~, BY AGE, SEX, m SECTION, 1955
SECTION V I (Male)
Educational Level
None Elem? ntary
Incomplete Graduate
High School Incomplete Graduate
College Incomplete Graduate Post-Graduate
No Report
Aae Group 76 Per
6-10 11-15 16-20 2 1 - 3 26-30 31-35 36-40 41-45 46-50 51-55 56-60 61-65 66-70 71-75 & over Total Cerrt - -
TOTAL 62 39 28 l o 21 46 34 35 35 19 19 l o 9 1 2 370 100.0
SECTION utWTOWX(hfale) Age Group -
Educational Level
76 6-10 11-15 16-20 21-25 26-30 31-35 36-40 41-45 46-50 51-55 56-60 61-65 66-70 71-75 & Over Total ---- - - - -
TOTAL

TABLB XIV (Continued) SECUIAR EDUUTION OF THOSE AGED SIX YEARS AND OVER, CANTON JEWISH POPWITION, BY AGE, SEX, AND SECTION, 1955
Am CANTON ~Feluale) Age Group
Educat t i o d 76 Per Level - 6-10 ll-15 16-20 21-25 26-30 31-35 36-40 41-45 46-50 51-55 56-60 61-65 66-70 71-75 & over Total Cent
C L - -- None Elementary
Incomplete Graduate High School
Incomplete Graduate
Coilege Iilcomplete Graduate Post -Graduat e No Report;
TOTAL 159 log go 48 73 El 129 1.28 103 83 74 61 50 26 30 1,264 100.0
SECTION I (Female1 Age Group
Educational 76 Per Isvel 6-10 11-15 16-20 21-25 26-30 31-35 36-40 41-45 46-50 51-55 56-60 61-65 66-70 71-75 & over Total Cent -
None 3Clementary f ncomplet e Gntduate
High School Incomplete Graduate
College Incomplete Graduate Post-Graduate
No Report
TOTAL

TABLE X N (Continued) SECUIAR EEUCATION OF THOSE ACED SIX YEARS AKD OVER, CANTDN JEWISH POPUIATION, BY AGE, SEX, AND SECTION, 1955
SECTION I1 (Female) Age Group
Educational 76 Per h v e l - 6-10 11-15 16-20 21-25 26-30 31-35. 36-40 41-45 46-50 51-55 56-60 61-65 66-70 71-75 & Over Total Cent
None Elementary
Incmplet e Graduate
Hlgh School Incomplete Graduate
College Incomplete Graduate Post 4raduat e
No Report
SECTION 111 (Female) Age GmuP
Educational 76 Per h v e l 6-10 11-15 16-20 21-25 26-30 31-35 36-40 41-45 46-50 51-55 56-60 61-65 66-70 71-75 & over Total Cent --- -- --
None Elementq
hcomplete Graduate
Ugh School Incomplete Graduate
College Incorqplete Graduate Post -Graduate
No Report -.
TOTAL l2 8 3 1 - 8 9 3 5 2 8 4 7 2 2 74 100.0

TABU XIV (Continued) SECUIAR EDUCATION OF THDSE AGED SIX YEARS AND OVW, CANTON JEWISH POPUIATIOI, BY AGE, SEX, AND SECTION, 1955
j;ECTION N (Female1 Age Group
Educational 76 Per Level - 6-10 ll-15 16-20 21-25 26-30 31-35 36-40 41-45 46-50 51-55 56-60 61-65 66-70 71-75 & over Tutal Cent
None , 6 1 - - - - - 0 - - 2 3 5 2 3 22 7.0 Elementary
Incomplete 17 17 - - 1 - - 1 w 2 - 5 6 1 - 50 15.9 Grailuat e 7 - . - - - 1 - 1 7 5 4 1 3 29 9.2 Hi& School Incomplete 4 9 - - - 2 2 1 5 - 4 - 1 - 28 8.9 Graduet e - - 6 1 5 11 19 19 10 11 8 4 4 1 1 100 31.9
College Incomplete w - 3 9 4 8 5 6 1 6 7 1 1 1 - 52 16.6 Graduate - - - 4 4 2 1 - 2 1 1 1 1 - - 17 5.4 Post-Graduate - - - 1 2 3 3 5 1 1 - - w w - 16 5.1
130 Report - o - - - - - - - - - - - - - - -
SECTION V (Female) Age Group
Educ3tional 76 Per isvel 6-10 11-15 16-20 21-25 26-30 31-35 36-1:0 41-45 46-30 51-53 56-60 61-65 66-70 11-75 & Over Total Cent - -
None Elementary Incomplete Graduate
High School Incomplete Graduate
College Incomplete Graduate Post-Gradwt e
NO Report
TOTAL
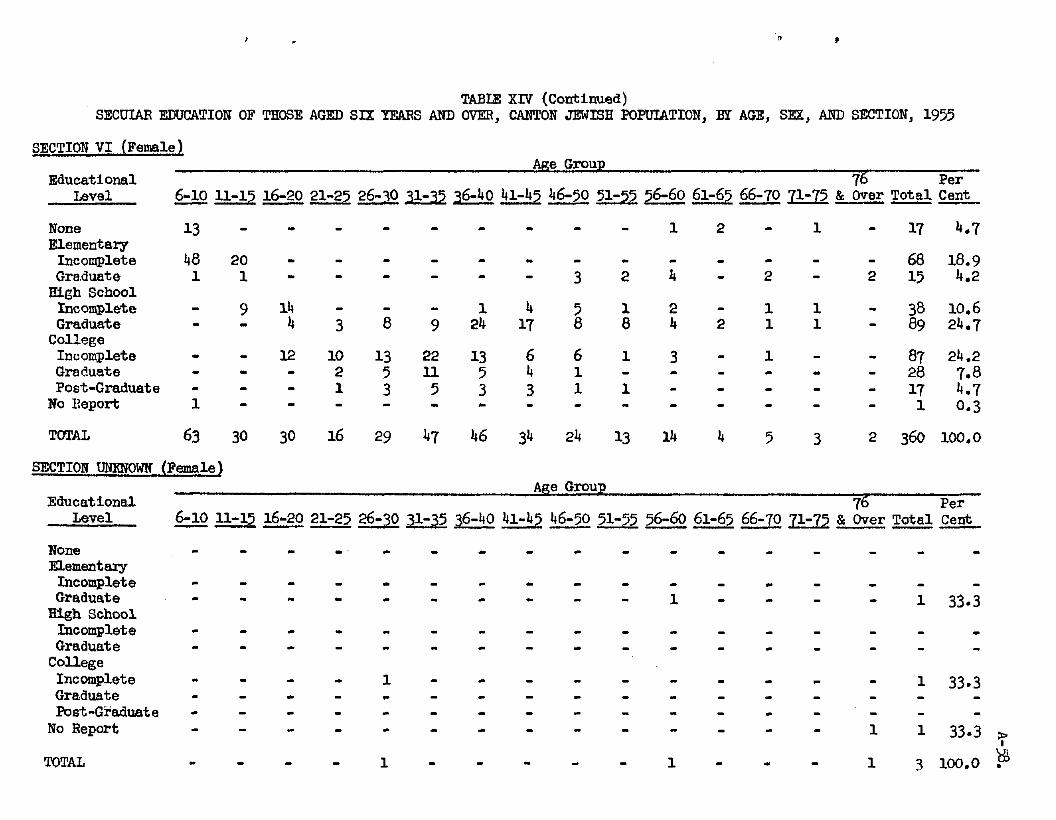
TABm X N (continued) SECUIAR EDUCATION OF THOSE AGED SIX YEARS AND OVER, CANTON JEWISH POPUTATION, BY AGE, SEX, AFJD SECTION, 1955
SECTION V I (~emaler Age Group
Educational 76 Per Level - 6-10 11-15 16-20 21-25 26-30 31-35 36-40 41-45 46-50 51-55 56-60 61-65 66-70 71-75 & Over Total Cent -- --
None Elementary
Incomplete Graduate
High School Incorqplet e Graduate
College Incomplete Gra auate Post-Graduate
No I?apol-t
TOTAL 63 30 30 16 29 47 46 34 24 13 1 4 4 5 3 2 360 100.0
SECTION UNKNOWN (Female) Age Group
Ehcational 76 Per Level 6-10 11-15 16-20 21-25 26-30 31-35 36-40 41-45 46-50 51-55 56-60 61-65 66-70 71-75 & Over Total Cent ---- ------
None Elementary
Incomplete Graduate U h School
Incomplete Graduate
College Incomplete Graduate Post-Graduat e
No Report
TOTAL

TABU XV WISH TI^, IrgUR YlBUS AND OVZR, CANTON JEWISH POPUIATIOIP, BY AGE AM) SEWION
6- 21 - 26- - - - 5 - 56- 61 - 66 - - Per Age Group - - 31- 36
10 15 20 4 40 & qZ 60 5 6 g e r ~ t a l Cent -- - - - - Sunday Sc%ol 190 PI 76 37 52 69 78 61 36 28 24 13 u 4 1
I t - 777 29.3 11 n
plus Hebrew School 46 60 50 25 21 48 35 33 26 16 14 5 5 - - 384 14.5 " Tutor 2 1 0 4 5 3 7 1 4 4 4 1 - 1 -
II II 46 1.7
" Hebrer School & Tutor - 1 3 5 3 1 1 4 1 2 - - - - -
11 w 21 0-8
' Hebrew School 84 All-Ikw - - - - - - 1 - 1 - - - 1 - -
11 n - - - - 3 0-1 " Other - - - 1 1 - 1 - - - -
11 3 0.1
I 1 " Hebrew School & Other - - - - - - - 1 - - - - - - - 1 #
Hebrew School 27 21 29 14 31 49 81 99 74 64 80 57 43 25 38 732 27.6 11 " plus All-Day
& mar - - - - - - - - 1 - 1 - 1 - - I t I 1 - 0.1
I' m-,, - - " - - - - 1 ; - - 2 - I t II
1 - - - - 3 o a I t
" Tutor - 3 - 6 3 5 4 3 1 2 - 11 - - " - - 27 1.0
" Other - 1 - 2 - - 1 - - - 4 0.2
A l l - B l g I' plus Tutor
Tutor 3 7 7 1 1 7 6 1 0 1 8 1 5 1 2 1 0 1 6 6 8 127 4.8
None 173 15 7 11 19 28 29 35 37 32 22 30 16 13 l o 477 18.0
No Report 1 - - - - - - - - - - - - - - 1 # m L 442 211 178 99 134 214 240 254 206 167 161 125 104 9 62 2,651 100.0
-8 than .W of one per cent. P VI UI

1 I 1
1 1 1
d l l
rid l
1 I 1
rid l
l r i l
I I l l , d l I I I @ d
m I I I I d l I I I I *
CV I I I I I I I I CU I n
t I I I I I t I I In I 3
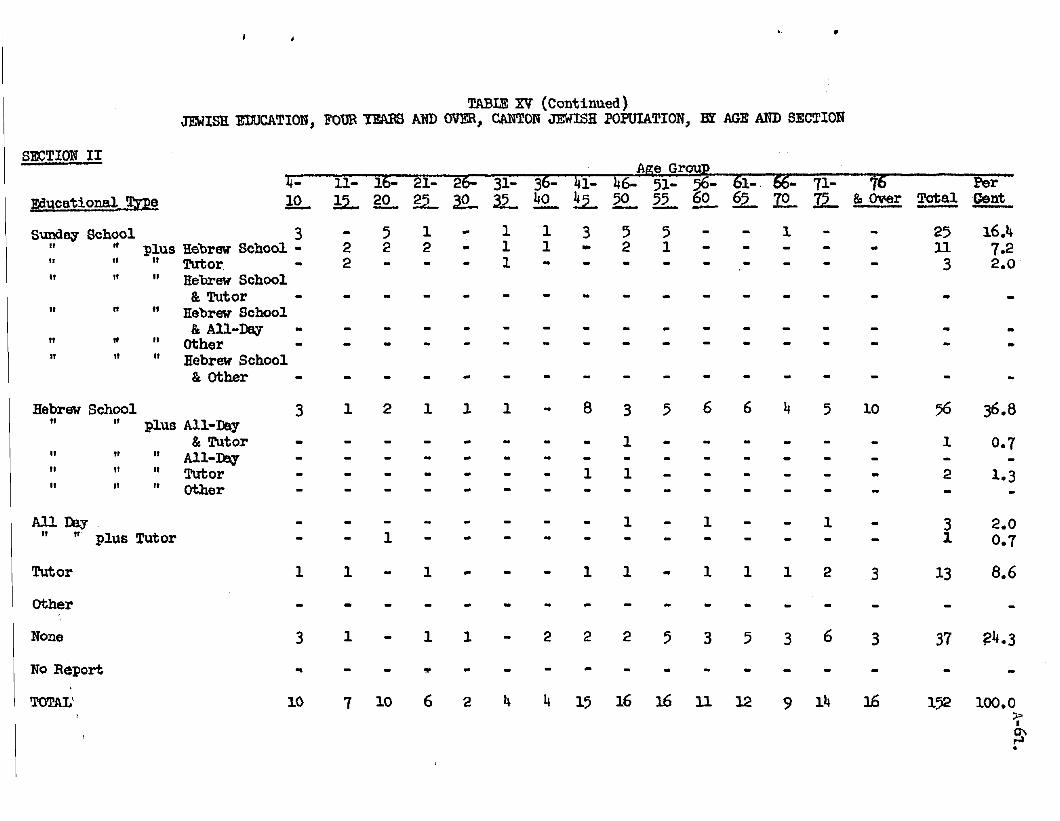
SECTION I1
Educa t iod !bPe
TABLE XV (continued) JlLWISH EDUCATION, FOUR PERRS AWD (rmfJii, CANTOW JEWISH POPUIATION, BY AGE AND SECXIOH
Aae Grou 4- ll- 16- 21- 2 6 1 - 36- 1 - 46- 51- 2- 61- - 71- 4 r 10 ~ ~ 2 j - ~ j l 4 0 5 5 0 55 ( & k g z & : e r = E n t - - --
S d e g School 3 - 5 1 1 1 3 5 5 - - 1 - - 25 16.4 !I " plus Hebrew School - 2 2 2 - 1 1 - 2 1 - - - - - I, 11
U - - - - - - - - - - 7.2 " Tutor 2 - - 1 - 3 2.0
II 11 Hebrew School
& mtor - - - - - - - - - - - - - - - - - II n " Hebrew School
& All-DBS. - - - - - - - - - - - - - - - - - 11 11
I' Other - - - - - - - - - - - - - - - - - II I t
" Hebrew School & Other - - - - o - - - - - - - - - - - -
Hebrew School I t
3 1 2 1 1 1 - 8 3 5 6 6 4 5 1 0 56 36.8 " plus All-Dey
& Tutor - - - - - - - - 1 - - - - - - II I t
1 - - - - 0 - - - - - - - - - - - 0.7 " All-Cey - II I t TVtor - - - - a - - 1 1 - - - - - - II I t
2 - - - - - - - - - - - - - - - - 1.3 I' Other -
U W g " " plus Tutor
Other
None

TAB= XV (Continued ) JEWISH EDUCATION, FOUR YJWE ARD OVER, CANTON JTNISH POPUIATION, EIY AGE AND SECTION
SECTION' I11 Age Group
4- 11- 16- 21- 26- 31- 36- 41- 46- 51- 56- 61- 66- 71- 76 Per Educational Type - lo 20 a 32. 40 a a & O v e r T o t a l Cent
Sunday School U . 6 3 1 - 3 4 5 2 - - 1 1 - - II - - - - ... .#
37 26.3 " plug Hebrew School 1 6 1 - - 2 2 2 - 11
1 4 I t
9.9 " M o r - - - - - - - - - 1 - - - - - 1
11 n 0.7
" Hebrew School & Tutor - - - 1 1 - - - - - - - - - - 2
I t 11 1.4
" Hebrew School & ~ l l - D R Y - - - - - - - - - - - - - - - - -
I! n " Other - - - - - - - - - - - - - - - - -
I1 11 " Hebrew School & Other - - - - - - - - - - - - - - - " -
Hebrew School n
1 1 - 1 1 8 7 4 3 2 1 1 7 2 4 2 54 38.3 " plus All-Day
& Tutor - - C - - - - C - - - - - - - . - - II n
I* All-Day - - - - - - - - - - - - - - I@ I1
1 1 - - - 0 - - .. - - - 0.7 Tutor - - - - - - -
n II " Other - - - - - - 1 - - - - - - - - 1 0.7
Tutor - - - - - - - - - - 1 - 1 2 1.4
Other - - - - - - - - - - - - 1 1 - 2 1.4
None 8 2 rn - r 2 1 m 3 1 3 2 2 1 1 26 18.5
No Report - - 4 - - C L 4. . e - - C - - -

SECTIOEl IV
~ducat ioaal Type
TABU3 XV (Continued) JEWISH lEO.Xl!IOl9, FOUR YEARS AND OVER, CANLOB JEWISH POPULATION, BY AGE Am) SECTION
Aae G-P 4- 11- 16- 21- 26- 31- 36- 41- 46- 51- 56- 61- 66- 71- 76 Per 10 20 30 32 40 42 50 60 65 70 75 Over T o t a l c a t
Sunday School 3 3 2 7 20 12 9 12 19 21 7 U 14 6 6 2 - I t - - 199 30.8
" plus Hebrew School 16 15 12 4 5 6 4 9 5 4 6 2 - 11 11
88 13.6 " Tutor 1 2 - 3 2 2 - 1 1 1 1 - 1 - -
I1 II 15 2.3
I' Hebrev School & Tutor - 1 2 1 - - 2 - - - - - - -
II 11
6 0.9 I' Hebrev School
& All-Dey - - - - - - 1 - - - - - 1 - - II t l
2 - - - - - - - - - 0.3 " Other - - - 1 -
II n 1 0.2
" Eebrev Schoal & Other - - - - - - - - - - - - - - - - -
Eebreu School 3 11 5 3 6 7 23 25 10 17 22 18 15 7 11 183 28.4 w " 'plus All -Dey
80 Tutor - - - - - - - - - - - - 1 - 0
II w 1 0.2
" All -Dey - - - - - - - - - - - - 2 - - w
2 w - - - - 0.3
'I 'k tor - 1 - 1 - 2 2 1 - B - w I t
7 1.1 " other - .. - - - - - - - - - - - - - - -
m - m y 'I plus Tutor
Tutor - 1 1 - 1 2 1 - 5 5 5 2 5 1 1 30 4.7
Other - - - - - 1 - - - 1 - - - - - 2 0.3
None 3 1 1 1 3 3 6 7 U 3 7 4 1 2 7 3 1 100 15.5
TOTAL

TABU W (continued) i?BlISH EDUCATION, FOUR YEAIiS AND OTRB, CAFION JEWISH PORJIATION, BY AGE AND SECTION
SECTION V Ape GrouD
4- - 16- 21- 26- 31- 36- 41- 46- 51- 56- 61- 6- 71- 76 Per Educational Type - l o 25 30 35 40 5 50 60 & 70 j'5 &Over Total Cent
Sunday School 55 32 20 9 17 10 18 16 12 7 7 4 - - 1 208 24.5 11
" plus Hebrew School 11 13 19 1 4 8 16 11 11 10 7 5 1 3 - . I # I1
129 15.2 " TUtor - 1 2 1 - 1 1 2 3 1 - - - - - 12 1.4
II I1 " Hebrew School & Tutor - 1 1 2 1 1 1 - 1 2 - - - - - 10 1.2
I1 I1 " Hebrew School & A l l - D a y - - - - - - - - - - - - - - - - -
II 11 " Other - - - - 1 - - - - - - - - - -
I t I1 1 0.1
" Hebrtw School & Other - - - - - - - - - - - - - - - - -
Hebrew School (1 " plus All-Dey
& Tutor I 1 11
11 " All-my
1 1 II
I* I f 'rut or
" Other
A l l my I' plus Tutor
Other
No Report

TABm XV (continuea) JEWISH EMXATION, POW YEARS AND OVER, CANTON JEWISH POPULATION, IT AGE AND SECTION
SECTION V I Age Group
4- 11- 16- 21- 26- 31- 36- 41 46- 51- 56- 61- 66- 71- 76 Per Educational TgPe - 10 20 30 15_ 40 45 50 60 65 =&Over Total Cent
Sunday School 85 32 28 1 4 26 42 36 15 9 5 3 2 3 2 - 11
302 38.5 " plus Hebrew School 18 23 16 5 7 24 17 10 7 4 3 2 2 - -
II 138 17.6
I1 " Tutor 1 5 2 1 1 3 - 1 - 1 - - - - - 15 1.9
II It " Hebrew School & Tutor - - 1 - - - - 2 - - - - - - 3 0.4 -
I1 It " Hebrev School
& A=-Day - - - - - - - - 1 - - - - - - 1 0.1 11 II
" Other - - - 1 - - - - - - - - - - - 1 0.1 II II
" Hebrew School & Other - - - - - - - 1 - - - - - - - 1 0.1
Hebrew School 11
6 2 9 2 10 11 19 28 26 10 18 5 5 1 1 153 19.5 " plus All-my
& m t o r - - - - - - - - - - - - - - - - - II II " All-Eay - - - - 1 - - 1 1 - - - - - - II 11
3 0.4 I' Tutor - - - - - - - - - - - - - - - - -
I t II " Other - - - - - - - - - - - - - - - - - Dey
" " plus Tutor
Tutor - 2 - - - 1 2 3 5 5 1 - 3 - 1 23 2.9
Other - - - - - 1 - 1 - - - - - - - 2 0.3
None 6 9 5 2 3 5 U 6 7 1 0 7 7 5 - 1 2 140 17.9

TABU' XV (Continued) JEWISH XINCATION, FOUR m AND o m , CAElTOEJ m s H m m I o N , E AGE AND m 1 m
M e a m p b- 11- 16- 21- 26- 31- 36- 41- 46- 51- 56- 61- 66- 71- 76 Per lo 15 20 25 30 35 40 5 50 2 60 a 70 a & over Total Cerrt ---
Sunday school - 9 - - - - - 0 - - 0 - - - - - - II " plus Hebm School - - - - - - - - - - - - - - - - - II I1 II mt or I - - - 0 - - 0 - - - - - - - - II II n Eebrw School
& Tutor - - - - - - - - - - - - - - - - - 11 I1 11 Hebrew School
& A l l - m y - - - - - - - - - .. - - - - - - II n 11 other - - - - - - - - - - - - - - - II
" It Hebm School 80 Other - - - 0 - - - - - - - - - - - - -
All-my " plus Tutor
TOTAL - - - 1 1 - - - - - 2 - - - 1

'IIABLE: LTI IISE aF XENfSH CENTER PROGRAM3 OR ACTIVITIES BY AGE, SEX, AND SECTION
~ 6 7 .
- 1955 - &rn,GiIE
B e - Occas- quent ly sionallg
TOTAL Fre- Occa.6-
MALE B e - Occas-
76 and Over - 6 26 Age Unknwn - - -
MAE3 Fre- Occas-
9uent.b sio=lly None
FEMAm Fre- Occas-
querrtly sionally None
TOTAL Fre- Occes-
quently sionally None
1 . - 5
76 and mer - - 2 Age Unknown - - - TOTAL 5 13 20 9 15 16 1 4 28 36 PW c m 13.2 34.2 52.6 22.5 37.5 40.0 18.2 36-4 45.4
( 3 4 100.0) (40- 100.0) (78. 100.0 )

TABU XVI (Continued) ~ 4 8 . . USE OF JEWISH PROGFNS OR ACTIVITIE BP AGE, SEX, AND SEC!CION
SECTION I1 - 1955 - MALE
Fre- Occae- !romL
me- occas- !!&E suentb sionally None quently sionally None
76 and over - 2 - 5 Age Dhknam - - TOTAL 14 37
CEmT 18.4 48.7
SECTION I11 MALE
R e - Occas- mmE
B e - Occas- quentb sionally None
TOTAL FTe- Occae-
&E guently eionally None quently sionally None
76 and Over - - 4 Age Unknown - - o

TABU XVI (Continued) A- 69. USE OF JEWISH CZNTER PROOW OR ACTIVITIES BY AGE. SEX, AND SECTION
SECTION IV - 1955 - MAIX TEWLIX TUTAL
Fre- Ocoae- Fro- Occaa- Fre- Occas- suentls sionaUg None 9uen& sionalls None guentls sionalls None
76 and ~ e r - 2 6 - 4 3 - - - - 6 - - - - 9 Agethknawn - - TOTAL 65 125 140 69 143 123 134 268 263 mcm 19.7 37.9 42.4 20.6 42.7 36.7 20.2 40.3 39.5
(33W 100.0) (335= 100.0) (665: 100.0)
SECTION V brim m m TOTAL
he- Ocoae- Fre- Occam- Fre- Occsa- 43% quently eionally None guently sionally None guently eionaUg None
76 and Over - 2 7 1 1 4 1 - 9 - - 3 11 Age unknown - 1 C - 1

TABLE W I (~onfiinued) A-70. USE OF JEWISH CEWPW PROf3M OR ACl"lYXTJ? BY ME, SEX, AND SECTION
SECTION V I - 1955 - W T'EMLE WrPIL
Fre- Oooae- Fre- Occae- f ie - Occae- & suentb sionsll;~ None guently eiondly None pent31 eionelly None
0-5 5 6 46 6 2 43 ll 8 89 6-10 27 17 18 23 18 22 So 35 40
ll-15 23 10 6 19 7 4 42 17 10 16-20 10 12 6 ll 13 6 21 25 12 21-25 2 7 1 2 4 10 4 11 11
H 26-30 - 1 4 7 7 16 6 7 1 4
30 22 10 11
13 31-35 31 5 25 53 15 36-40 8 21 5 17 22 7 25 4 3 12 41-45 1 4 15 6 10 17 7 24 46-50 Il
32 13 14 10 3 15 6 14 29 16
51-55 2 10 7 1 6 6 3 16 56-60 1 11 7 1 6 7 2 17 1 4
13
61-65 1 5 4 o 3 1 1 - 8 66-70 2 7 - 3 2 - 5
- - - - 5 9 71-75 1 1 2 2 2
76 and Over - - 2 - 1 1 - 1 AgeUnknam - - - - - 1 - - 3
1
TOTAL 118 167 142 u 165 136 229 332 278 27.6 39.1 33.3 27.0 40.0 33.0 2 -3 (4271 100.0) (4121 100.0)
39.6 33.1 ($9 100.0)
SE[TpIOfl m O U P J . Wml -
F6MAI6 TarAL ' W e - Occas- Re- Oocas- Fre- bcae-
& quently slonallg none guedlg sionaUy None quentlx slonallg None
76 and Over - - - - - 1 - - 1 Age IJhknom - - - - - - - - -

TABU! XVII A-7L. PAR'RCIPAmm m CWrPW aXaTED ACTMTLIES, .CCIBT(W JawIsX ~ I m ,
ALL CANWN BY AGE, SEX, AND SECTION, 1955 MAIS EEMLE TOTAL
Fre- Occas- R e - Occaa- We- Occaa- !iE g ~ e n t l y s1onaI.b mane 9uentl.y sionally None quently eionallv None
76 and Over - 5 27 - 6 24 - ll - - - - 51 Age Unkaaun - 1 2 1 2
TOTAL F'ERCaJT
MAD Fre- Occae-
quently sionaYy none
mMau Fre- Occas-
quently 6i0na- None
TOTAL Fre- Occas-
quently siomlly None -
76 and over - 1 1 - 1 2 - - 2 Age U n h m - - - - - - - 3 - TOTAL 5 12 21 6 17 17 11 29 PE4 13.1 31.6 55.3 15.0 42.5 42.5 14.1 37.2 48.7
38
(38. m * o ) (40s ~00.0) (78. 100.0)

TABIE ~ I I (~ontinued) A-72 PARTICIPATION I N CEm IOCATED ACTIVITISeS, CAWTON JEWISH POPUIATION,
SEETIOii I1 BY BOE, SEX, AlUD SBXIOI9 , 1955 MeIs FEMAfX TOTAL
Fre- Occas- Ere- Occae- Fre- Oocas- &? g u e n t l ~ 8iol~fll.y None F e n t ~ siomlly None guentb sionally None
76 and over - 2 5 - 1 8 .. - - - - 3 - 13 A g e U n h m - 1 1 -
3ECTION I11 MALE FmAm mAL
Fre- Ocoae- Fre- Occae- Be- occas- 9 2 guentw 8 i o r ~ d b None 9uentIs eionelly None quently sionally None
76 and Over - - 4 - 1 1 - Age Unknown - 1 - - - - - - - 5 - TOTAL 13 10 41 20 19 42 33 29 PWCElqP 20.3 15.6 64.1 24.7 23.5 51.8 22.8
83 20.0 57.2
(64. 100.0) (81. 100.0) (145- 100.0)

TABIE: XVII (Continued) A-73. PARTICIPATION I N JDCATED ACTIVITIES, CAMTON JEWISH PORIIATION,
SECTION IV BP AGE, SEX, AID SECTION, 1955 MILE FEMALE 'To!CAL
R e - Occas- Fre- Occas- Fre- Occas- !!@ quently eionallg None suently eionally None quentb sionally None
76 and over - - 8 - 1 6 - 1 1 4 AgeUnknawn - - - - - - - - - TOTAL 70 105 155 61 122 152 131 227
31.8 47.0 18.2 307
PER CmT 21.2 36.4 45.4 19.7 34.1 46.2 (330- 100.0) (3351 100.0) (6651 100.0)
3ECTION V MALE FEMALE TOTAL
Fre- Occas- Fre- Occas- Fre- Occas- &? guentb sionall. - None guently sionallg None quently s iona l J~ None
76 and over - 2 7 - 1 5 - Age Unknavn - - - 3 I2 - - 1 - - 1
TOTAL 96 148 1 104 166 181 200 FEZ CENT 22.0 34.0 44.0 23.1 36.8 40.1 22.5
314 373 35.4 42.1
(436: 100.0) (451= 100.0) (887= 100.0) .

TABLE XVII (Continued) A-74. PARTICIPATION I N CENTER LOCATED ACTIVITIES, CANTON JEWISH POPUIATION,
SECTION V I Blt AGE, SEX, AND SECTION, 1955 MAfE m m TOTAL
Fre- Occas- Fre- Occas- Fre- Occas- & guentlv s i o n a l u None auently slonallr Wne quently sionally None
76 and Over - - 2 - 1 1 - 1 - - - - - 3 Age Unknawn - 1 - 1
TOTAL 106 145 176 86 1 4 8 178 192 293 354 PER CENT 24.8 34.0 41.2 20.9 35.9 43.2 22.9 34.9 42.2
( 4 2 7 ~ 100.0) (4128 100.0) (839. 100.0)
SECTION UNIG?OWN MAIE FENALE T(YTAL
Fre- Occas- Fre- Occas- -8- Occaa- & suently sioneJ.l,y None guently eionally None guently sionally None
76 and Over - - - - - 1 - - 1 Age Unknown - - - - - - - - - TOTAL - - 2 - - 3 - - 5
A P P E N D I X B
(~echnical Note and Background Matertals)

TECHNICAL NOTE
Intemiewing f o r this Study was conducted i n October 1955. Age was taken i n terms of year of b i r th and the l a s t two d ig i t s coded. For example, those born i n 1955 were coded a s 55 and t h i s was translated i n the IBM tab les a s age 0. Therefore, the age group 0-5 i n t h i s Study covers those just born t o those up t o f ive and three-quarter years of age. This c a p a r e s w i t h the U.S. Census category of 0-4 (age determined by l a s t birthday) where the age span covers those just born t o those just under five.
The Canton 0-5 category, therefore, covers three-quarters of a year more i n a time span than the U.S. Cmsus 0-4 category. Subsequent categories c w e r identical f ive year spans but the Canton age groups begin and end three- quarters of a year l a t e r than the Census age groups, e.g., Census f ive year age group 5-9 includes those just f ive t o those just under ten. Canton f ive year age group 6-10 includes those f ive and three-quarter years old t o ten and three- quarters.
W r e are minor discrepancies i n to ta le am- various tables due t o problem8 incurred in the processing of these data by the IBM. The careful reader w i l l note this particularly i n those tables dealing wlth the labor force. Information tras asked about employment, occupation, and industry and the answers were not always consistent, e.g., a student might l i s t an occupation. hpending upon which major characteristic was f i r s t selected for Im tabulation, t h i s individual might i n one table be included and i n a subsequent table excluded. In a l l cases these variations were considered too small t o effect any C O ~ C ~ U S ~ O I I S whioh could be derived from the Study data.
Detail percentages do not always add t o t o t a l s because of rounding t o the nearest tenth of a per cent.

* (QUESTIONNAIRE SCREDULF OIJ TnIS AND FOLI,OWING PP.GE WAS CUT I N TWO AND REPRODUCED SEPARATELY 3ER COMQNIENCE I N BINDIXG .)
NAME OF EACH MEMBER OF TnE
HOUSEHOLD
-I-
F i r s t warn
-Lasf name i s ~nc!uded only ~f
d i f f e ren t from head
+ o f house- how. -
(Include those who
regu lar ly 1 ive wl th the family)
Name Interviewer-
Address Supervisor - Telephone no. Date o f Inter. ..w
\
PERSONAL DATP CITIZENSHIP EDUCAT I ON
-2- -3- 4 -5- -& -7- -8- -9- -10- - I I -
Rela- t ion
t o B i r t h 1. the -Slale.&Married
head of
house '
-.# W~ z.nate 3.Child 4.Parent 5.Aunt n i Sch. 5.uncle Li th. 9-12 7.Cousin 10.S0. Am. 0.Other 11.Engl and 9.None i2.France
13 .Canada la.Belgim 15. Is rae l 16. Others
Post Graq 18 on
I
a.~eacher 9 . None
wi le 10.Student 1l.Other iz.none

(QUESTIONNAIRE SCHEDULF ON THIS AND PRECEDING PAGE WAS CUT I N TWO AND REPROIKTCED SEPARATELY FOR CONVENIENCE IN BINDING .)
Code No. JEWISH POPUL4TlOn STUDY OF CANTON, OHIO
CONCREGA-
Zone no. Sponsoreo by: Jewish C m u n i t y Federat ion I n cooperat ion w i t h
Ed i ted by Nat ional counc i l o r Jewish w m n
EMPLOYKNT RELIGIOUS
ORIGINS
-19-
p r ~ ~ ~ ~ : s Re1 I joys
t,rr l l j a t Ion '
l.OTthod0~
.RESIDENCE nONAL
PFFILIATlON:
I C
LAIIGUAGES SPOKEN IN THE H M
- 20-
Sta te
aneuage I S
I
VETERAN S W J C E
-21-
AreYOu a
Serv ice veteran?
1. 1.English
2.1 1d.1~.
3.~erman i j . F r e m 5.Russian 6.Hungar-
I an 7. Hebrew B.Other
USE OF JEWISH COMMUNITY CENTER
-22- r
-12- -15- -16-
Yes
2.
DO oy Oar t l c l - pate i n center
Progrm?
1.Fre- quent ly
2~Occas~-2.OccasI ona l l y
3.NOt a t a l l
I
1. F u l l T i?
2. Par t Tim
L
i s n e w England z.centra1
A t l a n t i c 7.East
Centra l 4.West
Central 5.South
Eastern 6.South
western 7.Western
D O Y O U use the
tac 11- lt l e s
O f the
Center?
1.Fre- q w n t l y
o n a l l y
3 . ~ 0 t a t a1 l
r r i ~
enf mi- dence
-17- - 18- I
be YOU'
manent - home?
1. Wo
2. yes
\ t e n Y'S' -
MOBILITY
3.Reformed 2.Conser- c r t a vatlve 5 .None 3. Reformed
6.0thOr '".cDrlst 5'N0ne
**Other
Status o f
ployed 8 . Ret i red 5.0ther
1 present r r i l i a t ion
moved I n
l a s t
1.Self- Employed
2.Employee 3-une-
?.scrap, Metal h
Steel 6.Whole-
sa le 9.Ret3il
Foods I O . R r t 3 i l
Druqs 1.Rst.Furn
h Appl. 2.Retaj l
Clorh lng l3.0t hers
I
t u r i n g g.F inance,
etc. 4.Service
Ind. s.profes-
s iona l 5.Recrea-
t ion h Enter-
tainment
fee' t ha t
Canton will
business
i .constr - uction
2.Manufac-
1.0rthodox Z-COnser-
v a t i v e
,',
% 5 2
9 k j t n l w i t h
~n one y r.
m e note new area on
in
.
i n f i v e y rs.
map.
d i g i t s ;

VITAL FACTS
1. Every household assigned to you must be interviewed PERSONAILY.'
2. Reach each household by an advance telephone call so that an exact appoint- ment date and time can be agreed upon. NO NOT lXPERVIl!M O V W TEE -PHONE. Make only appointments by phone. Appointments should be made with an ADULT member of the household preferably husband or wife. If you encounter resist- ance, reassure the householder that all of his questions will be answered . when you see him.
3. Make all appointments as soon as possible, three a week minimum so that all may be completed by the deadline.
4. Daily, as you complete your questionnaires, bring them to Study Headquarters at the Jewish Center between 10 and 11 A.M. DO NOT WAIT UNTIL YOU HAVE COM- PLETED ALL OF YOLEI QUESTIONNAIRES. AS THEY ARE FnTISHED BRING THEM IN.
5. If at any time you need advice or guidance, telephone: 1. Your supervisor 2. Martha kvin GL 6-55n 3. Bebe Lavin GL 5-6265 4. Revella Kopstein GL 3-0133
INSTRUCTIONS FOR FILLING OUT QWTI0NNALRF;S
GENERAL
1. Prior to your having telephoned the households assigned to you, they wlll have received a letter from Headquarters advising that this study is being made and alerting them to the fact that they will be called upon.
2. In opening the interview, refer to the above mentioned letter. Esnphasize that this information will NEVER be used for any commercial or f'und raising purposes whatsoever. hphasize further that this is a statistical study and that all replies will be kept confidential.
3. This questionnaire is a HOUSEHOLD questionnaire. Therefore, each question- naire is to cover every individual residing in that household whether or not his last name is the same as the head of the family.
4. See circled information at end of booklet. . 5. Interviewer should complete file information at bottom of the sheets. Name
of person interviewed and your name and date.
6 . Use pencil, you may erase.
SPECIFIC QUESTIONS
NAME EACH MElMBER OF HOUSEHOLD - List names next to numbers, starting with (1) 1. - - - head of family. Unless otherwise specified last n8me of head of family should be the same last name for all individuals enumerated. Order of listing should be (1) father (2) mother (3) all children beginning with the oldest and ending with the youngest, and then all other members of household. List all members of household if they are regarded as permanently living with

hourrehold. These should include those temporarily in service, at school, out of town, etc. Also this should include all relatives of family if they are regarded as permanent household members such as grendpsrents, adopted children, foster children, etc.
Relation to the hesd...fill in relationehip of each member of household to head disregarding in-law or not.
Year of birth Use last two digits Ex. - 1925 as 25, 1890 as 9. If the - - -* personbeing interviewed is not certain of date, have him estimate within five year period. If he refuses to answer put an (x) in the box.
ax.. . self explanatory. - Marital status.. .self explanatory.
Country of birth.. .as of this time. Exmple: 1875 Poland was Russia, 1918 poland became ~oland, 1938 Poland still Poland.
Year of arrival in the U. S. , see #3. For those born in U. S. use a --- Citizenshir, status...self explanatory.
Gonerel education...for all mermbers of h~sehold, regardless of when fomal education was completed. If educstion is not ompleted, list present + of schooling. If individual was educated in country other than U.S., estimate equivalent of scholastic year. Smcial training...only special schools attended.
Jewish education. List oombinatim if there is more than one choice list all with a dash in between. Ex. 1-2.
Occu~tion...Professionsl and semi-professional doctors lawyers nurses accountants, etc.
Manager - one who runs but does not awn business Proprietor - owner of business Clerical - office work Sales - saleaman or clerk in a store Skilled - trained tbrougZl school6 Semi-skilled - learned on the job Unskilled - laborer, peddler, etc. Others.
If answer is housewife, student or none and there is no part-time work in- valved simply check boxes in questions 12 and 13. If there is part or full- time work with a housewife or student, give the answers to q. 12 and U.
.-
Status f'ull-tims - 40 hours a week, part-time - less than 40 hours a week, * * * - - self employed, etc. - self explenatory. Industriea...Construction - -builders
Manufacturing - making product (includes selling same) Finance,..real estate, insurance, banking, etc. Service Industries...ahoe repair, electrician, beauty shop,
travel agencies, tailoring, gas stations, plumbers, etc.
Professional,..doctors, accountants, social worker, pbarmaoists, etc.
Recreation & &tertainmsnt...self explanatory Scrap, metal & steel.. .self explanatory

Wholesale...selling of someone else's product Retail...foods, drugs, furniture & appliances, clothing Other. . .anything else .
14. -...Use tact. Only necessary to give information for head of household. Check boxes of other members of hmsehold.
15. If you plan to move.. .interviewer should select location from map in kit, G d put down numeral from proposed location. If whole household plans to move, it is only necessary to give information for head, check others; if not then itemized for each member. -
16. Date -- of arrival.. .Use last two digits; if family has moved to Canton more than once, the date of last arrival.. If born in Canton use check.
Last permanent residence, prior to moving to Canton. Select state from 17. - listed categories and put down number of category. (1) New w a n d (5) Southeastern
- Maine Alabama Neu Eampshire Tennessee Vermont Florida Massachusetts Virginia Rhode Island Georgia Connecticut North & South Carolina
(2) Central Atlantic (6) Southwestern New York Texas Penns ylvanie OUahoma Delaware Arkansas Maryland Louisana New Jersey Mississippi District of Columbia (7) Western
(3 ) East Central Arizona Indiana California Michigan Idaho Ohio Montana W. Virginia Wyoning Kentuclq Nevada
(4) West Central New Mexico Illinois Oregon Colorado Washington !Jisconsin Utah I m Kansas Number of times moved in last ten years.
Minnesota Count only homes the householder con-
Missouri sidered permanent, city to city; not
Nebraska A'om house to house. North and South Dakota
18. Present affiliation.. .use two nunibers as in #lo if necessary.
19. Previous affiliation.. .see i118.
20. Languages.. .use 2 or more numbers if necessary. Ex: 1-2-3.
21. Veteran service...self explanatory.
22. Use of Community Center...participation is attendance at Center sponsored affairs. Using the facilities is attendance at the Center at functions sponsored by other organizations.
0 N L Y N U M E R A L S A R E T 0 B E U S E D-The I.B.M. machines ----- cannot tabulate writing. WHEN NO ANSWW TO A QUESTION IS POSSIBLE AS IN QUESTION 7, USE A 2 OR !4HEN SOMEONE KEFUSES TO ANSWER AS IN #3, USE AN X.

CONTROL SHEET FOR INTERVIEWERS
JEWISH POPULATION STUDY-CANTON, OHIO
HEADQUARTERS: Jewish Community F e d e r a t i o n GL 3-0133
- I n t e r v i e w e r ' s Name -- --
S u p e r v i s o r ' s Name - Telephone Na- Z
Checked By
~ ~
N AME
I
2
3
4 -
5
6 -
7
e
9
0
I L
IL -
13
14
15 1 . - - - --
ACDRESS Corn- p l e t e d
ccde. Re- f u s e d NOS.
--- . -
,,
-
--
-
-
-
wrong ado.
I
- -
RE- -
-
-
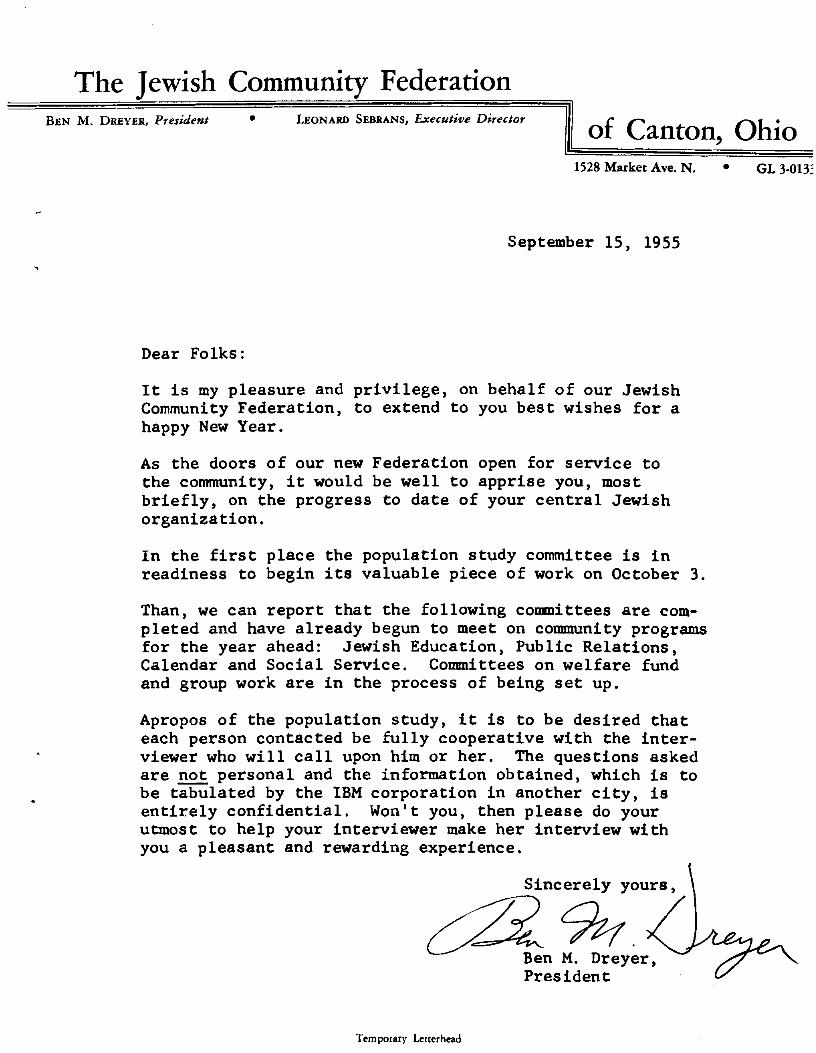
The Tewish Communitv Federation
11'
1528 Market Ave. N. GL 3-013:
J 4
September 15, 1955
BEN M. DREYER, President LEONARD SEBRANS, Executive Director 1
Dear Folks :
of Canton, Ohio
It i s my p leasure and p r i v i l ege , on behalf o f our Jewish Community Federat ion, t o extend t o you be s t wishes f o r a happy New Year.
A s t he doors of our new Federat ion open f o r s e r v i c e t o t he community, i t would be we l l t o app r i s e you, most b r i e f l y , on t h e progress t o d a t e of your c e n t r a l Jewish organiza t ion .
I n t h e f i r s t p lace the populat ion s tudy committee is i n readiness t o begin i t s va luab le p iece of work on October 3.
Than, we can r epo r t t h a t t he following cornnittees are com- p l e t ed and have a l ready begun t o meet on community programs f o r t h e year ahead: Jewish Education, Public Rela t ions , Calendar and Soc ia l Service. Conanittees on welfare fund and group work a r e i n t h e process of being s e t up.
Apropos of t he population s tudy, it is t o be des i red t h a t each person contacted be f u l l y cooperat ive wi th the i n t e r - viewer who w i l l c a l l upon him o r her . The quest ions asked a r e - not personal and t he information obtained, which i s t o be tabula ted by t he IBM corpora t ion i n another c i t y , is e n t i r e l y con f iden t i a l . Won't you, then p lease do your utmost t o help your interviewer make he r in terv iew wi th you a p leasant and rewarding experience.
S ince re ly yours,
&:s%er&
Temporary Letterhead

The lewish Community Federation
I" 1528 Market Ave. N. GL 3-0153
-r .
June 10, 1956
BFN M DRFYER, President LEONARD SFDRANC. E x e r ~ t t i ~ e Direitcl~ I
Dear Fr iend:
of Canton, Ohio
On beha l f o f ou r se lves pa r sona l ly and on beha l f of t he Board of D i r e c t o r s of t he Jewish Community Federa t ion , we wish t o extend t o you our thanks and a p p r e c i a t i o n f o r a job w e l l done.
The "Popula t ion Study" of o w community, long a most necessary and d e s i r e d program, has been completed,, From t h i s p o i n t the m a t e r i a l has been s e n t t o t he IBM Corporat ion i n Akron f o r t a b u l a t i o n and fo l lowing t h a t , w i l l be s e n t t o New York to be s e t up i n complete, r eadab le an2 book form. We a l l f e e l c e r t a i n t h a t the important in format ion g leaned o f our community w i l l be of d e f i n i t e and tremendous importance f o r t h e f u t u r e development of a l l community programs.
With k i n d e s t pe r sona l wishes, we a r e
Sincerc l y ,
D i r e c t o r
. 4 ; u d ~ s Achirn ;\:>J~S Achim Auxiliary I<'!*Ji l?:.th f j ' i . i l L l r i r l r Women
C o i l a y e s Labor Zionist Org. Councd of Jcaish Women Metro Club Hadassah Pioneer Women Jewish War Vctcrans Shaaray Torah
Shasray Tororah Sisterhood Temple Israel Temple Israel Men's Club Temple Israel Sisterhood Women's Committee. Brsndeis
Affiliated uitb Council Jewish Federations a d Welfare Funds