FRANKLIN TEMPLETON SERIES II FUNDS
47
FRANKLIN TEMPLETON SERIES II FUNDS société d’investissement à capital variable April 30, 2021 UNAUDITED SEMI-ANNUAL REPORT R.C.S. B 127 818
-
Upload
khangminh22 -
Category
Documents
-
view
3 -
download
0
Transcript of FRANKLIN TEMPLETON SERIES II FUNDS
FRANKLIN TEMPLETON SERIES II FUNDSsociété d’investissement à capital variableApril 30, 2021
UNAUDITED SEMI-ANNUAL REPORT
R.C.S. B 127 818

FRANKLIN TEMPLETON SERIES II FUNDSsociété d’investissement à capital variable
UNAUDITED SEMI-ANNUAL REPORTFor the period ended April 30, 2021
This report shall not constitute an offer or a solicitation of an offer to buy shares of Franklin Templeton Series II Funds (hereafter referred to as “FTSIIF” or the “Company”). Subscriptions are to be made on the basis of the current prospectus, a copy of the latest available audited report and, if published thereafter, the latest unaudited semi-annual report.


www.franklintempleton.lu UnaUdited Semi-annUal RepoRt 5
General Information . . . . . . . . . . . . . . . . . . . . . . . . . . . . . 6Report of the Investment Managers . . . . . . . . . . . . . . . 8Fund Performance . . . . . . . . . . . . . . . . . . . . . . . . . . . . . . 13Statement of Net Assets . . . . . . . . . . . . . . . . . . . . . . . . . 14Statement of Operations and Changes in Net Assets 16Statistical Information . . . . . . . . . . . . . . . . . . . . . . . . . . . 18Notes to Financial Statements . . . . . . . . . . . . . . . . . . . . 19Schedule of Investments . . . . . . . . . . . . . . . . . . . . . . . . 32Franklin Emerging Market Debt Opportunities II Fund .... ...32Franklin Emerging Market Investment Grade Debt Fund ...35Franklin Floating Rate II Fund ......................................... ...37Franklin Multi-Sector Credit Income Fund ....................... ...38Franklin Upper Tier Floating Rate Fund .......................... ...42Additional Information . . . . . . . . . . . . . . . . . . . . . . . . . . . 43Franklin Templeton Office Directory . . . . . . . . . . . . . . . 45Information for Qualified Investors in Switzerland . . 46
Contents
FRANKLIN TEMPLETON SERIES II FUNDS
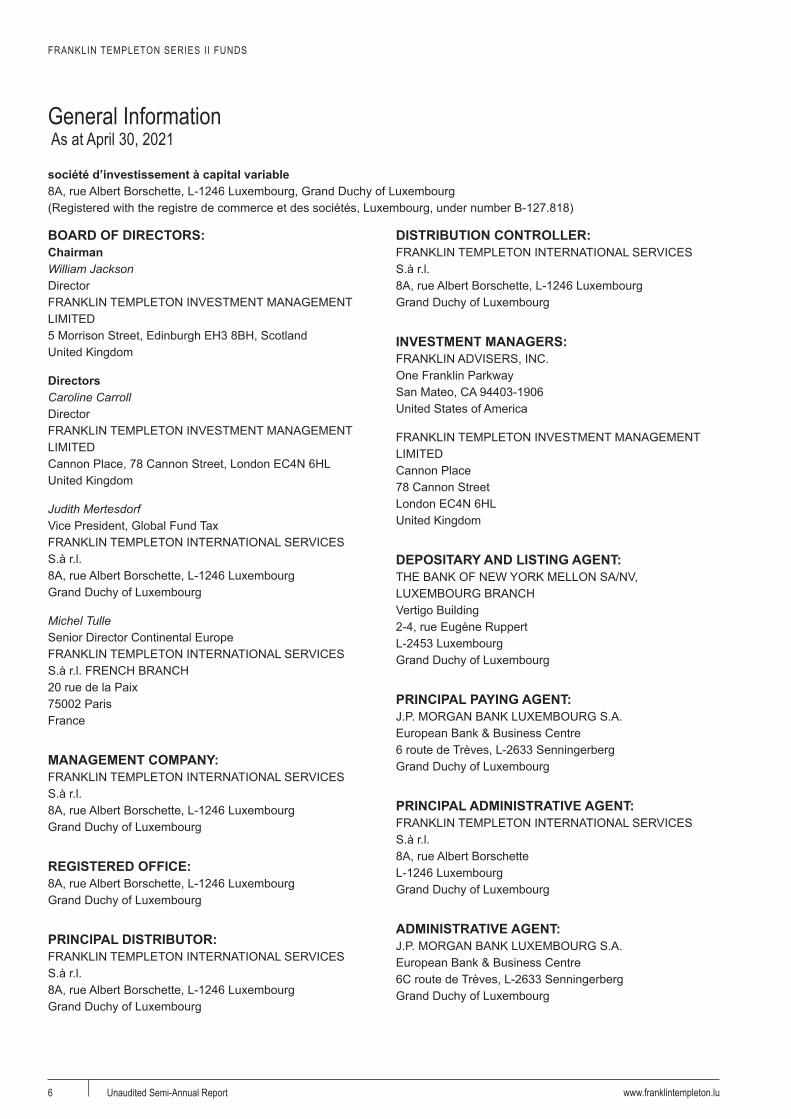
General Information As at April 30, 2021
www.franklintempleton.luUnaudited Semi-Annual Report6
société d’investissement à capital variable8A, rue Albert Borschette, L-1246 Luxembourg, Grand Duchy of Luxembourg(Registered with the registre de commerce et des sociétés, Luxembourg, under number B-127.818)
BOARD OF DIRECTORS:ChairmanWilliam JacksonDirectorFRANKLIN TEMPLETON INVESTMENT MANAGEMENT LIMITED5 Morrison Street, Edinburgh EH3 8BH, ScotlandUnited Kingdom
DirectorsCaroline CarrollDirectorFRANKLIN TEMPLETON INVESTMENT MANAGEMENT LIMITEDCannon Place, 78 Cannon Street, London EC4N 6HLUnited Kingdom
Judith MertesdorfVice President, Global Fund TaxFRANKLIN TEMPLETON INTERNATIONAL SERVICES S.à r.l.8A, rue Albert Borschette, L-1246 LuxembourgGrand Duchy of Luxembourg
Michel TulleSenior Director Continental EuropeFRANKLIN TEMPLETON INTERNATIONAL SERVICES S.à r.l. FRENCH BRANCH20 rue de la Paix75002 ParisFrance
MANAGEMENT COMPANY:FRANKLIN TEMPLETON INTERNATIONAL SERVICESS.à r.l.8A, rue Albert Borschette, L-1246 LuxembourgGrand Duchy of Luxembourg
REGISTERED OFFICE:8A, rue Albert Borschette, L-1246 LuxembourgGrand Duchy of Luxembourg
PRINCIPAL DISTRIBUTOR:FRANKLIN TEMPLETON INTERNATIONAL SERVICESS.à r.l.8A, rue Albert Borschette, L-1246 LuxembourgGrand Duchy of Luxembourg
DISTRIBUTION CONTROLLER:FRANKLIN TEMPLETON INTERNATIONAL SERVICESS.à r.l.8A, rue Albert Borschette, L-1246 LuxembourgGrand Duchy of Luxembourg
INVESTMENT MANAGERS:FRANKLIN ADVISERS, INC.One Franklin ParkwaySan Mateo, CA 94403-1906United States of America
FRANKLIN TEMPLETON INVESTMENT MANAGEMENT LIMITEDCannon Place78 Cannon StreetLondon EC4N 6HLUnited Kingdom
DEPOSITARY AND LISTING AGENT:THE BANK OF NEW YORK MELLON SA/NV, LUXEMBOURG BRANCHVertigo Building2-4, rue Eugène RuppertL-2453 LuxembourgGrand Duchy of Luxembourg
PRINCIPAL PAYING AGENT:J.P. MORGAN BANK LUXEMBOURG S.A.European Bank & Business Centre6 route de Trèves, L-2633 SenningerbergGrand Duchy of Luxembourg
PRINCIPAL ADMINISTRATIVE AGENT:FRANKLIN TEMPLETON INTERNATIONAL SERVICESS.à r.l.8A, rue Albert BorschetteL-1246 LuxembourgGrand Duchy of Luxembourg
ADMINISTRATIVE AGENT:J.P. MORGAN BANK LUXEMBOURG S.A. European Bank & Business Centre 6C route de Trèves, L-2633 Senningerberg Grand Duchy of Luxembourg

FRANKLIN TEMPLETON SERIES II FUNDSGENERAL INFORMATION
www.franklintempleton.lu Unaudited Semi-Annual Report 7
AUDITOR:Ernst & Young S.A.35E, avenue John F. KennedyL-1855 LuxembourgGrand Duchy of Luxembourg
LEGAL ADVISERS:ELVINGER HOSS PRUSSEN, Société anonyme2, Place Winston Churchill, L-1340 LuxembourgGrand Duchy of Luxembourg
INVESTMENT MANAGERS PER FUND:Franklin Emerging Market Debt Opportunities II Fund:Franklin Templeton Investment Management Limited
Franklin Emerging Market Investment Grade Debt Fund:Franklin Templeton Investment Management Limited
Franklin Multi-Sector Credit Income Fund:Franklin Advisers, Inc.
FRANKLIN TEMPLETON SERIES II FUNDS
Report of the Investment Managers
www.franklintempleton.luUnaudited Semi-Annual Report8
Franklin Templeton Emerging Market Opportunities II Fund
Market Overview
In the United States, the Democratic Party’s candidate Joe Biden unseated incumbent president Donald Trump in November. Biden’s fellow Democrats took control of the US Congress and, by early March, had signed a US$1.9 trillion stimulus into law, with more large-scale spending likely to follow. The Federal Reserve (Fed) raised its growth forecast for US GDP (gross domestic product) to 6.5% for 2021, with 2.4% inflation expected for the year.
The rollout of several coronavirus vaccines was a significant milestone in the six months under review. But while the number of coronavirus deaths fell in most developed nations, the outlook for many emerging markets remained weak. Countries like Brazil, Mexico and India, for example, saw coronavirus fatality numbers spike in early 2021, which put a brake on their economic prospects.
Oil prices rose more than 75% in the six months under review, to US$66.76 at the end of April 2021. Projections for world energy demand rose, but OPEC+ (the Organization of the Petroleum Exporting Countries and its allies, mainly Russia) increased its quotas only piecemeal.
• Emerging market (EM) hard-currency government bonds returned 2.01% in the six months to 30 April 2021, as per the JPMorgan EM Bond Index Global Diversified B-/B3 and higher, hedged into euros. Benchmark 10-year US Treasury yields rose 77 basis points (bps) during the review period, to 1.65% by the end of April 2021. Spreads on EM government bonds narrowed much less than that over the same timeframe.
• EM hard-currency corporate bonds returned 2.11% over the review period, as per the ICE BofAML Emerging Market Corporate Plus Index, hedged into euros. Despite their shorter duration, EM corporate bonds' risk spreads over US Treasuries narrowed significantly more than those on EM government bonds.
• EM local-currency sovereign debt returned 0.79% during the six months under review, as per the JP Morgan GBI-EM Broad Diversified index, in euros. EM local-currency yields rose 49 bps during that time, but most EM currencies strengthened, relative to the euro, and many of these bonds have high coupons.
Investment Strategy
The fund's objective is to achieve income yield and long-term capital appreciation. It seeks to achieve this objective by investing primarily in fixed- and floating-rate debt securities and debt obligations of government and government-related issuers, supranational entities organised or supported by several national governments, and corporate issuers located in an EM country and/or deriving a significant proportion of their economic activity from EM countries.
Manager’s Discussion
For the six-month period ending 30 April 2021, the fund returned 4.47% (I [Ydis] shares in euros), compared with a 2.01% return for the JPMorgan EM Bond Index Global Diversified B-/B3 and higher, hedged into euros, and a return of 0.79% for the JP Morgan GBI-EM Broad Diversified Index, also in euros.
Main contributors
1. Overweight allocation to Angolan US-dollar bonds
Angolan bonds traded at around 40% of par in April 2020, as some investors appeared to assume that the country’s government was near default. Shortly thereafter, however, the G20’s DSSI (Debt Service Suspension Initiative) offered short-term debt servicing relief and the country's debt to Chinese banks was renegotiated. During the six months under review, Angola benefited from rising oil prices, stayed on track with its IMF programme, and continued its reforms, including some initial privatisations. As a result, bond prices rebounded.
FRANKLIN TEMPLETON SERIES II FUNDSREPORT OF THE INVESTMENT MANAGERS
www.franklintempleton.lu Unaudited Semi-Annual Report 9
2. Overweight allocation to Iraqi US-dollar bonds
Iraqi bonds also benefited from rising oil prices, despite the country’s intensifying economic crisis in the final months of 2020. By the end of March 2021, the Iraqi parliament passed the government’s 2021 budget, which included major fiscal reforms. The budget conservatively assumed a US$42-per-barrel oil price and exports of 3.25 million barrels of oil per day. A budget agreement between the central government and the Kurdish Regional Government (KRG) of Iraq should also, it was hoped, help ease regional tensions.
Main detractors
1. Underweight allocation to Omani US-dollar bonds
Oil and gas sales make up over a third of Oman’s GDP (gross domestic product) and around 75% of its government’s revenues. As energy prices fell in early 2020, the Omani government’s budget was one of the worst hit. To finance its rising budget deficit, however, the government successfully tapped international markets in October and November. This supported prices for its bonds, and rising oil prices boosted the bonds for the remainder of the period under review.
2. Underweight allocation to Ecuadorian US-dollar bonds
Prices for Ecuadorian bonds fell in the run-up to the country’s presidential election, which started with a first round in February. Incumbent president Lenín Moreno was standing down at this election, and many investors feared that left-wing candidate Andrés Arauz, a supporter of former president Rafael Correa, would replace him. But prices for Ecuadorian bonds spiked after former banker and right-wing candidate Guillermo Lasso won the second round of the election in April. In addition, oil is Ecuador’s main export product, so higher oil prices in the six months under review also boosted the country’s current account balance and its government finances.
Franklin Templeton Emerging Market Investment Grade Debt Fund
Market overview
In the United States, the Democratic Party’s candidate Joe Biden unseated incumbent president Donald Trump in November. Biden’s fellow Democrats took control of the US Congress and, by early March, had signed a US$1.9 trillion stimulus into law, with more large-scale spending likely to follow. The Federal Reserve (Fed) raised its growth forecast for US GDP (gross domestic product) to 6.5% for 2021, with 2.4% inflation expected for the year.
The rollout of several coronavirus vaccines was a significant milestone in the six months under review. But while the number of coronavirus deaths fell in most developed nations, the outlook for many emerging markets remained weak. Countries like Brazil, Mexico and India, for example, saw coronavirus fatality numbers spike in early 2021, which put a brake on their economic prospects.
Oil prices rose more than 75% in the six months under review, to US$66.76 at the end of April 2021. Projections for world energy demand rose, but OPEC+ (the Organization of the Petroleum Exporting Countries and its allies, mainly Russia) increased its quotas only piecemeal.
• Emerging market (EM) hard-currency investment-grade (IG) government debt registered a loss of 1.73% in the six months under review, as per the JP Morgan EM Bond Index Global Diversified—Investment Grade, in US dollars. Benchmark 10-year US Treasury yields rose 77 basis points (bps) during the review period, to 1.65% by the end of April 2021. Over that same timeframe, EM hard-currency IG risk spreads narrowed only 32 bps, on a yield-to-worst basis.
• EM hard-currency IG corporate bonds returned 0.29% during the period under review, as per the ICE BofAML Emerging Markets High Grade Corporate Plus Index, hedged into US dollars. Despite their shorter duration, EM IG corporate bonds' risk spreads over US Treasuries narrowed significantly more than those on EM IG government bonds.
• EM local-currency IG sovereign debt retuned 2.98% over the review period, as per the JP Morgan GBI-EM Global Diversified—Investment Grade, in US dollars. EM local-currency IG yields rose 41 bps during the six months under review, but most EM currencies strengthened during that time, relative to the US dollar.
FRANKLIN TEMPLETON SERIES II FUNDSREPORT OF THE INVESTMENT MANAGERS
www.franklintempleton.luUnaudited Semi-Annual Report10
Investment Strategy
The fund's objective is to achieve income yield and long-term capital appreciation. It seeks to achieve this objective by investing primarily in fixed- and floating-rate debt securities and debt obligations of government and government-related issuers, supranational entities organised or supported by several national governments, and corporate issuers located in an EM country and/or deriving a significant proportion of their economic activity from EM countries. All investments will, at the time of purchase, be rated as investment grade by one or more credit ratings agencies or, if unrated, be declared to be of comparable quality by the Investment Manager.
Manager’s Discussion
The fund advanced 0.60% (I [acc] shares in US dollars), net of fees, for the six-month period ending 30 April 2021.
Main contributors
1. Short-dated selection among Peruvian US-dollar bonds
With an average life to maturity of more than 21 years, Peruvian bonds are the longest-dated segment of the hard-currency index. The Peruvian hard-currency holdings that we selected for the fund, however, have a significantly shorter duration, of nearer 15 years. US-dollar yields rose substantially during the six months under review, so the fund’s Peruvian holdings outperformed those in the benchmark.
2. Overweight allocation to the stronger Mexican peso
An economic revival in the US, President Biden’s activist fiscal policy and rising oil prices boosted the value of the peso in the six months under review. In addition, Mexico’s inflation rate rose sharply in early 2021, which made a near-term rate hike by the country’s central bank more likely.
Main detractors
1. Overweight allocation to Mexican local-currency bonds
Mexican bonds have a longer-than-average life to maturity than the local-currency index, so this segment suffered disproportionately from the significant rise in yields during the six months under review. Prices for these bonds fell because of the strong rise in US rates, and despite Banxico’s rate cut in early February. In addition, Mexico’s inflation rate rose significantly in early 2021. This led to a repositioning among investors, who had previously expected Mexico’s central bank to maintain or even cut interest rates over the medium term.
2. Long-dated selection among Kazakhstani US-dollar bonds
The fund’s Kazakhstani US-dollar holdings consist of particularly long-dated bonds, due 2042 and 2044. Despite a favourite move in oil prices, the prices of these long-duration assets trailed the rest of the broader Kazakhstani market, which is generally shorter-dated.
Franklin Multi-Sector Credit Income Fund
Market Overview
Following the US presidential election in 2020, market sentiment improved in November on apparent optimism over promising vaccine trials and prospects for a potential global economic recovery in 2021. Risk assets broadly rallied in November, as well as in December, as initial vaccine distributions commenced. Credit markets ended 2020 with generally positive returns. As financial markets settled into the new year, concerns surrounding potential inflationary pressures have resurfaced amidst a stronger-than-expected US economic recovery and surging longer-term US treasury (UST) yields. Investors have consequently begun to more closely assess the implications of unprecedented fiscal stimulus, an accommodative US Federal Reserve (Fed) and an economy poised to rebound as vaccination campaigns pave the way for reopening businesses.
FRANKLIN TEMPLETON SERIES II FUNDSREPORT OF THE INVESTMENT MANAGERS
www.franklintempleton.lu Unaudited Semi-Annual Report 11
During the six-month period under review, the Fed kept the fed funds rate at the zero-lower-bound. At its April 2021 meeting, the Fed made no major policy changes and maintained US$120 billion of asset purchases per month. In the press release attached to the meeting, the Fed chose to eliminate the word “considerable” when discussing the risks that the pandemic has to the economic outlook leaving the phrasing at “risks to the economic outlook remain.” At his press conference following the meeting, Fed Chair Powell stated, “vaccinations, along with unprecedented fiscal policy actions” had improved economic activity and employment, with household spending on goods rising “robustly” and a housing market that had fully recovered from the economic shutdowns. Although we have seen increases in employment, including strong gains in leisure and hospitality jobs, Chair Powell cautioned that we had not yet returned to pre-COVID employment levels.
The post meeting press release also changed the statement on inflation from "inflation continues to run below 2 percent " in favour of " inflation has risen, largely reflecting transitory factors." The Fed has repeatedly stated that it would look past any base effects that may impact reported levels of inflation before determining that moderate inflation would persist. Chair Powell also stated that current bottlenecks in supply chains may add to near-term increases in prices, but this too would likely be short lived. When reviewing under what circumstances the Fed would begin to consider either raising interest rates or reducing asset purchases, Chair Powell stated, "we're a long way from our goals...we don't have to get all the way to our goals to taper asset purchases, we need to make substantial further progress and it's going to take some time." When asked about asset prices, Chair Powell said we are seeing things in capital markets that are a “bit frothy,“ but “leverage in the financial system is not a problem.”
As the global recovery gets underway, it also promises to become increasingly uneven across regions and countries—with important investment implications. The likely divergence between the United States and Europe stands out as especially significant. US President Joe Biden’s administration has outlined another US$2 to US$4 trillion in spending packages, coming on the heels of the US$1.9 trillion stimulus approved last month—which in turn followed about US$3 trillion in 2020. This represents an extraordinary amount of stimulus for an economy already set to roar back, compounded by an extremely loose monetary policy. We believe the US stimulus might well have a bigger impact on inflation than the Fed hopes for, but there is no doubt that it will give a strong short-term boost to growth.
Investment Strategy
Bank LoansThe pause in loan spread compression that was observed in March of 2021 has persisted into April amidst investor discipline and more balanced supply and demand. Overall, market conditions have been steady and price and spread levels have not changed much as investors alternate between primary and secondary markets. Earnings are beginning to trickle in as expected and we expect positive market sentiment to remain. Discounted paper continues to find interest, and investors are working harder to identify potential investments as that universe continues to shrink. Despite a pullback in the UST market, improving economic fundamentals and prospect of additional stimulus remain supportive of higher interest rate and inflation expectations, in our view. We also expect supportive technical conditions such as healthy collateralised loan obligation (CLO) formation to persist. In short, our view has not changed in that below investment-grade credit asset classes should continue to outperform in an environment of rising interest rates, and that loans are well positioned as economic recovery further accelerates.
In terms of positioning, we are selectively adding exposure to what we believe to be attractive credits and industries that should be poised to benefit from a COVID-19—or broader—economic recovery. As stated previously, we believe the expectation of rising inflation and interest rates over the medium term are providing tailwinds to bank loans whilst making an increasingly compelling case for investors to add to the sector, as evidenced by persistent inflows into the asset class. In our view, security selection with a focus on the right capital structures, liquidity profiles and sustainability of business models remains of paramount importance, especially in a post COVID-19 world.
High Yield After a sharp rise in February and March of 2021, UST yields stabilised and declined slightly in April. Whilst CCC rated credits continued to outperform, that outperformance was moderate and all rating buckets returned within 20 basis points of the overall index. Against the backdrop of government stimulus and a continued economic upswing, we expect high-yield (HY) issuance to remain healthy alongside a generally declining default rate. As the US economy continues to re-open and recover from pandemic-related challenges, we maintain our view that improving credit fundamentals could enable HY spreads to tighten further, which could help alleviate the impact of rising interest rates on HY asset total returns.
FRANKLIN TEMPLETON SERIES II FUNDSREPORT OF THE INVESTMENT MANAGERS
www.franklintempleton.luUnaudited Semi-Annual Report12
In terms of our portfolio positioning, our focus has been on prudent security selection, rather than targetting specific industries or credit tiers. We do, however, have a general aversion to securities with longer-term secular challenges. Amidst significant progress in vaccine uptake, additional government stimulus on the horizon and a thus-far accommodative central bank stance, we believe the HY sector stands to benefit from current tailwinds. Longer term, we remain constructive on HY corporate bonds. As valuations are uplifted across the board amidst government stimulus, we maintain our stance that prudent security selection and vigorous credit differentiation remain crucial components of value generation.
Manager’s Discussion
During the six-month period ended 30 April 2021, the fund returned 5.61% (I [acc]) on a net basis. Over the period, our exposure to bank loans was the largest relative performance detractor. Conversely, our exposure to investment-grade corporate credit contributed to results. Our allocation to HY corporate bonds also benefitted performance, whilst our security selection in the sector hindered results. Our allocation to hard currency sovereign emerging market (EM) and sovereign developed market debt contributed to performance, whilst our security selection in the sectors detracted from results. Our allocation to non-US dollar denominated developed market debt also hindered performance, whilst our allocation to local currency sovereign EM debt benefitted results. Our allocation to residential mortgage-backed securities contributed to performance. Our US yield-curve positioning hindered results, whilst our non-US yield curve positioning contributed to performance. Our foreign currency exposure detracted from results, led primarily by our underweight euro positioning.
THE INVESTMENT MANAGERSMay 2021
The information stated in this report represents historical data and is not an indication of future results.

Fund Performance
FRANKLIN TEMPLETON SERIES II FUNDS
www.franklintempleton.lu Unaudited Semi-Annual Report 13
Percentage change to April 30, 2021
Share Class
Launch Date
6 Months
%
1 Year
%
3 Years
%
5 Years
%
Since Launch
%Franklin Emerging Market Debt Opportunities II Fund I (Ydis) EUR 30 Nov 12 4.47 16.15 6.39 20.05 29.85Franklin Emerging Market Investment Grade Debt Fund I (acc) EUR 24 Feb 12 (2.55) 0.48 13.06 19.59 49.02Franklin Emerging Market Investment Grade Debt Fund I (acc) EUR-H1 (hedged) 24 Feb 12 (0.09) 8.53 4.56 11.74 17.10Franklin Emerging Market Investment Grade Debt Fund I (acc) USD 24 Feb 12 0.60 10.18 12.51 25.45 33.11Franklin Emerging Market Investment Grade Debt Fund Y (Mdis) USD 12 Jan 18 0.99 11.13 15.15 – 13.49Franklin Multi-Sector Credit Income Fund I (acc) AUD-H1 (hedged) 02 Oct 15 4.97 14.49 11.42 25.41 28.80Franklin Multi-Sector Credit Income Fund I (acc) CHF-H1 (hedged) 02 Oct 15 4.93 14.20 6.58 13.30 15.00Franklin Multi-Sector Credit Income Fund I (acc) EUR-H1 (hedged) 02 Oct 15 4.91 14.29 7.79 15.29 17.60Franklin Multi-Sector Credit Income Fund I (acc) GBP-H1 (hedged) 02 Oct 15 5.13 15.06 9.82 20.12 23.00Franklin Multi-Sector Credit Income Fund I (acc) USD 02 Oct 15 5.61 15.92 15.41 28.71 31.80Franklin Multi-Sector Credit Income Fund I (Qdis) EUR-H1 (hedged) 02 Oct 15 4.94 14.33 7.67 15.17 17.54Franklin Multi-Sector Credit Income Fund I (Ydis) EUR 02 Oct 15 2.35 5.77 15.86 22.41 22.64Franklin Multi-Sector Credit Income Fund I (Ydis) EUR-H1 (hedged) 02 Oct 15 5.08 14.42 7.99 15.47 17.78Franklin Multi-Sector Credit Income Fund I (Ydis) GBP-H1 (hedged) 02 Oct 15 5.09 15.10 9.88 20.35 23.23Franklin Multi-Sector Credit Income Fund I (Ydis) USD 02 Oct 15 5.70 16.07 15.36 28.49 31.44
This report shall not constitute an offer or a solicitation of an offer to buy shares. Subscriptions are to be made on the basis of the current issuing document, and a copy of the latest available audited annual report and, if published thereafter, the latest unaudited semi-annual report. The price of shares and income from them can go down as well as up and you may not get back the full amount that you invested. Past performance is no guarantee of future performance. Currency fluctuations may affect the value of investments.
Data source: Performance – Franklin Templeton and JPMorgan
FRANKLIN TEMPLETON SERIES II FUNDS
Statement of Net AssetsAs at April 30, 2021
www.franklintempleton.luUnaudited Semi-Annual Report The accompanying notes are an integral part of these financial statements14
Total
Franklin Emerging
Market Debt Opportunities II
Fund
Franklin Emerging Market
Investment Grade Debt Fund
Franklin Floating Rate II Fund1
Franklin Multi-Sector Credit Income Fund
Franklin Upper Tier Floating Rate
Fund2
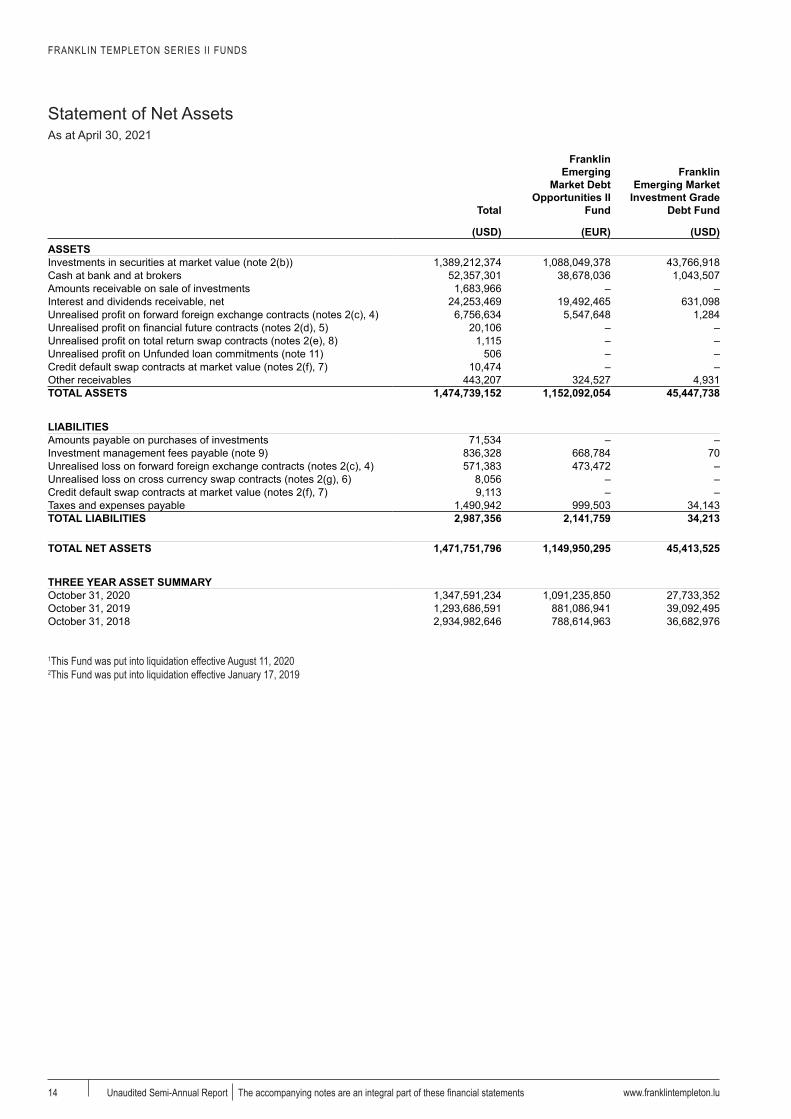
(USD) (EUR) (USD) (USD) (USD) (USD)ASSETSInvestments in securities at market value (note 2(b)) 1,389,212,374 1,088,049,378 43,766,918 7,511,424 13,156,658 16,554,002Cash at bank and at brokers 52,357,301 38,678,036 1,043,507 771,596 2,425,291 1,612,113Amounts receivable on sale of investments 1,683,966 – – 286,648 1,397,318 –Interest and dividends receivable, net 24,253,469 19,492,465 631,098 69,130 116,347 –Unrealised profit on forward foreign exchange contracts (notes 2(c), 4) 6,756,634 5,547,648 1,284 17,820 31,042 36,237Unrealised profit on financial future contracts (notes 2(d), 5) 20,106 – – – 20,106 –Unrealised profit on total return swap contracts (notes 2(e), 8) 1,115 – – – 1,115 –Unrealised profit on Unfunded loan commitments (note 11) 506 – – – 506 –Credit default swap contracts at market value (notes 2(f), 7) 10,474 – – – 10,474 –Other receivables 443,207 324,527 4,931 43,948 4,132 –TOTAL ASSETS 1,474,739,152 1,152,092,054 45,447,738 8,700,566 17,162,989 18,202,352
LIABILITIESAmounts payable on purchases of investments 71,534 – – – 71,534 –Investment management fees payable (note 9) 836,328 668,784 70 32,141 – –Unrealised loss on forward foreign exchange contracts (notes 2(c), 4) 571,383 473,472 – 4 2,097 –Unrealised loss on cross currency swap contracts (notes 2(g), 6) 8,056 – – – 8,056 –Credit default swap contracts at market value (notes 2(f), 7) 9,113 – – – 9,113 –Taxes and expenses payable 1,490,942 999,503 34,143 143,740 32,624 78,676TOTAL LIABILITIES 2,987,356 2,141,759 34,213 175,885 123,424 78,676
TOTAL NET ASSETS 1,471,751,796 1,149,950,295 45,413,525 8,524,681 17,039,565 18,123,676
THREE YEAR ASSET SUMMARYOctober 31, 2020 1,347,591,234 1,091,235,850 27,733,352 20,164,366 16,022,488 12,817,788October 31, 2019 1,293,686,591 881,086,941 39,092,495 212,186,294 15,863,595 19,412,435October 31, 2018 2,934,982,646 788,614,963 36,682,976 730,357,536 26,134,218 1,231,068,539
1This Fund was put into liquidation effective August 11, 20202This Fund was put into liquidation effective January 17, 2019

FRANKLIN TEMPLETON SERIES II FUNDS
Statement of Net AssetsAs at April 30, 2021
www.franklintempleton.lu The accompanying notes are an integral part of these financial statements Unaudited Semi-Annual Report 15
Total
Franklin Emerging
Market Debt Opportunities II
Fund
Franklin Emerging Market
Investment Grade Debt Fund
Franklin Floating Rate II Fund1
Franklin Multi-Sector Credit Income Fund
Franklin Upper Tier Floating Rate
Fund2
(USD) (EUR) (USD) (USD) (USD) (USD)ASSETSInvestments in securities at market value (note 2(b)) 1,389,212,374 1,088,049,378 43,766,918 7,511,424 13,156,658 16,554,002Cash at bank and at brokers 52,357,301 38,678,036 1,043,507 771,596 2,425,291 1,612,113Amounts receivable on sale of investments 1,683,966 – – 286,648 1,397,318 –Interest and dividends receivable, net 24,253,469 19,492,465 631,098 69,130 116,347 –Unrealised profit on forward foreign exchange contracts (notes 2(c), 4) 6,756,634 5,547,648 1,284 17,820 31,042 36,237Unrealised profit on financial future contracts (notes 2(d), 5) 20,106 – – – 20,106 –Unrealised profit on total return swap contracts (notes 2(e), 8) 1,115 – – – 1,115 –Unrealised profit on Unfunded loan commitments (note 11) 506 – – – 506 –Credit default swap contracts at market value (notes 2(f), 7) 10,474 – – – 10,474 –Other receivables 443,207 324,527 4,931 43,948 4,132 –TOTAL ASSETS 1,474,739,152 1,152,092,054 45,447,738 8,700,566 17,162,989 18,202,352
LIABILITIESAmounts payable on purchases of investments 71,534 – – – 71,534 –Investment management fees payable (note 9) 836,328 668,784 70 32,141 – –Unrealised loss on forward foreign exchange contracts (notes 2(c), 4) 571,383 473,472 – 4 2,097 –Unrealised loss on cross currency swap contracts (notes 2(g), 6) 8,056 – – – 8,056 –Credit default swap contracts at market value (notes 2(f), 7) 9,113 – – – 9,113 –Taxes and expenses payable 1,490,942 999,503 34,143 143,740 32,624 78,676TOTAL LIABILITIES 2,987,356 2,141,759 34,213 175,885 123,424 78,676
TOTAL NET ASSETS 1,471,751,796 1,149,950,295 45,413,525 8,524,681 17,039,565 18,123,676
THREE YEAR ASSET SUMMARYOctober 31, 2020 1,347,591,234 1,091,235,850 27,733,352 20,164,366 16,022,488 12,817,788October 31, 2019 1,293,686,591 881,086,941 39,092,495 212,186,294 15,863,595 19,412,435October 31, 2018 2,934,982,646 788,614,963 36,682,976 730,357,536 26,134,218 1,231,068,539
1This Fund was put into liquidation effective August 11, 20202This Fund was put into liquidation effective January 17, 2019
FRANKLIN TEMPLETON SERIES II FUNDS
Statement of Operations and Changes in Net AssetsFor the period ended April 30, 2021
www.franklintempleton.luUnaudited Semi-Annual Report The accompanying notes are an integral part of these financial statements16
Total
Franklin Emerging
Market Debt Opportunities II
Fund
Franklin Emerging Market
Investment Grade Debt
Fund Franklin Floating
Rate II Fund1
Franklin Multi-Sector Credit Income Fund
Franklin Upper Tier Floating
Rate Fund2
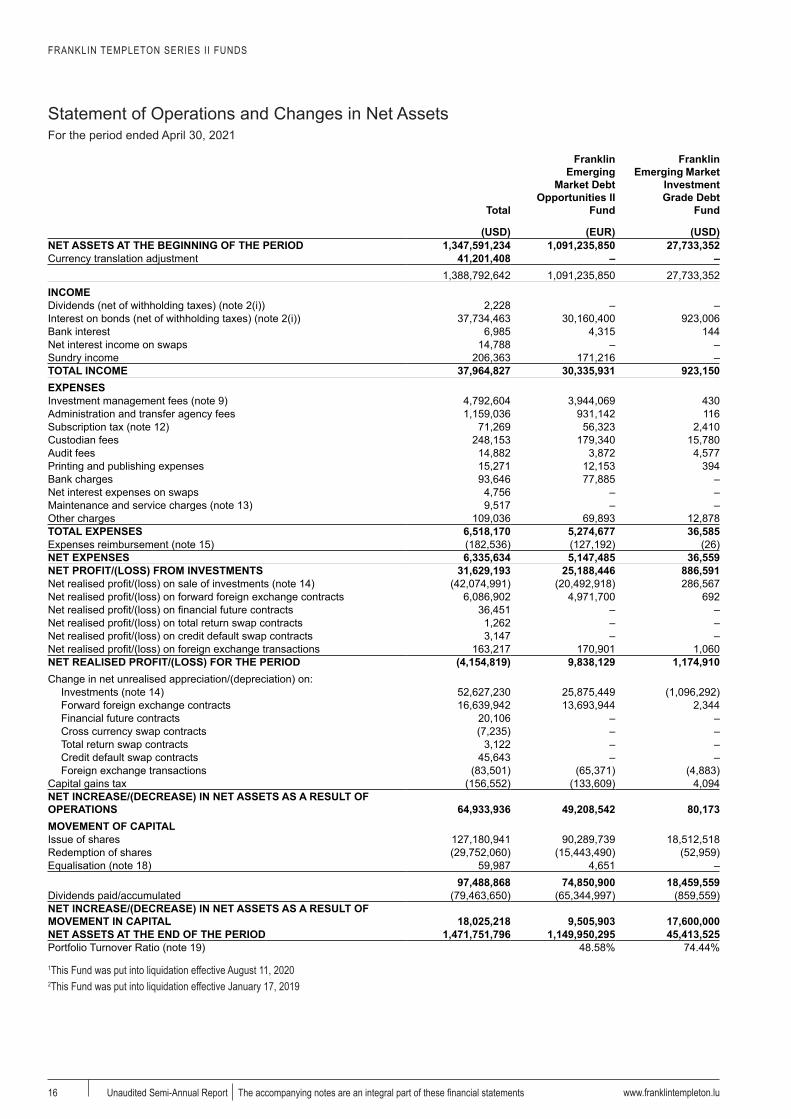
(USD) (EUR) (USD) (USD) (USD) (USD)NET ASSETS AT THE BEGINNING OF THE PERIOD 1,347,591,234 1,091,235,850 27,733,352 20,164,366 16,022,488 12,817,788Currency translation adjustment 41,201,408 – – – – –
1,388,792,642 1,091,235,850 27,733,352 20,164,366 16,022,488 12,817,788INCOMEDividends (net of withholding taxes) (note 2(i)) 2,228 – – – 2,228 –Interest on bonds (net of withholding taxes) (note 2(i)) 37,734,463 30,160,400 923,006 173,024 374,877 –Bank interest 6,985 4,315 144 1,059 38 556Net interest income on swaps 14,788 – – – 14,788 –Sundry income 206,363 171,216 – – 500 –TOTAL INCOME 37,964,827 30,335,931 923,150 174,083 392,431 556EXPENSESInvestment management fees (note 9) 4,792,604 3,944,069 430 – 49,997 –Administration and transfer agency fees 1,159,036 931,142 116 15,410 10,952 12,994Subscription tax (note 12) 71,269 56,323 2,410 – 727 412Custodian fees 248,153 179,340 15,780 – 16,742 –Audit fees 14,882 3,872 4,577 – 5,649 –Printing and publishing expenses 15,271 12,153 394 27 206 32Bank charges 93,646 77,885 – – – –Net interest expenses on swaps 4,756 – – – 4,756 –Maintenance and service charges (note 13) 9,517 – – 9,517 – –Other charges 109,036 69,893 12,878 – 12,122 –TOTAL EXPENSES 6,518,170 5,274,677 36,585 24,954 101,151 13,438Expenses reimbursement (note 15) (182,536) (127,192) (26) – (29,580) –NET EXPENSES 6,335,634 5,147,485 36,559 24,954 71,571 13,438NET PROFIT/(LOSS) FROM INVESTMENTS 31,629,193 25,188,446 886,591 149,129 320,860 (12,882)Net realised profit/(loss) on sale of investments (note 14) (42,074,991) (20,492,918) 286,567 (17,416,851) (304,911) –Net realised profit/(loss) on forward foreign exchange contracts 6,086,902 4,971,700 692 40,186 115,234 (46,968)Net realised profit/(loss) on financial future contracts 36,451 – – – 36,451 –Net realised profit/(loss) on total return swap contracts 1,262 – – – 1,262 –Net realised profit/(loss) on credit default swap contracts 3,147 – – – 3,147 –Net realised profit/(loss) on foreign exchange transactions 163,217 170,901 1,060 649 (37,643) (6,333)NET REALISED PROFIT/(LOSS) FOR THE PERIOD (4,154,819) 9,838,129 1,174,910 (17,226,887) 134,400 (66,183)Change in net unrealised appreciation/(depreciation) on:
Investments (note 14) 52,627,230 25,875,449 (1,096,292) 16,513,190 784,913 5,313,902Forward foreign exchange contracts 16,639,942 13,693,944 2,344 41,784 72,329 58,482Financial future contracts 20,106 – – – 20,106 –Cross currency swap contracts (7,235) – – – (7,235) –Total return swap contracts 3,122 – – – 3,122 –Credit default swap contracts 45,643 – – – 45,643 –Foreign exchange transactions (83,501) (65,371) (4,883) 81 (100) –
Capital gains tax (156,552) (133,609) 4,094 – – –NET INCREASE/(DECREASE) IN NET ASSETS AS A RESULT OF OPERATIONS 64,933,936 49,208,542 80,173 (671,832) 1,053,178 5,306,201MOVEMENT OF CAPITALIssue of shares 127,180,941 90,289,739 18,512,518 107,958 – –Redemption of shares (29,752,060) (15,443,490) (52,959) (11,130,206) – (313)Equalisation (note 18) 59,987 4,651 – 54,395 – –
97,488,868 74,850,900 18,459,559 (10,967,853) – (313)Dividends paid/accumulated (79,463,650) (65,344,997) (859,559) – (36,101) –NET INCREASE/(DECREASE) IN NET ASSETS AS A RESULT OF MOVEMENT IN CAPITAL 18,025,218 9,505,903 17,600,000 (10,967,853) (36,101) (313)NET ASSETS AT THE END OF THE PERIOD 1,471,751,796 1,149,950,295 45,413,525 8,524,681 17,039,565 18,123,676Portfolio Turnover Ratio (note 19) 48.58% 74.44% N/A 137.62% N/A
1This Fund was put into liquidation effective August 11, 20202This Fund was put into liquidation effective January 17, 2019
FRANKLIN TEMPLETON SERIES II FUNDS
Statement of Operations and Changes in Net AssetsFor the period ended April 30, 2021
www.franklintempleton.lu The accompanying notes are an integral part of these financial statements Unaudited Semi-Annual Report 17
Total
Franklin Emerging
Market Debt Opportunities II
Fund
Franklin Emerging Market
Investment Grade Debt
Fund Franklin Floating
Rate II Fund1
Franklin Multi-Sector Credit Income Fund
Franklin Upper Tier Floating
Rate Fund2
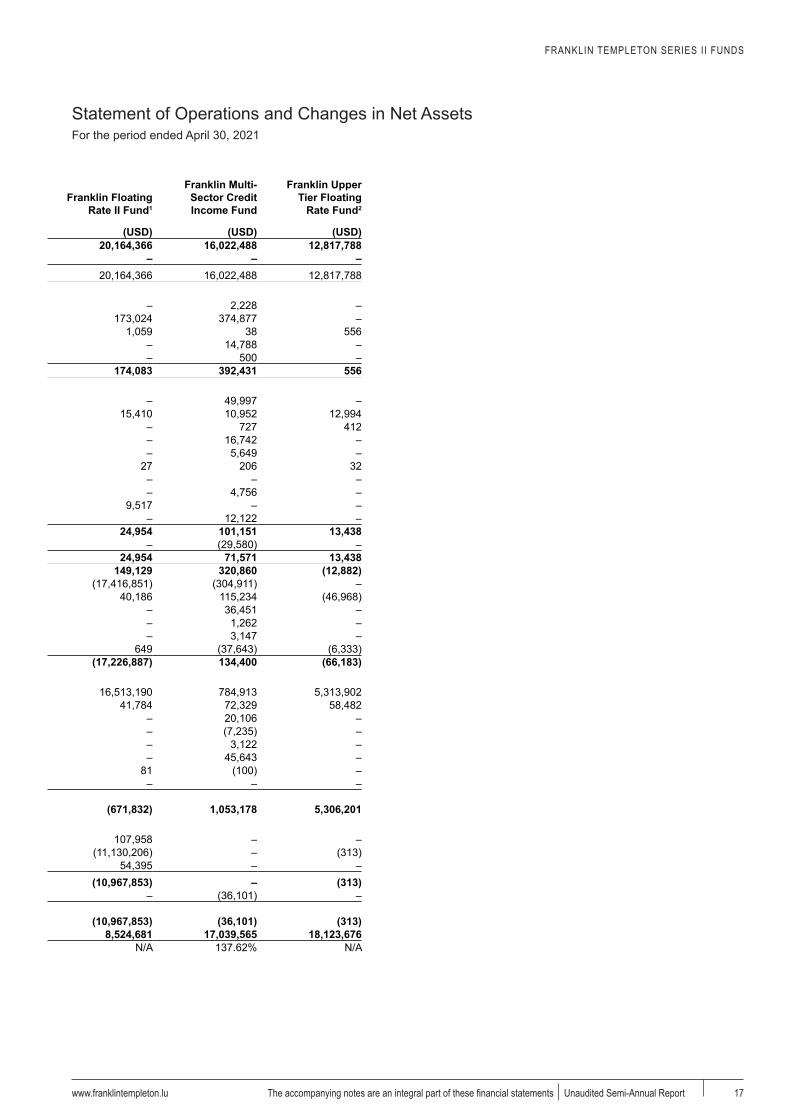
(USD) (EUR) (USD) (USD) (USD) (USD)NET ASSETS AT THE BEGINNING OF THE PERIOD 1,347,591,234 1,091,235,850 27,733,352 20,164,366 16,022,488 12,817,788Currency translation adjustment 41,201,408 – – – – –
1,388,792,642 1,091,235,850 27,733,352 20,164,366 16,022,488 12,817,788INCOMEDividends (net of withholding taxes) (note 2(i)) 2,228 – – – 2,228 –Interest on bonds (net of withholding taxes) (note 2(i)) 37,734,463 30,160,400 923,006 173,024 374,877 –Bank interest 6,985 4,315 144 1,059 38 556Net interest income on swaps 14,788 – – – 14,788 –Sundry income 206,363 171,216 – – 500 –TOTAL INCOME 37,964,827 30,335,931 923,150 174,083 392,431 556EXPENSESInvestment management fees (note 9) 4,792,604 3,944,069 430 – 49,997 –Administration and transfer agency fees 1,159,036 931,142 116 15,410 10,952 12,994Subscription tax (note 12) 71,269 56,323 2,410 – 727 412Custodian fees 248,153 179,340 15,780 – 16,742 –Audit fees 14,882 3,872 4,577 – 5,649 –Printing and publishing expenses 15,271 12,153 394 27 206 32Bank charges 93,646 77,885 – – – –Net interest expenses on swaps 4,756 – – – 4,756 –Maintenance and service charges (note 13) 9,517 – – 9,517 – –Other charges 109,036 69,893 12,878 – 12,122 –TOTAL EXPENSES 6,518,170 5,274,677 36,585 24,954 101,151 13,438Expenses reimbursement (note 15) (182,536) (127,192) (26) – (29,580) –NET EXPENSES 6,335,634 5,147,485 36,559 24,954 71,571 13,438NET PROFIT/(LOSS) FROM INVESTMENTS 31,629,193 25,188,446 886,591 149,129 320,860 (12,882)Net realised profit/(loss) on sale of investments (note 14) (42,074,991) (20,492,918) 286,567 (17,416,851) (304,911) –Net realised profit/(loss) on forward foreign exchange contracts 6,086,902 4,971,700 692 40,186 115,234 (46,968)Net realised profit/(loss) on financial future contracts 36,451 – – – 36,451 –Net realised profit/(loss) on total return swap contracts 1,262 – – – 1,262 –Net realised profit/(loss) on credit default swap contracts 3,147 – – – 3,147 –Net realised profit/(loss) on foreign exchange transactions 163,217 170,901 1,060 649 (37,643) (6,333)NET REALISED PROFIT/(LOSS) FOR THE PERIOD (4,154,819) 9,838,129 1,174,910 (17,226,887) 134,400 (66,183)Change in net unrealised appreciation/(depreciation) on:
Investments (note 14) 52,627,230 25,875,449 (1,096,292) 16,513,190 784,913 5,313,902Forward foreign exchange contracts 16,639,942 13,693,944 2,344 41,784 72,329 58,482Financial future contracts 20,106 – – – 20,106 –Cross currency swap contracts (7,235) – – – (7,235) –Total return swap contracts 3,122 – – – 3,122 –Credit default swap contracts 45,643 – – – 45,643 –Foreign exchange transactions (83,501) (65,371) (4,883) 81 (100) –
Capital gains tax (156,552) (133,609) 4,094 – – –NET INCREASE/(DECREASE) IN NET ASSETS AS A RESULT OF OPERATIONS 64,933,936 49,208,542 80,173 (671,832) 1,053,178 5,306,201MOVEMENT OF CAPITALIssue of shares 127,180,941 90,289,739 18,512,518 107,958 – –Redemption of shares (29,752,060) (15,443,490) (52,959) (11,130,206) – (313)Equalisation (note 18) 59,987 4,651 – 54,395 – –
97,488,868 74,850,900 18,459,559 (10,967,853) – (313)Dividends paid/accumulated (79,463,650) (65,344,997) (859,559) – (36,101) –NET INCREASE/(DECREASE) IN NET ASSETS AS A RESULT OF MOVEMENT IN CAPITAL 18,025,218 9,505,903 17,600,000 (10,967,853) (36,101) (313)NET ASSETS AT THE END OF THE PERIOD 1,471,751,796 1,149,950,295 45,413,525 8,524,681 17,039,565 18,123,676Portfolio Turnover Ratio (note 19) 48.58% 74.44% N/A 137.62% N/A
1This Fund was put into liquidation effective August 11, 20202This Fund was put into liquidation effective January 17, 2019

FRANKLIN TEMPLETON SERIES II FUNDS
Statistical InformationFor the period ended April 30, 2021
www.franklintempleton.luUnaudited Semi-Annual Report 18
Total Expense Ratio
April 30, 2021
(See note 22)
Shares Outstanding
as at April 30,
2021
Net Asset Value per share
as at April 30,
2021
Net Asset Value per share
as at October 31,
2020
Net Asset Value per share
as at October 31,
2019Franklin Emerging Market Debt Opportunities II Fund - EUR I (Ydis) EUR 0.90% 147,176,607.651 7.81 7.95 8.71X (Ydis) EURΩ – – – 9.13 9.99Y (acc) AUD-H1 (hedged)Ω – – – 10.14 10.26Y (acc) USD-H1 (hedged)Ω – – – 10.41 10.33
Franklin Emerging Market Investment Grade Debt Fund - USD I (acc) EUR 0.95% 743.080 14.90 15.29 15.39I (acc) EUR-H1 (hedged) 0.95% 7,865.896 11.71 11.72 11.57I (acc) USD 0.95% 500.029 13.31 13.23 12.75Y (Mdis) USD 0.16% 4,669,212.283 9.70 9.80 9.83
Franklin Floating Rate II Fund – USD1 A (acc) EUR-H1 (hedged) 0.55% 23,296.035 7.28 7.56 8.99A (acc) USD 0.55% 205,539.832 11.29 11.64 13.59A (Mdis) USD 0.55% 190,081.512 6.11 6.30 7.80I (acc) EUR-H1 (hedged) 0.18% 30,237.104 7.55 7.83 9.27I (acc) GBP-H1 (hedged) 0.18% 1,611.225 8.18 8.45 9.96I (acc) USD 0.18% 87,062.665 11.79 12.13 14.10I (Mdis) USD 0.18% 197,763.386 6.37 6.55 8.02I (Qdis) EUR-H1 (hedged) 0.18% 20,611.622 6.13 6.35 8.04I (Ydis) CHF-H1 (hedged) 0.18% 1,608.907 6.65 6.90 8.78I (Ydis) EUR-H1 (hedged) 0.13% 1,354.380 6.85 7.09 8.98I (Ydis) USD 0.00% 73.237 7.54 7.75 9.64W (acc) EUR-H1 (hedged) 0.18% 35,630.342 8.49 8.79 10.44W (acc) USD 0.18% 101,883.137 9.93 10.22 11.89W (Qdis) USD 0.18% 98,808.882 7.16 7.37 9.13Y (Mdis) USD 0.00% 92.007 7.42 7.62 9.28
Franklin Multi-Sector Credit Income Fund - USD I (acc) AUD-H1 (hedged) 0.80% 70,997.515 12.88 12.27 12.19I (acc) CHF-H1 (hedged) 0.80% 48,617.500 11.50 10.96 10.91I (acc) EUR-H1 (hedged) 0.80% 44,593.090 11.76 11.21 11.13I (acc) GBP-H1 (hedged) 0.80% 32,931.570 12.30 11.70 11.60I (acc) USD 0.80% 995,224.524 13.18 12.48 12.14I (Qdis) EUR-H1 (hedged) 0.80% 44,593.090 9.01 8.74 9.00I (Ydis) EUR 0.80% 445.931 9.50 9.59 10.35I (Ydis) EUR-H1 (hedged) 0.80% 44,593.090 9.10 8.94 9.45I (Ydis) GBP-H1 (hedged) 0.80% 32,931.570 9.47 9.31 9.80I (Ydis) USD 0.80% 500.000 10.19 9.96 10.30
Franklin Upper Tier Floating Rate Fund – USD2 I (acc) USD SP 0.18% 925.023 16.58 11.73 10.59I (Qdis) CHF-H1 (hedged) SP 0.19% 256,127.944 12.77 9.09 8.40I (Qdis) EUR-H1 (hedged) SP 0.19% 25,557.941 13.24 9.42 8.66I (Qdis) USD SP 0.19% 951,975.450 14.77 10.45 9.43Y (Qdis) USD SP 0.01% 3,554.593 15.73 11.12 10.02
ΩThis share class was closed on April 21, 20211This Fund was put into liquidation effective August 11, 20202This Fund was put into liquidation effective January 17, 2019
FRANKLIN TEMPLETON SERIES II FUNDS
www.franklintempleton.lu Unaudited Semi-Annual Report 19
Notes to Financial StatementsAt April 30, 2021
Note 1 - The CompanyFranklin Templeton Series II Funds (“FTSIIF” or the “Company”) is an Undertaking for Collective Investment pursuant to Part II of the Luxembourg law of December 17, 2010 relating to Undertakings for Collective Investment, as amended, and qualifies as a société d’investissement à capital variable. The Company qualifies as an Alternative Investment Fund within the meaning of article 1(39) of the law of July 12, 2013. The Company was incorporated in Luxembourg on May 14, 2007, for an undetermined period of time. At the date of this report, it offers shares in 3 sub-funds of the Company (the “Fund(s)”). The Board of Directors of the Company may authorise the creation of additional Funds in the future with different investment objectives.
The exclusive objective of the Company is to invest the assets of the Funds in transferable securities and other permitted assets of any kind, including units or shares of Investment Funds, with the purpose of spreading investment risks and affording its shareholders the results of the management of its assets.
Fund changesOn April 21, 2021, the following share classes closed
– Franklin Emerging Market Debt Opportunities II Fund X (Ydis) EUR– Franklin Emerging Market Debt Opportunities II Fund Y (acc) AUD-H1 (hedged)– Franklin Emerging Market Debt Opportunities II Fund Y (acc) USD-H1 (hedged)
Note 2 - Significant accounting policies
(a) GeneralThe financial statements are prepared in accordance with the regulations of the Grand Duchy of Luxembourg relating to investment funds under the going concern basis of accounting with the exception of the Franklin Floating Rate II Fund and the Franklin Upper Tier Floating Rate Fund which are both in liquidation and hence their financial statements have been prepared on a non-going concern basis.
(b) Investment in securitiesCorporate debt securities generally trade in the over-the-counter market rather than on a securities exchange. The Company may utilise independent pricing services, quotations from bond dealers, and information with respect to bond and note transactions, to assist in determining a current market value for each security. These pricing services may use valuation models or matrix pricing which considers information with respect to comparable bond and note transactions, quotations from bond dealers, or by reference to other securities that are considered comparable in such characteristics as rating, interest rate and maturity date, option adjusted spread models, prepayment projections, interest rate spreads and yield curves, to determine current value.
Senior secured corporate loans with floating or variable interest rates generally trade in the over-the-counter market rather than on a securities exchange. The Company may utilise independent pricing services, quotations from loan dealers and other financial institutions, and information with respect to bond and note transactions, to assist in determining a current market value for each security. These pricing services use independent market quotations from loan dealers or financial institutions and may incorporate valuation methodologies that consider multiple bond characteristics such as dealer quotes, issuer type, coupon, maturity, weighted average maturity, interest rate spreads and yield curves, cash flow and credit risk/quality analysis to determine current value.
Securities which are listed on a stock exchange or traded on any other organised market are valued at the last available price on such exchange or market which is normally the principal market for each security, and those securities dealt in on an over-the-counter market are valued in a manner as near as possible to that for quoted securities.
Securities not listed on any stock exchange nor traded on any organised market are valued at the last available price, or if such price is not representative of their fair value, they are valued prudently and in good faith on the basis of their reasonably foreseeable sales prices.
FRANKLIN TEMPLETON SERIES II FUNDSNOTES TO FINANCIAL STATEMENTS
www.franklintempleton.luUnaudited Semi-Annual Report20
For mortgage-backed and other similar holdings with scheduled debt paydowns, the Company records estimates, based on its historical experience, for anticipated paydowns. Such estimates are recorded as a reduction or increase to the related holdings as disclosed on the Schedule of Investments and are included in the related unrealised appreciation/(depreciation) on investments shown on the “Statement of Operations and Changes in Net Assets”.
Stocks, shares or units in open-ended investment funds are valued based on the last available net asset value determined according to the provisions of the particular investment fund’s prospectus as provided by the administration agent of such investment fund.
The Management Company has procedures to determine the fair value of individual securities and other assets for which market prices are not readily available or which may not be reliably priced. In such circumstances, the price of such investment shall be adjusted in accordance with the procedures adopted, as determined by or under the direction of the Board of Directors.
During the accounting period under review, discounts and premiums were amortised to income over the period to maturity, or date sold, if earlier and gains and losses on investment securities sold were computed on the average cost basis for all Funds.
(c) Forward foreign exchange contractsForward foreign exchange contracts are valued at the forward rate applicable at the “Statement of Net Assets” date for the remaining period, until maturity. Gains or losses resulting from forward foreign exchange contracts are recognised in the “Statement of Operations and Changes in Net Assets”
(d) Financial future contractsThe Company may enter into financial future contracts to gain exposure to market changes. A financial future contract is an agreement between two parties to buy or sell a security for a set price on a future date. Required initial margin deposits of cash or securities are maintained by a broker in a segregated account. Subsequent payments, known as variation margin, are made or received by the Company depending on the fluctuations in the value of the underlying securities. Such variation margin is accounted for as unrealised gains or losses until the contract is closed, at which time the gains or losses are reclassified to realised gains or losses. Realised and unrealised gains and losses are included in the “Statement of Operations and Changes in Net Assets”.
(e) Total return swap contractsA total return swap is an agreement in which one party makes payments based on a set rate, either fixed or variable, while the other party makes payments based on the return of an underlying asset, which includes both the income it generates and any capital gains.
Total return swap contracts are marked to market daily based upon quotations from the market makers and the change in value, if any, is recorded as an unrealised gain or loss in the “Statement of Operations and Changes in Net Assets”.
When the swap contract is terminated early, the Fund records a realised gain or loss equal to the difference between the current net present value and the executed net present value. Any outstanding interest accrual is recorded as either a net receivable or net payable.
The risks of total return swap contracts include changes in market conditions and the possible inability of the counterparty to fulfil its obligations under the agreement.
(f) Credit default swap contractsA credit default swap contract is a credit derivative transaction in which two parties enter into an agreement, whereby one party pays the other a fixed periodic payment for the specified life of the agreement. The other party makes no payments unless a credit event, relating to a predetermined reference asset, occurs. If such an event occurs, the party will then make a payment to the first party, and the swap will terminate. The value of the underlying securities shall be taken into account for the calculation of the investment and borrowing powers applicable to individual users.
Note 2 - Significant accounting policies (continued)
(b) Investment in securities (continued)
FRANKLIN TEMPLETON SERIES II FUNDSNOTES TO FINANCIAL STATEMENTS
www.franklintempleton.lu Unaudited Semi-Annual Report 21
Credit default swap contracts are marked to market daily based upon quotations from the market makers and the change in value, if any, is recorded as an unrealised gain or loss in the “Statement of Operations and Changes in Net Assets”. Any payment received or paid to initiate a contract is recorded as a liability or asset in the “Statement of Net Assets”. When the swap contract is terminated early, the Fund records a realised gain or loss for any payments received or paid.
The risks of credit default swap contracts include unfavourable changes in interest rates, an illiquid secondary market and the possible inability of the counterparty to fulfill its obligations under the agreement, which may be in excess of the amount reflected in the “Statement of Net Assets”.
(g) Cross currency swap contractsA cross currency swap is an agreement between two parties to exchange interest payments and principals denominated in two different currencies. Cross currency swap contracts are marked to market daily based upon quotations from the market makers and the change in value, if any, is recorded as an unrealised gain or loss in the “Statement of Operations and Changes in Net Assets”.
When the swap contract is terminated early, the Fund records a realised gain or loss equal to the difference between the current net present value and the executed net present value. Any outstanding interest accrual is recorded as either a net receivable or net payable.
The risks of cross currency swap contracts include changes in market conditions and the possible inability of the counterparty to fulfill its obligations under the agreement.
(h) Foreign exchange transactionsTransactions expressed in currencies other than each Fund’s currency are translated into each Fund’s currency at the exchange rates applicable on the transaction dates.
Assets and liabilities denominated in currencies other than each Fund’s currency are translated into each Fund’s currency at the appropriate exchange rates ruling at the period-end. Gains and losses on foreign exchange transactions are recognised in the “Statement of Operations and Changes in Net Assets” in determining the results for the accounting period.
The reference currency of the Company as reflected in the financial statements is U.S. dollar. The principal exchange rates applied as at April 30, 2021 are as follows:
AUD 1.2979CHF 0.9132EUR 0.8317GBP 0.7241JPY 109.2850
The list of the currency abbreviations is available in note 24.
(i) IncomeInterest income is accrued on a daily basis.
Where applicable, dividends are credited to income on their ex-dividend date.
(j) Charges and expensesAll expenses are estimated and accrued daily in the calculation of the Net Asset Value of each Fund.
(k) Formation expensesFormation expenses associated with the launch of the new Funds are expensed as incurred.
Note 2 - Significant accounting policies (continued)
(f) Credit default swap contracts (continued)

FRANKLIN TEMPLETON SERIES II FUNDSNOTES TO FINANCIAL STATEMENTS
www.franklintempleton.luUnaudited Semi-Annual Report22
(l) Senior floating rate interestSenior secured corporate loans pay interest at rates which are periodically reset by reference to a base lending rate plus a spread. These base lending rates are generally the prime rate offered by a designated U.S. bank or the London InterBank Offered Rate (LIBOR). Senior secured corporate loans often require prepayment of principal from excess cash flows or at the discretion of the borrower. As a result, actual maturity may be substantially less than the stated maturity.
Senior secured corporate loans in which Franklin Floating Rate II Fund or Franklin Multi-Sector Credit Income Fund invest are generally readily marketable, but may be subject to some restrictions on resale.
(m) Combined financial statementsThe accounts of the Company are expressed in U.S. dollars and the accounts of the Funds are kept in the currency of each Fund. The combined “Statement of Net Assets” and the combined “Statement of Operations and Changes in Net Assets” are the sum of the “Statement of Net Assets” and the “Statement of Operations and Changes in Net Assets” of each Fund converted into the currency of the Company using exchange rates prevailing at period-end. The currency translation adjustment presented on the “Statement of Operations and Changes in Net Assets” is the sum of exchange differences arising on translation of each Fund “Net assets is the beginning of the year” into the currency of the Company using exchange rates prevailed at previous period and current accounting period-end reporting.
(n) Swing pricingA Fund may suffer reduction of the Net Asset Value per Share due to Investors purchasing, selling and/or switching in and out of the Fund at a price that does not reflect the dealing costs associated with this Fund's portfolio trades undertaken by the Investment Managers to accommodate cash inflows or outflows.
To counter this dilution impact and to protect Shareholders’ interests, a swing pricing mechanism may be adopted by the Company as part of its valuation policy.
The Fund operates a swing pricing mechanism which is applied when the total capital activity (aggregate of inflows and outflows) at a Fund level exceeds a pre-determined threshold, as determined as a percentage of the net assets of that Fund for the Valuation Day. Funds can operate a full swing pricing mechanism where the threshold is set to zero or a partial swing pricing mechanism where the threshold is greater than zero.
Typically, such adjustment will increase the Net Asset Value per Share when there are net inflows into the Fund and decrease the Net Asset Value per Share when there are net outflows. The Net Asset Value per Share of each Share Class in a Fund will be calculated separately but any adjustment will, in percentage terms, affect the Net Asset Value per Share of each Share Class in a Fund identically. Swing pricing does not address the specific circumstances of each individual investor transaction.
The adjustments will seek to reflect the anticipated prices at which the Fund will be buying and selling assets, as well as estimated transaction costs.
Investors are advised that the volatility of any Fund’s Net Asset Value might not reflect the true portfolio performance as a consequence of the application of swing pricing.
The size of the adjustment impact is determined by factors such as the volume of transactions, the purchase or sale prices of the underlying investments and the valuation method adopted to calculate the value of such underlying investments of the Fund.
The swing pricing mechanism may be applied across all Funds of the Company. The extent of the price adjustment will be reset by the Company on a periodic basis to reflect an approximation of current dealing and other costs. Such adjustment may vary from Fund to Fund and under normal market conditions will not exceed 2% of the original Net Asset Value per Share. The Board of Directors can approve an increase of this limit in case of exceptional circumstances, unusually large Shareholders trading activities, and if it is deemed to be in the best interest of Shareholders.
The Management Company mandates authority to the Swing Pricing Oversight Committee to implement and on a periodic basis review, the operational decisions associated with swing pricing. This committee is responsible for decisions relating to swing pricing and the ongoing approval of swing factors which form the basis of pre-determined standing instructions.
Note 2 - Significant accounting policies (continued)

FRANKLIN TEMPLETON SERIES II FUNDSNOTES TO FINANCIAL STATEMENTS
www.franklintempleton.lu Unaudited Semi-Annual Report 23
The price adjustment is available on request from the Management Company at its registered office.
In the case of a swing pricing event on the last day of the annual/semi-annual period, the net assets as disclosed in the “Statement of Net Assets”, exclude the swing pricing adjustment, however, the net asset value per share as at annual/semi-annual period end, as disclosed in the Statistical Information, would include the swing pricing adjustment.
During the period ended April 30, 2021, swing pricing adjustments affected the net asset value per share of the following Funds:
- Franklin Emerging Market Debt Opportunities II Fund- Franklin Emerging Market Investment Grade Debt Fund- Franklin Floating Rate II Fund
Note 3 - Time deposits (“TDs”)As at April 30, 2021, the Company held no time deposits.
Note 4 - Forward foreign exchange contractsAs at April 30, 2021, the Company had entered into the following outstanding contracts:
Franklin Emerging Market Debt Opportunities II Fund
Purchases Sales Maturity Date
Unrealised profit/(loss)
EURForward foreign exchange contracts used for efficient portfolio management:EUR 10,235,383 JPY 1,322,000,000 15-Jun-21 179,367EUR 762,498,662 USD 911,100,000 15-Jun-21 5,367,886USD 46,800,000 EUR 39,363,861 15-Jun-21 (472,718)0 5,074,535Forward foreign exchange contracts used for share class hedging:AUD 148,582 EUR 94,900 17-May-21 291EUR 95,295 AUD 148,582 17-May-21 104EUR 88,407 USD 106,444 17-May-21 (103)USD 106,444 EUR 89,161 17-May-21 (651)
(359)5,074,176
The above contracts were opened with the below counterparties:Bank of America (35)Barclays 1,125,734BNP Paribas 10Citibank 902,572Deutsche Bank 1,041,190Goldman Sachs 8HSBC 29J.P. Morgan (6)Morgan Stanley 1,018,802RBC 986,119UBS (247)
5,074,176
Note 2 - Significant accounting policies (continued)
(n) Swing pricing (continued)

FRANKLIN TEMPLETON SERIES II FUNDSNOTES TO FINANCIAL STATEMENTS
www.franklintempleton.luUnaudited Semi-Annual Report24
Franklin Emerging Market Investment Grade Debt Fund
Purchases Sales Maturity Date
Unrealised profit/(loss)
USDForward foreign exchange contracts used for share class hedging:EUR 89,703 USD 106,579 10-May-21 1,284
1,284
The above contracts were opened with the below counterparties:Barclays 38Citibank 25Goldman Sachs 26HSBC 1,125J.P. Morgan 45Toronto-Dominion 25
1,284
Franklin Floating Rate II Fund*
Purchases Sales Maturity Date
Unrealised profit/(loss)
USDForward foreign exchange contracts used for share class hedging:CHF 15,122 USD 16,322 10-May-21 239EUR 1,144,817 USD 1,361,299 10-May-21 15,280GBP 19,151 USD 26,373 10-May-21 76USD 5,524 CHF 5,048 10-May-21 (4)USD 410,230 EUR 339,362 10-May-21 2,166USD 8,472 GBP 6,091 10-May-21 59
17,816
The above contracts were opened with the below counterparties:Bank of America 3,391Barclays 2,259BNP Paribas 4Citibank 2,303Credit Suisse 1,510Goldman Sachs 1,293HSBC 2,026J.P. Morgan 2,720Morgan Stanley 2,302UBS 8
17,816
*This Fund was put into liquidation effective August 11, 2020
Franklin Multi-Sector Credit Income Fund
Purchases Sales Maturity Date
Unrealised profit/(loss)
USDForward foreign exchange contracts used for efficient portfolio management:USD 91,076 CHF 85,000 14-Jun-21 (2,097)0 (2,097)Forward foreign exchange contracts used for share class hedging:AUD 877,905 USD 668,499 17-May-21 7,904CHF 538,619 USD 584,403 17-May-21 5,587EUR 1,287,264 USD 1,536,104 17-May-21 11,976GBP 689,303 USD 946,467 17-May-21 5,575
31,04228,945
Note 4 - Forward foreign exchange contracts (continued)

FRANKLIN TEMPLETON SERIES II FUNDSNOTES TO FINANCIAL STATEMENTS
www.franklintempleton.lu Unaudited Semi-Annual Report 25
Franklin Multi-Sector Credit Income Fund (continued)
The above contracts were opened with the below counterparties:
Unrealised profit/(loss)
USDBank of America 3,174Barclays 1,861BNP Paribas 735Citibank 1,722Deutsche Bank 199Goldman Sachs 1,865HSBC 1,229J.P. Morgan 14,514Morgan Stanley 2,562Toronto-Dominion 687UBS 397
28,945
Franklin Upper Tier Floating Rate Fund*
Purchases Sales Maturity Date
Unrealised profit/(loss)
USDForward foreign exchange contracts used for share class hedging:CHF 3,166,744 USD 3,435,597 17-May-21 33,176EUR 327,760 USD 391,109 17-May-21 3,061
36,237
The above contracts were opened with the below counterparties:Bank of America 10,222Barclays 644BNP Paribas 1,180Citibank 4,116Goldman Sachs 3,185HSBC 6,294J.P. Morgan 4,548Morgan Stanley 4,399Toronto-Dominion 1,649
36,237
*This Fund was put into liquidation effective January 17, 2019
Note 5 - Open positions on financial future contractsAs at April 30, 2021, the Company had entered into the following outstanding contracts:
Franklin Multi-Sector Credit Income Fund
Number of contracts
purchased/(sold)
Description Counterparty Trading currency
Commitment USD
Unrealised profit/(loss)
USDBond Future
(4) US 10 Year Note, 21/06/2021 J.P. Morgan USD (528,125) 1,807 (6) US 10 Year Ultra Bond, 21/06/2021 J.P. Morgan USD (873,281) 18,299
20,106
Note 6 - Open positions on cross currency swap contractsAs at April 30, 2021, the Company had entered into the following outstanding contracts:
Franklin Multi-Sector Credit Income FundUnrealised
Nominal Maturity Trading profit/(loss)Description Counterparty amount date currency USDPay fixed 2.5 Receive floating LIBOR +2.87% 3 month Citibank 232,400 4-May-21 USD (8,056)
200,000 EUR
Note 4 - Forward foreign exchange contracts (continued)
FRANKLIN TEMPLETON SERIES II FUNDSNOTES TO FINANCIAL STATEMENTS
www.franklintempleton.luUnaudited Semi-Annual Report26
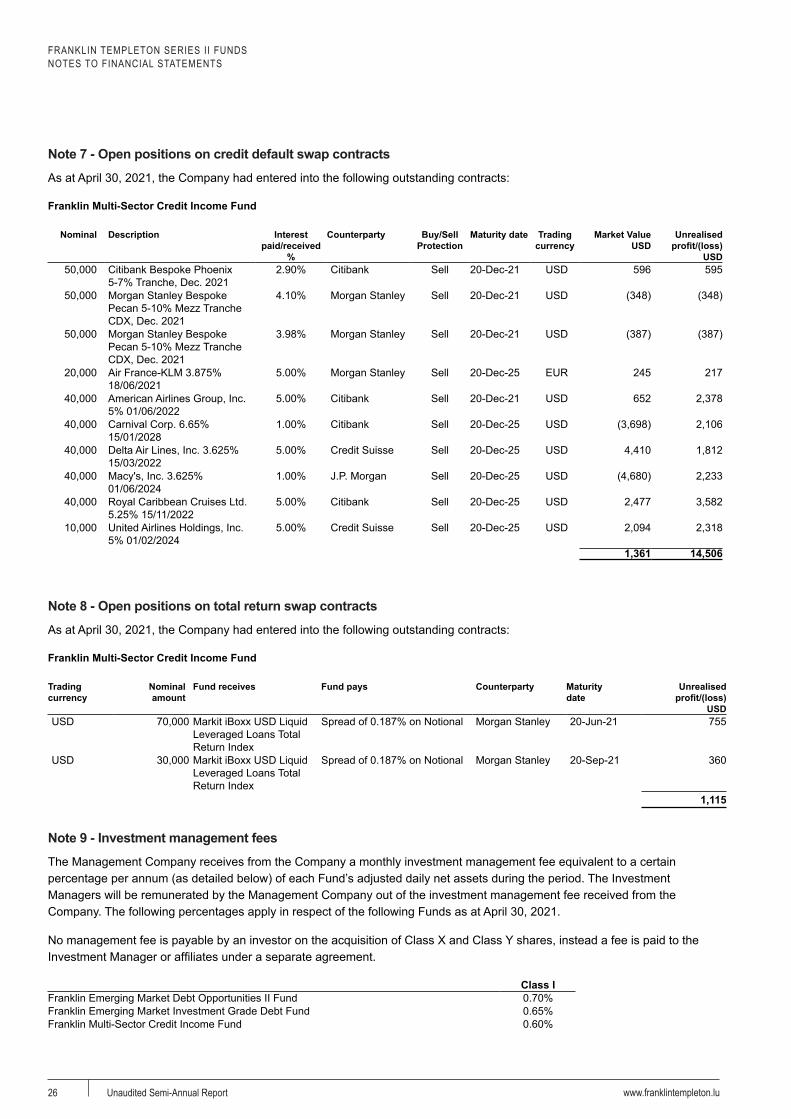
Note 7 - Open positions on credit default swap contractsAs at April 30, 2021, the Company had entered into the following outstanding contracts:
Franklin Multi-Sector Credit Income Fund
Nominal Description Interest paid/received
%
Counterparty Buy/Sell Protection
Maturity date Trading currency
Market Value USD
Unrealised profit/(loss)
USD50,000 Citibank Bespoke Phoenix
5-7% Tranche, Dec. 2021 2.90% Citibank Sell 20-Dec-21 USD 596 595
50,000 Morgan Stanley Bespoke Pecan 5-10% Mezz Tranche CDX, Dec. 2021
4.10% Morgan Stanley Sell 20-Dec-21 USD (348) (348)
50,000 Morgan Stanley Bespoke Pecan 5-10% Mezz Tranche CDX, Dec. 2021
3.98% Morgan Stanley Sell 20-Dec-21 USD (387) (387)
20,000 Air France-KLM 3.875% 18/06/2021
5.00% Morgan Stanley Sell 20-Dec-25 EUR 245 217
40,000 American Airlines Group, Inc. 5% 01/06/2022
5.00% Citibank Sell 20-Dec-21 USD 652 2,378
40,000 Carnival Corp. 6.65% 15/01/2028
1.00% Citibank Sell 20-Dec-25 USD (3,698) 2,106
40,000 Delta Air Lines, Inc. 3.625% 15/03/2022
5.00% Credit Suisse Sell 20-Dec-25 USD 4,410 1,812
40,000 Macy's, Inc. 3.625% 01/06/2024
1.00% J.P. Morgan Sell 20-Dec-25 USD (4,680) 2,233
40,000 Royal Caribbean Cruises Ltd. 5.25% 15/11/2022
5.00% Citibank Sell 20-Dec-25 USD 2,477 3,582
10,000 United Airlines Holdings, Inc. 5% 01/02/2024
5.00% Credit Suisse Sell 20-Dec-25 USD 2,094 2,318
1,361 14,506
Note 8 - Open positions on total return swap contractsAs at April 30, 2021, the Company had entered into the following outstanding contracts:
Franklin Multi-Sector Credit Income Fund
Trading currency
Nominal amount
Fund receives Fund pays Counterparty Maturity date
Unrealised profit/(loss)
USDUSD 70,000 Markit iBoxx USD Liquid
Leveraged Loans Total Return Index
Spread of 0.187% on Notional Morgan Stanley 20-Jun-21 755
USD 30,000 Markit iBoxx USD Liquid Leveraged Loans Total Return Index
Spread of 0.187% on Notional Morgan Stanley 20-Sep-21 360
1,115
Note 9 - Investment management feesThe Management Company receives from the Company a monthly investment management fee equivalent to a certain percentage per annum (as detailed below) of each Fund’s adjusted daily net assets during the period. The Investment Managers will be remunerated by the Management Company out of the investment management fee received from the Company. The following percentages apply in respect of the following Funds as at April 30, 2021.
No management fee is payable by an investor on the acquisition of Class X and Class Y shares, instead a fee is paid to the Investment Manager or affiliates under a separate agreement.
Class IFranklin Emerging Market Debt Opportunities II Fund 0.70%Franklin Emerging Market Investment Grade Debt Fund 0.65%Franklin Multi-Sector Credit Income Fund 0.60%
FRANKLIN TEMPLETON SERIES II FUNDSNOTES TO FINANCIAL STATEMENTS
www.franklintempleton.lu Unaudited Semi-Annual Report 27
Note 10 - Connected party transactionsCertain directors of the Company are or may also be officers and/or directors of the Management Company, i.e. Franklin Templeton International Services S.à r.l. or of the Investment Managers, among others, Franklin Advisers Inc., Franklin Templeton Institutional, LLC or Franklin Templeton Investment Management Limited. All transactions with connected parties were entered into in the ordinary course of business and under normal commercial terms.
The investment managers will be remunerated by the Management Company out of the investment management fee received from the Company, as more fully detailed in note 9 to the financial statements.
There are no connected brokers in Franklin Templeton, and no transactions were entered into with connected brokers during the period ended April 30, 2021.
The Company accrued fees in respect of Franklin Templeton International Services S.à r.l. as the Management Company and as the Principal Distributor of the Funds from November 1, 2020 to April 30, 2021.
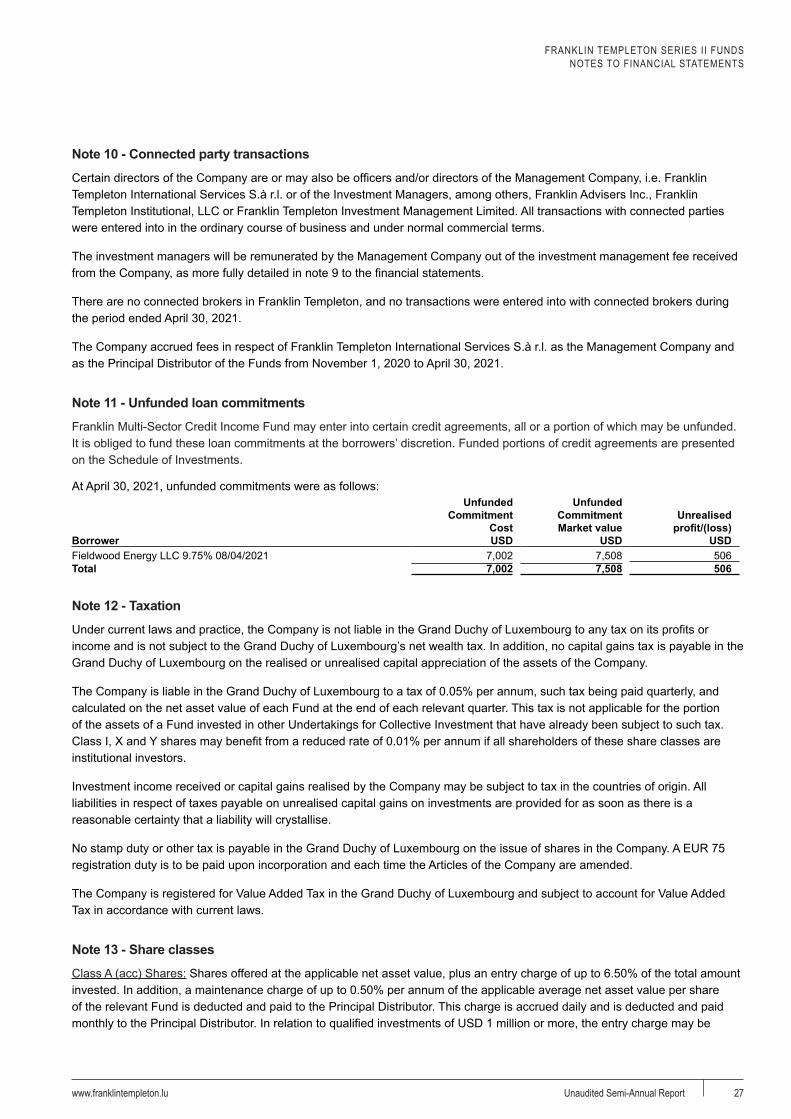
Note 11 - Unfunded loan commitmentsFranklin Multi-Sector Credit Income Fund may enter into certain credit agreements, all or a portion of which may be unfunded. It is obliged to fund these loan commitments at the borrowers’ discretion. Funded portions of credit agreements are presented on the Schedule of Investments.
At April 30, 2021, unfunded commitments were as follows:
Borrower
Unfunded Commitment
Cost USD
Unfunded Commitment Market value
USD
Unrealised profit/(loss)
USDFieldwood Energy LLC 9.75% 08/04/2021 7,002 7,508 506Total 7,002 7,508 506
Note 12 - TaxationUnder current laws and practice, the Company is not liable in the Grand Duchy of Luxembourg to any tax on its profits or income and is not subject to the Grand Duchy of Luxembourg’s net wealth tax. In addition, no capital gains tax is payable in the Grand Duchy of Luxembourg on the realised or unrealised capital appreciation of the assets of the Company.
The Company is liable in the Grand Duchy of Luxembourg to a tax of 0.05% per annum, such tax being paid quarterly, and calculated on the net asset value of each Fund at the end of each relevant quarter. This tax is not applicable for the portion of the assets of a Fund invested in other Undertakings for Collective Investment that have already been subject to such tax. Class I, X and Y shares may benefit from a reduced rate of 0.01% per annum if all shareholders of these share classes are institutional investors.
Investment income received or capital gains realised by the Company may be subject to tax in the countries of origin. All liabilities in respect of taxes payable on unrealised capital gains on investments are provided for as soon as there is a reasonable certainty that a liability will crystallise.
No stamp duty or other tax is payable in the Grand Duchy of Luxembourg on the issue of shares in the Company. A EUR 75 registration duty is to be paid upon incorporation and each time the Articles of the Company are amended.
The Company is registered for Value Added Tax in the Grand Duchy of Luxembourg and subject to account for Value Added Tax in accordance with current laws.
Note 13 - Share classesClass A (acc) Shares: Shares offered at the applicable net asset value, plus an entry charge of up to 6.50% of the total amount invested. In addition, a maintenance charge of up to 0.50% per annum of the applicable average net asset value per share of the relevant Fund is deducted and paid to the Principal Distributor. This charge is accrued daily and is deducted and paid monthly to the Principal Distributor. In relation to qualified investments of USD 1 million or more, the entry charge may be

FRANKLIN TEMPLETON SERIES II FUNDSNOTES TO FINANCIAL STATEMENTS
www.franklintempleton.luUnaudited Semi-Annual Report28
waived and a contingent deferred sales charge of up to 1.00% may apply if an investor sells shares within 18 months after each investment. No distribution of dividends will be made but the net income attributable will be reflected in the increased value of the shares.
Class A (dis) Shares: Distribution of dividend will be made monthly, quarterly or annually (depending on the frequency of the share class). All other terms and conditions are the same as those which apply for Class A(acc) shares.
Class I (acc) Shares: Shares offered to institutional investors as more fully described in the current Prospectus of the Company. No distribution of dividends will be made but the net income attributable will be reflected in the increased value of the shares. Class I(acc) shares are not subject to an entry charge, contingent deferred sales charge nor any maintenance charge. Class I shares benefit from a reduced Investment Management fee (note 9).
Class I (dis) Shares: Shares offered to institutional investors as more fully described in the current prospectus of the Company. Purchases of Class I (dis) shares are not subject to an entry charge, contingent deferred sales charge nor any maintenance charge. Class I shares benefit from a reduced Investment Management fee (note 9). Distribution of dividend will be made monthly, quarterly or annually (depending on the frequency of the share class).
Class W (acc) Shares: No distribution of dividends will be made but the net income attributable will be reflected in the increased value of the shares. Class W shares are not subject to an entry charge, contingent deferred sales charge nor any maintenance charge. Class W(acc) shares may be offered in certain limited circumstances as more fully described in the current prospectus of the Company.
Class W (dis) Shares: are not subject to an entry charge, contingent deferred sales charge nor any maintenance charge. Class W(dis) shares may be offered in certain limited circumstances as more fully described in the current prospectus of the Company.
Class X (dis) Shares: are not subject to an entry charge, contingent deferred sales charge nor any maintenance charge. Class X Shares are designed to accommodate an alternative charging structure whereby a fee covering the investment management fees is levied and collected by the Management Company directly from the Investors who are clients of Franklin Templeton Investments and who enter into a specific agreement with the Management Company. These fees will therefore not be payable out of the net assets of the relevant Fund attributable to Class X Shares. Class X Shares may only be offered to Institutional Investors in certain limited circumstances, at the discretion of the Management Company or the Investment Manager and its affiliates, as more fully described in the current prospectus of the Company.
Class Y (acc) and Y (dis) Shares: are not subject to an entry charge, contingent deferred sales charge nor any maintenance charge. Class Y shares are designed to accommodate an alternative charging structure whereby a fee covering the investment management and the registrar, transfer, corporate, domiciliary and administration fees is levied and collected by the Management Company directly from the Investors who are clients of Franklin Templeton Investments and who enter into a specific agreement with the Management Company. These fees will therefore not be payable out of the net assets of the relevant Fund attributable to Class Y Shares. Class Y Shares may only be offered to Institutional Investors in certain limited circumstances, at the discretion of the Management Company and/or its affiliates, as more fully described in the current prospectus of the Company.
Alternative currency hedged share classes: Shareholders of the hedged share class may be exposed to fluctuations in the Net Asset Value per Share reflecting the gains/losses on and the costs of the relevant financial instruments. The gains/losses and the costs of the relevant financial instruments will accrue solely to the relevant hedged share class.
The above mentioned distributing share classes may have different frequencies: (Mdis) share classes distribute monthly, (Qdis) share classes distribute quarterly and (Ydis) share classes distribute annually.
Note 13 - Share classes (continued)

FRANKLIN TEMPLETON SERIES II FUNDSNOTES TO FINANCIAL STATEMENTS
www.franklintempleton.lu Unaudited Semi-Annual Report 29
Note 14 - Net Profit/ Loss on Investments
Franklin Emerging Market Debt Opportunities II Fund
EUR
Franklin Emerging Market Investment Grade Debt
Fund USD
Franklin Floating Rate II Fund USD
Realised profit on sale of investments 15,719,950 424,522 79,820Realised loss on sale of investments (36,212,868) (137,955) (17,496,671)Net realised profit/(loss) on sale of investments (20,492,918) 286,567 (17,416,851)Change in unrealised profit on investments 60,572,570 314,541 18,880,738Change in unrealised loss on investments (34,697,121) (1,410,833) (2,367,548)Change in net unrealised profit/(loss) on investments 25,875,449 (1,096,292) 16,513,190
Franklin Multi-Sector Credit Income
Fund USD
Franklin Upper Tier Floating Rate
Fund USD
Realised profit on sale of investments 326,641 –Realised loss on sale of investments (631,552) –Net realised profit/(loss) on sale of investments (304,911) –Change in unrealised profit on investments 997,210 5,313,902Change in unrealised loss on investments (212,297) –Change in net unrealised profit/(loss) on investments 784,913 5,313,902
Note 15 - Expenses reimbursementFor the period ended April 30, 2021, the following expenses have been either reimbursed in the first instance by management company, Franklin Templeton International Services S.à r.l., or in the event that the expense exceeded the Administration fee, by the Funds’ individual Investment Manager as detailed on page 7.
In the event that the expenses exceeded the Administration and Investment Management fees, they have been reimbursed by Franklin Templeton International Services S.à r.l.
Fund Name Currency AmountFranklin Emerging Market Debt Opportunities II Fund EUR 127,192Franklin Emerging Market Investment Grade Debt Fund USD 26Franklin Multi-Sector Credit Income Fund USD 29,580
Note 16 - Statement of changes in the investment portfolioA list, specifying for each Fund total purchases and sales transacted during the period under review, may be obtained, upon request, at the registered office of the Company.
Note 17 - Transaction costsTransaction costs are costs incurred to acquire financial assets or liabilities. They include fees and commissions paid to agents, brokers and dealers. During the period ended April 30, 2021, the Company incurred the following transaction costs:
Fund Name Currency AmountFranklin Emerging Market Debt Opportunities II Fund EUR –*Franklin Emerging Market Investment Grade Debt Fund USD –*Franklin Floating Rate II Fund USD –*Franklin Multi-Sector Credit Income Fund USD 219Franklin Upper Tier Floating Rate Fund USD –*
*For debt securities and derivatives, transaction costs are not separately identifiable from the purchase price of the security and therefore cannot be disclosed separately.
FRANKLIN TEMPLETON SERIES II FUNDSNOTES TO FINANCIAL STATEMENTS
www.franklintempleton.luUnaudited Semi-Annual Report30
Note 18 - EqualisationThe Funds use an accounting practice known as equalisation, by which a portion of the proceeds from issues and the costs of sale of shares, equivalent on a per share basis to the amount of undistributed net investment income on the date of the transaction, is credited or charged to undistributed income. As a result, undistributed net investment income per share is unaffected by issues or redemptions of shares. However, in respect of any Fund offering only accumulation shares, the Board of Directors reserves the right not to apply equalisation.
Note 19 - Portfolio Turnover RatioThe Portfolio Turnover Ratio (“PTR”), expressed as a percentage, is equal to the total of purchases and sales of securities netted against the total value of subscriptions and redemptions, over average net assets of the Fund for a year. It is effectively a measure of how frequently a Fund buys or sells securities.
Note 20 - Security lendingAs at April 30, 2021, the Company was not involved in any securities lending programs.
Note 21 - Credit facilitiesEffective February 5, 2021, the Company together with other European and U.S. registered investment funds managed by Franklin Templeton Investments (individually, Borrower; collectively, Borrowers), entered into a joint syndicated revolving senior unsecured credit facility totalling USD 2,675 million (Global Credit Facility) with a group of banks to provide a source of funds to the Borrowers for temporary and emergency purposes, including the ability to meet future unanticipated or unusually large redemption requests.
Under the terms of the Global Credit Facility, a Borrower shall, in addition to interest charged on any borrowings and other costs incurred by the Borrower, pay its share of fees and expenses incurred in connection with the implementation and maintenance of the Global Credit Facility, based upon its relative share of the aggregate net assets of all of the Borrowers, including an annual commitment fee based upon the unused portion of the Global Credit Facility.
During the financial period ended April 30, 2021, the Company did not use the Global Credit Facility.
Note 22 - Total Expense RatioThe Total Expense Ratio (“TER”), expressed as a percentage, represents how the total annualised expenses of each share class relate to the average net assets of each share class for the period ended April 30, 2021. The total expenses comprise the investment management fees, the administration and transfer agency fees, the custodian fees and other expenses as summarised in the “Statement of Operations and Changes in Net Assets”.
Note 23 - Audited annual reports and unaudited semi-annual reportsThe audited annual reports and unaudited semi-annual reports will be available on the local Franklin Templeton Investments website, www.franklintempleton.lu or may be obtained, free of charge, on request at the registered office of the Company; they are only distributed to registered shareholders in those countries where local regulation so requires. The complete audited annual reports and unaudited semi-annual reports are available at the registered office of the Company.
Note 24 - AbbreviationsCountriesAGO Angola CZE Czech Republic JOR Jordan ROU RomaniaARE United Arab Emirates DEU Germany KAZ Kazakhstan RUS RussiaARG Argentina DOM Dominican Republic KEN Kenya SLV El SalvadorARM Armenia EGY Egypt LUX Luxembourg SP SupranationalAZE Azerbaijan ETH Ethiopia MAC Macau SRB SerbiaBEN Benin FRA France MEX Mexico SUR Suriname
BIHBosnia and Herzegovina GEO Georgia MKD Macedonia THA Thailand
BLR Belarus GHA Ghana MYS Malaysia TTO Trinidad and Tobago

FRANKLIN TEMPLETON SERIES II FUNDSNOTES TO FINANCIAL STATEMENTS
www.franklintempleton.lu Unaudited Semi-Annual Report 31
BRL Brazil HND Honduras NGA Nigeria TUN TunisiaCAN Canada IDN Indonesia PAK Pakistan TUR TurkeyCHL Chile IND India PAN Panama UKR UkraineCHN China IRL Ireland PER Peru URY Uruguay
CMR Cameroon IRQ Iraq PHL Philippines USAUnited States of America
COL Colombia ISR Israel POL Poland UZB UzbekistanCRI Costa Rica JAM Jamaica PRY Paraguay ZAF South Africa
CurrenciesAUD Australian Dollar EUR Euro JPY Japanese Yen RUB Russian RubleBYN Belarusian Ruble GBP British Pound Sterling KES Kenyan Shilling TRY Turkish LiraCHF Swiss Franc GEL Georgian Lari KZT Kazakhstani Tenge USD US DollarCOP Colombian Peso GHS Ghanaian Cedi MXN Mexican Peso UYU Uruguayan Peso
DOPDominican Republic Peso IDR Indonesian Rupiah PEN Peruvian Sol UZS Uzbekistani Som
EGP Egyptian Pound INR Indian Rupee PLN Polish Zloty ZAR South African Rand
Note 25 - Other informationBeginning in January 2020, global financial markets have experienced and may continue to experience significant volatility resulting from the spread of a novel corona virus known as COVID-19. The outbreak of COVID-19 has resulted in travel and border restrictions, quarantines, supply chain disruptions, lower consumer demand and general market uncertainty. The effects of COVID-19 have and may continue to adversely affect the global economy, the economies of certain nations and individual issuers, all of which may negatively impact the Fund’s performance.
Note 26 - Subsequent eventsFranklin Multi-Sector Credit Income Fund was put into liquidation process effective May 10, 2021.
Note 24 - Abbreviations (continued)
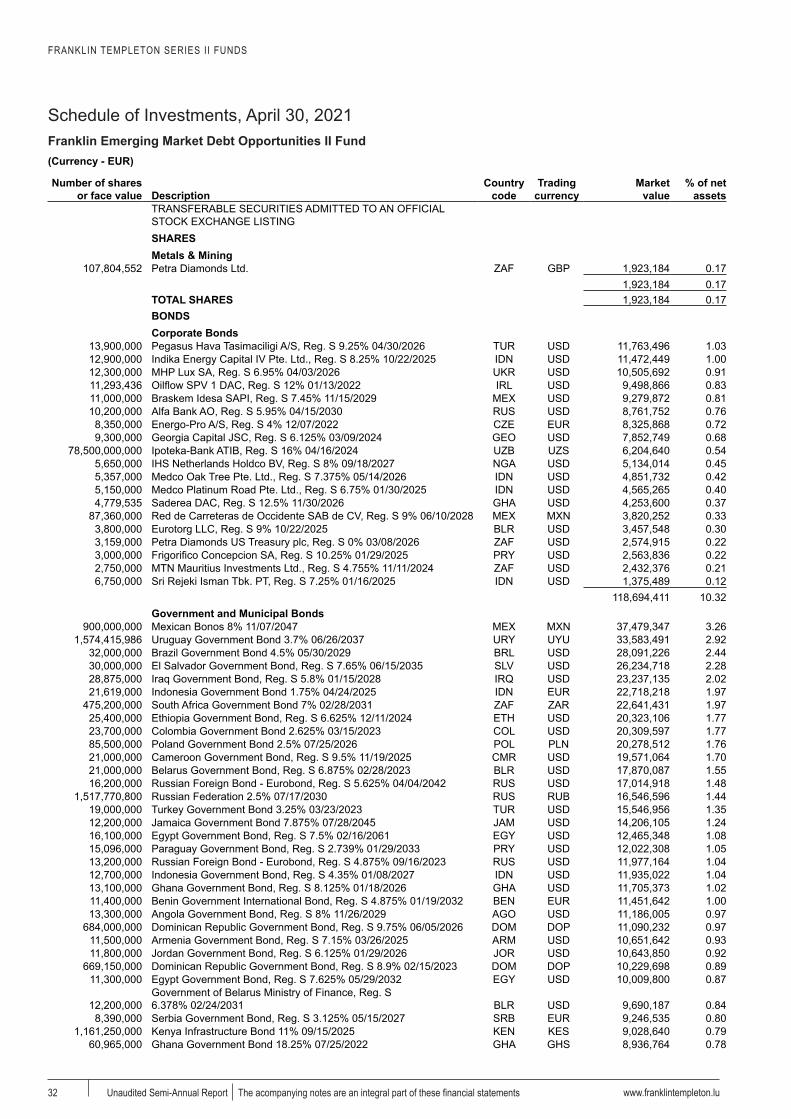
FRANKLIN TEMPLETON SERIES II FUNDS
Schedule of Investments, April 30, 2021Franklin Emerging Market Debt Opportunities II Fund
www.franklintempleton.lu32 Unaudited Semi-Annual Report The acompanying notes are an integral part of these financial statements
(Currency - EUR)
Number of shares or face value Description
Country code
Trading currency
Market value
% of net assets
TRANSFERABLE SECURITIES ADMITTED TO AN OFFICIAL STOCK EXCHANGE LISTINGSHARESMetals & Mining
107,804,552 Petra Diamonds Ltd. ZAF GBP 1,923,184 0.171,923,184 0.17
TOTAL SHARES 1,923,184 0.17BONDSCorporate Bonds
13,900,000 Pegasus Hava Tasimaciligi A/S, Reg. S 9.25% 04/30/2026 TUR USD 11,763,496 1.0312,900,000 Indika Energy Capital IV Pte. Ltd., Reg. S 8.25% 10/22/2025 IDN USD 11,472,449 1.0012,300,000 MHP Lux SA, Reg. S 6.95% 04/03/2026 UKR USD 10,505,692 0.9111,293,436 Oilflow SPV 1 DAC, Reg. S 12% 01/13/2022 IRL USD 9,498,866 0.8311,000,000 Braskem Idesa SAPI, Reg. S 7.45% 11/15/2029 MEX USD 9,279,872 0.8110,200,000 Alfa Bank AO, Reg. S 5.95% 04/15/2030 RUS USD 8,761,752 0.76
8,350,000 Energo-Pro A/S, Reg. S 4% 12/07/2022 CZE EUR 8,325,868 0.729,300,000 Georgia Capital JSC, Reg. S 6.125% 03/09/2024 GEO USD 7,852,749 0.68
78,500,000,000 Ipoteka-Bank ATIB, Reg. S 16% 04/16/2024 UZB UZS 6,204,640 0.545,650,000 IHS Netherlands Holdco BV, Reg. S 8% 09/18/2027 NGA USD 5,134,014 0.455,357,000 Medco Oak Tree Pte. Ltd., Reg. S 7.375% 05/14/2026 IDN USD 4,851,732 0.425,150,000 Medco Platinum Road Pte. Ltd., Reg. S 6.75% 01/30/2025 IDN USD 4,565,265 0.404,779,535 Saderea DAC, Reg. S 12.5% 11/30/2026 GHA USD 4,253,600 0.37
87,360,000 Red de Carreteras de Occidente SAB de CV, Reg. S 9% 06/10/2028 MEX MXN 3,820,252 0.333,800,000 Eurotorg LLC, Reg. S 9% 10/22/2025 BLR USD 3,457,548 0.303,159,000 Petra Diamonds US Treasury plc, Reg. S 0% 03/08/2026 ZAF USD 2,574,915 0.223,000,000 Frigorifico Concepcion SA, Reg. S 10.25% 01/29/2025 PRY USD 2,563,836 0.222,750,000 MTN Mauritius Investments Ltd., Reg. S 4.755% 11/11/2024 ZAF USD 2,432,376 0.216,750,000 Sri Rejeki Isman Tbk. PT, Reg. S 7.25% 01/16/2025 IDN USD 1,375,489 0.12
118,694,411 10.32Government and Municipal Bonds
900,000,000 Mexican Bonos 8% 11/07/2047 MEX MXN 37,479,347 3.261,574,415,986 Uruguay Government Bond 3.7% 06/26/2037 URY UYU 33,583,491 2.92
32,000,000 Brazil Government Bond 4.5% 05/30/2029 BRL USD 28,091,226 2.4430,000,000 El Salvador Government Bond, Reg. S 7.65% 06/15/2035 SLV USD 26,234,718 2.2828,875,000 Iraq Government Bond, Reg. S 5.8% 01/15/2028 IRQ USD 23,237,135 2.0221,619,000 Indonesia Government Bond 1.75% 04/24/2025 IDN EUR 22,718,218 1.97
475,200,000 South Africa Government Bond 7% 02/28/2031 ZAF ZAR 22,641,431 1.9725,400,000 Ethiopia Government Bond, Reg. S 6.625% 12/11/2024 ETH USD 20,323,106 1.7723,700,000 Colombia Government Bond 2.625% 03/15/2023 COL USD 20,309,597 1.7785,500,000 Poland Government Bond 2.5% 07/25/2026 POL PLN 20,278,512 1.7621,000,000 Cameroon Government Bond, Reg. S 9.5% 11/19/2025 CMR USD 19,571,064 1.7021,000,000 Belarus Government Bond, Reg. S 6.875% 02/28/2023 BLR USD 17,870,087 1.5516,200,000 Russian Foreign Bond - Eurobond, Reg. S 5.625% 04/04/2042 RUS USD 17,014,918 1.48
1,517,770,800 Russian Federation 2.5% 07/17/2030 RUS RUB 16,546,596 1.4419,000,000 Turkey Government Bond 3.25% 03/23/2023 TUR USD 15,546,956 1.3512,200,000 Jamaica Government Bond 7.875% 07/28/2045 JAM USD 14,206,105 1.2416,100,000 Egypt Government Bond, Reg. S 7.5% 02/16/2061 EGY USD 12,465,348 1.0815,096,000 Paraguay Government Bond, Reg. S 2.739% 01/29/2033 PRY USD 12,022,308 1.0513,200,000 Russian Foreign Bond - Eurobond, Reg. S 4.875% 09/16/2023 RUS USD 11,977,164 1.0412,700,000 Indonesia Government Bond, Reg. S 4.35% 01/08/2027 IDN USD 11,935,022 1.0413,100,000 Ghana Government Bond, Reg. S 8.125% 01/18/2026 GHA USD 11,705,373 1.0211,400,000 Benin Government International Bond, Reg. S 4.875% 01/19/2032 BEN EUR 11,451,642 1.0013,300,000 Angola Government Bond, Reg. S 8% 11/26/2029 AGO USD 11,186,005 0.97
684,000,000 Dominican Republic Government Bond, Reg. S 9.75% 06/05/2026 DOM DOP 11,090,232 0.9711,500,000 Armenia Government Bond, Reg. S 7.15% 03/26/2025 ARM USD 10,651,642 0.9311,800,000 Jordan Government Bond, Reg. S 6.125% 01/29/2026 JOR USD 10,643,850 0.92
669,150,000 Dominican Republic Government Bond, Reg. S 8.9% 02/15/2023 DOM DOP 10,229,698 0.8911,300,000 Egypt Government Bond, Reg. S 7.625% 05/29/2032 EGY USD 10,009,800 0.87
12,200,000Government of Belarus Ministry of Finance, Reg. S 6.378% 02/24/2031 BLR USD 9,690,187 0.84
8,390,000 Serbia Government Bond, Reg. S 3.125% 05/15/2027 SRB EUR 9,246,535 0.801,161,250,000 Kenya Infrastructure Bond 11% 09/15/2025 KEN KES 9,028,640 0.79
60,965,000 Ghana Government Bond 18.25% 07/25/2022 GHA GHS 8,936,764 0.78
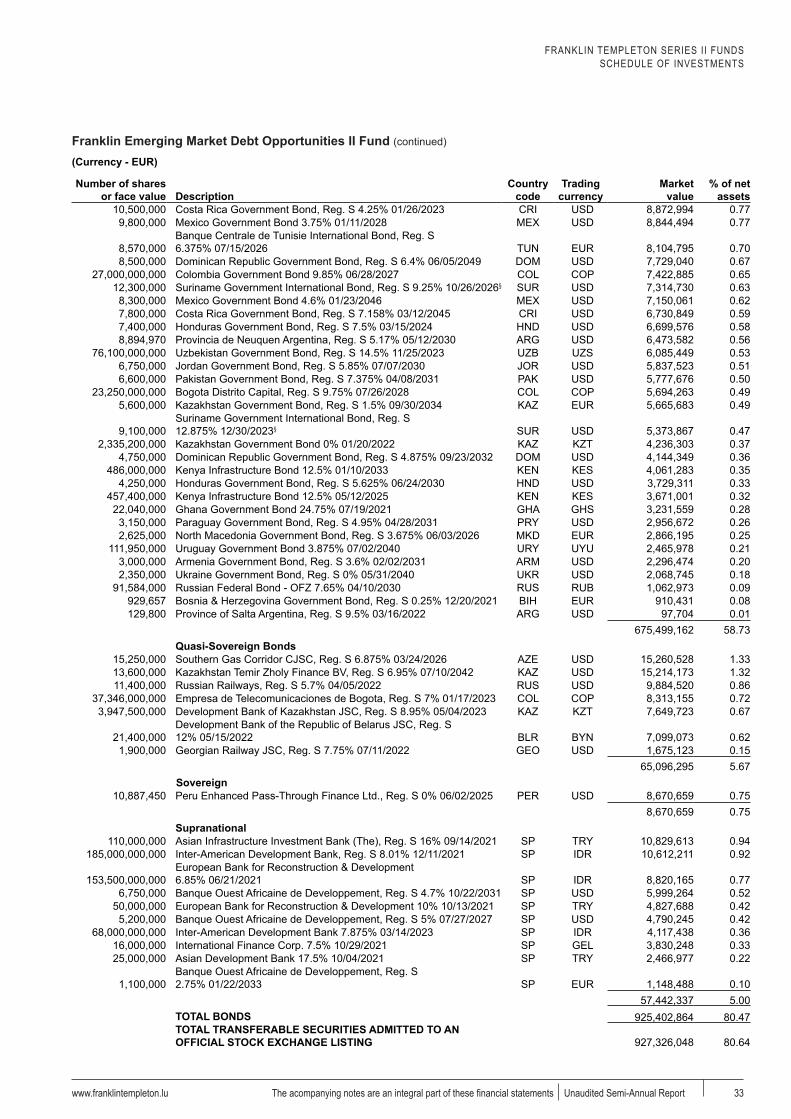
FRANKLIN TEMPLETON SERIES II FUNDSSCHEDULE OF INVESTMENTS
Franklin Emerging Market Debt Opportunities II Fund (continued)
www.franklintempleton.lu 33The acompanying notes are an integral part of these financial statements Unaudited Semi-Annual Report
(Currency - EUR)
Number of shares or face value Description
Country code
Trading currency
Market value
% of net assets
10,500,000 Costa Rica Government Bond, Reg. S 4.25% 01/26/2023 CRI USD 8,872,994 0.779,800,000 Mexico Government Bond 3.75% 01/11/2028 MEX USD 8,844,494 0.77
8,570,000Banque Centrale de Tunisie International Bond, Reg. S 6.375% 07/15/2026 TUN EUR 8,104,795 0.70
8,500,000 Dominican Republic Government Bond, Reg. S 6.4% 06/05/2049 DOM USD 7,729,040 0.6727,000,000,000 Colombia Government Bond 9.85% 06/28/2027 COL COP 7,422,885 0.65
12,300,000 Suriname Government International Bond, Reg. S 9.25% 10/26/2026§ SUR USD 7,314,730 0.638,300,000 Mexico Government Bond 4.6% 01/23/2046 MEX USD 7,150,061 0.627,800,000 Costa Rica Government Bond, Reg. S 7.158% 03/12/2045 CRI USD 6,730,849 0.597,400,000 Honduras Government Bond, Reg. S 7.5% 03/15/2024 HND USD 6,699,576 0.588,894,970 Provincia de Neuquen Argentina, Reg. S 5.17% 05/12/2030 ARG USD 6,473,582 0.56
76,100,000,000 Uzbekistan Government Bond, Reg. S 14.5% 11/25/2023 UZB UZS 6,085,449 0.536,750,000 Jordan Government Bond, Reg. S 5.85% 07/07/2030 JOR USD 5,837,523 0.516,600,000 Pakistan Government Bond, Reg. S 7.375% 04/08/2031 PAK USD 5,777,676 0.50
23,250,000,000 Bogota Distrito Capital, Reg. S 9.75% 07/26/2028 COL COP 5,694,263 0.495,600,000 Kazakhstan Government Bond, Reg. S 1.5% 09/30/2034 KAZ EUR 5,665,683 0.49
9,100,000Suriname Government International Bond, Reg. S 12.875% 12/30/2023§ SUR USD 5,373,867 0.47
2,335,200,000 Kazakhstan Government Bond 0% 01/20/2022 KAZ KZT 4,236,303 0.374,750,000 Dominican Republic Government Bond, Reg. S 4.875% 09/23/2032 DOM USD 4,144,349 0.36
486,000,000 Kenya Infrastructure Bond 12.5% 01/10/2033 KEN KES 4,061,283 0.354,250,000 Honduras Government Bond, Reg. S 5.625% 06/24/2030 HND USD 3,729,311 0.33
457,400,000 Kenya Infrastructure Bond 12.5% 05/12/2025 KEN KES 3,671,001 0.3222,040,000 Ghana Government Bond 24.75% 07/19/2021 GHA GHS 3,231,559 0.28
3,150,000 Paraguay Government Bond, Reg. S 4.95% 04/28/2031 PRY USD 2,956,672 0.262,625,000 North Macedonia Government Bond, Reg. S 3.675% 06/03/2026 MKD EUR 2,866,195 0.25
111,950,000 Uruguay Government Bond 3.875% 07/02/2040 URY UYU 2,465,978 0.213,000,000 Armenia Government Bond, Reg. S 3.6% 02/02/2031 ARM USD 2,296,474 0.202,350,000 Ukraine Government Bond, Reg. S 0% 05/31/2040 UKR USD 2,068,745 0.18
91,584,000 Russian Federal Bond - OFZ 7.65% 04/10/2030 RUS RUB 1,062,973 0.09929,657 Bosnia & Herzegovina Government Bond, Reg. S 0.25% 12/20/2021 BIH EUR 910,431 0.08129,800 Province of Salta Argentina, Reg. S 9.5% 03/16/2022 ARG USD 97,704 0.01
675,499,162 58.73Quasi-Sovereign Bonds
15,250,000 Southern Gas Corridor CJSC, Reg. S 6.875% 03/24/2026 AZE USD 15,260,528 1.3313,600,000 Kazakhstan Temir Zholy Finance BV, Reg. S 6.95% 07/10/2042 KAZ USD 15,214,173 1.3211,400,000 Russian Railways, Reg. S 5.7% 04/05/2022 RUS USD 9,884,520 0.86
37,346,000,000 Empresa de Telecomunicaciones de Bogota, Reg. S 7% 01/17/2023 COL COP 8,313,155 0.723,947,500,000 Development Bank of Kazakhstan JSC, Reg. S 8.95% 05/04/2023 KAZ KZT 7,649,723 0.67
21,400,000Development Bank of the Republic of Belarus JSC, Reg. S 12% 05/15/2022 BLR BYN 7,099,073 0.62
1,900,000 Georgian Railway JSC, Reg. S 7.75% 07/11/2022 GEO USD 1,675,123 0.1565,096,295 5.67
Sovereign10,887,450 Peru Enhanced Pass-Through Finance Ltd., Reg. S 0% 06/02/2025 PER USD 8,670,659 0.75
8,670,659 0.75Supranational
110,000,000 Asian Infrastructure Investment Bank (The), Reg. S 16% 09/14/2021 SP TRY 10,829,613 0.94185,000,000,000 Inter-American Development Bank, Reg. S 8.01% 12/11/2021 SP IDR 10,612,211 0.92
153,500,000,000European Bank for Reconstruction & Development 6.85% 06/21/2021 SP IDR 8,820,165 0.77
6,750,000 Banque Ouest Africaine de Developpement, Reg. S 4.7% 10/22/2031 SP USD 5,999,264 0.5250,000,000 European Bank for Reconstruction & Development 10% 10/13/2021 SP TRY 4,827,688 0.42
5,200,000 Banque Ouest Africaine de Developpement, Reg. S 5% 07/27/2027 SP USD 4,790,245 0.4268,000,000,000 Inter-American Development Bank 7.875% 03/14/2023 SP IDR 4,117,438 0.36
16,000,000 International Finance Corp. 7.5% 10/29/2021 SP GEL 3,830,248 0.3325,000,000 Asian Development Bank 17.5% 10/04/2021 SP TRY 2,466,977 0.22
1,100,000Banque Ouest Africaine de Developpement, Reg. S 2.75% 01/22/2033 SP EUR 1,148,488 0.10
57,442,337 5.00TOTAL BONDS 925,402,864 80.47TOTAL TRANSFERABLE SECURITIES ADMITTED TO AN OFFICIAL STOCK EXCHANGE LISTING 927,326,048 80.64
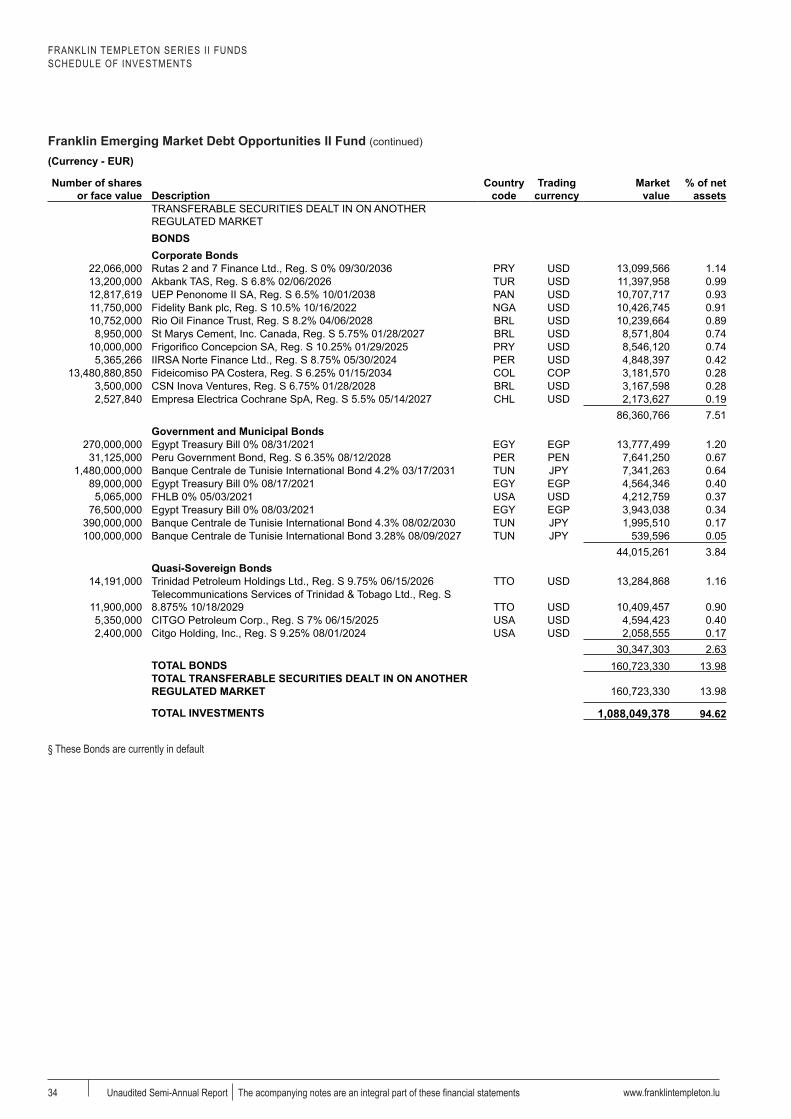
FRANKLIN TEMPLETON SERIES II FUNDSSCHEDULE OF INVESTMENTS
Franklin Emerging Market Debt Opportunities II Fund (continued)
www.franklintempleton.lu34 Unaudited Semi-Annual Report The acompanying notes are an integral part of these financial statements
(Currency - EUR)
Number of shares or face value Description
Country code
Trading currency
Market value
% of net assets
TRANSFERABLE SECURITIES DEALT IN ON ANOTHER REGULATED MARKETBONDSCorporate Bonds
22,066,000 Rutas 2 and 7 Finance Ltd., Reg. S 0% 09/30/2036 PRY USD 13,099,566 1.1413,200,000 Akbank TAS, Reg. S 6.8% 02/06/2026 TUR USD 11,397,958 0.9912,817,619 UEP Penonome II SA, Reg. S 6.5% 10/01/2038 PAN USD 10,707,717 0.9311,750,000 Fidelity Bank plc, Reg. S 10.5% 10/16/2022 NGA USD 10,426,745 0.9110,752,000 Rio Oil Finance Trust, Reg. S 8.2% 04/06/2028 BRL USD 10,239,664 0.89
8,950,000 St Marys Cement, Inc. Canada, Reg. S 5.75% 01/28/2027 BRL USD 8,571,804 0.7410,000,000 Frigorifico Concepcion SA, Reg. S 10.25% 01/29/2025 PRY USD 8,546,120 0.74
5,365,266 IIRSA Norte Finance Ltd., Reg. S 8.75% 05/30/2024 PER USD 4,848,397 0.4213,480,880,850 Fideicomiso PA Costera, Reg. S 6.25% 01/15/2034 COL COP 3,181,570 0.28
3,500,000 CSN Inova Ventures, Reg. S 6.75% 01/28/2028 BRL USD 3,167,598 0.282,527,840 Empresa Electrica Cochrane SpA, Reg. S 5.5% 05/14/2027 CHL USD 2,173,627 0.19
86,360,766 7.51Government and Municipal Bonds
270,000,000 Egypt Treasury Bill 0% 08/31/2021 EGY EGP 13,777,499 1.2031,125,000 Peru Government Bond, Reg. S 6.35% 08/12/2028 PER PEN 7,641,250 0.67
1,480,000,000 Banque Centrale de Tunisie International Bond 4.2% 03/17/2031 TUN JPY 7,341,263 0.6489,000,000 Egypt Treasury Bill 0% 08/17/2021 EGY EGP 4,564,346 0.40
5,065,000 FHLB 0% 05/03/2021 USA USD 4,212,759 0.3776,500,000 Egypt Treasury Bill 0% 08/03/2021 EGY EGP 3,943,038 0.34
390,000,000 Banque Centrale de Tunisie International Bond 4.3% 08/02/2030 TUN JPY 1,995,510 0.17100,000,000 Banque Centrale de Tunisie International Bond 3.28% 08/09/2027 TUN JPY 539,596 0.05
44,015,261 3.84Quasi-Sovereign Bonds
14,191,000 Trinidad Petroleum Holdings Ltd., Reg. S 9.75% 06/15/2026 TTO USD 13,284,868 1.16
11,900,000Telecommunications Services of Trinidad & Tobago Ltd., Reg. S 8.875% 10/18/2029 TTO USD 10,409,457 0.90
5,350,000 CITGO Petroleum Corp., Reg. S 7% 06/15/2025 USA USD 4,594,423 0.402,400,000 Citgo Holding, Inc., Reg. S 9.25% 08/01/2024 USA USD 2,058,555 0.17
30,347,303 2.63TOTAL BONDS 160,723,330 13.98TOTAL TRANSFERABLE SECURITIES DEALT IN ON ANOTHER REGULATED MARKET 160,723,330 13.98
TOTAL INVESTMENTS 1,088,049,378 94.62
a§ These Bonds are currently in default
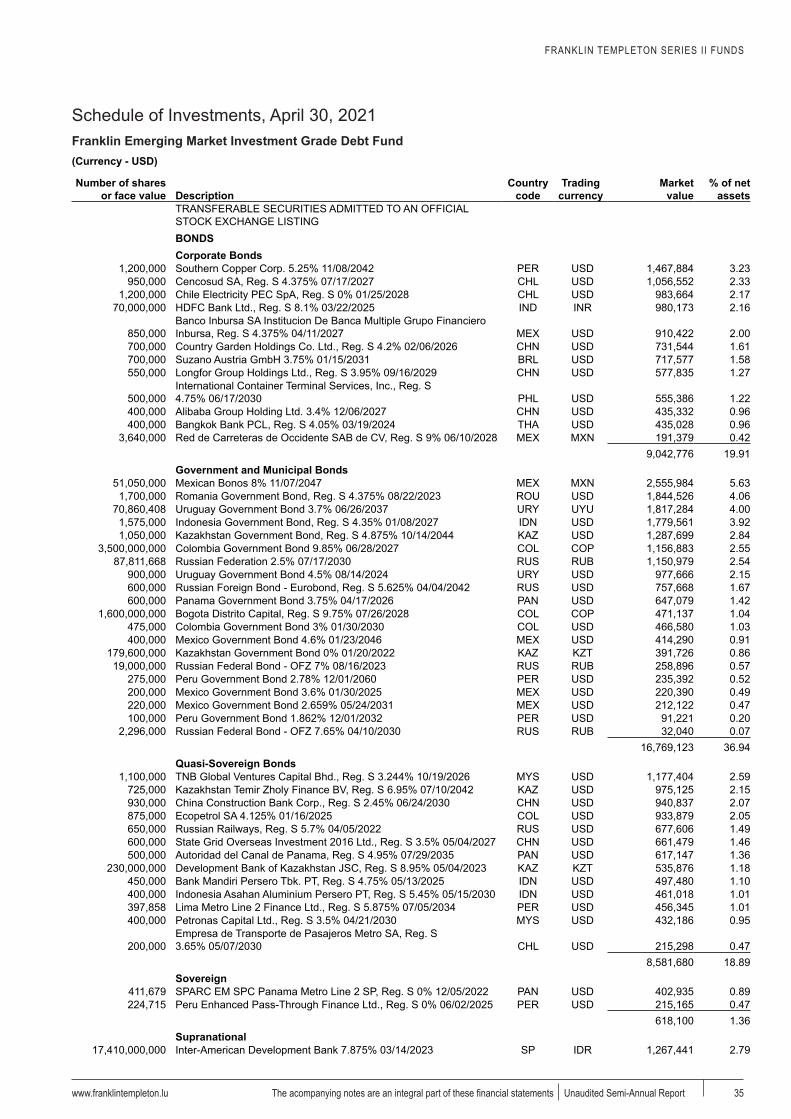
FRANKLIN TEMPLETON SERIES II FUNDS
Schedule of Investments, April 30, 2021Franklin Emerging Market Investment Grade Debt Fund
www.franklintempleton.lu 35The acompanying notes are an integral part of these financial statements Unaudited Semi-Annual Report
(Currency - USD)
Number of shares or face value Description
Country code
Trading currency
Market value
% of net assets
TRANSFERABLE SECURITIES ADMITTED TO AN OFFICIAL STOCK EXCHANGE LISTINGBONDSCorporate Bonds
1,200,000 Southern Copper Corp. 5.25% 11/08/2042 PER USD 1,467,884 3.23950,000 Cencosud SA, Reg. S 4.375% 07/17/2027 CHL USD 1,056,552 2.33
1,200,000 Chile Electricity PEC SpA, Reg. S 0% 01/25/2028 CHL USD 983,664 2.1770,000,000 HDFC Bank Ltd., Reg. S 8.1% 03/22/2025 IND INR 980,173 2.16
850,000Banco Inbursa SA Institucion De Banca Multiple Grupo Financiero Inbursa, Reg. S 4.375% 04/11/2027 MEX USD 910,422 2.00
700,000 Country Garden Holdings Co. Ltd., Reg. S 4.2% 02/06/2026 CHN USD 731,544 1.61700,000 Suzano Austria GmbH 3.75% 01/15/2031 BRL USD 717,577 1.58550,000 Longfor Group Holdings Ltd., Reg. S 3.95% 09/16/2029 CHN USD 577,835 1.27
500,000International Container Terminal Services, Inc., Reg. S 4.75% 06/17/2030 PHL USD 555,386 1.22
400,000 Alibaba Group Holding Ltd. 3.4% 12/06/2027 CHN USD 435,332 0.96400,000 Bangkok Bank PCL, Reg. S 4.05% 03/19/2024 THA USD 435,028 0.96
3,640,000 Red de Carreteras de Occidente SAB de CV, Reg. S 9% 06/10/2028 MEX MXN 191,379 0.429,042,776 19.91
Government and Municipal Bonds51,050,000 Mexican Bonos 8% 11/07/2047 MEX MXN 2,555,984 5.63
1,700,000 Romania Government Bond, Reg. S 4.375% 08/22/2023 ROU USD 1,844,526 4.0670,860,408 Uruguay Government Bond 3.7% 06/26/2037 URY UYU 1,817,284 4.00
1,575,000 Indonesia Government Bond, Reg. S 4.35% 01/08/2027 IDN USD 1,779,561 3.921,050,000 Kazakhstan Government Bond, Reg. S 4.875% 10/14/2044 KAZ USD 1,287,699 2.84
3,500,000,000 Colombia Government Bond 9.85% 06/28/2027 COL COP 1,156,883 2.5587,811,668 Russian Federation 2.5% 07/17/2030 RUS RUB 1,150,979 2.54
900,000 Uruguay Government Bond 4.5% 08/14/2024 URY USD 977,666 2.15600,000 Russian Foreign Bond - Eurobond, Reg. S 5.625% 04/04/2042 RUS USD 757,668 1.67600,000 Panama Government Bond 3.75% 04/17/2026 PAN USD 647,079 1.42
1,600,000,000 Bogota Distrito Capital, Reg. S 9.75% 07/26/2028 COL COP 471,137 1.04475,000 Colombia Government Bond 3% 01/30/2030 COL USD 466,580 1.03400,000 Mexico Government Bond 4.6% 01/23/2046 MEX USD 414,290 0.91
179,600,000 Kazakhstan Government Bond 0% 01/20/2022 KAZ KZT 391,726 0.8619,000,000 Russian Federal Bond - OFZ 7% 08/16/2023 RUS RUB 258,896 0.57
275,000 Peru Government Bond 2.78% 12/01/2060 PER USD 235,392 0.52200,000 Mexico Government Bond 3.6% 01/30/2025 MEX USD 220,390 0.49220,000 Mexico Government Bond 2.659% 05/24/2031 MEX USD 212,122 0.47100,000 Peru Government Bond 1.862% 12/01/2032 PER USD 91,221 0.20
2,296,000 Russian Federal Bond - OFZ 7.65% 04/10/2030 RUS RUB 32,040 0.0716,769,123 36.94
Quasi-Sovereign Bonds1,100,000 TNB Global Ventures Capital Bhd., Reg. S 3.244% 10/19/2026 MYS USD 1,177,404 2.59
725,000 Kazakhstan Temir Zholy Finance BV, Reg. S 6.95% 07/10/2042 KAZ USD 975,125 2.15930,000 China Construction Bank Corp., Reg. S 2.45% 06/24/2030 CHN USD 940,837 2.07875,000 Ecopetrol SA 4.125% 01/16/2025 COL USD 933,879 2.05650,000 Russian Railways, Reg. S 5.7% 04/05/2022 RUS USD 677,606 1.49600,000 State Grid Overseas Investment 2016 Ltd., Reg. S 3.5% 05/04/2027 CHN USD 661,479 1.46500,000 Autoridad del Canal de Panama, Reg. S 4.95% 07/29/2035 PAN USD 617,147 1.36
230,000,000 Development Bank of Kazakhstan JSC, Reg. S 8.95% 05/04/2023 KAZ KZT 535,876 1.18450,000 Bank Mandiri Persero Tbk. PT, Reg. S 4.75% 05/13/2025 IDN USD 497,480 1.10400,000 Indonesia Asahan Aluminium Persero PT, Reg. S 5.45% 05/15/2030 IDN USD 461,018 1.01397,858 Lima Metro Line 2 Finance Ltd., Reg. S 5.875% 07/05/2034 PER USD 456,345 1.01400,000 Petronas Capital Ltd., Reg. S 3.5% 04/21/2030 MYS USD 432,186 0.95
200,000Empresa de Transporte de Pasajeros Metro SA, Reg. S 3.65% 05/07/2030 CHL USD 215,298 0.47
8,581,680 18.89Sovereign
411,679 SPARC EM SPC Panama Metro Line 2 SP, Reg. S 0% 12/05/2022 PAN USD 402,935 0.89224,715 Peru Enhanced Pass-Through Finance Ltd., Reg. S 0% 06/02/2025 PER USD 215,165 0.47
618,100 1.36Supranational
17,410,000,000 Inter-American Development Bank 7.875% 03/14/2023 SP IDR 1,267,441 2.79
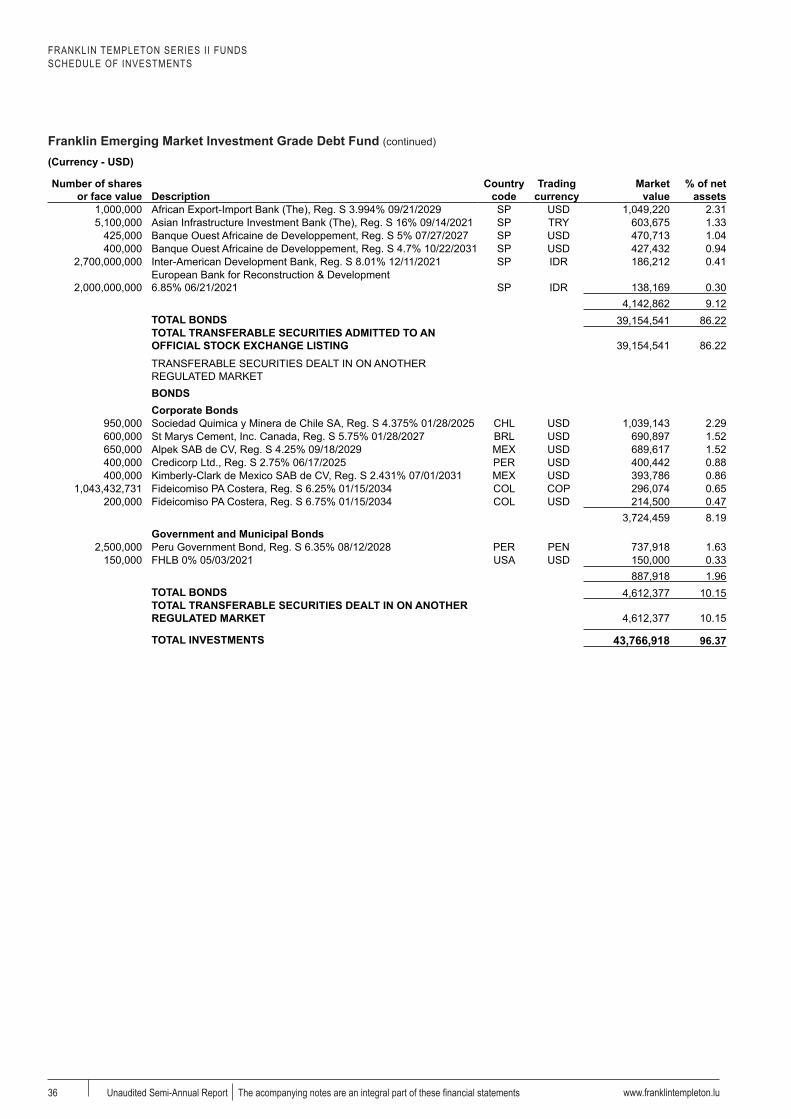
FRANKLIN TEMPLETON SERIES II FUNDSSCHEDULE OF INVESTMENTS
Franklin Emerging Market Investment Grade Debt Fund (continued)
www.franklintempleton.lu36 Unaudited Semi-Annual Report The acompanying notes are an integral part of these financial statements
(Currency - USD)
Number of shares or face value Description
Country code
Trading currency
Market value
% of net assets
1,000,000 African Export-Import Bank (The), Reg. S 3.994% 09/21/2029 SP USD 1,049,220 2.315,100,000 Asian Infrastructure Investment Bank (The), Reg. S 16% 09/14/2021 SP TRY 603,675 1.33
425,000 Banque Ouest Africaine de Developpement, Reg. S 5% 07/27/2027 SP USD 470,713 1.04400,000 Banque Ouest Africaine de Developpement, Reg. S 4.7% 10/22/2031 SP USD 427,432 0.94
2,700,000,000 Inter-American Development Bank, Reg. S 8.01% 12/11/2021 SP IDR 186,212 0.41
2,000,000,000European Bank for Reconstruction & Development 6.85% 06/21/2021 SP IDR 138,169 0.30
4,142,862 9.12TOTAL BONDS 39,154,541 86.22TOTAL TRANSFERABLE SECURITIES ADMITTED TO AN OFFICIAL STOCK EXCHANGE LISTING 39,154,541 86.22TRANSFERABLE SECURITIES DEALT IN ON ANOTHER REGULATED MARKETBONDSCorporate Bonds
950,000 Sociedad Quimica y Minera de Chile SA, Reg. S 4.375% 01/28/2025 CHL USD 1,039,143 2.29600,000 St Marys Cement, Inc. Canada, Reg. S 5.75% 01/28/2027 BRL USD 690,897 1.52650,000 Alpek SAB de CV, Reg. S 4.25% 09/18/2029 MEX USD 689,617 1.52400,000 Credicorp Ltd., Reg. S 2.75% 06/17/2025 PER USD 400,442 0.88400,000 Kimberly-Clark de Mexico SAB de CV, Reg. S 2.431% 07/01/2031 MEX USD 393,786 0.86
1,043,432,731 Fideicomiso PA Costera, Reg. S 6.25% 01/15/2034 COL COP 296,074 0.65200,000 Fideicomiso PA Costera, Reg. S 6.75% 01/15/2034 COL USD 214,500 0.47
3,724,459 8.19Government and Municipal Bonds
2,500,000 Peru Government Bond, Reg. S 6.35% 08/12/2028 PER PEN 737,918 1.63150,000 FHLB 0% 05/03/2021 USA USD 150,000 0.33
887,918 1.96TOTAL BONDS 4,612,377 10.15TOTAL TRANSFERABLE SECURITIES DEALT IN ON ANOTHER REGULATED MARKET 4,612,377 10.15
TOTAL INVESTMENTS 43,766,918 96.37
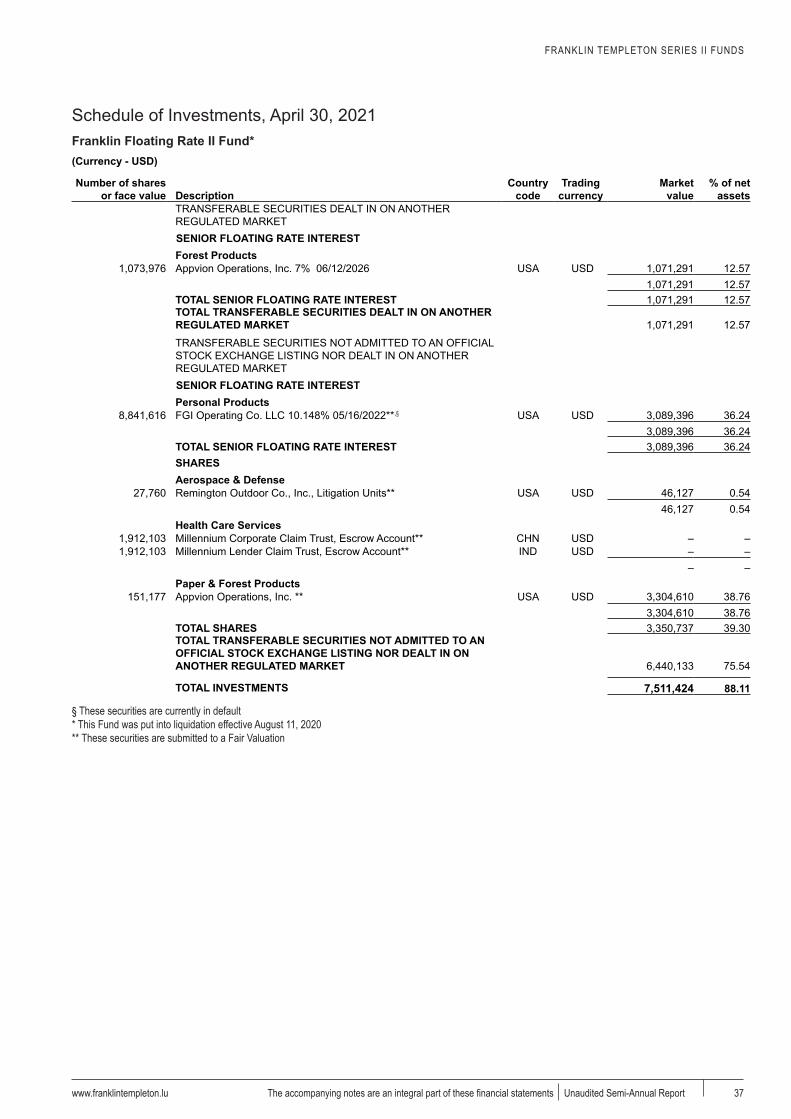
FRANKLIN TEMPLETON SERIES II FUNDS
Schedule of Investments, April 30, 2021Franklin Floating Rate II Fund*
www.franklintempleton.lu 37The accompanying notes are an integral part of these financial statements Unaudited Semi-Annual Report
(Currency - USD)
Number of shares or face value Description
Country code
Trading currency
Market value
% of net assets
TRANSFERABLE SECURITIES DEALT IN ON ANOTHER REGULATED MARKET
SENIOR FLOATING RATE INTERESTForest Products
1,073,976 Appvion Operations, Inc. 7% 06/12/2026 USA USD 1,071,291 12.571,071,291 12.57
TOTAL SENIOR FLOATING RATE INTEREST 1,071,291 12.57TOTAL TRANSFERABLE SECURITIES DEALT IN ON ANOTHER REGULATED MARKET 1,071,291 12.57TRANSFERABLE SECURITIES NOT ADMITTED TO AN OFFICIAL STOCK EXCHANGE LISTING NOR DEALT IN ON ANOTHER REGULATED MARKET
SENIOR FLOATING RATE INTERESTPersonal Products
8,841,616 FGI Operating Co. LLC 10.148% 05/16/2022**,§ USA USD 3,089,396 36.243,089,396 36.24
TOTAL SENIOR FLOATING RATE INTEREST 3,089,396 36.24SHARESAerospace & Defense
27,760 Remington Outdoor Co., Inc., Litigation Units** USA USD 46,127 0.5446,127 0.54
Health Care Services1,912,103 Millennium Corporate Claim Trust, Escrow Account** CHN USD – –1,912,103 Millennium Lender Claim Trust, Escrow Account** IND USD – –
– –Paper & Forest Products
151,177 Appvion Operations, Inc. ** USA USD 3,304,610 38.763,304,610 38.76
TOTAL SHARES 3,350,737 39.30TOTAL TRANSFERABLE SECURITIES NOT ADMITTED TO AN OFFICIAL STOCK EXCHANGE LISTING NOR DEALT IN ON ANOTHER REGULATED MARKET 6,440,133 75.54
TOTAL INVESTMENTS 7,511,424 88.11
§ These securities are currently in default* This Fund was put into liquidation effective August 11, 2020** These securities are submitted to a Fair Valuation

FRANKLIN TEMPLETON SERIES II FUNDS
Schedule of Investments, April 30, 2021Franklin Multi-Sector Credit Income Fund
www.franklintempleton.lu38 Unaudited Semi-Annual Report The acompanying notes are an integral part of these financial statements
(Currency - USD)
Number of shares or face value Description
Country code
Trading currency
Market value
% of net assets
TRANSFERABLE SECURITIES ADMITTED TO AN OFFICIAL STOCK EXCHANGE LISTINGSHARESSpecialty Retail
2,215 Party City Holdco, Inc. USA USD 15,504 0.0915,504 0.09
TOTAL SHARES 15,504 0.09BONDSCorporate Bonds
200,000 Cencosud SA, Reg. S 4.375% 07/17/2027 CHL USD 222,432 1.30200,000 State Grid Overseas Investment 2016 Ltd., Reg. S 3.5% 05/04/2027 CHN USD 220,493 1.29200,000 China Construction Bank Corp., Reg. S, FRN 4.25% 02/27/2029 CHN USD 214,676 1.26200,000 ICTSI Treasury BV, Reg. S 4.625% 01/16/2023 PHL USD 212,100 1.24200,000 Vertical US Newco, Inc., 144A 5.25% 07/15/2027 DEU USD 209,626 1.23200,000 Akbank TAS, Reg. S, FRN 6.797% 04/27/2028 TUR USD 198,946 1.17100,000 Netflix, Inc. 3.625% 05/15/2027 USA EUR 139,170 0.82100,000 Occidental Petroleum Corp. 8.875% 07/15/2030 USA USD 128,625 0.75100,000 OneMain Finance Corp. 6.625% 01/15/2028 USA USD 113,968 0.67
100,000Teva Pharmaceutical Finance Netherlands IV BV, Reg. S 0.5% 07/28/2022 ISR CHF 108,430 0.64
100,000 Wynn Macau Ltd., 144A 5.625% 08/26/2028 MAC USD 105,376 0.62100,000 MPT Operating Partnership LP, REIT 5% 10/15/2027 USA USD 105,375 0.62100,000 Commercial Metals Co. 3.875% 02/15/2031 USA USD 100,137 0.59
2,079,354 12.20Government and Municipal Bonds
200,000 Electricite de France SA, 144A, FRN 5.25% Perpetual FRA USD 209,574 1.23209,574 1.23
Quasi-Sovereign Bonds200,000 Indonesia Asahan Aluminium Persero PT, Reg. S 5.45% 05/15/2030 IDN USD 230,509 1.35
200,000Development Bank of the Republic of Belarus JSC, Reg. S 6.75% 05/02/2024 BLR USD 196,200 1.15
426,709 2.50Supranational
200,000 Banque Ouest Africaine de Developpement, Reg. S 5% 07/27/2027 SP USD 221,512 1.30200,000 African Export-Import Bank (The), Reg. S 4.125% 06/20/2024 SP USD 212,504 1.25
434,016 2.55TOTAL BONDS 3,149,653 18.48TOTAL TRANSFERABLE SECURITIES ADMITTED TO AN OFFICIAL STOCK EXCHANGE LISTING 3,165,157 18.57TRANSFERABLE SECURITIES DEALT IN ON ANOTHER REGULATED MARKET
SENIOR FLOATING RATE INTERESTApparel, Accessories & Luxury Goods
18,982 Champ Acquisition Corp. 5.757% 12/19/2025 USA USD 18,984 0.1118,984 0.11
Application Software12,964 Barracuda Networks, Inc. 4.5% 02/12/2025 USA USD 12,969 0.08
12,969 0.08Automotive Retail
52,530 Wand NewCo 3, Inc. 3.113% 02/05/2026 USA USD 51,902 0.3051,902 0.30
Broadcasting48,974 Univision Communications, Inc. 4.75% 03/15/2026 USA USD 49,133 0.29
49,133 0.29Cable & Satellite
6,738 Radiate Holdco LLC 4.25% 09/25/2026 USA USD 6,753 0.046,753 0.04
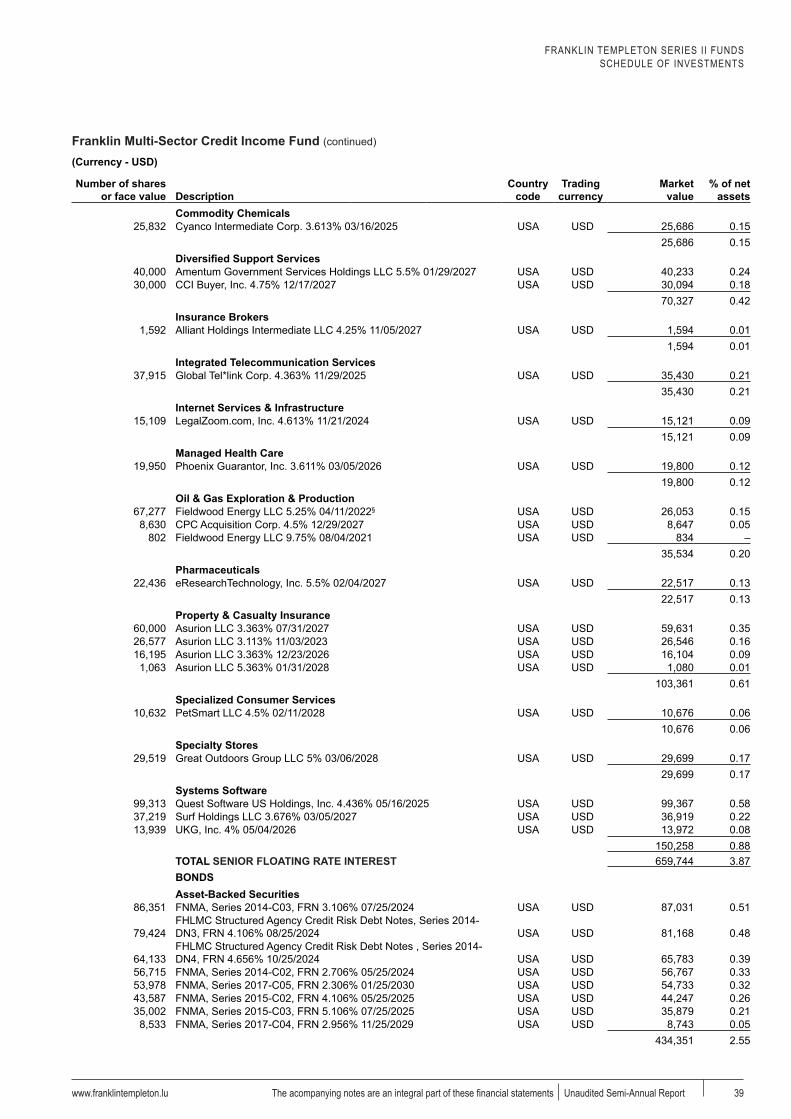
FRANKLIN TEMPLETON SERIES II FUNDSSCHEDULE OF INVESTMENTS
Franklin Multi-Sector Credit Income Fund (continued)
www.franklintempleton.lu 39The acompanying notes are an integral part of these financial statements Unaudited Semi-Annual Report
(Currency - USD)
Number of shares or face value Description
Country code
Trading currency
Market value
% of net assets
Commodity Chemicals25,832 Cyanco Intermediate Corp. 3.613% 03/16/2025 USA USD 25,686 0.15
25,686 0.15Diversified Support Services
40,000 Amentum Government Services Holdings LLC 5.5% 01/29/2027 USA USD 40,233 0.2430,000 CCI Buyer, Inc. 4.75% 12/17/2027 USA USD 30,094 0.18
70,327 0.42Insurance Brokers
1,592 Alliant Holdings Intermediate LLC 4.25% 11/05/2027 USA USD 1,594 0.011,594 0.01
Integrated Telecommunication Services37,915 Global Tel*link Corp. 4.363% 11/29/2025 USA USD 35,430 0.21
35,430 0.21Internet Services & Infrastructure
15,109 LegalZoom.com, Inc. 4.613% 11/21/2024 USA USD 15,121 0.0915,121 0.09
Managed Health Care19,950 Phoenix Guarantor, Inc. 3.611% 03/05/2026 USA USD 19,800 0.12
19,800 0.12Oil & Gas Exploration & Production
67,277 Fieldwood Energy LLC 5.25% 04/11/2022§ USA USD 26,053 0.158,630 CPC Acquisition Corp. 4.5% 12/29/2027 USA USD 8,647 0.05
802 Fieldwood Energy LLC 9.75% 08/04/2021 USA USD 834 –35,534 0.20
Pharmaceuticals22,436 eResearchTechnology, Inc. 5.5% 02/04/2027 USA USD 22,517 0.13
22,517 0.13Property & Casualty Insurance
60,000 Asurion LLC 3.363% 07/31/2027 USA USD 59,631 0.3526,577 Asurion LLC 3.113% 11/03/2023 USA USD 26,546 0.1616,195 Asurion LLC 3.363% 12/23/2026 USA USD 16,104 0.09
1,063 Asurion LLC 5.363% 01/31/2028 USA USD 1,080 0.01103,361 0.61
Specialized Consumer Services10,632 PetSmart LLC 4.5% 02/11/2028 USA USD 10,676 0.06
10,676 0.06Specialty Stores
29,519 Great Outdoors Group LLC 5% 03/06/2028 USA USD 29,699 0.1729,699 0.17
Systems Software99,313 Quest Software US Holdings, Inc. 4.436% 05/16/2025 USA USD 99,367 0.5837,219 Surf Holdings LLC 3.676% 03/05/2027 USA USD 36,919 0.2213,939 UKG, Inc. 4% 05/04/2026 USA USD 13,972 0.08
150,258 0.88TOTAL SENIOR FLOATING RATE INTEREST 659,744 3.87BONDSAsset-Backed Securities
86,351 FNMA, Series 2014-C03, FRN 3.106% 07/25/2024 USA USD 87,031 0.51
79,424FHLMC Structured Agency Credit Risk Debt Notes, Series 2014-DN3, FRN 4.106% 08/25/2024 USA USD 81,168 0.48
64,133FHLMC Structured Agency Credit Risk Debt Notes , Series 2014-DN4, FRN 4.656% 10/25/2024 USA USD 65,783 0.39
56,715 FNMA, Series 2014-C02, FRN 2.706% 05/25/2024 USA USD 56,767 0.3353,978 FNMA, Series 2017-C05, FRN 2.306% 01/25/2030 USA USD 54,733 0.3243,587 FNMA, Series 2015-C02, FRN 4.106% 05/25/2025 USA USD 44,247 0.2635,002 FNMA, Series 2015-C03, FRN 5.106% 07/25/2025 USA USD 35,879 0.21
8,533 FNMA, Series 2017-C04, FRN 2.956% 11/25/2029 USA USD 8,743 0.05434,351 2.55
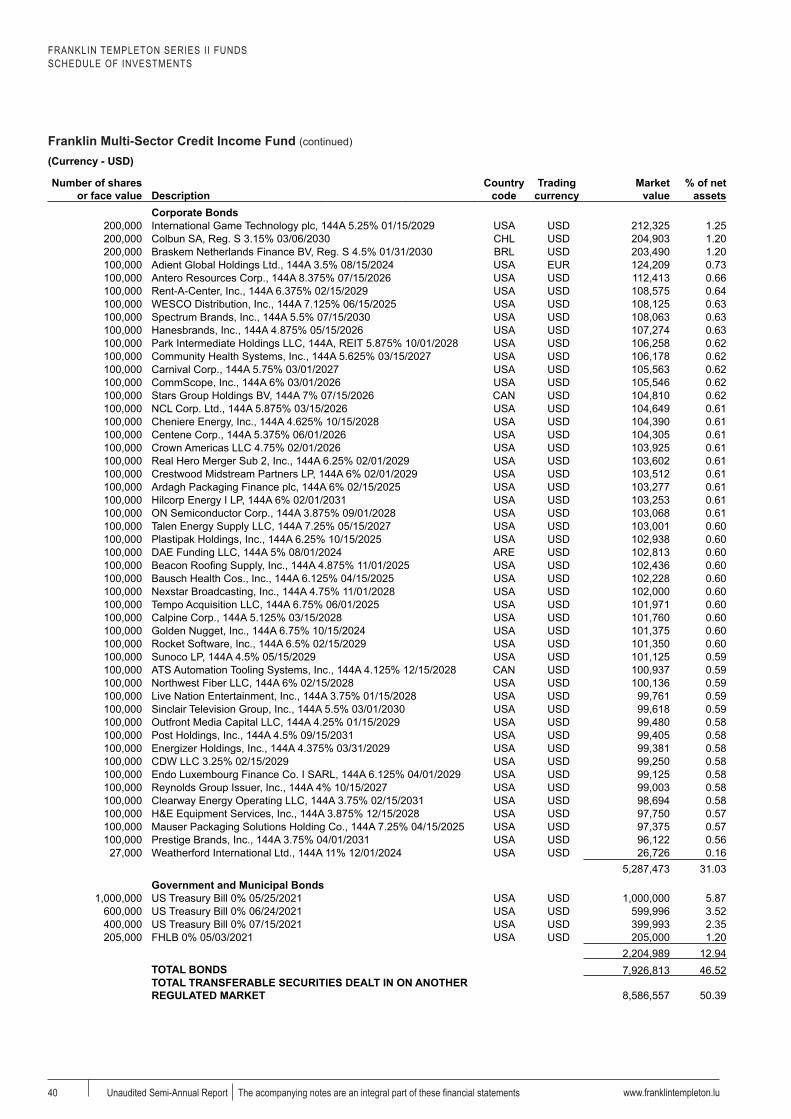
FRANKLIN TEMPLETON SERIES II FUNDSSCHEDULE OF INVESTMENTS
Franklin Multi-Sector Credit Income Fund (continued)
www.franklintempleton.lu40 Unaudited Semi-Annual Report The acompanying notes are an integral part of these financial statements
(Currency - USD)
Number of shares or face value Description
Country code
Trading currency
Market value
% of net assets
Corporate Bonds200,000 International Game Technology plc, 144A 5.25% 01/15/2029 USA USD 212,325 1.25200,000 Colbun SA, Reg. S 3.15% 03/06/2030 CHL USD 204,903 1.20200,000 Braskem Netherlands Finance BV, Reg. S 4.5% 01/31/2030 BRL USD 203,490 1.20100,000 Adient Global Holdings Ltd., 144A 3.5% 08/15/2024 USA EUR 124,209 0.73100,000 Antero Resources Corp., 144A 8.375% 07/15/2026 USA USD 112,413 0.66100,000 Rent-A-Center, Inc., 144A 6.375% 02/15/2029 USA USD 108,575 0.64100,000 WESCO Distribution, Inc., 144A 7.125% 06/15/2025 USA USD 108,125 0.63100,000 Spectrum Brands, Inc., 144A 5.5% 07/15/2030 USA USD 108,063 0.63100,000 Hanesbrands, Inc., 144A 4.875% 05/15/2026 USA USD 107,274 0.63100,000 Park Intermediate Holdings LLC, 144A, REIT 5.875% 10/01/2028 USA USD 106,258 0.62100,000 Community Health Systems, Inc., 144A 5.625% 03/15/2027 USA USD 106,178 0.62100,000 Carnival Corp., 144A 5.75% 03/01/2027 USA USD 105,563 0.62100,000 CommScope, Inc., 144A 6% 03/01/2026 USA USD 105,546 0.62100,000 Stars Group Holdings BV, 144A 7% 07/15/2026 CAN USD 104,810 0.62100,000 NCL Corp. Ltd., 144A 5.875% 03/15/2026 USA USD 104,649 0.61100,000 Cheniere Energy, Inc., 144A 4.625% 10/15/2028 USA USD 104,390 0.61100,000 Centene Corp., 144A 5.375% 06/01/2026 USA USD 104,305 0.61100,000 Crown Americas LLC 4.75% 02/01/2026 USA USD 103,925 0.61100,000 Real Hero Merger Sub 2, Inc., 144A 6.25% 02/01/2029 USA USD 103,602 0.61100,000 Crestwood Midstream Partners LP, 144A 6% 02/01/2029 USA USD 103,512 0.61100,000 Ardagh Packaging Finance plc, 144A 6% 02/15/2025 USA USD 103,277 0.61100,000 Hilcorp Energy I LP, 144A 6% 02/01/2031 USA USD 103,253 0.61100,000 ON Semiconductor Corp., 144A 3.875% 09/01/2028 USA USD 103,068 0.61100,000 Talen Energy Supply LLC, 144A 7.25% 05/15/2027 USA USD 103,001 0.60100,000 Plastipak Holdings, Inc., 144A 6.25% 10/15/2025 USA USD 102,938 0.60100,000 DAE Funding LLC, 144A 5% 08/01/2024 ARE USD 102,813 0.60100,000 Beacon Roofing Supply, Inc., 144A 4.875% 11/01/2025 USA USD 102,436 0.60100,000 Bausch Health Cos., Inc., 144A 6.125% 04/15/2025 USA USD 102,228 0.60100,000 Nexstar Broadcasting, Inc., 144A 4.75% 11/01/2028 USA USD 102,000 0.60100,000 Tempo Acquisition LLC, 144A 6.75% 06/01/2025 USA USD 101,971 0.60100,000 Calpine Corp., 144A 5.125% 03/15/2028 USA USD 101,760 0.60100,000 Golden Nugget, Inc., 144A 6.75% 10/15/2024 USA USD 101,375 0.60100,000 Rocket Software, Inc., 144A 6.5% 02/15/2029 USA USD 101,350 0.60100,000 Sunoco LP, 144A 4.5% 05/15/2029 USA USD 101,125 0.59100,000 ATS Automation Tooling Systems, Inc., 144A 4.125% 12/15/2028 CAN USD 100,937 0.59100,000 Northwest Fiber LLC, 144A 6% 02/15/2028 USA USD 100,136 0.59100,000 Live Nation Entertainment, Inc., 144A 3.75% 01/15/2028 USA USD 99,761 0.59100,000 Sinclair Television Group, Inc., 144A 5.5% 03/01/2030 USA USD 99,618 0.59100,000 Outfront Media Capital LLC, 144A 4.25% 01/15/2029 USA USD 99,480 0.58100,000 Post Holdings, Inc., 144A 4.5% 09/15/2031 USA USD 99,405 0.58100,000 Energizer Holdings, Inc., 144A 4.375% 03/31/2029 USA USD 99,381 0.58100,000 CDW LLC 3.25% 02/15/2029 USA USD 99,250 0.58100,000 Endo Luxembourg Finance Co. I SARL, 144A 6.125% 04/01/2029 USA USD 99,125 0.58100,000 Reynolds Group Issuer, Inc., 144A 4% 10/15/2027 USA USD 99,003 0.58100,000 Clearway Energy Operating LLC, 144A 3.75% 02/15/2031 USA USD 98,694 0.58100,000 H&E Equipment Services, Inc., 144A 3.875% 12/15/2028 USA USD 97,750 0.57100,000 Mauser Packaging Solutions Holding Co., 144A 7.25% 04/15/2025 USA USD 97,375 0.57100,000 Prestige Brands, Inc., 144A 3.75% 04/01/2031 USA USD 96,122 0.56
27,000 Weatherford International Ltd., 144A 11% 12/01/2024 USA USD 26,726 0.165,287,473 31.03
Government and Municipal Bonds1,000,000 US Treasury Bill 0% 05/25/2021 USA USD 1,000,000 5.87
600,000 US Treasury Bill 0% 06/24/2021 USA USD 599,996 3.52400,000 US Treasury Bill 0% 07/15/2021 USA USD 399,993 2.35205,000 FHLB 0% 05/03/2021 USA USD 205,000 1.20
2,204,989 12.94TOTAL BONDS 7,926,813 46.52TOTAL TRANSFERABLE SECURITIES DEALT IN ON ANOTHER REGULATED MARKET 8,586,557 50.39

FRANKLIN TEMPLETON SERIES II FUNDSSCHEDULE OF INVESTMENTS
Franklin Multi-Sector Credit Income Fund (continued)
www.franklintempleton.lu 41The acompanying notes are an integral part of these financial statements Unaudited Semi-Annual Report
(Currency - USD)
Number of shares or face value Description
Country code
Trading currency
Market value
% of net assets
TRANSFERABLE SECURITIES NOT ADMITTED TO AN OFFICIAL STOCK EXCHANGE LISTING NOR DEALT IN ON ANOTHER REGULATED MARKETSHARESAerospace & Defense
911 Remington Outdoor Co., Inc., Litigation Units** USA USD 1,514 0.011,514 0.01
TOTAL SHARES 1,514 0.01TOTAL TRANSFERABLE SECURITIES NOT ADMITTED TO AN OFFICIAL STOCK EXCHANGE LISTING NOR DEALT IN ON ANOTHER REGULATED MARKET 1,514 0.01UNITS OF AUTHORISED UCITS OR OTHER COLLECTIVE INVESTMENT UNDERTAKINGSCOLLECTIVE INVESTMENT SCHEMES - UCITSDiversified Financial Services
76,278 FTIF Franklin Emerging Market Corporate Debt Fund - Y (Acc) USD LUX USD 860,755 5.05860,755 5.05
TOTAL COLLECTIVE INVESTMENT SCHEMES - UCITS 860,755 5.05EXCHANGE TRADED FUNDSDiversified Financial Services
24,500 Invesco Senior Loan ETF USA USD 542,675 3.19542,675 3.19
TOTAL EXCHANGE TRADED FUNDS 542,675 3.19TOTAL UNITS OF AUTHORISED UCITS OR OTHER COLLECTIVE INVESTMENT UNDERTAKINGS 1,403,430 8.24
TOTAL INVESTMENTS 13,156,658 77.21§ These securities are currently in default** These securities are submitted to a Fair Valuation
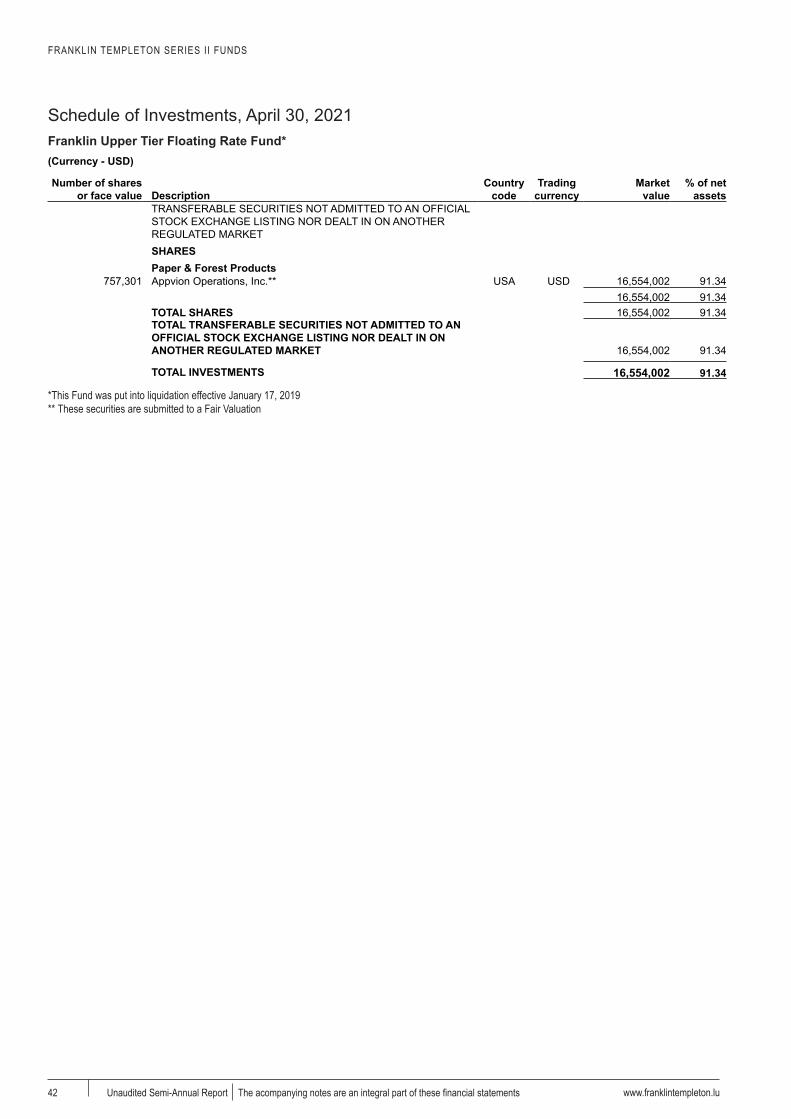
FRANKLIN TEMPLETON SERIES II FUNDS
Schedule of Investments, April 30, 2021Franklin Upper Tier Floating Rate Fund*
www.franklintempleton.lu42 Unaudited Semi-Annual Report The acompanying notes are an integral part of these financial statements
(Currency - USD)
Number of shares or face value Description
Country code
Trading currency
Market value
% of net assets
TRANSFERABLE SECURITIES NOT ADMITTED TO AN OFFICIAL STOCK EXCHANGE LISTING NOR DEALT IN ON ANOTHER REGULATED MARKETSHARESPaper & Forest Products
757,301 Appvion Operations, Inc.** USA USD 16,554,002 91.3416,554,002 91.34
TOTAL SHARES 16,554,002 91.34TOTAL TRANSFERABLE SECURITIES NOT ADMITTED TO AN OFFICIAL STOCK EXCHANGE LISTING NOR DEALT IN ON ANOTHER REGULATED MARKET 16,554,002 91.34
TOTAL INVESTMENTS 16,554,002 91.34
*This Fund was put into liquidation effective January 17, 2019** These securities are submitted to a Fair Valuation

FRANKLIN TEMPLETON SERIES II FUNDS
www.franklintempleton.lu Unaudited Semi-Annual Report 43
Additional Information
Securities Financing Transactions (SFTs) and Total Return Swaps (TRS)
The Company does not engage in Securities Financing Transactions (as defined in Article 3 of Regulation (EU) 2015/2365, securities financing transactions include repurchase transactions, securities or commodities lending and securities or commodities borrowing, buy-sell back transactions or sell-buy back transactions and margin lending transactions) but it had exposure in total return swap contracts during the period. Information on total return swaps are detailed below.
Global data
TotalGross Volume of TRS in
Fund Fund Currency TRS1 % of net assetsFranklin Multi-Sector Credit Income Fund USD 1,115 0.01
(1)absolute value of the unrealised gains/(losses)
Concentration data
Total return swaps, ten largest counterparties
Gross Volume ofTRS1
Fund Fund Currency Counterparties in Fund currencyFranklin Multi-Sector Credit Income Fund USD Morgan Stanley 1,115
(1)absolute value of the unrealised gains/(losses)
When less than 10 counterparties are disclosed, less than 10 counterparties are available.
Total return swaps, maturity tenor and country of incorporation
FundCountry of incorporation
Gross Volume of TRS1
Fund Currency Maturity of the Counterparty in Fund currencyFranklin Multi-Sector Credit Income Fund USD 1 to 3 months United States of America 755Franklin Multi-Sector Credit Income Fund USD 3 to 12 months United States of America 360
(1)absolute value of the unrealised gains/(losses)
Funds engaged in total return swap contracts utilise bi-lateral settlement and clearing with their respective counterparty.
Data on reuse of collateral
There was no collateral reuse during the period ended April 30, 2021. There was no cash collateral reinvestment during the period ended April 30, 2021.
Safekeeping of collateral
There was no collateral granted and received during the period ended April 30, 2021.
Data on return
The return from total return swap contracts is accrued to the Funds.
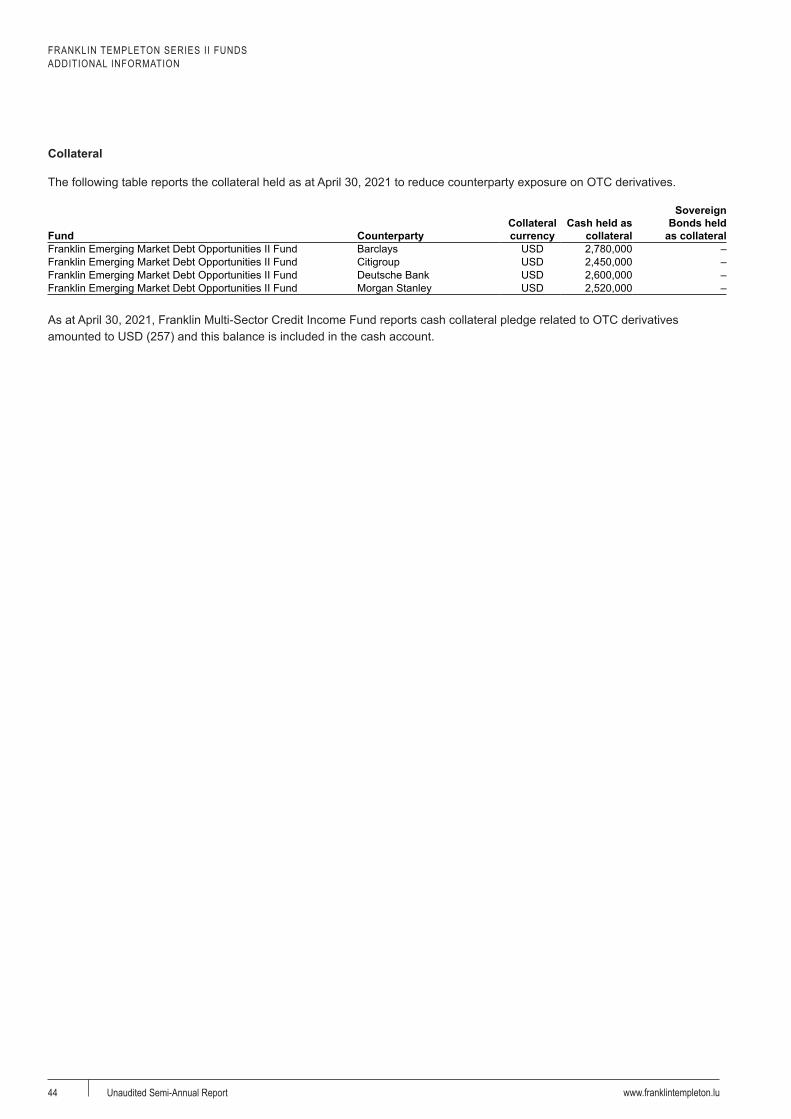
FRANKLIN TEMPLETON SERIES II FUNDSADDITIONAL INFORMATION
www.franklintempleton.luUnaudited Semi-Annual Report44
Collateral
The following table reports the collateral held as at April 30, 2021 to reduce counterparty exposure on OTC derivatives.
Fund CounterpartyCollateral currency
Cash held as collateral
Sovereign Bonds held
as collateralFranklin Emerging Market Debt Opportunities II Fund Barclays USD 2,780,000 –Franklin Emerging Market Debt Opportunities II Fund Citigroup USD 2,450,000 –Franklin Emerging Market Debt Opportunities II Fund Deutsche Bank USD 2,600,000 –Franklin Emerging Market Debt Opportunities II Fund Morgan Stanley USD 2,520,000 –
As at April 30, 2021, Franklin Multi-Sector Credit Income Fund reports cash collateral pledge related to OTC derivatives amounted to USD (257) and this balance is included in the cash account.
FRANKLIN TEMPLETON SERIES II FUNDS
www.franklintempleton.lu Unaudited Semi-Annual Report 45
Franklin Templeton Office Directory
Further information regarding Franklin Templeton Series II Funds is available from the following Franklin Templeton office:
EUROPE
LuxembourgFranklin Templeton International Services S.à r.l.8A, rue Albert Borschette, L-1246 LuxembourgB.P. 169, L-2011 LuxembourgGrand Duchy of LuxembourgTel: +352 46 66 67 212 Fax: +352 46 66 76www.franklintempleton.lu
Please note that the website mentioned above is directed at residents within the country stated on this website. (Please refer to the website disclaimers).
FRANKLIN TEMPLETON SERIES II FUNDS
www.franklintempleton.luUnaudited Semi-Annual Report46
INFORMATION FOR QUALIFIED INVESTORS IN SWITZERLAND
1. Representative
The representative in Switzerland is
Franklin Templeton Switzerland LtdStockerstrasse 388002 ZurichSwitzerland
2. Paying Agent
The paying agent in Switzerland is
NPB Neue Privat Bank AGLimmatquai 1 / am BellevuePostfach8022 Zürich
List of Funds represented in Switzerland
• Franklin Emerging Market Debt Opportunities II Fund• Franklin Emerging Market Investment Grade Debt Fund
3. Place where the relevant documents may be obtained
The Prospectus, the Articles of Association as well as the annual and semi-annual reports may be obtained free of charge from the representative in Switzerland.
4. Payment of fees and expenses to the Paying Agent
The fees and expenses of the Paying Agent will be at normal commercial rates.
5. Place of performance and jurisdiction
In respect of the units distributed in and from Switzerland, the place of performance and jurisdiction is at the registered office of the representative.

Franklin Templeton International Services S.à r.l.8A, rue Albert BorschetteL-1246 LuxembourgGrand Duchy of LuxembourgTel: +352 (46) 66-67-212Fax: +352 (46) 66-76