Franklin - Fundsquare
259
Franklin , . ., . . .. . . . Unaudited Semi-Annual Report December 3 1, 2006 FRANKLIN TEMPLETON INVESTMENTS
-
Upload
khangminh22 -
Category
Documents
-
view
0 -
download
0
Transcript of Franklin - Fundsquare
Frankl in
, . .,
. . . . . . .
Unaudited Semi-Annual Report
December 3 1, 2006
FRANKLIN TEMPLETON INVESTMENTS
FRANKLIN TEMPLETON INVESTMENT FUNDS societe d‘investissement a capital variable
U N A U D I T E D S E M I - A N N U A L R E P O R T FOR T H E S I X M O N T H S E N D E D D E C E M B E R 31, 2006
This report shall not constitute an offer or a solicitation of an offer to buy shares of Franklin Templeton Investment Funds (the “Company”). Subscriptions are to he made 011 the basis of the current simplified prospectus accompanied by the current full prospectus and its addendum, a copy of the latest available audited report and, if puhlished thereafter, the latest unaudited semi- annual report. 1-his report is an abridged version of h e report of the Company which is available free oC charge upon request at the registered office of the Company, at Franklin Tenipleton Investmcnts’ local offices or dist tihutors as stated in the current prospectus.
FRANKLIN TEMPLETON INVESTMENT FUNDS
CONTENTS
General Information Report of the liivestment Managers Fund Performance Spatement of Net Assets Statistical Inform at ion Statement of Operations and Changes in Net Assets Notes to the Financial Statements Franklin Templeton Investments Office Directory
3 5 6 8
18 26 36 52
2
FRANKLIN TEMPLETON INVESTMENT FUNDS socittk d’irirrcstissement i capital variable
26, boulevard Royal, L-2440 1 .r~xemhourg, Grand-Lhchy of 1.uxembourg (Kegisrered with thc rcgistrc (ic ~ ~ m i i i e r c e ct dcs socil.tl.5. I uxctnlmurg, uiadcr i iunihrr H 3.5 177)
GENERAL INFORMATION
BOARD OF DIRECTORS Chairman Thc Hunurubk Xi(.hola F. Brddy Chairman and Chief Executive Ohccr
l h North Uashingron Srlcet Easron, MD 21 601, 1 J . U
Directors Richard !I Frank
CHOFTAVK PARINkKS. IKC.
/lis Gratr rhc Dukt, ,$ Abcrcum, ]ani(.> Ilumil[on KG Chainnan ABEKCORN EST.4TES Rarons Court. Ken-toanstewart Omagh K178 4EZ, Korthern Ireland. 1J.K.
Murk C; Hdowrsko Prcsidcnt TEMPLE ION C.APIT.41. hD\;ISOB LlhllTtL> F . 0 Box N-7759, Wesr Hay Sireer. I.yfol-d Cay, N, <iss<iu, .. Raharnas
Jum~s J. K. Hur~g President and Chief I :SCCU~I \~ Officer ASIA SECI:RITIES (;LC>B..\L L1hlITtL~ 18 Harcourt Road. Koorn 2401, T~7n-e~ 1. Admiralty Center Hong Kong
Grqon. F. Johnson (:hicf Executive Ofiicei- FIUNKLIK RESOURCES. 1SC. One Franklin Parkwsy Sat1 Mareo. CA Y4+03-1YO6. I
Gcqtfrcj .4. Lunglad Managing Partner MNGMNLlS COKSLII.TORIA I.rd Avenida das i\niencas 500
Rio de Janeiro CEP 22630-010, Drazil
I hc 11iqhf Ibcrcnd Mlrhutd A hfunn K.C V . 0 The thtage, Lower End Farm, Easunglun Korthleach GL5.t 31:N. Englantl. L1 K.
Hloco 6, 51Ia 227 (Po*mlown)
500 Lasr Rrowrd Roulewrd. Suite 2 100 Fort I~udcrdale, FL 3 33Yt-3OY I , u S.A
Dt I B. Afark Mobius Dirfctor Ementus TE\IPLFTON ASSET MANAGEMENT LIMITED 7 Teinasek Boule\-ard, A 38-03 5untt.c .lower Orit Singapore 03R9R7
David E. Smart Dirccror and Chid E X ~ ~ U ~ I \ F Ofliccr FEWKLIK TEMPLETOS IIiVESTMENT \L4?iL4GEMEU LI\llTr”D .Ihc Adelphi Building. 1-11 lohn Adatn Sireer [.ondon \\‘C2S 6HT. England. I:.K
I h c Honourtibk Ircvx G. Trejgame Chairrnari G.4RRO SE(:URITIEL LIMITED Unir 6 PQro Place, 72-73 SI Dlonis Road London FW64TU, England, U.K.
CONDUCTING OFFICERS: U5111um Luckwuod 26. boule\nrd Royal. 1.-2449 Luxcmhourg Grand-Duchy of Luxemboui-g
Llcniw Vuss 26. boule\.ard Royal, 1-2439 I.ure~nbourg (;rand-Duchy of Luxeinhourg
REGISTERED OFFICE: 26. lmulevard Royal. IL2449 1.uxeinhourg Grand-Duchy ot Luxembourg
PRINCIPAL DISTRIBUTOR :
P.O. Box N-77.59. W’csr Uay StrecL, 1.ylord Cay. Nassau. Rahamas TEMPI-ETOI’; GLORAL ADVISORS LIMITED
INVESTMENT MANAGERS: As LO. I’crripleioii Furoland Fund:
Templeton European Fund ; Teniplewri Luropean Total Return Fund’ ; Tetrlpleron C;lohal (Euro) Fund; Tcrnplctoii &bal 1Val;inced Fund’ ; Templeton Glubal Eqult) Income Fund; ~leniplcion Global Income Fund*: and I ernpleuoii Glnhal Smaller Conipanits Fund
FRWKLIS ~ItMI’LCTOK IN\,TSTMEKT bMNAGE.ZIENT 1 .IMITED 5 Morrison Srrcct Edinburgh EH3 8BH. Scurhrrtl I.! K
‘Franklin Tcinplcton Investment M;inagenient Limited has been appoirited as Lo-InvestmcnL Managr of tlns Fund, together wirh Franklin Advisers. Inc.
ifranklin Tcmple~vri In\esrment hlauagenaent Limited has been appointed as Invc>mlcnr Manager 111 respect of the equity portion of the assets of the Ternpleton Glohal Balanced Fund and oI the TFiliplCtOn (;loha1 Income Fund.
‘2s to: Teinplctun , 4 im Grw.rh Fund: Tmmpleton ERIC Fund: TempGtun Chiria Tund ; Templeton Eastem Europe 1:urid , Templerun Emerging Markerj Fund : Tcrnpleton Japan Fund, Templeton Kort;i rund : Teinplt~on Latin Amenca Fund, and 1-cmplt.tun ’ l ‘hailarld Fund.
TE\IFLETOli ASSET hL4NAGEMENT ILTD 7 .Iemasek Boulewd f 38-03 Sunkc Twwr Onc Singapore 038987
:\s to Franklin Agrcssivc Growrh Fund: Fr;inklin Asian Flex Cap Fund; Fmnklin Uiorcchrrolngy TIi~co\~ei~ Fund , Franklin High lield (Euro) h n r l ; Frmkliri Incornc Fund ; Franklin India Fund; I rarihllri Technolo3 Fund: Franklin U.S tiluir? Fund:
l‘crripleron Asian Rand Fund, Templeion Furoland Bond Fund; Ternpleton hi-opean Total Return Fund* Teinpleton Global Dund (Euro) Fund. ~lcnipleton Global Inconic Fund+; and Templeton Global .Io~al Rckm Fund
FFWiKLIY .4DVlSERL, INC. One Fr;inklin Parkn-a!. Lan hlatco, CA 94403- lW6 L?.! A.
Franklin .ldnscrs. Inc. has ;ippoimcrl Franklin Tcmpleron Investment ?danageiiicnt Limireil as sub-advisor i n relation to the Templeton Euroland Bond Fund, Franltlin Templeton Investment Manap,ement Liinircd and Fi-ankh Tcmplcton Institutional. LLC a> sub-advisors in relation t n tht Tcm letori (;lobal Total lkturn l’unrl and Franklin Templeton Asset Management fndia? I’nvaLe Limircd as sub-advisor in relation to the Franklin Asian Flex Cap Fund and the Franltlm India Fund
‘Franklin ,\d\-isers. Inc. has been ;rppoinkd Fund togtther KiLh I:r;inklin Ternpleton lnvestinent hlanagtinenr Lltnwd.
TFranklin Advisers, Inc. has k c n appointed as Investment L1an;rger in rFSpeCt of thc fixed iiicmne poi-tion of the assets of Icrnpleron Global Income Fund
Co-Invesmicnt Manager ot this
I\< to: Franklin European Growth h n d : Franklin European Srnall-Mid Cap r;rowh Fund : Franklin Glohal Growth Fund, Franklin Glubd Kea1 Estate (Euro) Fund : hrihl in Global Redl Estate (USD) Fund; Franklin Global Small-Mid Cap Growth Fund: and Templeton Absolute I<cturn ( E u r d Fund.
FRAI’;KI .IN TEMPLETOK INLTIIL~IIONAL LLC 600 Filth Avenue, fie\\. York. KY 10020 1.- S.A.
3
FRANKLIN TEMPLETON INVESTMENT FUNDS
GENERAL INFORMATION
REGISTRAR A N D TRANSFER, CORPORATE, DOMICILIARY A N D ADMINISTRATIVE AGENT: I,IL\YKLlh TEMPI.FTOU I\TFRYLYILC)KiAL SERVICW <.A 26, hniilrv.ird Ih>);il. L-2449 Luxembourg (Jr;iritl-L)uch>- ot Luxcmhrrurg
FRANKLIN TEMPLETON INVESTMENT FUNDS
REPORT OF THE INVESTMENT MANAGERS
The strong perfclrmance of all asset categories in the second half of 2006 was in large measure due to the v e r y strong liquidity that has built up globally. This liquidity has fuelled an unprecedented boom in M&A and heavily-leveraged private-ecptity deals. Yet in the six months to end IJeceinber 2006, stocks still had to overcome a number of negative factors that might have been expected t o drag on performance in more risk- averse times. In the I;.$. , these included a problematic housing marlcet and manufacturing sector plus sluggish 1-etail sales toward the end of the year. In December. there was also a shar-p one-day sell-off of rhe Thai stock market after the introduction of severe resene requiremcnrs on new investments. Despite fears, rhere was little contagion of other emerging markets, underlining the extent to which investors' attitudes have changed since the Asian currency crisis of 1997-1998.
Uncertainties over interest rates, plus the Fed's relatively comforting s t m c e on inflation, helped bond prices in the latter part of the year. The srrong perfrxmance of bonds and equities at the same time appears t o some as a kind of dicho~om);. Late 2004 also saw inversion bctn-een longer- and shorter-dated maturities. The benchmark 10-year T-bill fell below 4.5% by hte Lovernber, thus yielding less than shorter-term paper. Inversion is often seen as a precursor to an ecoiiornic dowmtuni. in sharp contrast to the Imllish tone being struck on the equity and corporate bond markets. But low yields on long-term h i d s may simply indicate that pension funds and insurance companies are increasingly buying txmds to match their liabilities and have become cautious about alternatives.
By late December. eurozone equities were close t o rive-ancl-a-half-year highs. This perfui-mance seemed appropriate, given the relatively good economic growt h and solid perfmniance of European corporar.ions throughout much of 2006. E~ii-opeaii equities, like equities eveqdiere . have been benefiting rrom liquidity and credit growth, which the European Central Rank (ECR) has steadily lmm trying to win in. The ECB is poised to continue its efforts into 2007, although it mal; have to tread cautiously if it is to avoid overshooting. especially in light of downward pressure on the U.S. dollar.
Despite the release of some poor figures in the second par1 of the year, the Japanese economy seenis t o have picked up momentum. Given strong earnings growth and t h e generally healthy economic outlook, Japanese stocks might have been expected to perform better. Instead. foreign buying interest has petered out and share indices barely huclgecl in calendar 2006. Part of rhe problem is miserable 1-eturns, with clividend payouts still very Ic)w, albeit improving.
The I,'.S. dollar may be poised for further depreciation 21s interest rate differentials decline. However, the dollar's clecline may well be limited if the Fed remains as vigilant as it proclaims itself to be in light of inflationary pressures (especially if unit labour costs start rising strongly again).The euro has borne the brunt of dollar weakness, although much of its rise has seemed speculative leaving it vulnerable to short-tei-in pullbacks. Of equal interest has been the rise cof t.he euro against the yen. With further interest rate increases predicted in Europe, euro strength may well continue, although the Bank of Japan may also move to tighten monetary conditions.
Imbalances in the world economy are likely t.o come increasingly into focus. Asian central banks have accuniulatcd massive froreign resemes, which has been used to keep Asian currencies low against the dollar, helping to feed consumer spending (and indebtedness) in rhe I X and addiiig to a massive U S current account deficit. A blow-up of the bond and credit markets caused by a decline in the economy and a sharp increase in the corporate defmlt rate, for example. could Impact the market for stocks as well as fixed income. By contrast, a n y further rises in U.S. interest rates - incluced by fears of inflation - could be bad news Tor equities as it. ~ u l d further constrl-lin rhe srrearn of liquidity that has left companies awash with cash.
But such risks aside, prospects for the world economy look relatively good. Tnflatjon is modest and monetary policy is still relatively accommodative in niost places, Eurupe has recovered and emerging economies remain remarkably dynamic. On the corporate front, profitability is strong. Earnings multiples changed littlc in 2006 and look reasonable relative to historic norms.
THE INVESTMENT MANAGERS January, 2007
5
FRANKLIN TEMPLETON INVESTMENT FUNDS
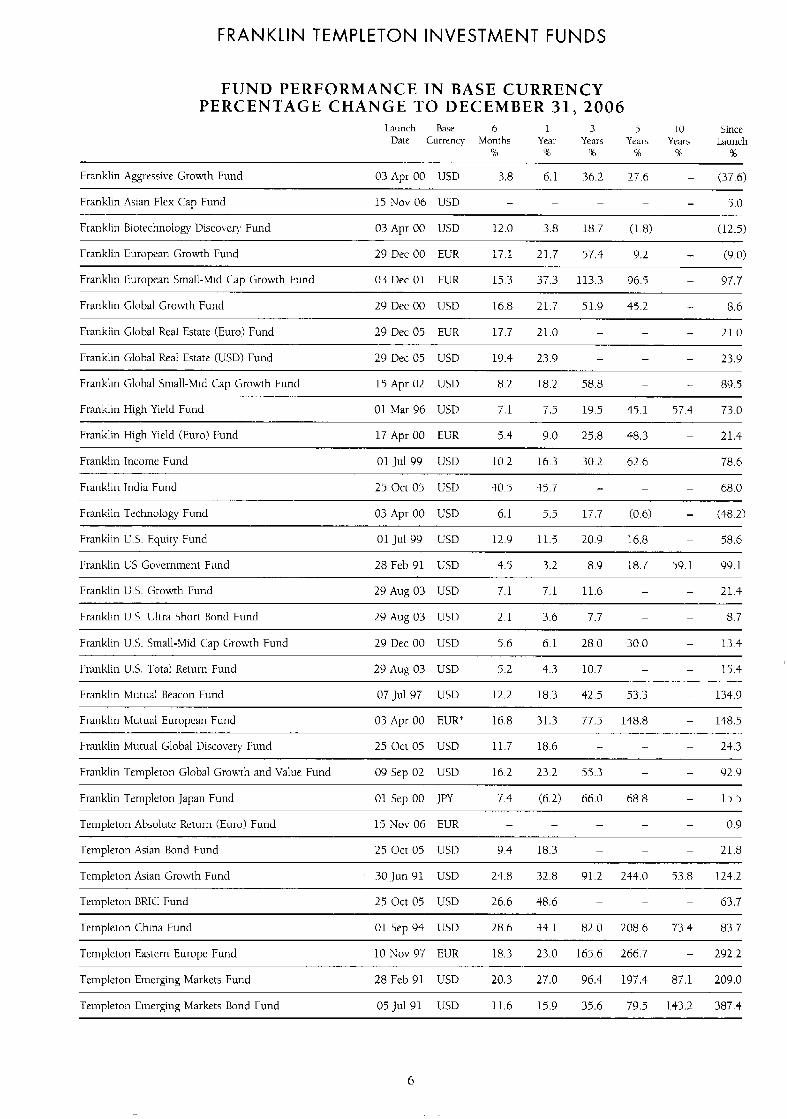
FUND PERFORMANCE IN BASE CURRENCY PERCENTAGE CHANGE TO DECEMBER 3 1 , 2 0 0 6
Launch Base 6 1 3 5 I O Since Date Currmcy blonths Year Years Yrars Yrars hunch
%I B 1% (XI %, %I
Franklin Apgressiw Growth Fund 03 Apr 00 IJSD 3.8 6.1 36.2 27.6 - (37.6) ~
- 5 0 Franklin Asian Flex Cap Fund 15 Nov 06 USD - - - -
Franklin Biotechnology Discowry Fund 0.3 Apr 00 USD 12.0 3.8 18.7 (1.8) - (12.5)
Franklin European Growth Fund 29 Dec 00 EUR 17.1 21.7 57.4 9.2 - (9.0)
Franklin Furopean Small-Mid Cap Growth Fund 03 Dec 01 EUR 15.3 37.3 113.3 96.5 - 97.7
Franklin Glohal Growth Fund 29 Dec 00 IJSD 16.8 21.7 51.9 45.2 - 8.6
- 21.0 FI-ankh Glohal Real Estate (Euro) Fund 29 Dec 05 EUR - - 1 7 7 21.0
- - 23.9 Franklin Cilohal Real Est.ate (IJSD) Fund 29 Dec 05 USD 1Y.4 23.9 -
- 89.5 Franklin Global Small-?vlid Cap Growth Fund 1s Apr 02 1JSD 8.2 18.2 58.8 - - ..
Frankliri High Yield Fund 01 Mar 96 USD 7.1 7.5 lY.5 45.1 57.4 73.0
Franklin High Yield (Euro) Fund 17 Apr 00 EUR 5.4 9.0 25.8 48.3 - 21.4
Franklin Income Fund 01 Jul 99 USD 10.2 16.3 30.2 62.6 - 78.6
- - 68.0 Franklin India Fund 25 Oct 05 LSD 40.5 45.7 -
Franklin Technology Fund 03 Apr 00 USD 6.1 5.5 17.7 (0.6) - (48.2)
- 58.6 Franklin LS. Equity Fund 01 Jul 99 USD 12.Y 11.5 20.9 16.8
1:ranklin C'S Government Fund 28 Feh 91 LSD 4 5 3.2 8.9 18.7 59.1 99.1
Franklin US. Growth Fund 29Aug03 USD 7.1 7.1 11.6 - - 21.4
- 8.7 2.1 3.6 7.7 - Franklin US. Ultra Short Bond Fund 29 Aug 03 IJSD
Franklin I.!.!-. Small-Mid Cap C;i-owth Fund 29 Dec 00 USD 5.6 6.1 28.0 30.0 - 13.4
i'rmklin U.S. Iota1 Return Fund 2 9 i Z ~ g 03 USD 5.2 4.3 10.7 - - 15.4
Franklin Mutual Beacon Fund 07Jul 97 USD 12.2 18.3 42.5 53.3 - 134.9
Franklin Mutual Eui-opean Fund 03 Apr 00 FUR* 16.8 31.3 77.5 148.8 - 148.5
Franklin Mutual Global Discover); I:und 25 Oct 05 USD 11.7 18.6 I - - 24.3
Franklin Templeton Global Growth and Value Fund 09 Sep 02 USD 1 6 2 2 3 2 55 3 - - Y29
Franklin Templeton Japan Fund 01 Sep 00 JPY 7 4 ( 6 2 ) 6 6 0 6 8 8 - 1 5 5
- 0.9 Templeton Absolute Return (Euro! Fund 15 Nov 06 EUR - - - -
- - 21.8 Templeton Asian Bond Fund 25 Oct 05 USn 9.4 18.3 -
Templeton Asian Growth Fund ' 30 Jun Y l USD 2 4 8 3 2 8 9 1 2 2440 5 3 8 1242
Templeton ERIC: Fund 25 Oct 05 USD 26.6 48.6 - - 63.7 -
Templeton China Fund 01 Sep 94 USD 28.6 44.1 82.0 208.6 73.4 83.7
Templeton Eilstem Europe Fund 10 Nov97 EUR 18.3 23.0 165.6 266.7 - 292.2
Templeton Emerging Markets Fund 28 Feb 91 USD 20.3 27.0 96.4 197.4 87.1 209.0
Templeton Einerging Mal-kets Bond Fund 05 Ju1 91 IJ5D 11.6 15.9 35.6 79.5 143.2 387.4
6
FRANKLIN TEMPLETON INVESTMENT FUNDS
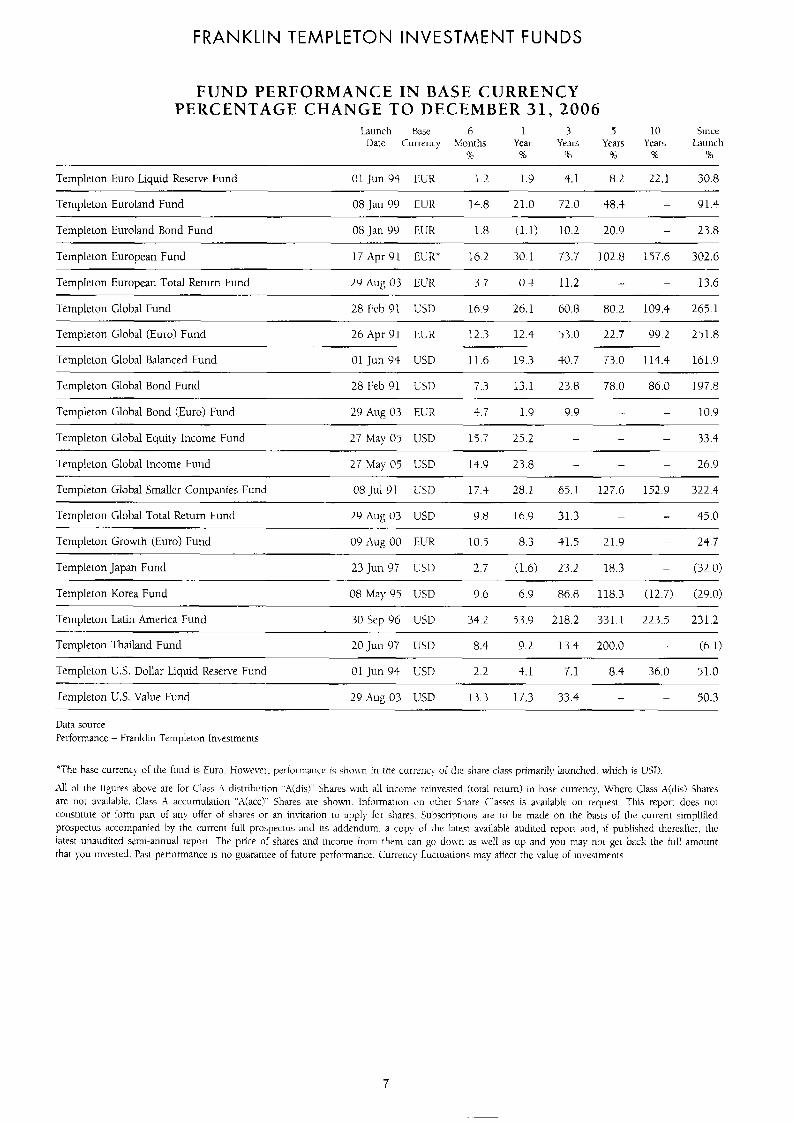
FUND PERFORMANCE I N BASE C U R R E N C Y PERCENTAGE C H A N G E T O DECEMBER 3 1 , 2 0 0 6
Launch Base 6 1 3 5 10 Since Ilatc Currericy 51otiths Year Years Years Years Liwtlch
'70 ?4 (70 % % %
8.2 22.1 30.8 Templeton Euro Liquid Reserve Fund 01 Juri 94 I:LK 1.2 1.9 4.1
Templeton Euroland Fund 08 Jan YY E U R 14.8 21.0 72.0 48.4 - 91.4
Templeton Euroland Bond Fund 08Jan99 EUR 1.8 (1.1) 10.2 20.Y - 23.8
Tcmplcton European Fund 17 ;lpr 91 ECR" 16.2 30.1 73.7 102.8 157.6 302.6
Templeton European Total Return Fund 2Y Aug 03 LUK 3.7 0.4 11.2 I - 13.6
1-cmpleton Global Fund 28 1:eb 91 LSD 16.9 26.1 60.8 80.2 109.4 2651
Templeton Global (Euro) Fund 26 Xpr 91 I!UH 12.3 12.4 53.0 22.7 YY.2 251.8
Templeton Global Balanced Fund 01 J u n Y4 USD 11.6 19.3 40.7 73.0 114.4 161.9
Templeton Glohal Bond Fund 28 I:eb 91 LSD 7.3 13.1 23.8 78.0 86.0 197.8
Templeton Global Bond (Euro) Fund 29 Aug @3 FUR 4.7 1.9 9.9 - - 10.Y ~ -. ~ ~~
Templeton Cilobal Equity Income Fund 27 May 05 LJSD 1 5 . i 25.2 - - 33.4
Templeton Global Income Fund 27 \ lay 05 LSD 14.9 23.8 - - - 26.Y
-
Templeton Global Smaller Companies Fund 08 J u l 91 L5D 17.4 28.1 65.1 127.6 152.9 322.4
Templeton Glohal Total Return Fund 29 ;\ug 03 LISD 9.8 1 6 9 31 3 - - 45.0
Templeton Growth (Euro) Fund 09 Aug00 FUR 10 5 8.3 41.5 21.Y - 2 4 7
- (320) Templeton Japan Fund 23 Jun Y T LSD 2 7 (1.6) 23.2 18 3 . .. -_ ~ ~~
Templeton Korea Fund 08 May 95 I1SD 9.6 6.9 86.8 118.3 (12.7) (29.0)
Tcnipleton Latin Ainerica Fund 30 Scp 96 USD 34.2 53.9 218.2 331.1 223..5 231.2
Templeton Thailand Fund 20 JLUI Y 7 USD 8.4 9.2 13.4 200.0 - (6.1)
Templeton US. Dollar Liquid R e s e ~ e Fund @ l ] u n 94 CSn 2.2 4.1 7.1. 8.4 36.0 51.0
Templeton U.S. Value Fund 29 Aug 03 I1SD 13.3 17.3 33.4 - - 50.3
Data source Perfomiance - Franklin Templelon In\esttnetits
*The has? currcnc! ol the lurid IS Euro. Howevet-. per-fomiancc. i ' i s honn III the curtrric!- of the s l i m class prirnanl!. launched. which is L!ST)
All oI the ligures rabove are for Class A disti-ilxition .'Aidis!" Sharch with all incoine reinwsrrd (total return) 111 base currency. Where Class A(&) Shares arc not available. Class .A ~ I C C L I I I ~ L I ~ ~ L I O I I "Alacc!'. Shares are shonn Infonnation tm orher Share Classes is awilable on request. This report does not Corisuttite or lorn1 pari of any ofler of sliai-cs or an invitation to apply lor shares. Stibl;cnptions arc t o he nxde on the basis of the ciii-reni s~r~ipliliecl prospectus accompanied by tlic ruiTenr full prtispectus and its addenduni. a copy of the latest a\-;iilahle audited report and, if published thereafter. the latest unaudited szini-annual repor(. The price of shares aiid income fi-om rhrm can go c lonn 215 well as up and you may not g e ~ back the fit11 amount rhar you invrslcd. Past performance 1s no guarantee of future pel-foimance Currency fluctuations may aftect the value of investments.
7
FRANKLIN TEMPLETON INVESTMENT FUNDS
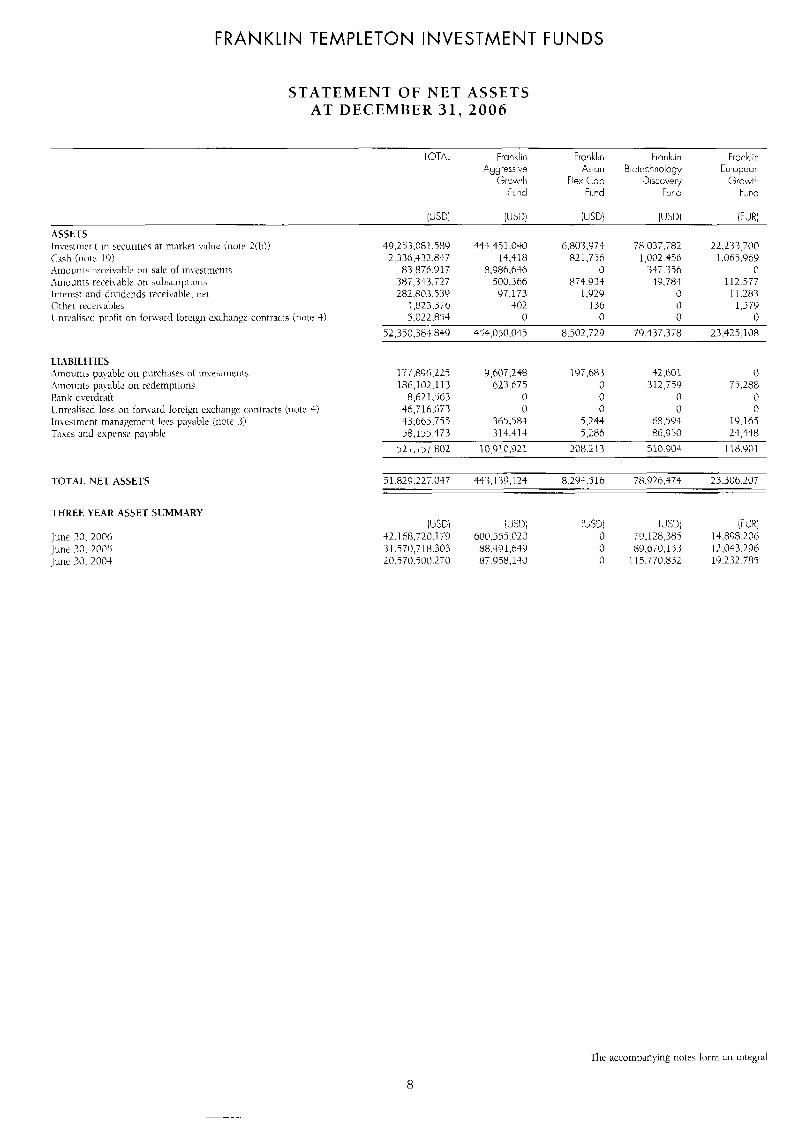
STATEMENT OF NET ASSETS AT DECEMBER 31, 2006
( S D j [IJSDi iUSDi [ULD] iF,IK:
49.25 3,(781,589 433.451 .@SO 6.803.974 78,037,782 22.233.700 2.336.4.32.847 14,318 82 1.756 1,002.458 1,065,969
83.876.917 8.986.64(i 0 347,356 k'
38i,3$3,727 [email protected] P73.93S 49.784 112.577 282.80.3.5.39 97.173 1 .9 20 0 1 I .L83
1,823,378 402 136 0 1,379 -l.i)22,8'j4 0 0 0 0
52.350.383.849 454,050,045 8.502.729 79,477,378 23.425.108
177,846,225 9,607,248 1 137.68 3 42,601 0 18F.lO2.113 h23.(175 (7 312,759 75.288
8.621.363 0 0 0 0 46.71h.fj73 0 0 0 (1 33,665,753 365.534 5,244 68,594 19.163 58,155.373 314.414 5,286 Fh.9 jtl LS.338
5LI.157.KW 10.910.921 208.2 I 3 510.904 I lii>WI
TOTAI. NET ASSETS
.I HREF YF.4K A%FT SUMMARY
June 30. ZOO6
Julie 30. 2004 Junr 30. 2Pi7'j
51.829.227.047 443.1 39.123 8.294.516 78.02h.474 23.306.207
llJSCi [JSD) :\., S3) lJSU iF:JK) 42.1 F8.72G.1 T(3 600.555.02C 0 T9,128.385 14,898,201; 31,570,718.303 H8.491.640 0 H9,670.153 12.043.296 20.570.500.2TO 87.958.14c7 0 I 15.770.832 19.232.785
FRANKLIN TEMPLETON INVESTMENT FUNDS
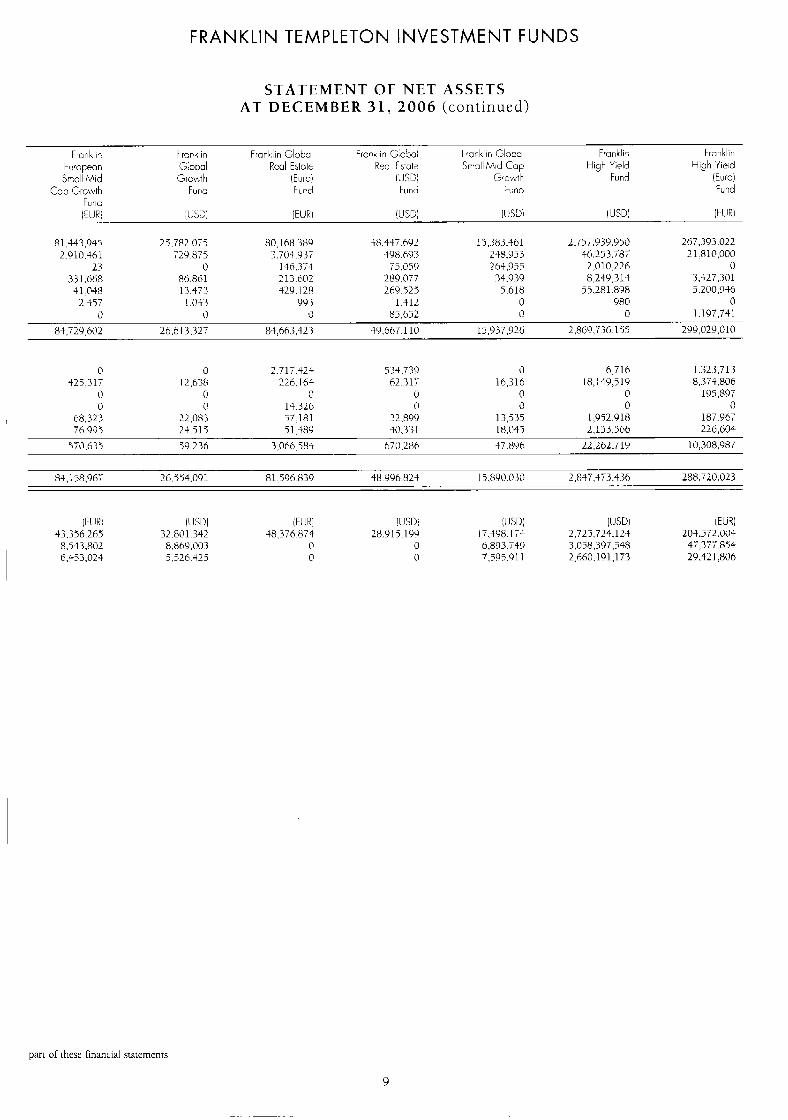
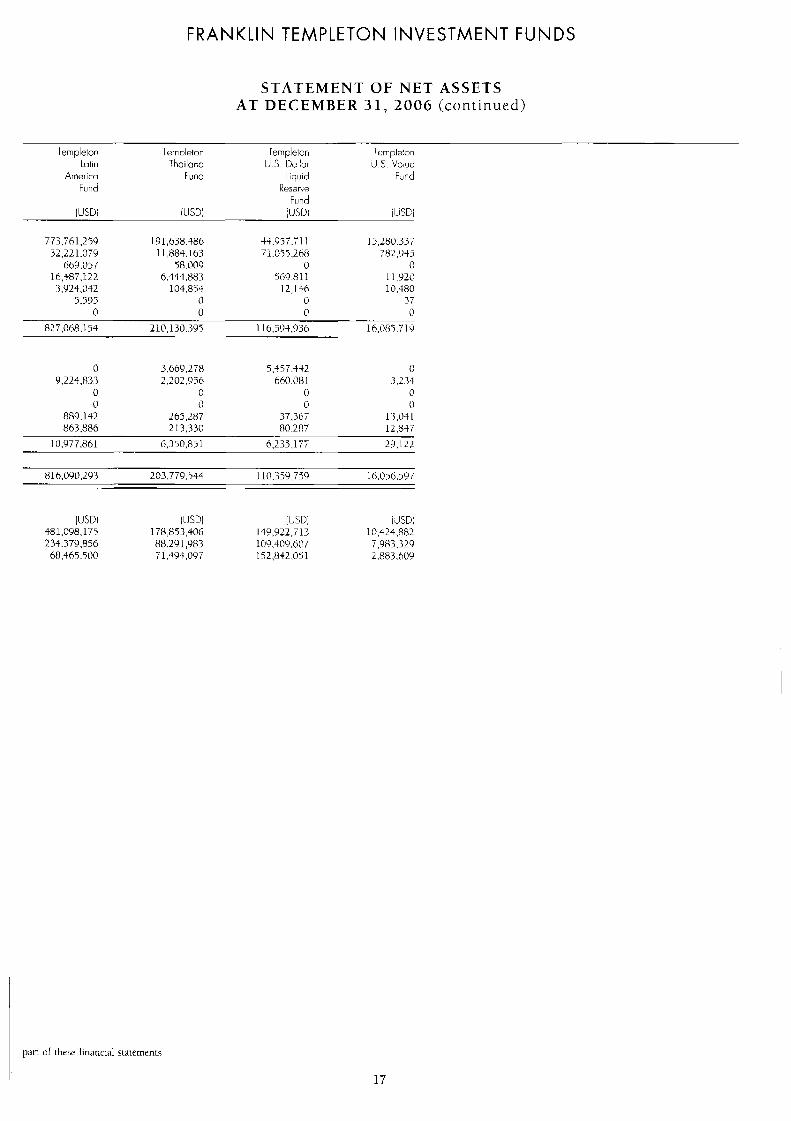
STATEMENT OF NET ASSETS AT DECEMBER 3 1 , 2006 (cont inued)
F,onkli- I r m c in Fwnkiiri Globol i r c n ~ In I; c5nl I vnklin Slonnl Franklip, Frclrikliri t 8~ ecln G.:lt)(ll Rcul Estotc Kec Fs-ot;, S r ~ l i l :Ad CUP hgh Yield High Yiemd s~nlE'\hid C;ro;vl t I [Eurci I:!.sc;: Fund (Eurci
Ccp Grcwth Furic FLrd Flint: -uno Fuld
8 1 >44 3.94'j 25,782.075 t8.4tT.692 15.383.481 2,757.939.950 267.393.022 498.693 238.953 36.25 3 . 2 7 21.81@,000
163,955 2 ,0 10,22(5 0 3 3 I .hh8 86.861 2 13.602 289.077 34.039 8.219.314 3.427.301 S1.0SB 13.373 429. ILP 269.529 5.618 55.281.898 5.200,946
2.457 I . O t 3 99 3 1.312 0 980 0 0 t1 I) 85,652 I! i) 1.197.741
84.~29.602 26.6 13,327 84,663.423 49.687.110 15,937,926 2,869.736.1$5 299,029,010
-- 2.910.461 729.875 2 3 L' i>,L159
0 0 2.717.323 534.739 I) 6,716 1.323.71 3 325,317 I L.63P 2.26. I64 62.311 16,316 18,I.t9,519 8,371.806
0 0 0 u 0 0 IO5 $9 7 0 0 13.326 0 0 0 0
68.323 L L . 0 8 3 57.181 32,800 13,535 1,952,918 187.Y67 76.993 24.514 5 1 .+w 40.33 I 1 ?l.('4-3 2.153.566 226,604
570,635 49.236 3,066,584 670,286 47.896 22.262,719 IO, 308.987
84.1 58.967 26,554,001 81.596.839 38.996.824 I5.890.030 2.R47,473.336 288.720.023
(E!JK1 [!!SUl iE!!R: iUSDi IUSD) (!!SUI iECi?i 33,396.264 32,801.342 $8.376.873 28.915.199 17.498. 174 2.725.724.121 204.572.003
8.54.3.802 8,869.003 0 il 6,893,749 3.058.397.548 47,377,854 6,453.024 5326.425 0 0 7.595.91 1 2.660.19 1 173 29.421,806
part of thew financial statements
9
.- . . . .
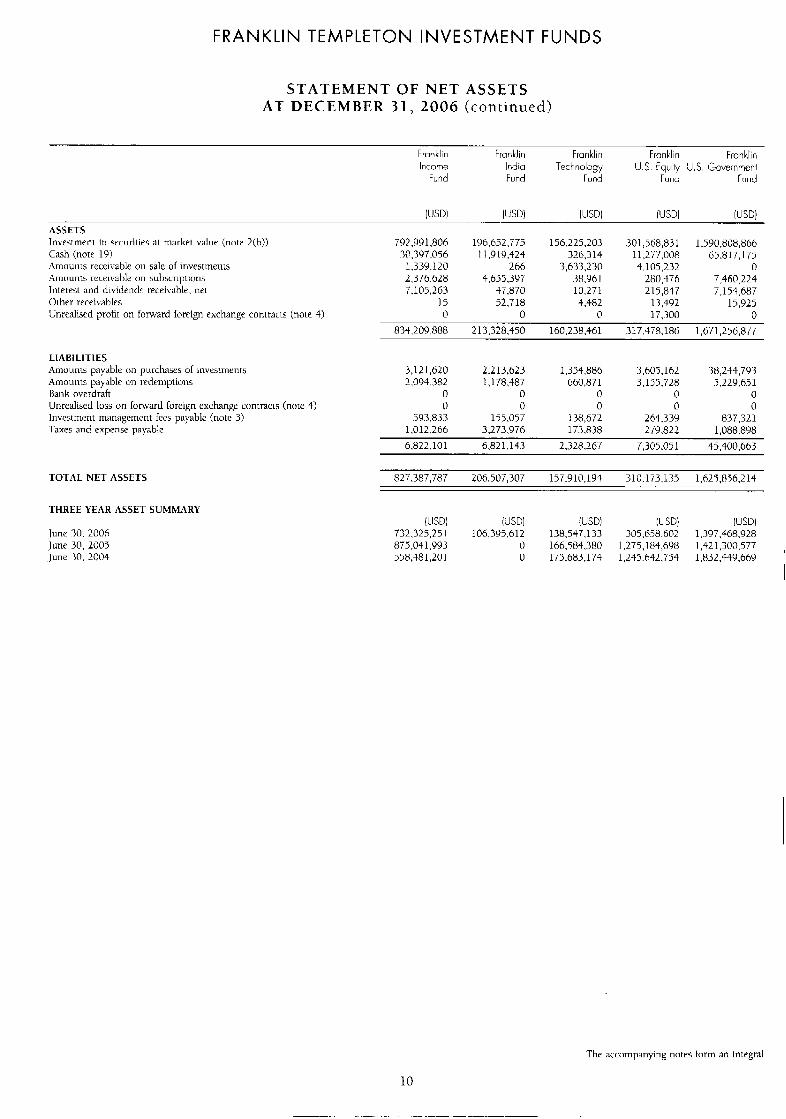
FRANKLIN TEMPLETON INVESTMENT FUNDS
STATEMENT OF NET ASSETS AT DECEMBER 31 , 2006 (continued)
Franklin Franklin Frankliri Franklin Franklin Income India Technology U.S Fquity U.S. Government
Furid Fund Fund Furid Fund
ASSETS In\cstment i n securities at market v;ilue (now 2(hj) Cash (note 19) :\mounts receivable on sale of investments Amtiunls receivahle on subscriptions Interest and dividends receivable, ne1 Other recehables Unrealised profit 0x1 toward foreign exchange contracts (note 4)
7Y2,Yg I .806 30.397.056
1,339,120 2,376.628 7,105,263
15 0
834,209,888
196,652,775 156,225.20.3 301,568,831 I 1319,424 326.314 11,277.008
266 3,633,230 4,105,232 4.655.397 38.961 230,476
47,870 10.271 215,847 52,718 4,482 13,492
0 0 17.300
213,328,450 160,238,461 317.478.186
1,590,808,806 65.81 7,175
0 7,460,224 7,154,687
15,925 0
1,671,256,877
LIABILITIES Amounts payable on purchases 01 investments Amounts payable on redemptions Hank nverdi-aft Unrealised loss or1 lornard loreign exchange contracts (note 4) Investment management fees payable (note 3) [.axes and expense payahlc
3, I 2 1,620 2,213,623 1,344,886 3,605.162 38,214,793 2.094.382 1 ~ 178.487 660 871 3,154,728 5.229551
0 0 0 0 0 0 0 0 0 0
593,833 155.057 I3H,67L 264,339 837,321 1,012,266 3,273,976 173.838 279.822 1,088.898
6,822,101 6,821.143 2.328.267 7,305.051 45,400,663
TOTAL NET ASSETS
THREE YEAR ASSET SUMMARY
June 30. 2006 June 30, 2005 June .30. 2004
827.387,787 206,507,307 157.910,194 310,173,137 1.625,856.214
W D I lUSD1 IUSDI I U W IUSD) 732.325,25 I 106,395,612 138,547,133 304,638 602 1.397.468.928 875,041 993 0 166.584.380 I .L75,1B3,6W 1,421,300,577 , 558,481 201 0 174,683,174 1,245 642 754 1.832.449.669
1
The accompanying notes form an integral
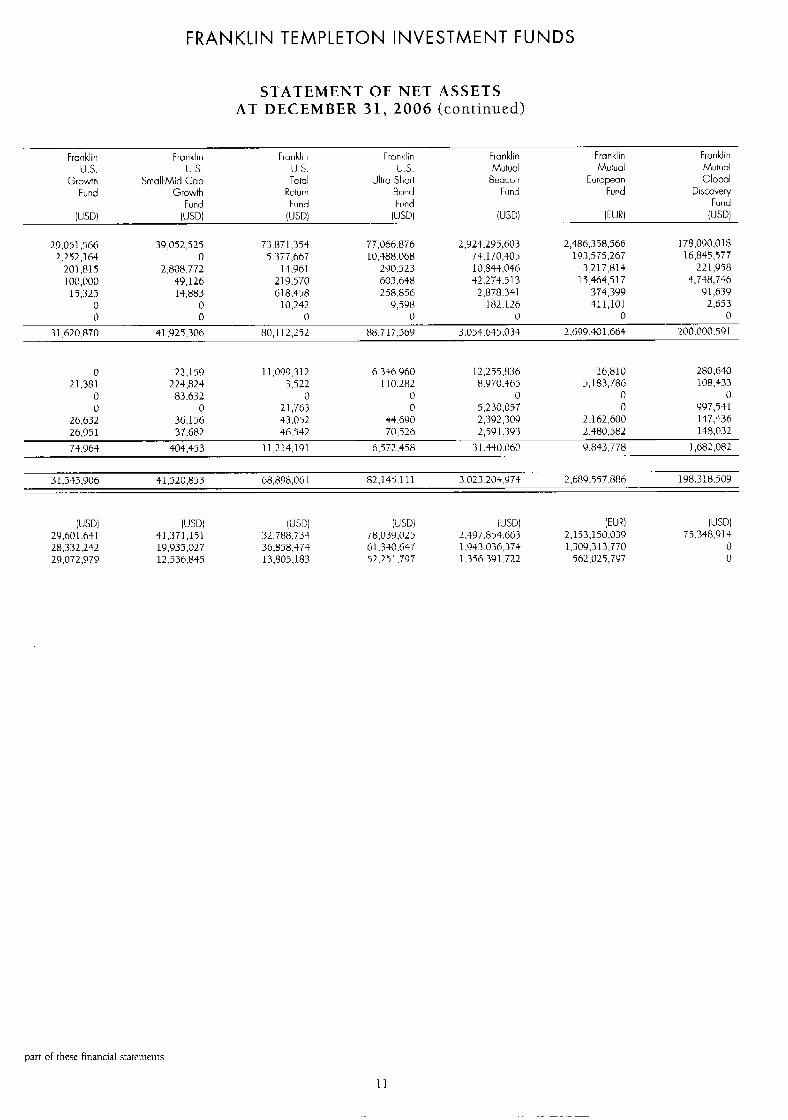
FRANKLIN TEMPLETON INVESTMENT FUNDS
STATEMENT OF NET ASSETS AT DECEMBER 31, 2006 (continued)
Franklin Franklin Frurilliri Franklin Fionklin Franklin Fronklin U.S. u 5. U.S. u s. Mutual Mulual M u t m
Growth Small-Mid Cap Total Ultra Short Bear-or1 European Global Fund Growth Return B o d Fund Furid Discovery
Fund Fund Fund Fund I U W LJSD) (USD) [LJSD] (USD) (EUK (USD)
29.051.566 39,052,525 73,871,354 77.066.876 2,924,205,603 2,486.378.566 178,090,018 2.2 52 ~ 164 0 5,371,667 10,488.068 73,170,405 19.3.575.267 16,845.577
201.815 2,808.772 14,961 2Y0.523 10,843.046 3,2 17,814 221,958 100,000 49,126 219.570 603.648 32.274.51 3 15,464.5 17 4,748,746
15.327 14,883 618.458 258.856 2,878.341 374,399 91,639 0 0 10,242 9,598 182.126 411,101 2,653 0 0 0 0 @ 0 0
31,620.870 41,925,306 80, I 12,252 88.717.56Y 3.054.645.034 2.61)9.4@1,664 200.000.59 I
0 22.159 11,009,312 6,336.960 12.255.836 16,810 280.640 21.381 224.824 3.522 1 10.282 8.970.3h5 5,183,786 108.333
0 83,632 0 @ 0 0 0 0 0 21,763 0 5,230,057 0 997,541
26.632 36.156 43.052 4S,6t)i) 2,392,309 2,162,600 147.436 26,951 37.682 46.542 70,526 1,591,393 2,480,582 148,032
74,Y64 404,453 11,214.191 6.572.358 31.3+0.060 9,843,778 1,682,082
3 1,745.906 41,520,853 68,898,06 I 82.14.5.1 1 1 3.023.204.974 2.689.557.886 198,318,509
(USD! [USD! (USI11 (LED) iUSDl (EUN (USD)
28.332.242 19.935,027 36,858,474 6 I ,340.647 1.943.036..37$ 1.309,313,T70 0 29,072,979 12.536.845 13,805.183 52.25 1.707 1.346.3Y1.722 562,025,797 0
29.601.6-tl 43.371.151 32,788,734 78.039.025 2.497.854.663 2.153,150,039 7 5 348.9 1 4
part of these financial statemelits
11
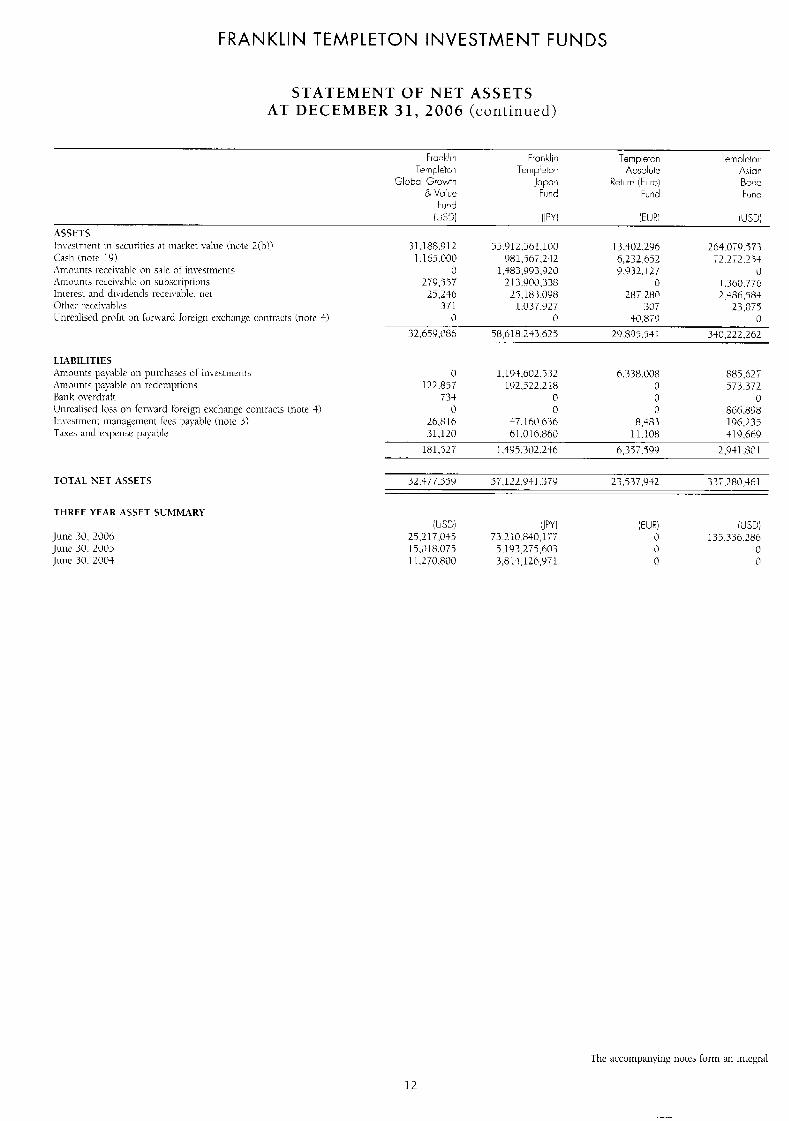
FRANKLIN TEMPLETON INVESTMENT FUNDS
STATEMENT OF NET ASSETS AT DECEMBER 31, 2006 (cont inued)
TOTAL NET ASSETS
THKFF YFAR ASSET SUhlMARY
32.+77,540 57,122.941.37.) 23.537.942 337,280,461
(LS3i jPYl :EURi i S D ; 25,217,045 73.210.840,l;; 0 135.336.286 15.018.075 5,193,275,603 i) 0 1 1 .270.800 3,s 1+,12~,t)71 0 0
The accotnpanying notes lorin an integral
12
FRANKLIN TEMPLETON INVESTMENT FUNDS
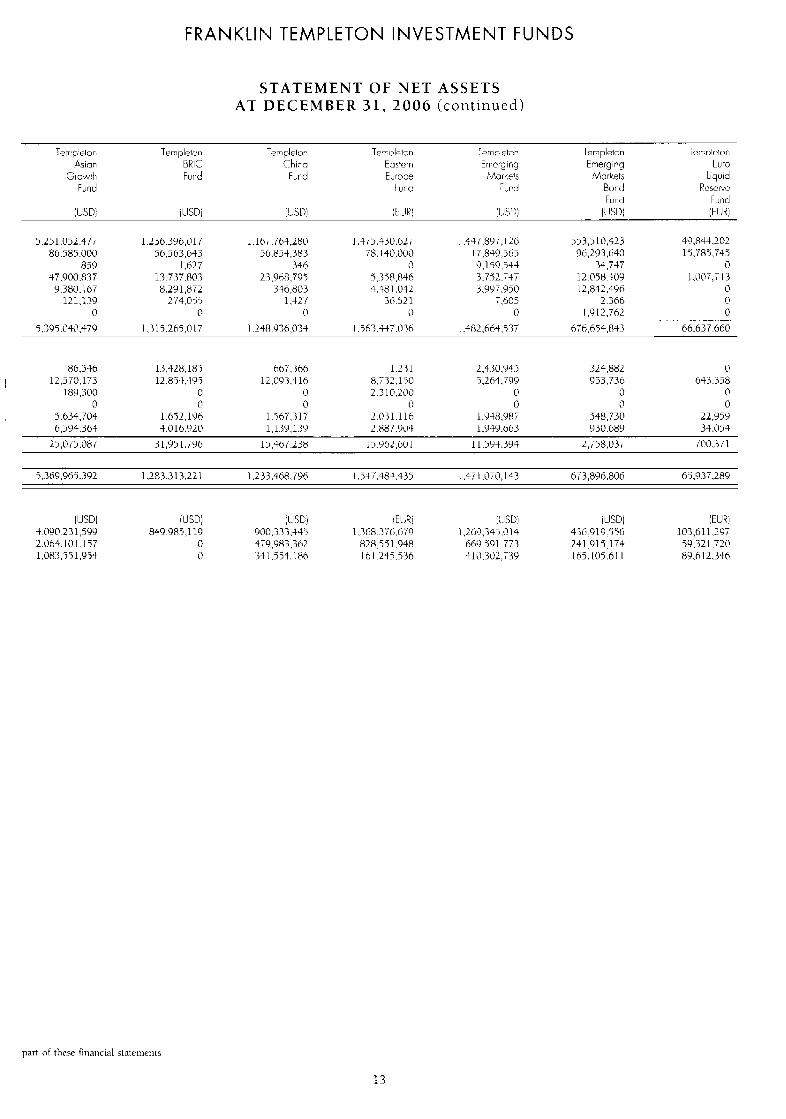
STATEMENT OF NET ASSETS AT D E C E M B E R 31, 2006 (conlinuccl)
5.251 .052.47T 86.585.000
859 47,000,837
9.380.167 12 1,1.39
0 5.395.040.379
1.230.396.017 1.16;.76+,28il I .3T5.330.62; 1,347,897,126 553,5 10,423 49.844.202 56,563,643 56.@54,383 78. I40.000 17,849,565 06,293,640 15.787.747
I .627 346 I! 9>159.544 34.747 0 13.737.803 2.3.968.795 5.3iX,84(< 3.7.52.71T 12.058.309 1.007,; I3 8.29 1,872 346,803 4.S8 I . P t2 3.99:.c)50 I 2,842,496 0
274.05.5 1.427 3tj.52 1 7.605 2.366 (1
0 0 0 0 I >9 12.762 0
I I 31 5<265>0 I 7 I .L48.936,071 I ,563.tfi.036 I ,482.664.5 37 676.654,84.3 66.637.660
86.746 1.3.428.185 hh7.36ti 1.231 2.430.945 12.570.173 12.854.495 12,093.416 8,732,150 7.264.799
I89,300 0 0 2.3 10.200 (1
0 0 o 0 0 5.634.704 1.672.196 1.767.31 7 2.031.116 1,948.985 6.594.363 3,016,920 1,139.135J :.887.r)c74 1.949.663
I 324 882 973 736
0 0
548 730 930 689
0 643.358
(1 0
22,959 34,051
2 5,075.087 3 I .95 1.796 15.467.238 15.962.601 11.59S.394 2.758.03; 700.371
5.369.967.392 1.283.31 3.221 1,233,468,796 I .547.48$.435 I .47 I , O T O . 1 1 3 673,896,806 65.937.289
!uSD) IUSDi ilJSCj i E L 7 j iiJSUj iUSDi IEUR! S.iWc1.23 1,599 849.985,119 900.3 33.445 1.368.376.670 1 .263.34s.C14 436.919.556 103.611.29; 2.064.101.157 0 t;9,983,3h2 828.54 1.94P 669.391.773 241.915.171) 59,321,720 1,08 3.55 1,954 0 341.55+.186 I 6 I ,245,536 3 IO, 302.739 165.105.61 I 89.612.346
parr of thesc finnnclal statement3
13
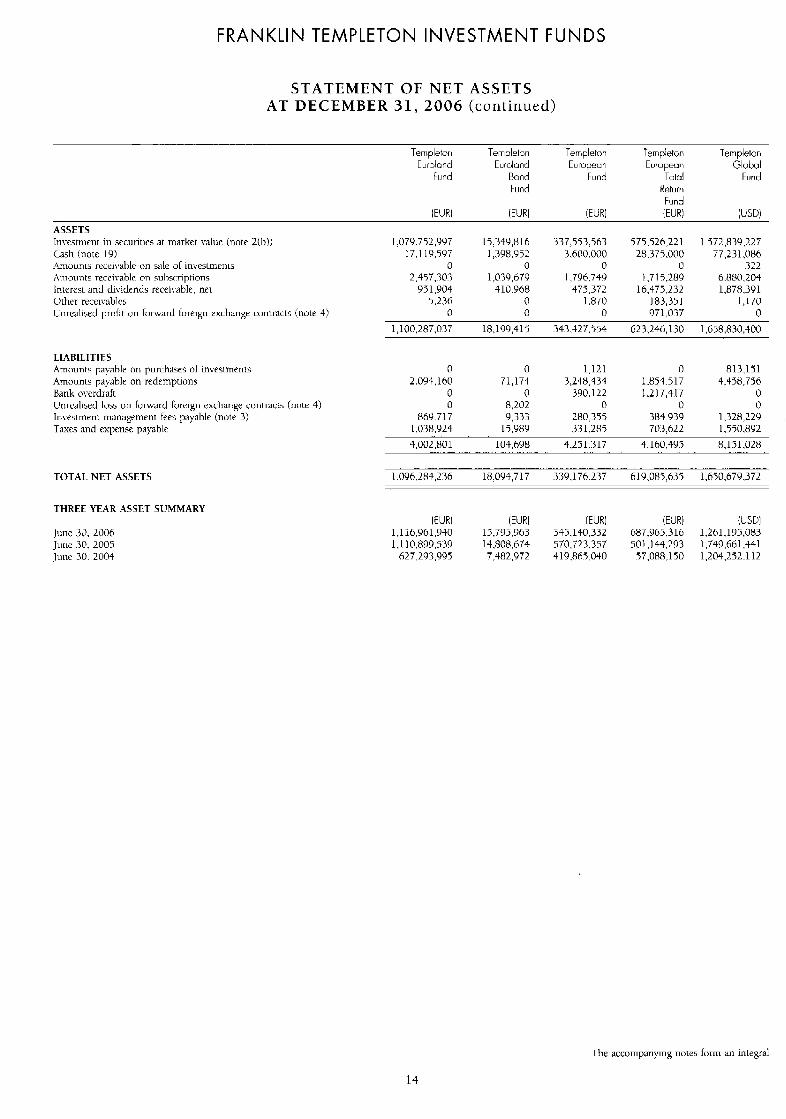
FRANKLIN TEMPLETON INVESTMENT FUNDS
STATEMENT OF NET ASSETS AT DECEMBER 31 , 2006 (continued)
Templetori Templeton Templeton rempleton Templeton Euroland Euroland Europeun European Global
Fund Bond Fund Total Fund Fund Returri
Fund IEW IEW IEUK I W ( U W
ASSETS Inrestnieiit in secitnties at market value (note 2(b)) Cash (note 19) .hinunts rcWi\d)lF on sale ol investments Amounts reccirahle on subscriptions Interest and clividcncls recei\able, net Other receivables Lnrcalisrd profir on fonvarcl foreign exchange contracts (note 4)
I .079.752,997 15,349,816 337,553,563
0 0 0 2,457.30 3 1,039.h79 I ,T96.749 Y41 904 410.968 $74,372 5.2% 0 1.870
0 0 0
1,100,287,037 18,199.415 343.427.554
17,l 19,597 1,398.952 3.h00.000 575,526,221 28,375.000
U
I ,7 I5.289 16.475,232 183.351 971.037
623.246.1 3 0
1 472,839,227 77,231,086
322 6.880.204 1,878,391
1,170 D
1.658.830.400
LIABILITIES
Amounts pa)atdc on redemptions 2.094,160 71,174 3,2+8,434 1,854.5 17 Bank overdraft 0 0 390.1 22 I ,217,417
Amounts payhlc on purchases of investmerits 0 0 1,121 0
hrealised loss on fonvarcl foreign rxchange cnntracrs (note 4) 0 8.202 0 0 Investment ItlJndgettlFtlt fees payable (note 3) 869.717 9,333 280,355 384.939 Taxes and expense payable 1.038,924 15.989 331.285 703,622
4.002.801 104.698 4.251.317 4.160.495
813.151
0 0
1.550.892 8.1S1.028
4,448,756
1,328,229
TOTAL NET ASSETS 1.096.284,236 18,094,717 339.1 76.237 619.085,635 1.650.679.372
THREE YEAR ASSET SUMMARY
,June 30. 2006 J L I I I ~ 30. 200s June 30. 2004
I W (EURI IEW IEUN 1u5d1 l,ll6,Y6l,Y40 15.795963 345,140,332 687.Y65.316 1,261,195,083 1,I 10,899,539 14.808.674 570,723.357 501,144,293 1,749,661,441 627.293,995 7,482,972 419,865.040 57.088,150 1.204.25.2.112 '
The accompanying notes form an integral
14
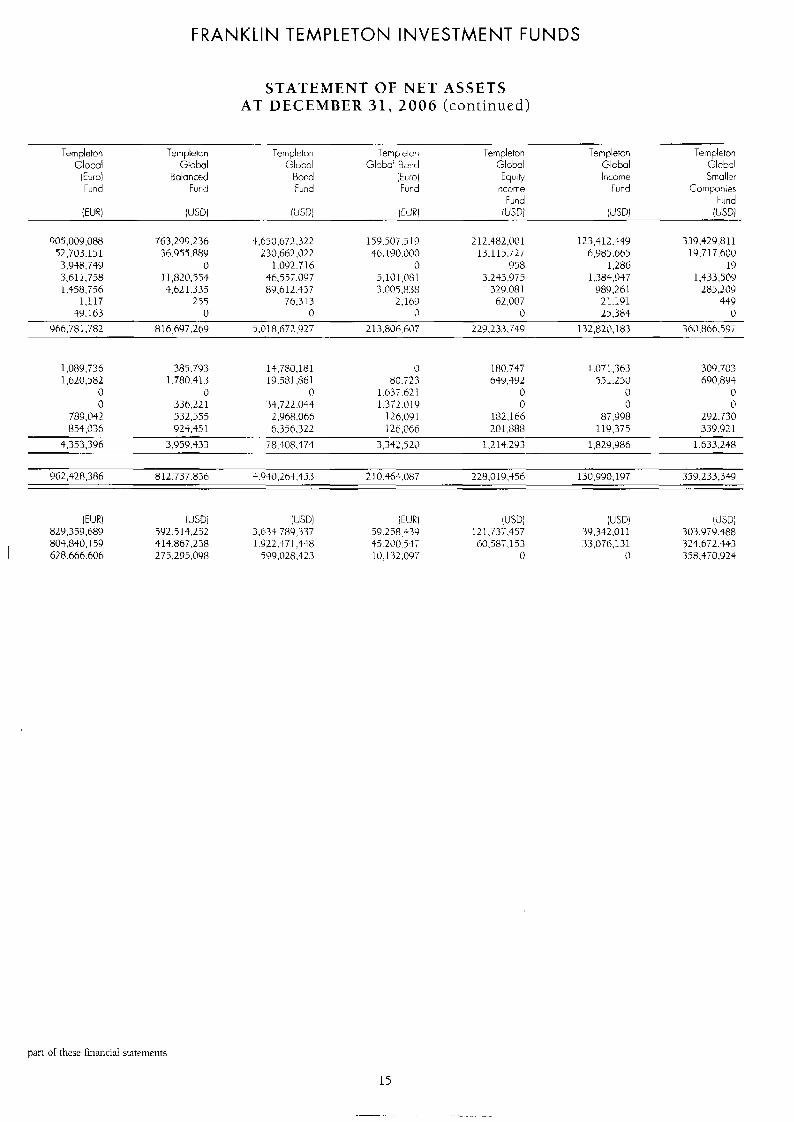
FRANKLIN TEMPLETON INVESTMENT FUNDS
STATEMENT OF NET ASSETS AT DECEMBER 3 1 , 2006 (continued)
Templeton Templeton Templeton Temp e t m Templeton Templetofi Templeton Globol Globcrl Global Glcbc B d Global Global Glcbc!
[Euro) Boloncd Bord (ELI01 E w f y I:icome Srr:aller Fund Funa iur id Fund Iccome Fund Compailes
Fuid Fund ( E W (US01 (1150) (EUt?J IUSDJ (USD! (USDI
905.009.088 16 3.299.236 52,703.15 1 36.955.889 3.948.749 0 9.611.758 1 1,820.554 1,458.756 4.621.335
1.117 255 49.163 0
966.781.782 816,697,269
4,650,672.322 230,662,022
1.032.716 46,55T.1797 89.612.437
76.3 I 3 0
5.018,672.<)27
159.501.5I9 2 12,482,OOl 123.412.449 46.1 c30.000 13.115.727 6.985.665
0 958 1,286 5,10l,L~81 3,243.9i5 1,384,947 3.005.838 329.081 989,26 I
2.169 62.007 21.191
21 3.806.607 229.2 3 3.749 132,820,183
0 0 25,384
339,429,811 1Y.717.600
I9 1.433 50Y
285,209 449
0
360,866.59T
1,089,736 385.793 13,780,181 0 180.747 I ,071.363 309.70 3 1,620,582 1.780.413 19,581,861 80.723 649.492 551.250 690,803
0 0 0 1.63T.621 0 0 0 0 336.221 34.722.044 1.372.Olc) 0 (3 17
789,041 532,555 2,068,066 126,091 182.166 81,998 292.730 854,036 924.35 1 6.356.322 126,066 201.888 119,375 339.921
4.353.396 3.959.433 78.408.474 3.342.520 1.2 14.29 3 1.82Y.Y86 1.633.248
962,428..386 812.737.836 4,940,264.453 2 I0.464.087 228.0 19,456 130.YY0,197 359,233,349
W E ! (USDi :USD! iEURl !USQ (USDi !J501 82Y ,359.689 592.514.252 3.633.789.337 99.258.439 121,737,457 39.342.011 303.9T9..t88 803.830, I59 414.867.238 J .9L2.471.448 45.200.54; 60,587,153 33.076.131 324.672.443 I 628.666.606 275.295,098 59'3,028,423 10,132,097 0 @ 358.370.924
pan of these financial statements
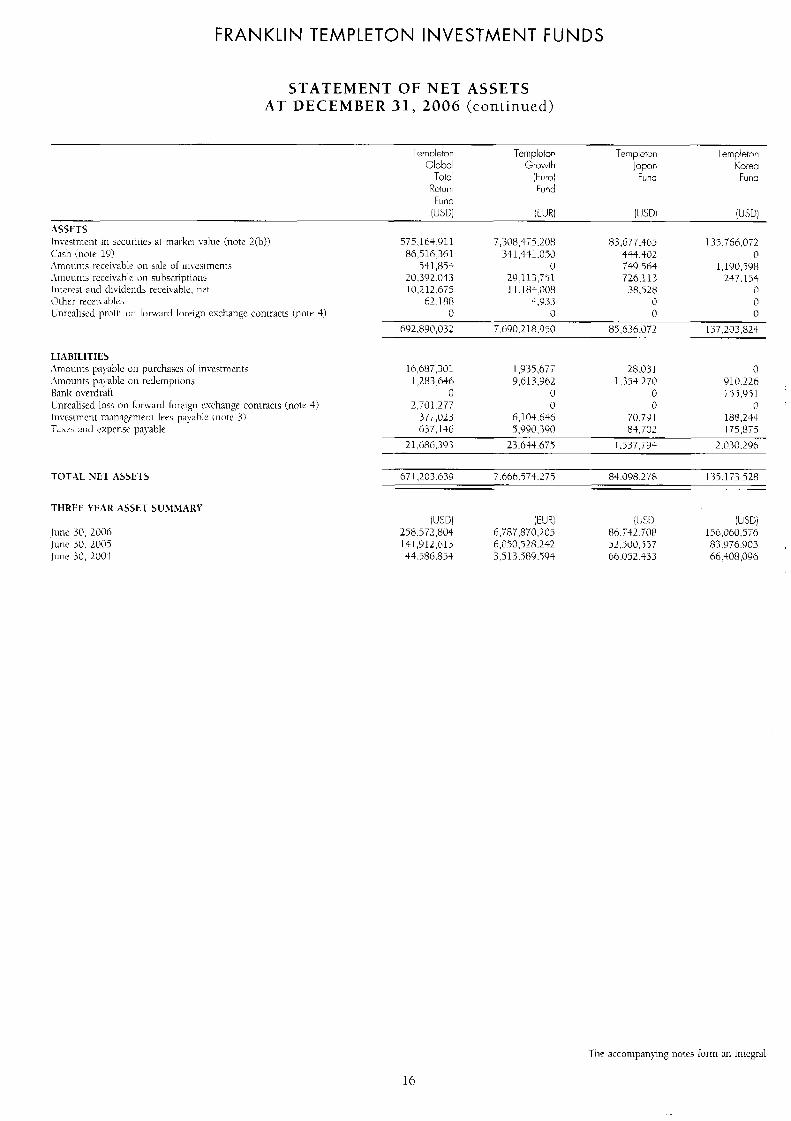
FRANKLIN TEMPLETON INVESTMENT FUNDS
STATEMENT OF NET ASSETS AT DECEMBER 31, 2006 (conLinued)
TOTAL NET ASSETS
T H R E t YEAR ASSET SUMMARY
June 30. 2006
Junc 3 0 , LOO+ June 30. 2005
16,087,301 1,935,677 28.031 0 910.226 1,283,648 9,6 13,962 1.354.270
0 0 0 I n 9 ' Y 2.701.277 0 3 I'
377,023 6.104.636 70.791 188.243 637.I4b 'j.Y90.lW 83,702 175,875
21.686.393 23.6Jr4.675 I .537,i94 2.030.296
---
h7 I .203.639 7,666,571,275 84 .098.2 78 135.173.528
[USE! (E!JRi jLS1: !USE)
141,912,613 6.c770. j28.242 52.500.557 87.976.903 44.5136.853 3.513.589.794 66 .OX433 66,308,036
258,572,804 6,787,870,205 86.742.708 156,060.576
The accompanying notes tortti an integral
1 ti
FRANKLIN TEMPLETON INVESTMENT FUNDS
STATEMENT OF NET ASSETS AT DECEMBER 31, 2006 ( c o n t i n u e d )
lernpleton Ternpleton IernFletcn Tcrrple'or, Lotin Thai1or.d U S Ilo!ar IJ s VG8UC
Americti Fund Liquid h r d Furid Reserve
F I I ~ (USD; (IISC) IIJSIJ [USCi
773,761.259 191,638.486 44.957.71 1 15,280.337 32,221.079 1 I ,884. I63 71,035,268 782,935
hh9.057 58.000 0 0 16,487,122 6.444.883 560.811 I 1.92P
3,924.042 101.854 12,136 10,480 5.595 0 0 3 7
0 0 0 0
827.068.1 54 210,130,395 1 I6,59+,936 16.385.71 r-)
0 3,669.278 5.457.4+2 0 Y.224.833 2,202.956 660.081 3.234
0 0 0 0 0 0 0 0
880,142 265,287 3T.367 13.04 I 863,886 2 I3330 80.287 12,837
10,977,861 6.350.87 1 6.234.177 29.I2.2
816.090.2(13 203.779.544 110.359 750 16.076.59i
lUSDl [USD) !USDj i JSD:
234,379,856 88.29 1,983 100.4Or-).607 T,OH3.320 481,098.175 178,853,306 149,922,713 10.424.882
68,465.500 71,494,097 152,8$2,051 2.883 .6G9
part 01 these financial state~nmts
17
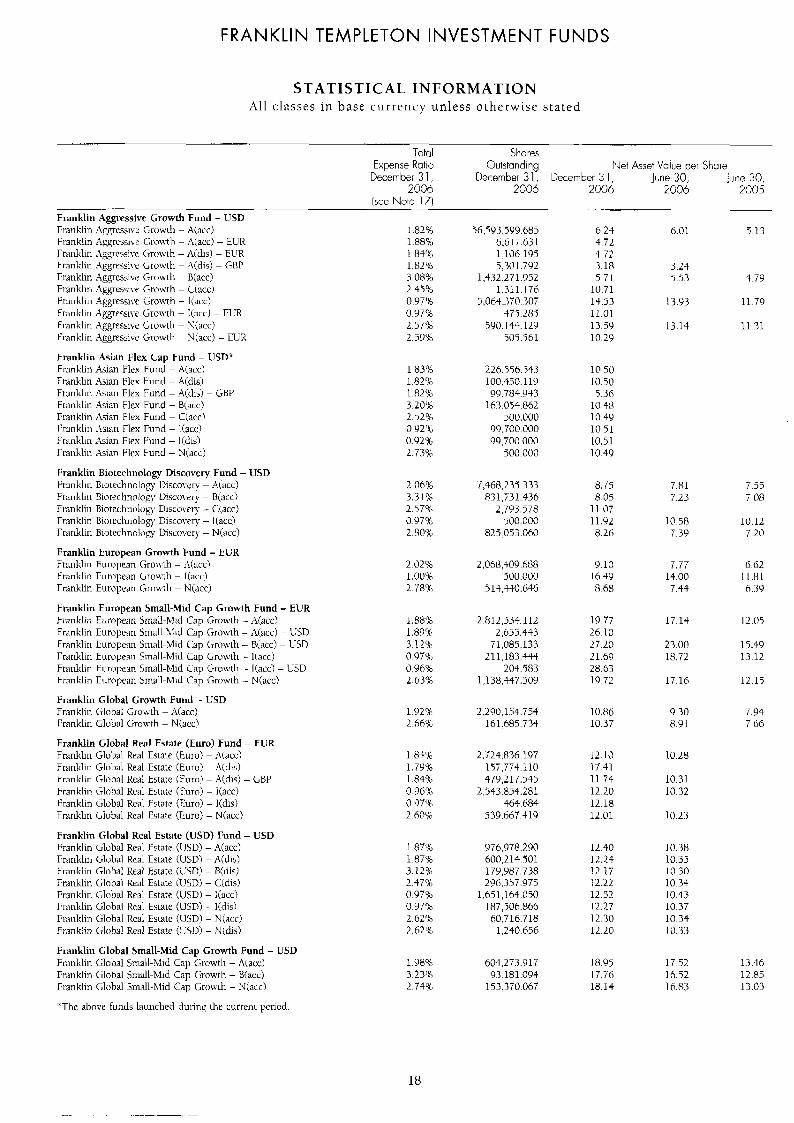
FRANKLIN TEMPLETON INVESTMENT FUNDS
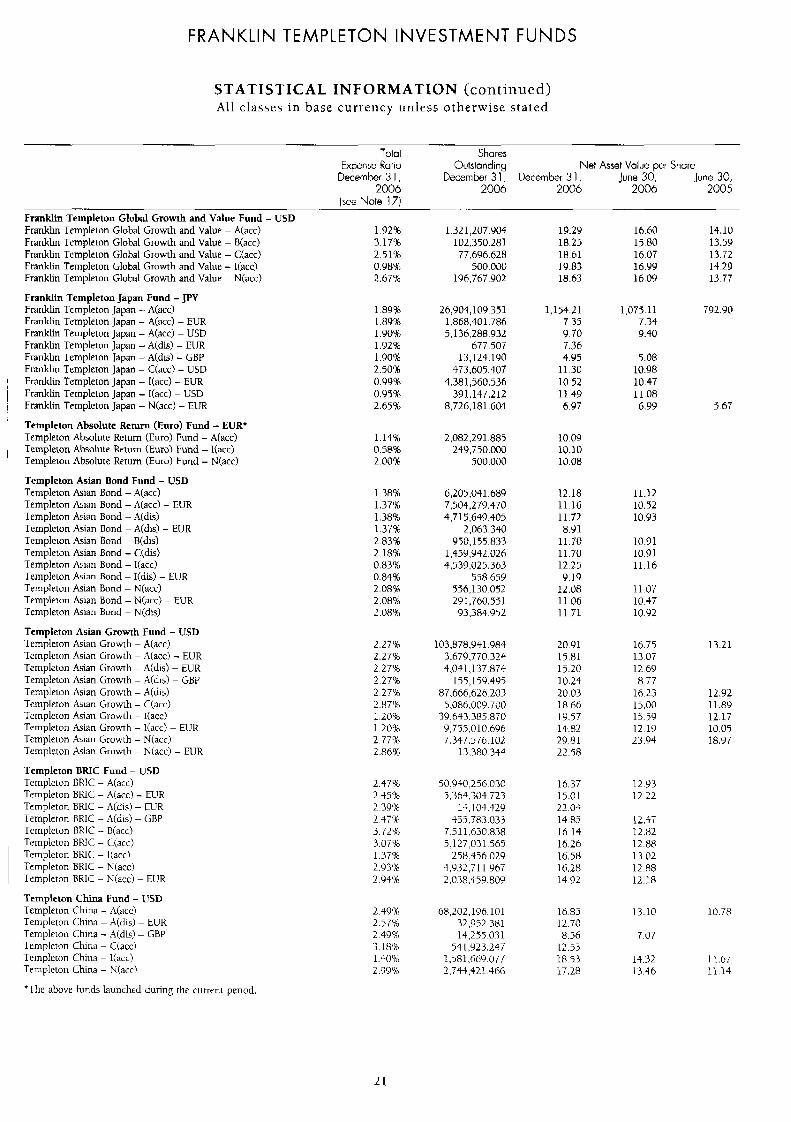
STATISTICAL INFORMATION All classes in base currency unless otherwise s t a t ed
Total Shares Expense Ratio Outstcrnding Net Asset Value per Shore
December 3 1 , December 3 1 , December 3 1 , Jme 30,
(see Note 17)
June 30, 2006 2006 2006 2006 2005
- Franklin Aggressive Growth Fund - USD Franklin Aggressive Growth - A(acc) Fi-anklin Agressile Cirowtli - :\(ace) - ELJR Frmltlm Aggressiw (;i-o\vth - A(&) - ELIR Franklin Aggressive Growth - A(dis) - GBP Franklin Aggrcssiw GroLb th - D(acc) Franltlin ,fgi-essi\c Growth - C(acc) Frankliri Aggressive Lrowth - l(x:c) Franklin AEressive Growth - Iiacc) - EIIR Franklin Aaressive Growth - S(acc.) Franklin Aggressive Growth - Niacc) - EG:R
Franklin Asian Flex Cap Fund - USD* Franklin h l a n Flex Fund - Aiacc! Franklin Asian Flex h i n d - A(&) Franklin Asian Flex Fund - Aidis! - C;HP Franklin Asian Flex Fund - Bvacc) Fraiildin ,\sian Flex Fund - C(accj Frmklin Aslan Flex Fund - 1iac:c) FrJnklin ,%&in Flex Fund - I(dis) Franklin Asian Flex- Fund - Niacc)
Franklin Biotechnology Discovery Fund - USD Franklin Biotechnology L)iscorc.ry - ..\(act) Fmrikliti Biorectinology 11imJvery - B(acc! Franklin Biotechnology Discovety ... C(acc) Franklin Biolechriology Discovery - I(acc) Franklin hotecIiiiol(y,y Discovery - N(acc)
Franklin European Growth Fund - EUR Franklin Furopcr:m Gron th - A(accl Frmklin ELiropfan C;i-oath - I(acc! Franklin European Growih - Ntacc)
Franklin European Small-Mid Cap Growth Fund - EUR hanklin European 5mnll-Mid Cap G r o w t i - A(3cc) Ffiinklin European Small-Vid Cap Growth - A(acc) - LSD Friiiiklin Etiropean Small-Mid Cap Growth - B(acc) - L5D Franklin European 5mall-Micl Cap Growth - Itace) Fraiiltlin European Sniall-Mid Cap Growtli - I(acc) - LSD Franklin European Smal~-Mid Cap Growth - Ntacc)
Franklin Global Growth Fund - USD Franklin (;lobal Gron th -- A(acc) Franklin Global Li-onth - Nkncc)
Franklin Global Real Estate (Euro) Fund - EUR Franklin Global Real Estate (Euro) - :\(act) Franklin Global Real Estate (Euro) - :\(dl Franklin Global Real Estate (Euro! - A(di Franklin Glohd Real Estate (Euro) - lkacc) Franklin Global Real Fstate (Euro) - l(c1ls) Franklin Global Kea1 Estate (Euro) - N(acc)
Franklin Glohal Real Estate (USU) Fund - USD kranklin Global Real Fstate (1JSD31 - ,\(ace) Franklin Cilohal Kea1 Esratc (USD) - A(dis) Franklin Global Real Estate (LSD! - B(dis) rrankliii C;lobal Kea1 Estate [USD) - C(dis) Franklin Global Real Estate (WD) - l(acc) Franltlin Global Kcal Eswte (USD) . I(disl Franklin Global Real Esratc (USD) - Niacc) Franklin Global Real Estate (1.SD) - Nidis!
Franklin Global Small-Mid Cap Growth Fund - USD Franklin Global Small-\lid Cap Growth - A(acc) Franklin Global Small-Mid Cap Cirowth - R(acc) Fi-ankh Glohal Small-Mid Cap Gro\vth - Nkicc)
'The abnrc furicls launched dunng the current penod.
I .82% 1.8836 1.8S'li. 1.82% 3.08% 2 45% 0.97% 0.97%
2.59'6 2.57%
1.83% 1.82% 1.82B 3.20% 2.52% 0.92's 0.92% 2.7390
2.06% 3.31% 2.57% 0.97% 2.80%
2.0236 1 .OO% 2.78%
1.88% 1.899 3.12%. 0.979;. 0.96'YC 2.63%
1.92% 2.669;;.
1.83% 1.79% 1.8441 0.968 0.97?4 2.60%
1.87% 1.87% 3.128 2.47's 0.979, 0.9 7% 2.62% 2.62%
l.Y8% 3.23'1 2.748
56,503,599.685
1,106 195 5,30 I .792
6.6 17.63 I
1.4.32.271.952 1,311.176
5,064,370.307 475.287
590,144.129 505.561
226.556.543 100,450.119 99.784.943
16 3.054.882 500.000
99.700.000 99.700.000
500.000
7.468.2.39.33.3 831 ,i31.436
2,793.578 500.000
825.053.060
2,068,409.688 500.000
5 14,440.646
2,812,534.112 2,655.433
71.085.133 21 1,183.444
204.583 1,138,447,509
2.290.154.754 16 1.685.733
2.724.836.197 157.774.1 10 379,217.545
2.543.854.281 464.684
539.667.419
976,978,290 600.2 14.501
296.357.975 1,651,164.050
187,506.866 60,716.718
1,240.656
179,987,738
604.273.917 93,181.094
153,370.067
6.24 4.72 't 72 3.18 5.7 I
10.71 13.43 11.01 13.50 10.29
10.50 10.50 5..38
10.48 10.49 10.51 10.51 10 49
8.75 8.05
11.07 11.92 8.26
9.10 I 6.40 8.68
19.77 26.10 27.20 21.69 28.63 19.72
10.86 10.37
12.10 17.41 11.74 12.20 12.18 12.01
12 40 12.23 12.17 12.22 12.52 12.27 12.30 12.20
J 8.95 17.76 18.13
6.01 5.13
3.24 5.53 4.79
I3 93 11 79
13.14 11 91
7.81 7 23
lC.58 7.39
7.77 14.00 7.44
17.14
23.00 18.72
17.16
9.30 8.9 I
10.28
10.31 l(1.32
10.23
10.38 10.35 10.70 10 34 10.43 10.37 10.34 10.33
17.52 16.52 16.83
- -- 1.33
T.08
10.12 7.20
6.62 11.81 6.39
12.05
15.49 13.12
12.17
7.94 7 66
13.46 12.85 13.03
18
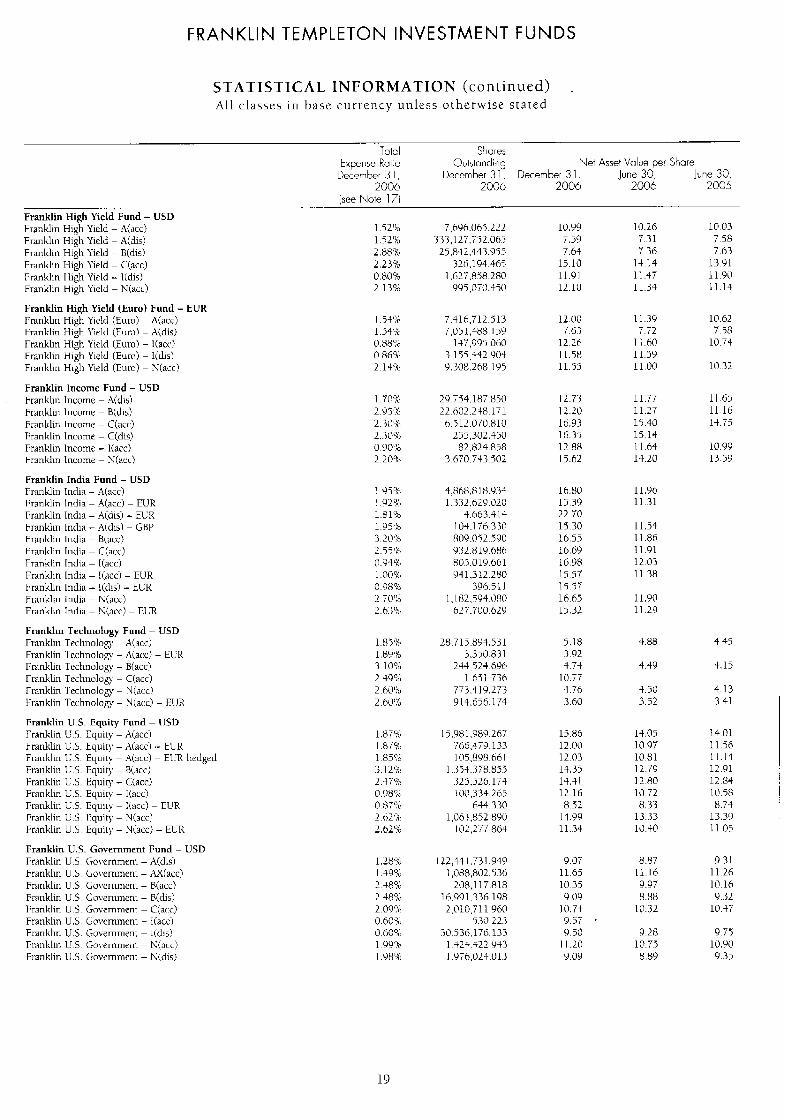
FRANKLIN TEMPLETON INVESTMENT FUNDS
STATISTICAL INFORMATION (cont inued) Al l classes in base cur rency unless o therwise s t a t ed
Totcl ShJres txFense Roto Obtstondiorj Net Asset \/due p e ~ Share
December 3 1 , Dcccmber 3 1 , December 3 1 June 30, June 30, 2006 2006 2006 2006 2005
(see Note 171 Franklin Hiph Yield Fund - USD Fi-anklin Hiih Yield - A(ACC) Franklin IHigh Yield - A(&) Franklin High Yield - B(dis) Franklin High Yield - C(acc) Franklin lligh Yield - I(dis) Franklin High Yield - N(acc)
Franklin High Yield (Euro) Fund - EUR Franklin High Yield (Euro) - /\(act:) Franklin High Yield (Eur~) - A(dis) Franklin High Yield (Euro) - I(acc) Franklin High Yield (Euro) - Iidisl Franklin High Yield (Euro) - S(acc!
Franklin income Fund - lJSD . Franklin Income - A(dis)
Franklin Incomr - B(dis: Franklin lncomr - C(acc) Franklin Income - C(diD Franklin Income - I(acc) Franklin Income - N(acc)
Franklin India Fund - USD Franklin India - A(acc) Franklin India - A(acc) - EUR Franklin India - A(dis) - EL'R Franklin lndia - A(dis) - GHP FI-ankh India - H~acc) Franklin India - C.(acc) Franklin India - Itacc) Franklin India - Ik~cc) - EUR Franklin India - I(dis! - EUR Franklin India - h(acc) Franklin India - N(acc) - ELR
Franklin Technology Fund - USD Franklin Technology - A(acc) Fi-ankh I cchnology - .A(ac:c) - EYR Franklin Technology - B(acc) Franklin Technolog - C(acc! Franklin Technolog). - 'd(acc! Fi-ankh Technolorn - U(ac:c) - EI!R
Franklin U.S. Equity Fund - l lSD Franklin C.S. Equity - Aiaccl Franklin L.S. Equity - Xacc) .- ELR
I
Franklin U.S. Equity - I(acc)
Franklin U.S. Government Fund - USD Franklin U.5 Governmrrii - A(clis) Franklin U 5 Government - iYX(acc) Franklin U 5 Looernment - RCaccl Franklin U.S. Lovemment - B(disl Franklin l J . 5 Govcminenr - C(ac:c) Franklin U.5. Governnient - I(acc) Franklin I J . 5 Govemnicnt - I(dis? Franklin U.S. Governmt.rit - Ki(acc)
7,696.064.222 333,127.752.065 25,842.443.95.5
326,194.463 1.627.848.28O
995,DT0.450
7.4 16.712.5 13 7,051,388 159
147.99 j 060 3.155.442.904 9.308.268 195
20.754.187.850 22.602.238.171
fj.512.070.810 255,302.350 82.824.858
3,670,743 502
4,868.8 I8 931 1.332.629 020
809.042.590 932.819.686 805.019.661 941.312.280
336.51 I I ~ 182.594.080
627,700.629
28.715.893.531 3.350.8 3 1
244.524 696 1.651 736
773.419.273 914.656.174
15.981.989 26: 766.479.133 10.5.898.66 I
1..334.378.84.5 324.526.174
644.330 1,06+,852.890
I00,334.265
102,277 864
122.331.731.949 1,088,802.5.36
208.1 17.818 16.991.336.198 2.010.711 960
5.30 22.3 30,536,176 133
1.423.$22.943 FI-ankh l.1 S. Government - li<disj 1,976,024.01.3
10.99 T.59 7.63
15.10 11.91 12.10
12 00 7.6.3
12.26 11.58 11.55
12.73 12.20 16.93 16.3,5 12.88 15.62
16.80 15.39 22.70 15.30 16.55 16.69 16.98 15.57 15.57 16.65 15.32
5.18 3.92 $.7+
I 0 . i 7 4.76 3.60
15.86 12.00 12.03 14.35 13.41 12.16 8.52
14.99 11.34
9.07 11.65 10.35 9.09
10.74 9.57 9.50
11.20 9.0Y
1 tJ.26 1 W 3 7.31 7.58 7.36 7.63
14.14 13.91 11.47 11 90 11.33 11.14
11 3 9 10.62 7.72 7.58
1 1.60 10 74 11.59 I I .00 1t732
11.77 11.65 11.27 11.16 15.40 lS.T5 El+ I l .h4 10.99 14.20 13.59
11.96 11.31
11.53 1 1-86 11.91 12.03 11.38
1 I .YO 11.29
4.88 4.45
4.49 +.I5
+.50 4.13 3.52 3.41
13.05 14.01 10.97 11.56 10 8 1 11.14 12.79 12.91 12.80 12.84 10.72 10.58 8.37 8.74
1.3.33 13.39 10.30 1 1.05
8.87 9.31 11.16 11.26 9.97 10.16 8.88 9.32
1 P..32 10 $7
9.28 9.75 10.75 10.90 8.89 9.35
19
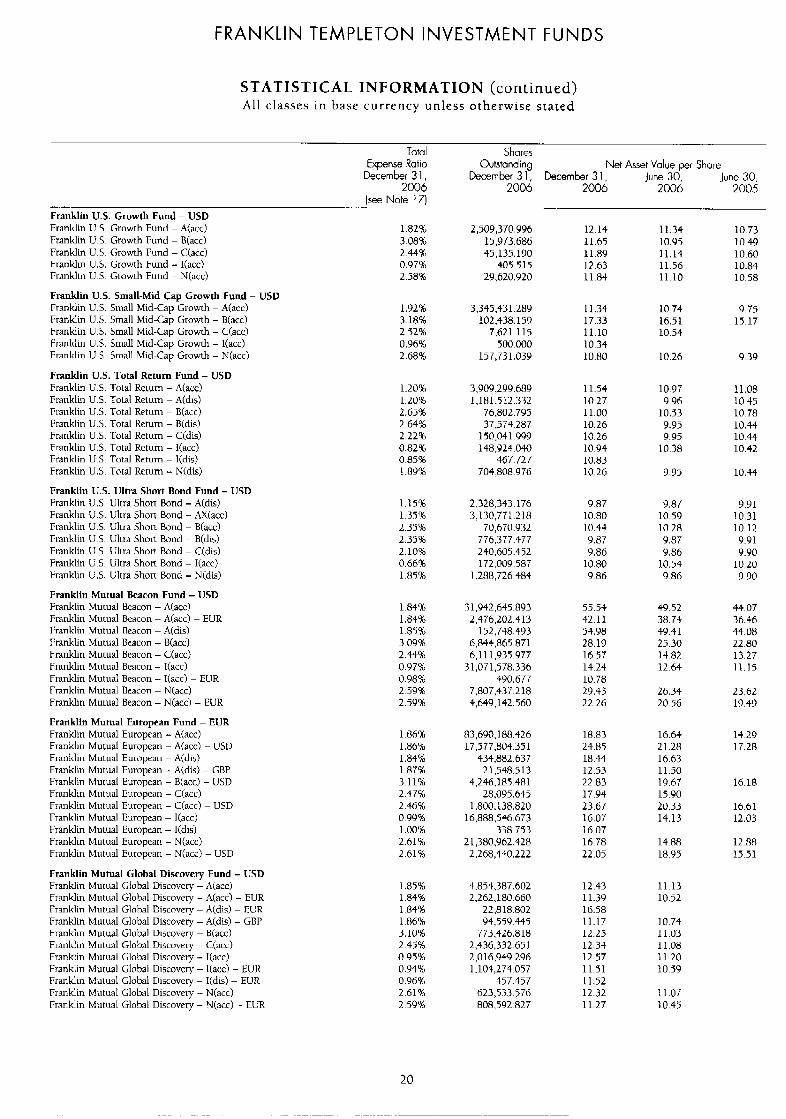
FRANKLIN TEMPLETON INVESTMENT FUNDS
STATISTICAL INFORMATION (continued) All classes in base currency unless otherwise stated
Total Shares Expense Ratio Outstanding Net Asset Value per Shore
December 3 1 , December 3 1 , December 3 1 , June 30,
(see Note 17)
June 30, 2006 2006 2006 2006 2005
.-. Franklin U.S. Growth Fund - USD Franklin U.S. Growth Fund - A(acc) Franklin U.S. Growth Fund - B(acc) Franklin U.S. Growth Fund - C(acc) Franklin U.S. Growth Fund - I(acc) Franklin U.S. Growth Fund - N(acc)
Franklin U.S. Small-Mid Cap Growth Fund - USD Franklin U.S. Sinall Mid-Cap Growth - A(acc) Franklin U.S. Small Mid-Cap Growth - B(acc) Franklin U.S. Small Mid-Cap Growth - C(acc) Franklin U.S. Small Mid-Cap Growth - I(acc) Franklin U.S. Small Mid-Cap Growth - N(acc)
Franklin U.S. Total Return Fund - USD Franklin U.S. Tobal Return - A(acc) Franklin U.S. Total Return - A(&) Franklin US. Total Return - B(acc) Franklin U.S. Total Return - B(dis) Franklin U.S. Total Return - C(dis) Franklin U.S. Total Return - I(acc) Franklin U.S. Total Return - I(dis) Franklin U.S. Total Return - N(dis)
Franklin U.S. Ultra Short Bond Fund - USD Franklin U.S. Ultra Short Bond - A(dis) Franklin 11.5. Ultra Short Bond - AX(acc) Franklin U.S. Ultra Short Bond - B(acc) Franklin U.S. Ultra Short Bond - B(dis) Franklin U.S. Ultra Short Bond - C(dis) Franklin U.S. Ultra Short Bond - Itace) Franklin U.S. Ultra Short Bond - N(dis)
Franklin Mutual Beacon Fund - USD Franklin Mutual Beacon - A(acc) Franklin Mutual Beacon - Atace) - EUR Franklin Mutual Rracon - A(dis) Franklin Mutual Beacon - B(acc) Franklin Mutual Beacon - C(acc) Franklin Mutual Beacon - I(acc) Franklin Mutual Beacon - I(acc) - EUR Franklin Mutual Beacon - N(acc) Franklin Mutual Beacon - Ntacc) - EUR
Franklin Mutual European Fund - EUR Franklin Mutual European - A(acc) Franklin Mutual European - A(acc) - USD Franklin Mutual European - A(dis) Franklin Mutual European - A(dis) - GBP Franklin Mutual European - R(acc) - USD Franklin Mutual European - C(acc) Franklin Mutual European - C(acc) - USD Franklin Mutual European - I(acc) Franklin Mutual European - I(dis) Franklin Mutual European - N(acc) Franklin Mutual European - N(acc) - USD
Franklin Mutual Global Discovery Fund - USD Franklin Mutual Global Discovev - A(acc) Franklin Mutual Global Discovery - A(acc) - EUR Franklin Mutual Global Discoveery - A(dis) - EUR Franklin Mutual Global Dlscovery - A(dis) - GBP Franklin Mutual Global 1)iscovery - B(acc) Franklin Mutual Global Discover). - C(acc) Franklin Mutual Global Discovery - I(acc) Franklin Mutual Global Discoveer). - I(acc) - EUK Franklin Mutual Global Discovery - I(dis) - EUR Franklin Mutual Global Discovery - N(acc) Franklin Mutual Global Discovery - V(acc) - ELR
1.82% 3.08%
0.97% 2.58%
2.44%
1.9216 3.18% 2.52% 0.96% 2.68%
1.20% 1.20% 2.65% 2.64% 2.22% 0.82% 0.85% 1.89%
1.15%
2.35% 2.35% 2.10% 0.6616 1.85%
1.35%
1.84% 1.8416 1.85% 3.09% 2.44% 0.97%
2.59% 2.59%
0.98%
1.86% 1.86% 1.84%
3.11% 2.47% 2.46% 0.99% 1.00% 2.61% 2.61%
1.87%
1.85% 1.84%
1.86% 3.10% 2.45% 0.95% 0.94%
2.61% 2.59%
1.84%
0.96%
2,509,370.996 15,973.686 45,135.190 405.5 15
29,620.920
3,345,431.289 102,438.159 7.621.115 500.000
157,731.039
3,909,299,689 1,181.512.332 76,802.795 37,574.287 150,04 1.999 148,924.040
467.727 704,808.976
2,328,343.176 3,130,771.218 70,670.932 776.377.477 240.605.452 172,009.587
1.288,726.484
31.942.645.893 2,476,202.413 152,748.493
6,844.865.871 6.1 11.935.977 3 1,071,578.336
490.677 7.807.437.2 18 4,649,142,460
87,690,188,426 17,577.804.35 1 434,882.637 21,548.513
4,246,185.481 28,095,645
16.888.546.673 338.753
I .800.138.a20
2 i,3ao,962.428 2,268,440,222
4,854,387,602 2,262,180.660 22,818.802 94,559.445 773,426.818
2,436,332.651 2.016.949.296 1,104,274.057
457.457 623,533.576 808.592.827
12.14 11.65 11.89 12.63 11.84
11.34 17.33 11.10 10.34 10.80
11.54 10.27 11.00 10.26 10.26 10.94 10.83 10.26
9.87 10.80 10.44
9.86 10.80 9.86
9.87
55.54 42.11 54.98 28.19 16.57 14.24 10.78 29.43 22.26
18.83 24.85 18.44 12.53
17.94 23.67 16.07 16.07 16.78 22.05
22.83
12.43 11.39 16.58 11-17 12.25 12.34 12.57 11.51 11.52 12.32 11.27
11.34 10.95 11.14 11.56 11.10
10.74 16.51 10.54
10.26
10.97 9.96 10.53 9.95 9.95 10.38
9.95
9.87 10.59 10.28 9.87 9.86 10.54 9.86
49.52
49.41 25.30 14.82 12.64
26.34 20.56
38.74
16.64 21.28 16.63 11.50 19.67 15.90 20.33 14.13
14.88 18.94
11.13 10.52
10.74 11.03 11.08 11.20 10.59
1 1.07 10.45
10.73 10.49 10.60 10.84 10.58
9.75 15.17
9.39
11.08 10.45 10.78 10.44 10.44 10.42
10.44
9.91 10.31 10.12 9.91 9.90 10.20 9.90
44.07 36.46 44.08 22.80 13.27 11.15
23.62 19.49
14.29 17.28
16.18
16.61 12.03
12.88 15.51
20
FRANKLIN TEMPLETON INVESTMENT FUNDS
STATISTICAL INFORMATION (continued) Al l classes in base cur rency unless otherwise s ta ted
Total Shares Expense Ratio Outstanding Net Asset Value per Share
December 3 1, December 3 1, December 3 1, June 30, June 30, 2006 2006 2006 2006 2005
(see Note 17) . _ ._ Franklin Templeton Global Growth and Value Fund - Franklin Templeton Global Growth and Value - A(acc) Franklin Templeton Global Growth and Value - B(acc) Franklin Templeton Global Growth and Value - C(acc) Franklin Templeton Global Growth and Value - I(acc) Franklin TempleLon Global Growth and Value - N(acc)
Franklin Templeton Japan Fund - JFT Franklin Templeton Japan - A(acc) Franklin Templeton Japan - A(acc) - EUR Franklin Templeton Japan - A(acc) - USD Franklin Templeton Japan - A(dis) - ElJR Franklin Templeton Japan - A(dis) - GBP Franklin Templeton Japan - C(acc) - USD Franklin Templeton Japan - I(acc) - EUR Franklin Templeton Japan - I(acc) - USD Franklin Templeton Japan - N(acc) - EUR
Templeton Absolute Return (Euro) Fund - EUR* Templeton Absolute Return (Euro) Fund - A(acc) Templeton Absolute Return (Euro) Fund - I(acc) Templeton Absolute Return (Euro) Fund - N(acc)
Templeton Asian Bond Fund - USD Templeton Asian Bond - A(acc) Templeton Asian Bond - A(acc) - EUR Templeton Asian Bond - A(&) Templeton Asian Bond - A(dis) - EUR Templeton Asian Bond - B(dis) Templeton Asian Bond - C(dis) Templeton Asian Bond - I(acc) Templeton Asian Bond - I(dis) - EUR Templcton Asian Bond - N(acc) Templeton Asian Bond - N(acc) - EUR Templeton Asian Bond - N(dis)
Templeton Asian Growth Fund - USD Templeton Asian Growth - A(acc) Templeton Asian Growth - A(acc) - EUR Templeton Asian Growth - A(dis) - EUR Tcmpleton Asian Growth - A(di5) - GBP Templeton Asian Growth - A(dis) Teinpleton ,4sian Growth - C(acc) Templeton Asian Growth - I(acc) Templeton Asran Growth - Ikacc) - EI!K Templeton Asian Growth - N(acc) Templeton Asian Growth - N(acc) - ElJR
Templeton BRIC Fund - USD Templeton BRlC - A(acc) Templeton BRIC - A(acc) - EUR Templeton BRIC - A(&) - EUR Templeton ERIC - A(dis) - GRP Templeton BRIC - B(acc) Templeton BRIC - Ciacc) Tcmpleton BRIC - I(acc) Templeton BRIC - N(acc) Templeton RRIC - N(acc) - EUR
Templeton China Fund - USD Templeton China - A(acc'i Templeton China - A(dis) - EUR Tempkton China - ,4(dis) - GBP Templeton China - C(acci Templeton China - l(wc) Tcmpleton China - h(acc)
*The above funds launched during the ctitrent pciiod.
USD 1.92% 3.17% 2.51% 0.98% 2.67%
1.89% 1.89% 1 .90% l.Y2% I ,90% 2.50% 0.99% 0.95% 2.65%
1.14% 0.58% 2.00%
1.38% 1.37%
1.37% 2.83% 2 .188 0.83% 0.84% 2.08%
2.08%
1.3816
2.0816
2.27% 2.27% 2.27% 2.27?4 2.27% 2.87% 1.20% 1 .20s 2.77% 2.8616
2.479(, 2.45% 2.39% 2 47% 3.72% 3 . 0 X 1.37% 2.93% 2.94%
2.49% 2.57%
3.18% 2.498
1.40% 2.99'1>
1.32 1,207.904 102.350.281 77.696.628
500.000 196.767.902
26,904,109.351 1,868,401.786 5,136,288.932
677.507 13,124.190
47.3.605.407 4.381,560.536
391.147.212 8.72h.181.604
2,082,291 2.85 249,750.000
500.000
6,205.04 1.689 7,504,279.470 4.715,649.405
2.063.340 950.155.833
1,459,942.026 4,539,025.363
558.659 556,130.052 29 1,760.451 93.384.952
103,878,941.984 3,679,770.324 4,041,137,874
155,159.495 87,666,626.203
5,086.009.700 39,643.384.870
9,755.010.696 7.347.576.102
1.3.380.344
50,940,256.030 5,364.304.723
1-t.104.429 455.783.033
7.51 1,630.8.38 5,127,031.565
258.456.029 4.932,711.967 2.018.459.809
68,202,196.101 32.952.381 14,255.0.31
541,923.247 1,581 .hh9.077 2.7W.421.466
19.29 18.25
19.83 18.63
18.61
1 ~ 154.2 1 7.35 9.70 7.36 4.95
11.30 10.52 11.49 6.97
10.09 10.10 10.08
12.18 11.16 11.72 8.91
11.70 11.70 12.25 9.19
12.08 11.06 11.71
20.Y1 15.81 15.20 10.24 20.03 18.66 19.57 14.82 29.81 22.58
16.37 15.01 22.04 14.85 16.14 16.26 16.58 16.28 14.92
16.85 12.70 8.56
12.53 18.53 17.28
16.60 14.10 15.80 13.59 16.07 13.72 16.99 14.29 16.09 13.77
1,075.11 792.90 7.34 9.40
5.08 10.98 10.47 11.08 6.99 5.67
11.12 10.52 10.93
10.91 10.91 11.16
11.07 10.47 10.92
16.75 13.07 12.69
16.23 15.00 15.59 12.19 23.94
8.77
12.33 12 22
12.47 12.82 12.88 13.02 12.88 12.18
13.10
7.07
14.32 13.46
13.21
12.92 11-80 12.17 10.05 18.97
10.78
11.67 11.14
21
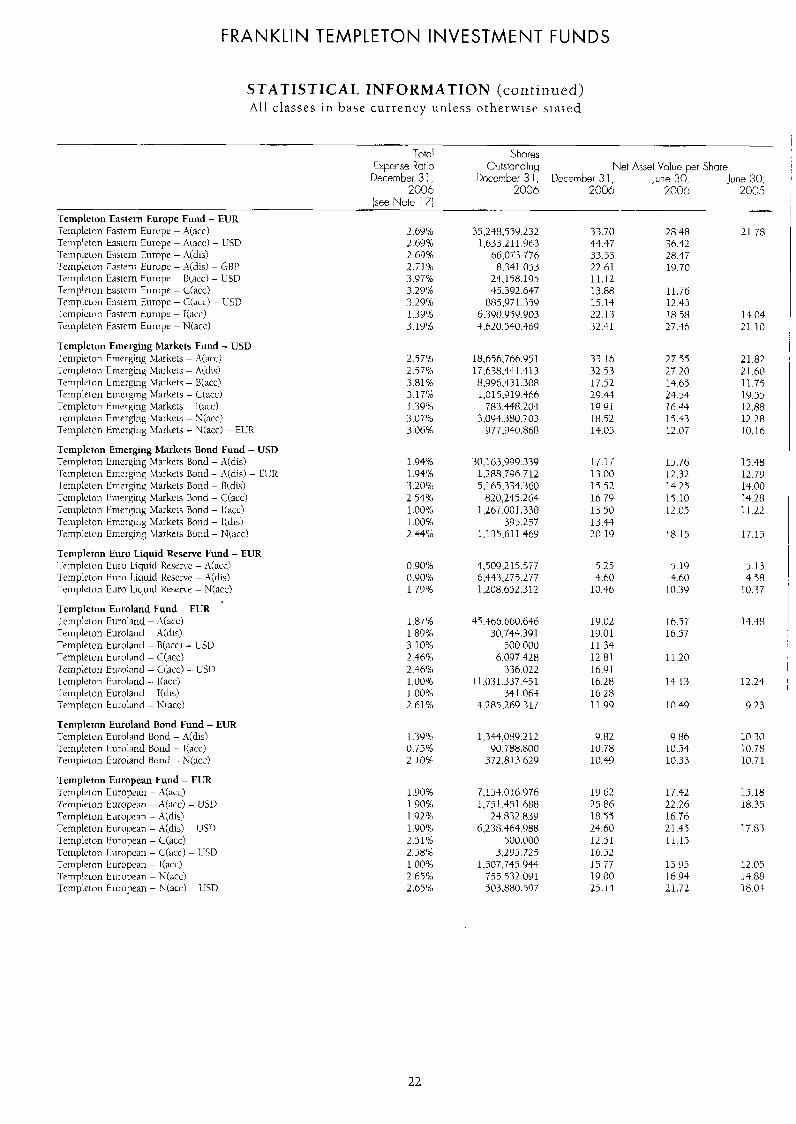
FRANKLIN TEMPLETON INVESTMENT FUNDS
STATISTICAL INFORMATION (continued) All classes in base cu r rency unless otherwise stated
~~ ______
Total Shnies Expense Ratio Outstanding Net Asset Value per Share
December 3 1 , Docember 3 1, December 3 1, June 30, June 30, 2006 2006 2006 2006 2005
(see Note 17) Templeion Eastern Furope Fund - EUR Templeton Eastern Europe - A(Kc) Templeton tastei-ri Europe - A(acc:) - I!SD Templelori Eastern Europe - A(clis) Tcrnplcton Fairtm Europe - .4(di5! - G H I ' l~miplctori Eastern Fun-npc: - B(acc) - USD Ternpleton Eastem Europe - C(acc) Tcmplrlon Eastern Europf - C(acc) - USD
rmplrl(!n Eastem Europe - 1 ( ~ c ) Teinpleton Eastern Europe - N(acc)
Templeton Emerging Markcts Fund - USD Templeton Emerging hlarkets - :I Templeron Emerging Markets - Aidis) Tcni p I CI o i i E rnerging L1 ai- kcr s - B(acc) 'Templeton Emerging Murkets - C(acc) Ternpleton hic:rRirig Markets - I(acc) Trmplelori Emerging Mal-krts - N(acc) Ternpleton Fmci-Ring \larkets - N(RCC) - EIJR
TFmpktoii Emerging Markets Bond Fund - USD Templ(~ton Eniergiiig hlarkrrs Bond - A(dis) I'eiTiphjn Emerging \Ixkets Bond - .A(&) - E1:R Templeton Emcr$ig Xlarkets Bond - H(dis) Templeton hiivi-,qirig Markets Bond - C(acc) Templeton Emerging Markets Rond - I ( Templeton Fmci-girig Markets Bond - I(dis) Trmplctori Emergin: Mal-kets Burid - Niacc)
Templcton Euro Liquid Reserve Fund - EUR l.mipleton Euro Liquid Kesrrve - A(accl Tcinpletoii Euro LicILticI Reserve - .A(dis! 1-empletori Euro Liquid Kescne - N(acc)
Templeton Euroland Fund - EUR ~J~cmplclori Euroland - :\iat.c) T ~ r r l p l e t ~ I l Euroland - ..\<tils! Tenipleton Euroland - B(acc) - L E D Ternpleton Eurolaiid - C(acc) Tc.rnpleton E u i - o l d - Ciacc) L5l) Tt.i~iplctnii turoland -- l(ncc) .l.ernplclorl Euroland - I(cli5) Templeton kui-olancl - K w c )
Tcmplcron Euroland Bond Fund - EUR Teiiipkturi Eurolnnd Bond - ,4(chs! Tenipleton t.uroland Bond - I(acc) Templetori Euroland Bond - N(acc)
Templeton European Fund - EUR 1-emplrton European - ,\(act.) Trmplcton Europcan - A(acc) - LISn Templeton Europl,an - A [ ~ I s ) Ternpleton k u r o p ~ i n - A(d~s) - USI) T?rnpleton Furopmi - C(acc) Templeton hiropean - C(acc) - 1ISD Templcrnn European - I(acc) T(~mpleturi European - Neacc) Templetmi kurupeaii - N(acc) - USD
2 69% 2 69% 2.69% 2.Tl'lo 0.97% 3.29% .3.29% 1.39% 3.19'yO
2.57% 2 .578 3.81%) 3.17% J .39% 0.07?0 3.06%
1.94% 1.94'1 3 .208 2 .548 1.008 I .00% 2.43':o
0.90'% 0.90% 1.79%
1.87% 1.898 3.108 2.46% 2.46% 1.00% J .00% 2.61%
I .39% 0.74% 2.109.
1.90% 1.908 1.92% 1.90% 2.51% 2.585 1.0@% 2.65%> 2.65%
35,248.559.232 1,633.21 1.963
66.073 776 8,341 053
24.158.195 4.7.392.647
885,971 359 6.390.999.903 1.620.440.469
18,656.766.951 17,638.431.41 3 8.996.431 3 0 8 1.01S.Yl9.466
783.448.204 3,09-t..380.7@3
977940.868
30,163,999.33Y 1,288,796 712 5.165.334.360
820,245.264 1 .26T.00 1.330
395.257 1~135,611 469
4,509 ,215.5T7 6.443.277.277 1.208.652.312
45,468,660.646 30,744.39 1
[email protected] 6,097.428
336.022 I I .031.037.491
34 I .064 4.285,269.317
1,344,089.212 90,788.800
372,813 629
7.154.01 6.976 1,75 1.451.688
24.832.8.30 6.238.464.988
500.000 3,295,725
1,507,745.044 + _ _ (>?,502.091
503.880 597
33.70 44.47 33.53 22.61 11.12 13.88 15.14 22.13 32.41
33.16 32.53 17.52 29.44 1Y.41 18.52 14.05
17.17 13.00 15.52 16 71) 13 50 13.44 20.19
5.25 4.60
10.46
19.02 1Y.01 11.34 12.81 16.91 16.28 16.28 11.99
9.82 10.78 10.49
19.62 25.86 18.57 24.60 12.51 16.52 15.77 19.00 25.14
28.48 36.32 28.47 19.70
11.76 12 43
27.46 18 58
27.55 27.20 14.65 24.51 16.44 15.43 12.07
15.76 11.32 14.25 15.10 12.05
I 8 15
5.19 4.60
10.39
16.57 16.47
11.20
14 13
10.49
9.86 10.54 10.33
17.42 22.26 16.76 21.43 11.17
13.95 16.94 21.72
2 I .78
15.04 21.10
21.82 L I .60 11.75 19.55 12.88 12.28 10.16
15.48 12 79 14.00 14.28 11 .22
17.15
5.13 4.98
10.37
14.48
12.24
9.23
10.30 10.78 10.71
15.18 18.35
17.83
12 05 14.88 18.03
22
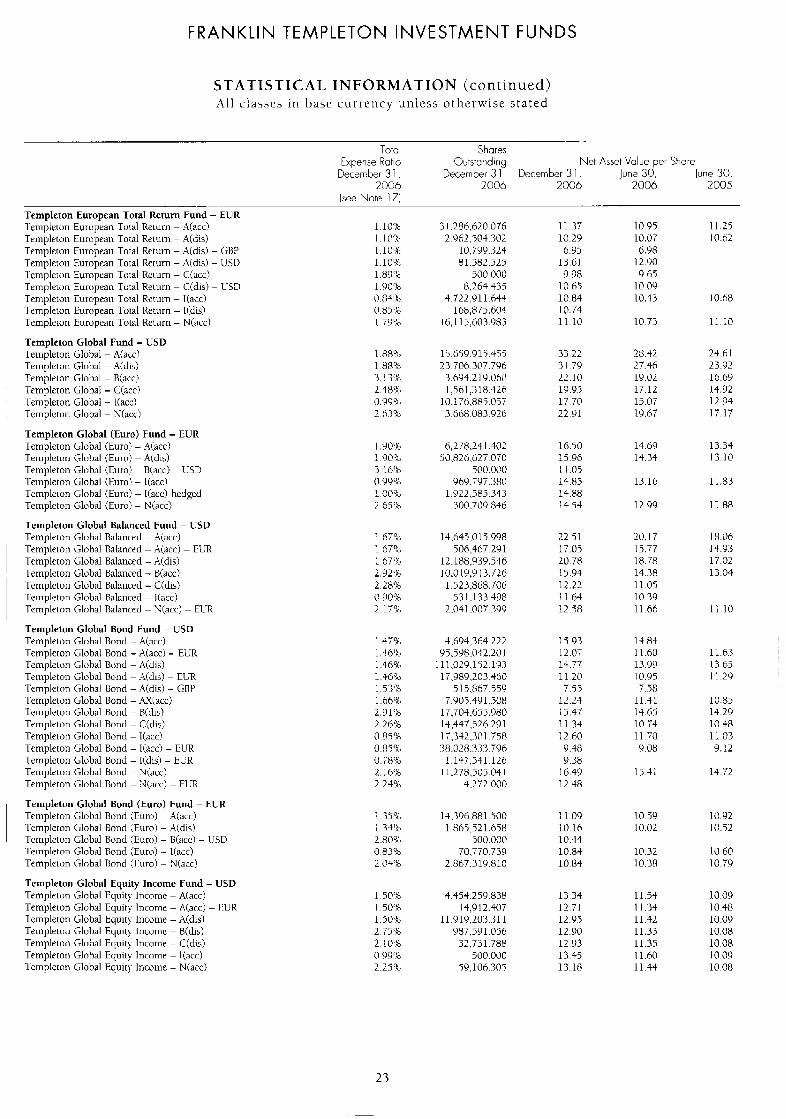
FRANKLIN TEMPLETON INVESTMENT FUNDS
S TAT1 S TIC AL IN F 0 RM AT ION (continued) Al l classes in base c u r r e n c y unless otherwise s t a t e d
Totcl Shares Expense Rotio Obtsturidirig Net Asset Value per Share
December 3 1 , December 3 1 December 3 1 June 30, June 30, 2006 2006 2006 2006 2005
(see Note 171 Templeton European Total Retuni Fund - ElJR lemplelon European Total Return - A(acc! Templeton European Total Return - A(&) Templeton European Total Return - tUdis) - G H P Tenipletoii European Total Return - A(dis) - I!S[) l'emplclon European Total Reiurn - C(acc) Templeton Eurtipvan Total Return - C(dis) - LSD Templeton European Total Return - liacc) Templeton European Tordl Return - I(dis) Templeton European Total Return - N(acc)
Templeion Global Fund - USD Templeton Global - A(acc! Templclon Glohal - A(dis) Templeton Global - B(acc! Templeton Llobal - C(acc! Templeton Global - [(arc) Templeton Global - S(
Templeton Global (Euro) Fund - EUR Templeton Llobal (Euro: - Aiacc) Templeton Global (Euro: - A(dis) Templeton Global (Euro) - B(acc) - USD Templeton Global (Euro) - I(acc) Templeton Glohal (Euro? - Iiacc) hedged Templeton Cilobal (Euro) - N(acc)
Templeton Global Balanced Fund - USD Templrton Gloh;il Ualanccd - Aiacc) Templeton Global Ualancecl - Acacc) - EUR Templeton Llobal Balanced - A(dis) Templeton Global Balanced - B(acc) 'Iempleton Global Balanced - C(dis) Tcmpletoii Global Balanced - I(acc) Trrnpleton Glohal Balanced - N(acc) - EllR
Templeton Global Bond Fund - USD Templetori Glohal Bond - A(acc) Templeton Global Bond - Xacc! -. EUR Templetun Glohal Bond - Aidis) Tenipleton Global Bond - .4(dis) - EUR Templeton Global Hond - Aidis? - GHP Templetoti Global Bond - .LY(xx) 'l.enipleton Global Bond - H(di5) Trrnplrton Glohal Bond - C(dis) Templeton Global h i d - l(acc) Templeton Global Bond - l(acc) - EUR Templeton Global Bond - l(dis) - EUR Templeton Glohal Bond - Niacc) Templeton Global Uond - S(
Templeton Glohal Bond (Euro) Fund - FUR Templeton Global Bond ;Euro) - A(acc) Templeton Global Hond [Furo) - A(d15) Templeton Global Bond :Euro) - U(acc) - I!SD Ismpleroii Global Bond [Euro) - l(acc) Templrton Glohal Bond [Euro) - N(acc1
Templeton Global Equity Income Fund - USD Templrton Glnhal EquitJ- Income - A(acc) Templeton Global Equit!- Income - !\(act) - H J K Templeton Global Equity Income - d(dis) Templrton Glohal Equit)- Income - H(dis) Templeton Global Equit!. Income - C(dis) Tempkton Global Equity Income - liacc) lempletcm Global Fquit)- Income - NCacc)
3 I ,286,620.076 2.962.SD4.302
10.799.324 81.582 525
500.000 8,264.335
4.722.911.644 168,875.60-t
16, I I5,603.983
15.659.91S.459 23.700.307.796
3.694.2 I9 060 1,561,318 426
10,176.885.097 3.668.083.920
6.278.24 I .40? 50,826,627.070
500.000 969.707.380
1.922,585.343 300.7OY .846
14,645,014 998 506,+67.291
12,188,939.5S6 10.0 I9,Y 13.726 I .523,868.706
531.1 33.498 2.041.00T..399
4,694,364.222 95.598.042.20 1
111.029.1S2 193 17,989,203 460
515.867.559 7,905,491.508
17,70$,655.980 1$.447.526 291 17.342.301 758 38.028333 796
1,147,541.126 1 I .27K5135 (14 I
4,272.000
14,396,881.500 1.865.52 1.658
500.000 70,770.739
2.867.319.810
3.454.259.838 14,912,407
11,019,203.31 1 987.591.056
32.731 788 500.000
59.106.305
11.37 10.29 6.95
13.61 9.98
10.65 10.84 10.74 11.10
33 22 3 I .79 22.10 19.95 17 70 22.91
16.50 15.96 I I .05 14.85
14.54 14.88
22.51 17.05 20 78 15.94 12.22 11.64 12.33
15.93 12.07 14.77 11.20 7.'j5
12.24 15.47 11.34 12.60 9.48 9.38
I h.49 12.48
11.09 10. l h 10.44
10.84 10.84
13 34 12.71 12.9s 12.90 12 93 13.45 13.18
10.95 11.25 10.07 10.62 6.98
12.90 9.69
10 09 10.43 10.68
10.73
28.42 27 46 19.02 17.12 15.07 19.67
14.69 14.34
13.16
12.99
20.17 15.77 18.78 14.38 1 1.05 10.39 11.66
14.84 1 1.60 13.99 10.95 7.58
11.41 13.65 10.74 11.70 9.08
15.41
10.59 I0.02
10.32 10.38
11.53 11.34 11.42 11.33 11.35 I 1.60 11.44
11.10
24 h l 23 92 16 69 14.92 12 94 17 17
13.34 13.111
11.83
11.88
18.06 14.93 17.02 13.04
I1 10
11.6.3 13.65 11.23
10.85 14.29 10.48 11.03 9.12
14.72
10.92 10.52
10.60 10.79
10.09 10.48 10.09 10.08 10.08 10 09 10 08
23
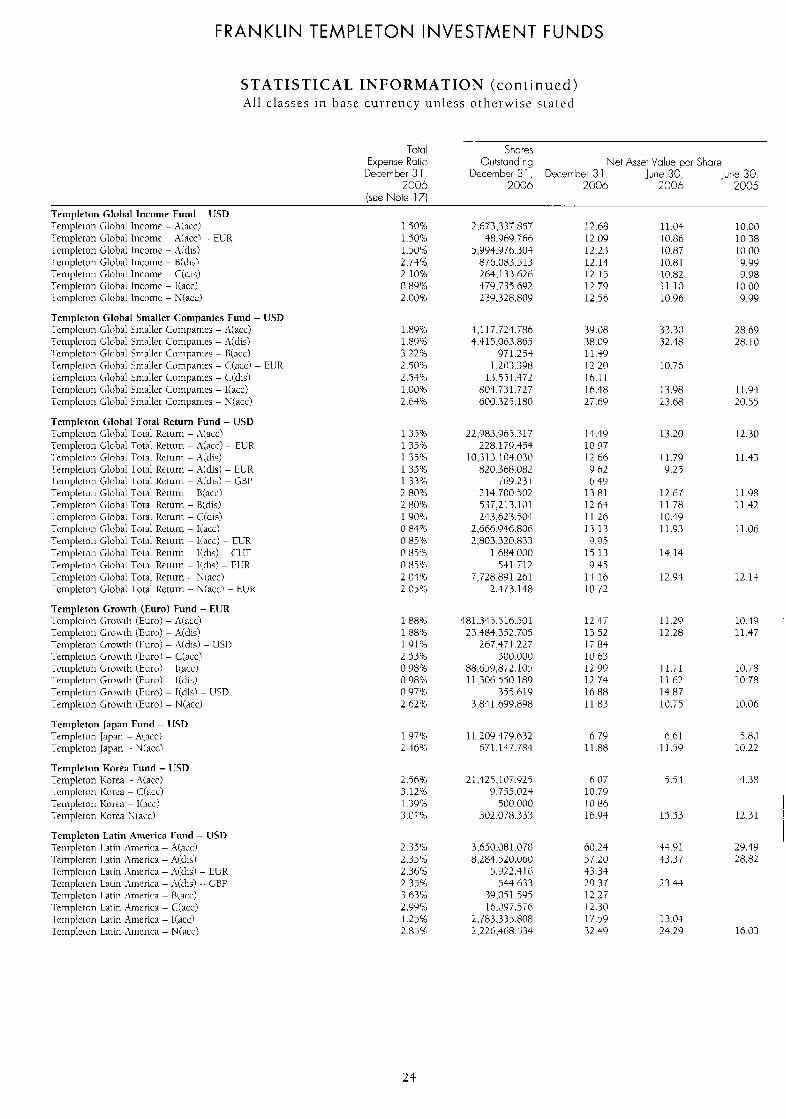
FRANKLIN TEMPLETON INVESTMENT FUNDS
STATISTICAL INFORMATION ( con l inued) Al l classes in hase cur rency unless otherwise s ta ted
Total Shares Expense Rntio 0iutsti.mdirg Net Asset \ /ale per Shore
December 3 1 December 3 1 , Deceniher 3 1 ,
( ~ c e Notc 17)
J w e 30, 2006 2006 2006 2006 2005
June 30
Templeton Ghihal Income Fund - USD Tempktoti Global Inco111e - A[acc) Tmipleroti Global Income A(acci . EUR Xempleton Global Incomc - ,lidis) Templeton Global Income - H(dis1 Tcnipletori Global Incorne - Ciclis) Templeton C;lobal Income - liaccj I cmplrron Glohal lncorntr -
Tcniplctoii Global Sniallrr Companics Fund - Tcriipletori Glohal Srrdlcr Compariies - Akacc) Templeton Global Smaller Companies -
Teriiplelcm (loha1 smaller Cornpanirs - QK) -
TtrripleLm Global Smaller Corripanies - Ciclisl TempleLon CJobal Smaller C:ornpanies - I(acc) TcmpleLon C;lobal Smller Conipanies - S(acc)
Tcmplrton Global .Total Return Fund - lJSD T ~ i i i p l t ~ ~ r i Glotxil Total Rc.tiirn - A(acc) Tetnpleroti Llobal Total Ket~iin - A(acc) -- EUR
I cmplcton (;lob~l Tot:d R m i l i - .A&;) TTIII~ITLVII Global Total Retiirn - A[clis) - ELR Tt-iiiplcrnii ( & h l I oral I < c w i i i - :l(dis) - GBl' Tcmplrtdn G l h l Total Return - Biacc) Templeton Cilobal Total Ketiim - H(dis)
I cmpleron Glohal Total R m n i - Cidis) Tcrnpleloii Global Tolal Return - Ikacc) Tc~iiplc~ori Global Told Return - Ihicc) - TCR Tc.rnpletm C;lobal Total Return - l(c11s) - C:I IT Tcmplcton C;lob,ll Total Rcturn - I(clls! - EUR Tmiplcton Global Total Return Ii l~empleton Glol,al l.otal Kctnm - h
Templeton Growth (Euro) Fund - EUR . I mipkt on (;i-owli (Euro) - A(xc) Teniplcton GronLh (Euro) - A(dis) 1-mipleron CTi-onTth (Furo) - ,\(dis) - L!SI) Ternpletori Gru\\Lh (Euro! - C[acc) Templeton Growth (Euro) I(aCci ~l~ciiipltmii (;rowrli (Euro) - I(dii) Tcrripletori Gro\\Lh [ELITO) - I(&) - USD Tenipleton (;ro\rLh (Euro) - Nkicc)
Tcmplcron Japan Fund - IJSD Trrnplclori Japiri - .4h1cc) Templeton Japan Y(accj
Templelon Korea Fund - USD Teiiipletoii Korea - Atacc?
I rmplcron Kortia - C(;icc) Tcrrlplctori Korea - I(acc) Templeton Korea \iat,c)
Teiiiple ton La tin .4nieri ca Templeton I .atin /\iiic,ric:a -
Tmiplrton LJ1iri Arrierica - Aiclis! - TLR Terripletun Laun America - A J~empleton I ntin :\mrnc.a - B l~rmplcrnn Latin ;\meric;i - C(acc) TernplcIori Laiin htrierica - 1:acc) Tmplcton Litin Anierica - N(acc)
I cmplcton C;lobnl Slllallrl- (:.ompalllc.-; - H(acc)
I emplcti)n l.:11111 Ilrr1erIc.a -
USD
EI!R
2.673.337.857 48,969.766
5,994.976..304
264.1 3.3.626 479,735 692 239.328.809
n ~ 6 , 0 ~ m i 3
4,117,724 786 4.415,063.86.5
9T1.25+ 1,203.398
13.551.472 804.73 1.727 600.329.180
22.983,965..317 228.179.454
10,31 3,104.030 820.368.082
T69.23 I 214.700.502 537.2 I 3.10 1 243,623.504
i.~ns.c)i)o
~n.nt)1.261
2.666.946.806 2.803.320.833
5-H.il2
2.473.148
- -.
481.345.516.701 23.483.352.705
267,47 I .227 500.000
88.659.872.105 11.306.550.189
355.619 3.841.699.89n
11.209.479.632 671.147.784
21.427. 107.925 9.7.55.024
500.000 332.078.333
3,650,381.078 8 , 2 n 4 , 5 ~ . 0 0 0
5,912.4 I6 544.633
39,051 595 L6.097.5Tb
2.783.335 808 2.226.468.5 34
J 2.68 12 09 12.23 12.14 12.15 12.79 12.56
39.08 38.09 11.30 12.20 16.1 1 16.48 27.69
14.49 10 97 I 1.66
11 04 10.86 10.8i 10.81 10.82 11.10 10.96
33.30 32.48
10.76
13.98 23 68
1 3 20
11.79 9 62 9.2i 6.49
13 81 12.67
1 1 .26 10 49 13 13 1 1.93 9.95
15 13 14.14 9.45
13 16 12.93 10.72
12.64 11.78
12 47 13 52 Ii84 10 63 12.99 12 74 i 6 . n ~ I I , n j
6.79 11.88
6 07 10.79 I O 86 16.94
60.24 57.20 43.M 29.37 12.27 I2.3C 17.59 32.49
10.00 10 38 10.00 9.99 9.98
IO.00 9.99
28.69 28. I O
I I.94 20 55
12.30
11.43
1.98 1.42
1.06
2.13
11.29 10.49 12.28 11.47
11.71 10.78 11.62 10.78 14.87 10.75 1 O.O6
6.61 5.80 1 1 .i9 10.22
5.71 4..38
15 53 12.31
$4 91 29.49 33.37 28.82
23 44
13.05 24.29 16 03
24
FRANKLIN TEMPLETON INVESTMENT FUNDS
STATISTICAL INFORMATION (cont inued) All classes 111 base c u r r e n c y unless o the rwise s ta ted
-roto. Shores Cvtstn r d i cg Expense Ram
necenlber 3 1 December 3 1 , Dcccmber 3 1 June 30, June 30, 2006 2006 2006 3006 2005
[see Note ! / I
Ne! Asset Value per Share
. .
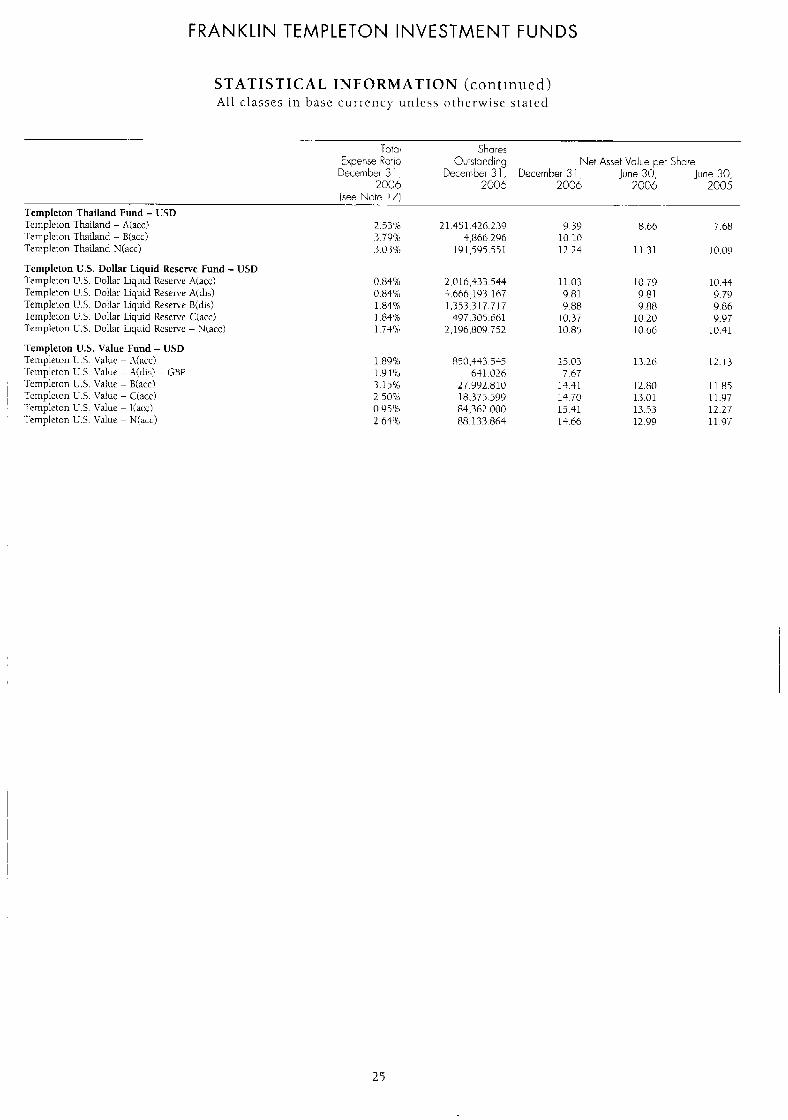
Templeton Thailand Fund - USD Tenipleion Thailand - A(acc! 2.53% 21.451.426.239 9 39 8.66 7.68
Teinplcton Thailand N(acc) 3.0 3% 191,595.551 12.24 11.31 J 0.09
Templeton U S . Dollar Liquid Reserve Fund - USD Templeton U S Dollar Liquid Reserve A(acc) 0.84% 2,016,333.534 11.03 10.79 10.34
Templeton Thailand - B(acc) 3.79%. 3,866 296 10 10
Templeton L!S Dollar Liquid Reserve A(d~s) 0.844') S.666. 193.167 9.81 9.81 9,79 Ternplelon I!.S. Dollar Liquid Resene B(dis) 184%) 1.353.317 717 9 88 9.88 9.86 Teiiipleton U.S. Ddtar Liquid Resenre C(acc) 1.83'% 497.005.661 10.37 10 20 9.97 Tmipleron L:S, Dollar Liquid Reserve - N(acc) 1 .74?,. 2,196,809 742 10.85 IO 66 10.41
Templeton L J S . Value Fund - lJSD Tcniplewn Ij.5. Value - ;\(act! 1.89% 850.4-t:3.545 14.03 13.26 12.13 Templeton U 5 . Value - A(dis) - C;f'# I .94'b 641.026 7.67 Templeton U.S. \;due - B(acc) 3.15% 27,992.810 14.41 12.80 11.85 Templeion US. Value - Cincc) 2 5 0 8 18.375.599 14 7@ 1.3.01 I 1 .97
Templeton U S Value - Npdct:) L.63'% 88.1.30.864 13.66 12.99 11 97 Templeton U.5 Value - I( 0 ,95% 84,362.000 15.41 13.51 12.27
25
FRANKLIN TEMPLETON INVESTMENT FUNDS
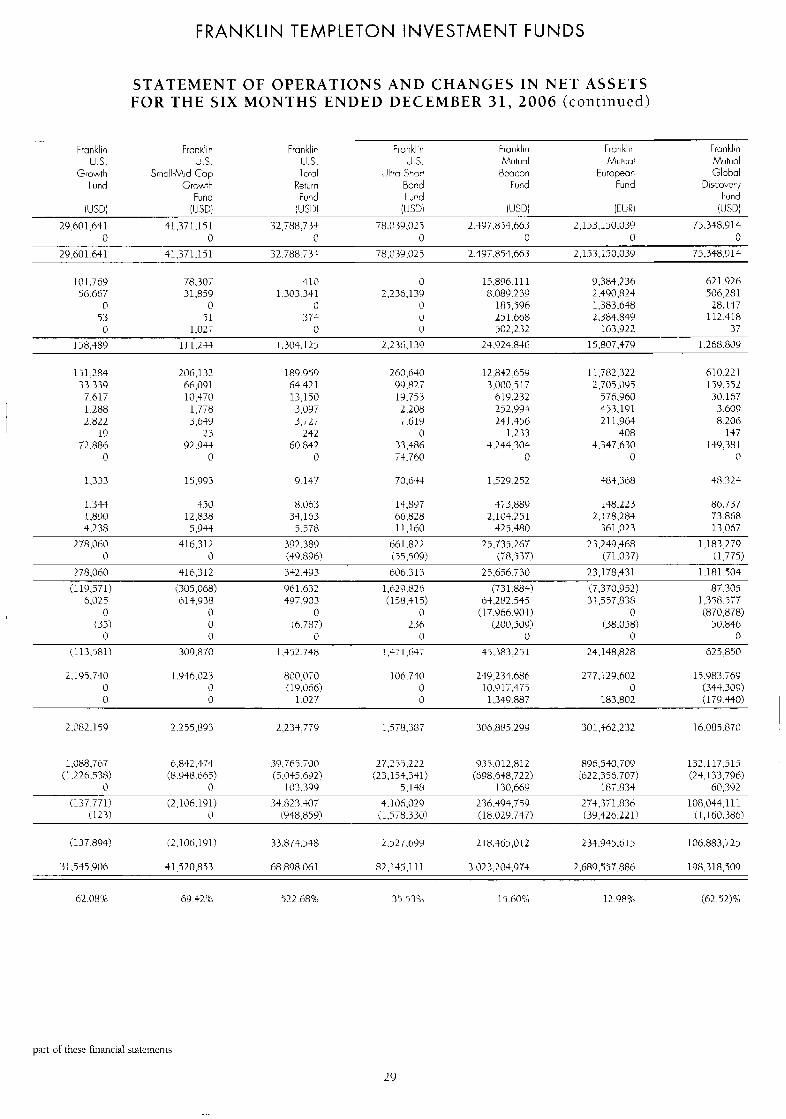
STATEMENT OF OPERATIONS A N D CHANGES IN NET ASSETS FOR THE SIX MONTHS ENDED DECEMBER 3 1 , 2 0 0 6
TOTAL Fronk:iri Fronilin F:ankli n Frorklin Aggressive Asian Biotechiology European
Growth Flex Cap Discovery Grcwth Furid Fund Fund Fund
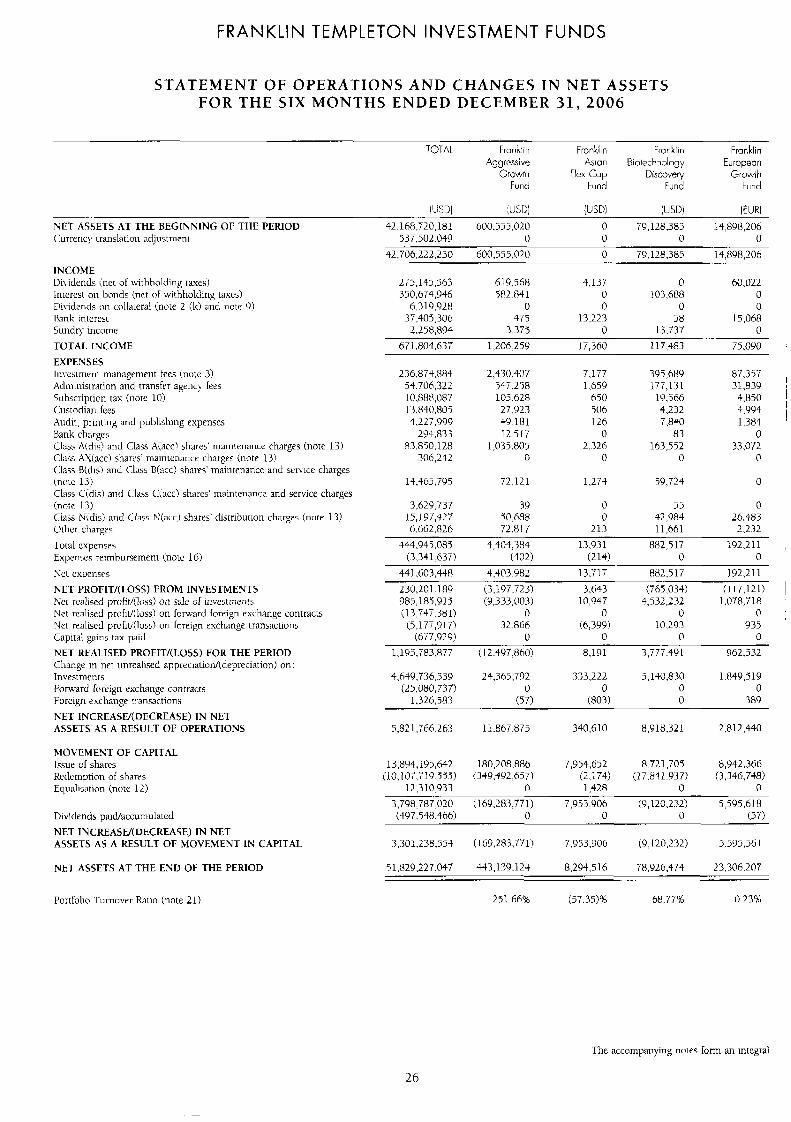
IUSD] jlJS[)) (USD) ( U W [EUR) hEf ASSETS AT THE BEGINNING OF THE PERIOD (yuri-cricy translation adpstnicnt
42.168,720,181 600.555,OLO 0 79.128.385 14,898,206 537 502.043 0 0 0 0
42,706,222,230 600.555,020 0 79,128,385 14,8'38,206
INCOME P i \ iclrncls (net of wthholding taxes) he res t on bonds (net of withholding taxes) Dividends on c.ollaLeral (note 2 (k) and notc '3) Hank iritcrcst 5unclry income
TOTAI. INCOME
EXPENSES Iiivesimcrit rrianagenient fees (note 3) Administration and transfrr agent:) lees Subscription tax (nm: 10) Custodian fccs Audit. printing and publishing expenses R m k charges
arid Class A(accl shares' maintenance charges (note 13) c ) sharcs' maintenance charges (note 13)
Class R(dis) and ( h 5 Rk~cc? shares' inaiiitcnaiiw and servlce charges (ntw 13) Class Cidis) and Clav, Ck~cc! shares. maintenance and service charges (note 13) Class Kidis) and C.lass Nkicc) shires' clisrribution chnrglis (note 1.3) Other c1iargc.s
Total expens(:\ Expenws reimhursetnent (note 16) Iiet expenses NET PROFIT/(I.OSS) FROM INVESTMENTS Net reiilised profit/(l(iss) on sale of 1tiveeStiiients Net I-calijed profiU(1oss) on fonvarcj foi-eign crxchange coiltracts Nct rcalised profid(loss! on foreign <xch;inge transactions Capital gains tax p i c 1 NET KEALISED PROFIT/(I.OSS) FOR THE PERIOD Change 111 net uni-calised appreciation/(depreciation) on : Invest men t 5 koim-ard hreign exchange contrx:ts Forcign exchange :i-ansacrions
NET INCREASE/(DECREASE) IN NET ASSETS AS A RESU1.T OF OPERATIONS
MOVEMENT OF CAPITAL Issue ol shares Rechiption of shai-(,s Equalisation (note 12)
Dividends paiNaccuniulated
NET INCREASE/(DECREASE) IN NET AS3ETS AS A RESULT OF MOVEMENT IN CAPITAL
NET ASSETS AT THE END OF THE PERIOD
275,145,563 619,568 4.137 0 60.022 350,674,946 582,841 0 103,688 0
6.319.928 0 0 0 0 37,405,306 475 13.223 58 15,068
2258,894 3.375 0 13.737 0 671,804,617 1,206.259 17,360 11 7.483 75,090 '
236,874,884 54,706,322 10.888,087 13,840,805 4.227.990
294.833 8.3.850.128
306,242
2,430.407 547.258 103.628 27,923 SY.181 12.517
1,035.805 0
7,177 1,659
650 506 126
0 2.326
i)
395.689 J 77,131
19.566 4.232 7,840
83 163,552
0
87.357 31.839 4,850 4,994 1.384
0 33.072
0
14,465,795 72.121 1,274 59,724 0
3,629,737 39 0 55 0 15,J 97,427 50,888 0 52,984 26.483 6.662326 72.8 I7 213 11,661 2,2.32
(3,341.637) (402 j (214) 0 0 444,945.085 4,404,384 13,031 882,517 192,211 ,
441.603.448 4,403.982 13.71 T 882,517 192,211
'385,184.91.5 (9,333,007) 10.947 4.532,232 1,078,718 230,201.189 (3,197,723) 3.643 (765.034) ( I 17,121) ! <13.7$7.381) 0 0 0 0 ,
i5,17T,917) 32.866 (6.399) 10.293 935 (677.929) 0 0 0 0
1,194,789,877 (12,497,860) 8,191 3,777,401 962.532
4.649.736,.539 24,365,792 333.222 5,140.830 1,849,519
1.326.583 (57) (80 3) 0 389
5,821,766.263 11,867,875 340,610 8.918.321 2 .8 12,440
(25,080.737) 0 0 0 0
13,894, I9 5,642 180,208.886 7,954,652 8.721.704 8,942.366 (10,107.719.5ST) i349.492.657) (2.174) (1 7.841.937) (3.346.748)
12.310.933 0 1,428 0 0 3.798:787,020 (l69.283,771) 7,953.906 ('3,120.232) 5,595.618 (497,548.466) 0 0 0 (57)
3.301.238,553 [ 169.283.771) 7.953.906 (9, 120,232) 5.595.56 I
5 1,829,227,047 443.139.124 8,294,516 78,926,474 23.306.207
251.66% (57.35)% 68.77% 0.23%
The accompanying noLes form an mtegi-al
26
FRANKLIN TEMPLETON INVESTMENT FUNDS
STATEMENT OF OPERATIONS A N D CHANGES IN NET ASSETS FOR T H E S I X MONTHS ENDED DECEMBER 31, 2006 (continued)
franklii Fiork!in Frcnklln Glohnl Frari kl I n Globc. I-ronklin Globul 1 rnnklin Fronklin Sr.1ull Mid cco High Yield High Yield Curopeon
Small-Mid Growth [Euro) (IJS[)] Growth Furid (Euro) Cap Growth Fund Funti I und Ftnd Fund
Global Reai Estnte Reo! tjtgte
Fund WRI [USDI I E W (USD) I U W (CISUI (EURI
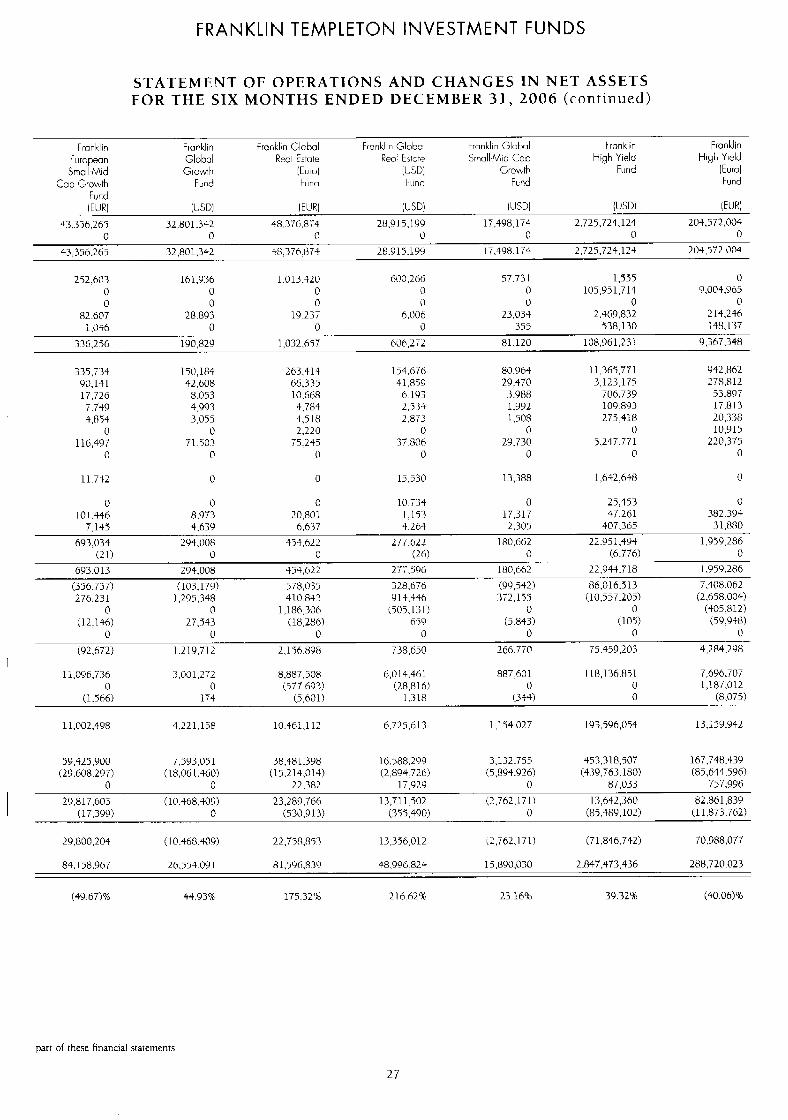
0 0 0 0 0 0 0 4'3.3.56.265 32.801.3+2 48,376,874 28.91 5.109 17,498.1T4 2.725.724.124 204,57 2,004
43,356,265 32 ,80 1,342 38,376,871 28.915.190 I 7.408.1 74 2,725,724,124 204.572.004
252,603 161.936 1.013.420 600,266 57.73 I 1.555 0 0 0 0 il 0 105.951.7 14 9,00$,965 0 0 0 0 0 0 0
82.607 28.893 19,237 6.006 23,034 2.469.8 32 214,246 1,046 0 0 0 355 738.130 148,137
336.256 190,829 1,032.657 bC)b,27Z 81.120 108,961,231 9,367.348
335,733 150,184 283,41$ 154.676 80.964 11J65.771 942,862 90.141 42.608 66.335 41.85IJ 29.470 3.123.175 278,812 17,726 8.053 10.668 6.193 .3.988 706.739 93.897 7.749 4,993 4,784 2,534 1,992 109,893 17.813 4,854 3,055 4,s I 8 2,873 1.508 275,418 20,338
0 0 2.220 0 0 0 10,915 116,497 'il.=j03 75.245 3T.806 29,730 5.247.771 220,375
0 0 0 0 0 0 0
11.732 0 17 15,530 13.388 1,642,648 0
0 0 0 10.734 0 25.453 c)
7,145 4,639 6.637 4.264 2.305 407,365 3 1.880
693,034 294.008 454.622 277,622 180.662 22,951,493 1 . 9 5 9 ~ ~ 6 (21) 0 0 iN 0 (6.776) 0
693,013 294,008 454.622 27Y.596 i n i w d 22,944.7ia I.950.286
0 0 1,186,306 t505.131? 0 0 ($05,812) (1 2.156) 27.543 (18,286) 6.59 (5.843) (105) (59,948)
0 0 0 0 0 0 0
I
101.446 8.973 20,801 1,153 17,317 47,261 382.393
(356.757) (103,179) 578.035 32a.676 (90,542) 86,016.513 7.408.062 276.231 1,295,348 410.843 9 1+,336 372.1 55 (10,557,205\ (2.658.004)
(92,672) 1.219.712 2.156.898 738,650 266.770 75.459,203 4.284,298
11.096.736 3,001,272 8,887,508 6,O 14.461 887,601 I18,136.851 7,696.707
(1.566) 174 (5,601) 1.318 (344) 0 (8.075)
11.002.498 4.22 1,158 10.461,112 6.725.61 3 1.154.027 193.596,054 13,159,942
0 0 ('577.693) (28,8 161 0 0 I,l8T.O12
59,425,900 7.593,051 38.48 1,398 16,588,299 3,132.755 453,318.507 167,748,439 (29,608,297) ( I 8.06 I ,460) (1 5.2 14.014) (2.894.726) (5,894.926i (4.39.763.180) (85,644,596)
0 0 22.382 17.929 0 87.033 757,996
29,H 17,603 (10.468.409) 23,LR9,766 13,711,902 (2,762,171) 13,642,360 81,861,839 (17,399) a (530,9 13) (3135.490) 0 (85.489.102) (1 1.873.762) I
29.800.203 ( 10.468.409) 22.758.8'i3 13,356,012 &T62.171) (71 -846,742) 70,988,077
84.158.967 26.554.09 I 81.506.839 4a,996,a2+ 15,890,030 1,847,473,436 288,720.023
(49.67)% 44 93% 175.32% 2 I6.62B 23.16010 39.32% (40.06)%
part of these financial statements
27
FRANKLIN TEMPLETON INVESTMENT FUNDS
STATEMENT OF OPERATIONS AND CHANGES IN NET ASSETS FOR THE SIX MONTHS ENDED DECEMBER 31, 2006 (continued)
Frankliri Franklin Fwiklin t : a 4 in Froiklin Income lndic Tucbm)logy U S Equity U.S. Goerrment
Furia f iind Fund f uvd Fund
NET ASSETS AT THE BEGINNING OF T H E PERIOD Cui-rcnc y t ran 513 t i mi ad 1 ustiii en t
INCOME Dividends (net of L< ithholding iaxes) Interest on bonds (net of withholcling raxes) I)ividendj on collateral (note 2 (k) ancl note 9) Hank interest Sundry inc:omc
TOTAL INCOME EXPENSES Investmerit rrrmagrrneIit frcs (notc 3) .ldministi-atioii and ti-ansfer agency fees Suhscripiion 13x (note 10) Custodian fees Audit. piinting and publishing expenses Bank charges
iacc) shai-c.5 maintcnance charges (note 13) c! shares’ rtvaintrrww chai-gcs (now 13)
Llass B(dis! and Cla.;~ Dkiccl shares’ rnaintcnancc and service charges (note 13) Class C(dis! and Class Ciacc) shares’ rnainteriance and service chai-xes (now 13) Class Niclis! aticl Class Nkicc) shares’ distrihution chargcs (now 13) Ot hfl- c:ha1-:es
Total rxpenst.s
Net expenses NET PROFIT/(LOSS) FROhl INVESTMENTS Ket realised profidilossl on sale of in\esmienis liet 1-ealised pi-ofit/(Ioss) on forward foreign exchange cotitracIs het realised profit/(loss! on foreign exchange Iransact ions Capital gains tau paid NET REAIHSFI) PROFIT/(LOSS) FOR THE PERIOD Change in net unrcaliied appr(~‘:iatinn/(dcprcciation) on: Iiirestitients Fomwcl foi-eign exchange cont i -a~t~ Foreign exchange transactions NET lNCREASE/(DECREASE) IN NET ASSETS AS A RESULT OF OPERATIONS
EXpellSes I.~LttlbLll.S~Ill~Ill (IloLC 16)
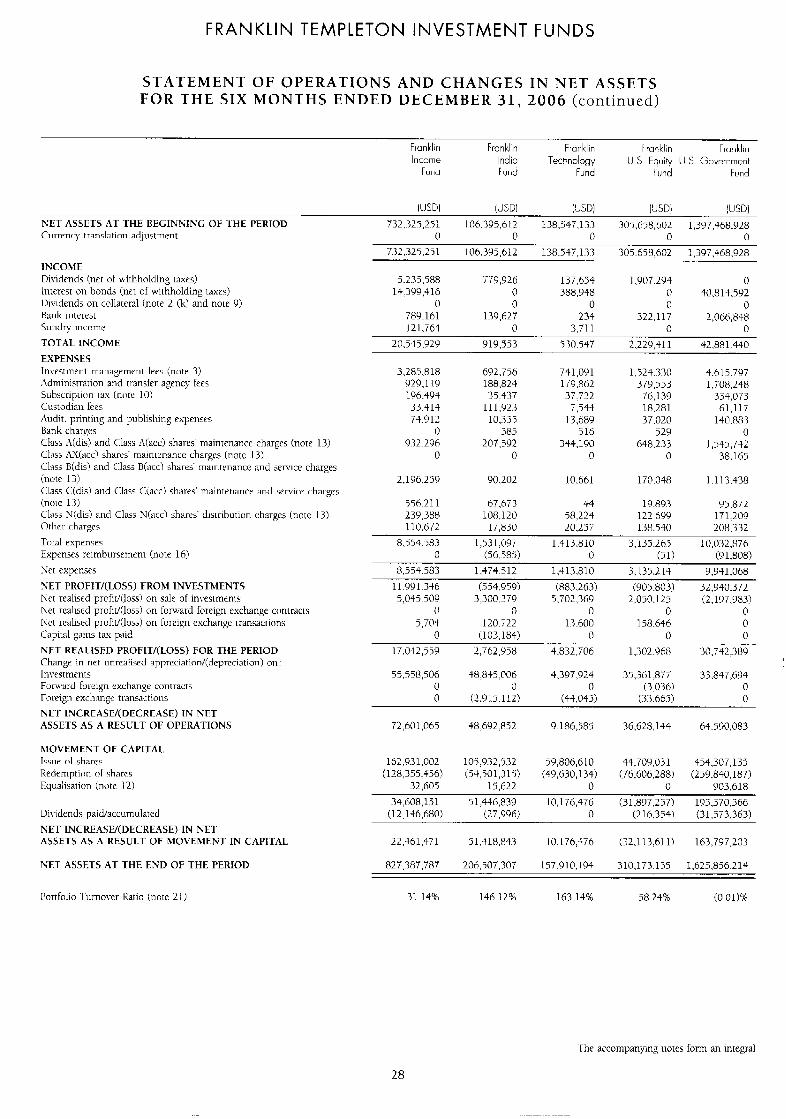
(LJSU] (USDI [CISD) i!JSCi (USD) 932,325.251 106.795,h I2 138,547,133 305.658,602 1.397.468.928
0 0 0 0 0 7.32.325.251 [email protected],612 138,547,133 305.658.602 1.397.468.928
5.235,588 779,926 137.644 1.907.294 0 14.399,416 0 388,948 0 40.814,592
0 0 0 P 0 789.161 139.627 233 322.117 2,066,838 I 2 I ,T64 0 3.71 1 0 0
20.515,929 919,343 530.547 2.229.311 42.881.440
3,285.818 929,I I 9 196.494 33.414 74.9 12
0 9.32.296
0
692.756 188,824
35.43T 11 1,923
10.394 384
207,592 D
741,091 179,862 37.732
T,54$
516 344,190
0
13,689
1.524.3 30 379,553
76.139 18.281 37.020
529 648,233
0
4.6 15.797 1,708 248
334.073 6 l . l l T
14~1.883 0
1,545,742 38.165
2,196.2.59 90.202 1.0.661 170.048 1.1 13.438
.ii6.211 67,673 44 19.893 95,872 239,388 108,120 58,224 122 699 171.209 110.672 1.7:830 20.247 138.540 208,332
8,555,583 1,53 I .O9T 1,413.810 3.13.5.265 10.032.876 0 (56,585) 0 (51) (9 1,808)
8.554.583 1.474.512 1 >413.810 3.135.213 9,941,068 I l.Y91.3$6 (.544.9591 (883.263) (905.803) 32,940,372 5,035. 509 3,300.3iY 5.702.369 2.050.125 (2,197,983)
0 0 0 0 0 5,704 120.T22 13.600 158.646 0
0 (103,184) 0 0 0 17.012,559 2,762,958 4,832,708 1.302.968 70.742.38’)
55.558,5@6 $8,8+4,@06 4,397,924 35~.361,8TT 33.847.694 0 0 0 i3.036) 0 0 (2.9L5.112) (44.044) (33.665) 0
72,601,065 48,692,852 9.186,585 36,628,144 64,590,083
MOVEMEN-1- OF CAPITAL ISUC OC .ihares 162931,002 105;932,5.32 59,806,610 $4,709.031 454.307.135 Reclrrnpticiri of sharrs (128,355.456) (94.501,314) (49,63@,134) (76,606.288) (259,840,187) Equalisation (note 12) 32,(i09 15,622 0 0 903,618
34,608,151 51,446.839 10,176,476 (31,897.257) 194.370.466 0 (216.354) (31,573,363) Dividrnds pai&act:uinulared (12.1$6,680) (27.996)
NET INCREASE/(DECREASE) IN NE1 ASSETS AS A RFSU1.T OF MOVEMENT IN CAPITAL 22,461,471 51.418.843 I O . 176,476 (32.1 13.61 1) 163,797,203
NET ASSETS AT THE END OF THE PERIOD 827937,787 206.507.307 157.910~194 310.173.134 1.625.846.214
I’ortfolio .I iimowr KaIici (notc 2 I ) 31.14% 146.128 163 144: 58 24% io, i! I ) %
The accompanyin:: notes fonn an integral
28
FRANKLIN TEMPLETON INVESTMENT FUNDS
STATEMENT OF OPERATIONS AND CHANGES IN NET ASSETS FOR T H E S I X MONTHS ENDED DECEMBER 31, 2006 (continued)
Frclnklir, Frcrk in Fr(iriklir~ 'lgfikl 1) Fronkliv Fronklir Frun klin u s. L.S. u 5. IJ 5. hSlltllnl MUILU! Mutuol
Growth SmollMid Cop lotfll J ? o SYS+ Y!XICOI Europeor Global I iind Grow:h Rzturr-1 BWd Fuld Fund Discow':,
Fund i U l d I ..d I und IUSDl !IJSD1 1!J51)1 (IJS3) [USD; [ELiR) (IJSD)
29.601,631 41,371,151 3L,T88.73$ T8.0 39.025 2.497.854.663 2.153,150,039 75.348.914
29 ,601.641 41,371.151 32.788.734 78 ,PJ9 ,02 5 2.49T.854.663 2,153,150.039 75,348,913
0 0 0 0 0 U a
IO I .769 56,667
0 53 0
78.307 410 0 15,806.111 9,384,236 62 I ,926 31.859 1.303,341 2,236,139 8.089.239 2.490.821 406,281
0 0 0 1 R.5,596 1,383.648 28.137 51 374 0 25 1.668 2.384,849 112.418
1.027 0 (1 iO2.232 163.922 37
158.489 1 I 1.244 I ,304,125 2.23h.l 39 24.924.846 15.80;.4x 1.268.809
1 51,284 33.'39 7.617 1.288 2,822
19 72.886
0
1.333
1,345
4.2 38 I ,890
2M.1.32 FF.OY1 10.470
1.778 3,649
23 02.944
0
15,993
450
5.943 12,838
189.959 64.421 13,150 3,097 3,727
242 60.842
0
9.147
8.06 3 35,163
5.578
260,640 '30.827 19.753 2.208 7.619
0 3 3,486 73.760
70.6.W
14.897 66.828 1 I ,160
12,8+2,659 3,W0.517
619.272 2 52.993 241 ,456
1.233 4,244,304
0
1.529.252
$73.889 2,104.2 5 I
425.480
11,782,322 2,705,0')5
576,960 433.191 21 1.964
408 4,347,630
0
484,368
148,223 2.178.281
361.023
610.221 139>352
30.167 3.600 8.206
147 159,38 I
0
48324
86.737 73.868 13,067
278.060 41 6.31 2 392,389 66 I ,822 25.735.267 23.249.468 1,183,279 0 0 <49.896) I 55,509! (78.539) (7 1,037) (1.775)
278,060 416,312 332.493 b06.313 25,656,770 23,178,431 1.181.504
(I 19,571) (3c)4,068) 061,632 1.620.826 (73 1.884) (7,370,952) 87.305 6,025 614,938 497,903 (158.415) 64,282.535 31,557.838 1,358.j;T
0 0 0 0 (17.966.901) 0 (870,878) (34) 0 (6.787) 2.36 (2o0.509) (38,058) 50.846
0 0 cl 0 0 0 0 . .
( 1 1.3.58 1 'I 309.870 I .4i2.758
2,195,740 I .946.1)23 800,070 0 0 (1 9.o66) 0 0 1.027
I .47 1.647 45.38 3,LS I 24.148.828 625,850
106.730 249,233.686 277. I 29.602 15.98 3.769 (7 10.91 7.475 0 (344.309) 0 1.349.887 183.802 ( 179.440)
2.P82.159 2.255.833 2,234,779 1.578.387 306,[email protected] 301,462,232 16.085.870
1,088,TbT 6,832,474 39.765.730 27.235.222 9 3 'j .0 12.8 1 2 896,5$0.700 132.117,515
c7 (1 IO3.399 5,148 I30,hhCI 187,834 (i(7.392 ( I ,226,538) (8.948.665) (5,0+4,6921 (23,153,331) (698,638,722) (622,356,707) (24,I33,796)
(137.771) <2.106.191) 34.823.40; 4. I dh.029 236,494,759 274.3x ,8 36 108.044.111 (123) 0 (948.859) (1,578.330) (18.029.737) (39 .426,2211 i I . Ib0.786!
(137.894) {2,lOh.l9 1 ) 33.873.548 2.527.699 218,365,012 233.945.6 I5 IOh.883,725
3 I .545,906 $1.520,873 (j8.898.Ml 82>14.3>1 11 3.02 3,204.973 2.689,557,886 198.318.509
62.08% 60.+2?0 722.68% 3'5 '53% 1 '5.609b 12.9891, (h2.52)9,
part of these firiancial sraternenls
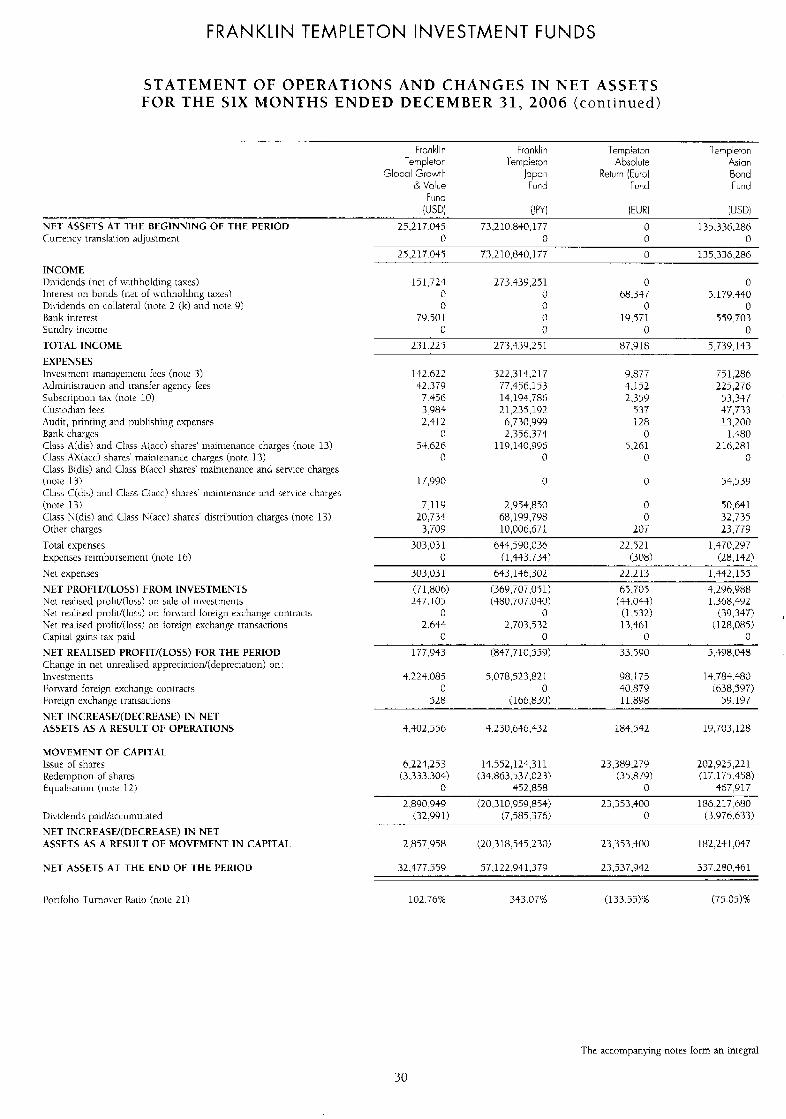
FRANKLIN TEMPLETON INVESTMENT FUNDS
STATEMENT OF OPERATIONS AND CHANGES I N NET ASSETS FOR THE S I X MONTHS ENDED DECEMBER 31 , 2006 (conrinued)
Frcnklin Fronkliri Ternpieton ‘lempleton Templeton 1emp:e:an Absolute Asian
Global Growth Japan Return (kur3) Bond & VdLe Fucd Fu7.d Fund
IUSU 2PY) I E W IUSD) 25,21T,045 73,210,830.177 0 135.336.286
Fiind
0 0 0 0 25.217.045 73,210,840.1 T7 0 135,336,286
NET PISSE.1-S AT THE BEGINNING OF l -HF PERIOD Currency I ranslaiioii adjusLrncnt
INCOhlE I)i\-idends (net of \whholding taxes) Intercsl on honds ( i i t L ol wiLhholding taxes) Dn idends on collateral (note 2 (kl and note 9) Hank iiittvsr Sunclrk income
TOTAL INCOME
EXPENSES Iiivcsirnrnt rnariagcnnerit fees (noLe 3) Adminisi tauon ancl Lransfer agency lees Subscripuon tax (note 10) Custodian fees :\lidit, piintiiig and publishing expenses Bank chargcs Class A(dis) ancl Class Aiacc) shares’ rnaintenance charges (now 13) Class AX(acc:) shares‘ maintenance charges (nor(: 13) Class Biclisl arid Class D(acc) shares’ mainLenatice and service charges (iiotc 13) C h 5 C(c1is) arid Class C(acc) 5 h ~ e s ’ tnainienancc and service charges (note 13) Class X(d1s) and Llass l i i acc) shares. distribution charges (note 13) Other charges
Total expenses Expenses reimburseinent (note 16)
Net expenses
NET PROFIT/(LOSS) FROM INVESTMENTS Net realised profit/(loss) on sale of investments Ne1 rcaliscd profi~l(Ios5) c!n for\vard foreign exchange conLrxts Ket realised protidiloss! on foreign excliangc transactions Capi1:il gains tax paid NET REALISED PROFIT/(LOSS) FOR THE PERIOD Change in net unrealised appreciation/idepreciation) on : Investments Fniwai-d foreign excliangc conti-acts Foreign exchange I ransxLions
ASSETS A5 A RESULT OF OPERATIONS NET INCKEASV(I)ECREnSE) IN NET
MOVEMENT O F CAPITAL Issue ol shares Redemption ot shares Equalisation (note 12)
Dividends paiicVaccumulated
NET INCREASU(DECREASE) IN NET ASSETS AS A RESULT OF MOVEMENT IN CAPITAL
NET A5SETS AT THE END O F T H E PEKIOD
15 1,724 273.439.251 0 0 0 0 68,337 9.17Y.440 0 0 0 0
79.501 0 19,471 559 .703 0 0 0 0
231,225 273.439.251 87,918 5,739,143
142.622 42,379
7 456 3 983 2.41 2
0 94 626
0
322.31 4.21 7 77.456.3 53 14.194.786 21,235.192
6,730,999 2.356.374
119,140.996 0
9.877 3.1 52 2.359
537 128
0 5,261
0
T51,286 225,276
53,347 47,733 13.200
1.480 216.28I
0
17,990 0 0 54,539
7.119 2,944,850 0 50.641 20.734 68,199,798 0 32,735
3,709 10,006,671 207 23,779
303,031 644,590,036 22.521 1.470.297 0 (1,4+3.734! (308) (28.142)
303,031 643,136,302 22.213 1,442.155
(71,806) (369,TOT,Oj 1) 69.705 4.2Y6.988 247. I05 (480.707.040) (34.043) 1,368,492
0 0 (1.532) (39.347) 2.644 2.703.532 13.461 (128,085)
0 0 0 0
177,943 (847,710,550) 33.590 9.498.048
4.224.085 5,0T8.523.82 I 98, I75 14.784.480 0 0 40.879 ((538.597)
528 (166,830) 11.898 59.197
4,402,550 4,230,646,432 184,542 19,703,128
6,224,253 14,552,124,311 23,389,279 202,925.221 (3.3’37.304) (.34.863.537.023) (.35.879) (17,175,458)
0 492,858 0 467,917
2,890,949 (20,310.959.854) 23,353.400 186,217,680 ( 3 2 9 1) (7,585,376) 0 (3.976.633)
2,857,958 (20,318.545.230) 23,353,400 182,241,047
32.477.559 57,122.941.379 23.537.942 337,280,461
102.768 343.07% (1 33.53‘1 (75.05!% I’ortfolio lurnovcr Ratio {note 21)
The accompanyng notes form an integral
30
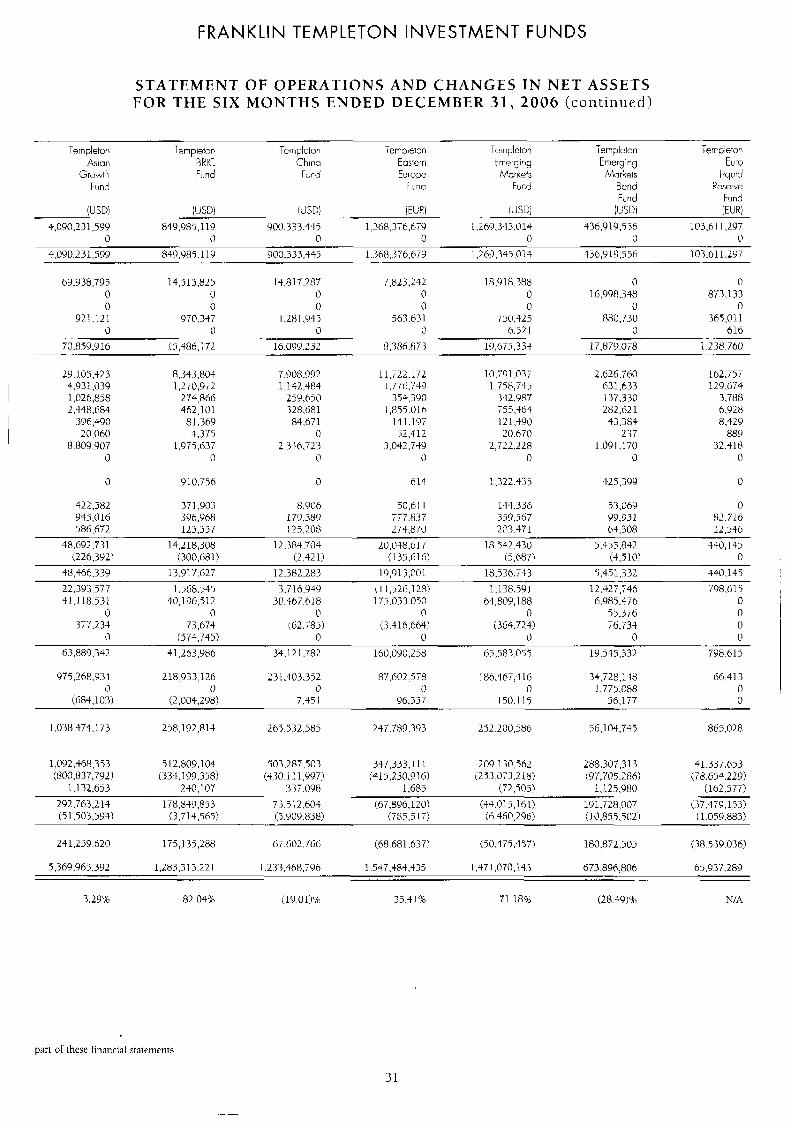
FRANKLIN TEMPLETON INVESTMENT FUNDS
STATEMENT OF OPERATIONS AND CHANGES IN NET ASSETS FOR THE S I X MONTHS ENDED DECEMBER 31 , 2006 (continued)
- Templeton Templetop Templetcn iers ,etm Ternplcton Ympleton ierrpietm
Asinri BRIC China E3itc.n Fmergirig Ernergir,g Euro
Fund 1 IJnC Fwd Bcnd Reserve Fund Furid
( U W ( U W !!JSDi iEURj [USDi iUSUi [EURi
4,090,231,599 849,985.1 19 900.3 33.445 1,368,376,679 1,269,345.013 436.919.556 103.6 I I .29T 0 0 0 0 0 0 0
4,090.231,59Y 849,085.11 9 Y00,333,345 1 ..368.376.670 I .2Wl.345.014 3369 19.556 103,011,297
Growth Fund F;rd Europe W,?c.kets Mmiets I iqu1rl
69,938,795 14,5 1 4.825 14.81 7.287 7,823,242 18,918.388 0 (1 873.133 0 0 (7 0 0 16.098.348
0 0 0 0 0 0 0 921.121 970,337 1.281.945 563.631 T50,425 880.730 365.011
0 0 0 0 6.52 1 i) 616
70,859.Yl6 L5,486,172 16.099.232 8.386.873 19,673,334 17.879.078 1,238.760
29.1.05.427 4,931,039 1,026,858 2,448.684
396.490 20.060
8.809.907 0
0
8.343.803 1 .ZT0.9T2
274,866 462.1 0 1
81.369 4.375
1.979.637 0
9 10.756
7.908.992 1.142,484
259,650 328.681 84.671
0 2.336.723
0
0
11,722,172 I .776.749
353.390 1,855.016
141.197 52.412
3,042,749 0
614
10.791.037 1.758,745
342,987 1 > ~ , $ 6 4 121,490 20.670
2,722.228 0
1,322.335
---
L.62h.7h0 631,633 137.330 282.621 43.384
237 1.091.170
0
425,3Y9
162.757 129,674
3.788 6.928 8.429
889 32.318
0
0
422.1582 371,903 8.906 50,6 I I 144,336 53.069 0 945,016 396.968 179.389 777.897 359,567 Y9.931 82.716 586.672 124.557 125,208 27+,n:i) 203.471 64,308 12,546
48,692.731 14,218,308 12.384.7k74 20,048,617 1 8.542.430 5,455,842 330.I45 (226,3921 i300,681! (2.S21) (135.616) (5,6871 (4.5 10) 0
48,366.339 13.91 7.627 12.382.283 1 9,913,001 18,536.T43 5,45 1,332 440,145
22,393.577 1.568.545 3.716.930 ( I I,526,1281 1,138.591 12.42 7.746 798.615 31,118.531 40,196.5 12 30.467.618 175.033.050 64,809,188 6.Y85.476 0
0 0 0 0 0 55,376 0 377.233 73.674 (62.785) (3.4 16,664) (364.724) 76,734 0
(7 (573.745) 0 0 0 a 0
63,880,342 $1.263.986 34. I2 I .T82 160,0Y0,258 65.583.057 19.545.332 7Y8.615
975.268.9.34 218,933,126 23 I .403.:352 [email protected] 186.46T,-tl6 34,728,148 66.413 0 0 0 0 0 1.775.088 0 I
(684.10.3) (2,004.2Y8) 7.45 I 96.557 150. I 15 56,177 D
1.038.473.1 73 258.1 92.814 263.532.583 247.789.393 252,200,586 56.104.745 865,028
1,092,$68,353 5 12.809.104 303.287.50.3 3+7,333, I I I 209.li0.562 288.307.31 3 41.337.653 (97.705.286) (78.654.229) (800,837,7921 (33+.199,358! (4.30.11 1,997) (415,230.91 h! (2 73,073.2 18)
1,132,653 230.1 07 337.098 1,685 (72.905) I , 125.980 (162.577)
292.763.214 178,849 ,853 7 3.5 1 2.604 (67.8Y6.120) i34.015,161) 101,728,037 ('7,479,153) ( 5 I ,503,594) (3.7 14.565) <5.909.838) (T85,5 17) (6,460,296) (Io.855.502) (1,059,883)
241.259.620 175,135,288 67.602.766 (68.681.637) (50.475.457) 180,872,505 (38.5 39.036)
4,369,965,392 1,283,313.221 I .2?3.468.T96 1.5+7,384,+35 I,471.070.14.3 673.896.806 65.937.289
3.29% 82.048 (19 01)% 35.4 I B 7 1.18% (28,49)% NfA
pan of these financial statements
31
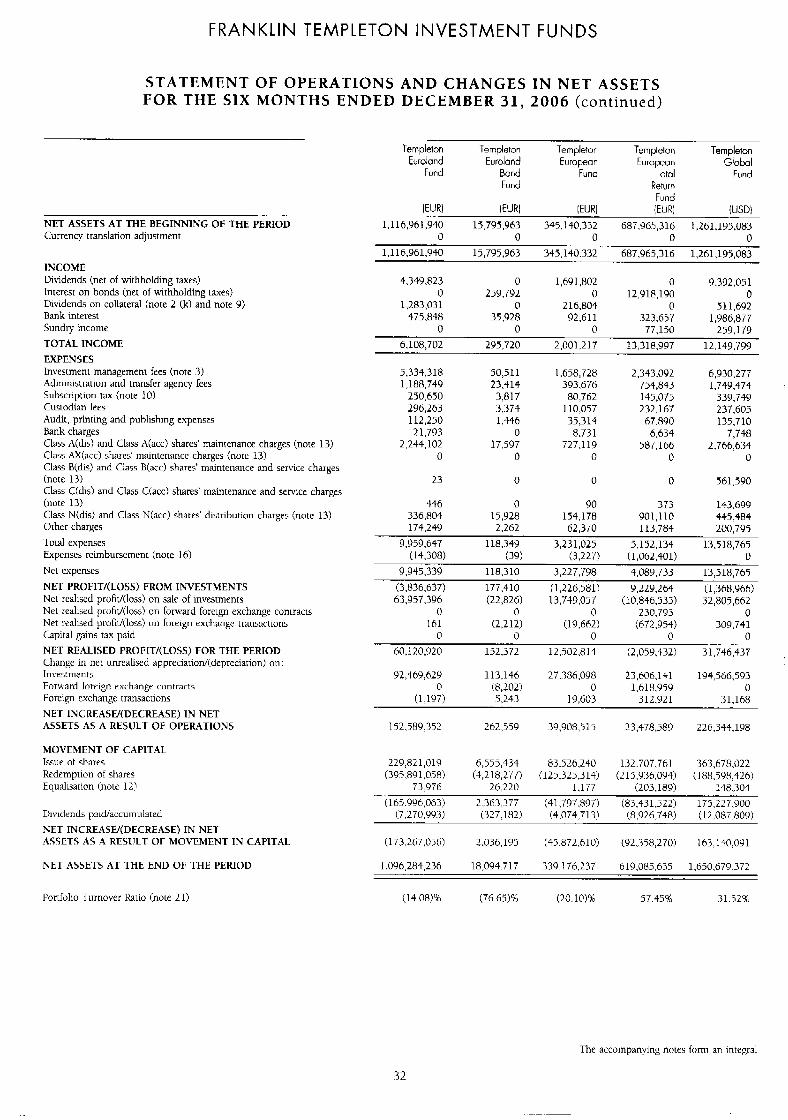
FRANKLIN TEMPLETON INVESTMENT FUNDS
STATEMENT OF OPERATIONS AND CHANGES IN NET ASSETS FOR THE SIX MONTHS ENDED DECEMBER 31, 2006 (continued)
Templeton Templeton Templeton Templeton Templeton Euroland Euroland European European Global
Fund Bond Fund Total Fund Fund Return
Fund IEW IEUW IEW IEUR] IUSDJ
NET ASSETS AT THE BEGINNING OF THE PERIOD Currency translation adjustment
l.l16,961,940 15,795.963 345,140,332 687.965,316 1,261,195,083 0 0 0 0 0
INCOME Dixldends (net of withholding taxes) Interest on bonds (net of withholding taxes) Dividends on collateral (note 2 (k) and note 9) Bank interest Sundry income
TOTAL INCOME EXPENSES Investment management fees (note 3) Administration and transfer agency fees Suhscription tax (note 10) Custodian fees Audit, printing and puhlishing expenses Bank charges Class A(dis) and Class A(acc) shares' maintenance charges (note 13) Class AX(acc) shares' maintenance charges (note 13) Class B(dis) and Class B(acc) shares' maintenance and service charges (note 13) Class C(dis) and Class C(acc) shares' maintenance and service charges (note 13) Class N(dis) and Class N(acc) shares' distrihurion charges (note 13) Other charges
Toral expenses Expeiises reimbursement (note 16)
Net expenses
NET PROFIT/(LOSS) FROM INVESTMENTS Net realised profit/(loss) on sale of investments Net realised prtifit/(loss) on forward foreign exchange contracLs Net realised prolid(1oss) on foreign exchange transactions Capital gains tax paid
NET REALISED PROFIT/(LOSS) FOR THE PERIOD Change in net utirealiserl appreciation/(depreciation) on : lnvestmenrs Forward forelgn exchange contracts Foreign exchange ti-ansactions
NET INCREASUDECREASE) IN NET ASSETS AS A RESIJLT O F OPERATIONS
MOVEMENT OF CAPITA1 Issue of shares Redemption of shares Equalisation [note 12)
Dividends paid/accuinulared
KET INCREASU(DECREASE) IN NET ASSETS AS A RESIJLT OF MOVEMENT IN CAPITAL
NET ASSETS AT THE END OF THE PERIOD
1,116,961,940 15,795,963 345,140.332 687,965,316 1.261,195,083-
4.349.823 0 1,691,802 0 9.392,051 0
1,283,031 0 216.804 0 511,692 475.848 35,928 92,611 32'3,657 1,986,877
0 0 0 77.150 259.1 79
0 259,792 0 12.918.190
6108,702 295,720 2.001.21 7 13,318,997 12.149.799
5,334,318 1,188.749
250,650 296,263 112,250 21,793
2.244,102 0
50,5 11 23,414
3,817 3.374 1.446
0 17,597
0
I ,658,728 393.676
80,762 110,057 35,314 8.731
727.119 0
2.343.092 754:843 145,075 232.167
67.890 6,634
0 587,166
6,930,277 1,749,474
339,749 237,605 135,710
7,748 2,766,634
0
23 0 0 0 561,590
446 0 90 373 143.699 336,804 15,928 154.178 901,110 445,484 174,249 2.262 62,370 113,784 200,795
9,959,647 118.349 3,231,025 4,152,134 13518,765
9,945,339 118.310 3.227.798 4.089.733 13.518.765
(14,308) (39) (3,227) (1,062,401) 0
(3,836,637) 177,410 (1,226,581) 9,229.264 (1,368.966) 63,957,396 (22,826) 13,749,057 (10,846.534) 32,805,662
0 0 0 230,793 0 161 (2,212) (19,662) (672,954) 309,741
0 0 0 0 0 60.1 20,920 142.372 12.502.814 (2,059,432) 31,746,437
Y2,469,62Y 113,146 27 386.098 23,606,141 194,566.593 0 (8,202) 0 1.618.959 0
(1,197) 5.243 19,603 312.921 31.168
152339,352 262,559 39.908.51 5 23,478,589 226,344,198
229,82 1,019 6,555,434 83,526.240 132.707.761 363,678.022 (395,891.078) (4,218,277) (125,325,314) (215,936,094) (188.598,426)
73.976 26.220 1.177 (203,189) 148,304
(165,996,063) 2.363.377 (41.797.897) (83,431,522) 175,227,900 (7.270.993) (327.182) (4.074.713) (8.926.748) ( I2.087.809)
1173.267.056) 2.036.195 (45.872,610) (92.358,270) l63.130,091
1.096.284.236 18,094.717 339,176,137 619,085,635 1.640.679.372
(14.08)% (76.65)8 (20.10)% 57.35% 31 5 2 8 Portfolio Turnover Ratio (note 21)
The accompanying notes form an inregral
32
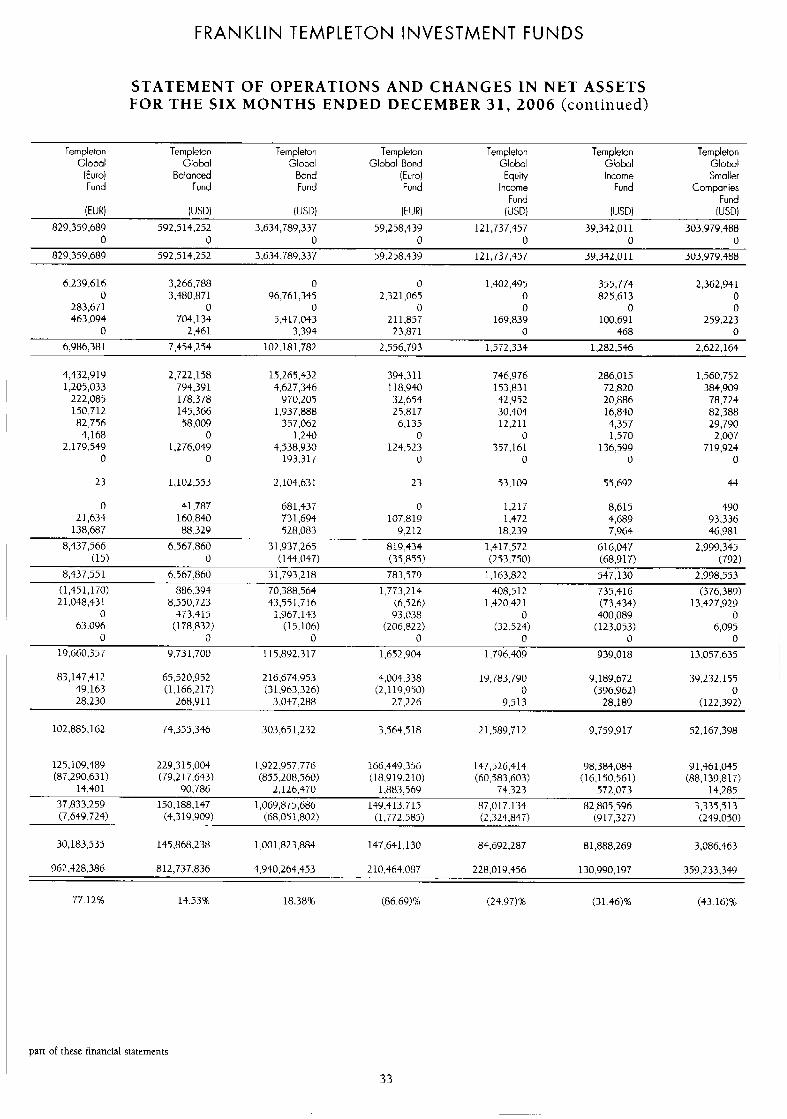
FRANKLIN TEMPLETON INVESTMENT FUNDS
STATEMENT OF OPERATIONS AND CHANGES IN NET ASSETS FOR THE SIX MONTHS ENDED DECEMBER 31, 2006 (continued)
Templeton Global
(Euro) Fund
WRl
Templeton Templeton Templeton Global Global Global Bond
Balanced Bond (Euro) Fund Fund Fund
USD) (US0 IEUK
Templeton Global Equih/
Income Fund
iUSDl
Templeton Templeton Globol Global Income Smcller
Fund Companies Fund
IUSDI IUSDI 829,359,689 592.514,252 3.634,789,337 59,258,439 121,737,457 39,342.011 303.979.488
829,359,689 592,514,252 3.634.789.337 59.258.439 121,737,457 39,342,011 303,979.488
6.239.616 3,266.788 0 0 1.402.495 355,774 2,362,941 0
283,671 0 0 0 0 0 0 463,094 704,134 5,4 17,043 21 1.857 169,839 100.691 259.223
0 2,461 3.394 23.871 0 468 0
0 0 0 0 0 0 0
825.613 0 3,480.871 96,761,345 2,321,065 0
6,986,381 7.454.254 102,181,782 2,556,793 1.572.334 1.282.546 2.622.164
4,432,919 1,205,033
222,085 150.712 82,756
4,168 2,179,549
0
2,722.158 794.39 1 178,378 145,366 58.009
0 1,276,049
0
15.265.432 4627,346
970,205 1,937,888
357,062 1.240
4.538.930 193.317
394,311 1 18,940 32,654 25,817
6,135 0
124.523 0
746,976 153,831 42,952 30.404 12,211
0 357,161
0
286,015 72.820 20,886 16,840 4,357 1.570
136,599 0
1.560.752 384,909
78,724
29,790 2,007
719,924 0
82,388
23 1,102,553 2.104.631 23 53,109 55,692 44
0 41,787 21,634 160,840
138,687 88.329
681,437 0 1.217 8,615 49 0 731.694 1 0 7 . 8 1 ~ 1.472 4,689 93.336 528.083 9.212 18.239 7.964 46.98 1
8,437,566 6.567.860 31.937,265 819,434 1.417.572 61 6,047 2,999,345 (15) 0 (144,047) (35,855) (253.750) (68,917) (792)
8,437,551 6.567,860 3 1,793.2 18 783.579 1,163,822 547,130 2,998,553 (1,45 1,170) 886.394 70,388,564 1.773.214 408,512 735,4 16 (376,389) 21.048,431 8,550,723 43,551,716 (6,526) 1,420.42 1 (73.434) 13,427,929
0 473.415 1,967,143 93.038 0 400,089 0 63.096 (1 78,832) (1 5,106) (206,822) (32.524) (123,053) 6,095
0 0 0 0 0 0 0
19.660.357 9.73 1,700 1 15.892.317 1,652,904 1.796.409 939,018 13,057,635
83,147,412 65,520,952 2 16.674.953 4,004 338 19,783,790 9,189.672 39.232.155 4r),163 (1 166.2 17) (3 1963,326) (2.1 19,950) 0 (396,962) 0 28,230 268.91 1 3,047,288 27.226 9,513 28,189 (122,392)
102885,162 74,355,346 303,65 1,232 3,564.518 21,589,712 9,759,917 52,167,398
125,109,489 229.3 15,004 1,922,957,776 166,449356 147,526,414 9 8,384,084 91,461,045 (87,290,631) (79,217,643) (855,208.560) (18.919.210) (60,483,603) (16.150.561) (88,139.8 17)
14,401 90.786 2,126,470 1,883,569 74,323 572,073 14,285
37,833,259 150,188.147 1,069,875,686 149,413,715 87,017.134 82,805,596 3.335.513 (7,649.724) (4,319,909) (68.051.802) (1,772.585) (2,324,847) (91 7,327) (249,050)
30,183,535 145368,238 1.001 j32.3.884 147,641, I30 84,692.287 8 1,888.269 3,086,463
962.428,386 812,737.836 4,940,264,453 2 10,464.087 228,019,456 130.990.197 359.233.349
77.12% 14.538 i a . 3 m (86.69)% (24.97)% (31.461% (43.16)%
part of these financial statements
33
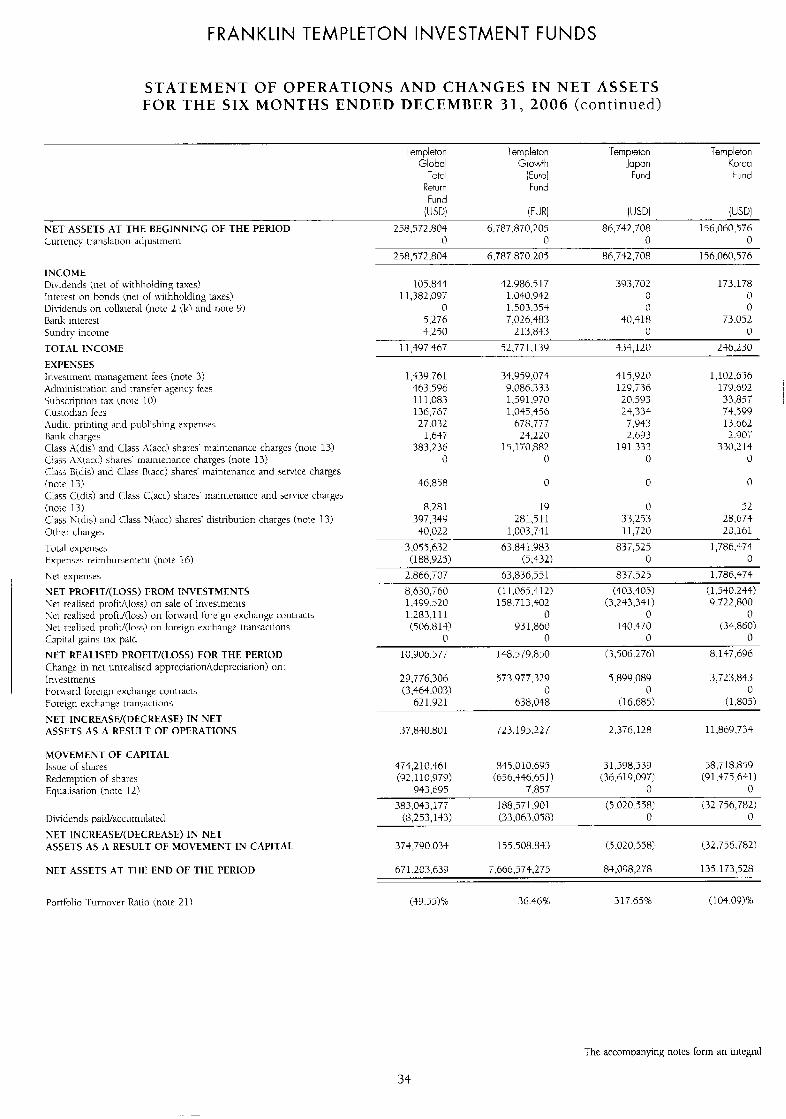
FRANKLIN TEMPLETON INVESTMENT FUNDS
STATEMENT OF OPERATIONS AND CHANGES IN NET ASSETS FOR THE SIX MONTHS ENDED DECEMBER 31, 2006 (continued)
Templeton lempleton .Tern peton Ternpleton Globul Grow!tr Japan Korea
Totol {Euro] Fund fund Return Fund fund
IUSD! (FUN IUSU I U W GET ASSETS AT THE REGINNISG OF THE PERIOD Currency translation at1jus~rnc.m
258,572.804 6.787,8i0,205 86,742.708 156.060.576 (7 0 0 0
INCOME Diwlencls (net of wtliholding taxes! Interest on bonds (net ol wn.hholcling raxes! I)i\-idencls on cvllaLera1 [note 2 (kl and note 9) Bank interest Sundry income TOTAL ISCOME EXPENSES In\w,unent maixigrnicnt lees (note 3) Aclniinistration and :i-ansfcr agency fws hJsciiption tax (nt>rt< 101 CUslOdl3II let; Auclir. printing and publishing cxpenstas Hank diarge.: Class .4(~lis) and Class , \ ( a d sharcs' maintenance charges (now 13) C:lajs ,\:(at:(:) shares' rrlairncnance charges (note 13) Class Didis1 and Clas R\acc) shai-es' maintenanc:c and service charges (nott. 13) Class C(dis) and Class Ciacc) shares' maintenance and senice chai-ges (notr 13) Class N(dis) :.ind Class Nkicc) shares' distiibution charges (note 13) Other cliai-gc>
Total cxpenscs t.yx:nsL's i-~<irnhurscrncnt (note 16)
her cxp(mses
NET PROFITl(LOS5) FROM INVESTMENTS \et realised pi-nfir/(loss) on sale u l in\ estttlenLs Zci r e a l i d prohd(1oss) on fonvat-d foreign exchange wntracLs Net realised profit/(liiss) on foreign exchmge itansacdons Capnal Kuris LIX paid
NET REALISED PROFIT/(LOSS) FOR THE PERIOD Ctangr 111 net unrealised appi-eciation/(depi-~~c:iarion) on In\ esirnen~c. Forward foreign exchange, ciint Foreign exchange transxiions
NET INCREASW(DECKEASE) IN NET ASSETS AS A RESULT OF OPERATIONS
MOVEMENT OF CAPITAL Issue ol shares Redeniption of shai-cs Equalisation (note 12)
Dividends paicl/acctimulated
NET INCKEASY(DECREASE) IN NET ASSEI-S AS A RESULT OF MOVEMENT IN CAPITAL
NET ASSETS AT l - H E END OF THE PERIOD
258.i72.804 6,787.870.204 86,732,708 156,060,576
105.844 42.986.5 I 7 393.702 173,178 1 1,382.097 1.040,942 0 (1
0 1,503,354 0 0 5.276 7.026.483 40.418 73.052 1,250 213,843 0 0
11,497.467 52.771.1 39 434,12@ 246.230
1,439 761 463.596 1 1 1,083 136,767 27.032
1,645 383.236
0
34,959,073 0.086.333 1..591.970 1,045,450
678.777 24,220
15,170,882 0
415.920 129 , i36 20.593 24,334
7,943 2.693
191.333 0
1,102.B'jd 179.692 I 33,857 I 74.599 13.662 2.90;
330.2 I4 0
46,858 0 0 0
8.281 19 397.349 28131 1 $0.022 1 [email protected]
5 2 28,673 2il.161
3 .05 5 .6 32 63.831 .Y83 837.525 1,786.474 (188.923 (5.432) 0 0
2,866,707 63,836.55 L 837.525 1,786.474
1.499.520 l W , 7 13,402 (3,243,341) 9,722,800 8.630,;60 ( I I ,065,412! (403,405) (1,4$0.244)
1.283,11 I 0 0 0 (506.814) 931,860 140,470 (.34,8601
0 0 0 0 10.Y06.577 148.579.850 (3.506.2761 8,147,696
29,T76.306 57 3.9 77.329 5.899.089 3.723343 (3.464.003) 0 0 0
621.921 638.048 (16.685: (1.803
37.840.801 723.195.227 2.376.128 11,869,734
4T4,210.461 845.010.695 3 1.598.539 58,T 18.859 (92.1 10,979) i656,446,651 (36,619,097) (Y 1,475,631)
933,695 7,857 0 0 383.043.1T7 188,5T1,901 (5.020..5.58) i32.756,782)
(8.253.1+3) (33.063.058) 0 (1
374,790.034 155.508.843 (5.020.558: (32.756.782)
671,203,639 7,066,574,275 81,098.278 135.173.528
(49.55% 36.46% 317.65% (104.09)B
The accompanyrig notes lortn an integral
34
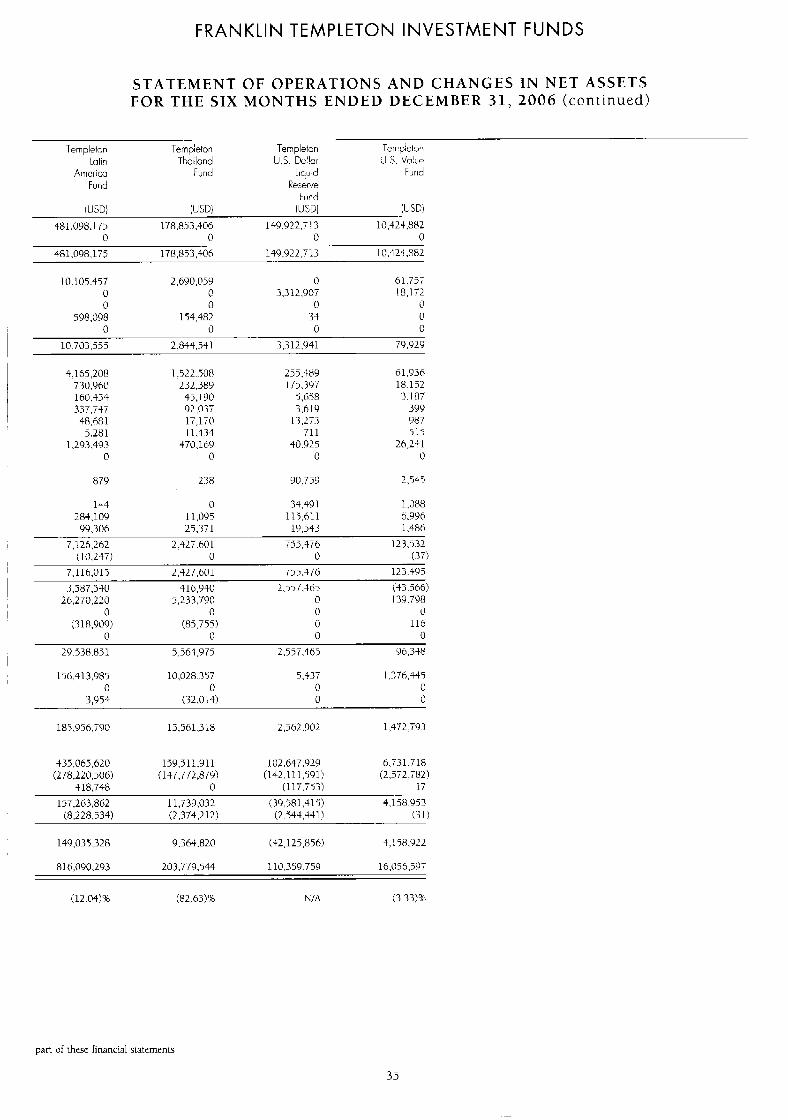
FRANKLIN TEMPLETON INVESTMENT FUNDS
STATEMENT OF OPERATIONS A N D CHANGES IN NET ASSETS FOR THE SIX MONTHS ENDED DECEMBER 31, 2006 (cont inued)
Ternpletcn Templeton Tenpletori Terrpie!y Lotiri Thailond I J S. Do'!ar I J 5. V&P
Amcricu Fund Liquid Furid Fund Resew
Furd I U W W D I (USD] [USCj
$81.098.175 178,853,406 149,922,i I3 10,324,882 0 0 0 0
481,098.175 178,853,406 140,922,713 10.424.882
IO. 105,457 2.690,059 0 61.75; 0 @ .3.312.907 18.172 0 0 0 0
598,098 174.482 33 0 0 0 0 0
10 703,545 2,844,541 3,312,941 79.929
4,165,208 730.960 160.444 33T,73T 48.681
5.281 1.293.493
0
1.522.508 232,389
45,190 92.037 17, l TO 11.434
470,169 0
255.389 175.397
5.658 3.619
13.27.3 71 1
40.925 0
61,936 18.152 3.187
399 987 'j 1 3
26,241 c
879 238 90.759 2,545
144 0 31,49 I 1 ,088
99.306 25.371 1Q,543 1.486 284,109 I 1,095 l l S , h l l 6.996
123.532 (1 0.247) 0 0 (37)
--- 7,126,262 2.42T.601 I >>,+TO
7.116.015 2.+27.601 755.476 123.4%
3.587.540 416,9+0 2.557.36.5 <33.566! 26.270.220 5,233.79C 0 139.798
0 0 0 ('I (3 18.9179) (85.755) 0 116
0 0 (7 0 29.538.841 5.564,975 2.557.465 ~ 6 . 3 ~
156.41 3.985 10.028..357 5,437 I .376.445 0 0 0 0
3.953 (32.014) 0 0
185,956,790 15.561,318 2,562,902 1,472,793
335,065,620 159,411,911 102.647.929 6.7.31.718 (278,220,506) (147 ,772 .87~ (1 42.1 1 1,591) (2,572,782)
$18.748 0 (117.7S3) 17
157,263,862 11,739,032 ( 39.581.41 5 ) 4.158.9 53 (8.228.534) (2.374.212) (2.744.4411 (31?
149.035.328 9.364.820 (42,125,856) 4,158.922
81 6,O90.293 203.779.544 110.359,759 16.056.59T
(12.041% (82.631% N/A (3.33)%
part uf these [inancial statements
35
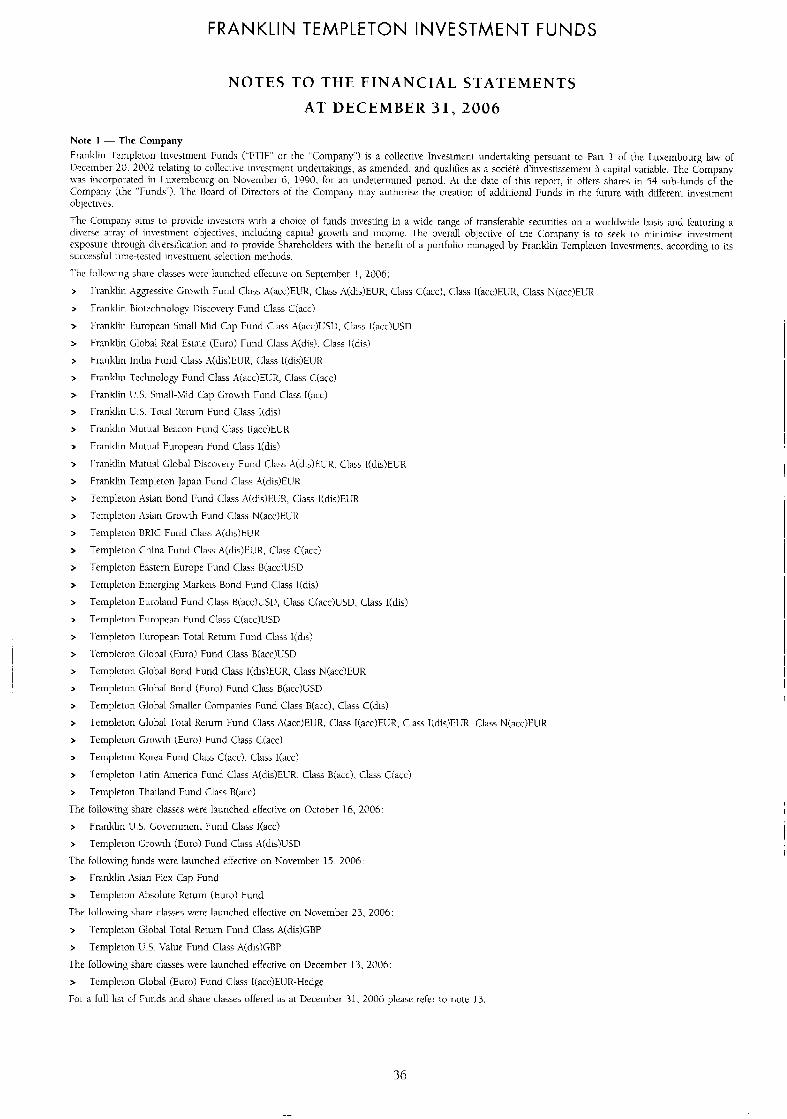
FRANKLIN TEMPLETON INVESTMENT FUNDS
NOTES TO THE FINANCIAL STATEMENTS
AT DECEMBER 31 , 2006
Now I - Tlic Company Franklin Ieinpleton Invemient Funds ("FTIF" or [he "Cornpalif! is a collective In\estmeni undertaking persuant to Pan 1 of the I uxembourg law of l.)eceinhcr 20. 2002 relating to collciiivc investmi'nt undertakings, as atnenclecl. and qualllirs as a societe d'iI1vestissernenl capital variable. The Company \\-as incoi-poi-atcd in I uxemboutg oti Novcrrihcr 6 , 19YO. foi- an undctemiined period. At the clatc of this 1-epoi-t, it offers shares in 54 sub-funds of the C C J I ~ ~ I I ~ > (the "Funels' ). 1 hv Hoard of lkectors of the Coinparij tnay authorisc rhc creation of additiortal Funds In the future w t h different mvcstnwnt objectives. The Coinpan) ainis to prowlc invemrs wi th 3 choice ot funds investing in a \ b i d e range of transferable securities on 21 worldwide hasis and featuring a eliwrsc, ai-ray of invrstiiicnt olijectivcs, iticludirig capiial growrh and income. l i e overall objective of the Company is to seek to rniri~rnise invesrmcnt exposuie through cli\erslf~cation and to pi-ovidc Shareholders w t h the benelit oI a portfolio managed by Franklin Templeton 1nvrstmen:s. accordmg to its sutwssful tmic-trsted investment selection triethods.
l'hc followng share classes were launched clfrctivc on September I , 2006:
>
>
>
>
>
>
>
>
>
>
>
>
>
>
>
>
>
>
>
>
>
>
>
>
>
>
>
>
>
>
The following slyare classes were laurichcd effectiw on Ocrober 16, 2006: >
>
.Thr follo\\-ing funds were lauiiched effective on Korember 14. 2006:
>
>
The following share classcs were launched effectiw on November 23, 2006.
>
>
The lolluwing share classes were lauiichcd dfcctive on December 13. 2006:
>
For a lull list or Funds and share classes offt.l-cd as at December 3 I , 2006 please refer to note 13.
Franklin Aggressive Growth Furid C1
rr:irlklin Bioit~chnology I)iscovciy Fund Class C(acc)
t i -mk l i i i Fiiropcan Small Mid Cap Fund Class A-2(acc)l;SDI. Class I(acc!USD
Fra i i l h C;lobal Reed1 Estate (Euro) Fund C.la,s A(dis). Class lidis,
Pi-anklin liidia Fund Class .\(cl1slE1JR. Class I(dls)FLJ K
Fi-ankh Teclinolog). Fuiicl Clash Aiacc)El:K. Class (liacc)
Franklin l!.S. Small-\lid Cap Cirowth Fund Class I(;icc)
r rd t l l r l L 5 . TOLA Kctum Fund Class I(dis)
rrariklin Ivlutual Ucac:on Fnnd C:lax l<acc)EUR
Franklin Murual European Fund Class I(&!
Franklin hlutual Global Disco\cry Fund Class A(dis )NR, Class I(dis)ELR
Franklin Templeton Japxi Fund Class .A(dis)EI!K
Teiiipl~to~i Asian Uond Fund C l a s s Aitlis)EUK, Class I(dis)EUR
Tetnpleton Asian Gron th Fund Class N(acc)tL:K
Tetnpletun BRlC Fund Cl;iss A(dis)hl!K
Templetoti China Furid Class A(dis)EI!K, Class C(acc)
Templeton Eastem Europe Funcl CIx,s B(acr:)lJ.SU
Templeton Etriergirig Markets Bond Fund Class I(&)
Ternpleton Euroland Fund Class H(acc!USD, Class C(acc)USD, Class I(dis)
Tcniplc.ton Europcan Fund Class C(acc)L!SD
I ciiiplctm European Total Return Fund Class I(dls)
.I rmpl(xm Glohal (Euro! Fund C-lass B(acc)USD
Tmiplrton Global Hond Fund Class l<dis)ELR. Class N(acc)EUR
Teiiiplelon Global Bnnd (Euro) Fund Class B(acc!USD
Tcrripleton Glohal Smaller Cnmpanies Fund Class R(acc), Class C(dis)
Tetnpleton Glohal Total Rciuin Fund Class A(acc)EUR. Class I(acc)ELR, Class I(dis)EUR. Class N(acc)EUK
Terriplctciri Growth (Euro) hind Class C.iacc)
Templrron Korea Fund Class C(acc!. Class I(acc)
renipleton I atin Anierica Fund Class A(dis)EUR. Class Btacc). Class (lcacc:)
Templeton Thailand Furid Class B(acc!
)FUR, Class A(dis)EUR. Class C:(acc). Class l(acc)FI:K, Class K<acc)EUR
Franklin U S , Loreinment Fund Class I(acc)
Templeton Cirowrh [Euro) Fund Class A(dis)USD
Franklin Asian Flex Cap Fund
Teiiiplclon Ahsolure Return (Eui-o) Fund
.l.empletoii Global Total Retuiii Fund Class A(dis!GBP
Templeton LS. Value Fund Class A(dislGBP
Templeton Gleibal (Euro) Fund Class I(acc:)EIJR-Hcdgc
I
36
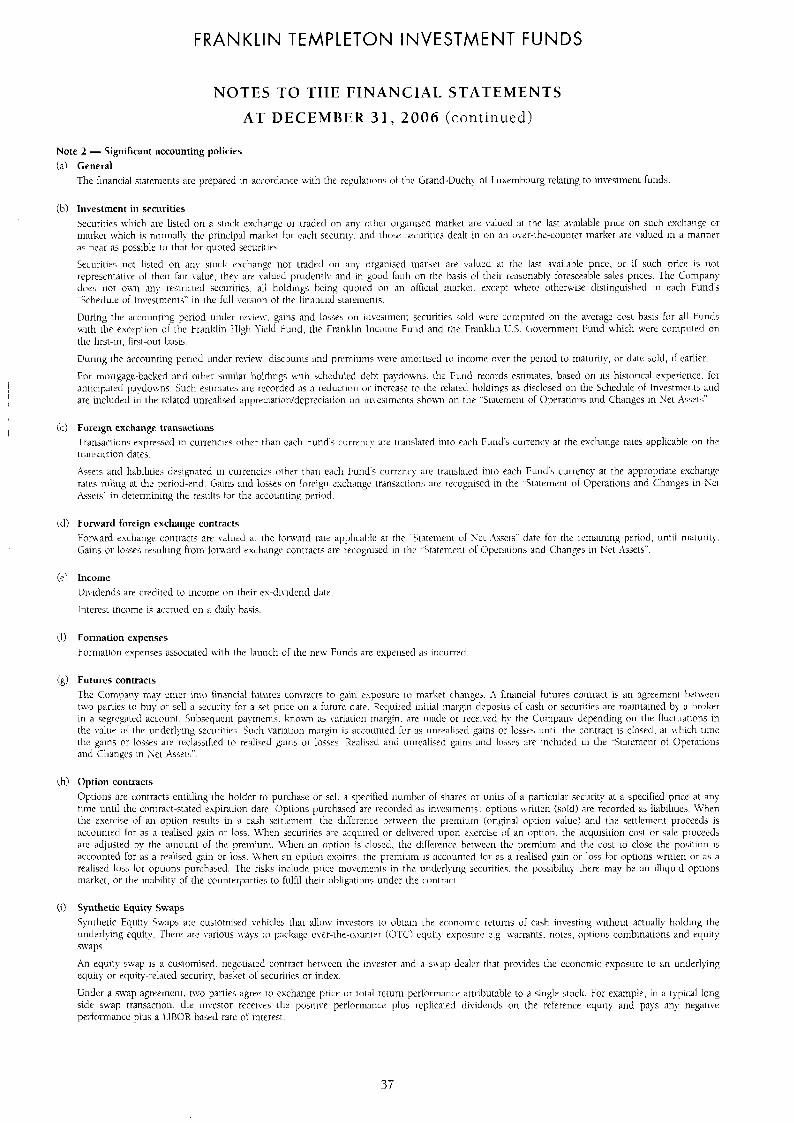
FRANKLIN TEMPLETON INVESTMENT FUNDS
NOTES TO THE FINANCIAL STATEMENTS
AT DECEMBER 31, 2006 (cont inued)
Note 2 - Significant accounting policies (a) General
The fir1;incial stateiiicnts are prellared in accordance w t h t he reguhiion\ ( i f the Gi-and .Duch! ol Luxrrnhourg relating to inrestinent rurlds
(11) Option contracts Options are (:#intracts entitlirig the lhiildci- to purchase or sel l J specified nuriihri- of shai-es or iinits of :I pal-ricwlai- securtt!- ai a specdid pi-1c.r at any rime until [he contrx~stated expifiitton date (.)ptioris ~)ui-di:ised arc recorded 3, invc\tiiicnrs, options \\riiteri (sold) 31-c recorded as liabilitie3. Whrn the tx(wise of an opiiiiii r(wi1ts in a cash s e ~ t I rmci i t . the dillertrict lh(~twccn the prerriiurii (original option \slue? arid I h r : scttleiiient proceeds is accourittcl inr as a realisecl xain 01- 105s. \+::hen 3rcui-ilics ai-e acquired o r dclivtwd upxi e.wrcise o1 :in option. the acquisition COSI 01- sale pi-ocecds ai-e adjusted hy rhc mioutit or thy pi-cmiuni. \Vlicri an ciptinii is closed the difk(:i-riit,c betwem th< premium and thc cost to close the posirion is accounted for as :i rralised gain or loss. \\hen a n optiori q x r c s . the prerniuiri IS :iciiiunrctj tor as a rralisecl Kain 01- loss tor options \vriiieri o r as a realistid loss for options purchased. The risks iiii:ludr price rriuvcriieriIs in rhc uiiderl~ irig -c.cui-irics. t he possibilit) there may hr an illiquid opuons iii3rlxt, or the inahiliry ot the couriirrparrie~ to fulfil their iihligatiiins under ihc L m m .
(3 Synthetic Equity Snaps Synthetic Ecpi ty 5waps are custorriised vrhicles that allow inwitni-s to olxain t h cconoiiiic returns of cash investing wthout aciirall! holding the underlying equity. Thrrt: are various \rays io pacltaRe oler-the-(:ri.~ntl,r i(NC ecluit) exposure e,g wrrxi ts . notes. ciptions conibmauons arid equity swaps.
An equi~): map is :i cusiomised. negotiated miti-act beti$eeri ihe invc'stor and a s \ r ~ t p cle:ilL~i- that provides the r c ( i n ( m i c exposure to an unelrrlying ccluii) or equity-1-elated srcui-it)-. basket ol securiti(:s 01- index.
L n d c r a swap agreernent. two parties agrw to cxchaiige price (ir t o l a l return per1orrri:iriw atti-ibutable to a singlr stock For example. irl a 1ypic:al long side swap transactioii. the investor receives ihc positire perftmlaricz plus 1-eplicatecl cli\-idends on the rcfererlce equity and pays any iiegaiiw pe~fcrrmance plus a 1 IROR-basccl rare nt in[erest.
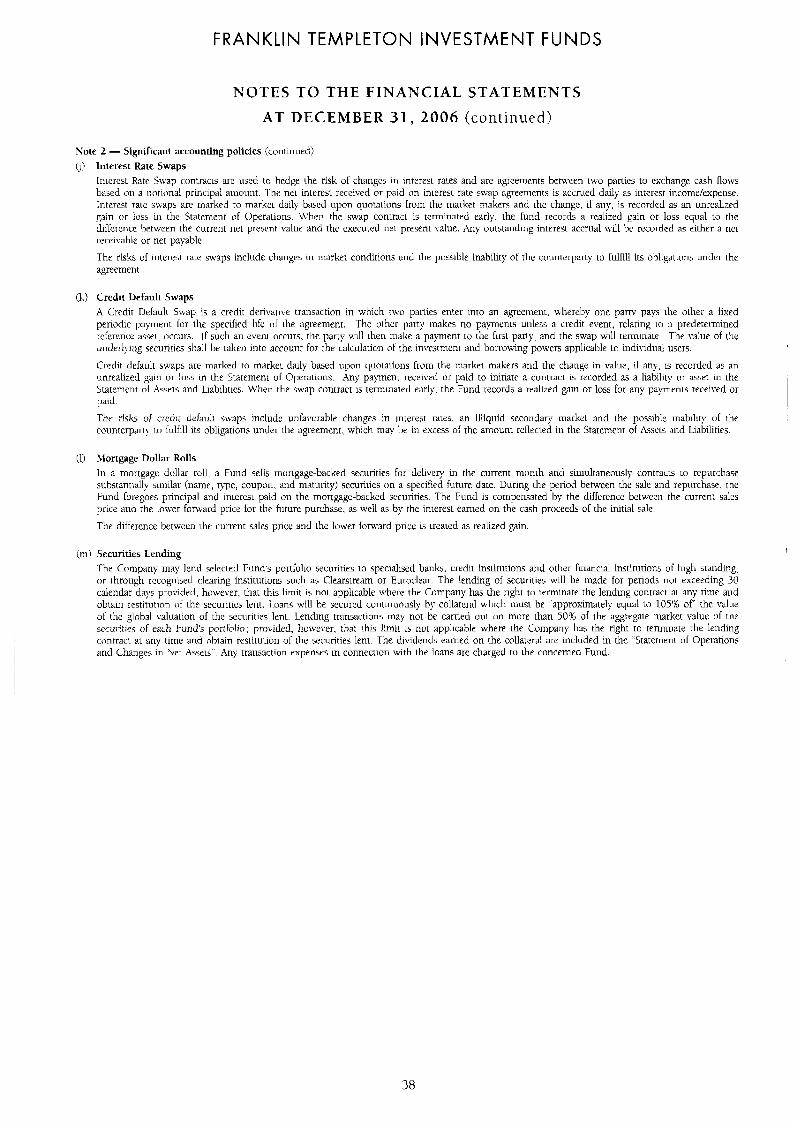
FRANKLIN TEMPLETON INVESTMENT FUNDS
NOTES TO THE FINANCIAL STATEMENTS
AT DECEMBER 31, 2006 (conlinued)
Kale 2 - Significant accounting policies (ctiiitinued) (1) Inlerest Rate Swaps
h e r e s t Rate Swap c‘ontrms arc used to hedge the risk of chaiiges in intcrcsi rates and are agreements between iwo pirties to exchange cash flows 1,ased oii a notional principal iiiiiount. .The net interest received or paid on interest rate swap agi-eenicmts is accrued daily as tntei-est incoiidexprnse. Interest raic s\\;ips are mal-ked to iiiarkeL daily based upon quotaticins from the market makers and ihe change. it any, is recorded as an unrealized gain o r loss in tlie 5tntciiient (if C)perations. When the swap contract is terminated rarly. the fund records a I-ealized p i n or loss equal to the difference hctwcen LhF current net presciir value and the executed net present \slue. Any outstanding inLerest accrual \\ill be recorded as either a nei i-eccivahle or net payable
The risks of iiitei-rst rate swaps include changes in market conditions and tlie posslhle inability ot the counrcrpany to lullill its obligations under the agreement
(L) Credit Defauh Swaps A Credit Drfaulr S\\ap is a credit drrivaiive transaction in which t\vo parties eiiter into an agreemenL. \\hereby one pan? pays the other a fixed periodic payment lor the specified life of the agreement. The oiher party makes no payiiienls unless a credit event, relating IO a predetemiined refei-cmce asset. occurs. If such an eveni occurs, the party will Lhen make a payment to the first party. and the swap will tetminaLe. The valuc of the underlyltig seciinties shall he taken into account for tht calculation ot tlie inve.stmen1 and borrowing powers applicable to individual users.
Credit default swaps are mal-ked i o market daily based upon quotations from the market makers and the change in value. if any, is recorded as an unrealized gain or loss in he Statement of Opera~ions. Any paymiit rccrived or paid to initiate a contract is recorded as ii liability or asset in lie Statement of .&sscis and Liabilities. When the swap contract is teminaied earl)*, the Fund records a realized gain or loss for any payments received or paid
The risks of cirdit defauli siraps mcliide unfarorahle changes in interest raLes, an illiquid secondar). market and the possible inahility of Lhe counterpai-ty IO fulfill its obligations under the agreement. which ma): he in excess of the amount reflected in the Statement of Assets and Liabilities.
(1) Mortgage Dollar Rolls In a mortgage dollar roll. a Fund sells iiicirtgage-backed securities for delivery in the current month and simultaneously contram to repurchase substantially similar (name, t p , coupon, md maturity) securities on a specified futui-e date. During the period between the sale and repurchase, the kund loregoes pnncipal and inLeresL paid on the mortgage-hacked securities. The Fund is compensated by the difference between the current d e s price and the lower fonvard price for the future purchase. as well as by the interest earned on the cash proceeds of the initial sale.
The difference betwen Lhe current sales price and the lower fonrard price is Lreaied as realized gain
(in) Securities Lending I
The Conipmy may lend selecied Funds portfolio securities io specialised banks. credit institutions and other financial institutiors of high standing. o r through recogiised clearing institutions such as ClearsLream or Eui-oclcar The lending of securities will he made for penods not exceeding 30 calendar days pi-oridcd. howeber, that this limit is not applicable whei-e the Company has the right t o ierminate the lending contract at any time and obtain restitution of the securities lent. Loans will he secured continuously by collateral w-hich must be ..approximately equal to 105% of the value of the global valuation of the securities lent. Lending transactions may not be carried oui on more than 50% of the agregate market value oC the secuTities 01 each Fund’s portfolio; probided. however, that ihis limit is not applicahle where the Company has the righL to terminate the lending cmtract at any time and nhain restitution of the securities lent. The dnldends earned on the collateral are included in the .‘Statemen1 01 Operations and Changes in k r t Assc~s” Any transaction expemes in connection with the loans are charged t o Lhe concerned Fund.
38
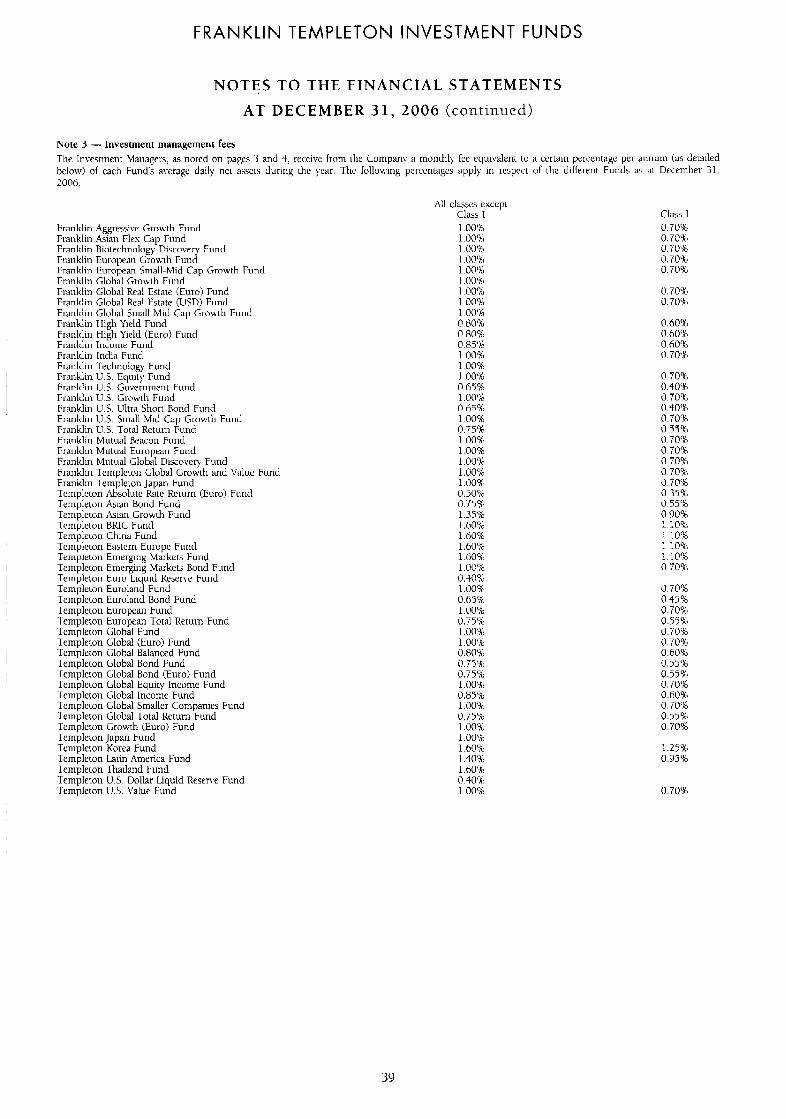
FRANKLIN TEMPLETON INVESTMENT FUNDS
NOTES TO THE FINANCIAL STATEMENTS
AT DECEMBER 3 1 , 2006 (continued)
Note 3 - Investment management fees The Investment hlanagers, as noted on pages 3 and 4. rrc-cive from Ihe Cornpan! a tnonthl) lee equivalent to a certain percentage per annum (as derailed below) of each Fund's avcwge daily net assers during the year The followmg percentages apply in respect of the different Funds 2s at Decemher 31. 2006.
All L
Franklin Aggressive Growth Fund Franklin Asian Flex Cap Fund Franklin Biotechnology Discovery Fund Franklin European Growth Fund Franklin European Small-Mid Cap Growth Fund Franklin Global Gro\\ th Fund Franklin Global Real Estate (Euro) Fund Franklin Global Real Estate (USD) Fund Franklin Global 5mill-Mid Cap Growrh Fund Franklin €ligh Yield Fund Franklin High Yield (Euro) Fund Franklin Income Fund Franklin India Fund Franklin Technology Fund Franklin U S . Equity Fund Franklin U.S. Government Fund Franklin U.S. Growth Fund Franklin U.S. Ultra Short Bond Fund Franklin 1J.5. Small-Mid Cap Growth Fund Franklin U.S. Total Return Fund Franklin Mutual Beacon Fund Franklin Mutual European Fund Franklin Mutual Global Discowq Fund Franklin Templeton Global Lrowth and Value Fund Franklin Templeton Japan Fund Tenipleton Absolute Rate Return (Euro) Fund Templeton Asian Bond Fund Tenipleton Axan Growth Fund Templeton BRlC Fund Templeton China Fund Templeton Eastern Europe Fund Templeton Emerging Markers Fund Templeton Emerging Markets Bond Fund Templeton Euro Li uid Resen-e Fund Templeton Eurolan?l Fund Templeton Euroland Boric1 Fund Templeton European Fund Templeton European Total Retuin Fund Templeton Global Fund Templeton Global (Euro) Fund Templeton Global Balanced Fund Templeton Global Bond Fund Templeton Global Bond (Euro) Fund Teltlp~Fton Global Equity Inconit. Fund Templeton Global Income Fund Templetori Global Smaller Companies Fund Templeton Global Total Return Fund Templetcin Growrh (Euro) Fund Templeton Japan Fund Templeton Korea Fund Templeton Latin America Fund Templeton Thailand Fund 1-empleton U.S. Dollar Liquid Reserve Fund Templeton US. Value Fund
.lasS(?s ext Class I 1.00% 1 .00% 1 .i)O'b 1 .00% 1.00% I .008 1 .PO% 1.00% 1.00% 0.80% 0.80% 0.84'6 1 .00% 1.00%> I .00% 0.67% 1 .00% 0.65% 1.00% 0.75% 1 .OOR 1 0 0 % 1.00% I .00% 1 . O m 0,50% 0.758 1 3 5 8 I .60% 1.60% 1.60% 1.60% 1 00% 0.30% 1 .00% 0 65% 100% 0.75% 100% 100% 0 80% 0 7 5 8 0.758 1 .00% 0.85% 1.008 0 75% 100% 1 0 0 % 1 60% 130% 1.608 0.40% 1 00%
:cpt Class I 0.70% 0.70% 0.70% 0.70% 0.708
0.70% 0.70%
0.60% 0.60% 0.60B 0.70'1
0 7016 0.40% 0.70% 0.4016 0.708 0.55% 0,7096 0 70% 0.70% 0.70% 0.70% 0 . 3 5 8 0,55% O.YO% 110% 1.10% 1.10% 1.10% 0.70%
0.70% 0 45% 0.70% 0.55% 0.700/0 0 7 0 8 0.608 0,55'k 0.55% 0.70'1 0.60% 0.70'1 0.55% 0.7016
1.25% 0.95%
0.70%
39
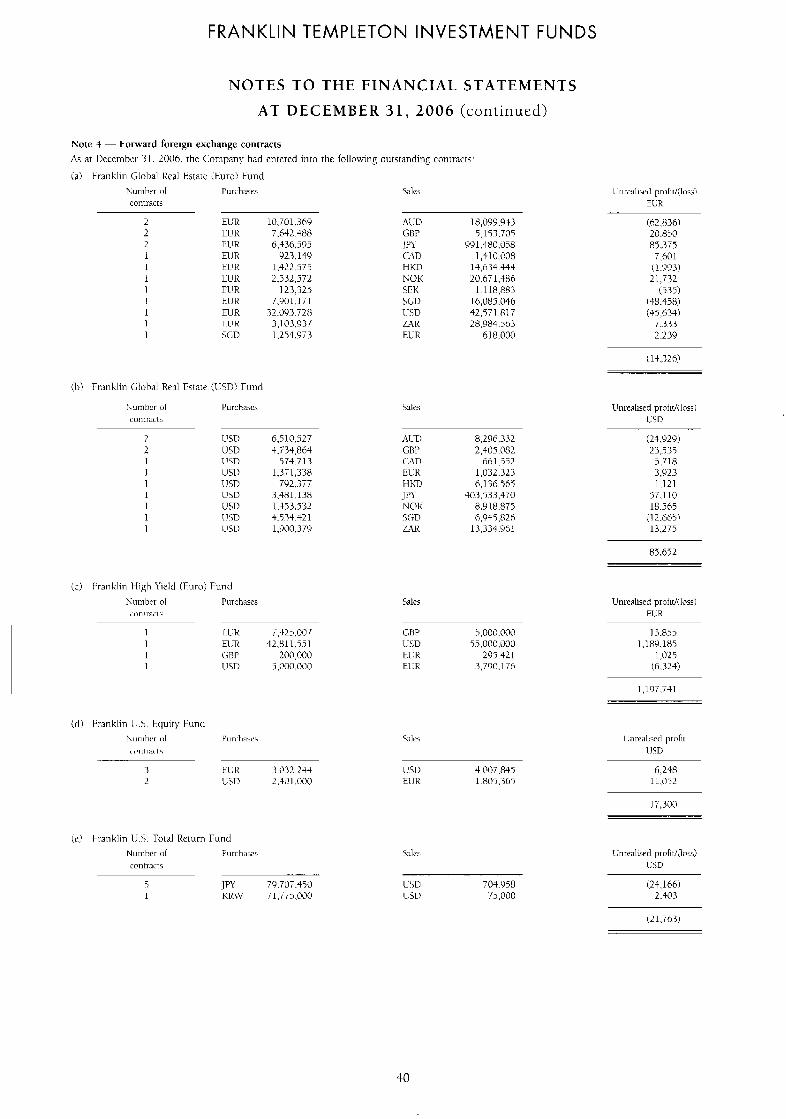
FRANKLIN TEMPLETON INVESTMENT FUNDS
NOTES TO THE FINANCIAL STATEMENTS
A T DECEMBER 31, 2006 (continued)
Now 4 - Forward foreign cxchangc coiitractS ,Is at I)c.cc~iiihu 3 1 , LOOb. rhc Cimipany had entered into the folloning outstanding contract2;'
( a i Franklin (.;lohal Kcal kstatc. (Eun-o' Fund Purchases Sales
2 2 2 I I 1 1 1 I 1 1
10,701,369 T.642.488 6:t36.595
923.149 1.422 3 7 5 2,532,572
323,325 7.901.171
32.U93.728
1,254,973 3.1 03.937
18,099.943 5.153.705
991.480.058 1,31 (3.(?08
14.634.444 2O.671.386
1 .I 18,883 16,085.036 42.571 817 28,984.563
618.000
(62.836) 20.850 e7.375
7.601 (1.9931 21,732
(535) (48.458) (35,634)
7.333 2.239
(14.32bl
(bl Franklin Global Real k t a l F (LSD? ruticl
2 L'SD 6.5 10,527 L'SD 4,733,864 1!SD 574.T13 CIS1) 1,371,338 1 ISD 792.3T7 UhD .3,481.138 Lw) l.-t53.532 l!SD 4.534.42 1 C I j I ) l,!kX1,379
8,296.332 2,405.082
66l . i i2 1,032.323 6,136.5l.5
40-3.5.3.3.470 8,918.875 6.94S.826
13.334.961
(24,929) 23,535
5>718 3,yz3 1.121
57.1 10 18.565
(1 2.665) 13,275
Salcs Unrenlised profitliloss! ELR
1.3.855 I .189 ,185
1,025 ((i.324)
C'SD '+.OO7.8$5 El JR 1.805.365
Sales
LhU 704.958 LSD 75,000
1,197,741
6,248 11.052
17,300
(24 166) 2.403
(21,763)
40
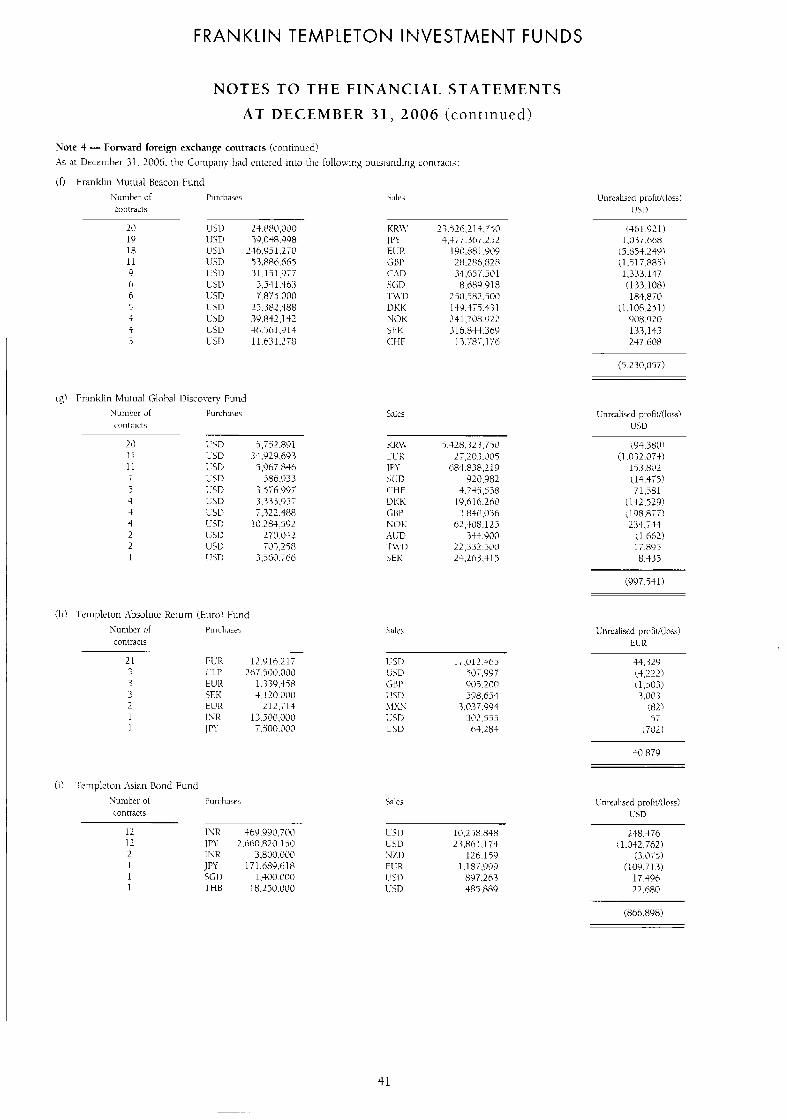
FRANKLIN TEMPLETON INVESTMENT FUNDS
N O T E S TO T H E F I N A N C I A L S T A T E M E N T S
A T DECEMBER 31, 2006 (continued)
L i i c s
L3H.476 , l.i)42.7h2!
(3.0i51 (100.713)
17.496 22.fi80
41
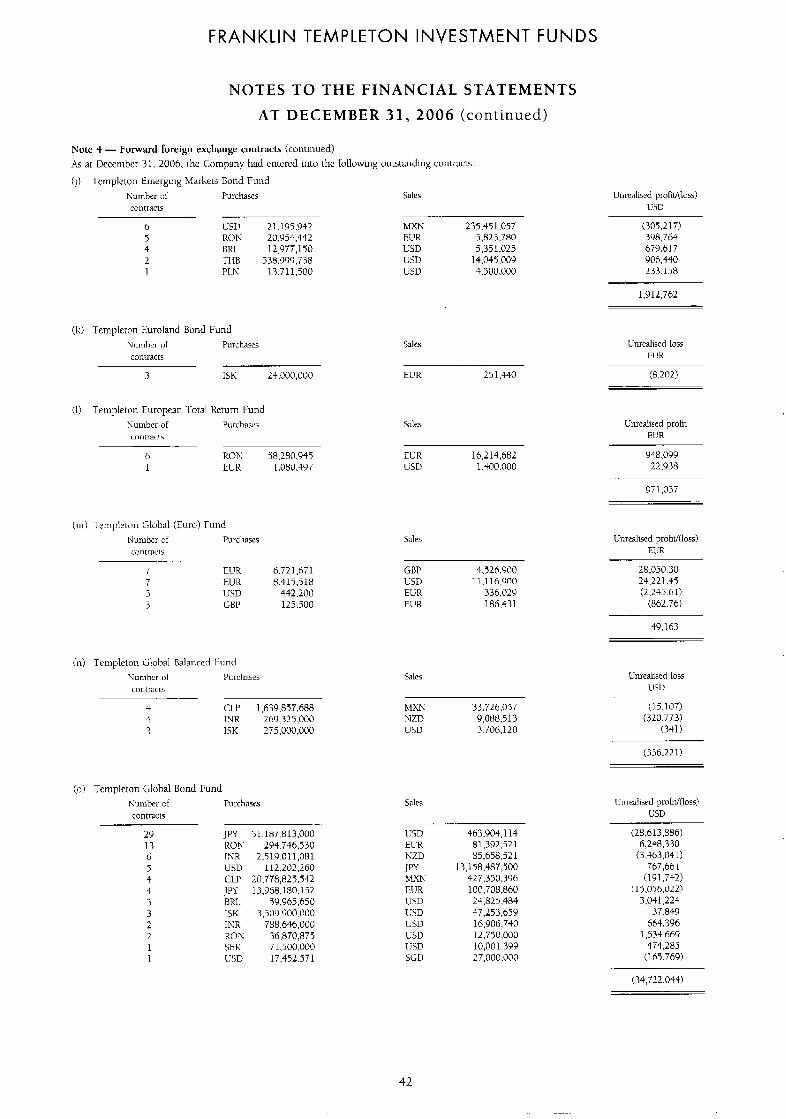
FRANKLIN TEMPLETON INVESTMENT FUNDS
NOTES TO THE FINANCIAL STATEMENTS AT DECEMBER 3 1, 2006 (continued)
Note 4 - Forward foreign exchange contracts (continued) As ‘it December 31, 2006. lhe Company had entered lnto the followin:, outstanding contracts:
[j) Templeton Emerging M;irkets Bond Fund Uiirealised profit/iloss!
l i D Sale5 riurnher 01 Purchases
coiltracts
6 L5U 21.195.942 5 RON 20,954,442 4 BRL 12,977,150 L THB 538.399.738 1 P1.K 13.711.500
MXN 235,451.057 EUR 5.823.780 LSD 5 351,025 USD 14,045,009 USD 4.500.000
(305.21 7) 3Y 8,764 679.61 7 906.440 233,158
1,912,762
(k) Tcnipletcn Eurolaiid Bond Fund Nurnhrr 111 Purchscs clllllracts
3 1SK 24,000,000
$de5 Uni-ealised loss n!R
EUR 25 1.440
Sales
(R.202)
(1) Ternpletoii European Total Ketum Fund Kuinbei- of Purch;ws c(intra<.l\
h ROK 58.280.945 I EUR 1.080.497
Unreahscd profit EI:R
ELR 16,214,682 LSD 1,300.000
YL8,099 22,938
971.03i
(m) -l.cmplctcin Global (Euro) Fund Nuiiibcr of Purchasrs contracts
7 ELTR 6.721.671 7 ELIR 8.415.518 3 USD 442.200 3 GBL’ 125.500
Cnreallscd profit/(loss! EI!R
Sales
GDP 4.526.900 U5D ll.llh.900 ELR 336 029 EUK 186.431
28,050.30 24,221.45 (2.245.61)
(862.76)
49.163
in) Tetnpleton CJobal Balanced Fund Rumher 01 Purchases coiltracts
4 CLP 1,639,857,688 4 INR 269.325,000 3 ISK 275.000,000
Unreahsed loss IJSD
Sales
hlXK 33.726.057 NZn 9,088,513 IJSD 3,706,120
( 1 5,107)
(331) (320.773)
(336,221)
(0) Teiuplftoii Glohal Bond Fund
cnntiilct5 liuinber of Pui-chasc
29 JW 51.187.813.000 13 IW!i 294.746,530 6 INR 2.519.01 1.081 5 USD 112.202.260 4 CLI’ 20,778,825.542 4 J P Y 13,968,180.152 3 BRI, 59.965,h50 3 ISK 3,5041.900.000 2 INR 788,646,000 2 ROY 36,870,875 1 SFK 71,500.000 1 1:SD 17,452.571
Sales
(28,613,886) 6,248.330
(3.463.041) 767,661
(191.742) (1 5,056,022)
3,041,224 37,849
663.396 1.534.669
ilh5<769) 474,285
463,904,114 R1.392.521 85,658.521
13,158,487,500 427,350,396 100,708,860 24,825,484 47,253,659 16,906,740 12.7$0.000 10,001 399 27.000.000
LSD ELK NZD JW XlXK EUR LJSD LSD LSD
IlSD SGD
L w
(34,722.034)
42
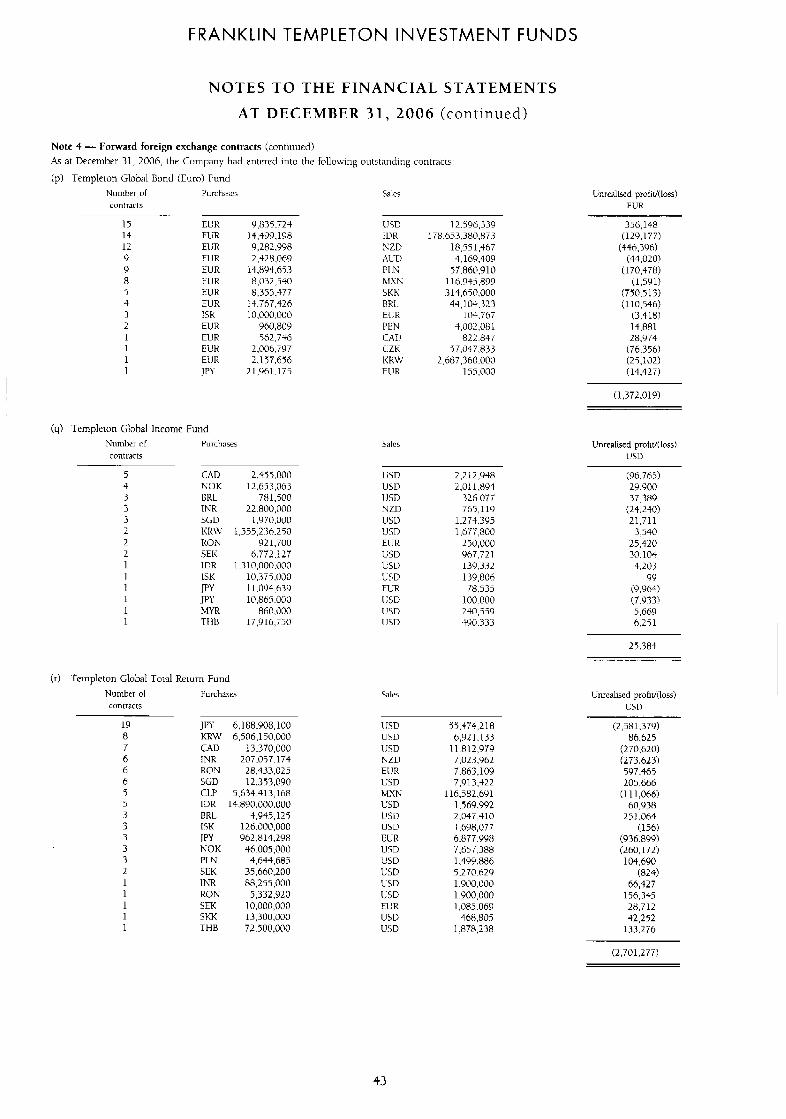
FRANKLIN TEMPLETON INVESTMENT FUNDS
NOTES TO THE FINANCIAL STATEMENTS
AT DECEMBER 3 1 , 2006 (cont inued)
Note 4 - Forward foreign exchange contracts (contiiiucd) As at DFCFnlbFr 31, 2006, the Company had cntcrcd into the followng outstanding contrdcts'
(p) T t m p h o n Global Bond (Euro) Fund Nuiiiber of
ciiril riltts
15 14 I2 9 9
3 3
8 5
2 1 1 1 1
Purchases
EUR FLR EljR ElJR EUR EUR FUR EUR ISK ElJR EUR EUK ElJR J PY
Y.835,TZ-t 14,399.198 9,282.998 2.328.069
14.894.653 8.c)32,540 8,355.477
14,767,426 10,000.000
960,809 562.746
2,006,797 2,157.656
2 1,961,175
I (q) Templrton Global Income Fund Numlxr ol Purchases contiilcts
5 CAD 2.455.000 3 NOK 12.653,063 3 URL 7H I .500 3 INR 22.800,000 3 5(iD 1.970.000 2 K R N 1,555,236,250 2 RON 921,700 2 SEK 6,772,127 1 IDR 1.310.000.000 1 ISK 10.3T5.000 1 JPY 11,094.639 1 JPY 10,865.000 1 41YR 860.000 1 T1iU 17,Yl6,750
(r) Tenplcton Global Totd Rctum Fund Number of Purchasrs contracts
19 JPI' 6,188,908.100 8 KRW 6,506,150,000 7 CAD 13,370,000 6 1NR 207,097,174 6 RON 28,433,025 6 SLD 12,353,090 5 CLP 5,634.413,168 5 IDR 14,890.000.000 3 BKL 4,945,125 3 1SK 126.000,000 3 JPY 962,814.298 3 KOK 46,005,000 3 PLN 4,644,683 2 SEK 35.660,200 I INR 88,255,000 1 RON 5,332,920 1 SEK 10.000,000 1 SKK 13,300.000 1 THB 72.500,000
Salcs
I!SD 1 D R NZD AUD P1K MNK 5KK RRl ELR PkN CAD CZK K K W EUR
12,596,339 178,653,380.873
1 8 3 1,467 4,169.409
57,860,910 1 16.935.899 314,650,000 44,104,323
104.767 4,002,081
822.847 97,047,833
2.687.360.000 155,000
Lnrcalised prolid(loss) FUR
356,148 (129.1 77)
(446.396) (44,020)
(170,478) (1.5Yl)
(750.513) (110,546)
(3,418) 14.881 28.974
(76,356) (25.102) (14,427)
(1,372.019)
Sales Unrealised profit/(loss) 1!5u
2.2 12,938 2.01 1,894
326.07i 765.119
1,274.395 1,677,800
250,000 967.721 130,332 139,806 78.535
100.000 240, i 99 490.3 3 3
(96,765) 29.900 37,389
(24.240) 21,711 3,540
25,420 30.10.t 4.203
99 CY ,964) (7.933) 5,669 6.251
Unrcallsed profit/iloss! LSD
IJSD 1JSD lJSD NZL) EI!R L5D MXK CSD 1'51) USD EUR 1JSD USD USD L-SD LSD ECR USD l!SD
55,+74,218 6,921,133
11.812,979 7,023.962 7,863,109 7.913.422
116.582,6Y 1 1.569.992 2,047.310 1,698,077 6,877.YY8 7,657,388 1.499.886 5,270.629 1,900,000 1.900,000 1,085.069
468.805 1,870,238
(1,5H1.379) 86,625
(270,620) (273 623) '197,465 205 b66
(1 11,066) 60,Y38
25 I ,064 (156)
(936.899) (260.172) 104,690
(824) 66,427
156,345 28,712 32,252
133.276
(2,701,277)
43
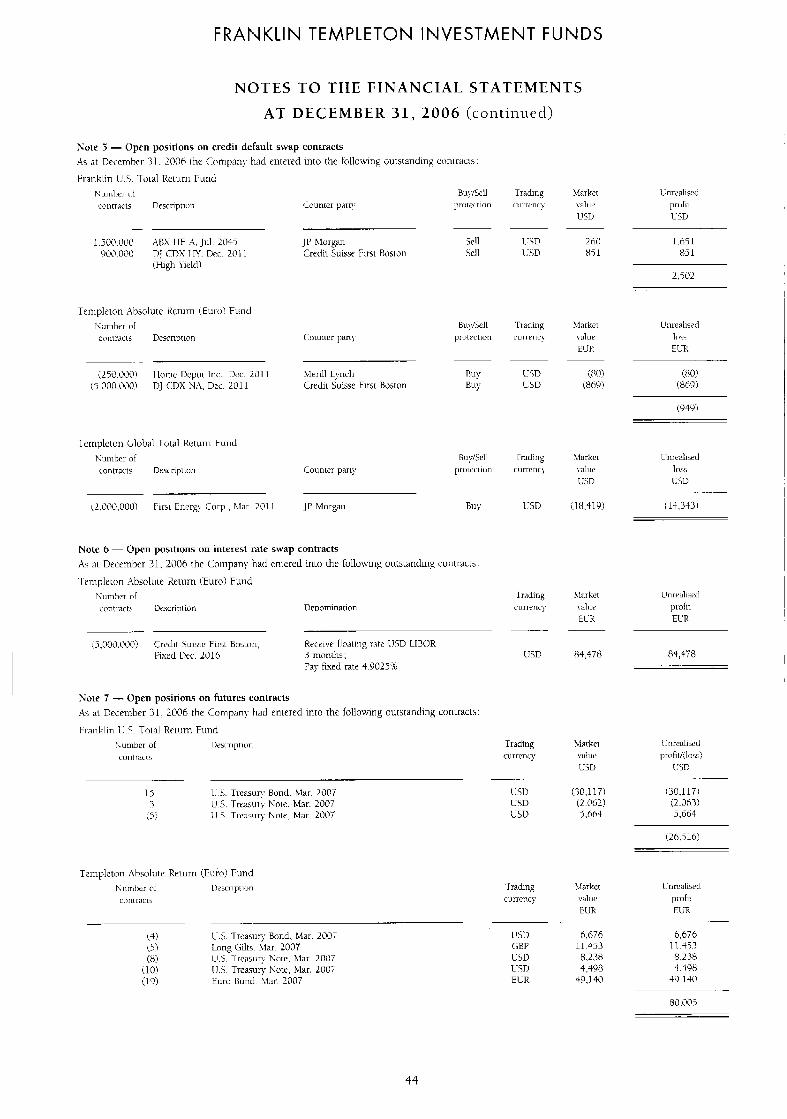
FRANKLIN TEMPLETON INVESTMENT FUNDS
NOTES TO THE FINANCIAL STATEMENTS
AT DECEMBER 31, 2006 (continued)
Note 3 - Open positions on credit default swap contracts .k 'It Deceinhci- 31. 2006 Ihc C(mi[,an\ had entered into the followng mirsranding c o n t r x I s :
Counrcr parr\;
L5D I:D
Tiadiiig currency
26i) 851
Slarkct valuc tUK
l.h51 85 I
2.5w
Huylicll protectloll
(Xi)! (869)
!darker d u e 1!5D
iHO,' (869)
41cnll Lynch RU? Crerlii Suisse Firs1 Rirston Buy
(949)
Counter pal-ty
1-5D
I rddinp cun-ency
(14,343) JP Morgan RU)
Note 6 - Open positions on interest rate swap contracts As ~ I L December 31, 2006 the C.ompan\- h:ld cmlerecl inLo the hllo\\lng outstandins contracts:
.I c~iiiplcion A1)solute Return (Euro) Fund h'umScr of ccnti-art-. Ut:~i.r11~iion Denomination
L!5D
Trading curi-ency
81,478
\hi-ket YdlLlt:
U5U
Note 7 - Open positions on futures contracts As ;it December 31. 2006 the Company had entered into the following outstaii(1ing cor1Lrxts'
ti-niiklin IJ 5. Told Rerum Fund humbcr of Wsr-i-iption coiitracn
('30.1 171 (2.0621 7.664
Marker \ d L W
EUR
(30,117) (2.1763) 5.664
(26.516)
1. nrcahscd
FUR profir
6 676 1 I .453 8.238 4,498
49.1 40
6,676 11.453 8,238 4,198
-tc).l40
RO.005
44
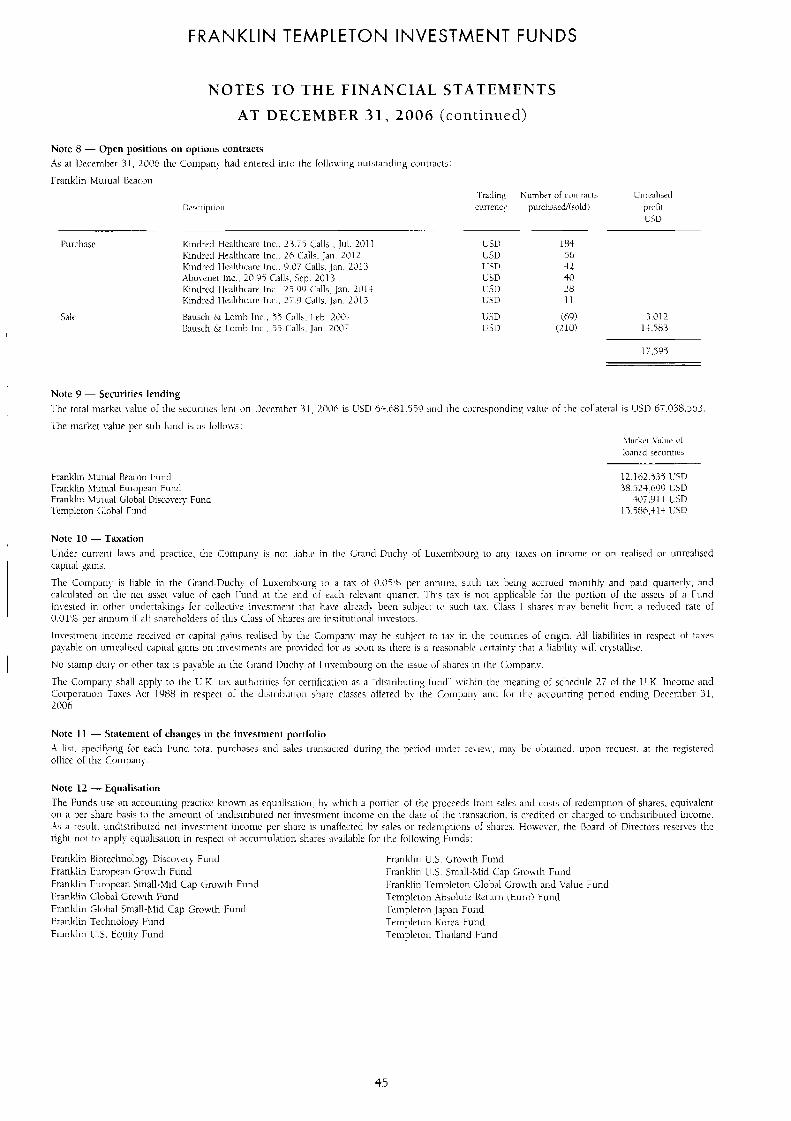
FRANKLIN TEMPLETON INVESTMENT FUNDS
NOTES TO THE FINANCIAL STATEMENTS
AT DECEMBER 3 1 , 2006 (continued)
3 1'1 2 14.56.3
Nore 12 - Equalisation The Funds w e an accounting prxticx. k n o w 'is eclwilisauori. h) which :I poi-tion of the proceeds frorn sales ancl coiis I-edemption of sliai-c:. cqiii\'alent oti '3 per shart hasis to thc amoiltit of uticlismhuied nct inwstiiiew iiiconw on the c l ,w o l ihc 1i-mis:x tion. 15 ci-edited or charged to unclisiributecl incorrie. .4s a I-esult. unclisuitxitrd nct inwstnient mcotiie per st1;ii-c IS uiiafte~wd I>\- 5aks or recktnptioris of s l i ~ c s . H(iwt , the Hoard of Directors iesenes the right m i to 3ppl:- cqualirauoti irl respec1 of acciiiiiiilntioti shares avdatilc io]- I lie i(ill,wiig Fumds
Fruriklin Hiotechno:og) Discovtr) F~iiid Fraiihlin European Gi-owth Fund Fratiltliri Lui-opmn Sinall-Mid Lip Grov,l h Funcl tranklin Cilobal Growth F~iiid Franltliri Glohal ';niall-hlid Cap Growth Funtl Fraiildiii Technology Fund Franklin I- 5. Equity F~irid
4 5
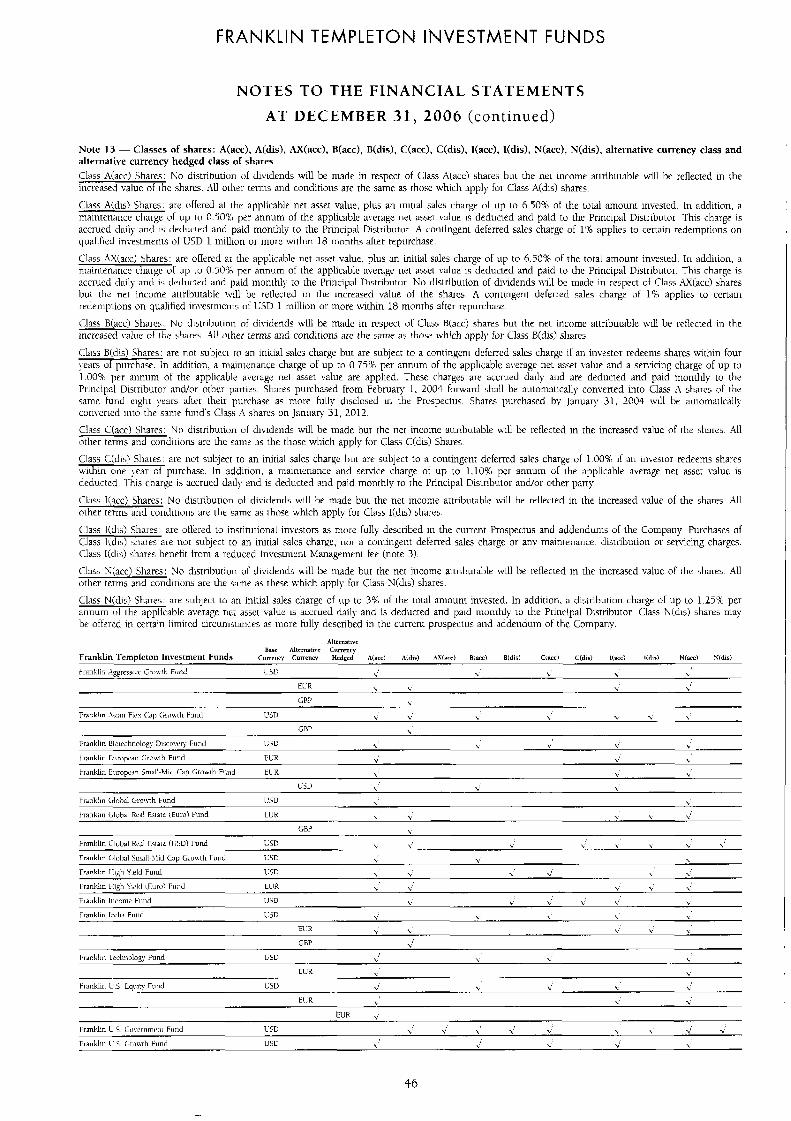
FRANKLIN TEMPLETON INVESTMENT FUNDS
NOTES TO THE FINANCIAL STATEMENTS
AT DECEMBER 31, 2006 (continued)
Note 13 - Classes of shares: ACacc), A(dis), AX(acc), R(acc), B(dis), C(acc), C(dis), ICacc), I(dis), N(acc), N(dis), alternative currency class and alternative currency hedged class of shares Class A(acc) Shai-es h o disti-ihuiion of dividends will be made in respect of Class A(acc! shares hut the net income attribuiable will be reflected in the increased value of Ihc shares. ,411 other ierms and conditions are the same as those whlch apply for Class A(dis) shares.
Class A(dis) Shares: arc: ofh:rc.d al ihc applica1)le net asset value. plus an initial sales charge or up to 6.50% of the total amount invested. In addition, a tnainteiiaiice charge of up io 0.70% per annum of the applicable average net assei value i s deducted ancl paid to the Principal Distributor. -[his charge is accrued daily and is deducied artd paid monthly to the Principal Distrihutor. A contingent deferred sales charge of 1'X applies to cenain redemptions on qualified inves~rnents ol USD 1 mlllion or more wirhin 18 months alter repurchase.
Class AXiacc:) Shares: are offered at the applicable net asset value, plus ;in initial sales charge of up to 6.50% of the total amount inwsied. I n acldition, a ni;iintenance charge of up to 0.5t% per annum of the applicable average net asset value is drduciecl and paid to the Principal Distributor. This charge is acciued daily and i i clcducted ancl p i d monthly to the Principal Distrihutor. No distribution of dilidends \\ill be made in respect of Class ..\X(acc) shares h i t the i ie i income attributable xi11 he retlectcd in the increased value of the shares. A contingent deferred sales charge of 1% applies io certain reclernptions on qualified invemienr~ of I:SD 1 million or more within 18 months after repurchase.
Class B(acc) S h a m : No distribution of dividends will be made in respect ot Class H(acc! shares hut ihe net 111come attributable w d l be retlected in the increased mluc of rhe %harts -211 a h e r terms and conditions ai-e the same as those which ;ipplj) for Class B(dis) shares.
Class B(dis) Shares: are not suhlec~ to an iniiral sales charge but are subject to a contingeni deferred sales charge il an investor redeems shai-es \whin four !ears of purchase. In addition, a mainltenance charge of up to 0.75% per annum of the applicable average net asset value and a senicing charge of up to 1.00% per annum of the applicable average ne1 asset value are applied. These charges are accmed daily and are deducted and paid monthly to the Principal Distributor and/or other parties. Shares purchased from Febtuay I . LO04 forward shall be automatically converted into Class A shares of the saiiie fund cighi years alter their purchase a5 iiiore fully disclosed in thc Prospectus. Shares purchased by J a n u a ~ 3 I , 2004 will he ;iutomitically converted into the same fund's Class A shares on Jantiarj 31. 2012.
Class CLacc) Shares: No disrrihution (if dividends will be made but the net income attributable \\ill be reflected in the increased value of the shares. All other terns and condilions are the same as the those which apply for Class C(dis) Shares.
Class C(dis1 Shares: are not subject to an initial saks charge hut are subject to a contingent deferred sales charge of 100% if an in\estor redeems shares within m e ! e x of pui-chase. In addition. a mainienance and senice charge of up to 1.108 per annuiii ol the applicable average net asset value is deducted. This charge IS accrued claily and is deducted and paid monthly t o the Principal Distributor and/or other party.
Cliiss Ihacc) Shares: No distribution of dividends will be made but the net income attributable will he reflecied in the increased value ot the shares. All other terms and conditions arc the same as Ihose which apply for Class I(dis) shares.
Class I(dis? Shares, are offered to institutional investors as more fully described in the cuimit Prospectus and addendurns of the Company. Pui-chases of Class I\dis) shares are not subject to an initial sales charge, nor a contingent defen-ed sales charge or any mainlenance. distrihution or senicing charges. C l m I(dis) shares benefit from a 1-educed Investiiient Management fee (note 31,
(I155 li(acc) Shares: No distnbution of dividends \\ill be made but the net income attrihu1ahle will be reflected in the increased value of the shares. All other terns and conditions are ihe same as these which apply for Class Y(dis) shares.
Class N(dis) Shai-es: are suhject io an initial sales charge of up to 7% of the toial amount invested. In addition. a distribution charge ol up to 1.25% per annum o[ h e applicable average net asset value i5 accrued daily and is deducted and paid monthly to the Principal Distributor. Class N(dis) shares may be offered in certain limited (:ircumstatices as more fully described in the curreni prospectus and addendum of the Company.
Altcmativc Barc r\ltcrnativc Corrcnry
Franklin ~I~CItiDlCtOli hVCStmCllt Funds C ~ r r r ~ w r Currcncy Hcdncd A(ac4 A(di9) A U n r ) R(arc) B(dir1 C m c ) C ( d 4 I ~ K ) I ( d ~ v ) N ( m ) S ( d 4
46
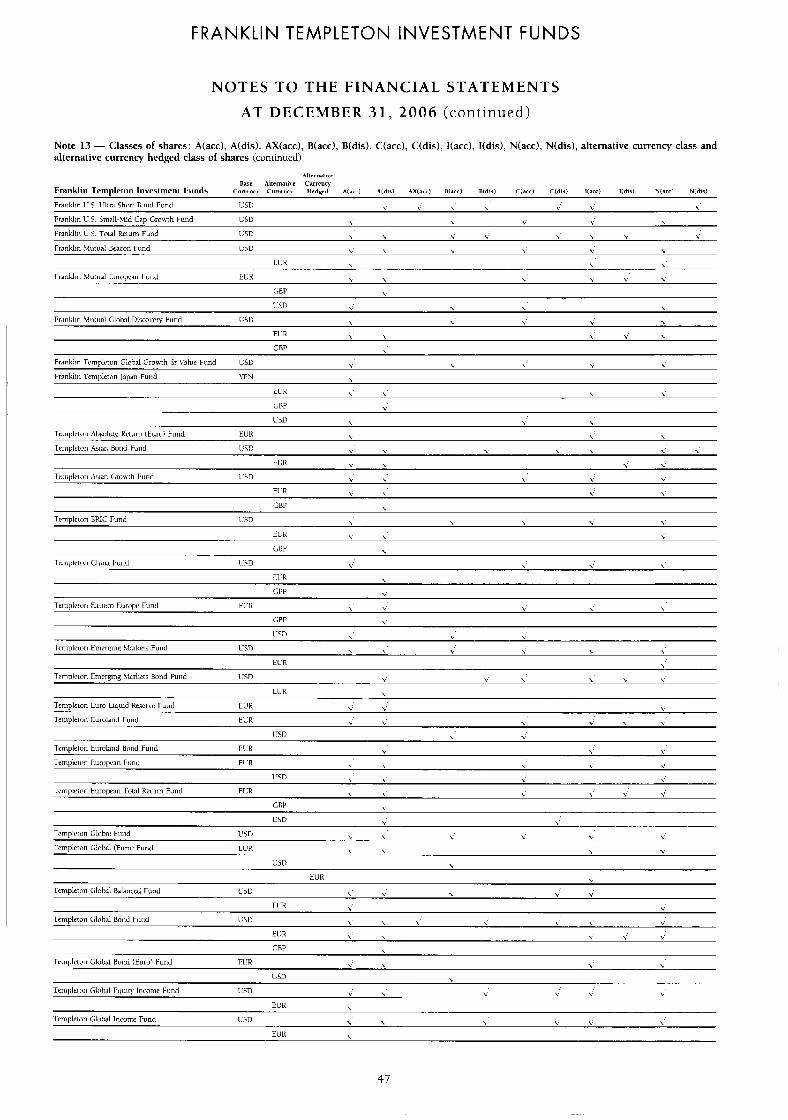
FRANKLIN TEMPLETON INVESTMENT FUNDS
NOTES TO THE FINANCIAL STATEMENTS
AT DECEMBER 31, 2006 (continued)
Note 13 - Classes of shares: A(acc), A(dis). AX(acc), Narc), B(dis). C(acc), C(dis). I(acc), [(dis), N(acc), N(dis), alternative currency class and alternative currency hedged class of shares (cuntinuccl)
*Ilrr"Jl,,r
Bnsc I l a r n i l o ~ c Corrency Franklin Tcmulctun 1nvcslmcnl Funds ~ u r r r ~ l r , Currrllr, Hrdvrll A ~ W I 4ldlrl 4R(rll 1 R(acr1 R(dlr1 Clacfl n d w l llaccl I(d1rl Waccl Ntdisl
GBI' \
Ternoletun IiHlC luna l 3 D
lcmplcrcn tintrgiiig !.l;ike!s Fund iw \ \ I \
t C R
T,mplcton Emerging \l:rl<trs Bond Fund 11sn \ \ \ \
El . R
llSD \
T ~ m ~ l c ~ n Euroocan lotal Keruin Fund FIX
lcmpleroii (.loha1 Bond Furd c 5L' \ \ I
E L R \
(cnp \ \
Tmplctcn Globai Bond (turoj Fund Ti1R \ t
47
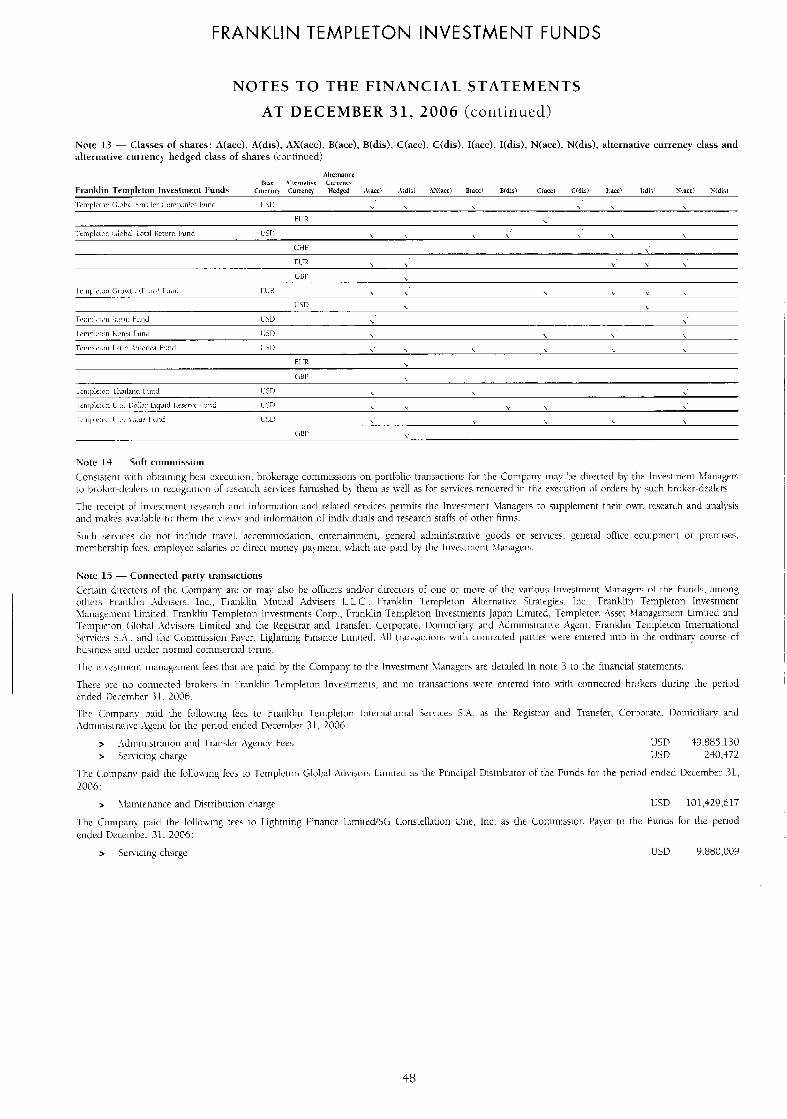
FRANKLIN TEMPLETON INVESTMENT FUNDS
NOTES TO THE FINANCIAL STATEMENTS
AT DECEMBER 31, 2006 (continued)
Wn 30.885.130 USD 240.472
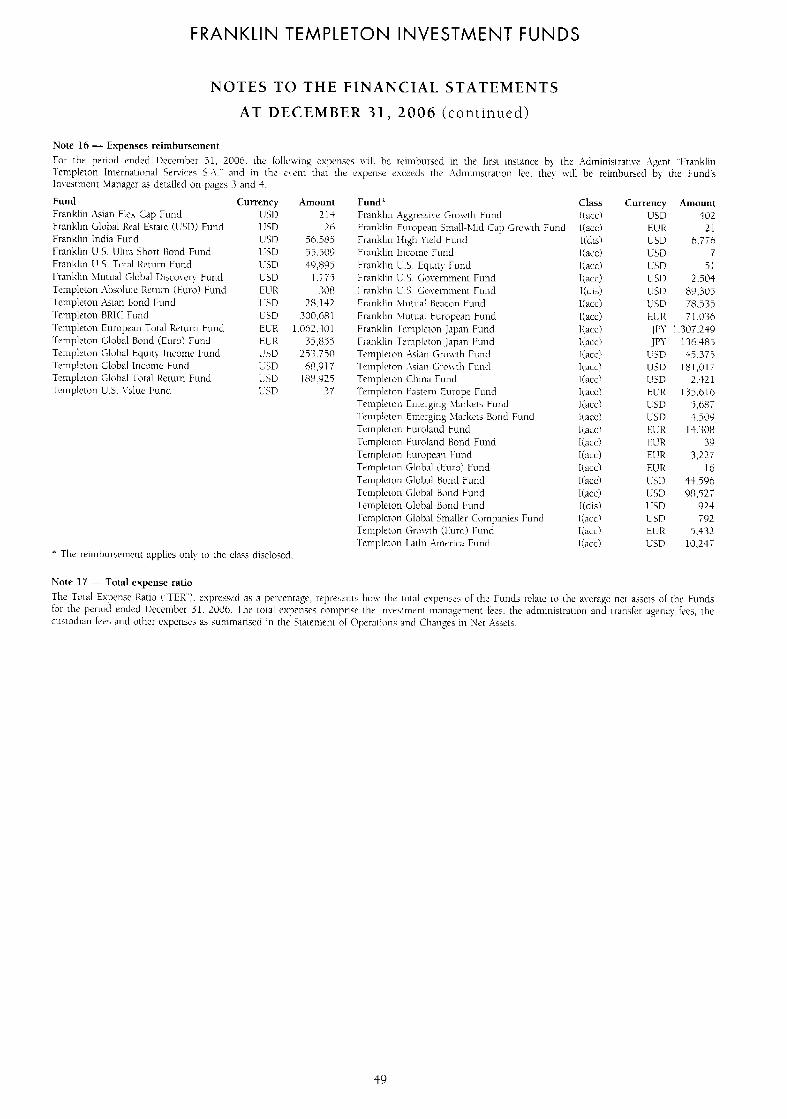
FRANKLIN TEMPLETON INVESTMENT FUNDS
NOTES TO T H E FINANCIAL STATEMENTS
AT DECEMBER 3 1 , 2006 (con t inued)
Amount 214 2 h
56.Wj 5 5,509 49,895
1 ,;.7 i 308
29.142 300,681
1,062,4\71 35,845
L 5 3,7 5 0 68.917
188,925 3 Y
* The rcrimbiirscmcnt applies cirily IO i hc c l x = disclosecl.
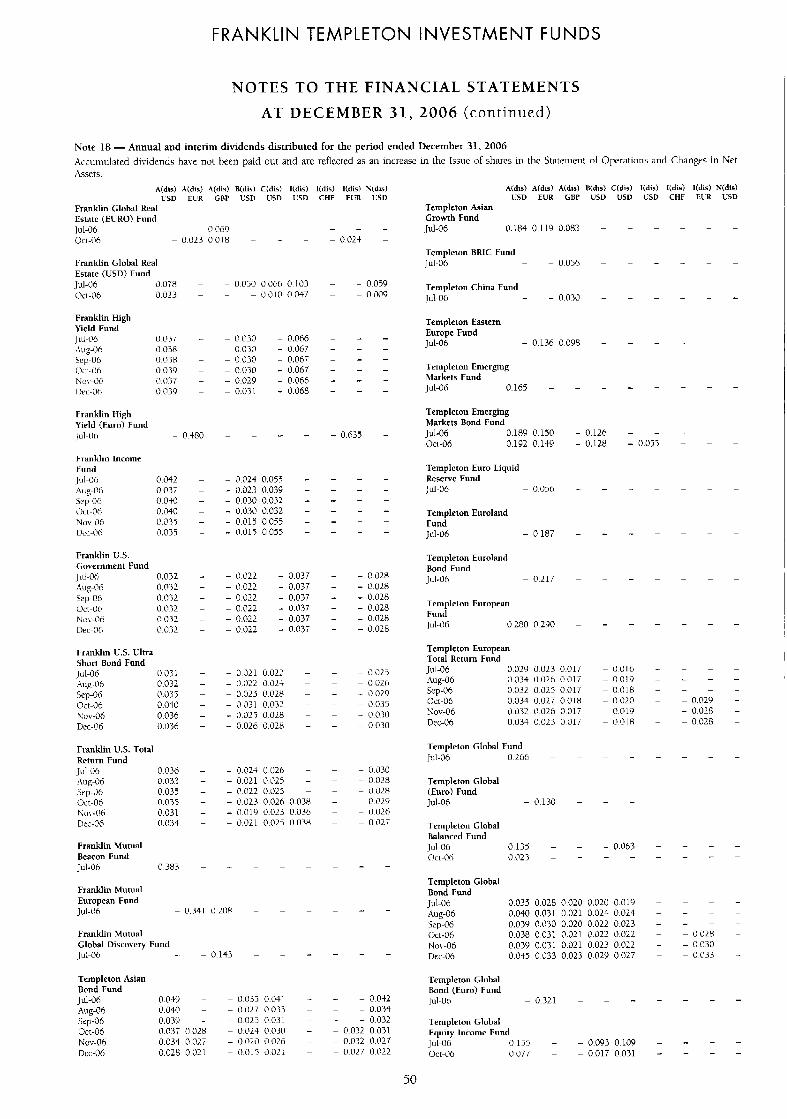
FRANKLIN TEMPLETON INVESTMENT FUNDS
N O T E S TO THE FINANCIAL STATEMENTS
AT DECEMBER 31, 2006 (continued)
Note 18 - Annual and i n t e r i m dividends distributed for the period ended December 31, 2006 Accumulated d iv idcnds have not been paid o u t and are reflected as an increase in (hc Issue of shares 111 the S ta temni t of Operations and Changes in Kct ,lsst.rs
A(dis) A(dis) A(&>) E(&&) C(dis) I(dis) l(dis) I(di5) U(di5) A(dis) A(dis) A(dis) H(di5) C(dis) I(dis) I(dia) I(di.;) N(dis) L5D EUK GBP USD USD 1:SD CHF EER LSU IJSD EUR tiBP USU L'SU USD CHF I T R W D
Franklin Glohal Kcal Templetun Asian L s k m (EURO) Fund Growth Fund JU-06 - -@@[j9 - - - - - - Jul-06 OI8401190.083 - - - - - - (j( I-llh - 0 0 2 3 0.018 - - - - 0024 -
Templeton BRlC Fund kranklin Global Real Jul-06 - - 0 0 5 6 - - - - - -
Estate (USn) Fund Templeton China Fund J d u h 0 0 7 8 - - 0050 0.066 0 I 0 3 - - 0 0 5 9
Oil-Oh 0 0 2 3 - - - 0 0 I O 0.037 - - 0 009 Jul-06 - - 0.()3(> - - - - - -
Frankliu High Templeton Eastern Yield Fund Jul-06 0037 - - 0030 - 0.066 - - - Aug-Oh 0 0 3 8 - - 0 0 3 0 - l).dh7 - - - Scp-06 0 0 3 H - - 0 0 3 0 - 0.06; - - - (.)CI.t!h 0.039 - - 0 0 3 0 - 0.067 - - - NIX-06 i1.1137 - - 0.029 - 0066 - - -
Europe Fund Jul-Ob - 0 1 3 6 0098 - - - - - -
Templclon Emerging Markets Fund Jul-06 0.165 - - - - - - - -
DF(..ilh 0.039 - - 0.031 - 0.068 - - -
Franklin High Yield (Euro) Fund Jul-Oh - 0 4 8 0 - - - - - 0.6.35 -
Franklin lncome h n d
..\ug-OB 003; - - 0023 0.0.39 - - - -
Scp-Oh 0030 - - 0 0 3 0 0.032 - - - -
ocl-o(; 0.1140 - - 0 0.032 - - - - Xo\--06 (?LO5 - - 0 0 1 5 0055 - - - -
U<.c-(lO 0.035 - - (1.015 0055 - - - -
Jlll-Oh 0.012 - - 0.024 0.055 - - - -
Templeton Emerging Markets Bond Fund J~ l -06 0.189 0.150 - 0 126 - - - - - OCI-Oh 0.192 0 149 - 0,128 - 0.055 - - -
Templetou Euro Liquid Resen.e Fund Jul-06 - 0.056 - - - - - - -
Tcmplelon Euroland Fund J~tl-Oh - 0,187 - - - - - - -
Franklin U.S. Templeton Earoland <;ovcrnment Fund Bond Fund
A~ig-06 0,032 - - 0 0 2 2 - 0.037 - - 0.028 Scp-06 0 0 3 2 - - 0 0 2 2 - 0.037 - - OO28
0.032 - - 0.1122 - 0 077 - - 0 0 2 8 Oct-06 Nu\-06 $032 - - 0.022 - 0.037 - - 0 0 2 8 Dcc-Oh 0.032 - - 0.022 - (1.037 - - 0.028
JLII-OC 0.032 - - 01!22 - 0 0 3 7 - - 0.028 J1.d -Oh - 021: - - - - - - -
Tcmplelon European Fund Jul-Oh 0 2 8 0 0 2 9 0 - - - - - - -
Franklin LS. Lhra Short Uond Fluid J u-06 OiUI - - 0 0 2 1 0 0 2 2 - - - 0025 Aug.(lh 0.032 - - 0 . 1 V 2 d O L S - - - 0 0 2 6 SclI-Oh i1.~):35 - - 0.025 0 0 2 8 - - - 0.029 Oct-Oh 9.010 - - 0031 0.032 - - - 0.035 hi)\ -Oh 0 0 3 6 - - 0.025 0.028 - - - 0.030 Dcc-06 0 03h - - 0.026 0.028 - - - 0.030
Frauklin U S . Total Retuni Fund Jul-Oh 0.036 - - 0 024 0 O2h - i\ug-06 MY3.3 - - 0 . 0 2 1 0 . 0 2 5 - SFp-Cl6 0 0 3 9 - - ~ ~ 1 1 2 2 O . 0 2 5 - Ocr-06 0 0 3 5 - - 0023 0 0 2 6 0038 Xi)\ -Oh 0 0 3 1 - - ( 1 i ) l Y 0.023 0 0 3 6 UcA!6 N(1.34 - - 0021 0.02'5 0.03H
Franklin Mutual Beacon Fund Jul-Oh 0 3 8 3 - - - - -
Frankliii Mutual European Fund Jul-Oh - 0.341 i) 20P - - -
Franklin Mutual Global Discovery Fund JUl-06 - - 0.143 - - -
Templeton Asian Bond Fund Jul-Otj 0 0W - - 8.035 0.041 - Aug-Oh 0 0 4 0 - - 0 0 2 7 0 . 0 . 3 3 - Sc:[>-0(5 0.030 - - 0 0 2 3 0.031 - Ocr-06 0 0 3 T 0 028 - 0 024 0.030 - NO\--Oh 0.034 0.02T - 0020 0026 - ne -0t; 0.028 0.021 - 0.015 0 0 2 1 -
- - 0.030 - - 0.028 - - W 2 H - - 0.029 - - 1) OLh - - 0 0 2 7
- - 0 0 4 2 - - 11 0.34 - - 0 0 3 2 - 0.032 0031 - 0.032 0 0 2 7 - 0 0 2 7 0.022
Templeton European Total Return Fund
0.029 0 0 2 3 0.017 - 0016 - - - - Jul-06 Aug-06 i).034 0 0 2 6 0.017 - 0019 - - - -
0.032 0 0 2 5 0.017 - (1018 - - - - Srp-Oh Ocr-06 0 0 3 4 0.027 0018 - 0010 - - 0.029 - Yov-06 01)32 0.026 0.017 - 0.019 - - 0.028 -
0 0 3 4 0.025 0 0 1 7 - 0.OIH - - 0.028 - Drt-Oh
Templclon Global Fund Jul-Oh 0.266 - - - -
Templernn Cilohal (Euro) Fund Jul-Oh - 0 1 3 0 - - - Tcmplelon Global Balanced Fund Jul-Oh 0 135 - - - 0063 Oci-(M 0.023 - - - -
Templeton Global Bond Fund Jul-Oh 0.035 0.028 0 020 0.020 0 019 hug-06 0.040 (1 031 0 021 0.024 0 0 2 4 Scp-06 0.03Y 0.030 0.020 0.022 0.023 Oc1-Oh 0 0 3 8 0 0 3 1 0.021 (1.1122 O.022 Nu\ -06 0.030 0.03 I 0.021 0.023 0.022 Der-Oh 0.045 0 0 3 3 0.023 0 0 2 0 01127
Templeton Glohal Bond (Euro) Fund Jul-Oh - 0.321 - - - Templeton Global Equity lncomc Fund Jul-06 (1.155 - - 0.093 0 109 Oct-06 (1077 - - 0.017 0 0 3 1
- - - - - 0 0 2 8 - - 0 0 30 - - 0.033
50
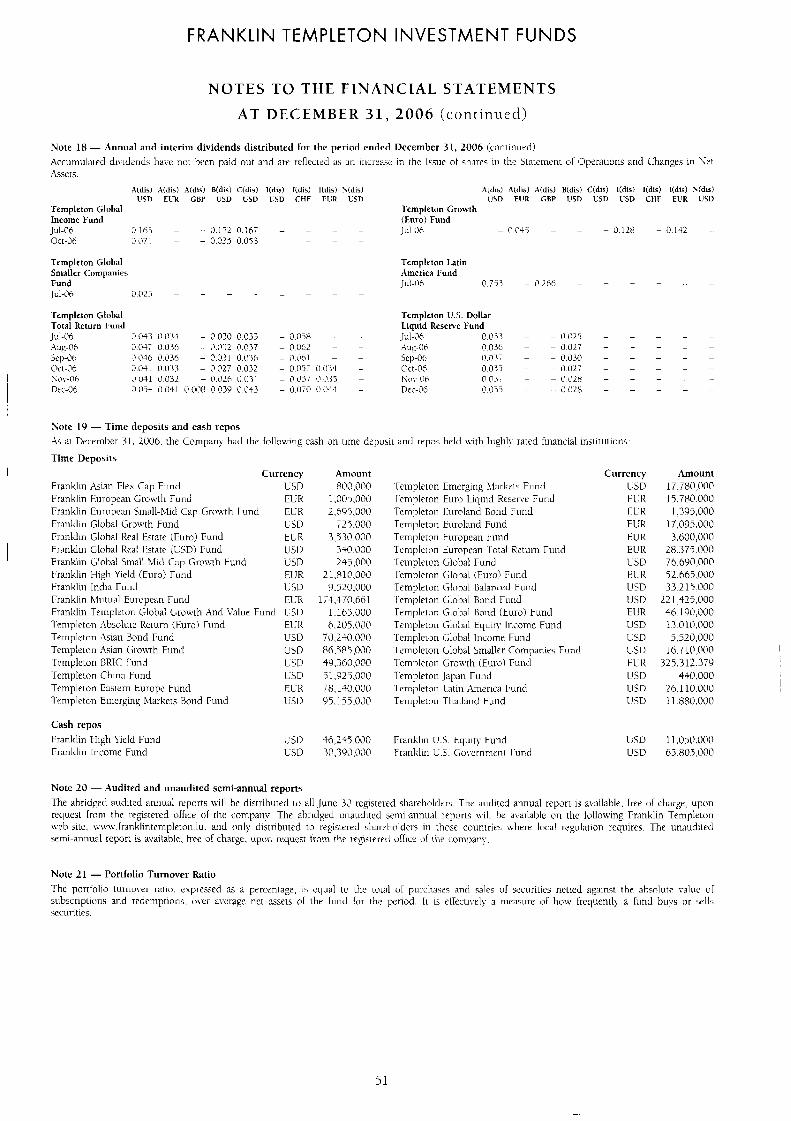
FRANKLIN TEMPLETON INVESTMENT FUNDS
NOTES TO THE FINANCIAL STATEMENTS
AT DECEMBER 3 1 , 2006 ( con t inued)
Cash repus Franldin High Yield Fund Franklin Income Fund
- 0 I + >
Amount
Note 20 - Audited and unaudited scmi-annual reports The iihridgcti audited annu;il ireports \\-ill be distributed t(1 all Junc 30 registered sharchc?lcl<rs Thv :iu(litcd annual report is available. lree ol charge, upon request ll-tJn1 the registered olficc o l th(< compaii!-, The abtdgcd unaticlltcd sciiii annu,d tepms I\ 111 he available on the following rrariklln Tcrnplrion neb-site. ~~~~,\\.li-anklintciiipleioii.lu. arid m l y distributed to registered shai-c4ioldci-s in those countries \\here local iregilation requires The unaudited semi-annual repon 15 available. ti-ec of chxge. upoil rccpcst froin the repaered d i c e of ~ h r company
Note 21 - Porifolici Turnover Ratio The poi-tfolio tutrluver ratio. c x p r c s d as a percrntagc, i s cqual to the toial ul pui-chascs and sale5 ol securities ricttecl axanst the a h ~ d i i t r value of subscriptions and redernpiions. ovei- awi-agc net assets of the fund h i - the pcnod. 1i is ellecu~ely 3 m(’asurc rrt how fiequcntl) a lurid I )LI~S o r sells scciii-ities.
51
FRANKLIN TEMPLETON INVESTMENT FUNDS
F RAN KL I N TEMPLE T 0 N INVEST M E N T S 0 F F I C E DIRECTORY
Further information regarding Franklin Templeton Investment Funds is availahle from the following Franklin Templeton Investments offices : EUROPE Austria 1~WNKl.lN TEMPLETOX INVES~I'.ZlENT SERVICES GMBH Mainzer Lindstr. l h Fosilach 11 18 03 D-60325 I'rankfurt, Germany h e f o n e : 08 00 29 59 11 ~w-.franklintempleton.at Belg i urn FRAKKl.lN TEMPLETON FRANCE SA.. succursalc belge Avenue de Tervueren. 93 B-1040 Brussels, Belgium Tel: 32 (0)2 743-3200 M~~,.franklintcmpleton.be France FRANKLIN TEMPLE-rON FRANCE S.A. 16-18, avenue George V €:-75008 Pans, France Tel: 33 (0)l 40 73 86 00 ~~v\~w.Cranklintempleton.fr Germany FRAXKLIY TEMPLETON IKVESTMENT SERVICES GMBH Mainzer Lmdstr. 16 hstfach 11 18 03 13.60325 Frankfui-t, Germany Tel: 49 (0) bY 272 23 0 Cicnnany Freefone: 08 00 0 73 80 02 ilustria 1,'reefone : 08 00 2Y 59 11 www.rranklintcnipleton.de
FIMN K1.liY TEMPLETON ITALIA S.G.K. 1x4 C.so Italia n.1 20122 Milan, Italy Tel: 39 02 854 591 www.franklintcinpleton.it
Fax: 49 69 272 23 120
Fax: 32 (0)2 743-3228
Fax: 33 (0)l 40 73 86 10
Fax: 49 69 272 23 120
Italy
Fax: 39 02 854 -59222
tuxem bourg FRANKLIN TEMPLETON 1NTFRNATIONAL SERVICES 5.A 26, boulevard lioyal. 1.-2449 Luxembourg B.P. 169, L-2011 lnxcmhourg Grand-Duchy of 1.uxemhourg Tcl: 352 46 66 67 1 www .Cranklinteniplcton.lu The Netherlands FRAXKLIN TEMPLETON INVESTMEKT MANAGEMENT I.lMlTED World Trade Center Amsterdam H-Toren 16e verdieping Zuidplein 134 1077 X\' I\msterdam Tel: 31 (0)20 575 2890 Netherlands Freefone : 0800 256 8049 ~~- . f rankl intempleton.nl
Fax: 352 46 66 76
Fax: 31 (@)20 575 2892
Spain FRANKLIN TEMPLETOK INVESTMENT MANAGEMENT LIMITED Sucursal en Espana Jose Ortega y Gasset, 29-6dg 28006 Madrid, Spain Tel: 34 91 426 3600 Fax: 34 91 517 18.57 ~~~~~.frankl internpleton.com.es WWry.franklintcmplcton.com.pt Sweden FRANKLIN TEMPLETON INVESTMENT hlAKAGEMENT LIMITED Stureplan 4C 5-113 35 Stockholm, Sweden .Tel: $6 (0!8 745 01 230 ~~~u;.franklintempleton.se Switzerland Franklin Templeton Switzerland Ltd Bahnhofstrasse 22. P.O. Box CH-8022 Zurich, Switzerland Tel: 41 (0) 44 217 81 81 ~~-.frankl i r i templeton.ch
Fax: 46 (018 463 1010
Fax: 41 (0) 44 217 81 82
United Kingdom London FRANKLIN TEMPLETON INVESTMENT MANAGEMENT LIMITED The Adelphi Building, 1-1 1 John Adam Street London WCZN 6HT, England, UK. Tel: 44 (0)20 7073 8500 U.K. Freefone: 0800 305 306 www . frank1intempleton.co .u k
Edinburgh FRANKLIN TEMPLETON INVESTMENT MANAGEMENT LIMITED 5 Morrison Street
Fax: 44 (0) 20 7073 8700
Edinburgh EH3 8BH, Scotland, U.K. Tel: 44 (0) 131 242 4000 Fax: 44 (0) 131 242 4533 U.K. Frecfonc: 0800 305 306 mw.franklintempleton.co.uk
AFRICA South Africa TEMPLETON ASSET MANAGEMENT LIMITED Harrow Court 2 Isle of Houghton Boundary Road Parktown 2193, South Africa Tel: 2711 645 6500 ~~~.frankl intempleton.co.za
Fax: 2711 484 3311
ASIA Hong Kong FRANKLIN TEMPLETON INVESTMENTS (ASIA) LIMITED 17/F Chater House, No. 8 Connaught Road Central Hong Kong Tel: 852-2877-7733 Fax: 852-2877-5401 wuw. franklin templeton.com.hk
Singapore Templeton Asset Management Ltd 7 Temasek Boulevard #38-03 Suntec Tower 1 Singapore 038987 Tel: (6s) 241 2662 ~w.franklintcmplcton.cnm.sg
Taiwan FRANKLIN TEMPLETON SECURITIES INVESTMENT CONSULTING (SINOAM) 1NC. 8th Floor, #87, Sec. 4 Chung Hsiao East Road
Fax: (65) 6332 2295
Taipe;,' Taiwan, R.O.C. Tcl: 886-2-2781-0088 Fax: 886-2-2781-7788 www, fran klinsinoam . corn. t w
NORTH AMERICA Bahamas TEMPLETON GLOBAL ADVISORS LIMITED, TEMPZETON CAPITAL ADVISORS LIMITED & TEMPLETON GLORAI. HOLDINGS LIMITED P.O. Box N-7759, West Bay Street, Lyford Cay Nassau, Bahamas Tel: 1-2.42-362 4600 Fax: 1-242-362 3308
SOUTH AMERICA Argentina TEMPLETON ASSET MAUAGEMENT LTD Ingeniero Butty 220, 1 lth Floor (C1001 AFB) Bucnos Aires, Argentina Tel 54-1 1-4313-0848 Fax 54-1 1-4313-0885
Plcnsc note that thr websites mentioned abow urc directpd at rvsidmts wilhin the country stated on these wrbsiles. Pleasc r+r to the wehsitr disclaimers).
52
_. . .,. 1.'
i.! .:... . . ,, ., . . (.. .!. i:; . :..
, . . . , . .. ,
. . ._ , ,... 1 . , . . .I . ' . . . .
, . I .
id Services S.A.
FTIF 1R RGBP 12/06
Unaudited Semi-Annual Report December 3 1, 2006
FRANKLIN TEMPLETON INVESTMENTS
FRANKLIN TEMPLETON INVESTMENT FUNDS societk d’investissement a capital variable
U N A U D I T E D S E M I - A N N U A L REPORT FOR THE SIX M O N T H S E N D E D D E C E M B E R 3 1 , 2006
This report shall not constitute an offer or a solicitation of an offer to buy shares of Franklin Templeton Investment Funds (the “Company”). Subscriptions are to be made on the basis of the current simplified prospectus accompanied by the current full pmspectus and its addendum, a copy of the latest available audited report and, if published thereafter, the latest unaudited semi- annual report.
FRANKLIN TEMPLETON INVESTMENT FUNDS
CONTENTS
General Information Report of the Investment Managers Fund Performance Statement of Net Assets Statistical Information Statement of Operations and Changes in Net Assets Notes to the Financial Statements Schedule of Investments Franklin Aggressive Growth Fund Franklin Asian Flex Cap Fund Franklin Biotechnology Discovery Fund Franklin European Growth Fund Frankllin European Small-Mid Cap Growth Fund Franklin Global Growth Fund Franklin Global Real Estate (EURO) Fund Franklin Global Real Estate (USD) Fund Franklin Global Small-Mid Cap Growth Fund Franklin High Yield Fund Franklin High Yield (Euro) Fund Franklin Income Fund Franklin India Fund Franklin Technology Fund Franklin U.S. Equity Fund Franklin US. Government Fund Franklin U.S. Growth Fund Franklin US. Small-Mid Cap Growth Fund Franklin U.S. Total Return Fund Franklin U.S. Ultra Short Bond Fund Franklin Mutual Beacon Fund Franklin Mutual European Fund Franklin Mutual Global Discovery Fund Franklin Templeton Global Growth and Value Fund Franklin Templeton Japan Fund Templeton Absolute Return (Euro) Fund Templeton Asian Bond Fund Templeton Asian Growth Fund Templeton BRIC Fund Templeton China Fund Templeton Eastern Europe Fund Templeton Emerging Markets Fund Templeton Emerging Markets Bond Fund Templeton Euro Liquid Reserve Fund Templeton Euroland Fund Templeton Euroland Bond Fund Templeton European Fund Templeton European Total Return Fund Templeton Global Fund Templeton Global (Euro) Fund Templeton Global Balanced Fund Templeton Global Bond Fund Templeton Global Bond (Euro) Fund Templeton Global Equity Income Fund Templeton Global Income Fund Templeton Global Smaller Companies Fund Templeton Global Total Return Fund Templeton Growth (Euro) Fund Templeton Japan Fund Templeton Korea Fund Templeton Latin America Fund Templeton Thailand Fund Templeton U.S. Dollar Liquid Reserve Fund Templeton U.S. Value Fund Franklin Templeton Investments Office Directory
3 5 6 8
18 26 36 52 52 55 58 60 62 64 66 68 70 73 76 78 81 83 85 88 89 92 96
100 103 110 114 119 124 128 130 132 135 138 141 143 147 149 150 152 153 156 158 161 164 168 171 173 175 179 182 187 191 194 196 198 200 201 203
2
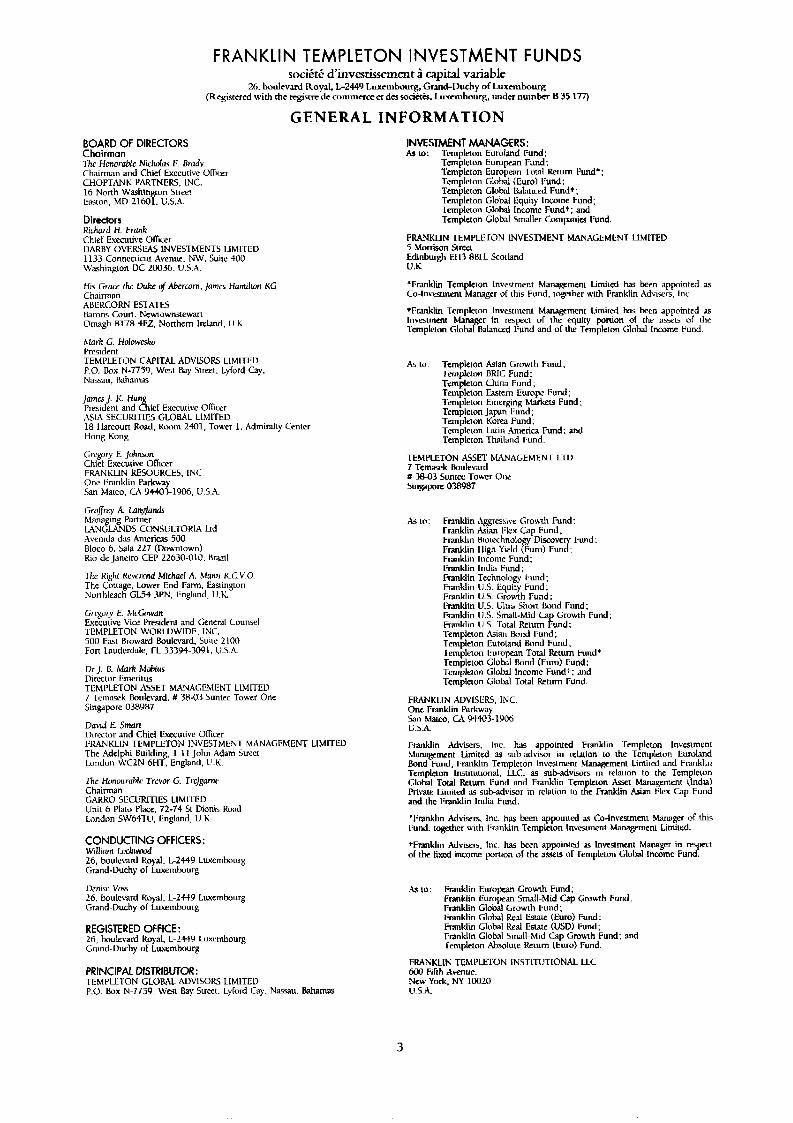
FRANKLIN TEMPLETON INVESTMENT FUNDS sociit; d'invatissement i capital variable
26. boulevard Royal, L-2449 Luxcmbourg, Grand-Duchy of Luxeitibourg (Rtgkrered with the registre dc commcrceer des rorikk, L m - b o u r g , under nuinber B 35 177)
GENERAL INFORMATION BOARD OF DIRECTORS Chairman Thc Honof-able N U h a h F. Srady Chaimin and Chief Executive Ohcer CHOPTANK PARTNERS. INC. 16 Nonh Wwhington Street Ewon . MD 21601, U.S.A.
Directors Richurd H. Frmk Chief Executive O l k t r UARBY OVERSEA5 INVESTMENTS LIMITED 1133 Connecticut Avenue, NW. Suite 400 Washington UC 20036. 11.S.A.
His Grace the Lkh i$Abetcoom. James Hamilton KG Chairman AUEKCORh' ESTATES Barons Coun. Nw-iownstewan Ornigh B-1-78 4E2, Northern Ireland, 1J.K
hlnrl: G. Hulowcsku President TEMPLETON W I T A L ADVISORS LIMITED P.O. BOX N-7759, Wcst Bay Street, Lybrd Cay, Nassau, I b h a m s
]a rm J. K. Hun President and 6 i e f Executive Ohcer ASIA SECURLTIES GLOBAL LIMITED 18 llarcoun R o d , Kcx,m LWl, Tower 1. Admiralty Center Hong Kong
G i , q o f y E. ]&win Chief Execurive Officer FRANKLIN KESOERCES. INC. One Franklin Parkway San htateo, cr\ YW3-1906, U.5.A
Gcoflrry A. Innglands hl;m;lging Partner U N G W N D S CONSUL-CORIA Lid Avenida d;is Amen= 500 Bloco b. %ala 227 (DOnntown) Rio de Janeiro CEP 22630-010. Brazil
The Right Rcvcrcnd .Wichocl A. Mum KC.V.0 The Cotiage. Lower End h r m , Eastingoton Nonhleach GLi4 3PN. England, U.K.
Grcgofy E. MoGnvun Executive Vice President and General Counsel TEMPLETON W O W W I D E . INC. 500 East Broward Boulcv~rd, Suile 2100 Fort Lsuderdale, FL 33394.3091, 1J.S.A.
IlrJ U. Mnik Mdius Director Ementus TEMPLETON ASSET MANAGEMENT LIMITED 7 -rem;lsek Boulevard. # 3R-03 Suntec Tower One Singapore 038087
Duvid k: Smut1 l>lrector And Chief Executive OlIicer I'RANKLIN TEMPLETON INVESTMENT hWNAGEhtENT LIMITED The Adelphi Building, 1-11 John Adam Street London WC2N 6HT. England. U.K.
Thc Honourahlc I-rcvor G. Trcfgumc Chairman GARKC3 SECURLTIES LIMII-ED Unit 6 Plat0 Place. 71-54 St Dionis Road London SW64TU. England, U.K.
CONDUCTING OFFICERS: Willicim h k w m d 26, boulevard bpi. L-2449 Luxembourg tnnd-Duchy of Luxembourg
Ueniw Voss 26, boukwxrd b y a l . L-2449 Luxembourg Grand-Duchy of L w m b o u r g
REGISTERED OFFICE: 26, boulevard k y a l , L-2449 hxcmbourg Grand-Duchy of Luxmhourg
PRINCIPAL DlSTRlBWOR:
p.0. Box N-7759. W-et Bay Street. Lyford Cay. Nassau. Bahamas TEMPLETON GLOBAL ADVISORS LIMITED
INVESTMENT MANAGERS: As IO: Templeton Euroland Fund:
Templclon European Fund; Templeton European Tow1 Renun Fund*: Templeton Global (Euro) Vund: Tenipleton Glohd Lbnccd Fund, ; Templeton Global Equity Income Fund; Templeton Glohal lncomc Fund+; and Templeton Global Smaller Companies Fund
FRAVKUN TEMPLEL'ON INVESTMENT MANAGEMENT LIMITED 5 Morrison Srmt Edinburgh El 13 $I31 I. Scotland U.K
' F r a d i n Templeton Investment Management Limited has h e n appointed as Co-lnvrament Manager of this Fund. togelher with Franklin AdLixrs. Inc.
*Franklin Templrton lnvesiment Management timired h;ls heen appointed as Inv-estmmi h n a g e r in respea of rhe equity portion of the 85x1~ of [he Templeton Global Balanced Fund and of the Templeton Global Income Fund.
I\s to: Templeion Asian Growth Fund; Templeron BRlC Fund Templeton China Fund; Templeton Eastern Europe Fund: Templeton Emerging hbrkels Fund: Templeton Japan Fund: Templeton Korca Fund; Templeion Latin America Fund; and Templeton Thailand Fund.
TEMPLETON ASSET MANAGEMENT Ll-U 7 Temasek Boulevard t 3803 Suntec Tower One Singapore OMY87
As IO: Fnnklin Agyessive Grouyh Fund: Franklin h i a n Flex (3p Fund; Franklin Bioiechnolo Diwovery Fund: Franklin lligh Yield &u) Fund: Franklin Income Fund: Franklin India Fund; Franklin Technology Fund: Franklin U S . Equity Fund; Franklin U.S. Growh Fund; F m k l i n U.S. Ultra Shon Bond Fund; F m k l i n US. Small-Mid Cap Growth Fund; Franklin U.S. Total Return Fund; Templeton Asian Bond Fund ; Templeton Eutoland k m d Fund: Templeton European Total Return Fund+ Templeton Glob31 Bond (Euro) Fund : Templeron Global Income Fund+; and Templeton Global Total Return Fund.
FRAWKLIN AUVISERS. INC. One Franklin Parkwa k n Lbm. a 9etOJ-1906 U.5.A
I:mklin Adrisers. Inc. hw a p p i n t e d Franklin Templeton Investmcnt \ h q e m e n t Limited as sukadvivisor in relation LO the Templeton Euroland Bond Fund. Franklin Templeton InveStment htmagement Limited and Franklin Templeton Iwtitutional. LLC. as subadvwrs in reh ion to the Templeton Global Total Return Fund and Franklin Tern leion Avat Managemeni tlndla) Pri\ate Limited as sub-advisor in relation to d!e Franklin &an Flex Cap Fund and the 1:ranklin India Fund.
'Franklin Mvixrs. Inc. h i s been appointed as Co-Investment Manager of this I'und. together with 1:ranklin Templeton Invstment Management Limikd.
+Franklin hd\-ixrs. Inc. has been appointed x lnvemhmx Manager in respect o l the fixed income portion of the a s s of Templeton Glohel Income Fund.
As to: Franklin Europwn Growth Fund; Franklin European Small-Mid Cap Gm*th Fund: Franklin Global Growth Fund: Franklin Global Real Estate (Eum) Fund : Franklin Global Real Estate (USD) Fund: Franklin Global Small-Mid (hp G m w h Fund: and l'empleton Absolute Kcturn (Euro) Fund.
FMXKLIP; TEhiPLETON INSTIIUTLONAL LLC 600 Fibh Avenue. Neu- York, NY 10020 V.5.A
3
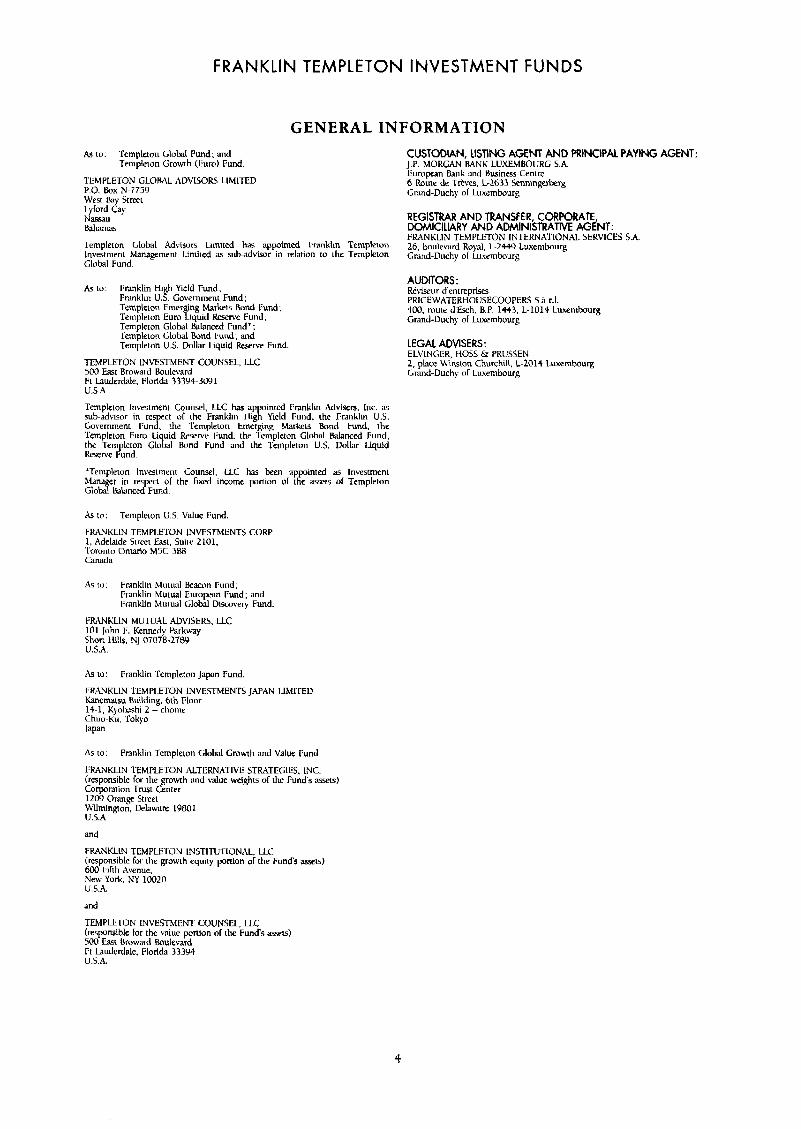
FRANKLIN TEMPLETON INVESTMENT FUNDS
GENERAL INFORMATION A5 to: Templeton GloM Fund; and
Templetan Growth (Cum) Fund.
TEMPLETON GLOBAL ADVISORS LIMITED P.O. Box 1\1-7759
Lyford Cay Nassau Bahamas
West bay Street
Templeuon Llobal Advisurs Limited h s appointed 1:nnklin Templeton Investment Management Liniiied :IS subadviwr in relation to ihe Templeton Clabal Fund.
As to: Franklin High Yield Fund; Franklin U.S. Government Fund: Templeton Emerging Markets Bond Fund; Templeton Eum Liquid Resense Fund; Templeton Global balanced Fund': Templeton Global Bond I:und; and Templeton US. Pollar Liquid Reserve Fund
TEMPLETON INVESTMENT COUNSEL. LLC 500 East Broward tbdevad Ft Lauderdale, Florida 33394-3091 U.S.A.
Templeion Investmeni Counsel, U C has ap ointcd 1:mnkIin Mviscrs. Inc. as sub-advisor in res ct o l ihe Franklin I l & Yield Fund. the Franklin U S . Government F u n r the l'ernpleton Emerging Markets Bond Fund, ihe 'Templeton Euro Li uid Rerrve Fund. the Templeton Clohal Balanced Fund. the Templeton Glo%al Bond Fund and the Templeton U.S. Uolhr Liquid Reserve h n d
*Templeton Investment Counsel, LLC h3s k e n appointed as Investment Mana er in respect or the fixed income portion of the awls of Templeton Globat Balanced Fund.
A$ to:
FRANKLIN TEMPLFIUN INVESTMENTS COW. I , Adelaide Sireet East, Suiic 2101, 'L'oronto Ontario M5C 388 Camda
Templeton U.S. Value I'und.
As tu: Fmkl in Mutual Beacon Fund; 1:ranklin Muiual European Fund; and I+. an& . ' Muiual Glohl D i m v e v Fund.
FIUNKLIN MUTUAL A1)VISERS. LLC 101 John I:. Kennedy Parks-ay Short ILills. NJ 07078-27HY U.S.A.
As to:
FRANKLIN .TEMPLETON INVESTMENTS JAPW LIMII~EI) Kanemasu Building, 6th Floor 14-1. Kyolushi 2 - chome Chuo-Ku. Tokyo
Franklin Templeton J a p n Fund.
lapan
As to: Franklin Templeion Global Growth and Value h n d
1:RANKUN TEMPLETON ALTERNATIVE STFATECIES. INC. (responsible for the growth and value weights of the Fund-s a se t s ) Corporation Trust Center 1209 Orange Street Wilmingion, Delaware lY801 US.A
and
FRANKLIN TEMPLETON INSTITUTIONAL, LLC (responsible for the Rrowth equity portion of the Funds assets) 600 I%th Avenue, New York. NY 10020 U.S.A.
and
TEMPETON INVESlMENT COUNSEL. LLC (responsible for the value portion or the Funds assew) 500 East Broward &>ulevard I;t Lauderdale. Florida 33394 U.S.A.
CUSTODIAN, LISTING AGENT AND PRINCIPAL PAYING AGENT: J.P. MORGAN BANK LUXEhlBOURG S.A European Bank and Business Centre 6 Roule de Trkves. L4633 Senningerberg Grand-Duchy of Luxembourg
REGISTRAR AND TRANSFER, CORPORATE DOMICILIARY AND ADMINISTRATIVE AGiNNf : FRANKLIN TEMPMl-ON INTERNXI'IONAL SERVICES S.A. 26, boulevard Royal, L-2449 Luxembourg Grand-Duchy of Luxembourg
AUDITORS: kviseur d'entreprises PRICEWATERHOUSECOOPERS 5.9 r.1. 400. rouie d E r h . B.P. 1443. L-1014 Luxemhoure Grand-Duih) of Luxembourg
LEGAL ADVISERS: ELVINGER, HOSS & PRUSSEN 2, phce Winston Churchill. L-2014 Luxembourg Grand-Duchy of Luxeinbourg
4
FRANKLIN TEMPLETON INVESTMENT FUNDS
REPORT OF THE INVESTMENT MANAGERS
The strong performance of all asset categories in the second half of 2006 was in large measure due to the very strong liquidity that has built up globally. This liquidity has fuelled an unprecedented boom in M&A and heavily-leveraged private-equity deals. Yet in the six months to end December 2006, stocks still had to overcome a number of negative factors that might have been expected to drag on performance in more risk- averse times. In the U.S., these included a problematic housing market and manufacturing sector plus sluggish retail sales toward the end of the year. In December, there was also a sharp one-day sell-off of the Thai stock market after the introduction of severe reserve requirements on new investments. Despite fears, there was little contagion of other emerging markets, underlining the extent to which investors’ attitudes have changed since the Asian currency crisis of 1997-1998.
Uncertainties over interest rates, plus the Fed’s relatively comforting stance on inflation, helped bond prices in the latter part of the year. The strong performance of bonds and equities at the same time appears to some as a kind of dichotomy. Late 2006 also saw inversion between longer- and shorter-dated maturities. The benchmark 10-year T-bill fell below 4.5% by late November, thus yielding less than shorter-term paper. Inversion is often seen as a precursor to an economic downturn, in sharp contrast to the bullish tone being struck on the equity and corporate bond markets. But low velds on long-term bonds may simply indicate that pension funds and insurance companies are increasingly b u p g bonds to match their liabilities and have become cautious about a1 ternatives.
By late December, eurozone equities were close to five-and-a-half-year highs. This performance seemed appropriate, given the relatively good economic growth and solid performance of European corporations throughout much of 2006. European equities, like equities everywhere, have been benefiting from liquidity and credit growth, which the European Central Bank (ECB) has steadily been trying to rein in. The ECB is poised to continue its efforts into 2007, although it may have to tread cautiously if it is to avoid overshooting, especially in light of downward pressure on the U.S. dollar.
Despite the release of some poor figures in the second part of the year, the Japanese economy seems to have picked up momentum. Given strong earnings growth and the generally healthy economic outlook, Japanese stocks might have been expected to perform better. Instead, foreign buying interest has petered out and share indices barely budged in calendar 2006. Part of the problem is miserable returns, with dividend payouts still very low, albeit improving.
The US. dollar may he poised for further depreciation as interest rate differentials decline. However, the dollar’s decline may well be limited if the Fed remains as vigilant as it proclaims itself to be in light of inflationary pressures (especially if unit labour costs start rising strongly again).The euro has borne the brunt of dollar weakness, although much of its rise has seemed speculative leaving it vulnerable to short-term pullbacks. Of equal interest has been the rise of the euro against the yen. With further interest rate increases predicted in Europe, euro strength may well continue, although the Bank of Japan may also move to tighten monetary conditions.
Imbalances in the world economy are likely to come increasingly into focus. Asian central banks have accumulated massive foreign reserves, which has been used to keep Asian currencies low against the dollar, helping to feed consumer spending (and indebtedness) in the U.S. and adding to a massive U.S. current account deficit. A blow-up of the bond and credit markets caused by a decline in the economy and a sharp increase in the corporate default rate, for example, could impact the market for stocks as well as fixed income. By contrast, any further rises in U.S. interest rates - induced by fears of inflation - could be bad news for equities as it would further constrain the stream of liquidity that has left companies awash with cash.
But such risks aside, prospects for the world economy look relatively good. Inflation is modest and monetary policy is still relatively accommodative in most places, Europe has recovered and emerging economies remain remarkably dynamic. On the corporate front, profitability is strong. Earnings multiples changed little in 2006 and look reasonable relative to historic norms.
THE INVESTMENT MANAGERS January, 2007
5
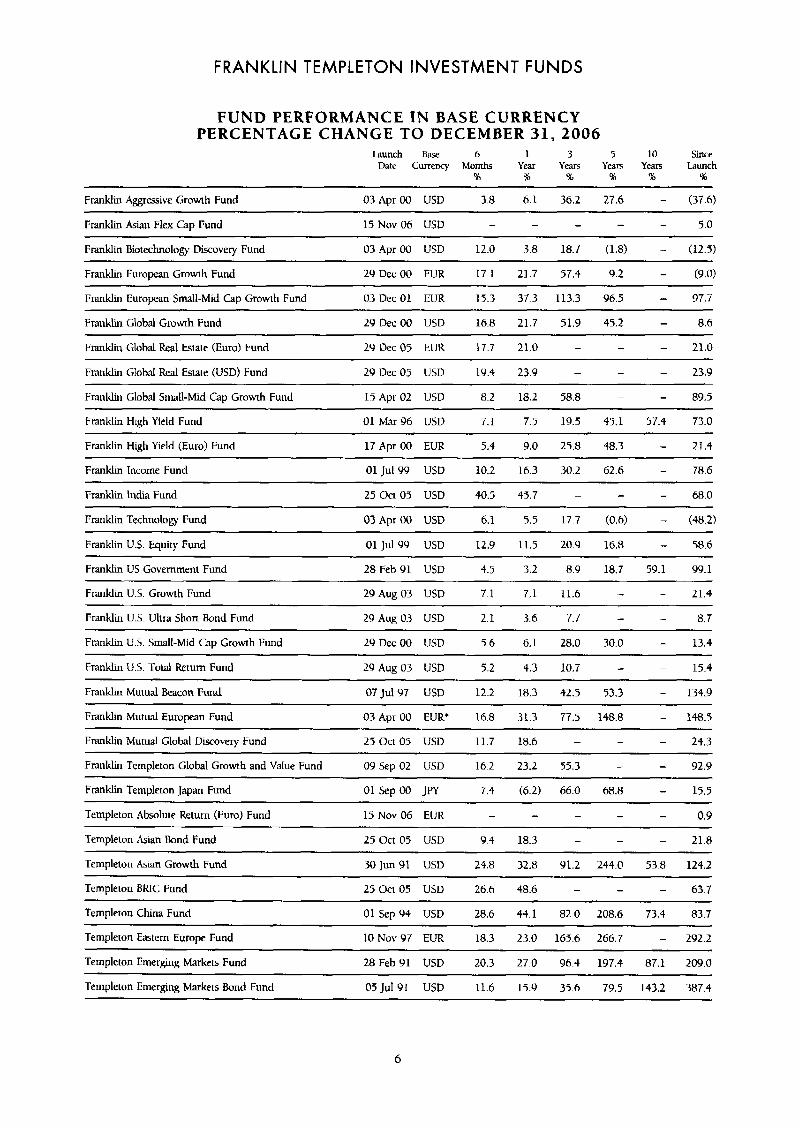
FRANKLIN TEMPLETON INVESTMENT FUNDS
FUND PERFORMANCE IN BASE CURRENCY PERCENTAGE CHANGE TO DECEMBER 31,2006
hunch B m 6 1 3 5 10 Since Date Currency Months Year Years Years Years Launch
% % % 1 7b % ~
Franklin Aggressive Growlh Fund ~
03Apr00 USD 3.8 6.1 36.2 27.6 - (37.6)
- 5.0 Franklin Asian Flex Cap Fund 15 Nov 06 USD
Franklin Biotechnology Discovery Fund 03 Apr 00 USD 12.0 3.8 18.7 (1.8) - (12.5)
- - - -
~ ~ ~~
Franklin European Growth Fund ~~ ~ ~ ~
29 Dec00 EUR 17 1 21.7 57.4 9 2 - (9.0)
Franklin European Small-Mid Cap Growth Fund 03 Dec 01 EXJR 15.3 37.3 113.3 Y6.5 - 97.7
Franklin Global Growth Fund 29 Dec 00 USD 16.8 21.7 51.9 45.2 - 8.6
Franklin Global Real EstaLe (Euro) Fund 29DecOS EUR 17.7 21.0 - - - 21.0
Franklin Global Real Estate (USD) Fund 29 Dec 05 USD 19.4 23.9 - - - 23.9
Franklin Global Small-Mid Cap Growth Fund 15Apr02 USD 8.2 18.2 58.8 - - 89.5
Franklin High Yield Fund 01 Mar 96 USD 7.1 7.5 19.5 45.1 57.4 73.0
Franklin High Yield (Euro) Fund 17Apr00 EUR 5.4 Y.0 25.8 48.3 - 21.4
Franklin Income Fund ~ ~ ~ ~~ ~
01 Jul 99 USD 102 16.3 30.2 6 2 6 - 78.6
- - 68.0 Franklin India Fund 25 Oct 09 USD 40.5 45.7 -
Franklin Technolog Fund O3Apr00 USD 6.1 5.5 17.7 (0.6) - (48.2)
Franklin U.S. Equity Fund 01 Jul99 USD 12.9 11.5 20.9 16.8 - 58.6
Franklin US Government Fund 28Feb91 USD 4.5 3.2 8.9 18.7 59.1 99.1
Franklin US. Growth Fund 29Aug03 USD 7.1 7.1 11.6 - - 21.4
Franklin U.S. Ultta Short Bond Fund 29 Aug 03 USD 2.1 3.6 7.7 - - 8.7
Franklin U.S. Small-Mid Cap Growth Fund 29 Dec00 USD 5.6 6.1 28.0 30.0 - 13.4
Franklin U.S. Total Return Fund 29Aug03 USD 5.2 4.3 10.7 - - 15.4
Franklin Mutual Beacon Fund ~ ~ ~ ~ ~ ~
07 Jul 97 USD 1 2 2 18.3 42.5 53.3 - 134.9
Franklin Mutual European Fund 03 Apr 00 EUR' 16.8 31.3 77.5 148.8 - 148.5
Franklin Mutual Global Discovev Fund 25 Oct 05 USD 11.7 18.6 - - - 24.3
Franklin Templeton Global Growth and Value Fund 09 Sep 02 USD 16.2 23.2 55.3 - - 92.9
Franklin Templeton Japan Fund 01 SepOO JPY 7.4 (6.2) 66.0 68.8 - 15.5
Templeton Absolute Return (Euro) Fund ~~
15 Novo6 EUR -
Tcmpleton Asian Bond Fund 25Oct 05 USD 9.4 18.3 - - - 21.8
Templeton Asian Growth Fund 30 Jun 91 USD 24.8 32.8 91.2 244.0 53.8 124.2
Templeton BRlC Fund ~
25 Oct 05 USD 26.6 48.6
Templeton China Fund 01 Sep 94 USD 28.6 43.1 82.0 208.6 73.4 83.7
Templeton Eastern Europe Fund 10 Nov 97 EUR 18.3 23.0 165.6 266.7 - 292.2
Templeton Emerging Mark& Fund 28 Feb 91 USD 20.3 27.0 96.4 197.4 87.1 209.0
Templeton Ernergmg Markets Bond Fund 05 Jul 91 USD 11.6 15.9 35.6 7Y.5 143.2 387.4
6
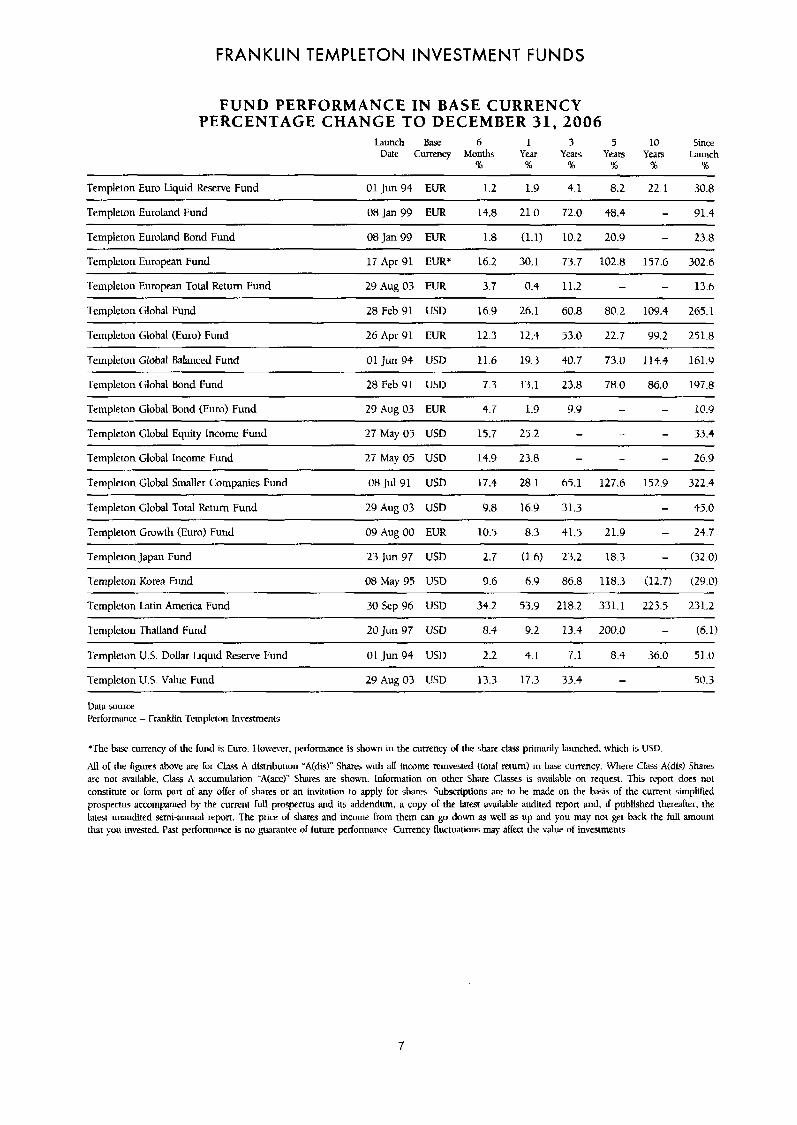
FRANKLIN TEMPLETON INVESTMENT FUNDS
F U N D PERFORMANCE IN BASE CURRENCY PERCENTAGE CHANGE TO DECEMBER 31,2006
Launch Base b 1 3 5 10 Since Date Currency Months Year Years Years Years Launch
% I % % % %
Templeton Euro Liquid Reserve Fund
___ ..
01 Jun94 EUR 1.2 1.9 4.1 8.2 22.1 30.8
Templeton Euroland Fund 08 Jan 99 EUR 14.8 21.0 72.0 48.4 - 91.4
Templeton Euroland Bond Fund 08 Jan99 EUR 1.8 (1.1) 10.2 20.9 - 23.8
Templeton European Fund ~~~
17 Apr 91 EUR* 16.2 30.1 73.7 102.8 157.6 302.6
- 13.6 Templeton European Total Return Fund 29Aug03 EUR 3.7 0.4 11.2 - ~~
Templeton Global Fund 28 Feb 91 USD 16.9 26.1 60.8 80.2 109.4 265.1
Templeton Global (Euro) Fund 26 Apr 91 EUR 12.3 12.4 53.0 22.7 99.2 251.8
Templeton Global Balanced Fund 01 Jun 94 USD 11.6 19.3 40.7 73.0 114.4 161.9 ~
Templeton Global Bond Fund 28 Feb91 USD 7.3 13.1 23.8 78.0 86.0 197.8
Templeton Global Ekmd (Euro) Fund 29 Aug03 EUR 4.7 1.9 9.9 - - 10.9
Templeton Global Equity Income Fund 27 May 03 USD 15.7 25.2 - - - 33.4
Templeton Global Income Fund 27 May 05 USD 14.9 23.8 - - - 26.9
Templeton Global Smaller Companies Fund 08 Jul 91 US0 17.4 28.1 65.1 127.6 152.9 322.4
templeton Global Total Rctum Fund 29Aug03 USD 9.8 16.9 31.3 - - 43.0
Templeton Growth (Euro) Fund 09 Aug 00 EUR 10.5 8.3 41.5 21.9 - 24.7
Templeton Japan Fund 23 Jun97 USD 2.7 (1.6) 23.2 18.3 - (32.0)
Templeton Korea Fund osMay95 US0 9.6 6.9 86.8 118.3 (12.7) (29.0)
Templeton Latin America Fund 30 Sep 96 USD 34.2 53.9 218.2 331.1 223.5 231.2
Templeton Thailand Fund 20Jun97 USD 8.4 9.2 13.4 200.0 - (6.1) ~ ~~
Templeton U.S. Dollar Liquid Resenre Fund ~ ~~
01 Jun94 USD 2.2 4.1 7.1 8.4 36.0 51.0
Templeton U.S. Vdue Fund 29 Aug 03 USD 13.3 17.3 33.4 - - 50.3
Data wurce I'erformance - Franklin Templeton Investments
'fhe basc cumncy uf the fiiiid b Euro. Huwrver. performance is shown in the currency o l the share class primarily hunched. which is USD.
All of the hgures above are lor Class A distribution ".A(dis)" Shares with all income reinvested (toral return) in base currency. Where Cka A(db) Shams are not available. Class A accumulation -'A(acc)" Shares are shown. lnfonnation on other Share Classes is available on request. This report dws not constitute or form part of any offer of shares or an invitation to apply for shares. Subscriptions are to be made on the basis uf the current simplified prospectus accompanied by the curi-enf full prospectus and its addendum, a copy of the latest available audited report and. if published thereafter, the latest unaudited semi-annual wprt . The prim of shares and income from them can gu down as well as up and you may not gt back the full amount that you invested. Past ptrfonnance is no gurantee of future performance. Currency fluctuations ma)- affect the value of investments.
7
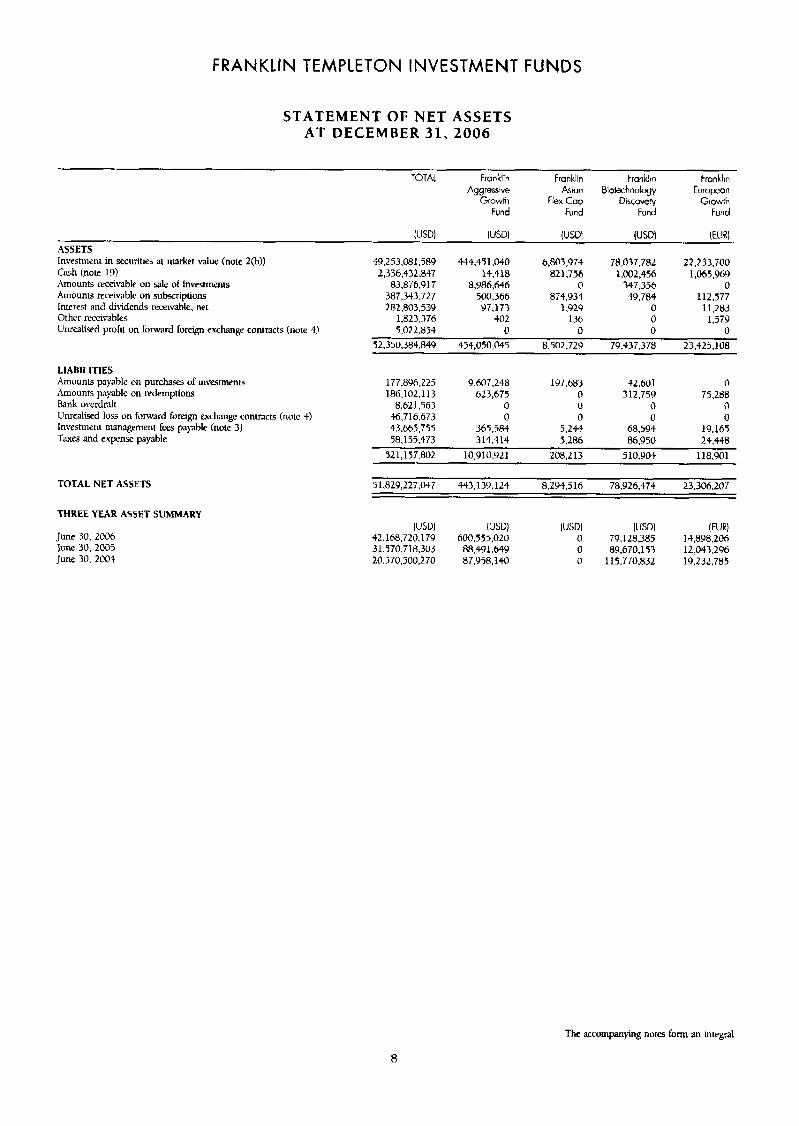
FRANKLIN TEMPLETON INVESTMENT FUNDS
STATEMENT OF NET ASSETS AT DECEMBER 31, 2006
TOTAL Franklin Franklin Frank!in Franklin Aggressive Asian Biotechnology Europeon
Growth Flex Cap Discovery Growth Fund Fund Fund Fund
ASSETS Investment in sfcuritits at market value (note 2(b)) Cash (note 19) Amounts receivable on d e of investmmts Amounts receivable on subscriptions Interest and dilldends receivable. net Other receivables Unrealised profit on forward foreign exchange contracts (note 4)
LIABILITIES Amounts payable on purchases of investmenrs Amounts pityable on redemptions Bank overdraft Unrealised loss on forward foreign exchange conimcts (note 4) Investment management fees pa)ablc (note 3) Taxes and expense payable
TOTAL NET ASSETS
THREE YEAR ASSET SUMMARY
June 30< 2006 June 30. 2005 June 30, 2004
IUSDI IUS01 (USDI IUSDI IEURI
49.253.081.589 444,451.040 6,803,974 78,037,782 22,233,700 2,336.432.847 14,418 82 1 -756 1,002,456 1,065,969
387,343.727 500.366 874,934 49.784 112.577 282,803,539 97,173 1.929 0 11 -283
1,823,376 so2 136 0 1,579 5,022,854 0 0 0 0
52,350,384.849 454,050,045 8,502,729 79.437.378 23.425.108
83.876.91 7 8,986,646 0 347.356 0
177,896.225 9.607.248 197,683 42,601 0 186,102.113 623,675 0 312.759 75,288
8.621.563 0 0 0 0 46.716.673 0 0 0 0 43.665.755 365.584 5,244 68.594 19.165 58.155,473 314,414 5.206 86,950 24,448
52 1,157.802 10.9 10.92 1 208,213 510.904 118.901
5 1.829.227.047 443.139.1 24 8.294.516 78.926.474 23.306.207
W D I I U W IUSDI IUS01 IEURI 42.168.720.179 h00.555,020 0 79,128,385 14,898,206 31,570.718.303 88,491.649 0 89,670.153 12,043.296 20.570.500.270 87,058,140 0 115,770,832 19.232.785
The accompanying note5 form an integral
8
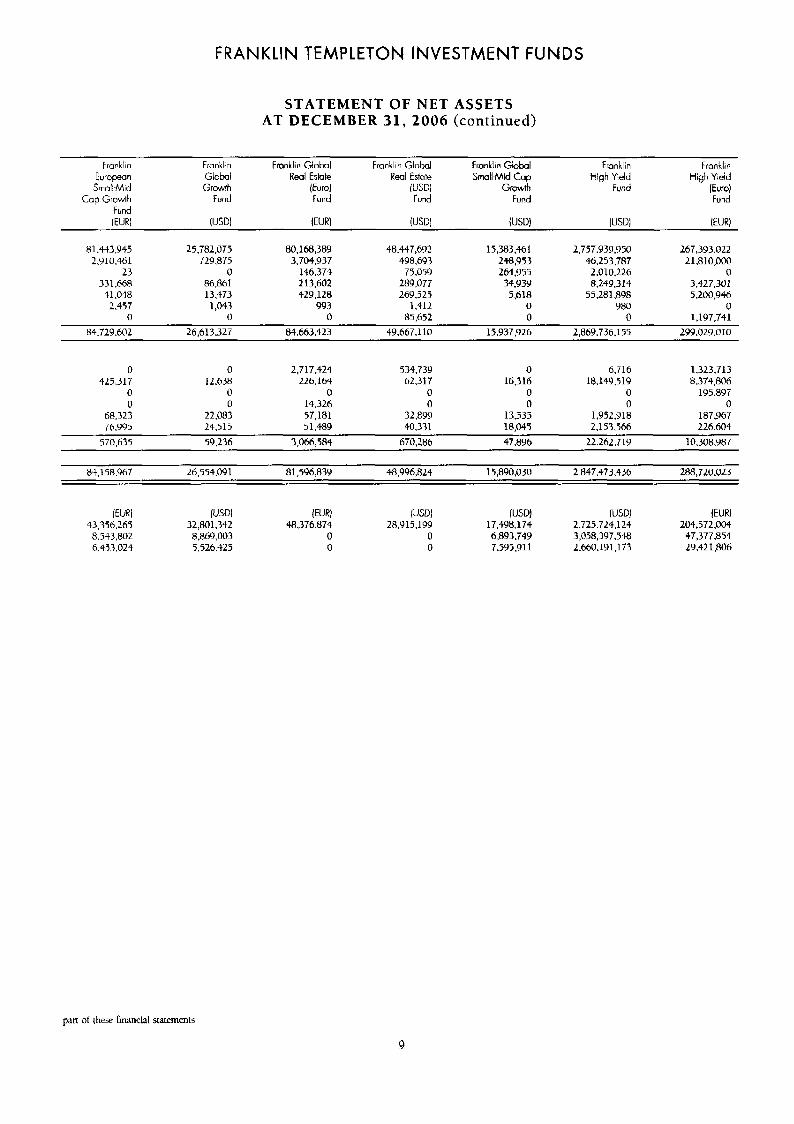
FRANKLIN TEMPLETON INVESTMENT FUNDS
STATEMENT OF NET ASSETS AT DECEMBER 31, 2006 (continued)
Fravklin Franklin Franklin Globol Franklin Global Franklin Global Fran kI i n Franklin High Yieid European Global R e a l Estate Rea Estate SmallMid 6 p High Yield
SvaIiMid Growih lEuml fUSD1 Growth Fund [Euro) Cap Growth Fund Fund Fund Fund Fund
Fund (EURI lUSDl I E W IUSDI (USDI IUSD1 I W
81,443,945 25.782.075 80,168,389 48,447,692 15,383,461 2,737,939,950 267,393.022 2.Y 10.461 729,875 3.704,937 498,693 148,953 46,253,787 21,810,000
23 0 146.374 7s.059 264955 2.010.226 0 331,hbR R6.861 213,602 289.077 34.939 8.249.314 3.427.301
41,048 13,473 429,128 269,525 5,618 55,281,898 5.200.946 2.457 1,043 993 1.412 0 980 0
0 0 0 85,652 0 0 1,197,741 299.02Y .O 10 84.729.602 26,613.327 84.663.423 49,667.110 15.937.926 2,869.736.l$5
1,323,713 0 0 2,717.424 534.739 0 6.716 425,317 1 2 . m 226,164 62,317 16,316 18.149.519 8,374,806
0 0 0 0 0 0 195.897 0 0 14,326 0 0 0 0
68,323 22,083 57,181 32.a99 13.535 1,952,918 187.967 76.995 24.515 5 1.489 40.331 18,045 2,153.566 226.604
$70.635 59,236 3,066,584 670,286 47.896 22.262.719 10.308.987
84.1 58.967 26,554.09 1 81,596,839 $8,996,824 15,890,030 2.847.473.436 288,720.023
W R J (USOl I E W IuSDl fUSDl fUSDJ IEURJ 43.356.265 32,801.342 48,376,874 28,915,199 17,498,174 2.725.724,lZ-l 201,572.004
29.42 1.806 a.543.802 8,869,003 0 0 6,893.749 3,058,397,548 47,377.854 6.453.024 5.526.425 0 0 7.595.91 1 2,660.191.173
pan of these financial statements
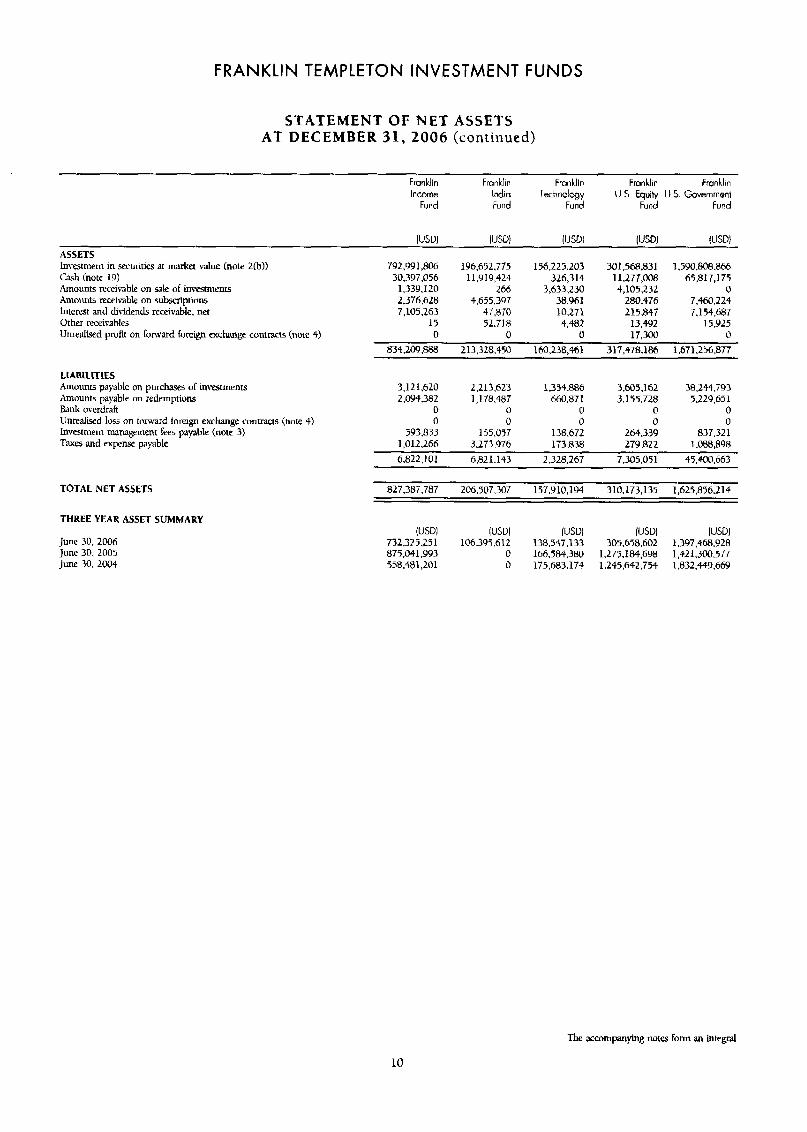
FRANKLIN TEMPLETON INVESTMENT FUNDS
STATEMENT OF NET ASSETS AT DECEMBER 31, 2006 (continued)
Fron klin Franklin Franklin FmnkJin Franklin Income India Technology U.S. Equity U.S. GDvernment
Fund Fund Fund Fund Fund
ASSETS Investment in securities at market value (note 2b)) Cash (note 19) Amounts receimble on sak of iniTjfmtlnts Amounts receivable on subscriptions Interest 3nd dividends receivable, net Other receivables Unrealised profit on fonvatd foreign exchange contracts (nore 4)
lUSD1 IUSDI IUSDl IUS01 IUSDI
792,991,806 196,632.775 156.225.203 301.5M.831 1,590,808.866 30,397.056 11.Y19,42-t 326,314 11,277,008 65,817,175
1.339.120 266 3,633.230 4,105.232 0 2,376.628 4,655.397 38,961 200.476 7.460.224 7,105.263 47.810 10.211 2 1 5 . 8 ~ 7.154.687
15 52.718 4.482 13,492 15,925 0 0 0 17,300 0
834.209.888 213.328.450 160.238.461 317,478,186 1.671.256.877
LlABILlTlES Amounts payable on purchases of invcstments 3.12 1,620 2.213.623 1,354,886 3,605,362 38,244,793 Amounts payable on redemptions 2.094.382 1,178,487 660.871 3,155,728 5.229.651 Bank overdraft 0 0 0 0 0 Unrealwd loss on forward foreign ewhangc contmcts (note $) 0 0 0 0 0 Investment management fees payable (note 3) 593.833 155.057 138,672 264.339 837.321 Taxes and expense payable 1,012,266 3,273.976 173.838 2 7 9 . m 1,088,898
6,822,101 6.82 1.143 2.328.267 7.305.051 45.400.663
TOTAL NET ASSETS 827,387.787 206.507.307 157,910,lW 310,173.135 1.625.856.214
THREE YEAR ASSET SUMMARY
June 30, 2006 June 30. 2005 l une 30. 2004
IUSW IUSDl IUSD1 IUSDl IUSDI 732,325.251 106.3YS.612 138.547.133 305,658,601 1.397.468.928 875.O41,YY 3 0 166,584,380 1,275.184.6Y8 1,421,300.577 558,481,201 0 175.683.174 1,245.642.754 1,832,449,669
The accompanying notes form an integral
10
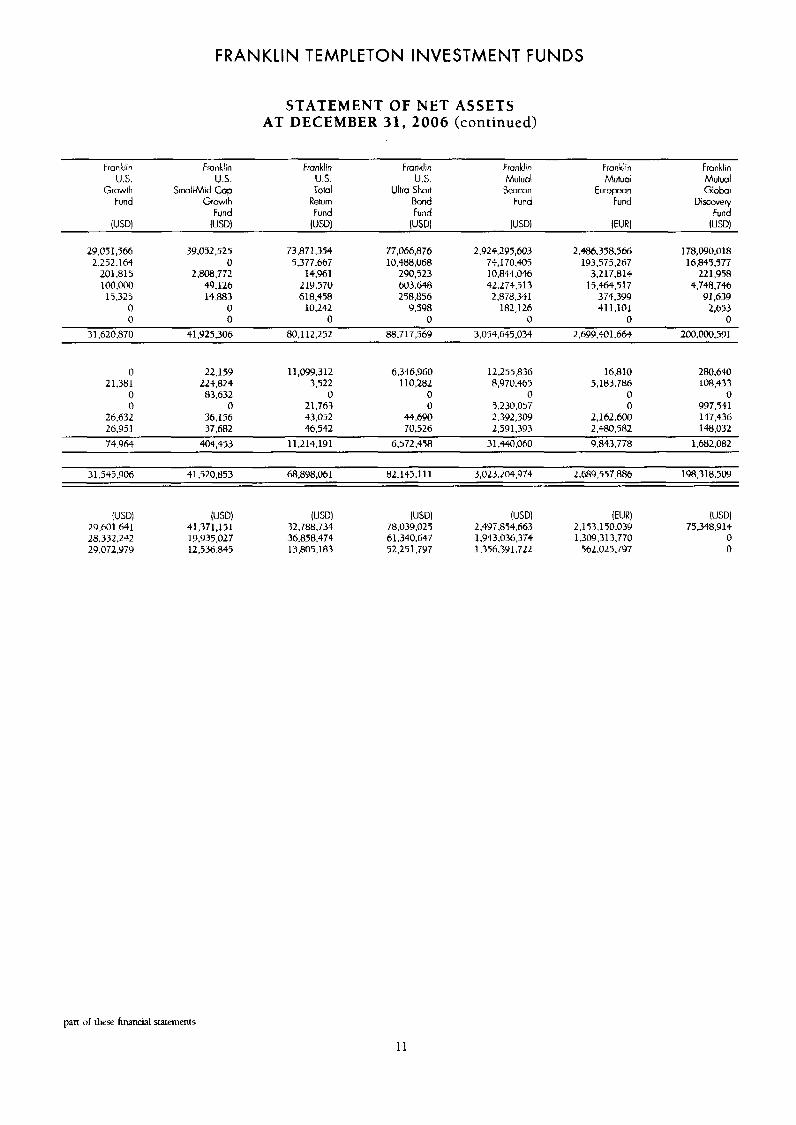
FRANKLIN TEMPLETON INVESTMENT FUNDS
STATEMENT OF NET ASSETS AT DECEMBER 31, 2006 (continued)
trankair, Franklin Franklin Franklin Franklin Franklin Franklm u s. us u s. u.s Mutual Mutuoi Mutwl
Growth SrnallMid Cap Total Ultra Short Beacon Europeoq Global Fund Gr&h Return Bond Fund Fund Discovery
Fund Fund Fund Fund IUSDI IUSD) I U W IUSDI IUSDI IEURI IUSDI
178,090,018 2,252.164 0 5,377,667 10,488,068 74,170.409 193.575.267 16845.577
201.815 2.808.772 14.961 290,523 10.844.046 3,217,813 221.958 100.000 49,126 219,570 603.648 42.271.513 15,464.5 17 4,748,746 15,325 14.883 618,458 258.856 2,878,341 374,399 9 1,639
0 0 10.242 9.598 182,126 411,101 2,b53 0 0 0 0 0 0 0
41 .Y25,306 80.112.252 88.717.569 3,094,645,034 2,699,401,664 200,000.591
29.05 1,566 39.052.525 73,871,354 77,066,876 2,924,295,603 2.486.358.566
31,620,870
0 22,159 11,099,312 6,346,960 12,255,836 16,810 280.640 21,381 224,824 3.522 110,282 8,970.469 5,183.786 108,433
0 83,632 0 0 0 0 0 0 0 21.763 0 5,230.057 0 997.531
26,632 36.156 43.052 44,690 2,392,309 2,162.600 147,436 148,032 26.951 37.682 46,542 70,526 2,591,393
1,682,082 74,964 404,453 11.214.191 6.572.458 31,440,060 9,843,778 2.480.582
198,318,509 31,549,906 41,520,853 68,898,061 82,1+5.111 3,023.204.974 2.689.557.886
IUSDI I U W IUSDI IUSD) IUSDI IEURI IUSD1 29.601.641 41,371,151 32,788,734 78,039,025 2.49 7,854.663 2.153.170.039 75,348,914 28.332.242 19,935,027 36.858.474 61,340,647 1.943.036.374 1.309.313.770 0 29.072.979 12,536.845 1 3 -805,183 52,251,797 1,356.391.722 562.025.797 0
part of thew financial statements
11
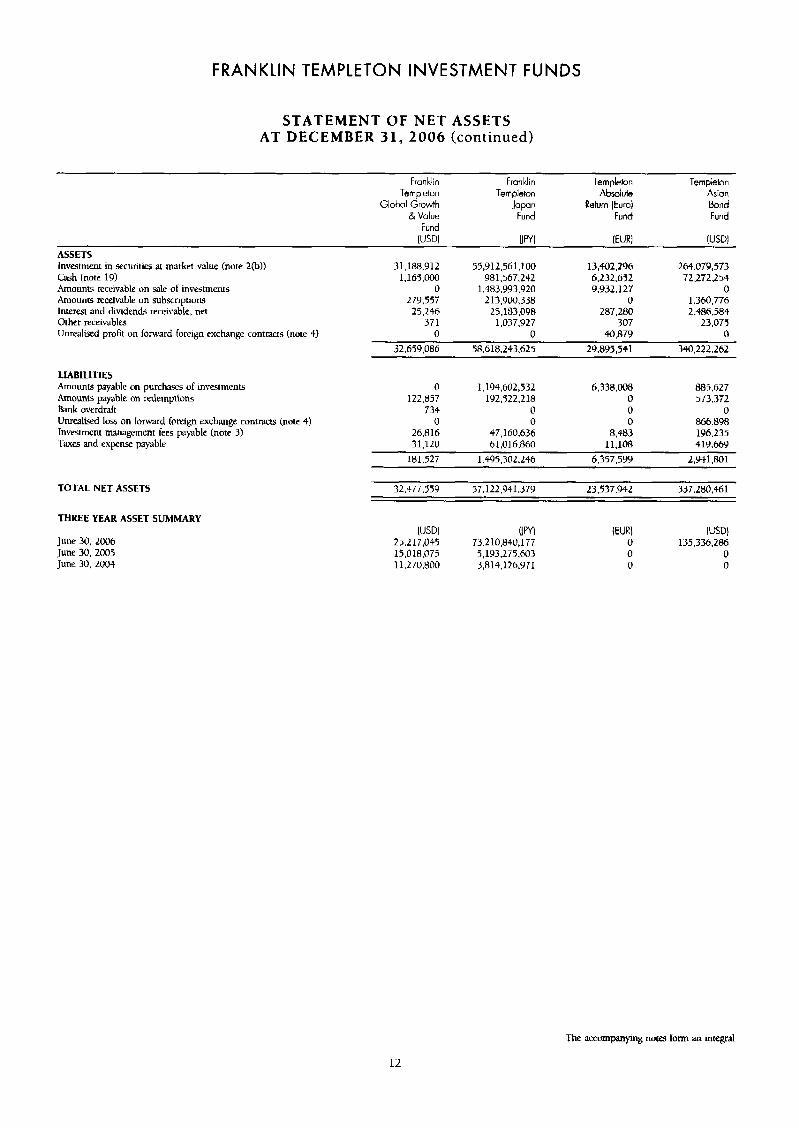
FRANKLIN TEMPLETON INVESTMENT FUNDS
STATEMENT OF NET ASSETS AT DECEMBER 31, 2006 (continued)
ASSETS Investment in securities at market value (note 2@)) Cash (note 19) Amounts receivable on sale of investments Amounts receivable on subscriptions Interest and dividends receivable, net Other receivables Unrealised profit on forward foreign exchange contracts (note 4)
F r a n k i i n Franklin Templeion Ternpkbn Templeton Templeton Absolute Asion
Glob1 Growln Japan Return [Euro] Bond & Value F u n d Fund F u n d
W D I UWI I E W IUSDI Fund
31,188.91 2 55,912,561.100 13,402,296 26+.079,573 1,165,000 981,567.242 6.232.652 72.272254
0 1,483,993,920 9.932.127 0 1.360.776
25.246 25,183,098 287.280 2,486.584 371 1.037.927 307 23.075
0 0 40.879 0 32.659.086 58,618,243,625 29,895,541 340.222.262
279.557 213,900,338 0
LIABILITIES
Amounts payable on redemptions 122,857 192.522,218 0 573.372 Bank ovcrdnft 734 0 0 0 Unrealiurd loss on forward foreign exchange contracts (note 4) 0 0 0 866.898 Investment management fees payable (note 3) 26.816 47.160.636 8.483 196.235 Taxes and expense payable 31,120 61,016.860 11,108 419.669
2,991,801
Amounts payable on purchases of investments 0 1,194,602,532 6.338.008 885.627
181.527 1.495.302.246 6,347,599
TOTAL NET ASSETS
THREE YEAR ASSET SUMMARY
June 30. 2006 June 30.2005 June 30, 2004
32.477.539 57.122,941.379 23.537.442 337.280.461
(US01 UWl WRI IUS01
15,018,073 5,193,275.603 0 0 11,270,800 3,814,126,971 0 0
25,217,045 73.2 10,840,177 0 135.336.286
The accmnpnying now form an integral
12
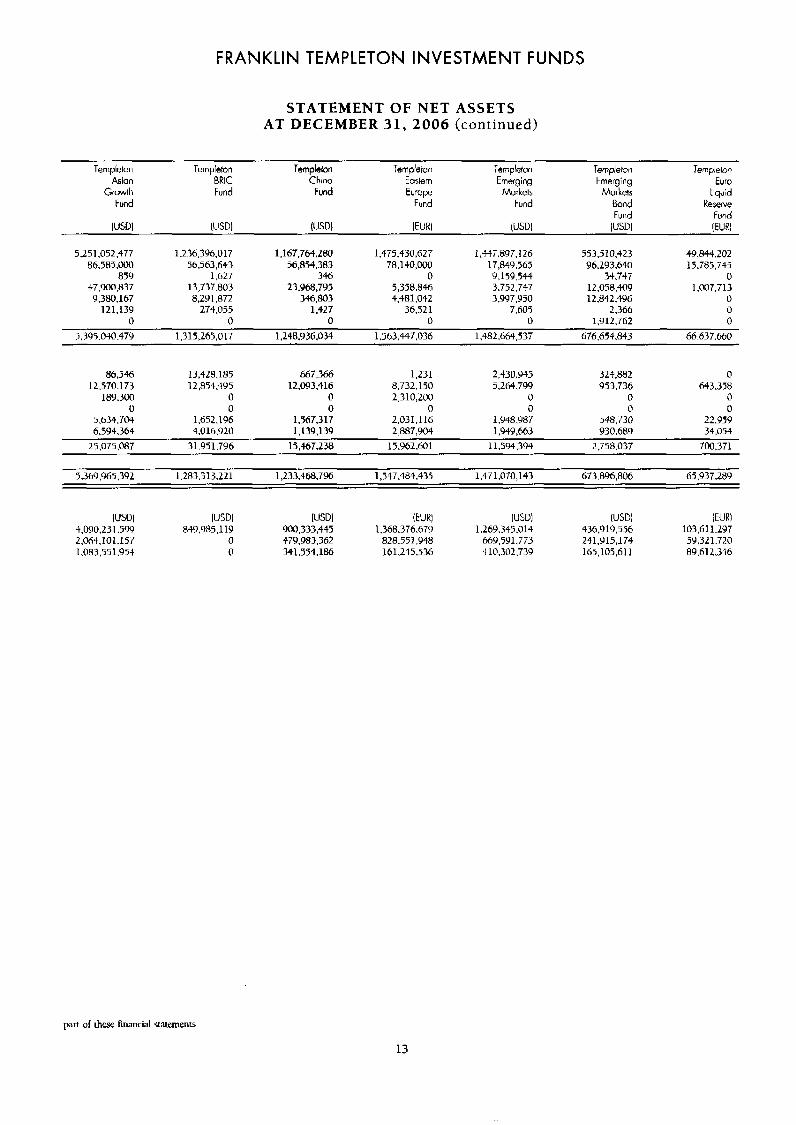
FRANKLIN TEMPLETON INVESTMENT FUNDS
STATEMENT OF NET ASSETS AT DECEMBER 31, 2006 (continued)
Templeton Asian BRlC China Eastern Emerging Emerging Euro
Growth Fund Fund Europe Mclrkets Markets Liquid Fund Fupd Fund Bond Reserve
Fund Fund lUSD1 IUSDI IUSDI IEURI IUSDI IUSDI IEURI
5.251.052.477 1,236,396,017 1,167,764.280 1,475,430,627 1,447.897.126 553,310,423 49,844.202 86,585,000 56,563,643 56,854.383 78,140,000 17,849.565 96.293.640 15,785,715
859 1,627 346 0 9.1 59,544 34.747 0 37.900.837 13,737.803 23.968,795 5,358,846 3.752.747 12,058,409 1.007.713 9 ,380,167 8,291 872 346.803 4,481,042 3,997,950 12.842.496 0
121.139 274.035 1,427 36.521 7.60s 2.366 0 0 0 0 0 0 1.9 12.762 0
9,395.040.479 1,315,265,017 1.248936.034 1,563,447,036 1.482.664.537 676.654.843 66.637.660
Ternpielon Templeton Templeton Templeton Templeton Templston
86.556 13,42%.185 h67.366 1,231 2.430.935 323,882 0 12.570.173 12 ,as4,49 5 12.093.416 8,732,150 5,264.T99 953.736 643,378
189.300 0 0 2,310,200 0 0 0 0 0 0 0 0 0 0
5,634.703 1,652.196 1.567.317 2,031,116 1 .Y48,Y87 548.730 22.939 6,594,364 4,016.920 1,139,139 2,887,904 1,949,663 930.689 34,054
2 5,075,087 31,951,796 15.467338 15,962,601 11,594394 2,758.037 700,371
5.369.965,392 1.283.313.221 1,233,468.7M 1,547,484,435 1,471,070,143 673,896,806 65,937.289
IUSDI IUSDI IUSDI W R 1 l U W IUSDI IEURl 103.61 1.297 .t,090.231.WY 849.985.119 r)00,333,445 1,368,376.679
2.064.101.157 0 $78.983.362 828,551,948 669,591.773 241,915,174 59.321.720 165,105.61 1 89.61 2.346 1.083.551.954 0 341,554.186 161,245,536 410,302,739
1.269.345.014 436919.556
pan of rhfse f i ~ n ~ i a l statements
13
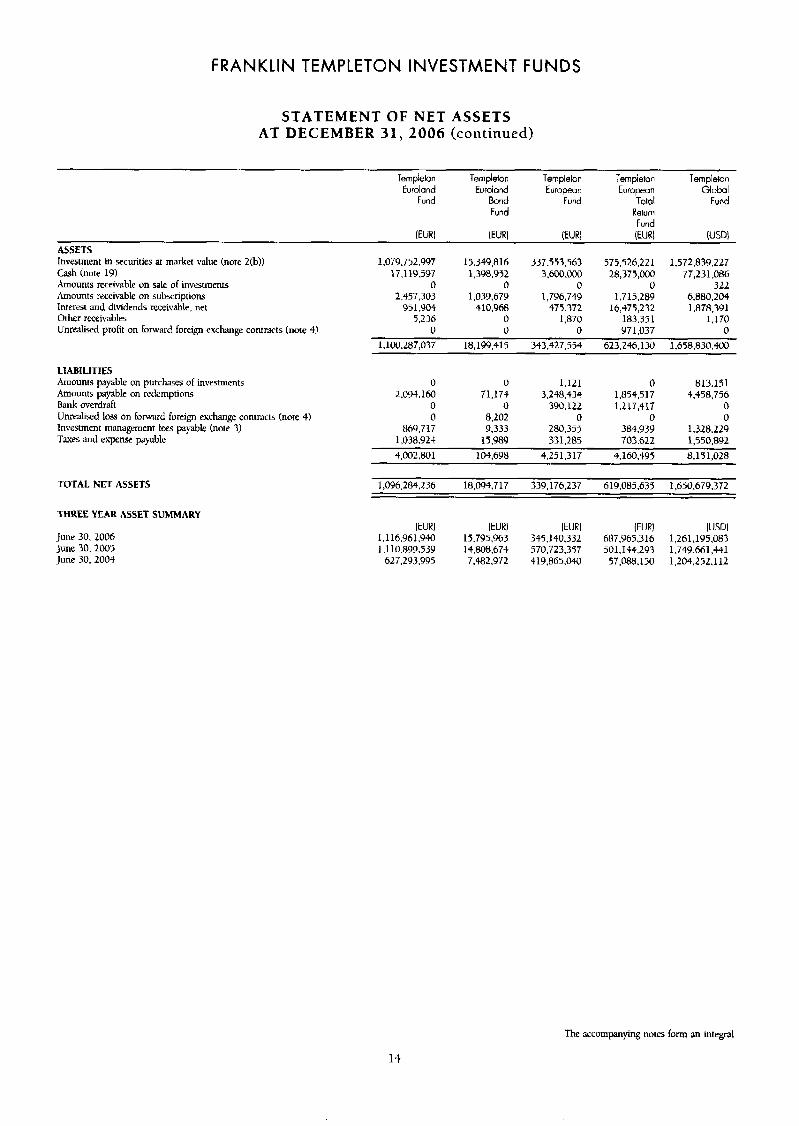
FRANKLIN TEMPLETON INVESTMENT FUNDS
STATEMENT OF NET ASSETS AT DECEMBER 31, 2006 (continued)
temp!eton Templeton Ternplelon Tern pieton Templeton Eurolond Eurolond Europar European Globol
Fund Bond Fund Told Fund Fund Return
Fund IEURl IEURl lEURl IEURI (USDI
ASSETS Investment in securities at market value (note Z(b)) Cash (note 19) Amounts receivable on sale of investments Amounts receinble on subscriptions Interest 3nd divdends receivable. net Other receivables Unrealiwd profit un forward foreign exchange contracts (note 4)
LIABILITIES Amounts payable on p u t c k s of investments Amounts payable OTI redemptions Bank overdraft Unrealised loss on forward foreign exchange contricts (note 4) Investment managment fees payxble (note 3) Taxes and expense payable
TOTAL NET ASSETS
THREE YEAR ASSET SUMMARY
June 30. 2006 June 30, 2005 June 30, 2004
1,079.752.997 15,349,816 337,553,563 575.526.221 1,572.839.227 17.1 19.597 1.398.952 3,600,000 28,375,000 77,231,086
0 0 0 0 322 2.457.303 1.039.679 1,796,749 1.71 5.289 6,880.204
1.878.391 5.236 0 1,870 183.351 1.170
0 0 0 971.037 0 1,1oO.287,037 18.199.41 T 343,427,554 623,246.1 30 1,658.830,4OO
951,904 410,968 475.372 16,475,232
0 0 1,121 0 813.151 2,094,Ifd 71,174 3,248,434 1,854,517 4,498,756
0 0 390.122 1.2 17,417 0 0 8.102 0 0 0
869.717 9,333 280.355 384.939 1,328.229 1.038.92+ i5.m~ 331.285 703.622 1,550,891 4,002,801 104.698 4.251.317 4,160.495 8,151,028
1,096,284.236 18.094.717 339,176.237 619.085.635 1,650,679.372
IEURl IEUR) IEW WRl IUSDI I,116,961,9W 15.795.963 345.140.332 687,965,316 1,261,195,083 1 .I 10.899.539 14.808.674 570,723,357 501,144,293 1,749,661,441 627.293.995 7.482.972 419,865,040 57,088,140 1,204.292.112
The accompanying notes form 311 i n t e p l
14
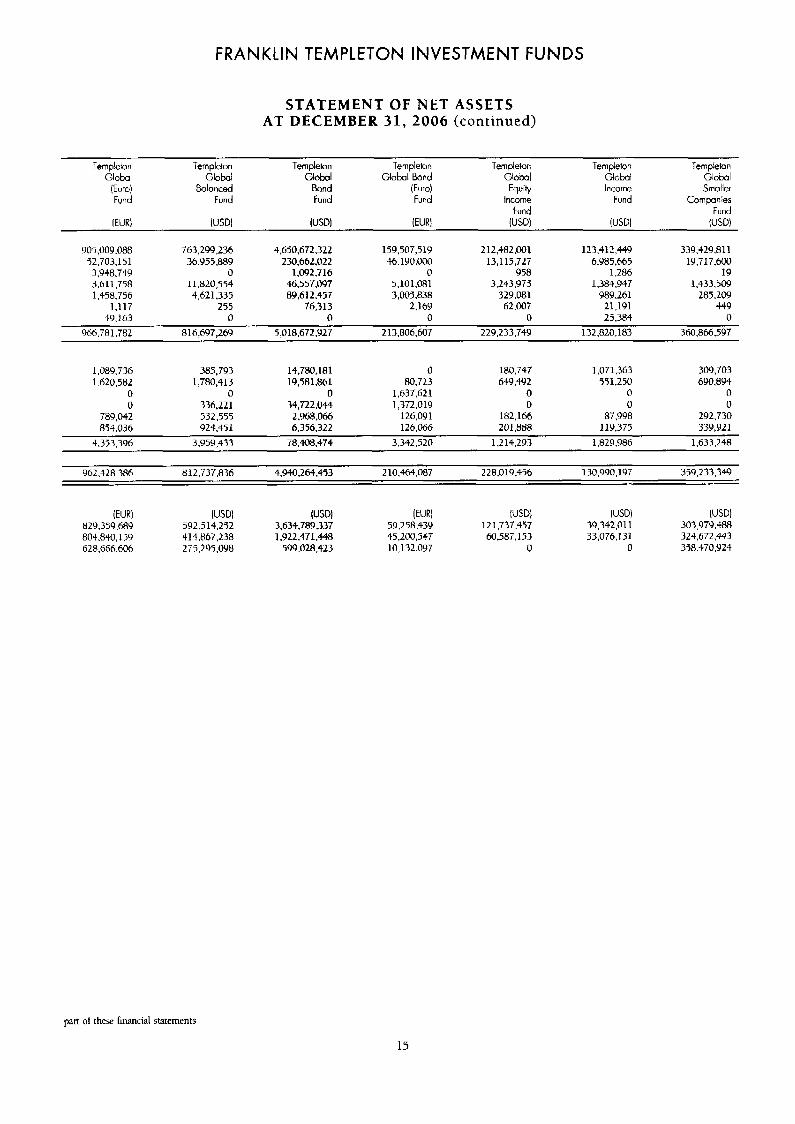
FRANKLIN TEMPLETON INVESTMENT FUNDS
STATEMENT OF NET ASSETS AT DECEMBER 31, 2006 (continued)
Temp!eton Templeton Templeton Templeton Templeton Templeton Templeton Global Globol Globol Global Bond Globol Global Globol
[Euro) Balanced Bond (Euro) Equity Income Smoller Fund Fund Fund Fund Income Fund Cornponies
Fund Fund IEURI IUSDI IUSDl IEURI IUSDl IUSDl IUSDI
YO5.009.088 763.299.236 4.650.672.322 159,507,519 212,482.001 123,412,449 339.429.811 52,703.151 36,955,889 230,662,022 46,190,000 13,115,727 6,985,665 19,717,600 3,948.749 0 1 .O92,716 0 9 58 1,286 19 3.61 1.758 11,820,554 46,557,097 5,101,081 3,243.975 1,384,947 1,433,509 1,458,756 4,621.335 89.61 2.457 3,005,838 329.081 989.261 285.209
1.117 255 76,313 2,169 62,007 21,191 449 49,163 0 0 0 0 25,384 0
966.781.782 81 6,697,269 5,018.672.927 213,806,607 229.233.7N 132.820.183 360,866,597
1.089.T36 385.793 14,780,181 0 180,747 1.071,363 3G9.703 1,620,582 1,780,413 19,581,861 80,723 649,492 551,250 690,894
0 0 0 1,637.621 0 0 0 0 336,221 34,722.044 1,372,019 0 0 0
789,042 532,555 2.968.066 126,091 182,166 87.998 292,730 854.036 924,451 6.356.322 126.066 201,888 119.375 339,921
4.353.396 3,959,433 7n.408.474 3342,520 1,214,293 1.829.986 1.633.248
962.428.386 812.737.836 4,940,264.453 210.464.087 2~8,019,456 130,990,197 359,233,349
WRI [USDI IUSDI WRI IUS01 IUSDI W D l 829.359.689 592,514.252 3,634.189.337 59,258,439 12 1,737,457 39,342.01 1 303,97Y.S88 804,840,159 41 4867.238 1.922.471.448 45,200,547 60,587.153 33,076.131 324.672.443 628.666.606 275.295.098 ~w.028.423 10,132.097 0 0 358,470,924
part of these fmncial statements
15
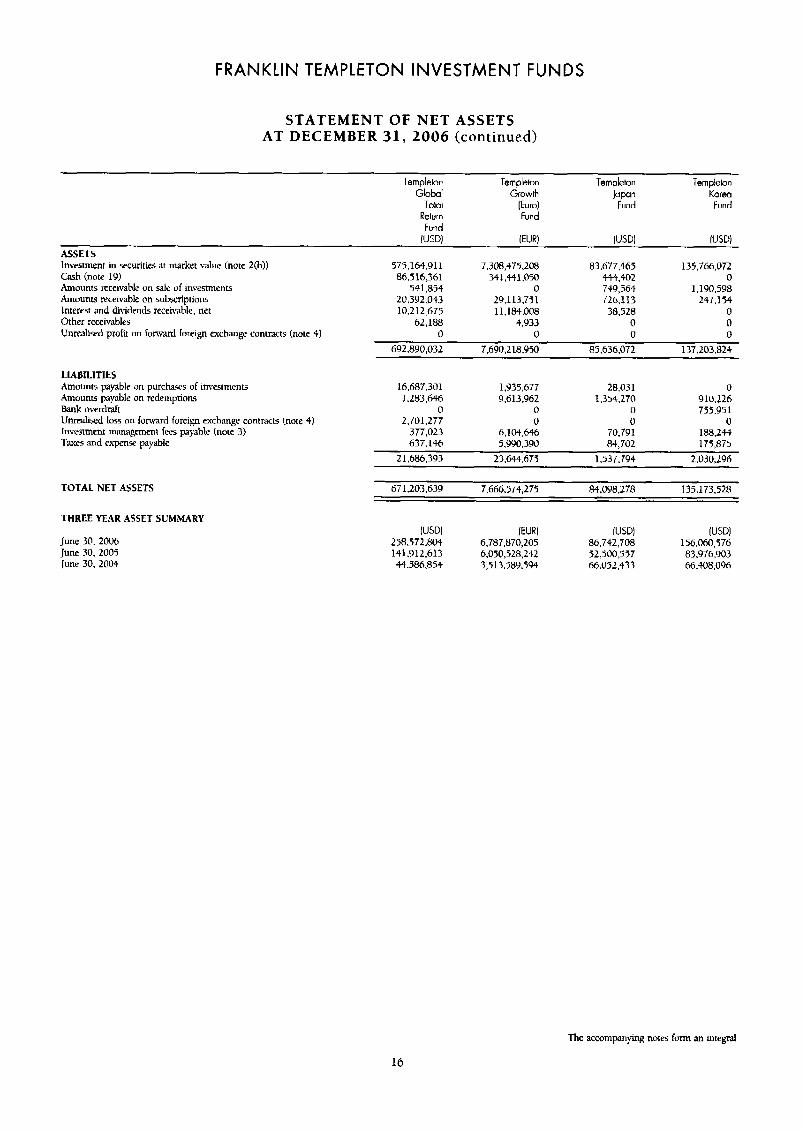
FRANKLIN TEMPLETON INVESTMENT FUNDS
STATEMENT OF NET ASSETS AT DECEMBER 31, 2006 (continued)
Templelor Templeton Templeton Templeion Globol Growth Japan Korm
Toto1 (Euro) Fund Fund Return Fund Fund
IUSDI lEURl IUSDI lUSDl
ASSETS Investment in securities at market d u e (note 2b) ) Cash (note 19) Amounts receivable on sale of investments Amounts receivable on subscriptions Interest and ditidends receivable, net Other receivables Unrealised profit on fonvard foreign exchn& cuntracts (note 4)
LIABILITIES Amounts payable on purchms of investments Amounts payable on redemptions Bank overdraft Unrealkd loss on foniard foreign exchange contract5 [note 4) Lnvcstment management lees payable (note 3) Taxes and expensf payable
TOTAL NET ASSETS
THREE YEAR ASSET SUMMARY
June 30, 2006 June 30, 2005 June 30. 2004
57S.lh4.911 7,308,475.2OU 63.677.465 135.166.072 8'5,516,361 341,441,050 444,402 0
541,654 0 749,564 1.190.598 20,392,043 29,113.771 726,113 247.154 10.212.675 11,184,006 38.528 0
62,188 4.933 0 0 0 0 0 0
692.890,032 7.690,218,950 85,636.072 137,203.a2+
16.687.301 1,935.677 28.031 0 1,263,646 Y,613,962 1.354.270 910,226
0 0 0 735.951 2,701.277 0 0 0
377,013 6.104.646 70.19 1 168.2et 637.146 5.W0.390 84,702 175,875
21,686,393 23,644,675 1.537.794 2,030,296
671.203.639 7.666.574,275 84.098.278 135,173,528
IusD) IEURI IUSDI IUSDI 2 ~ 8 ~ 7 2 , 8 0 9 6,787,870,205 86,742,708 156.060.576 141,912,613 6,050,518,242 52,500,557 83,976,903 et.58h.854 3,513.569.594 66,052,433 66,408,096
The accompanying notes form an integral
16
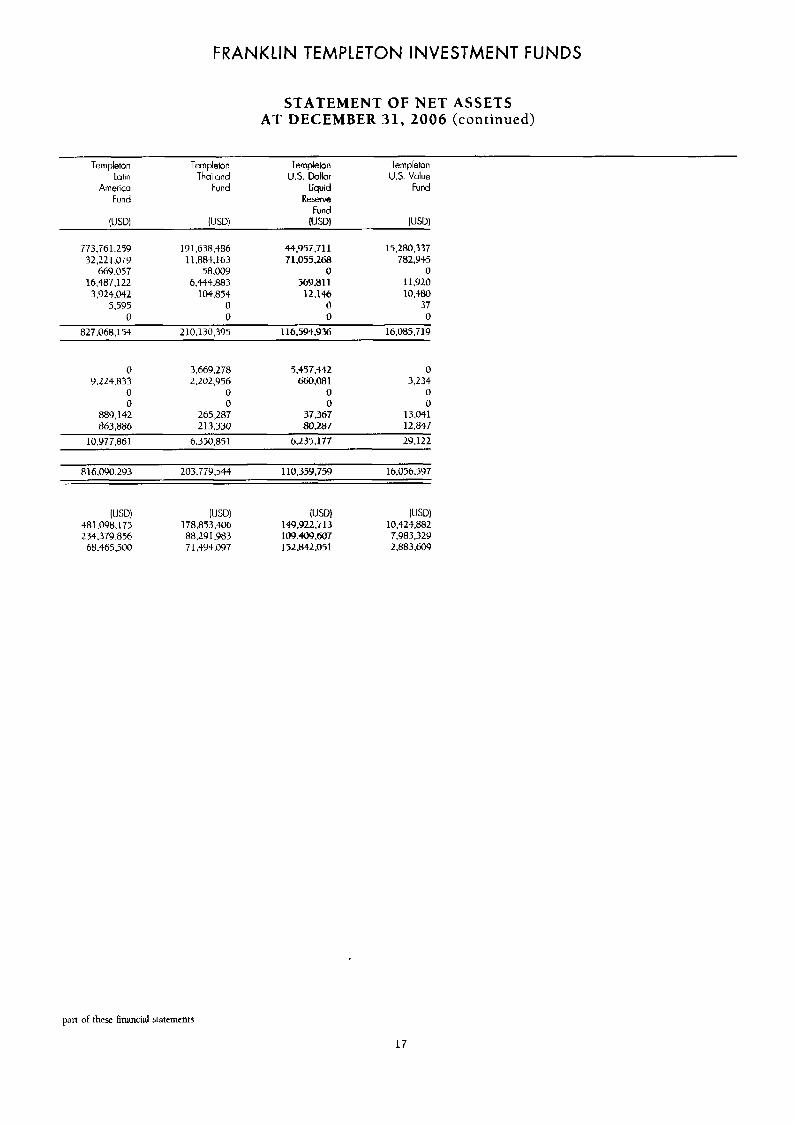
FRANKLIN TEMPLETON INVESTMENT FUNDS
STATEMENT OF NET ASSETS AT DECEMBER 31, 2006 (continued)
Templeton Templeton Ternpieton Templeton Lalin Thailand U.S. Dollar U.S. Value
America Fund Liquid Fund Fund ReSeW
Fund (USDI IUSDI IUS01 WSD1
773.761.259 191,638,486 44.957.711 15,280,337 32,221.079 11,884,163 7 1,055,268 782,945
669.057 58.009 0 0 16,487,122 6,444,883 569.811 1 1,920 3.924.042 1W.854 12.146 10.480
5,595 0 0 37 0 0 0 0
827.068.154 21 0.1 30.395 116,594,935 16,085,719
0 3,669,278 5,457,442 0 9.224.833 2.202.956 660.081 3,234
0 0 0 0 0 0 0 0
889.142 265,287 37.361 13.041 863,886 2 13.330 80287 12,847
10.977.861 6.350.851 6,235.177 29,122
81 6.090.293 203.779.544 110,359,759 16,056.597
IUSDI lUSDl IUSDi WSD1 481.0Y8.177 lT6.853.406 149,922,713 10.424.882 234,379.856 88,291,983 109.309.607 7,983.329 68.465.500 7 1 ,$94.097 15LR42.051 2,883,609
pan of these hnancial statements
17
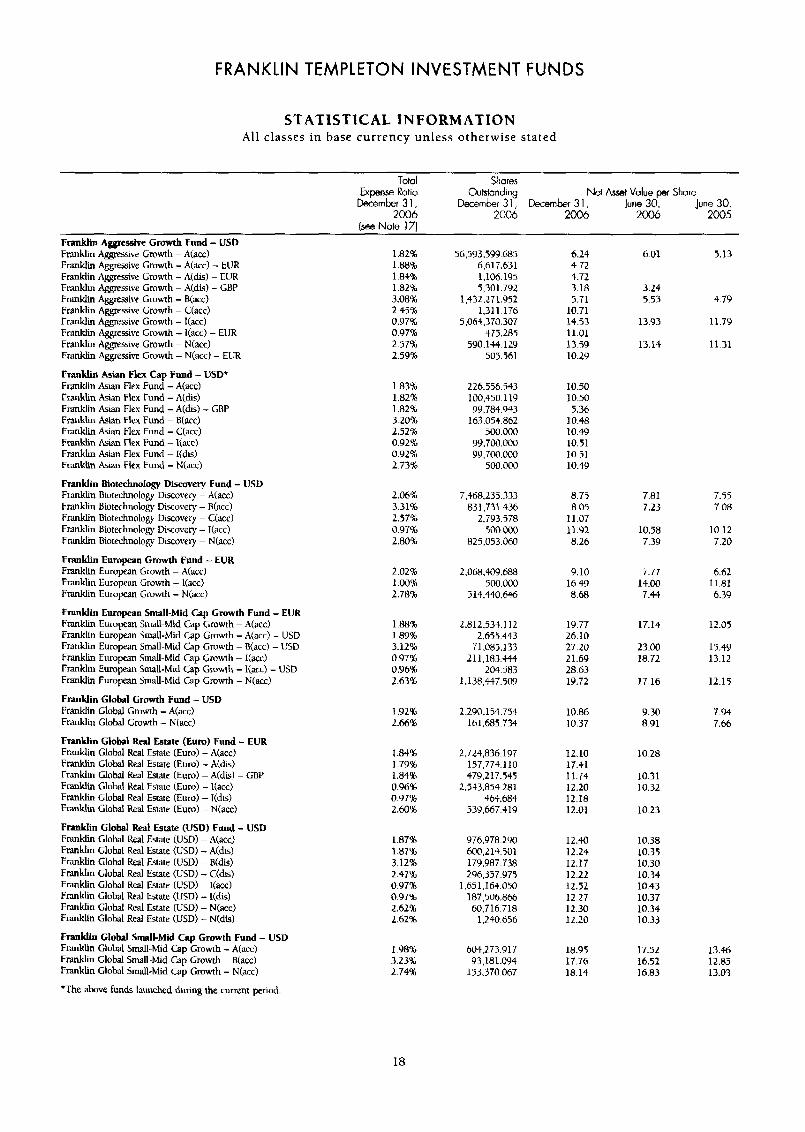
FRANKLIN TEMPLETON INVESTMENT FUNDS
STATISTICAL INFORMATION Al l classes in base currency unless otherwise stated
Tobl Shores Expense Ratio Outstanding Net Asset Value per Share
k r n b e r 3 1, December 3 1 , December 3 I , June 30, June 30, 2006 2006 2006 2006 2005
(see Note 17) Franklin Aggressive Growth Fund - USD Franklin AGssive Growth - A(acc) Franklin Agqessive Growth - A(acc) - EUR Franklin Agqessive Growth - A(dis) - EUR Franklin Aggnzssive Growth - A(dis) - GBP Franklin Aggressive Growth - B(acc) Franklin Aggressive Growth - C(acc) Franklin Aggressive Growth - l(acc) Fnnklin Agressive Growth - l(acc) - EUR Franklin Aggressive Growth - N(acc) Franklin Agqzssive Growth - N(acc) - EUR
Franklin Asian Flex Cap Fund - USDf Franklin Asian Flex Fund - A(acc) Franklin Asian Flex fund - A(dis) Franklin Asian Flex Fund - A(&) - GBP Franklin Asian Flex Fund - BCacc) Franklin Asian Flex Fund - C(acc) Franklin Asian Flex Fund - I(acc) Frankh Asian Flex Fund - I(dis) Franklin Asian Flex fund - N(acc)
Franklin Biotechnology Discovery Fund - USD Franklin Biotechnology Dixcovery - A(acc) Ftmklin Biotechnology D i s c w q - B(acc) Franklin Biotechnology D i x o v q - Ctacc) Franklin Biotechnology Dirwery - l(acc) Franklin Biotechnology Dixowty - N(acc)
Franklin European Growth Fund - EUR Franklin E u r o p n Growth - A(acc) Franklin European Growth - l(3cc) Franklin European Gruwth - N(acc)
franklin European Small-Mid Cap Growth Fund - EUR Franklin European Small-Mid Cap Growth - A(acc) Franklin European Small-Mid Cap Growth - A(acc) - USD Franklin European Small-Mid Cap Gniwth - BCacd - USD Franklin European Small-Mid Cap Growth - Iiacc) Franklin European Small-Mid Cap Gmwth - l(acc) - US13 Franklin European Small-Mid Cap Growth - N(acc)
Franklin Global Growth Fund - USD Franklin Global Growth - A(acc) Franklin Global Growth - NCacc)
Franklin Global Real Estate (Eum) Fund - EUR Franklin Global Real Estate (Euro) - A(acc) Franklin Global Real Estate (Euro) - Ndis) Franklin Global Real Estate (Euro) - A(dis) - GBP Franklin Global Real Estate (Euro) - Ifacc) Franklin Global Rwl Estate (Euro) - I(dis) Franklin Global Real Estate (Euro) - N(acc)
Franklin Global Real Estate (USD) Fund - USD Franklin Global Rwl Estare (USD) - A(acc) Franklin Global Red Estate (USD) - A(dis) Franklin Global Real Estate (USD) - B(dis) Franklin Global Real Estate (USD) - C(dis) Franklin Global Real Estate (USD) - I(acc) Fnnklin Global Real Eitate (USD) - I(dis) Franklin Glubal Real Estate (USD) - N(acc) Franklin Global Real Estatc (USD) - N(dis)
franklin Global Small-Mid Cap Growth Fund - USD Franklin Global Small-Mid Cap Growth - ACacc) Franklin Global Small-Mid Cap Growth - B(acc) Franklin Global Small-Mid Cap Growth - N(acc)
'The above funds launched during the current period.
1.82% 1.88% 1.84% 1.82% 3.08% 2.47% 0.97% 0 .971 2.57% 2.59%
1.83% 1.82% 1.82% 3.202 2.52% 0.92% 0.92% 2.73%
2.06% 3.31% 2.57% 0.97% 2.80%
2.02% 1.W% 2.78%
1.88% 1.89% 3.12% 0.97% 0.9696 2.63%
1.924; 2.66%
1.84% 1.79% 1.84% 0.96% 0.97% 2.60%
1.87% 1.87% 3.12% 2.4791 0.Y78 0.97% 2.624; 2.62%
1.98% 3.23% 2.74%
56,593.599.685 6,617.631 1.106.195 5,301.792
1.432.271.952 1.31 1.176
5,064.370.307
5g0.144.129 507.561
$73.285
226.556.543 100.450 119
163.054.862 500 000
99.700.000 9Y.700.ooO
500 000
99,784.943
7.368.235.333 831.731.436
2,793.578 joO.000
825,053.060
2.068.409.688 500.000
3 14,440.646
2.812.531.3 12 2.655.443
71,085.133 21 1.183.W
204.583 1.138.447.5O9
2.290.1 54.794 161.685.734
2.724,a36.197 157.774.110 479.2 17.545
2.513.854.281
539.667.419 ~64.684
976.978.290 600,214 501
296.357 975 1.651.164.050
187,506.866 60,716 718
1,240.656
179.987.7~
604.273.917 93,181.094
1$3,370.067
6.24 4.72 4.72
5.71 10.71 14.53 11.01 13.s9 10.29
3.18
10.50 10.50 5.36
10.48 10.49 10.51 10.51 10.49
8.75 8.05
11.07 11 .92 8.26
9.10 16.49 8-68
19.77 26.10 27.20 21.69
19.72 28.63
10.86 10.37
12.10 17.41 11.74 12.20 12.18 12.01
12.40 12.24 12.17 12.22 12.52 12.27 12.30 12.20
18.95 17.76 18.14
6.01 5.13
3.24 5.53 4.79
13.93 11.79
13.14 11.31
7.81 7.23
10.58 7.39
7.77 14.00 7.44
17.14
23.00 18.72
17.16
9.30 8.91
10.28
10.3 1 10.32
10.23
10.38 10.35 10.30 10.34 10.43 10.37 10.34 10.33
17.52 16.52 16.83
7.55 7.08
10.12 7.20
6.62 11.81 6.39
12.05
15.49 13.12
12.15
7-94 7.66
13.% 12.85 13.03
18
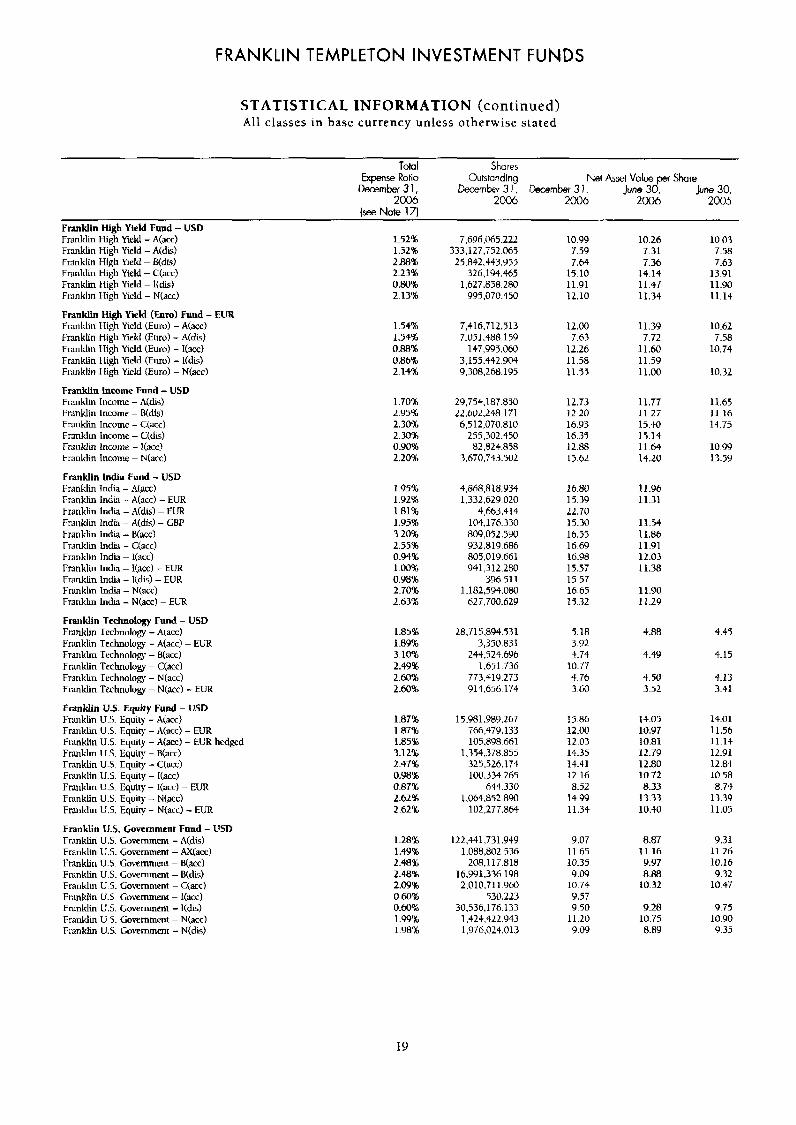
FRANKLIN TEMPLETON INVESTMENT FUNDS
STAT IS TICAL INFORMATION (continued) All classes in base currency unless otherwise stated
Total Shares Expense Ratio Outstanding Net Asset Volue per Share
Deaember31, December 3 I , December 3 1, June 30, June 30, 2006 2006 2006 2006 2005
[see Note 171 Franklin High Yield Fund - USD Franklin High Yield - A(acc) Franklin High Yield - A(dis) Frmklin High Yield - B(dis) Franklin High Yield - C(acc) Franklin High Yield - l(dis) Franklin High Yield - N(acc)
Franklin High Yield (Euro) Fund - EUR Franklin High Yield (Euro) - A(acc) Franklin High Yield (Euro) - A(dis) Franklin High Yield (Euro) - Nacc) Franklin 1 Iigh Meld (Euro) - I(dis) Franklin High Yield (Euro) - N(acc)
Franklin lncome Fund - USD Franklin lnciime - Ndis ) Franklin Income - B(dis) Franklin Inc-umc - Ctacc) Franklin Income - C(di) Franklin Income - I(Kc? Franklin Income - N(acc)
Franklin lndm Fund - USD Franklin India - .4(acc) Franklin India - A(acc) - EUR Franklin India - A(dis) - EUR Franklin India - A(db) - GBP Franklin India - NJCC) Franklin lndi - C(acc1 Franklin lndh - I(ac-c) Frmklin India - I(;lcc) - EUR Franklin India - Itdis) - EUK Franklin India - N(acc) Franklin l n d i - N(acc1 - EUR
Franklin Technology Fund - USD Franklin Technology - Alacc) Franklin Technology - A(acc! - EUR Franklin 'Technology - B(du.) Franklin Technulog - C(acc) Franklin Tcchnolog - N(acc) Franklin Technology - N(acc) - EUR
Franklin US. Equity Fund - USD Franklin U.S. Equity - Atacc) Frmklin U S . Equity - A(tlcc) - EUR Franklin U.S. Equity - Ma=) - EUR hedged Franklin U.S. Equity - B(3m) Franklin U.S. Equity - C(acc) Franklin U.S. Equity - Kacc) Franklin U.S. Equity - I(acc) - EUR Franklin U.S. Equity - N(acc) Franklin U.S. Equity - N ( a d - EUR
Franklin US. Government Fund - USD Franklin US. Government - A(dis) Franklin U.S. Government - .Ur(acc) Franklin U.S. Gowmmenr - B(acc) Franklin U.S. Government - B(&) Franklin U.S. Government - C(acc) Franklin U.S. Gowmnmt - Kacc) Franklin U.S. Go\.emment - lidis) Franklin U.S. Gowmment - Ntacc)
1.52% 1.52% 2.88% 2.23% 0.80% 2.13%
1.54% 1.54% 0.86% 0.86% 2.1491
1.708 2.95% 2.30% 2.30% 0.90% 2.20%
I.Y5% 1.92% 1.81% 1.95% 3.20% 2.55% 0.94% 1.00% 0.98% 2.70% 2.63%
1.85% I .89 t 3.10% 2.49% 2.60% 2.60s
1.87% 1.87% 1.85% 3.1236 2.47% 0.982 0.87% 2.62% 2.62%
1.28% 1.49% 2.48% 2.46% 2.09% 0.60% 0.602 1.99%
7.696.065.222 333,127.752.065 23,842,443,955
326.194.465 1,627.858.280
995.070.450
7,316.712.713 7.051.+88.159
147,995.060 3,155.442.904 9.308.2W. 195
29,754.187.850 22,602,248.171 6,512,070.810
255.302.450
3.670.743.502 82,824,858
4.868.818.934 1,332.629.020
4,663.414 1 L14.176.330 809,052.590 932.819.686 80?,019.661 941,312.280
396.511 1,182,594.080
627.7W.bZY
28,715.094.531 3,350.831
244.524.696 1.651.736
113.419.273 914.656.174
15.981.989.267 766.479.133 105.898.661
1,354,378.855 325.526.174 100.334.265
644.330 1,064.852.890
102.277.864
122.441.731.949 1,088,802.536
208.117.818 16,991.336.198 2,010,711.960
530.223 30,536,176.133
1,424.422.943 Franklin U.S. Government - N(dis) l.Y8% 1 ,(376,024.013
10.99 7.59 7.64
14.10 11.91 12.10
12.00 7.63
12.26 11.58 11.55
12.73 12.20 16.93 16.37 12.88 15.62
16-80 15.39 22.70 15.30 16.55 16.69 16.98 13.57 15.57 16.65 15.32
5.18 3.92 4.74
10.77 4.76 3.60
15.86 12.00 12.03 14.35 14.41 12.16 8.52
14.99 11.34
9.07 11 -65 10.35 9.09
10.74 9.57 9.50
11.20 9.09
10.26 10.03 7.31 7.58 7.36 7.63
14.14 13.91 11.47 11.00 11.34 11.14
11.39 10.62 7.72 7.58
11.60 10.74 11.59 11.00 10.32
11.77 11.65 11.27 11.16 15.W 14.75 15.14 11.64 10.99 14.20 13.59
11 -96 11.31
11.54 11.86 11.91 12.03 11.38
11.90 11.29
4.88
4.49
4.50 3.52
14.05 10.97 10.81 12.79 12.80 10.72 8.33
13.33 10.30
8.87 11.16 9.97 8.88
10.32
9.28 10.75 8.89
4.45
4.15
4.13 3.41
14.01 11.56 11-14 12.91 12.84 10.58
13.39 11.05
8.74
9.31 11 -26 10.16 9.32
10.47
9.75 10.90 9.35
19
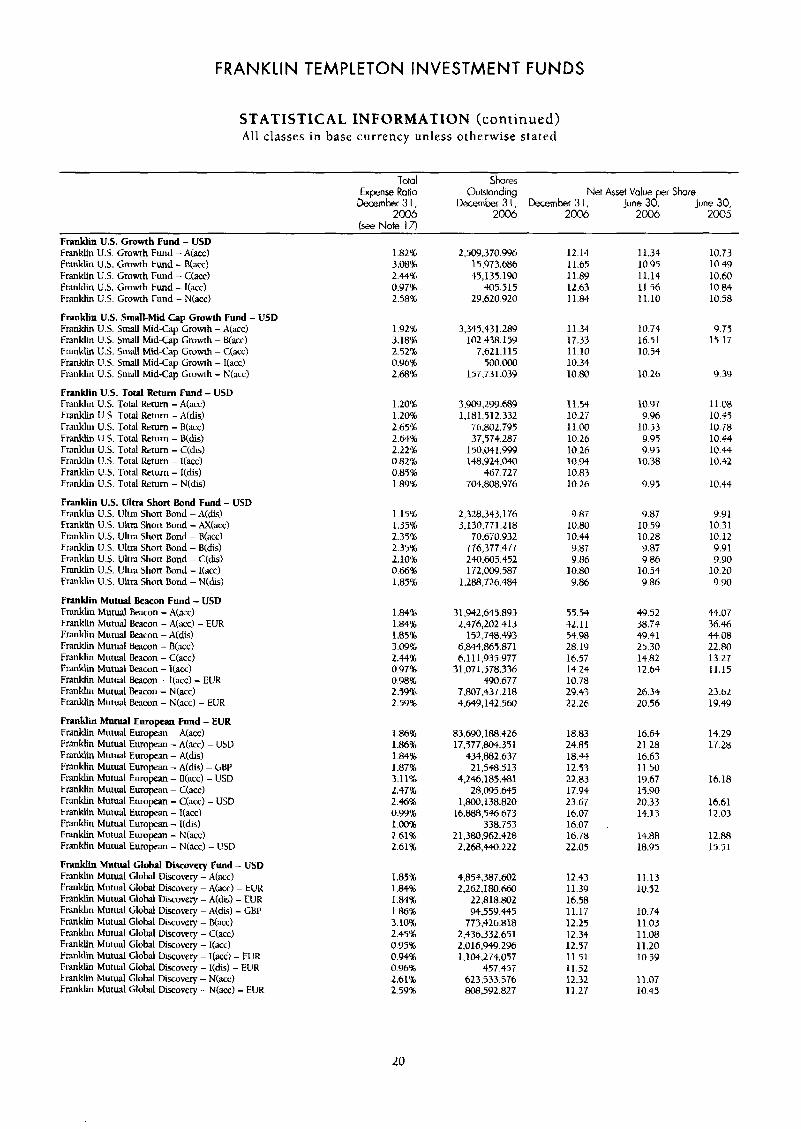
FRANKLIN TEMPLETON INVESTMENT FUNDS
STATISTICAL INFORMATION (continued) All classes in base currency unless otherwise stated
Total Shores Expense Ratio Outstanding Net Asset Value per Share
Oecember 3 1, December 3 1 December 3 1 , June 30, June 30, 2006 2ood 2004 2004 2005
[see Note 17) Franklin U.S. Growh Fund - USD Franklin US. Cmwth Fund - A(acc) Franklin U S . Growth Fund - Kacc) Franklin US. Growth Fund - C(acc) Franklin US. Growth Fund - I(acc) Franklin US. Growth Fund - N(acc)
Franklin U.S. Small-Mid Cap Growth Fund - US Franklin U.S. Small Mid-Cap Growth - A(acc) Franklin U.S. Small MidCap Growth - B(acc) Franklin US. Small Mid-Cap Growth - 43cc) Franklin U.S. Smll Mid-Cap Growth - l(acc) Franklin U.S. Stnall Mid-Cap Growth - Ntacc)
Franklin U.S. Total Return Fund - USD Franklin U.S. Total Return - A(acc) Franklin U.S. Total Return - A(dis) Franklin U.S. Total Return - B(acc) Franklin U.S. Tow1 Return - B(&) Franklin U.S. Total Return - C(dis) Franklin US. Total Return - I(acc) Franklin U.S. Total Return - I(dis) Franklin U.S. Total Return - N(dis)
Franklin U.S. Ultra Short Band Fund - USD Franklin U.S. Ultra Short Bond - A(dis) Franklin U S . Ultn Short Bond - rv((acc) Franklin U.S. Ultra Short Bond - B(acc) Franklin U.S. Ultm Short Bond - B(dis) Franklin U.S. Ultra Shon Bund - C(dis) Franklin US. Ultn Short Ehnd - I(acc) Franklin US . Uhra Shon Bond - N(&) Franklin Mutual Beacon Fund - USD Franklin Mutual Beacon - A(acc) Franklin Mutual Bracon - A&) - EUR Franklin Mutual b c o n - A(dis) Franklin Mutual Beacon - B(acc) Franklin Mutual Beacon - C(acc) Franklin Mutual Beacon - I(acc) Franklin Mutual Beacon - l(acc) - EUR Franklin Mutual Beacon - N(acc) Franklin Mutual k c o n - N(acc) - EUR
Franklin Mutual European Fund - EUR Franklin Mutual European - A(acc) Franklin Mutual European - A(acc) - USD Franklin Mutual European - h(dis) Franklin Mutual European - A(dis) - GBP Franklin hlutual European - B(acc) - USD Franklin Mutual European - C(acc) Franklin Mutual European - C(acc) - USD Franklin Mum1 European - I(acc) Franklin Mutual European - I(dis) Franklin Mutual Eumlxan - N(acc) Franklin Mutual European - N(acc) - USD
Franklin Mutual Global Discovery Fund - USD Franklin Mutual Global D i s c o ~ r y - A(acc) Fnnklin Mutual GIobal D~scotrry - A(dCC) - EIJR Frmklin Mutual Global Discovery - A(dis) - EUR Franklin Mutual Global Discovety - A(dis) - GBF Frankh Mutual Global Discovery - B(3cc) Franklin Mutual Global Discovery - C(acc) Franklin Mutual Globs1 Discoiwy - I(acc) Fmklin Mutual Global Discovery - I(acc) - EUR Franklin Mutual Global Di ro~ery - I(dis) - EUR fnnklin Mutual Global Discovery - N(acc) Frankh Mutual Clohl Dixovev - N(acc) - EUR
1.82% 3.08% 2.44% 0.979: 2.58%
1.92% 3.18% 2.52% 0.96% 2.68%
1.20% 1.20% 2.65%> 2.64% 2.22% 0.82% 0.85% 1.89%
1.15% 1.35% 2.35% 2.35% 2.10'3; 0.66% 1.85%
1.848 1.84% 1.85% 3.09% 2.44% 0.9746 0.98% 2.59% 2.59%
1.86% 1.86% 1.84% 1.8776 3.115; 2.47% 2.46% 0.99% 1.00% 2.61% 2.61%
1.85% 1.84% 1.84% 1.86% 3.10% 2.45% 0.95% 0.94% 0.96% 2.612 2.59%
2.509.370.996 15,973.686 $5,135.190
405.515 29.620.920
3,345,431.289 102.438.159
7,621.1 15 500.000
157.7'31.039
[email protected] 1,181.512.332
76,802.795 37,574.287
150.041.999 148,924.040
467.727 704.808.976
2,328,343.176 3,130.771.218
70.670.932 776,377.477 240.605.452 172.009.587
1.288.726.484
31.942.645.893 2.476,202.413
152,748.493 6,8et,M5.871 6.1 11,935977
31,071 S78.336 490.677
7.807.437.218 4,649,142.560
83.690.1RF1.426
433.882.637 21,548.513
4,246.185.481 28.095.1W5
1,800.138.820 16.888.5%.673
21.380.962.428 2.268,440.222
17,577,804.351
338.753
4.854.387.602 2,262.180.660
94,559.445
2.436.332.65 1 2.016.949.296 1.104.274.057
457.457 623.533.576 8oR,592.827
~ 2 . 8 1 a . l ~ ) ~
7 7 3 , 4 2 6 . ~ ~
12-14 11.65 11.89 12.63 11.84
11.34 17.33 11.10 10.34 10.80
11.54 10.27 11.00 10.26 10.26 10.94 10.83 10.26
9.87 10.80 10.34 9.87 9.86
10.80 9.86
55.54 42.11 54.98 28-19 16.57 14.24 10.78 29.43 22.26
18.83 24.83 18.44 12.53 22.83 17.94 23.67 16.07 16.07 16.78 22.05
12.43 11.39 16.38 11.17 12.25 12.34 12.57 11.51 11.52 12.32 11.27
11.34 10.94 11.14 11.56 11.10
10.74 16.51 10.54
10.26
10.Y7 9.96
10.53 9.95 9.95
10.38
9.95
9.87 10.59 10.28 9.87 9.86
10.54 9.86
49.52 38.74 49.41 25.30 14.82 12.64
26.34 20.56
16.64 2 1.28 16.63 11.50 19.67 15.90 20.33 14.13
14.88 18.94
11.13 10.52
10.74 11.03 11.08 11.20 10.59
11.07 10.45
10.73 10.49 10.60 10.84 10.58
9.75 15-17
9.39
11.08 10.45 10.78 10.44 10.44 10.42
10.44
9.91 10.31 10.12 9.91 9.90
10.20 9.90
44.07 36.46 44.08 22.80 13.27 11.15
23-62 19.49
14.29 17.28
16.18
16.61 12.03
12.88 15.51
20
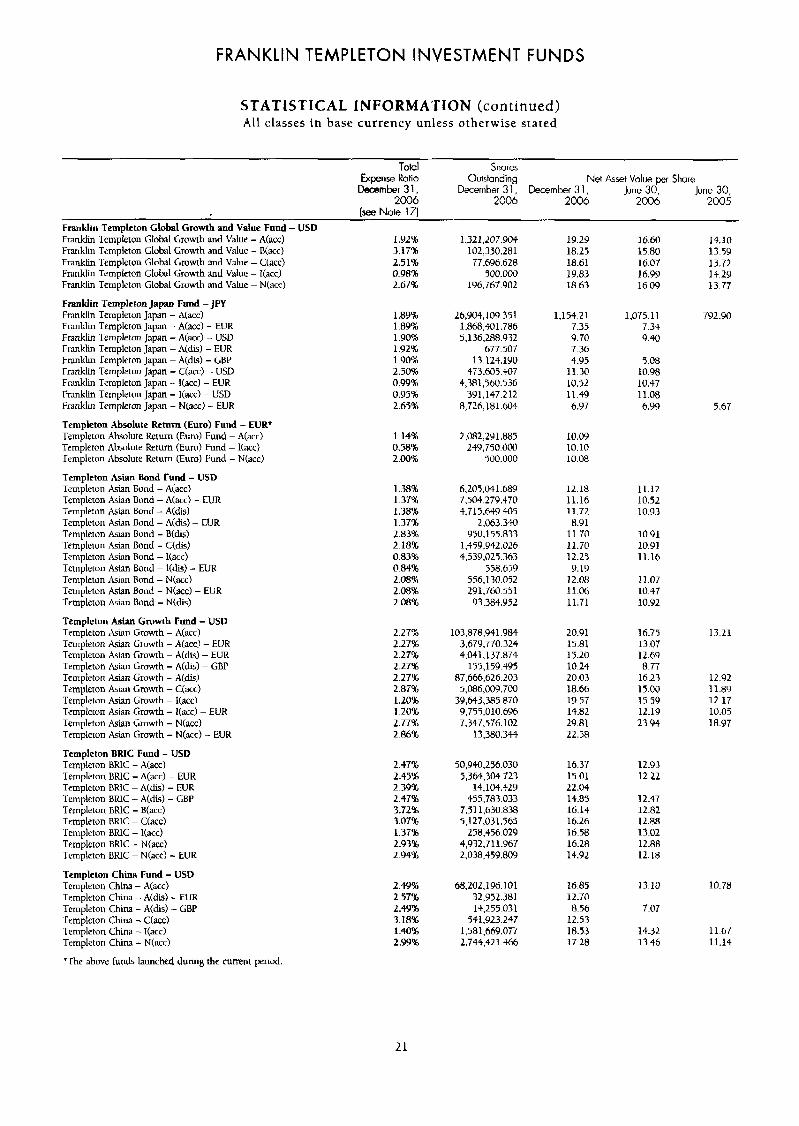
FRANKLIN TEMPLETON INVESTMENT FUNDS
STATISTICAL INFORMATION (continued) A l l classes in base currency unless otherwise stated
Total Shores Expense Ratio Outstanding
December 3 1, December 3 1 , December 3 1 ,
(see Note 171
Net Asset Value per Shore June 30, June 30,
2006 2006 2006 2006 2005
Franklin Templeton Global Growth and Value Fund - Franklin Tetnpleton Global Growh and t'alue - A(acc) Franklin Templeton Global Growth and Value - B(acc) Franklin Templeton Global Growth and Value - Ctacc) Franklin Templeton Global Growth and Value - I(acc) Franklin Templeton Global Gruwth and Value - N(acc)
Franklin Templeton Japan Fund - JPY Franklin Templetun Japan - A(acc) Franklin Templeton Japan - A(acc1 - EUR Franklin Ternpkton Japan - A[acc) - USD Franklin Templeton Japan - A(&&) - EUR Franklin .Templeton Japan - A(dis) - GBP Franklin Templeton Japan - C[acc) - USD Franklin Templeton Japan - I(acc) - EUR Franklin Templeton Japan - I(acc) - USD Franklin Templeton Japan - N(acc) - EUR
Templeton Absolute Return (Euro) Fund - EUR* Templeton Absolute Return (Euro) Fund - A(acc) Templeton Absolute Return (Euro) Fund - Itace) .Templeton Absolute Return (Euro) Fund - N(acc)
Templeton Asian Bond Fund - USD Tcmpieton Asian Bond - Aiacc) Templeton Asian Bond - A(acc) - EUR Templeton Asian Bond - A(dis) Templeton Asian Bond - A(dis) - EUR Templeton Asian Bond - B(dis) Templeton Asian Bond - C(dis) Templeton Asin Bond - l(acc) Templeton Asian Bond - I(&) - EUR Templetun Asian Bond - N(acc) Templeton Asian Bond - N(acc) - EUR Templeton Asian Bond - Ntdis)
Templeton Asian Growth Fund - USD Templetun Asian Grmvth - ACacc) Templeton Asian Gruwth - A(acc? - EUR Templeton him Growth - A(dis) - ELTR Templeton Asian Growth - A(dis) - GBP Templeton Asian Growth - A(dis) Templeton Asian Growth - C(acc) Templeton Asian Growth - I(acc) Templeton Asian Growth - I k c ) - EUR Templetun Asian Growth - N(acc) Templeton Asian Growth - N(acc) - EUR
Templeton BRlC Fund - USD Templeron BRlC - A(acc) Templeron BRlC - A(acc) - EUR Templetun BRlC - A(&) - n l R 'Templeton BRIC - A(dis) - GBP Templeton UKlC - B(acc) Templeton BRlC - C(acc) .Templeton BRIC - l(acc) Tetnpletim BRlC - N(acc) Templetun BRlC - N(acc) - EUR
Templeton China Fund - USD Templeton China - A(acc) Templeton Chim - A(&) - EUR Templeton China - A(dis) - GBP Ternpieton China - C(acc) Templetun China - I(acc1 Templeton China - N(acc)
*The above funds launched during the current period.
USD 1.92% 3.17% 2.51% 0.98% 2.6751
1.32 1.207.YO9 102,350.281 77.696.628
500.000 196.767.902
1.8996 1.89% 1.90% 1.92% 1.90% 2.50% 0.99% 0.95% 2.65%
1.14% 0.58% 2.00%
I ,388 1.3751 1.38% 1.37% 2.83% 2.1851 0.83% 0.84% 2.08% 2.08% 2.08%
2.27% 2.27% 2.27% 2.2791 2.2791 2.87% 1.20% 1.20% 2.779: 2.M%
2.+7% 2.45% 2.39% 2.47% 3.72% 3.0716 1.37% 2.93% 2.9491
2.49% 2.57% 2.4976 3.18% 1.40% 2.99%
26,904,109.35 1 1,868.30 1.786 5,136.288.932
677.507 13.124.190
473,605,407 4,381,960.536
391,147.212 8,726,181.604
2,082,291,885 249,750.000
$00.000
6.205.041.689 7,504.279.470 4,715.649.405
2.063.340 950.155.833
1,459.942.026 4,539,029.363
558.699 556,130.052 291.760.551 93.384.952
103,878.941.984 3,679,770.324 4.041.1 37.874
155,159.495 87,666,626.203
5,086,009.700 39,643,385.870 9,755,010.696 7,347.576.102
13,380.344
50,940,256.030 5,364.304.723
14.1O4.329 455,783.033
7.51 1,630.838 5,127,031,565
258,456.029 4,932.71 1.967 2,038,$5Y.809
68.2@2,196.101 32,952.381 1.1.255.031
541.923.247 1,581,669.077 2.744.421.466
19.29 18.25 18.61 19.83 18.63
,154.21 7.35 9.70 7.36 4.95
11.30 10.s2 11.49 6.97
10.09 10.10 10.08
12.18 11.16 11.72 8-91
11.70 11.70 12.25 9.19
12.08 11-06 11.71
20.91 15.81 17.20 10.24 20.03 18-66 19.57 14.82 29.81 22.58
16.37 15.01 22.04 14.84 16-14 16.26 16.58 16.28 14.92
16.85 12.70 8.56
12.53 18.53 17.28
16.60 14.10 15.80 13.59 16.07 13.72 16.99 14.29 16.09 13.77
,075.11 792.90 7.34 9.40
5-08 10.98 10.$7 11.08 6.99
11.12 10.52 10.93
10.91 10.91 11.16
11.07 10.47 10.92
16.75 13.07 12.69 8.77
16.23 15.00 15.59 12.19 23.94
12.93 12.22
12.47 12.82 12.88 13.02 12.88 12.18
13.10
7.07
14.32 13.46
5.67
13.21
12.92 11.89 12.17 10.05 18.97
10.78
11.67 11.14
21
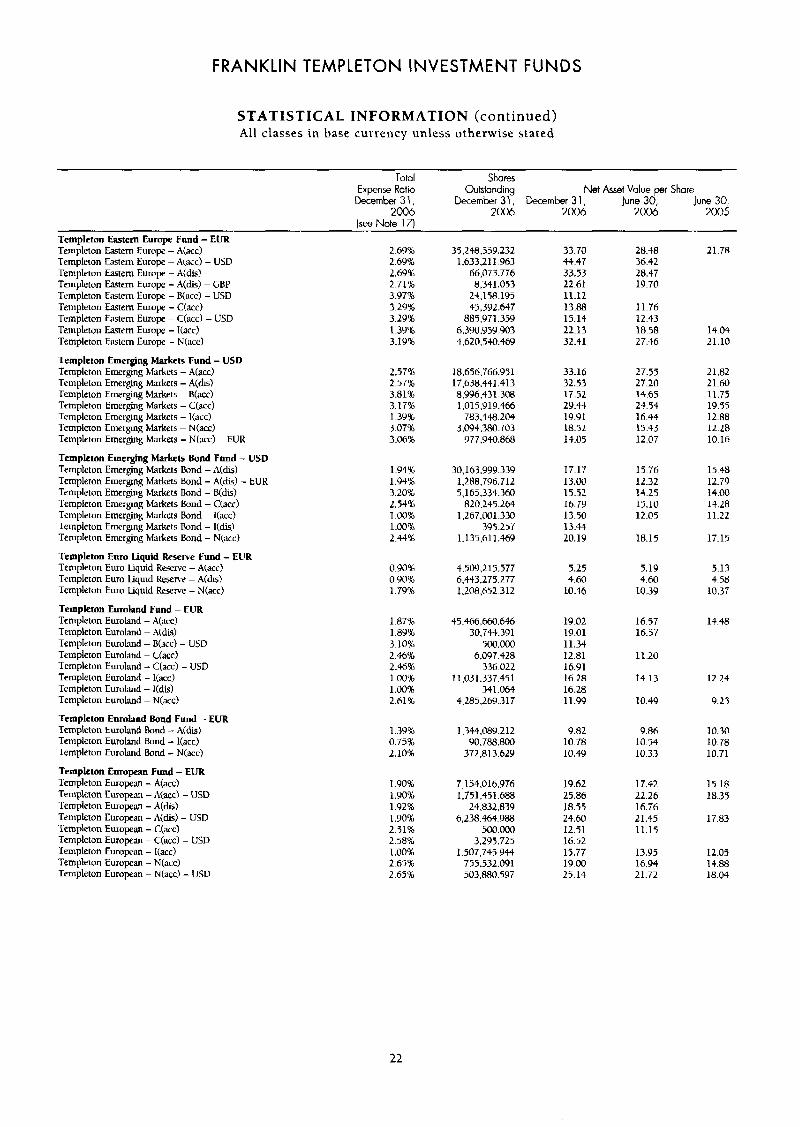
FRANKLIN TEMPLETON INVESTMENT FUNDS
STATISTICAL INFORMATION (continued) All classes in base currency unless otherwise stated
Total Shores Expense Ratio Gutstonding Net &set Value per Shore
December 3 1, December 3 1, December 3 1 , June 30, June 30, 2006 2006 2006 2006 2005
(see Note 17) Templeton Eastern Europe Fund - EUR Templeton Eastern Euro@ - Nacc) Templeton Eastern Europe - A(acc) - USD Templeton Eawm Europe - A(dis) Templeton Eastern Europe - A(dis) - GBP Templeton Estem Europe - B(acc) - U5D Templeton Eastern Eurqx - C(acc) Templeton Eastern Europe - C(acc) - USD Templeton Eastern Eumpe - l(acc) Templeton Eastern Europe - N(acc)
Templeton Emerging Markets Fund - USD Templeton Emerging Markets - A(acc) Templeton Emerging Markets - A(dis) Templeton Emerging Markets - B(acc) Templeton Emerging Markets - C(acc) Templeton Emerging Markets - I(acc) Templeton Emerging hbrkets - N(acc) Templeton Emergmg h r k e t s - N(acc) - EUR
Templeton Emerging Markets Bond Fund - USD Templeton Emerging Markets Bond - A(dis) Templeton Emerging Mtlrkets Bond - A(di5) - EUR Templeton Emerging Markets Bond - Btdis) Templeton Emerging Markets Bond - C(acc) Templeton Emerging Markets Dond - I(acc) Templetun Emerging Markets Bond - I(dis! Templeton Emerging Markets Bond - N(acc)
Templeton Euro Liquid Reserve Fund - EUR Templeton Euro Liquid Resrrve - ALacc) Templeton Euro Liquid Rrscn-e - A(dis) Templeton Euro liquid Rexwe - N(acc)
Templeton Eumland Fund - EUR Templeton Euroland - A(acc) Templeton Eurohnd - A(dis) Templeton Eurohd - B(acc) - USD Templeton Euroland - C(acc) Templeton Euroland - C(acc1 - USD Templeton Euroland - I(acc) Templeton Euroland - I(dis) Templeton Euroland - N(acc)
Templeton Euroland Bond Fund - EUR Templcton Euroland Bond - A(dis) Templeton Euroland Bond - l(acc) Templetun Euroland Bond - N(acc)
Templeton European Fund - EUR Templeton European - A(acc) Templeton European - A(acc) - USD Templeton European - A(dis) Templeton European - A(dis) - USD Templeton Europcan - C(acc) Templeton European - C(acc) - USD Templeton European - I(acc) Templeton European - N(acc) Templeton European - N(acc) - USD
2.69% 2.69% 2.69% 2.7176 3.97% 3.29% 3.29% 1.39% 3.19%
2.57% 2.57% 3.81% 3.17% 1.39% 3.07% 3.06%
1.94% 1.94% 3.20% 2.54% 1 . O O l 1.00% 2.44%
0.90% 0.90% 1.7976
1.87% 1.89% 3.101 2.46% 2.46% 1.00% 1.009 2.61%
1.39% 0.75%> 2.10%
1.90% 1.901 1.92% 1.90% 2.51% 2.58% 1 .OO% 2.65% 2.65%
35.238.359.232 1.633.211.963
66,073.776 8,341.053
24.158.195 45,392.6$7
885 9 7 1.359 6.390.959.903 4.620.5W.469
18.656.766.951 17,638.441.313 8,996.43 1 308 1.015.919.466
783.448.204 3,094.380.703
977.940.m
30,163.999.339 1.288.796.712 5,165.334.360
820.245.264 1.267,D01.3M
395.257 1.135.61 1.369
4,5W,215.577 f1.443~275.277 1,208,652.312
45.466.660.646 30,744.391
$00.000 6.097.428
336.022 11.031.337.451
341.064 4.285.269.31 7
1.344.089.212 90.788.800
372.813.629
7,154,016.976 1,751,451.688
6,238.464.988 500.000
3.293.725 1,507.745.944
755.532.091 503.R80.597
z+.832.839
33.70 44.47 33.53 22.61 11.12 13.88 15.14 22-13 32.41
33.16 32.53 17.52 29.44 19.91 18.52 14.05
17.17 13.00 15.52 16.79 13.50 13.44 20.19
5.25 4.60
10.46
19.02 19.01 11.34 12.81 16.91 16.28 16.28 11.99
9.82 10.78 10.49
19.62 25.86 18.55 24.60 12.51 16.52 15.77 19.00 25.14
28.48 21.78 36.42 28.37 19.70
11.76 12.43 10.58 27.46
27.55 27.20 14.65 24.54 16.44 15.43 12.07
15.76 12.32 14.25 15.10 12.05
18.15
5.19 4.60
10.39
16.57 16.57
11.20
14.13
10.49
9.86 10.54 10.33
17.42 22.26 16.76 21.45 11.15
13.94 16.94 21.72
14-04 21.10
2 1.82 21.60 11.73 19.55 12.88 12.28 10.16
15.48 12.79 14.00 14.28 11.22
17.15
5.13 4.58
10.37
14.48
12.21
9.23
10.30 10.78 10.71
15.18 18.35
17.83
12.05 14.88 18.04
22
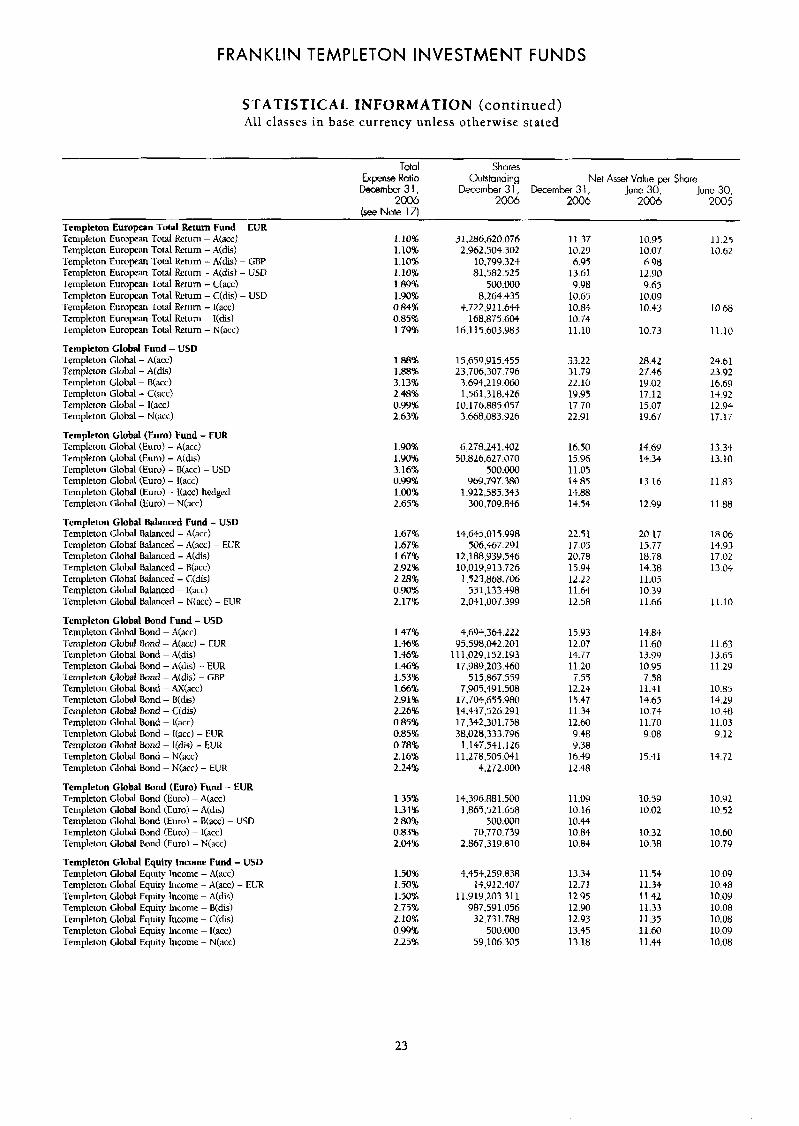
FRANKLIN TEMPLETON INVESTMENT FUNDS
STATISTICAL INFORMATION (continued) All classes in base currency unless otherwise stated
~ ~- Total Shares
Expense Ratio Outstanding Net Asset Value per Share December31, December 3 1, December 3 1 , June 30, June 30,
2006 2006 2006 2006 2005 lsee Note 171
Templeton European Total Return Fund - EUR Templcton European Total Retuni - A(& Templeton European Total Return - A(dis) Templeton European Tot31 %turn - A(dis) - GBP Templeton European Total Return - A(dis) - USD Templeton European Total Return - C(acc) Templeton E u r o p n Total Return - C(dis) - USD Templeton European Total Return - I(acc) Templeton European Total Return - I(dis) Templeton European Total Return - N(acc)
Templeton Global Fund - USD Templeton Global - A(acc) Templeton Glubal - A(dis) Templeton Global - B(acc) Templeton Global - C(acc) Templeton Global - Uacc) Templeton Glohal - N(acc)
Templeton Global (Euro) Fund - EUR Tcmpleton Glohal (Euro) - A(acc) Templeton Global (Euro) - A(dis) Templeton Global (Euro) - B(acc) - ESD Templeton Global Euro) - l(acc) Templeton Global (Euro) - I(acc) hedged Templeton Global (Euro) - N(acc)
Templeton Global Balanced Fund - USD Templeton Global Balanced - A(BCC) Templeton Global Balanced - A(acd - EUR Templeton Globdl Balanced - A(dis) Templeton Clohal Balanced - Rtacc) Templeton Global Balanced - C(dis) Templeton Global Balanced - I(acc) Templeton Global Balanced - N(acc) - EUR
Templeton Global Bond Fund - USD Templeton Global Bond - A(acc) Templetun Global Bond - A(acc) - EUR Templeton Global Bond - A(dis) Templeton Global Bond - A ( d d - EUR Templetun Global Bond - A(dis) - GBP Templeton Global Bond - AX(acc) Templeton Global Bond - B(dii) Templeton Global Dond - C(dis) Templeton Global Bond - I(acc) Templeton Global Bond - I(acc) - EUR Templeton Global Bond - l(dis) - EUR Templeton Global Bond - N(acc) Templetun Global Bond - N(acc) - EUR
Templeton Global Bond (Euro) Fund - EUR Templeton Global Bond (Euro) - A(acc) Templeton Global Bond (Euro) - A(dis) Templeton Global Bond (Euro) - B(acc) - USD Templeton Global Bond (Eum) - l(acc) Templeton Global Bond (Euro) - E;(acc)
Templeton Global Equity Income Fund - USD Templeton Global Equity Income - A((acc) Templeton Global Equity Income - A(acc) - EUR Templeton Global Equity lncome - A(dij) Templeton Global Equity Income - B(dis) Templeton Global Equity Income - Cidis) Templeton Global Equity Income - I(acc) Templcton Global Equity lncome - N(acc)
1.10% 1.10% 1.10% 1.10%
1.90% 0.84% 0.85% 1.79%
1.89%
1.88% 1.88% 3.13% 2.48% 0.99% 2.63%
1 .go% 1.90% 3.16% 0.99% 1.00% 2.6516
1.67% 1.67% 1.67% 2.92% 2.28% 0.90% 2.17%
1.47% 1.46% 1.46% 1.468 1.53% 1.66% 2.91% 2.26% 0.85% 0.85% 0.78% 2.16% 2.24%
1.35% 1 ..H% 2.80% 0.836% 2.04%
1.50% 1.70% 1.50% 2.75% 2.10% 0.99% 2.25%
31.2R6.620.076 2,962.504.302
10.799.324 81,582.525
500.000
$,722.911.644 168,875.604
16.115.603.983
~264 .435
15.659.9 15.455 23.706.307.796
3.694.219.060 1,561,318.426
10,176.885.051 3,668,083.926
6,278,241 ,402 50.826,627.070
50O.ooO 969.797.300
1,922,585.343 300.709.844
14,645,015,998 506.467.291
12,188,939.546 10.019,913.T26 1,523,868.706
531 ~ 133.498 2,041.007.399
4.693.364.222 95,598,042.201
11 1.029.152.193 17,989,203.460
5 15,867.559 7,905,491.508
17,704,653.980 14,447,526.291 17,342,301.758 38,028,333.796
1,147,541.126 11.278,TOS.Wl
4.272.000
14,396.881.500 1,865.521.658
500.000 70.770.739
2,867,319.810
4.454,m.a38 14.9 12.407
11,919,203.31 1 987.591.056
32.73 1.788 500.000
59.106.305
11.37 10.29 6.95
13.61 9 .w
10.65
10.74 11.10
10.84
33.22 31.79 22.10 19.95 17.70 22.91
16.50 15.96 11.05 14.85 14.88 14.54
22.51 17.05 20.78 15.93 12.22 11.64 12.58
15.93 12.07 14.77 11.20 T.57
12.24 15.47 11.34 12.60 9.48 9.38
16.49 12.48
11.09 10.16 10.44 10.84 10.84
13.33 12.71 12.95 12.90 12.93 13.45 13.18
10.95 10.07 6.98
12.90 9.65
10.09 10.43
10.73
28.42 27.46 19.02 17.12 15.07 19.67
14.69 14.34
13-16
12.99
20.17 15.77 18.78 14.38 11.05 10.39 11.66
14.84 11.60 13-99 10.95 7.58
11.41 14.65 10.74 11.70 9.08
15.41
10.59 10.02
10.32 10.38
11.54 11.34 11.42 11.33 11.35 11.60 11.44
11.25 10.62
10.68
11.10
24.61 23.92 16.69 14.92 12.94 17.17
13.34 13.10
11.83
11.88
18.06 14.93 17.02 13.04
11.10
11.63 13.65 11.29
10.85 14.29 10.48 11.03 9.12
14.72
10.Y2 10.52
10.60 10.79
10.09 10.48 10.09 10.08 10.08 10.09 10.08
23
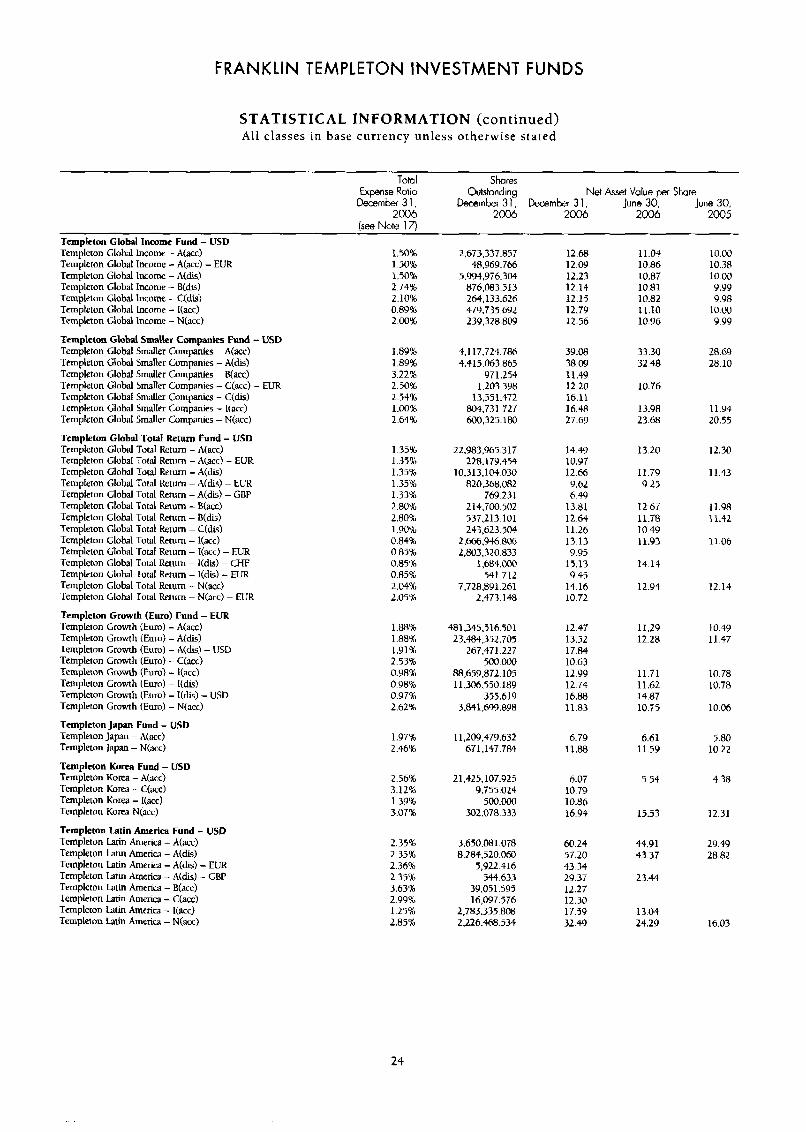
FRANKLIN TEMPLETON INVESTMENT FUNDS
STAT IS TIC A L IN F 0 RM AT1 ON (continued) All classes in base currency unless otherwise stated
Total Shares Expense Rotio Outstanding Net Asset Value per Share
kernbe, 3 1 , Oecember31 Decernlxr31, June 30, June 30, 2006 2ood 2Q36 2006 2005
[ s e e Note 17) Templeton Global Income Fund - USD Templeton Global Income - A(acc) 1.50% Templeton Global Income - A(acc) - EUR Templeton Global Income - A(&) Templeton Global Income - B(dis) Templeton Global Income - C(dis) Templeton Global Income - I(acc) Templeton Global lncome - NCacc)
Templeton Global Smaller Companies Fund - Templeton Global Smaller Companies - A(acc) Templeton Global Smaller Companies - A(dis) Templeton Global Smaller Companies - Haec) Templcton Global Smaller Companies - C(acc) - Templeton Global Smller Companies - C(dis) Templeton Global Smaller Comphes - Narc) Templeton Global Smaller Companies - N(acc)
Templeton Global Total Return Fund - US0 Templeton Global Total Return - A(acc) Tcmpleton Global Total Return - A(3cc) - EUR Templeton Global Total Return - A(&.) Templeton Global Total Return - A(dis) - EUR Templeton Global Total Return - A(dis) - GBP Templeton Global Total Return - B(& Templeton Global Total Return - B(dis) Templeton Global Total Rerum - C(dis) Templeton Global Total Rerum - l(acc) Templeton Global Total Return - I(acc) - EUR Templeton Global Total Retum - I(dis) - CHF Templeton Global Total Return - I(dis) - EUR Templeton Global Total Return - N(acc) Templeton Globdl Total &turn - N(acc) - EUK
Templeton Growth (Euro) Fund - EUR Templeton Growth (Euro) - A(acc) Templeton Growth (Euro) - A(dis) Templeton Growth (Eum) - A(&) - USD Templeton Growth (Euro) - C ( a d Templeton Growth (Euro) - l(acc) Templeton Growth (Eunl) - I(dis) Templeton Growth (Euro) - I(&) - USD Templeton Growth (Euro) - N ( x c )
Templeton Japan Fund - USD Templeton Japan - A(acc) Templeton Japan - N(acc)
Templcton Korca Fund - USD Templeton Korea - A(acc) Templeton Korea - C(acc) Templetan Korea - I(acc) Templeton Korea N(acc)
Templetan Latin America Fund - USD Templeton Latin America - A(=) Templeton Latin Ameriw - A(dis) Templeton latin America - A(&) - EUR Templeton latin America - A(&) - GBP Templeton Latin America - B(acc) Templeron Latin America - C(acc) Templeton latin America - I(acc) Templeton Latin Amcrica - N(acc)
USD
EUR
1.50% 1.50% 2.74% 2.10% 0.89% 2.00%
1.898 1.89% 3.22% 2.50% 2.5146 1.0076 2.64%
1.35% 1.39% 1.344; 1.35% 1.33% 2.80% 2.80% 1.908 0.84% 0.854; 0.85% 0.85% 2.0491 2.05%
1.8896 1.88% 1.91% 2.53% O.Y8% O.Y8% 0.97% 2.62%
1.97% 2.46%
2.56% 3.125; 1.39% 3.07%
2.35% 2.352 2.36% 2.35% 3.63% 2.99% 1.2576 2.851
2,673,337.857 48.969.766
5,994,976.304 876,083313 264,133.626 479.735.692 239.328.809
4.117.724 7% 4.415.063.865
971.254 1.203.398
13,551.472 804.731.727 600,329.180
22,983,965 317 228.179.454
10.313.1W 030 820,368.082
769.231 214.700.502 537,213.101 243,623 504
2.666.916.806 2,803.320.833
541 712
2.473.148
i.6n4.000
7 . 7 2 8 . a ~ i . m
481.345.516.501 23,484,352.705
267.471.227 500.000
813,659,872.105 11.306.550.189
355.619 3.84 1,699.898
11,209,479.632 671.147.784
2 1.325.107.92j 9.755.024
500.ooo 302.078.333
3.650.081.078 8.284.520.060
5,922.416 544.633
39.051.595 16,097.576
2,783,335.808 2.226.468.534
12.68 12.09 12.23 12.14 12.15 12.79 12.56
39-08 38.09 11.49 12.20 16.11 16.48 27.69
14.49 10.97 12.66 9.62 6.49
12.64 11.26 13.13 9.95
15.13 9.45
14-16 10.72
i3.ai
12.47 13.52 17.84 10.63 12.99 12-74 16.813 11.83
6.79 11.88
6.07 10.79 10.86 16.94
60.24 57.20 43.34 29.37 12.27 12.30 17.59 32.49
11-04 10.00 10.86 10.38 10.87 10.00 mi 9.99 10.82 9.98 11.10 10.00 10.96 9.99
33.30 28.69 32.48 28-10
10.76
13.98 23.68
13.20
11.79 9.25
12.67 11 -78 10.49 11.93
14.13
12.94
11.29 12.28
11.71 11.62 14.87 10.75
6.61 11.59
5.54
15.53
44.91 43.37
23.44
13.04 24.29
ll.Y4 20.55
12.30
11.43
11.98 11.42
11.06
12.14
10.49 11.47
10.78 10.78
10.06
5.80 10.22
4.38
12.31
29.49 28.82
16.03
24
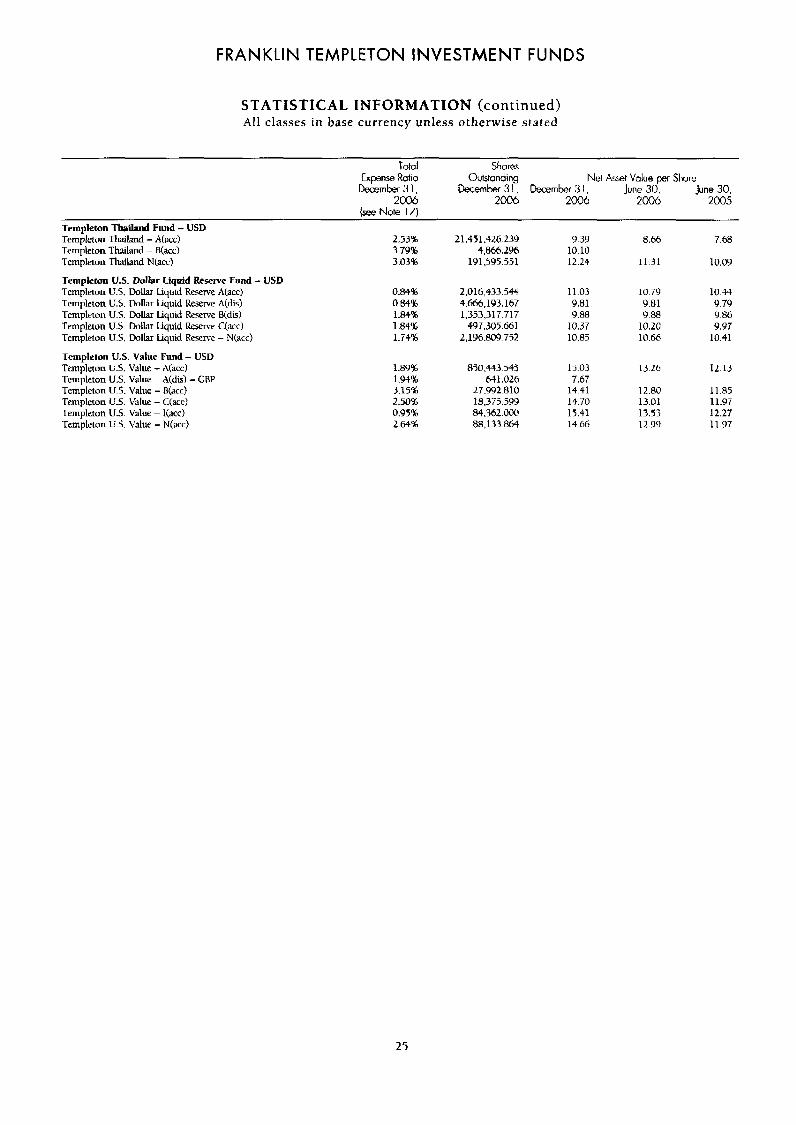
FRANKLIN TEMPLETON INVESTMENT FUNDS
STATISTICAL INFORMATION (continued) All classes in base currency unless otherwise stated
Totot Shares Expense Ratio Outstmtiing Net Asset Value per Share
December 31, December 3 1 December 3 1,
(see Note 17)
June 30, 2006 2ood 2006 2006 2005
lune 30,
Templeton Thailand Fund - USD Templeton Thailand - A(acc) 2.53% 21,451.426.239 9.39 8.66 7.68
Templetun Thailand NLacc) 3.03% 191,595.551 12.24 11.31 10.09
Templeton US. Dollar Liquid Reserve Fund - USD Templeton US. Dollar Liquid Reserve Aidis) 0.84% 4.666.193.167 9.81 9.81 9.79
Templeton Thailand - B(acc) 3.79% 4,866.296 10.10
Templeton U.S. Dollar Liquid Reserve A(acc) 0.84% 2.016.433.544 11.03 10.79 10.44
Templeton U.S. Dollar liquid k w v e B(cW 1.84% 1,353,317.717 9.88 9.88 (3.86 Templeton U.S. Dollar Liquid Reserve C(acc) 1.84'16 4'97.305661 10.37 10.20 9.97 Templeton US. Dollar Liquid R w x e - N(acc) l . i4 '% 2.196.809.752 10.85 10.66 10.41
Templeton US. Value Fund - USD Templeton U.5. Value - A(acc) 1.89% 850,443.545 15.03 13.26 12.13 Templeton U.S. Value - A(dis) - CRP 1.9346 631.026 7.67
Templeton U.S. Value - C(acc) 2.504; 18,375,599 14.70 13.01 11-97
14.66 12.9Y 11.97 Xcmpletlm U . 5 Value - N(acc) 2.64% 88.133.864
fcmpleton U.S. Value - B(acc) 3.1591 27.992.810 14.41 12.80 11 .85
Templetun U.5. Value - Itacc) 0.9516 84.362.000 13.41 13.53 12.27
25
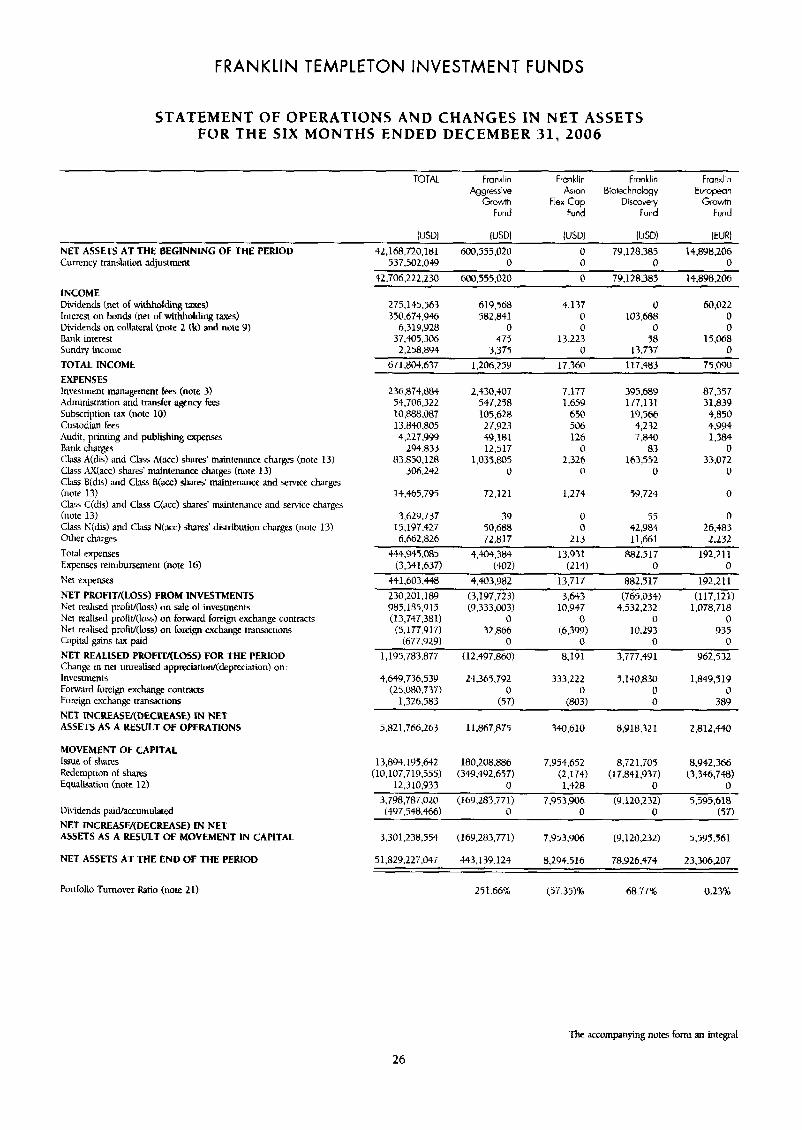
FRANKLIN TEMPLETON INVESTMENT FUNDS
STATEMENT OF OPERATIONS AND CHANGES IN NET ASSETS FOR THE SIX MONTHS ENDED DECEMBER 31,2006
TOTAL Fmnklin Franklin Franklin Franklin Aggressive Asian Biotechnology Europan
Growth Flex Cap Discoven/ Growth Fund Fund Fund Fund
IUSU I U W WD1 iUSDl IEUN
NET ASSETS AT THE BEGINNING OF THE PERIOD Currency translation adjustment
42,168,720.181 600,555,020 0 79.128.385 14,898.206 537,502,049 0 0 0 0
42.706.222.230 hoo.555.020 0 79,12a,385 14.898.206
INCOME Dividends (net of withholding w ~ e s ) Interest on bonds (net of withholding taws) Dividends on collaterdl (note 2 (k) and note 9) Bank interest Sundry income TOTAL INCOME EXPENSES Investment management fees (note 3) Administration and transfer agency fees Subscription tax (note IO) Custodian fees Audit, printing and publishing expenses Bank charges Class A(dis) and Chis A ( a d sham' maintenance charges (note 13) Class .4X(acc) shares' mintmame c h q e s (note 13) Class B(dis) and Class E(=) shares' maintenance and service charges (note 13) Class C(rlis) and Class C(acc) shares' maintenance and =mice chrges (note 13) Class f;(dis) and Class Nhcc) shares. distribution chargts (note 13) Other charges Total expenses Expenses reimbursement (note 16)
Net expenses NET PROFIT/(LOSS) FROM INVESTMENTS Kef realised profit/(loss) on sale of investments Net realised profit/(loss) on forward foreign exchange ConttacE K;ct realised pmfit/(loss) on foreign exchange trawctions Capital gains tax paid NET REALISED PROFITfiLOSS) FOR THE PERIOD Change in net unrealised appreciatiun/(depreciation) on: Investments Forward foreign exchange contrxm Foreign exchange trans;1ctions NET INCREASU(DECREASE) IN NET ASSETS AS A RESULT OF OPERATIONS
MOVEMENT OF CAPITAL Issue of shares Redemption of shares Equalisation (note 12)
Dividenb paid/accumulated NET INCREASV(DECREASE) IN NET ASSETS AS A RESULT OF MOVEMENT IN CAPITAL
NET ASSETS AT THE END OF THE PERIOD
275.145.563 619,568 4,137 0 60,022 350.674.9M 582.841 0 103,688 0
6,319,926 0 0 0 0 37,405,306 475 13.223 58 15,068 2,258,894 3.375 0 13.737 0
67 1.804.637 1.206.259 17.360 117.483 7 5 . 0 0
236.874,W 54,706.322 10,888,067 13.840.805 4.227.999
294.833 83,850,128
306.242
2.430.+07 547.258 105,628 27.923 49.181 12,517
1.035.805 0
7.177 1,659
650 506 126
0 2.326
0
395,689 177.131 19.5% 4,232 7.840
83 163,552
0
87.357 31,839 4,850 4.9w 1,384
0 33.072
0
13,465,795 12,121 1.274 59,724 0
3,620.737 39 0 55 0 15,197.427 50,688 0 42,984 26,383 6.662.826 72,817 213 11,661 2.232
444.945.085 4,404,384 13.931 882.517 192.21 1
$41,603.448 4,403.982 13,717 RR2.5 17 192,211
230,201,189 (3,197,723) 3,613 (76i.034) (117,121) 983,185,915 (9,333,003) 10.947 4.532.232 1,078,718 ( 13,747 38 1) 0 0 0 0
(5.177.9 17) 32.866 (6.399) 10.293 935 (677 .9 29) 0 a 0 0
1,195,783,1377 (12,497,860) 8,191 3,777,491 962.532
4,649.736,539 24.365.792 333,222 5.1+0,830 1,849,519 (25,060,737) 0 0 0 0
1,326,583 ($7) (803) 0 389
5.821.766.263 11.867,875 340,610 8.918.321 2,812MO
(3,341,637) (402) (214) 0 0
13,894.195.642 180,208.886 7,954.652 8,721,705 8.942.366 (10,107,719.555) (349,492,657) (2.174) (17.841.937) (3,346,748)
12,310,933 0 1.428 0 0 3,798,787.020 (169,283,771) 7,953.906 (9.120.232) 5,595,619 (497.548.466) 0 0 0 (57)
3,301,236,554 (169.283.771) 7,953,906 (9,120,232) 5,995.561
51,829,227,047 4443.139.124 8.294.516 78.926.474 23.306.207
25 1.66% (57.3'11% 68.77% 0.234; Portfolio Turnover Ratio (note 21)
The accompanying notes form an integral
26
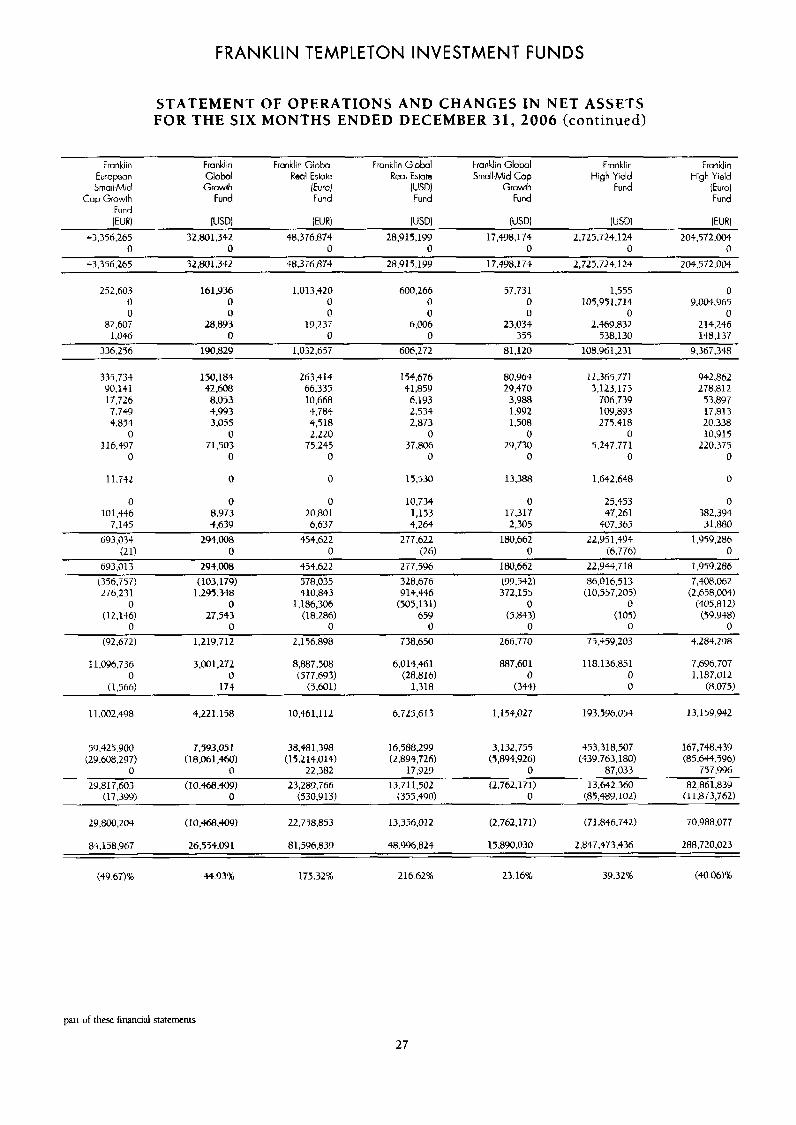
FRANKLIN TEMPLETON INVESTMENT FUNDS
STATEMENT OF OPERATIONS AND CHANGES IN NET ASSETS FOR THE SIX MONTHS ENDED DECEMBER 31, 2006 (continued)
Fran kiin Franklin Franklin Giobal Franklin Glob1 Franklin Global Franklin Franklin Europecln Globol Real Estate Rwl Estate Small-Mid Cop High Yield High Yield Small-Mid Growth /Euro) lUsU Growth Fund [Euro)
Cap Growth Fund Fund Fund Fund Fund
IW IUW I E W WSD1 (US0 lUSW IEURI $3.356.265 32.801,342 48.376.874 28,915,199 17,498,174 2,725.724.124 204.572.004
0 0 0 0 0 0 0 $3.356.165 32,801,342 48,376,874 28.915,199 17,498.1 74 2,727.724.124 204,572,004
252.603 161.936 1.013,420 600,266 57.731 1,555 0 0 0 0 0 0 105,951,714 9.004.965 0 0 0 0 0 0 0
82.607 28.893 19.237 6.006 23,034 2.469.832 214,246 1,046 0 0 0 355 $38.130 148,137
336.276 190.829 1.032.657 606.272 81.120 108.961.231 9.367.348
Fund
~~ ~ ~ ~ ~
335.734 150.184 263,414 154,676 80.Y4-l 11.365.771 9 4 z , m 90,141 42.608 66,335 41 ,859 29,470 3,123,175 278.812 17.726 8.053 10,668 6.193 3,988 706.739 53.897 7.749 4.993 4,784 2.534 1,992 109,893 17.813 4.854 3,055 4,518 2.873 1.508 275.418 20,338
0 0 2.220 0 0 0 10,913 116.497 71.503 75.243 37.806 29.730 5.247,771 220.375
0 0 0 0 0 0 0
11 .732 0 0 15.430 13,388 1.642.648 0
0 0 0 10,734 0 25.453 0 10 1 .+46 8.973 20,801 1,153 17,317 47,261 382.394
7,145 4.635, 6.637 4,264 2.303 407,367 31.880 1.959.286 693,034 ZY4.008 454,622 277.622 180,662 22,951,494
693,013 294.008 454.622 277.596 180,662 22,944.71H 1,959.286 (376,757) (103.179) 578.035 328.676 (99,542) 86.016.513 7,408,062 276,231 1.295.348 410,843 914.446 372,155 (10,557.205) (2 .6$8,004)
0 0 1,186,306 (505.131) 0 0 (405,812) (12,146) 27.543 (18.286) 659 (5.843) (105) (59.948)
0 0 0 0 0 0 0 (92.672) 1.219.712 2.156398 738650 266.770 75.+59,203 4.284.298
11,096,736 3.001.272 8,887,508 6.014.461 887,601 118.136.831 7,696,707 0 0 (577,693) (28.816) 0 0 1.187.012
(1 .Sbb) 17-l (5.601) 1,318 (344) 0 (8,075)
(21) 0 0 (26) 0 (6.776) 0
193.396.054 1 >.15Y,942 11,002,498 4.LZ1.158 10,461,112 6.725.613 1.154.027
59.423.900 7.593.05 1 38,481.398 16.988.29Y 3,132.755 493,318,507 167,748,439 (29 608.297) (18.061.4601 (15.214.014) (2.894.726) (5.894.926) (439.763.180) (85,644596)
1~
0 0 22.382 17,929 0 87,033 757.996
29,817,603 (10.468.4c)9) 23,289,766 13,711,502 (2.762.171) 13,642360 82,861,839 (1 7,399) 0 (530,913) (355.490) 0 (85,489.102) (11,873,762)
29,800,204 (10.468,409! 22.758.853 13,356,012 (2.762.1 71 ) (71.846.742) 70,988,077
81.158.967 26.554.091 81,596.839 48.996.824 15,890.030 2.847.473.436 288,720,023
( 4 9 . 6 m -t4.93% 175.32% 216.62% 23.16% 39.32% (40.06)%
part uf thesf financial statements
27
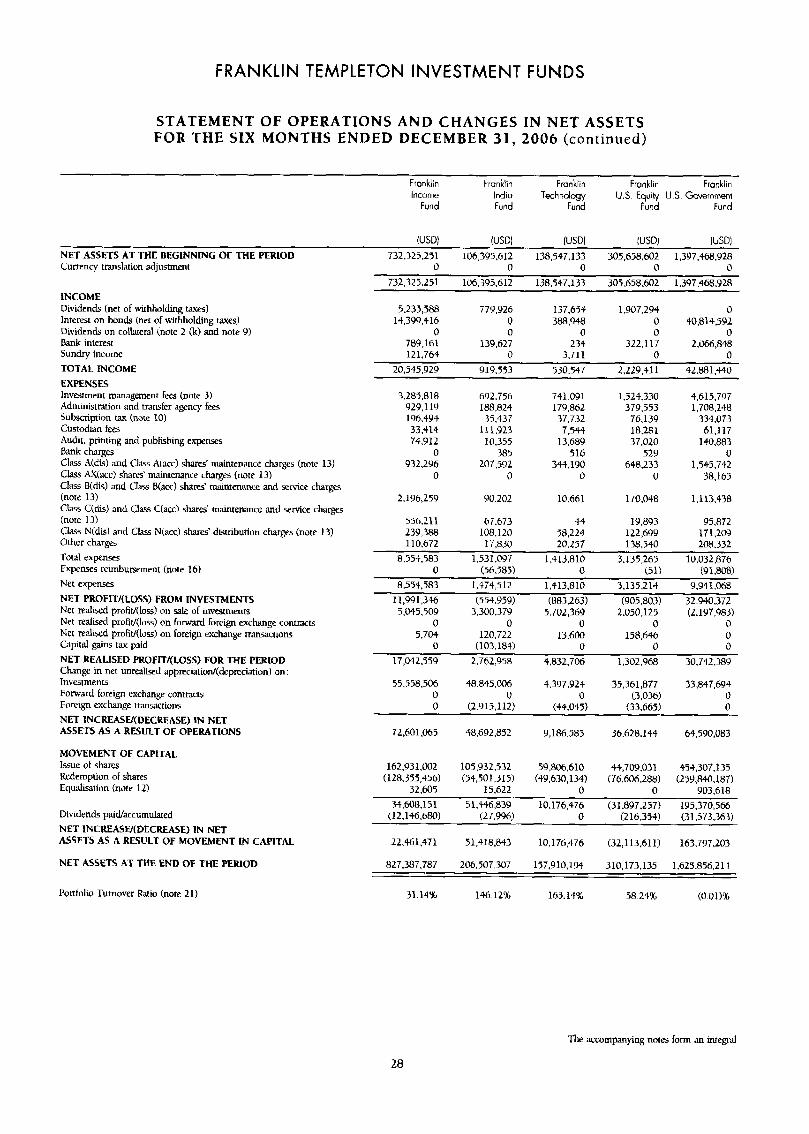
FRANKLIN TEMPLETON INVESTMENT FUNDS
STATEMENT OF OPERATIONS AND CHANGES IN NET ASSETS FOR THE SIX MONTHS ENDED DECEMBER 31, 2006 (continued)
Franklin Frankti? Franklin Fron klir! Franklin Income India Technology U.S. Equibj U.S. Government
Fund Fund Fund Fund Fund
IUSDt WSDI lUSDl IUSDI IUSDI NET ASSETS AT THE BEGINNING OF THE PERlOD Currency translation adjustment
INCOME Dibidends (net of withholding taxes) Interest on bnds (net of withholding taxes) Dividends on colhtenl (note 2 (k) and note 9) Bank interest Sundry income TOTAL INCOME EXPENSES Investment management fees (note 3) Administration and transfer agenq fees Subscription tax (note 10) Custodian fees Audit. printing and publishing e q w s Bank charges Class A(dis) and Class A(acc) shares' maintenance charges (note 13) Class AX(& shares' maintenance charges (note 13) Class B(dis) and C k B(acc) s h m i maintenance and service charges (note 13) Class C(dis) and class C(acc) shres' maintenance and rrvice charges (note 13) Clilss N(dis) and Class N(acc) shares' distribution charges (note 13) Other charges Total expenses Expenses reimburstment (note 16) Net expenses NET PROFIW(L0SS) FROM INVESTMENTS Net realked profit/(loss) on sile of investments Net realked profit/(loss) on forward foreign exchange contracts Net realiszd profitl(10u) on foreign exchange transactions Capital gains tax paid NET REALISED PROFITl(L0SS) FOR THE PERIOD Change in net unrealised appreciatiun/(&pre&tiun) on: Investments Forward fureign exchange contracts Foreign exchange transactions NET INCREASEKDECREASE) IN NET ASSETS AS A RESULT OF OPERATIONS
MOVEMENT OF CAPITAL Issue of shares Redemption of shares Equnlijation (note 12)
Dividenck paidhccumulated NET INCREASU(DECREASE) IN NET ASSETS AS A RESULT OF MOVEMENT IN CAPITAL
NET ASSETS AT THE END OF THE PERIOD
132325.251 106,395,612 138,547,133 305.658.602 1,397.468.928 0 0 0 0 0
732,325,251 106,393,612 138.547.133 305.858.602 1.397.468.928
5233,588 779.926 137,654 1,907,294 0 14,399,416 0 388,948 0 40,814,592
0 0 0 0 0 789,161 139.627 2 34 322.117 2,066,848 121.764 0 3.71 1 0 0
20,545,929 919.553 530.547 2,229,411 42.881.440
3,285,818 929.1 19 196.494 33,414 74.912
0 932,296
0
692.756 188.824 35,437
111,923 10,355
385 207.592
0
741.W1 179.862 37.732
7.544 13,689
516 344,190
0
1,524,330 379,553 76,139 18,281 37.020
529 648,233
0
4,615.7'27 1,708,248
334.073 61,117
140,883 0
1,945,742 38.169
1.196,ZS.Y 80.202 10.661 170.048 1.1 13.438
596.211 67,613 44 19.893 95372 239,388 108,120 58,224 122,699 17 1,209 110,672 17,830 20.257 138.540 208.332
8,554,983 1,531,097 l,.tl3.810 3,135,265 10.032.876
8.554.583 1,474,512 1.413.810 3,135,214 9,941,068 11,991,336 (554.959) (883,263) (905,803) 32.940.372 7,045,509 3,300,379 5,702,369 2.050.125 (2,197,983)
0 0 0 0 0 5.704 120.722 13,600 158,646 0
0 (103,184) 0 0 0 17,042,559 2.762,958 4832.706 1,302,968 30.742.389
55,558.506 48.845.006 4.397.924 35,361,877 33.847.694
0 (56.585) 0 (51) (91 ,ma)
0 0 0 (3.036) 0 0 (2.915.112) (44,045) (33.665) 0
72,601.065 48.692,852 9,186.585 36.628.144 64,590,083
162.931.002 105,932.532 59,806,610 44,709,031 454,307,135 (128,355,456) ($4,501,315) ($9,630,134) (76,606,288) (259,840.187)
32.605 15.622 0 0 903,618 3+,608,151 51,446,839 10,176,476 (31,897,257) 195,370,566
(216,354) (31,57333) ( 12,146,680) (27.996) 0
22,461,471 51,418,843 10.176.476 (32,113,611) 163.797.203
827,387.787 206.507.307 157,910,194 310,173.135 1623,856,214
PoItfOhO Turnover Ratio (note 21) 31.14% 146.12% 163.1% 58.2416 (0.01)'Xb
The accompanying notes form an integral
28
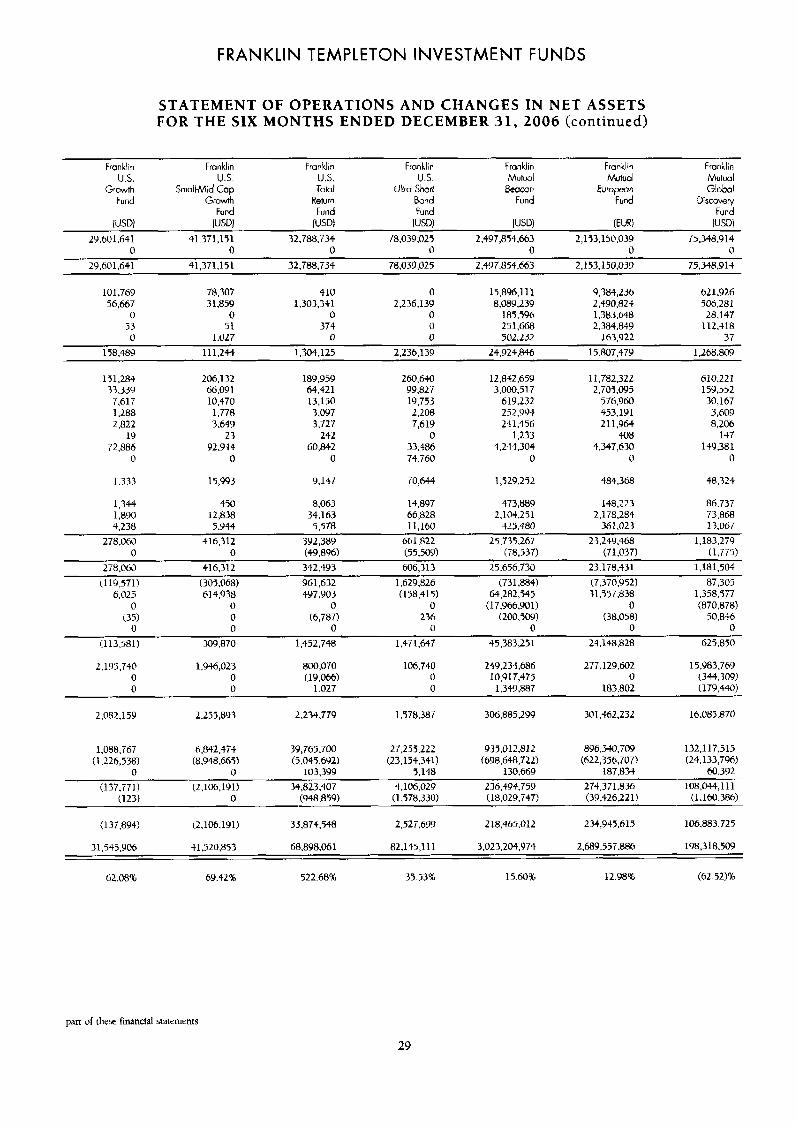
FRANKLIN TEMPLETON INVESTMENT FUNDS
STATEMENT OF OPERATIONS AND CHANGES IN NET ASSETS FOR THE SIX MONTHS ENDED DECEMBER 31, 2006 (continued)
Franklin Franklin U.S. U.S.
Gvowth Srnall&%d Cap Fund G(&h
Fund
Franklin Franklin us. U.S. Total Ultra Short
Return Bond Fund Fund
Fran kl I n Franklin Franklin Muluol Mutuol Mutual
Beocon European Global Fund Fund Oiscove y
Fund (USD) IUSQ IUSD) IUSDI luSQ IEURI IUSDI
15.348,914 29.601.641 41.371,151 32.788.734 78.039,025 2,497,854.663 2,l 53.150.03Y 0 0 0 0 0 0 0
29.601.641 41.371.15 1 32,708.734 78.039.025 2.497.854.663 2.153.130.039 75.348.911
101,769 18,307 410 0 1 5,896,111 9.384,236 621,926 56,667 3 1,859 1,303,341 2,236,139 8.089.239 2,490,824 506.281
0 0 0 0 185.596 1,383,648 28,147 53 51 374 0 251,668 2.384.849 112,418 u 1,027 0 0 502.232 163.922 37
178.489 111.244 1.304.125 2.236.139 24.924.846 14.807.479 1.268.809
151,283 33,339
7.617 1,288 2.822
19
0
1.333
72.886
206.1 32 1 66.091 10,470 1,778 3.649
23 92.944
0
15,993
189,959 64.42 1 13.150 3,097 3.727
24.2 60,842
0
9,147
260.640 99.827 19,733 2,208 7,619
0 33.486 74,760
70,644
12.842.659 3.000,Sli
619.232 252.994 241.456
1.233 4,244,304
0
1,529.2'12
11.782.322 2.707.095
576.960 453,191 211,96+
408 4,347,630
0
484.368
610.221 159,552 30,167 3,609 8.206
137 149,381
0
48.324
1.344 450 8.063 14.897 473,889 148.223 86.737 1,890 12,838 34.163 66,828 2.104.25 1 2.178.284 73.868 4,238 5.944 5,578 11,160 425.480 361.023 13.067
1,183.279 278,060 416.312 392,389 661.822 25.735.267
278,060 416,312 342.493 606,313 25.656.730 23,178,431 1,181,504
(1 19.571) (305,068) 961,632 1.629.826 (731.884) (7.370.9521 87,305 6.025 614,938 497,903 (1 58.415) 64,282,545 31.557.838 1.358.577
0 0 0 0 (17.966.901) 0 (870,878) (35) 0 (6.787) 236 (200.509) (38,058) 50.846
0 0 0 0 0 0 0 (113,581) 309.870 1.452,748 1.471.647 45,383,251 23,148,828 625.850
15,983,769 0 0 (19.066) 0 10,917,475 0 (344.3091
2 3,249.468 0 0 (49,896) (5 5.509) (78,537) (71,037) (1 -77'1)
249.234.686 277.129.602 2,195.740 1,936,023 800,070 106.740
0 0 1.027 0 1,349,887 183.802 (179,440)
2,082,159 2.255.893 2,234,779 1.578.387 306.885.299 301.+62.232 16.085.870
1,088,767 6.842.4TS 39,765,700 27,253,222 935.012.812 896,340,709 132.117.515 (I .226,538) (8,948,665) (5 .W5,692) (23,154,341) (698.648.722) (622,356,707) (24.133,T96)
0 0 103.399 5,148 130.669 187.834 60.392
(123) 0 (948,859) (1.578.330) (18,029,747) (39,426,221) (1,160.386)
106.883.725
(137.771) (2,106,191) 34,823.407 4,106.029 236.494.759 274,371.836 108,W,111
33,874.548 2.527.699 218.465.012 234,945,615 (1 37.89'0 (2,106.191)
31,545,906 41.520.853 68,898,061 R2.145.111 3,023,204,974 2,689,557.886 198,318,509
62.0876 69.42% 922.68% 35.53% 15.60% 12.98% (62.521%
part of these financial statements
29
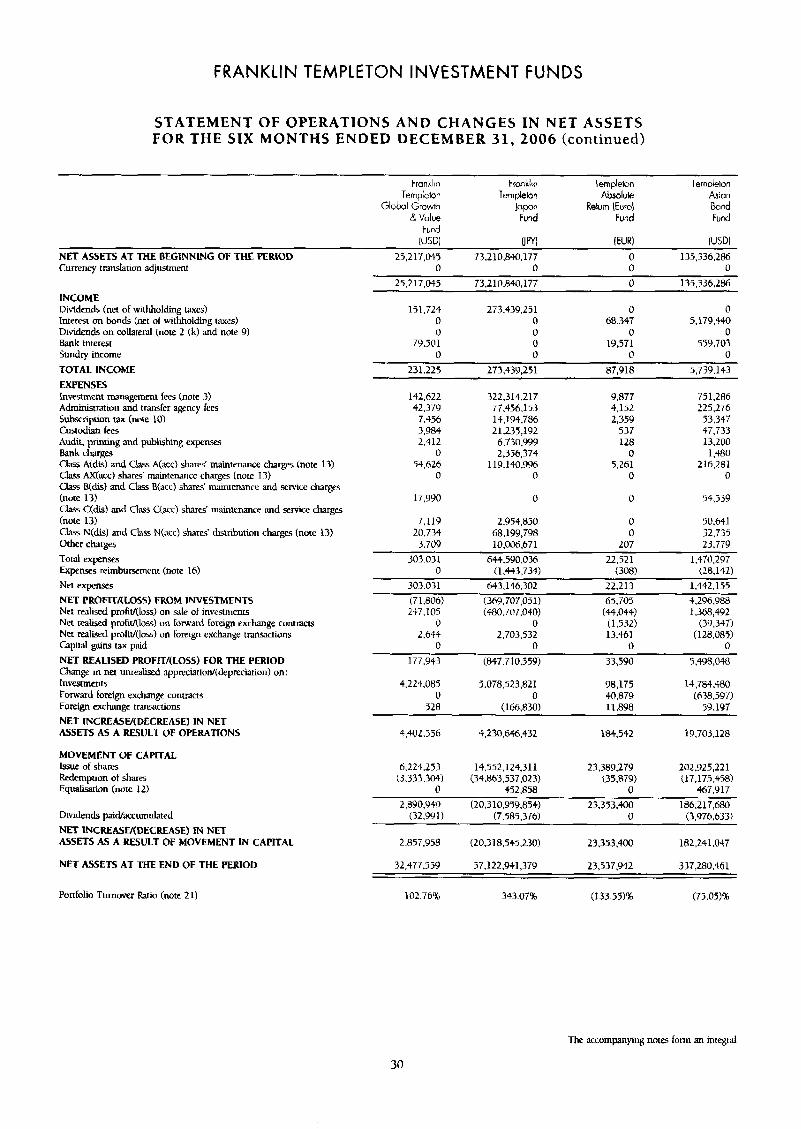
FRANKLIN TEMPLETON INVESTMENT FUNDS
STATEMENT OF OPERATIONS AND CHANGES IN NET ASSETS FOR THE SIX MONTHS ENDED DECEMBER 31, 2006 (continued)
Franklin Fraikh Templeton Templeton Temp:etor lernpleton Absolute A s m a n
Globol Growth lapon Return (Euro] Bond & Value Fund Fund Fund
Fund IUS01 u Wl IEURI (USDJ
25,217.045 73.210.840.177 0 135,336,286 0 0 0 0
135,336,286 25.217.045 73.210,&340,177 0
NET ASSETS AT THE BEGINNlNG OF THE PERIOD Currency tmnslation adjustment
INCOME Dividends (net of withholding taxes) lntemt on bonds (net of withholding taxes) Dividends on collaterd (note 2 (k) and note 9) Bank interest Sundry income
TOTAL INCOME EXPENSEE Investment management fecs (note 3 Administration and transfer agency fees Sukription tax (note 10) Custodian fees Audit. printing and publishing e x p e w s Bank charges Class A(&) and CLw A(acc) shares' maintenance charges (note 13) CIS AX(acc) sharfs' maintenance charges (note 13) Class Wdis) and C h s B(acc) shares' maintenance and %mice charges (note 13) Class C(dis) and Class C(acc) shares' mainienance and service charges (note 13) Class N(dis) and Class N(acc) shares' distribution charges (note 13) Other charges Toral expenses Expenses reimbursement (note 16) Net expenses NET PROFlT/(LOSS) FROM INVESTMENTS Net realised profitl(loss) on sale of investmenfs Net realised proF.t/(lnss) on brward foreign exchange conttacts Net realised pmlit/(loss) on foreign exchange tr-mctions Capital gains tax paid NET REALISED PROFlT/(LOSS) FOR THE PERIOD Change id net unrealised appmciition/(depreciation) on: Investments Forward foreign exchange contrads Foreign exchange transactions NET INCREASV(DECREASE) IN NET A S S D S AS A RESULT OF OPERATIONS
MOVEMENT OF CAPITAL Issue of shares Redemption of sham Equalisation (note 12)
Dividends paid/aaumulated NET lNCREASE/(DECREASE) IN NET ASSETS AS A RESULT OF MOVEMENT IN CAPITAL
NET ASSETS AT THE END OF THE PERIOD
151.724 273.439,231 0 0 0 0 68,347 5,179,440 0 0 0 0
79,501 0 19,571 559,703 0 0 0 0
231.225 273.439.251 87.918 5.739.143
142.622 42.379
7.356 3.984 2.412
0 54.626
0
322.3 14.2 17 77.456.153 14,194.786 21,235,192
6.730.999 2,356.374
119,1M,996 0
9.877 4,152 2,359
537 128
0 5.261
0
75 1,286 225.276
53,347 47.733 13,200 1,480
216,281 0
17,990 0 0 54,539
7,119 2,954,850 0 50.641 20,734 68,199,798 0 32,735
3.709 10.0@6,671 207 23.779
303.031 644,590,036 22.521 1,410,297 0 (1.443.734) (308) (28,142)
303.031 643,146.302 22,213 1,442,155
(71.806) (369,707,051) 65,705 4.296,988 1,368,492 247,105 (480.707.040) (44,044)
0 0 (1.532) (39,347) 2.644 2.703.532 13.461 (128.085)
0 0 0 0
177,943 (847,710559) 33,590 5.49 8,048
3,224,085 5.078.523,821 98,175 14.78+,+80 0 0 40.879 (638.597)
528 (166.830) 11,898 59<197
4.402.556 4,230.646.432 184,542 19.703.128
6.224.253 14,552,124,311 23.389.279 202.925,221 (3,333.304) (34,863,537,023) (35.879) (17,175,458)
0 452,858 0 467.917
2,890,949 (20,310,959.854) 23.353.400 186.2 17,680 (32.99 1) (7385,376) 0 (3,976,633)
2,857,958 (20,318,545,230) 23,353,4@2 182.241.0+7
32,477.559 57,122.9+1,379 23,537.942 337,280,461
102.76% 343.07% (133.551% (75.05)% Portfolio Turnover Ratio (note 21)
The accompanying notes form an integral
30
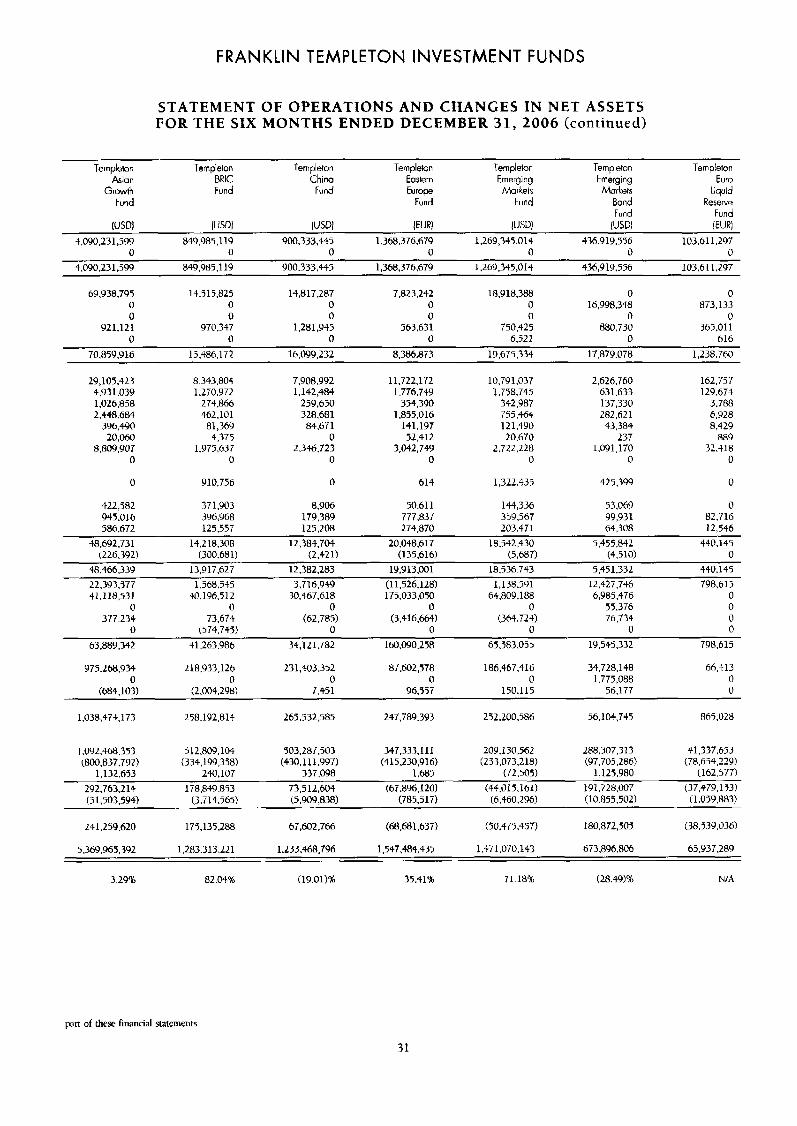
FRANKLIN TEMPLETON INVESTMENT FUNDS
STATEMENT OF OPERATIONS AND CHANGES IN NET ASSETS FOR THE SIX MONTHS ENDED DECEMBER 31, 2006 (continued)
Templeton Templeton Templeton Templeton Templeton Templeton Temp!eton &ion BRlC China Eastern Emerging Emerging Euro
Growth Fund Fund Europe Markets Morkets Liquid Fund Fund Fund Bond Reserve
Fund Fund IUS01 IUSDl IUSDl IEURl IUSD) IUSDl IEURI
- 4,090,231,~Y 849,985.1 19 900,333,445 1.368.376.679 1,269,345,014 $36.919.556 103,611.297 0 0 0 0 0 0 0
4,090,231,599 849,985.119 900.333.445 1,368.376.679 1,269,345,014 436,919.556 103.611.297
69.938.795 14,915,825 14,817.287 7.823.242 18.9 18,388 0 0 0 0 0 0 0 16,998.348 873.133 0 0 0 0 0 0 0
92 1.12 1 970,317 1,281,945 563.631 150.425 880.730 365.01 1 0 0 0 0 6,521 0 616
70,859,Y 16 15,486,172 16,099,232 8,386.873 19,675,334 17.879.078 1,238.760
29,105.423 4,931.039 1,026,858 2.448.6R4
396,490 20,060
8.80'9.907 0
0
8.343.804 1.270.972
274.866 462,101
81,369 4,375
1,975,637 0
910.756
7,908,992 1,142,484
259,650 328,681 84.671
0 2.346.723
0
0
11,722,172 1.776.749
354,390 1,855,016
141.197 52.412
3,042,749 0
614
10,791,037 1,758,745
342,987 755,464 1 21.490 20.670
2.722.228 0
1,322.435
2,626.760 631.633 137,330 282.621 43.384
237 1,091,170
0
425,399
162.757 129.671
3.788 6,928 8,429
889 32.+18
0
0
422,582 37 1.903 8,906 50.611 144,336 53.069 0 945.016 3Y6.968 179,389 777.837 339.567 99,931 82,716 586,672 125.557 125.208 274,870 203.471 64.308 12,546
48.692.731 14,218.308 12,384,704 20,048.617 18,542,430 5,455,842 440.145
48.466.339 13,917.627 12,382,283 19,913.001 18,536.743 5,451,332 440.145 22,393.577 1.56835 3.716.949 (1 1,526.128) 1,138,591 12.427.746 798,615 $1.1 18,531 40.196.512 30,467,618 175.033.050 64,809,188 6,985,476 0
0 0 0 0 0 55.376 0 377.234 73.674 (62,785) (3,416.664) (364,724) 76.734 0
0 (574.745) 0 0 0 0 0
(226.392) (300.681) (2,421) (135.616) (5,687) (4.510) 0
63,889.342 41,263.986 34,121,782 160.090.258 65.583.055 19,545,332 798,615
975.268.934 218,933,126 231,403.352 87,602,578 186,467,416 34,728.148 66.413 0 0 0 0 0 1,775,088 0
(684,103) (2.004.298) 7.451 96.5'17 150.115 56,177 0
1,038.474.173 258,192,813 265.532.585 247.789.393 2j2.200.586 56,104,735 R65.028
1,092,468.353 5 12.809.104 503,287.503 347,333.1 11 209,130,562 2M,307.?13 41,337,653 (800.837.792) (334,199,358) (~30.111.997) (4 15,230,9 16) (233.073.218) (97,705,286) (78.674.2211)
1.132.653 240,107 337,098 1.685 (72.505) 1,125,980 (162.577)
292,763,214 178.849.853 73,512,604 (67.896.120) (44.01 5.161) 191.728,Oo7 (37,479,1531 (3,503,594) (3,714,565) (5,909,838) (785.517) (6,460,296) (10.855.502) (1.059.883)
241,259.620 175,135.288 67,602.766 (Ci8.681.63T) (50.475.457) 180,872,505 (38,539,036)
673.896.806 65,937.289 5,369,865.39 2 1.283.313.221 1,233,468,796 1,547,484.435 1,471,070,143
3.2976 82.04% (19.01)% 35.41% 71.181 (28.49>% N/A
pan of these Financial statements
31
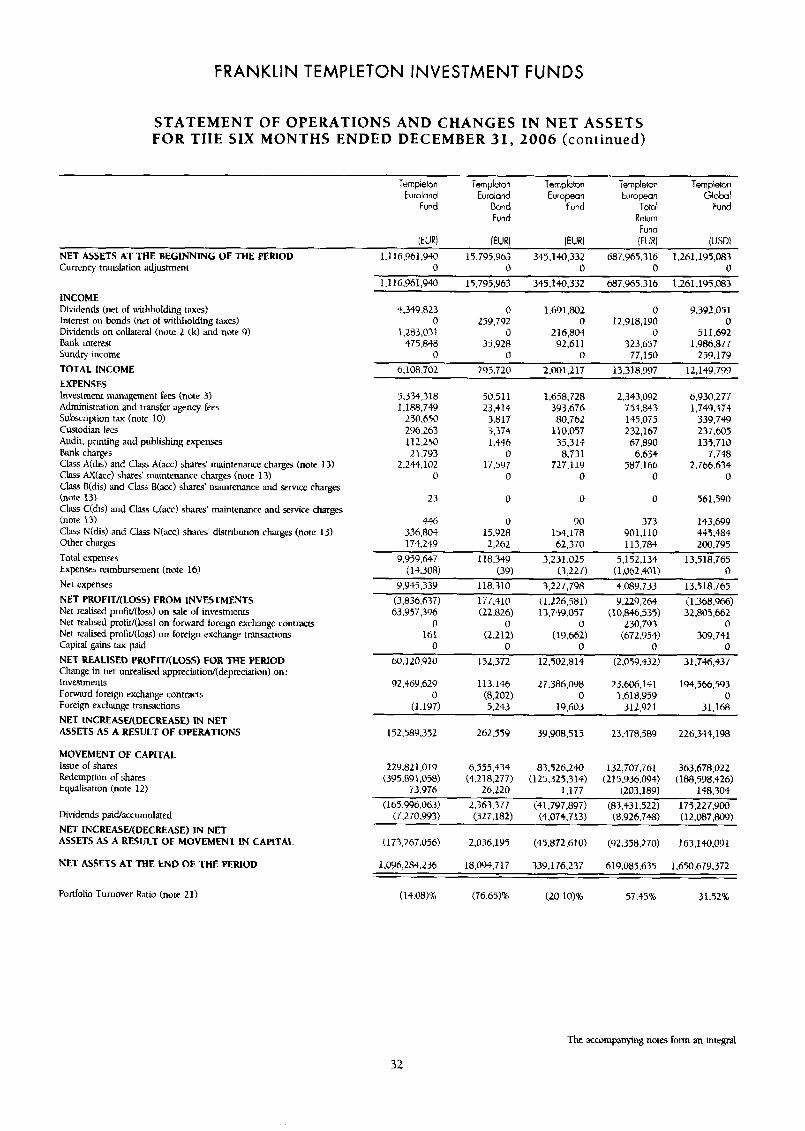
FRANKLIN TEMPLETON INVESTMENT FUNDS
STATEMENT OF OPERATIONS AND CHANGES IN NET ASSETS FOR THE SIX MONTHS ENDED DECEMBER 31, 2006 (continued)
Terr pieton Templeton Templeton Templeton Templeton Euroland Eurolond European European Glob!
Fund Bond fund Total Fund Fund Return
Fund IEURI IEURI IEURl W R 1 (USDI
NET ASSETS AT THE BEGINNING OF THE PERIOD Currency translation adjustment
1.1 16.961.940 15.795.963 345,140,332 687.965.316 1,261,195,083 0 0 0 0 0
1.1 16,q61,940 1 5,795,963 345,140.332 687,965.316 1,261.19$,083 INCOME Dividends (net of liithholding t a x 4 Interest on bonds (net of withholding taxes) Dk+dcntL on collateral (note 2 (k) and note 9) Bank interest Sundry income TOTAL INCOME EXPENSES lnvestment m;mr\gemcnt fees (note 3) Administration and transfer agency fees Subscription tax (note 10) Custodian fees Audit. printing and publishing expenses Bank charges Class A(dis) and C k s A(acc) shares’ maintenance charges (note 13) C k AX(acc) shares’ maintenance charges (note 13) C h B(dis) and Class E(acc) shares’ maintenance and srtvice charges (note 13) C l s s Udis) and Class C(acc) sham’ maintenance and servic~ charges (note 13) Class Ndis) and Clas N(acc) shares. distribution charges (note 13) Other charges Total expenses Expenses reimbursement (note 16) Net expenses KET PROFIT/(LOSS) FROM INVESTMENTS Net realisecl profit/(loss) on sale of investments Net realised ptofit/(loss) on forward foreign exchmgc contracts Net realised profiV(1oss) on foreign exchange triinsactions Capital gains tax paid NET REALISED PROFlT/(LOSS) FOR THE PERIOD Change in net unreaked apprrciatiu~(deprecion) on: Investments Fornard foreign exchange contracts Foreign exchange trawctions NET INCREASW(DECREASE) IN NET ASSETS AS A RESULT OF OPERATIONS
MOVEMENT OF CAPITAL Issue of shares Redemption of shares Equalisation (note 12)
Dividends paidkccumulated NET INCREASW(DECREASE) IN NET ASSETS AS A RESULT OF MOVEMENT IN CAPITAL
NET ASSETS AT THE END OF THE PERIOD
4.349.823 0 1.691.RD2 0 9,392,051 0 259,792 0 12,918,190 0
1,283,031 0 216,804 0 511.692 475.848 35.928 92,611 323.657 1986,877
0 0 0 77,150 2’59.179 6.108.702 295.720 2,001.217 13.318.997 12,149,799
5,334,318 1,188,749
296,263 112.250 21.793
2,234,102 0
250.650
50.511 23,414
3.817 3,374 1,446
0 17.597
0
1.658.728 393,676 80,762
110,057 35,314 8,731
727.119 0
2,343,092 754,843 14S.075 232,167
67,890 6.634
587.166 0
6.930.277 1.749.474
339.749 237.605 13S.710
7.748 2.766.634
0
23 0 0 0 561,590
446 0 90 373 143.699 336.804 15.928 154,178 901,110 345,484 174,249 2,262 62.370 113.7~4 200,795
9,959,647 118,340 3,231.025 5,152,134 13,518.765
9,947.339 118,310 3,227,798 4,089,733 13,518.765 (3,836,637) 177,410 (1.226.581) 9,229.264 (1,348,966) 63.957.396 (22.826) 13.749.057 (10,846,535) 32.805.662
0 0 0 230,793 0 161 (2.212) (19.662) (672.950 309.741
0 0 0 0 0 60.320.920 132.372 12.502.814 (2.039.432) 31,746,437
92.469.629 113.146 27.386.098 23,606,141 194,566.593
(1.197) 5,243 19,603 312,921 31,168
142.58Y.352 262,559 39,908,515 23.478.589 226.3+4,198
(13.308) 139) (3,227) (1.062.401) 0
0 (8.202) 0 1.618.959 0
229.821,019 6.555.434 83,526,240 132,701,761 363,678,022 (395.891,058) (4.218.277) (125,325,314) (215,936.094) (188,398,426)
148.304 (165,996,063 2.363.377 (41,797,897) (83.431.522) 175,227,900
(7,270.993) (327.182) (4,074,713) (8.926.748) (12.087,W)
(203.189) 73.976 26.220 1,177
(173.267.056) 2,036,195 (45,872,610) (92.358.270) 163,140,091
1,096,284.236 18.C44.717 339.176.237 619,085.635 1.650.679.372
Portfolio Turnover Ratio (note 21) (1 4.08)% (76.651% (20.10)% 57.45% 31.5291
The accompanying notes form an integral
32
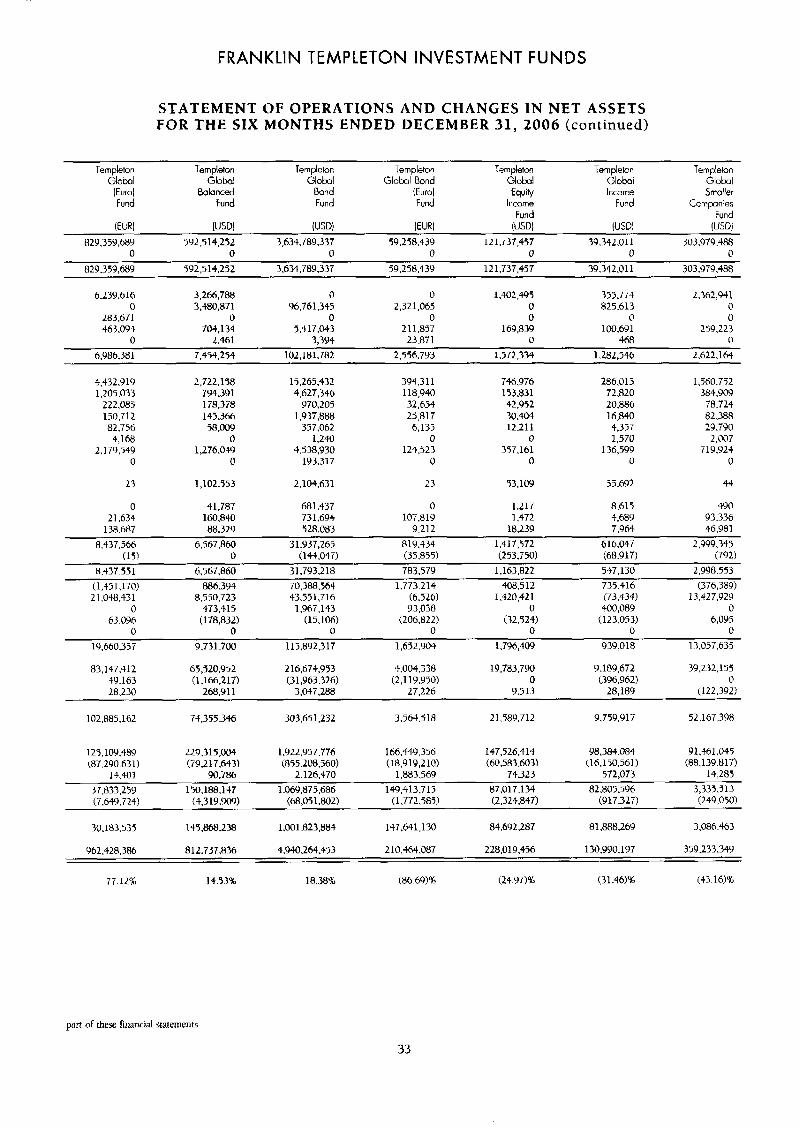
FRANKLIN TEMPLETON INVESTMENT FUNDS
STATEMENT OF OPERATIONS AND CHANGES IN NET ASSETS FOR THE SIX MONTHS ENDED DECEMBER 31, 2006 (continued)
~
Templeton Templeton lempleton Templeton Templeton Templeton Temp!eton Gloool Global Global Global Bond Globcl Global Global
(Euro) Balanced Bond (Euro) Equity lncnrre Smaller Fund Fund Fund Fund Income Fund Ccmpon:es
Fund Fuqd ( E W iusq I U W IEURI (USD1 IUSDI (USDl
H29,359,689 592.514.252 3.634.789.337 59258.439 12 1,737,437 39.342 .0 1 1 303.979.488 0 0 0 0 0 0 0
829.359,689 5'32.514.252 3,634,789,337 59.258.439 12 1.737.457 39.342.01 1 303.979.488
6.239.616 3.2b6+788 0 0 1,402.495 359.771 2,362,941 0 3,480,871 96.761.95 2,321.065 0 825,613 0
283.671 0 0 0 0 0 0 463,094 704,134 5.4 17.043 211.857 169,839 100,691 259.223
0 2.461 3,394 23.871 0 468 0 6.986.381 7.4'14.2 34 102.181.782 2.556.793 1.572.334 1.282.546 2.622.164
4,432,919 1.205.033
222.085 150.712 82.756 4,168
2.1 79 .i49 0
23
0 2 1,634
138.687
8.437.566
2.722.158 794.391 178.378 145,366
7 R . m 0
1,276.W 0
1,102,553
4 1.787 160.840 88.329
6.567.860
1'1.265.432 4,627,346
970,205
357.062 1.240
4.538930 193.317
1,937,888
3Y4.311 118,940 32.654 25,817 6,135
0 124,523
0
2,104.631 23
681.437 0 731.694 107,819 528.083 9.212
31.937.265 819.434
746.976 153,831 42,952 30.404 12.211
0 357.161
0
53,109
1.217 1,472
18.239
1.417.572
286,015 72.820 20,886 16,840 +,397 1,570
136,599 0
55.692
8,615 3,689 7.964
616.047
1.560.7i2 384,909 18,724 82.388 29.790 2,007
719,924 0
44
490 93.336 46,981
2.999.345 (13 0 (144.047) (35.855) (233,750) (68.9 17) (792)
H.437.551 6,561,860 31,793.218 783.579 1.163.822 347,130 2.9'38353
(1,$51.170) 886.394 70,388,564 1.773 214 408,512 735.416 (376,389) 13.427.929 2 1,048.43 1 8.530.723 43,551,716 (6.526) 1.420.42 1 (73,434)
0 473,415 1.967,143 93.038 0 400,089 0 63.096 (178,832) (15,106) (206,822) (32,524) (123,053) 6,095
0 0 0 0 0 0 0
19,660,357 9.T31.700 1 15.8Y2.3 17 1,652.YO4 1.796,W 939,018 13,057,633
83,147 .4 12 65,520.952 216,674,953 4.004.338 19,783,790 9.189.672 39.232.155 4Y.163 (l.lM.217) (31,963.326) (2.1 19.9 50) 0 (396.962) (1
28,230 268.91 1 3,047.288 27.226 9.513 28,189 (122.392)
102,885,162 74,355.346 303,651,232 3.564.518 21,589,712 9.759.917 52.167.3'38
1 2s. 109.489 229,315,004 1.922.9 57.776 166.44-Y.356 147,526.414 '48,384.084 91 .e1 -045 (87.290.631) (79,217.643) (855.208.560) (18,919,210) (60.583.603) (16,150,561) (88.1 39.813
14,401 90.786 2.126,470 1,883.569 74.323 572,073 14,285
37,833,259 150.188.1+7 1.069.875,686 149.413.715 87,017,134 82.805.5(36 3,335,513 (7,649,724) (4,3 19.909) (68,051.802) (1,772.585) (2,324,847) (917.327) (249,050)
30,183.535 145,868.238 1.001.823.884 147,641,130 84.692.287 81,888.269 3.086.463
062,428,386 812.737.836 4,940.264.453 2 10,464.087 228,019,456 130,990.197 359,233.349
77 12% 14 53% 18.38% (86 6'3)s (24 97)% (31.46)s (43 161%
pan of these financial statements
33
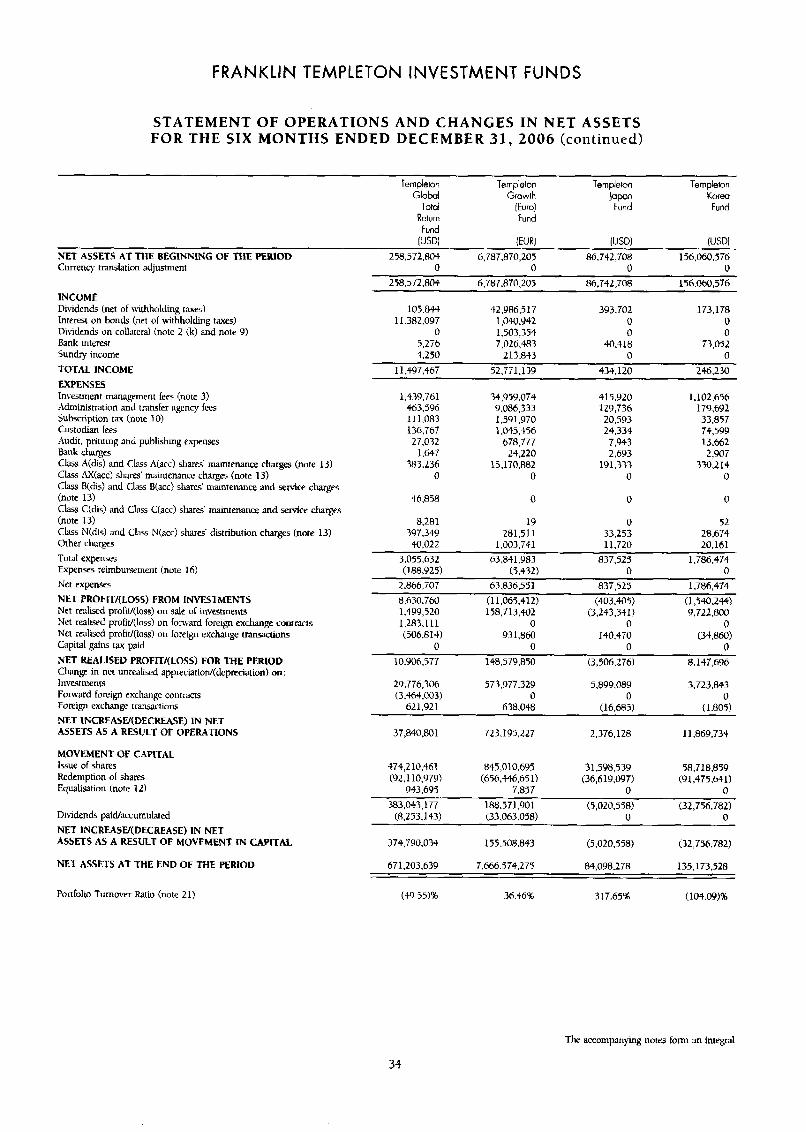
FRANKLIN TEMPLETON INVESTMENT FUNDS
STATEMENT OF OPERATIONS AND CHANGES IN NET ASSETS FOR THE SIX MONTHS ENDED DECEMBER 31, 2006 (continued)
Templeton Globcl Growlh lapon Koreo
Total [Euro) Fund Fund Relurn Fund Fund
WSD1 WR1 IUSDI IUSDI NET ASSETS AT THE BEGINNING OF THE PERIOD 258.572.804 6,7w.a70,20s 86.742,708 156.060.576
templeton Templeton Templeton
Currency translation adjustment
INCOME Dividends (net of withholding taxes) Interest on bonds (net of withholding tms) Dividends on collateral (note 2 (k) and note '3) Bank interest Sundry income TOTAL INCOME EXPENSES Investment management fees (now 3) Administration and trmsfer agency ffes Subscription tax (note 10) Custodian fees Audit. printing and publishing expenses Bank charges C b s Aid&) and Class Aiacc) shares' mintenance charges (note 13) Ckss AX(acc) shares' maintenance charges (note 13) Class Bidis) and Class Biacc) shares' maintenance and sewice charges (note 13) Ckss C(dis) and Class C(accj shares' maintenance and senice charges (note 13) CLLSS Nidis) and Class NQacc) shares. distribution charges (note 13) Other charges Total expenses Expenses reimbuwment (note 16)
Net expenses
NET PROFITI(L0SS) FROM INVESTMENTS Net realised prohtl[loss) un sale of investments Net realisrd prufitliloss) on fonvard foreign exchange contracts Net realised profit/(loss) on foreign exchange trdnsactions Capital gains tax paid NET REALISED PROFIT/(LOSS) FOR THE PERIOD Change in net unrealised appnciation/(deprrciation) on: Investments Fom-ard foreign exchange contracts Foreign exchange trawctiom NET INCREASW(DECREASE) IN NET ASSETS AS A RESULT OF OPERATIONS
MOVEMENT OF CAPITAL Issue of shares Redemption of shares Equalisation (note 12)
Dividends paid/accumulated NET INCREASU(DECREASE) IN NET ASSETS AS A RESULT OF MOVEMENT IN CAPITAL
NET ASSETS AT THE END OF THE RRlOD
0 0 0 0 2 5 a m . 8 0 4 6,787.870.205 86,742,708 156,060,576
105.844 42,9863 17 393,702 173.1 78 11.382.097 1,630.942 0 0
0 1,503,354 0 0 5.276 7.026.483 40.418 73.052 4.250 213.843 0 0
11.497.467 52.771.1 39 434,120 246,230
1.439.761 463,596
136.167 27.032
1.647 383.236
0
1 I I ,083
34,959.074 9.086.333 1,491,970 1,045,456
24,220 15,170,882
0
678.777
415.920 129,736 20.593 24.334
7,943 2,693
191.333 0
1.102.656 179.692 33.857 74,599 13.662 2,907
330.2 14 0
46.858 0 0 0
8,281 19 0 52 397.319 2ai.511 33.253 28,674 40,022 1,003,741 11.720 20,161
3,055,632 63 .a41 .Y 8 3 837,525 1,786.474 (188,925) (5.432) 0 0
2.866.707 63.836351 837,525 1,786,474
8.630.760 (11,065,412) (403.403) (1,540.24H) 1,499,520 158.713.$02 (3,243.331) 9,722,800 1,283,111 0 0 0 (506.814) 931.860 140,470 (34.860)
0 0 0 0 10.YOWh.577 148,579,850 (3,506,276) 8.147.696
29.776,306 573.977,329 5,899.089 3.723.843 (3,464,003) 0 0 0
621.921 638,048 (16.683) (1.805)
37,840.801 723.195.227 2,376.128 11,869,734
47S,210,461 H45.010.695 31,598.539 58,7188S9 (92.1 10.Y79) (656,446,651) (36,619,097) (91,475,641)
933.695 7.857 0 0
(8.253.1 43) (33.063.058) 0 0 383.043.177 188.571.901 (5,020,558) i 3 2 , 7 5 6 . m
671,2033,639 7,666.574.2 75 84,098.2 7R 135.173.528
Portfolio Turnover Ratio (note 21) (49.55)% 36.46% 317.65% (104.W)%
The accompanying notes form an integral
34
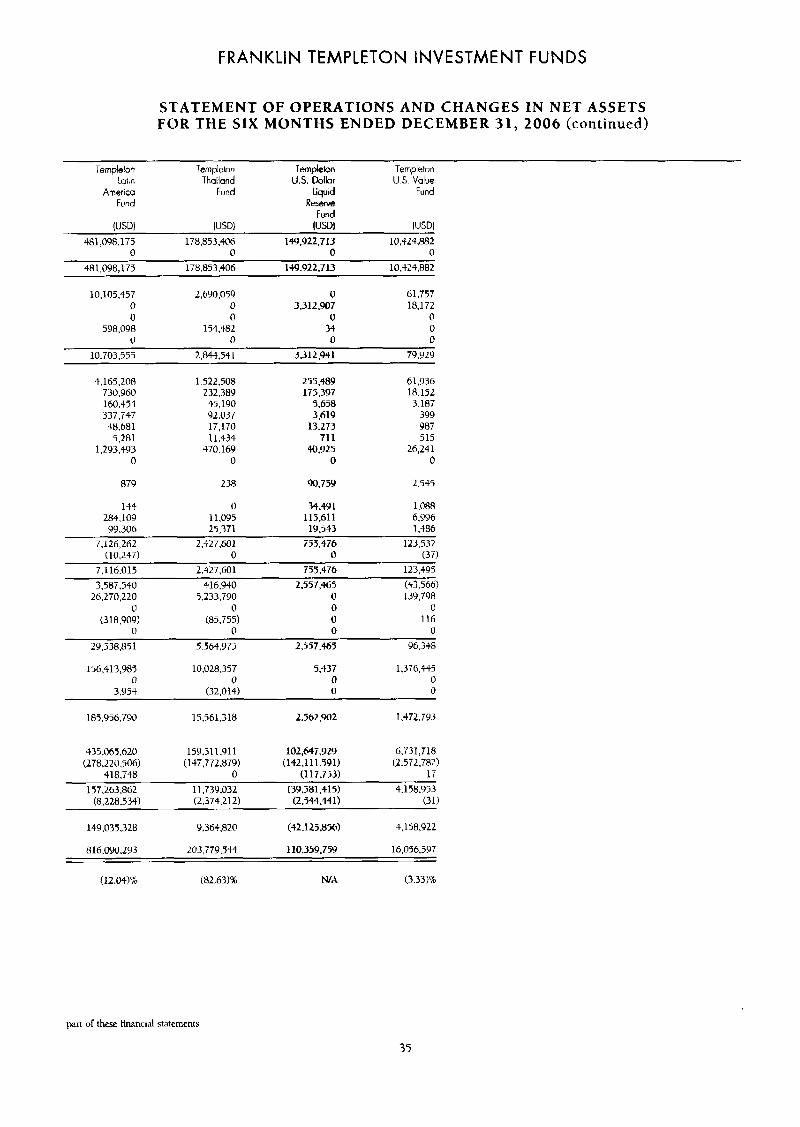
FRANKLIN TEMPLETON INVESTMENT FUNDS
STATEMENT OF OPERATIONS AND CHANGES IN NET ASSETS FOR THE SIX MONTHS ENDED DECEMBER 31, 2006 (continued)
Templeton Templeton Ternpieton Templeton 1at.n Thailand US. Dollar U S Value
America Fund Liquid Fund Furd Rem
Fund IUSDI IUS01 IUSDl IUSDl
~~
481,098,175 178,853.406 14'4.922.713 10,424.882 0 0 0 0
481,098.175 178,853.406 149.922.713 10.$24.882
10.105.457 2,690.059 0 61,757 0 0 3.312.907 18,172 0 0 0 0
598,098 154,482 34 0 0 0 0 0
10.703.555 2.844.541 3.312941 79.929
4,165.208 730,960 160,$54 337.747 48.681 5.281
1,293,493 0
1.522.508 232.380 45,190 92.037 17,170 11,434
470.169 0
255.489 175,397
5,658 3,619
13.273 71 1
40.925 0
61,936 18.152 3.187
399 987 515
26,241 0
879 238 90,759 2.W5
154 0 34.491 1,088 284,109 11,095 1 1 5.61 1 6,996 99.306 25,371 19,543 1,486
7.126,262 2.427.601 753,476 123.532 (10.247) 0 0 (37)
7.116.015 2.327.601 755.476 123,495 3,587,540 416,940 2.557.465 (43.566)
26,270,220 5,233.790 0 139.198 0 0 0 0
(3 18.909) (85,755) 0 116 0 0 0 0
19.j38.851 5.564.975 2.557.465 96.348
156,413,985 10.028.357 5.437 1.376.445 0 0 0 0
3.954 (32.014) 0 0
185,956,790 15,561,318 2.562.902 1.472.T9.?
435 .0h5,620 159.511.911 102,6+4T.9Z9 6.731,718 (278,220.506) (147,772.879) (142.11 1.591) (2,572,782)
4 18,748 0 (117.753) 17 157,263.862 11.73Y.032 (39.581.415) 4.158.953
(8,228.534) (2.374.212) (2,544,441) (31)
149.035.328 9.364.820 (42.1 25.856) 4,158,922
816,090,293 203,779.544 110.359.759 16.056397
(12.04% (82.63)% NIA (333x6
pan of these financial statements
35
FRANKLIN TEMPLETON INVESTMENT FUNDS
NOTES TO THE FINANCIAL STATEMENTS
AT DECEMBER 31, 2006
Note 1 - The Company Franklin Templeton Investment Funds ("FTIF or the "Company") is a collective Investment undenaking permant to Pan 1 of the Luxembourg law of December 20. 2002 relating to collective investment undertakings. a5 amended. and qualifies a5 a societe dinvestissement a capital variable. The Company was incorporated in Luxembourg on November 6, 1990, for an undetermined period. At the date of this report. it offers shares in 54 sub-funds of the Compny (the -'Funds"). The Board of Directors of the Company may authonw the creation of additional Funds in the future with different investment objectives.
The Cornpny aims to provide investors with a choice of funds investing in a wide range of transferable securities on a worldwide basis and featuring a diverse amy of investment objectives. including capital growth and income. The overall objective of the Company is to seek to minimix investment exposure through diversifiwtion and to provide Shareholders with the benefit of a pmblio mJnaRed by Franklin Templeton Investments, according to its successful time-tested investment selection methods.
The following share c k wre hunched effective on Septemkr 1. 2006:
>
> >
> > > >
> 5
> > > > > > > > >
> >
> >
>
>
>
>
> >
r
>
The following share classes were launched effective on October 16. Looh: > >
The following funds were launched effective on November 15. 2ooh: > >
The following share classes wre launched effective on Nowmbcr 23. 2 0 6 :
> > The following share classes were launched effective on December 13. 2 0 M :
> For a Full list of Funds and share c k s r s offend s at December 31, 2006 plear refer to note 13
Franklin Agressive Growth Fund C1w A(acc)cc)EUR. C h A(di5)EIJR. Class C(i1c-c). Class I(acc)EUR. Chss Nacc)EUR
Franklin Biotechnulogy Discovery Fund Class C(acc)
Franklin European Small Mid Cap Fund Class A(acc)USD, C k s I(iicc)USD
Franklin Global Red Estate (Euro) Fund Class A(dis). Class I(dis)
Franklin India Fund Class A(dis)EUR, C h I(dis)EUR
Franklin Technology Fund Class A(acc)EUR. Class C(acc)
Franklin U.5. Small-Mid Cap Grouvth Fund Class I(acc)
Franklin U.S. Total Return Fund Class Kdis)
Franklin Mutual Beacon Fund Clasc I(acc)EUR
Franklin Mutual European Fund CZVS I(&) Franklin Mutual Global Dkxovety Fund Class A(dis)EUfi Class I(dis)ELJR
Franklin Templeton Japan Fund Chis A(dis)EUR Templeton Asian Bond Fund Ckss A(&s)EUR. C k I(dis)EUR
Templeton &iin Growth Fund Class N(acc)EUR
Templeton BRlC Fund Class A(dis)EUR Templeton China Fund Class A(dis1EUR. Class Ciacc)
Templeton Eastern Europe Fund Cks B(acc)USD
Templeton Emerging Mar!+& Bond Fund Class I(dis)
Templeton Eurohnd Fund Class B(acc)USD, Class C(xc)USD. Class I(dis)
Templeton E U T ~ ~ ~ X I Fund Class C(i1cc)USD
Templeton Eurupean Total Return Fund Class I(&)
Templeton Global (Euro) Fund Class B(acc)USD
Templeton Global Bond Fund Class l(di5)EUR. Class N(acc)EUR
Templeton Global Bund (Euro) Fund Class B(acc)USD
Templeton Global Smaller Companies fund Class Bbcc), Cbss C(&=J
Templeton Global Total Return Fund Class A(acc)EUR, Class L(.acc)EUR, Class l(dis)EUR, Chss N(xc)EUR
Templeton Growth (Euro) Fund C : h C(acc)
Templeton Korea Fund Class C(acc). Class I(acc)
Templeton Latin Ameriu Fund Ckss A(di5)EUR C k B(acc). Class C(acd
Templeton Thailand Fund c135s B(acc)
Franklin U.S. Government Fund Class I(m)
Templeton Growth (Euro) Fund Class A(dis)USD
Fra& hian Flex Cap Fund
Templeton A h l u t e &turn (Euro) Fund
Templcton Global Toul Return Fund Class A(dis)GBP
Templeton U.S. Value Fund Class A(dis)GBP
Templeton Global (Euro) Fund Qajs I(acc)EUR-Hedge
36
FRANKLIN TEMPLETON INVESTMENT FUNDS
NOTES TO THE FINANCIAL STATEMENTS
AT DECEMBER 31, 2006 (continued)
Note 2 - Significant amounting polick (a) General
The financial statements are prepad in accordance with the regulations of the Grand-Duchy of Luxembourg relating to investment funds.
(b) Investment in securities Securities ahich are listed on a stock exchange or traded on any other urpnised market are valued at the last available price on such exchange or market ahich is normally the principal market for each security. and thost: securities dealt in on an over-the-counter market are valued in a manner as near as posible tu that for quoted securities.
kcurities not listed on any stock exchange nor traded on any orgmised market are valued at the last wailable price. or if such price is not representative of their Iair value. they are valued prudently and in good faith on the basis of their reasonably foreseeable sales prices. The Company does not own any restricted secutitics. all holding being quoted on an official market, except where otherwise distinguished in each Funds '-Schedule of Investments" in the full version o l the financial statements
During the accounting period under review. gains and losses on investment securitus sold were computed on the average cost bask for all Funds with the cxception of the Franklin High Yield Fund, the Franklin Income Fund and the Franklin US. Government Fund which were computed on the first-in, first-out basis.
During the accounting period under review. discounts and premiums were amonkd to income over the period to maturity, or date sold, if urlier.
For mort&ige-backed and othcr similar holdings with scheduled debt paydowns. the Fund records estimates. based on its historical experience, for anticipated paydmm. Such eaimates ate recorded s a reduction or inctwse to the related holdings 35 didosed on the Schedule of Investments and are included in the related unreakd apprrciatioddeprecition on investments shown on the "Statement of Operations and Changes in Net k c t s " .
(c) Foreign exchange transactions Transactions exprexed in currcncies other than each Funds Lwrrency are translated into each Funds currency at the exchange rates applicable on tht. transaction dates.
k t s and liabilities designated in currencies other than each Funds currency am translated into each Funds currency at the appropriate exchange rates ruling at the pcriod-end. Gam and losses on foreign exchange transactions arc recognised in the -'Statement of Operations and Changes in Net Assets" in &termining the results for the accounting period.
(dl Forward foreign exchange contTBCfS Fonvard exchange mntrxts a 4 valued at the forward rate applicable at the "Statement of Net Assets" date fur the remaining period. until maturity. Gains or losses resulting from fonmd exchange contracts are recogwed in the -'Statement of Operations and Changes in Net &sets".
(e ) Income Dividends are credited to income on their =-dividend date.
Interest income is accrued on a daily basis.
(0 Formation expenses Fomtion expenrs associated nith the launch of the new Funds are expensed as incurred.
(@ Futures contracts The Company m y enter into financial futures contracts to gain exposure to market changes. A financial futures contract is an agreement betwwn twu paniej to buy or xll a security for a Set price on a future date. Required initial margin deposits of cash or sccurities are maintained by a broker in a jcgregated account. Subsequent payments, known as variation margin. are made or received by the Company depending on the fluctuations in the \due of the underlying securities. Such variation margin is accounted for s unrealiid gains or k~sses until the contract is closed. at which timt the pins or losses are reclassified to rcalised gains or losses. Realkd and unrealisd gains and liisses are included in the "Statement of Operatiom and Changes in Net &zts'.
(h) Option mntmcts Options are contracts entitling the holdrr to purchase or sell a spmified number of shares or units of a particular security at a specified price at any time until the conuact-stated expiration date. Options purchased are recorded as investments; options written (sold) are recorded as liabilities. When the exerciq uf an option results in a cash settlement, the difference between the premium ( ~ r i g i ~ l option value) and the settlement proceeds is accounted for as a ruliwd gain or 10s. When securities aw acquired or deliwred upon exercise of an option, the acquisition cost or sale proceeds are adjusted by the amount of the premium. When an option is closed, the differencv between the premium and the cost to clixe the position is accounted fur as a realised gain or loss. W%en an option expires. the premium is accounted for as a realised gain or loss for options written or as a realiwd loss for options purchased. The risks include price movements in the underlying wcurities, the possibility there may be an illiquid options market, or the inability of the muntt-rpanies to fulfil their obligations under the contract.
(i) Synthetic Equity Swaps Synthetic Equity Swaps are customid vehicles that allow intetors to obtain the economic returns of cash investing without actually holding the underlying equity. There xr various Mays to package over-thecounter (OTC) equity exposure e.g. warrants, notes. options combinations and equity swaps. An equity swap is a customid. negotiated contract between the inmxor and a map dealer that prwides the economic exposure to an under1)ing equity or equity-related security. basket of Tecurities or index.
Under a swap agreement. two parties agree to exchange p i c e or total return performance attributahle to a single stock. For example. in a typical long side swap transaction. the im-esror receives the positive performvure plus replicated dividends on the reference equity and pa)3 any negative pedotmance plus a LIBOR-had rate of interest.
37
FRANKLIN TEMPLETON INVESTMENT FUNDS
NOTES TO THE FINANCIAL STATEMENTS AT DECEMBER 31, 2006 (continued)
Note 2 - Significant Mounting polides (continued) (j) lntercst Rate Swaps
Intewt Rate Swap contracts are used to hedge the risk of changes in interest rates and are agreeinents between two parties to exchange cash flows based on a notional principal amount. The net interest received or paid on interest rate swap agreerncnrs i s accrued daily as interest incomdexpensc. Interest VAttl swaps are marked to market daily based upon quotxiom from the mrket makers and the change, if any, is recorded as an unrealized gain or loss in the Statement of Operations. When the s w p contract is terminated early. the fund records a realized gain or loss equl tu the difference between the current net present value and the executed nct present value. Any outstanding interest accrual will be recorded as either a net receivable or net pa)zble.
The risks of interest rate swaps include changes in market cunditions and the possible inability of the caunterpany to fulfill its obligations under the ageement.
(k) Credit Default Swaps A Credit &fault Swap is a credit derivative tmnsaction in which two parties enter into an agreement. whereby one party p a p the other a fixed periodic payment for the specified life of the agreement. The other party makes nu payments unless Q credit event. relating to a pKdetemined reference zwt, occurs If such an event occurs. the pany will rhen make a payment to the first party, and the swap will terminate. The value of the underlying rcuritics shall be taken into account for the calculation of the investment and borrowing powers applicable to individual users.
CIredit default sui~ps are marked to market daily based upon qumations from the market makers and the change in value, if any. is recorded as an unrealizd gain or loss in the Statement of Olxntions. Any payment receiwd or paid to initiate a contract is recorded as a liability or asset in the Statement ol Aswts and Liabilities. &'hen the s w p contract is terminated cxly. the Fund records a realized gain or loss for any payments received or paid. The risks of credit default swaps include unfavorable changes in interest rates. an illiquid vcondary market and the possible inability of the counterparty to fulfill its obligations under the agreement. which mqy be in excess of the amount reflected in the Statement of Asxts and bbilitiFS.
(1) Mortgage Dollar Rolls In a mortgage dollar toll. a Fund sells inongage-backed securitits: for delivety in the cumnt month and simultaneously contracts to repurchase substantially similar (name, type, coupon. and maturity) rcurities on a specified future date. During the period between the sale and repurchase. the Fund foregoes principal and interest paid un the mtmgage-backed securities. The Fund is compensated by the difference between the current sales price and the lower fornard price for the future purchase, as well a by the interest earned on the cash proceeds of the initial d e . Thc difference between the current sales price and the lower forward price is treated as realized g3in.
(m) Securities Lending The Company may lend dected Funds portfolio securities to spffialked banks, credit imtitutions and other financial institutions of high swnding. or through rccugnised clearing institutions such i15 Clearstream ur Euroclear. The lending of securities will be made for periods not exceeding 30 calendar days pro\ided. however. that this limit k not applicable where the Company has the right to termimte the lending contrict at any time and obtain restitution of the securities lenr. ILXIIE will be sccured continuously by collater~l which must be .-approximately equal to 105% of' the value of the global valuation of the securities lent. Lending tmmctions may not be carried out on more than 50% uf the a g r e s t e mrket value of the rcuritics of each Funds portfolio; provided. however, that this limit is not applicable when the Company has the right to terminate the lending contract at any time and obtain restitution of the securitics km. The dividends umed on the colleteral are included in the "Statement of Operations and Changes in Net .4sscts". Any transaction expenses in connection with the loans altl charged tn the concerned Fund.
38
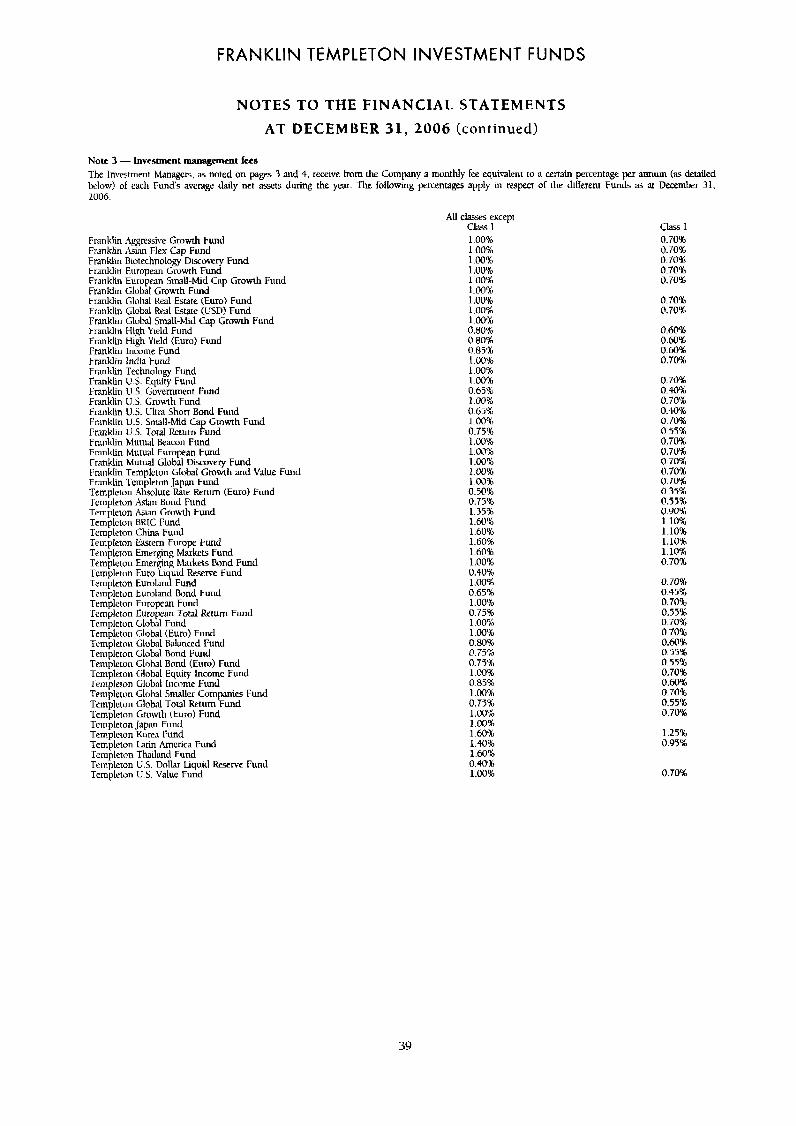
FRANKLIN TEMPLETON INVESTMENT FUNDS
NOTES TO THE FINANCIAL STATEMENTS AT DECEMBER 31, 2006 (continued)
Note 3 - Investment management fees The Investment Managers, a5 noted on pages 3 and 4, receive from the Company a monthly fee equivalent to a certain percentage per annum (as detailed below) of each Funds average daily net awt5 during the ywr. The following perantages apply in respcct of the different Funds as at December 31, 2006.
Franklin Agressive Growth Fund Franklin Aim Flex Cap Fund Franklin Biotechnology Discowry Fund Franklin European Growth Fund Franklin European SmaU-hlid Cap Growth Fund Franklin Global Growth Fund Franklin Glohal Real Esrate [Euro) Fund Franklin Global Real Estate (USD) Fund Franklin Global Small-Mid Cap Crcrwth Fund Franklin High Yield Fund Franklin High Yield (Euro) Fund Franklin Income Fund Franklin India Fund Franklin Technology Fund Franklin U.S. Equity Fund Franklin U.S. Government Fund Franklin u.5 Growth Fund Franklin U.S. Ultm Short Bond Fund Franklin 1J.S. Small-Mid Cap Growth Fund Franklin U.S. Total Return Fund Franklin Mutual Beacon Fund Franklin Mutual European Fund Franklin Mutual Global Dirovery Fund Franklin Templeton Global Growth and Value Fund Franklin Templeton Japan Fund Templeton Absolute Rate Return (Euro) Fund Templetun Asian Bond Fund Templeton h i a n Growth Fund Templeton BRlC Fund Templeton China Fund Templeton Eastern Europe Fund Templeton Emerging Markets Fund Tetnpleton Emerging Markets Bnnd Fund Templeton Euro Li uid Reserve Fund Templeton Eurolanl Fund Templeton Eurolmd Bond Fund Templeton Europan Fund Templeton European Total Return Fund Templeton Global Fund Templeton Gliibal (Euro) Fund Templeton Global Balanced Fund Templeton Global Bond Fund Templeton Global Blind (Euro) Fund Templeton Cilobal Equity Income Fund Templeton Global Income Fund Templeton Global Smaller Companies Fund Tetnpleton Global Total Return Fund Templeton Growth (Euro) Fund Templeton Japan Fund Templeton Korea fund Templeton Latin America Fund Templeton Thailand Fund Templeton U.S. Dollar Liquid k n ~ Fund Templeton U.S. Value Fund
All claws ex( class 1 1.00% 1.00% 1.00% 1.00% 1.00% 1.00% 1.00% 1.00% 1.00% 0.80% 0.80% 0.85% 1.00% 1.00% 1.00% 0.65% 1.00% 0.65% 1.00% 0.75% 1.00% 1.00% 1 .OO% 1.00% 1 .OO% 0.50% 0.75% 1.35% 1.60% 1.60% 1.60% 1.60% 1.00% 0.40% 1.00% 0.65% 1.00% 0.75% 1.001: 1 .oo% 0.80% 0.75% 0.75% 1.00% 0.85% 1.00% 0.7516 1 .00% 1.00% 1.60% 1.40% 1.6016 0.4U%> 1.002
xpt class I 0.70% 0.70% 0.70% 0.70% 0.70%
0.70% 0.70%
0.601 0.60% 0.60% 0.70%
0.70% O.M% 0.70% 0.40% 0.70% 0.55% 0.70% 0.70% 0.70% 0.70% 0.70% 0.354 0.55% 0.90% 1.10% 1.10% 1.10% 1.10% 0.70%
0.70% 0.45% 0.70% 0.57% 0.701 0.70% 0.60% 0.55% 0.55% 0.70% 0.60% 0.713% 0.55% i1.70%
1.25% 0.95%
0.70%
39
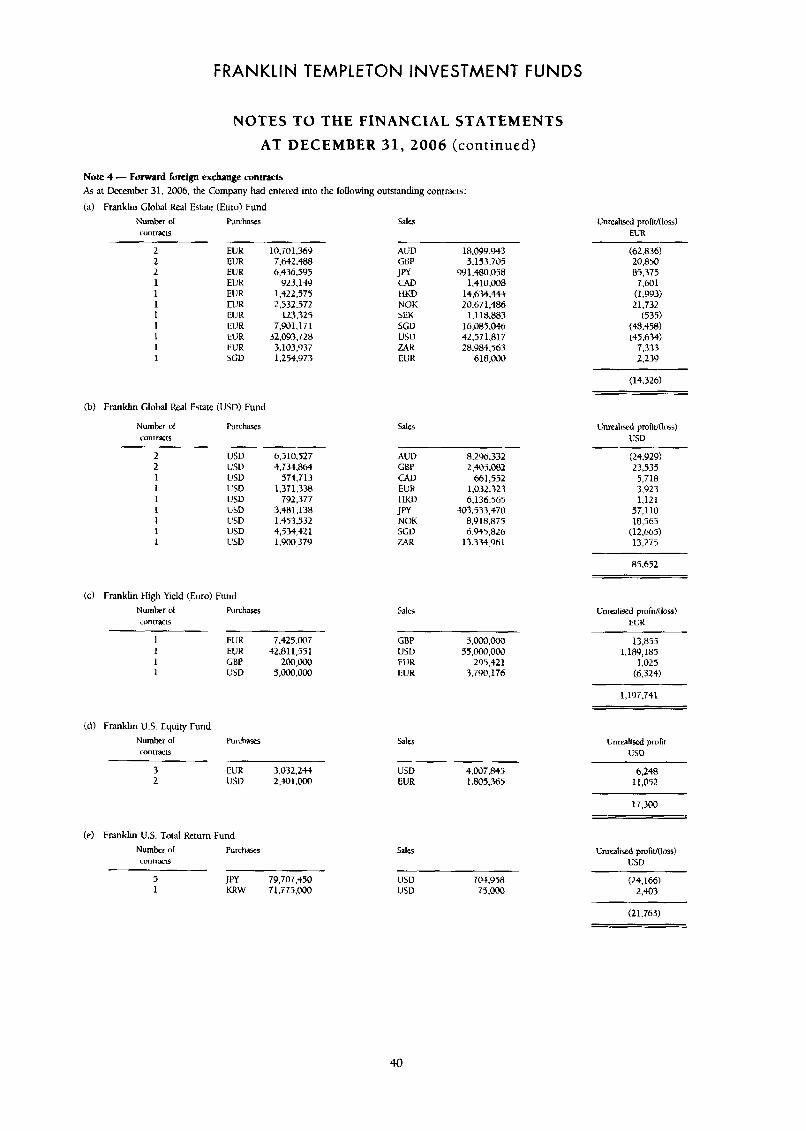
FRANKLIN TEMPLETON INVESTMENT FUNDS
NOTES TO THE FINANCIAL STATEMENTS
AT DECEMBER 31, 2006 (continued)
Note 4 - Forward foreign exchange contracts As at Decemkr 31. 2006. the Company had entered into the following outstanding contracts:
(a) Franklin Global Real Estate (Euro) Fund Number cuntracis
2 2 I 1 1 1 1 1 1 1 1
Purchases
EUK EUR ElJR EUK EUR EUR EUR EUR EUR EUR SCD
(b) Franklin Global Real Estate (USD) Fund
Purchases
10,701,369 7.642.488 6,436.595
Y23.1-W 1.422.575 2.532.572
123.325 7.g01, 17 1
32,097,728 3,103.937 1,254,973
AtiD GBP
CAD t IKD NOK SEK SCV us0 rn EUR
JPY
Sales
18,099.943 5.153.705
99 I .480.058 1.410.008
14.634.444 20,671,486 1.1 15.883
16,065,046 42.571.817 28,984.'163
618,000
(62.836) 20,850
7,601 (1,993) 21.732
(535) (48.458) (45.634)
7.333 2,239
(14.326)
85,375
1 1 1 1
USU 6,510,527 USU +,734.8M usu 574.713 1:SD 1.37 1,378 usv 792.377 USD 7.481.138 USD 1.453.532 usu $,?34,+21 USD 1,900,379
AUV CkP CAD EUK t lKu JW NVK SGU M R
8.296.332 2,403,082
661,552 1,032.323 6,136,565
403.533.470 8.9 18.875 6.945.826
13.334.961
(24.Y29) 23,535 5.718 3.923 1.121
57.110 18,563
(1 2.665) 13.I75
(c) Franklin High Yield (Euro) Fund Nurnhr ul Purchases iontwis
1 EUR 7.425.007 1 EUK 42.811.551 1 GBP 200,ooo 1 U j D 5,000.000
(ti) Franklin U.S. Equity Fund Number uf Purchasfs contracis
3 EUR 3.032.2-H 2 usv 2.w1.000
(e) Franklin U.S. Total Return Fund Nurnhr of Purchases cuntrxis
5 JrU 79,707,450 1 KKW 71.775,M)O
Sales
~
GBP ~,OOO.ooO USD 5 5 , ~ ~ , 0 ~ EUR 295.421 IiUR 3.790,176
USD 4.007.845 EUR 1,805,365
85.652
Unrealised pmfid(loss) ELR
13,855 1,189,185
1,025 (6.324)
1,197,741
Lnrealised proht USD
6,248 1 1,052
17.300
Sales
1lSD 704.958 USD 79.m
(24,166) 2.403
(21.763)
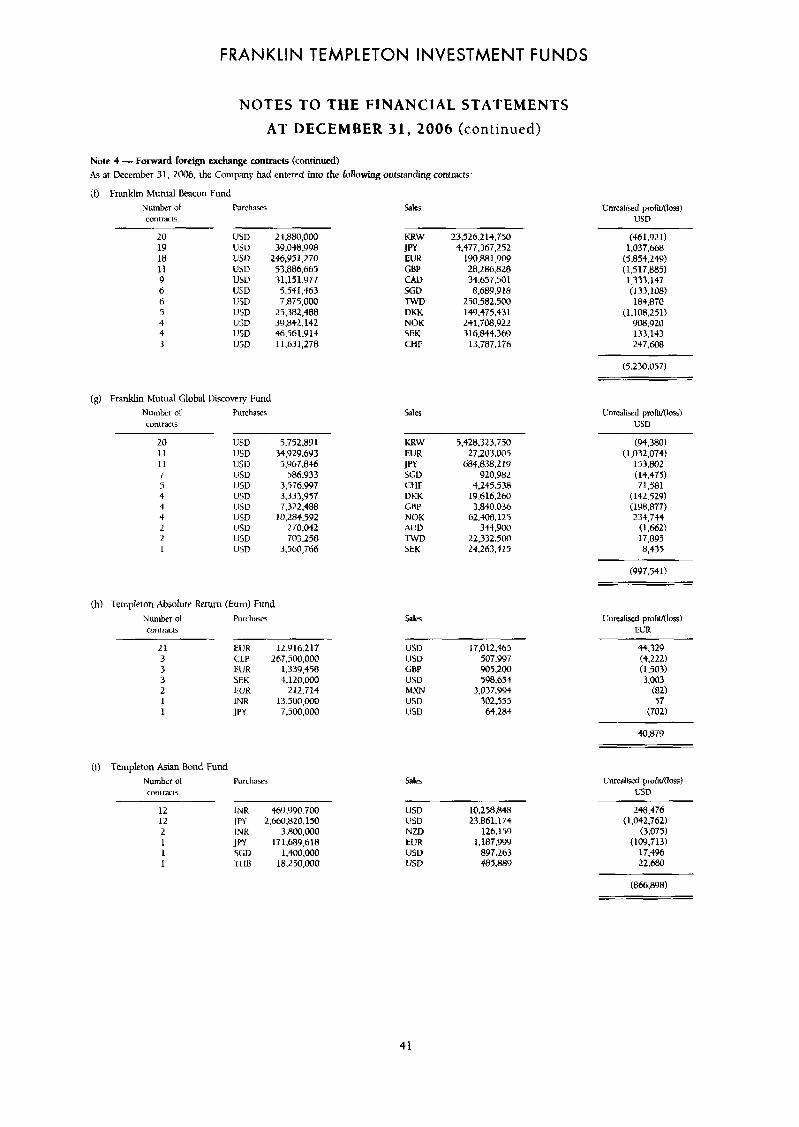
FRANKLIN TEMPLETON INVESTMENT FUNDS
NOTES TO THE FINANCIAL STATEMENTS
AT DECEMBER 31, 2006 (continued)
Note 4 - Forward foreign exchange contracts (continued) As at December 31, 2006, the Company had entered into the fokwing uutstandmg cuntr~ct~'
(t) Franklin hlutual Beacon Fund Number of Purchars %le5 contrxis
20 US13 24,880,000 KRW 23.526.21.t.730 19 USU 39.048998 JR 4,417,367.252 18 USD 246.Y51.270 EUK 190,861,909 11 USD 53.886.665 GBP 28,286,828 9 USD 31,151,977 CAD 34,657,501 6 USD 5.541.463 5GD 8,689,918 6 USD 7,875,000 TWD 250.582.500 5 USD 25,382,488 DKK 149.475.431 1 USU 39.842.142 NOK 231.70R.922 4 USD 46.561.914 5EK 316,844.369 3 USD 11,631,278 CHF 13,787,176
(g) Frankl~n Mutual Global Discoveq- Fund Number 01 furchases conlracls
20 usv 5,752.891 11 USD 34.929.693 11 us11 5,W7,8* 7 1ISU 586.933 5 USD 7,576,997 4 USD 3.333,957 4 Uju 7.322.488 4 USD 10,284.592 2 l!SU 210.042 2 USD 703,258 1 USD 3,560,766
(h) Templeton Absolute Return (Euro) Fund Number of Con 1 m-Ls
21 3 3 3 2 1 1
- Purchaws
EUR 12,916.217 CLP 267.500.000 EUR 1,339,498 SEK 1,120,000 EUK 212.714 LNR 1.3,500,000 JPY 7,500.000
(I) Templeton Asmn Bond Fund
conirxis Numbcr 01 I'urchaws
12 INR 4hY.990.700 12 JPY 2,660,820,150 2 INK 3,800,000 1 JPY 171,689,618 1 SGV 1,400,000 1 11 LE 18,250,000
Sales
KRW EUR J PY SGU CHF DKK C.BP NOK AlJU W D SEK
tiSV USD GBP usv MXN USD 11SD
5,428.323.750 27,203.005
684.838.2 19 920,982
4,245.538 19,616,260 3,840.036
62.508.125 344,900
22,332.500 24.263.415
17.012.465 507.997 905.200 598,654
3,037,994 302.555 64,284
Cnrealixd pmfifloss) CSD
(46 1 .92 1) 1,037,668
(5,854,249) (1,517,885) 1,333,147
( 1 33,108) 184,87@
(1.108.251) 908,920 133.143 247,608
(4.230.057)
(94,380) (1,032,074)
153,802 (14.475) 71.581
(142.529) (198,877) 231.744
(1,662) 17,895 8,435
(YYi.541)
Uiirealised proliVrloss) ECR
44,329 (4,222) (1.503) 3.003
(82) 55
(702)
40,879
USD 10.258.848 VSU 23.86 1.174 NZD 126,159 EVR 1,187,999 USD 897.263 USD 485.889
248.476 (1,042,762)
(3.075) (1OY.713)
17,496 22.680
(866,898)
41
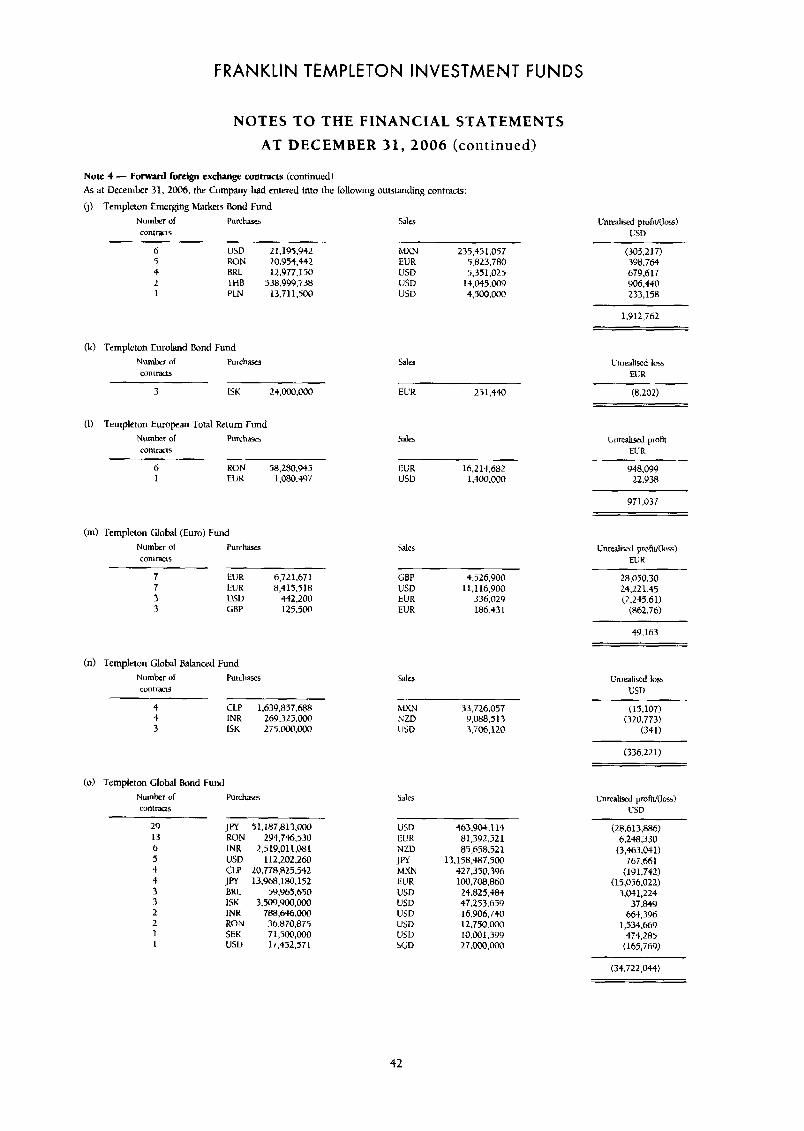
FRANKLIN TEMPLETON INVESTMENT FUNDS
NOTES TO THE FINANCIAL STATEMENTS AT DECEMBER 31, 2006 (continued)
Note 4 - Fornard foreign exchange mntracrs (contmued) As at December 31, 2006. the Cnrnpany had entered into the lollowng outstanding contracts.
(1) Templeton Emergng hlarkets Bond Fund Number of Furchases 5ales LuntracLs
6 USD 21.195.042 MXN 235.45 1.057 5 RON 20.Y54.442 EU R 5323,780 4 RRL 12.U77.150 USD 5,351,025 2 THB 538.999.738 USD li.045.009 1 PLN 13.711.500 USD 4.500.000
(k) Templeton Eurohd Bond Fund Nambtr of Purchases conirxts
3 ISK 2+.000.000
0) Templeton European Total Return Fund Nuinher ol Purchdvs coniratis
b RON 58.2xO.945 1 EU K 1,080.i97
(m) Templeton Global (Euro) Fund Number ol Purchars coniraa5
7 EUR 6,721.671 7 LUR 8,415,518
3 GRP 125.500 3 USL) 442,200
(n) Templeton Global Balanced Fund Number of Purchases cuntracls
4 CLP 1,639.897.CIHR 4 INR 269.325.000 3 ISK 275.IY?(1.000
(0) Templeton Global Bond Fund Number of tYlK-haScS conincis
29 JW 51.187.813.000 13 KON 294.746.530 6 INR L.519,011,081 5 USD 112,202,260 4 CLP 20,778,825.542 4 JI’Y 13.94S8.180,152 3 HkL 59,965.650 3 ISK 3,509.900,000 2 INR 788,696,000 2 RON 36,870,875 1 SEK 71,500,000 1 US0 lT.452.571
Salrs
E L K 151.440
Sales
~~
I X R 16,214,682 usu 1,400,000
Sales
GBP 4.526.900 USD 11.1 16,900 EUK 336.029 EUR 186.431
Sales
hlXN 33,126,057 KZD 9,088,513 11513 3,706,120
Sales
- USD EL’R NZD JR MXN EUR USD usu U5D U5D usu SGV
463.904.1 1.t $1,392,521 89,658,521
13.148,487,500 t27.350.3Y6 100.708,RhO 24.825.484 47.253.639 16.906.740 12,750.000 10.001.399 27,000,000
(305,217) 398.764 679,617 YO6.440 233,158
1,912,762
Unrealrsed loss EVR
(8.202)
Lnrealird profit EUR
948.099 22.Y3a
Cnrealiwrd profid(luss) EUR
28.050.30 24,221.45 (2.255.61) (862.76)
49.163
Unrealiwed loss USD
(15.107) (320,773)
(341)
(336.221)
Unrealird pmfit/(losss) LSD
(28.613386) 6,248,330 (3,463.Wl) 767.661 (191.742)
(15,056,022) 3.041.224
37.849 664,396
1,534.669 474.285 (165,769)
(34,722,044)
42
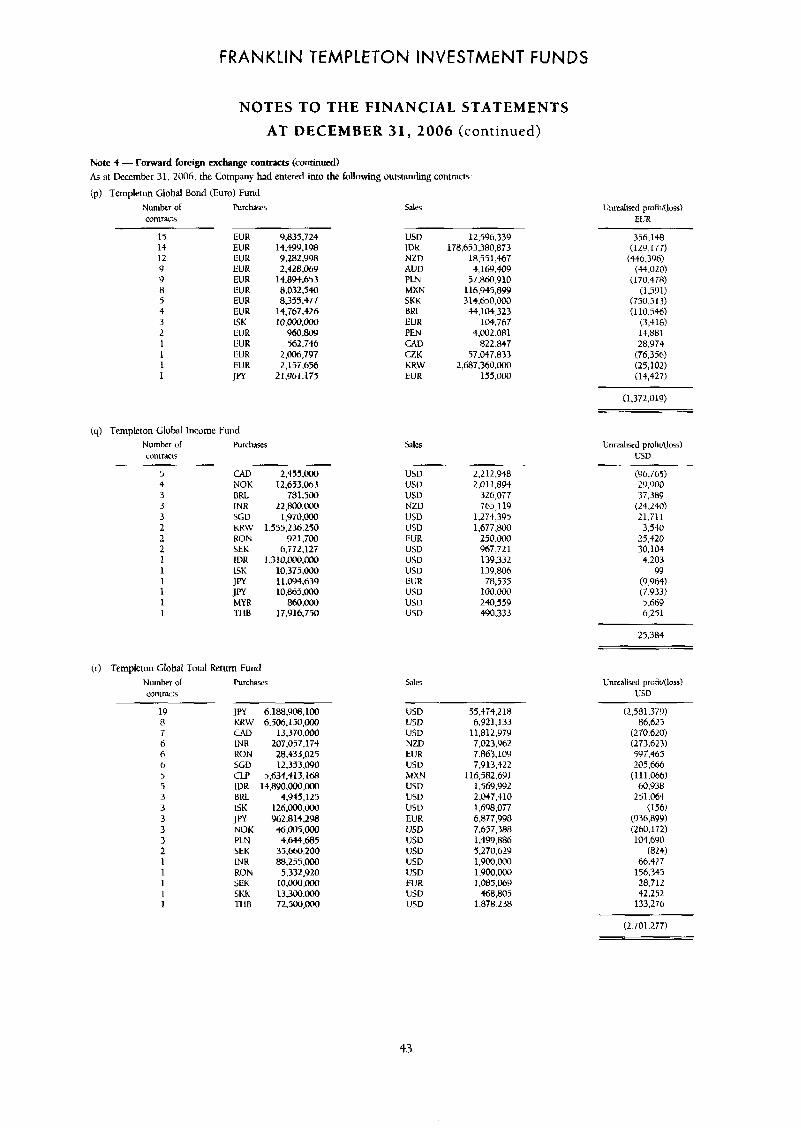
FRANKLIN TEMPLETON INVESTMENT FUNDS
NOTES TO THE FINANCIAL STATEMENTS
AT DECEMBER 31, 2006 (continued)
Note 4 - Forward foreign exchange coniiacts (continued) As at December 31. 2006. the Company had entered into the following outstanding contracts:
(p) Templeton Glohal Bond (Euro) Fund Number of Purchases Sales contracts
15 EUR 9.835.724 US0 12,4Y6.339 15 EUR 14,4!29.198 IDK 178,653,360,873 12 ElJK Y.282.998 NZD 18,551,467 9 EUR 2.428.069 AUD 4.169.409 9 EUR 14,8W.b53 PLN 57,860,910 8 IiUR 8.032.540 MXN 116,945,89Y 5 EUR 8,345.477 5KK 314,650,000 4 EUK 14.767.426 BHL 44,104,323 3 1SK 1o.m.o0O EUR 1lW.767 2 IilJR 960.809 PEN 4,002.081 I EUR 562,746 CAD 822,847 I EUR 2,006,797 C2K 57.047.833 1 EUR 2,157,656 KRW 2,687.360.000 1 JPY 21,961.175 EUK 155.000
(4) Templeton Global Incume Fund Nurnher of Purchaxs conir.+c[s
5 CAD 2,455.000 4 NOK 12,653,abl 3 BRL 781.300 3 INH 22,800.000 3 SG v 1,97O.OMI 2 KKW 1,555.236.250 2 RON 921,iW 2 SEK h.772.12i 1 IDR 1.31O,ooO,OOO 1 ISK 10.375.000 1 J PY 1 1,094,639 1 JPY 10,864,OOO 1 MYR 86O.OOO 1 T I IB 17.916.i50
(r) Templeton Global Total Return Fund Number 01 conim-ts
19 8 7 6 6 6 5 5 3 3 3
~ ~
IPY h.188,9@$.100 KKW 6.506.150,oOO CAD 13,370,000 INR 207.057.174 KON 28.433.025 SGD 12,353.090 CLP 5,634.41 3 . 1 H IDK 14,890.aM.000 BKL 4,945,115 ISK 126,000,000 JPY 962114.298 FiOK 46.005,OOO P W 4.644.685 SEK 35.660.200 LNR 88.255.000 RON 5.332.920
SKK 13.3W.000 -1.1 IB 72.500,WO
5EK 1O.ooO.OOO
Unrcalised profit/(luss) ECR
356.148 (129.17i)
(446.3136) ($4.020)
(170,478) (1.591)
(750.5 13) (1 10.546)
(3,418) 14.881 28,974
(76,356) (25,102) (14,427)
(1,372,019)
Sales
USD usv USU NZD 115D USD EUR USV USV usu EUR US0 USU USD
Sales
- USD USD USU NZD EUR usu MXN USD USD usv EUR USD US11 11so USD USD EUR USD USD
2.2 12.948 2,011,894
326,077 765,119
1,274,395 1,677,800
250.000 967,721 139,332 139,806 78,535
1W.OOO 240,559 490.333
55,474.218 6.92 1,133
1 1.81 2 ,Y 79 7.023.Y62 7.863.109 7.913.422
116,582,691 1,569,996 2.CW7.410 1,698,077 6.877.998 7.657.388 1.499.886 5,270,629 1,9W.000 1.Y00,ooo 1 .OH5.069
468.805 1.878.238
(96,765) 29.900 37.389
(24.240) 21,711 3,540
25,420 30.104 4,203
99 (9,964) (7.933) 5,669 6,251
25.384
(2,581.37'4) 86.625
(270,620) (273.623) 597.465 205,666
(111,Oab) 60.938
231.064 (156)
(936.8YY) (260.172) 104.6YO
(824) 66.427
156.345 28,712 42.252
133,276
(2.701.277)
43
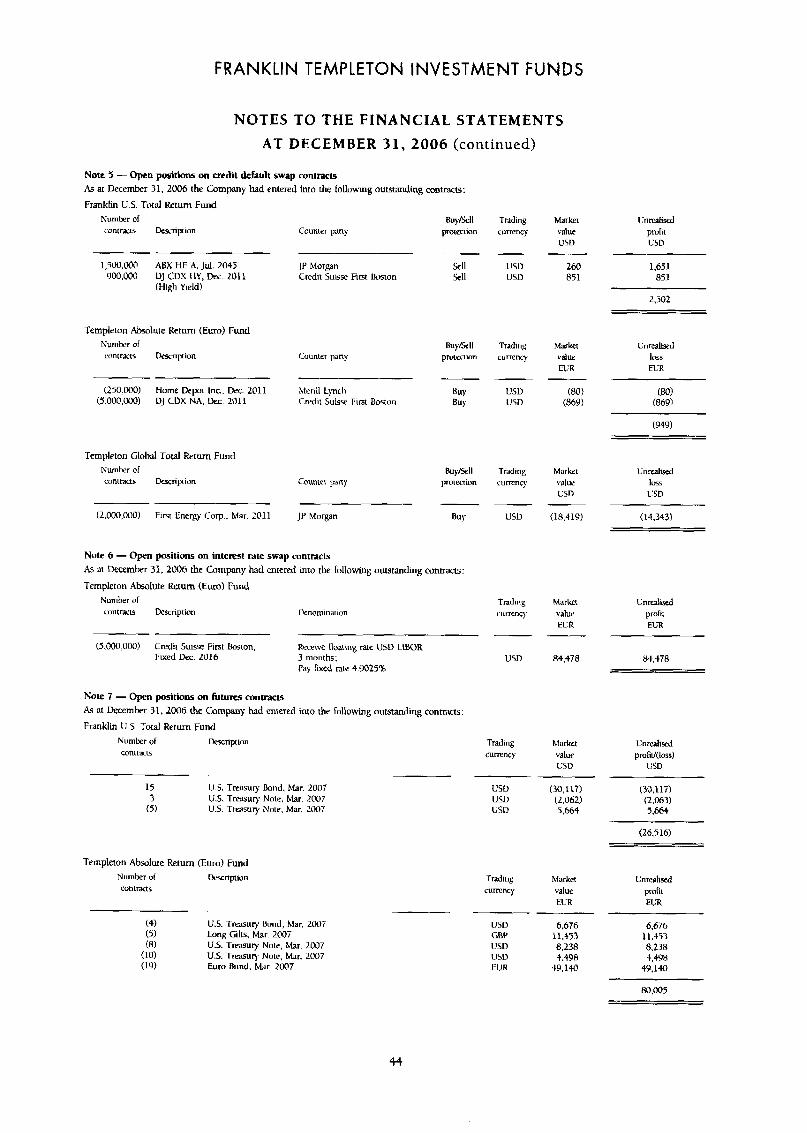
FRANKLIN TEMPLETON INVESTMENT FUNDS
NOTES TO THE FINANCIAL STATEMENTS AT DECEMBER 31, 2006 (continued)
Note 5 - open positions on credit default swap contracts As at December 31, 2006 the Company had entered into the folluuing outstanding contracts:
Franklin U.S. Total Return Fund
cuntrxis Descripiion Number of
1,500.00(1 900.000
ABX HE A. Jul. 2045 UJ ZDX ILY, Dec. 2011 (High Yield)
Templeton Absolute Return (Euro) Fund Number of contrxts [kaription
(250.000) (5,000,000)
Home Depot Inc.. Dec. 2011 DJ CUX NA. Uec. 2011
Templeton Global Total Return Fund Numher 01 conirdcis Dcrripiiun
(2,000,000) Firs1 Energy COT., Mar. 2011
Counier pan)-
JP Morgan Credit Suisse First krston
Counter p a y
Mcnll Lynch Cwdit Suisw: First Boston
Counier pans
~
JP Morgan
Note 6 - Open positions on interest rate swap contracts As at December 31, 2006 the Company had entered into the following outstanding contracts:
Templeton Absolute Return (Euro) Fund Number of cuntwts Dew-ription Dcnominauon
(5,000,000) Cmdit Sui= First tkmon, Keceivc noatinp rate USD LIBOR Fixed Uec. 2016 3 months;
Pay fixed rate 4.9025%
Note 7 - Open positions on h t u m contracts As at December 31. 2006 the C-ompany had mtmd into the following outstanding contracts'
Franklin U.S. Total Return Fund Numkr of lkxriptiun coniwts
15 3 (5)
U.S. T ~ ~ u r y Bond. htar. 2007 U S . Treasury Nole. Mar. 2007 U.S. Trebsury Note. Mar. 2007
Templeton Absolute Return (Euro) Fund Number of kscnption cuniracts
(4) (5) Long Gills. Mar. 2007 (8)
(10) (19) Euro Bund. Mar. 2007
US. Irasury Bond, Mar. 2007
U.S. Treasury Note, Mar. 2007 U.S. '1-reasui-y Note. Mar. 2007
Trading currenq
USD USD
Trading currency
USU USD
Trdding cumnc)
USD
Trading currency
USD
Trading currrnc)
Markci value USD
260 851
Market value EUR
(80) ($69
Markrt value CSD
(18.419)
Markci value FIX
84.478
Market value 1:sD
US0 (30,117) USD (2.062) USD 5.664
Unrcalised prolit US0
1.651 85 1
2.502
Unrealid Ims ELK
(m (869)
(949)
Unrulised luss USD
(14,343)
Cnmlixd profit EUR
84,478
Unrealird
LSD prufil/(loss)
~
(30.113 (2.063) 5,664
(26,516)
Trading cumncy
USD GBY USD USD EUK
Markci value ELR
6.676 11,453 8,238
49.140
-
4,498
Unrealid prolii EUR
6,676 11,453 8,238 4.498
4Y,140
80.005
44
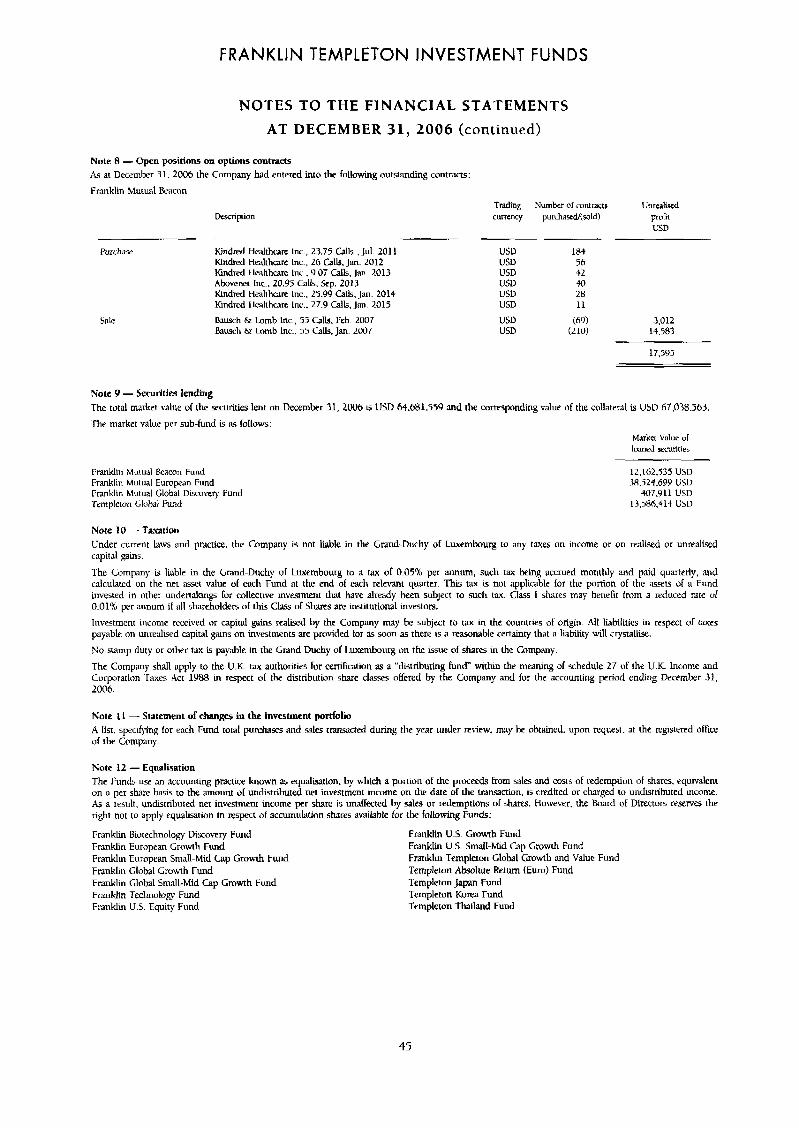
FRANKLIN TEMPLETON INVESTMENT FUNDS
NOTES TO THE FINANCIAL STATEMENTS AT DECEMBER 31, 2006 (continued)
Note 8 - Open positions on options contracts As 3t December 31. 2006 the Company had entered into the following outstanding contmcts:
Franklin Mutual Beacon
Dexnpiuri
Purchase Kjndrrd liealthwre LIE, 23.75 Calls . Jul. 201 I Kindred Healthare Inc., 26 Calls. Jan. 2012 Kindred Ilealthare Inc.. Y - O i Calls. Jan- 2013 Ahvenet Inc.. 20.95 Calk, Sep. 2013 Kindwd €kalihc;ire lnc., 25.99 Calls, Jan. 2014 Kindred I lealthure lnc.. 27.9 Calk., Jan. 2015
husch & Lomb Inc., 55 Calls. I:& 2007 Bousch 6r Lomb lnc.. 55 fills, Jan. 2007
Sale
Trading cumncy
usu USD USD VSD 1JSD USD
US0 USD
Number or contracts Unreal id purchmed/(wld) profit
USD -
184 56 42 40 28 11
(69) (210)
3,012 14.583
17,595
Note 9 - Securities lending The total market value of the rcurities lent on December 31, Lo06 is USD 64.681.559 and the corresponding value of the collateral is USD 67,038363. 'The market value per sub-fund is a5 follows:
Market Value o l loaned wcuniies
1:ranklin Mutual Beacon Fund Franklin hlutual European Fund Franklin Mutual C;lobal Discovev Fund Templeton Global Fund
12,162,535 USD 3R.524.69V USD
407.Y 11 USD 13.586.414 USD
Note 10 - Taxation Under current laws and practice. the Company is not liable in the Grand-Duchy of Luxembourg to any taxes on income or on realised or unxalised capital gains. The Company is liable in the Grand-Duchy of Luxembourg to a tax of 0.0516 per annum, such tax being accrued monthly and paid quarterly, and calculated on the net asset value of each Fund at the end of each relevant quarter. This tax is not applicable for the portion of the ZLWLS of a Fund invested in other undertahgs lor collective investment that have already been subject to such tax. Class I shares may benefic from a reduced rate of 0.01% per annum if all shareholders of this Class of Shares are institutional investors.
Investment income received or capital g a i ~ realwd by the Company may be subject to tax in the countnes of origin. All liabilities in respect of taxes payable on u n r a l i d capital gains on investments are pmvided for as soon 35 there is a reasonable certainty that a liability will crystallisr.
No stamp duty or other tax is payable in the Grand Duchy of Luxembourg on the issue of shams in the Company.
The Company shall apply to the U.K. tax authorities for certification as a "distributing fund" within the meaning of schedule 27 of the U K . Income and Corporation Taxes Act 1988 in respect of the distribution share c k ! offered by the Company and for the accounting period ending December 31, 2006.
Note 11 - Statement of changes in the investment portfolio A list. specifying for each Fund total purchases and d e s transacted during the year under review. may be obtained. upon request. at the registered oflice of the Company.
Note 12 - Equalisation The Funds use an accounting practice known as equalisation, by which a portion of the proceeds from sales and costs of redemption of shares. equi\.aknt on a per share h35k tu the amount of undistributed net investment income on the date of the transaction. is credited or charged to undistributed income. As a result. undistributed net investment income per share is u d w t e d by sales or redemptions of shares. However, the Board of Directors reserves the right not to apply equalisation in respect of accumubtion shares available for the following Funds:
Franklin Biotechnology Dixowq- Fund Franklin European Growth Fund Franklin European Small-Mid Cap Growth Fund Franklin Global Growth Fund Franklin Global Small-Mid G p Gmwth Fund Franklin Technology Fund Franklin U.S. Equity Fund
Franklin U.S. Growth Fund Franklin U.S. Small-Mid Cap Growth Fund Franklin Templeton Global Gmwth and Value Fund Templeton Absolute Return (Euro) Fund Templeton Japan Fund Templeton Korea Fund I'empleton Thailand Fund
45
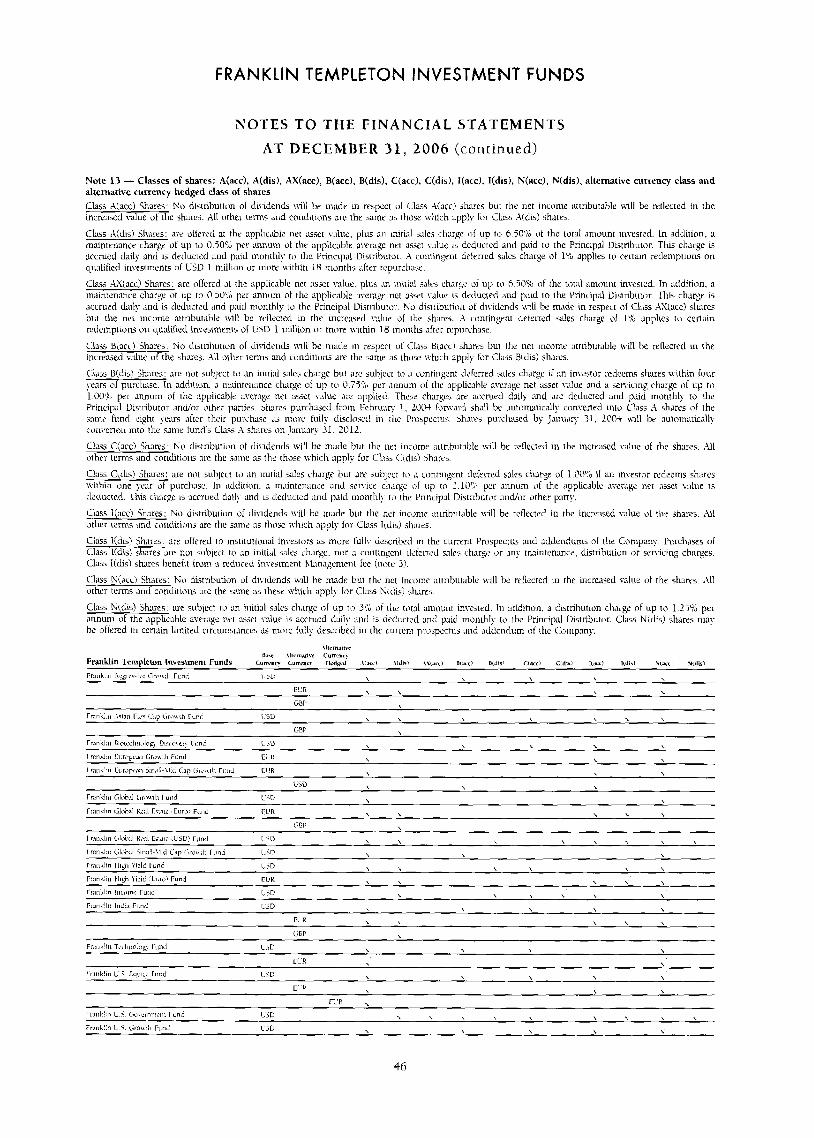
FRANKLIN TEMPLETON INVESTMENT FUNDS
NOTES TO THE FINANCIAL STATEMENTS AT DECEMBER 31 , 2006 (cont inued)
CI K \ \
46
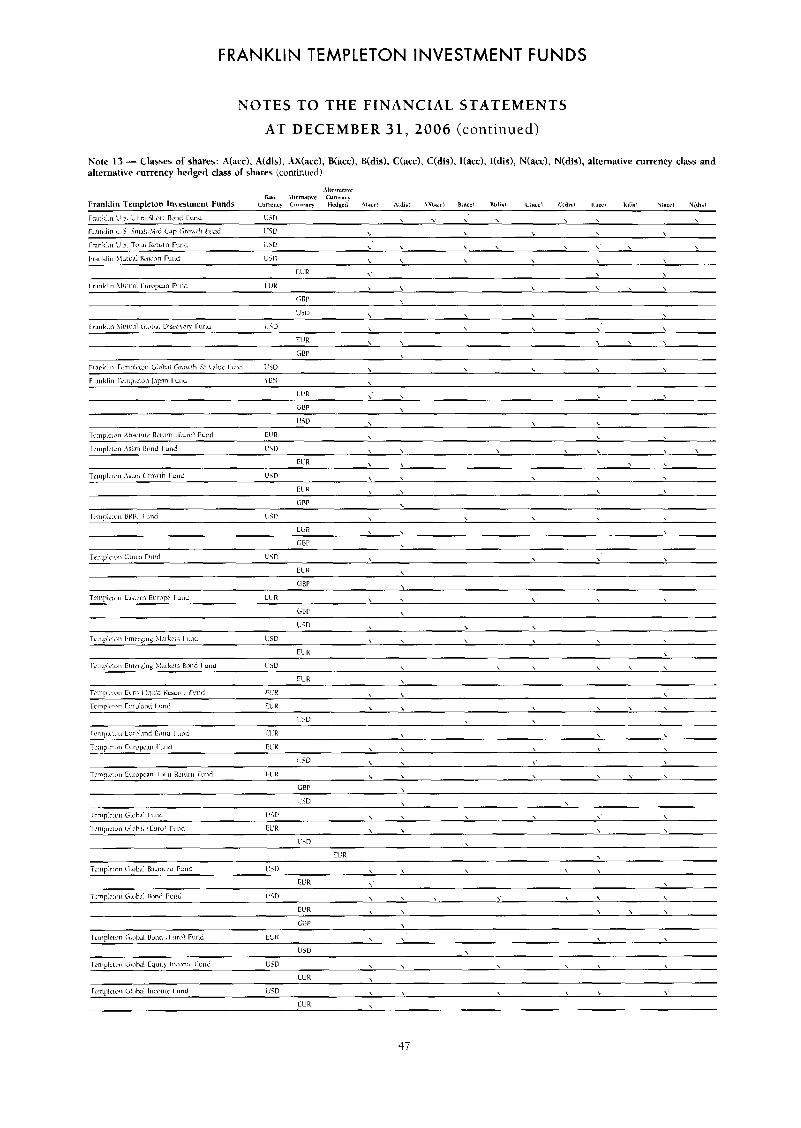
FRANKLIN TEMPLETON INVESTMENT FUNDS
NOTES TO THE FINANCIAL STATEMENTS
AT DECEMBER 31, 2006 (cont inued)
I I ' R \ \ \ \
1L R \ ,
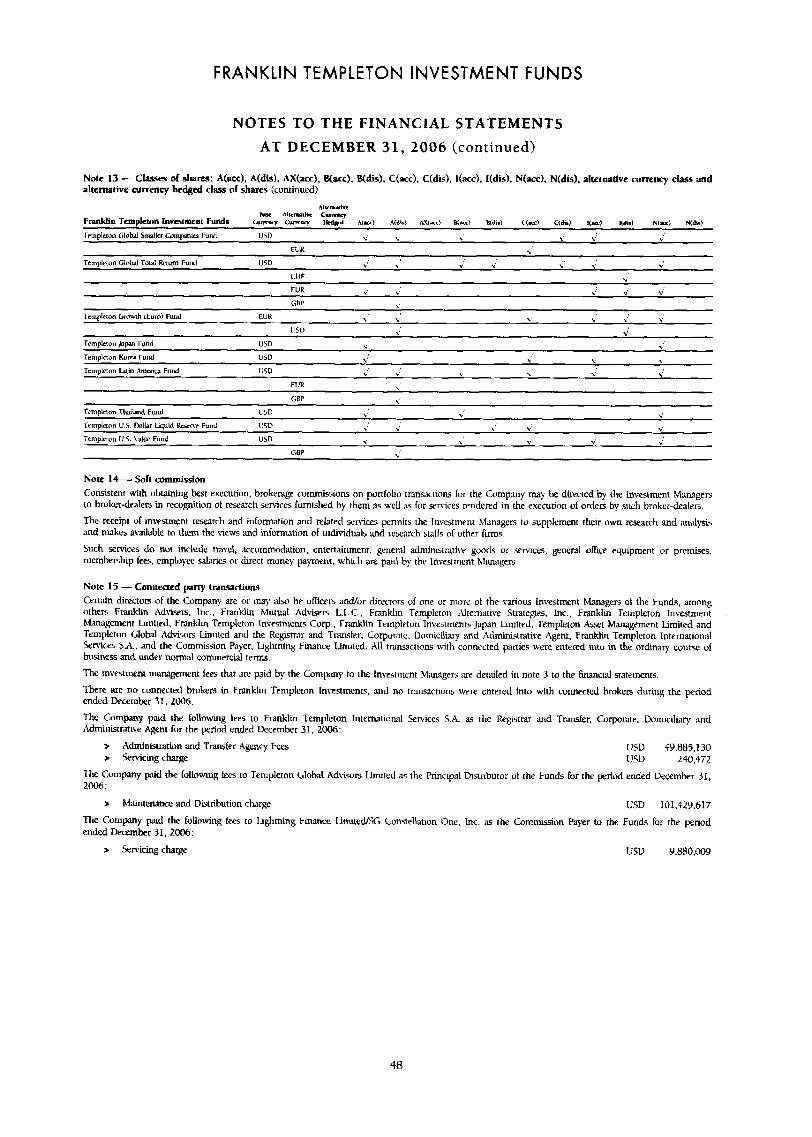
FRANKLIN TEMPLETON INVESTMENT FUNDS
NOTES TO THE FINANCIAL STATEMENTS AT DECEMBER 31, 2006 (continued)
Notc 13 - Classes of shares: Acacc), A(dis), AX(acc), Et(acc), B(dis), C(ncc), C(dis), I(acc), I(dis), N(acc), N(dis), alternative currency class and alternative currency hedged class of shares (continued)
A I u M ~ blu Ahcmstlrr Cu-
Franklin Tcmpkton InvCSLment Funds ( Y ~ I I T cumw 1- M-) A(&) AWarri B tx l i YLd C ( r c l U d d I(-) Kdid N ( u 1 N(db)
Tcrnpleian tilobdl Smaller Grrnpmtes fund IJrD , \ \ x' \
CUR \
Ttrnplrron Glohl T w l Rnurn Fund USD \ \ b \ \
CllF
Trrnpleion Japan Fund U5D \ \'
Tenipleton Kum Fund U5D \' V
Trrnnlcron Latin .Amcnca Futd us0
Templrton U.S. \due Fund USD \' v
GDP
Note 14 - Soft commission Consistent with obtaining best execution, brokerdge commissions on portfolio transactions for the Company niy be directed by the Investment Managers to broker-dealers in mugnition of restarch senices furnished by thmi ils well ZLS for W ~ ~ C F S rendered in the execution of orders by such broker-dealeE.
The receipt of inwstment re.wrch and information and related wnices pennits the Investment Managers to supplement their own research and annalysii, and makes amkible to them the views and infomation of individuals and rexarch staffs of other firms. Such senices do not include travel, accommodation. entertainment, general administrative goods or services, general office equipment or premises, membership fee. employee uhries or dmct money payment, which are paid by the Investment hiamgem
Note 15 - Connected party transactions Certain directors of the Company are or may a h be offices and/or directors of one or more of the various Investment hianagers of the Funds, among othefi Franklin Advkun. lnc., Franklin Mutual Advisers L.L.C.. Franklin Templeton Alternative Strategies, Inc.. Fnnklin Templeton Investment Management Limited, Franklin Templeton Investments Cop.. Franklin Templeton Investments Japan Limited. Templeton k w t Management Lmited and Templeton Global Advisors Limited and the Registmr and Transfer, Corporate. Domiciliary and Admin*trdtive Agent, Franklin Templeton International Senvices 5.A.. and the Commission Pay-er. Lightning Finance limited. All tramctiom with connected paaies were entered into in the ordinary coutse of business and under normal commercial terms.
The investmrnt management fees that dre paid by the Company to the Investment Managers are detailed in note 3 to the fmncial statements.
There are no connected brokers in Franklin Templeton Inwmnents. and no transactions were entered into with connected brokers during the petiod ended December 31.2006.
fhe Company paid the following fees to Frilnklin Templeton International Services S.A. a the &@trar and Transfer, Corporate. Domiciliary and Administrative Agent for the period ended Bcember 31, 2006:
> > Senicingcharge
Administration and Transfer Agency Fees USD 49,889.130 USD 240,472
?he Company p i d the following fees to Templeton Cilobal Adviwrs Limited as the Principal Distributor of the Funds for the period ended December 31, 2006:
> Maintenance and Distribution charge USD 101,429.617 The Company paid the following fees to Lightning Finance LimitecWG Constellation One, Inc. as the Commission Payer to the Funds for the period ended December 31. 2006:
> Senicing charge USD 9,880,009
48
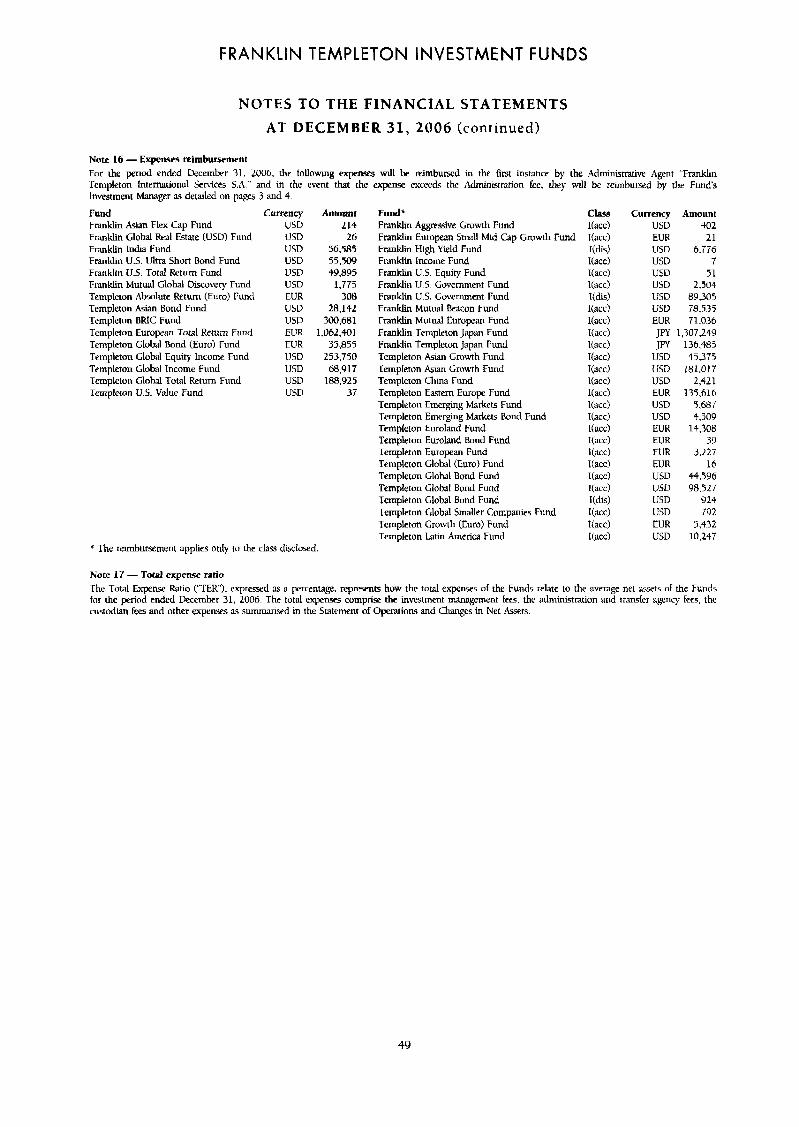
FRANKLIN TEMPLETON INVESTMENT FUNDS
NOTES TO THE FINANCIAL STATEMENTS
AT DECEMBER 31, 2006 (continued)
Note 16 - Expenses reimbursement For the period ended December 31. 2006. the following expenses will be reimbulsfd in the first instance by the Mministntive Agent '-Franklin .Templeton International Senices SA." and in the event that the expense exceeds the Administration fee, they will be reimbursed by the Fund's lnve&ment Manager as detailed on pages 3 and 4.
Fund Currency Franklin Asian Flex Cap Fund USD Franklin Glohal Real Estate (USD) Fund USD Franklin India Fund USD Franklin U.S. Illtra Short Bond Fund G'SD Franklin U.5. Total Return Fund USD Franklin Mutual Global Discovery Fund USD Templeton Abwlute Return (Euro) Fund EUR Templeton Asian Bond Fund USD Templetiin B R K Fund USD Templeton Europcan Total Return Fund EUR Templeton Global Bond (Euro) Fund EUR Templeton Global Equity Income Fund USD Templeton Global lncome Fund USD Tmpkton Global Total Return Fund USD Templaon U.S. Value Fund USD
AmOUUt 214 26
56.585 55.509 49.895
1,775 308
28.142 300,681
1 ,062.4Ol 35.855
253.750 68,917
1 R8.92 5 37
* The reimburwment applies only to the class disclosed.
F d f Franklin Aggressive Growth Fund Franklin European Small-Mid Cap Gmwth Fund Franklin High Yield Fund Franklin Income Fund Franklin U S . Equity Fund Franklin U.S. Government Fund Franklin U.S. Government Fund Franklin Mutual Beacon Fund Franklin Mutual European Fund Franklin Templeton Japan Fund Franklin Templeton Japan Fund Templeton Asian Growth Fund Templeton Asian Growth Fund Templeton China Fund Templeton Eastern Europe Fund Templeton Emerging Markets Fund Teinpleton Emerging Markets Bond Fund Templeton Euroland Fund Templeton Euroland Bond Fund Templeton European Fund Templeton Global (Euro) Fund Templeton Global Bond fund Templeton Global Bond Fund Templeton Global Bond Fund Templeton Global Smaller Companies Fund Templeton Growth (Euro) Fund Templeton Latin America Fund
Class I(accj I(acc) [(dis) I(acc) I(acc) I(accj I(dis) I ( a d ICACCj I(acc) I(acc) I(acc) I(acc) I(acc) I(acc) Itacc) I(acc) I(acc) I(acc) l(acc) I(acc) Kacc) I(acc) I(&) I(acc) t(acc) I(acc)
Currency Amount USD 402 EUR 21 USD 6.776 USD 7 USD 51 USD 2,504 USD 89.305 USD 78.535 EUR 71.036 JPY 1,307,249 JW 136.483
USD 45.373 USD 181.017 USD 2,421 EUR 13S.616 USD 7,687 USD 4.509 EUR 14,308 EUR 39 EUR 3.227 EUR 16 U5D 44.596 USD 98.527 USD 924 USD 792 EUR 5.432 USD 10,247
Note 17 - Total expense ratio The Total Exprnse Ratio ("TER"), expressed as B percentage. rep-ts how the total expenses of the Funds relate to the average net i sse ts of the Funds for the period ended kcember 31, 2006 The total expenses comprise the investment management fees. the adminlstration and transfer agency fees, the custodian fees and other expenses as summarised in the Statement of Operations and Changes in Net Assets
49
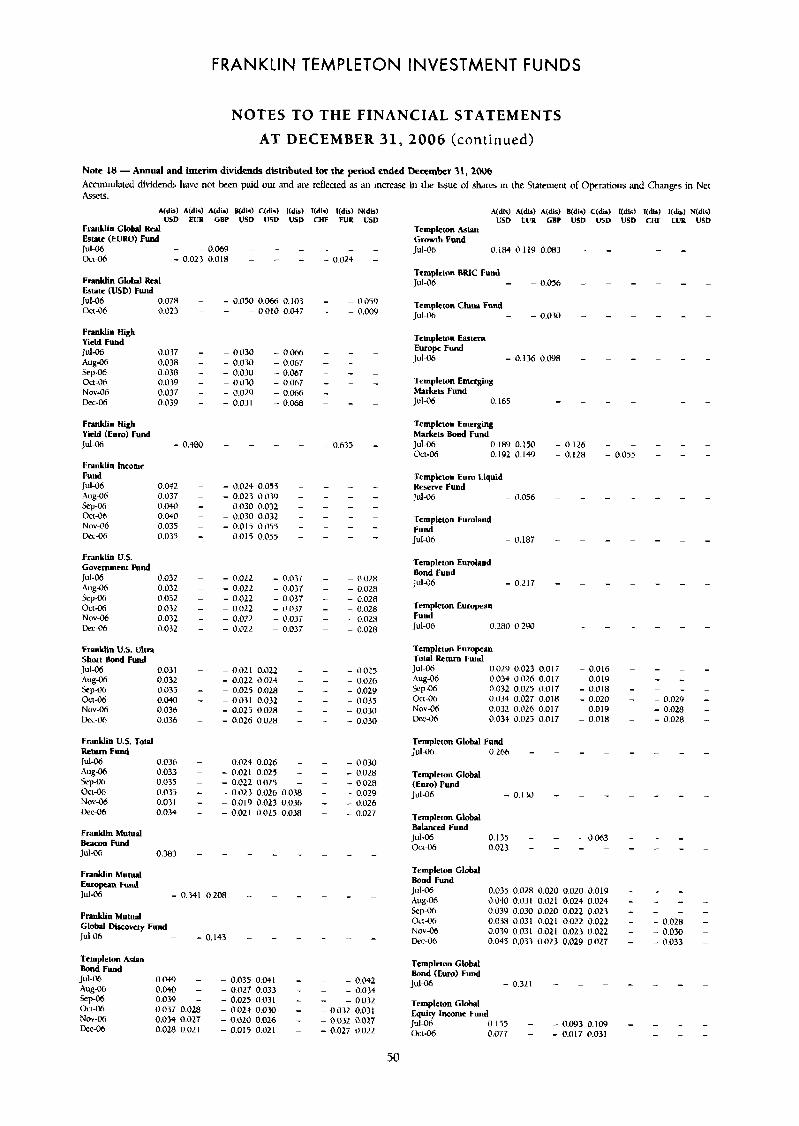
FRANKLIN TEMPLETON INVESTMENT FUNDS
NOTES TO THE FINANCIAL STATEMENTS AT DECEMBER 31, 2006 (continued)
Note 18 - Annual and interim dividends distributed for the period ended December 31,2006 Accumulated dividends have not been paid uut and art: reflected AS an increase in the ksue of shares in the Statement of Operations and Changes in Net &E..
Ndb) Ndis) N d i d Mdid C(dis) Mdis) I(dW I(dis) N(dW Ndir) MdW A(dis) Mdid C(d-1 l(dis) l(dW I(dir) N(di4 USD EUU GBP US0 U5D USD Cm EUR USD USD EUR GBP USD USD USD CHF EUP US0
Franklin Global Rul templeton Asian Estatc (EURO) F u d Growlh Fund Jul-06 - - 0 . m - - - - - - Jul-06 O C I G - 0.023 0.018 - - - - 0.024 -
0184 0119 0.M3 - - - - - -
Templeton ERIC Fund Franklin Global Rcal Jul-06 - - 0,056 - - - - - - Ikwe (USD) Fund Jul-06 m46 templeton China Fund 0.078 - - 0.050 0 . M 0.103 - - 0059
0.023 - - - 0 010 0.047 - - 0.009 jlll-06 - - 0.030 - - - - - - Franklin High Yild Fund Tcmpleton Easrern
Jul-oh 003; - - 0.030 - 0.066 - - - Aur-Oh 0.038 - - 0.030 - 0.067 - - -
Europe Fund Jul-06 - 0.1 36 0.wn - -
SCP-06 0.038 - - 0.030 - 0.067 - - - Oct416 0.039 - - 0.030 - 0.067 - - - Templeion Emcrging Nov-Oh 0.037 - - 0.029 - 0.066 - - - Markets Fund Dcc-Oh 0.039 - - 0.031 - 0 . M - - - Jul-06 0.165 - - - - - - - -
Franklin High Yicld ( E n d Fund Jul-06 - 0.480 - - - - - 0.633 - Franklin Income Fund Jul-06 0.042 - - 0.024 0.055 - - - - .4ug-116 0.037 - - 0.023 0.039 - - - - Sep-Oh 0040 - - 0.030 0.032 - - - - DcrUh 0.047 - - 0.030 0.032 - - - - NOV-06 0.035 - - 0315 0.055 - - - - Dee-Oh 0.035 - - 0.017 0055 - - - -
Templcton Emerging Markets Bond Fund Jul-06 0 I89 0150 - 0.126 - - - - - Oc1-06 0 192 0 IW - 0.128 - 0.055 - - - Templelon Euro Liquid Rewrvc Fund Jul-Oh - 0 0 5 6 - - - - - - - Templeton Eumland Fund Jul-06 - 0.187 - - - - - - -
Templcton Eumland Bond Fund Jul-Ob
Franklin U.S. Government Fund Jul-06 0.032 - - 0.022 - 0.037 - - 0.028 - 0217 - - - - - - - A u E - ~ ~ 0.032 - - 0022 - 0.037 - - n o m -~ . ... %;:Oh 0.032 - - 0.022 - 0037 - - 0.028 OEt.06 0.032 - - 0.022 - 0.057 - - 0.028 templeton European NOV-06 0.032 - - 0.022 - 0.037 - - 0.028 kc-& 17.032 - - 0.022 - 0.037 - - 0.028
Fund Jul-06 O2R002W - - - - - - -
Franklin US. Ulwa Short Bond Fund Jul-06 0.031 - - 0.021 0.022 - - - 0.025 A u g a 0.032 - - 0.022 0.024 - - - 0.026 Sep-M 0.035 - - 0.025 0.028 - - - 0.029 OCUh 0.040 - - 0.031 0.032 - - - 0.035 Nuv-Oh 0.036 - - 0.025 0.028 - - - 0.030 Dcc-Oh 0.036 - - 0.026 0.028 - - - 0.030
Franklin US. TOM Uetum Fund lUl-06 0.036 - - 0.024 0.026 -
0.033 - - 0.021 0.025 - %pOh 0.035 - - 0.022 0.025 - O c t M 0.035. - - 0.023 0026 0.0H N o 4 6 0.031 - - 0.019 0.023 0.036 Dec06 0.0.34 - - 0021 0.025 0.038
Franklin Mutual B e a m Fund Jul-06 0.383 - - - - - Franklin Mutual Europn Fund Jul-Oh - 0.341 0.208 - - - Franklin Mutual Glob1 Discovery Fund Jul-06 - - 0.143 - - -
- - 0030 - - 0.028 - - 0028 - - 0.029 - - 0.026 - - 0.027
- - -
Templeton European Told Return Fund Jul-06 0029 0023 0017 - 0016 - - - - .4ug-06 0034 0026 0017 - 0019 - - - - kp.06 0032 002s 0017 - 0018 - - - - Oct06 0034 0027 O O l R - 0020 - - 0029 - Nov-06 0032 0026 0017 - 0019 - - 0028 - Dcc-c)h 003t 0025 0017 - 0018 - - 0028 - Temploion Global Fund Jul-oh 0266 - - - -
Templeton Global (Euro) Fund Jul-Oh - 0.130 - - - Templcton Global Balanced Fund Jul-Oh 0.135 - - - 0.063 Oc14u6 0.023 - - - -
Templeton Global Bdnd Fund Jul-Oh 0.035 0.028 0,020 0.020 0.019 Aug-06 0040 0.031 0.021 0.024 0.024 seep-06 0.039 0.030 0.020 0.022 0.023 OClU6 0.038 0.031 0.021 0.022 0.022
0.03'3 0031 0.021 0.023 0.022 Nova6 Drc-06 0.045 0.033 0.022 0.029 0.027
- - - - - - - - - - - 0.028 - - 0.030 - - 0.033
Templcton Global fcmpleion Asian
Bond Fund Bond ( E r n ) Fund J U l - o h Aug-06 0.040 - - 0.027 0.033 - - - 0.034 Sep0b 0.039 - - 0.025 0.031 - - - 0.032 Oct-Oh 0.037 0.028 - 0.02$ 0.030 - - 0.032 0.031 Nov-Oh 0.034 0.027 - 0.020 0.016 - - 0032 0.027 D e C - 0 6 0.028 0.021 - 0.015 0.021 - - 0.027 0.022
0.049 - - 0.035 0.041 - - - 0.042 Jul-06 - 0.321 - - - - - - -
Templeton Global Equity Incomc Fund Jul-06 0.155 - - 0.093 0.109 - - - - Oct-Oh 0.077 - - 0.017 0.031 - - - -
50
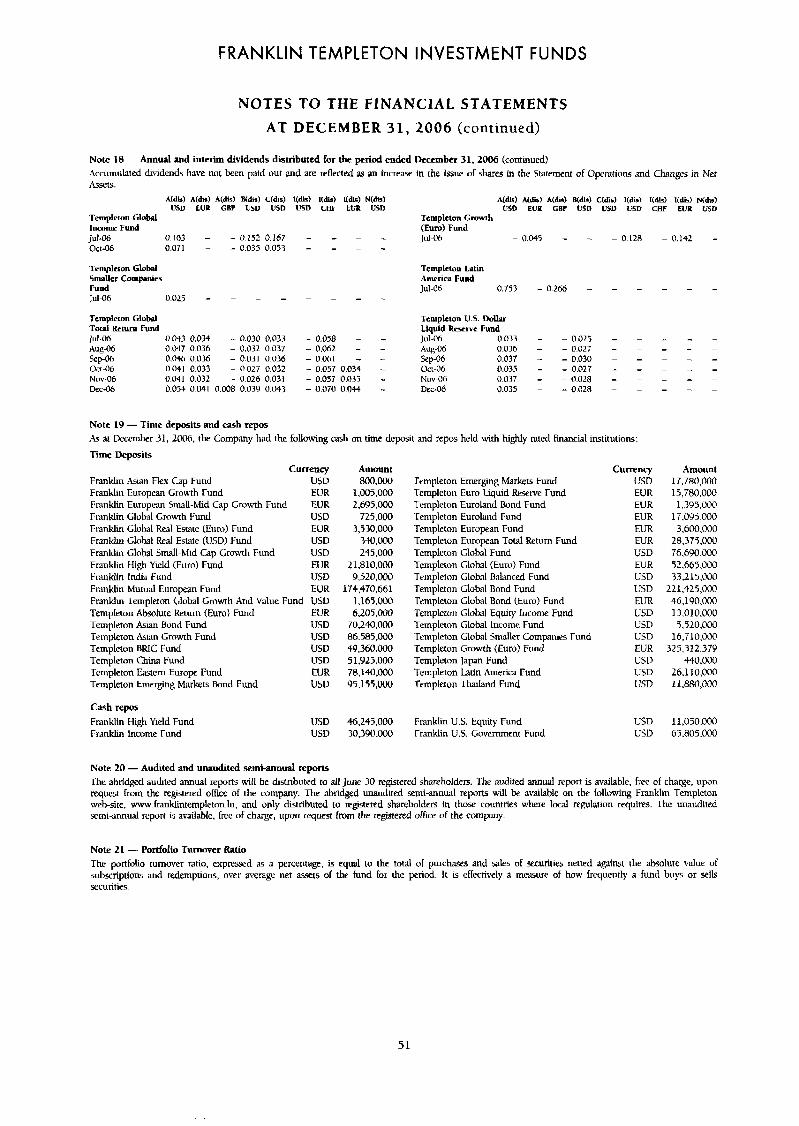
FRANKLIN TEMPLETON INVESTMENT FUNDS
NOTES TO THE FINANCIAL STATEMENTS AT DECEMBER 31, 2006 (continued)
Note 18 - Annual and interim dividends distributed for the period ended December 31, 2006 (continued) Accumulated dilidends have not been paid out and are reflected as an increase in the lssue of sharrs in the Statement of Operations and Changes in Net AsWtS.
Ndls) Mdid A(did B(dls) C(di6) I(d-) BdW Ndk) N(dir) A(&) Ndi5) A(di3 B(dl4 C(di6) I(di5) I(dI4 Ndls) N(dir) USD EUP GBP USD US0 US0 CHF EUR USD 050 EUP GBP t'SD USD USD CHF EUR USD
Templeton Global Templeton Growth lncnmc Fund (Euro) Fund Jut-06 0.163 - - 0.132 0.167 - - - - Jul-06 - 0.045 - - Oct-06 0.071 - - 0.035 0.053 - - - - Trmplclon Global Templeton Latin Smaller Companies America Fund Fund Jul-Oh 0.753 - 0.266 - - - - - - Jul-Ob 0.025 - - - - - - - -
- 0 l2R - 0.142 -
Templeton Global Total Rcturn Fund Jul-OA 0033 0.034 - 0.030 0.033 - 0.058 - - AU!@6 OW7 0.036 - 0.032 0037 - 0.062 - - Sep-Oh 0.0% 0.036 - 0.031 0.036 - 0.061 - - Oft-Oh 0.041 0.033 - 0.027 0.032 - 0.057 0.034 - Nor-06 0.OSI 0.032 - 0.026 0.031 - 0.057 0.033 - Drc-cb 0.054 0041 0.008 0.039 0.043 - 0.070 0.04.1 -
Templeton US. Dollar Liquid Revtve Fund Jul-06 0.033 - - 0.025 - - - - - .-\ug46 0.03b - - 0.027 - - - - - Stp-Ob 0.037 - - 0.030 - - - - - U c d 6 0.035 - - 0.027 - - - - - Nov-Oh 0.037 - - 0.028 - - - - - Dec-06 0.035 - - OO2R - - - - -
Note 19 - Time deposits and cash rep- As at December 31, Looh. the Company had the following cash on time deposit and repos held with highly rded financial institutions:
Timc Deposits Currency
Franklin Asian Flex Cap Fund USD Franklin European Growth Fund EUR Franklin European SmU-Mid Cap Growth Fund EUR Frmklin Global Growth Fund USD Franklin Global REal Estate (Euro) Fund EUR Franklin Global Real Estate (USD) Fund USD Franklin Global Small-Mid Cap Growth Fund USD
EUR Frmklin India Fund USD Franklin Mutual European Fund EUR Franklin Templeton Global Growth And Value Fund USD Templeton Absolute Return (Euro) Fund EUR Templeton Asin Dond Fund USD Templeton Askin Growth Fund USD Templeton BRIC Fund USD Templeton China Fund USD Templeton Eastern Europe Fund EUR
USD
Franklin High field (Euro) Fund
Templeton Emerging Markets Bond Fund
Amount 8oo.OOo
1 ,005,000 2,695.000
725.000 3,530,000
340,OOO 245,000
21.810.000 9,520,000
174.470.66 1 1.165.000 6.205.000
70,240,000 86.585.000 4Y.360.000 5 1,925.000 78.140.000 Y5.155,OOO
Cash repos Frmklin High Yield Fund Franklin lncome Fund
USD 46,247.000 USD 30,390.000
Tcmpleton Emerging Markets Fund Templcton Euro Liquid &serve Fund Tcmpleton Euroland Dond Fund Templeton Euroland Fund Templeton European Fund Templeton European Total Return Fund Templeton Global Fund Templeton Global (Euro) Fund Tcmpleton Global Balanced Fund Templeton Global Bond Fund Templeton Global Bond (Euro) Fund Templeton Global Equity hcume Fund Templeton Global lncome Fund Templeton Global Smaller Companies Fund Templeton Growth (Euro) Fund Templeton Japan Fund Tmpleton Latin America Fund Templeton Thailand Fund
Franklin U.S. Equity Fund Franklin U.S. Government Fund
Currency USD EUR EUR EUR EUR EUR USD EUR USD USD EUR USD USD USD EUR usn USD usn
Amount 17,78c),IX)0 15,780,000 1,399,000
17.09j,000 3,600.000
28,375.000 76.690.000 52,665.000 33,215,000
22 1.4Lj,OW 46,190.000 13.01 0.000 5,520,000
16,710.000 325.312.379
440.000 26.110.000 11,880,000
USD 11,050,000 u j D 67,805,000
Note 20 - Audited and unrmdited semi-annual reports The abridged audited annual repons will be distributed to all Junc 30 registered shareholders. The audited annual repon is available. free of charge. upon requcst from the registered office of the company. The abridged unaudited semi-annual reports will be available on the following Franklin Templeton web-site, www.franklintempleton.lu, and only distributed to mgistered shareholders in tho= countries where local regulation requires. The unaudited semiannual report B available. free of charge, upon request from the registettrd office of the company.
Note 21 - Portfolio Turnover Ratio The portfolio turnover ratio, expressed a percentage. is equal to the total of purchases and sales of securities netted against the absolute value of iubscriptions and redemptions, over average net a ~ ~ e t s of the fund for the period. It is effectively a measure of hoa frequently a fund buys or sells securities
51
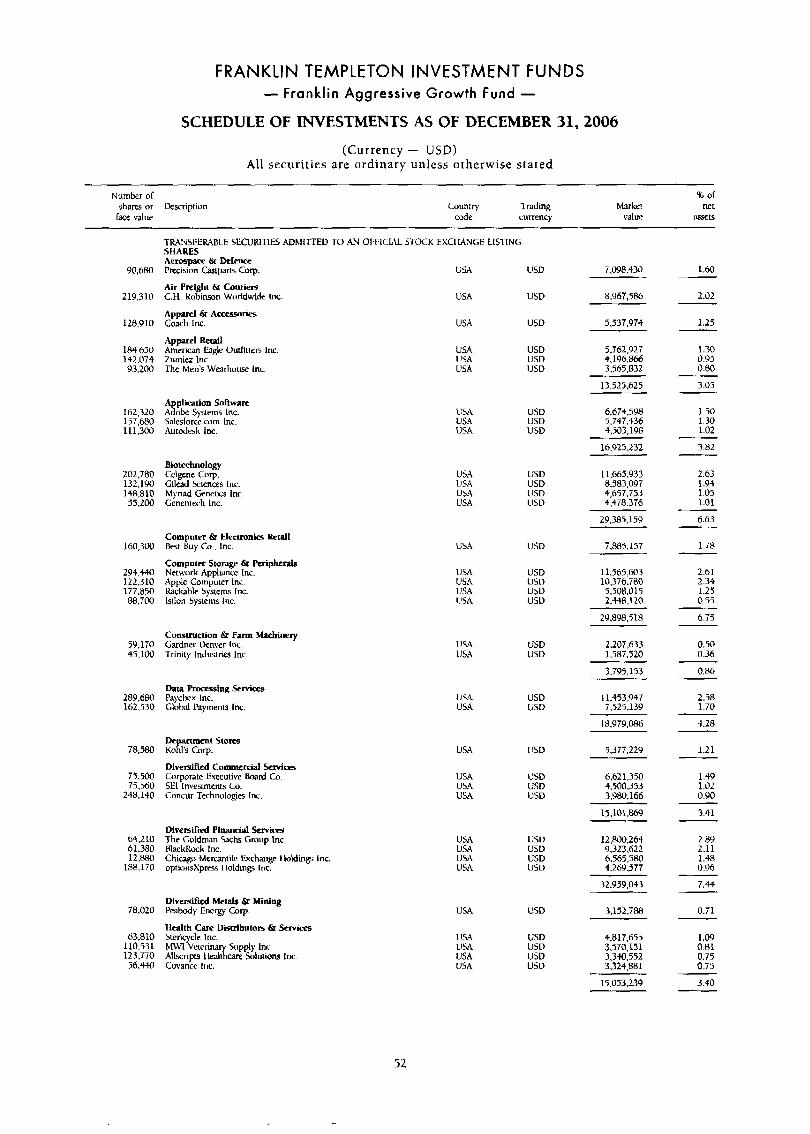
FRANKLIN TEMPLETON INVESTMENT FUNDS - Franklin Aggressive Growth Fund -
SCHEDULE OF INVESTMENTS AS OF DECEMBER 31,2006 (Currency - USD)
All securities are ordinary unless otherwise stated
Number or shares or Lkscription face value
% of Couniry Trading Marker net
code currency value i15Xts
TRANSFERXBLE SECUIUTIES ADMITTED TO AN 01~1~ICLAL S'IOCK EXCl IANGE LlSl-ING SHARES Aennpmx & Defence Precision Casipatts COT.
Air Freight h Couriers C.H. Robinson Wiirldwide 1w.
Apparel & Acrewries Cuach Inc.
Apparel Retail American bgle Outfiliers lnc. Zurniez Inc. The Men's Wearhouse Inc.
USA
USA
USA
USA USA USA
USA USA USA
USA USA USA USA
L;SA
USA USA USA USA
USA 1.1%
USA USA
USA
USA USA USA
USA USA USA USA
USA
LISA LISA USA LISA
90,680
219,310
128.910
184 650 142.074 93.200
162,320 157.680 111.300
202.780 132,190 14R.810 55.200
160,300
294,440 122.310 177.850 8R,70@
5Y,170 45.10
289.680 lh2.530
78,580
75.500 75,560
248.1W
64.210 A1.380 12.w
188,170
78.020
63,810 110.531 123.770 56.430
USD
USD
USD
USD USD USD
USD USD USD
USD U5D USD USD
USD
USD us11 U5D USU
U5D USD
USU USD
USU
U5D USD USD
USI) USD USD USD
USD
USD USD USL) USD
7.Cl98.430 1 .M)
2.02
1.25
5,762,927 4.196.866 3,565,832
1.30 0.93 0.80
3.05 13,525,625
6,674.598 5,747,436 4.503.198
Application Software Adobe Systems lnc. Salesforce.mm Inc. Autodesk Inc.
1.50 1.30 1.02
16,925.132 3.82
Biotechnology Celgene Corp. Gilead Sciences Inc. Myriad Genftir'5 Inc Gcneniech Inc.
11.665.9.33 2.63 8:583,097 4,657.753 4.478.376
1.44 1.05 1.01
~
6.63 29.385.159
Computer & Electmnirs Retail Best Buy Co.. Inc.
Computcr Storage 6r Peripkrals Network Appliance Inc. Apple Computer Inc. Rackable Sysiems Inc. lsilon Systems h e .
1.78 7,885,157
11,565,603 10.376.780 5,508.015 2.~R.120
2.61 2.34 1.25 0.55
6.75
0.50 0.36
0.86
2Y898.518
2,207,633 1,587,520
Construction & Farm Machinery Cardner iknver lnc. Trinity lndustris Inc.
3.795.153
Data Pnxessing Services Faychex Inc. Global Payments Inc.
11,453,947 7.525.139
2.58 1.70
4.28
Re anmentstores
Divemified Commercial Services Corporate Executive h r d Co. SEI Invemnenrs Co. Concur Technologies lnc.
Ko&'s COT. 1.21 5,377.229
1.49 1 .02 0.90
6,621,350 4,500.353 3.980.166
15,101,869 3.41
Diversified Finantiol Servirrs The Goldman %chs Group Inc. WackRock Inc. Shimgo Mercantilf Exchange I luldings Inc. optionsxpress 1 loldings Inc.
12.800.264 2.89 2.11 1.48 0.96
7.44
9:323;622 6,565,580 4.269.577
32.Y59.043
Diversified Metals & Mining Peabody Energy Corp
Hcalth Care Distributom C Services Stencycle lnc. MWI Veienm Supply Inc. A I I ~ " ~ I \ea~Xcare jolutions lnc. Cuvance Inc.
0.71 3,152,Z-Y
1.09 0.81 0.75 0.75
4,817,653 3.570.151 3.340.552 3;324:R81
15.053.239 3.40
52
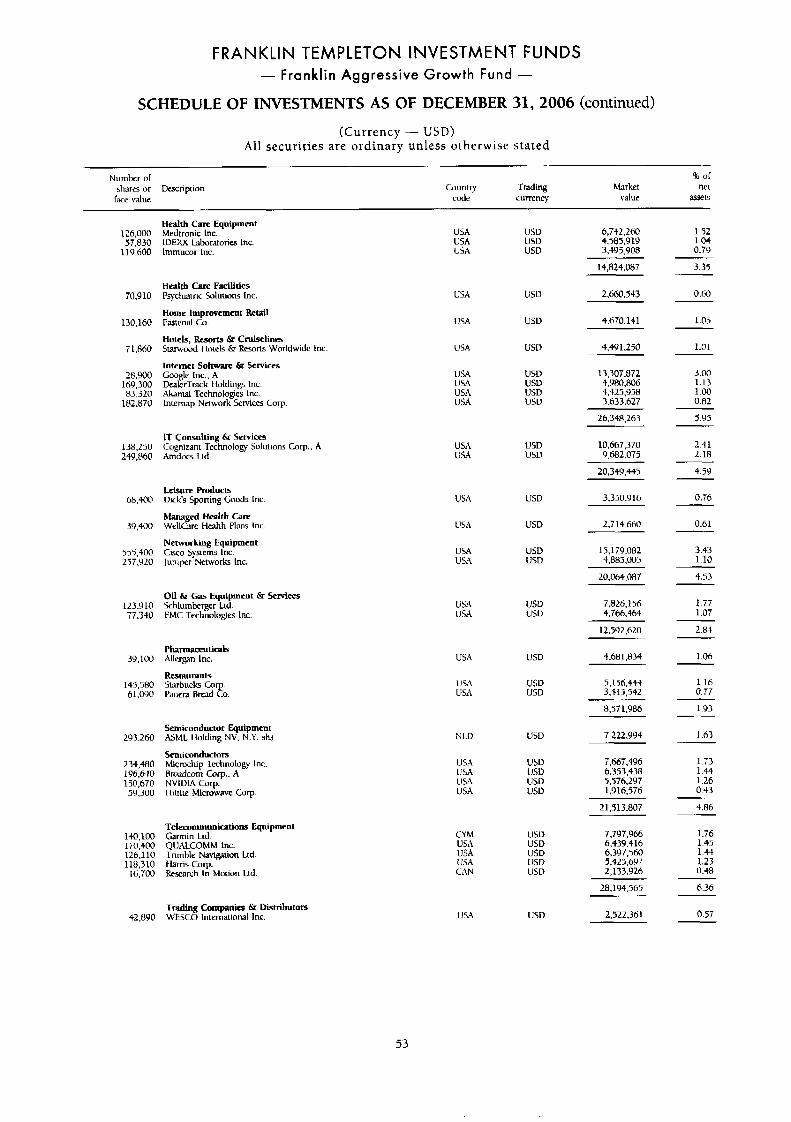
FRANKLIN TEMPLETON INVESTMENT FUNDS - Franklin Aggressive Growth Fund -
SCHEDULE OF INVESTMENTS AS OF DECEMBER 31,2006 (continued)
(Currency - L'SD) All securities are ordinary unless otherwise stated
Number rrl 46 of
race value code currency value wts shares or Desctipiion Country Trading Market nei
Health Care Equipmen1 Medtronic Inc. IUEXX hbontories 1nc. lmmumr lnc.
USD USD U5D
USD
USD
usv
USD USD USD USV
USD USD
1.52 I .04 0.79
126.000 57,830
llY.600
70.9 10
130.160
7 I .Rho
28.900 lbY.300
182,870 83.320
138,250 24Y.860
68,400
39,400
555.400 257,920
123.910 77.340
39.100
145.580 61,090
297.260
234,480 196.640 150.670 59,300
140,100 1T0,+00 lrh.110 118,310
16.700
42,800
USA USA USA
USA
USA
USA
USA USA USA USA
USA USA
6,742.260 +.585.919 3,495,908
3.35
0.60
14,824,0117
Health Care Facilities Psychiatric Solutions Inc.
Home Improvement Retail I:Zstenal co. Hotels, b r t s & Cruiselines Starwood IIc)iels & kwns Worldwide lnc.
Internet Software & Services Coogle Inc.. A DeilerTrack I Lolding lnc. A h m i Technologies Inc. lnternap Nawork Scrviccs Corp.
2.660.543
1.05
1.01
3.00 1.13 1.00 0.82
4.670.141
4.491.250
13,307.872 S.YHO.806 4,425.958 3.633.627
26,348,263 5-95
10,667,370 9,682.075
2.41 2.18
IT Consultin & Services Cognizint Te%nology Solulions Corp.. A Amdocs Lid.
20.349.445
3,350916
4.59
0.76 lnisure products Dick's Sponing Gods lnc.
Managed IkdIh Care WellCke Health Plans Inc.
Networking Equipment CISCO Svsiems lnc. Juniper'Networks Inc.
USA USD
0.61 USA USD 2,714.660
3.43 1.10
usu USD
USA USA
15,179,082 4,885,005
20,064.087 4.53
7.826.156 4.766.464
1.77 1.07
Oil &I Gas Equipmen1 &I Services Schlumlxrger Ltd. FMC Technologies Inc.
USA USA
USV USD
12,592,620 2.84
4.681.834 1.06 Pharmaceu tiolb Allergan Inc.
Restaurants Starbucks Cop. Panera Hrwd Co.
USA 1!SD
1.16 0.77
LJSA USA
usu USD
5.15b.444 3,414,542
1.93
1.63
8.571.986
Semiconductor Equipment tUML Ilolding NV. N.Y. shs
Semiconductors Micnxhip Technology Inc Urodcorn Corp.. A NVIDW Corp. I liltite Microwave Corp.
NLD USD 7.222.994
USA US4 USA USA
USD USD
USD usu
1.73 1.44 1.26 0.43
4.86
7.667.496 6.353.438 5.576.297 1.916.576
2 1.51 3.807
7.7517.966 6.439.416 6,397,560
5.425.697 2.133.926
1.76 1.45 1 .et 1.23 O.+R
Telecommunications Equipment Garmin Ltd. QUALCOhihi lnc. Trirnhle Na\igation hd. I lams Corp. Resirch In Motion Ltd.
CYM USA USA USA CAN
USA
USD USD
28,194.565 6.36
0.57 Trading Companies &I Distributors WESCO lniemaiional lnc. USD 2,522.361
53
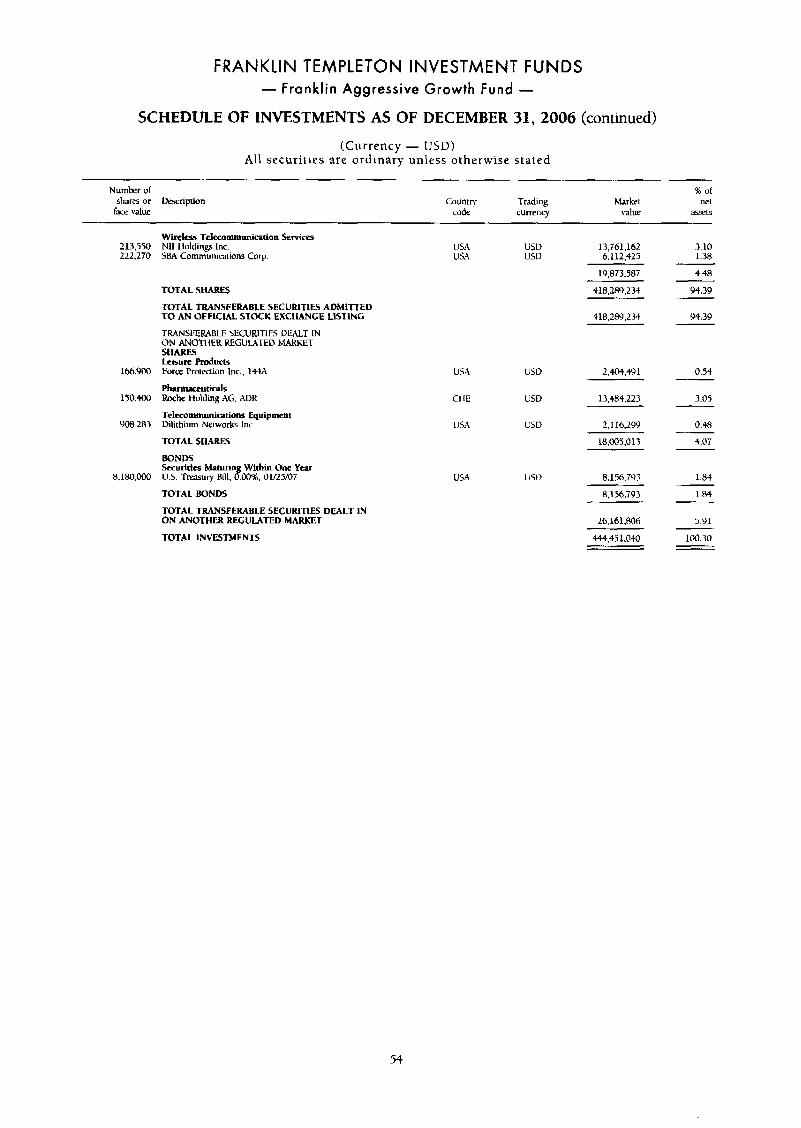
FRANKLIN TEMPLETON INVESTMENT FUNDS - Franklin Aggressive Growth Fund -
SCHEDULE OF INVESTMENTS AS OF DECEMBER 31, 2006 (continued)
(Currency - USD) All securities are ordinary unless otherwise stated
Number of B of shares or kcription Country Trading Market net
h e valw code currency value assell
213,550 222,270
166900
150.400
908,283
8,180,000
Wmk Tehmmunicatian Services NII Holdings Inc. SBA Communidons Corp
TOtAL SHARP5
TOTAL TRANSFERABLE SECURITIES ADMITTED TO AN OFFlClAL STOCK EXCHANGE LISTING
TRANSFERABLE SECURITIES DEALT IN ON ANO'I-lIER REGULATED MARKLT SHARES Lclsurc Roduets Force Pmtectmn Inc., 144A
PhDtmreUriCnls Rnche Holding AG. ADR
Telccommunimtions Equipment Dilithium Nelworks Inc.
TOTAL SHARES
BOND5 Securities Maturing Within One Year U.S. Trc;lsury Bill, 0.00% 01R5/07
TOTAL BONDS
TOTAL TRANSFERABLE SECURlTlES DEALT 1N ON ANOTHER REGULATED MARKET
TOTAL INVESTMENTS
USA USD 13,761,162 3.10 us.\ USU 6,112,425 1.38
4.48 19.873.587
418,289,234 94.39
418,289,234 94.39
U M
c1 IE
USA
USA
USD
USD
USD
USV
2,404,491
1.3.434.223
2.1 16,299
18,005.013
8.156.793
0.54
3.05
0.48
t.07
1.34
8,136,793 1 .B4
26,161.806
444,45 1.040
5.91
100.30
54
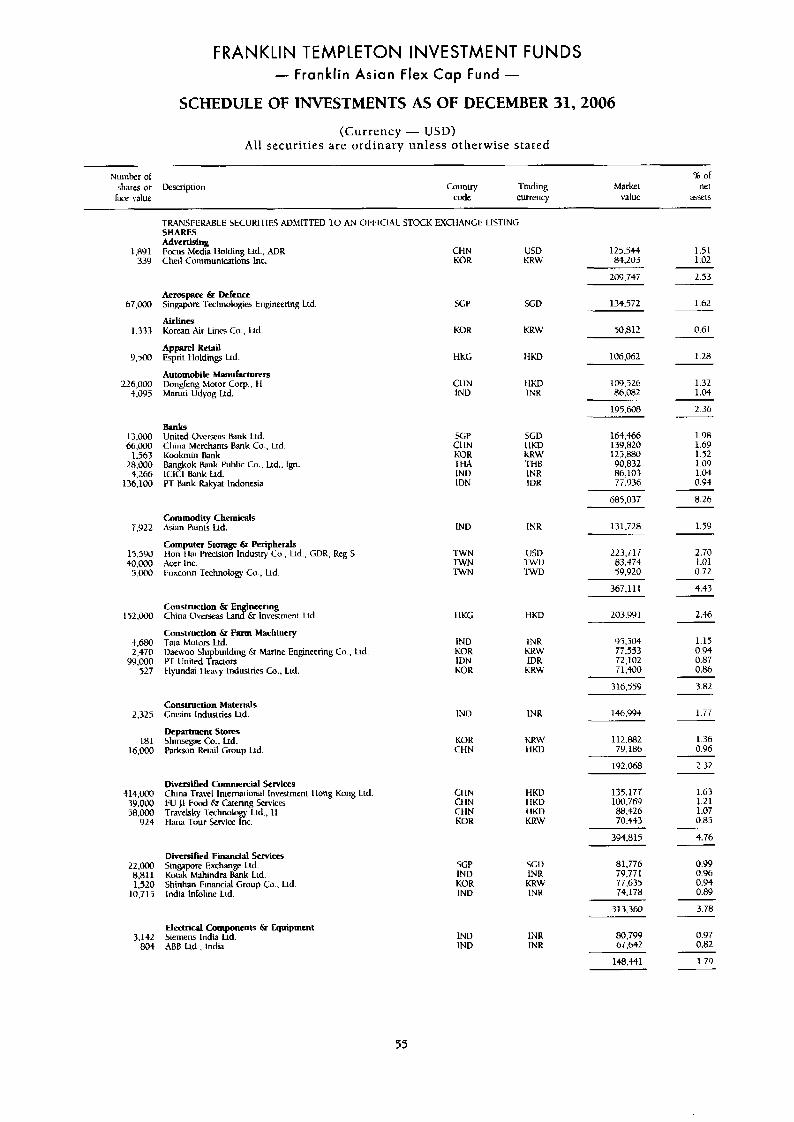
FRANKLIN TEMPLETON INVESTMENT FUNDS - Franklin Asian Flex Cap Fund -
SCHEDULE OF INVESTMENTS AS OF DECEMBER 31,2006
(Currency - USD) All securities are ordinary unless otherwise stated
Number of % of shares or Dcrription Country Trading Market ncr h e vduc code currency value ll55etS
TRANSFERABLE SECURITIES AUhllTTED TO AN 0I:IWAL STOCK EXCIIANGE LISTlNG SHARES Advertising Focus Media I lolding Ltd., ADR CHN Cheil Communicltions lnc. KOR
1,891 339
67,000
1.3 33
9.5.M)
226,000 4.w5
13,OOO 66,000
1.563 28.oa0 4,266
136,100
7,922
15.590 40,000 5.000
152.000
4,680 2.470
9Y ,000 527
2.325
181 16,000
414.000 39.000 58,Ooo
924
22.000 8.811 1,520
10.715
USD KRW
1.51 1.02
125.544 84,203
209,747 2.53
~ e ~ ~ p a ~ : L Dercm Singaptwe Technologies Enginefnng Ltd
Ai1linm Korean Air h n e s CO , LICI
Apparel Retail Espnt I loldings Ltd
Automobile Manufacturers Dongkng Moior COT.. I I Maruii Udyog Ltd.
SGP
KOR
HUG
Cl IN IND
SGD 1.62
0.61
134,572
KRW 50.812
1.28 tlKD 106,062
109.526 86,082
195.608
HKD INK
1.32 1.04
2.36
164,466 13Y ,820 125.880 90,832 ~6.103 77,936
1.98 Banks United Ovcrrsrxi Hank Ltd. China Merchants Rank Cu.. Lid. Kookmin Bank Ban kuk &mk Public Co., Ltd., g n I C l d Bank Ltd. PT b n k Rakyat Indonem
SGP Cl IN
SGD t 1KU KRM' THR I N R
1.69 1.52 1.09
KOR TI-M INV 1.04
0.94 1DN IVR
8.26
1.59
685.037
131.728 Commodity Chemicals Asian Paints Ltd.
Computer Storage br Peripherals Hon I Q i Precision Industry Co , Ltd., GDK, Keg 5 Acer Inc. I:oxconn Technulorn Cu.. Ltd.
IN D INK
223.717 83.474 59,920
2.70 1.01 0.72
TWN '1WN TtVN
us0 IW'U TWD
4.43 367.1 11
203.YY I Construction & E ineering China C h w w x s LaBdr Invesrmcnt Ltd
Construction &I Farm Machlnery Tala Motors Ltd. 1)aewoo Shipbuilding &z Marine Engineering Co , Ltd Pr United Tracrors tlyundai Ileavy Industries Co.. Ltd.
I IKG t-IKD 2.46
1.15 0.94
0.86 0.87
1ND KOR IDN KOK
INR 95.504 77.553 72.102 7 1 .NO
KRW IDR KRW
316.559 3.82
Construction Materials Gwim Industries Ud.
Department Stores Shinxgac Co.. Ltd. Rrkwn klail Group Lld.
146.994 1.77 INR IN13
112.882 79.186
1.36 0.96
KOR CHN
KKW HKD
192,068 2.32
Diversified Commercial Services China T n v ~ l Inlemlional Investment I long Kong Ltd. FU J1 Food 6r Catenng Services Travelsky 1chnoloR). Ltd., I I thna Tuur %mice Inc.
1.63 1.21 1.07
CI IN CI IN Ct IN KOR
H K D 135.177 100,769 $8,426 70.443
394,815
t IUD I IKD KRW 0.85
4.76
81.776 0.99 0.96 0.94 0.89
Divmified Financial Services Singapore lixchang Ltd. Kotak Mahindra Bank Ltd. Shinhan Financial Group Ca., Ltd India Inloline Ltd.
5GP IND KOR IND
SGU 1NR
KRW INK
79:77 1 77.635 74.178
313.360 3.78
80.799 67.642
0.97 0.82
Electrid Components & Equipment 3.142 Siemens India Ud.
804 ARB hd.. hdia IND IND
INR INR
1.79 148.441
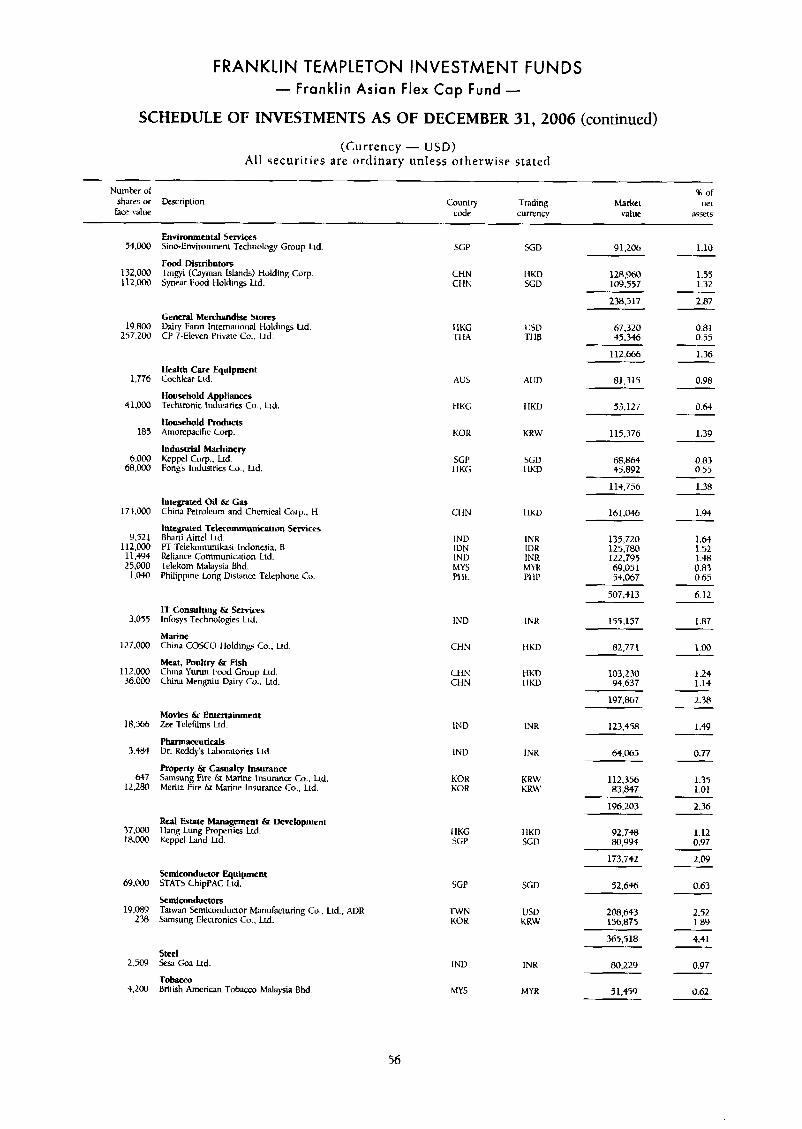
FRANKLIN TEMPLETON INVESTMENT FUNDS - Franklin Asian Flex Cap Fund -
SCHEDULE OF INVESTMENTS AS OF DECEMBER 31,2006 (continued)
(Currency - USD) A l l securit ies are ordinary unless otherwise stated
Numhcr of % or
face value code currenm value 3$$ei5
shares or Description Country Trading hlarkei net
Envimnmcntal Services Sino-Environment Technology Group Lid.
Food Distributors Tingyi (ayrnan Islands) Holding Corp Synear F w d Holding Ltd.
54,000
132,000 I12,MX)
1Y.800 257.2oil
1,776
41.000
185
6.013J 68.000
174.000
9.521 112,000 11 .4Y4 25,000
I .ow
3,055
127.000
112,000 36.000
18,566
3.484
647 12,280
37.000 1n.w
69.W
19,089 2 18
2.509
+.2m
SGP SGD 1.10
1.55 1.32
2.87
0 81 0.55
1.36
0.98
0.64
1.39
0.83 0.55
1.38
1.94
1.64 1 52 1.48 0 83 0.65
6.12
1.87
1 .oo
1-24 1.14
9 1,206
CHN 11KD CHN SGD
128960 109,557
238,517
General Merchandise Stows Uairy Farm Internaiional Holdings Ltd CP 71-Eleven Private Co.. Lrd.
IlKG USV .TI IA TI IB
67.320 45.3%
112,666
81,315
53.127
Health Care Equipment Cochlear Lnd.
Household A plianccs Techtronic Infuustries Co.. Lid.
Houwhold Rodurts Amorepcik COT.
Industrial Machincry Keppel Corp.. Ltd. Fong's Industries Co., Lid.
AUS AUD
t 1 lic; HKU
115,376 KOR KRW
SGP SGD IIKG 1 IKD
68,864 45.892
114.756
Integrated Oil & Gas China Petroleum and Chemical Corp.. 13
Integrated Telecommunication Services Bharti A i d Lid. PT Telekomunikasi Indonesia. B Reliance Communication Ltd. .relekom Malaysia Bhd. Philippine Long Distance Telephone Co,
1Rl.@46 CI IN 1 IKV
IND I N R IUN IUK INU INR MYS MYK PI It. PI IP
135,720 125,780 122.795 h9iO51 54,067
507.4 13 I f Consulting & Services Inhsys Technologies Lid. IND IkR 155,157 Marine China COSCO I lolding Co., Lid. CtIN IiKD 82,77 1
Meat, Poultry t Fish China Yurun I:ood Group Ltd. China Menpiu Dairy Co.. Ltd
CllN CHN
t1KD 1 IRV
103.230 94.637
1-38
1.49
0.77
1.35 1.01
2.36
1.12 0.97
2.w
0.63
2.52 1.89
4.41
0.97
0.62
197.867 Movies & Entertainment Zee TeleGlrns Ltd.
Phannareulitnls Ur. Reddy's Labora~ories Lid.
Property & Casualty hsurance Samsung Firc & Marine Insurance Co., hd. Merilt Fire br Marine lnsunncc Cn.. Ltd.
123.458 IND INR
I N D INR 64.@65
KOK KOR
KRW KRW
112,356 83.847
196.203 Real Estate Management t Development Ilang Lung Proprnies Ltd. Keppcl land Ltd.
IIKG I IKV SGP SGD
92,738 [email protected]+
173.742 Semiconductor Equipment 5'1-AT5 ChipPAC Ltd. 52.646 SGP SGD Semiconductors Taiwan Semiconductor Manuhcturing Cu.. Lid.. ADR Samsung Elecironics Co., Ltd.
.IWN USD KOR KRW
208.643 1M.875
365,518
80.229
51,459
Steel 5esi Go3 Lid,
T o k o British Ameriwn Tobacco hhlaysia Bhd.
IND INR
hlYS MYR
56
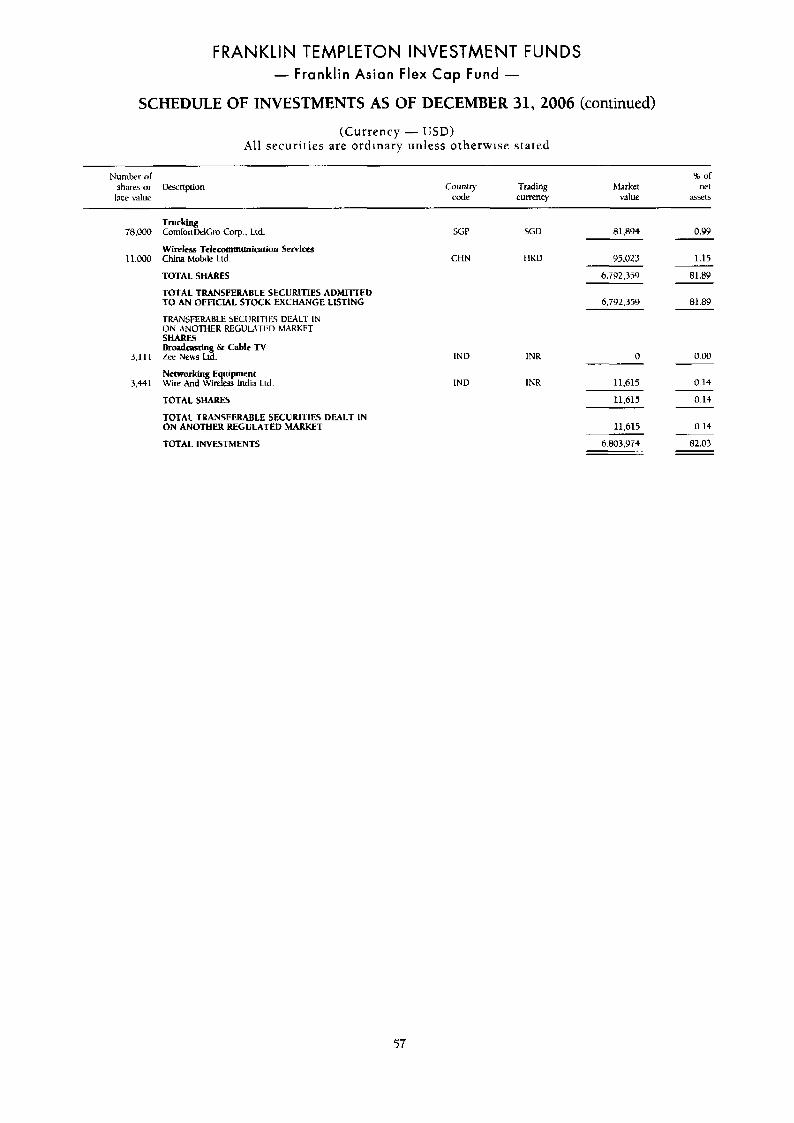
FRANKLIN TEMPLETON INVESTMENT FUNDS - Franklin Asian Flex Cap Fund -
SCHEDULE OF INVESTMENTS AS OF DECEMBER 31, 2006 (continued)
(Currency - USD) All securit ies are ordinary unless otherwise stated
Number or % or
bCe \dlW code currency value rmxts shares or kwription Country Trading Markel net
7R.000
1 1.olYo
3.1 11
1.441
Trucking ComlonklGro Corp., Ltd.
Wireless T~lmommunication Services chi^ Mobile Lld.
TOTAL SHARES
TOTAL TRANSFERABLE SECURITIES ADMITTED TO AN OFFICIAL STOCK EXCHANGE LISTING
TRANSFERZBLE SECURITIES UEAL-r IN ON ANOTIER REGULZTfD MARKET SHARES Brmdc*stln 6r Cable TV 7&~ News Lt%.
NemrkingE ipment Wire And \Vi$= India Ltd.
TOTAL SHARES
TOTAL TRANSFERABLE SECURITIES DEALT IN ON ANOTHER REGULATED MARKET
TOTAL INVESTMENTS
SLP SGD 81,894
CHN 1 IKD 95.023
IN D
IND
INR
IKR
0.9Y
1.15
6.792.75.9 81.89
6.792.359
0
11.615
81.89
0.00
0.14
11,615
11.615
0.14
0.14
6.803.~ 74 82.03
57
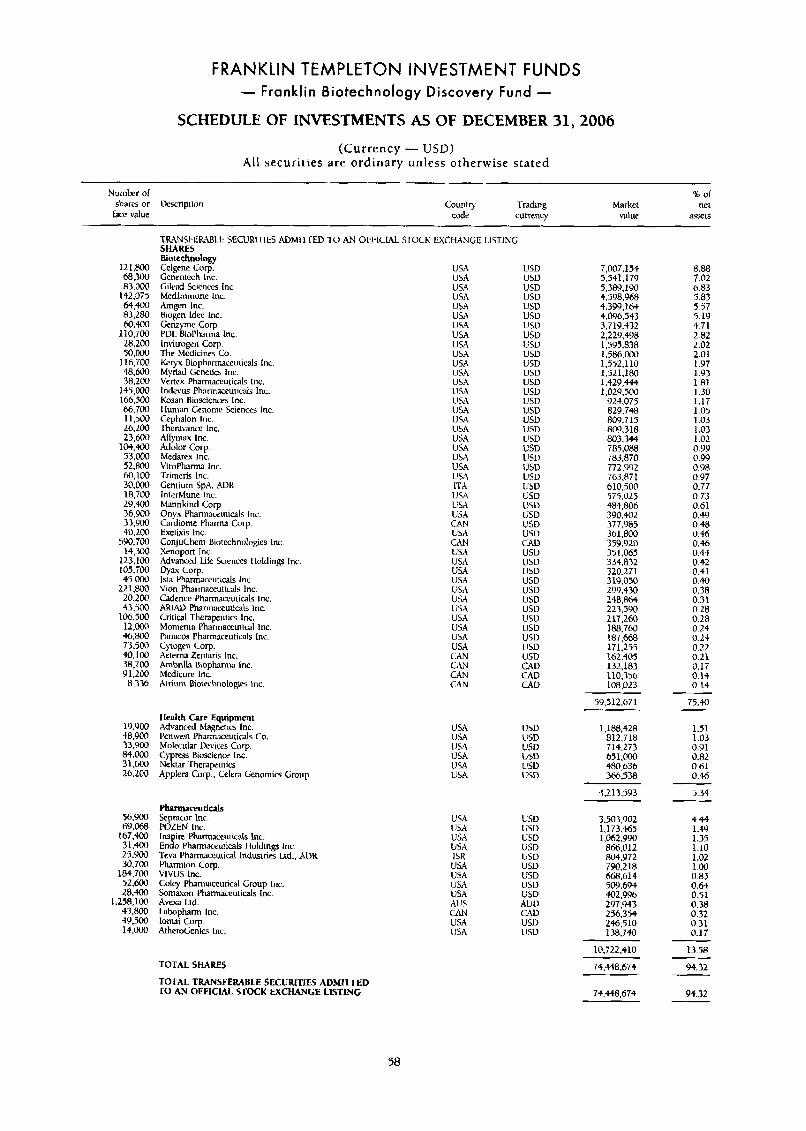
FRANKLIN TEMPLETON INVESTMENT FUNDS - Franklin Biotechnology Discovery Fund -
SCHEDULE OF INVESTMENTS AS OF DECEMBER 31,2006
(Currency - USD) A l l securities are ordinary unless otherwise stated
Number or shares or Uescripiion Countv Trading Marker face value code currency value
% of net
S W I S
12 1,800 68,300 83.000
142,075 64,400 83.280 60.WO
110.700 28.200 50.000
116,700 48,600 38,200
145.000 166,500 66.700 11.500 26.100 23,600
104,400 53.000 52,800 60.100 30,000 18,700 29,400 36.900 33,Yoo 40,LDO
500.700 14,300
123.100 105.T00 4 4 . m
221.8@0 20>2m 43,500
106,500 12,000 +wc@ 73.500 40,100 38.700 Y 1,200
8.334
.~
TRhNSI'ERhBLE SECURITIES ADMITIED TO AN OIWCLU STOCK EXCHAVCE LISTING SHARES Biotechnology Celgene Curp. USA USD Genentech Inc. USA USD Gilead Sciences Inc. USA USD Medlmmune Lnc. USA USV Arngen Inc. USA USV Biogen ldec lnc. USA USV Genzyme COT. USA USV PDL B i o P h a m lnc. USA USV Invitrogen Corp. USA USV The Medicines Cm U SA USD K q x Biopharmaceu~icals Inc. USA USD Myriiid Geneiics Inc. USA USD k K C X Pharmaceuticals Inc. USA usu lndevus Pharmaceuticals lnc. USA usu Komn Biosciences Inc. USA USD 1 lunian Genome Sciences Inc. 1JSA usv Cephalon lnc. USA USV TherJvanLr Inc. USA USD ANymuc Inc. (!SA USD Molor Corp USh usv Medarex Inc. USA USV ViroPhmw Inc. USA US13 Trimeris Inc. USA USV Gentium SPA. ADK 1TA usv lntcrMune Inc. USA USD Mannkind COT. tiSA USU Onyx Phannaceuticals Inc. USA USD Girdiotne Pharma COT. CAN USD Exelixis Inc. USA USU ConjuCheni Biotechnologies Inc. GW CAD Xenopon Inc. USA USV Advanced Life Sciences 1 lolding Inc. USA USD @as Corp. USA USV lsta Pharmaceuticals Inc. USA USD
Cadence Pharmaceuticals inc. 1JSA us0 ARlAD Pharmaceuticals Inc. USA usv Critical Thempuria Inc. USA us0 Momenta Pharmamutical lnc. USA USV Panacos Pharmaceuticals Inc. USA USV Cyrogcn COT. USA USD Aererna Zentirls Inc. ct\N U5D hbr i lh Biophrma lnc. ai4 Cr\V Mcdicure Inc. CAN CAV Atrium Biotechno\ogics Inc. CAN CAD
Vion Pharmaceuticals lnc. LISA USD
7.007.154 5,541,179 5.389.190 4.598.968 4,399,163 4.096.5$3 3,719,432 2,229,498 1,595.838 1,586,000 1,552.1 10 1.521.180 1.429.444 1,029.503
924.075 829,748 ROY.715 809.318 803.3+4 785.088 783,870 772.992 763.871 610.500 575.025 484,806 390.402 377.985 361;800 359.920 351.065 3 3 4.8 3 2 320.271 319.050 299,430 248,R64 223,590 217,260 188,760
171,255 162.405 132.183 110,356 108.023
187,668
Health Care Equipment 19,UOO Advanced Magnciics lnc. 48,903 Penwest Pharm~ceuticals Co. 33,900 Molecular &vices Corp. 84.000 C) res Bioscience Inc. 3 1 . W Nextar Therapeuiics 26.200 Applen CUT., Celera Genomic3 Group
56.900 69,06R
167.400 31,400 2-5.900 30.700
184,700 52.600 28.400
1.258.100 43.800 tY.500 14.000
Phnrmam ticals Sepncor Inc. POZEN Inc. lns ire Pharmaceuiicals lnc. d o Pharmaceuticals 1 lolding Inc. ' Iva Pharmaceuucal Industria Lid., ADR Pharmion Corp. VIVUS lnc. Coley Pharmaceutical Group h e . Somaxon Pharmaceuticals hc. Avexa Ltd. Lahopharm Inc. Lomai COT. AtheroGenics Inc.
TOTAL SHARES
TOTAL TRANSFERABLE SECURITIES ADMllTED TO A N OFFICIAL STOCK EXCHANGE LISTLYC
USA USD USA USD USA USV USA uju USA USV USA USD
USA usv U5A USV USA USD USA usv ISR USV USA usu USA USD USA USD USA usv AUS AUV CAN CAD USA USD 115.4 115D
59,512,671
1,188,428 812.718 714.273 651.W 480i636 366,538
4.213.593
3.503.902 1,173.465 1,062.Y90
866.012 804.972 790.218 h6S.614 509.694 402.996 297.943 256.354 246.510 138.740
8.88 7.@2 6.83 5.83 5.57 5.19 4.71 2.82 2.02 2.01 1.97 1.93 1.81 1.30 1.17 1.05 1.03 I .03 1.02 0.YY OW 0.98 0.97 0.77 0.73 0.61 0.49 0.48 0.46 0.46 0.44 0.42 0.41 0.40 0.38 0.31 0.28 0.28 0.24 0.24 0.22 0.21 0.17 0.14 0.13
75.40
1.51 1.03 0.9 1 0.R2 0.61 0.46
5.34
4.44 1-44 1.35 1.10 1.02 1-00 0.83 0.64 0.51 0.38 0.32 0.31 0.17
10,722,410 13.58
94.32
94.32
58
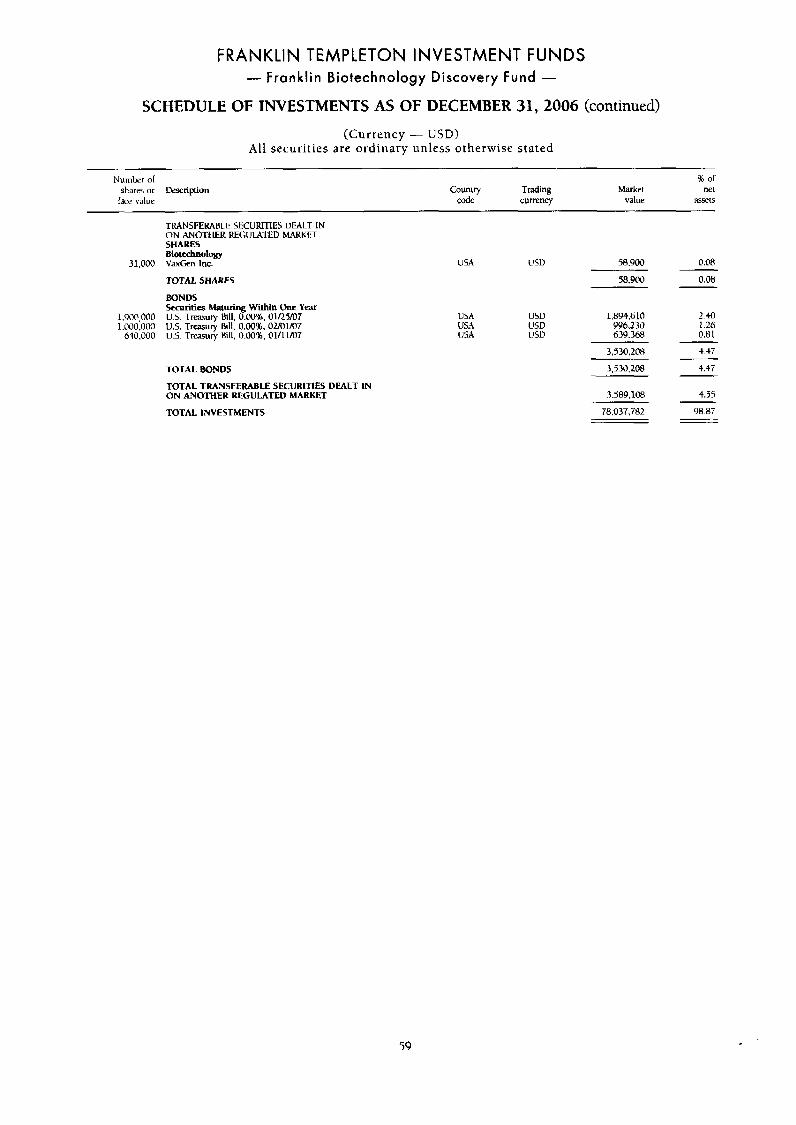
FRANKLIN TEMPLETON INVESTMENT FUNDS - Franklin Biotechnology Discovery Fund -
SCHEDULE OF INVESTMENTS AS OF DECEMBER 31, 2006 (continued)
(Currency - USD) All securities are ordinary unless otherwise stated
Nurnhcr o l % of shares or Wmiptiun counwy Trading Market net
hclce value code currency value a5555
TRANSFERABLE SECURlTlES UWLT IN O N ANQl'tlER REGULAIEU MAFXET SHARES BiOlrchwlOgy
31,000 V a e n Inc.
TOTAL SHARES
BONDS Securities Maturing Within One Year
1,900,000 U.S. Treasury Bill, 0.008. 01RYO7 1.000.000 US. Traury Bill. 0.00%. OM1/07
640,000 U.S. Trcasury &II. 0.00%. 01/11/07
TOTAL BONDS TOTAL TRANSFERABLE SECURITIES DEALT IN ON AVOTHER REGULATED MARKET
TOTAL INVESTMENTS
USA USD 58.900
58.900
0.08
0.08
lJSA USA USA
1,894.6 10 YY6.230 639.368
3.530.208
3330,208
2.40 1.26 0.81
4.47
4.47
3.589.108 4.55
78.037.782 98.87
59
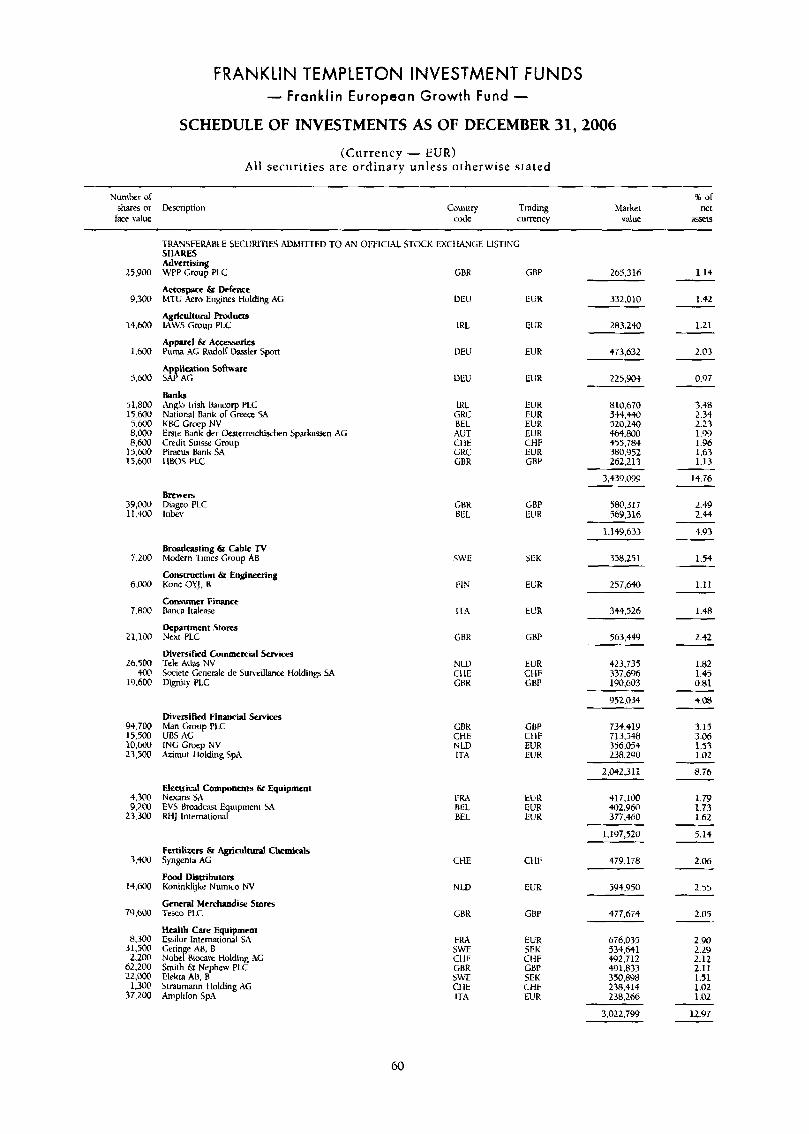
FRANKLIN TEMPLETON INVESTMENT FUNDS - Franklin European Growth F u n d -
SCHEDULE OF INVESTMENTS AS OF DECEMBER 31,2006
(Currency - EUR) All securit ies are ordinary unless otherwise stated
Number of shares or Description face value
% or code currency WlUe a55etS
Country Trading Market net
TMNSFERARLE SECUIUTIES AUMImED TO AN OIWC SHARES
:ML STOCK EXCflANGE LISTIKG
Advcrtising WPP Group PLC
AerosppEc & Defence MTU Arm Engines I+olding AG
Agricultural Ralucrs WWS Group PLC
Appnrel bt Acceswries Puma AG Rudolf D;lsslcr Sport
Application Software SAP AG
Banks Anglo Irish hricorp PLC National Rank UT Gmxe SX KBC Croep N V Ersre Bank der Otslemichischen S p a r k n AC Credit Sua% Group Piraeus Rank SA I lWS YLC
25.900
9,300
14.h00
1.600
4,600
51,800 15.600 5.600 8,000 8,600
15,600 15.600
39,000 11 .'to0
7.200
6.L-00
7.800
21,lM
26,500 400
19.600
91.700 15.500 10.600 23.5CQ
4,300 9,200
23,300
3.4w
14,600
79,600
8,300 31,500 2,200
62.200 2 2 . m
1,30@ 37,200
LBR GBP 265.316
332.010
1.14
1.42
1.21
2.03
0.97
3.48 2.34 2.23 1.99 1.96 1.63 1.13
14.76
2-49 2.H
4.93
1.54
1.11
1.48
2.42
1.82 1.45 0.81
4.08
3.15 3.06 1.33 1.02
8.7b
1.79 1.73 1.62
4.14
2.06
2.55
2.05
2.90 2.29 2.12 2.11 1.51 1.02 1.02
DELI EUR
IKL IJUR 283,240
LIEU EUR 473,632
UEU EUR 225.904
1Kl. GRC BEL AUT CIIE CKC GRR
EUR ElJK EUR EUR CHF EUR GBP
810.670 544,etO 320.240 464.800 455.784 380.952 262,213
3.439.099
Brewers Diageo PLC lnbev
GBR BEL
GBP EUR
580,317 569.316
1,149,633
358.291
257,640
Bmadating & Cable lV Modern Tirncs Group AB
Construction & Engineering Kontl UYJ. B
Consumer Finance knca halease
S W E SEK
EUR
344.526 ITA EL'R
Department Stores Next PLC GBR GBP 563.44'3
Diversified Comrncrcial Semices rele Atlas NV Societe Cenerale de S u n d a n c c tioldinks SA Dinity PLC
EUR CHF GRP
N LD CI LE CHR
423,735 337,696 190,603
952.034
Diversified Financial Services Man Group PLC UBS AG 1NG Croep NV Azirnut lblding SPA
GBK CHE NLD 11.A
CBP CkIF EUR EUR
734.41Y 713,548 356,054 238.290
2.042.31 1
E!ecUid Components & Equipment Nexans LA EVS Broadcm Equipment SA RtlJ l n remkml
417.100 402,9@3 377,460
ITA BEL. BEL
EU R EUR EUR
1,197,520
47'3.1 7a Fertilizers C Agricultural Chemids Syngenla AG
Food Disttibutom Koninklijkr Numico NV
Gencral Merchandise Stores Texo PLC
Hcalth Care Equipment Ewilor International SA Cain e AB, B Nokf Riocm Holding X Smith fir Nephew PLC Elekta AB. R Stnurnann tlolding AG h p l i f o n SPA
CHE CI 11:
N LV EUR 594,950
GBR GBP 477.674
FM SWE C11E
EUR SEK ZHF
SEK CHF
GBP
676.035 534,641 492,712
350.898 238.414 238.266
491.833 GBR W E CI IE ITA EUR
3,022,799 12.97
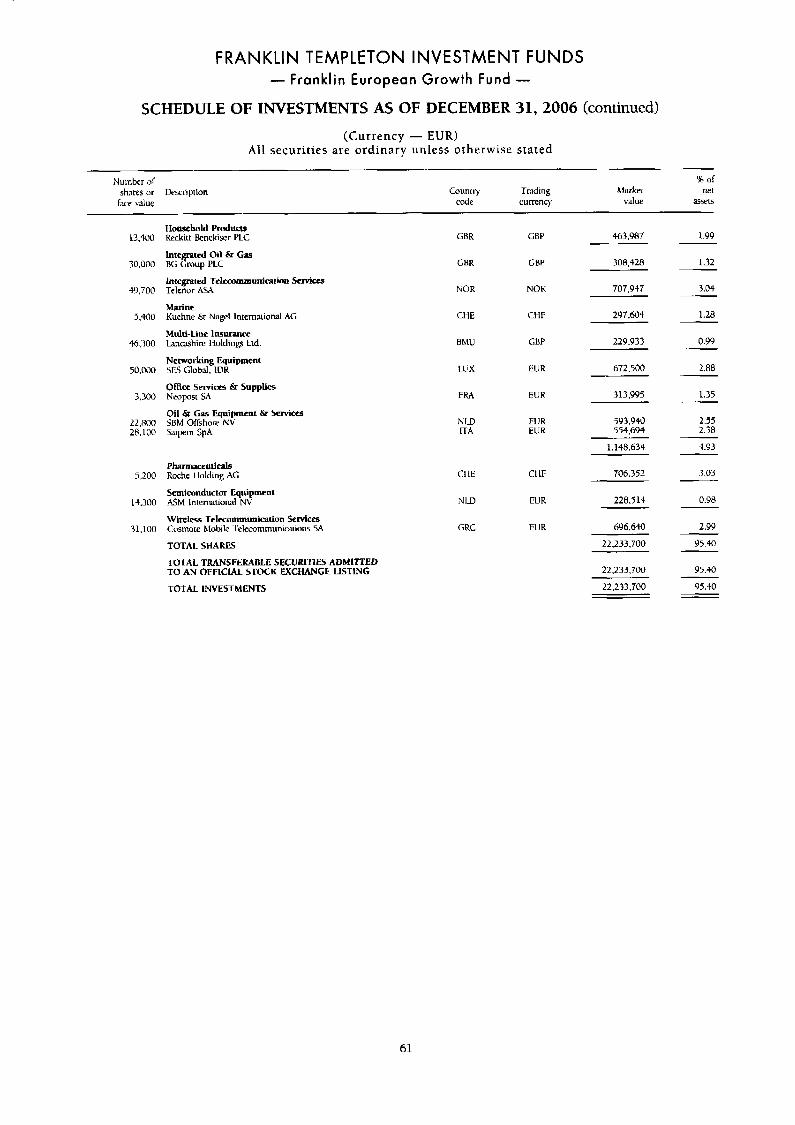
FRANKLIN TEMPLETON INVESTMENT FUNDS - Franklin European Growth Fund -
SCHEDULE OF INVESTMENTS AS OF DECEMBER 31,2006 (continued)
(Currency - EUR) All securities are ordinary unless otherwise stated
~~
Number or shares or Descripiion
lace value
% of Counrry Trading Market net
code currency value a55et5
~~
13,400
30,000
49.700
5.400
46.700
50,000
3.300
22,800 28,100
5,200
13,300
71,100
Household Product$ Krckitt Benckisrr PLC
Integrated Oil & Ga?. FIG Lroup PLC
Integrated Te~ecoInrnuniQtioiI S c m c u Telenur A M
Marine Kuehne & Nagel LnternaLional AG
Multi-Line lnsurancc Lmwshire I loldings Ltd
Networking Equipment SES Global. 1DR
Oficc Services & Supplies Ncopos~ SA
Oil & Cas Equipment & Services SBM Offshore NV' Saipem SpA
Phrmacouticals Roche I lolding AG
Semiconductor Equipment ASM International NV
Wireless Telecommunication Services Cusmotc Mobile ~l'ckcumrnunimions SA
TOTAL SHARES
TOTAL TRANSFERABLE SECURITIES ADMIITED To AN OFFICIAL STOCK EXCHANGE LISTING
TOTAL INVESTMENTS
GBR
GBR
hOR
Cl-IE
BMU
LUX
FRA
GBP 463,987 1.95)
GBP
NOK
CHF
308.428
707,947
297.604
GBP 229.933
1.32
3.04
1.28
0.99
EUR
EUR
672,500
313.995
2.88
1.35
NLD ITA
EUR EUK
5Y3,940 554,694
2.75 2.38
CI IE
NU)
GRC
CI 1F
EUR
EUR
1.148.634
706.352
6Yh,640
22,233,700
22,233.7CU
22.233.700
4.93
.lo3
0.98
2.99
95.40
95.30
97,40
61
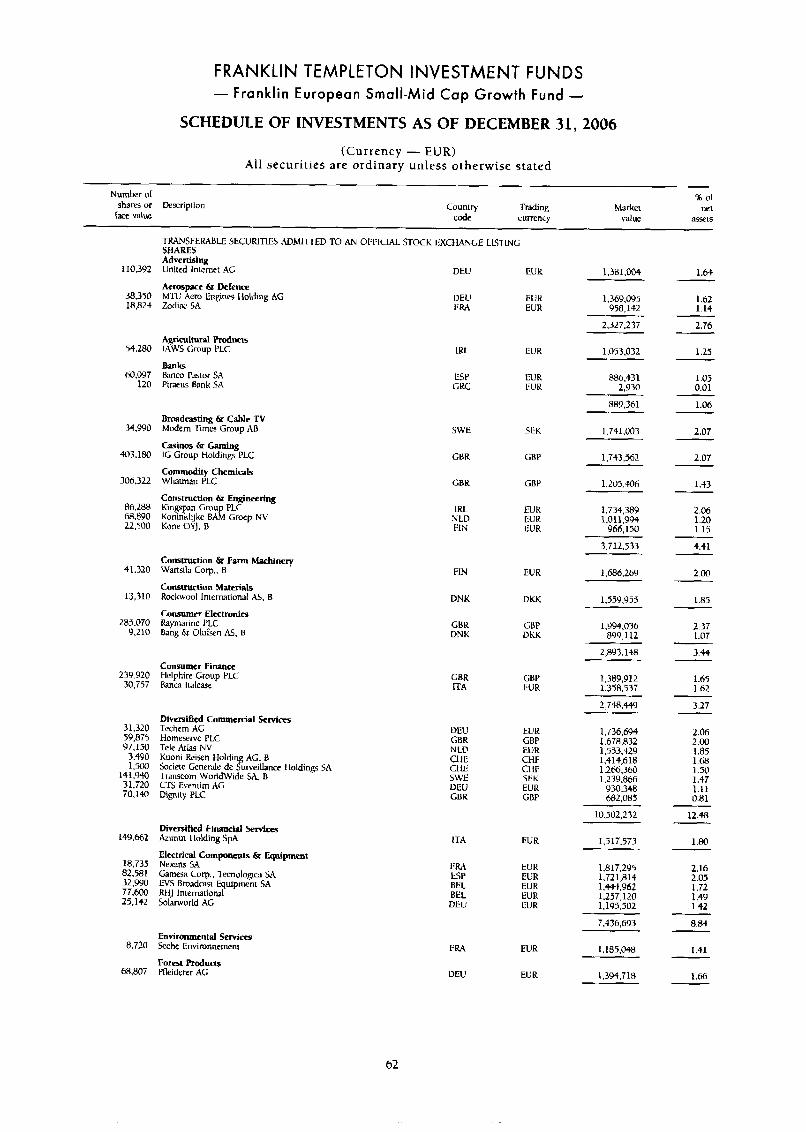
FRANKLIN TEMPLETON INVESTMENT FUNDS - Franklin European Small-Mid Cap Growth Fund -
SCHEDULE OF INVESTMENTS AS OF DECEMBER 31,2006
(Currency - EUR) All securities are ordinary unless otherwise stated
% or
code currency value 3$$etS
Number o l
shares or hxnption Country Trading Market net lace valw
TRANSFERABLE SECURiTlB .UJMI'ITED TO AN Ol'I~IClAL STOCK IiXCkIANGE LlSTlNC SHARES
110.392
38,350 18.824
54,280
h0.097 120
34,990
403.180
306,322
86.288 68.8Y0 22.500
41.320
13,310
284.070 Y.210
239,920 30.757
31,320 59,875 97,150
3.490 1,500
141.1340 31.720 70.140
149.6432
18.735 82.581 32,YYO 77.600 25.142
R.720
68.807
Advertising United Internet AC
Acrospacc & Defence M.1-U Aero Engines Ilolding AG Zodix SA
Agricultural Roducls
Bank5 Banco Pastor SA Piraeus Bank SA
IAWS Group PLC
Broadwting & Cable TV MDdern Time Gnwp AB
Casinos & Gaming lG Group Holdings PLC
Commodity Chemicals Whtman PLC
Construction & Engineering Kingpan Croup PLC Koninkltjke BAM Groep NV &me OlJ, R
Construction Q Farm Machinery Wartsila Corp.. R
Construction Materials Rockwool lnicmationill As. t! Consumer Electronin Raymanne PLC Bang Es Olufvrn AS, B
Consumer Finance Helphire Croup PLC Ranca ltalcve
Diversified Commercial Serviccs Tcchem AC Homeserve PLC Tek Alhs NV Kuoni Reirn Holding AG, B Societe Generale de Surveillance Iluldinp SA Tramcorn Worldwide SA B C E Eveniim AG Dignity PLC
Diversified Financial Services Aztimut I lolding SPA Ellrttical Components br ~ i p m e n l N c x m SA Garnrsa Corp.. Tecnologica W EVS Broadcasi Equipment SA KHJ Intemtional Solarworld AC
Environmcntal Services Seche Envirnnnerncnt
Forest Products Pfleidrrer AG
DEU
IJEU FRA
LRL
ESP C K
SWE
GBR
GBR
I R L N LD FIN
FIN
DNK
CBK VNK
CBR ITA
LIEU GBR N LD CllE CtlE 5WE UEU CBR
ITA
FRA tSP BEL BEL DEU
1;M
DEU
EUK
EUK EUR
EUR
EUR EUR
SEH
GRP
GBP
EUK EUR CUR
EVR
DKK
GnP DUK
GBP EUR
EUR GBP EUR CHF CI IF SEK EUR GBP
EUR
EUR EUR EUR EUR EUR
EUR
EU R
1,381.004
1,369,095 9 58,142
2.327.237
1,053.032
886,431 2,930
889.361
1.741.003
1,743,562
1.205.4006
1.734.389 1.01 1,994
966.150
3.712.533
1.686.269
1.55Y.955
1,994.036 89'4.1 12
2.893.148
1,389,912 1,358,937
2,748.449
1,736,694 1 . m a 3 2 1,553,429 1.414.618 1.266.361) 1.239366 930,3413 M32,085
10.502.232
1.517.573
1,817,295 1.72 1,814 1.444.962 1,257,120 1,195.502
7.436,693
1,185,048
1.394.7 18
1 .b4
1.62 1.14
2.76
1.25
1.05 0.01
1.06
2.07
2.07
1.33
2.06 1.20 1.15
4.41
2.00
1.85
2.37 1.07
3.44
1.65 1-62
3.27
2.06 2.00 1.85 1.M 1.50 1.47 1.11 0.81
12.48
1.60
2.16 2.05 1.72 1.49 1.42
8.84
1.41
1.66
-
62
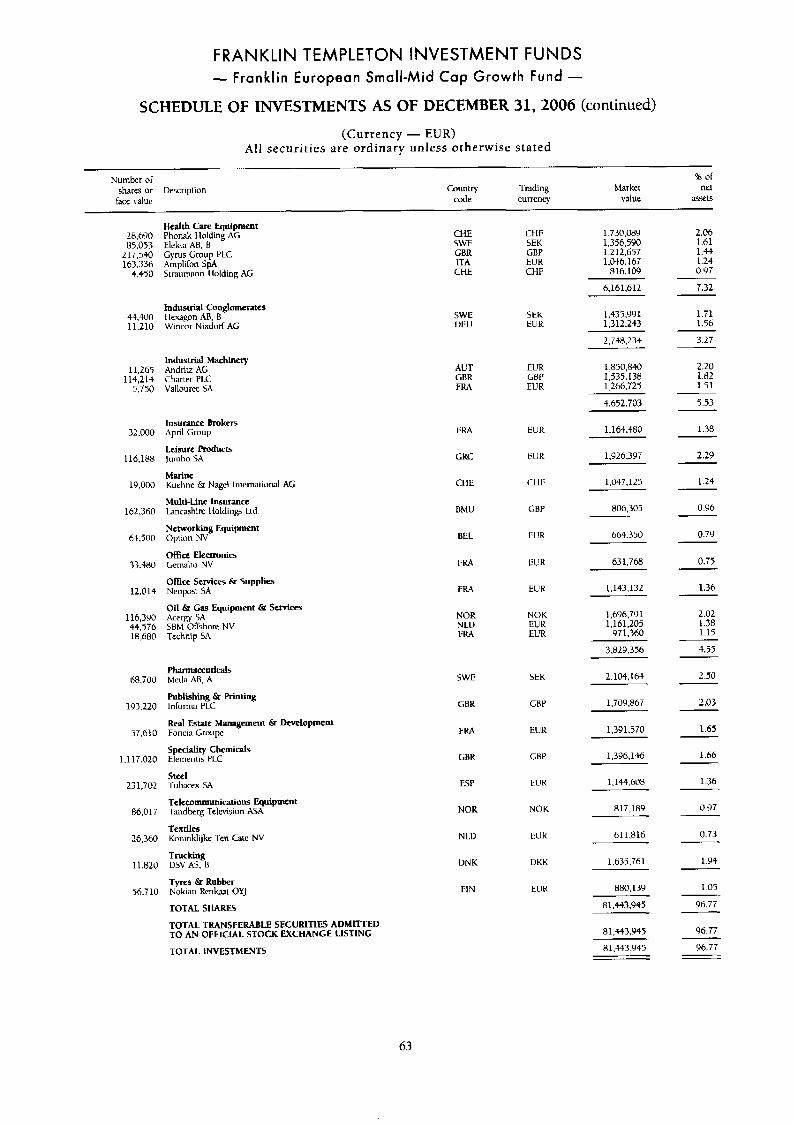
FRANKLIN TEMPLETON INVESTMENT FUNDS - Franklin European Small-Mid Cap Growth Fund -
SCHEDULE OF INVESTMENTS AS OF DECEMBER 31,2006 (continued)
(Currency - EUR) All securities are ordinary unless otherwise stated
Number of % u t
face value code cur renq \Talut ;1S?e:Ls shares iir Description Country 'Trading Market ne1
Health Care Equipment Phunak t lolding AG Elekta AH. I3 Gyms Gruup PLC Amplilon SPA jtraumann Ilolding AG
2.06 1.61 1.44 1.24 0.Y7
28.bYO 85.053
217.540 163.336
4,450
+4,400 11 210
11.265 114,21+
5.750
32.000
116,188
19.000
162.360
6t.500
33.480
12.014
llb,3YO 44.576 18,680
h8.700
193.220
37.610
1.1 17.020
231,702
86,017
26.360
11.820
56,710
CHE CHP 1,730,089 SWE SEK 1,396,590 GBR GBP 1,212.657 ITA EUR 1.046.167
CHE CHF 816.1W
6,161.612 7.32
1.71 1.56
3.27
industrial Conglomerates I Iexigun AR, B Wincor Nixdnrl AG
SWE UEU
SEK EUR
1,435,991 1,312.243
2.74$.>31
2.20 1.82 1.51
Industrial Machinery Andritz AG Charter PLC Vallourec SA
EUR GBP EUR
AUT GBR FRA
1,850,840 1,535.138 1,266.725
4.652.701 5.53
1.38 insurance Brokers Apnl Group
Leisure products Jumhli SA
Marine Kuehne & Nagel lniernational AG
Multi-Line lnsuranm lanmshire lioldiw Lrd
Networking Equipment Oprion NV
Office Electronics Gemallo NV
Ofice Services 6r Supplies Neopost SA
I:uA
GKC
CllE
BMU
EUR 1,164,480
2.29 EUR
CI 11:
1.926.397
I .24
096
0.79
1,047,125
GBP $06,305
BEL
I W
FRd
NOR N1.D I:Iw
EUR 664.350
IIL'R 0.75
1.36
631,768
EUR 1,143,132
Oil & Gas Equipment & Setvices kerm SA SBM Oll'shore NV
2.02 1.38 1.15
4.55
1 .bY6,791 1,161,205
971.360
3,829,356 Technip SA
Pharmacfuticals Meda M. A
Publishing 6r printing Informa PLC
Real Estate Management & Ikvplopmenr Funcia Group?
S cciality Chemic& EPcinentis PLc
Steel Tubacex SA
Telecommunications Equipment -l-:tndberg Television r U A
Textiles Koninklijke Ten Catc NV
2.50
2.03
2.104.164 jw
GBR
FRA
GHR
ESP
NOR
N LV
UN K
FIN
SEK
GHP
ElJR
GI3P
EUK
N O K
Eun
DKK
EllR
1,709,867
1.65 1,391.570
1.66
1.36
1.396.146
1.14-t.608
0.97 817,189
0.73
1.94
1 .or 96.77
96.77
611.816
Trucking DSV AS. B 1.635.761
Tyres & Rubber Nokian knkaar OYJ
TOTAL SHARES TOTAL TRANSFERABLE SECURITIES ADMITTED TO AN OFFICIAL STOCK EXCHANGE LISTING
880.13Y - 81.443.945
81,443.945 - ~
A1.443.955 96.77 TOTAL INVESTMENTS
63
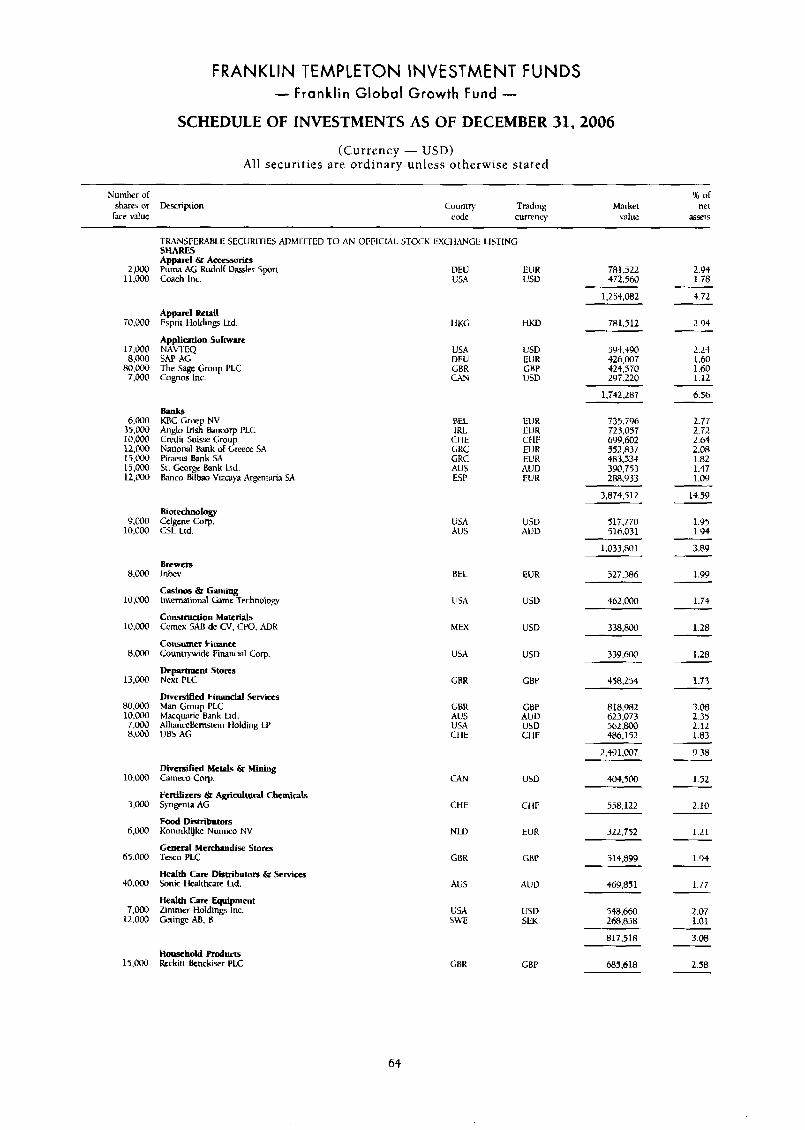
FRANKLIN TEMPLETON INVESTMENT FUNDS - Franklin Global Growth Fund -
SCHEDULE OF INVESTMENTS AS OF DECEMBER 31,2006
(Currency - USD) All securities are ordinary unless otherwise stated
Number of sh3res or Descripion
race value
B of Country Trdding Market net
code curremy value a5scl5
2 . m 11,000
70.000
17.000 8.000
80.000 7,000
6,000 35.100 10,000 12,000 15,000 15,000 12,000
9.000 10,000
8.000
10,000
10,000
8,000
13,000
80,OW 1 o . m 7,000 8.W
10.000
3.000
6.000
h5.0a0
40.000
7,000 12.000
15.ooi)
TRANSFEWLE SECURIIIES ADMI-nED TO A N OFFICML STOCK EXCILWGE LISTING SHARES
DEU Coach lnc.
Apparel &tail Esprit Holding Ltd
Applifntion Software NAWEQ SAP AG The Sage Group PLC Cognos Inc.
Bank5 KRC Crtep NV Anglo Irish hncorp P1.C Credit 5 u k Ck~up National Bank of Greece SA Pmeus b n k SA Si. Gmrge Bank Lid. kinm Bilbao V W y a Argentaria SA
Biotechnotogy Celgene Corp. CSL Ltd.
Brcwets I r l b e V
Cnsinos 67 Gming lntemaional &me Technolop
Construction Mawrials Cemex SAB de CV. CW. ADK
Consumer Finantc Counrqwide Financial Corp
Next PLC
Divemified Financial %Me Man Group PLC Macqwrie Bank Ud. Alliancckmtein Holding LP UBS AG
Department stores
Diversified Me& & Mining G m m Corp.
Fertilizers & Agricultural Chemicals Spngenra AG
Food Diurlbutors Koninklijkc Nurnico NV
General Merchandise Stores Tesco PLC
Heallb Care Distributorr dr Services Sonic tlwlthcarc Lid.
Health CM Equipment Zimmer Holdings Inc. Criinge M, I3
Hollsrhold products kckiu knckiser PLC
~~
USA
1 IKG
USA DEU t iBR C A N
BEL I RL c1 IE GRC GRC AUS ESP
USA AUS
BEL
LISA
MEX
USA
CBR
GBR AUS USA CIIE
CAN
CHE
NW
GBR
All5
USA SWE
GBR
EUR usv
HKD
USD EUR CBP U5D
EUR EUR Ct1F EUR EUR AUD EUR
U5V AU1)
EUR
usu
USD
U5D
GBP
CBP AUU USD c1 IF
USD
CI IF
EUR
CBP
AI!V
USD SEK
GBP
781.522 472.560
1,254,082
781.512
594,490 426,007 424.570 297.220
1.742.287
735.796 723.057 699.602 552.877 483.53+ 390,753 288.933
3.874.512
517.770 516.031
1.033,801
527.386
462.000
338.600
339.600
2.94 1.78
4.72
2.94
2.24 1.60 1 .hO 1.12
6.56
2.77 2.72 2.64 2.08 1 .82 1.47 1 .w
14.59
1-93 1.94
3.8Y
1.YY
1.74
1.28
1.28
438.254
818.982 623.073 562.800 486,152
1.73
7.08 2.35 2.12 1-83
2.491.007
404,500
558.122
322.752
514.899
369.851
548.660 263,858
817.518
685.618
9.38
1.52
2.10 ~
1.21
1.94
1.77 ~
2.07 1.01
3.08
2.58
64
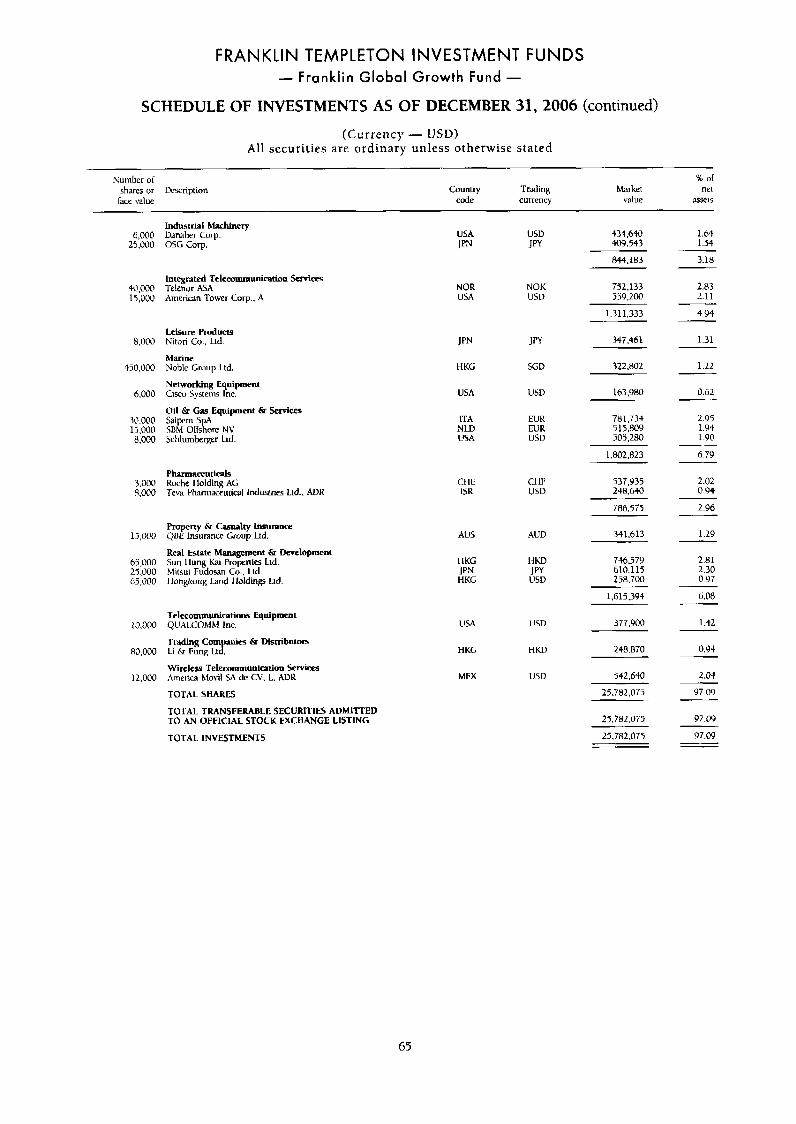
F RANKLlN TEMPLETON INVESTMENT FUNDS - Franklin Global Growth Fund -
SCHEDULE OF INVESTMENTS AS OF DECEMBER 31,2006 (continued)
(Currency - USD) All securit ies are ordinary unless otherwise stated
% of Country Trading Market net
code currency value Wls
Number of shares or Description face value
Industrial Mathinery Danaher COT. OSG Corp.
6,000 25,000
40,000 15,000
8,000
450.000
6,000
30,000 15.000 8,000
3.000 R . W
15,000
65.000 25,000 65,000
10,000
80,000
12,000
USA ClSD 434.640
$44.183
JPN J PY 409.543 1.64 1.54
3.18
Integrated Teleannmunktion Sovices .reelenor hsA American Tower Corp., A
2.83 2-11
4.94
NOR NOK 752,133 USA USD 359,200
1.31 1.333
Leisure Products Nitori Co.. bd.
Marine Nohle Group Ltd
Networking Equipment Cisco System Inc.
Oil & Gas Equipment h Services Saipem S A SBM OKs\ore NV Schlumberger h d
347.461 1.31
1.22
0.62
2.95 1.94 1.90
6.79
2.02 0.Y4
2.96
1.29
2.81 2.30 0.417
HKG SGV 322.802
USA USV 163.980
ITA NLD USA
EUR EUR USV
781.73.) 5 15.809 505.280
18002.823
537.Y35 25#.6+0
786.575
Pharmaceuticals Roche 1 Idding AG Teva Phamaceutid lndustnes Ltd.. ADR
CI IE ISK
CI IF USD
Property & Casualty Insurance Qtle Insurance Group Ltd.
Real Esmte Management & Development Sun I lung Kai Propcnies Ltd. Mitsui Fudoun Co.. Ltd. I longkong kind 1 loldinp Lrd.
AlJS AUD 341 ~51.3
746.57Y 610.115 258.700
I IKG JPN HKG
I IKD
USD J PY
1,615,394 6.08
1.42 377.900 Telecommunications Equipment QUAl.COhiM Inc.
Trading Compvlics &I Distributors Li fir Fung Ltd.
Wireless Telecommunicition Servicps America Mod SA de CV. L. AUUK
TOTAL SHARES
USA lJSD
HKD
USD
HKG 0.9s
2.04
248.870
542.640 MEX
Y7.09
97.0'3
25.782.07-5
25.782.075 TOTAL TRANSFERABLE SECURITIES ADMITTED TO AN OFFICIAL STOCK EXCHANGE LISTING
fOTAL INVESTMENTS 25.782.075 97.09
65
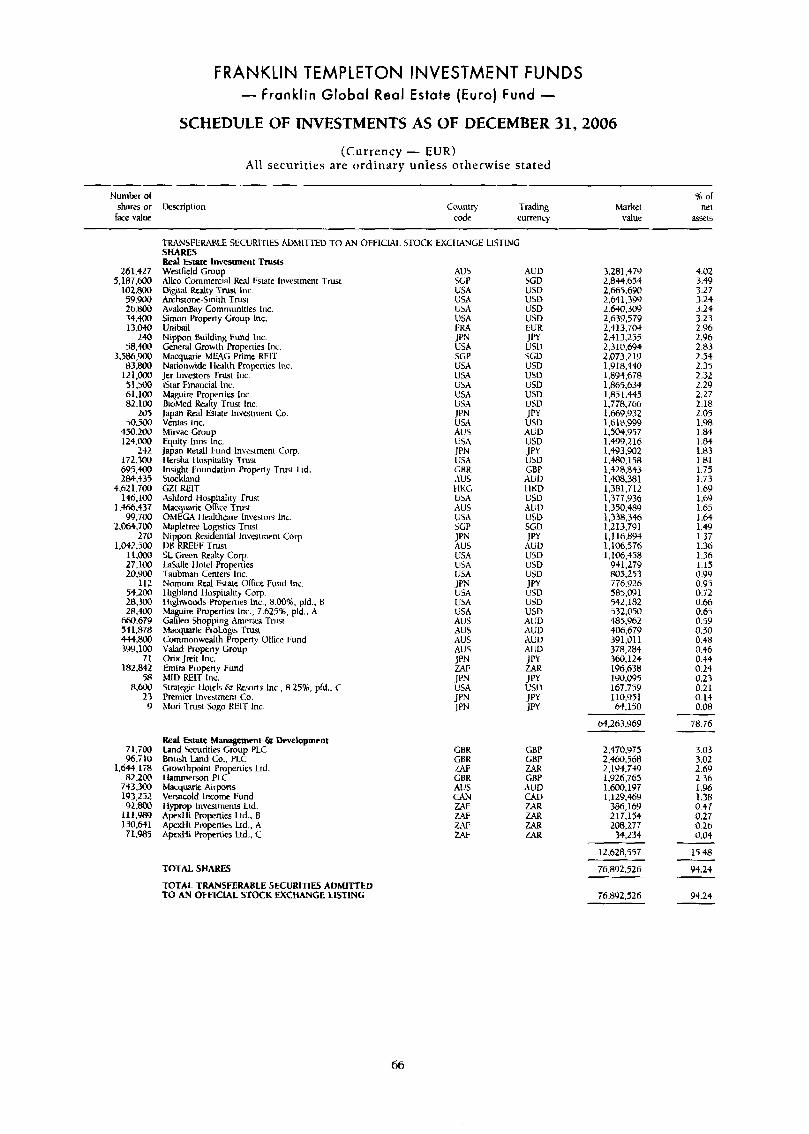
FRANKLIN TEMPLETON INVESTMENT FUNDS - Franklin Global Real Estate (Euro) Fund -
SCHEDULE OF INVESTMENTS AS OF DECEMBER 31,2006
(Currency - EUR) Al l securities are ordinary unless otherwise stated
Number oI 'K, of shares or Description Country Trading Market net
face value code currenq value as6ets
'TRANSFEUBLE SECURI-TIES ADMlnED TO AN OFFICML STOCK EXCl IANGE LISTING
26 1.42 7 5,187,600
102.800 59.900 26.W 34.400 13,040
240 58,400
3,586,900 8 3 . m
121,000 51.500 61.100 02.1w
2d5 50.503
450.200 I24.W
242 172,30(! 695,400 284.+35
4.62 1.700 146.100
1.466.437 99 ,700
2.W.7M) 270
1 , 0 4 2 . ~ 11.ooo 27,100 2O.W
112 54,200 2H,30(! 28,400
6Ro.679 541,878 et4.800 3Y9.100
71 182,642
5fl
13 9
8.m
71.700 96.510
1.64-l. 158 02.2M
743,303 193,232 92.800
lll.W9 130.6fl 7 1,985
SHARES R e d Estate Investment Trusts Westfield Group Allm Commercial Real Estate lnvearncni Trust Digiul Realty Trusi Inc. Archsione-Smirh T m i AvalonBay Communities Inc. Simon Propeny Cruup lnc. Unibail Nippn Building Fund lnc. Generd Growth Properties Inc. Macquarie MUG Prime R E l l Nationwide I h h h Properties lnc. Jer lnvesrors Trust Inc. istar Financial Inc. Maguire PropeniLs Inc. BioMed Kcdry Trusi Inc. Japan Real Estare lnvesiment Co. Ventas Inc. Minx Cruup Equiiy Inns he. Japan Retail Fund Investment Cnrp. I krsha 1 luspitaliiy Trusi h i rht Foundation Property Trust Lid. st mibnd GZI REIT &hlord llospiiality Trust Macquarie Ofice Trust OMEG4 I Iealthwre Invesrors Inc. hbpletrrt: lo lstics Trust Nippon Res.f I enlid .I lnvcsrmem COT. DH RREEI; Trust SL Gwen Realty COT. LaSalk llotcl Propenies Taubman Centers Inc. Nomura Kea1 Esvile Office Fund Inc. Highland Ilospitality Corp. lbghwoods Properties Inc.. 8.00%, pld.. B hhguire Pmpnics Inr.., 7.625%. pld.. A Gahleo Shopping America Trw hiacquarie Prologis T w l Commonwealth Property OIfice Fund Valad Property Group Orix J ~ t t lnc. Ernira Property Fund MID REIT Inc. Stntegjc llorek & ksorts Inc., 8.25%. pld.. C Premier lnvestmeni Co. hlori Trust Sogo REIT Inc.
k d Esmte Management & Development Land Securities Group PLC Briiish Land Go., PLC Growrhplint Pmperiies Ltd. I krnmemn PLC hlacqume Airpons Verwcold Income Fund liyprop Invcsments Lrd. Apexlli Propenies Ltd.. B Apexkli Propenies Ltd.. A ApexHi Propenits Ltd., C
xu5 SLP USA USA USA USA FIU JPN USA SCP USA USA USA USA USA JPN USA AUS USA IPN USA CBR AUS tiKG USA AUS USA SGP ] PN A u s USA USA USA J PN USA USA USA Al!j AUS AUS AUS J PN ZAF JPN USA JPN J PN
CBR GBR 7AF GHR AUS CAN ZAF i 3 F z.4F 2AF
AUD SGD 1JSD USD U5D USD EUR JPy us0 SCD USD USU L:SD USD USD J py USD ALD USD Jm USD GBP ALJI) 1 IKD
l l U 0 tis0 SGD
ALD USD USD USD JPY 1!SD USD USD Al!D AUV AUUD AU 0 J PY ZAK J!Y LSD JPY JPY
usv
JPF
GBP CBP U K GBP AUD CAD m ZAR ZAR ZXR
3,281,479 2,844.654 2,665.690 L641.399 2.640.309 2.639,579 2,413,704 2,413,255 2.310.694 2.073.2 19 1 .910,44O 1.894.678 1,865,634 1.83 1.445 1,778,766 I .669.932 1.618.999 1,504,957 1.499.216 1,493,902 1,480,158 1,428.843 1,508,381 1,301,712 1,377.9 36 1,350,489 1,338346 1,213,791 1,116.894 1.106.576 1.106.458
941,279 005.253 i76.926 585.09 1 542,182 532.050 485:Y62 406.679 391.01 I 378,284 360.124 196.638 190.095 167.759 110,951 64,150
M4,263.Y69
2,470.975 2.460.568 2,194,749 1 .9 26,765 1,600.197 1.129.469
306,169 2 17,154 208,277
34,234
TOTAL SHARES
TOTAL TRANSFERABLE SECURITIES ADMITTED TO AN OFFICIAL STOCK EXCHANGE LLSTINC
12,628,557
76.092.526
76.892,526
4.02 3.49 3.27 3.24 3.24 3.23 2 .% 2.Y6 2.83 2.54 2.35 2.32 2.29 2.27 2.18 2.05 1.98 1.84 1 .R4 1.83 1.81 1.75 1.73 1.69 1.69 1.65 1.64 1.49 1.37 1.76 1.36 1.15 0.w 0.95 0.72 0.66 0.65 0.59 0.50 0.48 0.46 0.+4 0.24 0.23 0.21 0.15 0.08
78.76
3.03 3.02 2.69 2.36 1.96 1.38 0.47 0.27 0.2b 0.04
15.48
94.24
94.24
66
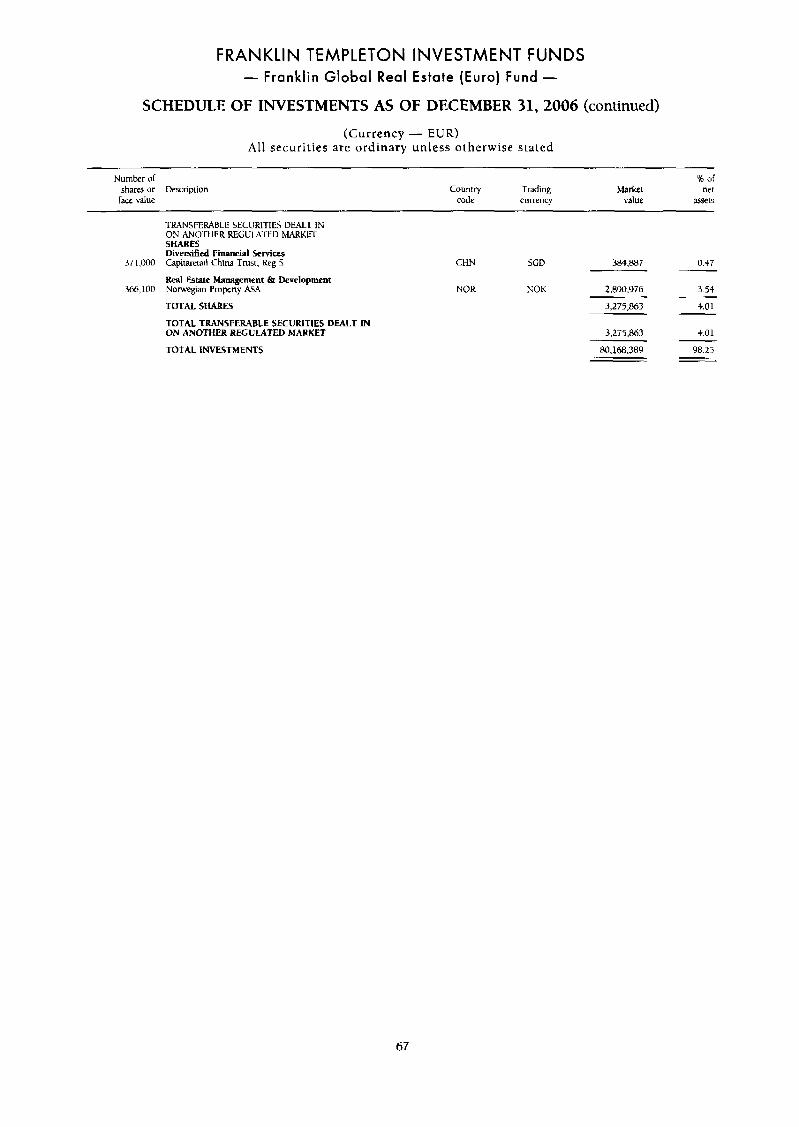
FRANKLIN TEMPLETON INVESTMENT FUNDS - Franklin Global Real Estate (Euro) Fund -
SCHEDULE OF INVESTMENTS AS OF DECEMBER 31,2006 (continued)
(Currency - EUR) Al l securities are ordinary unless otherwise stated
Number or sham or Descripiion face value
% of Counrry Trading Mark: ne:
code currency value ilSrtS
37 1,000
3h6.1DO
'CIWNSFEWBLE SECURITIES DWLT IN ON ANO'TtlER REGUIA'I'ED MARKET SHARES Diversified Financial Services Capitareiail China Trust. Rtg 5
Real Estate Management & Development Norwegian Pmpny &A
TOTAL SHARES
TOTAL TRANSFERABLE SECURITIES DEALT IN ON ANOTHER REGULATED MARKET
TOTAL lNVESTMENTS
CHN
NOH
SGD
EiOK
384.887 0.47
2.890.Y76
3,275,063
3.54
4.01
3.2i5.863
Ho. 168,389
+.01
98.29
67
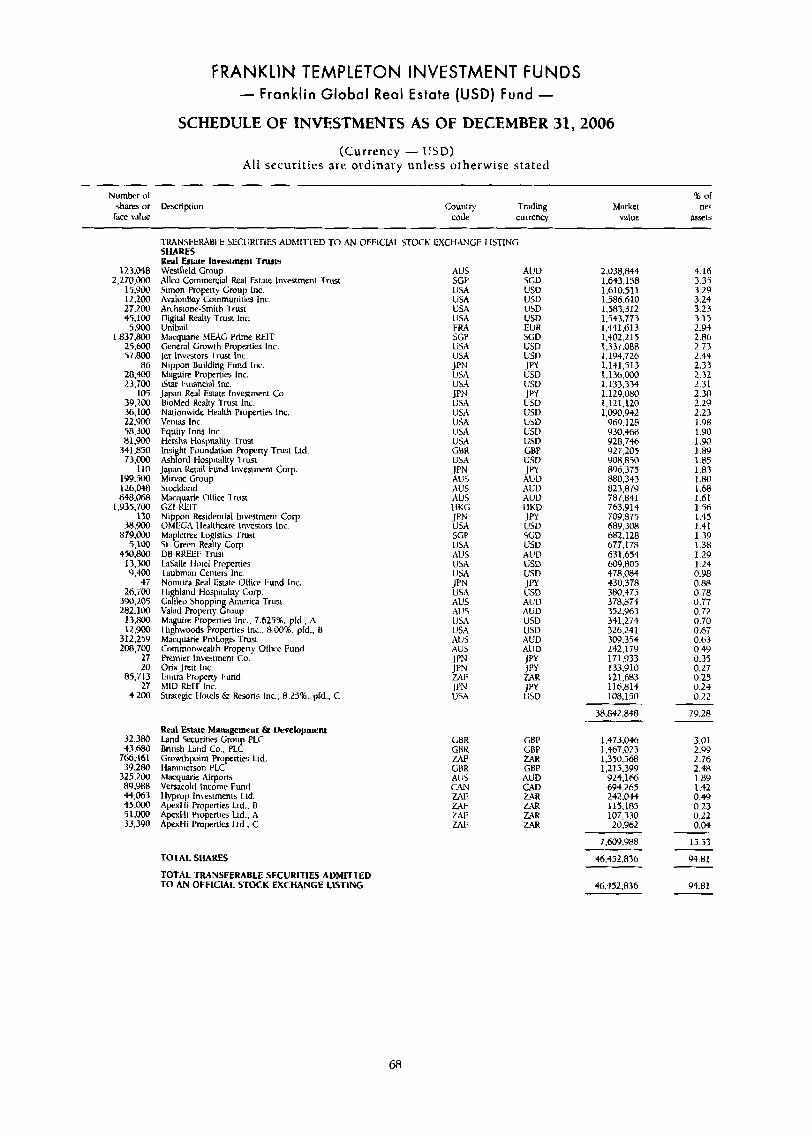
FRANKLIN TEMPLETON INVESTMENT FUNDS - Franklin Global Real Estate (USD) Fund -
SCHEDULE OF INVESTMENTS AS OF DECEMBER 31,2006
(Currency - USD) All securities are ordinary unless otherwise stated
Number or B of shares or kscripiion Country Trading Market net
h e % d u e code CUttCnC). value &XtS
123,048 2,270,000
15*9W 12.200 27.100 44.100 5.900
1.837.800 25,600 57,800
86 28,400 23.70
105 39.200 36.100 22.900 58.300
3-tl.850 73,000
I10 IYY.500 126,048 648,068
1.935.700 130
38.900 879,000
5.100 450.Roo
13,300 '3.w
47 26,700
3W.205 282,100
13.800 12 .W
312.259 208,700
27 20
85,713 27
4.2W
n i m
32,380 t 3 . m
766.461 39.280
325.200 8q,w 44,063 45,000 51.000 33.390
TRANSFERABLE SECURL'TIES ADMIITED TO AN OFFK SHARES Red Estate Investment T m t s Westfield Group Allco Commercial Rcal Estate Investment 'Crust Simon Proprny Group Inc. AvalonBay Communities Inc. Archstone-Smith Trust D i p 1 Reah). Trust Inc. Unibi l Macquarie MEA; Priinr RElT General Crow-rh Properties Inc. Jer Investors Trust Inc. Nippon Building Fund lnc. Maguire Properties Inc. Star 1:inmci;rl Inc. Japan Real Esvaie lnvestrncnl Co. BioMed Realty Trust Inc. Nationwide Health Properties Inc. Vcnias lnc. Equity Inns Inc. Helsha Hospitality Trust lnsi hr Foundation Propeny Trust Ltd. Ashford Hospitality Trust Japan k t i l Fund Investment COT. Mirvac Group Stuckland Macquarie Olficp Trust GZI mi-r Nippon Residential Investmen[ COT. OMEGA tkalthcare Investor$ Inc. Mapletwe Lo islie Trust SL Green d t y Corp. DB RREEI: Trusi L&Ik Howl Froperties Taubman Centers Inc. Nomura Real Estate OlTice Fund lnc. I li hland Hospitality COT. Ctfileo Shopping America Trust Vahd Property Ci-~iup M uire Properties Inc.. 7.b25%. prd. A il&vuods Properties inc.. 8.W04;. pid., B Macquarie ProLogis 'I-rust Commonwealth Pmpfny Ollicc Fund Premier lnvestmeni Lo. Orix Jreit Inc. Emin Property Fund MID RELT Inc. Strategic I-lo& 67 ksons Inc., 8.25%. pfd., C
Real Estate Management 6r Development Land Securities Group PLC British Land Co., PLC Growthpoint Properties Lid. I-lammerxm PLC Macquarie Airpons Vemcold income Fund I-lyprop Investments Ltd. Apexlli Pmpenies L I ~ . , B ApexHi Propenies Ltd.. A ApexHi Pmpertics Ltd., C
TOTAL SHARES TOTAL TRANSFERABLE SECURITIES ADMITTED TO AN OFFICLAL STOCK EXCHANGE LISTING
:ML 5rOCK EXCHANLE LISTING
AUS SCP USA lJSA USA USA FRA SGP uw USA
USA JPN USA USA USA USA USA GBR USA IPN AUS AUS L I U S HKG JPN USA SCP USA AUS USA USA
Jv: AUS AU5 USA IJSA /\US AUS JPN
JPN USA
$:
CBR GBK ZAF GHR AlJS CAN
.4uv SGD USU USD USD US11 EUR SCD USD USD J W USD USD J PY USD tiSD usu usu USD GBP USD J PY AUD AtiU AUD I IKV I py VSD SGV L'SD AUV USD USD JPY USD AUD AUD USD USD AUD AllU JPY JPY ZAR J PY USI)
LBP GBP U R GBP AUD CAD
2,038,844 1,643,158 1.610.511 1.586.610 1,583.312 1.543.773 1 .441.613 1,302,215 1,337.088 1,194.726 l.lt1.513 1,136,000 1,133,334 1.129 ,080 1,121,120 1,090,932
969.128 930,368 928,746 Y27.203 '308,830 896,375 880.343 823,879 787.841 763.9 14 709.875 689,308 682,128 677,178 631.654 609.805 478,084 330,378 380,475. 378,874 352.963 341.274 326.241 309.354 242,179 171,933 133,910 121,683 116,814 108,150
38.842.848
1.473.046 1,467,023 1,350.568 1,215,399
924.166 6Y4.265 242.W 115,185 107.330 20.962
7,609.988
4b.452.836
46,452,836
4.16 3.33 3.29 3.24 3.23 3.15 2.94 2.86 2.73 2.44 2.33 2.32 2.31 2.30 2.29 2.23 1.98 1.90 1.90 1.89 1 .85 1.83 1 .Ro 1 .a 1.61 1.56 1.45 1.41 1.39 1-38 1.29 1.24 0.Y8 0.88 0.78 0.77 0.72 0.70 0.67 0.63 0.49 0.35 0.27 0.24 0.2t 0.22
79.28
3.01 2.99 2-76 2.48 1.89 1.42 0.49 0.23 0.22 0.04
15.53
91.81
94.81
68
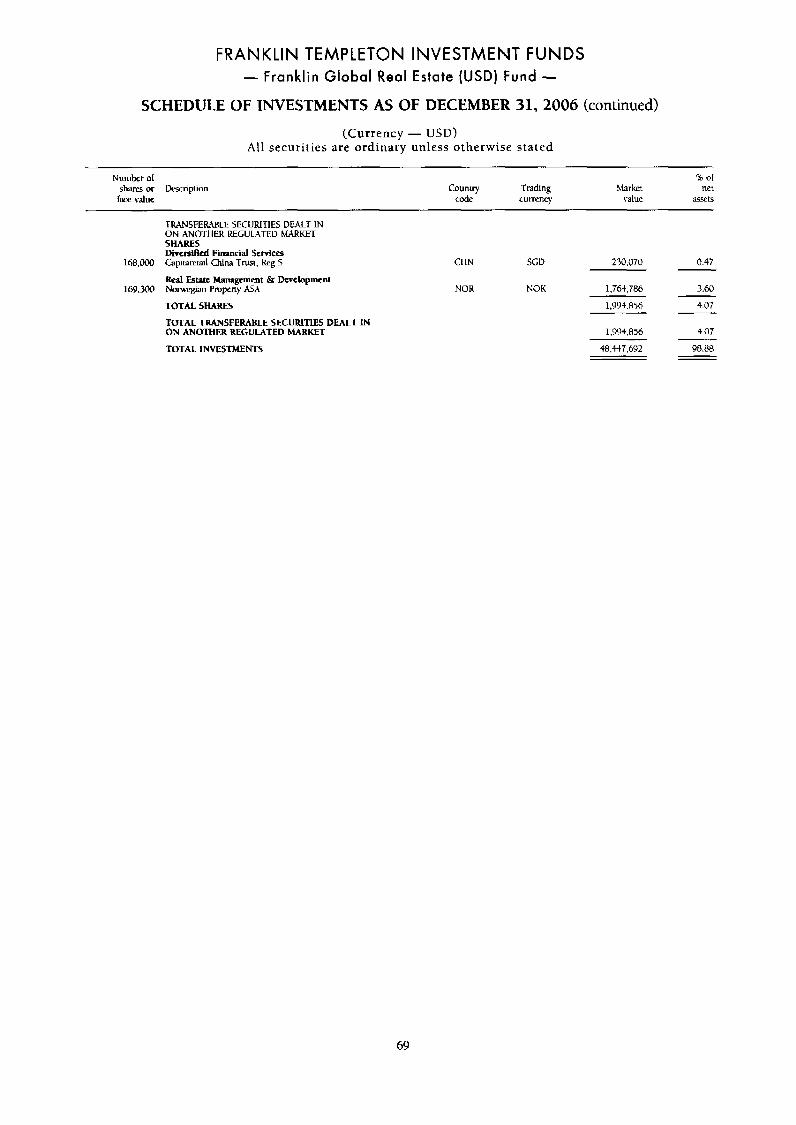
FRANKLIN TEMPLETON INVESTMENT FUNDS - Franklin Global Real Estate (USD) Fund -
SCHEDULE OF INVESTMENTS AS OF DECEMBER 31,2006 (continued)
(Currency - USD) A l l securities are ordinary unless otherwise stated
Number of
face value shares or Utscription
% o l Country h d i n g Market net
code currency value a5ssCLs
TRANSFERULE SECURITIES DEALT IN ON AN01 1 IER REGULATED hWRKET SHARES Diversified Financial Services Gpiwretail China Trusi. Kcg S
Red Estate Management & Dwelopmcnt
TOTAL SHARES
TOTAL TRAYSFERABLE SECURITIES DEALT W ON ANOTHER REGULATED MARKET
TOTAL INVES fMENTS
168,000
16Y.300 Norwepan Pnqwny M A
CIIN
NOR
SCD
KOK
230,070 0.47
1.763,786 3.60
l,Y9+.856 4.07
1.W4.856 4.07
98.88 48,447.6Y2
69
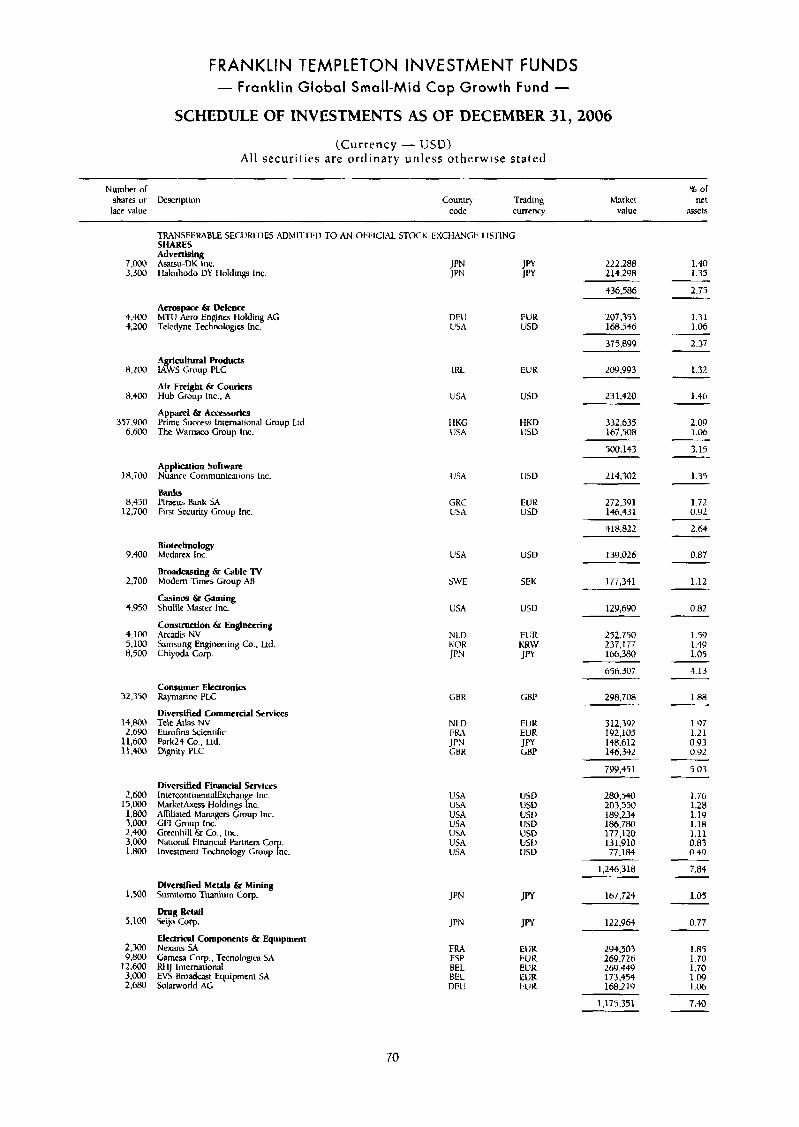
FRANKLIN TEMPLETON INVESTMENT FUNDS - Franklin Global Small-Mid Cap Growth Fund -
SCHEDULE OF INVESTMENTS AS OF DECEMBER 31,2006
(Currency - USD) All securities a re ordinary unless otherwise stated
Number or or shares or Dewription Countr) Trading hiarket net face value code current). value a x 1 5
TRXNSFEIWBLE SECURNIl3 ADMITTEU TO AN 0FI:IClAL STOCK EXCHANGE LISTING SHARES Advertising Asatsu-DK lnc. I lnkuhodo UY I loldmnp lnc
7.000 3,300
4,500 4,200
8,200
8.400
357.Y00 6.600
18,TQi)
8.450 12,700
9.400
2,700
4,950
4,100 5.100 8.900
32,350
14,800 2,690
11,600 11,400
2 . m 15,000 1.800 3.000 2.400 3.000 1.800
1.500
5,lM
2,300 9,800
12.600 3 . m 2,680
222.288 214.298
1.40 1.35
2.75
1.31 1.06
436,586
Aerospace Sr Defencc MTU Aero Engines tlolding AG Teledyne Technologies Inc.
DEU EUR 1!SA U5D
207.353 16A.546
375,899 2.37
1.32
1.46
2.09 1.06
3.15
1.35
1.72 0.92
2.64
0.87
1.12
A g r i c u l d Products
Air Freight & Couriers Hub Croup Inc., A
Apparel & Accesx~ries Prime Success International Croup Ltd. The LVarnaco Group Inc.
LAM'S Chup PLC IHL EUR
USA USD
209,993
231.420
I IKG MKD USA USD
332,635 167,508
500.143
Application 5oftwatt Nuance Communications lnc.
Banks Pirseus Rank SA First Security Gnwp Inc.
USA U5D 214.302
GRC Eun USA USD
272,391 146,431
418.822
Biotechnology Mcdarex Inc.
Broadcasting & Cable TV Modern Times Group AB
Casinos & Gaming ShuWe hlaskr Inc.
Construction & Engineering Arcadis NV Samsung Engineering Co.. Lid. Chiyuda COT.
139,026
177,341 SWE SEK
USA U5D 12Y,6Y0
252.750 237,177 166,380
656.307
0.82
1.59 1.49 1.05
4.13
N LD EUR l i O R K R W JPN Jfl
Consumer Electronics Raymarine PLC
Divcrrified Commercial Services Tele At& NV Eurofins Scientific Park24 Co., Ud. Dignity PLC
2Y8.708 GRR CBP 1.88
1.97 1.21 0.93 0.92
5.03
1.76 1.28 1 . l Y 1.18 1.11 0.83 0.49
7.84
1.05
0.77
1.85 1.70 1.70 1.09 1.06
7.40
312,392 IY2,105 148.612 146,342
NW EUK I Y R A EUR
G B K LRP JPN JPY
799,451
280,540 203,550 189.234 186.780 177.120 131.910 77.184
Diversified Financial Services Interccinrinent31Exchange Inc. Markehas Holdings lnc. Afkliated hianagcrs Group Inc. CFI Group Inc. Greenhill & Co., Inc. National Financial Parmen COT. Investment Technology Chup Inc
USA USD USA tJSD U5A USD USA U5D USA 1613 USA USD USA U5D
1,246,318
167.724 Diverrificd Metals & Mining Sumitorno Titanium COT.
kija Corp.
Electrical Components & Equipment Nexans SA Camesa Corp.. Tecnologica SA lU IJ International EV5 Broadwst Equipment SA Solarworld AG
Drug Retail JPN JPY 122,964
FRA EUR ESP EUR BEL EUK BEL EUR DEU EljR
294.503 269.726 269.449 173.454 168.219
1.175.351
70
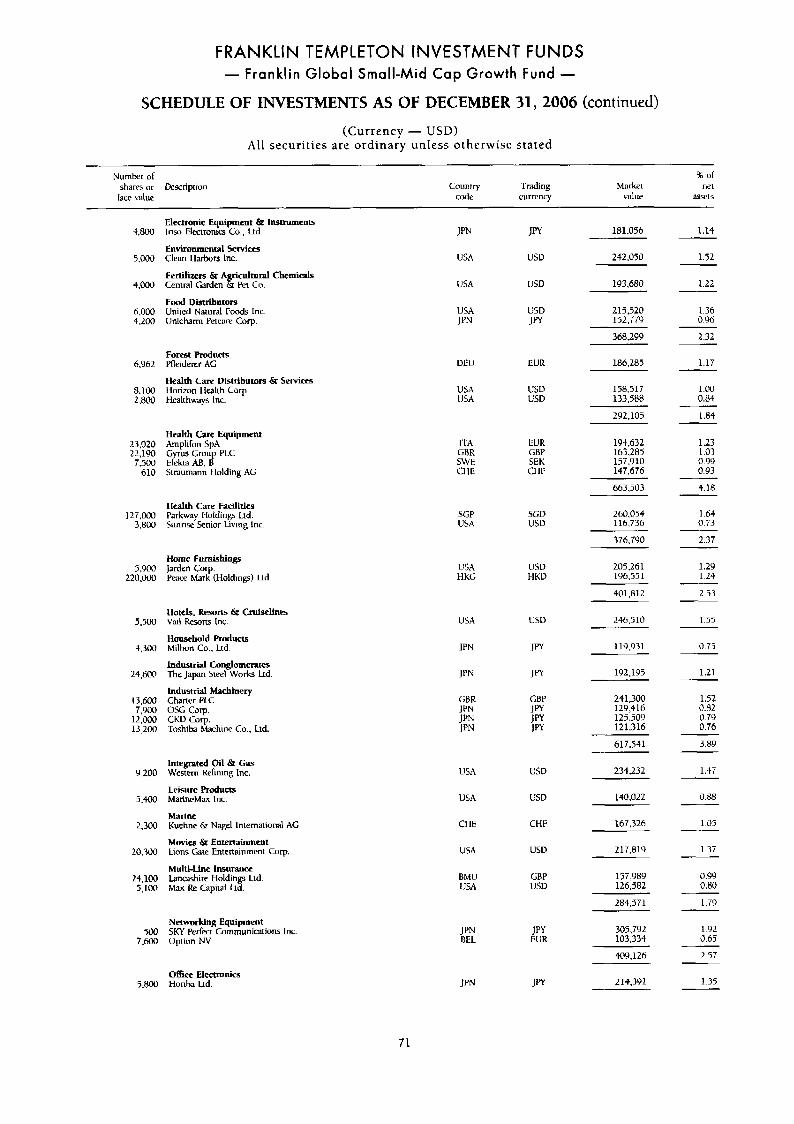
FRANKLIN TEMPLETON INVESTMENT FUNDS - Franklin Global Small-Mid Cap Growth Fund -
SCHEDULE OF INVESTMENTS AS OF DECEMBER 31, 2006 (continued)
[Currency - USD) A l l securities are ordinary unless otherwise stated
Number of 06 of
face value code currency value aSSeLS sharcs or firriptiun Country Trading Market net
Electronic Equipment & InsVUments Iriw Electroniu Co.. Ltd.
Environmental Services Clean Harbors Inc.
Fertilizers & AgricdNd themids Central Garden & Pet Co.
Food Diaributors United Natural Foods Inc. Unicharm Petwre Coy.
JPN
USA
USA
USA IPN
UEU
USA USA
ITA GBR S W E c1 IE
SGP USA
USA tiKG
Jm
usv
USU
USD JR
EUR
IJSD USD
EUR GBP SEK c111:
SGD USV
USD HKD
4,800
5,000
4,000
6.000 4.200
h.962
8.100 2.800
23,020 22,190 7.5m
610
127,ooO 3,800
5,900 220,000
5,500
+,3m
2 4 . m
13.m 7.900
12,000 13,2(w
Y ,200
5 .m
2,300
20.700
24,lM 5,lW
xx)
7 . m
5 . m
1.14
1.52
181.056
242.050
193.680 1.22
215,520 152.779
1.36 0.96
2.32 368,299
186.285 Forest Products Pfleiderer AG
Health Care Distributors & Servicts Ilorizon tlalih COT. Healthnays Inc.
1.17
1 .OO 0.114
1.84
158,517 133.588
~
292.105
Health Care Equipment
Gyrus Group PLC
Stnumann t lolding AG
Amplilon SpA
Ekk13 iW, B
194,632 163.283 157.910 147.676
663.503
1.23 1.03 0.99 0.93
4.18
260.054 116.736
1.64 0.73
Health Care Facilities Parkway ILoldinp Ltd. Sunrise Senior Living Inc.
376.790
205.261 196.551
2.37
1.29 1.24
2.53
1.55
Home Furnishings Jarden COT. Peam Mark (Holdings) Ltd
401,812
246.510 Hoteb, Resorts & Cruiselines \’ail Resorts Inc.
Houwhold P r o d u ~ Millxm Co., Ltd.
Industrial Conglomerates The J a p n Steel Works Ltd
Industrial Mnchinery Charter PLC
CKU COT. -roshiba Hachine Co., Ltd.
vsc C O T .
USA
119.931 0.75 JPN
JPN 192,195
211,300 129,416 125.509 121,316
1.21
1.52 0.82 0.i9 0.76
617.541
234,232
3.89
1.47 Integrated Oil & Gas Western Wining Inc.
Leisure Products MarineMax Inc.
Marine Kuehne 6- Nagel International AG
Movies & Entenainment Lions Gate Entertainment COT.
Multi-Line Insurance Lncashiw Holdin Ltd. Max Re Cjpital L$
USA USV
140.022 USA USD
CHF
0.88
1.05
1.37
0.99 0.80
1.79
1.92 0.65
2.57
1.35
CI LE 167.326
217.819 USA USD
157,989 126.582
BMU USA
t iRP us13
284.571
Networking Equipment SKY Perfect Communications Inc. Opiivn NV
J PN BEL
JPY EUR
305.792 103.334
409,126
214.391 Office Electronits Horiha Lid. JPN
71
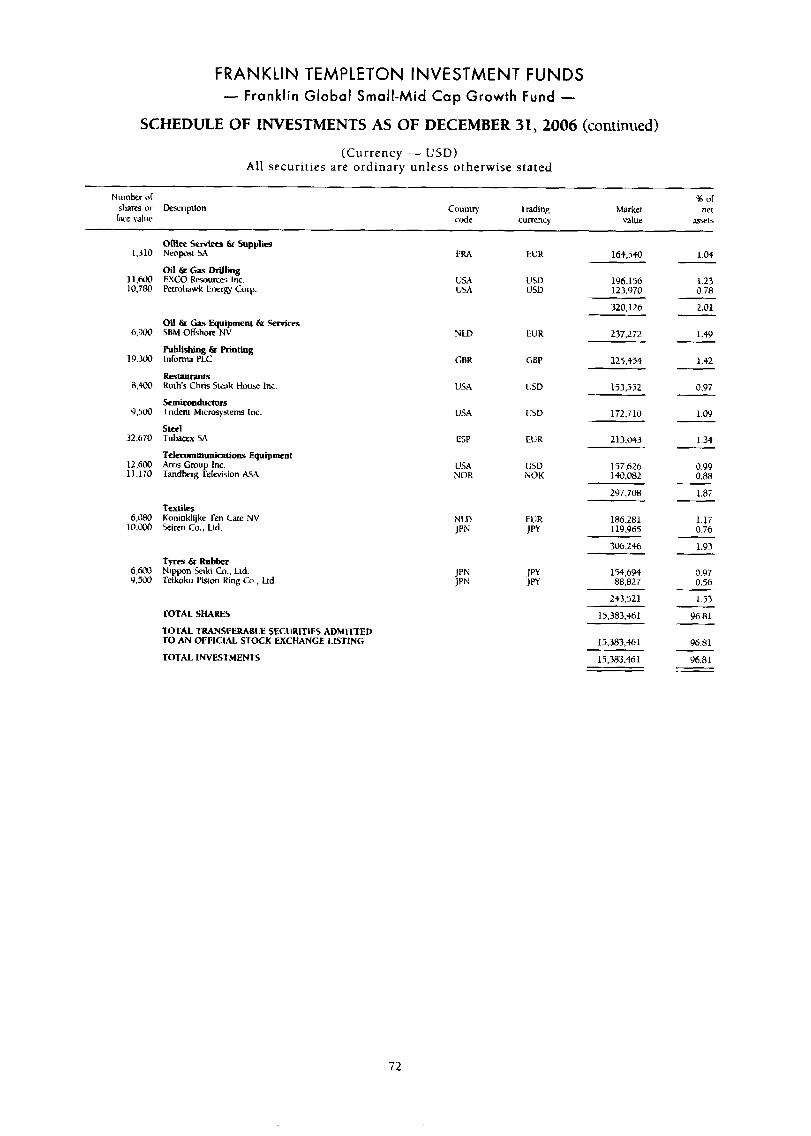
FRANKLIN TEMPLETON INVESTMENT FUNDS - Franklin Global Small-Mid Cap Growth Fund -
SCHEDULE OF INVESTMENTS AS OF DECEMBER 31,2006 (continued)
(Currency - USD) All securities are ordinary unless otherwise stated
Number of % of shares or b r i p t i o n Country Trading Market ne[
k e value code curmncy vnlue %XIS
offirr Serwim 6r Supplies Neopnt SA
EXCO Rf3Ounrs Inc. Pewhawk Energy Carp.
oil & Gas Drilling
1.310 EUR 164.540 1.M
l l , 6M 10,TBO
USA USA
usu USD
196.156 123,970
1.23 0.78
320.126 2.01
Oil &a Gas Equipment 6r Services SBM Ofkhore NV
Publishing & Printing lnfomw PLC
Restaunnts Ruth's Chris Stak House Inc.
Semiconductors Trideni Microsystems Inc.
Stcel Tubacex SA
Tekcommuni~tions Equipment Arris Group Inc. Tandberg Television .=A
6,900
lY.300
NLD EUR 237,272
225.454
1.49
GBR CBP 1.42
USA 1lSD 153,552
172,710
213,043
0.97
1.09 9.500 LJSA U5D
1.34 32.670 ESP EUR
157.616 140.082
0.99 0.88
12,600 11.170
USA NOR
VSD NOK
1.87 297,708
186.281 119.965
textiles Koninklgke Ten Caw NV SIliren Co. . Ltd.
1.17 0.76
6.080 10.MW
N LD JPN
EUK JPY
306,246 1.93 Tyres & Rubber Nippn jeiki Co.. Lid. Teikoku PMon King Co.. Lid
JPN JPN
154,694 88,827
243.521
0.97 0.56
1.53
96.81 TOTAL SHARES
TOTAL TRkNSFERABLE SECURITIES ADMITTED TO AN OFFICIAL STOCK EXCHANGE LISTING
TOTAL INVESTMENTS
15,383,461
15,383,461
15,383.46 1
96.81
96.81
72
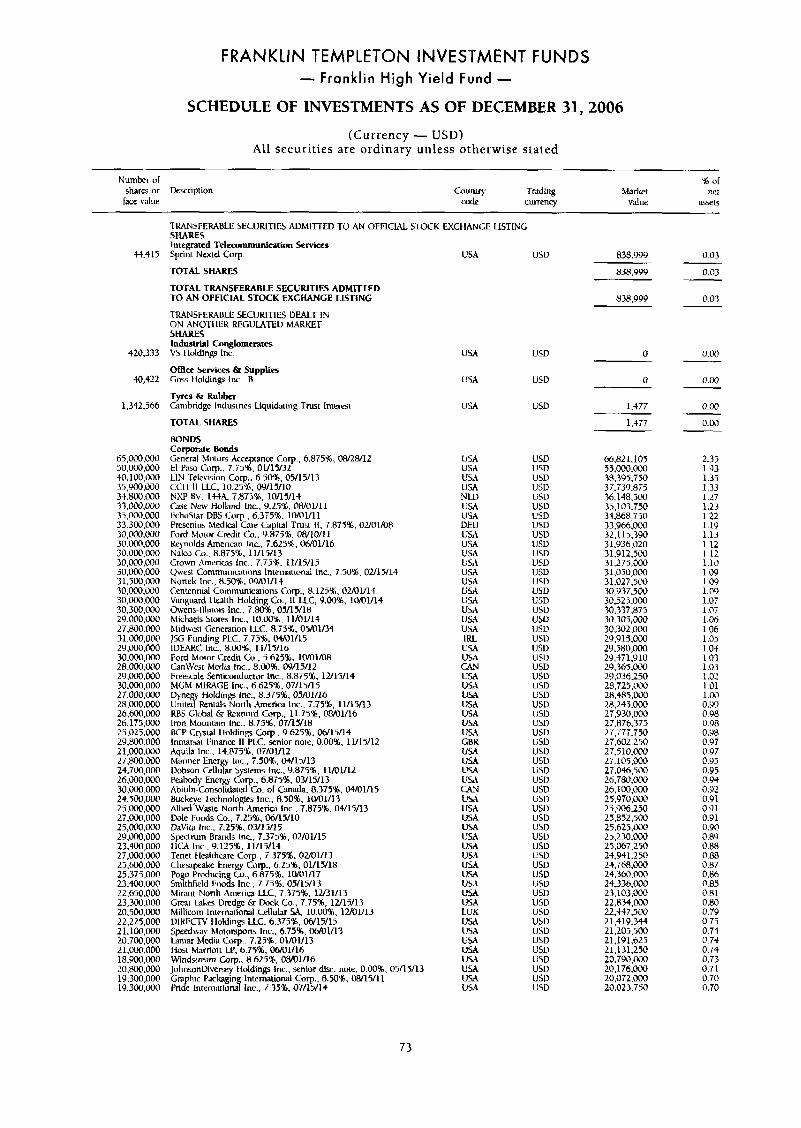
FRANKLIN TEMPLETON INVESTMENT FUNDS - Franklin High Yield Fund -
SCHEDULE OF INVESTMENTS AS OF DECEMBER 31,2006
(Currency - USD) All securit ies are ordinary unless otherwise stated
Numbcr o l 'x; or
lace value Codf currency value assets shares or Descriprion Cuunq Trading Market net
W,415
420,333
40,421
1,342.566
65,000.000 50,000,000 40'100,LwD 35,900.000 3S.xoO.000 33.001).000 35,000.000 33.300.000 30,000.000 30.000.000 30,000.000 30,000.000 30.000.000 31.i00.000 30,000,000 30.000.000 30,300.000 29,000,000 27,800.MO 31 ,OOO,000 29.~0.000 30.000.000 28.OOO.000 29.000.000 30.0W.000 17,000,000 28,000,000 26.600.000 26,175,000 25.025.000 29,800.000 2 1,000.000 27.800.000 24.700.000 L6.000.000 30.000.000 24,5LW,OOO 15,000,000 27,000,000 25,000,000 29.000.000 23,400,000 2T,W0.M0 25,600.000 25,375,000 23.400.WO 22,650,000 23.300.000 20.5w.mo 22.225.000 2 1.1 Oc1,000 L0.700.000 21.m.000 18,900,000 20.800.000 19,300,000 19,300,000
TRANSFEWHLE SECURITIES ADMITTED TO AN OFFICHL Sl-OCK EX( SHARES Integrated Telecommunication Services Sprint Nextel Corp
TOTAL SHARES
TOTAL TRANSFERABLE SECURITIES ADMITTED TO AN OFFICIAL STOCK EXCHANGE LISTING
TRANSFEKABLE SECURITIES DEALT IN ON ANO-TI IEK REGULATED MARKET SHARES Industrial Conglomerat~ VS I Iddings Inc.
O f h e Services & Supplies Goss Ilolding lnc.. R
Tyres & R u b k Cambridge Indusiries Liquidaiing Trust Interest
TOTAL SHARES
BONDS
General Motors Acre lance Corp., 6.875%, oRnW12 El Paso Ct~lrp.. 7-75?!, 0U15/32 LIN Television Corp., 6.50.16, 05/15/17 CCll II LLC, 10.25% oY/l5/10 NXP BV. lWA. 7.873%. 10115/1-t Case New Holhnd Inc., 9.259;. OWOl/ll Echostar DBS Curp., 6.375%. 10/01/11 Fresenius Medical Care Cjpiial Trust 11. 7.8752. OU01/08 Ford Muiar Credit GI.. 9.875%. W10/11 Reynolds American Inc., 7.625%. 06/01/16 Naled Co.. 8.875%. 11/15/13 Crown Americas Lnc.. 7.75%. 11/15/15 QweP Coniinunir-slinns Iniernational Inc., 7.50%. OU15/14 Nonek Inc., 8.50%. @9/0U1+ Centennial Commumcnions Corp, 8.125%. 02/01/14 Vanguard I kalth Holding (2.. I1 LLC, 9.00%. livO1/14 hens-Illinois lnc.. 7.80%. 05/15/18 Michaels Stores Inc.. 10.00%. 11/01/14 hlidwcsl Generation LLC. R.iSX. 0YJ1/34 JSC; I'unding PLC. 7.75%. 04/01/15 IDEe4FK Inc.. 8.ik)Q. 11/15/16 Ford hZoior Credit Cu., -5.625%. 10/01/08 CanWest Media Inc.. ~.LW%, OY/15/12 Freescale Stmiconductor Inc.. 8.8T5%. 12/15/14 MGM MIMGE Inc.. 6.625%. 07/15/15 Dyne? fiolding Inc.. 8.3752. 05/01/16 Unite Rentdls North America lnc.. 7.7596, 1l/15/13 RRS Global & Fkxnord Corp., 11.75%. @PA31116 Iron Mountain Inc. . 8.75%. Oifl5/18 BCP Crysral Iloldings Cmp. 9.625%. Oh/15/14 lnrnarsar 1:inance I1 P K , senior nore. 0.00%. 11/15/11 Aquila Inc.. 14.875%. 07/01/12 Mariner Ener Inc.. 7.50%. 04/15/13 IJohson CelluTr 5ystemS Inc.. 9.875%. 11/01/12 Pwlwbody Energy Corp., 6.87596, 03/15/13 Ahilibt-ConrJlidated Cc. or CM&, 8.375%. 04/01/15 Huckeye Technolo ies Inc. 8 50%. 10/01/13 Allied \Vase Nonf Arncricd inc.. 7.87546, 04/15/13 Dole t'ouds Co., 7.25%. 06/15/10 DaVita Inc.. 7.25%. 03/15/19 Spectrum Brands Inc., 7.375%. 0U01115 IICA lnc.. 9.125%. 11/15/14 Tenet I lealthcarc C o p . 7.375%. 0uO1/13 Ches;lpcake Energy COT., 6.2546, 01/15/18 Pogo Producin Co , 6 875%. 10/01/17 Smithfield I:oo%i I&.. 7.73%. 05/15/13 Miranr Nonh America LLC, 7.375%. 12/31/13 Greai Lakes Dredge &z h k Cn.. 7.75%. 1U15/13 Millicom International Cellular W, 10.00%6. 1U01/13 UIKECTV Holdings LLC. 6.375%. 06/15/15 Speedway hioiwspm In r... 6.7576, 06/01/13 hmar hkdkJ Corp.. 7.25%. 01/01/13 Host Marriott LP. 6.75%. 06/01/16 Windsiream Cop.. 8.625% 0801/16 JohnsonDivelgey tloldings In r... St'nior disc. note. 0.00%. 05/15/13 C;n hic Pdckagin International Corp.. 8.50%. 08/15/11 Pric! In&tariom~ Inc.. 7.75%. 07/15/14
Corporate Bo&
XtlANGE LISTIKG
USA usu 838.999 0.03
USA
USA
USA
USA USA USA USA NLD USA USA DEU LSA USA U M USA USA USA USA U!d USA USA USA IRL USX USA CAN USA USA USA USA USA USA U!i\ CBK USA liL4 USA U U CAN U U USA USA USA USA USA USA U5A U5A V5A U5A USA LUX USA USA us4 V U UI4 USA U M USA
USD
u w
LSD
USD USD us13 usu L'SD USD l 5 D USD USD USD USD USD USD USD USD ESD U5D U S 0 USD USD USD USD USD USD USD USD US13 LJSD USD us13 LiSD USD u SD
USD USD
USD USD usu USD USD USD USD USD USD L'SD usu USD USD USD usu USD uw L!SD USD USD USU USD
830.YW
838,999
0.03
0.07
n
0
0.00
0.00
1.477 0.00
1.477 0.00
66.02 1 .IO5 55,Mx1,oOO 38.395.750 37.739.875 36.148.500 35.103.750 34,868,750 33,966.0W 32.113.390 31.93b.020 31,912.500 31.275.000 31,0jO,0Do 31,027.500 30.Y37.5GIJ 30,523.000 30337,875 30.305,ooO 30.302.000 29.9 15.000 2Y ,580,000 29,471,910 29.365.000 19,036.250 2R.725.004 28.485.0Lw 28,245.000 27.930.000
27,777,750 27,602.250 27,510.000 27 105.000 27.046.500 L4.7W.000 26,100,000 25.9 70,OM) 2-5.906.250 25,852,500 25.625.rn 25.230,CW 25,067,250 23,941.250 24,768.@0@ 24,360.000 24,336.000 23,103,000 22.834.000 22.4-17.500 11,419,344 21.205.500 21,191.625 2 1.13 1,250 20,790,000 20,176.000 20,072.000 20.023.750
27.n76.375
2-35 1.93 1.35 1.33 1.27 1.23 1.22 1.19 1.13 1.12 1.12 1.10 1.09 1.09 1.09 1.07 1.07 1.06 1.06 1.05 1.04 1.03 1.03 1.02 1.01 1 .oo 0.99 0.98 0.98 0.Y8 0.97
0.95 0.95 0.Y3 0.92 O.Y 1 0.91 0.91 0.90 0.89 0.88 0.88 0.87 0.86 0.85 0.81 0.80 0.79 0.75 0.74 0.74 0.74 0.73 0.71 0.70 0.70
0.97
73
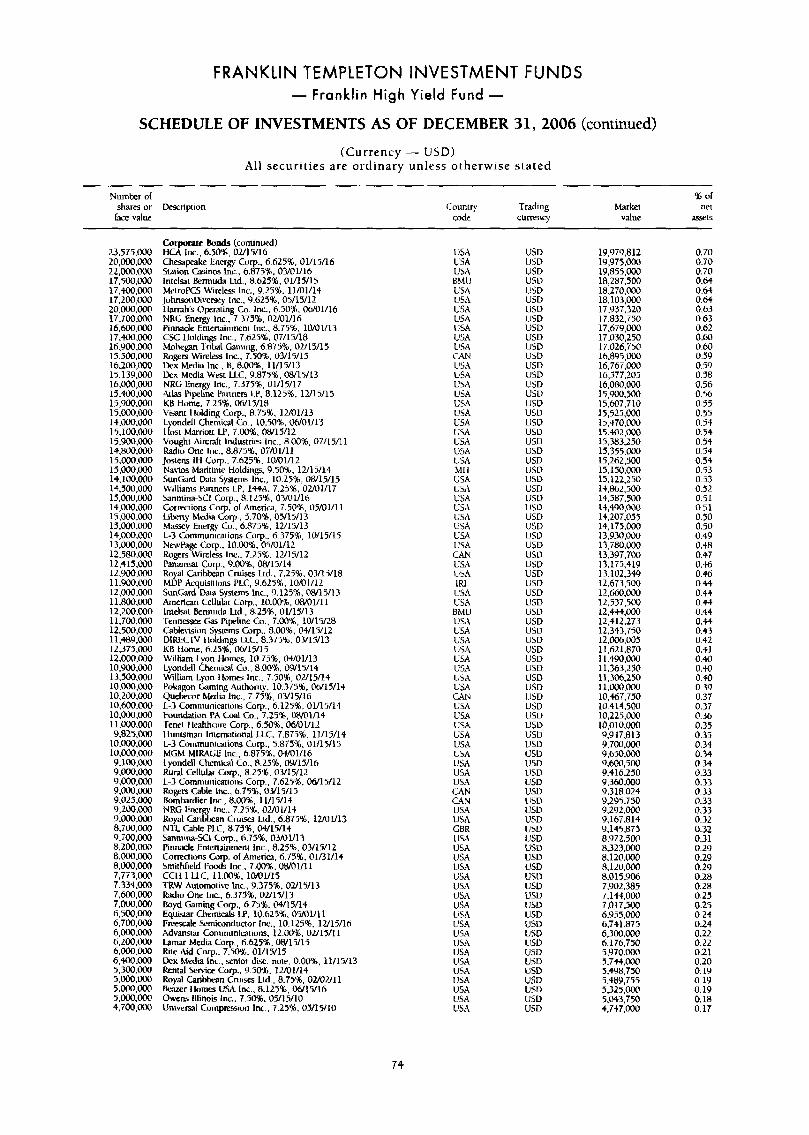
FRANKLIN TEMPLETON INVESTMENT FUNDS - Franklin High Yield Fund -
SCHEDULE OF INVESTMENTS AS OF DECEMBER 31, 2006 (continued)
(Currency - USD) All securities a re ordinary unless otherwise s ta ted
Number of % of shares or Vescription County Trading Market net lace value code currency value a55els
23,575,000 2o,m.o0o 22,ooo.000 17.500,ooO 17.400.000 17,200,000 20.000.000 17,700,000 16.hoo.000 17,400.ooO 16.900.000 15,500.000 16,200,000 15.139.000 16,ooO,oOO 15,4c10.000 15,900.oW 15,000.000 14,000,000 15.100.000 15,900,ooo 14.80@,000 15.OOO.000 15.000,OOO 14.100.000 14,500,000 15.000.000 14,000.000 15 .m.000 15,000,000 14,000,000 13.000.000 12.580.000 12,415,000 12.900.m 11,900,000 12,000.000 11,800.000 12,200,000 11.700.000 12.500.000 11.489.000 12.375.ooO 12.ooo.000 l o . ~ , w 0 13,500,000 10,ooo.ooo 10.200.000 10,600.000 10,ooo.wo 11.000.000 9,825,000
10,000.ooO 10,000.000 Y,100.000 9 . ~ , o o O g.000.m 9,000.OW Y.025.000 9,200,000 9.oOO.ooo 8.700.000 9.i00,OOa 8,200.00(! 8.ooo.Mx) 8.000.000 7,773,000 7.334.000 7.60@,000 7.000.000 6.500,Ooo 6,700,000 6,oM).000 h.2OO.000 6,000.W 6.400.000 5 .3w.m 5,000.w(! 5.ooO.m 5.m,ooo 4,700,000
Corporate Bonds (continued) HCA Inc.. 6.50%, 0U15/16 Chenpeakc Energy Corp.. 6.625%. 01/15/16 Stalion C3sinos lnr.. 6.875%. 03/01/18 Intelnt Bermuda Ltd., 8.625%. 01/15/15 MetroPCS Wireless Inc., 9.3%. 11/01/14 JobnUiverscy Inc., 9.625%. 05/15/12 lbmhs Operating Co. Inc.. 6.50%. 06/01/16 NRG Energy Inc.. 7.375%. 02/01/16 Pinnacle Entenainineni Inc., 0.75%. 10/01/13 CSC Holdinp Inc.. 7.625%, 07/15/18 Mohegan Tribal Gaming. 6.835%,02/15/15 Rogers W i m k Inc., 7.50%. 03/15/15 Ucx Media Inc., H. 8.00%, 11/15/13 Dex Media West UC. 9.8758, 08/15/13 NRG Energy lnc., 7.375%. 01/15/17 Atlas Pipeline Pmners LP. 8.125%. 12/15/15 KB Home. 7.25%. 06/15/18 Visant llrrlding Corp., 8.75%. 12/01/13 Lyondell Chemical Lo., 10.50%. 06/01/13 llost Marrion Ly. 7.00%. 08/15/12 Voughi Aircraft Industries Inc., 8.00%. 07/15/11 Radio One Inc., 8.87596, 07/01/11 Jostens Iti Curp.. 7.625%. laM1/12 Navios Maritimr Holdings. 9.50%. 12/15/14 SunGard Dam Sysirrns lnc., 10.25%, 08/15/15 Williams Partners LP. 1+4A 7.25%. 0U01117 Sanmina-SC1 (lorp., 8.125%. 03/01/16 Grmiions Corp. of America, 7.50%. 05/01/11 Liberty hlrdia Corp., 4.70%, 05/19/13 Masry Energy Co., 6.879%. 12/15/13 L-3 Communicliiuns Corp.. 6.375%. 10/15/15 Newpage Corp., 10.00%. 05/0l/lL Rogers Wireless Inc.. 7.25%. 12/15/12 Panamsat Corp., 9.0056, W15/14 Royal Caribhn Cruises Ltd.. 7.25% 03/15/18 MDP Acquisilions PLC, 9.6258, 10/01/12 SunGard Dau Systems lnc., 9.125%. 08/15/13 American Cellular Corp., 10.00%, 08/01/11 lntelsal Bermuda Ltd.. 8.25%. 01/15/13 Tennessue Gas Pipeline Co., 7.00%. 10/15/28 Cablevision 5yscms Corp.. 8.00% 04/15/12 DIWCW Iloldings L U . 8.375%. 03/15/13 LiB Home, 6.25%. 06/15/15 William Lvon tiomes, 10.75%. 04/01/13 Lyondell Lhernical Co.. 8.00%. 09/15/14 Willurn Lyon llornes Inc.. 7.50%. 02/15/14 PokaRon Gaming Authority. 10.375%. @W15/13 Q u e h r Medla Inc., 7.75%, 03/15/16 1-3 Cornmunicatiiins Corp.. 6.125%. 01/15/14 Foundation PA Coal CO.. 7.2596, owO1/14 Tenet I lealthwrp Corp.. 6.50%, 06/01/12 1 Iunlsman lniernarional LLC. 7.873%. 11/15/14 L-3 Communications Cop.. 5.87%. 01/15/15 MGM MIl?AGE Inc., 6.8T5%, 04/01/16 Lyondell Chemical Co.. 8.25%. @Y/15/16 Rural Cellular Corp., 8.25%. 03/15/12 L-3 Communiations Corp.. 7.625%. 06/15/12 Rogctr cjble lnc.. 6.758.03/15/15 Bombardier Inc., 8.00%;. 11/15/14 NRG Ener Inc.. 7.25%. 02/01/14 h p l NTL Cable PLC, 8.75%. (w/15/14 Sanminz-SCI Cq.. 6.75%. 03/01/13 Pinnacle Entenainment Inc., 8.25%. 03/15/12 Curreflions Gorp. of America. 6.75%. 01/31/lt Smirhfield 1:oods IN.. 7.0%. 08/01/11 CCli I LLC, 11.00%. 10/01115 TRW Autornotiw lnc.. 9.3751. 02/15/13 Radio One lnc., 6.37516. 02/15/13 Boyd Gaming Corp., 6.7536. WI5/14 QuisIar Chemicak LP, 10.625%. 05/01/11 F m u l e Semiconductor Inc.. 10.125%. 1U15/16 Advanstar Comrnuniations. 12.00%. 02/15/11 hmar Media Corp., 6.625%. OW15/15 Rite Aid Corp.. 7.50%. 01/15/15 k x hledia lnc.. senior dir. nore. 0.00%. 11/15/1 Renral Senice Corp.. 9.50%, lUOl/lS Royal &ribtan Cruises Lld., 8.75%, 0uOU11 k r llomes USA lnc.. 8.125%, 06/15/16 Owns-Illinois Inc.. 7.50%. 05/15/10 Universal Cumprrsion lnc.. 7.25%, 05/15/10
an Cruise; Ud., 6.879%. IUOY13
3
USA USA USA BMU USA USA USA USA USA USA USA CtW USA USA USA USA USA USA USA USA USA USA USA MI I USA USA USA USA USA USA USA USA CAN USA USA IRL (!SA USA BMU USA USA USA USA USA USA USA USA CAN USA USA UW USA USA USA L!SA USA us4 CAN CAN USA USA CBR LISA USA USA USA USA USA USA USA USA USA USA USA USA USA LISA USA USA USA USA
IJSV USV USV usv USV USD USD lJSV USD USD USD USD USD USD 1!SV usv USD US0 USD USU USD USD USD USD us0 USD USD USD USD USD usv usv US11 usv USD USD U5D USD USD USV USV USD USD usu USD LISD USD USV usv USD usu USD USU U5U USD USV USV USD USD USD VSD USD USV USV USD USD usu USD USL) USD USD USV USD USU USD U SD USU USV USD USU USD
19,979,812 19,975,000 19,855.000 18,287,500 18.270.000 18.103,000 17,937.320 17.032,750 17,679,wO 17,030,250 17.026.750 lh,f395,WO 16,767,000 16,577.205 16,080.000 15,900,500 15H7.710 15,525.ooO 15.$70.000 15.402,oOO 15,383,250 15.355.000 15,262,500 15.150.000 15,122,250 14,862,500 14,587,900 lt,490,00@ 14,207.055 14,175,000 13,930,000 13,780,000 13,397,700 33.175.419 13.102,349 12673,500 12,660,000 12,537,500 12.4$$,000 12.41 2.273 lL.343.750 12.006.005 1 1,621,870 11.490.000 11.363.250 11,306,254 11.ooo.000 10,467,750 10.414.500 10,225,000 10,010.Ooo 9,947813 9,700.000 9.650.WO 9,600,500 9,416.250 Y.36O.OO0 9.318.024 9.295.750 9.292.000 9,167.814 9,145,875 8,972.500 8,327,000 8.120.000 R,I20.000 8,015,906 7.902.385 7,144.000 7.017.500 6.955,@0@ 6.741.075 6,300.000 6.176.750 5.Y70.000 5,744,000 5.4Y8.750
5,325,000 5.043.750 4.747.000
5,489,755
0.70 0.70 0.70 0.64 0.64 0.64 0.63 0.63 0.62 0.43 0.60 0.5Y 0.59 0.58 0.56 0.56 0.55 0.55 0.51 0.54 0.54 0.54 0.54 0.53 0.53 0.52 0.51 0.51 0.50 0.50 0.49 0.18
O.% 0.46 0.44 0.44 0.44 0.44 0.44 0.43 0.42 0.41 0.40 0.40 0.40 0.39 0.37 0.37 0.36 0.35 0.35 0.34 0.34 0.34 0.33 0.33 0.33 0.33 0.33 0.32 0.32 0.31 0.29 0.29 0.29 0.28 0.28 0.25 0.25 0.24 0.24 0.22 0.22 0.21 0.20 0.1Y 0.19 0.19 0.18 0.17
0.47
74
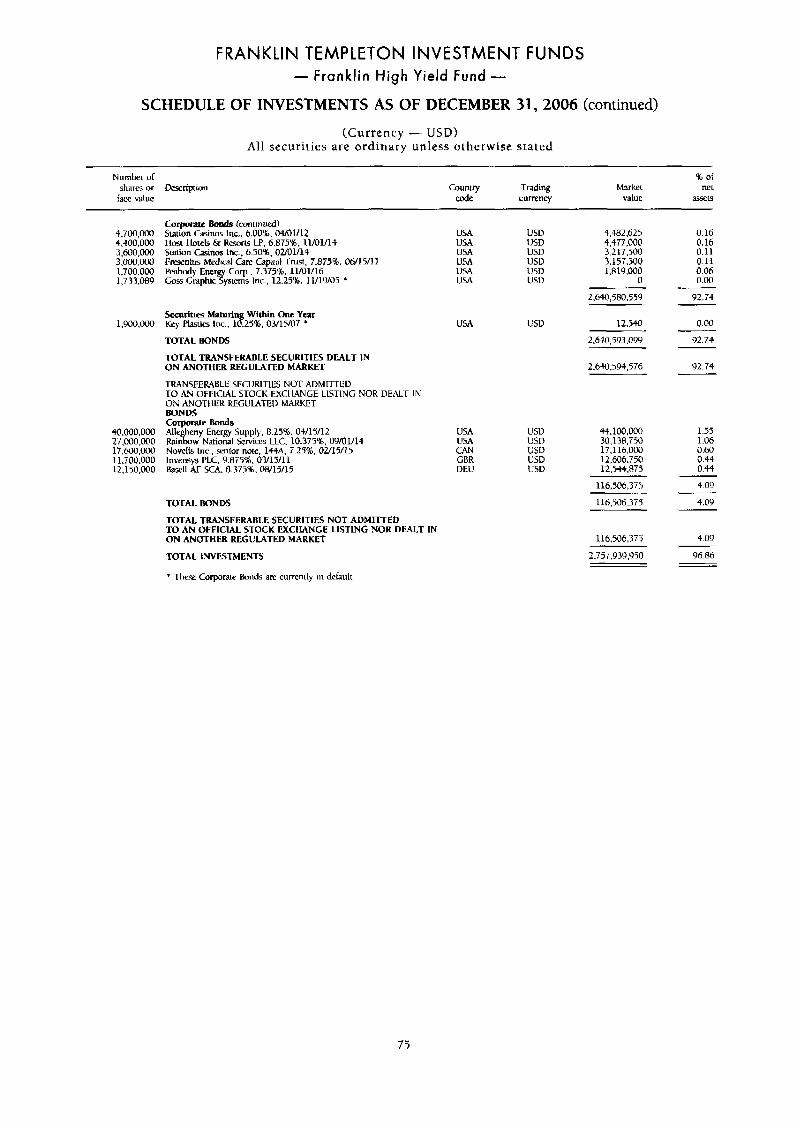
FRANKLIN TEMPLETON INVESTMENT FUNDS - Franklin High Yield Fund -
SCHEDULE OF INVESTMENTS AS OF DECEMBER 31,2006 (continued)
(Currency - USD) All securities are ordinary unless otherwise s ta ted
Number of shares or Derription face value
Couniry Trading Uldc currency
% of Market net
value 3SSetS
4.700.000 4..100,000 3.600,ooO 3,000,m 1,700.000 1,733,069
1,900,o0o
40.000.000 27.000.000 17.600.000 ll.TO0.000 12.1 50,OOO
Corporate Bwds (corttinwd) Sririon C s h o s lnc.. 6.00%. 04/01/12 I ~ K I I h t e l j & b w s LP. 6.875%. 11/01/14 Station Casinos Inc.. 6.50%. OUOlllJ F m n i u s Medial Csrc Capital Trust, 7.875%. 06/15/11 Peabody EnerW Corp.. 7.375%. 11/01/16 Goss Graphic Systems Inc., 12.2596. 11/19/05 *
USA USD 4,482.625 USA USD 4,477,000 USA USV 3.217.500 USA USD 3.157.500
usv 1 .RlY.OOO USD 0
2.640.580.55'3
USA USA
Securities Maturing Within One Year k y Plastics Inc.. 10.2516,03/15/07 *
TOTAL BONDS
TOTAL TRANSFERABLE SECURITIES DEALT IN ON ANOTHER REGULATED MARKET
TRANSFERABLE SECURITIB NOT ADMITTED TO *AN OFIKIAL STOCK EXCI-UNGE LISTING NOR DEAL-[- IN ON AVOTIIEK REGULATEI) h W E T BONDS
Allelheny Energy Supply. 8.25%. 04/15/12 !&irkow National Services LLC, 10.375%. 09/01/14 Novelis Inc.. senior note, 144A. 7.25%. 02/15/15 lnvenqs PLC, 9.875%. 03/13/11 W l l AF SCA. 8.375% 08/15/15
colpuratc Bonds
TCfrAL BONDS
TOTAL TRANSFERABLE SECURITIES NOT ADMlTTED TO AN OFFICIAL STOCK EXCHANGE LISTING NOR DEALT IN ON ANOTHER REGULATED MARKET
TOTAL INVESTMENTS
* Thew Corporate b n d s are curren(ly in dcfault
USA USV 12,540
2,640.593.099
USA USA CAN GBR DEU
USD C'SD usv USD C'SD
2,640,594,576
44,100,000 30,178,730 17.116.000 12,606.750 123t4.875
116,506.37'1
116.506.379
116506,373
0.16 0.16 0.11 0.11 0.06 0.00
92.7)
0.00
92.74
92.74
1.55 1.06 0.60 0.44 0.44
4.09
4.0Y
4.09
2,757,939.950 96.86
75
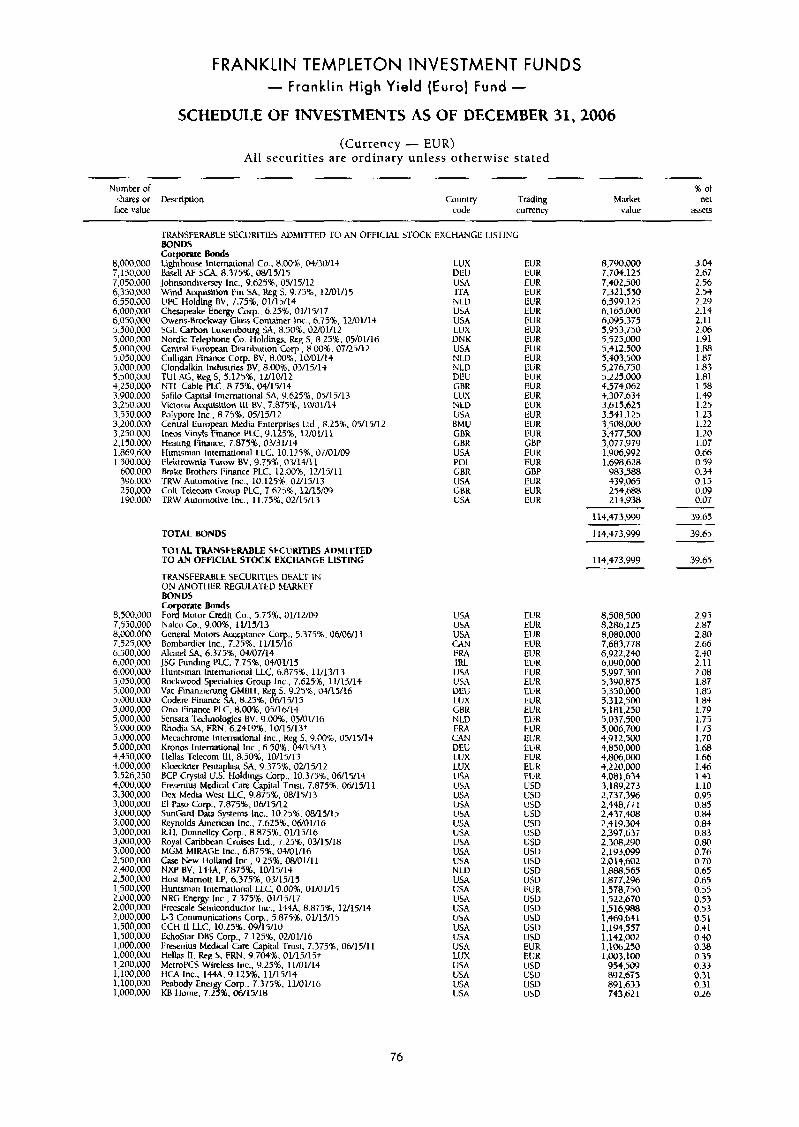
FRANKLIN TEMPLETON INVESTMENT F U N D S - Franklin High Yield (Euro) Fund -
SCHEDULE OF INVESTMENTS AS OF DECEMBER 31,2006
(Currency - EUR) All securit ies a re ordinary unless otherwise stated
Number of shares or Description face valur
% of Country Trading Market net
code currenq value a5sets
8.000,ooo 7,150,000 7,050.000 6,350,000 6.550.000 6,000,000 6,050.000 5.S00.ooU 5,000,000 5.000.000 5.050.000 5.000.000 5,500.000 't,250.000 3,900.000 3.250 cW0 3,550.000 3.200.000 3,250.000 2,150.000 1.869.600 1.500.000
600,000 396,000 2 50,000 lYO.000
8.500.000 7.550.000 8,000.000 7,525,000 6,500,000 6.000,OOO 6.000.000 5,050.000 5.000.000 5,000,000 5.000.000 5,000.000 ~.000,000 5.000.000 5,000,000 4,450.000 4.000.000 3.526250 4.000.000 3,300,000 :3.000.000 3,000.000 3.000,m 3.000.000 3,000.000 3.000.CCQ 2,500,000 2.400.@00 2,500.000 1,500,000 2.000.000 2.000,ooo 2,000,000 1.500,OOO 1.500,000 1.0oo.o0o 1,000,ooo 1,200.000 I , 1oo .m 1.100,ooo 1,ooo.m
TRANSI:ERABLE SECURITlES ADMI-TTED TO AN OFFICIAL STOCK EXC BONDS
Lighthouu International Co.. 8,00%, 04/30/14 k l l AF 5'3. 8.375%. 08/15/15 Johnsondiverxy Inc., 9.625%, 05/15/12 Wind Ac uisitiun Pin SA, Reg S. Y.7S%, 12/01/15 LVC H o l h g BV. 7.759, 01/13/14 Cheupake Energy Corp. 6.25%. 01/15/17 Owens-Bmkway Glass Container lnc.. h.75%, 1U0lll4 SGL Carbon Luxembourg SA. 8.50%. 02/01/12 Nordic Telephone t o . Holdings, Reg 5, 8.25%. 05/01/16 Central E u r o p n Distribution CUT., 8.00%. 07R5/12 Cullipn Finance Corp. BV. 8.00%. lO/Ol/l+ Clondalkin Indwtries BV, 8.008. 03/15/14 TU1 AG, k g 5, 5.125%. 12/10/12 NTL Cable PLC. 8.75%. 04/15/14 Sahlo hpiral lntemational SA, Y.6259b. 05/15/13 Vicmoria Acquisition 111 BV, 7.875%, 10/01/14 Polypore Inc., 8.75%, 05/15/12 Central European Media Enterpriws Ltd., 8.25%. 05/15/12 lneos Vinyls Finance PLC. Y.125%, 12/01/11 Heating 1:irnnt.e. 7.875%. 03/31/14 tluntsrnan International LLC. 10.125%. 07/01/09 Elektrownh Turow EV. 9.75%. 03/14/11 Brake Brothcrj I:inance PLC. 12.00%. 12/15/11 TRW Automotive Inc., 10.125%~ 02/15/13 Colt Telmom Croup PLC, 7.625%. 12/15/@9 TRW Aulornotive Inc.. 11.75%. 02/15/13
corporate Bo&
: W G E LIS1
LUX DEU USA ITA N LU USA USA LUX DNK USA NLD NLD DELI GBR LUX N LV USA BMU GBR GBR USA POL GBR USA GBR USA
:ING
EUR EUR EUR EUR EUR CUR EUK EUR CUR E U K EUR EUR EUR EUR EUR EUR EUR EUR EU K GBP EUR EU R GBP EUR EUR EUR
8,790.000 7,704,125 7.402.500 7.32 1.5 50 6,599,125 6.165,oOO 6,095,375 5,953,750 5,525,000 5,412,500 5.403.500 5.276.750 5,225.000 4.574.062 4.307.634 3,615.625 3,541,125 3 ,508 ,~O 3.477.500 3,077,979 1.906.992 1.698,628
983,588 439,065 2 5 4 . m 214.938
TOTAL BONDS
TOTAL TRAWSFERABLE SECURlTlES ADMITTED TO AN OFFICIAL STOCK EXCHANGE LISTING
TRANSFERABLE SECURITIES DEAL1 IN ON ANOTIIEK REGUL\TED MlrWiET BONDS
rate Bonds Credit 20.. 5.758, 01/12/09
Nalcu Co.. 9.00%. 1 YW1.3 Gcnenl Molars Acapmncc Corp.. 5.37516.06/06/11 Bornbardicr Inc., 7.25% 11/15/16 Alcatel SA. 6.37596, 04/07/14 JSG Funding P C . 7.75%. 04/01/15 lluntsman Inlerturional LLC. 6.875%. 11/13/13 Rockwood Spccialiies Group Inc.. 7.625%. lI/W14 Vac Fiwnzierung GMBII. Re 5 '3 ' 5%. 04/15/16 Cudere Finance SA. 8.2596. 86/61iYi5 Ono 1:inance PLC, 8.00%. OYlWl4 Sensata 'technologis BV, 9.008. 05/01/16 Rhodia SA, FRN. 6.241976. 10/15/13+ Meuchrome lntcmatioml Inc., Reg 5, '3.002, 05/15/14 Kronos lntemtional Inc., 6.50%. 04/15/13 llellas Telecom 111. 8.50%. 10/15/13 Klwcknrr Pentapbt SA, 9.3753;. 02/15/12 BCP Crystal U.S. tloldiys COT., 10.375%. 06/15/14 Fresenius Medical Care Capital Trust, 7.875%. 06/15/11 U e x Media West LLC, 9.8753;. OW15113 El Paso COT.. 7.8'1556, 06/15/12 SunGard Uata System Inc.. 10.25%. 08/15/15 Reynolds American Inc., 7.625%. 0fd01/16 K.I 1. Donnellcy tOrp.. 8.875%. 01/13/16 Royal Caribbenn Cruises Ltd., T.25%, 03/15/18 MGM MIRAGE lnc.. 6.875%. M/01/16 Case New llolland Im., 9.25%. OW0lI11 NXP EV. l e t A , 7.875%, 10/15/14 Host Marnott LP. 6.375%. 03/15/15 Huntsman Intemtional LLC, 0.00%. 01/01/15 NRG Energy lnc., 7.375%. 01/15/17 I:reexale Serniiunducior Inc., 144A 8,875%. 12/15/14 L-3 Communiwtions Corp.. 5.87516. 01/15/15 CCH 11 LLC. 10.25%. 09/15/10 EchoStar DBS Corp., 7.12541, 0UOlll6 I'resenius Medical Care GpiLal Trust, 7.375%. 06/15/11 Helbs 11. Reg 5, FRN. 9.7041;. 01/15/13 MetmPCS Wirelfss Inc., 9.25%. 11/01/14 tlCA Inc.. 14tA. 9.12%. 1Y15/14 Rabody Energy Corp.. 7.375%. llM1/16 KB Ilorne. 7.2596, WW18
USA USA USA G I N IX4 IRL USA USA UEU LUX GBR N LD FIW CAN DEL LUX LUX USA USA USA USA USA USA USA USA USA USA N LU USA USA USA USA USA USA USA USA LUX USA USA USA USA
El!K EUK EUR EUR EUR EU R EUR EUR EUR EUR EUK EL'R FUR ELlR EUR EUK EUK EUR USD USD USD USD USD USD USU USD USD USD USD EUR USD usu USD usu USD EUR EUR USD csu USD USD
114.473.999
114.473.999
114,473.999
8,508,500 8,286,125 8.080.000 7.683.778 6,922.240 6,090.000 5.Y97.300 5.390.875 5,350.000 9.312.500 5,181,250 5.037.500 5,006,700 4.9 12.500 5,850,000 4,806,000 4,220,000 4.081.634 3;189:273 2,137.396 2.448.77 1 2:437;40a 2.419.304 2.397.635 2.308.190 2.193.099 2 .o 14,602 1.888.565 1,877,296 1,578,750 1.522.670 1;516:988 1,469,641
1,194,557 1.142.002 1,106250 1.003.100
954.5oy 892.675 891,633 743.621
3.04 2.67 2.56 2.54 2.29 2.14 2.11 2.06 1.91 1.88 1.87 1.83 1.81 1.58 1.49 1.25 1.23 1.22 1.20 1.07 0.66 0.59 0.34 0.15 0.09 0.07
39.65
39.65
39.65
2.95 2.87 2.80 2.66 2.40 2.11 2.08 1.87 1.85 1.84 1.79 1.75 173 1.10 1.613 1-66 1.46 1.41 1.10 0.95 0.85 0.M 0.84 0.83 0.80 0.76 0.70 0.65 0.65 0.55 0.53 0.53 0.51 O.tl 0.40 0.38 0 35 0.33 0.31 0.31 0.26
76
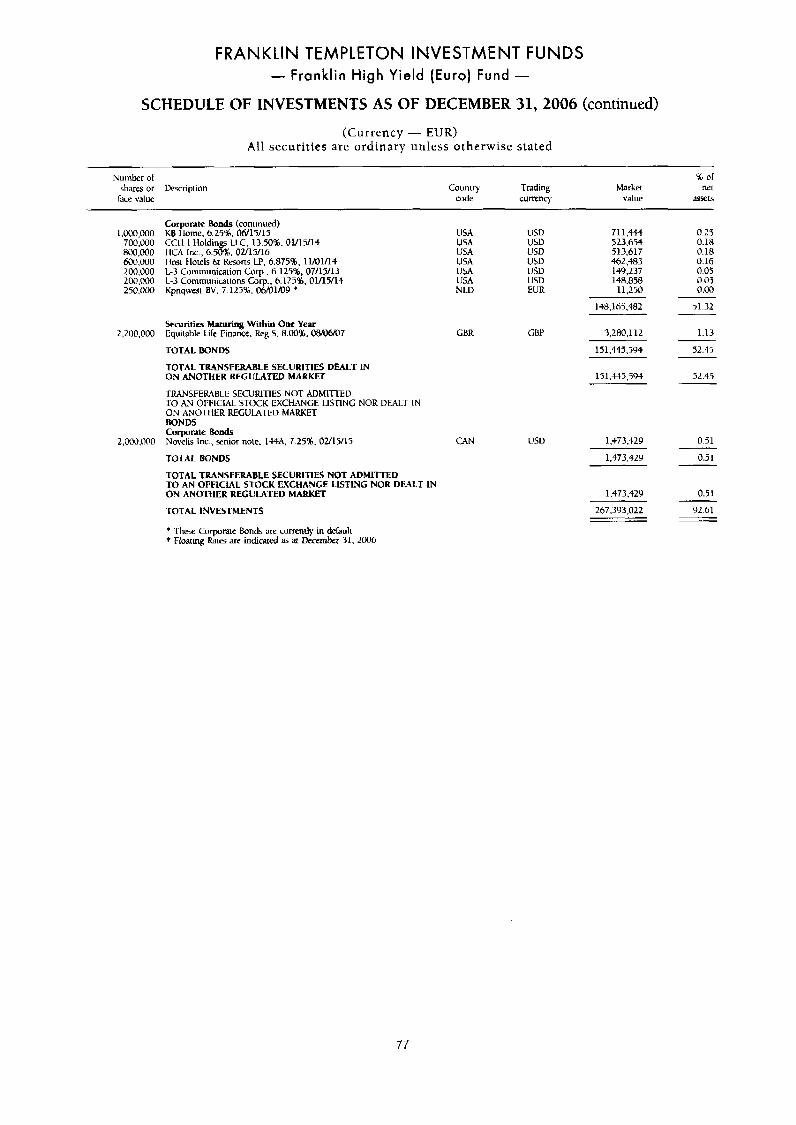
FRANKLIN TEMPLETON INVESTMENT FUNDS - Franklin High Yield (Euro) Fund -
SCHEDULE OF INVESTMENTS AS OF DECEMBER 31,2006 (continued) (Currency - EUR)
All securities are ordinary unless otherwise stated
Numbcr of 46 of shares or Descripiion Couniry Trading Market tKl
face value code currency value ;1ssels
Comorate Bonds (coniinurd) 1,000,000
700,000 800,000 600,000 200.000 20o.ooo 250,000
2,200,000
2,000,000
KB ilonw. 6.25% 06/15/15 CCll I Holdin l lC4 lnc.. 63%;. 02/15/16
LLC. 13.50%. 01/15/14
Il&i Hotels &I&& LP, 6.875%. lVOlll4 L-3 Communication Corp.. 6.125%. 07/15/13 L-3 Cornrnuniwiions Corp., 6.125%. OV15/14 Kpnqwes! BV. 7.125%. 06/01/f)9 *
liSA USA USA USA
USA N LD
u SA
USD USD USD USD 1!SD LJSD EUR
711,444 523.654 513.617 462,483 149,237 148.858 11.250
0.25 0.18 0.18 0.16 0.05 0.05 0.00
Securities Maturing Within Om Year Equitable Life Finance, k g S. 8.00%. WOW07
TOTAL BONDS
TOTAL TRANSFERABLE SECURITIES DEALT IN ON ANOTHER REGULATED MARKET
CBR
L'RANSFERABLt SECURITIES NOT ADDMITIED TO AN OITICLAL STWK LXCH.WGE LISTING NOR DFAL-r IN ON ANO~TIiER REGUIATED MARKET BONDS
Novelis Inc., rnior note. 144A. 7.25%, 02/15/15 corporate Bonds
CAN
TOtAL BONDS
TOTAL TRANSFERABLE SECURITIES NOT ADMITTED TO AN OFFICIAL STOCK EXCHANGE LISTING NOR DEALT IN ON ANOTHER REGULATED MARKET
TOTAL INVESTMENTS
* 'I'hcse Corpmie Bonds are currcntly in delauli t Floating hits are indicad aj at kernbet 31, 2006
148,165,482
GBP 7,280,112
USD
151,445.59-l
15 1 ,++5.594
5.1.32
1.13
52.55
52.45
1.473.429 0.51
1,473.429 0.51
1,473,429 0.5 I
92.61 267,393,022
77
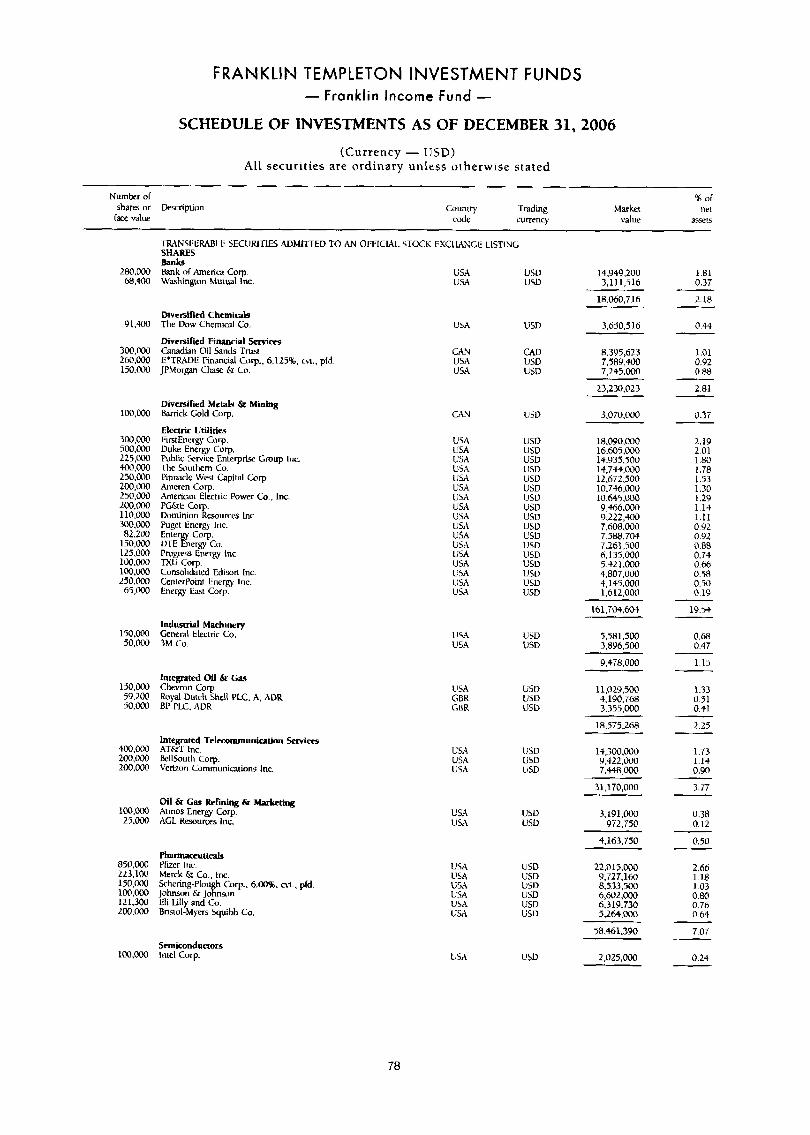
F RAN KLI N TEMP LETON I NVESTME NT F U N D S - Franklin Income Fund -
SCHEDULE OF INVESTMENTS AS OF DECEMBER 31,2006
(Currency - USD) All securities are ordinary unless otherwise stated
B of net
assets
Number of shares or Uerriprion Country Trading Market
race value code currency value
~1Rr\NSL:ERABLE 5ECURITlLs ADMI-ITED 1.0 AN OI'PLCML STOCK EXCI IAKCE LISTING SHARES Banhs
280.000 Bank or A W ~ ~ W CUT. 68.400 Washington Muiul Inc
USA LJSA
USD U5D
14.g4Y.200 3.1 11,516
18.060,716
3,640,516
8.395,623 7,589,400 7.245.000
23,230,023
1.81 0.37
2-18
Diversified Chemicals The Dow Chemical Co.
Diversified Financial Serwics
E * T U D E Financial Corp., 6.115%. M., pfd
9 1 .W
300.000 Canadian Oil Sands Tnrst 260.000 150.OiW JPMorpn C k & Co.
USA 115D 0.H
CAV U5A USA
CAD lJSD 1JSD
1.01 0.92 0.88
2.81
100,ooo Diversified Metals & W i g brrick Gold Corp.
Electric Utilities 300.00(! FirstEnergy Corp. 500.0(10 Duke Energy Corp. 225.000 Public %vice Ente rp r i r Gmup lnc.
T%e 5outhern Co. Pinnacle West Capital (lorp. Ameren Carp. Amencan Electric Power CO., lnc, PC&E Corp. Dominion Kcsourcej Inc. Pugel Energy Inc. Entcrgy Corp. UTE Energy Cu. Progress Energy Inc. TXU COT. ConsolidatEd Ediwn lnc. Centerl'omt Energy lnc. Energ East Corp.
GLV I!SD 3.070.000 0.37
2.19 2.01 1.80 1.78 1.53 1.30 1.29 1.14 1.11 0.92 0.92 0.88 0.74 0.66 0.58 0.50 0.19
1J5D L'sv
18,0Y0,000 16,605.000 14,935.500 14,744,000 12,672,500 10.746.000 10,645,000 9,466.000 9,222,400 7.608.000 7,586.70t 7,261,500 6,135,000 5.f21 .OW 4,807,000 4,145.000 1,612,000
USD U5D U5D USD USD US13 usv USV USD USD
400:000 250.Mx) 200,000 250,CU3l 2 0 0 , ~ 110,ooo 300.090 82.200
150,OW 125,000 100.000 100,OM 250.000 65,000
U S USA USA USA USA USA USA USA USA
U5D USI) USi) USD USD -
161,704,604 19.5+
0.68 0.47
1.15
Industrial Machinery 150.0'3'2 General Elfcrric Co. 50.00(! 3M Co.
USA USA
USD USD
5,581,500 3.896,500
9,478,000 Integrated Oil &I Gas
Royal Dutch Shell PLC. A. ADR 1 5 0 . ~ Chwmn COT. 59.2M3 5O.W BP PLC, ADR
USA GBR GBR
1jSD USD USD
11,029.MO 4,190,766 3.355.000
1.33 0.51 0.41 - ~
18,575,268 2.25 Integrated TelecommunicPtiorr SeMm
4oo.ooU AT&l Inc. 200.000 BcllSouth COT. 200.000 Verimn Cornrnuniwtiom inc.
1.73 I!SD USD U5D
U5A U 5.4 USA
14,100.00c) Y,422.000 7.448.000
31.170.000
1.1* 0.90
3.77 Oil & Gas Refming & Marketing
1OO.OOO Atmos Enera Corp. 25.000 AGL Resources Inc.
USA USA
USD u50
3,191 .OOO 5172,750
0.38 0.12
0.50 4,163.750
~ c c u t i c a l s
Schering-Plou h Corp.. 6.W%. ot. pfd
850.00(! Prier Inc. 223,100 hlerck & Co.. Inc. 150,000 1oO.OOO Johnson 6r Jofnwm 121,300 Eli Lilly and Co. 200.000 Briaol-Myers Squibb Cu.
2.66 1 . l R 1.03 0.60 0.76
USA USA LISA USA USA IJSA
USU 22.015.000 9,727.160 8,533,500 6,602,000 6.319.730 5.264.000
58.461.390
1:SD USD LISD USD USU 0.69
7.07
0.24 Semiconductors
1W.W Intel Corp. USA USD 2,025,000
78
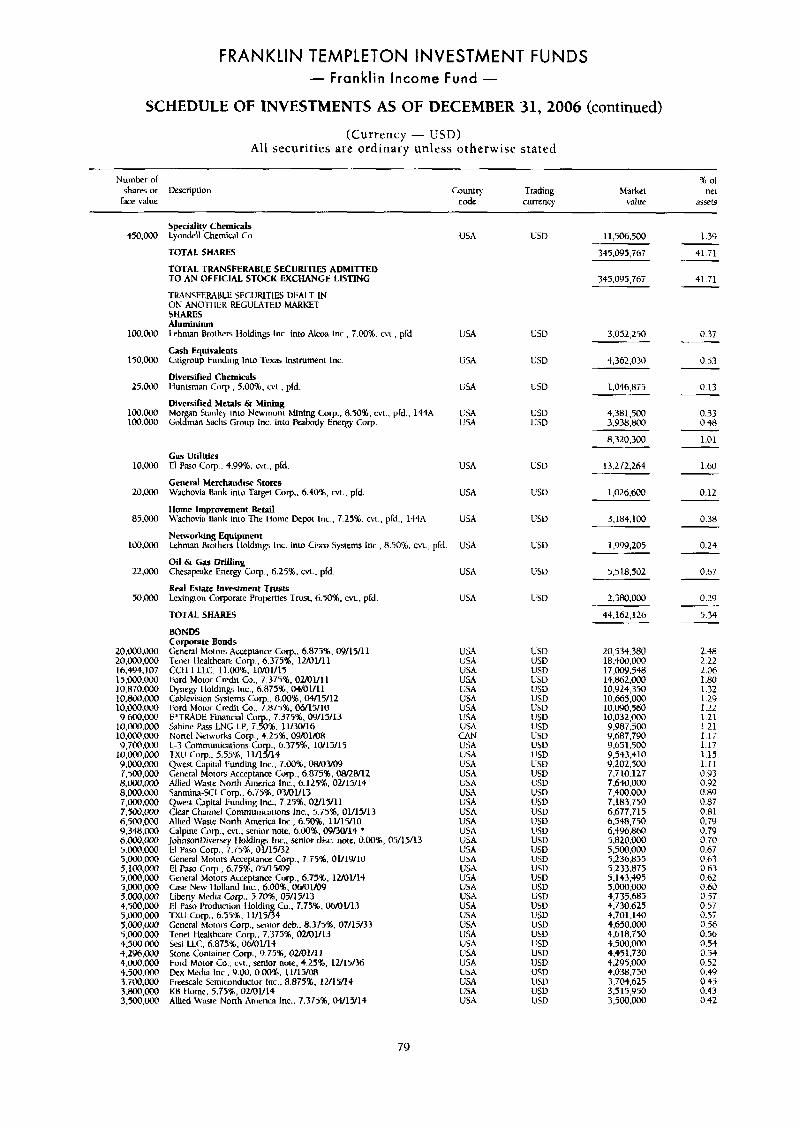
FRAN KLlN TEMPLETON INVESTMENT FUNDS - Franklin Income Fund -
SCHEDULE OF INVESTMENTS AS OF DECEMBER 31,2006 (continued)
(Currency - USD) All securities are ordinary unless otherwise stated
Number of shra or Lkwiption
ram value
~ ~
% of Country Trading Market net
code currency value ilSSeL$
+50,000
1W.00
I50,W
25.000
l W . W 100.000
lo.m
20.W
85.00
l 0 0 , W
2 2 . m
50.000
20.000.000 20,000,000 Ifr.494,107 1 5 . ~ . 0 0 0 10,870.IxM 1o.m.000 10.~W.000 9.600.m
IO.IMi).000 10,00(1.000 9,700.olM
lD.OoL).tMO 9.m.000 7.500.000 8,000.W 8.rn.000 7,000,000 7 , m . m 6 , 5 0 0 , ~ 9,34f3\000 6.000,'JM' 5.m.m 5.m.000 5,100,000 5.000,oMl 5,000.000 5.m.ow 4.500.000 5.m.0oil 5 . ~ . o w 5.cyx).000 4,500.000 4.2Y6.000 4,000.m 4.500.m 3.i~10.000 3,800,000 3,500.000
Speciallty Chemicals Lpndell Chemical Co
TOTAL S W R E S
TOTAL TRANSFERABLE SECURITIES ADMITTED TO AN OFFlClAL STOCK EXCHANGE LETTING
TMNSFERABLE SECURITILS DEALT IN ON ANNOTI ILK REGULATED MARKET SHARES Aluminium Lehman Brothers Holdings Inc. into Alu)a Inc., 7.@0%. w r . . pld
Cash Equivalents Ciligroup Funding lnlo 'Texas lnsrrument lnc
Diversified Chemicals Huntsman Corp., 5.00%. cvt., pld
Diversified Metals & &Mining Mor n Stmley into N m o n i Mining Corp.. 8.50%. cyf.. pk. , 144A Golgan Sack Group Inc. into Pahody Energy Corp
Gas Utilities El Paso Corp.. 4.Y9%. -I., pfd.
General Merchandix Stores Wchovia Bank into 'Target Corp.. 6.40%. M.. prd
Home Improvement Remil Wacho\.ia Bank into The llome Depot Inc.. 7.25%. cn., pld., 1MA
Networking Equipment lrhman Brothen lloldinp lnc. into Cixo Systems Lnc., 8.50%. cvt., pfd.
Oil & Gas Drilling Chewpeakc Energy Corp., 6.25%. cv.. pfd
Real Estate Investment TIUS& Lexington Corporate Properties Trust. 6.50%. CVL. pld.
TOTAL SHARES
BONDS Corporate Bonds Gcneral Motors Acceptarm Cop.. 6.875%. OYIIY11 Tenei llealthcare Gorp, 6.375%. luOVll CCIl I LLC. 11.00%. livo1/15 Ford Motor Credit Co.. 7.375%. OuOYl1 L>yneg. I loldinp Inc.. b.875%, aMol/ll Cablevision systems Corp.. 8,00%, 04/15/12 Ford Motor Credit Co.. 7.875%. 06/15/10 E*TRAUE Financial Corp.. 7.375%. @Y/15/13 Sahine P3ss LNG LP, 7.50%. 11/30/16 None1 Networks Corp.. 4.25%. 09/DllOR L-3 Communications Corp., 6.375% 1W15/15 TXU Corp., 5.55%. lYlY14 Q w s t Capital Funding lnc.. 7.M%, W0yo9 General Morors Acceptance Corp, 6.875%. OWLWl2 Allied Waste North Arneriw Inc., 6.125%. OUlY14 Smmina-SCI Corp., 6.75%. 0310l113 Qwest Gpital Funding Inc.. 7.25%. 02/15/11 Clear Channel Cornrnuniaions Inc., 5.75%. 01/15/13 Allied basre Noah Ameriw Inc., 6.50%. 11/15/10 C3lpine Cnrp.. cvt.. senior note. 6.001. 09/30/14 * JohnwnDiversey I loldinp Inc., Senior d k . note. 0.00%, 05/15/13 El Paw Corp.. 7.752, 01/15/)L General Morors Accc lance COT., 7.75%. 01/19/10 El Pam Corp., 6.752 05/15/09 General Motors Acrfpbnce Curp.. 6.75%. 1uO1114 Cast New llolland lnc.. 6.00%. 06/01/09 Liberty Media Corp., 5.70%. 05/15/13 El P3so Productiun lloldin Cu 7 75%. W l / 1 3 TXU Corp.. 6.55'16, 11/15/34 -' General hlurnr; Corp., senior deb.. 8.375%. 07/15/31 Tenet tiealthcare Corp.. 7.775%. 02/01/13 Smi LLC. 6.875%. 06/01/14 Stone Conminer COT.. 9.7596, 02/01/11 Ford Motor Co.. c u . , senior noie. 4.25%. lU15n6 Dex Media Lnc.. 9.00. 0.00%. 11/15/08 Freevrak kmicanductor Inc., 8.87596, 12/15/14 KB Home. 5.752, 0uOY14 Allied Wsie North America lnc.. 7.375%. 04/15/14
USA
USA
USA
lj5.4
LSA USA
USA
USA
USA
USA
USA
USA
V 54 USA LISA USA USA USA USA USA USA CAN USA IJSA l!SA USA USA USA USA USA USA USA USA USA USA USA USA USA USA USA USA US,4 USA USA U.M USA USA USA USA USA
us0 11,506.5OO
345095.767
1.39
41.71
1JSD
USD
LJSD
vsu U5D
USD
USU
USD
LSD
1JSD
U5V
USD USD USD USD USU USD USD vsu U SD Li5D V5D U SD U D USD l!SD USD USD vsu USIJ llSU USD USD USD iisu USD USU LSD USD USU VSD USD USD USD USD USD usu 11su USD
345.095.767
3,052,250
4,362.030
1.046.875
4,381,500 3,938,IMO
R.320.300
13.272.264
1,026.600
41.71
0.37
0.53 ~
0.13
0.53 0.48
1.01
1.60
0.12
3.184.100 0.38
1,999,205
5,518,501
~~
0.24
0.67
2.380.000
44,162.126
0.29
5.34
20,534.380 18.4lM.000 17.00Y.548 14.H62.000 10,5124,350 10,665,000 10,040,560 10.032.000 9.987.500 Y.bA7.790 9.651.500 9,543.410 Y ,202.500 7,710.127 7.640.000 7,400.000 7.183.750 6.671.715 6,548,750 6,496,860 5.820.000 5,500.000 5,236,835 5,233875 5.143.495 5.000.000 4,735.hHj 4,770,625 4.701.140 4,650.000 4,618,750 4 500.000 4.451.730 4.295.000 4,038,750 7,704,625 3,515,950 3.500.000
2.48 2.22 2.06 1.80 1.32 1.29 1.22 1.21 1.21 1.1: 1.17 1.15 1.11 0.93 0.92 0.89 0.87 0.81 0.79 0.79 0.70 0.67 0.63 0.63 0.62 0.60 0.57 0.57 0.51 0.56 0.56 0.54 0.54 0.52 0.49 0.43 0.43 0.42
79
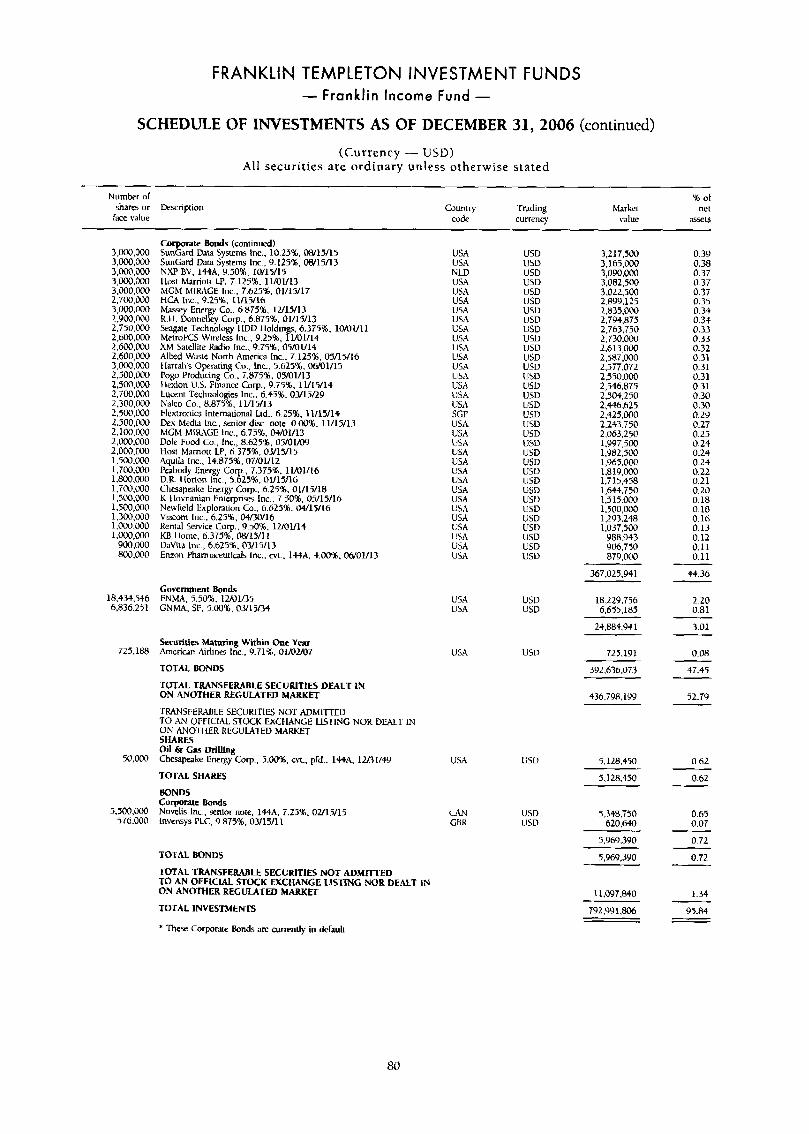
FRANKLIN TEMPLETON INVESTMENT FUNDS - Franklin Income Fund -
SCHEDULE OF INVESTMENTS AS OF DECEMBER 31,2006 (continued)
(Currency - USD) A l l securities are ordinary unless otherwise stated
Number ol share or kscription
lare wlue Country Trading
code currenq
~
% of hlarkel nei
value assets
3,000.000 3,000.000 3,aoo.m 3,000.000 3,000.000 2,700,000 3.000.000 2,900,000 2.750.000 2.600.000 2.600.000 2,600,000 3,000.000 2,;00.000 L.500.000 2.700.000 2..300,000 ~.500.@00 2.500.000 2.100.@00 2.000,@00 2,000,000 1.500.000 1.700.000 1.800,00@ 1,700.00@ 1.500.000 1,500,000 1,300.000 1,000,000 l,oOcJ,OM 900.w0 800.000
Corporate Bonds (continued) SunGard Data Systems Inc., 10.25%. OW15/15 SunCard Dam Systems Inc., 9.125%. W15/13 N X P BV. 144A. 9.50%, 10/15/15 1 lost Marriou LP. 7.124%. 11/0V13 MGM MIRAGE Inc., 7.625%. 01/15/17 HCA Inc., 9.25%. 11/15/16 Massey Ener Co.. 6.87516. 12/15/13 K.11. Donnelry Corp.. 6.875%. 01/15/13 Seagale Technolorn I IDD 1 loldings. 6.3754. 10/01/11 MetroPCS Wireless lnc.. 9.25%, 11/01/1$ XM Satellite Radio Inc.. 9.75%. 05mY14 Allied Waste North America Inc.. 7.125%. 05/15/16 tlarmhs Operating Co,, lnc.. 5.623%. 06/01/15 Pogo Pruducing Co.. 7.875%. 05/01/13 llexion U.S. Finance CUT., 9.75%. 11/15/14 Lucent Technologies Inc.. 6.45% OlllTR9 Nalco Co., 8.8758. 11/15/13 Flcxmnics Intematioml bd.. 6.2596, 11/15/14 Dex Media Inc., %nior disc note. 0.iW'lb. 11/15/13 MGM MIMLE Inc., 6.75% M/01/13 Dole Food Lo., Inc., 8.625%, 05/01/09 Hosl Marnott LP. 6.375%. OYlY15 Aquila Inc., 14.875%. 07/01/12 Rabody linergy Corp., 7.375%. 11/01/16 D.R. llorton Inc., 5.625%, 01/15/16 Chevpeake Energy Cop., b.25%, 01/15/18 K t lovnanian Enterprisrs Inc.. 7.30%. 05/15/16 NeBLeld Exploration CO.. 6.625%. 04/15/16 Viacom Inc., 6.25%. 04/30/16 Rental Service Corp.. 9.50I. 1MV14 KB Ilorne, b.375%. W l Y I 1 UaVit8 Inc., 6.62516, 03/15/13 Enzon Pharmx~utiwls Inc.. m., 144.4. 4.00%. 06/01/13
USA USA NLD USA USA USA USA USA USA USA LJSA USA USA USA USA USA USA SGP USA USA l ! jA LISA USA USA USA USA USA USA USA USA (!SA USA USA
USD USD USD USD USD 1JSD USU USD lisv USU USD lJSD USD US0 USU U5D USD USD USD
USD USD USD USU USD USD USU USD
usu
USD L'SD US0 L!SD USD
3,217,500 3,165,030 3,090.000 3.082.500 3.022.500 2.89Y.125 2,835,000 2.794,875 2,763.750 2,730,000 2,613,000 2,587,000 2,577.072 2,550,000 2,546.875 2,504,250 2,446.625 2,425.000 2.243.750 2,063,250 1.997.500 l.Y82,500 1,965,000 l.819.000 1.7 15,458 1,644,750 I .5 13.000 1,500,000 1293.248 1,037.500
988.943 906,750 879,000
0.39 0.38 0.37 0.37 0.37 0.35 0.34 0.33 0.33 0.33 0.32 0.31 0.31 0.31 0.31 0.30 0.30 0.29 0.25 0.25 0.24 0.24 0.24 0.22 0.21 0.20 0.18 0.18 0.16 0.13 0.12 0.11 0.11
18,434,546 6.836.251
Government Bonds FNMA. 5.50%. IU01/35 G N U , SF. 5.008.03/1S/34
USA USA
USD USV
367,025,941
18,229.756 6,655,185
44.36
2.20 0.81
725,188
50,OW
5,500,000 576.000
Securities Maturing Wnhin One Year American Airline lnc., Y.71%, 01/ouo7
TOTAL BONDS
TOTAL TRANSFERABLE SECURITIES DEALT IN ON ANOTHER REGULATED M A W
I R 4 N S I ~ E M L E SECUMTIB NOT ADDMITTED TO AN CXFICLAL STOCK EXCHANGE LISTING NOR DEALT IN ON ANOI-I~ER UGULATED MAwEr SHARES oil & Gas Drilling the-pke Energy Corp.. %On%. cm, prd.. 1MA. 1u71/W
TOTAL SHARES BONDS Corporate Bonds Novelis Inc.. senior note, l44A. 7.25%. 02/15/15 lnvensys PLC, 9.875%. 03/15/11
TOTAL BONDS
TOTAL TRANSFERABLE SECURITIES NOT ADMITTED TO AN OFFICIAL STOCK EXCHANGE LISTING NOR DEALT IN ON ANOTHER REGULATED M A R K D
TOTAL INVESTMENTS
* These Corporxe Bonds are curwntly in default
USA USD
23,884,941
725,191
392.b36.073
436.798.1Y9
3.01
0.08
47.45
52.79
USA USD 4.128.450 0.62
CAN GBK
USD 1JSD
5.128.450
5,348,750 620,640
5.969.390
0.62
0.65 0.07
0.72
5,969,390
11.097.840
0.72
1.34
792.Y91.806 95.84
80
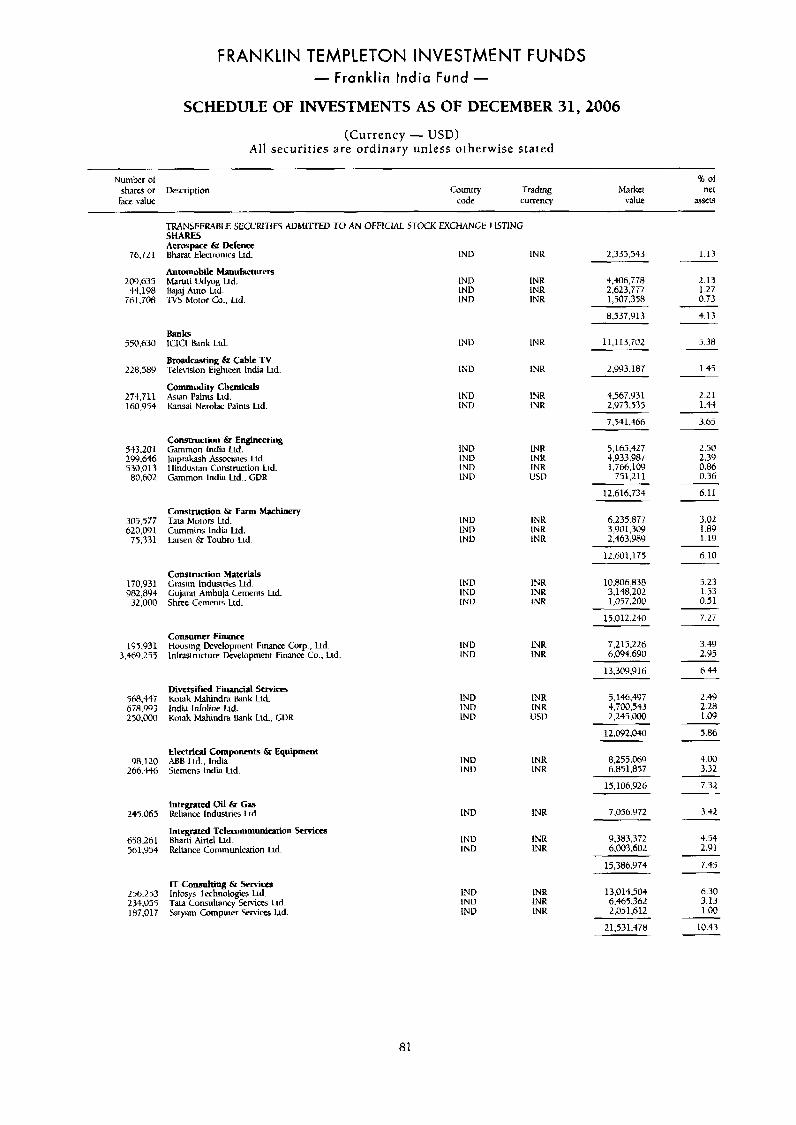
FRANKLIN TEMPLETON INVESTMENT FUNDS - Franklin India Fund -
SCHEDULE OF INVESTMENTS AS OF DECEMBER 31,2006 (Currency - USD)
Al l securities are ordinary unless otherwise s ta ted
Numkr of 16 of shares or Derription Country Trading hiarket ne1 lace value code currency valuc asssets
TRANSFERMLE SEC(JRlT1ES ADMITTED TO AN OFFICIAL STOCK EXCHANGE LISTING SHARES Aerospace & D e f e m Bharat Elmrunics Ltd.
Automobh Manufacturers Maruli Udyog Lrd. hJa j Auto Lid. TVS Motor Co., Lid.
I N D INK
1NU 1NR LND INR IND INR
1.13 76,721
209,635 44.198
76 1,708
550.630
228,589
274,711 160,954
543 .LO 1 2139.646 530,013 80.602
305,577 620.0'31 75.731
170.931 982,893
32,000
195.93 1 3.4159.259
56R.44T 62,993 250,000
Y8.120 266.M
245.065
658.261 5hl,Y54
2.335,543
4,406,778 2,623,777 1,507,358
2.13 1.27 0.73
8,537.913
11.113.i02
4.13
5.38 Banb lCKl Bank Lid.
Bruadmstiug & Cable TV Television Eighteen India Ltd.
Commodity Chemicals hian Paints Ltd. bnsai Nerolac Paints Ltd.
INU INR
1.45 IND INR 2.993.187
2.21 1-44
IND IND
INR INR
4,567.931 2.973.535
7.541.466 3.65
2.50 2.39 0.86 0.36
Construction & Engineering Gammon India Ltd. Jaipr~ksh Associates Ltd. 1 hndustan Construction Ltd. Gammon India Ltd.. GDK
IND INU IND IND
INR INK INR USV
5.165.427 4933.987 1.766.10Y
751,211
12.616.734 6.11
6,235,877 3,901,309 2,463.989
3.02 1.8'3 1.19
Construction & Farm Machinery Tata Motors Ltd. Cummins India Ltd. Larsen & Toubro Lrd.
1NV IN11 IN0
INK INK LNR
12,601.175 6.10
tunstruction Materials Gwim lndusmits Ltd. Gujant Amhuja Cements hd S h k Cemcnk Ltd.
5.23 157 0 51
1ND INV INU
INR INK INR
10,606,838 3,148,202 1,057,200
15,012,240 7.27
7,215.226 6,094,690
3.49 2.95
Consumer Finance Housing Development Finance Corp., Ltd. lnlrsiructure Development 1:innnce Co., Ltd.
IND IND
LNR INR
13.309.9 16
5.146.497 4,T00,543 2.245.000
6.44
Diversified Financial Kotak Mahindn &Ink Ltd. lndid lnfohne Lid. Ko~nk Mahindra b n k Ltd.. GUR
1ND IND IND
INR 1NR USU
2.49 2.28 1 .# . ,
12.W2.040 5.86
8,255.069 6.1151857
4.00 3.32
Eleclrical Compuncnts & Equipment AbB Lid., India Siemens India Ltd.
INV INU
INK LNR
7.32 15,106,926
7.056.972 Integrated Uil & Gas Reliance Industries Lld.
Integrad Telecommunication Semi- Bharti Airtel hd. kli;mce Communication bd.
3.42 IND INR
9.383.372 6.003.602
4.54 2.91
INU IND
INR INR
7.45
It Consulting & Services 256.253 Infosys IechnoIogiG Ltd. 234,055 -Pala Consultancy Serwes Lid. lR7,OlT Satyam Computer Servim Ild
IND INU INU
INK INR INR
6.30 3.13 1 .OO
10.43
13,014,504 6.465.362 2.05 1.612
21.531.478
81
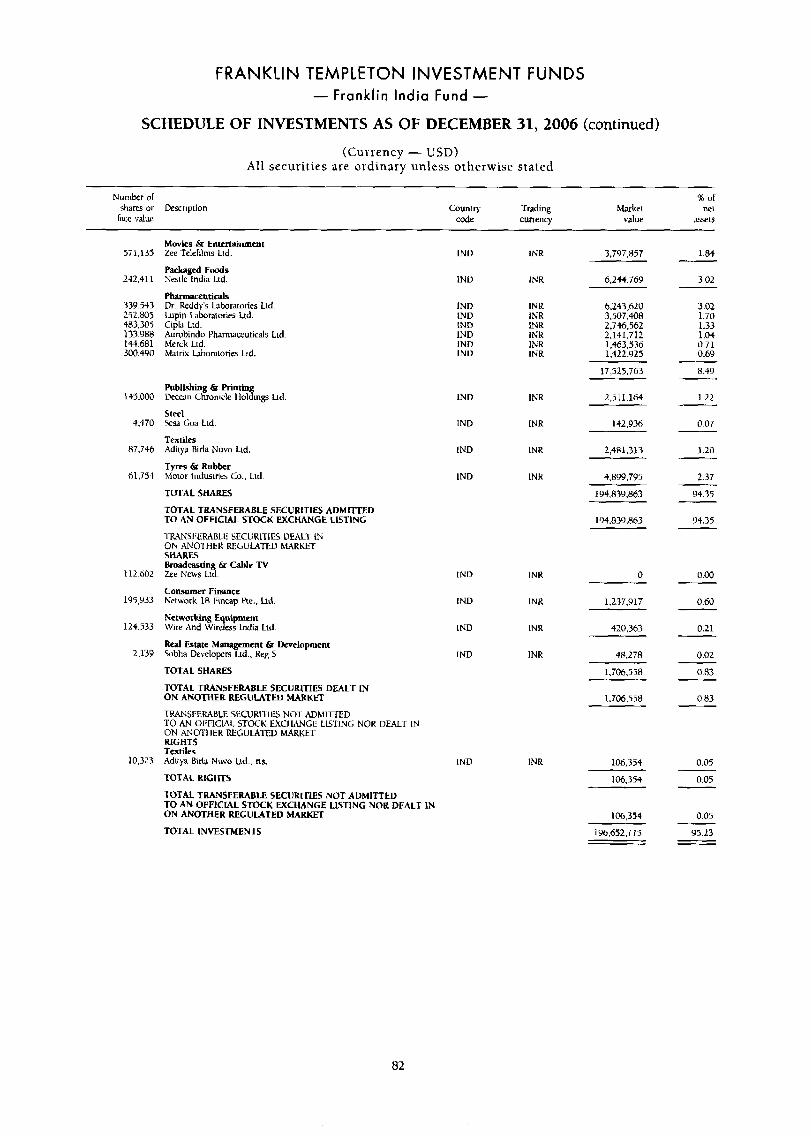
FRANKLIN TEMPLETON INVESTMENT FUNDS - Franklin India Fund -
SCHEDULE OF INVESTMENTS AS OF DECEMBER 31,2006 (continued)
(Currency - USD) All securities are ordinary unless otherwise stated
Number of B of shares or Derription COUrilry Trading Market Wl face value code currency value assee
571,135
242,411
33Y.543 252,805 483.305 133.988 144.681 300.490
l‘r5.000
4.470
87,746
61,754
112.hO2
195,933
124.533
2,139
10,323
Movies 6r Entertainment Zee ‘l’elefilnis Lid.
Packaged Foods Nestle India Lid.
Pharmaceutifals Dr. Keddys hboratories hd . LuDin Laboratories hd. Cipla Ltd. Aurobindo Pharma~xuticals Lid Merck Ltd. Matrix hboratotia Lid.
Publishing & Rinti Deccm Chronicle llo?jjmg hd.
Steel Scsa Goa Lld.
Textiles Adiiya Birla Nuvo I.td.
Tyms & Rubber Motor Industries Go.. Ltd
TOTAL SHARES TOTAL TRANSFERABLE SECURITIES ADMITTED TO AN OFFlClAL STOCK EXCHANGE LISTING
TRrWSI’ERABLE SECURlTlE5 DEALT IN OF; ANO~I~HER KEGULATED MARWT SHARES Broadfartin & Cable TV &e News Lt%.
Consumer Finance Network 18 IYncap Re., h d
Networking E uipment Wire And Wir&s India Ltd
Real Estate Management &I Lkvelopment Sobha Developen Lrd., Keg S
TOTAL SHARES
TOTAL TRANSFERABLE SECURITIES DEALT IN ON ANOTHEK REGULATED MARKET
TRANSFERABLE SECURll~lLS NO-1. ADhIlTlED TO AN 0I:FICLAL STOCK EXCI IANCE LISTING NOR DEAL-[ IN ON ANOTIIER WGUIA1~I.D MARKET RIGHTS Textiles Mitya Birla Nuvo Lid.. ns.
TOTAL RIGHTS
TOTAL TRANSFERABLE SECURITIES NOT ADMITTED TO AN OFFICIAL STOCK EXCHANGE LISTING NOR DEALT IN ON ANOTHER REGULATED MARKET
TOTAL INVESTMENTS
IND
1NV
IND IND IND IND IND INU
IND
IND
IND
IND
IN11
INU
lND
IND
IND
INK 3.797.857
INR 6,244.769
6,243,620 INR INR 3.507.408 INR 2,746.562 INK 2.141.712 INK 1,463,536 INR 1.422.925
17,525,763
INR 2.511.164
INR 142,936
2,481,313 INR
INN 3,899,795
194,839,863
194.839.863
INR
INR
INK
INR
INR
0
1,237.917
420,363
48.278
1,706,558
1,706,558
106.354 ~~
106,354
1.84
3.02
3.02 1.70 1.33 1 .M 0.71 0.69
8.49
1.22
0.07
1.20
2.37
94.35
94.35
0.00
0.60
0.21
0.02
0.83
0.83
0.05
0.05
106,334
196,632.775
0.05
95.23
82
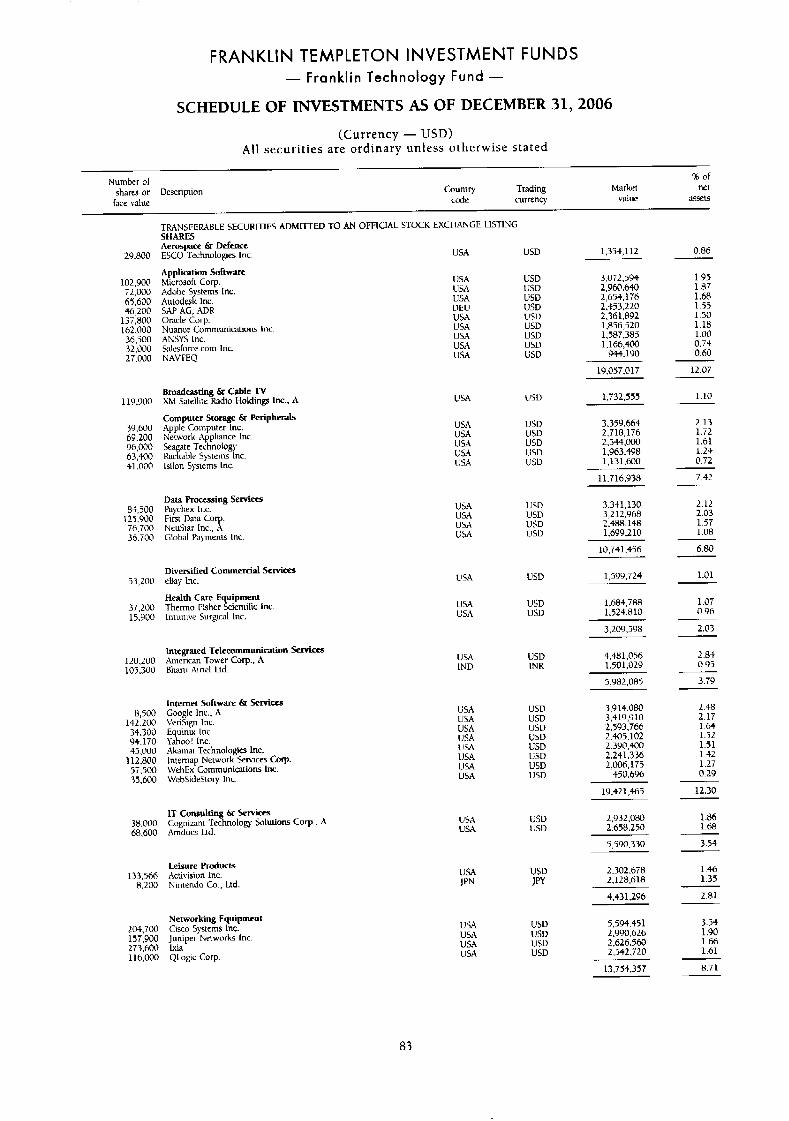
FRANKLIN TEMPLETON INVESTMENT FUNDS - Franklin Technology Fund -
SCHEDULE OF INVESTMENTS AS OF DECEMBER 31,2006
(Currency - USD) All securities are ordinary unless otherwise stated
% of Wl
Number or shares or Description Count? Trading M a r k t
lace ~a luc code currency value SSeG
TFblNS1:ERAUBLE SECURITIfi ADMITrED TO AN OFFICIAL STOCK EXCIIANGE LISTING SHARES Aerospace & Defence
29,800 ESCO Technolopjes Inc. USA U SD 1,354,112 0.86
1.95 1 .P7 1.6R 1.53 1.50 1.18
Application Software 102,900 Microsoft Corp. 72.000 Adobe S stems Inc. 65,600 Auiodes% lnc 46,200 SAP AG, ADR
137,800 Uncle Corp. l6L.000 Nuance Communications lncr 36.500 ANSYS Inc.
USA USA USA DEU USA USA USA USA USA
USD usu USD USV USD USD USD USD
3,072,594 2.960.640 2,651,176 2.453.220 2.36 1,892 1,856,520 1,587,385 1.166,4CO
944.190
1.00 0.74 0.60
12.07
32,000 Sdesfbrce coin lnc. 27.000 NAV'rEQ USD
19,057,017
1.10 Brodcasting & Cable TV Xhi Satellite bd io Holding lnc.. A
Computer Storage & Peripherals
119,900
39.600 Apple Computer Inc. 6Y.200 Network Appliance Inc. 96,000 Sea te Technology 63,400 h c f h e Systems Inc. 41.000 lsilon Systems Inc.
USA 1.732,555 lJS0
2.13 1.T2
USA USA USA USA USA
usv 3,359,664 2,718,176 2,544,000 1,963,498 1,131,600
USD USD lJSD
1.61 1.24 0.72 U S 0
11.716.938 7.42
2.12 2.03 1.57 1 .on 6.80
Data Processing Services 81,500 Paychex lnc.
125.900 First Ihla COT. 76,700 NeuSiar Inc., A 36.700 Global Pnymenls lnc.
3,341,130 3,212.Yh8 2.+88.148
USA USA USA USA
1:SD USD USD USD 1,699,210
10,741,456
1,599.724 1.01
1.0: 0.96
Diversified Commercid Sew-
Health Care Equipment
53,200 etlny lnc.
37.200 Themo I%her Scientific Inc 15.900 Intuitiw Surgiml Inc.
u SA USD
l.bR4.788 1.524.810
USD USD
USA USA
3,209,598 2.03
2.84 0.95
3.79
4.481.056 1.501.029
Integrated Telecommunication S C W i m 120.200 American Tower Corp., A 105,300 Bhani &ne1 Ltd.
USA IND
USW INR
5.882.085
3.914.080 3.5 I9 ,Y 10 1.593.766 2.405.102 2.390.400 2.241.336 2,006,173
450.696
19.421.465
2.48 2.17 1.64 1.52
8,500 142.200 34.301) 44.170 45.000
112,800 57,500 35,600
Internet Software 6T Services Coogle lnc.. A VeriSign Inc. E uinvt Inc A o o ! lnc.. Akaiirai Technolugis Lnc. Inrrrnap Network Sen~ces hrt, WchEx Communications Inc. WehSideStory Inc.
USA USD USD USV VSD USD USD
USA USA USA
1.51 1-42 1.27
l!sA LJSA USA USA
USD US0 0.29
12.30
2.932.080 2.658.250
1 .M 1.68
IT Consultin & Sewiccs 38.000 Cogniz3ni Te&nolog SClluLions Corp.. A 68,600 Amdocs Ltd.
USA USA
USU USD
5,590.330 3.54
2.302.6T8 2.128.618
Leisure l'roducts 133.566 Activision Inc.
8.200 Nintendo Co., Ltd. 1.46 1.35
USA JPN
usu JPY
281 4.431,296
3-54 1 .YO 1.66 1.61
Networking Equipment LOt.700 Cisco Systems h C . 157,900 Juniper NetwWks h C 273.600 lxia 116,000 QLogic Corp.
5.594.451 2,990.626 2.626.560
USA USA USA USA
usv usv USD USD 2.542.720
13,754,337 8.71
83
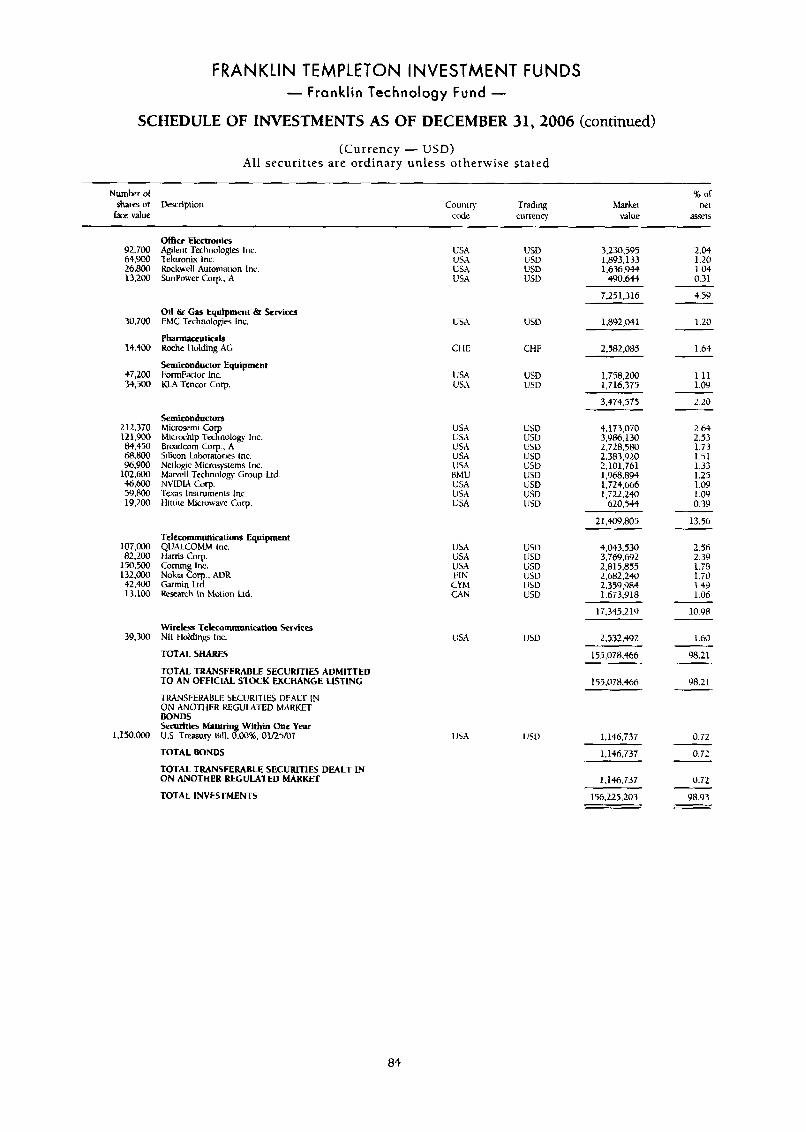
FRANKLIN TEMPLETON INVESTMENT FUNDS - Franklin Technology Fund -
SCHEDULE OF INVESTMENTS AS OF DECEMBER 31,2006 (continued)
(Currency - USD) All securities are ordinary unless otherwise stated
Number of shares or Dewripion race value
9h of Country Trading hlarket ne[
code currency value awls
92,700 64.9M1 26,800 13,200
30.700
14.+00
47,200 74,500
212,370 121,900 84.450 68.800 96,900
102,600 Ki.m 59 .Po0 19,200
107,000 82,200
150.500 132.000 42,400 13,100
39.300
1.150.ooO
ORicc Electronla Agilent Technologis Inc. Tekimnix Inc. bckuell Automa[ion lnc. SunPower Corp., A
Oil & Gps wipment & Services FMC Technologies Inc.
PharmarrutiEnls Roche I lolding AG
Semiconductor Equipment ForrnFacclur lnc. a - T e n c o r Cop.
Semiconductors Microwmi Corp. Micmmhip Technolog). Inc. Broadcnm Corp.. A Silicon labnratories Inc. Netlogic Microsystems Inc. Marvel1 Technology Group Ltd NVIDLA COT. Texas lnsirurnents lnc. tlilliLe Micruwwe Curp
Telecommunications Equipment QUALCOMM Inc. t lams Corp. Corning Inc. NvkiaCo .ADR Garmin Lx: Research In Molion Ltd.
Wireless Telecommunication Semces NI1 Holdings Inc.
TOTAL SHARES
TOTAL TRANSFERABLE SECURlTlES ADMITTED TO AN OFFICIAL STOCK EXCHANGE LISTING
TRANSFEMWBLE SECURITIES DEAU IN ON ANOTHER IU33JWl-ED MARKET BONDS Securilies Maturing Within One Year U.S. Treasury Bill. O.W%, OlR5/07
TOTAL BONDS
TOTAL TRANSFERABLE SECURITIES DEALT IN ON ANOTHER REGULATED MARKET
TOTAL INVESTMENTS
USA USA USA USA
USA
CI IE
USA USA
USA USA U SA USA USA HMU USA
USA USA
USA USA L!SA FIN CYM CAI\;
1:SA
USA
USD USD USD USD
USD
CHF
USD LJSD
CSV USU USD usv LSU
L;SD USD USD
u m
USU USD USD USD USD USD
USD
lJSI>
3,230,595 1,893.133 1.636.944 490.644
7.251.316
1,892,041
2,582.085
1,758,200 1.716.375
3,474,575
4,173,070 3.Y86.130 2.728,%0 2.383.920 2,101,761 1.968.894 1,724.666 1.722.L40
620.54?
2 1,409,805
4,043,530 3.769.692 2,815.855 2.682.240 2,399,984 1,673.918
17.345.219
2.532.492
155.078.466
155.078.466
1,146,737
1,146.737
1 A46.737
156.225.203
2.04 1.20 1.04 0.31
4.59
1.20
1.64
1.11 1.09
2.20
2-64 2.53 1.73 1.51 1.33 1.25 1.09 1 .OY 0.39
13.56
2.56 2.39 1.78 1.70 1.49 1.06
10.98
1.60
98.21
98.21
0.72
0.72
0.72
98.93
84
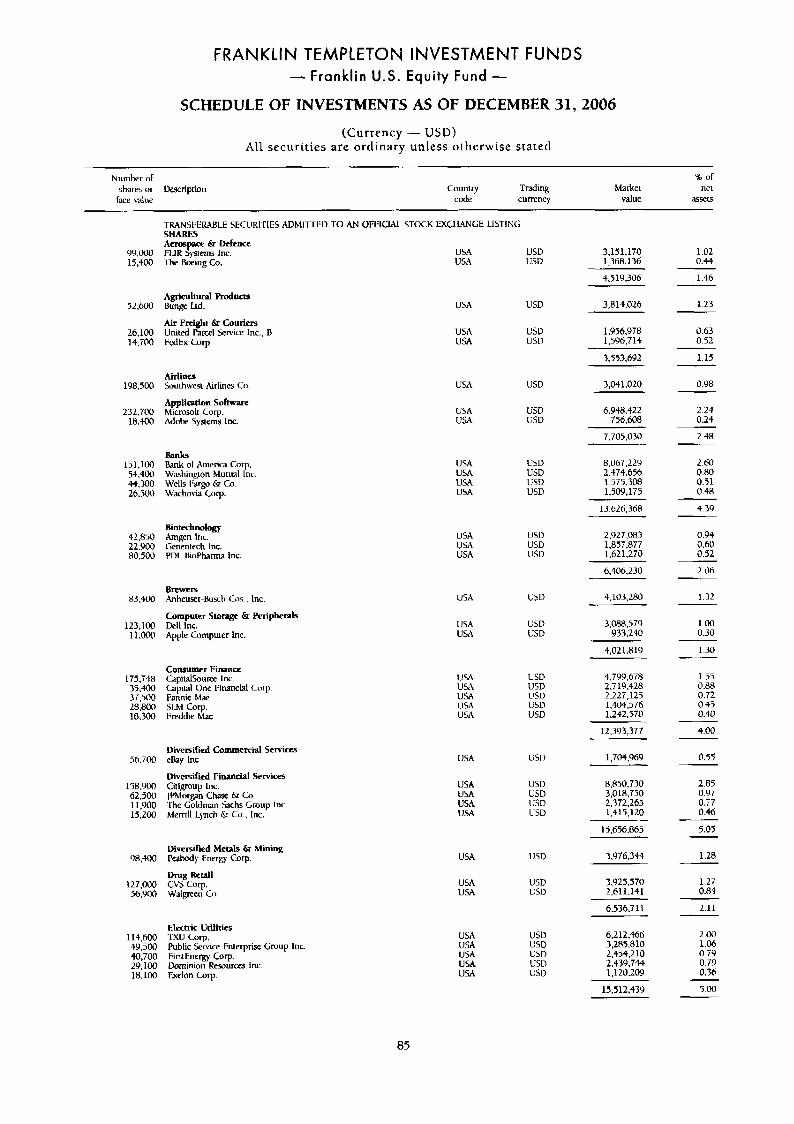
FRANKLIN TEMPLETON INVESTMENT FUNDS - Franklin U.S. Equity Fund -
SCHEDULE OF INVESTMENTS AS OF DECEMBER 31,2006
(Currency - USD) Al l securit ies are ordinary unless otherwise stated
Number or % of shares or Ucscription Country Trading Market net
f3ce s h e code currency value a55et5
TRANSIWABLE SECURI~L'IES ADMITWU TO AN 0FI:ICWL STOCK EXCIlANGE LISTING SHARES A m p c e & Defence
99,000 FIJR 5y51ems Inc. USA 15,400 The Boeing Co. USA
USD USD
3.151.170 1.368.1 36
1.02 0.4)
4,519,306 1 . t6
A g r i c u ~ t d Roducts
Air Frcight & Couriers Unitcd Panel kwice Inc., R
52.600 trunge Ltd.
26.100 14,700 IkdEx Corp.
USA 3.814.026 1.23 USD
0.63 0.52
USA USA
1.Y56.9T8 1.596.71t
3.557.692 1-15
0.98 Airlines
198,500 Southwest Airlines Co.
Appliation S o h r e 232,300 Microsoh Cop.
18.$00 Adobe Systems Inc.
USA USD 3,041.020
2.24 0.24
USA USA
USD IjSD
6.948.422 756,608
7.705.030 2.48
2.60 E k m h
151,100 Bank oCAmerim COT. 54.400 Washington Mutual Inc. 44,300 Wells 1:argo 6r CO. 26.500 Wachovia Corp.
USA USA U5A USA
USD USD LSD USD
8,067.229 2,474.656 1.575.308 1,509,175
13.62b.368
0.80 0.51 0.48
4.39
0.94 0.60 0.52
Biotechnolw 41.850 kngen Inc. 22.900 Gcnentech Inc. 80,500 PDL tlioPhanna lnc
U M USA USA
USD USD USI3
2,927.083 1,857,877 1.621.270
2.06 6.406.230
4,103,280 Brewers
Computer Storage & Peripherals
83,400 Anheuser-Bush Cos.. Inc.
123.100 Dell Inc. 11.0l3.l Apple Gbmputer lnc.
USA u w 1.32
3,088,579 Y33.240
USA USA
USD USD
1 .OO 0.30
4,021 819 1.30
4,799.678 2.7 19.428 2,227,125 1,404,576 1.242.570
Consumer Finance 175.T48 CapitalSource Inc. 35.400 Capiml <)ne Financial COT 37.500 Fannic Mae
18.300 breddie Mac 2 0 . m 5lhi COT.
1.55 0.88 0.72
USA USA USA USA USA
USD USD USD LiSD 0.45
0.40
4.00
USD
12,393,377
Diversified Commercial Services
Mversifd Financial Services
56.700 cBag Inc.
158,900 Ciligroup Inc. 62,500 JPkiorgan C k k CO. ll.YO0 15,200
'The Goldmn %chs Group Inc Merrill Lynch S- Co., Inc.
USA lis0 0.55 1.704,969
USA USD 8,850,730
2372.265 1.415.120
3,018,750 2.65 0.97 0.T7
USA USA USA
USD USD USD 0.46
13.656.865 5.05
3.976.344 1.28 Divedied Metals & Mining
98,40@ Pahody Energy Corp. U SA USD
3.1323.570 2.611.141
1.27 0.84
Drug Relail 127,000 Cvj Corp. 56.YM3 Walgreen Co
USA USA
USD USD
6.536.711 2.11
6,212.466 3,285.810 2,454,210 2.439.744 1.120.209
Electric Utilities
Public Service Enterprise Gmup Inc. 114,6W TXU Cop. 49,500 40,700 FimEnergj Corp. 29.100 Dominion Resourm Inc. 18.100 Exelon COT.
USA USA USA USA U U
1151) 2 .o@ 1.06 0.iY 0.79 0.36
USD USD USD L'SD
5.00 15.512,439
85
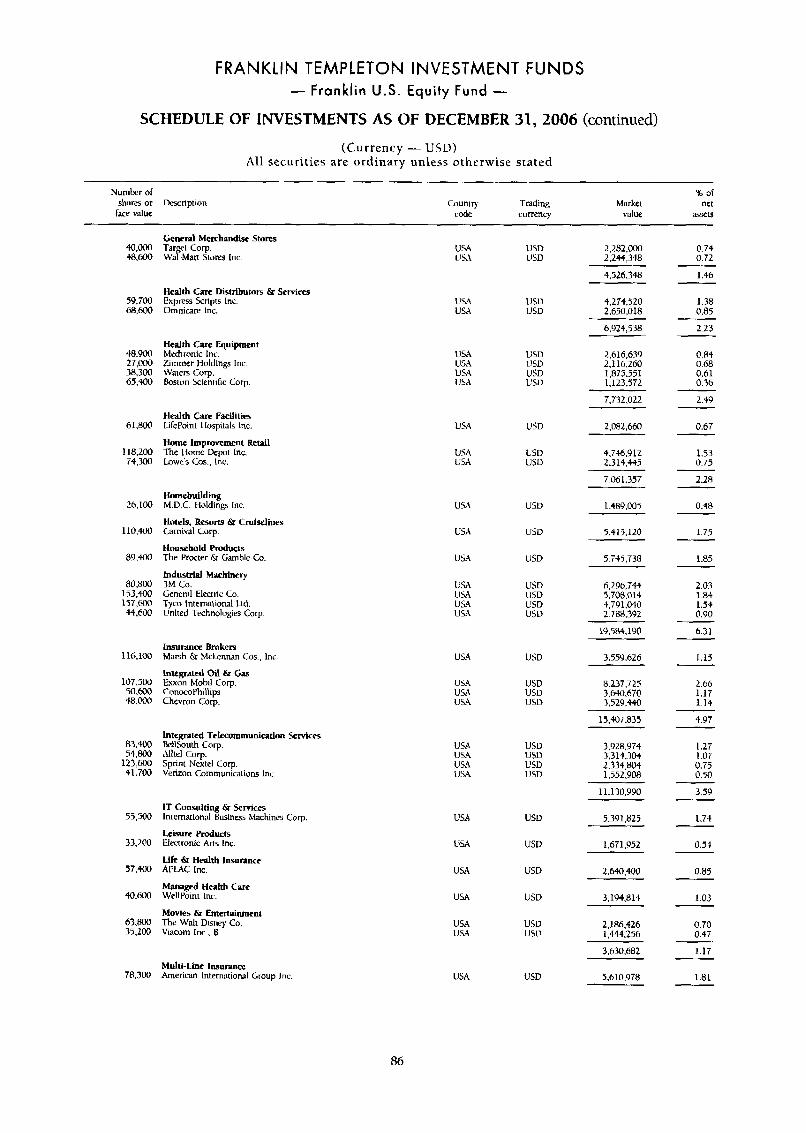
FRANKLIN TEMPLETON INVESTMENT FUNDS - Franklin U.S. Equity Fund -
SCHEDULE OF INVESTMENTS AS OF DECEMBER 31,2006 (continued)
(Currency - USD) All securities are ordinary unless otherwise stated
Nurnbfr or
Face value sham or Description Couniry Trading
code curremy
% of Markri ner
value 359x5
M.000 $8.600
59.700 68.m
48,900 27,000 38.300 65.400
61.800
118,200 74,300
26.100
110.400
89.400
80.000 153,400 157,W 44.6W
116,100
107,500 5o.m 48.m
83,400 54.800
123.W 41.700
53,500
33,200
57.400
4o.m
63.800 35,200
78.300
General Metrhandise Stores Tar el Corp LvafMan s t o w Inc.
Health Care Dbtribucorr & Services Express Scripts Inc. Omnicare Inc.
Health Care Equipment Medrronic Inc. Zirnmer Holding Inc. LVarers Corp. Boston Scieniific Corp.
Health Care Facilities Lifepoint I lospimls Inc.
Home Improvement Refail The Ilorne Depot Inc. Lowe's Cos.. lnc.
Homebuilding M.D.C. tlolding Inc
Hotels, Resorts & Cruiselines Carnival Corp.
thsehold F'mducts The Procter & Gamble Co.
Industrial Machinery 3M Cu. Cenerd Eleciric Co. T ~ C O Inremalional Lld. United Technologies Cop.
Insurance Brokers Marsh & Mcknnan Cos., lnc.
Integrated Oil h Gas Exxon hlobil COT. ConocoPhillips Chevron Corp.
Integrated Telmmmunirration Services BellSouth COT.
Sprint Nexrel COT. Verizon Communica~iuns Inc.
Alltel COT.
IT Consulting & Services lnremational Busin= Machines Cop.
Leisure Roducts Elecrronic Ans lnc.
Life & Health Insurance AFWC Inc.
Managed Health Care IVeIlPoint Inc.
Movies & Entertainment The Walt Disney Co. Viacom Inc , B
Multl-Lit Insurance Amencan International Croup Inc.
USA USA
USA USA
USA USA USA USA
USA
USA U M
USA
USA
l!SA
USA USA USA USA
USA
USA USA USA
USA USA USA USA
USA
U U
USA
USA
USA USA
USA
USD USD
usu USV
tis13 USD USD USD
USD
USV USD
USD
USV
USD
LJSD USD USD 1!5V
USV
USD USV USD
USV tiSD USD USD
usu
USD
USD
l!SV
USV usu
USD
2,292,m 2,294,348
4.526.348
4.274.520
6,924,538
2,650,018
2,616,639 2.116.260 1.875.551 1.123.572
7.732.022
2,082,660
4,7+6.Y 12 2,314,445
7.06 1.357
1,489,003
5.415.120
5.745.738
6,296,744 5.708.014 4.79 1,040 2,788,392
19,584,190
3.559.626
8.237.725 3.640.670 3.529,440
15,407.833
3,928,974 3,314,304 2,334,804 1,552,908
11.130.990
5.39i.m
1.671.952
2,640,400
3.1Y4.814
2,186.426 1.444.256
3.630.682
5.610.978
0.74 0.72
1.56
1.38 0.85
2.23
0.84 0.68 0.61 0.36
2.49
0.67
1.53 0.75
2.28
0.48
1.75
1.05 ~
2 03 1 84 1 54 0.90
6 31
115
2.66 1.17 114
4 97
1.2t 1.07 0.75 0 50
3 59
1.74
0.54
o a5
1 03
0.70 0.47
1.17
1.81
86
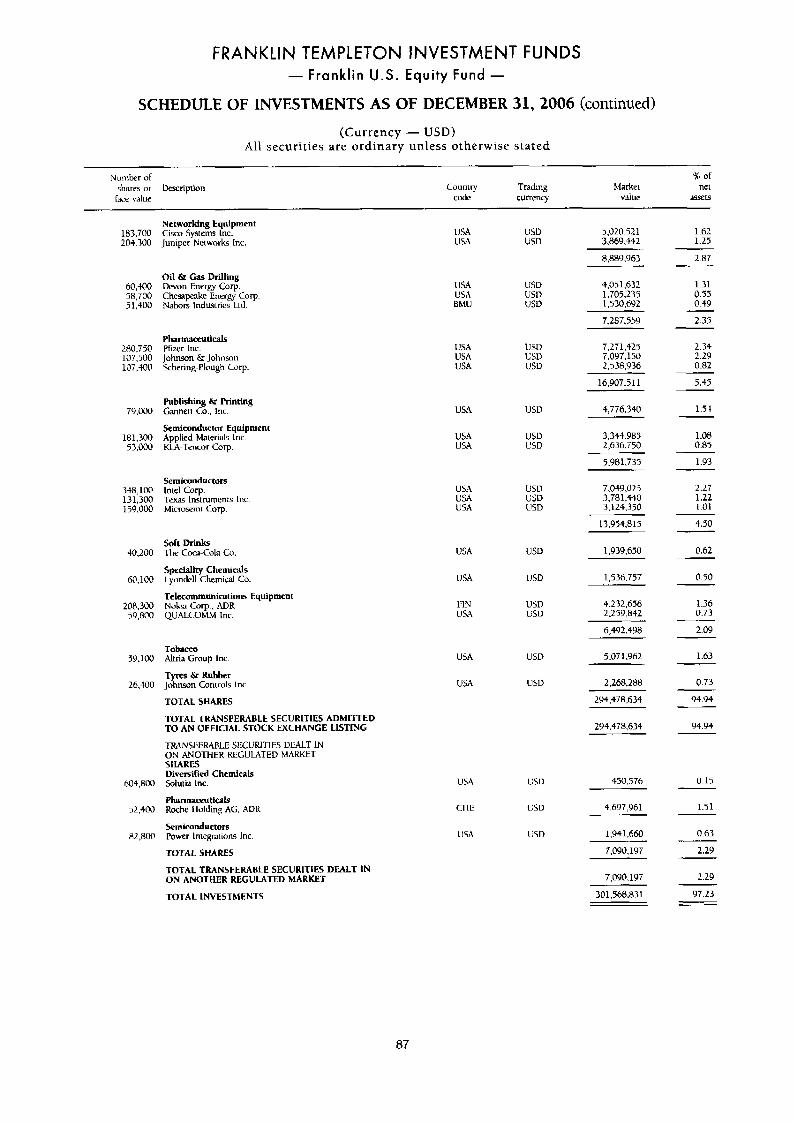
FRANKLIN TEMPLETON INVESTMENT FUNDS - Franklin U.S. Equity Fund -
SCHEDULE OF INVESTMENTS AS OF DECEMBER 31,2006 (continued) (Currency - USD)
All securities are ordinary unless otherwise stated ~ ~
Number of B of
race value code currcnq value m t s shares or bescription Counrry Trading MarkeL net
Nctworkhg Equipment Cisco Syslcms Inc. Juniper Nelworks Inc.
USA USA
USA USA BMlJ
USA USA l!SA
LISA
u s A USA
USA USA USA
USA
USA
FIN USA
USA
USA
usu USD
USV us11 VSU
USD usv l!SU
USD
USD USD
usv GSD USD
USD
USU
US13 USD
USD
U SD
5.0L0.521 3.R69.4+2
1.62 1.25
183,700 20+.300
60,300 58,700 5 1,400
280,750 107,500 107,400
79.000
181.300 53.000
3t8.100 131,300 15Y ,000
40.200
60,100
208,300 59.800
50.100
26.4011
6Ot.800
52.400
82.800
~
2.87
1.31 0.55 0.49
2.35
2.34 2.29 0.82
$.MY ,963
4,051632 1,705.235 1,530,692
Oil & Cas Drilling Devon Energy Coy. Chesapeake Energv Corp Nabors Industries Ltd.
7.287.55'3
Pharmaceuticab Pfizcr Inc. Johnson 6r Johnson Schering-Plough Corp
7,271.425 7.097.150 2.538.936
16,907,511 5.45
1.54 Publishing & Printing Gannet1 Co.. Inc.
Semiconductor Equipment Applied Malerials Inc. KU-TenuIr Coy.
4,776340
3.344.985 2.636.750
1 .OH 0.85
5.981.735 1-93
7.049.025 3,781,440 3,124.350
2.27 1.22 1.01
4.50
0.62
0.50
Semiconductors lnrel Corp. Texas Lnstrurnenls Inc Micmsemi Coy.
13.954.815
1 .9 39,650
1,536.757
Soft Drinks The Cow-Cola Cu.
Speciality Chemicals Lpndell Chemical Co.
Telecommunications Equipment Nokb COT., ADR QUALCOMM Inc
4232.656 2,259.842
1.36 0.73
6,492.498
5.071.962
2.09
1-63 Tobarn Altria Gmup lnc.
Tyres & Rubber Johnson Conmols Inc.
TOTAL SHARES
TOTAL TRANSFERABLE SECURITIES ADMITTED TO AN Of FlClAL STOCK EXCHANGE LISTING
2.268.288 0.73 ~
294,478,634 94.94
94.94 294.478.634
450.576
TRANSIW2ARLE SliCl~RITIES VIIALT IN ON ANOTHER KEGULITED MARKET SHARES
USA
CI IE
USA
LSU
LSU
LSD
DiversiFied Chemicals Soluila Inc
Pharnufeuticals Roche 1 lolding Ati. ADK
semiconductor5 Power lntegnuons Inc
tOTAL SHARES
TOTAL TRANSFERABLE SECURITIES DEALT IN ON ANOTHER REGULATED MARKET
TOTAL INVESTMENTS
0.15
1.51 4,697,961
1.94 1.660
7,090,197
7,090,197
301,568,871
0.63
2.29
2.29
97.23
87
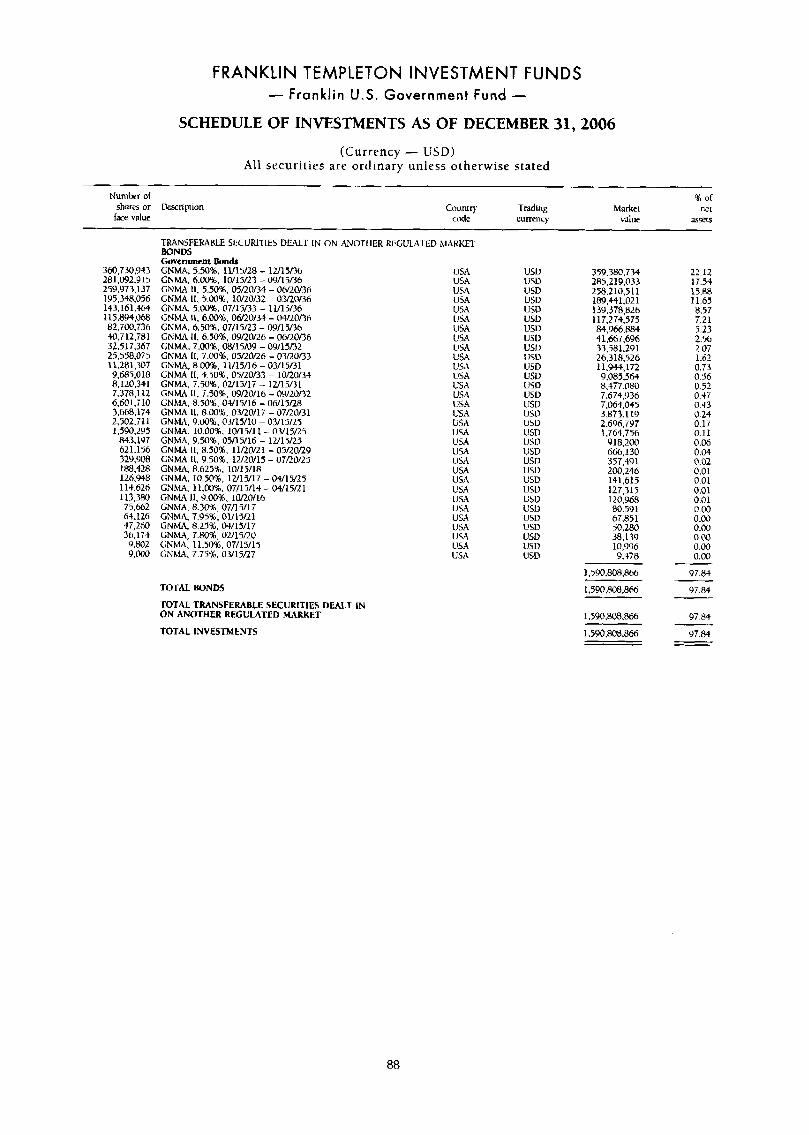
FRANKLIN TEMPLETON INVESTMENT FUNDS - Franklin U.S. Government Fund -
SCHEDULE OF INVESTMENTS AS OF DECEMBER 31,2006
(Currency - USD) All securities are ordinary unless otherwise stated
Number of % of shares or kscriprion Count? Trading hlarket net face value C& currenq value assee
360,730,943 281.092.5115 259.973.137 1'45,348.056 143.161.$W 115894.068 82.700.736 40.7 12,781 32.517.367 25.558.075 11,281,307 9,685,018 8.120,14l 7.378.1 12 6.601 .i10 3.668.174 2,502,711 1.590.295
843.1Y7 621.156 329,908 188,418 12R.948 11-t.626 113,380 75,662 64.126 47,260 36.174 9.802 9 s100
CNMA 11, 6.50%. 09/L0/26 - 06/20/36 CNMA. 7.00%. OW15/09 - W/15fi2 CNMA 11. 7.0016. 05/L0/26 - 03/20/33 GNhlA, 8.00%. 11/15/lb - 03/15/31 LNMA II, 4.50%,05/20/33 - 10/20/34 GNMA. 7.501. 02/15/17 - 12115fjl CNMA 11, T.5OB. @9/20/16 - LY/20/20/32 GNhM. 8.50%. @+/l5/16 - 06/15/28 GNMA II. 8.00%, 03/20/17 - 07/20/31 GNhU, 9.00%. 03/15/10 - 03/15/25 G N U . 10.00%. 10/15/11 - 0.3/15/25 GNhW. 9.50%. 05/15/16 - 1U15/25 GNMA II, 8.50'16. 11/20/2l - 05/20/29 CNMA II.Y.50%. 12/20/15 - 07RUV25 GNMq 8.625%. 10/15/18 GNMA. 10.50%. 1U1?/17 - 04/15/25 GNMA, 11.00%. 07/15/14 - 04/15/21 GNMA 11. Y.M)%. 10/20/16 GNMA. 8.30%. 07/15/17 GNhiA. 7.95%. 01/15/21 GNMA, 8.25%. 04/15/17 GNW, 7.80%. OU15/L0 C;NhM. 11.50%, 07/15/15 GNhM. 7.75%. 03/15/27
TRANSFERABLE SECURITIES DEALT IN ON ANOTl IER REGULXTED M A R W BONDS Govemmcnt Bonds GNMA. 5.5016. 11115/28 - 1211506 CNMA. 6.00%. 1W15fL3 - 09/15/36 CNMX II, 5.501. 05/20/34 - 06/20/36 LNMA 11,5.00%. lW20/32 - 07/L@/36 GNhW. 5.00%. 07/15/33 - 11/15/36 GNhW II. 6.0@%. 0#20/34 - 04/20/36 GNMA. 6.50%. 07/15/23 - 09/15/3b
USA USA USA U 5A USA l!SA USA USA USA USA USA USA USA USA USA USA USA USA USA USA USA USA USA USA USA USA USA USA USA USA USA
TOTAL BONDS
TOTAL TRANSFERABLE SECURITIES DEALT IN ON ANOTHER REGULATED MARKET
TOTAL INVESTMENTS
USD U5D USD USD USD USD US1) USI? USD usu USD lJSV US0 usu USV US13 usu USD lJSD USV USD usv USD USL) usv CSU USD USU USD L'SD USD
359.380.734 285.219.033 258210.511 189,441,021 139.378~826 117:274:575 84,966,884 41,667,696 33.581.291 26,318.526 1 1.944,172 9.085.364 8,477.080 7.674.936 7.064.045 3,873,119 2.696.797 1.764.756
Y 18,2oO 666.130 357,491 200,246 141.614 127,315 120.968 80.591 67.851 30,280 38.139 10.9'16 9,378
1,590.808.866
1,590,808,866
1 .YJ0,808.866
1.590.806.866
22.12 17.54 15.88 11.65 8.57 7.21 5.23 2.56 2.07 1-62 0.73 0.56 0.52 0.37 0.43 0.24 0.17 0.11 0.06 0.04 0.02 0.01 0.01 0.01 0.01 0.00 0.00 0.00 0.N 0.00 0.00
97-84
97.84
97.84
97.84
88
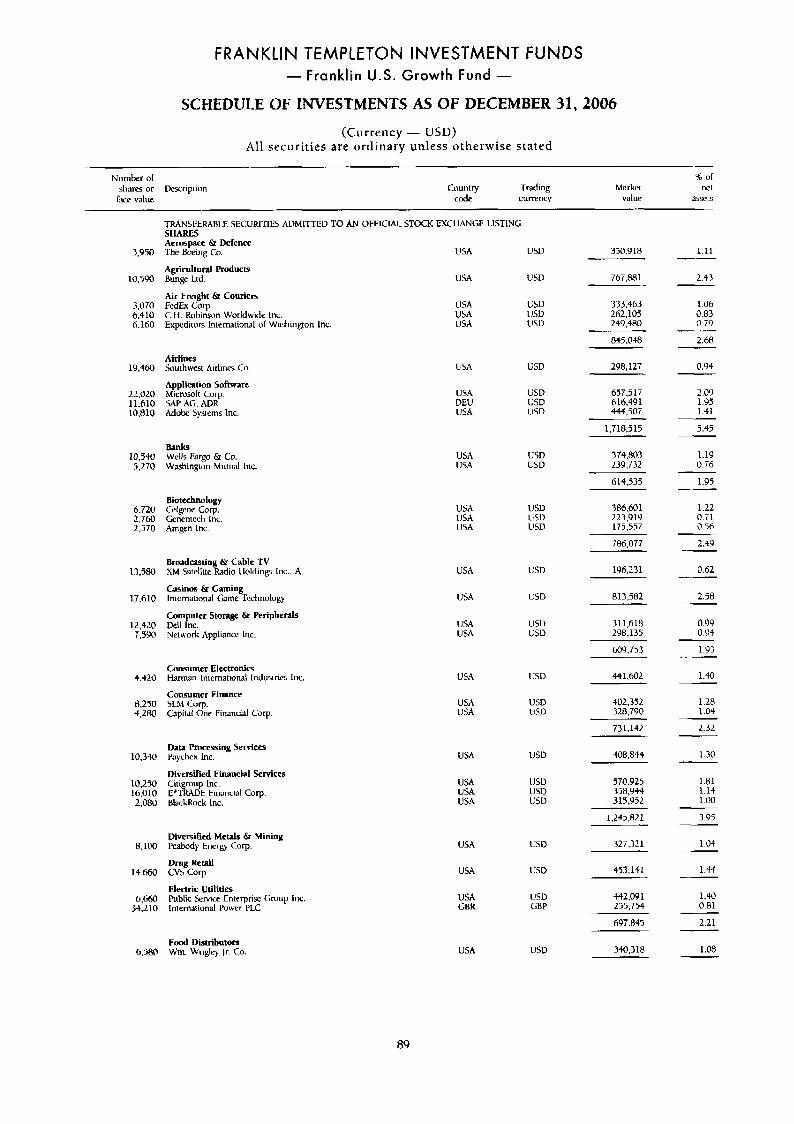
FRANKLIN TEMPLETON INVESTMENT FUNDS - Franklin U.S. Growth Fund -
SCHEDULE OF INVESTMENTS AS OF DECEMBER 31,2006 (Currency - USD)
All securities are ordinary unless otherwise stated
Number or % of shares or Descripiion Country Trading Market ne1
l ice value code currency value asssets
TFWSI'ERABLE SECURITIES AVMITTEU To AN OFFICLAL STOCK EXI WNGE LISTING SHARES Aerospace &I Defence The b e i n g Lo. USA USD 350.918 1.11 3,950
10.590
3.070 6.410 h.ltiO
19.460
22,020 11.610 10.H10
10,440 5,270
6.720 2.760 2.570
13,580
17,610
12,520 7.5YO
4.420
n,2m 4.280
10.3-10
10.250 16.010 2,080
8,ICO
14.660
6.660 34.210
767.W Agricultural Products Bunge L[d.
Air Frelght & Couriers FedEx Corp C.H. Robinson Worldwide Inc. Expeditors lnternational u l Washington Inc
USA
USA USA USA
C'SD 2.43
LSU us0 USD
333.463 262.105 249,480
845.048
1.06 0.83 0.79
2.68
Airlines kuihwest Airlines Co.
Appliation Software Microsoft COT. SAP AG, ADR Adobe Spiems Inc.
USA
USA VEll USA
LiSV 298,127 0.94
2.09 1.95 1.51
USV usu USD
657.517 616.491 444.507
1,718,515 5.45
374,803 239.732
1.19 O.T6
Banks Wells Rrgo & Co. h'ashingion Mutual Inc.
USA USA
USV USV
614,535 1.95
Biotechnology Celgene Cop. Gencntech Inc. Arngen Inc.
USA USA USA
386,601 223,919 175.557
USD bSD USD
1.22 0.71 0.56
786,077 2.49
0.62 196.231 Bruadcnsting & Cable f V Xhi Satellite Radio I lolding Inc.. A
Casinos & Gaming. inleinational Came lechnolog
Computer Storage & Peripherals Uell lnc. Network Appliance lnc.
USA
USA
USA USA
L'SV
LSD 813,582 2.58
USD b5U
311,618 298,135
0.99 0.94
1.93 609.753
441.602 Comumer Electronia tiarmen Inicrnatwnal Indusiries lnc. 1-40 USD
Consumer Finance
&pita1 One Financial Cirrp. SLM Curp. USA
USA USU LSD
402.352 328,790
1.20 1.04
2.32 731.142
Data Processing Services Rychex lnc.
Diversifid FiMrlCial Services
USA us0 1.30 -108,844
USA USA USA
USD USD lj5D
1.81 1.14 1.00
Citigroup Inc. E'T1WDE Financial COT. BlackKock lnc.
570.~25 358,Y44 315,Y52
1.245.RZ1 3.95
1.04 Diversified Metals & Mining Pedbodp Energy COT.
Drug Rerail
Electric Utilities Public %mice Enterprise Croup Inc. lntemarional Power PLC
cvs COT.
USA USD 327.321
453,141 USA USD 1 .et
1.40 0.81
2.21
442,oYl 255,754
USA GBK
USD GBP
697.845
340,318 F r d Distributors
6,XW Wm. Wriglq Jr. Co. USA USD 1.08
89
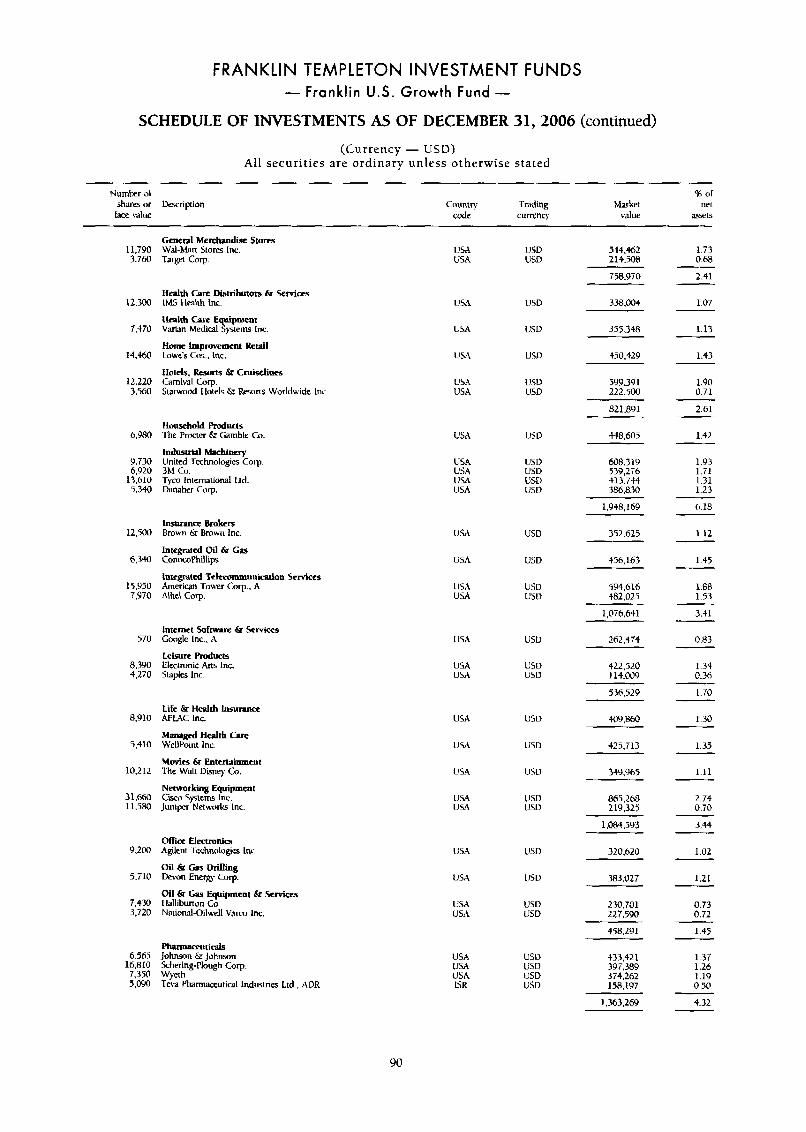
FRANKLIN TEMPLETON INVESTMENT FUNDS - Franklin U.S. Growth Fund -
SCHEDULE OF INVESTMENTS AS OF DECEMBER 31,2006 (continued)
(Currency - USD) Ail securit ies are ordinary unless otherwise stated
Number of % or
race vdue code currency value a5XlS
shares or k r i p t i o n Counmy Trading Market net
Gcnenl Merchandise Stores Wal-hhn Slow Inc. Targei COT.
11,790 3.760
12.300
7.470
14 .M
12,220 3.560
6.980
Y.730 6,920
13,610 5.340
12,500
6.340
15.Y50 7.970
570
8.3YO 4,270
8.Y 10
5,410
10.2 12
31,660 11,580
9.200
5.T10
7.430 3.720
6.565 16.810 7,350 5,WO
USA USD USA USD
344.462 214.5OR
1.73 0.m
2.41
1.07
1.13
1.43
1.90 0.71
2.61
142
1.93 1.71 1.31 1.23
b.18
1.12
758.970
USA USD 338.00) Henlth CM Distributofs & Setvices IMS H d t h lnc.
Health Care Equipment Varian Medial Sjstems lnc.
Home improvement Retail Low’s Cos.. Inc.
USA USD 355.348
lJSA USD $50,429
USA USD 5130.3Y 1 USA USD 222,500
821.891
Hotels. Resorts & Cruirelioes Carnival Cop. Smwood I lotels 6r h n s Worldwide Inc
Household Roducts The P e r & Gamble CO.
Industrial Mpfhinery United Technologies Corp. 3hi Co. - r p Inmnational Lrd. Danaher Corp.
USA U5D W8.605
608.31Y 539,276 413.744 386,830
USA USA USA USA
USD usu U5D USD
1,948,169
352.625 lnmrance Brokers Brown & Brown Inc
Integrated Oil & Gas ConocoPhillips
Integrated Tcltcommuni~~ion Services American Touvr Corp.. A Alltel Corp.
USA USD
USA USD 456,163
594,616 t82.025
1-45
1.88 1.53
3.41
0.83
1.34 0.36
1.70
1.30
1.35
1.11
2.74 0.70
3.44
1.02
1.21
0.73 0.72
1.43
1.37 1.26 1.19 0.50
4.32
USA USA
l!SU u w
1,076,641
262.474 Internet Software & Services CDogk lnc.. A
Leisure Roducts Electronic Ans Inc. Staples lnc.
USA USU
USA USA
u D usu 422,520
114.W9
536.529
$09,860 Life & Health h- A I U C lnc.
M m a g d Hdth Care Wellhint Inc.
Movies & Entcrtainmcnt The Wdt Disney (30.
Newtking Equipment Cisco Systems Inc. Juniper Networks lnc.
USA U5D
USD
USU
425.713 U M
USA 349,9415
LJSD USE!
865.268 219.325
1,084,593
Office E l e c t m N a Agilent Whologis lncl
Oil & Cos Drilling Devon Enew Corp.
Oil & Gas Equipment & Scmices I lallibunun Co. Nariorul-Oilwell VNCU inc.
USA USD 320.620
USA lJSD 383,027
2~30.701 227.590
LISA USA
LJSD USD
458.29 1
pharmaceuticals Johnson 6. Johnson Schering-Plough Corp. Wyeth TC\H Phamxeuticd Industries Lid., ADR
433.421 397.389 374.262 158.197
USA USA USA ISK
USU usu USD usv
1,363,269
90
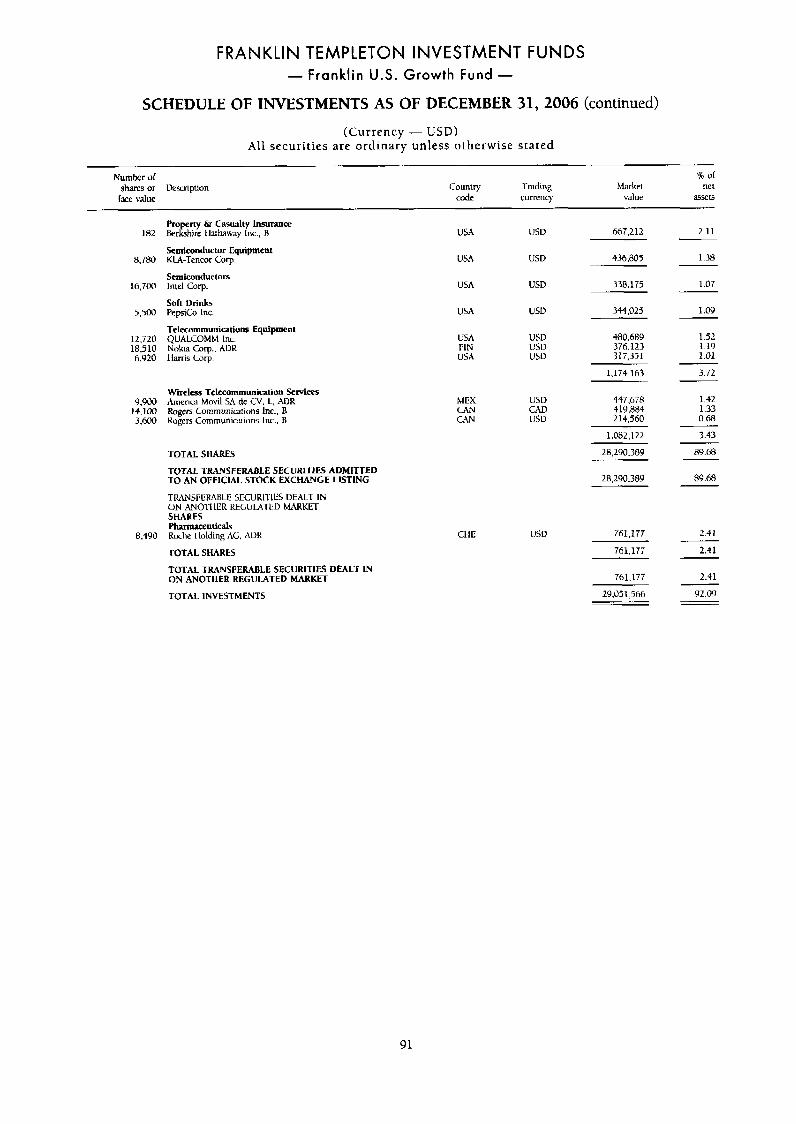
FRANKLIN TEMPLETON INVESTMENT FUNDS - Franklin U.S. Growth Fund -
SCHEDULE OF INVESTMENTS AS OF DECEMBER 31,2006 (continued)
(Currency - USD) All securit ies are ordinary unless otherwise stated
_____
Nurnkr of z or
Ixc value code currenq value a55et.5
shares or Description Country f'rnding Market net
1R2
8,780
16.7M
5.500
12.72@ 18,91@ 6.920
9,900 14.100 3.6@@
8,490
Property & Casualty Insurance Berkshire llathaway Inc., H
Semiconductor Equipment KLA-Tencor Corp.
Semiconductors Inirl Corp.
Soft Drinks PepsiCo Inc
Telecommunicatiuns Equipment QUALCOMM Inc. Nokia Corp. A I M I larris Corp.
Wirple56 Telecommunication S c M m s Arnenca Movil SA de CV. L, ADR Rogers Communiwrions Inc.. B Kogcrs Comrnunicauons lnc.. 8
TOTAL SHARES
TOTAL TRANSFERABLE SECURITIES ADMITTED TO AN OFFICIAL STOCK EXCHANGE LlSflNG
TRANS1:EWBLE SECURITIES DEALT IN ON ANO-ll IER REGUL+l.ED MARKET SHARES Pharmaceuticals Roche llolding AG. AUK
TOTAL SHARES
TOTAL TRANSFERABLE SECURITIES DEALT IN ON ANOTHER REGULATED MARKET
TOTAL INVESTMENTS
USA ljsv
USA USD
USA USD
USA USD
USA US13 FIN us11 USA USD
MEX CAN CAN
CHE
667.212 2.11
436.8@5 1.78
338.175
344,025
S80.689 376.123 31T.351
1.174.163
USD CAD USU
usu
1.082.122
28.290.38Y
28,290,389
1.07
1.09
1.52 1.19 1.01
3.72
1.42 1.33 0.68
3.43
0Y.68
8Y .BS
761,177 2.41
761,177 2.41
761,177 2.41
Y2.09 29,051,566
91
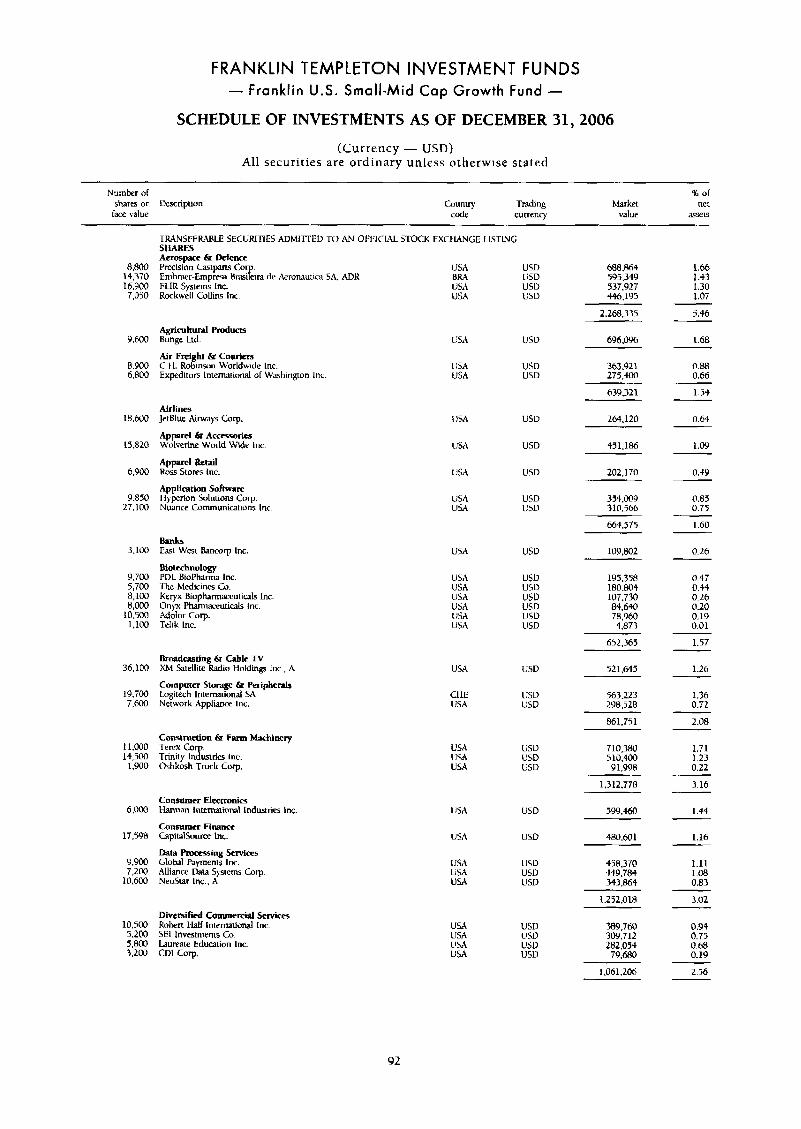
FRANKLIN TEMPLETON INVESTMENT FUNDS - Franklin U.S. Small-Mid Cap Growth Fund -
SCHEDULE OF INVESTMENTS AS OF DECEMBER 31,2006
(Currency - USD) All securities are ordinary unless otherwise stated
Number of shares or Uescription
face value Country Tnding
Code cumency Market
value
TRANSFERXRLE SECURLTIES ADMITTED TO AN 0FI;IClrV 5’I-OCK EXCkIANGE LISTING SHARES Aerospace 6r Defence
8,800 Precision Castpans Co USA USD USD
7.030 hckwell Gllins Inc. 1JSA USD
14.370 Enihraer-Empresa Bm%n de Aeromutica SA, ADK 16.g00 FLlR Sy-srems Inc. USA USU
688,864 595.349 537,927 446,195
2,268,335
1.66 I .33 1.30 1.OT
5.46
Agrimlnunl Rodurrs
Air Freight & Couriers C.t 1. Robinwn Worldwide Inc. Expediiors Intemlional of Washinson Inc.
9.600 Bunge Ltd.
R.900 6,800
L:SA l!SU 696.oY6 1.68
USA USD USA USU
363,021 275,400
639.321
0.68 0.66
1.53
0.64 Airlines
18.600 JetBlue Ximmys Crirp. USA usu 264.120
Apparel & Amcswrries
Apparel Retail 6,900 Ross Stom lnc.
Applleation Software 9.850 I Ipxion Solutions Corp.
15,820 Wolverine world Wide lnc.
27.100 Nuance Communications Inc
USA USD 1.04 451.186
L!SA USD 202,170 0.419
lJSA USD USA USD
354,009 310,566
664.575
0.85 0.75
1.60
Banks 3.100 East Wesr Bancorp Inc.
Biotechnology 9,700 PVL BioPharma lnc. 5,700 The hiedicines CO. 8,100 Kcryx Biophmnacculiwls Inc. 8,000 Onyx Pharmac~uticals Inc.
1,100 Telik Inc. 10,500 Wolor COT.
USA USV 109.802 0.26
0.47 0.44 0.26 0.20 0.19 0.01
1.57
USA usu USA USD USA USU USA USD L!SA USD USA LISD
195.358 180.804 107.730 84,640 78.W 4,873
652.365
Broadcasting & Cable TV X M Satellite Ldio Holdings Inc., A
Computer Storage 6r Peripherals
36,100
19,iW Logitech Intemiional SA 7.6W Network Applianm Inc.
USA USD 521,645 1.26
CllE USD USA USD
1.36 0.72
563.223 298,528
2.08 861,751 Constru&ou &z Farm Machinery
11,000 Tewx Co 14,500 Trinity InTkris Inc. 1,900 Oshkosh Truck Gwp.
USA USD USA USD USA USD
1.71 1.23 0.22
710,380 510,400 Y1.998
3.16 1,312.778 Consumer Electmniu
Consumer Financc
Data R o m s i n g krvices
6.000 Haman Intemarional Industries lnc
17,598 Capitalhum lnc.
9,900 Global Payments Inc. 7.200 Alliance Data Systems Gorp. 10,600 NeuSur lnc., h
IJSA USD 1.44 599,460
USA USD 480.601 1.16
IJSA USD LjSA USU USA USD
1.11 1.08 0.83
458.37@ 449 ,784 343,864
1.252.018 3.02 Diversifid Commerdal Services
10.500 Roherr I-hll Iniematitnal Inc. 5.200 SEI lnvetments Co. 5,800 hureaie Education Inc. 3,200 CDI Corp.
U M USA USA IJSA
USD USD USV USU
389,760 3oY,712 282,054 79.680
1.061.206
0.94 0.75 0.68 0.19
2.56
92
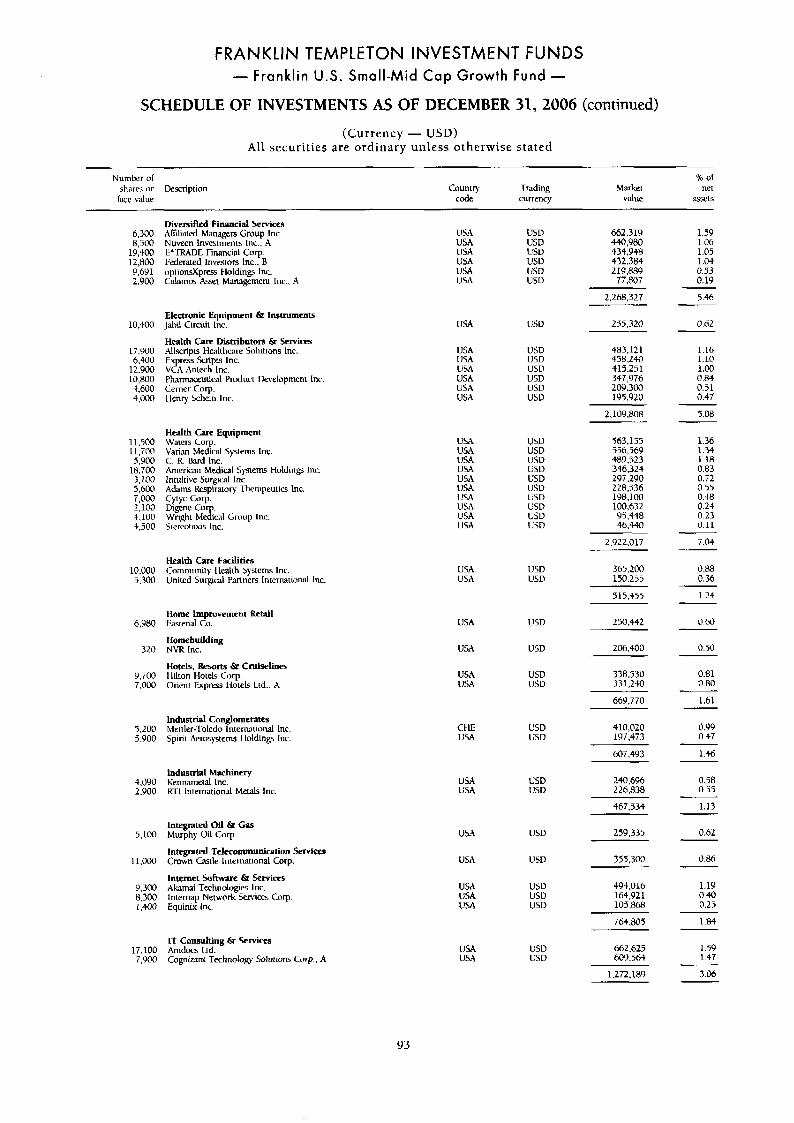
FRANKLIN TEMPLETON INVESTMENT FUNDS - Franklin U.S. Small-Mid Cap Growth Fund -
LE OF INVESTMENTS AS OF DECEMBER 31,2006 (continued)
(Currency - USD) Al l securities are ordinary unless otherwise stated
Number of g
lice value code currency value %sets shares or Description Couniry Trading Mark1 net
6,300 8,500
19,400 12,800 9.691 2.900
10,400
17.900 6,490
12.900 io,8ao 4.600 4 . m
11.500 I l . i O 0 5,900
18.700 3.100 5,600 7,000 2,100 t.100 t.400
10.000 5.300
6,980
320
9,TOO 7,00@
T.200 5,900
4.090 2.900
5.190
11,000
9,300 8.300 1.400
Diversified finnncial Services Afiliated Managers Gwup Inc. Nuveen Investments Inc.. A E*TRADE Financial Corp. Federated Lnveswrj Inc., B opticlnfipress tloldings Inc. Calamos k t Management Inc.. A
Electronic Equipment & Instruments Jahil Circuit Inc.
Health Crre Distributors & Services .+Ill;cripts Healthwre Solutions Inc. Express SCripLs Inc. \'CA Antrch lnc. Fharmacruticd Pruduct Ikd>pment lnc. Cemer Corp. I Ienry Schein Inc.
Hdth Care Equipment Waters Corp. Varian Medical Systems Inc. C. R Bard lnc. American Mcdiwl Systems Holding Inc. Intuitive Surgical Inc. Adam Respiratory Thempcutics Inc.
Digene Cop. . Wright Me tcnl Group Inc. Srereotaxk Inc.
Cytyc Corp.
Health Care Facilities Community I I 4 t h Systems Inc. United Surgiwl Partners International lnc.
Home Improvemen1 Retail Iksrenal to.
Homebuilding NVR Inc.
Hotels, Resorts & Cruiselines I lilton Hotels Corp. Orient-Exprtlss llotels Ltd.. A
Industml Conglomerates hlertler- loledo Intemrionll Inc hpini Aemsysrems i ioldinp In(
Industrial Machinery Kennamelal Inc. R-TI International MCLIIS Inc.
h e p t a d 0 1 1 &I Gas Murphy Oil Carp.
Integrated Telecomunication Selvlcos Crown Castle Intcmtional Corp.
Internet Software & Services Akamai Technologies Inc. lnternap Network %enices Gq. Equinix Inc.
It Consulting & Services
Cognimnt Technology .Solutions Corp.. A 17.1FO Amdocs lld. 7,900
USA USA USA USA USA USA
USA
USA USA LISA USA USA USA
UW USA USA UW USA USA USA
l!SA USA
usa
USA USA
USA
USA
USA USA
CtlE USA
USA USA
U M
USA
USA USA U.5A
USD USD USV us0 usu USD
l!SD
USD USD USD USD USD usv
U W U5D USV usu USD USD LiSD USD USD USD
USD USD
USD
USD
USD USD
USD USD
LJSD USD
lJSU
USD
USU us0 USD
662.319 4so,Y80 434.Y48 432.364 219,889 77.807
2.268.327
1.59 1.06 1.05 1 .Dt 0.53 0.19
5.46
245.320
483,121 458.240 415.251
2.109 .E08
~
0.62
1.16 1.10 1 .m 0.85 0.51 0.47
5.08
363,135 556,46Y 489.523 346.324 297.290 228.336 198.100 100.632 95,448 46,440
2.922.017
1.36 1.34 1.18 0.83 0.72 0.55 0.48 0.24 0.23 0.11
7.0+
365,200 150.255
5 15.455
0.88 0.36
1.24
250,442
206.400
338.530 331,z-w
669.770
0.69
0.50
0.81 0.80
1.61
0.Y9 0.47
607.493 1.46
240,696 226.838
467,434
259,335
355.300
4Y4,016 164,921 105.868
764.M5
1JW USA
usu USD
662.625 609,564
0.58 0.55
1.13
0.62
0.86
1.1Y 0.40 0.25
1.81
1.59 1.47
3.06 1.272.189
93
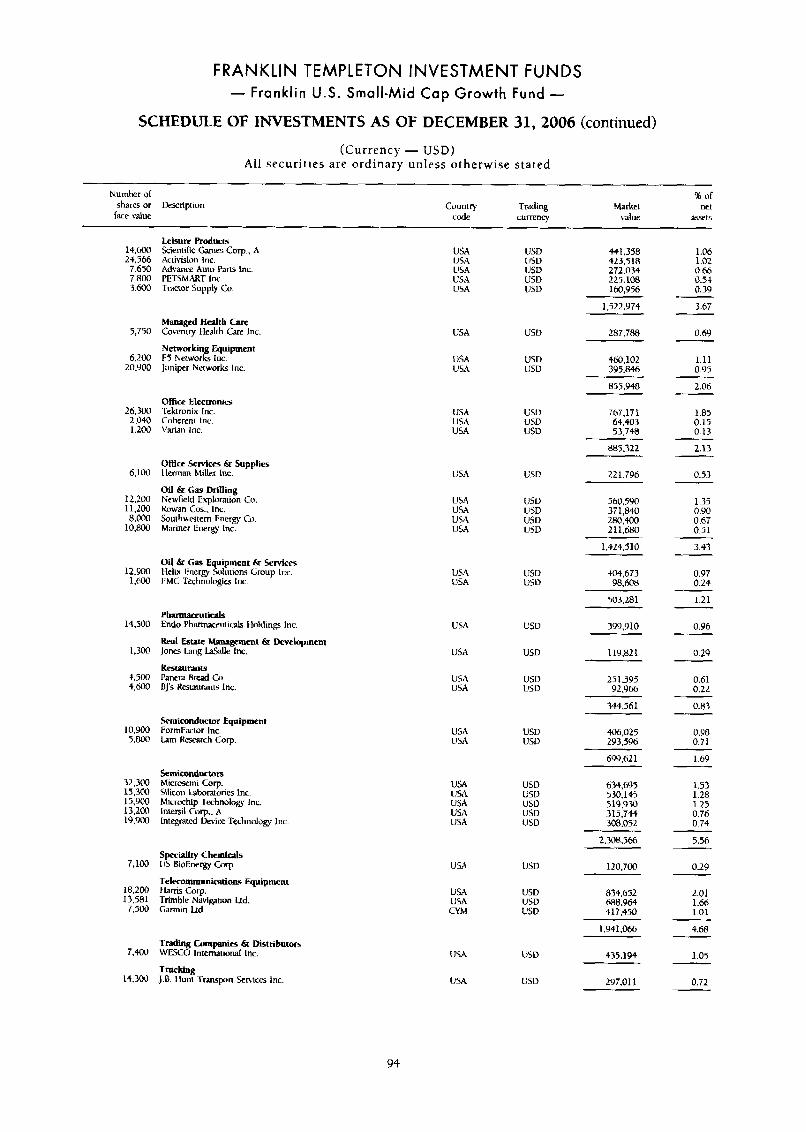
FRANKLIN TEMPLETON INVESTMENT FUNDS - Franklin U.S. Small-Mid Cap Growth Fund -
SCHEDULE OF INVESTMENTS AS OF DECEMBER 31,2006 (continued)
(Currency - USD) All securit ies are ordinary unless otherwise stated
Number or shares or krr ipt ion
face value Country Trading
c d e currency Market
value
14,600 24,566 7.650 7.000 3.600
5,750
6.200 20,900
26.300 2.040 1.2w
6,100
12.200 11.200 8 . m 10.m
12,900 1 .600
14.500
I ,3!M
3.500 4,600
10.900 5,800
32,3W 15.m 15,900 13,200 19,900
7,100
18,200 13,581 7.500
7.400
14,300
Leisure Roductr Scientific Games Corp., A Activision lnc. Advancz AUIO Pam lnc. PETSMART Inc. Tractor Supply Co.
Managed H d t h Care Coventry Health Cre Inc.
Networking Equipment F5 Networks Inc. Juniper Nerworks Inc.
Office Electmnia .Tektronix Inc. Coherent Inc. Varim Inc.
Offim Semccs 6r Supplies llenan Miller lnc.
Newficld Explnrauirn Cu. Kowm Cos., lnc. Southwsrern Energy Co. Mariner Energy Inc.
oil & tas mllig
Oil & Gas Equipment Sr Services tlelir Energy Sulutions Group h c . FMC Technologies Inc.
Pharmnceuticals Endo Pharmxeutiwls ttoldinp Inc.
Real Estatc Management C Development Jones Lane, Mhlle Inc.
Restaurants Panera Bread Gr. BJ's Restaurants Inc
Semimnductor Equipment FormFactor Inc. l a m Kesearch COT.
Semiconducum Microsemi Corp Silicon Laboratories lnc. Microchip Technoloa Inc. lntcnil Curp.. A Integmted h i c e lwhnology Inc.
USA USA USA U5A U5A
USA
USA v5A
us\ USA USA
USA
U.sA USA USA USA
US.\ USA
U SA
USA
USA USA
U5A USA
USA USA USA USA USA
USD 11SD US0 USU U5D
USU
USD U5D
lis0 USD USU
USD
USD USD USD US0
LIS0 usu
USU
USD
USD us13
USD U5D
U5D USD US0 USD USD
Speciality Chcmids US BioEncrgy Corp
TeIemmmunicuiom Equipment
Trimble Navigtion Lid. Gamin Ltd.
1 hrris Corp.
Trading Cornpanics & Distributors WESCO lntemaiional Inc.
Trucking J.B. I lunt Tmnspm %mica Inc.
USA
US4 USA CYM
USA
USA
llSD
USD USD USD
USD
U5U
441,350 423.518 272.034 225.108 160.956
~~
1,522.974
287.7118
460,102 395,M
855,948
767.171 64,403 53,748
885.322
221.796
550.590 371,840 280.400 211,680
1,424,510
404.673 98.608
503.281
399.910
119,821
251.493 92966
344,561
406.025 2Y3,596
699.621
634,695 530.143 5 19 :930 3 15,744 308.052
2.3oR.566
120,700
834,652 6RKY64 4 17.450
1.941.066
435.194
29 7.0 I 1
1.06 1.02 0.64 0.54 0.39
3.67
0.69
1-11 0.95
2.06
1.85 0.15 0.13
2.13
0.53
1.35 0.90 0.67 0.51
3.43
0.97 0.24
1.21
0.96
0.29
0.61 0.22
0.83
0.Y0 0.71
1.69
1.53 1.28 1.25 0.76 0.74
5.56
0.29
2.01 1.66 1.01
4.60
1.05
0.72
94
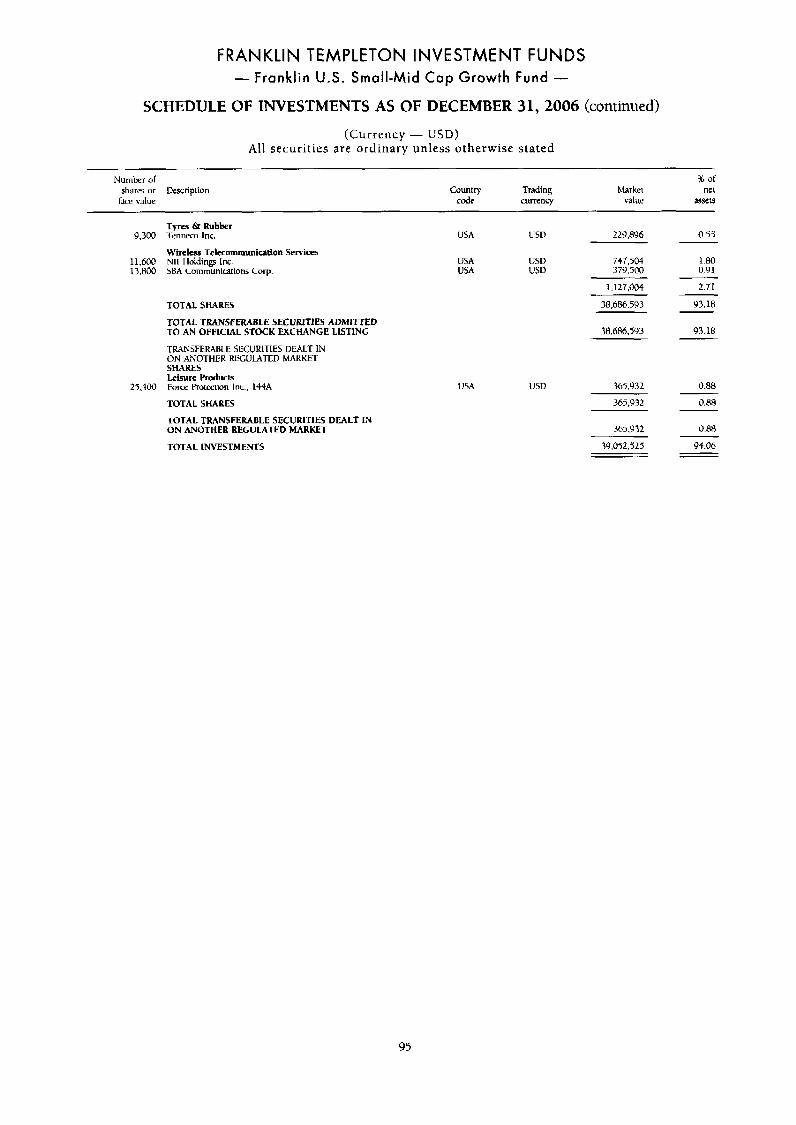
FRANKLIN TEMPLETON INVESTMENT FUNDS - Franklin U.S. Small-Mid Cap Growth Fund -
SCHEDULE OF INVESTMENTS AS OF DECEMBER 31,2006 (continued)
(Currency - USD) All securit ies are ordinary unless otherwise stated
Number or % of shares or Description Country Trading Market ne[
I;tcnc vdue code currency value ~ S e &
9,300
11,600 13.800
25.400
Tyres & Rubber Tenncco Inc.
Wireless Telecommunication Services NII lloldings lnc. SBA Communications Cow.
TOTAL SHARES
TOTAL TRANSFERABLE SECURITIES ADMITTED TO AN OFFICIAL STOCK EXCHANGE LISTING
TRAN5PERABLE SECURITIES DEALT IN ON ANOTHER WCULATED MAKKET SHARES Leisure Products Forcc Prokction Inc.. LetA
TOTAL SHARES TOTAL TRANSFERABLE SECURITIES DEALT IN ON ANOTHER REGULATED MARKET
TOTAL INVESTMENTS
USA USV 229.896 0.53
USA USA
USA
USD 747.5.04 1 .RO usu 379,500 0.91
USD
1.127,004 2.71
38,686.593 93.18
38,686,593 93.18
3hS.WZ 0.88
365,932 0.88
365.932 0.88
3Y.052.525 94.06
95
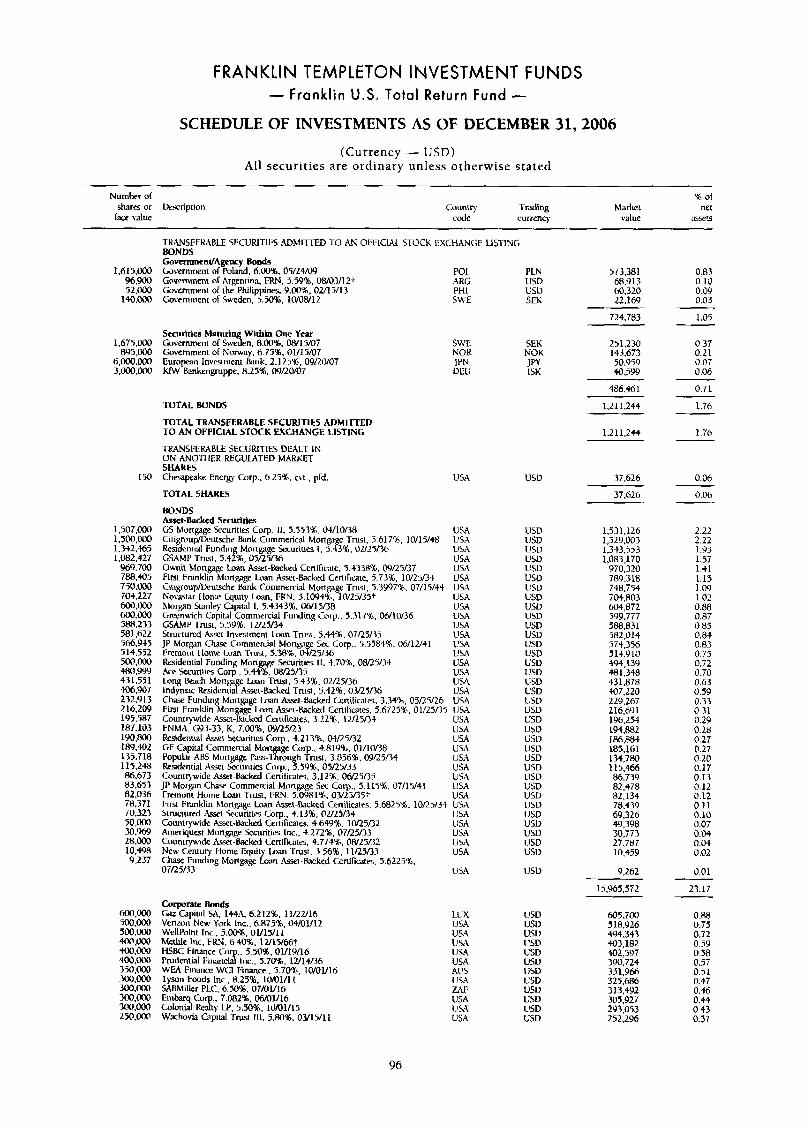
FRANKLIN TEMPLETON INVESTMENT FUNDS - Franklin U.S. Total Return Fund -
SCHEDULE OF INVESTMENTS AS OF DECEMBER 31,2006
(Currency - USD) All securities are ordinary unless otherwise stated
Number ol % of shmw or Urrription Couniry Trading Market net
tiw value code currency value asxts
1,615,000 96.900 52.000
140.000
1,675.000 8~5,000
6,000.000 3.000.000
150
1,507.000 1.5GO.ODD 1,3+2.+55 1,082.427
Y69.7'00 7'88.405 7 s 0 , ~ 704.227 ~ . o o o 6oo.m 588.233 581,622 566,945 514,552 500,000 +$O0.9w 431.551 406,907 232.91 3 L16,ZW 195.587 187.103 190,W 18g,402 135.718 115.248 86,673 83,653 82,036 713.371 70,323 5O.CCO 30.969 28,000 io,*n 9.237
~ . 0 0 0 500.000 500.000 a.m ~ . o o i , 4 0 0 . ~ 350,000 ~00,OOo 300,000 3m,000 ~ , 0 0 0 250.m
TKANSFEKARLE SECUMTIIS ADhiInED 1.0 AN OIWCWL STOCK EXCHAM BONDS GovcmmentlAgency Bonds Government ol Poland. 6.00%. 05/24/01) Government or ArRenimn. FRN. 5.59%, OW0.3/12+ Government crl the Philippines, 9.00%. 02/15/13 Government of Sweden. 5.50%. 10/08/12
POL ARG PHL SWE
L;E LlSJlNG
PLN 573.381 USD 68.913 USU 60,320 SEK 22.169
724.783
Securities Maturing Within One Year Government or Sweden, 8.0(1%, OW15/07 Government or Norway. 6.75%. 01/15/07 Europmn Investment &ink. 2.12%. 09fL0/07 KIW Bankengmppe. 8.25%. 09/2M)7
SWE NOK JPN DE11
SEK NOK JW ISK
251.230 143.673 50.959 40.599
486.461
TOTAL BONDS
TOTAL TRANSFERABLE SECUlUflES ADMITTED TO AN OFFICIAL STOCK WCHANGE LISTING
TRANSIWABLE SECURITIES DEALT IN ON ANOI-IIER EC;UIATED MARKET SHARES Chesapwke Energy Corp. 6.2% est., prd
TOTAL SHARES USA
BONDS Asset-Backed Sccurlries
CitigrqdDeutsche Bank Commerical Mortgage Trust, 5.6176. 10/15/48 GS Mongage Securities COT. II. 5.553%. 04/10/38 USA
USA Resideniial Funding Mongage &unties I , 5.43%, OU23M LISA GSAMP Xmt, 5.423,05i25/36 USA Owit hlongage Loan Asset-Backed Cenificate. 5.t33876. W/25nf USA First Franklin Mongage Loan h t - l k c k e d Certificate, 5.732. 10i25B4 USA Citigroup/DeuLxhc h n k Commend hiungage Trust. 5.3997%. 07/15/44 USA Nowtar Ilome Equity Loan. FRN. 3.1094%. lW2Y35t LISA hlorgan Sianley Capital I, 5.4343%. 06/15/38 USA Greenwich Capital Commerckl Funding Gwp. 5.317%. 06/10/36 USA GSAhiP Trusi. 5.59'16, l2Q5f34 USA Structured &isrt Lnuesttnent Loan Trust. 5.44%. 07/25/35 LISA JP Morgn Chasc Commercial hlongge st* Gorp., 5.5584%. 06/12/41 [!SA I'remom I Lome Laan Trust. 5.3%. @4/2.4/36 USA Rrsidential Funding Mongage Securities 11. 4.70%. 08/25/34 USA Ace kuritiPj Corp., 5.44%. o&r15/35 USA Long k c h hlong e Lrwn Trust. 5.43%. OU.5/36 USA
USA C k Funding hlortgige Lmn Asset-Backed Onirium. 3.34%. 05/25Rb USA Firs! I'ranklin .MongaIp Loan h i - t b c k e d Certificates. 5.6725%. 0 1/25/37 USA Couniqwide k t - k k d Certificms, 3.22%. 1U2~3-t USA FNUA. G93-33, K, 7.00%. OY/25/23 USA Residential k t kcurincs Corp.. $.213%. 04/25/32 USA GE Capital Commercial hio gc Corp.. 4.8191. 01/10/38 USA
USA Residential Assset Securities Corp.. 5.5Y%. 05/25/33 USA Countrywide kt-Backed Cenibtes. 3.1216. OfL!5/35 USA JP Morpn Chase Commercial Mongage Stx Corp., 5.115%. 07/15/41 USA Fremont Home Loan Trust, FRN. 5.0981%, 03/25/35+ USA I%st Fmnklin htortgage Luan k t - k k e d Cenihcates. 5.6825% 1OR5134 USA Structured Xsset Securities Corp.. 4.131, OU25L3$ L'SA Countrywide Asset-hcked CrrtiRcncs, 4.64'3%. 1005L32 USA Arneriquest hlongage kcuritifs Inc.. +.272%, 07/25/33 USA Countrywide Asei-Backrd Certifiwtes. 4.774%. OW5/32 USA New Century Home Equity Loan Trust. 3.56%. 11/25/33 USA Chase Funding Mortgage h a n hxt-8ncked Cenilicnres. i.6225%, 07/2%3 U M
lndymc Rrsideniiaf&t-bcked Trust. 5.42'16. OM25l36
Popular ABS Mortgage Pass-%qh Trust, 3.856%. G9/25/14
Corporate Bonds Gaz Capiul SA, 144A. 6.212%. 1 1RUlb LI!X Verizon NeH: York Lnc.. 6R75%, 04/Olfl2 USA Wellpoint Inc.. 5.001. OV15/11 USA hktMe Inc. FRU. 6.40%. 1U15/66+ USA MBC Finanm Coy.. 5.5!%. Ol/lY/16 USA Prudential Financia Inc.. 3.708. 12/14/36 USA WEA Finance WCI Finanm.. 5.713%. 1WOYlb AUS Tywn Foods Inc., 8.25%;. lC!Kll/l I USA SABhliller PLC. 6.50%. 07/01/16 zxt:
7.082'16. W 1 / 1 6 USA
Wachovia Capital '1-rust 111. 5.8016. 03/15/11 USA k:z3&yti, LP. 5.50%. liUUlll5 USA
USU
USD USD usv USD ujD USD U5v USD USD USD USV USU USD USD USD USD USD USD USD usu USD USD us11 usu USD USD USD USD USD USD USD USD USD USV Ljsv usu
1,211,244
1.211.244
37.626
37,626
1,531.126 1,529.003 1,343.553 1,083.170
970,320 789.318 748.754 704,803 604,872 599.777 588.831 582.014 574,356 51t.910 W4,lBC) 481,348 43 1.878 407.220 229.267 216,691 196.254 w.882 18h.M-I 185.16 1 134,780 1 1 5.466 88.739 82,478 82.134 78.439 69.326 49.398 30,773 27.787 10.459
9.262
15.965.572
USD USV USD USD USD usu USD USD USD USD USD USD
605.7'00 518.926 494,343 403,182 402,597 390,724 351,966 325.686 3 13.492 305,927 293,053 252,296
a.83 0 10 0.09 0.03
1 .OS
0.37 0.21 0.07 0.06
0.71
1.76
1.76
0.06
0.06
2.22 2.22 1.94 1.57 1.41 1.15 1.09 102 0.88 0.87 0.85 0.84 0.83 0.75 0.72 0.70 0.63 0.59 0.33 0.31 0.29 0.28 0.27 0.27 0.20 0.17 0.13 0.12 0.12 0.11 0.10 0.07 0.04 0.M 0.02
0.01
23.17
0 .RR 0.75 0.72 0.5Y 0.58 0.57 0.51 0.47 0.46 0.44 0.43 0.37
96
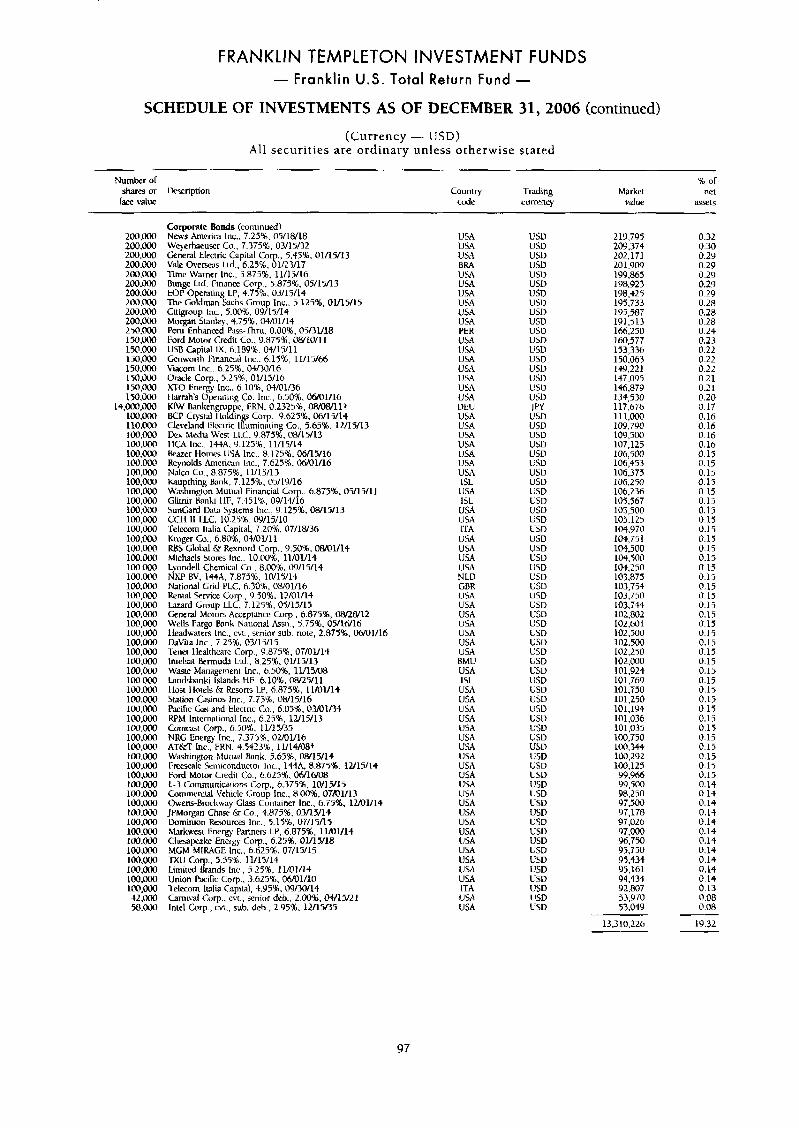
FRANKLIN TEMPLETON INVESTMENT FUNDS - Franklin U.S. Total Return Fund -
SCHEDULE OF INVESTMENTS AS OF DECEMBER 31,2006 (continued)
(Currency - USD) All securities are ordinary unless otherwise stated
Number of % of shm or Ucscription Country Trading Market mt
ram \3lW cude currency Value a5scts
200,000 200.000 200.000 200.OOO 200.@xl 200.000 200.000 2oo.m 200.000 2m.000 L50.000 150,000 150.000 150.0011 150.000 15o.m 15o.m 150,iWx)
I4.000.000 100,@xl 110,ooc) 1OO.GUO 1M1.000 1oi1,OOO lM.OO(! 1 00,000 1C@,OOO 100.000 100.000 100.i)oo 100,OOO 100.0011 l ~ , L x h J 100 .m 100.ooO liM.000 100.ocIo 1 0 0 . ~ 1011.000 1oi1.000 100.000 l C @ , ~ loi1.OoO 100,OOO 100,ooO lLW,iWx) 1 0 0 , ~ 100.WO li10.00(1 1LW.rn [email protected] lLW.OO0 1W.ooO 100.0011 1lW,oOo 100.(MO 1 0 0 . ~ 1OO.lW IiM,LW 1OO.lkh) 100,iWx) 100.01U lOO,@llO 100.CW liK).0(30 IW.IM 101).oOO 10(1.oOO lo(1.000 lC@,000 t 2 . m 58.0011
Corporate Bonds (continued) News Amcnca lnc.. 7.23%. 05/18/18 Weyerhaeuser (3,. 7.373%, 03/15/32 General Elecrric Capital Co Vale 0vew;ls Ltd., 6.2591,%h3/17 Time Warner Inc., 5.875%, 11/15/16 Bunge Lid. Finance Corp., 5.875%. 05/15/13 ECW 0 crating LP, 4.7516, 03/15/14 The Coydman Sack Croup Inc.. 5.12596, 01/15/15 Ciligroup Inc., 5.00%. 09 15/14 Morgan Stanley. 4.758. 04/01/14 Peru Enhanced PassJhru. 0.00%, 073U18 Ford hlotor Credit Co.. 9.875%, 08/10/11 USE Capital IX. 6.189%. 04/15/11 Genwonh Financial Inc.. h.l5%, 11/15/66 Viacum Inc.. 6.25% 0400/16 Uncle Corp., 3.25%, 01/15/16 Xl-O Energy Inc.. 6.10%. 04/01/36 Ilarrahs Operaring Co. Inc., 6.50%. oM)1/16 K k V Bankengmpac. FRN. 0.2325%. OW08/11t BCP Crystal I lul in Corp Y h25'K. 06/15/14 Cleveland Elw~ric Ii%inat&Co.. 5.65%. 12/15/13 Dex Media West L l L , 9.875%. 08/15/13 llCA lnc.. 1WA. Y.1258, 11/15/14 Beazer Homes USA lnc.. 8.1258, 06/15/16 Resnolds American Inc.. 7.625%. 06/01/16
5.45%. 01/15/13
N$u> Co., 8 875%. 11/15/13 Kau thing Hank. 7 1258, 05/19/16 Wa&nrtun Mutual Financial Corn.. 6.875'16. 05/15/1 I ~~
Glitnir h n k i IIF, 7.451%. 09/14/i6 SunCard Data Sysrcms Inc., Y.l25?& 08/15/13 CCH I1 LLC. 10.25% 0Y/15/10 Telecom Italia Capital. 7.20%. 07/18/36 Kroger Co.. 6.80%. 04/01/11 ms Global br Kexnord Corp.. 9.50%. 08/01/14 MichaelS Stores Inc.. 10.0091, 11/01/14 Lyondell Chemical Co.. 8.00%. 09/15/14 NXF BY, 144A. 7.875%. 10/15/15 Narioml Gnd PLC. 6.30%. 08/01/16 Rental Service Corp., 9.50%. 12/01/14 l xard Gmup LLC, 7.1251. 05/15/19 General Motors Acceptance Cop.. 6.87596, W W 1 2 \\'ells Fargo Bank National ksn., 5.75%. OYlfih5 lleadaarers Inc., cvt , senior sub. note, 2.875%. 06/01/16 DaVila Inc.. 7.258. 03/13/15 Tenei I-lealthcare COT., 9.875%. 07/01/14 Inielmt Bermuda Ltd.. 8.25%. 01/15/13 W a ~ e lbhnagemenl Inc., 6.50%. 11/15/08 Landsbanki Islands tiF. 6.1016, 08/25/11 Host Ilorels k Resorts L.P. 6.875%. 11/01/14 Station Casinos Inc., 7.75%. 08115/16 Pacific Cis and Electric Co.. 6.05%. 03/01/34 KPM International Inc., 6.258. 1UlY13 Comma Corn., 6.50%. 11/15/35 NRG Energy inc., 7.3i58, 0uOl/l6 ATkT lm.. FRN. 4.542316, 11/14/08+ Wiishincton hfuiual Bank. 5.65%. WlY14 Freescar; Stmiconducror Inc., l44A. 8.875%. lU15/14 Ford Motor Credit Co., 6.625%. 06/16/08 L-3 Cornmunimions Corp., 6.375%. 1WIY15 Commercial Vehicle Group Inc.. 8.00%. 07x)l/l3 Owens-Brockway C l m Container Inc.. 6.75%, 12/01/14 J P M o p n Chase & Co., 4.875%. 03/15/14 Dominion kwurces Inc.. 5.1576. 07/15/15 M.wkwest Energy Partners LP. 6.875%. llluY14 Chejapeake Energy COT., 6.25%. 01/15/18 MCM MIRAGE Inc.. 6.625%. 07/15/15 TXU Cnrp.. 5.55%. 11/15/14 Limited Brands Inc.. 5.2516, 11/01/14 Union Pacik Coro.. 3.625%. 0NO1/10 1-elecom lwlia Ca$al. 4.Y5%, 09/30/14 Carnival CUT., cvt., seni~r deb., 2.00%. ~ 1 5 R I Intel Corp., cvt., sub. deb., 2.95% 1U15435
USA USA USA BRA USA USA USA USA USA USA PER U.SA l!SA USA USA USA USA USA DEU USA USA USA USA LISA USA USA ISL USA ISL
USA USA ITA USA USA USA USA NLD GBR USA USA USA u w USA USA USA BMU USA ISL
USA USA USA USA USA USA USA USA USA USA USA U.5A USA USA USA USA USA USA USA USA U M ITA USA USA
L'SD USD usv USD USV USD USD USV USV USD USV 11SV LiSD USD USD USI> usv U5D JPY USD USD USD USD USD L:SU USV USD USD USV USD LiSD USD USD USD USD USD USD USV USD USD USV USD L!SV USV USD U SD USV USV usv USD USD USD usu 11SD U5D USD USV ClSD L!SV USD USV USD USV
USD USD USD USD USD USU USD USD
usu
219.795 2W.374 202,171 201.9w 199,865 198.923 198.425 195,733 195.587 1'41,513 lhh.250 160,577 153,336 150.063 149.221 147.095 146.879 134,530 117.676 111,000 1OY.7YO 10Y.500 107,125 106,500 106,453 106,375 106,250 106.236 104.567 105,500 105.125 104.970 104,751 104,500 104.500 104.250 103,875 103,754 103,750 103,744 102,802 102.60 1 102.500 102.500 102.L50 102,wo 101.924 101,769 101,750 101,250 101,194 101.036 101,035 100,750 1W.344 100,292 100,125 9P.Yh6 99,500 98.250 97,500 97,178 9T.026 97,000 96,750 95.750 95,434 95,161 94.434 92,807 53,970 53.049
13,310.226
0.32 0.30 0.29 0.29 0.29 0.29 0.29 0.28 0.28 0.28 0.24 0.23 0.22 0.22 0.22 0.21 0.21 0.2D 0.17 0.16 0.16 0.16 0.16 0.15 0.19 0.15 0.15 0.15 0.13 0.15 0.15 0.15 0.15 0.15 0.15 0.15 0.15 0.15 0.15 0.15 0.15
0.15 0.15 0.15 0.15 0.15 0.15 0.15 0.15 (1.15 0.15 0.15 0.15 0.15 0.15
0.15 0.14 0.14 0.14 0.1-1 0.14 0.14 0.14 0.14 0.14 0.14 0.14 0.13 0.08 0.08
19.32
0.15
0.13
97
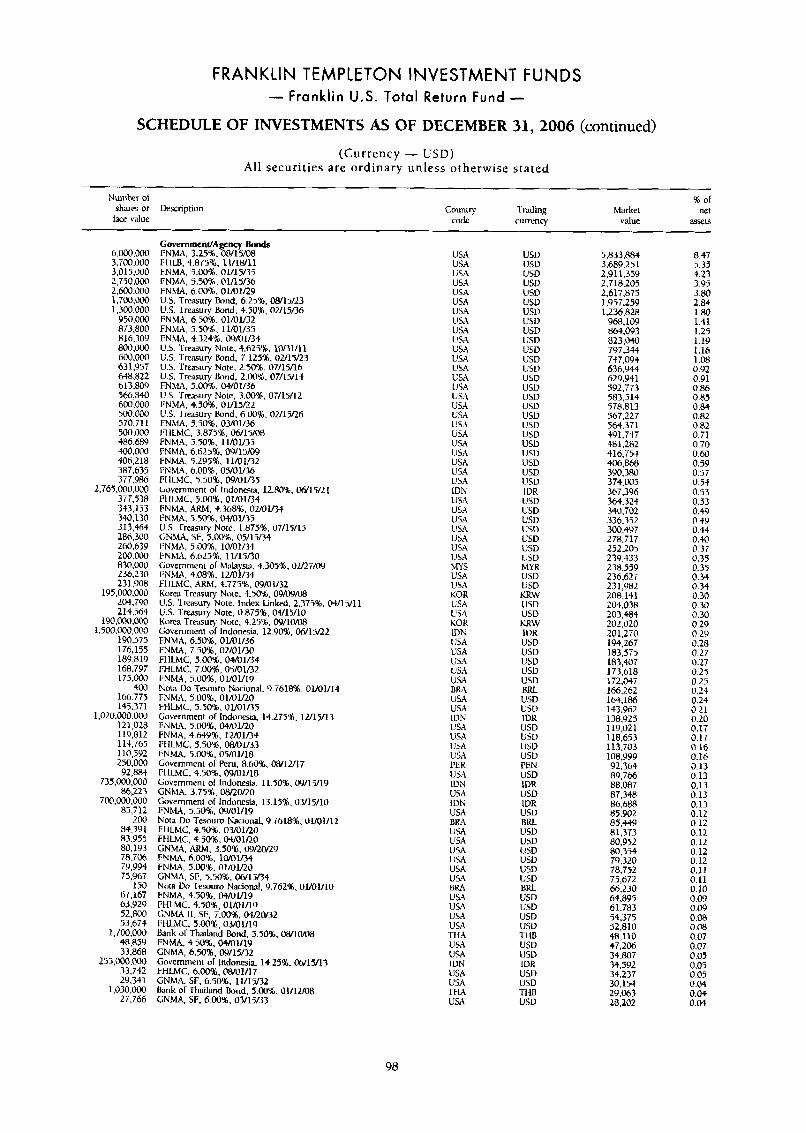
FRANKLIN TEMPLETON INVESTMENT FUNDS - Franklin U.S. Total Return Fund -
SCHEDULE OF INVESTMENTS AS OF DECEMBER 31,2006 (continued)
(Currency - LSD) A l l securities are ordinary unless otherwise stated
Nunrher of shares or Descnption face \due
Country code
1 of net
assels Trading currency
Market value
GovemmenrlAjyncy Bonds 6.000,300 FNbW, 3.25%. 06/15/08 3.700.000 FIILB, 4.8753, 11/18/11 3,015,000 FNMA. 5.00%. 01/15/35 2,750.0@0 FNMA. 5.50%. 01115136 2.600.000 FNhlA. 6.00%. 01/01/29 1.700.W 1.300.000
U.S. Treasury &md, 6.25%. Wl5123 U.S. Treasurs Bond. 4.50%. 02/15/36
USA USA USA USA US4 USA USA USA USA USA USA U M
5,833,884 3.689.2 51
8.47 5.35 4.23 3.95 3.80 2.84
usu USD USD USD USD usv usv USD USD
2.91 1.359 2,718.205 2,617.875 1.957.259 1.236.828
968.1W 864.093 823,040 797.344 747.094 636.944 629.U41 592,773 583,514
567.227 564.371 49 1.747 481,282 416.754 406,868 3Y0.380 374,005 367396 364.324 340.702 336.352 300.497 278.7 17 252.205 239.433
578.813
1.80 1.41 1.25 1.19
Y50,OOO FNMA, 6.50%. 01/0y32 873,800 FNMA, 5 50%. 11/01/35 R16.309 FNhlA. 4.3249. (w/01/34 USD
USD USD lJSD
800,000 600.000 631,957 648,822 613,80'9 FNMA. 5.00%, 04/01/36 566,840 600,000 I'NMA. 4.50%. 01/15/22
U.S. 'Tkasury Note. 4.625%. 1M1/11 ti5 'rmuury Bond, 7.125%. 02/15/23 US. Treasury Note. 2.50%. 07/15/16 U.S. Treasury t h d , 2.00'5, 07/15/14
U.S. Trcsury Note. 3.00%. 07/15/12
1.16 1 .OR 0.92 USA
LSA USA
usu USU U5D
@.si 0.86 0.85 0.84 0.82 0.82 0.71
US.\ USA LJSA
us13 USD USD
USD USD
USD
500.000 570.711 FNMA. 5 50%. 03/01/36 500.000 1:I ILMC. 3.875%. 06/15/08
U S. Trezuv Bond. 6 00%. 02/15/26 USA USA [!SA 486.689 FNMA, 5 50%. 11/01/35
400,000 FNMA, 6 625%, 09/15/09 406.218 FNMA. 5.295%. 11/01/32 387.635 I.NhlA, 6.00%. 05/01/56 377.9RA FlILMC, 5 50%. 09/01/35
.2,[email protected] Government of Indonesia. 12 Ao%, w 1 5 n 1 377,538 PI ILMC. 5 @Ox. 01/01/34
0.70 0.60 0.59
USA LJSA USA
USD USD USD
0.57 0.51 0.53 0.53 0.49 0.49 0.44 0.40 0.37 0.35 0.35 0.34 0.34 0.30
USA ID& USA USA
~~
IDR USD USD USD USD USD USD USD MYR USD
343,153 340.130 3 13,464 286.300 260.b39 200.000 830,000 236.230 231.908
195,000.000 204.790 214.564
190,000,000 1,500,000,000
190,575 176,155 189,819 168.797 175.000
400 166.775 145.371
1 ,020.000.00il 121,028 119.812 114,765 110.592 250,000 92,884
735,000,000 86,223
7cIo.000.000 85,712
FNMA, ARM, 4.368%. OU01134 FNMA. 5.50%. WO1/35 U.5. Treasury Note, 1.8751. 07/15/15 GNMA, SF, 5.00%. 05/15/34 I'NhW. 5.00%. 10/01134 I:NhM, b.h25%, 11/15/30 Government of h1alayssl;i. 4.305%. 0 U 2 i 9 IWhlA, 4.08%. 1UO1/34 FIILMC, ARM, 4.775%. 09M1132 Korea Trcasury Note. 4.50%. 09/09/08 U.S. 'l-reasury Note, Index Linked. 2.375%. W U.5. Treasury Note, 0.8754, 04/15/10 Korea Treasun' Note. 4.25%. DV/loMB
USA USA USA USA USA MY5 GSA
238;559 236.627 231.982 USA
KOR LSA USA KOK IDK USA USA USA 1!SA USA BHA U U USA 1I)N USA USA
LJSD KRW USD
208: 141 204.038 203.484 202,020 201,270 394.267 183,575 183,407 173,618 172.047 166.262 164,186 143.962 138.925
' l u l l 0.30 0.30 0.29
USD KRW IVR USD LJSD USD USD USD
Govemmenr d Indonesia. 12.90%. 0&15/22 FNMA, 6.50%, 01/01/36 FNMA, 7.50%, 02/01/30 FHLMC, 5.00%. 04/01/34 I'HLMC, 7.00%.05/01/32 FNMA, 5.00%. 01M1/19 Nota Do Tesoun, National. '3.7618%. 01/0V14 FNMA, 5.008, OIIVl/ZO FHLMC, 5.50%. 01/0105 Government or Indonesia, 14.275%. 12/15/13 FNMA. 5.@0%, 04/0l/L0 FNMA, 4.6SY%. 1MlL3-l IWLMC. 5.501. 08x11/3.3 I'NMA. 5.00%. 05/01/18 Government of Peru, 8.60%. 08/12/17 FIILMC, 4.50%. OyA)1/18 Governmeni of Indonesia. 11.50%. OY/1?/19 GNMA, 3.75%. OWLMO Government of Indonesia, 13.15%. 03/15/10 F N M , 5.50%. 09/01/19 Nora Do Tesouro NaCiuMl. 9.76188, 01/01/12 200
84.391 FIILMC, 4.50%. 03/01/20 83.955 FIIUIC, 4.50%. 04/01/20 80.193 CNMA. ARM, 3.50%. 09QOn9 Z8.7M FNMA, 6.00%. 1wO1/34 19.994 FNMA, 5.00%. 01/0Y20 75.967 CNMA. SF. 5.90%. 06/15/34
67.167 FNMA, 4.50%. LN/Ol/l9 63.Y29 FHLMC. 4.50%, 01/01/19 52.800 53.674 ITiLMC, 9.03%. 03Eo1119
150 Nota Do Tesouro Naciorcll. 9.762%. 0yOlilO
GNMA 11. 51:. 7.00%. W w 3 2
Bank or Thailand Bond. 5.50%. WiOm FNMA, 4.50%, 04/01/19 GNMA, 6.508, 09/15/72 Government of Indonesia. 14.25%. WlY13 FHLMC, 6.00%. 08/01/17 GNMA. SF, 6.501, ll/15/32 Bank or Thailand Bond, 5.00%> 01/1UoH GNMA. SF, 6.00%. OY15n3
0.29 0.28 0.27 0.27 0.25 0.25 0.24 BRL
VSD USD
0.24 0.21 0.20 1DK
USD USD usv USD PEN
119.021 118,653 113.703
0.17 0.17 0.16 USA
USA PER U5.4 IDN USA IDh
108;999 92.364 89.766
0.16 0.13 0.13 0.13
USD 88:Oi: 87.338 86,688 85.902 85.449 81.373 80.952 80,354 79.320 78.752 75,672 66,230 64,895 61.783
IDR USD IVR USD BRL USD USD USD USU USD USD BRL USD
0.13 0.13 0.12 0.12 0.12 0.12 0.12 0.12 0.11 0.11 0.10 0.W 0.w 0.08 0.08 0.07 0.07 0.05 0.05 0.05
USA BRA USA USA USA USA USA USA
U M USA USA U SA TIL4 USA USA I DN
nw USD USD USD
54.375 52.810 48.110 1.700:OOO
48,850 33,868
L5S,oOa.@w 33.742 2'3.341
1.030.m 27,766
USD usu IDK
47:2@6 34.807 34.592 34.237 LJSh
USA TtM
USD U5D -1718
30,154 29063 28,102
0.04 0.09 0.W USA USD
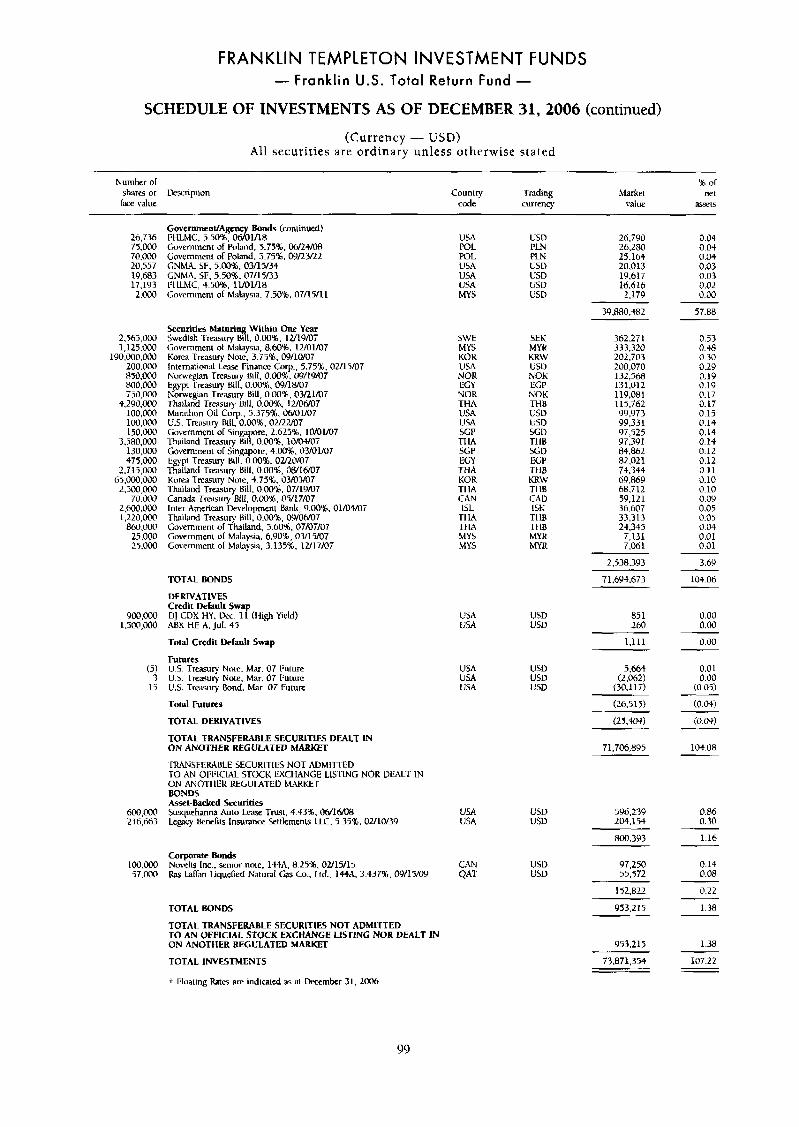
FRANKLIN TEMPLETON INVESTMENT FUNDS - Franklin U.S. Total Return Fund -
SCHEDULE OF INVESTMENTS AS OF DECEMBER 31,2006 (continued)
(Currency - USD) All securities are ordinary unless otherwise stated
Number <>I shares or kxription Im value
Countty Trading Code currency
___
B or Market net
value a5x15
GovernmenVAgency Bonds (coniinued) FHLMC. 5.508, 06/01/18 Government of Poland. 5.7546, Dbn4/0R Government of Poland. 5.75%. 0Y/IL3R2 CNMA, SF. 5.00%. 03/15/34 GNMA. SF, 5.50%. 07/15/33 I:I ILMC, 4.50%. 11/01/18 Governinenl or Malaysia. 7.50%. 07/15/11
26.136 75.000 70,000 20.557 19.683 17.1Y3 2.000
2,5hj,000 1,125.000
190,000.01)11 200.000 850,000 800,OOO 750,000
4.290,ooO l00,OoO 100.000 150.000
3,580,000 130,000 475,WO
2.71i.000 65.o00.000 2,500,WO
70.000 2,600.000 I ,220,000
860.000 25.000 25.000
900,000 1,500,Mx)
15) 3
13
600,oocI 21h.6h3
100.000 57 000
USA POL POL USA USA USA MYS
USD
PLN USD U5D OSD USD
ew
SEK MYR KUW USD NOK EGP Noli THB USD 1JSD SCD THB SGD EGP THB KRW TI 18 CAD ISK THB TI 1B MY K MYR
26.790 26,280 25.164 20.013 19,617 16.616 2.179
0.04 0.04 0.04 0.03 0.03 0.02 0.00
57.88 39.880.482
Securities Mnturing Within One Year Swedish Treasury Bill. 0.00%. 1U19/07 Coiwnmenl or hlalaysia, 8.60%. 1UOU07 Korea Tremury Note, 3.75%. 09/10/07 Internationd Le- Finance COT., 5.754;. OU15m7 Norwegian Treasury Bill, O.GU%. OY/IY/07 Egypt Treasury Bill, 0.00%. 09/16/07 Norwegian Treasury Bill, 0.00%. 03/21/07 Thailand Trmuty Bill, 0.00%. 12/@h107 h4anthon Oil COT., 5.3i5$, 06/01/07 US. Trwsury Bill, 0.00%. OvLUo7 Government o l Sing >re 2 625%. 1WO1/07 Ihiland Treasury B i l ~ 0 . b ~ . 10/0/0,/07 Government of Singqwe. 4.03%. 03/01/07 Egypt Treasury Bill. 0.00%. OUL0/07 Thailand Treasury Bill, 0.00%. 08/16/07 Kurea Treasury Noie. 4.75%. 03/03/07 Thibnd Tressury Bill. 0.OO'X;. 07/19/07 Cmada T w u l y Bill, 0.00%. 05/17/07 Inter-American Developmenl Bank, 9.00%. 01/04/07 Thailand Treasury Bill. 0.W8. 09IONOf Government o l Thailand, 5.60%. 07/07/07 Governmen1 id Malaysw. 6.YOZ. 03/15/07 Government of Mala.pia. 3.135%. 12/17/07
SWE MY5 KOK USA NOR ECY NOR THA USA USA SGP TIGZ SGP EGY THA KOR TI I A CAN ISL
THA MY5 MYS
'r HA
362.271 333.320 202.703 200,070 132,5158 131.012 119,081 115.762 Y9.973 99,331 97,525 Y7.3Y 1 84.862 82.021 71.344
613.712 59.121
w.aw
0.53 0.48 0.30 0.29 0.19 0.19 0.17 0.17 0.15 0.14 0.14 0.14 0.12 0.12 0.11 0.10 0.10 0.0y 0.05 0.05 0.04 0.01 0.01
3.69
361607 33.313 24,345 7,131 7.061
2.538.393
TOTAL BONDS
DERIVATIVES Credit Default Swap DJ CDX H Y . Ucc. 11 (High Yield) A5X HE A. Jul. 45
Total Credit Default Swap
Futures U.S. Treasury Now. Mar. 07 I:ulure U.S. Tresury Note. Mar. 07 Future U.5. Tresury Bond. Mar. 07 Future
Total Futures
TOTAL DERIVATIVES
TOTAL TRANSFEIWBLE SECURITIES DEALT IN ON ANOTHER REGULATED MARKET
TRANSFEWBLE SECURITILS NOT ADMll-IFD TO AN CII:I;ICIAL STOCK EXCtirWGE LIS-I'ING NOR U M T IN ON ANOTIIER REGULATED MIRKET BONDS hset-hcked Securities Susquehanna Auto Lease l-mt, 4.43%. 06/1WJ8 Legacy tlenefib lnsursnce Seettlemenls LLC, 5.352. 02/10/39
~
71.694.673 104.06
85 1 260
0.01) 0.00
USA USA
USD USD
1.111 0.00
0.01 0.00
(0.03
(0.04)
<@.o$)
104.08
5,664 (2.062)
(30.113
USD USD L'SD
USA USA USA
7 1,706,895
UW USA
VSD USD
596.239 204.154
800.393
0.86 0.30
1.16
97.250 55.572
0.14 0.08
Corporatc Bonds Novelis lnc., senior now, 1WA. 8.25%, 02/15/15 Fks Laman Liquefied Natural Gas Co., Ltd.. 144A. 3.437%, 09/15/09
C.W QAf
USU USD
152.822 0.22
TOTAL BONDS 1.38 953.215
TOTAL TRANSFERABLE SECURITIES NOT ADMITTED TO A N OFFICIAL STOCK EXCHANGE LISTING NOR DEALT IN ON ANOTHER REGULATED MARKET 953.215
73,871.354
1.38
107.22 TOTAL INVESTMENTS
t Floating Rates are indicated as at December 31, 2006
99
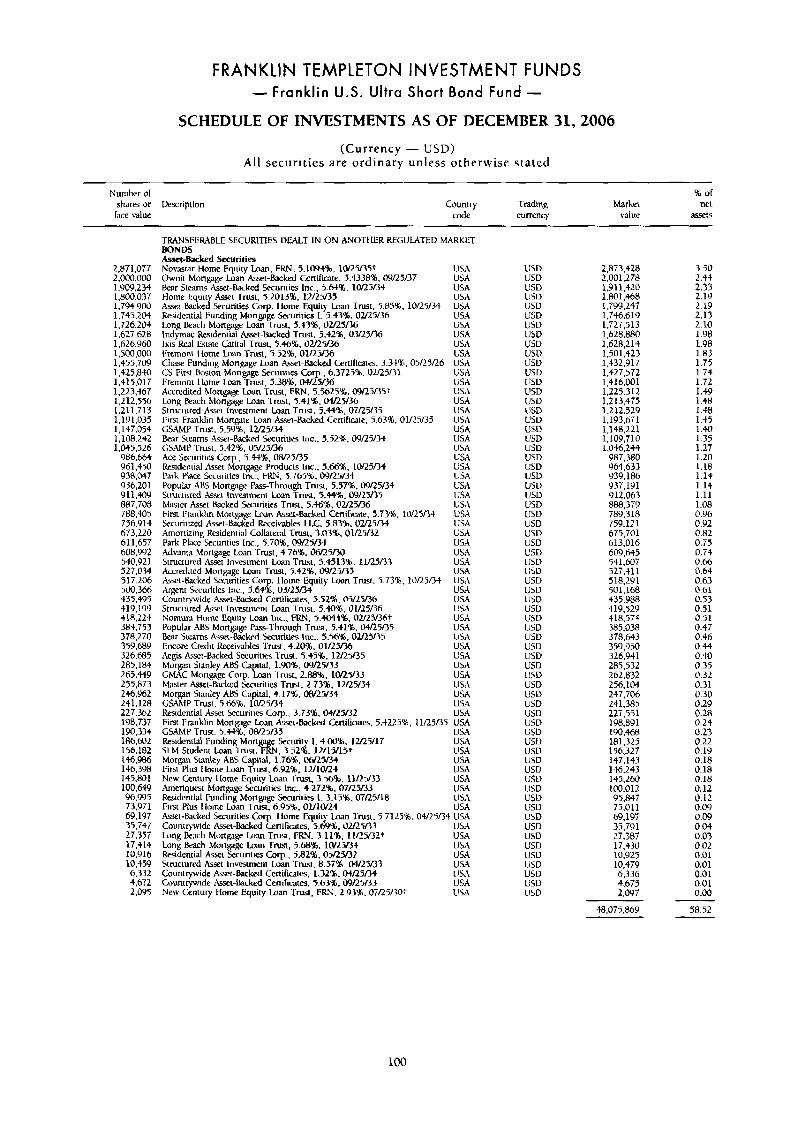
FRANKLIN TEMPLETON INVESTMENT FUNDS - Franklin U.S. Ultra Short Bond Fund -
SCHEDULE OF INVESTMENTS AS OF DECEMBER 31,2006
(Currency - USD) All securities are ordinary unless otherwise stated
Number or % of shares or Description Country Trading Market net lace value code currency value a55etS
2,871,077 2.000.000 1 .Y09.234 1,800.037 1.794.90i) 1,745.204 1.726 204 1.627 628 1,626 960 1.500 000 1,455,709 1,425,840 1,415.017 1,223.i67 1,212.556 1,211,713 1,191.035 1,147.054 1.108.242 1,045.526
986,664 961,450 938.047 936,201 9 11,409 887,708 788.405 756.914 673,220 61 1,657 608.992 540,921 527.034 517,206 5@0,366 435,495 419.199 418.124 383.753 378,270 359,689 326,685 285,184 265,449 255,873 246962 241.128 227.362 198,717 1Y0.334 186,602 156.182 146,966 146.398 145.801 100,6Qy 96.995 73,971 69.197 35.747 27.357 17.314 10.916 10,-159 6,332 4.672 2.0Y5
TRANSFERABLE SECURITIES DEALT IN ON AVOTt IER REGUWTED MARKET BONDS As=t-&dred S o e ~ r i t i e ~ Novastar Home Eqirity ban. FRN, 5.IWf')o. 10/25/.35+ 1JSA Ownit Morrgage Loan k t - h c k e d Certifiwle. 5.43381, OY/25/37 USA t h r Steams Asset-Backed Securities Inc., %M%. 1MjL34 USA Home Equity ASK1 Trust, 5.2013%. lU25/35 USA Asset-Bxked Securities COT. I lome Equitj- Loan Tmi, 5.85%, 10/25/34 USA Residential Funding Monpge kuriries 1. 5.47%. 02/25/36 USA Long Each hiongage Loan Trust, 5.43%.02/25/36 USA lndymac Residential kt-Backed Trust. 5.42%. 0.Y2506 USA 1x1s kid Estate Oliral Trust, 5.46%. 02/25/36 USA 1:rernont llome b a n Trust. 5.52%. 01/25/36 USA Chze Fundinp, Mongage Loan b x t - k k r d Certifimcs. 3.3% 05/25/26 USA CS First h a o n Mongage Securiiies Corp., 6.3725%. 02/25/31 USA 1:remont I lornc Loan Trust, 5.38%. W W 3 6 USA Accredited hlortgage Loan Tw. FRN. 5.5625%. 09/25/35* USA Long Reach Mortgage L I ~ Trust, 5.41%. WL!5/36 USA Struciured k t Inwstmcnt Loan T r w , 5.44%. 07Q5/35 USA First Franklin hiortpiiie Loan ht-Backed Certifimlr, 5.636, 01/25/35 USA CSAMP Trusi. 5.59%. 12/25/34 USA Bear Sieams Awi-Backcd Securities Inc.. 5.52%. 09/25/34 USA C&lMP Tru5t. 5.42%. 05/25/3h USA Ace Securities Co:orp., 5.44%, 0&rL5/35 l!SA Rcsidenual Asset Mortgage Producls Inc.. 5.66% LOn5/34 USA Park Place Sccurities Inc.. FRN, 5.765%. Wl25/34 USA Popular ABS Mortgage PassThrough T w . 5.57% 09/25/34 USA Siruaured Awt ln\7estrnent Loan Trust, 5.4+%. @9/2%5 USA M;lsrer Assset-Backed Securiries Trus~. 5.46%. 02/25/36 USA F h t 1:nnklin hlortwge Lwn h t - t b c k e d Cenificate, 5.73%. lW25n4 \ S A Securitized Asset-Backed Rrmivables LLC. 5.838. Ou25/34 USA Amortizing Residential Colhienl Truu. 3.03%. 01/25/32 USA Park Place Sccuritifi Inc., 5.701, 09/25M USA Advnnra Mortgage Loan '1-rust, 4.7616. i)6/25M USA
USA USA l!SA USA USA USA USA USA USA USA USA USA tJ5A
Master k r - k k e d Securities Trust, 2.73%. 12/25/34 USA Morgan Sranley ABS Capid, 4.17%. OW25/34 USA GSAhiP Trust. 5.fh8. 10R5fl4 USA Residential Asset Securiries Corp.. 3.T35, 04R5B2 USA First 1:nnklin Mortgage Lmn Assei-hcked Certifiaies. 5.4225%, 11/25/35 USA C;S*~UIP -rrua, j.+t%. 0W25/3/3s USA Residential Funding Mortgage Securily I. -t.W%. 12/25/17 U.M SLM Studcnr Imn T u r . FRN, 3 52%. lUlYlS* LISA Morgan Stanley ABS Capital. 1.7646, 06Rfi.W USA Fitst Plus llome h n Trust, 6.92%. 1NIM-t USA New Century llome Equity Loan Trust, 3.%%. 11/1%53 USA her iques t Mongage Sccurities Inc.. 4.272%. 07/25/33 USA Residential Funding Mongage Securities 1. 3.15%. 05/25/18 USA First Plus llome Loan Trust, 6.95%. 01/10/24 USA h t - h c k e d Securities COT. I bme Equitv h l-rusl. 5 71258. 04/25/34 USA Countrywide Aset-Backed CcniGcates. 5.69%. ilULY33 USA Long knch M t ) r t ~ ~ e lmn T ~ I , FRY. 3.11%. 11/25/32+ USA l m g k3ch Mortgage Loan Tntsr, 5.68%. IW%+ Residential h i Securities Carp.. 5.82%, 05/2njJ32 USA Structured Asset Investmenr b a n 'Trust. 8.378. WRY33 USA Countvwide kt-Backed Certifimtw, 1.328, 04/25B4 (!SA Countrywide k t - k k e d Cenihtes. 5.63%, W/25B3 USA Ne\&- Century Home Equity h n .I.FIL~~. F € S , 2.93%. 07/25/.30t LISA
Structured k i Investment b a n Trust. 5.4511%. 11/25/33 Accredited Monppge Loan Trust. 5.42%. CW/25/35 Asset-hcked Securities COT. Home Equity Lran Trust. 5.73%. 1@/25/34 Argent Securities Inc.. 5.64%. 03/25/33) Countrywide Asse-Backed Ccrtiliates, 5.525. 05/25/36 Struciured A w l Invcstmeni h n Irusi. 5.40%. 01/25/36 Nomura Home Equiiy Loan lnc.. FR!!. 5.4044%. OUL5/36t Popular ABS Mortgage P-Through Truw. 5.41%. 04/25/35 h r Steams k i - k k c d Securities Inc.. 5.56%. 02/25/35 Encorc Credit Rcceivables l'rust. 4.20%. 0 l R i n b Aegis Aw-hckcd Securities Trust. 5.45%. IN2335 Morgan Slanley ABS Capital. l.YO%, 09/25/33 G M C Mortgage Corp. Lmn Trust, 2.88%. 1oRY33
im
USD USD USD USD US0 USD 1!SD usu u w USD USU USD USD USD USD USD USU USD 1150 USU USD USD USD usu USD USD USD LISD USD USD CSD USD CSU USD USD USL> usu USD usv USU USD USD USD USD USD USU USD ti5D USD USD usu USD USD USD USD USD USD USD USD US0 USD USD USD USV USD USD USD
2.R73.42X
1.91 1,420 1,801,468 1.799,247 1.146.619 1,727,513 1.628.880 1.628,214 1,501,423 1,432.917 1.427.572 1,416.001 1,225 312 1,213,475 1.212.529 1.193.67 1 1,148,221 1,109,710 1,046,244
987,380 964.633 939.186 Y37.191 912,063 888.379 789,318 759,121 675.701 613.016 609.645 541,607 527.311 518,291 501,168 435.Y88 419.529
385.038 378.643 359.950 326.941 285.532 262.832 256.104 247,706 241.385 227.551 1 Y 8,89 1 190.468 181.325 156,327 147,143 146.243 145,260 100.012 95,847 75.01 1 69,197 35.791 2T.387 17.330 10,925 10,479 6.336
2.001.27a
418,574
4.R75 2,Wl
48,075,869
3.50 2.44 2.33 2.19 2.19 2.13 2.10 1-98 1.98 1.83 1.75 1.74 1.72 1.49 1.48 1.48 1.45 1.40 1.35 1.27 1.20 1.18 1.14 1.14 1.11 1.08 0.96 0.92 0.82 0.75 0.74 0.66 0.64 0.63 0.61 0.53 0.51 0.51 0.47 0.46 0.44 0.40 0.35 0.32 0.31 0.30 0.29 0.28 0.24 0.23 0.22 0 19 0.18 0.18 0.18 0.12 0.12 0.09 0.09 0.04 0 07 0.02 0.01 0.01 0.01 0.01 0.00
58.52
100
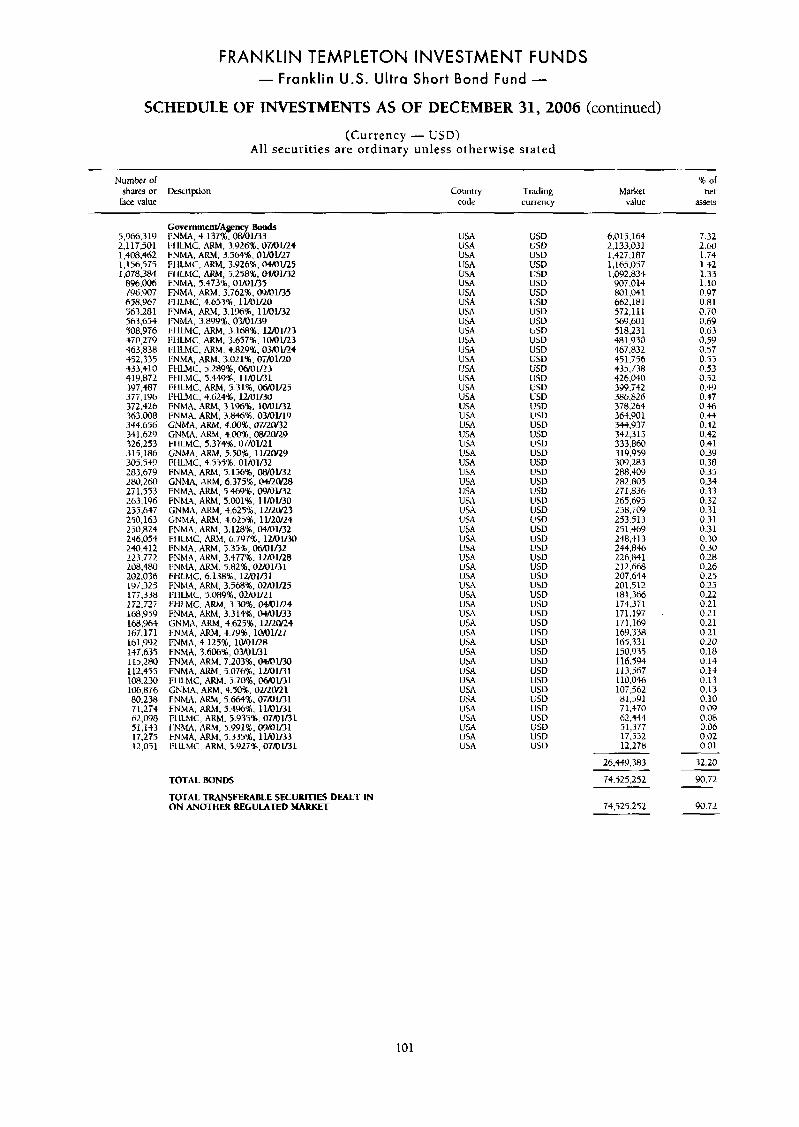
FRANKLIN TEMPLETON INVESTMENT FUNDS - Franklin U.S. Ultra Short Bond Fund -
SCHEDULE OF INVESTMENTS AS OF DECEMBER 31,2006 (continued)
(Currency - USD) All securit ies are ordinary unless otherwise s ta ted
Number of 96 of shares or Dexription Country Trading Market net
h e value code currency value S W t S
5.966.319 2,117,501 1,408.462 1,156.575 I ,078.38.t
896.00h 796.907 638,967 563.281 563,654 508,976 -t 7 0.2 7 41 463,838 452,335 433.410 4 19.872 397.487 377.196 372.426 363.W8 344.656 341.629 326,253 315.186 305.549 283.679 280.260 2T1.553 263.196 255,647 250,163 250,824 246.054 240,412 223.772 208,480 202,036 1Yi,325 177,338 172.72T 168.959 168.964 167.171 161,992 147,639 115,280 112,455 108.230 106.876 80.238 71.274 61,098 51.143 17.275 12,051
GmernrnentJAgency aMds 1:NMA. 4.13746. OR/01/33 1;IILMC. ARM, 3.926%. 07/U1/24 FNMA. ARM, 3.564%. 01/01/27 FIILMC, ARM, 3.926%. 04/01/25 F1 ILMC, ARM, 5.258%. aKo1132 FNMA. 5.473’16,01/01/35 FNMA, ARM, 3.762%. 09/01/35 1:) ILMC. 4.693%. 11/01/20 1:NMA. ARM. 3.196%. l l /Oy32 I:NMA, 3 899%. 03/01/39 I:IILhiC, ARM. 3.168%. 1UOlfZ3 FIILMC. ARM. 1.657%. 10/0UL3 FIlLMC. ARM: 4.82996, OMV24 FNMA, ARM. 3.021%. 0iNlRO FHLMC. 3.289%. O b M l K I
I:IILMC, AMI. 5:31%, M U 2 5 FHLMC, 4.624%. l U 0 W FNMA. ARht, 3.196%. IoNU32 PNMA, ARM, 3.846%. OMY19 GNMA. ARM. 4.00%,07/2Of32 GNMA. A M , 4.M%. owLOn9 FI ILMC, 5.37446. 07/01/21 GNMA, AkV, 5.50%. ll/2aR9 FHLMC. 4.5338.01/01/32 FNMA, ARM, 5.15656, WOY32 GNhlA. AKM. 6.375%;. 04/20/28 F N M . ARM, 5.46YX;. WOU32 FNMA. AKM. 5.001%. 11/01/30 GNMA. ARM, 4.625% lU2iv23 GNMA. Ami. 4.6258. 11/20/24 FNMA. ARht, 3.128%, 04/01/32 FIILMC, ARM, 6.7Y7Q. 1MluIIK) I:NMA, ARM, Y35’%, OWUlf32 FNMA. A W , 3.477%. 1MU28 FNMA, ARM, 5.82%, OUOlAl FI-1LMC. 6.1384. 12/01/31 FNhtA, ARM, 3.568% 0UO1Iz5 l:lILMC, 5.089%. 02/01/21 1:HLMC. AKM, 3.30%. 04/0U24 FNMA. ARM. 3.3141. lNNU33 GNMA, ARhl, 4.625%. 1UZar24 FNMA. ARM, 4.7Y‘K. 1OAl1/27 FNMA, 4.125%. 10101R8 FNMA. 3.606%, 03/01/31 FNMA. ARM. 7.203%. M U 3 0 FNMA. ARM. 5.076%. 1MU31 FIILMC, ARM, 5.70%. OW01131 GNMA. ARM. 4.50%. OU2Onl FNMA. AKM, 5.6642,07/0Y31 FNMA, AKM, 5.4%%, 11/01/31 FI ILMC, ARM. 5.935% 07101/31 I N M A . AKM, 5.991%. WMV31 FNMA. ARM. 5.335%. Ill01133 I:IILMC. ARM, 5.927%, 0710K31
FHLMC, 5.449s.. 11/0V31
USA USA USA USA USA USA USA USA USA USA USA USA USA USA USA USA USA USA USA USA USA USA U M (!SA USA USA USA USA USA USA USA USA USA USA US.4 USA Usri USA USA USA USA USA USA USA USA USA USA USA USA USA USA USA USA I! 5A USA
USD USV USD USD USV USD USD usu USV us0 USD USD USD USD USD us11 usu USD USD 115u USD USD usu USD USD USD USV us0 USD U5D USD USU USD lJ5V USD USD USD USV usu USD USD USD USD USD USD USD USD usu USU USD USD 11su USD USD
uso
6.015.164 2.133.031 1,427.187 1,165.057 1,092,834
Y07.014 801,041 662,18 1 572,111 569,601 518,231 481,930 467,832 451.756 435.738 426,040 399.742 3 t w 2 6 378.264 364,901 344.937 342,315 333,860 319.959 309,283 288.409 282,805 271,836 265.695 258.70Y 253.513 251.469 248,413 234.846 226,841 2 12.668 207,644 201.512 181.366 174,371 171.197 17 1,169 169,338 165.331 150,935 116.594 113.567 110,046 107,562 81,591 7 1,470 b2.444 51,377 17.552 12.278
7.32 2.w 1.14 1.42 1.33 1.10 0.97 0.81 0.70 0.69 0.63 0.59 0.57 0.55 0.53 0.52 0.39 0.47 0.46 o.-H 0.42 0.42 0.41 0.39 0.38 0.35 0.34 0.33 0.32 0.31 0.31 0.31 c1.30 0.30
0.26 0.25 0.25 0.22 0.21 0.21 0.21 0.21 0.20 0.18 0.14 0.15 0.13 0.13 0.10 0.09 0.08 0.06 0.02 0.01
0.28
TOTAL BONDS
TOTAL TRANSFERABLE SECUlUTlES DEALT IN ON ANOTHER REGULATED MARKET
26,44Y.383
74,725,252
74,525.252
32.20
90.72
90.72
101
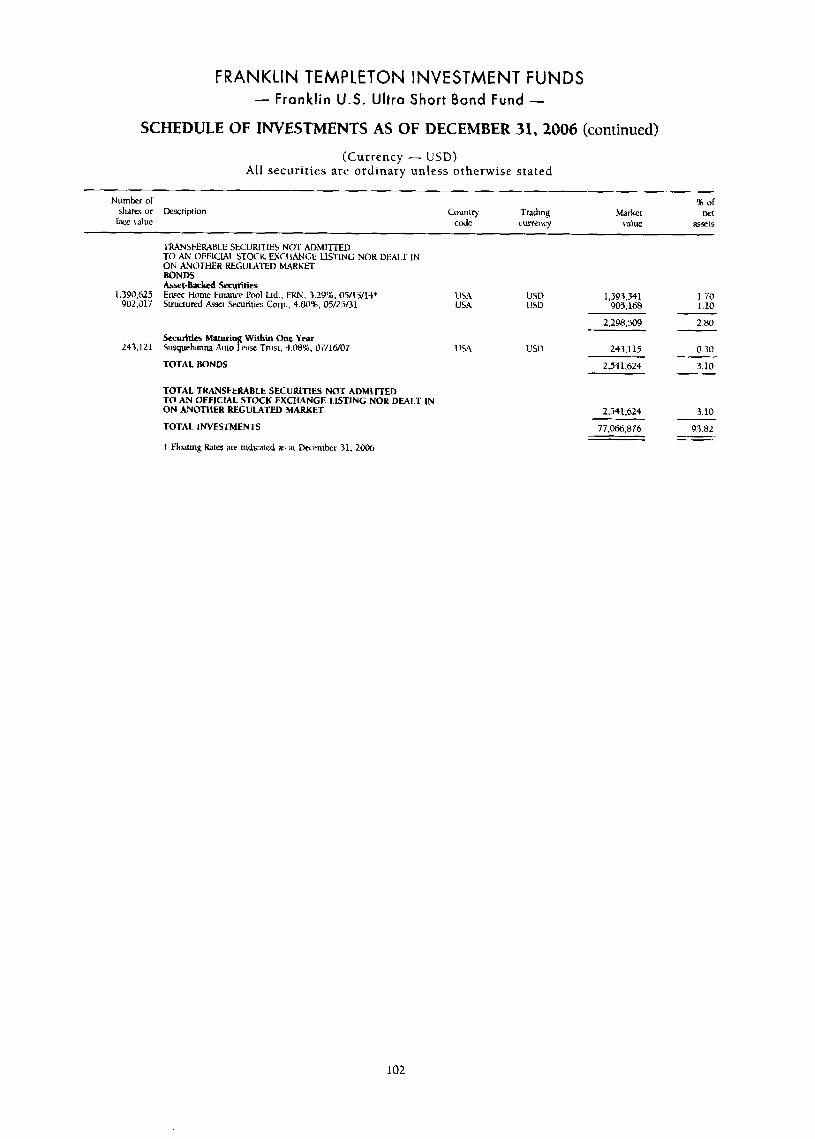
FRANKLIN TEMPLETON INVESTMENT FUNDS - Franklin U . S . Ultra Short Bond Fund -
SCHEDULE OF INVESTMENTS AS OF DECEMBER 31,2006 (continued)
(Currency - USD) All securities are ordinary unless otherwise stated
Number of % of
face value code currency value aSrL5 shares or Dew-nption Countr) Trading Market ne[
~~
TRANSFEIURLE SECURITIES NOT A D M l n E D 1.0 AN OFFICIAL STOCK EXCIlrZNGf LlSTINC NOR DIL4LT IN ON ANOTHER REGULAI~ED MARKET BONDS Asset-Brktd securities
1.390.625 Ewer Hnmc Fmnre Pool Ltd., FEN, 3 2976. 05/IYlJ+ U M 902.017 Structured k i Securiria C o p , 4.80%. 05/25/31 USA
Securities Maturing Within One Year Susquehmna Au[o Lc;lse T u [ . 4.08%. 07/16/07
TOTAL BONDS
243.121
TOTAL TRANSFERABLE SECURITIES NOT ADMITTED TO AN OFFICIAL STOCK EXCHANGE LISTING NOR DEALT IN OS ANOTHER REGULATED MARKET
TOTAL INVESTMENTS
t Floa[uig Ram are uidicdwd a5 u Dekctmbcr 31, 2006
USA
USD usu
USD
1,393,341 905.168
1.70 1.10
2,298.5m
243.115
2.541.624
2,541,624
17,066,876
2.80
0.30
3.10
3.10
93.82
102
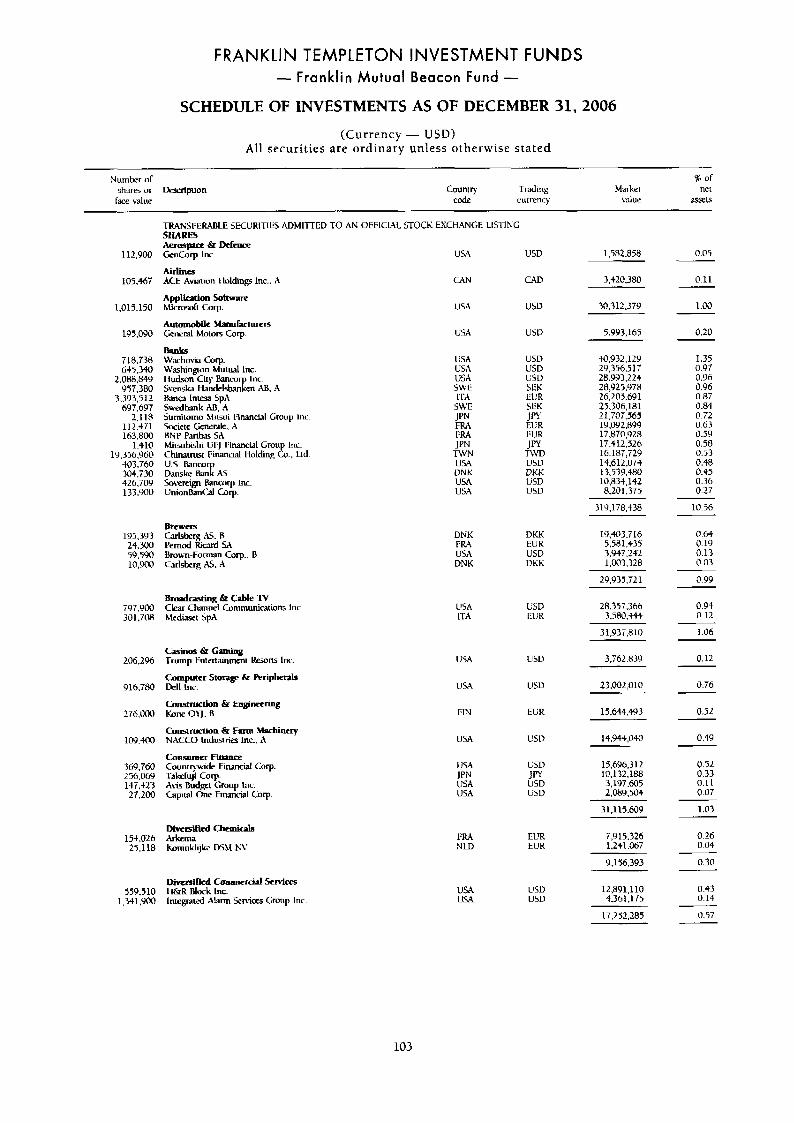
FRANKLIN TEMPLETON INVESTMENT FUNDS - Franklin Mutual Beacon Fund -
SCHEDULE OF INVESTMENTS AS OF DECEMBER 31,2006
(Currency - USD) A l l securities are ordinary unless otherwise stated
~~
Number or shares or k r i p u o n face value
% of Market net
V B I M ;IsY3s Country Trading
code currenc)
TRANSIWWBLE SECURl~WS ADMlnED TO AN OFFICIAL Sl-OCK EXCtlANCE LlS-rlNG SHARES
ten&rp lnc USA Aeraspace & Defence
USD 0.05 112,900
105.467
1,015.150
195,090
71H.738 645.340
2.088.849 95,380
3,393.512 h95.697
2.118 112.471 163,800
1410 19.356.960
303.760 304,730 426.709 133.900
195.393
59,590 10,900
24.300
797.90 301,708
206.2%
916,780
276,000
109.4W
369,760 256.06Y 137.+23 27.200
154,026 25.118
559.510 1,341 ,Y@O
1,582.858
3,420,380
30312.379
CAN
USA
USA
USA USA USA SWE 1 - M S W E
E FIW
TWN USA VNK USA USA
JPN
0.11
1.00 u w
0.20 U5V 5.YY3.165
1.35 0.97
U SD USD US11
40,932,129 29.356.517 28:V93.224 28,925,978 26.205.69 1 25.3M.181 21,707,565 19.092.8U9 17.870.9 28 17.412.526 16 187,729 14,612,074 13,539,480 10.834,142 8.201.375
0.96 0.96 0.87 0.84
SEK EUK SEK JPY EUR EUK JW
TWD USD DKK tiSD USD
0.72 0.63 0.59 0.58 0.53 0.48 0.45 0.36 0.27
10.56 31Y.178.438
19,[email protected] 5.58 1.435
@,64 DNK FM USA DNK
DKK EUK USD DKK
0.19 0.13 0.03
3947,242 1,003328
29.9.35.721 0.99
28.357.766 3.580.444
0.94 0.12
Eropdcvting & a l e TV Clear Channel Communications lnc hledixt 5p.A
USA K A
us11 EljK
1.06 31.937.810
3.762.839 0.12 k i m s & Gaming Trump Entertainmen1 Kejurts Inc.
Computer Srorpse & f'eriphefals Dell Inc.
Conenution C Engineering Kone OYJ. 6
Constnrtion & Farm Machinery NACCO lnduslries lnc.. A
Consumer Fi- Counirywide Financial Corp. T~kduji COT. A\+, Budset Group Inc. Capital One Financial carp.
USA
USA
FIN
USA
USA JPN USA USA
USD
USU
EUR
USD
23,002,010
15,645,4!43
0.76
0.52
0.49 14,944,040
15,696.312 1'2.1 32.188 3,197.605 2,089.504
31.115.60Y
USD JW USD LSD
0.52 0.33 0.11 0.07
1.03
0.26 0.04
FRA NLD
EUR EUR
7,915.326 1,241,667
0.30 9.156.39 3
12.89 1.1 10 4.361 .I75
0.43 0.14
Divctsifii c~mm~rdpl Services I16rR Block Inc. InlfRrated XLam Wnires Croup Inc.
U M USA
usu USD
17.252.285 0.57
103
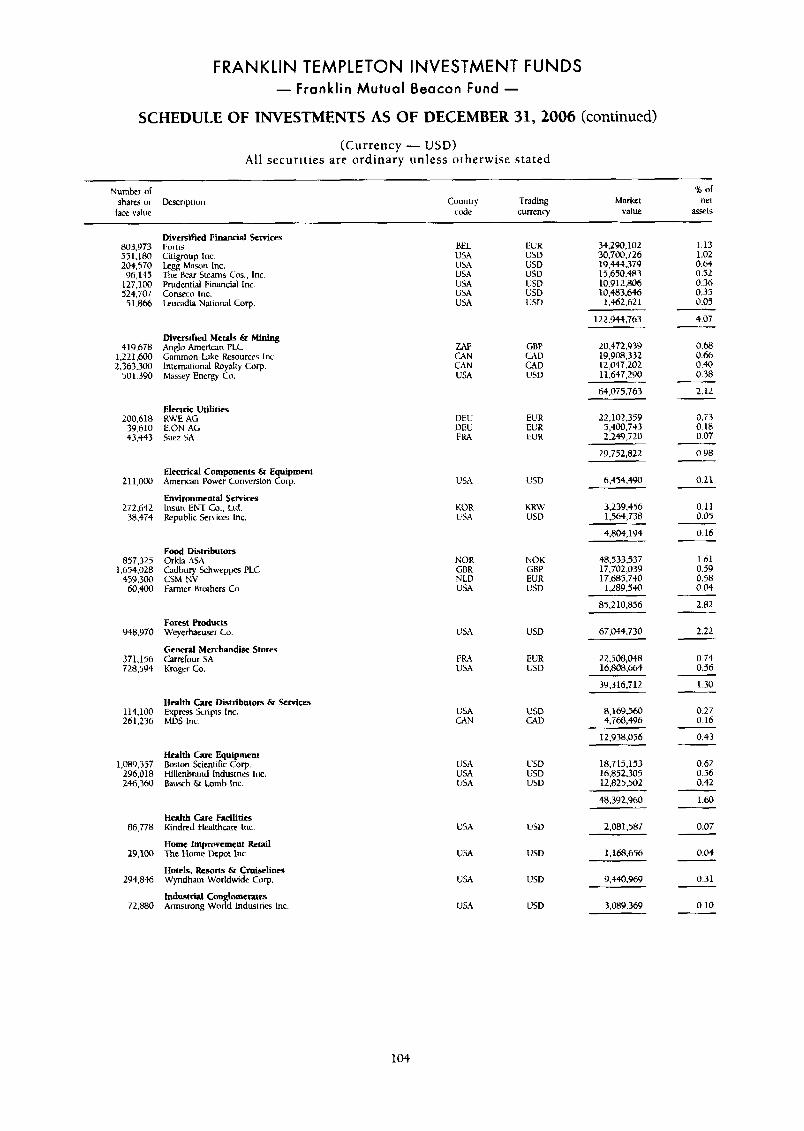
FRANKLIN TEMPLETON INVESTMENT FUNDS - Franklin Mutual Beacon Fund -
SCHEDULE OF INVESTMENTS AS OF DECEMBER 31,2006 (continued)
(Currency - USD) Al l securities are ordinary unless otherwise stated
Number of % of shares or Derripiion Country Trading Market net
face value cude currency value Wt5
Divcrstfied Financial Services Fortis Citigroup lnc. kgg Mason Inc. The Bear Stearns Cos., Inc Prudsntlal Financial Inc. Corwco Inc. kucadia Nanonal Corp.
1.13 1.02 0.64 0.52 0.36 0.35 0.05
803,973
2W.570 96,145
127.100 5 2 4.7 0 7 51.866
5 m a o BEL W R 34,290,102 USA USD 30.700.726 USA USD 19,444.379 U 5.4 USU 15.650.483 USA I!SD 10.912,806 USA USD 10.483.646 USA USD 1.962.621
122.944.763 4.07
0.68 0.66 0.40 0.38
2.12
Diversified Metals & Mining Anglo American PLC Gammon h k e Resources Inc. Intemmonal Il?yaliy COT. Massey Energy Co.
20,472,939 19.908.332
m CAN CZN USA
GBP CAD C4D USD
419,678 I ,22 1.600 2.363.300
501.390 12;047.202 11.647.290
64.075.763
Elmtic Utilities RWE AG E.ON AG Suet SA
200.618 39.610 43.433
DEU VEL! FKX
EUR EUR EU R
22.102.359 5,400.743 2.249.520
29.752,822
6.454.4'40
0.73 0.18 0.07
0.98
Electrid Components & Equipment American Power Conversion Corp.
Environmental Sewices lnsun ENT CO.. h d . Republic Senices Inc.
211.000 USA USD 0.21
272.642 38.474
KOR USA
KRW USD
0.11 0.05
3,239.456 1,564,738
4,804,194 0.16
Fwd Distributors Orkla .GA Cadbury Scrhweppa FLC CSM NV Farnier Brothers Co.
48.533537 17,702,039 17.685.740 1,289,540
NOR GBR NLU USA
NOK GBP EUR L!SD
1.61 0.59 0.58
857.325 1.654.018
459.300 60.400 0.04
85,210,856 2.82
2.22 Forest Products Weyerhaeuxr Co
General Merchandise Stores Carrefour SA Kroger Co.
946.970 USA USD 67.044.730
0.74 0.56
FR;\ USA
EUR USD
371.156 728,594
22,508,048 16.808.664
1-30 39,316,712
Health Care Distributors h Services Express Scripts Inc. MUS lnc.
8,169,560 4.768.496
114,100 Lh1.236
USD 0
0.27 0.16
0.43 12,938,056
18,715,153 16.852.305 12,625,502
Health Care Equipment Boston ScientiRc Carp. Hiiienbnnd lndustrifs Inc Bausch &z Lamb Inc.
0.62 0.56 0.42
1,089,757 296,018 244,360
USA USA USA
USD USD USD
1-60
Health Care Facilities KindrPd t h l t h c m Inc
Home Improvement Retail The Home Depot lnc.
Hotels, Resorts &I Cruiselinls Wyndham Worldwide Corp.
industrial C o n p t a i F Armstrong Word Indunes Inc
86,778 U5.4 USD
USD
USD
USD
0.07
0.04
2,081.587
1.163.656 29.100 USA
9.+40.969 0.31 294.846 USA
72,880 USA 0.10 3.08Y.369
104
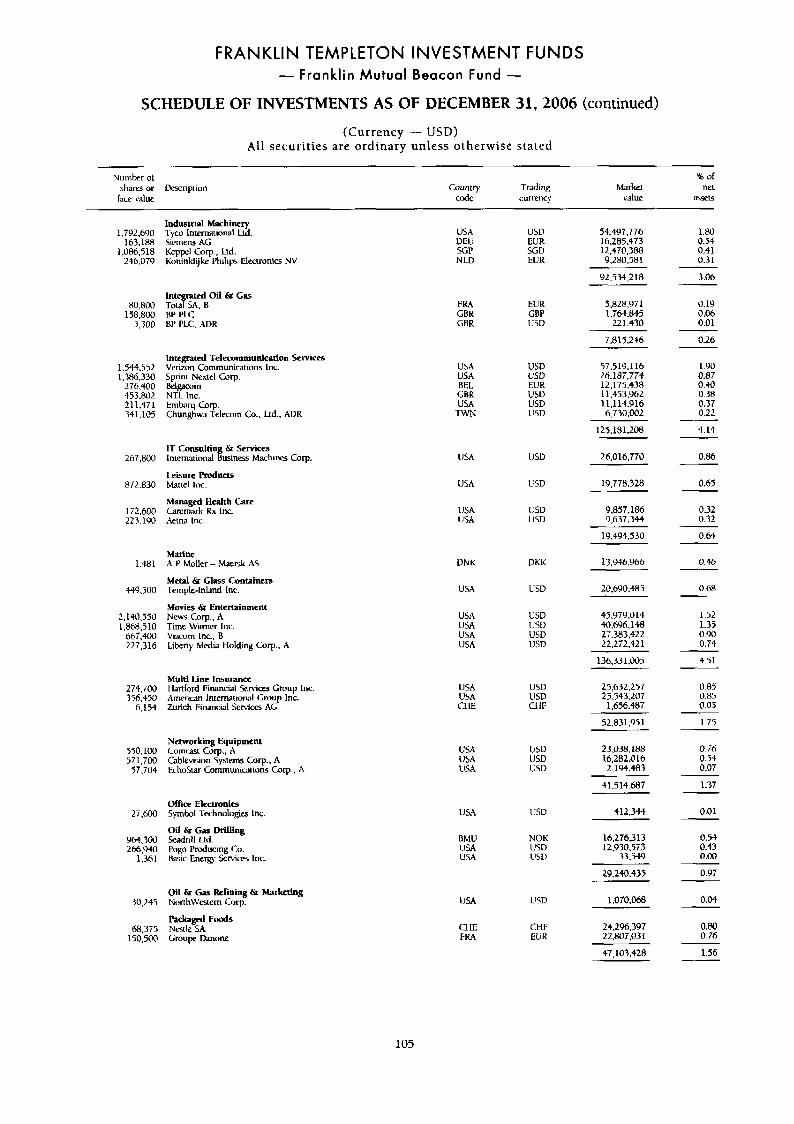
FRANKLIN TEMPLETON INVESTMENT FUNDS - Franklin Mutual Beacon F u n d -
SCHEDULE OF INVESTMENTS AS OF DECEMBER 31,2006 (continued)
(Currency - USD) All securit ies are ordinary unless otherwise stated
Nuinber o l
h e value shares or Description
96 of Country Trading Markel ne1
code currency value wts
1,792,690 163.188
1,08h,518 246,079
80,800 158.800
3,300
1.544.552 1.386.330
276.400 553.802 211.471 34 1.105
267,800
$72.830
172,600 223.190
1.481
w').500
2,140,550 1,868.510
667,400 227.316
274.700 356.450
6,154
550,100 571.700 57,704
2 7 . m
Y64.300 2h6.940
1.361
30,245
68.375 150.5ocI
industrial Machinery Tyco International Lld. Siemens AG Keppll Corp., Ltd. Koninklijke Philips Eledronics NV
Integrated Telecommunication Services Veruon Communications Inc. Sprinl Nextel Cop. &lgacom NTL Inc. Emhrq Corp. Chunghwa Telecorn Co.. Ltd.. AIIR
IT Consulting & Services lntemxional Busincss Machines Corp.
Leisure Roducts Matlel Inc.
Managed Health Care Carernark Rx Inr Aetna Inc.
Marine A P Muller - Maersk A!i
M e d & G l w Conminers Temple-lnhnd Inc.
Movies & Entertainment
Time Warner Iiic. Viacorn Inc., R Liheny Media Holding Corp., A
New$ Corp., A
Multi-Line Insurance Hartford I:inancial Services Croup lnc. American lnternalional Croup Inc Zurich Financial Senriccs AG
Networking Equipment Comwt Corp., A Gblevision S)stems Corp., A EchoStlar Cornmuniutions Corp.. A
Office Elecurmk Symhol ~kchnolop;les Inc.
Oil & Gas DriUmg !%adrill Lid. Pogo Producing Co. Basic Energj t;en*icrs lnc.
Oil & Gar Refining t Marketing North\Vfitern Gwp.
Packaged F d s Nestle SA Croup Vmme
USA VEU SGP NLD
FRA GBR GBR
USA USA BEL CBR USA
TWN
LISA
USA
USA USA
UNK
USA
USA USA USA USA
USA USA CI IE
u54 USA USA
USA
RMU USA USA
USA
CHE FR4
USD EUK SGD EUR
EUR CBP USD
usv uju EUR usu USD USD
VSD
LSD
USU USD
IIliK
USD
US11 LSL) USD us13
USD USD CIIF
11511 USD L'SD
USD
NOK USD USD
USD
CHI: EUK
54,497,776 16.285.413 12,470,388 9,280.581
1.80 0.54 0.41 0.31
92,534,218
5,828,971 1.764.845
221.430
7.815.246 ~~~
57.519.116 26,187.774 12,175,478 11.453.962 11.1 15.9 16 6,730,002
125.181.208
26.016.770
19,778.328
9.857.1R6 9,637.344
19,494,530
13.946.966
20,690,485
$5.979.014 $0,696.148 27.383.422 22.272.42 1
136.331.005
25,632.257 25.543,207
1,656.487
52.83 1.95 1
3.06
0.19 0.06 0.01
0.26
1.90 0.87 0.40 0.38 0.37 0.22
4.14
0.M
0.65
0.32 0 32
064
0.46
0.68
1.52 1.35 0.90 0.74
4.51
0.83 0.85 0.05
1.75
23,038,188 16,282.016 2,194.483
0.76 0.54 @.OT
41.514.@7
412,344
1.37
0.01
16,276313 12,930,573
33,549
29.240.435
24.296.397 22.807.03 1
47Y03.428
0.5) 0.43 0.00
0.97
0.04
0.m 0.76
1.56
105
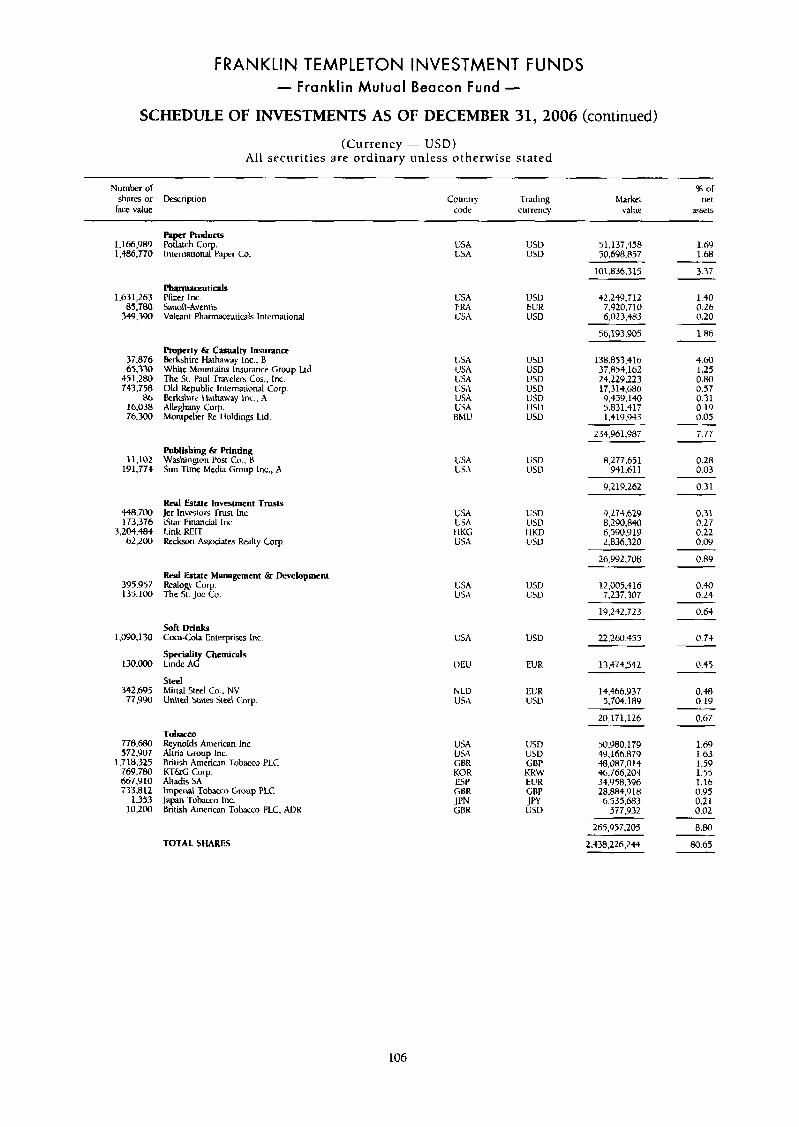
FRANKLIN TEMPLETON INVESTMENT FUNDS - Franklin Mutual Beacon Fund -
SCHEDULE OF INVESTMENTS AS OF DECEMBER 31,2006 (continued)
(Currency - USD) All securit ies are ordinary unless otherwise stated
Numbfr of shares or face value
% or net
ZXts Trading currency
Market value
Uexriprion
Pa Products Patch Corp. hernational Paper Co.
couniry code
I, 166,989 1,486,770
USA USA
US0 USD
51,135,458 50.698,857
101,836.3 15
1-69 1.68
3.37
PhprnuoeUtiCals Pker Inc. Sandi-Avemis Valant Pharmaceuticals lnternaiional
1.40 0.26 0.20
1,631,263 85.780
349.390
USA FRA USA
USU EUK USD
42.249.7 12 7.920.710 6.023.483
56,193.905 1.86
4.60 Property 6r Casualty Insurance krkshire Hathaway Inc., 0 Wile Mountaim Insurance Group Lid The Si. Paul Travelers Cos., Inc. Old Hepublic 1ntern;itional COT. Berkshire Ibthawy lnc.. A Alleghany Corp. Montpelier Re 1 loldinp Ltd.
37.876 65.330
451.280 747.758
pb 16.038 76.300
LISA USA USA USA USA USA BMU
U5D 138.853.416 37.85$.162 24.229.223 17.31$.686 9,459,140 5.831.417 1,419,943
234.961.987
USD L5D USD
1.25 0.80 0.57
USD USU USD
0.31 0.19 0.05
7.77
Publishing & Ptinting Wishington Post Co.. B Sun-Time Media Group lnc,, A
8.277.651 941.611
0.28 0.03
11,102 191.77+
l!SA USA
USD USD
9.219.262 0.31
Red Estate Investment Trusts Jer Investors Trust Inc. istar Financial Inc. Link RElT &&son k x i a r e s Realty Corp
.. 448.700 173,356
3.2c4.484
USA USA I IKG USA
LSD USD I IKD LiSD
9.274.629 8,290.840 6.590.919 2,836,320
26.992.708
0.31 0.27 0.22 0.0y
0.a9
62:200
Repl Estate Management & Dwelopmcnt Realoe CUT. The St. Joe Cu.
12.005.4 16 7.237.307
0.40 0.24
395.957 134.1M
LISA USA
USD LSD
19,242,723
22.260.455
0.64
0.7) soft D r i h Cm-Cola Enterprises lnc.
Speciality Chemicals Linde AG
1.090.130 USA USD
130.000 0 EL' EUR 13,474,542 0.45
0.48 0.19
0.67
Steel Mitral Steel Co.. NV Uniied Smes Sreel Corp
342.695 77.9w
N LD 11%
EUR USD
14.466.937 5,704.189
20,171.126
50.980.179 49,166879 48,087.014 46,766,204 34.Y58.396 28,884,918 6.535.683
577.932
265.957.205
2,438,226.24$
Tobatm Reynolds Ameriwn Inc. Ahria Group Inc. British American Tobacco P l C hT&G Curp. Aliadis SA lmperial Tobacco Group PLC Japn '1~1),hScco lnc. British American Tobacco PLC. MK
778.680 USD USD GBP KRW EUR GRP JPY USU
u5A USA C0K KOR ESP GBK
1.69 1.63 1.59 1.35 1.16 0.95 0.21 0.02
572.907 1,718325
769.780 667.910 733.812
1.353 10,2M
8.80
TOTAL SHARES 80.65
106
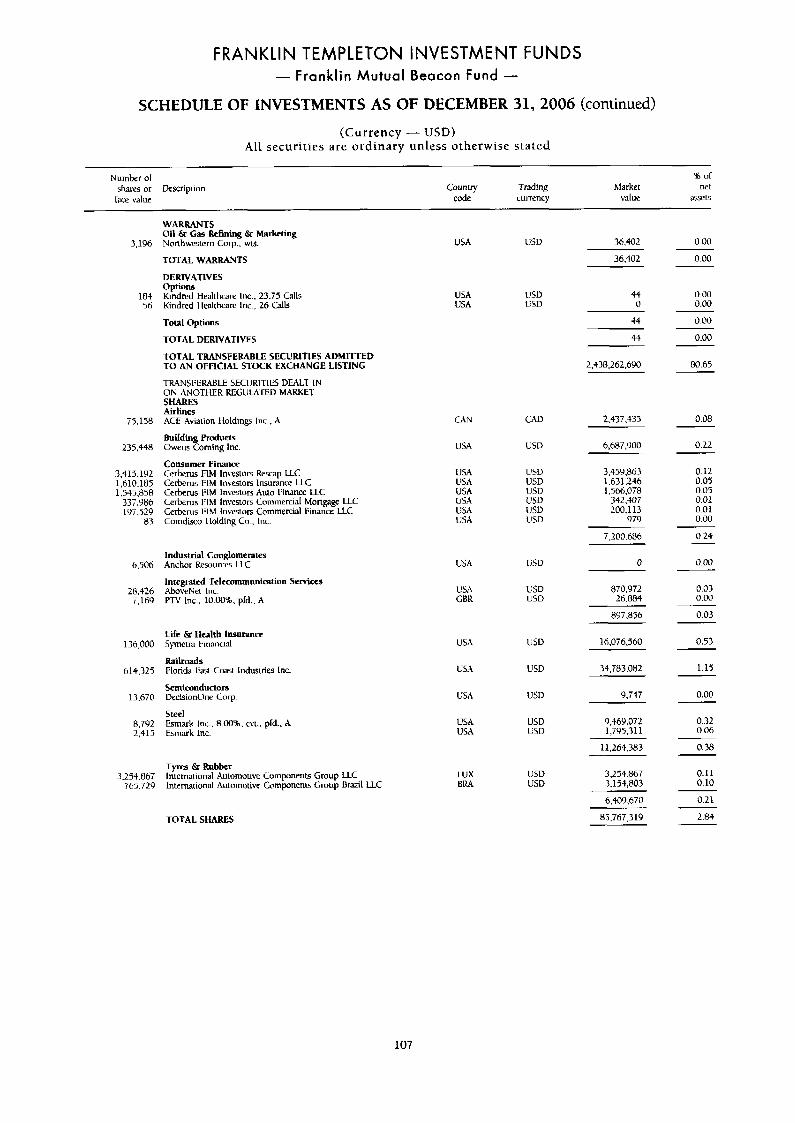
FRANKLIN TEMPLETON INVESTMENT FUNDS - Franklin Mutual Beacon Fund -
SCHEDULE OF INVESTMENTS AS OF DECEMBER 31,2006 (continued)
(Currency - USD) All securities are ordinary unless otherwise stated
~
Number or % uf
race value code currency value assfts shares or Description Country Trading Marker net
WARRANTS Oil 6r Gas Refining Q Marketing Nonhwestern Corp.. wts.
TOTAL WARRANTS
DERIVATIVES
3,196
184 5h
75.158
235.448
3.419.192 1,610 185 1.545.858
337.1)86 197.529
83
6.50h
28.426 7.16Y
136,000
614.325
13,670
8.792 2,415
3,254.86T 765.721)
0.00
0.00
USA usv 36.402
36,402
Options Kindred Healthcare Inc., 23.75 Calls Kindred I Imlthcare Inc., 26 Calls
0.00 0.00
0.00
0.00
USA USU 44 USA LSD 0
44
4d Total Options
TDfAL DERIVATIVES
TOTAL TRANSFERABLE SECURITIES ADMITTED t O AN OFFICIAL STOCK EXCHANGE LISTING 2.438,262,690 80.65
0.08
TRANSFERABLE SECURITIES DEALT IN ON ANOTHER REGULATED MARKET SHARES Airlines ACE Aviaiion Holdings Inc., A CAN
USA
2.437.435
0.22 Building Products Owens Corning Inc.
Consumer Finance Cerberus FIM Investors &Tap LLC Cerbcrus FIM Investors Insurance LLC Ccrkrus I:IM Investors Auto I:imnce U C Ce&ms I:lht Investors Commercial Mortgage U C Cerbems IW investors Commercial Finance LLC Comdiscu 1 lolding Co., Inc.
USV 6,687.Y00
0.12 0.05 0.05 0.01 0.01 0.00
us.4 USA USA
USD USD u s v
3.459867 1.631.246 1,566,078
342.407 200.113
979
7,200.686 0.24
0.00
0.03 O.w
hdusmial Conglomerates Anchor Resources LLC
Integrated Telemmunitxtion Services AboveNet Inc. PTV h c , 10.00%. pfd.. A
USA 0
USA GBK
usv USD
$70.972 26.084
8’37,856 0.03
0.53 l ife & Health Insurance Symctra 1:inancial
Railroads Florida SI Cuut Industries Inc
Semiconductors IkcisionOne Corp.
Steel Esmark Inc.. 8.W%. wt.. pld.. A Esniark lnc.
USA USU 16,076,560
1-15 USA USD 34,783,082
USA 0.00
0.32 0.06
Y>747
USA USA
USD LSD
9,469.072 1,795.3 11
11,264.383 0.3H
0.11 0.10
0.21
2.84
Tyres 67 Rubber International Automotive Components Group LLC Internatiunal htomurive Compnenls Gmup Bmil LLC
LUX BRA
1150 USD
3,254,867 3,154,803
-
6,409,670
TOTAL SHARES 85,767,319
107
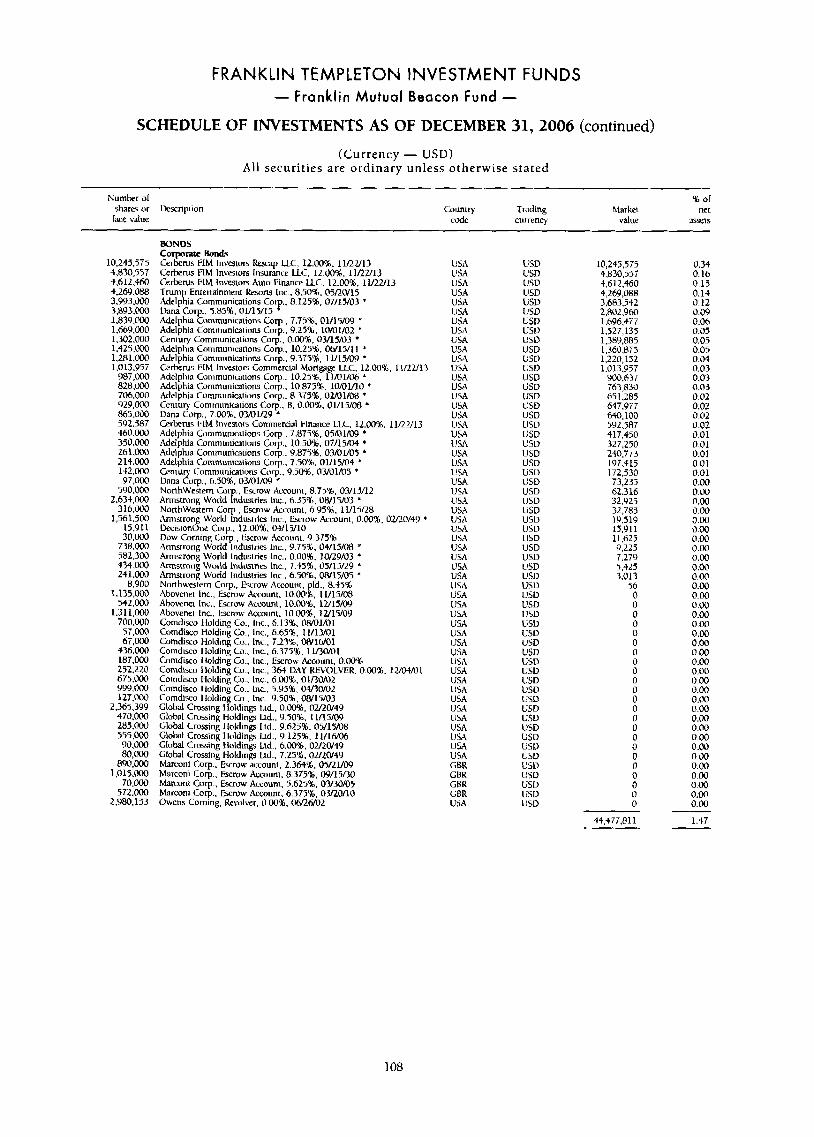
FRANKLIN TEMPLETON INVESTMENT FUNDS - Franklin Mutual Beacon Fund -
SCHEDULE OF INVESTMENTS AS OF DECEMBER 31,2006 (continued)
(Currency - USD) All securities are ordinary unless otherwise stated
Number of shares or lkscripiion Couniy Trading Market
tact value code currency value
BONDS torpoiate Bonds Ccrberus FIM Invcsiors k a p LLC, 12.00%. 11/22/13 Cerberus FlM Invesiors Insurance LLC. 12.00%. 1 lRUl.3 Cerberus FIIl lnvewors Auio Finance LLC, 12.00%. 11/22/13 Trum Enienainment KmM Inc., 8.50%. 05/2W15 Adelptia Communications C o p . 8.12556, 07/15/03 * Dam Corp.. 5.85%. 01/15/15 ' Adelphia Communimions COT.. 7.75%, 01/15/09 Melphia Communiuiions Corp., 9.258. 10/01/02 * Ceniury Communications Corp.. 0.00%. 03/15/03 * Adelphia Communications Corp.. 10.25%, 06/15/11 * Adelphia Comrnuniations Corp.. 9.373%. 11/15/Iw * Cerbems FIM Investors Commercial Mortgage LLC. 12.00%. 11/22/13 Adelphia Communiwtions Corp.. 10.25%, 1 1/01/06 * Melphia Communicliions Corp., 10.875%. 10/01/10 Adclphia Cornmuniations Gorp.. 8.775%,02/01/08 * Centuv Communiations COT.. 6. 0.00%. 01/15/08 * Dnna C i q . , 7.0096.03A31i29 * Cerberus VIM h e s t o n Commercial Finance L.LC. 12.00%. 11/22/13 Adclphis Communicalions Corp.. 7.875%. 05M1/09 * Adelphia Communiwiiuns Curp.. 10.50%. 07/15/04 Adelphio Communications Corp.. 9.87%. 03/01/05 ' Adelphia Comrnunimrions COT.. 7.501, Ol/15/04 * Ceniu Communications Corp., 9.50%. 03/01/05 * Dana FOG., h.5Olb. 03/01/09 * NorthWestem Corp.. Errow Account. 8.75%. 03/15/12 Armstrong World lndustries Inc.. 6.35%,0W15/03 * Northwestern Corp.. Escrow kccount, 6.95%. 11/15/28 Armsirong World Indusirie; lnc., &row Account, 0.@0%, 0320/4Y * OecisionOne Corp, 12.00%. 04/1j/10 Dow Corning Corp., &row Accaunt. 9.375% Annstrong World hdus1ric lnc.. 9.75%. 04/15/08 * AmstronR World Indusitim Inc.. 0.00%. 10/29/03 * Amstrong World Industries Inc., 7.45%. 05/15/29 * Armstrong World Indmuics Inc., 6.5016, OW15/05 * Northwestern Corp., &row Accouni. pfd., 8.45% Abovenet lnc., k m w kcouni. 10.M%, 11/15/08 Abovenet lnc.. Escrow kcount. 10.00%. 1U15/09 Abovenet Inc.. Escrow Account. 10.0096, 12/15/04 Corndisco Holding Co., lnc., 6.13%. 08/01/01 Corndim Holding Co., Inc.., 6.65%. 11/13/01 Comdiro Holding Cu.. lnc., 7.23%. OW16/01 Comdisco llolding Go.. Inc.. 6.3758, 11/3oMl Corndisco 1 lolding Co.. Inc.. k m w Account, 0.00% Corndisco llolding Co.. Inc., 364 DAY REVOLVER. 0.008. lU04Kll Comdisco Holding CU., lnc., 6.00%. OlD0/02 Corndisco llolding Go., lnc.. 5.95%, 04nW02 Comdisuo lldding Lo., lnc.. Y.508. 08/15/03 Global Crossing Holdings !Ad.. WO%. @U2W49 Global Cmssing Holding bd.. 9.50%. 111151w Globnl Crossing llolding Ltd.. 9.625%. 05/15/08 Global Crossing llulding hd., 9.125%. 1l/lhx)6 Global Crossing Holdings Ltd.. 6.m. OmW49 Global Crossing Holding Ltd., 7.25%. OuLw49 Marconi Corp.. Escms account. 2.31is$. 0xZYO9 Marconi Corp.. Escmw h u n i . 8.3752. O9/15/30 Marcom Corp.. Exww Account. 5.62516,0Y30/05 Idmoni Corp. Escmw .kcouni. 6.375%. OllzWl0 Owens Coming, Revolver, 0.00%. W26/02
10.245.575 4,830,557 4.612.460 4,269.088 3,993,000 3.8Y3.m 1.839.COO 1.66Y.000 1.302.000 1.425,oM) 1 >28 1 ,ooo 1.013.957
987.LX10 828,W 706.000 929,000 R65.0N 592.587 ffl0.000
USA L'SA USA USA USA USA LJSA USA
USD L'SD l!SD USD LiSD L'SD usv USD
10,245,575 4.830.557 +,612.460 4,26Y,088 3.683.542 2,802,960 1,696,477 1,527,135 1,389,885 1.360.875 1,220,152 1.013.957
UOO.h37 763,830 651.285 647.Y77 640.100 592,587 417,450 327.250 2.t0.773 197,415 172.530 73,235 62.316 32.023 32,784 19.511) 15,911 11,625 9.225 7.279 5.425 3,013
56
0.34 0.16 0.15 0.14 0.12 0.09 0.06 0.05 0.05 0.05 0.04 0.03 0.03 0.03 0.02 0.02 0.02 0.02 0.01 0.01 0.01 0.01 0.01 0.00 0.00 0.00 0.00 0.00 0.00 0.00 0.00 0.00 0.00 0.00 0.00 0.00
U5A USA USA
USD USD USD
USA USA USA
LJSD lJSD USD
USA USA USA USA USA l!SA USA 1JSA USA USA USA
USD USD USD USV usv USV USD USV USD USD USD USD USV USD
350.000 261.000 214.000 142.000 97,000
590 .m Z.634.000
3 16,000 1,561,500
15.911 30.000
738,000 582,300 434.000 241,000
8,900 1.135.009
542.000 1.311,m
700,000 s7,OOo hi,000 536.000 187.000 242,220 675.000 Y99.000 127,000
2,365.399 470,000 285.000 555,000 Y0,ooo mooo
890.000 1,015.000
70.000 572.000
2,980,153
USA USA USA USA USA U M USA USA USA USA
l!SD USD USD USD USD USD USD USD USD U5D U5U USD USD USD
USA USA USA
0 0 0
0.W 0.00 0.00 0.00 0.00 0.00
U U USA USA USA lJSA U W USA USA USA USA 1JSA USA 1 1 9 U S 4 U M GBK GBK GBK GBR USA
0 0 0 0 0 0 0
0.00 0.00 0.00 0.00 0.00 0.00 0.00
USD USD USD
0 0 0
USD USD USD usv USV USD USD USD U5D USD
0.00 0.00 0.00 0.00 0.00 0.00 0.00 0.00 0.00
1.47
0 0
44,477.81 1
108
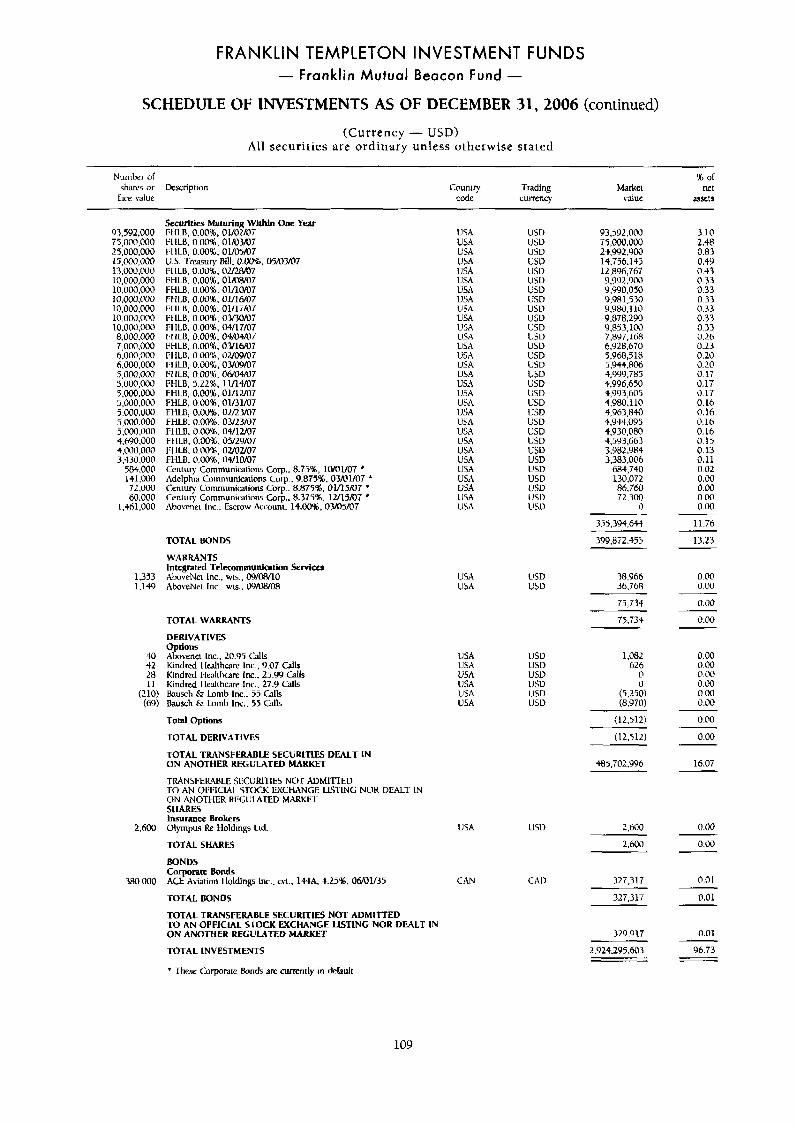
FRANKLIN TEMPLETON INVESTMENT FUNDS - Franklin Mutual Beacon Fund -
SCHEDULE OF INVESTMENTS AS OF DECEMBER 31,2006 (continued)
(Currency - USD) All securities are ordinary unless otherwise stated
Number of shares or Description Counlry Trading Market net face value code currency value
Securities k N r i n n Wilhin O m Year 93,592,000 75,000,000 25,000,000 15,000,000 13.000.000 10,000,000 10.000.000 10.o0o.000 10,000,000 10,000.000 10,000,000 8,000,000 7,000.000 6,000,000 6,0@@,000 5,m.m 5,000.000 5.000.000 5.000.000 5.000.000 5,000.000 5.000.000 4.h90.000 4,000,000 3,430.000 584,000 141.0(10 72,000 60.000
I ,46 1,000
1,353 1,149
40 42 28 11
(210) (69)
2.600
380.000
USA USA USA lJSA us.\ USA USA USA USA USA USA LISA USA USA VSA USA US,\ USA USA USA USA USA USA USA USA USA USA USA USA USA
U w USD usv USV USD USD USD USD USU L'su USD lJSD ClSD USD vsu USD USD L'SD USD USD USD USD USD usu USD USD USD usu USD 1'SD
93,542.000 75,000,000 2$,'392.900 14.756.143; 12,896,761 Y.9Y2.900 9,990,050 9,981,530 9,[email protected] 9.878.LYO 9,853,100 7.8Y7.168 6.YL8.670 5,968,518 5,441,806 4,999,785 4,996,650 4,993,605 4.980.110 4,963,840 4,944,095 4.930,080 4,5Y3,663 3.982.YR4 3,383,006
684,740 130.072 M.760 72.300
0
FLU. 0.00%. 01/OYUOi FIILB. 0.00%, 01/03/07 HILB. @.GO%, 01/05/07 U.S. Treasury Rill, 0.IWZ. 05/03/07 FIILB. 0.00%. 02/2IM17 FIILB. 0.00%. 01/0W07 FHLB. 0.00%. Ol/1@/07 FHLB. 0.00%. O U l ~ ~ I:I ILB, 0.00%. 01/17/07 FIILB, O.DO%, OY30/07 FHLB. 0.001, @4/17/@7 1:1 ILB, 0.00%. 04/04/07 FliLB, 0.00%. 03/16/07 F1 ILU, 0.00%. 0U09/07 I:I ILB, 0.00%, 0YWOi 1;1 ILB, 0.00%. 0N04/07 FHLB. 5.22%. 11/14/07
3.10 2.48 0.83 0.49 0.43 0.33 0.33 0.33 0.33 0.33 0.33 0.2h 0.23 0.20 0.20 0.17 0.17 0.17 0.16 0.16 0.16 0.16 0.15 0.13 0.11 0.02 0.00 0.00 0.00 0.00
FHLR, 0.00%. 0UluU7 FtILB. 000%. 01/31/07 FHLB. 0.W)'k. 02/23/07 FHLB: o.oom. 0 ~ 2 ~ 0 7 FHLB. 0.00'16. 04/1UO7 Ft ILK 0.00%. 0S/29/07 171 ILB, 0.00%, @MU07 FHLB, 0.001, 04/10/07 Century Communications Corp.. 8.7596, 1010L/07 * Adelphia Communications Corp., 9.875%. 03/01/07 * Ceniury Comrnunimtions Corp.. 8.875%. 01/15M7 * Century Cornmuniwlions Corp.. 8.375%. 1U15/07 * Abownei Inc.. Escrow Account. 14.00%. 03/05/07
355.394,644 11.76
TOTAL BONDS 399,8i2.455 13.23
0.00 0.00
0.00
WARRANTS Integrated Telecummunicntion Sewices AhweNet lnc., wts.. W/W10 AhoveNet Inc.. w s . . OYr9A/08
l!SA USA
USD USD
38.966 36.768
75.734
TOTAL WARRANTS
DERIVATIVES options Ahvenet Inc., 20.95 '2111s Kindred t1ealrhL;lre lnc., 9.07 Calls Kindred I-leal1hcare lnc.. 25.W Glls Kindred 1le;llthcare lnc.. 27.9 Calk h u x h & Lomb lnc.. 55 Glls Hausch 6r Lumb Inc.. 55 Calls
T a d Options
0.@@ 75.734
USA USA LiSA USA USA USA
USU USD
0.00 0.M) D.00 0.00 0.00 0.00
1,082 626 0 0
(5,250) (8.970)
(12.512)
USD llSU VSD LJSD
0.00
TOTAL DERIVATIVES t 12.5 12)
485,702,996
0.00
16.07 TOTAL TRANSFEIUBLE SECLiRLTIES DEALT IN ON ANOTHER REGUIATEU MARKET TWNSFERWLE SLICIJKLTIES NOT AI)MITTED TO AN 0I:L;ICLAL STUCK EXCHANGE LISTING NOR DEAL-1. IN ON ANOTHER RECCIATED M m . 1 SHARES Insurance Brokfrs Olyrnpus h Holdings Ild.
TOTAL SHARES
BONDS Corporate hnds ACE Aiaion I loldinp lnc.. 01.. 144.4. 4.25'16, OW@1/35
2,600 USA
CAN
USD
CAD
2 . m 0.00
0.01
0.01
327,317
327.317 TOTAL BONOS
0.01
TOTAL TRANSFERABLE SECURITIES NOT ADMITTED TO AN OFFICIAL STOCK MCHANGE LISTING NOR DEALT IN ON ANOTHER REGULATED MARKET TOTAL INVESTMENTS
* These Corporate Bonds are c u m t l y in default
329.917
2.924.295.bOO3 96.73
109
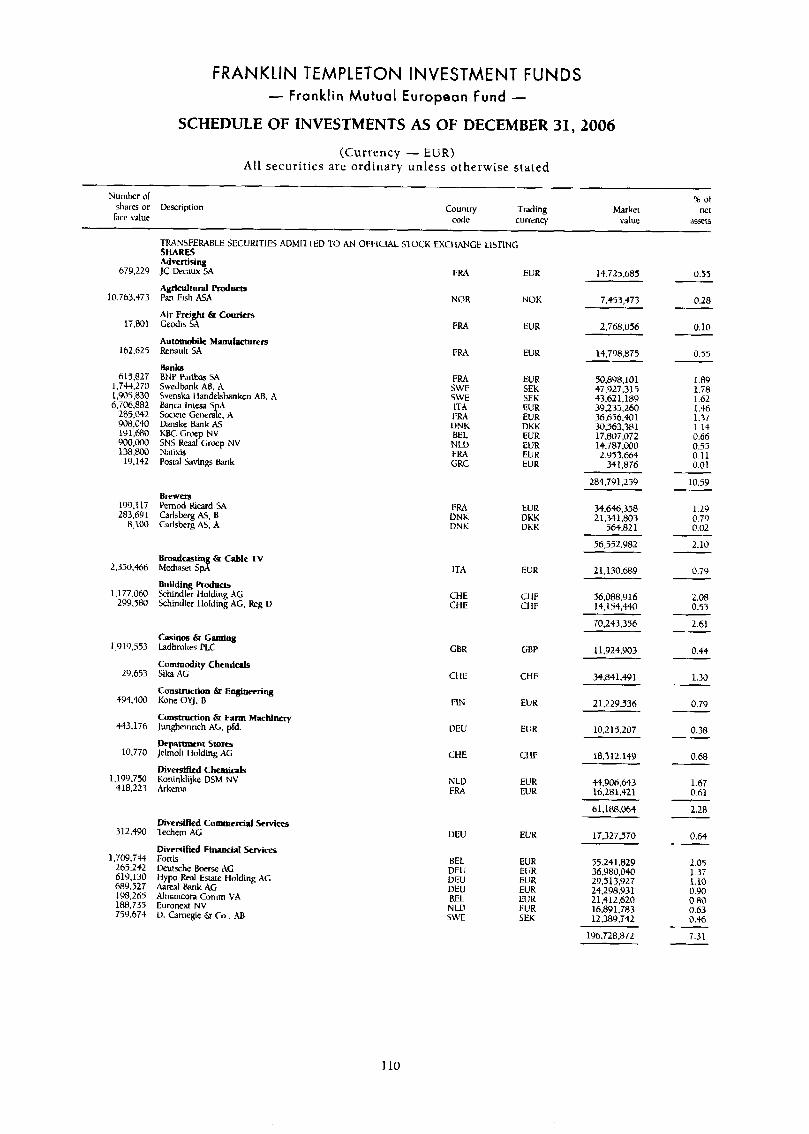
FRANKLIN TEMPLETON INVESTMENT FUNDS - Franklin Mutual European Fund -
SCHEDULE OF INVESTMENTS AS OF DECEMBER 31,2006
(Currency - EUR) All securit ies are ordinary unless otherwise stated
% of Number ol shares or firription Country Trading Marker net face \-slue code currency value S X t S
679.229
10.763.473
15,801
1b2.625
615.827 1,743,270 1,905,830 6,706,882
L85.042 908,040 191,MO '300,mo 138.8QO 19,142
199.117 283.69 1 8,100
2.330.466
1.177.060 299,580
1,919 ,553
29,653
494,4m
543,176
10,770
1,199.750 418,223
3 12.490
1.709,i44 265.242 619,130 689.527 198,265 1fi8.735 759.674
TRANSFERABLE SECURITIES ADMl11-ED TCI AN ( SHARES Advertising JC Uecaux SA
Agricultud Products Pan Fish M A
Air Freight L Couriers Ceodis M
AutDmobilt MMU~CNIWS Rcn;lult SA
s a n h BNP Paribm SA Swedtwnk AB. A Svensh I landelsbankm AB. A Banca Inresa 5 A Soclere Generaye, A Uanske Bank AS KBC C ~ w p NV SNS Red Lrwp NV Natixis i'OSt31 Savings Bank
Brewers Rmod Kicard SA Carldxg AS, B Carlsbeg AS. A
31:IKWL STOCK EXCI IrWCE LISTING
I Y R A EUR
N O R NOK
FRA EUR
F M EUR
FRA EUR SWE SEK SWE SEK ITA ELiR FRA FUR UNK DKK BEL EUR NLl) EUR FRA EUR GRC EUR
14,725,685
7,453,473
2,768,056
14.iYR.875
50.8Y8,lOl $7,927,315 43.62 1,189 39,235,260 36.65b.401 30,563,381
14.787.WO 2,953,664
34 1.876
284,791,259
i7.no7.072
34,646,358 >1,341.803
564.82 1
56,552,902 Broadwring &I Cable TV Media1 SPA
Building Products Schindler Holding At i khindlet Holding AC. k g D
ITA EUK
CHE u IF C1iE c1 IF
2 1,130,689
56.0P8.916 14.154,4W
70,243,356 Casinm & taming ladbrokes PLC Commodity Chemicals S i b AG
Construction & Engineering kme OYJ. B
Construction L Farm Machinery Junghcinnch Ati. pfd.
Depamrwnt Stom Jelmoli I lolding AG
Diveflif~ed Chemicals Koninklijke DSM NV Arkcma
CBR GBP
CI 1E CHF
FIN EUR
DEU EUR
CHE CI IF
NLD EUR FRA EUR
11,924,903
34.841.491
2 1 .L2Y.i36
10,215,207
18,312,149
44,906,643 16.281.421
0.55
0.28
0.10
0.55
1.89 1.78 1.62 1.46 1.37 1.14 0.66 0.55 0.11 0.01
10.5Y
1.29 0.79 0.02
2.10
0.79
2.08 0.53
2.61
0.44
1.30 - 0.79
0.38
0.68
1-67 0.61
Diversifid Cornmerial Services Techem AG OEU EUK
61.188.064
17,327,570
2.28
0.64 Diversified FlnuKhl Services Fortis Deursche Bww AG Hypo Red Estate Iiolding AG Aaw31 Bank AG Arnancora Comm VA Euronext NV D. camegie 6r Co.. AB
BEL EUR DEU EUR UEU EUR DEU EUK BEL EUR NLD EUR SWE SEK
55.241.829 36,980,090 29.513927 24,298.931 21,412.620 lh.RY1.783 12.389.742
196.728.872
2.05 1.37 1.10 0.90 0.80 0.63 0.46
7.31
110
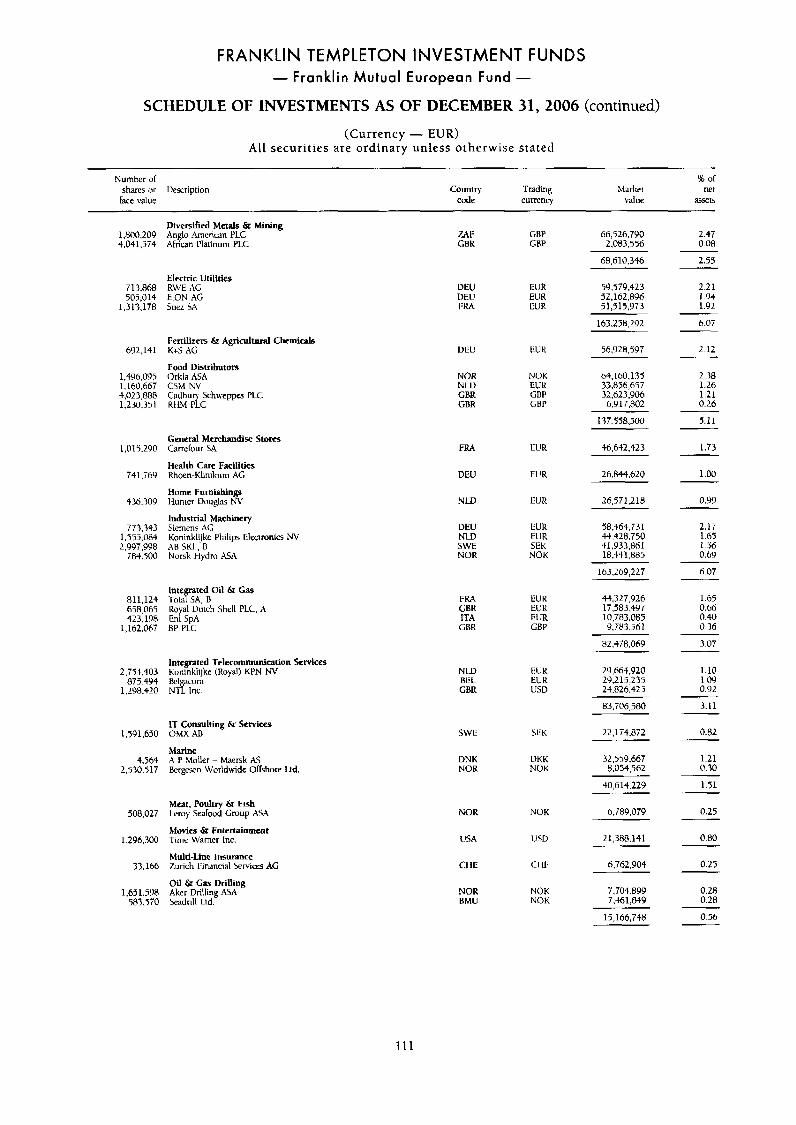
FRANKLIN TEMPLETON INVESTMENT FUNDS - Franklin Mutual European Fund -
SCHEDULE OF INVESTMENTS AS OF DECEMBER 31,2006 (continued)
(Currency - EUR) Al l securities are ordinary unless otherwise stated
Number ol % of shares or Description Country Trading Market net lace value code currency value asset5
1,800,209 $.041,374
713,868 505,014
1.313.178
692.141
1,496.OY 5 1,160,667 4,023,888 1,230,351
1 .O1?.290
741,769
436.309
773.343 1,553,084 2.997,998
784.500
811.124 658,065 423,198
1,162,067
2,754,403 875,494
1,298,420
1,591,650
4.564 2.530.517
508,027
1,296,300
33.166
1.651.5YP 583.570
Diversified Metals & Mining Anglo Arncrican PLC African Platinum PLC
Electric Utllitles RWE AC E.ON AC Suez SA
Fertilizers & Agricultural t h e m i d s K+5 AG
Food Distributor$ Orkla ASA CSM NV Cadhurj Schweppes PLC KtlM FLC
General Merchandise S t o w Grrrelour SA
Health Care Facilities Khoen-Klinikurn AG
Home Furnishings Hunter D~q l .?s NV
Industrial Machinery Siemens AG Koninklijke Fhilips Ikimnics NV AB SKI:, B Norsk llydm .&I
lnte ated Oil & Gas T o P ~ S A , B b y a l Dutch Shcll PLC. A h i SpA BP PLC
lntegratcd Telecommunication Services lioninklijke (Royal) KPN NV Hflgacom NTL Inc.
IT Ccrnsdting & Services UMX AB
Marine A P Moller - Maersk AS Bergcsen Worldwide Okhore Lrd.
Meat. Poultry & Fish k r o y Seafood Croup ASSA
Movies Qr Entertainment Time Warner Inc.
Multi-Line Insurance Zurich Financial Services AG
Oil & Ga% Drilling Aker Drilling ASA Seadrill Ltd.
ZAt; CBK
DEU DEU i X 4
DEU
NOR N LU GBR GBR
FRA
DEU
NU)
UEU NU) 5WE NOR
I W CBK ITA
CBR
NU) BEL GBR
SWE
DNK NOR
NOR
USA
CIIE
NOR BMU
GBP GBP
EU K EUR EUK
EUK
NOK ElJK CBP GRP
EUR
ELIR
EUR
tUR EUR SEK NOK
EU K EL'R EUR GBP
EU K lrlJK USD
SEK
DKK NOK
NOK
USD
CI 11.
NOK NOK
66,526.790 2.083.556
2.47 0.08
68,610.346
59379,423 52,162.896 51,515,973
lb3.258.292
56.928.397
64.160.133 33,856,657 32,623,906 6.9 17,802
2.55
2.21 1.94 1.92
6.07
2.12
2.38 1.26 1.21 0.26
137.358.500
46,652,423
5.11
1.73
26.844.620
26,571,218
58,464.731 44.428.750 41.1133.861 18.44 1.885
1-00 ~
0.9Y
2.17 1.65 1.56 0.69
163,269,227
44327,926 17,583,497 10,783.085 9.783.561
6.07
1.65 0.66 0.40 0.36
82.4i8.069 3.07
29.664.920 29,215.235 24.826.425
83,706.580
1.10 1 .os1 0.92
3.11
22,174,872
32.559.667 8.054,562
40.614.229
6.789.079
21,388.141
6,762,904
7,704.899 7,461,649
15,166,748
0.82
1.21 0.30
1-51
0.25
0.80
0.25
0.28 0.28
0.56
111
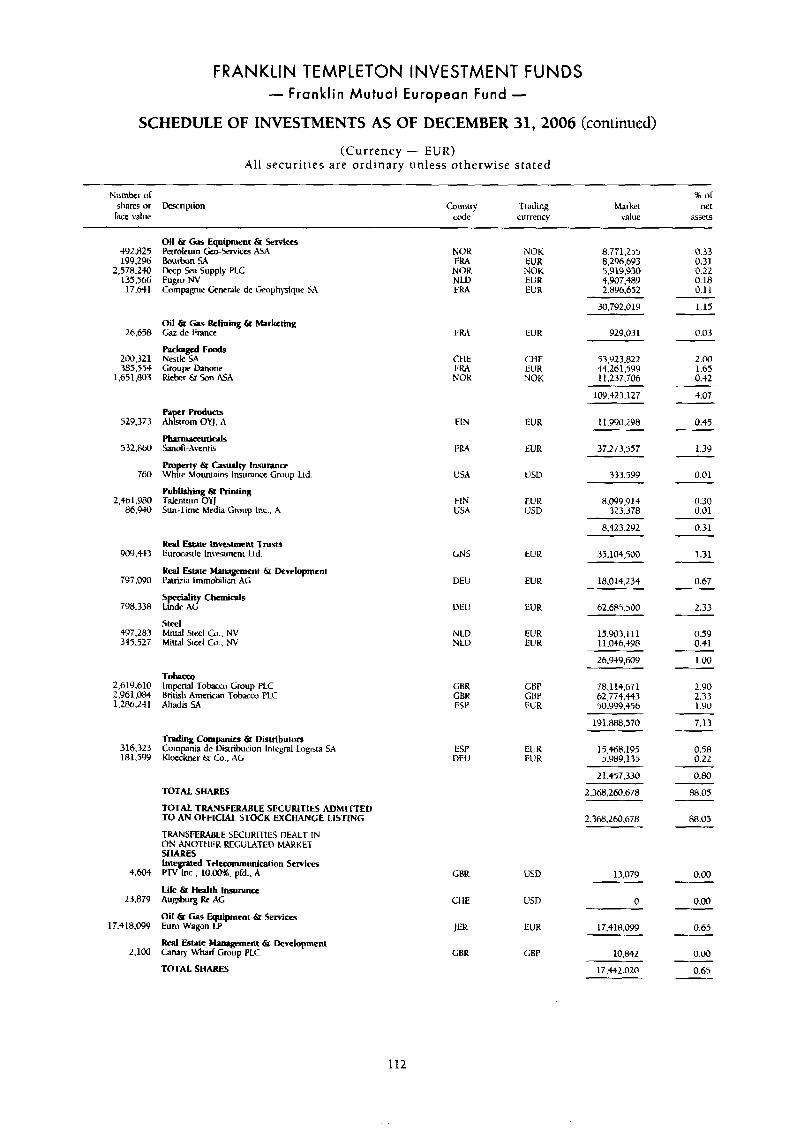
FRANKLIN TEMPLETON INVESTMENT FUNDS - Franklin Mutual European Fund -
SCHEDULE OF INVESTMENTS AS OF DECEMBER 31,2006 (continued)
(Currency - E U R ) Al l securities are ordinary unless otherwise stated
Number of % lsr
k e value cude currency villue as5ets shares or Derriplion buntry Trading Market net
492.825 199,296
2,578.240 135.566 17,641
26.658
200.321 385.55.t
1.65 1,803
529,373
5 3 2 . W
760
2,461,1180 86.9$0
909.443
797,090
7Y8*33S
497,287 345.527
2,619.610 2,961,084 1.286.241
316.323 181,599
4.604
23.879
17.318,KW
2.100
Oil & Gas Equipment 6r Services Petroleum *Services M A &>Uhon M
Fugro NV Cmpapir Ckncralr de Geophysique SA
De€p sea Supply PLC
Oil & Gas Refining & Marketing Laz de I:ram
l ’ a c k d Fmds Neslle SA Group Danone Ricbcr 6r bn ASA
Pa r P r c d u m *Gram oyj, r\
P h l I W X U W Sanofi-Aventis
Property Sr twnlty lmuranm Whitc Mounlaim Insurmre Criiup Ltd
Publishing & Printing Talenturn OYJ Sun-Time Media Cmup lnc.. A
Real Euatp lnMsrwnt TNSS Eurocasilc Invewrnent Ltd.
Real Estate Management & Development Patrizia lrnmobilien AC
Speciality Chemids Lmdc AG
Steel Muul Stecl Co.. NV Mittal Siml C L NV
Tolnlcco Imperial T o h i Group PLC British American 1~obacc-o PLC Ahadis SA
Trading Cornpanics & Distrlbutom Compnia dc Diaribuciun lnregnl Logisla SA ldueckner & Lo.. AG
TOTAL SHARES
TOTAL TWVSFERAELE SECURITLES ADMlTTED TO AN OFFICIAL STOCK EXCHANGE LISTING
TRANSFERABLE SECURITIES DEALT IN ON &P4OTILER REC.L;MTED MARKET SHARES Integmted Tclemmmunirration Services Mv Inc., 10.UOI. pfd.. A
Life & Health Insurance Augsburg Re AG
Oil Q Gps Equipment & Services Euro Wagon LF’
R d Estate Management & Development Carwry Wharf Group PLC
TOTAL SHARES
NOK F!M NOR NU, FRA
FRA
CHE FRA NOK
FlN
I:RA
USA
FIN USA
GNS
DEU
DEU
N I.D N LU
CBK GBK ESP
ESP DEU
GBR
CI IE
JW
GBK
NOK EUR NOK EUR EUR
EUR
CHF CUR NOK
EUR
EUR
USD
EUK USD
EU K
EUK
EUR
EUR EUR
GHP GBP EUR
EUR EUR
LiSD
USD
EUR
G U P
8,771.255 8,296.6Y3 5,919,930 4,907,489 2.896.652
33,792,019
929.031
53.923.822 Mi26 1 :5Y9 11,237.706
1N.423.127
11.990.298
37,273,457
733.599
8.OY9,9l+ 323,378
35,104,500
18,014,234
62.685.500
15.9O3.111 11.046.+Y8
26.94Y.609
78.1 14,671 62,774.443 50,999.+56
191.888.370
15,468.195 5,989,135
21,457,330
2,368,260,678
2.368,260,678
13.079
0
17,418,099
10842
17.442.020
0.33 0.31 0.22 0.18 0.1 I 1.15
0.03
2.00 1.65 0.42
4.07
0.45
1.3Y
0.01
0.30 0.01
0.31
1.31
0.b7
2.33
0.59 0.41
1.00
2.90 2.33 1.90
7.13
0.58 0.22
0.80
88.05
M.03
0.00
0.00
0.65
0.00
0.65
112
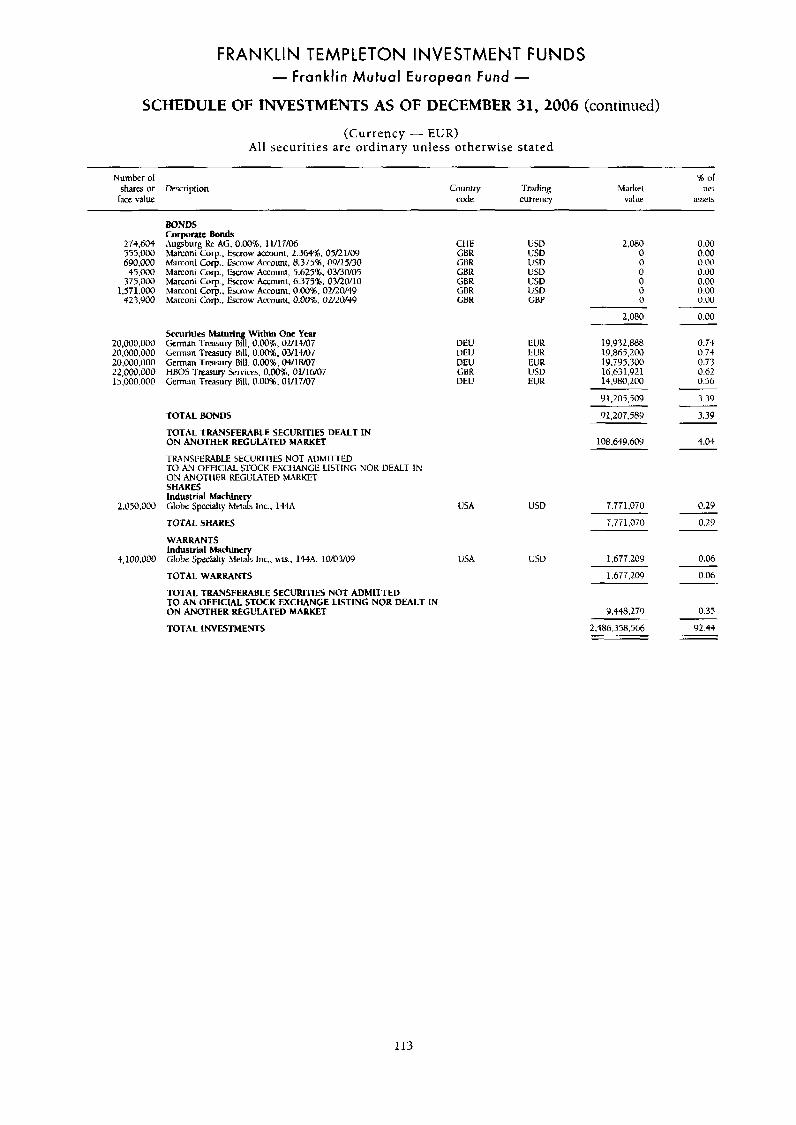
FRANKLIN TEMPLETON INVESTMENT FUNDS - Franklin Mutual European Fund -
SCHEDULE OF INVESTMENTS AS OF DECEMBER 31,2006 (continued)
(Currency - EUR) All securities are ordinary unless otherwise stated
~ ~
Number of shares or Description
race value Country Trading code currency
B of Market net
value assets
274.604 555,000 690,000 45 000 ~.~~~
375.000 1.j71.000
423,900
BONDS Corporate Bonds Augsburg k AG, 0.00%. 11/17/!M hlarconi COT.. Escrow account. 2.364% 05/21/09 hhrcmi Corp.. k r n w b u n t , 8.375%. 09/15/30 Marconi Corp., I-%row Account, 5.625%. 03/30/05 Marconi Colp.. Escrow Aixuunt, 6.375%* 03/20/10 Marconi Corp.. k m w Amount. 0.00%. 02/20/49 Marconi COT.. &row Awount. 0.00%, OZQO/+Y
CI IE CBK CBR CBR GBR CBR GBR
USD USU USD USD USD USU GBP
2.080 0 0 0 0 0 0
0.00 0.00 O.O@ 0.00 0.00 0.00 0.00
2,080 0.00
20,000.00i) 20.000.000 20,000,000 22,001).000 15.000.000
Serurities Mnturi Within One Year German Treasury #I, 0.001, 0U14Al7 German Trcasury Bill, 0.00%. 03114X17 German Tltusury Bill. 0.00%. 04/18107 HBOS Treasury knirrs. 0.00%. 01/16/07 Cermnn Treasury Bill. 11.00%. OY17/07
UEU DEU DEU GBK DEU
EUK EUK EUR USD EUR
19.9 32.888 19.Mj.200 19.T95.300 16.631921 14.980.200
0.74 0.74 0.77 0.62 0.56
2,050,000
4,100.000
USA
TOTAL BONDS
TOTAL fRkYSFERABLE SECURITIES DEALT IN ON ANOTHER REGULATED MARKET
TMNSFERAWBLE SECURI~IIES NOT ADhiI~I~l~E’U TO AN OFFICWL S-I’OCK EXCIIANCE LISTING NOK DEALT IN ON WOTIIER KECUL\TED MARKET SHARES Industrial Mnrhin Globe Spcrialty M e 3 Inc.. lMA
TOrAL SHARES
WARRANTS Industrial Machine Globe ~prcria~iy idL In<.. xis., 1 ~ r \ . ~O/OYOY l!SA
T o m wmtmts TOTAL TR.C?iSFERABLE SECURITIES NOf ADMITTED TO AN OFFlClAL STOCK EXCHANGE LISTING NOR DEALT IN O N ANOTHER REGULATED MARKET
TOTAL INVESTMENTS
USD
USU
9 1.L05.509 3.39
91,207,5Rb)
108.649.609
3.39
4.04
7,771,070 0.29
7,771.070 0.29
1.677.209 0.06
1.677.209 0.06
Y.448.279 0.35
2,486.358.566 Y2.4-l
113
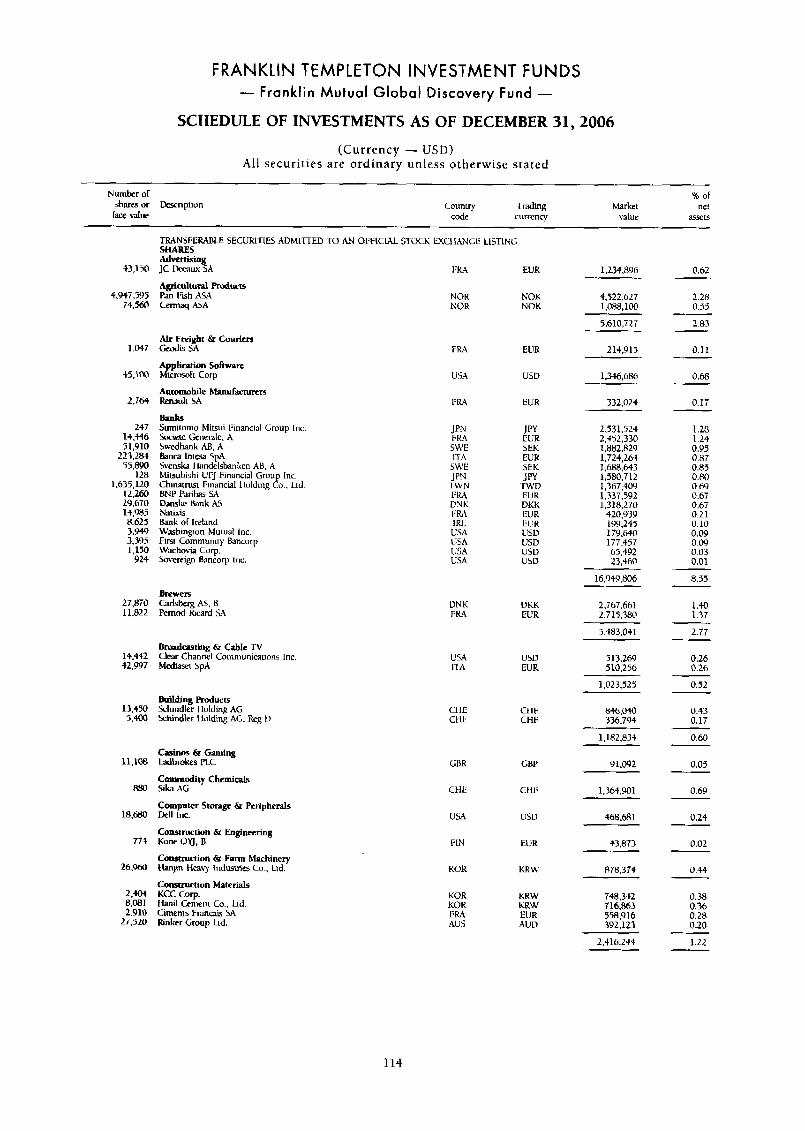
FRANKLIN TEMPLETON INVESTMENT FUNDS - Franklin Mutual Global Discovery Fund -
SCHEDULE OF INVESTMENTS AS OF DECEMBER 31,2006
(Currency - USD) A l l securit ies are ordinary unless otherwise stated
~ ~-
Numkr or % of shares or k n p t i o n Country Trading Market net h e b d U e code currency value a5se15
TRANSI’ERARLE SECURITIES h D M I n E D TO AN WFIClAL STOCK SHARES Advettising JC h w SA
Agricultutal R&ts Pan Fish ASA Cermaq A5A
EXCHANGE LISTING
43,130
4947,595 74.560
1.047
45,100
2,764
247 14.4% 51,YIO
223.284 55,890
128 1.635,lAI
12.260 29.670 14,9115 8.625 3.949 3,395 1,150
024
27.870 11,822
14,442 42.997
13.STO 5.400
11.loB
880
18,680
771
16,960
2 . w 8.0111 2.910
27.520
Flu EUR 0.62 1.234.896
NOR NOK NOR NOK
4.522,627 1,088,100
2.28 0.55
2.83
0.11
0.68
0.17
1.28 1.24 0.95 0.87 0.85 0.80 0.69 0.67 0.67 0.21 0.10 0.09 0.09 0.03 0.01
5,610,727
214.915 Air Ftright 6r Couriers & d i S SA
Applimtion Software M i c m f t Corp.
Automobile Manufacturers Relwult S A
nililk Sumitorno Mitsui I:inanci31 Group Inc. kciete Genenle, A Swedbank AB, A hnca Inma SPA Svenska 1 Imdelsbwiken AB. A Mitsubishi 1JFJ Financial Group Inc. Chinatrust Financial I lulding (3.. Ltd. BNP h r i h SA b m k c bnk i\s Naiiris Bank or Ireland b’ashingion Muiual Inc. Fim Community hncorp Wachovia Corp. Smrrrign Bancorp inc.
FIW EUR
1.346.686 USA usv
1:nA ElJR 332,024
JPY EUR SEK
K S W E
2.5 31.524 2,452,330 1,882829 1.72$,264 1,688.643 1,580.7 12 1,367,409 1.337.592 1,318.270
420.939 lY9.245 179.640 177.457 65.492 23,460
16,949.806
2.767.661 2.715.380
ITA EUR
1:R.I EUR VNK DKK l+A IWR 1 RL EL‘R USA USD USA USD USA USD VSA USD
8.55
1 .a 1.37
2.77
0.26 0.26
0.52
0.43 0.17
0.60
U N K UKK FR4 EUR
5,383,041 Braadasling & Cable TV Clwr Channel Communimtions Inc. hiediaset SpA
USA USD ITA EUR
513.269 510,256
1.@23,525 B u i i g Roducts khindler I lolding AG Schindlcr kfolding AG. Fkg D
846,040 336.794
1,182,834
91.092 Casinos Q Gaming Ladbrokes PLC
Commodity Chemicals Silw AG
GBR GBP 0.05
0.69
0.24
0.02
0.44
0.38 0.36 0.28 0.20
1.22
CtIE Ct il; 1.3&t.901
468.68 1 Computer Storagr & Dell Inc.
Peripherals USA U5D
Construction & Engineering Kone OYJ, R
Collstruction Q Farm Machtnery Hanjin Heavy industries Co., Lid.
Gnwmction Materials KCC COT. l h i l Cement Co.. Ltd. Cirnents Fnncais SA Rinker Group Lid.
93.873 FIN EUR
KOK KRW 870,374
748.3+2 716,863 558.916 392.123
KOR KRW KOR KRW F RA EUR AUS AUV
2.416.244
114
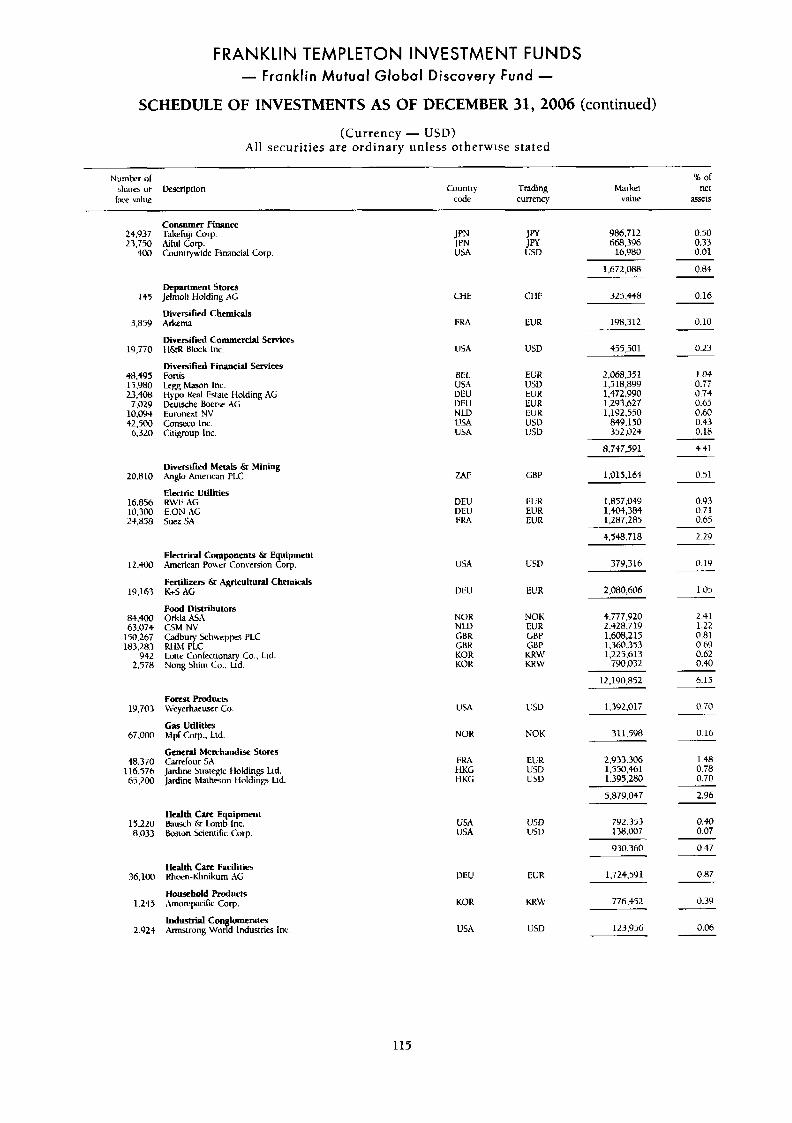
FRANKLIN TEMPLETON INVESTMENT FUNDS - Franklin Mutual Global Discovery Fund -
SCHEDULE OF INVESTMENTS AS OF DECEMBER 31,2006 (continued)
(Currency - USD) All securities are ordinary unless otherwise stated
Number of 5% of
face value code currency value a5XK
shares or lkscription Country Trading Markel net
Consumer Finance Takekji Corp.
Countrywide Financial Corp ArUi CUT.
24.937 23,750
400
145
3,859
19,770
4H.495 13.980 23,408 7.029
10.094 42,500 6,320
20.8IO
16.856 10,300 14,858
1 2 . m
19.163
84.400 63.074
150.267 183.283
942 2,578
1Y.703
67,000
48.370 116.576 65.LW
13,220 8,033
36,100
1,245
2.92+
JPN JPN USA
CHE
FRA
USA
BEL USA LIEU UEU N LD I!% USA
ZAF
DEU DEU I;M
USA
I)EU
NOR N LU GBR G B K KOR UClK
Jm JR USD
CI 11:
EUR
USD
EUR USV EUR EUR EV K USD USD
CBP
EEK EUR EUR
LSU
EUK
NOK EUR CBP GBP KRW K R W
LSU
NOK
E1.X USD USD
USD USV
EUR
KKLV
um
986.712 668.396
16,980
0.50 0.33 0.01
0 . ~ 4
0.16
0.10
1,672,088
325.448 Uepartment Stores Jelmoli Holding AG
Diverrifted Chemicals Arkma
Diversified Commercial Services t I&R Block lnc.
Diversitied Financial Services Fortis Le= M a n Inc. Ilypo Kea1 Estate Holding AG kuische Boerse AG Eumnexl NV Conswo lnc. Cirigmup Inc.
198.312
435.501 0.23
1.04 0.77 0.74 0.65 0.60 0.43 0.18
2.068.351 1,516,899 1.472.990 1.29 3.627 1,192.550
849.150 352.023
8,747,591 4.41
0.51 Diver&t’d Metals & Mining Anglo American P1.C
Electric Utilities
1.013.164
1.857.049 0.93 0.71 0.65
2.29
R\VE AG E.ON Ac; Suez SA
1,404,384 1,287,285
+.548.718
379 ,3 16
2,080,606
4,777,920 2.528.719 1,608,215 1.360.353 1,225.613
790.032
0.1Y
1.05
Electrical Components & Equipment .hencan Power Cmvcrsion Cop.
Fertilizers & Agricultud Chemicals K+S AG
Food Distributors Orkla ASA G M NV Gdbur). Schn-epp PLC HIM PLC Lolie Cimfectionav Co.. 1 . d Nong Shim Cu.. bd.
2.41 1.22 0.81 0.69 0.62 0.40
6.15 12,190,852
0.70
0.16
Forcst Prcducts Weyerhaeuxr Cn
Gas litilitles hip[ Corp.. Ltd
t c n c d Merchandise Stores Carrefour SA Jardine Stniegic tlolding Ltd. Jardine Maheson Holdings Lld
1.3YL.01T USA
311.598 NOR
2.933.306 1,550,461 1.395.280
1.48 0.78 O.TO
2.96
0.40 0.07
L.Lw t IKG HKC;
5,879.047
Health Care Equipment Bausch 6z h m b Inc. h i o n kientific Corp.
792.393 138.007
USA USA
930.360 0.47
1,723,591
776.452
0 . ~ 7
0.39
0.06
Health Cam Facilities Rhuen-Klinikum AC
Hous~hoM Roducts Amorepacific Cop.
I n d d Con lomcmtm Amstrong &&I Industries Inc
UEU
KOK
USA 123.956
115
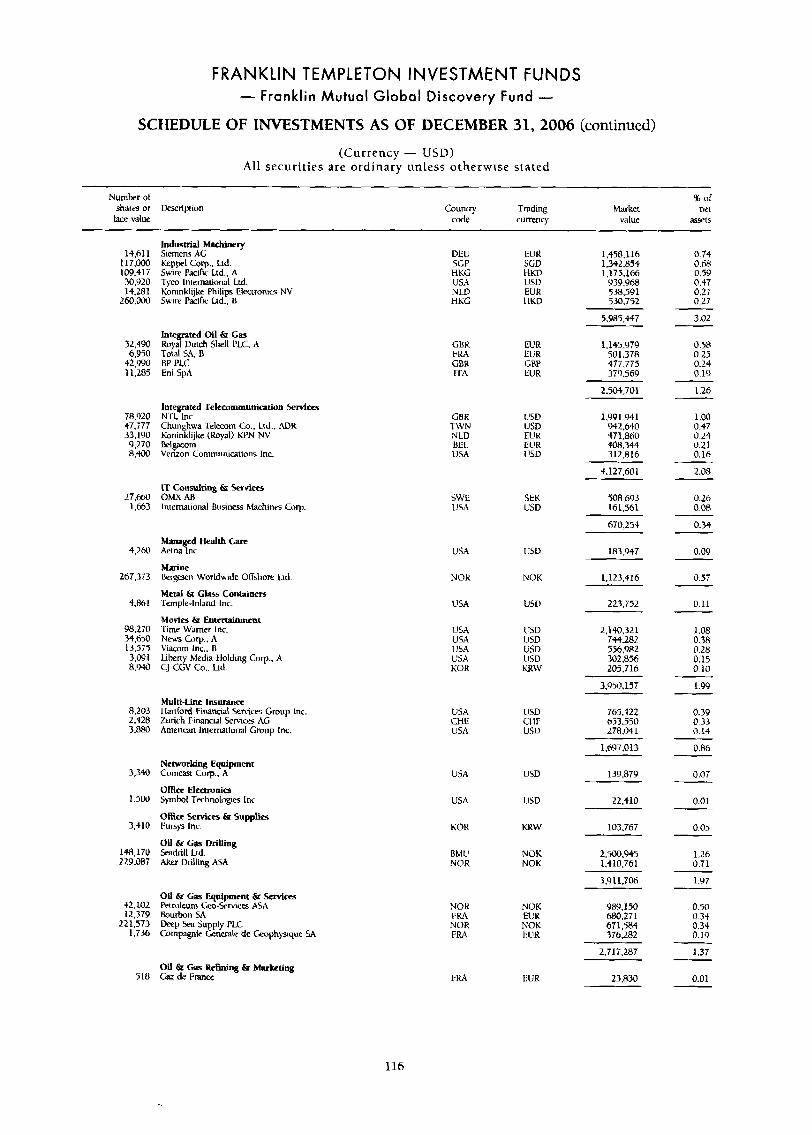
FRANKLIN TEMPLETON INVESTMENT FUNDS - Franklin Mutual Global Discovery Fund -
SCHEDULE OF INVESTMENTS AS OF DECEMBER 31,2006 (continued)
(Currency - USD) Al l securit ies are ordinary unless otherwise stated
Number id Ih of shares or Description Country Trading Market nei race \due code currency value aSY%
Industrial Mnehiwy Siemens AG Keppel Corp., hd. Swim Pacific Ind., A Tyco Iniemtional Ltd. Koninklijk Philips Eleuronics NV Swire Pacific Ltd., B
DEE EUR 1,458,116 SGP SGD 1,342.854 tiKC HKD 1,175.166 us;\ usu Y39,Yrn N LD EtiK 538.59 1 HKG 1 LKD 530.752
14,611 I 117.000 109,417 30.920 14.281
260.000
32,490 6.950
42.Y90 1 1.285
78.920 47,777 33.190 9.170 8.400
27.660 1,663
4.260
267,373
4361
98,270 34,630 13,575 3,OYl 8.940
8.203 2.428 3.880
3,340
I.S(x1
3,410
148.170 229.087
t2.102 12.379
221.573 1.736
5 I8
0.74 0.68 0.55) 0.47 0.27 0.27
3.02
0.58 0.25 0.24 0.19
1.26
1 .oo 0.57 0.24 0.21 0.16
5,985,447
Integrated Oil & Gas Royal Dutch Shell PLC, A Total SA, B BP PLC Eni SpA
CBR FIW GBK ITA
EUR 1,145,979 501.378 477.775 379.569
2.504.701
EUR CBP EUR
Inregrated Telccomrnunication Senices NTL Inc. Chun hura .Ielecom Co., Lid.. AUK lioninhgke (hyal ) KYN NV Belgacom Verizon Communications Inc.
1,991.941 942.640 471.860 4008.344 312.836
CBR T W N N LD BEL. USA
USD lJSD EUK EUR USD
4.127.601 2.08
0.26 0.08
0.34
0.09
0.5i
0.11
1.08 0.38 0.28 0.15 0. 10
1.99
0.39 0.33 0.14
0.86
0.0i
0.01
0.05
1.26 0.71
1.Y7
-
0.50 0.34 0.34 0.19
1.37
0.01
-
IT Consulring 6t Services Ohm AH Iniemiional Business Machines Corp.
SWE USA
SEK USV
508.693 161,561
610,254
183.Y47 Managed Health C m Aeina Inc
Marine krgescn Worldmidc OKshorr [.id
M e d & G b s s Containers Icmple-Inland InL.
Movies & Entenainment 1 ime Wdrncr Inc. News Corp.. A Viacom In<.. B Lheny Media tlolding Corp , A CJ CGV Co.. Ltd
USA
NOR NOK 1,123.416
USA USD 223,752
u SA USA USA USA KOR
USD USD USV (!SO K R W
2,140,321 744.282 556,982 302,856 205.716
3,950,157
Multi-Lie Insurance Ilartford Firmmid Senices Group lnc, Zurich 1;inancial Services AG American Iniemtional Group Inc.
USA CHE l!SA
USD CI IF USD
765.422 653.550 278.041
1,697,013
Networking Equipment Comcasi Corp.. A
Omee Electmnia Symbol Technologies lnc
OKct Services &I Supplies Fursys Inc.
Oil P Cas DriUIng seadrill Lid. hkcr Drilling .SA
USD 139.879
22,410
103,767
2.500.945 1.410.76 1
3.9 11.706
lJSD
KRW
NOK NOK
Oil & Gas Equipmrnt & Setvim Petroleum Geo-Services ASA t l o u h n SA Deep 5ea h ply PLC Coinpagnie &nerale de Geophysique SA
Y8Y. 150 680.271 671,584 376.282
NOR 1:RA NOR FRA
NOK E I X XOK EUR
2.717.287 Oil & Gas Refining & Marketing Gaz de I:rancr 23.830 FRA IiUR
116
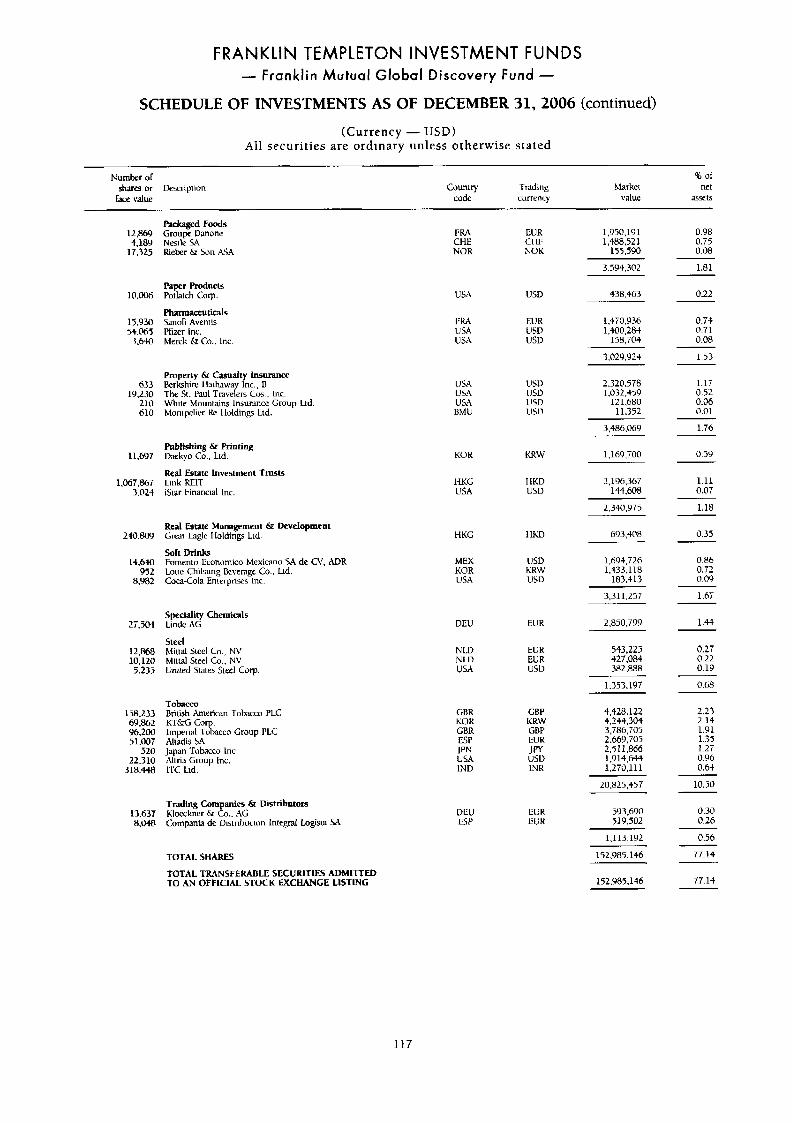
FRANKLIN TEMPLETON INVESTMENT FUNDS - Franklin Mutual Global Discovery Fund -
SCHEDULE OF INVESTMENTS AS OF DECEMBER 31,2006 (continued)
(Currency - USD) All securit ies are ordinary unless otherwise stated
Kurnbcr or sham or Dexripiinn
h e value
% of Country Trading Market net
codc currency value a 5 W 5
Packaged Foods Groupe Ibnonc NSIIL SA Uieber & Son ?SA
0.98 0.75 0.08
12.869 4.189
17.325
1(1,OM
15.930 54.c-i vJ4a
633 19.230
2 LO 610
11,697
1,067,8667 3,024
240.809
1+,6W 952
8.Y&2
Z i , j N
12.868 10,120 5.235
158,233 69,862 Y6.200 51,007
520 22.310
318.448
13.637 8.048
FRA CHE NOR
USA
I;M USA LISA
l!SA USA USA HMU
KOR
HKG USA
HKG
MEX KOR USA
DEI:
N LD N LU USA
EUR CI 11: NOK
USD
EU R USD USD
us11 1150 USD uju
KRW
HKD USD
IHKD
usu KRW USD
EUR
EUR EU R USU
1,950.19 1 1,488.521
155.590
3.594.302 1.81
0.22 Paper Roducts Potlatch Corp.
Pharmaceuticals Sanoh-Avent is Ffizer Inc. Merck Q Co.. Inc.
438.463
1,470.Y36 1,400,284
158.704
0.71 0.71 0.08
3,029,924 1.53
1.17 0.52 0.06 0.01
Property 6r Casualty Insurance Berkshm lhihawa Inc B The St. Paul TraveLrj cb , Inc. White Mountains Insurancc Group Lid Monrpelier Hf I loldings Ltd.
2.320.578 1.032.459
121,680 11.352
3,486.069
1,169 .TOO
1.76
0.59 Publishing & Printing Lhekyo Co., Ltd.
Real Estate Investment Trusts Link REIT iStar Financial Inc.
2.196,367 144.608
1.11 0.07
2,340.Y75 1.18
0.35 Real Estate Management 6r Development Grea hglc Holdings Ltd.
Fornenio Econoinico Mexiuno SA de CV, ADR Lorre Chilsung Beverage Co., Ltd. Corn-Cola Enterpriws Inc.
sort rinks
693.408
1.6r34.726 1,433,118
183.413
0.86 0.72 0.0')
l.bT 3.311.257
2,850,199 1.44
0.27 0.22 0.19
0.bH
Speciality Chemids Lindc AG
Steel hiittal Steel Co., NV Mitral Steel to . . NV United States Stet1 Corp
543,225 421.084
1.353.197
382.888
4,428.122 4,244.304 3,786,705 2.669.705 2.5 11.866
2.23 2.14 1.Y1 1.35 1.27 0.96 0.64
10.50
Tobacco British American Tobacco PLC GBR
KOK GBR ESP
iJE IND
GBP KKW GBF EUR J PY usu INR
K l B G Corp. lmpenal Tohccii Group PLC Alradis SA Japan Tobacco Inc Aliria Group Inc. II'C Lid.
1,914,644 1,2i0,111
20.825.457
0.30 0.26
0.56
77.14
77.14
Trading Companies & Distributors Kloeckncr dr Co.. AC Cumpanh de Distrihucion Integral hgiaa .SA
593.690 519.502
1.113.192
VEU ESP
EUK EUK
152.985.146 TOTAL SHARES
tOTAL TRANSFERABLE SECURITIES ADMITTED TO AN OFFICIAL STOCK fXCHANGE LlStlNG 1 SZ.YR5.146
117
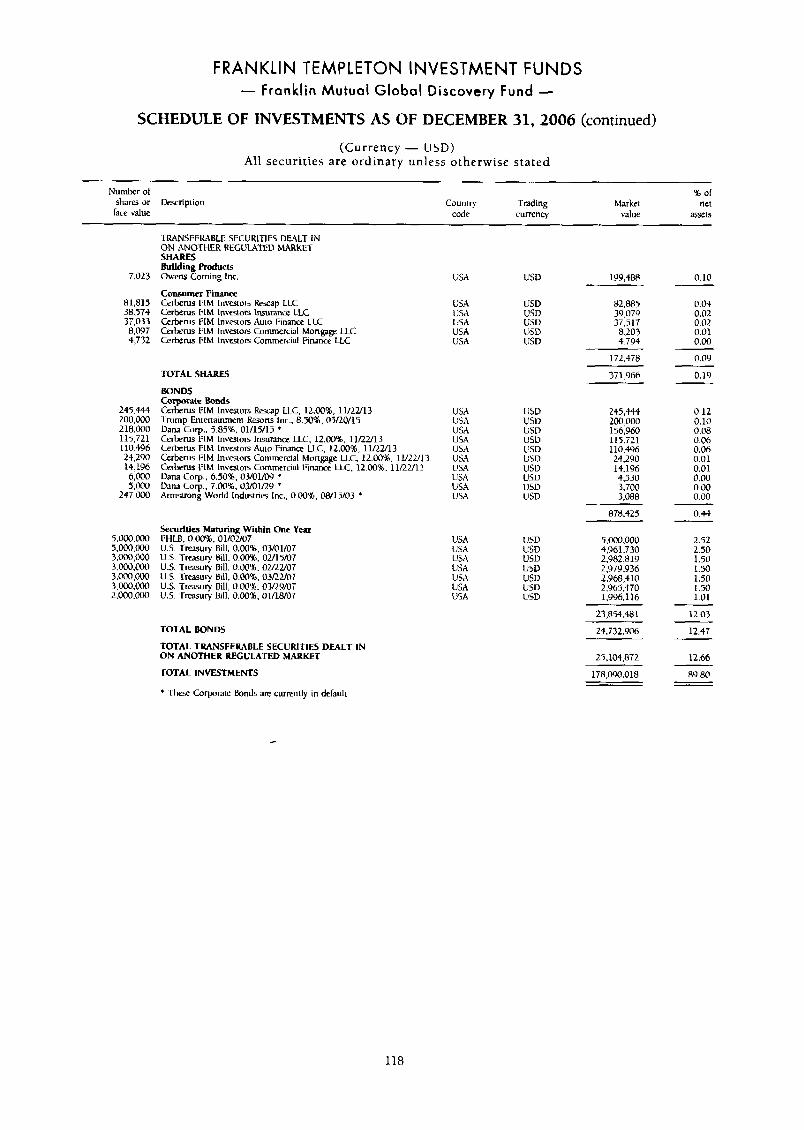
FRANKLIN TEMPLETON INVESTMENT FUNDS - Franklin Mutual Global Discovery Fund -
SCHEDULE OF INVESTMENTS AS OF DECEMBER 31,2006 (continued)
(Currency - USD) All securities are ordinary unless otherwise stated
Number of shares or Description face value
Counlry Trading code currency
hlarket value
% of net
a5W5
7.023
81.815 38,574 37,033 8.097 4.732
245.444 200,000 218.000 115,721 110.496 24.290 14,196 6,000 5,000
147.000
5.000.000 5.000.m 3 . O O O . ~ 3.000.m 3.m.m 3.000.000 2.000.000
TRANSFERABLE SECURITIES DMLT IN ON ANOTHER REGUNTEU MARK1:T SHARES Building Products Owens Corning Inr.
Consumer Financo Cetberus I;IM lnvestorj Rescap LLC Ccrberus FlM Investors Insurance LLC Cerberus FIM lnvesrors Auio Finance LLC Cerberus FIM Investors Cominercial Mongge LLC Cerberus Flht Investors Commercial Finance LLC
U M USA USA USA USA
TOTAL SHARES BONDS corporate Bonds Cerberus I:IM lnveaors Rescap LLC, 12.00%. llCU13 Trump Enirnainmenr Resorts Inc., R.TO%. 05l20115 Dana Corp.. 5.85%. 01/15/15 * Ccrberus L;IM Invcsicm Insurance LLC. 12.00%. IlRU13 Cerberus FIM Investors Auto Finance LLC, 12.00%. l lnU13 Cerberus I:IM lnvcstors Commercial hiongage LLC. 12.00%. 11/2U13 Cerberus I:lM lnves\ors Commerdal 1:inance LLC. 12.0%. 11/22/13 Dana COT.. 6.501. 03/01/OY *
USA USA USA USA USA USA LISA LJSA USA USA
Dam Corp.. 7.00%, 0mIl29 * Armstrong World lndustris Inc., 0.M%, (?8/15/03 *
Securities Maturing Within One Year I'HLB. 0.00%, 01/02/07 US. T m u r y Bill, 0.00%. 03/01/07 U.5. Treasury Bill. 0.00%. 0U15/07 U.S. Treasury Bill. 0.00%. 0ZRU07 U.S. Treasury Bill, 0.W% 03RM7 U.S. Treasury Bill, 0.03%. 03/29/07 E.5. 'Ttusury tl i l l . 0.00%. 01/18107
TOTAL BONDS
TOTAL TRANSFERABLE SECURITIES DEALT IN ON ANOTHER REGULATED MARKET TOTAL INVESTMENTS
* These Grporate bnds are currently in defm~lt
USA USA USA LJSA 1JSA USA USA
VSV 199,488
USD 82,885 VSV 39,079 USD 37,517 USD 8,203 USD 4.794
172.478
371,966
0.10
0.04 0.02 0.02 0.01 0.00
0.09
0.19
USV USD US13 USU USV us13 USV usu USD USD
USD USD USD USD USV us13 USD
245,444 Loo,000 156,960 115.721 110,496 24.290 14,196 4,530 3.700 3,088
0.12 0.10 0.08 0.06 0.06 0.01 0.01 0.00 0.00 0.00
0.+4
5.000.000 4961,730 2,982,819 2979.936 2 .Y 68.4 10 2,965,470 1,996,116
2.52 2.50 1.50 1.50 1.50 1.50 1.01
23,854.48 1
24.732.906
12.03
12.47
25,104,872
178,090.018
12.66
89.80
118
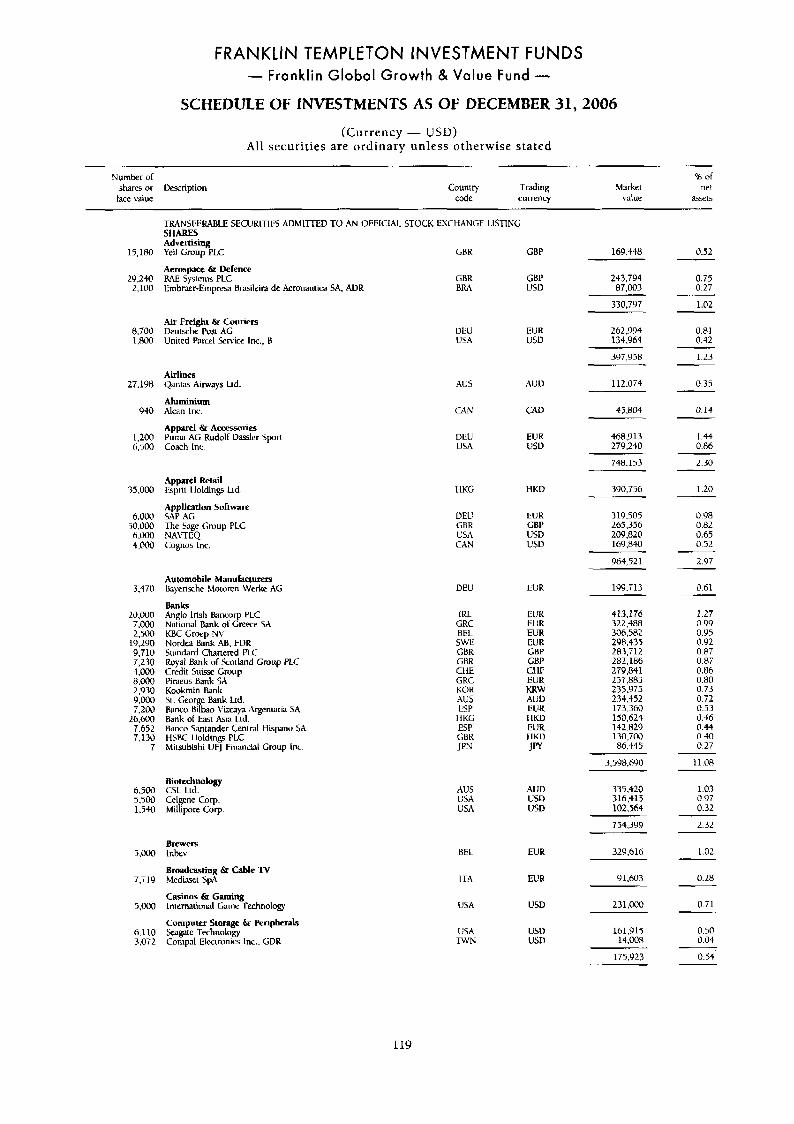
FRANKLIN TEMPLETON INVESTMENT FUNDS - Franklin Global Growth & Value Fund -
SCHEDULE OF INVESTMENTS AS OF DECEMBER 31,2006
(Currency - USD) All securities are ordinary unless otherwise stated
Number of shares or Description lace d u e
9h of Country Trading Market net code curreniy value s x t s
TRANS1:EKABLE SECURITILS ADMITIED TO AN OFFICML STOCK EXCHANGE LISTING SHARES Advertising Yell Group PLC GBR GBP 15,180
29,24@ 2,100
8.700 1 .Roo
2i.198
YW
1,200 6.OO
35.000
6.000 50.000 6 . m 4.000
3.470
20.000 7.003 2.500
lY.290 9,710 T.230 4.ooo 8.000 2.930 9.000 7,200
26,600 7.652 7.130
7
6.500 5.500 1.540
5.000
7.T19
5,000
6.110 3.072
169.448 0.52
0.75 0.27
Aerospact 6r Defence RAE Systems PLC Ernbrxr -Emprm Brasileird de Aeronautica SA. AUK
GBR BRA
GBP USD
2+3.794 $7.003
330.7Y7 1.02
262,1394 134.964
0.81 0.42
Air Freight & Couriers Dcutsche Posi AG United Pdrcel Sfrvicc Inc., B
UEU USA
EUR USU
397,958 1.23
Airlines Qantas Airways b d
Aluminium Alan Inc.
Apparel & Acmswi'ie$ Puma AG Rudolf Uisskr Sport Coach Inc.
AUS
CAN
DEU USA
112.074 0.35 AUV
CAO 45.804 0.1+
46a .9 13 279.240
EUR 1!SU
I .44 0.86
2.30 748.1 5 3
Apparel Rerail bprit Iloldinp Ltd I-IKG
DEE GBR USA CAN
HKD 1.20 390,756
A p p h t i o n Software SAP Ac; The Sage Group PLC
Cognos Inc. NAVrEQ
EUK CBP USD
3113.505 265.356 209.820
0.98 0.82 0.65
USD 169:840 0.52
964,521 2.97
0.61 Automobde Manufacturers Bayensche Motown Wcrkc A(;
Banks Anglo Irish Bancorp PLC National h n k ut Greece SA KRC Groep NV Nordea Bank AB. FDR Srandard Chartered PLC K o p l Bank or k-oiland Gmup PLC Credit Suisx Group Pirmus Bank SA Kookmin Bank St. Ceo e Bank Ltd Banco &ao vim, Argentaria SA Hank of East Asia Ild. Banco Santander Central Hipanu SA I I S K 1 loldings PLC Milsubishi UFJ Financial Gmup lnc.
199.T13 DEU EUK
4 13.176 322,388 306.582 208.475 287.712 282,186 279,841
235,975 234.452 173.360 150,623 142.829 130,700 86.445
257,885
1.27 0.99 0.Y5 0.Y2 O . R i 0.87 0.86 0.80
IKL GRC BEL SWE CBK GBR CHE GRC KOR
EUK EUR EUR EUR CBP CBP CHF EUR KRW AUU EUK I IKU EUR tlliU JW
0.73 0.72 0.53
AUS ESP
I IKG 0.46 0.44 0.40 0.27
3.5Y8.6Y0 11.08
Biotechnology CSL Lid. Cel ene COT. M i f ipre h r p
AUS USA USA
AUD USD USD
1.03 0.97 0.32
335,420 316,415 102.564
754.399 2.32
Brewers l n k v
Broadcarting 6r Cable TV blcdiasei SpA
Casinos & Gaming Iniernational Game Technolog).
Computer Storage 6s Peripherals Seagate Technology Compnl Elecimnics Inc.. GDR
BEL EL!R 329,616
9 1.603
1.02
0.28 ITA EUR
0.71 USA USD 23 1,000
161.Y15 14.008
0.50 0.04
USA TWN
USD USD
175.923 0.54
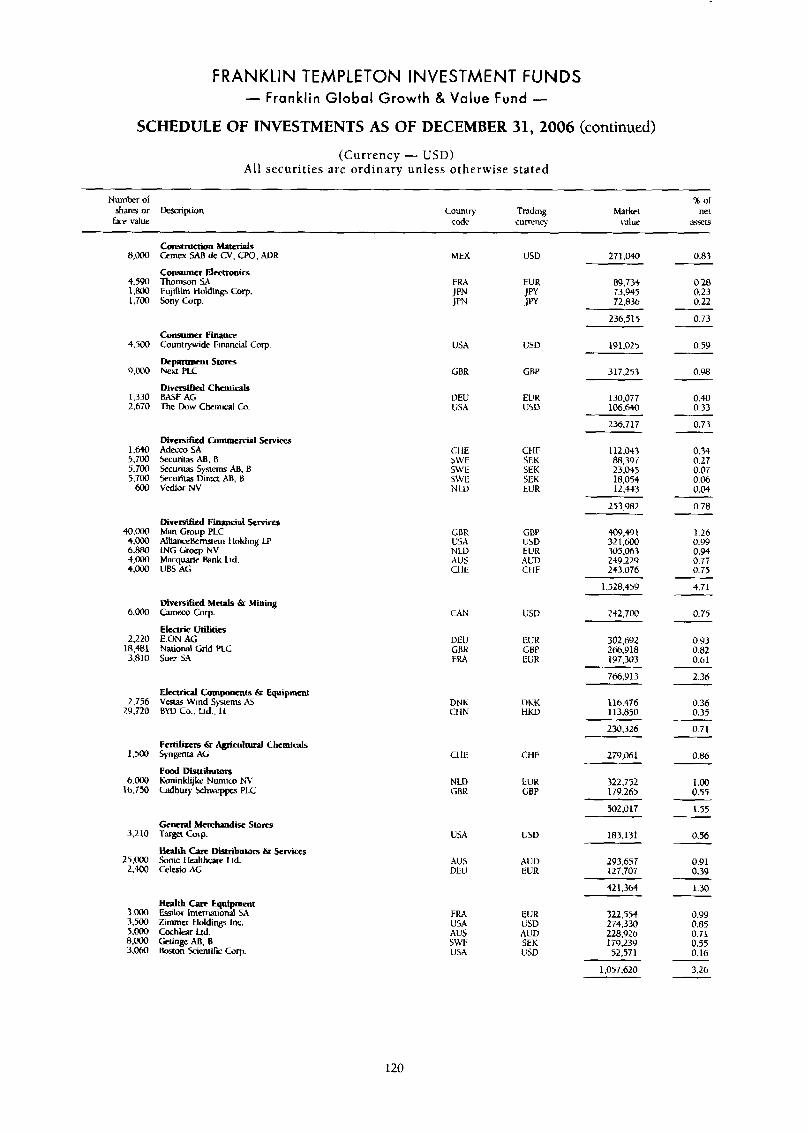
FRANKLIN TEMPLETON INVESTMENT FUNDS - Franklin Global Growth 8 Value Fund -
SCHEDULE OF INVESTMENTS AS OF DECEMBER 31,2006 (continued)
(Currency - USD) Al l securities are ordinary unless otherwise stated
Number of sham or Descripuon
h e value
% or
code currmcj vdue %5?15 Counlry Trading Market net
&m
4,590 1 .Iu)o 1,700
4.=Joo
9.000
1.330 2.670
1,640 5.700 5.700 5,700 600
40.ooo 4.m 6,BW 4 . m 4.000
6.000
2.210 16,481 3,810
2,756 29.720
1,500
6.000 lb.T50
3,210
25.00@ 2.m
3 .m 3.500 5..w 8.000 3,040
Colcunrcno . nMaterials Cernex SAB de CV, CW, A D R
Consumer Electtonits Thomson SA FujiRlm Holding Corp. Sony Corp.
Consumer Finance Countrywide Financial COT.
Ikpamamt Storrs Next PLC
Diversified Chemicals B&F AG 'The Dow Chemical CO.
Divemifwd Commercial Semieps A d a 0 SA securilas AB. B kcurilas Sysrems AB. B Securim DiMct AB. B Vedior NV
Divemifii Fitrancial Services Man GNUP PLC Allianuekmswin I kddmg LP ING Cmep NV Macquaric b n k Ld. UBS AC;
Diversified Me& & Mining G m m , torp.
Electric U t i l i t k E.ON AG National Grid PLC Suez 54
~cfuiul Cnnponents & Equipment Vestas Wind Syaems AS BYD Co., Ud.. I 1
Fertilizers 6r Agricultural Chcrnicals Syngenta AG
Food Dmtibutors lioninklijke Nurnico h'V Cadbury Schweppa PLC
G e d Mmhandisc Stores 'hrget COT.
Health Carc Dktributors Sr Services Sonic I ldthcare Lid. Celesio AG
MEX
F M J PN JPN
USA
GBR
DEU USA
CI IE S W E SWE SWE N Ll)
CRR US4 NLD AUS CllE
CAN
DEU GBH FRA
DNli CHN
C11E
N U GBK
USD
EUR Jfl JR
US0
GBP
EUR USU
CHF SEK SEK SEK EUR
GBP USD EUH AUD CI IF
USD
EUR GBP EUR
UtiK HKD
CHF
EUR GBP
271.040
69.734 73,945. 72.836
236.515
19 1.025
317.253
130,077 106.640
236.717
112,043 88.3Y7 23,045 18.054 12.443
253.982
409,491 32 1,600 305,063 249.22r) 243.076
1.528.459
242.700
302,692 246.918 197.303
766,Y13
116.476 113,850
230,326
279,061
322,752 179265
USA USD
502,017
183.131
AUS AUD DEU CUR
293.657 127.i07
H d t h Cam Equipment k i l o r Intertmional SA Zimmer Holdings Inc. Cochlear Lld. &tinge AB, B &on kicniilic Corp.
FRA EUR USA USD
SWE SEK USA USD
AUS Aun
421.364
322.554 274,330
179.239 52,571
228,926
1.057.620
0.83
0.28 0.23 0.22
0.73
0.59
0.98
0.40 0.33
0.73
0.34 0.27 0.07 0.06 0.04
0.78
1.26 0.9'3 0.94 0.77 0.75
+.71
0.75
0.93 0.82 0.61
2.3b
0.36 0.33
0.71
0.86
1 .oo 0.55
1.55
0.56
0.91 0.39
1.30
0.99 0.85 0.71 0.55 0.16
3.26
120
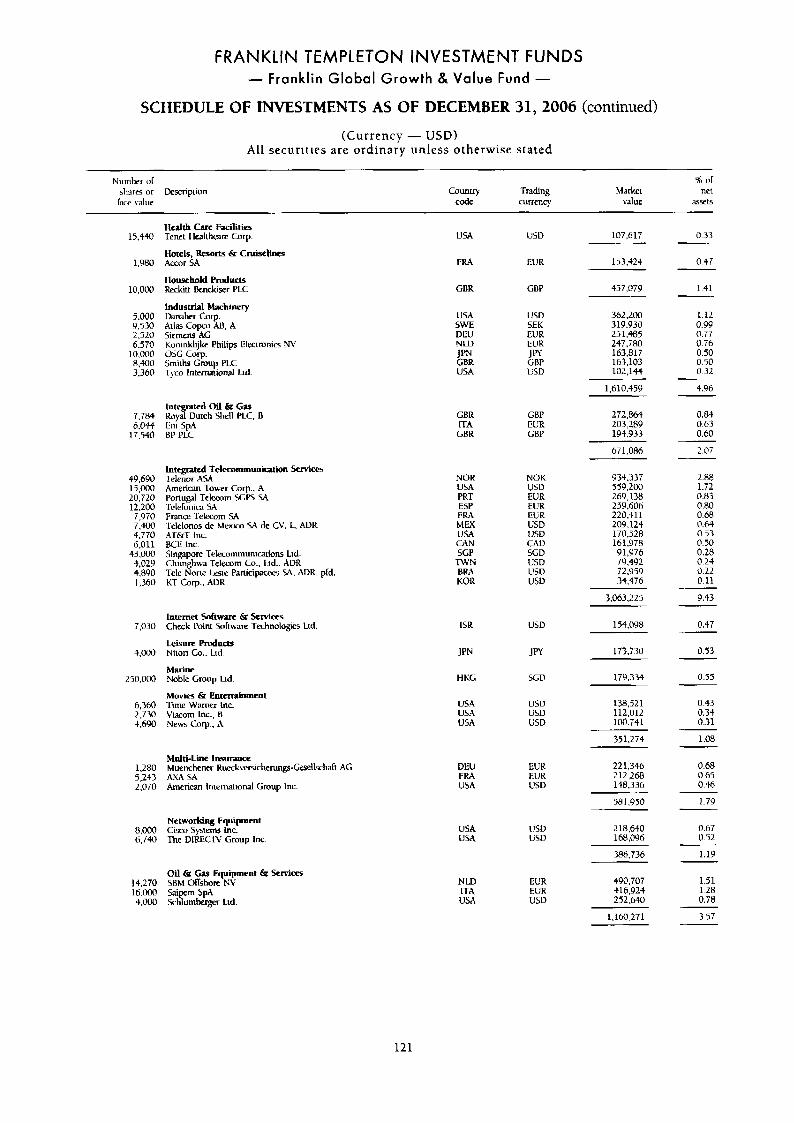
FRANKLIN TEMPLETON INVESTMENT FUNDS - Franklin Global Growth 8, Value Fund -
SCHEDULE OF INVESTMENTS AS OF DECEMBER 31,2006 (continued)
(Currency - USD) All securities are ordinary unless otherwise stated
Number d B ur
hce value code currency value asxts shares or Dexripiion Country Trading Market net
Health Cam Facilities Tenet tiahhwre Corp
Hotels, Resorts 6r Cruiselines A x o r SA
Household Product$ Reckitt Benckiser PLC
Industrial Machinery Danaher Corp
Siemens AG Kuninklijke Philips Eltrimnics NV OSC Corp. Smiths Croup PLC - 1 - p ~ International hi
Atlas Copco M, A
15.440 USA LJSD 107.617 0.33
EU R 1,980 153.424
457,079
0.47
1.41 10.000 GBR GBP
362.2130 1.12 5,000 9.530 2.520
USA SWE DEV N LD r: USA
USD SEK 319:930
251.485 247,780 163,817 163,103 102.144
0.99 0.77 0.76 0.50 0.50 0.32
EUR EUR J PY GRP USD
6,570 10.000 8.400 3,360
496 1.610.45Y
lnte tedOi l&Cas b ly f iu t ch Shell PLC, B Eni SPA BP PLC
272,864 203,289 194.933
GBR ITA GBR
CBP EUR GBP
7,784 6.044
17.540
0.84 0.63 0.60
2.07 67 I .Os6
Integrated Telemmmuniation Services 49.690 Telenor &SA 15,000 Americw Tower Corp.. A 20,720 Pi~flugal Telemm SGPS SA 12,200 Tclcfoniw SA 7,970 Fnncr Tekcorn SA 7,400 4.7TO AT&T Inc. 6.011 BCE Inc.
4,029 4,890 1,360 KT Cop.. AOR
-1clelonos de Mexico 51 de CV. L, ADR
43,000 Singapore Telecommunications Lld. Chunghwa Telecom Co., Ltd.. ADK Tele Norw ksic Pantcipmxs M. ADR. pld.
NOR USA PRT ESP 1:IW MEX
NOK USU EUR EUR EVK USD usv CAD SGD
Y34.337 2 88 539,200 172 269,138 0.83 259.60b 0.80 220,411 0 68 209.124 0.64
0 53 0 50 0.28
USA CAN SGP
170,528 161,978 91,Y76 79.492 72.959 74.476
USD USD IJSD
0.24 0.22 0.11
BRA KOK
3,063,225 9.43
Internet Software & Services Check Point SoltviaE Technologies hd.
IwLEure M U C & Nitori Co.. lid.
Marine Noble Group h d
M- t Entertainment Time Warner Inc. Viacorn Inc., B News Gwp, A
ISR USD 7,030 154,098
113.730
0.47
0.53 4.000 JPN
179.334 0.55 SGD 250.000
USA USA USA
usu USD USD
6,360 2,730 4.690
138.521 112,012 100.741
351.274
0.43 0.34 0.31
1.08
Multi-Line Imu- hluenchener Rueckwrsichemngs-Ccrllschalt AG .eA SA Amerirm Inlernalional Group Inc.
221.346 212.268 148.336
0.68
0.46 0.65
1,280 5,243 2,070
DEL! FM USA
1.79 581,950
218,640 168,096
0.67 0.52
Networking Equipment Cisco S:stems Inc. The DIECLV Group Inc.
USA USA
I!SU VSD
8,000 6,740
1.19 386,736
490,707 416.924 252.640
Oil & Gas Eipipment 6r Scn<ces SBM O&hore NV Saipem SPA khlumberger hd.
1.51 1.28 0.78
14.270 16.11M3 4.000
NLD ITA USA
EUR EUK usu
~
1,160.271 3.57
121
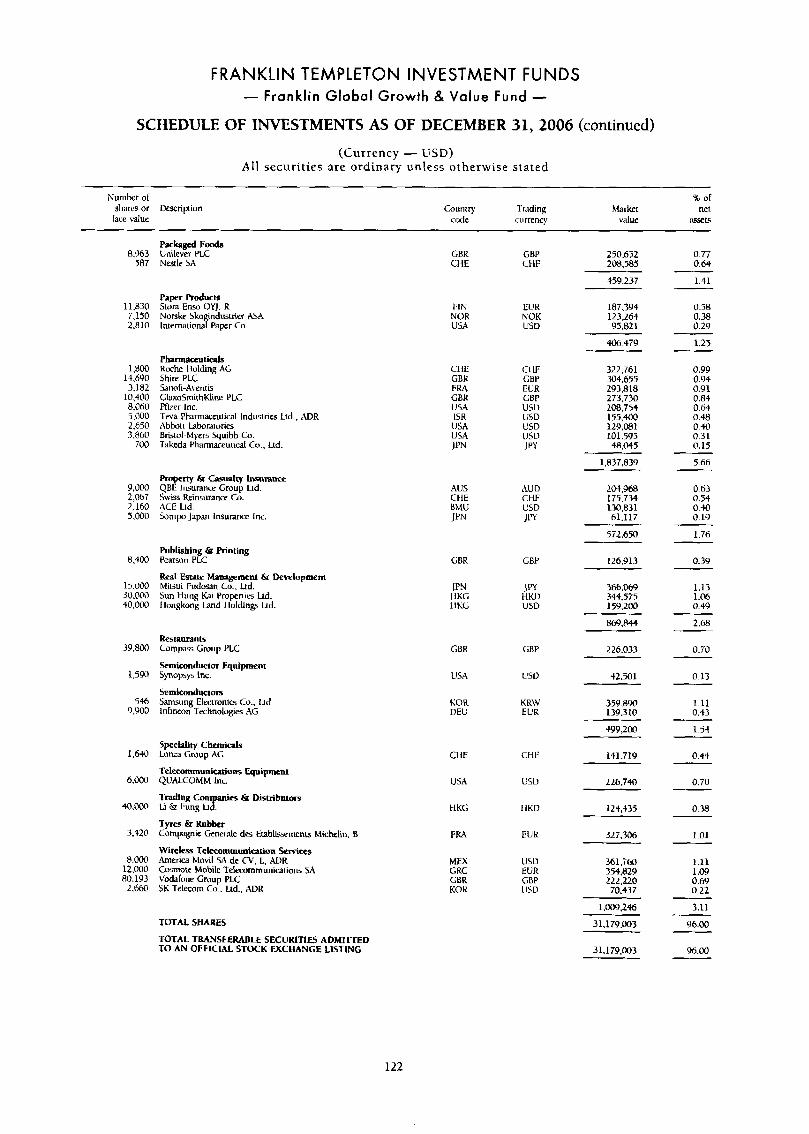
FRANKLIN TEMPLETON INVESTMENT FUNDS - Franklin Global Growth 8, Value Fund -
SCHEDULE OF INVESTMENTS AS OF DECEMBER 31,2006 (continued)
(Currency - USD) All securities are ordinary unless otherwise stated
N u m b of % of shares or Dexription Coun1ry Trading hhrket net
Face value cixle currency value iwuts
Pacluged Fmds Unilever PLC N d e SA
GBP CHF
EUR NOK US13
CI IF CBP EUR CBP usu USD USD USD JPY
AU u CHF USD J PY
GBP
JPF HhD USD
8.363 587
11.830 7,130 2.810
1 .BDo 14,AYO 3.182
10,400 8,060 5,000 2.650 3.860
700
Y ,000 2,067 2.160 5.000
8,400
15.000 3 0 . W 40,000
39,800
1,590
5% 9,900
1,640
6,000
4o.m
3,420
8,000 12.000 80,193 2,Rb@
GBR CI IE
E1N N O R USA
CI 1E GBK FRA GBK USA ISR
USA USA JPN
AUS CHE BhlU JPN
GBR
I P N I IKG lllic;
250.652 208,585
0.77 0.64
1.41 ~~
459.237
Paper pfaducls Stom E m OYJ. R Norske Sko industriec ASA lnlemiionaf Paper Co.
187.394 123.264 95.821
406.479
0.58 0.38 0.29
1.25
0.99 0.94 0.91 0.84 0.64 0.48 0.40 0.31 0.15
5-66
0.63 0.54 0.40 0.19
I .7h
0.39
1.13 1 .@6 0.49
2.68
0.70
0.13
1.11 0.43
1.54
0.44
0.70
Pharmaoeutiuk Ruche 1 lolding AG Shire PLC Sanofi-Aventis CbxoSmithKlinc PLC Pfizer Inc. Teva Pham~eutical Industries Ltd.. AVR Abbou Laboraories Btistol-Myers Squibb Co. Takeda Pharmaceutical GI,. Ltd.
322.761 304.655 293,818 273.730 208,74+ 155,400 129.081 101.595 48.045
1.837.839
Property & Casualty Insurance QBE Insurance Group Ltd. Swiss Ueinsumnre Ca. ACE Lid. Smpo japan Insurance lnc.
2cn.968 175.734 130,831 61.117
572.6%
Publishing 6r Printing Pearwm PLC
Real Estnlr Management L Dewlopment Mitsui Fudwn Co., Ltd. Sun llung Kai Propcnies Lid. llongkong Land 1 lolding Ltd.
126.9 13
366,069 344,575 15Y.2W
869344
Restaurants Compass Gmup PLC:
Scmiconductor Equipment Symopsys lnc.
Semiconductors Samsung Eleclronia Co., Lrd Infineon Technologies AG
GBR GBP 226.033
42.501 USA USD
359.890 139.3 10
KOR DEC:
KRW EUK
* Y 2 0
141.71Y Speciality Chemicals L o r n Cwup t K
Telecommwhtiom Equipment QUALCOMM lnc.
CI1E CHF
226.740 USA Lisu & Distributors
HKG 1 IKV
EUK
124,435
327.306
0.38
1.01
1.11 I .J9 0.69 0.22
3.11
96.00
lyres & Rubber Cornpapie Genenle d e Ewbliwrnen\s hiichelin, H
Wireless Tehmmunicit ion Serviros America Movil SA de CV. L, WV)K Cosmote Mobile '~elemmmuniaiions SA Vodalone Grwp PLC SK Tclccorn Co.. Ltd.. AVR
FRA
MEX USU 361.760 354,829 222,220 70.437
1,0@3,246
31.179.M)3
GRC GBR KOK
EUR GBP USD
TOTAL SHARES
TOTAL TRANSFERABLE SECURITIES ADMITTED TO AN OFFLCIAL STOCK E?KHANCE LlSTlNG 31.179.003 96.00
122
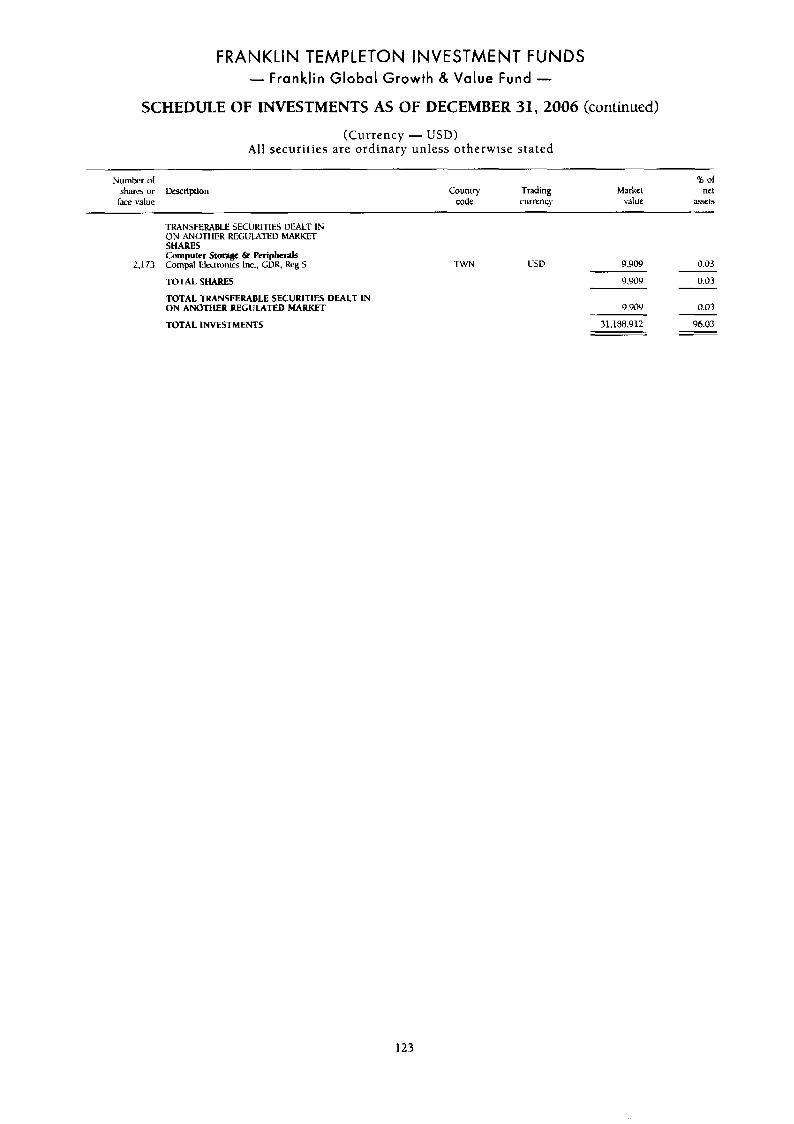
FRANKLIN TEMPLETON INVESTMENT FUNDS - Franklin Global Growth 8, Value Fund -
SCHEDULE OF INVESTMENTS AS OF DECEMBER 31, 2006 (continued)
(Currency - USD) All securities are ordinary unless otherwise stated
Number ol shares or Ufrription face value
% of Country Trading Market net
code currency value a5555
TRANSFEWOLE SECURITIES UMLT IN ON ANOTHER RELULXIED MARKET SHARES Computer Stange & Periph& Cornpal Elmronic3 lnc., GDK. k g S
TOTAL SHARES
TOTAL TRANSFERABLE SECURITIES DEALT IN ON ANOttiER REGULATED MARKET
TOTAL INVESTMENTS
2.173 TWN USD 9,909 0.03
Y*YOY 0.03
Y.9OY 0.03
31.188.912 96-03
123
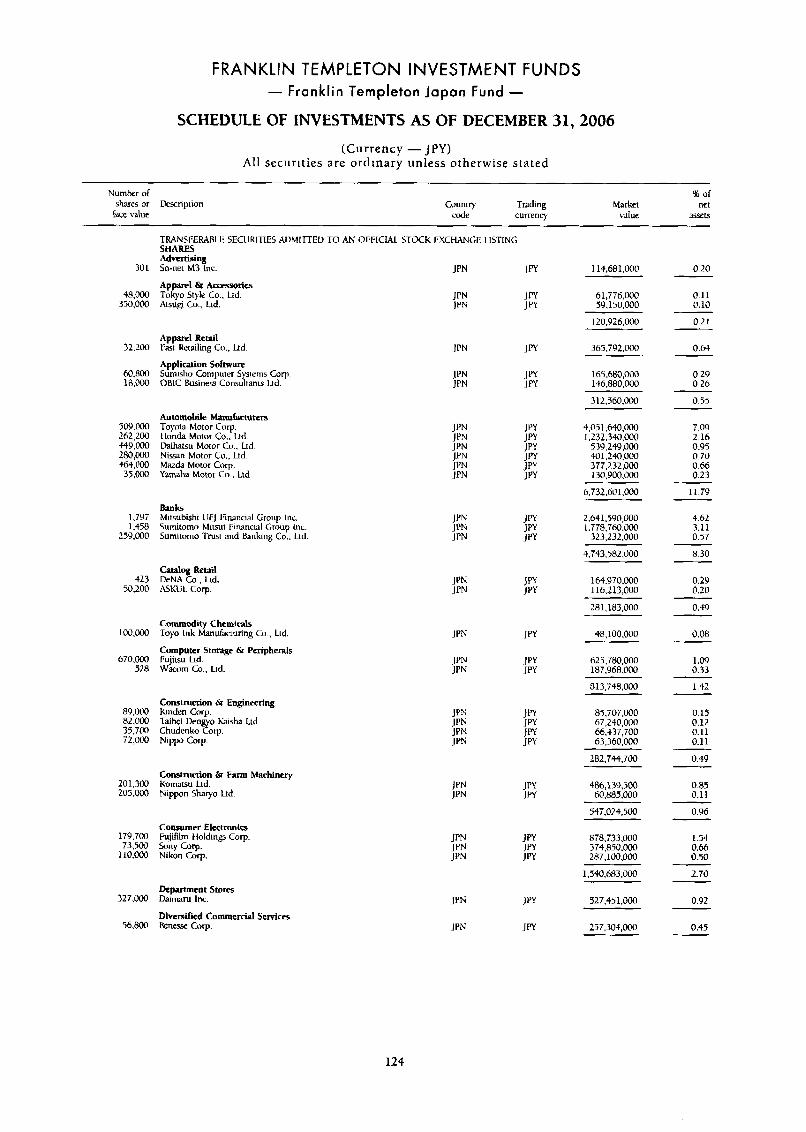
FRANKLIN TEMPLETON INVESTMENT FUNDS - Franklin Templeton Japan Fund -
SCHEDULE OF INVESTMENTS AS OF DECEMBER 31,2006
(Currency - J P Y ) All securities are ordinary unless otherwise stated
Number oI % or
face value code cumency vdue aS!x15 shares or Description Couniry Trading hbrket net
TRANSI'ERABLE SECUKl-nES AUMITTEIJ TO AN OITICIAL STOCK EXCHANGE LISl'ING S H A W Advertising So-net M3 Inc. JPN 301
48,000 350.000
32.200
60,800 18.000
50Y.000 262,200 449.000 280,rn -)6+.@00 35.000
1\79: 1,458
259,000
423 50,200
100,Ooo
670,oM) 528
89,OCU B2,OW 35.700 72,opo
201,300 205.000
17Y.700 73.500
110.m
327,000
56.800
114,681,000 0.20
0.11 0.10
0.2 1
0.65
0.29 0.26
0.55
7.09 2.16 0.95 0.70 0.66 0.23
11.79
4.62 3.11 0.57
8.30
0.29 0.20
0.49
0.08
1.09 0.33
1.42
Apparel Sr Accessories Tokyo Style Co., Lid. &ugi Lo.. h d .
JPN JPN
61,776,000 59.150,000
120,926,000
Apparel Retail Fast Retailing Co, , Ltd
Appliration Software Sumisho Computer Sysicrns Corp. ORlC Business Consultants I.td.
365.71-12.000
165.680,OOO 146,880.000
3 12.56O.OOO
Automobile Manufacturers Toyota Motor Cop. Ilonda Motor Co,. Ltd. Daihatsu Moror Co., Ltd. Nimn Motor Co., Ltd. Mad3 Moror Corp. Yarnaha hlutor Co.. Ltd.
4.0il.640.000 1,232,350,000
539.249.000 401,240,000 377,232,000 130.900.000
6,732,601,000
Banks Mitsubishi UFJ I:inancid Group Inc. Sumitorno htitsui 1:inancial Group lnc. Sumiromo Trust and hnking Co.. Ltd
JPN JPN JPN
2,641.5Y0.000 1.778.76O.ooO
323,232.000
4,743,582,000
Catalog Retail DeNA Co., Lid. ASStiUL COT.
J FN J FN
164.970,ooO 116,213,000
281.183.000
Commodity Chrmicals Toyo Ink Manulactunng Co., Lid.
Computer Storage & Peripherals Fujitsu LLd. Waciirn Co.. Lid.
JPN
JPN JPN
48,100,000
625,780,000 187.968.000
813,748.000
Construction 6r Engineering Kinden Corp. Taihei Dengyo haisha I.rd. Chudenko Corp. Nppo Cop.
J P 3
% JFN
85,707,000 67,240,000 66.$37,700 63,360,000
282.744.700
0.15 0.12 0.11 0.11
0.49
0.85 0.11
0.96
1.54 0.66 0.50
2.70
0.92
Consvucrion & Farm Machinery Kornatsu h d . Nippon Sharyo Ltd.
486,139.500 60.885.000
547,024.500
Consumer Electronla FujiRlm tloldings COT b n y Corp Nikon Corp.
878.733.000 374,850.000 287,100.000
1,540,683,000
927,451,000 Depamnent Stores Daimatu Inc.
Diversified Commercial Service k n e w Cop.
JPN
JPN JPY 257,304,000 0.45
124
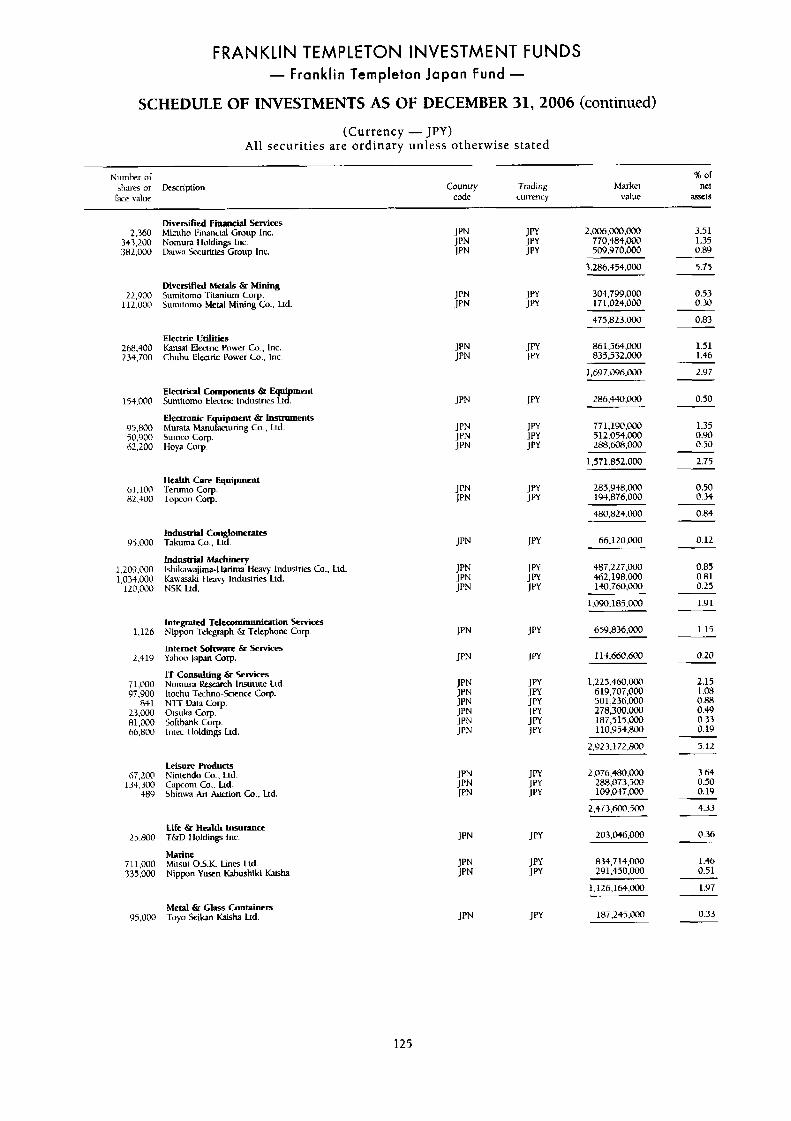
FRANKLIN TEMPLETON INVESTMENT FUNDS - Franklin Templeton Japan Fund -
SCHEDULE OF INVESTMENTS AS OF DECEMBER 31, 2006 (continued)
(Currency - JPY) All securities are ordinary unless otherwise stated
Number of B or
race value code currency value assel5 shares or Description Couniry Trading Market ne1
2.360 317,200 3R2.000
22,900 112,000
26H.100 234,700
154.000
Y5.800 50,900 62,200
61.100 82 , tOO
95.000
1,203,000 1,034,000
120.000
1,126
2.419
71.000 97,900
841 23,000 81,000 66,800
67,200 134,300
489
25.800
71 1,000 335,000
95.000
Diversifid Financial SCM- Mizuho I%anci;ll Group lnc. Nornun I lolding Inc. Uaiaa Lcurities Group Inc.
Diversified Me& & Mining Surnilomo Tilaniurn COT. Sumitorno Metal Mining Cu., Ltd
Electric Utilities hnsai Elec~ric Power G., Inc. Chubu Elearic Power Co., Inc.
Electrical Components &I Equipment Sumitorno Elmric Industries Ltd.
Electronic +men1 & instruments
Sumco Corp Hoya Corp.
Muram Manu 7: .xiunng Co.. Ltd.
HealIh Care Equipment Terumo COT. Topcon Corp
Indusuial Conglomerates Takuma Co., Ltd.
Industrial Machinery Ishikawajirna-l hnnu Heavy lnduslries Co., Kawsaki l h q hdustnes Ltd. NSK Ltd.
Integrated Tel-munication krvices Nippon Telegraph & Telephune COT.
Internet Software &I Services Yahou Japan Corp.
LT Consulting 6r Sprvicps Nomun m r c h Institute Lld. Itochu Techno-Eience COT.
Solhank COT.
N1-1- nJl3 COT. O I S U k a COT.
Inw I loldinp Ltd.
Leisure Products Ninicndo CO., Lld. Capcorn Co.. hd. Shinwa An Auciion Cc., Ltd.
Life & Health Lnsu- T&D I Iddings Inc.
Marine biilsui O.S.K. Lines !.Id. Nippon Yusen Kahushiki ksha
Metal C Glass Conminers Toyo Seikan K&u Ltd.
Ltd.
2,006,000.000 770,484,009 509.970.000
3.51 1.35 0.89
3.286,454,000
304.799.000 1 7 1.024.000
475,823,000
861564.000 035.532.000
286.440,@00
771.190,OOO 512.054.0CN 288.608.000
5.75
0.53 0.30 0.83
1.51 1.46
2.97
0.50
1.35 0.W 0.50
1.571.052.000
205,948,000 IY4,R76.000
400.824.000
2.75
0.50 0.34
0.84
66,120,0000
48T.227.000 462.198.000 140,760.000
1.090.10?.000
659,836,000
113,660.600
1.223,460,000 6 19,7Oi,OCQ 5@1,236.OOO 278,300.000 187,5 15.000 110.Y54.800
2.923.172.i3M
2.@76,480.000 2$$,073,500 1G9.M7,000
2.473.hoO.joO
203,046,000
R.34.715.000 291.450,oM)
1.126.164,COO
10T.245.000
0.12
0.85 0.81 0.25
1.91
1.15
0.20
2.15 1.08 0.w 0.49 0.33 0.19
5.12
3.64 0.50 0.1v
4.33
0.36
1.46 0.51
1.Y7
0.33
125
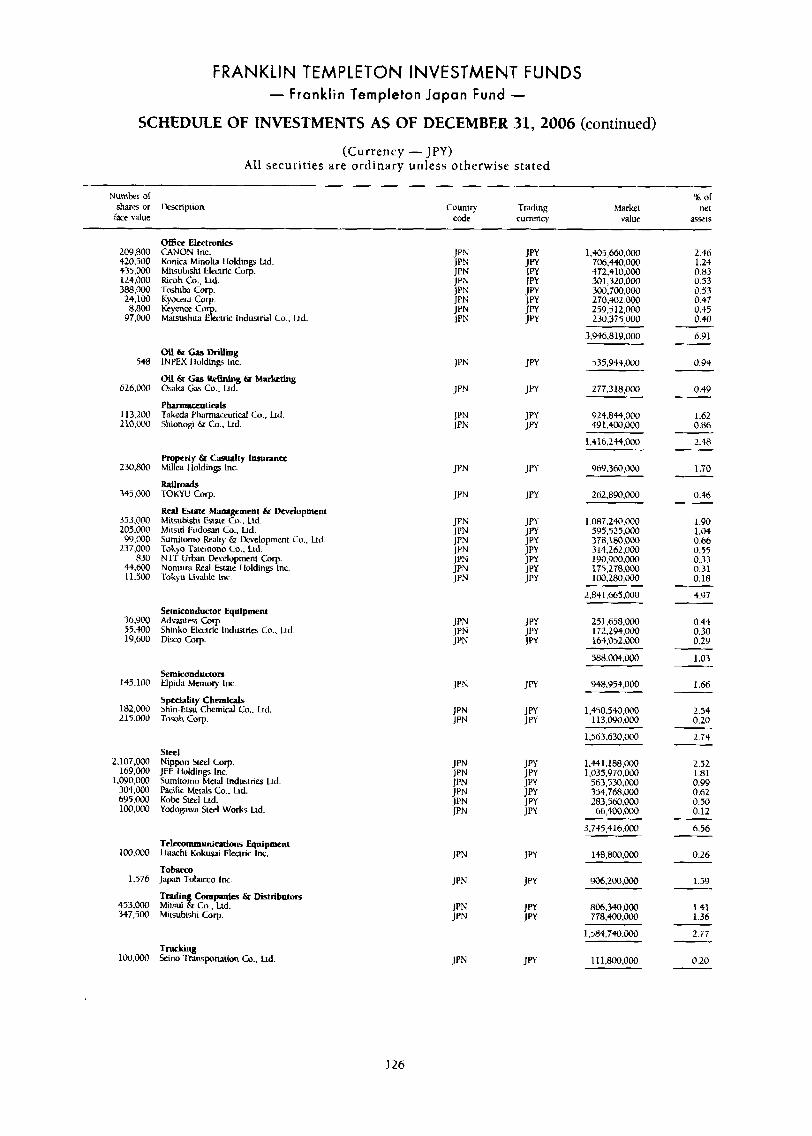
FRANKLIN TEMPLETON INVESTMENT FUNDS - Franklin Templeton Japan Fund -
SCHEDULE OF INVESTMENTS AS OF DECEMBER 31,2006 (continued)
(Currency - JPY) All securities are ordinary unless otherwise s t a t e d
Number ol ‘x; of sham or Wription country Trading hiarkel net face value ccde currency value asyts
Office Elcctmnic5 209.800 420,500 435,000 124.000
24.100 8.800 97.000
388.000
548
626.000
113,200 210.m
230.800
345,030
353,000 205,000 99,000 237.000
830 44.600 11,500
36.9N 55,400 19,600
145.100
182,003 215,000
2.107,000 169.000
1.090,000 304.000 695,000 100,ooO
100,000
1.576
453,000 347,500
100.OOO
CANON Inc. Konica Minolta lloldings Ltd. Mitsubishi Electric Gorp Ricoh Co., hd. ToShh COT. Kywra Corp Keyence Ca Matsushim &tric Industrial Co., Lid
Oil &z Gas Drilling INPEX 1 loldings Inc.
Oil & Gas &fining P Marketing & a h Gx, Co., Ltd.
P ~ ~ t i d S Takeda Pharnlaceutid Co., Lid. Shionoa & Co., hd.
Pmpctty & Casualty lmranee Mille3 I lolding Inc.
Railroads TOKYU Cop.
Real Estatc Management Q Development Mitsubishi Estate Co., Lrd. Mitsui h d w n Co., Ud. Sumitorno k 3 h y & Uevelopment Cu.. Ltd. Tokyo Talernono Co.. Lid. NTT Urban Uevelopment COT. Numura Real Eslaw I lolding Inc. L>kyu Livable lnc.
Semiconductor Equipment Advantest Gorp. Shinko Electric Industria Go.. Ltd Disco COT.
Semiconductors Elpida Memo? Inc
5 iality C k m i a l s S%-Etsu Chemical Co.. Ltd Tomb COT.
Steel Nipprn S t e l Carp. JFE I Iddings Inc. Sumitorno Metal lndustrio k d Pacific M a a k co.. hd. Kok Steel Lid. Yodupwa Steel \Vorks Ltd.
Telecommunications Equipwmt Ilitachi Kokuwi Eleciric lnc.
Tobacco Japan Tobacco Inc.
Tradi Companies & Distributors M i d % Co.. Ltd. Milsubishi Corp.
Trucking Seino Transporntion to.. Lid.
1,405,660,000 706,440,000 472,410,000 301,310,000 300,700.000 270.402.000 259.5 12,000 230,375,000
7,936,819,000
535,949,000
277,318,000
924.844.000 49 1,400,000
1.416.244.000
96Y ,360,000
262,890.000
[email protected] 595,525,000 378,180,000 314.262.000 190,900.000 175,278,000 100,280,000
234 1.665.000
251,658,000 172,294,000 164,052.000
588.004,000
948,954,000
1,450.54O.OOO 113.W0.000
1.563.630.000
1,441.188,OOO 1,035,970,000 563,530,000 354.768.000 283:560,000 66,400.000
3.7+5,416,000
148,800,000
906.200.000
806,340,000 778,400,000
1,584,740.000
1 1 1.800.000
2.46 1.24
0.53 0.53 0.44 0.45 0.40
6.91
0.83
0.94
0.49
1.62 0.86
2-48
1.70
0.46
1.90 1.04 0.66 0.55 0.33 0.31 0.18
4-97
0.44 0.30 0.29
1.03
1.66
2.54 0.20
2.74 -
2.52 1.81 0.99 0.62 0.50 0.12
6.56 -
0.26
1.59
1.41 1-36
2.77
0.20 -
126
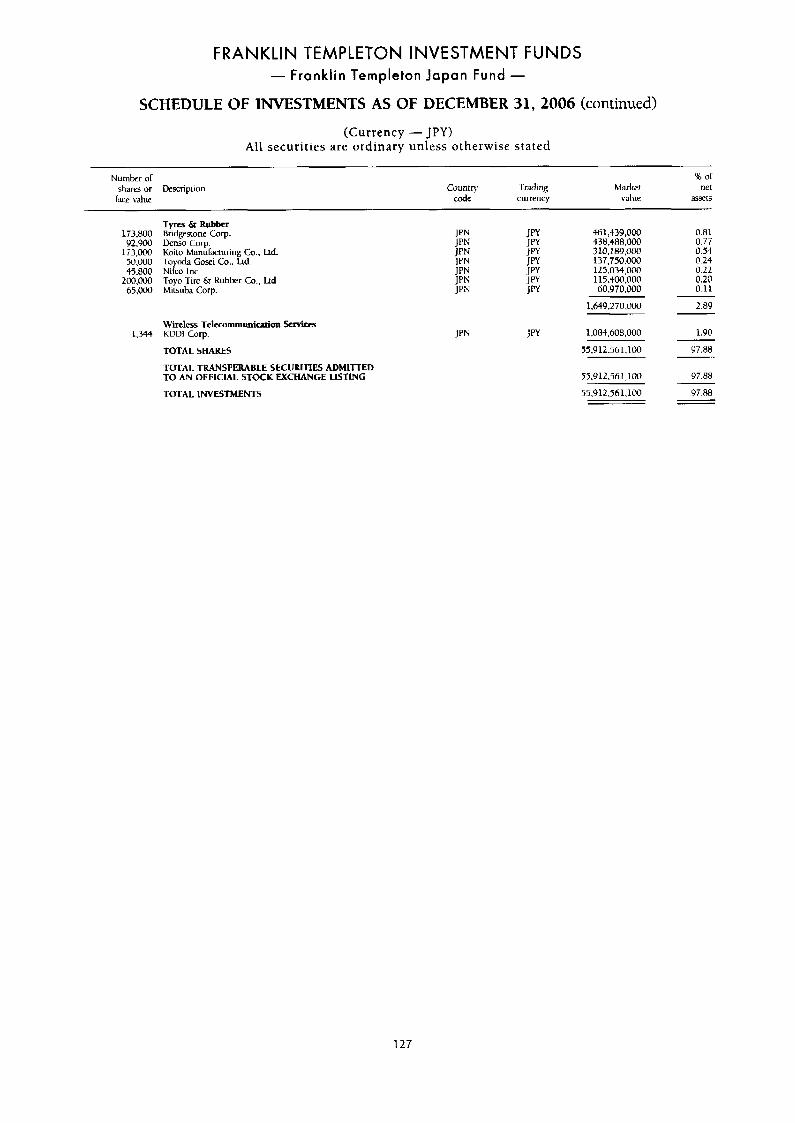
FRANKLIN TEMPLETON INVESTMENT FUNDS - Franklin Templeton Japan Fund -
SCHEDULE OF INVESTMENTS AS OF DECEMBER 31,2006 (continued)
(Currency - JPY) All securities are ordinary unless otherwise stated
~
Number or shares or Descnpiion [;ice value
Country Tmding code currency
B or Markct net
value =sets
Tyres & Rubber 1T3,800 Bridgestone Corp
173,000 Koilo Manufacturing Co.. Ld Y2.900 Denso Corp
50,000 45.800 Niko k c . 200.000 65.000 Mitsuba Crrrp.
To ,odd Gosei co.. hd.
Toyo Tire fir Kubkr Co.. h d
461,439,OOO 438,488,000 3 10.189.OOO 137,750.000 125,034,000 115.4OO.000 60.Y70.000
0.81 0.77 0.54 0.24 0.22 0.20 0.11
Wireless Telecommuniation Services 1,344 KDUl COT.
tOTAL SHARES
TOTAL TRANSFERABLE SECURITIES ADMInED TO AN OFFICIAL STOCK EXCHANGE LLSTING
TOTAL INVESTMENTS
1,08t,608,000
55,Y 12.561.100
JPN IPY
55,912,561.1~
55.Y12.561.100
2.89
1.90
Y7.88
97-88
97.M
127
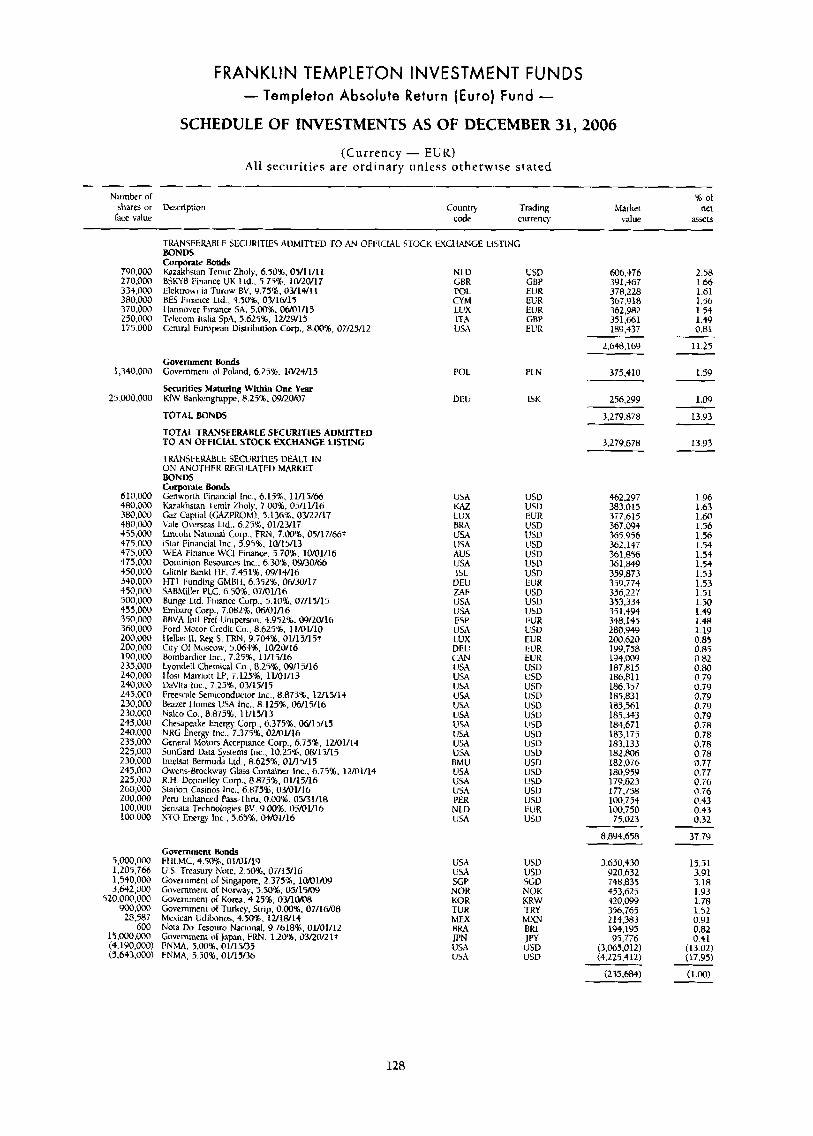
FRANKLIN TEMPLETON INVESTMENT FUNDS - Tampleton Absolute Return (Euro) Fund -
SCHEDULE OF INVESTMENTS AS OF DECEMBER 31,2006 (Currency - EUR)
All securit ies are ordinary unless otherwise s ta ted
Number of 95 of shares or lkxnption Country Trading Market net lace value code currenq value asr ls
TRANSFERABLE SECURITIES ADMITTED TO AN OFIKk4L STOCK EXCllANGE LISTING BONDS Corporate Bonds
790,000 bzakhsian Temir Zholy, 6.501, 0511 1/11 NLO USD 606,476 2.58
334,000 Elektrownia Turow BV, 9.75%. 03/14/11 POL EUK 378.228 1.61 380.GO0 RES 1:inance Ltd., 4.50%. 03/16/15 CYM EUR 367.918 1.56 370.000 I lannover Finance SA, 5.00%. DblOlll5 LUX EUR 362,982 1.54
270.000 HSKYB Finance U K Ltd.. 5.75%. 1W2W17 LRR CBP 3Y 1 .$67 1 .MI
250.000 k k o m llalia SPA. 5.625%. 12/29/15 ITA GBP 351.661 1.49 175.000 Central Europan Distribution COT., 8.00%. 07/25/12 USA ELlR 189,437 0.81
2.648.169 11.25
1,340,000 Government u1 Poland, 6.25%. 1M4/15 375.410 1.59 Govcmmcnt Bonds
Securities Maturing Within One Year
TOTAL BONDS 3.279.878 13.93
TOTAL TRANSFERABLE SECURITIES ADMITTED TO AN OFFICLAI. STOCK EXCHANGE LISTING 3,279.878 13.93 TRANSFEWLE SECURl'l~lLS DMLT 1N O N WOTHEK REGULATED MARKET BONDS Corporate Bonds Gcnwonh I~immcid Inc.. 6.15%. 11/15/66 Kazakhstan Temir ilholy. 7.008, 05/11/16 fizz Caplial (CAZPROM). 5.136%. OY2U17 Lale Overseas Lld.. 6.25$. 0lLWli
25,000,000 KW Bankengmpp.. 8.25% 09RW07 256.299 1.09
610.000 480.000 380.000 480.W
POL
DEU
PLN
1st;
USA w
USV USD
462.297 383.015 377,615 367.064 365.956 362.147
1.96 1.63
L l X BRA USA
EUR USD USD
1.M) 1.56 1 56 1.54
435,000 Lmculn Naduml Corp.. F b , 7.00%, 05/17/h6+ 475.000 1St3r Financial Inc., 9.95%, lWlY13 475.000 W M Finance WCl Fiwnce. 5.70%. 10/01/16 475,000 Dominion Rfwurces Inc.. 6.3096. W/30/66 450.000 Llitnir Banki HF? 7.451%. 09/13/16 340.000 HTl I:unding GMBII. 6.352%. 06/30/17 450,000 SABMiller PLC, 6.502.07XIY16 500.000 Bung Ltd. Finance Curp.. 5.10%, 07/13/15 455.000 Embarq Corp., 7.082%. oh/01/16 350,000 BBVA In11 Pref Uniperson. 4.952%. WWRO/lh 360.000 Ford Motor Credit Co.. 8.625%. I1/01/10 200.000 Hells 11, 5. FRN. 9.704%. 01/15/13! 200,000 City Of Moscow. 5.064%, 10/20/16 190,000 Bombardier lnc., 7.25%. 11/15/16 235,000 Lyondell Chemical Co.. 8.25%. 09/15/16 240,000 tlosl Marriutt LF, 7.125%. 11/01/13 240,000 DaViia Inc.. 7.25%, 03/15/15 245,000 I:reescralc Semiconductor lnc., 8.879%. 1U15/14 230.000 kazer llomfs GSA Inc.. 8.124%. 06/15/16 230,000 Nalco Co., 8.875%. 11/15/13 245.000 Chesapeiike Energy Curp.. 6.375%. 06/15/15 240,000 NRG Energy Inc., i.375%, OMYl6 235,000 Cenenl hloton Acceptance Corp., b.73lh. 12/01/14 225,000 SunGard Uata Systems Inc.. 10.25%, 08/15/15 230,000 Intelm Rermuda Ltd., 8.625%, 01/15/15 245.000 Owens-Brockway Glass Conminer Inc., 6.751. 12/01/14 225.000 R. M. Donnelley Gorp 8.875%. 01/15/16 260,000 Station Casinos Inc.. 6.87%. 0M)1116 200.000 Peru Enhmced Rss-Thru. O.Oa&. OY31118 100,000 Sensa13 Technologies BV. Y.0016. 05/01116 100.000 XI-0 Energy lnc., 9.651, 04/01/16
USA AUS LISA 1SL
DElJ M I L
USA l!SA ESP USA 1.ux DEE CAN USA USA USA U U USA USA LISA USA
VSD USD US0 USD EUR USD USD
36118% 361,844 359.873 359.774
1.51 1.54 1.53 1.53
356,227 353,334 351.494
1.51 1.50 1.4Y USD
EUR USD EUR
348.145 280.949 200,620 1Y9,i58 194,009 187.815 186.81 1 186.357 185.831 I85.561
1.48 1.19 0.85
0.82 0.M
0.85 EUR EUK usu USD USD U5D
0.79 0.79 0.79 0.79 USD
USD 1!SD USD usu USD USD USD USD US0 USD
185i343 184,671 183.177
0.79 0.78 0.78 0.78 USA
USA RMU
182.806 182.076 180.959 179,823 177,758 100.754
0.78 0.77 0.77 USi
USA V M PER N LD USA
0.76 0.76 0.43
EUR USD
100:750 75,023
0.43 0.32
37.79 8.894.658
Guvemment Bonds 5,000,000 FIILMC. 4.50%. 01/01/19 1,205,766 US. Treasury Note. 2.50%. 07/15/16 1,540,000 Government or Singapre, 2.375%, lW1/09 3,642>00@ Government or Norwa)-. 5.50%. 05/15/C9
520,000.000 Government of Kom. 4.25%. 0YlCKhY YO0.W Government of Turkey, Sirip. 0.00%. 07/1M18
600 Nola Do Tesouro Nacional. 9.7618%. 01/01/12 15,ooO,uO0 Cnvcmment of Japan. FRN. 1.20%. 03QCV21* (4,190,000) F N M , 5.00%. 0l/ly15 (5,643.000) FNMA, 5.50%. 01/15/36
28,587 Mexican Lldibonos, 4.50%. 12/18/14
3.650.430 920,632 748,835 453,625 420,099 356.765
USA USA SGP NOR KOR TUR MEX BRA IPN USA USA
USV USD SGD NOK KRW TRY
15.51 3.91 3.18 1.93 1.78 1.52 0.91 MXN
BKL m USD USD
214i383 lYSJ95 95.776
0.82 0.41
(13.02) (17.95)
(1.00)
(3.065iOl2) (4,225,412)
(235.684) . . .
128
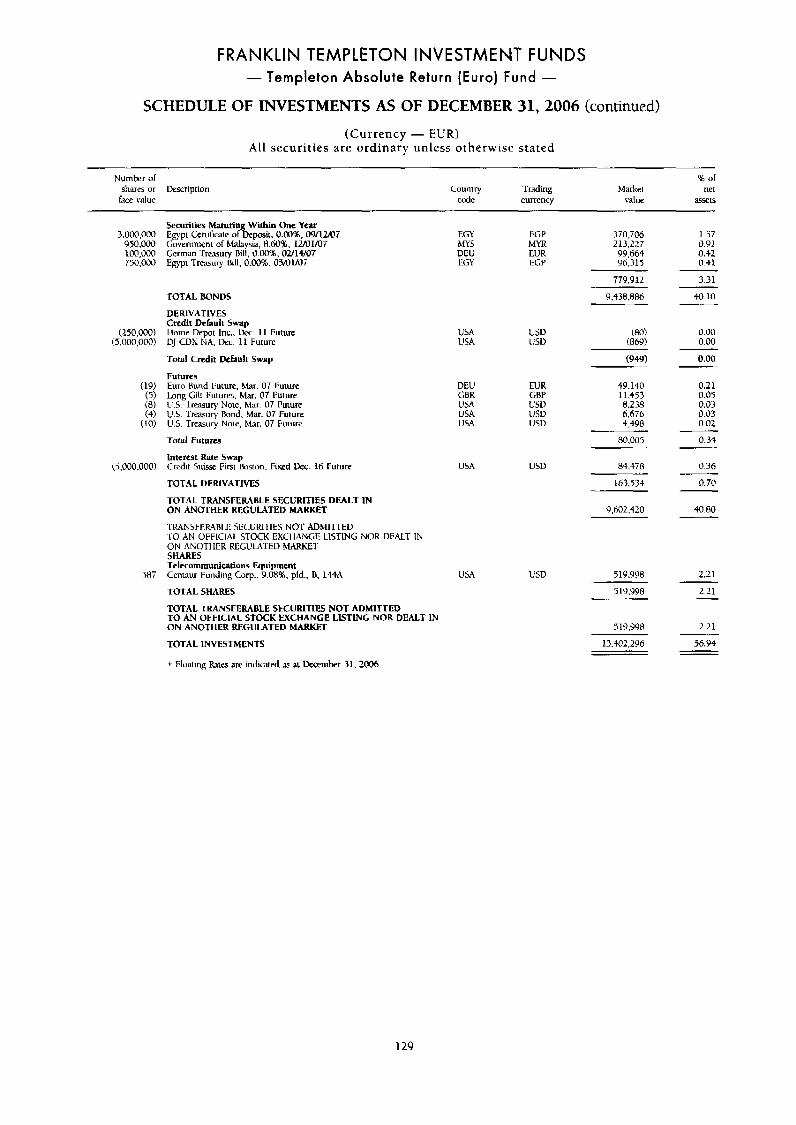
FRANKLIN TEMPLETON INVESTMENT FUNDS - Templeton Absolute Return (Euro) Fund -
SCHEDULE OF INVESTMENTS AS OF DECEMBER 31,2006 (continued)
(Currency - EUR) Al l securit ies are ordinary unless otherwise stated
Numkr of I of shares or lkscription Couniry Trading Market net face value code currency value asset5
3.000.000 9 50.000 100,000 750.000
(250,000) (5,000,000)
(19) (5 ) (8) (4)
(10)
(j.000.OOO)
58i
Securities Maturing Within One Year Egypt Certihcatc of Deposil. 0.00%. i)9/1Mi Government of Makysia, 8.6096, 1Uola7 German Treasury Rill. 0.00%. OU14W7 Egypt Treaur). Bill. 0.00%. O ~ l / O T
EGY EGP 370.706 MY5 MYR 213,227 DEU EUR 99.664 EGY EGP 9b.315
779.912
1.57 0.91 0.42 0.41
3.31
TOTAL BONDS
DERIVATIVES Credit Default Swap lhmc Depot Inc.. Uec. 11 Future DJ CDX KA. Dcc. 11 Future
Total Credit Default Swmp
Futures Euro Bund Future, Mar. 07 I:uiurc Long Gill Futures. Mar. 07 Fu~ure 115 Treasur). Now. Mar 07 Future U.S. Treasury b n d . Mar. 07 Future U.5. Treasury Notc. hiar. 07 Fuiurc
Total Futures
Interest Rate Swap Credit Suisx F i m Boston, Fixed k. 16 Future
TOTAL DERIVATIVES
TOTAL TRANSFERABLE SECURITIES DEALT IN ON ANOTHER REGULATED MARKET
TRANSFERABLII 5ECURlTlES NO-C MMLITED .l'O AN OFFICIAL STOCK EXCI ItWiGE LISTING NOR DEALT IN ON ANOTHER WCl!lATED M A R K F ~ SHARES 'Telecommunications Equipment Centaur Funding COT.. 9.08%. pfd., B, 144A
TOTAL SHARES
TOTAL TRANSFERABLE SECURLTLES NOT ADMITTED TO AN OFFICIAL STOCK EXCHANGE LISTING NOR DEALT IN ON ANOTHER REGULATED MARKET
TOTAL INVESTMENTS
t Floating Rxt.5 ere indicated at h l u b e r 31. 2006
USA USA
DEU CBR USA USA USA
USU LjSD
EUR GBP 1:sv l!SU USD
Y.438.886 40.10
(949)
49.140 11.453 8.238 6.676 4,498
80,005
USA 84.478
USA W D
163.331
0.00 0.00
0.00
0.21 0.05 0.07 0.03 0.02
0.34
0.36
0.70
9 .hi)2,420 40.80
SlY.YY8 2.21
519,998 2.21
519,998 2.21
56.94 13,402,296
129
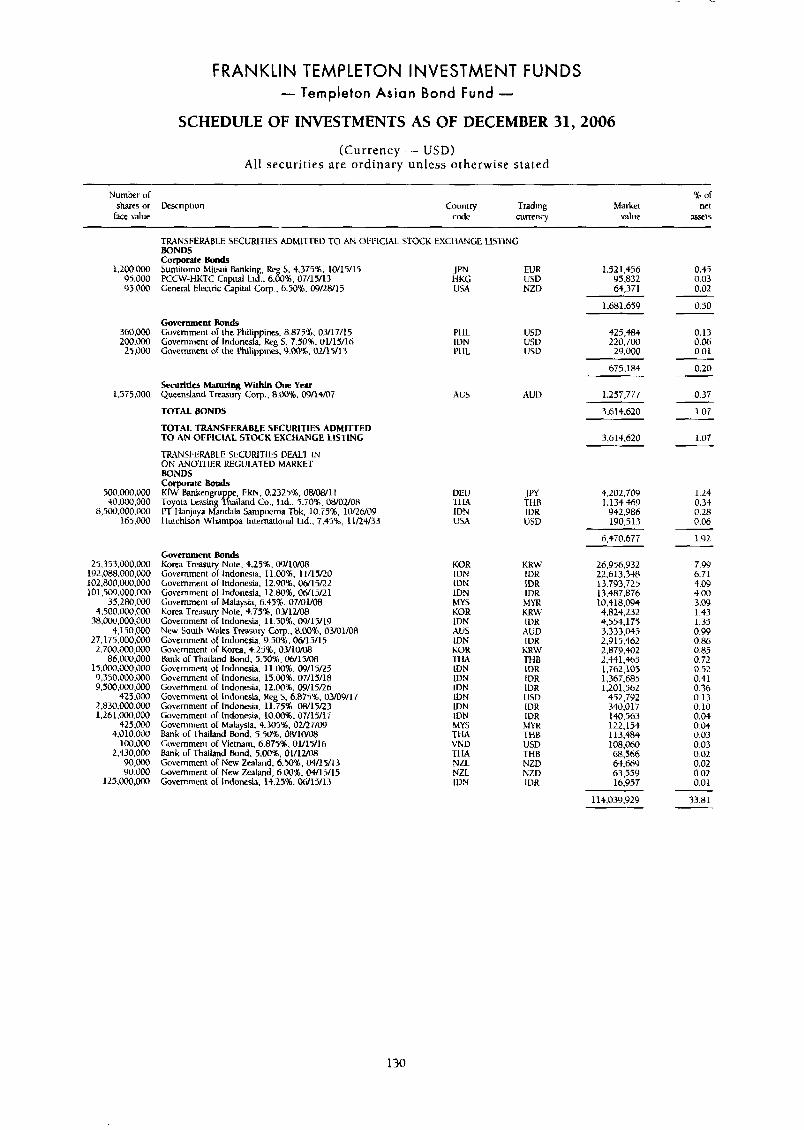
FRANKLIN TEMPLETON INVESTMENT FUNDS - Templeton Asian Bond Fund -
SCHEDULE OF INVESTMENTS AS OF DECEMBER 31,2006
(Currency - USD) A l l securities are ordinary unless otherwise stated
Number or shares or Description fze l-alue
9h of Counrry Trading Market net
code currency value as-
1,200.000 95.000 93.000
360.m 200,000 25.000
1.575.000
500.000.000 t0,000,000
8,500.000.000 165.000
25.353.000.000 192.088.000.000 102,800,000,000 101.509.000.000
35.280.@00 t.500.000.000
3A.000,000.000 4,150,CQO
27.175.000.000 2,700,000,000
86,000,000 15 .m0.000.000 9.350.~.000 9,500.000,000
425.000 2,830,000,000 1.261.000.000
425.090 +,010.000
1W.OOo 2,430.000
~ , O O o 90,000
125,000,000
TUNSFEMBLE SECURITIES ADMLTTED TO AN 01.I:ICML SlOCK E X BONDS
Sumitorno Mitsui Bankiri Reg S. 5.375%. 10/15/15 PCCWHKTC Gpital L i t . 6.00%. 07/15/13 General Elfctnc Capiml COT, 6 50%. 09RW15
torporatt Bonds
Government Bonds Government of Ihe Philippines, 6.R751. 03/17/15 Government of Indonesia, k g 5. 7.50%. 01/15/16 Govemmeni of the Philippines, 9.00'1(., 0U15/13
Securities Maturing Wirhin One Year Queensland Treasur)- Corp.. 8.00%. 09/14/07
TOTAL BONDS
TOTAL TRANSFERABLE SECURITIES ADMITTED TO AN OFFLCIAL STOCK EXCHANGE LlSTlNG
TRANSI+RABLE SECURITIES DEALl- IN ON AN011 IER REGULATED MARKET BONDS Corporate Bonds KIW Bankengrup FKLV. 0.2325% O W 1 1 ToyoLa Leasing M%md G>., Ltd.. 5.70%. 08/02/08 PT thnjaya Mandala Sampwma Tbk, 10.T54;. 10/2N@Y llutchiwn Whampcra lntenwional Ltd., 7.45%. 11/24/33
Government Bonds Korea Treaury Note, 4.25%. iK1110108 Government of Indonesia, 11.00%, 11/15/20 Government of Indonesia. 12.90%. WlY22 Government ol Indonesia, 12.f3096, W15/21 Government of Malaysia, 6.43%. 07/01/08 kurea Treasury Note, 4.75%. 113/1uo8 Government or Indonaia, 11.50%. 09/15/19 New South WdkS Treasury Colp.. 8.00%, 03/01/08 Cmcrnment of Indonfsia. 9.50%. 06/15/15 Government or Korea, +.25%, 03/10108 Bank or Thailand b n d . 5.50%. 06/15/06 Guvernmeni of Indonesia. ll.IM%. 09/15/25 Government of Indoncsia. 15.W%, 07/15/18 Government or Indonesia, 12.00%. 09/15R6 Government of Indonesia, Keg 5, 6.8758, 03/09/17 Government or Indonaia. 11.75%. 08/15/23 Government or Indonesia. lO.W%, 07/15/17 Government ol hlahpi3, 4.305%. 02n7/oY Bank of Thailand Bond. 5.50%. 0WlW08 Cuvernrneni of Vietnam. 6.875%. 01/15/16 Bank of Thailand Bond, 5.0096, 01/1LKW Government or New &land. 6.5@%, 04/15/13 Government of New h l a n d , 6.00%. 04/15/15 Government of Indonesia. 1+.25%, 06/15/13
:lLAWC;E LISTING
1.521.456 EUR USD 95.832 I-IKG
USA NZD 64,371
JPN
1,681,639
PHL USD 525,484 IDN USV 220.700 PI 1L USD 29.000
675,184
AUS AUD 1.257,777
3.614.620
DEL! TI LA IDN USA
KOR 113N LUN IDN MKS KOR IDN AUS IDN KOR 1'1 u IDN IDN IllN IUN IDN IDN YYS TIM VKD T1-U NZL NZL IVN
IPY THB IDR USD
KKW IDK IDR IDR MYR KRW IVR AUD IDR
KKW THB IDR 1VR 1I)K USD IDR IDR
M Y K THB USD THB NZD NZD IUK
3,614,620
+,202,T09 1 J34.469
942.986 190,513
6,470.677
26,956,932 22,613.348 13,193.725 13.487.876 10.1 18,094
4.554.175 3.333.043 2.9 15,462 2.879.402 2,441,465 1,762,105 1,367,685 1,201.562
452.792 340,017 140.563
4.a24.232
122:154 113,484 108.0M) 68,566 63@9 63,559 16,957
114,039.929
0.45 0.03 0.02
0.50
0.13 0.N 0.01
0.20
0.37 ~
1.07
1.07
1.24 0.34 0.28 (1.06
1.92
7.99 6.71 5.09 4.00 3.09 1.43 1.34 0.99 0.86 0.85 0.72 0.52 0.41 0.3b 0.1 3 0.10 0.04 0.03 0.03 0.03 0.02 0.02 0.02 0.01
33.81
130
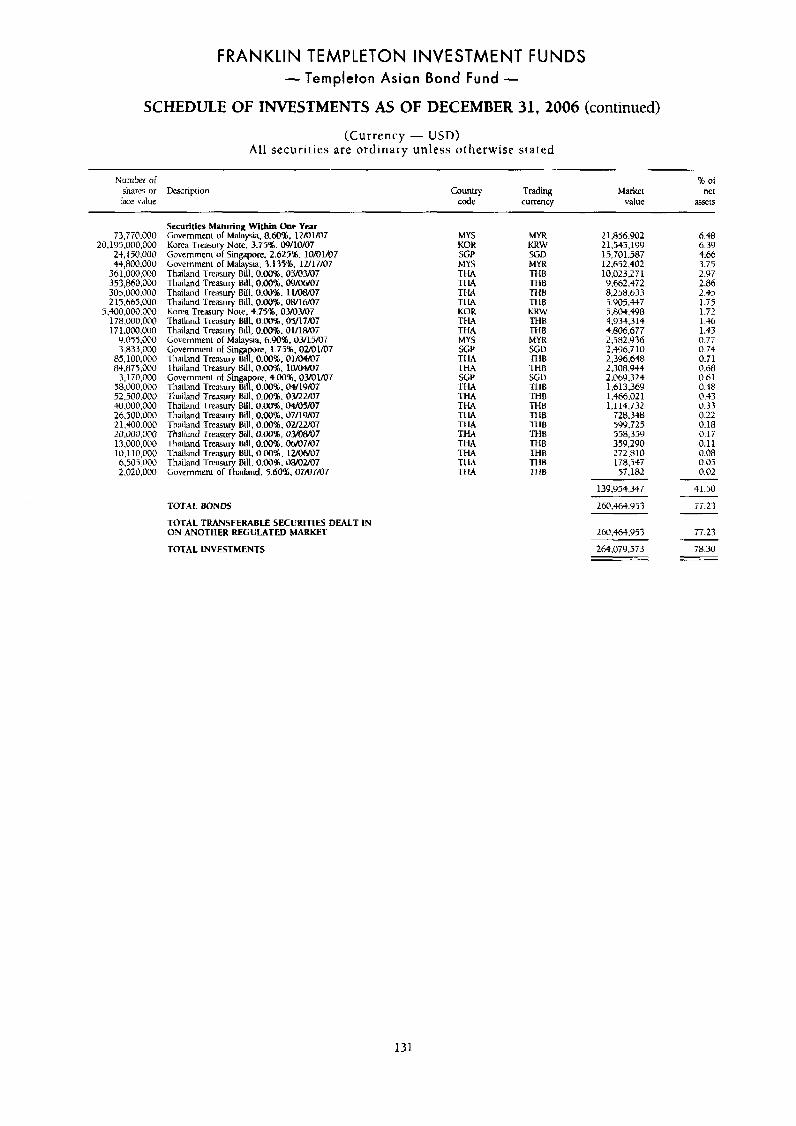
FRANKLIN TEMPLETON INVESTMENT FUNDS - Templeton Asian Bond Fund -
SCHEDULE OF INVESTMENTS AS OF DECEMBER 31,2006 (continued)
(Currency - USD) Al l securit ies are ordinary unless otherwise stated
Number of % of sharcs or Dexriprion Country 'l'rading Market llft race value code currency value asset5
3,170,000 58,000,000 52.500.000 w,000.000 26.500.000 2 1,400.000 20.000.000 13,000,000 10,110,000
6.505,OOO 2.020.000
Securities Maturing Within One Year Government uf Malaysia, 8.60%. 12/01/07 Korea Treasury Note. 3.7591. 09/10/07
73,770.000 20,195.000.000
2t.150.000 Governmen[ of Sin pore. 2 625% 10/01/07 ++,HOO.OO~ Government or MagTia. 3 . i n 9 , iui7/07
361.000.000 353,860.000 305.000.000 2 15.665.000
5,400,000.000 178,000.000 171.000.000
Y.055.000 3.833.000 Gcivernment of Sing re, 1.75%, 0uO1/07
Thamland Trtsur). Bill, 0.00%. 05/03/07 Thailand 'Treasury Bill, 0.0016. 09/06/07 Thailand .L'reasur). Bill. 0.W%. I 1 M 7 Thailand Treasury Bill. 0.00%. 08/16/07 Korea Treasury Now. 4.754. 03/03/07 Thailand Treasury Hill, 0.00%. 05/17/07 Thailand T r w u v Bill, 0.001. Ol/l&rOT Government of Malaysia, 6.90%. 03/15/07
85.100.000 Ihaihnd Treasury BilrO.OO%, 01/04/07 84.875.000 Thiiland Trwsuly Bill, 0.00%. 10/04/07
Go\wnment of Sin@ Thailand Treasury Bill?O.00%, 04/19/07 h i l a n d Tresury Bill, 0.005;. OYZ2/07 Thailand Trwsur). Bill. 0.00%. 04/05/07 Thailand l'reasur). Bill, 0.00%. 07/19/07 Thailand Treasury Hill, 0.00%. 02/22/07 Th3iland Treasury Bill, 0.0n.X. 0yo8ro7 Thailand Treasury Hill. 0.00%. OWV7/07 Thailand Treaury Bill. 0.00%. 12AWO7 Thailand Treasury Bill. 0.00%. i)81oUO7 Go\rernmcnt of Thailand. 5.60%. 07/07/07
re. 4 00%, 03/01/07
TOTAL BONDS TOTAL TRANSFERABLE SECURITIES DEALT IN O N ANOTHER REGULATED MARKET TOTAL INVESTMENTS
6.48 21.856.902 hlyS MYR KOR KRW 21,345,199 6 39
MYS UYR 12.652.402 3.75 SGP SGD 15,701 387 4.66
Tk1A THB TI L4 -nit3 TIM THE TI LA TI 16 KOR THA THA MYS SGP THA THA SCP .I'ti.A THA TtA TI LA T I IA THA THA TkiA TI IA 7.1 U
KKW TtiB MB MYR SCU I'HB THB SGU -r1 IB THB TI IB TllB -1-1 IH THB T'HB THB TI IB TI 18
10:023:271 2.97 9.662.+72 2 $6 8,258.633 2 45 3.905.437 1 T 5 5,804,498 172 4.934,314 1 46 4.806,677 143 2.582936 0 77 2.4'36.7 10 2.396.648 2,308.444 2.069.324 1.6 13,369 1.466.02 1 1,114,732
728.318 5Y9,725 558,359 359,290 272.810 178.547 57,182
139,954,347
260,464.Y53
0.74 0.71 0.68 0.61 0.48 0.43 0.33 0.22 0.18 0.17 0.11 0.08 0.05 0.02
41.50
I 1.2.3 --
260,464.Y 53
264.079.573
77.23
78.30
131
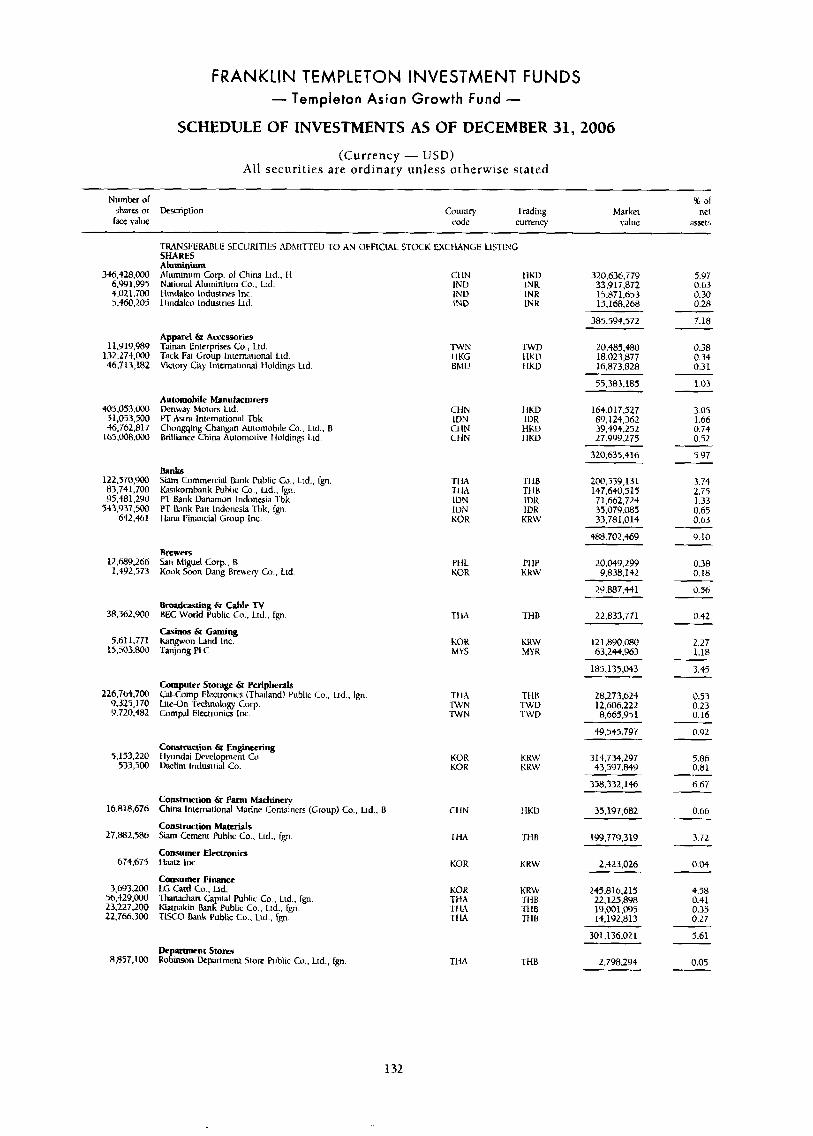
FRANKLIN TEMPLETON INVESTMENT FUNDS - Templeton Asian Growth Fund -
SCHEDULE OF INVESTMENTS AS OF DECEMBER 31,2006
(Currency - USD) All securities are ordinary unless otherwise stated
Number o l or lace value code currenc) value * X I S
shares or k r i p t i o n Country Tmding Market net
TRANSIWMLE SECURITIES ADMITTED TO AN OFFICIAL S m c K EXCI WNGE LISTIXG SHARES AhuPinium Aluminum Corp. of China Lid.. ti Nalional Aluminium Co.. Ltd. Hindako Industries Inc. 1lind;llco lndusrnes Lid.
346,428,000 6,941,995 4,021.iW 5,460,205
ll.Yl9.989 132,274,000 46.713,lRL
405,053,000 5 1,053,500 46,762.81 7
1 6 5 . 0 0 8 . ~
122,570,yoO 83,741,700 Y 5,481,290
642.461 5+3,937.5w
12.h89.266 1,492,573
38.362.900
5.611.771 15.503.SOC~
226,764,700 9,325,170 Y.720.482
5.153.220 533,500
16,818.676
17,882,386
674.675
3,693.2m 56,429,000 23227.200 22,766,300
8,857,100
CllN HKD IND INK IND INR IND INK
320,636,779 33,917,872 15.871.653 15.168.268
385.594.572
70.4M5.480 18.023.877 16.873.828
55,383,185
5.97 0.63 0.30 0.28
7.18
0.38 0.34 0.31
1.03
3.05 1.66 0.74 0.52
5.97
3.74 2.75 1.33 0.65 0.63
9-10
0.38 0.18
O.5h
0.42
1.27 1.10
3.45
0.53 0.23 0.16
0.92
5.06 o.ai 6.67
0.66
3.72
0.04
4.58 0.4 1 0.35 0.27
5.61
0.05
Apparel C Accessories 'Tainan Enterprises Co., Ltd. Tack Fa1 Gmup Intem;riional Ltd. Victory City lntemational Holdings Ltd.
T W N TWD 1 IKG IlKU BMU IlKD
Automobile Manufacturers Denway Moiurs Ltd. YT &tm lntemational Tbk Chongqing Changan Auioniobile Co.. Lid.. R Brilliance China Auionioiive Iloldings 1 . d
CHN 1 IKP I DN 1I)R Cl IN HKD CI IN 1 IKD
164,017,527 89,124,362 39.494.252 17.999.275
320,635.416
Banks Siam Commercial Ekmk Public Co., Lid.. Cgn. tiasikornbank Public Co., Lid., Ign. PT b n k Dmamon Indonesia l b k PT b n k Piin Indonesia Tbk, fgn. I lana 1:inancial Group lnc.
M TI I8 TI IA TI 1B IDN 1DK IUN IDK KOK KRW
200.53Y,131 147,640,515 71.662,724 35,079,085 33,781,014
488,702.469
20,049,299 9,838,142
29.887.441
Brewers S;in Miguel Corp., B Kook Soon Pang Firewry Co.. Ltd
PI11 PI IP KOR KKW
Broadcasling C Cablc TV BEC World Public Co., L I ~ . . fgn
C s i m & Gaming kingwon Land lnc. t n jong PLC
TI lA THB 22.833.771
121890.080 63,244.963
185.1 35.043
KOR KRW MYS MYK
Computer Storage & Peripherals CdComp EIEctronicLs (Thailand) Public Lo., t.td., fgn, LiieUn .Technology CUT. Compl Electronics Inc.
TI IA THB T W N nvu -nvN TWD
20,213,624 12,606.222 8,665.95 1
49.545.797
Construction & Engineering I lyundai Ewelo ment Cu k l i m Indusiriz! Co. '
K O R KHW KCjR KRW
314,734,297 43,597.849
358,332,146
35,197,682
199,779,319
C o m c t i o n & Farm Machinery China lntemational Marine Containers (Group) Co.. hd.. B
Construction Materials Sum Cement Public Co., Ltd., fgn
Consumer Electronics I h t z lnc.
Consumer Finance
Thanxhan Capital Public Co.. Lid., Ign KQtnakin &Ink Public Co., Ltd., Ign. T I C 0 Bank Public Co., Ltd.. fgn.
ffi card co.. Lld.
Cl IN HKD
TIM -rtm
KOR K KW 2.423.026
245.816.215 22.124,898 19.001 -095
K(3K KRW THA T l i B 1-1 IA TI 16 TIM THB
301,136.02 1
2.798.294 De anmcntStom R&wn Department Store Public Ca., Ltd., rgn. THA THB
132
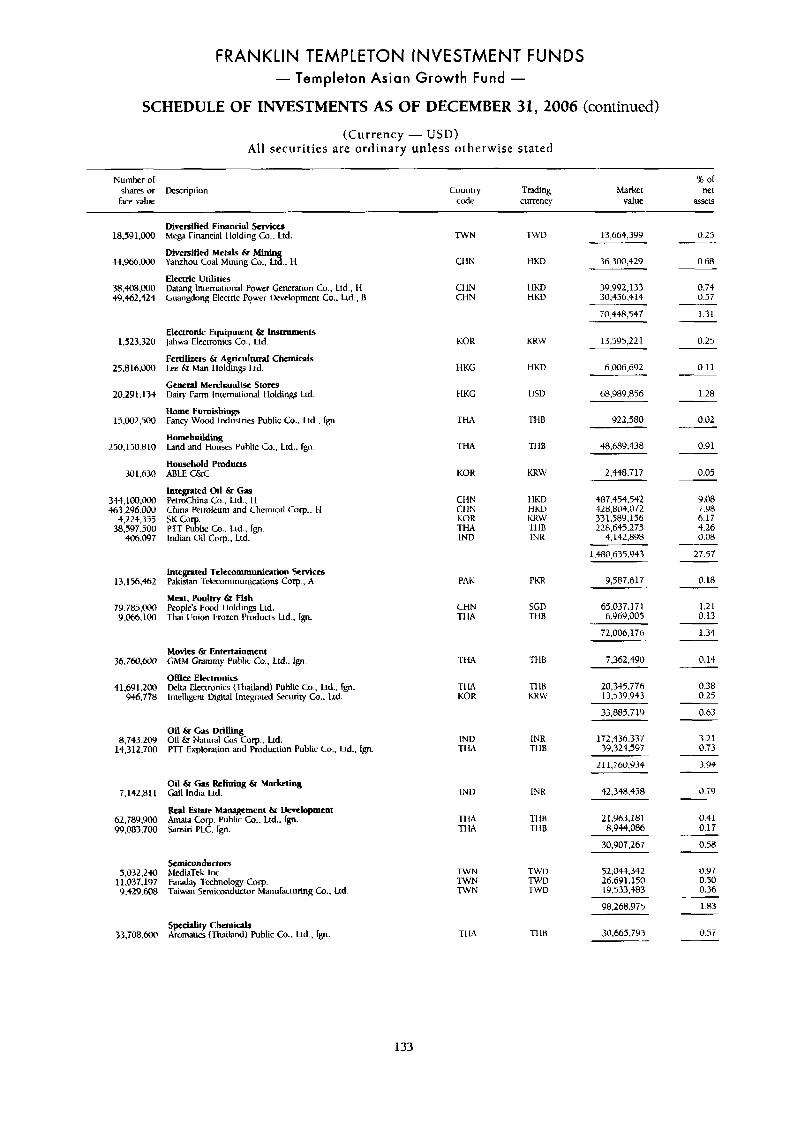
FRANKLIN TEMPLETON INVESTMENT FUNDS - Templeton Asian Growth Fund -
SCHEDULE OF INVESTMENTS AS OF DECEMBER 31, 2006 (continued)
(Currency - USD) All securit ies are ordinary unless otherwise stated
Nurnkr ot s h a m or lkscripiion
raLP valw
s or Country Trading Market net
code currency value aswts
Divedied Financial Services Mega Financial I lolding Co.. Ltd
Diversified Metals &I ,%finin Yarnhou Coal Mining Co., LA., 11
Electric Utilities Daiang International Powcr Generation Co.. Lid.. I+ tilwngdong Electnc Power Uevelopment Co.. Ltc.. 11
18,591,000
+i,966.oi10
3$.4C@,D00 $9.462.424
1.523.320
25.816.000
20,291.134
15.002.500
250.150.8 10
30 1.630
3+t,IOO.OOL1 463.296.001)
t.22t.355 38,597.500
406.097
13.15h.462
79.785.ml Y.W.lM
36.760.W
41,691,200 Y-Wi.178
8,743.2W 14,312.700
7,142.81 I
62.WY.900 99,083.700
5.032.2.M 11.037.197 9,429.608
33.i08.600
0.25 TWN TWD 13,664,399
C1 IN HKD 36,300,429 0.68
Cl IN HKD 39,992,133 CHN HKD 30.456.414
0.74 0.57
1.31 70.448.547
Electronic Equipment & Instruments Jahua Electronics Co , Ltd
Fertilizers & A 'cultural Chemiaks Lee & Man 1 lolf&s Ltd.
General Merchandise Stom Dairy Farm lntemational tlolding Ltd
Home Furnishings Fancy Wmid lndustnes Puhlic Clo , Ltd . fp
Homebuilding Land and Houses Public Co , Lid , Ign
l iOK
11KG
11KG
THA
'1'1 LA
KOR
KRW
HKD
L!SU
'THB
13,595,221 0.25
0.11 6,006,692
1.28 b8.989.856
922,580 0.02
0.91
0.05
-ri in
KRW
48.b89.438
Household Products ABLE cdrc 2.448.717
w a 7.98 6.17 4.26 0.08
Iutepted Oil 6r Gas PetroChinn Co , Ltd.. 11 China Peiroleum and Chernid COT.. tI
E - E X i c co.. L.td , rgn. Indian Oil Corp.. Ltd.
Ct IN Cl IN KOR
IND T1-W
HKD HKD KU1V .1'1 IB INR
487.454.542 928,804,072 331.589.156 228,615,275
4.142.898
1.480.635.943 27.57
0.18 Integrated TelrcommuNcation Servicm Pakistan Tclccommunir;ltionsm COT., h
Meat, Poultry & Fish People's Food tloldings Ltd. Thai L:nicin brazen Products Lid., rpp
PAK
CHN TI IA
PKR 9.587.bl7
1.11 0.13
SGD ~i in
65.037.171 6.969.005
72,006,176 1.34
0.14 Movles & Entertainment CMRl Crammy Public Co., Ltd.. rgn.
O f k Electmnics Delta Eleciwnics (Thailand) Public Cc., hd.. rgn Intelligcni Digital Integnterl Security Co.. l ~ d .
l'tM
TI IA KOK
7,362,490
0.38 0.25
TlIB KRM:
20,335,776 13,539.943
33.884.719 0.63
Oil & Cas Drilling Oil & Natural CiLE COT.. Ltd. P l T Exploriiion and Produciion Public Co.. Ld.. fgn
172.436.337 39.324.597
IND -ri w
INR TI I8
3.21 0.73
3.94
0.79
211,760.933
Oil & Gas Refining & Marketing Gail India Ltd.
R e d Estate Management & Dwehpmcnt Amam Cop. Puhlic Co.. Ltd.. fgn. Sansiri PLC. rgn.
I N V INR 42,348,458
TI IA TI IA
1-1 in TI IH
2 1.963.161 8.W4.086
0.41 0.17
0.58
0.97 0.50 0.36
1.83
30,907,267
Sumkonductors MediaTek Inc. Farad3)- Icchnology Corp. ~aiwan Semiconductor Manutauwing CU., Ltd
T W N 1WN TWN
TWD 52,044.342 26591.150 19.533.483
TWD TWD
98.268.975
0.5T Speciality Chemicals Ammatics (Thailand) Public Co.. hd., fgm TIM 30,665,793
133
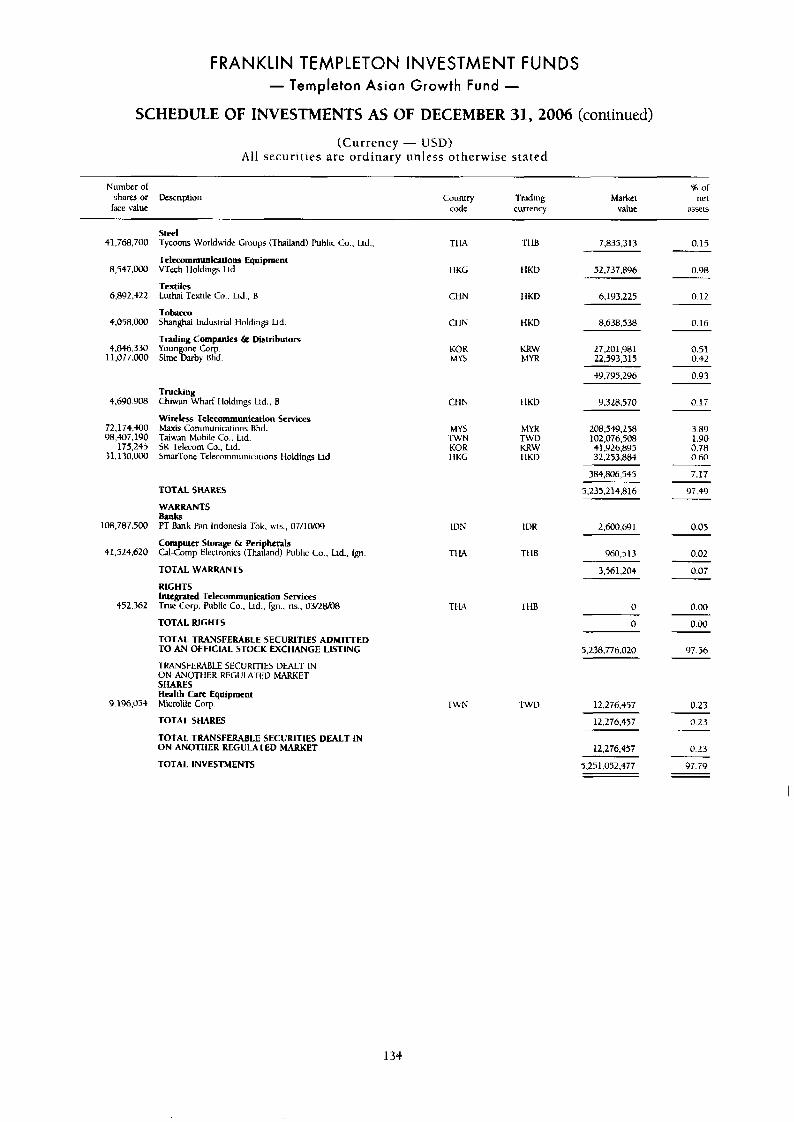
FRANKLIN TEMPLETON INVESTMENT FUNDS - Templeton Asian Growth Fund -
SCHEDULE OF INVESTMENTS AS OF DECEMBER 31,2006 (continued)
(Currency - USD) A l l securities are ordinary unless otherwise stated
Number of shares or kxnption
face value
% uf Country l'nding Markei net
c1Uk currency value aSx15
Steel Tycouns Worldwide Croups (Thailand) Public Co.. Ltd..
Telecornrnunirntiom Equipment VTtxh I loldings Ltd.
Tcxtiles Luthai Textile Co.. Lid., B
Tobacco Shanghai Induanal Holding Lid
Trading Cornpanics & Distributors Youngune COT. Sime Darby Bhd.
41,768.700
8,547,000
6.892.422
4.058.000
4.1146.330 11,077.OOO
4,690 YO8
72.1 74.400 98,407,190
1i5.245 11.130.OO0
108.787.500
41.524.620
452,362
9.196,034
TIM TI in 7,835,318 0.15
0.98
0.12
I IKG I IKD 52,737,896
CHN I IKD 6.193.225
CI IN HKD 8,638,538 0.16
0.51 0.42
0.93
27.201,l)Bl UUR KKW MYS MYR 22,593,315
S9.795.296
Trucking Chiu~an Wharf Holdings Ltd.. B
W i r c k Telecommunieatlon Services Maxi5 Ciimmunications Bhd. Taiwan Mobile Co.. Ltd. SK Telmom Co., Lid. Smar-1.one Telecomniunicaiions Holding L I ~ .
CHN I IKU 9.320.570 0.17
3.89 1.90 0.78 0.60
hlYS M Y K .IWN TWD KOR KRW
208.jQ9.1SR 102,076,508 $1 .Y26,8¶5 32.253.884 IIKG 1 IKI)
384,806,545
5.235.114.816
7.17
97.49
0.05
0.02
0.07
0.00
0.00
'37.56
0.23
TOTAL SHARES
WARRANTS Banks PT Bank Pan Indonesia Thk. w s . , 07/10109
Corn ulet Storage &I Prri herals G I - A m p Electronics (Thafmd) Public Co.. Ltd.. fgn.
TOTAL WARRANTS
RIGHTS Integrated Telcrommunication Services True Corp. Public Co., LK., fgn., m., i)WtVoH
TOTAL RlCHtS
TOtAL TRANSFERABLE SECURITIES ADMITTED TO AN OFFICIAL STOCK EXCHANGE USTING
'1-KANSFERABLE SECURITIES DEAL1 IN ON ANOTtIER REGULATliD MARKET SHARES
IDS
TI IA
IDR
n IB
2.600.691
960,513
3.ihl.203
TI-W THB 0
0
5.238.776.020
Health Care Equipment Microlile CUT.
TOTAL SHARES
TOTAL TRANSFERABLE SECURITIES DEALT IN ON ANOTHER REGULATED MARKET
TOTAL INVESTMENTS
12,276,457
12,276.457 0.23
0.23
97.79
12,276.457
5.251 052,477
134
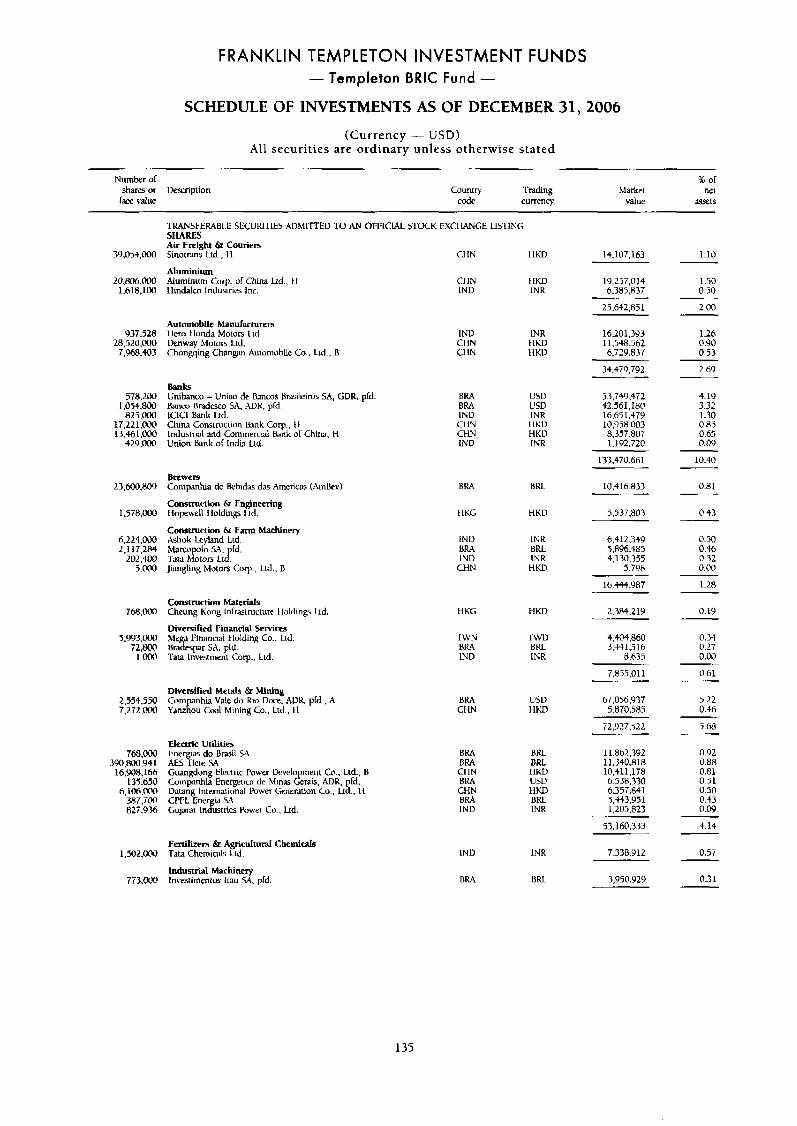
FRANKLIN TEMPLETON INVESTMENT FUNDS - Templeton BRlC Fund -
SCHEDULE OF INVESTMENTS AS OF DECEMBER 31,2006
(Currency - USD) All securities are ordinary unless otherwise stated
Number of sham or Description PLT value
% of Market ne I
value s r t s Country Trading
code currency
TRANSFERABLE SECURIllES ADMI~ITED TO AN 0I;I:IClAL STOCK EXCl IANCE LLSTING SHARES Air Freight & Couriers
Aluminium
l.hlP.lOO Hindalco Indusiries Inc.
3Y.054.000 5inoirdns Ltc., H
20.806.000 Aluminum Gorp. or China Ltd., t I
CHN 1 IKD 14,107,163
19,257,014 6.385837
1.10
1'1 IN tfKD LND INK
1.50 0.50
25.642.851 2.00 Automobile Manufacturers
937,528 llem tlonda Motors Lid. 28.520.000 Lknway Motors Ltd. 7.968.403 Chongqing Changm Automobile Co.. Lid., B
IND INR CI IN t 1KD CI IN I I K V
16,201,393 11,548,562 6.72Y.831
1.26 @.YO 0.53
34.479,792
53.749.472 42,561,180 16,65 1,4iY 10.Y 58.003 8,357.807 l.lY2.720
133.470.661
2.69
hk5 Unibanco - Uniao de Rancos Bmsileims SA, GDR. pld. Ranm Brddcsco SA. ADR. pld.
Chim Construciion bank COT., t l lndusirial and Commercial Rank or China. H Union bank of India Lid.
578,200 1.054.8W 825,OW lClC1 Bank Ltd.
17,221.00(1 13.+61.00@
429,Mx!
BRA L'SD BRA USD INlJ INR Cl IN I IKD CHN HKD IND INR
4.19 3.32 1.30 0.85 0.65 0.09 10.40
10.416.833 0.81 Brewers Companhia de khidas das Americas (AmRev)
Construction & Engineering blopewell I loldings Lid.
Construction & Fann Machinery
23,600.w)Y
I ,578,OM)
6.224,OW Ashok Lcyland Ltd. 1.117.2p4 Marcoplo SA, Id 202.400 TaIA hiotors Ltd: 5.001) Jiangling Motus Corp., Ltd., 8
BRA BKL
I IKC HKD 5.5 37.803 0.43
IND INK 8RA bRL LNU INR CHN HKD
6.412.349 5896.485 4,130,355
5.798
0.50 0.46 0.32 0.00
16.444.987 1.28
Construction Materids Chcung Kong Inlmstructure lloldings Ltd
Diversified Financial Services Mega Financial Holding Co.. Ltd.
7 M . m
3,993,000 72,800 Bradespar SA. pld-
1.00(\ rata Investmen1 Corp., Ltd.
HKG HKD 2.384.219 0.19
4,404,860 3,t-ll.S 16
8,b35
0.34 0.27 0.00
I'LVN f W D BRA BRL LND INR
7,855,011 0.61
5.22 0.46 5.66
Diversified Metals & Mining 2,554,550 Corn nhia Vale do Rio Dwe AUY pfd., A 7.272.W YmzEu Cod Mining Co., Lid,, I I
BRA USD CHN t1KD
67.05b.937 5.810.585
72,927.522
11.862.392 11,340,818 10,411,178 6,538.330 6.351.841 5.w3.951 1,204,823
Electric Utilities 768,WJ Energis do Brasil SA
135.650 Compnhia Energetiw de Minas Gerais. ADS Id 6,106.CdM b u n g International Power Grnerdtion Co.. Lt!.. i l 387.iM CPFL Ene id SA 827.976 Gujamt In%mies Power Co.. Ltd
390,80i).Y41 AES Tiete SA 16,!40$,16h Guangdong Electric Power tkvelopment Co.. Ltd, B
BRA BRL BRA BRL CI IN IlKU BRA U5D CHN HKD BRA HKL IND INR
0.92 0.88 0.81 0.31 0.50 0.43 0.09 4.14 53.16(1.373
7,338.912 Fertilizers & Agricultural Chemids
Industrial Machinery
1,502.CKNI T3u Chemiwls Ltd.
7 T 3 . W Lnvestimenka ltnu 5A, prd.
IND INR
BRA BRL
0.5T
3.950929 0.31
135
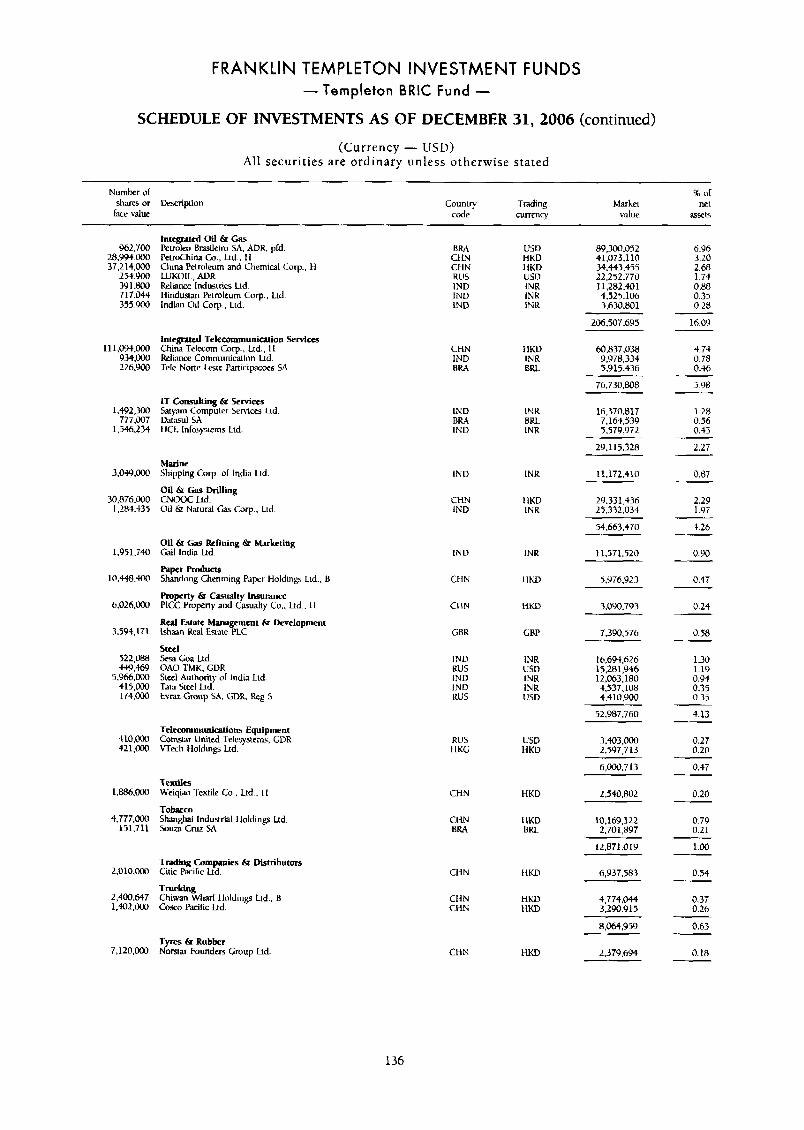
FRANKLIN TEMPLETON INVESTMENT FUNDS - Templeton ERIC Fund -
SCHEDULE OF INVESTMENTS AS OF DECEMBER 31, 2006 (continued)
(Currency - USD) All securit ies are ordinary unless otherwise stated
Numbcr of shares or k r i p t i o n f3ce value
o County Trading Market net
code currency value i155etS
Integrated Oil & Gas Pctmlm Brasileim SA, ADR. pld. PermChina CU., Ltd., t1 China Petrrhun and Chemic31 Corp.. t I LUKOIL, ADR Rrlince Industries Ltd. liindusian Petmleum Corp., Lrd. Indian Oil Corp. Ltd.
962.700 2A.YM.000 37,2 1 +,COO
254.Y00 3Yl.800 717.044 355,900
11 1,oY~.ooo 934.000 226,Y00
1,492,300 777.007
1,546.234
3,0.tu,000
30,876.000 1,284,435
1.Y51.740
10.448.400
6,026.000
3,594,171
522,m t.W.469
5,966,000 415.000 l74.W
410.000 421,000
1.W.OOO
4,777.000 151.711
2.010.000
2,400,647 1.402.000
7,120,003
BRA CIIN CHN KU5 1ND INV IND
CHN IND BRA
INU BRA IND
I N U
CHN IND
IND
CHN
CI LN
CBR
IND RUS IND INU RUS
USV HKD I IKD USU INR INK INK
I IKD INR B U
INK BRL I N R
IRK
I IKD INR
INR
1 IKD
HKD
GBP
INR CiSD INR INK U5D
89,300,052 41,073.110 34.443.455 22,252.770 11.282.401 4.525.106 3.630.801
206.507.69 5
6 96 3 20 2.68 1.74 0.88 0 35 0 28
16.0'3
4.74 0.78 0.36
5 98
1 28 0 56 0.43
2.27
htrgrrted Telecommunication Services China Telccom Corp., Ltd., 11 Ueliance Comrnunicatinn Ltd. Tele None k t e Panicipacces SA
60B37.039 9,978,334 5.914.436
76,730.808
IT Consulting & Services Satyam Computer Senices Ltd. h tasu l SA I ICL Infosyslerns Ltd.
16.370.817 7,164.53'3 5.579,Y 72
29,115.328
Marine Shipping COT. of India Ltd
Oil 6r Gas Drillig UJOOC Ltd. Oil Ez Natural G;ls Corp.. Ltd
11,172,410 0.87
2.29 I.Y7
4.26
0.90
0.47
0.24
0.58
1.30 1.19 0.94 0.35 0.35
2'3.331.436 25.332.034
54.663.370
Oil & Gas Refining & Marketing Gail India Ltd. 11,571.520
5,976,923 hpet Products Shandong Chenming Papcr Holding Ltd., B
Property Q Casualty lnsumnce PlCC Propcny and Casualty Cu., Ltd.. I 1
Real Estate Management & Development Ishaan h l Enate PLC
3.090.793
7,390.576
Stnl Sesa Goa Ltd. OAO TMK. GDR Sieel Authority of India Ltd. Tala Steel h d . Evraz Group SA, C;D4 Kog 5
16,694,626 15 28 1,946 12,063,180 4,537.108 4.410.900
52,987.760 4.13
0.27 0.20
0.47
0.20
0.79 0.21
1-00
0.54
0.37 0.26
0.63
0.18
Telecommunications Equipment Comsrar United Tclcsyaems, GDR \Tech Holdings Ltd.
3.403.000 2.5Y7,713
RU5 tIKG
USV HKV
6,000,713
textile Weiqiao Textile Co.. Ltd., 1 1 CHN
CHN BRA
HKD 2,540,802 Tobacco SJwnghai Industrial I ioldings Lrd. Sow Cruz SA
IIKD BRL
10,169,122 2,701,897
12,871.019 Trading Companies & Distributors Citic Pacific Ltd. CIIN IIKD 6,937.583 Trufkiw Chiwan Wharf Iloldings Lid.. B Cosco Pacific Ltd.
CHN CHN
HKD HKD
4,774.044 3.290.9 15
8.064,959
2,379,694 Tyres 6r Rubber Norstar Founders Group Ltd. CHN HKD
136
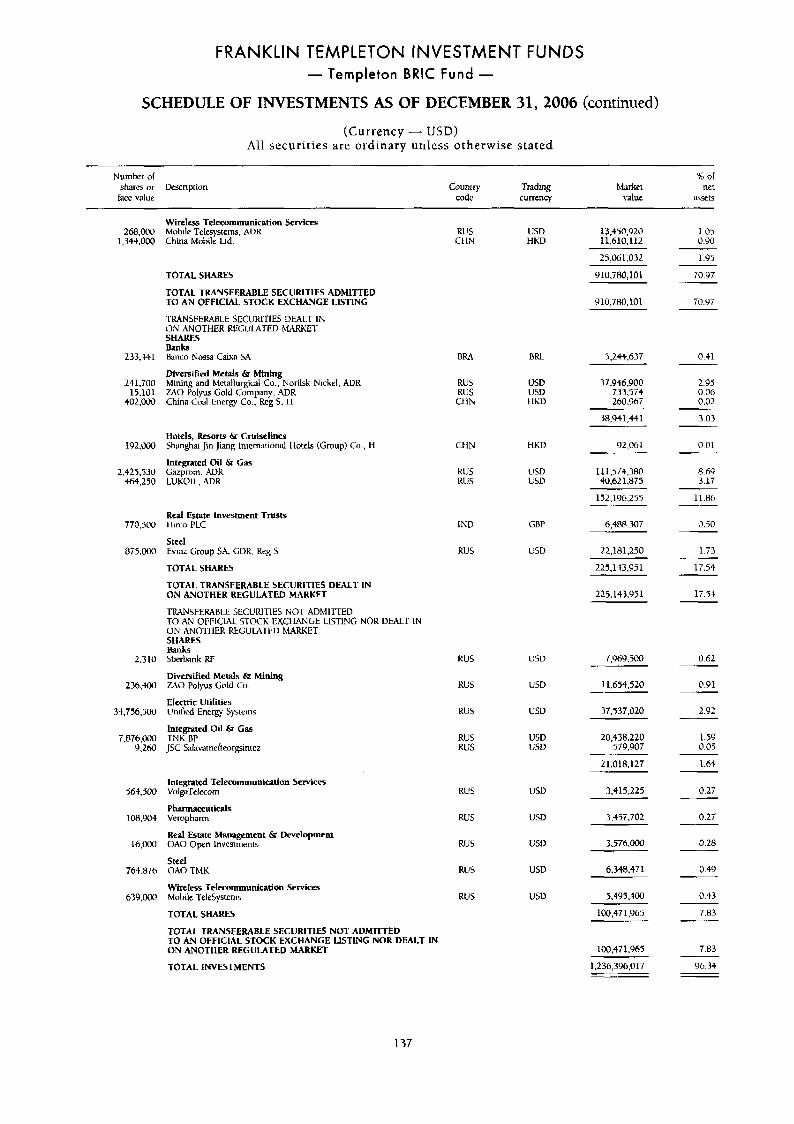
FRANKLIN TEMPLETON INVESTMENT FUNDS - Templeton BRlC Fund -
SCHEDULE OF INVESTMENTS AS OF DECEMBER 31,2006 (continued)
(Currency - USD) All securit ies are ordinary unless otherwise stated
Numher of 46 or
ram value code currency value asset3 shares or Orscnption Country Trading Market net
Wireless Tclecommuniration Services Mobile Telesysteins. AUK China Mobile Lid.
RU S CllN
263,000 1,34$.000
233,541
241,700 15.101
402.000
192,000
2.425.530 464,250
770,500
8T5.000
2.310
236.400
34,756.jOO
7.87b.000 9.2M
564.500
1oH.Yo4
Ih.WO
764.8ib
639,000
13.450.920 USD HKD 11,610,112
1.05 0.90
1.95 25.061.032
Y10.780,101 70.97 TOTAL SHARES
TOTAL TRANSFERABLE SECURLTlES ADMIlTED TO AN Of FlCiAL STOCK EXCHANGE LISTING 910,780,101
5.244.637
70.Y7
0.41
TRANSFERABLE SECUKICIES DEALT IN ON ANOTHER KEGUWTED h U R K E l SHARES Banks Banco Nos- Caixi 5.4
Diverdied Me& 67 Mining Mining and Metallurgical Co., Norilsk Nickel. AUK ZAO Polyus Gold Company, ADR China Coal Energy Co.. Reg 5. 11
BRL
37.946.900 733,574 264.96T
RUS RUS CllN
USD USD IIKD
2.95 0.06 0.02
3.03 38,941.44 1
Hotels, Rcsorts & Cruiselines Shanghai Jin Jiang lnremaional Hotels (Group) Co., H lntepted Oil & Gas Gazpmm. AUK LUKOIL. ADR
CfIN HKD 92,061 0.01
H.69 3.17
11.86
KUS RUS
U SD LSD
11 1,574,380 40.62 1,875
152.196.255
Real &Ute lnvestment Trusts I limo PLC
Steel E v n ; Group SA. GDR. Reg S
TOTAL SHARES
TO-rAL TRANSFERABLE SECURITIES DEALT IN ON ANOTHER REGULATED MARKET
IND
RGS
GRP
USD
6.488.307
22,181.250
0.50
1.73
17.54
1 T . i t
225,143,Y51
225.143.931
'I'RANSFERW1.E SECURITIES N O T ADMITTED
ON ANQIIIER REGUlAl~lIU MARKET TO AN OI:I:ICNL %rocti EXCIMNGE LISTING NOR ULUT IN
SHARES Bank+ Sberbank RI;
Diversified Metals & Mining U O Folyus Grrld Co.
Electric Utilities llnified EnerR- Sysrcms
KUS
KCS
KUS
RUS RUS
USV 7.969.500 0.62
0.91 USD 11,654,520
37,537,020
20,438.220 57'3.907
2i.oia.127
3.415.225
2.92
Integrated Oil & Gas TNK-RP JSC Sakrvarnclteorpintez
USD USV
1.59 0.07
1-64
Integrated Telemmmunlution Services Vdga rekcom
Pharmaceuticals Veropham
Red Estate Management & Dwclopment OACJ Open lnvestiiients
Steel O M TMK
Wireless Telecommunication Services Mobile TeleSystems
TOTAL SHARES
KUS
RUS
RUS
RUS
KUS
USU
USD
US11
USD
USD
0.27
0.27 3.457.702
0.28 3.576.000
6.348.471
5,493.400
0.49
0.43
100,471,965 7.83
7-83
TOTAL TRANSFERABLE SECURITIES NOT A D M l n E D TO AN OFFICIAL STOCK EXCHANGE LISTING NOR DEALT IN ON ANOTHER REGULATED MARKET 100,411,965
TOTAL INVESTMENTS 96.34 1,236,396,017
137
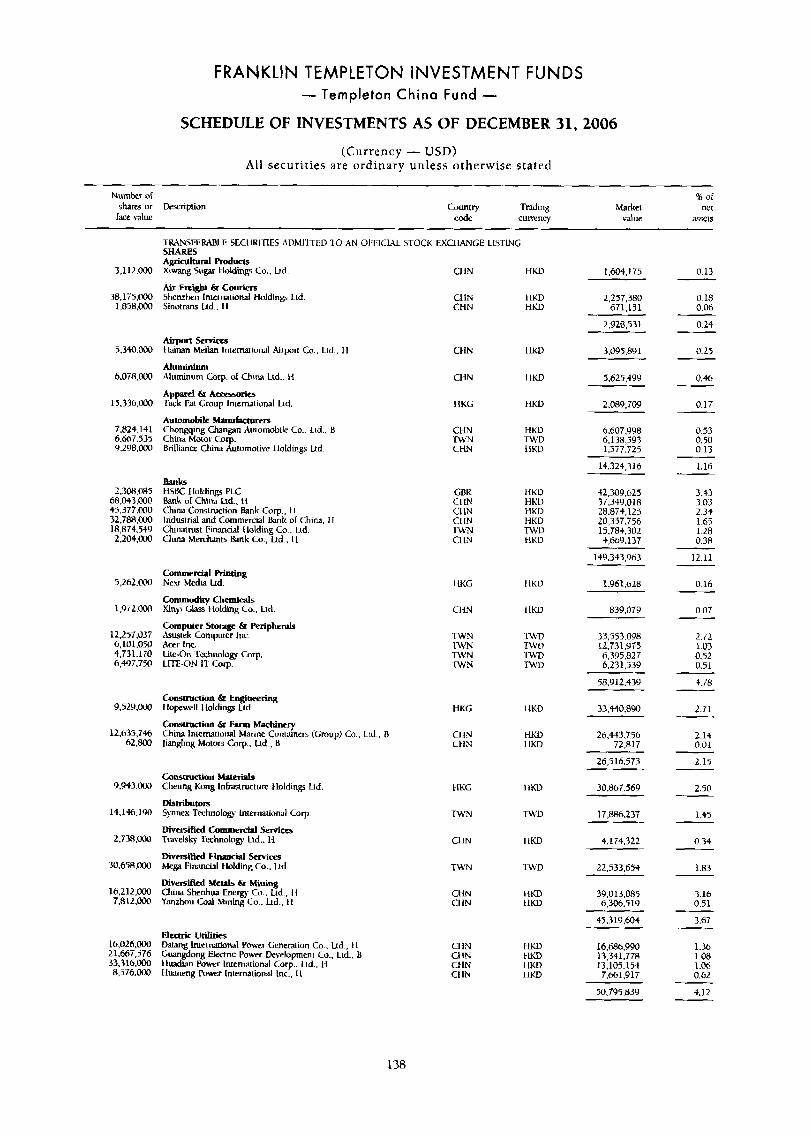
FRANKLIN TEMPLETON INVESTMENT FUNDS - Templeton China Fund -
SCHEDULE OF INVESTMENTS AS OF DECEMBER 31,2006
(Currency - USD) All securities are ord inary unless otherwise s t a t e d
Number or % of shares or krription Country Trdding Market net
hce value COdC currency value assets
TMNSFEMBLE SECURITIES ADMI'lED 10 .4N OITICWL STOCK EXCI IANGE LISTING SHARES i&i& pmdurts Xiwang Sugar Holdings Co., Ltd
Air Fmght & Couriers Shenzhen lntematlonal Holding Ltd. Sinotrans Ltd.. 11
3,112.000
38,li 5.000 l.858.000
5.340.000
6.078.000
15.336,WO
7.824.141 6.M7.535 Y,298.000
1,308.rn5 68.043.M@ 45,377.1330 32.78A.COO 18,874,549 2.204.000
5 , 2 6 2 . ~
1 ,9 T2 .#
12,257.037 6,101.050 4.73 1.170 6.4Y7.750
9.529.W
12,635.7W h2.800
9,943.000
14,146,190
2.73R.000
30,658,00(1
16.212,Ooo 7.8 I2.000
16.02h.000 21.667,S76 33,316,000 8,576.01)o
CI IN
CtlN CHN
CHN
CIIN
IIKG
Ct1N IWN CttN
GBR CI IN CI IN CI IN IU'N CI IN
I IKG
CI IN
TWN 1WN TWN -rWs
H W
I IKD HKD
IIKD
1 IKD
HKD
H W -nvu IIKD
HKL) HKD HKD HKD TWL) t i K D
t IKI3
I IKU
'IWD T t W 'IU'D TWV
1.604.175 0.13
0.18 0.06
0.24
0.25
0.46
0.17
0.53 0.50 0.13
1.16
3.43 3.03 2.34 1.67 1.28
12.11
0.16
0.07
0 . 3 ~
2.72 1.03 0.52 0.51
+.in
2.71
2.14 0.01
2.15
2.50
1.45
0.34
1.83
3.16 0.51
3.67
1.36
1-06 0.62
4.12
i.on
2.257,380 671.151
2.928.531
Airport servires llainan Meilan Inremional Airpod Co.. Ltd.. ti
AlUminium Aluminum hrp. ol China Ltd.. l i
Apparel & 'es Tack Fat Croup lntemtiunal Lid.
Automobile .H*nufpcturers Chongqing Changan Auiomobilc Co.. Lid., B
Brilliana Chim Automoiivc lloldings Ltd. Chilld Motor COT.
3,095.89 1
5.625.499
2.089.709 ~
6.607998 6,138,593 1.577.725
14,324,314
Bank tiSK Holdinp PLC Bank d China Lid.. H China Consiruction h n k COT., 1 1 Industrial and Commercial bank of China. I 1 Chinatrust Financial I lolding Co., Lid. China Merchants Bank Co., Lid.. 11
42,309,625 37.349.018 28.874.125 20,357.756 15.784.302 W9.137
149.343.9h3
Commercial Printing Nexi Media Ltd.
Commodity t h e m i d s
Computer Stongc & Peripherals Asustek Computer Inc. Amr I n c Lite-On TcchnoloB- Corp. LITE-ON I T COT.
y' , iny : Glass Ilolding Co., Lid
1,961,628
839,079
33.553.098 12.731.975 6.395,827 6.231.539 . ,
58,912.439
Coostnrctian & Engineering I l o p e l l I lolding L t d
Consuuctian & Farm Machinery China lnlemational Marine Cuntainrrs iGmup) Co.. Ltd., I3 Jiangling Motors Grp.. Ud., I3
t IKG IlKD 33.440.890
CI 13 ct IN
HKD I IKD
26.+43.756 72.817
26.51h.573
collstruaiMI Moterials Cheung Kong lnlmmcture Holding Lid.
D * U i h t O R Sgnnes Technolw International COT
D i v e i f i d Commercial Services Travelsky Technology Ltd.. 11
Diversifid Financial 5crvices Mew Financial Holding 15. Ltd
Divai fmi Metals & Mining China Shenhlw. Energy CCT.. hd.. I 1 Ymzhou Coal Mining Co., Lid.. t i
IiKC I 1KD 30,867.569
17,886,237 TWU
CllN I K D 4.174.322
TWN 'IWD 22,533,654
39,013,085 6,306.519
CtGU CI IN
ItKD IIKD
45.319.604
Electric Utilitiu DaLzng lnlemational Power Generation Co., Lid., 11 Guangdonp, Electric Power Development Co., Lid.. tl lluadian Powr Infernational Corp.. Lid.. H Huaneng Powr International hc., 11
c1 IN CIIN C1 IN CHN
HKD t1KU I IKD 1 lliD
16.686.990 13,341.778 13.105.154 7,661,917
50,7Y 5.839
138
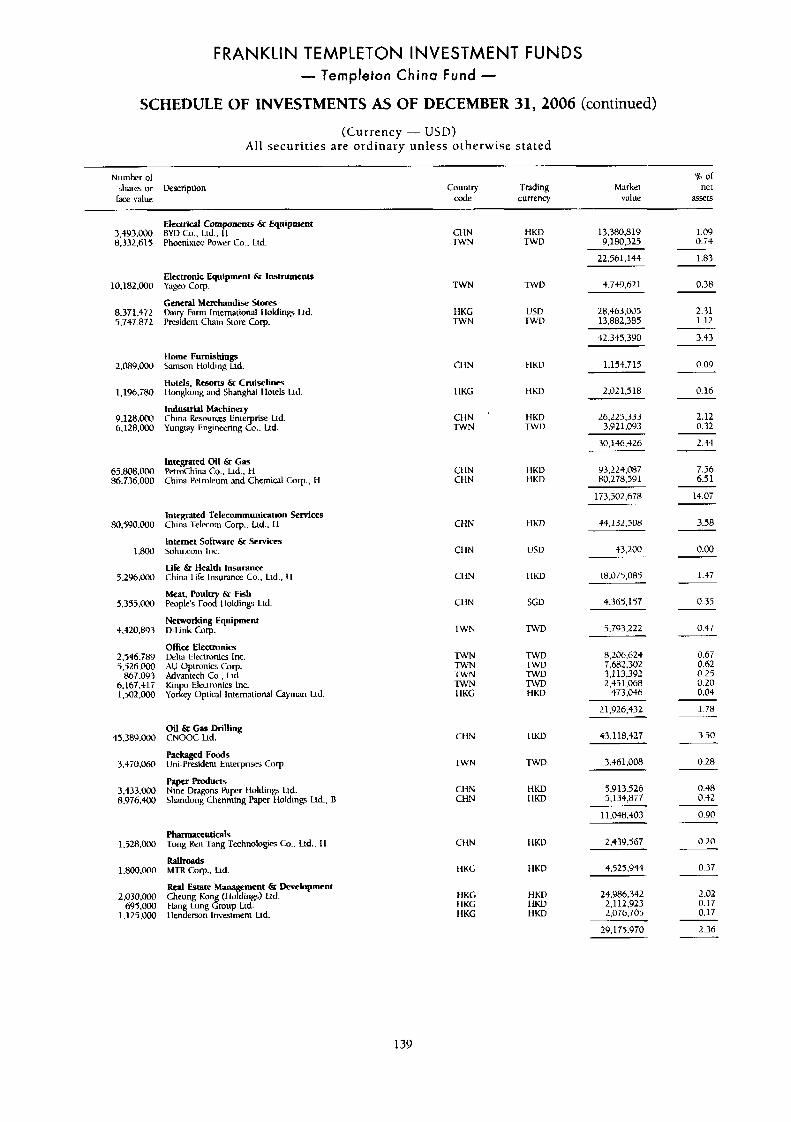
FRANKLIN TEMPLETON INVESTMENT FUNDS - Templeton China Fund -
SCHEDULE OF INVESTMENTS AS OF DECEMBER 31,2006 (continued)
(Currency - USD) All securities are ordinary unless otherwise stated
Numtcr of B of
face value code currency value 3sXtS shares or Oerription Country Trading Market net
Elecrrld Components 6r Equipment BYD Co., Ltd.. I 1 Phoenixtec Power Co., Ltd
HKD TWD
n V D
USD TWD
HKD
t iKD
HKD n v u
I lull IiKD
tlKD
usu
I LKU
sc;o
TWO
TWD TwV -1wu TWD HKD
I IKU
TWV
IiKD HKD
t1KV
tl l i iu
HKV 11w HKD
1.09 O.T4
3,4Y3.000 8.332,hl-j
10,182,000
8.37 1.47 1 5.747.872
2.089.000
1,196.780
9.128.000 6.i2R.OM)
65.808.000 $6.7 36,000
H0,-590.~0
I .ROO
5.206.000
5,355,000
4.+2O.R93
2.346.789 5,526.CGU
867.093 6.167.417 1.502.D0(!
45,389 oil0
3.4TO.060
3,433.000 8.Y76.400
1 .J28,000
1.8oO.MO
2.030.000 695.000
1,125.ow
CHN TWN
TWN
HKG TWN
CI IN
HKG
CIIN '
IWN
CI IN CHN
13,380,619 9,180,325
22.561.144 1.83
4.7+9.621 0.38 Electronic Equipment & Instruments
General Merchandise Stom hiry Farm International lloldings Ltd President Chain Store Corp.
Y3gtO COT.
2.31 1.12
16,463,005 13,882,385
42,345,390 3.43
tlome Furnishings Samson tlulding Ltd
Hotels, Resons & Cruiselitm Ilongkong and Shanghai llotels Ltd.
industrial Machinery China Resources Enierprise Ltd. Yungtay Engineering Co.. Ltd.
0.09
0.16
1,154.715
2,021,518
26,225.333 3921.093
2.12 0.32
2.44 30.146.426
7.56 6.51
Integrated Oil & Gas PctroChina Co.. Lid.. H China Petroleum and Chemiwl Corp., tl
Y3.224.087 R0.278,59 1
173.502.678 14.07
lntegrated Telecommunication Services China 'lelecorn Corp.. Ltd., I 1
Internet Software & Scrvims Sohu.com Inc.
Life & Health Insurance China Lire Insurance Co.. Ltd.. 11
Meat, Poult I Fish People's FmTl lulding Ltd
Networking Equipment D-Link Corp.
OfFice Electronics Delia Eltctronics lnc. AU Optronics Carp. Advantech Co.. Lid. Kin o Lleumnics Inc. Yoriey ,pkal lnternaliunal C a p a n Ltd.
3.58
0.00
44,132,508
43.200
CHN
CI IN
1.t7 CllN 18.075.085
4.365.157
3,793,222
CllN 0.35
0.47
0.67 0.61 0.25 0.20 0.04
TWN
8,206,624 7.682 3 0 2 3.1 13,392 2,451,068
473.046
TWN TWN
1.78
3.50
0.28
11,926,432
43.1 18.427 Oil & Gas Drilling CNOOC Lid.
hckaged Foods L'ni-President Enterprises Corp
Paper Products Nine Dragons Papfr Holding 1.1d. Shandong Chenming Paper liddings Ltd., B
CI IN
3.461.008 T W N
CIiN CHN
0.48 0.t2
0.90
5,913.526 5,134,877
11.048.403
Phammuticals Tong Ren Tang Technologis Co.. Ltd.. 14
Railroads MTR Cor& Lid.
-1 Esmte Mana ment & Development Cheung Kmg (llof&$ lid. tlang Lung Group Ltd. Ilenderson lnvestmeni ud.
Ct IN 0.20
0.37
2.02 0.17 0.li
2.439.567
4.525.944 HUG
tIKG I IKG HKG
24,986,341 2.1 12,923 2,076.705
29.175.970 2.36
139
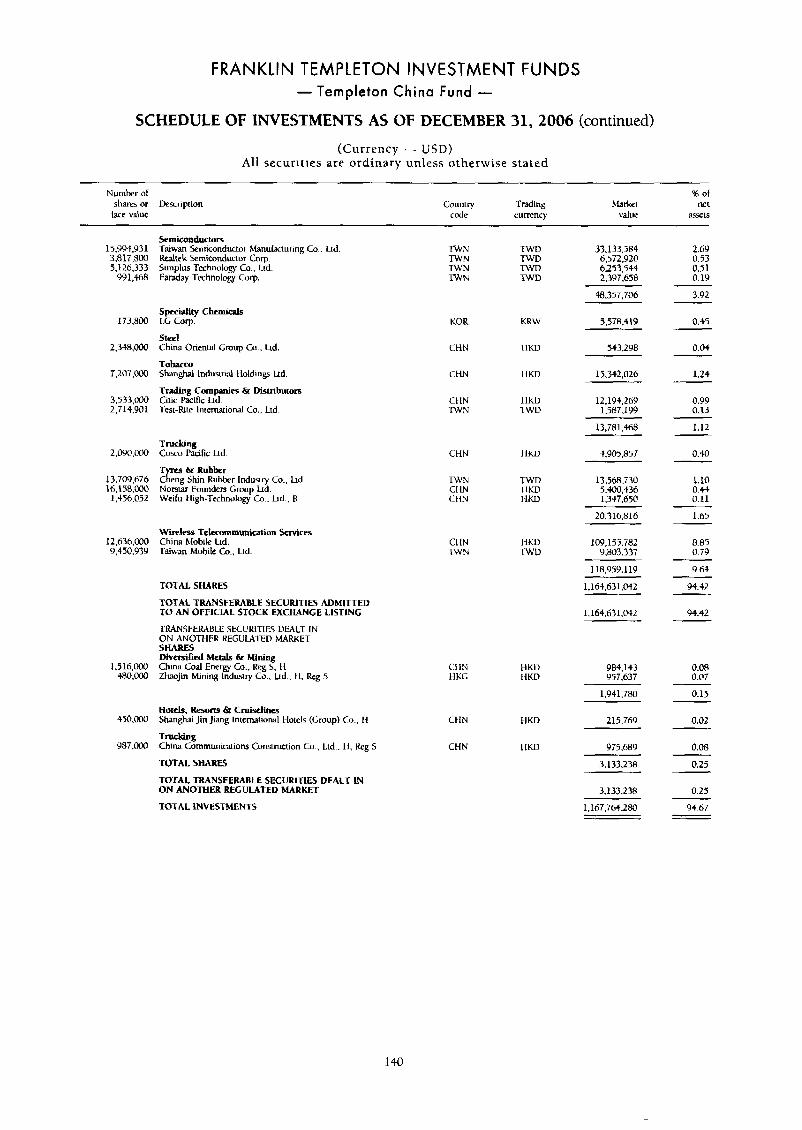
FRANKLIN TEMPLETON INVESTMENT FUNDS - Templeton China Fund -
SCHEDULE OF INVESTMENTS AS OF DECEMBER 31,2006 (continued)
(Currency - USD) All securities are ordinary unless otherwise stated
Number or shares or lkaription
face value Country Trading
code currency
Semiconductors Taiwan Scmiconductor Manufacturing Co.. Ud. Kealtek Semiconductor Cop. Sunplus Technology Co., lid. Faraday Technology Corp.
15,994,931 3,817,Yoo 5,126,333
991,468
173,800
2,348.000
7,207.000
3.533.m 2.714.901
2,0Y0,000
13,709,674 1 6 . 1 5 8 . ~ 1.456.052
12,636,000 9.450.939
1.516.000 480,000
+50.000
Y87.000
TWN TWD W N TWD TWN TWD TWN TWD
33.133.584 6.572,920 6.253.544 2,397.658
2.69 0.53 0.51 0.19
3.92
0.45
0.04
1.24
0.99 0.13
48,357,706
SpccMity Chcmicak LG Corp.
Steel China Onental Group CO., Ud.
Tobacco Shanghai lndusuial t loldings Ltd
Trading Companies & Distributors Ciric Pacific Lrd. 'Itst-Rite lniemational Co.. Ltd.
KOU KRW 5,578.419
543.298 CHN 1 IKD
13,342.026 CHN I IKD
12,194,269 1.587.199
CI IN HKU .IWN TWD
~ ~
13,781,468 1.12
Trucking Cox0 P3cilic Lrd
T s&Ruhber C E g Shin Ruhber Indusiry Co., h d Norstar Founders Group Ltd. Weifu lligh-Technology CO., hd. . R
CHN I IKD 4.905857 0.40
1.10 0.44 0.11
TWN TWD CHN I IKD CHN k IKD
13,568.530 5,400,436 1.347.650
20316,816 1.65
8.85 0.i9
9.64
94.42
94.42
0.08 0.07
0.15
0.02
0.08
0.25
Wireless telmommunication Services China Mobile Lrd. Taiwan Mobile CO., Ltd.
109,153.782 9,803.337
CI IN HKU -1WN TWD
118.959.1 19
1,16-+,631,042
l,l64.631,042
TOTAL SHARES
TOTAL TRANSFERABLE SECURITIES ADMITTED TO AN OFFICIAL STOCK EXCHANGE LISTING
TRANSFERABLE SECURITIES DEALT IN ON ANOTHER KEGUW~TELI MAUKET SHARES Dhersificd Metals &r Mining China Coal Energy Co.. Keg 5. tl Zhaojin Mining Induar). Co.. Ltd., 11, Reg 5
CllN HKU HKG I1KD
984,143 957,637
1,941.780
215,769 Hotels. Resorts & Cruiulines Shanghai Jin Jiang International I-lotels (Croup) Co.. I1
Trucking China Cnrnrnunicdotw Constmcuon Co., Lid.. 11. Keg 5
TUfAL SHARES
TOTAL TRANSFERABLE SECURLTIES DEALT IN ON ANOTHER REGULATED MARKET
TOTAL 1NVESTMEMS
Ct IN HKD
CHN I 1Ko 975,689
3.133.238
3,133,238
1,167.764.280
0.25
94.67
140
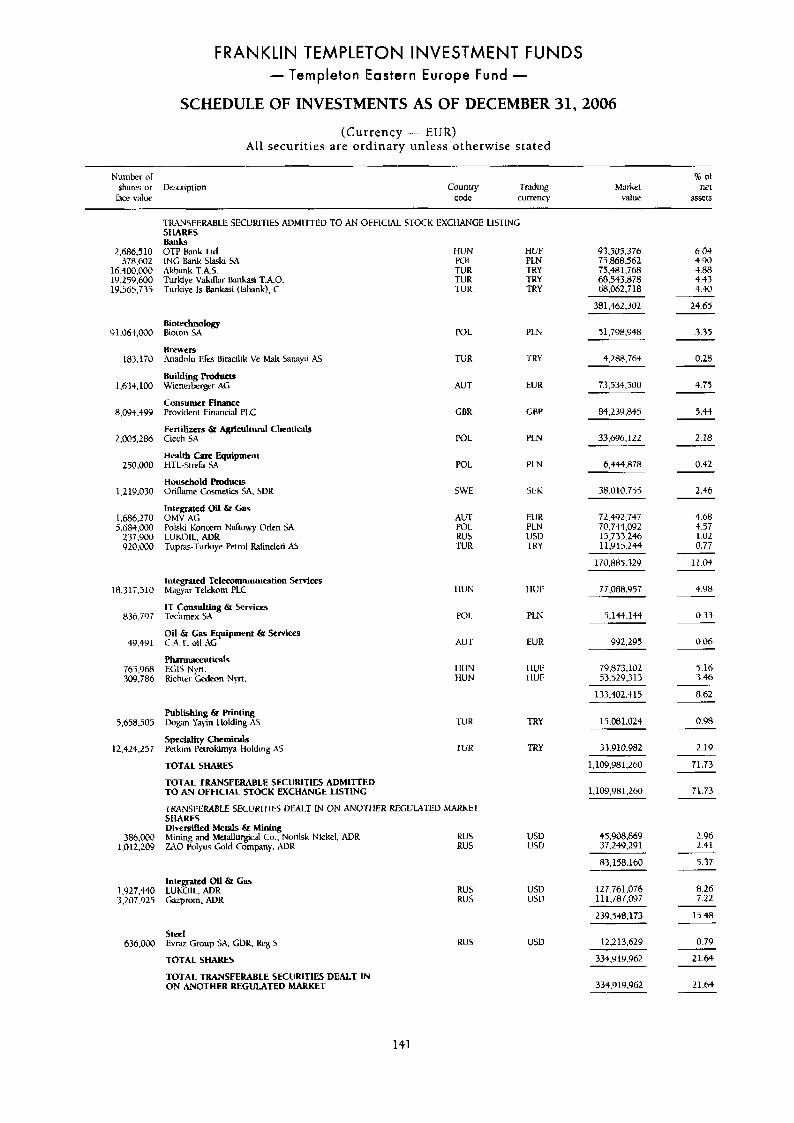
FRANKLIN TEMPLETON INVESTMENT FUNDS - Templeton Eastern Europe Fund -
SCHEDULE OF INVESTMENTS AS OF DECEMBER 31,2006
(Currency - EUR) All securities are ordinary unless otherwise stated
Number or shares or Dexriprion
race value
% of Market net
value assets Country Trading
code currency
TRANSFERABLE SECURITIES ADMIn-ED TO AN OFFICIAL STOCK EXCHANGE LISTING SHARES Banks OTP B3nk A. INC h n k Slaski SA Akhank T.AS. Turkiye Vakiflar L n k i T.A.O. Turkiye Is b n k i (Ishnk), C
HUN POL
2.6Rh.510 378,602
16,900,000 19,259.600 1'4.565.7'35
W O ~ ~ , O O O
183,170
I .63+.100
8.aY4.499
2,005,286
250.000
1,219.030
1.686.270 5.684.000
237.900 920,000
18,31T,510
836.797
49.49 1
765.968 '309.786
5,658,505
12.424.257
386.000 1 .0 12,209
1 ,927,440 3.207.925
636.000
HUF PLN
93,305,376 73,868,562 75,481,768 68.543.878 68.062.718
6.03 4.90 4.RH 4.43 4.40
TUK TUR TUR
TRY TKY TRY
381,462,302 24.65
Biotechnology Rioiun SA POL
TUR
AUT
GRU
POL
51.798.948 3.35 PLN
Brewers hadolu Eres Biracilik Ve Malt Sanayii A5
Building Roducts Wienerbeqy AG
0.28
4.75
4.2RR.764
73.534.500 EUR
Consumer Finante Provident Financial P1.C
Fertilizers & Agricultural Chemicals Ciech SA
84.239.8+5 5.44 GBP
PLN 33,696,122
6.444.878
2.18
0.42 Health Care Equipment I L T L - S ~ ~ ~ SA POL PLN
Household Products Oriflarne Cosmetics SA, SDK
Intemated Oil & Gas
SWE
Au-r POI. KUS .ruu
3P.010.755 2.46 S t i i
72.492.747 T0,744,092 15,733.246 11.915.244
EUR PLN USD TRY
OMV AG Polski Koncem N a f t o y Orlen SA LUKOIL. AUK TupnsJurkiye Petrol Rafineleri A5
4.68 4.57 1.02 0.77
11.04
4.98
0.33
170.885.32Y
77,088.957 Integrated Telwommunieation Services Magyar Telekom PLC
IT Consulting &I Services Techrnex SA
Oil & Gas Equipment 6r Services C.A.T. oil AG
Pharmaeeut- EGIS Nyn. Richrcr Gfdeon N y t
I11JN
POL
AUT
l - l l l l ~
PLN
EUR
5.144.144
992.295 0.06
5.16 3.46
I lUN HUN
I IUF I lUF
79.873.102 53.329.31 3
133.402.515 8.62
Publishing & Printing Dogan Yay-in I lolding AS Speciality Chcmicnls Petkim Pctmkimp Holding AS
TOTAL SHARES TOTAL TRANSFERABLE SECURITIES ADhlInED TO AN OFFICIAL StOCK EXCHANGE LISTING
-suu
TUR
TRY
TRY
O.YR
2.19
15.08 1.024
33.910.982
71.73 1,109,981,260
1,109,981.260 71.73
TWNSFEKABLE SECURll~lB DEALT IN ON ANOTHER REGUWI-EIJ MARKET SHARES Divemifwd Metals & Mining
U O Polyus Cold Company. AUK MininR and hletallurgical Co., Norilsk Nickel, ADR KUS
RUS USU USD
45,908,869 37.2WW.291
2.96 2.41
83,158.160 5.37
Integrated Oil t Gas LUKOIL, ADR Gazpmm, ADR
RUS RUS
127.761.076 111.787.097
USV USD
8.26 7.22
239.H8.173
12.213.629
15.48
0.79
21.64
Steel Evraz Group SA, GDK, k g S KUS USD
TOTAL SHARES
TOTAL TRANSFERABLE SECURITIES DEALT IN ON ANOTHER REGULATED MARKET
334.Y 19.962
334.919.962 21.64
141
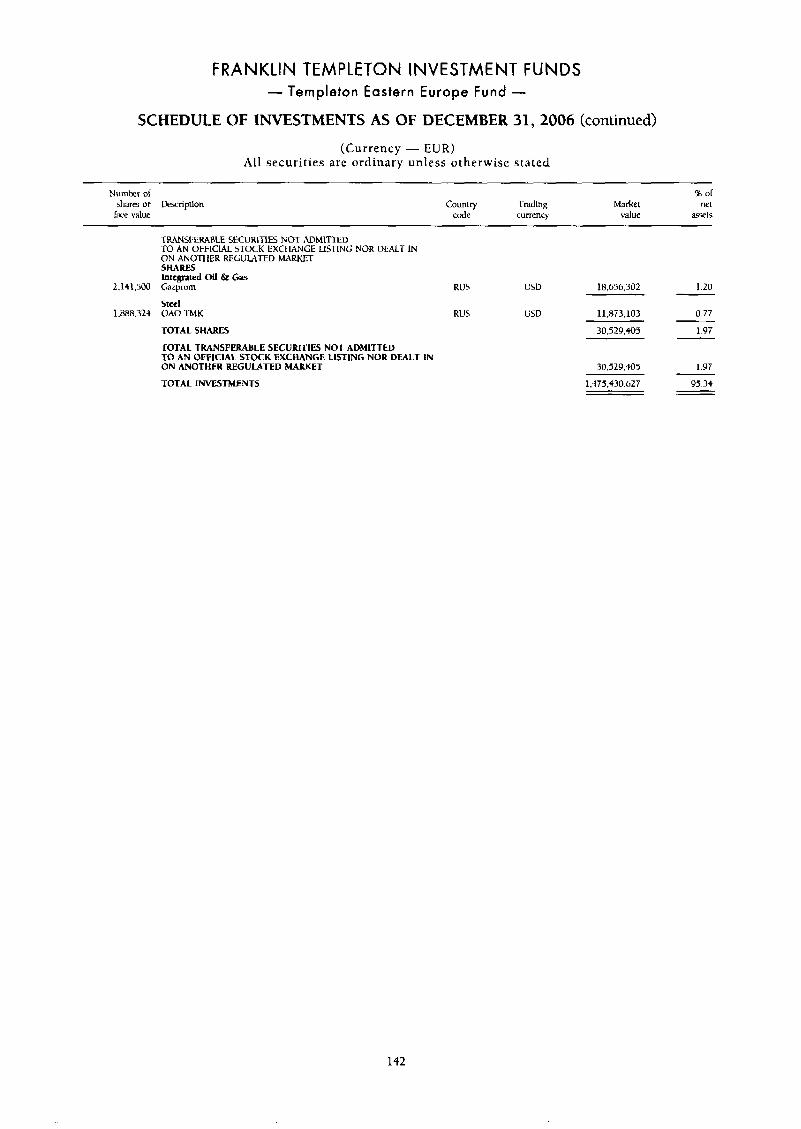
FRANKLIN TEMPLETON INVESTMENT FUNDS - Templeton Eastern Europe Fund -
SCHEDULE OF INVESTMENTS AS OF DECEMBER 31,2006 (continued)
(Currency - E U R ) Al l securit ies a re ordinary unless otherwise stated
Numkr of 96 of shares or Description Country Trading Market net
race value cude currcnq value a W t 5
2,141,500
1.888.323
TRhNS1;EKXBLE SECURITIES NOT ADMlTIEU TO AN OFFICLAL STOCK EXCl IANGE LISTING NOR UEALT IN
SHARES Integrated Oil & G a Cazprom
ON mo-ri IER REGUUTED MARKET
stet1 OAO TMK
RUS
RU5
usu
USD
TOTAL SHARES
18,646,302 1.20
11.873.103 0.77
30,529.405 1.97
TOTAL TRANSFERABLE SECURITIES NOT ADMITTED TO AN OFFICIAL STOCK EXCHANGE LISTING NOR DEALT IN ON ANOTIIER REGULATED MARKET TOTAL INVESTMENTS
30.529.405 1.Y7
1,475.430.627 95.34
142
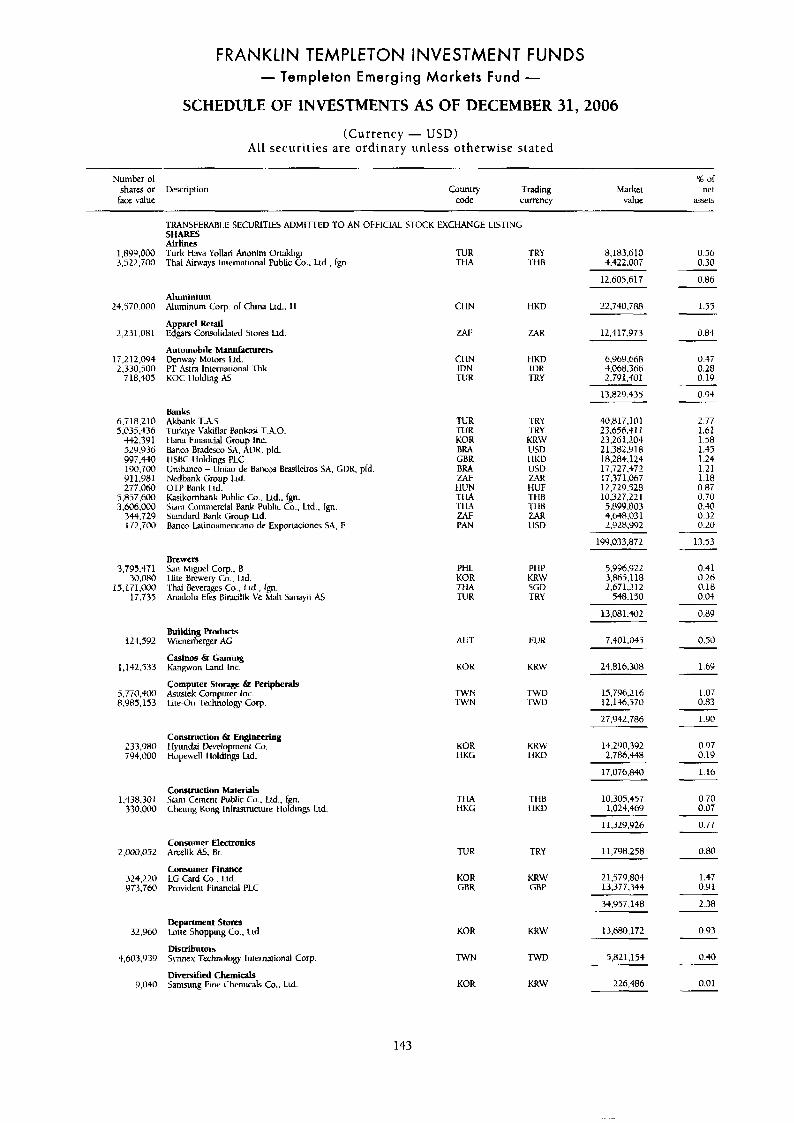
FRANKLIN TEMPLETON INVESTMENT FUNDS - Templeton Emerging Markets Fund -
SCHEDULE OF INVESTMENTS AS OF DECEMBER 31,2006
(Currency - USD) All securities are ordinary unless otherwise stated
Number of % of shares or Dfrription Counq Trading Market ne t face value code currency value 35yt5
TRANSFERAB1.E SECURITIES ADMITrEU TO AN OFFICIAL STOCK EXCHANGE LISTING SHARES Airlics Turk Hava Yollari Anonirn Omkligi TUR PKY Thai Airways Inier;ltional Public Co., Ltd., fgn. TtlA T H B
1,89Y ,000 3,522,700
24.570.000
2,231.081
17,212,094 2.330.500
718,405
6.718.210 5,035,436
442.391 52Y.036 997,440 190.700 Y11.981 277.0h0
5.R37.600 7.606.000
172,700 344.729
3.795.47 1 30.080
15,171.000 17.735
124.592
1,142,533
5.770.400 X.YR5.153
233.Y80 794,000
1,438.30 I 33o.CHK1
2.0.052
324.220 Y7 3,760
32,960
4,603.U39
8,183,610 4.422.007
12.605.617
22,740,788
0.56 0.30
0.86
1-57 Aluminium Aluminum COT. o l Chna hd.. 11
Apparel Retail I'dgas Consolidatd Stores Ud
Automobile M ~ U ~ C I U I Y E Denway Motors Ltd. YI' Astm lntema~ional lbk KOC 1 lolding AS
CI IN HKD
WI: ZAR
Cl lN HKD IDN IUK TllR TRY
12.417.973 0.84
0.41 0.28 0.19
6,969,668 4,068.366 L,7¶1,40 1
13.829.135 0.94
Banks TUR TUR KOR BFN GBR R R A ZAF HUN TI IA .I1 L4 w P.4N
T K Y TKY KRW USD I IKD USD ZAR HUF THB TI IB L4R USD
40,817,101 23.656.411 23,261,104 21,382.918 18.284.124 17.72 7.472 17.37 1,067 12,729.528 10,327,221 5.8YU.803
2.77 1.61 1.58
Akhank T.A.5. Turkiye Vakiflar Ekinksi XA.0. 113113 Financial Croup Inc banco Bradesco SA. ALX. pfd I 1SBC llolding PLC Unthanco - Uniao de Bmws Brasikiros SA. GIIK. pld. Nedbank Gmup ].id. OTP Rink Lid. Kastkurnhnk Public Go.. Ltd.. Tgn. Sam Commercial Rank Public Co., Ltd., fgn. Standard Rank Group Ltd. Banco Laiinnaniericano de Exporiaclones SA, E
1.45 1.24 1.21 1.18 0.87 0.70 0.40 0.32 0.20
13-53
4.618.031
199.073,872
5.YYb.922 3,865,118 2.671.212
548.150
13,081.402
2,928.992
Brewers S m Migue! Corp.. R llite Brewery Co.. Lid. 'L'hai kvcraRes Co.. hd., fgi. hadolu Efes llirxilik Ve Malt Sanryii AS
PHL PI IP KOR KRW THA SGD TUR TRY
0.41 0.26 0.18 0.04
0.89
Building Products Wienerherger AG
Casinos & Gaming Kanp-on I;md Inc.
Computer Storage & Peripherals Asustek Compuier Inc. Lite-On Technolog Corp.
AUT EUK
KOK KRW
TWN T W V TWN -1-wu
7.401.045 0.50
24.816.308 1.6y
15,796,216 12,146,570
1.07 0.83
27.942.706
14,290,392 L.786.*8
17,076,840
1.90
0.97 0.19
1.16
Construction & Engineering Hyundai IJwelnpmenl Go. Hopewell I loldtng Ltd.
KOK KKW I IKG I IKD
Construction Materials Siani Cement Puhlic Co.. Ltd., fgn. Cheung Kong Infrastructure t lolding Ltd.
10.305.457 1.024.469
0.70 0.07
TI 1B I IKI) . .
11.329.926 0.77
0.80 Consumer Electronics Arcelik As. Rr.
Consumer Financc LG Card Cn.. Ud. Provident I;inancid PLC
TUR TRY
1.47 O.Y 1
KOR GRR
KRM' GRP
21,579,804 13,377,344
34.Y 57,148 2.38
0.93 Department Stom Lone Shopping Co.. h d
5ynnex lrhnology In~ernaional Corp. DiSUibUtOrS
UOR
T W N
KOR
KKW
TWD
KRW
13.680,172
5,821,154 0.40
0.01 Diversified Chemids Samsung Fine Chcmtds Go.. Ltd 9.040 226,406
143
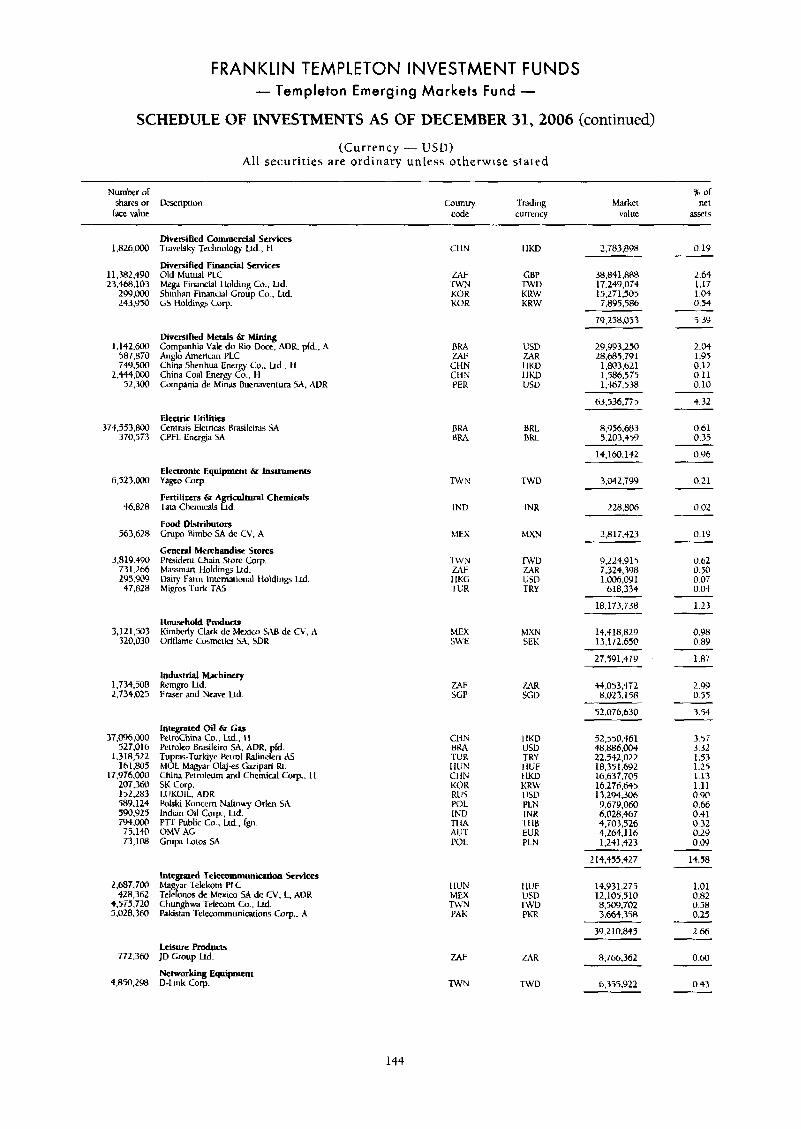
FRANKLIN TEMPLETON INVESTMENT FUNDS - Templeton Emerging Markets Fund -
SCHEDULE OF INVESTMENTS AS OF DECEMBER 31,2006 (continued)
(Currency - USD) All securities are ordinary unless otherwise stated
Number of shares or Description lace d u e
I ol Country 'hading Market net
code currency value a5w15
1,826,000
11,382,490 23.468.103
299,000 243.9M
1.142.600 587.870 749.500
2.444.000 52.300
374,553.W 370,573
6,523,000
46.828
563,628
3,819,490 731,266 LY5.909 47.828
3,12 1,503 320,030
1,734,508 2.734.025
37,096.000 527.016
1,318,522 1 b 1,805
17,976,000 207,360 152.283 589,124 590.Y25 794.m 75,140 73,108
2.687.700 428,362
4.5T5.il0 5,028.360
772,3610
4,850,298
Divetsified Commercial Services Travelsky Technology Ltd., tl
Divcrsificd F i ~ ~ ~ c i a l Services Old Mutual PLC Mega Financial I Idding Co.. Lld. Shinhan Financial Group Co.. Ltd GS ltolding Corp.
Diversified Me& & Mining Cornpnhia Vale do Kio the, ADR pld., A Anglo Ameriwn PLC China Shenhua Ener China Coal Energy 8.. H Compnia de hiins Bucmventura 54, ADR
Co. . Ltd.. 11
Electric Utilities Centnis Eletriw Brasileiw SA CPFL Energia SA
Electrunic Equipment & instruments
Fertilizers & Agricultural Chemicals Tam Chcrnicab Lid.
Food Distributors Grupo Bimbo SA de CV, A
General Metthandisc Stores President Chain Store Corp. Massmnn Holdings Ltd. Dairy Farm Internniional Holdings Ltd. Migros Turk TA.5
YageO COT.
Household F'mdwts Kimberly Clark de Mexico SA6 de CV, A Oriflnmc Cosmeticrs SA. SDK
~ndusvial Machinery Kerngro Ltd. Frsser and Neave Ltd.
C1 IN
ZAF XWN KOR KOR
BRA ztu: CHN CHN PER
BRA BFA
TWN
IND
MEX
'IWN U F HKG T L R
MEX SWE
ZAF StiP
HKD
GBP TWU KRW KRW
USD 7- 1 IKV llKD LJSV
BRL miu
TWD
INK
MXN
mu 7AR US13 TKY
tVl.Xii SEK
7AR SGV
2,783,898
38,841,888 17.249.07.) 15.271,505 7.8Y 5,586
79,258,033
29.993.250 28.685.791
1,807,621 1.586.575 1,467,538
b3.536.775
8,956,683 5.203.459
14.160.142
3,042,799
228,806
2,817.423
9,224.915 7,324,398 1.oorj.0Y1
618,334
18,173,738
14,418,829 13.172.650
~
27.591,379
W ,053,47 2 8.023.1 58
52.076.630
Integrated Oil & Cas PettoChina Co., Ltd.. I \ Pclroleo Brasileiro SA. ADR. pfd. Tu m Turkiye Riml Rafine e n & k J L M39yilr ohj-es k i p a r i m. China Petroleum and Cherniul Curp.. tl SK Corp. LUKOIL. AUK Polski Koncem N a f m y Orlen 5A Indian Oil Cop.. Ltd. FTI. Public Co.. Ltd., Ign OMV AG Grupa Lot05 SA
CHN I IKD BILZ USU TUK TRY I1UN 1 IUF CI IN k1KD KOR KRW RUj USD POL PLN IND INR TItA 'Yl IB AU-I- EUR POL PLN
52,550.461 48,886,004 22.542.022 18.35 1.692 16.637.705 16,276,645 13.294.306 9 .b79,060 6,028,467 4,703,526 4,264,116 1.241.423
Integrated Telecommunication Senices Ma itr Telekom PLC TelFonos de Mexico SA de N, I- AOR Chunghw Telmrn CO.. Lid. Pakistan 'I'rlecommunications Carp.. A
I IUN I IUF MEX USV 'IWN TWU PAK PKR
214,455.427
14,931.275 12,105,510 8,509,702 3,664,358
Lcisure PTodUEts JD Croup Lid.
Networking Equipment D-Link COT.
ZAF ZrZR
TWN TWD
39,210,849
8.766.362
6,355,922
0.19
2.64 1.17 1.04 0.54
5.39
2.04 1.95 0.12 0.11 0.10
4.32
0.61 0.35
0.96
0.21
0.02
0.1y
0.62 0.50 0.07 0.04
1-23
0.98 0.89
1.87
2.99 0.55
3.54
3.57 3.32 1.53 1.25 1.13 1.11 0.90 0.66 0.41 0.32 0.29 0.01)
14.58
1.01 0.82 0.58 0.25
2.66
0.60
0.43
144
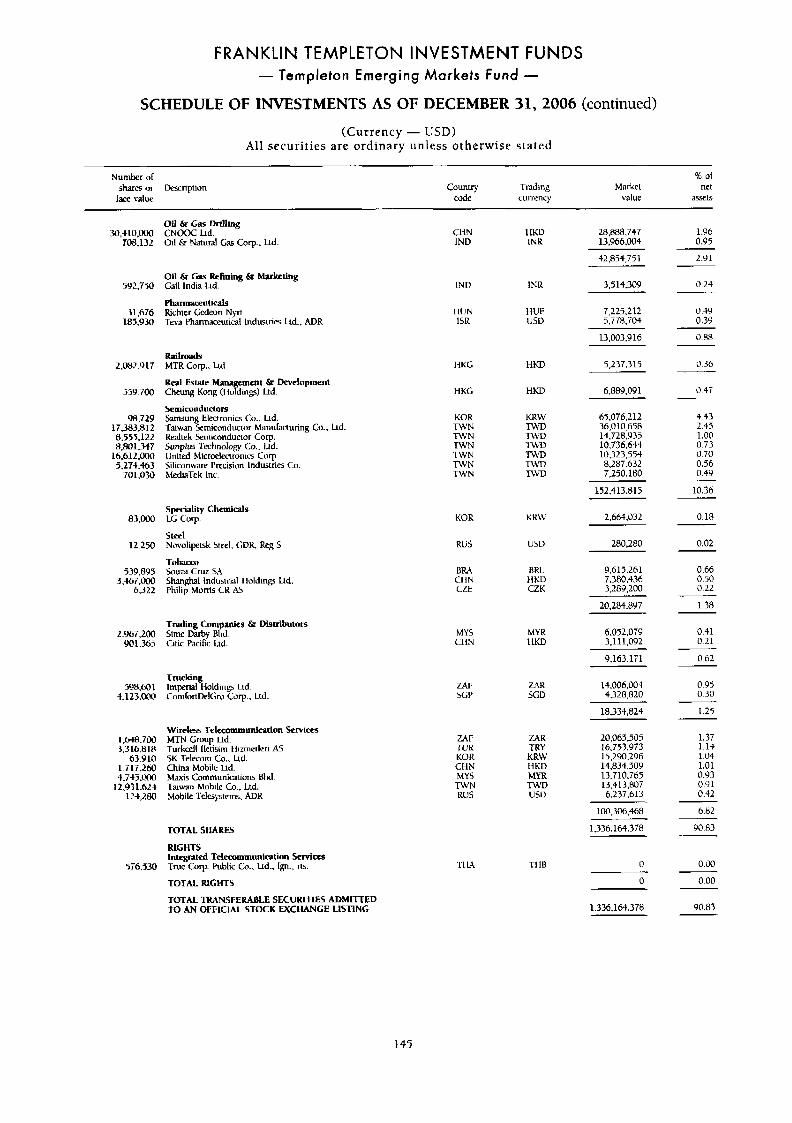
FRANKLIN TEMPLETON INVESTMENT FUNDS - Templeton Emerging Markets Fund -
SCHEDULE OF INVESTMENTS AS OF DECEMBER 31,2006 (continued)
(Currency - USD) All securit ies are ordinary unless otherwise stated
Numbcr of % of
lam d u e code currency value 35x15 shares or kcription Country m d i n g Market net
Oil & Gas Drilling CNOOc Ltd. Oil & Natural Gas Corp., Ltd
1.96 0.95
2.91
30.410.000 708.132
592.730
31,676 185.930
2,082.917
559.700
98.729 17,383.812 8.55i.122 R.801.347
16.612.000 5.274.463
70 1.031)
R3.NW
12.250
539,899 3.467.000
6,322
2.967.200 yO1.365
598.60 I 4.123.NW
I ,6+8.7ik) 3.316.818
63.910 1,717,260 4.74T.CW
12.93 1.624 124,180
576.530
CliN IND
IND
I llJN 1SR
HKG
HKC;
KOR TWN 1 W N
TWN W N TWN
'rwN
KOR
RUS
BRr\ Cl IN CZE
MYS CliN
m; SGP
1 IKU m u
1iiR
11ut: USV
HKD
HKD
KRW TWD TWD TWD TWD T h W TWD
KUW
U5D
BRL HKD CZK
M\'R 11KD
7AK SGD
28,883.747 13,966,004
42,854,751
3,514,309 0.24
0.49 0.39
0.88
Oil & Cas Refining 6r Marketing Gail India Ild.
Pharmaceuticals Richier Cdeon Nyn. Teva Pharmaceutical Indusiri- Ltd., ADR
7,225.212 5.778.704
13.003.916
5.237.315
6,889,091
0.36
0.47
RnilropdS MTR Corp.. Lid
Real hmte Manyement &I Development Chcung Kong (I lo dlngs) Ltd.
Semiwnductors Samsung Electronia Co.. Ltd. Taiwan Semiconducior Manulacturing Co.. hd. Realtek Semiconductor Corp. Sunplus Technology LO.. lid. United Microelectronics Corp iiliconwarc Precisiun Industries Co. hiediaTek Inc.
65,076,212 36,010,658 14,728935 10.736.644 10,323.554
7,250.180
152.4 13.81 5
8,287,632
4.43 2.45 1.00 0.73 0.70 OS6 0.4Y
10.36
2,664,032
280,280
0.18
0.02
0.66 0.50 0.22
Speciality themimls LG cvrp
Steel Novolipetsk Steel. CVK, k g 5
9,619.261
3,289,200
20.284.897
7,380,436
Tobacco %IUr;l C W SA Shgha i Indusirhl Iloldinfi Lrd. Philip Morris CR AS
1.38
8,052,079 3.1 1 1.092
0.41 0.21
0.62
0.95 0.30
1.25
1.37 1.13 1.04 1.01 0.93 0.Y 1 0.42
Trading Companies & Disuibutors Simc Darby Rhd. Citic Pacific Lid.
9,163.171
14.006.00t 4,328,820
Trucking lmpfnal Holding Lld. ComlortklGro Colrp., Ltd.
18,334,824
Wmless Telecommunication Services MTN Group Ltd. Turkcfll Iletisiin I Iizrneileri ds SK Telecom GI.< Lid. China Mohilc Ltd. Maxis Comrnunimtions Rhd. Taiwan Mohile Co., Ltd. Mobile Tckcsystcms. ADK
20,069,505 16.753.YY3 15,290,296 14.834.509 13.710.765 13.4 13,807 6,237.613
ZAF 1-vu KOR CHN
ZAR TRY
K R W HKD hIYR T W V USD
MYS TWN uus
lM,306,468 6.82
90.83 1,336.164.378 TOTAL SHARES
RIGHTS lntegnted Tclemmmunication kwim True COT. Public Lo.. Lid., I@. rts. -11 w TI iB 0
0
0.00
0.00 TOTAL RIGHTS
TOTAL TRAYSFERABLE SECURITIES ADMIITED to AN OFFlClAL STOCK EXCHANGE LISTING 1.336.164.378 90.83
145
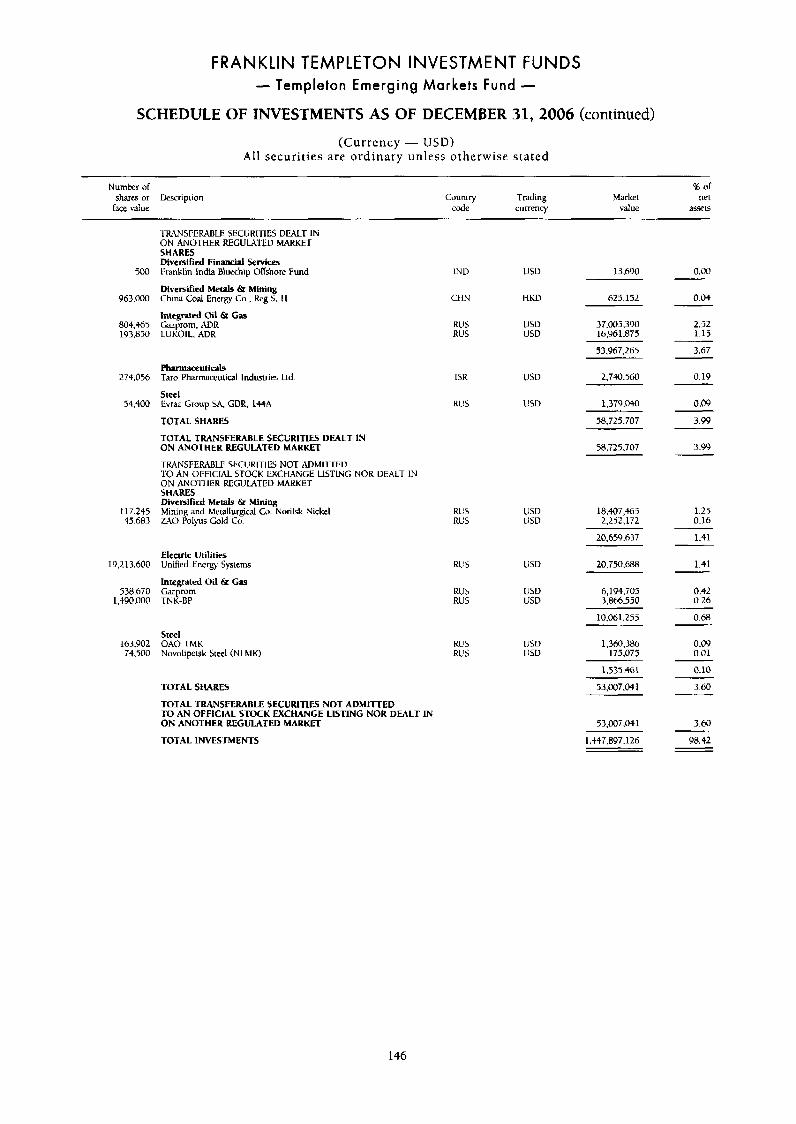
FRANKLIN TEMPLETON INVESTMENT FUNDS - Templeton Emerging Markets Fund -
SCHEDULE OF INVESTMENTS AS OF DECEMBER 31,2006 (continued)
(Currency - USD) All securit ies are ordinary unless otherwise stated
Number or I or
face value code currency value ass55 shares or Uescripiion Ciruniry Trading Market net
XUNSFELmLE SECUKl-rlES DEALT IN ON ANOTHER REGUW'I-El) MARKET SHARES D i v e d i e d Financinl SeMees 1:ranklin India Bluechip Ollshore Fund
Diversified Me& Sr Mining China Coal Energy Co.. k g S . I I
lntepted Oil & Cas
500
963.000
804,465 193,850
27+.056
54,400
117,245 45.683
19.213.600
538,670 1,490,000
163,902 7$.500
IN13
Cl IN
KUS RUS
USD 13.690
tIKD 629,152
0.00
0.04
USU 37.005390 USD 16.961.R75
Cazcrom, ADR LUKOIL. ADR
2.52 1.15
3.67
0.19
53.967.265
USD 2.740.560 PharmaceUtlc;lls Taro Pharmacrulial Industries Ltd 1SR
KUS Steel Evraz Group SA. GDR. l+tA 0.09 USD 1,379.040
58.725.707 3.99 TOTAL SHARES
TOTAL TRANSFERABLE SECURITIES DEALT IN ON ANOTHER REGULATED MARKET
TFANSFERr\BLE SLCVRITIES NOT :\DMll-l~EU 10 AN OFFICIAL STOCK 1:XCtIAKGE LISTING NOR DEALT IN ON ANO-I-IIER REGULATED MAKYET SHARES Diversified Metals &I Mining Mining and hlciallurgtcd Cir. Norilsk Nickel MU Polyus Gold Co.
3.w
RUS RUS
USD vsv
18.$07,464 2.252.172
1.27 0.16
20,659,677 1.41
Electric Utilities Unified Encrgy Systems 1.41 R l . 5 USD 20.750,688
0.42 0.26
Integrated Oil 67 Gas Gazprom TNK-BP
K1JS RUS
USD USD
6,194,705 3.866.550
0.68 10,061,255
1.:360,386 175,075
Steel OAO TMK Novolipclsk Sled (NLhlK)
0.09 0.01
R L 5 KI!S
1JSD usu
0.10
3.60
1535.461
53.007.041 TOTAL SHARES
TOTAL TRANSFERABLE SECURITIES HOT ADMITTED TO AN OFFICIAL STOCK EXCHANGE LISTING NOR DEALT 1N ON ANOTHER REGULATED MARKET
TOTAL 1NVESfMENTS
53,007,041
1.447.897.126
3.60
98.42
146
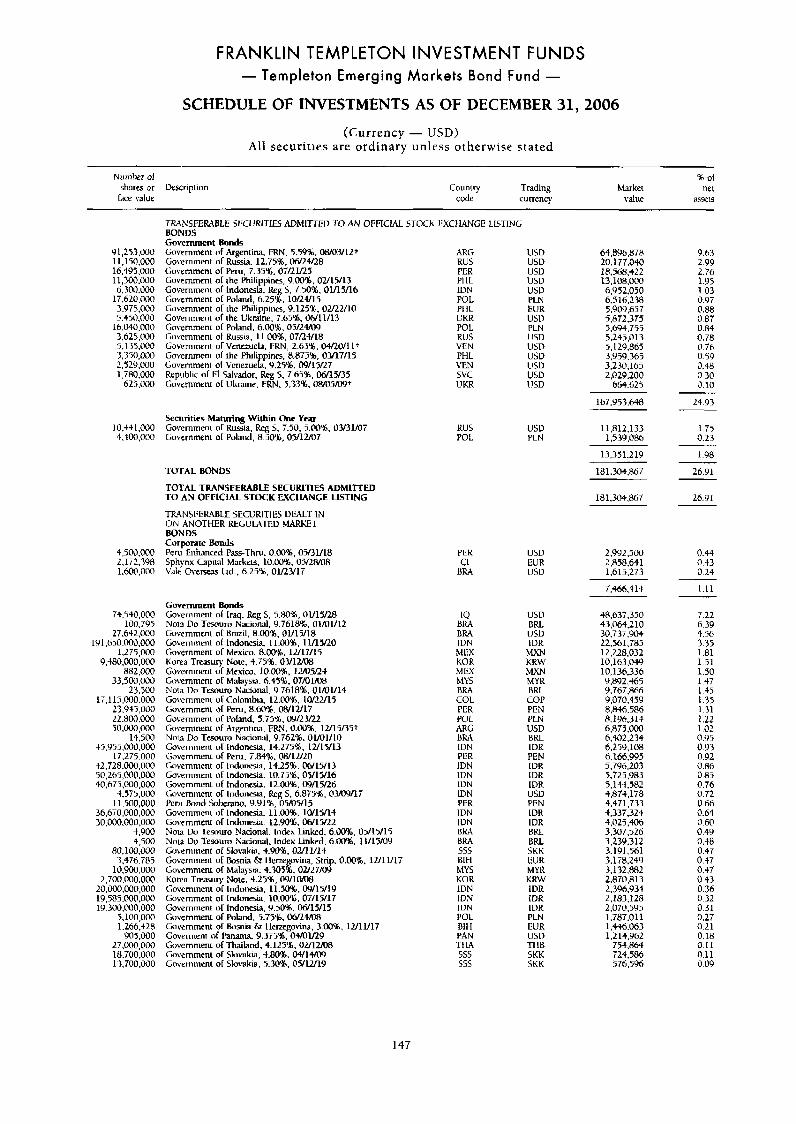
FRANKLIN TEMPLETON INVESTMENT FUNDS - Templeton Emerging Markets Bond Fund -
SCHEDULE OF INVESTMENTS AS OF DECEMBER 31,2006
(Currency - USD) Al l securities are ordinary unless otherwise stated
Numher of % of shares or Description Country Trading Market net
lacp value code currency value assets
Y I,253.000 1 1,150,000 16,495.000 11,3OO.M10 6.300.000
17,620.000 3.973.000 5.450.000
16,040.000 3,625.000 5.1 35,NW 3,350,000 2,529,000 1,780,000
623,000
TRANSFERABLE SECURITIES ADh!ln-EV TO AN OFFIClAL STOCK EXCHAh'GE 1 BONDS Government fbnds
Government of Russia. 12.752. W24t28 Government of Peru, 7.35%. 07f2l125
Government or Indon-k, Rep, S. 7.50%. 01/15/16 Government o l Poland, 6.25%. 10/14/15
Government of Argentitxi. FRN. 5.59%. Myo7/lZt
Government o l the Philippines, 9.00%. 02/15/13
Governnient o l the Philippin-, 9.125%. 02/22/10 Government or ihe Ukrme, 7.65%. Ohll1/13
Government o l Russia. I LOO%> 07/24/18
Governmen1 al the Phili pines, 8.875'36. 03/17/15
Republic of El Salvador, Reg S. 7.65%. 06/15/35
ARC. RUS PER PI IL 1DN POL PI IL UKR POL RUS VCN PHL VEN SVC UKR
Gowmmenr o l Poland, 6.00%:. 03/24h)9
Government of Vcnuucla, FRN, 2.63%. 04/2U/I I +
Governmenl of Venezue&. 9.25%. 09/15/27
Go\wnnienr o l U h i i e . FRN. 5.3316, 08105/09+
LISTING
USD USD USD USD usv PLIi EUR us13 PLN USD u j D USV USU USD lKD
64,896,878 20.177.040 18.568.422 13.108.000 6,952.050 6.516.238 5.909.657 5.8i2.3i5 5,694.755 5.245.013 5.1 ZY.Hb5 3,959.365 3,230,165 2,029.200
664.b25
9.h3 2.99 2.76 1.95 1.03 0.9T 0.88 0.87 0.84 0.78 0 7h 0.59 0.48 0.30 0.10
10.1~1,OOO 4,400,000
4,500,000 2.1T2.398 l.bOr~,OOO
74.540.000 100.7Y5
27.6.)2,000 lU1.650.m,000
1,275,000 Y.480,000,000
882,000 33,500.000
23.700 17,115.000.000
23.9+5,000 22.800.000 50.M)0.000
14.500 45 .Y 55 ,000,000
17.275.000 +2,728.000.000 50,2b5,000.000 40,hi5,000,000
4.575.000 11.5O0,OOO
36.6i0.000.000 30.000.000.000
4.900 4,500
80,100,000 3,476,785
10,900.000 2.700.~0.000
20 .~ .000 ,000 19,585.00O.OOO lY.300,000,000
5,100,000 1.266.428
905.,000 2i,ooo,000 18.700.000 13,700,090
Securities hhturing Within One Year Government of Russia. Reg 5, 7.50, 5.M08, OWliUi Go\wnment o l Poland. 830%. 05/12/07
TOTAL BONDS
TOTAL TRANSFERABLE SECURITIES ADMlmED TO AN OFFICIAL STOCK EXCHANGE USTING
TR\NSI:ERABLE SECURITIES V M T 1N ON A N O M E R REGUlAT1:U bhWKFI BONDS Corporate B o d s Peru Enhmmd Pass-Thru. 0.00%. 05/31/18 Sphynx Gpital Markas. 1O.CW16, 05/28NB Vale O v e m lid.. 6.27%. 01/23/17
Government Bonds Government of Iraq. Reg S . 5.80%. 01/15/28 No13 Do Tesouro Nxioml. 9.7618%, OvOlll2 Government of Brazil, 8.00%. illll5/ln Govemmenl of Indonesia. 11.00%. 11/15/20 Government of Mexico, 8.00%. 12/17/15 Kow3 Treasury Note. 4.75%. OYluo8 Gwerninent of Mexim. 10.002. 12/05/24 Colvemmcnt or Malaysia. 6.4396, 07/011M1 Nota Do Ttwuro NAC~OM~. Y.761816. 01/01/14 Government o l Colombia, 12.W2. Iot22/15 Government ol Peru. 8.60%. W12/17 Government uT Polmd, 5.75% W/zY22 Govrrntwtlr of Argentiibi, FRN. 0.0%. lUl5/35+ Nota Do Tesoum Nacional, 9.i62S. 01/01/10 Government ul Indonesla. 14.275%. 12/lY13 Government of Peru. i.849;. WlU20 Government of Indunrsia. 14.25%. WlW13 Government or Indonesia. 10.75%. 05/15/16 Government o l Indonesia. 12.00%. 09/15/26 Government ol Indunsia, Kcg 5, 6.875%. @.M39/1T Peru Bond Lkbemno, 9.918, 051oY15 Government or Indoncsh. 11.00%. 10/15/14 Governrneni ol Indonesia. 12.90%. 06/15/22 Nota Do Tksouro Nacional. Index Linked. 6.009;. 05/15/15 N o u DO Tesouro Sacional, Index Linked. 6.00%. I1/1YO9 Covernmenr of Slovakia. +.YO%, OU11/14 Government o l Bosnia & I lenegovina, Strip. 0.02%. 1U11/1 Govcrnment o l hLilayjb. 4.303%. 02/27/09 Korea Trrasury Note, 4.25%. W/lOKW Government of Indoneia. 11.509k WlYlY Government uf Indonesia. 10.00%. 07/15/17 Government ol Indonesia. 9.50%. 06/15/15 Guverninent of Poland. 5.75%, W24iU8 Government of kisnia &i Iletzepina, 3.00%. 12/11/17 Goverment of Panama. 9.3T5'%, 04iUV2Y Government o l Thailand. 4.115%, OUlUO8 Government of SIwakia, 4.80%. 04/14/Iw Gowrnmcnt o l Sloxakia. 5.30%. 05/12/19
KUS usv POL PLN
PER CI
BRA
IQ tlM BRA IDN MEX KOR MILK M Y S BRA COL PER POL ARG BRA IDN PER IDN IDN IUN IDN PER IVN IUN B M BRA SSS
17 BIH M Y S KOR IDN IDN IUN POL RIH PAN Tf iA sss sss
USD EU R 1JSU
167.Y53.648
11,812,133 1,539,086
13.341.219
181.304.867
24.93
1.73 0.23
1.98
26.91
181.304.867 26.91
2.99 2,500 2,858.641 1.615.273
0.44 0.43 0.24
7,4Mj,414 1.11
USD BRL USD IDR
MXN KRW MXN MY K BRL COP PEN PLN USD BKL IDR PEN IUK IDR IDR USU PEN IDR IDR BRL BRL SKK EUR M Y K UUW IDR 1DR IDR PLN EUR us13 -1-1 I 8 SKK SKU
48,637,350 43,064,210 30,737,904 22,361,785 12,228,032 10,163.049 10,136,336 9.89 2 .+65 9.767.866 9.070.459 8.846.586 8.196.3 14 6.875.000 6.402.234 6,259,108 6.166.995 5.796.203 5,725.983 5,144,582 4.871.178 4,471,733 4,337.324 4,025,406 3,307526 3,239.31 L 3 191.561 3.178.249 3.132382 2,870,813 1,396,934 2.183.128 2,070.595 1.787.01 1 1,416.063 1,214,Y62
I 24.586 576.596
z54.864
7.22 6.39 4.56 3.35 1.81 1.51 1.50 1.47 1.45 1.35 1.31 1.22 102 0.95 0.93 0.92 0.86 0.85 0.76 0.72 0.66 0.64 0.60 0.49 0.48 0.4T 0.47 0.47 0.43 0.36 0.32 0.31 0.27 0.21 0.18 0.11 0.11 0.09
147
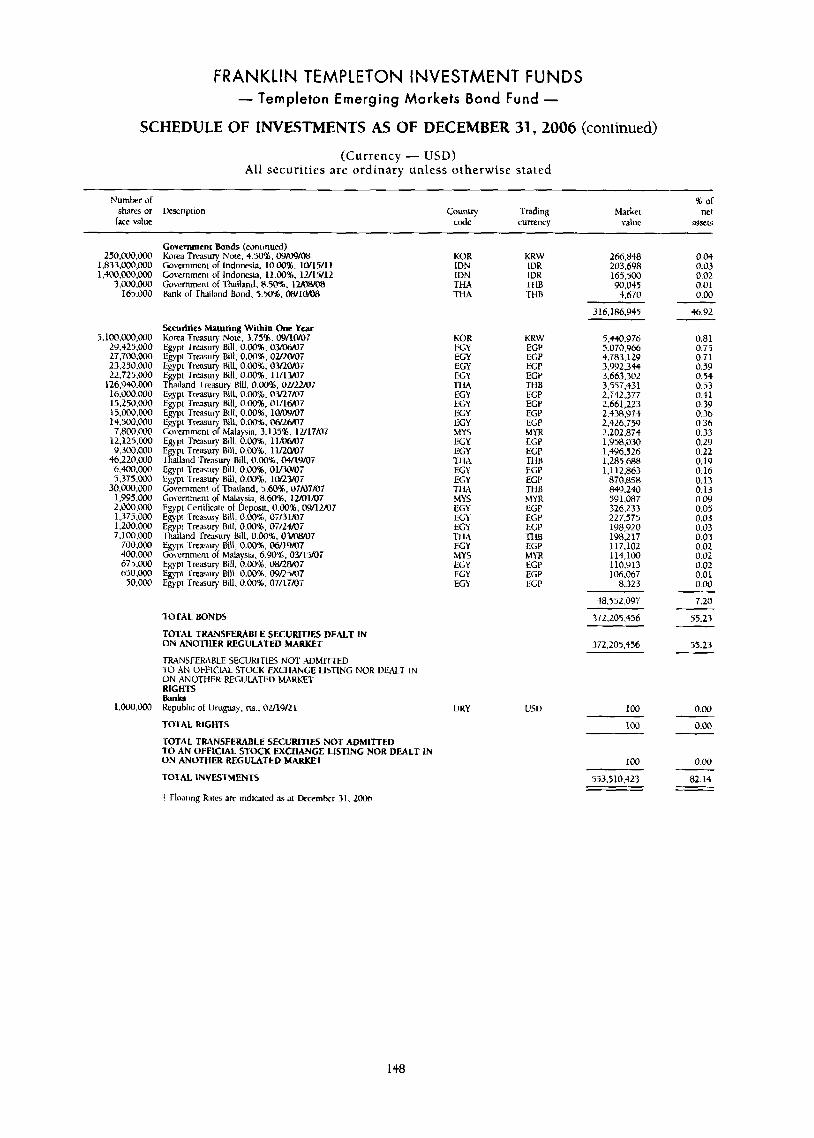
FRANKLIN TEMPLETON INVESTMENT FUNDS - Templeton Emerging Markets Bond Fund -
SCHEDULE OF INVESTMENTS AS OF DECEMBER 31,2006 (continued)
(Currency - USD) All securities are ordinary unless otherwise stated
Number or % or
face V3he C d C currency value ;isXtpI
shares or Description Country Trading Marker net
250.000.000 1,833,000,000 1 , W . O O o , ~
3,000.000 165.000
5,1C@,000,000 29,425,000 17,700,Mx) 23,250,000 22.725.000
126.940.000 16.W.000 15.250,000 15,000.@@0 14.500,OOO 7,80@,oUO
12,125,MO Y,300.000
46,220.WO 6,400,000 5,375,000
30.000.000 1,Q95,000 2,000.@00 1.375.000 1,200.000 7,100,000
700,000 .too.OOo 675,ooi) 650,000
50.000
1.000,@00
Government Bonds (conlinued) Korea Treasury Now. 4.50%. 091c19/08 Government of Indonsia. 10.00%. l0llWll Gowmment or Indonesia. 11.001. 1U15I12 Government of Thailand, R.5@%, I 2 K M H Bank of Thiland Bond, 5.50%. WlNotl
Securities Mnturing Within Ooc Year Korea T r t x ~ u ~ Now. 3.75%. GY/lO/o: Egypt Treisury Bill. 0.00%. 0 . W i I@pt -rreasury Bill, 0.M%, 02/1o/oi Egypt Trrasury Hill, 0.00%. OWWi Etypt Tre;lsury Bill. 0.00%. 11/13/07 T alland rrpasuty Bill. 0.00%. 02/22/07 Egypt Treasury Bill, 0.00%. 03/27@7 Egypt Trwsiiry Bill, 0.00%. 01/lM?7 Egypt Treasury Bill, 0.001, 10AWU7 Egypt Treasury Bill, O.W%. D&RfitV Go\7ernment Or Malaysia. 3.135%. 1 2/17/07 Egypt Trcasury Bill. 0.00%. 1 IK)&ro7 E pt Treasury Bill. 0.00%. llQW07 TKilmd Treasury Hill, 0.00%. OQ119Mi Egypt Treasury Bill. 0.~30%. Ol/Xv07 Egypt Treasury Bill, 0.00%. IWYOi Government d Thailand. 5.60%. @7N7/07 Government o l Malaysia, 8.60%. IMY07 Egypt Cenific3le of Deposit, 0.WXX;. 09/1M7 Egypt Treaurj Bill, 0.00%. O T I 3 V O i Egypt Tresury Bill, 0.00%. OT/24mIUT Thailand Tre;isury Bill, 0.00%. O W 7 Egypt 'Treasury Bill, O.oo'K, 06/19/07 Government of Malaysia. 6.90%. 0YlSKlT Egypi Treasury Bill, 0.001. owZWO7 Egypt Treilsury Bill. O.W%. 09/25/07 Egypt Trtlilsuv Bill. 0.00%. 07/I/LiMi
TOTAL BONDS
TOTAL TRANSFERABLE SECURITIES DEALT IN ON ANOTHER REGULATED MARKET TRANSFERABLE SECUKlTlE5 NO1 AUhIIITED
AN OF1:ICIAL STOCK EXCI IAhGE LISTING NOR DEALT IN ON ANOTHER RECULATEO hiARKEf RIGHTS Bank Kepublic of IJmguay, ns., 02/19/21
TOTAL RIGHTS TOTAL TRANSFERABLE SECURITIES NOT ADMImED
ON ANOTHER REGULATED MARKET
TOTAL INVESTMENTS
* Flo;lring Rites am indlcared ;IS at aEcemhcr 31. LOWI
+o AN OFFICIAL STOCK EXCHANGE LisTiNt NOR DEALT IN
KOR IDN IDN T U THA
KOR EGY EGY ELY EGY TI LA EGY EGY EGY EGY MYS LiGY EGY TI IX EGY EGY TIM hlY5 EGY E m kGY TI 1A EGY MY5 EGY EGY EGY
URY
K R W IDR IUR .TI IB THB
KKW EGP ECP EGP ECP THB EGP ECP EGP EGP MYR EGP EGP TI 1B EGP ECP THB MYR EGP EGP EGP TIIB ELP M Y R EGP EGP EGP
266.848 203.698 165.500 90,045 4.670
316,186,945
5,440,976 5.070.966 +.783.129 3,992,344 3,663.302 3,557.431 2.742.377 2,661,223 2.538.974 2.426.75Y 2.202.874 1,958,030 1 ,+96,526 1,285,668 1.1 12,863
870.858 849.240 591.087 3 2 6 ~ L 3 3 227,575 lY8.920 198.21T 117.102 114,100 110,913 106.067
6.323
48,352,097
372,205.456
372,205.456
100
100
100
543,510,423
0.04 0.03 0.02 0.01 0.00
46.92
0.81 0.75 0.71 0.59 0.54 0.53 0.41 0.39 0.3b 0.36 0.33 0.29 0.22 0.19 0.16 0.13 0.13 0.09 0.05 0.03 0.03 0.03 0.02 0.02 0.02 0.01 0.00
7.20
55.23
55.23
0.00
0.00
0.00
82.14
I 48
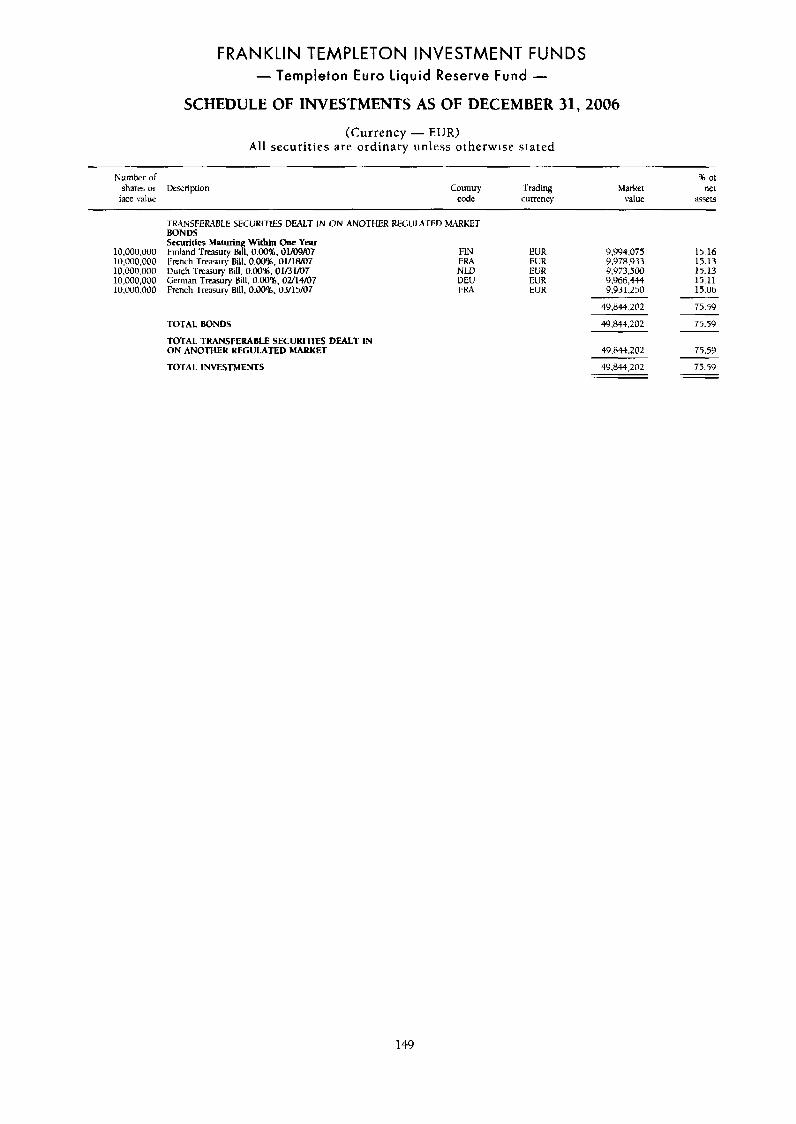
FRANKLIN TEMPLETON INVESTMENT FUNDS - Templeton Euro liquid Reserve Fund -
SCHEDULE OF INVESTMENTS AS OF DECEMBER 31,2006
(Currency - EUR) Al l securit ies are ord inary unless otherwise stated
Nurnher of % of shares or Description Country Trading Market ne1
face valuc code currency value assets ~ ~~~ ~~ ~~ -.
TRANSFERABLE SECUFXWS DEALT IN O N ANOTHER REGULATED MARKET BONDS Securities Mntu Within Onc Yepr
10,000,000 Finland 'I.rcasury%, 0.00%.01/@9/07 FIN
10,000.000 Uuich ~Lreasur). Bill. @.OO%. 01/31/u7 NLD 10,000,000 I3tnch Treasuty Bill. 0.00%. Ol/l&rD7 F M
10,000,000 German Treasury Bill. 0.0096, 0244107 VEU 10,000.000 French Treasury Hill. O.i)o%. 03/15/07 IWA
TOTAL BONDS
TOTAL TRANSFERABLE SECURITIES DEALT IN ON ANOTHER REGULATED MAPKFX
TOTAL INVESTMENTS
EUR EUR EUR EUR EUR
9.994.075 9.978.933 9.973.500 9 .Y66,4+4 9,931,250
15.16 15.13 15.13 15.11 15.06
4Y,844.2@2
$9.841.202
75.59
75.5'3
49.H44.202
49.844.202
75.59
75.59
149
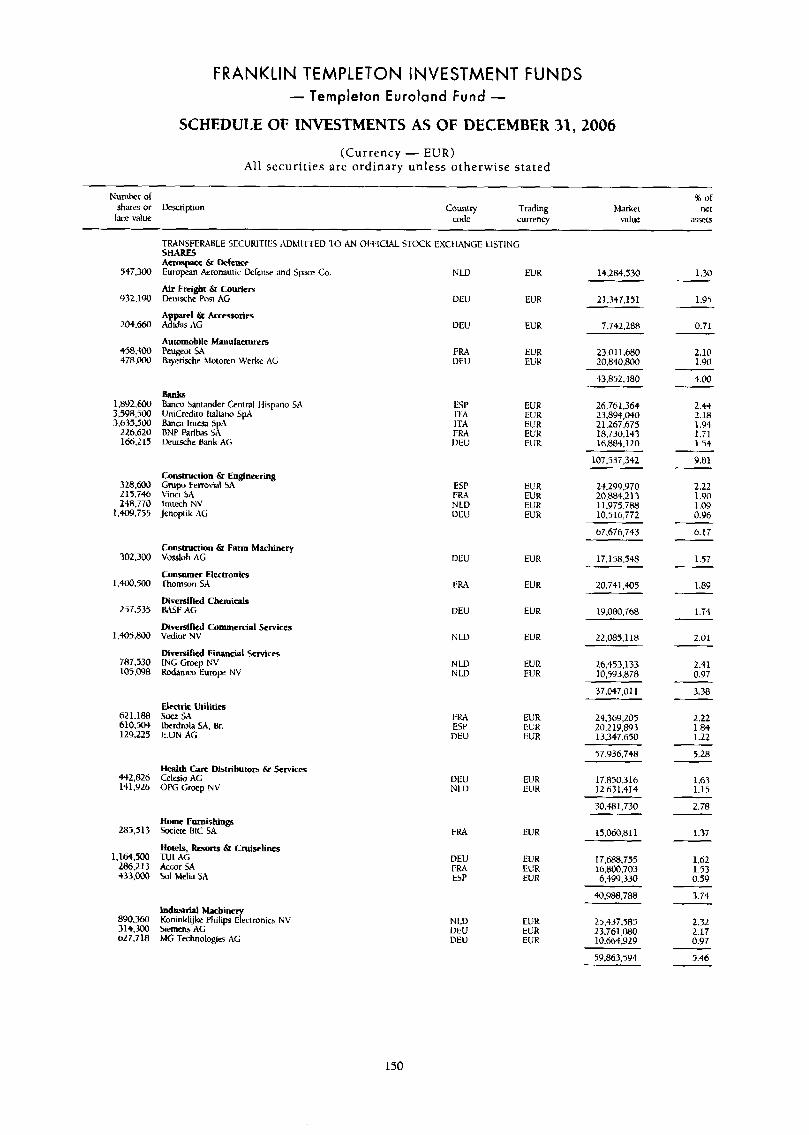
FRANKLIN TEMPLETON INVESTMENT FUNDS - Templeton Euroiand Fund -
SCHEDULE OF INVESTMENTS AS OF DECEMBER 31,2006
(Currency - EUR) All securit ies are ordinary unless otherwise stated
Nunther or 'x; of shares or Dfsctiption country Trading Marker net h e value code currency value =ts
TRANSFER4BLE SECURITIE5 ADMI-ITED '1.0 AN O I ' I K I A L STOCK EXCI IANGE SHARE5 Arrosppoe &I Defence Eumpcan Aeronauric &Ten= and Space Co. N W
LlSTlNC
547,300
932,190
204.660
433.400 47a .m
1,892,600 3,498,500 3,635,5110
226.620 166.215
m.600 215.746 248.770
1.409.55
302.3133
l.W,5@J
257.535
1.405,WJ
787.530 105.098
621.188 610.504 129.225
442,826 141,926
285.51 3
1.164.500 286.213 t 3 3 . m
890.360 314,3013 627,718
EUR 14.284.530 1.30
1.95
0.71
2.10 1.90
4.00
2-44 2.18 1.94 1.71 1.54
9.81
2.22 1.90 1.09 0.Y6
6-17
1.57
1.89
1.74
2.01
2.41 0.97
3.38
2.22 1.84 1.22
5.28
1.63 1.15
2.78
1.37
1.62 1.53 0.5Y
3.74
2.32 2.17 0.97
5.46
Air Fttight & Couriers Dcumhe Fa\ AG
A p l & Accessories Ji;idas AG
Automobile Manufacturers Peugmt 5A Ehyetische &lotoren Werke AC;
DEU
DEU
FRA DEU
EUR 2 1.347.1 5 1
EU R 7.742.28A
EUR 23.01 1.680 EU K 20.840.800
43,852,480
Bank Banco Sanmder Central Hispano SA UniCrediio Iulkno SpA h n c a 1ntes;r SpA RNP Paribas SA Lkutrhe Bank AG
ESP EUR EUR
26,761,364 23.894.040 l'l-A
ITA FRA
EL'R EUK EUR
2 1 :267:675 18.730,1+3 16.8tw.120 DEU
107,537,342
Construction 6r Engineering G r u p Fermvial SA Vinci 5.A lmtech NV Jenoptik AC;
ESP I:RA NLD
EL'R ELK EUR FUR
24.299.Y70 20,aa4.213 11 .Y75.788 10,516,772
67.676.743
DEU
Construction & Farm Machinery Vmloh AG
Consumer Electronin Thornxln SA
UEU
V R A
DELi
NLD
N LD NU)
EUR
EUH
17,158.548
20.741.405
Diversified Chemicals RASE .4G
Diversified Commercial Services Vedior NV
EUR 19.080.768
EUK 22.085.1 18
DiVeRihed Financial Services INC Groep NV Robrnco Europc NV
EU R EUR
26.453.133 10,593.878
37,047.01 1
E l d c Utilities Suez 5.A Iberdmh SA, Br. 1i.ON AC;
FkN ESP DEU
EUR CUR EUR
24.369.205
13.347.650 20.2 19,897
57.936.748 Heal& Care DLtributors & Servica Celeio AG O K Grwp NV
VlIU N LV
EUR EUR
17.850,316 12,631.414 - 30,481,730
Home Furnishings Societe RIC SA 13,060,811 FRA EUR
Hotels, Resons & Cruiselines r u i AG DEU
F l u ESP
EUR EUR EUR
17.6W755 16,800,703 6.499.330
443,988,788
Accor SA SUI Melh SA
lndusuial W h i n e Koninklijke Phil ip Zctronics NV Siemens AG MG Technologies AG
N 1.D DEU DEU
EUK EUR EUR
25,437.585 23,761,080 10.6,64.929 - 59,863,594
150
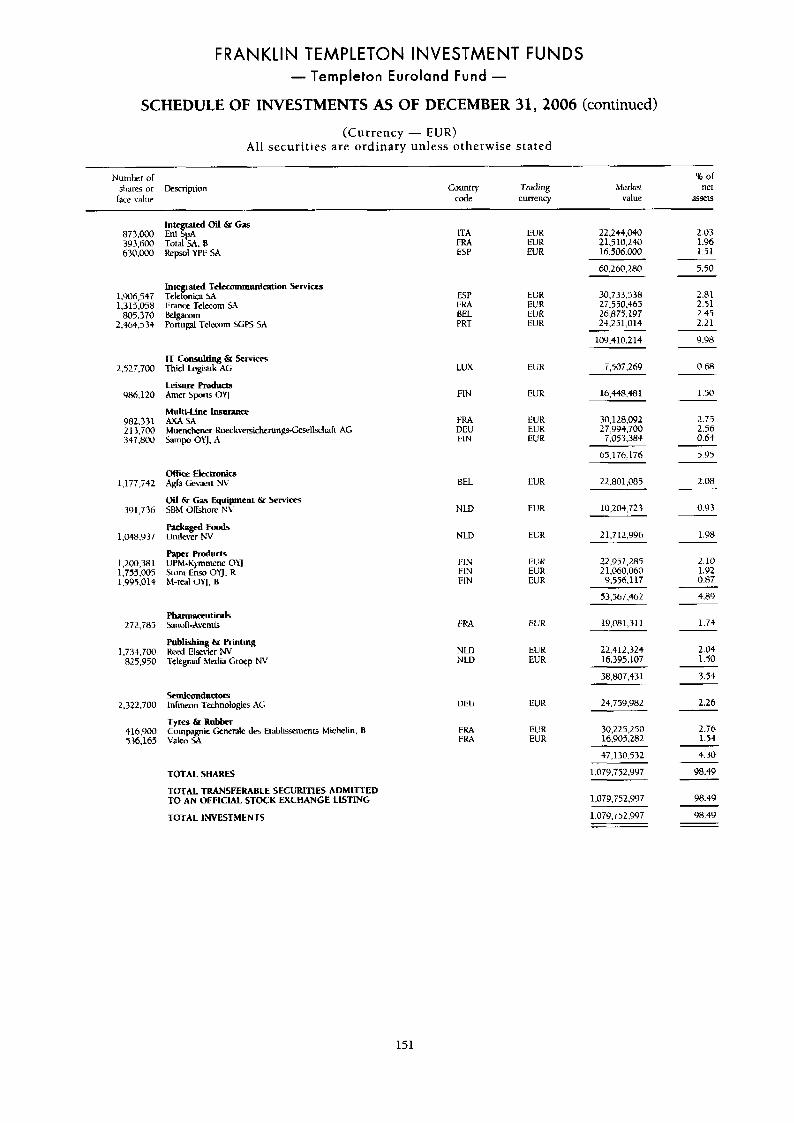
FRANKLIN TEMPLETON INVESTMENT FUNDS - Ternpleton Euroland Fund -
SCHEDULE OF INVESTMENTS AS OF DECEMBER 31,2006 (continued)
(Currency - EUR) All securities are ordinary unless otherwise stated
Number or shares or Drscriprion race value
yb or
code currency value 35wt5 country Trading Market net
lntegratcd Oil & Gas 873.000 Eni SpA 393.600 Total SA. B 630.000 Repsol YPF SA
Intytcd T c h m u n i c a t i o n Services 1.906.547 Tele om- W 1,315.058 I;rmce Teeletom $4
2.464.534 Portupl Telwrm jcPS SA 805.370 k l p m
IT Consulting br Services 2,727,700 Thiel h@lk AC;
Leisure Prducts 986,120 Amer S p n s OYJ
Multi-Line Insurance 982,331 AXASA 2 13,700 Muenchener Kueckversicherung-Ge~l~~rl AG 347,800 krnp OYJ, A
om- ~ ~ 6 - 1,177,742 &PJ Ck'3Cn Nv
Oil & Gas Equipment & Servlces 391,736 SBM Offshore NL
Packqed F d
Papcr Products
1,048,937 Unilever NV
I .2W,381 UPM-Kymmene OkJ 1.T55.005 Silw Enu, OYJ. R 1.YY5.014 M-real OYJ. B
P h a m t i c n l s
Publishii C Rinting
2i2,T85 Sanofi-Avcntk
1,734,700 ked Elmier NV 825.950 T e l e g d Media Croep NV
Semiconductors
T p s & Rubber
2.322.700 lnhneon Technologies AG
416,900 Compagnie Gcntlnle des Elat 5 36.165 Valet> SA
wments Michi 1. I3
TOTAL SHARES
TOTAL TRANSFERABLE SECURITIES ADMITTED TO A N OFFICIAL STOCK EXCHANGE LISTING
TOTAL INVESTMENTS
ITA PRA ESP
ESP i:KA BEL PRT
LUX
FIN
1:UA DEU ITIN
BEL
NLD
NLD
FIN FIN FIN
1:RA
NLD N LD
LIEU
FUA FRA
EUK EUR EUR
EUR EUR EUK EUR
EUK
EUR
EUR EUR EUR
EUR
EUR
ELR
EUK EUR EUR
EL'R
EUR EUR
EUR
EUR EUR
22,244,040 2 1.5 10,240 16.506.oW
60.260.280
2.03 1.96 1.51
5.50
30,733.938 27.550.465 26.875.197 2+.251,014
109.410.214
2.81 2.51 2.45 2.21
9.98
T,507.269
16.448.481
0.68
1.90
30,128,092 27,994,700 7,057,384
65.176.176
22,801.085
10,204,723
21,712,996
22.951.205 21,060,060 9.556.117
53,967,462
19,081.311
2.75 2.56 0.64
5.95
2.08
0.Y3
1.98
2.10 1.92 0.87
4.8')
1.73
22,412,324 16.395.107
2.04 1.50
38.807.431 3-54
L4.759,982
30,225,250 16.905.282
47,130,532
1,079,752.YY7
1.079.752.997
2.26
2.76 1.54
4.30
98.49
98-49
98.49
151
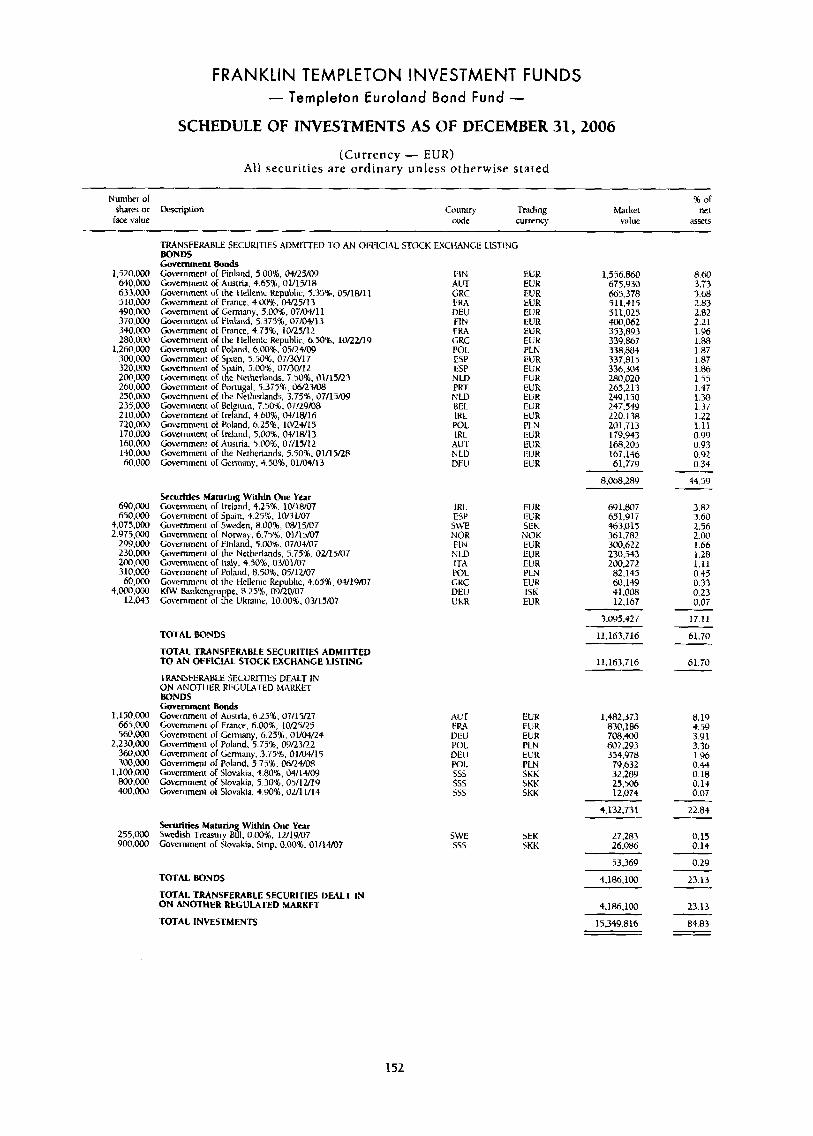
FRANKLIN TEMPLETON INVESTMENT FUNDS - Templeton Euroland Bond Fund -
SCHEDULE OF INVESTMENTS AS OF DECEMBER 31,2006 (Currency - EUR)
All securities are ordinary unless otherwise stated
Number of shares or kcription face value
Country Tmding code currcncy
Market wlue
TRANSFEWRLE SECUKITIES ADMl'lTED 10 AN 0I:FIClAL S T K K E X C I N G E LISTING BONDS tovcrnmcnt Bonds Government of Finland. 5.00%. 04/25/09 FIN Government or Austria, 4.658, 01/15/18 AUT C;overnment of the I lellenic Republic, 5.35%. 05/18/11 GRC Government of France. 4.00%. Mf25/13 FM Government of Germany. 5.00%, 0T/04/11 DEU Governmenr of Finland, 5.375%, 07/04/13 FIN Government of Frmce, 4.75%. l!Y25/12 FRh Cob-ernment or the 1 lellenic Repuhlic. 6.508, 10QU19 cuc Go\muwnt of Poland. 6.00%. 05/24/09 POI. Government of Spain, 5.50%. 07/30/17 ESP Government of Spain, 5.00%, 07/30/12 PSF Government of the Netherlands. i.50%, 01/15/23 NLD Governmenr of Portugal. 5.375%. 0W23/@8 PR.1- Govemmeni of the Netherlands. 3.75%. 07/15/OY NU) Government or Belgium, 7%%, 07/29/08 BEL Cuvernment of Ireland. 4.60%. 04/1W16 IRL Government of Poland. 6.25%. 10/2+/15 POL. Government of lrtlnnd. 5.130%. 04/1A/13 IRL Government of Austria. 5.00%. 07/15/12 AUT tiovemmcnl of the Netherlands. 5.40%, 0Yl5/28 NLD Government uf Germany. f.M%.01/0+/13 DELJ
1,520,000 640,000 633.000 510.000 490.000 370.000 340.000 280,00(1
1.260.000 :300,1!GU 320.000 200.000 260,000 250.000 233.000 210,030 720,oiK) 170.000 160.@O!l 140,OiW 6O.OiK)
EUK EUK EUR
8.64 3.53 3.68
1,556.860 675.930 665,378 511.415 511.025 400,062 353,893 339,867 338.884 337,815 336.304 280,020 265,213 249,150 247.549 220.138 201.713 179.943 168.205 167,146 61.779
8.06E.289
EUR EUR EUR
2.83 2.82 2.21 1.Y6 1.R8 1.87 I .87 1.86 1.55 1.47
EUR ECK PLN EUR ELK EUK EUR ELjR EUR
1.38 1.37 1.22 EUR
PLN EUR EUR
1.11 0.99 0.93 0.92 0.34
EUR EUR
44.59
Securities Maturing Within One Year 690,OCUI Go\-ernmcnt of Ireland. 4.25%. 1WlW07 650iKM Government of Spain. 4.25%. 10/31/07
4.075.000 Government cir Sweden, 8.00%. OH/15/07 2.975.000 Government of Norway, 6.75%. 01115il37 29Y.000 Gowrnmeni of Finland, 5.001. 07/0+/0i 230,000 tiovemment or the Netherlmds. 5.75'16. 02/15/07 200.ooO Cwernment of Italy. 4.50%. 03/01/07 310,GW Government of Poland. 8.50%. 05/12/07
hO,D00 Government of the Hellcnic Republic. 4.65%. 01/1Y/U7 4,001).000 K(U' knkengruppe. H.25%, 09f2W07
12.043 Government u l the Ukrainc. 10.00%. 03/15/07
IKI. EUK ESP EGR
SLVE S i x NOR NOii FIN EUR NLD EUR ITA EI!R POL PLV CKC EUK DEL! ISK UKK EUR
691.807 651.91i 4b3.015 36 1.782 300,622 230,543 200,272 82.145 60,149 41.008 12.167
3.82 3.60 2.56 2.00 1.66 1.28 1.11 0.44 0.33 0.23 0.07
3,095,427 17.11
TOTAL BONDS 11.163.716 61.70
TOTAL TRANSFERABLE SECURITIES ADMITTED 'to AN OFFICIAL STOCK EXCHANGE USTINC 61.70 11,163,716
TRANSFEUBE SECURITlLS DEALT IN ON ANOTIIER REGULMED MARKFT BONDS Government Bunds Gowrnment of Austria. 6.23% 07/1%!7 Gowmmeni of Franw. 6.00%. 10/25/25
1,150,000 665.000
AUT 1x4 DEU POL DELI POL sss SSS 5 s
EGR EUR EUK
1,482,373 830,186 708,400 607.293
8.19 4.59 3.91 3.36 1.96 0.44 0.18 0.1-4 0.07
560.000 Government uf Germany. 6.25% 01/&h4 2,230,000 Cowrnment or Poland. 5.75%. 0YL23R2
360,iKx) Cowrnment of Germany. 3.75%. 01/04/15 .W,OOO Cm-ernment or Poland. 5.75%. OhR.t/OR
1,100.000 Government of Slovakia. 4.809, 04/14/OY 800.001) Government of Slovakia. 5.30%, 05/lU19 400,OW Governmen1 o l Slovakia. 4.90%. 02/11/14
FLN ELR PLU SKK
334sJ78 79.632 32.289
SKK SKU
25:506 12,074
4.132.731 22.84
0.15 0.14
0.29
Securities Maturin Within One Y n r 255.000 Swedish Treasury dl. 0.00%. 12/1Y/07 900.003 Government of Slovakia, Strip, 0.00%. Olll-HO7
SWE 555
SEK 5KK
27.283 26.0136
53.369
TOTAL BONDS 23.13 4,186,100
4,186.100
15,349.816
TOTAL TRANSFERABLE SECURITIES DEALT IN ON ANOTHER REGULATED MARKET 23.13
84.83 TOTAL INVESTMENTS
152
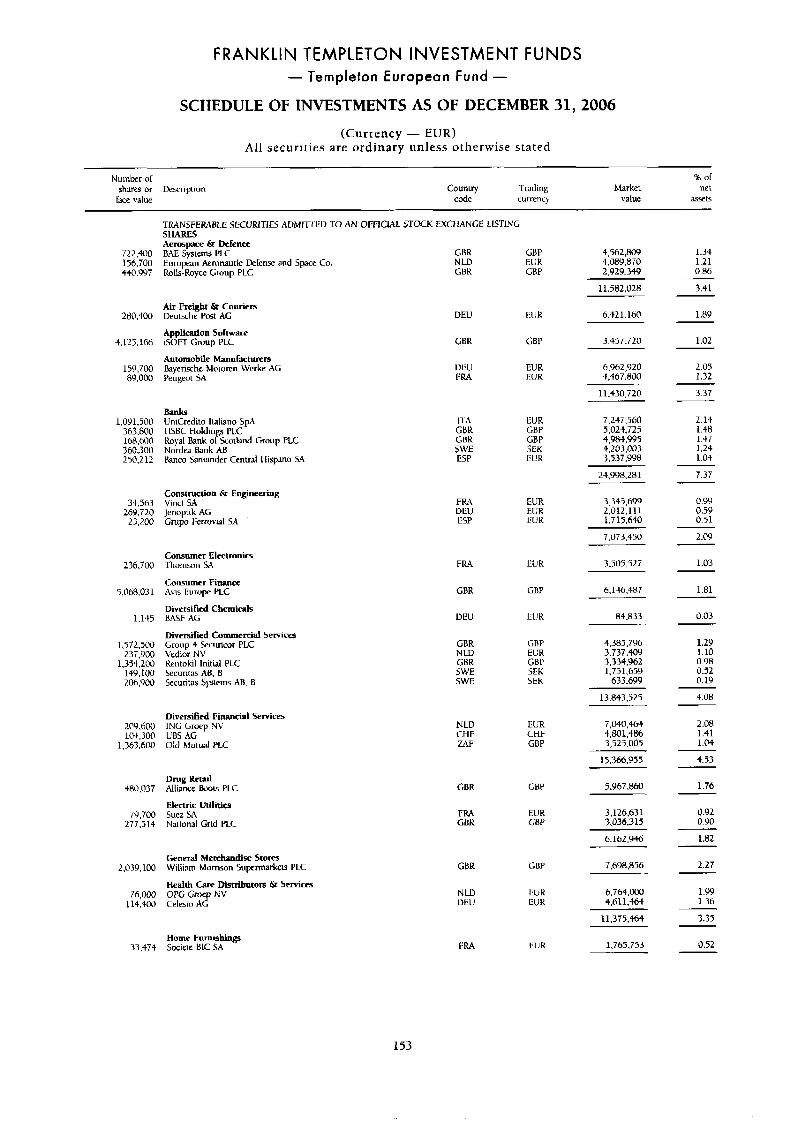
FRANKLIN TEMPLETON INVESTMENT FUNDS - Templeton European Fund -
SCHEDULE OF INVESTMENTS AS OF DECEMBER 31,2006 (Currency - EUR)
All securities are ordinary unless otherwise stated
Number of % of
Face value code w r e n q value assets shares or Dexnption Couniry Trading hhrket net
TFS,NSFEWHI.E SECURITIES ADM177'ED TO AN OFFICML STOCK EXCIiANGE LISTING SHARES Aerospace & Defence BAE Systems PLC GBR
NU) Rolls-Royce Gmup PLC GBK European Aemnautic Defense and Spce Co.
CBP EUK GBP
4,562,W 4.08Y ,870 2.929.349
1.34 1.21 0.86
722,400 156,700 440.997
280,400
4.125.166
159,700 89,000
1,OY 1.500 363.800 168.600 360.300 250.212
74,563 26Y.720 27,200
236.700
Ti.OhH.031
1.145
I .572,500 237,900
1,354,200 14% 100 20h.900
209.600 1o.t.300
1,363,600
480,037
79.700 277,514
2.039.100
76,000 114.401)
11.582.02S 3.41
1.8Y AU Freight & Couricrs Deursche Post AG
Application Software ISOFT Gruup PLC
Automobile Manufacturers hyerixhe Moionm Werke AG Peugeot SA
6.421.160 DEU E U K
3.457720 1.02 CBR GBP
EUR EUR
6,962,Y20 4.467.800
2.05 1.32
UEU I X A
11,430,720 3.37
7.247,560 5,024.725 4,984,995 4.203.003 3,537,998
Banks UniCredito Italiano SpA I ISBC Holdinp: rl.5 - Koyal Bank o woillnd &roup PLC Nordea €lank AB Banco $anunder Centnl llispano SA
ITA GHK
EUR GBP GRP SEK EUR
2.14 1.48 1.47 I .24 1.04
GBK SWE ESP
21.998,281 7.37
0.99 0.5Y 0.51
3.345.699 Consrmction & Engineering Vinci SA Jenoptik AG Grupo lkrrot-id 5.4
FRA UEU ESP
EUR ELR EI!K
2.012;111 1.715.640
7.073.450 2.09
1.03 Consumer Electmni- Thommn SA
Consumer Finance Avis I:.urupe PLC
Diversified Chemicals BWF AG
Diversified Commercial Services Group 4 Securicor PLC Vedior NV Kentokil Initial PLC Sccuritas AB. B Seturiras Systems AB. B
FRA EUR 3.505.52T
6,146,487 GBR GBP 1.81
0.03 $4.833 DEU
4.385,796 3.737.4013
1.2Y 1.10 0.98 0.52 0.19
GBP EUR GHP SEK SEK
GBR N LD GBR SWE SWE
3;334;962 1.751,659
633.699
13.843.525 4.08
i.040.464 4,801,486 3,529,005
2.08 Diversified Financial Services ING Groep NV UBS AG Old Mutual PLC
N LD CHE W F
EUR CHF GBP
1.41 1.04
4.53 15,766,955
Drug Retail Alliance kw15 PLC 5.Yhi,RM) GBR 1.76
3,126,631 7,036,315
Electric Utilities Suez SA Naiionnl Grid PLC
FR4 CBK
EU R GBP
0.92 0.YO
6.162.YM 1.82 -.
7698.856 General Merchandise Stores William Momson 5upmJrkts PLC
Health Cart Distributors & Servirrs OPC; Cnwp NV Celesio AG
GBK CBP 2.27
1.99 1.36
6.764.000 4.61 1,464
NU3 UElJ
EbK liUK
3.35
0.52
11.375.464
1.765,753 Home Furnishings
33,474 Sociew BIC 5.i EUK
153
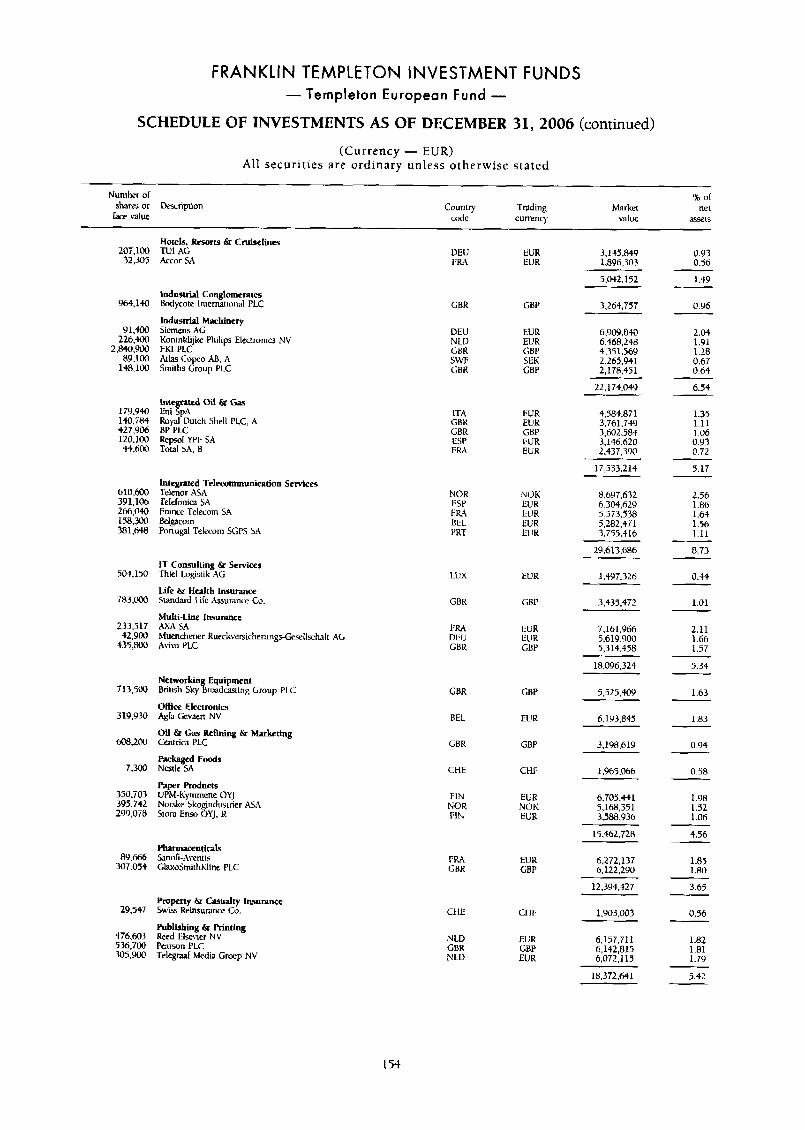
FRANKLIN TEMPLETON INVESTMENT FUNDS - Templeton European Fund -
SCHEDULE OF INVESTMENTS AS OF DECEMBER 31,2006 (continued)
(Currency - EUR) All securit ies are ordinary unless otherwise stated
Number of % ol
I a value code currency value assets sham or Dcxlription Country 'trading Markei net
205.100 32,305
964,lto
91,400 226.W
2.w.900 8Y.locI
14.3.100
179,940 140,784 427,906 1LO.100 44,tWo
610.W 39 1,106 266.w 158.300 38 1 ,M8
504.151)
i83.000
233.517 42,900
435,800
713,500
31Y.Y30
608.200
7.300
350.T03 395.742 299.OT8
8Y.666 307.0%
29.541
476.603 536,700 305.W
Hotels, Ilesmts & Cruiselines TU1 AG Accor SA
Industrial Conglorncrates W y c o t e Iniemational PLC
InddusRinl Machincry Siemens AG Koninklijke Philips Electronics NV FKl PLC Atlas corn0 AB. A Smiths Croup PLC
lntcarted Oil 6r Ga4 Eni :PA Royal Dutch Shell PLC, A BP PLC
Integrated Telermnmunication Sewices Telenor ASA Teldonim SA France Telecom SA Belgacorn Pimugal Telecom SGPS SA
IT Consulting & Services Thiel bast ik AG
Life 61 Health Insurance Smndard Life Assurance Cu
Multi-Line lmurance XG! SA hluenchener KuPckverjicherung~Ge~l1lsc.h h l V 3 P1.C
Networking Equipment British Sky Broadusling Cmup PLC
Offim Electronics Agra Gevaen NV
Oil & Gap Refining 6r Marketing Cenirica PLC
Packaged Foods Ncsrle SA
Paper Products UPM-Kymmene OYJ Norskc Skogindustner ASA Sion Enso OYJ. K
Roperty & Casualty Insurance Swiss Reinsurance Co.
Publishing & Rinting Red Elsevier N V Parson PLC Telegmf Media Grwp NV
aft A&
VEU FRA
CBK
UEU NLD GBR S W GHR
i-rA GBK GBR ESP FRA
NOR ESP Flt4 BEL PUT
LUX
GBK
1;RA DEU GBH
CBR
BEL
&BR
CHE
FIN NOR FIN
FRh GtlR
CHE
N LD GBR NLD
EUR EUR
CBP
EUR EUR GBP SEK GRP
EUR EUR GBP EUR EUR
NOK EUR EUR EUR EUR
EUR
GBP
EUR EllR CBP
CBP
ELlK
GBP
CHF
EUR NOK EUR
EUR GBP
CI 11:
EUR CBP EUR
3,145,849 1,896.303
5.042.152
3.263,757
6,909.840 6.468.248 4.351.56Y 2,265.941 2,178,451
22,174,045)
4,584,871 3.761.749 3.602.584 3.146.620 2,437.390
17,533,214
8,697,632 6.304.629 5,573.538 5,282.471 3.755.416
25) 613,686
1.497,326
3.435.472
7,161 -966 5,619.900 5,314.458
18.096,324
5,525.4OY
6.193.845
3,198.619
1,965,066
6.705.441 5,168,351 3,588,936
i 5 , ~ 2 , r 2 8
6.272,137 6.122.290
12.394.427
1.903.003
6,157,711 6,142,815 6.072.115
0.93 0.5b
1.49
0.96
2.04 1.91 1.28 0.67 0.64
6.54
1.35 1.11 1.06 0.93 0.72
5.17
2.56
1.64 1.56 1.11
8.73
0.M
1.01
2.11 1.66 1.57
5.34
1 .a6
1.63
1.83
0.94
0.58
1.98 I .52 1.06
4.56
1.85 1 BO
3.65
0.56
1.82 1.81 1.79
18.372.641 5.42
154
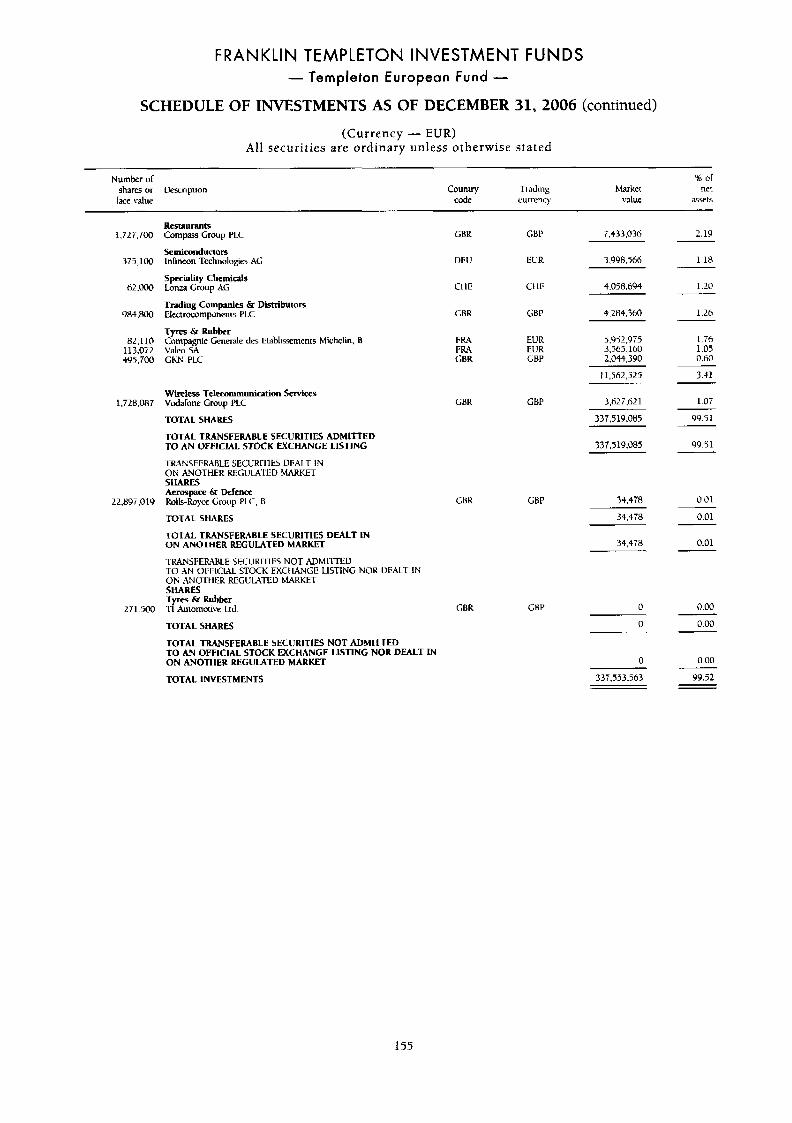
FRANKLIN TEMPLETON INVESTMENT FUNDS - Templeton European Fund -
SCHEDULE OF INVESTMENTS AS OF DECEMBER 31,2006 (continued)
(Currency - EUR) Al l securit ies are ordinary unless otherwise stated
Numbcr or or
race value code currency value aSYitS shares or Wscripiion Country Trading Market net
1,727,700
375,100
hZ,OO(!
984.800
82.110 113.072 .w5.700
i .na.087
22.8YT.019
271.500
Restaurants Compass Group PLC
klliwndumts Infineon Technologies AG
Speciality Chernirals Loma Croup AG
Trading Cornpanics & Distributors Electnwmponcnts PLC
Tytps & Rubber Compagnie Gencnle des ~mblissciments Michelin, 0 Valco sr\ G W PLC
Wmless Telecommunication Sewices vdaronr C ~ U P PLC
TOTAL SHARES
TOTAL TRANSFERABLE SECURITIES ADMIITED TO AN OFFICIAL STOCK EXCHANGE LISTING
TRZNSFEIUBLE SECl!KIWlES DEALT IN ON ANOTtIER EGULACED UARKET SHARES Aerospace & Defence Rolls-Royce Gmiip PLC, B
TOTAL SHARES
TMAL TRANSFERABLE SECURITIES DEALT IN ON ANOTHER REGULATED MARKET
-1WANSFERULE 9:.CUKIIIES NOT ADMI~TTED TO AN OITICWL STOCK EXCI LANGE LISTING NOK DEALT IN Ob ANOl'tlER REGUWTI3J MARKET SHARES tym 6r Rubber -1.1 Automotive LKI
TOTAL SHARES TOTAL TRANSFERABLE SECURITIES NOT ADMlrCED TO AN OFFICIAL STOCK EXCHANGE LISTING NOR DEALT IN ON ANOTHER REGULATED MARKET
GBR
DEU
Ct LE
GBR
FRA FRA GBK
GBP 7.433.036
EUR 3.9YX.566
CI 11: 4.058.694
GBP 4.284.360
EUR EUR GBP
5.9i2.975 3,565,160 2.044.390 , ,
I1.5hL.525
GBR CBP 3,627.62 1
337,519,085
GBK
GBR
CHP
GBP
337.519.085
2.19
1.18
1.20
1.26
1.76 1.05 0.60
3.41
1.07
99.51
99.51
34.478 0.01
34,478 0 01
34.478 0.01
0 0.00
0 0.00
0 0.00
337,553.563 99.52 TOTAL INVESTMENTS
155
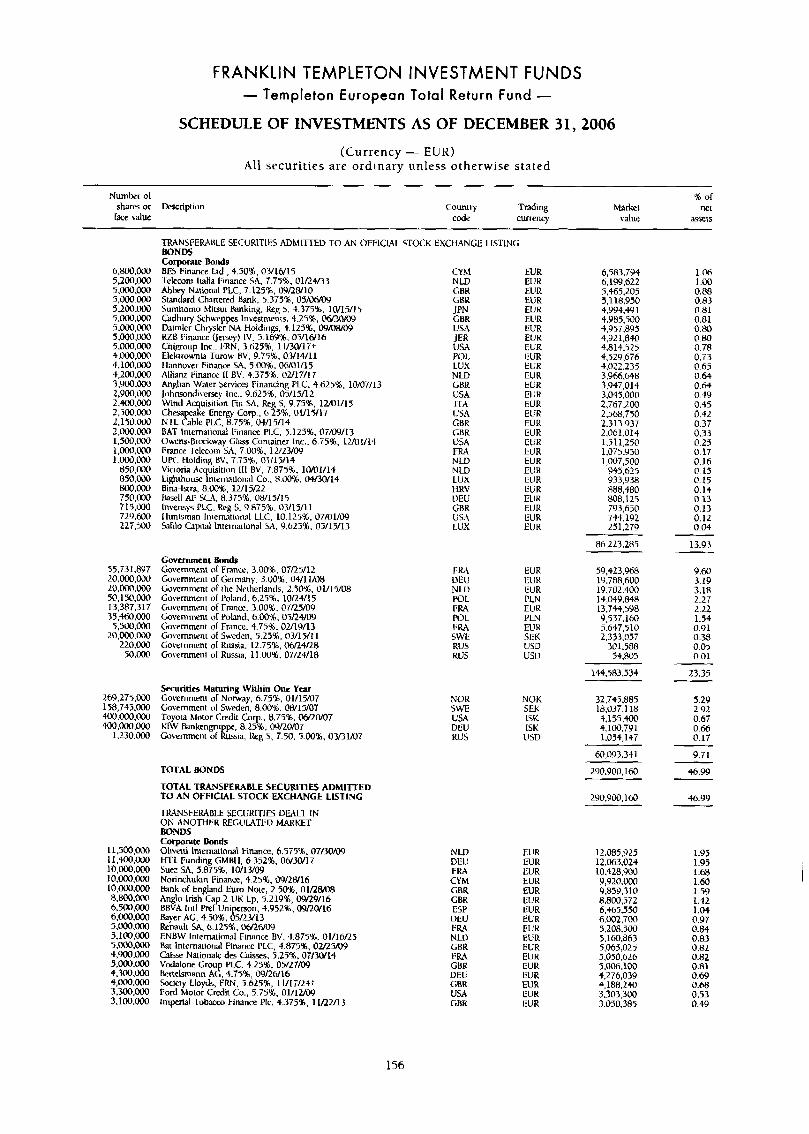
FRANKLIN TEMPLETON INVESTMENT FUNDS - Templeton European Total Return Fund -
SCHEDULE OF INVESTMENTS AS OF DECEMBER 31,2006
(Currency - EUR) All securit ies are ordinary unless otherwise stated
Number of 'x: of sharcs or Description Cnuniry Twding hlarkct Wt Face value code currency value assets
6,800.000 5,200.000 5,ooo.ooo 5.000.000 5.200.Doil 5.ooo.000 5.000,m 5.000.m 5.000.000 4,000,000 4,100.ooO 4,200.000 3.900.000 2.900.000 2.400,OOO 2.5OO.ooi) 2.150,m 2.wo.000 1.500.000 l,oOO,~W 1 .ooi),cw
850,00(1 850.000 800.000 750,000 7t4,IMO 72Y ,600 225,500
55.731.RY7 20.000.000 20,m.M)0 [email protected]@,000 13.387.317 35,460,00@
5,500,000 20.M)o.000
220.m 50,000
269.275.000 158,745.wo 400.wo.000 [email protected]
1.230.wo
11.500,000 11.400.oi)0 lO,ooo.Oo@ 10.ooo.m 10,ooo.OOO 8.8Oo.m 6.500.000 ~.0@0,000 5.000.000 5,100.000 5.000.000 4.m.000 5,000.000 4,300.ikxI 4.000.000 3.K)o.m 3.100.000
TRANSFERAMBLE SECURITIES ADMITIEL) TO AN OFFICIAL STOCK EXCHANGE I BONDS torporate Bonds BES Finance Lid., 4.504, 03/16/15 CKM 'l~elemm Italia 1;inance SA, 7.754. 01/2+/33 N L P Ahbe Ndrional PLC, 7.125% OYR8110 GBR StandardCbnered Bank. 5.373%, 05/OfiW GBK Sumitorno hlilsui Ranking. k g 5. 4.375%. 10/15/15 JPN bdbury Schweppes Investments. 4.254, OW30/09 GBR Daimler Chrysler NA Holdinp. 4.125%. oY/U8/oU USA RZB Finance (jersey) IV. 5.169%. 05/16/16 JER Cttigroup Inc.. FRN, 3.625%, 11/30/17t 1JU Elektrownh Tumw BV, 9.75%. 03/14/11 POL Ilannuver Finance SA. 5.@@%, 06/01/15 LUX Allianz 1;inance 11 BV. 4.3756. 02/17/17 NLD Anglian Water %vices Financing PLC. 4.625%. 1@/07/13 GBR Johnsondiverse). Inc., Y.625&, 05/15/12 USA Wind Acquisition Fin SA, Re 5 Y 75% lUOl/lS ITA
NTL ?able PLC, 8.75%. 0+/15/14 GBR BAT International Finance PLC, 5.123%. 07/09/13 GBR Owens-Brockway C l s s Conuiner lnc., 6.75%. 1U01114 USA Fnnce Telecom SA, 7.00%. 1U23/W F M UPC Holding BV. 7.75% 01/15/14 NLD Vicioria Acquisition 111 BV. 7.875%. 10/01/14 N LD Lighhoux lniemlioml Co., 8.00%. 04/30/14 LUX &M-l$ira, 8.00% 12/15/22 HRV k l l AI: SGI. 8.37576. 08/15/15 VEU Invfnsys P1.C. Reg S. 9.875%. 03/15/11 GBR Hunkman lnlernational U C . 10.125%. @7ml/W USA hf i lo Capital lniemational U. 9.625%. 03/1X13 LUX
C h e a cake Energy Corp.. 6 .55 i . OU1</17 USA
Govcmmcnt Bonds Government of Fnncr. 3.@0%, 07/25/12 Government of Gennany. 3.00%. 04/11/@8 Covcrnment of ihe Nciherlands. 2.50%. O l l l Government of Poland. 6.25%. 10/24/15 Go\,ernmeni of France. 3.00%. 07/25/09 Government or Poland, 6 .W, . 05/24/09 Government or Fnncr. 4.75%. 02/19/13 Government of Sweden. 5.23%. 03/13/11 Government of Russia. 12.79%. obn4/28 Governmen1 of R w i a , 11.00%. 07/24/18
15/08
Securities Maturing Within One Year Covernmenl or Norway. 6.75%. 01115M7 Government of Sweden. 8.00%. @H/15/07 'I-oyota Motor Credit Corp., 8.75%. 06RaM7 KhV Bankengruppe, 8.25%. 09/20/07 Government or Russia, k g S , i.50. 5.00%. 03f31W7
TOTAL BONDS
TOTAL TRANSFERABLE SECURlTlES ADMIITITED TO AN OFFICIAL STOCK EXCHANGE LISTING
TRANSFEMBLE SECURITIES DEALT IN
BONDS Corporate Bonds Ohvetti Iniemational Finanm, 6.575%. 07/30/09 HTl Funding GMBt1, 6.3524. 06/30/17 Sue: SA. 5.875%. 10/13/Oy Norinchukin FinancK, 4.256, Wi28/16 h n k of England Euro Note, 2.50%. @lnW@$ Anglo Irish Lip 2 UK Lp. 5.2192, 09/29/16 BBVA lntl Prel Uniperson, i.Y52%, 09120116 Bayer AG. 4.50%. 05/2Y13 Renauli SA. 6.1252, W W @ Y ENBW International Finance BV. 4.875% 01/16/25 h t International Finance PLC. 4.875%, 02/25xW Gisx Naiionale des Gisses, 5.25%. 07/30/14 Voddone Croup PLC. 4.29%. @5/27LKJ Bertelsmann A L 4.73%, @9i26/16 Society Lloyds, FRN, j.b>S'%, 1 I /L i /L++ Ford Motor Credit Co., 5.75%. DlllMw lmperial Tobacm Finance PIC. 4.375%. 1 1/22/13
ON ANCJTHER muwrm MARKET
F l u DEU N LV POL 1:RA POL FUA SWE RUS RUS
NOR SWE USA DEU RUS
.ISTIN(;
EUR EUR EUR Ell R EUR EUR EUR EUK EUR EUR EUR EU R ELJK EUK EUR EUR EUR EUR EUR EUR EUR EUK EUR ELjR EUR EUR EUR EUR
EUR EUR EUR PLN ELJK PLN EUR SliK USD usu
NOK SEK ISK ISK USD
6,583,794 6,199,622 5,465,205 5,118,950 4.994.+Y 1 4.Y85.500 4,957,895 4,921.840 4,814,525 4.529.676 4,022,235 3 ,9 M,648 3.947.014 3.045.000 2,767.200 2,568,750 2.313.937 2,061,014 1.51 1,250 1,075,950 1,007,500
945.625 Y33,938 888,480 808.125 793,650 744.192 251.279
1.06 I .m 0.88 0.83 0.81 0.81 0.80 0.60 0 7u 0.73 0.65 0.64 0.64 0.4Y 0.45 0.42 0.37 0.33 0.25 0.17 0.16 0.15 0.15 0.14 0.17 0.13 0.12 0.04
~
86.223.285
59,423,968 19,788,600 19.702.400 14.04Y.848 13.744.598 9,537.160 5.647.510 2.333.057
301.588 %BO5
144.583.534
4.100.TY1 1,054,147
60.093.341
2Y0.900.160
290.9W.160
N UJ DEU FRA CY hl CBK GBK ESP VEU 1:KA NLD GBR FRA GMR DEU CBR USA GBR
EUR EUR EUR EUR EUR EUR EUR EUR EUK EU R EUR EUR EUR ElJR EUR EUR EUR
12.085.925 12,063,024 10.428.900 '4,920,000 9.859.310 8,800.372 6,465,550 6.002,700 4.208.500 5.160.8R3 5,065,023 5,050.626 5.006.100 4.276,039 4,188,240 3.303,300 3,050,385
13.93
Y .60 3.19 3.18 2.27 2.22 1.54 0.91 0.38 0.05 0.01
23.33
5.29 2.92 0.67 0.66 0.17
9.71
46.99
4&99
1.95 1.95 1.68 1-60 1.59 1.42 1.04 0.97 0.84 0.83 0.82 0.82
0.69 0.68 0.53 0.49
0.81
156
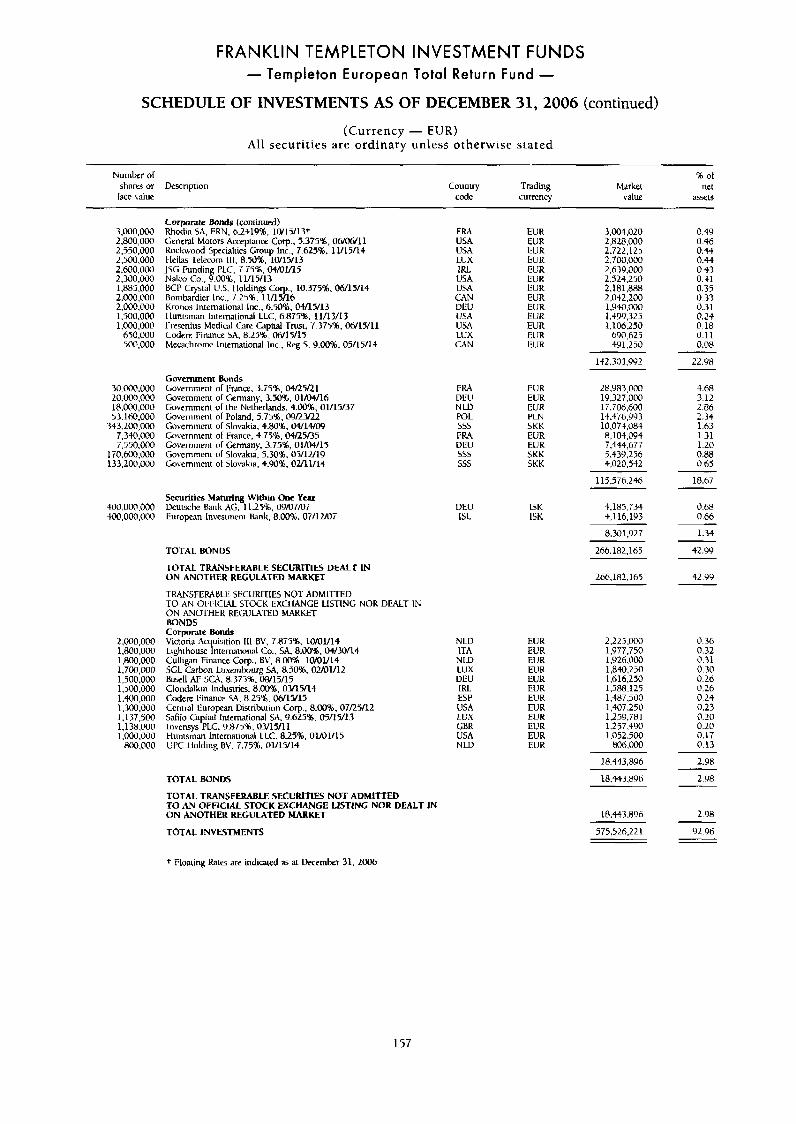
FRANKLIN TEMPLETON INVESTMENT FUNDS - Templeton European Total Return Fund -
SCHEDULE OF INVESTMENTS AS OF DECEMBER 31, 2006 (continued)
(Currency - EUR) All securities are ord inary unless otherwise stated
Number of sharts or
race \-due Trading currency
Description
Corporate Bonds (continued) Rhodia SA. FRN, h.2+19%, l W l Y l % + General Motors Acceptanm Coqx. 5.375%, 06/06/11 Mckwood Specialties Gmup lnc. 7.625%. 11/15/14 klellas Telecom 111. 8.50%. 10/15/13 JSC Funding PLC. i.75'%, 04/1)l/15
BCP Crystal U.S. t Iddings COT., 10.375%. 06/15/14 Bomhrdier Inc.. 7.25%. 11/15/16 Kronos International lnc.. 6.50%. W W 1 3 I luntsman Internalional LLC. 6.8758. 1111 3/13 Fresenius Mediwl C ~ r e Capital Trusl. 7.375%. 06/15/11 Codere I:inance SA, 8.25%. 06/15/17 Mecachrome International Inc.. Reg S . Y.OO%, 05/15/14
N a l ~ CO., 9.0076, 1l/15/13
Country code
Market value
3,000.000 2,800,000 2,550,000 2.500.000 2.600.00cl 2,300,oiK) 1.885.000 2.000.000 2.000.000 1.500.OOO 1.m.000
650.000 500.000
FRA USA USA LUX IRL USA USA CAN UEU USA USA LI!X CAN
EU R EUK EUR EUR EUR EUR EUR EUR EUR EUR EUR EUR E U K
3,004,020 2,828,000 2.722.1 25 ~.700.000 2.639.000 2.524.250 2.181.8R8 2,042,200 1 ,940.000 I ,499,725 1.106.250
690,625 491.250
0.49 0.46 0.44 0.44 0.43 0.41 0.35 0.33 0.31 0.24 0.18 0.11 0.08
142.303.9Y2 22.98
Gwernment Bonds Government olI:wncc, 3.758, i)4/25R1 Govcrninen~ of Germany, 3.50%. 01/04/16 Governmcni of the Netherlands. 4.002, 01/15/37 Government of Poland, 5.752.OYfZ3/22 Government of Slovakia. 9.80%. W14fW Government or F n n a . 4.75%. W 5 / 3 5 Governmenr or Germany, 3.7596, OLM)/15 Government of Slovakia, 5.30%, 05/lU19 Gowrnment or Slovakia. 4.90%. 0U11114
28,983,000 19,327,000 1 T.706,6M 14.47699 3 10,071,084 8,104,094 7,444,677 5,43Y ,256 4,020,542
4.68 3.12 2.86 2.33 1.63 1.31 1.20 0.88 0.65
30.000.000 20.000.000 18.000.0@0 53.160,OOO
~ 4 3 , 2 ~ 0 , 0 0 0 7,340,000 7,550,000
I T0.600.000 133,200.000
EUR EUR EUR PLii SKK EUR EUR SKK SKK
115.576.246 18.67
0.68 0.66
1.34
Securities Maturing Within One Year Ueutsche Bank AG. 11.23%. 09/07/0i European Inwsrmcni bank, 8.00%. 07/12/07
DEU ISI.
400,000.000 ~W,000,000
ISK 1SK
4.185.734 4,116,193
8,301,927
2bb.182.165 42.9') TOTAL BONDS
TOTAL TIMNSFERABLE SECURITIES DEALT IN ON ANOTHER REGULATED MARKET 266.182.165 42.YY
TRANSFERABLE SECURlTlES NOT ADMIITED TO AN OFFICIAL STOCK EXCLIANGE LISTING NOR DEALT IN ON ANOTHER REGULATED MARKET BONDS Corporate Bonds
2.000,OOO Victutia Acquisition 111 BV, 7.87576. 10/01/14 1,800,000 Lighihousc lnterrwtioml Co.. SA, 8.00%. 04/30/14 1,800,000 Cullipn Finance Corp.. tlV, 8.00%. laM1/14 1.700,OOO SCL f i r h n Luxernhurg SA, 8.50%. 0ZOl/I2 1,500,000 Basell AF Sth. 8.37576, 08115/15 1,500.WO Clonddkin Industries. 8.00%. 03/15/14 1,400,000 Codere Finanrr SA, 8.25%. OWW15 I.300.000 Central European Distribution COT.. 8.00%. 07R5/12 I , 137,500 Salilo Capital lnrernarional SA. 9.625%. 091 5/13 1,138.000 lnvensys PLC. 9.8752, 0315/11 I .OOO.000 lluntsman International LLC. 8.2596. 01/01/15
800.000 W C lblding BV. 7.75%. 01/15/14
2.225.000 1 .9 77,750 1,926.000 1,840.250 1,616,250 1,588.125 1,487.500 1,407,250 1.259.781 1,251,490
1.052.500 806.000
N LD ITA N LD LUX UEU
EUR EUR
0.36 0.32 0.31 0.30 0.26 0.26 0.2-l 0.23
EUR EUK EUK
IRL ESP USA
EUR EUR EUR
LUX (;nK USA NLU
EUR EUR EU R EUR
0.20 0.20 0.17 0.13
18.443,896
18.443.8YB
2.98
2.98 TOTAL BONDS
TOTAL TRANSFERABLE SECURITIES NOT ADMITTED TO AN OFFICIAL STOCK EXCHANGE LlSTlNG NOR DEALT IN ON ANOTHER REGULAtED MARKET
TOTAL INVESTMENTS
18.443.896 2.98
575.526.221 92.96
t Floating h L e s are indicated ;E at December 31, 2006
157
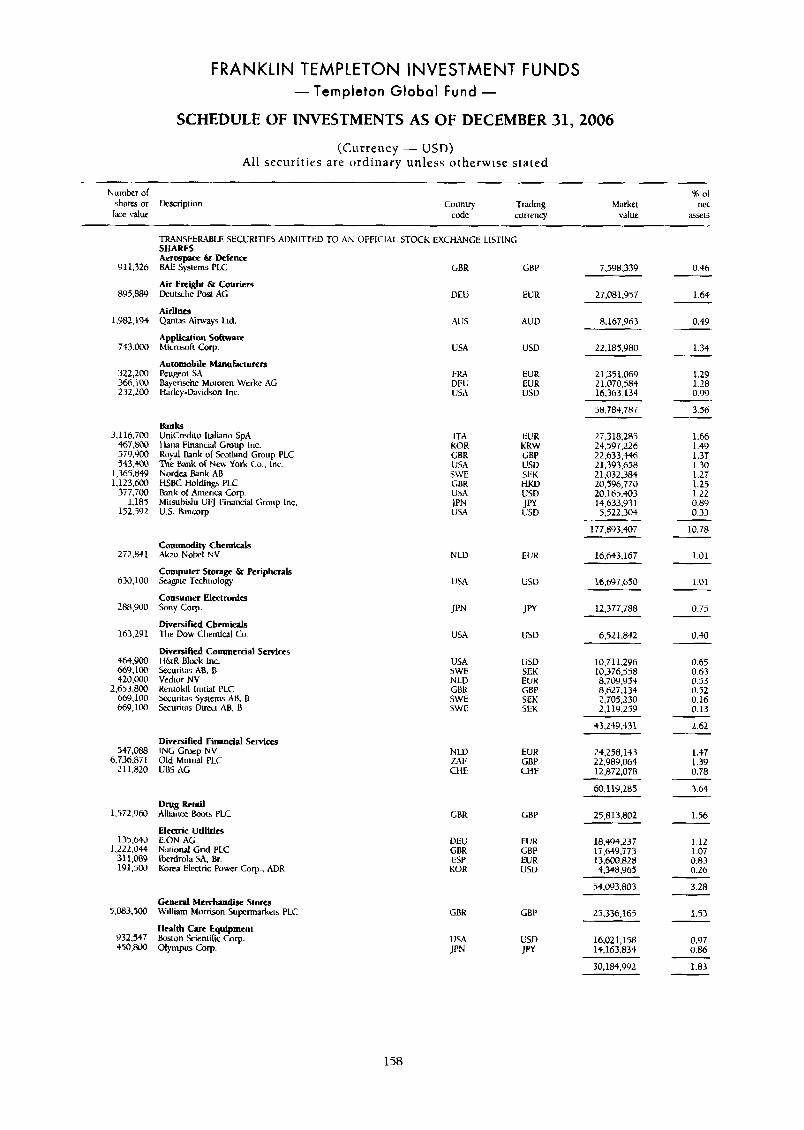
FRANKLIN TEMPLETON INVESTMENT FUNDS - Templeton Global Fund -
SCHEDULE OF INVESTMENTS AS OF DECEMBER 31,2006
(Currency - USD) All securities are ordinary unless otherwise s ta ted
Nurnbcr of 5% of shares or Description Country Trading Markei ne1 face value code currency va I ue a55ets
'IRANSFEMBLE SECURITIES A13MITTEI) SHARES Aerospace & Defence BAE Systems PLC:
Air Frclght & Couriers Deukxhe Post AG
Airlines Qantas Airways L I ~ .
Applimtion Softwnuare Microsoft Corp.
Automobile Mnnufacmren PeuReot SA Bayerixhe Muloren Werke AG 1-larley-D;lvidson 1nc.
TO AN CMFlClAL STOCK EXCHANGE LISTING
GBF
EUR
AUD
USD
EUK EUR USD
911.326
895,889
1.982.194
743.000
322,200 366.100 232,200
3,116,700 467,800 5T9.Y00 543,MO
1,365,849 1.123.600
377,700 1,183
152.592
272,841
630.100
288.900
163.291
464.900 669,100 420,000
2.653.800 669.100 669,100
5$7.088 6.T36.871
2 11,820
l,S72.9~%3
135,640 1.222,044
311,089 191.500
5,083,500
932.547 450.800
GBR 7.498.339 0.46
1.64
0.49
DEU 27,081.957
8,167,963
22.185.980
AUS
USA 1.34
1.29 1.28 0.99
21,351,069 21,070.584 16,363,134
I-&+ DEU 1!SA
58,784.787 3.56
1.66 1.49 1.37 1.30 1.27 1.25 1.22 0.89 0.33
10.78
1.01
1.01
0.75
Bank UniCrtdilo Italino SPA llana Financial Group lnc. Royal Bank of Scotland Group PLC The Bank of New Yo& Co.. lnc. Nordea Bank AB IiSK Holding FLC Bmk o l h e r i a Gorp. Mitsubishi UFJ 1:inanchl Group Inc. us. B3nurrp
ITA KOR CtX
El!R liKW GBP USD SEK HliV USD JFY IJSD
27.318,285 24.597,226 22.633.346
USA SWE CtlK USA IFN USA
21 ,032,384 10,596,770 20.165.403 14,633.931 5.522.304
177.893.407 Commodity Chemicals A h o N o k l NV
Computer Storage br Peripherals Seagte Technology
Consumer Electroni- Sony Cwp
Diversified Chemicals ' h e Dow Chemia l Co
Diversified Commercial Services I I&R Block lnc. Srcuritas AB. B Vedior NV Rentokil Initial PLC kuritas Sysiems AB, B LSecuriws Dim! AB, B
N Ll) EUK 16,643.167
16,697.650 1JSA USD
12.377.788 . . ~
6,521,842
~
0.40 USA USD
USA
N LD SWE
USD 10,711,296 10.376.558 8.709.95.) 8.627.134 2.705.230 2.11Y.259
43.249.431
0.65 0.63 0.53 0.52 0.16 0.13
2.62
1.47 1.39 0.78
SEK EUR GBP GBK
SWE SWE
SEK SEK
Diversified Finnncial Services ING Crwp NV Old Mutual PLC UBS AG
N W wt; CHE
EUK GBP CHF
24,258,143 22,989,064 12,872,078
60,119,285 3.64 Drug Retail Alliance b t s PLC
Electric Utilities E.ON AG National Grid PLC lbcrdrola SA, Br. Korea Electric Power Corp., ADR
25.813.802 GBR GBF 1.56
1.12 1.07 0.83 0.26
3.28
1.53
0.97 0.86
DEU GBR ESP KOK
EUK GBF EUR USD
18.494.237 17.W.773 13.600.828 4,348.965
54.093.803 General Memhandise Stores William Morrison Supermarkets PLC
Health Cue Equipment Boston Sciintilic Gorp. Olympus Gorp.
GBK GBP 25,336,165
16.02 1,158 14,163834
30,184.992 1.83
158
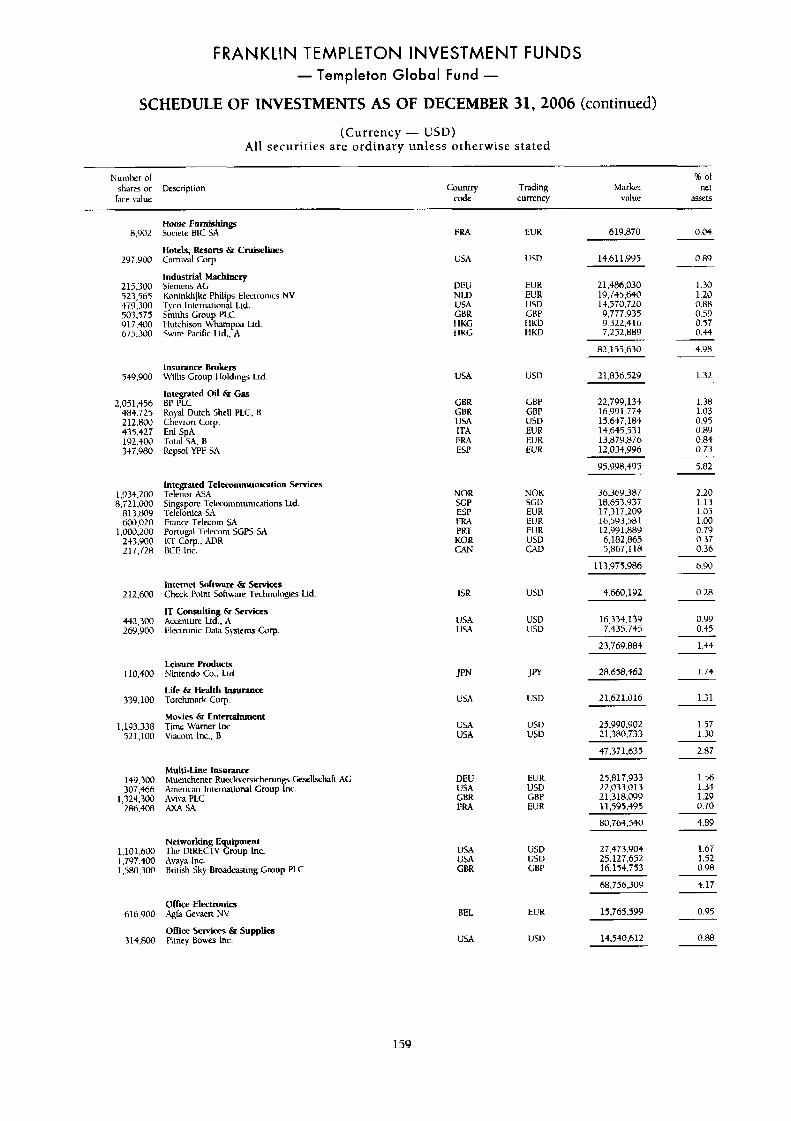
FRANKLIN TEMPLETON INVESTMENT FUNDS - Templeton Global Fund -
SCHEDULE OF INVESTMENTS AS OF DECEMBER 31,2006 (continued)
(Currency - USD) A l l securities are ordinary unless otherwise stated
~~
Numhcr of % of
face mluc code currency value Wls shares or Descriplion Country Tnding Market net
Home Furnishings Societe BIC SA
Hotels, Resorts & Cruiselines Carnival Corp.
Industrial Machinery Siemens AG Kminklijke Fhdips Electronics NV 'Tyco International I.td. Smiths Group PLC Hutchison Whampoa Lid 5wire Pacific Ltd., A
FRA
USA
VEU NU) USA CBR t IkG I I K G
EU R 619.870 13,902
2Y7,YIm
215.300 523,565 $79,300 501.575 917 400 675,300
549,900
2,031,456 484.725 2 12.800 435.427 1YL.300 3Si.980
1,931.200 8.721,rn
813.809 hOl3.02I)
1,ooi1,200 243.Y00 217.7213
212,600
442.300 26Y.YOO
I10.400
339.100
1.193.338 521,100
14Y.300 307.4hh
1.324.700 186.408
1.10 1 .hOO 1.797.400 1,5130.3~
616,YOO
314.800
0.04
0.89 USD 14.61 1,995
EUR 2 1.4R6.030 FUR 19.7+5.640 USD 14.570.720 GBP 9.777.935 I IUD 9.322.416 HKD 7.252.889
1.30 1.20 0.88 0.59 0.57 0.44
4-98
1.32
82.155.630
21,836.529 Insurance Brokers 1Villis Group I loldings Ltd
Integrated Oil h Gns BP PLC KL1)'al Dutch Shell PLC. H Chevron Corn.
USA us13
22,799,134 16.991.774 15.647.184 14,645.53 1 13,879,876 12,034.YY6
CBK GHK IJSA ITA FM ESP
GRP LBP US13 EUR EL'K EUR
1 . 3 ~ 1.03 0.95 0.89 0.84 0.73
5.82
2.20 1.13 1.05 1 .oo 0.79 0.37 0.36
h.9@
0.28
Eni 5pA
Repsol YPF SA 'rotai SA. R
Y5.YY8.495
36,369.387 18.653.937 17,317,209 16.59 3.58 I 12,991 -889 6,182,865 5,867.1 18
Integrated Telecornmuniation Services Telenor ASA Singapore 1~elccotnrnunications Ud. -1.clcfonica SA Fnnce Telecom SA Portugal Tclecom SGPS SA K-1. Corp.. ADR BCE lnc.
N O K SCD EUR
NOR SGP ESP FRA PRT liOK CAN
EL'K EUR USD Gill
113.975.YE-6
4.660.1Y2 Internet Software & Services Chtxk Point Software Technulogis Ltd
IT Consulting h Services kcccnlure Ltd., A Electronic Data System Corp.
ISR USD
16,334.139 7.435.745
0.99 0.45
1!SA USA
USV USV
23,769.884 1.4)
1.74 Leisure Products Nintendo Co.. Lld.
Life &I Health Iw- Torchmark COT.
Modes & Entertainment Time Warner lnc. Viacom lnc., B
JPN
USA 1.31 USD 2 1.62 1,016
25.YY0.902 2 1.380.733
1.57 1.30
C M USA
us13 USV
47.37 1.635 2.87
Muhi-Line Insurance Muenchener RueckveEjicherun~-Ixl~hafi AG American lntcmationd Group Inc. Avlva PLC AKA SA
DEU USA GnK FRA
EUR USD GRP EUR
1.56 1.34 1.2Y 0.70
4.89
25.817.933 22,033,013 21.318.099 11,595.+95
80.764.540
27.473.YO4 25.127.652 16.154.753
Networking Equipmcnt The DIRECD' Croup lnc Avaya Inc. British Sky Bmdat ing Group PLC
USV usu CBP
1.67 1.52 0.98
4.17 68.735.309
15,765.5Y9 Ollice Electronia &fa Gcvaerl NV
Pitney Bows lnc. Office services & Supplies
0.95 BEL
U U
EUR
14.540.612 0.88 usu
159
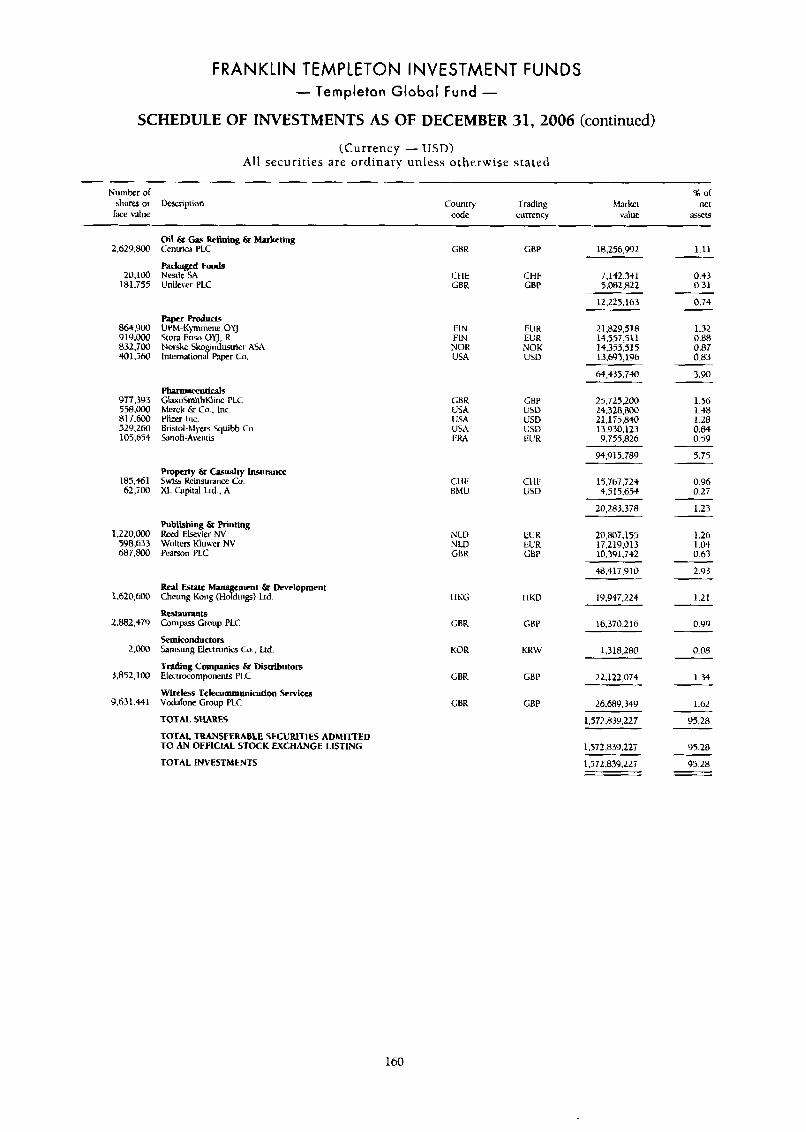
FRANKLIN TEMPLETON INVESTMENT FUNDS - Templeton Global Fund -
SCHEDULE OF INVESTMENTS AS OF DECEMBER 31, 2006 (continued)
(Currency - USD) All securities are ordinary unless otherwise statad
Number of 9: of sham or Description Country Trading htarkct net k c value c& currency value iLSxt5
Oil & Gam Refming & Marketing tentrim PLC
Paclragrd Foods Nesile SA Unilever PLC
2,629,W
20,100 181.755
864900 919.000 832,700 401,563
977.393 558.000 817.6C-3 52Y.26i) 105,654
185.461 62.7-00
1,220,000 598,633 687,800
1.620,MK)
2,882,479
moo
3,852,100
9,631 .et1
GBK CBP 18.L56.992 1.11
0.43 0.31
0.74
1.32 0.88 0.87 0.83
CI LE CHF 7.142.341 GBR GBP 5,082,822
12.225.163
FIN EUR 2 1,829.518 FIN Eli K 14,557,511 NOR NOK 14.355.515 USA USD 13:$3196
64.435.740 3.90
1.56 1.48 1.28 0.H 0.59
5.75
0.96 0.2T
1.23
1.26 1.04 0.63
2.93
1.21
0.Y9
0.08
1.34
1.62
PhanaarrutirnlS GlaxoSrniihKline PLC hkrck & Co.. Inc. Pfuer hc. Bristol-hlyers Squibb Co. SanoR-Xvenlis
25.725.200 24.328.800 2 1 . 1 7 5 . ~ 13.930.123 Y.755.RZb
CBR USA U5A USA FM
cw USV USD L!SD EI!R
94.915.789
Property Q Casualty Insurance Swiss Reinsurance Co. X L Gpital Ltd., A
CltE BMU
CHF USD
13.767.724 4,515,654
20.283.378
Publishing & Printing Reed Elsevier NV Woltcrs Kluwer NV Pearwn PLC
N LD N LV CBK
2O.BO7.155 17,219.013 10.391.742
EU R El jR GBP
+8,417.910
Real Estate M Chcung Kong s i n g ) Ltd.
IkStRUIWltS Cornpas Croup PLC
Semironducton Sarnsung Electronics Co., Ltd
Trading Compania & Dfitributors Elecmcomponents PLC
Wnless Telewmmuni4on Services Vodnfone Group PLC
TOTAL SHARES
ment & Development IIKG
GHR
KOR
CBR
GBR
l l K D 19,947.224
16,370.216
1.3 18,280
GBP
KRW
GBP 22,122,074
26.68Y.349 GBP
1,572.839.227
1,572,839.227
95.28
g5.28
95.28
TOTAL TRANSFERABLE SECURITIES ADMITTED TO AN OFFIClAL STOCK EXCHANGE LISTING
TOTAL INVESTMENTS t 572.839.225
160
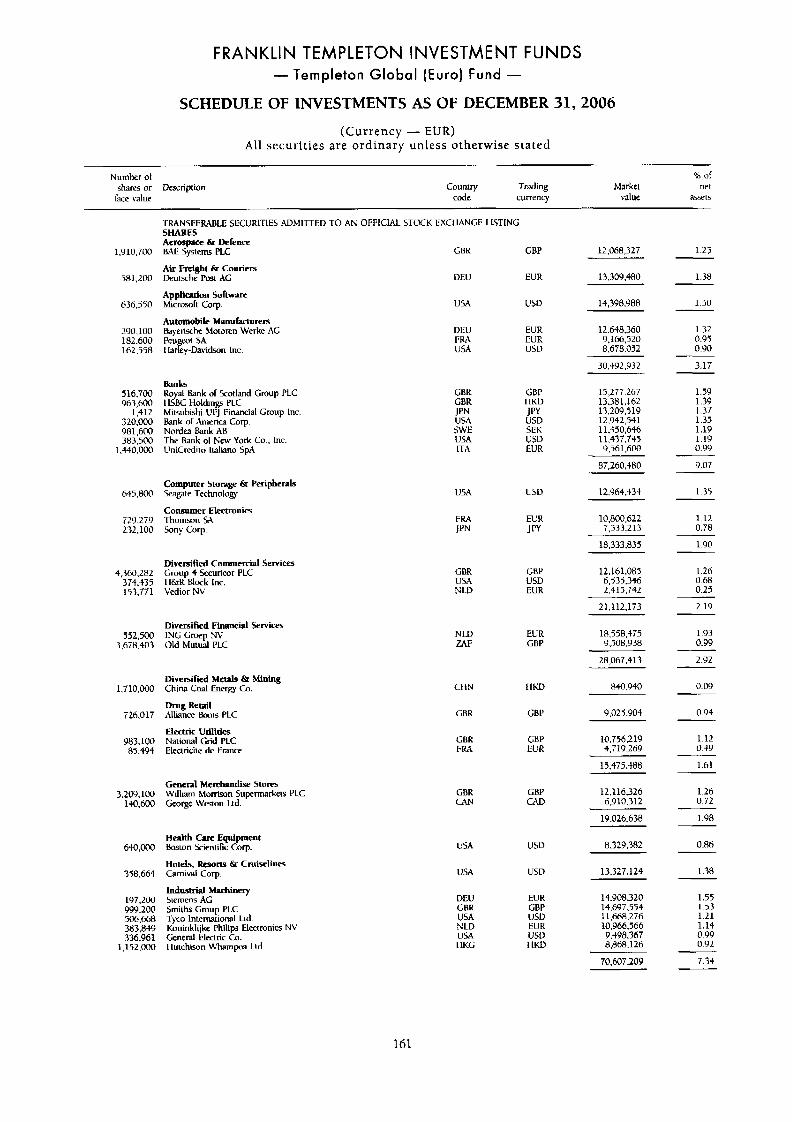
FRANKLIN TEMPLETON INVESTMENT FUNDS - Templeton Global (Euro) Fund -
SCHEDULE OF INVESTMENTS AS OF DECEMBER 31,2006
(Currency - EUR) All securit ies are ordinary unless otherwise stated
N u m k r of ?b of
value code currency value &set5 shares or Dexripiion Country fixding Market net
'TRANSFEMBLE SECURITIES A D M l n E D TO AN OFFlClAl STOCK EXCl I M G E LISTING SHARES Aerospncc & Defence
Air Frelght EI Couriers
Application Software
Automobile M a n u h r e r s
1,910,700 B M System PLC GBK
5.81.200 Deutsche Pmi AG DEU
636.550 Microsort Gorp. USA
290.100 lbyen.erische Motoren Werke AG DEU
162.558 I I;lr&h%lson lnc. USA 182,600 Peu 01 SA IW
GBP 1.25
1.38
12,068,327
EUR 13.309.480
1.50 14,398,988
1.32 0.97 0.90
EUR EUR USD
12,648,360 9,166,520 8,678.052
30,492,932 3.17
Banks 516.700 Royal Hank o I Scotland Group PLC 963,600 ILBC Holdings PLC
1,412 Mitsubishl L!FJ I%unciaI Group Inc 320,ooO Eiank or h e n c a Corp 981,600 Ncirdtv Ehnk AB 383.500 The Bank or LW York Co , Inc
I .+40.000 UniCreditu Iinllano >pA
GHK GBR JPN USA SWE USA ITA
GBP I IKU J PY VSD SEK USU EUR
1.59 1.3Y 1.37 1.35 1.1Y 1.19 0.99
15,277.267 13.381.162 13.209.519 12,942,541 11.450,646 11.437.7)J 9 ,561,600
87,260,480 9.07
Computer S t o w & Peripherals
Consumer ElectronicE
645,800 sfagate Technology
729.279 Thornson SA 232,100 Son) Corp
135 USA USD 12,964,434
1.12 0.78
EUR J PY
10,800,622 7.533.213
1.90 18.333.835
12.161.085 6.333,346 2,415,742
21.112.173
Diversified C o m r c i a l Services 4,360.282 Group 4 Sfcuncor PLC
374.435 II&K Block lnc. 153.771 Vcdior NV
GBR USA N 1.V
CBP USD EUR
1.26 0.68 0.25
2.19
1.93 0.99
Diversified Financd Services 552,500 ING G r w p YV
3,678.403 Old Mutual PLC NU) U F
EUR GBP
18.558,475 9,508.9 38
2.92 28.067.413
0.09 Diversified me& & Mining
Drug Retail
Electric Utilities
1.710.000 China Cod Energ Cc.
726,017 Alllance hrls PLC
Y83.101) National Grid PLC 85,494 ElPcinLile de Franm
ct IN llKD 840.940
9.02 5.904 CBR 0.94
CBR FRA
1.12 0.m
10.756.219 4,719.269
15,475.488 1.61
1.26 0.72
General Merchandii Stores 3.209.100 William Morrison Supermarkeis PLC
140.600 George Wmon Ltd. GBR cw
GBP CAD
12,116,326 6.910.312
1.98 19.026.638
0.86 H e a t h Care Equipment
Hotels, Rcsom & Cruiselinos
industrial Machiwry
6.to.000 m i o n Etntiiic Coq-.
358,664 Carnival COT.
197.200 Siemens AG 999,200 Smiths Group PLC 506.668 Tyco International hd. 383,8+9 Koninklijke Philips Electroniu NV 336,961 General kleclric Co.
1.152.000 1 luichiwn \\%arnpw Ltd.
USA USU 8.329.382
13.327.124 USA USD 1.38
1.55 1.53 1.21 1.14 0.99 0.92
7.3+
14.908.320 DEU GBR USA N LD USA I IKG
EUR GBP USD EUR
14.697.55) 11.668.276 10,966,566 Y.498.367 8,868,126
70,607,209
USll I IKU
161
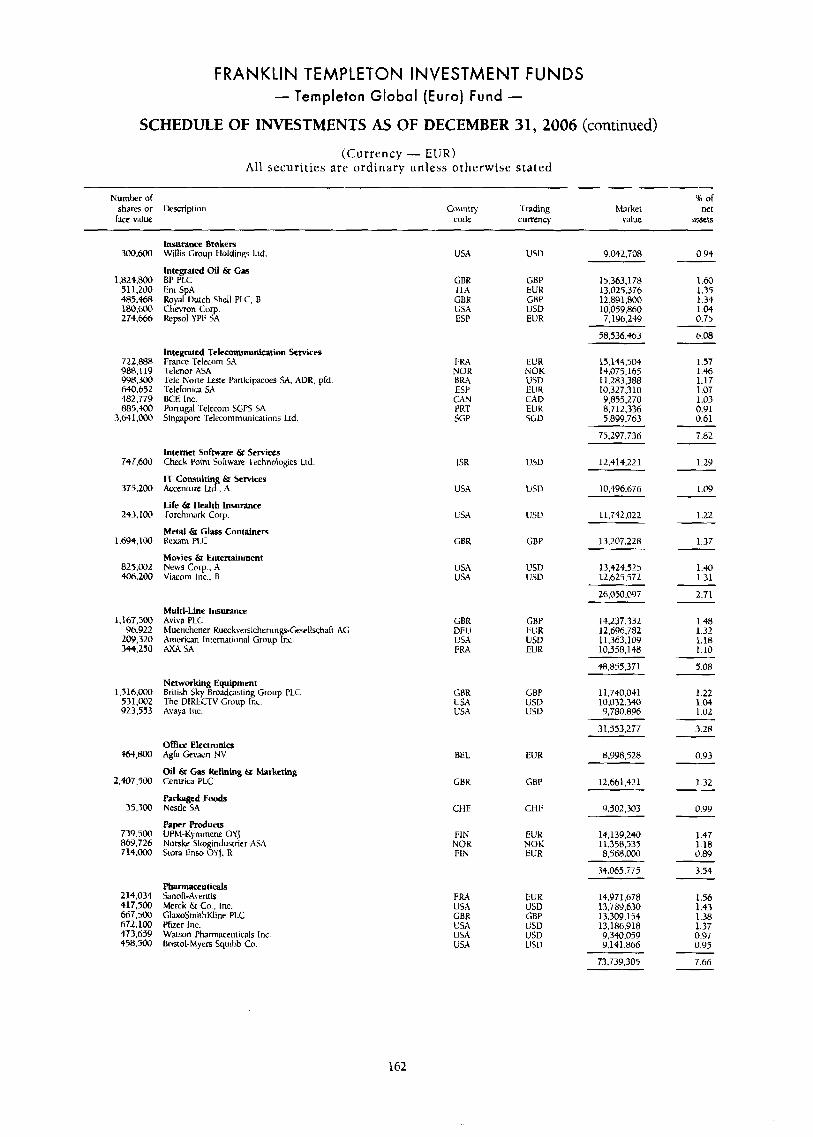
FRANKLIN TEMPLETON INVESTMENT FUNDS - Templeton Global (Euro) Fund -
SCHEDULE OF INVESTMENTS AS OF DECEMBER 31,2006 (continued) (Currency - EUR)
All securit ies a re ordinary unless otherwise stated
Number ol B of sham or Description Country Trading Market net h e value code currency VdW e t 5
lnsurawe Brokers Willis Group Holdings L I ~ .
Integrated Oil & G a BP PLC
M0.m
1,824.800 511.200 485.468 1RO.m 274,666
722,888 968.1 19 998.300 640,652 482.779 885.400
3.M1,MW
747,600
375.200
24 1.1M
1.694.100
825,002 40h2W
1.167,500 96,922
20Y,320 344,250
l5lh.000 531,002 923.553
*,@JJ
2.407.500
35,300
739,500 869,726 714.000
214.034 417.500 667.30 672.100 473.649 458,500
USA
GBR ITA GBK USA ESP
FM NOR BM ESP CAY PRT SGF
ISR
USA
USA
CHR
USA USA
usu
GBP ElJK GBP USD EUR
EUR NOK USD EUR CAI) EUK SGD
USD
USV
USV
GBP
USD USD
9,042,708 0.94
1.60 1.35 1.34 1.74 0.75
6.08
1.57 1.46 1.17 1.07 1.03 0.91 0.61
7.82
1.29
1.09
1.22
1.37
1 .+0 1.31
2.71
1.48 1.32 1.18 1.10
15.363.178 13.025.376 12,891,800 10,059,860 7.196,249
58,536.+63
Eni SPA Royal Durch Shell PLC. 8 Chevron Corn. kpsol YPF S'A
Integrated Telccommunicarion Services France Telccom SA Telenor ?SA Tek N o m Lese Panicipacoes SA. ADK. pfd Telefoniw 51 BCE lnc. Ponugal .l-elecom SGPS SA Singapore Telecoinmunicuions Lld.
15.144.504 14,075,165 11.283.388 10.327:710 9,853,270 8,712,336 5.899.763
75.297.736
Internet Software & Services Check Point Miware Technologies Lid
IT Consultin 6t Services Accenture L t t , A
Life & Health Insurance Torchmark Corp.
Metal & Class Containers Rexam PLC
Movies &I Entenainment News Cop.. A Viacom Inc.. B
12,414,221
10,496.676
13,207.228
13,424,525 12.625.572
26.050.@97
Multi-Line Insurance AviL-a PLC hiuenchener RueckversichcruneS-CexllschaIt AG American International Group Inc. A M SA
14,237.332 12.696.782
GBK DELI USA FRA
1 1 :363,109 10,558,148
48,855,371 5.08
1.22 1.04 1.02
3.28
0.93
1.32
0.99
1.47 1.18 0.89
3.54
1.56 1.43 1.38 1.37 0.97 0.95
7.66
Networking Equipment British Sky Rroadcasling Group PLC The VIWCTV Group Inc. Avaya lnc.
GBR LISA
GBF USD L'SD
11,740,041 10,032.340 '3,780.896 USA
31.553.277
8,998,526
12,661,421
4,502,303
office Electronic$ Agh G e ~ c n NV
Oil & Gas Refining 6r Marketing Centrica PLC
Packaged Foods Nrstle SA
Paper Roducts 1JPMKymment OYJ Norske Skogindusirier ASA Ston Enso OYJ. R
BEL EUR
GBK GBP
CHE CHI;
EUK NOK EUR
14,139.240 11358,535 8,568,000
34.065.775
NOR FIN
Pharmaceuticals k.nofi-..\ventis Merck & Co., Inc. GhxoSmithKline PLC PTuer Inc. Watson Pharmaceuticals lnc Bristol-Myers Squihb Cn.
FRA USA CHR USA USA USA
EUR USD GBF USD l!SV US11
14.Y 7 1,678 17,789,630 13.309.134 13.186.918 9.340.059 9,141.866
73,739,305
162
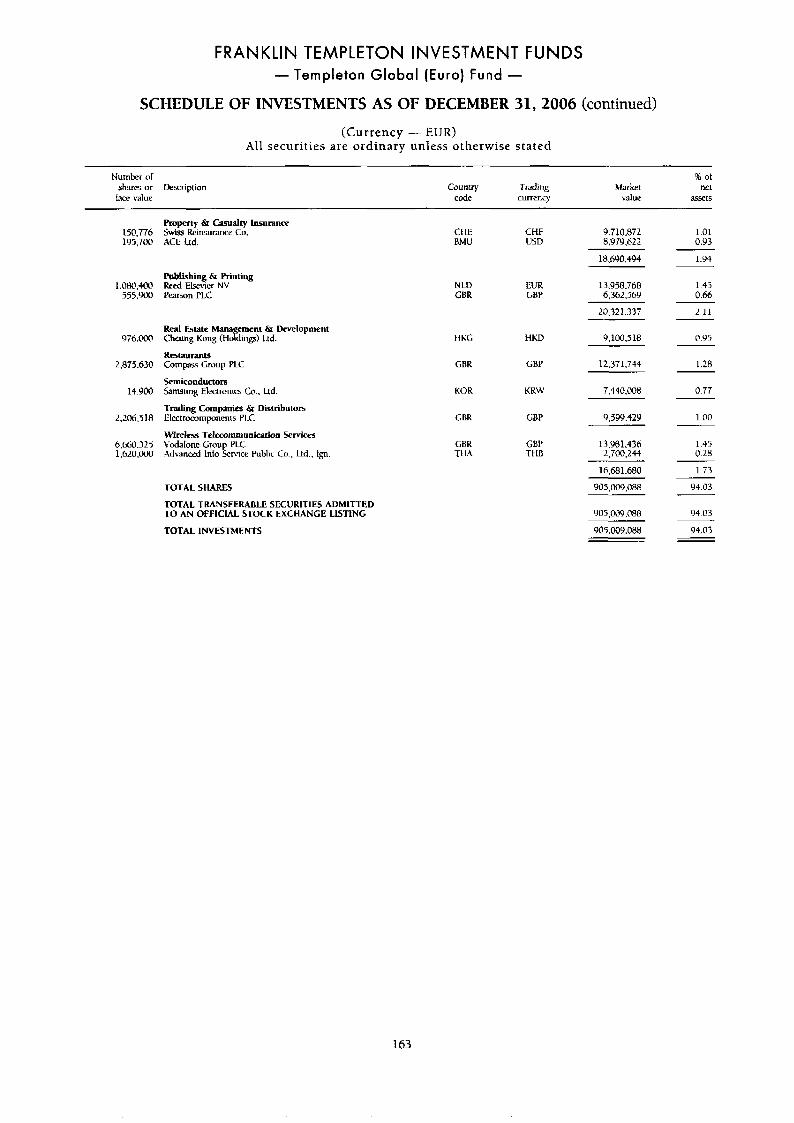
FRANKLIN TEMPLETON INVESTMENT FUNDS - Templeton Global (Euro) Fund -
SCHEDULE OF INVESTMENTS AS OF DECEMBER 31,2006 (continued)
(Currency - EUR) All securities are ordinary unless otherwise stated
Number of shares or Descripliun face value
Country Trading c d e currency
% of Marker ne1
value assets
150,776 195,700
1.0Ho.400 555,900
9i6.00(1
2,875.630
14.9W
2.206.5 I8
6,660.323 1,620.KlO
Roperty & Casualty lnsuranoe Swiss Reinsurance Co. ACE Ltd.
Publishing & Printing Reed Elsevier NV Pcarjon PLC
Real Estate htana cmcnt &I Development Ckung Kong (tiofdlmg) I.id.
ReStaUlWItS Cornpss Croup FLC
Semiconductors kmsung Electronics (3, Ltd.
Trading Companies & Dwtributors Elcctrocomponenrs P1.C W i r d e Telecommunication Services Vdalone Group PLC Addvanccd Info Service Public Co.. Ltd., fgn
TOTAL SHARES
TOTAL TRANSFERABLE SECURITIES ADMITTED TO AN OFFIClAL STOCK EXCHANGE LISTING
TOTAL INVESTMENTS
CtIE BMU
NLD GBR
HKC
C;RR
KOK
GBR
GBR TI 1.4
CHF 9.710.872 USD 8.979.622
1.01 0.93
18.690.494
13.958.768 EUR LBP 6,362.569
20.321.377
1.94
1.43 0.66
2.11
HKD 9,100,518
GBF 12.37 1.744
KRW 7.W.Mtl
GBP 9.399.429
GtiP 13,981.436 THE 2.700,244
16.681.680
Y05.009,088
Y05.009.088
0.Y5
1.28
0.77
1.00
1.45 0.28
1.73
94.03
94.03
905.009.oX8 94.03
163
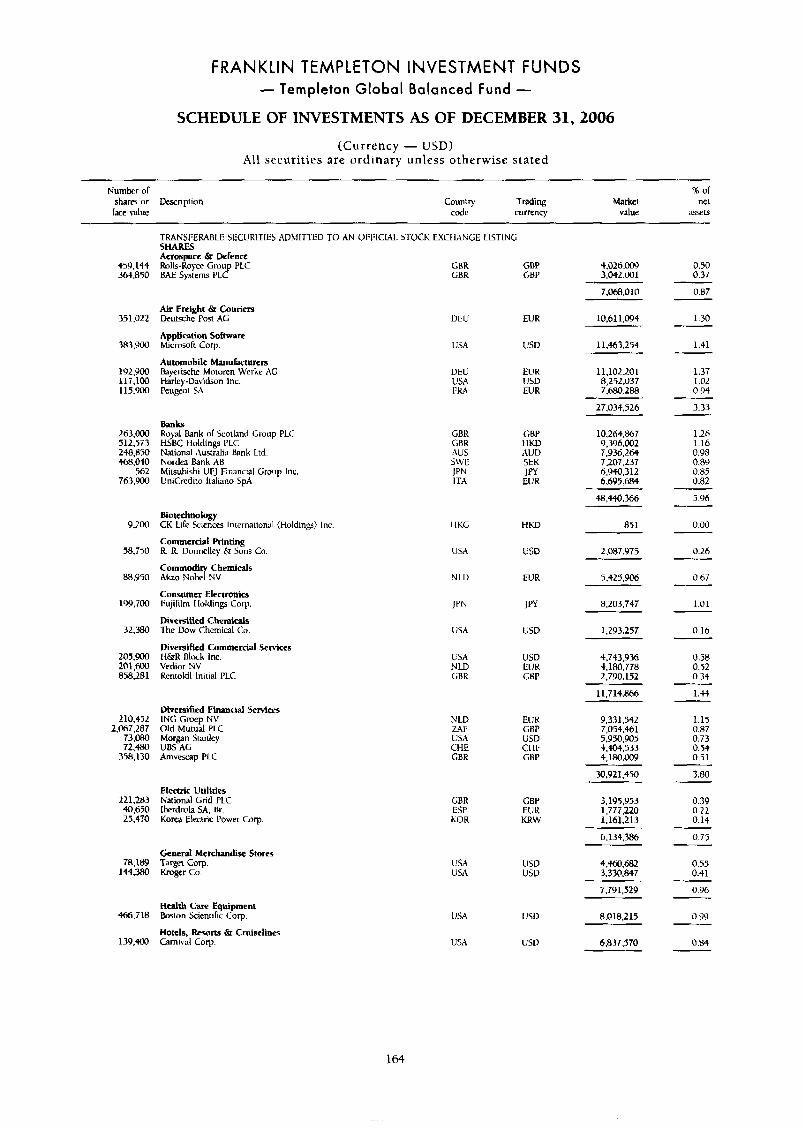
FRANKLIN TEMPLETON INVESTMENT FUNDS - Templeton Global Balanced fund -
SCHEDULE OF INVESTMENTS AS OF DECEMBER 31,2006 (Currency - USD)
All securities are ordinary unless otherwise stated
Nurnbcr or K, or
h e value code currency value =Sell shares or Description Country Trading Market net
TRANS1:ERARLE SECURITIES ADhllTTEU TO AN 0I~I:ICIAL SHARES Aerospace & Defence Rolls-Royce Croup PLC RAE Systems PLC
STOCK EXCI WPiCE LISTING
459.144 364,850
351.022
383,900
192,900 117,LoO 115.900
263.000 512.573 248,850 +mm
562 763.900
9.200
58,750
BR.950
199.700
32,380
205,900 201,600 858.281
210.452 2,067.287
73.m 72,480 358,130
22 1,283 40.650 25.470
78.1851 144.380
466,718
139,400
CBK GBP 4.026.m GBR CBP 3,042.001
7,069,010
DELI EUR 10,611,094
0.50 0.37
0.87
1.30
1.41
1.37 1.02 0.94
3.33
1.26 1.16 0.98 0.89 0.85 0.82 5.96
0.00
0.26
0.67
1.01
0.16
0.5R 0.52 0.34
1.44
1.15 0.87 0.73 0.54 0.51
3.80
0.39 0.22 0.14
0.75
0.55 0.41
0.96
0.99
0.84
Air Freight & Couriers Deutrhe Post AG
Application Software hlicrowlt Corp.
Automobile Manufactures Bayerische Moioren Wcrkc AG Harley-Uavidson Inc. Peugcot SA
USA lJSD 11.463.254
DEU EUR 11,102.20 1 l!SA USD 8,252,037 F M EUR 7,680.288
27.034.526
Banks Royal Rank or Scotland Cmup PLC HSBC t loldings PLC National Australia Bank Ltd. Nordea Bank AB Mitsubishi Ul'J Financial Group Inc. UniCredito haliano SpA
GRK GRR AUS S h E
K
GBP I 1KV AUD
10,264,867 9,396,002 i.936.264
SEK J f l EUR
71201 1237 6,940,312 6.69 5,684
48,440.366
851
2.087.975
Biotechnology Cti Life Sciences Inmmtionid (Holdings) Inc.
Commercial Printing R R Uonnelley 8 Sons Co
Commodit Chemicals
Consumer Electronic3 Fujirilm tloldings Corp.
Diversified Chemicals The Dow Chemical Co.
Diversified Commercial Services H&R Block Inc. Vedior NV Rentokil Initial PLC
A h 0 N o d N v
I IRG IiW
USD
N LD EUR 5.425,906
JPN 8,203,747
USA llSD 1.293.257
4.743936 4,180,778 2.790.152
USA NLD LRR
USD EUR GBP
11,714.866
Diversified Financial Services ING Gmep NV Old Mu~ual PLC
N LD L91: USA CHE CBR
EUK GRP USD CI IF GBP
9.331.542 7.054.46 I 5.950.905 4,404,533 4,180.ooy
30.921.450
Morgan Stanley UBS AC h v e s m p PLC
Eimtric Utilities National Grid PLC Ibfrdmla SA. tlr. Korea Electric Power COT.
3,195,953 1.777220 1.161.213
CBR ESP liOK
GBP EUK KRW
6,134.386
General Mefchandise Stores T3rger COT. Kmger Co.
4.W.682 3330.847
USA USA
USD USV
7,791,529
8.018.215 Health Carp Equipment Boston Scientific COT.
Hotels, RLsorts & Cruiselines Carnival COT.
USA
USA
usu
USD 6.837.570
164
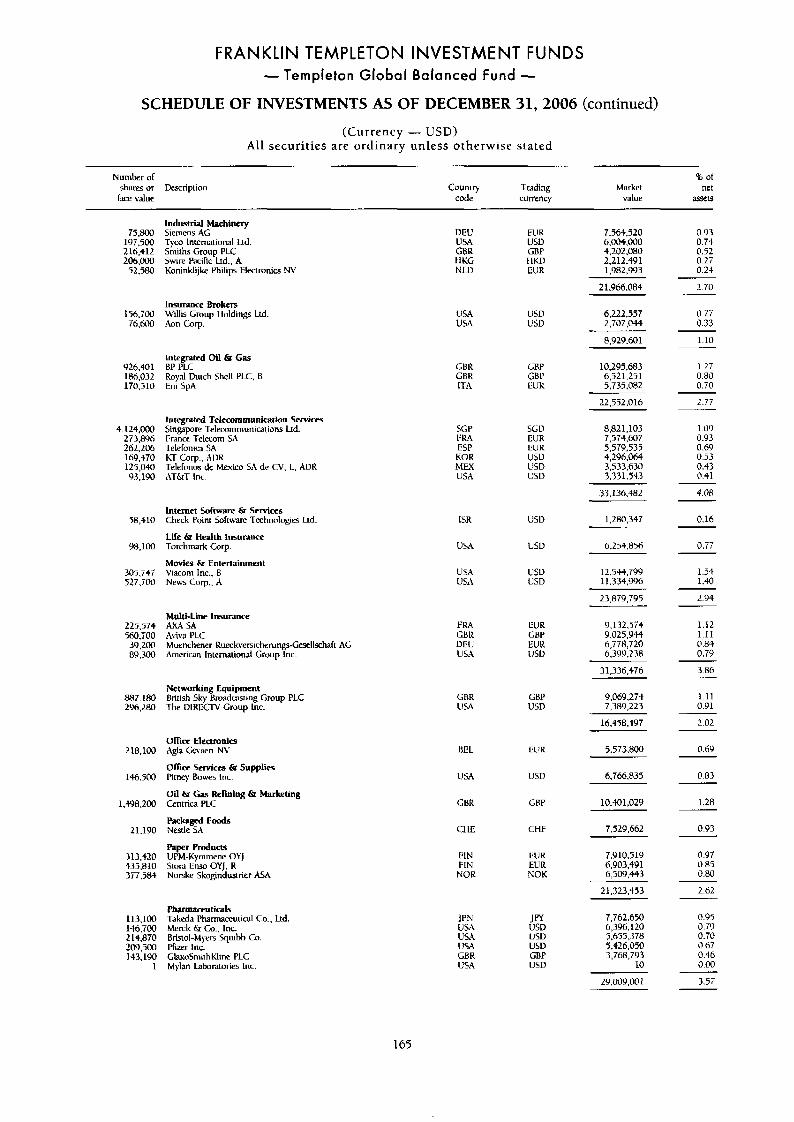
FRANKLIN TEMPLETON INVESTMENT FUNDS - Templeton Global Balanced Fund -
SCHEDULE OF INVESTMENTS AS OF DECEMBER 31,2006 (continued)
(Currency - USD) All securities are ordinary unless otherwise stated
Number of
value shams or Dexription
% of Count) Trading Market net
code currency value ii5SetS
Industrial Machinery Siemens AG ryco International Ltd. Smiths Group PLC Swire Pacific Ltd., A hninklijke Philips Electronics NV
75,800 197.500 Ilh.412 206,000
52.580
156.700 76.6@0
926.401 IR6.032 170,510
4 124.000 273.8Y6 262.206 1 hY ,470 125,040
Y 3,190
58,410
98.100
305.T4i 527,TDcl
225.574 560,700 39,2Ml 89.300
8117.180 LY6,>80
L18,loi)
146.500
1,$98.200
21,190
313,420 435.810 377.58)
113,100 146.700 214,RT@ 209.500 143.190
1
DEE EU R 7,564.520 USA 1151) 6,004.000 GBK GRP 4,202,080 IlKG tIKD 2,212.491 NLD IiUR 1,982,993
2 1,966,084
0.Y3 0.74 0.52 0.27 0.24
2.70
0.77 0.33
1.10
Insurance Brokers Willis Group Iloldings Ltd. A m Corp
1;SA USA
USD L‘SD
6.222,557 2.707.M
8.929.601
Integrated Oil & Gas BP PLC Ryal Dutch Shell PLC, R Eni Spa
10,295,683 6.521.251 5,735.082
1.2i 0.80 0.70
CBK CBR 1TA
GBP CXP EUK
22,552.016 2.77
1.0Y 0.93 0.69 0.53 0.43 0.41
lntegtnted Teletwmmunication ServirrS Sinppore Telecornmuniwrions Ltd. Fnncc Telecorn SA Tcleloniw SA KI Corp.. AIIK Telefonos de Mexico SA dc CV. L. AUK AT\TM Inc.
SGP FRA ESP
8,821,103 7,574,607 5,579,535 4,296.064 3,533,630 3.331.543
SGD EUR EUK USD USD USD
KOR hZEX USA
4.08 33,136,482
Internet Software & Services Check Point So~warc Technologis Ud
Life & Health Insurance Torchmark Corp.
Movies & Entertainment Viacorn Inc.. R N e w Corp.. A
1,280,347
6.254.856
12.5W.799 I1.334.Y96
23.879.795
0.M 1SR USD
0.77
1.54 1.40
2.94
USA 1:su
USA USA
USU USD
~~
Y I 132.574 9.025.944 6,778,720 6.3YY.238
1.12 1.11 0.84 0.79
Multi-Line Insurance M A SA FRA
GBK DEL;
EUK GRP EUR
A\iva PLC Muenchmncr Rueckversirherungs-Gesellrh American Intemational Group lnc.
ah AG U U iisu
31,336,476 3.86
1.11 0.91
Networking Equipment british Sky Rroadwxing Group PLC The DIRliClV Gmup lnc.
9.069.274 7,389,223
GRR USA
CBP USD
2.02 16,458,497
0.69 OfF~ce Electronics .Ash Ckv3en NV
Oll i e 5wm & Supplies Atney Ebwes Inc.
Oil & Gas Refining t Marketing Ccntrica PLC
Packaged Foods Ne~tle SA
Paper Roducrs UPM-Kymmene OYJ Stora Ens0 OYJ. R Norskc Skoginduslrier A5A
BEL
USA
GBK
CHE
f l ! K 5.573.800
0.83
1.28
0.93
0.97 0.85 0.80
6.766,835 USD
GHP
CHF
10.4001.029
7.529.662
7.U10.519 6,903,491 6.509.443
FIN FIN NOR
EUK EUR NOK
21.323.453 2.62
7.762.650 6,396.120 5,655,378 5,426,050 3,768,793
10
0.95 0.79 0.70 0.67 0.46 0.W
3 .5 i
PharmPceuticab Takeda Pharmamutiwl 6.. Ltd. h+erck & Co.. Inc. Rristol-M~-ers Squibb Co. ffier Inc. GlaxoSmithKlinc PLC Mylan L;lbonwries Inc.
JPN USA U U USA GBR USA
J f l USD USD USD CRP USD
29,00Y,001
165
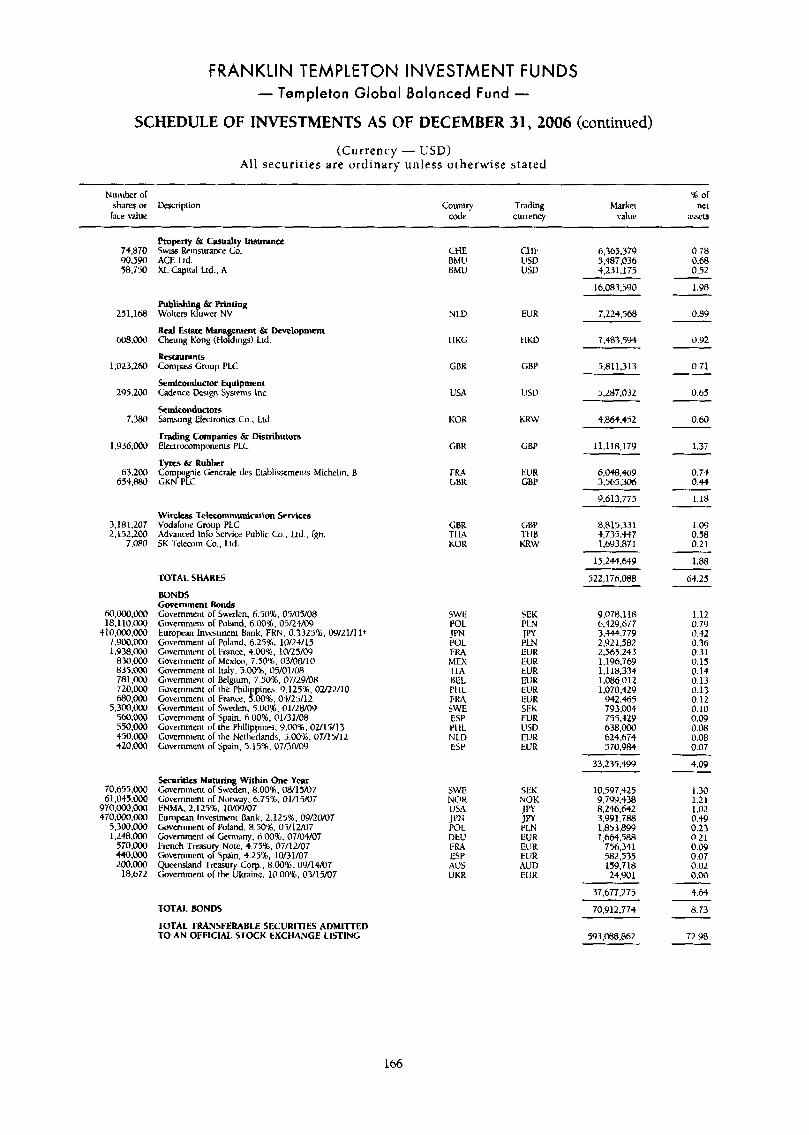
FRANKLIN TEMPLETON INVESTMENT FUNDS - Templeton Global Balanced Fund -
SCHEDULE OF INVESTMENTS AS OF DECEMBER 31,2006 (continued)
(Currency - USD) All securit ies are ordinary unless otherwise stated
Number ol
value shares or Uescription Country Tnding
cude currency
% of hhrkei net
value asT15
h p r l y Q cosualty lmrnnce Swiss Rcinsurance Co. ACE Lid. X L Capital Ltd., A
74.870 90,590 58,750
251.168
608.m
1.023,2M,
295.2W
7.380
1.936,OOO
63.200 654.880
3.181.207 2.152.2CQ
7.080
m,000,000 18.110.0@0 510.000.000
7.900.m 1,938,000
830,000 835.000 781.000 720,000 fmm
5.300.000 m.Oo0 550.000 450.000 420.m
70.655.000 61,045.000 970,000,000 470.000.000 5,300.m 1,248.000
570,OOO 44o.ooo Loo.MM 18.672
CtiE ClII' 6,363.379 BhW USD 5,487.036 BMU USD 4,231,175
0.78 0.68 0.52
16,083,590
7.224.568
1.Y8
0.8'3 Publishin &Printing Welters KBuwer NV
Rcal Estate Mana ement & Dcvelopment Cheung Kong (idding4 Lid.
u€saurnnts Cornpars Croup PLC
5emiconductor Equipment Gdence Design Systems Inc.
Semiconductors Lmsung Electronics Co., Ltd
'Trading Companies st Disaihutots Elecmcomponen& PLC
Tvres & Rubber
N LD EUR
7,483.594 0.92 1 IKG t 1KD
5,611,313
5,287.032
0.71
0.65
0.60
1.37
0.74 0.44
1.18
1.09 0.58 0.21
1.88
GBR GBP
UW US17
4,864,452 KOK KRW
t B R GBP 11.1 18.179
Cbmpagnie Genenle des Etabliwments Michelin. B CKN PLC
FIW EUR GBR GBP
6,048,469 7,565,306
9,613.775
Wireless l~elewmmunication Services Vcdarone Group PLC Mvanced Info Service Puhlic Co.. Ltd., fgn. SK 'relecoin Co., Ltd.
8.815.331 4,733.447 1,693,871
GBR tiBP T€iA TI IB KOR KRW
15.244.649
TOTAL SHARES
BONDS Government Bonds Government of Sweden, 6.50%. 05/05/08 Govemrneni of Pobnd, 6.@0%, 05/24/09 Europan Invtmnent Bank, FRN. 0.3329%. 09/2l/llt Covemment or Poland, 6.251. 10/24/15 Covernment oi l%ancc, 4.@J%, 10/25/0g Government of Mexico, 7.50&, 03/08/10 Covemment of Italy. 5.00%. 05/01/08 Cowrnmmt of klgium, 7.50%. 07/29/08 Government of the Philippines. 9.12516. 0U2U10 Government of Franc%, 5.00%. 04QY12 Cavernment or Sweden, 5 . 0 % . Ol/LHIOY Government of Spain, 6.00%. 01/31/08 Government of the Philippines. 9.00%, 02/15/13 Government ol ihe Netherlands. 5.00$, 07/15/12 Government of Spain. 5.15%. 07/30/09
522.1 Th.088 64.25
1.12 0.79 0 32 0.36 0.31 0.15 0.14 0.13 0.13 0.12 0.10 0.09 0.08 0.08 0.07
4.09
1.30 1.21 1.02 0.49 0.23 0.21 0.09 0.07 (1.02 0.W
-
SWE SEK POL PLN
9,078,116 6.429.677 3.w.779 2.921382 2,565.243 1,196,769 1,118,334 1,086,012 1.070.429 942.465 793,004 755.429 638,000 624.675 570.984
33.235.499
JPY PLN EUR FKA
MU( EU R ITA EUR BEL EUR PI II. EUR FRA EUR SWE SEK ESP EUR PI IL USD NLD EUR ESP EUR
!E
Securities hhturing Within One Year C4vernment of Sweden. 13.00%. 08/13/07 Governmeni of Norway, 6.75%. 01/15/0i ENhU, 2.12516, 10/09/07 European Investment Bank, 2.125%, 09/20/07 Governmeni of Poland. 8.50%. 03/12/07 Government ol Gemany. 6.00%. 07/04/07 French Treasu Note 4 75%, 07/1U07 Governmen1 o?Spain:4.i5%, 10/31/07 Queensland Treasuly Corp., 8.00%. 09/14/07 Government of the Ukraine. 10.00%, 03/15/07
10,597,425 9.79Y.438 8.246.642
1,853,899 1,66+,588 756,341 582.535 159,718 24.901
3.991.7a~
SWE SEK NOR NOK USA JPY JPN Jm POL PLN DEU CUR FRA EUR ESP EUR ALIS AUD UKR EUR
37.677.275
70.912.774
4.64
8.73
72.98
TOTAL BONDS
TOTAL TRANSFERABLE SECURITIES ADMITTED TO AN OFFICIAL STOCK EXCHANGE LISTING 593,088,862
166
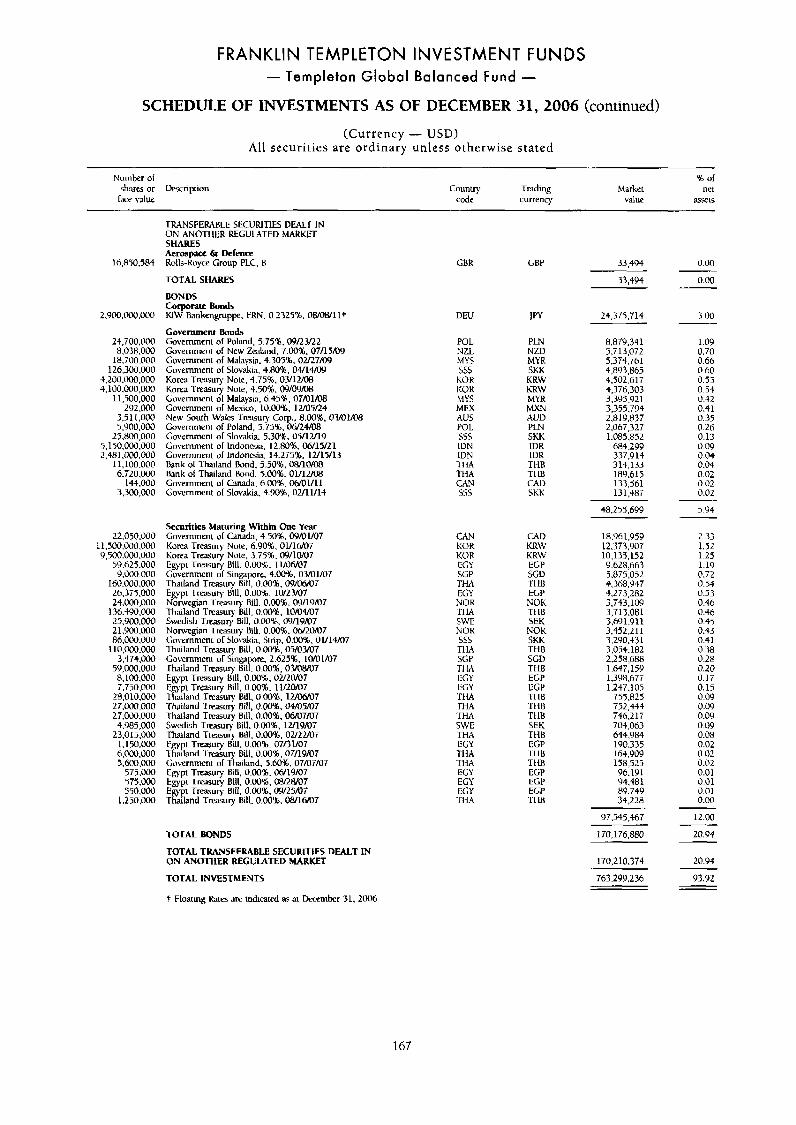
FRANKLIN TEMPLETON INVESTMENT FUNDS - Templeton Global Balanced Fund -
SCHEDULE OF INVESTMENTS AS OF DECEMBER 31,2006 (continued)
(Currency - USD) All securities are ordinary unless otherwise stated
Numkr of
lace d u e shares or Uexription
~
% of Market net
value ilSSSel5
Country Tmding code currency
TRANSFERABLE SECURITIES DEALT IN ON AN0TIIl:'K REGUL4TED MABKET SHARES Aerospace br ticfence Rolls-Royce Croup PLC, B TOTAL SHARES
BONDS Corporate Bonds KlW Bankengmppe, FRN. 0 1325%. OW11+
Government Bonds Government or Poland. 5.75%,09/23/22 Governmen1 rrl New Zealand. 7.00%. 07/15AN Government of Malaysia. 4.305%. 0U27/OY Government of Slobxkia. S.$OI, Ot/14/OY Korea Trc;tsur). Note, 4.75%, OYluoB Korca Tressury Note. 4.50%. 09/09/06 Government o l Malaysia, b.4596. 0im1/06 Ctivcrnmenl of Mcxiui. 10.00%. 12/05/24 New South Wales T~a5ur). Corp., 8.00%. OUOl/@8 Government ol Poland, 5.75%, 06/24/08 Government o l Slovakia. 5.308. 05/12/19 Government of Indonesia. 12.80%. 06/15/21 Government or Indoncsi3. 14.275%. 12/15/13 Bank or Thailand Bond. 5.50%. 06/10/08 Bank o l Thailand Rond, 5.00%. 01/12/08 Government or Gmda, 6.008, 06/01/11 C;overnment of Slovakia. .I.YO%. ON1 1/14
GBK GBP 33.494 0.00 16,850,584
33,494
24.375.714
0.00
DEL' 3 00
8.879.341 5,713.072 5.374,T61 4,093,865
3.395.921 3,355.794 2.819337 2.067.327 1.085.852
684.299 337.9 14 314.133 189.615
4.502.617 4,376,303
1.09 0.70
24,700,000 8.038.000
18,700.000 126,300,@@0
4.200.100.000 4.100.000,000
11,500,000 292.000
3.5 1 1,000 5,Y00,000
25,800,000 5,150,o0O.000 2.481.000.000
I1.lOO.OOO 6.720.W
144.000 '3,300,GOO
POL NZL MYS 55s K O K KOK M Y S MEX AUS
PLN NZD MYR SKK KRW KRW MYR MXS.I AUI) PLN SKK IDR
0.66 0.60 0.53 0.54 0.42 0.41 0.35
POL SSS IUN
0.26 0.13 0.09
IDN
THA -ri LA
IDR THB TI IB
0.04 0.04 0.02 0.02 0.02
CAN s5s
CAD SKK
1331361 131.487
5.Y4 48.255.699
Securities Maturing Within One Year Government d Cmada, 4.50%. OY/01/07 Korea Treasury Yule. 6.90%. 01/16/07 Korea Treasury Note, 3.75%. OYllaM7 Egypt T m u r y Bill. 0.00%, 1 I/06/@7 Government of Singapore, 4.00%. 03/01/07 Thailand rrwnry Bill, IIOO%, 09/06/07 Eppt Treasury Bill. 0.00%. 10/23/07 Ndrwegian I'reasury Bill. 0.00%. W/19/07 lkailand Treasury Bill. 0.00%. 10/04/0i Swedish Treasury Hill, 0.@@%, 09/19/07 Norwegian Trc~urf Bill. 0.00%. W O N 7 Govcrnmcnt of Slovakia. 5irip. 0.00%. 01114m7 Thailiind T m u r y Bill, 0.00%. 05mM7 Government of S i n g Thailand Tmsurs B i l ~ O . 0 O % , 0 3 / 0 7 Egypt Twsury Id!, 0.00%. 02QaM7 E pi -rm+ury Bill, 0.00%. 11/20/07 Triiland Treasury Bill. 0.00%. 12/0697 Thailand Tmsury Bill, 0.00%. 04/05/07 Thailand Tre3jury Bill. 0.00%. 06/07/07 Swedish Tmasury Bill, 0.00%. 1U19/07 lkuland Treasury Bill, 0.00%. 0U2MT E pi Treasul) Bill 000% 07/31/07 TKiland 'l&uv iili. 0.0&%. 07/19/07 Givemmcnt ol Thailand. 5.60%. 07/0i/i17 Egypt Tm.uur)- Bill, 0.00%. 06/19/07 Egypt Treasu~ Bill, 0.00%. W W 0 7 E pt T m u n Sill 00@%, C&'/25K)7 TEiland T-ry hll. 0.00%. OW16407
re, 2 625%. laMl/07
22.050.000 ll,500.000.000 9,500.dooo.rH)0
59.625.000 9.000.000
160.000.000 26.3T5.000 24.000,000
136.490,000 25,900,000 21.Y00.000 8h.000.000
110,000.000 3,474.000
SY,000.000 8.100.0@0 7,730,00@
2$,010,rn@ 27.000.000 L7.@00,000 4.985.000
23,015.000 1,150.000 b.000,000 5,600.000
5 7 5 . W 575,000 540.000
I ,250.m
CAN KOR KOH ECY SGP TM
CAD KRW KHW EGP SCU
EGP NOK TI IB SEK NOK SKK
-rt in
18,961,959 lL.173.907 10.139.152 9 628,663 5.875.052 4.3M3.9 47 4,273,282 3,743,104 3,7 13.08 1 3.69 1.9 11 3,452,211 3,290.431 3.034.182 2,258,688 1647,159 1.398.67i 1.247.105
755.825 T52.44t 746.217 704,063 644,984 190,335 16+.90Y 158,525 96.191 94.481 89.7413 34,228
2.33 1.52 1.25 1.19 0.72 0.5+
EGY NOR -1-1 M
0.33 0.46 0.46 0.45 0.43 0.41 0:38 0.28 0.20 0.17 0.15 0.09 0.09 0.09 0.09 0.08 0.02 0.02 0.02 0.01 0.01 0.01 0.00
SWE NOR S S S T W SGP TI IA IJGY EGY
TI-IA 'rtiA
THB SGD THE EGP EGP -1-1 in T I IB 'rtm SEK THB EGP -1-1 IB THB EGP ECP EGP TI in
Ttw, SWE THA EGY 1 1 IA T l G EGY EGY EGY 'I't IA
97.545.447
1 7 0 ~ 7 6 . ~ 8 0
170,210.374
12.00
TOTAL BONDS
TOTAL TRANSFEUABLE SECURITIES DEALT IN ON ANOTHER REGULATED MARKET
20.94
20.94
TOTAL INVESTMENTS 763.299236 93.92
t Floating Raw drc mdiated as at l h m h e r 31. 2006
167
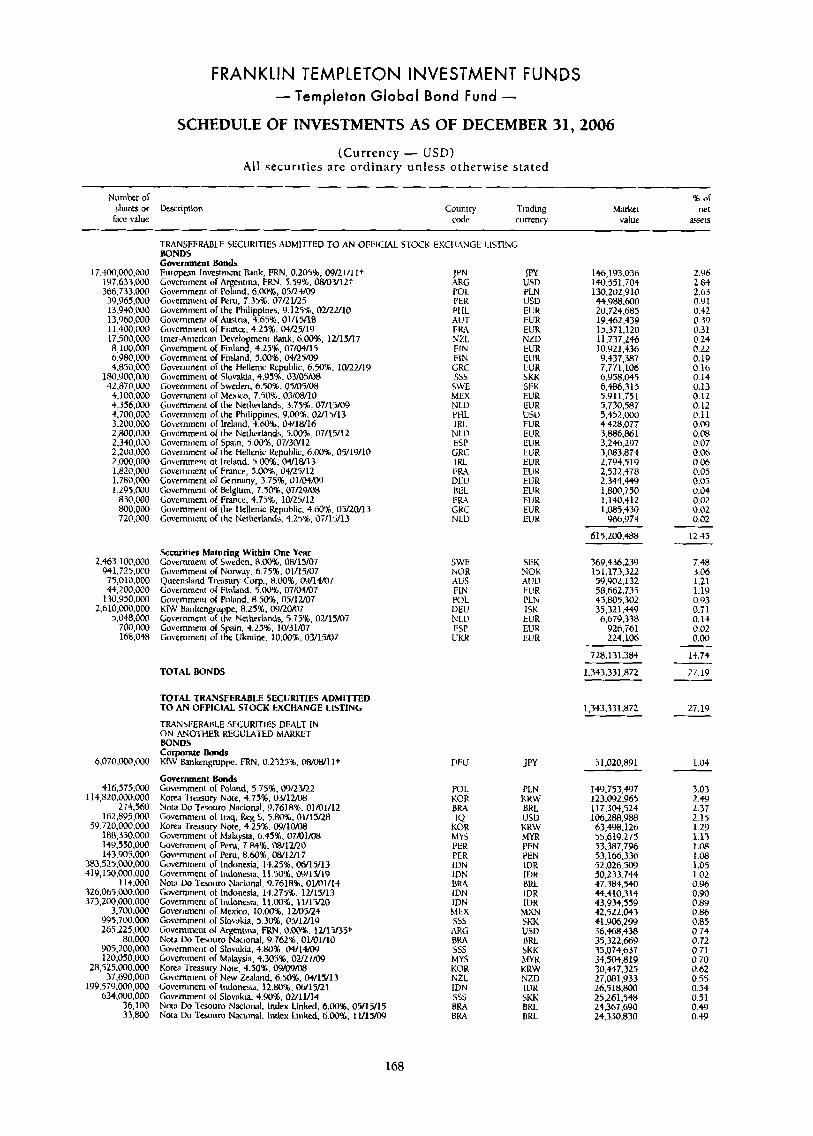
FRANKLIN TEMPLETON INVESTMENT FUNDS - Templeton Global Bond Fund -
SCHEDULE OF INVESTMENTS AS OF DECEMBER 31,2006
(Currency - USD) All securities are ordinary unless otherwise stated
Numher of % of shares or Description Couniry trading Marhi net
face value code currency value 5wt5
I7.WO.000.000 197,633,M)o 366.733.000 39,965,000 13,940.000 13,960.000 I1,400.000 17.500.000 8,100.000 6,980.000 4.850.WO
180,900,MM 42,870,000 4,100.000 4,356,6130 5.700.000 3.200,uoO 2,800.0D0 2.340.000 2.200,m 2,000,000 1.820,000 1,780,000 1,295,000
830,000 800,000 720.000
2.463.100,OOO Y41,725.000 75,010,000 44.200.000
130,950.ooO 2,610,000,000
5.048.000 700,000 168.048
6,070,002,000
416,575,000 114,820,000,000
274,360 162,895.00(1
59 .720,000,00O 188,350,000 14Y.330,002 143.905.000
383,525.000.000 41Y,150.000,000
114.000 326,069,000,000 373.200.000.000
3,700.m 995.700.000 265.22j.000
80;000 W5.200,OoO 120.050.000
28,525,000.000 31.690.000
1Y9.579,~.000 634,000,000
36.100 83,800
TMNSFEUBLE SECURI-FIES ADMITTED TO AN 0FI;ICIAL STOCK EXCI IANGE BONDS Government Bands Europan lnvestmmt Bank, FRN. 0.2058, OW2 111 1+ JPN Government of Ar fn t in i FRN. i.59%, 08/03/1Lt ARC
Government of Peru, 7.35%. 07/21/25 PER Government of the Philippines, 9.125%. 02/22/10 PI 11 Government o l Austria, 4.65%. 01/15/18 AUT Government of France. 4.25%. 04/25/19 F LL4 Inter-American Vevelo meni Bank. 6.00%. 1U15/17 NIL Government o l Finhnj. 4.25%, 07/04/15 FIN Government of I:inland, 5.005, 04/L5/09 FIN Government of the tiellenic Republic. 6.50%. lOnUl9 GRC Government o l Slovakia, 4.95%. 03hJ5Kl8 SSS Govrmmeni of Swden, 6.50%. 05/05/08 SWE Government or Mexico, 7.50%. 03/08/10 MEX Government ol the Netherhnds. 3.75%, 07/15/09 NLD Government of lhe Fhilippmcs, 9.00%. OU15/13 PHL Governmeni ol Ireland, 4.60%. 03/18/16 IRL Government o l the Netherlands, 5.00%, 07/15/12 N LD Government of Spain, 5.00%. 07/30/12 ESP Government ol the Hellenic Republic, 6.00%. 05/19/10 LRC Government o l lreland. 5.00%. 04/18/13 IRL Government of Fnnce, 5.00%. 04/25/12 ITA Government of (;emany, 3.75%. 01/04/W DEL! Government of Belgium, 7.50%. 07/29/08 HE1 Government of Fnncc. 4.75%. 10/25/12 1:Rh Government or the 1 lellenic Republic. 4.60%. 05f20/13 CKC
NLD
Government of Pofand. 6:001,05/r4/09 POL
Government or the Netherlands. 4.25%. 07/15/13
Securities Maturing Within One Year Government o l Sweden, R.00%, 08/15/07 Government or Nom-ay. 6.75%. 01/15/07 Queensland Trasury Corp., H.00%, 09/14/07 Governrncnt of Finland. 5.00%. 07/04/07 Governmeni of Poland. 8.50%. 05/12/07 KIW Bankengruppe. 8.25%. 09L!ax17 Government or the Netherlands, 5.75%, 02/15/07 Government ol Spain, 5.25%. 10/31/07 Governrneni ol the Ukraine. 10.00%. 03/15/07
TOTAL BONDS
TOTAL TRANSFERABLE SECURITIES ADMIlTED TO AN OFFICIAL STOCK EXCHANGE LISTING
TRANSFERABLE SECURITIES DULT IN O N ANOTHER REGULATED MARKET BONDS Corporate Bonds KhV Bdumgrupr~. FRN. 0.2329% Mvo8/11+
Govemmcnt Bonds Government ol Poland, 5.75%. 09nyL2 Korea 'Treasury Note. 4.75%, 03/12/08 Nota Do Tesouro Naciorul, Y.761A%. 01/01/12 Government of Iraq, Keg 5. 5.80% 01/15l28 Korea Treasury Note, 4.25%. 09/10/08 Government ol Malaysia. 6.45% 07/01/08 Government ol Peru, 7.W'X. WluZO Governmen1 of Peru. 8.60%, 08/12/17 Government of Indonesia. 14.25%. 06/15/13 Government ol Indonesia, 11 SO&, 09/1Y19 Nola Do 'l~esoum Nacional, 9.761896, OVOl/l4 Government ol Indonesia. 14.275%. 12/15/13 Government o l Indonesia. 11.0046, 11/15/20 Governmeni ol Mexico, 10.00%. 1Mo5/24 Government of Slowkia, 5.30%. 05/12/19 Ckvernment ol .irgcntia. FRN. O.W%. I u i i / 3 ~ + Nota DO Tewum Nacional, 9.762%. Ol/Ol/lO Government of Slovakia. 4.80%. 04/14/09 Government ol Malaysia. 4.305%. 02/27/09 Korea Treasury Note, 4.50%. 09/09/08 Gowmrnent of New Zealand, 6.50%. 04/15/13 Government or Indonesia. 12.80%. W l x 1 Government nl Slowkia. 4.90%. 02/11/14 Nota Do Tesouro Naciclnal, Index Linked, 6.00%. OYlYI5 Nota Do Twuw Nacional, Index Linked, 6.00%. 1V15/00
LISTlG
IW USD PLN GSD EUR EUR EUR NZD EUR EUR ELiR SKK SEK EUR EUR USD EUK EUR EUR EUR EL'R EUK EUR EUK EUK BUR EUR
SWE SEK !%OR NOK AUS AUD FIN EI!R POL PLN DEU 1SK N1.D EUR ESP EUR UKK EUR
DEL' JW
146,193,036 140,351,704 130,202,910 44.988.600 20,724.685 19.462.439 15.371.120 11,737.246 10.Y21.436 9,437,387 T,771,106 6,958.045 6,486.3 15 5911.751 5,730,587 5,452,000 4.428.077 3.886,861 3.246,297 3.083874 2.T94.519 2.522.478 2.344.449 1,800.750 1,140,512 1,085,430
966,974
615,200,488
369.436.239 151,173.322 59 .V02,132 58.662,735 45,805.302 35.321.449 6,679,338
926.761 224,106
2.96 2 8 4 2.63 0.9 1 0.42 0.39 0.31 0.24 0.22 0.19 0.16 0.14 0.13 0.12 0.12 0.11 0.09 0.08 0.07 0.w 0.06 0.05 0.05 0.04 0.02 0.02 0.02
12.45
7.48 3.06 1.21 1-19 0.93 0.71 0.14 0.02 0.00
728.131.384
1,343,331,672
1,343,331,872
5 1.020.891
14.74
27.19
27.19
104
POL PLN KOR KKW 6R4 BKL IU USD
KOR KRlV M Y S MYR PER PEN FER PEN IDEU' 1VR 1DN IDR BKA 0RL IDN I DR IDN IDR MEX MXN SSS SKK
ARG USD BRA nm SSS SKK MYS M Y R KOR KRW NZL NZD IDN IDR SSS SKK BRA BRL BRA BRL
149.753,497 123,092,965 117,304,524 106,288.988 63,498,126 55,619.275 53.387.796 57.166.336 52.026.509 50,233.744 47.384.540 4,410,314 43,934.559 42.522.043 41906.299 36,468,438 35.322.669 35,074,637 34,504.819 30,447,325 27,081 ,Y 33 26.518.Roo 25,261,548 24.367.690 24,330830
3.03 2.49 2.37 2.15 1.29 1.17 1.08 1.08 1.05 1.02 0.96 0.90 0.89 0.86 0.85 0 74 0.72 0.71 0.70 0.62 0.55 0.54 0.51 0.49 0.N
168
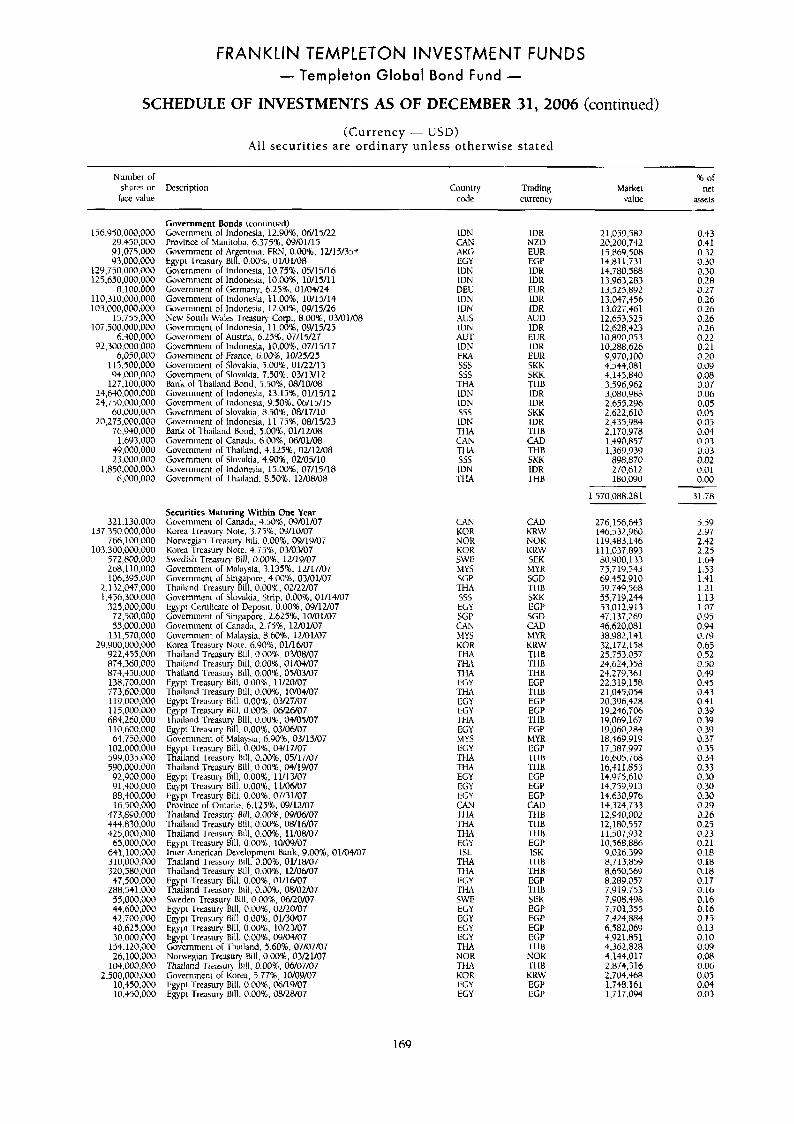
FRANKLIN TEMPLETON INVESTMENT FUNDS - Templeton Global Bond Fund -
SCHEDULE OF INVESTMENTS AS OF DECEMBER 31, 2006 (continued)
(Currency - USD) All securities are ordinary unless otherwise stated
Number of shares or Description
lace value Country Trading
code currenq
'16 of Market net
value assets
156.Y50.000,OOO 29.450.000 Y1.075.000 Y3.000,000
129.750.000.000 125.650,000,000
8.100.000 110,310.000.000 103,000,000.000
15,755,000 107,500.000.000
6,400,000 Y2,300.000.000
6,050,000 113,500,000 Y4,000,000
12T.100.000 24,640:000.000 24,750,000,000
60,000.000 20,275,000.000
76,910,000 1.6Y3.000
49.000.000 21.000.000
1.850.000.000 6,000,000
Government Bonds icontinued) Governmenr of Indonesia, 12.90%, 06/15/22 Pmvince of Manitoba, 6.375%. 09/01/15 Government of Ar tnrina. FRN. 0.00%. 12/15/35* Egypt Treasury BiI~,'O.OO'%. O1/0Y08 Governmcni o l Indonesia. 10.75%. 05/15/16 Gwernment of Indonesia. 10.00%. 10/15/11 Government of Germany. 6.25%. 01/04/24 Government of Indonesia. 11.00%. 10/15/14 Government ol Indunesia. 12.00%. 09/15/26 New South Wales Treacur). Corp.. 8.00%, 03/01/08 Government or Indonesia, 11.001, 09/15/25 Governmcni o l Austria, 6.251, 07/15/27 Government of Indonesia, 10.008, 07/15/17 Coverniiicnt of France. h.OO%, 1W25125 Government of Slovnkia. 5.00%. 01/2U13 Government d Slovakia, 7.5091. 03/13/12 Bank o l Thailand Bond. 5.50%. 08/10/08 Government of Indonesia. 13.1% 01/15/12 Government or Indonesia. Y.50%. 06/15/15 Govcrnment of Slovakia, 8.50%. 08/17/10 Government of Indonesia. 11.75%. 08/15/23 Bank of Thailand Bond. 5.00%. 01/12/08 Government of Canada. 6.00%. 06/01/08 Government 01 Thaihd. 4.125%. 02/12/08 Govemmenr ul Sltxakia, 4.90%. 02/05/10 Government o l Indonesia. 15.00%. 07/15/18 Government o l .Ihailand. 8.50%. lUOW08
321.130.000 137.350.000.000
766.100,000 103,300,000,000
572.800.000 268,110,000 106,395,000
2.1 32.047.000 1.47h.300.000
725,000,000 72,500.000 55,000.000
131,570,000
922,455,000 874,360,000 874,450.000 138.700.000 773.600.000 119.000,000 115.000,000 68t,260,000 110,600,000 64.750.000
102.000.000 599.035.000 590.000.000 9 2 .Y 00,000 Y1.400.000 88,400.000 16.500.000
473,890,000 444.830.000 425.000.000 65,000.000
641,100,000 310.000.000 720,580,000 47,500.000
288.541.000 55,000.000 44.600.000 42.700.000 40,625,000 30,000.000
134.120.000 26.100.000
1o.t.000.000 2.500,000.000
10,450,000 10.$50.000
29,900.000.000
Securities Maturing Within One Year Government of Canada. 4.50%. 09/01/07 Korea Treasury Noie. 3 I S % , 09/10/07 Norwegian Trcnur) Bill. 0.00%. 09/1Y/07 Korea Treasury Note. 4.798. 03/03/07 Swedish Treasury Hill, O.OO%, 12/19/07 Governmem of hl;ilaysia. 3.135%. 12/17/07 Governmcni nl Singa ore 4.00%. 03/01/07 Thailand Creasu Bily, O . i O % , 02/22/07 Governmeni of S?'ovakia, Strip. 0.00%. 01/14/07 Lgypi Cenificnte of Deposit. 0.001. 0Y/lU07 Government of Singa ore. 2.625%. 10/01/07 Government of Can&. 2.75%. 12Wl/07 Covernnient of hlalaysia. P.bO%. 12/01/07 Korea Treasury Note. 6.90%. 01/16/07 Thailand Trciur) Bill. 0.00%. 03/0W07 Thailand 'Treasury Bill. 0.00%. 01/04/07 -Chailand Treasury Bill. 0.00%. 05/03/07 Empt Treasury Bill. 0.00%. ll/20/07 Thailand Tre;lsuv Bill, 0.0091, 10/04/07 Egypt Treasury Rill. 0.00%. 07/27/07 Egspt T r y r v Bill. 0.008. 06126/07 T ailand I reiury Bill, 0.00%. 04/05/07 Egypt .I'n.asury Bill. 0.00%. 03/OWOi Government of Malaysrs. 6.YO8, 03/15/07 E )pt Treasury H i l l . 0.00% 04/17/07 Tiailand Treasur). Bill. 0.00%. 05/17/07 Thailand Twiur). Bill, 0.00%. 04/19/07 Egypt Treasury Bill, O.OO%, 11/13/07 Egypi Trfasury Bill. 0.00%. 11/06/07 &pi rreasury Bill. 0.00%. 07/31/07 Province of Ontario, 6.125%. 09/1U07 'Thailand Treasuy Hill, 0.00'X;. 09/06/07 Thailand Treasury Bill, 0.00%. @W16/07 Thailand Treauq Bill, 0.00%. lllOW07 Egypt Treilsury Bill, 0.00%. 10MY/07 Inier-American Development Bank. 9.001, 0 1/04/07 Thailand TE:ISU~~ Bill. O.OO%, OlllW07 Thalland Treasurs Bill. 0.00%. IUOW07 E pL 'Treasur). Rill. 0.008< 1)1/16/07 TRiland Tremty Bill, 0.00%. OtvoU07 Sweden Treasurv bill. 0.00%. 06/20/07 Egypt Trcasur), bill, 0.00%. OU20m7 Egypt Treasury Bill, 0.@0%, 01/30/07 E g p i Treasurv Bill, 0.008. 10/23/07 kgvpt TreJsuG Bill. 0.00%. 09/04/07 Gckrnment o l Thailand. 3.60%. 07/07/07 Norwegian Trcaur). Bill. 0.001, 03/21/07 Thailand Treasury Bill. 0.00%. 06/07/07 Governmcnr d Korea, 5.77%. 10/0Y/07 Egypt 'Treasury Bill. 0.00&. 06/19/07 Egypt Treasury Bill. 0.00%. 0&28/07
IDN CAK ARG EGY lUN IDN DEU IUN IUN .\US IUN AUT IDN FR4 sss 55s TtLi 113N IUN SSS IDK Tt IA CAN TI w 5 s IUN .TI w
CAN KOR NOR KOR SWE \lYS SCP THA SSS EGY SGP CAN MYS KOR 'rtih rim THA ECY T M EGY tGY TI-lA EGY MYS tGY
TtU EGY EGY llGY CAN 1'1 u TtW EGY ISL
TtW T t t i EGY
SWE EGY EGY EGY ECY Tthl NOR TtU KC3R EGY EGY
.rim
TiW
-nu
IDR NZD EUR EGP 1DR IUK EUR IDR IDR
AUD 1DR EUR IUR EUR SKK SKK T I 1B IUR IDR SKK IUR 'n 1B CAD THB SKK IDR THB
CZU KRW NOK K K W SEK MYR SGD T I IB SKK ECP SGD CAD MYR KRW ~ I B '1'1 IB T H B EGP -1-1 IB EGP EGP
EGP MYR EGP
-TI in
TI in -1-1 in ECP EGP EGP CZD TI 1H T I 18 -11 IB EGP 1SK
-1-1 18
EGP '1-1 IB SEK EGP EGP EGP EGP -1-1 in NOK TI 18 KRW EGP ECP
'rtm
2 1.059.582 20,200,742 1 i,86Y ,508 14.811.731 14,780,588 13,963,283 13,525.8Y2 13.047,456 13.027.361 12.653.525 12.628.423 10,890,053 10,288,626 9,970,100 4,544,081 4.145.840 3,596,962 3,080.988 2,655.296 2.622.610 2 435,984 2.170.978 1.490.857 I .36Y .939
$98,870 270,612 180,090
1 570.088.281
276,156,643 146.532.9hO 11Y.483,146 11 1,037.893 80.Y00.133 73.719.543 69.452 910 59 74Y.568 95,719,144 53.012.Yl3 47.137.269 46.620.081 38.Y82.141 32.172.158 25,753.037 24,624.358 24.27'3.361 22,319,158 21,045.054 20,396,428 19,246,706 19,069.167 19.0hO.284 18.469.919 17,387.997 16,605.768 16,-tl1.853 14.YT5.610 14,759,913 14,630,976 14,324,733 12,940,002 12,180.557 11,507,932 10,568,886 9,026,399 8,713.859 8~350.569 8,289.057 7919.753 7908,498 7.701.335 7,424,884 6.582.069 4.92 1.85 1 4.362.828 4,144,017 2.874.716 2.704.468 1,748.161 1,717.094
0.43 0.41 0.32 0.30 0.30 0.28 0.27 0.26 0.26 0.26 0.26 0.22 0.21 0.20 0.09 0.08 0.07 0.06 0.05 0.05 0.05 0.04 0.03 0.03 0.02 0.01 0.00
31.78
3-59 2.97 2.42 2.23 1.64 1.53 1.41 1.21 1.13 1.07 0.95 0.93 0.79 0.65 0.52 0.50 0.49 0.45 0.43 0.41 0.39 0.3Y 0.3'3 0.37 0.35 0.34 0.33 0.30 0.30 0.30 0.29 0.26 0.25 0.23 0.21 0.18 0.18 0.18 0.17 0.16 0.16 0.16 0.13 0.13 0.10 0.09 0.08 0.06 0.05 0.04 0.03
169
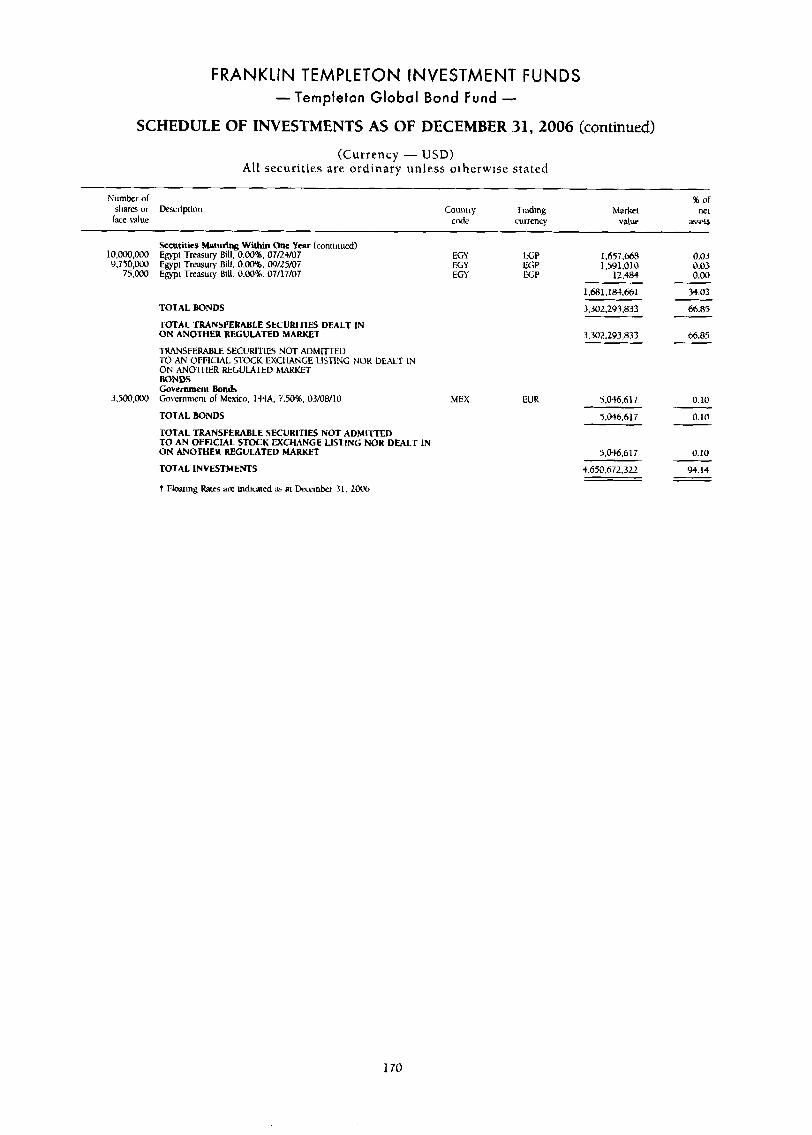
FRANKLIN TEMPLETON INVESTMENT FUNDS - Templeton Global Bond Fund -
SCHEDULE OF INVESTMENTS AS OF DECEMBER 31,2006 (continued)
(Currency - USD) All securities are ordinary unless otherwise stated
Number of share; or Descripliim
T w value Country Trading
code currency
10,000,000 9,750,000
75,000
3,500,000
SeCUritics Maturing Within One Ycar (continued) Egypt Treasury Bill, 0.0016. 07/2+/07 Egypt Tresury Bill. 0.0016. 09/25/07 Egyp~ Tresury Bill. O.M%. 07/17/07
EGY EGP 1,657.660 EGY EGP 1,591,010 EGY ECP 12,484
TOTAL BONDS
TOTAL TRANSFERABLE SECURITIES DEALT IN ON ANOTHER REGULATED YMtlCET
TRANSFERABLE SECURll~lfi NOT ADMITTED '1.0 AN OFFlClAL STOCK EXCHANGE LISTING NOR DEALT IN ON ANDrI IER REGULATED hL4RKET BONDS Government Bonds Govrrnrnent of Mexico, l44A. 7.50%. OUOW10
TOTAL BONDS
TOTAL TRANSFERABLE SECURITIES NOT ADMITTED TO AN OFFICIAL STOCK EXCHANGE LISTING NOR DEALT IN ON ANOTHER REGULATED MARKET
TOTAL LNVESTMEYTS
t Floating Rates are mdmted 35 at k-ember 31. LOO6
MEX EUR
1 ,M11,184,b61
3.302,293,833
3.302.293.833
5,046,617
5.046.617
9,046,617
4.650.672,322
0.03 0.03 0.00
34.03
M.85
66.85
0.10
0.10
0.10
94.14
1 70
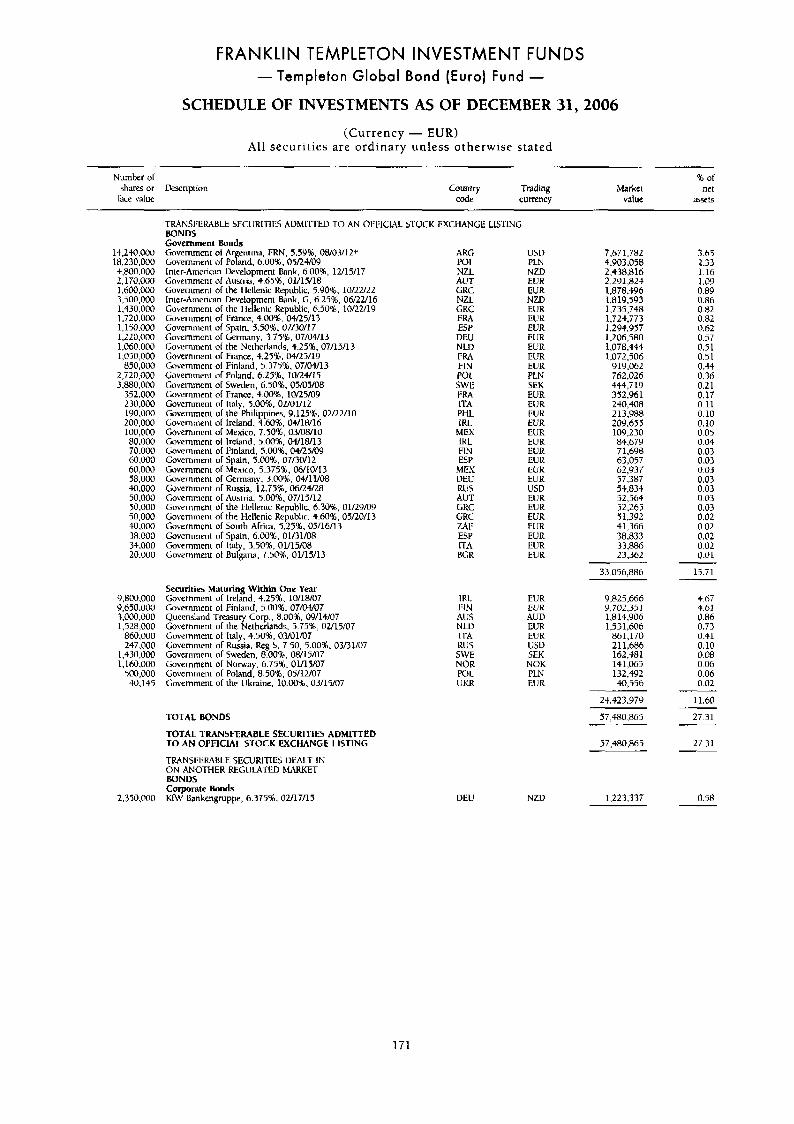
FRANKLIN TEMPLETON INVESTMENT FUNDS - Templeton Global Bond (Euro) Fund -
SCHEDULE OF INVESTMENTS AS OF DECEMBER 31,2006
(Currency - EUR) All securit ies are ordinary unless otherwise stated
Number or % or bce value code currency value =sets sh;lrfs or Description Country Trading Market net
TMNSIWUBLE SECURITIES ADMITTED TO AN OIWCIAL STOCK EXCHANGE LISTING BONDS Government Bonds
14,240.000 Government of Ar nrin? FRN. 5.5Y'b. 0tvO3/I2+ ARG USD
S.800.000 Inter-American Uevelopment Bank. 6.00%. 12/15/17 NZL NZD 18.230.000 Governmeni Pognd, k:00%. 05/24/09 POL PLN
2,170.000 Government of Austria. +.652, 01/15/18 AUT EUR 1,600,000 Governmeni or ihe llellenic Republic. 5.90%. 10/22/22 GRC LUK 3.500.000 Inter-American Develo ment Bank, C. 6.2556, 06/22/16 NZL NZD 1,430.000 Government or the I IeEenic Republic, 6.50%, 10/22/19 GKC EUR
1,150.000 Government of Spain, 5.50%. 070W17 ESP EUR 1,220.000 Government of Germany. 3.752. 07/04/13 DEU EUR 1,060.000 Government of the Netherlands. 4.25%. 07/15/13 NLU EUR 1,050,000 Governnient or France, 4.251. 04/25/19 F RA EUR
850,000 Government of Finland, 5.37506, 07/04/13 13% EUR 2,720,000 Cowrnment of Poland. 6.25%. 10/24/15 POL PLN 3,880,000 Government of Sweden, 6.50%. 05/05/08 SWE SEK
352.000 Government or FranLY. 4.0016. 10/25/09 l%4 ELiR 230,000 Governmen[ or Italy, 5.00%. 02/01/12 ITA EUR
200,001) Government of [reland. 4.60%. 04/1W16 IRL EUR 100,000 Government or Mexico. 7.50%. 03/08/10 M EX EUR 80.000 Government or Ireland, 5.00%. 04/18/13 LKL EUR
60.001) Government or Spain, 5.00%. 07/30/12 ESF EUK
58,000 Governmem of Germany. 3.008. 04/11/08 DEU PUR
50.000 Government or Austria. 5.M)%, 07/15/12 AllT EU R 50,000 Government or the llellenic Republic. 6.3006, 01/29/09 GRC EUR 50,000 Governmeni of the Hellenic Republic. 4.60%. 05/20/13 GRC EUR 40,000 Government or South A h a . 5.25%. 05/16/13 MI' EUR 38.000 Government or Spain. 6.00%. 01/31/08 ESP FUR 34.000 Government Or llaly, 3.50%. 01/15/08 ITA EUR 20,000 Government or B U I ~ M . 7.50%. 01/15/13 RGR EUR
1.720.000 Government or France, 4.00%. 04/25/13 FRA EUK
190,000 Government or ihe Philippines, 9.125%. 02i22/10 PHL EUK
70.000 Government of Finland. 5.00%. 04/25/09 FIN EUK
60,000 Governmeni of Mexico. 5.375%, 06/10/13 ME?( EUK
40,000 Government or Russia, 12.75%. 06/24/28 UQS usu
Securities Maturing Within One Year 9.800.000 Government of Ireland. 4.25%. 10/18/07 9,650,000 Gowrnment of Finland. 5.00%. 07/@4/07 3.000,OOO Queensland Treasury Corp., 8.00%. 09/14/07 1,528,000 Government of the Netherlands. 5.75%. 02/15/07
860,000 Guvernment of Italy, 4.50%. 03/01/07 247.000 Government of Russia. Reg S. 7.50, 5.00%. 03/31/07
1.430.MM Government or Sweden. 8 00%. OW1507 I.lhO.OM) Government of Noway. 6.75%. 01/15/07
500,000 Governmeni of Poland, 8.50%. 05/12/07 40.145 Government or the Ukraine. 10.001,03/15/07
TOTAL BONDS
TOTAL TRANSFERABLE SECURITIES ADMITTED TO AN OFFICIAL STOCK EXCHANGE LISTING
TRANSI:tMBLE SECURITIES U W T IN ON ANOTHER REGl!LAfED hWRKET BONDS Corporate Bonds
2,350,000 KR3' Bnkengruppe, 6.375%. 02/17/15
I RL EUR I:IN EUR AUS AUD NUI EUR I-L'A EU R UUS USU 5WE SEK NOR NOK POL PLN UKK EUR
UElJ NZU
7.671.782 4.903058 2.438.816
1,878.496 1.819.593 1,735,748 1,724,773 1.294.957 1.20630 1.078.444 1,072,306
919.062 762.026 444.719 352,961 240,408 213,YBA 20Y.655 109,230 84,679 71.698 63,057 62,Y37 57,387 54,834 52,564 52.265 51.392 41,366 38.837
2,291,824
33.m 23.362
33.056.886
9,823,666 9,702.35 1 1,814,906 1,531,606
86 1,170 211,686 162,481 14 1,065 132,492 40,556
24.423.979
57,480.865
57.4Ro.865
1.223.337
2.33 1.16 1.09 0.89 0.86 0.82 0.82 0.62 0.57 0.51 0.51 0.44 0.36 0.21 0.17 0.11 0.10 0.10 0.05 0.04 0.03 0.03 0.03 0.03 0.03 0.03 0.03 0.02 0.02 0.02 0.02 0.01
15.71
4.67 4.61 0.86 0.73 0.41 0.10
0.06 0.06 0.02
11.60
27.31
0. on
27.31
0.58
171
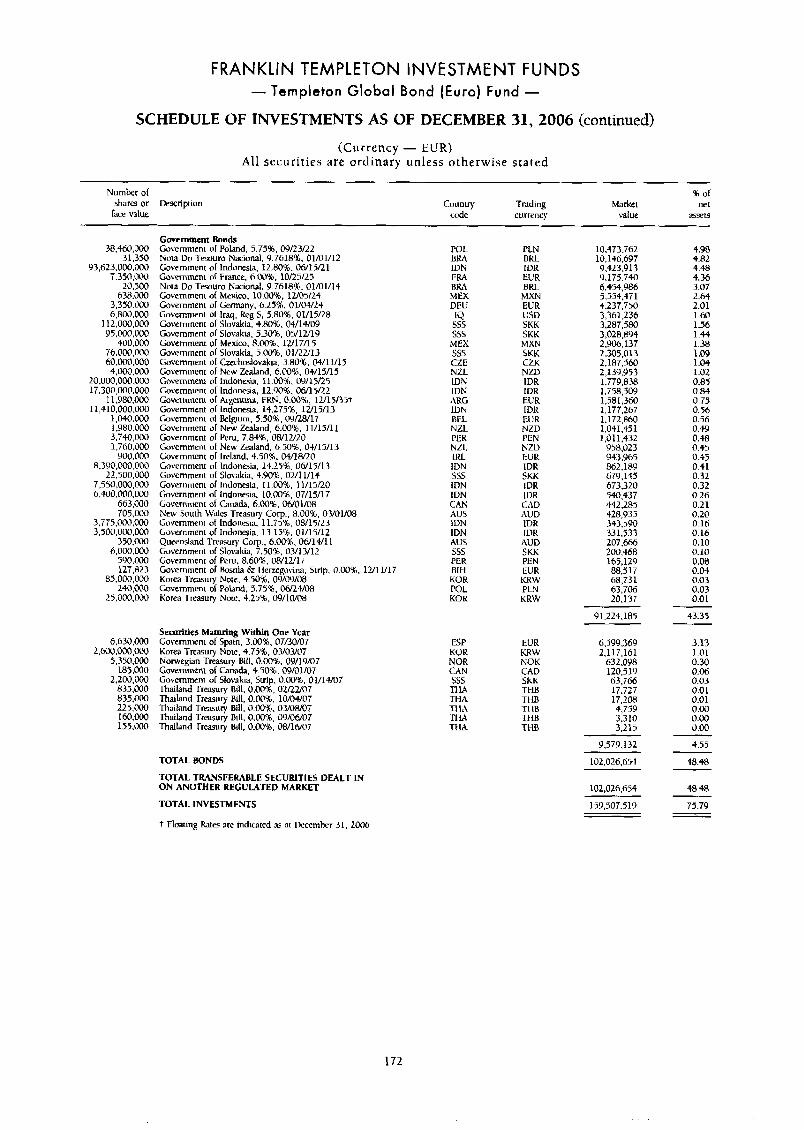
FRANKLIN TEMPLETON INVESTMENT FUNDS - Templeton Global Bond (Euro) Fund -
SCHEDULE OF INVESTMENTS AS OF DECEMBER 31, 2006 (continued)
(Currency - EUR) All securities a re ordinary unless otherwise sta ted
Numkr of shares or Description
face value
% of net
a5sets Country l'rading
code currency hiarket
value
Government Bonds Covernmeni of Poland. 5.75%. 09/23/22 Nota Do Tesourti Nacional. Q.7618%. 01/01/1L Government of Indonesia, 12.80%. 06/15/21 Covcrnmenl of France. h.0096, 10/25/25 Not3 Do Tesoum Nacional. 9.7618%* 01/01/14 Government of htexico. 10.008, 12/05/24 Covernmeni of Gemny. 6.25%. 01/04/24 Government a l Iraq. Reg 5, 5.80%. 01/15/28 Government or Slovakia. +BO%, 04/14/09 Government of Slovakia. 5.30%. 05/12/19 Government of Mexico, 8.00%. 12/17/15 Government of Slovakw. 5.00%. 0lQ2/13 Government of Cmhoslowkta. 3.801, 04/11/15 C~overnment of New Zealand, 6.@0%, 04/15/15 Government of Indonesia. 11.00%. 09/15/25 Go\wnnieni of Indonesia, 12.90%* 06/15/22 Govcmmeni of Argentiiu, FRN, O.OO%, 12/15/35+ Government of Indonesia, 14.27516. 12/15/13 Covernmeni of Belgium. 5.50%. 09/28/17 Government of New Zealand, 6.008, 11/15/11 Government of Peru. 7.84%. 0tVlU20 Government of New Zealand. 6.50%. 04/15/13 Government of Ireland, 4.50%, 04/18/20 Government ol Indonesia. 14.25%. 06/15/13 Government of Slovakia, 9.90%. 02/11/14 Government of Indonesia. 11.00%. 11/15/20 Government of Indonesia. 10.00%. 07/15/17 Lovernrnent of G M ~ . 6.03%. 06/01/08 New Srruth W~les Tre3sury Corp., 8.00%. 03/01/08 Governmen[ ol Indonesia. 11.75%. 08/15/23 Government of Indonesia. 13.15%. 01/15/12 Queensland Twasury Corp.. 6.00%.06/14/11 Government of Slovakia, 7.50%. 03/13/12 Government of Pcru. 8.60%. OWlU17 Government of Bosnia 6- I ierzegovina. Strip. 0.00%. Korea Irrasury Now. 4.50%. 09/0Y/O8 Covernmeni of Pobnd. 4.75%. 0W24/0H Korea Treasury NOW. 4.25%. 09/10/08
38,460.000 31,350
Y3,623,000.000 7.350.000
20,500 638.000
3.350.000 6,800.000
11L,000.000 Y5.000.000
400.000 76.000.000 h0.~,000 4,000,000
20,000,000,000 17.300,000.000
1 1,980,000 11,410.000.000
1,040,000 1 .Y80.000 3,740,000 1,760,000
900.000 8.300,0@0.@00
22.500,@00 7,550.000.CW 6 400,000,000
663,LWO 705,000
3.775,000.000 3.500,000.000
350,000 6,000.000
590.000 127,823
85,000,000 240.WJ
POL BRA IDN 1:ILZ BRA MEX DEU
IQ SSS sss
MEX sss
PLN BIU
10.473.762 10.1+6.697
4.98 +.At 4.48 4.36 3.07
IDR EUR nru
9,423.91 3 9.175.740 6.454.986
MXN EUR USD
4.554:471 4.237.750 3,361,236 3.287.5Ro 3,028,894 2,906,137 2,309,013 2,187.560 2,139.Y53 1,779.838 1.758.5W 1,581,360 1,177.267 1,172,860 1 .0+1,451 1.01 1,432
958.023
2.64 2.01 1.60
SKK SKK MXN SUK
1.56 1.44 1.38 1.09
CZE NZL IDN
CZK NZD IDR IDR EUR IDK
1.04 1.02 0.85
IDN ARC IDN BEL NZL PER NZI. IRL IDN SS5
0.84 0.75 0.5b 0.56 0.44 0.W 0.45 0.45 0.41 0.32 0.32
EUR NZV PEN NZD EtiR IDR SKK IVR
947iY65 R62.18Y 679.145
IDN IDN CAN AUS IDN IDN AUS sss PER
12/11/17 Rltl
673:320 440.437 442.285 428,933 343,SYO 331.533 207.666 200,468 165,129 88,517 68,731 63,706 20.137
Y1.224.185
IDR CAD AUV
0.26 0.21 0.20
IDK IDR
AUD SKK PEN EUR KRW PLN KRW
0.16 0.16 0.10 0.10 0.08 0.04
UOR POL KOK
0.03 0.03 0.01 25.000:WO
43.35
Securities Maturing Within One Year 6,630.000 Government of Spin. 3.00%. 07/30/07
2.600.000.OOO Korea Treasury Note, 4.75%. 0YOY07 5.340,000 Norwegian Treasury Bill. 0.00%. 0Y/19/@7
185,000 Guvernment ol Cmxla, 4.50%. 09/01/07 2,200.000 Covernmcnt of Slovakia. Strip. 0.00%. 01/14107
835.000 Thailand Tmsury Bill. 0.00%. 02i2M7 834,000 Thailand Treasury Rill, 0.00%. 10/04/07 225.000 'Ihailand Tmury Bill. 0.00%. 03/0RMi 160,000 Thailand T m u r y Rill, 0.00%, 0Y/06/07 155.000 Thailand Treasury Bill, 0.008, 08/lW07
ESP EUR 6,399,369 KOK KRW 2,117,161 NOR NOK 632.098 C.4N CZD 120.51Y sss SkK 63,766 TIM T1-lB 17.727 T U THB TI IA 1-1 IB TI w TtiB TtiA TtiR
3.13 1.01 0.30 0.06 0.03 0.01 0.01 0.00 0.00 0.00
17;208 4,759 3.310 3,215
9,579.132
102,026,654
4.55
48.48 TOTAL BONDS
TOTAL TRANSFERABLE SECURITlES DEALT IN ON ANOTHER REGULATED MARKET 102,026.654 45-48
75.79 TOTAL INVESTMENTS
t Floating Rates arc indicitcd as 31 Dcccmkr 31. Looh
159.507.519
172

FRANKLIN TEMPLETON INVESTMENT FUNDS - Templeton Global Equity Income Fund -
SCHEDULE OF INVESTMENTS AS OF DECEMBER 31,2006
(Currency - USD) All securities are ordinary unless otherwise stated
-.
Number o l shares or Description face value
or
code currency value aSxL5 Country Trading hiarket net
TRANSFERAB1.E SECURLTIES ADMITFEU 'CO AN OFFICIAL STOCK EXCHANGE LISTING SHARES Apparel & AccessmiPs
I.175.400 Yue Yuen Industrial Holdings Lid. HKG HKD 3.732.076
5,911,105 4.1+3.786
10,054,891
1.64
2.59 1.82
4.41
Automobile Manufacturers 89.202 Peugwt SA 71,998 Bayerische Moruren \ e k e AG
FRA DEU
E l l K EUR
Bank Royal b n k of Scotland Group PLC 166.087
267.563 I ISBC Holdinp P K
245.689 Nordea Bank AB 419,554 Hanw lntesa SPA
340,761 UniCredito Italianu SpA
89.737 bank of Amenca Curp
98,301 National Australia Bank l id
GBK GBK USA S W E 1.I-A AUS ITA
6,482,361 4.078,272 4.791.058 3.783.306 3,239,919 3,134.992 2.986.81 5
2-84 2-14 2.10 1.66 1.42 1.38
GBP GBP USD SEK EUR AUD ElJK 1.31
29,296,123
1.8~5.421
12.85
0.81 Computer Storage & Peripherals
Divelsified Commercial Sew-
2,058.767 Coinpal Elecrronics Inc.
82,800 Vedior NV
Diversified Financial Services 131.417 JPMorgan Chase & Co. 134,903 ING Groep NV
1.505.389 Old Mutual PLC 256,387 Lloyds TSSB Croup PLC
TWD TWN
0.75 N U ) EU R 1,717,105
USA N LD ZAF GBK
US13
GBP GBP
Eun 2.79 2.62 2.25 1.26
6.347.441 5,981,664 5,137.026 2.869.475
8-92 20,375,606
Drug Retail
Electric Utilitirs
324,409 Alliance Boots P1.C
13,155 E.ON AG 113,540 Narional Grid PLC 34,868 lkrdmla SA. Br.
GBR GBP 5323,863 2.34
1,793,657 1,639,839 1.524.4.31
UElJ GBR ESP
Eun GBP EUR
0.78 0.72 0.67
4.957.927 2.17
Electronic Equipment & Instruments 497,000 \'mure COT., Lrd.
Food Distributors 491,534 Cadhury Schweppes P U
Industrial hlachincry 50,457 Siemens AG
155.781 Smiths Group PLC 213.2iK) tlukhiwn Whampoa Lrd
SGP SCU 4375,428
5.260.385
1-92
2.31 CBK
2.21 1.33 0.95
DEU GBR tlKG
Fun GBP IiKD
5,035,395 3,024,806 2,166,491
10.226.692 4.49
Integrated Oil & Gas 347.846 BP PLC 45.043 Chevron Corp. Y7.455 Eni SpA 63.267 Royal Dutch Shell PLC. A
3,1165.834 3.312.012
GBK USA 1.1-A CBK
GBP cisv EUR liUK
1.69 1.45 1.44 0.98
5.56
3.277.8M 2.231.i37
12.681.269
Integrated Telemmmunimtion Services 1YO.L)Ph France Telaom 5A 154.641 BCE Inc. 257.440 Chunghwa Telecorn G>.. Ud.
2.31 1.83 0.21
5.281.727 4,167,112
478.Y60
1:RA CAN TWN
EUR CAD TWD
9.927,799
4.391.124
4.35
1.93 Multi-Line lnsu-
Office Electronits
Offrce SerVim dr Supplirs
25.393 Muenchcner Rueck~~eersicherungsCesfllrhalt AC
IP3.320 Agh Gwaen NV
98.Y98 Pitney Bows Inc.
DEU
BEL
USA
EUK
EUR
USD
2.05 4,664,956
4.572.718 2.01
173
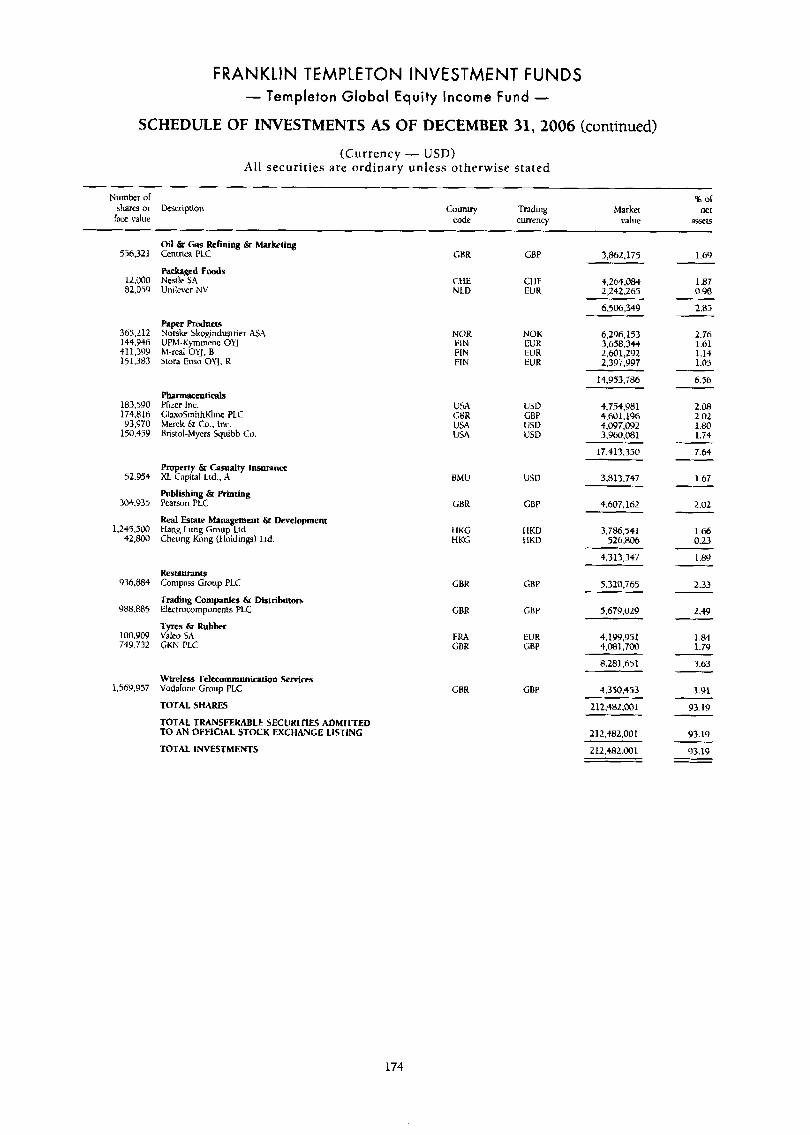
FRANKLIN TEMPLETON INVESTMENT FUNDS - Templeton Global Equity Income Fund -
SCHEDULE OF INVESTMENTS AS OF DECEMBER 31,2006 (continued)
(Currency - USD) All securit ies are ordinary unless otherwise stated
Number of % or shares or Description Country Trading Market net bce value code currency value a$Y?L5
Oil 6r Gas Refining & Marketing Centrica PLC
Pachgcd Fuods Nestle SA Unilever NV
CBR GBP 3,862.175 556,321
12.000 82,059
365.212 144.946 411.399 15 1.383
183.590 174.816 Y3.970
150.459
52.954
304.935
1.2+5,500 42,800
936.RB.t
908885
lOO.Y@9 749,732
1,569,957
1.6Y
1.87 0.98
2.85
2.76 1.61 1.14 1.05
6-36
2.08 2.02 1.80 1.74
7.64
1.67
2.02
1.66 0.23
1.89
2.33
2.w
1,84 1-79
3.63
CHE C1 IF 4.264.084 NLD EUR 2.242.265
6,506,349
paper Products Nor$ke Skogindusiner ASA UPM-Kymmene OYJ M-real OYJ, B Stora Enso OYJ. K
NOR NOK 6,296.1 53 FIN EUR 3.658,34$ FIN EUR 2.601,25)2 FIN EUR 2.397.997
14,953.786
PharmaCeUtiCak Pfizer Inc. GlaxoSmirhKline PLC Merck & to.. lnr. Bristol-Myers Squibb Co.
4,754,981 4,601,196 4.097.0!J2 3.960.081
USA GliR USA USA
USD LBP USD USD
17.413.350
Property L CPnralty Insurance XL Capiml Lrd., A
Publishing & Printing Pearson PLC
Real Estate Management & Development Hang Lung Gmup Ltd. Cheung K w g ( t loldmg) Ltd.
3,813.747 RMU USD
GBK CBP 4.607.162
3.786.541 526.806
4.313.347
5.320.765
I IKG HKG
I 1KD I IKD
Resmurants Compass Group PLC
Trading Companies & Distributors Electrocomponents PLC
Tyres & Rubber Valeo SA CKN PLC
GRK
GBK
GBP
5.679.025)
4,199,951 4.081.700
CBP
EUR CBP
FRA GRR
8.281351
Wireless Telecommunication Services Vodafone Group PLC
TOTAL SHARES
TOTAL TRANSFERABLE SECURITIES ADMITTED TO AN OFFICIAL STOCK EXCHANGE LLSTINC
TOTAL INVESTMENTS
4.350.453
212,482,001
1.91
93.19
GRR GBP
212.482.001
212.482.001
93.19
93.19
174
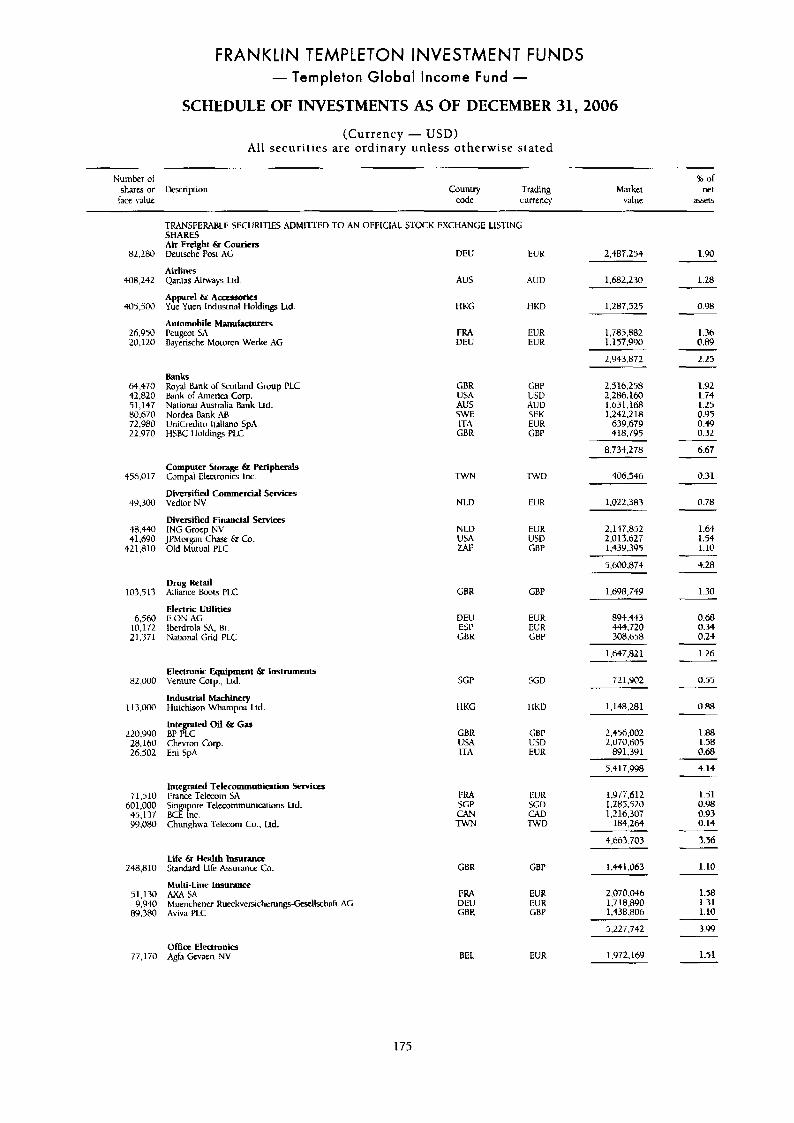
FRANKLIN TEMPLETON INVESTMENT FUNDS - Templeton Global Income Fund -
SCHEDULE OF INVESTMENTS AS OF DECEMBER 31,2006
(Currency - USD) All securities are ordinary unless otherwise stated
Nurnbcr of B of shares or Demption Country Trading Market net face d u e code currency value asset5
TRANSFERABLE SECURITIES ADMI~l~lTD TO AN OFFlClAL SIOCK EXCHANGE LISl-lNG SHARES Air Freight & Couriers Deutschc Post AC DEU EU R 2.487.254 1.90 82.280
408,242
405.500
26,950 LO. 120
64,470 42,820 51,147 80.670 72.980 22,970
456,017
49.300
48,440 41.690
421.810
103.513
6.560 10,172 21.371
82,000
1 I3.000
220,L)L)O 28.160 26,502
71,510 601,000 45.137 99.080
248,810
51,130 9,g40
8 v . 3 ~
Airlines Qanias Airways Ltd
Apparel & Amesmrks Yue Yuen Indusirial tioldinp h d
Automobile Manuhcturers Feugeot SA Bayerixhe Moiuren Wcrkc AG
AUS AUD
HUG HKD
FR4 EUR DEU EUR
1,682,230
1.287.525
1.28
0.Y8
1,785,882 1,157,990
I .36 @BY
2.943,872 2.25
Banks Rural h n k ul Scotland Gwup PLC &nk of hierim Corp. Narional Australia kink Ud. Nordca Bank AB UniCreditci lialiano SpA HSBC I hlding FLC
GEK GBP 1JSA 1ISD AUS auu SWE SEK ITA EUR CBR GEP
2,516.258 2,286.160 1.631.168 1.242.218
639,679 418.795
8,734,278
406,546
1.Y2 1.i4 1.25 0.Y5 0.49 0.32
6.67
Computer Storage 6r Peripherals Cornpal Elecironics lnc.
Diversified Commercial Setvim5 Vedior NV
Diversified Financial !jeervices ING Groep NV JPMorpirn C h w k CO. Old Mutual PLC
TWN TWD
NLD EUR
N LU EUR V SA USD UL: GBP
0.31
1,022,383 0.78
1.64 2,147,852 2 ,0 13.627 1,43Y .3Y5
1.54 1.10
5.600.814 $.28
1,698,744 1.30 Drug Retail Alliance BOOIS P1.C
Electric Utilities E.ON AG lbcrdrola SA. Br. National Grid PLC
GBR GBP
DEU EUR ESP EUR G B K GBP
894.443 444.T20 308.658
0.68 0.34 0.2)
1,647,821 1.26
Electronic Equipment & lnsmrments Venturr Corp., Lid.
Industrial Machinery Hutchison Whampm Ltd.
Integrated Oil 6r Cas BF FLC Chevron Corp. Eni SpA
721,902 0.55 SGP SGD
I IKU 0.88 t IKC 1.148.281
2.456.002 2.070.605
891.391
1-88 1.58 0.68
CBK USA ITA
GEP USD EUR
5 .+ 17.998 4.14
letegratcd Telecommunicition %cer I:rance Telecorn SA Singapore Telemrnrnunications Ltd. ECE Inc. Chunghwa 'kkcom Co.. Ltd.
1,977.612 1.2Ri.520 1,216,307
184.264
1-31 0.98 0.93 0.14
FKA 5CF CAN TWN
13.IK SGU CAD TWD
~~~
4,663.703 3.56
1.441.063 1.10 Life & Health lnsu- Standard Life h u m n = Co.
Multi-Line insurance M A SA Muenchener RucrkversichetungsCesellschali AC Aviva FLC
CBK GEP
1-58 1.31 1.10
2.070.046 1.718.8Y0 1.438806
FRA DE11 GBR
EU R EUR GBF
5,227.142
1.Y72.169
3.99
1.51 Offim Electtonlcf
77.170 Agh Gevaen NV BEL EUR
175
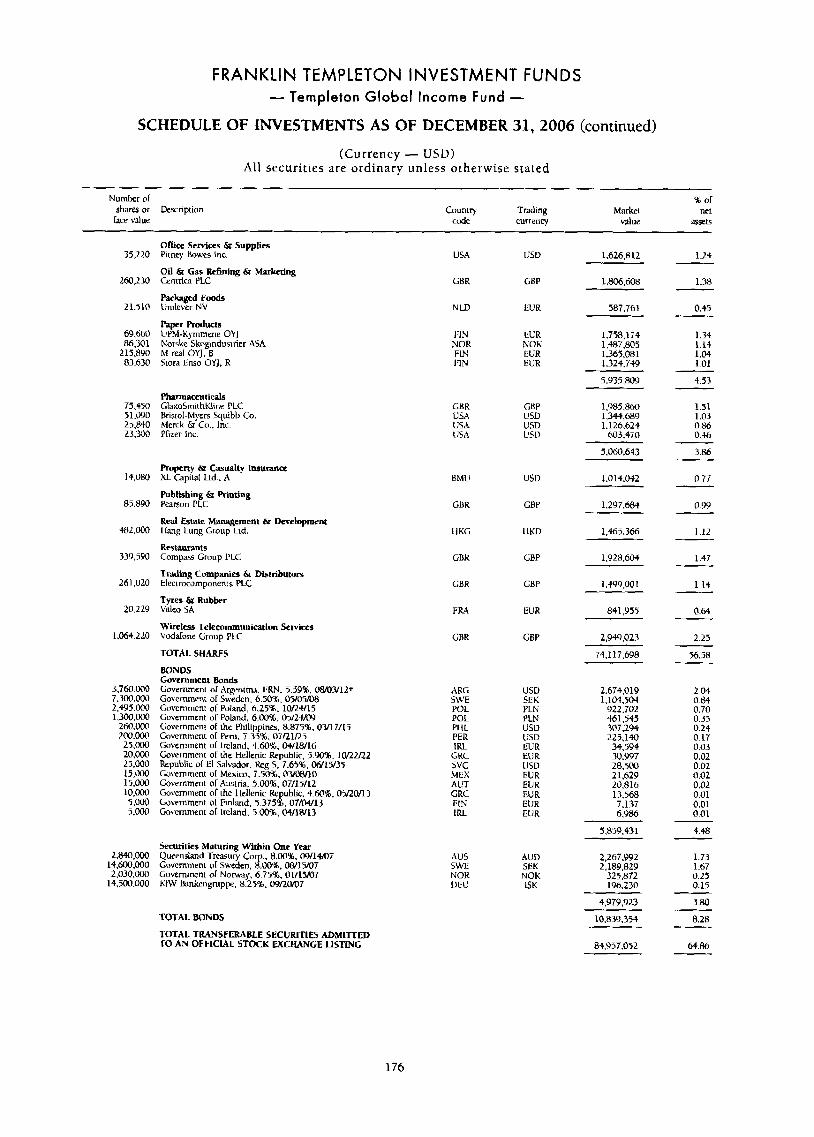
FRANKLIN TEMPLETON INVESTMENT FUNDS - Ternpleton Global Income Fund -
SCHEDULE OF INVESTMENTS AS OF DECEMBER 31,2006 (continued)
(Currency - USD) All securities are ordinary unless otherwise stated
Number of % of shares or Description Counq Trading Market net race vslue Code currency value %5et5
35,220
260,230
21,510
69.660 86.301
215.890 83,630
75,450 5 1 .@90 25.840 2 3 3 0
14,080
85.890
482,000
339,590
261,020
10.229
1.064.220
3,760.m 7,300.000 2.4995.000 1,300.oocl
260,00(! 200.m 25.000 20.000 25.000 15.W 15,000 10,@@0 5.000 5,000
L.84o.ooo 14,600,000 2.030.000
Ofice Services & Supplirs Pitney Bowes Inc.
Oil & Gas Refining & Marketing Centrim PLC
Packaged F d s ljnilever NV
Papcr RC~UCIS UPM-Kymncne OYJ Norske Skoginduaner S A M-real OYJ. B Stora Enso OYJ, R
USA USL) 1.626.8 12
GBR GnP 1.806.608
N LD EUR 587.761
I W EUR 1,758,174 NOR NOK 1,487805 FIN EUR 1,365,081 FIN EUU 1.324.749
5.935.8OY
Pharmaceuticals CbxoSmithKline PLC Bristol-Myers Squibb CU. Merck Sr Co.. Inc. PLzer Inc.
CBR USA USA lJSA
GHP USU USD USV
1 .Q85,860 1,344,689 1.126.b24
603.470
Property & CasuaIty insurance XL Capital Ltd., A
Publishing & Printing Pearson PLC
Real Estate Management & Development 1 lang Lung Group Lid.
Restaurants Compas Group PLC
Trading Companies & Distributors Elecmcomponcnts PLC
fyres & Rubber Valeo SA
Wireless Telecommunication Service$ Vcdalone Group PLC
TOTAL SHARES
BONDS Gavcrnment Bonds Government 01 Argemind. FRN. 5.39%. 08MY12f Government of Sweden. 6.508. 05/Os/uB Governmeni of Poland, h.259h. 1WV15 Government 01 Poland, 6.00%. @5/2S/W Government OF the Philippines, 8.875%. 0YlUl j Cavemment of Peru. 7.35%. 07RlR5 Government of Ireland. 4.h05, &/18/16 Govemmcni of the Hellenic Republic, 5W%. IoRU22 Republic of El Salvador. Reg 5. 7.6%. WlY'Iu33 Cuvernment ol Mexiw, 7.50%. 0YWiO Government of Awlria, 5.00%. 07/15/12 Government of the Ilellenic Republic. 4.60%, 0-jno113 Government or Finland, 5.3752. 07/@4/11 Gownment or Ireland, 5.00%. 04/18/13
Securities Maturing Within One Yepr Queensland Trcsury Corp., 8.00'16. 09/1Mi Government or Sweden, H.OO%. OW15107 Government of Noway. 6.?5%, 01/15/07 K I W Bankengruppe. 8.25%. @Y/20/@7
TOTAL BONDS
TOTAL TRkWSFERABLE SECURITIES ADMITTED TO AN Of FlClAL STOCK EXCHANGE LLSTLYG
BMU
Gnu
I IKG
GBK
GBR
FRA
GBR
ARG SW'E POL POL PI IL PER IRL
GRC SVC MEX ACT GRC FIY IRL
AUS S W E NOR DELI
USD
GBP
1 IKD
LBP
GBP
EUR
GBP
LISP SEK PLN PLN USD USD EUR EUR IJSD EUR EUR EU R EUR EIJR
AUD SEK NOK ISK
5,oAo,643
1.014.042
1,297,684
1,463,366
1,928.604
1.4Y9.001
841.955
2,949.013
74,117,648
2.674.019 1,1@4,504
922.702 461.545 307,294 225,140 33,594 30.997 28.500 21.629 20.816 13.568 7.137 6.986
5359,431
2,267.992
32 R ,872 196,230
4.979.923
2,189,829
. .
10.839.354
84,997,052
1.24
1.38
0.45
1.34 1.14 I .M 1-01
4.53
1.51 1.03 0.86 0.46
3.86
0.77
0.99
1.12
1.47
114
0.64
2.25
56.58
2 0 4 0.84 0.70 0.35 0 24 0.17 0.03 0.02 0.02 0.02 0.02 0.01 O.@l 0.01
4.48
1 73 1.67 0.25 0.15
3-80 ~~
8.28
64-86
176
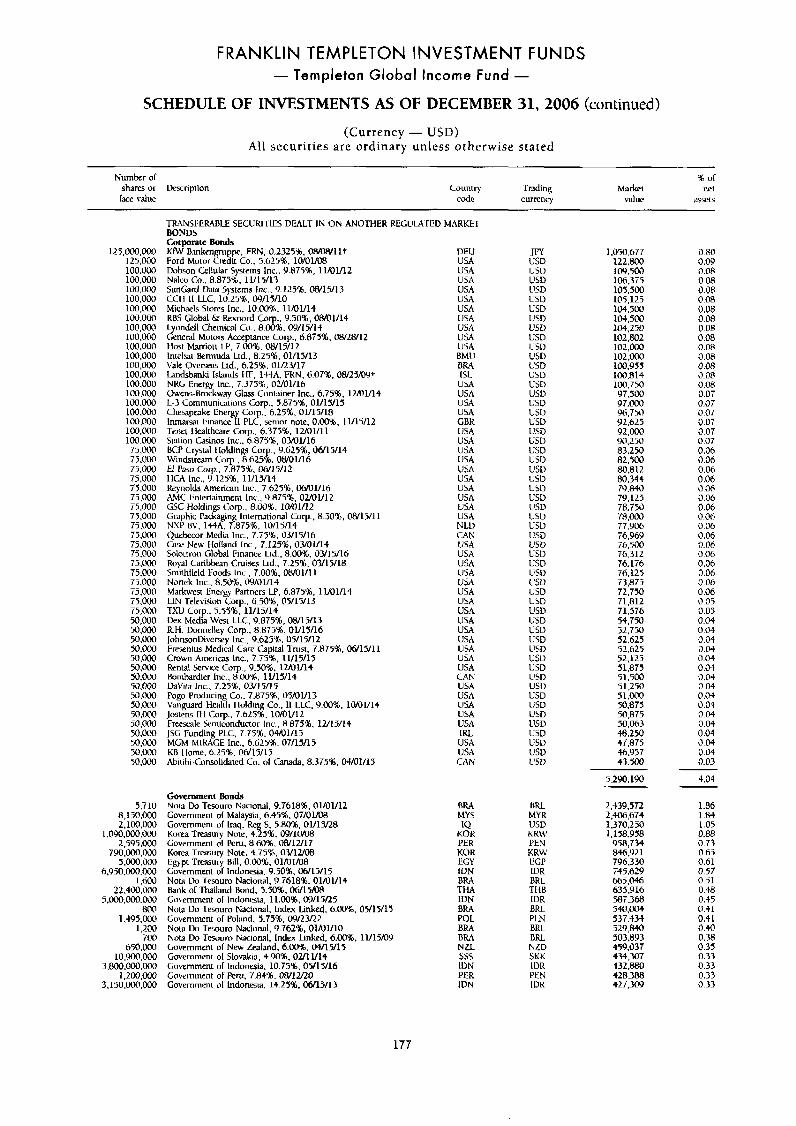
FRANKLIN TEMPLETON INVESTMENT FUNDS - Templeton Global Income Fund -
SCHEDULE OF INVESTMENTS AS OF DECEMBER 31,2006 (continued)
(Currency - USD) All securities are ordinary unless otherwise stated
Number or shares or Description face value
Country 'Trading code currency
hiarkel value
125,000,OOO 125,000 100.000 100.000 l!JO,OOO 100.000 100,MM 100,0M! 100,00(1 100.Ooo 100,000 100.000 100,000 l@@.O(IO 100.000 100,000 100.000 100.ooi) 100.000 100.000 100.ooO 75.00(1 75;oOcl 75,000 75.000 75:OOO 75.000 75.000 75.000 75.W 7 5 . m 75.000 75,OW 75,OW 75,000 75.000 75.000 75,VIx) 75,000 50,000 50.000 50,000 50,000 50.000 5 0 . M 50.000 50.o0O 50.000 50.000 50,WO 50,OOO 50.000 50,000 50,000 50.000
5,710 8.15O.ooO 2;100.000
1.090.ooo.000 2.595.000
7Y0;000.m 5.m.000
6.950.OOO.000 I .cioll
22,400.000 5.000.000.000
800 1.495.m
1,200 700
650.oM3 10.901~,000
3.800.000,000 1.200.000
3.150,ooO.000
TRANSFERABLE SECl!RI~l'IES DEALT IN ON ANOTHER RECUMTED MARKET BONDS torpora1c Bonds KIW Ehnkcngnippe. FRN. 0.2325%. OWOW1 I t Ford Motor Credit Co.. 5.625%. 1@/@1/08 Dobson Cellular System lnc.. Y.875%, 11/0U12 Nalco Co., 8.875%. 11/15/13 SunCard Data Svstems Inc.. 9.125%. oH/15/13 CCll 11 LLC, lii25%, 09/17/10 Michaels Swres lnc., 10.00%. 11/01/14 RBS Global & Rexnord Carp., 9.50%, OM1114 Lymdell Cheiniul G).. 8.00%. @Y/15/lt General Motors Acceptance Corp.. 6.875%. 08/28/12 Host Marrioii LP, 7.00%. OW15/12 Inrelw krmuda Ltd., 8.25%. 01/15/13 Vale Overseas Lid., 6.23%. 01/23/17 Lmdsbanki Islands HF, lt4A. FRN, 6.07%. 08/15/09t NRG Energy Inc., 7.375%, 02/01/16 Owns-Brockway Glass Container Inc.. 6.75%. 1MU14 L-3 Communications Corp., 5.875%. 0U15/15 Chesapeske Energy Corp.. 6.25%. 01/15/18 Inmami hancc I1 PLC. senior note, 0.001. 11/15/12 Tens llwlthcare Corp,, 6.375%, luOl/l I Sintion Casinos lnc.. 6.875%. 03/01/16 BCP Crystal Iloldings Corp., 9.625%, 06/15/14 Windsiream Cmp, 8.6251. OW01116 El P&o Corp.. 7.875%. 06/15/12 H a Inc.. 9.125%. 11/15/14 kynolds Amerimn Inc.. 7.625%. 06/01/16 AMC Entertainment Inc.. 9.875%. 0uOl/12 CSC Holdins Corp., 8.00%. 1W01112 Graphic Packaging Intermtional Corp.. 8.50%, OWlYll NXP IN, 144A, 7.875%. 10/15/14 Quchecor Media Inc.. 7.75%. 03/15/16 Caw New Holland lnc., 7.125%. OM11/1+ Solectron Global Finance Lid.. 8.00%. 03/15/16 Royal Caribbean Cruists hd., 7.25%. 03/15/18 Smithfild Foods Inc.. 7.00%. OtVOl/l1 Nortek Inc.. 8.50%. 1)9/01/14 Markwest Energy ParIners LI'. 6.875%. 13/01/14 LIN Televisiun Corp., 6.501, 05/15/13 TXU Corp., 5.5476, 11/15/14 Dex Media West LLC. 9.875%. OW15113 RH. Donnelley Corp., 8.87?4;, 01/15/16 Johnsonl1iverwy lnc., 9.625% 05/15/12 fksenius Medical Care Capiul Trust, 7.875%. 06/15/11 Crown Ameriws Inc., 7.75%. 11/15/15 Rental Sen-ce COT., 9.50%. lUo1/14 Romhardier Inc.. 8.00%. 11/15/14 DaVita Inc.. 7.25%. 03/15/14 Poeo Pnducine CO.. 7.875%. 05/01/13 Va~guard tieaih I Iulding-Co:, II LLC. 9.00%. 1Q101114 Jostens It1 Corp.. 7.625%. 10/01/11 Freeswle kmiconductor lnc.. 8.875'16, 1U1Y14 JSG Funding PLC, 7.751. 04/01/15 MLM MIRAGE Inc., 6.625%. 07/15/15 KB Ilome. 6.25%. 06/15/15 Abitibi-Conwlidated Co. of C3Mda. 8.375%. 04Kllll5
Goverllment Bonds No13 Do Tesoum Naciod. 9.7618%. 01/01/12 Government ol Malaysm, 6.458, 07/0MW Govemmeni d Iraq. Reg 5. 5.80%. 01/15/28
Government ol Peru, 8.60%. 08/12/17 Kom Twasury Note. 4.751,03/1U08 Egypt Trearurv Bill. O.W%, 01/01/08 Government 6' Indonesia. 9.50%. 06/15/15 Nota Do Tcsouro Nacional. 9.761876. 01/D1/14 Bank of Thailand Bond, 7.50%. 06/15/08 Government or Indonsia, 11.00%. 09/15/25 Nuva Do Tesouro Ez;lc~od, Index Linked. 6.00%. 05/15/15 Government of Polmd, 5.75%. 09/23/22 Nora UO Tesouro Nacional. 9.7621. OlnJlll0 Nota Do T w u m I r iac i~~l , Index Linked. 6.00%. 11/15/09 Governmeni of New Zealand. 6.0076, 04/15/15 Lowmment or Slovakia, 4.908, OU1 U14 tiovernment or Indonsia, 10.75%. 05/13/16 Government of Peru. 7.84%. 08/12/20 Covemrncni of Indonesia. 14.25%. W l Y l 3
K ~ W A -rre=ur). NOW. 4.25%;. 09/1om
DEU USA USA USA USA USA USA USA USA USA U M BMU BRA ISL USA USA USA USA GBR USA USA USA USA USA USA USA USA USA USA NLD CAN USA USA USA USA USA USA USA USA USA USA USA USA USA USA CAN USA USA USA USA USA IRL USA USA CAN
BRA MYS IV
KOK PER K O R EGY IDN BRA Tt LA IDN
POL BRA BRA NZL
IDN PER IDN
nRr\
sss
.im USD liSD USD USD USD KSD USD USD USD L'SD US0 USD USD USD USD um USD USD USD USD USD USI) USU
1JSD ESD USD U5D U5D USD USD USD USD lis11 USU USD LSD USD USD l!SD LSD USD USD CSD USD USD USD ljSD USD USD LSD ESD US11 L'SV
usD
BRL MY R USD KKW PEN KRW ECP IDR HRL
IDR BRL PLN BRL BRL NZD SKK IDR PEN IDR
'r1 IB
1,050.h77 122.800 1OY.500 106,375 105,500 105.123 104:500 104,500 104.250 102,802 102,000 102.000 100.955 1W:814 100.750 97.500 97.000 96.750 91.625 92,ooo 90,250 83.250 82.500 80.812 no344 79.840 79.125 78.750 78.000 77,9@6 76,964, 76.500 76.312 76.1i6 T6.125 73.875 72.750 71.812 71,576 54,750 52.750 52,625 52.625 52.125 51,875 51.500 51,250 51.000 ~ ~.~ 50.875 50,875 50,063 48.250 47.875 46.957 43.500
5.290.190
2,439,572 2.W5.614 1;370;250 I , 1 S.958
958,734 846,921 796,330 i45.629 665,046 635,916 587.368 5xI.w-l 537.?3-? 529,840 503.893 459.037 434.307 432.880 428.3M 427,3@9
0.80 0.0y 0.08 0.08 0.08 0.08 0.08 0.08 0.08 0.08 0.08 0.08 0.08 0.08 0.08 0.01 0.07 0.07 0.07 0.07 0.07 0.06 0.06 0.06 0.06 0.06 0.06 0.06 0.06 0.06 0.06 0.06 0.06 0.06 0.06 0.M 0.06 0.05 0.05 0.04 0.04 0.04 0.04 0.04 0.04 0.0) 0.04 0.04 0.04 0.04 0.04 0.04 0.04 0.04 0.03
4.04
1.86 1.84 1.05 0.88 0.73 0.63 0.61 0.57 0.51 0.48 0.35 0.41 0.41 0.40 0.38 0.35 0.33 0.33 0.33 0.33
177
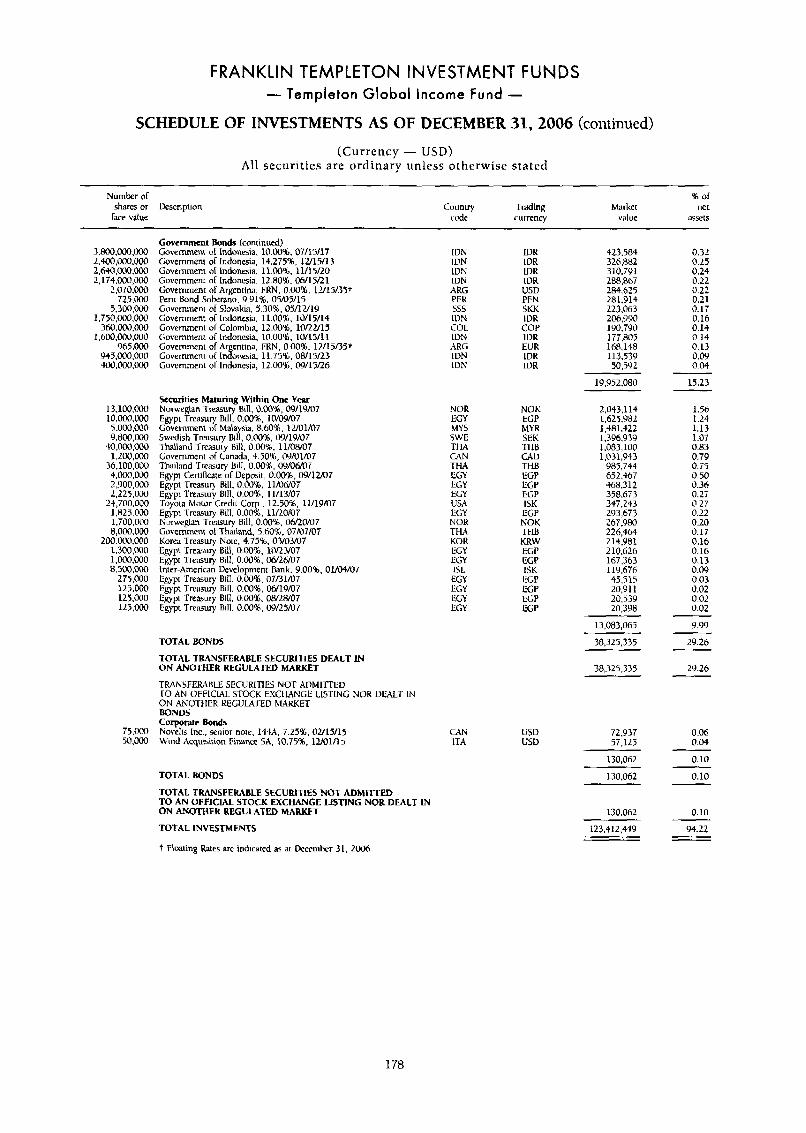
FRANKLIN TEMPLETON INVESTMENT FUNDS - Templeton Global Income Fund -
SCHEDULE OF INVESTMENTS AS OF DECEMBER 31,2006 (continued)
(Currency - USD) All securities are ordinary unless otherwise stated
Numbfr o l shares or Description
lace value
96 of Country Trading Market net
c d e currency value a$sets
3.800,CGQ,oM) 2,400,000.0Co 2,640,OOO.ooO 2.174.000,OOO
?.070.ooO 725.CiJ!l
5.300.000 1.750,ooo.000
3600.000,000 1 .600 ,~ .000
965.000 y44,ooO.000 4iw.000,000
13,100.000 10.000.000 5.00O.WO 9.800.000
4o .oon .~ 1,200,000
36.1M.000 4,000,000 2,900,Oi)o 2.225.000
24,700.000 1.824.OCIO 1.700.000 8,000,000
200.000,0@0 1.100,ooo 1,o00,000 8,500.000
275,000 125.000 125.000 123,000
7 5 . W 50,000
Government Bonds (continued) Governmcni ol Indonesia, 10.00%. 07/15/17 Governmen! of Indonesia. 14.275%. 12/15/13 Government o l Indonesia. 11.0096, 11/15/20 Government (>I Indoncsia. 12.80%. 06/15/21 Govemmenr of Argenm.1, FRN. 0.0016. 11115/35+ Peru Bond Sokmno. 9.91%. 05/05/14 Governineni of Slovakia, 5.30%. 05/12/19 Government o l Indonesla. 11.00%, 10/15/14 Government or Colombia, 12.005, l0/2Ul5 Government of Indonesia. 10.00%. 10/15/1 I Government of Ar entina. TRN. OOOOX., 1U15/35+ Government of done&, il.754b. 0Wl5/23 Government or Indonesia, 12.0095, 09/15/26
Securities Maturing Within One Year Nurwegian Treasury Bill, 0.00%. 09/19/07 Egypt Treasury Bill. 0.00%. 10/09/07 Government ul Mala sia. R 60%. 12/01/07 Swedish Treisury Bi i , 0.00%. 1)9/19/07 Thailand Treasury Bill, 0.00%. 11/08/07 Government of Canada, 4.50%. 1)9/01/07 Thailand Treasury Bill, 0.DOI. OY/O,/o6x17 Egypt Certificate o l Deposit, 0.00&, 09/1M7 Egypt Treasul) Hill. 0.00%. 11/06/07 Egypt Tre;lsury Bill. O.W%, 11/13/07 Toyuia Motor Credil Co 12.50%. 11/19/07 Egypt Treasury Rill, 0.00%: lll20/07 Norwegian Treasury Bill, 0.00%. 0W2ON7 Government o l Thailand, 5.60%. 07/07/07 Korea Treasury Note. 4.75%. 03/03/07 Egypt Treasuly Bill, 0.00%. 10L23/07 Egypt Treasury Bill. O.OO%* 0W2WO7 Inter-American Development Bank. 9.0016. 01K14/07 Egypt Treasury Bill. 0.M)'X. 07/31/07 Egypt Treasury Bill. O.@O'X;. 06/19m7 Egypt Trriury Bill, 0.00%. OBRW07 Egypt Tresuly Bill. 0.00%. 09/25/07
TOTAL BONDS
TOTAL TRANSFERABLE SECURITIES DEALT IN ON ANOTHER REGULATED MARKET
TRANSFEKABLE SECURITIES NOT ADMITTED TO AN OFFlClAL STOCK EXCI IANGE I.ISTING NOR DEALT IN ON ANOTHER kXGULATED hWKET BONDS Corporate Bonds Novelis Inc., senior note. l44A. 7.25%. 02/15/15 Wind Acquisition Finani~ SA, 10.75%. luO1/15
TOTAL BONDS
TOTAL TRANSFERABLE SECURITIES NOT ADMITTED TO AN OFFICIAL STOCK EXCHANGE LISTING NOR DEALT IN ON kUOTHER REGULATED MARKET
TOTAL INVESTMENTS
7 Floating Rates arc indicarcd as ar tkccmhcr 3 I , 2ooh
IDN IDN IUN IUN ARG PEK 55s IDN COL IDN ARC IVN IVN
NOR EGY MY5 SWE TI w CAN THA LGY EGY ECY USA EGY NOR THA KOR EGY EGY ISL EGY EGY EGY EGY
IDR IDR IDR IDR USD PEN SKK IVR COP 1UR EUR IDR IUR
NOK EGP h1YR SEK l 1 I B CAD THB EGP EtP EGP 1% EGP NOK Tt1B KRW EGP ELP 1SK EGP EGP EGP EGP
423.584 326.882 310.7Y1 288,867 284,625 281,914 223.063 206,990 190.790 177,805 168.148 113.539 50.592
19,952,080
2,043,114 1,625,982 1 ,481.422 1,396,939 1,083,100 1,031,943
985.744 652.467 468,312 358.673 347.243 293,673 267,980 226,564 214,981 210.626 167.363 119.676 45.515 20.91 1 20.53Y 20.398
13,083,063
38,325.335
38.325.335
GZN ITA
USD USD
72,937 47.125
130,062
130,062
130,062
123,412,449
0.32 0.25 0.24 0.22 0.22 0.21 0.17 0.16 0.14 0.14 0.13 0.W 0.04
15.23
1.56 1.24 1.13 1.07 0.83 0.79 0.75 0.50 0.36 0.2T 0.27 0.22 0.20 0.17 0.16 0.16 0.13 0.09 0.03 0.02 0.02 0.02
9.99
29.26
29.26
0.06 0.04
0.10
0.10
0.10
w.22
178
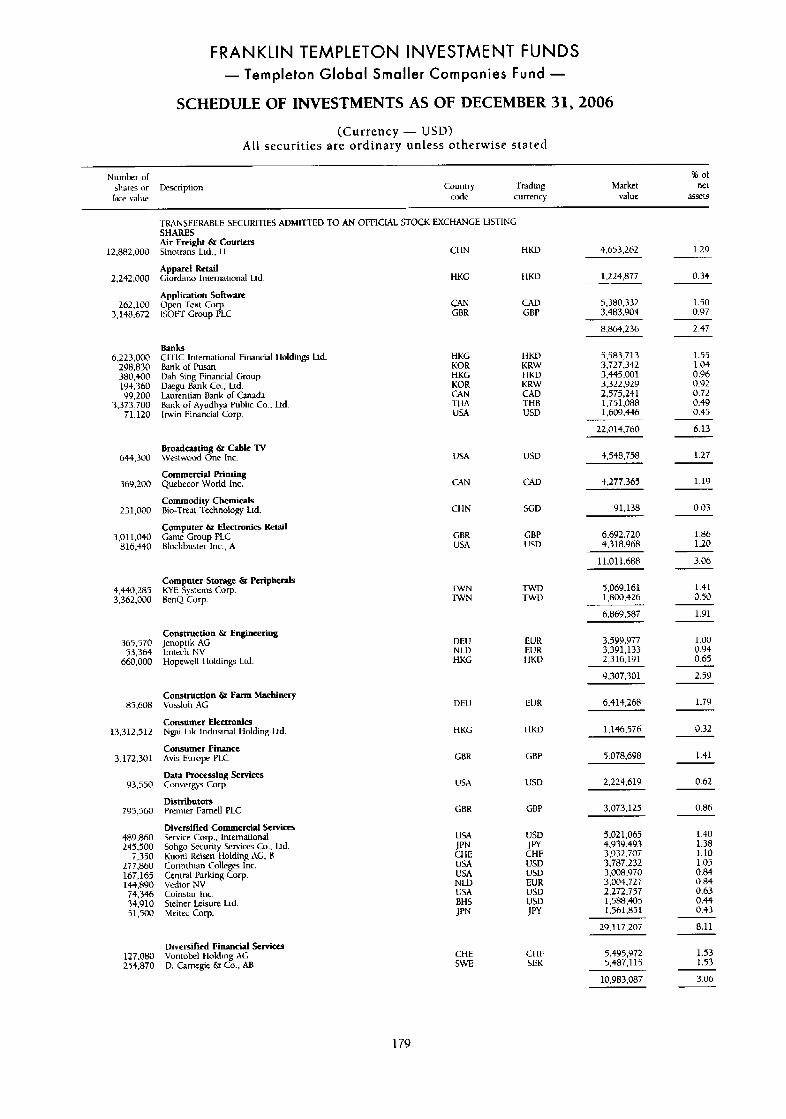
FRANKLIN TEMPLETON INVESTMENT FUNDS - Templeton Global Smaller Companies Fund -
SCHEDULE OF INVESTMENTS AS OF DECEMBER 31,2006
(Currency - USDI All securities are ordinary unless otherwise stated
Number o l 8 of
I x e value Code currency value sssets shares or Dernption Country h d i n g Market ne1
T I U N S F E ~ L E SECURITIES ADMI’ITEU TO AN OFFICML STOCK EXCHANGE I SHARES Air Freight 6r Couriers Sinotnns Lid.. I1 CI IN
.ISTING
12.8R2.000
2.242.000
262,100 3,148.672
6,223.000 298,830 380,400 194,360 99.200
3,373,700 71,120
644,300
369.200
23 1,000
3.01 1,040 816,440
4.440.285 3,362,000
365.570 53.364
660,000
85,608
13.712.512
3.172.301
93,550
795,460
489.860 145.500
7,350 277.860 167,169 144,890 74.746 34.910 51.500
HKD 4.653.262 1.29
0.34 Apparcl Remil Ciordano lntemational Ltd.
Application Software Open lext Corp. iSWI’ Group PLC
HKG t IUD 1,224,877
5,380.332 7.403.904
1.50 0.97
CAN CBR
CAD GBP
8.864.236 2.47
1.55 1 .04 0.96 0.92 0.72 0.49 0.45
Banks CITIC lntemtional Financial I Idding Ltd. Bank of Puun Dah Sing Financial Group Daegu Bank Co., Ltd. Laurentian Bank UT Canadd Bank of Ayudhya Public Co.. Ltd. Irwin Financial Corp
HKG KOR HKG KOR CAN T I I A USA
USA
crw
Ct IN
GBR USA
IIKV KRW t IUD KKW CAD
5,583,713 3.727,342 3,445.001 3,322,929 2,575,241 1.751.088 1.609.446
THB USD
6.13 22.014.760
4.548.758 1.27 Broadating & Cabk TV Westwood One lnc.
Commercial Printing Quebccor World lnc.
Commodity Chemicals Rio-Twal Technology Ltd.
Computer &I Electronia Retail Game Group PLC Blockbuster Inc., A
USV
1-11) CAD 4,271,365
91.138 0.03 SGD
6.692.720 4.318.968
1.86 1.20
GBP lJSD
11.01 1.688 3.06
5,069,161 1,600,426
1.41 0.50
Computer Storage & Peripherals KYE Sysrcms (lorp. BenQ Corp.
-1wN TWN
TWD TWV
1.91
1.00 0.94 0.65
Construction & Enghcering Jenoptik AG lintech NV t iope \d 1 loldings Ltd.
3.999.977 3,391,133 2.316.191
DEU N U HKG
EUK EUR I IKV
9,307,301 2.59
Construction & Farm Machinery Vosslvh AC
Consumer Electmni- Ngzi Lik Indusirial Holding Ltd.
Consumer Finance Avis Europe PLC
Data Processing Services Converms Corp.
Distributors Premier Farnell PLC
Diversified Commercial Semi- Service Corp.. Iniernational Sohgo Security Seniccs Co.. Ltd. Kuoni Keisen tiolding AG. H Corinihian Colleges lnc. Ceniral Parking COT. Vedior NV Coinstar Inc. Steiner Leisure Ltd. Meitec Corp.
DEU EI!K 1-79 6,414,268
1,146.576
5.078.698
0.32 1 IKU HKG
1.41 GBK GBP
2.224.619 0.62 USA USD
0.8R GBP GRR 3.073.125
5.021.065 4.939.493 3.972.707 3.787.232 7,008,970 3.004.727
1.40 1.38 1.10 1.05 0.84 0.84
USA USV J py CHF USD
JPN CHE USA USA N U ) USA BHS JPN
USD EUR USD 2:272:757
1.588.405 1.561.851
0.63 0.44 0.43
USD JPY .- .
29.117.207 8.11
5.49 5,972 5.487.1 15
1.53 1.53
Diversified Financial Services
D. Camegie Q Co.. AB 127,OW Vontobel I-lolding AG 254,870
CHE 5WE
c111: SEK
3.06 10,983,087
179
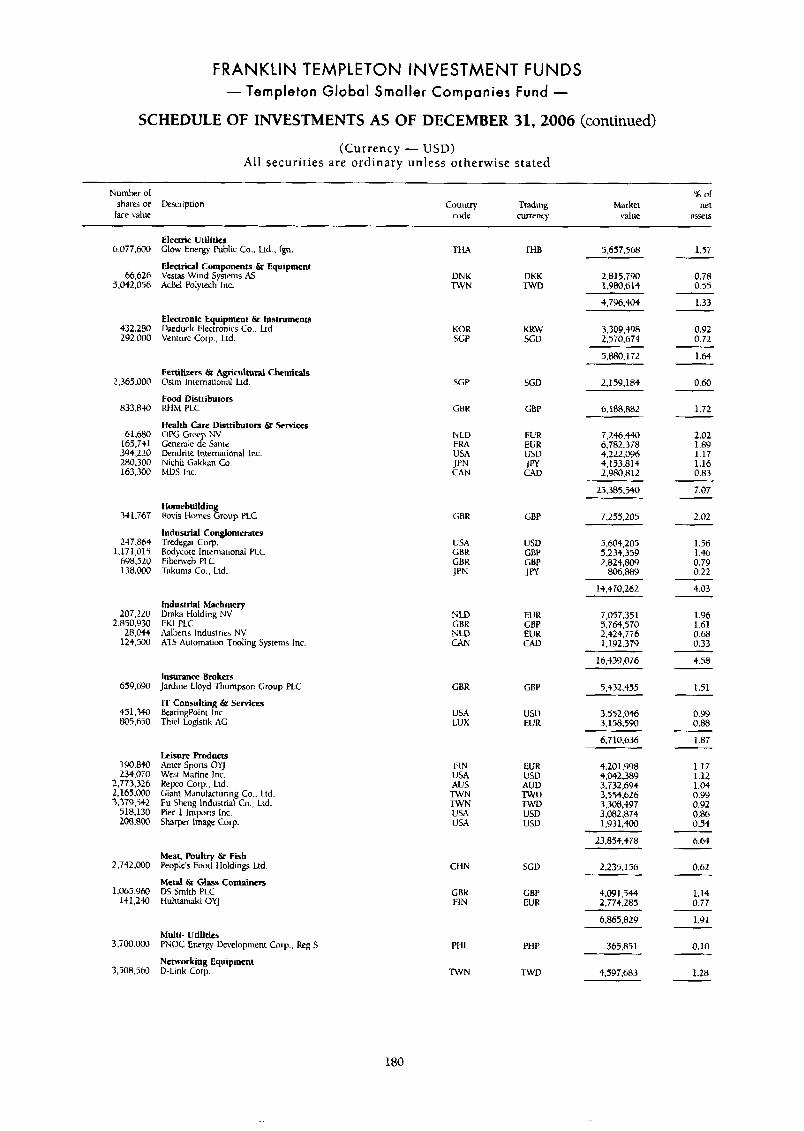
FRANKLIN TEMPLETON INVESTMENT FUNDS - Templeton Global Smaller Companies Fund -
SCHEDULE OF INVESTMENTS AS OF DECEMBER 31,2006 (continued)
(Currency - USD) Al l securit ies are ordinary unless otherwise stated
Number of % ol shares or Description Country Trading Market net
face value code currcnq value assets
Electric Utilities Glow Energy Public 6.. Lid., rgn.
Electrical Componcnls 6r Equipment Vestas Wind Systems As Ackl Polytech Inc.
6,077.600
66.626 5,042,056
432.280 292,000
2.365.000
833.A30
61.WO 165,741 344,220 280.300 163,300
341.767
247.8b4 1,171,015
698,520 138.000
207.220 2.850.Y30
28.L744 123,500
659.690
451,340 805.650
190,840 234.070
2,773.326 2,165.000 7.379.542
518.130 208,800
2.742.000
1,065,960 131,240
3,700.000
3,508,563
TtM
DN li TWN
KOR 5GP
SGP
CBR
N LU FRA USA JPN CAN
LBR
USA C H K CHK JPN
N LD GBR N LU CAN
GBR
USA LUX
FIN 1J5A AUS nvN T W N LISA USA
THB
DKK TWD
KKW .XU
SGD
CBP
EUR EUR USD JW CAV
GBF
USV GBP GBP J f l
5,657,568 1.57
2.815.790 1,980.6 14
0.78 0.55
1.33
0.92 0.72
1.64
0.60
1.72
2.02 1.89 1.17 1.16 0.83
7.07
4,796,404
3,309,498 2.570.674
Electronic Equipment &I Instruments Daeduck Electronics Co.. Ltd. Venture Cop., Lid.
5,880,172
2,159.184 Fertilizers & Agricultural Chemicals Osiin International Ltd.
Food Distributors RHM PLC
Health Care Distributors & Services OPCGroc NV Gcncrale 2 Snnte Dendrite Intemaiianal lnc. Nichii Gakkan Co. MDS Inc.
6,188,882
7,246,440 6.782.378 4.222,@96 4.143.814 2.9R0.812
25,385.540
Homebuilding Bovis Homes Group PLC
Industrial Conglomerates Trcdegar Corp. Rodycote International PLC Fibfnveb FLC '1;ikuma Co., Ltd.
7,235,205
5,604,205 5,234,359 2,824,809
806,WY
2.02
1.56 1.46 0.79 0.22
4.03
1.96 1-61 0.68 0.33
4.58
14,470,262
industrial Machinery Dnka tioldinR NV FKI PLC hlberrs Industries NV ATS Automation Tooling Systems Inc.
7,057.351 5.764.570 2.424,776 1.192.379
EUR GBP EUR CAD
16,439.076
Insurance Broken Jardine Lloyd Thompson Group FLC
IT Consulting 6r Services Bearinghint Inc. Thiel Logistik AG
5432.455 GBP 1.51
0.99 0.88
1.87
1.17 1.12 1.04 0.99 0.92 0.86 0.54
b.64
0.62
1.14 0.77
1.91
0.10
1.28
u5u EUR
3,552,046 3,158.590
6,710,636
Leisure Products Arner Sports OYJ West Marine Inc. Kepco Corp., Ltd. Giant Manuracturing to., Lid. Fu Sheng lndustrial Co., Ltd. tier 1 lmpons Inc. Sharper lmagr COT.
EUR 11SD AUV TWU
4,201,998 4,042,389 3,732,694 3,554.626 3.308,+97 3.082.874 1,93 1,400
23,854,478
TWD USD USD
Meat, Poult7 & Fyh Peoplc's Foo I loldings Ltd SGU 2.235.156 Metal &i Glass Containers DS Smith PLC Huhmmaki OYJ
GBK FIN
GBP EUR
4,091,544 2.774.285
6.865.829 Multi- Utilities PNOC Energy Development C o q ~ . , k g
Networking Equipment D-Link Corp.
S PHL
IWN
PHP 365,851
4,597.683 l-WD
180
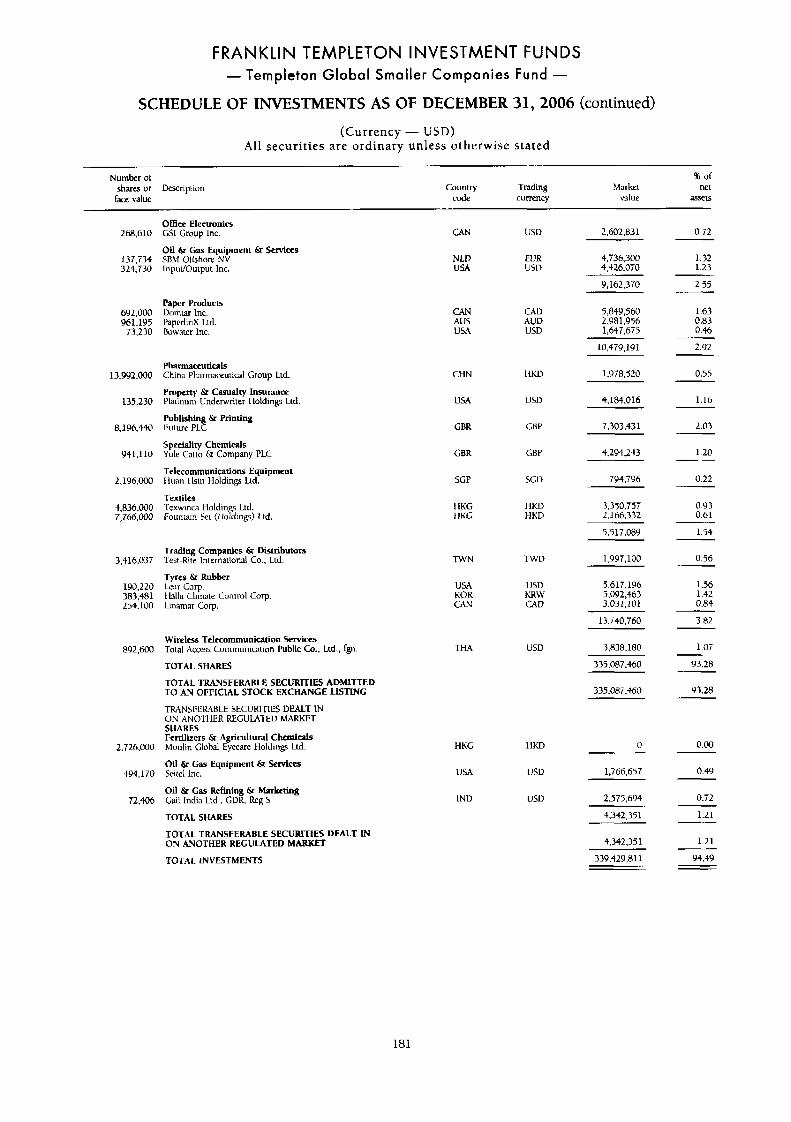
FRANKLIN TEMPLETON INVESTMENT FUNDS - Templeton Global Smaller Companies Fund -
SCHEDULE OF INVESTMENTS AS OF DECEMBER 31,2006 (continued)
(Currency - USD) All securit ies are ordinary unless otherwise stated
~
Number of shares ur Ufrnption face value
% of Country Trading Market net
code currency value a5st5
O f k e Electronics GSI Cruup Inc.
011 & Gas Equipment & SerVirrs 5BhI Oflshore NV InpuVOutput Inc.
CAN USD 2,802,831 0.72 268,610
137.734 324,730
692.000 961,195 73.230
13,992,000
135.230
8,196.440
941,110
2,196,000
4,836.0i10 7,766,000
3,416.037
190,220
25s.100 383 ,+a 1
892.600
2.726.000
494.170
72.406
NLU EUR 4,736,300 USA USD 4,416,070
9,162,370
1.32 1.23
2.55
1.63 0.83 0.46
2.92
Paper Products Vointar Inc. PaperlinX Ltd. Bowater Inc.
Gw AUS USA
CAD AUD USD
5,849,560
1,647.675 2.~31.956
10.47Y.191
0.55
1.16
2.03
Pharmaceuticals China Pharmaceutical Group Ltd
Property & Casualty Insurance Platinum Underwriter I lolding Ltd.
Publishing & Printing 1:uture PLC
Speciality Chemicals Yule Catto Q Company PLC
Telecommunications Equipment I luan I lsin Holding Ltd.
Textiles Texwinca tloldin Lttl. Fountain Set ( I lofiings) Ltd
CHN liKu
USD
1.1)78.520
4.184.016
7,303.431
USA
CBR CHP
4,294,243 1.20 CBK GBP
SGV 0.22
0.93 0.61
1.44
0.56
1.56 1.42 0.84
3.82
794,796 SCP
HKG I IKG
I IKD HKD
3.350.757 2.1 66,332
5.5 17.089
Trading Companies & Distributors Test-Rite Inrernationnl Co., Ltd.
Tyres & Rubber
D V N TwD 1,997,100
USA KOR CAN
USD KRW CAD
5.617.196 Liar COT. lhlla Climate Control COT. 5,092,463
3,031,101 Linamar Corp
13.740.760
3,838,180
335.087.460
1.OT
93.28
Wireless Telecommunieation Services Total Access Communiwtiun Public Co., Lid.. rgn
TOTAL SHARES
TOTAL TRANSFERABLE SECURITIES ADMITTED TO AN OFFICIAL STOCK EXCHANGE LISTING
TIWNSFEKULE SECURITIES DEALT IN ON ANOfIIER REGULATEU hiARKET SHARES Fertilizers & Agricultural t h e m i d s Moulin Global Eyecare tlolding Ltd.
Oil & Gas Equipment & Services Seirel Inc.
Oil & Gas Refining & Marketing Gail India Ltd.. GDK. Reg S
TOTAL SHARES
THA USD
335,08i.460 Y3.28
HKG
USA
IND
tIKD
USV
llSD
0 0.00
1.766.657 0.49
2.575.694 0.i2
1.21 4,342,351
1.21
Y4.M
TOTAL TRANSFERABLE SECURITIES DEALT IN ON ANOTHER REGULATED MAR= 4.342.351
339,429,811 TOTAL INVESTMENTS
181
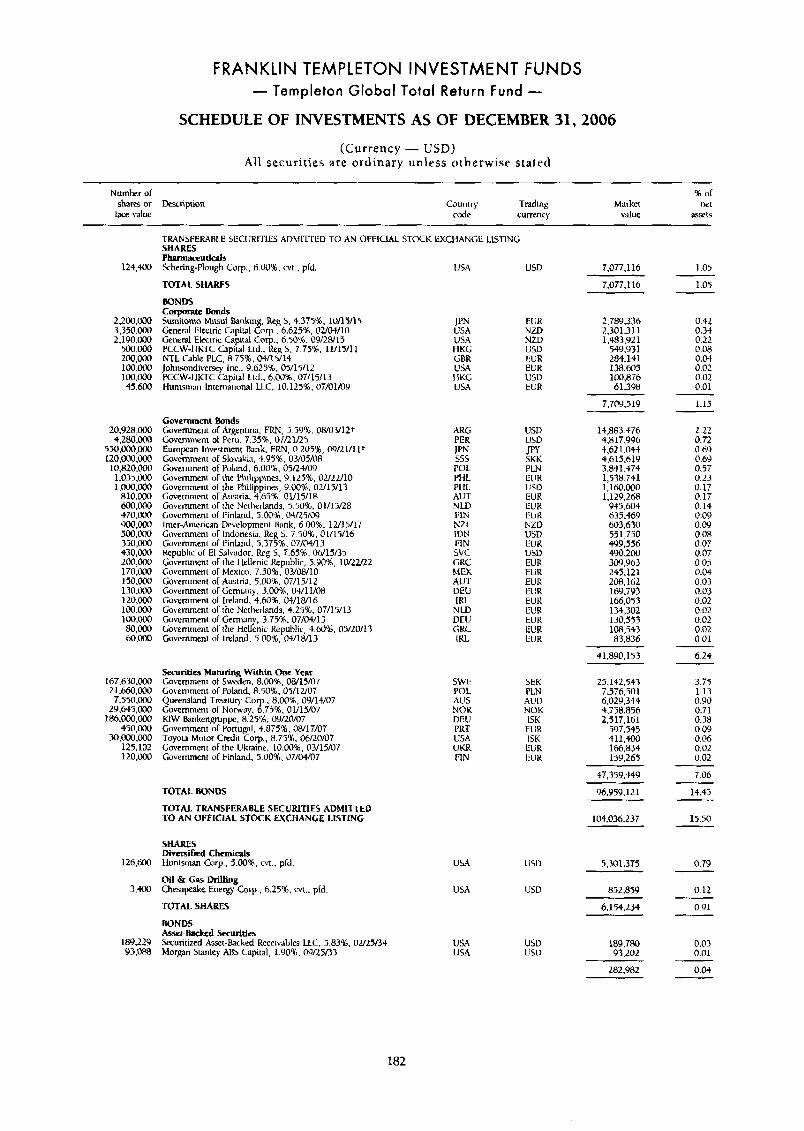
FRANKLIN TEMPLETON INVESTMENT FUNDS - Templeton Global Total Return Fund -
SCHEDULE OF INVESTMENTS AS OF DECEMBER 31,2006
(Currency - USD) All securit ies a re o r d i n a r y u n l e s s otherwise stated
Number of sh3w or &ripion far value
Country Trading code currency
% of Market net
value SXts
124,400
2,200,000 3.350.000 2,190.m
500.Ow 200 m 1@@.ooO 100,OOO 45.600
20,928,000 4.2m.000
550,000,000 120,o.ooo.m 10,820.000 1,035.000 [email protected]
810.@0@ 6@0.(x10 $70.000 900,000 5oo.m 350,000 430,000 200,000 170.000 15O.ooO 130.000 120.000 1@@,ooO 1 0 0 . ~ 8o.m ~.~
167.630,(100 2 1.660,oOo
7.550.m 29.645.000
186.000,ooO 450.000
30.000.000 125.102 12o.m
126,600
3 .m
189.229 Y 3 . W
TRANSFERABLE SECURITIES ADMITTED T O AN OFFICLAL STOCK EX< SHARES Phnrmaceutid Schering-Plough Corp., 6.00%. cvt., pfd.
:HANGE LISTING
USA USD 7,077.116 1.05
TOTAL SHARES
BONDS Corporate Bonds Sumitorno Mitsui Banking, Reg S. 4.375%, 10/15/15 General Electric Capiwl COT., 6.62556, 0U04/10 General Electric Capital Corp., 6.50‘s. OY/LW15 PCCW-IIhTC Capital Lid.. Keg 5, 7.75%. 11/15/11 NTL Cable PLC, 8.75%, 04/15/14 Johnsondivemy Inc., 9.625%. 05/15/12 PCCW-I IKTC Capital Ltd.. 6.00%. 07/15/13 Huntsman Intcrnaiional LLC. 10.125%. 07/01/09
Government Bonds Gvvenitnent ol Argentm. FRN, 5.59%. 08/03/12+ Government ol Peru, 7.359. 07/21/25 Eurnpcin Investmcnr Bank, FRN. 0.20iqh. 09/2lll I + Government ol Slovakia, 4.95%. 03/05/08 Government of Poland. 6.00%. 05/24/09 Cot-ernment of the Philippines. 9.125%. OzlL2llO Government of the Philippines, 9.00%. OU15/13 Guvernment of Austria. 4.658. 01/15/18 Government of the Nelherlands. 5 50%. 01/15/28 Government ol Finland. 5.00%. 04fW09 Inter-American Development Bank, 6.00%. 12/15/17 Gmernmeni of Indonesia. Rcg 5 , 7.50%. @l/lU16 Government of h l and , 5.375%. 07/04/13 Republic of El Salvador. Reg S. 7.63%. 06/15/35 Governnrent ot the 1 lcllenic Republic. 5.909, 10/22/22 Governmenl of Mexico. 7.50%. 03/08/10 Government ol Austrra. 5.00%. 07/15/12 Government ol Gemtiany. 3.001. 04/l 1/08 Giwmment or Ireland. 4.60%. 04/18/16 Government of the Netherlands. 4.25%. 07/15/13 Government or Gerniany, 3.758. 07/04/13 Government of the Hellenic Republic, 4.60%. 05/20/13 Government of Ireland. 5.00%. 04/1H/13
JPN USA USA HKG GBR USA HKG U W
ARC; PEK
,E POL Pt 11 P l l L AUT N W FIN NZL IDN FIN svc GKC
N LD DEU GRC IRL
EUR NZD NZU USD EUR EUK USD EUR
U5D USD
SKK PLN IEUR USD EUR EI!R EL, K NZD USD EUR USD EUK ELiR EUR EUR EUK EUR
JW
EUR EUR EUR
7,077.116
2,789.33b 2.301.311 1.483.92 1
549,931 284.141 138.605 100,876 61.308
7.709,519
14,883,476 4,817,996 4.62 1,044 4,615,619 3.841.474 1,538,741 1,1rio.0@0 I, 129,268
945,604 635,469 603,630 551,730 499,556 490.200 3OY.963 245.121
169,793 166,053 134,302 130.553 106.543 83,836
41.890.153
208.162
Securities Maturing Within One Year Covernmenr of Swden. 8.00%. 08/15/07 Government of Poland, 8.50%. OYlU07 Queensland Treasury COT.. 8.00%. 09/14/07 Covernmeni ol Norway. 6.73%. 01/15/07 KiW Bankengmppc, 8.25% 09/20/07 Government of Portugl. 4.8758, 08/17/07 Toyota Motor Credit Corp., 8.75%. 06/20/07 Government of the Ukraine. 10.00%. 03/15/07 Government ol Finland. 5.00%. 07/04/07
SWE POL AL’S NOR DEL! PRT USA UKR 1:m
SEK PLN AUlI NOK ISK
EUR ISK EUR EUR
25,142,533 7.576.501 6,029,344 4.758.856 2,517,161
397.545 411.400 166,834 159.265
TOTAL BONDS
TOTAL TRANSFEMBLE SECURITIES ADMLTTED TO AN OFFICIAL StOCK EXCHANGE LISTING
SHARES Diversified Chemicals Huntsman Corp.. 5.00%. Cvt., pfd.
Oil & Gas Drilling Chmpake Energy COT., 6.25%. cvt.. pld.
TOTAL SHARES
BONDS Asset-Backed k u r l t i e s Sfcuritized k t - b c k e d Receivables LLC. 5.83%. 02/25/34 Morgan Stanley AB5 Capital, 1.90%. OW25L33
USA
USA
USA USA
usu
USD
usu L’SD
47,359,449
96.Y 59.12 1
104.036.237
5,301,375
852,859
6,154,234
189,780 93.202
282.982
1.05
0.42 0.34 0.22 0.0r 0.M 0.02 0.02 0.01
1.15 ~
2.22 0.72 0.69 0.69 0.57 0.23 0.17 0.17 0.14 0.09 0.09 0.08 0.07 0.07 0.05 0.04 0.03 0.03 0.02 0.02 0.02 0.02 0.01
6.24
3.75 1.13 0.90 0.71 0.38 0.09 0.M 0.02 0.02
7.06
14.45
15.50
0.79
0.12
0.91
0.03 0.01
0.04
182
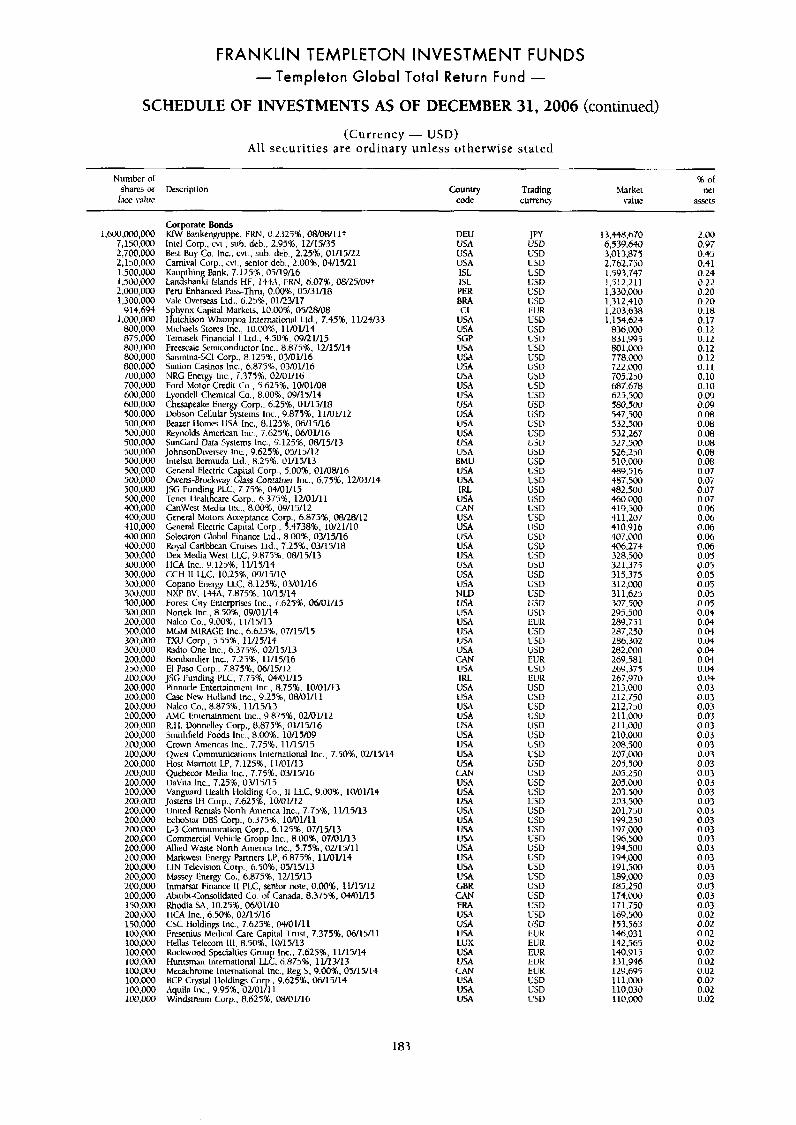
FRANKLIN TEMPLETON INVESTMENT FUNDS - Templeton Global Total Return Fund -
SCHEDULE OF INVESTMENTS AS OF DECEMBER 31,2006 (continued)
(Currency - USD) All securities are ordinary unless otherwise stated
Number or shares or Vescripiiiin
lace value Country Trading
code currenc)
96 of Market net
value asscts
1 , ~ , 0 0 0 , ~ 7,150.000 2,700.000 Best Ruy'CU. Inc-.. CVI., sub. deb., 2.25%. 01/15/22 2,150.000 Carnival Corp.. e\%, senior deb., 2.00%. 04/15/21 1.500.000 Kau thin Rank, 7.125%. 05/19/16 1,500.OOO Lanlshanfi islands HF, 1 4 - M F R N . h.07%, 08/25/0Yt 2,000,000 Peru Enhanced PassThru, 0.00%. 05/31/18 1.300.000 Vale Overseas Lid.. 6.25%. 01/23/17
Y 14.694 Sphynx Capital Markets, 10.00%. 05/28/08 [email protected] Hutchisun Whainpoa International LLd., 7.45%, 11/24/33
800.000 Michaels Stores Inc., 10.00%. 11/01/14 875.000 Temasek Financial I Lid., 4.50'16. 09/21/15 800,000 Fremale Semiconductor lnc., 8.875%. 12/15/14 800.000 Sanmina-SC1 COT., 8.125%. 03/01/16 800.000 Swtion Casinos Inc.. 6.877%. 03/01/16 700.000 NRG Energy Inc., 7.375%. OUOl/l6 700.000 Ford Motor Credit Co., 5.625%. 10/01/08 600,000 Lyondell Chemical Co., 8.00%. W/15/14 600.000 Chesapeake Energy Corp.. 6.254. 01/15/18 500.000 Dobson Cellular Systems Inc., 9.875%. 11/01/12 500.000 k z e r llomes USA Inc., 8.1252. 06/15/16 500.000 kynolds American lnc.. 7.625%. 06/01/16 500.000 SunCard Dam Systems Inc.. 9.125%. 08/15/13 500.000 JohnsonDiwrx Inc , 9.625%, 05/15/12 500.0O0 Inlelwt BErmucfi Lta., 8.251, 01/15/13 500,000 General Electric Capital Corp., 5.0056, 01/08/16 500.000 Owens-Rrockway LIS Container Inc.. 6.75%. 1U01/14 500.000 JSG Funding PLC, 7.75%. 04/01/15 500.000 Tenei llcalthcare C o p . 6.375%. 12/01/11 SOO.000 CanWest Medie Inc., 8.008, 09/15/12 400,000 General Motors Amcptance Corp., 6.875%. 08/28/12 410,000 General Elcctnc Capital Corp.. 7.4738%. 10/21/10 400.000 Solectron Global Finance Lrd.. 8.00%. 03/15/16 400,000 R n p l Caribbean Cruises Ltd.. 7.2576. 03/15/18 300.000 Uex Media West LLC. 9.875%. 08/15/13 300.oM) 300.000 300.000 300,000 300.0O0 Forest City Enterprises lnc., 7.625%. 06/01/15 300.000 Nonek Inc., 8.50%. 09/01/14 200,000 Nalco Co., 9.0041. 11/15/13 3oc1.000 MGM MIRAGE Inc.. 6.625%. 07/15/15 300,000 rxu COT.. 5.55%. 11/15/14 300,000 Radio One lnc., 6.3752. 02/15/13 200,000 Bombardier Inc.. 7.25%, 11/15/16 250.000 El Pao Corp.. 7.875%. 06/15/12 200,000 JSG Funding YLC. 7.75%. 04/01/15 200.000 Pinmcle Entenainrnenl Inc., 8.75%. 10/01/13 200.000 Case New Holland Inc., 9.2596, OW01/11 2Do.000 Nalco Co.. 8.8758. 11/15/13 200.000 AMC L:.nrmainnient Inc.. 9.875%. O M l l l 2 200,000 R.11. Donnelley Corp., 8.875%. 01/15/16 200.000 Smithfield Foods Inc., 8.00%. 10/15/09 200,000 Crown Ameria Inc.. 7.75%. 11/15/15 200,000 (Twest Communimtions In~ernational Inc., 7.50%. 02/15/1 200.000 Host Marnoti LP, 7.125%. 11/01/13 200.000 Quckux Media Inc.. 7.75%. 03/15/16 200.000 UaViu lnc., 7.25%. 07/15/15 200,000 Vanguard Ilealth Holding Co.. 11 LLC, 9.00%. 10/01/14 200,000 Jmtens It1 Corp.. 7.625%, 10/01/12 200.000 llnited Rentals Nonh America lnc.. 7.75%. 11/15/13 200.000 EchoSrar USS Corp., 6.375%. IoMl/ll 200,000 L-3 Communication Curp.. 6.125%. 07/15/13 200.000 Commercial Vehicle Group Inr.. 8.00%. 07Klll13 200,000 Allied Waste Nonh Amenca Inc., 5.75%. 0UlYll LO0,OM) Markww Energy Partners L.P. 6.875%. lllOl/l4 200,000 LIN Television Corp.. 6.50%. 05/15/13 200,000 hbs$ey Energy Co.. 6.875%. 1U15/13 200,000 Inmarut Finanm I1 PLC, senior note, 0.00%. 11/15/12 200,000 Abitibi-Conwrlidated Lo. of Canada, 8.375%. WMl/l5 150,000 Khodia SA, 10.25%. 06/01/10 200.000 llCA lnc., 6.50%;. OUlY16 150.GilO CSC Holding Inc., 7.625%. 04/01/11 100.000 Fwsenius Medical Care Capital Trust. 7.375%, 06/15/11 100.000 Hells Tclwom 111. 8.50%. 10/15/13 lOO.(XIo Hockwood Specialrics Croup Inc.. 7.623%. 11/15/14 100,ooO tiuntsrnsn lniemational LLC. h.87596, 11/13/13 100.000 Mecachrome International Inc., Reg 5, 9.00%. 05/15/14 100.000 BCP Crystal lloldings Co 9.6251, 06/15/14 100.000 Aquila [ne., 9.958, ouoi'pii 100.000 Windstream Corp.. 8.62516, 08/01/16
Corporate Bonds KtW Bankengruppe, FRN. 0 2325%. OWOfVI It Intel Corn.. WI . sub. deb.. 2.95%. IUl5/35
IlCA Inc.. Y.125%, 11/15/14 CCH 11 LLC. 10.25%. 09/15/10 Cooano Enem, LLC R 125%. 03/01/16
DEU USA USA USA 1SL ISL PER BRA ct
USA USA SGP USA L:sA U M USA USA USA USA USA USA USA USA USA HMU USA USA IRL USA CAN USA USA USA IJSA USA USA USA USA N LD USA l!SA USA USA USA USA CAN USA IRL USA LISA USA USA USA USA USA
4 USA USA cw USA USA U M USA USA USA USA U W USA USA USA GRR CAN FRA
JPY USD USD USD USD USD USD USV EUK USD U5D usv USD USD ljSD USD USU USD USD USD USD USD usv USD USV USV USD USD USD USD USD USD usn usv 11SD USD USD USD USD USV USV EUK USD USD LSD EUR USV ElJK U5D USD USV USD 1JSU USU VSV l!SV USD L:SD USD USD USD USD USD USD USD USD USD USD USD C'SD USD USD
us4 USV USA LiSU U44 EUK LUX EUR USA EUR USA EUH CAN EUR l!SA USV USA USD USA USD
I3.44H.h70 6,339,640 3,013.875 2,762,730 1.59 3.747 I ,512,211 1,330,000 1,312,410 1.203.638 1.1 54.624
836.000 831.Y95 801.ooo 778.030 722,000 705.250 687.618 625,500 580.500 547:500 531,500 532.267 52i,500 526.250 510,000 484,516 487,500
4m.000 419.500 41 1,207 410,916 4@7,000 $06.274 328.500 321,375 315,375 312,000 3 11.625
482,500
307.500 295.500 289.731 287,250 286.302 282.000 269,581 26Y ,375 267.970 213,000 2 12,750 212,750 211.000 211,000 210.000 208,500 207.000 207.500 205.250 205.000 203.300 203,500 201,750
197,000 196.500 194,500 194,OW 191,500 189,000
1w.m
185.250 174.W 17 1.750 169.500 153.563 146.031
2.00 0.97 0.45 0.41 0.24 0.21 0.20 0.20 0.18 0.17 0.12 0.12 0.12 0.12 0.11 0.10 0.10 0.09 0.09 0.08 0.08 0.08 0.08 0.08 0.08 0.07 0.07 0.07 0.07 0.06 0.06 0.06 0.06 0.06 0.05 0.05 0.05 0.05 0.05 0.05 0.04 0.04 0.04 0.04 0.M 0.04 0.04 0.04 0.03 0.03 0.03 0.03 0.0.3 0.03 0.03 0.03 0.03 0.03 0.03 0.03 0.03 0.03 0.03 0.03 0.03 0.03 0.03 0.03 0.03 0.03 0.03 0.03 0.02 0.02 0.02
1421565 0.02 140.9 15 0.02 131.9% 0.02 129,695 0.02 lll.0O0 0.02 110,030 0.02 11o.ooo 0.02
183
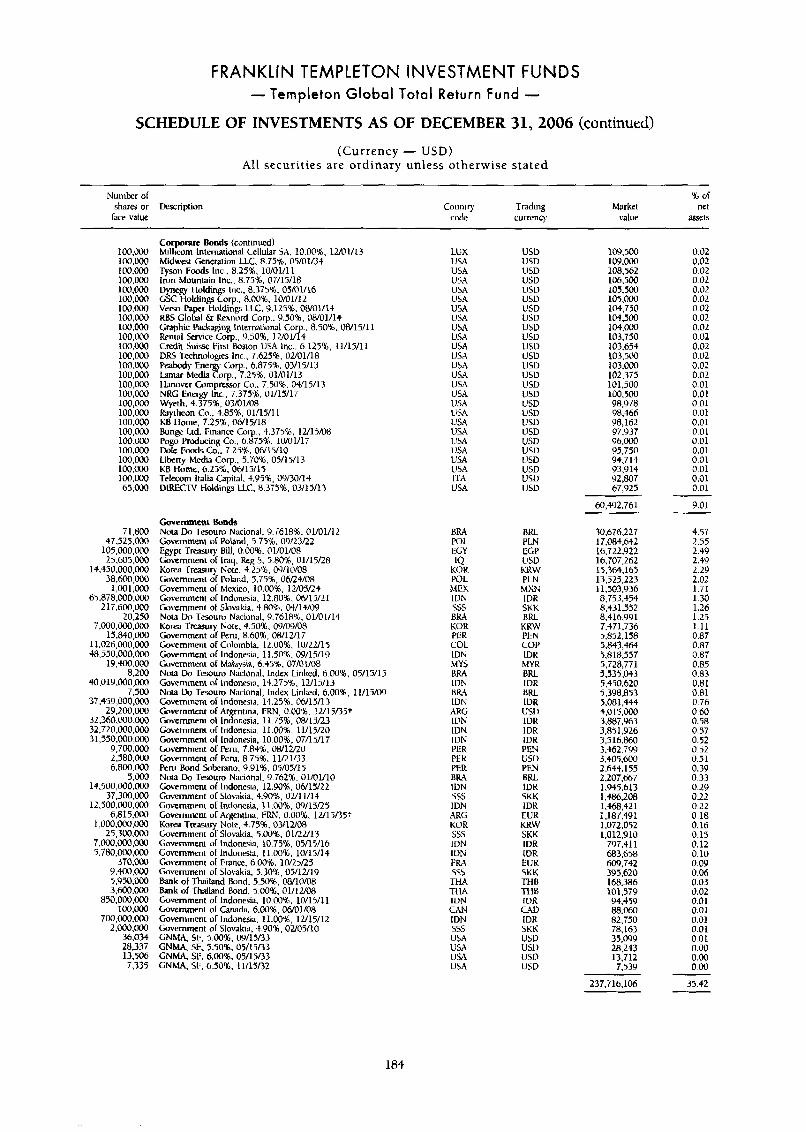
FRANKLIN TEMPLETON INVESTMENT FUNDS - Templeton Global Total Return Fund -
SCHEDULE OF INVESTMENTS AS OF DECEMBER 31,2006 (continued) (Currency - USD)
All securities are ordinary unless otherwise sta ted
Number of shares or Dcsuription
face value Counir) Trading
code currenq
% of Market ne t
value a5w.5
100.030 100,000 100,000 100,000 100,ooo 100,000 100.030 100,000 100.000 100,ooO l@O,ooO 100.000 100,ooO 100,oOO 100,000 100,ooO 100,000 1oo.ooo 100,000 100,030 100.000 l00,oOO 100,000 100,oOO 100.000 65,000
7 1.800 47.525.000
105,000.ocIo L5.605.000
14.450.000.000 38,6C0:000
1.001.ooo 65.878.000.000
L17.600.WO 20.250
7.000.000.000 15:840:&l0
11.026,000.000 48.550.000.000
40.019.000~6 7,500
37,459,000 ,000 2Y,Z00.000
32.360.000.000 32,720.000:W 31,550,000,000
9,700.000 2,580,000 6,800,000
5.000 14.500.000.000
37,300,000 12,500.000,000
6.815.0@@ 1,0o0,0oo:ooo
25,300.000
370,000 9,400,000 5.950.0.000 3.600;000
850,000,000 100,OOO
700,000,000 2,000.000
36.034 28,337 13.506 7,335
Corpoutc Bonds (continued) Millicom International Cellular SA. 10.002. 12/01/13 Midwat Gfneration LLC. 8.75%. 05/01/34 Tywn Foods Inc.. 8.25%. 10/0Vl1 Iron Mountain lnc.. 8.758. 07/15/18 Dynew lloldings lnc., 8.375%. 05/01/16 GSC tloldings Corp., 8.00%. 10/01/12 Verso Paper Holding LLC. Y.1259h. 0WO1/1+ RES Glohl & Rexnord Corp.. Y.50%, oIvol/lS Graphic Parkaging International Corp.. 8.5096, 08/15/11 Rental Service Gorp., 9.50%. 12/01/14 Credit Suisr First Bosion USA Inc.. 6.125%. 11/15/11 DRS Technolcgies Inc.. 7.625%. 02/01/18 Peakdy Energy Corp.. 6.875%. 03/15/13 lamar Media Corp.. 7.258, 01/01/13 t-lanover Compressor Co.. 7.50?& 04/15/13 NRG Energy Inc.. 7.375% 01/15/17 Wyeth. 4.375%. 03/01/08 bytheon Cn.. 4.85%. 01/15/11 KB llorne, 7.25%. 0h/15/18 Bunee Ltd. Finamp Cirra.. 4.375%. 12/15/08 Fog." Producing Co . 6 875%. 10/01/17 Dole Fwds Co.. 7 25%. 06/15/10 Libcnv hledla Corn 5 702 05/15/13 KB tdme. 6.25&.'06/15/15 Telecom I tah Capitd, +.Y5%, 09/30/1+ DIWCTV Holdings UC. 8 375%. 03/15/13
Cavpmment Bonds Nota Do Tesoum Nacional, 9.7618%. 01/01/12 Government of Poland. 5.75%. 09/23/22 Egypt Trcwury Bill. 0.00%. 01/01/08 Government ul Iraq, Keg 5. 5.80%. 01/15/28 Korea Trwury Note, 4.25%. OY/10/08 tiovernment or Poland. 5.75%. 06/24/08 Government of Mexico. 10.00%. lU05/24 Covemmeni of Indonesia, 12.80%. OWl5/21 Government of Slovakia. 4.80%. W/l+/09 Nota Do Tesouro Nacional. 9.7618% 01/01/14 Korea Tresury Note. 4.50'X. 09/09/08 Government of Peru, 8.60%. 08/12/17 Government ol Colombia. 12.0056. 10/22/1', Gowrnment of Indonesia, 11.50%. @Y/15/19 Guvemment of Malaysia, 6.35%. 07/01/08 Not3 Do Twuro Ndcional. lndex Linked. 6.@0?& 05/15/1 Government of Indonesia. 14.275%. 12/15/13 Nota UU Tewunl Nacional, lndex Linked. 6.00%. 11/15/C Government of indonesid. 14.25%. 06/15/13 Government of Ar ntini FRY 0 &I% 1UI 3/35,
Govemrneni uf Indonesia. 11.00%. 11/15/20 Government or Indonesia, 10.00%, 07/15/17 tiovernment of Peru. 7.84%. 08/1UZ@ Government of Peru. 8.75%. l lRlf i3 Fern Bond Soberano. 9.91%. 04/05/15 Nota lh Tewum Nacional. 9.762%. 01/01/10 Government of Indonesia. 12.90%, 06/15tT2 Cwemment of Slovakia. +.YO%, OUl1114 Government of Indonesia, 11.00%. 09/15/25 Govemnleni ul Argentina. FRN. 0.00%. 12/15B5+ Korea Twasury Note, 4.75%. 03/12/08 Government of Slovakia. 5.00%. 01/22/13 Government of Indonesia. 10.7516. 05/15/16 Government of Indonesia. 11.00%. 10/15/14 Cmemmenr of Fnnce, 6.00% 10R5/25 Gmrrnrnenr of Slovakia, 5.30%. 05/1U19 Bank of Thailand Bond. 5.50%. 0&110/08 Bank of Thailand Bond. 5.00%. 01/12/08 Government of Indoncsia. 10.00%. 10/15/1 I Gownmen1 of Canada. 6.00%. 06/01/08 Government of Indonesia. 11.00%, 12/15/12 Government of Slovakia, 4.90%. 02/05/10 G N W SF, 5.0076. 09/15/33 GNMA. SF, 5.50%, 05/15/33 CNM4 SI;. 6.0096, 05/15/33 GNhW SI., 6.5016, 11/15/32
Governmeni of In f onesia. 11 : ' . 758, 08/15/23 '
LUX USA USA USA USA USA USA USA USA USA USA USA USA USA USA USA USA USA U.SA USA USA USA U U USA ITA USA
BRA POL EGY
1-3 KOR PO1. MEX IVN sss BRA KOR PER COL IDN MY5
5 BRA IUN
19 BR4 IUN ARG IDN IUN IVN PER PER PER BRA IDN 5SS IDN ARG KOR sss IUN IDN F M ss5 TtiA THA IUN CAN IDN sss USA USA
USA USA
USD USD USD usv USD USD I!SD usv USV usu USU
USD USU USD USD USD USD USD USD LJSD USD USD USD LlSU USD
usu
BRL PLN EGGP USV KRW PLN M U 4 IVR SKK BRl KRW PEN COP IDK
MY R BRL IVR BRL IDR usn 1DR IDR IDR PEN USD PEN BRL 1DR SKK 1DK EUR KUW SKK IVR 1DR EUR SKU TtIB TH5 IVR CAD IDR SKK USV USD USD lJSD
1oY,500 109,000 108.562 106.500 105,500 105.000 104,750 104.500 104,000 103,750 103,654 103,500 103,000 102.375 101.500 100,500 98.978 Y8.466 98,162 97,937 96.000 95,750 94.714 9319i4 Y2,807 h7.925 - I ~
60.492.761
30.676.227 17,084,642 16.722.922 16,707,262 15,364,163 13,525,223 11,503,936 8,753.454 8.431.552 8.416.991 7,471,736 5,892,158 5,843,464 5.818.557 5.728,771 5,535.043 5,450.620 5,398,853 5.081.444 4.015,OOO 3.88i.Y63 3,831,926 3,516.W 3.462.799 3.405.6M 2.644.155 2.207.667 1.945.613 1.486.208 1,968,421 1,187.491 1,072,052 1,012.9 10
797.411 683,658 609.742 3951620 168.386 101.579 94.459 88.060 82.750 78.163 35,09Y 28,243 13.712 7.539
0.02 0.02 0.02 0.01 0.02 0.02 0.02 0.02 0.02 0.@2 0.02 0.02 0.02 0.02 0.01 0.01 0.01 0.01 0.01 0.01 0.01 0.01 0.01 0.01 0.01 0.01
9.01
4.57 2.55 2.49 2.49 2.29 2.02 1.71 1.30 1.26 1.25 1.11 0.87 0.87 0.87 0.85 0.83 0.81 0.81 0.76 0 60 0.58 0.57 0.52 0.32 0.51 0.39 0.33 0.29 0.22 0.22 0 18 0.16 0.15 0.12 0. IO 0.0Y 0.w 0.03 0.02 0.01 0.01 0.01 0.01 0.0 1 0.00 0 .oo 0.00
237,716,106
184
35.42
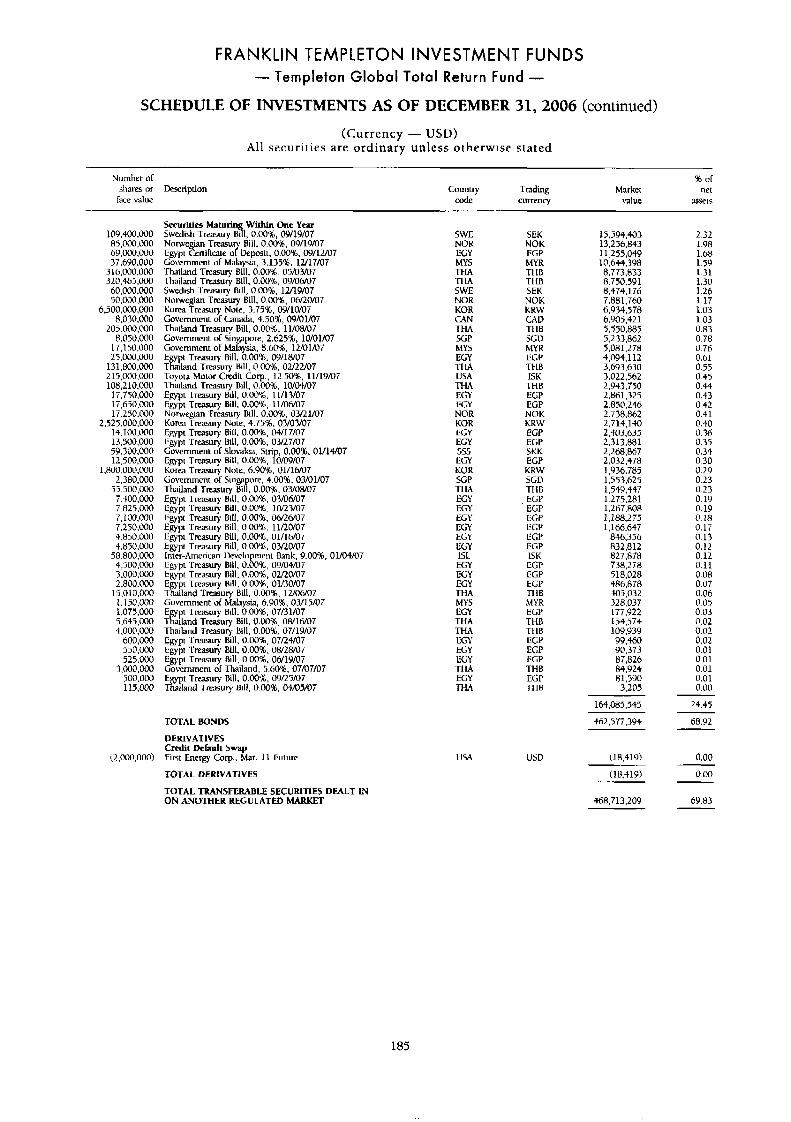
FRANKLIN TEMPLETON INVESTMENT FUNDS - Templeton Global Total Return Fund -
SCHEDULE OF INVESTMENTS AS OF DECEMBER 31,2006 (continued)
(Currency - USD) All securities are ordinary unless otherwise stated
Number or shares or face value
109.400.000 85,000,000 69,000,000 37.690.000
3 16.000.0~ 320,465,000 60,000.000 50.000.000
6,500.000.000 8,030.000
L05.000.000 8.050.000
17.150.000 25.000.000
13 1,800,000 215,000.000
17,750,000 1T.650.000 17.250.000
2.525.000.000 14,100,000 13.500.000 59.300.000 12,500,000
1 .R00,000,000 2,380,000 Lowrnrnenr d Singapore. 4.00%. 03/01/07
55.500.000 Thailand Treasury Bill, 0.00%. 03/08/07 i.400,000 Egypt Treasury Bill. 0.00%. 03/06/07 7,825.000 Egypt Twm~n- Bill, 0.00%. 10/23/07 7,100.000 Egypt Treasurj. Bill, 0.00%. 06/26/07 7.290.000 Egypt Treasury Rill, 0.0091, lln0/07 4.H90.000 Egypt Treasury Rill, 0.00%. Ol/lb/OT S.850.000 Egypt Treasury Bill, 0.008, 03/20/07
58,800,000 Inter-American Development Bank, 9.00%. 01/04/07 4,500,000 Egyp~ Treasury Bill, 0.00%. 09/04/07 3,000.000 Egypt Treasury Bill. O.OO%, 02!20/07 2,800.000 Egypt Treasury Bill. 0.00%. 01/30/07
15.010.000 1-hailand Treasury Bill, 0.00%. 12/06/07 I. 150,000 Government of Malaysw, 6.90%. 03/15/07 1.075.000 xpt Treasury Rill. 0.00%. 07/31/07 5,(i45,000 [land Treasury Bill. 0.00%. 08/16/07 4.000.000 Thailand Treasuv Bill, 0.0076, 07/19/07
600,000 Egypt I'reasu~~ Bill, 0.00%. 07/24/07 550,000 I!gypt 'I'reasu6 Bill, 0.00%. 08/28/07 525.000 Egypt Treasury Bill, 0.001. 06I19hlT
3.000.000 Government or Thailand. 5.60%. 07/07/07 t Trasury Rill, 0.00%. 09/25/07
108,210.000
T m u y Bill, 0.00%. 04/05/07
Description
Securities Matun Within One Year Swedish Treasury 31, 0.008, 09/19/07 Norwegian Treasu Bill. 0.008. 09/19/07 Egypi C e n i k i r o?Deposit. 0.00%. 09/12/07 Government of Malaysia, 3.135%. 12/17/07 'Thailand Tmasury Rill. 0.00%. 05/03/07 Thailand Treiuury Bill, 0.00%. 09/06/07 Swedish Treasury Rill, 0.00%. 12/19/07 Norwegian Treasury Rill, 0.00%. 06f20/07 Korea Treasury Note, 3.75%. W/1W07 Government of Canada, 4.50%, N/01/07 Thailand Treajurv Rill, 0.0091, 11/08/07 Government of Sin pore 2 625%, 10/01/07 Government of hia$sia, b.dO8. IU01M7 E t Treasury Rill. 0.00%. 09/18/07 Tmand Tmury Bill, 0.00%. 02/22/07 Toyuia Molor Cwdit Corp, 12.50%. 11/19/07 Thailand Treasury Bill, O.oO%, 10/04/07 Egypt Treasury Bill. 0.001, 11/13/07 Egypt Tressury Bill, 0.00%. 11/06/07 Norwegian Treasuv Bill. 0.00%. 03/21/07 KoFca Treasury Note, 4.758, 03/03/07 Egypt Trasury Bill. 0.00%. 04/17/07 Egypt lreasury Bill, 0.00%. 03/27/07 Government ot Slovakia. Strip, 0.00%. 01/14/07 Egypt Treasury Bill. 0.00%. 10/09/07 Korea Treamw Note. 6.90%. 01/16/07
TOTAL BONDS
DERIVATIVES
First Energy Corp.. Mar. 11 I;uturc
TOTAL DERIVATIVES
credit Default swap (2.000.000)
TOTAL TRANSFERABLE SECURITIES DEALT IN ON ANOTHER REGULATED MARKET
Country code
SWE NOR EGY MYS TtL4 -n LA SWE NOR KOR crw TtiA SGP hfY5 EGY TI w USA
Trading currency
Market value
SEK NOK EGP MYR THB THB SEK NVK KRW CAV -1-1 IB SCD MYR ECP THB ISK THR THA
EGY EGP ECK EGP NOR NOK KOR KRN' EGY EGP EGY ELP 55s SKK ECY EGP KOR KRW 5GP SGD 1,5531625 TI W THB 1,549.447 ECY EGP 1.275.281 EGY EGP 1.267.808 ELY liCP 1.188.275 EGY ECP 1,166.647 EGY EGP 846,356 ECY EGP 832,812 ISL ISK 827.878 EGY EGP 738.2T8 ECY ECP 518,028
TtiA T I IB 4003.032 ECY EGP 386,878
15.594.403 13,236,843 11,255,049 10.644.398 8,773,833 8.750.591 8.474.176 7.881.760 6.934.578 6,905.42 1 5,550,885
5.081.278 4,094.1 12 3,693,630 3.022.562 2.943.750 2.861..325 2.850.246 2.738.862 2,714,140 2,403,635 2.313.881 2.268.867 2,032,478 1.936.785
5.233.a62
MYS MYR EGY EGP TIM THR THA TI 18 EGY EGY ECY
ECP EGP EGP
T I L 4 THR ECY EGP THA 1-1 IB
USA USD
328:037 177.922 154.574 109,939 99,460 90,373 87,826 84,924 81,590 3.205
164,085,545
462.577.394
(18.419)
(18,41Y)
2.32 1.98 1.68 1.59 1.31 1.30 1-26 1.17 1.03 1.03 0.83 0.78 0.76 0.61 0.55 0.45 0.44 0.43 0.32 0.41 0.40 0.36 0.35 0.34 0.30 0.29 0.23 0.23 0.19 0.19 0.18 0.17 0.13 0.12 0.12 0.11 0.08 0.07 0.06 0.05 0.03 0.02 0.02 0.02 0.01 0.01 0.01 0.01 0.00
24.45
68.92
0.00
0.00
69.83 468.713.209
185
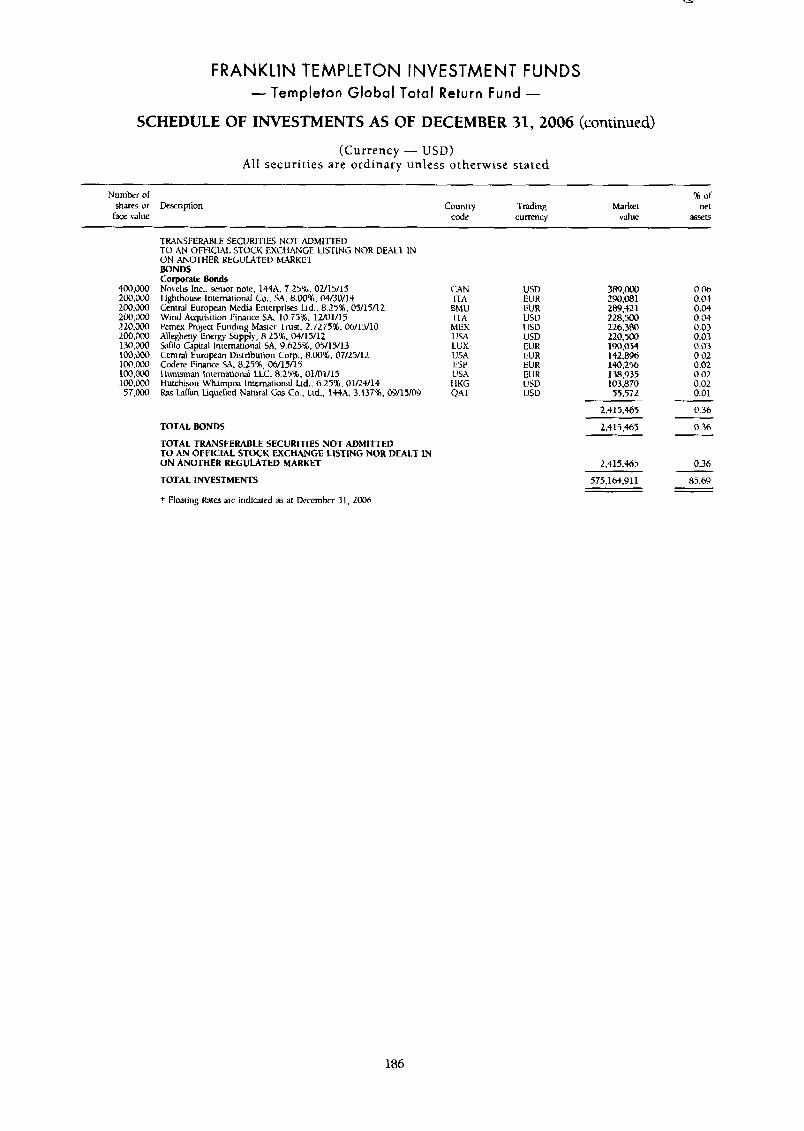
FRANKLIN TEMPLETON INVESTMENT FUNDS - Templeton Global Total Return Fund -
SCHEDULE OF INVESTMENTS AS OF DECEMBER 31,2006 (continued)
(Currency - USD) All securit ies are ordinary unless otherwise stated
Number of 16 of shares or Description Country Tnding Market net
f3ce value code currency value =!?e15
TRANSI:ERhRLE SECURITIES NOT AIJMllTEU TO AN OFFlClAL STOCK EXCtIANCE LlSXlNG NOR DEALT IN ON ANOTHER KEGULXTEU MARKET BOND5 Corporate Bonds
4OO.ooO Novelis Inc.. wnior note, 144A. 7.25%. 02/15/15 LAN 200.000 Lighthow IntemaLional Co.. SA 8.00%. oQ/30/1.t ITA 200.000 Central European Media Enierprirs Lid.. 8.25%. 05/15/12 BMU 200.000 Wind Acquisition Finanm SA. 10.751. 12/01/15 ITA 220,000 Pernex Project Funding Master Trust, 2.727516. 06/15/10 MEX 200.~100 Allegheny Energy Supply, 8.25%, 04/15/12 USA 130,000 bfi lo Capit31 InLernational SA, 9.6251, 05/15/13 LUX 100,iKx, Ccnird European Distrihulion Corp., 8.00%. 07/25/12 USA lCW.000 Codere Finance M, 8.2516, 06/15/15 ESP 100,000 lluntsmm International LLC, 8.25%. 01/01/15 USA 100.000 I-lutchiwn Whmnpoa International Ltd.. 6.25%. 01/24/1$ I1KG
QAT 57,000 ks L k n Liquefied Natural Gas Co.. Ltd., 1+A, 3.437%. 09/15/09
TOTAL BONDS
TOTAL TRANSFERABLE SECURITIES NOT ADMITTED TO AN OFFlClAL STOCK EXCHANGE LISTING NOR DEALT IN ON ANOTHER REGULATED MARKET
TOTAL INVESTMENTS
t Floating Rates arc indicatcd z at Dcccmhrr 31, 2oOe
USD EUR EUR USV USD USD EUR EUR EUK EUR USD us0
389.000 290,081 289.421 228,500 226.380 220.500 190,054 142.8% 190:256 138.935 103.870 ~ 55:572
2.415.465
2,415,465
2.415.4415
575,lh4,911
0.06 0.04 0.04 0.04 0.03 0.03 0.03 0.02 0.02 0.02 0.02 0.01 0.36
0.36
0.36
$5.69
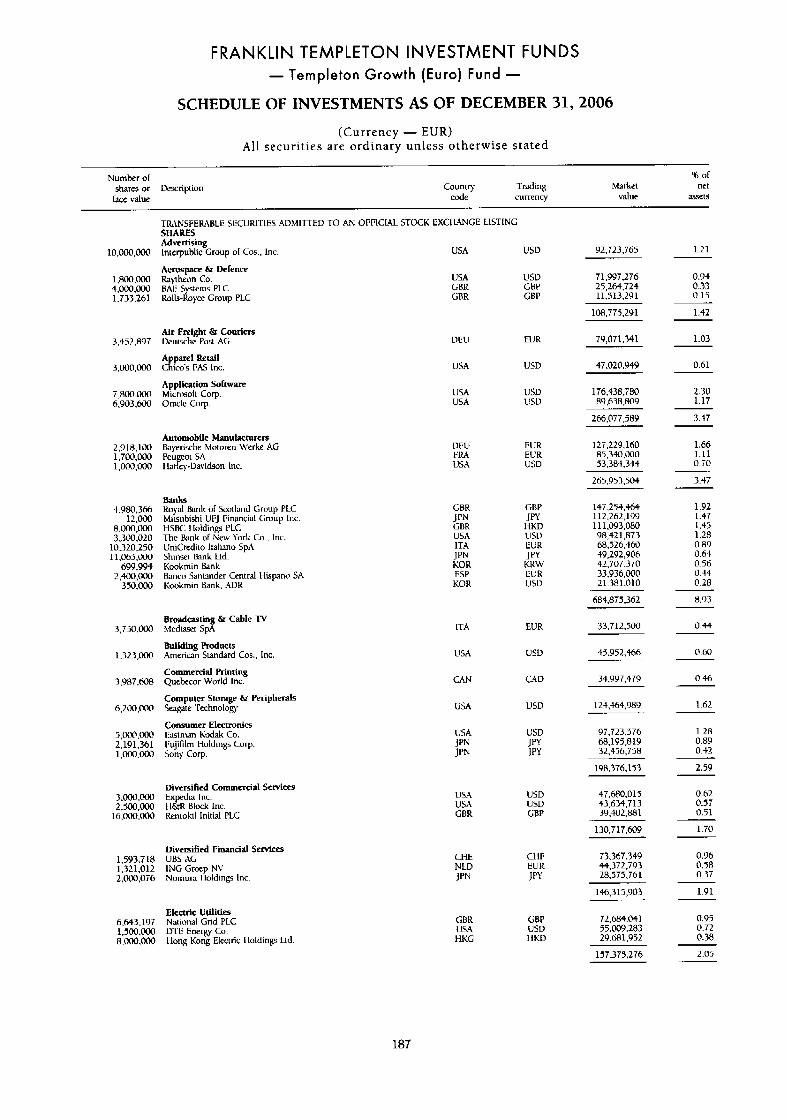
FRANKLIN TEMPLETON INVESTMENT FUNDS - Templeton Growth (Euro) Fund -
SCHEDULE OF INVESTMENTS AS OF DECEMBER 31,2006
(Currency - EUR) A l l securit ies are ordinary unless otherwise stated
Number of or
k e value code currency value a5xts shares or Description couniry Trading Markt net
TRANSFEFAB1.E SECURITIES ADMITTED TO AN OFFlCLV STOCK EXCl IANGE LlSTlNG SHARES Advcnbing lnierpuhlic Group or Cos., lnc.
Aerospace & Defence 1,ROo.ooO Raytheon Co. 4.000.000 BAL Systems PLC 1,733,261 Kolk-Royce Group PLC
10,000,ooO USA USD 92.723.765 1.21
71.997.276 25.264.724 11.513.291
USA GBR GRR
usv CBP GBP
0.94 0.33 0.15
1.42 1011,775,291
79,071,341 Air Freight &I Couriers
3,452,897 Ucutschc Post AC;
A parel Retail 3.000.000 CRico's FA^ 1nc
Appliedtion Software 7,800.000 Microsof1 COT. 6,903.600 Oracle Corp.
1.03
0.61
UEU EUR
47.020.949 USA USD
176,438,780 89.638.809
2.30 1.17
USA USA
usv L'SD
266,077,589 3.47
1.66 1.11 0.70
Automobile Mwufacturers 2,9IH,lW h y e r i r h e hiororen Werke AG 1,700,000 Feu eot SA 1 , 0 0 0 , ~ ti;irk).-gavividson Inc.
VEU t:M USA
EUR EUR USU
12i.229.160 H5.340.000 33,384,344
265.953.504 3.47
147,254,464 112.262.199 11 1,093,080 98,421,873 68,526,460 49,292,YOh 42.707.370 33,936,000 21.381.010
1.92 1.47 1.45 1-28 0.89
Banks Royal Bank of kotland Group PLC Mitsubishi UFJ 1:inancid Group Inc.
The Bank of New York Co.. lnc.
-t,980,3fh 12.000
8.000.000 H S K I loldings PLC 3,.300,020
10,320,250 UniCrediio Iialiano SpA 1 1 , 0 6 5 . ~ Shinsei Bank Ltd.
699,994 Kookmin tank
350.000 Koukmin Bank. ADK 2,400,~ Banco Sanlander Centrai tiiispino sit
GBR
1;; USA ITA
KOR JFN
GBP JPY I IKD US13 EUR J PY KKW EUK USU
0.64 0.56 0.44 ESP
KOR 0.28
684,875,362 8.93
33.712.500 0.44 Broadcasting & Cable TV 3,750.000 hlediasct SpA
Building Products 1,323,000 American Sundard Cos., lnc
Commercial Printing 3,9$7,rx)8 Quebecor World Inc.
Computer Storage &I Peripherals 6,200,W Seagate Technology
Consumer Electronia 5,000.000 Iias~man tiodak Co. 2,191.361 I:ujifilm Holdings Corp. l,MX).000 5ony Corp.
ITA EUR
0.60 USU USA 45.Y52.Sh6
3497.479 CAN 0.46
1.62 124.464.989 USA USD
1.28 0.89 0.42
USA J PN J PN
L'SD J f l I py
97,723,576 68,195,819 32.456.758
198.376.153 2.59
47.h80.015 43,634.713 39.402.881
Diversified Commercial SeWiCeS 3.000,ooO Expedia Inc. 2,500,ooO I I&R Block lnc.
16,000,000 hntoki l Initial PLC
0.62 0.57 0.51
USA USD USA CBR
USD CBP
130.7 17,609 1.70
73.367.345, 44.372.793 28,575,761
Diversified Financial Services 1.593.718 UBS AG 1,321,012 ING Groep NV 2,000,076 Nornun I loldings lnc.
CI-LE NLD
Ct IF EUR JPY
0.96 0.58 0.37
1.91 146,315,903
0.95 0.72 0.38
Electric Ulilities 6.643.197 Naiional Grid FLC 1,500.000 U-IE Energy Co. 8,000.oc1o llong Kong Elecitic Iloldings Ltd
72,684.04 1 55.005,.283 29.681.952
GBK GBP US0 1 IKD
USA tiKG
157,375.276 2.05
187
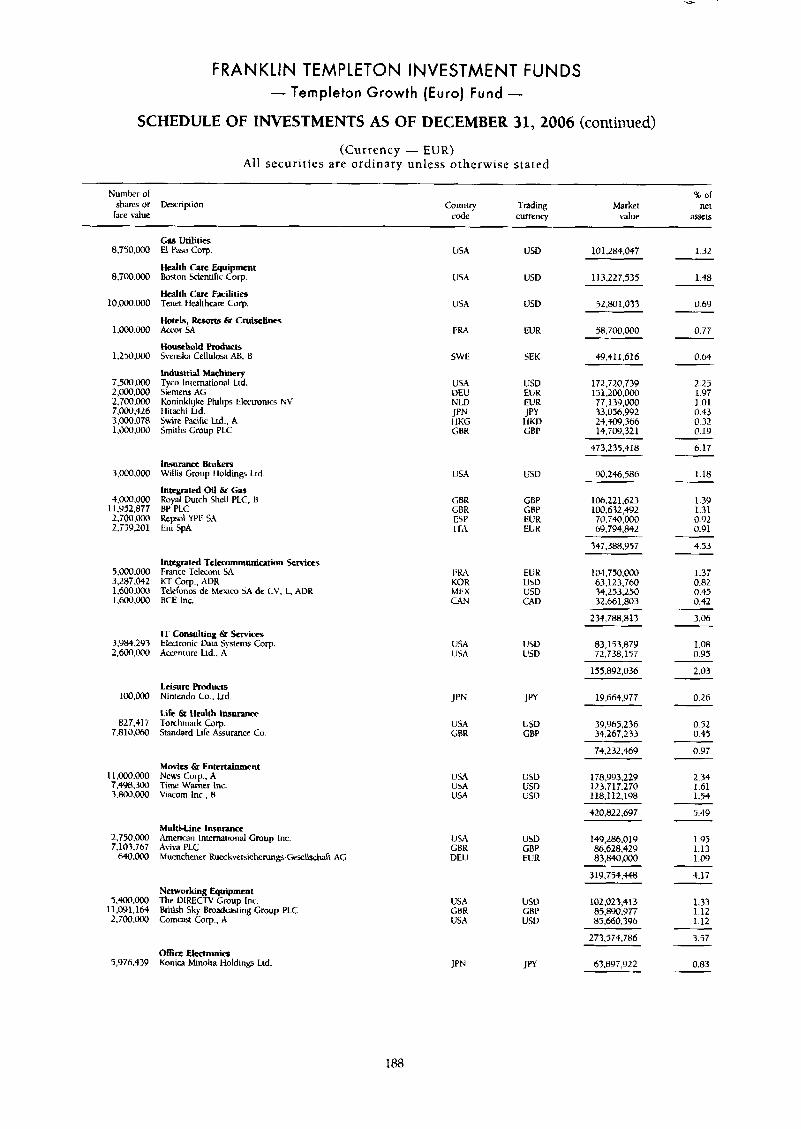
FRANKLIN TEMPLETON INVESTMENT FUNDS - Templeton Growth (Euro) Fund -
SCHEDULE OF INVESTMENTS AS OF DECEMBER 31,2006 (continued)
(Currency - EUR) Al l securit ies are ordinary unless otherwise stated
Numher of % or
lam d u e code currency value ssers shares or Descnption Country fmding Market net
8.750.000
8.700.000
10,000.000
1.ooO.000
1.250.000
7,500,000 2,000.000 2,700,000 7,000,426 3,000,078 1.ooo.0M)
3.000.000
4.Ooo.000 11.Y52.877 2,700.OOO 2,739,201
5.000.000 3,287.W2 1,600,000 I.600.000
3,984.2Y3 2 , m , m
100,OOO
827.41 7 7.810.060
1 I .ooo.M)o 7.4YR.rn 3.8M3.m
2.750.000 7,103,767
64o.ooo
5.400,OOo 11 .oY1,164 .?.7Oo0.ooo
5,976.439
Gas Utilitis El Paso COT.
Health Care Equipment Boston Scientific COT.
HLalth Caw Facilities Tenet tlealthwre Corp.
Hotels, h r t s & Cruiselinca Accor SA
Hou~hold F'rducts Svenska Cellulosa AB, B
I n d W W i n e r y Tyco lnremational Lid. Siemens AC; Koninklijke Philips Electrunics N\; Ilitachi Lid. h i r e Pacihc Ltd.. A Smiths Group PLC
lnsurancc Brokers Willis Group 1 loldinp Ltd
Integrated Oil Q Gu Royal Dutch Shell PLC. I3 BP PLC
Eni SPA kpl YPIC SA
Integrated Telecommunication Services France Telecom SA Kl- COT.. AUR Tclelonos dc Mexico SA de CV, I- AVR BCE Inc.
IT Consulting & Sorvim Elwronic DAW systems COT. kcenture Ltd.. A
Leisure Roducts Ninkndo Co.. 1.td
Lift & Health Insurance Torchmark Corp. Standard Life Assurance Co.
M w l e s & Entertainment News Corp, A Time Warner Inc. Viacorn Inc.. B
Multi-Line Insurance Xrncriwn lntemalional Group Inc. Aviva PLC h1uenchent.r Rucckve~icherungs-~l l~~ft AG
Networking Equipment The DlRECTV Group Inc. British Sky Broddwsting Croup PLC C o m a COT.. A
OBicc Elmmnia hniw Minoha Holding Ltd
USA
USA
USA
FRA
SWE
USA DEU N LD JPN I IKG CXR
USA
GBK GBR ESP ITA
FKA KOR MEX CAN
USA 1JSA
JPN
USA GBR
us4 USA USA
USA CBK DEU
USA GBR USA
JPN
USD
USD
usv
CUR
SEK
LjSU EUR EUK J PY IiKD GBP
USD
C;BP GRP EUK EUK
EUK u5v USD CZD
us0 USD
JYY
USU GBP
usv USD USD
USD GBP EUR
US0 CBP usv
Jm
101,284.047 1.32
113,227,535
52.801.033
58.700.000
4!Jy.411,616
172,720,739 151,200,000 77,139,000 33.0X.992 24,409.366 14,709,321
473.235.318
90,246,586
1M.221,623 103,632,492 70.740.000 69,794.842
347,388,957
104,750,000 63,123,760 34.253.250 32.661.803
234,788.813
83,153.87Y 72,736,157
155,892,036
19.664.977
39.965.236 34,267.233
74.232,469
178,993,229 123.717.270 118.1 12.198
~~
420.822.697
149,286,019 86,628,429 83,840,000
3 1Y .754.M
102.023.413 85,8W0.Y77 85,660.396
273,974,786
1.48
0.69
0.77
0.64
2-23 1.97 1.01 0.43 0.32 0.19
6.17
1.18
1.39 1.31 0.Y2 0.91
4.53
1.37 0.82 0.45 0.42
3.06
1.08 0.95
2.03
0.26
0.52 0.45
0.97
2.34 1.61 1.54
5.49
1.95 1.13 1.09
4.17
1.33 1.12 1.12
3.57
0.83
188
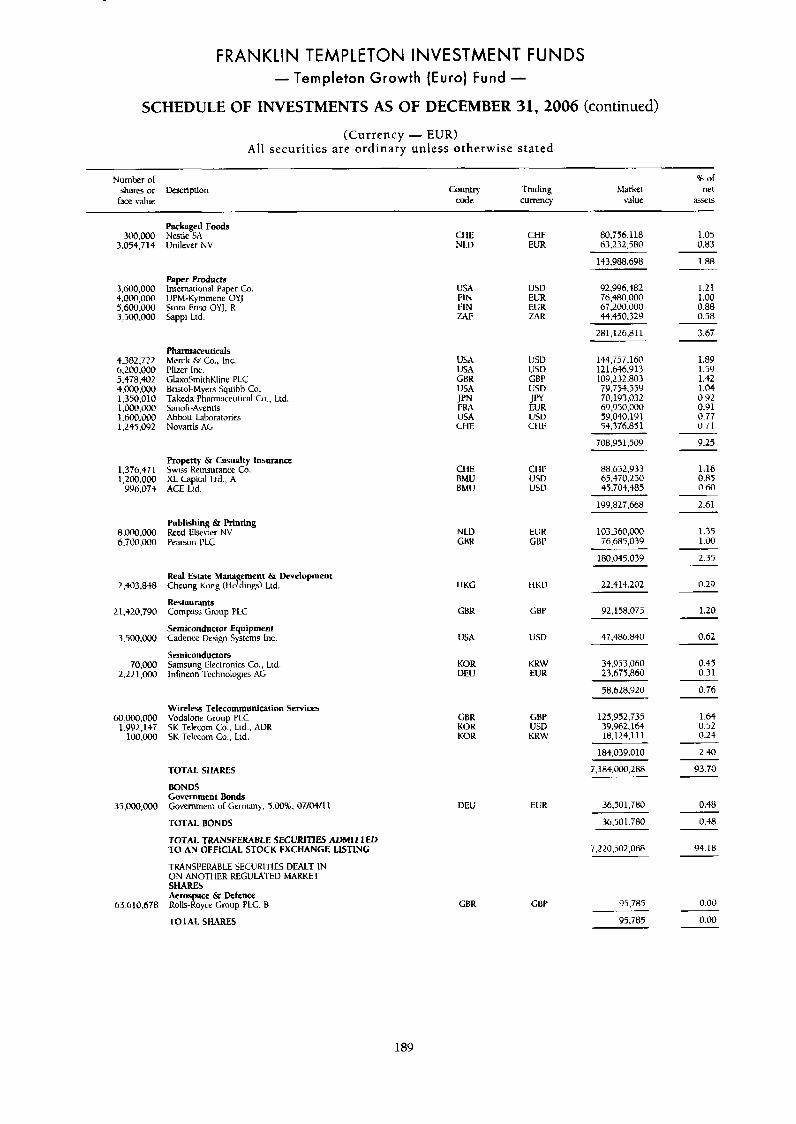
FRANKLIN TEMPLETON INVESTMENT FUNDS - Templeton Growth (Euro) Fund -
SCHEDULE OF INVESTMENTS AS OF DECEMBER 31,2006 (continued)
(Currency - EUR) A l l securities are ordinary unless otherwise stated
Number or % of
race value code currency value a5555 shares or Wscription Country Trading Marker net
Packaged Foods Nestle SA Unilever NV
300.000 3,054,714
3.~0.000 4.0Ix),000 5,600,000 3,900,000
4.382.722 6.200.000 5,478,402 +.000.000 1,350,010 l.O00,i100 1,600.WO 1,245.OYL
1,376,471 1,200.000
YYh.074
P.oc10.m 6.iO0.000
2.403,848
2 1.420.790
3.500.000
70.oM) 2,L21,000
6 0 , ~ . 0 0 0 1.Y92.147
1oo.m
35,000,000
63,610,678
CtlE NW
USA FIN FIN W F
USA USA GBR USA r; USA CHE
UiE BMU BMU
N LD CBK
I IKG
CHK
USA
KOR DEU
CBR KOK KOK
CHF EUR
USD EUR EUK W K
usu USD CBP USD JPY EUR llSD CHI:
CI 11: USD USD
EUK GBP
1.05 0.83
1.88
80.736.118 63,232,330
143.988.698
Paper Products International Paper Co. UPM-Kymmene OYl SLOM Enso OY], R Sappi Ltd.
1.21 1.00 0.88 0.58
3.67
92,996,482 76,4Ro,000 67,200,000 44.450.329
281,126,811
pharmaceuticals Merck dr Co., Inc. Prier Inc. GlaxoSrnithKline PLC Bristol-Myers Squlbh Co. Takeda Pham~ceutical Co., Ltd. SmoL-Aventis Abbhou Laboratones Novanis AC;
144,757.160 12 1.6+6.913 109,232,803 79.754.59 70.193.032 69,950,000 59,040,lY 1 5+.376,8il
1.89 1.5Y 1.42 1.04 0.92 0.9 1 0.77 0.71
9.25 708.951.50B
Property & Casualty Insurance Swiss Ucinsurancc Co. XL Capital Ltd., A ACE Lid.
1.16 0.85 0.60
88,692,933 65.470.230 45,704,485
199,827,668
103,360,000 76,685,039
180,045,039
2-61
1.35 1.00
Publishing & Printing k e d Elsevier NV Pearsun P1.C
2.35
Real Estate Maw ement & Development Cheung Kong (tiofdin& Ltd.
Restaurants Compm Group PLC
Semiconductor Equipment Cadence Design Systems lnc.
Semiconductors Sarnsung Electronics Co., Ltd Infineon Technologies AG
22,414.202 0.29
1.20
HKU
GBP 92,158,075
0.62 USD 47.486.840
34953.060 23.675860
58.628.920
0.43 0.31
KKW EUK
0.76
125,952,735 39.962,164 18.124.111
Wircless Telecommunication Services Vodalone Group P1.C SK Telecorn Co.. Ltd., ADR SK Telccotn Co., Ltd.
GBP USD KKLV
1.64 0.52 0.24
2.40 184,039,010
7,l RQ.OOO,LRR TOtAL SHARES
BONDS Government Bonds Government or Germany. 5.W%. 07/M/11
TOTAL BONDS
93.70
0.48 DEU EUR 36,501,7110
36.50 1.780
7.220.502.068
0.48
94.18 TOTAL TRANSFERABLE SECURITIES ADMlnED TO AN OFFICLAL STOCK EXCHANGE LISTING
TRANSFEKABLE SECURITIES DEALT IN O N ANOTHER E G U W 1 ' E D MARKET SHARES Aerospace & Defence RoII.-Ro~w Croup PLC. B TOtAL SHARES
CBK 95,785 0.00
95,785. 0.00
189
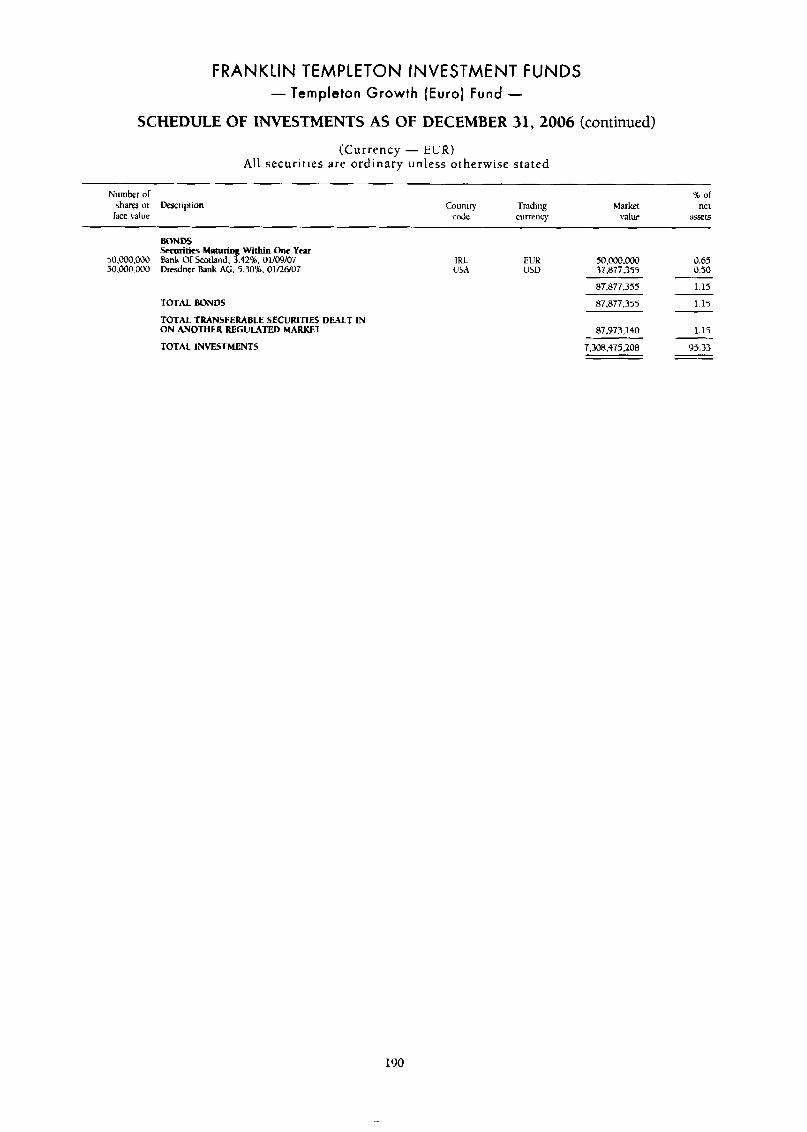
FRANKLIN TEMPLETON INVESTMENT FUNDS - Templeton Growth (Euro) Fund -
SCHEDULE OF INVESTMENTS AS OF DECEMBER 31,2006 (continued)
(Currency - E U R ) All securities are ordinary unless otherwise stated
Number or shares or Description
race value
% of Country Trading Market net
COdC currency value ;1ssets
50.000,000 50.000.000
BONDS Sccuritics M;lturiog Within One Year Bank 0 1 Scotland. 3.42% 01/09/07 Dresdnet Bank AG. 5.30% 01/26/07
TOTAL BONDS
TOTAL TRANSFERABLE SECURITIES DWLT IN ON ANOTHER REGULATED MARKET
TOTAL INVESTMENTS
IRL EUK 50.000.WO USA USD 37,877.355
87.~7.355
87,877.355
0.65 0.50
1.15
1.15
87973,140
7,308,475,206
1.15
95.33
190
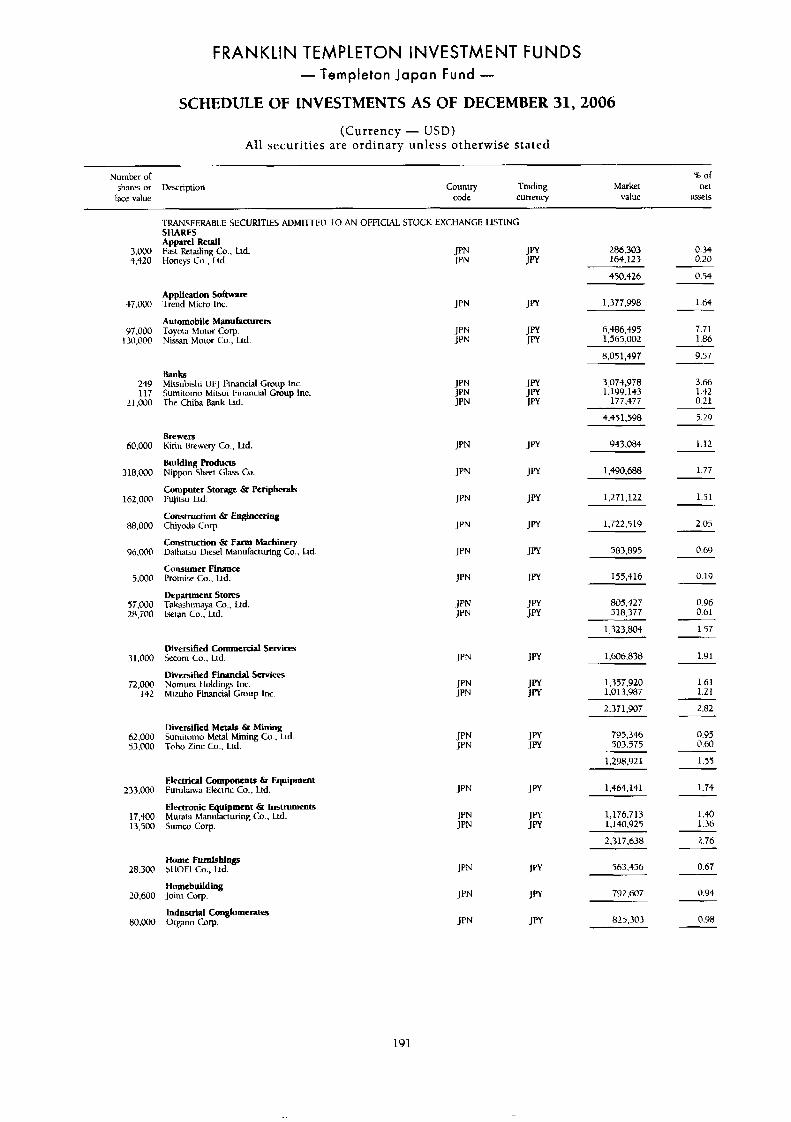
FRANKLIN TEMPLETON INVESTMENT FUNDS - Templeton Japan Fund -
SCHEDULE OF INVESTMENTS AS OF DECEMBER 31,2006
(Currency - USD) All securities are ordinary unless otherwise stated
Nuinber of % of shares or Description Country fnding Market net
fact value code currency value Lwels
TRANSFERABLE SECURITIES ADMIXED -1.0 AN OFFICUL STOCK EXCHANGE LISTING SHARES Apparel Retail
3.000 Fast Retailing Co.. Ltd. JPN 4.420 Honeys Co., Ltd. JPN
JW Ifl
0.34 0.20
286.303 164.123
450.426 0.54
Application Soltwm
Automobile M a n u h r e m
$7,000 Trend Micru Inc.
97.000 Toyota M o w Curp 170,000 Nissan Motor Co., Ltd.
J P N 1.64
7.71 1.86
9.57
1.377.998
15.486~495 1,565,002
IPN JPN
8,051,497
Banks Mitsubishi 119 Financial Group Inc. Sumitorno Mitsui 1:inancial Croup Inc.
249 117
21,000 The Chih h n k LIA
3,075,978 1.199.1+3
177,477
3.66 1.42 0.21
5.29
1.12
4,451,598
943.084 Brewers
60,000 Kirin Bnwery Co.. Ltd. JPN
Building Products
Computer Storage & Peripherals
Construction & Engineering
Construction 6r Farm Mpchinery Uaihatsu Diesel Manufacturing Co.. hd.
Consumer Finance
Department Stores
318,000 Nippon Sheet Glass Cu
162,000 Fujilsu Ltd.
88,000 Chiyoda Gwp.
96,000
5.000 Promise CO.. L[d.
57,000 Takhimaya Co., Ltd. 28,700 lwan Co., Ltd.
JPN
JPN
JPN
1.77 1.490.688
1.271.122 1.51
1.722.519 2.05 JW
Jp*I JPN 0.69 583,895
JPN 0.19 155,416
805,427 518,377
0.96 0.61
1,323,804
1,606838
1.57
1.91 Diversified Commercial Servirps
Diversified f iruncid Services
31.000 Secom Co.. Lrd.
72,000 Nomum I loldinp lnc. 142 Mituho Financial Group Inc.
JPN
1,357,920 1.01 3.987
1.61 1.21
JPN JPN
2.82
0.95 0.60
1.57
2,371,907
Diversified Me& &I .Mining Sumitorno Met31 Mining CU.. u d 62.000
53,000 Toho Zinc Co.. Ltd. JPN JPN
795,346 503.575
1.298.921
Electrical Components & Equipment
Electronic Eiyipmmt & Instruments Murdla hhnu actunng Lo., Ltd.
233.000 Futuhwa Elearic Co., Ltd.
17.W 13,500 Sumcu Corp.
1.74
1.40 1.36
2.76
1.464.141
1,176.713 1,140,925
2.317.638
JPN J PN
Home Furnishings
Homebuildq
Mustrial Conglomerates
28.300 SIlOEl Co., Ltd.
20,600 Join1 Corp
80.000 Orpno Corp.
0.67
0.94
563.456
792.607
825.303 0.98
191
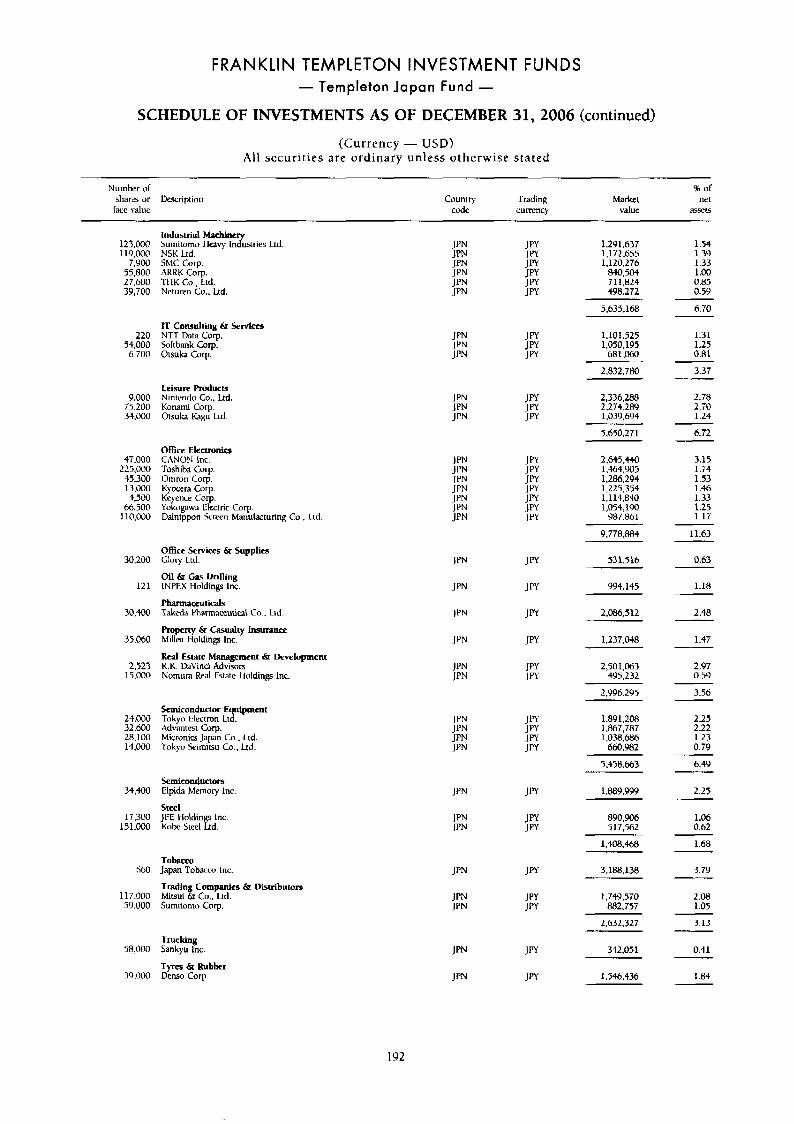
FRANKLIN TEMPLETON INVESTMENT FUNDS - Templeton Japan Fund -
SCHEDULE OF INVESTMENTS AS OF DECEMBER 31,2006 (continued)
(Currency - USD) Al l securit ies are ordinary unless otherwise stated
Number of 96 of sham or 13escnption Country Trading h4arkei net lace value code currency value a5XlS
123.000 119,000
7,900 54,800 27,600 39,700
220 54,000 6.700
9.000 75,200 31.000
45,000 225.000 45.300 13,000 4,500
66.500 110.000
30,200
121
30.40@
35 060
1,523 15.000
2.t.000 32.600 28.100 14,000
34.400
17.300 14 1,000
b6O
117,000 59,000
58,000
39.000
industrial Mnchim Sumitorno 1 lay i n ? k e s Ltd. NSK Lid. ShlC Corp. M R K Corp. 'TIIK Co., Ltd. Ncturen Co.. Lid.
IT Consulting Q SeMm NTT Data Corp. Snltbank Corp Otsuka Corp.
Leisure Products Nintmdo Co.. Ltd. Konami Corp. Otsuka Kagu Ltd.
Office Electronics CANON lnc. Toshiha Corp. Omron Corp. Kyocen Corp. Kc e w e Corp yottogiw Electric corp. Dainippon Screen Manufacturing Co.. 1.td.
Office Services 6r Supplips Glory Ltd.
Oil &I Gas Drilling INPEX Moldings Inc.
Pharmaceuticals Takcda Yharmareutiul Co., hd.
Property & Casualty Insurance Millca I loldinp,5 Inc.
Real Estate Managerncnt & k e l o p m e n t K.K. DaVinci Advisors Nornun Real Estate 1 loldinp lnc.
Semiconductor E uipment Tokyo Electron Lt!. Advantest Corp Micronia Japan Co., Ltd. Tokyo Seimitsu Co.. hd.
Semiconductors EIpida Memory lnc.
Steel JFE Holding Inc. ffih Steel Ltd.
Tobacco lapan Tobxw Inc.
Trading Cumpanics 67 Distributors Mitsui & Co.. Ltd. Sumitorno Cop.
Trucking hnkyu Inc.
Tyres & Rubber Denso Corp.
1.2Y 1,637 1.172.655 1,120.276
840.5lJ4 711,824 498.272
1.54 1.39 1.33 1 .oo 0.85 0.59
5,635,168 6.70
1,101,525 1,050.195
68 1.060
2.832.780
2,336,288
1,039.694
5,650.271
I .274.289
2.645.440 1,464,905 1,286.294 1,225.354 1.1 14,840 1,054,190
987.861
9.778.884
5.3 1.5 I6
994,145
2,086.512
1,237,048
2.50 1,063 $95,232
2.996.295
1 .89 1 ,zm 1,867,787 1,038.686
660,982
5.458.663
1,889.999
1.31 1.25 0.81
3-37
2.78 2.70 1.24
6.72
3.15 1.74 1.53 1 .46 1.33 1.25 1.17
11.63
0.63
1-18
2.48
1.47
2.97 0.59
3.56
2.25 2.22 1.23 0.79
6.49
2.25
890.906 517,562
1.06 0.62
1,408,448
3,188,138
1.749.570 882.757
1.68
3.79
2.08 1.05
2.632.327
342.051
1.546.436
3.13
0.41
1.84
192
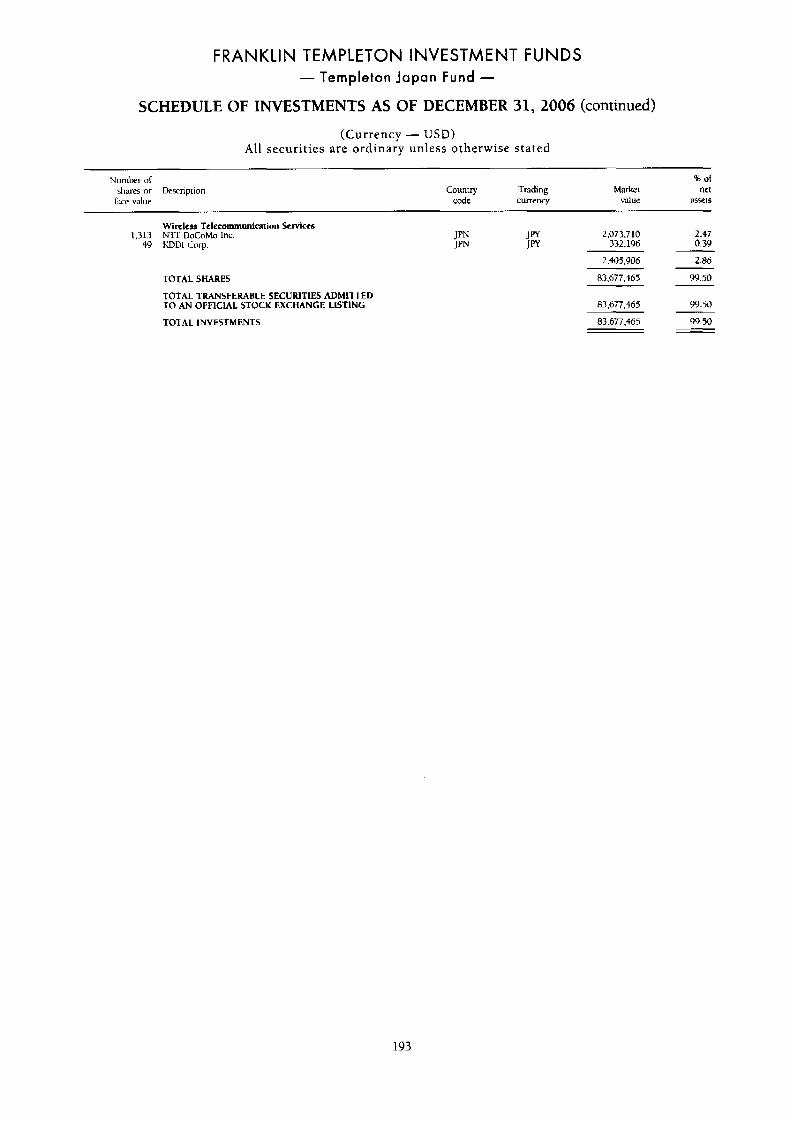
FRANKLIN TEMPLETON INVESTMENT FUNDS - Templeton Japan Fund -
SCHEDULE OF INVESTMENTS AS OF DECEMBER 31,2006 (continued)
(Currency - USD) Al l securit ies are ordinary unless otherwise stated
~
Number of shares or Dernption
lice value
% of Country Trading Market ne1
code currency vnluc SX15
Wireless 'Telecommunication Strviccs 1.111 NTT DoCoMo Inc
49 KDDl Corp.
TOTAL SHARES
TOTAL TRANSFERABLE SECURITIES ADMlTfED TO AN OFFlClAL STOCK EXCHANGE LLSTlNG
TOTAL INVESTMENTS
2,073.7 10 2.47 0.39
J PY JW 332.196
2.405.906 2.86
83.677.465 99.50
83,617,465 99.50
83.677.465 99.50
193
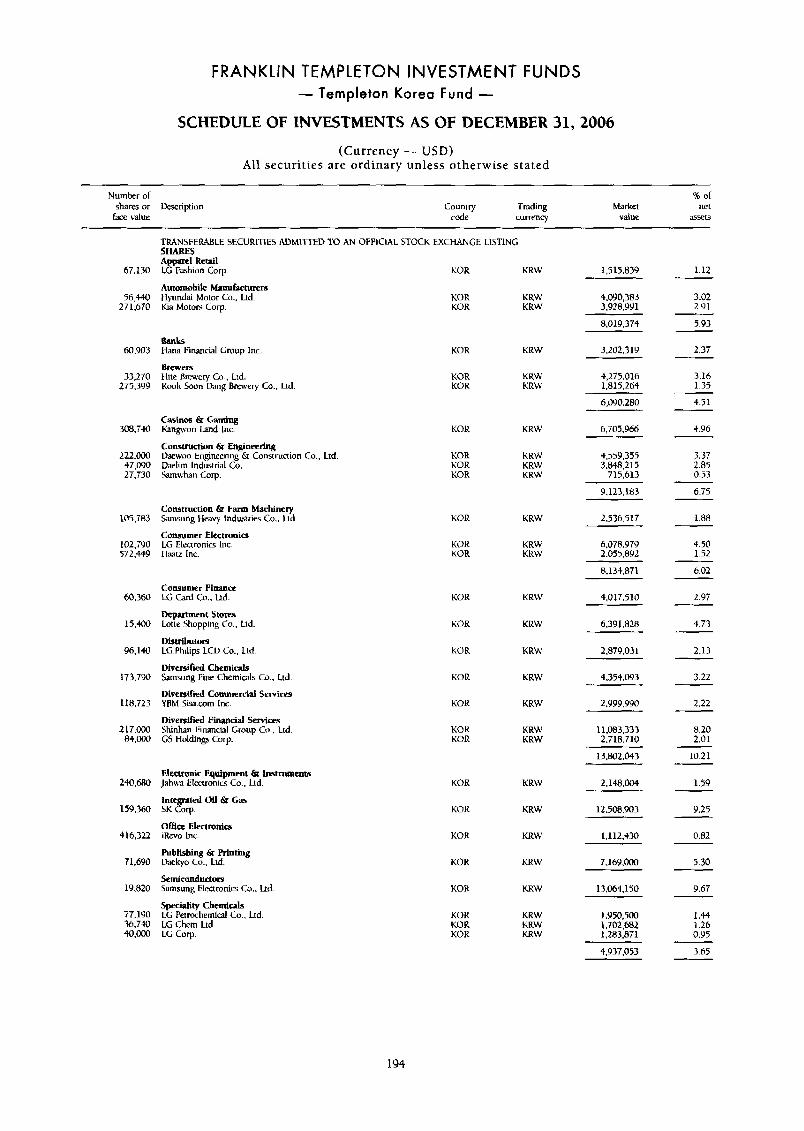
FRANKLIN TEMPLETON INVESTMENT FUNDS - Templeton Korea Fund -
SCHEDULE OF INVESTMENTS AS OF DECEMBER 31,2004
(Currency - USD) All securities are ordinary unless otherwise stated
Number of % of shares or Uexription Cowry Trading hiarket net
race value Code currency value SXt5
TRANSFEWLE SECURITIES ADMInED TO AN OFFICLAL STOCK EXCHANGE LISTING SHARES Aa-1 Rerail
67.130
56,440 271,670
60.903
33,270 275,399
308,TSO
222,000 47.090 27,730
105,783
102,790 572.4451
60,360
15.400
96,140
173.790
118,723
217,000 84,000
240.680
159,360
416,322
71,690
19.820
77.190 36,740 4o.m
Lc'Fashion Corp
Automobile Manufacturers tiyundai Motor Co.. Ltd Kia Motors COT.
6anlrs tbna I;inancial Cniup Inc
Brewers Hite Brewery Co.. Ltd. Kook Soon Dang Brcwery Co., Ltd
Casinos C Gaming Kangwon Land Inc.
Construction & Enginerring Daewoo Enpeering & Construclion Co.. Ltd Uaelim Industrial Co. Samwhn Corp.
Consttuction & Farm Machinery Samsung Heavy Indmtries Cu.. Ltd
Cansumcr Electronics LG Electroni- Inc. Ilmtz Inc.
Consumer Finance LG Card Cn., Ltd.
Department Stores Litk Shopping Co., Ltd.
Distributors LG.Philips LCU Co., Ltd
Diversified C h e m i d Samsung Fine Chemicals Co., I.td
DiverslFied Commercid S e m m YRM Si=.com Inc.
Diversified Financial Services Shinhan I~inancial Croup Co.. Ltd. G5 Holdings COT.
Elcctrcmic Equipment & hunurnmts Jahwa Elmtronins Co., Ltd.
Integrated Oil & Gas SK LOT.
Omee Electronics iRevo lnc.
Publishing & Printing Daekyo Co.. Ltd.
Semiconductors Samsung Electroni- 6.. Ltd
Speciality Chemirals LG Pewochemical Co., Ltd. LG Chem Ltd. LG Corp.
YOR
KOR KOR
KOR
KOR KOR
KOK
KOR KOR KOR
KOK
KOK KOR
KOR
KOR
KOR
KOK
KOK
KOK KOR
KOR
KOR
KOK
KOR
KOR
KOR KOR KOR
KRW
KRW KRW
KKW
KRW KRLV
KRW
KRW KRW KRW
KRW
KRW KKW
KR\\'
unw
KRlV
KRU'
KRW
KRW KRW
KKW
KRW
KRW
KKW
KRW
KRW KRW KRW
1.515.839
4.W0.383 3.928.YYl
8,019.374
3.202.31Y
4,275,016 1,815.264
6,090.280
6,705,966
4,559,355 3,848,215
715.613
9,123,183
2,536.517
6.078.979 2,055.892
8,134,871
4.017.510
6,391.828
2,879.03 1
4,354.093
2,999,990
11,083,333 2.718.710
13.802.043
2,148.004
12.508.903
1,112,430
7,16Y.000
13064,150
1,950,500 1,702,682 1,283,871
4,937,053
1.12
3.02 2.9 1
5.93
2.37
3.16 1.35
4.51
4.96
3.37
0.53
6.75
1 .H8
4.50 1.52
6.02
2 . ~ 5
2.97
4.73
2.13
3.22
2.22
8.20 2.01
10.21
1-59
9.25
0.82
5.30
9.67
1 .et 1.26 0.Y5
3.65
194
.. .
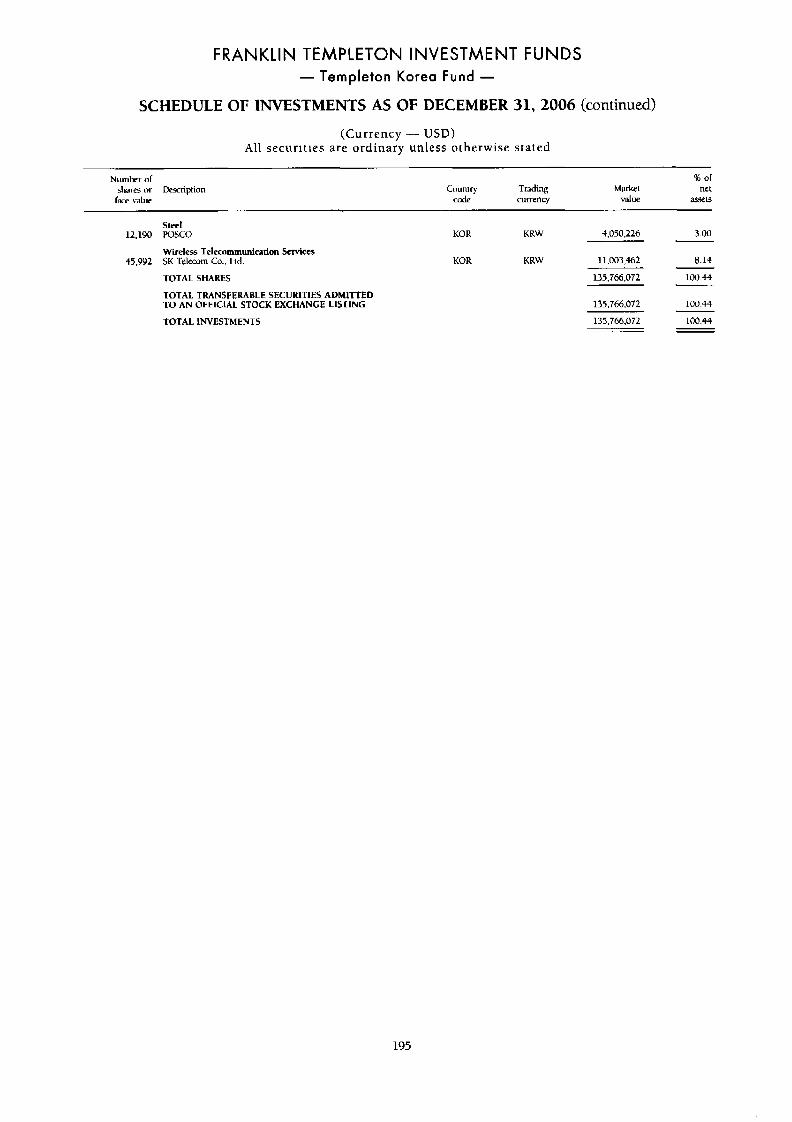
FRANKLIN TEMPLETON INVESTMENT FUNDS - Templeton Korea Fund -
SCHEDULE OF INVESTMENTS AS OF DECEMBER 31,2006 (continued)
(Currency - USD) All securit ies are ordinary unless otherwise stated
Number of % of
Pace value code currency value ;155el$
share or Description Couniry Trading Market ne1
Steel
Wireless Telecommunication Services
12,190 POSCO
45.992 SK 'l'elecom Co., Ltd.
TOTAL SHARES
TOTAL TRANSFERABLE SECURITIES ADMITTED TO AN OFFlClAL STOCK EXCHANGE LISTING
TOTAL 1NVESTMENTS
KOR KUW 4,050,216 3.00
KOR K K W 11,003,462 8.14
135,766.072 1W.44
135.766.072 100.44
135,766,072 100.43
195
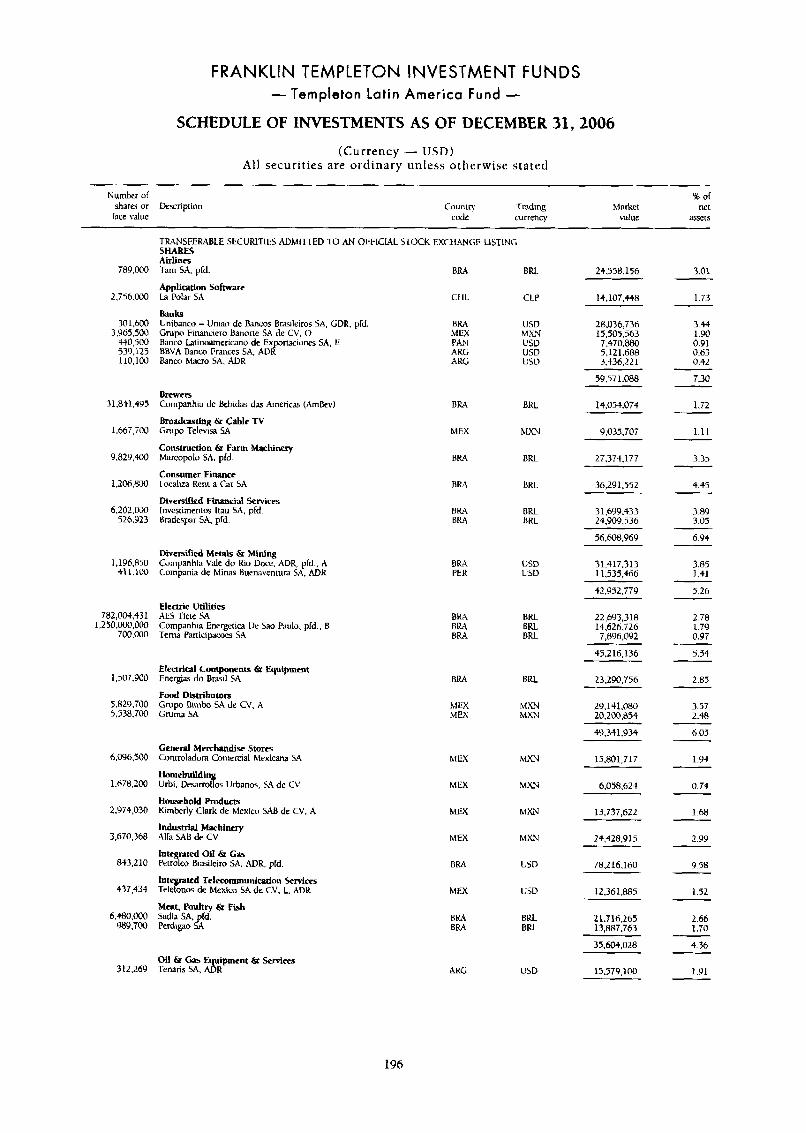
FRANKLIN TEMPLETON INVESTMENT FUNDS - Templeton Latin America Fund -
SCHEDULE OF INVESTMENTS AS OF DECEMBER 31,2006
(Currency - USD) All securities are ordinary unless otherwise stated
Numbcr or shares or Description
race value
% of net
i s m s Country 'Trdding code currency
Market value
TRANSFERABLE SECURITIES ADMIXED TO AN OI'FLCWL STOCK EXCHANGE LISTING SHARES Airlines Tarn SA. pfd.
Applicltion Software La Polar SA
Banks Unibanco - Uniao de Rancos Rnsileiros SA, GDR. prd. G i p o Fimnciero Banorte SA de CV. 0 Banco latinoamericana de Expomciones SA, E B W A Banco Frances SA AVR Ranco Macro SA. AVR
789.000
2.756.000
301,600 5.Y65.500
430,500 539.125 110,100
31.8+1.495
1 .667,T00
9.829.400
1,206*8N
6,202.000 526.923
1,196350 411.100
782,004.43 1 1,230,000.00O
700.000
1,507,900
5,829,700 5,538,700
6.0Y6.500
1,678,200
2.974.030
3,670,368
843.210
437.434
6.480.000 989,700
312.269
BRA RRL 24,558.156 3.01
1.73
3.44 1.90 0.91 0.63 0.42
7.30
1.72
1.11
3.35
4.45
3.89 3.05
6.94
3.85 1.41
5.26
2.78 1.79 0.97
CI IL CLP 14,107.+48
tm USD 28,036,736 MEX MX! 15.505.563
ARG USP 5.12 1.688 ARC; USD 3.436.221 ~,
59.571.088
Brewers Companhia de behidas &E Americas (Arnkv)
Broadcasting & Cable TV G N ~ O Televisa SA
Construction & Farm Machiwry btarcopok3 SA, pfd.
Consumer Finance Cocahza Rent a Car SA
Diversified Fmcial Services Inveshentos l rau SA, pfd. Bndcspr SA. prd.
BRA BKL 14,054,074
9,035,707 MEX blxN
R R L 27.374.177
BRA 36,291.552
BRL BRL
31 fM.433 24,909.536
56.608,969
Diversilled Metals & Mining Cornpanhia Valc do Rio Uocc. ADK pfd., A Cornpanla de Minas Buena\~enrura SA. ADK
BRA PER
USU USD
31.417.313 11.535.466
42952,779
22.61)3,318 14.626.726 7,896.0Y2
Electric Utilities AES Tiek SA Cornpanhia Energetics De Sa0 Pado, pfd.. R Tema Participacoes SA
B U BRA R R A
BRL
BRL nuL
45,216,136
23,290,756
5.54
2.85
3.57 2.48
B.05
1.94
0.74
1.68
2.99
9-58
1.52
Electrical Components L Equipment Eneraas do Brasil SA
Food Distributors Crupo Bimho SA de CV. .i Gruma SA
BRA RKL
29.141.080 20,200.854
MEX MXN MEX MXN
49.351.934
15.801.717 General Merchandisc Stores Controladun Comercial hlexicana SA
Homebuiidi Urbi. UesarmToos Urbanos, 5.i de CV
Household Roducts Kimberly Clark de Mexico S M de CV. A
Industrial Machinery Alfa SAB de CV
Integrated 011 & Gas Petrole0 Bmileiro SA. ADR, pfd
lnte tcd Telecommunication %vices TeleEos de htexico SA de CV. L. ADU
M a t , Podtty 6r Fish Sadia SA, pTd. Pedigao M
hlEX MXN
MEX MXN 6,058,624
13,737,622
24.428.915
78216,160
12.361.A85
MEX hlXN
MEX MXN
MEX USD
2 1.716.265 13 887.763
2.66 1.70
BRA R R L BRA RRL . .
35,604,028 4.36
1.Y1 Oil & Gas Equipment br Services Tcnaris SA, ADR ARC; USD 15,579,100
196
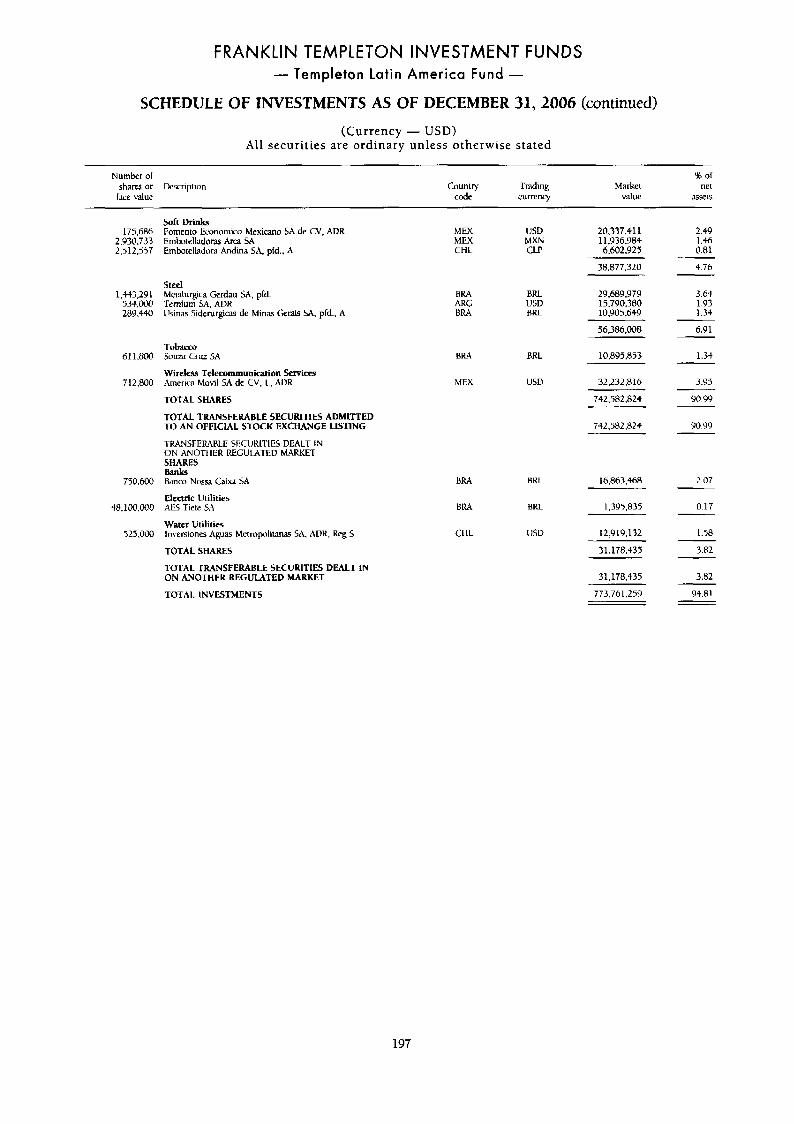
FRANKLIN TEMPLETON INVESTMENT FUNDS - Templeton Latin America Fund -
SCHEDULE OF INVESTMENTS AS OF DECEMBER 31,2006 (continued) (Currency - USD)
Al l securit ies are ordinary unless otherwise stated
Number of shares o r Oerription
lace v3luc Country Trading
code currenq
or Marker net
value i\ssels
175,686 2,930,733 2.5.12.537
l.tt3.29 1 534.000 28Y ,440
611,800
712,800
750.600
48,lCW.OOO
525,000
Soft Drinks Fomento 1:conomico Mexican0 SA de CV. ADR Emhtellador& Arc3 SA Emhtelladord Andina SA, pfd.. A
Steel Meidurgica Gcrdau SA. pld. Tcrnium SA. ADK Usinas Siderurgiw dc hiinas Gemis SA. pfd., A
Tobacco Soum C m SA
Wireless Telecommunication Services America Movil SA de CV. 1.. AVR
TOTAL SHARES
TOTAL TRANSFERABLE SECURITIES ADMITTED TO AN OFFlCIAL STOCK EXCHANGE LISTING
I K4NSFEMRLE 5ECIIKI'TIES DEALT IN ON ANC)TI ILH KEGULATED W E T SHARES aanh Banco Nos= Caixa SA
Electric Utilities AES Tietc SA
Water Utilities lnversioncs Aguas Mcrmpolimm SA. AVK, k g S
TOTAL SHARES
TOTAL TRANSFERABLE SECURlTlES DEALT IN ON ANOTHER REGULATED MARKET
TOTAL INVESTMENTS
MEX MEX CHL
RRA ARG BRA
BRJ4
MEX
BRA
B M
CI IL
USV Mm CLP
BRL USD BKL
BRL
USD
BKL
BKL
USV
20.337.41 1 11,936,984 6.602.925
38.R77.320
29,689,979 15,790,380 10,905,639
56.386.008
2.M 1 .M 0.81
4.76
3.64 1.93 1,34
6.91
10.895.853 1.33
32,232,016
16.863.468
1,395,835
129 19.1 32
31.178.+33
31,178,435
773,761.259
3.95
90.99
90.99
2.07
0.17
1.58
3.82
3.82
9S.81
197
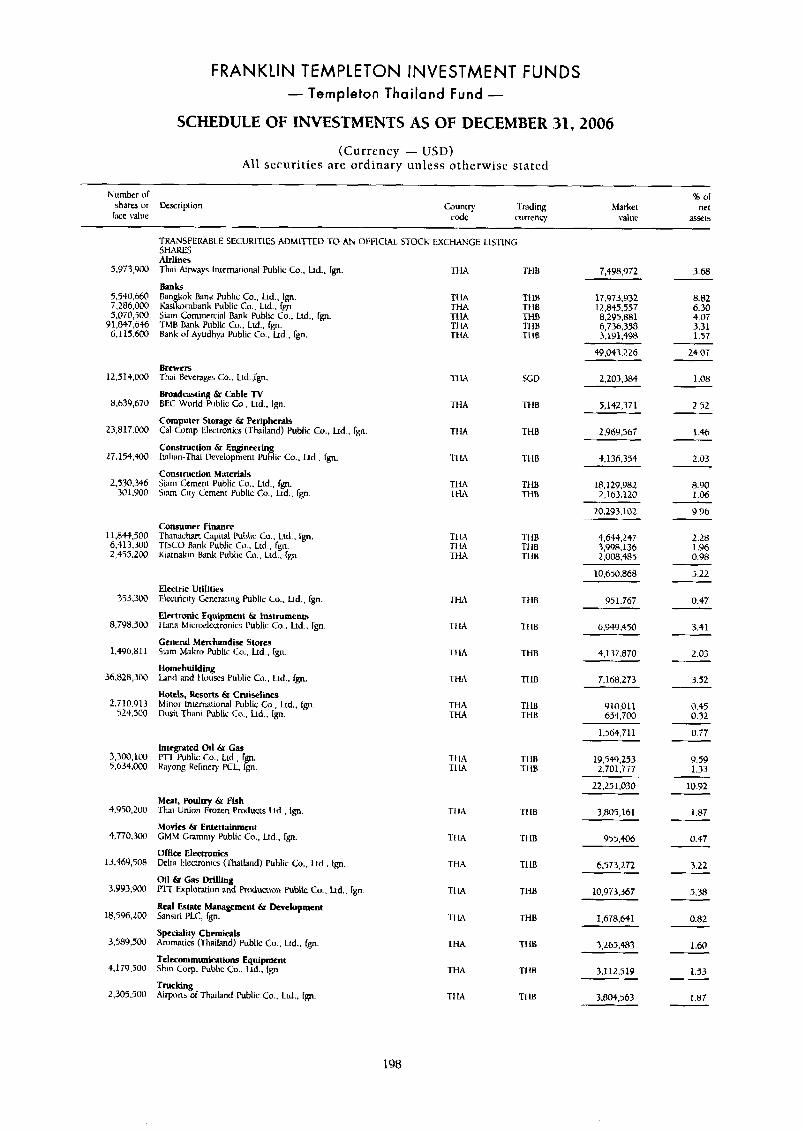
FRANKLIN TEMPLETON INVESTMENT FUNDS - Templeton Thailand Fund -
SCHEDULE OF INVESTMENTS AS OF DECEMBER 31,2006
(Currency - USD) All securit ies are ordinary unless otherwise stated
Number or % or
r x e value code currency value assets shares or Uexription Country Trading Market net
5,973,900
5.5.tO.660 7.286.000 5.0i0,jOO
9 1,847.6$6 6.1 15.600
12,514,000
8,639,670
23,817.000
27.154.400
2,530.346 301,YOO
11.844.500 6,413,300 2,455.200
353,300
8,798.500
1,496.81 1
36,828,300
2.710.913 524.5N
3,300,100 5,634.000
4,950,200
4,770,300
13,469,508
3,993,900
18,596,200
3,589,500
4,17Y.500
2,305.500
Airlines Thai Always Iniemarional Public CO.. hd.. Ign.
Bank Ban hok Bank Public Co., Lid.. fgn. Kas&rnbank Public CO., Ltd., rp. Siam Commercial Bank Public Co., Ltd.. rpp 'IMB Bank Public Co., Ltd.. Ign. Bank of Apdhya Public Co., Lid., rgn,
Brewers Thai Beverages Co.. Lid.,@.
Broadcasting 6r Cable TV BEC World Public Co., Lrd., fgn.
Computer Storage & Peripherals Cal-Comp Electronics (Thailand) Public Cu., Lid., fgn
Construction 6r Engineoting Italian-Thai Development Public Co.. Ltd.. fgn,
Construction MateriPls $am Cement Public Co.. Ltd., Cgn. Sinm CiIy Cemeni Public Co.. Lid.. Ign
Consumer Finance T h a c h a n Capitd Public Co.. Ltd., rgn, TISCO Hank Public Co.. Ltd., fgn. Kiatnakin Bank Public Co.. Ltd., Tgn.
Electric Utilities Electricity Geneniing Public Co.. Lid., tgn
Electronic Equipment L Instruments 1 lana Micmelecimnics Public Cu.. Lid., rgn
General Merchandise Stores Siam Makro Public Co., Lid., Ign.
Homebuilding h n d and llouxs Public Co.. Ltd., rgn,
Hotels, Resorts & C r u i s e l i i Minor International Public Co., Lid., fgn. Dusit Thani Public Co., Lid.. Ign.
Integrated Oil 6r Gas P n Public Co., Ltd., r n byong khncr). E L , 6;. Meat, p m t l ~ y 6r Fish 1-hai Union Frozen Products Lid.. Ign.
Movies 6r Entertainment CMM Grammy Public Co., Lid.. I p .
Oflice ElecVonits Del13 Electronics (Thailand) Public Crr.. Ltd.. IF.
€'-[ Exploration 3 d Pnduaion Public Co., Lid.. Ign. Oil & cas Drilling
Real Estate Management Sansiri PLC, fgn.
& Dwelopment
Speciality Chemicals Aromaiics ('Thailand) Public Co., Lid.. Ign.
Yelecommunieatiom Equipment Shin COT. Public Co.. Lid.. I p .
Trucking Airpons of Thailand Public Co., Ltd.. Ign
TtM
TllA THA THA TI IA TtlA
f l M
Tt IA
TtiA
'1.1 IA
THA TtM
TIL', TI M T t U
THA
TIM
T I IA
-ri-n
TtiA THA
?I IA Tl LA
TI It$
1'1 IA
TtiA
TI 1A
1-1 IA
TtW
THA
TtM
TtlB
TI ltl TtlB THE .TI IB TI IB
SCD
rt im
THE
11-18
Tt 16 THB
TI 1B TI IB TI 1B
THB
11 1B
TtlB
THB
TI IB Tt-IB
1.1 IB -1.1 LB
'1.1 IB
- r i i ~
TI IB
THB
THB
TI 1B
TI 1B
TI Itl
7,498.972
17.973.932 12.845.557 8.295.881
49 m3.226
2.203.384
5,142,371
L.969.56i
4,136,354
18.129.982 2,163.120
20.293.102
4.644.247 3,998.1 36 2.008.485
10.650.868
951.767
6.949.450
4,137.870
7.168.273
910.0ll 654.700
1.564.71 1
19,544,253 2,701.777
22.251.030
3.805.161
955.406
6,573,212
10,973,367
1.678.641
3,265,483
3.112.519
3.804.563
3-68
8.82 6.30 4.07 3.31 1.57
24.07
1.08
2.52
1.M
2.03
8.90 1.06
9.96
2.28 1.96 0.98
5.22
0.47
3.41
2.03
3.52
0.45 0.32
0.77
Y.59 1.33
10.92
1.87
0.47
3.22
5.38
0.82
1.60
1.53
1.87
198
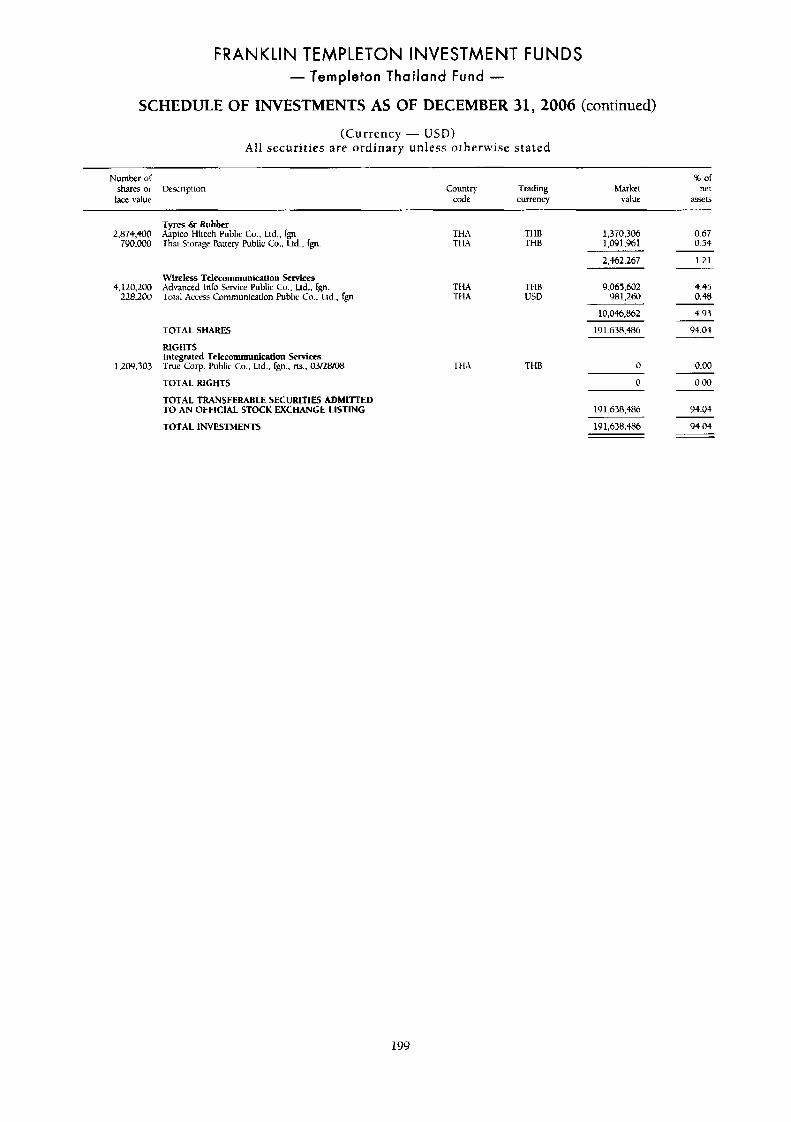
FRANKLIN TEMPLETON INVESTMENT FUNDS - Templeton Thailand Fund -
SCHEDULE OF INVESTMENTS AS OF DECEMBER 31,2006 (continued)
(Currency - USD) All securities are ordinary unless otherwise stated
Numher of % of shares or Description Country Trading hlarket net lam rdue code currency value asset5
2,874,400 790,000
4,120,200 228,200
1.2w.303
Tyres & Rubber Aapico Hitech Public Co.. hd.. fgn 'Thai Storage Battery Public Co.. I&.. fp
TI 1A THB 1,370,306 TI LA THB 1,091,961
2,442,267
0.67 0.54
1.21
Wireless Telecommunication Services Advanced Inko Service Public Co.. Lid.. kgn. Total Access Communication Public Co.. Ud.. kgn
THA TI IB 9,065,602 -rm USD 981.260
4.45 0.48
TOTAL SHARES
RIGHTS Integrated Telecommunication SeMm True COT. Publlc Co.. Lid., tgn., m.. 03RWO8
TOTAL RIGHTS
TOTAL TRANSFERABLE SECURITIES ADMITTED TO AN OFFICIAL STOCK EXCHANGE LISTING
TOTAL INVESTMENTS
10,046,862
191.630.486
4.93
94.04
THE 0 0.00
0
191.638.486
0.00
94.04
19 1,638.4Rb 94.04
199
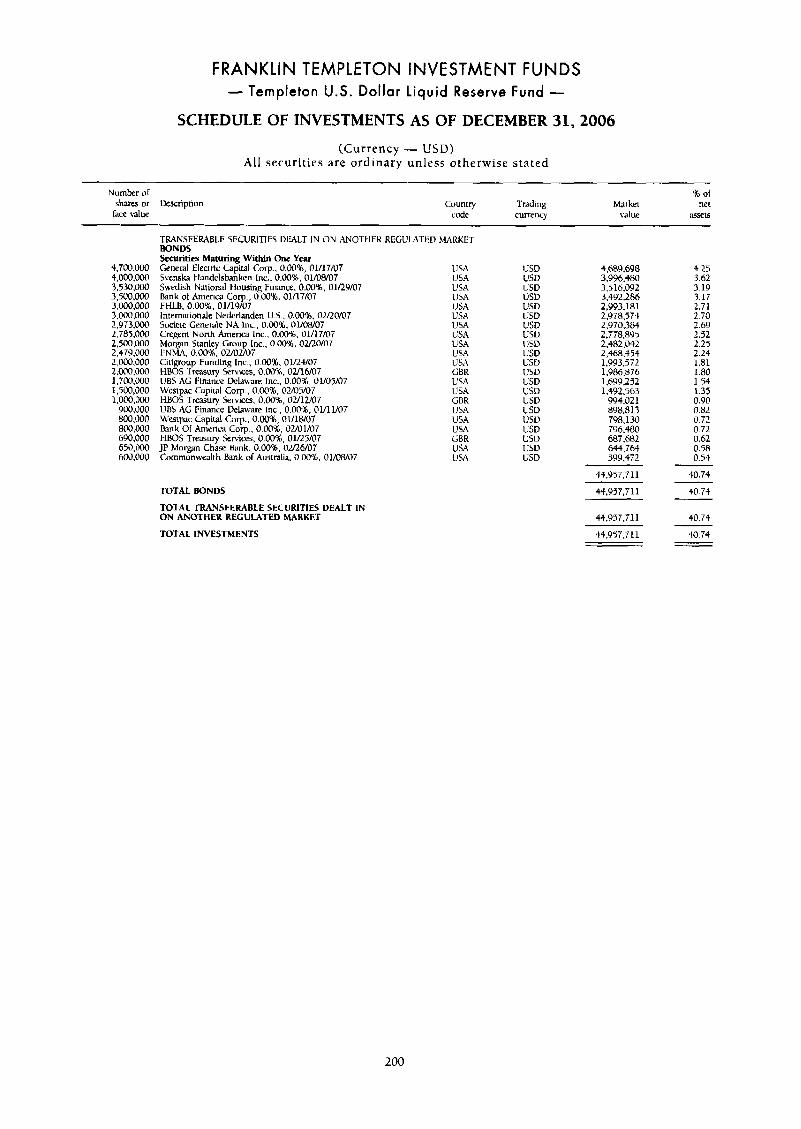
FRANKLIN TEMPLETON INVESTMENT FUNDS - Templeton U.S. Dollar Liquid Reserve Fund -
SCHEDULE OF INVESTMENTS AS OF DECEMBER 31,2006 (Currency - USD)
Al l securities are ordinary unless otherwise stated
Number of shares or Uescription face value
Country Trading cude currency
~ ~
4 or Market net
value a5535
TRANSFERABLE SECURITIES DEALT IN ON ANOTHER RECUUTED MARKET BONDS Securities Maturing Within Onc Year
4,700,000 General Elcciric Capital Corp., O.oO%, 01/17/07 USA USD 4,689,698 4.25 4,000,000 Svenska I-landelsbanken Inc. 0.00%, 01/08/07 US.4 USD 3.996.4W 3.62 7,530,000 Swedish Nalional liousing Fimncr. 0.00%. 01/29/07 USA USD 3.5 16,092 3.19 3,500.000 Bank of America Corp., 0.00%. 01/17/07 USA USI) 3.492.286 3.17 3,000.000 FHLH. 0.00%. 01/19/07 1JSA LSD 2,993,18 1 2.71 3.000.000 Internationale Nederlanden U.S.. 0.00%. OU20/07 USA USD 2378,574 2.70 2,973.000 Societe Genetale NA lnc.. 0.00'16, 01/08J07 USA us13 2,970,384 2.69 2,785.000 Cregem North America Inc., 0.00%. 01/17/07 USA USU 2,778,895 2.52
2.25 2,500,000 Morgan Stanley Group Inc.. 0.00%. OU20/07 LISA USD 2.47Y.000 FNM.4, O.OO%, OuUuO7 L'SA USD 2,468.354 2.24
2.000.000 HBOS Treasurv Services. 0.00%. 0216/07 CBK USD 1.986 876 1.80
2.+82.042
2.000.000 Citigruup Funding Inc., 0.00%, 01/24/07 USA USD 1,993,572 1.81
1.700.W@ UBS AG Finarice Delaw& Inc.. 0.00%. 01/05/07 1,500,000 Watpac Capirai Corp.. 0.0Osb. 02/05/07 1,000,000 1-1805 Treasury Services. 0.00%. 02/12/07
900.000 UBS AG Finance Delaware Inc., 0.0016, 01/11/07 800.000 Westpac Capital Corp.. 0.00%. OlllPM7 800.000 Bank Of Amcried Corp., 0.0016. 02/01/07 690.000 I-IBOS Treasury Services, 0.00%. 01/25/07 650,000 JP Morgan Chase Bank. 0.00%. 02/26/07 600,000 Commonwealth Bank of Austrdia. 0.00%. 01/0W07
TOTAL BONDS TOTAL TRANSFERABLE SECURITIES DEALT IN ON ANOTHER REGULATED MARKET
TOTAL INVESTMENTS
USA U S 0 1:699;2?2 USA USD 1.492.563 tiBR USD 99 4.02 1 USA USD 898.813 USA usu 798.130 USA LJSD 796.480 CBR USD 687.682 USA USD 614.764 LISA USD 599:472
1.54 1.35 0.90 0.82 0.72 0.72 0.62 0.58 0.54
44,957.711
44.937.71 1
40.74
40.7-l
44.957.711
44.%7.i11
40.74
40.74
200
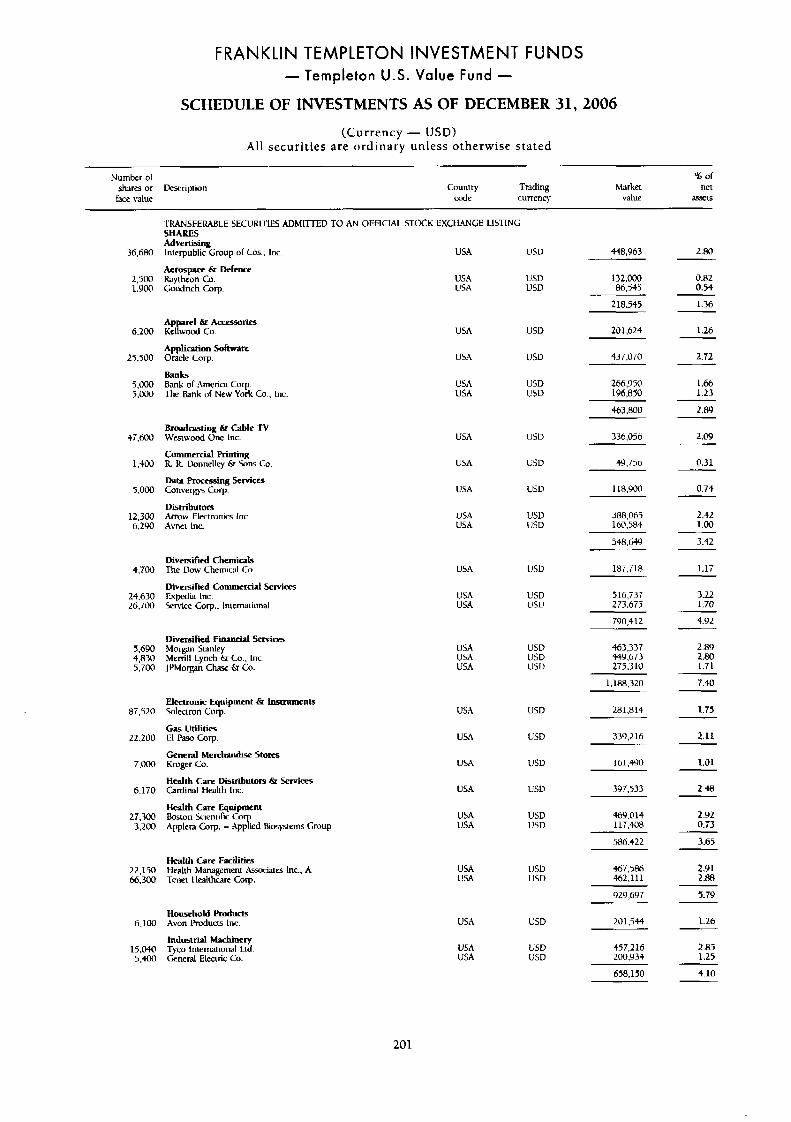
FRANKLIN TEMPLETON INVESTMENT FUNDS - Templeton U.S. Value Fund -
SCHEDULE OF INVESTMENTS AS OF DECEMBER 31,2006
(Currency - USD) All securities are ordinary unless otherwise stated
~. ~
Number nl shares or Description face value
?4 of Country Trading Market net
code currency value a55ets
I'MNSFERABLE SECURI~I'IES ADMITTED TO AN OFFICLAL STOCK EXCllANGE LISTING SHARES Advertising Interpublic Croup or Cos., Inc. USA usv 36.680
2,500 1.900
6,200
25,500
5.000 5.000
Si.600
1.400
5,000
12,300 6.290
4.700
24,630 26.700
5,690 4.830 5,700
87.520
22.200
7.000
6,170
27.7M 3,200
22,150 66,300
6.100
15,040 5 . m
448,963
132.000 86,545
218.545
2-80
0.82 0.54
1.36
Aemspacl & Defence Rayrheun Cu. Goidrich Corp.
USA USA
usw USD
Apparel & Accssorier Kellwood Co.
Applimtion Software
Bank Bank of America Corp. The Bank ul New York CO., Inc.
Oracle cop.
USA
USA
USA USA
USD 201.624
437,070
1.26
2.72 USD
266.950 196.850
1.66 1.23
USD I!SD
2.w
2.09
463.800
336,056 Broadlnrting & Cable TV \Vcsrwod One Inc.
Commercial Printing R. R Donnelley 8 Sons Co
Data -sing Services Converms Corp.
Distributors A w w Electronla Inc Avnet Inc.
USA USD
49.756 0.31 USA USU
USA usv 118,Yoo 0.74
USA USA
USD USD
2.42 1-00
3R8.065 160.584
548.649 3.42
Diversified Chemicals The Dow Cherniwl Ci).
Diversified Commercial Services I:xptdia lnc. sfnice Corp.. Internaiiimal
USA 187.7 18
516,i37 273.675
790.412
1.17
3.22 1.70
USA USA
USD USV
4.92
463,337 449.673 275.310
2.89 2.80 1.71
Diversified F h a n c i d Setvices Morgan Sianley Merrill Lynch & Co.. Inc. JPMorpn Chaw 6r Crr.
USA USA USA
USD USD u w
7.40
1.i5
1,188,320
281.814 Electronic Equipment & Instruments Solecrmn Crrrp
Gas Utlliti-
General Merrhandise StO- K n v p Co.
Health Care Distributors & services Cadiml Health Inc.
Hdth Care Equipment Buston kieniific Coy. ,
Applera Cop. - App ied Bioqxterns Croup
El Pas0 Corp
USA USD
2-11 USA USW 339,216
USA USD 161,+YO 1.01
USA lJSU 397,533 2.48
46Y.01+ 117.408
2.92 0.73
USA USA
USD USD
3.65 586.422
Health Care F a c i l i t k Health Mamgcment . k h s Inc.. A Tenet I lealthcarr Corp.
USA USA
usv W W
467.586 4fl2.111
2.91 2 .e8
5.79
1.26
929,697
201,544 Household Products hvon Pnducts Inc
Industrial Machinery Ty-co lnlematiorwl Lld. General Electric Co.
USA USD
USA USA
USD usv
2 .B5 1.25
4.10
457,216 200934
658,150
201
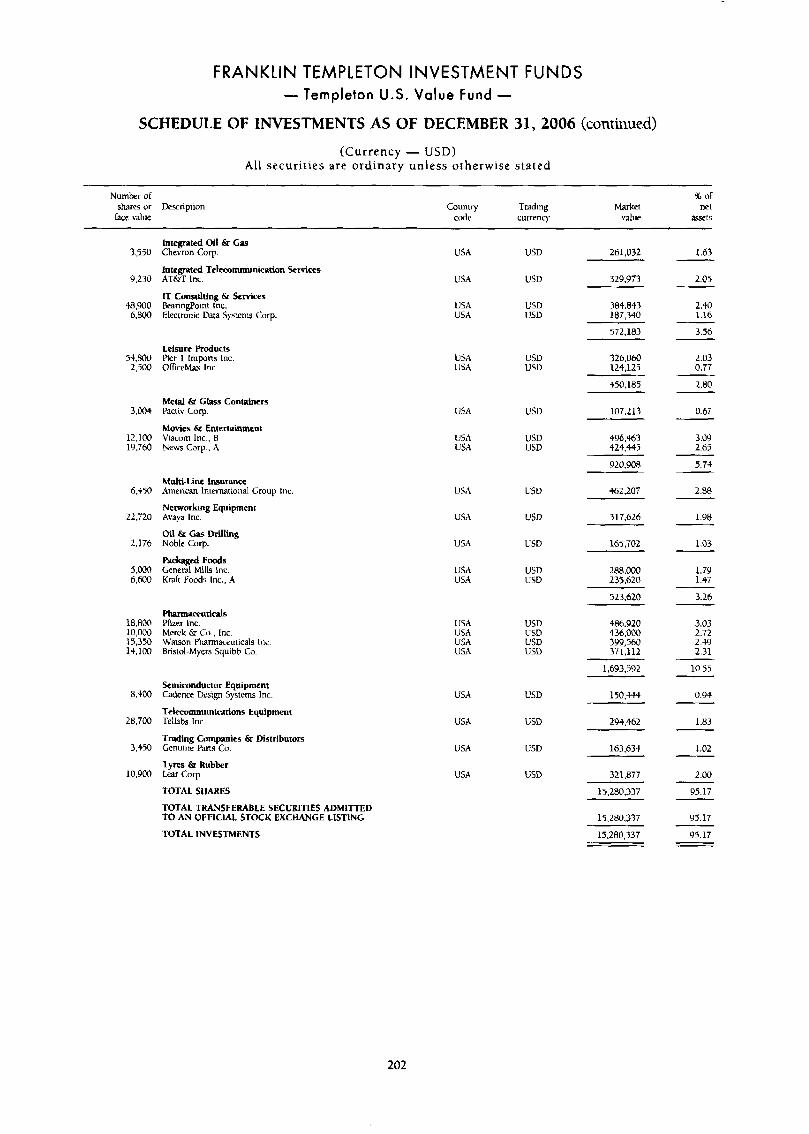
FRANKLIN TEMPLETON INVESTMENT FUNDS - Templeton U.S. Value Fund -
SCHEDULE OF INVESTMENTS AS OF DECEMBER 31,2006 (continued) (Currency - USD)
All securities are ordinary unless otherwise stated
Number of shares or Description
race value
73 of Couniry Trading Market net
code currency \due assets
3,550
9.230
48,900 6,800
5 4 . a ~ 2,300
3,004
12,100 19.760
6,450
22,720
2.176
5.000 6.M10
18.80@ 10,000 15,330 1+.100
8.400
28.700
3,450
10,900
Integrated Oil & Gas Chevron COT.
Integrated Telecommunication Stwices AT&T Inc.
IT Consulting & Services BearingPoint Inc. Elecmnic Data Systems COT.
LeisulY ploducrs Pier I Imports Inc. OfficcMax Inc.
Metal 6r Glass Containers Pmiv COT.
Movies 6r Entertainment Viacom Inc., B New Corp., A
Multi-Line Insurance American Iniemational Group Inc.
Networking Equipment Avaya Inc.
Oil &I Cas Drilhg Noble Corp.
Packaged Foods General Mills Inr. K n h Foods Inc., A
Phannncouticals Pfizer lnc. Merck & Co., Inc. Wawon PharmJceuticals Inc Bristol-Myers Squibb Co.
Semiconductor Equipmint Cadence Deslgn Systems Inc.
TelKmnmunimtions Equipment Tellabs Inc.
Trading Companies Q Distributors Genuine Parts Co.
T p s &I Rubber k a r COT.
TOTAL SHARES
TOTAL TRANSFERABLE SECURITIES ADMITTED TO AN OFFICIAL STOCK EXCHANGE LISTING
TOTAL INVESTMENTS
llSA
l!SA
USA USA
11% USA
USA
USA 1JSA
LJSA
LJSA
USA
USA USA
USA USA USA USA
USA
USA
USA
USA
USD
USD
USD USU
USD USD
l!SD
US0 USV
usv
usv
USD
USD USD
USD USD USV USD
USD
USD
USD
USD
261,032
329.973
384.843 187,340
572,183
326,060 124,125
450.185
107.213
496,463 424,445
920,908
462,207
317,626
165,702
288,000 235.620
523,620
486.920 436,000 3Y9,560 371,112
1,693,592
150,444
294.462
163.634
321.877
15.280.337
15.2ao.m
15,280,337
1.63
2.05
2.40 1.16
3.56
2.03 0.77
2.80
0.67
3.09 2.65
5.74
2.68
1.98
1.03
1.7Y 1.47
3.26 ~
3.03 2.72 2.49 2.31
10.55
0.94
1.83 ~
1.02
2.00
95.17
95.17
Y5.17
202
FRANKLIN TEMPLETON INVESTMENT FUNDS
FRANKLIN TEMPLETON INVESTMENTS OFFICE DIRECTORY
Further information regarding Franklin Templeton Investment Funds is available from the following Franklin Templeton lnvestments oflices : EUROPE Austria FRANKLIN TEMPLETON INVESTMENT SERVICES GMBH Mainzer Landstr. 16 Postlach 11 18 03 D-60325 Frankfurt, Germany Freelone: 08 00 29 59 11 www.lranklintempleton.al Belgium FRANKLIN TEMPLETON FRANCE S.A., succursale belge Avenue de Tervueren, 93 B-1040 Brussels, Belgium Tel: 32 (0j2 743-3200 www.franklintemple~on.he France FRANKLIN TEMPLETON FRANCE S.A. 16-18, avenue George \’ F-75008 Paris, France Tel: 33 (0)l 40 73 86 00 www. franklintempleton. fr
Fax: 49 69 272 23 120
Fax: 32 (0)2 743-3228
Fax: 33 (011 40 73 86 10
Germany FRANKLIN TEMPLETON INVESTMENT SERVICES GMBH Mainzer ktndstr. 16
D-60325 Frankfurt, Germany Tel: 49 (0) 69 272 23 0 Germany Freelone: 08 00 0 73 80 02 Austria Freehe: 08 00 29 59 11 www.lranklintempleton.de Italy FRANKLIN TEMPLETON ITALIA S.G.R. p.A C.so Italia n.1
rostrach 11 18 03
Fax: 49 69 272 23 120
20122 Milan, Italy Tel: 39 02 854 591 www.lranklintempleton.it
Fax: 39 02 854 59222
Luxembourg FRANKLIN TEMPLETON INTERNATIONAL SERVICES S.A. 26, boulevard Royal, L-2149 Luxembourg B.P. lbY, L-2011 Luxembourg Grand-Duchy ol hxernbourg Tel: 352 46 66 67 1 www.lranklintempleton.lu The Netherlands FRANKLIN TEMPLETON INVESTMENT MAKAGEMENT LIMITED World Trade Center Amsterdam H-Toren 16e verdieping Zuidplein 134 1077 XV Amsterdam Tel: 31 (0)20 575 2890 Netherlands Freelone: 0800 256 8049 www.lranklintempleton.nl Spain FRANKLIN TEMPLETON INVESTMENT MANAGEMENT LIMITED Sucursal en Espafia Jose Ortega y Gasset, 29-6og 28006 Madrid, Spain Tel: 34 91 426 3600
Fax: 352 46 66 76
Fax: 31 (0)20 575 2892
Fax: 34 91 577 1857 v.ww.lranklintempleton.com.es www.Cranklintempleton.com.pt Sweden FRANKLIN TEMPLETON INVEStMENT MANAGEMENT LIMITED Stureplan 4C 5-114 35 Siuckholrn, Sweden Tel: 46 (0)s 545 01 230 Fax: 46 (0)s 463 1010 www.franklintempleton.se Switzerland Franklin Templeton Switzerland Ltd Bahnhofstrasse 22, P.0. Box CH-8022 Zurich, Switzerland Tel: 41 (0) 44 217 81 81 www.lrdnklintempleton.ch
Fax: 41 (0) 44 217 81 82
United Kingdom London FRANKLIN TEMPLETON INVESTMENT MANAGEMENT LIMlTED The Adelphi Building, 1-1 1 John Adam Street London WC2N BHT, England, U.K. Tel: 44 (0)20 7073 8500 U.K. Freelone: 0800 305 306 www,franklintempIeton.co.uk
Edinburgh FRANKLIN TEMPLETON INVESTMENT MANAGEMENT LIMlTED 5 Morrison Street Edinburgh E H 3 8BH, Scotland, U.K. Tel: 4 4 (0) 131 242 4000 U.K. Freelone: 0800 305 306 www.fmnklintempIeton.co.uk
AFRICA Souh Africa TEMPLETON ASSET MANAGEMENT LIMITED Harrow Court 2 Isle of Houghton Boundary Road Parktown 2193, South Alriw Tel: 2711 645 6500 ww.lranklintempleton.co.za
ASIA Hong Kong FRANKLIN TEMPLETON INVESTMENTS (ASIA) LIMITED 1 7 F Chater House. No. 8 Connaught Road Central Hong Kong Tel: 852-2877-7733 F ~ : 852-2877-5401 www.lranklintempleton.com.hk
Singapore Templeton Asset Management Ltd 7 Temasek Boulevard #38-03 Suntec Tower 1
Fax: 44 (0) 20 7073 8700
Fax: 44 (0) 131 242 4533
Fax: 2711 484 3311
Singapore 038987 Tel: (65) 241 2662 www.Iranklinternpleton.com.sg
Taiwan FRANKLIN TEMPLETON SECURITIES IWESTMENT CONSULTING (SINOAM) INC. 8th Floor, M7, Sec. 4 Chung Hsiao East Road Taipei, Taiwan, R O C .
www.franklinsinoam.com.tw
Fax: (65) 6332 2295
Tel: 886-2-2781-0088 FW: 886-2-2781 -7788
NORTH AMERICA Bahamas TEMPLETON GLOBAL ADVISORS LIMITED, TEMPLETON CAPITAL ADVISORS LIMITED & TEMPLETON GLOBAL HOLDINGS LIMITED P.O. Box N-7759, West Bay Street, Lyford Cay Nassau, Bahamas Tel: 1-242-362 4600 Fax: 1-242-362 4308
SOUTH AMERICA Argentina TEMPLETON ASSET MANAGEMENT LTD Ingeniero Butty 220, 11th Floor (C1001 AFB) Buenos Aires, Argentina Tel: 54-1 1-4313-0848 Fax: 54- 1 1-43 13-0885
Please twie that the wubsiles mentioned abuvt. urc directed at residfnls within he country stated on lhese websites. (PIease refer to the wcbsiic discluimers).
203
FTIF IR RGB 12/06