
BG SICAV - Fundsquare
305
as at 31/12/16 Database Publishing System: CO-Reporter® by CO-Link, Belgium. Audited annual report BG SICAV RCS Luxembourg N B115.297
-
Upload
khangminh22 -
Category
Documents
-
view
0 -
download
0
Transcript of BG SICAV - Fundsquare
as at 31/12/16
Database Publishing System: CO-Reporter® by CO-Link, Belgium.
Audited annual report
BG SICAV
RCS Luxembourg N B115.297
BG SICAV
Page 2
Table of Contents
Page
Management and Administration 3
Board of Directors 5
Managers’ Report 6
Audit report 21
Combined 23
BG SICAV – European Equities 27 BG SICAV – US Equities 34 BG SICAV – Pictet Japanese Equities 40
BG SICAV – Schroder High Dividend Europe 45 BG SICAV – Small-Mid Cap Euro Equities 51 BG SICAV – UBS Global Long Short
(formerly BG SICAV – Columbia Threadneedle Global Equity Long Short) 58 BG SICAV – Morgan Stanley Global Real Estate & Infrastructure Equities Fund 63 BG SICAV – Controlfida Low-Volatility European Equities 71 BG SICAV – Generali Investments Europe - Equity Recovery Fund 79 BG SICAV – Tenax Global Financial Equity Long Short 85 BG SICAV – Short Equities 90 BG SICAV – Flexible Global Equities 95 BG SICAV – Euro Income Bond 102 BG SICAV – Eurizon Multiasset Optimal Diversified Approach 107 BG SICAV – Amundi Absolute Forex 115 BG SICAV – Controlfida Global Macro 120 BG SICAV – Vontobel Pure Strategy 126 BG SICAV – Algebris - Best Ideas
(launched on May 19, 2016) 132 BG SICAV – Euro Debt 138 BG SICAV – Vontobel Global Active Bond 143 BG SICAV – BlackRock Global Opportunities Bond Fund 152 BG SICAV – Invesco Financial Credit Bond 172 BG SICAV – HSBC Euro Credit Opportunities 179 BG SICAV – Amundi Global Income Bond 186 BG SICAV – UBS Dynamic Credit High Yield 195 BG SICAV – UBS Global Income Alpha
(merged into BG SICAV – UBS Dynamic Credit High Yield on December 12, 2016) 206 BG SICAV – Schroder Convertible Bond Opportunities 209 BG SICAV – Vontobel New Frontier Debt 216 BG SICAV – Global Supranational 223 BG SICAV – JP Morgan Capital Structure Opportunity 228 BG SICAV – Muzinich Credit Alternative Fund
(launched on December 15, 2016) 233 Notes to the financial statements 237 Global exposure calculation method (unaudited information) 300
Subscriptions can only be received on the basis of the latest prospectus accompanied by the latest annual report as well as by the latest semi-annual report, if published thereafter.
BG SICAV
Management and Administration
Page 3
MANAGEMENT COMPANY BG FUND MANAGEMENT LUXEMBOURG S.A. 5, allée Scheffer L - 2520 Luxembourg REGISTERED OFFICE 5, allée Scheffer L - 2520 Luxembourg
CENTRAL ADMINISTRATION, REGISTRAR AND TRANSFER AGENT CACEIS Bank, Luxembourg Branch S.A.* 5, allée Scheffer L - 2520 Luxembourg LEGAL ADVISOR Bonn & Schmitt Avocats 148, avenue de la Faïencerie
DEPOSITARY, PAYING AGENT AND DOMICILIATION AGENT CACEIS Bank, Luxembourg Branch S.A.* 5, allée Scheffer L - 2520 Luxembourg
L - 1511 Luxembourg AUDITOR Ernst & Young S.A. 35E, avenue J.F. Kennedy L - 1855 Luxembourg
INVESTMENT MANAGERS For BG SICAV – PICTET JAPANESE EQUITIES PICTET ASSET MANAGEMENT LIMITED Moor House, Level 11 120 London Wall EC2Y 5ET London United Kingdom
For BG SICAV – SCHRODER HIGH DIVIDEND EUROPE and BG SICAV – SCHRODER CONVERTIBLE BOND OPPORTUNITIES SCHRODER INVESTMENT MANAGEMENT LIMITED 31 Gresham Street EC2V 7QA London United Kingdom
With as Sub-Investment Manager for BG SICAV – SCHRODER CONVERTIBLE BOND OPPORTUNITIES SCHRODER INVESTMENT MANAGEMENT (SWITZERLAND) AG Central 2, Postfach 1828 CH - 8021 Zürich Switzerland
For BG SICAV – UBS GLOBAL LONG SHORT (formerly BG SICAV – COLUMBIA THREADNEEDLE GLOBAL EQUITY LONG SHORT) (Until December 9, 2016) THREADNEEDLE ASSET MANAGEMENT LIMITED Cannon Place 78 Cannon Street EC4N 6AG London United Kingdom (Since December 12, 2016) UBS ASSET MANAGEMENT (UK) LIMITED 5 Broadgate EC2M 2QS London United Kingdom
For BG SICAV – UBS DYNAMIC CREDIT HIGH YIELD and BG SICAV – UBS GLOBAL INCOME ALPHA (until its merger in BG SICAV – UBS DYNAMIC CREDIT HIGH YIELD) UBS ASSET MANAGEMENT (UK) LIMITED 5 Broadgate EC2M 2QS London United Kingdom
With as Sub-Investment Manager for BG SICAV – UBS DYNAMIC CREDIT HIGH YIELD and BG SICAV – UBS GLOBAL INCOME ALPHA (until its merger in BG SICAV – UBS DYNAMIC CREDIT HIGH YIELD) UBS GLOBAL ASSET MANAGEMENT (AMERICAS) INC. UBS Tower Once North Wacker Drive Chicago, Illinois 60606 USA
For BG SICAV – MORGAN STANLEY GLOBAL REAL ESTATE & INFRASTRUCTURE EQUITIES FUND MORGAN STANLEY INVESTMENT MANAGEMENT LIMITED 25 Cabot Square Canary Wharf E14 4QA London United Kingdom
With as Sub-Investment Managers MORGAN STANLEY INVESTMENT MANAGEMENT INC. 522 Fifth Avenue New York, NY10036 USA and MORGAN STANLEY INVESTMENT MANAGEMENT COMPANY 23 Church Street #16-01 Capital Square Singapore 049481
*CACEIS Bank Luxembourg S.A. until December 31, 2016.
BG SICAV
Management and Administration (continued)
Page 4
INVESTMENT MANAGERS (continued)
For BG SICAV – CONTROLFIDA LOW-VOLATILITY EUROPEAN EQUITIES and BG SICAV – CONTROLFIDA GLOBAL MACRO CONTROLFIDA MANAGEMENT COMPANY LIMITED George’s court, 54-62 Townsend Street Dublin 2 Ireland
With as Sub-Investment Manager CONTROLFIDA (Suisse) Piazza della Riscossa, 16 CH - 6906 Lugano Switzerland
For BG SICAV – GENERALI INVESTMENTS EUROPE - EQUITY RECOVERY FUND Generali Investments Europe S.p.A. Società di Gestione del Risparmio French Branch 2, rue Pillet-Will F - 75009 Paris France
For BG SICAV – TENAX GLOBAL FINANCIAL EQUITY LONG SHORT TENAX CAPITAL LIMITED Dominican House 4 Priory Court Pilgrim Street EC4V 6DE London United Kingdom
For BG SICAV – EURIZON MULTIASSET OPTIMAL DIVERSIFIED APPROACH EURIZON CAPITAL SGR S.p.A. Piazzetta Giordano Dell’Amore, 3 I - 20121 Milano Italy
For BG SICAV – AMUNDI ABSOLUTE FOREX and BG SICAV – AMUNDI GLOBAL INCOME BOND AMUNDI LONDON BRANCH 41 Lothbury EC2R 7HF London United Kingdom
For BG SICAV – VONTOBEL PURE STRATEGY, BG SICAV – VONTOBEL GLOBAL ACTIVE BOND and BG SICAV – VONTOBEL NEW FRONTIER DEBT VONTOBEL ASSET MANAGEMENT AG Gotthardstrasse 43 CH - 8022 Zürich Switzerland
For BG SICAV – ALGEBRIS - BEST IDEAS ALGEBRIS INVESTMENTS (UK) LLP 7 Clifford Street W1S 2FT London United Kingdom
With as Sub-Investment Managers ALGEBRIS INVESTMENTS (ASIA) PTE LTD 20 Cecil Street, #05-07 Equity Plaza Singapore 049705 and ALGEBRIS INVESTMENTS (US) INC. 1209 Orange Street Wilmington, New Castle County, Delaware 19801 USA
For BG SICAV – BLACKROCK GLOBAL OPPORTUNITIES BOND FUND BLACKROCK INVESTMENT MANAGEMENT (UK) LIMITED 12 Throgmorton Avenue EC2N 2DL London United Kingdom
With as Sub-Investment Managers BLACKROCK FINANCIAL MANAGEMENT INC. 40 East 52nd Street New York, NY 10022-5911 USA and BLACKROCK (SINGAPORE) LIMITED #18-01 20 Anson Road Singapore 079912
For BG SICAV – INVESCO FINANCIAL CREDIT BOND INVESCO ASSET MANAGEMENT LIMITED Perpetual Park, Perpetual Park Drive Henley-on-Thames, Oxfordshire RG9 1HH United Kingdom
For BG SICAV – HSBC EURO CREDIT OPPORTUNITIES HSBC GLOBAL ASSET MANAGEMENT (FRANCE) Immeuble Ile-de-France 4 Place de la Pyramide, la Défense 9 F - 92800 Puteaux France
For BG SICAV – JP MORGAN CAPITAL STRUCTURE OPPORTUNITY JPMORGAN ASSET MANAGEMENT (UK) LIMITED 60 Victoria Embankment EC4Y 0JP London United Kingdom
BG SICAV
Management and Administration (continued)
Page 5
INVESTMENT MANAGERS (continued) For BG SICAV – MUZINICH CREDIT ALTERNATIVE FUND MUZINICH & CO. LTD 8, Hanover Street W1S 1YQ London United Kingdom With as Sub-Investment Manager MUZINICH & CO. INC. 450, Park Avenue New York, NY 10022 USA
Board of Directors Chairman Mrs Claudia Vacanti, Chief Investment Officer of Asset Management Division, Banca Generali S.p.A., via Machiavelli, 4, I - 34132 Trieste, Italy Vice Chairman Mrs Barbara Malagutti, Head of Marketing, Banca Generali S.p.A., via Machiavelli, 4, I - 34132 Trieste, Italy Directors Mr Gian Maria Mossa, General Manager, Banca Generali S.p.A., via Machiavelli, 4, I - 34132 Trieste, Italy Mr Alex Schmitt, Attorney-at-law, Bonn & Schmitt Avocats, 148, avenue de la Faïencerie, L - 1511 Luxembourg, Grand Duchy of Luxembourg Mr Edoardo Tubia, Independent Director, 18, avenue de la Porte Neuve, L - 2227 Luxembourg, Grand Duchy of Luxembourg
BG SICAV
Managers’ Report
Page 6
The Global Economy and Financial Markets in 2016
Elevated political risks and repeated growth fears have kept volatility on global financial markets high in 2016. Concerns about the fallout of the first key rate hike by the US Federal Reserve (“Fed”) at the end of 2015 and fears of a sharper growth deceleration in China weighed on financial markets initially. The oil price plummeted to a 12-year low in February and core bond yields fell to record lows toward the mid of the year. Political uncertainties culminated in a surprising decision by British voters to leave the EU on June 23. That said European economies proved strikingly resilient to this political event, while the US economic growth was continuing to accelerate. Later in November, the victory of Donald Trump in the US presidential elections, largely anticipated as an uncertainty shock, was followed by a strong market rally, with global financial markets focusing on the reflationary promises of a fiscal stimulus and eased regulation. In a third political key event of the year, the clear ‘No’ by Italian voters in a constitutional referendum in Italy in December was again and quickly followed by a rebound in risk sentiment.
Going through a sequence of tail risk events, resilience of the global economy and financial markets prevailed. This was also the result of a more accommodative shift by major central banks. The Fed delayed its second rate hike until December, while the European Central Bank (“ECB”) stepped up its quantitative easing by € 20bn to a pace of € 80bn per month, including corporate bonds in its asset purchase program. In this environment, developed Equity markets recorded positive performances in 2016, leaded by the US market, US Treasury yields rose on balance, core euro area yields continued to trend down, and euro non-financial corporate bonds rallied.
According to the International Monetary Fund (“IMF”) estimates, in 2016 Global GDP growth is tracking an above-trend 3.10% pace and global CPI inflation is likely to have returned to 2% by year-end. However, divergent developments were recorded in different country groups. There has been a stronger-than-expected pickup in growth in advanced economies, due mostly to a reduced drag from inventories and some recovery in manufacturing output. In contrast, an unexpected slowdown in some emerging market economies was recorded.
Among advanced economies, activity rebounded strongly in the United States after a weak first half of 2016, with two quarters of subdued growth; in the second part of the year, US GDP accelerated driven by private consumption and net trade, while investment continued to lag behind, and the unemployment rate was reported at year-end below the 4.80% equilibrium rate. Labor market tightening is eventually feeding through wages, which recorded the fastest yearly increase in more than five years. The stabilization in oil prices drove headline inflation to 2.10% in December, with increasing evidence of upward pressures. Output remains below potential in a number of other advanced economies, notably in the euro area, where key sentiment indicators continued to advance during the year, but the GDP continued to expand at a very slow rate, while employment growth has stabilized. Moreover, low inflation, the highly accommodative ECB monetary policy stance and some support from fiscal policy helped. Growth figures were somewhat stronger at year-end in some economies, such as Spain and the United Kingdom, where domestic demand held up better than expected in the aftermath of the Brexit vote. Historical growth revisions indicate that Japan’s growth rate in 2016 and in preceding years was stronger than previously estimated, while the picture for emerging market and developing economies remained much more diverse. The growth rate in China was a bit stronger than expected, supported by continued policy stimulus. But activity was weaker than expected in some Latin American countries currently in recession, such as Argentina and Brazil, as well as in Turkey, which faced a sharp contraction in tourism revenues. Activity in Russia was slightly better than expected, in part reflecting firmer oil prices that recovered in the period since the February lows.
BG SICAV
Managers’ Report (continued)
Page 7
The Global Economy and Financial Markets in 2016 (continued)
In 2016, interbank market rates for the Eurozone continued to steadily fell down deep in negative territory: the Euribor 3-month started the year at -0.13% closed and -0.32%, while the EONIA traded from the -0.13% level to -0.33%. These market movements were favored by the ongoing loosening monetary policy of the ECB’s that in March cut the Main Refinancing Rate to 0.00% and the Deposit Rate from -0.30% to -0.40%, also deciding at the beginning of December that the quantitative easing (“QE”) program will be extended at least until the end of 2017.
In the bond market, long-term yields on the reference markets (Germany and the United States) were very volatile, falling in the first part of the year, stabilizing in the third quarter, while moving up quickly in the fourth quarter especially in the US. Starting respectively from 0.63% and 2.27%, German rates fell in negative territory closing in June at -0.13% rebounding to 0.21%. At year-end, while US rates, after falling to the 1.45% level in July, rebounded to 2.44% in December. The short term rates followed different patterns: in Germany, the 2-year rate decreased constantly from -0.35% to -0.77% driven by the purchases of the ECB, while in the US, the 2-year started the year at the 1.05% level and decreased to 0.84% at the end of October, then showing a tendency to raise, anticipating the Fed Funds December hike to 0.75%, closing the year at 1.19%. In the Eurozone, long-term peripheral country yields fell until August, but then started a fast raising movement caused by the pressures arising from the euro-sceptic political parties gaining power in Europe. In Italy, 10 year spread against Germany widened markedly from the 97 level to the 161 level.
Equity Markets recorded positive total returns both in the developed and in the emerging countries, with the exclusion of the Italian market. The MSCI World Index in Euro rose by 11.01%, the S&P 500 by 14.73% and the Topix by 7.29%. In Europe, the reference index for the whole area (STOXX 600) rose by 1.86%, the index for the Eurozone (Euro STOXX) by 4.18%, while the FTSE MIB fell by -6.51%. The MSCI Emerging Markets index increased by 15.97%, with big contribution from the Latin America markets (Brazil Bovespa 76.16%) and the Eastern Europe markets (MSCI Emerging Eastern Europe soared by 46.43%) while the MSCI India index recording a small positive performance of 2.78%, the MSCI China index of 7.99%.
In the first part of 2016, the Euro exchange rate appreciated against the US Dollar, starting from the 1.0862 level and reaching a high of 1.1451 in April. Then, given the divergence of the Monetary Policies between Europe and the United States, the euro exchange rate showed a steady tendency to depreciate, ending the year at 1.0517. The Japanese yen appreciated against the Euro, starting from 130.64 level to close at 122.97. In Emerging markets, Asian currencies appreciated against the Euro especially in the last part of the year with the exclusion of the Chinese Renminbi, while Eastern Europe and Latin America currencies appreciating the most.
Economic Outlook
The dichotomy in Central Bank behavior is anticipated to persist well into 2017. The Fed is expected to continue its hiking cycle, whereas the ECB will extend its quantitative easing. Towards the end of the year, though, the further picking up growth will probably fuel discussions on the ECB starting to gradually decrease its asset purchases. The very low yield levels on high-quality bonds will keep the current income of this asset class unattractive. Together with the assumption of rising yields, the corresponding total return levels are expected to fall back into negative territory. The yields increase will likely be more pronounced for US bonds than for European ones, thereby undoing the apparent advantage of higher current levels. For the time being, resilient growth and easing tailwinds from Central Banks favor investments in real assets and higher yielding corporate bonds in Europe. Having said that, southern European debt appear particularly endangered to political uncertainties. Also on the equity side, there is a clear preference for Europe compared to the US. Valuations of US equities are already stretched. Additionally, wage pressure, a tighter Fed policy, and a stronger US dollar should work negatively. On the contrary, euro area equities which have been performing below average in 2016 should be able to provide at least small positive returns. On emerging markets, the Investment Managers remain selective, preferring Countries more exposed to growth and to the commodity cycle.
BG SICAV
Managers’ Report (continued)
Page 8
BG SICAV – European Equities
In 2016, the sub-fund BG SICAV – European Equities recorded a negative absolute return of 7.28% (Class Dl). During the period, the sub-fund has varied its equity exposure between 84% and 115%. In the first quarter the sector allocation privileged industrials, consumer discretionary, financials, energy underweighting utilities, healthcare and food & beverage. At the beginning of the second quarter, there has been a strong sector rotation, which has favored healthcare at the expense of banks, financials and insurance stocks. In this period, the sub-fund kept a preferred exposure on large caps, and favored on fundamental basis companies with high levels of dividend yield, interested in buy-backs, and taking advantage of the devaluation of the pound caused by Brexit. Styles based on the search of growth, momentum and quality under performed. During the third quarter there was a strengthening of small-mid caps, and the sub-fund favored sectors as chemical, technology, auto, media, industrial and basic material, disfavoring utility, healthcare and food & beverage. This sector composition was maintained in the fourth quarter as well, increasing cyclical component. Beyond that, the sub-fund focused on the opposition between value and growth investment styles that the market played all along the year and especially in the last part as a consequence of the reflation scenario deriving by the announced new Trump’s fiscal policy. Fundamental analysis with quantitative approach has been affected by the continuous sector rotations, which have marked the whole year. Our focus remains on shares that, in addition to attractive historical valuations, strong balance sheets and stable dividends, show better view and outlook on future earnings, with strong cash flow generation.
BG SICAV – US Equities
In 2016 the Standard & Poor’s 500 index has risen 9.5% in USD. The sub-fund BG SICAV – US Equities delivered a positive return of 8.26% (Class Dl) in Euro. Over the first six months the sub-fund has adopted a somewhat prudent stance, keeping the overall equity exposure between 85% and 90% due to several reasons: expansive valuations (Price to earnings ratio above the historical average) in a period of flat to slightly negative YoY earnings growth for some quarters in a row, disappointing GDP growth (+1.1% the average for the first two quarters), very weak manufacturing data and corporate capex growth pattern. The sector allocation has favored technology, industrials, consumer discretionary and healthcare and has underweighted telecoms, utilities, materials and energy. The economic landscape has begun to improve during the second half of the year and thanks to expectations for a positive inflection point for corporate earnings growth, equity indexes have climbed to new high throughout the summer. Strategically the sub-fund changed the asset allocation during the fourth quarter, particularly after Donald Trump won the Presidential election in November. Trump’s victory and the Republican majority in the Congress have radically changed the outlook for fiscal policy and have quickly nourished market hopes of a broader reflationary environment in the US. Treasury bonds sold off sharply, equities rallied while the US dollar soared broadly. The new US administration’s economic plan features a large reduction in corporate and personal income tax and a large infrastructures spending. The portfolio adopted a more aggressive stance increasing the overall equity exposure to 100% (even above it for several weeks), raising financials, technology and industrials sectors’ weight. The Fed had the opportunity to continue the normalization of its monetary policy by raising the target Fed Funds rate by 25bp. Over the year the sub-fund has always favored large cap stocks to mid and small cap stocks. It has favored Microsoft Apple Alphabet and Amazon.com within technology, Johnson & Johnson Pfizer and Merck within healthcare, General Electric and Union Pacific within industrials, JPMorgan Visa Bank of America Chubb and Citigroup within financials, Exxon Mobil and Schlumberger within energy. The currency exposure has varied between 85% and 100% over the year. The sub-fund used derivatives, mainly S&P 500 and NASDAQ 100 Index Futures, for hedging and investment purposes within the limits allowed by the prospectus.
BG SICAV
Managers’ Report (continued)
Page 9
BG SICAV – Pictet Japanese Equities
BG SICAV – Pictet Japanese Equities has performed positively over 2016 by 4.30% (Class Dl). After the Trump’s victory a more expansionary fiscal policy in the US is expected, which is of course positive for Japanese equities: higher growth in the US supports global growth, to which the Japanese market is particularly highly leveraged; the strong dollar is a major boon for Japan’s export sector. Meanwhile, the positive domestic backdrop remains solidly in place. The sub-fund overweights materials, IT and financials and underweights consumer staples and healthcare. Within materials the Investment Manager focused on companies with leading global positions in highly specialized areas such as Nitto Denko in polarising film and Shin Etsu Chemical in silicon wafers. The largest positions in IT are in semiconductor equipment (Disco) and high-end components (Murata), where Japanese companies have maintained their technological lead. In the financial sector , the sub-fund holds positions in real estate as well as in the major city banks and non-life insurer Tokio Marine. The sub-fund has underweight defensive areas such as consumer staples, healthcare and utilities as the Investment Manager still struggles to find attractive investment candidates in these sectors even after the recent underperformance.
BG SICAV – Schroder High Dividend Europe
In 2016, BG SICAV – Schroder High Dividend Europe registered a negative return of 3.57% (Class Dl). On the negative side, Cape was a key detractor from sub-fund returns. In November, the industrial services provider warned that product liability litigation could lead to an extended period of uncertainty which may threaten its capacity to make dividend payments. However, the stock rallied in early January of this year after issuing a trading update which suggested 2016 results are materially ahead of current expectations. Stock selection within the food retail sector was a key positive contributor, specifically the holdings in WM Morrison and Tesco. The management turnaround at Tesco is starting to bear fruit and the company issued positive interim results in October. Similarly, steel tubes maker Vallourec also published results showing progress is being made on its restructuring plan. Both Vallourec and its Italian peer Tenaris made gains in the wake of the US presidential election, with Trump known to support fracking. Both groups are suppliers to the oil & gas industry. The agreement by OPEC to cut production and subsequent oil price rally provided further support.
BG SICAV – Small-Mid Cap Euro Equities
The sub-fund BG SICAV – Small-Mid Cap Euro Equities posted a negative total return of 5.18% (Class Dl). In the period the equity exposure was maintained between 90% and 110%, with an overexposure to the Italian market, whose weight remained around 40%. The portfolio have been focused on companies with high visibility of revenue growth, expanding profit margins and strongly oriented to export and global demand. During the year, the main sectors in the portfolio were Information Technology (17%) and Industrial (17%). The largest overweight positions were on Technology and Consumer Discretionary, while the main underweights were on Industrial securities. The Portfolio result was affected by four market drivers: concerns about the weak Chinese economic situation with the yuan devaluation in January; the referendum vote on "Brexit" in June; the weak performance of the oil and the decisions of OPEC to cut the production only in December; the U.S. Presidential election. Furthermore, the European equity markets amplified the January correction, and this has been followed by a slow recovery of stock markets. Only in the last three months of the year the markets reacted, thanks to better data news flow as well as the increase of the extraordinary monetary stimulus made by the European Central Bank. But only after the Italian constitutional referendum vote, the European markets followed the good recovery undertaken globally by equity markets. The results of the fund have been negatively affected by the overweight of the financial component of the Italian portfolio (affected by the refinancing problems). On the other hand, the depreciation of the Euro has rewarded the industrial stocks in portfolio, which were able to catch the opportunities offered by the moderate recovery in the European domestic consumption and the better U.S. demand improvements. In terms of relative strength and for most of the year, the Small Caps asset class outperformed Large Caps sectors. Valuations are confirmed “appealing” relative to Large Caps.
BG SICAV
Managers’ Report (continued)
Page 10
BG SICAV – UBS Global Long Short (formerly BG SICAV – Columbia Threadneedle Global Equity Long Short)
BG SICAV – UBS Global Long Short (formerly BG SICAV – Columbia Threadneedle Global Equity Long Short) delivered an absolute return of -10.42% (Class Dl) from January 1 till December 9, 2016, date of change of name and investment manager. 2016 was a year in which political uncertainty, rising populism and policy divergence dominated investor sentiment. The result was a volatile period for global equity markets and one which saw a series of rotations, initially favouring the more defensive yield sectors and latterly favouring value.
Underperformance was driven by the long and short books. On the long side, the healthcare holdings detracted in part due to the sector underperforming in the run up to the US election and also because of some stock-specific surprises in names such as Alkermes and Bristol-Myers Squibb. Emerging-market names also detracted, as did the holdings in the UK. Success stories during the year included the sub-fund’s US bank exposure through JP Morgan and BB&T, which gained on the prospect of rising US rates, especially in the wake of Trump’s election success. On the short side, positions in auto-related firms and industrials detracted, as the market sought cyclicality with, in many cases, little view to fundamentals. However, the Investment Manager did have some success through short positions in European telecoms and media companies.
Early in the year, net equity exposure halved as the Investment Manager saw the worst opening period in global equity markets for over 20 years. It then averaged around 12% for the rest of the year, corresponding to an average gross exposure of around 110%. Over the course of the year, the key equity exposures remained in technology, healthcare and financials. Net short positions in energy, industrials and materials early in the year gave way to shorts in the consumer sectors by year end. On December 12th 2016, the sub-fund was renamed BG SICAV – UBS Global Long Short and the investment management was taken over by UBS Global Asset Management Limited. In this short period before year-end, the sub-fund generate a slightly negative return. The equity market background was relatively flat during this time and performance drivers included both long and short positions. As at the end of December, the sub-fund's overall exposure was 23% net long, comprised of a large number of idiosyncratic stock positions aimed at delivering equity-like returns whilst minimizing volatility.
The return of the sub-fund during the whole year 2016 was negative : -10.65% (Class Dl).
BG SICAV – Morgan Stanley Global Real Estate & Infrastructure Equities Fund
The sub-fund is managed as a Real Estate & Infrastructure sub-portfolio, with a top-down asset allocation. Each of the sub-portfolios reflects the core investment philosophy as value investors, which results in the ownership of stocks that provide the best valuation relative to their underlying asset values and growth prospects. For the period ended December 31, 2016, the sub-fund was relatively equally weighted to the Real Estate and Infrastructure markets. Within the Infrastructure sub-portfolio, the major overweights were in renewables, pipeline companies, toll roads, and diversified infrastructure, and key underweights were in network utilities. Within the Real Estate sub-portfolio, the Hong Kong REOCs remain a significant overweight, as the stocks offer highly attractive value with the widest discrepancy between private and public valuations among public listed global property markets. Within Japan, The investment Manager remains overweight the J-REOCs and underweight the J-REITs, as there is a significant disparity in valuations with the J-REOCs trading at a discount to NAVs and offering value versus the J-REITs trading at premiums. In Europe, the investment Manager remains overweight the U.K., in particular the U.K. Majors and London office specialists, which trade at attractive discounts and underweight the Continent which trades at a slight premium to NAVs. In the U.S., the sub-fund was overweight high quality malls, primary CBD (Central Business District) office assets and apartments, and underweight the net lease and health care sectors. In 2016, BG SICAV – Morgan Stanley Global Real Estate & Infrastructure Equities Fund delivered a positive return of 8.32% (Class Dl).Within the Infrastructure sub-portfolio, performance was favorable overall, driven predominantly by bottom-up stock selection (i.e., attribution was meaningfully
BG SICAV
Managers’ Report (continued)
Page 11
BG SICAV – Morgan Stanley Global Real Estate & Infrastructure Equities Fund (continued)
positive from a bottom-up perspective and neutral from a top-down perspective). More specifically, stock-picking in the pipeline companies, toll road, gas distribution utilities, communications, and airports sectors was favorable. Furthermore, the meaningful underweight to network utilities, which in the Investment Manager’s view remains unattractive on a valuation basis and more susceptible to adverse price performance in a rising interest rate environment, contributed to relative performance. The Real Estate sub-portfolio underperformed during the year primarily due to 1H 2016, where there was investor preference for yield-oriented stocks and/or market segments with perceived defensive characteristics, irrespective of underlying valuations (which included the J-REIT sector, U.S. net lease and health care sectors, German residential sector, Australia and Canada). Investors also appeared to rotate away from segments where cash flows were viewed as more economically sensitive despite trading at very attractive discounted valuations (which included the U.S. apartment and lodging sectors and Hong Kong, Tokyo and New York office markets). The overweight to the U.K. prior to Brexit was also a significant detractor from full year performance due to the outcome of the vote. The Real Estate sub-portfolio outperformed in third and fourth quarter 2016 amid a partial reversal of the lower-for-longer investment theme that dominated the market in the first half 2016, as well as building enthusiasm for better economic growth following the U.S. election in November, though this was not sufficient to offset the underperformance in the first half of 2016.
BG SICAV – Controlfida Low-Volatility European Equities
BG SICAV – Controlfida Low-Volatility European Equities has closed the year with a performance of -3.54% (Class Dl) against -4.45% of the benchmark and an annualized weekly volatility of 14.06% (significantly below the European Equity markets one of 17.90%). The sub-fund during the 2016 has maintained the Delta exposure between 58% and 62% with a geographical exposure of 48% in Eurozone (out of which 24% in Germany), 31% in England and 21% in Switzerland. The proprietary trading strategy of the Investment Manager helped to contain losses in negative markets while partially participating to any market upswing.
BG SICAV – Generali Investments Europe - Equity Recovery Fund
BG SICAV – Generali Investments Europe - Equity Recovery Fund has performed positively over 2016 by +3.71% (Class Dl). As per its strategy, the sub-fund has focused on stock picking in its geographical scope, the Southern European countries and selected emerging economies, mostly in Eastern Europe. Since the beginning of the year the sub-fund has taken a cautious stance towards Financials due to uncertainty about regulation and capital needs of some banks; its weight, which averaged +/-16%, has been increasing in the second part of the year, becoming the second most owned sector by the fund after Industrials. In turn, Industrials has been the most invested sector close to 30% weight, with stocks having a strong lever on local economic recovery and attractive valuations. The investment focus has been on high free cash flow generative companies and clear business strategy, both for well managed companies and for those in restructuring on a clear path. Industrials, Energy and Materials have been the best performing sectors, whereas Healthcare and Telecoms lagged. Amongst the very successful investments there are restructured businesses like Raiffeisen or Leonardo, and high growth companies like Arkema and Galp. Liberbank and Salini lagged the sub-fund performance, though the valuation and investment cases remaining still attractive.
BG SICAV – Tenax Global Financial Equity Long Short
The performance of the sub-fund BG SICAV – Tenax Global Financial Equity Long Short registered a negative return of 11.08% (Class Dl) in 2016. Such disappointing result was accumulated mainly in January and in the volatility event following the Brexit vote, in June. In January the sub-fund had a gross exposure of 120% and a net 50%, banks went down 15% and Insurance roughly 10%, it was a very difficult task to risk manage the core positions and limit capital depreciation. February was an extension of the previous month with financials down more than 6% and in aggregate the
BG SICAV
Managers’ Report (continued)
Page 12
BG SICAV – Tenax Global Financial Equity Long Short (continued)
sub-fund was down 3%. In the following months the sub-fund managed to lower its volatility and at the same time trying to hold the core positions which at that moment looked even more attractive on fundamental basis. Brexit in June brought another wave of volatility and correlation-one price action that was extremely disruptive for the sub-fund that it was gradually rebuilding its gross exposure. The negative performance accumulated up that moment, for the year, prevented the sub-fund to withstand the heavy p&l hit of the post Brexit, with negative implication for the optimal gross exposure. The Investment Manager believes that Brexit event postponed the return of more positive rates overall; the low/negative interest rates environment witnessed in the first part of the year has been detrimental to a long short strategy in global Financials Equities. From July onwards the Investment Manager has seen fundamentals improving both for Financials as an industry and for Equity long-short strategies. Accordingly the sub-fund performance has reverted to historic standard. The Investment Manager believes that there is still a significant amount of alpha to be recovered in the sector.
BG SICAV – Short Equities
In 2016, the sub-fund BG SICAV – Short Equities posted a negative total return of 12.53% (Class Dl). During the year, the sub-fund has maintained a negative net exposure of around 97%, mainly managed through futures. The asset allocation of the sub-fund kept a (negative) overweight on North America (60%), versus Europe (27%) and Pacific (13%), giving the positive expectation on the European economy versus the US at the beginning of the year, and the earnings momentum revisions on the European stock markets. Unfortunately geo-political risks (Brexit, incremental European populism fears, U.S. presidential elections) played a more important role, in conjunction with a strong negative momentum on periphery linked to Italian Banks’ refinancing problems. Post USA elections, steps were taken in the asset allocation of the Sub-fund to open a short position on Asian emerging markets, based on sluggish global trade data and fears of future US import barriers erection.
BG SICAV – Flexible Global Equities
In 2016, the sub-fund BG SICAV – Flexible Global Equities reported a negative total return of 3.61% (Class Dl). Equity exposure has varied between 10% and 70%, closing the end of December close to 40%. At the beginning of the year the international markets have had a sudden and serious fall due to strong concerns about a weak Chinese economy, joint with multi-year oil lows, and the possible impact on the biggest economies. In the following months, the recovery of the stock markets was difficult and very slow, in light of moderate economic data in the US and rather weak and erratic ones in Europe, Japan and Emerging countries. This did not help the recovery of the performances of the Fund exposed around 20%-35%. In June, the "Brexit" vote in the UK has greatly elevated the levels of volatility. The consequence of this has been months of fears for political country risk. The turning point for the risky assets was only in November, with the US presidential election and fiscal stimulus expectation of the new Administration. Good benefits also came from OPEC decisions that stabilized the oil prices. Latest, the laggard European markets have found positive impulses only after the Italian constitutional referendum in December and overcoming fears about the Euro currency system. In the last three months, a significant equity rotation to more pro-cycle and reflationary sectors has been observed, such as Banks and Financials, Oil, Energy and industrials. In December the equity exposure was diversified between 19% on the United States and 21% on Europe. The exposure to the US dollar was around 35% together with a short currency yen position of 9%. About 55% of the assets were invested in short-term bonds (duration of 1.5 years).
BG SICAV
Managers’ Report (continued)
Page 13
BG SICAV – Euro Income Bond
In 2016, the sub-fund BG SICAV – Euro Income Bond posted a negative performance of 0.75% (Class Dl). At the beginning of the year the sub-fund maintained the duration around 1.2 years. 75% of the portfolio was invested into Italian government bonds, diversifying the maturities across the curve, with 5% invested on inflation linked bonds, that were sold during the quarter; the remaining 25% was mainly invested in Financial Corporate, both senior and subordinated (13.90%), High Yield (6.90%) and foreign bonds (USD 0.30% e BRL 1.60%). During the second quarter the asset allocation of the sub-fund has not changed. The duration of the Fund has been managed through futures between 1 years and 0.5 years. During the third quarter, the duration of the sub-fund has been increased and managed between 1,6 years and 3.5 years due to the uncertainty related to the English Brexit referendum. During this period Government bonds has been reduced in order to increase high risky positions. As a consequence, Financial Corporate both senior and subordinated represented at the end of the year the 20.50% of the portfolio and High Yield weights 7.5%. During the last quarter, with the increase in market volatility due to the US Election, Italian referendum and the mounting expectations on central banks decisions, duration has been reduced to 2 years, while at year end it has been increased back to above 3 years. In the government bonds area, 11.90% of Italian Government bonds has been switched to Spanish government bonds. The position on non Euro bonds has been increased from 2% to 6.70% (0.60% USD, 1.10% INR, 1% IDR, 1.80% BRL, 1.20% RUB, 1% MXN), reducing government bonds.
BG SICAV – Eurizon Multiasset Optimal Diversified Approach
In 2016, the sub-fund BG SICAV – Eurizon Multiasset Optimal Diversified Approach returned -2.75% (Class Dl). In the course of the year, the weight of the stock component ranged between a low of 3.50% and a high of around 15%. The position was built using flexible in-house share funds and derivative instruments (futures and options on the EuroStoxx50, FtseMib, Topix, Hong Kong and S&P stock indices). In the first half of 2016, the weight of the stock component was gradually reduced, by acting primarily on the European index. In the fourth quarter of the year, the sub-fund marginally increased exposure to stocks, using option structures to optimise the portfolio’s risk/return profile, while keeping risks under control in any case. In 2016, the portfolio duration ranged between a low of -0.50 and a high of around 2.5 years. Duration management was particularly dynamic, to hedge risks tied to potential interest rate increases. The bond component was mostly invested in government bonds, and includes medium-long term sovereigns issued by Italy, the United States, Spain and Portugal, with a residual portion of supranational bonds and government agencies. The spread bond component included on average a 15% share of emerging country bonds, around 9% in corporate issues, and around 15% in High Yield corporates. In the course of the year the sub-und reduced exposure to long-term peripheral bonds, in terms of both portfolio weight and duration. At the end of November, exposure to Spanish government bonds was fully unwound to the advantage of Italian sovereigns, to profit from the widening of the spread in the run-up to the referendum. In the second half of 2016 exposure was reduced to the spread component, to emerging bonds and to High Yielders. The investment in US government bonds was also cut, mostly on the ultra-long end of the curve, and the position on US inflation-linked bonds was fully unwound. A preference was confirmed for Italian inflation-linkers, which offer a good risk/return ratio. For what concerns tactical management, positions were opened mostly on derivatives, including a short duration position on core bonds (sale of futures on 10Y German and French government bonds and, opportunistically, of 10Y US Treasuries as well). For what concerns the currency component, the sub-fund took a long US dollar position against the euro, managed dynamically throughout the year, and a long yen vs. euro position for diversification ends and to hedge portfolio risks. In correspondence with major geopolitical events in the course of the year (Brexit, US elections and Italian referendum), the sub-fund used currencies for hedging ends, for instance by taking short sterling and short Mexican peso positions. Furthermore, the sub-fund was long on emerging currencies, using in-house funds, for risk-diversification ends, and short on the Korean won as hedging. In 2016, the sub-fund’s performance was negative. Both the stock component and the duration-hedging position built using futures on German and French government bonds contributed negatively. US and peripheral euro area government bonds made a slightly positive contribution, led by euro area inflation-linkers. A positive contribution also came from the component invested in emerging country bonds, both in hard currency and local currency, and from corporate issues.
BG SICAV
Managers’ Report (continued)
Page 14
BG SICAV – Amundi Absolute Forex
Over 2016, the sub-fund BG SICAV – Amundi Absolute Forex realized an absolute performance of +0.47% (Class Dl), compared to the Eonia benchmark which delivered -0.32% in absolute terms over this same period. This amounts to a relative performance of +0.79% compared to the benchmark. 2016 was a challenging year for FX markets due to the unfolding of unexpected political events such as BREXIT, US election on one side and further slowdown of China and global growth on the other. But thanks to sub-fund’s multi- strategy diversification approach, it manages to overcome these challenges. In 2016, the Carry strategy was the main driver of the performance, as it benefitted from strong performance of Emerging currencies such as RUB and BRL, which offered very attractive interest rates supplemented by very attractive valuations at start of the year. Also, the strategy managed to capture the rebound in Commodity prices well by staying overweight commodity linked currencies such as NZD and NOK against Euro-bloc low yielding currencies (EUR,CHF). The Macro (Fundamental) strategy also contributed positively this year. The main trade of long CAD vs USD and long USD vs CNH worked well. At start of year, the market was very pessimistic on the Canadian currency due to weak oil price and softer inflation outlook. The Investment Manager bought the oversold CAD, which later rebounded sharply thanks to the recovery of oil price. At the same time, the strategy also benefited from selling CNH vs USD, as the currency was overvalued and more capital outflows from China were expected. In second half of the year, higher US rates further intensified the interest rate divergence between US and China, which saw CNH making new lows against USD. The main trade which dragged the performance was the long NOK and SEK vs USD on the base of very attractive valuation. However, the broad base strength of the US dollar in the last quarter of the year hurt the trade. The trend strategy was flat this year, most of its losses occurred in first half of the year due to lack of conviction in markets ended up in very range bound trading in G10 currencies. But most of these loses were recouped in the second half of the year as strong rally in global interest rates, brought stronger momentum in most of the currencies. The Investment Manager’s strategy mainly benefitted by staying Long USD against GBP and TRY this year. The Volatility Strategy, even though it contributed slightly negatively to the overall fund, however it performed well in terms of minimizing the drawdowns and hedging many binary macro risks such as BREXIT and US elections this year.
BG SICAV – Controlfida Global Macro
BG SICAV – Controlfida Global Macro closed the year 2016 with a negative performance of 0.53% (Class Dl). The investment strategy has been focused both on a directional bet (interest rate normalization) and an absolute return strategy (skew on equity options). The sub-fund’s performance has been negatively impacted by the investment strategy on interest rate normalization which has been continuously rolled down during the year. The skew strategy has contributed positively to the sub-fund's performance especially in the last quarter of 2016. The annual performance on rates has been -1.15% and the arbitrage strategy annualized return was positive of 0.62%.
BG SICAV – Vontobel Pure Strategy
In 2016, BG SICAV – Vontobel Pure Strategy achieved a negative performance of -5.72% (Class Dl). The annual performance of the benchmark HFRX Global Index EUR, was slightly positive at +0.70% which results in an underperformance of the sub-fund of -6.42%. The fund exhibited a volatility of approximately 5.60%. BG SICAV – Vontobel Pure Strategy actively invests across three risk premia sources, Momentum, Defensive and Value. Each risk premia source has an equal target weighting that is driven by a risk parity approach. Each risk premia’s return contribution was negative in 2016. It was a particularly difficult year for the Momentum strategy. This is not sub-fund specific: The HFRX CTA index, which tracks the performance of hedge funds that invest in momentum, also exhibits a negative performance of -2% in 2016. The problem for Momentum investors was the sharp reversals of trends. For example: Momentum profited from the sell-off in the equity market in the beginning of the year but the profits could not be locked in because the recovery was too quick. The high volatility in combination with the negative returns forced the weight of the
BG SICAV
Managers’ Report (continued)
Page 15
BG SICAV – Vontobel Pure Strategy (continued)
Momentum strategy to be minimal in the second half of the year. The Defensive and Value strategies could not profit this year as much as cyclical sectors did. Especially in the aftermath of the US election the strategies could only make up a small part of the losses encountered in the beginning of the year.
BG SICAV – Algebris - Best Ideas
The sub-fund BG SICAV – Algebris - Best Ideas returned +2.60% (Class Dl) in 2016. The investment strategy focuses thematic investing across equity and credit, with an absolute return mindset and a volatility management overlay. The key positive contributors thematically were reflation plays (DM financial equities and short positions in European rates), Asian technology and European industrials/food processors. Key detractors were index hedges and short positions, principally in UK equities. Higher rates and shift in central bank policy kept financials as the highest invested sector over the year, predominantly in AT1 securities and common equity. In addition to being key beneficiaries of higher rates, financials had seen underweight positioning extremes due to volatility in the early part of the year, which in The Investment Managers’ view represented one of the key opportunities to capture. Given the volatile environment, the sub-fund ran a below average market exposure in the region of 40-50%, with a two thirds/one third credit/equity split while hedges were mainly focused on index futures and shorts on developed market rates. This caution restricted some of the beta capture in exchange for downside management, which in the Investment Manager’s view was prudent given the numerous binary risks in the second half of 2016. This represented an approximately 2pp drag on performance, which with the benefit of hindsight represented over-hedging on Investment Manager’s part. In the latter part of the year, the carry positions in equity and credit also gave back some performance due to higher rates, and the Investment Manager reduced exposure to European and Asian telcos as a result of the changed rates outlook globally.
BG SICAV – Euro Debt
In 2016, the sub-fund BG SICAV – Euro Debt delivered a positive performance of 0.05% (Class Dl), underperforming its benchmark. During the 2016 the sub-fund over weighted the Peripheral countries and underweighted core and semi-core Euro bonds, maintaining the preference for Italian, Spanish and Irish bonds. During the first quarter of the year the duration has been managed between 4 and 5,7 years and the weight of corporate bonds was kept around 8%. In the second quarter, duration has been gradually reduced as well as the weight of Corporate bonds (around 7.50%). In the third quarter, after to the English Brexit referendum, the duration of the sub-fund has been gradually increased to 5,4 years. At the same time the weight of Corporate bonds was also increased until 12%. During the last quarter, with the increase in market volatility due to the US Election, Italian referendum and the mounting expectations on central banks decisions, the duration has been marginally decrease to 5 years and around 12% of portfolio has been switched from Italian government bonds to Spanish government bonds.
BG SICAV – Vontobel Global Active Bond
In calendar year 2016, the sub-fund BG SICAV – Vontobel Global Active Bond delivered a positive absolute performance of +1.11% (Class Dl). Bond markets behaved differently in three distinct periods in 2016, which suits the flexible style of management well. The first half of the year, including Chinese induced stress at the start of the year, ECB corporate QE in Spring through until Brexit, was characterised by an extremely strong performance. Central banks remained dovish and yields went lower and more negative. Bond markets then stagnated through summer as negative yields weighed on investor sentiment before turning violently negative in the last quarter on rumours of fiscal expansion in the US post Trump. Four distinct strategies have been played through the year : Asymmetric risk rising in bond markets : The portfolio has been underweight duration for most of the year. This was linked to the belief that the economy was gradually improving, a low point in global inflation and monetary policy had been reached and that valuations were stretched. This position was switched to long
BG SICAV
Managers’ Report (continued)
Page 16
BG SICAV – Vontobel Global Active Bond (continued)
duration after the Trump tantrum in November. The short duration was a detractor to performance in the first half as rates continued to fall, however it generated performance in the second half as yields started to rise. Spread carry run : With rates expected to rise at only a gradual pace, the Investment Manager believed that investors would still seek exposure to spread instruments in order to increase yield. The portfolio has preferred subordinated financials, industrial hybrids, periphery debt, selective exposure to high yield and emerging debt/currencies through the year. Despite volatility in the first quarter and to a lesser extent in autumn, this theme added value in aggregate over the year China slowdown : the rotation in the Chinese economy will be gradual. In the meantime, the Investment manager has seen bouts of stress in currency and equity markets. He feels that the reflation of the Chinese economy will require a weakening currency with second round effects being felt in the Asian complex which competes with China, namely Singapore, Korea, Taiwan. Commodity countries such as Australia and New Zealand will also feel the effect of the slowdown. The Investment Manager has been short the currencies of all these countries through the year against USD, which has been the major source of outperformance in the sub-fund. Geopolitical risks and tail risk hedging : the Investment Manager has actively managed the extreme risks of the portfolio against “known unknowns”. This has mainly been done through volatility strategies. Given that there has not been any major blow up (despite minor tremors), these insurance strategies have weighed on the performance of the portfolio but have helped reduce overall volatility in times of stress.
BG SICAV – BlackRock Global Opportunities Bond Fund
In 2016, BG SICAV – BlackRock Global Opportunities Bond Fund delivered a negative return of -0.58% (Class Dl). The Investment Manager started the year with a modest overall level of risk and used the sell-off in risk-assets in the first quarter to increase the risk and carry of the portfolio. He paired this with an increase in the level of fund duration. The positions in high-yield and high-grade US and European corporates as well as global securitised assets all contributed positively to performance. The preference for EM local currency bonds also benefitted performance with positive contributions from higher yielding allocations including Brazil, Argentina and Indonesia. The Investment Manager continues to favour select EM bonds where it was expected further monetary policy easing, however, overall we decreased their Emerging Markets exposures in the fourth quarter and reduced the maturity of many of these positions. Duration and curve positioning in developed markets also added to returns, particularly US duration positions. In the US, the Investment Manager shifted exposures from longer maturities in the first half of the year, towards the belly of the curve and ultimately moved to a curve steepening bias. Curve steepening positions in Japan and inflation linked bonds in the UK, US and Europe also aided returns in the second half of the year. On the other hand, the active FX positions in aggregate detracted from performance and specifically the long GBP position around Brexit and long Emerging Markets FX exposures at the beginning of the year impacted performance negatively. In the first half of 2016 the short position in UK gilts, which have been since closed, also detracted from returns. Lastly, long positions in Portuguese sovereign bonds were also negative as spreads to Germany widened sharply in the first quarter of the year.
BG SICAV – Invesco Financial Credit Bond
For the year 2016, BG SICAV – Invesco Financial Credit Bond achieved a total return of 3.35% (Class Dl). Subordinated insurance, Additional Tier 1 securities (AT1), ECN’s, and Tier 2 bank capital all made positive contributions to performance. On the other hand, the Investment Manager did experience some weakness in the senior bond and tier 1 bank bond holdings. There was also some single name weakness in particular in respect to our exposure to the Co-Operative Bank, which detracted from performance. The investment Manager continues to hold a well-diversified portfolio of national champion banks. In terms of our positioning in the capital structure he hold a sizable position in legacy Tier 1 and Tier 2 capital for the additional yield he can obtain through these bonds. The largest exposure is, however, to Additional Tier 1 Bank capital, which the Investment Manager thinks pays a good level of income to compensate for the
BG SICAV
Managers’ Report (continued)
Page 17
BG SICAV – Invesco Financial Credit Bond (continued)
additional subordination risk. In the Investment Manager’s view, the biggest risk with these bonds is coupon suspension, which is therefore a key area of focus for his analysis. Looking ahead, the investment Manager thinks financials remain attractive relative to other corporate bonds and is reasonably positive on the sector. From the fundamentals point of view, the Investment Manager still has a lot more capital in the system in aggregate. Banks still have a lot of liquidity, and the profitability outlook would improve as well with the recent moves in some interest rates and the steepening of the yield curve. On the other hand, the electoral calendar is quite heavy this year and there will likely be phases of risk-on and risk-off. However, given the positive fundamentals that characterize the sector, such periods are likely to provide opportunities to add exposure.
BG SICAV – HSBC Euro Credit Opportunities
BG SICAV – HSBC Euro Credit Opportunities finished 2016 with a net positive return of 3.30% (Class Dl) while its benchmark posted a performance of 5.38%. Over the year, the Investment Manager maintained a long positioning on credit markets, with a beta range of 1.00-1.50 (Average 1.25). In terms of real credit duration, it was slightly lower than the one of the benchmark, as the sub-fund held 10-12% of sovereign bonds over the period, and shorter maturity credit bonds. On the other side, the Investment Manager was more aggressive in terms of credit ratings than the benchmark. The sub-fund held 18-25% of high yield bonds. This strategy could deliver a decent yield in a low rate environment (1.45% for the sub-fund versus 1.14% for the benchmark). The sub-fund was overweight in corporate hybrids bonds, with a preference for short-dated calls. It also was long financials over non-financials, with a strong focus on insurance subordinated bonds. The Investment Manager still finds the insurance sector really interesting on a carry / rating perspective. In terms of rates duration, the sub-fund was short around 1 year versus the benchmark, as the absolute level of rates appeared prohibitive. The Investment Manager had a positioning to the flattening of the yield curve in the first semester, and reversed to steepening when 10y German rates entered negative territory last summer. Finally, the positioning on inflation linked bonds was also a contributor to the performance, as EUR breakevens rallied strongly into the year-end. The sub-fund suffered from volatility spikes over the course of the year (Brexit, February financials widening), but strongly benefited from the Corporate Sector Purchase Program (CSPP). The European Central Bank actions gave a solid bid to credit markets and was technically very supportive for the asset class.
BG SICAV – Amundi Global Income Bond
In 2016, the sub-fund BG SICAV – Amundi Global Income Bond realized a negative return of 1.74% (Class Dl) versus +0.96% for the benchmark. The full year performance can be broken into two; the first half of the year was challenging, however during the second half of the year, performance strongly rebounded despite the negative benchmark returns of -1.30%. First half performance was harmed by being underweight duration as it was expected to see yields rising across developed markets, especially on the back of the first Fed rate hike in December of 2015. However, the Investment Manager saw opposite and yields continued to fall as both the Bank of Japan and ECB took actions that caused government yields to fall significantly, so that our underweight allocation to duration left it lagging the benchmark. Overweight allocations to investment grade corporate bonds also affected fund performance as yield spreads relative to government bonds rose in the first 3 months. During the second half of the year the underweight duration positioning finally paid off as yields started to rise, with this trend accelerating following the US election result. Off-benchmark exposure to US inflation linked bonds, which now make up a significant portion of the sub-funds total duration has proven to be beneficial to performance in the second half. Performance has also benefitted from overweight exposure to corporate and emerging markets bonds, although the largest contribution has come from currencies, in particular the US dollar and select EM currencies. The Investment Manager believes the diversified nature of the portfolio will be key to weathering markets in 2017. If bond yields do indeed continue to rise, lowly correlated sources of return such as currencies will become more important.
BG SICAV
Managers’ Report (continued)
Page 18
BG SICAV – UBS Dynamic Credit High Yield
In 2016, BG SICAV – UBS Dynamic Credit High Yield delivered an absolute positive performance of 7.53% (Class Dl). The sub-fund does not have a reference benchmark. At the beginning of the year, the portfolio's main sector positions were Telecommunications, Basic Industry and Banking. The largest sector allocations at year-end were to Banking, Energy and Telecommunications. During the year the Investment Manager reduced the allocation to Building Materials, Homebuilders/Real Estate and Telecommunications and added to sectors such as Services, Chemicals and Transport. During the period the allocation to UBS (Lux) Bond Fund – EUR High Yield was reduced and exposure was purchased to the UBS (Lux) Bond Sicav – Short Duration High Yield. The largest contributor to performance during 2016 was the allocation to Energy, followed by the allocation to Metals & Mining and Telecommunications. Detractors to performance included the allocation to the UBS (Lux) Bond Fund – EUR High Yield and UBS (Lux) Bond Sicav – Short Duration High Yield as their total returns, whilst positive, were lower than the UBS Dynamic Credit High Yield.
BG SICAV – UBS Global Income Alpha
From the beginning of the year till December 9, 2016 the last Net Asset Value before its merger into the sub-fund BG SICAV – UBS Dynamic Credit High Yield, BG SICAV – UBS Global Income Alpha posted a negative performance of -6.50% (Class Dl), underperforming its benchmark. Over the course of the year, the sub-fund had both strategic and tactical allocations across global interest rates, global credit, and global currency markets that included both long and short exposures. In global rates markets, the sub-fund typically had short exposure to US interest rates throughout the year, on the view that US interest rates would likely rise due to continued improvement in the US economy and gradually increasing inflation. This short US rates exposure was the primary detractor from performance for the year, particularly in the first half of the year, where 2-year, 10-year, and 30-year US Treasury yields fell -47 bps, -79 bps, and -70 bps, respectively. As US Treasury yields fell (and therefore US Treasury prices rose) in the first half of the year, the sub-fund's short exposure to US Treasury rates during this period had a notably adverse impact on performance. In global credit markets, the sub-fund generally favored long exposure to high yield corporates, emerging market debt, and securitized assets throughout the year on the view that decent fundamentals coupled with strong investor demand for higher-yielding fixed income assets would be supportive for fixed income credit. These spread sectors meaningfully outperformed duration-equivalent Treasuries in 2016 and was the primary positive contributor to the sub-fund's performance for the year, as market technicals (e.g., investor demand, fund flows) were quite favorable for credit in 2016. The sub-fund's global currency positioning had mixed results on performance in 2016. In general, the sub-fund was long the U.S. dollar throughout the year, as the USD appreciated approximately 3.60% in 2016 on the prospect of higher future inflation and policy rates. However, the sub-fund's short exposure to the Canadian dollar detracted from performance, particularly in the second half of the year, as the price of oil rallied and the CAD appreciated. The sub-fund's long Mexican peso positioning also detracted from performance, as the MXN was hurt in the second half of the year by President-elect Trump's surprise win.
BG SICAV – Schroder Convertible Bond Opportunities
BG SICAV – Schroder Convertible Bond Opportunities has performed negatively over 2016 by -0.25% (Class Dl) . The strategy protected well during the bad equity markets at the start of 2016 and delivered a good upside performance when markets turned after the first quarter. However, convertible bonds as an asset class did not fully live up to their traditional strong equity market participation in 2016. Against a pure equity strategy, the asset class’s natural regional underweight to the US market and relatively high exposure to Japan, as well as sector concentration in IT names and mid-cap growth stocks did result in a sub-average return. The strategy itself outperformed its convertible bond index before costs. Typical for this strategy, performance was driven by bottom up convertible bond selection, sector rotation, and trading. From a top down perspective, the Investment Manager actively increased the risk positions after the somewhat irrational
BG SICAV
Managers’ Report (continued)
Page 19
BG SICAV – Schroder Convertible Bond Opportunities (continued)
sell-off in early first quarter, directly after Brexit, and just before the US election – here with a focus on US names. All calls delivered good returns. Turning to single issues, the Investment Manager made the highest value add from US Technology names such as Micron and NXPI as well as industrials such as Siemens and Trinity Industries. The long-term savings nature of the capital also allows to access small-cap opportunities which were a consistent source of outperformance, especially in Japan, with multiple contributors such as NH Foods, Hazama Ando, Bic Camera and Makino Milling. Relative performance also came from avoiding the largest underperformers of the year, with underweights in Aabar/Unicredit, Tesla and Cobalt Energy all being significant.
BG SICAV – Vontobel New Frontier Debt
The sub-fund BG SICAV – Vontobel New Frontier Debt has delivered strong absolute performance in 2016 : +7.61% (Class Dl) on the back of a strong bond market, especially in the first half of the year, and on a significant tightening of emerging credit spreads, from early spring onwards. Local (15% of the portfolio) and hard currency debt returned similar levels of performance over the period. However overall performance was enhanced by an overexposure to frontier markets, a partial replacement of local currency exposure into USD exposure and underexposure to cash. Several thematics have been in place through the year. The Investment Manager has remained positive on the asset class overall given the improving fundamentals of the emerging investment universe. Specifically, he has believed that growth differentials will increasingly rotate in favour of emerging versus developed markets. Debt levels remain generally under control and deficits have improved. Emerging currency has acted as a shock absorber in the last few years. Commodity prices are firming, valuations are attractive and developed markets remain stuck in a low yield environment. Within the emerging universe, the Investment Manager has been underweight in local currency bonds but added some USD risk to replace it. He continued to see value in the hard currency space, and especially in the Quasi sovereign sector (companies held at least 50% by the sovereign). However, the Investment Manager have reduced sovereigns such as Turkey and South Africa which have been at risk of a ratings downgrade to Junk bond status (Turkey has since been downgraded). On a bottom up basis, he has continued to invest in mispriced securities due to the inefficient nature of this market. Opportunities have continued to appear in cross currency, curve and issuer areas. This has led to strong overweights through all or part of the year in countries such as Brazil, Indonesia, Ghana and Mexico. The Investment Manager has generally tended to avoid low yielding regions such as Europe, e.g. Poland where valuations have appeared stretched and Asia to a lesser extent where the Philippines stands out in our opinion as having a poor political backdrop and elevated valuations.
BG SICAV – Global Supranational
In 2016, BG SICAV – Global Supranational delivered a positive performance of 9.72% (Class Dl). During the year the asset allocation preferred emerging countries, whose exposure has been maintained between 55% and 65% all year long, closing the year at 64%, versus Developed countries, whose exposure has been managed between 20% and 35%, closing the year 23%. The duration of the sub-fund has been gradually reduced, starting the year at around 2.5 years and closing at 1.5 years. The biggest over weights on the emerging markets were India, Indonesia and Brazil whose currencies performed respectively +0.50%, +5.60% and +25.40%. In the developed area, Europe and USA has been maintained underweight during all the period, preferring Canada, Australia and New Zealand. This asset allocation has been favored by the uncertainty deriving from European referendums (Brexit and constitutional referendum in Italy), from the President Election vote in the USA and from the divergences of the monetary policies between ECB and FED, with the ECB extending the QE whilst the FEB raising rates at the end of the year. This situation led to weakness of the Euro against the US Dollar as well as the most of the foreign currencies. In the period the dollar index has been the most important driver registering a positive performance of +3.30%. The over weight of emerging area has benefited also from the raise in the commodity index (+13%ytd) and from the gain in the oil price (+45% ytd).
BG SICAV
Managers’ Report (continued)
Page 20
BG SICAV – Global Supranational (continued)
At the end of the year, the portfolio allocation sees Africa at 3.60% (South Africa), Asia at 30.20% (distributed on China, India and Indonesia), Europe 3.20% (Norway and Great Britain), the Emerging Europe at 8% (Russia), South America 22% (Brazil and Mexico), the North America to 11.20% (USA and Canada) and the Pacific to 8.70% (Australia and New Zealand).
BG SICAV – JP Morgan Capital Structure Opportunity
BG SICAV – JP Morgan Capital Structure Opportunity delivered a positive return over 2016 of 0.51% (Class Dl). As per its strategy, the sub-fund has focused on accessing equity and credit instruments to build a globally diversified portfolio. In a year characterised by political upsets, policy divergence and volatile markets, the primary drivers of returns were the equity positioning. The largest weights throughout the period were to industrials and consumer cyclicals which both contributed to the sub-fund’s outperformance. In particular, the high growth, improving fundamental and catalyst names benefited from the marked rotation out of defensive equities and into cyclicals that began in August and continued through year-end. Following the US presidential election the investment Manager saw a sell-off in duration sensitive assets including straight bonds. Heading into 2017, the fixed income exposure has been reduced to stable companies in favour of adding equity risk in particular to European aerospace names. Top performers in the portfolio over the course of the year include European car manufacturer Peugeot SA and US real estate investment trust VEREIT. The equity position in Peugeot was initiated on the grounds of what the investment Manager considered to be an attractive valuation and exposure to a continued European recovery, and replaced a previous holding of Peugeot bonds. The company performed well in 2016 as progress in cost saving programs enabled them to improve margins, supported by a benign macroeconomic environment. The investment Manager opted for a high yielding convertible position in VEREIT, on the basis that continued efforts by new management to move on from historic reporting difficulties and regain their lost investment grade credit rating would have a positive impact on the credit spread applied to their debt that could exceed the potential equity performance. In addition, the portfolio’s holding of Asset Swapped Convertible Option Transactions (ASCOTs) in Japan has been supportive for portfolio performance, following strong Japanese equity performance in recent months as economic data improved and the Yen weakened against a strong US dollar following the US presidential elections.
BG SICAV – Muzinich Credit Alternative Fund
BG SICAV – Muzinich Credit Alternative Fund was launched in the second half of December 2016. The performance from incorporation till the end of the year was slightly negative : -0.10% (Class Dl). The sub-fund received funding in late December when the market had very little trading volume. The Investment Manager purchased a conservative low-duration corporate ETF position, to keep the fund invested the Investment Manager expects to liquidate this “placeholder” ETF position and to have the fund invested in the strategy by the end of January 2017. Luxembourg, March 13, 2017 Note: The information stated in this report are historical and not necessarily indicative of future performance.
Ernst & Young Société anonyme
35E, Avenue John F, Kennedy L-1855 Luxembourg
Tel : +352 42 124 1
www.ey.com/luxembourg
Page 21
A member firm of Ernst & Young Global Limited
B.P. 780 L-2017 Luxembourg
R.C.S. Luxembourg B 47 771 TVA LU 16063074
Audit report
To the Shareholders of BG SICAV 5, allée Scheffer, L-2520 Luxembourg We have audited the accompanying financial statements of BG SICAV (the “SICAV”) and of each of its sub-funds, which comprise the statement of net assets and the securities portfolio as at December 31, 2016 and the statement of operations and changes in net assets for the year then ended, and a summary of significant accounting policies and other explanatory notes to the financial statements.
Responsibility of the Board of Directors of the SICAV for the financial statements
The Board of Directors of the SICAV is responsible for the preparation and fair presentation of these financial statements in accordance with Luxembourg legal and regulatory requirements relating to the preparation and presentation of the financial statements and for such internal control as the Board of Directors of the SICAV determines is necessary to enable the preparation and presentation of financial statements that are free from material misstatement, whether due to fraud or error.
Responsibility of the “réviseur d’entreprises agréé”
Our responsibility is to express an opinion on these financial statements based on our audit. We conducted our audit in accordance with International Standards on Auditing as adopted for Luxembourg by the “Commission de Surveillance du Secteur Financier”. Those standards require that we comply with ethical requirements and plan and perform the audit to obtain reasonable assurance about whether the financial statements are free from material misstatement.
An audit involves performing procedures to obtain audit evidence about the amounts and disclosures in the financial statements. The procedures selected depend on the judgement of the “réviseur d’entreprises agréé”, including the assessment of the risks of material misstatement of the financial statements, whether due to fraud or error. In making those risk assessments, the “réviseur d’entreprises agréé” considers internal control relevant to the entity’s preparation and fair presentation of the financial statements in order to design audit procedures that are appropriate in the circumstances, but not for the purpose of expressing an opinion on the effectiveness of the entity’s internal control. An audit also includes evaluating the appropriateness of accounting policies used and the reasonableness of accounting estimates made by the Board of Directors of the SICAV, as well as evaluating the overall presentation of the financial statements.
We believe that the audit evidence we have obtained is sufficient and appropriate to provide a basis for our audit opinion.
Page 22
A member firm of Ernst & Young Global Limited
Opinion In our opinion, the financial statements give a true and fair view of the financial position of BG SICAV and of each of its sub-funds as of December 31, 2016, and of the results of their operations and changes in their net assets for the year then ended in accordance with Luxembourg legal and regulatory requirements relating to the preparation of the financial statements. Other matters Supplementary information included in the annual report has been reviewed in the context of our mandate but has not been subject to specific audit procedures carried out in accordance with the standards described above. Consequently, we express no opinion on such information. However, we have no observation to make concerning such information in the context of the financial statements taken as a whole.
Ernst & Young Société anonyme Cabinet de révision agréé
Bernard Lhoest Luxembourg, March 13, 2017
Audrey.blaizot
Stamp
23Page
BG SICAVCombined
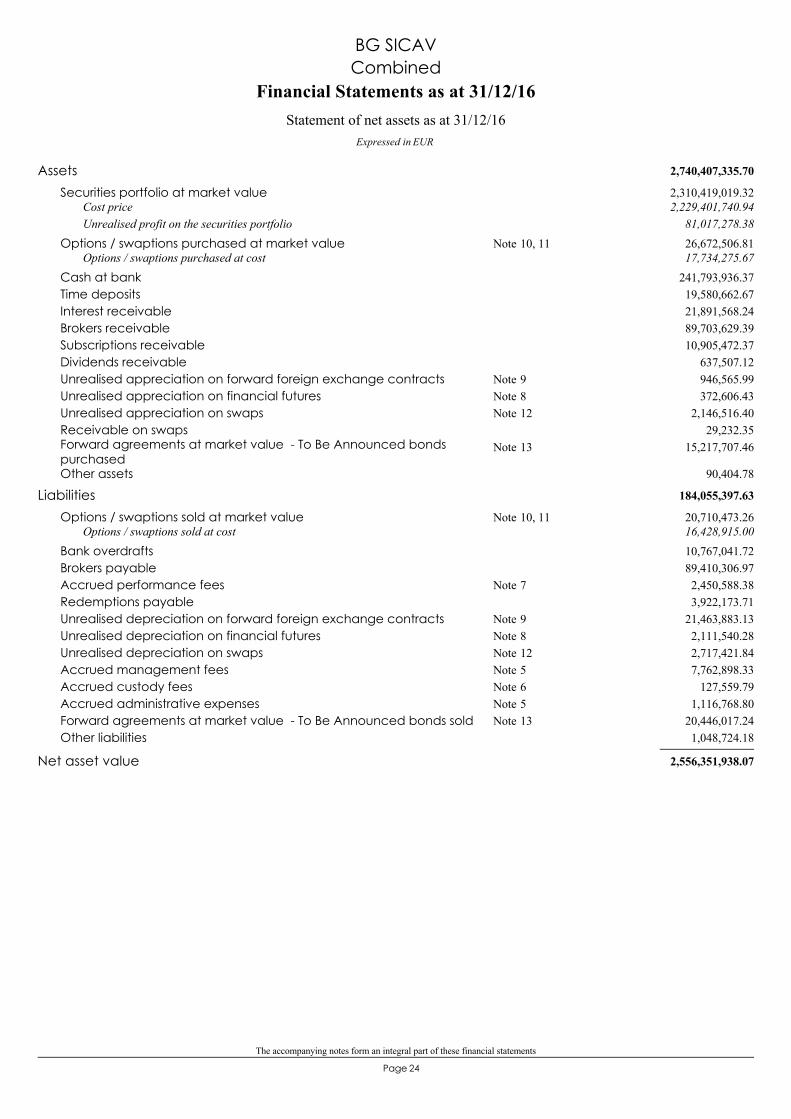
The accompanying notes form an integral part of these financial statements
24Page
2,740,407,335.70Assets2,310,419,019.32Securities portfolio at market value2,229,401,740.94Cost price
81,017,278.38Unrealised profit on the securities portfolio26,672,506.81Options / swaptions purchased at market value 10, 11Note17,734,275.67Options / swaptions purchased at cost
241,793,936.37Cash at bank19,580,662.67Time deposits21,891,568.24Interest receivable89,703,629.39Brokers receivable10,905,472.37Subscriptions receivable
637,507.12Dividends receivable946,565.99Unrealised appreciation on forward foreign exchange contracts 9Note372,606.43Unrealised appreciation on financial futures 8Note
2,146,516.40Unrealised appreciation on swaps 12Note29,232.35Receivable on swaps
15,217,707.46Forward agreements at market value - To Be Announced bondspurchased
13Note
90,404.78Other assets
184,055,397.63Liabilities20,710,473.26Options / swaptions sold at market value 10, 11Note16,428,915.00Options / swaptions sold at cost10,767,041.72Bank overdrafts89,410,306.97Brokers payable2,450,588.38Accrued performance fees 7Note3,922,173.71Redemptions payable
21,463,883.13Unrealised depreciation on forward foreign exchange contracts 9Note2,111,540.28Unrealised depreciation on financial futures 8Note2,717,421.84Unrealised depreciation on swaps 12Note7,762,898.33Accrued management fees 5Note
127,559.79Accrued custody fees 6Note1,116,768.80Accrued administrative expenses 5Note
20,446,017.24Forward agreements at market value - To Be Announced bonds sold 13Note1,048,724.18Other liabilities
2,556,351,938.07Net asset value
BG SICAV
Financial Statements as at 31/12/16
Expressed in EUR
Statement of net assets as at 31/12/16
Combined
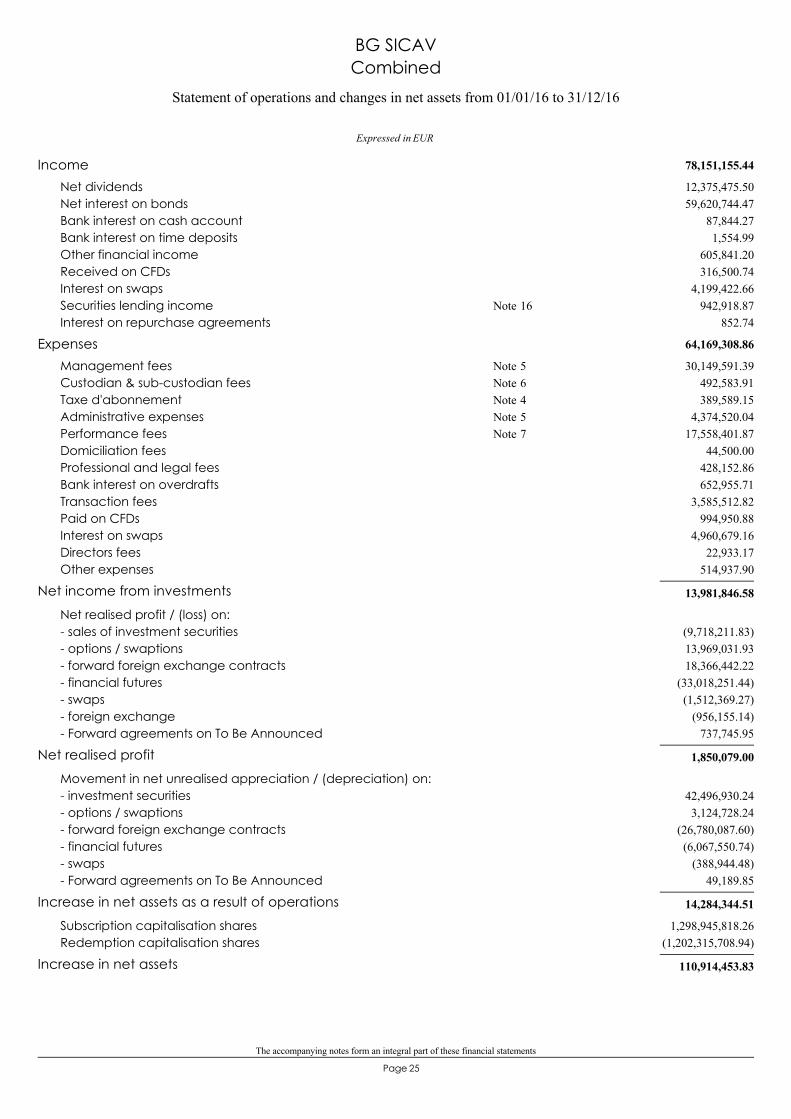
The accompanying notes form an integral part of these financial statements
25Page
78,151,155.44Income12,375,475.50Net dividends59,620,744.47Net interest on bonds
87,844.27Bank interest on cash account1,554.99Bank interest on time deposits
605,841.20Other financial income316,500.74Received on CFDs
4,199,422.66Interest on swaps942,918.87Securities lending income 16Note
852.74Interest on repurchase agreements
64,169,308.86Expenses30,149,591.39Management fees 5Note
492,583.91Custodian & sub-custodian fees 6Note389,589.15Taxe d'abonnement 4Note
4,374,520.04Administrative expenses 5Note17,558,401.87Performance fees 7Note
44,500.00Domiciliation fees428,152.86Professional and legal fees652,955.71Bank interest on overdrafts
3,585,512.82Transaction fees994,950.88Paid on CFDs
4,960,679.16Interest on swaps22,933.17Directors fees
514,937.90Other expenses
13,981,846.58Net income from investments
Net realised profit / (loss) on:(9,718,211.83)- sales of investment securities13,969,031.93- options / swaptions18,366,442.22- forward foreign exchange contracts
(33,018,251.44)- financial futures(1,512,369.27)- swaps
(956,155.14)- foreign exchange737,745.95- Forward agreements on To Be Announced
1,850,079.00Net realised profit
Movement in net unrealised appreciation / (depreciation) on:42,496,930.24- investment securities3,124,728.24- options / swaptions
(26,780,087.60)- forward foreign exchange contracts(6,067,550.74)- financial futures
(388,944.48)- swaps49,189.85- Forward agreements on To Be Announced
14,284,344.51Increase in net assets as a result of operations
1,298,945,818.26Subscription capitalisation shares(1,202,315,708.94)Redemption capitalisation shares
110,914,453.83Increase in net assets
EUR
Statement of operations and changes in net assets from 01/01/16 to 31/12/16
BG SICAVCombined
Expressed in
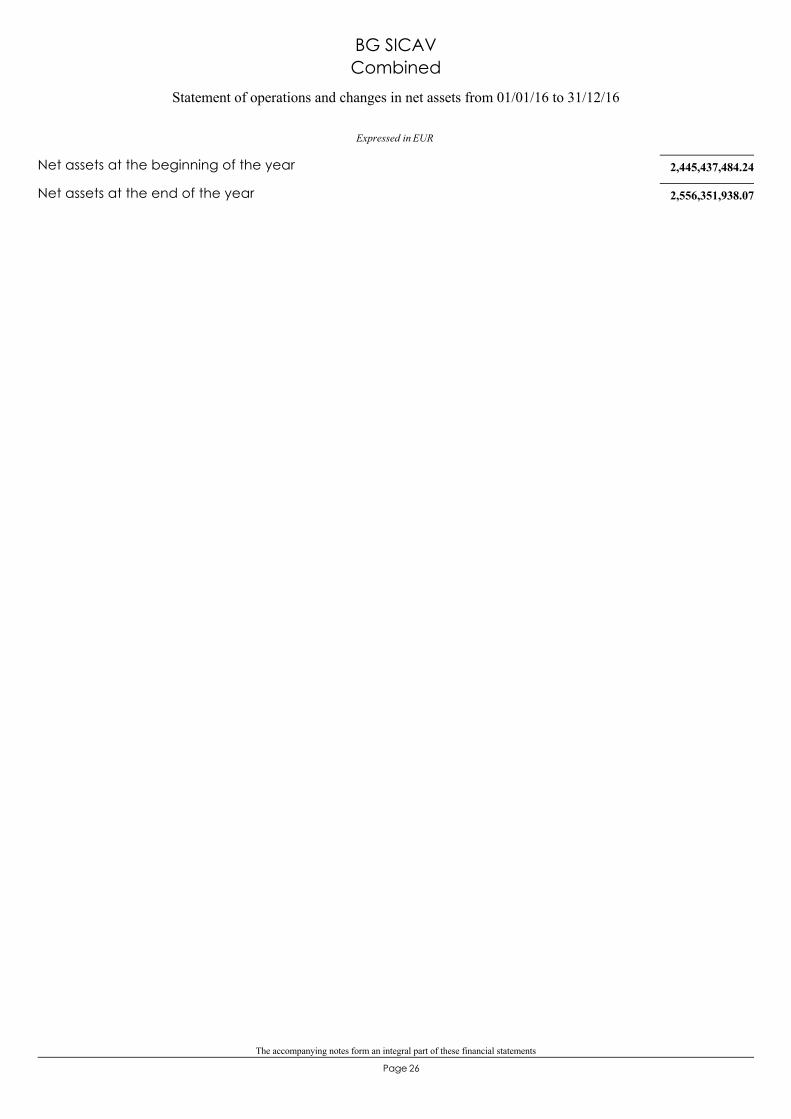
The accompanying notes form an integral part of these financial statements
26Page
2,445,437,484.24Net assets at the beginning of the year
2,556,351,938.07Net assets at the end of the year
EUR
Statement of operations and changes in net assets from 01/01/16 to 31/12/16
BG SICAVCombined
Expressed in
27Page
BG SICAV– European Equities
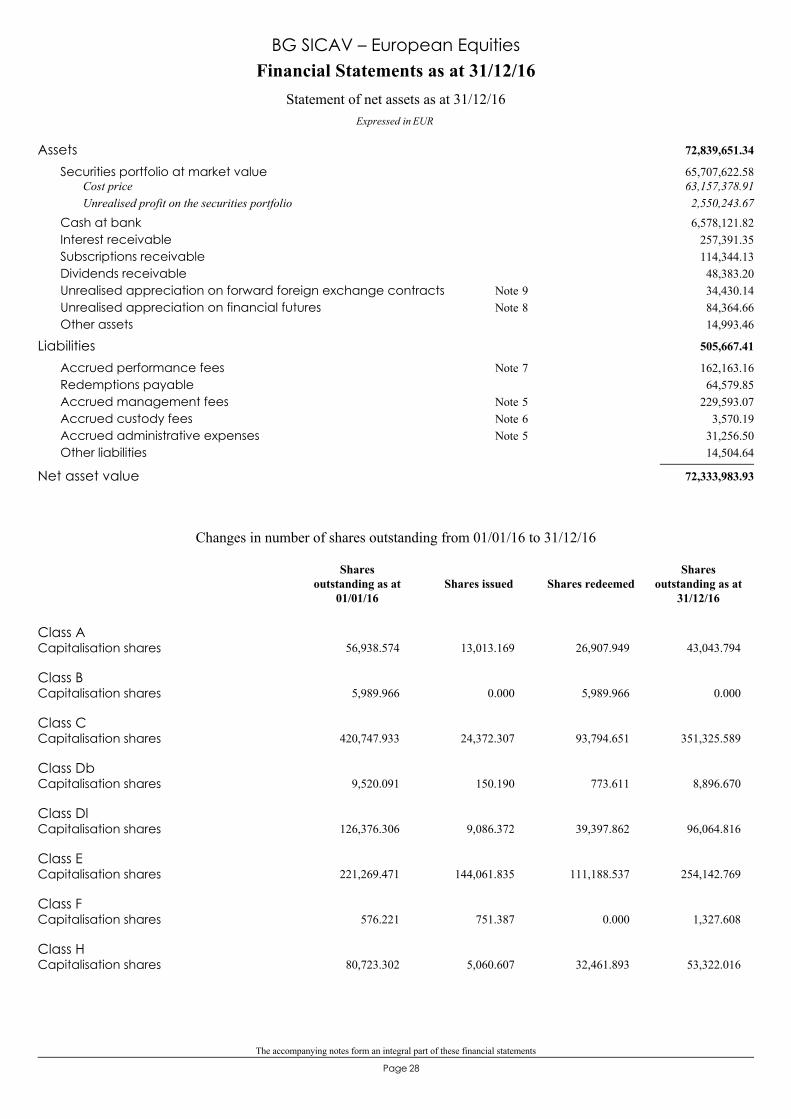
The accompanying notes form an integral part of these financial statements
28Page
72,839,651.34Assets65,707,622.58Securities portfolio at market value63,157,378.91Cost price2,550,243.67Unrealised profit on the securities portfolio6,578,121.82Cash at bank
257,391.35Interest receivable114,344.13Subscriptions receivable48,383.20Dividends receivable34,430.14Unrealised appreciation on forward foreign exchange contracts 9Note84,364.66Unrealised appreciation on financial futures 8Note14,993.46Other assets
505,667.41Liabilities162,163.16Accrued performance fees 7Note64,579.85Redemptions payable
229,593.07Accrued management fees 5Note3,570.19Accrued custody fees 6Note
31,256.50Accrued administrative expenses 5Note14,504.64Other liabilities
72,333,983.93Net asset value
Financial Statements as at 31/12/16
Expressed in EUR
Statement of net assets as at 31/12/16
BG SICAV – European Equities
Class ACapitalisation shares 56,938.574 13,013.169 26,907.949 43,043.794
Class BCapitalisation shares 5,989.966 0.000 5,989.966 0.000
Class CCapitalisation shares 420,747.933 24,372.307 93,794.651 351,325.589
Class DbCapitalisation shares 9,520.091 150.190 773.611 8,896.670
Class DlCapitalisation shares 126,376.306 9,086.372 39,397.862 96,064.816
Class ECapitalisation shares 221,269.471 144,061.835 111,188.537 254,142.769
Class FCapitalisation shares 576.221 751.387 0.000 1,327.608
Class HCapitalisation shares 80,723.302 5,060.607 32,461.893 53,322.016
Changes in number of shares outstanding from 01/01/16 to 31/12/16
Shares issued Shares redeemedShares
outstanding as at31/12/16
Sharesoutstanding as at
01/01/16
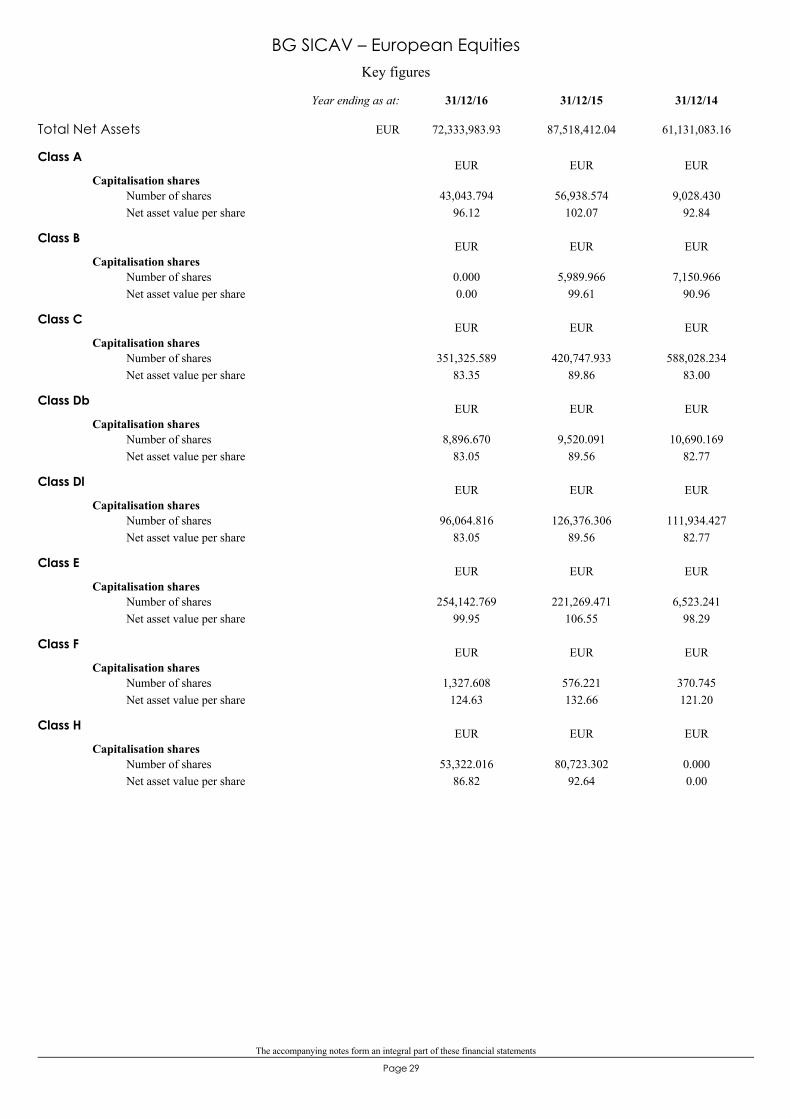
The accompanying notes form an integral part of these financial statements
29Page
Key figures
BG SICAV – European Equities
Class A
Capitalisation shares
96.1243,043.794 56,938.574
102.079,028.430
92.84Number of sharesNet asset value per share
EUR EUR EUR
Class B
Capitalisation shares
0.000.000 5,989.966
99.617,150.966
90.96Number of sharesNet asset value per share
EUR EUR EUR
Class C
Capitalisation shares
83.35351,325.589 420,747.933
89.86588,028.234
83.00Number of sharesNet asset value per share
EUR EUR EUR
Class Db
Capitalisation shares
83.058,896.670 9,520.091
89.5610,690.169
82.77Number of sharesNet asset value per share
EUR EUR EUR
Class Dl
Capitalisation shares
83.0596,064.816 126,376.306
89.56111,934.427
82.77Number of sharesNet asset value per share
EUR EUR EUR
Class E
Capitalisation shares
99.95254,142.769 221,269.471
106.556,523.241
98.29Number of sharesNet asset value per share
EUR EUR EUR
Class F
Capitalisation shares
124.631,327.608 576.221
132.66370.745121.20
Number of sharesNet asset value per share
EUR EUR EUR
Class H
Capitalisation shares
86.8253,322.016 80,723.302
92.640.0000.00
Number of sharesNet asset value per share
EUR EUR EUR
Total Net Assets 72,333,983.93 87,518,412.04 61,131,083.16
31/12/1431/12/1531/12/16Year ending as at:
EUR
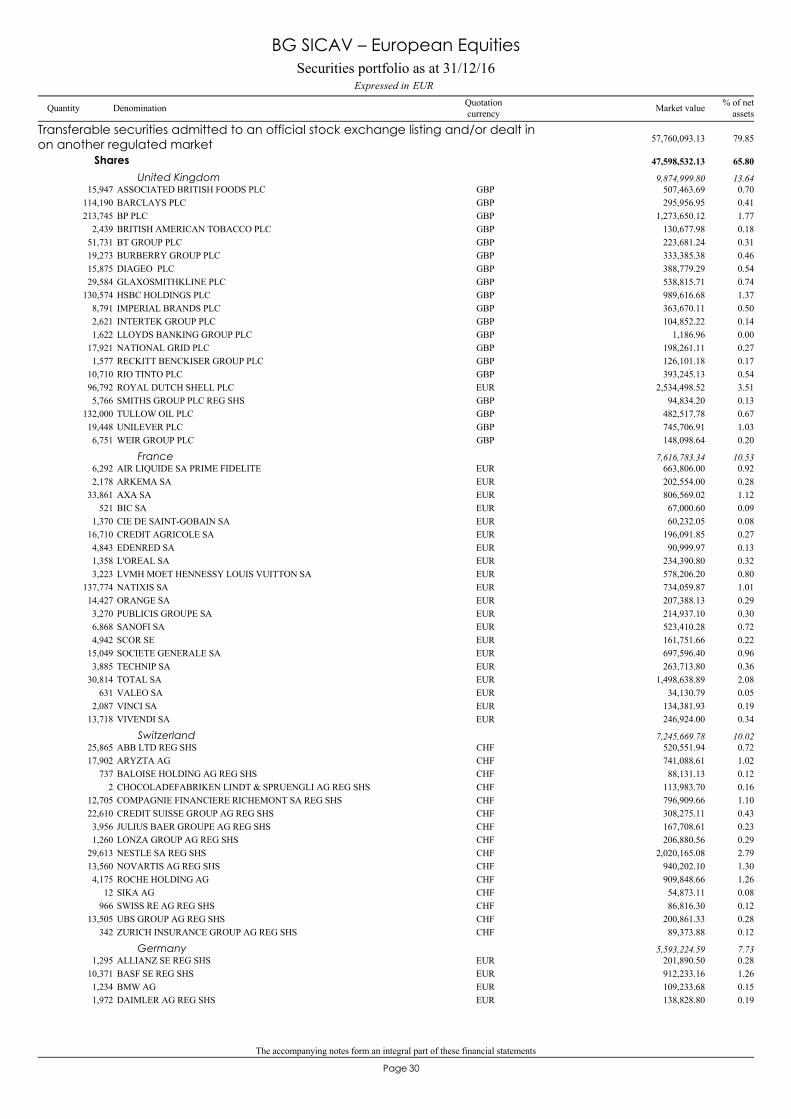
The accompanying notes form an integral part of these financial statements
30Page
ASSOCIATED BRITISH FOODS PLC15,947 507,463.69 0.70GBP
Transferable securities admitted to an official stock exchange listing and/or dealt inon another regulated market 57,760,093.13 79.85
Shares 47,598,532.13 65.80
United Kingdom 9,874,999.80 13.64
BARCLAYS PLC114,190 295,956.95 0.41GBPBP PLC213,745 1,273,650.12 1.77GBPBRITISH AMERICAN TOBACCO PLC2,439 130,677.98 0.18GBPBT GROUP PLC51,731 223,681.24 0.31GBPBURBERRY GROUP PLC19,273 333,385.38 0.46GBPDIAGEO PLC15,875 388,779.29 0.54GBPGLAXOSMITHKLINE PLC29,584 538,815.71 0.74GBPHSBC HOLDINGS PLC130,574 989,616.68 1.37GBPIMPERIAL BRANDS PLC8,791 363,670.11 0.50GBPINTERTEK GROUP PLC2,621 104,852.22 0.14GBPLLOYDS BANKING GROUP PLC1,622 1,186.96 0.00GBPNATIONAL GRID PLC17,921 198,261.11 0.27GBPRECKITT BENCKISER GROUP PLC1,577 126,101.18 0.17GBPRIO TINTO PLC10,710 393,245.13 0.54GBPROYAL DUTCH SHELL PLC96,792 2,534,498.52 3.51EURSMITHS GROUP PLC REG SHS5,766 94,834.20 0.13GBPTULLOW OIL PLC132,000 482,517.78 0.67GBPUNILEVER PLC19,448 745,706.91 1.03GBPWEIR GROUP PLC6,751 148,098.64 0.20GBP
AIR LIQUIDE SA PRIME FIDELITE6,292 663,806.00 0.92EURFrance 7,616,783.34 10.53
ARKEMA SA2,178 202,554.00 0.28EURAXA SA33,861 806,569.02 1.12EURBIC SA521 67,000.60 0.09EURCIE DE SAINT-GOBAIN SA1,370 60,232.05 0.08EURCREDIT AGRICOLE SA16,710 196,091.85 0.27EUREDENRED SA4,843 90,999.97 0.13EURL'OREAL SA1,358 234,390.80 0.32EURLVMH MOET HENNESSY LOUIS VUITTON SA3,223 578,206.20 0.80EURNATIXIS SA137,774 734,059.87 1.01EURORANGE SA14,427 207,388.13 0.29EURPUBLICIS GROUPE SA3,270 214,937.10 0.30EURSANOFI SA6,868 523,410.28 0.72EURSCOR SE4,942 161,751.66 0.22EURSOCIETE GENERALE SA15,049 697,596.40 0.96EURTECHNIP SA3,885 263,713.80 0.36EURTOTAL SA30,814 1,498,638.89 2.08EURVALEO SA631 34,130.79 0.05EURVINCI SA2,087 134,381.93 0.19EURVIVENDI SA13,718 246,924.00 0.34EUR
ABB LTD REG SHS25,865 520,551.94 0.72CHFSwitzerland 7,245,669.78 10.02
ARYZTA AG17,902 741,088.61 1.02CHFBALOISE HOLDING AG REG SHS737 88,131.13 0.12CHFCHOCOLADEFABRIKEN LINDT & SPRUENGLI AG REG SHS2 113,983.70 0.16CHFCOMPAGNIE FINANCIERE RICHEMONT SA REG SHS12,705 796,909.66 1.10CHFCREDIT SUISSE GROUP AG REG SHS22,610 308,275.11 0.43CHFJULIUS BAER GROUPE AG REG SHS3,956 167,708.61 0.23CHFLONZA GROUP AG REG SHS1,260 206,880.56 0.29CHFNESTLE SA REG SHS29,613 2,020,165.08 2.79CHFNOVARTIS AG REG SHS13,560 940,202.10 1.30CHFROCHE HOLDING AG4,175 909,848.66 1.26CHFSIKA AG12 54,873.11 0.08CHFSWISS RE AG REG SHS966 86,816.30 0.12CHFUBS GROUP AG REG SHS13,505 200,861.33 0.28CHFZURICH INSURANCE GROUP AG REG SHS342 89,373.88 0.12CHF
ALLIANZ SE REG SHS1,295 201,890.50 0.28EURGermany 5,593,224.59 7.73
BASF SE REG SHS10,371 912,233.16 1.26EURBMW AG1,234 109,233.68 0.15EURDAIMLER AG REG SHS1,972 138,828.80 0.19EUR
Securities portfolio as at 31/12/16EURExpressed in
BG SICAV – European Equities
Quantity Denomination Quotationcurrency
% of netassetsMarket value
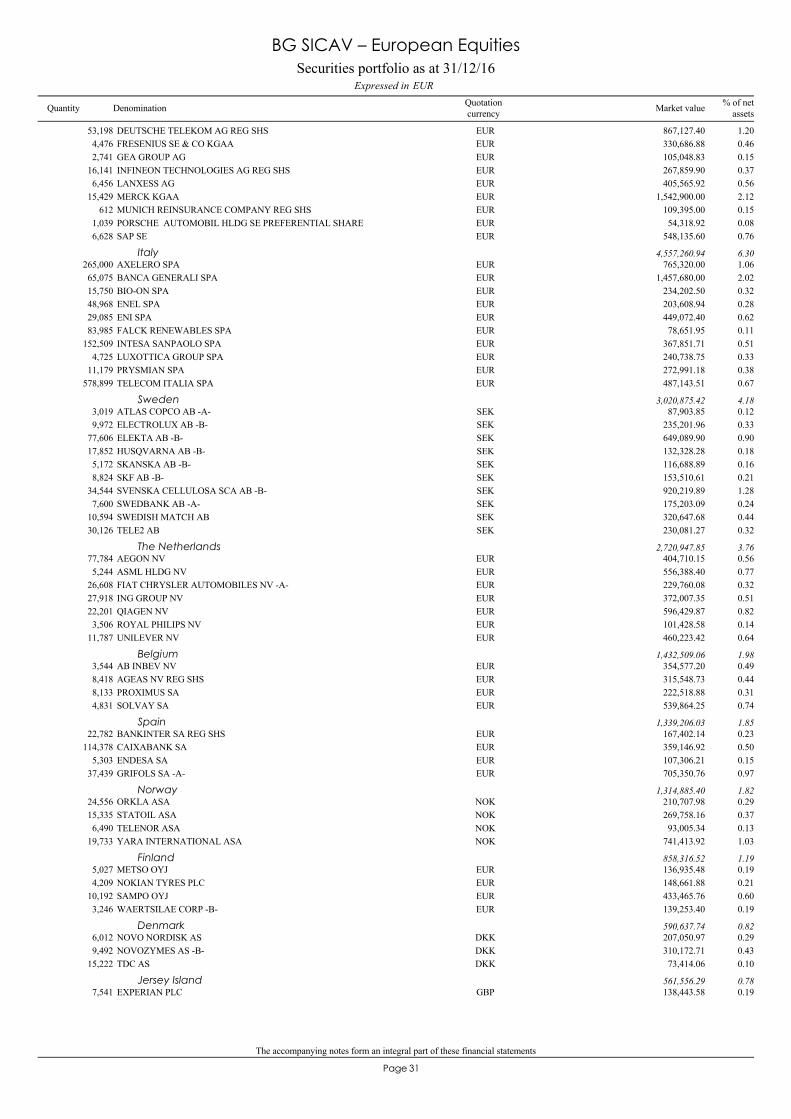
The accompanying notes form an integral part of these financial statements
31Page
DEUTSCHE TELEKOM AG REG SHS53,198 867,127.40 1.20EURFRESENIUS SE & CO KGAA4,476 330,686.88 0.46EURGEA GROUP AG2,741 105,048.83 0.15EURINFINEON TECHNOLOGIES AG REG SHS16,141 267,859.90 0.37EURLANXESS AG6,456 405,565.92 0.56EURMERCK KGAA15,429 1,542,900.00 2.12EURMUNICH REINSURANCE COMPANY REG SHS612 109,395.00 0.15EURPORSCHE AUTOMOBIL HLDG SE PREFERENTIAL SHARE1,039 54,318.92 0.08EURSAP SE6,628 548,135.60 0.76EUR
AXELERO SPA265,000 765,320.00 1.06EURItaly 4,557,260.94 6.30
BANCA GENERALI SPA65,075 1,457,680.00 2.02EURBIO-ON SPA15,750 234,202.50 0.32EURENEL SPA48,968 203,608.94 0.28EURENI SPA29,085 449,072.40 0.62EURFALCK RENEWABLES SPA83,985 78,651.95 0.11EURINTESA SANPAOLO SPA152,509 367,851.71 0.51EURLUXOTTICA GROUP SPA4,725 240,738.75 0.33EURPRYSMIAN SPA11,179 272,991.18 0.38EURTELECOM ITALIA SPA578,899 487,143.51 0.67EUR
ATLAS COPCO AB -A-3,019 87,903.85 0.12SEKSweden 3,020,875.42 4.18
ELECTROLUX AB -B-9,972 235,201.96 0.33SEKELEKTA AB -B-77,606 649,089.90 0.90SEKHUSQVARNA AB -B-17,852 132,328.28 0.18SEKSKANSKA AB -B-5,172 116,688.89 0.16SEKSKF AB -B-8,824 153,510.61 0.21SEKSVENSKA CELLULOSA SCA AB -B-34,544 920,219.89 1.28SEKSWEDBANK AB -A-7,600 175,203.09 0.24SEKSWEDISH MATCH AB10,594 320,647.68 0.44SEKTELE2 AB30,126 230,081.27 0.32SEK
AEGON NV77,784 404,710.15 0.56EURThe Netherlands 2,720,947.85 3.76
ASML HLDG NV5,244 556,388.40 0.77EURFIAT CHRYSLER AUTOMOBILES NV -A-26,608 229,760.08 0.32EURING GROUP NV27,918 372,007.35 0.51EURQIAGEN NV22,201 596,429.87 0.82EURROYAL PHILIPS NV3,506 101,428.58 0.14EURUNILEVER NV11,787 460,223.42 0.64EUR
AB INBEV NV3,544 354,577.20 0.49EURBelgium 1,432,509.06 1.98
AGEAS NV REG SHS8,418 315,548.73 0.44EURPROXIMUS SA8,133 222,518.88 0.31EURSOLVAY SA4,831 539,864.25 0.74EUR
BANKINTER SA REG SHS22,782 167,402.14 0.23EURSpain 1,339,206.03 1.85
CAIXABANK SA114,378 359,146.92 0.50EURENDESA SA5,303 107,306.21 0.15EURGRIFOLS SA -A-37,439 705,350.76 0.97EUR
ORKLA ASA24,556 210,707.98 0.29NOKNorway 1,314,885.40 1.82
STATOIL ASA15,335 269,758.16 0.37NOKTELENOR ASA6,490 93,005.34 0.13NOKYARA INTERNATIONAL ASA19,733 741,413.92 1.03NOK
METSO OYJ5,027 136,935.48 0.19EURFinland 858,316.52 1.19
NOKIAN TYRES PLC4,209 148,661.88 0.21EURSAMPO OYJ10,192 433,465.76 0.60EURWAERTSILAE CORP -B-3,246 139,253.40 0.19EUR
NOVO NORDISK AS6,012 207,050.97 0.29DKKDenmark 590,637.74 0.82
NOVOZYMES AS -B-9,492 310,172.71 0.43DKKTDC AS15,222 73,414.06 0.10DKK
EXPERIAN PLC7,541 138,443.58 0.19GBPJersey Island 561,556.29 0.78
Securities portfolio as at 31/12/16EURExpressed in
BG SICAV – European Equities
Quantity Denomination Quotationcurrency
% of netassetsMarket value
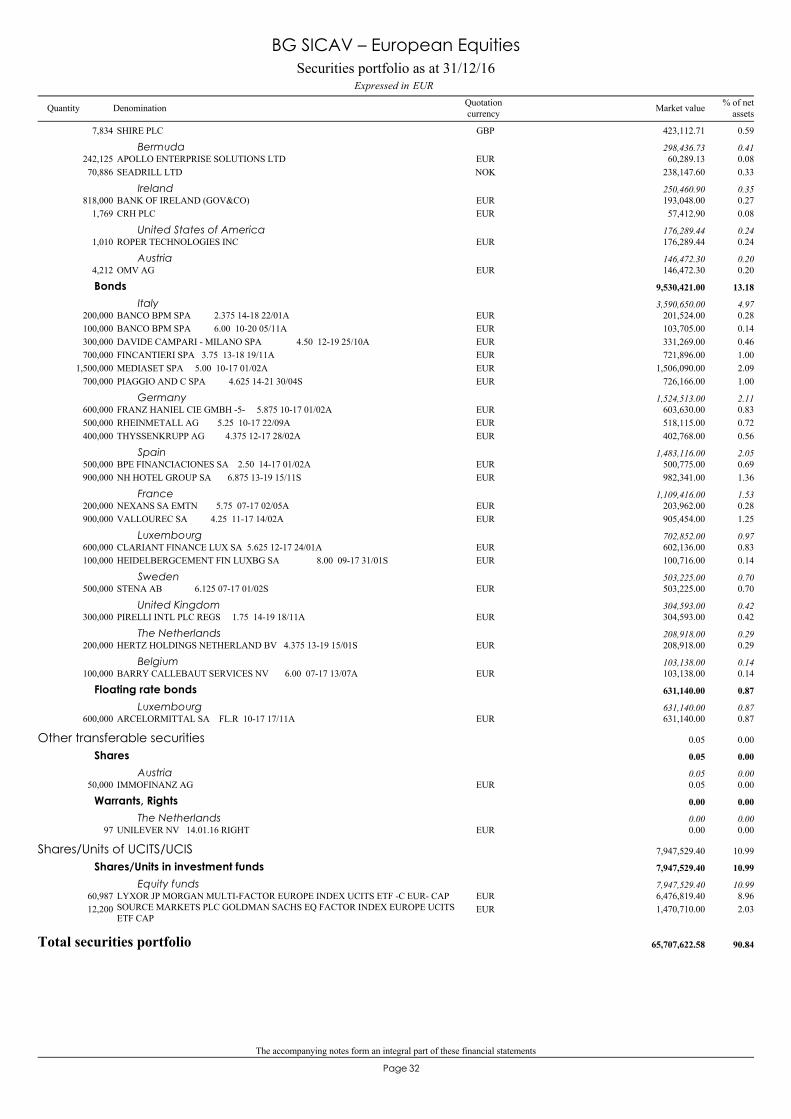
The accompanying notes form an integral part of these financial statements
32Page
SHIRE PLC7,834 423,112.71 0.59GBP
APOLLO ENTERPRISE SOLUTIONS LTD242,125 60,289.13 0.08EURBermuda 298,436.73 0.41
SEADRILL LTD70,886 238,147.60 0.33NOK
BANK OF IRELAND (GOV&CO)818,000 193,048.00 0.27EURIreland 250,460.90 0.35
CRH PLC1,769 57,412.90 0.08EUR
ROPER TECHNOLOGIES INC1,010 176,289.44 0.24EURUnited States of America 176,289.44 0.24
OMV AG4,212 146,472.30 0.20EURAustria 146,472.30 0.20
BANCO BPM SPA 2.375 14-18 22/01A200,000 201,524.00 0.28EUR
Bonds 9,530,421.00 13.18
Italy 3,590,650.00 4.97
BANCO BPM SPA 6.00 10-20 05/11A100,000 103,705.00 0.14EURDAVIDE CAMPARI - MILANO SPA 4.50 12-19 25/10A300,000 331,269.00 0.46EURFINCANTIERI SPA 3.75 13-18 19/11A700,000 721,896.00 1.00EURMEDIASET SPA 5.00 10-17 01/02A1,500,000 1,506,090.00 2.09EURPIAGGIO AND C SPA 4.625 14-21 30/04S700,000 726,166.00 1.00EUR
FRANZ HANIEL CIE GMBH -5- 5.875 10-17 01/02A600,000 603,630.00 0.83EURGermany 1,524,513.00 2.11
RHEINMETALL AG 5.25 10-17 22/09A500,000 518,115.00 0.72EURTHYSSENKRUPP AG 4.375 12-17 28/02A400,000 402,768.00 0.56EUR
BPE FINANCIACIONES SA 2.50 14-17 01/02A500,000 500,775.00 0.69EURSpain 1,483,116.00 2.05
NH HOTEL GROUP SA 6.875 13-19 15/11S900,000 982,341.00 1.36EUR
NEXANS SA EMTN 5.75 07-17 02/05A200,000 203,962.00 0.28EURFrance 1,109,416.00 1.53
VALLOUREC SA 4.25 11-17 14/02A900,000 905,454.00 1.25EUR
CLARIANT FINANCE LUX SA 5.625 12-17 24/01A600,000 602,136.00 0.83EURLuxembourg 702,852.00 0.97
HEIDELBERGCEMENT FIN LUXBG SA 8.00 09-17 31/01S100,000 100,716.00 0.14EUR
STENA AB 6.125 07-17 01/02S500,000 503,225.00 0.70EURSweden 503,225.00 0.70
PIRELLI INTL PLC REGS 1.75 14-19 18/11A300,000 304,593.00 0.42EURUnited Kingdom 304,593.00 0.42
HERTZ HOLDINGS NETHERLAND BV 4.375 13-19 15/01S200,000 208,918.00 0.29EURThe Netherlands 208,918.00 0.29
BARRY CALLEBAUT SERVICES NV 6.00 07-17 13/07A100,000 103,138.00 0.14EURBelgium 103,138.00 0.14
ARCELORMITTAL SA FL.R 10-17 17/11A600,000 631,140.00 0.87EUR
Floating rate bonds 631,140.00 0.87
Luxembourg 631,140.00 0.87
IMMOFINANZ AG50,000 0.05 0.00EUR
Other transferable securities 0.05 0.00
Shares 0.05 0.00
Austria 0.05 0.00
UNILEVER NV 14.01.16 RIGHT97 0.00 0.00EUR
Warrants, Rights 0.00 0.00
The Netherlands 0.00 0.00
LYXOR JP MORGAN MULTI-FACTOR EUROPE INDEX UCITS ETF -C EUR- CAP60,987 6,476,819.40 8.96EUR
Shares/Units of UCITS/UCIS 7,947,529.40 10.99
Shares/Units in investment funds 7,947,529.40 10.99
Equity funds 7,947,529.40 10.99
SOURCE MARKETS PLC GOLDMAN SACHS EQ FACTOR INDEX EUROPE UCITSETF CAP
12,200 1,470,710.00 2.03EUR
Total securities portfolio 65,707,622.58 90.84
Securities portfolio as at 31/12/16EURExpressed in
BG SICAV – European Equities
Quantity Denomination Quotationcurrency
% of netassetsMarket value
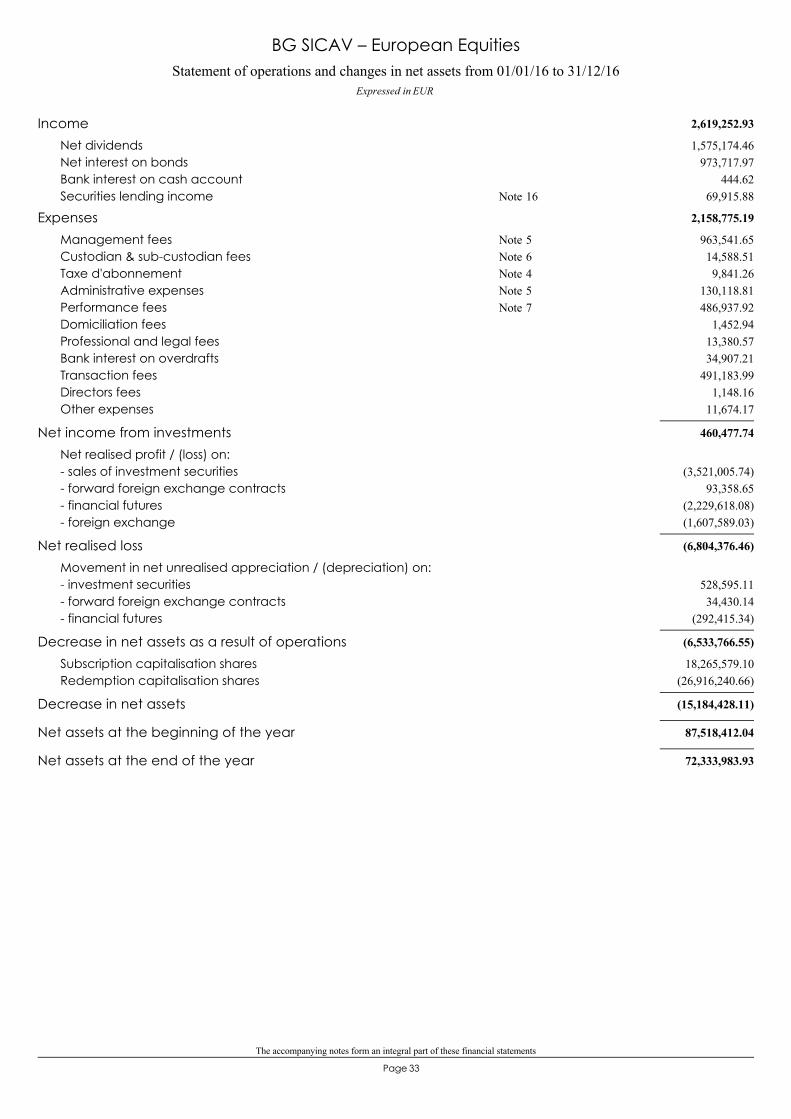
The accompanying notes form an integral part of these financial statements
33Page
Statement of operations and changes in net assets from 01/01/16 to 31/12/16Expressed in EUR
BG SICAV – European Equities
2,619,252.93Income1,575,174.46Net dividends
973,717.97Net interest on bonds444.62Bank interest on cash account
69,915.88Securities lending income 16Note
2,158,775.19Expenses963,541.65Management fees 5Note14,588.51Custodian & sub-custodian fees 6Note9,841.26Taxe d'abonnement 4Note
130,118.81Administrative expenses 5Note486,937.92Performance fees 7Note
1,452.94Domiciliation fees13,380.57Professional and legal fees34,907.21Bank interest on overdrafts
491,183.99Transaction fees1,148.16Directors fees
11,674.17Other expenses
460,477.74Net income from investmentsNet realised profit / (loss) on:
(3,521,005.74)- sales of investment securities93,358.65- forward foreign exchange contracts
(2,229,618.08)- financial futures(1,607,589.03)- foreign exchange
(6,804,376.46)Net realised lossMovement in net unrealised appreciation / (depreciation) on:
528,595.11- investment securities34,430.14- forward foreign exchange contracts
(292,415.34)- financial futures
(6,533,766.55)Decrease in net assets as a result of operations18,265,579.10Subscription capitalisation shares
(26,916,240.66)Redemption capitalisation shares
(15,184,428.11)Decrease in net assets
87,518,412.04Net assets at the beginning of the year
72,333,983.93Net assets at the end of the year

34Page
BG SICAV– US Equities
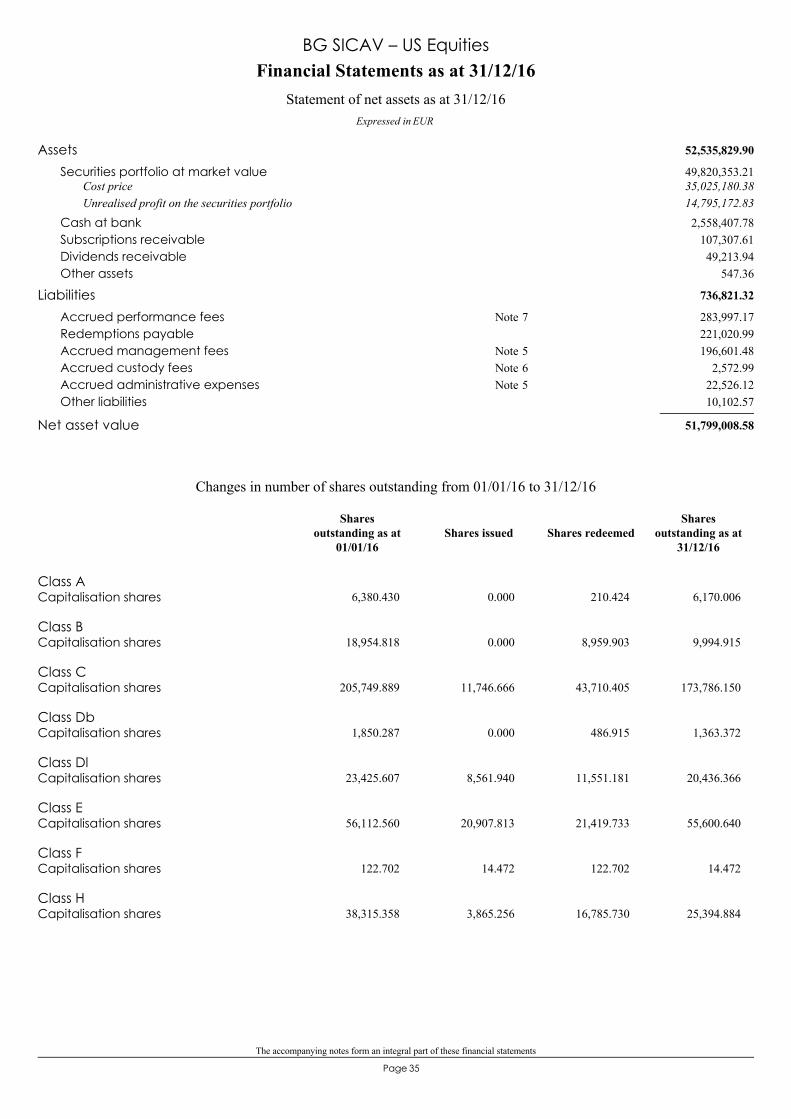
The accompanying notes form an integral part of these financial statements
35Page
52,535,829.90Assets49,820,353.21Securities portfolio at market value35,025,180.38Cost price14,795,172.83Unrealised profit on the securities portfolio2,558,407.78Cash at bank
107,307.61Subscriptions receivable49,213.94Dividends receivable
547.36Other assets
736,821.32Liabilities283,997.17Accrued performance fees 7Note221,020.99Redemptions payable196,601.48Accrued management fees 5Note
2,572.99Accrued custody fees 6Note22,526.12Accrued administrative expenses 5Note10,102.57Other liabilities
51,799,008.58Net asset value
Financial Statements as at 31/12/16
Expressed in EUR
Statement of net assets as at 31/12/16
BG SICAV – US Equities
Class ACapitalisation shares 6,380.430 0.000 210.424 6,170.006
Class BCapitalisation shares 18,954.818 0.000 8,959.903 9,994.915
Class CCapitalisation shares 205,749.889 11,746.666 43,710.405 173,786.150
Class DbCapitalisation shares 1,850.287 0.000 486.915 1,363.372
Class DlCapitalisation shares 23,425.607 8,561.940 11,551.181 20,436.366
Class ECapitalisation shares 56,112.560 20,907.813 21,419.733 55,600.640
Class FCapitalisation shares 122.702 14.472 122.702 14.472
Class HCapitalisation shares 38,315.358 3,865.256 16,785.730 25,394.884
Changes in number of shares outstanding from 01/01/16 to 31/12/16
Shares issued Shares redeemedShares
outstanding as at31/12/16
Sharesoutstanding as at
01/01/16
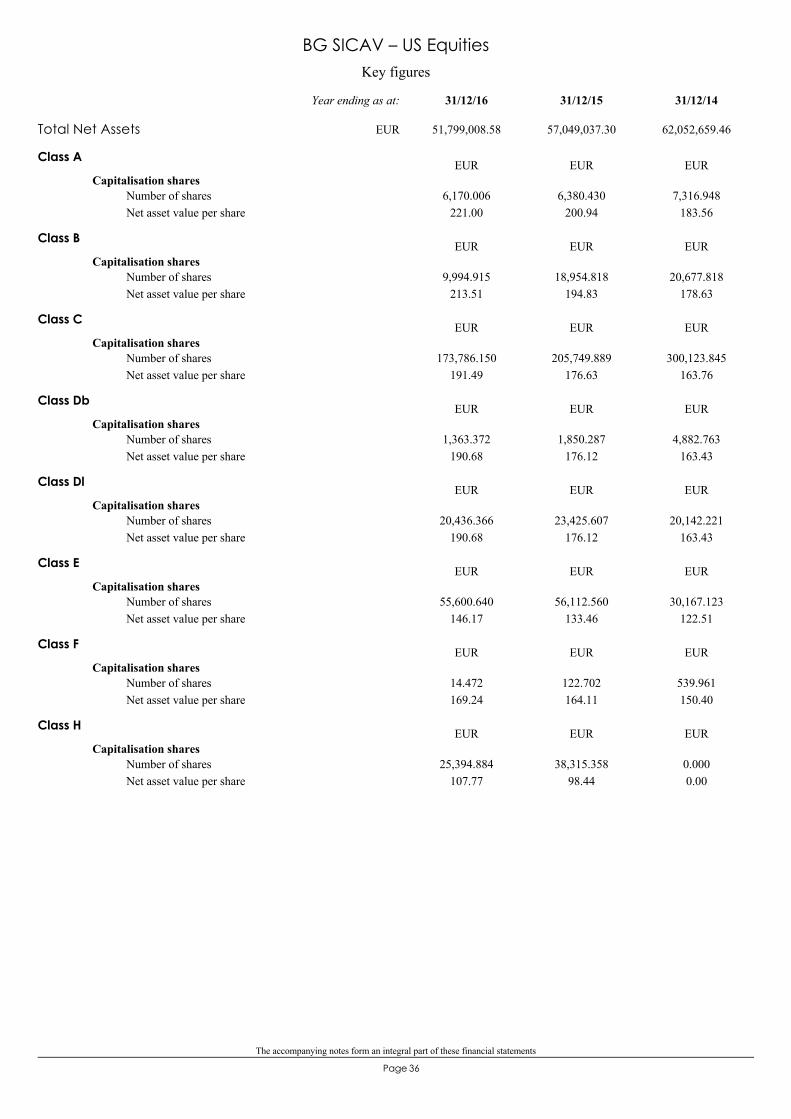
The accompanying notes form an integral part of these financial statements
36Page
Key figures
BG SICAV – US Equities
Class A
Capitalisation shares
221.006,170.006 6,380.430
200.947,316.948
183.56Number of sharesNet asset value per share
EUR EUR EUR
Class B
Capitalisation shares
213.519,994.915 18,954.818
194.8320,677.818
178.63Number of sharesNet asset value per share
EUR EUR EUR
Class C
Capitalisation shares
191.49173,786.150 205,749.889
176.63300,123.845
163.76Number of sharesNet asset value per share
EUR EUR EUR
Class Db
Capitalisation shares
190.681,363.372 1,850.287
176.124,882.763
163.43Number of sharesNet asset value per share
EUR EUR EUR
Class Dl
Capitalisation shares
190.6820,436.366 23,425.607
176.1220,142.221
163.43Number of sharesNet asset value per share
EUR EUR EUR
Class E
Capitalisation shares
146.1755,600.640 56,112.560
133.4630,167.123
122.51Number of sharesNet asset value per share
EUR EUR EUR
Class F
Capitalisation shares
169.2414.472 122.702
164.11539.961150.40
Number of sharesNet asset value per share
EUR EUR EUR
Class H
Capitalisation shares
107.7725,394.884 38,315.358
98.440.0000.00
Number of sharesNet asset value per share
EUR EUR EUR
Total Net Assets 51,799,008.58 57,049,037.30 62,052,659.46
31/12/1431/12/1531/12/16Year ending as at:
EUR
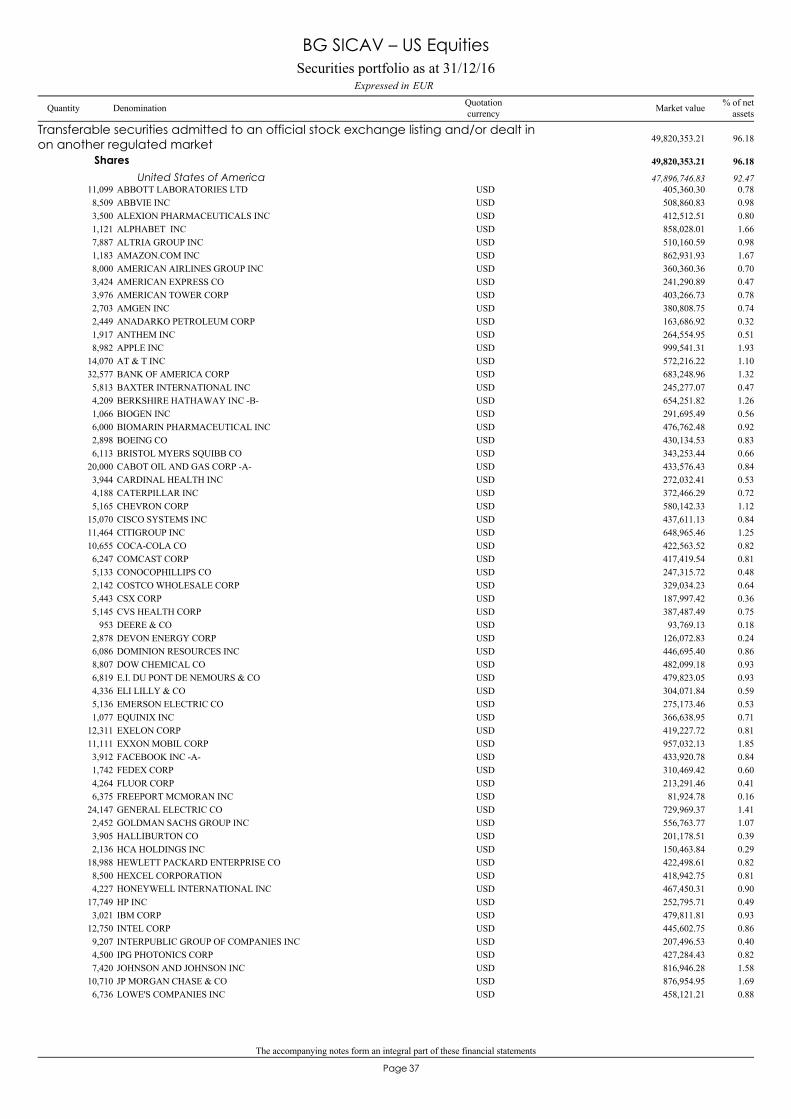
The accompanying notes form an integral part of these financial statements
37Page
ABBOTT LABORATORIES LTD11,099 405,360.30 0.78USD
Transferable securities admitted to an official stock exchange listing and/or dealt inon another regulated market 49,820,353.21 96.18
Shares 49,820,353.21 96.18
United States of America 47,896,746.83 92.47
ABBVIE INC8,509 508,860.83 0.98USDALEXION PHARMACEUTICALS INC3,500 412,512.51 0.80USDALPHABET INC1,121 858,028.01 1.66USDALTRIA GROUP INC7,887 510,160.59 0.98USDAMAZON.COM INC1,183 862,931.93 1.67USDAMERICAN AIRLINES GROUP INC8,000 360,360.36 0.70USDAMERICAN EXPRESS CO3,424 241,290.89 0.47USDAMERICAN TOWER CORP3,976 403,266.73 0.78USDAMGEN INC2,703 380,808.75 0.74USDANADARKO PETROLEUM CORP2,449 163,686.92 0.32USDANTHEM INC1,917 264,554.95 0.51USDAPPLE INC8,982 999,541.31 1.93USDAT & T INC14,070 572,216.22 1.10USDBANK OF AMERICA CORP32,577 683,248.96 1.32USDBAXTER INTERNATIONAL INC5,813 245,277.07 0.47USDBERKSHIRE HATHAWAY INC -B-4,209 654,251.82 1.26USDBIOGEN INC1,066 291,695.49 0.56USDBIOMARIN PHARMACEUTICAL INC6,000 476,762.48 0.92USDBOEING CO2,898 430,134.53 0.83USDBRISTOL MYERS SQUIBB CO6,113 343,253.44 0.66USDCABOT OIL AND GAS CORP -A-20,000 433,576.43 0.84USDCARDINAL HEALTH INC3,944 272,032.41 0.53USDCATERPILLAR INC4,188 372,466.29 0.72USDCHEVRON CORP5,165 580,142.33 1.12USDCISCO SYSTEMS INC15,070 437,611.13 0.84USDCITIGROUP INC11,464 648,965.46 1.25USDCOCA-COLA CO10,655 422,563.52 0.82USDCOMCAST CORP6,247 417,419.54 0.81USDCONOCOPHILLIPS CO5,133 247,315.72 0.48USDCOSTCO WHOLESALE CORP2,142 329,034.23 0.64USDCSX CORP5,443 187,997.42 0.36USDCVS HEALTH CORP5,145 387,487.49 0.75USDDEERE & CO953 93,769.13 0.18USDDEVON ENERGY CORP2,878 126,072.83 0.24USDDOMINION RESOURCES INC6,086 446,695.40 0.86USDDOW CHEMICAL CO8,807 482,099.18 0.93USDE.I. DU PONT DE NEMOURS & CO6,819 479,823.05 0.93USDELI LILLY & CO4,336 304,071.84 0.59USDEMERSON ELECTRIC CO5,136 275,173.46 0.53USDEQUINIX INC1,077 366,638.95 0.71USDEXELON CORP12,311 419,227.72 0.81USDEXXON MOBIL CORP11,111 957,032.13 1.85USDFACEBOOK INC -A-3,912 433,920.78 0.84USDFEDEX CORP1,742 310,469.42 0.60USDFLUOR CORP4,264 213,291.46 0.41USDFREEPORT MCMORAN INC6,375 81,924.78 0.16USDGENERAL ELECTRIC CO24,147 729,969.37 1.41USDGOLDMAN SACHS GROUP INC2,452 556,763.77 1.07USDHALLIBURTON CO3,905 201,178.51 0.39USDHCA HOLDINGS INC2,136 150,463.84 0.29USDHEWLETT PACKARD ENTERPRISE CO18,988 422,498.61 0.82USDHEXCEL CORPORATION8,500 418,942.75 0.81USDHONEYWELL INTERNATIONAL INC4,227 467,450.31 0.90USDHP INC17,749 252,795.71 0.49USDIBM CORP3,021 479,811.81 0.93USDINTEL CORP12,750 445,602.75 0.86USDINTERPUBLIC GROUP OF COMPANIES INC9,207 207,496.53 0.40USDIPG PHOTONICS CORP4,500 427,284.43 0.82USDJOHNSON AND JOHNSON INC7,420 816,946.28 1.58USDJP MORGAN CHASE & CO10,710 876,954.95 1.69USDLOWE'S COMPANIES INC6,736 458,121.21 0.88USD
Securities portfolio as at 31/12/16EURExpressed in
BG SICAV – US Equities
Quantity Denomination Quotationcurrency
% of netassetsMarket value
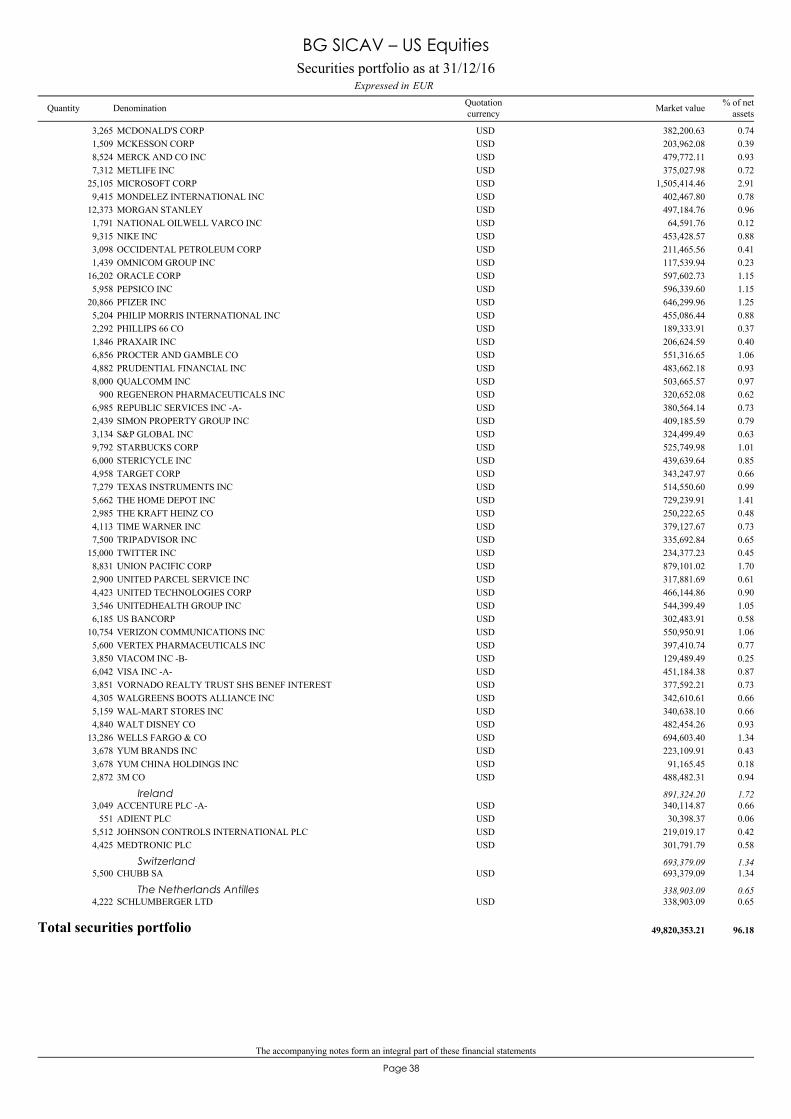
The accompanying notes form an integral part of these financial statements
38Page
MCDONALD'S CORP3,265 382,200.63 0.74USDMCKESSON CORP1,509 203,962.08 0.39USDMERCK AND CO INC8,524 479,772.11 0.93USDMETLIFE INC7,312 375,027.98 0.72USDMICROSOFT CORP25,105 1,505,414.46 2.91USDMONDELEZ INTERNATIONAL INC9,415 402,467.80 0.78USDMORGAN STANLEY12,373 497,184.76 0.96USDNATIONAL OILWELL VARCO INC1,791 64,591.76 0.12USDNIKE INC9,315 453,428.57 0.88USDOCCIDENTAL PETROLEUM CORP3,098 211,465.56 0.41USDOMNICOM GROUP INC1,439 117,539.94 0.23USDORACLE CORP16,202 597,602.73 1.15USDPEPSICO INC5,958 596,339.60 1.15USDPFIZER INC20,866 646,299.96 1.25USDPHILIP MORRIS INTERNATIONAL INC5,204 455,086.44 0.88USDPHILLIPS 66 CO2,292 189,333.91 0.37USDPRAXAIR INC1,846 206,624.59 0.40USDPROCTER AND GAMBLE CO6,856 551,316.65 1.06USDPRUDENTIAL FINANCIAL INC4,882 483,662.18 0.93USDQUALCOMM INC8,000 503,665.57 0.97USDREGENERON PHARMACEUTICALS INC900 320,652.08 0.62USDREPUBLIC SERVICES INC -A-6,985 380,564.14 0.73USDSIMON PROPERTY GROUP INC2,439 409,185.59 0.79USDS&P GLOBAL INC3,134 324,499.49 0.63USDSTARBUCKS CORP9,792 525,749.98 1.01USDSTERICYCLE INC6,000 439,639.64 0.85USDTARGET CORP4,958 343,247.97 0.66USDTEXAS INSTRUMENTS INC7,279 514,550.60 0.99USDTHE HOME DEPOT INC5,662 729,239.91 1.41USDTHE KRAFT HEINZ CO2,985 250,222.65 0.48USDTIME WARNER INC4,113 379,127.67 0.73USDTRIPADVISOR INC7,500 335,692.84 0.65USDTWITTER INC15,000 234,377.23 0.45USDUNION PACIFIC CORP8,831 879,101.02 1.70USDUNITED PARCEL SERVICE INC2,900 317,881.69 0.61USDUNITED TECHNOLOGIES CORP4,423 466,144.86 0.90USDUNITEDHEALTH GROUP INC3,546 544,399.49 1.05USDUS BANCORP6,185 302,483.91 0.58USDVERIZON COMMUNICATIONS INC10,754 550,950.91 1.06USDVERTEX PHARMACEUTICALS INC5,600 397,410.74 0.77USDVIACOM INC -B-3,850 129,489.49 0.25USDVISA INC -A-6,042 451,184.38 0.87USDVORNADO REALTY TRUST SHS BENEF INTEREST3,851 377,592.21 0.73USDWALGREENS BOOTS ALLIANCE INC4,305 342,610.61 0.66USDWAL-MART STORES INC5,159 340,638.10 0.66USDWALT DISNEY CO4,840 482,454.26 0.93USDWELLS FARGO & CO13,286 694,603.40 1.34USDYUM BRANDS INC3,678 223,109.91 0.43USDYUM CHINA HOLDINGS INC3,678 91,165.45 0.18USD3M CO2,872 488,482.31 0.94USD
ACCENTURE PLC -A-3,049 340,114.87 0.66USDIreland 891,324.20 1.72
ADIENT PLC551 30,398.37 0.06USDJOHNSON CONTROLS INTERNATIONAL PLC5,512 219,019.17 0.42USDMEDTRONIC PLC4,425 301,791.79 0.58USD
CHUBB SA5,500 693,379.09 1.34USDSwitzerland 693,379.09 1.34
SCHLUMBERGER LTD4,222 338,903.09 0.65USDThe Netherlands Antilles 338,903.09 0.65
Total securities portfolio 49,820,353.21 96.18
Securities portfolio as at 31/12/16EURExpressed in
BG SICAV – US Equities
Quantity Denomination Quotationcurrency
% of netassetsMarket value

The accompanying notes form an integral part of these financial statements
39Page
Statement of operations and changes in net assets from 01/01/16 to 31/12/16Expressed in EUR
BG SICAV – US Equities
1,272,013.24Income1,258,127.28Net dividends
2,051.83Bank interest on cash account11,834.13Securities lending income 16Note
1,926,317.43Expenses797,328.22Management fees 5Note10,457.06Custodian & sub-custodian fees 6Note6,561.68Taxe d'abonnement 4Note
93,129.01Administrative expenses 5Note912,702.24Performance fees 7Note
967.62Domiciliation fees9,393.36Professional and legal fees4,283.78Bank interest on overdrafts
83,109.40Transaction fees852.71Directors fees
7,532.35Other expenses
(654,304.19)Net loss from investmentsNet realised profit / (loss) on:
3,738,913.99- sales of investment securities(416,194.54)- forward foreign exchange contracts
31,776.05- financial futures2,145,929.54- foreign exchange
4,846,120.85Net realised profitMovement in net unrealised appreciation / (depreciation) on:
(980,249.06)- investment securities
3,865,871.79Increase in net assets as a result of operations6,643,641.40Subscription capitalisation shares
(15,759,541.91)Redemption capitalisation shares
(5,250,028.72)Decrease in net assets
57,049,037.30Net assets at the beginning of the year
51,799,008.58Net assets at the end of the year

40Page
BG SICAV– Pictet Japanese Equities
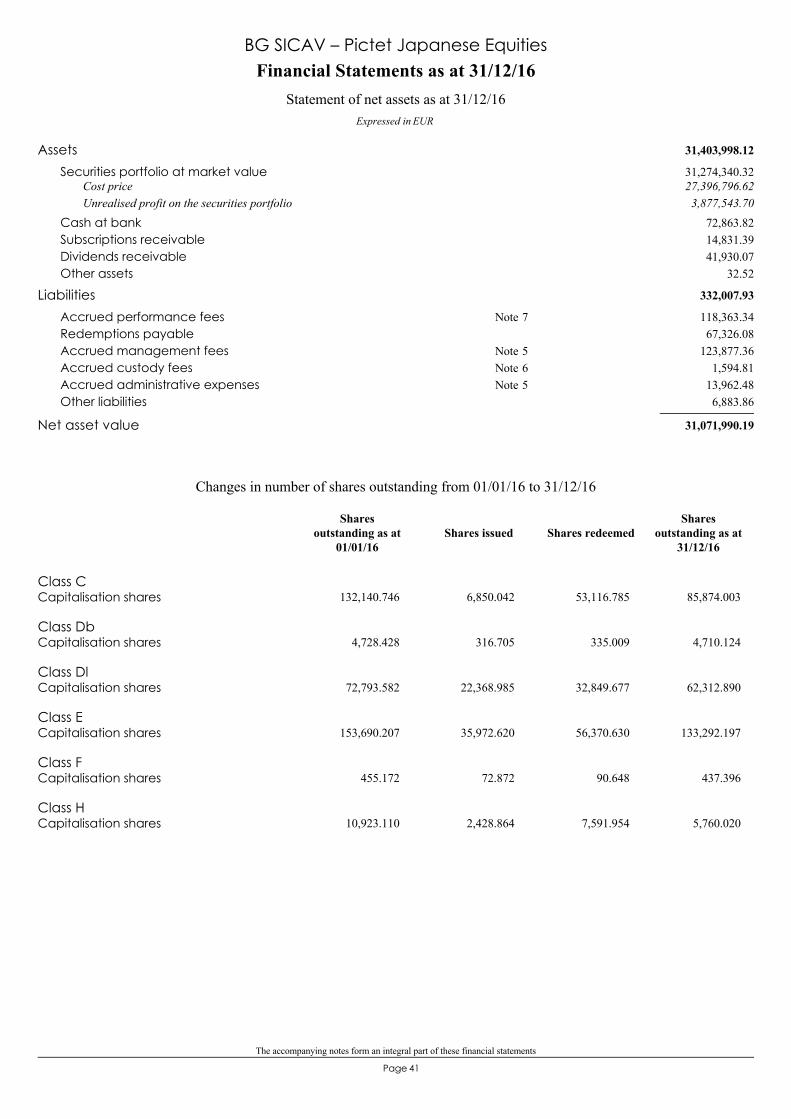
The accompanying notes form an integral part of these financial statements
41Page
31,403,998.12Assets31,274,340.32Securities portfolio at market value27,396,796.62Cost price3,877,543.70Unrealised profit on the securities portfolio
72,863.82Cash at bank14,831.39Subscriptions receivable41,930.07Dividends receivable
32.52Other assets
332,007.93Liabilities118,363.34Accrued performance fees 7Note67,326.08Redemptions payable
123,877.36Accrued management fees 5Note1,594.81Accrued custody fees 6Note
13,962.48Accrued administrative expenses 5Note6,883.86Other liabilities
31,071,990.19Net asset value
Financial Statements as at 31/12/16
Expressed in EUR
Statement of net assets as at 31/12/16
BG SICAV – Pictet Japanese Equities
Class CCapitalisation shares 132,140.746 6,850.042 53,116.785 85,874.003
Class DbCapitalisation shares 4,728.428 316.705 335.009 4,710.124
Class DlCapitalisation shares 72,793.582 22,368.985 32,849.677 62,312.890
Class ECapitalisation shares 153,690.207 35,972.620 56,370.630 133,292.197
Class FCapitalisation shares 455.172 72.872 90.648 437.396
Class HCapitalisation shares 10,923.110 2,428.864 7,591.954 5,760.020
Changes in number of shares outstanding from 01/01/16 to 31/12/16
Shares issued Shares redeemedShares
outstanding as at31/12/16
Sharesoutstanding as at
01/01/16

The accompanying notes form an integral part of these financial statements
42Page
Key figures
BG SICAV – Pictet Japanese Equities
Class A
Capitalisation shares
0.000.000 0.000
0.003,627.287
91.66Number of sharesNet asset value per share
EUR EUR EUR
Class C
Capitalisation shares
90.3785,874.003 132,140.746
86.58195,419.375
82.44Number of sharesNet asset value per share
EUR EUR EUR
Class Db
Capitalisation shares
89.714,710.124 4,728.428
86.007,614.774
82.17Number of sharesNet asset value per share
EUR EUR EUR
Class Dl
Capitalisation shares
89.7162,312.890 72,793.582
86.0035,602.548
82.17Number of sharesNet asset value per share
EUR EUR EUR
Class E
Capitalisation shares
125.00133,292.197 153,690.207
118.6251,935.556
112.14Number of sharesNet asset value per share
EUR EUR EUR
Class F
Capitalisation shares
126.54437.396 455.172
119.4798.126112.46
Number of sharesNet asset value per share
EUR EUR EUR
Class H
Capitalisation shares
101.235,760.020 10,923.110
96.140.0000.00
Number of sharesNet asset value per share
EUR EUR EUR
Total Net Assets 31,071,990.19 37,442,488.67 25,828,840.73
31/12/1431/12/1531/12/16Year ending as at:
EUR
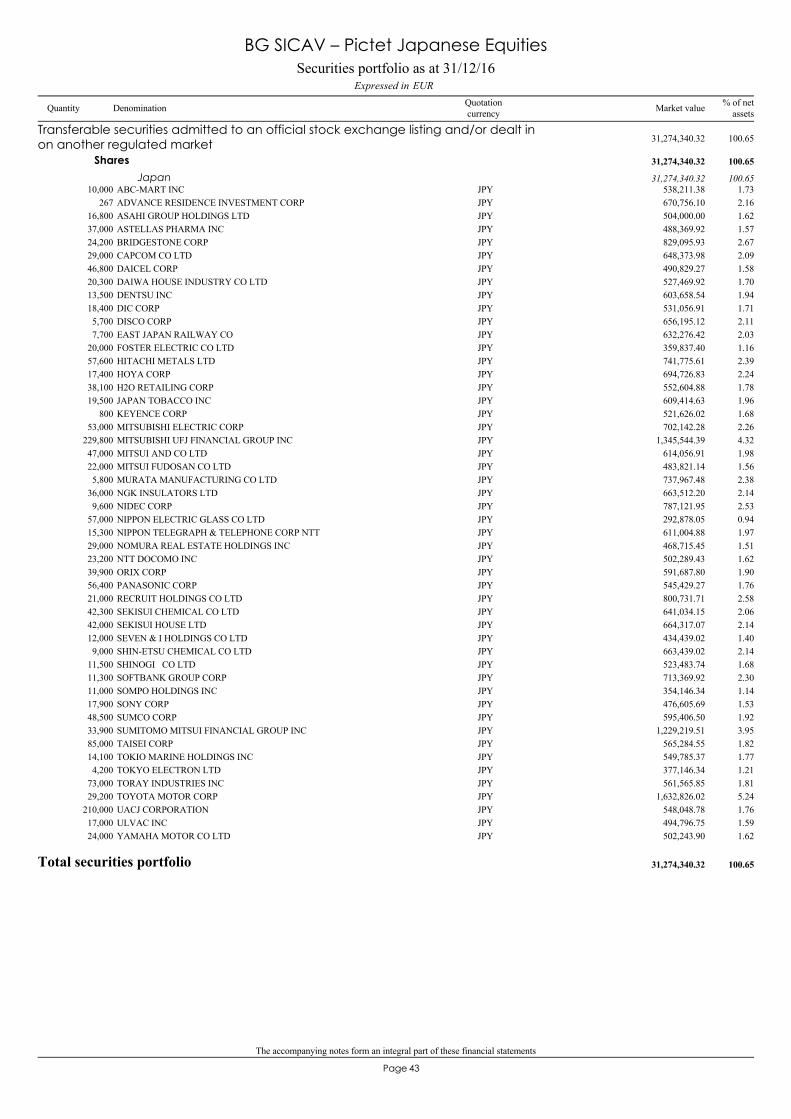
The accompanying notes form an integral part of these financial statements
43Page
ABC-MART INC10,000 538,211.38 1.73JPY
Transferable securities admitted to an official stock exchange listing and/or dealt inon another regulated market 31,274,340.32 100.65
Shares 31,274,340.32 100.65
Japan 31,274,340.32 100.65
ADVANCE RESIDENCE INVESTMENT CORP267 670,756.10 2.16JPYASAHI GROUP HOLDINGS LTD16,800 504,000.00 1.62JPYASTELLAS PHARMA INC37,000 488,369.92 1.57JPYBRIDGESTONE CORP24,200 829,095.93 2.67JPYCAPCOM CO LTD29,000 648,373.98 2.09JPYDAICEL CORP46,800 490,829.27 1.58JPYDAIWA HOUSE INDUSTRY CO LTD20,300 527,469.92 1.70JPYDENTSU INC13,500 603,658.54 1.94JPYDIC CORP18,400 531,056.91 1.71JPYDISCO CORP5,700 656,195.12 2.11JPYEAST JAPAN RAILWAY CO7,700 632,276.42 2.03JPYFOSTER ELECTRIC CO LTD20,000 359,837.40 1.16JPYHITACHI METALS LTD57,600 741,775.61 2.39JPYHOYA CORP17,400 694,726.83 2.24JPYH2O RETAILING CORP38,100 552,604.88 1.78JPYJAPAN TOBACCO INC19,500 609,414.63 1.96JPYKEYENCE CORP800 521,626.02 1.68JPYMITSUBISHI ELECTRIC CORP53,000 702,142.28 2.26JPYMITSUBISHI UFJ FINANCIAL GROUP INC229,800 1,345,544.39 4.32JPYMITSUI AND CO LTD47,000 614,056.91 1.98JPYMITSUI FUDOSAN CO LTD22,000 483,821.14 1.56JPYMURATA MANUFACTURING CO LTD5,800 737,967.48 2.38JPYNGK INSULATORS LTD36,000 663,512.20 2.14JPYNIDEC CORP9,600 787,121.95 2.53JPYNIPPON ELECTRIC GLASS CO LTD57,000 292,878.05 0.94JPYNIPPON TELEGRAPH & TELEPHONE CORP NTT15,300 611,004.88 1.97JPYNOMURA REAL ESTATE HOLDINGS INC29,000 468,715.45 1.51JPYNTT DOCOMO INC23,200 502,289.43 1.62JPYORIX CORP39,900 591,687.80 1.90JPYPANASONIC CORP56,400 545,429.27 1.76JPYRECRUIT HOLDINGS CO LTD21,000 800,731.71 2.58JPYSEKISUI CHEMICAL CO LTD42,300 641,034.15 2.06JPYSEKISUI HOUSE LTD42,000 664,317.07 2.14JPYSEVEN & I HOLDINGS CO LTD12,000 434,439.02 1.40JPYSHIN-ETSU CHEMICAL CO LTD9,000 663,439.02 2.14JPYSHINOGI CO LTD11,500 523,483.74 1.68JPYSOFTBANK GROUP CORP11,300 713,369.92 2.30JPYSOMPO HOLDINGS INC11,000 354,146.34 1.14JPYSONY CORP17,900 476,605.69 1.53JPYSUMCO CORP48,500 595,406.50 1.92JPYSUMITOMO MITSUI FINANCIAL GROUP INC33,900 1,229,219.51 3.95JPYTAISEI CORP85,000 565,284.55 1.82JPYTOKIO MARINE HOLDINGS INC14,100 549,785.37 1.77JPYTOKYO ELECTRON LTD4,200 377,146.34 1.21JPYTORAY INDUSTRIES INC73,000 561,565.85 1.81JPYTOYOTA MOTOR CORP29,200 1,632,826.02 5.24JPYUACJ CORPORATION210,000 548,048.78 1.76JPYULVAC INC17,000 494,796.75 1.59JPYYAMAHA MOTOR CO LTD24,000 502,243.90 1.62JPY
Total securities portfolio 31,274,340.32 100.65
Securities portfolio as at 31/12/16EURExpressed in
BG SICAV – Pictet Japanese Equities
Quantity Denomination Quotationcurrency
% of netassetsMarket value
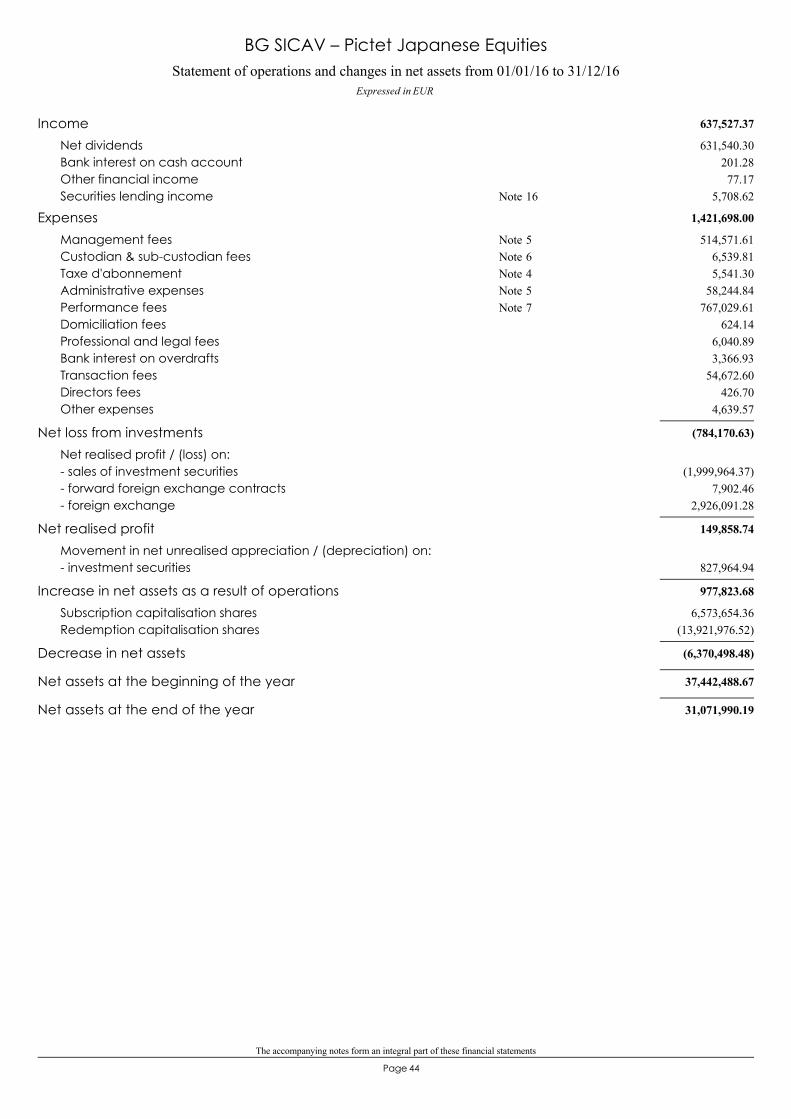
The accompanying notes form an integral part of these financial statements
44Page
Statement of operations and changes in net assets from 01/01/16 to 31/12/16Expressed in EUR
BG SICAV – Pictet Japanese Equities
637,527.37Income631,540.30Net dividends
201.28Bank interest on cash account77.17Other financial income
5,708.62Securities lending income 16Note
1,421,698.00Expenses514,571.61Management fees 5Note
6,539.81Custodian & sub-custodian fees 6Note5,541.30Taxe d'abonnement 4Note
58,244.84Administrative expenses 5Note767,029.61Performance fees 7Note
624.14Domiciliation fees6,040.89Professional and legal fees3,366.93Bank interest on overdrafts
54,672.60Transaction fees426.70Directors fees
4,639.57Other expenses
(784,170.63)Net loss from investmentsNet realised profit / (loss) on:
(1,999,964.37)- sales of investment securities7,902.46- forward foreign exchange contracts
2,926,091.28- foreign exchange
149,858.74Net realised profitMovement in net unrealised appreciation / (depreciation) on:
827,964.94- investment securities
977,823.68Increase in net assets as a result of operations6,573,654.36Subscription capitalisation shares
(13,921,976.52)Redemption capitalisation shares
(6,370,498.48)Decrease in net assets
37,442,488.67Net assets at the beginning of the year
31,071,990.19Net assets at the end of the year
45Page
BG SICAV– Schroder High Dividend Europe

The accompanying notes form an integral part of these financial statements
46Page
77,014,899.39Assets74,105,428.48Securities portfolio at market value73,964,985.71Cost price
140,442.77Unrealised profit on the securities portfolio2,267,065.05Cash at bank
484,493.53Subscriptions receivable150,751.41Dividends receivable
7,160.92Other assets
777,714.54Liabilities366,211.81Accrued performance fees 7Note94,899.92Redemptions payable
264,041.94Accrued management fees 5Note3,918.91Accrued custody fees 6Note
34,309.56Accrued administrative expenses 5Note14,332.40Other liabilities
76,237,184.85Net asset value
Financial Statements as at 31/12/16
Expressed in EUR
Statement of net assets as at 31/12/16
BG SICAV – Schroder High Dividend Europe
Class CCapitalisation shares 59,134.376 7,739.993 10,683.148 56,191.221
Class DlCapitalisation shares 89,509.852 30,256.010 37,120.441 82,645.421
Class ECapitalisation shares 499,463.685 279,755.403 272,586.380 506,632.708
Class FCapitalisation shares 812.605 638.815 516.921 934.499
Class HCapitalisation shares 12,136.992 170,839.544 83,840.423 99,136.113
Changes in number of shares outstanding from 01/01/16 to 31/12/16
Shares issued Shares redeemedShares
outstanding as at31/12/16
Sharesoutstanding as at
01/01/16

The accompanying notes form an integral part of these financial statements
47Page
Key figures
BG SICAV – Schroder High Dividend Europe
Class C
Capitalisation shares
95.8556,191.221 59,134.376
99.3244,677.792
92.07Number of sharesNet asset value per share
EUR EUR EUR
Class Dl
Capitalisation shares
102.2782,645.421 89,509.852
106.0530,489.848
98.40Number of sharesNet asset value per share
EUR EUR EUR
Class E
Capitalisation shares
104.52506,632.708 499,463.685
107.35141,511.408
98.66Number of sharesNet asset value per share
EUR EUR EUR
Class F
Capitalisation shares
105.93934.499 812.605
108.13166.85299.08
Number of sharesNet asset value per share
EUR EUR EUR
Class H
Capitalisation shares
94.2799,136.113 12,136.992
96.920.0000.00
Number of sharesNet asset value per share
EUR EUR EUR
Total Net Assets 76,237,184.85 70,249,420.68 21,091,602.41
31/12/1431/12/1531/12/16Year ending as at:
EUR
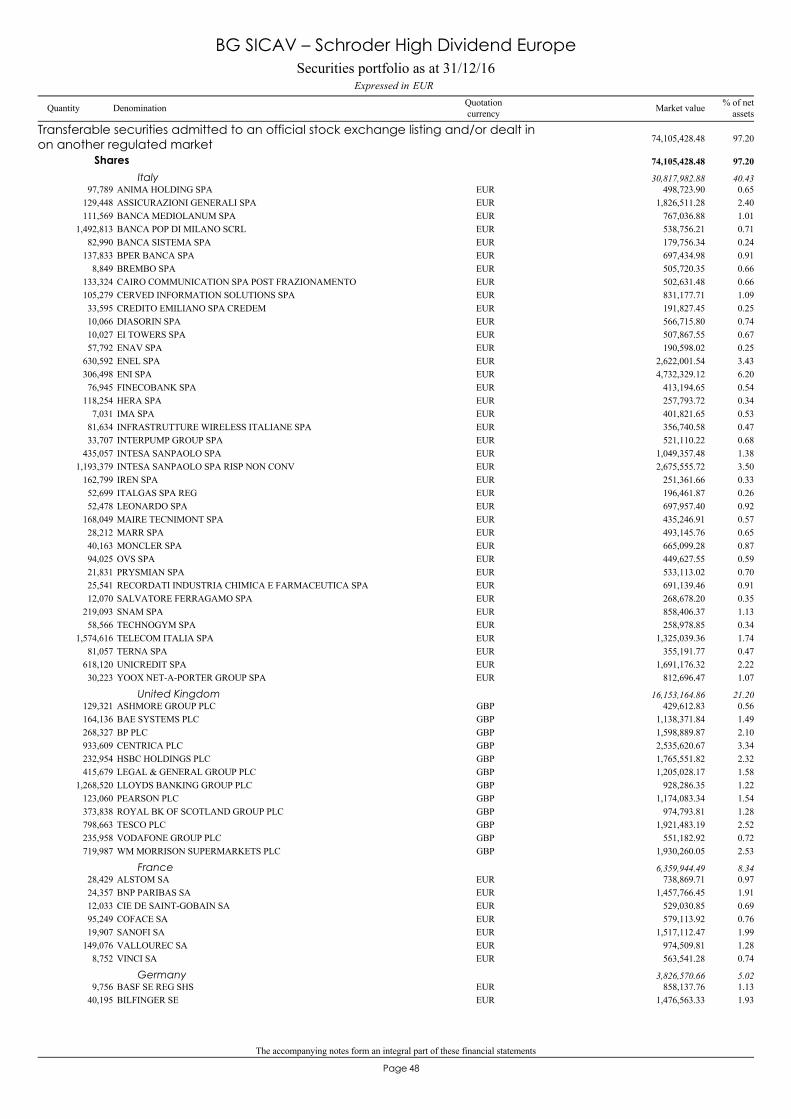
The accompanying notes form an integral part of these financial statements
48Page
ANIMA HOLDING SPA97,789 498,723.90 0.65EUR
Transferable securities admitted to an official stock exchange listing and/or dealt inon another regulated market 74,105,428.48 97.20
Shares 74,105,428.48 97.20
Italy 30,817,982.88 40.43
ASSICURAZIONI GENERALI SPA129,448 1,826,511.28 2.40EURBANCA MEDIOLANUM SPA111,569 767,036.88 1.01EURBANCA POP DI MILANO SCRL1,492,813 538,756.21 0.71EURBANCA SISTEMA SPA82,990 179,756.34 0.24EURBPER BANCA SPA137,833 697,434.98 0.91EURBREMBO SPA8,849 505,720.35 0.66EURCAIRO COMMUNICATION SPA POST FRAZIONAMENTO133,324 502,631.48 0.66EURCERVED INFORMATION SOLUTIONS SPA105,279 831,177.71 1.09EURCREDITO EMILIANO SPA CREDEM33,595 191,827.45 0.25EURDIASORIN SPA10,066 566,715.80 0.74EUREI TOWERS SPA10,027 507,867.55 0.67EURENAV SPA57,792 190,598.02 0.25EURENEL SPA630,592 2,622,001.54 3.43EURENI SPA306,498 4,732,329.12 6.20EURFINECOBANK SPA76,945 413,194.65 0.54EURHERA SPA118,254 257,793.72 0.34EURIMA SPA7,031 401,821.65 0.53EURINFRASTRUTTURE WIRELESS ITALIANE SPA81,634 356,740.58 0.47EURINTERPUMP GROUP SPA33,707 521,110.22 0.68EURINTESA SANPAOLO SPA435,057 1,049,357.48 1.38EURINTESA SANPAOLO SPA RISP NON CONV1,193,379 2,675,555.72 3.50EURIREN SPA162,799 251,361.66 0.33EURITALGAS SPA REG52,699 196,461.87 0.26EURLEONARDO SPA52,478 697,957.40 0.92EURMAIRE TECNIMONT SPA168,049 435,246.91 0.57EURMARR SPA28,212 493,145.76 0.65EURMONCLER SPA40,163 665,099.28 0.87EUROVS SPA94,025 449,627.55 0.59EURPRYSMIAN SPA21,831 533,113.02 0.70EURRECORDATI INDUSTRIA CHIMICA E FARMACEUTICA SPA25,541 691,139.46 0.91EURSALVATORE FERRAGAMO SPA12,070 268,678.20 0.35EURSNAM SPA219,093 858,406.37 1.13EURTECHNOGYM SPA58,566 258,978.85 0.34EURTELECOM ITALIA SPA1,574,616 1,325,039.36 1.74EURTERNA SPA81,057 355,191.77 0.47EURUNICREDIT SPA618,120 1,691,176.32 2.22EURYOOX NET-A-PORTER GROUP SPA30,223 812,696.47 1.07EUR
ASHMORE GROUP PLC129,321 429,612.83 0.56GBPUnited Kingdom 16,153,164.86 21.20
BAE SYSTEMS PLC164,136 1,138,371.84 1.49GBPBP PLC268,327 1,598,889.87 2.10GBPCENTRICA PLC933,609 2,535,620.67 3.34GBPHSBC HOLDINGS PLC232,954 1,765,551.82 2.32GBPLEGAL & GENERAL GROUP PLC415,679 1,205,028.17 1.58GBPLLOYDS BANKING GROUP PLC1,268,520 928,286.35 1.22GBPPEARSON PLC123,060 1,174,083.34 1.54GBPROYAL BK OF SCOTLAND GROUP PLC373,838 974,793.81 1.28GBPTESCO PLC798,663 1,921,483.19 2.52GBPVODAFONE GROUP PLC235,958 551,182.92 0.72GBPWM MORRISON SUPERMARKETS PLC719,987 1,930,260.05 2.53GBP
ALSTOM SA28,429 738,869.71 0.97EURFrance 6,359,944.49 8.34
BNP PARIBAS SA24,357 1,457,766.45 1.91EURCIE DE SAINT-GOBAIN SA12,033 529,030.85 0.69EURCOFACE SA95,249 579,113.92 0.76EURSANOFI SA19,907 1,517,112.47 1.99EURVALLOUREC SA149,076 974,509.81 1.28EURVINCI SA8,752 563,541.28 0.74EUR
BASF SE REG SHS9,756 858,137.76 1.13EURGermany 3,826,570.66 5.02
BILFINGER SE40,195 1,476,563.33 1.93EUR
Securities portfolio as at 31/12/16EURExpressed in
BG SICAV – Schroder High Dividend Europe
Quantity Denomination Quotationcurrency
% of netassetsMarket value
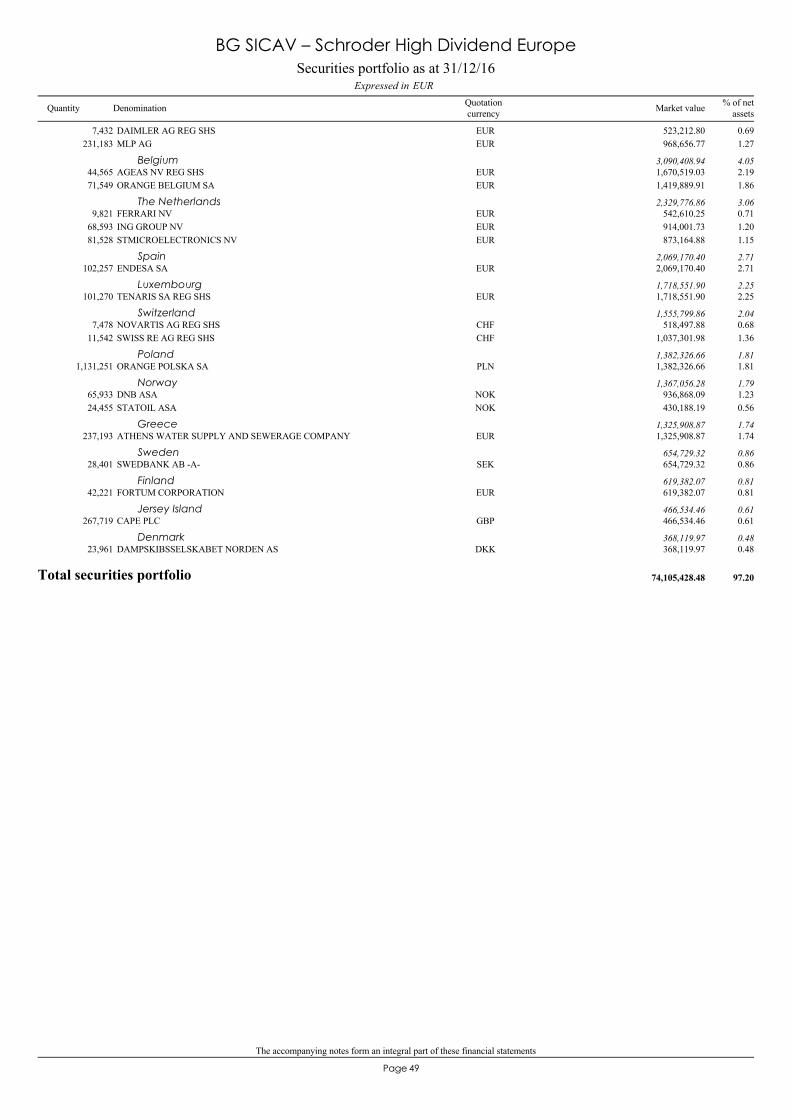
The accompanying notes form an integral part of these financial statements
49Page
DAIMLER AG REG SHS7,432 523,212.80 0.69EURMLP AG231,183 968,656.77 1.27EUR
AGEAS NV REG SHS44,565 1,670,519.03 2.19EURBelgium 3,090,408.94 4.05
ORANGE BELGIUM SA71,549 1,419,889.91 1.86EUR
FERRARI NV9,821 542,610.25 0.71EURThe Netherlands 2,329,776.86 3.06
ING GROUP NV68,593 914,001.73 1.20EURSTMICROELECTRONICS NV81,528 873,164.88 1.15EUR
ENDESA SA102,257 2,069,170.40 2.71EURSpain 2,069,170.40 2.71
TENARIS SA REG SHS101,270 1,718,551.90 2.25EURLuxembourg 1,718,551.90 2.25
NOVARTIS AG REG SHS7,478 518,497.88 0.68CHFSwitzerland 1,555,799.86 2.04
SWISS RE AG REG SHS11,542 1,037,301.98 1.36CHF
ORANGE POLSKA SA1,131,251 1,382,326.66 1.81PLNPoland 1,382,326.66 1.81
DNB ASA65,933 936,868.09 1.23NOKNorway 1,367,056.28 1.79
STATOIL ASA24,455 430,188.19 0.56NOK
ATHENS WATER SUPPLY AND SEWERAGE COMPANY237,193 1,325,908.87 1.74EURGreece 1,325,908.87 1.74
SWEDBANK AB -A-28,401 654,729.32 0.86SEKSweden 654,729.32 0.86
FORTUM CORPORATION42,221 619,382.07 0.81EURFinland 619,382.07 0.81
CAPE PLC267,719 466,534.46 0.61GBPJersey Island 466,534.46 0.61
DAMPSKIBSSELSKABET NORDEN AS23,961 368,119.97 0.48DKKDenmark 368,119.97 0.48
Total securities portfolio 74,105,428.48 97.20
Securities portfolio as at 31/12/16EURExpressed in
BG SICAV – Schroder High Dividend Europe
Quantity Denomination Quotationcurrency
% of netassetsMarket value
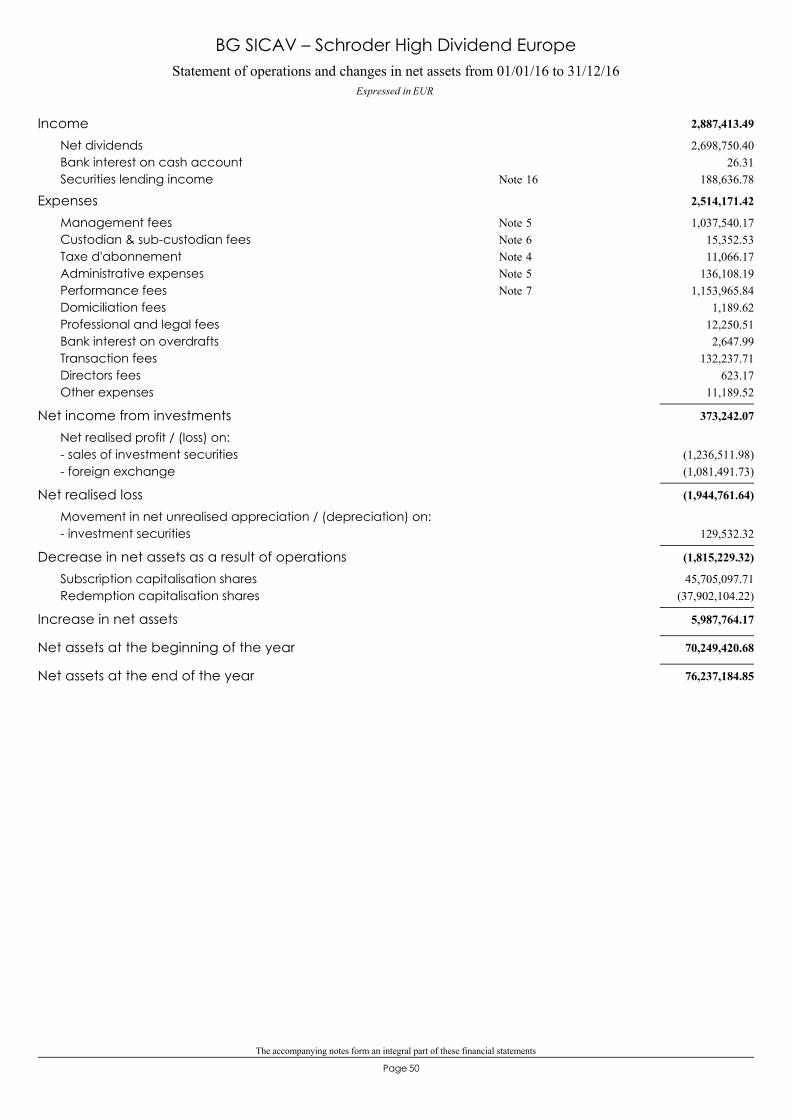
The accompanying notes form an integral part of these financial statements
50Page
Statement of operations and changes in net assets from 01/01/16 to 31/12/16Expressed in EUR
BG SICAV – Schroder High Dividend Europe
2,887,413.49Income2,698,750.40Net dividends
26.31Bank interest on cash account188,636.78Securities lending income 16Note
2,514,171.42Expenses1,037,540.17Management fees 5Note
15,352.53Custodian & sub-custodian fees 6Note11,066.17Taxe d'abonnement 4Note
136,108.19Administrative expenses 5Note1,153,965.84Performance fees 7Note
1,189.62Domiciliation fees12,250.51Professional and legal fees2,647.99Bank interest on overdrafts
132,237.71Transaction fees623.17Directors fees
11,189.52Other expenses
373,242.07Net income from investmentsNet realised profit / (loss) on:
(1,236,511.98)- sales of investment securities(1,081,491.73)- foreign exchange
(1,944,761.64)Net realised lossMovement in net unrealised appreciation / (depreciation) on:
129,532.32- investment securities
(1,815,229.32)Decrease in net assets as a result of operations45,705,097.71Subscription capitalisation shares
(37,902,104.22)Redemption capitalisation shares
5,987,764.17Increase in net assets
70,249,420.68Net assets at the beginning of the year
76,237,184.85Net assets at the end of the year

51Page
BG SICAV– Small-Mid Cap Euro Equities
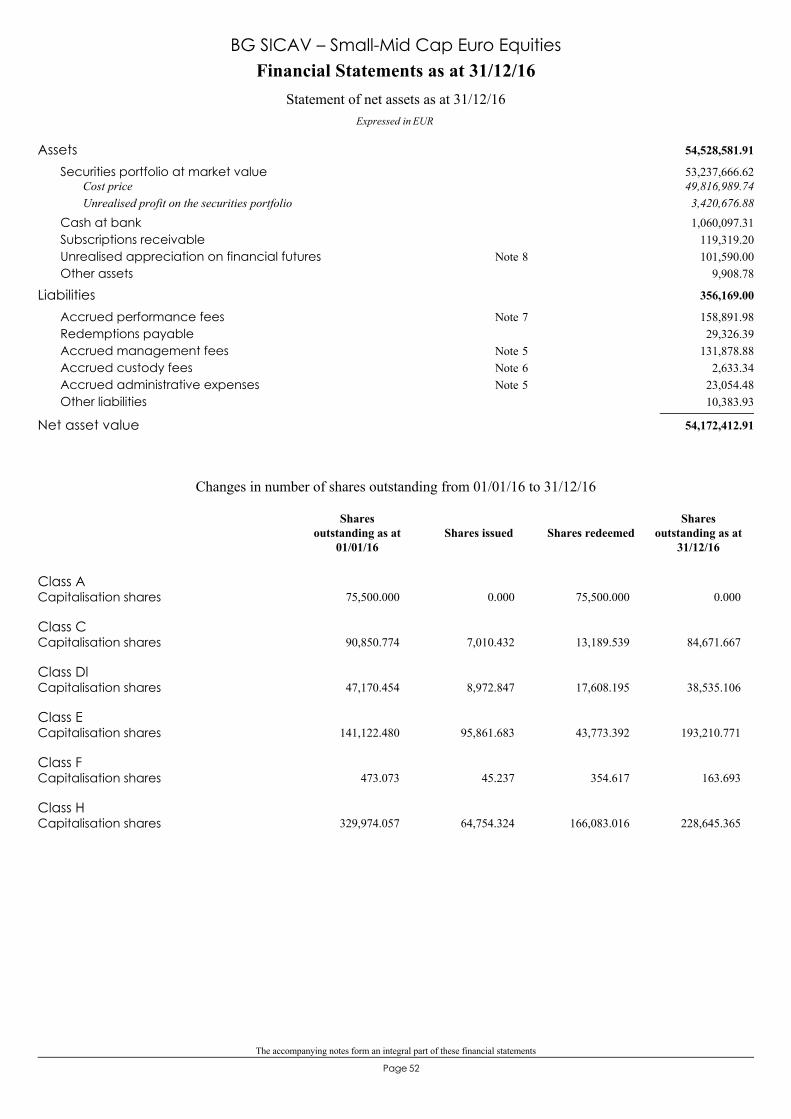
The accompanying notes form an integral part of these financial statements
52Page
54,528,581.91Assets53,237,666.62Securities portfolio at market value49,816,989.74Cost price3,420,676.88Unrealised profit on the securities portfolio1,060,097.31Cash at bank
119,319.20Subscriptions receivable101,590.00Unrealised appreciation on financial futures 8Note
9,908.78Other assets
356,169.00Liabilities158,891.98Accrued performance fees 7Note29,326.39Redemptions payable
131,878.88Accrued management fees 5Note2,633.34Accrued custody fees 6Note
23,054.48Accrued administrative expenses 5Note10,383.93Other liabilities
54,172,412.91Net asset value
Financial Statements as at 31/12/16
Expressed in EUR
Statement of net assets as at 31/12/16
BG SICAV – Small-Mid Cap Euro Equities
Class ACapitalisation shares 75,500.000 0.000 75,500.000 0.000
Class CCapitalisation shares 90,850.774 7,010.432 13,189.539 84,671.667
Class DlCapitalisation shares 47,170.454 8,972.847 17,608.195 38,535.106
Class ECapitalisation shares 141,122.480 95,861.683 43,773.392 193,210.771
Class FCapitalisation shares 473.073 45.237 354.617 163.693
Class HCapitalisation shares 329,974.057 64,754.324 166,083.016 228,645.365
Changes in number of shares outstanding from 01/01/16 to 31/12/16
Shares issued Shares redeemedShares
outstanding as at31/12/16
Sharesoutstanding as at
01/01/16
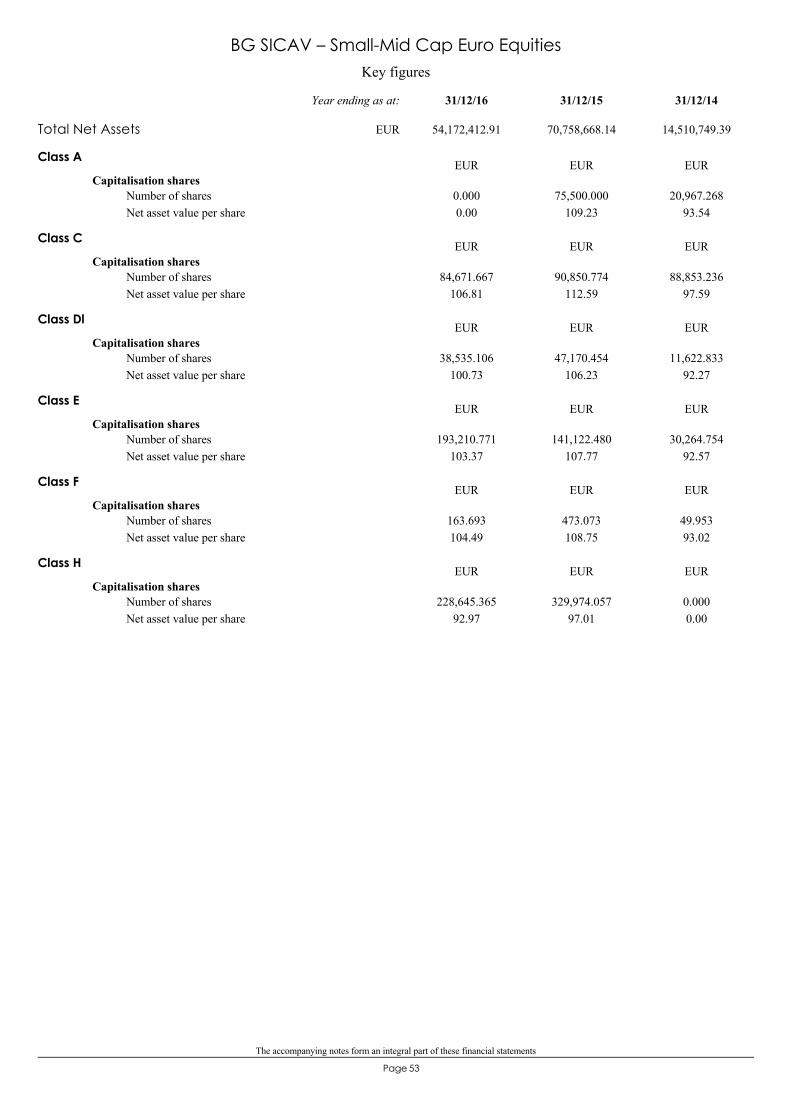
The accompanying notes form an integral part of these financial statements
53Page
Key figures
BG SICAV – Small-Mid Cap Euro Equities
Class A
Capitalisation shares
0.000.000 75,500.000
109.2320,967.268
93.54Number of sharesNet asset value per share
EUR EUR EUR
Class C
Capitalisation shares
106.8184,671.667 90,850.774
112.5988,853.236
97.59Number of sharesNet asset value per share
EUR EUR EUR
Class Dl
Capitalisation shares
100.7338,535.106 47,170.454
106.2311,622.833
92.27Number of sharesNet asset value per share
EUR EUR EUR
Class E
Capitalisation shares
103.37193,210.771 141,122.480
107.7730,264.754
92.57Number of sharesNet asset value per share
EUR EUR EUR
Class F
Capitalisation shares
104.49163.693 473.073
108.7549.95393.02
Number of sharesNet asset value per share
EUR EUR EUR
Class H
Capitalisation shares
92.97228,645.365 329,974.057
97.010.0000.00
Number of sharesNet asset value per share
EUR EUR EUR
Total Net Assets 54,172,412.91 70,758,668.14 14,510,749.39
31/12/1431/12/1531/12/16Year ending as at:
EUR
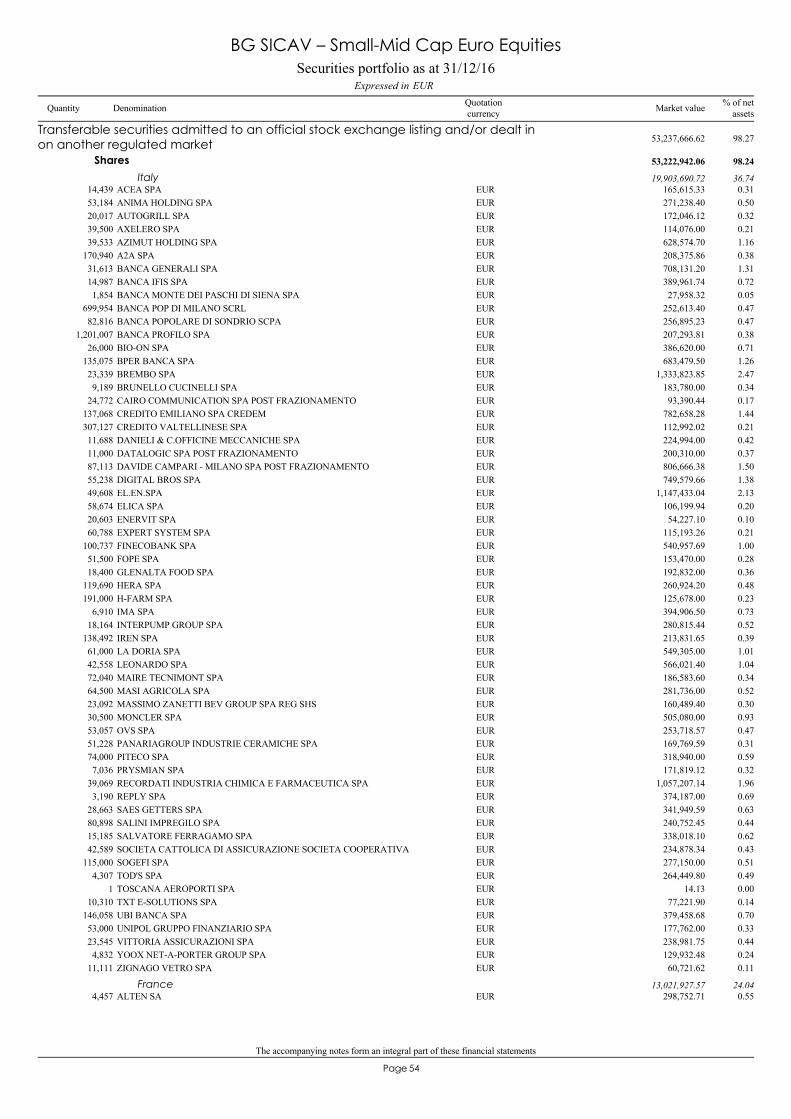
The accompanying notes form an integral part of these financial statements
54Page
ACEA SPA14,439 165,615.33 0.31EUR
Transferable securities admitted to an official stock exchange listing and/or dealt inon another regulated market 53,237,666.62 98.27
Shares 53,222,942.06 98.24
Italy 19,903,690.72 36.74
ANIMA HOLDING SPA53,184 271,238.40 0.50EURAUTOGRILL SPA20,017 172,046.12 0.32EURAXELERO SPA39,500 114,076.00 0.21EURAZIMUT HOLDING SPA39,533 628,574.70 1.16EURA2A SPA170,940 208,375.86 0.38EURBANCA GENERALI SPA31,613 708,131.20 1.31EURBANCA IFIS SPA14,987 389,961.74 0.72EURBANCA MONTE DEI PASCHI DI SIENA SPA1,854 27,958.32 0.05EURBANCA POP DI MILANO SCRL699,954 252,613.40 0.47EURBANCA POPOLARE DI SONDRIO SCPA82,816 256,895.23 0.47EURBANCA PROFILO SPA1,201,007 207,293.81 0.38EURBIO-ON SPA26,000 386,620.00 0.71EURBPER BANCA SPA135,075 683,479.50 1.26EURBREMBO SPA23,339 1,333,823.85 2.47EURBRUNELLO CUCINELLI SPA9,189 183,780.00 0.34EURCAIRO COMMUNICATION SPA POST FRAZIONAMENTO24,772 93,390.44 0.17EURCREDITO EMILIANO SPA CREDEM137,068 782,658.28 1.44EURCREDITO VALTELLINESE SPA307,127 112,992.02 0.21EURDANIELI & C.OFFICINE MECCANICHE SPA11,688 224,994.00 0.42EURDATALOGIC SPA POST FRAZIONAMENTO11,000 200,310.00 0.37EURDAVIDE CAMPARI - MILANO SPA POST FRAZIONAMENTO87,113 806,666.38 1.50EURDIGITAL BROS SPA55,238 749,579.66 1.38EUREL.EN.SPA49,608 1,147,433.04 2.13EURELICA SPA58,674 106,199.94 0.20EURENERVIT SPA20,603 54,227.10 0.10EUREXPERT SYSTEM SPA60,788 115,193.26 0.21EURFINECOBANK SPA100,737 540,957.69 1.00EURFOPE SPA51,500 153,470.00 0.28EURGLENALTA FOOD SPA18,400 192,832.00 0.36EURHERA SPA119,690 260,924.20 0.48EURH-FARM SPA191,000 125,678.00 0.23EURIMA SPA6,910 394,906.50 0.73EURINTERPUMP GROUP SPA18,164 280,815.44 0.52EURIREN SPA138,492 213,831.65 0.39EURLA DORIA SPA61,000 549,305.00 1.01EURLEONARDO SPA42,558 566,021.40 1.04EURMAIRE TECNIMONT SPA72,040 186,583.60 0.34EURMASI AGRICOLA SPA64,500 281,736.00 0.52EURMASSIMO ZANETTI BEV GROUP SPA REG SHS23,092 160,489.40 0.30EURMONCLER SPA30,500 505,080.00 0.93EUROVS SPA53,057 253,718.57 0.47EURPANARIAGROUP INDUSTRIE CERAMICHE SPA51,228 169,769.59 0.31EURPITECO SPA74,000 318,940.00 0.59EURPRYSMIAN SPA7,036 171,819.12 0.32EURRECORDATI INDUSTRIA CHIMICA E FARMACEUTICA SPA39,069 1,057,207.14 1.96EURREPLY SPA3,190 374,187.00 0.69EURSAES GETTERS SPA28,663 341,949.59 0.63EURSALINI IMPREGILO SPA80,898 240,752.45 0.44EURSALVATORE FERRAGAMO SPA15,185 338,018.10 0.62EURSOCIETA CATTOLICA DI ASSICURAZIONE SOCIETA COOPERATIVA42,589 234,878.34 0.43EURSOGEFI SPA115,000 277,150.00 0.51EURTOD'S SPA4,307 264,449.80 0.49EURTOSCANA AEROPORTI SPA1 14.13 0.00EURTXT E-SOLUTIONS SPA10,310 77,221.90 0.14EURUBI BANCA SPA146,058 379,458.68 0.70EURUNIPOL GRUPPO FINANZIARIO SPA53,000 177,762.00 0.33EURVITTORIA ASSICURAZIONI SPA23,545 238,981.75 0.44EURYOOX NET-A-PORTER GROUP SPA4,832 129,932.48 0.24EURZIGNAGO VETRO SPA11,111 60,721.62 0.11EUR
ALTEN SA4,457 298,752.71 0.55EURFrance 13,021,927.57 24.04
Securities portfolio as at 31/12/16EURExpressed in
BG SICAV – Small-Mid Cap Euro Equities
Quantity Denomination Quotationcurrency
% of netassetsMarket value
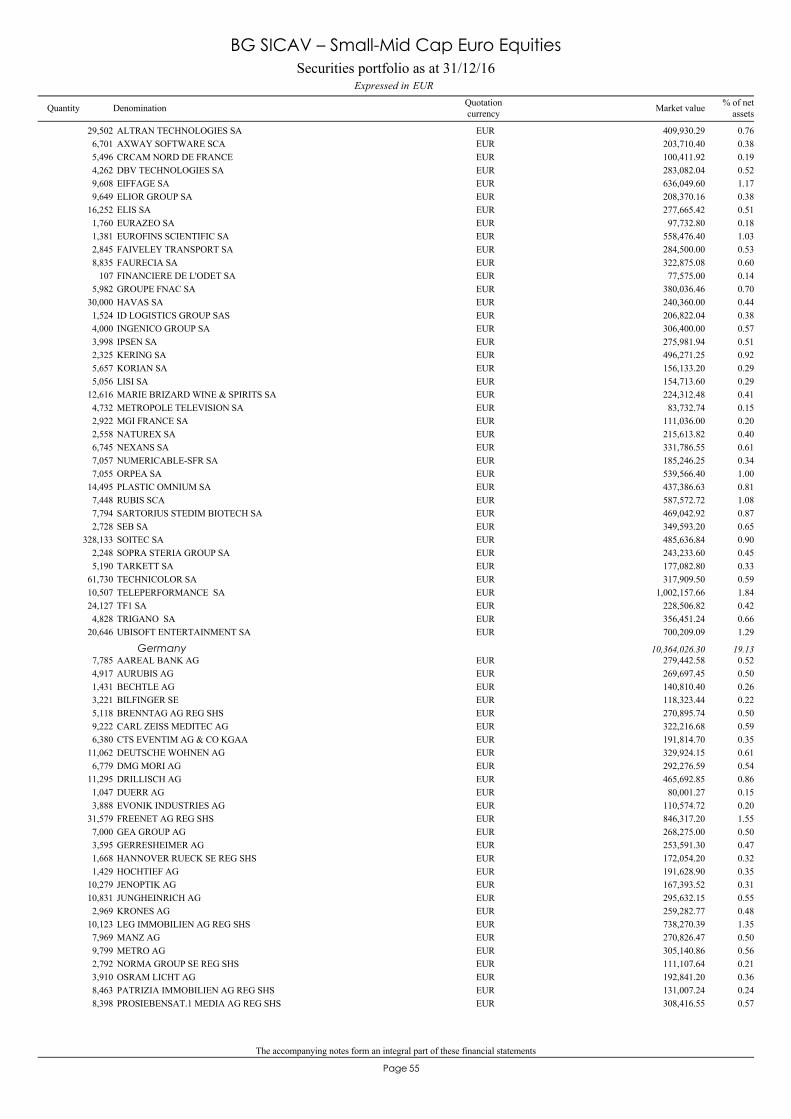
The accompanying notes form an integral part of these financial statements
55Page
ALTRAN TECHNOLOGIES SA29,502 409,930.29 0.76EURAXWAY SOFTWARE SCA6,701 203,710.40 0.38EURCRCAM NORD DE FRANCE5,496 100,411.92 0.19EURDBV TECHNOLOGIES SA4,262 283,082.04 0.52EUREIFFAGE SA9,608 636,049.60 1.17EURELIOR GROUP SA9,649 208,370.16 0.38EURELIS SA16,252 277,665.42 0.51EUREURAZEO SA1,760 97,732.80 0.18EUREUROFINS SCIENTIFIC SA1,381 558,476.40 1.03EURFAIVELEY TRANSPORT SA2,845 284,500.00 0.53EURFAURECIA SA8,835 322,875.08 0.60EURFINANCIERE DE L'ODET SA107 77,575.00 0.14EURGROUPE FNAC SA5,982 380,036.46 0.70EURHAVAS SA30,000 240,360.00 0.44EURID LOGISTICS GROUP SAS1,524 206,822.04 0.38EURINGENICO GROUP SA4,000 306,400.00 0.57EURIPSEN SA3,998 275,981.94 0.51EURKERING SA2,325 496,271.25 0.92EURKORIAN SA5,657 156,133.20 0.29EURLISI SA5,056 154,713.60 0.29EURMARIE BRIZARD WINE & SPIRITS SA12,616 224,312.48 0.41EURMETROPOLE TELEVISION SA4,732 83,732.74 0.15EURMGI FRANCE SA2,922 111,036.00 0.20EURNATUREX SA2,558 215,613.82 0.40EURNEXANS SA6,745 331,786.55 0.61EURNUMERICABLE-SFR SA7,057 185,246.25 0.34EURORPEA SA7,055 539,566.40 1.00EURPLASTIC OMNIUM SA14,495 437,386.63 0.81EURRUBIS SCA7,448 587,572.72 1.08EURSARTORIUS STEDIM BIOTECH SA7,794 469,042.92 0.87EURSEB SA2,728 349,593.20 0.65EURSOITEC SA328,133 485,636.84 0.90EURSOPRA STERIA GROUP SA2,248 243,233.60 0.45EURTARKETT SA5,190 177,082.80 0.33EURTECHNICOLOR SA61,730 317,909.50 0.59EURTELEPERFORMANCE SA10,507 1,002,157.66 1.84EURTF1 SA24,127 228,506.82 0.42EURTRIGANO SA4,828 356,451.24 0.66EURUBISOFT ENTERTAINMENT SA20,646 700,209.09 1.29EUR
AAREAL BANK AG7,785 279,442.58 0.52EURGermany 10,364,026.30 19.13
AURUBIS AG4,917 269,697.45 0.50EURBECHTLE AG1,431 140,810.40 0.26EURBILFINGER SE3,221 118,323.44 0.22EURBRENNTAG AG REG SHS5,118 270,895.74 0.50EURCARL ZEISS MEDITEC AG9,222 322,216.68 0.59EURCTS EVENTIM AG & CO KGAA6,380 191,814.70 0.35EURDEUTSCHE WOHNEN AG11,062 329,924.15 0.61EURDMG MORI AG6,779 292,276.59 0.54EURDRILLISCH AG11,295 465,692.85 0.86EURDUERR AG1,047 80,001.27 0.15EUREVONIK INDUSTRIES AG3,888 110,574.72 0.20EURFREENET AG REG SHS31,579 846,317.20 1.55EURGEA GROUP AG7,000 268,275.00 0.50EURGERRESHEIMER AG3,595 253,591.30 0.47EURHANNOVER RUECK SE REG SHS1,668 172,054.20 0.32EURHOCHTIEF AG1,429 191,628.90 0.35EURJENOPTIK AG10,279 167,393.52 0.31EURJUNGHEINRICH AG10,831 295,632.15 0.55EURKRONES AG2,969 259,282.77 0.48EURLEG IMMOBILIEN AG REG SHS10,123 738,270.39 1.35EURMANZ AG7,969 270,826.47 0.50EURMETRO AG9,799 305,140.86 0.56EURNORMA GROUP SE REG SHS2,792 111,107.64 0.21EUROSRAM LICHT AG3,910 192,841.20 0.36EURPATRIZIA IMMOBILIEN AG REG SHS8,463 131,007.24 0.24EURPROSIEBENSAT.1 MEDIA AG REG SHS8,398 308,416.55 0.57EUR
Securities portfolio as at 31/12/16EURExpressed in
BG SICAV – Small-Mid Cap Euro Equities
Quantity Denomination Quotationcurrency
% of netassetsMarket value
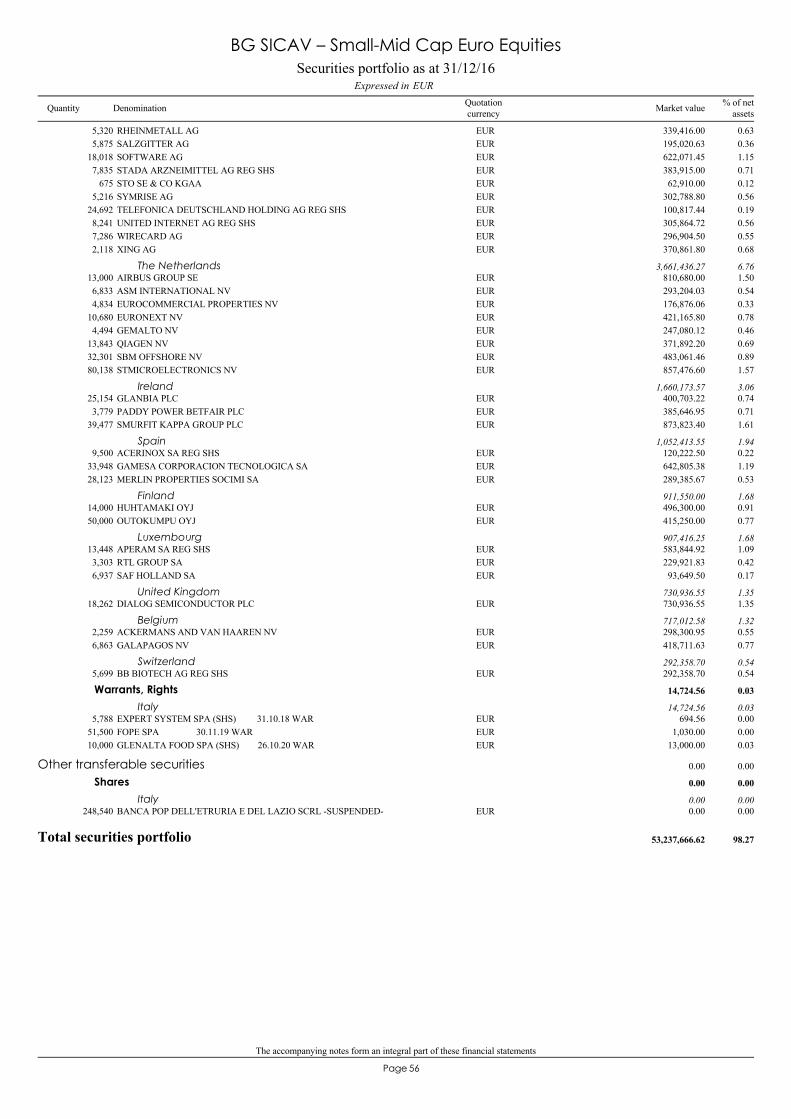
The accompanying notes form an integral part of these financial statements
56Page
RHEINMETALL AG5,320 339,416.00 0.63EURSALZGITTER AG5,875 195,020.63 0.36EURSOFTWARE AG18,018 622,071.45 1.15EURSTADA ARZNEIMITTEL AG REG SHS7,835 383,915.00 0.71EURSTO SE & CO KGAA675 62,910.00 0.12EURSYMRISE AG5,216 302,788.80 0.56EURTELEFONICA DEUTSCHLAND HOLDING AG REG SHS24,692 100,817.44 0.19EURUNITED INTERNET AG REG SHS8,241 305,864.72 0.56EURWIRECARD AG7,286 296,904.50 0.55EURXING AG2,118 370,861.80 0.68EUR
AIRBUS GROUP SE13,000 810,680.00 1.50EURThe Netherlands 3,661,436.27 6.76
ASM INTERNATIONAL NV6,833 293,204.03 0.54EUREUROCOMMERCIAL PROPERTIES NV4,834 176,876.06 0.33EUREURONEXT NV10,680 421,165.80 0.78EURGEMALTO NV4,494 247,080.12 0.46EURQIAGEN NV13,843 371,892.20 0.69EURSBM OFFSHORE NV32,301 483,061.46 0.89EURSTMICROELECTRONICS NV80,138 857,476.60 1.57EUR
GLANBIA PLC25,154 400,703.22 0.74EURIreland 1,660,173.57 3.06
PADDY POWER BETFAIR PLC3,779 385,646.95 0.71EURSMURFIT KAPPA GROUP PLC39,477 873,823.40 1.61EUR
ACERINOX SA REG SHS9,500 120,222.50 0.22EURSpain 1,052,413.55 1.94
GAMESA CORPORACION TECNOLOGICA SA33,948 642,805.38 1.19EURMERLIN PROPERTIES SOCIMI SA28,123 289,385.67 0.53EUR
HUHTAMAKI OYJ14,000 496,300.00 0.91EURFinland 911,550.00 1.68
OUTOKUMPU OYJ50,000 415,250.00 0.77EUR
APERAM SA REG SHS13,448 583,844.92 1.09EURLuxembourg 907,416.25 1.68
RTL GROUP SA3,303 229,921.83 0.42EURSAF HOLLAND SA6,937 93,649.50 0.17EUR
DIALOG SEMICONDUCTOR PLC18,262 730,936.55 1.35EURUnited Kingdom 730,936.55 1.35
ACKERMANS AND VAN HAAREN NV2,259 298,300.95 0.55EURBelgium 717,012.58 1.32
GALAPAGOS NV6,863 418,711.63 0.77EUR
BB BIOTECH AG REG SHS5,699 292,358.70 0.54EURSwitzerland 292,358.70 0.54
EXPERT SYSTEM SPA (SHS) 31.10.18 WAR5,788 694.56 0.00EUR
Warrants, Rights 14,724.56 0.03
Italy 14,724.56 0.03
FOPE SPA 30.11.19 WAR51,500 1,030.00 0.00EURGLENALTA FOOD SPA (SHS) 26.10.20 WAR10,000 13,000.00 0.03EUR
BANCA POP DELL'ETRURIA E DEL LAZIO SCRL -SUSPENDED-248,540 0.00 0.00EUR
Other transferable securities 0.00 0.00
Shares 0.00 0.00
Italy 0.00 0.00
Total securities portfolio 53,237,666.62 98.27
Securities portfolio as at 31/12/16EURExpressed in
BG SICAV – Small-Mid Cap Euro Equities
Quantity Denomination Quotationcurrency
% of netassetsMarket value
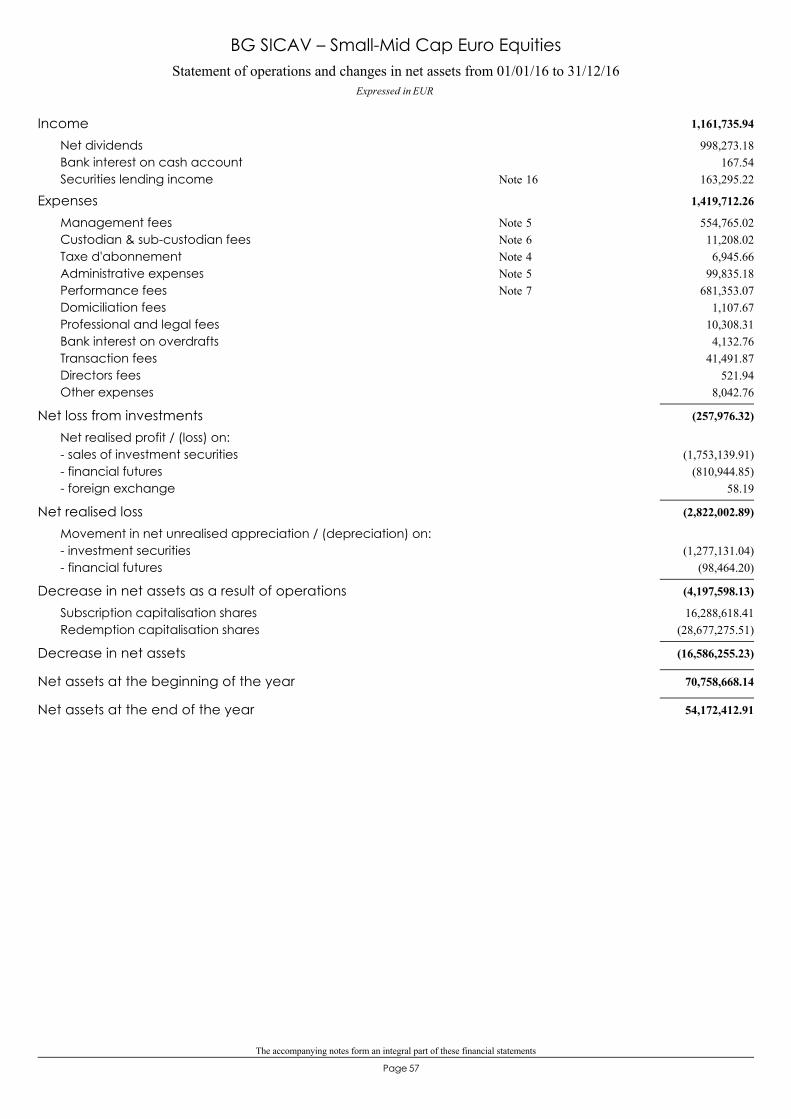
The accompanying notes form an integral part of these financial statements
57Page
Statement of operations and changes in net assets from 01/01/16 to 31/12/16Expressed in EUR
BG SICAV – Small-Mid Cap Euro Equities
1,161,735.94Income998,273.18Net dividends
167.54Bank interest on cash account163,295.22Securities lending income 16Note
1,419,712.26Expenses554,765.02Management fees 5Note11,208.02Custodian & sub-custodian fees 6Note6,945.66Taxe d'abonnement 4Note
99,835.18Administrative expenses 5Note681,353.07Performance fees 7Note
1,107.67Domiciliation fees10,308.31Professional and legal fees4,132.76Bank interest on overdrafts
41,491.87Transaction fees521.94Directors fees
8,042.76Other expenses
(257,976.32)Net loss from investmentsNet realised profit / (loss) on:
(1,753,139.91)- sales of investment securities(810,944.85)- financial futures
58.19- foreign exchange
(2,822,002.89)Net realised lossMovement in net unrealised appreciation / (depreciation) on:
(1,277,131.04)- investment securities(98,464.20)- financial futures
(4,197,598.13)Decrease in net assets as a result of operations16,288,618.41Subscription capitalisation shares
(28,677,275.51)Redemption capitalisation shares
(16,586,255.23)Decrease in net assets
70,758,668.14Net assets at the beginning of the year
54,172,412.91Net assets at the end of the year
58Page
BG SICAV– UBS Global Long Short
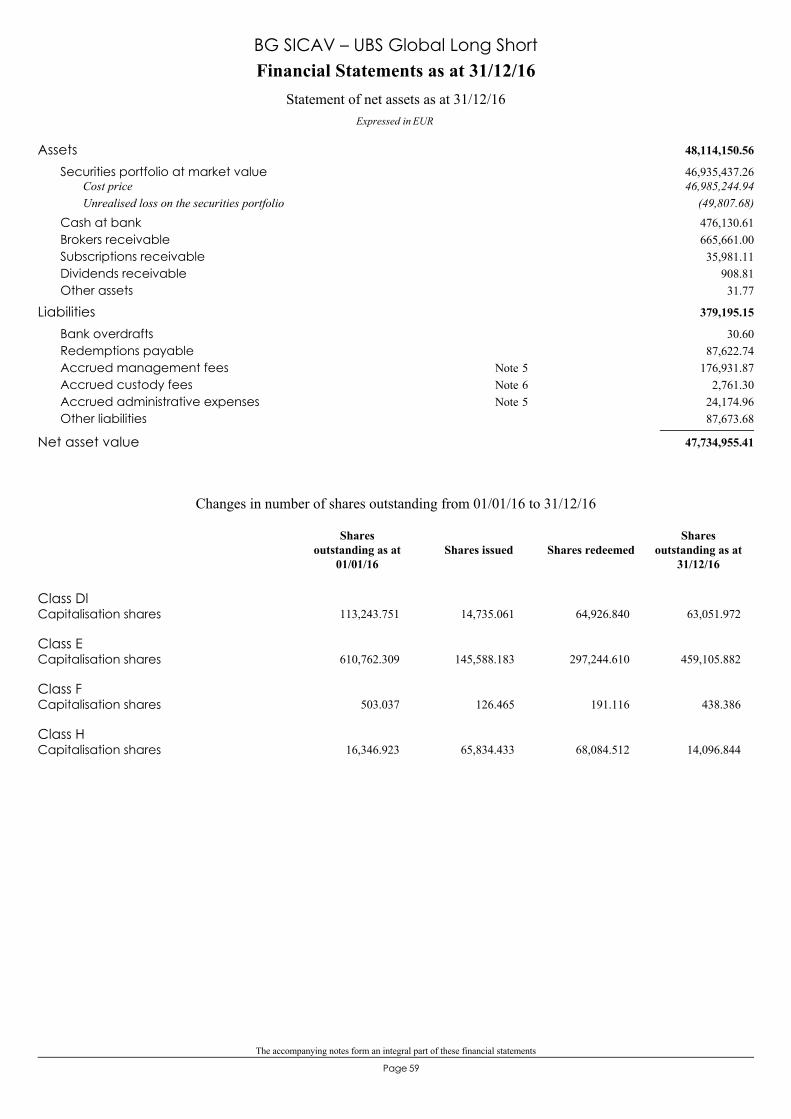
The accompanying notes form an integral part of these financial statements
59Page
48,114,150.56Assets46,935,437.26Securities portfolio at market value46,985,244.94Cost price
(49,807.68)Unrealised loss on the securities portfolio476,130.61Cash at bank665,661.00Brokers receivable35,981.11Subscriptions receivable
908.81Dividends receivable31.77Other assets
379,195.15Liabilities30.60Bank overdrafts
87,622.74Redemptions payable176,931.87Accrued management fees 5Note
2,761.30Accrued custody fees 6Note24,174.96Accrued administrative expenses 5Note87,673.68Other liabilities
47,734,955.41Net asset value
Financial Statements as at 31/12/16
Expressed in EUR
Statement of net assets as at 31/12/16
BG SICAV – UBS Global Long Short
Class DlCapitalisation shares 113,243.751 14,735.061 64,926.840 63,051.972
Class ECapitalisation shares 610,762.309 145,588.183 297,244.610 459,105.882
Class FCapitalisation shares 503.037 126.465 191.116 438.386
Class HCapitalisation shares 16,346.923 65,834.433 68,084.512 14,096.844
Changes in number of shares outstanding from 01/01/16 to 31/12/16
Shares issued Shares redeemedShares
outstanding as at31/12/16
Sharesoutstanding as at
01/01/16

The accompanying notes form an integral part of these financial statements
60Page
Key figures
BG SICAV – UBS Global Long Short
Class C
Capitalisation shares
0.000.000 0.000
0.00249.783100.61
Number of sharesNet asset value per share
EUR EUR EUR
Class Dl
Capitalisation shares
86.7563,051.972 113,243.751
97.0919,298.595
97.33Number of sharesNet asset value per share
EUR EUR EUR
Class E
Capitalisation shares
89.29459,105.882 610,762.309
98.93252,540.567
98.17Number of sharesNet asset value per share
EUR EUR EUR
Class F
Capitalisation shares
90.10438.386 503.037
99.17270.00698.02
Number of sharesNet asset value per share
EUR EUR EUR
Class H
Capitalisation shares
87.3314,096.844 16,346.923
96.870.0000.00
Number of sharesNet asset value per share
EUR EUR EUR
Total Net Assets 47,734,955.41 73,049,600.71 26,722,629.46
31/12/1431/12/1531/12/16Year ending as at:
EUR
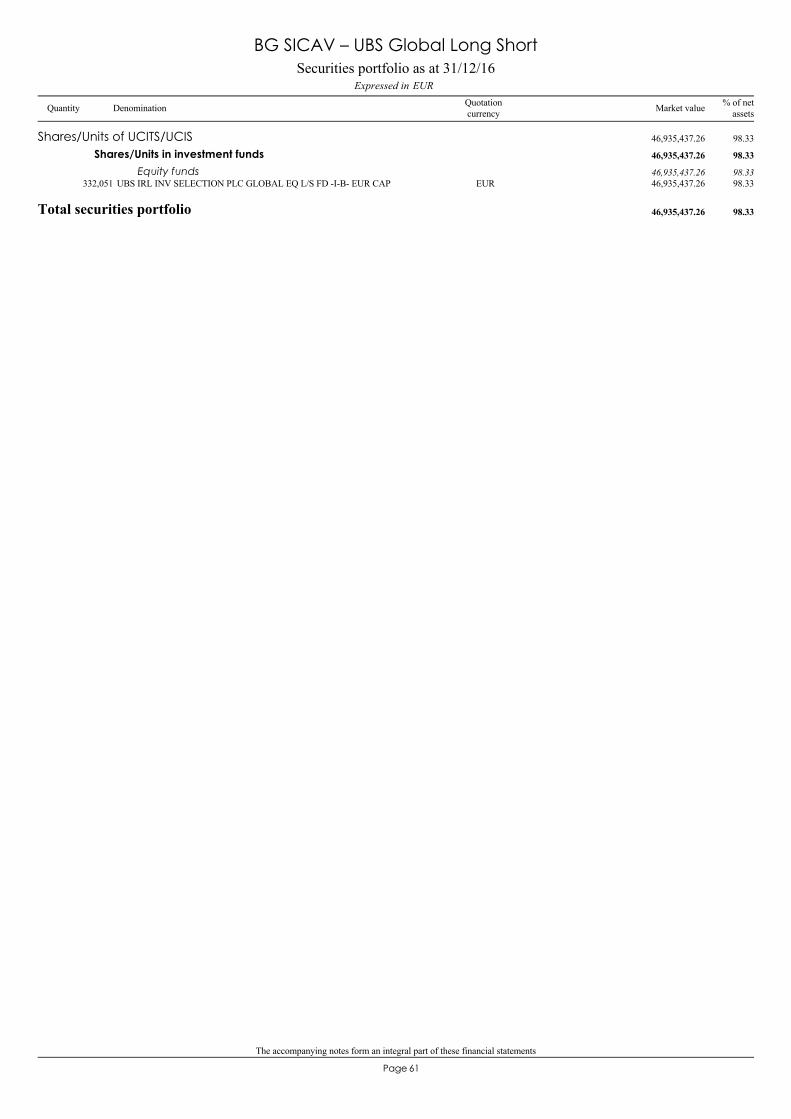
The accompanying notes form an integral part of these financial statements
61Page
UBS IRL INV SELECTION PLC GLOBAL EQ L/S FD -I-B- EUR CAP332,051 46,935,437.26 98.33EUR
Shares/Units of UCITS/UCIS 46,935,437.26 98.33
Shares/Units in investment funds 46,935,437.26 98.33
Equity funds 46,935,437.26 98.33
Total securities portfolio 46,935,437.26 98.33
Securities portfolio as at 31/12/16EURExpressed in
BG SICAV – UBS Global Long Short
Quantity Denomination Quotationcurrency
% of netassetsMarket value
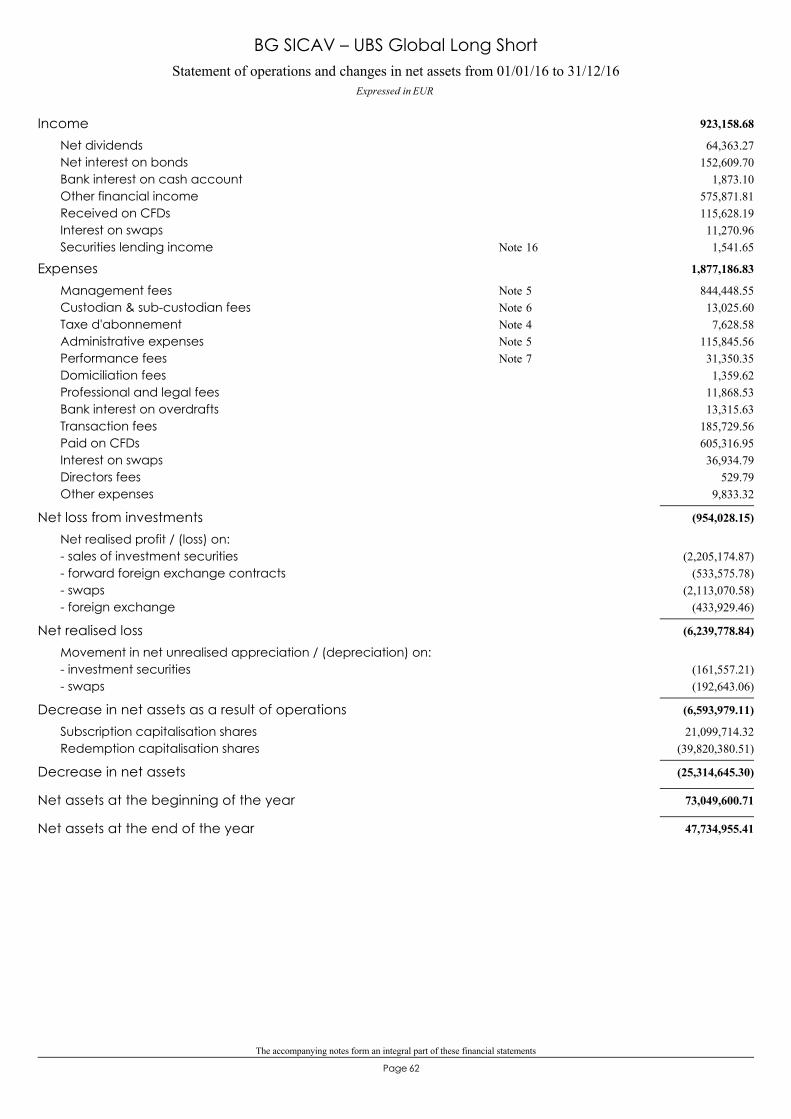
The accompanying notes form an integral part of these financial statements
62Page
Statement of operations and changes in net assets from 01/01/16 to 31/12/16Expressed in EUR
BG SICAV – UBS Global Long Short
923,158.68Income64,363.27Net dividends
152,609.70Net interest on bonds1,873.10Bank interest on cash account
575,871.81Other financial income115,628.19Received on CFDs11,270.96Interest on swaps1,541.65Securities lending income 16Note
1,877,186.83Expenses844,448.55Management fees 5Note13,025.60Custodian & sub-custodian fees 6Note7,628.58Taxe d'abonnement 4Note
115,845.56Administrative expenses 5Note31,350.35Performance fees 7Note1,359.62Domiciliation fees
11,868.53Professional and legal fees13,315.63Bank interest on overdrafts
185,729.56Transaction fees605,316.95Paid on CFDs36,934.79Interest on swaps
529.79Directors fees9,833.32Other expenses
(954,028.15)Net loss from investmentsNet realised profit / (loss) on:
(2,205,174.87)- sales of investment securities(533,575.78)- forward foreign exchange contracts
(2,113,070.58)- swaps(433,929.46)- foreign exchange
(6,239,778.84)Net realised lossMovement in net unrealised appreciation / (depreciation) on:
(161,557.21)- investment securities(192,643.06)- swaps
(6,593,979.11)Decrease in net assets as a result of operations21,099,714.32Subscription capitalisation shares
(39,820,380.51)Redemption capitalisation shares
(25,314,645.30)Decrease in net assets
73,049,600.71Net assets at the beginning of the year
47,734,955.41Net assets at the end of the year
63Page
BG SICAV– Morgan Stanley Global Real Estate & Infrastructure
Equities Fund
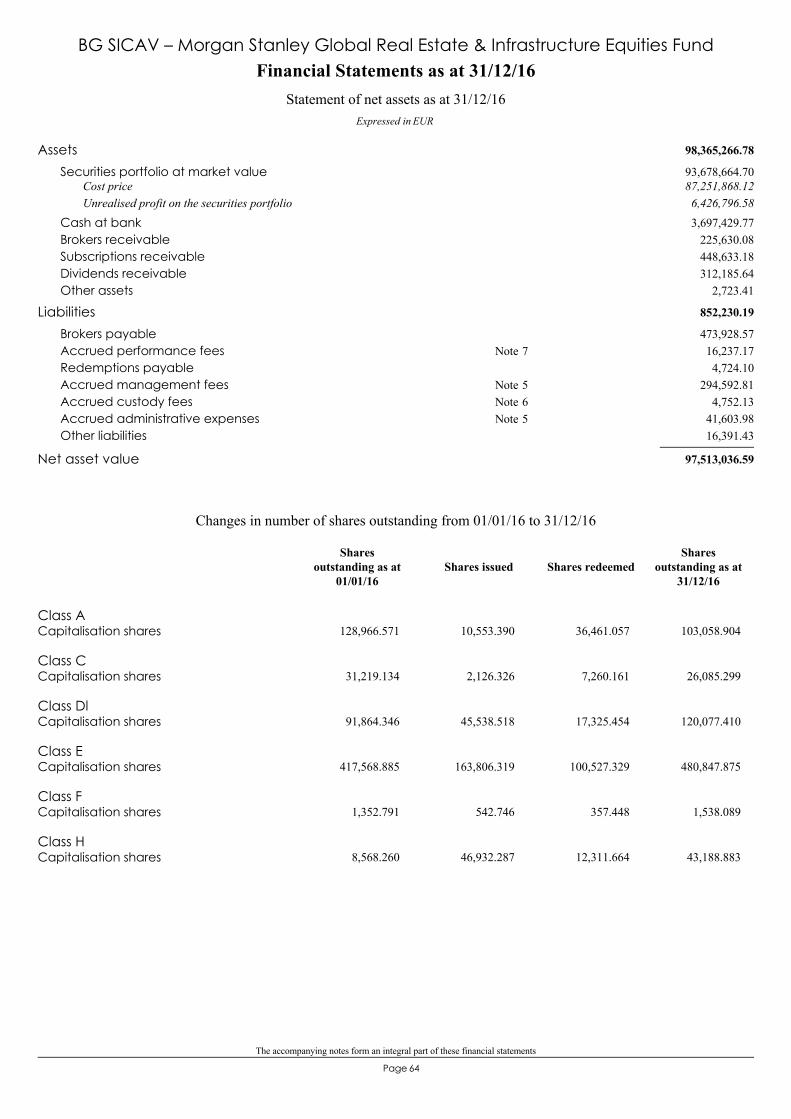
The accompanying notes form an integral part of these financial statements
64Page
98,365,266.78Assets93,678,664.70Securities portfolio at market value87,251,868.12Cost price6,426,796.58Unrealised profit on the securities portfolio3,697,429.77Cash at bank
225,630.08Brokers receivable448,633.18Subscriptions receivable312,185.64Dividends receivable
2,723.41Other assets
852,230.19Liabilities473,928.57Brokers payable16,237.17Accrued performance fees 7Note4,724.10Redemptions payable
294,592.81Accrued management fees 5Note4,752.13Accrued custody fees 6Note
41,603.98Accrued administrative expenses 5Note16,391.43Other liabilities
97,513,036.59Net asset value
Financial Statements as at 31/12/16
Expressed in EUR
Statement of net assets as at 31/12/16
BG SICAV – Morgan Stanley Global Real Estate & Infrastructure Equities Fund
Class ACapitalisation shares 128,966.571 10,553.390 36,461.057 103,058.904
Class CCapitalisation shares 31,219.134 2,126.326 7,260.161 26,085.299
Class DlCapitalisation shares 91,864.346 45,538.518 17,325.454 120,077.410
Class ECapitalisation shares 417,568.885 163,806.319 100,527.329 480,847.875
Class FCapitalisation shares 1,352.791 542.746 357.448 1,538.089
Class HCapitalisation shares 8,568.260 46,932.287 12,311.664 43,188.883
Changes in number of shares outstanding from 01/01/16 to 31/12/16
Shares issued Shares redeemedShares
outstanding as at31/12/16
Sharesoutstanding as at
01/01/16
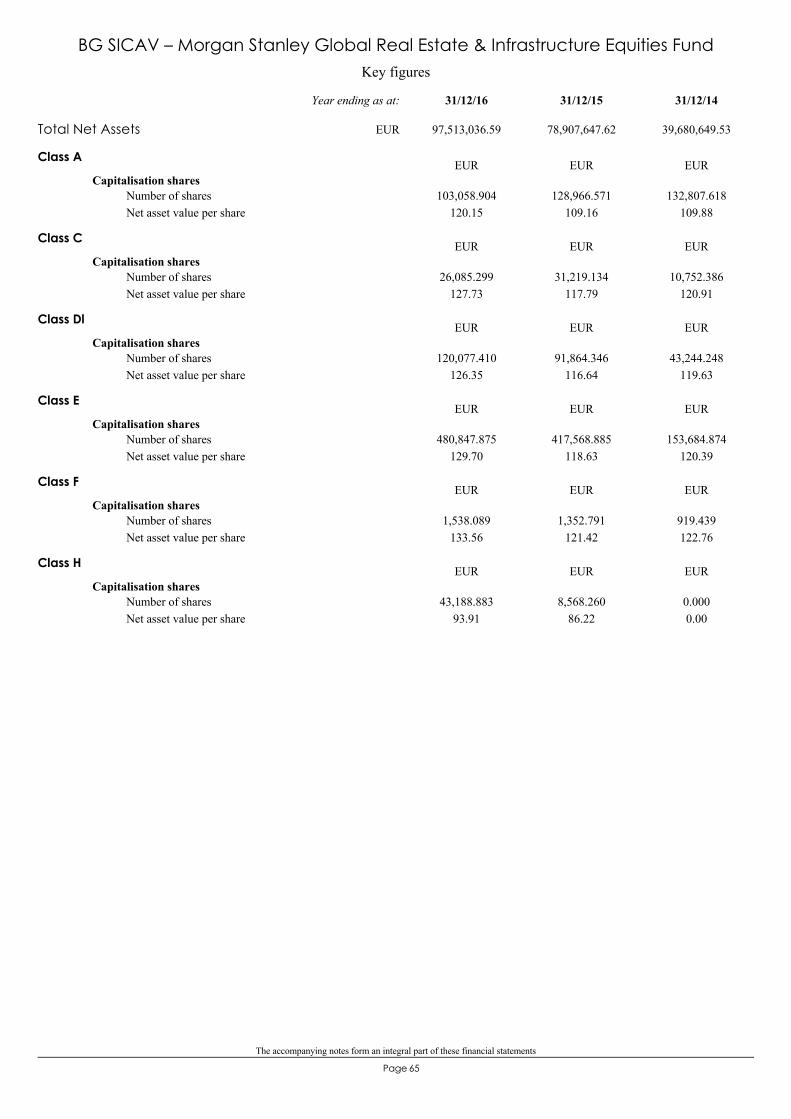
The accompanying notes form an integral part of these financial statements
65Page
Key figures
BG SICAV – Morgan Stanley Global Real Estate & Infrastructure Equities Fund
Class A
Capitalisation shares
120.15103,058.904 128,966.571
109.16132,807.618
109.88Number of sharesNet asset value per share
EUR EUR EUR
Class C
Capitalisation shares
127.7326,085.299 31,219.134
117.7910,752.386
120.91Number of sharesNet asset value per share
EUR EUR EUR
Class Dl
Capitalisation shares
126.35120,077.410 91,864.346
116.6443,244.248
119.63Number of sharesNet asset value per share
EUR EUR EUR
Class E
Capitalisation shares
129.70480,847.875 417,568.885
118.63153,684.874
120.39Number of sharesNet asset value per share
EUR EUR EUR
Class F
Capitalisation shares
133.561,538.089 1,352.791
121.42919.439122.76
Number of sharesNet asset value per share
EUR EUR EUR
Class H
Capitalisation shares
93.9143,188.883 8,568.260
86.220.0000.00
Number of sharesNet asset value per share
EUR EUR EUR
Total Net Assets 97,513,036.59 78,907,647.62 39,680,649.53
31/12/1431/12/1531/12/16Year ending as at:
EUR
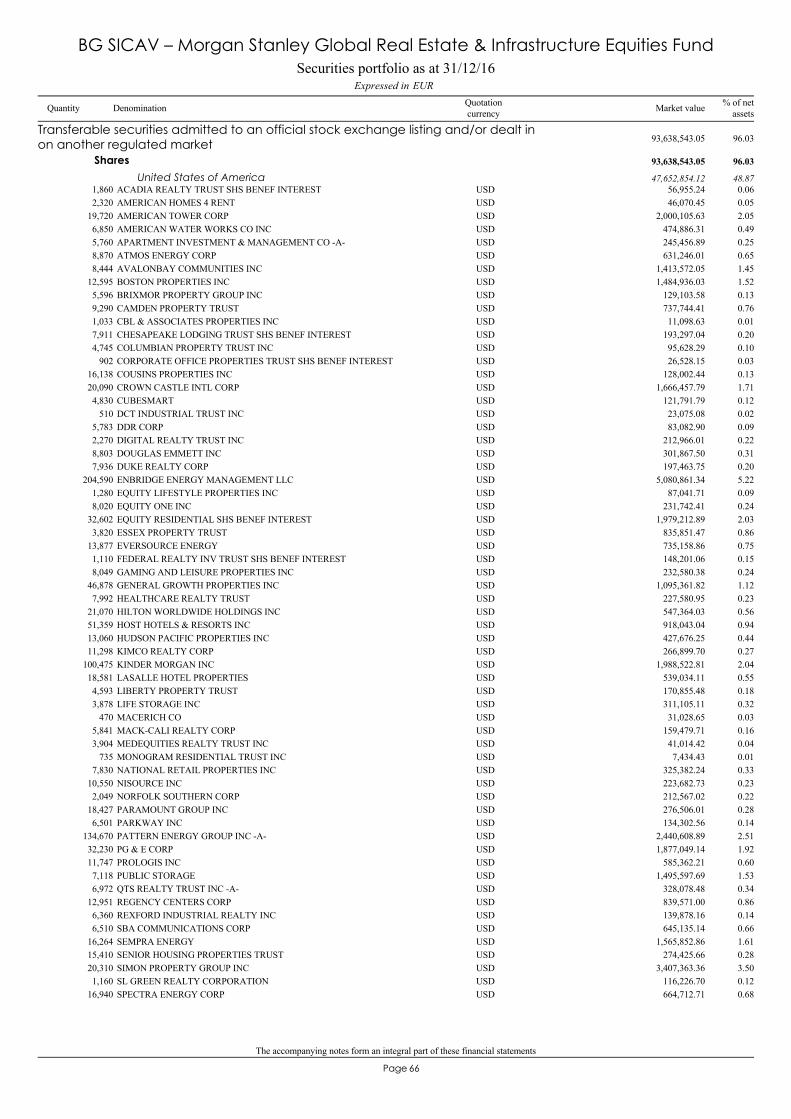
The accompanying notes form an integral part of these financial statements
66Page
ACADIA REALTY TRUST SHS BENEF INTEREST1,860 56,955.24 0.06USD
Transferable securities admitted to an official stock exchange listing and/or dealt inon another regulated market 93,638,543.05 96.03
Shares 93,638,543.05 96.03
United States of America 47,652,854.12 48.87
AMERICAN HOMES 4 RENT2,320 46,070.45 0.05USDAMERICAN TOWER CORP19,720 2,000,105.63 2.05USDAMERICAN WATER WORKS CO INC6,850 474,886.31 0.49USDAPARTMENT INVESTMENT & MANAGEMENT CO -A-5,760 245,456.89 0.25USDATMOS ENERGY CORP8,870 631,246.01 0.65USDAVALONBAY COMMUNITIES INC8,444 1,413,572.05 1.45USDBOSTON PROPERTIES INC12,595 1,484,936.03 1.52USDBRIXMOR PROPERTY GROUP INC5,596 129,103.58 0.13USDCAMDEN PROPERTY TRUST9,290 737,744.41 0.76USDCBL & ASSOCIATES PROPERTIES INC1,033 11,098.63 0.01USDCHESAPEAKE LODGING TRUST SHS BENEF INTEREST7,911 193,297.04 0.20USDCOLUMBIAN PROPERTY TRUST INC4,745 95,628.29 0.10USDCORPORATE OFFICE PROPERTIES TRUST SHS BENEF INTEREST902 26,528.15 0.03USDCOUSINS PROPERTIES INC16,138 128,002.44 0.13USDCROWN CASTLE INTL CORP20,090 1,666,457.79 1.71USDCUBESMART4,830 121,791.79 0.12USDDCT INDUSTRIAL TRUST INC510 23,075.08 0.02USDDDR CORP5,783 83,082.90 0.09USDDIGITAL REALTY TRUST INC2,270 212,966.01 0.22USDDOUGLAS EMMETT INC8,803 301,867.50 0.31USDDUKE REALTY CORP7,936 197,463.75 0.20USDENBRIDGE ENERGY MANAGEMENT LLC204,590 5,080,861.34 5.22USDEQUITY LIFESTYLE PROPERTIES INC1,280 87,041.71 0.09USDEQUITY ONE INC8,020 231,742.41 0.24USDEQUITY RESIDENTIAL SHS BENEF INTEREST32,602 1,979,212.89 2.03USDESSEX PROPERTY TRUST3,820 835,851.47 0.86USDEVERSOURCE ENERGY13,877 735,158.86 0.75USDFEDERAL REALTY INV TRUST SHS BENEF INTEREST1,110 148,201.06 0.15USDGAMING AND LEISURE PROPERTIES INC8,049 232,580.38 0.24USDGENERAL GROWTH PROPERTIES INC46,878 1,095,361.82 1.12USDHEALTHCARE REALTY TRUST7,992 227,580.95 0.23USDHILTON WORLDWIDE HOLDINGS INC21,070 547,364.03 0.56USDHOST HOTELS & RESORTS INC51,359 918,043.04 0.94USDHUDSON PACIFIC PROPERTIES INC13,060 427,676.25 0.44USDKIMCO REALTY CORP11,298 266,899.70 0.27USDKINDER MORGAN INC100,475 1,988,522.81 2.04USDLASALLE HOTEL PROPERTIES18,581 539,034.11 0.55USDLIBERTY PROPERTY TRUST4,593 170,855.48 0.18USDLIFE STORAGE INC3,878 311,105.11 0.32USDMACERICH CO470 31,028.65 0.03USDMACK-CALI REALTY CORP5,841 159,479.71 0.16USDMEDEQUITIES REALTY TRUST INC3,904 41,014.42 0.04USDMONOGRAM RESIDENTIAL TRUST INC735 7,434.43 0.01USDNATIONAL RETAIL PROPERTIES INC7,830 325,382.24 0.33USDNISOURCE INC10,550 223,682.73 0.23USDNORFOLK SOUTHERN CORP2,049 212,567.02 0.22USDPARAMOUNT GROUP INC18,427 276,506.01 0.28USDPARKWAY INC6,501 134,302.56 0.14USDPATTERN ENERGY GROUP INC -A-134,670 2,440,608.89 2.51USDPG & E CORP32,230 1,877,049.14 1.92USDPROLOGIS INC11,747 585,362.21 0.60USDPUBLIC STORAGE7,118 1,495,597.69 1.53USDQTS REALTY TRUST INC -A-6,972 328,078.48 0.34USDREGENCY CENTERS CORP12,951 839,571.00 0.86USDREXFORD INDUSTRIAL REALTY INC6,360 139,878.16 0.14USDSBA COMMUNICATIONS CORP6,510 645,135.14 0.66USDSEMPRA ENERGY16,264 1,565,852.86 1.61USDSENIOR HOUSING PROPERTIES TRUST15,410 274,425.66 0.28USDSIMON PROPERTY GROUP INC20,310 3,407,363.36 3.50USDSL GREEN REALTY CORPORATION1,160 116,226.70 0.12USDSPECTRA ENERGY CORP16,940 664,712.71 0.68USD
Securities portfolio as at 31/12/16EURExpressed in
BG SICAV – Morgan Stanley Global Real Estate & Infrastructure Equities Fund
Quantity Denomination Quotationcurrency
% of netassetsMarket value
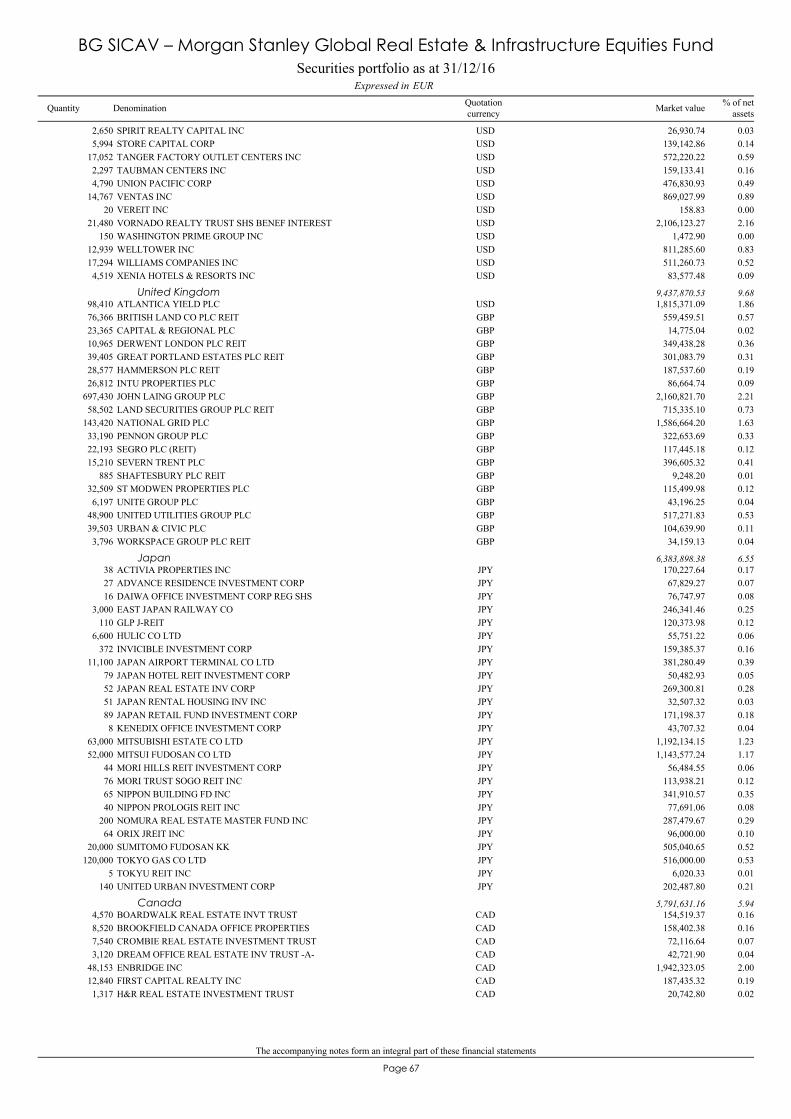
The accompanying notes form an integral part of these financial statements
67Page
SPIRIT REALTY CAPITAL INC2,650 26,930.74 0.03USDSTORE CAPITAL CORP5,994 139,142.86 0.14USDTANGER FACTORY OUTLET CENTERS INC17,052 572,220.22 0.59USDTAUBMAN CENTERS INC2,297 159,133.41 0.16USDUNION PACIFIC CORP4,790 476,830.93 0.49USDVENTAS INC14,767 869,027.99 0.89USDVEREIT INC20 158.83 0.00USDVORNADO REALTY TRUST SHS BENEF INTEREST21,480 2,106,123.27 2.16USDWASHINGTON PRIME GROUP INC150 1,472.90 0.00USDWELLTOWER INC12,939 811,285.60 0.83USDWILLIAMS COMPANIES INC17,294 511,260.73 0.52USDXENIA HOTELS & RESORTS INC4,519 83,577.48 0.09USD
ATLANTICA YIELD PLC98,410 1,815,371.09 1.86USDUnited Kingdom 9,437,870.53 9.68
BRITISH LAND CO PLC REIT76,366 559,459.51 0.57GBPCAPITAL & REGIONAL PLC23,365 14,775.04 0.02GBPDERWENT LONDON PLC REIT10,965 349,438.28 0.36GBPGREAT PORTLAND ESTATES PLC REIT39,405 301,083.79 0.31GBPHAMMERSON PLC REIT28,577 187,537.60 0.19GBPINTU PROPERTIES PLC26,812 86,664.74 0.09GBPJOHN LAING GROUP PLC697,430 2,160,821.70 2.21GBPLAND SECURITIES GROUP PLC REIT58,502 715,335.10 0.73GBPNATIONAL GRID PLC143,420 1,586,664.20 1.63GBPPENNON GROUP PLC33,190 322,653.69 0.33GBPSEGRO PLC (REIT)22,193 117,445.18 0.12GBPSEVERN TRENT PLC15,210 396,605.32 0.41GBPSHAFTESBURY PLC REIT885 9,248.20 0.01GBPST MODWEN PROPERTIES PLC32,509 115,499.98 0.12GBPUNITE GROUP PLC6,197 43,196.25 0.04GBPUNITED UTILITIES GROUP PLC48,900 517,271.83 0.53GBPURBAN & CIVIC PLC39,503 104,639.90 0.11GBPWORKSPACE GROUP PLC REIT3,796 34,159.13 0.04GBP
ACTIVIA PROPERTIES INC38 170,227.64 0.17JPYJapan 6,383,898.38 6.55
ADVANCE RESIDENCE INVESTMENT CORP27 67,829.27 0.07JPYDAIWA OFFICE INVESTMENT CORP REG SHS16 76,747.97 0.08JPYEAST JAPAN RAILWAY CO3,000 246,341.46 0.25JPYGLP J-REIT110 120,373.98 0.12JPYHULIC CO LTD6,600 55,751.22 0.06JPYINVICIBLE INVESTMENT CORP372 159,385.37 0.16JPYJAPAN AIRPORT TERMINAL CO LTD11,100 381,280.49 0.39JPYJAPAN HOTEL REIT INVESTMENT CORP79 50,482.93 0.05JPYJAPAN REAL ESTATE INV CORP52 269,300.81 0.28JPYJAPAN RENTAL HOUSING INV INC51 32,507.32 0.03JPYJAPAN RETAIL FUND INVESTMENT CORP89 171,198.37 0.18JPYKENEDIX OFFICE INVESTMENT CORP8 43,707.32 0.04JPYMITSUBISHI ESTATE CO LTD63,000 1,192,134.15 1.23JPYMITSUI FUDOSAN CO LTD52,000 1,143,577.24 1.17JPYMORI HILLS REIT INVESTMENT CORP44 56,484.55 0.06JPYMORI TRUST SOGO REIT INC76 113,938.21 0.12JPYNIPPON BUILDING FD INC65 341,910.57 0.35JPYNIPPON PROLOGIS REIT INC40 77,691.06 0.08JPYNOMURA REAL ESTATE MASTER FUND INC200 287,479.67 0.29JPYORIX JREIT INC64 96,000.00 0.10JPYSUMITOMO FUDOSAN KK20,000 505,040.65 0.52JPYTOKYO GAS CO LTD120,000 516,000.00 0.53JPYTOKYU REIT INC5 6,020.33 0.01JPYUNITED URBAN INVESTMENT CORP140 202,487.80 0.21JPY
BOARDWALK REAL ESTATE INVT TRUST4,570 154,519.37 0.16CADCanada 5,791,631.16 5.94
BROOKFIELD CANADA OFFICE PROPERTIES8,520 158,402.38 0.16CADCROMBIE REAL ESTATE INVESTMENT TRUST7,540 72,116.64 0.07CADDREAM OFFICE REAL ESTATE INV TRUST -A-3,120 42,721.90 0.04CADENBRIDGE INC48,153 1,942,323.05 2.00CADFIRST CAPITAL REALTY INC12,840 187,435.32 0.19CADH&R REAL ESTATE INVESTMENT TRUST1,317 20,742.80 0.02CAD
Securities portfolio as at 31/12/16EURExpressed in
BG SICAV – Morgan Stanley Global Real Estate & Infrastructure Equities Fund
Quantity Denomination Quotationcurrency
% of netassetsMarket value
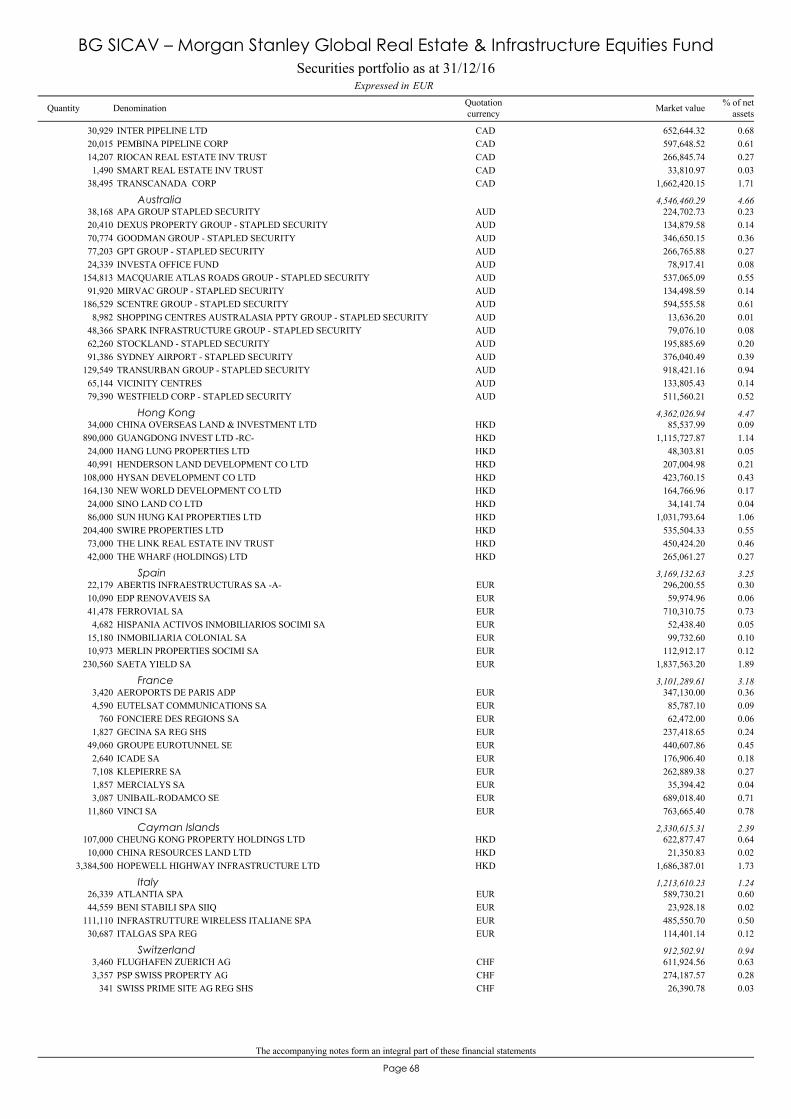
The accompanying notes form an integral part of these financial statements
68Page
INTER PIPELINE LTD30,929 652,644.32 0.68CADPEMBINA PIPELINE CORP20,015 597,648.52 0.61CADRIOCAN REAL ESTATE INV TRUST14,207 266,845.74 0.27CADSMART REAL ESTATE INV TRUST1,490 33,810.97 0.03CADTRANSCANADA CORP38,495 1,662,420.15 1.71CAD
APA GROUP STAPLED SECURITY38,168 224,702.73 0.23AUDAustralia 4,546,460.29 4.66
DEXUS PROPERTY GROUP - STAPLED SECURITY20,410 134,879.58 0.14AUDGOODMAN GROUP - STAPLED SECURITY70,774 346,650.15 0.36AUDGPT GROUP - STAPLED SECURITY77,203 266,765.88 0.27AUDINVESTA OFFICE FUND24,339 78,917.41 0.08AUDMACQUARIE ATLAS ROADS GROUP - STAPLED SECURITY154,813 537,065.09 0.55AUDMIRVAC GROUP - STAPLED SECURITY91,920 134,498.59 0.14AUDSCENTRE GROUP - STAPLED SECURITY186,529 594,555.58 0.61AUDSHOPPING CENTRES AUSTRALASIA PPTY GROUP - STAPLED SECURITY8,982 13,636.20 0.01AUDSPARK INFRASTRUCTURE GROUP - STAPLED SECURITY48,366 79,076.10 0.08AUDSTOCKLAND - STAPLED SECURITY62,260 195,885.69 0.20AUDSYDNEY AIRPORT - STAPLED SECURITY91,386 376,040.49 0.39AUDTRANSURBAN GROUP - STAPLED SECURITY129,549 918,421.16 0.94AUDVICINITY CENTRES65,144 133,805.43 0.14AUDWESTFIELD CORP - STAPLED SECURITY79,390 511,560.21 0.52AUD
CHINA OVERSEAS LAND & INVESTMENT LTD34,000 85,537.99 0.09HKDHong Kong 4,362,026.94 4.47
GUANGDONG INVEST LTD -RC-890,000 1,115,727.87 1.14HKDHANG LUNG PROPERTIES LTD24,000 48,303.81 0.05HKDHENDERSON LAND DEVELOPMENT CO LTD40,991 207,004.98 0.21HKDHYSAN DEVELOPMENT CO LTD108,000 423,760.15 0.43HKDNEW WORLD DEVELOPMENT CO LTD164,130 164,766.96 0.17HKDSINO LAND CO LTD24,000 34,141.74 0.04HKDSUN HUNG KAI PROPERTIES LTD86,000 1,031,793.64 1.06HKDSWIRE PROPERTIES LTD204,400 535,504.33 0.55HKDTHE LINK REAL ESTATE INV TRUST73,000 450,424.20 0.46HKDTHE WHARF (HOLDINGS) LTD42,000 265,061.27 0.27HKD
ABERTIS INFRAESTRUCTURAS SA -A-22,179 296,200.55 0.30EURSpain 3,169,132.63 3.25
EDP RENOVAVEIS SA10,090 59,974.96 0.06EURFERROVIAL SA41,478 710,310.75 0.73EURHISPANIA ACTIVOS INMOBILIARIOS SOCIMI SA4,682 52,438.40 0.05EURINMOBILIARIA COLONIAL SA15,180 99,732.60 0.10EURMERLIN PROPERTIES SOCIMI SA10,973 112,912.17 0.12EURSAETA YIELD SA230,560 1,837,563.20 1.89EUR
AEROPORTS DE PARIS ADP3,420 347,130.00 0.36EURFrance 3,101,289.61 3.18
EUTELSAT COMMUNICATIONS SA4,590 85,787.10 0.09EURFONCIERE DES REGIONS SA760 62,472.00 0.06EURGECINA SA REG SHS1,827 237,418.65 0.24EURGROUPE EUROTUNNEL SE49,060 440,607.86 0.45EURICADE SA2,640 176,906.40 0.18EURKLEPIERRE SA7,108 262,889.38 0.27EURMERCIALYS SA1,857 35,394.42 0.04EURUNIBAIL-RODAMCO SE3,087 689,018.40 0.71EURVINCI SA11,860 763,665.40 0.78EUR
CHEUNG KONG PROPERTY HOLDINGS LTD107,000 622,877.47 0.64HKDCayman Islands 2,330,615.31 2.39
CHINA RESOURCES LAND LTD10,000 21,350.83 0.02HKDHOPEWELL HIGHWAY INFRASTRUCTURE LTD3,384,500 1,686,387.01 1.73HKD
ATLANTIA SPA26,339 589,730.21 0.60EURItaly 1,213,610.23 1.24
BENI STABILI SPA SIIQ44,559 23,928.18 0.02EURINFRASTRUTTURE WIRELESS ITALIANE SPA111,110 485,550.70 0.50EURITALGAS SPA REG30,687 114,401.14 0.12EUR
FLUGHAFEN ZUERICH AG3,460 611,924.56 0.63CHFSwitzerland 912,502.91 0.94
PSP SWISS PROPERTY AG3,357 274,187.57 0.28CHFSWISS PRIME SITE AG REG SHS341 26,390.78 0.03CHF
Securities portfolio as at 31/12/16EURExpressed in
BG SICAV – Morgan Stanley Global Real Estate & Infrastructure Equities Fund
Quantity Denomination Quotationcurrency
% of netassetsMarket value
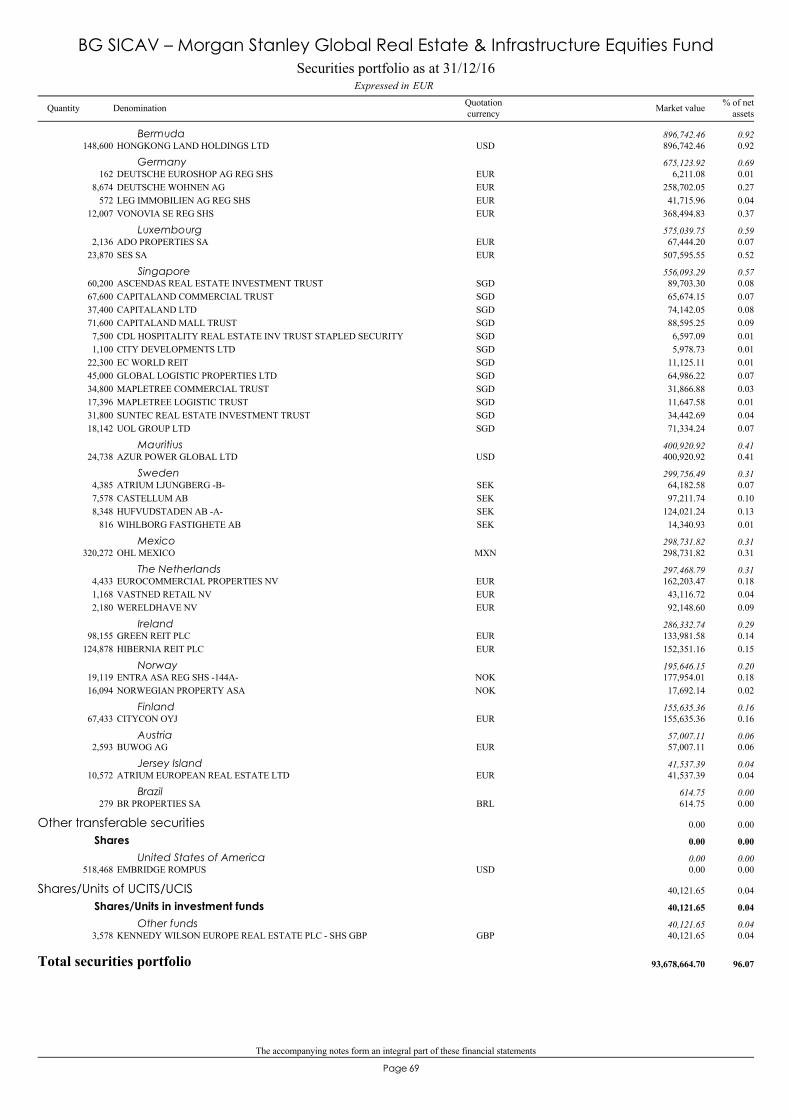
The accompanying notes form an integral part of these financial statements
69Page
HONGKONG LAND HOLDINGS LTD148,600 896,742.46 0.92USDBermuda 896,742.46 0.92
DEUTSCHE EUROSHOP AG REG SHS162 6,211.08 0.01EURGermany 675,123.92 0.69
DEUTSCHE WOHNEN AG8,674 258,702.05 0.27EURLEG IMMOBILIEN AG REG SHS572 41,715.96 0.04EURVONOVIA SE REG SHS12,007 368,494.83 0.37EUR
ADO PROPERTIES SA2,136 67,444.20 0.07EURLuxembourg 575,039.75 0.59
SES SA23,870 507,595.55 0.52EUR
ASCENDAS REAL ESTATE INVESTMENT TRUST60,200 89,703.30 0.08SGDSingapore 556,093.29 0.57
CAPITALAND COMMERCIAL TRUST67,600 65,674.15 0.07SGDCAPITALAND LTD37,400 74,142.05 0.08SGDCAPITALAND MALL TRUST71,600 88,595.25 0.09SGDCDL HOSPITALITY REAL ESTATE INV TRUST STAPLED SECURITY7,500 6,597.09 0.01SGDCITY DEVELOPMENTS LTD1,100 5,978.73 0.01SGDEC WORLD REIT22,300 11,125.11 0.01SGDGLOBAL LOGISTIC PROPERTIES LTD45,000 64,986.22 0.07SGDMAPLETREE COMMERCIAL TRUST34,800 31,866.88 0.03SGDMAPLETREE LOGISTIC TRUST17,396 11,647.58 0.01SGDSUNTEC REAL ESTATE INVESTMENT TRUST31,800 34,442.69 0.04SGDUOL GROUP LTD18,142 71,334.24 0.07SGD
AZUR POWER GLOBAL LTD24,738 400,920.92 0.41USDMauritius 400,920.92 0.41
ATRIUM LJUNGBERG -B-4,385 64,182.58 0.07SEKSweden 299,756.49 0.31
CASTELLUM AB7,578 97,211.74 0.10SEKHUFVUDSTADEN AB -A-8,348 124,021.24 0.13SEKWIHLBORG FASTIGHETE AB816 14,340.93 0.01SEK
OHL MEXICO320,272 298,731.82 0.31MXNMexico 298,731.82 0.31
EUROCOMMERCIAL PROPERTIES NV4,433 162,203.47 0.18EURThe Netherlands 297,468.79 0.31
VASTNED RETAIL NV1,168 43,116.72 0.04EURWERELDHAVE NV2,180 92,148.60 0.09EUR
GREEN REIT PLC98,155 133,981.58 0.14EURIreland 286,332.74 0.29
HIBERNIA REIT PLC124,878 152,351.16 0.15EUR
ENTRA ASA REG SHS -144A-19,119 177,954.01 0.18NOKNorway 195,646.15 0.20
NORWEGIAN PROPERTY ASA16,094 17,692.14 0.02NOK
CITYCON OYJ67,433 155,635.36 0.16EURFinland 155,635.36 0.16
BUWOG AG2,593 57,007.11 0.06EURAustria 57,007.11 0.06
ATRIUM EUROPEAN REAL ESTATE LTD10,572 41,537.39 0.04EURJersey Island 41,537.39 0.04
BR PROPERTIES SA279 614.75 0.00BRLBrazil 614.75 0.00
EMBRIDGE ROMPUS518,468 0.00 0.00USD
Other transferable securities 0.00 0.00
Shares 0.00 0.00
United States of America 0.00 0.00
KENNEDY WILSON EUROPE REAL ESTATE PLC - SHS GBP3,578 40,121.65 0.04GBP
Shares/Units of UCITS/UCIS 40,121.65 0.04
Shares/Units in investment funds 40,121.65 0.04
Other funds 40,121.65 0.04
Total securities portfolio 93,678,664.70 96.07
Securities portfolio as at 31/12/16EURExpressed in
BG SICAV – Morgan Stanley Global Real Estate & Infrastructure Equities Fund
Quantity Denomination Quotationcurrency
% of netassetsMarket value
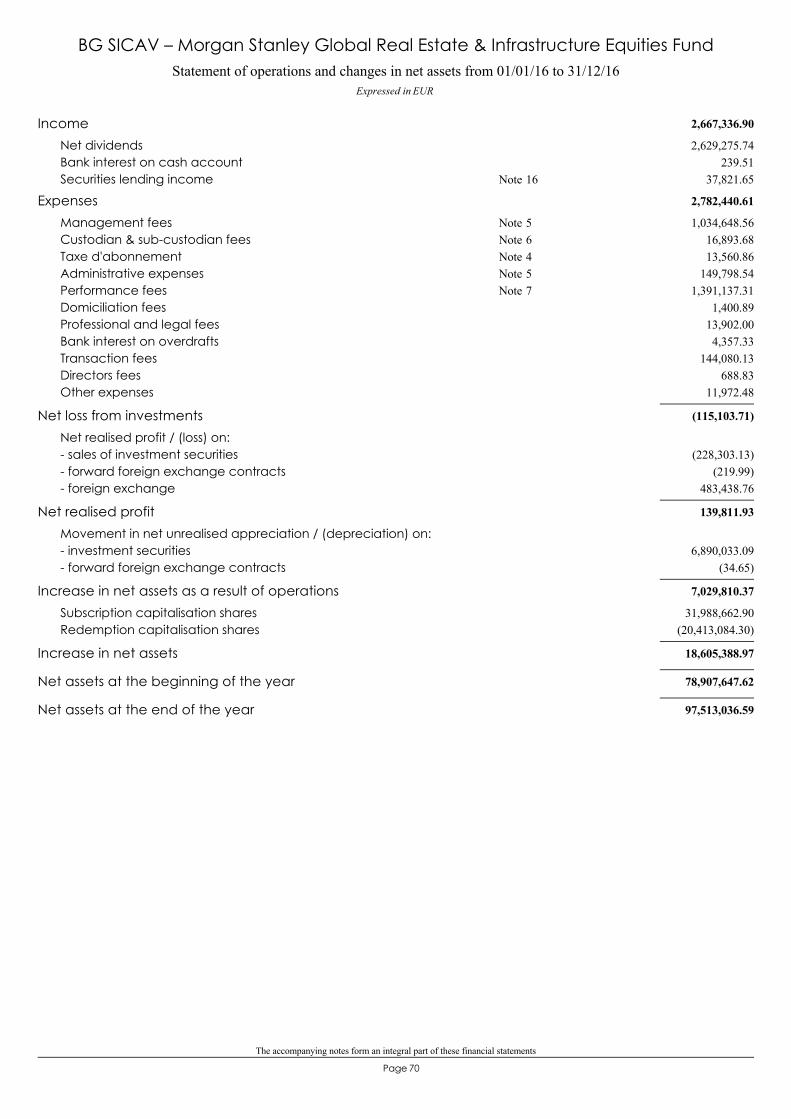
The accompanying notes form an integral part of these financial statements
70Page
Statement of operations and changes in net assets from 01/01/16 to 31/12/16Expressed in EUR
BG SICAV – Morgan Stanley Global Real Estate & Infrastructure Equities Fund
2,667,336.90Income2,629,275.74Net dividends
239.51Bank interest on cash account37,821.65Securities lending income 16Note
2,782,440.61Expenses1,034,648.56Management fees 5Note
16,893.68Custodian & sub-custodian fees 6Note13,560.86Taxe d'abonnement 4Note
149,798.54Administrative expenses 5Note1,391,137.31Performance fees 7Note
1,400.89Domiciliation fees13,902.00Professional and legal fees4,357.33Bank interest on overdrafts
144,080.13Transaction fees688.83Directors fees
11,972.48Other expenses
(115,103.71)Net loss from investmentsNet realised profit / (loss) on:
(228,303.13)- sales of investment securities(219.99)- forward foreign exchange contracts
483,438.76- foreign exchange
139,811.93Net realised profitMovement in net unrealised appreciation / (depreciation) on:
6,890,033.09- investment securities(34.65)- forward foreign exchange contracts
7,029,810.37Increase in net assets as a result of operations31,988,662.90Subscription capitalisation shares
(20,413,084.30)Redemption capitalisation shares
18,605,388.97Increase in net assets
78,907,647.62Net assets at the beginning of the year
97,513,036.59Net assets at the end of the year

71Page
BG SICAV– Controlfida Low-Volatility European Equities
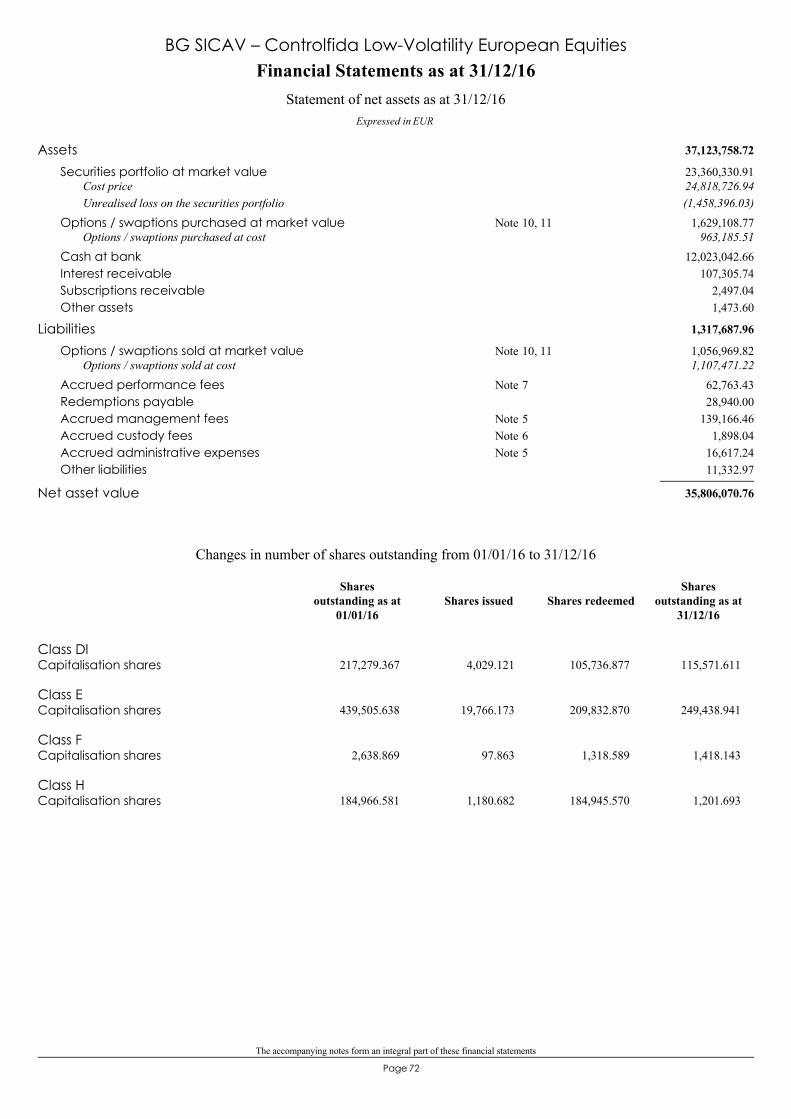
The accompanying notes form an integral part of these financial statements
72Page
37,123,758.72Assets23,360,330.91Securities portfolio at market value24,818,726.94Cost price(1,458,396.03)Unrealised loss on the securities portfolio
1,629,108.77Options / swaptions purchased at market value 10, 11Note963,185.51Options / swaptions purchased at cost
12,023,042.66Cash at bank107,305.74Interest receivable
2,497.04Subscriptions receivable1,473.60Other assets
1,317,687.96Liabilities1,056,969.82Options / swaptions sold at market value 10, 11Note1,107,471.22Options / swaptions sold at cost
62,763.43Accrued performance fees 7Note28,940.00Redemptions payable
139,166.46Accrued management fees 5Note1,898.04Accrued custody fees 6Note
16,617.24Accrued administrative expenses 5Note11,332.97Other liabilities
35,806,070.76Net asset value
Financial Statements as at 31/12/16
Expressed in EUR
Statement of net assets as at 31/12/16
BG SICAV – Controlfida Low-Volatility European Equities
Class DlCapitalisation shares 217,279.367 4,029.121 105,736.877 115,571.611
Class ECapitalisation shares 439,505.638 19,766.173 209,832.870 249,438.941
Class FCapitalisation shares 2,638.869 97.863 1,318.589 1,418.143
Class HCapitalisation shares 184,966.581 1,180.682 184,945.570 1,201.693
Changes in number of shares outstanding from 01/01/16 to 31/12/16
Shares issued Shares redeemedShares
outstanding as at31/12/16
Sharesoutstanding as at
01/01/16
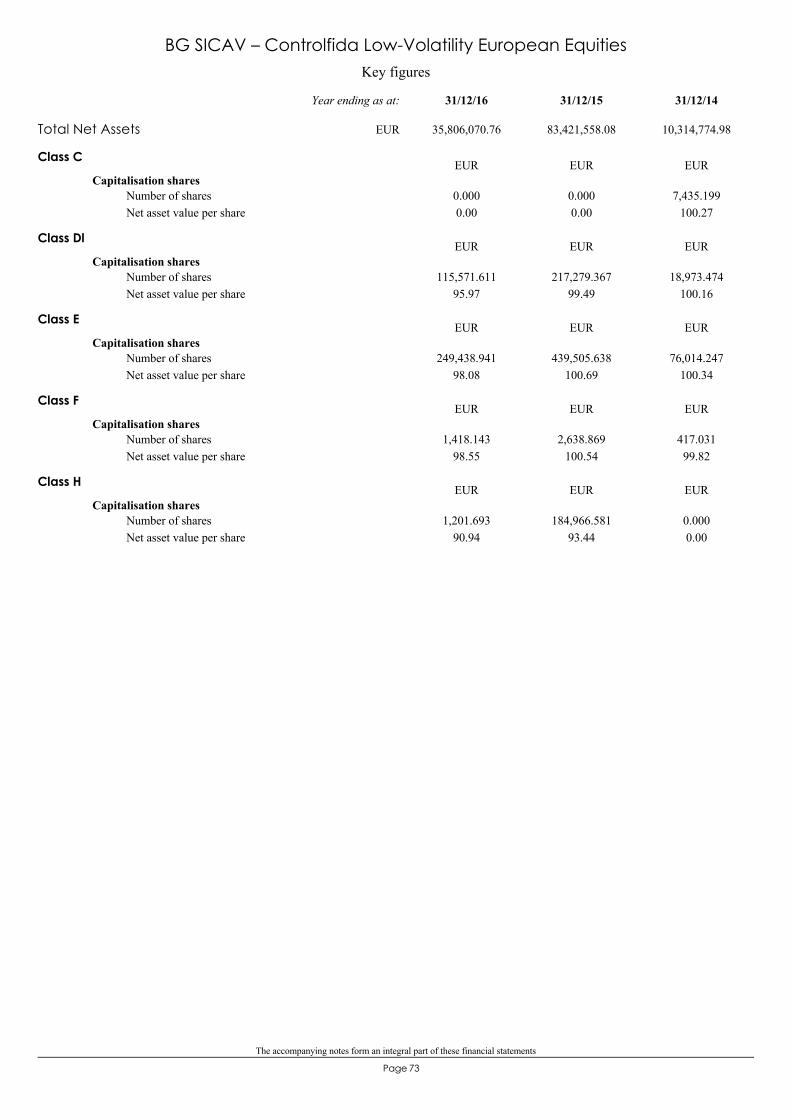
The accompanying notes form an integral part of these financial statements
73Page
Key figures
BG SICAV – Controlfida Low-Volatility European Equities
Class C
Capitalisation shares
0.000.000 0.000
0.007,435.199
100.27Number of sharesNet asset value per share
EUR EUR EUR
Class Dl
Capitalisation shares
95.97115,571.611 217,279.367
99.4918,973.474
100.16Number of sharesNet asset value per share
EUR EUR EUR
Class E
Capitalisation shares
98.08249,438.941 439,505.638
100.6976,014.247
100.34Number of sharesNet asset value per share
EUR EUR EUR
Class F
Capitalisation shares
98.551,418.143 2,638.869
100.54417.03199.82
Number of sharesNet asset value per share
EUR EUR EUR
Class H
Capitalisation shares
90.941,201.693 184,966.581
93.440.0000.00
Number of sharesNet asset value per share
EUR EUR EUR
Total Net Assets 35,806,070.76 83,421,558.08 10,314,774.98
31/12/1431/12/1531/12/16Year ending as at:
EUR
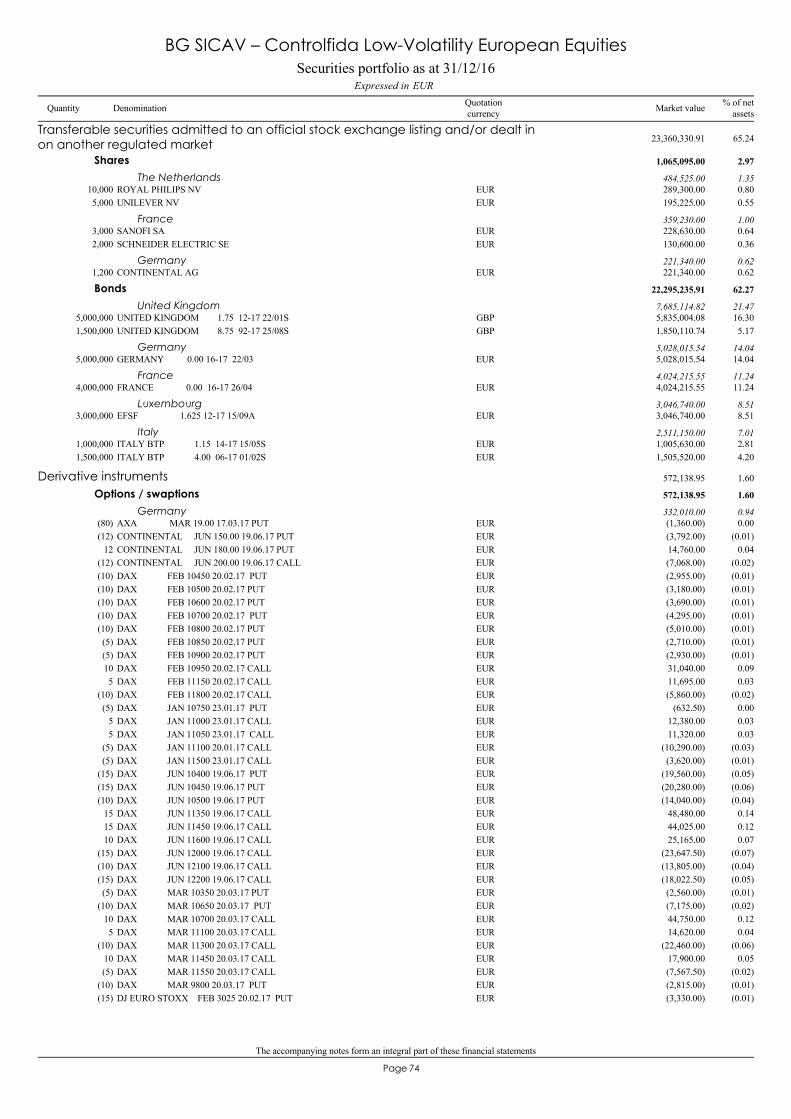
The accompanying notes form an integral part of these financial statements
74Page
ROYAL PHILIPS NV10,000 289,300.00 0.80EUR
Transferable securities admitted to an official stock exchange listing and/or dealt inon another regulated market 23,360,330.91 65.24
Shares 1,065,095.00 2.97
The Netherlands 484,525.00 1.35
UNILEVER NV5,000 195,225.00 0.55EUR
SANOFI SA3,000 228,630.00 0.64EURFrance 359,230.00 1.00
SCHNEIDER ELECTRIC SE2,000 130,600.00 0.36EUR
CONTINENTAL AG1,200 221,340.00 0.62EURGermany 221,340.00 0.62
UNITED KINGDOM 1.75 12-17 22/01S5,000,000 5,835,004.08 16.30GBP
Bonds 22,295,235.91 62.27
United Kingdom 7,685,114.82 21.47
UNITED KINGDOM 8.75 92-17 25/08S1,500,000 1,850,110.74 5.17GBP
GERMANY 0.00 16-17 22/035,000,000 5,028,015.54 14.04EURGermany 5,028,015.54 14.04
FRANCE 0.00 16-17 26/044,000,000 4,024,215.55 11.24EURFrance 4,024,215.55 11.24
EFSF 1.625 12-17 15/09A3,000,000 3,046,740.00 8.51EURLuxembourg 3,046,740.00 8.51
ITALY BTP 1.15 14-17 15/05S1,000,000 1,005,630.00 2.81EURItaly 2,511,150.00 7.01
ITALY BTP 4.00 06-17 01/02S1,500,000 1,505,520.00 4.20EUR
AXA MAR 19.00 17.03.17 PUT(80) (1,360.00) 0.00EUR
Derivative instruments 572,138.95 1.60
Options / swaptions 572,138.95 1.60
Germany 332,010.00 0.94
CONTINENTAL JUN 150.00 19.06.17 PUT(12) (3,792.00) (0.01)EURCONTINENTAL JUN 180.00 19.06.17 PUT12 14,760.00 0.04EURCONTINENTAL JUN 200.00 19.06.17 CALL(12) (7,068.00) (0.02)EURDAX FEB 10450 20.02.17 PUT(10) (2,955.00) (0.01)EURDAX FEB 10500 20.02.17 PUT(10) (3,180.00) (0.01)EURDAX FEB 10600 20.02.17 PUT(10) (3,690.00) (0.01)EURDAX FEB 10700 20.02.17 PUT(10) (4,295.00) (0.01)EURDAX FEB 10800 20.02.17 PUT(10) (5,010.00) (0.01)EURDAX FEB 10850 20.02.17 PUT(5) (2,710.00) (0.01)EURDAX FEB 10900 20.02.17 PUT(5) (2,930.00) (0.01)EURDAX FEB 10950 20.02.17 CALL10 31,040.00 0.09EURDAX FEB 11150 20.02.17 CALL5 11,695.00 0.03EURDAX FEB 11800 20.02.17 CALL(10) (5,860.00) (0.02)EURDAX JAN 10750 23.01.17 PUT(5) (632.50) 0.00EURDAX JAN 11000 23.01.17 CALL5 12,380.00 0.03EURDAX JAN 11050 23.01.17 CALL5 11,320.00 0.03EURDAX JAN 11100 20.01.17 CALL(5) (10,290.00) (0.03)EURDAX JAN 11500 23.01.17 CALL(5) (3,620.00) (0.01)EURDAX JUN 10400 19.06.17 PUT(15) (19,560.00) (0.05)EURDAX JUN 10450 19.06.17 PUT(15) (20,280.00) (0.06)EURDAX JUN 10500 19.06.17 PUT(10) (14,040.00) (0.04)EURDAX JUN 11350 19.06.17 CALL15 48,480.00 0.14EURDAX JUN 11450 19.06.17 CALL15 44,025.00 0.12EURDAX JUN 11600 19.06.17 CALL10 25,165.00 0.07EURDAX JUN 12000 19.06.17 CALL(15) (23,647.50) (0.07)EURDAX JUN 12100 19.06.17 CALL(10) (13,805.00) (0.04)EURDAX JUN 12200 19.06.17 CALL(15) (18,022.50) (0.05)EURDAX MAR 10350 20.03.17 PUT(5) (2,560.00) (0.01)EURDAX MAR 10650 20.03.17 PUT(10) (7,175.00) (0.02)EURDAX MAR 10700 20.03.17 CALL10 44,750.00 0.12EURDAX MAR 11100 20.03.17 CALL5 14,620.00 0.04EURDAX MAR 11300 20.03.17 CALL(10) (22,460.00) (0.06)EURDAX MAR 11450 20.03.17 CALL10 17,900.00 0.05EURDAX MAR 11550 20.03.17 CALL(5) (7,567.50) (0.02)EURDAX MAR 9800 20.03.17 PUT(10) (2,815.00) (0.01)EURDJ EURO STOXX FEB 3025 20.02.17 PUT(15) (3,330.00) (0.01)EUR
Securities portfolio as at 31/12/16EURExpressed in
BG SICAV – Controlfida Low-Volatility European Equities
Quantity Denomination Quotationcurrency
% of netassetsMarket value
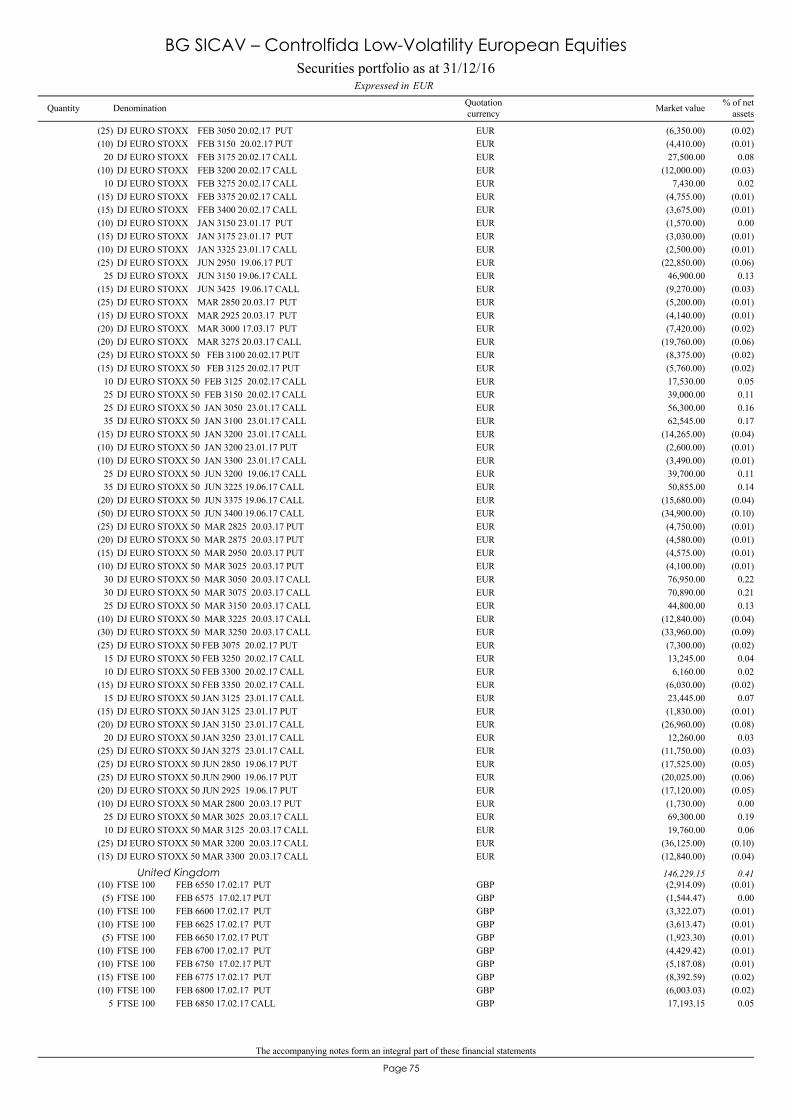
The accompanying notes form an integral part of these financial statements
75Page
DJ EURO STOXX FEB 3050 20.02.17 PUT(25) (6,350.00) (0.02)EURDJ EURO STOXX FEB 3150 20.02.17 PUT(10) (4,410.00) (0.01)EURDJ EURO STOXX FEB 3175 20.02.17 CALL20 27,500.00 0.08EURDJ EURO STOXX FEB 3200 20.02.17 CALL(10) (12,000.00) (0.03)EURDJ EURO STOXX FEB 3275 20.02.17 CALL10 7,430.00 0.02EURDJ EURO STOXX FEB 3375 20.02.17 CALL(15) (4,755.00) (0.01)EURDJ EURO STOXX FEB 3400 20.02.17 CALL(15) (3,675.00) (0.01)EURDJ EURO STOXX JAN 3150 23.01.17 PUT(10) (1,570.00) 0.00EURDJ EURO STOXX JAN 3175 23.01.17 PUT(15) (3,030.00) (0.01)EURDJ EURO STOXX JAN 3325 23.01.17 CALL(10) (2,500.00) (0.01)EURDJ EURO STOXX JUN 2950 19.06.17 PUT(25) (22,850.00) (0.06)EURDJ EURO STOXX JUN 3150 19.06.17 CALL25 46,900.00 0.13EURDJ EURO STOXX JUN 3425 19.06.17 CALL(15) (9,270.00) (0.03)EURDJ EURO STOXX MAR 2850 20.03.17 PUT(25) (5,200.00) (0.01)EURDJ EURO STOXX MAR 2925 20.03.17 PUT(15) (4,140.00) (0.01)EURDJ EURO STOXX MAR 3000 17.03.17 PUT(20) (7,420.00) (0.02)EURDJ EURO STOXX MAR 3275 20.03.17 CALL(20) (19,760.00) (0.06)EURDJ EURO STOXX 50 FEB 3100 20.02.17 PUT(25) (8,375.00) (0.02)EURDJ EURO STOXX 50 FEB 3125 20.02.17 PUT(15) (5,760.00) (0.02)EURDJ EURO STOXX 50 FEB 3125 20.02.17 CALL10 17,530.00 0.05EURDJ EURO STOXX 50 FEB 3150 20.02.17 CALL25 39,000.00 0.11EURDJ EURO STOXX 50 JAN 3050 23.01.17 CALL25 56,300.00 0.16EURDJ EURO STOXX 50 JAN 3100 23.01.17 CALL35 62,545.00 0.17EURDJ EURO STOXX 50 JAN 3200 23.01.17 CALL(15) (14,265.00) (0.04)EURDJ EURO STOXX 50 JAN 3200 23.01.17 PUT(10) (2,600.00) (0.01)EURDJ EURO STOXX 50 JAN 3300 23.01.17 CALL(10) (3,490.00) (0.01)EURDJ EURO STOXX 50 JUN 3200 19.06.17 CALL25 39,700.00 0.11EURDJ EURO STOXX 50 JUN 3225 19.06.17 CALL35 50,855.00 0.14EURDJ EURO STOXX 50 JUN 3375 19.06.17 CALL(20) (15,680.00) (0.04)EURDJ EURO STOXX 50 JUN 3400 19.06.17 CALL(50) (34,900.00) (0.10)EURDJ EURO STOXX 50 MAR 2825 20.03.17 PUT(25) (4,750.00) (0.01)EURDJ EURO STOXX 50 MAR 2875 20.03.17 PUT(20) (4,580.00) (0.01)EURDJ EURO STOXX 50 MAR 2950 20.03.17 PUT(15) (4,575.00) (0.01)EURDJ EURO STOXX 50 MAR 3025 20.03.17 PUT(10) (4,100.00) (0.01)EURDJ EURO STOXX 50 MAR 3050 20.03.17 CALL30 76,950.00 0.22EURDJ EURO STOXX 50 MAR 3075 20.03.17 CALL30 70,890.00 0.21EURDJ EURO STOXX 50 MAR 3150 20.03.17 CALL25 44,800.00 0.13EURDJ EURO STOXX 50 MAR 3225 20.03.17 CALL(10) (12,840.00) (0.04)EURDJ EURO STOXX 50 MAR 3250 20.03.17 CALL(30) (33,960.00) (0.09)EURDJ EURO STOXX 50 FEB 3075 20.02.17 PUT(25) (7,300.00) (0.02)EURDJ EURO STOXX 50 FEB 3250 20.02.17 CALL15 13,245.00 0.04EURDJ EURO STOXX 50 FEB 3300 20.02.17 CALL10 6,160.00 0.02EURDJ EURO STOXX 50 FEB 3350 20.02.17 CALL(15) (6,030.00) (0.02)EURDJ EURO STOXX 50 JAN 3125 23.01.17 CALL15 23,445.00 0.07EURDJ EURO STOXX 50 JAN 3125 23.01.17 PUT(15) (1,830.00) (0.01)EURDJ EURO STOXX 50 JAN 3150 23.01.17 CALL(20) (26,960.00) (0.08)EURDJ EURO STOXX 50 JAN 3250 23.01.17 CALL20 12,260.00 0.03EURDJ EURO STOXX 50 JAN 3275 23.01.17 CALL(25) (11,750.00) (0.03)EURDJ EURO STOXX 50 JUN 2850 19.06.17 PUT(25) (17,525.00) (0.05)EURDJ EURO STOXX 50 JUN 2900 19.06.17 PUT(25) (20,025.00) (0.06)EURDJ EURO STOXX 50 JUN 2925 19.06.17 PUT(20) (17,120.00) (0.05)EURDJ EURO STOXX 50 MAR 2800 20.03.17 PUT(10) (1,730.00) 0.00EURDJ EURO STOXX 50 MAR 3025 20.03.17 CALL25 69,300.00 0.19EURDJ EURO STOXX 50 MAR 3125 20.03.17 CALL10 19,760.00 0.06EURDJ EURO STOXX 50 MAR 3200 20.03.17 CALL(25) (36,125.00) (0.10)EURDJ EURO STOXX 50 MAR 3300 20.03.17 CALL(15) (12,840.00) (0.04)EUR
FTSE 100 FEB 6550 17.02.17 PUT(10) (2,914.09) (0.01)GBPUnited Kingdom 146,229.15 0.41
FTSE 100 FEB 6575 17.02.17 PUT(5) (1,544.47) 0.00GBPFTSE 100 FEB 6600 17.02.17 PUT(10) (3,322.07) (0.01)GBPFTSE 100 FEB 6625 17.02.17 PUT(10) (3,613.47) (0.01)GBPFTSE 100 FEB 6650 17.02.17 PUT(5) (1,923.30) (0.01)GBPFTSE 100 FEB 6700 17.02.17 PUT(10) (4,429.42) (0.01)GBPFTSE 100 FEB 6750 17.02.17 PUT(10) (5,187.08) (0.01)GBPFTSE 100 FEB 6775 17.02.17 PUT(15) (8,392.59) (0.02)GBPFTSE 100 FEB 6800 17.02.17 PUT(10) (6,003.03) (0.02)GBPFTSE 100 FEB 6850 17.02.17 CALL5 17,193.15 0.05GBP
Securities portfolio as at 31/12/16EURExpressed in
BG SICAV – Controlfida Low-Volatility European Equities
Quantity Denomination Quotationcurrency
% of netassetsMarket value
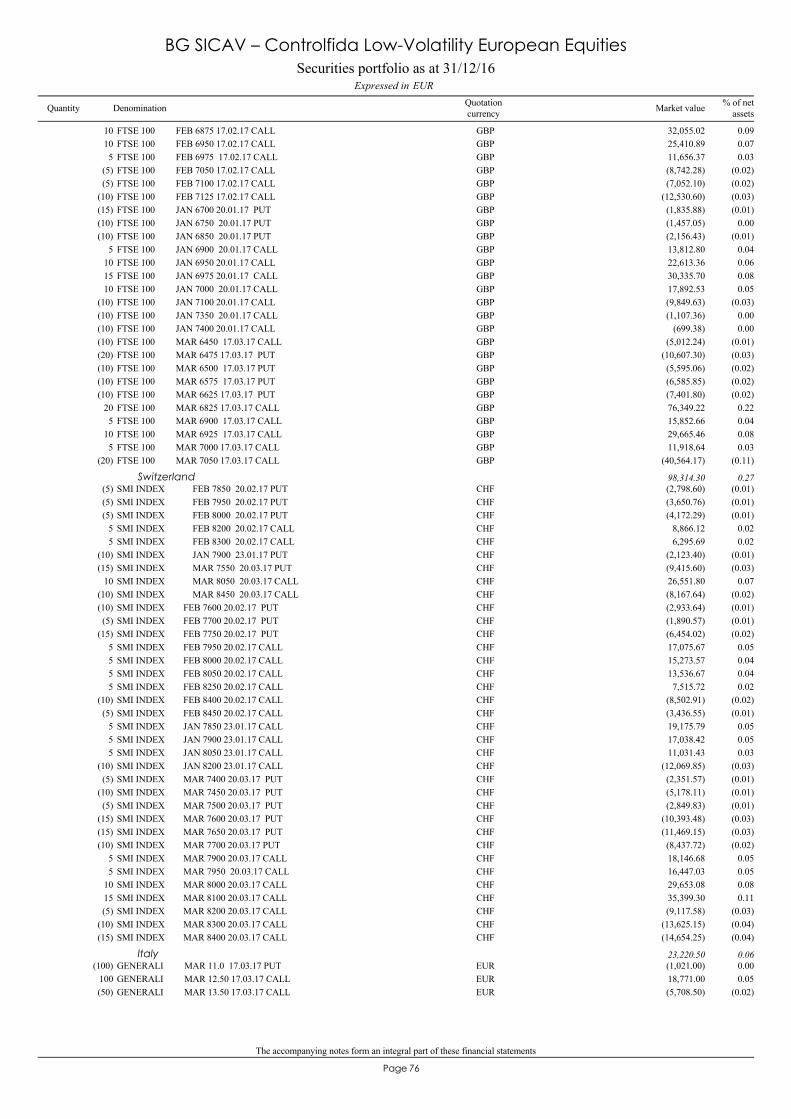
The accompanying notes form an integral part of these financial statements
76Page
FTSE 100 FEB 6875 17.02.17 CALL10 32,055.02 0.09GBPFTSE 100 FEB 6950 17.02.17 CALL10 25,410.89 0.07GBPFTSE 100 FEB 6975 17.02.17 CALL5 11,656.37 0.03GBPFTSE 100 FEB 7050 17.02.17 CALL(5) (8,742.28) (0.02)GBPFTSE 100 FEB 7100 17.02.17 CALL(5) (7,052.10) (0.02)GBPFTSE 100 FEB 7125 17.02.17 CALL(10) (12,530.60) (0.03)GBPFTSE 100 JAN 6700 20.01.17 PUT(15) (1,835.88) (0.01)GBPFTSE 100 JAN 6750 20.01.17 PUT(10) (1,457.05) 0.00GBPFTSE 100 JAN 6850 20.01.17 PUT(10) (2,156.43) (0.01)GBPFTSE 100 JAN 6900 20.01.17 CALL5 13,812.80 0.04GBPFTSE 100 JAN 6950 20.01.17 CALL10 22,613.36 0.06GBPFTSE 100 JAN 6975 20.01.17 CALL15 30,335.70 0.08GBPFTSE 100 JAN 7000 20.01.17 CALL10 17,892.53 0.05GBPFTSE 100 JAN 7100 20.01.17 CALL(10) (9,849.63) (0.03)GBPFTSE 100 JAN 7350 20.01.17 CALL(10) (1,107.36) 0.00GBPFTSE 100 JAN 7400 20.01.17 CALL(10) (699.38) 0.00GBPFTSE 100 MAR 6450 17.03.17 CALL(10) (5,012.24) (0.01)GBPFTSE 100 MAR 6475 17.03.17 PUT(20) (10,607.30) (0.03)GBPFTSE 100 MAR 6500 17.03.17 PUT(10) (5,595.06) (0.02)GBPFTSE 100 MAR 6575 17.03.17 PUT(10) (6,585.85) (0.02)GBPFTSE 100 MAR 6625 17.03.17 PUT(10) (7,401.80) (0.02)GBPFTSE 100 MAR 6825 17.03.17 CALL20 76,349.22 0.22GBPFTSE 100 MAR 6900 17.03.17 CALL5 15,852.66 0.04GBPFTSE 100 MAR 6925 17.03.17 CALL10 29,665.46 0.08GBPFTSE 100 MAR 7000 17.03.17 CALL5 11,918.64 0.03GBPFTSE 100 MAR 7050 17.03.17 CALL(20) (40,564.17) (0.11)GBP
SMI INDEX FEB 7850 20.02.17 PUT(5) (2,798.60) (0.01)CHFSwitzerland 98,314.30 0.27
SMI INDEX FEB 7950 20.02.17 PUT(5) (3,650.76) (0.01)CHFSMI INDEX FEB 8000 20.02.17 PUT(5) (4,172.29) (0.01)CHFSMI INDEX FEB 8200 20.02.17 CALL5 8,866.12 0.02CHFSMI INDEX FEB 8300 20.02.17 CALL5 6,295.69 0.02CHFSMI INDEX JAN 7900 23.01.17 PUT(10) (2,123.40) (0.01)CHFSMI INDEX MAR 7550 20.03.17 PUT(15) (9,415.60) (0.03)CHFSMI INDEX MAR 8050 20.03.17 CALL10 26,551.80 0.07CHFSMI INDEX MAR 8450 20.03.17 CALL(10) (8,167.64) (0.02)CHFSMI INDEX FEB 7600 20.02.17 PUT(10) (2,933.64) (0.01)CHFSMI INDEX FEB 7700 20.02.17 PUT(5) (1,890.57) (0.01)CHFSMI INDEX FEB 7750 20.02.17 PUT(15) (6,454.02) (0.02)CHFSMI INDEX FEB 7950 20.02.17 CALL5 17,075.67 0.05CHFSMI INDEX FEB 8000 20.02.17 CALL5 15,273.57 0.04CHFSMI INDEX FEB 8050 20.02.17 CALL5 13,536.67 0.04CHFSMI INDEX FEB 8250 20.02.17 CALL5 7,515.72 0.02CHFSMI INDEX FEB 8400 20.02.17 CALL(10) (8,502.91) (0.02)CHFSMI INDEX FEB 8450 20.02.17 CALL(5) (3,436.55) (0.01)CHFSMI INDEX JAN 7850 23.01.17 CALL5 19,175.79 0.05CHFSMI INDEX JAN 7900 23.01.17 CALL5 17,038.42 0.05CHFSMI INDEX JAN 8050 23.01.17 CALL5 11,031.43 0.03CHFSMI INDEX JAN 8200 23.01.17 CALL(10) (12,069.85) (0.03)CHFSMI INDEX MAR 7400 20.03.17 PUT(5) (2,351.57) (0.01)CHFSMI INDEX MAR 7450 20.03.17 PUT(10) (5,178.11) (0.01)CHFSMI INDEX MAR 7500 20.03.17 PUT(5) (2,849.83) (0.01)CHFSMI INDEX MAR 7600 20.03.17 PUT(15) (10,393.48) (0.03)CHFSMI INDEX MAR 7650 20.03.17 PUT(15) (11,469.15) (0.03)CHFSMI INDEX MAR 7700 20.03.17 PUT(10) (8,437.72) (0.02)CHFSMI INDEX MAR 7900 20.03.17 CALL5 18,146.68 0.05CHFSMI INDEX MAR 7950 20.03.17 CALL5 16,447.03 0.05CHFSMI INDEX MAR 8000 20.03.17 CALL10 29,653.08 0.08CHFSMI INDEX MAR 8100 20.03.17 CALL15 35,399.30 0.11CHFSMI INDEX MAR 8200 20.03.17 CALL(5) (9,117.58) (0.03)CHFSMI INDEX MAR 8300 20.03.17 CALL(10) (13,625.15) (0.04)CHFSMI INDEX MAR 8400 20.03.17 CALL(15) (14,654.25) (0.04)CHF
GENERALI MAR 11.0 17.03.17 PUT(100) (1,021.00) 0.00EURItaly 23,220.50 0.06
GENERALI MAR 12.50 17.03.17 CALL100 18,771.00 0.05EURGENERALI MAR 13.50 17.03.17 CALL(50) (5,708.50) (0.02)EUR
Securities portfolio as at 31/12/16EURExpressed in
BG SICAV – Controlfida Low-Volatility European Equities
Quantity Denomination Quotationcurrency
% of netassetsMarket value
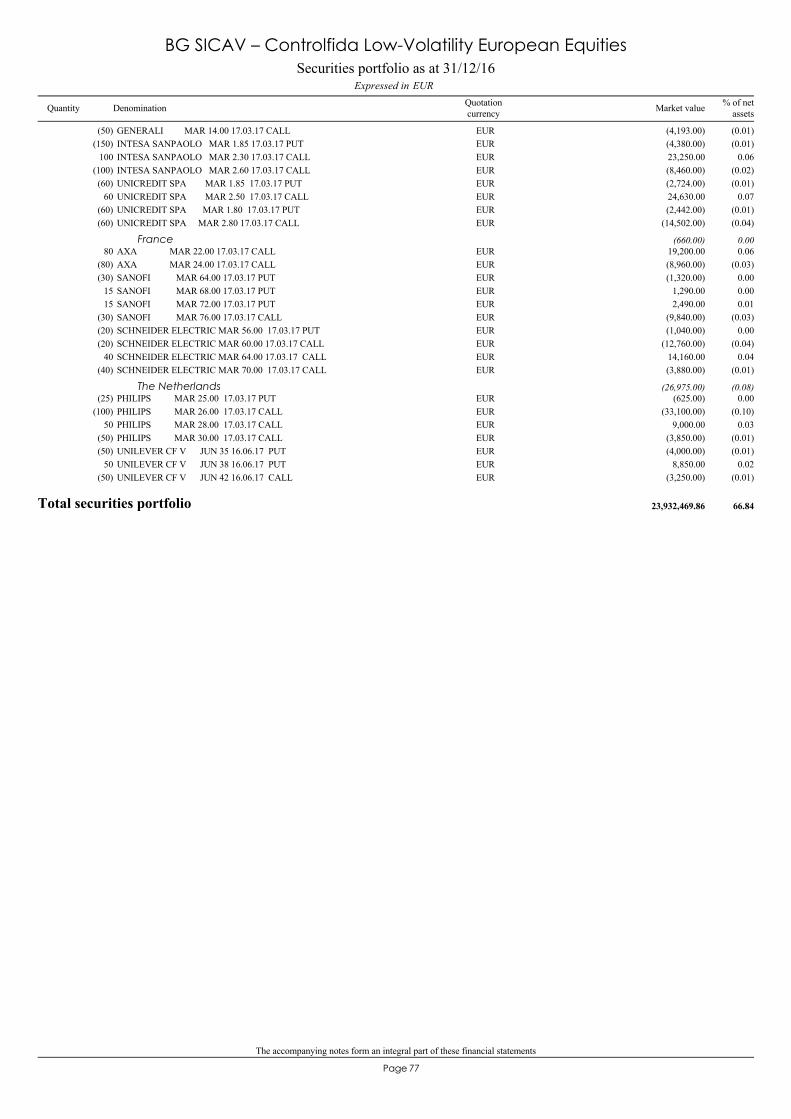
The accompanying notes form an integral part of these financial statements
77Page
GENERALI MAR 14.00 17.03.17 CALL(50) (4,193.00) (0.01)EURINTESA SANPAOLO MAR 1.85 17.03.17 PUT(150) (4,380.00) (0.01)EURINTESA SANPAOLO MAR 2.30 17.03.17 CALL100 23,250.00 0.06EURINTESA SANPAOLO MAR 2.60 17.03.17 CALL(100) (8,460.00) (0.02)EURUNICREDIT SPA MAR 1.85 17.03.17 PUT(60) (2,724.00) (0.01)EURUNICREDIT SPA MAR 2.50 17.03.17 CALL60 24,630.00 0.07EURUNICREDIT SPA MAR 1.80 17.03.17 PUT(60) (2,442.00) (0.01)EURUNICREDIT SPA MAR 2.80 17.03.17 CALL(60) (14,502.00) (0.04)EUR
AXA MAR 22.00 17.03.17 CALL80 19,200.00 0.06EURFrance (660.00) 0.00
AXA MAR 24.00 17.03.17 CALL(80) (8,960.00) (0.03)EURSANOFI MAR 64.00 17.03.17 PUT(30) (1,320.00) 0.00EURSANOFI MAR 68.00 17.03.17 PUT15 1,290.00 0.00EURSANOFI MAR 72.00 17.03.17 PUT15 2,490.00 0.01EURSANOFI MAR 76.00 17.03.17 CALL(30) (9,840.00) (0.03)EURSCHNEIDER ELECTRIC MAR 56.00 17.03.17 PUT(20) (1,040.00) 0.00EURSCHNEIDER ELECTRIC MAR 60.00 17.03.17 CALL(20) (12,760.00) (0.04)EURSCHNEIDER ELECTRIC MAR 64.00 17.03.17 CALL40 14,160.00 0.04EURSCHNEIDER ELECTRIC MAR 70.00 17.03.17 CALL(40) (3,880.00) (0.01)EUR
PHILIPS MAR 25.00 17.03.17 PUT(25) (625.00) 0.00EURThe Netherlands (26,975.00) (0.08)
PHILIPS MAR 26.00 17.03.17 CALL(100) (33,100.00) (0.10)EURPHILIPS MAR 28.00 17.03.17 CALL50 9,000.00 0.03EURPHILIPS MAR 30.00 17.03.17 CALL(50) (3,850.00) (0.01)EURUNILEVER CF V JUN 35 16.06.17 PUT(50) (4,000.00) (0.01)EURUNILEVER CF V JUN 38 16.06.17 PUT50 8,850.00 0.02EURUNILEVER CF V JUN 42 16.06.17 CALL(50) (3,250.00) (0.01)EUR
Total securities portfolio 23,932,469.86 66.84
Securities portfolio as at 31/12/16EURExpressed in
BG SICAV – Controlfida Low-Volatility European Equities
Quantity Denomination Quotationcurrency
% of netassetsMarket value
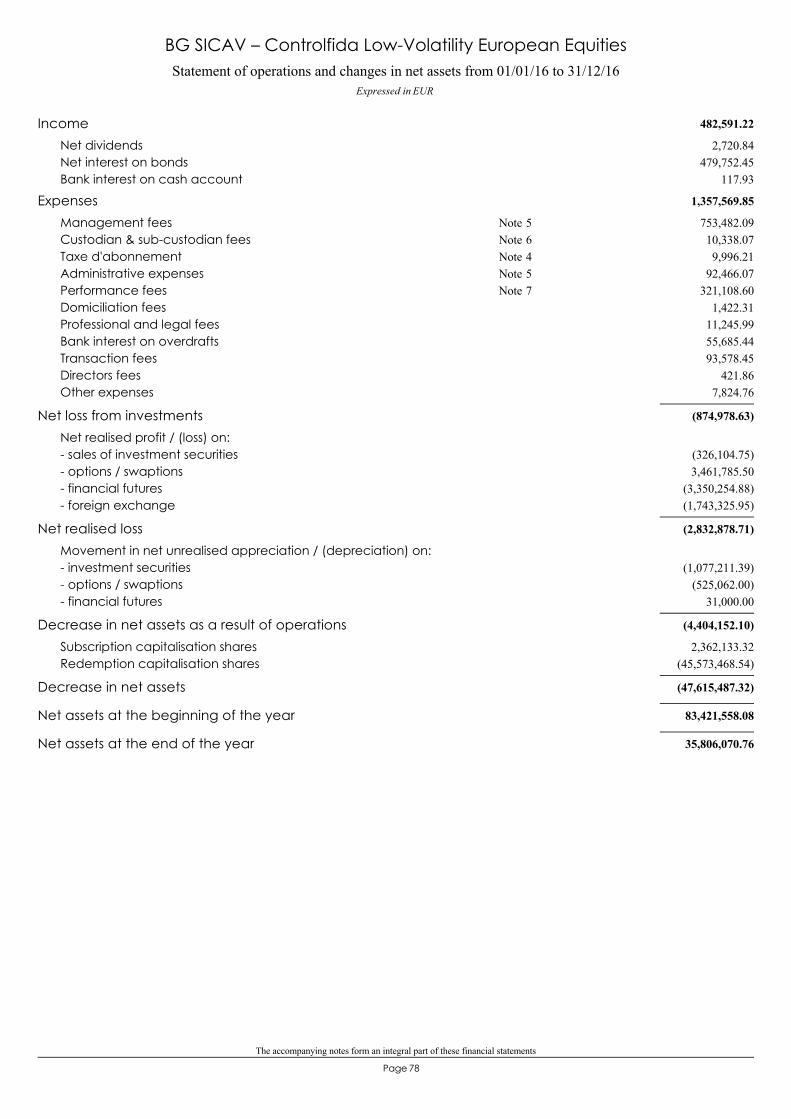
The accompanying notes form an integral part of these financial statements
78Page
Statement of operations and changes in net assets from 01/01/16 to 31/12/16Expressed in EUR
BG SICAV – Controlfida Low-Volatility European Equities
482,591.22Income2,720.84Net dividends
479,752.45Net interest on bonds117.93Bank interest on cash account
1,357,569.85Expenses753,482.09Management fees 5Note10,338.07Custodian & sub-custodian fees 6Note9,996.21Taxe d'abonnement 4Note
92,466.07Administrative expenses 5Note321,108.60Performance fees 7Note
1,422.31Domiciliation fees11,245.99Professional and legal fees55,685.44Bank interest on overdrafts93,578.45Transaction fees
421.86Directors fees7,824.76Other expenses
(874,978.63)Net loss from investmentsNet realised profit / (loss) on:
(326,104.75)- sales of investment securities3,461,785.50- options / swaptions
(3,350,254.88)- financial futures(1,743,325.95)- foreign exchange
(2,832,878.71)Net realised lossMovement in net unrealised appreciation / (depreciation) on:
(1,077,211.39)- investment securities(525,062.00)- options / swaptions
31,000.00- financial futures
(4,404,152.10)Decrease in net assets as a result of operations2,362,133.32Subscription capitalisation shares
(45,573,468.54)Redemption capitalisation shares
(47,615,487.32)Decrease in net assets
83,421,558.08Net assets at the beginning of the year
35,806,070.76Net assets at the end of the year
79Page
BG SICAV– Generali Investments Europe - Equity Recovery Fund
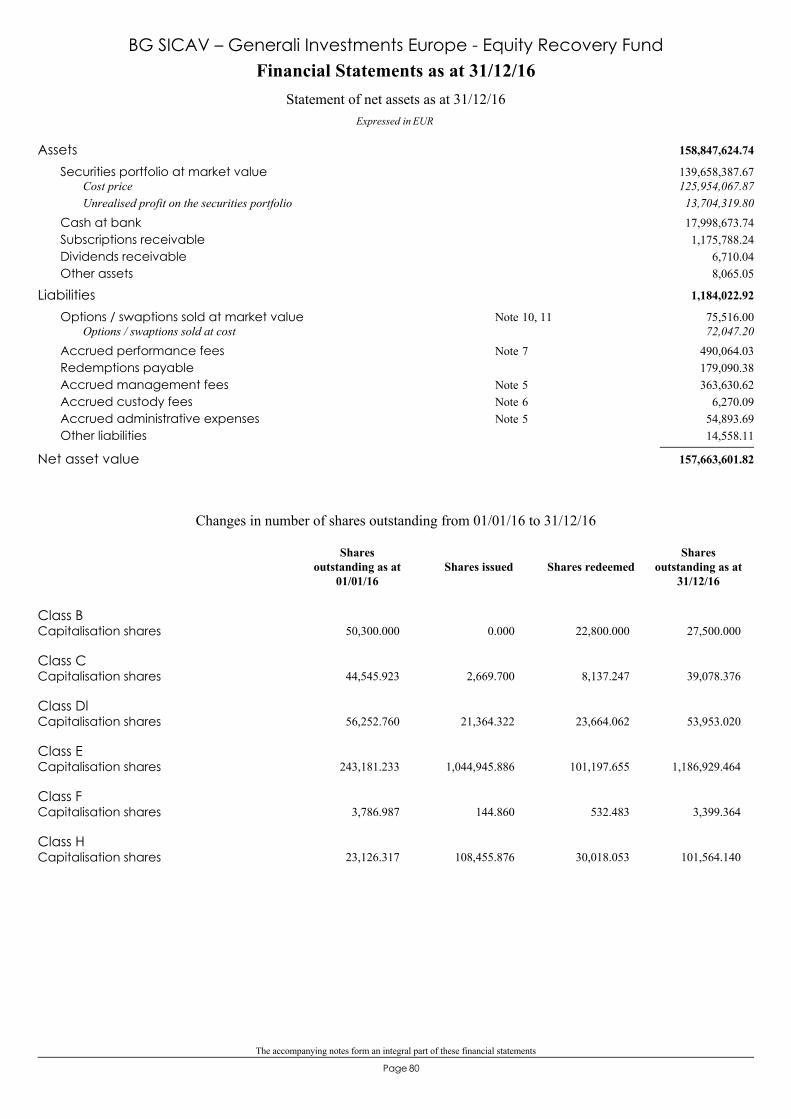
The accompanying notes form an integral part of these financial statements
80Page
158,847,624.74Assets139,658,387.67Securities portfolio at market value125,954,067.87Cost price13,704,319.80Unrealised profit on the securities portfolio17,998,673.74Cash at bank1,175,788.24Subscriptions receivable
6,710.04Dividends receivable8,065.05Other assets
1,184,022.92Liabilities75,516.00Options / swaptions sold at market value 10, 11Note72,047.20Options / swaptions sold at cost
490,064.03Accrued performance fees 7Note179,090.38Redemptions payable363,630.62Accrued management fees 5Note
6,270.09Accrued custody fees 6Note54,893.69Accrued administrative expenses 5Note14,558.11Other liabilities
157,663,601.82Net asset value
Financial Statements as at 31/12/16
Expressed in EUR
Statement of net assets as at 31/12/16
BG SICAV – Generali Investments Europe - Equity Recovery Fund
Class BCapitalisation shares 50,300.000 0.000 22,800.000 27,500.000
Class CCapitalisation shares 44,545.923 2,669.700 8,137.247 39,078.376
Class DlCapitalisation shares 56,252.760 21,364.322 23,664.062 53,953.020
Class ECapitalisation shares 243,181.233 1,044,945.886 101,197.655 1,186,929.464
Class FCapitalisation shares 3,786.987 144.860 532.483 3,399.364
Class HCapitalisation shares 23,126.317 108,455.876 30,018.053 101,564.140
Changes in number of shares outstanding from 01/01/16 to 31/12/16
Shares issued Shares redeemedShares
outstanding as at31/12/16
Sharesoutstanding as at
01/01/16
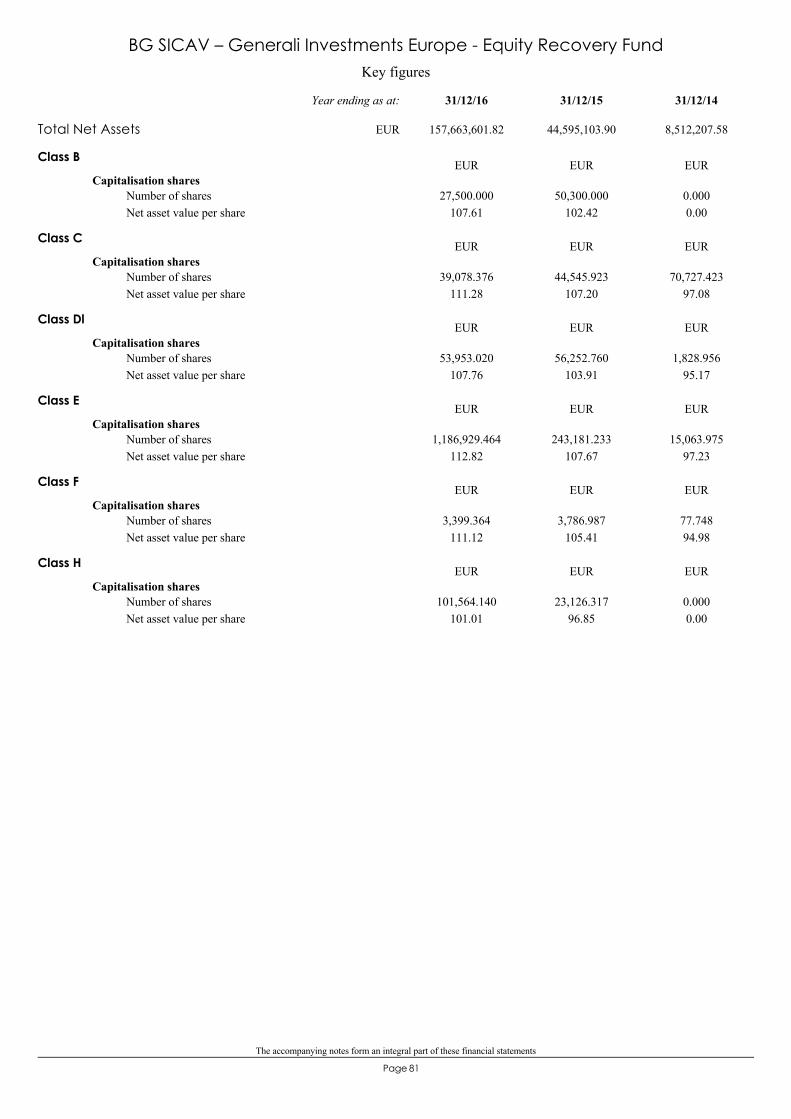
The accompanying notes form an integral part of these financial statements
81Page
Key figures
BG SICAV – Generali Investments Europe - Equity Recovery Fund
Class B
Capitalisation shares
107.6127,500.000 50,300.000
102.420.0000.00
Number of sharesNet asset value per share
EUR EUR EUR
Class C
Capitalisation shares
111.2839,078.376 44,545.923
107.2070,727.423
97.08Number of sharesNet asset value per share
EUR EUR EUR
Class Dl
Capitalisation shares
107.7653,953.020 56,252.760
103.911,828.956
95.17Number of sharesNet asset value per share
EUR EUR EUR
Class E
Capitalisation shares
112.821,186,929.464 243,181.233
107.6715,063.975
97.23Number of sharesNet asset value per share
EUR EUR EUR
Class F
Capitalisation shares
111.123,399.364 3,786.987
105.4177.74894.98
Number of sharesNet asset value per share
EUR EUR EUR
Class H
Capitalisation shares
101.01101,564.140 23,126.317
96.850.0000.00
Number of sharesNet asset value per share
EUR EUR EUR
Total Net Assets 157,663,601.82 44,595,103.90 8,512,207.58
31/12/1431/12/1531/12/16Year ending as at:
EUR
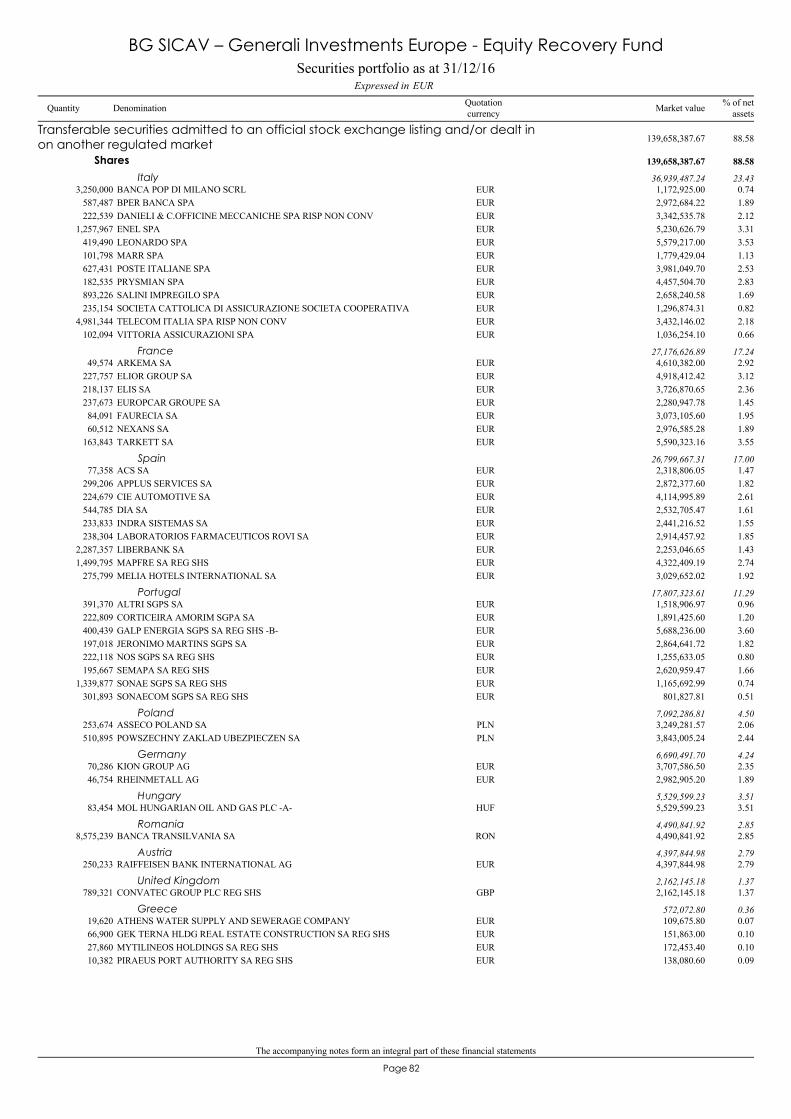
The accompanying notes form an integral part of these financial statements
82Page
BANCA POP DI MILANO SCRL3,250,000 1,172,925.00 0.74EUR
Transferable securities admitted to an official stock exchange listing and/or dealt inon another regulated market 139,658,387.67 88.58
Shares 139,658,387.67 88.58
Italy 36,939,487.24 23.43
BPER BANCA SPA587,487 2,972,684.22 1.89EURDANIELI & C.OFFICINE MECCANICHE SPA RISP NON CONV222,539 3,342,535.78 2.12EURENEL SPA1,257,967 5,230,626.79 3.31EURLEONARDO SPA419,490 5,579,217.00 3.53EURMARR SPA101,798 1,779,429.04 1.13EURPOSTE ITALIANE SPA627,431 3,981,049.70 2.53EURPRYSMIAN SPA182,535 4,457,504.70 2.83EURSALINI IMPREGILO SPA893,226 2,658,240.58 1.69EURSOCIETA CATTOLICA DI ASSICURAZIONE SOCIETA COOPERATIVA235,154 1,296,874.31 0.82EURTELECOM ITALIA SPA RISP NON CONV4,981,344 3,432,146.02 2.18EURVITTORIA ASSICURAZIONI SPA102,094 1,036,254.10 0.66EUR
ARKEMA SA49,574 4,610,382.00 2.92EURFrance 27,176,626.89 17.24
ELIOR GROUP SA227,757 4,918,412.42 3.12EURELIS SA218,137 3,726,870.65 2.36EUREUROPCAR GROUPE SA237,673 2,280,947.78 1.45EURFAURECIA SA84,091 3,073,105.60 1.95EURNEXANS SA60,512 2,976,585.28 1.89EURTARKETT SA163,843 5,590,323.16 3.55EUR
ACS SA77,358 2,318,806.05 1.47EURSpain 26,799,667.31 17.00
APPLUS SERVICES SA299,206 2,872,377.60 1.82EURCIE AUTOMOTIVE SA224,679 4,114,995.89 2.61EURDIA SA544,785 2,532,705.47 1.61EURINDRA SISTEMAS SA233,833 2,441,216.52 1.55EURLABORATORIOS FARMACEUTICOS ROVI SA238,304 2,914,457.92 1.85EURLIBERBANK SA2,287,357 2,253,046.65 1.43EURMAPFRE SA REG SHS1,499,795 4,322,409.19 2.74EURMELIA HOTELS INTERNATIONAL SA275,799 3,029,652.02 1.92EUR
ALTRI SGPS SA391,370 1,518,906.97 0.96EURPortugal 17,807,323.61 11.29
CORTICEIRA AMORIM SGPA SA222,809 1,891,425.60 1.20EURGALP ENERGIA SGPS SA REG SHS -B-400,439 5,688,236.00 3.60EURJERONIMO MARTINS SGPS SA197,018 2,864,641.72 1.82EURNOS SGPS SA REG SHS222,118 1,255,633.05 0.80EURSEMAPA SA REG SHS195,667 2,620,959.47 1.66EURSONAE SGPS SA REG SHS1,339,877 1,165,692.99 0.74EURSONAECOM SGPS SA REG SHS301,893 801,827.81 0.51EUR
ASSECO POLAND SA253,674 3,249,281.57 2.06PLNPoland 7,092,286.81 4.50
POWSZECHNY ZAKLAD UBEZPIECZEN SA510,895 3,843,005.24 2.44PLN
KION GROUP AG70,286 3,707,586.50 2.35EURGermany 6,690,491.70 4.24
RHEINMETALL AG46,754 2,982,905.20 1.89EUR
MOL HUNGARIAN OIL AND GAS PLC -A-83,454 5,529,599.23 3.51HUFHungary 5,529,599.23 3.51
BANCA TRANSILVANIA SA8,575,239 4,490,841.92 2.85RONRomania 4,490,841.92 2.85
RAIFFEISEN BANK INTERNATIONAL AG250,233 4,397,844.98 2.79EURAustria 4,397,844.98 2.79
CONVATEC GROUP PLC REG SHS789,321 2,162,145.18 1.37GBPUnited Kingdom 2,162,145.18 1.37
ATHENS WATER SUPPLY AND SEWERAGE COMPANY19,620 109,675.80 0.07EURGreece 572,072.80 0.36
GEK TERNA HLDG REAL ESTATE CONSTRUCTION SA REG SHS66,900 151,863.00 0.10EURMYTILINEOS HOLDINGS SA REG SHS27,860 172,453.40 0.10EURPIRAEUS PORT AUTHORITY SA REG SHS10,382 138,080.60 0.09EUR
Securities portfolio as at 31/12/16EURExpressed in
BG SICAV – Generali Investments Europe - Equity Recovery Fund
Quantity Denomination Quotationcurrency
% of netassetsMarket value
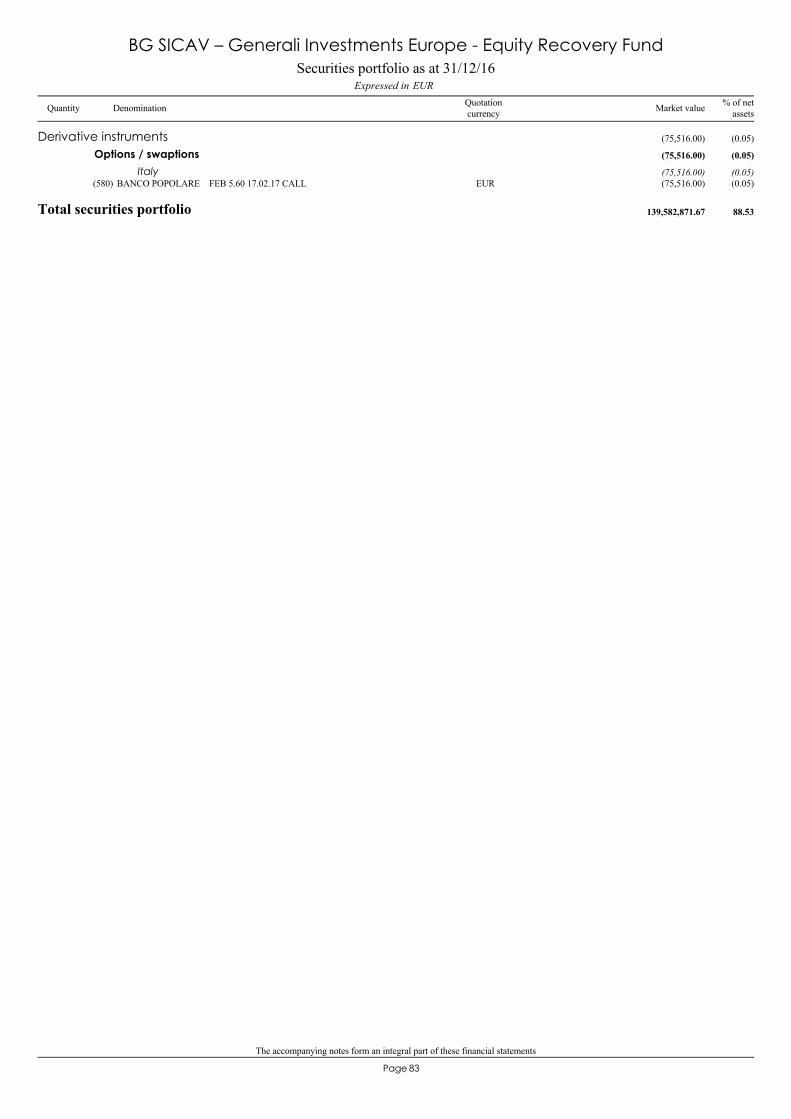
The accompanying notes form an integral part of these financial statements
83Page
BANCO POPOLARE FEB 5.60 17.02.17 CALL(580) (75,516.00) (0.05)EUR
Derivative instruments (75,516.00) (0.05)
Options / swaptions (75,516.00) (0.05)
Italy (75,516.00) (0.05)
Total securities portfolio 139,582,871.67 88.53
Securities portfolio as at 31/12/16EURExpressed in
BG SICAV – Generali Investments Europe - Equity Recovery Fund
Quantity Denomination Quotationcurrency
% of netassetsMarket value
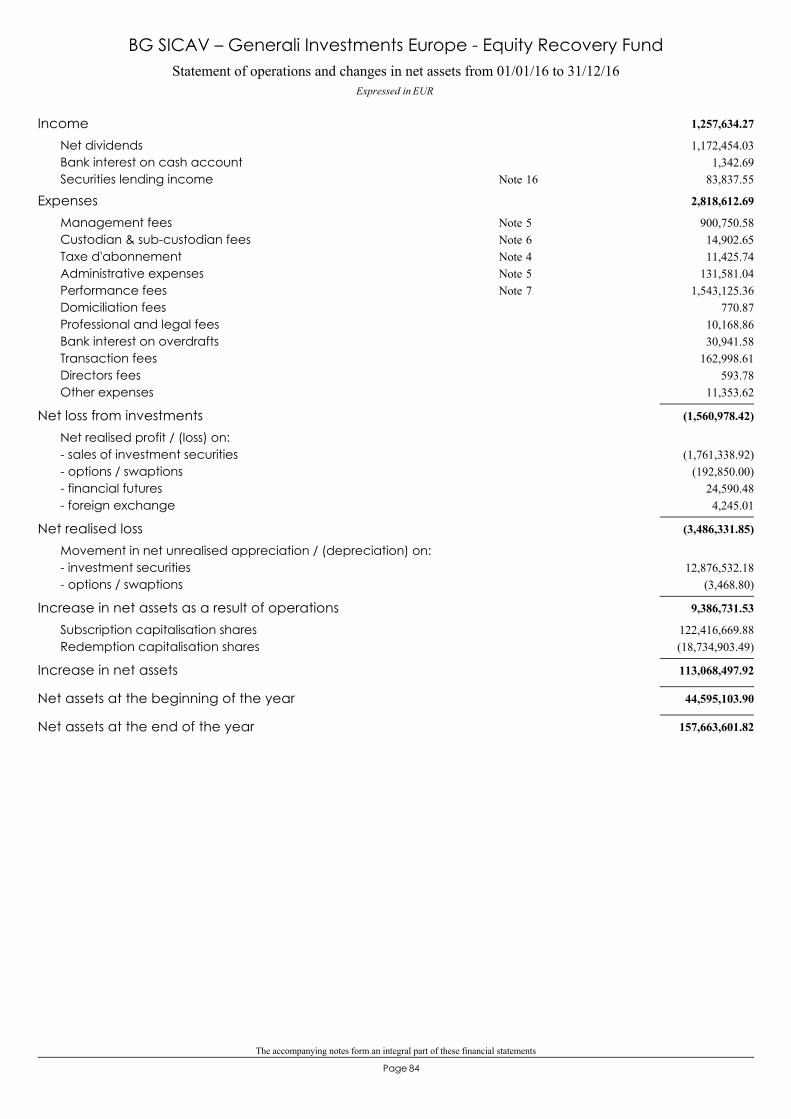
The accompanying notes form an integral part of these financial statements
84Page
Statement of operations and changes in net assets from 01/01/16 to 31/12/16Expressed in EUR
BG SICAV – Generali Investments Europe - Equity Recovery Fund
1,257,634.27Income1,172,454.03Net dividends
1,342.69Bank interest on cash account83,837.55Securities lending income 16Note
2,818,612.69Expenses900,750.58Management fees 5Note14,902.65Custodian & sub-custodian fees 6Note11,425.74Taxe d'abonnement 4Note
131,581.04Administrative expenses 5Note1,543,125.36Performance fees 7Note
770.87Domiciliation fees10,168.86Professional and legal fees30,941.58Bank interest on overdrafts
162,998.61Transaction fees593.78Directors fees
11,353.62Other expenses
(1,560,978.42)Net loss from investmentsNet realised profit / (loss) on:
(1,761,338.92)- sales of investment securities(192,850.00)- options / swaptions
24,590.48- financial futures4,245.01- foreign exchange
(3,486,331.85)Net realised lossMovement in net unrealised appreciation / (depreciation) on:
12,876,532.18- investment securities(3,468.80)- options / swaptions
9,386,731.53Increase in net assets as a result of operations122,416,669.88Subscription capitalisation shares(18,734,903.49)Redemption capitalisation shares
113,068,497.92Increase in net assets
44,595,103.90Net assets at the beginning of the year
157,663,601.82Net assets at the end of the year
85Page
BG SICAV– Tenax Global Financial Equity Long Short
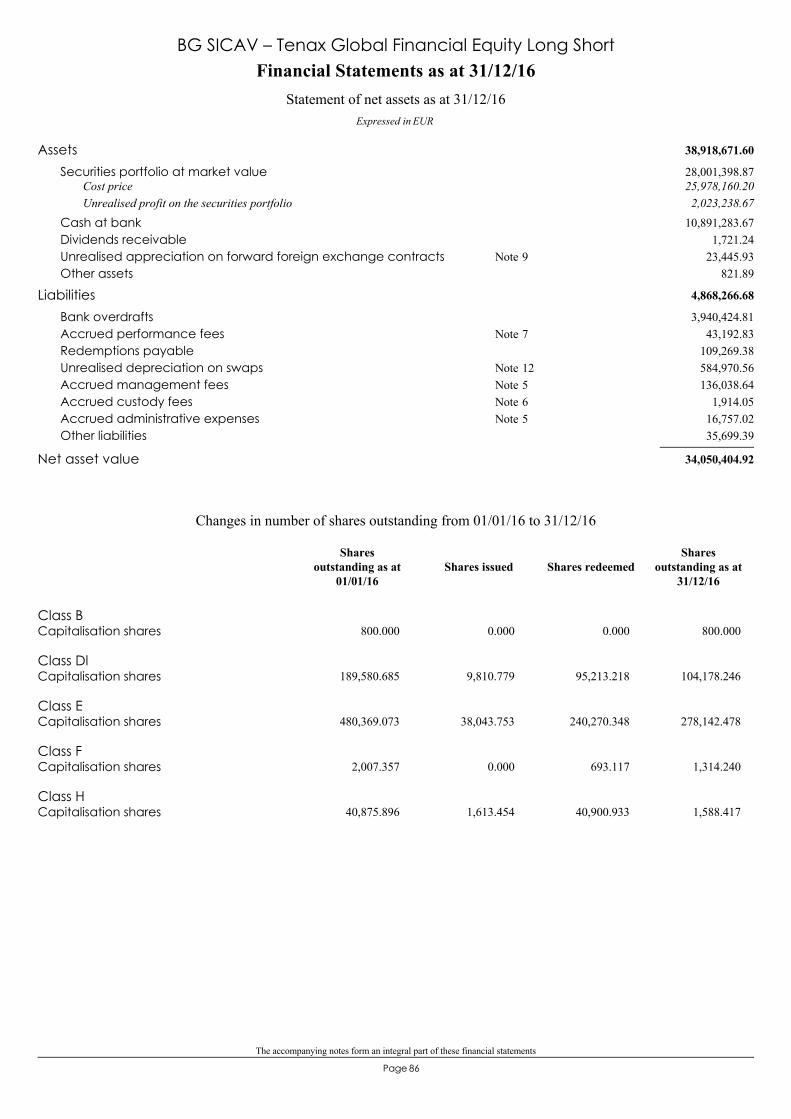
The accompanying notes form an integral part of these financial statements
86Page
38,918,671.60Assets28,001,398.87Securities portfolio at market value25,978,160.20Cost price2,023,238.67Unrealised profit on the securities portfolio
10,891,283.67Cash at bank1,721.24Dividends receivable
23,445.93Unrealised appreciation on forward foreign exchange contracts 9Note821.89Other assets
4,868,266.68Liabilities3,940,424.81Bank overdrafts
43,192.83Accrued performance fees 7Note109,269.38Redemptions payable584,970.56Unrealised depreciation on swaps 12Note136,038.64Accrued management fees 5Note
1,914.05Accrued custody fees 6Note16,757.02Accrued administrative expenses 5Note35,699.39Other liabilities
34,050,404.92Net asset value
Financial Statements as at 31/12/16
Expressed in EUR
Statement of net assets as at 31/12/16
BG SICAV – Tenax Global Financial Equity Long Short
Class BCapitalisation shares 800.000 0.000 0.000 800.000
Class DlCapitalisation shares 189,580.685 9,810.779 95,213.218 104,178.246
Class ECapitalisation shares 480,369.073 38,043.753 240,270.348 278,142.478
Class FCapitalisation shares 2,007.357 0.000 693.117 1,314.240
Class HCapitalisation shares 40,875.896 1,613.454 40,900.933 1,588.417
Changes in number of shares outstanding from 01/01/16 to 31/12/16
Shares issued Shares redeemedShares
outstanding as at31/12/16
Sharesoutstanding as at
01/01/16
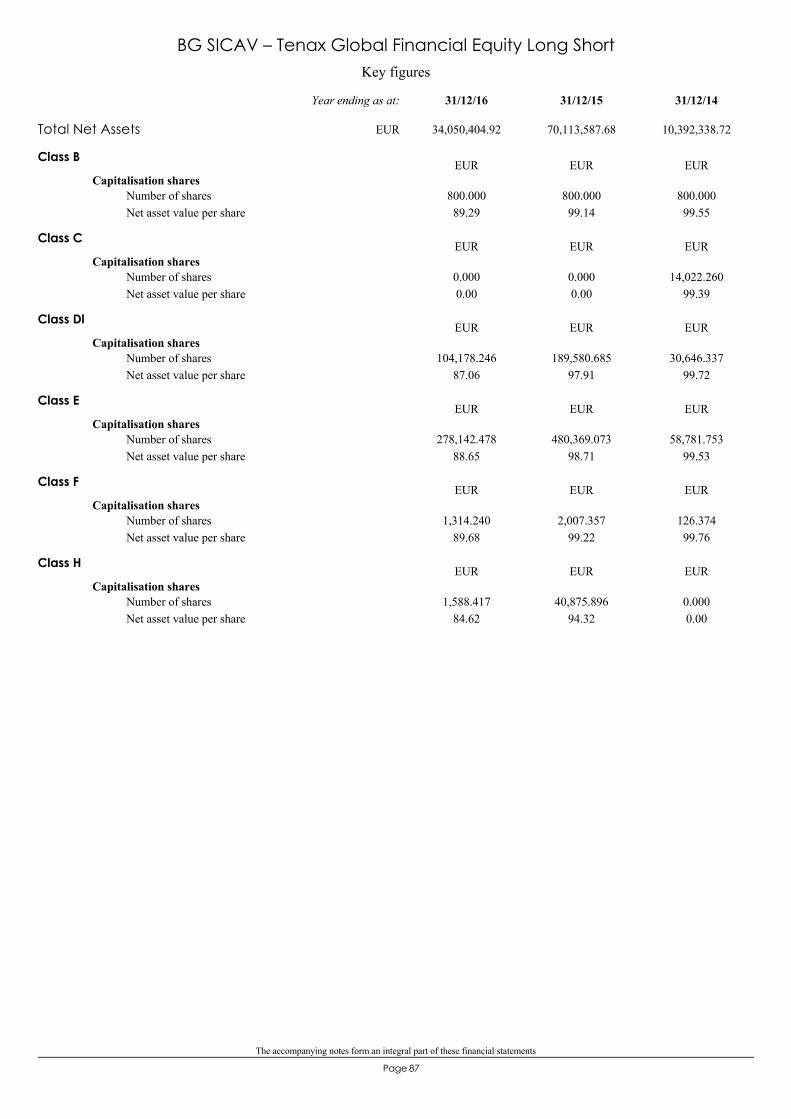
The accompanying notes form an integral part of these financial statements
87Page
Key figures
BG SICAV – Tenax Global Financial Equity Long Short
Class B
Capitalisation shares
89.29800.000 800.000
99.14800.00099.55
Number of sharesNet asset value per share
EUR EUR EUR
Class C
Capitalisation shares
0.000.000 0.000
0.0014,022.260
99.39Number of sharesNet asset value per share
EUR EUR EUR
Class Dl
Capitalisation shares
87.06104,178.246 189,580.685
97.9130,646.337
99.72Number of sharesNet asset value per share
EUR EUR EUR
Class E
Capitalisation shares
88.65278,142.478 480,369.073
98.7158,781.753
99.53Number of sharesNet asset value per share
EUR EUR EUR
Class F
Capitalisation shares
89.681,314.240 2,007.357
99.22126.37499.76
Number of sharesNet asset value per share
EUR EUR EUR
Class H
Capitalisation shares
84.621,588.417 40,875.896
94.320.0000.00
Number of sharesNet asset value per share
EUR EUR EUR
Total Net Assets 34,050,404.92 70,113,587.68 10,392,338.72
31/12/1431/12/1531/12/16Year ending as at:
EUR
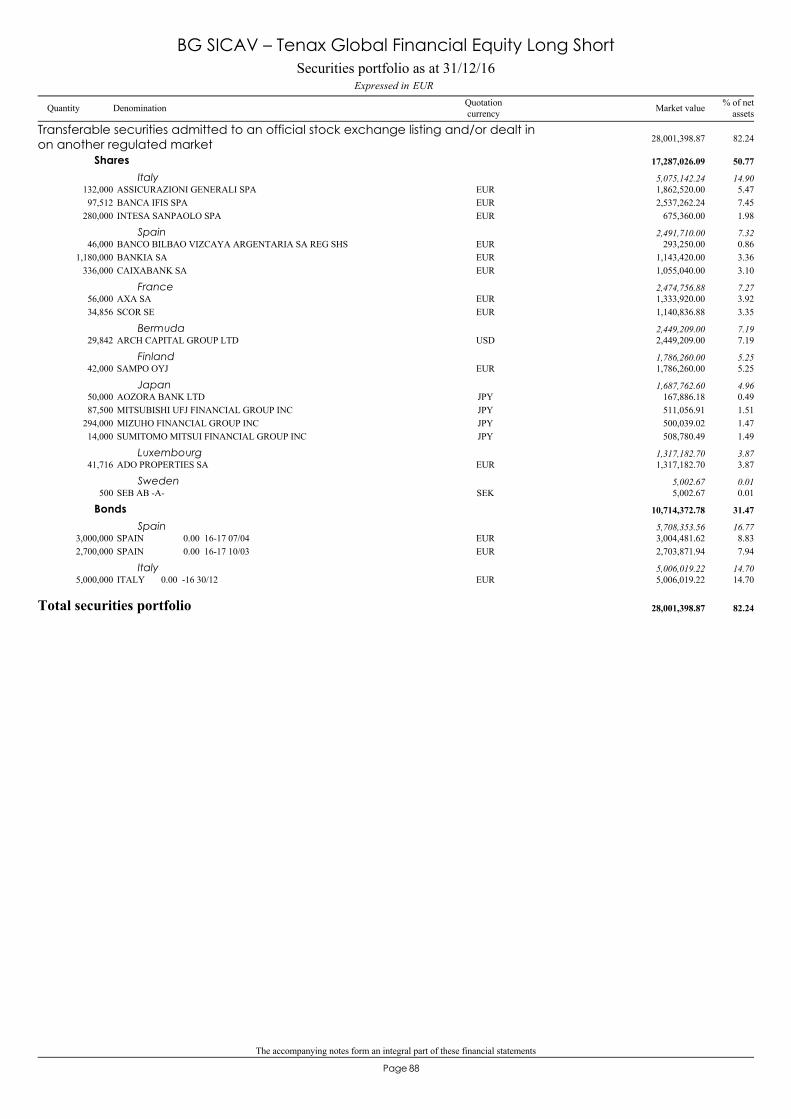
The accompanying notes form an integral part of these financial statements
88Page
ASSICURAZIONI GENERALI SPA132,000 1,862,520.00 5.47EUR
Transferable securities admitted to an official stock exchange listing and/or dealt inon another regulated market 28,001,398.87 82.24
Shares 17,287,026.09 50.77
Italy 5,075,142.24 14.90
BANCA IFIS SPA97,512 2,537,262.24 7.45EURINTESA SANPAOLO SPA280,000 675,360.00 1.98EUR
BANCO BILBAO VIZCAYA ARGENTARIA SA REG SHS46,000 293,250.00 0.86EURSpain 2,491,710.00 7.32
BANKIA SA1,180,000 1,143,420.00 3.36EURCAIXABANK SA336,000 1,055,040.00 3.10EUR
AXA SA56,000 1,333,920.00 3.92EURFrance 2,474,756.88 7.27
SCOR SE34,856 1,140,836.88 3.35EUR
ARCH CAPITAL GROUP LTD29,842 2,449,209.00 7.19USDBermuda 2,449,209.00 7.19
SAMPO OYJ42,000 1,786,260.00 5.25EURFinland 1,786,260.00 5.25
AOZORA BANK LTD50,000 167,886.18 0.49JPYJapan 1,687,762.60 4.96
MITSUBISHI UFJ FINANCIAL GROUP INC87,500 511,056.91 1.51JPYMIZUHO FINANCIAL GROUP INC294,000 500,039.02 1.47JPYSUMITOMO MITSUI FINANCIAL GROUP INC14,000 508,780.49 1.49JPY
ADO PROPERTIES SA41,716 1,317,182.70 3.87EURLuxembourg 1,317,182.70 3.87
SEB AB -A-500 5,002.67 0.01SEKSweden 5,002.67 0.01
SPAIN 0.00 16-17 07/043,000,000 3,004,481.62 8.83EUR
Bonds 10,714,372.78 31.47
Spain 5,708,353.56 16.77
SPAIN 0.00 16-17 10/032,700,000 2,703,871.94 7.94EUR
ITALY 0.00 -16 30/125,000,000 5,006,019.22 14.70EURItaly 5,006,019.22 14.70
Total securities portfolio 28,001,398.87 82.24
Securities portfolio as at 31/12/16EURExpressed in
BG SICAV – Tenax Global Financial Equity Long Short
Quantity Denomination Quotationcurrency
% of netassetsMarket value
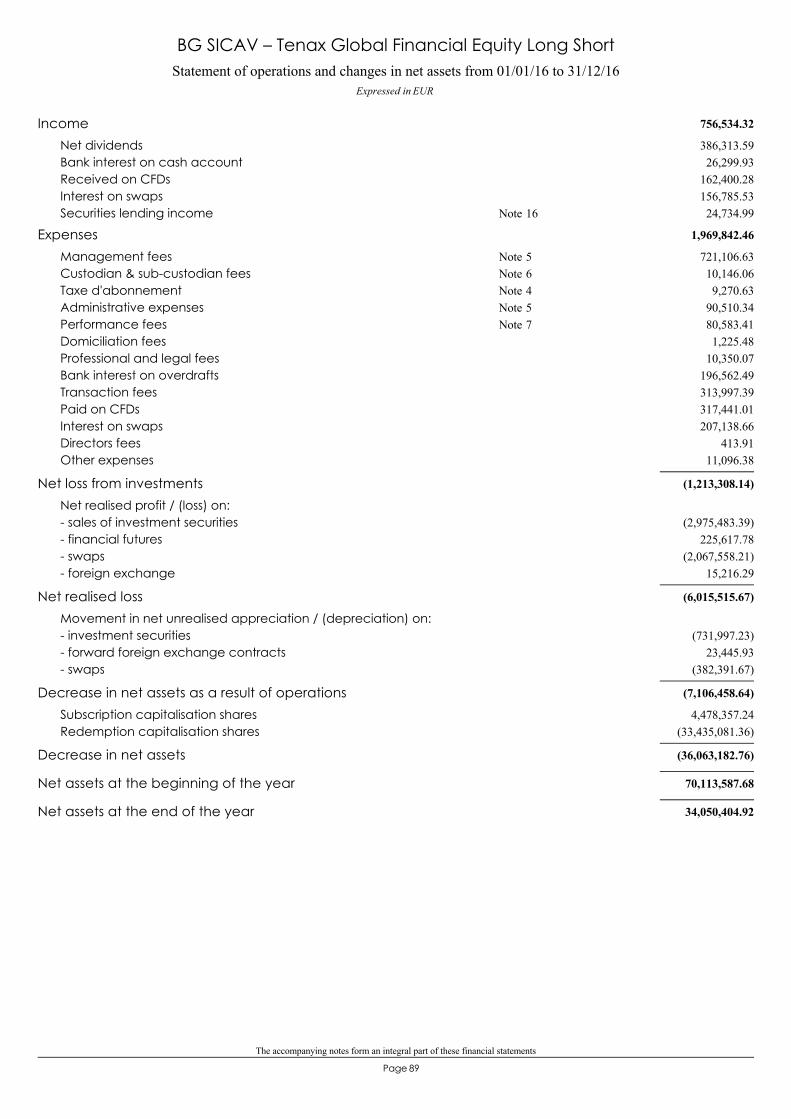
The accompanying notes form an integral part of these financial statements
89Page
Statement of operations and changes in net assets from 01/01/16 to 31/12/16Expressed in EUR
BG SICAV – Tenax Global Financial Equity Long Short
756,534.32Income386,313.59Net dividends26,299.93Bank interest on cash account
162,400.28Received on CFDs156,785.53Interest on swaps24,734.99Securities lending income 16Note
1,969,842.46Expenses721,106.63Management fees 5Note10,146.06Custodian & sub-custodian fees 6Note9,270.63Taxe d'abonnement 4Note
90,510.34Administrative expenses 5Note80,583.41Performance fees 7Note1,225.48Domiciliation fees
10,350.07Professional and legal fees196,562.49Bank interest on overdrafts313,997.39Transaction fees317,441.01Paid on CFDs207,138.66Interest on swaps
413.91Directors fees11,096.38Other expenses
(1,213,308.14)Net loss from investmentsNet realised profit / (loss) on:
(2,975,483.39)- sales of investment securities225,617.78- financial futures
(2,067,558.21)- swaps15,216.29- foreign exchange
(6,015,515.67)Net realised lossMovement in net unrealised appreciation / (depreciation) on:
(731,997.23)- investment securities23,445.93- forward foreign exchange contracts
(382,391.67)- swaps
(7,106,458.64)Decrease in net assets as a result of operations4,478,357.24Subscription capitalisation shares
(33,435,081.36)Redemption capitalisation shares
(36,063,182.76)Decrease in net assets
70,113,587.68Net assets at the beginning of the year
34,050,404.92Net assets at the end of the year
90Page
BG SICAV– Short Equities
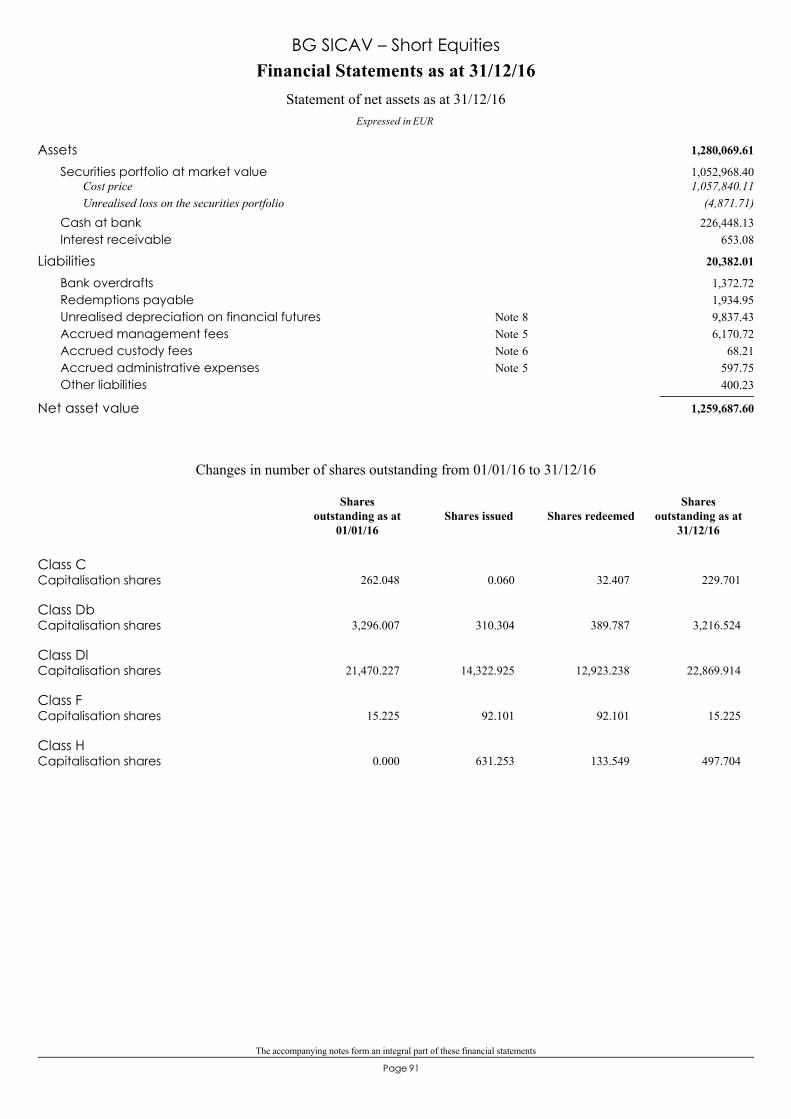
The accompanying notes form an integral part of these financial statements
91Page
1,280,069.61Assets1,052,968.40Securities portfolio at market value1,057,840.11Cost price
(4,871.71)Unrealised loss on the securities portfolio226,448.13Cash at bank
653.08Interest receivable
20,382.01Liabilities1,372.72Bank overdrafts1,934.95Redemptions payable9,837.43Unrealised depreciation on financial futures 8Note6,170.72Accrued management fees 5Note
68.21Accrued custody fees 6Note597.75Accrued administrative expenses 5Note400.23Other liabilities
1,259,687.60Net asset value
Financial Statements as at 31/12/16
Expressed in EUR
Statement of net assets as at 31/12/16
BG SICAV – Short Equities
Class CCapitalisation shares 262.048 0.060 32.407 229.701
Class DbCapitalisation shares 3,296.007 310.304 389.787 3,216.524
Class DlCapitalisation shares 21,470.227 14,322.925 12,923.238 22,869.914
Class FCapitalisation shares 15.225 92.101 92.101 15.225
Class HCapitalisation shares 0.000 631.253 133.549 497.704
Changes in number of shares outstanding from 01/01/16 to 31/12/16
Shares issued Shares redeemedShares
outstanding as at31/12/16
Sharesoutstanding as at
01/01/16
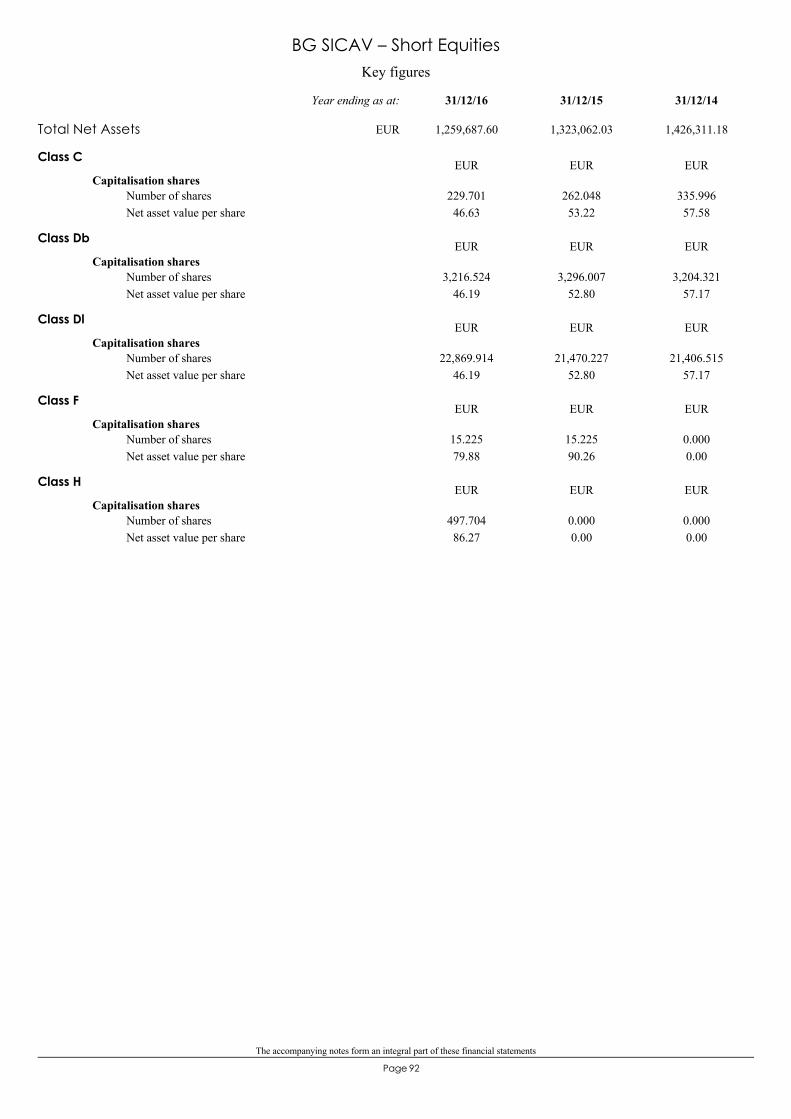
The accompanying notes form an integral part of these financial statements
92Page
Key figures
BG SICAV – Short Equities
Class C
Capitalisation shares
46.63229.701 262.048
53.22335.99657.58
Number of sharesNet asset value per share
EUR EUR EUR
Class Db
Capitalisation shares
46.193,216.524 3,296.007
52.803,204.321
57.17Number of sharesNet asset value per share
EUR EUR EUR
Class Dl
Capitalisation shares
46.1922,869.914 21,470.227
52.8021,406.515
57.17Number of sharesNet asset value per share
EUR EUR EUR
Class F
Capitalisation shares
79.8815.225 15.225
90.260.0000.00
Number of sharesNet asset value per share
EUR EUR EUR
Class H
Capitalisation shares
86.27497.704 0.000
0.000.0000.00
Number of sharesNet asset value per share
EUR EUR EUR
Total Net Assets 1,259,687.60 1,323,062.03 1,426,311.18
31/12/1431/12/1531/12/16Year ending as at:
EUR
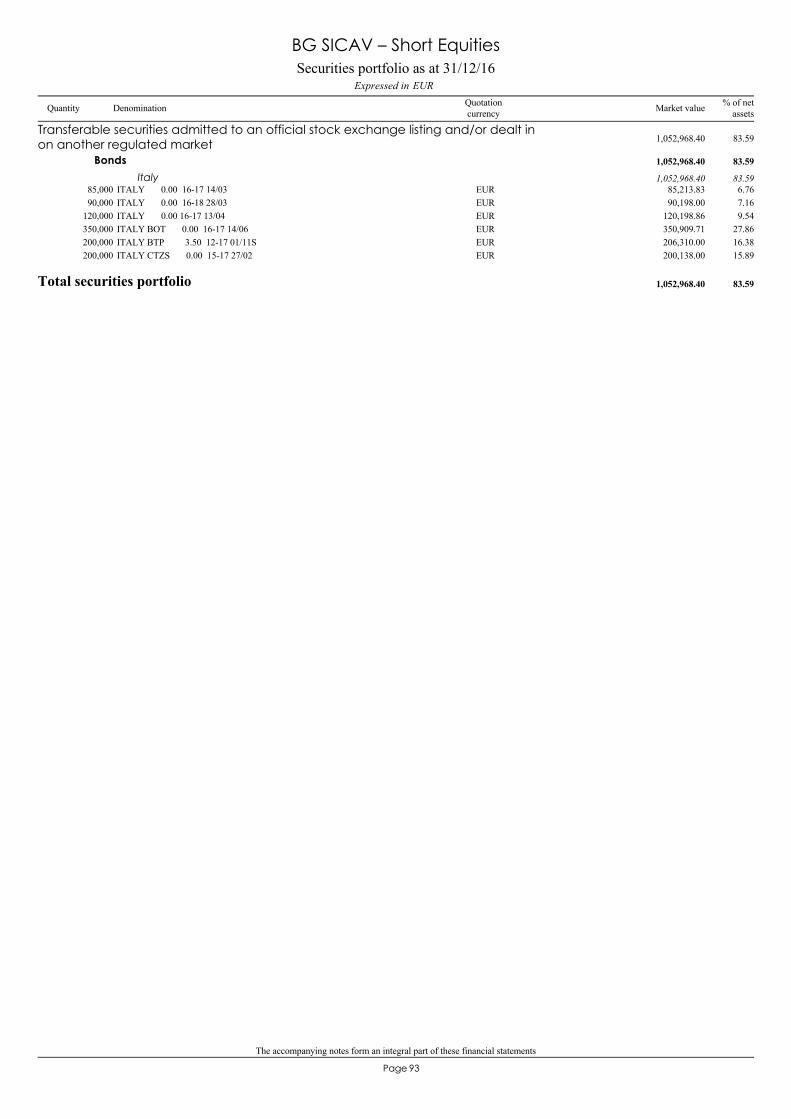
The accompanying notes form an integral part of these financial statements
93Page
ITALY 0.00 16-17 14/0385,000 85,213.83 6.76EUR
Transferable securities admitted to an official stock exchange listing and/or dealt inon another regulated market 1,052,968.40 83.59
Bonds 1,052,968.40 83.59
Italy 1,052,968.40 83.59
ITALY 0.00 16-18 28/0390,000 90,198.00 7.16EURITALY 0.00 16-17 13/04120,000 120,198.86 9.54EURITALY BOT 0.00 16-17 14/06350,000 350,909.71 27.86EURITALY BTP 3.50 12-17 01/11S200,000 206,310.00 16.38EURITALY CTZS 0.00 15-17 27/02200,000 200,138.00 15.89EUR
Total securities portfolio 1,052,968.40 83.59
Securities portfolio as at 31/12/16EURExpressed in
BG SICAV – Short Equities
Quantity Denomination Quotationcurrency
% of netassetsMarket value
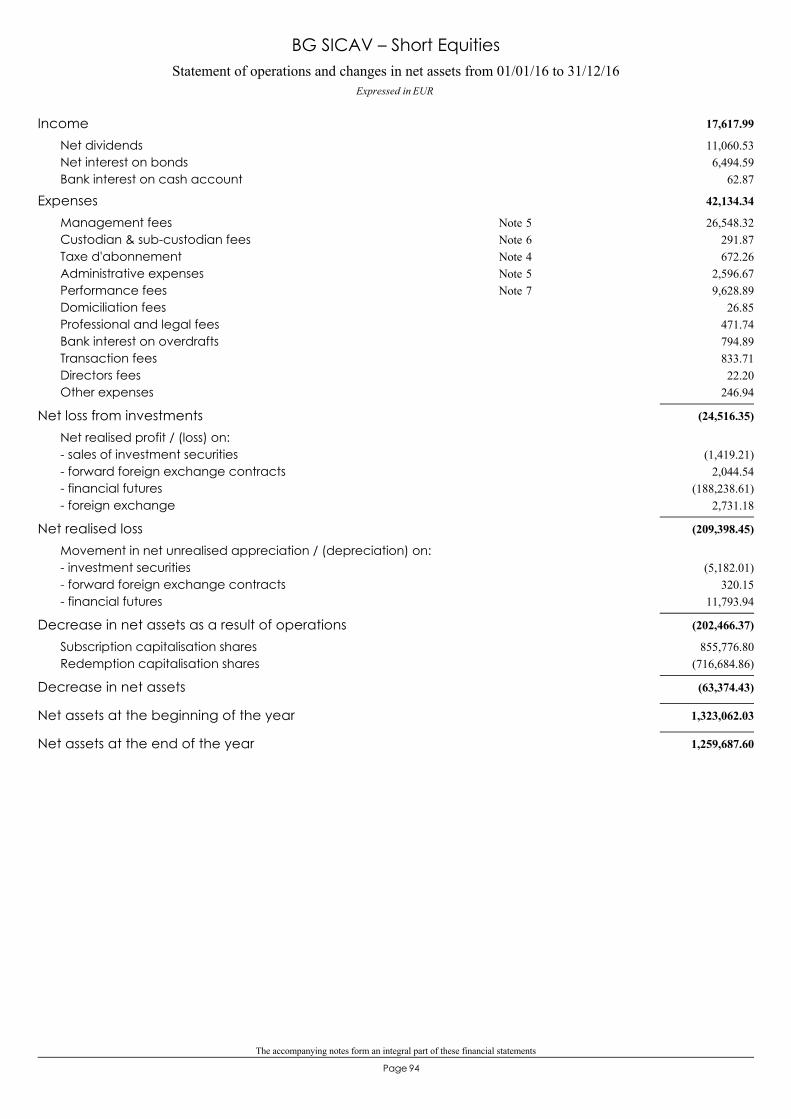
The accompanying notes form an integral part of these financial statements
94Page
Statement of operations and changes in net assets from 01/01/16 to 31/12/16Expressed in EUR
BG SICAV – Short Equities
17,617.99Income11,060.53Net dividends6,494.59Net interest on bonds
62.87Bank interest on cash account
42,134.34Expenses26,548.32Management fees 5Note
291.87Custodian & sub-custodian fees 6Note672.26Taxe d'abonnement 4Note
2,596.67Administrative expenses 5Note9,628.89Performance fees 7Note
26.85Domiciliation fees471.74Professional and legal fees794.89Bank interest on overdrafts833.71Transaction fees22.20Directors fees
246.94Other expenses
(24,516.35)Net loss from investmentsNet realised profit / (loss) on:
(1,419.21)- sales of investment securities2,044.54- forward foreign exchange contracts
(188,238.61)- financial futures2,731.18- foreign exchange
(209,398.45)Net realised lossMovement in net unrealised appreciation / (depreciation) on:
(5,182.01)- investment securities320.15- forward foreign exchange contracts
11,793.94- financial futures
(202,466.37)Decrease in net assets as a result of operations855,776.80Subscription capitalisation shares
(716,684.86)Redemption capitalisation shares
(63,374.43)Decrease in net assets
1,323,062.03Net assets at the beginning of the year
1,259,687.60Net assets at the end of the year
95Page
BG SICAV– Flexible Global Equities
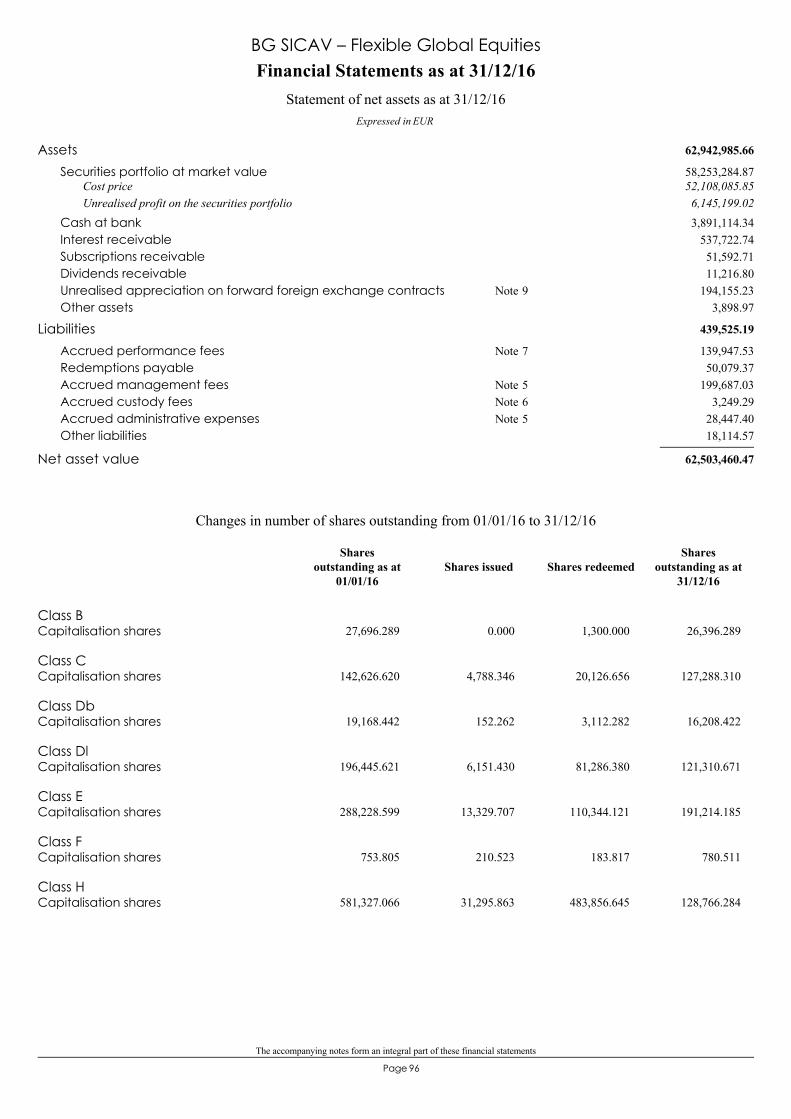
The accompanying notes form an integral part of these financial statements
96Page
62,942,985.66Assets58,253,284.87Securities portfolio at market value52,108,085.85Cost price6,145,199.02Unrealised profit on the securities portfolio3,891,114.34Cash at bank
537,722.74Interest receivable51,592.71Subscriptions receivable11,216.80Dividends receivable
194,155.23Unrealised appreciation on forward foreign exchange contracts 9Note3,898.97Other assets
439,525.19Liabilities139,947.53Accrued performance fees 7Note50,079.37Redemptions payable
199,687.03Accrued management fees 5Note3,249.29Accrued custody fees 6Note
28,447.40Accrued administrative expenses 5Note18,114.57Other liabilities
62,503,460.47Net asset value
Financial Statements as at 31/12/16
Expressed in EUR
Statement of net assets as at 31/12/16
BG SICAV – Flexible Global Equities
Class BCapitalisation shares 27,696.289 0.000 1,300.000 26,396.289
Class CCapitalisation shares 142,626.620 4,788.346 20,126.656 127,288.310
Class DbCapitalisation shares 19,168.442 152.262 3,112.282 16,208.422
Class DlCapitalisation shares 196,445.621 6,151.430 81,286.380 121,310.671
Class ECapitalisation shares 288,228.599 13,329.707 110,344.121 191,214.185
Class FCapitalisation shares 753.805 210.523 183.817 780.511
Class HCapitalisation shares 581,327.066 31,295.863 483,856.645 128,766.284
Changes in number of shares outstanding from 01/01/16 to 31/12/16
Shares issued Shares redeemedShares
outstanding as at31/12/16
Sharesoutstanding as at
01/01/16
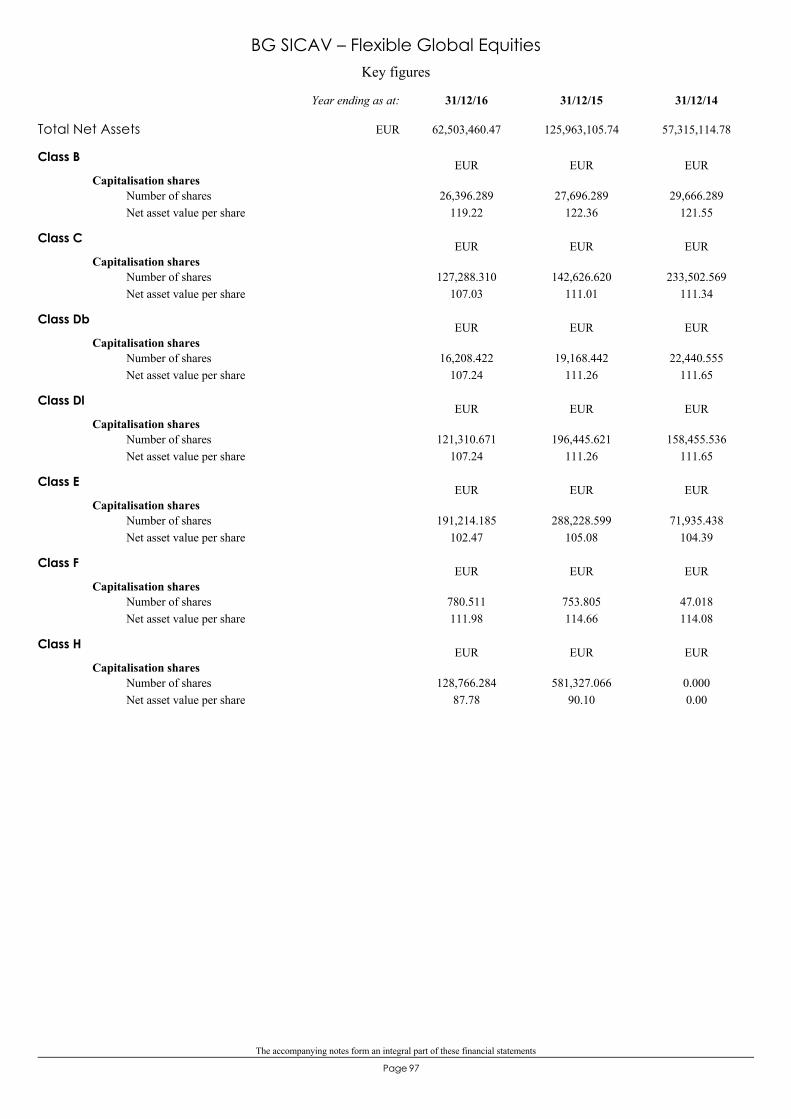
The accompanying notes form an integral part of these financial statements
97Page
Key figures
BG SICAV – Flexible Global Equities
Class B
Capitalisation shares
119.2226,396.289 27,696.289
122.3629,666.289
121.55Number of sharesNet asset value per share
EUR EUR EUR
Class C
Capitalisation shares
107.03127,288.310 142,626.620
111.01233,502.569
111.34Number of sharesNet asset value per share
EUR EUR EUR
Class Db
Capitalisation shares
107.2416,208.422 19,168.442
111.2622,440.555
111.65Number of sharesNet asset value per share
EUR EUR EUR
Class Dl
Capitalisation shares
107.24121,310.671 196,445.621
111.26158,455.536
111.65Number of sharesNet asset value per share
EUR EUR EUR
Class E
Capitalisation shares
102.47191,214.185 288,228.599
105.0871,935.438
104.39Number of sharesNet asset value per share
EUR EUR EUR
Class F
Capitalisation shares
111.98780.511 753.805
114.6647.018114.08
Number of sharesNet asset value per share
EUR EUR EUR
Class H
Capitalisation shares
87.78128,766.284 581,327.066
90.100.0000.00
Number of sharesNet asset value per share
EUR EUR EUR
Total Net Assets 62,503,460.47 125,963,105.74 57,315,114.78
31/12/1431/12/1531/12/16Year ending as at:
EUR
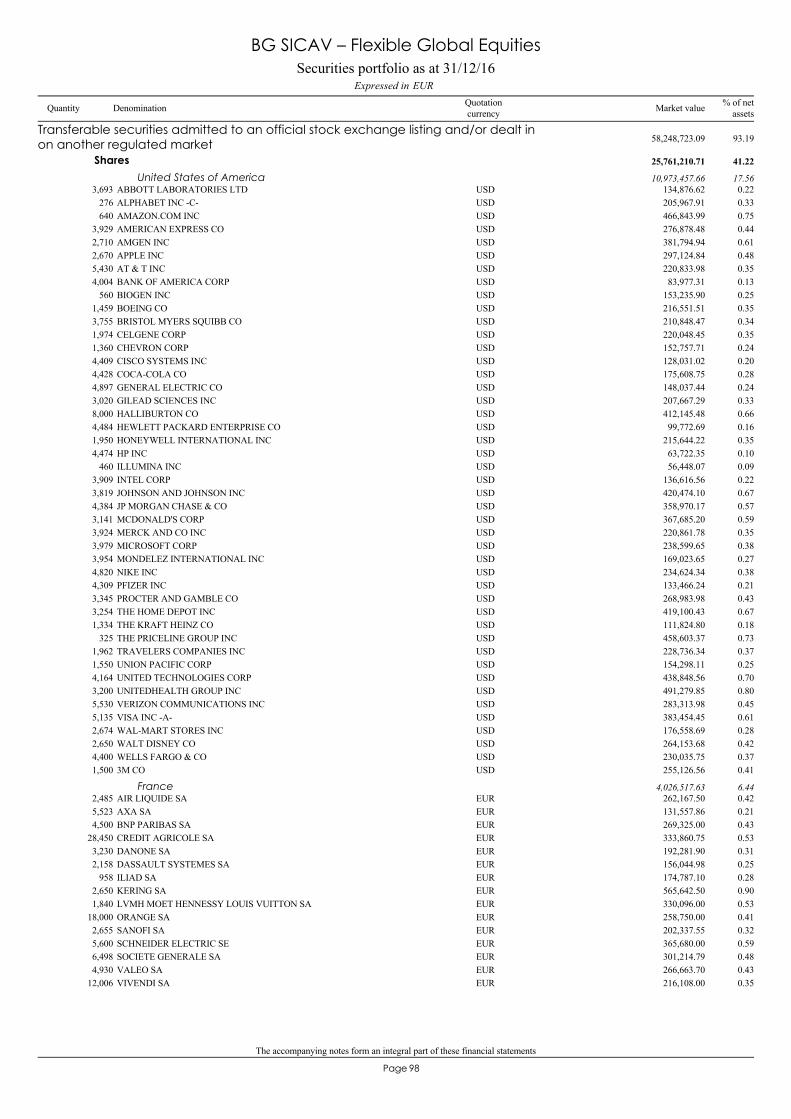
The accompanying notes form an integral part of these financial statements
98Page
ABBOTT LABORATORIES LTD3,693 134,876.62 0.22USD
Transferable securities admitted to an official stock exchange listing and/or dealt inon another regulated market 58,248,723.09 93.19
Shares 25,761,210.71 41.22
United States of America 10,973,457.66 17.56
ALPHABET INC -C-276 205,967.91 0.33USDAMAZON.COM INC640 466,843.99 0.75USDAMERICAN EXPRESS CO3,929 276,878.48 0.44USDAMGEN INC2,710 381,794.94 0.61USDAPPLE INC2,670 297,124.84 0.48USDAT & T INC5,430 220,833.98 0.35USDBANK OF AMERICA CORP4,004 83,977.31 0.13USDBIOGEN INC560 153,235.90 0.25USDBOEING CO1,459 216,551.51 0.35USDBRISTOL MYERS SQUIBB CO3,755 210,848.47 0.34USDCELGENE CORP1,974 220,048.45 0.35USDCHEVRON CORP1,360 152,757.71 0.24USDCISCO SYSTEMS INC4,409 128,031.02 0.20USDCOCA-COLA CO4,428 175,608.75 0.28USDGENERAL ELECTRIC CO4,897 148,037.44 0.24USDGILEAD SCIENCES INC3,020 207,667.29 0.33USDHALLIBURTON CO8,000 412,145.48 0.66USDHEWLETT PACKARD ENTERPRISE CO4,484 99,772.69 0.16USDHONEYWELL INTERNATIONAL INC1,950 215,644.22 0.35USDHP INC4,474 63,722.35 0.10USDILLUMINA INC460 56,448.07 0.09USDINTEL CORP3,909 136,616.56 0.22USDJOHNSON AND JOHNSON INC3,819 420,474.10 0.67USDJP MORGAN CHASE & CO4,384 358,970.17 0.57USDMCDONALD'S CORP3,141 367,685.20 0.59USDMERCK AND CO INC3,924 220,861.78 0.35USDMICROSOFT CORP3,979 238,599.65 0.38USDMONDELEZ INTERNATIONAL INC3,954 169,023.65 0.27USDNIKE INC4,820 234,624.34 0.38USDPFIZER INC4,309 133,466.24 0.21USDPROCTER AND GAMBLE CO3,345 268,983.98 0.43USDTHE HOME DEPOT INC3,254 419,100.43 0.67USDTHE KRAFT HEINZ CO1,334 111,824.80 0.18USDTHE PRICELINE GROUP INC325 458,603.37 0.73USDTRAVELERS COMPANIES INC1,962 228,736.34 0.37USDUNION PACIFIC CORP1,550 154,298.11 0.25USDUNITED TECHNOLOGIES CORP4,164 438,848.56 0.70USDUNITEDHEALTH GROUP INC3,200 491,279.85 0.80USDVERIZON COMMUNICATIONS INC5,530 283,313.98 0.45USDVISA INC -A-5,135 383,454.45 0.61USDWAL-MART STORES INC2,674 176,558.69 0.28USDWALT DISNEY CO2,650 264,153.68 0.42USDWELLS FARGO & CO4,400 230,035.75 0.37USD3M CO1,500 255,126.56 0.41USD
AIR LIQUIDE SA2,485 262,167.50 0.42EURFrance 4,026,517.63 6.44
AXA SA5,523 131,557.86 0.21EURBNP PARIBAS SA4,500 269,325.00 0.43EURCREDIT AGRICOLE SA28,450 333,860.75 0.53EURDANONE SA3,230 192,281.90 0.31EURDASSAULT SYSTEMES SA2,158 156,044.98 0.25EURILIAD SA958 174,787.10 0.28EURKERING SA2,650 565,642.50 0.90EURLVMH MOET HENNESSY LOUIS VUITTON SA1,840 330,096.00 0.53EURORANGE SA18,000 258,750.00 0.41EURSANOFI SA2,655 202,337.55 0.32EURSCHNEIDER ELECTRIC SE5,600 365,680.00 0.59EURSOCIETE GENERALE SA6,498 301,214.79 0.48EURVALEO SA4,930 266,663.70 0.43EURVIVENDI SA12,006 216,108.00 0.35EUR
Securities portfolio as at 31/12/16EURExpressed in
BG SICAV – Flexible Global Equities
Quantity Denomination Quotationcurrency
% of netassetsMarket value
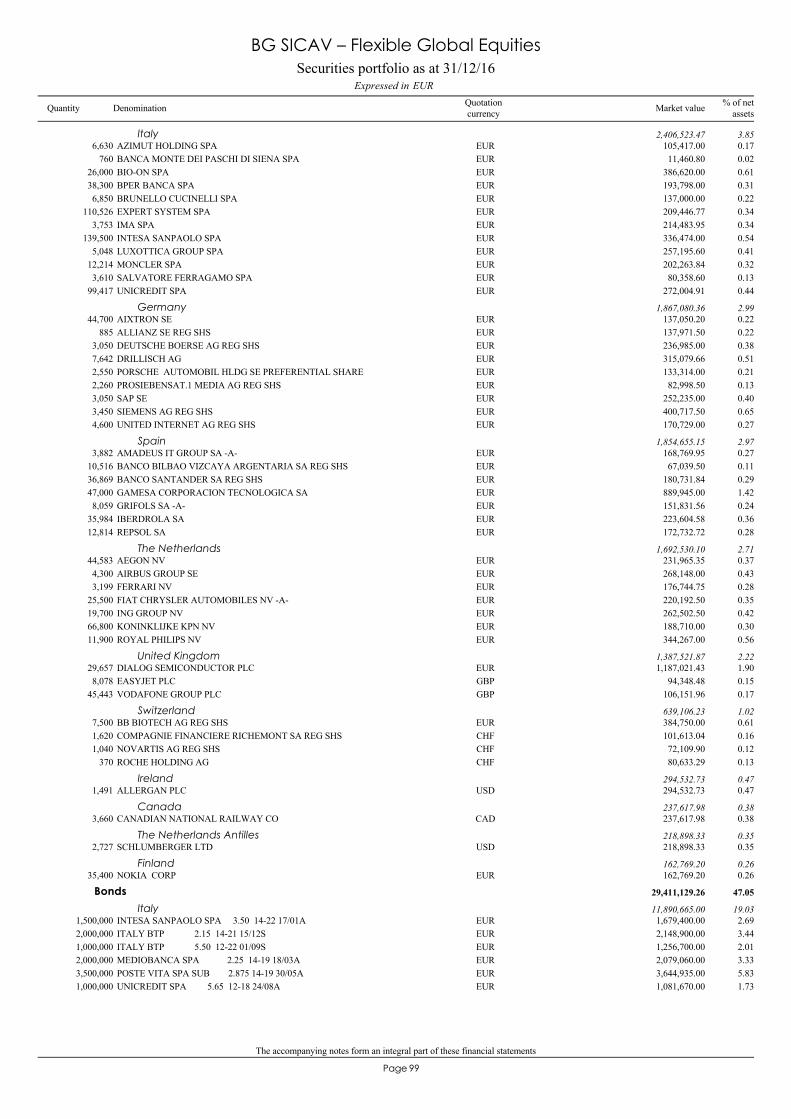
The accompanying notes form an integral part of these financial statements
99Page
AZIMUT HOLDING SPA6,630 105,417.00 0.17EURItaly 2,406,523.47 3.85
BANCA MONTE DEI PASCHI DI SIENA SPA760 11,460.80 0.02EURBIO-ON SPA26,000 386,620.00 0.61EURBPER BANCA SPA38,300 193,798.00 0.31EURBRUNELLO CUCINELLI SPA6,850 137,000.00 0.22EUREXPERT SYSTEM SPA110,526 209,446.77 0.34EURIMA SPA3,753 214,483.95 0.34EURINTESA SANPAOLO SPA139,500 336,474.00 0.54EURLUXOTTICA GROUP SPA5,048 257,195.60 0.41EURMONCLER SPA12,214 202,263.84 0.32EURSALVATORE FERRAGAMO SPA3,610 80,358.60 0.13EURUNICREDIT SPA99,417 272,004.91 0.44EUR
AIXTRON SE44,700 137,050.20 0.22EURGermany 1,867,080.36 2.99
ALLIANZ SE REG SHS885 137,971.50 0.22EURDEUTSCHE BOERSE AG REG SHS3,050 236,985.00 0.38EURDRILLISCH AG7,642 315,079.66 0.51EURPORSCHE AUTOMOBIL HLDG SE PREFERENTIAL SHARE2,550 133,314.00 0.21EURPROSIEBENSAT.1 MEDIA AG REG SHS2,260 82,998.50 0.13EURSAP SE3,050 252,235.00 0.40EURSIEMENS AG REG SHS3,450 400,717.50 0.65EURUNITED INTERNET AG REG SHS4,600 170,729.00 0.27EUR
AMADEUS IT GROUP SA -A-3,882 168,769.95 0.27EURSpain 1,854,655.15 2.97
BANCO BILBAO VIZCAYA ARGENTARIA SA REG SHS10,516 67,039.50 0.11EURBANCO SANTANDER SA REG SHS36,869 180,731.84 0.29EURGAMESA CORPORACION TECNOLOGICA SA47,000 889,945.00 1.42EURGRIFOLS SA -A-8,059 151,831.56 0.24EURIBERDROLA SA35,984 223,604.58 0.36EURREPSOL SA12,814 172,732.72 0.28EUR
AEGON NV44,583 231,965.35 0.37EURThe Netherlands 1,692,530.10 2.71
AIRBUS GROUP SE4,300 268,148.00 0.43EURFERRARI NV3,199 176,744.75 0.28EURFIAT CHRYSLER AUTOMOBILES NV -A-25,500 220,192.50 0.35EURING GROUP NV19,700 262,502.50 0.42EURKONINKLIJKE KPN NV66,800 188,710.00 0.30EURROYAL PHILIPS NV11,900 344,267.00 0.56EUR
DIALOG SEMICONDUCTOR PLC29,657 1,187,021.43 1.90EURUnited Kingdom 1,387,521.87 2.22
EASYJET PLC8,078 94,348.48 0.15GBPVODAFONE GROUP PLC45,443 106,151.96 0.17GBP
BB BIOTECH AG REG SHS7,500 384,750.00 0.61EURSwitzerland 639,106.23 1.02
COMPAGNIE FINANCIERE RICHEMONT SA REG SHS1,620 101,613.04 0.16CHFNOVARTIS AG REG SHS1,040 72,109.90 0.12CHFROCHE HOLDING AG370 80,633.29 0.13CHF
ALLERGAN PLC1,491 294,532.73 0.47USDIreland 294,532.73 0.47
CANADIAN NATIONAL RAILWAY CO3,660 237,617.98 0.38CADCanada 237,617.98 0.38
SCHLUMBERGER LTD2,727 218,898.33 0.35USDThe Netherlands Antilles 218,898.33 0.35
NOKIA CORP35,400 162,769.20 0.26EURFinland 162,769.20 0.26
INTESA SANPAOLO SPA 3.50 14-22 17/01A1,500,000 1,679,400.00 2.69EUR
Bonds 29,411,129.26 47.05
Italy 11,890,665.00 19.03
ITALY BTP 2.15 14-21 15/12S2,000,000 2,148,900.00 3.44EURITALY BTP 5.50 12-22 01/09S1,000,000 1,256,700.00 2.01EURMEDIOBANCA SPA 2.25 14-19 18/03A2,000,000 2,079,060.00 3.33EURPOSTE VITA SPA SUB 2.875 14-19 30/05A3,500,000 3,644,935.00 5.83EURUNICREDIT SPA 5.65 12-18 24/08A1,000,000 1,081,670.00 1.73EUR
Securities portfolio as at 31/12/16EURExpressed in
BG SICAV – Flexible Global Equities
Quantity Denomination Quotationcurrency
% of netassetsMarket value
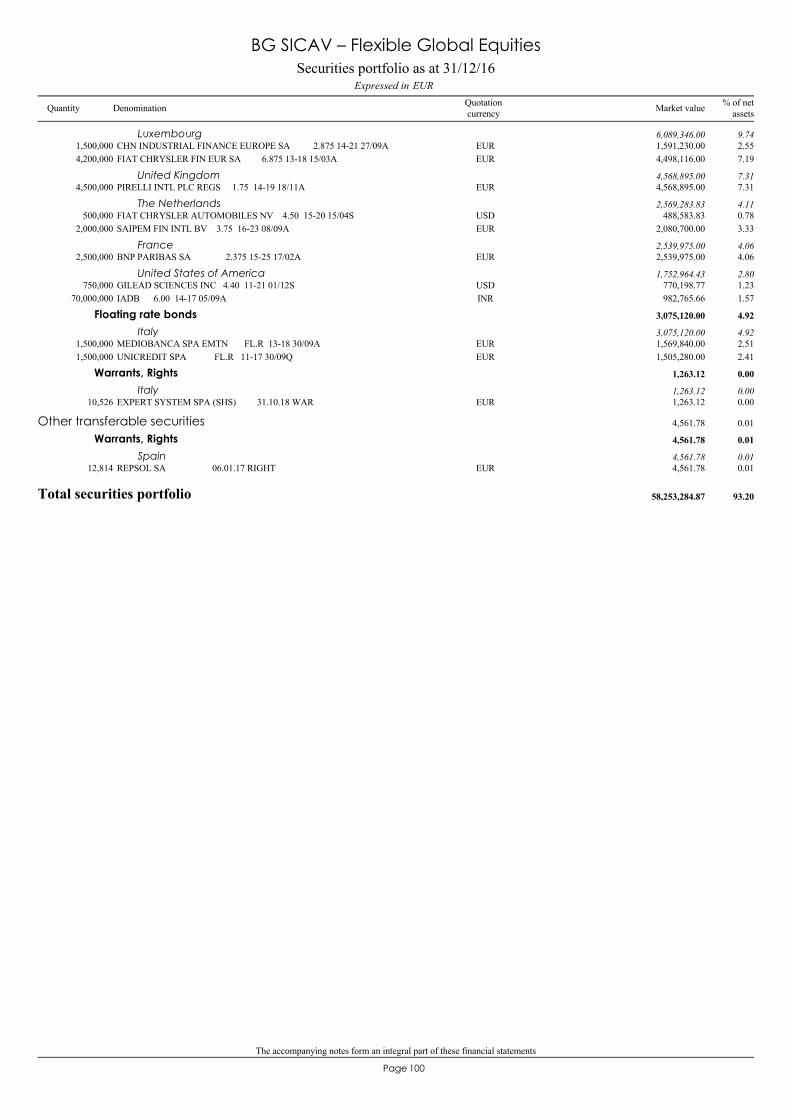
The accompanying notes form an integral part of these financial statements
100Page
CHN INDUSTRIAL FINANCE EUROPE SA 2.875 14-21 27/09A1,500,000 1,591,230.00 2.55EURLuxembourg 6,089,346.00 9.74
FIAT CHRYSLER FIN EUR SA 6.875 13-18 15/03A4,200,000 4,498,116.00 7.19EUR
PIRELLI INTL PLC REGS 1.75 14-19 18/11A4,500,000 4,568,895.00 7.31EURUnited Kingdom 4,568,895.00 7.31
FIAT CHRYSLER AUTOMOBILES NV 4.50 15-20 15/04S500,000 488,583.83 0.78USDThe Netherlands 2,569,283.83 4.11
SAIPEM FIN INTL BV 3.75 16-23 08/09A2,000,000 2,080,700.00 3.33EUR
BNP PARIBAS SA 2.375 15-25 17/02A2,500,000 2,539,975.00 4.06EURFrance 2,539,975.00 4.06
GILEAD SCIENCES INC 4.40 11-21 01/12S750,000 770,198.77 1.23USDUnited States of America 1,752,964.43 2.80
IADB 6.00 14-17 05/09A70,000,000 982,765.66 1.57INR
MEDIOBANCA SPA EMTN FL.R 13-18 30/09A1,500,000 1,569,840.00 2.51EUR
Floating rate bonds 3,075,120.00 4.92
Italy 3,075,120.00 4.92
UNICREDIT SPA FL.R 11-17 30/09Q1,500,000 1,505,280.00 2.41EUR
EXPERT SYSTEM SPA (SHS) 31.10.18 WAR10,526 1,263.12 0.00EUR
Warrants, Rights 1,263.12 0.00
Italy 1,263.12 0.00
REPSOL SA 06.01.17 RIGHT12,814 4,561.78 0.01EUR
Other transferable securities 4,561.78 0.01
Warrants, Rights 4,561.78 0.01
Spain 4,561.78 0.01
Total securities portfolio 58,253,284.87 93.20
Securities portfolio as at 31/12/16EURExpressed in
BG SICAV – Flexible Global Equities
Quantity Denomination Quotationcurrency
% of netassetsMarket value
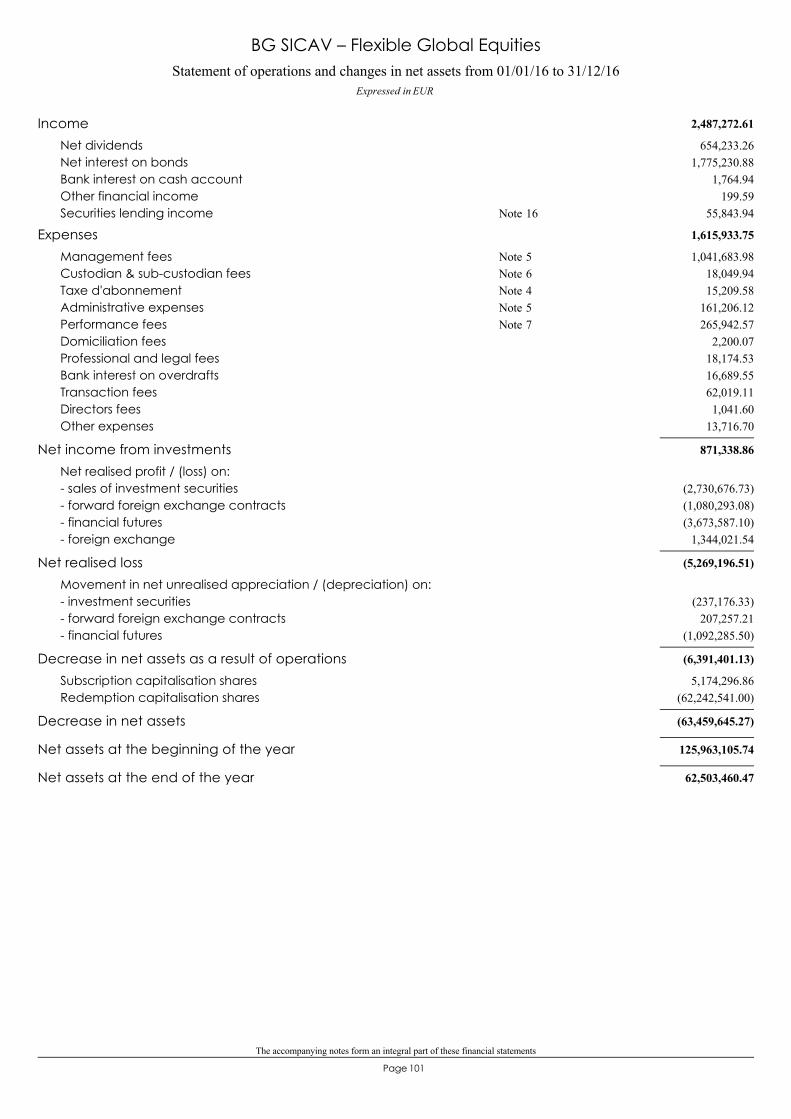
The accompanying notes form an integral part of these financial statements
101Page
Statement of operations and changes in net assets from 01/01/16 to 31/12/16Expressed in EUR
BG SICAV – Flexible Global Equities
2,487,272.61Income654,233.26Net dividends
1,775,230.88Net interest on bonds1,764.94Bank interest on cash account
199.59Other financial income55,843.94Securities lending income 16Note
1,615,933.75Expenses1,041,683.98Management fees 5Note
18,049.94Custodian & sub-custodian fees 6Note15,209.58Taxe d'abonnement 4Note
161,206.12Administrative expenses 5Note265,942.57Performance fees 7Note
2,200.07Domiciliation fees18,174.53Professional and legal fees16,689.55Bank interest on overdrafts62,019.11Transaction fees1,041.60Directors fees
13,716.70Other expenses
871,338.86Net income from investmentsNet realised profit / (loss) on:
(2,730,676.73)- sales of investment securities(1,080,293.08)- forward foreign exchange contracts(3,673,587.10)- financial futures
1,344,021.54- foreign exchange
(5,269,196.51)Net realised lossMovement in net unrealised appreciation / (depreciation) on:
(237,176.33)- investment securities207,257.21- forward foreign exchange contracts
(1,092,285.50)- financial futures
(6,391,401.13)Decrease in net assets as a result of operations5,174,296.86Subscription capitalisation shares
(62,242,541.00)Redemption capitalisation shares
(63,459,645.27)Decrease in net assets
125,963,105.74Net assets at the beginning of the year
62,503,460.47Net assets at the end of the year
102Page
BG SICAV– Euro Income Bond
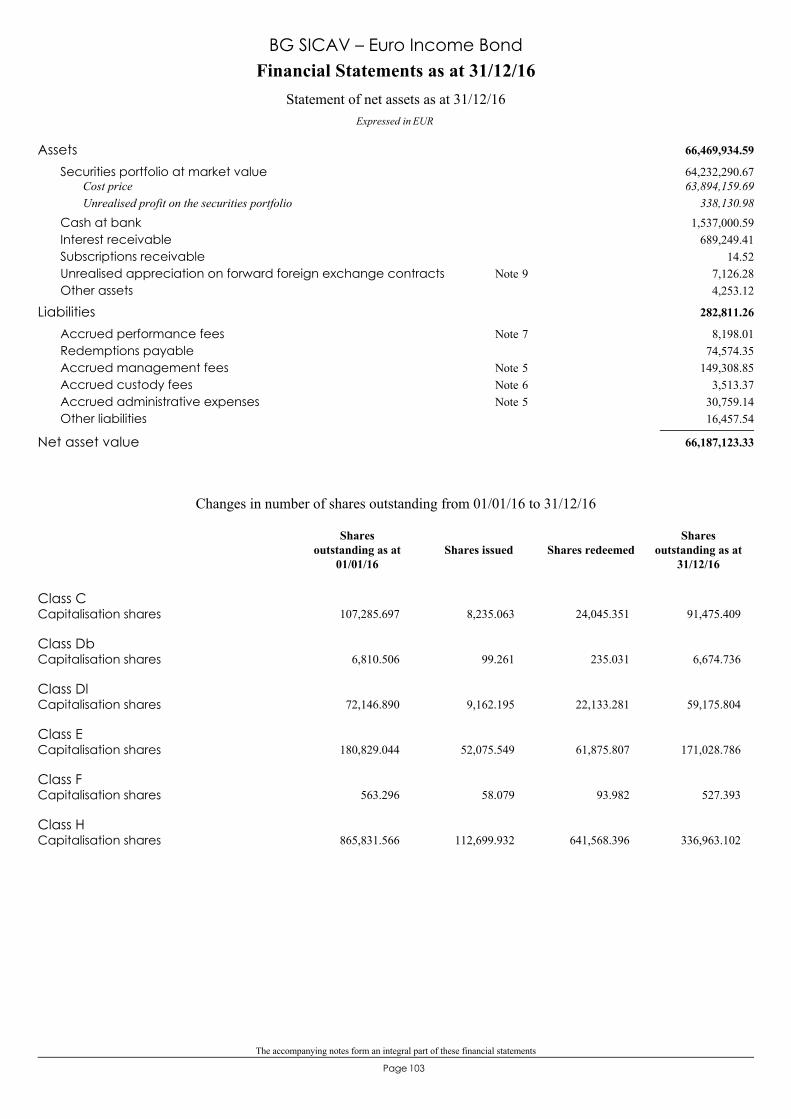
The accompanying notes form an integral part of these financial statements
103Page
66,469,934.59Assets64,232,290.67Securities portfolio at market value63,894,159.69Cost price
338,130.98Unrealised profit on the securities portfolio1,537,000.59Cash at bank
689,249.41Interest receivable14.52Subscriptions receivable
7,126.28Unrealised appreciation on forward foreign exchange contracts 9Note4,253.12Other assets
282,811.26Liabilities8,198.01Accrued performance fees 7Note
74,574.35Redemptions payable149,308.85Accrued management fees 5Note
3,513.37Accrued custody fees 6Note30,759.14Accrued administrative expenses 5Note16,457.54Other liabilities
66,187,123.33Net asset value
Financial Statements as at 31/12/16
Expressed in EUR
Statement of net assets as at 31/12/16
BG SICAV – Euro Income Bond
Class CCapitalisation shares 107,285.697 8,235.063 24,045.351 91,475.409
Class DbCapitalisation shares 6,810.506 99.261 235.031 6,674.736
Class DlCapitalisation shares 72,146.890 9,162.195 22,133.281 59,175.804
Class ECapitalisation shares 180,829.044 52,075.549 61,875.807 171,028.786
Class FCapitalisation shares 563.296 58.079 93.982 527.393
Class HCapitalisation shares 865,831.566 112,699.932 641,568.396 336,963.102
Changes in number of shares outstanding from 01/01/16 to 31/12/16
Shares issued Shares redeemedShares
outstanding as at31/12/16
Sharesoutstanding as at
01/01/16
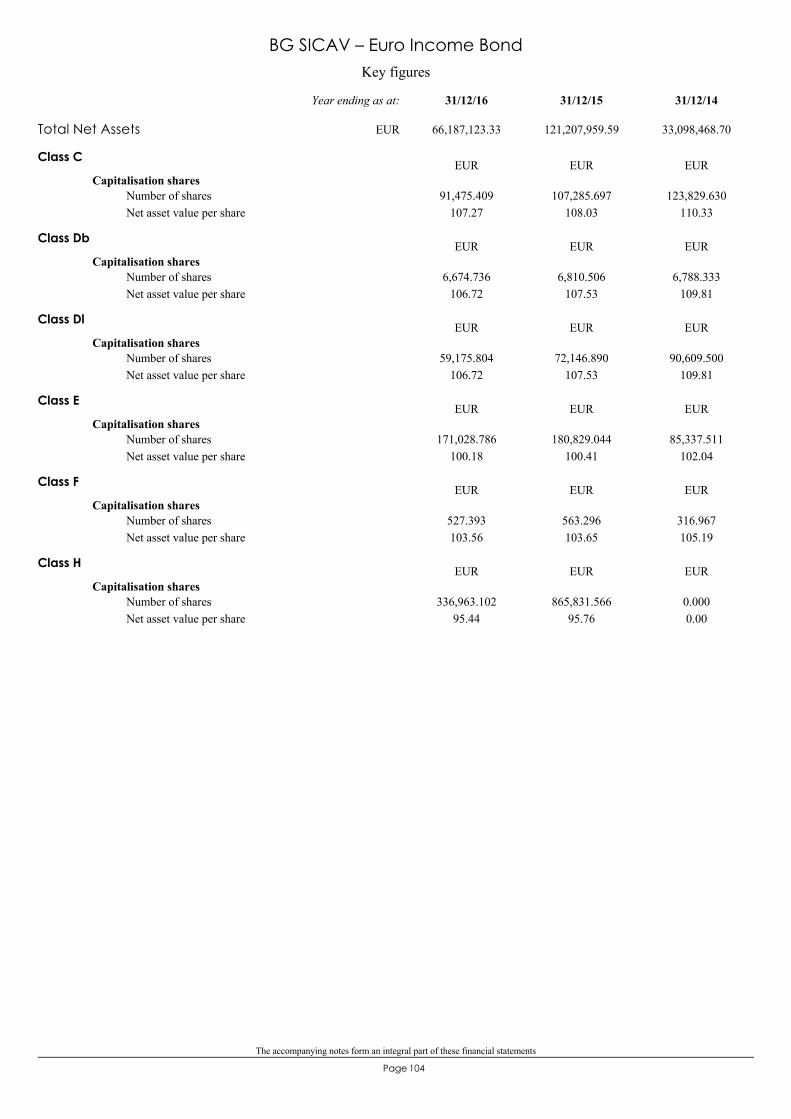
The accompanying notes form an integral part of these financial statements
104Page
Key figures
BG SICAV – Euro Income Bond
Class C
Capitalisation shares
107.2791,475.409 107,285.697
108.03123,829.630
110.33Number of sharesNet asset value per share
EUR EUR EUR
Class Db
Capitalisation shares
106.726,674.736 6,810.506
107.536,788.333
109.81Number of sharesNet asset value per share
EUR EUR EUR
Class Dl
Capitalisation shares
106.7259,175.804 72,146.890
107.5390,609.500
109.81Number of sharesNet asset value per share
EUR EUR EUR
Class E
Capitalisation shares
100.18171,028.786 180,829.044
100.4185,337.511
102.04Number of sharesNet asset value per share
EUR EUR EUR
Class F
Capitalisation shares
103.56527.393 563.296
103.65316.967105.19
Number of sharesNet asset value per share
EUR EUR EUR
Class H
Capitalisation shares
95.44336,963.102 865,831.566
95.760.0000.00
Number of sharesNet asset value per share
EUR EUR EUR
Total Net Assets 66,187,123.33 121,207,959.59 33,098,468.70
31/12/1431/12/1531/12/16Year ending as at:
EUR
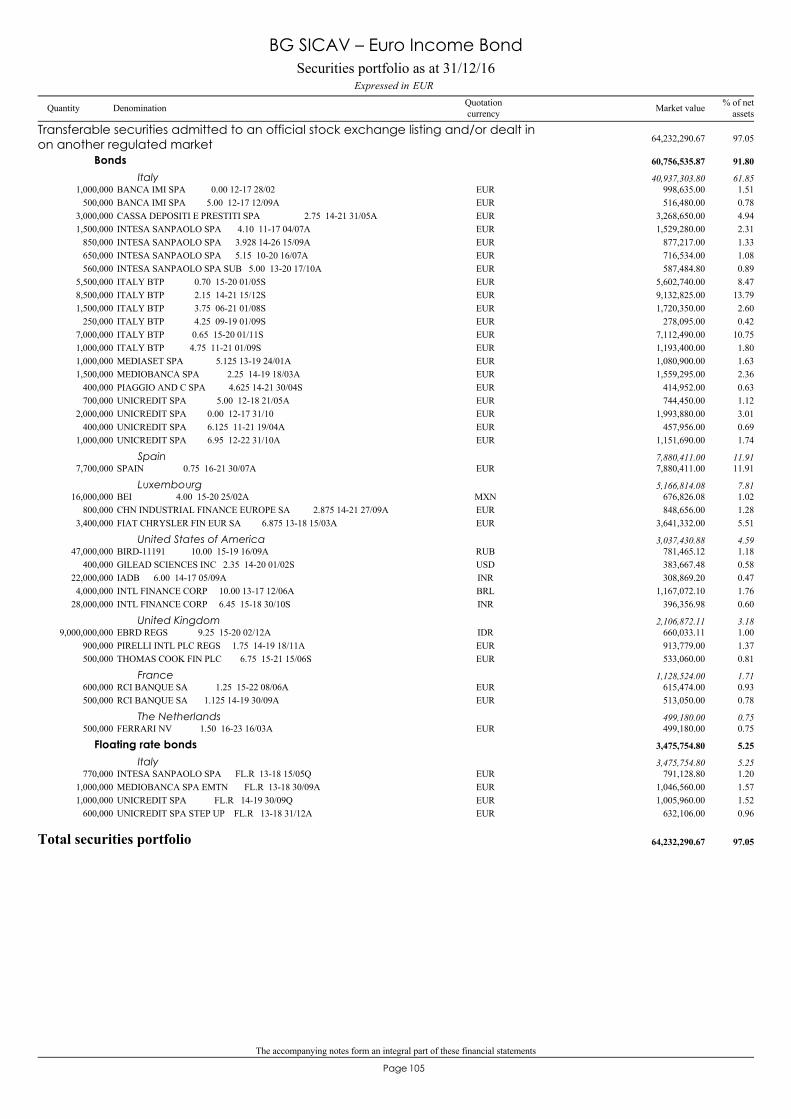
The accompanying notes form an integral part of these financial statements
105Page
BANCA IMI SPA 0.00 12-17 28/021,000,000 998,635.00 1.51EUR
Transferable securities admitted to an official stock exchange listing and/or dealt inon another regulated market 64,232,290.67 97.05
Bonds 60,756,535.87 91.80
Italy 40,937,303.80 61.85
BANCA IMI SPA 5.00 12-17 12/09A500,000 516,480.00 0.78EURCASSA DEPOSITI E PRESTITI SPA 2.75 14-21 31/05A3,000,000 3,268,650.00 4.94EURINTESA SANPAOLO SPA 4.10 11-17 04/07A1,500,000 1,529,280.00 2.31EURINTESA SANPAOLO SPA 3.928 14-26 15/09A850,000 877,217.00 1.33EURINTESA SANPAOLO SPA 5.15 10-20 16/07A650,000 716,534.00 1.08EURINTESA SANPAOLO SPA SUB 5.00 13-20 17/10A560,000 587,484.80 0.89EURITALY BTP 0.70 15-20 01/05S5,500,000 5,602,740.00 8.47EURITALY BTP 2.15 14-21 15/12S8,500,000 9,132,825.00 13.79EURITALY BTP 3.75 06-21 01/08S1,500,000 1,720,350.00 2.60EURITALY BTP 4.25 09-19 01/09S250,000 278,095.00 0.42EURITALY BTP 0.65 15-20 01/11S7,000,000 7,112,490.00 10.75EURITALY BTP 4.75 11-21 01/09S1,000,000 1,193,400.00 1.80EURMEDIASET SPA 5.125 13-19 24/01A1,000,000 1,080,900.00 1.63EURMEDIOBANCA SPA 2.25 14-19 18/03A1,500,000 1,559,295.00 2.36EURPIAGGIO AND C SPA 4.625 14-21 30/04S400,000 414,952.00 0.63EURUNICREDIT SPA 5.00 12-18 21/05A700,000 744,450.00 1.12EURUNICREDIT SPA 0.00 12-17 31/102,000,000 1,993,880.00 3.01EURUNICREDIT SPA 6.125 11-21 19/04A400,000 457,956.00 0.69EURUNICREDIT SPA 6.95 12-22 31/10A1,000,000 1,151,690.00 1.74EUR
SPAIN 0.75 16-21 30/07A7,700,000 7,880,411.00 11.91EURSpain 7,880,411.00 11.91
BEI 4.00 15-20 25/02A16,000,000 676,826.08 1.02MXNLuxembourg 5,166,814.08 7.81
CHN INDUSTRIAL FINANCE EUROPE SA 2.875 14-21 27/09A800,000 848,656.00 1.28EURFIAT CHRYSLER FIN EUR SA 6.875 13-18 15/03A3,400,000 3,641,332.00 5.51EUR
BIRD-11191 10.00 15-19 16/09A47,000,000 781,465.12 1.18RUBUnited States of America 3,037,430.88 4.59
GILEAD SCIENCES INC 2.35 14-20 01/02S400,000 383,667.48 0.58USDIADB 6.00 14-17 05/09A22,000,000 308,869.20 0.47INRINTL FINANCE CORP 10.00 13-17 12/06A4,000,000 1,167,072.10 1.76BRLINTL FINANCE CORP 6.45 15-18 30/10S28,000,000 396,356.98 0.60INR
EBRD REGS 9.25 15-20 02/12A9,000,000,000 660,033.11 1.00IDRUnited Kingdom 2,106,872.11 3.18
PIRELLI INTL PLC REGS 1.75 14-19 18/11A900,000 913,779.00 1.37EURTHOMAS COOK FIN PLC 6.75 15-21 15/06S500,000 533,060.00 0.81EUR
RCI BANQUE SA 1.25 15-22 08/06A600,000 615,474.00 0.93EURFrance 1,128,524.00 1.71
RCI BANQUE SA 1.125 14-19 30/09A500,000 513,050.00 0.78EUR
FERRARI NV 1.50 16-23 16/03A500,000 499,180.00 0.75EURThe Netherlands 499,180.00 0.75
INTESA SANPAOLO SPA FL.R 13-18 15/05Q770,000 791,128.80 1.20EUR
Floating rate bonds 3,475,754.80 5.25
Italy 3,475,754.80 5.25
MEDIOBANCA SPA EMTN FL.R 13-18 30/09A1,000,000 1,046,560.00 1.57EURUNICREDIT SPA FL.R 14-19 30/09Q1,000,000 1,005,960.00 1.52EURUNICREDIT SPA STEP UP FL.R 13-18 31/12A600,000 632,106.00 0.96EUR
Total securities portfolio 64,232,290.67 97.05
Securities portfolio as at 31/12/16EURExpressed in
BG SICAV – Euro Income Bond
Quantity Denomination Quotationcurrency
% of netassetsMarket value
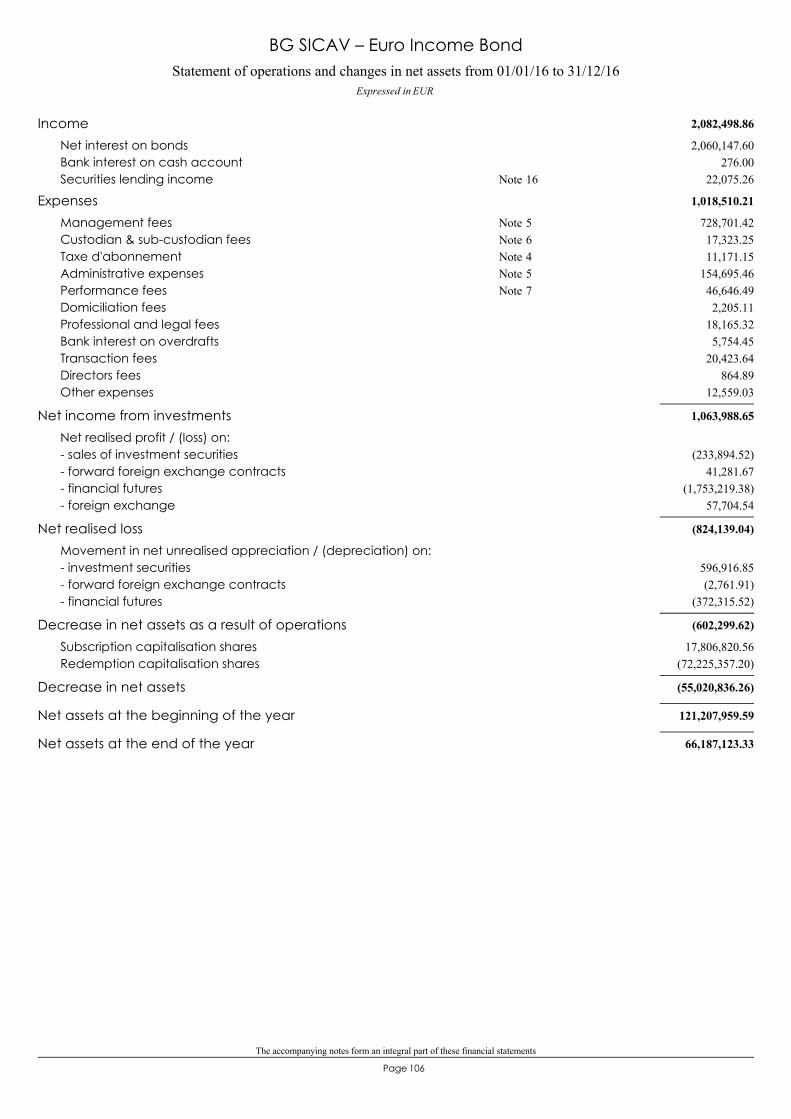
The accompanying notes form an integral part of these financial statements
106Page
Statement of operations and changes in net assets from 01/01/16 to 31/12/16Expressed in EUR
BG SICAV – Euro Income Bond
2,082,498.86Income2,060,147.60Net interest on bonds
276.00Bank interest on cash account22,075.26Securities lending income 16Note
1,018,510.21Expenses728,701.42Management fees 5Note17,323.25Custodian & sub-custodian fees 6Note11,171.15Taxe d'abonnement 4Note
154,695.46Administrative expenses 5Note46,646.49Performance fees 7Note2,205.11Domiciliation fees
18,165.32Professional and legal fees5,754.45Bank interest on overdrafts
20,423.64Transaction fees864.89Directors fees
12,559.03Other expenses
1,063,988.65Net income from investmentsNet realised profit / (loss) on:
(233,894.52)- sales of investment securities41,281.67- forward foreign exchange contracts
(1,753,219.38)- financial futures57,704.54- foreign exchange
(824,139.04)Net realised lossMovement in net unrealised appreciation / (depreciation) on:
596,916.85- investment securities(2,761.91)- forward foreign exchange contracts
(372,315.52)- financial futures
(602,299.62)Decrease in net assets as a result of operations17,806,820.56Subscription capitalisation shares
(72,225,357.20)Redemption capitalisation shares
(55,020,836.26)Decrease in net assets
121,207,959.59Net assets at the beginning of the year
66,187,123.33Net assets at the end of the year
107Page
BG SICAV– Eurizon Multiasset Optimal Diversified Approach
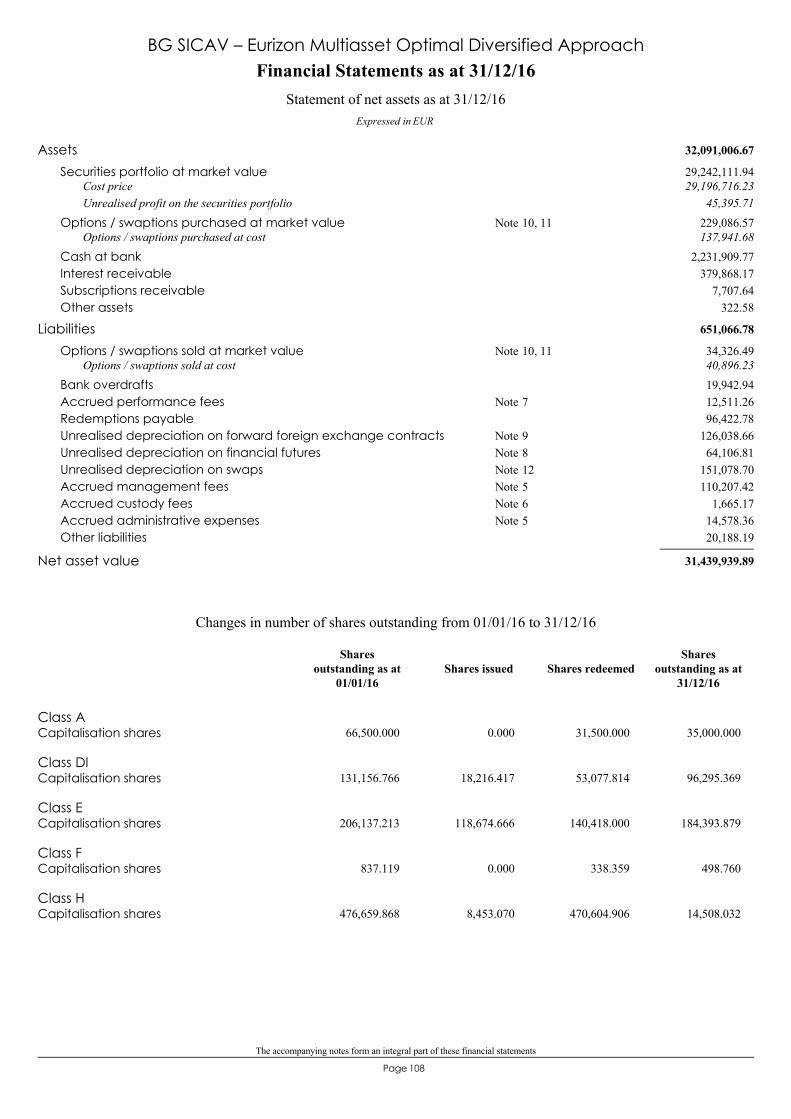
The accompanying notes form an integral part of these financial statements
108Page
32,091,006.67Assets29,242,111.94Securities portfolio at market value29,196,716.23Cost price
45,395.71Unrealised profit on the securities portfolio229,086.57Options / swaptions purchased at market value 10, 11Note137,941.68Options / swaptions purchased at cost
2,231,909.77Cash at bank379,868.17Interest receivable
7,707.64Subscriptions receivable322.58Other assets
651,066.78Liabilities34,326.49Options / swaptions sold at market value 10, 11Note40,896.23Options / swaptions sold at cost19,942.94Bank overdrafts12,511.26Accrued performance fees 7Note96,422.78Redemptions payable
126,038.66Unrealised depreciation on forward foreign exchange contracts 9Note64,106.81Unrealised depreciation on financial futures 8Note
151,078.70Unrealised depreciation on swaps 12Note110,207.42Accrued management fees 5Note
1,665.17Accrued custody fees 6Note14,578.36Accrued administrative expenses 5Note20,188.19Other liabilities
31,439,939.89Net asset value
Financial Statements as at 31/12/16
Expressed in EUR
Statement of net assets as at 31/12/16
BG SICAV – Eurizon Multiasset Optimal Diversified Approach
Class ACapitalisation shares 66,500.000 0.000 31,500.000 35,000.000
Class DlCapitalisation shares 131,156.766 18,216.417 53,077.814 96,295.369
Class ECapitalisation shares 206,137.213 118,674.666 140,418.000 184,393.879
Class FCapitalisation shares 837.119 0.000 338.359 498.760
Class HCapitalisation shares 476,659.868 8,453.070 470,604.906 14,508.032
Changes in number of shares outstanding from 01/01/16 to 31/12/16
Shares issued Shares redeemedShares
outstanding as at31/12/16
Sharesoutstanding as at
01/01/16
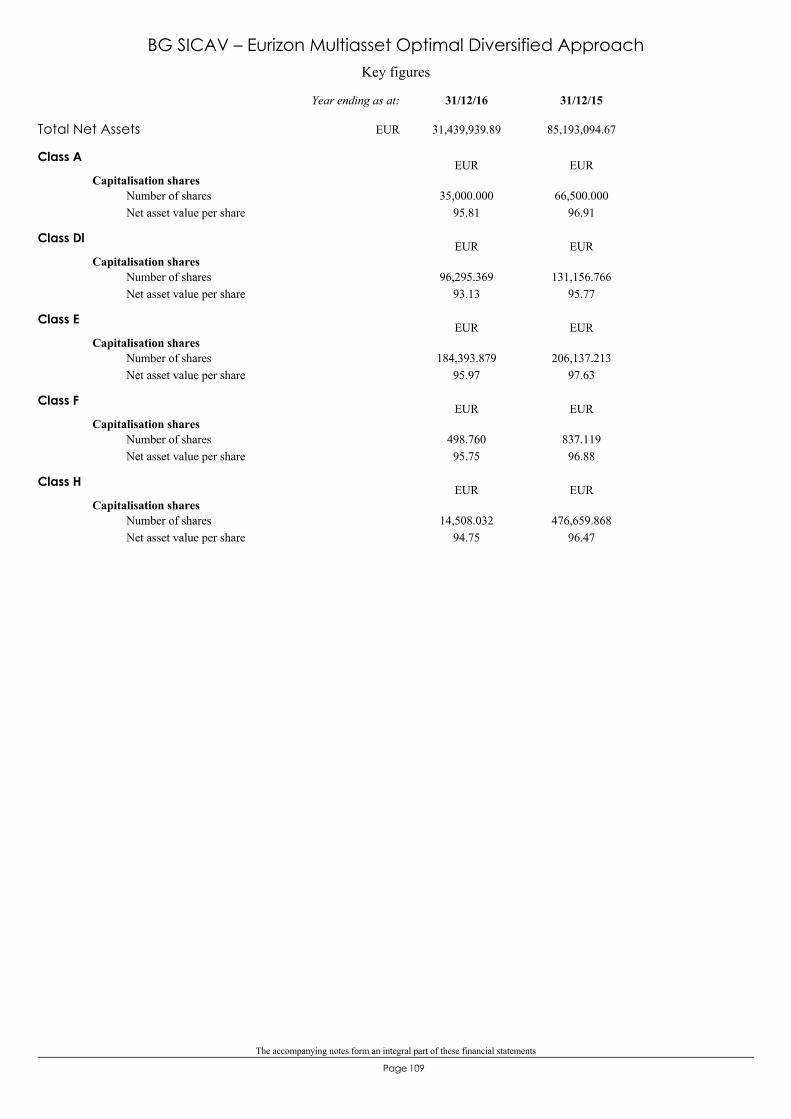
The accompanying notes form an integral part of these financial statements
109Page
Key figures
BG SICAV – Eurizon Multiasset Optimal Diversified Approach
Class A
Capitalisation shares
95.8135,000.000 66,500.000
96.91Number of sharesNet asset value per share
EUR EUR
Class Dl
Capitalisation shares
93.1396,295.369 131,156.766
95.77Number of sharesNet asset value per share
EUR EUR
Class E
Capitalisation shares
95.97184,393.879 206,137.213
97.63Number of sharesNet asset value per share
EUR EUR
Class F
Capitalisation shares
95.75498.760 837.119
96.88Number of sharesNet asset value per share
EUR EUR
Class H
Capitalisation shares
94.7514,508.032 476,659.868
96.47Number of sharesNet asset value per share
EUR EUR
Total Net Assets 31,439,939.89 85,193,094.67
31/12/1531/12/16Year ending as at:
EUR
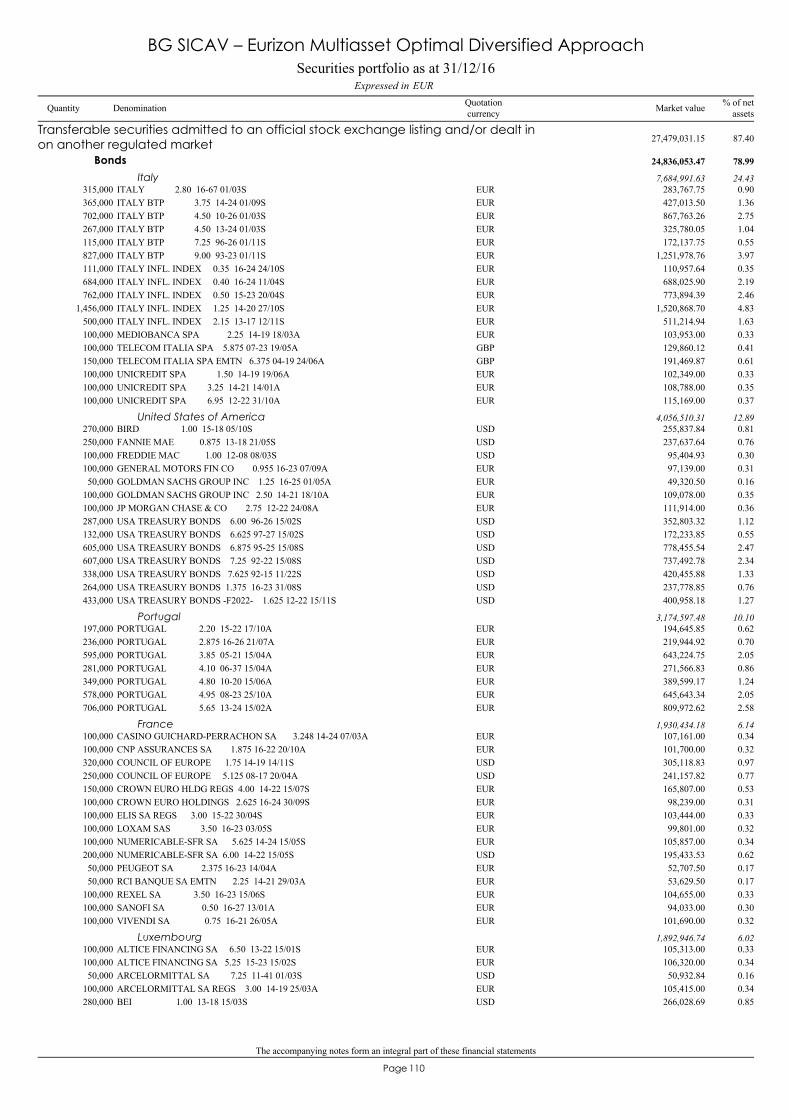
The accompanying notes form an integral part of these financial statements
110Page
ITALY 2.80 16-67 01/03S315,000 283,767.75 0.90EUR
Transferable securities admitted to an official stock exchange listing and/or dealt inon another regulated market 27,479,031.15 87.40
Bonds 24,836,053.47 78.99
Italy 7,684,991.63 24.43
ITALY BTP 3.75 14-24 01/09S365,000 427,013.50 1.36EURITALY BTP 4.50 10-26 01/03S702,000 867,763.26 2.75EURITALY BTP 4.50 13-24 01/03S267,000 325,780.05 1.04EURITALY BTP 7.25 96-26 01/11S115,000 172,137.75 0.55EURITALY BTP 9.00 93-23 01/11S827,000 1,251,978.76 3.97EURITALY INFL. INDEX 0.35 16-24 24/10S111,000 110,957.64 0.35EURITALY INFL. INDEX 0.40 16-24 11/04S684,000 688,025.90 2.19EURITALY INFL. INDEX 0.50 15-23 20/04S762,000 773,894.39 2.46EURITALY INFL. INDEX 1.25 14-20 27/10S1,456,000 1,520,868.70 4.83EURITALY INFL. INDEX 2.15 13-17 12/11S500,000 511,214.94 1.63EURMEDIOBANCA SPA 2.25 14-19 18/03A100,000 103,953.00 0.33EURTELECOM ITALIA SPA 5.875 07-23 19/05A100,000 129,860.12 0.41GBPTELECOM ITALIA SPA EMTN 6.375 04-19 24/06A150,000 191,469.87 0.61GBPUNICREDIT SPA 1.50 14-19 19/06A100,000 102,349.00 0.33EURUNICREDIT SPA 3.25 14-21 14/01A100,000 108,788.00 0.35EURUNICREDIT SPA 6.95 12-22 31/10A100,000 115,169.00 0.37EUR
BIRD 1.00 15-18 05/10S270,000 255,837.84 0.81USDUnited States of America 4,056,510.31 12.89
FANNIE MAE 0.875 13-18 21/05S250,000 237,637.64 0.76USDFREDDIE MAC 1.00 12-08 08/03S100,000 95,404.93 0.30USDGENERAL MOTORS FIN CO 0.955 16-23 07/09A100,000 97,139.00 0.31EURGOLDMAN SACHS GROUP INC 1.25 16-25 01/05A50,000 49,320.50 0.16EURGOLDMAN SACHS GROUP INC 2.50 14-21 18/10A100,000 109,078.00 0.35EURJP MORGAN CHASE & CO 2.75 12-22 24/08A100,000 111,914.00 0.36EURUSA TREASURY BONDS 6.00 96-26 15/02S287,000 352,803.32 1.12USDUSA TREASURY BONDS 6.625 97-27 15/02S132,000 172,233.85 0.55USDUSA TREASURY BONDS 6.875 95-25 15/08S605,000 778,455.54 2.47USDUSA TREASURY BONDS 7.25 92-22 15/08S607,000 737,492.78 2.34USDUSA TREASURY BONDS 7.625 92-15 11/22S338,000 420,455.88 1.33USDUSA TREASURY BONDS 1.375 16-23 31/08S264,000 237,778.85 0.76USDUSA TREASURY BONDS -F2022- 1.625 12-22 15/11S433,000 400,958.18 1.27USD
PORTUGAL 2.20 15-22 17/10A197,000 194,645.85 0.62EURPortugal 3,174,597.48 10.10
PORTUGAL 2.875 16-26 21/07A236,000 219,944.92 0.70EURPORTUGAL 3.85 05-21 15/04A595,000 643,224.75 2.05EURPORTUGAL 4.10 06-37 15/04A281,000 271,566.83 0.86EURPORTUGAL 4.80 10-20 15/06A349,000 389,599.17 1.24EURPORTUGAL 4.95 08-23 25/10A578,000 645,643.34 2.05EURPORTUGAL 5.65 13-24 15/02A706,000 809,972.62 2.58EUR
CASINO GUICHARD-PERRACHON SA 3.248 14-24 07/03A100,000 107,161.00 0.34EURFrance 1,930,434.18 6.14
CNP ASSURANCES SA 1.875 16-22 20/10A100,000 101,700.00 0.32EURCOUNCIL OF EUROPE 1.75 14-19 14/11S320,000 305,118.83 0.97USDCOUNCIL OF EUROPE 5.125 08-17 20/04A250,000 241,157.82 0.77USDCROWN EURO HLDG REGS 4.00 14-22 15/07S150,000 165,807.00 0.53EURCROWN EURO HOLDINGS 2.625 16-24 30/09S100,000 98,239.00 0.31EURELIS SA REGS 3.00 15-22 30/04S100,000 103,444.00 0.33EURLOXAM SAS 3.50 16-23 03/05S100,000 99,801.00 0.32EURNUMERICABLE-SFR SA 5.625 14-24 15/05S100,000 105,857.00 0.34EURNUMERICABLE-SFR SA 6.00 14-22 15/05S200,000 195,433.53 0.62USDPEUGEOT SA 2.375 16-23 14/04A50,000 52,707.50 0.17EURRCI BANQUE SA EMTN 2.25 14-21 29/03A50,000 53,629.50 0.17EURREXEL SA 3.50 16-23 15/06S100,000 104,655.00 0.33EURSANOFI SA 0.50 16-27 13/01A100,000 94,033.00 0.30EURVIVENDI SA 0.75 16-21 26/05A100,000 101,690.00 0.32EUR
ALTICE FINANCING SA 6.50 13-22 15/01S100,000 105,313.00 0.33EURLuxembourg 1,892,946.74 6.02
ALTICE FINANCING SA 5.25 15-23 15/02S100,000 106,320.00 0.34EURARCELORMITTAL SA 7.25 11-41 01/03S50,000 50,932.84 0.16USDARCELORMITTAL SA REGS 3.00 14-19 25/03A100,000 105,415.00 0.34EURBEI 1.00 13-18 15/03S280,000 266,028.69 0.85USD
Securities portfolio as at 31/12/16EURExpressed in
BG SICAV – Eurizon Multiasset Optimal Diversified Approach
Quantity Denomination Quotationcurrency
% of netassetsMarket value
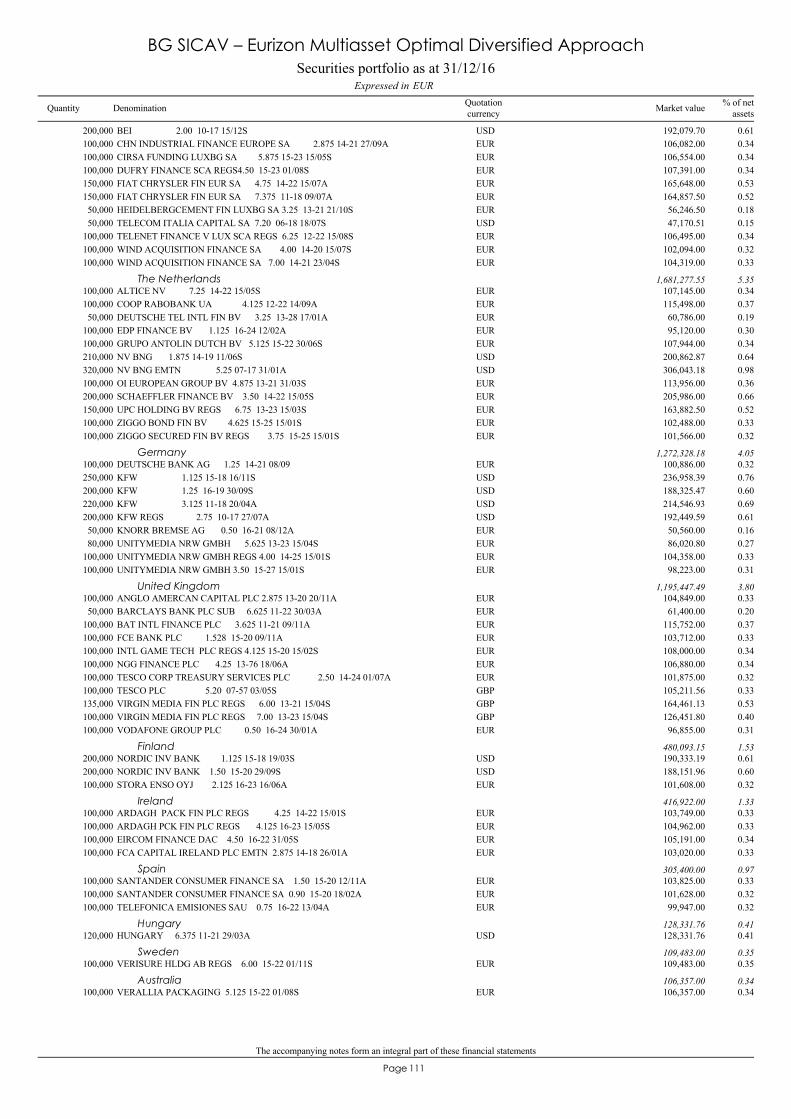
The accompanying notes form an integral part of these financial statements
111Page
BEI 2.00 10-17 15/12S200,000 192,079.70 0.61USDCHN INDUSTRIAL FINANCE EUROPE SA 2.875 14-21 27/09A100,000 106,082.00 0.34EURCIRSA FUNDING LUXBG SA 5.875 15-23 15/05S100,000 106,554.00 0.34EURDUFRY FINANCE SCA REGS4.50 15-23 01/08S100,000 107,391.00 0.34EURFIAT CHRYSLER FIN EUR SA 4.75 14-22 15/07A150,000 165,648.00 0.53EURFIAT CHRYSLER FIN EUR SA 7.375 11-18 09/07A150,000 164,857.50 0.52EURHEIDELBERGCEMENT FIN LUXBG SA 3.25 13-21 21/10S50,000 56,246.50 0.18EURTELECOM ITALIA CAPITAL SA 7.20 06-18 18/07S50,000 47,170.51 0.15USDTELENET FINANCE V LUX SCA REGS 6.25 12-22 15/08S100,000 106,495.00 0.34EURWIND ACQUISITION FINANCE SA 4.00 14-20 15/07S100,000 102,094.00 0.32EURWIND ACQUISITION FINANCE SA 7.00 14-21 23/04S100,000 104,319.00 0.33EUR
ALTICE NV 7.25 14-22 15/05S100,000 107,145.00 0.34EURThe Netherlands 1,681,277.55 5.35
COOP RABOBANK UA 4.125 12-22 14/09A100,000 115,498.00 0.37EURDEUTSCHE TEL INTL FIN BV 3.25 13-28 17/01A50,000 60,786.00 0.19EUREDP FINANCE BV 1.125 16-24 12/02A100,000 95,120.00 0.30EURGRUPO ANTOLIN DUTCH BV 5.125 15-22 30/06S100,000 107,944.00 0.34EURNV BNG 1.875 14-19 11/06S210,000 200,862.87 0.64USDNV BNG EMTN 5.25 07-17 31/01A320,000 306,043.18 0.98USDOI EUROPEAN GROUP BV 4.875 13-21 31/03S100,000 113,956.00 0.36EURSCHAEFFLER FINANCE BV 3.50 14-22 15/05S200,000 205,986.00 0.66EURUPC HOLDING BV REGS 6.75 13-23 15/03S150,000 163,882.50 0.52EURZIGGO BOND FIN BV 4.625 15-25 15/01S100,000 102,488.00 0.33EURZIGGO SECURED FIN BV REGS 3.75 15-25 15/01S100,000 101,566.00 0.32EUR
DEUTSCHE BANK AG 1.25 14-21 08/09100,000 100,886.00 0.32EURGermany 1,272,328.18 4.05
KFW 1.125 15-18 16/11S250,000 236,958.39 0.76USDKFW 1.25 16-19 30/09S200,000 188,325.47 0.60USDKFW 3.125 11-18 20/04A220,000 214,546.93 0.69USDKFW REGS 2.75 10-17 27/07A200,000 192,449.59 0.61USDKNORR BREMSE AG 0.50 16-21 08/12A50,000 50,560.00 0.16EURUNITYMEDIA NRW GMBH 5.625 13-23 15/04S80,000 86,020.80 0.27EURUNITYMEDIA NRW GMBH REGS 4.00 14-25 15/01S100,000 104,358.00 0.33EURUNITYMEDIA NRW GMBH 3.50 15-27 15/01S100,000 98,223.00 0.31EUR
ANGLO AMERCAN CAPITAL PLC 2.875 13-20 20/11A100,000 104,849.00 0.33EURUnited Kingdom 1,195,447.49 3.80
BARCLAYS BANK PLC SUB 6.625 11-22 30/03A50,000 61,400.00 0.20EURBAT INTL FINANCE PLC 3.625 11-21 09/11A100,000 115,752.00 0.37EURFCE BANK PLC 1.528 15-20 09/11A100,000 103,712.00 0.33EURINTL GAME TECH PLC REGS 4.125 15-20 15/02S100,000 108,000.00 0.34EURNGG FINANCE PLC 4.25 13-76 18/06A100,000 106,880.00 0.34EURTESCO CORP TREASURY SERVICES PLC 2.50 14-24 01/07A100,000 101,875.00 0.32EURTESCO PLC 5.20 07-57 03/05S100,000 105,211.56 0.33GBPVIRGIN MEDIA FIN PLC REGS 6.00 13-21 15/04S135,000 164,461.13 0.53GBPVIRGIN MEDIA FIN PLC REGS 7.00 13-23 15/04S100,000 126,451.80 0.40GBPVODAFONE GROUP PLC 0.50 16-24 30/01A100,000 96,855.00 0.31EUR
NORDIC INV BANK 1.125 15-18 19/03S200,000 190,333.19 0.61USDFinland 480,093.15 1.53
NORDIC INV BANK 1.50 15-20 29/09S200,000 188,151.96 0.60USDSTORA ENSO OYJ 2.125 16-23 16/06A100,000 101,608.00 0.32EUR
ARDAGH PACK FIN PLC REGS 4.25 14-22 15/01S100,000 103,749.00 0.33EURIreland 416,922.00 1.33
ARDAGH PCK FIN PLC REGS 4.125 16-23 15/05S100,000 104,962.00 0.33EUREIRCOM FINANCE DAC 4.50 16-22 31/05S100,000 105,191.00 0.34EURFCA CAPITAL IRELAND PLC EMTN 2.875 14-18 26/01A100,000 103,020.00 0.33EUR
SANTANDER CONSUMER FINANCE SA 1.50 15-20 12/11A100,000 103,825.00 0.33EURSpain 305,400.00 0.97
SANTANDER CONSUMER FINANCE SA 0.90 15-20 18/02A100,000 101,628.00 0.32EURTELEFONICA EMISIONES SAU 0.75 16-22 13/04A100,000 99,947.00 0.32EUR
HUNGARY 6.375 11-21 29/03A120,000 128,331.76 0.41USDHungary 128,331.76 0.41
VERISURE HLDG AB REGS 6.00 15-22 01/11S100,000 109,483.00 0.35EURSweden 109,483.00 0.35
VERALLIA PACKAGING 5.125 15-22 01/08S100,000 106,357.00 0.34EURAustralia 106,357.00 0.34
Securities portfolio as at 31/12/16EURExpressed in
BG SICAV – Eurizon Multiasset Optimal Diversified Approach
Quantity Denomination Quotationcurrency
% of netassetsMarket value
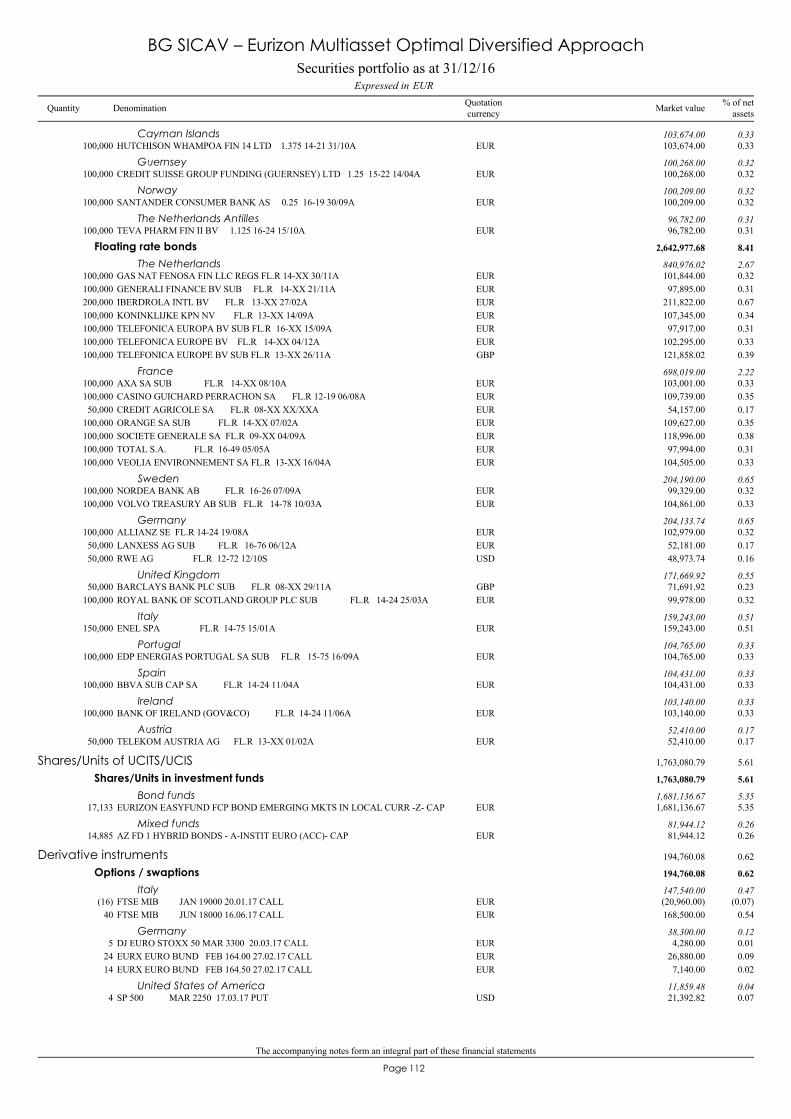
The accompanying notes form an integral part of these financial statements
112Page
HUTCHISON WHAMPOA FIN 14 LTD 1.375 14-21 31/10A100,000 103,674.00 0.33EURCayman Islands 103,674.00 0.33
CREDIT SUISSE GROUP FUNDING (GUERNSEY) LTD 1.25 15-22 14/04A100,000 100,268.00 0.32EURGuernsey 100,268.00 0.32
SANTANDER CONSUMER BANK AS 0.25 16-19 30/09A100,000 100,209.00 0.32EURNorway 100,209.00 0.32
TEVA PHARM FIN II BV 1.125 16-24 15/10A100,000 96,782.00 0.31EURThe Netherlands Antilles 96,782.00 0.31
GAS NAT FENOSA FIN LLC REGS FL.R 14-XX 30/11A100,000 101,844.00 0.32EUR
Floating rate bonds 2,642,977.68 8.41
The Netherlands 840,976.02 2.67
GENERALI FINANCE BV SUB FL.R 14-XX 21/11A100,000 97,895.00 0.31EURIBERDROLA INTL BV FL.R 13-XX 27/02A200,000 211,822.00 0.67EURKONINKLIJKE KPN NV FL.R 13-XX 14/09A100,000 107,345.00 0.34EURTELEFONICA EUROPA BV SUB FL.R 16-XX 15/09A100,000 97,917.00 0.31EURTELEFONICA EUROPE BV FL.R 14-XX 04/12A100,000 102,295.00 0.33EURTELEFONICA EUROPE BV SUB FL.R 13-XX 26/11A100,000 121,858.02 0.39GBP
AXA SA SUB FL.R 14-XX 08/10A100,000 103,001.00 0.33EURFrance 698,019.00 2.22
CASINO GUICHARD PERRACHON SA FL.R 12-19 06/08A100,000 109,739.00 0.35EURCREDIT AGRICOLE SA FL.R 08-XX XX/XXA50,000 54,157.00 0.17EURORANGE SA SUB FL.R 14-XX 07/02A100,000 109,627.00 0.35EURSOCIETE GENERALE SA FL.R 09-XX 04/09A100,000 118,996.00 0.38EURTOTAL S.A. FL.R 16-49 05/05A100,000 97,994.00 0.31EURVEOLIA ENVIRONNEMENT SA FL.R 13-XX 16/04A100,000 104,505.00 0.33EUR
NORDEA BANK AB FL.R 16-26 07/09A100,000 99,329.00 0.32EURSweden 204,190.00 0.65
VOLVO TREASURY AB SUB FL.R 14-78 10/03A100,000 104,861.00 0.33EUR
ALLIANZ SE FL.R 14-24 19/08A100,000 102,979.00 0.32EURGermany 204,133.74 0.65
LANXESS AG SUB FL.R 16-76 06/12A50,000 52,181.00 0.17EURRWE AG FL.R 12-72 12/10S50,000 48,973.74 0.16USD
BARCLAYS BANK PLC SUB FL.R 08-XX 29/11A50,000 71,691.92 0.23GBPUnited Kingdom 171,669.92 0.55
ROYAL BANK OF SCOTLAND GROUP PLC SUB FL.R 14-24 25/03A100,000 99,978.00 0.32EUR
ENEL SPA FL.R 14-75 15/01A150,000 159,243.00 0.51EURItaly 159,243.00 0.51
EDP ENERGIAS PORTUGAL SA SUB FL.R 15-75 16/09A100,000 104,765.00 0.33EURPortugal 104,765.00 0.33
BBVA SUB CAP SA FL.R 14-24 11/04A100,000 104,431.00 0.33EURSpain 104,431.00 0.33
BANK OF IRELAND (GOV&CO) FL.R 14-24 11/06A100,000 103,140.00 0.33EURIreland 103,140.00 0.33
TELEKOM AUSTRIA AG FL.R 13-XX 01/02A50,000 52,410.00 0.17EURAustria 52,410.00 0.17
EURIZON EASYFUND FCP BOND EMERGING MKTS IN LOCAL CURR -Z- CAP17,133 1,681,136.67 5.35EUR
Shares/Units of UCITS/UCIS 1,763,080.79 5.61
Shares/Units in investment funds 1,763,080.79 5.61
Bond funds 1,681,136.67 5.35
AZ FD 1 HYBRID BONDS - A-INSTIT EURO (ACC)- CAP14,885 81,944.12 0.26EURMixed funds 81,944.12 0.26
FTSE MIB JAN 19000 20.01.17 CALL(16) (20,960.00) (0.07)EUR
Derivative instruments 194,760.08 0.62
Options / swaptions 194,760.08 0.62
Italy 147,540.00 0.47
FTSE MIB JUN 18000 16.06.17 CALL40 168,500.00 0.54EUR
DJ EURO STOXX 50 MAR 3300 20.03.17 CALL5 4,280.00 0.01EURGermany 38,300.00 0.12
EURX EURO BUND FEB 164.00 27.02.17 CALL24 26,880.00 0.09EUREURX EURO BUND FEB 164.50 27.02.17 CALL14 7,140.00 0.02EUR
SP 500 MAR 2250 17.03.17 PUT4 21,392.82 0.07USDUnited States of America 11,859.48 0.04
Securities portfolio as at 31/12/16EURExpressed in
BG SICAV – Eurizon Multiasset Optimal Diversified Approach
Quantity Denomination Quotationcurrency
% of netassetsMarket value
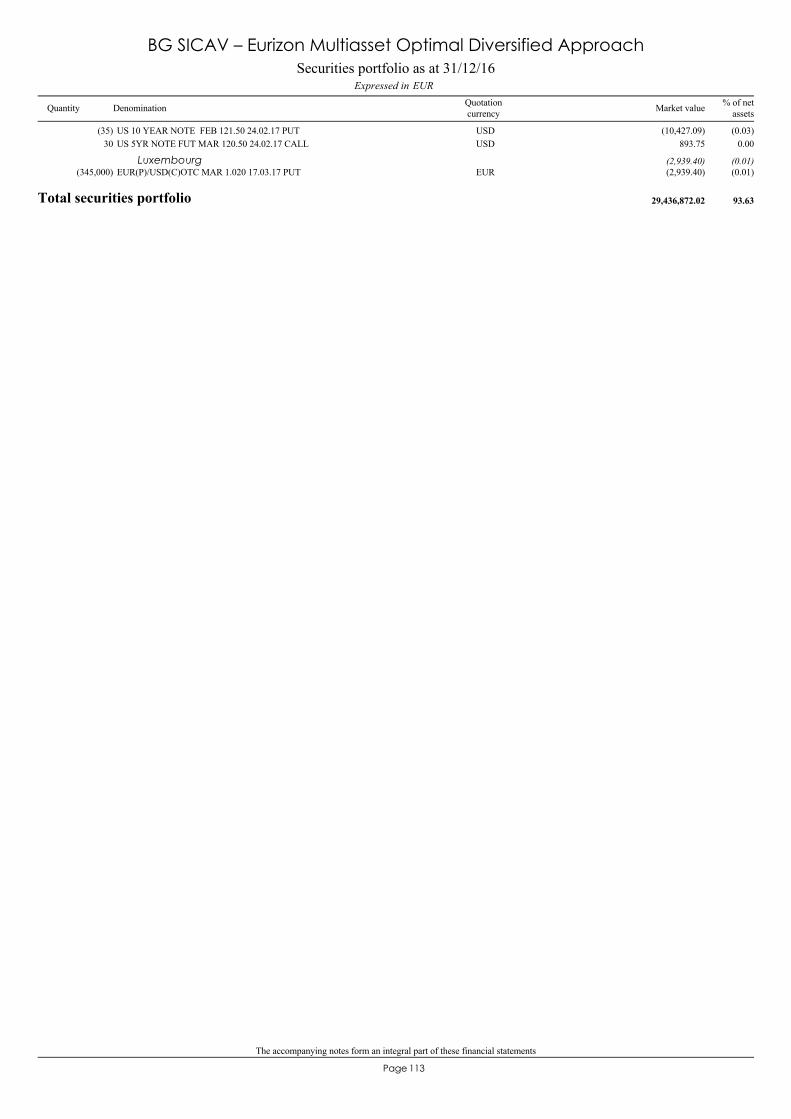
The accompanying notes form an integral part of these financial statements
113Page
US 10 YEAR NOTE FEB 121.50 24.02.17 PUT(35) (10,427.09) (0.03)USDUS 5YR NOTE FUT MAR 120.50 24.02.17 CALL30 893.75 0.00USD
EUR(P)/USD(C)OTC MAR 1.020 17.03.17 PUT(345,000) (2,939.40) (0.01)EURLuxembourg (2,939.40) (0.01)
Total securities portfolio 29,436,872.02 93.63
Securities portfolio as at 31/12/16EURExpressed in
BG SICAV – Eurizon Multiasset Optimal Diversified Approach
Quantity Denomination Quotationcurrency
% of netassetsMarket value
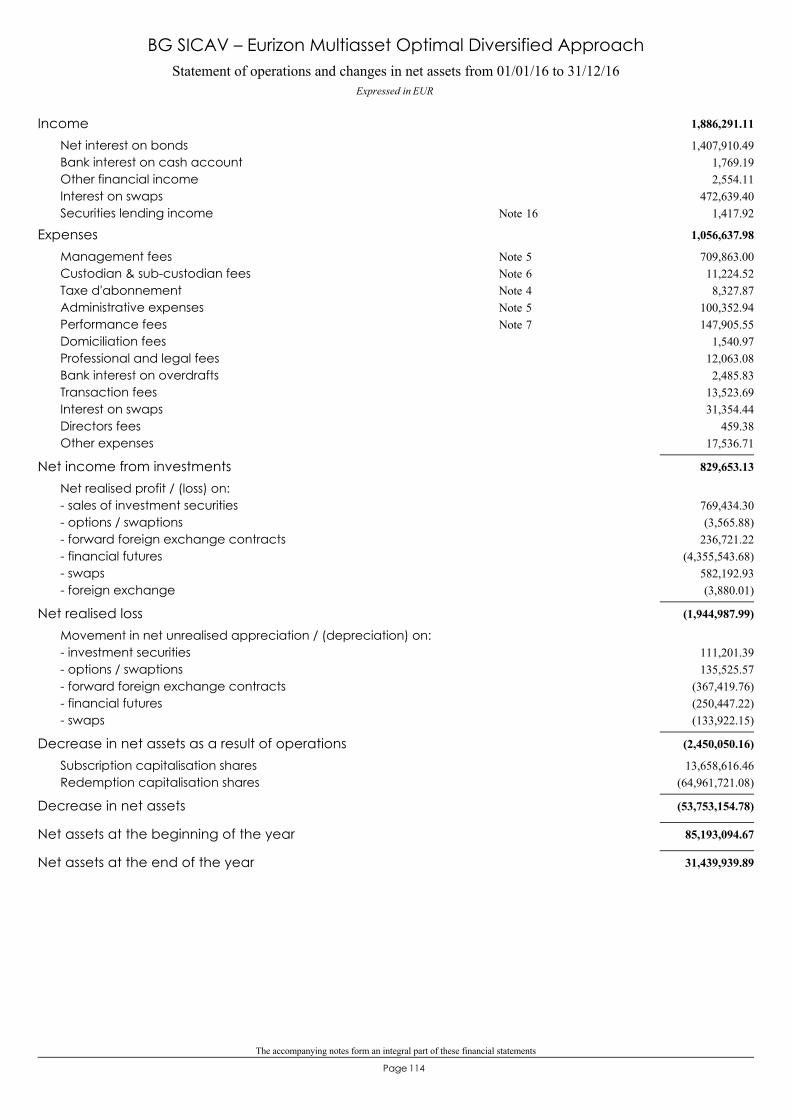
The accompanying notes form an integral part of these financial statements
114Page
Statement of operations and changes in net assets from 01/01/16 to 31/12/16Expressed in EUR
BG SICAV – Eurizon Multiasset Optimal Diversified Approach
1,886,291.11Income1,407,910.49Net interest on bonds
1,769.19Bank interest on cash account2,554.11Other financial income
472,639.40Interest on swaps1,417.92Securities lending income 16Note
1,056,637.98Expenses709,863.00Management fees 5Note11,224.52Custodian & sub-custodian fees 6Note8,327.87Taxe d'abonnement 4Note
100,352.94Administrative expenses 5Note147,905.55Performance fees 7Note
1,540.97Domiciliation fees12,063.08Professional and legal fees2,485.83Bank interest on overdrafts
13,523.69Transaction fees31,354.44Interest on swaps
459.38Directors fees17,536.71Other expenses
829,653.13Net income from investmentsNet realised profit / (loss) on:
769,434.30- sales of investment securities(3,565.88)- options / swaptions
236,721.22- forward foreign exchange contracts(4,355,543.68)- financial futures
582,192.93- swaps(3,880.01)- foreign exchange
(1,944,987.99)Net realised lossMovement in net unrealised appreciation / (depreciation) on:
111,201.39- investment securities135,525.57- options / swaptions
(367,419.76)- forward foreign exchange contracts(250,447.22)- financial futures(133,922.15)- swaps
(2,450,050.16)Decrease in net assets as a result of operations13,658,616.46Subscription capitalisation shares
(64,961,721.08)Redemption capitalisation shares
(53,753,154.78)Decrease in net assets
85,193,094.67Net assets at the beginning of the year
31,439,939.89Net assets at the end of the year
115Page
BG SICAV– Amundi Absolute Forex
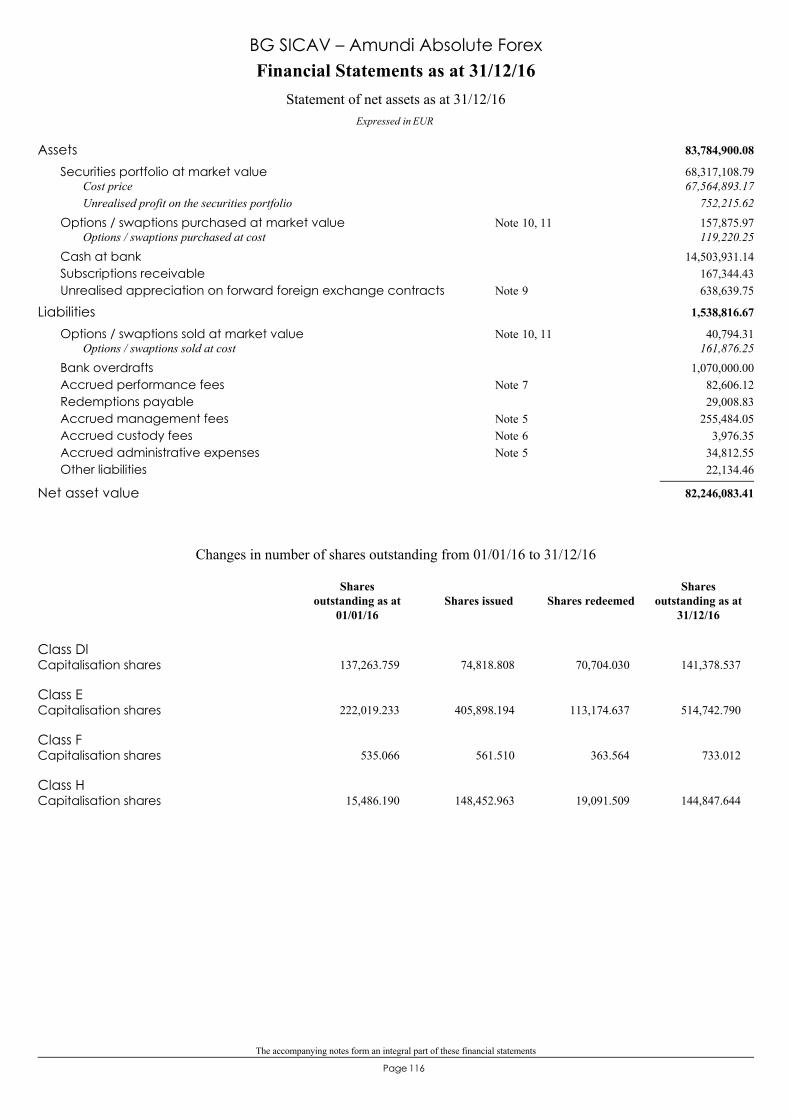
The accompanying notes form an integral part of these financial statements
116Page
83,784,900.08Assets68,317,108.79Securities portfolio at market value67,564,893.17Cost price
752,215.62Unrealised profit on the securities portfolio157,875.97Options / swaptions purchased at market value 10, 11Note119,220.25Options / swaptions purchased at cost
14,503,931.14Cash at bank167,344.43Subscriptions receivable638,639.75Unrealised appreciation on forward foreign exchange contracts 9Note
1,538,816.67Liabilities40,794.31Options / swaptions sold at market value 10, 11Note
161,876.25Options / swaptions sold at cost1,070,000.00Bank overdrafts
82,606.12Accrued performance fees 7Note29,008.83Redemptions payable
255,484.05Accrued management fees 5Note3,976.35Accrued custody fees 6Note
34,812.55Accrued administrative expenses 5Note22,134.46Other liabilities
82,246,083.41Net asset value
Financial Statements as at 31/12/16
Expressed in EUR
Statement of net assets as at 31/12/16
BG SICAV – Amundi Absolute Forex
Class DlCapitalisation shares 137,263.759 74,818.808 70,704.030 141,378.537
Class ECapitalisation shares 222,019.233 405,898.194 113,174.637 514,742.790
Class FCapitalisation shares 535.066 561.510 363.564 733.012
Class HCapitalisation shares 15,486.190 148,452.963 19,091.509 144,847.644
Changes in number of shares outstanding from 01/01/16 to 31/12/16
Shares issued Shares redeemedShares
outstanding as at31/12/16
Sharesoutstanding as at
01/01/16

The accompanying notes form an integral part of these financial statements
117Page
Key figures
BG SICAV – Amundi Absolute Forex
Class Dl
Capitalisation shares
101.29141,378.537 137,263.759
100.81Number of sharesNet asset value per share
EUR EUR
Class E
Capitalisation shares
102.82514,742.790 222,019.233
101.23Number of sharesNet asset value per share
EUR EUR
Class F
Capitalisation shares
104.12733.012 535.066
101.95Number of sharesNet asset value per share
EUR EUR
Class H
Capitalisation shares
103.04144,847.644 15,486.190
101.55Number of sharesNet asset value per share
EUR EUR
Total Net Assets 82,246,083.41 37,939,651.13
31/12/1531/12/16Year ending as at:
EUR
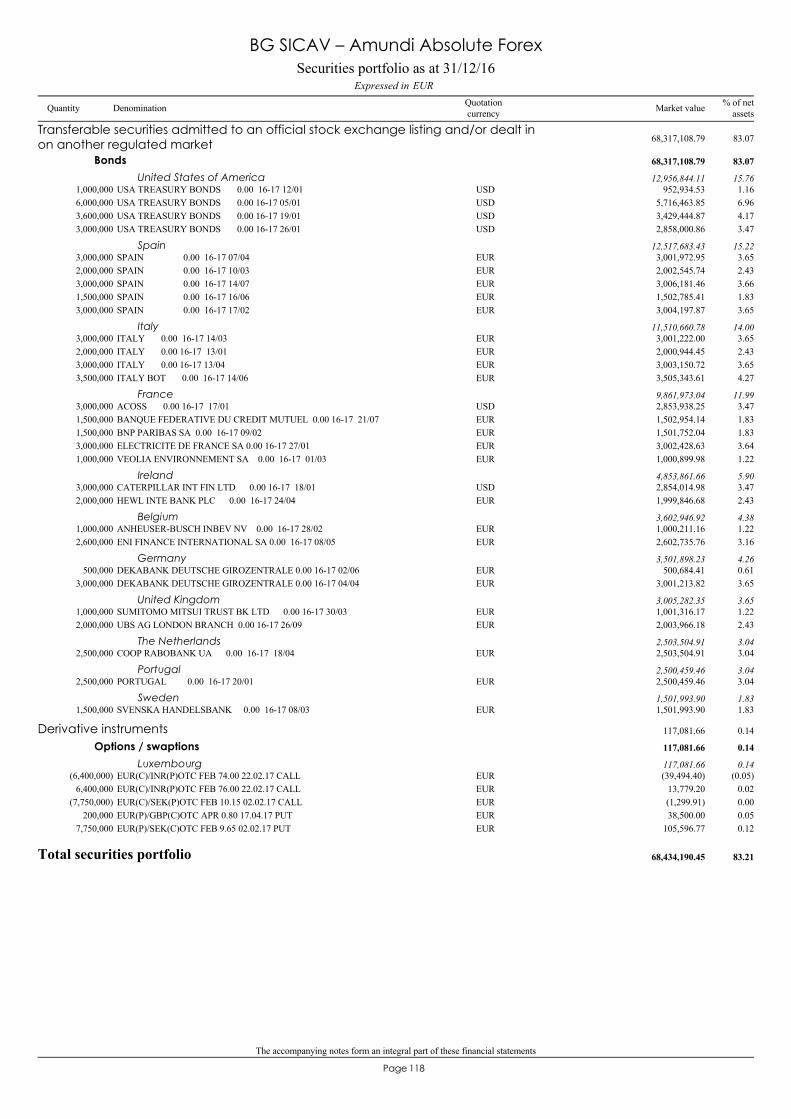
The accompanying notes form an integral part of these financial statements
118Page
USA TREASURY BONDS 0.00 16-17 12/011,000,000 952,934.53 1.16USD
Transferable securities admitted to an official stock exchange listing and/or dealt inon another regulated market 68,317,108.79 83.07
Bonds 68,317,108.79 83.07
United States of America 12,956,844.11 15.76
USA TREASURY BONDS 0.00 16-17 05/016,000,000 5,716,463.85 6.96USDUSA TREASURY BONDS 0.00 16-17 19/013,600,000 3,429,444.87 4.17USDUSA TREASURY BONDS 0.00 16-17 26/013,000,000 2,858,000.86 3.47USD
SPAIN 0.00 16-17 07/043,000,000 3,001,972.95 3.65EURSpain 12,517,683.43 15.22
SPAIN 0.00 16-17 10/032,000,000 2,002,545.74 2.43EURSPAIN 0.00 16-17 14/073,000,000 3,006,181.46 3.66EURSPAIN 0.00 16-17 16/061,500,000 1,502,785.41 1.83EURSPAIN 0.00 16-17 17/023,000,000 3,004,197.87 3.65EUR
ITALY 0.00 16-17 14/033,000,000 3,001,222.00 3.65EURItaly 11,510,660.78 14.00
ITALY 0.00 16-17 13/012,000,000 2,000,944.45 2.43EURITALY 0.00 16-17 13/043,000,000 3,003,150.72 3.65EURITALY BOT 0.00 16-17 14/063,500,000 3,505,343.61 4.27EUR
ACOSS 0.00 16-17 17/013,000,000 2,853,938.25 3.47USDFrance 9,861,973.04 11.99
BANQUE FEDERATIVE DU CREDIT MUTUEL 0.00 16-17 21/071,500,000 1,502,954.14 1.83EURBNP PARIBAS SA 0.00 16-17 09/021,500,000 1,501,752.04 1.83EURELECTRICITE DE FRANCE SA 0.00 16-17 27/013,000,000 3,002,428.63 3.64EURVEOLIA ENVIRONNEMENT SA 0.00 16-17 01/031,000,000 1,000,899.98 1.22EUR
CATERPILLAR INT FIN LTD 0.00 16-17 18/013,000,000 2,854,014.98 3.47USDIreland 4,853,861.66 5.90
HEWL INTE BANK PLC 0.00 16-17 24/042,000,000 1,999,846.68 2.43EUR
ANHEUSER-BUSCH INBEV NV 0.00 16-17 28/021,000,000 1,000,211.16 1.22EURBelgium 3,602,946.92 4.38
ENI FINANCE INTERNATIONAL SA 0.00 16-17 08/052,600,000 2,602,735.76 3.16EUR
DEKABANK DEUTSCHE GIROZENTRALE 0.00 16-17 02/06500,000 500,684.41 0.61EURGermany 3,501,898.23 4.26
DEKABANK DEUTSCHE GIROZENTRALE 0.00 16-17 04/043,000,000 3,001,213.82 3.65EUR
SUMITOMO MITSUI TRUST BK LTD 0.00 16-17 30/031,000,000 1,001,316.17 1.22EURUnited Kingdom 3,005,282.35 3.65
UBS AG LONDON BRANCH 0.00 16-17 26/092,000,000 2,003,966.18 2.43EUR
COOP RABOBANK UA 0.00 16-17 18/042,500,000 2,503,504.91 3.04EURThe Netherlands 2,503,504.91 3.04
PORTUGAL 0.00 16-17 20/012,500,000 2,500,459.46 3.04EURPortugal 2,500,459.46 3.04
SVENSKA HANDELSBANK 0.00 16-17 08/031,500,000 1,501,993.90 1.83EURSweden 1,501,993.90 1.83
EUR(C)/INR(P)OTC FEB 74.00 22.02.17 CALL(6,400,000) (39,494.40) (0.05)EUR
Derivative instruments 117,081.66 0.14
Options / swaptions 117,081.66 0.14
Luxembourg 117,081.66 0.14
EUR(C)/INR(P)OTC FEB 76.00 22.02.17 CALL6,400,000 13,779.20 0.02EUREUR(C)/SEK(P)OTC FEB 10.15 02.02.17 CALL(7,750,000) (1,299.91) 0.00EUREUR(P)/GBP(C)OTC APR 0.80 17.04.17 PUT200,000 38,500.00 0.05EUREUR(P)/SEK(C)OTC FEB 9.65 02.02.17 PUT7,750,000 105,596.77 0.12EUR
Total securities portfolio 68,434,190.45 83.21
Securities portfolio as at 31/12/16EURExpressed in
BG SICAV – Amundi Absolute Forex
Quantity Denomination Quotationcurrency
% of netassetsMarket value
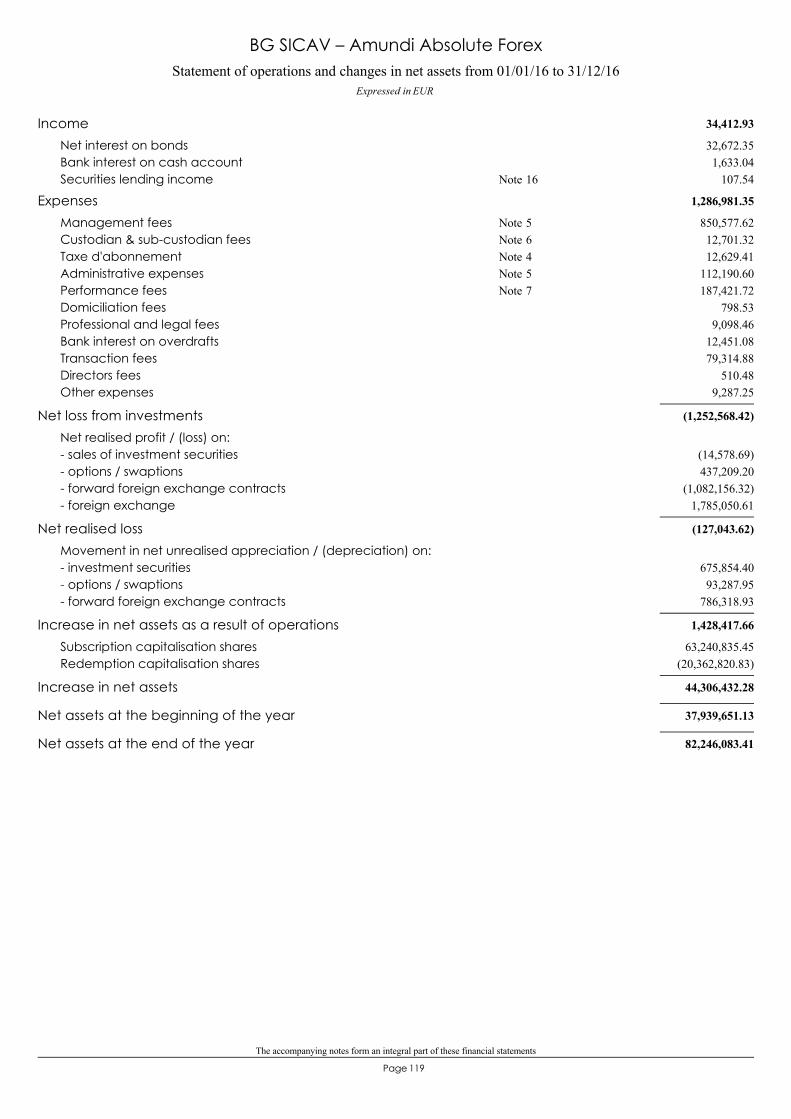
The accompanying notes form an integral part of these financial statements
119Page
Statement of operations and changes in net assets from 01/01/16 to 31/12/16Expressed in EUR
BG SICAV – Amundi Absolute Forex
34,412.93Income32,672.35Net interest on bonds1,633.04Bank interest on cash account
107.54Securities lending income 16Note
1,286,981.35Expenses850,577.62Management fees 5Note12,701.32Custodian & sub-custodian fees 6Note12,629.41Taxe d'abonnement 4Note
112,190.60Administrative expenses 5Note187,421.72Performance fees 7Note
798.53Domiciliation fees9,098.46Professional and legal fees
12,451.08Bank interest on overdrafts79,314.88Transaction fees
510.48Directors fees9,287.25Other expenses
(1,252,568.42)Net loss from investmentsNet realised profit / (loss) on:
(14,578.69)- sales of investment securities437,209.20- options / swaptions
(1,082,156.32)- forward foreign exchange contracts1,785,050.61- foreign exchange
(127,043.62)Net realised lossMovement in net unrealised appreciation / (depreciation) on:
675,854.40- investment securities93,287.95- options / swaptions
786,318.93- forward foreign exchange contracts
1,428,417.66Increase in net assets as a result of operations63,240,835.45Subscription capitalisation shares
(20,362,820.83)Redemption capitalisation shares
44,306,432.28Increase in net assets
37,939,651.13Net assets at the beginning of the year
82,246,083.41Net assets at the end of the year
120Page
BG SICAV– Controlfida Global Macro
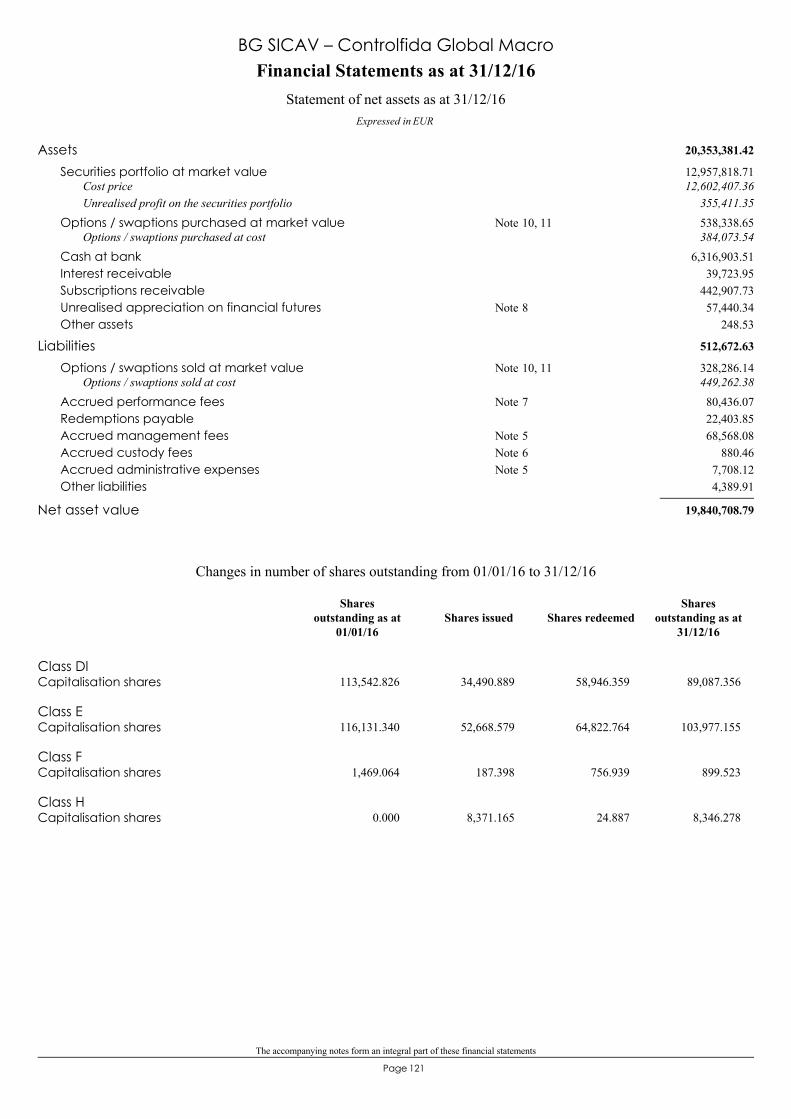
The accompanying notes form an integral part of these financial statements
121Page
20,353,381.42Assets12,957,818.71Securities portfolio at market value12,602,407.36Cost price
355,411.35Unrealised profit on the securities portfolio538,338.65Options / swaptions purchased at market value 10, 11Note384,073.54Options / swaptions purchased at cost
6,316,903.51Cash at bank39,723.95Interest receivable
442,907.73Subscriptions receivable57,440.34Unrealised appreciation on financial futures 8Note
248.53Other assets
512,672.63Liabilities328,286.14Options / swaptions sold at market value 10, 11Note449,262.38Options / swaptions sold at cost80,436.07Accrued performance fees 7Note22,403.85Redemptions payable68,568.08Accrued management fees 5Note
880.46Accrued custody fees 6Note7,708.12Accrued administrative expenses 5Note4,389.91Other liabilities
19,840,708.79Net asset value
Financial Statements as at 31/12/16
Expressed in EUR
Statement of net assets as at 31/12/16
BG SICAV – Controlfida Global Macro
Class DlCapitalisation shares 113,542.826 34,490.889 58,946.359 89,087.356
Class ECapitalisation shares 116,131.340 52,668.579 64,822.764 103,977.155
Class FCapitalisation shares 1,469.064 187.398 756.939 899.523
Class HCapitalisation shares 0.000 8,371.165 24.887 8,346.278
Changes in number of shares outstanding from 01/01/16 to 31/12/16
Shares issued Shares redeemedShares
outstanding as at31/12/16
Sharesoutstanding as at
01/01/16

The accompanying notes form an integral part of these financial statements
122Page
Key figures
BG SICAV – Controlfida Global Macro
Class Dl
Capitalisation shares
96.9989,087.356 113,542.826
97.50Number of sharesNet asset value per share
EUR EUR
Class E
Capitalisation shares
98.64103,977.155 116,131.340
98.13Number of sharesNet asset value per share
EUR EUR
Class F
Capitalisation shares
99.79899.523 1,469.064
98.63Number of sharesNet asset value per share
EUR EUR
Class H
Capitalisation shares
102.338,346.278 0.000
0.00Number of sharesNet asset value per share
EUR EUR
Total Net Assets 19,840,708.79 22,611,315.57
31/12/1531/12/16Year ending as at:
EUR
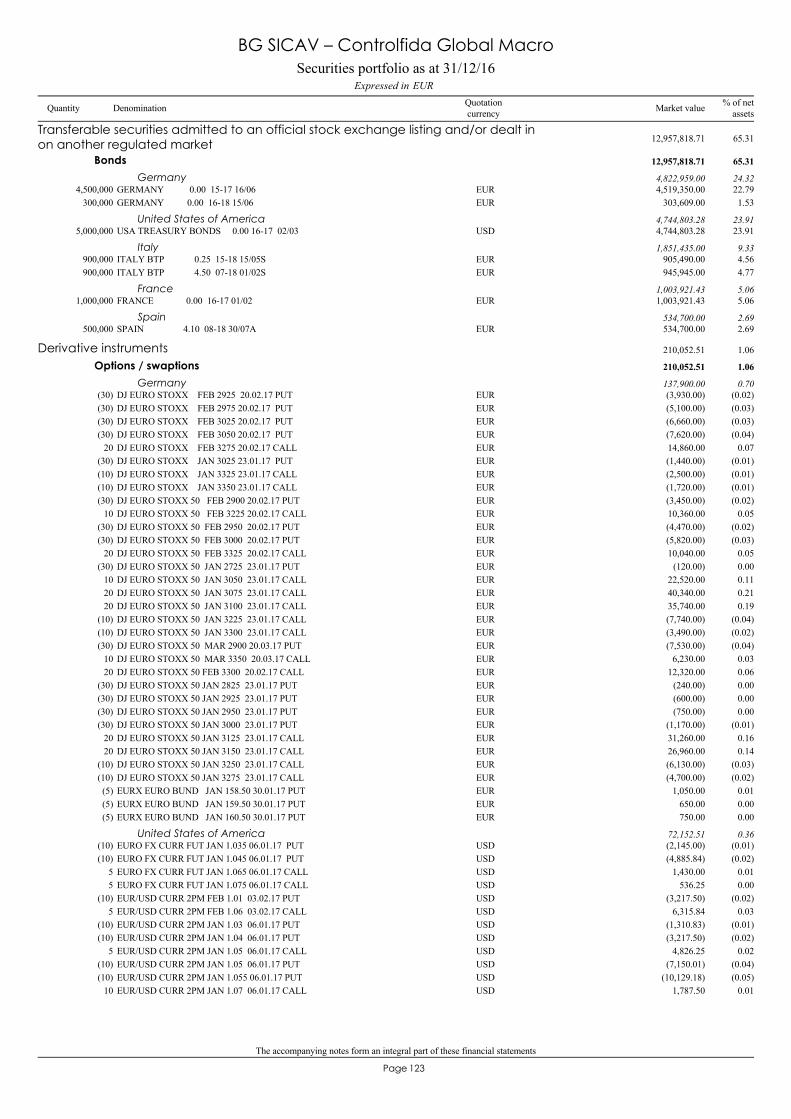
The accompanying notes form an integral part of these financial statements
123Page
GERMANY 0.00 15-17 16/064,500,000 4,519,350.00 22.79EUR
Transferable securities admitted to an official stock exchange listing and/or dealt inon another regulated market 12,957,818.71 65.31
Bonds 12,957,818.71 65.31
Germany 4,822,959.00 24.32
GERMANY 0.00 16-18 15/06300,000 303,609.00 1.53EUR
USA TREASURY BONDS 0.00 16-17 02/035,000,000 4,744,803.28 23.91USDUnited States of America 4,744,803.28 23.91
ITALY BTP 0.25 15-18 15/05S900,000 905,490.00 4.56EURItaly 1,851,435.00 9.33
ITALY BTP 4.50 07-18 01/02S900,000 945,945.00 4.77EUR
FRANCE 0.00 16-17 01/021,000,000 1,003,921.43 5.06EURFrance 1,003,921.43 5.06
SPAIN 4.10 08-18 30/07A500,000 534,700.00 2.69EURSpain 534,700.00 2.69
DJ EURO STOXX FEB 2925 20.02.17 PUT(30) (3,930.00) (0.02)EUR
Derivative instruments 210,052.51 1.06
Options / swaptions 210,052.51 1.06
Germany 137,900.00 0.70
DJ EURO STOXX FEB 2975 20.02.17 PUT(30) (5,100.00) (0.03)EURDJ EURO STOXX FEB 3025 20.02.17 PUT(30) (6,660.00) (0.03)EURDJ EURO STOXX FEB 3050 20.02.17 PUT(30) (7,620.00) (0.04)EURDJ EURO STOXX FEB 3275 20.02.17 CALL20 14,860.00 0.07EURDJ EURO STOXX JAN 3025 23.01.17 PUT(30) (1,440.00) (0.01)EURDJ EURO STOXX JAN 3325 23.01.17 CALL(10) (2,500.00) (0.01)EURDJ EURO STOXX JAN 3350 23.01.17 CALL(10) (1,720.00) (0.01)EURDJ EURO STOXX 50 FEB 2900 20.02.17 PUT(30) (3,450.00) (0.02)EURDJ EURO STOXX 50 FEB 3225 20.02.17 CALL10 10,360.00 0.05EURDJ EURO STOXX 50 FEB 2950 20.02.17 PUT(30) (4,470.00) (0.02)EURDJ EURO STOXX 50 FEB 3000 20.02.17 PUT(30) (5,820.00) (0.03)EURDJ EURO STOXX 50 FEB 3325 20.02.17 CALL20 10,040.00 0.05EURDJ EURO STOXX 50 JAN 2725 23.01.17 PUT(30) (120.00) 0.00EURDJ EURO STOXX 50 JAN 3050 23.01.17 CALL10 22,520.00 0.11EURDJ EURO STOXX 50 JAN 3075 23.01.17 CALL20 40,340.00 0.21EURDJ EURO STOXX 50 JAN 3100 23.01.17 CALL20 35,740.00 0.19EURDJ EURO STOXX 50 JAN 3225 23.01.17 CALL(10) (7,740.00) (0.04)EURDJ EURO STOXX 50 JAN 3300 23.01.17 CALL(10) (3,490.00) (0.02)EURDJ EURO STOXX 50 MAR 2900 20.03.17 PUT(30) (7,530.00) (0.04)EURDJ EURO STOXX 50 MAR 3350 20.03.17 CALL10 6,230.00 0.03EURDJ EURO STOXX 50 FEB 3300 20.02.17 CALL20 12,320.00 0.06EURDJ EURO STOXX 50 JAN 2825 23.01.17 PUT(30) (240.00) 0.00EURDJ EURO STOXX 50 JAN 2925 23.01.17 PUT(30) (600.00) 0.00EURDJ EURO STOXX 50 JAN 2950 23.01.17 PUT(30) (750.00) 0.00EURDJ EURO STOXX 50 JAN 3000 23.01.17 PUT(30) (1,170.00) (0.01)EURDJ EURO STOXX 50 JAN 3125 23.01.17 CALL20 31,260.00 0.16EURDJ EURO STOXX 50 JAN 3150 23.01.17 CALL20 26,960.00 0.14EURDJ EURO STOXX 50 JAN 3250 23.01.17 CALL(10) (6,130.00) (0.03)EURDJ EURO STOXX 50 JAN 3275 23.01.17 CALL(10) (4,700.00) (0.02)EUREURX EURO BUND JAN 158.50 30.01.17 PUT(5) 1,050.00 0.01EUREURX EURO BUND JAN 159.50 30.01.17 PUT(5) 650.00 0.00EUREURX EURO BUND JAN 160.50 30.01.17 PUT(5) 750.00 0.00EUR
EURO FX CURR FUT JAN 1.035 06.01.17 PUT(10) (2,145.00) (0.01)USDUnited States of America 72,152.51 0.36
EURO FX CURR FUT JAN 1.045 06.01.17 PUT(10) (4,885.84) (0.02)USDEURO FX CURR FUT JAN 1.065 06.01.17 CALL5 1,430.00 0.01USDEURO FX CURR FUT JAN 1.075 06.01.17 CALL5 536.25 0.00USDEUR/USD CURR 2PM FEB 1.01 03.02.17 PUT(10) (3,217.50) (0.02)USDEUR/USD CURR 2PM FEB 1.06 03.02.17 CALL5 6,315.84 0.03USDEUR/USD CURR 2PM JAN 1.03 06.01.17 PUT(10) (1,310.83) (0.01)USDEUR/USD CURR 2PM JAN 1.04 06.01.17 PUT(10) (3,217.50) (0.02)USDEUR/USD CURR 2PM JAN 1.05 06.01.17 CALL5 4,826.25 0.02USDEUR/USD CURR 2PM JAN 1.05 06.01.17 PUT(10) (7,150.01) (0.04)USDEUR/USD CURR 2PM JAN 1.055 06.01.17 PUT(10) (10,129.18) (0.05)USDEUR/USD CURR 2PM JAN 1.07 06.01.17 CALL10 1,787.50 0.01USD
Securities portfolio as at 31/12/16EURExpressed in
BG SICAV – Controlfida Global Macro
Quantity Denomination Quotationcurrency
% of netassetsMarket value
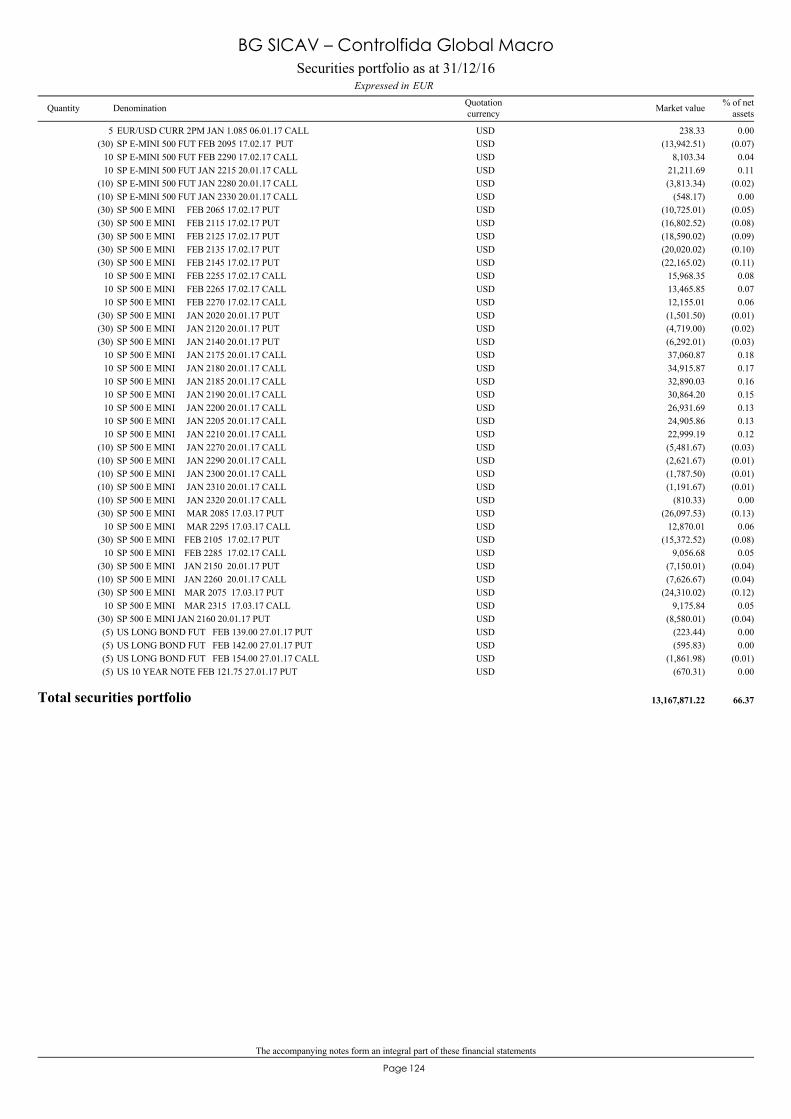
The accompanying notes form an integral part of these financial statements
124Page
EUR/USD CURR 2PM JAN 1.085 06.01.17 CALL5 238.33 0.00USDSP E-MINI 500 FUT FEB 2095 17.02.17 PUT(30) (13,942.51) (0.07)USDSP E-MINI 500 FUT FEB 2290 17.02.17 CALL10 8,103.34 0.04USDSP E-MINI 500 FUT JAN 2215 20.01.17 CALL10 21,211.69 0.11USDSP E-MINI 500 FUT JAN 2280 20.01.17 CALL(10) (3,813.34) (0.02)USDSP E-MINI 500 FUT JAN 2330 20.01.17 CALL(10) (548.17) 0.00USDSP 500 E MINI FEB 2065 17.02.17 PUT(30) (10,725.01) (0.05)USDSP 500 E MINI FEB 2115 17.02.17 PUT(30) (16,802.52) (0.08)USDSP 500 E MINI FEB 2125 17.02.17 PUT(30) (18,590.02) (0.09)USDSP 500 E MINI FEB 2135 17.02.17 PUT(30) (20,020.02) (0.10)USDSP 500 E MINI FEB 2145 17.02.17 PUT(30) (22,165.02) (0.11)USDSP 500 E MINI FEB 2255 17.02.17 CALL10 15,968.35 0.08USDSP 500 E MINI FEB 2265 17.02.17 CALL10 13,465.85 0.07USDSP 500 E MINI FEB 2270 17.02.17 CALL10 12,155.01 0.06USDSP 500 E MINI JAN 2020 20.01.17 PUT(30) (1,501.50) (0.01)USDSP 500 E MINI JAN 2120 20.01.17 PUT(30) (4,719.00) (0.02)USDSP 500 E MINI JAN 2140 20.01.17 PUT(30) (6,292.01) (0.03)USDSP 500 E MINI JAN 2175 20.01.17 CALL10 37,060.87 0.18USDSP 500 E MINI JAN 2180 20.01.17 CALL10 34,915.87 0.17USDSP 500 E MINI JAN 2185 20.01.17 CALL10 32,890.03 0.16USDSP 500 E MINI JAN 2190 20.01.17 CALL10 30,864.20 0.15USDSP 500 E MINI JAN 2200 20.01.17 CALL10 26,931.69 0.13USDSP 500 E MINI JAN 2205 20.01.17 CALL10 24,905.86 0.13USDSP 500 E MINI JAN 2210 20.01.17 CALL10 22,999.19 0.12USDSP 500 E MINI JAN 2270 20.01.17 CALL(10) (5,481.67) (0.03)USDSP 500 E MINI JAN 2290 20.01.17 CALL(10) (2,621.67) (0.01)USDSP 500 E MINI JAN 2300 20.01.17 CALL(10) (1,787.50) (0.01)USDSP 500 E MINI JAN 2310 20.01.17 CALL(10) (1,191.67) (0.01)USDSP 500 E MINI JAN 2320 20.01.17 CALL(10) (810.33) 0.00USDSP 500 E MINI MAR 2085 17.03.17 PUT(30) (26,097.53) (0.13)USDSP 500 E MINI MAR 2295 17.03.17 CALL10 12,870.01 0.06USDSP 500 E MINI FEB 2105 17.02.17 PUT(30) (15,372.52) (0.08)USDSP 500 E MINI FEB 2285 17.02.17 CALL10 9,056.68 0.05USDSP 500 E MINI JAN 2150 20.01.17 PUT(30) (7,150.01) (0.04)USDSP 500 E MINI JAN 2260 20.01.17 CALL(10) (7,626.67) (0.04)USDSP 500 E MINI MAR 2075 17.03.17 PUT(30) (24,310.02) (0.12)USDSP 500 E MINI MAR 2315 17.03.17 CALL10 9,175.84 0.05USDSP 500 E MINI JAN 2160 20.01.17 PUT(30) (8,580.01) (0.04)USDUS LONG BOND FUT FEB 139.00 27.01.17 PUT(5) (223.44) 0.00USDUS LONG BOND FUT FEB 142.00 27.01.17 PUT(5) (595.83) 0.00USDUS LONG BOND FUT FEB 154.00 27.01.17 CALL(5) (1,861.98) (0.01)USDUS 10 YEAR NOTE FEB 121.75 27.01.17 PUT(5) (670.31) 0.00USD
Total securities portfolio 13,167,871.22 66.37
Securities portfolio as at 31/12/16EURExpressed in
BG SICAV – Controlfida Global Macro
Quantity Denomination Quotationcurrency
% of netassetsMarket value
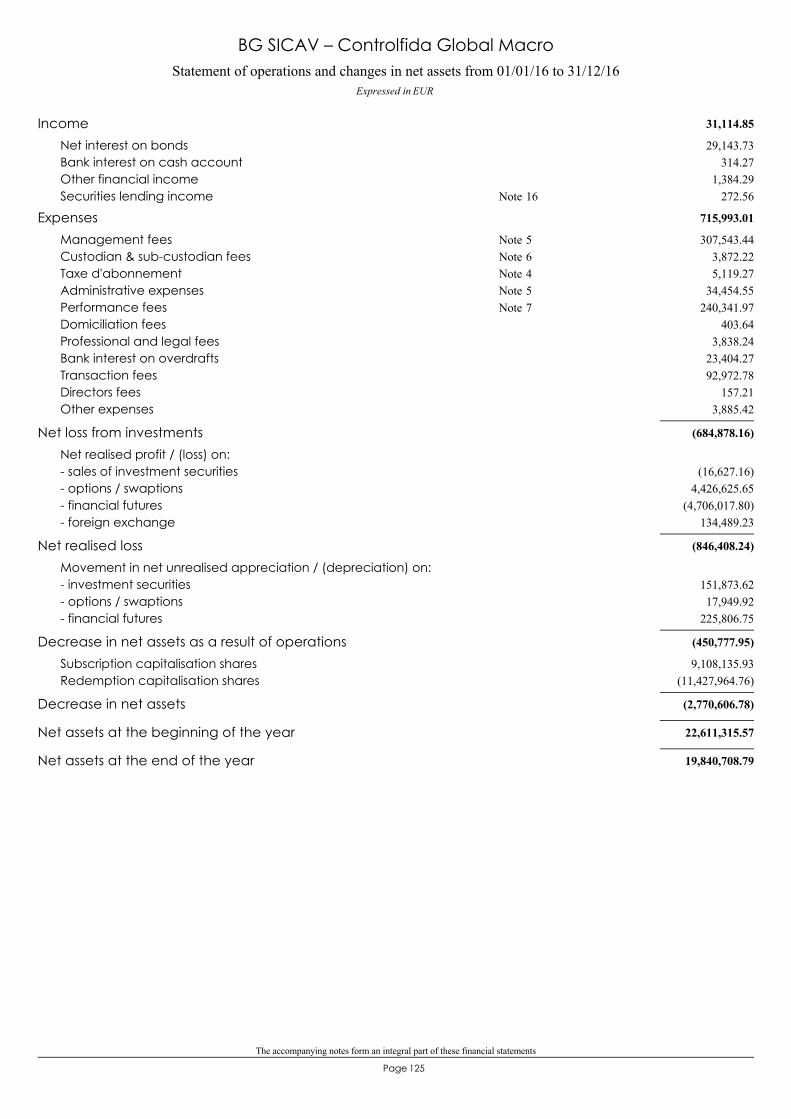
The accompanying notes form an integral part of these financial statements
125Page
Statement of operations and changes in net assets from 01/01/16 to 31/12/16Expressed in EUR
BG SICAV – Controlfida Global Macro
31,114.85Income29,143.73Net interest on bonds
314.27Bank interest on cash account1,384.29Other financial income
272.56Securities lending income 16Note
715,993.01Expenses307,543.44Management fees 5Note
3,872.22Custodian & sub-custodian fees 6Note5,119.27Taxe d'abonnement 4Note
34,454.55Administrative expenses 5Note240,341.97Performance fees 7Note
403.64Domiciliation fees3,838.24Professional and legal fees
23,404.27Bank interest on overdrafts92,972.78Transaction fees
157.21Directors fees3,885.42Other expenses
(684,878.16)Net loss from investmentsNet realised profit / (loss) on:
(16,627.16)- sales of investment securities4,426,625.65- options / swaptions
(4,706,017.80)- financial futures134,489.23- foreign exchange
(846,408.24)Net realised lossMovement in net unrealised appreciation / (depreciation) on:
151,873.62- investment securities17,949.92- options / swaptions
225,806.75- financial futures
(450,777.95)Decrease in net assets as a result of operations9,108,135.93Subscription capitalisation shares
(11,427,964.76)Redemption capitalisation shares
(2,770,606.78)Decrease in net assets
22,611,315.57Net assets at the beginning of the year
19,840,708.79Net assets at the end of the year

126Page
BG SICAV– Vontobel Pure Strategy
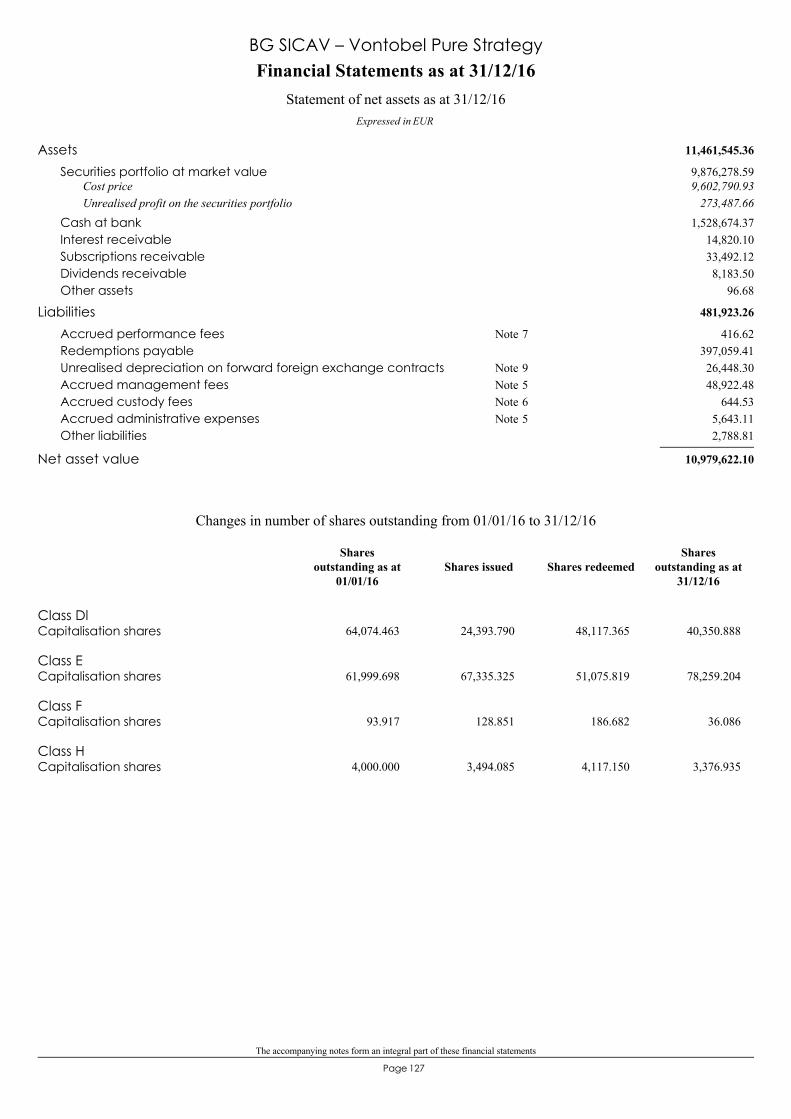
The accompanying notes form an integral part of these financial statements
127Page
11,461,545.36Assets9,876,278.59Securities portfolio at market value9,602,790.93Cost price
273,487.66Unrealised profit on the securities portfolio1,528,674.37Cash at bank
14,820.10Interest receivable33,492.12Subscriptions receivable8,183.50Dividends receivable
96.68Other assets
481,923.26Liabilities416.62Accrued performance fees 7Note
397,059.41Redemptions payable26,448.30Unrealised depreciation on forward foreign exchange contracts 9Note48,922.48Accrued management fees 5Note
644.53Accrued custody fees 6Note5,643.11Accrued administrative expenses 5Note2,788.81Other liabilities
10,979,622.10Net asset value
Financial Statements as at 31/12/16
Expressed in EUR
Statement of net assets as at 31/12/16
BG SICAV – Vontobel Pure Strategy
Class DlCapitalisation shares 64,074.463 24,393.790 48,117.365 40,350.888
Class ECapitalisation shares 61,999.698 67,335.325 51,075.819 78,259.204
Class FCapitalisation shares 93.917 128.851 186.682 36.086
Class HCapitalisation shares 4,000.000 3,494.085 4,117.150 3,376.935
Changes in number of shares outstanding from 01/01/16 to 31/12/16
Shares issued Shares redeemedShares
outstanding as at31/12/16
Sharesoutstanding as at
01/01/16
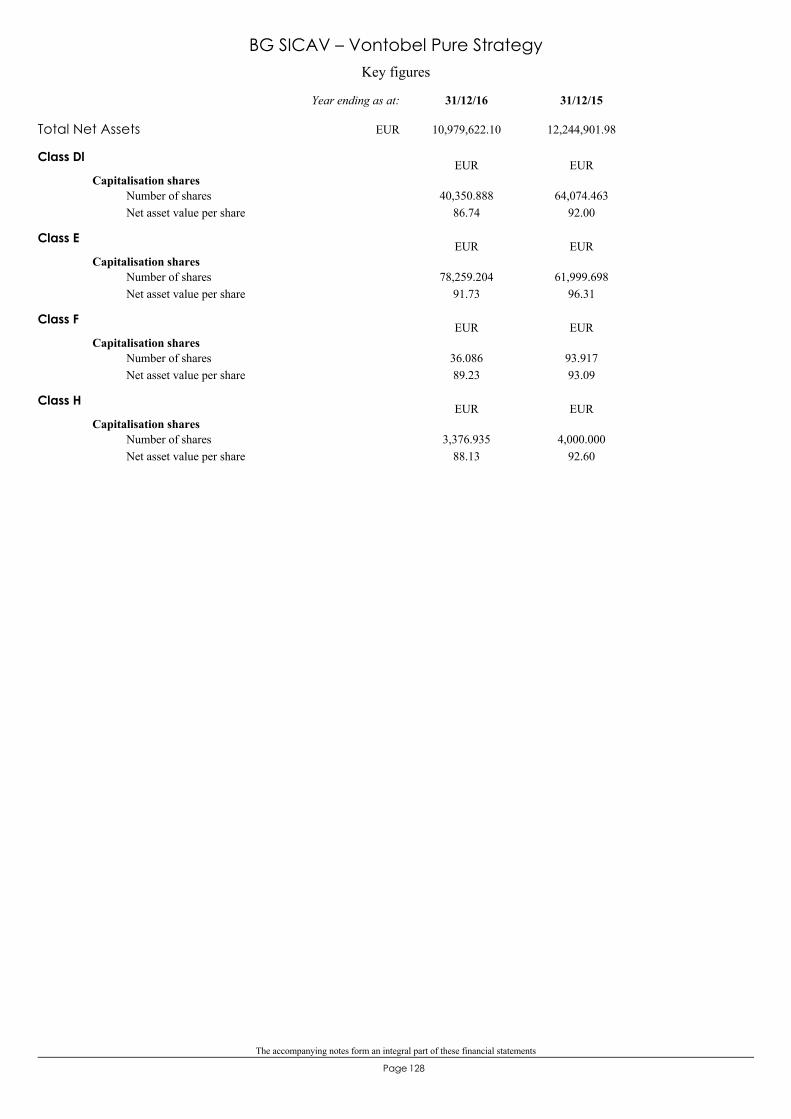
The accompanying notes form an integral part of these financial statements
128Page
Key figures
BG SICAV – Vontobel Pure Strategy
Class Dl
Capitalisation shares
86.7440,350.888 64,074.463
92.00Number of sharesNet asset value per share
EUR EUR
Class E
Capitalisation shares
91.7378,259.204 61,999.698
96.31Number of sharesNet asset value per share
EUR EUR
Class F
Capitalisation shares
89.2336.086 93.917
93.09Number of sharesNet asset value per share
EUR EUR
Class H
Capitalisation shares
88.133,376.935 4,000.000
92.60Number of sharesNet asset value per share
EUR EUR
Total Net Assets 10,979,622.10 12,244,901.98
31/12/1531/12/16Year ending as at:
EUR
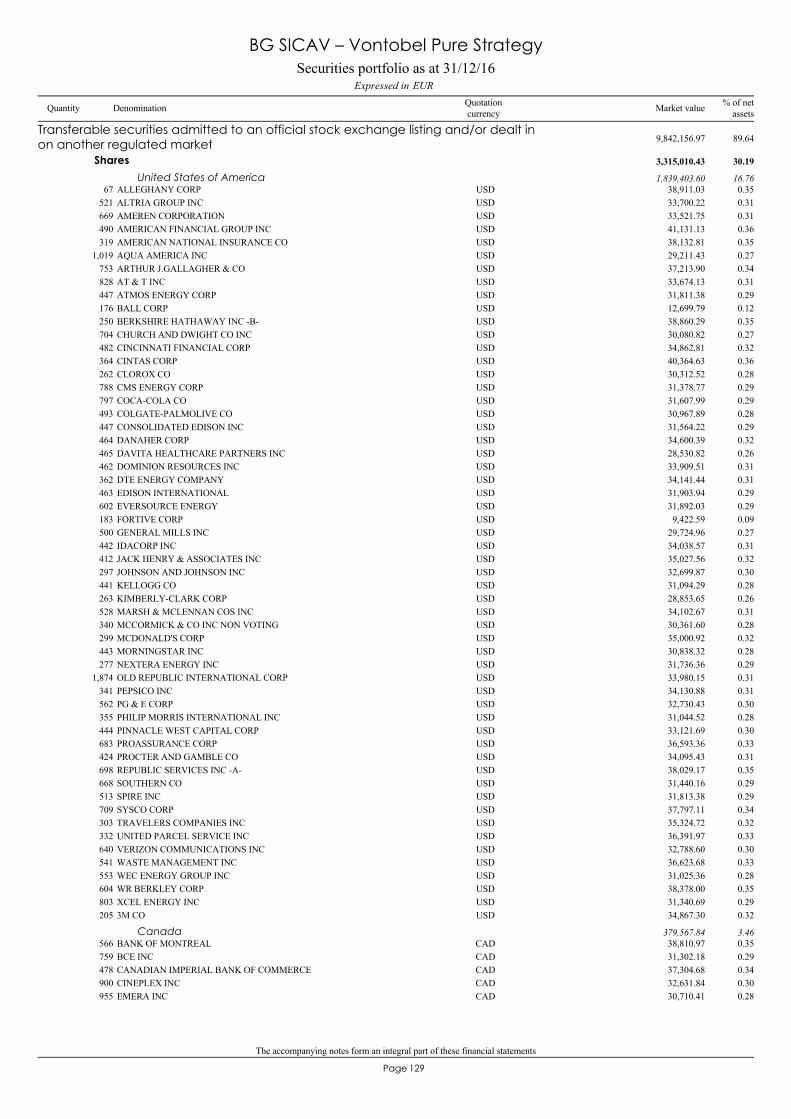
The accompanying notes form an integral part of these financial statements
129Page
ALLEGHANY CORP67 38,911.03 0.35USD
Transferable securities admitted to an official stock exchange listing and/or dealt inon another regulated market 9,842,156.97 89.64
Shares 3,315,010.43 30.19
United States of America 1,839,403.60 16.76
ALTRIA GROUP INC521 33,700.22 0.31USDAMEREN CORPORATION669 33,521.75 0.31USDAMERICAN FINANCIAL GROUP INC490 41,131.13 0.36USDAMERICAN NATIONAL INSURANCE CO319 38,132.81 0.35USDAQUA AMERICA INC1,019 29,211.43 0.27USDARTHUR J.GALLAGHER & CO753 37,213.90 0.34USDAT & T INC828 33,674.13 0.31USDATMOS ENERGY CORP447 31,811.38 0.29USDBALL CORP176 12,699.79 0.12USDBERKSHIRE HATHAWAY INC -B-250 38,860.29 0.35USDCHURCH AND DWIGHT CO INC704 30,080.82 0.27USDCINCINNATI FINANCIAL CORP482 34,862.81 0.32USDCINTAS CORP364 40,364.63 0.36USDCLOROX CO262 30,312.52 0.28USDCMS ENERGY CORP788 31,378.77 0.29USDCOCA-COLA CO797 31,607.99 0.29USDCOLGATE-PALMOLIVE CO493 30,967.89 0.28USDCONSOLIDATED EDISON INC447 31,564.22 0.29USDDANAHER CORP464 34,600.39 0.32USDDAVITA HEALTHCARE PARTNERS INC465 28,530.82 0.26USDDOMINION RESOURCES INC462 33,909.51 0.31USDDTE ENERGY COMPANY362 34,141.44 0.31USDEDISON INTERNATIONAL463 31,903.94 0.29USDEVERSOURCE ENERGY602 31,892.03 0.29USDFORTIVE CORP183 9,422.59 0.09USDGENERAL MILLS INC500 29,724.96 0.27USDIDACORP INC442 34,038.57 0.31USDJACK HENRY & ASSOCIATES INC412 35,027.56 0.32USDJOHNSON AND JOHNSON INC297 32,699.87 0.30USDKELLOGG CO441 31,094.29 0.28USDKIMBERLY-CLARK CORP263 28,853.65 0.26USDMARSH & MCLENNAN COS INC528 34,102.67 0.31USDMCCORMICK & CO INC NON VOTING340 30,361.60 0.28USDMCDONALD'S CORP299 35,000.92 0.32USDMORNINGSTAR INC443 30,838.32 0.28USDNEXTERA ENERGY INC277 31,736.36 0.29USDOLD REPUBLIC INTERNATIONAL CORP1,874 33,980.15 0.31USDPEPSICO INC341 34,130.88 0.31USDPG & E CORP562 32,730.43 0.30USDPHILIP MORRIS INTERNATIONAL INC355 31,044.52 0.28USDPINNACLE WEST CAPITAL CORP444 33,121.69 0.30USDPROASSURANCE CORP683 36,593.36 0.33USDPROCTER AND GAMBLE CO424 34,095.43 0.31USDREPUBLIC SERVICES INC -A-698 38,029.17 0.35USDSOUTHERN CO668 31,440.16 0.29USDSPIRE INC513 31,813.38 0.29USDSYSCO CORP709 37,797.11 0.34USDTRAVELERS COMPANIES INC303 35,324.72 0.32USDUNITED PARCEL SERVICE INC332 36,391.97 0.33USDVERIZON COMMUNICATIONS INC640 32,788.60 0.30USDWASTE MANAGEMENT INC541 36,623.68 0.33USDWEC ENERGY GROUP INC553 31,025.36 0.28USDWR BERKLEY CORP604 38,378.00 0.35USDXCEL ENERGY INC803 31,340.69 0.29USD3M CO205 34,867.30 0.32USD
BANK OF MONTREAL566 38,810.97 0.35CADCanada 379,567.84 3.46
BCE INC759 31,302.18 0.29CADCANADIAN IMPERIAL BANK OF COMMERCE478 37,304.68 0.34CADCINEPLEX INC900 32,631.84 0.30CADEMERA INC955 30,710.41 0.28CAD
Securities portfolio as at 31/12/16EURExpressed in
BG SICAV – Vontobel Pure Strategy
Quantity Denomination Quotationcurrency
% of netassetsMarket value
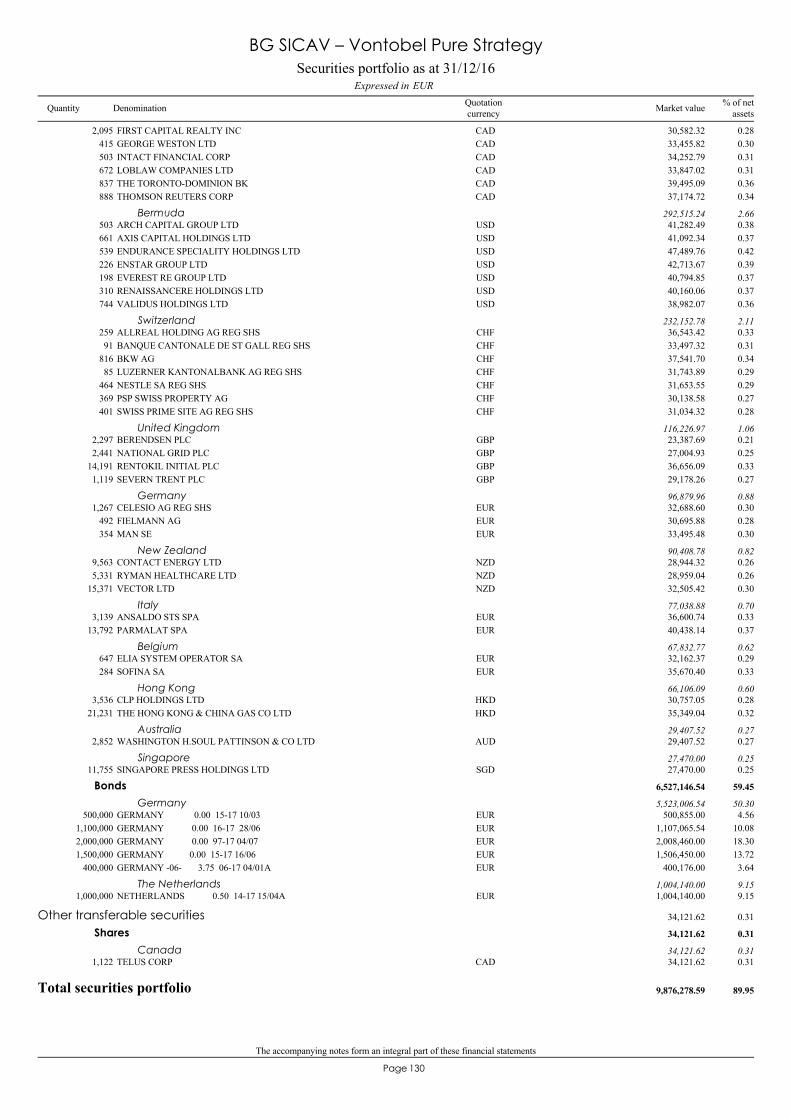
The accompanying notes form an integral part of these financial statements
130Page
FIRST CAPITAL REALTY INC2,095 30,582.32 0.28CADGEORGE WESTON LTD415 33,455.82 0.30CADINTACT FINANCIAL CORP503 34,252.79 0.31CADLOBLAW COMPANIES LTD672 33,847.02 0.31CADTHE TORONTO-DOMINION BK837 39,495.09 0.36CADTHOMSON REUTERS CORP888 37,174.72 0.34CAD
ARCH CAPITAL GROUP LTD503 41,282.49 0.38USDBermuda 292,515.24 2.66
AXIS CAPITAL HOLDINGS LTD661 41,092.34 0.37USDENDURANCE SPECIALITY HOLDINGS LTD539 47,489.76 0.42USDENSTAR GROUP LTD226 42,713.67 0.39USDEVEREST RE GROUP LTD198 40,794.85 0.37USDRENAISSANCERE HOLDINGS LTD310 40,160.06 0.37USDVALIDUS HOLDINGS LTD744 38,982.07 0.36USD
ALLREAL HOLDING AG REG SHS259 36,543.42 0.33CHFSwitzerland 232,152.78 2.11
BANQUE CANTONALE DE ST GALL REG SHS91 33,497.32 0.31CHFBKW AG816 37,541.70 0.34CHFLUZERNER KANTONALBANK AG REG SHS85 31,743.89 0.29CHFNESTLE SA REG SHS464 31,653.55 0.29CHFPSP SWISS PROPERTY AG369 30,138.58 0.27CHFSWISS PRIME SITE AG REG SHS401 31,034.32 0.28CHF
BERENDSEN PLC2,297 23,387.69 0.21GBPUnited Kingdom 116,226.97 1.06
NATIONAL GRID PLC2,441 27,004.93 0.25GBPRENTOKIL INITIAL PLC14,191 36,656.09 0.33GBPSEVERN TRENT PLC1,119 29,178.26 0.27GBP
CELESIO AG REG SHS1,267 32,688.60 0.30EURGermany 96,879.96 0.88
FIELMANN AG492 30,695.88 0.28EURMAN SE354 33,495.48 0.30EUR
CONTACT ENERGY LTD9,563 28,944.32 0.26NZDNew Zealand 90,408.78 0.82
RYMAN HEALTHCARE LTD5,331 28,959.04 0.26NZDVECTOR LTD15,371 32,505.42 0.30NZD
ANSALDO STS SPA3,139 36,600.74 0.33EURItaly 77,038.88 0.70
PARMALAT SPA13,792 40,438.14 0.37EUR
ELIA SYSTEM OPERATOR SA647 32,162.37 0.29EURBelgium 67,832.77 0.62
SOFINA SA284 35,670.40 0.33EUR
CLP HOLDINGS LTD3,536 30,757.05 0.28HKDHong Kong 66,106.09 0.60
THE HONG KONG & CHINA GAS CO LTD21,231 35,349.04 0.32HKD
WASHINGTON H.SOUL PATTINSON & CO LTD2,852 29,407.52 0.27AUDAustralia 29,407.52 0.27
SINGAPORE PRESS HOLDINGS LTD11,755 27,470.00 0.25SGDSingapore 27,470.00 0.25
GERMANY 0.00 15-17 10/03500,000 500,855.00 4.56EUR
Bonds 6,527,146.54 59.45
Germany 5,523,006.54 50.30
GERMANY 0.00 16-17 28/061,100,000 1,107,065.54 10.08EURGERMANY 0.00 97-17 04/072,000,000 2,008,460.00 18.30EURGERMANY 0.00 15-17 16/061,500,000 1,506,450.00 13.72EURGERMANY -06- 3.75 06-17 04/01A400,000 400,176.00 3.64EUR
NETHERLANDS 0.50 14-17 15/04A1,000,000 1,004,140.00 9.15EURThe Netherlands 1,004,140.00 9.15
TELUS CORP1,122 34,121.62 0.31CAD
Other transferable securities 34,121.62 0.31
Shares 34,121.62 0.31
Canada 34,121.62 0.31
Total securities portfolio 9,876,278.59 89.95
Securities portfolio as at 31/12/16EURExpressed in
BG SICAV – Vontobel Pure Strategy
Quantity Denomination Quotationcurrency
% of netassetsMarket value
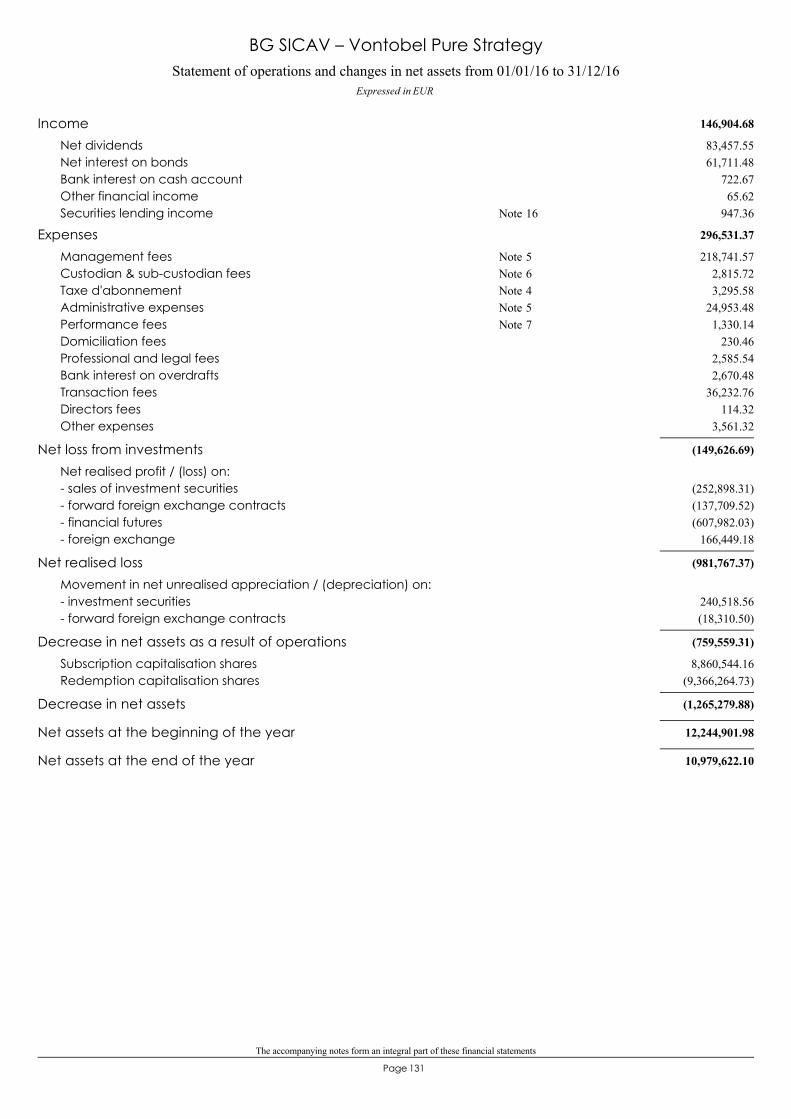
The accompanying notes form an integral part of these financial statements
131Page
Statement of operations and changes in net assets from 01/01/16 to 31/12/16Expressed in EUR
BG SICAV – Vontobel Pure Strategy
146,904.68Income83,457.55Net dividends61,711.48Net interest on bonds
722.67Bank interest on cash account65.62Other financial income
947.36Securities lending income 16Note
296,531.37Expenses218,741.57Management fees 5Note
2,815.72Custodian & sub-custodian fees 6Note3,295.58Taxe d'abonnement 4Note
24,953.48Administrative expenses 5Note1,330.14Performance fees 7Note
230.46Domiciliation fees2,585.54Professional and legal fees2,670.48Bank interest on overdrafts
36,232.76Transaction fees114.32Directors fees
3,561.32Other expenses
(149,626.69)Net loss from investmentsNet realised profit / (loss) on:
(252,898.31)- sales of investment securities(137,709.52)- forward foreign exchange contracts(607,982.03)- financial futures
166,449.18- foreign exchange
(981,767.37)Net realised lossMovement in net unrealised appreciation / (depreciation) on:
240,518.56- investment securities(18,310.50)- forward foreign exchange contracts
(759,559.31)Decrease in net assets as a result of operations8,860,544.16Subscription capitalisation shares
(9,366,264.73)Redemption capitalisation shares
(1,265,279.88)Decrease in net assets
12,244,901.98Net assets at the beginning of the year
10,979,622.10Net assets at the end of the year
132Page
BG SICAV– Algebris - Best Ideas
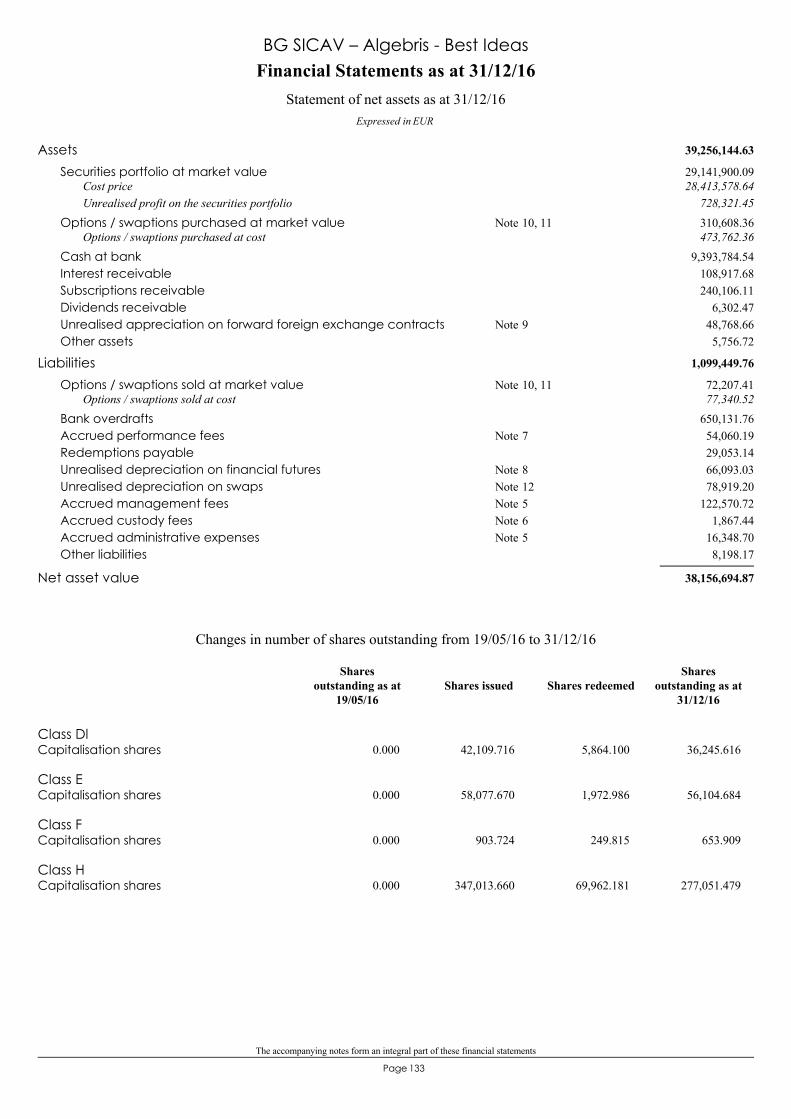
The accompanying notes form an integral part of these financial statements
133Page
39,256,144.63Assets29,141,900.09Securities portfolio at market value28,413,578.64Cost price
728,321.45Unrealised profit on the securities portfolio310,608.36Options / swaptions purchased at market value 10, 11Note473,762.36Options / swaptions purchased at cost
9,393,784.54Cash at bank108,917.68Interest receivable240,106.11Subscriptions receivable
6,302.47Dividends receivable48,768.66Unrealised appreciation on forward foreign exchange contracts 9Note5,756.72Other assets
1,099,449.76Liabilities72,207.41Options / swaptions sold at market value 10, 11Note77,340.52Options / swaptions sold at cost
650,131.76Bank overdrafts54,060.19Accrued performance fees 7Note29,053.14Redemptions payable66,093.03Unrealised depreciation on financial futures 8Note78,919.20Unrealised depreciation on swaps 12Note
122,570.72Accrued management fees 5Note1,867.44Accrued custody fees 6Note
16,348.70Accrued administrative expenses 5Note8,198.17Other liabilities
38,156,694.87Net asset value
Financial Statements as at 31/12/16
Expressed in EUR
Statement of net assets as at 31/12/16
BG SICAV – Algebris - Best Ideas
Class DlCapitalisation shares 0.000 42,109.716 5,864.100 36,245.616
Class ECapitalisation shares 0.000 58,077.670 1,972.986 56,104.684
Class FCapitalisation shares 0.000 903.724 249.815 653.909
Class HCapitalisation shares 0.000 347,013.660 69,962.181 277,051.479
Changes in number of shares outstanding from 19/05/16 to 31/12/16
Shares issued Shares redeemedShares
outstanding as at31/12/16
Sharesoutstanding as at
19/05/16
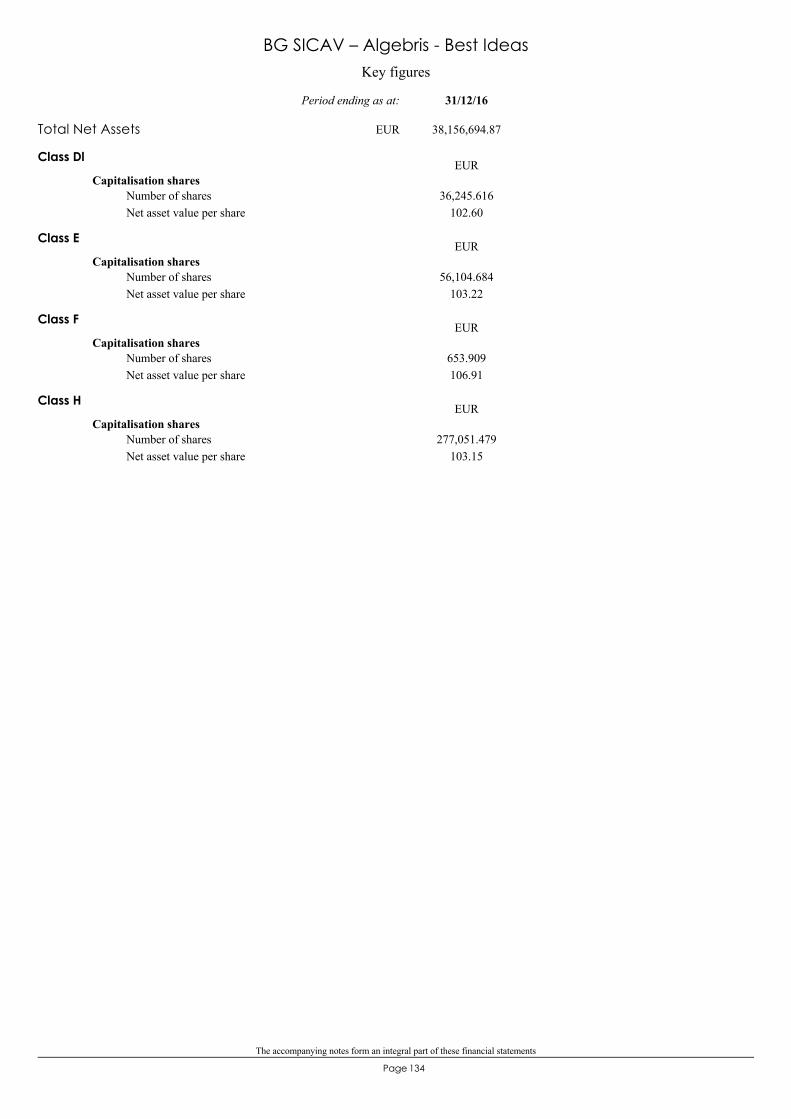
The accompanying notes form an integral part of these financial statements
134Page
Key figures
BG SICAV – Algebris - Best Ideas
Class Dl
Capitalisation shares
102.6036,245.616Number of shares
Net asset value per share
EUR
Class E
Capitalisation shares
103.2256,104.684Number of shares
Net asset value per share
EUR
Class F
Capitalisation shares
106.91653.909Number of shares
Net asset value per share
EUR
Class H
Capitalisation shares
103.15277,051.479Number of shares
Net asset value per share
EUR
Total Net Assets 38,156,694.87
31/12/16Period ending as at:
EUR
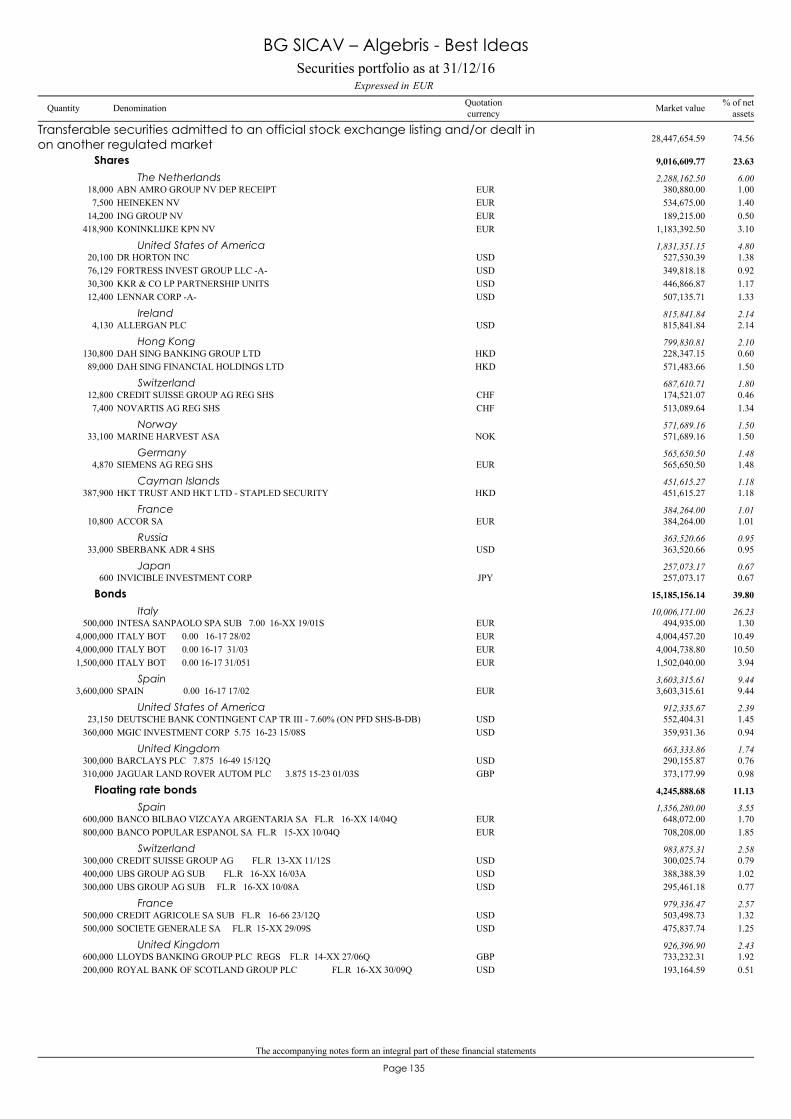
The accompanying notes form an integral part of these financial statements
135Page
ABN AMRO GROUP NV DEP RECEIPT18,000 380,880.00 1.00EUR
Transferable securities admitted to an official stock exchange listing and/or dealt inon another regulated market 28,447,654.59 74.56
Shares 9,016,609.77 23.63
The Netherlands 2,288,162.50 6.00
HEINEKEN NV7,500 534,675.00 1.40EURING GROUP NV14,200 189,215.00 0.50EURKONINKLIJKE KPN NV418,900 1,183,392.50 3.10EUR
DR HORTON INC20,100 527,530.39 1.38USDUnited States of America 1,831,351.15 4.80
FORTRESS INVEST GROUP LLC -A-76,129 349,818.18 0.92USDKKR & CO LP PARTNERSHIP UNITS30,300 446,866.87 1.17USDLENNAR CORP -A-12,400 507,135.71 1.33USD
ALLERGAN PLC4,130 815,841.84 2.14USDIreland 815,841.84 2.14
DAH SING BANKING GROUP LTD130,800 228,347.15 0.60HKDHong Kong 799,830.81 2.10
DAH SING FINANCIAL HOLDINGS LTD89,000 571,483.66 1.50HKD
CREDIT SUISSE GROUP AG REG SHS12,800 174,521.07 0.46CHFSwitzerland 687,610.71 1.80
NOVARTIS AG REG SHS7,400 513,089.64 1.34CHF
MARINE HARVEST ASA33,100 571,689.16 1.50NOKNorway 571,689.16 1.50
SIEMENS AG REG SHS4,870 565,650.50 1.48EURGermany 565,650.50 1.48
HKT TRUST AND HKT LTD - STAPLED SECURITY387,900 451,615.27 1.18HKDCayman Islands 451,615.27 1.18
ACCOR SA10,800 384,264.00 1.01EURFrance 384,264.00 1.01
SBERBANK ADR 4 SHS33,000 363,520.66 0.95USDRussia 363,520.66 0.95
INVICIBLE INVESTMENT CORP600 257,073.17 0.67JPYJapan 257,073.17 0.67
INTESA SANPAOLO SPA SUB 7.00 16-XX 19/01S500,000 494,935.00 1.30EUR
Bonds 15,185,156.14 39.80
Italy 10,006,171.00 26.23
ITALY BOT 0.00 16-17 28/024,000,000 4,004,457.20 10.49EURITALY BOT 0.00 16-17 31/034,000,000 4,004,738.80 10.50EURITALY BOT 0.00 16-17 31/0511,500,000 1,502,040.00 3.94EUR
SPAIN 0.00 16-17 17/023,600,000 3,603,315.61 9.44EURSpain 3,603,315.61 9.44
DEUTSCHE BANK CONTINGENT CAP TR III - 7.60% (ON PFD SHS-B-DB)23,150 552,404.31 1.45USDUnited States of America 912,335.67 2.39
MGIC INVESTMENT CORP 5.75 16-23 15/08S360,000 359,931.36 0.94USD
BARCLAYS PLC 7.875 16-49 15/12Q300,000 290,155.87 0.76USDUnited Kingdom 663,333.86 1.74
JAGUAR LAND ROVER AUTOM PLC 3.875 15-23 01/03S310,000 373,177.99 0.98GBP
BANCO BILBAO VIZCAYA ARGENTARIA SA FL.R 16-XX 14/04Q600,000 648,072.00 1.70EUR
Floating rate bonds 4,245,888.68 11.13
Spain 1,356,280.00 3.55
BANCO POPULAR ESPANOL SA FL.R 15-XX 10/04Q800,000 708,208.00 1.85EUR
CREDIT SUISSE GROUP AG FL.R 13-XX 11/12S300,000 300,025.74 0.79USDSwitzerland 983,875.31 2.58
UBS GROUP AG SUB FL.R 16-XX 16/03A400,000 388,388.39 1.02USDUBS GROUP AG SUB FL.R 16-XX 10/08A300,000 295,461.18 0.77USD
CREDIT AGRICOLE SA SUB FL.R 16-66 23/12Q500,000 503,498.73 1.32USDFrance 979,336.47 2.57
SOCIETE GENERALE SA FL.R 15-XX 29/09S500,000 475,837.74 1.25USD
LLOYDS BANKING GROUP PLC REGS FL.R 14-XX 27/06Q600,000 733,232.31 1.92GBPUnited Kingdom 926,396.90 2.43
ROYAL BANK OF SCOTLAND GROUP PLC FL.R 16-XX 30/09Q200,000 193,164.59 0.51USD
Securities portfolio as at 31/12/16EURExpressed in
BG SICAV – Algebris - Best Ideas
Quantity Denomination Quotationcurrency
% of netassetsMarket value
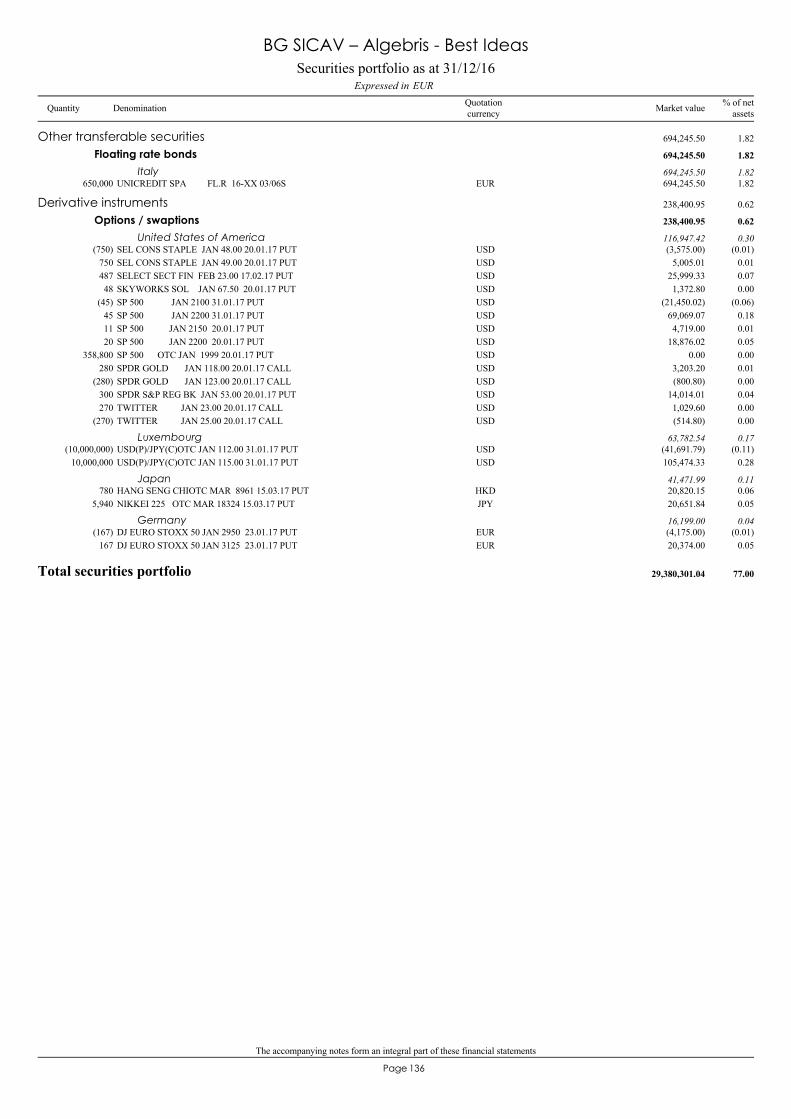
The accompanying notes form an integral part of these financial statements
136Page
UNICREDIT SPA FL.R 16-XX 03/06S650,000 694,245.50 1.82EUR
Other transferable securities 694,245.50 1.82
Floating rate bonds 694,245.50 1.82
Italy 694,245.50 1.82
SEL CONS STAPLE JAN 48.00 20.01.17 PUT(750) (3,575.00) (0.01)USD
Derivative instruments 238,400.95 0.62
Options / swaptions 238,400.95 0.62
United States of America 116,947.42 0.30
SEL CONS STAPLE JAN 49.00 20.01.17 PUT750 5,005.01 0.01USDSELECT SECT FIN FEB 23.00 17.02.17 PUT487 25,999.33 0.07USDSKYWORKS SOL JAN 67.50 20.01.17 PUT48 1,372.80 0.00USDSP 500 JAN 2100 31.01.17 PUT(45) (21,450.02) (0.06)USDSP 500 JAN 2200 31.01.17 PUT45 69,069.07 0.18USDSP 500 JAN 2150 20.01.17 PUT11 4,719.00 0.01USDSP 500 JAN 2200 20.01.17 PUT20 18,876.02 0.05USDSP 500 OTC JAN 1999 20.01.17 PUT358,800 0.00 0.00USDSPDR GOLD JAN 118.00 20.01.17 CALL280 3,203.20 0.01USDSPDR GOLD JAN 123.00 20.01.17 CALL(280) (800.80) 0.00USDSPDR S&P REG BK JAN 53.00 20.01.17 PUT300 14,014.01 0.04USDTWITTER JAN 23.00 20.01.17 CALL270 1,029.60 0.00USDTWITTER JAN 25.00 20.01.17 CALL(270) (514.80) 0.00USD
USD(P)/JPY(C)OTC JAN 112.00 31.01.17 PUT(10,000,000) (41,691.79) (0.11)USDLuxembourg 63,782.54 0.17
USD(P)/JPY(C)OTC JAN 115.00 31.01.17 PUT10,000,000 105,474.33 0.28USD
HANG SENG CHIOTC MAR 8961 15.03.17 PUT780 20,820.15 0.06HKDJapan 41,471.99 0.11
NIKKEI 225 OTC MAR 18324 15.03.17 PUT5,940 20,651.84 0.05JPY
DJ EURO STOXX 50 JAN 2950 23.01.17 PUT(167) (4,175.00) (0.01)EURGermany 16,199.00 0.04
DJ EURO STOXX 50 JAN 3125 23.01.17 PUT167 20,374.00 0.05EUR
Total securities portfolio 29,380,301.04 77.00
Securities portfolio as at 31/12/16EURExpressed in
BG SICAV – Algebris - Best Ideas
Quantity Denomination Quotationcurrency
% of netassetsMarket value
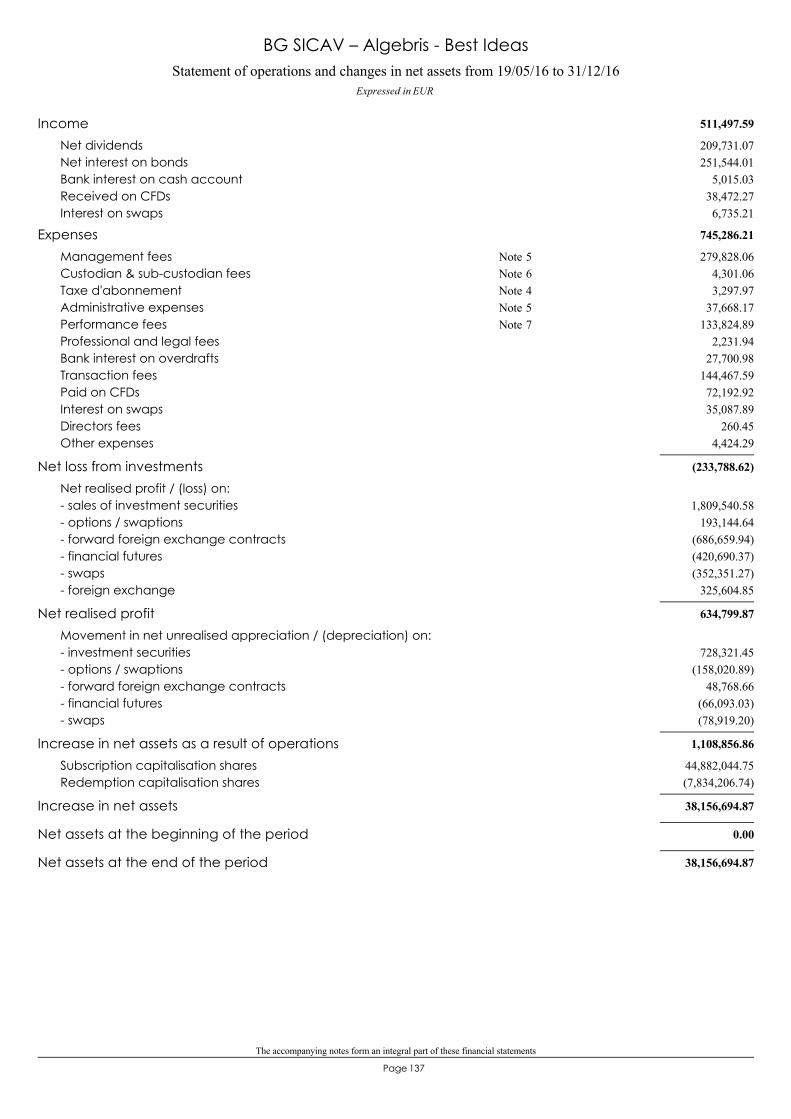
The accompanying notes form an integral part of these financial statements
137Page
Statement of operations and changes in net assets from 19/05/16 to 31/12/16Expressed in EUR
BG SICAV – Algebris - Best Ideas
511,497.59Income209,731.07Net dividends251,544.01Net interest on bonds
5,015.03Bank interest on cash account38,472.27Received on CFDs6,735.21Interest on swaps
745,286.21Expenses279,828.06Management fees 5Note
4,301.06Custodian & sub-custodian fees 6Note3,297.97Taxe d'abonnement 4Note
37,668.17Administrative expenses 5Note133,824.89Performance fees 7Note
2,231.94Professional and legal fees27,700.98Bank interest on overdrafts
144,467.59Transaction fees72,192.92Paid on CFDs35,087.89Interest on swaps
260.45Directors fees4,424.29Other expenses
(233,788.62)Net loss from investmentsNet realised profit / (loss) on:
1,809,540.58- sales of investment securities193,144.64- options / swaptions
(686,659.94)- forward foreign exchange contracts(420,690.37)- financial futures(352,351.27)- swaps
325,604.85- foreign exchange
634,799.87Net realised profitMovement in net unrealised appreciation / (depreciation) on:
728,321.45- investment securities(158,020.89)- options / swaptions
48,768.66- forward foreign exchange contracts(66,093.03)- financial futures(78,919.20)- swaps
1,108,856.86Increase in net assets as a result of operations44,882,044.75Subscription capitalisation shares(7,834,206.74)Redemption capitalisation shares
38,156,694.87Increase in net assets
0.00Net assets at the beginning of the period
38,156,694.87Net assets at the end of the period
138Page
BG SICAV– Euro Debt
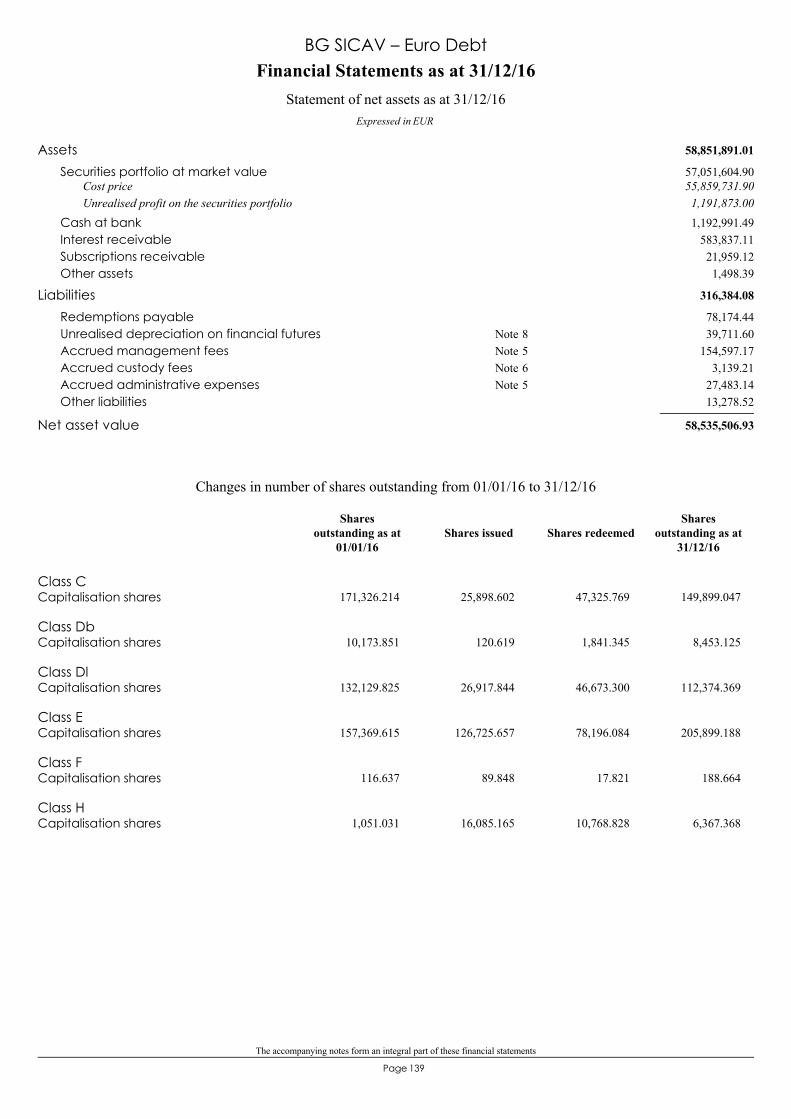
The accompanying notes form an integral part of these financial statements
139Page
58,851,891.01Assets57,051,604.90Securities portfolio at market value55,859,731.90Cost price1,191,873.00Unrealised profit on the securities portfolio1,192,991.49Cash at bank
583,837.11Interest receivable21,959.12Subscriptions receivable1,498.39Other assets
316,384.08Liabilities78,174.44Redemptions payable39,711.60Unrealised depreciation on financial futures 8Note
154,597.17Accrued management fees 5Note3,139.21Accrued custody fees 6Note
27,483.14Accrued administrative expenses 5Note13,278.52Other liabilities
58,535,506.93Net asset value
Financial Statements as at 31/12/16
Expressed in EUR
Statement of net assets as at 31/12/16
BG SICAV – Euro Debt
Class CCapitalisation shares 171,326.214 25,898.602 47,325.769 149,899.047
Class DbCapitalisation shares 10,173.851 120.619 1,841.345 8,453.125
Class DlCapitalisation shares 132,129.825 26,917.844 46,673.300 112,374.369
Class ECapitalisation shares 157,369.615 126,725.657 78,196.084 205,899.188
Class FCapitalisation shares 116.637 89.848 17.821 188.664
Class HCapitalisation shares 1,051.031 16,085.165 10,768.828 6,367.368
Changes in number of shares outstanding from 01/01/16 to 31/12/16
Shares issued Shares redeemedShares
outstanding as at31/12/16
Sharesoutstanding as at
01/01/16
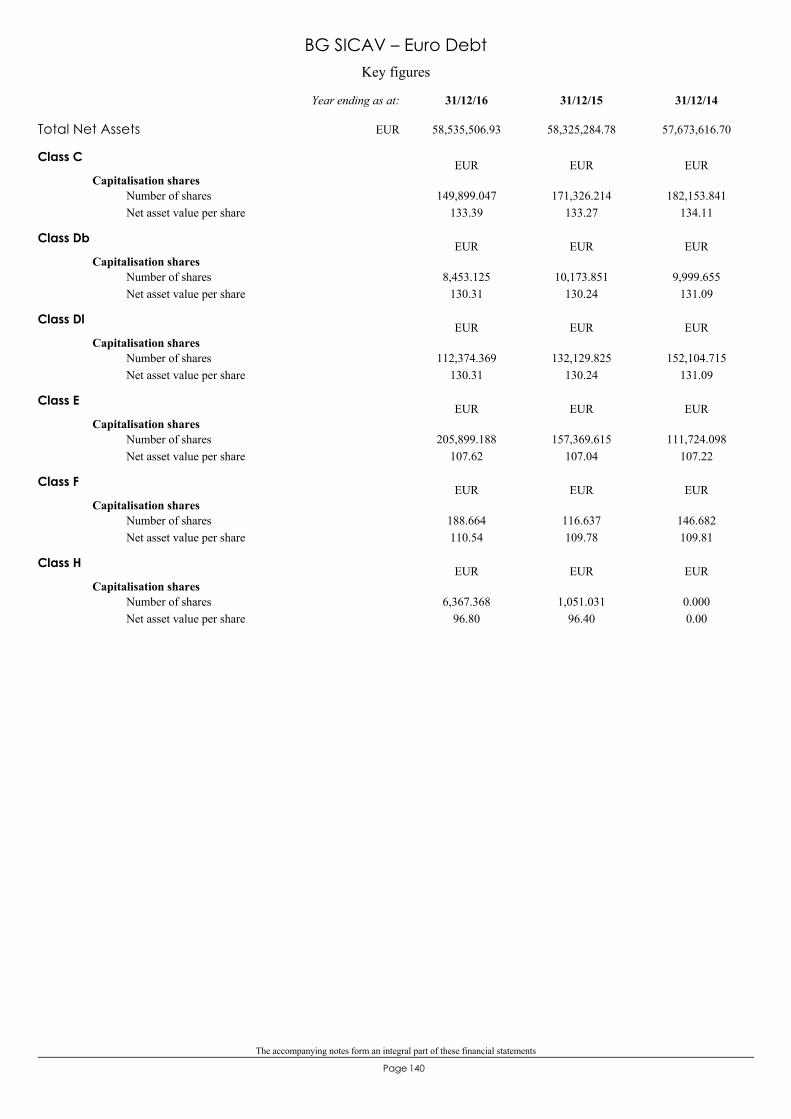
The accompanying notes form an integral part of these financial statements
140Page
Key figures
BG SICAV – Euro Debt
Class C
Capitalisation shares
133.39149,899.047 171,326.214
133.27182,153.841
134.11Number of sharesNet asset value per share
EUR EUR EUR
Class Db
Capitalisation shares
130.318,453.125 10,173.851
130.249,999.655
131.09Number of sharesNet asset value per share
EUR EUR EUR
Class Dl
Capitalisation shares
130.31112,374.369 132,129.825
130.24152,104.715
131.09Number of sharesNet asset value per share
EUR EUR EUR
Class E
Capitalisation shares
107.62205,899.188 157,369.615
107.04111,724.098
107.22Number of sharesNet asset value per share
EUR EUR EUR
Class F
Capitalisation shares
110.54188.664 116.637
109.78146.682109.81
Number of sharesNet asset value per share
EUR EUR EUR
Class H
Capitalisation shares
96.806,367.368 1,051.031
96.400.0000.00
Number of sharesNet asset value per share
EUR EUR EUR
Total Net Assets 58,535,506.93 58,325,284.78 57,673,616.70
31/12/1431/12/1531/12/16Year ending as at:
EUR
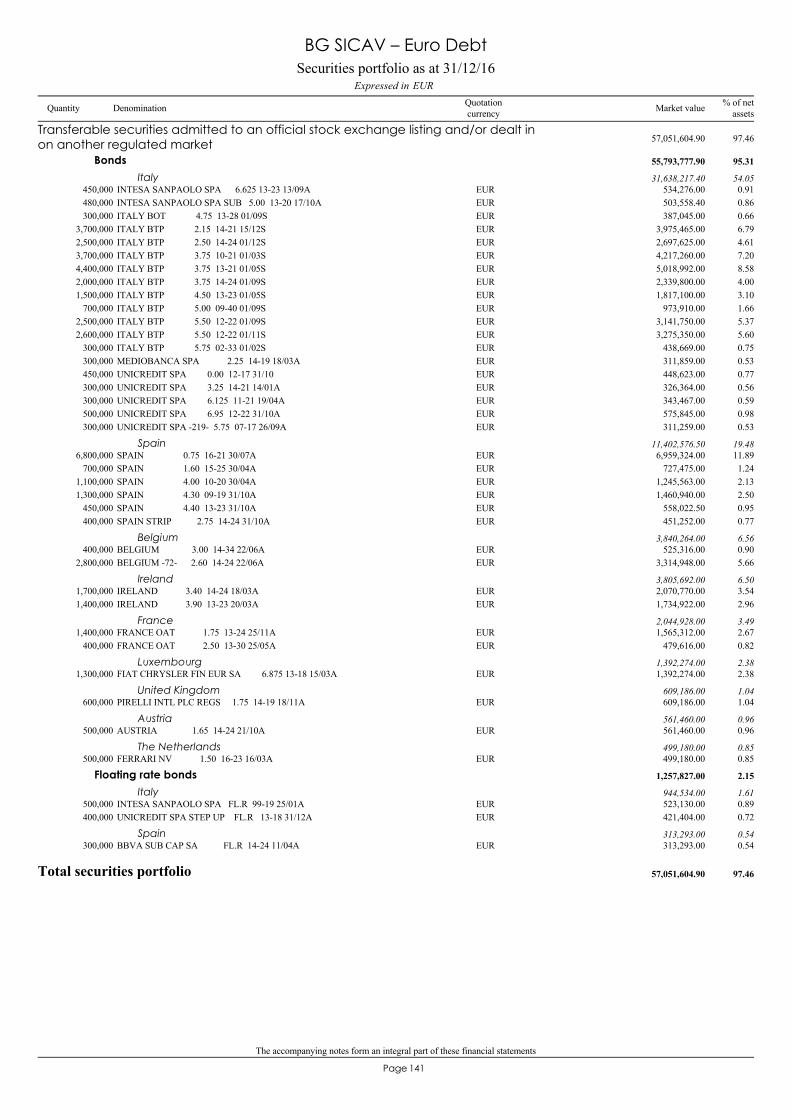
The accompanying notes form an integral part of these financial statements
141Page
INTESA SANPAOLO SPA 6.625 13-23 13/09A450,000 534,276.00 0.91EUR
Transferable securities admitted to an official stock exchange listing and/or dealt inon another regulated market 57,051,604.90 97.46
Bonds 55,793,777.90 95.31
Italy 31,638,217.40 54.05
INTESA SANPAOLO SPA SUB 5.00 13-20 17/10A480,000 503,558.40 0.86EURITALY BOT 4.75 13-28 01/09S300,000 387,045.00 0.66EURITALY BTP 2.15 14-21 15/12S3,700,000 3,975,465.00 6.79EURITALY BTP 2.50 14-24 01/12S2,500,000 2,697,625.00 4.61EURITALY BTP 3.75 10-21 01/03S3,700,000 4,217,260.00 7.20EURITALY BTP 3.75 13-21 01/05S4,400,000 5,018,992.00 8.58EURITALY BTP 3.75 14-24 01/09S2,000,000 2,339,800.00 4.00EURITALY BTP 4.50 13-23 01/05S1,500,000 1,817,100.00 3.10EURITALY BTP 5.00 09-40 01/09S700,000 973,910.00 1.66EURITALY BTP 5.50 12-22 01/09S2,500,000 3,141,750.00 5.37EURITALY BTP 5.50 12-22 01/11S2,600,000 3,275,350.00 5.60EURITALY BTP 5.75 02-33 01/02S300,000 438,669.00 0.75EURMEDIOBANCA SPA 2.25 14-19 18/03A300,000 311,859.00 0.53EURUNICREDIT SPA 0.00 12-17 31/10450,000 448,623.00 0.77EURUNICREDIT SPA 3.25 14-21 14/01A300,000 326,364.00 0.56EURUNICREDIT SPA 6.125 11-21 19/04A300,000 343,467.00 0.59EURUNICREDIT SPA 6.95 12-22 31/10A500,000 575,845.00 0.98EURUNICREDIT SPA -219- 5.75 07-17 26/09A300,000 311,259.00 0.53EUR
SPAIN 0.75 16-21 30/07A6,800,000 6,959,324.00 11.89EURSpain 11,402,576.50 19.48
SPAIN 1.60 15-25 30/04A700,000 727,475.00 1.24EURSPAIN 4.00 10-20 30/04A1,100,000 1,245,563.00 2.13EURSPAIN 4.30 09-19 31/10A1,300,000 1,460,940.00 2.50EURSPAIN 4.40 13-23 31/10A450,000 558,022.50 0.95EURSPAIN STRIP 2.75 14-24 31/10A400,000 451,252.00 0.77EUR
BELGIUM 3.00 14-34 22/06A400,000 525,316.00 0.90EURBelgium 3,840,264.00 6.56
BELGIUM -72- 2.60 14-24 22/06A2,800,000 3,314,948.00 5.66EUR
IRELAND 3.40 14-24 18/03A1,700,000 2,070,770.00 3.54EURIreland 3,805,692.00 6.50
IRELAND 3.90 13-23 20/03A1,400,000 1,734,922.00 2.96EUR
FRANCE OAT 1.75 13-24 25/11A1,400,000 1,565,312.00 2.67EURFrance 2,044,928.00 3.49
FRANCE OAT 2.50 13-30 25/05A400,000 479,616.00 0.82EUR
FIAT CHRYSLER FIN EUR SA 6.875 13-18 15/03A1,300,000 1,392,274.00 2.38EURLuxembourg 1,392,274.00 2.38
PIRELLI INTL PLC REGS 1.75 14-19 18/11A600,000 609,186.00 1.04EURUnited Kingdom 609,186.00 1.04
AUSTRIA 1.65 14-24 21/10A500,000 561,460.00 0.96EURAustria 561,460.00 0.96
FERRARI NV 1.50 16-23 16/03A500,000 499,180.00 0.85EURThe Netherlands 499,180.00 0.85
INTESA SANPAOLO SPA FL.R 99-19 25/01A500,000 523,130.00 0.89EUR
Floating rate bonds 1,257,827.00 2.15
Italy 944,534.00 1.61
UNICREDIT SPA STEP UP FL.R 13-18 31/12A400,000 421,404.00 0.72EUR
BBVA SUB CAP SA FL.R 14-24 11/04A300,000 313,293.00 0.54EURSpain 313,293.00 0.54
Total securities portfolio 57,051,604.90 97.46
Securities portfolio as at 31/12/16EURExpressed in
BG SICAV – Euro Debt
Quantity Denomination Quotationcurrency
% of netassetsMarket value
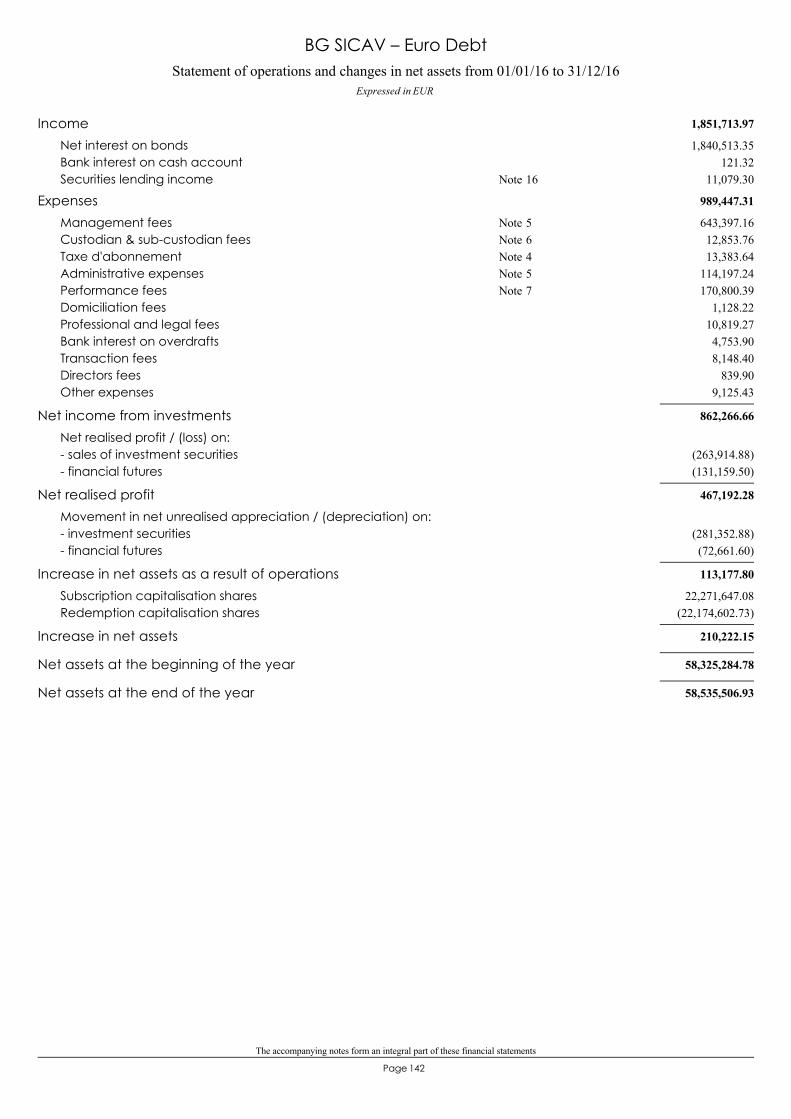
The accompanying notes form an integral part of these financial statements
142Page
Statement of operations and changes in net assets from 01/01/16 to 31/12/16Expressed in EUR
BG SICAV – Euro Debt
1,851,713.97Income1,840,513.35Net interest on bonds
121.32Bank interest on cash account11,079.30Securities lending income 16Note
989,447.31Expenses643,397.16Management fees 5Note12,853.76Custodian & sub-custodian fees 6Note13,383.64Taxe d'abonnement 4Note
114,197.24Administrative expenses 5Note170,800.39Performance fees 7Note
1,128.22Domiciliation fees10,819.27Professional and legal fees4,753.90Bank interest on overdrafts8,148.40Transaction fees
839.90Directors fees9,125.43Other expenses
862,266.66Net income from investmentsNet realised profit / (loss) on:
(263,914.88)- sales of investment securities(131,159.50)- financial futures
467,192.28Net realised profitMovement in net unrealised appreciation / (depreciation) on:
(281,352.88)- investment securities(72,661.60)- financial futures
113,177.80Increase in net assets as a result of operations22,271,647.08Subscription capitalisation shares
(22,174,602.73)Redemption capitalisation shares
210,222.15Increase in net assets
58,325,284.78Net assets at the beginning of the year
58,535,506.93Net assets at the end of the year

143Page
BG SICAV– Vontobel Global Active Bond

The accompanying notes form an integral part of these financial statements
144Page
274,992,894.21Assets200,841,027.90Securities portfolio at market value200,376,408.73Cost price
464,619.17Unrealised profit on the securities portfolio19,598,341.32Options / swaptions purchased at market value 10, 11Note13,417,143.51Options / swaptions purchased at cost50,381,005.55Cash at bank3,365,625.11Interest receivable
800,177.08Subscriptions receivable6,717.25Other assets
22,949,009.02Liabilities15,972,466.89Options / swaptions sold at market value 10, 11Note12,269,969.01Options / swaptions sold at cost
693,654.26Bank overdrafts59,681.77Accrued performance fees 7Note
652,316.72Redemptions payable3,420,881.42Unrealised depreciation on forward foreign exchange contracts 9Note
440,741.05Unrealised depreciation on financial futures 8Note749,600.55Unrealised depreciation on swaps 12Note772,228.17Accrued management fees 5Note12,262.08Accrued custody fees 6Note
107,352.78Accrued administrative expenses 5Note67,823.33Other liabilities
252,043,885.19Net asset value
Financial Statements as at 31/12/16
Expressed in EUR
Statement of net assets as at 31/12/16
BG SICAV – Vontobel Global Active Bond
Class CCapitalisation shares 7,493.870 1,801.559 2,092.337 7,203.092
Class DlCapitalisation shares 581,966.246 140,071.703 157,608.287 564,429.662
Class ECapitalisation shares 746,358.291 410,585.744 177,297.760 979,646.275
Class FCapitalisation shares 2,584.503 1,115.440 1,363.701 2,336.242
Class HCapitalisation shares 662,471.000 576,342.366 465,954.382 772,858.984
Changes in number of shares outstanding from 01/01/16 to 31/12/16
Shares issued Shares redeemedShares
outstanding as at31/12/16
Sharesoutstanding as at
01/01/16

The accompanying notes form an integral part of these financial statements
145Page
Key figures
BG SICAV – Vontobel Global Active Bond
Class C
Capitalisation shares
109.717,203.092 7,493.870
108.47106,823.630
105.54Number of sharesNet asset value per share
EUR EUR EUR
Class Dl
Capitalisation shares
108.90564,429.662 581,966.246
107.71335,942.152
104.83Number of sharesNet asset value per share
EUR EUR EUR
Class E
Capitalisation shares
115.52979,646.275 746,358.291
113.53383,426.436
109.78Number of sharesNet asset value per share
EUR EUR EUR
Class F
Capitalisation shares
112.562,336.242 2,584.503
110.051,714.178
106.00Number of sharesNet asset value per share
EUR EUR EUR
Class H
Capitalisation shares
98.80772,858.984 662,471.000
97.210.0000.00
Number of sharesNet asset value per share
EUR EUR EUR
Total Net Assets 252,043,885.19 212,911,142.80 88,763,082.33
31/12/1431/12/1531/12/16Year ending as at:
EUR
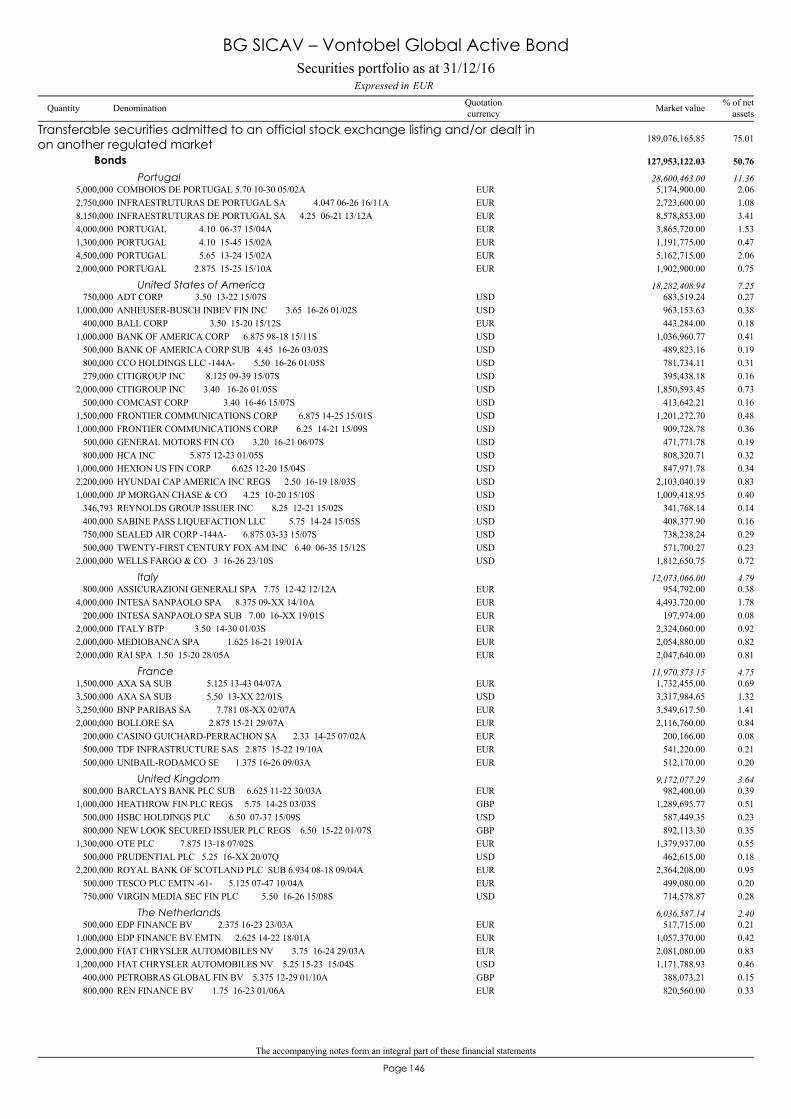
The accompanying notes form an integral part of these financial statements
146Page
COMBOIOS DE PORTUGAL 5.70 10-30 05/02A5,000,000 5,174,900.00 2.06EUR
Transferable securities admitted to an official stock exchange listing and/or dealt inon another regulated market 189,076,165.85 75.01
Bonds 127,953,122.03 50.76
Portugal 28,600,463.00 11.36
INFRAESTRUTURAS DE PORTUGAL SA 4.047 06-26 16/11A2,750,000 2,723,600.00 1.08EURINFRAESTRUTURAS DE PORTUGAL SA 4.25 06-21 13/12A8,150,000 8,578,853.00 3.41EURPORTUGAL 4.10 06-37 15/04A4,000,000 3,865,720.00 1.53EURPORTUGAL 4.10 15-45 15/02A1,300,000 1,191,775.00 0.47EURPORTUGAL 5.65 13-24 15/02A4,500,000 5,162,715.00 2.06EURPORTUGAL 2.875 15-25 15/10A2,000,000 1,902,900.00 0.75EUR
ADT CORP 3.50 13-22 15/07S750,000 683,519.24 0.27USDUnited States of America 18,282,408.94 7.25
ANHEUSER-BUSCH INBEV FIN INC 3.65 16-26 01/02S1,000,000 963,153.63 0.38USDBALL CORP 3.50 15-20 15/12S400,000 443,284.00 0.18EURBANK OF AMERICA CORP 6.875 98-18 15/11S1,000,000 1,036,960.77 0.41USDBANK OF AMERICA CORP SUB 4.45 16-26 03/03S500,000 489,823.16 0.19USDCCO HOLDINGS LLC -144A- 5.50 16-26 01/05S800,000 781,734.11 0.31USDCITIGROUP INC 8.125 09-39 15/07S279,000 395,438.18 0.16USDCITIGROUP INC 3.40 16-26 01/05S2,000,000 1,850,593.45 0.73USDCOMCAST CORP 3.40 16-46 15/07S500,000 413,642.21 0.16USDFRONTIER COMMUNICATIONS CORP 6.875 14-25 15/01S1,500,000 1,201,272.70 0.48USDFRONTIER COMMUNICATIONS CORP 6.25 14-21 15/09S1,000,000 909,728.78 0.36USDGENERAL MOTORS FIN CO 3.20 16-21 06/07S500,000 471,771.78 0.19USDHCA INC 5.875 12-23 01/05S800,000 808,320.71 0.32USDHEXION US FIN CORP 6.625 12-20 15/04S1,000,000 847,971.78 0.34USDHYUNDAI CAP AMERICA INC REGS 2.50 16-19 18/03S2,200,000 2,103,040.19 0.83USDJP MORGAN CHASE & CO 4.25 10-20 15/10S1,000,000 1,009,418.95 0.40USDREYNOLDS GROUP ISSUER INC 8.25 12-21 15/02S346,793 341,768.14 0.14USDSABINE PASS LIQUEFACTION LLC 5.75 14-24 15/05S400,000 408,377.90 0.16USDSEALED AIR CORP -144A- 6.875 03-33 15/07S750,000 738,238.24 0.29USDTWENTY-FIRST CENTURY FOX AM INC 6.40 06-35 15/12S500,000 571,700.27 0.23USDWELLS FARGO & CO 3 16-26 23/10S2,000,000 1,812,650.75 0.72USD
ASSICURAZIONI GENERALI SPA 7.75 12-42 12/12A800,000 954,792.00 0.38EURItaly 12,073,066.00 4.79
INTESA SANPAOLO SPA 8.375 09-XX 14/10A4,000,000 4,493,720.00 1.78EURINTESA SANPAOLO SPA SUB 7.00 16-XX 19/01S200,000 197,974.00 0.08EURITALY BTP 3.50 14-30 01/03S2,000,000 2,324,060.00 0.92EURMEDIOBANCA SPA 1.625 16-21 19/01A2,000,000 2,054,880.00 0.82EURRAI SPA 1.50 15-20 28/05A2,000,000 2,047,640.00 0.81EUR
AXA SA SUB 5.125 13-43 04/07A1,500,000 1,732,455.00 0.69EURFrance 11,970,373.15 4.75
AXA SA SUB 5.50 13-XX 22/01S3,500,000 3,317,984.65 1.32USDBNP PARIBAS SA 7.781 08-XX 02/07A3,250,000 3,549,617.50 1.41EURBOLLORE SA 2.875 15-21 29/07A2,000,000 2,116,760.00 0.84EURCASINO GUICHARD-PERRACHON SA 2.33 14-25 07/02A200,000 200,166.00 0.08EURTDF INFRASTRUCTURE SAS 2.875 15-22 19/10A500,000 541,220.00 0.21EURUNIBAIL-RODAMCO SE 1.375 16-26 09/03A500,000 512,170.00 0.20EUR
BARCLAYS BANK PLC SUB 6.625 11-22 30/03A800,000 982,400.00 0.39EURUnited Kingdom 9,172,077.29 3.64
HEATHROW FIN PLC REGS 5.75 14-25 03/03S1,000,000 1,289,695.77 0.51GBPHSBC HOLDINGS PLC 6.50 07-37 15/09S500,000 587,449.35 0.23USDNEW LOOK SECURED ISSUER PLC REGS 6.50 15-22 01/07S800,000 892,113.30 0.35GBPOTE PLC 7.875 13-18 07/02S1,300,000 1,379,937.00 0.55EURPRUDENTIAL PLC 5.25 16-XX 20/07Q500,000 462,615.00 0.18USDROYAL BANK OF SCOTLAND PLC SUB 6.934 08-18 09/04A2,200,000 2,364,208.00 0.95EURTESCO PLC EMTN -61- 5.125 07-47 10/04A500,000 499,080.00 0.20EURVIRGIN MEDIA SEC FIN PLC 5.50 16-26 15/08S750,000 714,578.87 0.28USD
EDP FINANCE BV 2.375 16-23 23/03A500,000 517,715.00 0.21EURThe Netherlands 6,036,587.14 2.40
EDP FINANCE BV EMTN 2.625 14-22 18/01A1,000,000 1,057,370.00 0.42EURFIAT CHRYSLER AUTOMOBILES NV 3.75 16-24 29/03A2,000,000 2,081,080.00 0.83EURFIAT CHRYSLER AUTOMOBILES NV 5.25 15-23 15/04S1,200,000 1,171,788.93 0.46USDPETROBRAS GLOBAL FIN BV 5.375 12-29 01/10A400,000 388,073.21 0.15GBPREN FINANCE BV 1.75 16-23 01/06A800,000 820,560.00 0.33EUR
Securities portfolio as at 31/12/16EURExpressed in
BG SICAV – Vontobel Global Active Bond
Quantity Denomination Quotationcurrency
% of netassetsMarket value
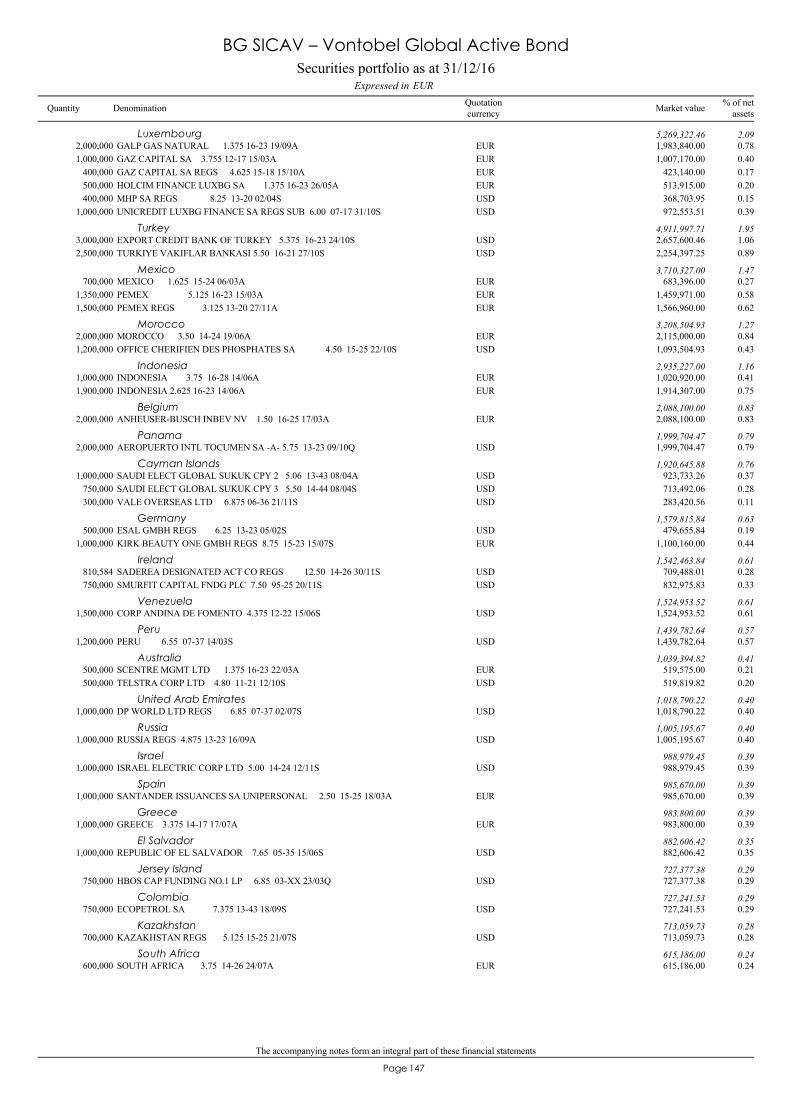
The accompanying notes form an integral part of these financial statements
147Page
GALP GAS NATURAL 1.375 16-23 19/09A2,000,000 1,983,840.00 0.78EURLuxembourg 5,269,322.46 2.09
GAZ CAPITAL SA 3.755 12-17 15/03A1,000,000 1,007,170.00 0.40EURGAZ CAPITAL SA REGS 4.625 15-18 15/10A400,000 423,140.00 0.17EURHOLCIM FINANCE LUXBG SA 1.375 16-23 26/05A500,000 513,915.00 0.20EURMHP SA REGS 8.25 13-20 02/04S400,000 368,703.95 0.15USDUNICREDIT LUXBG FINANCE SA REGS SUB 6.00 07-17 31/10S1,000,000 972,553.51 0.39USD
EXPORT CREDIT BANK OF TURKEY 5.375 16-23 24/10S3,000,000 2,657,600.46 1.06USDTurkey 4,911,997.71 1.95
TURKIYE VAKIFLAR BANKASI 5.50 16-21 27/10S2,500,000 2,254,397.25 0.89USD
MEXICO 1.625 15-24 06/03A700,000 683,396.00 0.27EURMexico 3,710,327.00 1.47
PEMEX 5.125 16-23 15/03A1,350,000 1,459,971.00 0.58EURPEMEX REGS 3.125 13-20 27/11A1,500,000 1,566,960.00 0.62EUR
MOROCCO 3.50 14-24 19/06A2,000,000 2,115,000.00 0.84EURMorocco 3,208,504.93 1.27
OFFICE CHERIFIEN DES PHOSPHATES SA 4.50 15-25 22/10S1,200,000 1,093,504.93 0.43USD
INDONESIA 3.75 16-28 14/06A1,000,000 1,020,920.00 0.41EURIndonesia 2,935,227.00 1.16
INDONESIA 2.625 16-23 14/06A1,900,000 1,914,307.00 0.75EUR
ANHEUSER-BUSCH INBEV NV 1.50 16-25 17/03A2,000,000 2,088,100.00 0.83EURBelgium 2,088,100.00 0.83
AEROPUERTO INTL TOCUMEN SA -A- 5.75 13-23 09/10Q2,000,000 1,999,704.47 0.79USDPanama 1,999,704.47 0.79
SAUDI ELECT GLOBAL SUKUK CPY 2 5.06 13-43 08/04A1,000,000 923,733.26 0.37USDCayman Islands 1,920,645.88 0.76
SAUDI ELECT GLOBAL SUKUK CPY 3 5.50 14-44 08/04S750,000 713,492.06 0.28USDVALE OVERSEAS LTD 6.875 06-36 21/11S300,000 283,420.56 0.11USD
ESAL GMBH REGS 6.25 13-23 05/02S500,000 479,655.84 0.19USDGermany 1,579,815.84 0.63
KIRK BEAUTY ONE GMBH REGS 8.75 15-23 15/07S1,000,000 1,100,160.00 0.44EUR
SADEREA DESIGNATED ACT CO REGS 12.50 14-26 30/11S810,584 709,488.01 0.28USDIreland 1,542,463.84 0.61
SMURFIT CAPITAL FNDG PLC 7.50 95-25 20/11S750,000 832,975.83 0.33USD
CORP ANDINA DE FOMENTO 4.375 12-22 15/06S1,500,000 1,524,953.52 0.61USDVenezuela 1,524,953.52 0.61
PERU 6.55 07-37 14/03S1,200,000 1,439,782.64 0.57USDPeru 1,439,782.64 0.57
SCENTRE MGMT LTD 1.375 16-23 22/03A500,000 519,575.00 0.21EURAustralia 1,039,394.82 0.41
TELSTRA CORP LTD 4.80 11-21 12/10S500,000 519,819.82 0.20USD
DP WORLD LTD REGS 6.85 07-37 02/07S1,000,000 1,018,790.22 0.40USDUnited Arab Emirates 1,018,790.22 0.40
RUSSIA REGS 4.875 13-23 16/09A1,000,000 1,005,195.67 0.40USDRussia 1,005,195.67 0.40
ISRAEL ELECTRIC CORP LTD 5.00 14-24 12/11S1,000,000 988,979.45 0.39USDIsrael 988,979.45 0.39
SANTANDER ISSUANCES SA UNIPERSONAL 2.50 15-25 18/03A1,000,000 985,670.00 0.39EURSpain 985,670.00 0.39
GREECE 3.375 14-17 17/07A1,000,000 983,800.00 0.39EURGreece 983,800.00 0.39
REPUBLIC OF EL SALVADOR 7.65 05-35 15/06S1,000,000 882,606.42 0.35USDEl Salvador 882,606.42 0.35
HBOS CAP FUNDING NO.1 LP 6.85 03-XX 23/03Q750,000 727,377.38 0.29USDJersey Island 727,377.38 0.29
ECOPETROL SA 7.375 13-43 18/09S750,000 727,241.53 0.29USDColombia 727,241.53 0.29
KAZAKHSTAN REGS 5.125 15-25 21/07S700,000 713,059.73 0.28USDKazakhstan 713,059.73 0.28
SOUTH AFRICA 3.75 14-26 24/07A600,000 615,186.00 0.24EURSouth Africa 615,186.00 0.24
Securities portfolio as at 31/12/16EURExpressed in
BG SICAV – Vontobel Global Active Bond
Quantity Denomination Quotationcurrency
% of netassetsMarket value
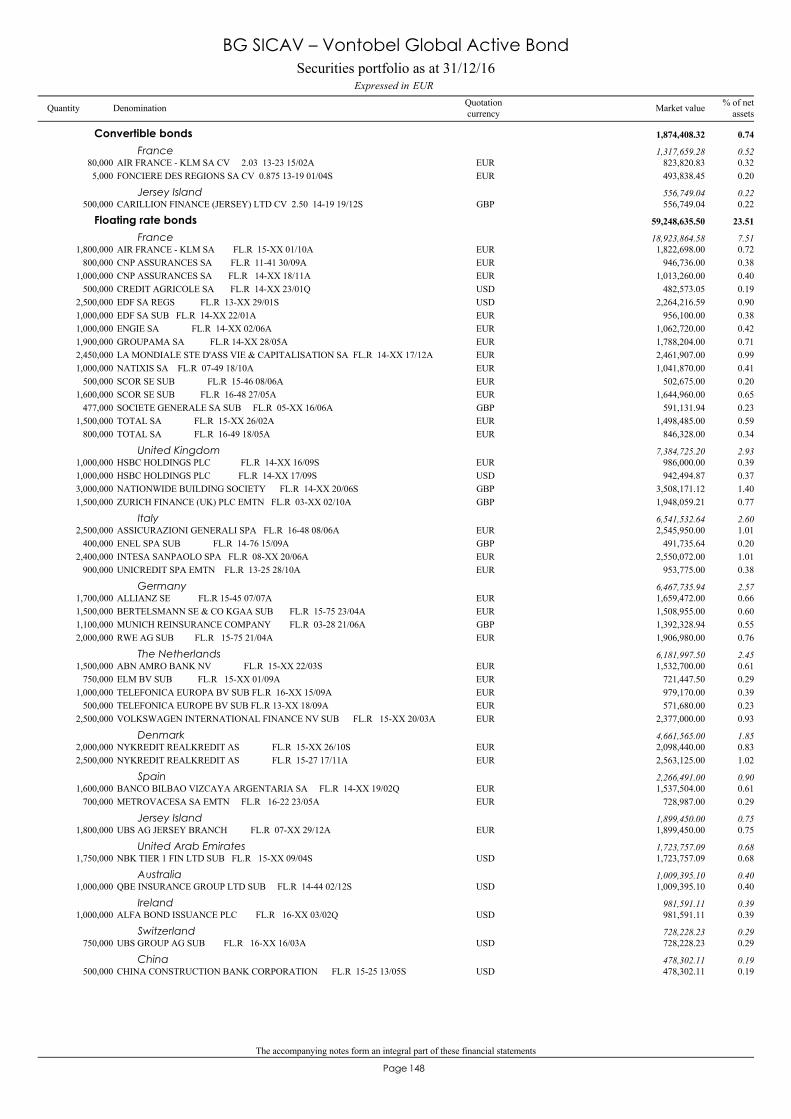
The accompanying notes form an integral part of these financial statements
148Page
AIR FRANCE - KLM SA CV 2.03 13-23 15/02A80,000 823,820.83 0.32EUR
Convertible bonds 1,874,408.32 0.74
France 1,317,659.28 0.52
FONCIERE DES REGIONS SA CV 0.875 13-19 01/04S5,000 493,838.45 0.20EUR
CARILLION FINANCE (JERSEY) LTD CV 2.50 14-19 19/12S500,000 556,749.04 0.22GBPJersey Island 556,749.04 0.22
AIR FRANCE - KLM SA FL.R 15-XX 01/10A1,800,000 1,822,698.00 0.72EUR
Floating rate bonds 59,248,635.50 23.51
France 18,923,864.58 7.51
CNP ASSURANCES SA FL.R 11-41 30/09A800,000 946,736.00 0.38EURCNP ASSURANCES SA FL.R 14-XX 18/11A1,000,000 1,013,260.00 0.40EURCREDIT AGRICOLE SA FL.R 14-XX 23/01Q500,000 482,573.05 0.19USDEDF SA REGS FL.R 13-XX 29/01S2,500,000 2,264,216.59 0.90USDEDF SA SUB FL.R 14-XX 22/01A1,000,000 956,100.00 0.38EURENGIE SA FL.R 14-XX 02/06A1,000,000 1,062,720.00 0.42EURGROUPAMA SA FL.R 14-XX 28/05A1,900,000 1,788,204.00 0.71EURLA MONDIALE STE D'ASS VIE & CAPITALISATION SA FL.R 14-XX 17/12A2,450,000 2,461,907.00 0.99EURNATIXIS SA FL.R 07-49 18/10A1,000,000 1,041,870.00 0.41EURSCOR SE SUB FL.R 15-46 08/06A500,000 502,675.00 0.20EURSCOR SE SUB FL.R 16-48 27/05A1,600,000 1,644,960.00 0.65EURSOCIETE GENERALE SA SUB FL.R 05-XX 16/06A477,000 591,131.94 0.23GBPTOTAL SA FL.R 15-XX 26/02A1,500,000 1,498,485.00 0.59EURTOTAL SA FL.R 16-49 18/05A800,000 846,328.00 0.34EUR
HSBC HOLDINGS PLC FL.R 14-XX 16/09S1,000,000 986,000.00 0.39EURUnited Kingdom 7,384,725.20 2.93
HSBC HOLDINGS PLC FL.R 14-XX 17/09S1,000,000 942,494.87 0.37USDNATIONWIDE BUILDING SOCIETY FL.R 14-XX 20/06S3,000,000 3,508,171.12 1.40GBPZURICH FINANCE (UK) PLC EMTN FL.R 03-XX 02/10A1,500,000 1,948,059.21 0.77GBP
ASSICURAZIONI GENERALI SPA FL.R 16-48 08/06A2,500,000 2,545,950.00 1.01EURItaly 6,541,532.64 2.60
ENEL SPA SUB FL.R 14-76 15/09A400,000 491,735.64 0.20GBPINTESA SANPAOLO SPA FL.R 08-XX 20/06A2,400,000 2,550,072.00 1.01EURUNICREDIT SPA EMTN FL.R 13-25 28/10A900,000 953,775.00 0.38EUR
ALLIANZ SE FL.R 15-45 07/07A1,700,000 1,659,472.00 0.66EURGermany 6,467,735.94 2.57
BERTELSMANN SE & CO KGAA SUB FL.R 15-75 23/04A1,500,000 1,508,955.00 0.60EURMUNICH REINSURANCE COMPANY FL.R 03-28 21/06A1,100,000 1,392,328.94 0.55GBPRWE AG SUB FL.R 15-75 21/04A2,000,000 1,906,980.00 0.76EUR
ABN AMRO BANK NV FL.R 15-XX 22/03S1,500,000 1,532,700.00 0.61EURThe Netherlands 6,181,997.50 2.45
ELM BV SUB FL.R 15-XX 01/09A750,000 721,447.50 0.29EURTELEFONICA EUROPA BV SUB FL.R 16-XX 15/09A1,000,000 979,170.00 0.39EURTELEFONICA EUROPE BV SUB FL.R 13-XX 18/09A500,000 571,680.00 0.23EURVOLKSWAGEN INTERNATIONAL FINANCE NV SUB FL.R 15-XX 20/03A2,500,000 2,377,000.00 0.93EUR
NYKREDIT REALKREDIT AS FL.R 15-XX 26/10S2,000,000 2,098,440.00 0.83EURDenmark 4,661,565.00 1.85
NYKREDIT REALKREDIT AS FL.R 15-27 17/11A2,500,000 2,563,125.00 1.02EUR
BANCO BILBAO VIZCAYA ARGENTARIA SA FL.R 14-XX 19/02Q1,600,000 1,537,504.00 0.61EURSpain 2,266,491.00 0.90
METROVACESA SA EMTN FL.R 16-22 23/05A700,000 728,987.00 0.29EUR
UBS AG JERSEY BRANCH FL.R 07-XX 29/12A1,800,000 1,899,450.00 0.75EURJersey Island 1,899,450.00 0.75
NBK TIER 1 FIN LTD SUB FL.R 15-XX 09/04S1,750,000 1,723,757.09 0.68USDUnited Arab Emirates 1,723,757.09 0.68
QBE INSURANCE GROUP LTD SUB FL.R 14-44 02/12S1,000,000 1,009,395.10 0.40USDAustralia 1,009,395.10 0.40
ALFA BOND ISSUANCE PLC FL.R 16-XX 03/02Q1,000,000 981,591.11 0.39USDIreland 981,591.11 0.39
UBS GROUP AG SUB FL.R 16-XX 16/03A750,000 728,228.23 0.29USDSwitzerland 728,228.23 0.29
CHINA CONSTRUCTION BANK CORPORATION FL.R 15-25 13/05S500,000 478,302.11 0.19USDChina 478,302.11 0.19
Securities portfolio as at 31/12/16EURExpressed in
BG SICAV – Vontobel Global Active Bond
Quantity Denomination Quotationcurrency
% of netassetsMarket value
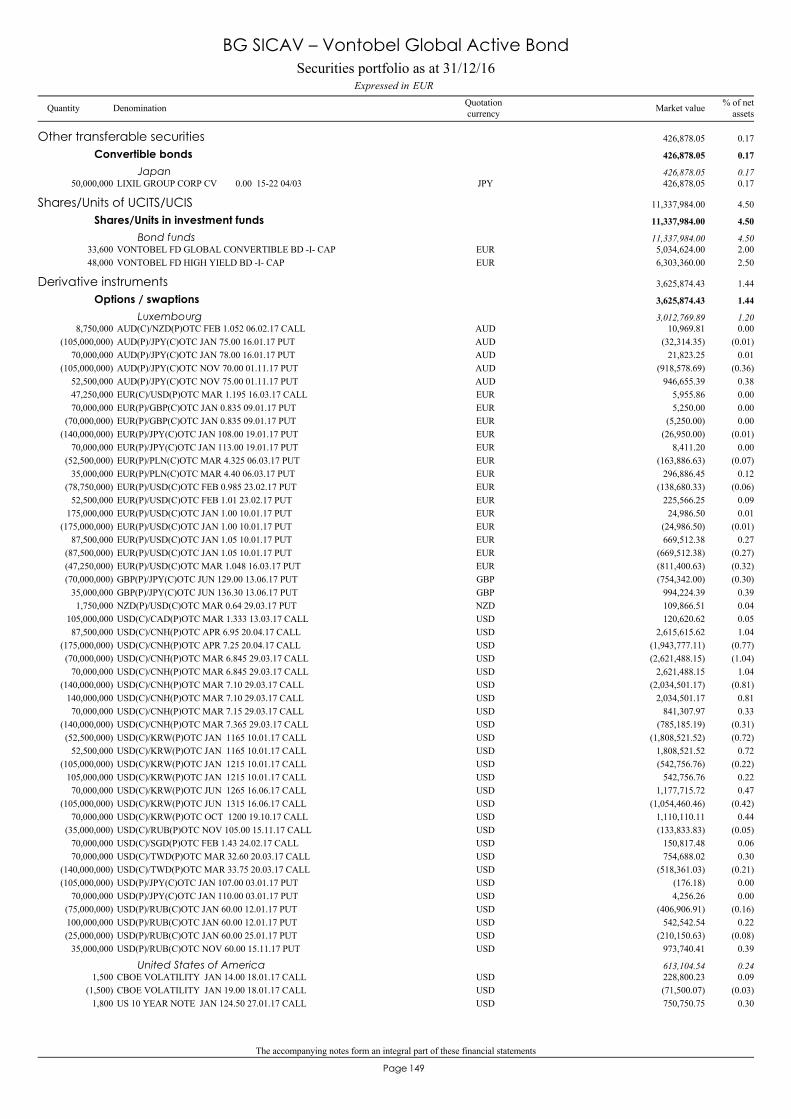
The accompanying notes form an integral part of these financial statements
149Page
LIXIL GROUP CORP CV 0.00 15-22 04/0350,000,000 426,878.05 0.17JPY
Other transferable securities 426,878.05 0.17
Convertible bonds 426,878.05 0.17
Japan 426,878.05 0.17
VONTOBEL FD GLOBAL CONVERTIBLE BD -I- CAP33,600 5,034,624.00 2.00EUR
Shares/Units of UCITS/UCIS 11,337,984.00 4.50
Shares/Units in investment funds 11,337,984.00 4.50
Bond funds 11,337,984.00 4.50
VONTOBEL FD HIGH YIELD BD -I- CAP48,000 6,303,360.00 2.50EUR
AUD(C)/NZD(P)OTC FEB 1.052 06.02.17 CALL8,750,000 10,969.81 0.00AUD
Derivative instruments 3,625,874.43 1.44
Options / swaptions 3,625,874.43 1.44
Luxembourg 3,012,769.89 1.20
AUD(P)/JPY(C)OTC JAN 75.00 16.01.17 PUT(105,000,000) (32,314.35) (0.01)AUDAUD(P)/JPY(C)OTC JAN 78.00 16.01.17 PUT70,000,000 21,823.25 0.01AUDAUD(P)/JPY(C)OTC NOV 70.00 01.11.17 PUT(105,000,000) (918,578.69) (0.36)AUDAUD(P)/JPY(C)OTC NOV 75.00 01.11.17 PUT52,500,000 946,655.39 0.38AUDEUR(C)/USD(P)OTC MAR 1.195 16.03.17 CALL47,250,000 5,955.86 0.00EUREUR(P)/GBP(C)OTC JAN 0.835 09.01.17 PUT70,000,000 5,250.00 0.00EUREUR(P)/GBP(C)OTC JAN 0.835 09.01.17 PUT(70,000,000) (5,250.00) 0.00EUREUR(P)/JPY(C)OTC JAN 108.00 19.01.17 PUT(140,000,000) (26,950.00) (0.01)EUREUR(P)/JPY(C)OTC JAN 113.00 19.01.17 PUT70,000,000 8,411.20 0.00EUREUR(P)/PLN(C)OTC MAR 4.325 06.03.17 PUT(52,500,000) (163,886.63) (0.07)EUREUR(P)/PLN(C)OTC MAR 4.40 06.03.17 PUT35,000,000 296,886.45 0.12EUREUR(P)/USD(C)OTC FEB 0.985 23.02.17 PUT(78,750,000) (138,680.33) (0.06)EUREUR(P)/USD(C)OTC FEB 1.01 23.02.17 PUT52,500,000 225,566.25 0.09EUREUR(P)/USD(C)OTC JAN 1.00 10.01.17 PUT175,000,000 24,986.50 0.01EUREUR(P)/USD(C)OTC JAN 1.00 10.01.17 PUT(175,000,000) (24,986.50) (0.01)EUREUR(P)/USD(C)OTC JAN 1.05 10.01.17 PUT87,500,000 669,512.38 0.27EUREUR(P)/USD(C)OTC JAN 1.05 10.01.17 PUT(87,500,000) (669,512.38) (0.27)EUREUR(P)/USD(C)OTC MAR 1.048 16.03.17 PUT(47,250,000) (811,400.63) (0.32)EURGBP(P)/JPY(C)OTC JUN 129.00 13.06.17 PUT(70,000,000) (754,342.00) (0.30)GBPGBP(P)/JPY(C)OTC JUN 136.30 13.06.17 PUT35,000,000 994,224.39 0.39GBPNZD(P)/USD(C)OTC MAR 0.64 29.03.17 PUT1,750,000 109,866.51 0.04NZDUSD(C)/CAD(P)OTC MAR 1.333 13.03.17 CALL105,000,000 120,620.62 0.05USDUSD(C)/CNH(P)OTC APR 6.95 20.04.17 CALL87,500,000 2,615,615.62 1.04USDUSD(C)/CNH(P)OTC APR 7.25 20.04.17 CALL(175,000,000) (1,943,777.11) (0.77)USDUSD(C)/CNH(P)OTC MAR 6.845 29.03.17 CALL(70,000,000) (2,621,488.15) (1.04)USDUSD(C)/CNH(P)OTC MAR 6.845 29.03.17 CALL70,000,000 2,621,488.15 1.04USDUSD(C)/CNH(P)OTC MAR 7.10 29.03.17 CALL(140,000,000) (2,034,501.17) (0.81)USDUSD(C)/CNH(P)OTC MAR 7.10 29.03.17 CALL140,000,000 2,034,501.17 0.81USDUSD(C)/CNH(P)OTC MAR 7.15 29.03.17 CALL70,000,000 841,307.97 0.33USDUSD(C)/CNH(P)OTC MAR 7.365 29.03.17 CALL(140,000,000) (785,185.19) (0.31)USDUSD(C)/KRW(P)OTC JAN 1165 10.01.17 CALL(52,500,000) (1,808,521.52) (0.72)USDUSD(C)/KRW(P)OTC JAN 1165 10.01.17 CALL52,500,000 1,808,521.52 0.72USDUSD(C)/KRW(P)OTC JAN 1215 10.01.17 CALL(105,000,000) (542,756.76) (0.22)USDUSD(C)/KRW(P)OTC JAN 1215 10.01.17 CALL105,000,000 542,756.76 0.22USDUSD(C)/KRW(P)OTC JUN 1265 16.06.17 CALL70,000,000 1,177,715.72 0.47USDUSD(C)/KRW(P)OTC JUN 1315 16.06.17 CALL(105,000,000) (1,054,460.46) (0.42)USDUSD(C)/KRW(P)OTC OCT 1200 19.10.17 CALL70,000,000 1,110,110.11 0.44USDUSD(C)/RUB(P)OTC NOV 105.00 15.11.17 CALL(35,000,000) (133,833.83) (0.05)USDUSD(C)/SGD(P)OTC FEB 1.43 24.02.17 CALL70,000,000 150,817.48 0.06USDUSD(C)/TWD(P)OTC MAR 32.60 20.03.17 CALL70,000,000 754,688.02 0.30USDUSD(C)/TWD(P)OTC MAR 33.75 20.03.17 CALL(140,000,000) (518,361.03) (0.21)USDUSD(P)/JPY(C)OTC JAN 107.00 03.01.17 PUT(105,000,000) (176.18) 0.00USDUSD(P)/JPY(C)OTC JAN 110.00 03.01.17 PUT70,000,000 4,256.26 0.00USDUSD(P)/RUB(C)OTC JAN 60.00 12.01.17 PUT(75,000,000) (406,906.91) (0.16)USDUSD(P)/RUB(C)OTC JAN 60.00 12.01.17 PUT100,000,000 542,542.54 0.22USDUSD(P)/RUB(C)OTC JAN 60.00 25.01.17 PUT(25,000,000) (210,150.63) (0.08)USDUSD(P)/RUB(C)OTC NOV 60.00 15.11.17 PUT35,000,000 973,740.41 0.39USD
CBOE VOLATILITY JAN 14.00 18.01.17 CALL1,500 228,800.23 0.09USDUnited States of America 613,104.54 0.24
CBOE VOLATILITY JAN 19.00 18.01.17 CALL(1,500) (71,500.07) (0.03)USDUS 10 YEAR NOTE JAN 124.50 27.01.17 CALL1,800 750,750.75 0.30USD
Securities portfolio as at 31/12/16EURExpressed in
BG SICAV – Vontobel Global Active Bond
Quantity Denomination Quotationcurrency
% of netassetsMarket value
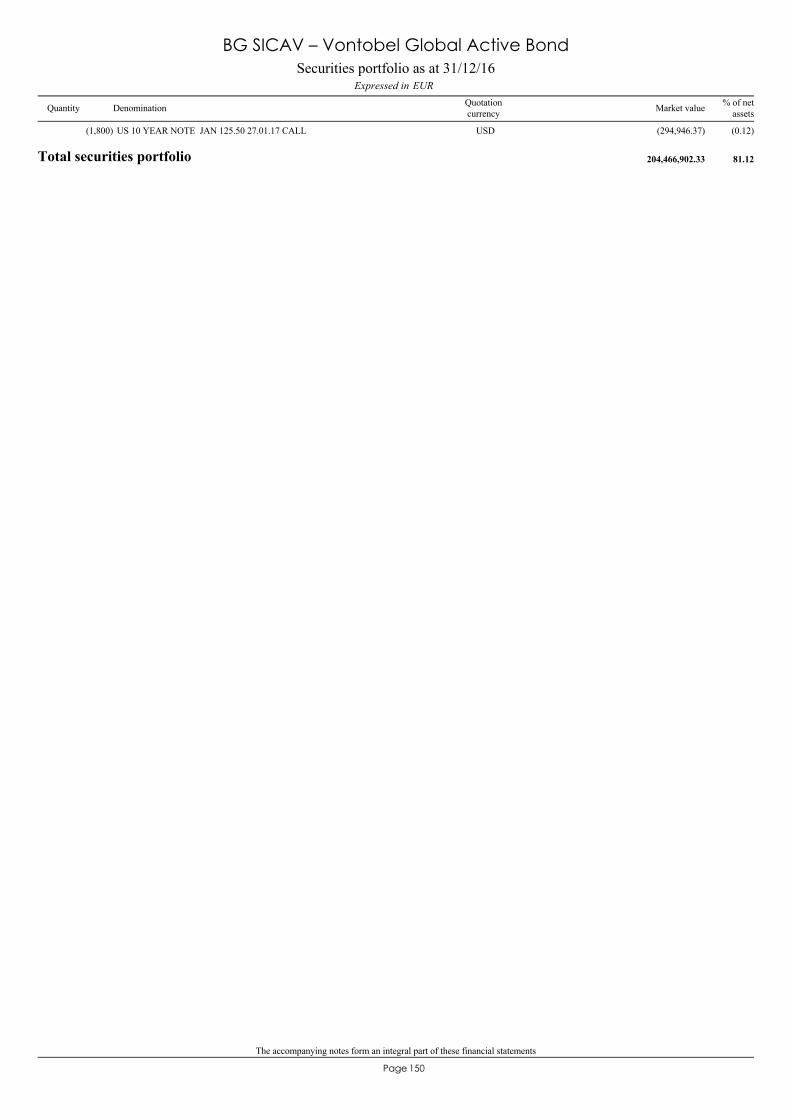
The accompanying notes form an integral part of these financial statements
150Page
US 10 YEAR NOTE JAN 125.50 27.01.17 CALL(1,800) (294,946.37) (0.12)USD
Total securities portfolio 204,466,902.33 81.12
Securities portfolio as at 31/12/16EURExpressed in
BG SICAV – Vontobel Global Active Bond
Quantity Denomination Quotationcurrency
% of netassetsMarket value

The accompanying notes form an integral part of these financial statements
151Page
Statement of operations and changes in net assets from 01/01/16 to 31/12/16Expressed in EUR
BG SICAV – Vontobel Global Active Bond
8,980,325.34Income8,866,497.01Net interest on bonds
11,728.10Bank interest on cash account18,335.26Other financial income83,764.97Securities lending income 16Note
5,843,553.78Expenses2,937,182.22Management fees 5Note
46,190.61Custodian & sub-custodian fees 6Note45,459.87Taxe d'abonnement 4Note
409,910.34Administrative expenses 5Note965,064.49Performance fees 7Note
4,083.32Domiciliation fees38,280.91Professional and legal fees89,209.92Bank interest on overdrafts
874,055.89Transaction fees368,750.00Interest on swaps
2,137.28Directors fees63,228.93Other expenses
3,136,771.56Net income from investmentsNet realised profit / (loss) on:
982,653.69- sales of investment securities7,368,333.58- options / swaptions7,816,929.41- forward foreign exchange contracts
(9,317,261.28)- financial futures936,318.52- swaps
(6,678,272.01)- foreign exchange
4,245,473.47Net realised profitMovement in net unrealised appreciation / (depreciation) on:
2,814,154.53- investment securities2,347,167.42- options / swaptions
(4,333,284.27)- forward foreign exchange contracts(827,450.97)- financial futures(749,600.55)- swaps
3,496,459.63Increase in net assets as a result of operations118,413,529.20Subscription capitalisation shares(82,777,246.44)Redemption capitalisation shares
39,132,742.39Increase in net assets
212,911,142.80Net assets at the beginning of the year
252,043,885.19Net assets at the end of the year
152Page
BG SICAV– BlackRock Global Opportunities Bond Fund
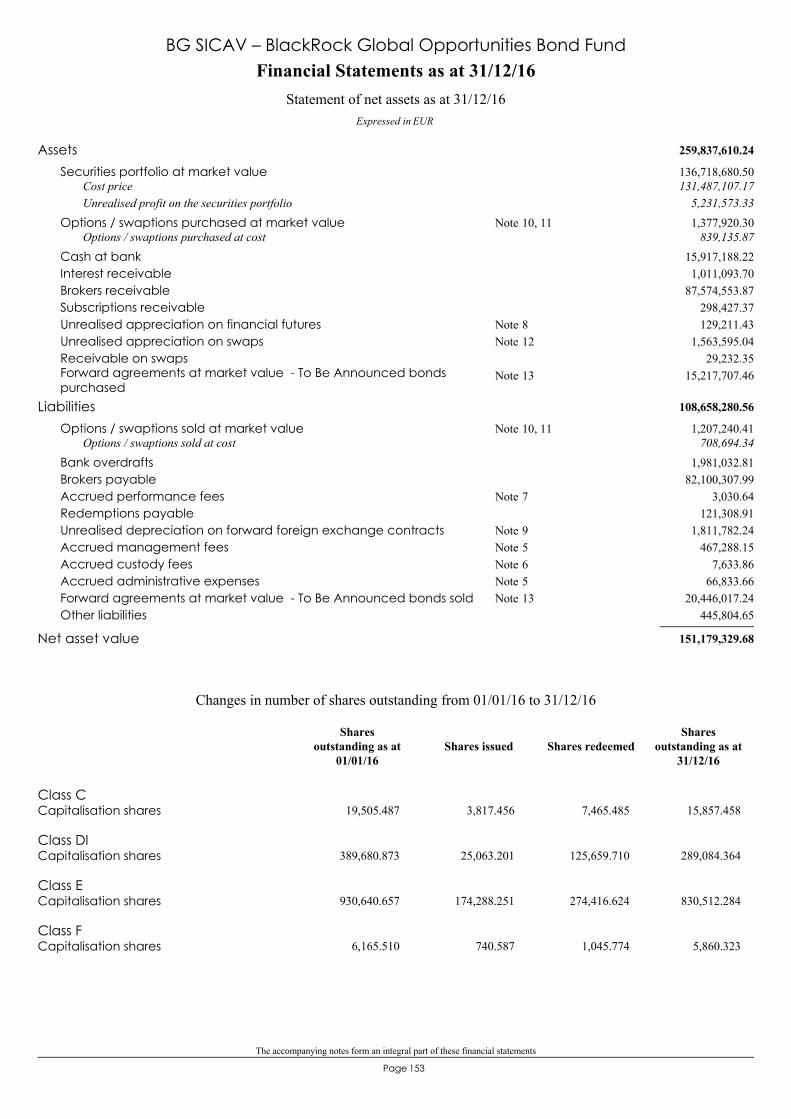
The accompanying notes form an integral part of these financial statements
153Page
259,837,610.24Assets136,718,680.50Securities portfolio at market value131,487,107.17Cost price
5,231,573.33Unrealised profit on the securities portfolio1,377,920.30Options / swaptions purchased at market value 10, 11Note
839,135.87Options / swaptions purchased at cost15,917,188.22Cash at bank1,011,093.70Interest receivable
87,574,553.87Brokers receivable298,427.37Subscriptions receivable129,211.43Unrealised appreciation on financial futures 8Note
1,563,595.04Unrealised appreciation on swaps 12Note29,232.35Receivable on swaps
15,217,707.46Forward agreements at market value - To Be Announced bondspurchased
13Note
108,658,280.56Liabilities1,207,240.41Options / swaptions sold at market value 10, 11Note
708,694.34Options / swaptions sold at cost1,981,032.81Bank overdrafts
82,100,307.99Brokers payable3,030.64Accrued performance fees 7Note
121,308.91Redemptions payable1,811,782.24Unrealised depreciation on forward foreign exchange contracts 9Note
467,288.15Accrued management fees 5Note7,633.86Accrued custody fees 6Note
66,833.66Accrued administrative expenses 5Note20,446,017.24Forward agreements at market value - To Be Announced bonds sold 13Note
445,804.65Other liabilities
151,179,329.68Net asset value
Financial Statements as at 31/12/16
Expressed in EUR
Statement of net assets as at 31/12/16
BG SICAV – BlackRock Global Opportunities Bond Fund
Class CCapitalisation shares 19,505.487 3,817.456 7,465.485 15,857.458
Class DlCapitalisation shares 389,680.873 25,063.201 125,659.710 289,084.364
Class ECapitalisation shares 930,640.657 174,288.251 274,416.624 830,512.284
Class FCapitalisation shares 6,165.510 740.587 1,045.774 5,860.323
Changes in number of shares outstanding from 01/01/16 to 31/12/16
Shares issued Shares redeemedShares
outstanding as at31/12/16
Sharesoutstanding as at
01/01/16
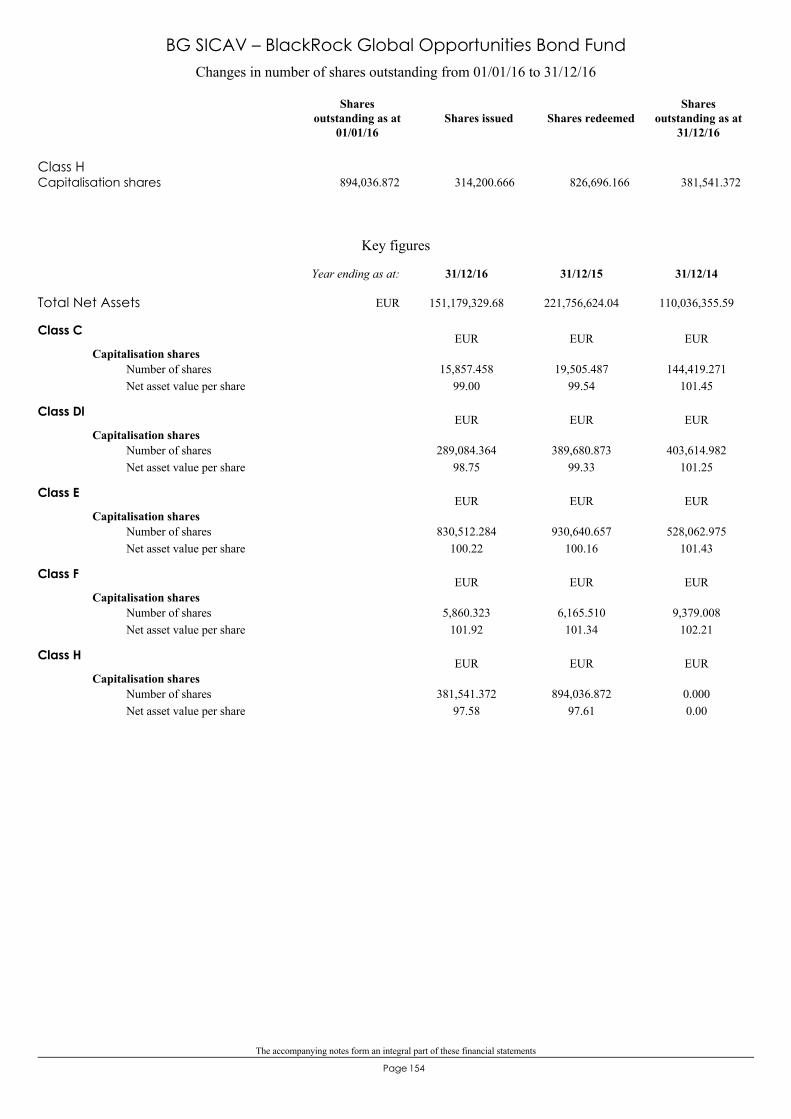
The accompanying notes form an integral part of these financial statements
154Page
Class HCapitalisation shares 894,036.872 314,200.666 826,696.166 381,541.372
Changes in number of shares outstanding from 01/01/16 to 31/12/16
Shares issued Shares redeemedShares
outstanding as at31/12/16
Sharesoutstanding as at
01/01/16
BG SICAV – BlackRock Global Opportunities Bond Fund
Key figures
Class C
Capitalisation shares
99.0015,857.458 19,505.487
99.54144,419.271
101.45Number of sharesNet asset value per share
EUR EUR EUR
Class Dl
Capitalisation shares
98.75289,084.364 389,680.873
99.33403,614.982
101.25Number of sharesNet asset value per share
EUR EUR EUR
Class E
Capitalisation shares
100.22830,512.284 930,640.657
100.16528,062.975
101.43Number of sharesNet asset value per share
EUR EUR EUR
Class F
Capitalisation shares
101.925,860.323 6,165.510
101.349,379.008
102.21Number of sharesNet asset value per share
EUR EUR EUR
Class H
Capitalisation shares
97.58381,541.372 894,036.872
97.610.0000.00
Number of sharesNet asset value per share
EUR EUR EUR
Total Net Assets 151,179,329.68 221,756,624.04 110,036,355.59
31/12/1431/12/1531/12/16Year ending as at:
EUR
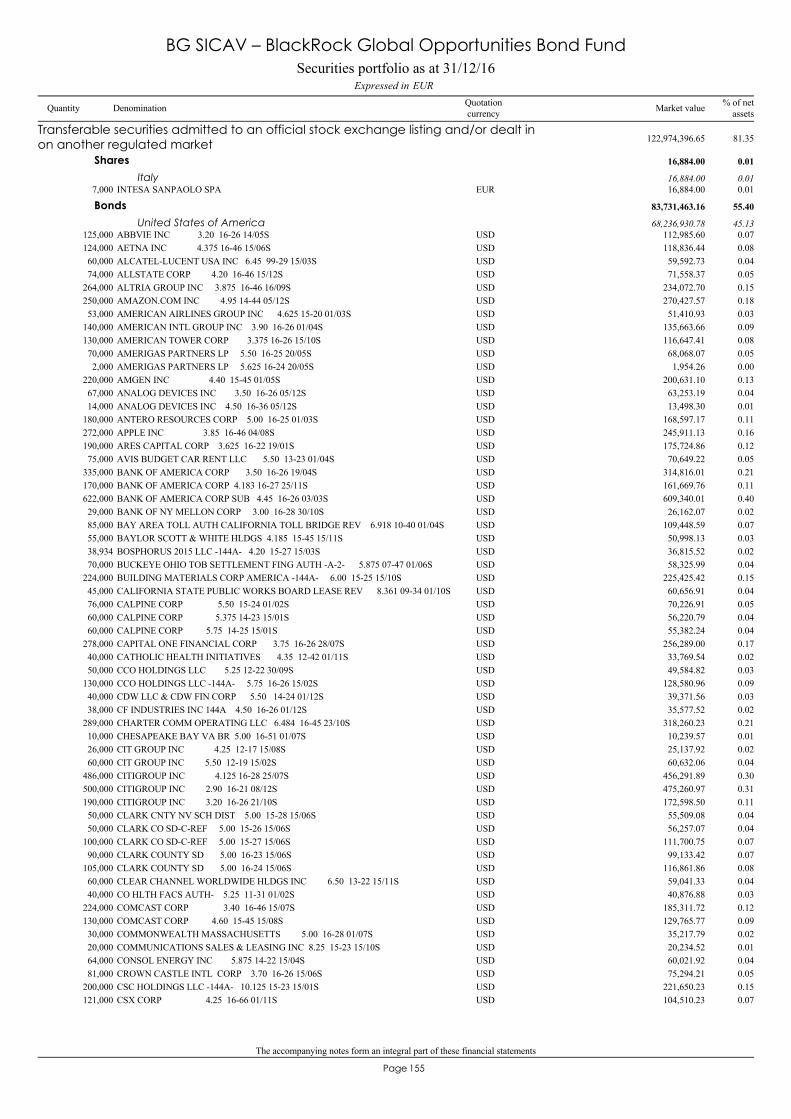
The accompanying notes form an integral part of these financial statements
155Page
INTESA SANPAOLO SPA7,000 16,884.00 0.01EUR
Transferable securities admitted to an official stock exchange listing and/or dealt inon another regulated market 122,974,396.65 81.35
Shares 16,884.00 0.01
Italy 16,884.00 0.01
ABBVIE INC 3.20 16-26 14/05S125,000 112,985.60 0.07USD
Bonds 83,731,463.16 55.40
United States of America 68,236,930.78 45.13
AETNA INC 4.375 16-46 15/06S124,000 118,836.44 0.08USDALCATEL-LUCENT USA INC 6.45 99-29 15/03S60,000 59,592.73 0.04USDALLSTATE CORP 4.20 16-46 15/12S74,000 71,558.37 0.05USDALTRIA GROUP INC 3.875 16-46 16/09S264,000 234,072.70 0.15USDAMAZON.COM INC 4.95 14-44 05/12S250,000 270,427.57 0.18USDAMERICAN AIRLINES GROUP INC 4.625 15-20 01/03S53,000 51,410.93 0.03USDAMERICAN INTL GROUP INC 3.90 16-26 01/04S140,000 135,663.66 0.09USDAMERICAN TOWER CORP 3.375 16-26 15/10S130,000 116,647.41 0.08USDAMERIGAS PARTNERS LP 5.50 16-25 20/05S70,000 68,068.07 0.05USDAMERIGAS PARTNERS LP 5.625 16-24 20/05S2,000 1,954.26 0.00USDAMGEN INC 4.40 15-45 01/05S220,000 200,631.10 0.13USDANALOG DEVICES INC 3.50 16-26 05/12S67,000 63,253.19 0.04USDANALOG DEVICES INC 4.50 16-36 05/12S14,000 13,498.30 0.01USDANTERO RESOURCES CORP 5.00 16-25 01/03S180,000 168,597.17 0.11USDAPPLE INC 3.85 16-46 04/08S272,000 245,911.13 0.16USDARES CAPITAL CORP 3.625 16-22 19/01S190,000 175,724.86 0.12USDAVIS BUDGET CAR RENT LLC 5.50 13-23 01/04S75,000 70,649.22 0.05USDBANK OF AMERICA CORP 3.50 16-26 19/04S335,000 314,816.01 0.21USDBANK OF AMERICA CORP 4.183 16-27 25/11S170,000 161,669.76 0.11USDBANK OF AMERICA CORP SUB 4.45 16-26 03/03S622,000 609,340.01 0.40USDBANK OF NY MELLON CORP 3.00 16-28 30/10S29,000 26,162.07 0.02USDBAY AREA TOLL AUTH CALIFORNIA TOLL BRIDGE REV 6.918 10-40 01/04S85,000 109,448.59 0.07USDBAYLOR SCOTT & WHITE HLDGS 4.185 15-45 15/11S55,000 50,998.13 0.03USDBOSPHORUS 2015 LLC -144A- 4.20 15-27 15/03S38,934 36,815.52 0.02USDBUCKEYE OHIO TOB SETTLEMENT FING AUTH -A-2- 5.875 07-47 01/06S70,000 58,325.99 0.04USDBUILDING MATERIALS CORP AMERICA -144A- 6.00 15-25 15/10S224,000 225,425.42 0.15USDCALIFORNIA STATE PUBLIC WORKS BOARD LEASE REV 8.361 09-34 01/10S45,000 60,656.91 0.04USDCALPINE CORP 5.50 15-24 01/02S76,000 70,226.91 0.05USDCALPINE CORP 5.375 14-23 15/01S60,000 56,220.79 0.04USDCALPINE CORP 5.75 14-25 15/01S60,000 55,382.24 0.04USDCAPITAL ONE FINANCIAL CORP 3.75 16-26 28/07S278,000 256,289.00 0.17USDCATHOLIC HEALTH INITIATIVES 4.35 12-42 01/11S40,000 33,769.54 0.02USDCCO HOLDINGS LLC 5.25 12-22 30/09S50,000 49,584.82 0.03USDCCO HOLDINGS LLC -144A- 5.75 16-26 15/02S130,000 128,580.96 0.09USDCDW LLC & CDW FIN CORP 5.50 14-24 01/12S40,000 39,371.56 0.03USDCF INDUSTRIES INC 144A 4.50 16-26 01/12S38,000 35,577.52 0.02USDCHARTER COMM OPERATING LLC 6.484 16-45 23/10S289,000 318,260.23 0.21USDCHESAPEAKE BAY VA BR 5.00 16-51 01/07S10,000 10,239.57 0.01USDCIT GROUP INC 4.25 12-17 15/08S26,000 25,137.92 0.02USDCIT GROUP INC 5.50 12-19 15/02S60,000 60,632.06 0.04USDCITIGROUP INC 4.125 16-28 25/07S486,000 456,291.89 0.30USDCITIGROUP INC 2.90 16-21 08/12S500,000 475,260.97 0.31USDCITIGROUP INC 3.20 16-26 21/10S190,000 172,598.50 0.11USDCLARK CNTY NV SCH DIST 5.00 15-28 15/06S50,000 55,509.08 0.04USDCLARK CO SD-C-REF 5.00 15-26 15/06S50,000 56,257.07 0.04USDCLARK CO SD-C-REF 5.00 15-27 15/06S100,000 111,700.75 0.07USDCLARK COUNTY SD 5.00 16-23 15/06S90,000 99,133.42 0.07USDCLARK COUNTY SD 5.00 16-24 15/06S105,000 116,861.86 0.08USDCLEAR CHANNEL WORLDWIDE HLDGS INC 6.50 13-22 15/11S60,000 59,041.33 0.04USDCO HLTH FACS AUTH- 5.25 11-31 01/02S40,000 40,876.88 0.03USDCOMCAST CORP 3.40 16-46 15/07S224,000 185,311.72 0.12USDCOMCAST CORP 4.60 15-45 15/08S130,000 129,765.77 0.09USDCOMMONWEALTH MASSACHUSETTS 5.00 16-28 01/07S30,000 35,217.79 0.02USDCOMMUNICATIONS SALES & LEASING INC 8.25 15-23 15/10S20,000 20,234.52 0.01USDCONSOL ENERGY INC 5.875 14-22 15/04S64,000 60,021.92 0.04USDCROWN CASTLE INTL CORP 3.70 16-26 15/06S81,000 75,294.21 0.05USDCSC HOLDINGS LLC -144A- 10.125 15-23 15/01S200,000 221,650.23 0.15USDCSX CORP 4.25 16-66 01/11S121,000 104,510.23 0.07USD
Securities portfolio as at 31/12/16EURExpressed in
BG SICAV – BlackRock Global Opportunities Bond Fund
Quantity Denomination Quotationcurrency
% of netassetsMarket value
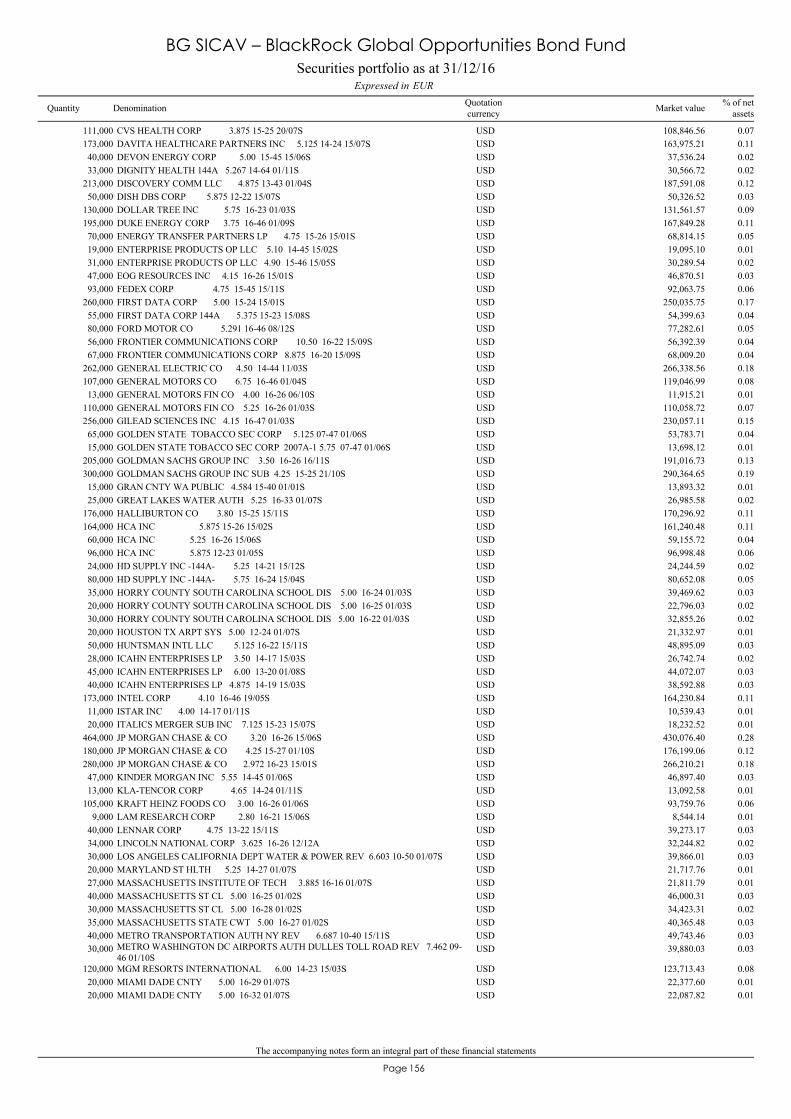
The accompanying notes form an integral part of these financial statements
156Page
CVS HEALTH CORP 3.875 15-25 20/07S111,000 108,846.56 0.07USDDAVITA HEALTHCARE PARTNERS INC 5.125 14-24 15/07S173,000 163,975.21 0.11USDDEVON ENERGY CORP 5.00 15-45 15/06S40,000 37,536.24 0.02USDDIGNITY HEALTH 144A 5.267 14-64 01/11S33,000 30,566.72 0.02USDDISCOVERY COMM LLC 4.875 13-43 01/04S213,000 187,591.08 0.12USDDISH DBS CORP 5.875 12-22 15/07S50,000 50,326.52 0.03USDDOLLAR TREE INC 5.75 16-23 01/03S130,000 131,561.57 0.09USDDUKE ENERGY CORP 3.75 16-46 01/09S195,000 167,849.28 0.11USDENERGY TRANSFER PARTNERS LP 4.75 15-26 15/01S70,000 68,814.15 0.05USDENTERPRISE PRODUCTS OP LLC 5.10 14-45 15/02S19,000 19,095.10 0.01USDENTERPRISE PRODUCTS OP LLC 4.90 15-46 15/05S31,000 30,289.54 0.02USDEOG RESOURCES INC 4.15 16-26 15/01S47,000 46,870.51 0.03USDFEDEX CORP 4.75 15-45 15/11S93,000 92,063.75 0.06USDFIRST DATA CORP 5.00 15-24 15/01S260,000 250,035.75 0.17USDFIRST DATA CORP 144A 5.375 15-23 15/08S55,000 54,399.63 0.04USDFORD MOTOR CO 5.291 16-46 08/12S80,000 77,282.61 0.05USDFRONTIER COMMUNICATIONS CORP 10.50 16-22 15/09S56,000 56,392.39 0.04USDFRONTIER COMMUNICATIONS CORP 8.875 16-20 15/09S67,000 68,009.20 0.04USDGENERAL ELECTRIC CO 4.50 14-44 11/03S262,000 266,338.56 0.18USDGENERAL MOTORS CO 6.75 16-46 01/04S107,000 119,046.99 0.08USDGENERAL MOTORS FIN CO 4.00 16-26 06/10S13,000 11,915.21 0.01USDGENERAL MOTORS FIN CO 5.25 16-26 01/03S110,000 110,058.72 0.07USDGILEAD SCIENCES INC 4.15 16-47 01/03S256,000 230,057.11 0.15USDGOLDEN STATE TOBACCO SEC CORP 5.125 07-47 01/06S65,000 53,783.71 0.04USDGOLDEN STATE TOBACCO SEC CORP 2007A-1 5.75 07-47 01/06S15,000 13,698.12 0.01USDGOLDMAN SACHS GROUP INC 3.50 16-26 16/11S205,000 191,016.73 0.13USDGOLDMAN SACHS GROUP INC SUB 4.25 15-25 21/10S300,000 290,364.65 0.19USDGRAN CNTY WA PUBLIC 4.584 15-40 01/01S15,000 13,893.32 0.01USDGREAT LAKES WATER AUTH 5.25 16-33 01/07S25,000 26,985.58 0.02USDHALLIBURTON CO 3.80 15-25 15/11S176,000 170,296.92 0.11USDHCA INC 5.875 15-26 15/02S164,000 161,240.48 0.11USDHCA INC 5.25 16-26 15/06S60,000 59,155.72 0.04USDHCA INC 5.875 12-23 01/05S96,000 96,998.48 0.06USDHD SUPPLY INC -144A- 5.25 14-21 15/12S24,000 24,244.59 0.02USDHD SUPPLY INC -144A- 5.75 16-24 15/04S80,000 80,652.08 0.05USDHORRY COUNTY SOUTH CAROLINA SCHOOL DIS 5.00 16-24 01/03S35,000 39,469.62 0.03USDHORRY COUNTY SOUTH CAROLINA SCHOOL DIS 5.00 16-25 01/03S20,000 22,796.03 0.02USDHORRY COUNTY SOUTH CAROLINA SCHOOL DIS 5.00 16-22 01/03S30,000 32,855.26 0.02USDHOUSTON TX ARPT SYS 5.00 12-24 01/07S20,000 21,332.97 0.01USDHUNTSMAN INTL LLC 5.125 16-22 15/11S50,000 48,895.09 0.03USDICAHN ENTERPRISES LP 3.50 14-17 15/03S28,000 26,742.74 0.02USDICAHN ENTERPRISES LP 6.00 13-20 01/08S45,000 44,072.07 0.03USDICAHN ENTERPRISES LP 4.875 14-19 15/03S40,000 38,592.88 0.03USDINTEL CORP 4.10 16-46 19/05S173,000 164,230.84 0.11USDISTAR INC 4.00 14-17 01/11S11,000 10,539.43 0.01USDITALICS MERGER SUB INC 7.125 15-23 15/07S20,000 18,232.52 0.01USDJP MORGAN CHASE & CO 3.20 16-26 15/06S464,000 430,076.40 0.28USDJP MORGAN CHASE & CO 4.25 15-27 01/10S180,000 176,199.06 0.12USDJP MORGAN CHASE & CO 2.972 16-23 15/01S280,000 266,210.21 0.18USDKINDER MORGAN INC 5.55 14-45 01/06S47,000 46,897.40 0.03USDKLA-TENCOR CORP 4.65 14-24 01/11S13,000 13,092.58 0.01USDKRAFT HEINZ FOODS CO 3.00 16-26 01/06S105,000 93,759.76 0.06USDLAM RESEARCH CORP 2.80 16-21 15/06S9,000 8,544.14 0.01USDLENNAR CORP 4.75 13-22 15/11S40,000 39,273.17 0.03USDLINCOLN NATIONAL CORP 3.625 16-26 12/12A34,000 32,244.82 0.02USDLOS ANGELES CALIFORNIA DEPT WATER & POWER REV 6.603 10-50 01/07S30,000 39,866.01 0.03USDMARYLAND ST HLTH 5.25 14-27 01/07S20,000 21,717.76 0.01USDMASSACHUSETTS INSTITUTE OF TECH 3.885 16-16 01/07S27,000 21,811.79 0.01USDMASSACHUSETTS ST CL 5.00 16-25 01/02S40,000 46,000.31 0.03USDMASSACHUSETTS ST CL 5.00 16-28 01/02S30,000 34,423.31 0.02USDMASSACHUSETTS STATE CWT 5.00 16-27 01/02S35,000 40,365.48 0.03USDMETRO TRANSPORTATION AUTH NY REV 6.687 10-40 15/11S40,000 49,743.46 0.03USDMETRO WASHINGTON DC AIRPORTS AUTH DULLES TOLL ROAD REV 7.462 09-46 01/10S
30,000 39,880.03 0.03USD
MGM RESORTS INTERNATIONAL 6.00 14-23 15/03S120,000 123,713.43 0.08USDMIAMI DADE CNTY 5.00 16-29 01/07S20,000 22,377.60 0.01USDMIAMI DADE CNTY 5.00 16-32 01/07S20,000 22,087.82 0.01USD
Securities portfolio as at 31/12/16EURExpressed in
BG SICAV – BlackRock Global Opportunities Bond Fund
Quantity Denomination Quotationcurrency
% of netassetsMarket value
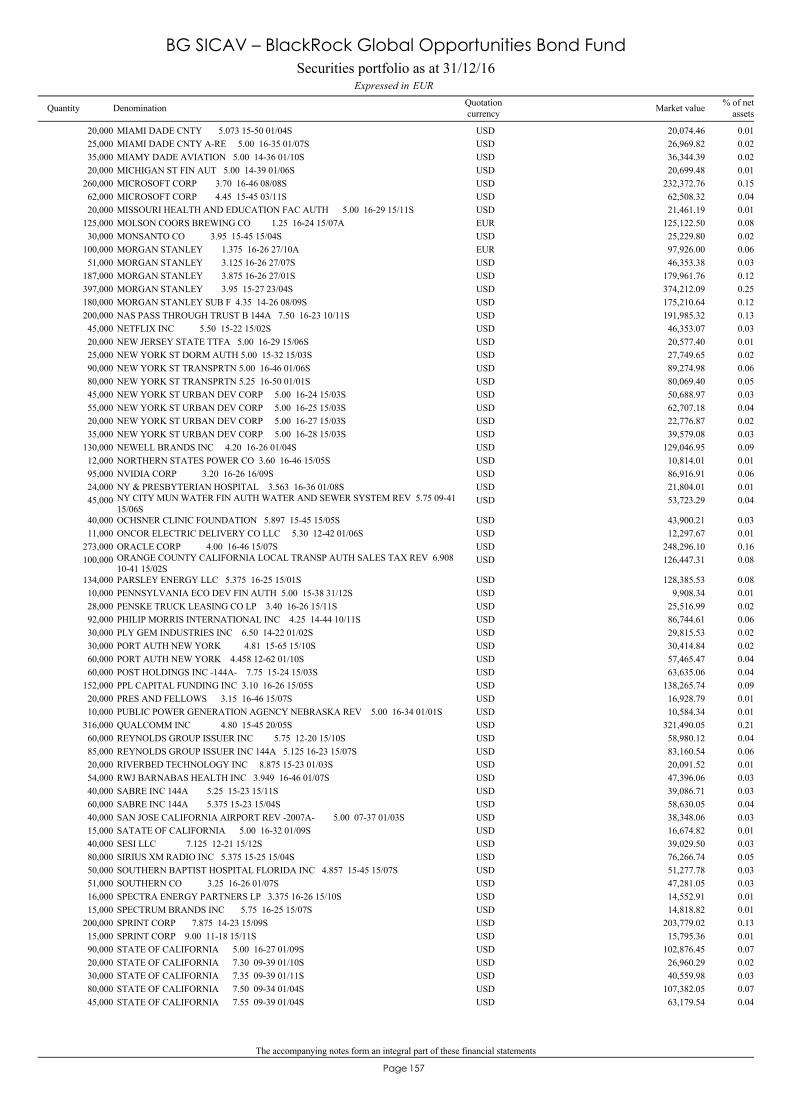
The accompanying notes form an integral part of these financial statements
157Page
MIAMI DADE CNTY 5.073 15-50 01/04S20,000 20,074.46 0.01USDMIAMI DADE CNTY A-RE 5.00 16-35 01/07S25,000 26,969.82 0.02USDMIAMY DADE AVIATION 5.00 14-36 01/10S35,000 36,344.39 0.02USDMICHIGAN ST FIN AUT 5.00 14-39 01/06S20,000 20,699.48 0.01USDMICROSOFT CORP 3.70 16-46 08/08S260,000 232,372.76 0.15USDMICROSOFT CORP 4.45 15-45 03/11S62,000 62,508.32 0.04USDMISSOURI HEALTH AND EDUCATION FAC AUTH 5.00 16-29 15/11S20,000 21,461.19 0.01USDMOLSON COORS BREWING CO 1.25 16-24 15/07A125,000 125,122.50 0.08EURMONSANTO CO 3.95 15-45 15/04S30,000 25,229.80 0.02USDMORGAN STANLEY 1.375 16-26 27/10A100,000 97,926.00 0.06EURMORGAN STANLEY 3.125 16-26 27/07S51,000 46,353.38 0.03USDMORGAN STANLEY 3.875 16-26 27/01S187,000 179,961.76 0.12USDMORGAN STANLEY 3.95 15-27 23/04S397,000 374,212.09 0.25USDMORGAN STANLEY SUB F 4.35 14-26 08/09S180,000 175,210.64 0.12USDNAS PASS THROUGH TRUST B 144A 7.50 16-23 10/11S200,000 191,985.32 0.13USDNETFLIX INC 5.50 15-22 15/02S45,000 46,353.07 0.03USDNEW JERSEY STATE TTFA 5.00 16-29 15/06S20,000 20,577.40 0.01USDNEW YORK ST DORM AUTH 5.00 15-32 15/03S25,000 27,749.65 0.02USDNEW YORK ST TRANSPRTN 5.00 16-46 01/06S90,000 89,274.98 0.06USDNEW YORK ST TRANSPRTN 5.25 16-50 01/01S80,000 80,069.40 0.05USDNEW YORK ST URBAN DEV CORP 5.00 16-24 15/03S45,000 50,688.97 0.03USDNEW YORK ST URBAN DEV CORP 5.00 16-25 15/03S55,000 62,707.18 0.04USDNEW YORK ST URBAN DEV CORP 5.00 16-27 15/03S20,000 22,776.87 0.02USDNEW YORK ST URBAN DEV CORP 5.00 16-28 15/03S35,000 39,579.08 0.03USDNEWELL BRANDS INC 4.20 16-26 01/04S130,000 129,046.95 0.09USDNORTHERN STATES POWER CO 3.60 16-46 15/05S12,000 10,814.01 0.01USDNVIDIA CORP 3.20 16-26 16/09S95,000 86,916.91 0.06USDNY & PRESBYTERIAN HOSPITAL 3.563 16-36 01/08S24,000 21,804.01 0.01USDNY CITY MUN WATER FIN AUTH WATER AND SEWER SYSTEM REV 5.75 09-4115/06S
45,000 53,723.29 0.04USD
OCHSNER CLINIC FOUNDATION 5.897 15-45 15/05S40,000 43,900.21 0.03USDONCOR ELECTRIC DELIVERY CO LLC 5.30 12-42 01/06S11,000 12,297.67 0.01USDORACLE CORP 4.00 16-46 15/07S273,000 248,296.10 0.16USDORANGE COUNTY CALIFORNIA LOCAL TRANSP AUTH SALES TAX REV 6.90810-41 15/02S
100,000 126,447.31 0.08USD
PARSLEY ENERGY LLC 5.375 16-25 15/01S134,000 128,385.53 0.08USDPENNSYLVANIA ECO DEV FIN AUTH 5.00 15-38 31/12S10,000 9,908.34 0.01USDPENSKE TRUCK LEASING CO LP 3.40 16-26 15/11S28,000 25,516.99 0.02USDPHILIP MORRIS INTERNATIONAL INC 4.25 14-44 10/11S92,000 86,744.61 0.06USDPLY GEM INDUSTRIES INC 6.50 14-22 01/02S30,000 29,815.53 0.02USDPORT AUTH NEW YORK 4.81 15-65 15/10S30,000 30,414.84 0.02USDPORT AUTH NEW YORK 4.458 12-62 01/10S60,000 57,465.47 0.04USDPOST HOLDINGS INC -144A- 7.75 15-24 15/03S60,000 63,635.06 0.04USDPPL CAPITAL FUNDING INC 3.10 16-26 15/05S152,000 138,265.74 0.09USDPRES AND FELLOWS 3.15 16-46 15/07S20,000 16,928.79 0.01USDPUBLIC POWER GENERATION AGENCY NEBRASKA REV 5.00 16-34 01/01S10,000 10,584.34 0.01USDQUALCOMM INC 4.80 15-45 20/05S316,000 321,490.05 0.21USDREYNOLDS GROUP ISSUER INC 5.75 12-20 15/10S60,000 58,980.12 0.04USDREYNOLDS GROUP ISSUER INC 144A 5.125 16-23 15/07S85,000 83,160.54 0.06USDRIVERBED TECHNOLOGY INC 8.875 15-23 01/03S20,000 20,091.52 0.01USDRWJ BARNABAS HEALTH INC 3.949 16-46 01/07S54,000 47,396.06 0.03USDSABRE INC 144A 5.25 15-23 15/11S40,000 39,086.71 0.03USDSABRE INC 144A 5.375 15-23 15/04S60,000 58,630.05 0.04USDSAN JOSE CALIFORNIA AIRPORT REV -2007A- 5.00 07-37 01/03S40,000 38,348.06 0.03USDSATATE OF CALIFORNIA 5.00 16-32 01/09S15,000 16,674.82 0.01USDSESI LLC 7.125 12-21 15/12S40,000 39,029.50 0.03USDSIRIUS XM RADIO INC 5.375 15-25 15/04S80,000 76,266.74 0.05USDSOUTHERN BAPTIST HOSPITAL FLORIDA INC 4.857 15-45 15/07S50,000 51,277.78 0.03USDSOUTHERN CO 3.25 16-26 01/07S51,000 47,281.05 0.03USDSPECTRA ENERGY PARTNERS LP 3.375 16-26 15/10S16,000 14,552.91 0.01USDSPECTRUM BRANDS INC 5.75 16-25 15/07S15,000 14,818.82 0.01USDSPRINT CORP 7.875 14-23 15/09S200,000 203,779.02 0.13USDSPRINT CORP 9.00 11-18 15/11S15,000 15,795.36 0.01USDSTATE OF CALIFORNIA 5.00 16-27 01/09S90,000 102,876.45 0.07USDSTATE OF CALIFORNIA 7.30 09-39 01/10S20,000 26,960.29 0.02USDSTATE OF CALIFORNIA 7.35 09-39 01/11S30,000 40,559.98 0.03USDSTATE OF CALIFORNIA 7.50 09-34 01/04S80,000 107,382.05 0.07USDSTATE OF CALIFORNIA 7.55 09-39 01/04S45,000 63,179.54 0.04USD
Securities portfolio as at 31/12/16EURExpressed in
BG SICAV – BlackRock Global Opportunities Bond Fund
Quantity Denomination Quotationcurrency
% of netassetsMarket value
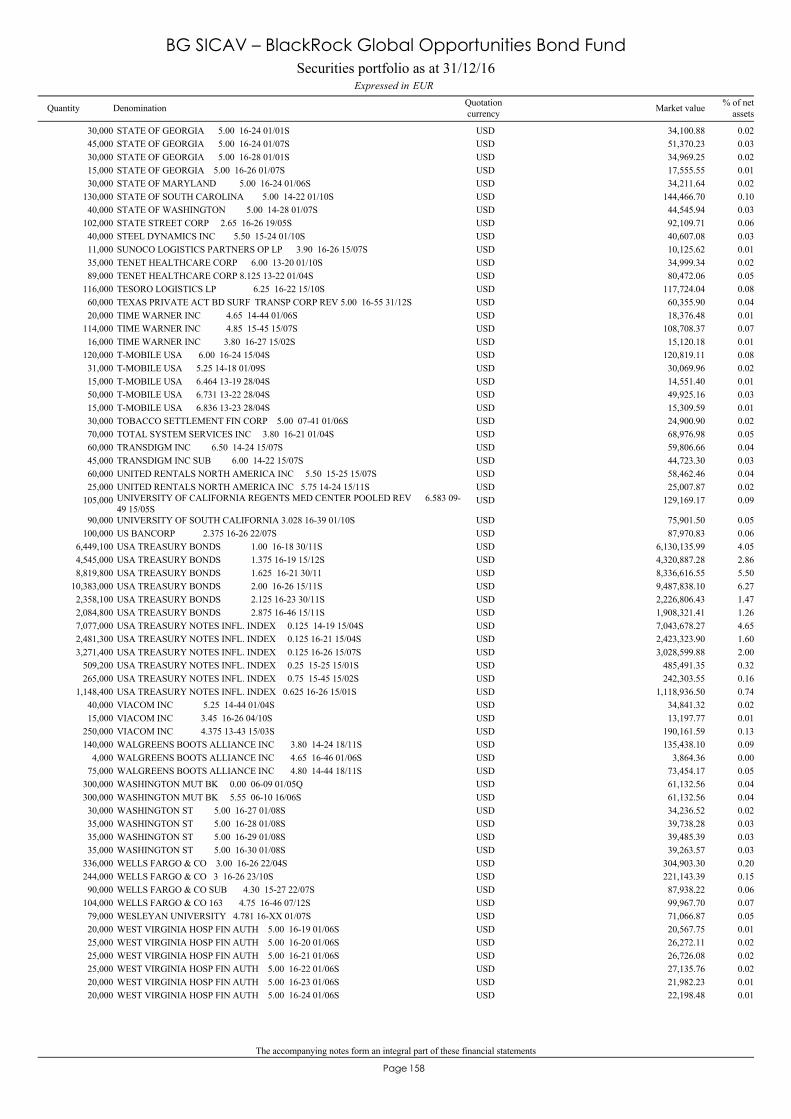
The accompanying notes form an integral part of these financial statements
158Page
STATE OF GEORGIA 5.00 16-24 01/01S30,000 34,100.88 0.02USDSTATE OF GEORGIA 5.00 16-24 01/07S45,000 51,370.23 0.03USDSTATE OF GEORGIA 5.00 16-28 01/01S30,000 34,969.25 0.02USDSTATE OF GEORGIA 5.00 16-26 01/07S15,000 17,555.55 0.01USDSTATE OF MARYLAND 5.00 16-24 01/06S30,000 34,211.64 0.02USDSTATE OF SOUTH CAROLINA 5.00 14-22 01/10S130,000 144,466.70 0.10USDSTATE OF WASHINGTON 5.00 14-28 01/07S40,000 44,545.94 0.03USDSTATE STREET CORP 2.65 16-26 19/05S102,000 92,109.71 0.06USDSTEEL DYNAMICS INC 5.50 15-24 01/10S40,000 40,607.08 0.03USDSUNOCO LOGISTICS PARTNERS OP LP 3.90 16-26 15/07S11,000 10,125.62 0.01USDTENET HEALTHCARE CORP 6.00 13-20 01/10S35,000 34,999.34 0.02USDTENET HEALTHCARE CORP 8.125 13-22 01/04S89,000 80,472.06 0.05USDTESORO LOGISTICS LP 6.25 16-22 15/10S116,000 117,724.04 0.08USDTEXAS PRIVATE ACT BD SURF TRANSP CORP REV 5.00 16-55 31/12S60,000 60,355.90 0.04USDTIME WARNER INC 4.65 14-44 01/06S20,000 18,376.48 0.01USDTIME WARNER INC 4.85 15-45 15/07S114,000 108,708.37 0.07USDTIME WARNER INC 3.80 16-27 15/02S16,000 15,120.18 0.01USDT-MOBILE USA 6.00 16-24 15/04S120,000 120,819.11 0.08USDT-MOBILE USA 5.25 14-18 01/09S31,000 30,069.96 0.02USDT-MOBILE USA 6.464 13-19 28/04S15,000 14,551.40 0.01USDT-MOBILE USA 6.731 13-22 28/04S50,000 49,925.16 0.03USDT-MOBILE USA 6.836 13-23 28/04S15,000 15,309.59 0.01USDTOBACCO SETTLEMENT FIN CORP 5.00 07-41 01/06S30,000 24,900.90 0.02USDTOTAL SYSTEM SERVICES INC 3.80 16-21 01/04S70,000 68,976.98 0.05USDTRANSDIGM INC 6.50 14-24 15/07S60,000 59,806.66 0.04USDTRANSDIGM INC SUB 6.00 14-22 15/07S45,000 44,723.30 0.03USDUNITED RENTALS NORTH AMERICA INC 5.50 15-25 15/07S60,000 58,462.46 0.04USDUNITED RENTALS NORTH AMERICA INC 5.75 14-24 15/11S25,000 25,007.87 0.02USDUNIVERSITY OF CALIFORNIA REGENTS MED CENTER POOLED REV 6.583 09-49 15/05S
105,000 129,169.17 0.09USD
UNIVERSITY OF SOUTH CALIFORNIA 3.028 16-39 01/10S90,000 75,901.50 0.05USDUS BANCORP 2.375 16-26 22/07S100,000 87,970.83 0.06USDUSA TREASURY BONDS 1.00 16-18 30/11S6,449,100 6,130,135.99 4.05USDUSA TREASURY BONDS 1.375 16-19 15/12S4,545,000 4,320,887.28 2.86USDUSA TREASURY BONDS 1.625 16-21 30/118,819,800 8,336,616.55 5.50USDUSA TREASURY BONDS 2.00 16-26 15/11S10,383,000 9,487,838.10 6.27USDUSA TREASURY BONDS 2.125 16-23 30/11S2,358,100 2,226,806.43 1.47USDUSA TREASURY BONDS 2.875 16-46 15/11S2,084,800 1,908,321.41 1.26USDUSA TREASURY NOTES INFL. INDEX 0.125 14-19 15/04S7,077,000 7,043,678.27 4.65USDUSA TREASURY NOTES INFL. INDEX 0.125 16-21 15/04S2,481,300 2,423,323.90 1.60USDUSA TREASURY NOTES INFL. INDEX 0.125 16-26 15/07S3,271,400 3,028,599.88 2.00USDUSA TREASURY NOTES INFL. INDEX 0.25 15-25 15/01S509,200 485,491.35 0.32USDUSA TREASURY NOTES INFL. INDEX 0.75 15-45 15/02S265,000 242,303.55 0.16USDUSA TREASURY NOTES INFL. INDEX 0.625 16-26 15/01S1,148,400 1,118,936.50 0.74USDVIACOM INC 5.25 14-44 01/04S40,000 34,841.32 0.02USDVIACOM INC 3.45 16-26 04/10S15,000 13,197.77 0.01USDVIACOM INC 4.375 13-43 15/03S250,000 190,161.59 0.13USDWALGREENS BOOTS ALLIANCE INC 3.80 14-24 18/11S140,000 135,438.10 0.09USDWALGREENS BOOTS ALLIANCE INC 4.65 16-46 01/06S4,000 3,864.36 0.00USDWALGREENS BOOTS ALLIANCE INC 4.80 14-44 18/11S75,000 73,454.17 0.05USDWASHINGTON MUT BK 0.00 06-09 01/05Q300,000 61,132.56 0.04USDWASHINGTON MUT BK 5.55 06-10 16/06S300,000 61,132.56 0.04USDWASHINGTON ST 5.00 16-27 01/08S30,000 34,236.52 0.02USDWASHINGTON ST 5.00 16-28 01/08S35,000 39,738.28 0.03USDWASHINGTON ST 5.00 16-29 01/08S35,000 39,485.39 0.03USDWASHINGTON ST 5.00 16-30 01/08S35,000 39,263.57 0.03USDWELLS FARGO & CO 3.00 16-26 22/04S336,000 304,903.30 0.20USDWELLS FARGO & CO 3 16-26 23/10S244,000 221,143.39 0.15USDWELLS FARGO & CO SUB 4.30 15-27 22/07S90,000 87,938.22 0.06USDWELLS FARGO & CO 163 4.75 16-46 07/12S104,000 99,967.70 0.07USDWESLEYAN UNIVERSITY 4.781 16-XX 01/07S79,000 71,066.87 0.05USDWEST VIRGINIA HOSP FIN AUTH 5.00 16-19 01/06S20,000 20,567.75 0.01USDWEST VIRGINIA HOSP FIN AUTH 5.00 16-20 01/06S25,000 26,272.11 0.02USDWEST VIRGINIA HOSP FIN AUTH 5.00 16-21 01/06S25,000 26,726.08 0.02USDWEST VIRGINIA HOSP FIN AUTH 5.00 16-22 01/06S25,000 27,135.76 0.02USDWEST VIRGINIA HOSP FIN AUTH 5.00 16-23 01/06S20,000 21,982.23 0.01USDWEST VIRGINIA HOSP FIN AUTH 5.00 16-24 01/06S20,000 22,198.48 0.01USD
Securities portfolio as at 31/12/16EURExpressed in
BG SICAV – BlackRock Global Opportunities Bond Fund
Quantity Denomination Quotationcurrency
% of netassetsMarket value
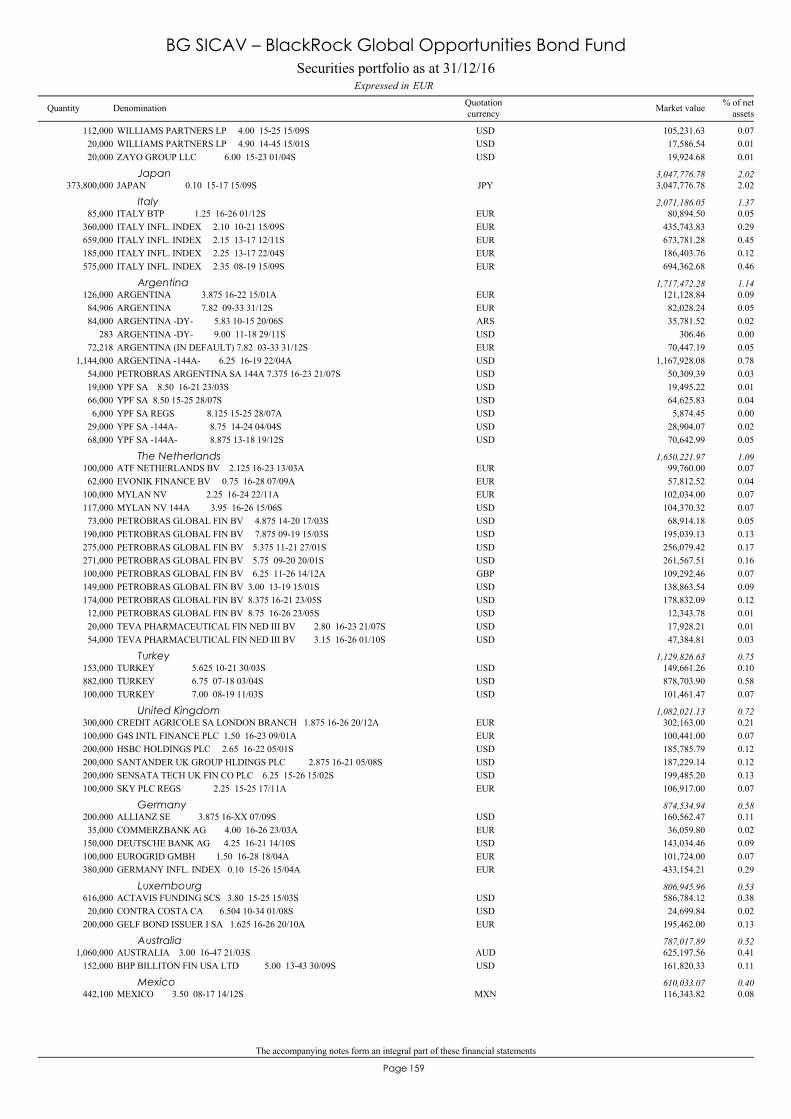
The accompanying notes form an integral part of these financial statements
159Page
WILLIAMS PARTNERS LP 4.00 15-25 15/09S112,000 105,231.63 0.07USDWILLIAMS PARTNERS LP 4.90 14-45 15/01S20,000 17,586.54 0.01USDZAYO GROUP LLC 6.00 15-23 01/04S20,000 19,924.68 0.01USD
JAPAN 0.10 15-17 15/09S373,800,000 3,047,776.78 2.02JPYJapan 3,047,776.78 2.02
ITALY BTP 1.25 16-26 01/12S85,000 80,894.50 0.05EURItaly 2,071,186.05 1.37
ITALY INFL. INDEX 2.10 10-21 15/09S360,000 435,743.83 0.29EURITALY INFL. INDEX 2.15 13-17 12/11S659,000 673,781.28 0.45EURITALY INFL. INDEX 2.25 13-17 22/04S185,000 186,403.76 0.12EURITALY INFL. INDEX 2.35 08-19 15/09S575,000 694,362.68 0.46EUR
ARGENTINA 3.875 16-22 15/01A126,000 121,128.84 0.09EURArgentina 1,717,472.28 1.14
ARGENTINA 7.82 09-33 31/12S84,906 82,028.24 0.05EURARGENTINA -DY- 5.83 10-15 20/06S84,000 35,781.52 0.02ARSARGENTINA -DY- 9.00 11-18 29/11S283 306.46 0.00USDARGENTINA (IN DEFAULT) 7.82 03-33 31/12S72,218 70,447.19 0.05EURARGENTINA -144A- 6.25 16-19 22/04A1,144,000 1,167,928.08 0.78USDPETROBRAS ARGENTINA SA 144A 7.375 16-23 21/07S54,000 50,309.39 0.03USDYPF SA 8.50 16-21 23/03S19,000 19,495.22 0.01USDYPF SA 8.50 15-25 28/07S66,000 64,625.83 0.04USDYPF SA REGS 8.125 15-25 28/07A6,000 5,874.45 0.00USDYPF SA -144A- 8.75 14-24 04/04S29,000 28,904.07 0.02USDYPF SA -144A- 8.875 13-18 19/12S68,000 70,642.99 0.05USD
ATF NETHERLANDS BV 2.125 16-23 13/03A100,000 99,760.00 0.07EURThe Netherlands 1,650,221.97 1.09
EVONIK FINANCE BV 0.75 16-28 07/09A62,000 57,812.52 0.04EURMYLAN NV 2.25 16-24 22/11A100,000 102,034.00 0.07EURMYLAN NV 144A 3.95 16-26 15/06S117,000 104,370.32 0.07USDPETROBRAS GLOBAL FIN BV 4.875 14-20 17/03S73,000 68,914.18 0.05USDPETROBRAS GLOBAL FIN BV 7.875 09-19 15/03S190,000 195,039.13 0.13USDPETROBRAS GLOBAL FIN BV 5.375 11-21 27/01S275,000 256,079.42 0.17USDPETROBRAS GLOBAL FIN BV 5.75 09-20 20/01S271,000 261,567.51 0.16USDPETROBRAS GLOBAL FIN BV 6.25 11-26 14/12A100,000 109,292.46 0.07GBPPETROBRAS GLOBAL FIN BV 3.00 13-19 15/01S149,000 138,863.54 0.09USDPETROBRAS GLOBAL FIN BV 8.375 16-21 23/05S174,000 178,832.09 0.12USDPETROBRAS GLOBAL FIN BV 8.75 16-26 23/05S12,000 12,343.78 0.01USDTEVA PHARMACEUTICAL FIN NED III BV 2.80 16-23 21/07S20,000 17,928.21 0.01USDTEVA PHARMACEUTICAL FIN NED III BV 3.15 16-26 01/10S54,000 47,384.81 0.03USD
TURKEY 5.625 10-21 30/03S153,000 149,661.26 0.10USDTurkey 1,129,826.63 0.75
TURKEY 6.75 07-18 03/04S882,000 878,703.90 0.58USDTURKEY 7.00 08-19 11/03S100,000 101,461.47 0.07USD
CREDIT AGRICOLE SA LONDON BRANCH 1.875 16-26 20/12A300,000 302,163.00 0.21EURUnited Kingdom 1,082,021.13 0.72
G4S INTL FINANCE PLC 1.50 16-23 09/01A100,000 100,441.00 0.07EURHSBC HOLDINGS PLC 2.65 16-22 05/01S200,000 185,785.79 0.12USDSANTANDER UK GROUP HLDINGS PLC 2.875 16-21 05/08S200,000 187,229.14 0.12USDSENSATA TECH UK FIN CO PLC 6.25 15-26 15/02S200,000 199,485.20 0.13USDSKY PLC REGS 2.25 15-25 17/11A100,000 106,917.00 0.07EUR
ALLIANZ SE 3.875 16-XX 07/09S200,000 160,562.47 0.11USDGermany 874,534.94 0.58
COMMERZBANK AG 4.00 16-26 23/03A35,000 36,059.80 0.02EURDEUTSCHE BANK AG 4.25 16-21 14/10S150,000 143,034.46 0.09USDEUROGRID GMBH 1.50 16-28 18/04A100,000 101,724.00 0.07EURGERMANY INFL. INDEX 0.10 15-26 15/04A380,000 433,154.21 0.29EUR
ACTAVIS FUNDING SCS 3.80 15-25 15/03S616,000 586,784.12 0.38USDLuxembourg 806,945.96 0.53
CONTRA COSTA CA 6.504 10-34 01/08S20,000 24,699.84 0.02USDGELF BOND ISSUER I SA 1.625 16-26 20/10A200,000 195,462.00 0.13EUR
AUSTRALIA 3.00 16-47 21/03S1,060,000 625,197.56 0.41AUDAustralia 787,017.89 0.52
BHP BILLITON FIN USA LTD 5.00 13-43 30/09S152,000 161,820.33 0.11USD
MEXICO 3.50 08-17 14/12S442,100 116,343.82 0.08MXNMexico 610,033.07 0.40
Securities portfolio as at 31/12/16EURExpressed in
BG SICAV – BlackRock Global Opportunities Bond Fund
Quantity Denomination Quotationcurrency
% of netassetsMarket value
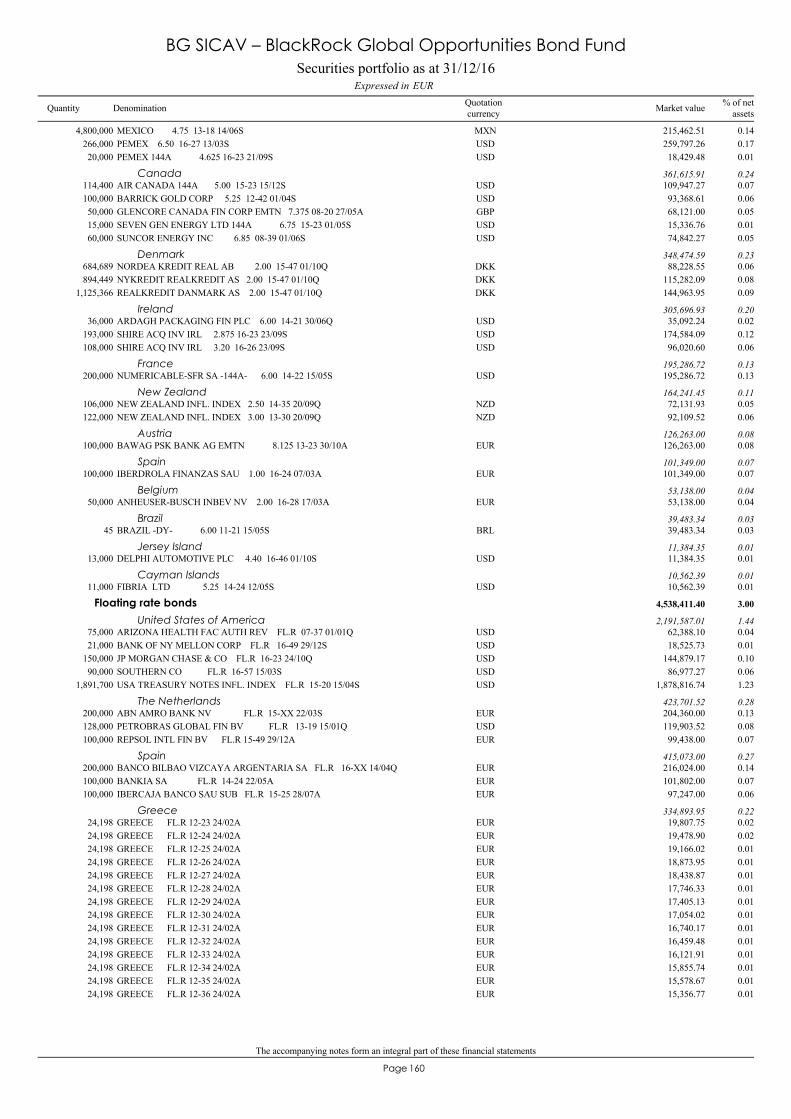
The accompanying notes form an integral part of these financial statements
160Page
MEXICO 4.75 13-18 14/06S4,800,000 215,462.51 0.14MXNPEMEX 6.50 16-27 13/03S266,000 259,797.26 0.17USDPEMEX 144A 4.625 16-23 21/09S20,000 18,429.48 0.01USD
AIR CANADA 144A 5.00 15-23 15/12S114,400 109,947.27 0.07USDCanada 361,615.91 0.24
BARRICK GOLD CORP 5.25 12-42 01/04S100,000 93,368.61 0.06USDGLENCORE CANADA FIN CORP EMTN 7.375 08-20 27/05A50,000 68,121.00 0.05GBPSEVEN GEN ENERGY LTD 144A 6.75 15-23 01/05S15,000 15,336.76 0.01USDSUNCOR ENERGY INC 6.85 08-39 01/06S60,000 74,842.27 0.05USD
NORDEA KREDIT REAL AB 2.00 15-47 01/10Q684,689 88,228.55 0.06DKKDenmark 348,474.59 0.23
NYKREDIT REALKREDIT AS 2.00 15-47 01/10Q894,449 115,282.09 0.08DKKREALKREDIT DANMARK AS 2.00 15-47 01/10Q1,125,366 144,963.95 0.09DKK
ARDAGH PACKAGING FIN PLC 6.00 14-21 30/06Q36,000 35,092.24 0.02USDIreland 305,696.93 0.20
SHIRE ACQ INV IRL 2.875 16-23 23/09S193,000 174,584.09 0.12USDSHIRE ACQ INV IRL 3.20 16-26 23/09S108,000 96,020.60 0.06USD
NUMERICABLE-SFR SA -144A- 6.00 14-22 15/05S200,000 195,286.72 0.13USDFrance 195,286.72 0.13
NEW ZEALAND INFL. INDEX 2.50 14-35 20/09Q106,000 72,131.93 0.05NZDNew Zealand 164,241.45 0.11
NEW ZEALAND INFL. INDEX 3.00 13-30 20/09Q122,000 92,109.52 0.06NZD
BAWAG PSK BANK AG EMTN 8.125 13-23 30/10A100,000 126,263.00 0.08EURAustria 126,263.00 0.08
IBERDROLA FINANZAS SAU 1.00 16-24 07/03A100,000 101,349.00 0.07EURSpain 101,349.00 0.07
ANHEUSER-BUSCH INBEV NV 2.00 16-28 17/03A50,000 53,138.00 0.04EURBelgium 53,138.00 0.04
BRAZIL -DY- 6.00 11-21 15/05S45 39,483.34 0.03BRLBrazil 39,483.34 0.03
DELPHI AUTOMOTIVE PLC 4.40 16-46 01/10S13,000 11,384.35 0.01USDJersey Island 11,384.35 0.01
FIBRIA LTD 5.25 14-24 12/05S11,000 10,562.39 0.01USDCayman Islands 10,562.39 0.01
ARIZONA HEALTH FAC AUTH REV FL.R 07-37 01/01Q75,000 62,388.10 0.04USD
Floating rate bonds 4,538,411.40 3.00
United States of America 2,191,587.01 1.44
BANK OF NY MELLON CORP FL.R 16-49 29/12S21,000 18,525.73 0.01USDJP MORGAN CHASE & CO FL.R 16-23 24/10Q150,000 144,879.17 0.10USDSOUTHERN CO FL.R 16-57 15/03S90,000 86,977.27 0.06USDUSA TREASURY NOTES INFL. INDEX FL.R 15-20 15/04S1,891,700 1,878,816.74 1.23USD
ABN AMRO BANK NV FL.R 15-XX 22/03S200,000 204,360.00 0.13EURThe Netherlands 423,701.52 0.28
PETROBRAS GLOBAL FIN BV FL.R 13-19 15/01Q128,000 119,903.52 0.08USDREPSOL INTL FIN BV FL.R 15-49 29/12A100,000 99,438.00 0.07EUR
BANCO BILBAO VIZCAYA ARGENTARIA SA FL.R 16-XX 14/04Q200,000 216,024.00 0.14EURSpain 415,073.00 0.27
BANKIA SA FL.R 14-24 22/05A100,000 101,802.00 0.07EURIBERCAJA BANCO SAU SUB FL.R 15-25 28/07A100,000 97,247.00 0.06EUR
GREECE FL.R 12-23 24/02A24,198 19,807.75 0.02EURGreece 334,893.95 0.22
GREECE FL.R 12-24 24/02A24,198 19,478.90 0.02EURGREECE FL.R 12-25 24/02A24,198 19,166.02 0.01EURGREECE FL.R 12-26 24/02A24,198 18,873.95 0.01EURGREECE FL.R 12-27 24/02A24,198 18,438.87 0.01EURGREECE FL.R 12-28 24/02A24,198 17,746.33 0.01EURGREECE FL.R 12-29 24/02A24,198 17,405.13 0.01EURGREECE FL.R 12-30 24/02A24,198 17,054.02 0.01EURGREECE FL.R 12-31 24/02A24,198 16,740.17 0.01EURGREECE FL.R 12-32 24/02A24,198 16,459.48 0.01EURGREECE FL.R 12-33 24/02A24,198 16,121.91 0.01EURGREECE FL.R 12-34 24/02A24,198 15,855.74 0.01EURGREECE FL.R 12-35 24/02A24,198 15,578.67 0.01EURGREECE FL.R 12-36 24/02A24,198 15,356.77 0.01EUR
Securities portfolio as at 31/12/16EURExpressed in
BG SICAV – BlackRock Global Opportunities Bond Fund
Quantity Denomination Quotationcurrency
% of netassetsMarket value
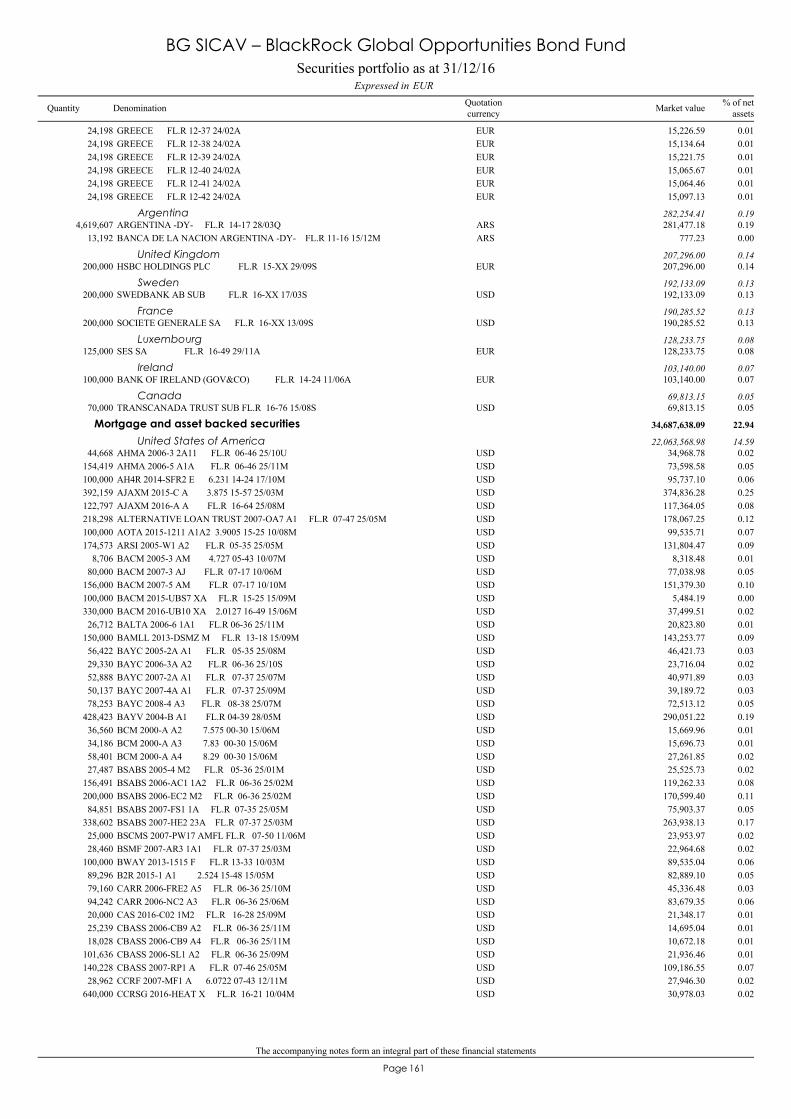
The accompanying notes form an integral part of these financial statements
161Page
GREECE FL.R 12-37 24/02A24,198 15,226.59 0.01EURGREECE FL.R 12-38 24/02A24,198 15,134.64 0.01EURGREECE FL.R 12-39 24/02A24,198 15,221.75 0.01EURGREECE FL.R 12-40 24/02A24,198 15,065.67 0.01EURGREECE FL.R 12-41 24/02A24,198 15,064.46 0.01EURGREECE FL.R 12-42 24/02A24,198 15,097.13 0.01EUR
ARGENTINA -DY- FL.R 14-17 28/03Q4,619,607 281,477.18 0.19ARSArgentina 282,254.41 0.19
BANCA DE LA NACION ARGENTINA -DY- FL.R 11-16 15/12M13,192 777.23 0.00ARS
HSBC HOLDINGS PLC FL.R 15-XX 29/09S200,000 207,296.00 0.14EURUnited Kingdom 207,296.00 0.14
SWEDBANK AB SUB FL.R 16-XX 17/03S200,000 192,133.09 0.13USDSweden 192,133.09 0.13
SOCIETE GENERALE SA FL.R 16-XX 13/09S200,000 190,285.52 0.13USDFrance 190,285.52 0.13
SES SA FL.R 16-49 29/11A125,000 128,233.75 0.08EURLuxembourg 128,233.75 0.08
BANK OF IRELAND (GOV&CO) FL.R 14-24 11/06A100,000 103,140.00 0.07EURIreland 103,140.00 0.07
TRANSCANADA TRUST SUB FL.R 16-76 15/08S70,000 69,813.15 0.05USDCanada 69,813.15 0.05
AHMA 2006-3 2A11 FL.R 06-46 25/10U44,668 34,968.78 0.02USD
Mortgage and asset backed securities 34,687,638.09 22.94
United States of America 22,063,568.98 14.59
AHMA 2006-5 A1A FL.R 06-46 25/11M154,419 73,598.58 0.05USDAH4R 2014-SFR2 E 6.231 14-24 17/10M100,000 95,737.10 0.06USDAJAXM 2015-C A 3.875 15-57 25/03M392,159 374,836.28 0.25USDAJAXM 2016-A A FL.R 16-64 25/08M122,797 117,364.05 0.08USDALTERNATIVE LOAN TRUST 2007-OA7 A1 FL.R 07-47 25/05M218,298 178,067.25 0.12USDAOTA 2015-1211 A1A2 3.9005 15-25 10/08M100,000 99,535.71 0.07USDARSI 2005-W1 A2 FL.R 05-35 25/05M174,573 131,804.47 0.09USDBACM 2005-3 AM 4.727 05-43 10/07M8,706 8,318.48 0.01USDBACM 2007-3 AJ FL.R 07-17 10/06M80,000 77,038.98 0.05USDBACM 2007-5 AM FL.R 07-17 10/10M156,000 151,379.30 0.10USDBACM 2015-UBS7 XA FL.R 15-25 15/09M100,000 5,484.19 0.00USDBACM 2016-UB10 XA 2.0127 16-49 15/06M330,000 37,499.51 0.02USDBALTA 2006-6 1A1 FL.R 06-36 25/11M26,712 20,823.80 0.01USDBAMLL 2013-DSMZ M FL.R 13-18 15/09M150,000 143,253.77 0.09USDBAYC 2005-2A A1 FL.R 05-35 25/08M56,422 46,421.73 0.03USDBAYC 2006-3A A2 FL.R 06-36 25/10S29,330 23,716.04 0.02USDBAYC 2007-2A A1 FL.R 07-37 25/07M52,888 40,971.89 0.03USDBAYC 2007-4A A1 FL.R 07-37 25/09M50,137 39,189.72 0.03USDBAYC 2008-4 A3 FL.R 08-38 25/07M78,253 72,513.12 0.05USDBAYV 2004-B A1 FL.R 04-39 28/05M428,423 290,051.22 0.19USDBCM 2000-A A2 7.575 00-30 15/06M36,560 15,669.96 0.01USDBCM 2000-A A3 7.83 00-30 15/06M34,186 15,696.73 0.01USDBCM 2000-A A4 8.29 00-30 15/06M58,401 27,261.85 0.02USDBSABS 2005-4 M2 FL.R 05-36 25/01M27,487 25,525.73 0.02USDBSABS 2006-AC1 1A2 FL.R 06-36 25/02M156,491 119,262.33 0.08USDBSABS 2006-EC2 M2 FL.R 06-36 25/02M200,000 170,599.40 0.11USDBSABS 2007-FS1 1A FL.R 07-35 25/05M84,851 75,903.37 0.05USDBSABS 2007-HE2 23A FL.R 07-37 25/03M338,602 263,938.13 0.17USDBSCMS 2007-PW17 AMFL FL.R 07-50 11/06M25,000 23,953.97 0.02USDBSMF 2007-AR3 1A1 FL.R 07-37 25/03M28,460 22,964.68 0.02USDBWAY 2013-1515 F FL.R 13-33 10/03M100,000 89,535.04 0.06USDB2R 2015-1 A1 2.524 15-48 15/05M89,296 82,889.10 0.05USDCARR 2006-FRE2 A5 FL.R 06-36 25/10M79,160 45,336.48 0.03USDCARR 2006-NC2 A3 FL.R 06-36 25/06M94,242 83,679.35 0.06USDCAS 2016-C02 1M2 FL.R 16-28 25/09M20,000 21,348.17 0.01USDCBASS 2006-CB9 A2 FL.R 06-36 25/11M25,239 14,695.04 0.01USDCBASS 2006-CB9 A4 FL.R 06-36 25/11M18,028 10,672.18 0.01USDCBASS 2006-SL1 A2 FL.R 06-36 25/09M101,636 21,936.46 0.01USDCBASS 2007-RP1 A FL.R 07-46 25/05M140,228 109,186.55 0.07USDCCRF 2007-MF1 A 6.0722 07-43 12/11M28,962 27,946.30 0.02USDCCRSG 2016-HEAT X FL.R 16-21 10/04M640,000 30,978.03 0.02USD
Securities portfolio as at 31/12/16EURExpressed in
BG SICAV – BlackRock Global Opportunities Bond Fund
Quantity Denomination Quotationcurrency
% of netassetsMarket value
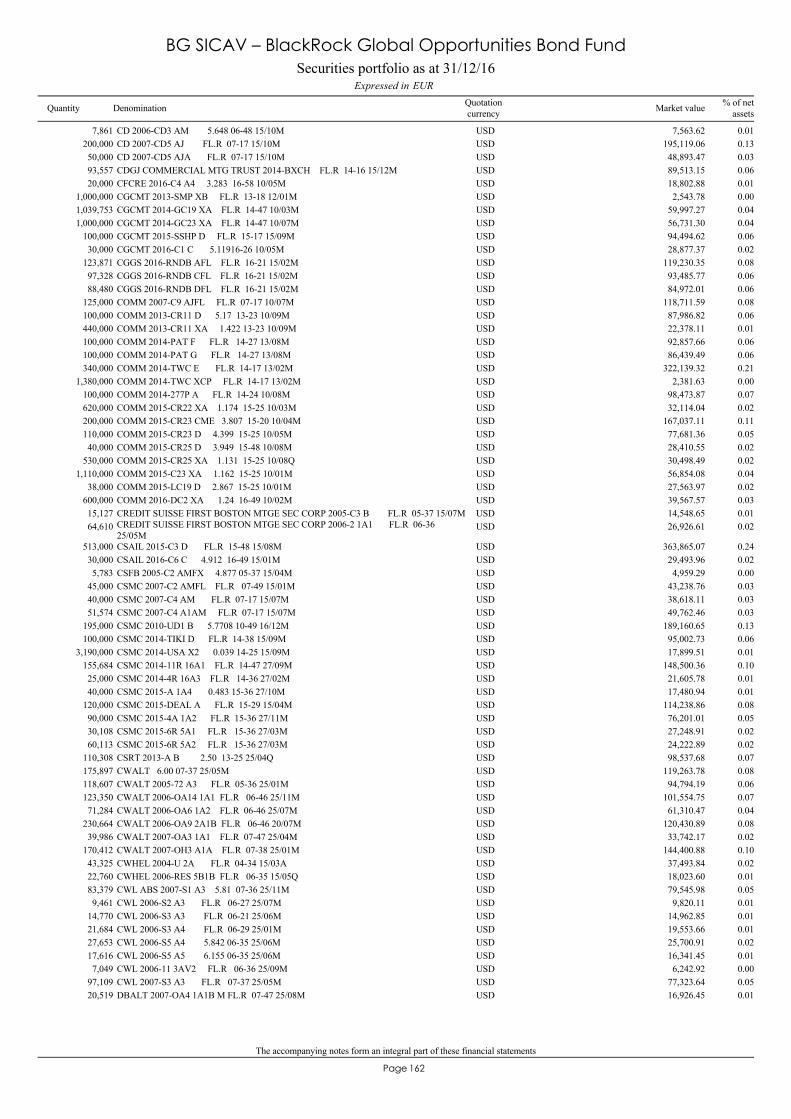
The accompanying notes form an integral part of these financial statements
162Page
CD 2006-CD3 AM 5.648 06-48 15/10M7,861 7,563.62 0.01USDCD 2007-CD5 AJ FL.R 07-17 15/10M200,000 195,119.06 0.13USDCD 2007-CD5 AJA FL.R 07-17 15/10M50,000 48,893.47 0.03USDCDGJ COMMERCIAL MTG TRUST 2014-BXCH FL.R 14-16 15/12M93,557 89,513.15 0.06USDCFCRE 2016-C4 A4 3.283 16-58 10/05M20,000 18,802.88 0.01USDCGCMT 2013-SMP XB FL.R 13-18 12/01M1,000,000 2,543.78 0.00USDCGCMT 2014-GC19 XA FL.R 14-47 10/03M1,039,753 59,997.27 0.04USDCGCMT 2014-GC23 XA FL.R 14-47 10/07M1,000,000 56,731.30 0.04USDCGCMT 2015-SSHP D FL.R 15-17 15/09M100,000 94,494.62 0.06USDCGCMT 2016-C1 C 5.11916-26 10/05M30,000 28,877.37 0.02USDCGGS 2016-RNDB AFL FL.R 16-21 15/02M123,871 119,230.35 0.08USDCGGS 2016-RNDB CFL FL.R 16-21 15/02M97,328 93,485.77 0.06USDCGGS 2016-RNDB DFL FL.R 16-21 15/02M88,480 84,972.01 0.06USDCOMM 2007-C9 AJFL FL.R 07-17 10/07M125,000 118,711.59 0.08USDCOMM 2013-CR11 D 5.17 13-23 10/09M100,000 87,986.82 0.06USDCOMM 2013-CR11 XA 1.422 13-23 10/09M440,000 22,378.11 0.01USDCOMM 2014-PAT F FL.R 14-27 13/08M100,000 92,857.66 0.06USDCOMM 2014-PAT G FL.R 14-27 13/08M100,000 86,439.49 0.06USDCOMM 2014-TWC E FL.R 14-17 13/02M340,000 322,139.32 0.21USDCOMM 2014-TWC XCP FL.R 14-17 13/02M1,380,000 2,381.63 0.00USDCOMM 2014-277P A FL.R 14-24 10/08M100,000 98,473.87 0.07USDCOMM 2015-CR22 XA 1.174 15-25 10/03M620,000 32,114.04 0.02USDCOMM 2015-CR23 CME 3.807 15-20 10/04M200,000 167,037.11 0.11USDCOMM 2015-CR23 D 4.399 15-25 10/05M110,000 77,681.36 0.05USDCOMM 2015-CR25 D 3.949 15-48 10/08M40,000 28,410.55 0.02USDCOMM 2015-CR25 XA 1.131 15-25 10/08Q530,000 30,498.49 0.02USDCOMM 2015-C23 XA 1.162 15-25 10/01M1,110,000 56,854.08 0.04USDCOMM 2015-LC19 D 2.867 15-25 10/01M38,000 27,563.97 0.02USDCOMM 2016-DC2 XA 1.24 16-49 10/02M600,000 39,567.57 0.03USDCREDIT SUISSE FIRST BOSTON MTGE SEC CORP 2005-C3 B FL.R 05-37 15/07M15,127 14,548.65 0.01USDCREDIT SUISSE FIRST BOSTON MTGE SEC CORP 2006-2 1A1 FL.R 06-3625/05M
64,610 26,926.61 0.02USD
CSAIL 2015-C3 D FL.R 15-48 15/08M513,000 363,865.07 0.24USDCSAIL 2016-C6 C 4.912 16-49 15/01M30,000 29,493.96 0.02USDCSFB 2005-C2 AMFX 4.877 05-37 15/04M5,783 4,959.29 0.00USDCSMC 2007-C2 AMFL FL.R 07-49 15/01M45,000 43,238.76 0.03USDCSMC 2007-C4 AM FL.R 07-17 15/07M40,000 38,618.11 0.03USDCSMC 2007-C4 A1AM FL.R 07-17 15/07M51,574 49,762.46 0.03USDCSMC 2010-UD1 B 5.7708 10-49 16/12M195,000 189,160.65 0.13USDCSMC 2014-TIKI D FL.R 14-38 15/09M100,000 95,002.73 0.06USDCSMC 2014-USA X2 0.039 14-25 15/09M3,190,000 17,899.51 0.01USDCSMC 2014-11R 16A1 FL.R 14-47 27/09M155,684 148,500.36 0.10USDCSMC 2014-4R 16A3 FL.R 14-36 27/02M25,000 21,605.78 0.01USDCSMC 2015-A 1A4 0.483 15-36 27/10M40,000 17,480.94 0.01USDCSMC 2015-DEAL A FL.R 15-29 15/04M120,000 114,238.86 0.08USDCSMC 2015-4A 1A2 FL.R 15-36 27/11M90,000 76,201.01 0.05USDCSMC 2015-6R 5A1 FL.R 15-36 27/03M30,108 27,248.91 0.02USDCSMC 2015-6R 5A2 FL.R 15-36 27/03M60,113 24,222.89 0.02USDCSRT 2013-A B 2.50 13-25 25/04Q110,308 98,537.68 0.07USDCWALT 6.00 07-37 25/05M175,897 119,263.78 0.08USDCWALT 2005-72 A3 FL.R 05-36 25/01M118,607 94,794.19 0.06USDCWALT 2006-OA14 1A1 FL.R 06-46 25/11M123,350 101,554.75 0.07USDCWALT 2006-OA6 1A2 FL.R 06-46 25/07M71,284 61,310.47 0.04USDCWALT 2006-OA9 2A1B FL.R 06-46 20/07M230,664 120,430.89 0.08USDCWALT 2007-OA3 1A1 FL.R 07-47 25/04M39,986 33,742.17 0.02USDCWALT 2007-OH3 A1A FL.R 07-38 25/01M170,412 144,400.88 0.10USDCWHEL 2004-U 2A FL.R 04-34 15/03A43,325 37,493.84 0.02USDCWHEL 2006-RES 5B1B FL.R 06-35 15/05Q22,760 18,023.60 0.01USDCWL ABS 2007-S1 A3 5.81 07-36 25/11M83,379 79,545.98 0.05USDCWL 2006-S2 A3 FL.R 06-27 25/07M9,461 9,820.11 0.01USDCWL 2006-S3 A3 FL.R 06-21 25/06M14,770 14,962.85 0.01USDCWL 2006-S3 A4 FL.R 06-29 25/01M21,684 19,553.66 0.01USDCWL 2006-S5 A4 5.842 06-35 25/06M27,653 25,700.91 0.02USDCWL 2006-S5 A5 6.155 06-35 25/06M17,616 16,341.45 0.01USDCWL 2006-11 3AV2 FL.R 06-36 25/09M7,049 6,242.92 0.00USDCWL 2007-S3 A3 FL.R 07-37 25/05M97,109 77,323.64 0.05USDDBALT 2007-OA4 1A1B M FL.R 07-47 25/08M20,519 16,926.45 0.01USD
Securities portfolio as at 31/12/16EURExpressed in
BG SICAV – BlackRock Global Opportunities Bond Fund
Quantity Denomination Quotationcurrency
% of netassetsMarket value
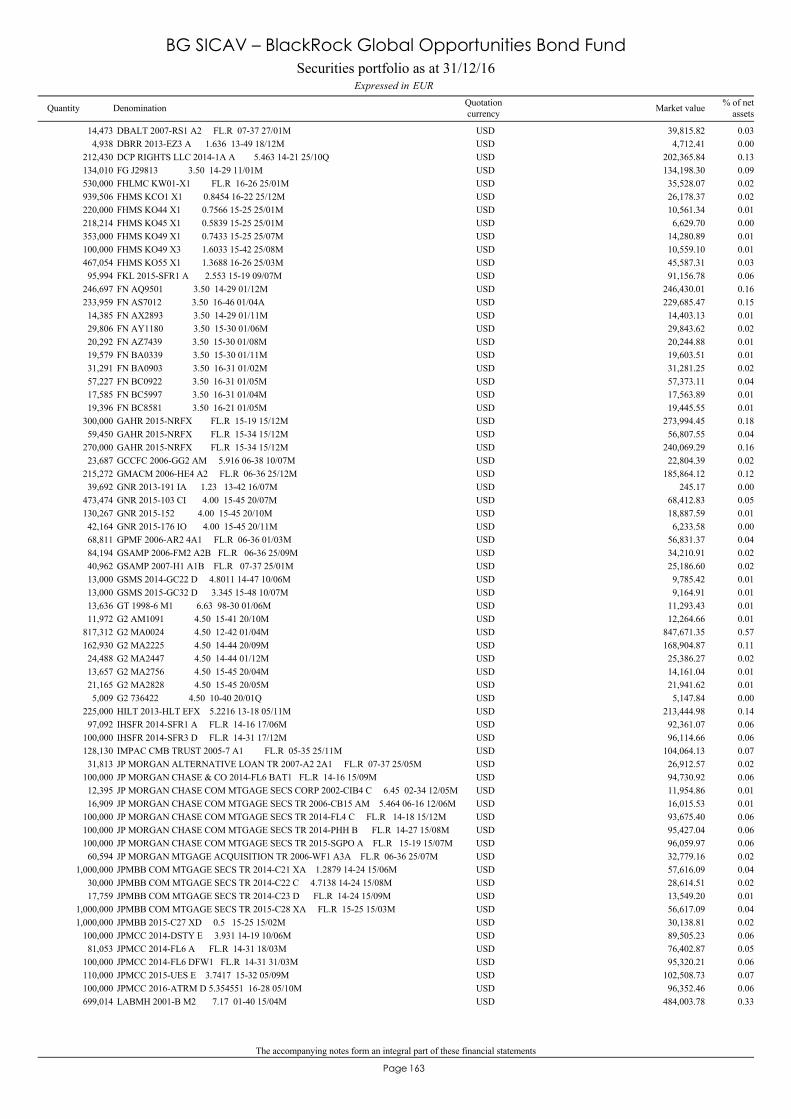
The accompanying notes form an integral part of these financial statements
163Page
DBALT 2007-RS1 A2 FL.R 07-37 27/01M14,473 39,815.82 0.03USDDBRR 2013-EZ3 A 1.636 13-49 18/12M4,938 4,712.41 0.00USDDCP RIGHTS LLC 2014-1A A 5.463 14-21 25/10Q212,430 202,365.84 0.13USDFG J29813 3.50 14-29 11/01M134,010 134,198.30 0.09USDFHLMC KW01-X1 FL.R 16-26 25/01M530,000 35,528.07 0.02USDFHMS KCO1 X1 0.8454 16-22 25/12M939,506 26,178.37 0.02USDFHMS KO44 X1 0.7566 15-25 25/01M220,000 10,561.34 0.01USDFHMS KO45 X1 0.5839 15-25 25/01M218,214 6,629.70 0.00USDFHMS KO49 X1 0.7433 15-25 25/07M353,000 14,280.89 0.01USDFHMS KO49 X3 1.6033 15-42 25/08M100,000 10,559.10 0.01USDFHMS KO55 X1 1.3688 16-26 25/03M467,054 45,587.31 0.03USDFKL 2015-SFR1 A 2.553 15-19 09/07M95,994 91,156.78 0.06USDFN AQ9501 3.50 14-29 01/12M246,697 246,430.01 0.16USDFN AS7012 3.50 16-46 01/04A233,959 229,685.47 0.15USDFN AX2893 3.50 14-29 01/11M14,385 14,403.13 0.01USDFN AY1180 3.50 15-30 01/06M29,806 29,843.62 0.02USDFN AZ7439 3.50 15-30 01/08M20,292 20,244.88 0.01USDFN BA0339 3.50 15-30 01/11M19,579 19,603.51 0.01USDFN BA0903 3.50 16-31 01/02M31,291 31,281.25 0.02USDFN BC0922 3.50 16-31 01/05M57,227 57,373.11 0.04USDFN BC5997 3.50 16-31 01/04M17,585 17,563.89 0.01USDFN BC8581 3.50 16-21 01/05M19,396 19,445.55 0.01USDGAHR 2015-NRFX FL.R 15-19 15/12M300,000 273,994.45 0.18USDGAHR 2015-NRFX FL.R 15-34 15/12M59,450 56,807.55 0.04USDGAHR 2015-NRFX FL.R 15-34 15/12M270,000 240,069.29 0.16USDGCCFC 2006-GG2 AM 5.916 06-38 10/07M23,687 22,804.39 0.02USDGMACM 2006-HE4 A2 FL.R 06-36 25/12M215,272 185,864.12 0.12USDGNR 2013-191 IA 1.23 13-42 16/07M39,692 245.17 0.00USDGNR 2015-103 CI 4.00 15-45 20/07M473,474 68,412.83 0.05USDGNR 2015-152 4.00 15-45 20/10M130,267 18,887.59 0.01USDGNR 2015-176 IO 4.00 15-45 20/11M42,164 6,233.58 0.00USDGPMF 2006-AR2 4A1 FL.R 06-36 01/03M68,811 56,831.37 0.04USDGSAMP 2006-FM2 A2B FL.R 06-36 25/09M84,194 34,210.91 0.02USDGSAMP 2007-H1 A1B FL.R 07-37 25/01M40,962 25,186.60 0.02USDGSMS 2014-GC22 D 4.8011 14-47 10/06M13,000 9,785.42 0.01USDGSMS 2015-GC32 D 3.345 15-48 10/07M13,000 9,164.91 0.01USDGT 1998-6 M1 6.63 98-30 01/06M13,636 11,293.43 0.01USDG2 AM1091 4.50 15-41 20/10M11,972 12,264.66 0.01USDG2 MA0024 4.50 12-42 01/04M817,312 847,671.35 0.57USDG2 MA2225 4.50 14-44 20/09M162,930 168,904.87 0.11USDG2 MA2447 4.50 14-44 01/12M24,488 25,386.27 0.02USDG2 MA2756 4.50 15-45 20/04M13,657 14,161.04 0.01USDG2 MA2828 4.50 15-45 20/05M21,165 21,941.62 0.01USDG2 736422 4.50 10-40 20/01Q5,009 5,147.84 0.00USDHILT 2013-HLT EFX 5.2216 13-18 05/11M225,000 213,444.98 0.14USDIHSFR 2014-SFR1 A FL.R 14-16 17/06M97,092 92,361.07 0.06USDIHSFR 2014-SFR3 D FL.R 14-31 17/12M100,000 96,114.66 0.06USDIMPAC CMB TRUST 2005-7 A1 FL.R 05-35 25/11M128,130 104,064.13 0.07USDJP MORGAN ALTERNATIVE LOAN TR 2007-A2 2A1 FL.R 07-37 25/05M31,813 26,912.57 0.02USDJP MORGAN CHASE & CO 2014-FL6 BAT1 FL.R 14-16 15/09M100,000 94,730.92 0.06USDJP MORGAN CHASE COM MTGAGE SECS CORP 2002-CIB4 C 6.45 02-34 12/05M12,395 11,954.86 0.01USDJP MORGAN CHASE COM MTGAGE SECS TR 2006-CB15 AM 5.464 06-16 12/06M16,909 16,015.53 0.01USDJP MORGAN CHASE COM MTGAGE SECS TR 2014-FL4 C FL.R 14-18 15/12M100,000 93,675.40 0.06USDJP MORGAN CHASE COM MTGAGE SECS TR 2014-PHH B FL.R 14-27 15/08M100,000 95,427.04 0.06USDJP MORGAN CHASE COM MTGAGE SECS TR 2015-SGPO A FL.R 15-19 15/07M100,000 96,059.97 0.06USDJP MORGAN MTGAGE ACQUISITION TR 2006-WF1 A3A FL.R 06-36 25/07M60,594 32,779.16 0.02USDJPMBB COM MTGAGE SECS TR 2014-C21 XA 1.2879 14-24 15/06M1,000,000 57,616.09 0.04USDJPMBB COM MTGAGE SECS TR 2014-C22 C 4.7138 14-24 15/08M30,000 28,614.51 0.02USDJPMBB COM MTGAGE SECS TR 2014-C23 D FL.R 14-24 15/09M17,759 13,549.20 0.01USDJPMBB COM MTGAGE SECS TR 2015-C28 XA FL.R 15-25 15/03M1,000,000 56,617.09 0.04USDJPMBB 2015-C27 XD 0.5 15-25 15/02M1,000,000 30,138.81 0.02USDJPMCC 2014-DSTY E 3.931 14-19 10/06M100,000 89,505.23 0.06USDJPMCC 2014-FL6 A FL.R 14-31 18/03M81,053 76,402.87 0.05USDJPMCC 2014-FL6 DFW1 FL.R 14-31 31/03M100,000 95,320.21 0.06USDJPMCC 2015-UES E 3.7417 15-32 05/09M110,000 102,508.73 0.07USDJPMCC 2016-ATRM D 5.354551 16-28 05/10M100,000 96,352.46 0.06USDLABMH 2001-B M2 7.17 01-40 15/04M699,014 484,003.78 0.33USD
Securities portfolio as at 31/12/16EURExpressed in
BG SICAV – BlackRock Global Opportunities Bond Fund
Quantity Denomination Quotationcurrency
% of netassetsMarket value
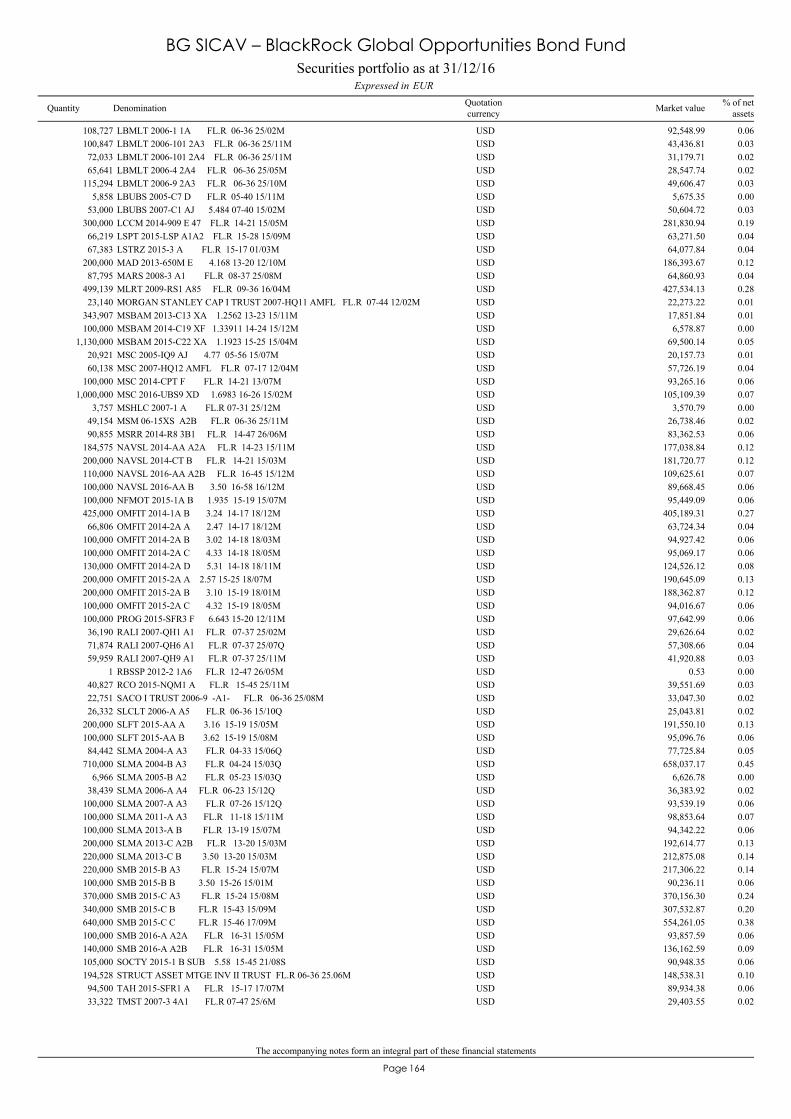
The accompanying notes form an integral part of these financial statements
164Page
LBMLT 2006-1 1A FL.R 06-36 25/02M108,727 92,548.99 0.06USDLBMLT 2006-101 2A3 FL.R 06-36 25/11M100,847 43,436.81 0.03USDLBMLT 2006-101 2A4 FL.R 06-36 25/11M72,033 31,179.71 0.02USDLBMLT 2006-4 2A4 FL.R 06-36 25/05M65,641 28,547.74 0.02USDLBMLT 2006-9 2A3 FL.R 06-36 25/10M115,294 49,606.47 0.03USDLBUBS 2005-C7 D FL.R 05-40 15/11M5,858 5,675.35 0.00USDLBUBS 2007-C1 AJ 5.484 07-40 15/02M53,000 50,604.72 0.03USDLCCM 2014-909 E 47 FL.R 14-21 15/05M300,000 281,830.94 0.19USDLSPT 2015-LSP A1A2 FL.R 15-28 15/09M66,219 63,271.50 0.04USDLSTRZ 2015-3 A FL.R 15-17 01/03M67,383 64,077.84 0.04USDMAD 2013-650M E 4.168 13-20 12/10M200,000 186,393.67 0.12USDMARS 2008-3 A1 FL.R 08-37 25/08M87,795 64,860.93 0.04USDMLRT 2009-RS1 A85 FL.R 09-36 16/04M499,139 427,534.13 0.28USDMORGAN STANLEY CAP I TRUST 2007-HQ11 AMFL FL.R 07-44 12/02M23,140 22,273.22 0.01USDMSBAM 2013-C13 XA 1.2562 13-23 15/11M343,907 17,851.84 0.01USDMSBAM 2014-C19 XF 1.33911 14-24 15/12M100,000 6,578.87 0.00USDMSBAM 2015-C22 XA 1.1923 15-25 15/04M1,130,000 69,500.14 0.05USDMSC 2005-IQ9 AJ 4.77 05-56 15/07M20,921 20,157.73 0.01USDMSC 2007-HQ12 AMFL FL.R 07-17 12/04M60,138 57,726.19 0.04USDMSC 2014-CPT F FL.R 14-21 13/07M100,000 93,265.16 0.06USDMSC 2016-UBS9 XD 1.6983 16-26 15/02M1,000,000 105,109.39 0.07USDMSHLC 2007-1 A FL.R 07-31 25/12M3,757 3,570.79 0.00USDMSM 06-15XS A2B FL.R 06-36 25/11M49,154 26,738.46 0.02USDMSRR 2014-R8 3B1 FL.R 14-47 26/06M90,855 83,362.53 0.06USDNAVSL 2014-AA A2A FL.R 14-23 15/11M184,575 177,038.84 0.12USDNAVSL 2014-CT B FL.R 14-21 15/03M200,000 181,720.77 0.12USDNAVSL 2016-AA A2B FL.R 16-45 15/12M110,000 109,625.61 0.07USDNAVSL 2016-AA B 3.50 16-58 16/12M100,000 89,668.45 0.06USDNFMOT 2015-1A B 1.935 15-19 15/07M100,000 95,449.09 0.06USDOMFIT 2014-1A B 3.24 14-17 18/12M425,000 405,189.31 0.27USDOMFIT 2014-2A A 2.47 14-17 18/12M66,806 63,724.34 0.04USDOMFIT 2014-2A B 3.02 14-18 18/03M100,000 94,927.42 0.06USDOMFIT 2014-2A C 4.33 14-18 18/05M100,000 95,069.17 0.06USDOMFIT 2014-2A D 5.31 14-18 18/11M130,000 124,526.12 0.08USDOMFIT 2015-2A A 2.57 15-25 18/07M200,000 190,645.09 0.13USDOMFIT 2015-2A B 3.10 15-19 18/01M200,000 188,362.87 0.12USDOMFIT 2015-2A C 4.32 15-19 18/05M100,000 94,016.67 0.06USDPROG 2015-SFR3 F 6.643 15-20 12/11M100,000 97,642.99 0.06USDRALI 2007-QH1 A1 FL.R 07-37 25/02M36,190 29,626.64 0.02USDRALI 2007-QH6 A1 FL.R 07-37 25/07Q71,874 57,308.66 0.04USDRALI 2007-QH9 A1 FL.R 07-37 25/11M59,959 41,920.88 0.03USDRBSSP 2012-2 1A6 FL.R 12-47 26/05M1 0.53 0.00USDRCO 2015-NQM1 A FL.R 15-45 25/11M40,827 39,551.69 0.03USDSACO I TRUST 2006-9 -A1- FL.R 06-36 25/08M22,751 33,047.30 0.02USDSLCLT 2006-A A5 FL.R 06-36 15/10Q26,332 25,043.81 0.02USDSLFT 2015-AA A 3.16 15-19 15/05M200,000 191,550.10 0.13USDSLFT 2015-AA B 3.62 15-19 15/08M100,000 95,096.76 0.06USDSLMA 2004-A A3 FL.R 04-33 15/06Q84,442 77,725.84 0.05USDSLMA 2004-B A3 FL.R 04-24 15/03Q710,000 658,037.17 0.45USDSLMA 2005-B A2 FL.R 05-23 15/03Q6,966 6,626.78 0.00USDSLMA 2006-A A4 FL.R 06-23 15/12Q38,439 36,383.92 0.02USDSLMA 2007-A A3 FL.R 07-26 15/12Q100,000 93,539.19 0.06USDSLMA 2011-A A3 FL.R 11-18 15/11M100,000 98,853.64 0.07USDSLMA 2013-A B FL.R 13-19 15/07M100,000 94,342.22 0.06USDSLMA 2013-C A2B FL.R 13-20 15/03M200,000 192,614.77 0.13USDSLMA 2013-C B 3.50 13-20 15/03M220,000 212,875.08 0.14USDSMB 2015-B A3 FL.R 15-24 15/07M220,000 217,306.22 0.14USDSMB 2015-B B 3.50 15-26 15/01M100,000 90,236.11 0.06USDSMB 2015-C A3 FL.R 15-24 15/08M370,000 370,156.30 0.24USDSMB 2015-C B FL.R 15-43 15/09M340,000 307,532.87 0.20USDSMB 2015-C C FL.R 15-46 17/09M640,000 554,261.05 0.38USDSMB 2016-A A2A FL.R 16-31 15/05M100,000 93,857.59 0.06USDSMB 2016-A A2B FL.R 16-31 15/05M140,000 136,162.59 0.09USDSOCTY 2015-1 B SUB 5.58 15-45 21/08S105,000 90,948.35 0.06USDSTRUCT ASSET MTGE INV II TRUST FL.R 06-36 25.06M194,528 148,538.31 0.10USDTAH 2015-SFR1 A FL.R 15-17 17/07M94,500 89,934.38 0.06USDTMST 2007-3 4A1 FL.R 07-47 25/6M33,322 29,403.55 0.02USD
Securities portfolio as at 31/12/16EURExpressed in
BG SICAV – BlackRock Global Opportunities Bond Fund
Quantity Denomination Quotationcurrency
% of netassetsMarket value
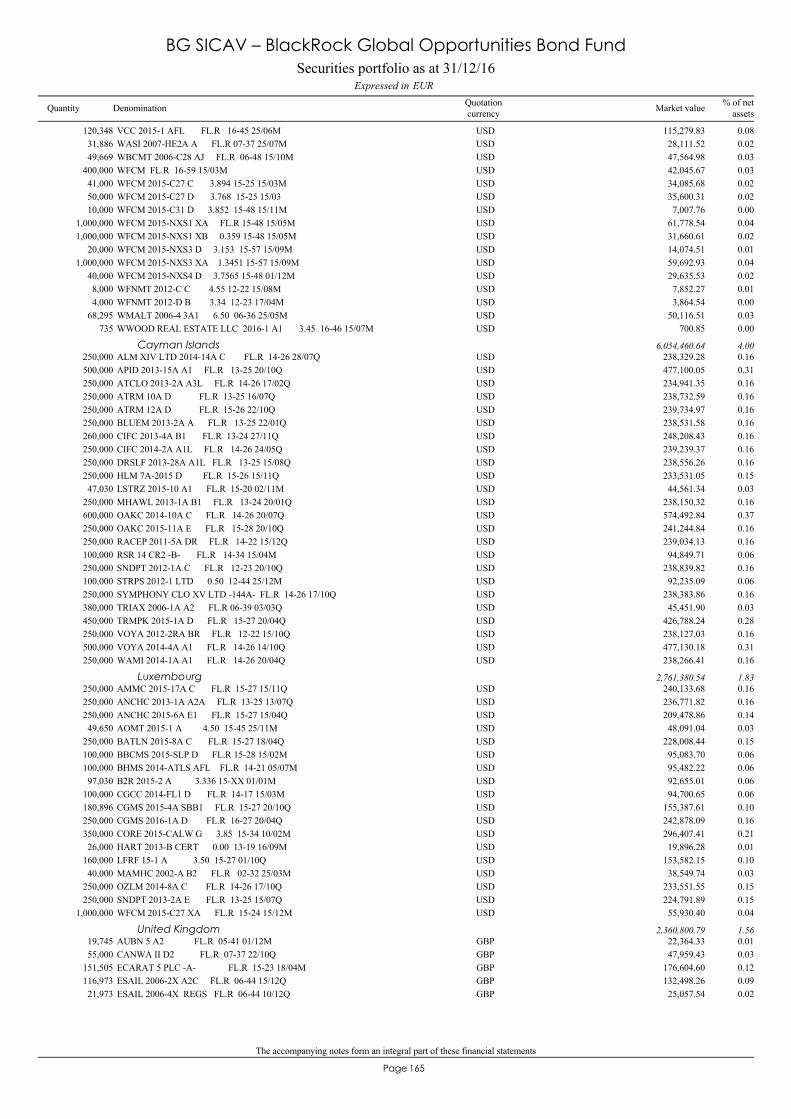
The accompanying notes form an integral part of these financial statements
165Page
VCC 2015-1 AFL FL.R 16-45 25/06M120,348 115,279.83 0.08USDWASI 2007-HE2A A FL.R 07-37 25/07M31,886 28,111.52 0.02USDWBCMT 2006-C28 AJ FL.R 06-48 15/10M49,669 47,564.98 0.03USDWFCM FL.R 16-59 15/03M400,000 42,045.67 0.03USDWFCM 2015-C27 C 3.894 15-25 15/03M41,000 34,085.68 0.02USDWFCM 2015-C27 D 3.768 15-25 15/0350,000 35,600.31 0.02USDWFCM 2015-C31 D 3.852 15-48 15/11M10,000 7,007.76 0.00USDWFCM 2015-NXS1 XA FL.R 15-48 15/05M1,000,000 61,778.54 0.04USDWFCM 2015-NXS1 XB 0.359 15-48 15/05M1,000,000 31,660.61 0.02USDWFCM 2015-NXS3 D 3.153 15-57 15/09M20,000 14,074.51 0.01USDWFCM 2015-NXS3 XA 1.3451 15-57 15/09M1,000,000 59,692.93 0.04USDWFCM 2015-NXS4 D 3.7565 15-48 01/12M40,000 29,635.53 0.02USDWFNMT 2012-C C 4.55 12-22 15/08M8,000 7,852.27 0.01USDWFNMT 2012-D B 3.34 12-23 17/04M4,000 3,864.54 0.00USDWMALT 2006-4 3A1 6.50 06-36 25/05M68,295 50,116.51 0.03USDWWOOD REAL ESTATE LLC 2016-1 A1 3.45 16-46 15/07M735 700.85 0.00USD
ALM XIV LTD 2014-14A C FL.R 14-26 28/07Q250,000 238,329.28 0.16USDCayman Islands 6,054,460.64 4.00
APID 2013-15A A1 FL.R 13-25 20/10Q500,000 477,100.05 0.31USDATCLO 2013-2A A3L FL.R 14-26 17/02Q250,000 234,941.35 0.16USDATRM 10A D FL.R 13-25 16/07Q250,000 238,732.59 0.16USDATRM 12A D FL.R 15-26 22/10Q250,000 239,734.97 0.16USDBLUEM 2013-2A A FL.R 13-25 22/01Q250,000 238,531.58 0.16USDCIFC 2013-4A B1 FL.R 13-24 27/11Q260,000 248,208.43 0.16USDCIFC 2014-2A A1L FL.R 14-26 24/05Q250,000 239,239.37 0.16USDDRSLF 2013-28A A1L FL.R 13-25 15/08Q250,000 238,556.26 0.16USDHLM 7A-2015 D FL.R 15-26 15/11Q250,000 233,531.05 0.15USDLSTRZ 2015-10 A1 FL.R 15-20 02/11M47,030 44,561.34 0.03USDMHAWL 2013-1A B1 FL.R 13-24 20/01Q250,000 238,150.32 0.16USDOAKC 2014-10A C FL.R 14-26 20/07Q600,000 574,492.84 0.37USDOAKC 2015-11A E FL.R 15-28 20/10Q250,000 241,244.84 0.16USDRACEP 2011-5A DR FL.R 14-22 15/12Q250,000 239,034.13 0.16USDRSR 14 CR2 -B- FL.R 14-34 15/04M100,000 94,849.71 0.06USDSNDPT 2012-1A C FL.R 12-23 20/10Q250,000 238,839.82 0.16USDSTRPS 2012-1 LTD 0.50 12-44 25/12M100,000 92,235.09 0.06USDSYMPHONY CLO XV LTD -144A- FL.R 14-26 17/10Q250,000 238,383.86 0.16USDTRIAX 2006-1A A2 FL.R 06-39 03/03Q380,000 45,451.90 0.03USDTRMPK 2015-1A D FL.R 15-27 20/04Q450,000 426,788.24 0.28USDVOYA 2012-2RA BR FL.R 12-22 15/10Q250,000 238,127.03 0.16USDVOYA 2014-4A A1 FL.R 14-26 14/10Q500,000 477,130.18 0.31USDWAMI 2014-1A A1 FL.R 14-26 20/04Q250,000 238,266.41 0.16USD
AMMC 2015-17A C FL.R 15-27 15/11Q250,000 240,133.68 0.16USDLuxembourg 2,761,380.54 1.83
ANCHC 2013-1A A2A FL.R 13-25 13/07Q250,000 236,771.82 0.16USDANCHC 2015-6A E1 FL.R 15-27 15/04Q250,000 209,478.86 0.14USDAOMT 2015-1 A 4.50 15-45 25/11M49,650 48,091.04 0.03USDBATLN 2015-8A C FL.R 15-27 18/04Q250,000 228,008.44 0.15USDBBCMS 2015-SLP D FL.R 15-28 15/02M100,000 95,083.70 0.06USDBHMS 2014-ATLS AFL FL.R 14-21 05/07M100,000 95,482.22 0.06USDB2R 2015-2 A 3.336 15-XX 01/01M97,030 92,655.01 0.06USDCGCC 2014-FL1 D FL.R 14-17 15/03M100,000 94,700.65 0.06USDCGMS 2015-4A SBB1 FL.R 15-27 20/10Q180,896 155,387.61 0.10USDCGMS 2016-1A D FL.R 16-27 20/04Q250,000 242,878.09 0.16USDCORE 2015-CALW G 3.85 15-34 10/02M350,000 296,407.41 0.21USDHART 2013-B CERT 0.00 13-19 16/09M26,000 19,896.28 0.01USDLFRF 15-1 A 3.50 15-27 01/10Q160,000 153,582.15 0.10USDMAMHC 2002-A B2 FL.R 02-32 25/03M40,000 38,549.74 0.03USDOZLM 2014-8A C FL.R 14-26 17/10Q250,000 233,551.55 0.15USDSNDPT 2013-2A E FL.R 13-25 15/07Q250,000 224,791.89 0.15USDWFCM 2015-C27 XA FL.R 15-24 15/12M1,000,000 55,930.40 0.04USD
AUBN 5 A2 FL.R 05-41 01/12M19,745 22,364.33 0.01GBPUnited Kingdom 2,360,800.79 1.56
CANWA II D2 FL.R 07-37 22/10Q55,000 47,959.43 0.03GBPECARAT 5 PLC -A- FL.R 15-23 18/04M151,505 176,604.60 0.12GBPESAIL 2006-2X A2C FL.R 06-44 15/12Q116,973 132,498.26 0.09GBPESAIL 2006-4X REGS FL.R 06-44 10/12Q21,973 25,057.54 0.02GBP
Securities portfolio as at 31/12/16EURExpressed in
BG SICAV – BlackRock Global Opportunities Bond Fund
Quantity Denomination Quotationcurrency
% of netassetsMarket value
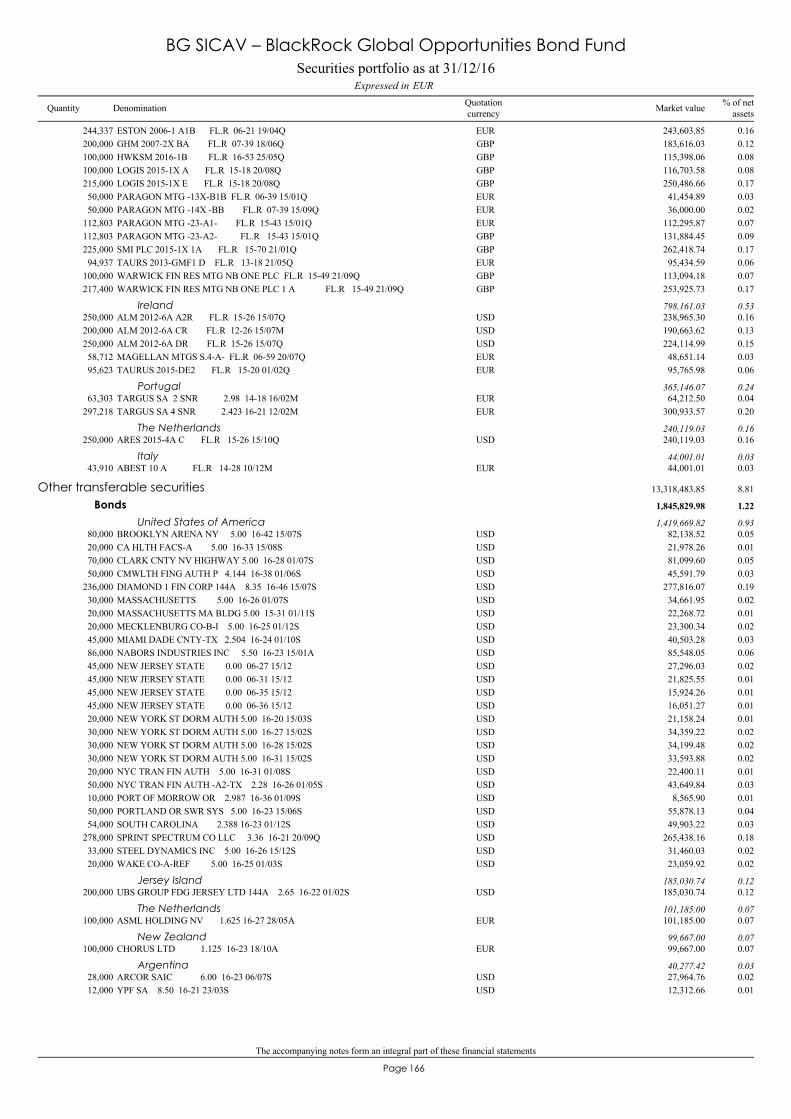
The accompanying notes form an integral part of these financial statements
166Page
ESTON 2006-1 A1B FL.R 06-21 19/04Q244,337 243,603.85 0.16EURGHM 2007-2X BA FL.R 07-39 18/06Q200,000 183,616.03 0.12GBPHWKSM 2016-1B FL.R 16-53 25/05Q100,000 115,398.06 0.08GBPLOGIS 2015-1X A FL.R 15-18 20/08Q100,000 116,703.58 0.08GBPLOGIS 2015-1X E FL.R 15-18 20/08Q215,000 250,486.66 0.17GBPPARAGON MTG -13X-B1B FL.R 06-39 15/01Q50,000 41,454.89 0.03EURPARAGON MTG -14X -BB FL.R 07-39 15/09Q50,000 36,000.00 0.02EURPARAGON MTG -23-A1- FL.R 15-43 15/01Q112,803 112,295.87 0.07EURPARAGON MTG -23-A2- FL.R 15-43 15/01Q112,803 131,884.45 0.09GBPSMI PLC 2015-1X 1A FL.R 15-70 21/01Q225,000 262,418.74 0.17GBPTAURS 2013-GMF1 D FL.R 13-18 21/05Q94,937 95,434.59 0.06EURWARWICK FIN RES MTG NB ONE PLC FL.R 15-49 21/09Q100,000 113,094.18 0.07GBPWARWICK FIN RES MTG NB ONE PLC 1 A FL.R 15-49 21/09Q217,400 253,925.73 0.17GBP
ALM 2012-6A A2R FL.R 15-26 15/07Q250,000 238,965.30 0.16USDIreland 798,161.03 0.53
ALM 2012-6A CR FL.R 12-26 15/07M200,000 190,663.62 0.13USDALM 2012-6A DR FL.R 15-26 15/07Q250,000 224,114.99 0.15USDMAGELLAN MTGS S.4-A- FL.R 06-59 20/07Q58,712 48,651.14 0.03EURTAURUS 2015-DE2 FL.R 15-20 01/02Q95,623 95,765.98 0.06EUR
TARGUS SA 2 SNR 2.98 14-18 16/02M63,303 64,212.50 0.04EURPortugal 365,146.07 0.24
TARGUS SA 4 SNR 2.423 16-21 12/02M297,218 300,933.57 0.20EUR
ARES 2015-4A C FL.R 15-26 15/10Q250,000 240,119.03 0.16USDThe Netherlands 240,119.03 0.16
ABEST 10 A FL.R 14-28 10/12M43,910 44,001.01 0.03EURItaly 44,001.01 0.03
BROOKLYN ARENA NY 5.00 16-42 15/07S80,000 82,138.52 0.05USD
Other transferable securities 13,318,483.85 8.81
Bonds 1,845,829.98 1.22
United States of America 1,419,669.82 0.93
CA HLTH FACS-A 5.00 16-33 15/08S20,000 21,978.26 0.01USDCLARK CNTY NV HIGHWAY 5.00 16-28 01/07S70,000 81,099.60 0.05USDCMWLTH FING AUTH P 4.144 16-38 01/06S50,000 45,591.79 0.03USDDIAMOND 1 FIN CORP 144A 8.35 16-46 15/07S236,000 277,816.07 0.19USDMASSACHUSETTS 5.00 16-26 01/07S30,000 34,661.95 0.02USDMASSACHUSETTS MA BLDG 5.00 15-31 01/11S20,000 22,268.72 0.01USDMECKLENBURG CO-B-I 5.00 16-25 01/12S20,000 23,300.34 0.02USDMIAMI DADE CNTY-TX 2.504 16-24 01/10S45,000 40,503.28 0.03USDNABORS INDUSTRIES INC 5.50 16-23 15/01A86,000 85,548.05 0.06USDNEW JERSEY STATE 0.00 06-27 15/1245,000 27,296.03 0.02USDNEW JERSEY STATE 0.00 06-31 15/1245,000 21,825.55 0.01USDNEW JERSEY STATE 0.00 06-35 15/1245,000 15,924.26 0.01USDNEW JERSEY STATE 0.00 06-36 15/1245,000 16,051.27 0.01USDNEW YORK ST DORM AUTH 5.00 16-20 15/03S20,000 21,158.24 0.01USDNEW YORK ST DORM AUTH 5.00 16-27 15/02S30,000 34,359.22 0.02USDNEW YORK ST DORM AUTH 5.00 16-28 15/02S30,000 34,199.48 0.02USDNEW YORK ST DORM AUTH 5.00 16-31 15/02S30,000 33,593.88 0.02USDNYC TRAN FIN AUTH 5.00 16-31 01/08S20,000 22,400.11 0.01USDNYC TRAN FIN AUTH -A2-TX 2.28 16-26 01/05S50,000 43,649.84 0.03USDPORT OF MORROW OR 2.987 16-36 01/09S10,000 8,565.90 0.01USDPORTLAND OR SWR SYS 5.00 16-23 15/06S50,000 55,878.13 0.04USDSOUTH CAROLINA 2.388 16-23 01/12S54,000 49,903.22 0.03USDSPRINT SPECTRUM CO LLC 3.36 16-21 20/09Q278,000 265,438.16 0.18USDSTEEL DYNAMICS INC 5.00 16-26 15/12S33,000 31,460.03 0.02USDWAKE CO-A-REF 5.00 16-25 01/03S20,000 23,059.92 0.02USD
UBS GROUP FDG JERSEY LTD 144A 2.65 16-22 01/02S200,000 185,030.74 0.12USDJersey Island 185,030.74 0.12
ASML HOLDING NV 1.625 16-27 28/05A100,000 101,185.00 0.07EURThe Netherlands 101,185.00 0.07
CHORUS LTD 1.125 16-23 18/10A100,000 99,667.00 0.07EURNew Zealand 99,667.00 0.07
ARCOR SAIC 6.00 16-23 06/07S28,000 27,964.76 0.02USDArgentina 40,277.42 0.03
YPF SA 8.50 16-21 23/03S12,000 12,312.66 0.01USD
Securities portfolio as at 31/12/16EURExpressed in
BG SICAV – BlackRock Global Opportunities Bond Fund
Quantity Denomination Quotationcurrency
% of netassetsMarket value
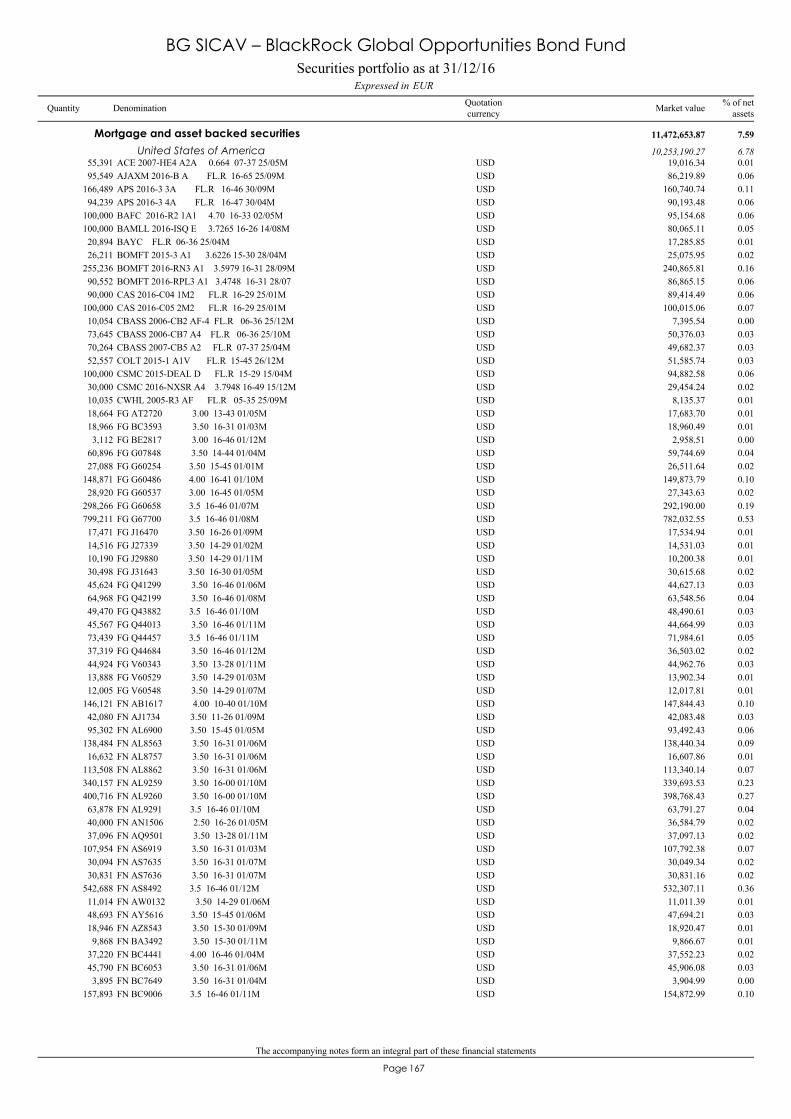
The accompanying notes form an integral part of these financial statements
167Page
ACE 2007-HE4 A2A 0.664 07-37 25/05M55,391 19,016.34 0.01USD
Mortgage and asset backed securities 11,472,653.87 7.59
United States of America 10,253,190.27 6.78
AJAXM 2016-B A FL.R 16-65 25/09M95,549 86,219.89 0.06USDAPS 2016-3 3A FL.R 16-46 30/09M166,489 160,740.74 0.11USDAPS 2016-3 4A FL.R 16-47 30/04M94,239 90,193.48 0.06USDBAFC 2016-R2 1A1 4.70 16-33 02/05M100,000 95,154.68 0.06USDBAMLL 2016-ISQ E 3.7265 16-26 14/08M100,000 80,065.11 0.05USDBAYC FL.R 06-36 25/04M20,894 17,285.85 0.01USDBOMFT 2015-3 A1 3.6226 15-30 28/04M26,211 25,075.95 0.02USDBOMFT 2016-RN3 A1 3.5979 16-31 28/09M255,236 240,865.81 0.16USDBOMFT 2016-RPL3 A1 3.4748 16-31 28/0790,552 86,865.15 0.06USDCAS 2016-C04 1M2 FL.R 16-29 25/01M90,000 89,414.49 0.06USDCAS 2016-C05 2M2 FL.R 16-29 25/01M100,000 100,015.06 0.07USDCBASS 2006-CB2 AF-4 FL.R 06-36 25/12M10,054 7,395.54 0.00USDCBASS 2006-CB7 A4 FL.R 06-36 25/10M73,645 50,376.03 0.03USDCBASS 2007-CB5 A2 FL.R 07-37 25/04M70,264 49,682.37 0.03USDCOLT 2015-1 A1V FL.R 15-45 26/12M52,557 51,585.74 0.03USDCSMC 2015-DEAL D FL.R 15-29 15/04M100,000 94,882.58 0.06USDCSMC 2016-NXSR A4 3.7948 16-49 15/12M30,000 29,454.24 0.02USDCWHL 2005-R3 AF FL.R 05-35 25/09M10,035 8,135.37 0.01USDFG AT2720 3.00 13-43 01/05M18,664 17,683.70 0.01USDFG BC3593 3.50 16-31 01/03M18,966 18,960.49 0.01USDFG BE2817 3.00 16-46 01/12M3,112 2,958.51 0.00USDFG G07848 3.50 14-44 01/04M60,896 59,744.69 0.04USDFG G60254 3.50 15-45 01/01M27,088 26,511.64 0.02USDFG G60486 4.00 16-41 01/10M148,871 149,873.79 0.10USDFG G60537 3.00 16-45 01/05M28,920 27,343.63 0.02USDFG G60658 3.5 16-46 01/07M298,266 292,190.00 0.19USDFG G67700 3.5 16-46 01/08M799,211 782,032.55 0.53USDFG J16470 3.50 16-26 01/09M17,471 17,534.94 0.01USDFG J27339 3.50 14-29 01/02M14,516 14,531.03 0.01USDFG J29880 3.50 14-29 01/11M10,190 10,200.38 0.01USDFG J31643 3.50 16-30 01/05M30,498 30,615.68 0.02USDFG Q41299 3.50 16-46 01/06M45,624 44,627.13 0.03USDFG Q42199 3.50 16-46 01/08M64,968 63,548.56 0.04USDFG Q43882 3.5 16-46 01/10M49,470 48,490.61 0.03USDFG Q44013 3.50 16-46 01/11M45,567 44,664.99 0.03USDFG Q44457 3.5 16-46 01/11M73,439 71,984.61 0.05USDFG Q44684 3.50 16-46 01/12M37,319 36,503.02 0.02USDFG V60343 3.50 13-28 01/11M44,924 44,962.76 0.03USDFG V60529 3.50 14-29 01/03M13,888 13,902.34 0.01USDFG V60548 3.50 14-29 01/07M12,005 12,017.81 0.01USDFN AB1617 4.00 10-40 01/10M146,121 147,844.43 0.10USDFN AJ1734 3.50 11-26 01/09M42,080 42,083.48 0.03USDFN AL6900 3.50 15-45 01/05M95,302 93,492.43 0.06USDFN AL8563 3.50 16-31 01/06M138,484 138,440.34 0.09USDFN AL8757 3.50 16-31 01/06M16,632 16,607.86 0.01USDFN AL8862 3.50 16-31 01/06M113,508 113,340.14 0.07USDFN AL9259 3.50 16-00 01/10M340,157 339,693.53 0.23USDFN AL9260 3.50 16-00 01/10M400,716 398,768.43 0.27USDFN AL9291 3.5 16-46 01/10M63,878 63,791.27 0.04USDFN AN1506 2.50 16-26 01/05M40,000 36,584.79 0.02USDFN AQ9501 3.50 13-28 01/11M37,096 37,097.13 0.02USDFN AS6919 3.50 16-31 01/03M107,954 107,792.38 0.07USDFN AS7635 3.50 16-31 01/07M30,094 30,049.34 0.02USDFN AS7636 3.50 16-31 01/07M30,831 30,831.16 0.02USDFN AS8492 3.5 16-46 01/12M542,688 532,307.11 0.36USDFN AW0132 3.50 14-29 01/06M11,014 11,011.39 0.01USDFN AY5616 3.50 15-45 01/06M48,693 47,694.21 0.03USDFN AZ8543 3.50 15-30 01/09M18,946 18,920.47 0.01USDFN BA3492 3.50 15-30 01/11M9,868 9,866.67 0.01USDFN BC4441 4.00 16-46 01/04M37,220 37,552.23 0.02USDFN BC6053 3.50 16-31 01/06M45,790 45,906.08 0.03USDFN BC7649 3.50 16-31 01/04M3,895 3,904.99 0.00USDFN BC9006 3.5 16-46 01/11M157,893 154,872.99 0.10USD
Securities portfolio as at 31/12/16EURExpressed in
BG SICAV – BlackRock Global Opportunities Bond Fund
Quantity Denomination Quotationcurrency
% of netassetsMarket value
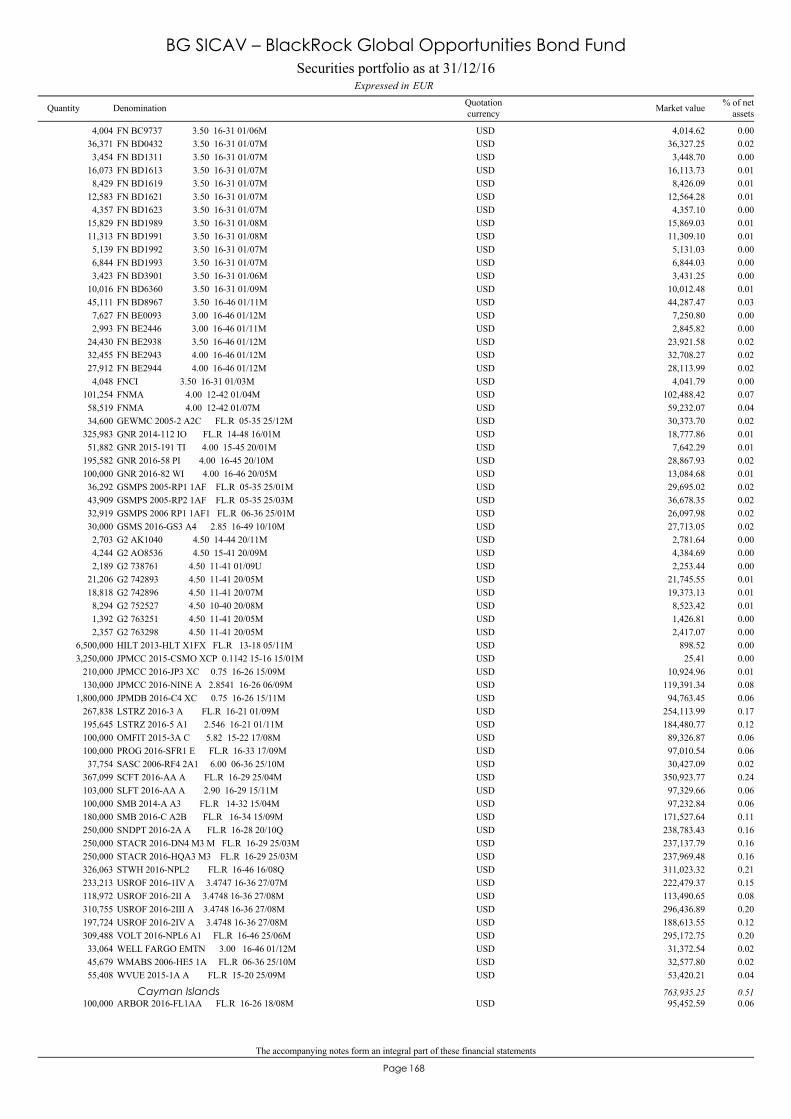
The accompanying notes form an integral part of these financial statements
168Page
FN BC9737 3.50 16-31 01/06M4,004 4,014.62 0.00USDFN BD0432 3.50 16-31 01/07M36,371 36,327.25 0.02USDFN BD1311 3.50 16-31 01/07M3,454 3,448.70 0.00USDFN BD1613 3.50 16-31 01/07M16,073 16,113.73 0.01USDFN BD1619 3.50 16-31 01/07M8,429 8,426.09 0.01USDFN BD1621 3.50 16-31 01/07M12,583 12,564.28 0.01USDFN BD1623 3.50 16-31 01/07M4,357 4,357.10 0.00USDFN BD1989 3.50 16-31 01/08M15,829 15,869.03 0.01USDFN BD1991 3.50 16-31 01/08M11,313 11,309.10 0.01USDFN BD1992 3.50 16-31 01/07M5,139 5,131.03 0.00USDFN BD1993 3.50 16-31 01/07M6,844 6,844.03 0.00USDFN BD3901 3.50 16-31 01/06M3,423 3,431.25 0.00USDFN BD6360 3.50 16-31 01/09M10,016 10,012.48 0.01USDFN BD8967 3.50 16-46 01/11M45,111 44,287.47 0.03USDFN BE0093 3.00 16-46 01/12M7,627 7,250.80 0.00USDFN BE2446 3.00 16-46 01/11M2,993 2,845.82 0.00USDFN BE2938 3.50 16-46 01/12M24,430 23,921.58 0.02USDFN BE2943 4.00 16-46 01/12M32,455 32,708.27 0.02USDFN BE2944 4.00 16-46 01/12M27,912 28,113.99 0.02USDFNCI 3.50 16-31 01/03M4,048 4,041.79 0.00USDFNMA 4.00 12-42 01/04M101,254 102,488.42 0.07USDFNMA 4.00 12-42 01/07M58,519 59,232.07 0.04USDGEWMC 2005-2 A2C FL.R 05-35 25/12M34,600 30,373.70 0.02USDGNR 2014-112 IO FL.R 14-48 16/01M325,983 18,777.86 0.01USDGNR 2015-191 TI 4.00 15-45 20/01M51,882 7,642.29 0.01USDGNR 2016-58 PI 4.00 16-45 20/10M195,582 28,867.93 0.02USDGNR 2016-82 WI 4.00 16-46 20/05M100,000 13,084.68 0.01USDGSMPS 2005-RP1 1AF FL.R 05-35 25/01M36,292 29,695.02 0.02USDGSMPS 2005-RP2 1AF FL.R 05-35 25/03M43,909 36,678.35 0.02USDGSMPS 2006 RP1 1AF1 FL.R 06-36 25/01M32,919 26,097.98 0.02USDGSMS 2016-GS3 A4 2.85 16-49 10/10M30,000 27,713.05 0.02USDG2 AK1040 4.50 14-44 20/11M2,703 2,781.64 0.00USDG2 AO8536 4.50 15-41 20/09M4,244 4,384.69 0.00USDG2 738761 4.50 11-41 01/09U2,189 2,253.44 0.00USDG2 742893 4.50 11-41 20/05M21,206 21,745.55 0.01USDG2 742896 4.50 11-41 20/07M18,818 19,373.13 0.01USDG2 752527 4.50 10-40 20/08M8,294 8,523.42 0.01USDG2 763251 4.50 11-41 20/05M1,392 1,426.81 0.00USDG2 763298 4.50 11-41 20/05M2,357 2,417.07 0.00USDHILT 2013-HLT X1FX FL.R 13-18 05/11M6,500,000 898.52 0.00USDJPMCC 2015-CSMO XCP 0.1142 15-16 15/01M3,250,000 25.41 0.00USDJPMCC 2016-JP3 XC 0.75 16-26 15/09M210,000 10,924.96 0.01USDJPMCC 2016-NINE A 2.8541 16-26 06/09M130,000 119,391.34 0.08USDJPMDB 2016-C4 XC 0.75 16-26 15/11M1,800,000 94,763.45 0.06USDLSTRZ 2016-3 A FL.R 16-21 01/09M267,838 254,113.99 0.17USDLSTRZ 2016-5 A1 2.546 16-21 01/11M195,645 184,480.77 0.12USDOMFIT 2015-3A C 5.82 15-22 17/08M100,000 89,326.87 0.06USDPROG 2016-SFR1 E FL.R 16-33 17/09M100,000 97,010.54 0.06USDSASC 2006-RF4 2A1 6.00 06-36 25/10M37,754 30,427.09 0.02USDSCFT 2016-AA A FL.R 16-29 25/04M367,099 350,923.77 0.24USDSLFT 2016-AA A 2.90 16-29 15/11M103,000 97,329.66 0.06USDSMB 2014-A A3 FL.R 14-32 15/04M100,000 97,232.84 0.06USDSMB 2016-C A2B FL.R 16-34 15/09M180,000 171,527.64 0.11USDSNDPT 2016-2A A FL.R 16-28 20/10Q250,000 238,783.43 0.16USDSTACR 2016-DN4 M3 M FL.R 16-29 25/03M250,000 237,137.79 0.16USDSTACR 2016-HQA3 M3 FL.R 16-29 25/03M250,000 237,969.48 0.16USDSTWH 2016-NPL2 FL.R 16-46 16/08Q326,063 311,023.32 0.21USDUSROF 2016-1IV A 3.4747 16-36 27/07M233,213 222,479.37 0.15USDUSROF 2016-2II A 3.4748 16-36 27/08M118,972 113,490.65 0.08USDUSROF 2016-2III A 3.4748 16-36 27/08M310,755 296,436.89 0.20USDUSROF 2016-2IV A 3.4748 16-36 27/08M197,724 188,613.55 0.12USDVOLT 2016-NPL6 A1 FL.R 16-46 25/06M309,488 295,172.75 0.20USDWELL FARGO EMTN 3.00 16-46 01/12M33,064 31,372.54 0.02USDWMABS 2006-HE5 1A FL.R 06-36 25/10M45,679 32,577.80 0.02USDWVUE 2015-1A A FL.R 15-20 25/09M55,408 53,420.21 0.04USD
ARBOR 2016-FL1AA FL.R 16-26 18/08M100,000 95,452.59 0.06USDCayman Islands 763,935.25 0.51
Securities portfolio as at 31/12/16EURExpressed in
BG SICAV – BlackRock Global Opportunities Bond Fund
Quantity Denomination Quotationcurrency
% of netassetsMarket value
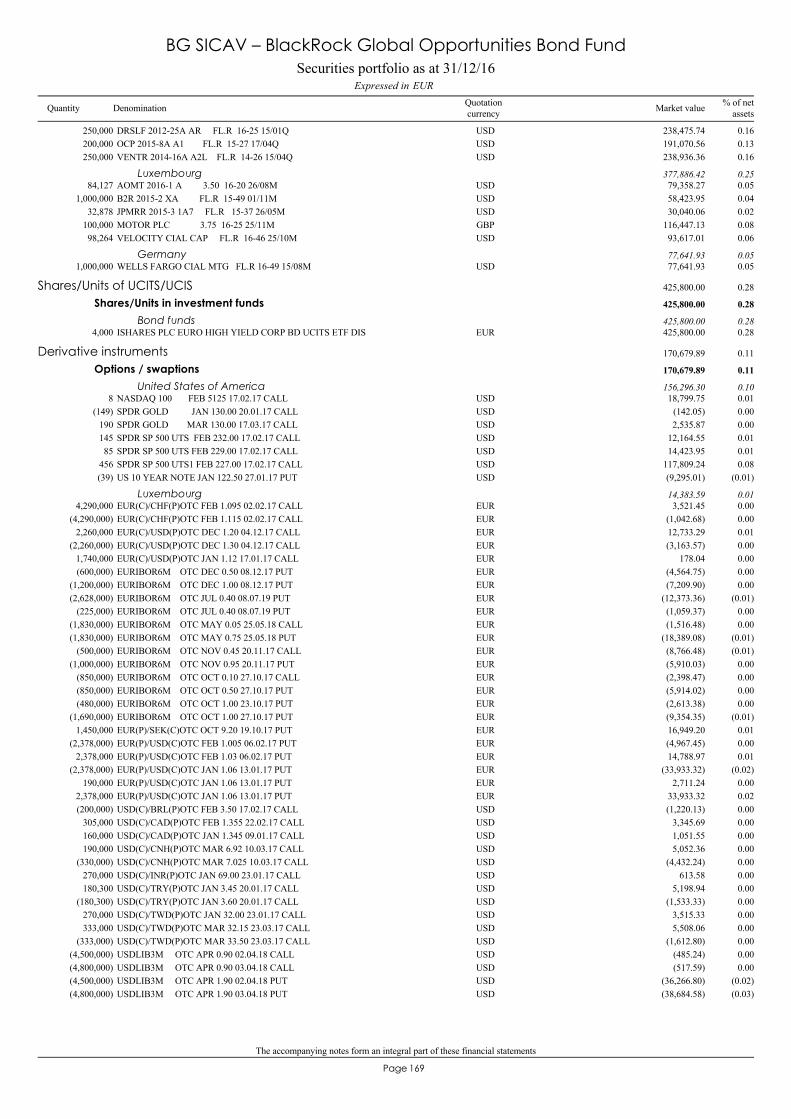
The accompanying notes form an integral part of these financial statements
169Page
DRSLF 2012-25A AR FL.R 16-25 15/01Q250,000 238,475.74 0.16USDOCP 2015-8A A1 FL.R 15-27 17/04Q200,000 191,070.56 0.13USDVENTR 2014-16A A2L FL.R 14-26 15/04Q250,000 238,936.36 0.16USD
AOMT 2016-1 A 3.50 16-20 26/08M84,127 79,358.27 0.05USDLuxembourg 377,886.42 0.25
B2R 2015-2 XA FL.R 15-49 01/11M1,000,000 58,423.95 0.04USDJPMRR 2015-3 1A7 FL.R 15-37 26/05M32,878 30,040.06 0.02USDMOTOR PLC 3.75 16-25 25/11M100,000 116,447.13 0.08GBPVELOCITY CIAL CAP FL.R 16-46 25/10M98,264 93,617.01 0.06USD
WELLS FARGO CIAL MTG FL.R 16-49 15/08M1,000,000 77,641.93 0.05USDGermany 77,641.93 0.05
ISHARES PLC EURO HIGH YIELD CORP BD UCITS ETF DIS4,000 425,800.00 0.28EUR
Shares/Units of UCITS/UCIS 425,800.00 0.28
Shares/Units in investment funds 425,800.00 0.28
Bond funds 425,800.00 0.28
NASDAQ 100 FEB 5125 17.02.17 CALL8 18,799.75 0.01USD
Derivative instruments 170,679.89 0.11
Options / swaptions 170,679.89 0.11
United States of America 156,296.30 0.10
SPDR GOLD JAN 130.00 20.01.17 CALL(149) (142.05) 0.00USDSPDR GOLD MAR 130.00 17.03.17 CALL190 2,535.87 0.00USDSPDR SP 500 UTS FEB 232.00 17.02.17 CALL145 12,164.55 0.01USDSPDR SP 500 UTS FEB 229.00 17.02.17 CALL85 14,423.95 0.01USDSPDR SP 500 UTS1 FEB 227.00 17.02.17 CALL456 117,809.24 0.08USDUS 10 YEAR NOTE JAN 122.50 27.01.17 PUT(39) (9,295.01) (0.01)USD
EUR(C)/CHF(P)OTC FEB 1.095 02.02.17 CALL4,290,000 3,521.45 0.00EURLuxembourg 14,383.59 0.01
EUR(C)/CHF(P)OTC FEB 1.115 02.02.17 CALL(4,290,000) (1,042.68) 0.00EUREUR(C)/USD(P)OTC DEC 1.20 04.12.17 CALL2,260,000 12,733.29 0.01EUREUR(C)/USD(P)OTC DEC 1.30 04.12.17 CALL(2,260,000) (3,163.57) 0.00EUREUR(C)/USD(P)OTC JAN 1.12 17.01.17 CALL1,740,000 178.04 0.00EUREURIBOR6M OTC DEC 0.50 08.12.17 PUT(600,000) (4,564.75) 0.00EUREURIBOR6M OTC DEC 1.00 08.12.17 PUT(1,200,000) (7,209.90) 0.00EUREURIBOR6M OTC JUL 0.40 08.07.19 PUT(2,628,000) (12,373.36) (0.01)EUREURIBOR6M OTC JUL 0.40 08.07.19 PUT(225,000) (1,059.37) 0.00EUREURIBOR6M OTC MAY 0.05 25.05.18 CALL(1,830,000) (1,516.48) 0.00EUREURIBOR6M OTC MAY 0.75 25.05.18 PUT(1,830,000) (18,389.08) (0.01)EUREURIBOR6M OTC NOV 0.45 20.11.17 CALL(500,000) (8,766.48) (0.01)EUREURIBOR6M OTC NOV 0.95 20.11.17 PUT(1,000,000) (5,910.03) 0.00EUREURIBOR6M OTC OCT 0.10 27.10.17 CALL(850,000) (2,398.47) 0.00EUREURIBOR6M OTC OCT 0.50 27.10.17 PUT(850,000) (5,914.02) 0.00EUREURIBOR6M OTC OCT 1.00 23.10.17 PUT(480,000) (2,613.38) 0.00EUREURIBOR6M OTC OCT 1.00 27.10.17 PUT(1,690,000) (9,354.35) (0.01)EUREUR(P)/SEK(C)OTC OCT 9.20 19.10.17 PUT1,450,000 16,949.20 0.01EUREUR(P)/USD(C)OTC FEB 1.005 06.02.17 PUT(2,378,000) (4,967.45) 0.00EUREUR(P)/USD(C)OTC FEB 1.03 06.02.17 PUT2,378,000 14,788.97 0.01EUREUR(P)/USD(C)OTC JAN 1.06 13.01.17 PUT(2,378,000) (33,933.32) (0.02)EUREUR(P)/USD(C)OTC JAN 1.06 13.01.17 PUT190,000 2,711.24 0.00EUREUR(P)/USD(C)OTC JAN 1.06 13.01.17 PUT2,378,000 33,933.32 0.02EURUSD(C)/BRL(P)OTC FEB 3.50 17.02.17 CALL(200,000) (1,220.13) 0.00USDUSD(C)/CAD(P)OTC FEB 1.355 22.02.17 CALL305,000 3,345.69 0.00USDUSD(C)/CAD(P)OTC JAN 1.345 09.01.17 CALL160,000 1,051.55 0.00USDUSD(C)/CNH(P)OTC MAR 6.92 10.03.17 CALL190,000 5,052.36 0.00USDUSD(C)/CNH(P)OTC MAR 7.025 10.03.17 CALL(330,000) (4,432.24) 0.00USDUSD(C)/INR(P)OTC JAN 69.00 23.01.17 CALL270,000 613.58 0.00USDUSD(C)/TRY(P)OTC JAN 3.45 20.01.17 CALL180,300 5,198.94 0.00USDUSD(C)/TRY(P)OTC JAN 3.60 20.01.17 CALL(180,300) (1,533.33) 0.00USDUSD(C)/TWD(P)OTC JAN 32.00 23.01.17 CALL270,000 3,515.33 0.00USDUSD(C)/TWD(P)OTC MAR 32.15 23.03.17 CALL333,000 5,508.06 0.00USDUSD(C)/TWD(P)OTC MAR 33.50 23.03.17 CALL(333,000) (1,612.80) 0.00USDUSDLIB3M OTC APR 0.90 02.04.18 CALL(4,500,000) (485.24) 0.00USDUSDLIB3M OTC APR 0.90 03.04.18 CALL(4,800,000) (517.59) 0.00USDUSDLIB3M OTC APR 1.90 02.04.18 PUT(4,500,000) (36,266.80) (0.02)USDUSDLIB3M OTC APR 1.90 03.04.18 PUT(4,800,000) (38,684.58) (0.03)USD
Securities portfolio as at 31/12/16EURExpressed in
BG SICAV – BlackRock Global Opportunities Bond Fund
Quantity Denomination Quotationcurrency
% of netassetsMarket value
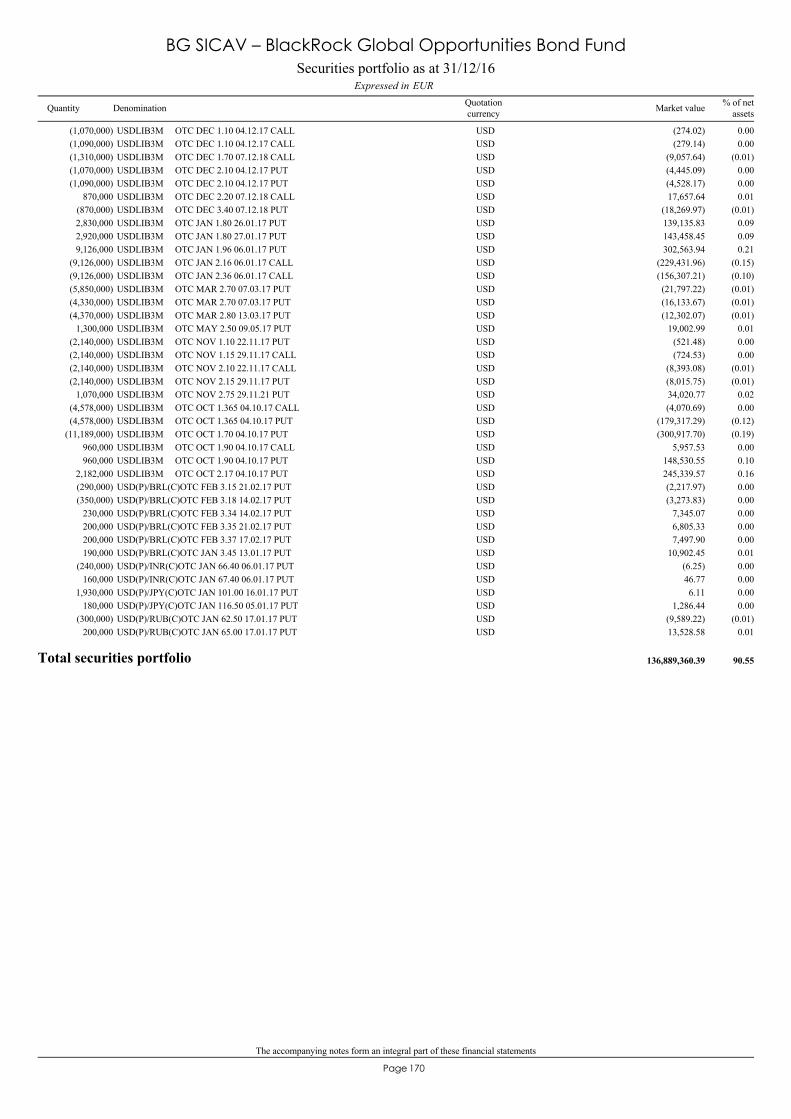
The accompanying notes form an integral part of these financial statements
170Page
USDLIB3M OTC DEC 1.10 04.12.17 CALL(1,070,000) (274.02) 0.00USDUSDLIB3M OTC DEC 1.10 04.12.17 CALL(1,090,000) (279.14) 0.00USDUSDLIB3M OTC DEC 1.70 07.12.18 CALL(1,310,000) (9,057.64) (0.01)USDUSDLIB3M OTC DEC 2.10 04.12.17 PUT(1,070,000) (4,445.09) 0.00USDUSDLIB3M OTC DEC 2.10 04.12.17 PUT(1,090,000) (4,528.17) 0.00USDUSDLIB3M OTC DEC 2.20 07.12.18 CALL870,000 17,657.64 0.01USDUSDLIB3M OTC DEC 3.40 07.12.18 PUT(870,000) (18,269.97) (0.01)USDUSDLIB3M OTC JAN 1.80 26.01.17 PUT2,830,000 139,135.83 0.09USDUSDLIB3M OTC JAN 1.80 27.01.17 PUT2,920,000 143,458.45 0.09USDUSDLIB3M OTC JAN 1.96 06.01.17 PUT9,126,000 302,563.94 0.21USDUSDLIB3M OTC JAN 2.16 06.01.17 CALL(9,126,000) (229,431.96) (0.15)USDUSDLIB3M OTC JAN 2.36 06.01.17 CALL(9,126,000) (156,307.21) (0.10)USDUSDLIB3M OTC MAR 2.70 07.03.17 PUT(5,850,000) (21,797.22) (0.01)USDUSDLIB3M OTC MAR 2.70 07.03.17 PUT(4,330,000) (16,133.67) (0.01)USDUSDLIB3M OTC MAR 2.80 13.03.17 PUT(4,370,000) (12,302.07) (0.01)USDUSDLIB3M OTC MAY 2.50 09.05.17 PUT1,300,000 19,002.99 0.01USDUSDLIB3M OTC NOV 1.10 22.11.17 PUT(2,140,000) (521.48) 0.00USDUSDLIB3M OTC NOV 1.15 29.11.17 CALL(2,140,000) (724.53) 0.00USDUSDLIB3M OTC NOV 2.10 22.11.17 CALL(2,140,000) (8,393.08) (0.01)USDUSDLIB3M OTC NOV 2.15 29.11.17 PUT(2,140,000) (8,015.75) (0.01)USDUSDLIB3M OTC NOV 2.75 29.11.21 PUT1,070,000 34,020.77 0.02USDUSDLIB3M OTC OCT 1.365 04.10.17 CALL(4,578,000) (4,070.69) 0.00USDUSDLIB3M OTC OCT 1.365 04.10.17 PUT(4,578,000) (179,317.29) (0.12)USDUSDLIB3M OTC OCT 1.70 04.10.17 PUT(11,189,000) (300,917.70) (0.19)USDUSDLIB3M OTC OCT 1.90 04.10.17 CALL960,000 5,957.53 0.00USDUSDLIB3M OTC OCT 1.90 04.10.17 PUT960,000 148,530.55 0.10USDUSDLIB3M OTC OCT 2.17 04.10.17 PUT2,182,000 245,339.57 0.16USDUSD(P)/BRL(C)OTC FEB 3.15 21.02.17 PUT(290,000) (2,217.97) 0.00USDUSD(P)/BRL(C)OTC FEB 3.18 14.02.17 PUT(350,000) (3,273.83) 0.00USDUSD(P)/BRL(C)OTC FEB 3.34 14.02.17 PUT230,000 7,345.07 0.00USDUSD(P)/BRL(C)OTC FEB 3.35 21.02.17 PUT200,000 6,805.33 0.00USDUSD(P)/BRL(C)OTC FEB 3.37 17.02.17 PUT200,000 7,497.90 0.00USDUSD(P)/BRL(C)OTC JAN 3.45 13.01.17 PUT190,000 10,902.45 0.01USDUSD(P)/INR(C)OTC JAN 66.40 06.01.17 PUT(240,000) (6.25) 0.00USDUSD(P)/INR(C)OTC JAN 67.40 06.01.17 PUT160,000 46.77 0.00USDUSD(P)/JPY(C)OTC JAN 101.00 16.01.17 PUT1,930,000 6.11 0.00USDUSD(P)/JPY(C)OTC JAN 116.50 05.01.17 PUT180,000 1,286.44 0.00USDUSD(P)/RUB(C)OTC JAN 62.50 17.01.17 PUT(300,000) (9,589.22) (0.01)USDUSD(P)/RUB(C)OTC JAN 65.00 17.01.17 PUT200,000 13,528.58 0.01USD
Total securities portfolio 136,889,360.39 90.55
Securities portfolio as at 31/12/16EURExpressed in
BG SICAV – BlackRock Global Opportunities Bond Fund
Quantity Denomination Quotationcurrency
% of netassetsMarket value
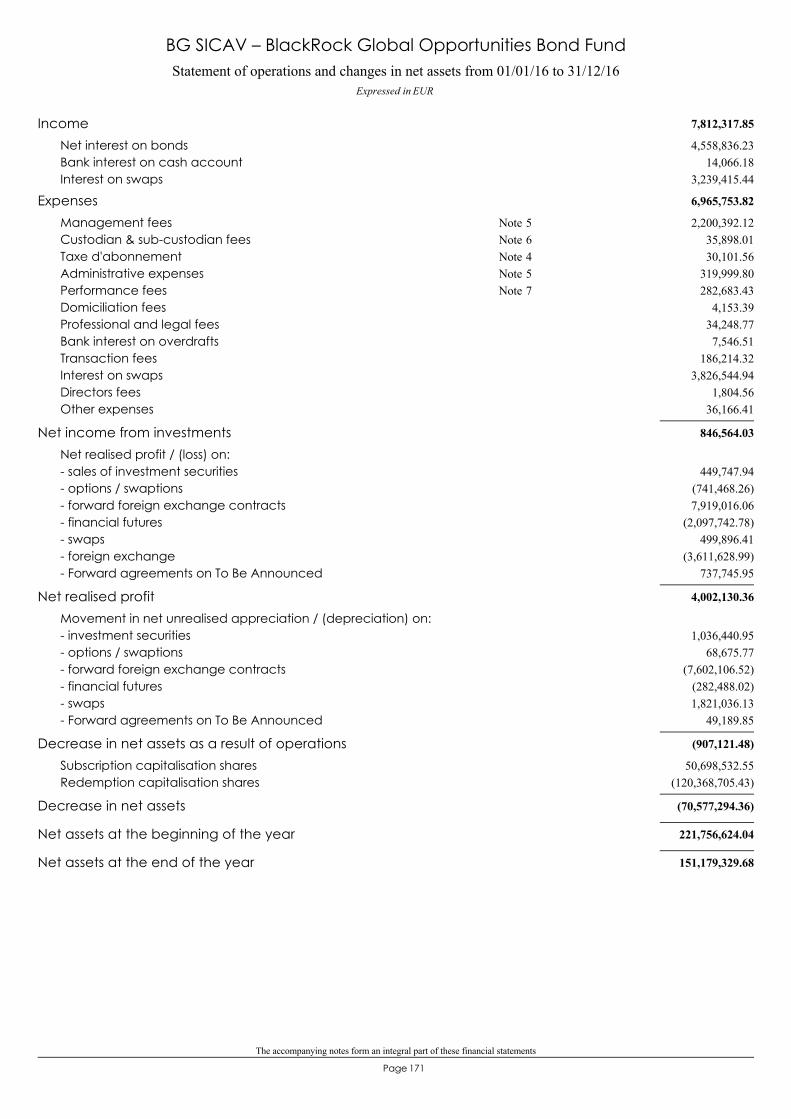
The accompanying notes form an integral part of these financial statements
171Page
Statement of operations and changes in net assets from 01/01/16 to 31/12/16Expressed in EUR
BG SICAV – BlackRock Global Opportunities Bond Fund
7,812,317.85Income4,558,836.23Net interest on bonds
14,066.18Bank interest on cash account3,239,415.44Interest on swaps
6,965,753.82Expenses2,200,392.12Management fees 5Note
35,898.01Custodian & sub-custodian fees 6Note30,101.56Taxe d'abonnement 4Note
319,999.80Administrative expenses 5Note282,683.43Performance fees 7Note
4,153.39Domiciliation fees34,248.77Professional and legal fees7,546.51Bank interest on overdrafts
186,214.32Transaction fees3,826,544.94Interest on swaps
1,804.56Directors fees36,166.41Other expenses
846,564.03Net income from investmentsNet realised profit / (loss) on:
449,747.94- sales of investment securities(741,468.26)- options / swaptions7,919,016.06- forward foreign exchange contracts
(2,097,742.78)- financial futures499,896.41- swaps
(3,611,628.99)- foreign exchange737,745.95- Forward agreements on To Be Announced
4,002,130.36Net realised profitMovement in net unrealised appreciation / (depreciation) on:
1,036,440.95- investment securities68,675.77- options / swaptions
(7,602,106.52)- forward foreign exchange contracts(282,488.02)- financial futures1,821,036.13- swaps
49,189.85- Forward agreements on To Be Announced
(907,121.48)Decrease in net assets as a result of operations50,698,532.55Subscription capitalisation shares
(120,368,705.43)Redemption capitalisation shares
(70,577,294.36)Decrease in net assets
221,756,624.04Net assets at the beginning of the year
151,179,329.68Net assets at the end of the year
172Page
BG SICAV– Invesco Financial Credit Bond
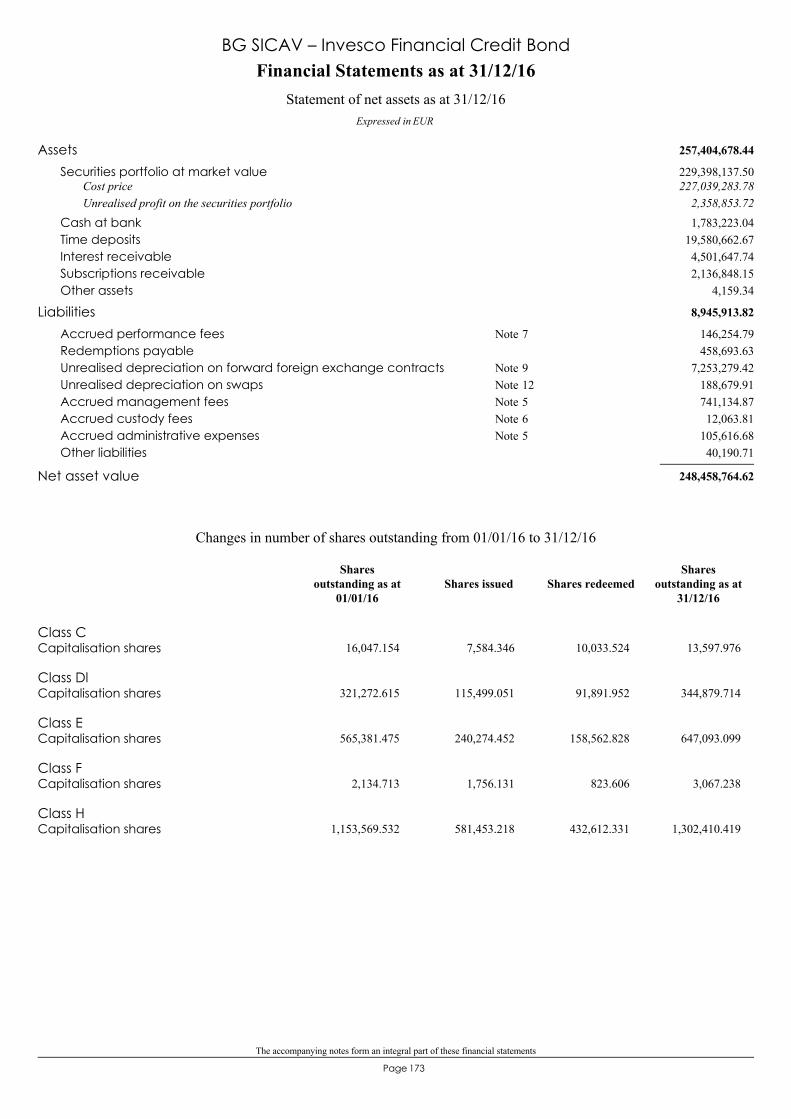
The accompanying notes form an integral part of these financial statements
173Page
257,404,678.44Assets229,398,137.50Securities portfolio at market value227,039,283.78Cost price
2,358,853.72Unrealised profit on the securities portfolio1,783,223.04Cash at bank
19,580,662.67Time deposits4,501,647.74Interest receivable2,136,848.15Subscriptions receivable
4,159.34Other assets
8,945,913.82Liabilities146,254.79Accrued performance fees 7Note458,693.63Redemptions payable
7,253,279.42Unrealised depreciation on forward foreign exchange contracts 9Note188,679.91Unrealised depreciation on swaps 12Note741,134.87Accrued management fees 5Note12,063.81Accrued custody fees 6Note
105,616.68Accrued administrative expenses 5Note40,190.71Other liabilities
248,458,764.62Net asset value
Financial Statements as at 31/12/16
Expressed in EUR
Statement of net assets as at 31/12/16
BG SICAV – Invesco Financial Credit Bond
Class CCapitalisation shares 16,047.154 7,584.346 10,033.524 13,597.976
Class DlCapitalisation shares 321,272.615 115,499.051 91,891.952 344,879.714
Class ECapitalisation shares 565,381.475 240,274.452 158,562.828 647,093.099
Class FCapitalisation shares 2,134.713 1,756.131 823.606 3,067.238
Class HCapitalisation shares 1,153,569.532 581,453.218 432,612.331 1,302,410.419
Changes in number of shares outstanding from 01/01/16 to 31/12/16
Shares issued Shares redeemedShares
outstanding as at31/12/16
Sharesoutstanding as at
01/01/16

The accompanying notes form an integral part of these financial statements
174Page
Key figures
BG SICAV – Invesco Financial Credit Bond
Class C
Capitalisation shares
117.7713,597.976 16,047.154
113.90234,145.943
111.15Number of sharesNet asset value per share
EUR EUR EUR
Class Dl
Capitalisation shares
115.81344,879.714 321,272.615
112.06238,565.639
109.39Number of sharesNet asset value per share
EUR EUR EUR
Class E
Capitalisation shares
111.12647,093.099 565,381.475
106.86379,859.576
103.63Number of sharesNet asset value per share
EUR EUR EUR
Class F
Capitalisation shares
117.493,067.238 2,134.713
112.446,968.503
108.62Number of sharesNet asset value per share
EUR EUR EUR
Class H
Capitalisation shares
103.391,302,410.419 1,153,569.532
99.510.0000.00
Number of sharesNet asset value per share
EUR EUR EUR
Total Net Assets 248,458,764.62 213,278,813.26 92,246,714.84
31/12/1431/12/1531/12/16Year ending as at:
EUR
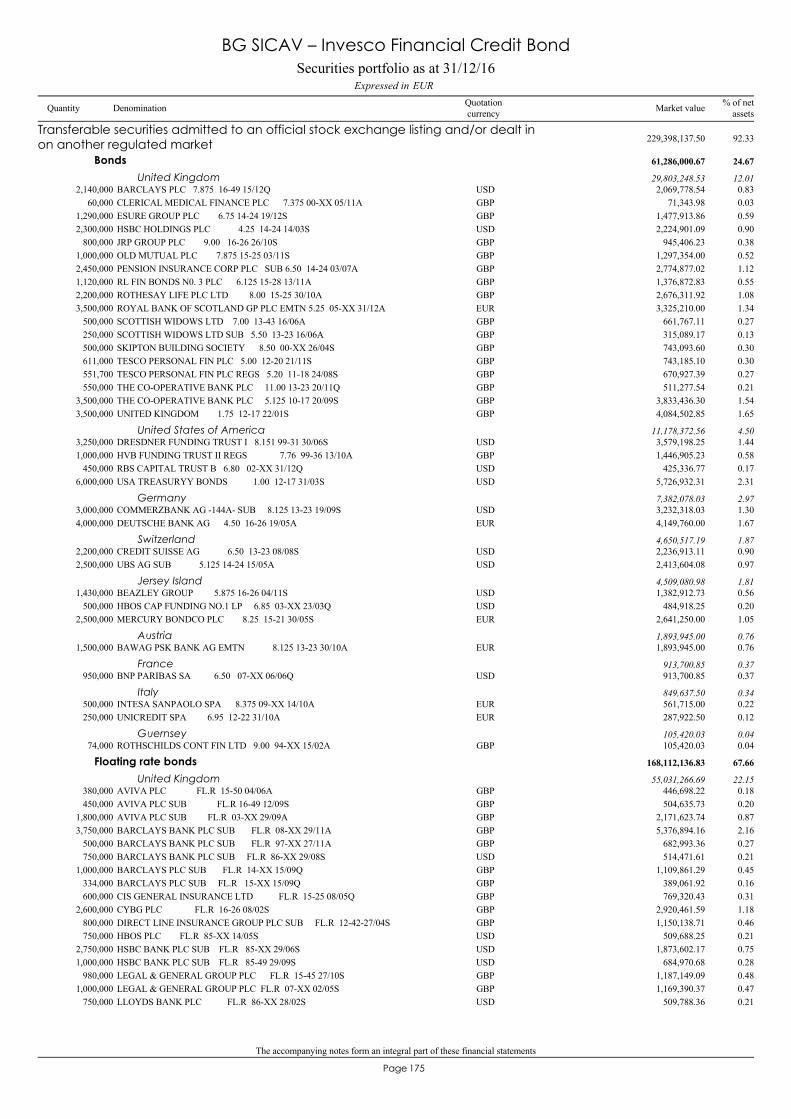
The accompanying notes form an integral part of these financial statements
175Page
BARCLAYS PLC 7.875 16-49 15/12Q2,140,000 2,069,778.54 0.83USD
Transferable securities admitted to an official stock exchange listing and/or dealt inon another regulated market 229,398,137.50 92.33
Bonds 61,286,000.67 24.67
United Kingdom 29,803,248.53 12.01
CLERICAL MEDICAL FINANCE PLC 7.375 00-XX 05/11A60,000 71,343.98 0.03GBPESURE GROUP PLC 6.75 14-24 19/12S1,290,000 1,477,913.86 0.59GBPHSBC HOLDINGS PLC 4.25 14-24 14/03S2,300,000 2,224,901.09 0.90USDJRP GROUP PLC 9.00 16-26 26/10S800,000 945,406.23 0.38GBPOLD MUTUAL PLC 7.875 15-25 03/11S1,000,000 1,297,354.00 0.52GBPPENSION INSURANCE CORP PLC SUB 6.50 14-24 03/07A2,450,000 2,774,877.02 1.12GBPRL FIN BONDS N0. 3 PLC 6.125 15-28 13/11A1,120,000 1,376,872.83 0.55GBPROTHESAY LIFE PLC LTD 8.00 15-25 30/10A2,200,000 2,676,311.92 1.08GBPROYAL BANK OF SCOTLAND GP PLC EMTN 5.25 05-XX 31/12A3,500,000 3,325,210.00 1.34EURSCOTTISH WIDOWS LTD 7.00 13-43 16/06A500,000 661,767.11 0.27GBPSCOTTISH WIDOWS LTD SUB 5.50 13-23 16/06A250,000 315,089.17 0.13GBPSKIPTON BUILDING SOCIETY 8.50 00-XX 26/04S500,000 743,093.60 0.30GBPTESCO PERSONAL FIN PLC 5.00 12-20 21/11S611,000 743,185.10 0.30GBPTESCO PERSONAL FIN PLC REGS 5.20 11-18 24/08S551,700 670,927.39 0.27GBPTHE CO-OPERATIVE BANK PLC 11.00 13-23 20/11Q550,000 511,277.54 0.21GBPTHE CO-OPERATIVE BANK PLC 5.125 10-17 20/09S3,500,000 3,833,436.30 1.54GBPUNITED KINGDOM 1.75 12-17 22/01S3,500,000 4,084,502.85 1.65GBP
DRESDNER FUNDING TRUST I 8.151 99-31 30/06S3,250,000 3,579,198.25 1.44USDUnited States of America 11,178,372.56 4.50
HVB FUNDING TRUST II REGS 7.76 99-36 13/10A1,000,000 1,446,905.23 0.58GBPRBS CAPITAL TRUST B 6.80 02-XX 31/12Q450,000 425,336.77 0.17USDUSA TREASURYY BONDS 1.00 12-17 31/03S6,000,000 5,726,932.31 2.31USD
COMMERZBANK AG -144A- SUB 8.125 13-23 19/09S3,000,000 3,232,318.03 1.30USDGermany 7,382,078.03 2.97
DEUTSCHE BANK AG 4.50 16-26 19/05A4,000,000 4,149,760.00 1.67EUR
CREDIT SUISSE AG 6.50 13-23 08/08S2,200,000 2,236,913.11 0.90USDSwitzerland 4,650,517.19 1.87
UBS AG SUB 5.125 14-24 15/05A2,500,000 2,413,604.08 0.97USD
BEAZLEY GROUP 5.875 16-26 04/11S1,430,000 1,382,912.73 0.56USDJersey Island 4,509,080.98 1.81
HBOS CAP FUNDING NO.1 LP 6.85 03-XX 23/03Q500,000 484,918.25 0.20USDMERCURY BONDCO PLC 8.25 15-21 30/05S2,500,000 2,641,250.00 1.05EUR
BAWAG PSK BANK AG EMTN 8.125 13-23 30/10A1,500,000 1,893,945.00 0.76EURAustria 1,893,945.00 0.76
BNP PARIBAS SA 6.50 07-XX 06/06Q950,000 913,700.85 0.37USDFrance 913,700.85 0.37
INTESA SANPAOLO SPA 8.375 09-XX 14/10A500,000 561,715.00 0.22EURItaly 849,637.50 0.34
UNICREDIT SPA 6.95 12-22 31/10A250,000 287,922.50 0.12EUR
ROTHSCHILDS CONT FIN LTD 9.00 94-XX 15/02A74,000 105,420.03 0.04GBPGuernsey 105,420.03 0.04
AVIVA PLC FL.R 15-50 04/06A380,000 446,698.22 0.18GBP
Floating rate bonds 168,112,136.83 67.66
United Kingdom 55,031,266.69 22.15
AVIVA PLC SUB FL.R 16-49 12/09S450,000 504,635.73 0.20GBPAVIVA PLC SUB FL.R 03-XX 29/09A1,800,000 2,171,623.74 0.87GBPBARCLAYS BANK PLC SUB FL.R 08-XX 29/11A3,750,000 5,376,894.16 2.16GBPBARCLAYS BANK PLC SUB FL.R 97-XX 27/11A500,000 682,993.36 0.27GBPBARCLAYS BANK PLC SUB FL.R 86-XX 29/08S750,000 514,471.61 0.21USDBARCLAYS PLC SUB FL.R 14-XX 15/09Q1,000,000 1,109,861.29 0.45GBPBARCLAYS PLC SUB FL.R 15-XX 15/09Q334,000 389,061.92 0.16GBPCIS GENERAL INSURANCE LTD FL.R 15-25 08/05Q600,000 769,320.43 0.31GBPCYBG PLC FL.R 16-26 08/02S2,600,000 2,920,461.59 1.18GBPDIRECT LINE INSURANCE GROUP PLC SUB FL.R 12-42-27/04S800,000 1,150,138.71 0.46GBPHBOS PLC FL.R 85-XX 14/05S750,000 509,688.25 0.21USDHSBC BANK PLC SUB FL.R 85-XX 29/06S2,750,000 1,873,602.17 0.75USDHSBC BANK PLC SUB FL.R 85-49 29/09S1,000,000 684,970.68 0.28USDLEGAL & GENERAL GROUP PLC FL.R 15-45 27/10S980,000 1,187,149.09 0.48GBPLEGAL & GENERAL GROUP PLC FL.R 07-XX 02/05S1,000,000 1,169,390.37 0.47GBPLLOYDS BANK PLC FL.R 86-XX 28/02S750,000 509,788.36 0.21USD
Securities portfolio as at 31/12/16EURExpressed in
BG SICAV – Invesco Financial Credit Bond
Quantity Denomination Quotationcurrency
% of netassetsMarket value
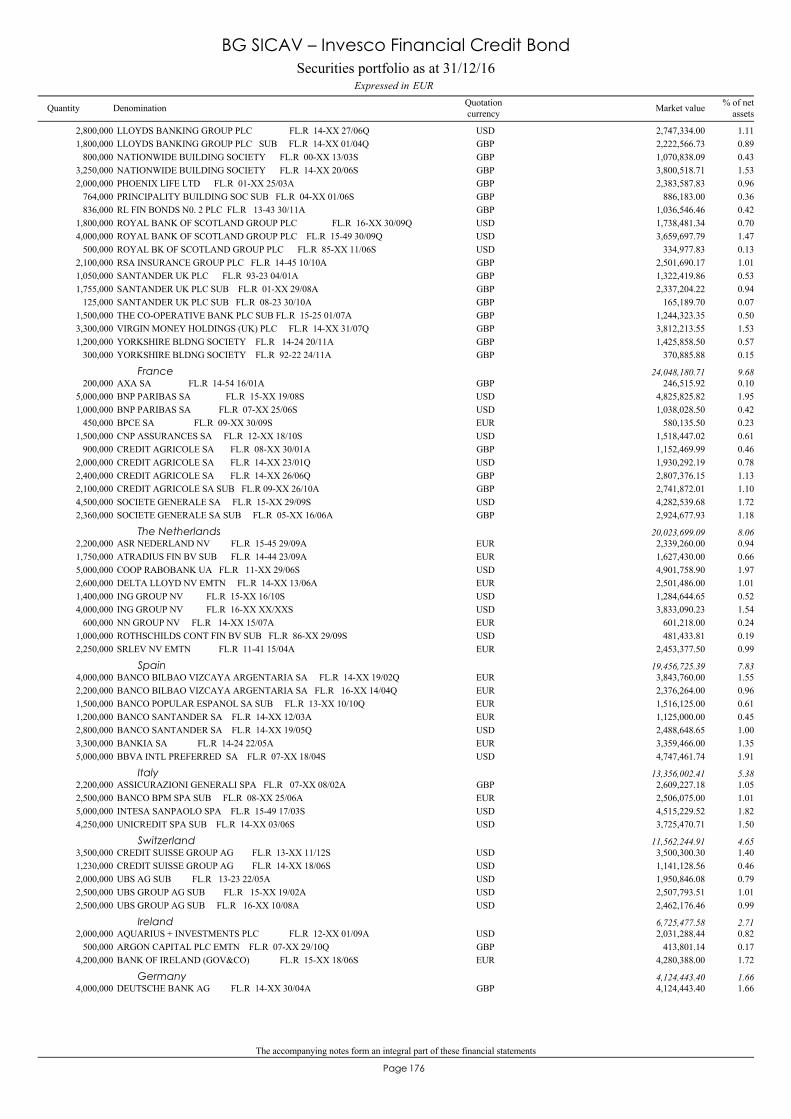
The accompanying notes form an integral part of these financial statements
176Page
LLOYDS BANKING GROUP PLC FL.R 14-XX 27/06Q2,800,000 2,747,334.00 1.11USDLLOYDS BANKING GROUP PLC SUB FL.R 14-XX 01/04Q1,800,000 2,222,566.73 0.89GBPNATIONWIDE BUILDING SOCIETY FL.R 00-XX 13/03S800,000 1,070,838.09 0.43GBPNATIONWIDE BUILDING SOCIETY FL.R 14-XX 20/06S3,250,000 3,800,518.71 1.53GBPPHOENIX LIFE LTD FL.R 01-XX 25/03A2,000,000 2,383,587.83 0.96GBPPRINCIPALITY BUILDING SOC SUB FL.R 04-XX 01/06S764,000 886,183.00 0.36GBPRL FIN BONDS N0. 2 PLC FL.R 13-43 30/11A836,000 1,036,546.46 0.42GBPROYAL BANK OF SCOTLAND GROUP PLC FL.R 16-XX 30/09Q1,800,000 1,738,481.34 0.70USDROYAL BANK OF SCOTLAND GROUP PLC FL.R 15-49 30/09Q4,000,000 3,659,697.79 1.47USDROYAL BK OF SCOTLAND GROUP PLC FL.R 85-XX 11/06S500,000 334,977.83 0.13USDRSA INSURANCE GROUP PLC FL.R 14-45 10/10A2,100,000 2,501,690.17 1.01GBPSANTANDER UK PLC FL.R 93-23 04/01A1,050,000 1,322,419.86 0.53GBPSANTANDER UK PLC SUB FL.R 01-XX 29/08A1,755,000 2,337,204.22 0.94GBPSANTANDER UK PLC SUB FL.R 08-23 30/10A125,000 165,189.70 0.07GBPTHE CO-OPERATIVE BANK PLC SUB FL.R 15-25 01/07A1,500,000 1,244,323.35 0.50GBPVIRGIN MONEY HOLDINGS (UK) PLC FL.R 14-XX 31/07Q3,300,000 3,812,213.55 1.53GBPYORKSHIRE BLDNG SOCIETY FL.R 14-24 20/11A1,200,000 1,425,858.50 0.57GBPYORKSHIRE BLDNG SOCIETY FL.R 92-22 24/11A300,000 370,885.88 0.15GBP
AXA SA FL.R 14-54 16/01A200,000 246,515.92 0.10GBPFrance 24,048,180.71 9.68
BNP PARIBAS SA FL.R 15-XX 19/08S5,000,000 4,825,825.82 1.95USDBNP PARIBAS SA FL.R 07-XX 25/06S1,000,000 1,038,028.50 0.42USDBPCE SA FL.R 09-XX 30/09S450,000 580,135.50 0.23EURCNP ASSURANCES SA FL.R 12-XX 18/10S1,500,000 1,518,447.02 0.61USDCREDIT AGRICOLE SA FL.R 08-XX 30/01A900,000 1,152,469.99 0.46GBPCREDIT AGRICOLE SA FL.R 14-XX 23/01Q2,000,000 1,930,292.19 0.78USDCREDIT AGRICOLE SA FL.R 14-XX 26/06Q2,400,000 2,807,376.15 1.13GBPCREDIT AGRICOLE SA SUB FL.R 09-XX 26/10A2,100,000 2,741,872.01 1.10GBPSOCIETE GENERALE SA FL.R 15-XX 29/09S4,500,000 4,282,539.68 1.72USDSOCIETE GENERALE SA SUB FL.R 05-XX 16/06A2,360,000 2,924,677.93 1.18GBP
ASR NEDERLAND NV FL.R 15-45 29/09A2,200,000 2,339,260.00 0.94EURThe Netherlands 20,023,699.09 8.06
ATRADIUS FIN BV SUB FL.R 14-44 23/09A1,750,000 1,627,430.00 0.66EURCOOP RABOBANK UA FL.R 11-XX 29/06S5,000,000 4,901,758.90 1.97USDDELTA LLOYD NV EMTN FL.R 14-XX 13/06A2,600,000 2,501,486.00 1.01EURING GROUP NV FL.R 15-XX 16/10S1,400,000 1,284,644.65 0.52USDING GROUP NV FL.R 16-XX XX/XXS4,000,000 3,833,090.23 1.54USDNN GROUP NV FL.R 14-XX 15/07A600,000 601,218.00 0.24EURROTHSCHILDS CONT FIN BV SUB FL.R 86-XX 29/09S1,000,000 481,433.81 0.19USDSRLEV NV EMTN FL.R 11-41 15/04A2,250,000 2,453,377.50 0.99EUR
BANCO BILBAO VIZCAYA ARGENTARIA SA FL.R 14-XX 19/02Q4,000,000 3,843,760.00 1.55EURSpain 19,456,725.39 7.83
BANCO BILBAO VIZCAYA ARGENTARIA SA FL.R 16-XX 14/04Q2,200,000 2,376,264.00 0.96EURBANCO POPULAR ESPANOL SA SUB FL.R 13-XX 10/10Q1,500,000 1,516,125.00 0.61EURBANCO SANTANDER SA FL.R 14-XX 12/03A1,200,000 1,125,000.00 0.45EURBANCO SANTANDER SA FL.R 14-XX 19/05Q2,800,000 2,488,648.65 1.00USDBANKIA SA FL.R 14-24 22/05A3,300,000 3,359,466.00 1.35EURBBVA INTL PREFERRED SA FL.R 07-XX 18/04S5,000,000 4,747,461.74 1.91USD
ASSICURAZIONI GENERALI SPA FL.R 07-XX 08/02A2,200,000 2,609,227.18 1.05GBPItaly 13,356,002.41 5.38
BANCO BPM SPA SUB FL.R 08-XX 25/06A2,500,000 2,506,075.00 1.01EURINTESA SANPAOLO SPA FL.R 15-49 17/03S5,000,000 4,515,229.52 1.82USDUNICREDIT SPA SUB FL.R 14-XX 03/06S4,250,000 3,725,470.71 1.50USD
CREDIT SUISSE GROUP AG FL.R 13-XX 11/12S3,500,000 3,500,300.30 1.40USDSwitzerland 11,562,244.91 4.65
CREDIT SUISSE GROUP AG FL.R 14-XX 18/06S1,230,000 1,141,128.56 0.46USDUBS AG SUB FL.R 13-23 22/05A2,000,000 1,950,846.08 0.79USDUBS GROUP AG SUB FL.R 15-XX 19/02A2,500,000 2,507,793.51 1.01USDUBS GROUP AG SUB FL.R 16-XX 10/08A2,500,000 2,462,176.46 0.99USD
AQUARIUS + INVESTMENTS PLC FL.R 12-XX 01/09A2,000,000 2,031,288.44 0.82USDIreland 6,725,477.58 2.71
ARGON CAPITAL PLC EMTN FL.R 07-XX 29/10Q500,000 413,801.14 0.17GBPBANK OF IRELAND (GOV&CO) FL.R 15-XX 18/06S4,200,000 4,280,388.00 1.72EUR
DEUTSCHE BANK AG FL.R 14-XX 30/04A4,000,000 4,124,443.40 1.66GBPGermany 4,124,443.40 1.66
Securities portfolio as at 31/12/16EURExpressed in
BG SICAV – Invesco Financial Credit Bond
Quantity Denomination Quotationcurrency
% of netassetsMarket value
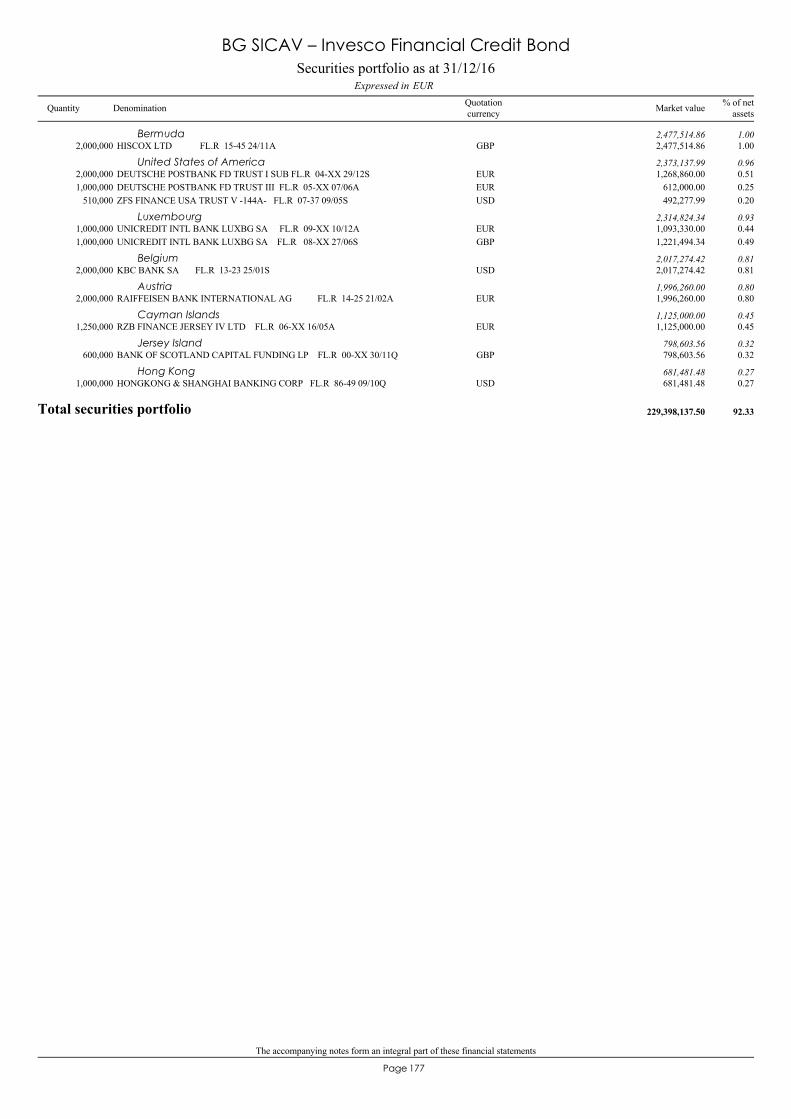
The accompanying notes form an integral part of these financial statements
177Page
HISCOX LTD FL.R 15-45 24/11A2,000,000 2,477,514.86 1.00GBPBermuda 2,477,514.86 1.00
DEUTSCHE POSTBANK FD TRUST I SUB FL.R 04-XX 29/12S2,000,000 1,268,860.00 0.51EURUnited States of America 2,373,137.99 0.96
DEUTSCHE POSTBANK FD TRUST III FL.R 05-XX 07/06A1,000,000 612,000.00 0.25EURZFS FINANCE USA TRUST V -144A- FL.R 07-37 09/05S510,000 492,277.99 0.20USD
UNICREDIT INTL BANK LUXBG SA FL.R 09-XX 10/12A1,000,000 1,093,330.00 0.44EURLuxembourg 2,314,824.34 0.93
UNICREDIT INTL BANK LUXBG SA FL.R 08-XX 27/06S1,000,000 1,221,494.34 0.49GBP
KBC BANK SA FL.R 13-23 25/01S2,000,000 2,017,274.42 0.81USDBelgium 2,017,274.42 0.81
RAIFFEISEN BANK INTERNATIONAL AG FL.R 14-25 21/02A2,000,000 1,996,260.00 0.80EURAustria 1,996,260.00 0.80
RZB FINANCE JERSEY IV LTD FL.R 06-XX 16/05A1,250,000 1,125,000.00 0.45EURCayman Islands 1,125,000.00 0.45
BANK OF SCOTLAND CAPITAL FUNDING LP FL.R 00-XX 30/11Q600,000 798,603.56 0.32GBPJersey Island 798,603.56 0.32
HONGKONG & SHANGHAI BANKING CORP FL.R 86-49 09/10Q1,000,000 681,481.48 0.27USDHong Kong 681,481.48 0.27
Total securities portfolio 229,398,137.50 92.33
Securities portfolio as at 31/12/16EURExpressed in
BG SICAV – Invesco Financial Credit Bond
Quantity Denomination Quotationcurrency
% of netassetsMarket value
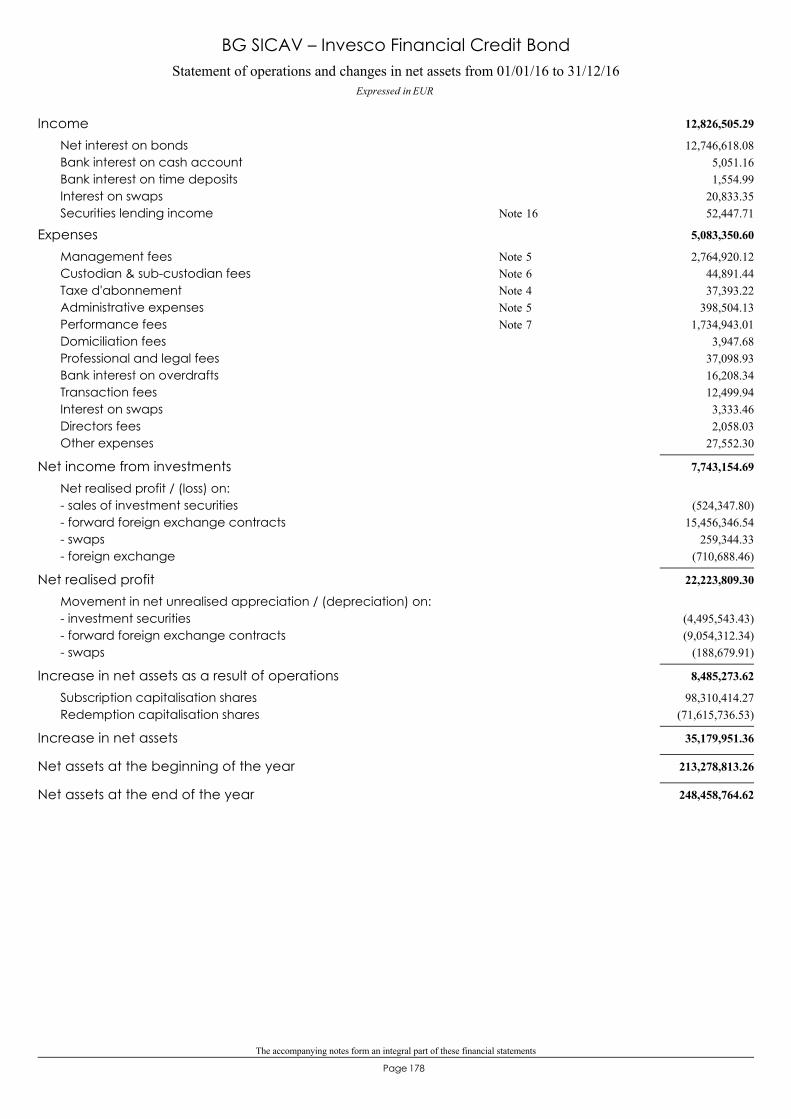
The accompanying notes form an integral part of these financial statements
178Page
Statement of operations and changes in net assets from 01/01/16 to 31/12/16Expressed in EUR
BG SICAV – Invesco Financial Credit Bond
12,826,505.29Income12,746,618.08Net interest on bonds
5,051.16Bank interest on cash account1,554.99Bank interest on time deposits
20,833.35Interest on swaps52,447.71Securities lending income 16Note
5,083,350.60Expenses2,764,920.12Management fees 5Note
44,891.44Custodian & sub-custodian fees 6Note37,393.22Taxe d'abonnement 4Note
398,504.13Administrative expenses 5Note1,734,943.01Performance fees 7Note
3,947.68Domiciliation fees37,098.93Professional and legal fees16,208.34Bank interest on overdrafts12,499.94Transaction fees3,333.46Interest on swaps2,058.03Directors fees
27,552.30Other expenses
7,743,154.69Net income from investmentsNet realised profit / (loss) on:
(524,347.80)- sales of investment securities15,456,346.54- forward foreign exchange contracts
259,344.33- swaps(710,688.46)- foreign exchange
22,223,809.30Net realised profitMovement in net unrealised appreciation / (depreciation) on:
(4,495,543.43)- investment securities(9,054,312.34)- forward foreign exchange contracts
(188,679.91)- swaps
8,485,273.62Increase in net assets as a result of operations98,310,414.27Subscription capitalisation shares
(71,615,736.53)Redemption capitalisation shares
35,179,951.36Increase in net assets
213,278,813.26Net assets at the beginning of the year
248,458,764.62Net assets at the end of the year

179Page
BG SICAV– HSBC Euro Credit Opportunities
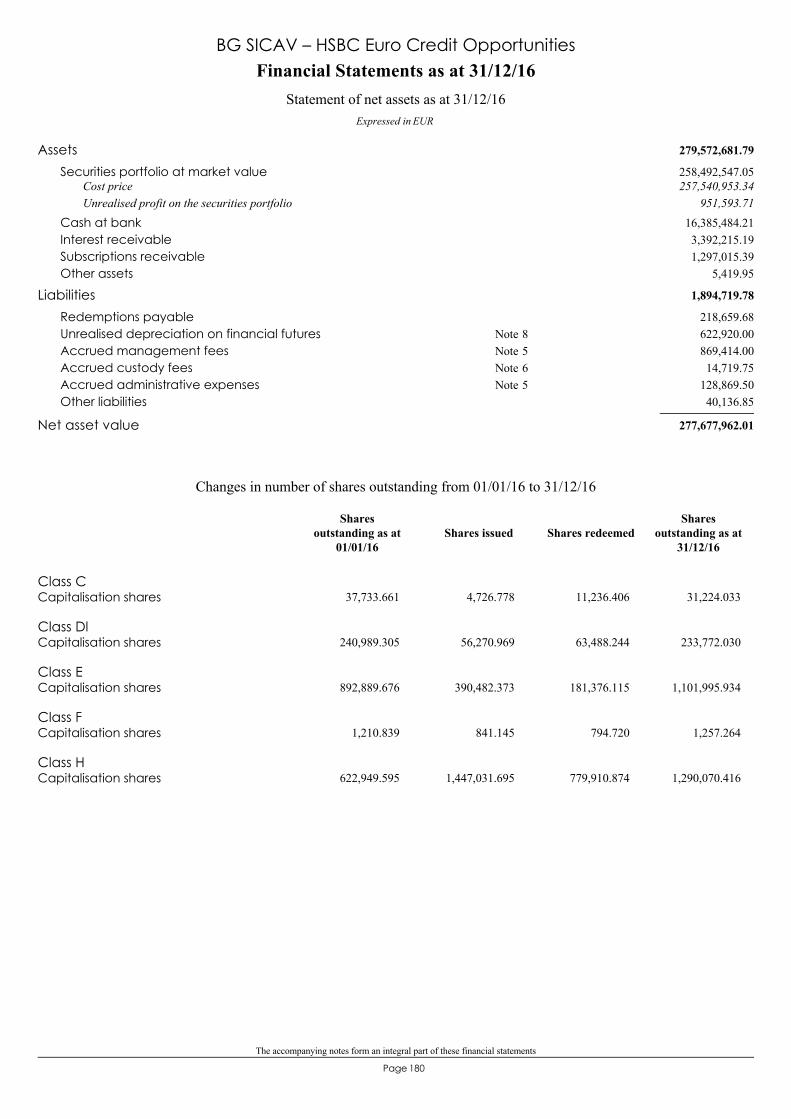
The accompanying notes form an integral part of these financial statements
180Page
279,572,681.79Assets258,492,547.05Securities portfolio at market value257,540,953.34Cost price
951,593.71Unrealised profit on the securities portfolio16,385,484.21Cash at bank3,392,215.19Interest receivable1,297,015.39Subscriptions receivable
5,419.95Other assets
1,894,719.78Liabilities218,659.68Redemptions payable622,920.00Unrealised depreciation on financial futures 8Note869,414.00Accrued management fees 5Note14,719.75Accrued custody fees 6Note
128,869.50Accrued administrative expenses 5Note40,136.85Other liabilities
277,677,962.01Net asset value
Financial Statements as at 31/12/16
Expressed in EUR
Statement of net assets as at 31/12/16
BG SICAV – HSBC Euro Credit Opportunities
Class CCapitalisation shares 37,733.661 4,726.778 11,236.406 31,224.033
Class DlCapitalisation shares 240,989.305 56,270.969 63,488.244 233,772.030
Class ECapitalisation shares 892,889.676 390,482.373 181,376.115 1,101,995.934
Class FCapitalisation shares 1,210.839 841.145 794.720 1,257.264
Class HCapitalisation shares 622,949.595 1,447,031.695 779,910.874 1,290,070.416
Changes in number of shares outstanding from 01/01/16 to 31/12/16
Shares issued Shares redeemedShares
outstanding as at31/12/16
Sharesoutstanding as at
01/01/16

The accompanying notes form an integral part of these financial statements
181Page
Key figures
BG SICAV – HSBC Euro Credit Opportunities
Class C
Capitalisation shares
109.3431,224.033 37,733.661
105.8138,035.873
107.49Number of sharesNet asset value per share
EUR EUR EUR
Class Dl
Capitalisation shares
108.88233,772.030 240,989.305
105.40216,949.389
107.12Number of sharesNet asset value per share
EUR EUR EUR
Class E
Capitalisation shares
108.071,101,995.934 892,889.676
103.98600,520.964
104.98Number of sharesNet asset value per share
EUR EUR EUR
Class F
Capitalisation shares
110.881,257.264 1,210.839
106.131,074.221
106.75Number of sharesNet asset value per share
EUR EUR EUR
Class H
Capitalisation shares
100.441,290,070.416 622,949.595
96.770.0000.00
Number of sharesNet asset value per share
EUR EUR EUR
Total Net Assets 277,677,962.01 182,643,970.03 90,485,942.88
31/12/1431/12/1531/12/16Year ending as at:
EUR
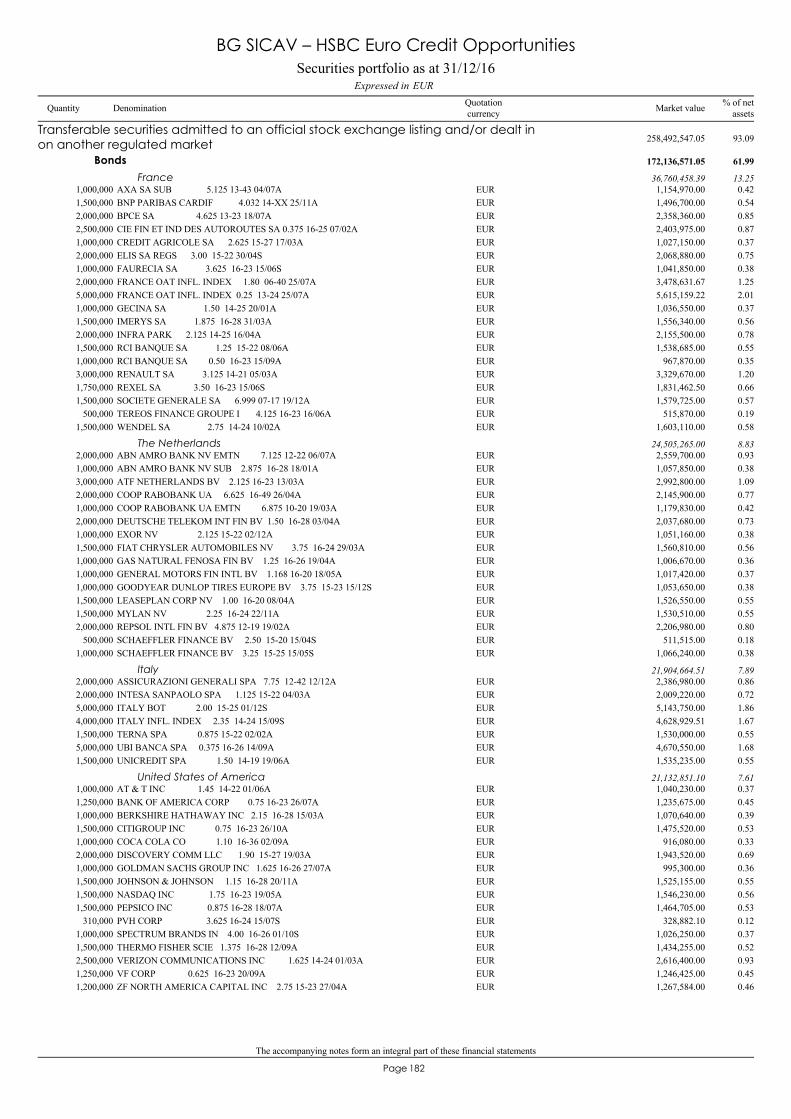
The accompanying notes form an integral part of these financial statements
182Page
AXA SA SUB 5.125 13-43 04/07A1,000,000 1,154,970.00 0.42EUR
Transferable securities admitted to an official stock exchange listing and/or dealt inon another regulated market 258,492,547.05 93.09
Bonds 172,136,571.05 61.99
France 36,760,458.39 13.25
BNP PARIBAS CARDIF 4.032 14-XX 25/11A1,500,000 1,496,700.00 0.54EURBPCE SA 4.625 13-23 18/07A2,000,000 2,358,360.00 0.85EURCIE FIN ET IND DES AUTOROUTES SA 0.375 16-25 07/02A2,500,000 2,403,975.00 0.87EURCREDIT AGRICOLE SA 2.625 15-27 17/03A1,000,000 1,027,150.00 0.37EURELIS SA REGS 3.00 15-22 30/04S2,000,000 2,068,880.00 0.75EURFAURECIA SA 3.625 16-23 15/06S1,000,000 1,041,850.00 0.38EURFRANCE OAT INFL. INDEX 1.80 06-40 25/07A2,000,000 3,478,631.67 1.25EURFRANCE OAT INFL. INDEX 0.25 13-24 25/07A5,000,000 5,615,159.22 2.01EURGECINA SA 1.50 14-25 20/01A1,000,000 1,036,550.00 0.37EURIMERYS SA 1.875 16-28 31/03A1,500,000 1,556,340.00 0.56EURINFRA PARK 2.125 14-25 16/04A2,000,000 2,155,500.00 0.78EURRCI BANQUE SA 1.25 15-22 08/06A1,500,000 1,538,685.00 0.55EURRCI BANQUE SA 0.50 16-23 15/09A1,000,000 967,870.00 0.35EURRENAULT SA 3.125 14-21 05/03A3,000,000 3,329,670.00 1.20EURREXEL SA 3.50 16-23 15/06S1,750,000 1,831,462.50 0.66EURSOCIETE GENERALE SA 6.999 07-17 19/12A1,500,000 1,579,725.00 0.57EURTEREOS FINANCE GROUPE I 4.125 16-23 16/06A500,000 515,870.00 0.19EURWENDEL SA 2.75 14-24 10/02A1,500,000 1,603,110.00 0.58EUR
ABN AMRO BANK NV EMTN 7.125 12-22 06/07A2,000,000 2,559,700.00 0.93EURThe Netherlands 24,505,265.00 8.83
ABN AMRO BANK NV SUB 2.875 16-28 18/01A1,000,000 1,057,850.00 0.38EURATF NETHERLANDS BV 2.125 16-23 13/03A3,000,000 2,992,800.00 1.09EURCOOP RABOBANK UA 6.625 16-49 26/04A2,000,000 2,145,900.00 0.77EURCOOP RABOBANK UA EMTN 6.875 10-20 19/03A1,000,000 1,179,830.00 0.42EURDEUTSCHE TELEKOM INT FIN BV 1.50 16-28 03/04A2,000,000 2,037,680.00 0.73EUREXOR NV 2.125 15-22 02/12A1,000,000 1,051,160.00 0.38EURFIAT CHRYSLER AUTOMOBILES NV 3.75 16-24 29/03A1,500,000 1,560,810.00 0.56EURGAS NATURAL FENOSA FIN BV 1.25 16-26 19/04A1,000,000 1,006,670.00 0.36EURGENERAL MOTORS FIN INTL BV 1.168 16-20 18/05A1,000,000 1,017,420.00 0.37EURGOODYEAR DUNLOP TIRES EUROPE BV 3.75 15-23 15/12S1,000,000 1,053,650.00 0.38EURLEASEPLAN CORP NV 1.00 16-20 08/04A1,500,000 1,526,550.00 0.55EURMYLAN NV 2.25 16-24 22/11A1,500,000 1,530,510.00 0.55EURREPSOL INTL FIN BV 4.875 12-19 19/02A2,000,000 2,206,980.00 0.80EURSCHAEFFLER FINANCE BV 2.50 15-20 15/04S500,000 511,515.00 0.18EURSCHAEFFLER FINANCE BV 3.25 15-25 15/05S1,000,000 1,066,240.00 0.38EUR
ASSICURAZIONI GENERALI SPA 7.75 12-42 12/12A2,000,000 2,386,980.00 0.86EURItaly 21,904,664.51 7.89
INTESA SANPAOLO SPA 1.125 15-22 04/03A2,000,000 2,009,220.00 0.72EURITALY BOT 2.00 15-25 01/12S5,000,000 5,143,750.00 1.86EURITALY INFL. INDEX 2.35 14-24 15/09S4,000,000 4,628,929.51 1.67EURTERNA SPA 0.875 15-22 02/02A1,500,000 1,530,000.00 0.55EURUBI BANCA SPA 0.375 16-26 14/09A5,000,000 4,670,550.00 1.68EURUNICREDIT SPA 1.50 14-19 19/06A1,500,000 1,535,235.00 0.55EUR
AT & T INC 1.45 14-22 01/06A1,000,000 1,040,230.00 0.37EURUnited States of America 21,132,851.10 7.61
BANK OF AMERICA CORP 0.75 16-23 26/07A1,250,000 1,235,675.00 0.45EURBERKSHIRE HATHAWAY INC 2.15 16-28 15/03A1,000,000 1,070,640.00 0.39EURCITIGROUP INC 0.75 16-23 26/10A1,500,000 1,475,520.00 0.53EURCOCA COLA CO 1.10 16-36 02/09A1,000,000 916,080.00 0.33EURDISCOVERY COMM LLC 1.90 15-27 19/03A2,000,000 1,943,520.00 0.69EURGOLDMAN SACHS GROUP INC 1.625 16-26 27/07A1,000,000 995,300.00 0.36EURJOHNSON & JOHNSON 1.15 16-28 20/11A1,500,000 1,525,155.00 0.55EURNASDAQ INC 1.75 16-23 19/05A1,500,000 1,546,230.00 0.56EURPEPSICO INC 0.875 16-28 18/07A1,500,000 1,464,705.00 0.53EURPVH CORP 3.625 16-24 15/07S310,000 328,882.10 0.12EURSPECTRUM BRANDS IN 4.00 16-26 01/10S1,000,000 1,026,250.00 0.37EURTHERMO FISHER SCIE 1.375 16-28 12/09A1,500,000 1,434,255.00 0.52EURVERIZON COMMUNICATIONS INC 1.625 14-24 01/03A2,500,000 2,616,400.00 0.93EURVF CORP 0.625 16-23 20/09A1,250,000 1,246,425.00 0.45EURZF NORTH AMERICA CAPITAL INC 2.75 15-23 27/04A1,200,000 1,267,584.00 0.46EUR
Securities portfolio as at 31/12/16EURExpressed in
BG SICAV – HSBC Euro Credit Opportunities
Quantity Denomination Quotationcurrency
% of netassetsMarket value
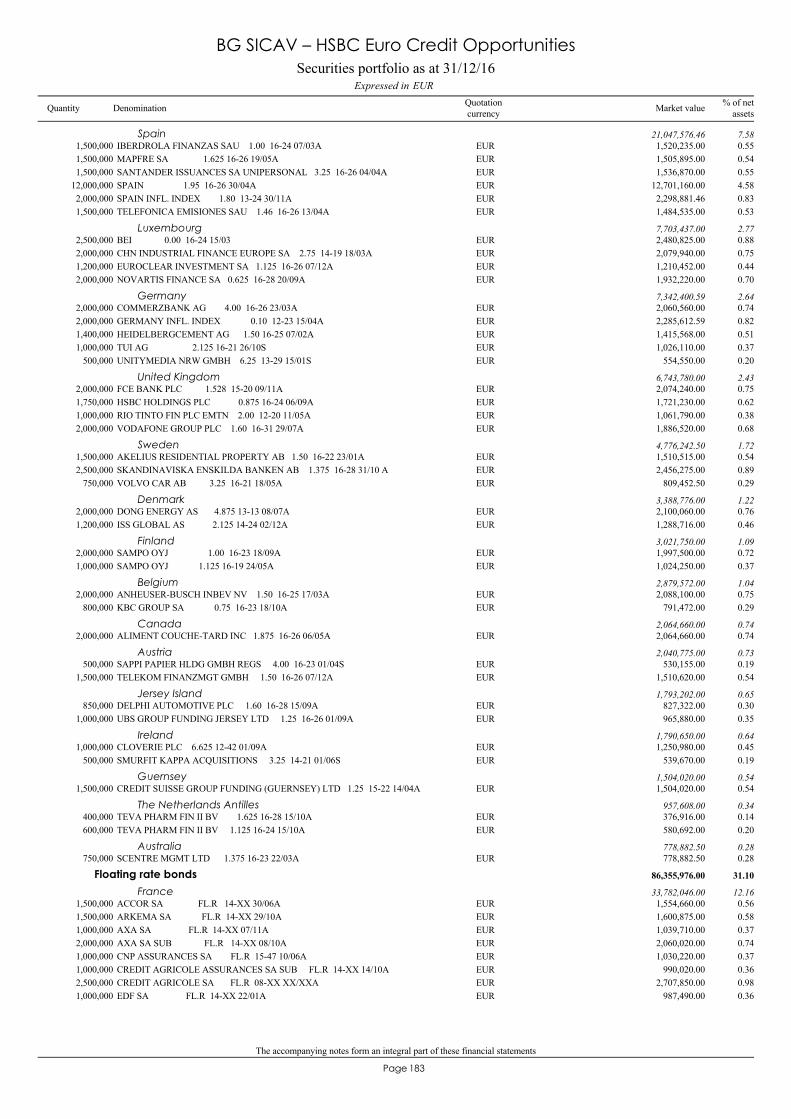
The accompanying notes form an integral part of these financial statements
183Page
IBERDROLA FINANZAS SAU 1.00 16-24 07/03A1,500,000 1,520,235.00 0.55EURSpain 21,047,576.46 7.58
MAPFRE SA 1.625 16-26 19/05A1,500,000 1,505,895.00 0.54EURSANTANDER ISSUANCES SA UNIPERSONAL 3.25 16-26 04/04A1,500,000 1,536,870.00 0.55EURSPAIN 1.95 16-26 30/04A12,000,000 12,701,160.00 4.58EURSPAIN INFL. INDEX 1.80 13-24 30/11A2,000,000 2,298,881.46 0.83EURTELEFONICA EMISIONES SAU 1.46 16-26 13/04A1,500,000 1,484,535.00 0.53EUR
BEI 0.00 16-24 15/032,500,000 2,480,825.00 0.88EURLuxembourg 7,703,437.00 2.77
CHN INDUSTRIAL FINANCE EUROPE SA 2.75 14-19 18/03A2,000,000 2,079,940.00 0.75EUREUROCLEAR INVESTMENT SA 1.125 16-26 07/12A1,200,000 1,210,452.00 0.44EURNOVARTIS FINANCE SA 0.625 16-28 20/09A2,000,000 1,932,220.00 0.70EUR
COMMERZBANK AG 4.00 16-26 23/03A2,000,000 2,060,560.00 0.74EURGermany 7,342,400.59 2.64
GERMANY INFL. INDEX 0.10 12-23 15/04A2,000,000 2,285,612.59 0.82EURHEIDELBERGCEMENT AG 1.50 16-25 07/02A1,400,000 1,415,568.00 0.51EURTUI AG 2.125 16-21 26/10S1,000,000 1,026,110.00 0.37EURUNITYMEDIA NRW GMBH 6.25 13-29 15/01S500,000 554,550.00 0.20EUR
FCE BANK PLC 1.528 15-20 09/11A2,000,000 2,074,240.00 0.75EURUnited Kingdom 6,743,780.00 2.43
HSBC HOLDINGS PLC 0.875 16-24 06/09A1,750,000 1,721,230.00 0.62EURRIO TINTO FIN PLC EMTN 2.00 12-20 11/05A1,000,000 1,061,790.00 0.38EURVODAFONE GROUP PLC 1.60 16-31 29/07A2,000,000 1,886,520.00 0.68EUR
AKELIUS RESIDENTIAL PROPERTY AB 1.50 16-22 23/01A1,500,000 1,510,515.00 0.54EURSweden 4,776,242.50 1.72
SKANDINAVISKA ENSKILDA BANKEN AB 1.375 16-28 31/10 A2,500,000 2,456,275.00 0.89EURVOLVO CAR AB 3.25 16-21 18/05A750,000 809,452.50 0.29EUR
DONG ENERGY AS 4.875 13-13 08/07A2,000,000 2,100,060.00 0.76EURDenmark 3,388,776.00 1.22
ISS GLOBAL AS 2.125 14-24 02/12A1,200,000 1,288,716.00 0.46EUR
SAMPO OYJ 1.00 16-23 18/09A2,000,000 1,997,500.00 0.72EURFinland 3,021,750.00 1.09
SAMPO OYJ 1.125 16-19 24/05A1,000,000 1,024,250.00 0.37EUR
ANHEUSER-BUSCH INBEV NV 1.50 16-25 17/03A2,000,000 2,088,100.00 0.75EURBelgium 2,879,572.00 1.04
KBC GROUP SA 0.75 16-23 18/10A800,000 791,472.00 0.29EUR
ALIMENT COUCHE-TARD INC 1.875 16-26 06/05A2,000,000 2,064,660.00 0.74EURCanada 2,064,660.00 0.74
SAPPI PAPIER HLDG GMBH REGS 4.00 16-23 01/04S500,000 530,155.00 0.19EURAustria 2,040,775.00 0.73
TELEKOM FINANZMGT GMBH 1.50 16-26 07/12A1,500,000 1,510,620.00 0.54EUR
DELPHI AUTOMOTIVE PLC 1.60 16-28 15/09A850,000 827,322.00 0.30EURJersey Island 1,793,202.00 0.65
UBS GROUP FUNDING JERSEY LTD 1.25 16-26 01/09A1,000,000 965,880.00 0.35EUR
CLOVERIE PLC 6.625 12-42 01/09A1,000,000 1,250,980.00 0.45EURIreland 1,790,650.00 0.64
SMURFIT KAPPA ACQUISITIONS 3.25 14-21 01/06S500,000 539,670.00 0.19EUR
CREDIT SUISSE GROUP FUNDING (GUERNSEY) LTD 1.25 15-22 14/04A1,500,000 1,504,020.00 0.54EURGuernsey 1,504,020.00 0.54
TEVA PHARM FIN II BV 1.625 16-28 15/10A400,000 376,916.00 0.14EURThe Netherlands Antilles 957,608.00 0.34
TEVA PHARM FIN II BV 1.125 16-24 15/10A600,000 580,692.00 0.20EUR
SCENTRE MGMT LTD 1.375 16-23 22/03A750,000 778,882.50 0.28EURAustralia 778,882.50 0.28
ACCOR SA FL.R 14-XX 30/06A1,500,000 1,554,660.00 0.56EUR
Floating rate bonds 86,355,976.00 31.10
France 33,782,046.00 12.16
ARKEMA SA FL.R 14-XX 29/10A1,500,000 1,600,875.00 0.58EURAXA SA FL.R 14-XX 07/11A1,000,000 1,039,710.00 0.37EURAXA SA SUB FL.R 14-XX 08/10A2,000,000 2,060,020.00 0.74EURCNP ASSURANCES SA FL.R 15-47 10/06A1,000,000 1,030,220.00 0.37EURCREDIT AGRICOLE ASSURANCES SA SUB FL.R 14-XX 14/10A1,000,000 990,020.00 0.36EURCREDIT AGRICOLE SA FL.R 08-XX XX/XXA2,500,000 2,707,850.00 0.98EUREDF SA FL.R 14-XX 22/01A1,000,000 987,490.00 0.36EUR
Securities portfolio as at 31/12/16EURExpressed in
BG SICAV – HSBC Euro Credit Opportunities
Quantity Denomination Quotationcurrency
% of netassetsMarket value
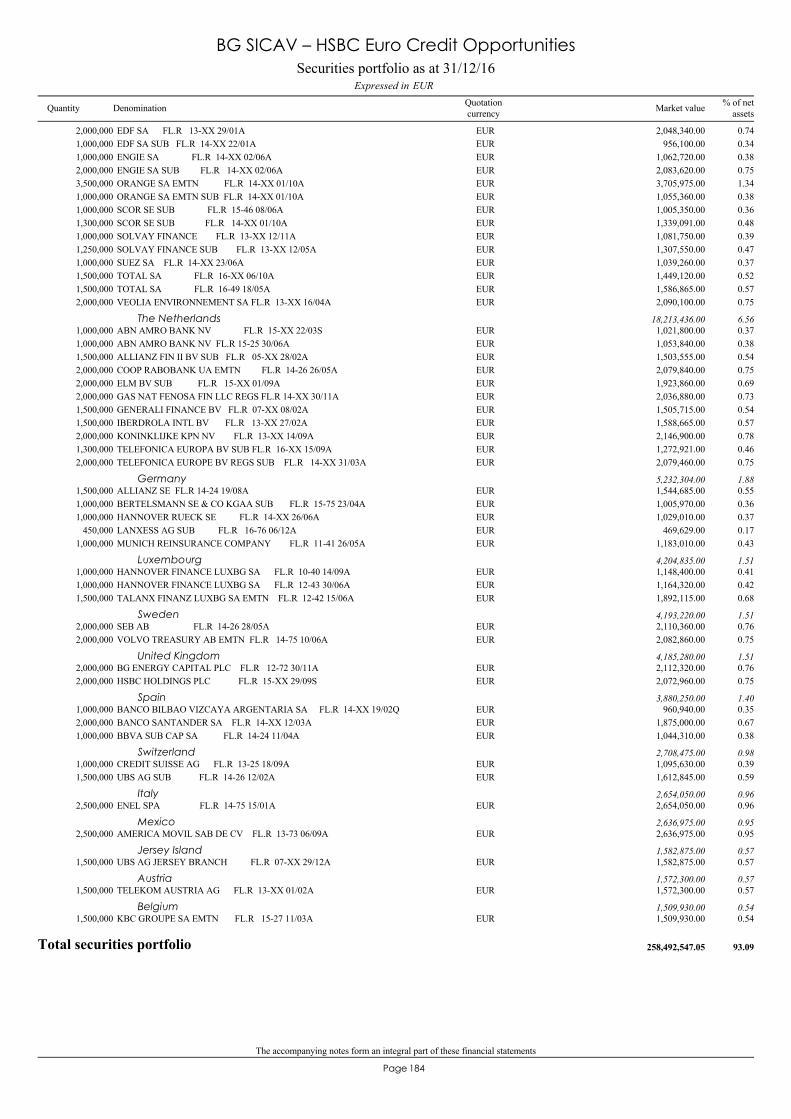
The accompanying notes form an integral part of these financial statements
184Page
EDF SA FL.R 13-XX 29/01A2,000,000 2,048,340.00 0.74EUREDF SA SUB FL.R 14-XX 22/01A1,000,000 956,100.00 0.34EURENGIE SA FL.R 14-XX 02/06A1,000,000 1,062,720.00 0.38EURENGIE SA SUB FL.R 14-XX 02/06A2,000,000 2,083,620.00 0.75EURORANGE SA EMTN FL.R 14-XX 01/10A3,500,000 3,705,975.00 1.34EURORANGE SA EMTN SUB FL.R 14-XX 01/10A1,000,000 1,055,360.00 0.38EURSCOR SE SUB FL.R 15-46 08/06A1,000,000 1,005,350.00 0.36EURSCOR SE SUB FL.R 14-XX 01/10A1,300,000 1,339,091.00 0.48EURSOLVAY FINANCE FL.R 13-XX 12/11A1,000,000 1,081,750.00 0.39EURSOLVAY FINANCE SUB FL.R 13-XX 12/05A1,250,000 1,307,550.00 0.47EURSUEZ SA FL.R 14-XX 23/06A1,000,000 1,039,260.00 0.37EURTOTAL SA FL.R 16-XX 06/10A1,500,000 1,449,120.00 0.52EURTOTAL SA FL.R 16-49 18/05A1,500,000 1,586,865.00 0.57EURVEOLIA ENVIRONNEMENT SA FL.R 13-XX 16/04A2,000,000 2,090,100.00 0.75EUR
ABN AMRO BANK NV FL.R 15-XX 22/03S1,000,000 1,021,800.00 0.37EURThe Netherlands 18,213,436.00 6.56
ABN AMRO BANK NV FL.R 15-25 30/06A1,000,000 1,053,840.00 0.38EURALLIANZ FIN II BV SUB FL.R 05-XX 28/02A1,500,000 1,503,555.00 0.54EURCOOP RABOBANK UA EMTN FL.R 14-26 26/05A2,000,000 2,079,840.00 0.75EURELM BV SUB FL.R 15-XX 01/09A2,000,000 1,923,860.00 0.69EURGAS NAT FENOSA FIN LLC REGS FL.R 14-XX 30/11A2,000,000 2,036,880.00 0.73EURGENERALI FINANCE BV FL.R 07-XX 08/02A1,500,000 1,505,715.00 0.54EURIBERDROLA INTL BV FL.R 13-XX 27/02A1,500,000 1,588,665.00 0.57EURKONINKLIJKE KPN NV FL.R 13-XX 14/09A2,000,000 2,146,900.00 0.78EURTELEFONICA EUROPA BV SUB FL.R 16-XX 15/09A1,300,000 1,272,921.00 0.46EURTELEFONICA EUROPE BV REGS SUB FL.R 14-XX 31/03A2,000,000 2,079,460.00 0.75EUR
ALLIANZ SE FL.R 14-24 19/08A1,500,000 1,544,685.00 0.55EURGermany 5,232,304.00 1.88
BERTELSMANN SE & CO KGAA SUB FL.R 15-75 23/04A1,000,000 1,005,970.00 0.36EURHANNOVER RUECK SE FL.R 14-XX 26/06A1,000,000 1,029,010.00 0.37EURLANXESS AG SUB FL.R 16-76 06/12A450,000 469,629.00 0.17EURMUNICH REINSURANCE COMPANY FL.R 11-41 26/05A1,000,000 1,183,010.00 0.43EUR
HANNOVER FINANCE LUXBG SA FL.R 10-40 14/09A1,000,000 1,148,400.00 0.41EURLuxembourg 4,204,835.00 1.51
HANNOVER FINANCE LUXBG SA FL.R 12-43 30/06A1,000,000 1,164,320.00 0.42EURTALANX FINANZ LUXBG SA EMTN FL.R 12-42 15/06A1,500,000 1,892,115.00 0.68EUR
SEB AB FL.R 14-26 28/05A2,000,000 2,110,360.00 0.76EURSweden 4,193,220.00 1.51
VOLVO TREASURY AB EMTN FL.R 14-75 10/06A2,000,000 2,082,860.00 0.75EUR
BG ENERGY CAPITAL PLC FL.R 12-72 30/11A2,000,000 2,112,320.00 0.76EURUnited Kingdom 4,185,280.00 1.51
HSBC HOLDINGS PLC FL.R 15-XX 29/09S2,000,000 2,072,960.00 0.75EUR
BANCO BILBAO VIZCAYA ARGENTARIA SA FL.R 14-XX 19/02Q1,000,000 960,940.00 0.35EURSpain 3,880,250.00 1.40
BANCO SANTANDER SA FL.R 14-XX 12/03A2,000,000 1,875,000.00 0.67EURBBVA SUB CAP SA FL.R 14-24 11/04A1,000,000 1,044,310.00 0.38EUR
CREDIT SUISSE AG FL.R 13-25 18/09A1,000,000 1,095,630.00 0.39EURSwitzerland 2,708,475.00 0.98
UBS AG SUB FL.R 14-26 12/02A1,500,000 1,612,845.00 0.59EUR
ENEL SPA FL.R 14-75 15/01A2,500,000 2,654,050.00 0.96EURItaly 2,654,050.00 0.96
AMERICA MOVIL SAB DE CV FL.R 13-73 06/09A2,500,000 2,636,975.00 0.95EURMexico 2,636,975.00 0.95
UBS AG JERSEY BRANCH FL.R 07-XX 29/12A1,500,000 1,582,875.00 0.57EURJersey Island 1,582,875.00 0.57
TELEKOM AUSTRIA AG FL.R 13-XX 01/02A1,500,000 1,572,300.00 0.57EURAustria 1,572,300.00 0.57
KBC GROUPE SA EMTN FL.R 15-27 11/03A1,500,000 1,509,930.00 0.54EURBelgium 1,509,930.00 0.54
Total securities portfolio 258,492,547.05 93.09
Securities portfolio as at 31/12/16EURExpressed in
BG SICAV – HSBC Euro Credit Opportunities
Quantity Denomination Quotationcurrency
% of netassetsMarket value

The accompanying notes form an integral part of these financial statements
185Page
Statement of operations and changes in net assets from 01/01/16 to 31/12/16Expressed in EUR
BG SICAV – HSBC Euro Credit Opportunities
6,930,120.07Income6,874,215.52Net interest on bonds
200.07Bank interest on cash account55,704.48Securities lending income 16Note
5,508,944.00Expenses2,989,382.45Management fees 5Note
50,317.62Custodian & sub-custodian fees 6Note35,325.19Taxe d'abonnement 4Note
445,154.05Administrative expenses 5Note1,886,066.53Performance fees 7Note
3,417.12Domiciliation fees37,104.51Professional and legal fees16,454.51Bank interest on overdrafts14,875.02Transaction fees2,082.37Directors fees
28,764.63Other expenses
1,421,176.07Net income from investmentsNet realised profit / (loss) on:
1,581,972.30- sales of investment securities25,500.00- options / swaptions
2,732,847.50- financial futures
5,761,495.87Net realised profitMovement in net unrealised appreciation / (depreciation) on:
2,708,290.00- investment securities(602,500.00)- financial futures
7,867,285.87Increase in net assets as a result of operations192,047,557.54Subscription capitalisation shares
(104,880,851.43)Redemption capitalisation shares
95,033,991.98Increase in net assets
182,643,970.03Net assets at the beginning of the year
277,677,962.01Net assets at the end of the year

186Page
BG SICAV– Amundi Global Income Bond
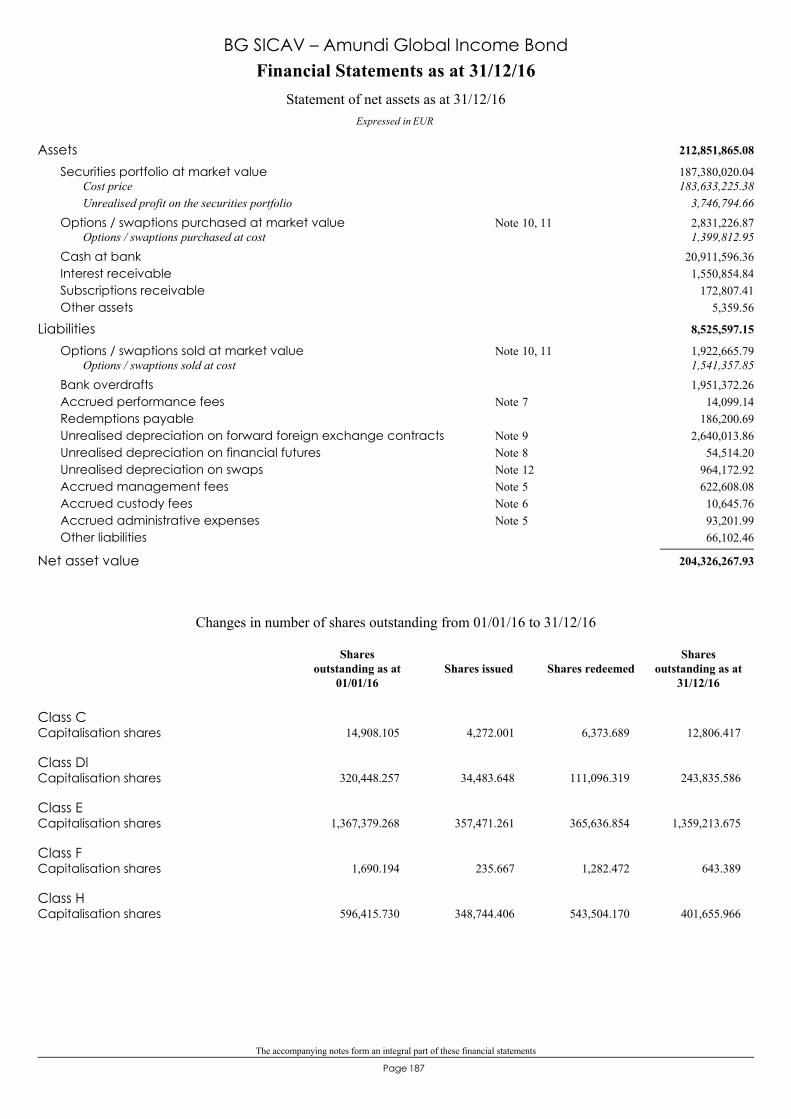
The accompanying notes form an integral part of these financial statements
187Page
212,851,865.08Assets187,380,020.04Securities portfolio at market value183,633,225.38Cost price
3,746,794.66Unrealised profit on the securities portfolio2,831,226.87Options / swaptions purchased at market value 10, 11Note1,399,812.95Options / swaptions purchased at cost
20,911,596.36Cash at bank1,550,854.84Interest receivable
172,807.41Subscriptions receivable5,359.56Other assets
8,525,597.15Liabilities1,922,665.79Options / swaptions sold at market value 10, 11Note1,541,357.85Options / swaptions sold at cost1,951,372.26Bank overdrafts
14,099.14Accrued performance fees 7Note186,200.69Redemptions payable
2,640,013.86Unrealised depreciation on forward foreign exchange contracts 9Note54,514.20Unrealised depreciation on financial futures 8Note
964,172.92Unrealised depreciation on swaps 12Note622,608.08Accrued management fees 5Note10,645.76Accrued custody fees 6Note93,201.99Accrued administrative expenses 5Note66,102.46Other liabilities
204,326,267.93Net asset value
Financial Statements as at 31/12/16
Expressed in EUR
Statement of net assets as at 31/12/16
BG SICAV – Amundi Global Income Bond
Class CCapitalisation shares 14,908.105 4,272.001 6,373.689 12,806.417
Class DlCapitalisation shares 320,448.257 34,483.648 111,096.319 243,835.586
Class ECapitalisation shares 1,367,379.268 357,471.261 365,636.854 1,359,213.675
Class FCapitalisation shares 1,690.194 235.667 1,282.472 643.389
Class HCapitalisation shares 596,415.730 348,744.406 543,504.170 401,655.966
Changes in number of shares outstanding from 01/01/16 to 31/12/16
Shares issued Shares redeemedShares
outstanding as at31/12/16
Sharesoutstanding as at
01/01/16
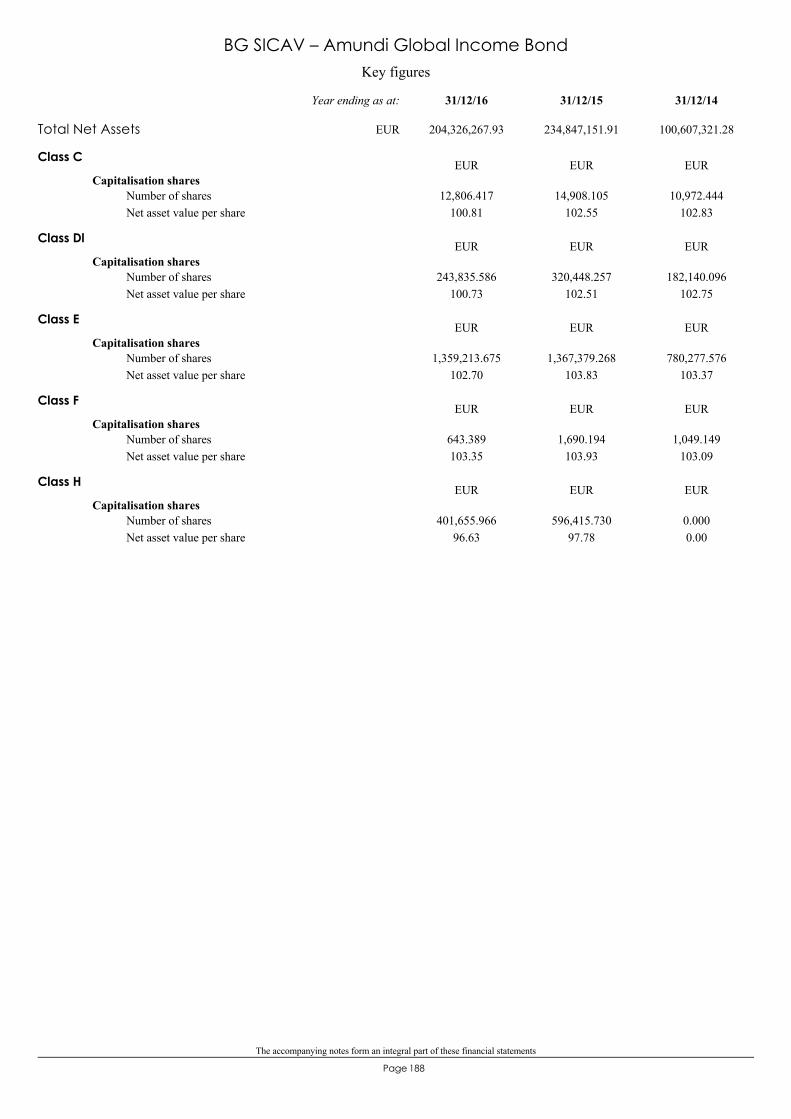
The accompanying notes form an integral part of these financial statements
188Page
Key figures
BG SICAV – Amundi Global Income Bond
Class C
Capitalisation shares
100.8112,806.417 14,908.105
102.5510,972.444
102.83Number of sharesNet asset value per share
EUR EUR EUR
Class Dl
Capitalisation shares
100.73243,835.586 320,448.257
102.51182,140.096
102.75Number of sharesNet asset value per share
EUR EUR EUR
Class E
Capitalisation shares
102.701,359,213.675 1,367,379.268
103.83780,277.576
103.37Number of sharesNet asset value per share
EUR EUR EUR
Class F
Capitalisation shares
103.35643.389 1,690.194
103.931,049.149
103.09Number of sharesNet asset value per share
EUR EUR EUR
Class H
Capitalisation shares
96.63401,655.966 596,415.730
97.780.0000.00
Number of sharesNet asset value per share
EUR EUR EUR
Total Net Assets 204,326,267.93 234,847,151.91 100,607,321.28
31/12/1431/12/1531/12/16Year ending as at:
EUR
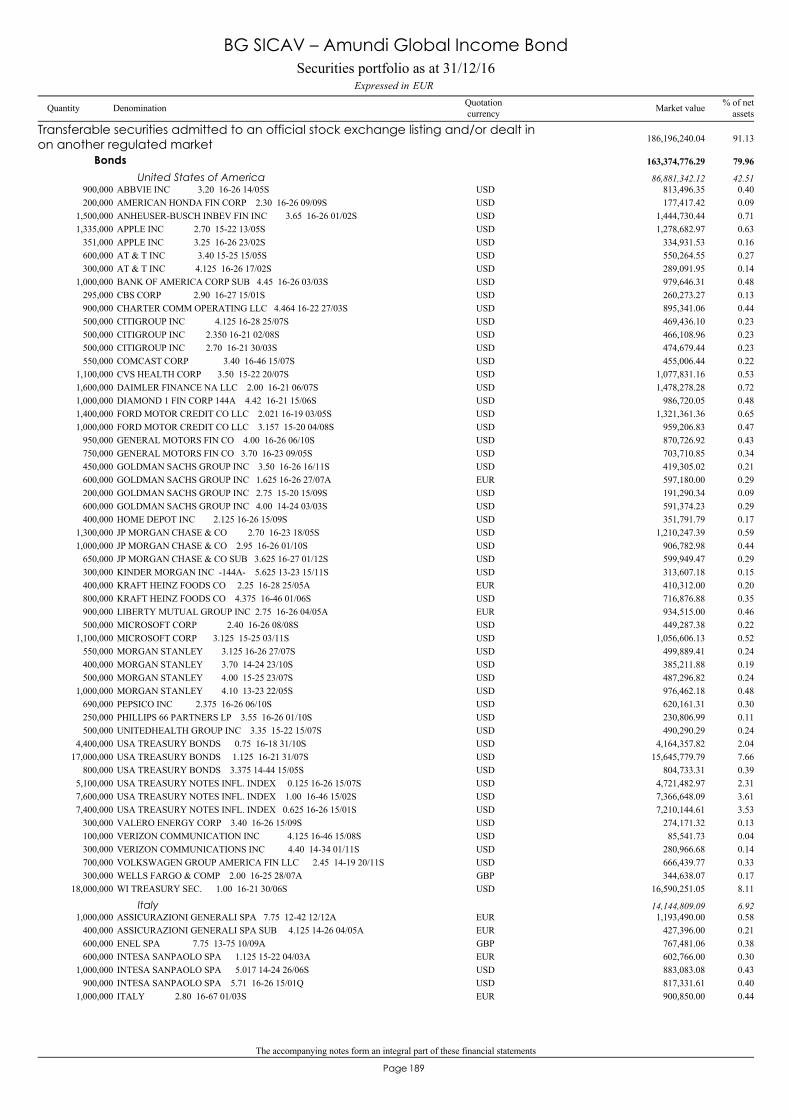
The accompanying notes form an integral part of these financial statements
189Page
ABBVIE INC 3.20 16-26 14/05S900,000 813,496.35 0.40USD
Transferable securities admitted to an official stock exchange listing and/or dealt inon another regulated market 186,196,240.04 91.13
Bonds 163,374,776.29 79.96
United States of America 86,881,342.12 42.51
AMERICAN HONDA FIN CORP 2.30 16-26 09/09S200,000 177,417.42 0.09USDANHEUSER-BUSCH INBEV FIN INC 3.65 16-26 01/02S1,500,000 1,444,730.44 0.71USDAPPLE INC 2.70 15-22 13/05S1,335,000 1,278,682.97 0.63USDAPPLE INC 3.25 16-26 23/02S351,000 334,931.53 0.16USDAT & T INC 3.40 15-25 15/05S600,000 550,264.55 0.27USDAT & T INC 4.125 16-26 17/02S300,000 289,091.95 0.14USDBANK OF AMERICA CORP SUB 4.45 16-26 03/03S1,000,000 979,646.31 0.48USDCBS CORP 2.90 16-27 15/01S295,000 260,273.27 0.13USDCHARTER COMM OPERATING LLC 4.464 16-22 27/03S900,000 895,341.06 0.44USDCITIGROUP INC 4.125 16-28 25/07S500,000 469,436.10 0.23USDCITIGROUP INC 2.350 16-21 02/08S500,000 466,108.96 0.23USDCITIGROUP INC 2.70 16-21 30/03S500,000 474,679.44 0.23USDCOMCAST CORP 3.40 16-46 15/07S550,000 455,006.44 0.22USDCVS HEALTH CORP 3.50 15-22 20/07S1,100,000 1,077,831.16 0.53USDDAIMLER FINANCE NA LLC 2.00 16-21 06/07S1,600,000 1,478,278.28 0.72USDDIAMOND 1 FIN CORP 144A 4.42 16-21 15/06S1,000,000 986,720.05 0.48USDFORD MOTOR CREDIT CO LLC 2.021 16-19 03/05S1,400,000 1,321,361.36 0.65USDFORD MOTOR CREDIT CO LLC 3.157 15-20 04/08S1,000,000 959,206.83 0.47USDGENERAL MOTORS FIN CO 4.00 16-26 06/10S950,000 870,726.92 0.43USDGENERAL MOTORS FIN CO 3.70 16-23 09/05S750,000 703,710.85 0.34USDGOLDMAN SACHS GROUP INC 3.50 16-26 16/11S450,000 419,305.02 0.21USDGOLDMAN SACHS GROUP INC 1.625 16-26 27/07A600,000 597,180.00 0.29EURGOLDMAN SACHS GROUP INC 2.75 15-20 15/09S200,000 191,290.34 0.09USDGOLDMAN SACHS GROUP INC 4.00 14-24 03/03S600,000 591,374.23 0.29USDHOME DEPOT INC 2.125 16-26 15/09S400,000 351,791.79 0.17USDJP MORGAN CHASE & CO 2.70 16-23 18/05S1,300,000 1,210,247.39 0.59USDJP MORGAN CHASE & CO 2.95 16-26 01/10S1,000,000 906,782.98 0.44USDJP MORGAN CHASE & CO SUB 3.625 16-27 01/12S650,000 599,949.47 0.29USDKINDER MORGAN INC -144A- 5.625 13-23 15/11S300,000 313,607.18 0.15USDKRAFT HEINZ FOODS CO 2.25 16-28 25/05A400,000 410,312.00 0.20EURKRAFT HEINZ FOODS CO 4.375 16-46 01/06S800,000 716,876.88 0.35USDLIBERTY MUTUAL GROUP INC 2.75 16-26 04/05A900,000 934,515.00 0.46EURMICROSOFT CORP 2.40 16-26 08/08S500,000 449,287.38 0.22USDMICROSOFT CORP 3.125 15-25 03/11S1,100,000 1,056,606.13 0.52USDMORGAN STANLEY 3.125 16-26 27/07S550,000 499,889.41 0.24USDMORGAN STANLEY 3.70 14-24 23/10S400,000 385,211.88 0.19USDMORGAN STANLEY 4.00 15-25 23/07S500,000 487,296.82 0.24USDMORGAN STANLEY 4.10 13-23 22/05S1,000,000 976,462.18 0.48USDPEPSICO INC 2.375 16-26 06/10S690,000 620,161.31 0.30USDPHILLIPS 66 PARTNERS LP 3.55 16-26 01/10S250,000 230,806.99 0.11USDUNITEDHEALTH GROUP INC 3.35 15-22 15/07S500,000 490,290.29 0.24USDUSA TREASURY BONDS 0.75 16-18 31/10S4,400,000 4,164,357.82 2.04USDUSA TREASURY BONDS 1.125 16-21 31/07S17,000,000 15,645,779.79 7.66USDUSA TREASURY BONDS 3.375 14-44 15/05S800,000 804,733.31 0.39USDUSA TREASURY NOTES INFL. INDEX 0.125 16-26 15/07S5,100,000 4,721,482.97 2.31USDUSA TREASURY NOTES INFL. INDEX 1.00 16-46 15/02S7,600,000 7,366,648.09 3.61USDUSA TREASURY NOTES INFL. INDEX 0.625 16-26 15/01S7,400,000 7,210,144.61 3.53USDVALERO ENERGY CORP 3.40 16-26 15/09S300,000 274,171.32 0.13USDVERIZON COMMUNICATION INC 4.125 16-46 15/08S100,000 85,541.73 0.04USDVERIZON COMMUNICATIONS INC 4.40 14-34 01/11S300,000 280,966.68 0.14USDVOLKSWAGEN GROUP AMERICA FIN LLC 2.45 14-19 20/11S700,000 666,439.77 0.33USDWELLS FARGO & COMP 2.00 16-25 28/07A300,000 344,638.07 0.17GBPWI TREASURY SEC. 1.00 16-21 30/06S18,000,000 16,590,251.05 8.11USD
ASSICURAZIONI GENERALI SPA 7.75 12-42 12/12A1,000,000 1,193,490.00 0.58EURItaly 14,144,809.09 6.92
ASSICURAZIONI GENERALI SPA SUB 4.125 14-26 04/05A400,000 427,396.00 0.21EURENEL SPA 7.75 13-75 10/09A600,000 767,481.06 0.38GBPINTESA SANPAOLO SPA 1.125 15-22 04/03A600,000 602,766.00 0.30EURINTESA SANPAOLO SPA 5.017 14-24 26/06S1,000,000 883,083.08 0.43USDINTESA SANPAOLO SPA 5.71 16-26 15/01Q900,000 817,331.61 0.40USDITALY 2.80 16-67 01/03S1,000,000 900,850.00 0.44EUR
Securities portfolio as at 31/12/16EURExpressed in
BG SICAV – Amundi Global Income Bond
Quantity Denomination Quotationcurrency
% of netassetsMarket value
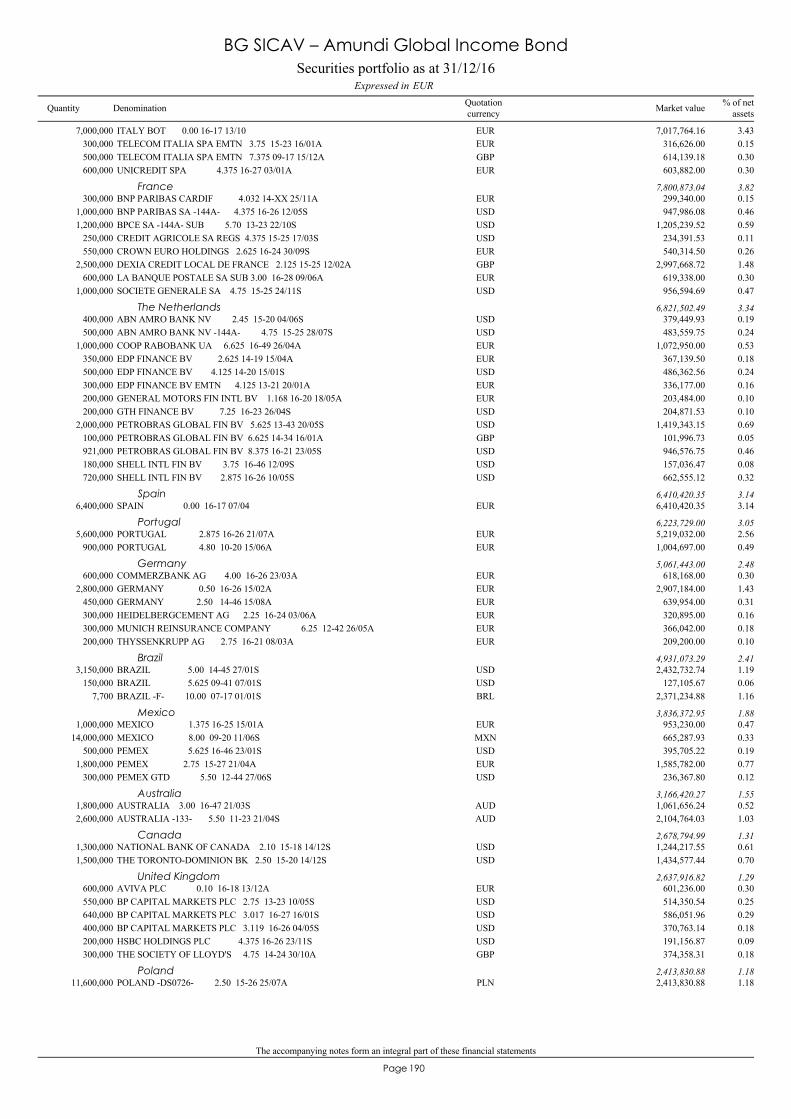
The accompanying notes form an integral part of these financial statements
190Page
ITALY BOT 0.00 16-17 13/107,000,000 7,017,764.16 3.43EURTELECOM ITALIA SPA EMTN 3.75 15-23 16/01A300,000 316,626.00 0.15EURTELECOM ITALIA SPA EMTN 7.375 09-17 15/12A500,000 614,139.18 0.30GBPUNICREDIT SPA 4.375 16-27 03/01A600,000 603,882.00 0.30EUR
BNP PARIBAS CARDIF 4.032 14-XX 25/11A300,000 299,340.00 0.15EURFrance 7,800,873.04 3.82
BNP PARIBAS SA -144A- 4.375 16-26 12/05S1,000,000 947,986.08 0.46USDBPCE SA -144A- SUB 5.70 13-23 22/10S1,200,000 1,205,239.52 0.59USDCREDIT AGRICOLE SA REGS 4.375 15-25 17/03S250,000 234,391.53 0.11USDCROWN EURO HOLDINGS 2.625 16-24 30/09S550,000 540,314.50 0.26EURDEXIA CREDIT LOCAL DE FRANCE 2.125 15-25 12/02A2,500,000 2,997,668.72 1.48GBPLA BANQUE POSTALE SA SUB 3.00 16-28 09/06A600,000 619,338.00 0.30EURSOCIETE GENERALE SA 4.75 15-25 24/11S1,000,000 956,594.69 0.47USD
ABN AMRO BANK NV 2.45 15-20 04/06S400,000 379,449.93 0.19USDThe Netherlands 6,821,502.49 3.34
ABN AMRO BANK NV -144A- 4.75 15-25 28/07S500,000 483,559.75 0.24USDCOOP RABOBANK UA 6.625 16-49 26/04A1,000,000 1,072,950.00 0.53EUREDP FINANCE BV 2.625 14-19 15/04A350,000 367,139.50 0.18EUREDP FINANCE BV 4.125 14-20 15/01S500,000 486,362.56 0.24USDEDP FINANCE BV EMTN 4.125 13-21 20/01A300,000 336,177.00 0.16EURGENERAL MOTORS FIN INTL BV 1.168 16-20 18/05A200,000 203,484.00 0.10EURGTH FINANCE BV 7.25 16-23 26/04S200,000 204,871.53 0.10USDPETROBRAS GLOBAL FIN BV 5.625 13-43 20/05S2,000,000 1,419,343.15 0.69USDPETROBRAS GLOBAL FIN BV 6.625 14-34 16/01A100,000 101,996.73 0.05GBPPETROBRAS GLOBAL FIN BV 8.375 16-21 23/05S921,000 946,576.75 0.46USDSHELL INTL FIN BV 3.75 16-46 12/09S180,000 157,036.47 0.08USDSHELL INTL FIN BV 2.875 16-26 10/05S720,000 662,555.12 0.32USD
SPAIN 0.00 16-17 07/046,400,000 6,410,420.35 3.14EURSpain 6,410,420.35 3.14
PORTUGAL 2.875 16-26 21/07A5,600,000 5,219,032.00 2.56EURPortugal 6,223,729.00 3.05
PORTUGAL 4.80 10-20 15/06A900,000 1,004,697.00 0.49EUR
COMMERZBANK AG 4.00 16-26 23/03A600,000 618,168.00 0.30EURGermany 5,061,443.00 2.48
GERMANY 0.50 16-26 15/02A2,800,000 2,907,184.00 1.43EURGERMANY 2.50 14-46 15/08A450,000 639,954.00 0.31EURHEIDELBERGCEMENT AG 2.25 16-24 03/06A300,000 320,895.00 0.16EURMUNICH REINSURANCE COMPANY 6.25 12-42 26/05A300,000 366,042.00 0.18EURTHYSSENKRUPP AG 2.75 16-21 08/03A200,000 209,200.00 0.10EUR
BRAZIL 5.00 14-45 27/01S3,150,000 2,432,732.74 1.19USDBrazil 4,931,073.29 2.41
BRAZIL 5.625 09-41 07/01S150,000 127,105.67 0.06USDBRAZIL -F- 10.00 07-17 01/01S7,700 2,371,234.88 1.16BRL
MEXICO 1.375 16-25 15/01A1,000,000 953,230.00 0.47EURMexico 3,836,372.95 1.88
MEXICO 8.00 09-20 11/06S14,000,000 665,287.93 0.33MXNPEMEX 5.625 16-46 23/01S500,000 395,705.22 0.19USDPEMEX 2.75 15-27 21/04A1,800,000 1,585,782.00 0.77EURPEMEX GTD 5.50 12-44 27/06S300,000 236,367.80 0.12USD
AUSTRALIA 3.00 16-47 21/03S1,800,000 1,061,656.24 0.52AUDAustralia 3,166,420.27 1.55
AUSTRALIA -133- 5.50 11-23 21/04S2,600,000 2,104,764.03 1.03AUD
NATIONAL BANK OF CANADA 2.10 15-18 14/12S1,300,000 1,244,217.55 0.61USDCanada 2,678,794.99 1.31
THE TORONTO-DOMINION BK 2.50 15-20 14/12S1,500,000 1,434,577.44 0.70USD
AVIVA PLC 0.10 16-18 13/12A600,000 601,236.00 0.30EURUnited Kingdom 2,637,916.82 1.29
BP CAPITAL MARKETS PLC 2.75 13-23 10/05S550,000 514,350.54 0.25USDBP CAPITAL MARKETS PLC 3.017 16-27 16/01S640,000 586,051.96 0.29USDBP CAPITAL MARKETS PLC 3.119 16-26 04/05S400,000 370,763.14 0.18USDHSBC HOLDINGS PLC 4.375 16-26 23/11S200,000 191,156.87 0.09USDTHE SOCIETY OF LLOYD'S 4.75 14-24 30/10A300,000 374,358.31 0.18GBP
POLAND -DS0726- 2.50 15-26 25/07A11,600,000 2,413,830.88 1.18PLNPoland 2,413,830.88 1.18
Securities portfolio as at 31/12/16EURExpressed in
BG SICAV – Amundi Global Income Bond
Quantity Denomination Quotationcurrency
% of netassetsMarket value
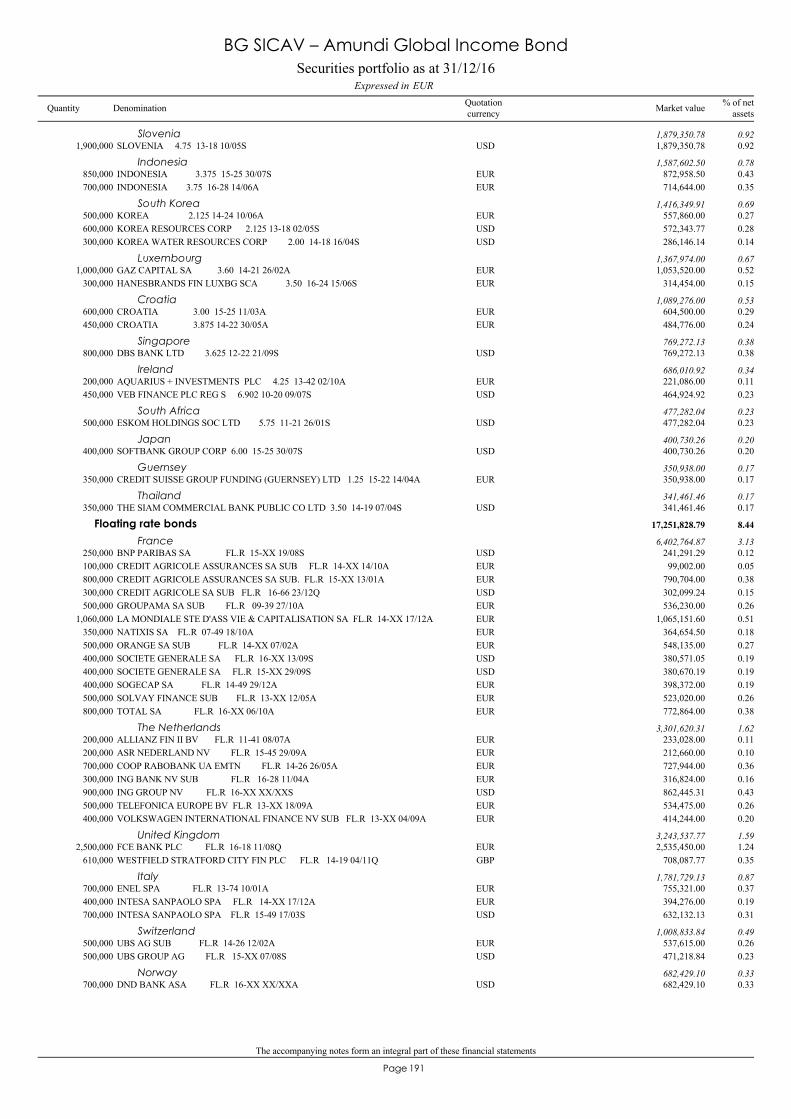
The accompanying notes form an integral part of these financial statements
191Page
SLOVENIA 4.75 13-18 10/05S1,900,000 1,879,350.78 0.92USDSlovenia 1,879,350.78 0.92
INDONESIA 3.375 15-25 30/07S850,000 872,958.50 0.43EURIndonesia 1,587,602.50 0.78
INDONESIA 3.75 16-28 14/06A700,000 714,644.00 0.35EUR
KOREA 2.125 14-24 10/06A500,000 557,860.00 0.27EURSouth Korea 1,416,349.91 0.69
KOREA RESOURCES CORP 2.125 13-18 02/05S600,000 572,343.77 0.28USDKOREA WATER RESOURCES CORP 2.00 14-18 16/04S300,000 286,146.14 0.14USD
GAZ CAPITAL SA 3.60 14-21 26/02A1,000,000 1,053,520.00 0.52EURLuxembourg 1,367,974.00 0.67
HANESBRANDS FIN LUXBG SCA 3.50 16-24 15/06S300,000 314,454.00 0.15EUR
CROATIA 3.00 15-25 11/03A600,000 604,500.00 0.29EURCroatia 1,089,276.00 0.53
CROATIA 3.875 14-22 30/05A450,000 484,776.00 0.24EUR
DBS BANK LTD 3.625 12-22 21/09S800,000 769,272.13 0.38USDSingapore 769,272.13 0.38
AQUARIUS + INVESTMENTS PLC 4.25 13-42 02/10A200,000 221,086.00 0.11EURIreland 686,010.92 0.34
VEB FINANCE PLC REG S 6.902 10-20 09/07S450,000 464,924.92 0.23USD
ESKOM HOLDINGS SOC LTD 5.75 11-21 26/01S500,000 477,282.04 0.23USDSouth Africa 477,282.04 0.23
SOFTBANK GROUP CORP 6.00 15-25 30/07S400,000 400,730.26 0.20USDJapan 400,730.26 0.20
CREDIT SUISSE GROUP FUNDING (GUERNSEY) LTD 1.25 15-22 14/04A350,000 350,938.00 0.17EURGuernsey 350,938.00 0.17
THE SIAM COMMERCIAL BANK PUBLIC CO LTD 3.50 14-19 07/04S350,000 341,461.46 0.17USDThailand 341,461.46 0.17
BNP PARIBAS SA FL.R 15-XX 19/08S250,000 241,291.29 0.12USD
Floating rate bonds 17,251,828.79 8.44
France 6,402,764.87 3.13
CREDIT AGRICOLE ASSURANCES SA SUB FL.R 14-XX 14/10A100,000 99,002.00 0.05EURCREDIT AGRICOLE ASSURANCES SA SUB. FL.R 15-XX 13/01A800,000 790,704.00 0.38EURCREDIT AGRICOLE SA SUB FL.R 16-66 23/12Q300,000 302,099.24 0.15USDGROUPAMA SA SUB FL.R 09-39 27/10A500,000 536,230.00 0.26EURLA MONDIALE STE D'ASS VIE & CAPITALISATION SA FL.R 14-XX 17/12A1,060,000 1,065,151.60 0.51EURNATIXIS SA FL.R 07-49 18/10A350,000 364,654.50 0.18EURORANGE SA SUB FL.R 14-XX 07/02A500,000 548,135.00 0.27EURSOCIETE GENERALE SA FL.R 16-XX 13/09S400,000 380,571.05 0.19USDSOCIETE GENERALE SA FL.R 15-XX 29/09S400,000 380,670.19 0.19USDSOGECAP SA FL.R 14-49 29/12A400,000 398,372.00 0.19EURSOLVAY FINANCE SUB FL.R 13-XX 12/05A500,000 523,020.00 0.26EURTOTAL SA FL.R 16-XX 06/10A800,000 772,864.00 0.38EUR
ALLIANZ FIN II BV FL.R 11-41 08/07A200,000 233,028.00 0.11EURThe Netherlands 3,301,620.31 1.62
ASR NEDERLAND NV FL.R 15-45 29/09A200,000 212,660.00 0.10EURCOOP RABOBANK UA EMTN FL.R 14-26 26/05A700,000 727,944.00 0.36EURING BANK NV SUB FL.R 16-28 11/04A300,000 316,824.00 0.16EURING GROUP NV FL.R 16-XX XX/XXS900,000 862,445.31 0.43USDTELEFONICA EUROPE BV FL.R 13-XX 18/09A500,000 534,475.00 0.26EURVOLKSWAGEN INTERNATIONAL FINANCE NV SUB FL.R 13-XX 04/09A400,000 414,244.00 0.20EUR
FCE BANK PLC FL.R 16-18 11/08Q2,500,000 2,535,450.00 1.24EURUnited Kingdom 3,243,537.77 1.59
WESTFIELD STRATFORD CITY FIN PLC FL.R 14-19 04/11Q610,000 708,087.77 0.35GBP
ENEL SPA FL.R 13-74 10/01A700,000 755,321.00 0.37EURItaly 1,781,729.13 0.87
INTESA SANPAOLO SPA FL.R 14-XX 17/12A400,000 394,276.00 0.19EURINTESA SANPAOLO SPA FL.R 15-49 17/03S700,000 632,132.13 0.31USD
UBS AG SUB FL.R 14-26 12/02A500,000 537,615.00 0.26EURSwitzerland 1,008,833.84 0.49
UBS GROUP AG FL.R 15-XX 07/08S500,000 471,218.84 0.23USD
DND BANK ASA FL.R 16-XX XX/XXA700,000 682,429.10 0.33USDNorway 682,429.10 0.33
Securities portfolio as at 31/12/16EURExpressed in
BG SICAV – Amundi Global Income Bond
Quantity Denomination Quotationcurrency
% of netassetsMarket value
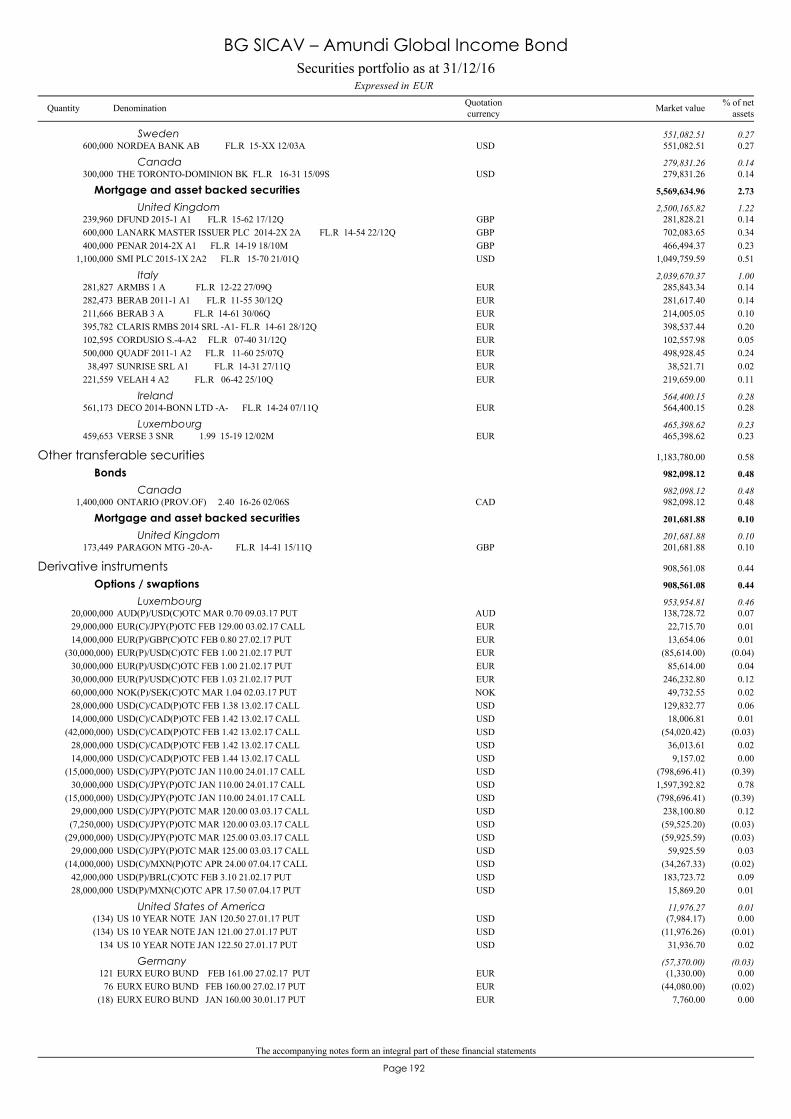
The accompanying notes form an integral part of these financial statements
192Page
NORDEA BANK AB FL.R 15-XX 12/03A600,000 551,082.51 0.27USDSweden 551,082.51 0.27
THE TORONTO-DOMINION BK FL.R 16-31 15/09S300,000 279,831.26 0.14USDCanada 279,831.26 0.14
DFUND 2015-1 A1 FL.R 15-62 17/12Q239,960 281,828.21 0.14GBP
Mortgage and asset backed securities 5,569,634.96 2.73
United Kingdom 2,500,165.82 1.22
LANARK MASTER ISSUER PLC 2014-2X 2A FL.R 14-54 22/12Q600,000 702,083.65 0.34GBPPENAR 2014-2X A1 FL.R 14-19 18/10M400,000 466,494.37 0.23GBPSMI PLC 2015-1X 2A2 FL.R 15-70 21/01Q1,100,000 1,049,759.59 0.51USD
ARMBS 1 A FL.R 12-22 27/09Q281,827 285,843.34 0.14EURItaly 2,039,670.37 1.00
BERAB 2011-1 A1 FL.R 11-55 30/12Q282,473 281,617.40 0.14EURBERAB 3 A FL.R 14-61 30/06Q211,666 214,005.05 0.10EURCLARIS RMBS 2014 SRL -A1- FL.R 14-61 28/12Q395,782 398,537.44 0.20EURCORDUSIO S.-4-A2 FL.R 07-40 31/12Q102,595 102,557.98 0.05EURQUADF 2011-1 A2 FL.R 11-60 25/07Q500,000 498,928.45 0.24EURSUNRISE SRL A1 FL.R 14-31 27/11Q38,497 38,521.71 0.02EURVELAH 4 A2 FL.R 06-42 25/10Q221,559 219,659.00 0.11EUR
DECO 2014-BONN LTD -A- FL.R 14-24 07/11Q561,173 564,400.15 0.28EURIreland 564,400.15 0.28
VERSE 3 SNR 1.99 15-19 12/02M459,653 465,398.62 0.23EURLuxembourg 465,398.62 0.23
ONTARIO (PROV.OF) 2.40 16-26 02/06S1,400,000 982,098.12 0.48CAD
Other transferable securities 1,183,780.00 0.58
Bonds 982,098.12 0.48
Canada 982,098.12 0.48
PARAGON MTG -20-A- FL.R 14-41 15/11Q173,449 201,681.88 0.10GBP
Mortgage and asset backed securities 201,681.88 0.10
United Kingdom 201,681.88 0.10
AUD(P)/USD(C)OTC MAR 0.70 09.03.17 PUT20,000,000 138,728.72 0.07AUD
Derivative instruments 908,561.08 0.44
Options / swaptions 908,561.08 0.44
Luxembourg 953,954.81 0.46
EUR(C)/JPY(P)OTC FEB 129.00 03.02.17 CALL29,000,000 22,715.70 0.01EUREUR(P)/GBP(C)OTC FEB 0.80 27.02.17 PUT14,000,000 13,654.06 0.01EUREUR(P)/USD(C)OTC FEB 1.00 21.02.17 PUT(30,000,000) (85,614.00) (0.04)EUREUR(P)/USD(C)OTC FEB 1.00 21.02.17 PUT30,000,000 85,614.00 0.04EUREUR(P)/USD(C)OTC FEB 1.03 21.02.17 PUT30,000,000 246,232.80 0.12EURNOK(P)/SEK(C)OTC MAR 1.04 02.03.17 PUT60,000,000 49,732.55 0.02NOKUSD(C)/CAD(P)OTC FEB 1.38 13.02.17 CALL28,000,000 129,832.77 0.06USDUSD(C)/CAD(P)OTC FEB 1.42 13.02.17 CALL14,000,000 18,006.81 0.01USDUSD(C)/CAD(P)OTC FEB 1.42 13.02.17 CALL(42,000,000) (54,020.42) (0.03)USDUSD(C)/CAD(P)OTC FEB 1.42 13.02.17 CALL28,000,000 36,013.61 0.02USDUSD(C)/CAD(P)OTC FEB 1.44 13.02.17 CALL14,000,000 9,157.02 0.00USDUSD(C)/JPY(P)OTC JAN 110.00 24.01.17 CALL(15,000,000) (798,696.41) (0.39)USDUSD(C)/JPY(P)OTC JAN 110.00 24.01.17 CALL30,000,000 1,597,392.82 0.78USDUSD(C)/JPY(P)OTC JAN 110.00 24.01.17 CALL(15,000,000) (798,696.41) (0.39)USDUSD(C)/JPY(P)OTC MAR 120.00 03.03.17 CALL29,000,000 238,100.80 0.12USDUSD(C)/JPY(P)OTC MAR 120.00 03.03.17 CALL(7,250,000) (59,525.20) (0.03)USDUSD(C)/JPY(P)OTC MAR 125.00 03.03.17 CALL(29,000,000) (59,925.59) (0.03)USDUSD(C)/JPY(P)OTC MAR 125.00 03.03.17 CALL29,000,000 59,925.59 0.03USDUSD(C)/MXN(P)OTC APR 24.00 07.04.17 CALL(14,000,000) (34,267.33) (0.02)USDUSD(P)/BRL(C)OTC FEB 3.10 21.02.17 PUT42,000,000 183,723.72 0.09USDUSD(P)/MXN(C)OTC APR 17.50 07.04.17 PUT28,000,000 15,869.20 0.01USD
US 10 YEAR NOTE JAN 120.50 27.01.17 PUT(134) (7,984.17) 0.00USDUnited States of America 11,976.27 0.01
US 10 YEAR NOTE JAN 121.00 27.01.17 PUT(134) (11,976.26) (0.01)USDUS 10 YEAR NOTE JAN 122.50 27.01.17 PUT134 31,936.70 0.02USD
EURX EURO BUND FEB 161.00 27.02.17 PUT121 (1,330.00) 0.00EURGermany (57,370.00) (0.03)
EURX EURO BUND FEB 160.00 27.02.17 PUT76 (44,080.00) (0.02)EUREURX EURO BUND JAN 160.00 30.01.17 PUT(18) 7,760.00 0.00EUR
Securities portfolio as at 31/12/16EURExpressed in
BG SICAV – Amundi Global Income Bond
Quantity Denomination Quotationcurrency
% of netassetsMarket value

The accompanying notes form an integral part of these financial statements
193Page
EURX EURO BUND JAN 163.00 30.01.17 CALL(17) (19,720.00) (0.01)EUR
Total securities portfolio 188,288,581.12 92.15
Securities portfolio as at 31/12/16EURExpressed in
BG SICAV – Amundi Global Income Bond
Quantity Denomination Quotationcurrency
% of netassetsMarket value
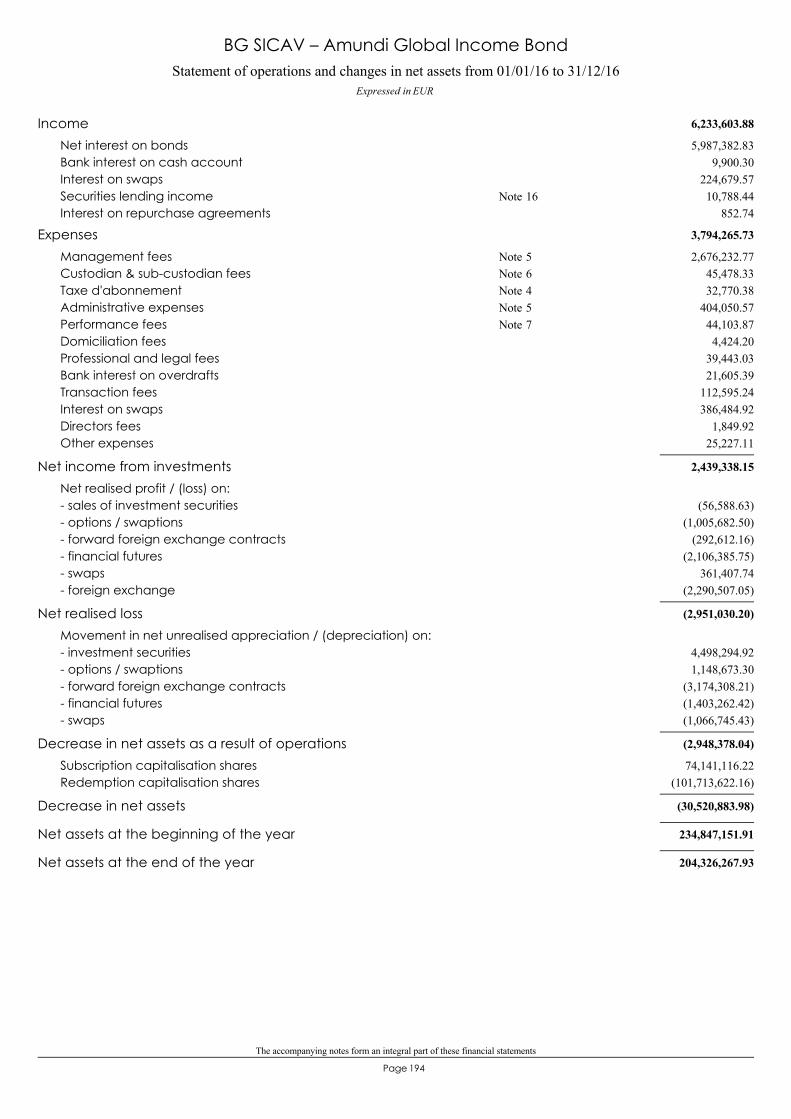
The accompanying notes form an integral part of these financial statements
194Page
Statement of operations and changes in net assets from 01/01/16 to 31/12/16Expressed in EUR
BG SICAV – Amundi Global Income Bond
6,233,603.88Income5,987,382.83Net interest on bonds
9,900.30Bank interest on cash account224,679.57Interest on swaps10,788.44Securities lending income 16Note
852.74Interest on repurchase agreements
3,794,265.73Expenses2,676,232.77Management fees 5Note
45,478.33Custodian & sub-custodian fees 6Note32,770.38Taxe d'abonnement 4Note
404,050.57Administrative expenses 5Note44,103.87Performance fees 7Note4,424.20Domiciliation fees
39,443.03Professional and legal fees21,605.39Bank interest on overdrafts
112,595.24Transaction fees386,484.92Interest on swaps
1,849.92Directors fees25,227.11Other expenses
2,439,338.15Net income from investmentsNet realised profit / (loss) on:
(56,588.63)- sales of investment securities(1,005,682.50)- options / swaptions
(292,612.16)- forward foreign exchange contracts(2,106,385.75)- financial futures
361,407.74- swaps(2,290,507.05)- foreign exchange
(2,951,030.20)Net realised lossMovement in net unrealised appreciation / (depreciation) on:
4,498,294.92- investment securities1,148,673.30- options / swaptions
(3,174,308.21)- forward foreign exchange contracts(1,403,262.42)- financial futures(1,066,745.43)- swaps
(2,948,378.04)Decrease in net assets as a result of operations74,141,116.22Subscription capitalisation shares
(101,713,622.16)Redemption capitalisation shares
(30,520,883.98)Decrease in net assets
234,847,151.91Net assets at the beginning of the year
204,326,267.93Net assets at the end of the year

195Page
BG SICAV– UBS Dynamic Credit High Yield
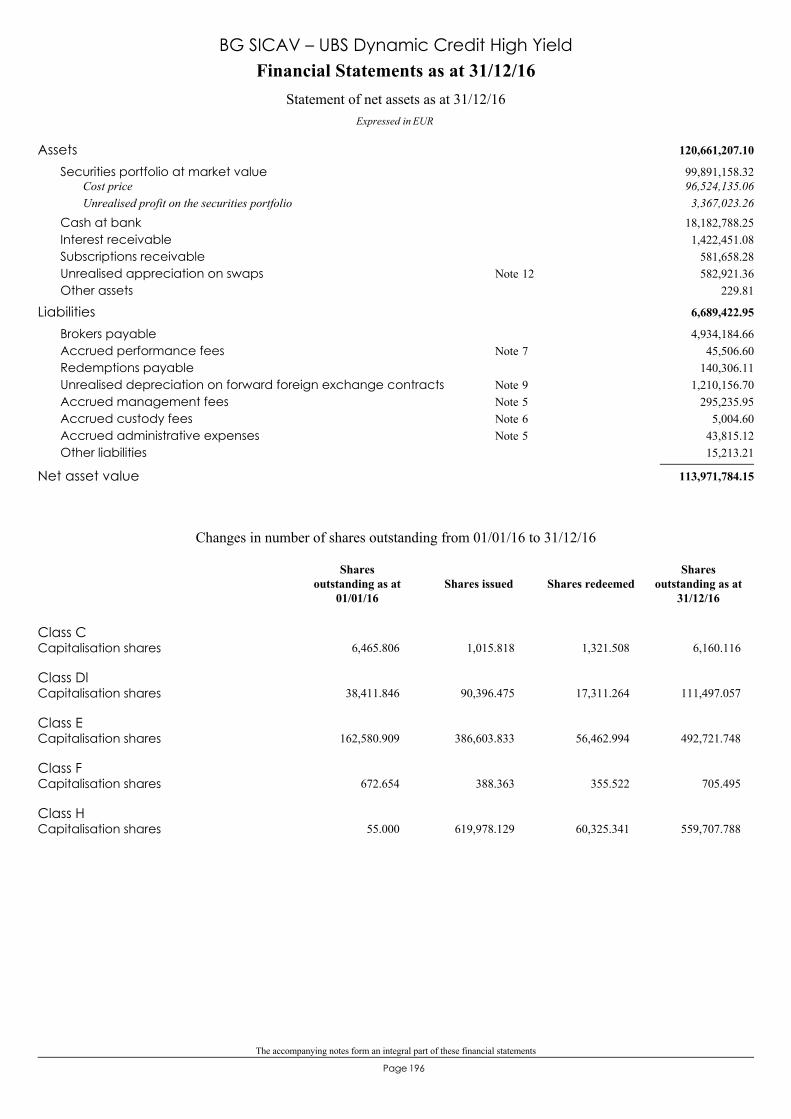
The accompanying notes form an integral part of these financial statements
196Page
120,661,207.10Assets99,891,158.32Securities portfolio at market value96,524,135.06Cost price3,367,023.26Unrealised profit on the securities portfolio
18,182,788.25Cash at bank1,422,451.08Interest receivable
581,658.28Subscriptions receivable582,921.36Unrealised appreciation on swaps 12Note
229.81Other assets
6,689,422.95Liabilities4,934,184.66Brokers payable
45,506.60Accrued performance fees 7Note140,306.11Redemptions payable
1,210,156.70Unrealised depreciation on forward foreign exchange contracts 9Note295,235.95Accrued management fees 5Note
5,004.60Accrued custody fees 6Note43,815.12Accrued administrative expenses 5Note15,213.21Other liabilities
113,971,784.15Net asset value
Financial Statements as at 31/12/16
Expressed in EUR
Statement of net assets as at 31/12/16
BG SICAV – UBS Dynamic Credit High Yield
Class CCapitalisation shares 6,465.806 1,015.818 1,321.508 6,160.116
Class DlCapitalisation shares 38,411.846 90,396.475 17,311.264 111,497.057
Class ECapitalisation shares 162,580.909 386,603.833 56,462.994 492,721.748
Class FCapitalisation shares 672.654 388.363 355.522 705.495
Class HCapitalisation shares 55.000 619,978.129 60,325.341 559,707.788
Changes in number of shares outstanding from 01/01/16 to 31/12/16
Shares issued Shares redeemedShares
outstanding as at31/12/16
Sharesoutstanding as at
01/01/16

The accompanying notes form an integral part of these financial statements
197Page
Key figures
BG SICAV – UBS Dynamic Credit High Yield
Class C
Capitalisation shares
93.466,160.116 6,465.806
86.846,875.582
93.31Number of sharesNet asset value per share
EUR EUR EUR
Class Dl
Capitalisation shares
94.33111,497.057 38,411.846
87.7262,186.621
94.30Number of sharesNet asset value per share
EUR EUR EUR
Class E
Capitalisation shares
96.22492,721.748 162,580.909
88.93278,224.658
94.96Number of sharesNet asset value per share
EUR EUR EUR
Class F
Capitalisation shares
96.19705.495 672.654
88.43222.01894.11
Number of sharesNet asset value per share
EUR EUR EUR
Class H
Capitalisation shares
98.99559,707.788 55.000
92.030.0000.00
Number of sharesNet asset value per share
EUR EUR EUR
Total Net Assets 113,971,784.15 18,453,419.37 32,945,364.76
31/12/1431/12/1531/12/16Year ending as at:
EUR
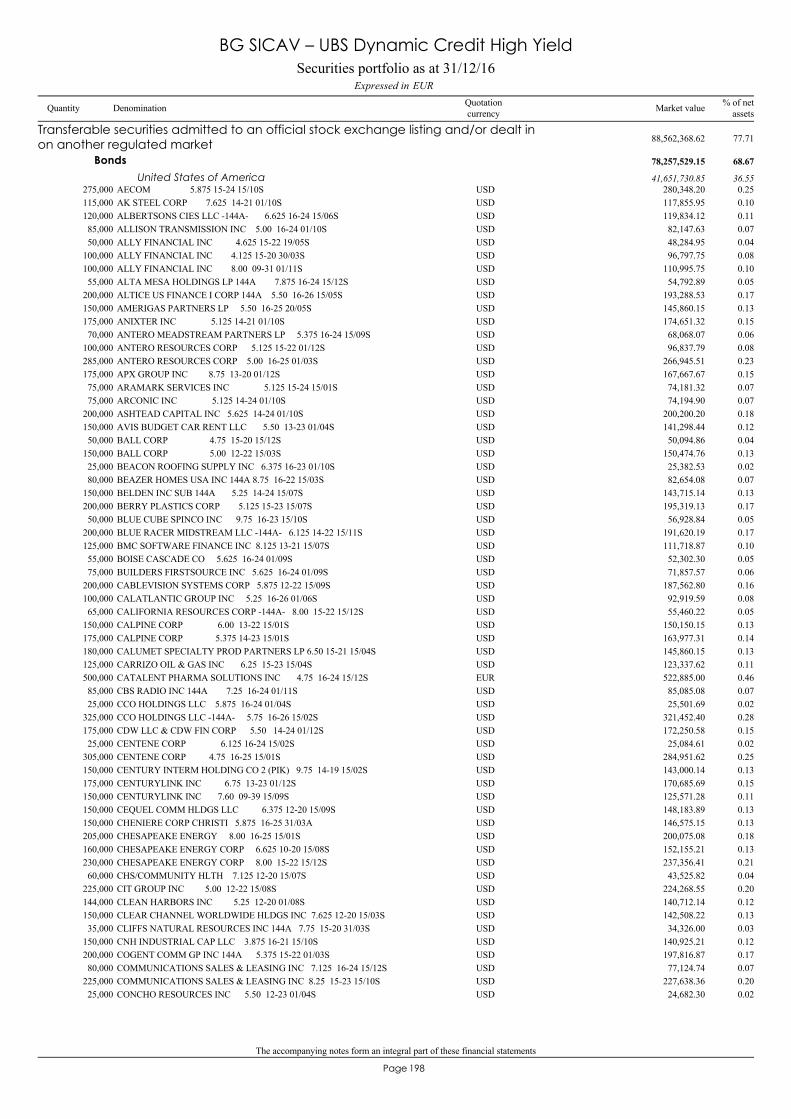
The accompanying notes form an integral part of these financial statements
198Page
AECOM 5.875 15-24 15/10S275,000 280,348.20 0.25USD
Transferable securities admitted to an official stock exchange listing and/or dealt inon another regulated market 88,562,368.62 77.71
Bonds 78,257,529.15 68.67
United States of America 41,651,730.85 36.55
AK STEEL CORP 7.625 14-21 01/10S115,000 117,855.95 0.10USDALBERTSONS CIES LLC -144A- 6.625 16-24 15/06S120,000 119,834.12 0.11USDALLISON TRANSMISSION INC 5.00 16-24 01/10S85,000 82,147.63 0.07USDALLY FINANCIAL INC 4.625 15-22 19/05S50,000 48,284.95 0.04USDALLY FINANCIAL INC 4.125 15-20 30/03S100,000 96,797.75 0.08USDALLY FINANCIAL INC 8.00 09-31 01/11S100,000 110,995.75 0.10USDALTA MESA HOLDINGS LP 144A 7.875 16-24 15/12S55,000 54,792.89 0.05USDALTICE US FINANCE I CORP 144A 5.50 16-26 15/05S200,000 193,288.53 0.17USDAMERIGAS PARTNERS LP 5.50 16-25 20/05S150,000 145,860.15 0.13USDANIXTER INC 5.125 14-21 01/10S175,000 174,651.32 0.15USDANTERO MEADSTREAM PARTNERS LP 5.375 16-24 15/09S70,000 68,068.07 0.06USDANTERO RESOURCES CORP 5.125 15-22 01/12S100,000 96,837.79 0.08USDANTERO RESOURCES CORP 5.00 16-25 01/03S285,000 266,945.51 0.23USDAPX GROUP INC 8.75 13-20 01/12S175,000 167,667.67 0.15USDARAMARK SERVICES INC 5.125 15-24 15/01S75,000 74,181.32 0.07USDARCONIC INC 5.125 14-24 01/10S75,000 74,194.90 0.07USDASHTEAD CAPITAL INC 5.625 14-24 01/10S200,000 200,200.20 0.18USDAVIS BUDGET CAR RENT LLC 5.50 13-23 01/04S150,000 141,298.44 0.12USDBALL CORP 4.75 15-20 15/12S50,000 50,094.86 0.04USDBALL CORP 5.00 12-22 15/03S150,000 150,474.76 0.13USDBEACON ROOFING SUPPLY INC 6.375 16-23 01/10S25,000 25,382.53 0.02USDBEAZER HOMES USA INC 144A 8.75 16-22 15/03S80,000 82,654.08 0.07USDBELDEN INC SUB 144A 5.25 14-24 15/07S150,000 143,715.14 0.13USDBERRY PLASTICS CORP 5.125 15-23 15/07S200,000 195,319.13 0.17USDBLUE CUBE SPINCO INC 9.75 16-23 15/10S50,000 56,928.84 0.05USDBLUE RACER MIDSTREAM LLC -144A- 6.125 14-22 15/11S200,000 191,620.19 0.17USDBMC SOFTWARE FINANCE INC 8.125 13-21 15/07S125,000 111,718.87 0.10USDBOISE CASCADE CO 5.625 16-24 01/09S55,000 52,302.30 0.05USDBUILDERS FIRSTSOURCE INC 5.625 16-24 01/09S75,000 71,857.57 0.06USDCABLEVISION SYSTEMS CORP 5.875 12-22 15/09S200,000 187,562.80 0.16USDCALATLANTIC GROUP INC 5.25 16-26 01/06S100,000 92,919.59 0.08USDCALIFORNIA RESOURCES CORP -144A- 8.00 15-22 15/12S65,000 55,460.22 0.05USDCALPINE CORP 6.00 13-22 15/01S150,000 150,150.15 0.13USDCALPINE CORP 5.375 14-23 15/01S175,000 163,977.31 0.14USDCALUMET SPECIALTY PROD PARTNERS LP 6.50 15-21 15/04S180,000 145,860.15 0.13USDCARRIZO OIL & GAS INC 6.25 15-23 15/04S125,000 123,337.62 0.11USDCATALENT PHARMA SOLUTIONS INC 4.75 16-24 15/12S500,000 522,885.00 0.46EURCBS RADIO INC 144A 7.25 16-24 01/11S85,000 85,085.08 0.07USDCCO HOLDINGS LLC 5.875 16-24 01/04S25,000 25,501.69 0.02USDCCO HOLDINGS LLC -144A- 5.75 16-26 15/02S325,000 321,452.40 0.28USDCDW LLC & CDW FIN CORP 5.50 14-24 01/12S175,000 172,250.58 0.15USDCENTENE CORP 6.125 16-24 15/02S25,000 25,084.61 0.02USDCENTENE CORP 4.75 16-25 15/01S305,000 284,951.62 0.25USDCENTURY INTERM HOLDING CO 2 (PIK) 9.75 14-19 15/02S150,000 143,000.14 0.13USDCENTURYLINK INC 6.75 13-23 01/12S175,000 170,685.69 0.15USDCENTURYLINK INC 7.60 09-39 15/09S150,000 125,571.28 0.11USDCEQUEL COMM HLDGS LLC 6.375 12-20 15/09S150,000 148,183.89 0.13USDCHENIERE CORP CHRISTI 5.875 16-25 31/03A150,000 146,575.15 0.13USDCHESAPEAKE ENERGY 8.00 16-25 15/01S205,000 200,075.08 0.18USDCHESAPEAKE ENERGY CORP 6.625 10-20 15/08S160,000 152,155.21 0.13USDCHESAPEAKE ENERGY CORP 8.00 15-22 15/12S230,000 237,356.41 0.21USDCHS/COMMUNITY HLTH 7.125 12-20 15/07S60,000 43,525.82 0.04USDCIT GROUP INC 5.00 12-22 15/08S225,000 224,268.55 0.20USDCLEAN HARBORS INC 5.25 12-20 01/08S144,000 140,712.14 0.12USDCLEAR CHANNEL WORLDWIDE HLDGS INC 7.625 12-20 15/03S150,000 142,508.22 0.13USDCLIFFS NATURAL RESOURCES INC 144A 7.75 15-20 31/03S35,000 34,326.00 0.03USDCNH INDUSTRIAL CAP LLC 3.875 16-21 15/10S150,000 140,925.21 0.12USDCOGENT COMM GP INC 144A 5.375 15-22 01/03S200,000 197,816.87 0.17USDCOMMUNICATIONS SALES & LEASING INC 7.125 16-24 15/12S80,000 77,124.74 0.07USDCOMMUNICATIONS SALES & LEASING INC 8.25 15-23 15/10S225,000 227,638.36 0.20USDCONCHO RESOURCES INC 5.50 12-23 01/04S25,000 24,682.30 0.02USD
Securities portfolio as at 31/12/16EURExpressed in
BG SICAV – UBS Dynamic Credit High Yield
Quantity Denomination Quotationcurrency
% of netassetsMarket value
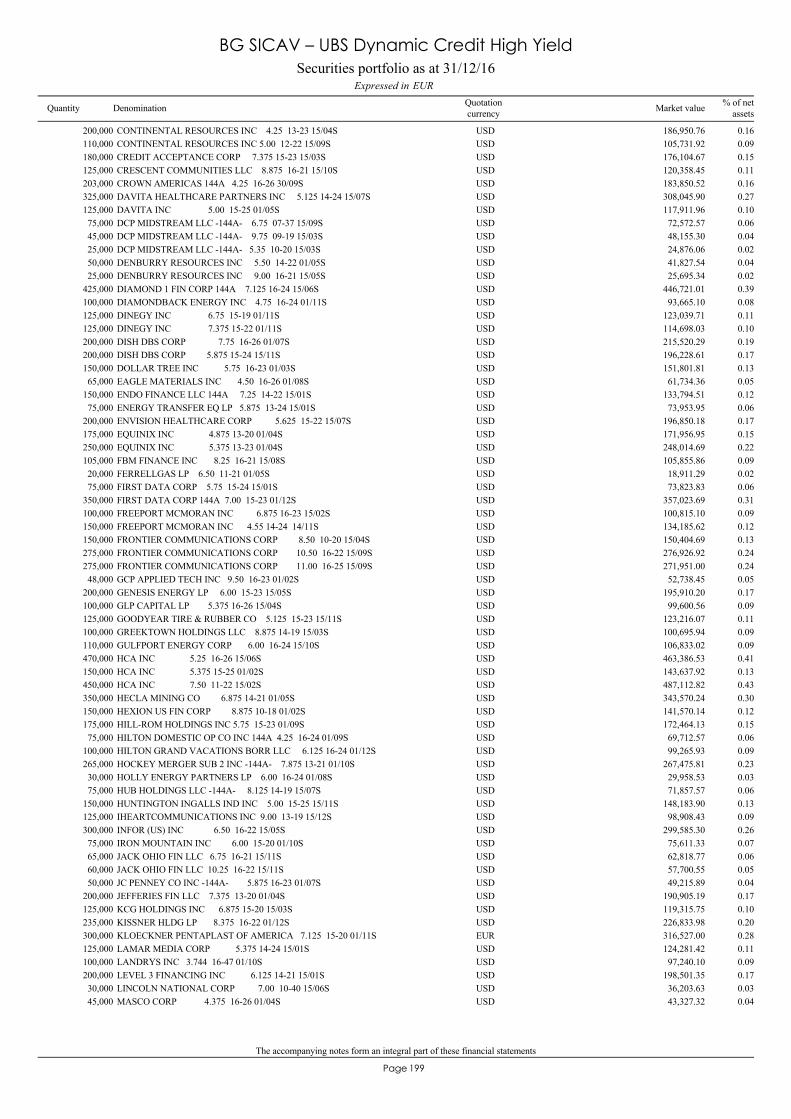
The accompanying notes form an integral part of these financial statements
199Page
CONTINENTAL RESOURCES INC 4.25 13-23 15/04S200,000 186,950.76 0.16USDCONTINENTAL RESOURCES INC 5.00 12-22 15/09S110,000 105,731.92 0.09USDCREDIT ACCEPTANCE CORP 7.375 15-23 15/03S180,000 176,104.67 0.15USDCRESCENT COMMUNITIES LLC 8.875 16-21 15/10S125,000 120,358.45 0.11USDCROWN AMERICAS 144A 4.25 16-26 30/09S203,000 183,850.52 0.16USDDAVITA HEALTHCARE PARTNERS INC 5.125 14-24 15/07S325,000 308,045.90 0.27USDDAVITA INC 5.00 15-25 01/05S125,000 117,911.96 0.10USDDCP MIDSTREAM LLC -144A- 6.75 07-37 15/09S75,000 72,572.57 0.06USDDCP MIDSTREAM LLC -144A- 9.75 09-19 15/03S45,000 48,155.30 0.04USDDCP MIDSTREAM LLC -144A- 5.35 10-20 15/03S25,000 24,876.06 0.02USDDENBURRY RESOURCES INC 5.50 14-22 01/05S50,000 41,827.54 0.04USDDENBURRY RESOURCES INC 9.00 16-21 15/05S25,000 25,695.34 0.02USDDIAMOND 1 FIN CORP 144A 7.125 16-24 15/06S425,000 446,721.01 0.39USDDIAMONDBACK ENERGY INC 4.75 16-24 01/11S100,000 93,665.10 0.08USDDINEGY INC 6.75 15-19 01/11S125,000 123,039.71 0.11USDDINEGY INC 7.375 15-22 01/11S125,000 114,698.03 0.10USDDISH DBS CORP 7.75 16-26 01/07S200,000 215,520.29 0.19USDDISH DBS CORP 5.875 15-24 15/11S200,000 196,228.61 0.17USDDOLLAR TREE INC 5.75 16-23 01/03S150,000 151,801.81 0.13USDEAGLE MATERIALS INC 4.50 16-26 01/08S65,000 61,734.36 0.05USDENDO FINANCE LLC 144A 7.25 14-22 15/01S150,000 133,794.51 0.12USDENERGY TRANSFER EQ LP 5.875 13-24 15/01S75,000 73,953.95 0.06USDENVISION HEALTHCARE CORP 5.625 15-22 15/07S200,000 196,850.18 0.17USDEQUINIX INC 4.875 13-20 01/04S175,000 171,956.95 0.15USDEQUINIX INC 5.375 13-23 01/04S250,000 248,014.69 0.22USDFBM FINANCE INC 8.25 16-21 15/08S105,000 105,855.86 0.09USDFERRELLGAS LP 6.50 11-21 01/05S20,000 18,911.29 0.02USDFIRST DATA CORP 5.75 15-24 15/01S75,000 73,823.83 0.06USDFIRST DATA CORP 144A 7.00 15-23 01/12S350,000 357,023.69 0.31USDFREEPORT MCMORAN INC 6.875 16-23 15/02S100,000 100,815.10 0.09USDFREEPORT MCMORAN INC 4.55 14-24 14/11S150,000 134,185.62 0.12USDFRONTIER COMMUNICATIONS CORP 8.50 10-20 15/04S150,000 150,404.69 0.13USDFRONTIER COMMUNICATIONS CORP 10.50 16-22 15/09S275,000 276,926.92 0.24USDFRONTIER COMMUNICATIONS CORP 11.00 16-25 15/09S275,000 271,951.00 0.24USDGCP APPLIED TECH INC 9.50 16-23 01/02S48,000 52,738.45 0.05USDGENESIS ENERGY LP 6.00 15-23 15/05S200,000 195,910.20 0.17USDGLP CAPITAL LP 5.375 16-26 15/04S100,000 99,600.56 0.09USDGOODYEAR TIRE & RUBBER CO 5.125 15-23 15/11S125,000 123,216.07 0.11USDGREEKTOWN HOLDINGS LLC 8.875 14-19 15/03S100,000 100,695.94 0.09USDGULFPORT ENERGY CORP 6.00 16-24 15/10S110,000 106,833.02 0.09USDHCA INC 5.25 16-26 15/06S470,000 463,386.53 0.41USDHCA INC 5.375 15-25 01/02S150,000 143,637.92 0.13USDHCA INC 7.50 11-22 15/02S450,000 487,112.82 0.43USDHECLA MINING CO 6.875 14-21 01/05S350,000 343,570.24 0.30USDHEXION US FIN CORP 8.875 10-18 01/02S150,000 141,570.14 0.12USDHILL-ROM HOLDINGS INC 5.75 15-23 01/09S175,000 172,464.13 0.15USDHILTON DOMESTIC OP CO INC 144A 4.25 16-24 01/09S75,000 69,712.57 0.06USDHILTON GRAND VACATIONS BORR LLC 6.125 16-24 01/12S100,000 99,265.93 0.09USDHOCKEY MERGER SUB 2 INC -144A- 7.875 13-21 01/10S265,000 267,475.81 0.23USDHOLLY ENERGY PARTNERS LP 6.00 16-24 01/08S30,000 29,958.53 0.03USDHUB HOLDINGS LLC -144A- 8.125 14-19 15/07S75,000 71,857.57 0.06USDHUNTINGTON INGALLS IND INC 5.00 15-25 15/11S150,000 148,183.90 0.13USDIHEARTCOMMUNICATIONS INC 9.00 13-19 15/12S125,000 98,908.43 0.09USDINFOR (US) INC 6.50 16-22 15/05S300,000 299,585.30 0.26USDIRON MOUNTAIN INC 6.00 15-20 01/10S75,000 75,611.33 0.07USDJACK OHIO FIN LLC 6.75 16-21 15/11S65,000 62,818.77 0.06USDJACK OHIO FIN LLC 10.25 16-22 15/11S60,000 57,700.55 0.05USDJC PENNEY CO INC -144A- 5.875 16-23 01/07S50,000 49,215.89 0.04USDJEFFERIES FIN LLC 7.375 13-20 01/04S200,000 190,905.19 0.17USDKCG HOLDINGS INC 6.875 15-20 15/03S125,000 119,315.75 0.10USDKISSNER HLDG LP 8.375 16-22 01/12S235,000 226,833.98 0.20USDKLOECKNER PENTAPLAST OF AMERICA 7.125 15-20 01/11S300,000 316,527.00 0.28EURLAMAR MEDIA CORP 5.375 14-24 15/01S125,000 124,281.42 0.11USDLANDRYS INC 3.744 16-47 01/10S100,000 97,240.10 0.09USDLEVEL 3 FINANCING INC 6.125 14-21 15/01S200,000 198,501.35 0.17USDLINCOLN NATIONAL CORP 7.00 10-40 15/06S30,000 36,203.63 0.03USDMASCO CORP 4.375 16-26 01/04S45,000 43,327.32 0.04USD
Securities portfolio as at 31/12/16EURExpressed in
BG SICAV – UBS Dynamic Credit High Yield
Quantity Denomination Quotationcurrency
% of netassetsMarket value
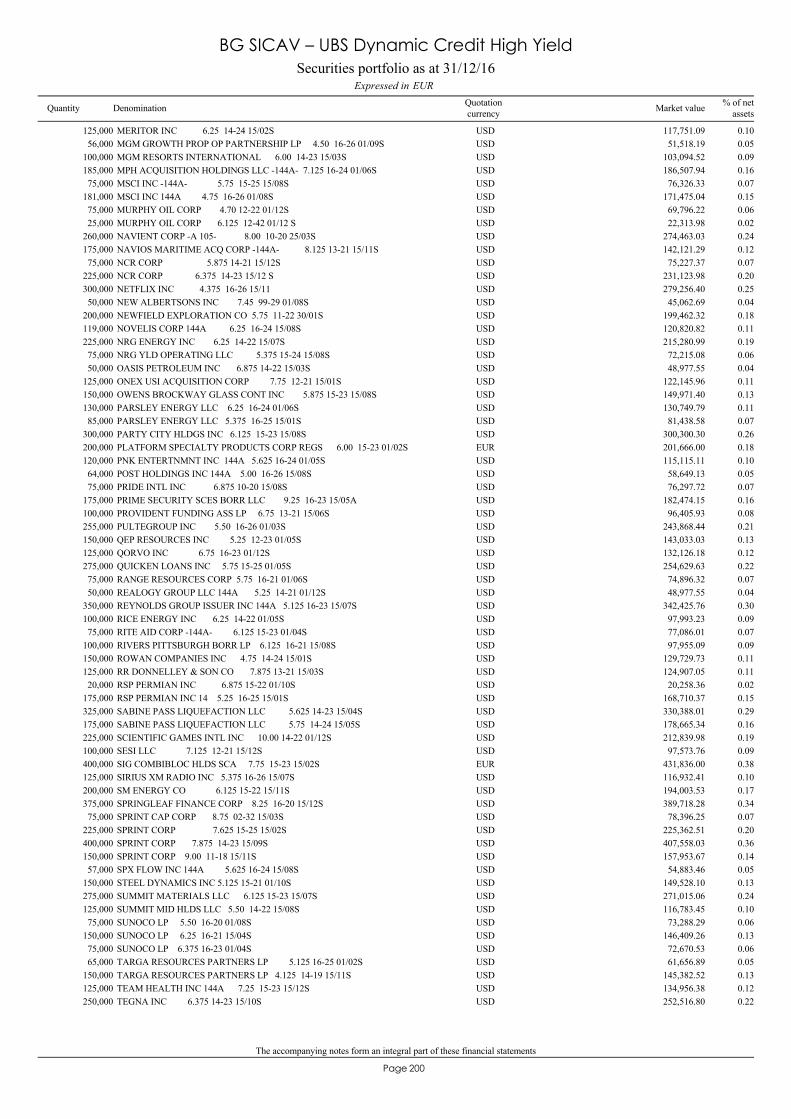
The accompanying notes form an integral part of these financial statements
200Page
MERITOR INC 6.25 14-24 15/02S125,000 117,751.09 0.10USDMGM GROWTH PROP OP PARTNERSHIP LP 4.50 16-26 01/09S56,000 51,518.19 0.05USDMGM RESORTS INTERNATIONAL 6.00 14-23 15/03S100,000 103,094.52 0.09USDMPH ACQUISITION HOLDINGS LLC -144A- 7.125 16-24 01/06S185,000 186,507.94 0.16USDMSCI INC -144A- 5.75 15-25 15/08S75,000 76,326.33 0.07USDMSCI INC 144A 4.75 16-26 01/08S181,000 171,475.04 0.15USDMURPHY OIL CORP 4.70 12-22 01/12S75,000 69,796.22 0.06USDMURPHY OIL CORP 6.125 12-42 01/12 S25,000 22,313.98 0.02USDNAVIENT CORP -A 105- 8.00 10-20 25/03S260,000 274,463.03 0.24USDNAVIOS MARITIME ACQ CORP -144A- 8.125 13-21 15/11S175,000 142,121.29 0.12USDNCR CORP 5.875 14-21 15/12S75,000 75,227.37 0.07USDNCR CORP 6.375 14-23 15/12 S225,000 231,123.98 0.20USDNETFLIX INC 4.375 16-26 15/11300,000 279,256.40 0.25USDNEW ALBERTSONS INC 7.45 99-29 01/08S50,000 45,062.69 0.04USDNEWFIELD EXPLORATION CO 5.75 11-22 30/01S200,000 199,462.32 0.18USDNOVELIS CORP 144A 6.25 16-24 15/08S119,000 120,820.82 0.11USDNRG ENERGY INC 6.25 14-22 15/07S225,000 215,280.99 0.19USDNRG YLD OPERATING LLC 5.375 15-24 15/08S75,000 72,215.08 0.06USDOASIS PETROLEUM INC 6.875 14-22 15/03S50,000 48,977.55 0.04USDONEX USI ACQUISITION CORP 7.75 12-21 15/01S125,000 122,145.96 0.11USDOWENS BROCKWAY GLASS CONT INC 5.875 15-23 15/08S150,000 149,971.40 0.13USDPARSLEY ENERGY LLC 6.25 16-24 01/06S130,000 130,749.79 0.11USDPARSLEY ENERGY LLC 5.375 16-25 15/01S85,000 81,438.58 0.07USDPARTY CITY HLDGS INC 6.125 15-23 15/08S300,000 300,300.30 0.26USDPLATFORM SPECIALTY PRODUCTS CORP REGS 6.00 15-23 01/02S200,000 201,666.00 0.18EURPNK ENTERTNMNT INC 144A 5.625 16-24 01/05S120,000 115,115.11 0.10USDPOST HOLDINGS INC 144A 5.00 16-26 15/08S64,000 58,649.13 0.05USDPRIDE INTL INC 6.875 10-20 15/08S75,000 76,297.72 0.07USDPRIME SECURITY SCES BORR LLC 9.25 16-23 15/05A175,000 182,474.15 0.16USDPROVIDENT FUNDING ASS LP 6.75 13-21 15/06S100,000 96,405.93 0.08USDPULTEGROUP INC 5.50 16-26 01/03S255,000 243,868.44 0.21USDQEP RESOURCES INC 5.25 12-23 01/05S150,000 143,033.03 0.13USDQORVO INC 6.75 16-23 01/12S125,000 132,126.18 0.12USDQUICKEN LOANS INC 5.75 15-25 01/05S275,000 254,629.63 0.22USDRANGE RESOURCES CORP 5.75 16-21 01/06S75,000 74,896.32 0.07USDREALOGY GROUP LLC 144A 5.25 14-21 01/12S50,000 48,977.55 0.04USDREYNOLDS GROUP ISSUER INC 144A 5.125 16-23 15/07S350,000 342,425.76 0.30USDRICE ENERGY INC 6.25 14-22 01/05S100,000 97,993.23 0.09USDRITE AID CORP -144A- 6.125 15-23 01/04S75,000 77,086.01 0.07USDRIVERS PITTSBURGH BORR LP 6.125 16-21 15/08S100,000 97,955.09 0.09USDROWAN COMPANIES INC 4.75 14-24 15/01S150,000 129,729.73 0.11USDRR DONNELLEY & SON CO 7.875 13-21 15/03S125,000 124,907.05 0.11USDRSP PERMIAN INC 6.875 15-22 01/10S20,000 20,258.36 0.02USDRSP PERMIAN INC 14 5.25 16-25 15/01S175,000 168,710.37 0.15USDSABINE PASS LIQUEFACTION LLC 5.625 14-23 15/04S325,000 330,388.01 0.29USDSABINE PASS LIQUEFACTION LLC 5.75 14-24 15/05S175,000 178,665.34 0.16USDSCIENTIFIC GAMES INTL INC 10.00 14-22 01/12S225,000 212,839.98 0.19USDSESI LLC 7.125 12-21 15/12S100,000 97,573.76 0.09USDSIG COMBIBLOC HLDS SCA 7.75 15-23 15/02S400,000 431,836.00 0.38EURSIRIUS XM RADIO INC 5.375 16-26 15/07S125,000 116,932.41 0.10USDSM ENERGY CO 6.125 15-22 15/11S200,000 194,003.53 0.17USDSPRINGLEAF FINANCE CORP 8.25 16-20 15/12S375,000 389,718.28 0.34USDSPRINT CAP CORP 8.75 02-32 15/03S75,000 78,396.25 0.07USDSPRINT CORP 7.625 15-25 15/02S225,000 225,362.51 0.20USDSPRINT CORP 7.875 14-23 15/09S400,000 407,558.03 0.36USDSPRINT CORP 9.00 11-18 15/11S150,000 157,953.67 0.14USDSPX FLOW INC 144A 5.625 16-24 15/08S57,000 54,883.46 0.05USDSTEEL DYNAMICS INC 5.125 15-21 01/10S150,000 149,528.10 0.13USDSUMMIT MATERIALS LLC 6.125 15-23 15/07S275,000 271,015.06 0.24USDSUMMIT MID HLDS LLC 5.50 14-22 15/08S125,000 116,783.45 0.10USDSUNOCO LP 5.50 16-20 01/08S75,000 73,288.29 0.06USDSUNOCO LP 6.25 16-21 15/04S150,000 146,409.26 0.13USDSUNOCO LP 6.375 16-23 01/04S75,000 72,670.53 0.06USDTARGA RESOURCES PARTNERS LP 5.125 16-25 01/02S65,000 61,656.89 0.05USDTARGA RESOURCES PARTNERS LP 4.125 14-19 15/11S150,000 145,382.52 0.13USDTEAM HEALTH INC 144A 7.25 15-23 15/12S125,000 134,956.38 0.12USDTEGNA INC 6.375 14-23 15/10S250,000 252,516.80 0.22USD
Securities portfolio as at 31/12/16EURExpressed in
BG SICAV – UBS Dynamic Credit High Yield
Quantity Denomination Quotationcurrency
% of netassetsMarket value
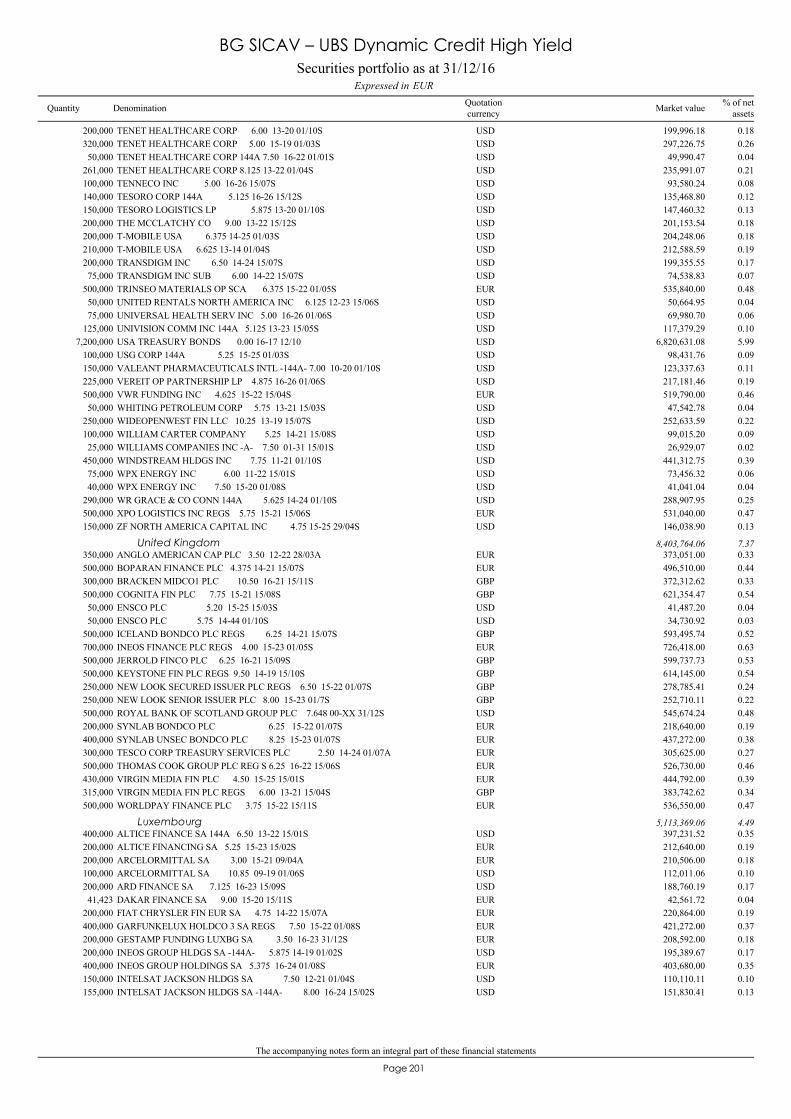
The accompanying notes form an integral part of these financial statements
201Page
TENET HEALTHCARE CORP 6.00 13-20 01/10S200,000 199,996.18 0.18USDTENET HEALTHCARE CORP 5.00 15-19 01/03S320,000 297,226.75 0.26USDTENET HEALTHCARE CORP 144A 7.50 16-22 01/01S50,000 49,990.47 0.04USDTENET HEALTHCARE CORP 8.125 13-22 01/04S261,000 235,991.07 0.21USDTENNECO INC 5.00 16-26 15/07S100,000 93,580.24 0.08USDTESORO CORP 144A 5.125 16-26 15/12S140,000 135,468.80 0.12USDTESORO LOGISTICS LP 5.875 13-20 01/10S150,000 147,460.32 0.13USDTHE MCCLATCHY CO 9.00 13-22 15/12S200,000 201,153.54 0.18USDT-MOBILE USA 6.375 14-25 01/03S200,000 204,248.06 0.18USDT-MOBILE USA 6.625 13-14 01/04S210,000 212,588.59 0.19USDTRANSDIGM INC 6.50 14-24 15/07S200,000 199,355.55 0.17USDTRANSDIGM INC SUB 6.00 14-22 15/07S75,000 74,538.83 0.07USDTRINSEO MATERIALS OP SCA 6.375 15-22 01/05S500,000 535,840.00 0.48EURUNITED RENTALS NORTH AMERICA INC 6.125 12-23 15/06S50,000 50,664.95 0.04USDUNIVERSAL HEALTH SERV INC 5.00 16-26 01/06S75,000 69,980.70 0.06USDUNIVISION COMM INC 144A 5.125 13-23 15/05S125,000 117,379.29 0.10USDUSA TREASURY BONDS 0.00 16-17 12/107,200,000 6,820,631.08 5.99USDUSG CORP 144A 5.25 15-25 01/03S100,000 98,431.76 0.09USDVALEANT PHARMACEUTICALS INTL -144A- 7.00 10-20 01/10S150,000 123,337.63 0.11USDVEREIT OP PARTNERSHIP LP 4.875 16-26 01/06S225,000 217,181.46 0.19USDVWR FUNDING INC 4.625 15-22 15/04S500,000 519,790.00 0.46EURWHITING PETROLEUM CORP 5.75 13-21 15/03S50,000 47,542.78 0.04USDWIDEOPENWEST FIN LLC 10.25 13-19 15/07S250,000 252,633.59 0.22USDWILLIAM CARTER COMPANY 5.25 14-21 15/08S100,000 99,015.20 0.09USDWILLIAMS COMPANIES INC -A- 7.50 01-31 15/01S25,000 26,929.07 0.02USDWINDSTREAM HLDGS INC 7.75 11-21 01/10S450,000 441,312.75 0.39USDWPX ENERGY INC 6.00 11-22 15/01S75,000 73,456.32 0.06USDWPX ENERGY INC 7.50 15-20 01/08S40,000 41,041.04 0.04USDWR GRACE & CO CONN 144A 5.625 14-24 01/10S290,000 288,907.95 0.25USDXPO LOGISTICS INC REGS 5.75 15-21 15/06S500,000 531,040.00 0.47EURZF NORTH AMERICA CAPITAL INC 4.75 15-25 29/04S150,000 146,038.90 0.13USD
ANGLO AMERICAN CAP PLC 3.50 12-22 28/03A350,000 373,051.00 0.33EURUnited Kingdom 8,403,764.06 7.37
BOPARAN FINANCE PLC 4.375 14-21 15/07S500,000 496,510.00 0.44EURBRACKEN MIDCO1 PLC 10.50 16-21 15/11S300,000 372,312.62 0.33GBPCOGNITA FIN PLC 7.75 15-21 15/08S500,000 621,354.47 0.54GBPENSCO PLC 5.20 15-25 15/03S50,000 41,487.20 0.04USDENSCO PLC 5.75 14-44 01/10S50,000 34,730.92 0.03USDICELAND BONDCO PLC REGS 6.25 14-21 15/07S500,000 593,495.74 0.52GBPINEOS FINANCE PLC REGS 4.00 15-23 01/05S700,000 726,418.00 0.63EURJERROLD FINCO PLC 6.25 16-21 15/09S500,000 599,737.73 0.53GBPKEYSTONE FIN PLC REGS 9.50 14-19 15/10S500,000 614,145.00 0.54GBPNEW LOOK SECURED ISSUER PLC REGS 6.50 15-22 01/07S250,000 278,785.41 0.24GBPNEW LOOK SENIOR ISSUER PLC 8.00 15-23 01/7S250,000 252,710.11 0.22GBPROYAL BANK OF SCOTLAND GROUP PLC 7.648 00-XX 31/12S500,000 545,674.24 0.48USDSYNLAB BONDCO PLC 6.25 15-22 01/07S200,000 218,640.00 0.19EURSYNLAB UNSEC BONDCO PLC 8.25 15-23 01/07S400,000 437,272.00 0.38EURTESCO CORP TREASURY SERVICES PLC 2.50 14-24 01/07A300,000 305,625.00 0.27EURTHOMAS COOK GROUP PLC REG S 6.25 16-22 15/06S500,000 526,730.00 0.46EURVIRGIN MEDIA FIN PLC 4.50 15-25 15/01S430,000 444,792.00 0.39EURVIRGIN MEDIA FIN PLC REGS 6.00 13-21 15/04S315,000 383,742.62 0.34GBPWORLDPAY FINANCE PLC 3.75 15-22 15/11S500,000 536,550.00 0.47EUR
ALTICE FINANCE SA 144A 6.50 13-22 15/01S400,000 397,231.52 0.35USDLuxembourg 5,113,369.06 4.49
ALTICE FINANCING SA 5.25 15-23 15/02S200,000 212,640.00 0.19EURARCELORMITTAL SA 3.00 15-21 09/04A200,000 210,506.00 0.18EURARCELORMITTAL SA 10.85 09-19 01/06S100,000 112,011.06 0.10USDARD FINANCE SA 7.125 16-23 15/09S200,000 188,760.19 0.17USDDAKAR FINANCE SA 9.00 15-20 15/11S41,423 42,561.72 0.04EURFIAT CHRYSLER FIN EUR SA 4.75 14-22 15/07A200,000 220,864.00 0.19EURGARFUNKELUX HOLDCO 3 SA REGS 7.50 15-22 01/08S400,000 421,272.00 0.37EURGESTAMP FUNDING LUXBG SA 3.50 16-23 31/12S200,000 208,592.00 0.18EURINEOS GROUP HLDGS SA -144A- 5.875 14-19 01/02S200,000 195,389.67 0.17USDINEOS GROUP HOLDINGS SA 5.375 16-24 01/08S400,000 403,680.00 0.35EURINTELSAT JACKSON HLDGS SA 7.50 12-21 01/04S150,000 110,110.11 0.10USDINTELSAT JACKSON HLDGS SA -144A- 8.00 16-24 15/02S155,000 151,830.41 0.13USD
Securities portfolio as at 31/12/16EURExpressed in
BG SICAV – UBS Dynamic Credit High Yield
Quantity Denomination Quotationcurrency
% of netassetsMarket value
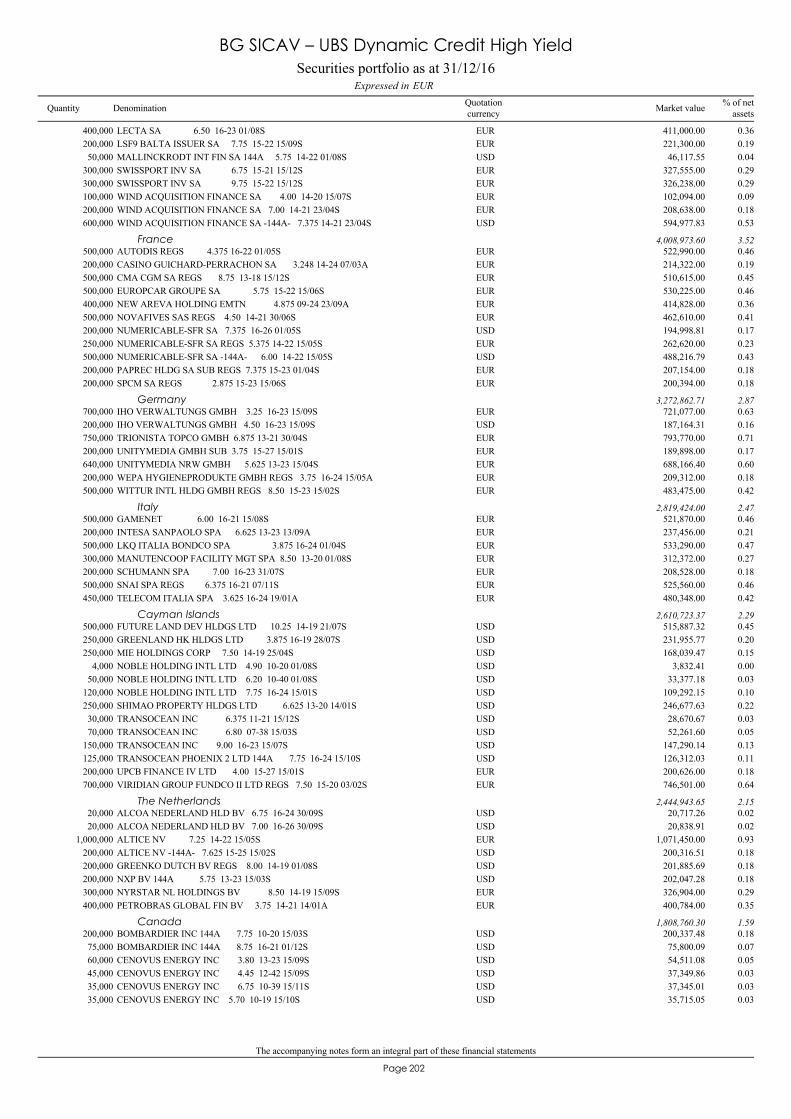
The accompanying notes form an integral part of these financial statements
202Page
LECTA SA 6.50 16-23 01/08S400,000 411,000.00 0.36EURLSF9 BALTA ISSUER SA 7.75 15-22 15/09S200,000 221,300.00 0.19EURMALLINCKRODT INT FIN SA 144A 5.75 14-22 01/08S50,000 46,117.55 0.04USDSWISSPORT INV SA 6.75 15-21 15/12S300,000 327,555.00 0.29EURSWISSPORT INV SA 9.75 15-22 15/12S300,000 326,238.00 0.29EURWIND ACQUISITION FINANCE SA 4.00 14-20 15/07S100,000 102,094.00 0.09EURWIND ACQUISITION FINANCE SA 7.00 14-21 23/04S200,000 208,638.00 0.18EURWIND ACQUISITION FINANCE SA -144A- 7.375 14-21 23/04S600,000 594,977.83 0.53USD
AUTODIS REGS 4.375 16-22 01/05S500,000 522,990.00 0.46EURFrance 4,008,973.60 3.52
CASINO GUICHARD-PERRACHON SA 3.248 14-24 07/03A200,000 214,322.00 0.19EURCMA CGM SA REGS 8.75 13-18 15/12S500,000 510,615.00 0.45EUREUROPCAR GROUPE SA 5.75 15-22 15/06S500,000 530,225.00 0.46EURNEW AREVA HOLDING EMTN 4.875 09-24 23/09A400,000 414,828.00 0.36EURNOVAFIVES SAS REGS 4.50 14-21 30/06S500,000 462,610.00 0.41EURNUMERICABLE-SFR SA 7.375 16-26 01/05S200,000 194,998.81 0.17USDNUMERICABLE-SFR SA REGS 5.375 14-22 15/05S250,000 262,620.00 0.23EURNUMERICABLE-SFR SA -144A- 6.00 14-22 15/05S500,000 488,216.79 0.43USDPAPREC HLDG SA SUB REGS 7.375 15-23 01/04S200,000 207,154.00 0.18EURSPCM SA REGS 2.875 15-23 15/06S200,000 200,394.00 0.18EUR
IHO VERWALTUNGS GMBH 3.25 16-23 15/09S700,000 721,077.00 0.63EURGermany 3,272,862.71 2.87
IHO VERWALTUNGS GMBH 4.50 16-23 15/09S200,000 187,164.31 0.16USDTRIONISTA TOPCO GMBH 6.875 13-21 30/04S750,000 793,770.00 0.71EURUNITYMEDIA GMBH SUB 3.75 15-27 15/01S200,000 189,898.00 0.17EURUNITYMEDIA NRW GMBH 5.625 13-23 15/04S640,000 688,166.40 0.60EURWEPA HYGIENEPRODUKTE GMBH REGS 3.75 16-24 15/05A200,000 209,312.00 0.18EURWITTUR INTL HLDG GMBH REGS 8.50 15-23 15/02S500,000 483,475.00 0.42EUR
GAMENET 6.00 16-21 15/08S500,000 521,870.00 0.46EURItaly 2,819,424.00 2.47
INTESA SANPAOLO SPA 6.625 13-23 13/09A200,000 237,456.00 0.21EURLKQ ITALIA BONDCO SPA 3.875 16-24 01/04S500,000 533,290.00 0.47EURMANUTENCOOP FACILITY MGT SPA 8.50 13-20 01/08S300,000 312,372.00 0.27EURSCHUMANN SPA 7.00 16-23 31/07S200,000 208,528.00 0.18EURSNAI SPA REGS 6.375 16-21 07/11S500,000 525,560.00 0.46EURTELECOM ITALIA SPA 3.625 16-24 19/01A450,000 480,348.00 0.42EUR
FUTURE LAND DEV HLDGS LTD 10.25 14-19 21/07S500,000 515,887.32 0.45USDCayman Islands 2,610,723.37 2.29
GREENLAND HK HLDGS LTD 3.875 16-19 28/07S250,000 231,955.77 0.20USDMIE HOLDINGS CORP 7.50 14-19 25/04S250,000 168,039.47 0.15USDNOBLE HOLDING INTL LTD 4.90 10-20 01/08S4,000 3,832.41 0.00USDNOBLE HOLDING INTL LTD 6.20 10-40 01/08S50,000 33,377.18 0.03USDNOBLE HOLDING INTL LTD 7.75 16-24 15/01S120,000 109,292.15 0.10USDSHIMAO PROPERTY HLDGS LTD 6.625 13-20 14/01S250,000 246,677.63 0.22USDTRANSOCEAN INC 6.375 11-21 15/12S30,000 28,670.67 0.03USDTRANSOCEAN INC 6.80 07-38 15/03S70,000 52,261.60 0.05USDTRANSOCEAN INC 9.00 16-23 15/07S150,000 147,290.14 0.13USDTRANSOCEAN PHOENIX 2 LTD 144A 7.75 16-24 15/10S125,000 126,312.03 0.11USDUPCB FINANCE IV LTD 4.00 15-27 15/01S200,000 200,626.00 0.18EURVIRIDIAN GROUP FUNDCO II LTD REGS 7.50 15-20 03/02S700,000 746,501.00 0.64EUR
ALCOA NEDERLAND HLD BV 6.75 16-24 30/09S20,000 20,717.26 0.02USDThe Netherlands 2,444,943.65 2.15
ALCOA NEDERLAND HLD BV 7.00 16-26 30/09S20,000 20,838.91 0.02USDALTICE NV 7.25 14-22 15/05S1,000,000 1,071,450.00 0.93EURALTICE NV -144A- 7.625 15-25 15/02S200,000 200,316.51 0.18USDGREENKO DUTCH BV REGS 8.00 14-19 01/08S200,000 201,885.69 0.18USDNXP BV 144A 5.75 13-23 15/03S200,000 202,047.28 0.18USDNYRSTAR NL HOLDINGS BV 8.50 14-19 15/09S300,000 326,904.00 0.29EURPETROBRAS GLOBAL FIN BV 3.75 14-21 14/01A400,000 400,784.00 0.35EUR
BOMBARDIER INC 144A 7.75 10-20 15/03S200,000 200,337.48 0.18USDCanada 1,808,760.30 1.59
BOMBARDIER INC 144A 8.75 16-21 01/12S75,000 75,800.09 0.07USDCENOVUS ENERGY INC 3.80 13-23 15/09S60,000 54,511.08 0.05USDCENOVUS ENERGY INC 4.45 12-42 15/09S45,000 37,349.86 0.03USDCENOVUS ENERGY INC 6.75 10-39 15/11S35,000 37,345.01 0.03USDCENOVUS ENERGY INC 5.70 10-19 15/10S35,000 35,715.05 0.03USD
Securities portfolio as at 31/12/16EURExpressed in
BG SICAV – UBS Dynamic Credit High Yield
Quantity Denomination Quotationcurrency
% of netassetsMarket value
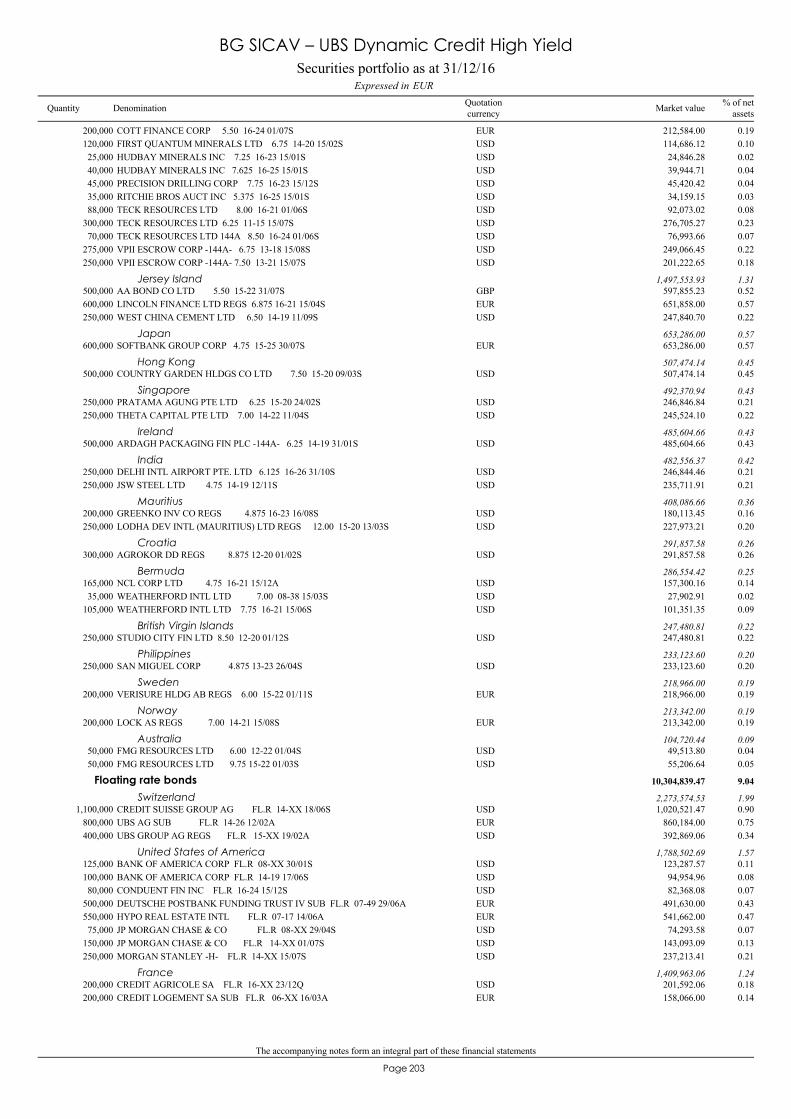
The accompanying notes form an integral part of these financial statements
203Page
COTT FINANCE CORP 5.50 16-24 01/07S200,000 212,584.00 0.19EURFIRST QUANTUM MINERALS LTD 6.75 14-20 15/02S120,000 114,686.12 0.10USDHUDBAY MINERALS INC 7.25 16-23 15/01S25,000 24,846.28 0.02USDHUDBAY MINERALS INC 7.625 16-25 15/01S40,000 39,944.71 0.04USDPRECISION DRILLING CORP 7.75 16-23 15/12S45,000 45,420.42 0.04USDRITCHIE BROS AUCT INC 5.375 16-25 15/01S35,000 34,159.15 0.03USDTECK RESOURCES LTD 8.00 16-21 01/06S88,000 92,073.02 0.08USDTECK RESOURCES LTD 6.25 11-15 15/07S300,000 276,705.27 0.23USDTECK RESOURCES LTD 144A 8.50 16-24 01/06S70,000 76,993.66 0.07USDVPII ESCROW CORP -144A- 6.75 13-18 15/08S275,000 249,066.45 0.22USDVPII ESCROW CORP -144A- 7.50 13-21 15/07S250,000 201,222.65 0.18USD
AA BOND CO LTD 5.50 15-22 31/07S500,000 597,855.23 0.52GBPJersey Island 1,497,553.93 1.31
LINCOLN FINANCE LTD REGS 6.875 16-21 15/04S600,000 651,858.00 0.57EURWEST CHINA CEMENT LTD 6.50 14-19 11/09S250,000 247,840.70 0.22USD
SOFTBANK GROUP CORP 4.75 15-25 30/07S600,000 653,286.00 0.57EURJapan 653,286.00 0.57
COUNTRY GARDEN HLDGS CO LTD 7.50 15-20 09/03S500,000 507,474.14 0.45USDHong Kong 507,474.14 0.45
PRATAMA AGUNG PTE LTD 6.25 15-20 24/02S250,000 246,846.84 0.21USDSingapore 492,370.94 0.43
THETA CAPITAL PTE LTD 7.00 14-22 11/04S250,000 245,524.10 0.22USD
ARDAGH PACKAGING FIN PLC -144A- 6.25 14-19 31/01S500,000 485,604.66 0.43USDIreland 485,604.66 0.43
DELHI INTL AIRPORT PTE. LTD 6.125 16-26 31/10S250,000 246,844.46 0.21USDIndia 482,556.37 0.42
JSW STEEL LTD 4.75 14-19 12/11S250,000 235,711.91 0.21USD
GREENKO INV CO REGS 4.875 16-23 16/08S200,000 180,113.45 0.16USDMauritius 408,086.66 0.36
LODHA DEV INTL (MAURITIUS) LTD REGS 12.00 15-20 13/03S250,000 227,973.21 0.20USD
AGROKOR DD REGS 8.875 12-20 01/02S300,000 291,857.58 0.26USDCroatia 291,857.58 0.26
NCL CORP LTD 4.75 16-21 15/12A165,000 157,300.16 0.14USDBermuda 286,554.42 0.25
WEATHERFORD INTL LTD 7.00 08-38 15/03S35,000 27,902.91 0.02USDWEATHERFORD INTL LTD 7.75 16-21 15/06S105,000 101,351.35 0.09USD
STUDIO CITY FIN LTD 8.50 12-20 01/12S250,000 247,480.81 0.22USDBritish Virgin Islands 247,480.81 0.22
SAN MIGUEL CORP 4.875 13-23 26/04S250,000 233,123.60 0.20USDPhilippines 233,123.60 0.20
VERISURE HLDG AB REGS 6.00 15-22 01/11S200,000 218,966.00 0.19EURSweden 218,966.00 0.19
LOCK AS REGS 7.00 14-21 15/08S200,000 213,342.00 0.19EURNorway 213,342.00 0.19
FMG RESOURCES LTD 6.00 12-22 01/04S50,000 49,513.80 0.04USDAustralia 104,720.44 0.09
FMG RESOURCES LTD 9.75 15-22 01/03S50,000 55,206.64 0.05USD
CREDIT SUISSE GROUP AG FL.R 14-XX 18/06S1,100,000 1,020,521.47 0.90USD
Floating rate bonds 10,304,839.47 9.04
Switzerland 2,273,574.53 1.99
UBS AG SUB FL.R 14-26 12/02A800,000 860,184.00 0.75EURUBS GROUP AG REGS FL.R 15-XX 19/02A400,000 392,869.06 0.34USD
BANK OF AMERICA CORP FL.R 08-XX 30/01S125,000 123,287.57 0.11USDUnited States of America 1,788,502.69 1.57
BANK OF AMERICA CORP FL.R 14-19 17/06S100,000 94,954.96 0.08USDCONDUENT FIN INC FL.R 16-24 15/12S80,000 82,368.08 0.07USDDEUTSCHE POSTBANK FUNDING TRUST IV SUB FL.R 07-49 29/06A500,000 491,630.00 0.43EURHYPO REAL ESTATE INTL FL.R 07-17 14/06A550,000 541,662.00 0.47EURJP MORGAN CHASE & CO FL.R 08-XX 29/04S75,000 74,293.58 0.07USDJP MORGAN CHASE & CO FL.R 14-XX 01/07S150,000 143,093.09 0.13USDMORGAN STANLEY -H- FL.R 14-XX 15/07S250,000 237,213.41 0.21USD
CREDIT AGRICOLE SA FL.R 16-XX 23/12Q200,000 201,592.06 0.18USDFrance 1,409,963.06 1.24
CREDIT LOGEMENT SA SUB FL.R 06-XX 16/03A200,000 158,066.00 0.14EUR
Securities portfolio as at 31/12/16EURExpressed in
BG SICAV – UBS Dynamic Credit High Yield
Quantity Denomination Quotationcurrency
% of netassetsMarket value
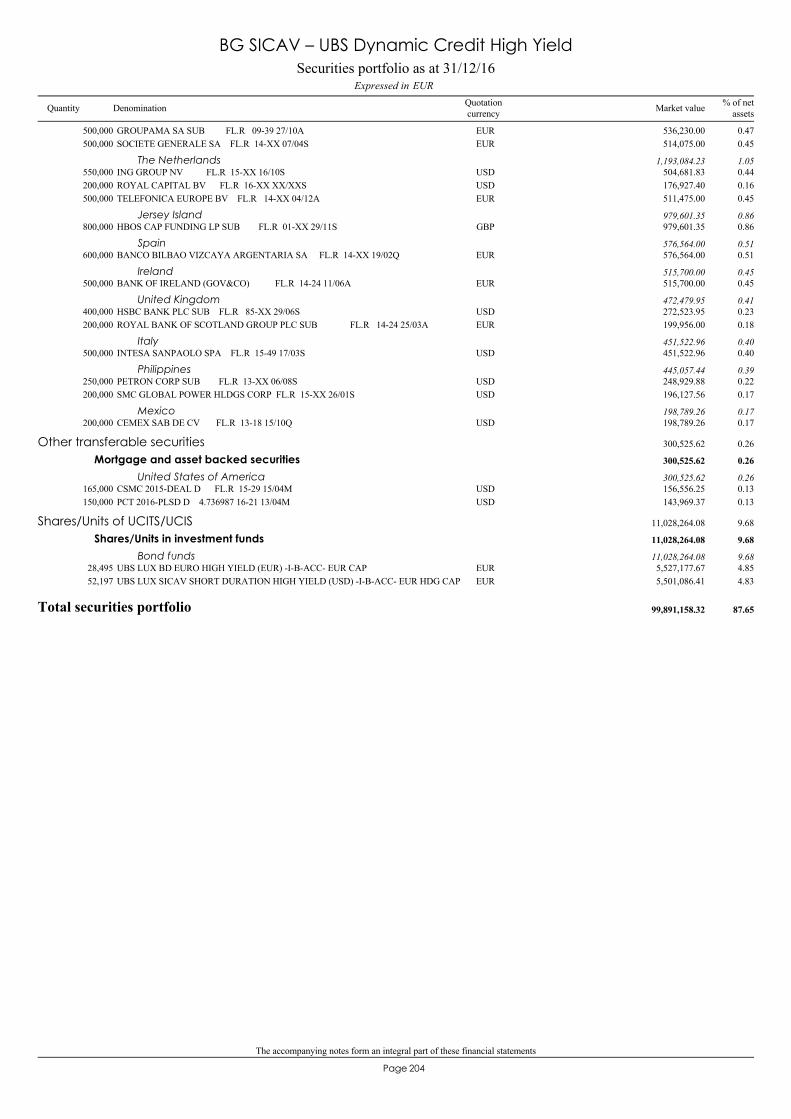
The accompanying notes form an integral part of these financial statements
204Page
GROUPAMA SA SUB FL.R 09-39 27/10A500,000 536,230.00 0.47EURSOCIETE GENERALE SA FL.R 14-XX 07/04S500,000 514,075.00 0.45EUR
ING GROUP NV FL.R 15-XX 16/10S550,000 504,681.83 0.44USDThe Netherlands 1,193,084.23 1.05
ROYAL CAPITAL BV FL.R 16-XX XX/XXS200,000 176,927.40 0.16USDTELEFONICA EUROPE BV FL.R 14-XX 04/12A500,000 511,475.00 0.45EUR
HBOS CAP FUNDING LP SUB FL.R 01-XX 29/11S800,000 979,601.35 0.86GBPJersey Island 979,601.35 0.86
BANCO BILBAO VIZCAYA ARGENTARIA SA FL.R 14-XX 19/02Q600,000 576,564.00 0.51EURSpain 576,564.00 0.51
BANK OF IRELAND (GOV&CO) FL.R 14-24 11/06A500,000 515,700.00 0.45EURIreland 515,700.00 0.45
HSBC BANK PLC SUB FL.R 85-XX 29/06S400,000 272,523.95 0.23USDUnited Kingdom 472,479.95 0.41
ROYAL BANK OF SCOTLAND GROUP PLC SUB FL.R 14-24 25/03A200,000 199,956.00 0.18EUR
INTESA SANPAOLO SPA FL.R 15-49 17/03S500,000 451,522.96 0.40USDItaly 451,522.96 0.40
PETRON CORP SUB FL.R 13-XX 06/08S250,000 248,929.88 0.22USDPhilippines 445,057.44 0.39
SMC GLOBAL POWER HLDGS CORP FL.R 15-XX 26/01S200,000 196,127.56 0.17USD
CEMEX SAB DE CV FL.R 13-18 15/10Q200,000 198,789.26 0.17USDMexico 198,789.26 0.17
CSMC 2015-DEAL D FL.R 15-29 15/04M165,000 156,556.25 0.13USD
Other transferable securities 300,525.62 0.26
Mortgage and asset backed securities 300,525.62 0.26
United States of America 300,525.62 0.26
PCT 2016-PLSD D 4.736987 16-21 13/04M150,000 143,969.37 0.13USD
UBS LUX BD EURO HIGH YIELD (EUR) -I-B-ACC- EUR CAP28,495 5,527,177.67 4.85EUR
Shares/Units of UCITS/UCIS 11,028,264.08 9.68
Shares/Units in investment funds 11,028,264.08 9.68
Bond funds 11,028,264.08 9.68
UBS LUX SICAV SHORT DURATION HIGH YIELD (USD) -I-B-ACC- EUR HDG CAP52,197 5,501,086.41 4.83EUR
Total securities portfolio 99,891,158.32 87.65
Securities portfolio as at 31/12/16EURExpressed in
BG SICAV – UBS Dynamic Credit High Yield
Quantity Denomination Quotationcurrency
% of netassetsMarket value
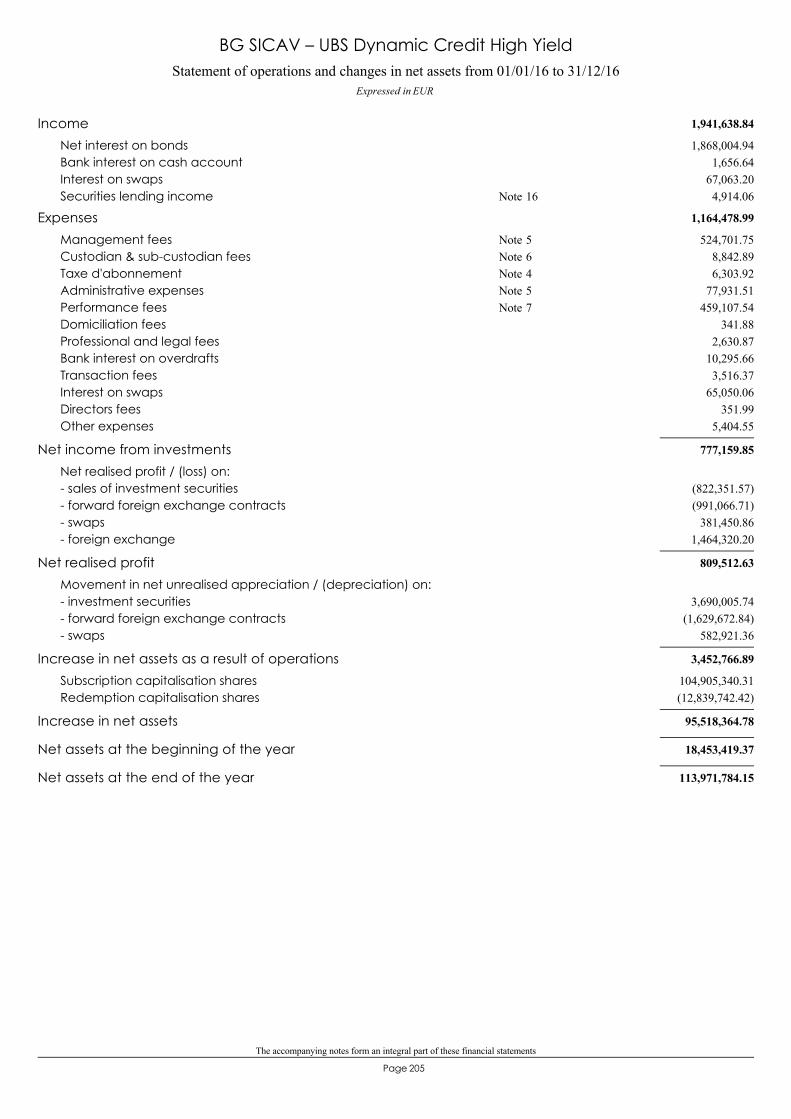
The accompanying notes form an integral part of these financial statements
205Page
Statement of operations and changes in net assets from 01/01/16 to 31/12/16Expressed in EUR
BG SICAV – UBS Dynamic Credit High Yield
1,941,638.84Income1,868,004.94Net interest on bonds
1,656.64Bank interest on cash account67,063.20Interest on swaps4,914.06Securities lending income 16Note
1,164,478.99Expenses524,701.75Management fees 5Note
8,842.89Custodian & sub-custodian fees 6Note6,303.92Taxe d'abonnement 4Note
77,931.51Administrative expenses 5Note459,107.54Performance fees 7Note
341.88Domiciliation fees2,630.87Professional and legal fees
10,295.66Bank interest on overdrafts3,516.37Transaction fees
65,050.06Interest on swaps351.99Directors fees
5,404.55Other expenses
777,159.85Net income from investmentsNet realised profit / (loss) on:
(822,351.57)- sales of investment securities(991,066.71)- forward foreign exchange contracts
381,450.86- swaps1,464,320.20- foreign exchange
809,512.63Net realised profitMovement in net unrealised appreciation / (depreciation) on:
3,690,005.74- investment securities(1,629,672.84)- forward foreign exchange contracts
582,921.36- swaps
3,452,766.89Increase in net assets as a result of operations104,905,340.31Subscription capitalisation shares(12,839,742.42)Redemption capitalisation shares
95,518,364.78Increase in net assets
18,453,419.37Net assets at the beginning of the year
113,971,784.15Net assets at the end of the year
206Page
BG SICAV– UBS Global Income Alpha
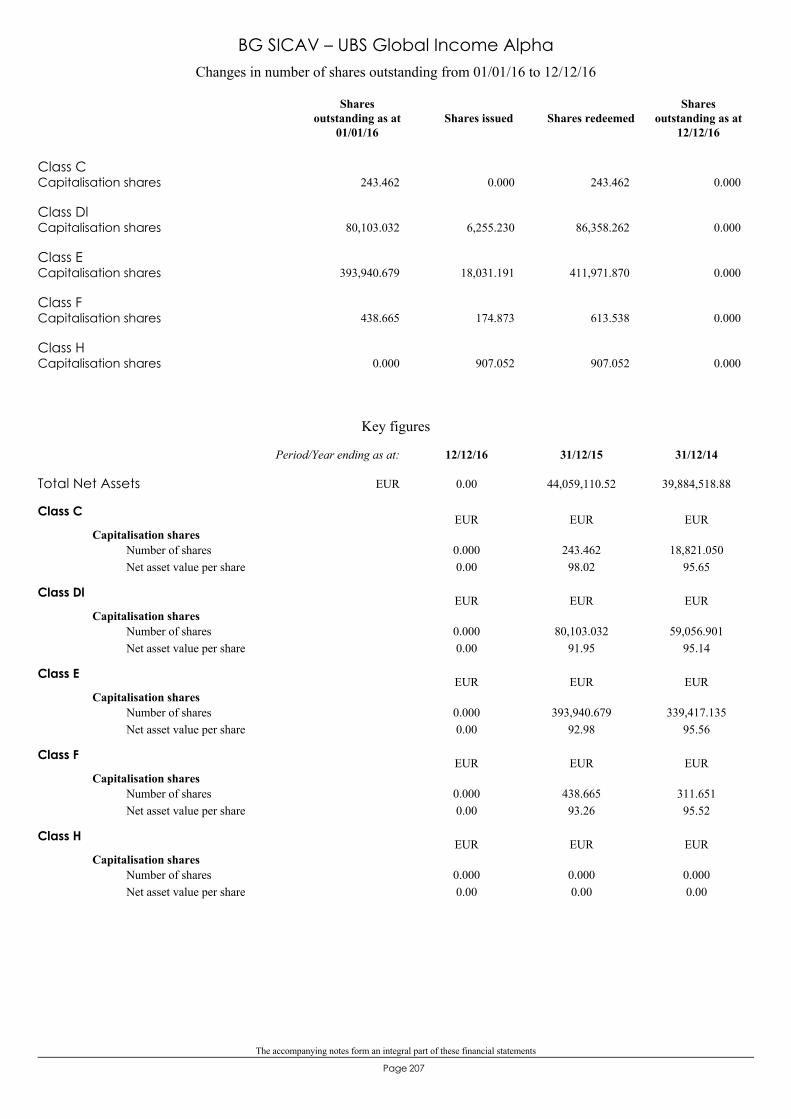
The accompanying notes form an integral part of these financial statements
207Page
Class CCapitalisation shares 243.462 0.000 243.462 0.000
Class DlCapitalisation shares 80,103.032 6,255.230 86,358.262 0.000
Class ECapitalisation shares 393,940.679 18,031.191 411,971.870 0.000
Class FCapitalisation shares 438.665 174.873 613.538 0.000
Class HCapitalisation shares 0.000 907.052 907.052 0.000
Changes in number of shares outstanding from 01/01/16 to 12/12/16
Shares issued Shares redeemedShares
outstanding as at12/12/16
Sharesoutstanding as at
01/01/16
BG SICAV – UBS Global Income Alpha
Key figures
Class C
Capitalisation shares
0.000.000 243.462
98.0218,821.050
95.65Number of sharesNet asset value per share
EUR EUR EUR
Class Dl
Capitalisation shares
0.000.000 80,103.032
91.9559,056.901
95.14Number of sharesNet asset value per share
EUR EUR EUR
Class E
Capitalisation shares
0.000.000 393,940.679
92.98339,417.135
95.56Number of sharesNet asset value per share
EUR EUR EUR
Class F
Capitalisation shares
0.000.000 438.665
93.26311.65195.52
Number of sharesNet asset value per share
EUR EUR EUR
Class H
Capitalisation shares
0.000.000 0.000
0.000.0000.00
Number of sharesNet asset value per share
EUR EUR EUR
Total Net Assets 0.00 44,059,110.52 39,884,518.88
31/12/1431/12/1512/12/16Period/Year ending as at:
EUR
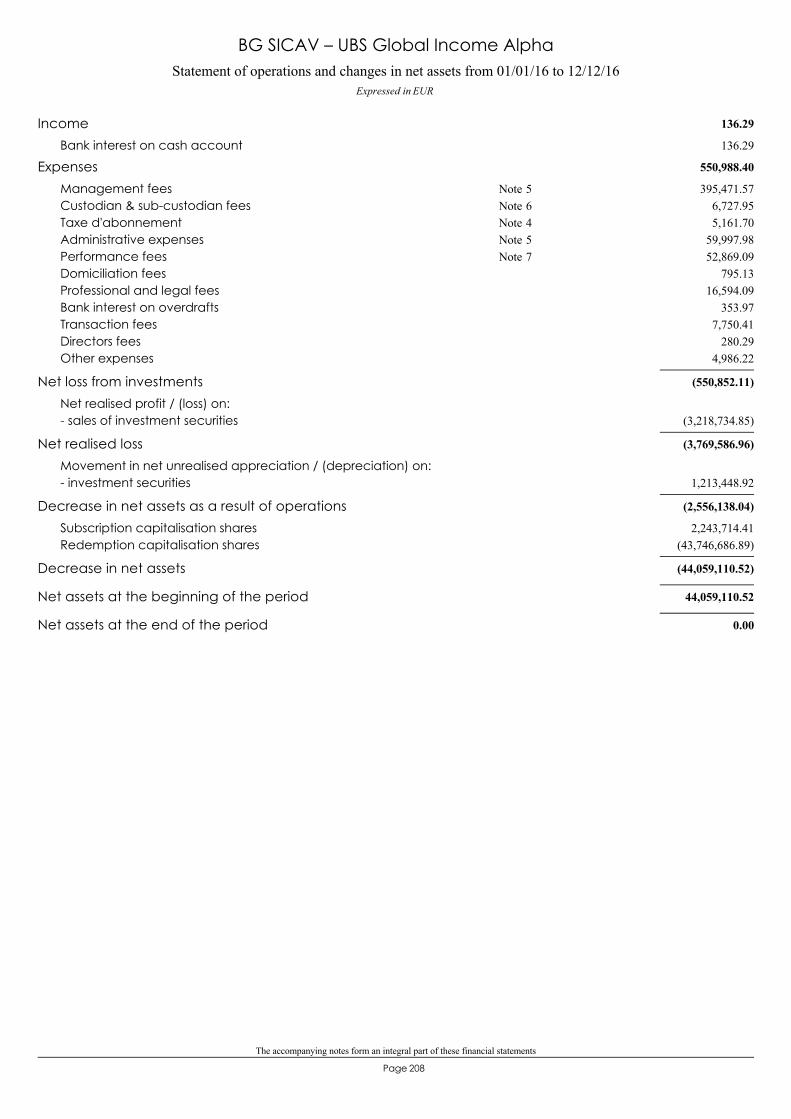
The accompanying notes form an integral part of these financial statements
208Page
Statement of operations and changes in net assets from 01/01/16 to 12/12/16Expressed in EUR
BG SICAV – UBS Global Income Alpha
136.29Income136.29Bank interest on cash account
550,988.40Expenses395,471.57Management fees 5Note
6,727.95Custodian & sub-custodian fees 6Note5,161.70Taxe d'abonnement 4Note
59,997.98Administrative expenses 5Note52,869.09Performance fees 7Note
795.13Domiciliation fees16,594.09Professional and legal fees
353.97Bank interest on overdrafts7,750.41Transaction fees
280.29Directors fees4,986.22Other expenses
(550,852.11)Net loss from investmentsNet realised profit / (loss) on:
(3,218,734.85)- sales of investment securities
(3,769,586.96)Net realised lossMovement in net unrealised appreciation / (depreciation) on:
1,213,448.92- investment securities
(2,556,138.04)Decrease in net assets as a result of operations2,243,714.41Subscription capitalisation shares
(43,746,686.89)Redemption capitalisation shares
(44,059,110.52)Decrease in net assets
44,059,110.52Net assets at the beginning of the period
0.00Net assets at the end of the period
209Page
BG SICAV– Schroder Convertible Bond Opportunities
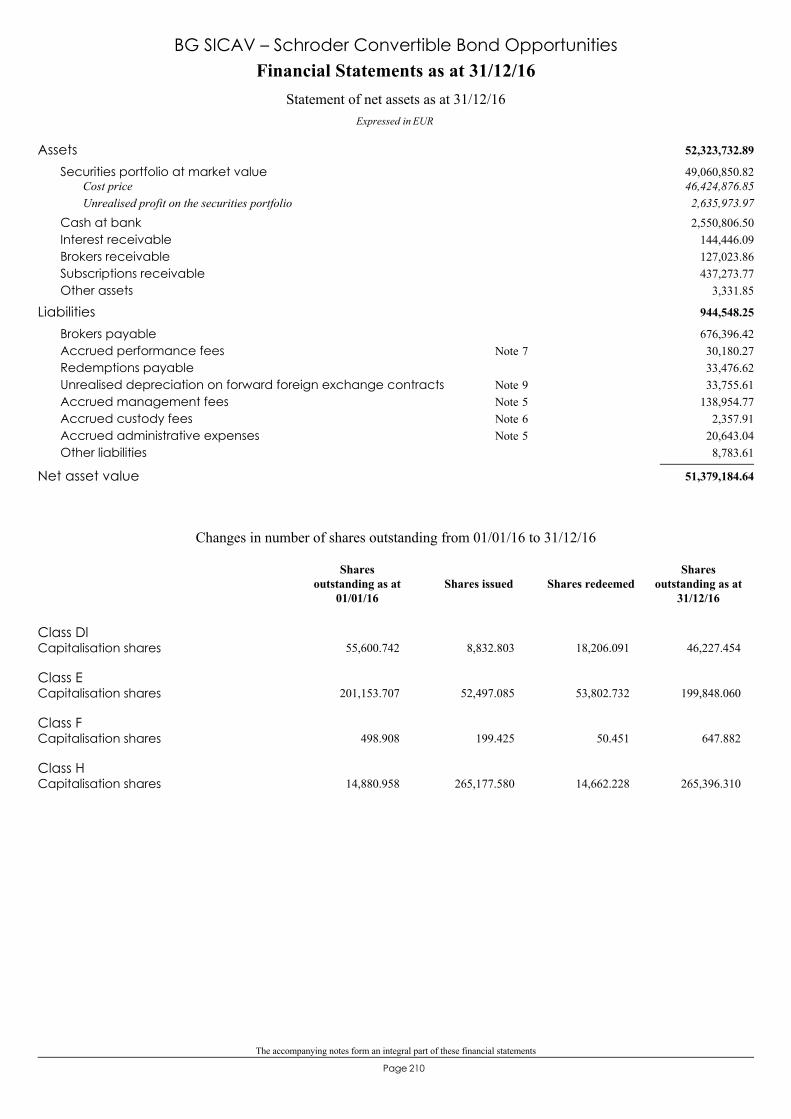
The accompanying notes form an integral part of these financial statements
210Page
52,323,732.89Assets49,060,850.82Securities portfolio at market value46,424,876.85Cost price2,635,973.97Unrealised profit on the securities portfolio2,550,806.50Cash at bank
144,446.09Interest receivable127,023.86Brokers receivable437,273.77Subscriptions receivable
3,331.85Other assets
944,548.25Liabilities676,396.42Brokers payable30,180.27Accrued performance fees 7Note33,476.62Redemptions payable33,755.61Unrealised depreciation on forward foreign exchange contracts 9Note
138,954.77Accrued management fees 5Note2,357.91Accrued custody fees 6Note
20,643.04Accrued administrative expenses 5Note8,783.61Other liabilities
51,379,184.64Net asset value
Financial Statements as at 31/12/16
Expressed in EUR
Statement of net assets as at 31/12/16
BG SICAV – Schroder Convertible Bond Opportunities
Class DlCapitalisation shares 55,600.742 8,832.803 18,206.091 46,227.454
Class ECapitalisation shares 201,153.707 52,497.085 53,802.732 199,848.060
Class FCapitalisation shares 498.908 199.425 50.451 647.882
Class HCapitalisation shares 14,880.958 265,177.580 14,662.228 265,396.310
Changes in number of shares outstanding from 01/01/16 to 31/12/16
Shares issued Shares redeemedShares
outstanding as at31/12/16
Sharesoutstanding as at
01/01/16

The accompanying notes form an integral part of these financial statements
211Page
Key figures
BG SICAV – Schroder Convertible Bond Opportunities
Class C
Capitalisation shares
0.000.000 0.000
0.0019,033.761
101.65Number of sharesNet asset value per share
EUR EUR EUR
Class Dl
Capitalisation shares
101.6746,227.454 55,600.742
101.9226,324.073
100.65Number of sharesNet asset value per share
EUR EUR EUR
Class E
Capitalisation shares
103.63199,848.060 201,153.707
103.23114,893.275
101.29Number of sharesNet asset value per share
EUR EUR EUR
Class F
Capitalisation shares
104.41647.882 498.908
103.49454.921101.17
Number of sharesNet asset value per share
EUR EUR EUR
Class H
Capitalisation shares
97.60265,396.310 14,880.958
97.410.0000.00
Number of sharesNet asset value per share
EUR EUR EUR
Total Net Assets 51,379,184.64 27,934,002.20 16,267,828.89
31/12/1431/12/1531/12/16Year ending as at:
EUR
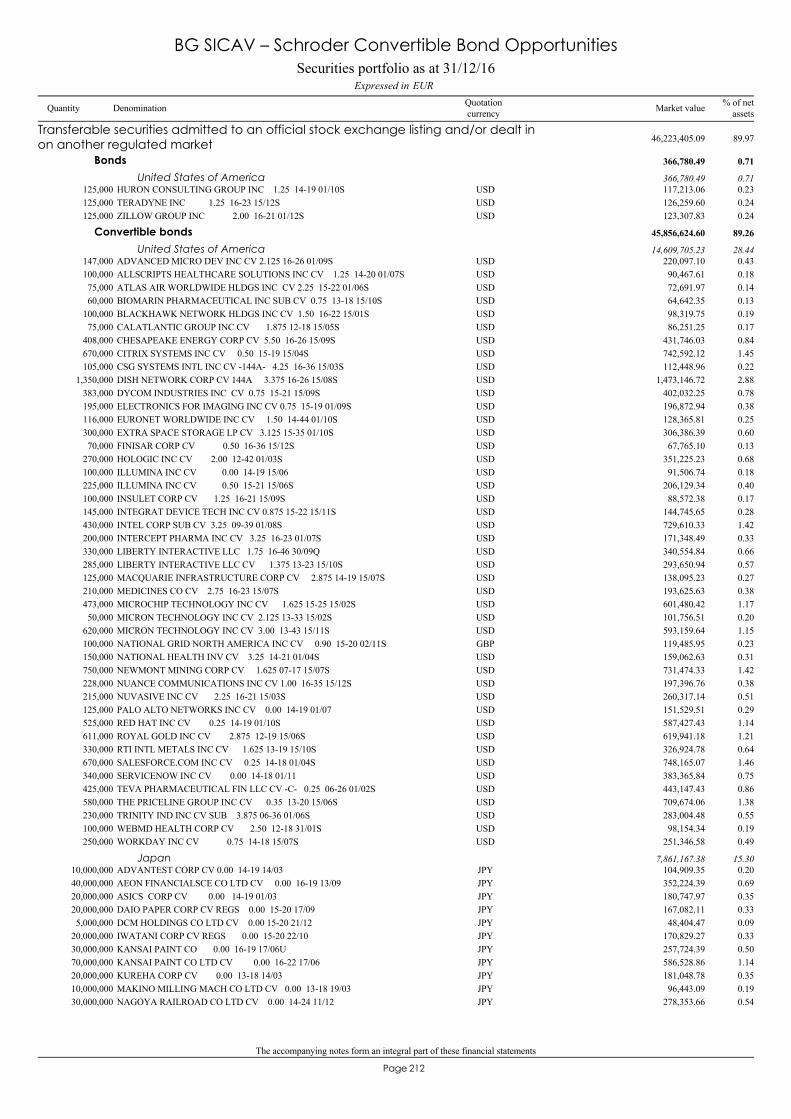
The accompanying notes form an integral part of these financial statements
212Page
HURON CONSULTING GROUP INC 1.25 14-19 01/10S125,000 117,213.06 0.23USD
Transferable securities admitted to an official stock exchange listing and/or dealt inon another regulated market 46,223,405.09 89.97
Bonds 366,780.49 0.71
United States of America 366,780.49 0.71
TERADYNE INC 1.25 16-23 15/12S125,000 126,259.60 0.24USDZILLOW GROUP INC 2.00 16-21 01/12S125,000 123,307.83 0.24USD
ADVANCED MICRO DEV INC CV 2.125 16-26 01/09S147,000 220,097.10 0.43USD
Convertible bonds 45,856,624.60 89.26
United States of America 14,609,705.23 28.44
ALLSCRIPTS HEALTHCARE SOLUTIONS INC CV 1.25 14-20 01/07S100,000 90,467.61 0.18USDATLAS AIR WORLDWIDE HLDGS INC CV 2.25 15-22 01/06S75,000 72,691.97 0.14USDBIOMARIN PHARMACEUTICAL INC SUB CV 0.75 13-18 15/10S60,000 64,642.35 0.13USDBLACKHAWK NETWORK HLDGS INC CV 1.50 16-22 15/01S100,000 98,319.75 0.19USDCALATLANTIC GROUP INC CV 1.875 12-18 15/05S75,000 86,251.25 0.17USDCHESAPEAKE ENERGY CORP CV 5.50 16-26 15/09S408,000 431,746.03 0.84USDCITRIX SYSTEMS INC CV 0.50 15-19 15/04S670,000 742,592.12 1.45USDCSG SYSTEMS INTL INC CV -144A- 4.25 16-36 15/03S105,000 112,448.96 0.22USDDISH NETWORK CORP CV 144A 3.375 16-26 15/08S1,350,000 1,473,146.72 2.88USDDYCOM INDUSTRIES INC CV 0.75 15-21 15/09S383,000 402,032.25 0.78USDELECTRONICS FOR IMAGING INC CV 0.75 15-19 01/09S195,000 196,872.94 0.38USDEURONET WORLDWIDE INC CV 1.50 14-44 01/10S116,000 128,365.81 0.25USDEXTRA SPACE STORAGE LP CV 3.125 15-35 01/10S300,000 306,386.39 0.60USDFINISAR CORP CV 0.50 16-36 15/12S70,000 67,765.10 0.13USDHOLOGIC INC CV 2.00 12-42 01/03S270,000 351,225.23 0.68USDILLUMINA INC CV 0.00 14-19 15/06100,000 91,506.74 0.18USDILLUMINA INC CV 0.50 15-21 15/06S225,000 206,129.34 0.40USDINSULET CORP CV 1.25 16-21 15/09S100,000 88,572.38 0.17USDINTEGRAT DEVICE TECH INC CV 0.875 15-22 15/11S145,000 144,745.65 0.28USDINTEL CORP SUB CV 3.25 09-39 01/08S430,000 729,610.33 1.42USDINTERCEPT PHARMA INC CV 3.25 16-23 01/07S200,000 171,348.49 0.33USDLIBERTY INTERACTIVE LLC 1.75 16-46 30/09Q330,000 340,554.84 0.66USDLIBERTY INTERACTIVE LLC CV 1.375 13-23 15/10S285,000 293,650.94 0.57USDMACQUARIE INFRASTRUCTURE CORP CV 2.875 14-19 15/07S125,000 138,095.23 0.27USDMEDICINES CO CV 2.75 16-23 15/07S210,000 193,625.63 0.38USDMICROCHIP TECHNOLOGY INC CV 1.625 15-25 15/02S473,000 601,480.42 1.17USDMICRON TECHNOLOGY INC CV 2.125 13-33 15/02S50,000 101,756.51 0.20USDMICRON TECHNOLOGY INC CV 3.00 13-43 15/11S620,000 593,159.64 1.15USDNATIONAL GRID NORTH AMERICA INC CV 0.90 15-20 02/11S100,000 119,485.95 0.23GBPNATIONAL HEALTH INV CV 3.25 14-21 01/04S150,000 159,062.63 0.31USDNEWMONT MINING CORP CV 1.625 07-17 15/07S750,000 731,474.33 1.42USDNUANCE COMMUNICATIONS INC CV 1.00 16-35 15/12S228,000 197,396.76 0.38USDNUVASIVE INC CV 2.25 16-21 15/03S215,000 260,317.14 0.51USDPALO ALTO NETWORKS INC CV 0.00 14-19 01/07125,000 151,529.51 0.29USDRED HAT INC CV 0.25 14-19 01/10S525,000 587,427.43 1.14USDROYAL GOLD INC CV 2.875 12-19 15/06S611,000 619,941.18 1.21USDRTI INTL METALS INC CV 1.625 13-19 15/10S330,000 326,924.78 0.64USDSALESFORCE.COM INC CV 0.25 14-18 01/04S670,000 748,165.07 1.46USDSERVICENOW INC CV 0.00 14-18 01/11340,000 383,365.84 0.75USDTEVA PHARMACEUTICAL FIN LLC CV -C- 0.25 06-26 01/02S425,000 443,147.43 0.86USDTHE PRICELINE GROUP INC CV 0.35 13-20 15/06S580,000 709,674.06 1.38USDTRINITY IND INC CV SUB 3.875 06-36 01/06S230,000 283,004.48 0.55USDWEBMD HEALTH CORP CV 2.50 12-18 31/01S100,000 98,154.34 0.19USDWORKDAY INC CV 0.75 14-18 15/07S250,000 251,346.58 0.49USD
ADVANTEST CORP CV 0.00 14-19 14/0310,000,000 104,909.35 0.20JPYJapan 7,861,167.38 15.30
AEON FINANCIALSCE CO LTD CV 0.00 16-19 13/0940,000,000 352,224.39 0.69JPYASICS CORP CV 0.00 14-19 01/0320,000,000 180,747.97 0.35JPYDAIO PAPER CORP CV REGS 0.00 15-20 17/0920,000,000 167,082.11 0.33JPYDCM HOLDINGS CO LTD CV 0.00 15-20 21/125,000,000 48,404.47 0.09JPYIWATANI CORP CV REGS 0.00 15-20 22/1020,000,000 170,829.27 0.33JPYKANSAI PAINT CO 0.00 16-19 17/06U30,000,000 257,724.39 0.50JPYKANSAI PAINT CO LTD CV 0.00 16-22 17/0670,000,000 586,528.86 1.14JPYKUREHA CORP CV 0.00 13-18 14/0320,000,000 181,048.78 0.35JPYMAKINO MILLING MACH CO LTD CV 0.00 13-18 19/0310,000,000 96,443.09 0.19JPYNAGOYA RAILROAD CO LTD CV 0.00 14-24 11/1230,000,000 278,353.66 0.54JPY
Securities portfolio as at 31/12/16EURExpressed in
BG SICAV – Schroder Convertible Bond Opportunities
Quantity Denomination Quotationcurrency
% of netassetsMarket value
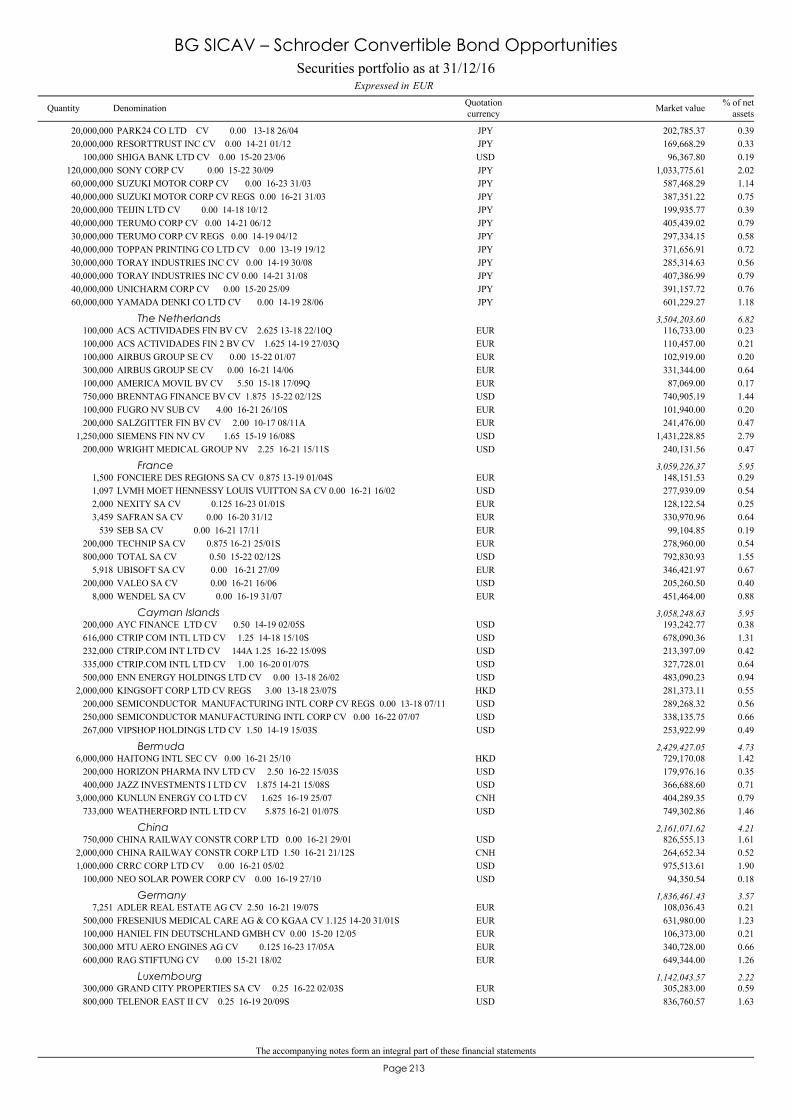
The accompanying notes form an integral part of these financial statements
213Page
PARK24 CO LTD CV 0.00 13-18 26/0420,000,000 202,785.37 0.39JPYRESORTTRUST INC CV 0.00 14-21 01/1220,000,000 169,668.29 0.33JPYSHIGA BANK LTD CV 0.00 15-20 23/06100,000 96,367.80 0.19USDSONY CORP CV 0.00 15-22 30/09120,000,000 1,033,775.61 2.02JPYSUZUKI MOTOR CORP CV 0.00 16-23 31/0360,000,000 587,468.29 1.14JPYSUZUKI MOTOR CORP CV REGS 0.00 16-21 31/0340,000,000 387,351.22 0.75JPYTEIJIN LTD CV 0.00 14-18 10/1220,000,000 199,935.77 0.39JPYTERUMO CORP CV 0.00 14-21 06/1240,000,000 405,439.02 0.79JPYTERUMO CORP CV REGS 0.00 14-19 04/1230,000,000 297,334.15 0.58JPYTOPPAN PRINTING CO LTD CV 0.00 13-19 19/1240,000,000 371,656.91 0.72JPYTORAY INDUSTRIES INC CV 0.00 14-19 30/0830,000,000 285,314.63 0.56JPYTORAY INDUSTRIES INC CV 0.00 14-21 31/0840,000,000 407,386.99 0.79JPYUNICHARM CORP CV 0.00 15-20 25/0940,000,000 391,157.72 0.76JPYYAMADA DENKI CO LTD CV 0.00 14-19 28/0660,000,000 601,229.27 1.18JPY
ACS ACTIVIDADES FIN BV CV 2.625 13-18 22/10Q100,000 116,733.00 0.23EURThe Netherlands 3,504,203.60 6.82
ACS ACTIVIDADES FIN 2 BV CV 1.625 14-19 27/03Q100,000 110,457.00 0.21EURAIRBUS GROUP SE CV 0.00 15-22 01/07100,000 102,919.00 0.20EURAIRBUS GROUP SE CV 0.00 16-21 14/06300,000 331,344.00 0.64EURAMERICA MOVIL BV CV 5.50 15-18 17/09Q100,000 87,069.00 0.17EURBRENNTAG FINANCE BV CV 1.875 15-22 02/12S750,000 740,905.19 1.44USDFUGRO NV SUB CV 4.00 16-21 26/10S100,000 101,940.00 0.20EURSALZGITTER FIN BV CV 2.00 10-17 08/11A200,000 241,476.00 0.47EURSIEMENS FIN NV CV 1.65 15-19 16/08S1,250,000 1,431,228.85 2.79USDWRIGHT MEDICAL GROUP NV 2.25 16-21 15/11S200,000 240,131.56 0.47USD
FONCIERE DES REGIONS SA CV 0.875 13-19 01/04S1,500 148,151.53 0.29EURFrance 3,059,226.37 5.95
LVMH MOET HENNESSY LOUIS VUITTON SA CV 0.00 16-21 16/021,097 277,939.09 0.54USDNEXITY SA CV 0.125 16-23 01/01S2,000 128,122.54 0.25EURSAFRAN SA CV 0.00 16-20 31/123,459 330,970.96 0.64EURSEB SA CV 0.00 16-21 17/11539 99,104.85 0.19EURTECHNIP SA CV 0.875 16-21 25/01S200,000 278,960.00 0.54EURTOTAL SA CV 0.50 15-22 02/12S800,000 792,830.93 1.55USDUBISOFT SA CV 0.00 16-21 27/095,918 346,421.97 0.67EURVALEO SA CV 0.00 16-21 16/06200,000 205,260.50 0.40USDWENDEL SA CV 0.00 16-19 31/078,000 451,464.00 0.88EUR
AYC FINANCE LTD CV 0.50 14-19 02/05S200,000 193,242.77 0.38USDCayman Islands 3,058,248.63 5.95
CTRIP COM INTL LTD CV 1.25 14-18 15/10S616,000 678,090.36 1.31USDCTRIP.COM INT LTD CV 144A 1.25 16-22 15/09S232,000 213,397.09 0.42USDCTRIP.COM INTL LTD CV 1.00 16-20 01/07S335,000 327,728.01 0.64USDENN ENERGY HOLDINGS LTD CV 0.00 13-18 26/02500,000 483,090.23 0.94USDKINGSOFT CORP LTD CV REGS 3.00 13-18 23/07S2,000,000 281,373.11 0.55HKDSEMICONDUCTOR MANUFACTURING INTL CORP CV REGS 0.00 13-18 07/11200,000 289,268.32 0.56USDSEMICONDUCTOR MANUFACTURING INTL CORP CV 0.00 16-22 07/07250,000 338,135.75 0.66USDVIPSHOP HOLDINGS LTD CV 1.50 14-19 15/03S267,000 253,922.99 0.49USD
HAITONG INTL SEC CV 0.00 16-21 25/106,000,000 729,170.08 1.42HKDBermuda 2,429,427.05 4.73
HORIZON PHARMA INV LTD CV 2.50 16-22 15/03S200,000 179,976.16 0.35USDJAZZ INVESTMENTS I LTD CV 1.875 14-21 15/08S400,000 366,688.60 0.71USDKUNLUN ENERGY CO LTD CV 1.625 16-19 25/073,000,000 404,289.35 0.79CNHWEATHERFORD INTL LTD CV 5.875 16-21 01/07S733,000 749,302.86 1.46USD
CHINA RAILWAY CONSTR CORP LTD 0.00 16-21 29/01750,000 826,555.13 1.61USDChina 2,161,071.62 4.21
CHINA RAILWAY CONSTR CORP LTD 1.50 16-21 21/12S2,000,000 264,652.34 0.52CNHCRRC CORP LTD CV 0.00 16-21 05/021,000,000 975,513.61 1.90USDNEO SOLAR POWER CORP CV 0.00 16-19 27/10100,000 94,350.54 0.18USD
ADLER REAL ESTATE AG CV 2.50 16-21 19/07S7,251 108,036.43 0.21EURGermany 1,836,461.43 3.57
FRESENIUS MEDICAL CARE AG & CO KGAA CV 1.125 14-20 31/01S500,000 631,980.00 1.23EURHANIEL FIN DEUTSCHLAND GMBH CV 0.00 15-20 12/05100,000 106,373.00 0.21EURMTU AERO ENGINES AG CV 0.125 16-23 17/05A300,000 340,728.00 0.66EURRAG STIFTUNG CV 0.00 15-21 18/02600,000 649,344.00 1.26EUR
GRAND CITY PROPERTIES SA CV 0.25 16-22 02/03S300,000 305,283.00 0.59EURLuxembourg 1,142,043.57 2.22
TELENOR EAST II CV 0.25 16-19 20/09S800,000 836,760.57 1.63USD
Securities portfolio as at 31/12/16EURExpressed in
BG SICAV – Schroder Convertible Bond Opportunities
Quantity Denomination Quotationcurrency
% of netassetsMarket value
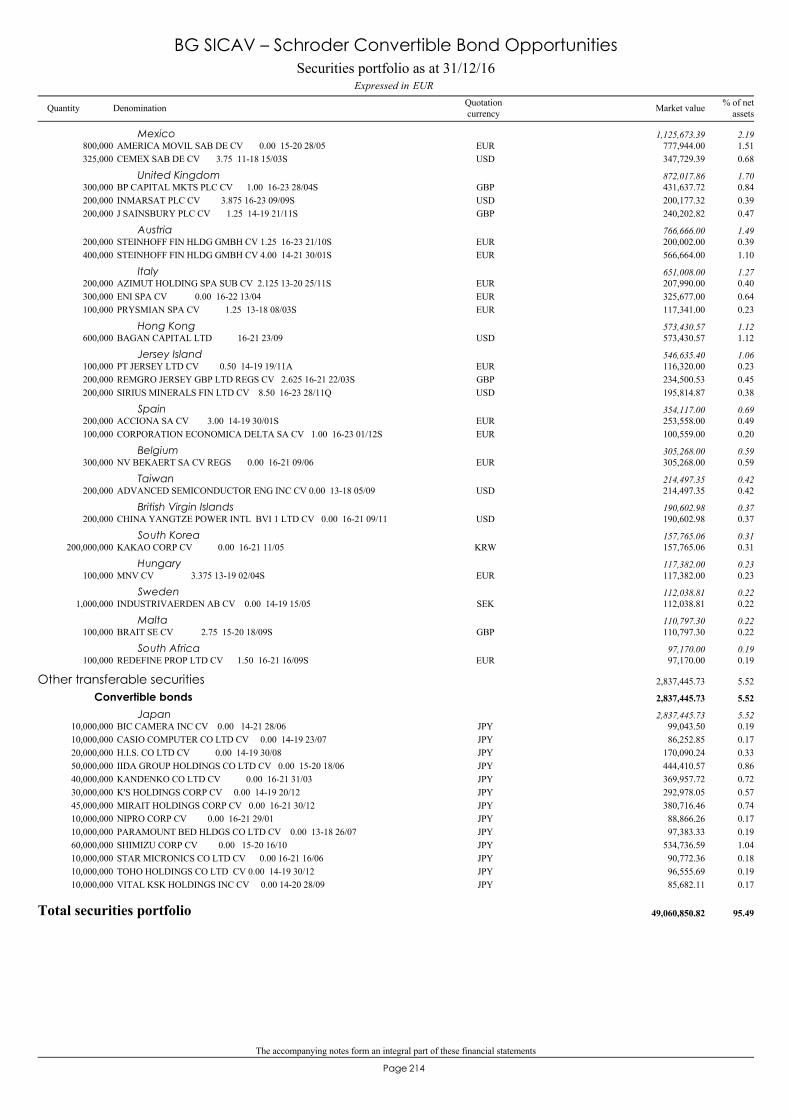
The accompanying notes form an integral part of these financial statements
214Page
AMERICA MOVIL SAB DE CV 0.00 15-20 28/05800,000 777,944.00 1.51EURMexico 1,125,673.39 2.19
CEMEX SAB DE CV 3.75 11-18 15/03S325,000 347,729.39 0.68USD
BP CAPITAL MKTS PLC CV 1.00 16-23 28/04S300,000 431,637.72 0.84GBPUnited Kingdom 872,017.86 1.70
INMARSAT PLC CV 3.875 16-23 09/09S200,000 200,177.32 0.39USDJ SAINSBURY PLC CV 1.25 14-19 21/11S200,000 240,202.82 0.47GBP
STEINHOFF FIN HLDG GMBH CV 1.25 16-23 21/10S200,000 200,002.00 0.39EURAustria 766,666.00 1.49
STEINHOFF FIN HLDG GMBH CV 4.00 14-21 30/01S400,000 566,664.00 1.10EUR
AZIMUT HOLDING SPA SUB CV 2.125 13-20 25/11S200,000 207,990.00 0.40EURItaly 651,008.00 1.27
ENI SPA CV 0.00 16-22 13/04300,000 325,677.00 0.64EURPRYSMIAN SPA CV 1.25 13-18 08/03S100,000 117,341.00 0.23EUR
BAGAN CAPITAL LTD 16-21 23/09600,000 573,430.57 1.12USDHong Kong 573,430.57 1.12
PT JERSEY LTD CV 0.50 14-19 19/11A100,000 116,320.00 0.23EURJersey Island 546,635.40 1.06
REMGRO JERSEY GBP LTD REGS CV 2.625 16-21 22/03S200,000 234,500.53 0.45GBPSIRIUS MINERALS FIN LTD CV 8.50 16-23 28/11Q200,000 195,814.87 0.38USD
ACCIONA SA CV 3.00 14-19 30/01S200,000 253,558.00 0.49EURSpain 354,117.00 0.69
CORPORATION ECONOMICA DELTA SA CV 1.00 16-23 01/12S100,000 100,559.00 0.20EUR
NV BEKAERT SA CV REGS 0.00 16-21 09/06300,000 305,268.00 0.59EURBelgium 305,268.00 0.59
ADVANCED SEMICONDUCTOR ENG INC CV 0.00 13-18 05/09200,000 214,497.35 0.42USDTaiwan 214,497.35 0.42
CHINA YANGTZE POWER INTL BVI 1 LTD CV 0.00 16-21 09/11200,000 190,602.98 0.37USDBritish Virgin Islands 190,602.98 0.37
KAKAO CORP CV 0.00 16-21 11/05200,000,000 157,765.06 0.31KRWSouth Korea 157,765.06 0.31
MNV CV 3.375 13-19 02/04S100,000 117,382.00 0.23EURHungary 117,382.00 0.23
INDUSTRIVAERDEN AB CV 0.00 14-19 15/051,000,000 112,038.81 0.22SEKSweden 112,038.81 0.22
BRAIT SE CV 2.75 15-20 18/09S100,000 110,797.30 0.22GBPMalta 110,797.30 0.22
REDEFINE PROP LTD CV 1.50 16-21 16/09S100,000 97,170.00 0.19EURSouth Africa 97,170.00 0.19
BIC CAMERA INC CV 0.00 14-21 28/0610,000,000 99,043.50 0.19JPY
Other transferable securities 2,837,445.73 5.52
Convertible bonds 2,837,445.73 5.52
Japan 2,837,445.73 5.52
CASIO COMPUTER CO LTD CV 0.00 14-19 23/0710,000,000 86,252.85 0.17JPYH.I.S. CO LTD CV 0.00 14-19 30/0820,000,000 170,090.24 0.33JPYIIDA GROUP HOLDINGS CO LTD CV 0.00 15-20 18/0650,000,000 444,410.57 0.86JPYKANDENKO CO LTD CV 0.00 16-21 31/0340,000,000 369,957.72 0.72JPYK'S HOLDINGS CORP CV 0.00 14-19 20/1230,000,000 292,978.05 0.57JPYMIRAIT HOLDINGS CORP CV 0.00 16-21 30/1245,000,000 380,716.46 0.74JPYNIPRO CORP CV 0.00 16-21 29/0110,000,000 88,866.26 0.17JPYPARAMOUNT BED HLDGS CO LTD CV 0.00 13-18 26/0710,000,000 97,383.33 0.19JPYSHIMIZU CORP CV 0.00 15-20 16/1060,000,000 534,736.59 1.04JPYSTAR MICRONICS CO LTD CV 0.00 16-21 16/0610,000,000 90,772.36 0.18JPYTOHO HOLDINGS CO LTD CV 0.00 14-19 30/1210,000,000 96,555.69 0.19JPYVITAL KSK HOLDINGS INC CV 0.00 14-20 28/0910,000,000 85,682.11 0.17JPY
Total securities portfolio 49,060,850.82 95.49
Securities portfolio as at 31/12/16EURExpressed in
BG SICAV – Schroder Convertible Bond Opportunities
Quantity Denomination Quotationcurrency
% of netassetsMarket value
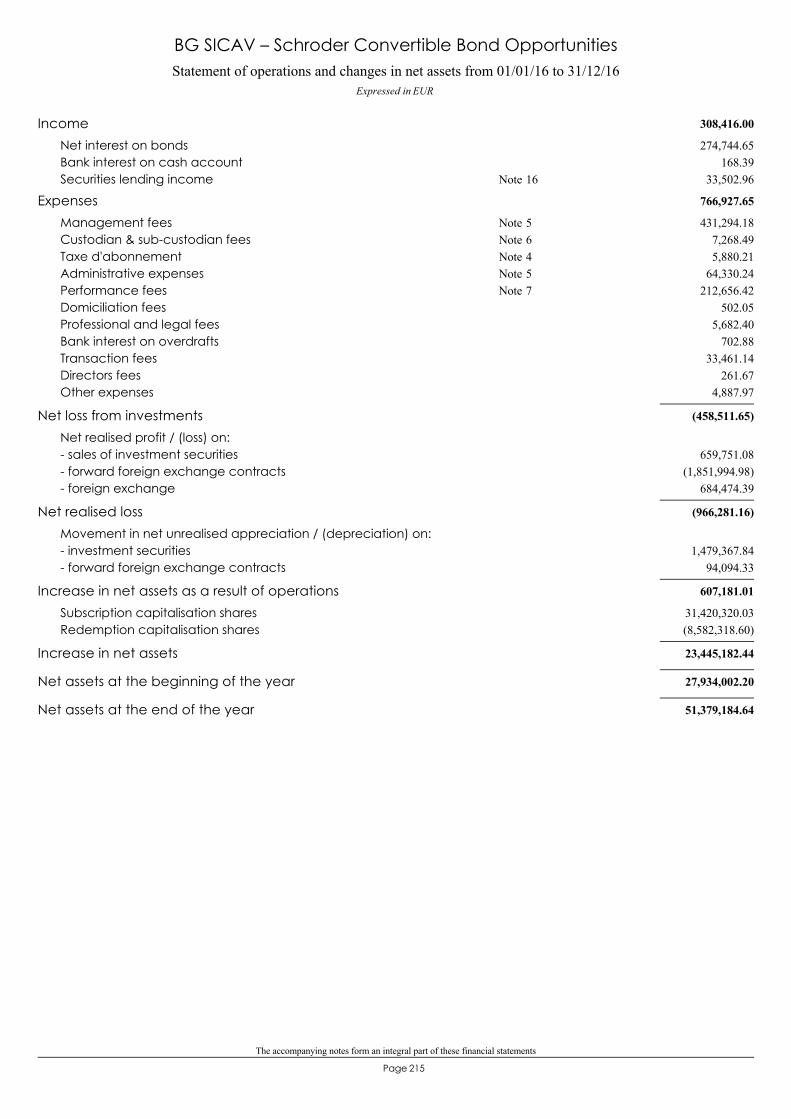
The accompanying notes form an integral part of these financial statements
215Page
Statement of operations and changes in net assets from 01/01/16 to 31/12/16Expressed in EUR
BG SICAV – Schroder Convertible Bond Opportunities
308,416.00Income274,744.65Net interest on bonds
168.39Bank interest on cash account33,502.96Securities lending income 16Note
766,927.65Expenses431,294.18Management fees 5Note
7,268.49Custodian & sub-custodian fees 6Note5,880.21Taxe d'abonnement 4Note
64,330.24Administrative expenses 5Note212,656.42Performance fees 7Note
502.05Domiciliation fees5,682.40Professional and legal fees
702.88Bank interest on overdrafts33,461.14Transaction fees
261.67Directors fees4,887.97Other expenses
(458,511.65)Net loss from investmentsNet realised profit / (loss) on:
659,751.08- sales of investment securities(1,851,994.98)- forward foreign exchange contracts
684,474.39- foreign exchange
(966,281.16)Net realised lossMovement in net unrealised appreciation / (depreciation) on:
1,479,367.84- investment securities94,094.33- forward foreign exchange contracts
607,181.01Increase in net assets as a result of operations31,420,320.03Subscription capitalisation shares(8,582,318.60)Redemption capitalisation shares
23,445,182.44Increase in net assets
27,934,002.20Net assets at the beginning of the year
51,379,184.64Net assets at the end of the year
216Page
BG SICAV– Vontobel New Frontier Debt
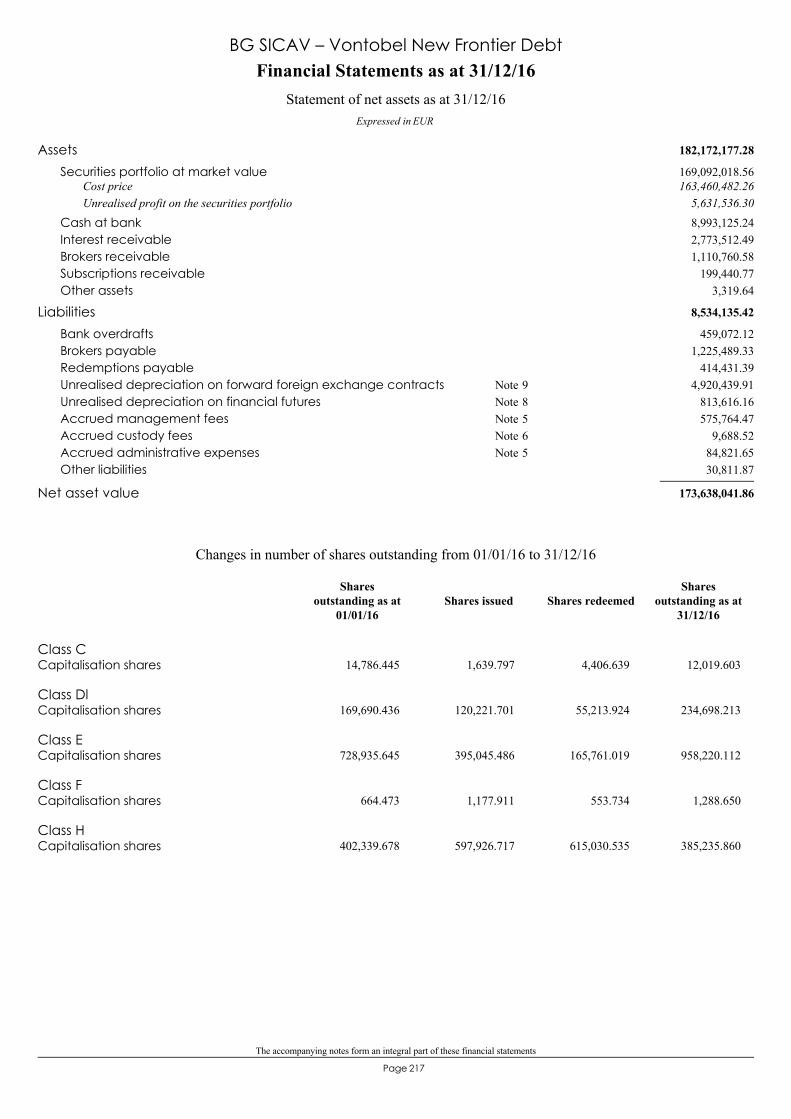
The accompanying notes form an integral part of these financial statements
217Page
182,172,177.28Assets169,092,018.56Securities portfolio at market value163,460,482.26Cost price
5,631,536.30Unrealised profit on the securities portfolio8,993,125.24Cash at bank2,773,512.49Interest receivable1,110,760.58Brokers receivable
199,440.77Subscriptions receivable3,319.64Other assets
8,534,135.42Liabilities459,072.12Bank overdrafts
1,225,489.33Brokers payable414,431.39Redemptions payable
4,920,439.91Unrealised depreciation on forward foreign exchange contracts 9Note813,616.16Unrealised depreciation on financial futures 8Note575,764.47Accrued management fees 5Note
9,688.52Accrued custody fees 6Note84,821.65Accrued administrative expenses 5Note30,811.87Other liabilities
173,638,041.86Net asset value
Financial Statements as at 31/12/16
Expressed in EUR
Statement of net assets as at 31/12/16
BG SICAV – Vontobel New Frontier Debt
Class CCapitalisation shares 14,786.445 1,639.797 4,406.639 12,019.603
Class DlCapitalisation shares 169,690.436 120,221.701 55,213.924 234,698.213
Class ECapitalisation shares 728,935.645 395,045.486 165,761.019 958,220.112
Class FCapitalisation shares 664.473 1,177.911 553.734 1,288.650
Class HCapitalisation shares 402,339.678 597,926.717 615,030.535 385,235.860
Changes in number of shares outstanding from 01/01/16 to 31/12/16
Shares issued Shares redeemedShares
outstanding as at31/12/16
Sharesoutstanding as at
01/01/16

The accompanying notes form an integral part of these financial statements
218Page
Key figures
BG SICAV – Vontobel New Frontier Debt
Class C
Capitalisation shares
105.1912,019.603 14,786.445
97.6554,054.530
98.89Number of sharesNet asset value per share
EUR EUR EUR
Class Dl
Capitalisation shares
108.82234,698.213 169,690.436
101.13151,770.445
102.45Number of sharesNet asset value per share
EUR EUR EUR
Class E
Capitalisation shares
110.89958,220.112 728,935.645
102.40506,136.316
103.08Number of sharesNet asset value per share
EUR EUR EUR
Class F
Capitalisation shares
110.031,288.650 664.473
101.161,280.590
101.46Number of sharesNet asset value per share
EUR EUR EUR
Class H
Capitalisation shares
104.97385,235.860 402,339.678
97.090.0000.00
Number of sharesNet asset value per share
EUR EUR EUR
Total Net Assets 173,638,041.86 132,375,794.36 73,198,787.48
31/12/1431/12/1531/12/16Year ending as at:
EUR
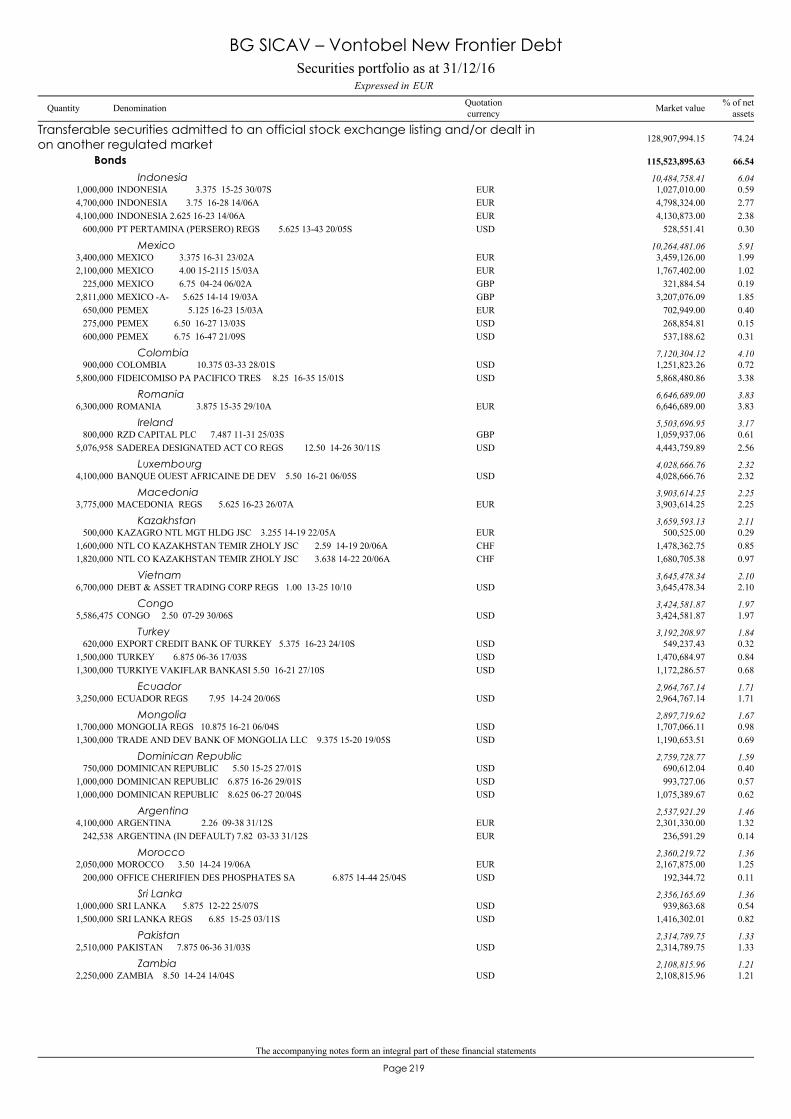
The accompanying notes form an integral part of these financial statements
219Page
INDONESIA 3.375 15-25 30/07S1,000,000 1,027,010.00 0.59EUR
Transferable securities admitted to an official stock exchange listing and/or dealt inon another regulated market 128,907,994.15 74.24
Bonds 115,523,895.63 66.54
Indonesia 10,484,758.41 6.04
INDONESIA 3.75 16-28 14/06A4,700,000 4,798,324.00 2.77EURINDONESIA 2.625 16-23 14/06A4,100,000 4,130,873.00 2.38EURPT PERTAMINA (PERSERO) REGS 5.625 13-43 20/05S600,000 528,551.41 0.30USD
MEXICO 3.375 16-31 23/02A3,400,000 3,459,126.00 1.99EURMexico 10,264,481.06 5.91
MEXICO 4.00 15-2115 15/03A2,100,000 1,767,402.00 1.02EURMEXICO 6.75 04-24 06/02A225,000 321,884.54 0.19GBPMEXICO -A- 5.625 14-14 19/03A2,811,000 3,207,076.09 1.85GBPPEMEX 5.125 16-23 15/03A650,000 702,949.00 0.40EURPEMEX 6.50 16-27 13/03S275,000 268,854.81 0.15USDPEMEX 6.75 16-47 21/09S600,000 537,188.62 0.31USD
COLOMBIA 10.375 03-33 28/01S900,000 1,251,823.26 0.72USDColombia 7,120,304.12 4.10
FIDEICOMISO PA PACIFICO TRES 8.25 16-35 15/01S5,800,000 5,868,480.86 3.38USD
ROMANIA 3.875 15-35 29/10A6,300,000 6,646,689.00 3.83EURRomania 6,646,689.00 3.83
RZD CAPITAL PLC 7.487 11-31 25/03S800,000 1,059,937.06 0.61GBPIreland 5,503,696.95 3.17
SADEREA DESIGNATED ACT CO REGS 12.50 14-26 30/11S5,076,958 4,443,759.89 2.56USD
BANQUE OUEST AFRICAINE DE DEV 5.50 16-21 06/05S4,100,000 4,028,666.76 2.32USDLuxembourg 4,028,666.76 2.32
MACEDONIA REGS 5.625 16-23 26/07A3,775,000 3,903,614.25 2.25EURMacedonia 3,903,614.25 2.25
KAZAGRO NTL MGT HLDG JSC 3.255 14-19 22/05A500,000 500,525.00 0.29EURKazakhstan 3,659,593.13 2.11
NTL CO KAZAKHSTAN TEMIR ZHOLY JSC 2.59 14-19 20/06A1,600,000 1,478,362.75 0.85CHFNTL CO KAZAKHSTAN TEMIR ZHOLY JSC 3.638 14-22 20/06A1,820,000 1,680,705.38 0.97CHF
DEBT & ASSET TRADING CORP REGS 1.00 13-25 10/106,700,000 3,645,478.34 2.10USDVietnam 3,645,478.34 2.10
CONGO 2.50 07-29 30/06S5,586,475 3,424,581.87 1.97USDCongo 3,424,581.87 1.97
EXPORT CREDIT BANK OF TURKEY 5.375 16-23 24/10S620,000 549,237.43 0.32USDTurkey 3,192,208.97 1.84
TURKEY 6.875 06-36 17/03S1,500,000 1,470,684.97 0.84USDTURKIYE VAKIFLAR BANKASI 5.50 16-21 27/10S1,300,000 1,172,286.57 0.68USD
ECUADOR REGS 7.95 14-24 20/06S3,250,000 2,964,767.14 1.71USDEcuador 2,964,767.14 1.71
MONGOLIA REGS 10.875 16-21 06/04S1,700,000 1,707,066.11 0.98USDMongolia 2,897,719.62 1.67
TRADE AND DEV BANK OF MONGOLIA LLC 9.375 15-20 19/05S1,300,000 1,190,653.51 0.69USD
DOMINICAN REPUBLIC 5.50 15-25 27/01S750,000 690,612.04 0.40USDDominican Republic 2,759,728.77 1.59
DOMINICAN REPUBLIC 6.875 16-26 29/01S1,000,000 993,727.06 0.57USDDOMINICAN REPUBLIC 8.625 06-27 20/04S1,000,000 1,075,389.67 0.62USD
ARGENTINA 2.26 09-38 31/12S4,100,000 2,301,330.00 1.32EURArgentina 2,537,921.29 1.46
ARGENTINA (IN DEFAULT) 7.82 03-33 31/12S242,538 236,591.29 0.14EUR
MOROCCO 3.50 14-24 19/06A2,050,000 2,167,875.00 1.25EURMorocco 2,360,219.72 1.36
OFFICE CHERIFIEN DES PHOSPHATES SA 6.875 14-44 25/04S200,000 192,344.72 0.11USD
SRI LANKA 5.875 12-22 25/07S1,000,000 939,863.68 0.54USDSri Lanka 2,356,165.69 1.36
SRI LANKA REGS 6.85 15-25 03/11S1,500,000 1,416,302.01 0.82USD
PAKISTAN 7.875 06-36 31/03S2,510,000 2,314,789.75 1.33USDPakistan 2,314,789.75 1.33
ZAMBIA 8.50 14-24 14/04S2,250,000 2,108,815.96 1.21USDZambia 2,108,815.96 1.21
Securities portfolio as at 31/12/16EURExpressed in
BG SICAV – Vontobel New Frontier Debt
Quantity Denomination Quotationcurrency
% of netassetsMarket value
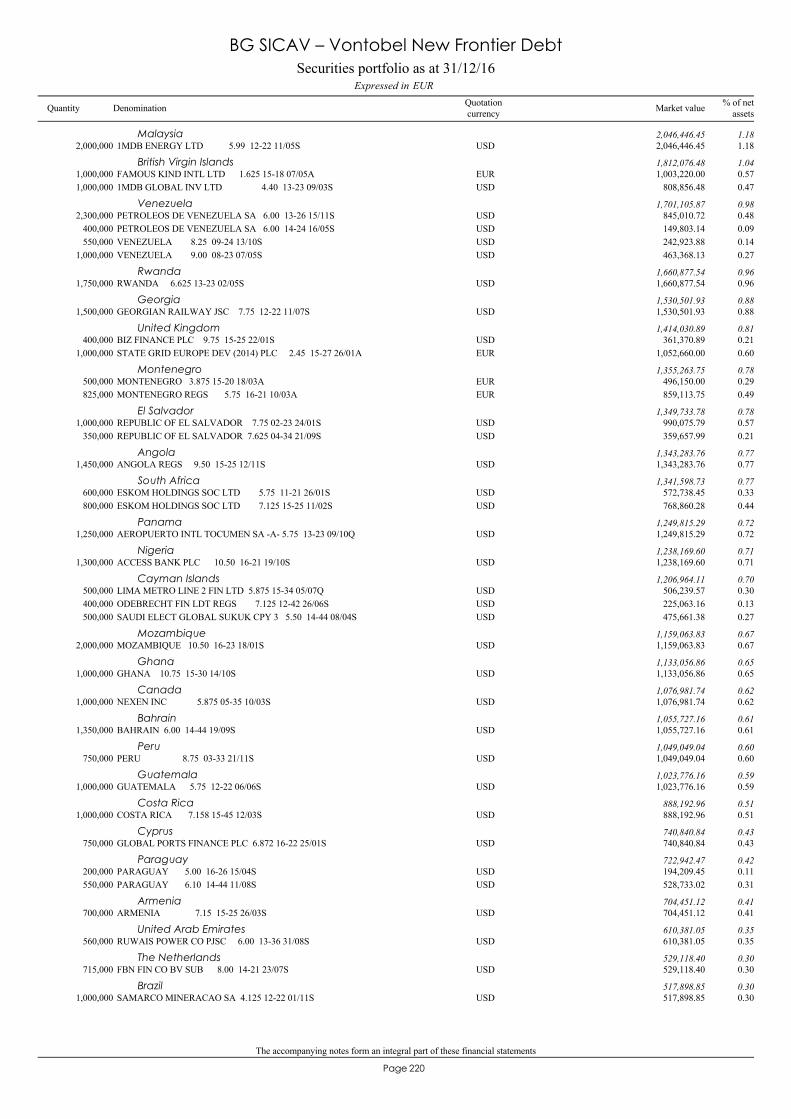
The accompanying notes form an integral part of these financial statements
220Page
1MDB ENERGY LTD 5.99 12-22 11/05S2,000,000 2,046,446.45 1.18USDMalaysia 2,046,446.45 1.18
FAMOUS KIND INTL LTD 1.625 15-18 07/05A1,000,000 1,003,220.00 0.57EURBritish Virgin Islands 1,812,076.48 1.04
1MDB GLOBAL INV LTD 4.40 13-23 09/03S1,000,000 808,856.48 0.47USD
PETROLEOS DE VENEZUELA SA 6.00 13-26 15/11S2,300,000 845,010.72 0.48USDVenezuela 1,701,105.87 0.98
PETROLEOS DE VENEZUELA SA 6.00 14-24 16/05S400,000 149,803.14 0.09USDVENEZUELA 8.25 09-24 13/10S550,000 242,923.88 0.14USDVENEZUELA 9.00 08-23 07/05S1,000,000 463,368.13 0.27USD
RWANDA 6.625 13-23 02/05S1,750,000 1,660,877.54 0.96USDRwanda 1,660,877.54 0.96
GEORGIAN RAILWAY JSC 7.75 12-22 11/07S1,500,000 1,530,501.93 0.88USDGeorgia 1,530,501.93 0.88
BIZ FINANCE PLC 9.75 15-25 22/01S400,000 361,370.89 0.21USDUnited Kingdom 1,414,030.89 0.81
STATE GRID EUROPE DEV (2014) PLC 2.45 15-27 26/01A1,000,000 1,052,660.00 0.60EUR
MONTENEGRO 3.875 15-20 18/03A500,000 496,150.00 0.29EURMontenegro 1,355,263.75 0.78
MONTENEGRO REGS 5.75 16-21 10/03A825,000 859,113.75 0.49EUR
REPUBLIC OF EL SALVADOR 7.75 02-23 24/01S1,000,000 990,075.79 0.57USDEl Salvador 1,349,733.78 0.78
REPUBLIC OF EL SALVADOR 7.625 04-34 21/09S350,000 359,657.99 0.21USD
ANGOLA REGS 9.50 15-25 12/11S1,450,000 1,343,283.76 0.77USDAngola 1,343,283.76 0.77
ESKOM HOLDINGS SOC LTD 5.75 11-21 26/01S600,000 572,738.45 0.33USDSouth Africa 1,341,598.73 0.77
ESKOM HOLDINGS SOC LTD 7.125 15-25 11/02S800,000 768,860.28 0.44USD
AEROPUERTO INTL TOCUMEN SA -A- 5.75 13-23 09/10Q1,250,000 1,249,815.29 0.72USDPanama 1,249,815.29 0.72
ACCESS BANK PLC 10.50 16-21 19/10S1,300,000 1,238,169.60 0.71USDNigeria 1,238,169.60 0.71
LIMA METRO LINE 2 FIN LTD 5.875 15-34 05/07Q500,000 506,239.57 0.30USDCayman Islands 1,206,964.11 0.70
ODEBRECHT FIN LDT REGS 7.125 12-42 26/06S400,000 225,063.16 0.13USDSAUDI ELECT GLOBAL SUKUK CPY 3 5.50 14-44 08/04S500,000 475,661.38 0.27USD
MOZAMBIQUE 10.50 16-23 18/01S2,000,000 1,159,063.83 0.67USDMozambique 1,159,063.83 0.67
GHANA 10.75 15-30 14/10S1,000,000 1,133,056.86 0.65USDGhana 1,133,056.86 0.65
NEXEN INC 5.875 05-35 10/03S1,000,000 1,076,981.74 0.62USDCanada 1,076,981.74 0.62
BAHRAIN 6.00 14-44 19/09S1,350,000 1,055,727.16 0.61USDBahrain 1,055,727.16 0.61
PERU 8.75 03-33 21/11S750,000 1,049,049.04 0.60USDPeru 1,049,049.04 0.60
GUATEMALA 5.75 12-22 06/06S1,000,000 1,023,776.16 0.59USDGuatemala 1,023,776.16 0.59
COSTA RICA 7.158 15-45 12/03S1,000,000 888,192.96 0.51USDCosta Rica 888,192.96 0.51
GLOBAL PORTS FINANCE PLC 6.872 16-22 25/01S750,000 740,840.84 0.43USDCyprus 740,840.84 0.43
PARAGUAY 5.00 16-26 15/04S200,000 194,209.45 0.11USDParaguay 722,942.47 0.42
PARAGUAY 6.10 14-44 11/08S550,000 528,733.02 0.31USD
ARMENIA 7.15 15-25 26/03S700,000 704,451.12 0.41USDArmenia 704,451.12 0.41
RUWAIS POWER CO PJSC 6.00 13-36 31/08S560,000 610,381.05 0.35USDUnited Arab Emirates 610,381.05 0.35
FBN FIN CO BV SUB 8.00 14-21 23/07S715,000 529,118.40 0.30USDThe Netherlands 529,118.40 0.30
SAMARCO MINERACAO SA 4.125 12-22 01/11S1,000,000 517,898.85 0.30USDBrazil 517,898.85 0.30
Securities portfolio as at 31/12/16EURExpressed in
BG SICAV – Vontobel New Frontier Debt
Quantity Denomination Quotationcurrency
% of netassetsMarket value
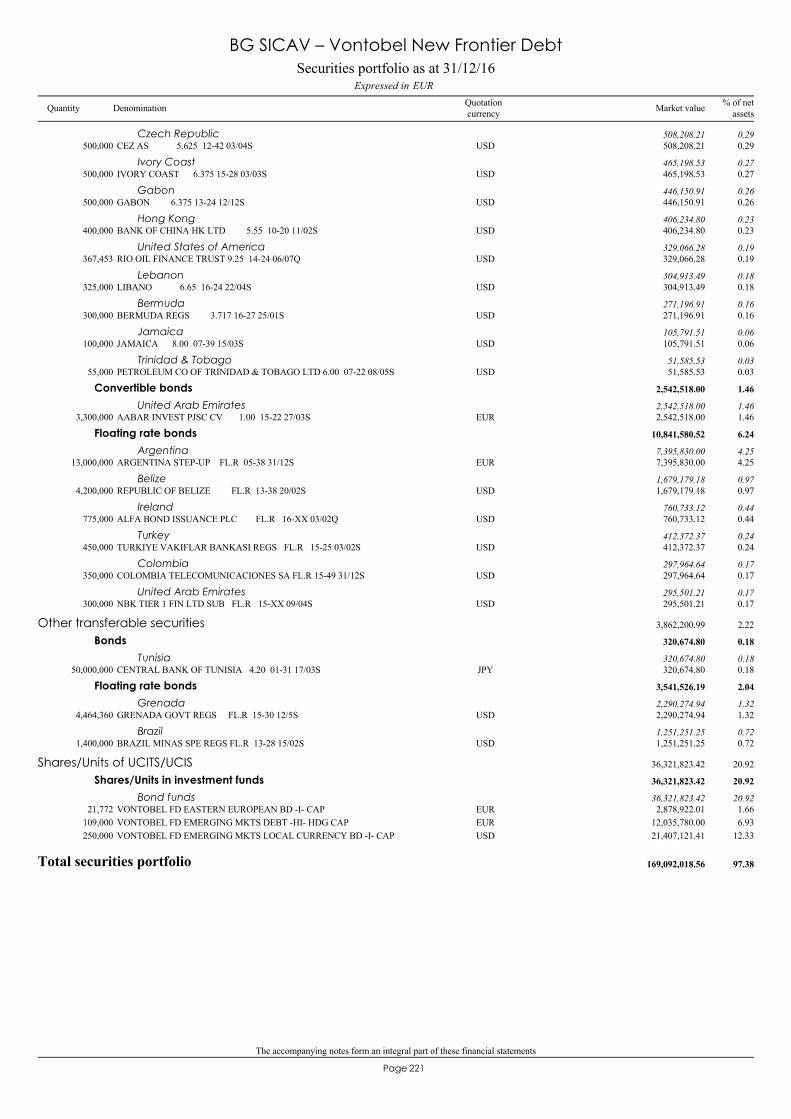
The accompanying notes form an integral part of these financial statements
221Page
CEZ AS 5.625 12-42 03/04S500,000 508,208.21 0.29USDCzech Republic 508,208.21 0.29
IVORY COAST 6.375 15-28 03/03S500,000 465,198.53 0.27USDIvory Coast 465,198.53 0.27
GABON 6.375 13-24 12/12S500,000 446,150.91 0.26USDGabon 446,150.91 0.26
BANK OF CHINA HK LTD 5.55 10-20 11/02S400,000 406,234.80 0.23USDHong Kong 406,234.80 0.23
RIO OIL FINANCE TRUST 9.25 14-24 06/07Q367,453 329,066.28 0.19USDUnited States of America 329,066.28 0.19
LIBANO 6.65 16-24 22/04S325,000 304,913.49 0.18USDLebanon 304,913.49 0.18
BERMUDA REGS 3.717 16-27 25/01S300,000 271,196.91 0.16USDBermuda 271,196.91 0.16
JAMAICA 8.00 07-39 15/03S100,000 105,791.51 0.06USDJamaica 105,791.51 0.06
PETROLEUM CO OF TRINIDAD & TOBAGO LTD 6.00 07-22 08/05S55,000 51,585.53 0.03USDTrinidad & Tobago 51,585.53 0.03
AABAR INVEST PJSC CV 1.00 15-22 27/03S3,300,000 2,542,518.00 1.46EUR
Convertible bonds 2,542,518.00 1.46
United Arab Emirates 2,542,518.00 1.46
ARGENTINA STEP-UP FL.R 05-38 31/12S13,000,000 7,395,830.00 4.25EUR
Floating rate bonds 10,841,580.52 6.24
Argentina 7,395,830.00 4.25
REPUBLIC OF BELIZE FL.R 13-38 20/02S4,200,000 1,679,179.18 0.97USDBelize 1,679,179.18 0.97
ALFA BOND ISSUANCE PLC FL.R 16-XX 03/02Q775,000 760,733.12 0.44USDIreland 760,733.12 0.44
TURKIYE VAKIFLAR BANKASI REGS FL.R 15-25 03/02S450,000 412,372.37 0.24USDTurkey 412,372.37 0.24
COLOMBIA TELECOMUNICACIONES SA FL.R 15-49 31/12S350,000 297,964.64 0.17USDColombia 297,964.64 0.17
NBK TIER 1 FIN LTD SUB FL.R 15-XX 09/04S300,000 295,501.21 0.17USDUnited Arab Emirates 295,501.21 0.17
CENTRAL BANK OF TUNISIA 4.20 01-31 17/03S50,000,000 320,674.80 0.18JPY
Other transferable securities 3,862,200.99 2.22
Bonds 320,674.80 0.18
Tunisia 320,674.80 0.18
GRENADA GOVT REGS FL.R 15-30 12/5S4,464,360 2,290,274.94 1.32USD
Floating rate bonds 3,541,526.19 2.04
Grenada 2,290,274.94 1.32
BRAZIL MINAS SPE REGS FL.R 13-28 15/02S1,400,000 1,251,251.25 0.72USDBrazil 1,251,251.25 0.72
VONTOBEL FD EASTERN EUROPEAN BD -I- CAP21,772 2,878,922.01 1.66EUR
Shares/Units of UCITS/UCIS 36,321,823.42 20.92
Shares/Units in investment funds 36,321,823.42 20.92
Bond funds 36,321,823.42 20.92
VONTOBEL FD EMERGING MKTS DEBT -HI- HDG CAP109,000 12,035,780.00 6.93EURVONTOBEL FD EMERGING MKTS LOCAL CURRENCY BD -I- CAP250,000 21,407,121.41 12.33USD
Total securities portfolio 169,092,018.56 97.38
Securities portfolio as at 31/12/16EURExpressed in
BG SICAV – Vontobel New Frontier Debt
Quantity Denomination Quotationcurrency
% of netassetsMarket value
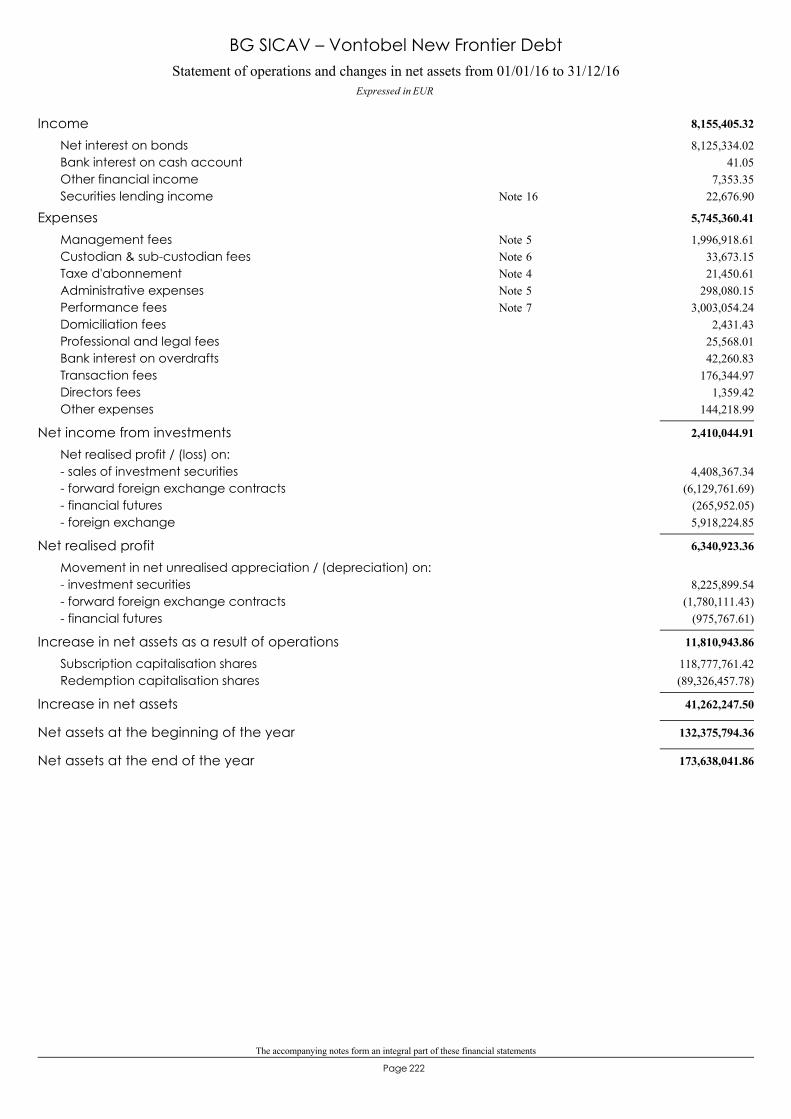
The accompanying notes form an integral part of these financial statements
222Page
Statement of operations and changes in net assets from 01/01/16 to 31/12/16Expressed in EUR
BG SICAV – Vontobel New Frontier Debt
8,155,405.32Income8,125,334.02Net interest on bonds
41.05Bank interest on cash account7,353.35Other financial income
22,676.90Securities lending income 16Note
5,745,360.41Expenses1,996,918.61Management fees 5Note
33,673.15Custodian & sub-custodian fees 6Note21,450.61Taxe d'abonnement 4Note
298,080.15Administrative expenses 5Note3,003,054.24Performance fees 7Note
2,431.43Domiciliation fees25,568.01Professional and legal fees42,260.83Bank interest on overdrafts
176,344.97Transaction fees1,359.42Directors fees
144,218.99Other expenses
2,410,044.91Net income from investmentsNet realised profit / (loss) on:
4,408,367.34- sales of investment securities(6,129,761.69)- forward foreign exchange contracts
(265,952.05)- financial futures5,918,224.85- foreign exchange
6,340,923.36Net realised profitMovement in net unrealised appreciation / (depreciation) on:
8,225,899.54- investment securities(1,780,111.43)- forward foreign exchange contracts
(975,767.61)- financial futures
11,810,943.86Increase in net assets as a result of operations118,777,761.42Subscription capitalisation shares(89,326,457.78)Redemption capitalisation shares
41,262,247.50Increase in net assets
132,375,794.36Net assets at the beginning of the year
173,638,041.86Net assets at the end of the year
223Page
BG SICAV– Global Supranational

The accompanying notes form an integral part of these financial statements
224Page
39,057,740.59Assets33,058,284.25Securities portfolio at market value32,088,463.51Cost price
969,820.74Unrealised profit on the securities portfolio4,545,453.78Cash at bank1,010,232.67Interest receivable
443,736.26Subscriptions receivable33.63Other assets
211,103.97Liabilities67,337.21Accrued performance fees 7Note30,156.76Redemptions payable21,087.01Unrealised depreciation on forward foreign exchange contracts 9Note70,677.08Accrued management fees 5Note1,749.08Accrued custody fees 6Note
15,312.94Accrued administrative expenses 5Note4,783.89Other liabilities
38,846,636.62Net asset value
Financial Statements as at 31/12/16
Expressed in EUR
Statement of net assets as at 31/12/16
BG SICAV – Global Supranational
Class DlCapitalisation shares 36,618.870 37,326.424 20,267.010 53,678.284
Class ECapitalisation shares 25,901.372 98,006.364 20,925.773 102,981.963
Class FCapitalisation shares 593.948 0.000 342.176 251.772
Class HCapitalisation shares 106,509.020 219,170.721 89,443.642 236,236.099
Changes in number of shares outstanding from 01/01/16 to 31/12/16
Shares issued Shares redeemedShares
outstanding as at31/12/16
Sharesoutstanding as at
01/01/16

The accompanying notes form an integral part of these financial statements
225Page
Key figures
BG SICAV – Global Supranational
Class Dl
Capitalisation shares
97.1153,678.284 36,618.870
88.51Number of sharesNet asset value per share
EUR EUR
Class E
Capitalisation shares
103.26102,981.963 25,901.372
93.74Number of sharesNet asset value per share
EUR EUR
Class F
Capitalisation shares
98.50251.772 593.948
89.17Number of sharesNet asset value per share
EUR EUR
Class H
Capitalisation shares
97.25236,236.099 106,509.020
88.33Number of sharesNet asset value per share
EUR EUR
Total Net Assets 38,846,636.62 15,130,128.10
31/12/1531/12/16Year ending as at:
EUR
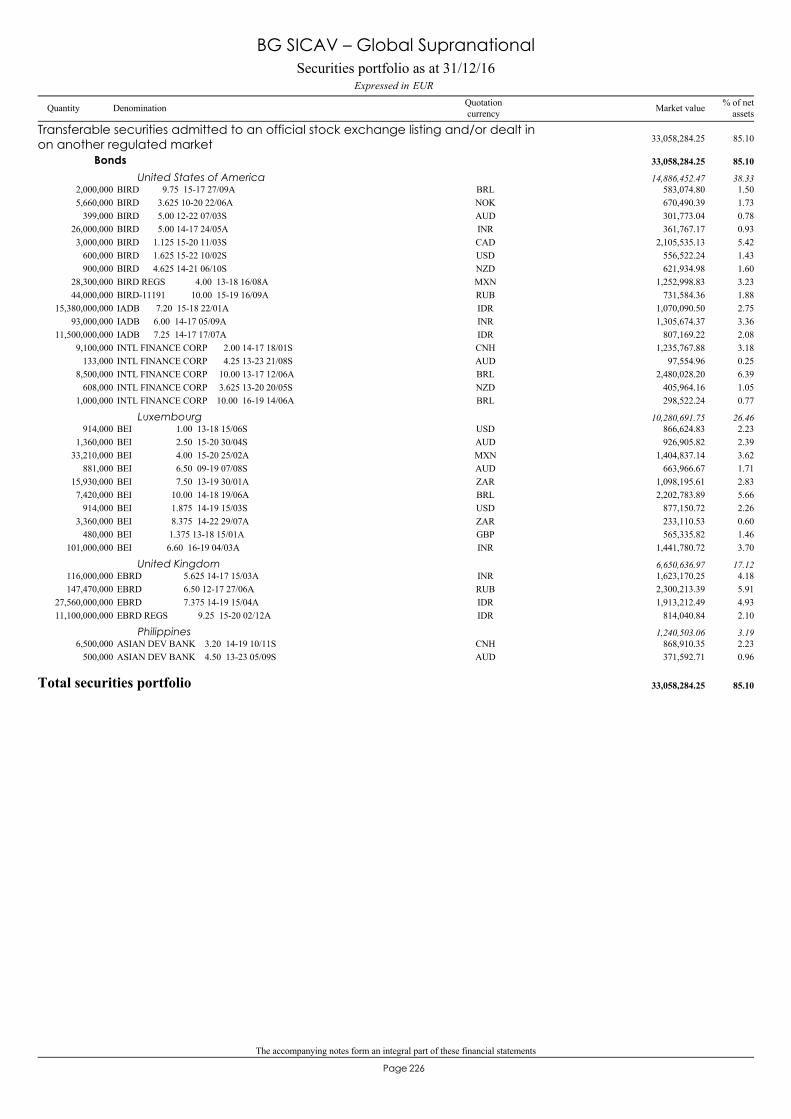
The accompanying notes form an integral part of these financial statements
226Page
BIRD 9.75 15-17 27/09A2,000,000 583,074.80 1.50BRL
Transferable securities admitted to an official stock exchange listing and/or dealt inon another regulated market 33,058,284.25 85.10
Bonds 33,058,284.25 85.10
United States of America 14,886,452.47 38.33
BIRD 3.625 10-20 22/06A5,660,000 670,490.39 1.73NOKBIRD 5.00 12-22 07/03S399,000 301,773.04 0.78AUDBIRD 5.00 14-17 24/05A26,000,000 361,767.17 0.93INRBIRD 1.125 15-20 11/03S3,000,000 2,105,535.13 5.42CADBIRD 1.625 15-22 10/02S600,000 556,522.24 1.43USDBIRD 4.625 14-21 06/10S900,000 621,934.98 1.60NZDBIRD REGS 4.00 13-18 16/08A28,300,000 1,252,998.83 3.23MXNBIRD-11191 10.00 15-19 16/09A44,000,000 731,584.36 1.88RUBIADB 7.20 15-18 22/01A15,380,000,000 1,070,090.50 2.75IDRIADB 6.00 14-17 05/09A93,000,000 1,305,674.37 3.36INRIADB 7.25 14-17 17/07A11,500,000,000 807,169.22 2.08IDRINTL FINANCE CORP 2.00 14-17 18/01S9,100,000 1,235,767.88 3.18CNHINTL FINANCE CORP 4.25 13-23 21/08S133,000 97,554.96 0.25AUDINTL FINANCE CORP 10.00 13-17 12/06A8,500,000 2,480,028.20 6.39BRLINTL FINANCE CORP 3.625 13-20 20/05S608,000 405,964.16 1.05NZDINTL FINANCE CORP 10.00 16-19 14/06A1,000,000 298,522.24 0.77BRL
BEI 1.00 13-18 15/06S914,000 866,624.83 2.23USDLuxembourg 10,280,691.75 26.46
BEI 2.50 15-20 30/04S1,360,000 926,905.82 2.39AUDBEI 4.00 15-20 25/02A33,210,000 1,404,837.14 3.62MXNBEI 6.50 09-19 07/08S881,000 663,966.67 1.71AUDBEI 7.50 13-19 30/01A15,930,000 1,098,195.61 2.83ZARBEI 10.00 14-18 19/06A7,420,000 2,202,783.89 5.66BRLBEI 1.875 14-19 15/03S914,000 877,150.72 2.26USDBEI 8.375 14-22 29/07A3,360,000 233,110.53 0.60ZARBEI 1.375 13-18 15/01A480,000 565,335.82 1.46GBPBEI 6.60 16-19 04/03A101,000,000 1,441,780.72 3.70INR
EBRD 5.625 14-17 15/03A116,000,000 1,623,170.25 4.18INRUnited Kingdom 6,650,636.97 17.12
EBRD 6.50 12-17 27/06A147,470,000 2,300,213.39 5.91RUBEBRD 7.375 14-19 15/04A27,560,000,000 1,913,212.49 4.93IDREBRD REGS 9.25 15-20 02/12A11,100,000,000 814,040.84 2.10IDR
ASIAN DEV BANK 3.20 14-19 10/11S6,500,000 868,910.35 2.23CNHPhilippines 1,240,503.06 3.19
ASIAN DEV BANK 4.50 13-23 05/09S500,000 371,592.71 0.96AUD
Total securities portfolio 33,058,284.25 85.10
Securities portfolio as at 31/12/16EURExpressed in
BG SICAV – Global Supranational
Quantity Denomination Quotationcurrency
% of netassetsMarket value
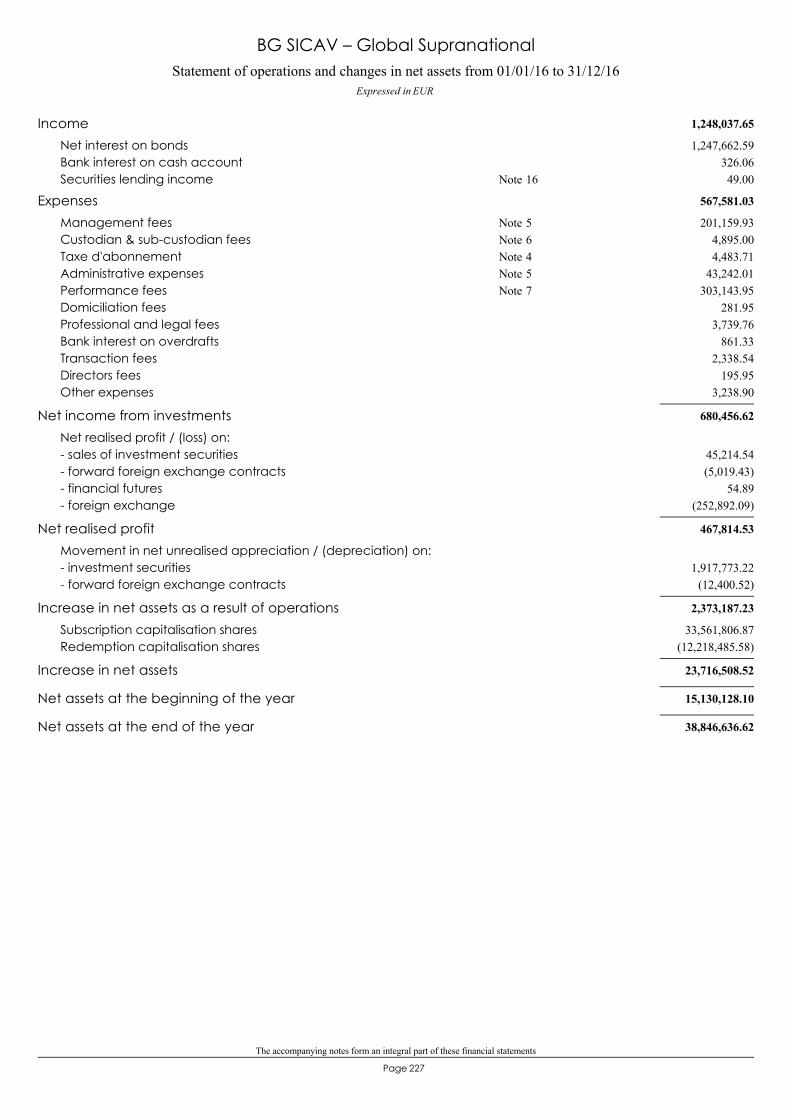
The accompanying notes form an integral part of these financial statements
227Page
Statement of operations and changes in net assets from 01/01/16 to 31/12/16Expressed in EUR
BG SICAV – Global Supranational
1,248,037.65Income1,247,662.59Net interest on bonds
326.06Bank interest on cash account49.00Securities lending income 16Note
567,581.03Expenses201,159.93Management fees 5Note
4,895.00Custodian & sub-custodian fees 6Note4,483.71Taxe d'abonnement 4Note
43,242.01Administrative expenses 5Note303,143.95Performance fees 7Note
281.95Domiciliation fees3,739.76Professional and legal fees
861.33Bank interest on overdrafts2,338.54Transaction fees
195.95Directors fees3,238.90Other expenses
680,456.62Net income from investmentsNet realised profit / (loss) on:
45,214.54- sales of investment securities(5,019.43)- forward foreign exchange contracts
54.89- financial futures(252,892.09)- foreign exchange
467,814.53Net realised profitMovement in net unrealised appreciation / (depreciation) on:
1,917,773.22- investment securities(12,400.52)- forward foreign exchange contracts
2,373,187.23Increase in net assets as a result of operations33,561,806.87Subscription capitalisation shares
(12,218,485.58)Redemption capitalisation shares
23,716,508.52Increase in net assets
15,130,128.10Net assets at the beginning of the year
38,846,636.62Net assets at the end of the year
228Page
BG SICAV– JP Morgan Capital Structure Opportunity
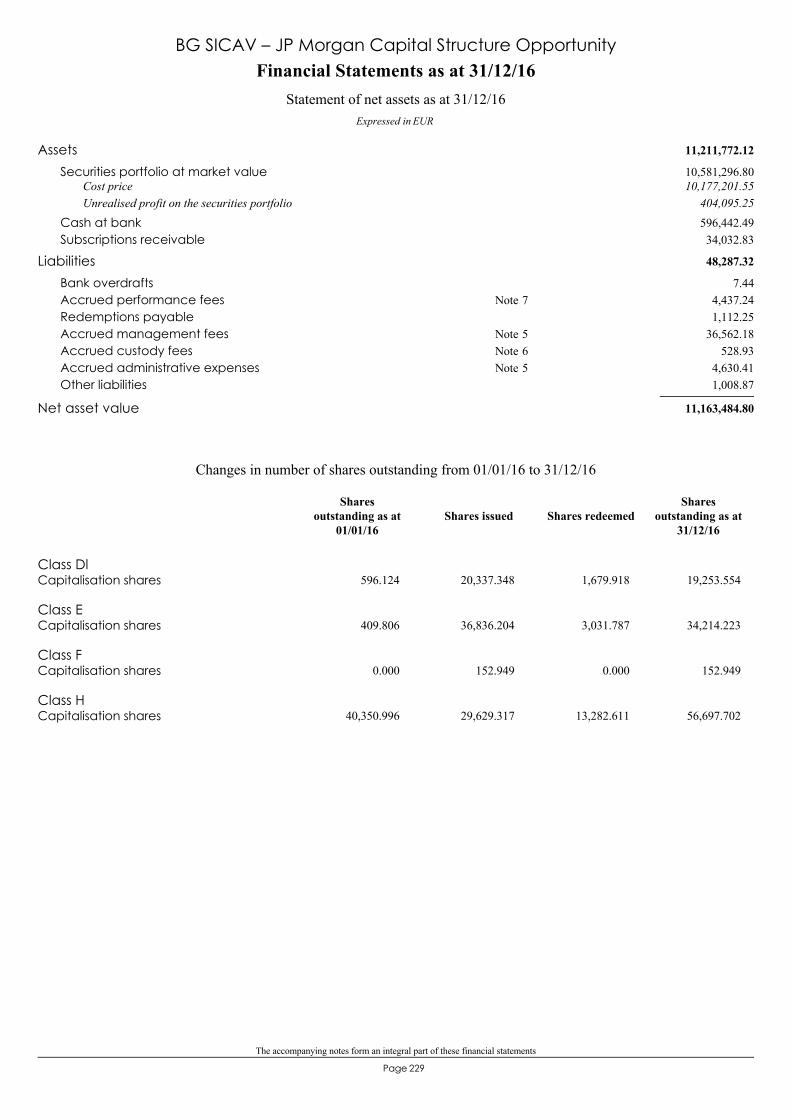
The accompanying notes form an integral part of these financial statements
229Page
11,211,772.12Assets10,581,296.80Securities portfolio at market value10,177,201.55Cost price
404,095.25Unrealised profit on the securities portfolio596,442.49Cash at bank34,032.83Subscriptions receivable
48,287.32Liabilities7.44Bank overdrafts
4,437.24Accrued performance fees 7Note1,112.25Redemptions payable
36,562.18Accrued management fees 5Note528.93Accrued custody fees 6Note
4,630.41Accrued administrative expenses 5Note1,008.87Other liabilities
11,163,484.80Net asset value
Financial Statements as at 31/12/16
Expressed in EUR
Statement of net assets as at 31/12/16
BG SICAV – JP Morgan Capital Structure Opportunity
Class DlCapitalisation shares 596.124 20,337.348 1,679.918 19,253.554
Class ECapitalisation shares 409.806 36,836.204 3,031.787 34,214.223
Class FCapitalisation shares 0.000 152.949 0.000 152.949
Class HCapitalisation shares 40,350.996 29,629.317 13,282.611 56,697.702
Changes in number of shares outstanding from 01/01/16 to 31/12/16
Shares issued Shares redeemedShares
outstanding as at31/12/16
Sharesoutstanding as at
01/01/16
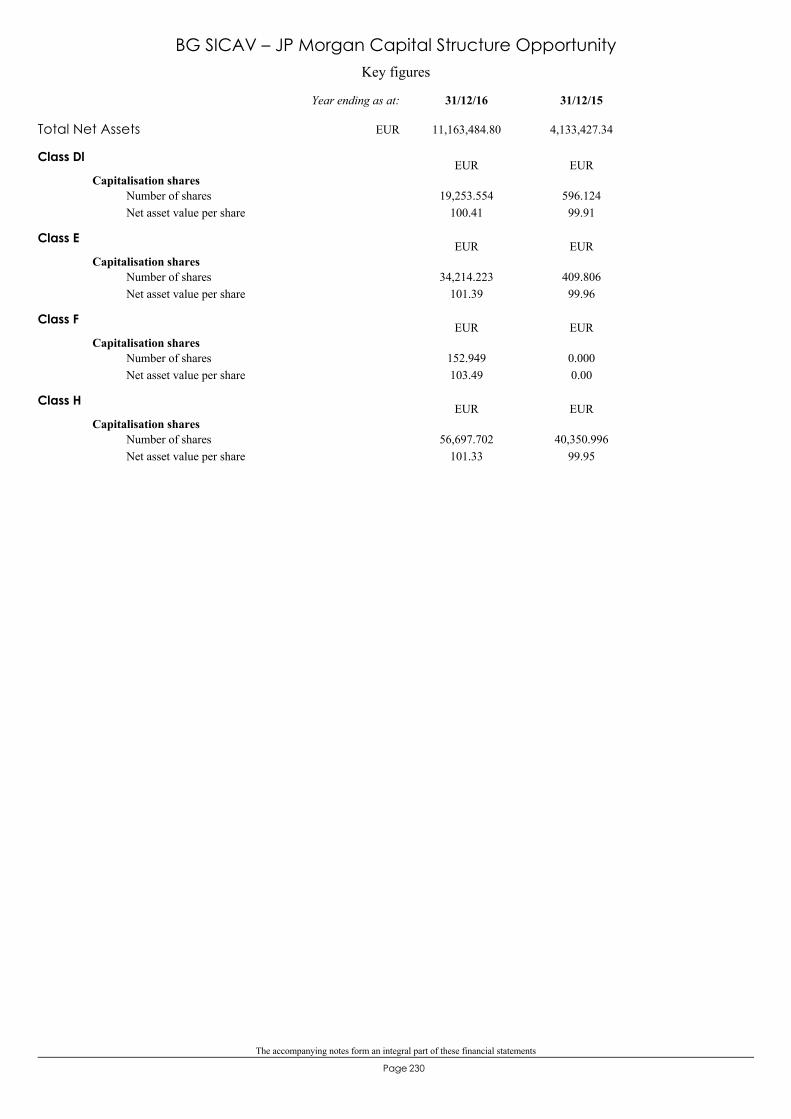
The accompanying notes form an integral part of these financial statements
230Page
Key figures
BG SICAV – JP Morgan Capital Structure Opportunity
Class Dl
Capitalisation shares
100.4119,253.554 596.124
99.91Number of sharesNet asset value per share
EUR EUR
Class E
Capitalisation shares
101.3934,214.223 409.806
99.96Number of sharesNet asset value per share
EUR EUR
Class F
Capitalisation shares
103.49152.949 0.000
0.00Number of sharesNet asset value per share
EUR EUR
Class H
Capitalisation shares
101.3356,697.702 40,350.996
99.95Number of sharesNet asset value per share
EUR EUR
Total Net Assets 11,163,484.80 4,133,427.34
31/12/1531/12/16Year ending as at:
EUR
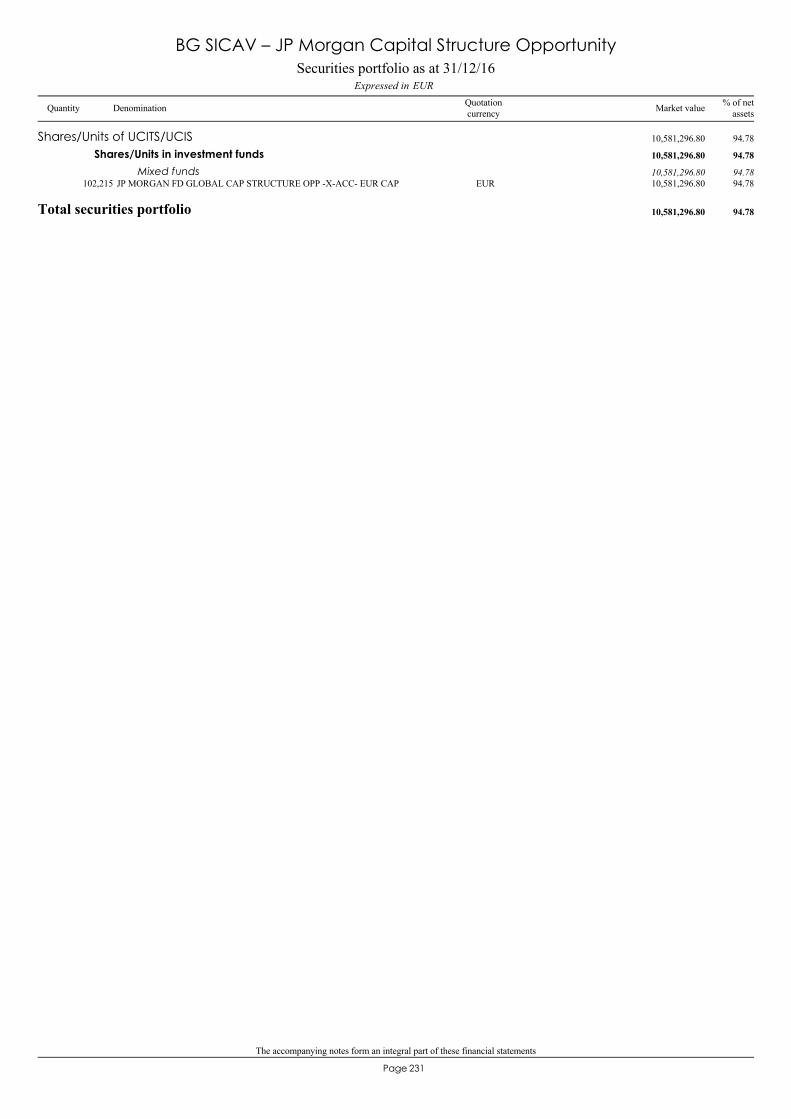
The accompanying notes form an integral part of these financial statements
231Page
JP MORGAN FD GLOBAL CAP STRUCTURE OPP -X-ACC- EUR CAP102,215 10,581,296.80 94.78EUR
Shares/Units of UCITS/UCIS 10,581,296.80 94.78
Shares/Units in investment funds 10,581,296.80 94.78
Mixed funds 10,581,296.80 94.78
Total securities portfolio 10,581,296.80 94.78
Securities portfolio as at 31/12/16EURExpressed in
BG SICAV – JP Morgan Capital Structure Opportunity
Quantity Denomination Quotationcurrency
% of netassetsMarket value
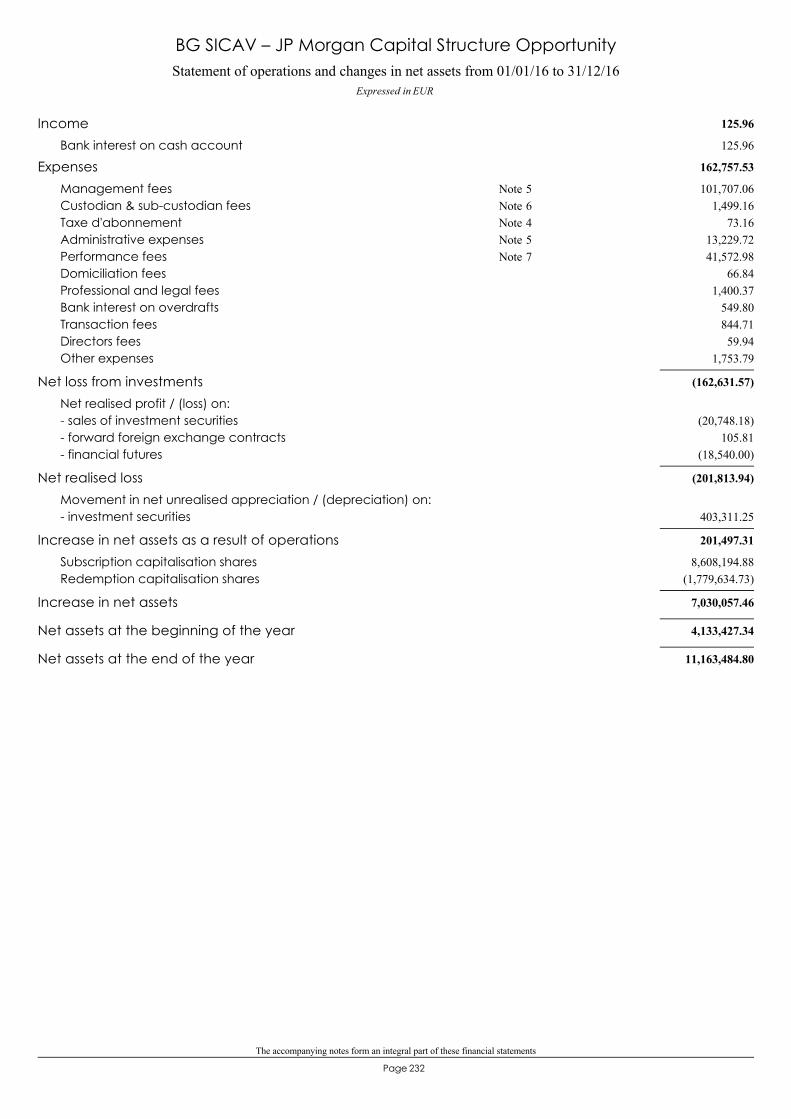
The accompanying notes form an integral part of these financial statements
232Page
Statement of operations and changes in net assets from 01/01/16 to 31/12/16Expressed in EUR
BG SICAV – JP Morgan Capital Structure Opportunity
125.96Income125.96Bank interest on cash account
162,757.53Expenses101,707.06Management fees 5Note
1,499.16Custodian & sub-custodian fees 6Note73.16Taxe d'abonnement 4Note
13,229.72Administrative expenses 5Note41,572.98Performance fees 7Note
66.84Domiciliation fees1,400.37Professional and legal fees
549.80Bank interest on overdrafts844.71Transaction fees59.94Directors fees
1,753.79Other expenses
(162,631.57)Net loss from investmentsNet realised profit / (loss) on:
(20,748.18)- sales of investment securities105.81- forward foreign exchange contracts
(18,540.00)- financial futures
(201,813.94)Net realised lossMovement in net unrealised appreciation / (depreciation) on:
403,311.25- investment securities
201,497.31Increase in net assets as a result of operations8,608,194.88Subscription capitalisation shares
(1,779,634.73)Redemption capitalisation shares
7,030,057.46Increase in net assets
4,133,427.34Net assets at the beginning of the year
11,163,484.80Net assets at the end of the year
233Page
BG SICAV– Muzinich Credit Alternative Fund
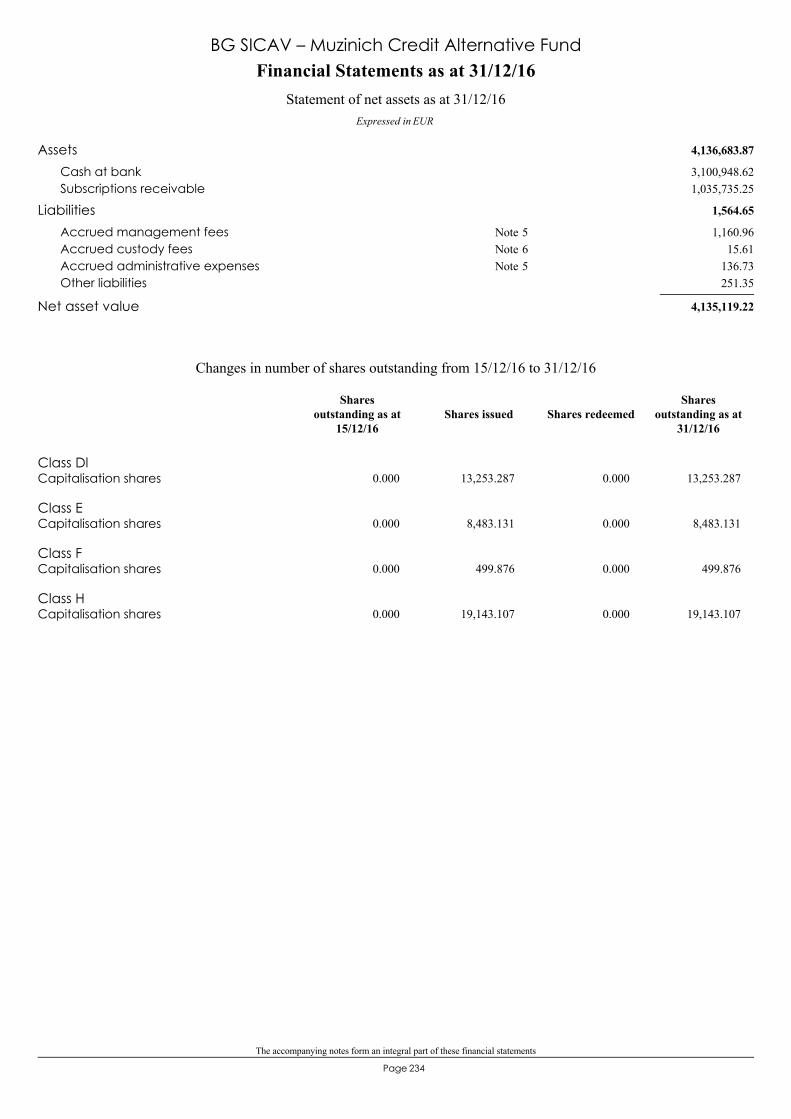
The accompanying notes form an integral part of these financial statements
234Page
4,136,683.87Assets3,100,948.62Cash at bank1,035,735.25Subscriptions receivable
1,564.65Liabilities1,160.96Accrued management fees 5Note
15.61Accrued custody fees 6Note136.73Accrued administrative expenses 5Note251.35Other liabilities
4,135,119.22Net asset value
Financial Statements as at 31/12/16
Expressed in EUR
Statement of net assets as at 31/12/16
BG SICAV – Muzinich Credit Alternative Fund
Class DlCapitalisation shares 0.000 13,253.287 0.000 13,253.287
Class ECapitalisation shares 0.000 8,483.131 0.000 8,483.131
Class FCapitalisation shares 0.000 499.876 0.000 499.876
Class HCapitalisation shares 0.000 19,143.107 0.000 19,143.107
Changes in number of shares outstanding from 15/12/16 to 31/12/16
Shares issued Shares redeemedShares
outstanding as at31/12/16
Sharesoutstanding as at
15/12/16
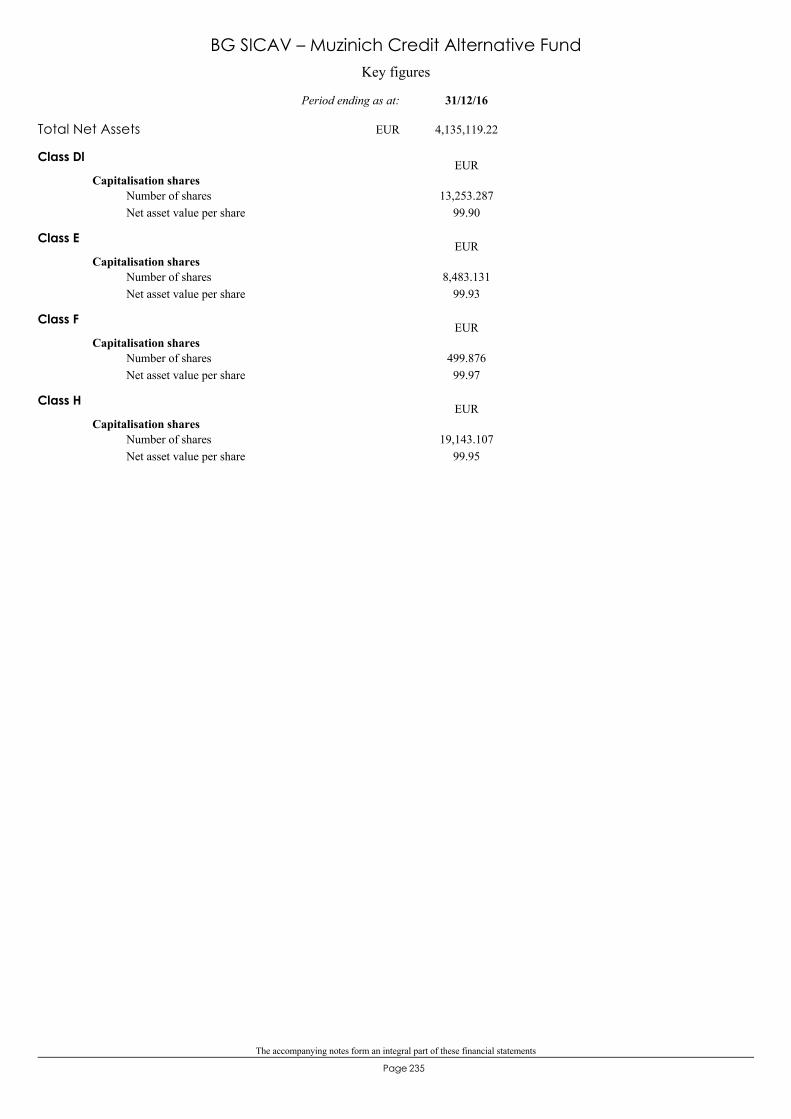
The accompanying notes form an integral part of these financial statements
235Page
Key figures
BG SICAV – Muzinich Credit Alternative Fund
Class Dl
Capitalisation shares
99.9013,253.287Number of shares
Net asset value per share
EUR
Class E
Capitalisation shares
99.938,483.131Number of shares
Net asset value per share
EUR
Class F
Capitalisation shares
99.97499.876Number of shares
Net asset value per share
EUR
Class H
Capitalisation shares
99.9519,143.107Number of shares
Net asset value per share
EUR
Total Net Assets 4,135,119.22
31/12/16Period ending as at:
EUR
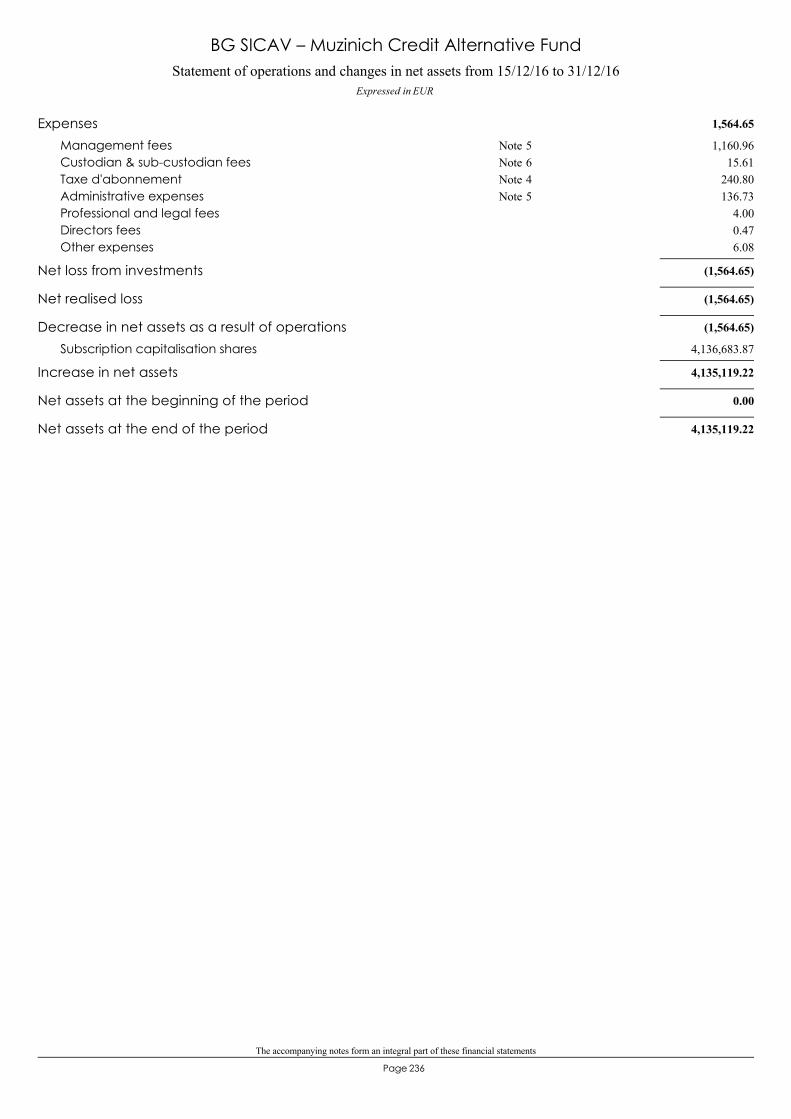
The accompanying notes form an integral part of these financial statements
236Page
Statement of operations and changes in net assets from 15/12/16 to 31/12/16Expressed in EUR
BG SICAV – Muzinich Credit Alternative Fund
1,564.65Expenses1,160.96Management fees 5Note
15.61Custodian & sub-custodian fees 6Note240.80Taxe d'abonnement 4Note136.73Administrative expenses 5Note
4.00Professional and legal fees0.47Directors fees6.08Other expenses
(1,564.65)Net loss from investments
(1,564.65)Net realised loss
(1,564.65)Decrease in net assets as a result of operations4,136,683.87Subscription capitalisation shares
4,135,119.22Increase in net assets
0.00Net assets at the beginning of the period
4,135,119.22Net assets at the end of the period

237Page
BG SICAVNotes to the financial statements

BG SICAV
Notes to the financial statements as at December 31, 2016
Page 238
1. ORGANISATION BG SICAV (the “SICAV”) is an investment company, qualifying as a “société d’investissement à capital variable”, incorporated on April 4, 2006 for an unlimited duration under Part I of the modified law of December 17, 2010 on undertakings for collective investment. The SICAV is registered at the Luxembourg Commercial Register under the number B115.297 and is established at 5, allée Scheffer, L - 2520 Luxembourg. BG FUND MANAGEMENT LUXEMBOURG S.A. (RCS Luxembourg B134.555), a limited liability company, société anonyme, having its registered office at 5, allée Scheffer, L - 2520 Luxembourg, has been designated to serve as Management Company of the SICAV in accordance with the provisions of the UCI Law. The Management Company has also been designated as management company of the “Sociétés d’Investissement à Capital Variable” BG SELECTION SICAV, BG ALTERNATIVE SICAV-SIF and BG DRAGON CHINA. On December 31, 2016, the following Classes of Shares are active:
Sub-funds name Classes of Shares
Currency Launch date(1)
1. Equity sub-funds
BG SICAV – European Equities
Class A Class C Class Db Class Dl Class E Class F Class H
EUR EUR EUR EUR EUR EUR EUR
July 14, 2006 July 14, 2006 July 14, 2006 July 14, 2006
March 6, 2014 November 30, 2012
April 8, 2015
BG SICAV – US Equities
Class A Class B Class C Class Db Class Dl Class E Class F Class H
EUR EUR EUR EUR EUR EUR EUR EUR
July 14, 2006 July 14, 2006 July 14, 2006 July 14, 2006 July 19, 2006
March 6, 2014 November 30, 2012
April 8, 2015
BG SICAV – Pictet Japanese Equities
Class C Class Db Class Dl Class E Class F Class H
EUR EUR EUR EUR EUR EUR
July 14, 2006 July 14, 2006 July 14, 2006
March 6, 2014 March 20, 2013
May 4, 2015
BG SICAV – Schroder High Dividend Europe
Class C Class Dl Class E Class F Class H
EUR EUR EUR EUR EUR
June 11, 2014 February 27, 2014
March 6, 2014 February 26, 2014
May 6, 2015
BG SICAV – Small-Mid Cap Euro Equities
Class C Class Dl Class E Class F Class H
EUR EUR EUR EUR EUR
February 7, 2014 February 27, 2014
March 6, 2014 March 12, 2014
April 7, 2015
BG SICAV – UBS Global Long Short
(formerly BG SICAV – Columbia Threadneedle Global Equity Long Short)
Class Dl Class E Class F Class H
EUR EUR EUR EUR
March 4, 2014 March 6, 2014 June 19, 2014
April 22, 2015
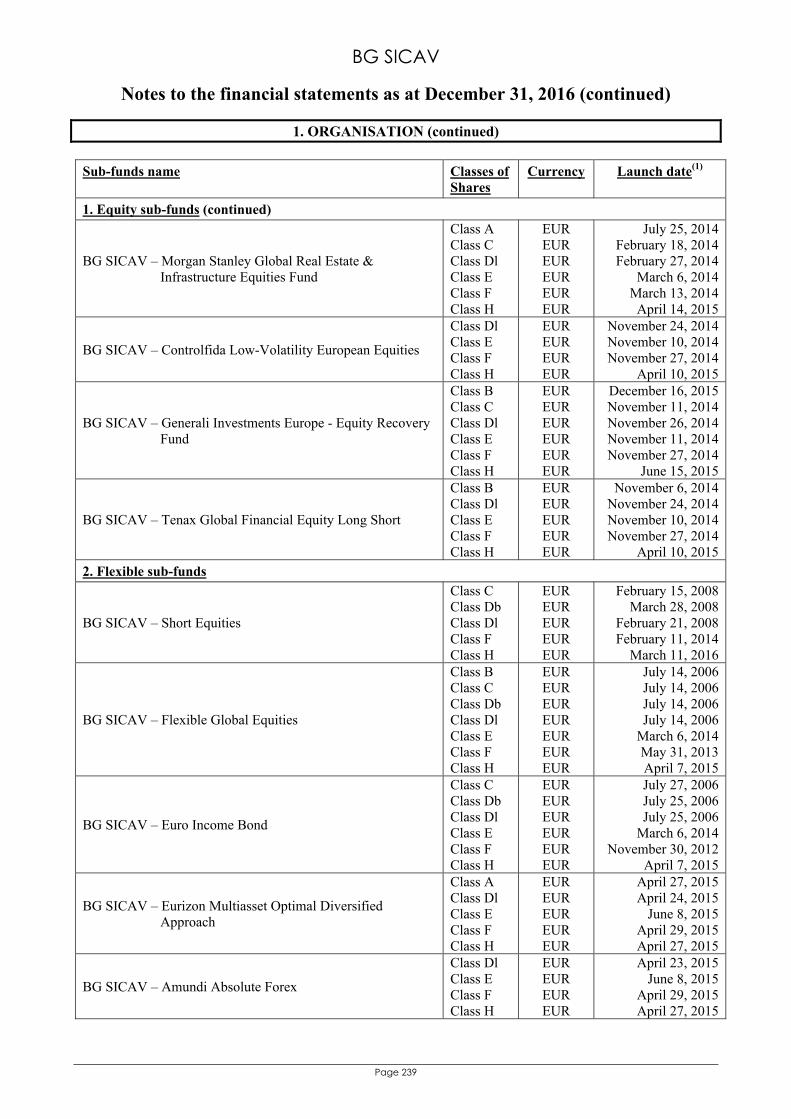
BG SICAV
Notes to the financial statements as at December 31, 2016 (continued)
Page 239
1. ORGANISATION (continued)
Sub-funds name Classes of Shares
Currency Launch date(1)
1. Equity sub-funds (continued)
BG SICAV – Morgan Stanley Global Real Estate & Infrastructure Equities Fund
Class A Class C Class Dl Class E Class F Class H
EUR EUR EUR EUR EUR EUR
July 25, 2014 February 18, 2014 February 27, 2014
March 6, 2014 March 13, 2014 April 14, 2015
BG SICAV – Controlfida Low-Volatility European Equities
Class Dl Class E Class F Class H
EUR EUR EUR EUR
November 24, 2014 November 10, 2014 November 27, 2014
April 10, 2015
BG SICAV – Generali Investments Europe - Equity Recovery Fund
Class B Class C Class Dl Class E Class F Class H
EUR EUR EUR EUR EUR EUR
December 16, 2015 November 11, 2014 November 26, 2014 November 11, 2014 November 27, 2014
June 15, 2015
BG SICAV – Tenax Global Financial Equity Long Short
Class B Class Dl Class E Class F Class H
EUR EUR EUR EUR EUR
November 6, 2014 November 24, 2014 November 10, 2014 November 27, 2014
April 10, 2015
2. Flexible sub-funds
BG SICAV – Short Equities
Class C Class Db Class Dl Class F
Class H
EUR EUR EUR EUR EUR
February 15, 2008 March 28, 2008
February 21, 2008 February 11, 2014
March 11, 2016
BG SICAV – Flexible Global Equities
Class B Class C Class Db Class Dl Class E Class F Class H
EUR EUR EUR EUR EUR EUR EUR
July 14, 2006 July 14, 2006 July 14, 2006 July 14, 2006
March 6, 2014 May 31, 2013 April 7, 2015
BG SICAV – Euro Income Bond
Class C Class Db Class Dl Class E Class F Class H
EUR EUR EUR EUR EUR EUR
July 27, 2006 July 25, 2006 July 25, 2006
March 6, 2014 November 30, 2012
April 7, 2015
BG SICAV – Eurizon Multiasset Optimal Diversified Approach
Class A Class Dl Class E Class F Class H
EUR EUR EUR EUR EUR
April 27, 2015 April 24, 2015
June 8, 2015 April 29, 2015 April 27, 2015
BG SICAV – Amundi Absolute Forex
Class Dl Class E Class F Class H
EUR EUR EUR EUR
April 23, 2015 June 8, 2015
April 29, 2015 April 27, 2015
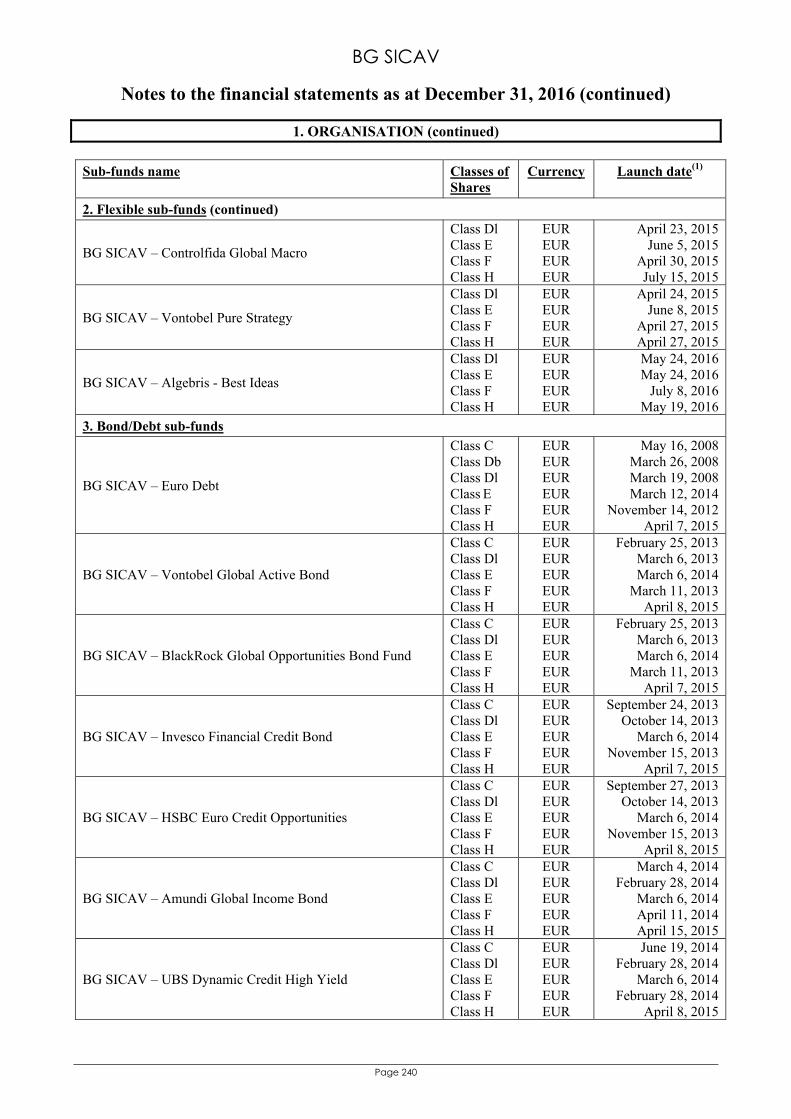
BG SICAV
Notes to the financial statements as at December 31, 2016 (continued)
Page 240
1. ORGANISATION (continued)
Sub-funds name Classes of Shares
Currency Launch date(1)
2. Flexible sub-funds (continued)
BG SICAV – Controlfida Global Macro
Class Dl Class E Class F Class H
EUR EUR EUR EUR
April 23, 2015 June 5, 2015
April 30, 2015 July 15, 2015
BG SICAV – Vontobel Pure Strategy
Class Dl Class E Class F Class H
EUR EUR EUR EUR
April 24, 2015 June 8, 2015
April 27, 2015 April 27, 2015
BG SICAV – Algebris - Best Ideas
Class Dl Class E Class F Class H
EUR EUR EUR EUR
May 24, 2016 May 24, 2016
July 8, 2016 May 19, 2016
3. Bond/Debt sub-funds
BG SICAV – Euro Debt
Class C Class Db Class Dl Class E Class F Class H
EUR EUR EUR EUR EUR EUR
May 16, 2008 March 26, 2008 March 19, 2008 March 12, 2014
November 14, 2012 April 7, 2015
BG SICAV – Vontobel Global Active Bond
Class C Class Dl Class E Class F Class H
EUR EUR EUR EUR EUR
February 25, 2013 March 6, 2013 March 6, 2014
March 11, 2013 April 8, 2015
BG SICAV – BlackRock Global Opportunities Bond Fund
Class C Class Dl Class E Class F Class H
EUR EUR EUR EUR EUR
February 25, 2013 March 6, 2013 March 6, 2014
March 11, 2013 April 7, 2015
BG SICAV – Invesco Financial Credit Bond
Class C Class Dl Class E Class F Class H
EUR EUR EUR EUR EUR
September 24, 2013 October 14, 2013
March 6, 2014 November 15, 2013
April 7, 2015
BG SICAV – HSBC Euro Credit Opportunities
Class C Class Dl Class E Class F Class H
EUR EUR EUR EUR EUR
September 27, 2013 October 14, 2013
March 6, 2014 November 15, 2013
April 8, 2015
BG SICAV – Amundi Global Income Bond
Class C Class Dl Class E Class F Class H
EUR EUR EUR EUR EUR
March 4, 2014 February 28, 2014
March 6, 2014 April 11, 2014 April 15, 2015
BG SICAV – UBS Dynamic Credit High Yield
Class C Class Dl Class E Class F Class H
EUR EUR EUR EUR EUR
June 19, 2014 February 28, 2014
March 6, 2014 February 28, 2014
April 8, 2015
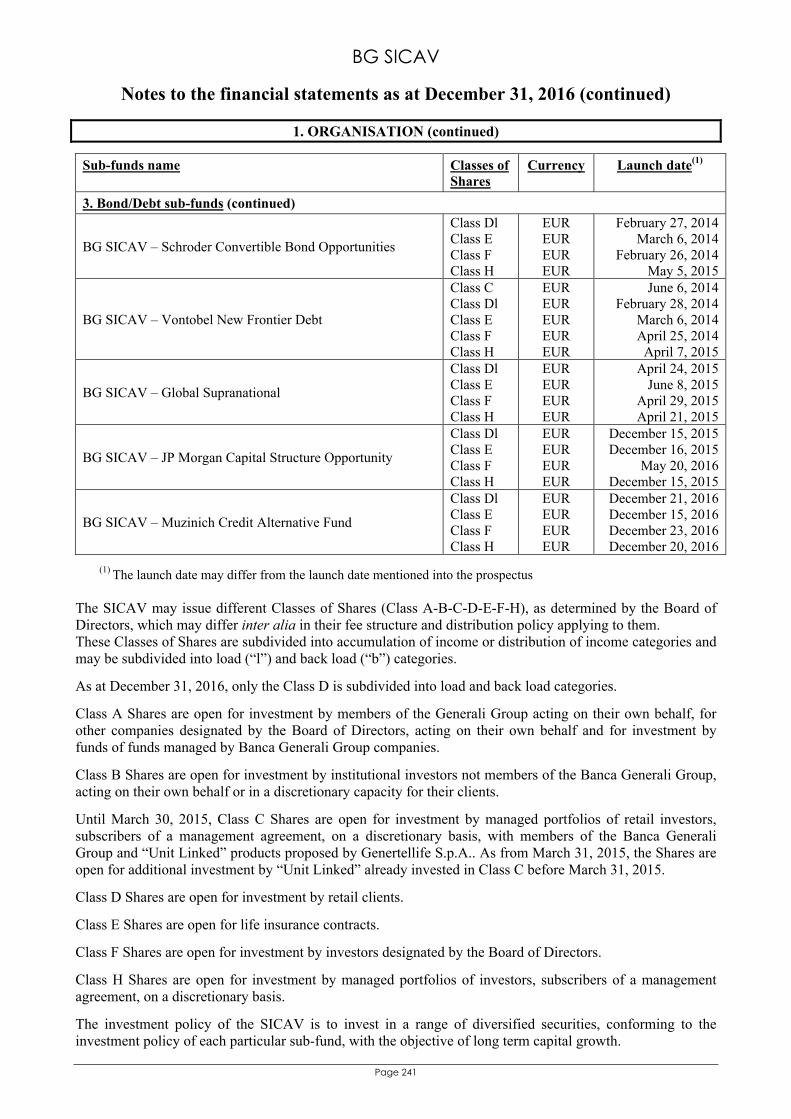
BG SICAV
Notes to the financial statements as at December 31, 2016 (continued)
Page 241
1. ORGANISATION (continued)
Sub-funds name Classes of Shares
Currency Launch date(1)
3. Bond/Debt sub-funds (continued)
BG SICAV – Schroder Convertible Bond Opportunities
Class Dl Class E Class F Class H
EUR EUR EUR EUR
February 27, 2014 March 6, 2014
February 26, 2014 May 5, 2015
BG SICAV – Vontobel New Frontier Debt
Class C Class Dl Class E Class F Class H
EUR EUR EUR EUR EUR
June 6, 2014 February 28, 2014
March 6, 2014 April 25, 2014 April 7, 2015
BG SICAV – Global Supranational
Class Dl Class E Class F Class H
EUR EUR EUR EUR
April 24, 2015 June 8, 2015
April 29, 2015 April 21, 2015
BG SICAV – JP Morgan Capital Structure Opportunity
Class Dl Class E Class F Class H
EUR EUR EUR EUR
December 15, 2015 December 16, 2015
May 20, 2016 December 15, 2015
BG SICAV – Muzinich Credit Alternative Fund
Class Dl Class E Class F Class H
EUR EUR EUR EUR
December 21, 2016 December 15, 2016 December 23, 2016 December 20, 2016
(1) The launch date may differ from the launch date mentioned into the prospectus
The SICAV may issue different Classes of Shares (Class A-B-C-D-E-F-H), as determined by the Board of Directors, which may differ inter alia in their fee structure and distribution policy applying to them. These Classes of Shares are subdivided into accumulation of income or distribution of income categories and may be subdivided into load (“l”) and back load (“b”) categories.
As at December 31, 2016, only the Class D is subdivided into load and back load categories.
Class A Shares are open for investment by members of the Generali Group acting on their own behalf, for other companies designated by the Board of Directors, acting on their own behalf and for investment by funds of funds managed by Banca Generali Group companies.
Class B Shares are open for investment by institutional investors not members of the Banca Generali Group, acting on their own behalf or in a discretionary capacity for their clients.
Until March 30, 2015, Class C Shares are open for investment by managed portfolios of retail investors, subscribers of a management agreement, on a discretionary basis, with members of the Banca Generali Group and “Unit Linked” products proposed by Genertellife S.p.A.. As from March 31, 2015, the Shares are open for additional investment by “Unit Linked” already invested in Class C before March 31, 2015.
Class D Shares are open for investment by retail clients.
Class E Shares are open for life insurance contracts.
Class F Shares are open for investment by investors designated by the Board of Directors.
Class H Shares are open for investment by managed portfolios of investors, subscribers of a management agreement, on a discretionary basis.
The investment policy of the SICAV is to invest in a range of diversified securities, conforming to the investment policy of each particular sub-fund, with the objective of long term capital growth.
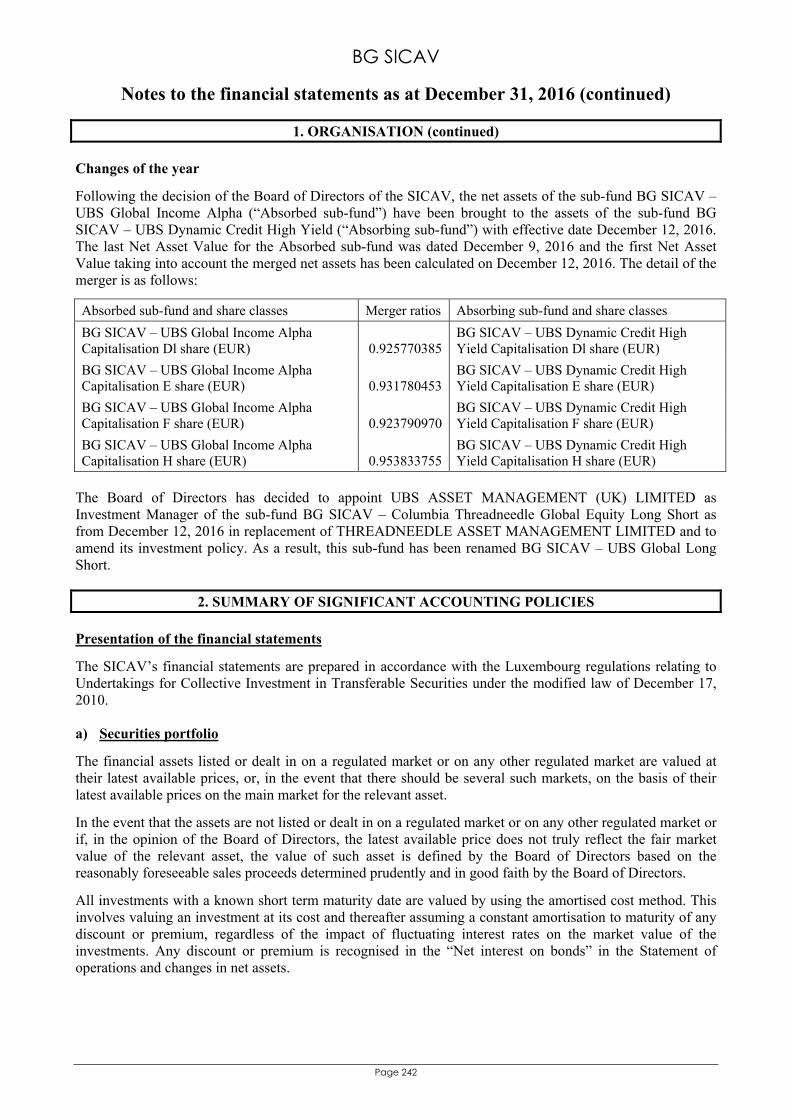
BG SICAV
Notes to the financial statements as at December 31, 2016 (continued)
Page 242
1. ORGANISATION (continued) Changes of the year
Following the decision of the Board of Directors of the SICAV, the net assets of the sub-fund BG SICAV – UBS Global Income Alpha (“Absorbed sub-fund”) have been brought to the assets of the sub-fund BG SICAV – UBS Dynamic Credit High Yield (“Absorbing sub-fund”) with effective date December 12, 2016. The last Net Asset Value for the Absorbed sub-fund was dated December 9, 2016 and the first Net Asset Value taking into account the merged net assets has been calculated on December 12, 2016. The detail of the merger is as follows:
Absorbed sub-fund and share classes Merger ratios Absorbing sub-fund and share classes
BG SICAV – UBS Global Income Alpha Capitalisation Dl share (EUR) 0.925770385
BG SICAV – UBS Dynamic Credit High Yield Capitalisation Dl share (EUR)
BG SICAV – UBS Global Income Alpha Capitalisation E share (EUR) 0.931780453
BG SICAV – UBS Dynamic Credit High Yield Capitalisation E share (EUR)
BG SICAV – UBS Global Income Alpha Capitalisation F share (EUR) 0.923790970
BG SICAV – UBS Dynamic Credit High Yield Capitalisation F share (EUR)
BG SICAV – UBS Global Income Alpha Capitalisation H share (EUR) 0.953833755
BG SICAV – UBS Dynamic Credit High Yield Capitalisation H share (EUR)
The Board of Directors has decided to appoint UBS ASSET MANAGEMENT (UK) LIMITED as Investment Manager of the sub-fund BG SICAV – Columbia Threadneedle Global Equity Long Short as from December 12, 2016 in replacement of THREADNEEDLE ASSET MANAGEMENT LIMITED and to amend its investment policy. As a result, this sub-fund has been renamed BG SICAV – UBS Global Long Short.
2. SUMMARY OF SIGNIFICANT ACCOUNTING POLICIES Presentation of the financial statements
The SICAV’s financial statements are prepared in accordance with the Luxembourg regulations relating to Undertakings for Collective Investment in Transferable Securities under the modified law of December 17, 2010. a) Securities portfolio
The financial assets listed or dealt in on a regulated market or on any other regulated market are valued at their latest available prices, or, in the event that there should be several such markets, on the basis of their latest available prices on the main market for the relevant asset.
In the event that the assets are not listed or dealt in on a regulated market or on any other regulated market or if, in the opinion of the Board of Directors, the latest available price does not truly reflect the fair market value of the relevant asset, the value of such asset is defined by the Board of Directors based on the reasonably foreseeable sales proceeds determined prudently and in good faith by the Board of Directors.
All investments with a known short term maturity date are valued by using the amortised cost method. This involves valuing an investment at its cost and thereafter assuming a constant amortisation to maturity of any discount or premium, regardless of the impact of fluctuating interest rates on the market value of the investments. Any discount or premium is recognised in the “Net interest on bonds” in the Statement of operations and changes in net assets.
BG SICAV
Notes to the financial statements as at December 31, 2016 (continued)
Page 243
2. SUMMARY OF SIGNIFICANT ACCOUNTING POLICIES (continued) If the Board of Directors believes that a deviation from the amortised cost per share may result in material dilution or other unfair results to shareholders, the Board of Directors shall take such corrective action, if any, as they deem appropriate to eliminate or reduce, to the extent reasonably practicable, the dilution or unfair results.
Units or shares issued by open-ended investment funds are valued at their last available Net Asset Value. Feeder UCITS investments into Master UCITS are valued at the latest available Net Asset Value as published by the Master UCITS. b) To Be Announced Bonds
Certain sub-funds may enter into To Be Announced (“TBA”) purchase/sell commitments, pursuant to which they agreed to purchase or sell mortgage-backed securities for a fixed unit price, with payment and delivery at a scheduled future date beyond the customary settlement period for such mortgage-backed securities. With TBA transactions, the particular securities to be delivered are not identified at the trade date; however, delivered securities must meet specified terms, including issuer, rate and mortgage term, and be within industry-accepted “good delivery” standards. The sub-funds enter into TBA transactions with the intention of taking possession of or deliver the underlying mortgage securities. Until settlement, the sub-funds maintain cash reserves and liquid assets sufficient to settle its TBA commitments.
The same valuation principles (as described in paragraph a)) are applied in TBA’s. c) Portfolio valuation
The financial statements are prepared based on the last Net Asset Value of the year which has been calculated on December 30, 2016 with the last available prices as at December 29, 2016 in accordance with the accounting valuation principles as mentioned in the last prospectus of the SICAV. The comparison between the sub-fund’s portfolio valuation using prices as at December 29, 2016 and prices as at December 30, 2016 did not result in any material appreciation or depreciation of the Net Asset Value of the sub-funds.
As at December 31, 2016, there is no significant portfolio valuation impact. d) Conversion of items expressed in foreign currencies
The SICAV’s financial statements are expressed in EUR.
Transactions and acquisition costs denominated in foreign currencies are converted into the accounting currency of each sub-fund based on the exchange rate in force on the date of the transaction or acquisition. Assets and liabilities denominated in foreign currencies are converted into the accounting currency of each sub-fund based on the exchange rate in force at the end of the financial year. Any resulting gains or losses are recognised in the Statement of operations and changes in net assets.
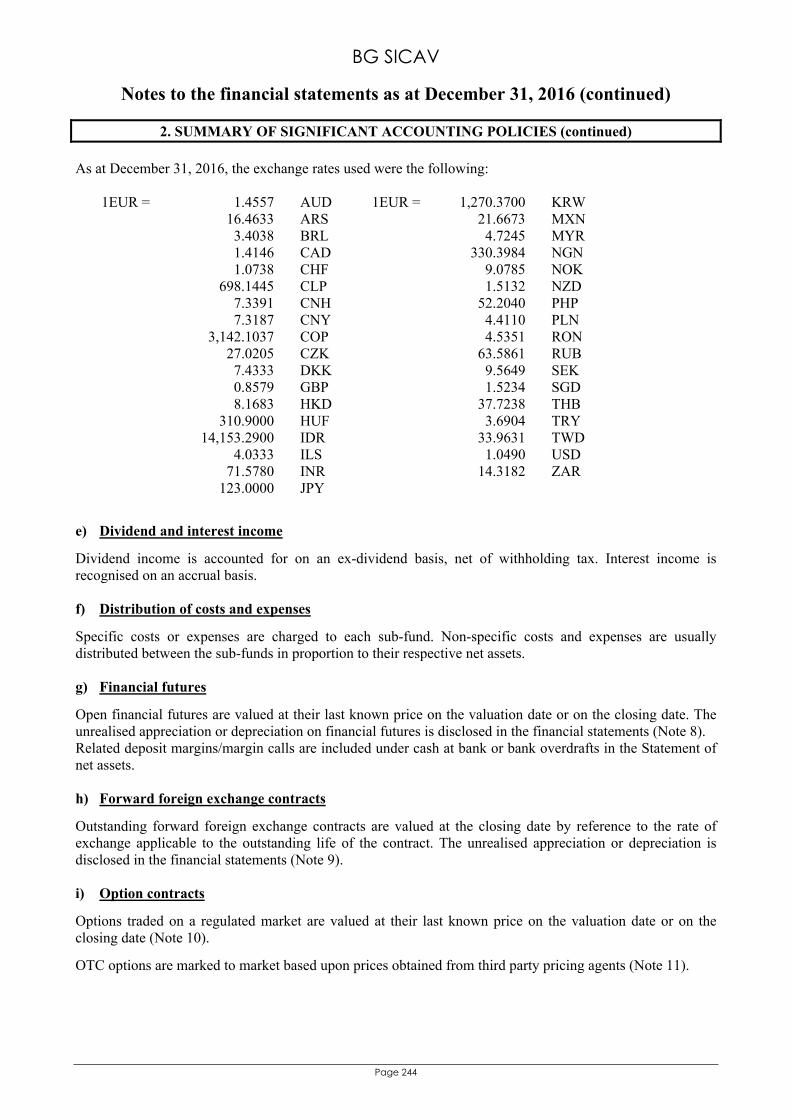
BG SICAV
Notes to the financial statements as at December 31, 2016 (continued)
Page 244
2. SUMMARY OF SIGNIFICANT ACCOUNTING POLICIES (continued) As at December 31, 2016, the exchange rates used were the following:
e) Dividend and interest income
Dividend income is accounted for on an ex-dividend basis, net of withholding tax. Interest income is recognised on an accrual basis. f) Distribution of costs and expenses
Specific costs or expenses are charged to each sub-fund. Non-specific costs and expenses are usually distributed between the sub-funds in proportion to their respective net assets. g) Financial futures
Open financial futures are valued at their last known price on the valuation date or on the closing date. The unrealised appreciation or depreciation on financial futures is disclosed in the financial statements (Note 8). Related deposit margins/margin calls are included under cash at bank or bank overdrafts in the Statement of net assets. h) Forward foreign exchange contracts
Outstanding forward foreign exchange contracts are valued at the closing date by reference to the rate of exchange applicable to the outstanding life of the contract. The unrealised appreciation or depreciation is disclosed in the financial statements (Note 9). i) Option contracts
Options traded on a regulated market are valued at their last known price on the valuation date or on the closing date (Note 10).
OTC options are marked to market based upon prices obtained from third party pricing agents (Note 11).
1EUR = 1.4557 AUD 1EUR = 1,270.3700 KRW 16.4633 ARS 21.6673 MXN 3.4038 BRL 4.7245 MYR 1.4146 CAD 330.3984 NGN 1.0738 CHF 9.0785 NOK 698.1445 CLP 1.5132 NZD 7.3391 CNH 52.2040 PHP 7.3187 CNY 4.4110 PLN 3,142.1037 COP 4.5351 RON 27.0205 CZK 63.5861 RUB 7.4333 DKK 9.5649 SEK 0.8579 GBP 1.5234 SGD 8.1683 HKD 37.7238 THB 310.9000 HUF 3.6904 TRY 14,153.2900 IDR 33.9631 TWD 4.0333 ILS 1.0490 USD 71.5780 INR 14.3182 ZAR 123.0000 JPY
BG SICAV
Notes to the financial statements as at December 31, 2016 (continued)
Page 245
2. SUMMARY OF SIGNIFICANT ACCOUNTING POLICIES (continued) j) Valuation of Interest Rate Swaps
An interest rate swap is a bilateral agreement in which each party agrees to exchange a series of interest payments for another series of interest payments (usually fixed/floating) based on a notional amount that serves as a computation basis which is usually not exchanged.
Interest rate swaps are marked to market at each Net Asset Value calculation date. The market value is based on the valuation elements laid down in the contracts and is obtained from third party pricing agents, market makers or internal models.
The unrealised appreciation or depreciation and the receivable or payable amount from realised are disclosed in the Statement of net assets under “Unrealised appreciation/(depreciation) on swaps” and “Receivable/Payable on swaps”. Realised profits/(losses) and changes in unrealised appreciation /(depreciation) as a result thereof are included in the Statement of operations and changes in net assets respectively under “Net realised profit/(loss) on swaps” and “Movement in net unrealised appreciation/(depreciation) on swaps” (Note 12). The related interests to be received and to be paid are included in the financial statements respectively under “Interest receivable” and “Other liabilities” in the Statement of net assets and under "Interest on swaps" in the Statement of operations and changes in net assets. k) Valuation of Credit Default Swaps
A credit default swap is a credit derivative bilateral agreement in which one counterparty (the protection buyer) pays a periodic fee to the other party (the protection seller) for the specified life of the contract in return for a contingent payment by the protection seller upon occurrence of a credit event on any referenced issuers. If such an event occurs, the protection seller will then make payment to the buyer and the swap will terminate. In certain cases, the protection seller may take possession of the underlying securities.
Credit default swaps are marked to market at each Net Asset Value calculation date. The market value is based on the valuation elements laid down in the contracts and is obtained from third party pricing agents, market makers or internal models.
The unrealised appreciation or depreciation and the receivable or payable amount from realised are disclosed in the Statement of net assets under “Unrealised appreciation/(depreciation) on swaps” and “Receivable/Payable on swaps”. Realised profits/(losses) and changes in unrealised appreciation/(depreciation) as a result thereof are included in the Statement of operations and changes in net assets respectively under “Net realised profit/(loss) on swaps” and “Movement in net unrealised appreciation/(depreciation) on swaps” (Note 12). The related interests to be received and to be paid are included in the financial statements respectively under “Interest receivable” and “Other liabilities” in the Statement of net assets and under "Interest on swaps" in the Statement of operations and changes in net assets.
BG SICAV
Notes to the financial statements as at December 31, 2016 (continued)
Page 246
2. SUMMARY OF SIGNIFICANT ACCOUNTING POLICIES (continued) l) Valuation of Inflation Swaps
An inflation swap is a bilateral contract which allows investors wishing to protect their investment to secure an inflation-linked return against an inflation index. The inflation buyer (inflation receiver) pays a predetermined fixed or variable rate. In exchange, the inflation buyer receives from the inflation seller (inflation payer) one or more inflation-related payments.
Inflation swaps are marked to market at each Net Asset Value calculation date. The market value is based on the valuation elements laid down in the contracts and is obtained from third party pricing agents, market makers or internal models.
The unrealised appreciation or depreciation and the receivable or payable amount from realised are disclosed in the Statement of net assets under “Unrealised appreciation/(depreciation) on swaps” and “Receivable/Payable on swaps”. Realised profits/(losses) and changes in unrealised appreciation /(depreciation) as a result thereof are included in the Statement of operations and changes in net assets respectively under “Net realised profit/(loss) on swaps” and “Movement in net unrealised appreciation/(depreciation) on swaps” (Note 12). m) Valuation of Contracts for Difference
A contract for difference is a bilateral contract essentially between the client (the “buyer”) and his broker (the “seller”), whereby the buyer receives or pays the difference between the current value of a determined underlying asset and its value at the entry in the agreement, according if its value is positive or negative.
Contracts for difference are marked to market at each Net Asset Value calculation date. The market value is based on the valuation elements laid down in the contracts and is obtained from third party pricing agents, market makers or internal models.
The unrealised appreciation or depreciation and the receivable or payable amount from realised are disclosed in the Statement of net assets under “Unrealised appreciation/(depreciation) on swaps” and “Receivable/Payable on swaps”. Realised profits/(losses) and changes in unrealised appreciation /(depreciation) as a result thereof are included in the Statement of operations and changes in net assets respectively under “Net realised profit/(loss) on swaps” and “Movement in net unrealised appreciation/(depreciation) on swaps” (Note 12). n) Transaction fees
The transaction fees, i.e. fees charged by the brokers and the Depositary for securities transactions and similar transactions are recorded separately in the Statement of operations and changes in net assets under “Transaction fees”. o) Securities lending
The SICAV may lend securities included in its portfolio to a borrower. To guarantee this transaction, the SICAV receives a collateral. Securities lending attracts remuneration for the SICAV according to the contracts and is accounted for in the Statement of operations and changes in net assets under “Securities lending income”.
Securities lending are delivered to a third party broker, the assets of which continue to be valued as part of the portfolio of the SICAV (Note 16).
BG SICAV
Notes to the financial statements as at December 31, 2016 (continued)
Page 247
3. DETERMINATION OF NET ASSET VALUE OF SHARES
The Net Asset Value per Share of each Class of Shares in each sub-fund is determined by dividing the value of the total net assets of that sub-fund properly allocated to such Class by the total number of Shares of such Class outstanding on such valuation day (“Valuation Day”), being any Luxembourg business day.
4. TAXATION
The SICAV is registered in Luxembourg and as a result, is exempt from tax except for the “taxe d'abonnement”. Under current legislation, Classes of Shares reserved to institutional investors are subject to a tax rate of 0.01% (Class of Shares A, B, C, E and H) and those reserved to retail investors are subject to a tax rate of 0.05% (Class of Shares D and F). The tax is calculated and payable quarterly on the net assets of the SICAV at the end of the relevant quarter.
The value of assets represented by investments in other Luxembourg UCIs which have already been subject to the “taxe d’abonnement” is exempt.
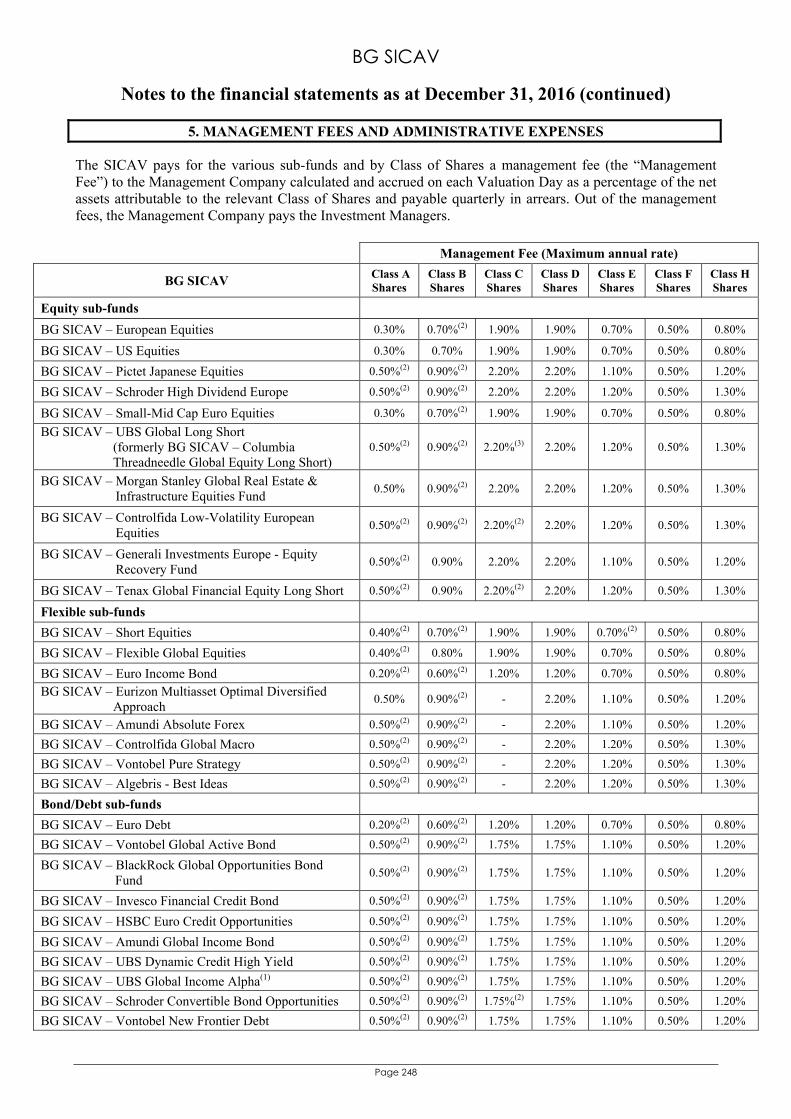
BG SICAV
Notes to the financial statements as at December 31, 2016 (continued)
Page 248
5. MANAGEMENT FEES AND ADMINISTRATIVE EXPENSES
The SICAV pays for the various sub-funds and by Class of Shares a management fee (the “Management Fee”) to the Management Company calculated and accrued on each Valuation Day as a percentage of the net assets attributable to the relevant Class of Shares and payable quarterly in arrears. Out of the management fees, the Management Company pays the Investment Managers.
Management Fee (Maximum annual rate)
BG SICAV Class A Shares
Class B Shares
Class C Shares
Class D Shares
Class E Shares
Class F Shares
Class H Shares
Equity sub-funds
BG SICAV – European Equities 0.30% 0.70%(2) 1.90% 1.90% 0.70% 0.50% 0.80%
BG SICAV – US Equities 0.30% 0.70% 1.90% 1.90% 0.70% 0.50% 0.80%
BG SICAV – Pictet Japanese Equities 0.50%(2) 0.90%(2) 2.20% 2.20% 1.10% 0.50% 1.20%
BG SICAV – Schroder High Dividend Europe 0.50%(2) 0.90%(2) 2.20% 2.20% 1.20% 0.50% 1.30%
BG SICAV – Small-Mid Cap Euro Equities 0.30% 0.70%(2) 1.90% 1.90% 0.70% 0.50% 0.80%
BG SICAV – UBS Global Long Short (formerly BG SICAV – Columbia Threadneedle Global Equity Long Short)
0.50%(2) 0.90%(2) 2.20%(3) 2.20% 1.20% 0.50% 1.30%
BG SICAV – Morgan Stanley Global Real Estate & Infrastructure Equities Fund
0.50% 0.90%(2) 2.20% 2.20% 1.20% 0.50% 1.30%
BG SICAV – Controlfida Low-Volatility European Equities
0.50%(2) 0.90%(2) 2.20%(2) 2.20% 1.20% 0.50% 1.30%
BG SICAV – Generali Investments Europe - Equity Recovery Fund
0.50%(2) 0.90% 2.20% 2.20% 1.10% 0.50% 1.20%
BG SICAV – Tenax Global Financial Equity Long Short 0.50%(2) 0.90% 2.20%(2) 2.20% 1.20% 0.50% 1.30%
Flexible sub-funds
BG SICAV – Short Equities 0.40%(2) 0.70%(2) 1.90% 1.90% 0.70%(2) 0.50% 0.80%
BG SICAV – Flexible Global Equities 0.40%(2) 0.80% 1.90% 1.90% 0.70% 0.50% 0.80%
BG SICAV – Euro Income Bond 0.20%(2) 0.60%(2) 1.20% 1.20% 0.70% 0.50% 0.80%
BG SICAV – Eurizon Multiasset Optimal Diversified Approach
0.50% 0.90%(2) - 2.20% 1.10% 0.50% 1.20%
BG SICAV – Amundi Absolute Forex 0.50%(2) 0.90%(2) - 2.20% 1.10% 0.50% 1.20%
BG SICAV – Controlfida Global Macro 0.50%(2) 0.90%(2) - 2.20% 1.20% 0.50% 1.30%
BG SICAV – Vontobel Pure Strategy 0.50%(2) 0.90%(2) - 2.20% 1.20% 0.50% 1.30%
BG SICAV – Algebris - Best Ideas 0.50%(2) 0.90%(2) - 2.20% 1.20% 0.50% 1.30%
Bond/Debt sub-funds
BG SICAV – Euro Debt 0.20%(2) 0.60%(2) 1.20% 1.20% 0.70% 0.50% 0.80%
BG SICAV – Vontobel Global Active Bond 0.50%(2) 0.90%(2) 1.75% 1.75% 1.10% 0.50% 1.20%
BG SICAV – BlackRock Global Opportunities Bond Fund
0.50%(2) 0.90%(2) 1.75% 1.75% 1.10% 0.50% 1.20%
BG SICAV – Invesco Financial Credit Bond 0.50%(2) 0.90%(2) 1.75% 1.75% 1.10% 0.50% 1.20%
BG SICAV – HSBC Euro Credit Opportunities 0.50%(2) 0.90%(2) 1.75% 1.75% 1.10% 0.50% 1.20%
BG SICAV – Amundi Global Income Bond 0.50%(2) 0.90%(2) 1.75% 1.75% 1.10% 0.50% 1.20%
BG SICAV – UBS Dynamic Credit High Yield 0.50%(2) 0.90%(2) 1.75% 1.75% 1.10% 0.50% 1.20%
BG SICAV – UBS Global Income Alpha(1) 0.50%(2) 0.90%(2) 1.75% 1.75% 1.10% 0.50% 1.20%
BG SICAV – Schroder Convertible Bond Opportunities 0.50%(2) 0.90%(2) 1.75%(2) 1.75% 1.10% 0.50% 1.20%
BG SICAV – Vontobel New Frontier Debt 0.50%(2) 0.90%(2) 1.75% 1.75% 1.10% 0.50% 1.20%
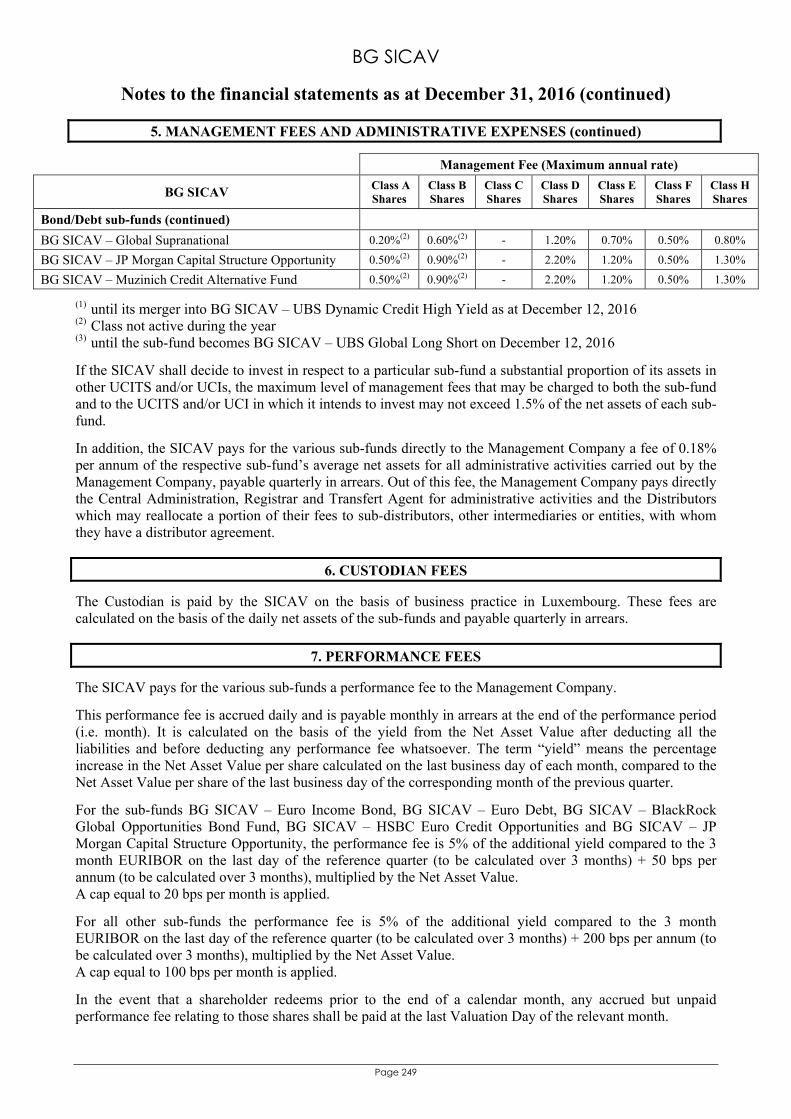
BG SICAV
Notes to the financial statements as at December 31, 2016 (continued)
Page 249
5. MANAGEMENT FEES AND ADMINISTRATIVE EXPENSES (continued)
Management Fee (Maximum annual rate)
BG SICAV Class A Shares
Class B Shares
Class C Shares
Class D Shares
Class E Shares
Class F Shares
Class H Shares
Bond/Debt sub-funds (continued)
BG SICAV – Global Supranational 0.20%(2) 0.60%(2) - 1.20% 0.70% 0.50% 0.80%
BG SICAV – JP Morgan Capital Structure Opportunity 0.50%(2) 0.90%(2) - 2.20% 1.20% 0.50% 1.30%
BG SICAV – Muzinich Credit Alternative Fund 0.50%(2) 0.90%(2) - 2.20% 1.20% 0.50% 1.30% (1) until its merger into BG SICAV – UBS Dynamic Credit High Yield as at December 12, 2016 (2) Class not active during the year (3) until the sub-fund becomes BG SICAV – UBS Global Long Short on December 12, 2016
If the SICAV shall decide to invest in respect to a particular sub-fund a substantial proportion of its assets in other UCITS and/or UCIs, the maximum level of management fees that may be charged to both the sub-fund and to the UCITS and/or UCI in which it intends to invest may not exceed 1.5% of the net assets of each sub-fund.
In addition, the SICAV pays for the various sub-funds directly to the Management Company a fee of 0.18% per annum of the respective sub-fund’s average net assets for all administrative activities carried out by the Management Company, payable quarterly in arrears. Out of this fee, the Management Company pays directly the Central Administration, Registrar and Transfert Agent for administrative activities and the Distributors which may reallocate a portion of their fees to sub-distributors, other intermediaries or entities, with whom they have a distributor agreement.
6. CUSTODIAN FEES
The Custodian is paid by the SICAV on the basis of business practice in Luxembourg. These fees are calculated on the basis of the daily net assets of the sub-funds and payable quarterly in arrears.
7. PERFORMANCE FEES
The SICAV pays for the various sub-funds a performance fee to the Management Company.
This performance fee is accrued daily and is payable monthly in arrears at the end of the performance period (i.e. month). It is calculated on the basis of the yield from the Net Asset Value after deducting all the liabilities and before deducting any performance fee whatsoever. The term “yield” means the percentage increase in the Net Asset Value per share calculated on the last business day of each month, compared to the Net Asset Value per share of the last business day of the corresponding month of the previous quarter.
For the sub-funds BG SICAV – Euro Income Bond, BG SICAV – Euro Debt, BG SICAV – BlackRock Global Opportunities Bond Fund, BG SICAV – HSBC Euro Credit Opportunities and BG SICAV – JP Morgan Capital Structure Opportunity, the performance fee is 5% of the additional yield compared to the 3 month EURIBOR on the last day of the reference quarter (to be calculated over 3 months) + 50 bps per annum (to be calculated over 3 months), multiplied by the Net Asset Value. A cap equal to 20 bps per month is applied.
For all other sub-funds the performance fee is 5% of the additional yield compared to the 3 month EURIBOR on the last day of the reference quarter (to be calculated over 3 months) + 200 bps per annum (to be calculated over 3 months), multiplied by the Net Asset Value. A cap equal to 100 bps per month is applied.
In the event that a shareholder redeems prior to the end of a calendar month, any accrued but unpaid performance fee relating to those shares shall be paid at the last Valuation Day of the relevant month.
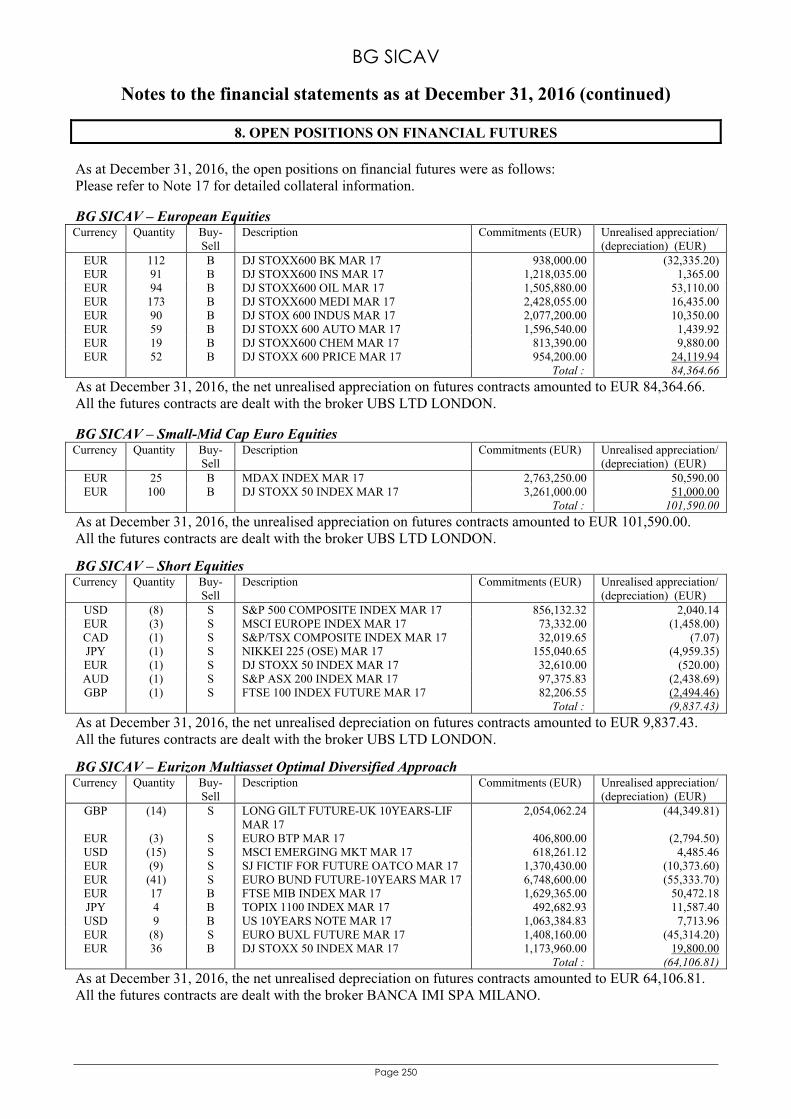
BG SICAV
Notes to the financial statements as at December 31, 2016 (continued)
Page 250
8. OPEN POSITIONS ON FINANCIAL FUTURES As at December 31, 2016, the open positions on financial futures were as follows: Please refer to Note 17 for detailed collateral information. BG SICAV – European Equities Currency Quantity Buy-
Sell Description Commitments (EUR) Unrealised appreciation/
(depreciation) (EUR) EUR 112 B DJ STOXX600 BK MAR 17 938,000.00 (32,335.20) EUR 91 B DJ STOXX600 INS MAR 17 1,218,035.00 1,365.00 EUR 94 B DJ STOXX600 OIL MAR 17 1,505,880.00 53,110.00 EUR 173 B DJ STOXX600 MEDI MAR 17 2,428,055.00 16,435.00 EUR 90 B DJ STOX 600 INDUS MAR 17 2,077,200.00 10,350.00 EUR 59 B DJ STOXX 600 AUTO MAR 17 1,596,540.00 1,439.92 EUR 19 B DJ STOXX600 CHEM MAR 17 813,390.00 9,880.00 EUR 52 B DJ STOXX 600 PRICE MAR 17 954,200.00 24,119.94
Total : 84,364.66
As at December 31, 2016, the net unrealised appreciation on futures contracts amounted to EUR 84,364.66. All the futures contracts are dealt with the broker UBS LTD LONDON. BG SICAV – Small-Mid Cap Euro Equities Currency Quantity Buy-
Sell Description Commitments (EUR) Unrealised appreciation/
(depreciation) (EUR) EUR 25 B MDAX INDEX MAR 17 2,763,250.00 50,590.00 EUR 100 B DJ STOXX 50 INDEX MAR 17 3,261,000.00 51,000.00
Total : 101,590.00
As at December 31, 2016, the unrealised appreciation on futures contracts amounted to EUR 101,590.00. All the futures contracts are dealt with the broker UBS LTD LONDON.
BG SICAV – Short Equities Currency Quantity Buy-
Sell Description Commitments (EUR) Unrealised appreciation/
(depreciation) (EUR) USD (8) S S&P 500 COMPOSITE INDEX MAR 17 856,132.32 2,040.14 EUR (3) S MSCI EUROPE INDEX MAR 17 73,332.00 (1,458.00) CAD (1) S S&P/TSX COMPOSITE INDEX MAR 17 32,019.65 (7.07) JPY (1) S NIKKEI 225 (OSE) MAR 17 155,040.65 (4,959.35) EUR (1) S DJ STOXX 50 INDEX MAR 17 32,610.00 (520.00) AUD (1) S S&P ASX 200 INDEX MAR 17 97,375.83 (2,438.69) GBP (1) S FTSE 100 INDEX FUTURE MAR 17 82,206.55 (2,494.46)
Total : (9,837.43)
As at December 31, 2016, the net unrealised depreciation on futures contracts amounted to EUR 9,837.43. All the futures contracts are dealt with the broker UBS LTD LONDON.
BG SICAV – Eurizon Multiasset Optimal Diversified Approach Currency Quantity Buy-
Sell Description Commitments (EUR) Unrealised appreciation/
(depreciation) (EUR) GBP (14) S LONG GILT FUTURE-UK 10YEARS-LIF
MAR 17 2,054,062.24 (44,349.81)
EUR (3) S EURO BTP MAR 17 406,800.00 (2,794.50) USD (15) S MSCI EMERGING MKT MAR 17 618,261.12 4,485.46 EUR (9) S SJ FICTIF FOR FUTURE OATCO MAR 17 1,370,430.00 (10,373.60) EUR (41) S EURO BUND FUTURE-10YEARS MAR 17 6,748,600.00 (55,333.70) EUR 17 B FTSE MIB INDEX MAR 17 1,629,365.00 50,472.18 JPY 4 B TOPIX 1100 INDEX MAR 17 492,682.93 11,587.40 USD 9 B US 10YEARS NOTE MAR 17 1,063,384.83 7,713.96 EUR (8) S EURO BUXL FUTURE MAR 17 1,408,160.00 (45,314.20) EUR 36 B DJ STOXX 50 INDEX MAR 17 1,173,960.00 19,800.00
Total : (64,106.81)
As at December 31, 2016, the net unrealised depreciation on futures contracts amounted to EUR 64,106.81. All the futures contracts are dealt with the broker BANCA IMI SPA MILANO.
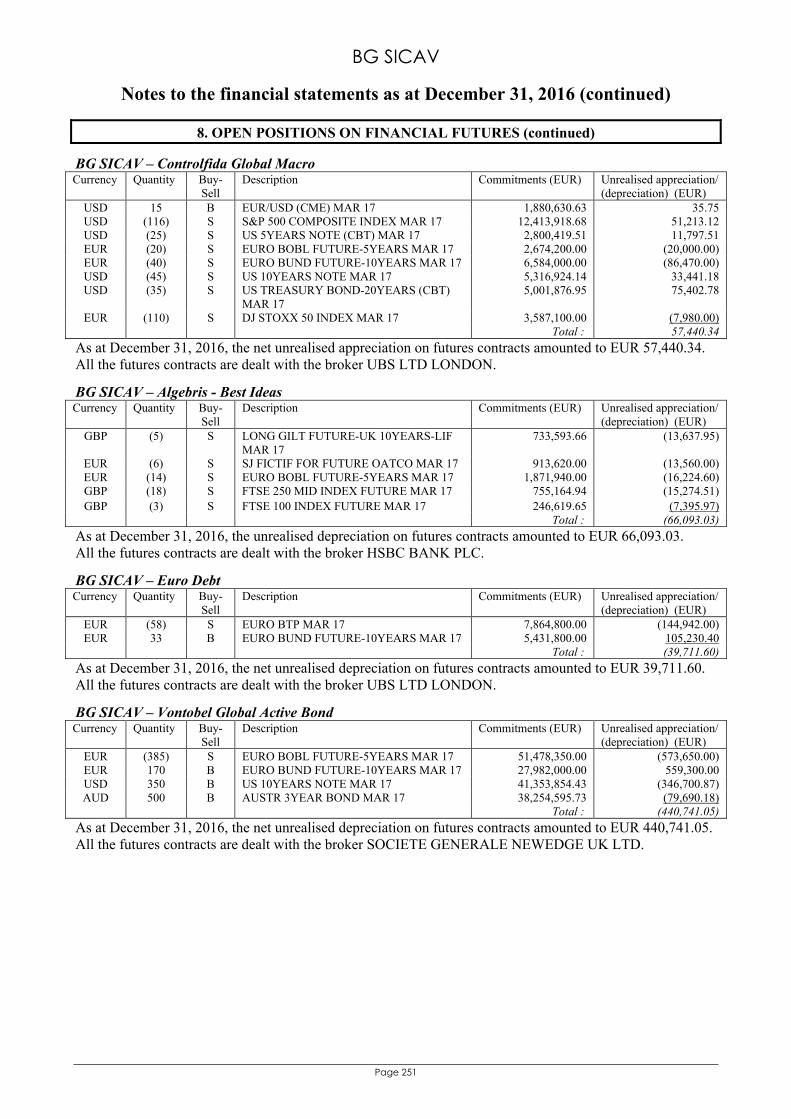
BG SICAV
Notes to the financial statements as at December 31, 2016 (continued)
Page 251
8. OPEN POSITIONS ON FINANCIAL FUTURES (continued)
BG SICAV – Controlfida Global Macro Currency Quantity Buy-
Sell Description Commitments (EUR) Unrealised appreciation/
(depreciation) (EUR) USD 15 B EUR/USD (CME) MAR 17 1,880,630.63 35.75 USD (116) S S&P 500 COMPOSITE INDEX MAR 17 12,413,918.68 51,213.12 USD (25) S US 5YEARS NOTE (CBT) MAR 17 2,800,419.51 11,797.51 EUR (20) S EURO BOBL FUTURE-5YEARS MAR 17 2,674,200.00 (20,000.00) EUR (40) S EURO BUND FUTURE-10YEARS MAR 17 6,584,000.00 (86,470.00) USD (45) S US 10YEARS NOTE MAR 17 5,316,924.14 33,441.18 USD (35) S US TREASURY BOND-20YEARS (CBT)
MAR 17 5,001,876.95 75,402.78
EUR (110) S DJ STOXX 50 INDEX MAR 17 3,587,100.00 (7,980.00) Total : 57,440.34
As at December 31, 2016, the net unrealised appreciation on futures contracts amounted to EUR 57,440.34. All the futures contracts are dealt with the broker UBS LTD LONDON.
BG SICAV – Algebris - Best Ideas Currency Quantity Buy-
Sell Description Commitments (EUR) Unrealised appreciation/
(depreciation) (EUR) GBP (5) S LONG GILT FUTURE-UK 10YEARS-LIF
MAR 17 733,593.66 (13,637.95)
EUR (6) S SJ FICTIF FOR FUTURE OATCO MAR 17 913,620.00 (13,560.00) EUR (14) S EURO BOBL FUTURE-5YEARS MAR 17 1,871,940.00 (16,224.60) GBP (18) S FTSE 250 MID INDEX FUTURE MAR 17 755,164.94 (15,274.51) GBP (3) S FTSE 100 INDEX FUTURE MAR 17 246,619.65 (7,395.97)
Total : (66,093.03)
As at December 31, 2016, the unrealised depreciation on futures contracts amounted to EUR 66,093.03. All the futures contracts are dealt with the broker HSBC BANK PLC.
BG SICAV – Euro Debt Currency Quantity Buy-
Sell Description Commitments (EUR) Unrealised appreciation/
(depreciation) (EUR) EUR (58) S EURO BTP MAR 17 7,864,800.00 (144,942.00) EUR 33 B EURO BUND FUTURE-10YEARS MAR 17 5,431,800.00 105,230.40
Total : (39,711.60)
As at December 31, 2016, the net unrealised depreciation on futures contracts amounted to EUR 39,711.60. All the futures contracts are dealt with the broker UBS LTD LONDON.
BG SICAV – Vontobel Global Active Bond Currency Quantity Buy-
Sell Description Commitments (EUR) Unrealised appreciation/
(depreciation) (EUR) EUR (385) S EURO BOBL FUTURE-5YEARS MAR 17 51,478,350.00 (573,650.00) EUR 170 B EURO BUND FUTURE-10YEARS MAR 17 27,982,000.00 559,300.00 USD 350 B US 10YEARS NOTE MAR 17 41,353,854.43 (346,700.87) AUD 500 B AUSTR 3YEAR BOND MAR 17 38,254,595.73 (79,690.18)
Total : (440,741.05)
As at December 31, 2016, the net unrealised depreciation on futures contracts amounted to EUR 440,741.05. All the futures contracts are dealt with the broker SOCIETE GENERALE NEWEDGE UK LTD.
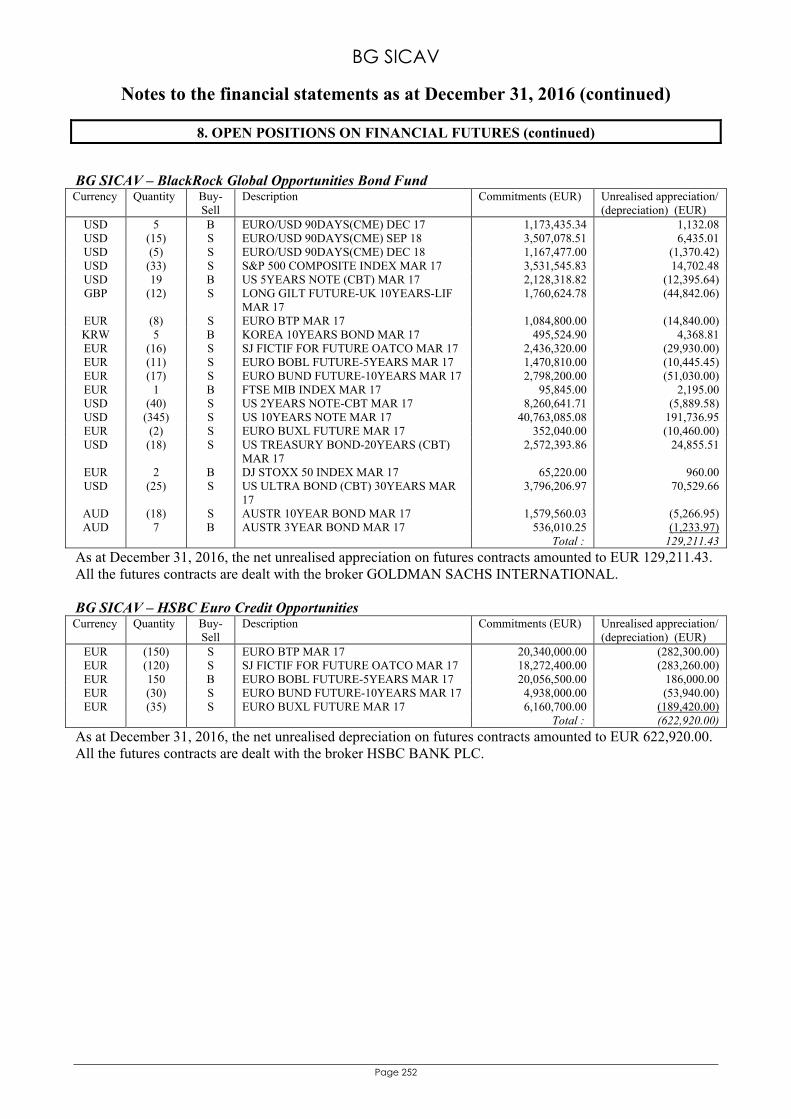
BG SICAV
Notes to the financial statements as at December 31, 2016 (continued)
Page 252
8. OPEN POSITIONS ON FINANCIAL FUTURES (continued) BG SICAV – BlackRock Global Opportunities Bond Fund Currency Quantity Buy-
Sell Description Commitments (EUR) Unrealised appreciation/
(depreciation) (EUR) USD 5 B EURO/USD 90DAYS(CME) DEC 17 1,173,435.34 1,132.08 USD (15) S EURO/USD 90DAYS(CME) SEP 18 3,507,078.51 6,435.01 USD (5) S EURO/USD 90DAYS(CME) DEC 18 1,167,477.00 (1,370.42) USD (33) S S&P 500 COMPOSITE INDEX MAR 17 3,531,545.83 14,702.48 USD 19 B US 5YEARS NOTE (CBT) MAR 17 2,128,318.82 (12,395.64) GBP (12) S LONG GILT FUTURE-UK 10YEARS-LIF
MAR 17 1,760,624.78 (44,842.06)
EUR (8) S EURO BTP MAR 17 1,084,800.00 (14,840.00) KRW 5 B KOREA 10YEARS BOND MAR 17 495,524.90 4,368.81 EUR (16) S SJ FICTIF FOR FUTURE OATCO MAR 17 2,436,320.00 (29,930.00) EUR (11) S EURO BOBL FUTURE-5YEARS MAR 17 1,470,810.00 (10,445.45) EUR (17) S EURO BUND FUTURE-10YEARS MAR 17 2,798,200.00 (51,030.00) EUR 1 B FTSE MIB INDEX MAR 17 95,845.00 2,195.00 USD (40) S US 2YEARS NOTE-CBT MAR 17 8,260,641.71 (5,889.58) USD (345) S US 10YEARS NOTE MAR 17 40,763,085.08 191,736.95 EUR (2) S EURO BUXL FUTURE MAR 17 352,040.00 (10,460.00) USD (18) S US TREASURY BOND-20YEARS (CBT)
MAR 17 2,572,393.86 24,855.51
EUR 2 B DJ STOXX 50 INDEX MAR 17 65,220.00 960.00 USD (25) S US ULTRA BOND (CBT) 30YEARS MAR
17 3,796,206.97 70,529.66
AUD (18) S AUSTR 10YEAR BOND MAR 17 1,579,560.03 (5,266.95) AUD 7 B AUSTR 3YEAR BOND MAR 17 536,010.25 (1,233.97)
Total : 129,211.43
As at December 31, 2016, the net unrealised appreciation on futures contracts amounted to EUR 129,211.43. All the futures contracts are dealt with the broker GOLDMAN SACHS INTERNATIONAL. BG SICAV – HSBC Euro Credit Opportunities Currency Quantity Buy-
Sell Description Commitments (EUR) Unrealised appreciation/
(depreciation) (EUR) EUR (150) S EURO BTP MAR 17 20,340,000.00 (282,300.00) EUR (120) S SJ FICTIF FOR FUTURE OATCO MAR 17 18,272,400.00 (283,260.00) EUR 150 B EURO BOBL FUTURE-5YEARS MAR 17 20,056,500.00 186,000.00 EUR (30) S EURO BUND FUTURE-10YEARS MAR 17 4,938,000.00 (53,940.00) EUR (35) S EURO BUXL FUTURE MAR 17 6,160,700.00 (189,420.00)
Total : (622,920.00)
As at December 31, 2016, the net unrealised depreciation on futures contracts amounted to EUR 622,920.00. All the futures contracts are dealt with the broker HSBC BANK PLC.
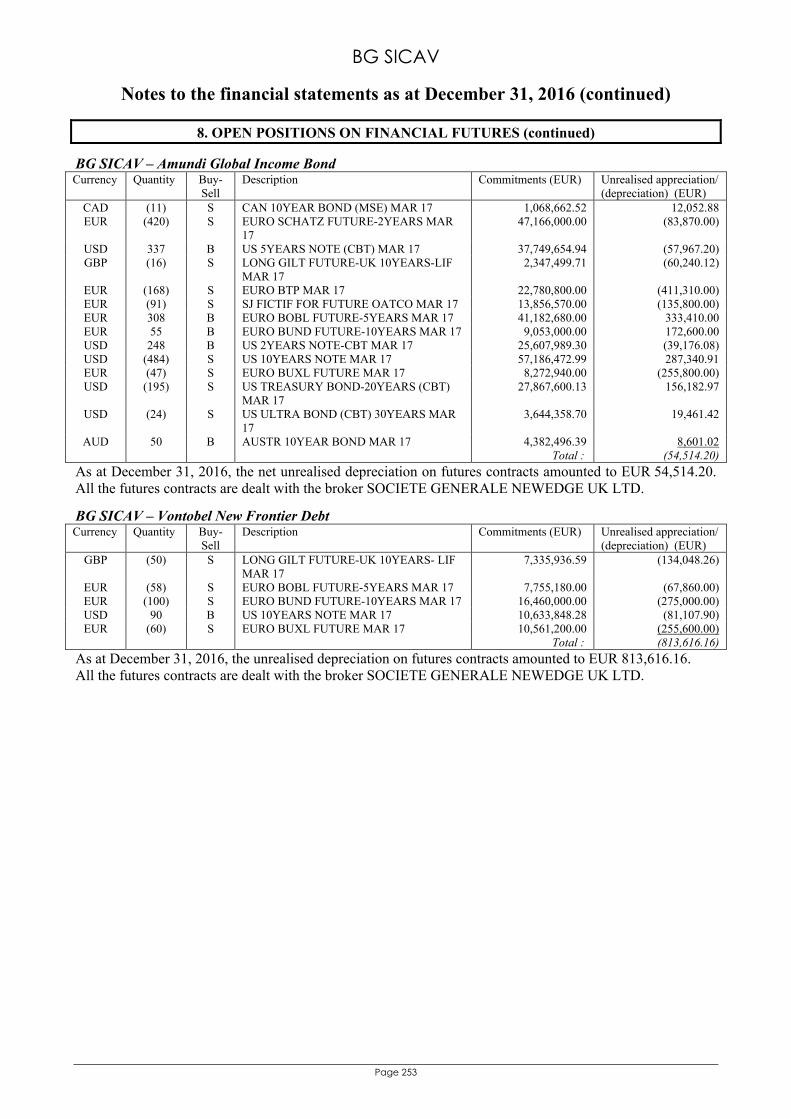
BG SICAV
Notes to the financial statements as at December 31, 2016 (continued)
Page 253
8. OPEN POSITIONS ON FINANCIAL FUTURES (continued)
BG SICAV – Amundi Global Income Bond Currency Quantity Buy-
Sell Description Commitments (EUR) Unrealised appreciation/
(depreciation) (EUR) CAD (11) S CAN 10YEAR BOND (MSE) MAR 17 1,068,662.52 12,052.88 EUR (420) S EURO SCHATZ FUTURE-2YEARS MAR
17 47,166,000.00 (83,870.00)
USD 337 B US 5YEARS NOTE (CBT) MAR 17 37,749,654.94 (57,967.20) GBP (16) S LONG GILT FUTURE-UK 10YEARS-LIF
MAR 17 2,347,499.71 (60,240.12)
EUR (168) S EURO BTP MAR 17 22,780,800.00 (411,310.00) EUR (91) S SJ FICTIF FOR FUTURE OATCO MAR 17 13,856,570.00 (135,800.00) EUR 308 B EURO BOBL FUTURE-5YEARS MAR 17 41,182,680.00 333,410.00 EUR 55 B EURO BUND FUTURE-10YEARS MAR 17 9,053,000.00 172,600.00 USD 248 B US 2YEARS NOTE-CBT MAR 17 25,607,989.30 (39,176.08) USD (484) S US 10YEARS NOTE MAR 17 57,186,472.99 287,340.91 EUR (47) S EURO BUXL FUTURE MAR 17 8,272,940.00 (255,800.00) USD (195) S US TREASURY BOND-20YEARS (CBT)
MAR 17 27,867,600.13 156,182.97
USD (24) S US ULTRA BOND (CBT) 30YEARS MAR 17
3,644,358.70 19,461.42
AUD 50 B AUSTR 10YEAR BOND MAR 17 4,382,496.39 8,601.02 Total : (54,514.20)
As at December 31, 2016, the net unrealised depreciation on futures contracts amounted to EUR 54,514.20. All the futures contracts are dealt with the broker SOCIETE GENERALE NEWEDGE UK LTD.
BG SICAV – Vontobel New Frontier Debt Currency Quantity Buy-
Sell Description Commitments (EUR) Unrealised appreciation/
(depreciation) (EUR) GBP (50) S LONG GILT FUTURE-UK 10YEARS- LIF
MAR 17 7,335,936.59 (134,048.26)
EUR (58) S EURO BOBL FUTURE-5YEARS MAR 17 7,755,180.00 (67,860.00) EUR (100) S EURO BUND FUTURE-10YEARS MAR 17 16,460,000.00 (275,000.00) USD 90 B US 10YEARS NOTE MAR 17 10,633,848.28 (81,107.90) EUR (60) S EURO BUXL FUTURE MAR 17 10,561,200.00 (255,600.00)
Total : (813,616.16)
As at December 31, 2016, the unrealised depreciation on futures contracts amounted to EUR 813,616.16. All the futures contracts are dealt with the broker SOCIETE GENERALE NEWEDGE UK LTD.
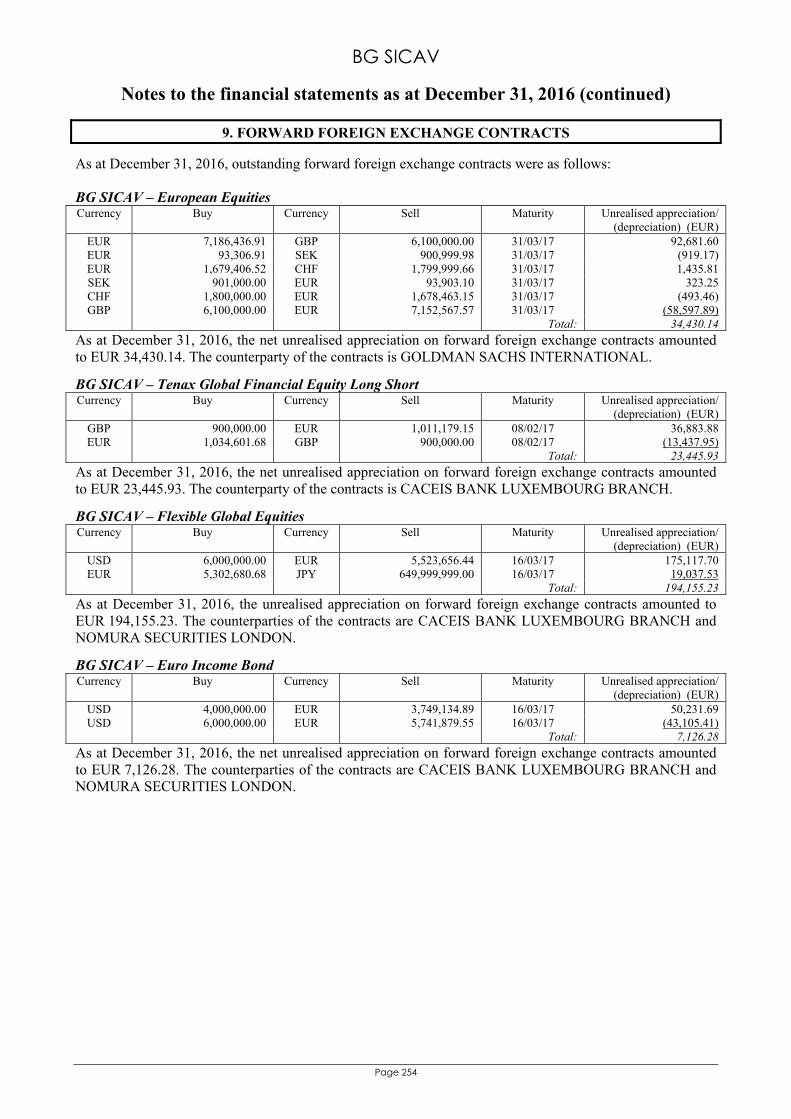
BG SICAV
Notes to the financial statements as at December 31, 2016 (continued)
Page 254
9. FORWARD FOREIGN EXCHANGE CONTRACTS
As at December 31, 2016, outstanding forward foreign exchange contracts were as follows: BG SICAV – European Equities Currency Buy Currency Sell Maturity Unrealised appreciation/
(depreciation) (EUR) EUR 7,186,436.91 GBP 6,100,000.00 31/03/17 92,681.60 EUR 93,306.91 SEK 900,999.98 31/03/17 (919.17) EUR 1,679,406.52 CHF 1,799,999.66 31/03/17 1,435.81 SEK 901,000.00 EUR 93,903.10 31/03/17 323.25 CHF 1,800,000.00 EUR 1,678,463.15 31/03/17 (493.46) GBP 6,100,000.00 EUR 7,152,567.57 31/03/17 (58,597.89)
Total: 34,430.14
As at December 31, 2016, the net unrealised appreciation on forward foreign exchange contracts amounted to EUR 34,430.14. The counterparty of the contracts is GOLDMAN SACHS INTERNATIONAL.
BG SICAV – Tenax Global Financial Equity Long Short Currency Buy Currency Sell Maturity Unrealised appreciation/
(depreciation) (EUR) GBP 900,000.00 EUR 1,011,179.15 08/02/17 36,883.88 EUR 1,034,601.68 GBP 900,000.00 08/02/17 (13,437.95)
Total: 23,445.93
As at December 31, 2016, the net unrealised appreciation on forward foreign exchange contracts amounted to EUR 23,445.93. The counterparty of the contracts is CACEIS BANK LUXEMBOURG BRANCH.
BG SICAV – Flexible Global Equities Currency Buy Currency Sell Maturity Unrealised appreciation/
(depreciation) (EUR) USD 6,000,000.00 EUR 5,523,656.44 16/03/17 175,117.70 EUR 5,302,680.68 JPY 649,999,999.00 16/03/17 19,037.53
Total: 194,155.23
As at December 31, 2016, the unrealised appreciation on forward foreign exchange contracts amounted to EUR 194,155.23. The counterparties of the contracts are CACEIS BANK LUXEMBOURG BRANCH and NOMURA SECURITIES LONDON.
BG SICAV – Euro Income Bond Currency Buy Currency Sell Maturity Unrealised appreciation/
(depreciation) (EUR) USD 4,000,000.00 EUR 3,749,134.89 16/03/17 50,231.69 USD 6,000,000.00 EUR 5,741,879.55 16/03/17 (43,105.41)
Total: 7,126.28
As at December 31, 2016, the net unrealised appreciation on forward foreign exchange contracts amounted to EUR 7,126.28. The counterparties of the contracts are CACEIS BANK LUXEMBOURG BRANCH and NOMURA SECURITIES LONDON.
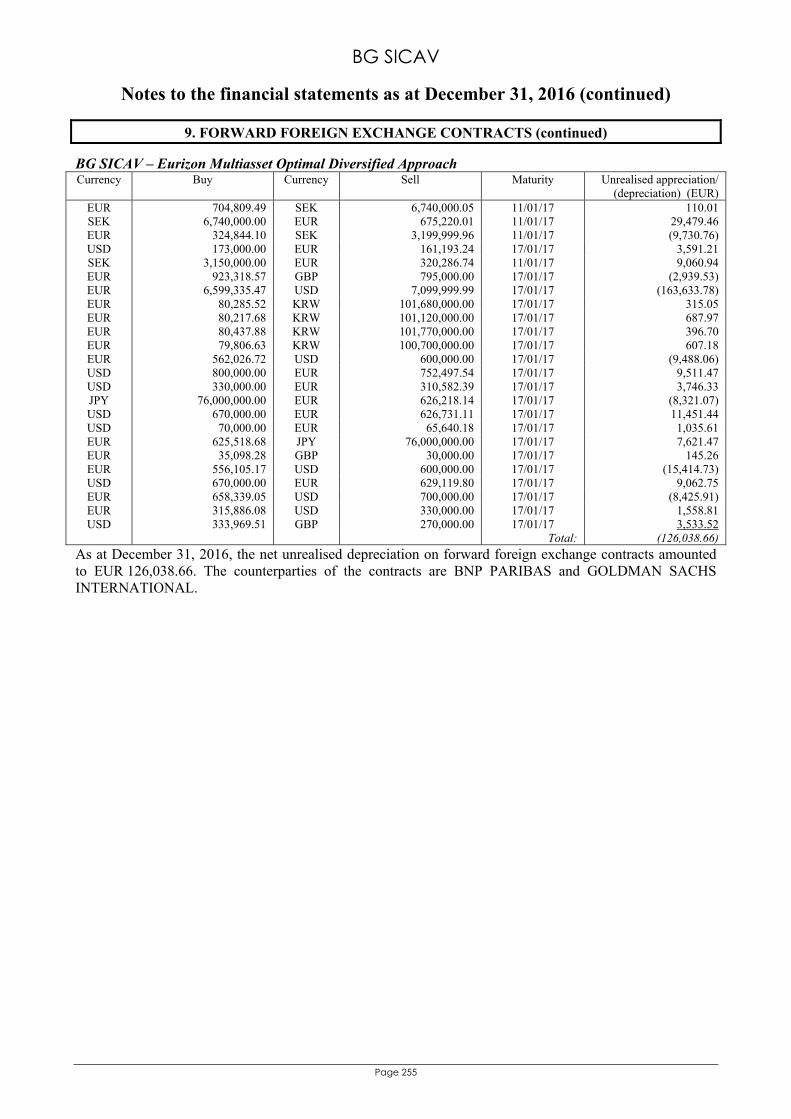
BG SICAV
Notes to the financial statements as at December 31, 2016 (continued)
Page 255
9. FORWARD FOREIGN EXCHANGE CONTRACTS (continued)
BG SICAV – Eurizon Multiasset Optimal Diversified Approach Currency Buy Currency Sell Maturity Unrealised appreciation/
(depreciation) (EUR) EUR 704,809.49 SEK 6,740,000.05 11/01/17 110.01 SEK 6,740,000.00 EUR 675,220.01 11/01/17 29,479.46 EUR 324,844.10 SEK 3,199,999.96 11/01/17 (9,730.76) USD 173,000.00 EUR 161,193.24 17/01/17 3,591.21 SEK 3,150,000.00 EUR 320,286.74 11/01/17 9,060.94 EUR 923,318.57 GBP 795,000.00 17/01/17 (2,939.53) EUR 6,599,335.47 USD 7,099,999.99 17/01/17 (163,633.78) EUR 80,285.52 KRW 101,680,000.00 17/01/17 315.05 EUR 80,217.68 KRW 101,120,000.00 17/01/17 687.97 EUR 80,437.88 KRW 101,770,000.00 17/01/17 396.70 EUR 79,806.63 KRW 100,700,000.00 17/01/17 607.18 EUR 562,026.72 USD 600,000.00 17/01/17 (9,488.06) USD 800,000.00 EUR 752,497.54 17/01/17 9,511.47 USD 330,000.00 EUR 310,582.39 17/01/17 3,746.33 JPY 76,000,000.00 EUR 626,218.14 17/01/17 (8,321.07) USD 670,000.00 EUR 626,731.11 17/01/17 11,451.44 USD 70,000.00 EUR 65,640.18 17/01/17 1,035.61 EUR 625,518.68 JPY 76,000,000.00 17/01/17 7,621.47 EUR 35,098.28 GBP 30,000.00 17/01/17 145.26 EUR 556,105.17 USD 600,000.00 17/01/17 (15,414.73) USD 670,000.00 EUR 629,119.80 17/01/17 9,062.75 EUR 658,339.05 USD 700,000.00 17/01/17 (8,425.91) EUR 315,886.08 USD 330,000.00 17/01/17 1,558.81 USD 333,969.51 GBP 270,000.00 17/01/17 3,533.52
Total: (126,038.66)
As at December 31, 2016, the net unrealised depreciation on forward foreign exchange contracts amounted to EUR 126,038.66. The counterparties of the contracts are BNP PARIBAS and GOLDMAN SACHS INTERNATIONAL.
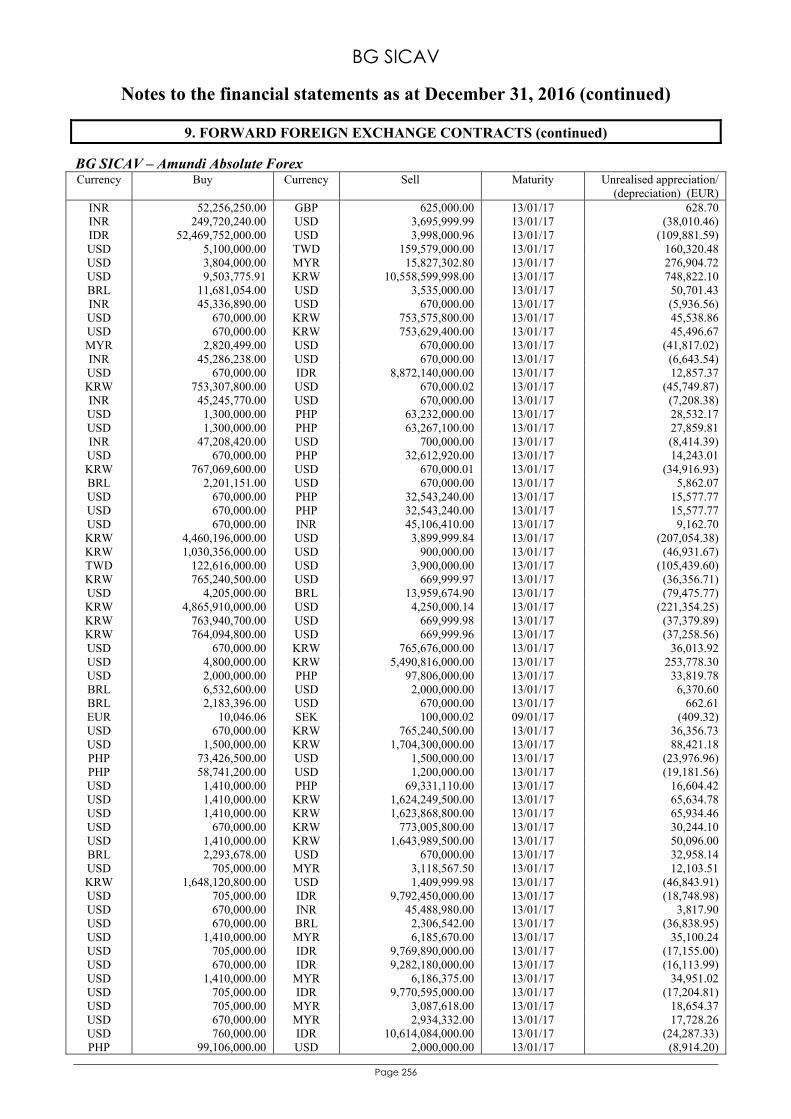
BG SICAV
Notes to the financial statements as at December 31, 2016 (continued)
Page 256
9. FORWARD FOREIGN EXCHANGE CONTRACTS (continued)
BG SICAV – Amundi Absolute Forex Currency Buy Currency Sell Maturity Unrealised appreciation/
(depreciation) (EUR) INR 52,256,250.00 GBP 625,000.00 13/01/17 628.70 INR 249,720,240.00 USD 3,695,999.99 13/01/17 (38,010.46) IDR 52,469,752,000.00 USD 3,998,000.96 13/01/17 (109,881.59) USD 5,100,000.00 TWD 159,579,000.00 13/01/17 160,320.48 USD 3,804,000.00 MYR 15,827,302.80 13/01/17 276,904.72 USD 9,503,775.91 KRW 10,558,599,998.00 13/01/17 748,822.10 BRL 11,681,054.00 USD 3,535,000.00 13/01/17 50,701.43 INR 45,336,890.00 USD 670,000.00 13/01/17 (5,936.56) USD 670,000.00 KRW 753,575,800.00 13/01/17 45,538.86 USD 670,000.00 KRW 753,629,400.00 13/01/17 45,496.67 MYR 2,820,499.00 USD 670,000.00 13/01/17 (41,817.02) INR 45,286,238.00 USD 670,000.00 13/01/17 (6,643.54) USD 670,000.00 IDR 8,872,140,000.00 13/01/17 12,857.37 KRW 753,307,800.00 USD 670,000.02 13/01/17 (45,749.87) INR 45,245,770.00 USD 670,000.00 13/01/17 (7,208.38) USD 1,300,000.00 PHP 63,232,000.00 13/01/17 28,532.17 USD 1,300,000.00 PHP 63,267,100.00 13/01/17 27,859.81 INR 47,208,420.00 USD 700,000.00 13/01/17 (8,414.39) USD 670,000.00 PHP 32,612,920.00 13/01/17 14,243.01 KRW 767,069,600.00 USD 670,000.01 13/01/17 (34,916.93) BRL 2,201,151.00 USD 670,000.00 13/01/17 5,862.07 USD 670,000.00 PHP 32,543,240.00 13/01/17 15,577.77 USD 670,000.00 PHP 32,543,240.00 13/01/17 15,577.77 USD 670,000.00 INR 45,106,410.00 13/01/17 9,162.70 KRW 4,460,196,000.00 USD 3,899,999.84 13/01/17 (207,054.38) KRW 1,030,356,000.00 USD 900,000.00 13/01/17 (46,931.67) TWD 122,616,000.00 USD 3,900,000.00 13/01/17 (105,439.60) KRW 765,240,500.00 USD 669,999.97 13/01/17 (36,356.71) USD 4,205,000.00 BRL 13,959,674.90 13/01/17 (79,475.77) KRW 4,865,910,000.00 USD 4,250,000.14 13/01/17 (221,354.25) KRW 763,940,700.00 USD 669,999.98 13/01/17 (37,379.89) KRW 764,094,800.00 USD 669,999.96 13/01/17 (37,258.56) USD 670,000.00 KRW 765,676,000.00 13/01/17 36,013.92 USD 4,800,000.00 KRW 5,490,816,000.00 13/01/17 253,778.30 USD 2,000,000.00 PHP 97,806,000.00 13/01/17 33,819.78 BRL 6,532,600.00 USD 2,000,000.00 13/01/17 6,370.60 BRL 2,183,396.00 USD 670,000.00 13/01/17 662.61 EUR 10,046.06 SEK 100,000.02 09/01/17 (409.32) USD 670,000.00 KRW 765,240,500.00 13/01/17 36,356.73 USD 1,500,000.00 KRW 1,704,300,000.00 13/01/17 88,421.18 PHP 73,426,500.00 USD 1,500,000.00 13/01/17 (23,976.96) PHP 58,741,200.00 USD 1,200,000.00 13/01/17 (19,181.56) USD 1,410,000.00 PHP 69,331,110.00 13/01/17 16,604.42 USD 1,410,000.00 KRW 1,624,249,500.00 13/01/17 65,634.78 USD 1,410,000.00 KRW 1,623,868,800.00 13/01/17 65,934.46 USD 670,000.00 KRW 773,005,800.00 13/01/17 30,244.10 USD 1,410,000.00 KRW 1,643,989,500.00 13/01/17 50,096.00 BRL 2,293,678.00 USD 670,000.00 13/01/17 32,958.14 USD 705,000.00 MYR 3,118,567.50 13/01/17 12,103.51 KRW 1,648,120,800.00 USD 1,409,999.98 13/01/17 (46,843.91) USD 705,000.00 IDR 9,792,450,000.00 13/01/17 (18,748.98) USD 670,000.00 INR 45,488,980.00 13/01/17 3,817.90 USD 670,000.00 BRL 2,306,542.00 13/01/17 (36,838.95) USD 1,410,000.00 MYR 6,185,670.00 13/01/17 35,100.24 USD 705,000.00 IDR 9,769,890,000.00 13/01/17 (17,155.00) USD 670,000.00 IDR 9,282,180,000.00 13/01/17 (16,113.99) USD 1,410,000.00 MYR 6,186,375.00 13/01/17 34,951.02 USD 705,000.00 IDR 9,770,595,000.00 13/01/17 (17,204.81) USD 705,000.00 MYR 3,087,618.00 13/01/17 18,654.37 USD 670,000.00 MYR 2,934,332.00 13/01/17 17,728.26 USD 760,000.00 IDR 10,614,084,000.00 13/01/17 (24,287.33) PHP 99,106,000.00 USD 2,000,000.00 13/01/17 (8,914.20)
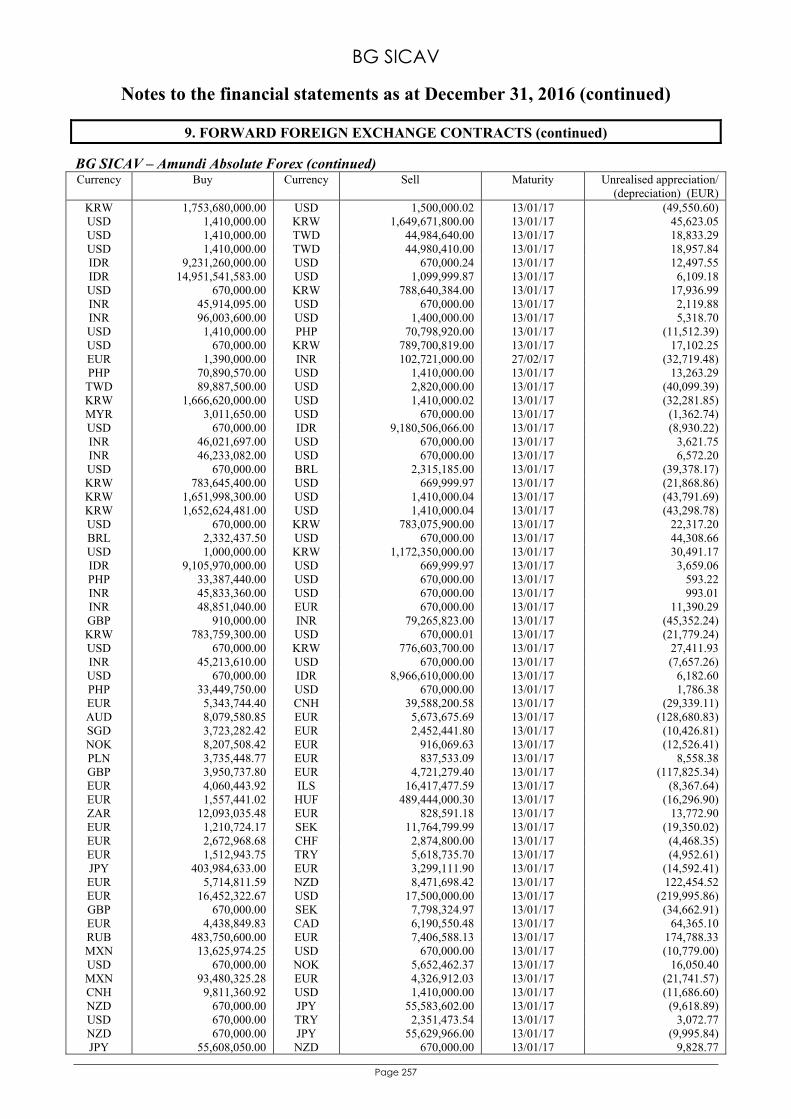
BG SICAV
Notes to the financial statements as at December 31, 2016 (continued)
Page 257
9. FORWARD FOREIGN EXCHANGE CONTRACTS (continued)
BG SICAV – Amundi Absolute Forex (continued) Currency Buy Currency Sell Maturity Unrealised appreciation/
(depreciation) (EUR) KRW 1,753,680,000.00 USD 1,500,000.02 13/01/17 (49,550.60) USD 1,410,000.00 KRW 1,649,671,800.00 13/01/17 45,623.05 USD 1,410,000.00 TWD 44,984,640.00 13/01/17 18,833.29 USD 1,410,000.00 TWD 44,980,410.00 13/01/17 18,957.84 IDR 9,231,260,000.00 USD 670,000.24 13/01/17 12,497.55 IDR 14,951,541,583.00 USD 1,099,999.87 13/01/17 6,109.18 USD 670,000.00 KRW 788,640,384.00 13/01/17 17,936.99 INR 45,914,095.00 USD 670,000.00 13/01/17 2,119.88 INR 96,003,600.00 USD 1,400,000.00 13/01/17 5,318.70 USD 1,410,000.00 PHP 70,798,920.00 13/01/17 (11,512.39) USD 670,000.00 KRW 789,700,819.00 13/01/17 17,102.25 EUR 1,390,000.00 INR 102,721,000.00 27/02/17 (32,719.48) PHP 70,890,570.00 USD 1,410,000.00 13/01/17 13,263.29 TWD 89,887,500.00 USD 2,820,000.00 13/01/17 (40,099.39) KRW 1,666,620,000.00 USD 1,410,000.02 13/01/17 (32,281.85) MYR 3,011,650.00 USD 670,000.00 13/01/17 (1,362.74) USD 670,000.00 IDR 9,180,506,066.00 13/01/17 (8,930.22) INR 46,021,697.00 USD 670,000.00 13/01/17 3,621.75 INR 46,233,082.00 USD 670,000.00 13/01/17 6,572.20 USD 670,000.00 BRL 2,315,185.00 13/01/17 (39,378.17) KRW 783,645,400.00 USD 669,999.97 13/01/17 (21,868.86) KRW 1,651,998,300.00 USD 1,410,000.04 13/01/17 (43,791.69) KRW 1,652,624,481.00 USD 1,410,000.04 13/01/17 (43,298.78) USD 670,000.00 KRW 783,075,900.00 13/01/17 22,317.20 BRL 2,332,437.50 USD 670,000.00 13/01/17 44,308.66 USD 1,000,000.00 KRW 1,172,350,000.00 13/01/17 30,491.17 IDR 9,105,970,000.00 USD 669,999.97 13/01/17 3,659.06 PHP 33,387,440.00 USD 670,000.00 13/01/17 593.22 INR 45,833,360.00 USD 670,000.00 13/01/17 993.01 INR 48,851,040.00 EUR 670,000.00 13/01/17 11,390.29 GBP 910,000.00 INR 79,265,823.00 13/01/17 (45,352.24) KRW 783,759,300.00 USD 670,000.01 13/01/17 (21,779.24) USD 670,000.00 KRW 776,603,700.00 13/01/17 27,411.93 INR 45,213,610.00 USD 670,000.00 13/01/17 (7,657.26) USD 670,000.00 IDR 8,966,610,000.00 13/01/17 6,182.60 PHP 33,449,750.00 USD 670,000.00 13/01/17 1,786.38 EUR 5,343,744.40 CNH 39,588,200.58 13/01/17 (29,339.11) AUD 8,079,580.85 EUR 5,673,675.69 13/01/17 (128,680.83) SGD 3,723,282.42 EUR 2,452,441.80 13/01/17 (10,426.81) NOK 8,207,508.42 EUR 916,069.63 13/01/17 (12,526.41) PLN 3,735,448.77 EUR 837,533.09 13/01/17 8,558.38 GBP 3,950,737.80 EUR 4,721,279.40 13/01/17 (117,825.34) EUR 4,060,443.92 ILS 16,417,477.59 13/01/17 (8,367.64) EUR 1,557,441.02 HUF 489,444,000.30 13/01/17 (16,296.90) ZAR 12,093,035.48 EUR 828,591.18 13/01/17 13,772.90 EUR 1,210,724.17 SEK 11,764,799.99 13/01/17 (19,350.02) EUR 2,672,968.68 CHF 2,874,800.00 13/01/17 (4,468.35) EUR 1,512,943.75 TRY 5,618,735.70 13/01/17 (4,952.61) JPY 403,984,633.00 EUR 3,299,111.90 13/01/17 (14,592.41) EUR 5,714,811.59 NZD 8,471,698.42 13/01/17 122,454.52 EUR 16,452,322.67 USD 17,500,000.00 13/01/17 (219,995.86) GBP 670,000.00 SEK 7,798,324.97 13/01/17 (34,662.91) EUR 4,438,849.83 CAD 6,190,550.48 13/01/17 64,365.10 RUB 483,750,600.00 EUR 7,406,588.13 13/01/17 174,788.33 MXN 13,625,974.25 USD 670,000.00 13/01/17 (10,779.00) USD 670,000.00 NOK 5,652,462.37 13/01/17 16,050.40 MXN 93,480,325.28 EUR 4,326,912.03 13/01/17 (21,741.57) CNH 9,811,360.92 USD 1,410,000.00 13/01/17 (11,686.60) NZD 670,000.00 JPY 55,583,602.00 13/01/17 (9,618.89) USD 670,000.00 TRY 2,351,473.54 13/01/17 3,072.77 NZD 670,000.00 JPY 55,629,966.00 13/01/17 (9,995.84) JPY 55,608,050.00 NZD 670,000.00 13/01/17 9,828.77
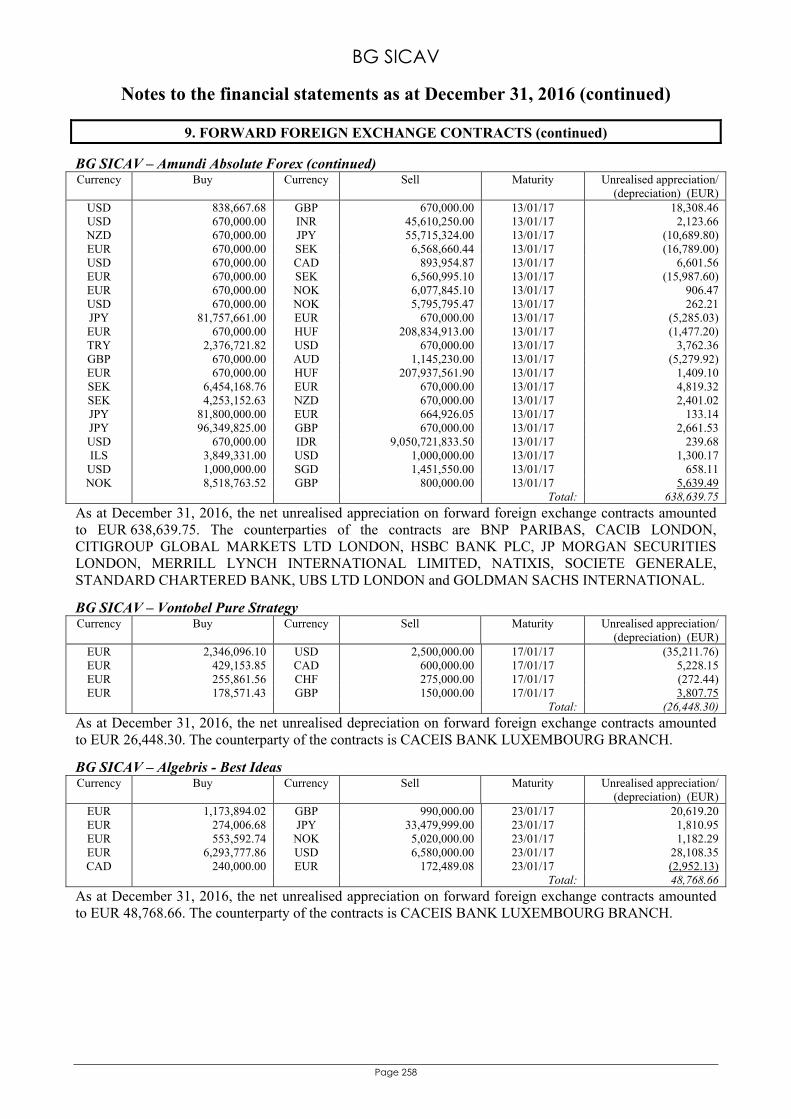
BG SICAV
Notes to the financial statements as at December 31, 2016 (continued)
Page 258
9. FORWARD FOREIGN EXCHANGE CONTRACTS (continued)
BG SICAV – Amundi Absolute Forex (continued) Currency Buy Currency Sell Maturity Unrealised appreciation/
(depreciation) (EUR) USD 838,667.68 GBP 670,000.00 13/01/17 18,308.46 USD 670,000.00 INR 45,610,250.00 13/01/17 2,123.66 NZD 670,000.00 JPY 55,715,324.00 13/01/17 (10,689.80) EUR 670,000.00 SEK 6,568,660.44 13/01/17 (16,789.00) USD 670,000.00 CAD 893,954.87 13/01/17 6,601.56 EUR 670,000.00 SEK 6,560,995.10 13/01/17 (15,987.60) EUR 670,000.00 NOK 6,077,845.10 13/01/17 906.47 USD 670,000.00 NOK 5,795,795.47 13/01/17 262.21 JPY 81,757,661.00 EUR 670,000.00 13/01/17 (5,285.03) EUR 670,000.00 HUF 208,834,913.00 13/01/17 (1,477.20) TRY 2,376,721.82 USD 670,000.00 13/01/17 3,762.36 GBP 670,000.00 AUD 1,145,230.00 13/01/17 (5,279.92) EUR 670,000.00 HUF 207,937,561.90 13/01/17 1,409.10 SEK 6,454,168.76 EUR 670,000.00 13/01/17 4,819.32 SEK 4,253,152.63 NZD 670,000.00 13/01/17 2,401.02 JPY 81,800,000.00 EUR 664,926.05 13/01/17 133.14 JPY 96,349,825.00 GBP 670,000.00 13/01/17 2,661.53 USD 670,000.00 IDR 9,050,721,833.50 13/01/17 239.68 ILS 3,849,331.00 USD 1,000,000.00 13/01/17 1,300.17 USD 1,000,000.00 SGD 1,451,550.00 13/01/17 658.11 NOK 8,518,763.52 GBP 800,000.00 13/01/17 5,639.49
Total: 638,639.75
As at December 31, 2016, the net unrealised appreciation on forward foreign exchange contracts amounted to EUR 638,639.75. The counterparties of the contracts are BNP PARIBAS, CACIB LONDON, CITIGROUP GLOBAL MARKETS LTD LONDON, HSBC BANK PLC, JP MORGAN SECURITIES LONDON, MERRILL LYNCH INTERNATIONAL LIMITED, NATIXIS, SOCIETE GENERALE, STANDARD CHARTERED BANK, UBS LTD LONDON and GOLDMAN SACHS INTERNATIONAL.
BG SICAV – Vontobel Pure Strategy Currency Buy Currency Sell Maturity Unrealised appreciation/
(depreciation) (EUR) EUR 2,346,096.10 USD 2,500,000.00 17/01/17 (35,211.76) EUR 429,153.85 CAD 600,000.00 17/01/17 5,228.15 EUR 255,861.56 CHF 275,000.00 17/01/17 (272.44) EUR 178,571.43 GBP 150,000.00 17/01/17 3,807.75
Total: (26,448.30)
As at December 31, 2016, the net unrealised depreciation on forward foreign exchange contracts amounted to EUR 26,448.30. The counterparty of the contracts is CACEIS BANK LUXEMBOURG BRANCH.
BG SICAV – Algebris - Best Ideas Currency Buy Currency Sell Maturity Unrealised appreciation/
(depreciation) (EUR) EUR 1,173,894.02 GBP 990,000.00 23/01/17 20,619.20 EUR 274,006.68 JPY 33,479,999.00 23/01/17 1,810.95 EUR 553,592.74 NOK 5,020,000.00 23/01/17 1,182.29 EUR 6,293,777.86 USD 6,580,000.00 23/01/17 28,108.35 CAD 240,000.00 EUR 172,489.08 23/01/17 (2,952.13)
Total: 48,768.66
As at December 31, 2016, the net unrealised appreciation on forward foreign exchange contracts amounted to EUR 48,768.66. The counterparty of the contracts is CACEIS BANK LUXEMBOURG BRANCH.
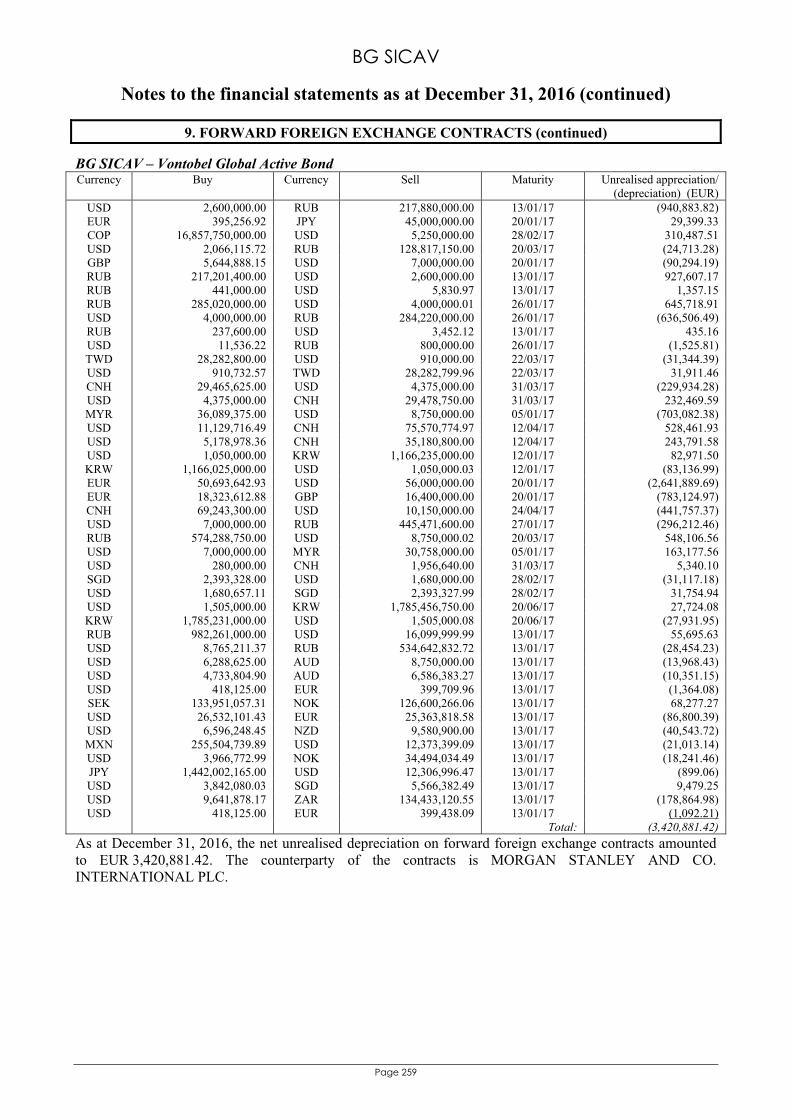
BG SICAV
Notes to the financial statements as at December 31, 2016 (continued)
Page 259
9. FORWARD FOREIGN EXCHANGE CONTRACTS (continued) BG SICAV – Vontobel Global Active Bond Currency Buy Currency Sell Maturity Unrealised appreciation/
(depreciation) (EUR) USD 2,600,000.00 RUB 217,880,000.00 13/01/17 (940,883.82) EUR 395,256.92 JPY 45,000,000.00 20/01/17 29,399.33 COP 16,857,750,000.00 USD 5,250,000.00 28/02/17 310,487.51 USD 2,066,115.72 RUB 128,817,150.00 20/03/17 (24,713.28) GBP 5,644,888.15 USD 7,000,000.00 20/01/17 (90,294.19) RUB 217,201,400.00 USD 2,600,000.00 13/01/17 927,607.17 RUB 441,000.00 USD 5,830.97 13/01/17 1,357.15 RUB 285,020,000.00 USD 4,000,000.01 26/01/17 645,718.91 USD 4,000,000.00 RUB 284,220,000.00 26/01/17 (636,506.49) RUB 237,600.00 USD 3,452.12 13/01/17 435.16 USD 11,536.22 RUB 800,000.00 26/01/17 (1,525.81) TWD 28,282,800.00 USD 910,000.00 22/03/17 (31,344.39) USD 910,732.57 TWD 28,282,799.96 22/03/17 31,911.46 CNH 29,465,625.00 USD 4,375,000.00 31/03/17 (229,934.28) USD 4,375,000.00 CNH 29,478,750.00 31/03/17 232,469.59 MYR 36,089,375.00 USD 8,750,000.00 05/01/17 (703,082.38) USD 11,129,716.49 CNH 75,570,774.97 12/04/17 528,461.93 USD 5,178,978.36 CNH 35,180,800.00 12/04/17 243,791.58 USD 1,050,000.00 KRW 1,166,235,000.00 12/01/17 82,971.50 KRW 1,166,025,000.00 USD 1,050,000.03 12/01/17 (83,136.99) EUR 50,693,642.93 USD 56,000,000.00 20/01/17 (2,641,889.69) EUR 18,323,612.88 GBP 16,400,000.00 20/01/17 (783,124.97) CNH 69,243,300.00 USD 10,150,000.00 24/04/17 (441,757.37) USD 7,000,000.00 RUB 445,471,600.00 27/01/17 (296,212.46) RUB 574,288,750.00 USD 8,750,000.02 20/03/17 548,106.56 USD 7,000,000.00 MYR 30,758,000.00 05/01/17 163,177.56 USD 280,000.00 CNH 1,956,640.00 31/03/17 5,340.10 SGD 2,393,328.00 USD 1,680,000.00 28/02/17 (31,117.18) USD 1,680,657.11 SGD 2,393,327.99 28/02/17 31,754.94 USD 1,505,000.00 KRW 1,785,456,750.00 20/06/17 27,724.08 KRW 1,785,231,000.00 USD 1,505,000.08 20/06/17 (27,931.95) RUB 982,261,000.00 USD 16,099,999.99 13/01/17 55,695.63 USD 8,765,211.37 RUB 534,642,832.72 13/01/17 (28,454.23) USD 6,288,625.00 AUD 8,750,000.00 13/01/17 (13,968.43) USD 4,733,804.90 AUD 6,586,383.27 13/01/17 (10,351.15) USD 418,125.00 EUR 399,709.96 13/01/17 (1,364.08) SEK 133,951,057.31 NOK 126,600,266.06 13/01/17 68,277.27 USD 26,532,101.43 EUR 25,363,818.58 13/01/17 (86,800.39) USD 6,596,248.45 NZD 9,580,900.00 13/01/17 (40,543.72) MXN 255,504,739.89 USD 12,373,399.09 13/01/17 (21,013.14) USD 3,966,772.99 NOK 34,494,034.49 13/01/17 (18,241.46) JPY 1,442,002,165.00 USD 12,306,996.47 13/01/17 (899.06) USD 3,842,080.03 SGD 5,566,382.49 13/01/17 9,479.25 USD 9,641,878.17 ZAR 134,433,120.55 13/01/17 (178,864.98) USD 418,125.00 EUR 399,438.09 13/01/17 (1,092.21)
Total: (3,420,881.42)
As at December 31, 2016, the net unrealised depreciation on forward foreign exchange contracts amounted to EUR 3,420,881.42. The counterparty of the contracts is MORGAN STANLEY AND CO. INTERNATIONAL PLC.
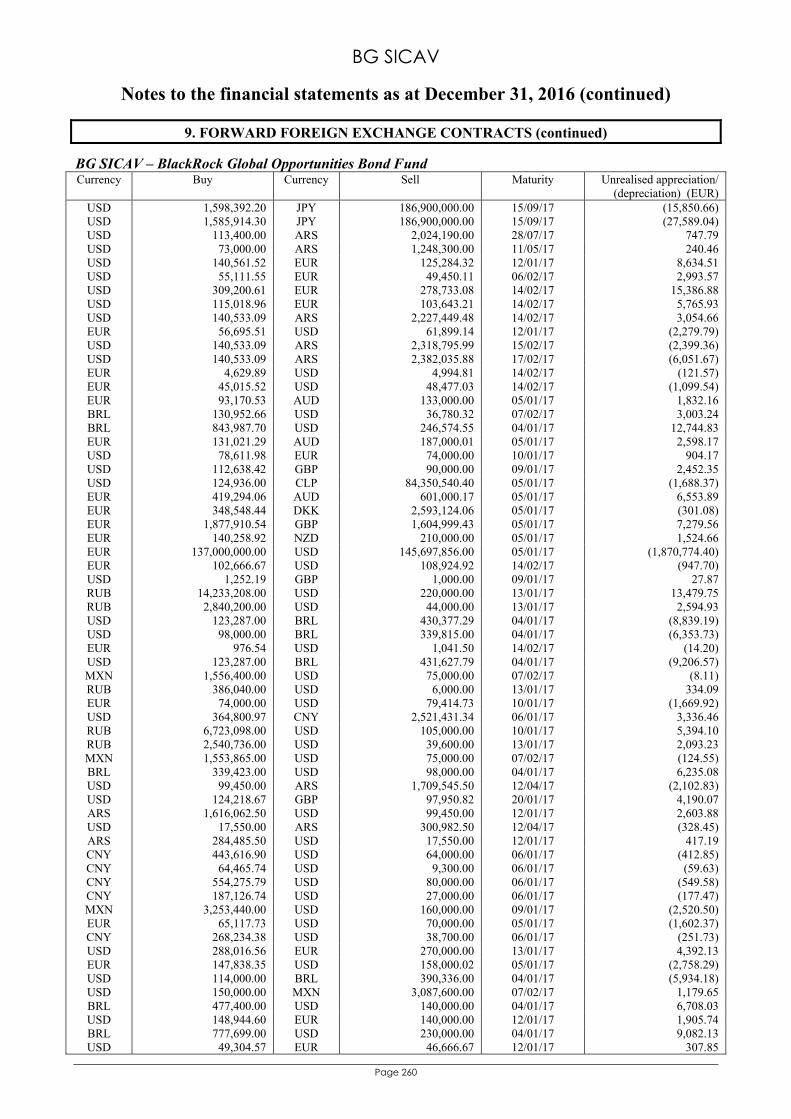
BG SICAV
Notes to the financial statements as at December 31, 2016 (continued)
Page 260
9. FORWARD FOREIGN EXCHANGE CONTRACTS (continued) BG SICAV – BlackRock Global Opportunities Bond Fund Currency Buy Currency Sell Maturity Unrealised appreciation/
(depreciation) (EUR) USD 1,598,392.20 JPY 186,900,000.00 15/09/17 (15,850.66) USD 1,585,914.30 JPY 186,900,000.00 15/09/17 (27,589.04) USD 113,400.00 ARS 2,024,190.00 28/07/17 747.79 USD 73,000.00 ARS 1,248,300.00 11/05/17 240.46 USD 140,561.52 EUR 125,284.32 12/01/17 8,634.51 USD 55,111.55 EUR 49,450.11 06/02/17 2,993.57 USD 309,200.61 EUR 278,733.08 14/02/17 15,386.88 USD 115,018.96 EUR 103,643.21 14/02/17 5,765.93 USD 140,533.09 ARS 2,227,449.48 14/02/17 3,054.66 EUR 56,695.51 USD 61,899.14 12/01/17 (2,279.79) USD 140,533.09 ARS 2,318,795.99 15/02/17 (2,399.36) USD 140,533.09 ARS 2,382,035.88 17/02/17 (6,051.67) EUR 4,629.89 USD 4,994.81 14/02/17 (121.57) EUR 45,015.52 USD 48,477.03 14/02/17 (1,099.54) EUR 93,170.53 AUD 133,000.00 05/01/17 1,832.16 BRL 130,952.66 USD 36,780.32 07/02/17 3,003.24 BRL 843,987.70 USD 246,574.55 04/01/17 12,744.83 EUR 131,021.29 AUD 187,000.01 05/01/17 2,598.17 USD 78,611.98 EUR 74,000.00 10/01/17 904.17 USD 112,638.42 GBP 90,000.00 09/01/17 2,452.35 USD 124,936.00 CLP 84,350,540.40 05/01/17 (1,688.37) EUR 419,294.06 AUD 601,000.17 05/01/17 6,553.89 EUR 348,548.44 DKK 2,593,124.06 05/01/17 (301.08) EUR 1,877,910.54 GBP 1,604,999.43 05/01/17 7,279.56 EUR 140,258.92 NZD 210,000.00 05/01/17 1,524.66 EUR 137,000,000.00 USD 145,697,856.00 05/01/17 (1,870,774.40) EUR 102,666.67 USD 108,924.92 14/02/17 (947.70) USD 1,252.19 GBP 1,000.00 09/01/17 27.87 RUB 14,233,208.00 USD 220,000.00 13/01/17 13,479.75 RUB 2,840,200.00 USD 44,000.00 13/01/17 2,594.93 USD 123,287.00 BRL 430,377.29 04/01/17 (8,839.19) USD 98,000.00 BRL 339,815.00 04/01/17 (6,353.73) EUR 976.54 USD 1,041.50 14/02/17 (14.20) USD 123,287.00 BRL 431,627.79 04/01/17 (9,206.57) MXN 1,556,400.00 USD 75,000.00 07/02/17 (8.11) RUB 386,040.00 USD 6,000.00 13/01/17 334.09 EUR 74,000.00 USD 79,414.73 10/01/17 (1,669.92) USD 364,800.97 CNY 2,521,431.34 06/01/17 3,336.46 RUB 6,723,098.00 USD 105,000.00 10/01/17 5,394.10 RUB 2,540,736.00 USD 39,600.00 13/01/17 2,093.23 MXN 1,553,865.00 USD 75,000.00 07/02/17 (124.55) BRL 339,423.00 USD 98,000.00 04/01/17 6,235.08 USD 99,450.00 ARS 1,709,545.50 12/04/17 (2,102.83) USD 124,218.67 GBP 97,950.82 20/01/17 4,190.07 ARS 1,616,062.50 USD 99,450.00 12/01/17 2,603.88 USD 17,550.00 ARS 300,982.50 12/04/17 (328.45) ARS 284,485.50 USD 17,550.00 12/01/17 417.19 CNY 443,616.90 USD 64,000.00 06/01/17 (412.85) CNY 64,465.74 USD 9,300.00 06/01/17 (59.63) CNY 554,275.79 USD 80,000.00 06/01/17 (549.58) CNY 187,126.74 USD 27,000.00 06/01/17 (177.47) MXN 3,253,440.00 USD 160,000.00 09/01/17 (2,520.50) EUR 65,117.73 USD 70,000.00 05/01/17 (1,602.37) CNY 268,234.38 USD 38,700.00 06/01/17 (251.73) USD 288,016.56 EUR 270,000.00 13/01/17 4,392.13 EUR 147,838.35 USD 158,000.02 05/01/17 (2,758.29) USD 114,000.00 BRL 390,336.00 04/01/17 (5,934.18) USD 150,000.00 MXN 3,087,600.00 07/02/17 1,179.65 BRL 477,400.00 USD 140,000.00 04/01/17 6,708.03 USD 148,944.60 EUR 140,000.00 12/01/17 1,905.74 BRL 777,699.00 USD 230,000.00 04/01/17 9,082.13 USD 49,304.57 EUR 46,666.67 12/01/17 307.85
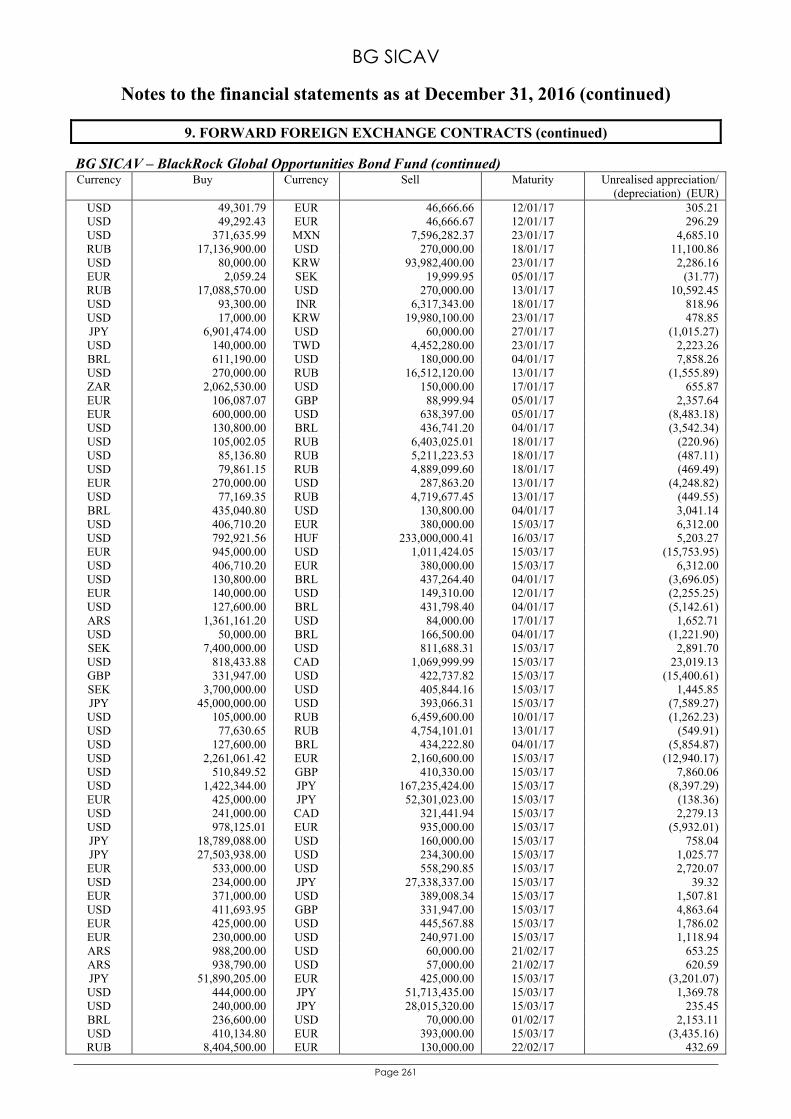
BG SICAV
Notes to the financial statements as at December 31, 2016 (continued)
Page 261
9. FORWARD FOREIGN EXCHANGE CONTRACTS (continued) BG SICAV – BlackRock Global Opportunities Bond Fund (continued) Currency Buy Currency Sell Maturity Unrealised appreciation/
(depreciation) (EUR) USD 49,301.79 EUR 46,666.66 12/01/17 305.21 USD 49,292.43 EUR 46,666.67 12/01/17 296.29 USD 371,635.99 MXN 7,596,282.37 23/01/17 4,685.10 RUB 17,136,900.00 USD 270,000.00 18/01/17 11,100.86 USD 80,000.00 KRW 93,982,400.00 23/01/17 2,286.16 EUR 2,059.24 SEK 19,999.95 05/01/17 (31.77) RUB 17,088,570.00 USD 270,000.00 13/01/17 10,592.45 USD 93,300.00 INR 6,317,343.00 18/01/17 818.96 USD 17,000.00 KRW 19,980,100.00 23/01/17 478.85 JPY 6,901,474.00 USD 60,000.00 27/01/17 (1,015.27) USD 140,000.00 TWD 4,452,280.00 23/01/17 2,223.26 BRL 611,190.00 USD 180,000.00 04/01/17 7,858.26 USD 270,000.00 RUB 16,512,120.00 13/01/17 (1,555.89) ZAR 2,062,530.00 USD 150,000.00 17/01/17 655.87 EUR 106,087.07 GBP 88,999.94 05/01/17 2,357.64 EUR 600,000.00 USD 638,397.00 05/01/17 (8,483.18) USD 130,800.00 BRL 436,741.20 04/01/17 (3,542.34) USD 105,002.05 RUB 6,403,025.01 18/01/17 (220.96) USD 85,136.80 RUB 5,211,223.53 18/01/17 (487.11) USD 79,861.15 RUB 4,889,099.60 18/01/17 (469.49) EUR 270,000.00 USD 287,863.20 13/01/17 (4,248.82) USD 77,169.35 RUB 4,719,677.45 13/01/17 (449.55) BRL 435,040.80 USD 130,800.00 04/01/17 3,041.14 USD 406,710.20 EUR 380,000.00 15/03/17 6,312.00 USD 792,921.56 HUF 233,000,000.41 16/03/17 5,203.27 EUR 945,000.00 USD 1,011,424.05 15/03/17 (15,753.95) USD 406,710.20 EUR 380,000.00 15/03/17 6,312.00 USD 130,800.00 BRL 437,264.40 04/01/17 (3,696.05) EUR 140,000.00 USD 149,310.00 12/01/17 (2,255.25) USD 127,600.00 BRL 431,798.40 04/01/17 (5,142.61) ARS 1,361,161.20 USD 84,000.00 17/01/17 1,652.71 USD 50,000.00 BRL 166,500.00 04/01/17 (1,221.90) SEK 7,400,000.00 USD 811,688.31 15/03/17 2,891.70 USD 818,433.88 CAD 1,069,999.99 15/03/17 23,019.13 GBP 331,947.00 USD 422,737.82 15/03/17 (15,400.61) SEK 3,700,000.00 USD 405,844.16 15/03/17 1,445.85 JPY 45,000,000.00 USD 393,066.31 15/03/17 (7,589.27) USD 105,000.00 RUB 6,459,600.00 10/01/17 (1,262.23) USD 77,630.65 RUB 4,754,101.01 13/01/17 (549.91) USD 127,600.00 BRL 434,222.80 04/01/17 (5,854.87) USD 2,261,061.42 EUR 2,160,600.00 15/03/17 (12,940.17) USD 510,849.52 GBP 410,330.00 15/03/17 7,860.06 USD 1,422,344.00 JPY 167,235,424.00 15/03/17 (8,397.29) EUR 425,000.00 JPY 52,301,023.00 15/03/17 (138.36) USD 241,000.00 CAD 321,441.94 15/03/17 2,279.13 USD 978,125.01 EUR 935,000.00 15/03/17 (5,932.01) JPY 18,789,088.00 USD 160,000.00 15/03/17 758.04 JPY 27,503,938.00 USD 234,300.00 15/03/17 1,025.77 EUR 533,000.00 USD 558,290.85 15/03/17 2,720.07 USD 234,000.00 JPY 27,338,337.00 15/03/17 39.32 EUR 371,000.00 USD 389,008.34 15/03/17 1,507.81 USD 411,693.95 GBP 331,947.00 15/03/17 4,863.64 EUR 425,000.00 USD 445,567.88 15/03/17 1,786.02 EUR 230,000.00 USD 240,971.00 15/03/17 1,118.94 ARS 988,200.00 USD 60,000.00 21/02/17 653.25 ARS 938,790.00 USD 57,000.00 21/02/17 620.59 JPY 51,890,205.00 EUR 425,000.00 15/03/17 (3,201.07) USD 444,000.00 JPY 51,713,435.00 15/03/17 1,369.78 USD 240,000.00 JPY 28,015,320.00 15/03/17 235.45 BRL 236,600.00 USD 70,000.00 01/02/17 2,153.11 USD 410,134.80 EUR 393,000.00 15/03/17 (3,435.16) RUB 8,404,500.00 EUR 130,000.00 22/02/17 432.69
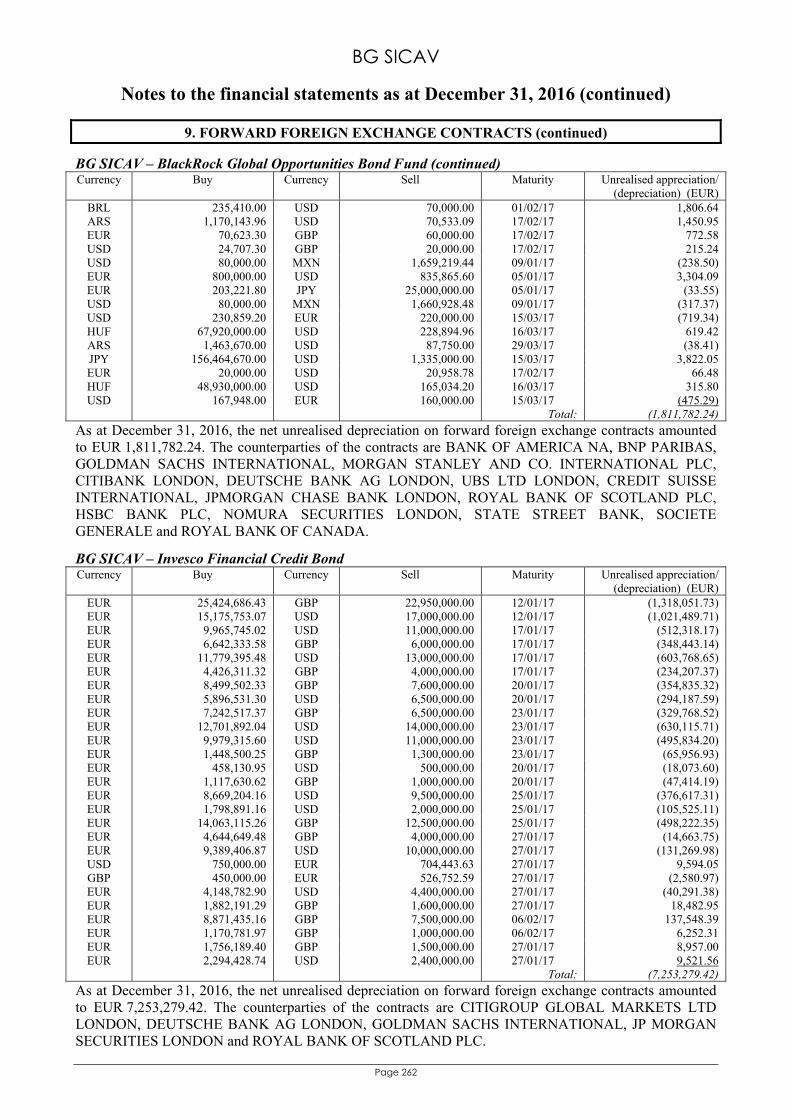
BG SICAV
Notes to the financial statements as at December 31, 2016 (continued)
Page 262
9. FORWARD FOREIGN EXCHANGE CONTRACTS (continued) BG SICAV – BlackRock Global Opportunities Bond Fund (continued) Currency Buy Currency Sell Maturity Unrealised appreciation/
(depreciation) (EUR) BRL 235,410.00 USD 70,000.00 01/02/17 1,806.64 ARS 1,170,143.96 USD 70,533.09 17/02/17 1,450.95 EUR 70,623.30 GBP 60,000.00 17/02/17 772.58 USD 24,707.30 GBP 20,000.00 17/02/17 215.24 USD 80,000.00 MXN 1,659,219.44 09/01/17 (238.50) EUR 800,000.00 USD 835,865.60 05/01/17 3,304.09 EUR 203,221.80 JPY 25,000,000.00 05/01/17 (33.55) USD 80,000.00 MXN 1,660,928.48 09/01/17 (317.37) USD 230,859.20 EUR 220,000.00 15/03/17 (719.34) HUF 67,920,000.00 USD 228,894.96 16/03/17 619.42 ARS 1,463,670.00 USD 87,750.00 29/03/17 (38.41) JPY 156,464,670.00 USD 1,335,000.00 15/03/17 3,822.05 EUR 20,000.00 USD 20,958.78 17/02/17 66.48 HUF 48,930,000.00 USD 165,034.20 16/03/17 315.80 USD 167,948.00 EUR 160,000.00 15/03/17 (475.29)
Total: (1,811,782.24)
As at December 31, 2016, the net unrealised depreciation on forward foreign exchange contracts amounted to EUR 1,811,782.24. The counterparties of the contracts are BANK OF AMERICA NA, BNP PARIBAS, GOLDMAN SACHS INTERNATIONAL, MORGAN STANLEY AND CO. INTERNATIONAL PLC, CITIBANK LONDON, DEUTSCHE BANK AG LONDON, UBS LTD LONDON, CREDIT SUISSE INTERNATIONAL, JPMORGAN CHASE BANK LONDON, ROYAL BANK OF SCOTLAND PLC, HSBC BANK PLC, NOMURA SECURITIES LONDON, STATE STREET BANK, SOCIETE GENERALE and ROYAL BANK OF CANADA.
BG SICAV – Invesco Financial Credit Bond Currency Buy Currency Sell Maturity Unrealised appreciation/
(depreciation) (EUR) EUR 25,424,686.43 GBP 22,950,000.00 12/01/17 (1,318,051.73) EUR 15,175,753.07 USD 17,000,000.00 12/01/17 (1,021,489.71) EUR 9,965,745.02 USD 11,000,000.00 17/01/17 (512,318.17) EUR 6,642,333.58 GBP 6,000,000.00 17/01/17 (348,443.14) EUR 11,779,395.48 USD 13,000,000.00 17/01/17 (603,768.65) EUR 4,426,311.32 GBP 4,000,000.00 17/01/17 (234,207.37) EUR 8,499,502.33 GBP 7,600,000.00 20/01/17 (354,835.32) EUR 5,896,531.30 USD 6,500,000.00 20/01/17 (294,187.59) EUR 7,242,517.37 GBP 6,500,000.00 23/01/17 (329,768.52) EUR 12,701,892.04 USD 14,000,000.00 23/01/17 (630,115.71) EUR 9,979,315.60 USD 11,000,000.00 23/01/17 (495,834.20) EUR 1,448,500.25 GBP 1,300,000.00 23/01/17 (65,956.93) EUR 458,130.95 USD 500,000.00 20/01/17 (18,073.60) EUR 1,117,630.62 GBP 1,000,000.00 20/01/17 (47,414.19) EUR 8,669,204.16 USD 9,500,000.00 25/01/17 (376,617.31) EUR 1,798,891.16 USD 2,000,000.00 25/01/17 (105,525.11) EUR 14,063,115.26 GBP 12,500,000.00 25/01/17 (498,222.35) EUR 4,644,649.48 GBP 4,000,000.00 27/01/17 (14,663.75) EUR 9,389,406.87 USD 10,000,000.00 27/01/17 (131,269.98) USD 750,000.00 EUR 704,443.63 27/01/17 9,594.05 GBP 450,000.00 EUR 526,752.59 27/01/17 (2,580.97) EUR 4,148,782.90 USD 4,400,000.00 27/01/17 (40,291.38) EUR 1,882,191.29 GBP 1,600,000.00 27/01/17 18,482.95 EUR 8,871,435.16 GBP 7,500,000.00 06/02/17 137,548.39 EUR 1,170,781.97 GBP 1,000,000.00 06/02/17 6,252.31 EUR 1,756,189.40 GBP 1,500,000.00 27/01/17 8,957.00 EUR 2,294,428.74 USD 2,400,000.00 27/01/17 9,521.56
Total: (7,253,279.42)
As at December 31, 2016, the net unrealised depreciation on forward foreign exchange contracts amounted to EUR 7,253,279.42. The counterparties of the contracts are CITIGROUP GLOBAL MARKETS LTD LONDON, DEUTSCHE BANK AG LONDON, GOLDMAN SACHS INTERNATIONAL, JP MORGAN SECURITIES LONDON and ROYAL BANK OF SCOTLAND PLC.
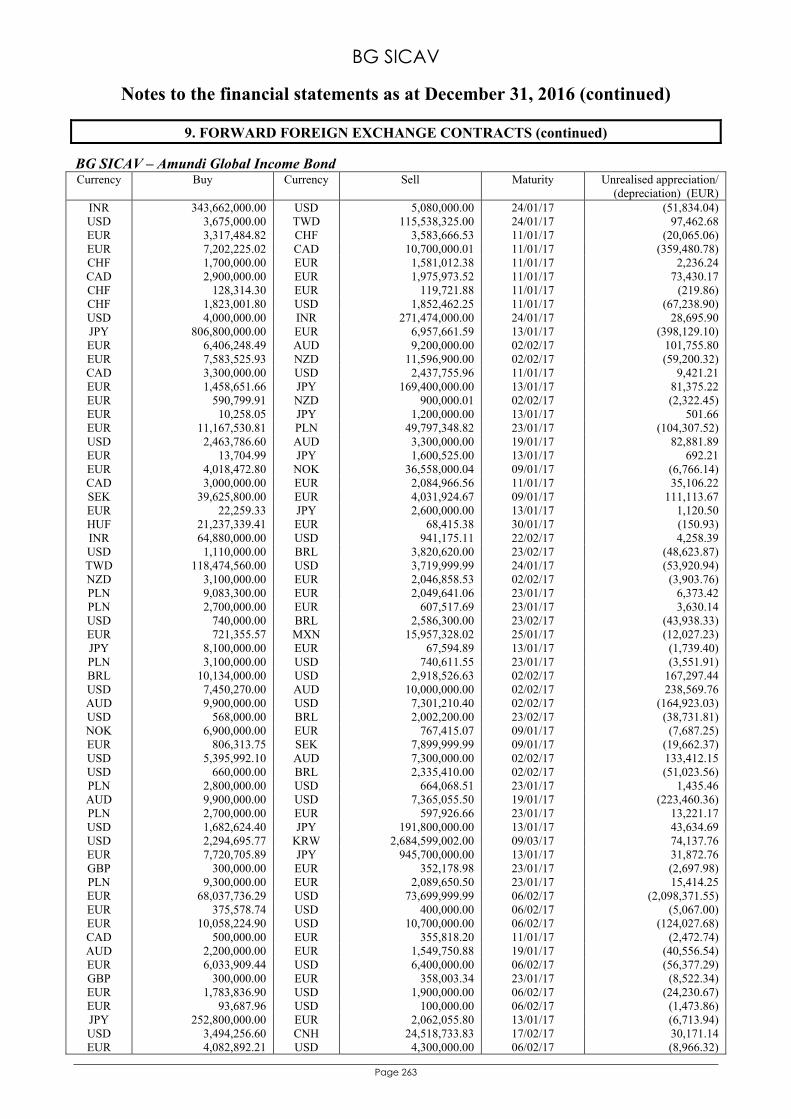
BG SICAV
Notes to the financial statements as at December 31, 2016 (continued)
Page 263
9. FORWARD FOREIGN EXCHANGE CONTRACTS (continued) BG SICAV – Amundi Global Income Bond Currency Buy Currency Sell Maturity Unrealised appreciation/
(depreciation) (EUR) INR 343,662,000.00 USD 5,080,000.00 24/01/17 (51,834.04) USD 3,675,000.00 TWD 115,538,325.00 24/01/17 97,462.68 EUR 3,317,484.82 CHF 3,583,666.53 11/01/17 (20,065.06) EUR 7,202,225.02 CAD 10,700,000.01 11/01/17 (359,480.78) CHF 1,700,000.00 EUR 1,581,012.38 11/01/17 2,236.24 CAD 2,900,000.00 EUR 1,975,973.52 11/01/17 73,430.17 CHF 128,314.30 EUR 119,721.88 11/01/17 (219.86) CHF 1,823,001.80 USD 1,852,462.25 11/01/17 (67,238.90) USD 4,000,000.00 INR 271,474,000.00 24/01/17 28,695.90 JPY 806,800,000.00 EUR 6,957,661.59 13/01/17 (398,129.10) EUR 6,406,248.49 AUD 9,200,000.00 02/02/17 101,755.80 EUR 7,583,525.93 NZD 11,596,900.00 02/02/17 (59,200.32) CAD 3,300,000.00 USD 2,437,755.96 11/01/17 9,421.21 EUR 1,458,651.66 JPY 169,400,000.00 13/01/17 81,375.22 EUR 590,799.91 NZD 900,000.01 02/02/17 (2,322.45) EUR 10,258.05 JPY 1,200,000.00 13/01/17 501.66 EUR 11,167,530.81 PLN 49,797,348.82 23/01/17 (104,307.52) USD 2,463,786.60 AUD 3,300,000.00 19/01/17 82,881.89 EUR 13,704.99 JPY 1,600,525.00 13/01/17 692.21 EUR 4,018,472.80 NOK 36,558,000.04 09/01/17 (6,766.14) CAD 3,000,000.00 EUR 2,084,966.56 11/01/17 35,106.22 SEK 39,625,800.00 EUR 4,031,924.67 09/01/17 111,113.67 EUR 22,259.33 JPY 2,600,000.00 13/01/17 1,120.50 HUF 21,237,339.41 EUR 68,415.38 30/01/17 (150.93) INR 64,880,000.00 USD 941,175.11 22/02/17 4,258.39 USD 1,110,000.00 BRL 3,820,620.00 23/02/17 (48,623.87) TWD 118,474,560.00 USD 3,719,999.99 24/01/17 (53,920.94) NZD 3,100,000.00 EUR 2,046,858.53 02/02/17 (3,903.76) PLN 9,083,300.00 EUR 2,049,641.06 23/01/17 6,373.42 PLN 2,700,000.00 EUR 607,517.69 23/01/17 3,630.14 USD 740,000.00 BRL 2,586,300.00 23/02/17 (43,938.33) EUR 721,355.57 MXN 15,957,328.02 25/01/17 (12,027.23) JPY 8,100,000.00 EUR 67,594.89 13/01/17 (1,739.40) PLN 3,100,000.00 USD 740,611.55 23/01/17 (3,551.91) BRL 10,134,000.00 USD 2,918,526.63 02/02/17 167,297.44 USD 7,450,270.00 AUD 10,000,000.00 02/02/17 238,569.76 AUD 9,900,000.00 USD 7,301,210.40 02/02/17 (164,923.03) USD 568,000.00 BRL 2,002,200.00 23/02/17 (38,731.81) NOK 6,900,000.00 EUR 767,415.07 09/01/17 (7,687.25) EUR 806,313.75 SEK 7,899,999.99 09/01/17 (19,662.37) USD 5,395,992.10 AUD 7,300,000.00 02/02/17 133,412.15 USD 660,000.00 BRL 2,335,410.00 02/02/17 (51,023.56) PLN 2,800,000.00 USD 664,068.51 23/01/17 1,435.46 AUD 9,900,000.00 USD 7,365,055.50 19/01/17 (223,460.36) PLN 2,700,000.00 EUR 597,926.66 23/01/17 13,221.17 USD 1,682,624.40 JPY 191,800,000.00 13/01/17 43,634.69 USD 2,294,695.77 KRW 2,684,599,002.00 09/03/17 74,137.76 EUR 7,720,705.89 JPY 945,700,000.00 13/01/17 31,872.76 GBP 300,000.00 EUR 352,178.98 23/01/17 (2,697.98) PLN 9,300,000.00 EUR 2,089,650.50 23/01/17 15,414.25 EUR 68,037,736.29 USD 73,699,999.99 06/02/17 (2,098,371.55) EUR 375,578.74 USD 400,000.00 06/02/17 (5,067.00) EUR 10,058,224.90 USD 10,700,000.00 06/02/17 (124,027.68) CAD 500,000.00 EUR 355,818.20 11/01/17 (2,472.74) AUD 2,200,000.00 EUR 1,549,750.88 19/01/17 (40,556.54) EUR 6,033,909.44 USD 6,400,000.00 06/02/17 (56,377.29) GBP 300,000.00 EUR 358,003.34 23/01/17 (8,522.34) EUR 1,783,836.90 USD 1,900,000.00 06/02/17 (24,230.67) EUR 93,687.96 USD 100,000.00 06/02/17 (1,473.86) JPY 252,800,000.00 EUR 2,062,055.80 13/01/17 (6,713.94) USD 3,494,256.60 CNH 24,518,733.83 17/02/17 30,171.14 EUR 4,082,892.21 USD 4,300,000.00 06/02/17 (8,966.32)
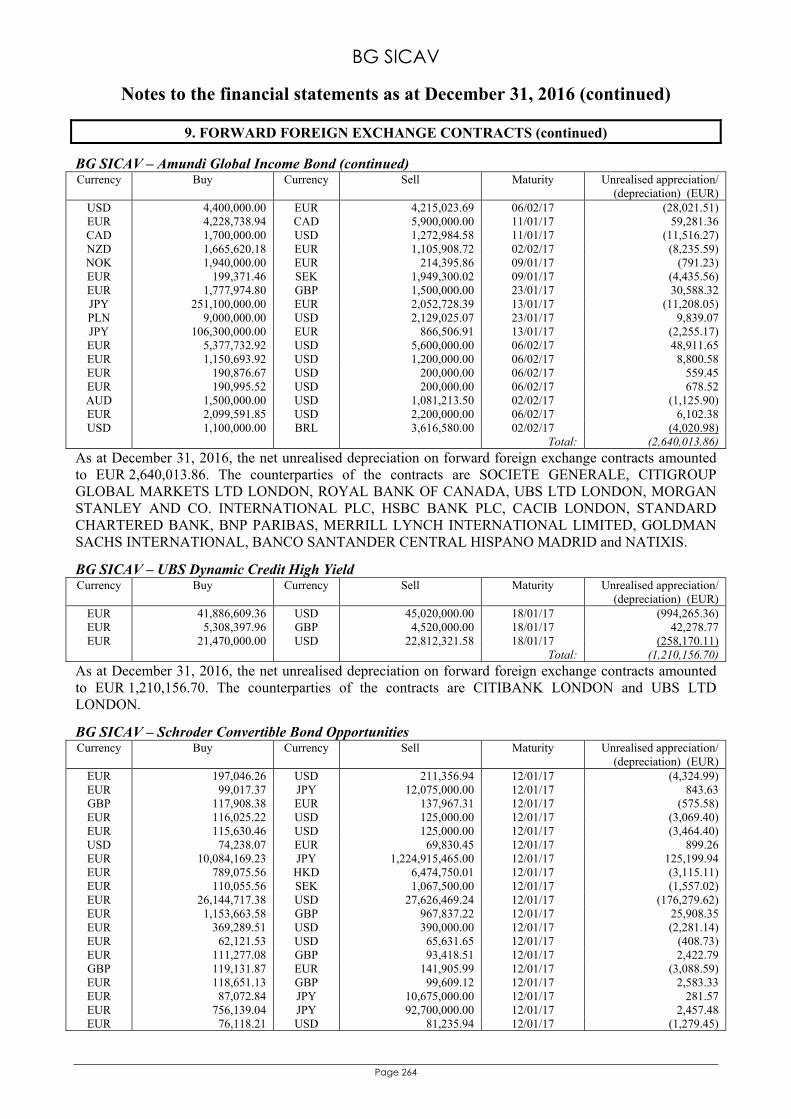
BG SICAV
Notes to the financial statements as at December 31, 2016 (continued)
Page 264
9. FORWARD FOREIGN EXCHANGE CONTRACTS (continued) BG SICAV – Amundi Global Income Bond (continued) Currency Buy Currency Sell Maturity Unrealised appreciation/
(depreciation) (EUR) USD 4,400,000.00 EUR 4,215,023.69 06/02/17 (28,021.51) EUR 4,228,738.94 CAD 5,900,000.00 11/01/17 59,281.36 CAD 1,700,000.00 USD 1,272,984.58 11/01/17 (11,516.27) NZD 1,665,620.18 EUR 1,105,908.72 02/02/17 (8,235.59) NOK 1,940,000.00 EUR 214,395.86 09/01/17 (791.23) EUR 199,371.46 SEK 1,949,300.02 09/01/17 (4,435.56) EUR 1,777,974.80 GBP 1,500,000.00 23/01/17 30,588.32 JPY 251,100,000.00 EUR 2,052,728.39 13/01/17 (11,208.05) PLN 9,000,000.00 USD 2,129,025.07 23/01/17 9,839.07 JPY 106,300,000.00 EUR 866,506.91 13/01/17 (2,255.17) EUR 5,377,732.92 USD 5,600,000.00 06/02/17 48,911.65 EUR 1,150,693.92 USD 1,200,000.00 06/02/17 8,800.58 EUR 190,876.67 USD 200,000.00 06/02/17 559.45 EUR 190,995.52 USD 200,000.00 06/02/17 678.52 AUD 1,500,000.00 USD 1,081,213.50 02/02/17 (1,125.90) EUR 2,099,591.85 USD 2,200,000.00 06/02/17 6,102.38 USD 1,100,000.00 BRL 3,616,580.00 02/02/17 (4,020.98)
Total: (2,640,013.86)
As at December 31, 2016, the net unrealised depreciation on forward foreign exchange contracts amounted to EUR 2,640,013.86. The counterparties of the contracts are SOCIETE GENERALE, CITIGROUP GLOBAL MARKETS LTD LONDON, ROYAL BANK OF CANADA, UBS LTD LONDON, MORGAN STANLEY AND CO. INTERNATIONAL PLC, HSBC BANK PLC, CACIB LONDON, STANDARD CHARTERED BANK, BNP PARIBAS, MERRILL LYNCH INTERNATIONAL LIMITED, GOLDMAN SACHS INTERNATIONAL, BANCO SANTANDER CENTRAL HISPANO MADRID and NATIXIS.
BG SICAV – UBS Dynamic Credit High Yield Currency Buy Currency Sell Maturity Unrealised appreciation/
(depreciation) (EUR) EUR 41,886,609.36 USD 45,020,000.00 18/01/17 (994,265.36) EUR 5,308,397.96 GBP 4,520,000.00 18/01/17 42,278.77 EUR 21,470,000.00 USD 22,812,321.58 18/01/17 (258,170.11)
Total: (1,210,156.70)
As at December 31, 2016, the net unrealised depreciation on forward foreign exchange contracts amounted to EUR 1,210,156.70. The counterparties of the contracts are CITIBANK LONDON and UBS LTD LONDON.
BG SICAV – Schroder Convertible Bond Opportunities Currency Buy Currency Sell Maturity Unrealised appreciation/
(depreciation) (EUR) EUR 197,046.26 USD 211,356.94 12/01/17 (4,324.99) EUR 99,017.37 JPY 12,075,000.00 12/01/17 843.63 GBP 117,908.38 EUR 137,967.31 12/01/17 (575.58) EUR 116,025.22 USD 125,000.00 12/01/17 (3,069.40) EUR 115,630.46 USD 125,000.00 12/01/17 (3,464.40) USD 74,238.07 EUR 69,830.45 12/01/17 899.26 EUR 10,084,169.23 JPY 1,224,915,465.00 12/01/17 125,199.94 EUR 789,075.56 HKD 6,474,750.01 12/01/17 (3,115.11) EUR 110,055.56 SEK 1,067,500.00 12/01/17 (1,557.02) EUR 26,144,717.38 USD 27,626,469.24 12/01/17 (176,279.62) EUR 1,153,663.58 GBP 967,837.22 12/01/17 25,908.35 EUR 369,289.51 USD 390,000.00 12/01/17 (2,281.14) EUR 62,121.53 USD 65,631.65 12/01/17 (408.73) EUR 111,277.08 GBP 93,418.51 12/01/17 2,422.79 GBP 119,131.87 EUR 141,905.99 12/01/17 (3,088.59) EUR 118,651.13 GBP 99,609.12 12/01/17 2,583.33 EUR 87,072.84 JPY 10,675,000.00 12/01/17 281.57 EUR 756,139.04 JPY 92,700,000.00 12/01/17 2,457.48 EUR 76,118.21 USD 81,235.94 12/01/17 (1,279.45)
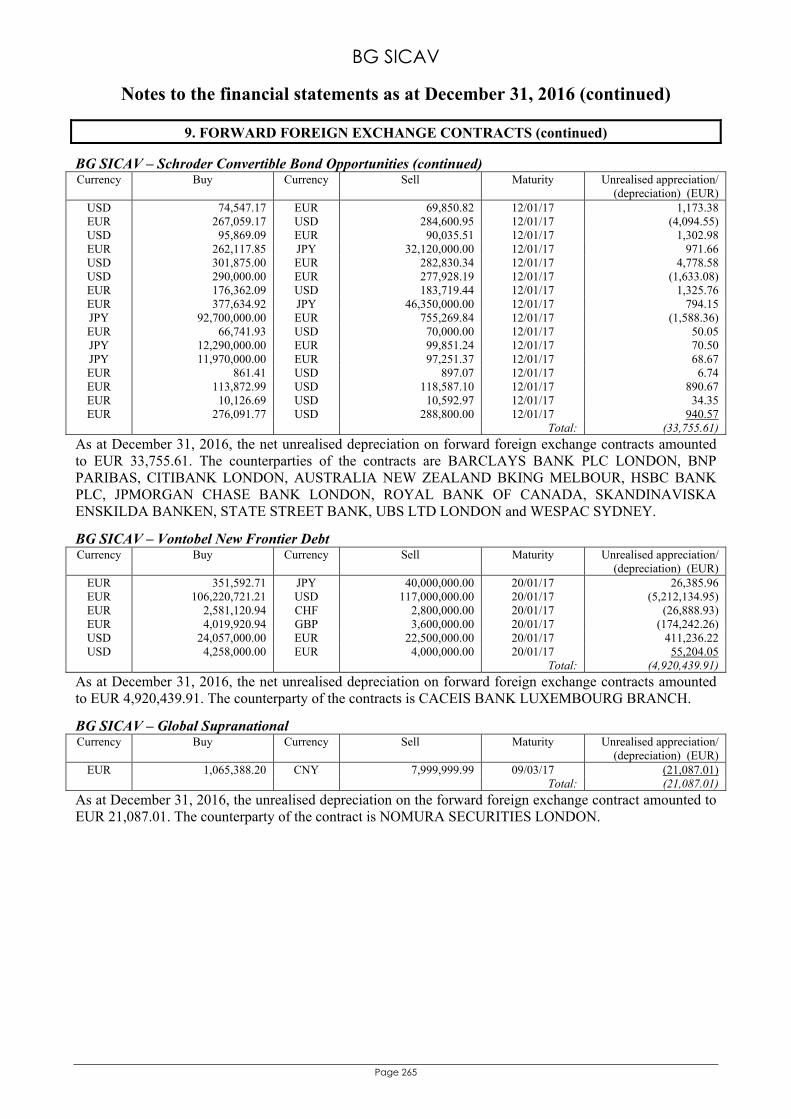
BG SICAV
Notes to the financial statements as at December 31, 2016 (continued)
Page 265
9. FORWARD FOREIGN EXCHANGE CONTRACTS (continued) BG SICAV – Schroder Convertible Bond Opportunities (continued) Currency Buy Currency Sell Maturity Unrealised appreciation/
(depreciation) (EUR) USD 74,547.17 EUR 69,850.82 12/01/17 1,173.38 EUR 267,059.17 USD 284,600.95 12/01/17 (4,094.55) USD 95,869.09 EUR 90,035.51 12/01/17 1,302.98 EUR 262,117.85 JPY 32,120,000.00 12/01/17 971.66 USD 301,875.00 EUR 282,830.34 12/01/17 4,778.58 USD 290,000.00 EUR 277,928.19 12/01/17 (1,633.08) EUR 176,362.09 USD 183,719.44 12/01/17 1,325.76 EUR 377,634.92 JPY 46,350,000.00 12/01/17 794.15 JPY 92,700,000.00 EUR 755,269.84 12/01/17 (1,588.36) EUR 66,741.93 USD 70,000.00 12/01/17 50.05 JPY 12,290,000.00 EUR 99,851.24 12/01/17 70.50 JPY 11,970,000.00 EUR 97,251.37 12/01/17 68.67 EUR 861.41 USD 897.07 12/01/17 6.74 EUR 113,872.99 USD 118,587.10 12/01/17 890.67 EUR 10,126.69 USD 10,592.97 12/01/17 34.35 EUR 276,091.77 USD 288,800.00 12/01/17 940.57
Total: (33,755.61)
As at December 31, 2016, the net unrealised depreciation on forward foreign exchange contracts amounted to EUR 33,755.61. The counterparties of the contracts are BARCLAYS BANK PLC LONDON, BNP PARIBAS, CITIBANK LONDON, AUSTRALIA NEW ZEALAND BKING MELBOUR, HSBC BANK PLC, JPMORGAN CHASE BANK LONDON, ROYAL BANK OF CANADA, SKANDINAVISKA ENSKILDA BANKEN, STATE STREET BANK, UBS LTD LONDON and WESPAC SYDNEY.
BG SICAV – Vontobel New Frontier Debt Currency Buy Currency Sell Maturity Unrealised appreciation/
(depreciation) (EUR) EUR 351,592.71 JPY 40,000,000.00 20/01/17 26,385.96 EUR 106,220,721.21 USD 117,000,000.00 20/01/17 (5,212,134.95) EUR 2,581,120.94 CHF 2,800,000.00 20/01/17 (26,888.93) EUR 4,019,920.94 GBP 3,600,000.00 20/01/17 (174,242.26) USD 24,057,000.00 EUR 22,500,000.00 20/01/17 411,236.22 USD 4,258,000.00 EUR 4,000,000.00 20/01/17 55,204.05
Total: (4,920,439.91)
As at December 31, 2016, the net unrealised depreciation on forward foreign exchange contracts amounted to EUR 4,920,439.91. The counterparty of the contracts is CACEIS BANK LUXEMBOURG BRANCH.
BG SICAV – Global Supranational Currency Buy Currency Sell Maturity Unrealised appreciation/
(depreciation) (EUR) EUR 1,065,388.20 CNY 7,999,999.99 09/03/17 (21,087.01)
Total: (21,087.01)
As at December 31, 2016, the unrealised depreciation on the forward foreign exchange contract amounted to EUR 21,087.01. The counterparty of the contract is NOMURA SECURITIES LONDON.
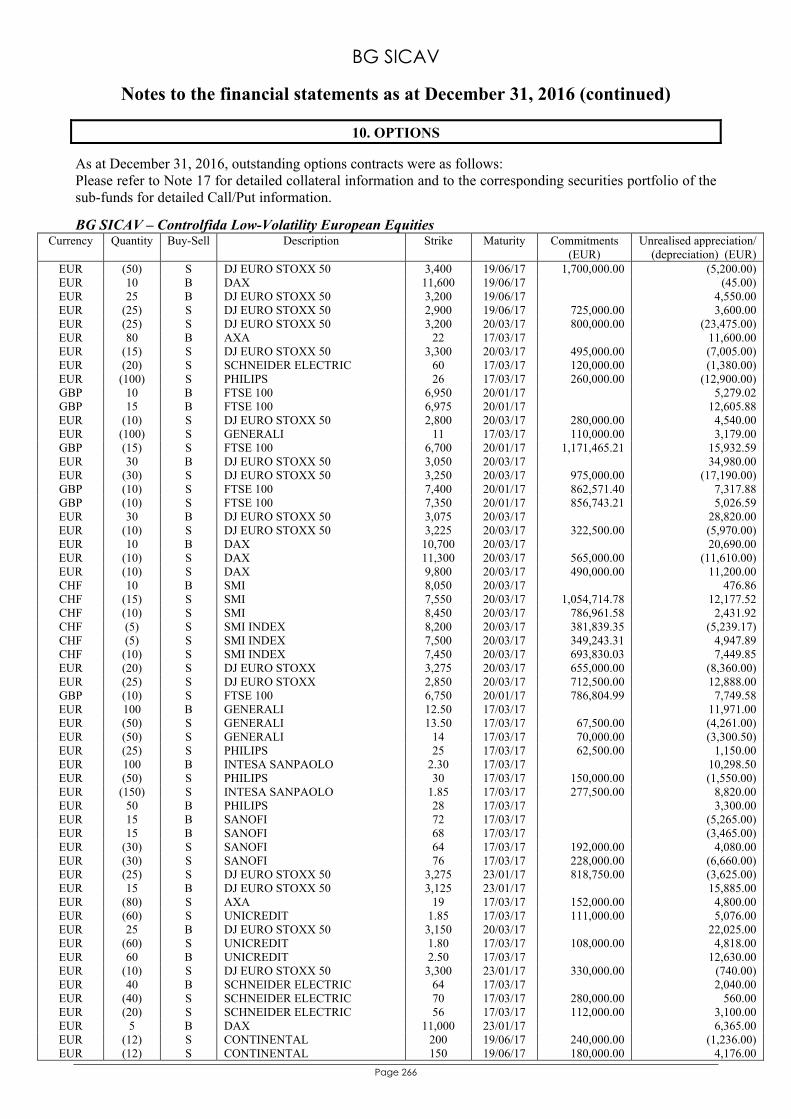
BG SICAV
Notes to the financial statements as at December 31, 2016 (continued)
Page 266
10. OPTIONS As at December 31, 2016, outstanding options contracts were as follows: Please refer to Note 17 for detailed collateral information and to the corresponding securities portfolio of the sub-funds for detailed Call/Put information.
BG SICAV – Controlfida Low-Volatility European Equities Currency Quantity Buy-Sell Description Strike Maturity Commitments
(EUR) Unrealised appreciation/
(depreciation) (EUR) EUR (50) S DJ EURO STOXX 50 3,400 19/06/17 1,700,000.00 (5,200.00) EUR 10 B DAX 11,600 19/06/17 (45.00) EUR 25 B DJ EURO STOXX 50 3,200 19/06/17 4,550.00 EUR (25) S DJ EURO STOXX 50 2,900 19/06/17 725,000.00 3,600.00 EUR (25) S DJ EURO STOXX 50 3,200 20/03/17 800,000.00 (23,475.00) EUR 80 B AXA 22 17/03/17 11,600.00 EUR (15) S DJ EURO STOXX 50 3,300 20/03/17 495,000.00 (7,005.00) EUR (20) S SCHNEIDER ELECTRIC 60 17/03/17 120,000.00 (1,380.00) EUR (100) S PHILIPS 26 17/03/17 260,000.00 (12,900.00) GBP 10 B FTSE 100 6,950 20/01/17 5,279.02 GBP 15 B FTSE 100 6,975 20/01/17 12,605.88 EUR (10) S DJ EURO STOXX 50 2,800 20/03/17 280,000.00 4,540.00 EUR (100) S GENERALI 11 17/03/17 110,000.00 3,179.00 GBP (15) S FTSE 100 6,700 20/01/17 1,171,465.21 15,932.59 EUR 30 B DJ EURO STOXX 50 3,050 20/03/17 34,980.00 EUR (30) S DJ EURO STOXX 50 3,250 20/03/17 975,000.00 (17,190.00) GBP (10) S FTSE 100 7,400 20/01/17 862,571.40 7,317.88 GBP (10) S FTSE 100 7,350 20/01/17 856,743.21 5,026.59 EUR 30 B DJ EURO STOXX 50 3,075 20/03/17 28,820.00 EUR (10) S DJ EURO STOXX 50 3,225 20/03/17 322,500.00 (5,970.00) EUR 10 B DAX 10,700 20/03/17 20,690.00 EUR (10) S DAX 11,300 20/03/17 565,000.00 (11,610.00) EUR (10) S DAX 9,800 20/03/17 490,000.00 11,200.00 CHF 10 B SMI 8,050 20/03/17 476.86 CHF (15) S SMI 7,550 20/03/17 1,054,714.78 12,177.52 CHF (10) S SMI 8,450 20/03/17 786,961.58 2,431.92 CHF (5) S SMI INDEX 8,200 20/03/17 381,839.35 (5,239.17) CHF (5) S SMI INDEX 7,500 20/03/17 349,243.31 4,947.89 CHF (10) S SMI INDEX 7,450 20/03/17 693,830.03 7,449.85 EUR (20) S DJ EURO STOXX 3,275 20/03/17 655,000.00 (8,360.00) EUR (25) S DJ EURO STOXX 2,850 20/03/17 712,500.00 12,888.00 GBP (10) S FTSE 100 6,750 20/01/17 786,804.99 7,749.58 EUR 100 B GENERALI 12.50 17/03/17 11,971.00 EUR (50) S GENERALI 13.50 17/03/17 67,500.00 (4,261.00) EUR (50) S GENERALI 14 17/03/17 70,000.00 (3,300.50) EUR (25) S PHILIPS 25 17/03/17 62,500.00 1,150.00 EUR 100 B INTESA SANPAOLO 2.30 17/03/17 10,298.50 EUR (50) S PHILIPS 30 17/03/17 150,000.00 (1,550.00) EUR (150) S INTESA SANPAOLO 1.85 17/03/17 277,500.00 8,820.00 EUR 50 B PHILIPS 28 17/03/17 3,300.00 EUR 15 B SANOFI 72 17/03/17 (5,265.00) EUR 15 B SANOFI 68 17/03/17 (3,465.00) EUR (30) S SANOFI 64 17/03/17 192,000.00 4,080.00 EUR (30) S SANOFI 76 17/03/17 228,000.00 (6,660.00) EUR (25) S DJ EURO STOXX 50 3,275 23/01/17 818,750.00 (3,625.00) EUR 15 B DJ EURO STOXX 50 3,125 23/01/17 15,885.00 EUR (80) S AXA 19 17/03/17 152,000.00 4,800.00 EUR (60) S UNICREDIT 1.85 17/03/17 111,000.00 5,076.00 EUR 25 B DJ EURO STOXX 50 3,150 20/03/17 22,025.00 EUR (60) S UNICREDIT 1.80 17/03/17 108,000.00 4,818.00 EUR 60 B UNICREDIT 2.50 17/03/17 12,630.00 EUR (10) S DJ EURO STOXX 50 3,300 23/01/17 330,000.00 (740.00) EUR 40 B SCHNEIDER ELECTRIC 64 17/03/17 2,040.00 EUR (40) S SCHNEIDER ELECTRIC 70 17/03/17 280,000.00 560.00 EUR (20) S SCHNEIDER ELECTRIC 56 17/03/17 112,000.00 3,100.00 EUR 5 B DAX 11,000 23/01/17 6,365.00 EUR (12) S CONTINENTAL 200 19/06/17 240,000.00 (1,236.00) EUR (12) S CONTINENTAL 150 19/06/17 180,000.00 4,176.00
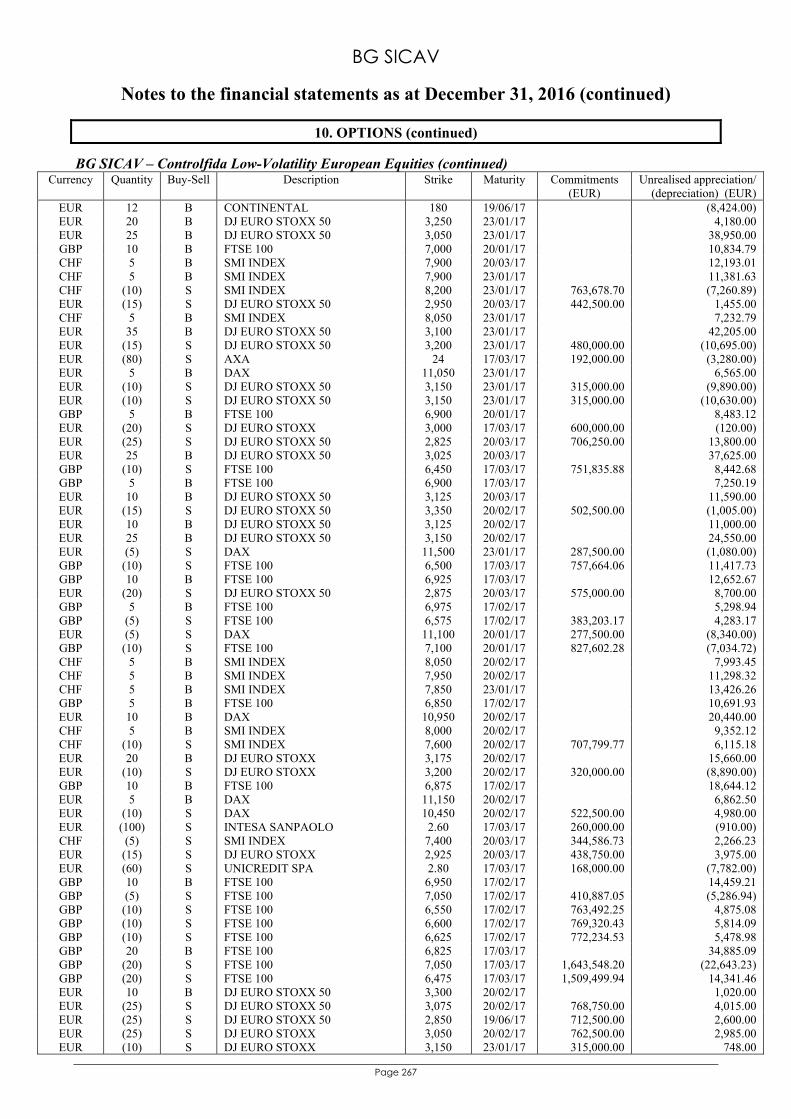
BG SICAV
Notes to the financial statements as at December 31, 2016 (continued)
Page 267
10. OPTIONS (continued)
BG SICAV – Controlfida Low-Volatility European Equities (continued) Currency Quantity Buy-Sell Description Strike Maturity Commitments
(EUR) Unrealised appreciation/
(depreciation) (EUR) EUR 12 B CONTINENTAL 180 19/06/17 (8,424.00) EUR 20 B DJ EURO STOXX 50 3,250 23/01/17 4,180.00 EUR 25 B DJ EURO STOXX 50 3,050 23/01/17 38,950.00 GBP 10 B FTSE 100 7,000 20/01/17 10,834.79 CHF 5 B SMI INDEX 7,900 20/03/17 12,193.01 CHF 5 B SMI INDEX 7,900 23/01/17 11,381.63 CHF (10) S SMI INDEX 8,200 23/01/17 763,678.70 (7,260.89) EUR (15) S DJ EURO STOXX 50 2,950 20/03/17 442,500.00 1,455.00 CHF 5 B SMI INDEX 8,050 23/01/17 7,232.79 EUR 35 B DJ EURO STOXX 50 3,100 23/01/17 42,205.00 EUR (15) S DJ EURO STOXX 50 3,200 23/01/17 480,000.00 (10,695.00) EUR (80) S AXA 24 17/03/17 192,000.00 (3,280.00) EUR 5 B DAX 11,050 23/01/17 6,565.00 EUR (10) S DJ EURO STOXX 50 3,150 23/01/17 315,000.00 (9,890.00) EUR (10) S DJ EURO STOXX 50 3,150 23/01/17 315,000.00 (10,630.00) GBP 5 B FTSE 100 6,900 20/01/17 8,483.12 EUR (20) S DJ EURO STOXX 3,000 17/03/17 600,000.00 (120.00) EUR (25) S DJ EURO STOXX 50 2,825 20/03/17 706,250.00 13,800.00 EUR 25 B DJ EURO STOXX 50 3,025 20/03/17 37,625.00 GBP (10) S FTSE 100 6,450 17/03/17 751,835.88 8,442.68 GBP 5 B FTSE 100 6,900 17/03/17 7,250.19 EUR 10 B DJ EURO STOXX 50 3,125 20/03/17 11,590.00 EUR (15) S DJ EURO STOXX 50 3,350 20/02/17 502,500.00 (1,005.00) EUR 10 B DJ EURO STOXX 50 3,125 20/02/17 11,000.00 EUR 25 B DJ EURO STOXX 50 3,150 20/02/17 24,550.00 EUR (5) S DAX 11,500 23/01/17 287,500.00 (1,080.00) GBP (10) S FTSE 100 6,500 17/03/17 757,664.06 11,417.73 GBP 10 B FTSE 100 6,925 17/03/17 12,652.67 EUR (20) S DJ EURO STOXX 50 2,875 20/03/17 575,000.00 8,700.00 GBP 5 B FTSE 100 6,975 17/02/17 5,298.94 GBP (5) S FTSE 100 6,575 17/02/17 383,203.17 4,283.17 EUR (5) S DAX 11,100 20/01/17 277,500.00 (8,340.00) GBP (10) S FTSE 100 7,100 20/01/17 827,602.28 (7,034.72) CHF 5 B SMI INDEX 8,050 20/02/17 7,993.45 CHF 5 B SMI INDEX 7,950 20/02/17 11,298.32 CHF 5 B SMI INDEX 7,850 23/01/17 13,426.26 GBP 5 B FTSE 100 6,850 17/02/17 10,691.93 EUR 10 B DAX 10,950 20/02/17 20,440.00 CHF 5 B SMI INDEX 8,000 20/02/17 9,352.12 CHF (10) S SMI INDEX 7,600 20/02/17 707,799.77 6,115.18 EUR 20 B DJ EURO STOXX 3,175 20/02/17 15,660.00 EUR (10) S DJ EURO STOXX 3,200 20/02/17 320,000.00 (8,890.00) GBP 10 B FTSE 100 6,875 17/02/17 18,644.12 EUR 5 B DAX 11,150 20/02/17 6,862.50 EUR (10) S DAX 10,450 20/02/17 522,500.00 4,980.00 EUR (100) S INTESA SANPAOLO 2.60 17/03/17 260,000.00 (910.00) CHF (5) S SMI INDEX 7,400 20/03/17 344,586.73 2,266.23 EUR (15) S DJ EURO STOXX 2,925 20/03/17 438,750.00 3,975.00 EUR (60) S UNICREDIT SPA 2.80 17/03/17 168,000.00 (7,782.00) GBP 10 B FTSE 100 6,950 17/02/17 14,459.21 GBP (5) S FTSE 100 7,050 17/02/17 410,887.05 (5,286.94) GBP (10) S FTSE 100 6,550 17/02/17 763,492.25 4,875.08 GBP (10) S FTSE 100 6,600 17/02/17 769,320.43 5,814.09 GBP (10) S FTSE 100 6,625 17/02/17 772,234.53 5,478.98 GBP 20 B FTSE 100 6,825 17/03/17 34,885.09 GBP (20) S FTSE 100 7,050 17/03/17 1,643,548.20 (22,643.23) GBP (20) S FTSE 100 6,475 17/03/17 1,509,499.94 14,341.46 EUR 10 B DJ EURO STOXX 50 3,300 20/02/17 1,020.00 EUR (25) S DJ EURO STOXX 50 3,075 20/02/17 768,750.00 4,015.00 EUR (25) S DJ EURO STOXX 50 2,850 19/06/17 712,500.00 2,600.00 EUR (25) S DJ EURO STOXX 3,050 20/02/17 762,500.00 2,985.00 EUR (10) S DJ EURO STOXX 3,150 23/01/17 315,000.00 748.00
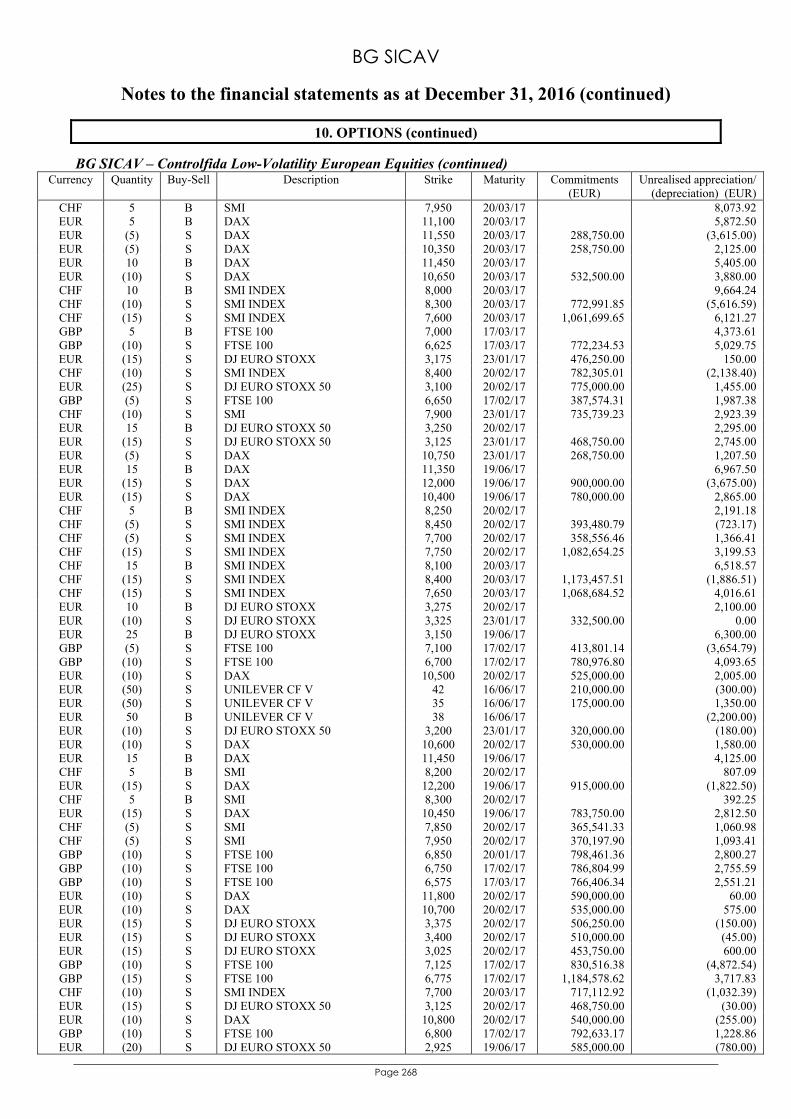
BG SICAV
Notes to the financial statements as at December 31, 2016 (continued)
Page 268
10. OPTIONS (continued)
BG SICAV – Controlfida Low-Volatility European Equities (continued) Currency Quantity Buy-Sell Description Strike Maturity Commitments
(EUR) Unrealised appreciation/
(depreciation) (EUR) CHF 5 B SMI 7,950 20/03/17 8,073.92 EUR 5 B DAX 11,100 20/03/17 5,872.50 EUR (5) S DAX 11,550 20/03/17 288,750.00 (3,615.00) EUR (5) S DAX 10,350 20/03/17 258,750.00 2,125.00 EUR 10 B DAX 11,450 20/03/17 5,405.00 EUR (10) S DAX 10,650 20/03/17 532,500.00 3,880.00 CHF 10 B SMI INDEX 8,000 20/03/17 9,664.24 CHF (10) S SMI INDEX 8,300 20/03/17 772,991.85 (5,616.59) CHF (15) S SMI INDEX 7,600 20/03/17 1,061,699.65 6,121.27 GBP 5 B FTSE 100 7,000 17/03/17 4,373.61 GBP (10) S FTSE 100 6,625 17/03/17 772,234.53 5,029.75 EUR (15) S DJ EURO STOXX 3,175 23/01/17 476,250.00 150.00 CHF (10) S SMI INDEX 8,400 20/02/17 782,305.01 (2,138.40) EUR (25) S DJ EURO STOXX 50 3,100 20/02/17 775,000.00 1,455.00 GBP (5) S FTSE 100 6,650 17/02/17 387,574.31 1,987.38 CHF (10) S SMI 7,900 23/01/17 735,739.23 2,923.39 EUR 15 B DJ EURO STOXX 50 3,250 20/02/17 2,295.00 EUR (15) S DJ EURO STOXX 50 3,125 23/01/17 468,750.00 2,745.00 EUR (5) S DAX 10,750 23/01/17 268,750.00 1,207.50 EUR 15 B DAX 11,350 19/06/17 6,967.50 EUR (15) S DAX 12,000 19/06/17 900,000.00 (3,675.00) EUR (15) S DAX 10,400 19/06/17 780,000.00 2,865.00 CHF 5 B SMI INDEX 8,250 20/02/17 2,191.18 CHF (5) S SMI INDEX 8,450 20/02/17 393,480.79 (723.17) CHF (5) S SMI INDEX 7,700 20/02/17 358,556.46 1,366.41 CHF (15) S SMI INDEX 7,750 20/02/17 1,082,654.25 3,199.53 CHF 15 B SMI INDEX 8,100 20/03/17 6,518.57 CHF (15) S SMI INDEX 8,400 20/03/17 1,173,457.51 (1,886.51) CHF (15) S SMI INDEX 7,650 20/03/17 1,068,684.52 4,016.61 EUR 10 B DJ EURO STOXX 3,275 20/02/17 2,100.00 EUR (10) S DJ EURO STOXX 3,325 23/01/17 332,500.00 0.00 EUR 25 B DJ EURO STOXX 3,150 19/06/17 6,300.00 GBP (5) S FTSE 100 7,100 17/02/17 413,801.14 (3,654.79) GBP (10) S FTSE 100 6,700 17/02/17 780,976.80 4,093.65 EUR (10) S DAX 10,500 20/02/17 525,000.00 2,005.00 EUR (50) S UNILEVER CF V 42 16/06/17 210,000.00 (300.00) EUR (50) S UNILEVER CF V 35 16/06/17 175,000.00 1,350.00 EUR 50 B UNILEVER CF V 38 16/06/17 (2,200.00) EUR (10) S DJ EURO STOXX 50 3,200 23/01/17 320,000.00 (180.00) EUR (10) S DAX 10,600 20/02/17 530,000.00 1,580.00 EUR 15 B DAX 11,450 19/06/17 4,125.00 CHF 5 B SMI 8,200 20/02/17 807.09 EUR (15) S DAX 12,200 19/06/17 915,000.00 (1,822.50) CHF 5 B SMI 8,300 20/02/17 392.25 EUR (15) S DAX 10,450 19/06/17 783,750.00 2,812.50 CHF (5) S SMI 7,850 20/02/17 365,541.33 1,060.98 CHF (5) S SMI 7,950 20/02/17 370,197.90 1,093.41 GBP (10) S FTSE 100 6,850 20/01/17 798,461.36 2,800.27 GBP (10) S FTSE 100 6,750 17/02/17 786,804.99 2,755.59 GBP (10) S FTSE 100 6,575 17/03/17 766,406.34 2,551.21 EUR (10) S DAX 11,800 20/02/17 590,000.00 60.00 EUR (10) S DAX 10,700 20/02/17 535,000.00 575.00 EUR (15) S DJ EURO STOXX 3,375 20/02/17 506,250.00 (150.00) EUR (15) S DJ EURO STOXX 3,400 20/02/17 510,000.00 (45.00) EUR (15) S DJ EURO STOXX 3,025 20/02/17 453,750.00 600.00 GBP (10) S FTSE 100 7,125 17/02/17 830,516.38 (4,872.54) GBP (15) S FTSE 100 6,775 17/02/17 1,184,578.62 3,717.83 CHF (10) S SMI INDEX 7,700 20/03/17 717,112.92 (1,032.39) EUR (15) S DJ EURO STOXX 50 3,125 20/02/17 468,750.00 (30.00) EUR (10) S DAX 10,800 20/02/17 540,000.00 (255.00) GBP (10) S FTSE 100 6,800 17/02/17 792,633.17 1,228.86 EUR (20) S DJ EURO STOXX 50 2,925 19/06/17 585,000.00 (780.00)
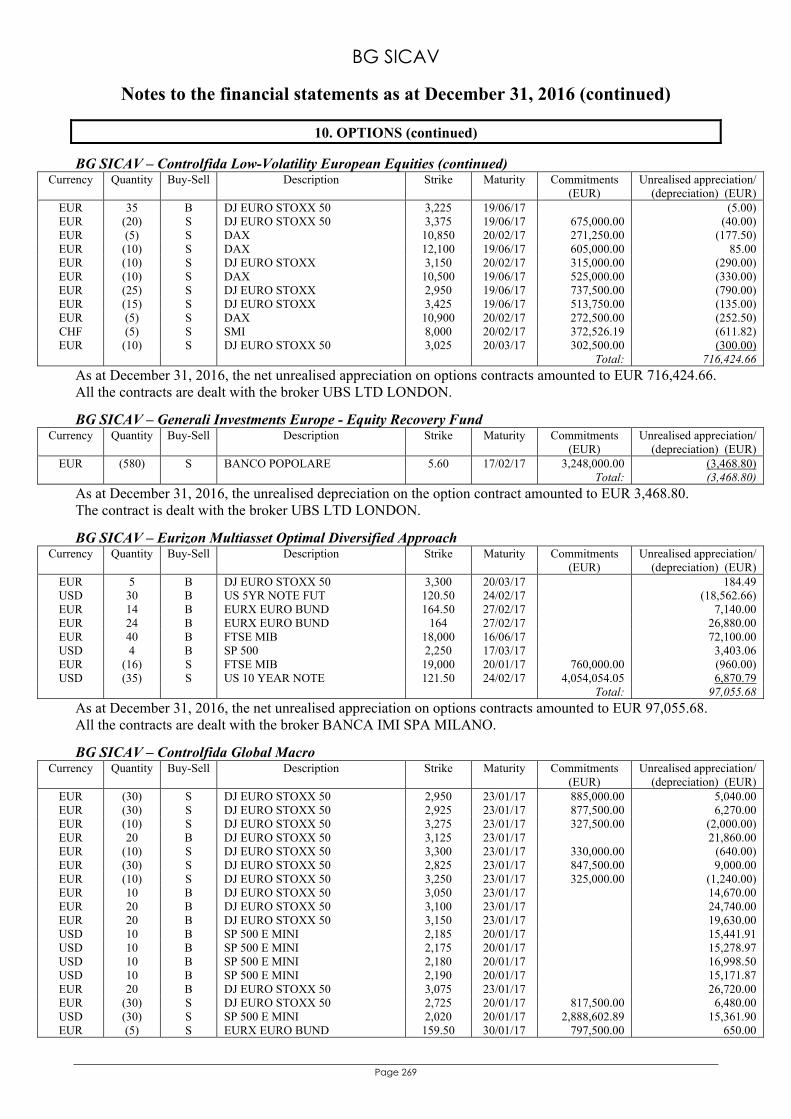
BG SICAV
Notes to the financial statements as at December 31, 2016 (continued)
Page 269
10. OPTIONS (continued)
BG SICAV – Controlfida Low-Volatility European Equities (continued) Currency Quantity Buy-Sell Description Strike Maturity Commitments
(EUR) Unrealised appreciation/
(depreciation) (EUR) EUR 35 B DJ EURO STOXX 50 3,225 19/06/17 (5.00) EUR (20) S DJ EURO STOXX 50 3,375 19/06/17 675,000.00 (40.00) EUR (5) S DAX 10,850 20/02/17 271,250.00 (177.50) EUR (10) S DAX 12,100 19/06/17 605,000.00 85.00 EUR (10) S DJ EURO STOXX 3,150 20/02/17 315,000.00 (290.00) EUR (10) S DAX 10,500 19/06/17 525,000.00 (330.00) EUR (25) S DJ EURO STOXX 2,950 19/06/17 737,500.00 (790.00) EUR (15) S DJ EURO STOXX 3,425 19/06/17 513,750.00 (135.00) EUR (5) S DAX 10,900 20/02/17 272,500.00 (252.50) CHF (5) S SMI 8,000 20/02/17 372,526.19 (611.82) EUR (10) S DJ EURO STOXX 50 3,025 20/03/17 302,500.00 (300.00)
Total: 716,424.66
As at December 31, 2016, the net unrealised appreciation on options contracts amounted to EUR 716,424.66. All the contracts are dealt with the broker UBS LTD LONDON.
BG SICAV – Generali Investments Europe - Equity Recovery Fund Currency Quantity Buy-Sell Description Strike Maturity Commitments
(EUR) Unrealised appreciation/
(depreciation) (EUR) EUR (580) S BANCO POPOLARE 5.60 17/02/17 3,248,000.00 (3,468.80)
Total: (3,468.80)
As at December 31, 2016, the unrealised depreciation on the option contract amounted to EUR 3,468.80. The contract is dealt with the broker UBS LTD LONDON.
BG SICAV – Eurizon Multiasset Optimal Diversified Approach Currency Quantity Buy-Sell Description Strike Maturity Commitments
(EUR) Unrealised appreciation/
(depreciation) (EUR) EUR 5 B DJ EURO STOXX 50 3,300 20/03/17 184.49 USD 30 B US 5YR NOTE FUT 120.50 24/02/17 (18,562.66) EUR 14 B EURX EURO BUND 164.50 27/02/17 7,140.00 EUR 24 B EURX EURO BUND 164 27/02/17 26,880.00 EUR 40 B FTSE MIB 18,000 16/06/17 72,100.00 USD 4 B SP 500 2,250 17/03/17 3,403.06 EUR (16) S FTSE MIB 19,000 20/01/17 760,000.00 (960.00) USD (35) S US 10 YEAR NOTE 121.50 24/02/17 4,054,054.05 6,870.79
Total: 97,055.68
As at December 31, 2016, the net unrealised appreciation on options contracts amounted to EUR 97,055.68. All the contracts are dealt with the broker BANCA IMI SPA MILANO.
BG SICAV – Controlfida Global Macro Currency Quantity Buy-Sell Description Strike Maturity Commitments
(EUR) Unrealised appreciation/
(depreciation) (EUR) EUR (30) S DJ EURO STOXX 50 2,950 23/01/17 885,000.00 5,040.00 EUR (30) S DJ EURO STOXX 50 2,925 23/01/17 877,500.00 6,270.00 EUR (10) S DJ EURO STOXX 50 3,275 23/01/17 327,500.00 (2,000.00) EUR 20 B DJ EURO STOXX 50 3,125 23/01/17 21,860.00 EUR (10) S DJ EURO STOXX 50 3,300 23/01/17 330,000.00 (640.00) EUR (30) S DJ EURO STOXX 50 2,825 23/01/17 847,500.00 9,000.00 EUR (10) S DJ EURO STOXX 50 3,250 23/01/17 325,000.00 (1,240.00) EUR 10 B DJ EURO STOXX 50 3,050 23/01/17 14,670.00 EUR 20 B DJ EURO STOXX 50 3,100 23/01/17 24,740.00 EUR 20 B DJ EURO STOXX 50 3,150 23/01/17 19,630.00 USD 10 B SP 500 E MINI 2,185 20/01/17 15,441.91 USD 10 B SP 500 E MINI 2,175 20/01/17 15,278.97 USD 10 B SP 500 E MINI 2,180 20/01/17 16,998.50 USD 10 B SP 500 E MINI 2,190 20/01/17 15,171.87 EUR 20 B DJ EURO STOXX 50 3,075 23/01/17 26,720.00 EUR (30) S DJ EURO STOXX 50 2,725 20/01/17 817,500.00 6,480.00 USD (30) S SP 500 E MINI 2,020 20/01/17 2,888,602.89 15,361.90 EUR (5) S EURX EURO BUND 159.50 30/01/17 797,500.00 650.00
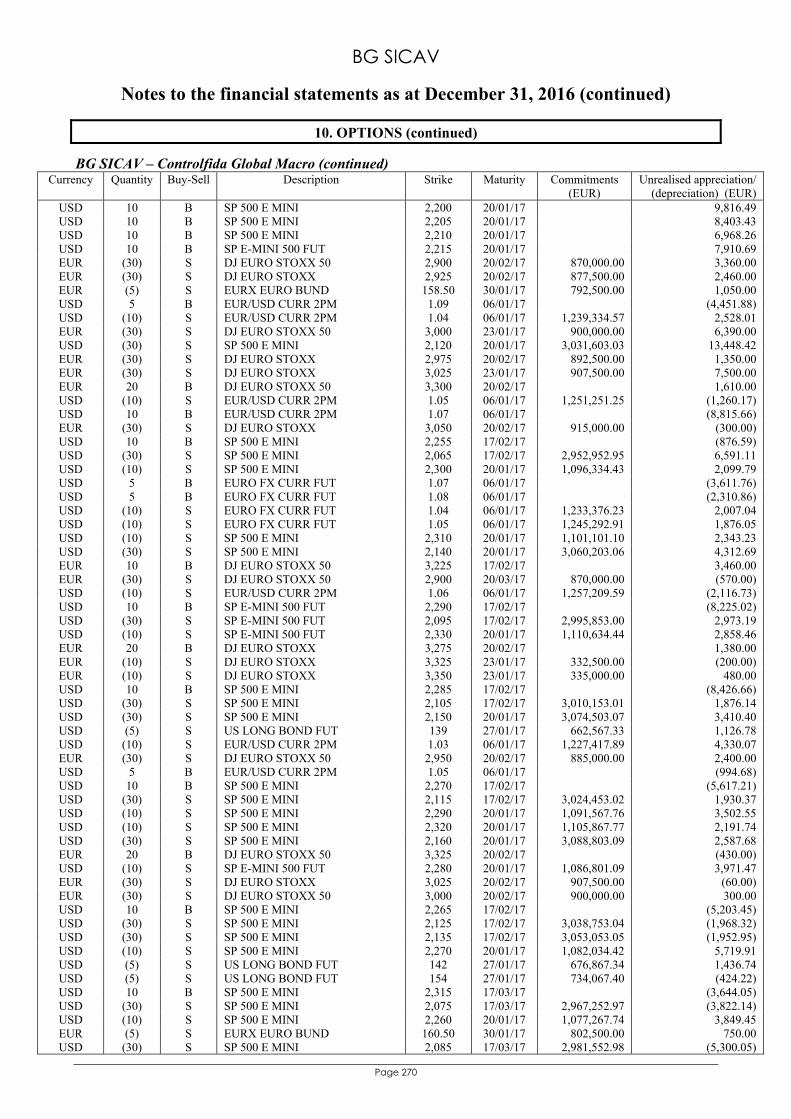
BG SICAV
Notes to the financial statements as at December 31, 2016 (continued)
Page 270
10. OPTIONS (continued)
BG SICAV – Controlfida Global Macro (continued) Currency Quantity Buy-Sell Description Strike Maturity Commitments
(EUR) Unrealised appreciation/
(depreciation) (EUR) USD 10 B SP 500 E MINI 2,200 20/01/17 9,816.49 USD 10 B SP 500 E MINI 2,205 20/01/17 8,403.43 USD 10 B SP 500 E MINI 2,210 20/01/17 6,968.26 USD 10 B SP E-MINI 500 FUT 2,215 20/01/17 7,910.69 EUR (30) S DJ EURO STOXX 50 2,900 20/02/17 870,000.00 3,360.00 EUR (30) S DJ EURO STOXX 2,925 20/02/17 877,500.00 2,460.00 EUR (5) S EURX EURO BUND 158.50 30/01/17 792,500.00 1,050.00 USD 5 B EUR/USD CURR 2PM 1.09 06/01/17 (4,451.88) USD (10) S EUR/USD CURR 2PM 1.04 06/01/17 1,239,334.57 2,528.01 EUR (30) S DJ EURO STOXX 50 3,000 23/01/17 900,000.00 6,390.00 USD (30) S SP 500 E MINI 2,120 20/01/17 3,031,603.03 13,448.42 EUR (30) S DJ EURO STOXX 2,975 20/02/17 892,500.00 1,350.00 EUR (30) S DJ EURO STOXX 3,025 23/01/17 907,500.00 7,500.00 EUR 20 B DJ EURO STOXX 50 3,300 20/02/17 1,610.00 USD (10) S EUR/USD CURR 2PM 1.05 06/01/17 1,251,251.25 (1,260.17) USD 10 B EUR/USD CURR 2PM 1.07 06/01/17 (8,815.66) EUR (30) S DJ EURO STOXX 3,050 20/02/17 915,000.00 (300.00) USD 10 B SP 500 E MINI 2,255 17/02/17 (876.59) USD (30) S SP 500 E MINI 2,065 17/02/17 2,952,952.95 6,591.11 USD (10) S SP 500 E MINI 2,300 20/01/17 1,096,334.43 2,099.79 USD 5 B EURO FX CURR FUT 1.07 06/01/17 (3,611.76) USD 5 B EURO FX CURR FUT 1.08 06/01/17 (2,310.86) USD (10) S EURO FX CURR FUT 1.04 06/01/17 1,233,376.23 2,007.04 USD (10) S EURO FX CURR FUT 1.05 06/01/17 1,245,292.91 1,876.05 USD (10) S SP 500 E MINI 2,310 20/01/17 1,101,101.10 2,343.23 USD (30) S SP 500 E MINI 2,140 20/01/17 3,060,203.06 4,312.69 EUR 10 B DJ EURO STOXX 50 3,225 17/02/17 3,460.00 EUR (30) S DJ EURO STOXX 50 2,900 20/03/17 870,000.00 (570.00) USD (10) S EUR/USD CURR 2PM 1.06 06/01/17 1,257,209.59 (2,116.73) USD 10 B SP E-MINI 500 FUT 2,290 17/02/17 (8,225.02) USD (30) S SP E-MINI 500 FUT 2,095 17/02/17 2,995,853.00 2,973.19 USD (10) S SP E-MINI 500 FUT 2,330 20/01/17 1,110,634.44 2,858.46 EUR 20 B DJ EURO STOXX 3,275 20/02/17 1,380.00 EUR (10) S DJ EURO STOXX 3,325 23/01/17 332,500.00 (200.00) EUR (10) S DJ EURO STOXX 3,350 23/01/17 335,000.00 480.00 USD 10 B SP 500 E MINI 2,285 17/02/17 (8,426.66) USD (30) S SP 500 E MINI 2,105 17/02/17 3,010,153.01 1,876.14 USD (30) S SP 500 E MINI 2,150 20/01/17 3,074,503.07 3,410.40 USD (5) S US LONG BOND FUT 139 27/01/17 662,567.33 1,126.78 USD (10) S EUR/USD CURR 2PM 1.03 06/01/17 1,227,417.89 4,330.07 EUR (30) S DJ EURO STOXX 50 2,950 20/02/17 885,000.00 2,400.00 USD 5 B EUR/USD CURR 2PM 1.05 06/01/17 (994.68) USD 10 B SP 500 E MINI 2,270 17/02/17 (5,617.21) USD (30) S SP 500 E MINI 2,115 17/02/17 3,024,453.02 1,930.37 USD (10) S SP 500 E MINI 2,290 20/01/17 1,091,567.76 3,502.55 USD (10) S SP 500 E MINI 2,320 20/01/17 1,105,867.77 2,191.74 USD (30) S SP 500 E MINI 2,160 20/01/17 3,088,803.09 2,587.68 EUR 20 B DJ EURO STOXX 50 3,325 20/02/17 (430.00) USD (10) S SP E-MINI 500 FUT 2,280 20/01/17 1,086,801.09 3,971.47 EUR (30) S DJ EURO STOXX 3,025 20/02/17 907,500.00 (60.00) EUR (30) S DJ EURO STOXX 50 3,000 20/02/17 900,000.00 300.00 USD 10 B SP 500 E MINI 2,265 17/02/17 (5,203.45) USD (30) S SP 500 E MINI 2,125 17/02/17 3,038,753.04 (1,968.32) USD (30) S SP 500 E MINI 2,135 17/02/17 3,053,053.05 (1,952.95) USD (10) S SP 500 E MINI 2,270 20/01/17 1,082,034.42 5,719.91 USD (5) S US LONG BOND FUT 142 27/01/17 676,867.34 1,436.74 USD (5) S US LONG BOND FUT 154 27/01/17 734,067.40 (424.22) USD 10 B SP 500 E MINI 2,315 17/03/17 (3,644.05) USD (30) S SP 500 E MINI 2,075 17/03/17 2,967,252.97 (3,822.14) USD (10) S SP 500 E MINI 2,260 20/01/17 1,077,267.74 3,849.45 EUR (5) S EURX EURO BUND 160.50 30/01/17 802,500.00 750.00 USD (30) S SP 500 E MINI 2,085 17/03/17 2,981,552.98 (5,300.05)
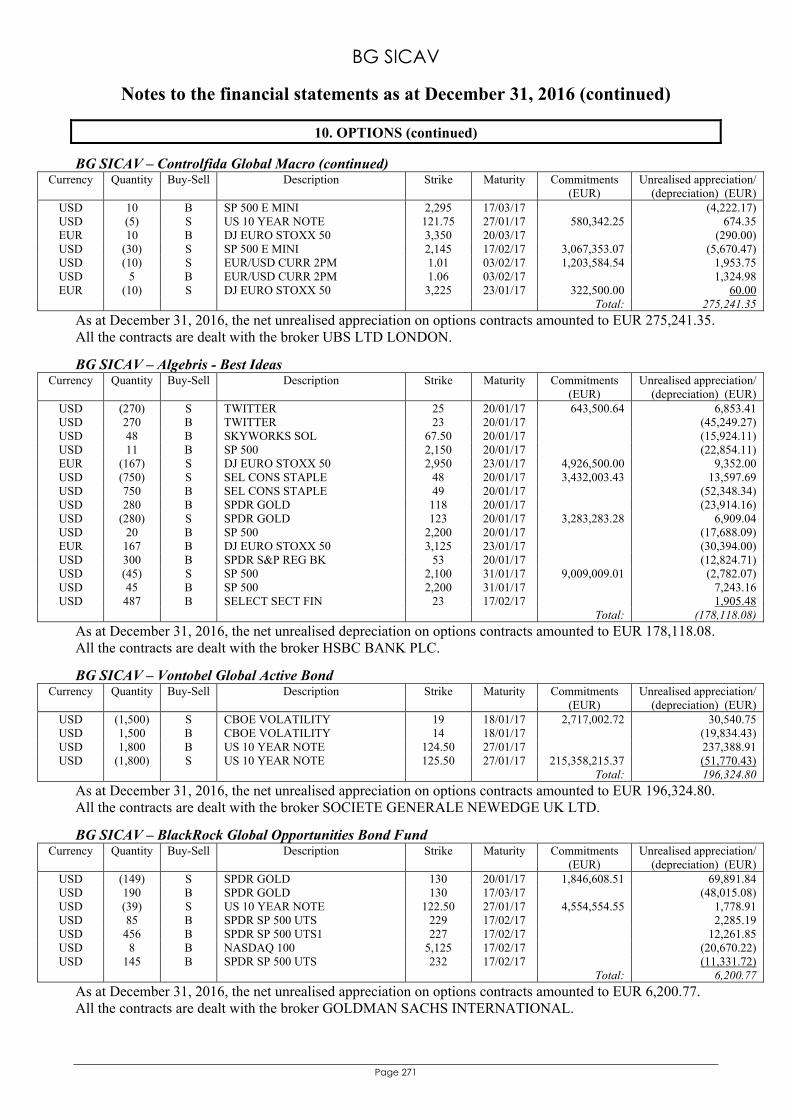
BG SICAV
Notes to the financial statements as at December 31, 2016 (continued)
Page 271
10. OPTIONS (continued)
BG SICAV – Controlfida Global Macro (continued) Currency Quantity Buy-Sell Description Strike Maturity Commitments
(EUR) Unrealised appreciation/
(depreciation) (EUR) USD 10 B SP 500 E MINI 2,295 17/03/17 (4,222.17) USD (5) S US 10 YEAR NOTE 121.75 27/01/17 580,342.25 674.35 EUR 10 B DJ EURO STOXX 50 3,350 20/03/17 (290.00) USD (30) S SP 500 E MINI 2,145 17/02/17 3,067,353.07 (5,670.47) USD (10) S EUR/USD CURR 2PM 1.01 03/02/17 1,203,584.54 1,953.75 USD 5 B EUR/USD CURR 2PM 1.06 03/02/17 1,324.98 EUR (10) S DJ EURO STOXX 50 3,225 23/01/17 322,500.00 60.00
Total: 275,241.35
As at December 31, 2016, the net unrealised appreciation on options contracts amounted to EUR 275,241.35. All the contracts are dealt with the broker UBS LTD LONDON.
BG SICAV – Algebris - Best Ideas Currency Quantity Buy-Sell Description Strike Maturity Commitments
(EUR) Unrealised appreciation/
(depreciation) (EUR) USD (270) S TWITTER 25 20/01/17 643,500.64 6,853.41 USD 270 B TWITTER 23 20/01/17 (45,249.27) USD 48 B SKYWORKS SOL 67.50 20/01/17 (15,924.11) USD 11 B SP 500 2,150 20/01/17 (22,854.11) EUR (167) S DJ EURO STOXX 50 2,950 23/01/17 4,926,500.00 9,352.00 USD (750) S SEL CONS STAPLE 48 20/01/17 3,432,003.43 13,597.69 USD 750 B SEL CONS STAPLE 49 20/01/17 (52,348.34) USD 280 B SPDR GOLD 118 20/01/17 (23,914.16) USD (280) S SPDR GOLD 123 20/01/17 3,283,283.28 6,909.04 USD 20 B SP 500 2,200 20/01/17 (17,688.09) EUR 167 B DJ EURO STOXX 50 3,125 23/01/17 (30,394.00) USD 300 B SPDR S&P REG BK 53 20/01/17 (12,824.71) USD (45) S SP 500 2,100 31/01/17 9,009,009.01 (2,782.07) USD 45 B SP 500 2,200 31/01/17 7,243.16 USD 487 B SELECT SECT FIN 23 17/02/17 1,905.48
Total: (178,118.08)
As at December 31, 2016, the net unrealised depreciation on options contracts amounted to EUR 178,118.08. All the contracts are dealt with the broker HSBC BANK PLC.
BG SICAV – Vontobel Global Active Bond Currency Quantity Buy-Sell Description Strike Maturity Commitments
(EUR) Unrealised appreciation/
(depreciation) (EUR) USD (1,500) S CBOE VOLATILITY 19 18/01/17 2,717,002.72 30,540.75 USD 1,500 B CBOE VOLATILITY 14 18/01/17 (19,834.43) USD 1,800 B US 10 YEAR NOTE 124.50 27/01/17 237,388.91 USD (1,800) S US 10 YEAR NOTE 125.50 27/01/17 215,358,215.37 (51,770.43)
Total: 196,324.80
As at December 31, 2016, the net unrealised appreciation on options contracts amounted to EUR 196,324.80. All the contracts are dealt with the broker SOCIETE GENERALE NEWEDGE UK LTD.
BG SICAV – BlackRock Global Opportunities Bond Fund Currency Quantity Buy-Sell Description Strike Maturity Commitments
(EUR) Unrealised appreciation/
(depreciation) (EUR) USD (149) S SPDR GOLD 130 20/01/17 1,846,608.51 69,891.84 USD 190 B SPDR GOLD 130 17/03/17 (48,015.08) USD (39) S US 10 YEAR NOTE 122.50 27/01/17 4,554,554.55 1,778.91 USD 85 B SPDR SP 500 UTS 229 17/02/17 2,285.19 USD 456 B SPDR SP 500 UTS1 227 17/02/17 12,261.85 USD 8 B NASDAQ 100 5,125 17/02/17 (20,670.22) USD 145 B SPDR SP 500 UTS 232 17/02/17 (11,331.72)
Total: 6,200.77
As at December 31, 2016, the net unrealised appreciation on options contracts amounted to EUR 6,200.77. All the contracts are dealt with the broker GOLDMAN SACHS INTERNATIONAL.
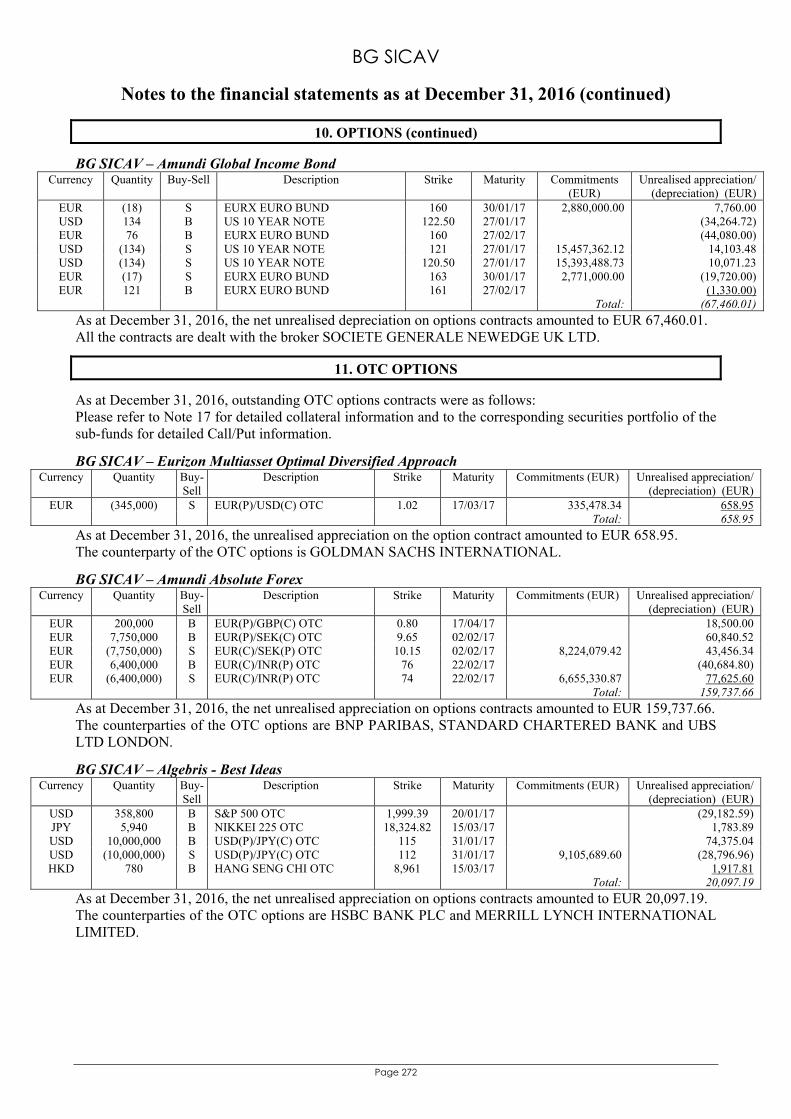
BG SICAV
Notes to the financial statements as at December 31, 2016 (continued)
Page 272
10. OPTIONS (continued)
BG SICAV – Amundi Global Income Bond Currency Quantity Buy-Sell Description Strike Maturity Commitments
(EUR) Unrealised appreciation/
(depreciation) (EUR) EUR (18) S EURX EURO BUND 160 30/01/17 2,880,000.00 7,760.00 USD 134 B US 10 YEAR NOTE 122.50 27/01/17 (34,264.72) EUR 76 B EURX EURO BUND 160 27/02/17 (44,080.00) USD (134) S US 10 YEAR NOTE 121 27/01/17 15,457,362.12 14,103.48 USD (134) S US 10 YEAR NOTE 120.50 27/01/17 15,393,488.73 10,071.23 EUR (17) S EURX EURO BUND 163 30/01/17 2,771,000.00 (19,720.00) EUR 121 B EURX EURO BUND 161 27/02/17 (1,330.00)
Total: (67,460.01)
As at December 31, 2016, the net unrealised depreciation on options contracts amounted to EUR 67,460.01. All the contracts are dealt with the broker SOCIETE GENERALE NEWEDGE UK LTD.
11. OTC OPTIONS
As at December 31, 2016, outstanding OTC options contracts were as follows: Please refer to Note 17 for detailed collateral information and to the corresponding securities portfolio of the sub-funds for detailed Call/Put information.
BG SICAV – Eurizon Multiasset Optimal Diversified Approach Currency Quantity Buy-
Sell Description Strike Maturity Commitments (EUR) Unrealised appreciation/
(depreciation) (EUR) EUR (345,000) S EUR(P)/USD(C) OTC 1.02 17/03/17 335,478.34 658.95
Total: 658.95
As at December 31, 2016, the unrealised appreciation on the option contract amounted to EUR 658.95. The counterparty of the OTC options is GOLDMAN SACHS INTERNATIONAL.
BG SICAV – Amundi Absolute Forex Currency Quantity Buy-
Sell Description Strike Maturity Commitments (EUR) Unrealised appreciation/
(depreciation) (EUR) EUR 200,000 B EUR(P)/GBP(C) OTC 0.80 17/04/17 18,500.00 EUR 7,750,000 B EUR(P)/SEK(C) OTC 9.65 02/02/17 60,840.52 EUR (7,750,000) S EUR(C)/SEK(P) OTC 10.15 02/02/17 8,224,079.42 43,456.34 EUR 6,400,000 B EUR(C)/INR(P) OTC 76 22/02/17 (40,684.80) EUR (6,400,000) S EUR(C)/INR(P) OTC 74 22/02/17 6,655,330.87 77,625.60
Total: 159,737.66
As at December 31, 2016, the net unrealised appreciation on options contracts amounted to EUR 159,737.66. The counterparties of the OTC options are BNP PARIBAS, STANDARD CHARTERED BANK and UBS LTD LONDON.
BG SICAV – Algebris - Best Ideas Currency Quantity Buy-
Sell Description Strike Maturity Commitments (EUR) Unrealised appreciation/
(depreciation) (EUR) USD 358,800 B S&P 500 OTC 1,999.39 20/01/17 (29,182.59) JPY 5,940 B NIKKEI 225 OTC 18,324.82 15/03/17 1,783.89 USD 10,000,000 B USD(P)/JPY(C) OTC 115 31/01/17 74,375.04 USD (10,000,000) S USD(P)/JPY(C) OTC 112 31/01/17 9,105,689.60 (28,796.96) HKD 780 B HANG SENG CHI OTC 8,961 15/03/17 1,917.81
Total: 20,097.19
As at December 31, 2016, the net unrealised appreciation on options contracts amounted to EUR 20,097.19. The counterparties of the OTC options are HSBC BANK PLC and MERRILL LYNCH INTERNATIONAL LIMITED.
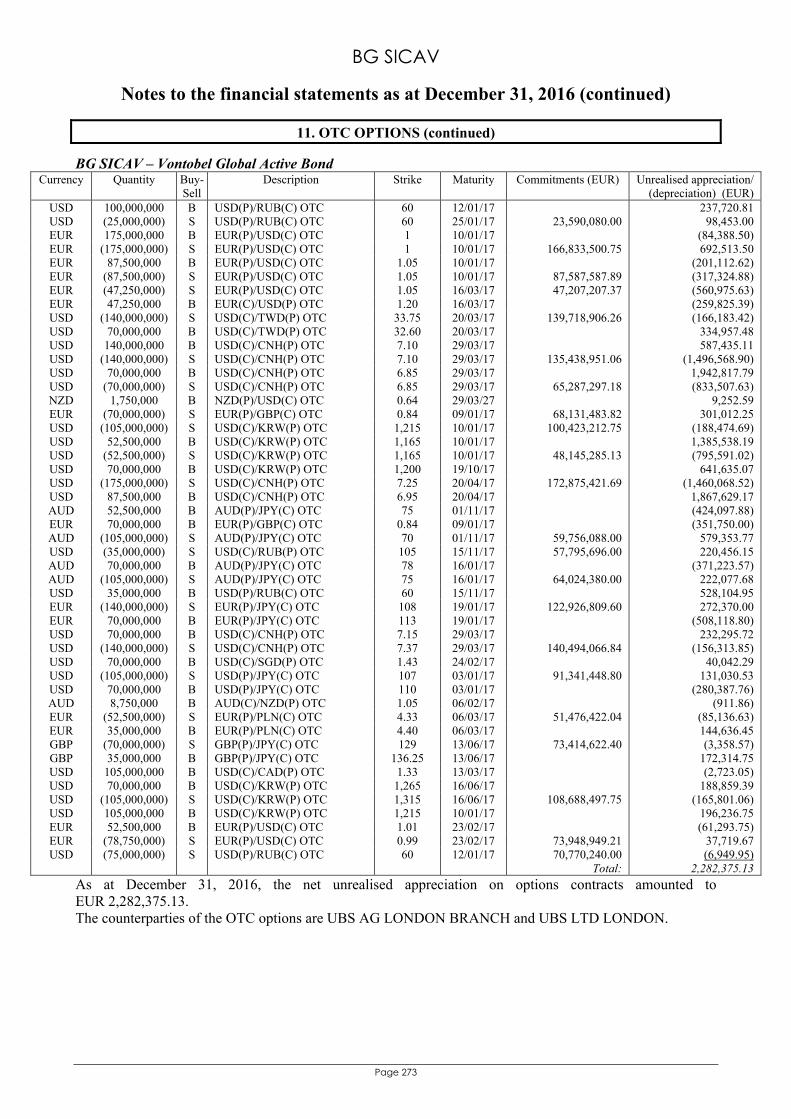
BG SICAV
Notes to the financial statements as at December 31, 2016 (continued)
Page 273
11. OTC OPTIONS (continued)
BG SICAV – Vontobel Global Active Bond Currency Quantity Buy-
Sell Description Strike Maturity Commitments (EUR) Unrealised appreciation/
(depreciation) (EUR) USD 100,000,000 B USD(P)/RUB(C) OTC 60 12/01/17 237,720.81 USD (25,000,000) S USD(P)/RUB(C) OTC 60 25/01/17 23,590,080.00 98,453.00 EUR 175,000,000 B EUR(P)/USD(C) OTC 1 10/01/17 (84,388.50) EUR (175,000,000) S EUR(P)/USD(C) OTC 1 10/01/17 166,833,500.75 692,513.50 EUR 87,500,000 B EUR(P)/USD(C) OTC 1.05 10/01/17 (201,112.62) EUR (87,500,000) S EUR(P)/USD(C) OTC 1.05 10/01/17 87,587,587.89 (317,324.88) EUR (47,250,000) S EUR(P)/USD(C) OTC 1.05 16/03/17 47,207,207.37 (560,975.63) EUR 47,250,000 B EUR(C)/USD(P) OTC 1.20 16/03/17 (259,825.39) USD (140,000,000) S USD(C)/TWD(P) OTC 33.75 20/03/17 139,718,906.26 (166,183.42) USD 70,000,000 B USD(C)/TWD(P) OTC 32.60 20/03/17 334,957.48 USD 140,000,000 B USD(C)/CNH(P) OTC 7.10 29/03/17 587,435.11 USD (140,000,000) S USD(C)/CNH(P) OTC 7.10 29/03/17 135,438,951.06 (1,496,568.90) USD 70,000,000 B USD(C)/CNH(P) OTC 6.85 29/03/17 1,942,817.79 USD (70,000,000) S USD(C)/CNH(P) OTC 6.85 29/03/17 65,287,297.18 (833,507.63) NZD 1,750,000 B NZD(P)/USD(C) OTC 0.64 29/03/27 9,252.59 EUR (70,000,000) S EUR(P)/GBP(C) OTC 0.84 09/01/17 68,131,483.82 301,012.25 USD (105,000,000) S USD(C)/KRW(P) OTC 1,215 10/01/17 100,423,212.75 (188,474.69) USD 52,500,000 B USD(C)/KRW(P) OTC 1,165 10/01/17 1,385,538.19 USD (52,500,000) S USD(C)/KRW(P) OTC 1,165 10/01/17 48,145,285.13 (795,591.02) USD 70,000,000 B USD(C)/KRW(P) OTC 1,200 19/10/17 641,635.07 USD (175,000,000) S USD(C)/CNH(P) OTC 7.25 20/04/17 172,875,421.69 (1,460,068.52) USD 87,500,000 B USD(C)/CNH(P) OTC 6.95 20/04/17 1,867,629.17 AUD 52,500,000 B AUD(P)/JPY(C) OTC 75 01/11/17 (424,097.88) EUR 70,000,000 B EUR(P)/GBP(C) OTC 0.84 09/01/17 (351,750.00) AUD (105,000,000) S AUD(P)/JPY(C) OTC 70 01/11/17 59,756,088.00 579,353.77 USD (35,000,000) S USD(C)/RUB(P) OTC 105 15/11/17 57,795,696.00 220,456.15 AUD 70,000,000 B AUD(P)/JPY(C) OTC 78 16/01/17 (371,223.57) AUD (105,000,000) S AUD(P)/JPY(C) OTC 75 16/01/17 64,024,380.00 222,077.68 USD 35,000,000 B USD(P)/RUB(C) OTC 60 15/11/17 528,104.95 EUR (140,000,000) S EUR(P)/JPY(C) OTC 108 19/01/17 122,926,809.60 272,370.00 EUR 70,000,000 B EUR(P)/JPY(C) OTC 113 19/01/17 (508,118.80) USD 70,000,000 B USD(C)/CNH(P) OTC 7.15 29/03/17 232,295.72 USD (140,000,000) S USD(C)/CNH(P) OTC 7.37 29/03/17 140,494,066.84 (156,313.85) USD 70,000,000 B USD(C)/SGD(P) OTC 1.43 24/02/17 40,042.29 USD (105,000,000) S USD(P)/JPY(C) OTC 107 03/01/17 91,341,448.80 131,030.53 USD 70,000,000 B USD(P)/JPY(C) OTC 110 03/01/17 (280,387.76) AUD 8,750,000 B AUD(C)/NZD(P) OTC 1.05 06/02/17 (911.86) EUR (52,500,000) S EUR(P)/PLN(C) OTC 4.33 06/03/17 51,476,422.04 (85,136.63) EUR 35,000,000 B EUR(P)/PLN(C) OTC 4.40 06/03/17 144,636.45 GBP (70,000,000) S GBP(P)/JPY(C) OTC 129 13/06/17 73,414,622.40 (3,358.57) GBP 35,000,000 B GBP(P)/JPY(C) OTC 136.25 13/06/17 172,314.75 USD 105,000,000 B USD(C)/CAD(P) OTC 1.33 13/03/17 (2,723.05) USD 70,000,000 B USD(C)/KRW(P) OTC 1,265 16/06/17 188,859.39 USD (105,000,000) S USD(C)/KRW(P) OTC 1,315 16/06/17 108,688,497.75 (165,801.06) USD 105,000,000 B USD(C)/KRW(P) OTC 1,215 10/01/17 196,236.75 EUR 52,500,000 B EUR(P)/USD(C) OTC 1.01 23/02/17 (61,293.75) EUR (78,750,000) S EUR(P)/USD(C) OTC 0.99 23/02/17 73,948,949.21 37,719.67 USD (75,000,000) S USD(P)/RUB(C) OTC 60 12/01/17 70,770,240.00 (6,949.95)
Total: 2,282,375.13
As at December 31, 2016, the net unrealised appreciation on options contracts amounted to EUR 2,282,375.13. The counterparties of the OTC options are UBS AG LONDON BRANCH and UBS LTD LONDON.
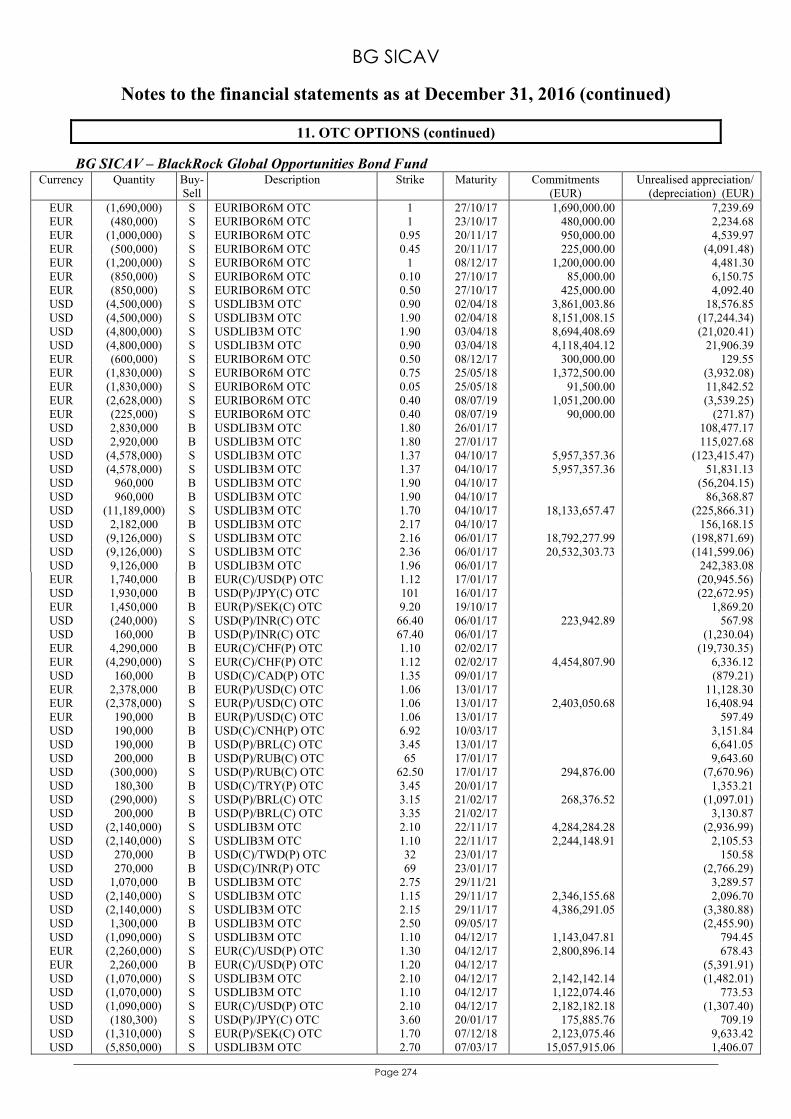
BG SICAV
Notes to the financial statements as at December 31, 2016 (continued)
Page 274
11. OTC OPTIONS (continued)
BG SICAV – BlackRock Global Opportunities Bond Fund Currency Quantity Buy-
Sell Description Strike Maturity Commitments
(EUR) Unrealised appreciation/
(depreciation) (EUR) EUR (1,690,000) S EURIBOR6M OTC 1 27/10/17 1,690,000.00 7,239.69 EUR (480,000) S EURIBOR6M OTC 1 23/10/17 480,000.00 2,234.68 EUR (1,000,000) S EURIBOR6M OTC 0.95 20/11/17 950,000.00 4,539.97 EUR (500,000) S EURIBOR6M OTC 0.45 20/11/17 225,000.00 (4,091.48) EUR (1,200,000) S EURIBOR6M OTC 1 08/12/17 1,200,000.00 4,481.30 EUR (850,000) S EURIBOR6M OTC 0.10 27/10/17 85,000.00 6,150.75 EUR (850,000) S EURIBOR6M OTC 0.50 27/10/17 425,000.00 4,092.40 USD (4,500,000) S USDLIB3M OTC 0.90 02/04/18 3,861,003.86 18,576.85 USD (4,500,000) S USDLIB3M OTC 1.90 02/04/18 8,151,008.15 (17,244.34) USD (4,800,000) S USDLIB3M OTC 1.90 03/04/18 8,694,408.69 (21,020.41) USD (4,800,000) S USDLIB3M OTC 0.90 03/04/18 4,118,404.12 21,906.39 EUR (600,000) S EURIBOR6M OTC 0.50 08/12/17 300,000.00 129.55 EUR (1,830,000) S EURIBOR6M OTC 0.75 25/05/18 1,372,500.00 (3,932.08) EUR (1,830,000) S EURIBOR6M OTC 0.05 25/05/18 91,500.00 11,842.52 EUR (2,628,000) S EURIBOR6M OTC 0.40 08/07/19 1,051,200.00 (3,539.25) EUR (225,000) S EURIBOR6M OTC 0.40 08/07/19 90,000.00 (271.87) USD 2,830,000 B USDLIB3M OTC 1.80 26/01/17 108,477.17 USD 2,920,000 B USDLIB3M OTC 1.80 27/01/17 115,027.68 USD (4,578,000) S USDLIB3M OTC 1.37 04/10/17 5,957,357.36 (123,415.47) USD (4,578,000) S USDLIB3M OTC 1.37 04/10/17 5,957,357.36 51,831.13 USD 960,000 B USDLIB3M OTC 1.90 04/10/17 (56,204.15) USD 960,000 B USDLIB3M OTC 1.90 04/10/17 86,368.87 USD (11,189,000) S USDLIB3M OTC 1.70 04/10/17 18,133,657.47 (225,866.31) USD 2,182,000 B USDLIB3M OTC 2.17 04/10/17 156,168.15 USD (9,126,000) S USDLIB3M OTC 2.16 06/01/17 18,792,277.99 (198,871.69) USD (9,126,000) S USDLIB3M OTC 2.36 06/01/17 20,532,303.73 (141,599.06) USD 9,126,000 B USDLIB3M OTC 1.96 06/01/17 242,383.08 EUR 1,740,000 B EUR(C)/USD(P) OTC 1.12 17/01/17 (20,945.56) USD 1,930,000 B USD(P)/JPY(C) OTC 101 16/01/17 (22,672.95) EUR 1,450,000 B EUR(P)/SEK(C) OTC 9.20 19/10/17 1,869.20 USD (240,000) S USD(P)/INR(C) OTC 66.40 06/01/17 223,942.89 567.98 USD 160,000 B USD(P)/INR(C) OTC 67.40 06/01/17 (1,230.04) EUR 4,290,000 B EUR(C)/CHF(P) OTC 1.10 02/02/17 (19,730.35) EUR (4,290,000) S EUR(C)/CHF(P) OTC 1.12 02/02/17 4,454,807.90 6,336.12 USD 160,000 B USD(C)/CAD(P) OTC 1.35 09/01/17 (879.21) EUR 2,378,000 B EUR(P)/USD(C) OTC 1.06 13/01/17 11,128.30 EUR (2,378,000) S EUR(P)/USD(C) OTC 1.06 13/01/17 2,403,050.68 16,408.94 EUR 190,000 B EUR(P)/USD(C) OTC 1.06 13/01/17 597.49 USD 190,000 B USD(C)/CNH(P) OTC 6.92 10/03/17 3,151.84 USD 190,000 B USD(P)/BRL(C) OTC 3.45 13/01/17 6,641.05 USD 200,000 B USD(P)/RUB(C) OTC 65 17/01/17 9,643.60 USD (300,000) S USD(P)/RUB(C) OTC 62.50 17/01/17 294,876.00 (7,670.96) USD 180,300 B USD(C)/TRY(P) OTC 3.45 20/01/17 1,353.21 USD (290,000) S USD(P)/BRL(C) OTC 3.15 21/02/17 268,376.52 (1,097.01) USD 200,000 B USD(P)/BRL(C) OTC 3.35 21/02/17 3,130.87 USD (2,140,000) S USDLIB3M OTC 2.10 22/11/17 4,284,284.28 (2,936.99) USD (2,140,000) S USDLIB3M OTC 1.10 22/11/17 2,244,148.91 2,105.53 USD 270,000 B USD(C)/TWD(P) OTC 32 23/01/17 150.58 USD 270,000 B USD(C)/INR(P) OTC 69 23/01/17 (2,766.29) USD 1,070,000 B USDLIB3M OTC 2.75 29/11/21 3,289.57 USD (2,140,000) S USDLIB3M OTC 1.15 29/11/17 2,346,155.68 2,096.70 USD (2,140,000) S USDLIB3M OTC 2.15 29/11/17 4,386,291.05 (3,380.88) USD 1,300,000 B USDLIB3M OTC 2.50 09/05/17 (2,455.90) USD (1,090,000) S USDLIB3M OTC 1.10 04/12/17 1,143,047.81 794.45 EUR (2,260,000) S EUR(C)/USD(P) OTC 1.30 04/12/17 2,800,896.14 678.43 EUR 2,260,000 B EUR(C)/USD(P) OTC 1.20 04/12/17 (5,391.91) USD (1,070,000) S USDLIB3M OTC 2.10 04/12/17 2,142,142.14 (1,482.01) USD (1,070,000) S USDLIB3M OTC 1.10 04/12/17 1,122,074.46 773.53 USD (1,090,000) S EUR(C)/USD(P) OTC 2.10 04/12/17 2,182,182.18 (1,307.40) USD (180,300) S USD(P)/JPY(C) OTC 3.60 20/01/17 175,885.76 709.19 USD (1,310,000) S EUR(P)/SEK(C) OTC 1.70 07/12/18 2,123,075.46 9,633.42 USD (5,850,000) S USDLIB3M OTC 2.70 07/03/17 15,057,915.06 1,406.07
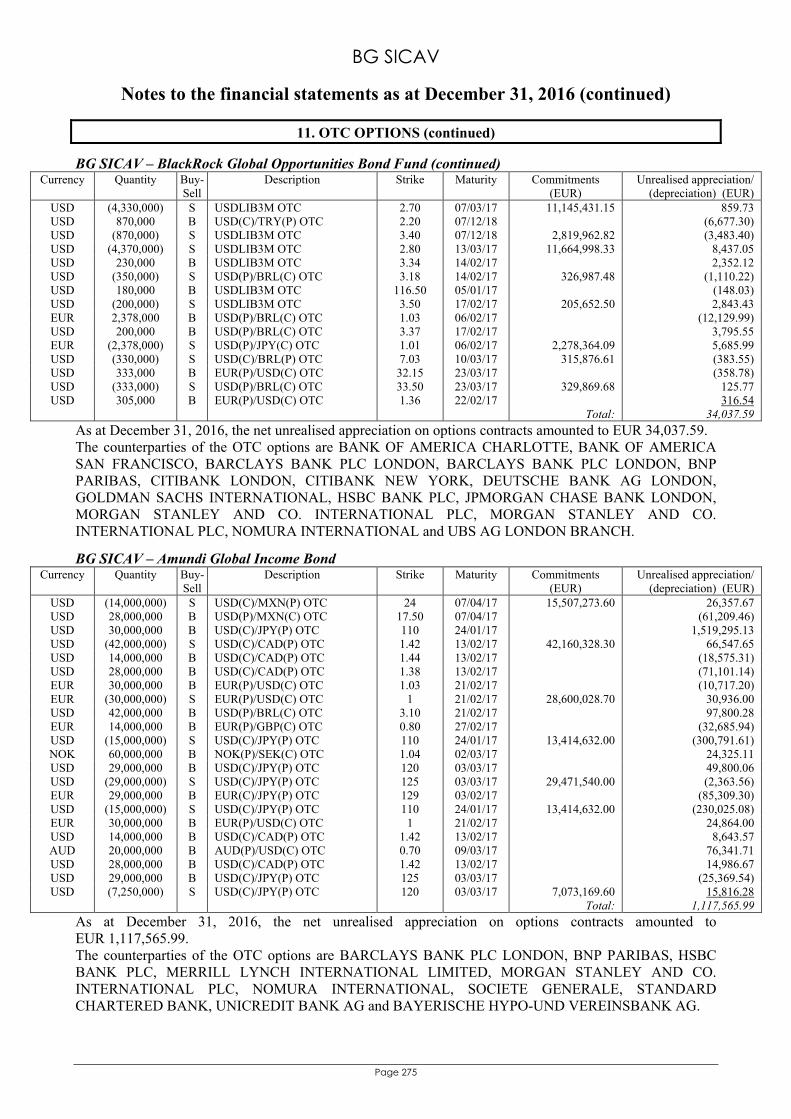
BG SICAV
Notes to the financial statements as at December 31, 2016 (continued)
Page 275
11. OTC OPTIONS (continued)
BG SICAV – BlackRock Global Opportunities Bond Fund (continued) Currency Quantity Buy-
Sell Description Strike Maturity Commitments
(EUR) Unrealised appreciation/
(depreciation) (EUR) USD (4,330,000) S USDLIB3M OTC 2.70 07/03/17 11,145,431.15 859.73 USD 870,000 B USD(C)/TRY(P) OTC 2.20 07/12/18 (6,677.30) USD (870,000) S USDLIB3M OTC 3.40 07/12/18 2,819,962.82 (3,483.40) USD (4,370,000) S USDLIB3M OTC 2.80 13/03/17 11,664,998.33 8,437.05 USD 230,000 B USDLIB3M OTC 3.34 14/02/17 2,352.12 USD (350,000) S USD(P)/BRL(C) OTC 3.18 14/02/17 326,987.48 (1,110.22) USD 180,000 B USDLIB3M OTC 116.50 05/01/17 (148.03) USD (200,000) S USDLIB3M OTC 3.50 17/02/17 205,652.50 2,843.43 EUR 2,378,000 B USD(P)/BRL(C) OTC 1.03 06/02/17 (12,129.99) USD 200,000 B USD(P)/BRL(C) OTC 3.37 17/02/17 3,795.55 EUR (2,378,000) S USD(P)/JPY(C) OTC 1.01 06/02/17 2,278,364.09 5,685.99 USD (330,000) S USD(C)/BRL(P) OTC 7.03 10/03/17 315,876.61 (383.55) USD 333,000 B EUR(P)/USD(C) OTC 32.15 23/03/17 (358.78) USD (333,000) S USD(P)/BRL(C) OTC 33.50 23/03/17 329,869.68 125.77 USD 305,000 B EUR(P)/USD(C) OTC 1.36 22/02/17 316.54
Total: 34,037.59
As at December 31, 2016, the net unrealised appreciation on options contracts amounted to EUR 34,037.59. The counterparties of the OTC options are BANK OF AMERICA CHARLOTTE, BANK OF AMERICA SAN FRANCISCO, BARCLAYS BANK PLC LONDON, BARCLAYS BANK PLC LONDON, BNP PARIBAS, CITIBANK LONDON, CITIBANK NEW YORK, DEUTSCHE BANK AG LONDON, GOLDMAN SACHS INTERNATIONAL, HSBC BANK PLC, JPMORGAN CHASE BANK LONDON, MORGAN STANLEY AND CO. INTERNATIONAL PLC, MORGAN STANLEY AND CO. INTERNATIONAL PLC, NOMURA INTERNATIONAL and UBS AG LONDON BRANCH.
BG SICAV – Amundi Global Income Bond Currency Quantity Buy-
Sell Description Strike Maturity Commitments
(EUR) Unrealised appreciation/
(depreciation) (EUR) USD (14,000,000) S USD(C)/MXN(P) OTC 24 07/04/17 15,507,273.60 26,357.67 USD 28,000,000 B USD(P)/MXN(C) OTC 17.50 07/04/17 (61,209.46) USD 30,000,000 B USD(C)/JPY(P) OTC 110 24/01/17 1,519,295.13 USD (42,000,000) S USD(C)/CAD(P) OTC 1.42 13/02/17 42,160,328.30 66,547.65 USD 14,000,000 B USD(C)/CAD(P) OTC 1.44 13/02/17 (18,575.31) USD 28,000,000 B USD(C)/CAD(P) OTC 1.38 13/02/17 (71,101.14) EUR 30,000,000 B EUR(P)/USD(C) OTC 1.03 21/02/17 (10,717.20) EUR (30,000,000) S EUR(P)/USD(C) OTC 1 21/02/17 28,600,028.70 30,936.00 USD 42,000,000 B USD(P)/BRL(C) OTC 3.10 21/02/17 97,800.28 EUR 14,000,000 B EUR(P)/GBP(C) OTC 0.80 27/02/17 (32,685.94) USD (15,000,000) S USD(C)/JPY(P) OTC 110 24/01/17 13,414,632.00 (300,791.61) NOK 60,000,000 B NOK(P)/SEK(C) OTC 1.04 02/03/17 24,325.11 USD 29,000,000 B USD(C)/JPY(P) OTC 120 03/03/17 49,800.06 USD (29,000,000) S USD(C)/JPY(P) OTC 125 03/03/17 29,471,540.00 (2,363.56) EUR 29,000,000 B EUR(C)/JPY(P) OTC 129 03/02/17 (85,309.30) USD (15,000,000) S USD(C)/JPY(P) OTC 110 24/01/17 13,414,632.00 (230,025.08) EUR 30,000,000 B EUR(P)/USD(C) OTC 1 21/02/17 24,864.00 USD 14,000,000 B USD(C)/CAD(P) OTC 1.42 13/02/17 8,643.57 AUD 20,000,000 B AUD(P)/USD(C) OTC 0.70 09/03/17 76,341.71 USD 28,000,000 B USD(C)/CAD(P) OTC 1.42 13/02/17 14,986.67 USD 29,000,000 B USD(C)/JPY(P) OTC 125 03/03/17 (25,369.54) USD (7,250,000) S USD(C)/JPY(P) OTC 120 03/03/17 7,073,169.60 15,816.28
Total: 1,117,565.99
As at December 31, 2016, the net unrealised appreciation on options contracts amounted to EUR 1,117,565.99. The counterparties of the OTC options are BARCLAYS BANK PLC LONDON, BNP PARIBAS, HSBC BANK PLC, MERRILL LYNCH INTERNATIONAL LIMITED, MORGAN STANLEY AND CO. INTERNATIONAL PLC, NOMURA INTERNATIONAL, SOCIETE GENERALE, STANDARD CHARTERED BANK, UNICREDIT BANK AG and BAYERISCHE HYPO-UND VEREINSBANK AG.
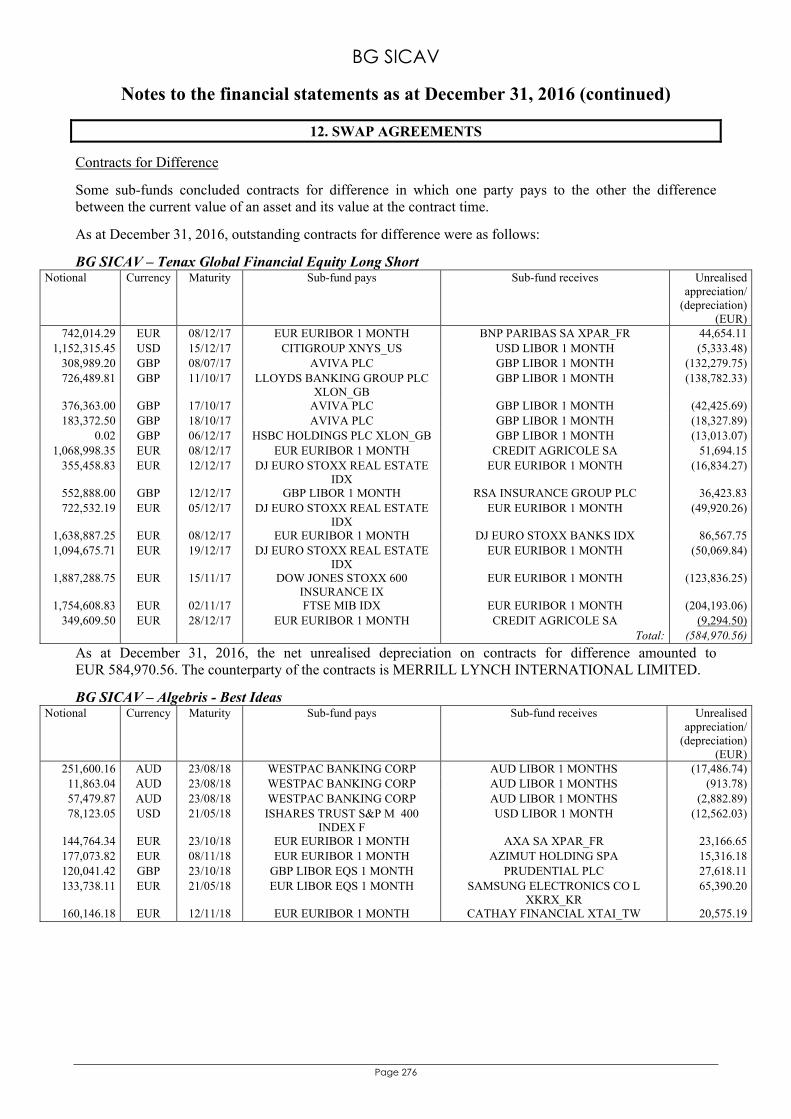
BG SICAV
Notes to the financial statements as at December 31, 2016 (continued)
Page 276
12. SWAP AGREEMENTS
Contracts for Difference
Some sub-funds concluded contracts for difference in which one party pays to the other the difference between the current value of an asset and its value at the contract time.
As at December 31, 2016, outstanding contracts for difference were as follows:
BG SICAV – Tenax Global Financial Equity Long Short Notional Currency Maturity Sub-fund pays Sub-fund receives Unrealised
appreciation/(depreciation)
(EUR)742,014.29 EUR 08/12/17 EUR EURIBOR 1 MONTH BNP PARIBAS SA XPAR_FR 44,654.11
1,152,315.45 USD 15/12/17 CITIGROUP XNYS_US USD LIBOR 1 MONTH (5,333.48)308,989.20 GBP 08/07/17 AVIVA PLC GBP LIBOR 1 MONTH (132,279.75)726,489.81 GBP 11/10/17 LLOYDS BANKING GROUP PLC
XLON_GB GBP LIBOR 1 MONTH (138,782.33)
376,363.00 GBP 17/10/17 AVIVA PLC GBP LIBOR 1 MONTH (42,425.69)183,372.50 GBP 18/10/17 AVIVA PLC GBP LIBOR 1 MONTH (18,327.89)
0.02 GBP 06/12/17 HSBC HOLDINGS PLC XLON_GB GBP LIBOR 1 MONTH (13,013.07)1,068,998.35 EUR 08/12/17 EUR EURIBOR 1 MONTH CREDIT AGRICOLE SA 51,694.15
355,458.83 EUR 12/12/17 DJ EURO STOXX REAL ESTATE IDX
EUR EURIBOR 1 MONTH (16,834.27)
552,888.00 GBP 12/12/17 GBP LIBOR 1 MONTH RSA INSURANCE GROUP PLC 36,423.83722,532.19 EUR 05/12/17 DJ EURO STOXX REAL ESTATE
IDX EUR EURIBOR 1 MONTH (49,920.26)
1,638,887.25 EUR 08/12/17 EUR EURIBOR 1 MONTH DJ EURO STOXX BANKS IDX 86,567.751,094,675.71 EUR 19/12/17 DJ EURO STOXX REAL ESTATE
IDX EUR EURIBOR 1 MONTH (50,069.84)
1,887,288.75 EUR 15/11/17 DOW JONES STOXX 600 INSURANCE IX
EUR EURIBOR 1 MONTH (123,836.25)
1,754,608.83 EUR 02/11/17 FTSE MIB IDX EUR EURIBOR 1 MONTH (204,193.06)349,609.50 EUR 28/12/17 EUR EURIBOR 1 MONTH CREDIT AGRICOLE SA (9,294.50)
Total: (584,970.56)
As at December 31, 2016, the net unrealised depreciation on contracts for difference amounted to EUR 584,970.56. The counterparty of the contracts is MERRILL LYNCH INTERNATIONAL LIMITED.
BG SICAV – Algebris - Best Ideas Notional Currency Maturity Sub-fund pays Sub-fund receives Unrealised
appreciation/(depreciation)
(EUR)251,600.16 AUD 23/08/18 WESTPAC BANKING CORP AUD LIBOR 1 MONTHS (17,486.74)11,863.04 AUD 23/08/18 WESTPAC BANKING CORP AUD LIBOR 1 MONTHS (913.78)57,479.87 AUD 23/08/18 WESTPAC BANKING CORP AUD LIBOR 1 MONTHS (2,882.89)78,123.05 USD 21/05/18 ISHARES TRUST S&P M 400
INDEX F USD LIBOR 1 MONTH (12,562.03)
144,764.34 EUR 23/10/18 EUR EURIBOR 1 MONTH AXA SA XPAR_FR 23,166.65177,073.82 EUR 08/11/18 EUR EURIBOR 1 MONTH AZIMUT HOLDING SPA 15,316.18120,041.42 GBP 23/10/18 GBP LIBOR EQS 1 MONTH PRUDENTIAL PLC 27,618.11133,738.11 EUR 21/05/18 EUR LIBOR EQS 1 MONTH SAMSUNG ELECTRONICS CO L
XKRX_KR 65,390.20
160,146.18 EUR 12/11/18 EUR EURIBOR 1 MONTH CATHAY FINANCIAL XTAI_TW 20,575.19
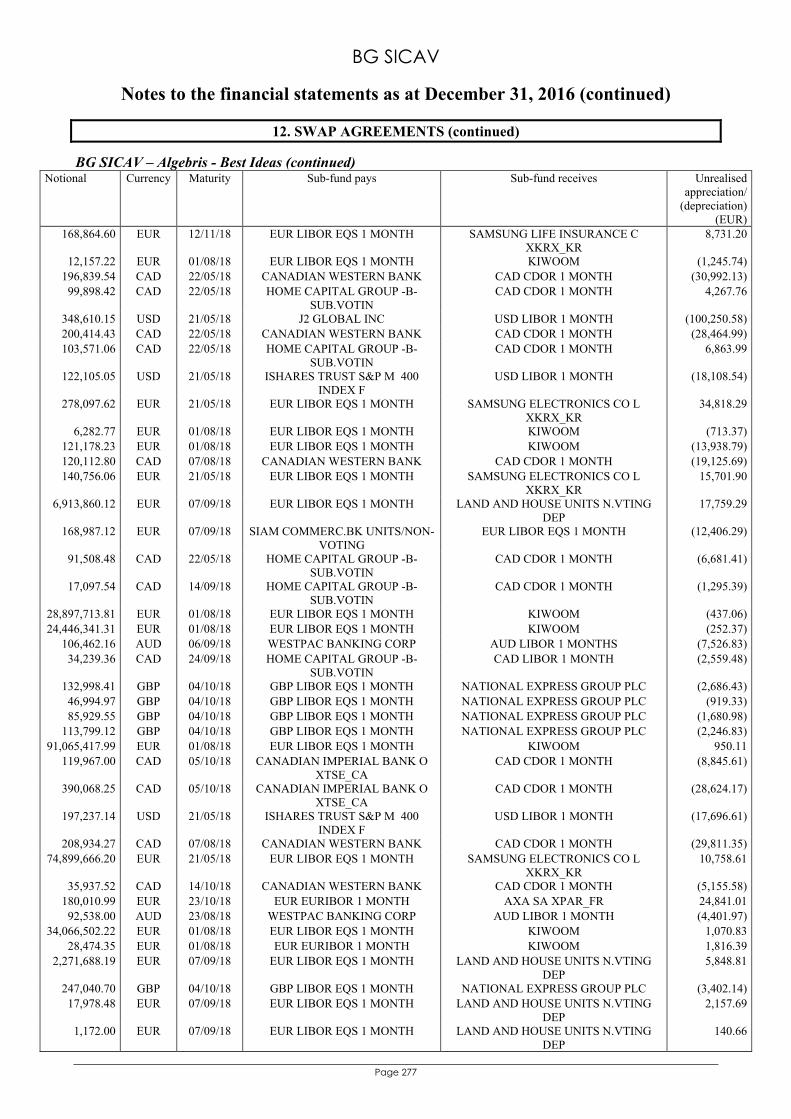
BG SICAV
Notes to the financial statements as at December 31, 2016 (continued)
Page 277
12. SWAP AGREEMENTS (continued)
BG SICAV – Algebris - Best Ideas (continued) Notional Currency Maturity Sub-fund pays Sub-fund receives Unrealised
appreciation/(depreciation)
(EUR)168,864.60 EUR 12/11/18 EUR LIBOR EQS 1 MONTH SAMSUNG LIFE INSURANCE C
XKRX_KR 8,731.20
12,157.22 EUR 01/08/18 EUR LIBOR EQS 1 MONTH KIWOOM (1,245.74)196,839.54 CAD 22/05/18 CANADIAN WESTERN BANK CAD CDOR 1 MONTH (30,992.13)99,898.42 CAD 22/05/18 HOME CAPITAL GROUP -B-
SUB.VOTIN CAD CDOR 1 MONTH 4,267.76
348,610.15 USD 21/05/18 J2 GLOBAL INC USD LIBOR 1 MONTH (100,250.58)200,414.43 CAD 22/05/18 CANADIAN WESTERN BANK CAD CDOR 1 MONTH (28,464.99)103,571.06 CAD 22/05/18 HOME CAPITAL GROUP -B-
SUB.VOTIN CAD CDOR 1 MONTH 6,863.99
122,105.05 USD 21/05/18 ISHARES TRUST S&P M 400 INDEX F
USD LIBOR 1 MONTH (18,108.54)
278,097.62 EUR 21/05/18 EUR LIBOR EQS 1 MONTH SAMSUNG ELECTRONICS CO L XKRX_KR
34,818.29
6,282.77 EUR 01/08/18 EUR LIBOR EQS 1 MONTH KIWOOM (713.37)121,178.23 EUR 01/08/18 EUR LIBOR EQS 1 MONTH KIWOOM (13,938.79)120,112.80 CAD 07/08/18 CANADIAN WESTERN BANK CAD CDOR 1 MONTH (19,125.69)140,756.06 EUR 21/05/18 EUR LIBOR EQS 1 MONTH SAMSUNG ELECTRONICS CO L
XKRX_KR 15,701.90
6,913,860.12 EUR 07/09/18 EUR LIBOR EQS 1 MONTH LAND AND HOUSE UNITS N.VTING DEP
17,759.29
168,987.12 EUR 07/09/18 SIAM COMMERC.BK UNITS/NON-VOTING
EUR LIBOR EQS 1 MONTH (12,406.29)
91,508.48 CAD 22/05/18 HOME CAPITAL GROUP -B- SUB.VOTIN
CAD CDOR 1 MONTH (6,681.41)
17,097.54 CAD 14/09/18 HOME CAPITAL GROUP -B- SUB.VOTIN
CAD CDOR 1 MONTH (1,295.39)
28,897,713.81 EUR 01/08/18 EUR LIBOR EQS 1 MONTH KIWOOM (437.06)24,446,341.31 EUR 01/08/18 EUR LIBOR EQS 1 MONTH KIWOOM (252.37)
106,462.16 AUD 06/09/18 WESTPAC BANKING CORP AUD LIBOR 1 MONTHS (7,526.83)34,239.36 CAD 24/09/18 HOME CAPITAL GROUP -B-
SUB.VOTIN CAD LIBOR 1 MONTH (2,559.48)
132,998.41 GBP 04/10/18 GBP LIBOR EQS 1 MONTH NATIONAL EXPRESS GROUP PLC (2,686.43)46,994.97 GBP 04/10/18 GBP LIBOR EQS 1 MONTH NATIONAL EXPRESS GROUP PLC (919.33)85,929.55 GBP 04/10/18 GBP LIBOR EQS 1 MONTH NATIONAL EXPRESS GROUP PLC (1,680.98)
113,799.12 GBP 04/10/18 GBP LIBOR EQS 1 MONTH NATIONAL EXPRESS GROUP PLC (2,246.83)91,065,417.99 EUR 01/08/18 EUR LIBOR EQS 1 MONTH KIWOOM 950.11
119,967.00 CAD 05/10/18 CANADIAN IMPERIAL BANK O XTSE_CA
CAD CDOR 1 MONTH (8,845.61)
390,068.25 CAD 05/10/18 CANADIAN IMPERIAL BANK O XTSE_CA
CAD CDOR 1 MONTH (28,624.17)
197,237.14 USD 21/05/18 ISHARES TRUST S&P M 400 INDEX F
USD LIBOR 1 MONTH (17,696.61)
208,934.27 CAD 07/08/18 CANADIAN WESTERN BANK CAD CDOR 1 MONTH (29,811.35)74,899,666.20 EUR 21/05/18 EUR LIBOR EQS 1 MONTH SAMSUNG ELECTRONICS CO L
XKRX_KR 10,758.61
35,937.52 CAD 14/10/18 CANADIAN WESTERN BANK CAD CDOR 1 MONTH (5,155.58)180,010.99 EUR 23/10/18 EUR EURIBOR 1 MONTH AXA SA XPAR_FR 24,841.0192,538.00 AUD 23/08/18 WESTPAC BANKING CORP AUD LIBOR 1 MONTH (4,401.97)
34,066,502.22 EUR 01/08/18 EUR LIBOR EQS 1 MONTH KIWOOM 1,070.8328,474.35 EUR 01/08/18 EUR EURIBOR 1 MONTH KIWOOM 1,816.39
2,271,688.19 EUR 07/09/18 EUR LIBOR EQS 1 MONTH LAND AND HOUSE UNITS N.VTING DEP
5,848.81
247,040.70 GBP 04/10/18 GBP LIBOR EQS 1 MONTH NATIONAL EXPRESS GROUP PLC (3,402.14)17,978.48 EUR 07/09/18 EUR LIBOR EQS 1 MONTH LAND AND HOUSE UNITS N.VTING
DEP 2,157.69
1,172.00 EUR 07/09/18 EUR LIBOR EQS 1 MONTH LAND AND HOUSE UNITS N.VTING DEP
140.66
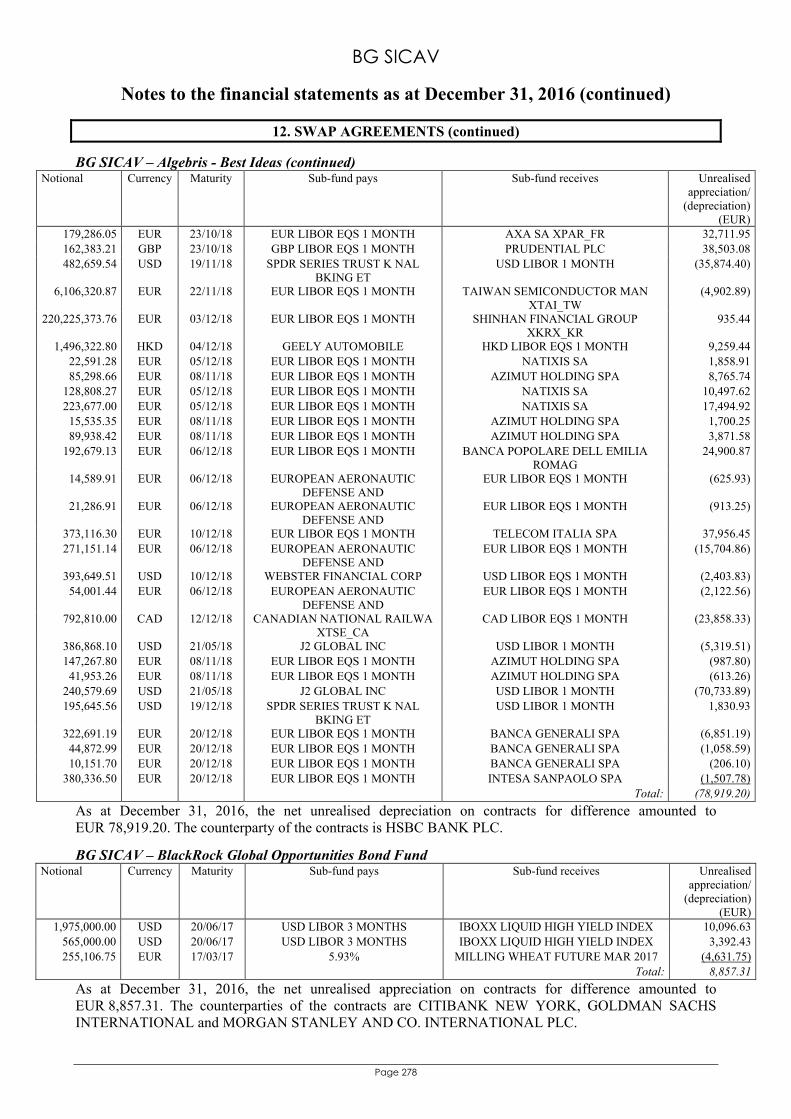
BG SICAV
Notes to the financial statements as at December 31, 2016 (continued)
Page 278
12. SWAP AGREEMENTS (continued)
BG SICAV – Algebris - Best Ideas (continued) Notional Currency Maturity Sub-fund pays Sub-fund receives Unrealised
appreciation/(depreciation)
(EUR)179,286.05 EUR 23/10/18 EUR LIBOR EQS 1 MONTH AXA SA XPAR_FR 32,711.95162,383.21 GBP 23/10/18 GBP LIBOR EQS 1 MONTH PRUDENTIAL PLC 38,503.08482,659.54 USD 19/11/18 SPDR SERIES TRUST K NAL
BKING ET USD LIBOR 1 MONTH (35,874.40)
6,106,320.87 EUR 22/11/18 EUR LIBOR EQS 1 MONTH TAIWAN SEMICONDUCTOR MAN XTAI_TW
(4,902.89)
220,225,373.76 EUR 03/12/18 EUR LIBOR EQS 1 MONTH SHINHAN FINANCIAL GROUP XKRX_KR
935.44
1,496,322.80 HKD 04/12/18 GEELY AUTOMOBILE HKD LIBOR EQS 1 MONTH 9,259.4422,591.28 EUR 05/12/18 EUR LIBOR EQS 1 MONTH NATIXIS SA 1,858.9185,298.66 EUR 08/11/18 EUR LIBOR EQS 1 MONTH AZIMUT HOLDING SPA 8,765.74
128,808.27 EUR 05/12/18 EUR LIBOR EQS 1 MONTH NATIXIS SA 10,497.62223,677.00 EUR 05/12/18 EUR LIBOR EQS 1 MONTH NATIXIS SA 17,494.9215,535.35 EUR 08/11/18 EUR LIBOR EQS 1 MONTH AZIMUT HOLDING SPA 1,700.2589,938.42 EUR 08/11/18 EUR LIBOR EQS 1 MONTH AZIMUT HOLDING SPA 3,871.58
192,679.13 EUR 06/12/18 EUR LIBOR EQS 1 MONTH BANCA POPOLARE DELL EMILIA ROMAG
24,900.87
14,589.91 EUR 06/12/18 EUROPEAN AERONAUTIC DEFENSE AND
EUR LIBOR EQS 1 MONTH (625.93)
21,286.91 EUR 06/12/18 EUROPEAN AERONAUTIC DEFENSE AND
EUR LIBOR EQS 1 MONTH (913.25)
373,116.30 EUR 10/12/18 EUR LIBOR EQS 1 MONTH TELECOM ITALIA SPA 37,956.45271,151.14 EUR 06/12/18 EUROPEAN AERONAUTIC
DEFENSE AND EUR LIBOR EQS 1 MONTH (15,704.86)
393,649.51 USD 10/12/18 WEBSTER FINANCIAL CORP USD LIBOR EQS 1 MONTH (2,403.83)54,001.44 EUR 06/12/18 EUROPEAN AERONAUTIC
DEFENSE AND EUR LIBOR EQS 1 MONTH (2,122.56)
792,810.00 CAD 12/12/18 CANADIAN NATIONAL RAILWA XTSE_CA
CAD LIBOR EQS 1 MONTH (23,858.33)
386,868.10 USD 21/05/18 J2 GLOBAL INC USD LIBOR 1 MONTH (5,319.51)147,267.80 EUR 08/11/18 EUR LIBOR EQS 1 MONTH AZIMUT HOLDING SPA (987.80)41,953.26 EUR 08/11/18 EUR LIBOR EQS 1 MONTH AZIMUT HOLDING SPA (613.26)
240,579.69 USD 21/05/18 J2 GLOBAL INC USD LIBOR 1 MONTH (70,733.89)195,645.56 USD 19/12/18 SPDR SERIES TRUST K NAL
BKING ET USD LIBOR 1 MONTH 1,830.93
322,691.19 EUR 20/12/18 EUR LIBOR EQS 1 MONTH BANCA GENERALI SPA (6,851.19)44,872.99 EUR 20/12/18 EUR LIBOR EQS 1 MONTH BANCA GENERALI SPA (1,058.59)10,151.70 EUR 20/12/18 EUR LIBOR EQS 1 MONTH BANCA GENERALI SPA (206.10)
380,336.50 EUR 20/12/18 EUR LIBOR EQS 1 MONTH INTESA SANPAOLO SPA (1,507.78) Total: (78,919.20)
As at December 31, 2016, the net unrealised depreciation on contracts for difference amounted to EUR 78,919.20. The counterparty of the contracts is HSBC BANK PLC.
BG SICAV – BlackRock Global Opportunities Bond Fund Notional Currency Maturity Sub-fund pays Sub-fund receives Unrealised
appreciation/(depreciation)
(EUR)1,975,000.00 USD 20/06/17 USD LIBOR 3 MONTHS IBOXX LIQUID HIGH YIELD INDEX 10,096.63
565,000.00 USD 20/06/17 USD LIBOR 3 MONTHS IBOXX LIQUID HIGH YIELD INDEX 3,392.43255,106.75 EUR 17/03/17 5.93% MILLING WHEAT FUTURE MAR 2017 (4,631.75)
Total: 8,857.31
As at December 31, 2016, the net unrealised appreciation on contracts for difference amounted to EUR 8,857.31. The counterparties of the contracts are CITIBANK NEW YORK, GOLDMAN SACHS INTERNATIONAL and MORGAN STANLEY AND CO. INTERNATIONAL PLC.
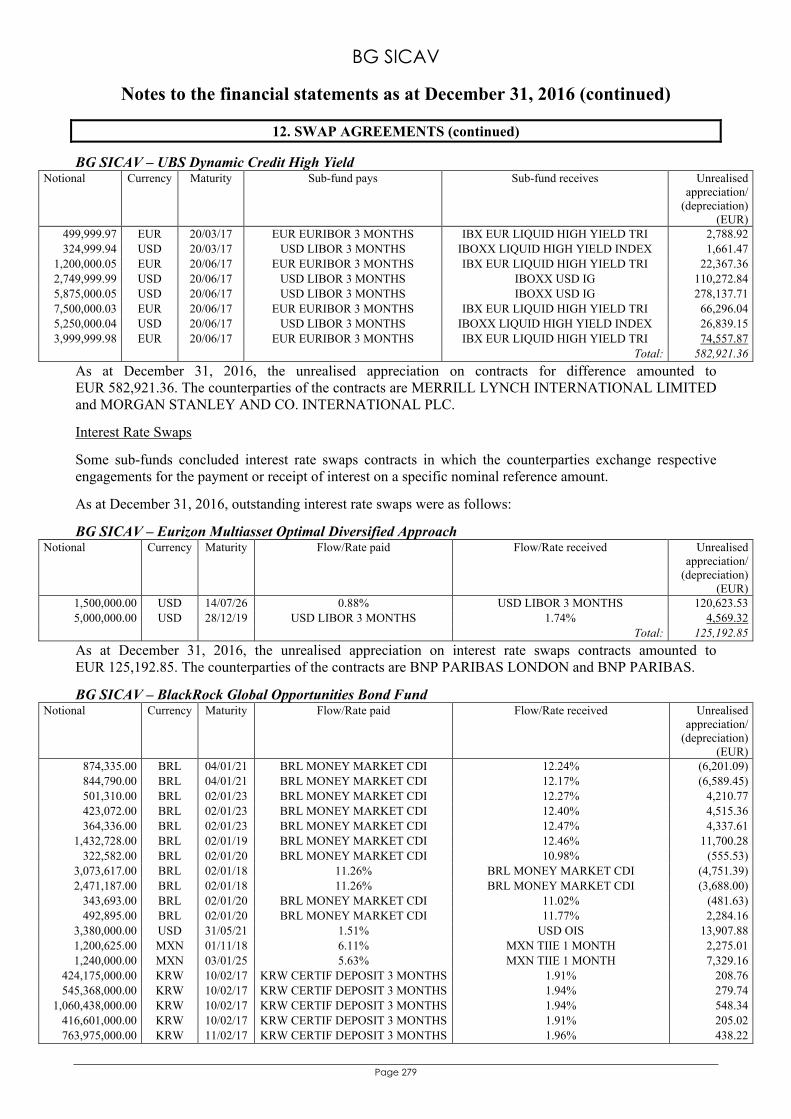
BG SICAV
Notes to the financial statements as at December 31, 2016 (continued)
Page 279
12. SWAP AGREEMENTS (continued)
BG SICAV – UBS Dynamic Credit High Yield Notional Currency Maturity Sub-fund pays Sub-fund receives Unrealised
appreciation/(depreciation)
(EUR)499,999.97 EUR 20/03/17 EUR EURIBOR 3 MONTHS IBX EUR LIQUID HIGH YIELD TRI 2,788.92324,999.94 USD 20/03/17 USD LIBOR 3 MONTHS IBOXX LIQUID HIGH YIELD INDEX 1,661.47
1,200,000.05 EUR 20/06/17 EUR EURIBOR 3 MONTHS IBX EUR LIQUID HIGH YIELD TRI 22,367.362,749,999.99 USD 20/06/17 USD LIBOR 3 MONTHS IBOXX USD IG 110,272.845,875,000.05 USD 20/06/17 USD LIBOR 3 MONTHS IBOXX USD IG 278,137.717,500,000.03 EUR 20/06/17 EUR EURIBOR 3 MONTHS IBX EUR LIQUID HIGH YIELD TRI 66,296.045,250,000.04 USD 20/06/17 USD LIBOR 3 MONTHS IBOXX LIQUID HIGH YIELD INDEX 26,839.153,999,999.98 EUR 20/06/17 EUR EURIBOR 3 MONTHS IBX EUR LIQUID HIGH YIELD TRI 74,557.87
Total: 582,921.36
As at December 31, 2016, the unrealised appreciation on contracts for difference amounted to EUR 582,921.36. The counterparties of the contracts are MERRILL LYNCH INTERNATIONAL LIMITED and MORGAN STANLEY AND CO. INTERNATIONAL PLC.
Interest Rate Swaps
Some sub-funds concluded interest rate swaps contracts in which the counterparties exchange respective engagements for the payment or receipt of interest on a specific nominal reference amount.
As at December 31, 2016, outstanding interest rate swaps were as follows:
BG SICAV – Eurizon Multiasset Optimal Diversified Approach Notional Currency Maturity Flow/Rate paid Flow/Rate received Unrealised
appreciation/(depreciation)
(EUR)1,500,000.00 USD 14/07/26 0.88% USD LIBOR 3 MONTHS 120,623.535,000,000.00 USD 28/12/19 USD LIBOR 3 MONTHS 1.74% 4,569.32
Total: 125,192.85
As at December 31, 2016, the unrealised appreciation on interest rate swaps contracts amounted to EUR 125,192.85. The counterparties of the contracts are BNP PARIBAS LONDON and BNP PARIBAS.
BG SICAV – BlackRock Global Opportunities Bond Fund Notional Currency Maturity Flow/Rate paid Flow/Rate received Unrealised
appreciation/(depreciation)
(EUR)874,335.00 BRL 04/01/21 BRL MONEY MARKET CDI 12.24% (6,201.09)844,790.00 BRL 04/01/21 BRL MONEY MARKET CDI 12.17% (6,589.45)501,310.00 BRL 02/01/23 BRL MONEY MARKET CDI 12.27% 4,210.77423,072.00 BRL 02/01/23 BRL MONEY MARKET CDI 12.40% 4,515.36364,336.00 BRL 02/01/23 BRL MONEY MARKET CDI 12.47% 4,337.61
1,432,728.00 BRL 02/01/19 BRL MONEY MARKET CDI 12.46% 11,700.28322,582.00 BRL 02/01/20 BRL MONEY MARKET CDI 10.98% (555.53)
3,073,617.00 BRL 02/01/18 11.26% BRL MONEY MARKET CDI (4,751.39)2,471,187.00 BRL 02/01/18 11.26% BRL MONEY MARKET CDI (3,688.00)
343,693.00 BRL 02/01/20 BRL MONEY MARKET CDI 11.02% (481.63)492,895.00 BRL 02/01/20 BRL MONEY MARKET CDI 11.77% 2,284.16
3,380,000.00 USD 31/05/21 1.51% USD OIS 13,907.881,200,625.00 MXN 01/11/18 6.11% MXN TIIE 1 MONTH 2,275.011,240,000.00 MXN 03/01/25 5.63% MXN TIIE 1 MONTH 7,329.16
424,175,000.00 KRW 10/02/17 KRW CERTIF DEPOSIT 3 MONTHS 1.91% 208.76545,368,000.00 KRW 10/02/17 KRW CERTIF DEPOSIT 3 MONTHS 1.94% 279.74
1,060,438,000.00 KRW 10/02/17 KRW CERTIF DEPOSIT 3 MONTHS 1.94% 548.34416,601,000.00 KRW 10/02/17 KRW CERTIF DEPOSIT 3 MONTHS 1.91% 205.02763,975,000.00 KRW 11/02/17 KRW CERTIF DEPOSIT 3 MONTHS 1.96% 438.22
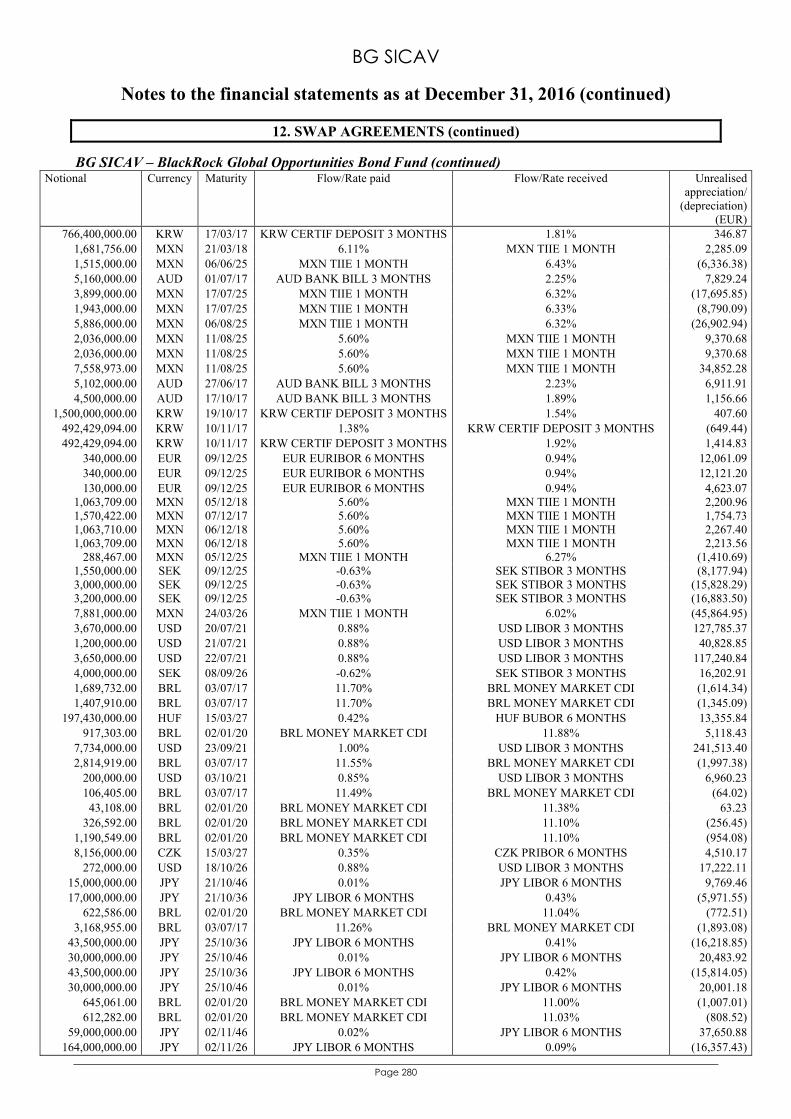
BG SICAV
Notes to the financial statements as at December 31, 2016 (continued)
Page 280
12. SWAP AGREEMENTS (continued)
BG SICAV – BlackRock Global Opportunities Bond Fund (continued) Notional Currency Maturity Flow/Rate paid Flow/Rate received Unrealised
appreciation/(depreciation)
(EUR)766,400,000.00 KRW 17/03/17 KRW CERTIF DEPOSIT 3 MONTHS 1.81% 346.87
1,681,756.00 MXN 21/03/18 6.11% MXN TIIE 1 MONTH 2,285.091,515,000.00 MXN 06/06/25 MXN TIIE 1 MONTH 6.43% (6,336.38)5,160,000.00 AUD 01/07/17 AUD BANK BILL 3 MONTHS 2.25% 7,829.243,899,000.00 MXN 17/07/25 MXN TIIE 1 MONTH 6.32% (17,695.85)1,943,000.00 MXN 17/07/25 MXN TIIE 1 MONTH 6.33% (8,790.09)5,886,000.00 MXN 06/08/25 MXN TIIE 1 MONTH 6.32% (26,902.94)2,036,000.00 MXN 11/08/25 5.60% MXN TIIE 1 MONTH 9,370.682,036,000.00 MXN 11/08/25 5.60% MXN TIIE 1 MONTH 9,370.687,558,973.00 MXN 11/08/25 5.60% MXN TIIE 1 MONTH 34,852.285,102,000.00 AUD 27/06/17 AUD BANK BILL 3 MONTHS 2.23% 6,911.914,500,000.00 AUD 17/10/17 AUD BANK BILL 3 MONTHS 1.89% 1,156.66
1,500,000,000.00 KRW 19/10/17 KRW CERTIF DEPOSIT 3 MONTHS 1.54% 407.60492,429,094.00 KRW 10/11/17 1.38% KRW CERTIF DEPOSIT 3 MONTHS (649.44)492,429,094.00 KRW 10/11/17 KRW CERTIF DEPOSIT 3 MONTHS 1.92% 1,414.83
340,000.00 EUR 09/12/25 EUR EURIBOR 6 MONTHS 0.94% 12,061.09340,000.00 EUR 09/12/25 EUR EURIBOR 6 MONTHS 0.94% 12,121.20130,000.00 EUR 09/12/25 EUR EURIBOR 6 MONTHS 0.94% 4,623.07
1,063,709.00 MXN 05/12/18 5.60% MXN TIIE 1 MONTH 2,200.961,570,422.00 MXN 07/12/17 5.60% MXN TIIE 1 MONTH 1,754.731,063,710.00 MXN 06/12/18 5.60% MXN TIIE 1 MONTH 2,267.401,063,709.00 MXN 06/12/18 5.60% MXN TIIE 1 MONTH 2,213.56
288,467.00 MXN 05/12/25 MXN TIIE 1 MONTH 6.27% (1,410.69)1,550,000.00 SEK 09/12/25 -0.63% SEK STIBOR 3 MONTHS (8,177.94)3,000,000.00 SEK 09/12/25 -0.63% SEK STIBOR 3 MONTHS (15,828.29)3,200,000.00 SEK 09/12/25 -0.63% SEK STIBOR 3 MONTHS (16,883.50)7,881,000.00 MXN 24/03/26 MXN TIIE 1 MONTH 6.02% (45,864.95)3,670,000.00 USD 20/07/21 0.88% USD LIBOR 3 MONTHS 127,785.371,200,000.00 USD 21/07/21 0.88% USD LIBOR 3 MONTHS 40,828.853,650,000.00 USD 22/07/21 0.88% USD LIBOR 3 MONTHS 117,240.844,000,000.00 SEK 08/09/26 -0.62% SEK STIBOR 3 MONTHS 16,202.911,689,732.00 BRL 03/07/17 11.70% BRL MONEY MARKET CDI (1,614.34)1,407,910.00 BRL 03/07/17 11.70% BRL MONEY MARKET CDI (1,345.09)
197,430,000.00 HUF 15/03/27 0.42% HUF BUBOR 6 MONTHS 13,355.84917,303.00 BRL 02/01/20 BRL MONEY MARKET CDI 11.88% 5,118.43
7,734,000.00 USD 23/09/21 1.00% USD LIBOR 3 MONTHS 241,513.402,814,919.00 BRL 03/07/17 11.55% BRL MONEY MARKET CDI (1,997.38)
200,000.00 USD 03/10/21 0.85% USD LIBOR 3 MONTHS 6,960.23106,405.00 BRL 03/07/17 11.49% BRL MONEY MARKET CDI (64.02)43,108.00 BRL 02/01/20 BRL MONEY MARKET CDI 11.38% 63.23
326,592.00 BRL 02/01/20 BRL MONEY MARKET CDI 11.10% (256.45)1,190,549.00 BRL 02/01/20 BRL MONEY MARKET CDI 11.10% (954.08)8,156,000.00 CZK 15/03/27 0.35% CZK PRIBOR 6 MONTHS 4,510.17
272,000.00 USD 18/10/26 0.88% USD LIBOR 3 MONTHS 17,222.1115,000,000.00 JPY 21/10/46 0.01% JPY LIBOR 6 MONTHS 9,769.4617,000,000.00 JPY 21/10/36 JPY LIBOR 6 MONTHS 0.43% (5,971.55)
622,586.00 BRL 02/01/20 BRL MONEY MARKET CDI 11.04% (772.51)3,168,955.00 BRL 03/07/17 11.26% BRL MONEY MARKET CDI (1,893.08)
43,500,000.00 JPY 25/10/36 JPY LIBOR 6 MONTHS 0.41% (16,218.85)30,000,000.00 JPY 25/10/46 0.01% JPY LIBOR 6 MONTHS 20,483.9243,500,000.00 JPY 25/10/36 JPY LIBOR 6 MONTHS 0.42% (15,814.05)30,000,000.00 JPY 25/10/46 0.01% JPY LIBOR 6 MONTHS 20,001.18
645,061.00 BRL 02/01/20 BRL MONEY MARKET CDI 11.00% (1,007.01)612,282.00 BRL 02/01/20 BRL MONEY MARKET CDI 11.03% (808.52)
59,000,000.00 JPY 02/11/46 0.02% JPY LIBOR 6 MONTHS 37,650.88164,000,000.00 JPY 02/11/26 JPY LIBOR 6 MONTHS 0.09% (16,357.43)
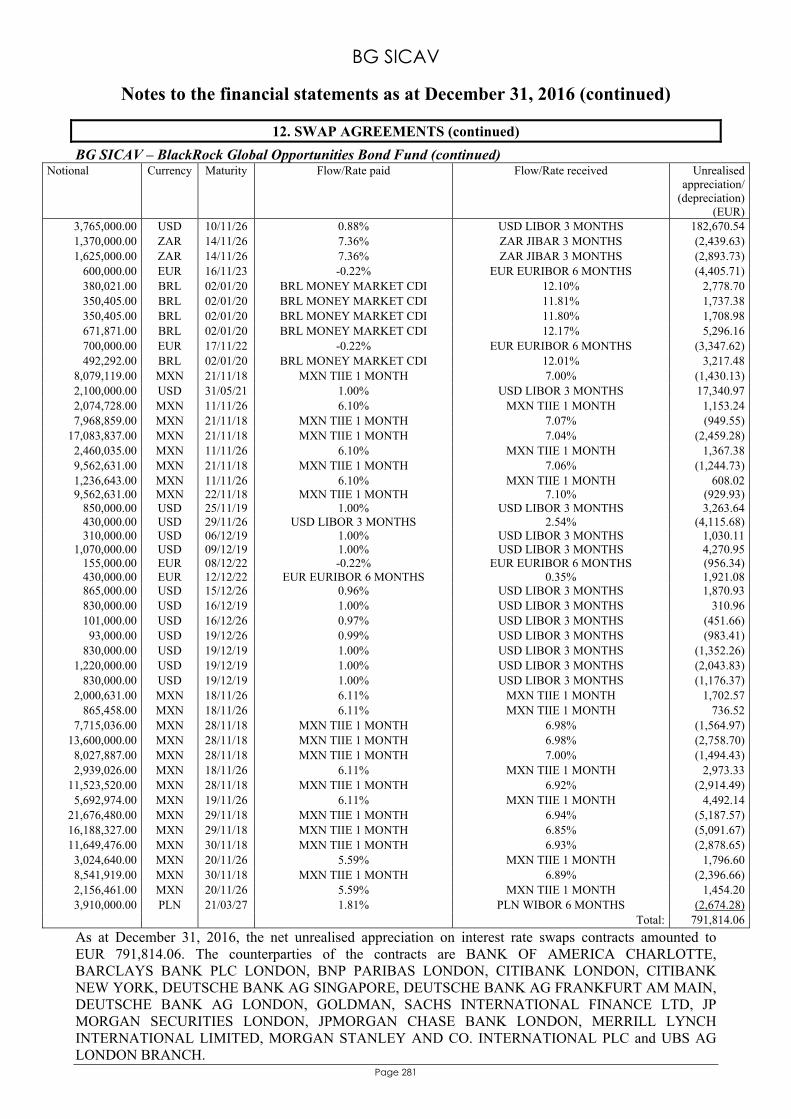
BG SICAV
Notes to the financial statements as at December 31, 2016 (continued)
Page 281
12. SWAP AGREEMENTS (continued)
BG SICAV – BlackRock Global Opportunities Bond Fund (continued) Notional Currency Maturity Flow/Rate paid Flow/Rate received Unrealised
appreciation/(depreciation)
(EUR)3,765,000.00 USD 10/11/26 0.88% USD LIBOR 3 MONTHS 182,670.541,370,000.00 ZAR 14/11/26 7.36% ZAR JIBAR 3 MONTHS (2,439.63)1,625,000.00 ZAR 14/11/26 7.36% ZAR JIBAR 3 MONTHS (2,893.73)
600,000.00 EUR 16/11/23 -0.22% EUR EURIBOR 6 MONTHS (4,405.71)380,021.00 BRL 02/01/20 BRL MONEY MARKET CDI 12.10% 2,778.70350,405.00 BRL 02/01/20 BRL MONEY MARKET CDI 11.81% 1,737.38350,405.00 BRL 02/01/20 BRL MONEY MARKET CDI 11.80% 1,708.98671,871.00 BRL 02/01/20 BRL MONEY MARKET CDI 12.17% 5,296.16700,000.00 EUR 17/11/22 -0.22% EUR EURIBOR 6 MONTHS (3,347.62)492,292.00 BRL 02/01/20 BRL MONEY MARKET CDI 12.01% 3,217.48
8,079,119.00 MXN 21/11/18 MXN TIIE 1 MONTH 7.00% (1,430.13)2,100,000.00 USD 31/05/21 1.00% USD LIBOR 3 MONTHS 17,340.972,074,728.00 MXN 11/11/26 6.10% MXN TIIE 1 MONTH 1,153.247,968,859.00 MXN 21/11/18 MXN TIIE 1 MONTH 7.07% (949.55)
17,083,837.00 MXN 21/11/18 MXN TIIE 1 MONTH 7.04% (2,459.28)2,460,035.00 MXN 11/11/26 6.10% MXN TIIE 1 MONTH 1,367.389,562,631.00 MXN 21/11/18 MXN TIIE 1 MONTH 7.06% (1,244.73)1,236,643.00 MXN 11/11/26 6.10% MXN TIIE 1 MONTH 608.029,562,631.00 MXN 22/11/18 MXN TIIE 1 MONTH 7.10% (929.93)
850,000.00 USD 25/11/19 1.00% USD LIBOR 3 MONTHS 3,263.64430,000.00 USD 29/11/26 USD LIBOR 3 MONTHS 2.54% (4,115.68)310,000.00 USD 06/12/19 1.00% USD LIBOR 3 MONTHS 1,030.11
1,070,000.00 USD 09/12/19 1.00% USD LIBOR 3 MONTHS 4,270.95155,000.00 EUR 08/12/22 -0.22% EUR EURIBOR 6 MONTHS (956.34)430,000.00 EUR 12/12/22 EUR EURIBOR 6 MONTHS 0.35% 1,921.08865,000.00 USD 15/12/26 0.96% USD LIBOR 3 MONTHS 1,870.93830,000.00 USD 16/12/19 1.00% USD LIBOR 3 MONTHS 310.96101,000.00 USD 16/12/26 0.97% USD LIBOR 3 MONTHS (451.66)93,000.00 USD 19/12/26 0.99% USD LIBOR 3 MONTHS (983.41)
830,000.00 USD 19/12/19 1.00% USD LIBOR 3 MONTHS (1,352.26)1,220,000.00 USD 19/12/19 1.00% USD LIBOR 3 MONTHS (2,043.83)
830,000.00 USD 19/12/19 1.00% USD LIBOR 3 MONTHS (1,176.37)2,000,631.00 MXN 18/11/26 6.11% MXN TIIE 1 MONTH 1,702.57
865,458.00 MXN 18/11/26 6.11% MXN TIIE 1 MONTH 736.527,715,036.00 MXN 28/11/18 MXN TIIE 1 MONTH 6.98% (1,564.97)
13,600,000.00 MXN 28/11/18 MXN TIIE 1 MONTH 6.98% (2,758.70)8,027,887.00 MXN 28/11/18 MXN TIIE 1 MONTH 7.00% (1,494.43)2,939,026.00 MXN 18/11/26 6.11% MXN TIIE 1 MONTH 2,973.33
11,523,520.00 MXN 28/11/18 MXN TIIE 1 MONTH 6.92% (2,914.49)5,692,974.00 MXN 19/11/26 6.11% MXN TIIE 1 MONTH 4,492.14
21,676,480.00 MXN 29/11/18 MXN TIIE 1 MONTH 6.94% (5,187.57)16,188,327.00 MXN 29/11/18 MXN TIIE 1 MONTH 6.85% (5,091.67)11,649,476.00 MXN 30/11/18 MXN TIIE 1 MONTH 6.93% (2,878.65)3,024,640.00 MXN 20/11/26 5.59% MXN TIIE 1 MONTH 1,796.608,541,919.00 MXN 30/11/18 MXN TIIE 1 MONTH 6.89% (2,396.66)2,156,461.00 MXN 20/11/26 5.59% MXN TIIE 1 MONTH 1,454.203,910,000.00 PLN 21/03/27 1.81% PLN WIBOR 6 MONTHS (2,674.28)
Total: 791,814.06
As at December 31, 2016, the net unrealised appreciation on interest rate swaps contracts amounted to EUR 791,814.06. The counterparties of the contracts are BANK OF AMERICA CHARLOTTE, BARCLAYS BANK PLC LONDON, BNP PARIBAS LONDON, CITIBANK LONDON, CITIBANK NEW YORK, DEUTSCHE BANK AG SINGAPORE, DEUTSCHE BANK AG FRANKFURT AM MAIN, DEUTSCHE BANK AG LONDON, GOLDMAN, SACHS INTERNATIONAL FINANCE LTD, JP MORGAN SECURITIES LONDON, JPMORGAN CHASE BANK LONDON, MERRILL LYNCH INTERNATIONAL LIMITED, MORGAN STANLEY AND CO. INTERNATIONAL PLC and UBS AG LONDON BRANCH.
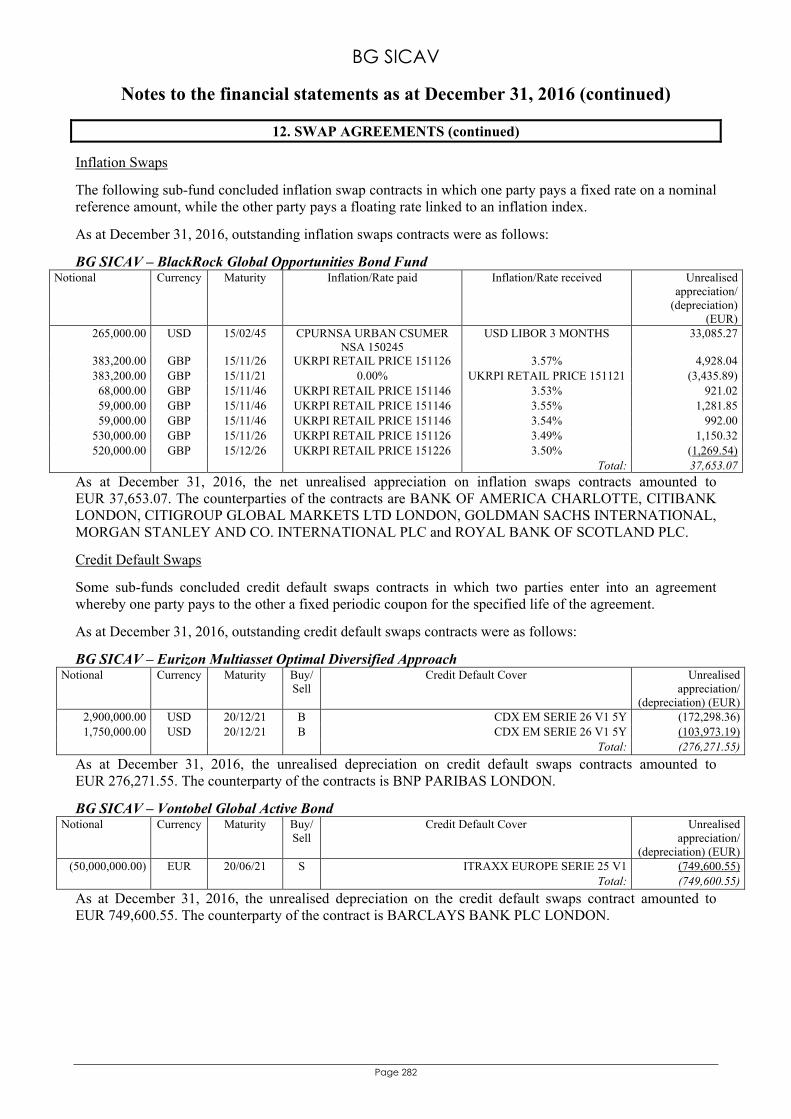
BG SICAV
Notes to the financial statements as at December 31, 2016 (continued)
Page 282
12. SWAP AGREEMENTS (continued)
Inflation Swaps
The following sub-fund concluded inflation swap contracts in which one party pays a fixed rate on a nominal reference amount, while the other party pays a floating rate linked to an inflation index.
As at December 31, 2016, outstanding inflation swaps contracts were as follows:
BG SICAV – BlackRock Global Opportunities Bond Fund Notional Currency Maturity Inflation/Rate paid Inflation/Rate received Unrealised
appreciation/(depreciation)
(EUR)265,000.00 USD 15/02/45 CPURNSA URBAN CSUMER
NSA 150245 USD LIBOR 3 MONTHS 33,085.27
383,200.00 GBP 15/11/26 UKRPI RETAIL PRICE 151126 3.57% 4,928.04383,200.00 GBP 15/11/21 0.00% UKRPI RETAIL PRICE 151121 (3,435.89)68,000.00 GBP 15/11/46 UKRPI RETAIL PRICE 151146 3.53% 921.0259,000.00 GBP 15/11/46 UKRPI RETAIL PRICE 151146 3.55% 1,281.8559,000.00 GBP 15/11/46 UKRPI RETAIL PRICE 151146 3.54% 992.00
530,000.00 GBP 15/11/26 UKRPI RETAIL PRICE 151126 3.49% 1,150.32520,000.00 GBP 15/12/26 UKRPI RETAIL PRICE 151226 3.50% (1,269.54)
Total: 37,653.07
As at December 31, 2016, the net unrealised appreciation on inflation swaps contracts amounted to EUR 37,653.07. The counterparties of the contracts are BANK OF AMERICA CHARLOTTE, CITIBANK LONDON, CITIGROUP GLOBAL MARKETS LTD LONDON, GOLDMAN SACHS INTERNATIONAL, MORGAN STANLEY AND CO. INTERNATIONAL PLC and ROYAL BANK OF SCOTLAND PLC.
Credit Default Swaps
Some sub-funds concluded credit default swaps contracts in which two parties enter into an agreement whereby one party pays to the other a fixed periodic coupon for the specified life of the agreement.
As at December 31, 2016, outstanding credit default swaps contracts were as follows:
BG SICAV – Eurizon Multiasset Optimal Diversified Approach Notional Currency Maturity Buy/
Sell Credit Default Cover Unrealised
appreciation/(depreciation) (EUR)
2,900,000.00 USD 20/12/21 B CDX EM SERIE 26 V1 5Y (172,298.36)1,750,000.00 USD 20/12/21 B CDX EM SERIE 26 V1 5Y (103,973.19)
Total: (276,271.55)
As at December 31, 2016, the unrealised depreciation on credit default swaps contracts amounted to EUR 276,271.55. The counterparty of the contracts is BNP PARIBAS LONDON.
BG SICAV – Vontobel Global Active Bond Notional Currency Maturity Buy/
Sell Credit Default Cover Unrealised
appreciation/(depreciation) (EUR)
(50,000,000.00) EUR 20/06/21 S ITRAXX EUROPE SERIE 25 V1 (749,600.55) Total: (749,600.55)
As at December 31, 2016, the unrealised depreciation on the credit default swaps contract amounted to EUR 749,600.55. The counterparty of the contract is BARCLAYS BANK PLC LONDON.
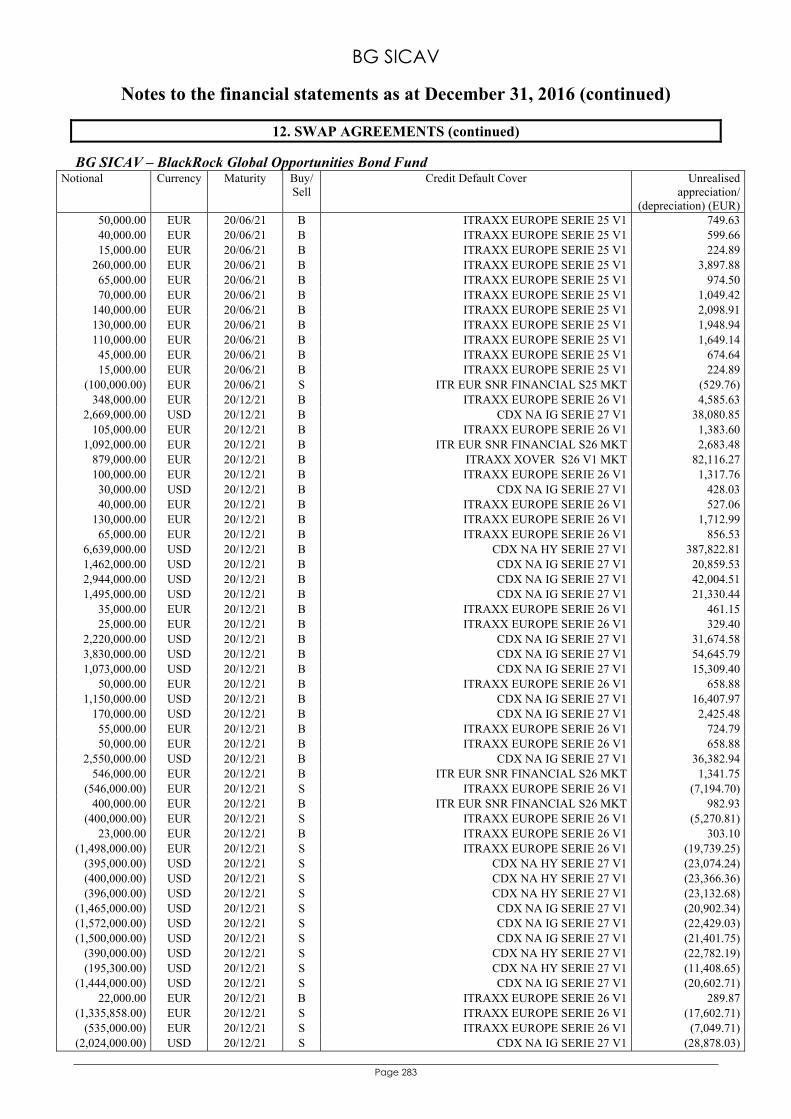
BG SICAV
Notes to the financial statements as at December 31, 2016 (continued)
Page 283
12. SWAP AGREEMENTS (continued)
BG SICAV – BlackRock Global Opportunities Bond Fund Notional Currency Maturity Buy/
Sell Credit Default Cover Unrealised
appreciation/(depreciation) (EUR)
50,000.00 EUR 20/06/21 B ITRAXX EUROPE SERIE 25 V1 749.6340,000.00 EUR 20/06/21 B ITRAXX EUROPE SERIE 25 V1 599.6615,000.00 EUR 20/06/21 B ITRAXX EUROPE SERIE 25 V1 224.89
260,000.00 EUR 20/06/21 B ITRAXX EUROPE SERIE 25 V1 3,897.8865,000.00 EUR 20/06/21 B ITRAXX EUROPE SERIE 25 V1 974.5070,000.00 EUR 20/06/21 B ITRAXX EUROPE SERIE 25 V1 1,049.42
140,000.00 EUR 20/06/21 B ITRAXX EUROPE SERIE 25 V1 2,098.91130,000.00 EUR 20/06/21 B ITRAXX EUROPE SERIE 25 V1 1,948.94110,000.00 EUR 20/06/21 B ITRAXX EUROPE SERIE 25 V1 1,649.1445,000.00 EUR 20/06/21 B ITRAXX EUROPE SERIE 25 V1 674.6415,000.00 EUR 20/06/21 B ITRAXX EUROPE SERIE 25 V1 224.89
(100,000.00) EUR 20/06/21 S ITR EUR SNR FINANCIAL S25 MKT (529.76)348,000.00 EUR 20/12/21 B ITRAXX EUROPE SERIE 26 V1 4,585.63
2,669,000.00 USD 20/12/21 B CDX NA IG SERIE 27 V1 38,080.85105,000.00 EUR 20/12/21 B ITRAXX EUROPE SERIE 26 V1 1,383.60
1,092,000.00 EUR 20/12/21 B ITR EUR SNR FINANCIAL S26 MKT 2,683.48879,000.00 EUR 20/12/21 B ITRAXX XOVER S26 V1 MKT 82,116.27100,000.00 EUR 20/12/21 B ITRAXX EUROPE SERIE 26 V1 1,317.7630,000.00 USD 20/12/21 B CDX NA IG SERIE 27 V1 428.0340,000.00 EUR 20/12/21 B ITRAXX EUROPE SERIE 26 V1 527.06
130,000.00 EUR 20/12/21 B ITRAXX EUROPE SERIE 26 V1 1,712.9965,000.00 EUR 20/12/21 B ITRAXX EUROPE SERIE 26 V1 856.53
6,639,000.00 USD 20/12/21 B CDX NA HY SERIE 27 V1 387,822.811,462,000.00 USD 20/12/21 B CDX NA IG SERIE 27 V1 20,859.532,944,000.00 USD 20/12/21 B CDX NA IG SERIE 27 V1 42,004.511,495,000.00 USD 20/12/21 B CDX NA IG SERIE 27 V1 21,330.44
35,000.00 EUR 20/12/21 B ITRAXX EUROPE SERIE 26 V1 461.1525,000.00 EUR 20/12/21 B ITRAXX EUROPE SERIE 26 V1 329.40
2,220,000.00 USD 20/12/21 B CDX NA IG SERIE 27 V1 31,674.583,830,000.00 USD 20/12/21 B CDX NA IG SERIE 27 V1 54,645.791,073,000.00 USD 20/12/21 B CDX NA IG SERIE 27 V1 15,309.40
50,000.00 EUR 20/12/21 B ITRAXX EUROPE SERIE 26 V1 658.881,150,000.00 USD 20/12/21 B CDX NA IG SERIE 27 V1 16,407.97
170,000.00 USD 20/12/21 B CDX NA IG SERIE 27 V1 2,425.4855,000.00 EUR 20/12/21 B ITRAXX EUROPE SERIE 26 V1 724.7950,000.00 EUR 20/12/21 B ITRAXX EUROPE SERIE 26 V1 658.88
2,550,000.00 USD 20/12/21 B CDX NA IG SERIE 27 V1 36,382.94546,000.00 EUR 20/12/21 B ITR EUR SNR FINANCIAL S26 MKT 1,341.75
(546,000.00) EUR 20/12/21 S ITRAXX EUROPE SERIE 26 V1 (7,194.70)400,000.00 EUR 20/12/21 B ITR EUR SNR FINANCIAL S26 MKT 982.93
(400,000.00) EUR 20/12/21 S ITRAXX EUROPE SERIE 26 V1 (5,270.81)23,000.00 EUR 20/12/21 B ITRAXX EUROPE SERIE 26 V1 303.10
(1,498,000.00) EUR 20/12/21 S ITRAXX EUROPE SERIE 26 V1 (19,739.25)(395,000.00) USD 20/12/21 S CDX NA HY SERIE 27 V1 (23,074.24)(400,000.00) USD 20/12/21 S CDX NA HY SERIE 27 V1 (23,366.36)(396,000.00) USD 20/12/21 S CDX NA HY SERIE 27 V1 (23,132.68)
(1,465,000.00) USD 20/12/21 S CDX NA IG SERIE 27 V1 (20,902.34)(1,572,000.00) USD 20/12/21 S CDX NA IG SERIE 27 V1 (22,429.03)(1,500,000.00) USD 20/12/21 S CDX NA IG SERIE 27 V1 (21,401.75)
(390,000.00) USD 20/12/21 S CDX NA HY SERIE 27 V1 (22,782.19)(195,300.00) USD 20/12/21 S CDX NA HY SERIE 27 V1 (11,408.65)
(1,444,000.00) USD 20/12/21 S CDX NA IG SERIE 27 V1 (20,602.71)22,000.00 EUR 20/12/21 B ITRAXX EUROPE SERIE 26 V1 289.87
(1,335,858.00) EUR 20/12/21 S ITRAXX EUROPE SERIE 26 V1 (17,602.71)(535,000.00) EUR 20/12/21 S ITRAXX EUROPE SERIE 26 V1 (7,049.71)
(2,024,000.00) USD 20/12/21 S CDX NA IG SERIE 27 V1 (28,878.03)
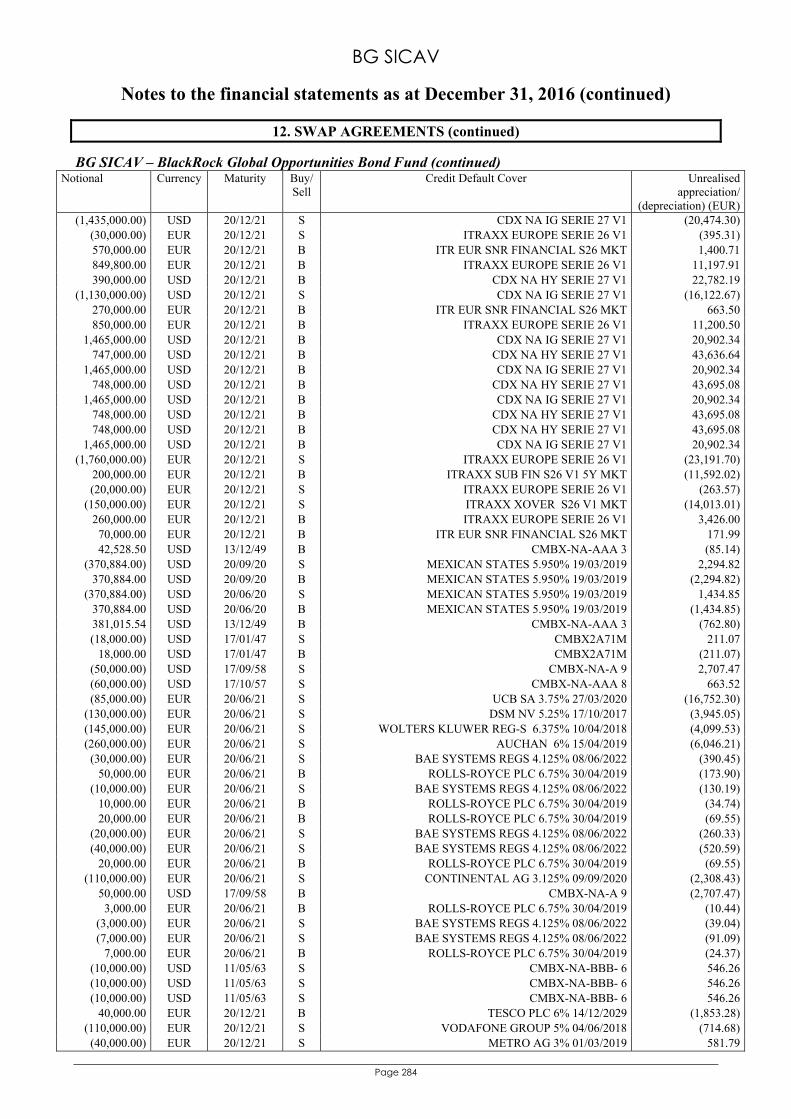
BG SICAV
Notes to the financial statements as at December 31, 2016 (continued)
Page 284
12. SWAP AGREEMENTS (continued)
BG SICAV – BlackRock Global Opportunities Bond Fund (continued) Notional Currency Maturity Buy/
Sell Credit Default Cover Unrealised
appreciation/(depreciation) (EUR)
(1,435,000.00) USD 20/12/21 S CDX NA IG SERIE 27 V1 (20,474.30)(30,000.00) EUR 20/12/21 S ITRAXX EUROPE SERIE 26 V1 (395.31)570,000.00 EUR 20/12/21 B ITR EUR SNR FINANCIAL S26 MKT 1,400.71849,800.00 EUR 20/12/21 B ITRAXX EUROPE SERIE 26 V1 11,197.91390,000.00 USD 20/12/21 B CDX NA HY SERIE 27 V1 22,782.19
(1,130,000.00) USD 20/12/21 S CDX NA IG SERIE 27 V1 (16,122.67)270,000.00 EUR 20/12/21 B ITR EUR SNR FINANCIAL S26 MKT 663.50850,000.00 EUR 20/12/21 B ITRAXX EUROPE SERIE 26 V1 11,200.50
1,465,000.00 USD 20/12/21 B CDX NA IG SERIE 27 V1 20,902.34747,000.00 USD 20/12/21 B CDX NA HY SERIE 27 V1 43,636.64
1,465,000.00 USD 20/12/21 B CDX NA IG SERIE 27 V1 20,902.34748,000.00 USD 20/12/21 B CDX NA HY SERIE 27 V1 43,695.08
1,465,000.00 USD 20/12/21 B CDX NA IG SERIE 27 V1 20,902.34748,000.00 USD 20/12/21 B CDX NA HY SERIE 27 V1 43,695.08748,000.00 USD 20/12/21 B CDX NA HY SERIE 27 V1 43,695.08
1,465,000.00 USD 20/12/21 B CDX NA IG SERIE 27 V1 20,902.34(1,760,000.00) EUR 20/12/21 S ITRAXX EUROPE SERIE 26 V1 (23,191.70)
200,000.00 EUR 20/12/21 B ITRAXX SUB FIN S26 V1 5Y MKT (11,592.02)(20,000.00) EUR 20/12/21 S ITRAXX EUROPE SERIE 26 V1 (263.57)
(150,000.00) EUR 20/12/21 S ITRAXX XOVER S26 V1 MKT (14,013.01)260,000.00 EUR 20/12/21 B ITRAXX EUROPE SERIE 26 V1 3,426.0070,000.00 EUR 20/12/21 B ITR EUR SNR FINANCIAL S26 MKT 171.9942,528.50 USD 13/12/49 B CMBX-NA-AAA 3 (85.14)
(370,884.00) USD 20/09/20 S MEXICAN STATES 5.950% 19/03/2019 2,294.82370,884.00 USD 20/09/20 B MEXICAN STATES 5.950% 19/03/2019 (2,294.82)
(370,884.00) USD 20/06/20 S MEXICAN STATES 5.950% 19/03/2019 1,434.85370,884.00 USD 20/06/20 B MEXICAN STATES 5.950% 19/03/2019 (1,434.85)381,015.54 USD 13/12/49 B CMBX-NA-AAA 3 (762.80)(18,000.00) USD 17/01/47 S CMBX2A71M 211.07
18,000.00 USD 17/01/47 B CMBX2A71M (211.07)(50,000.00) USD 17/09/58 S CMBX-NA-A 9 2,707.47(60,000.00) USD 17/10/57 S CMBX-NA-AAA 8 663.52(85,000.00) EUR 20/06/21 S UCB SA 3.75% 27/03/2020 (16,752.30)
(130,000.00) EUR 20/06/21 S DSM NV 5.25% 17/10/2017 (3,945.05)(145,000.00) EUR 20/06/21 S WOLTERS KLUWER REG-S 6.375% 10/04/2018 (4,099.53)(260,000.00) EUR 20/06/21 S AUCHAN 6% 15/04/2019 (6,046.21)(30,000.00) EUR 20/06/21 S BAE SYSTEMS REGS 4.125% 08/06/2022 (390.45)
50,000.00 EUR 20/06/21 B ROLLS-ROYCE PLC 6.75% 30/04/2019 (173.90)(10,000.00) EUR 20/06/21 S BAE SYSTEMS REGS 4.125% 08/06/2022 (130.19)
10,000.00 EUR 20/06/21 B ROLLS-ROYCE PLC 6.75% 30/04/2019 (34.74)20,000.00 EUR 20/06/21 B ROLLS-ROYCE PLC 6.75% 30/04/2019 (69.55)
(20,000.00) EUR 20/06/21 S BAE SYSTEMS REGS 4.125% 08/06/2022 (260.33)(40,000.00) EUR 20/06/21 S BAE SYSTEMS REGS 4.125% 08/06/2022 (520.59)
20,000.00 EUR 20/06/21 B ROLLS-ROYCE PLC 6.75% 30/04/2019 (69.55)(110,000.00) EUR 20/06/21 S CONTINENTAL AG 3.125% 09/09/2020 (2,308.43)
50,000.00 USD 17/09/58 B CMBX-NA-A 9 (2,707.47)3,000.00 EUR 20/06/21 B ROLLS-ROYCE PLC 6.75% 30/04/2019 (10.44)
(3,000.00) EUR 20/06/21 S BAE SYSTEMS REGS 4.125% 08/06/2022 (39.04)(7,000.00) EUR 20/06/21 S BAE SYSTEMS REGS 4.125% 08/06/2022 (91.09)
7,000.00 EUR 20/06/21 B ROLLS-ROYCE PLC 6.75% 30/04/2019 (24.37)(10,000.00) USD 11/05/63 S CMBX-NA-BBB- 6 546.26(10,000.00) USD 11/05/63 S CMBX-NA-BBB- 6 546.26(10,000.00) USD 11/05/63 S CMBX-NA-BBB- 6 546.26
40,000.00 EUR 20/12/21 B TESCO PLC 6% 14/12/2029 (1,853.28)(110,000.00) EUR 20/12/21 S VODAFONE GROUP 5% 04/06/2018 (714.68)(40,000.00) EUR 20/12/21 S METRO AG 3% 01/03/2019 581.79
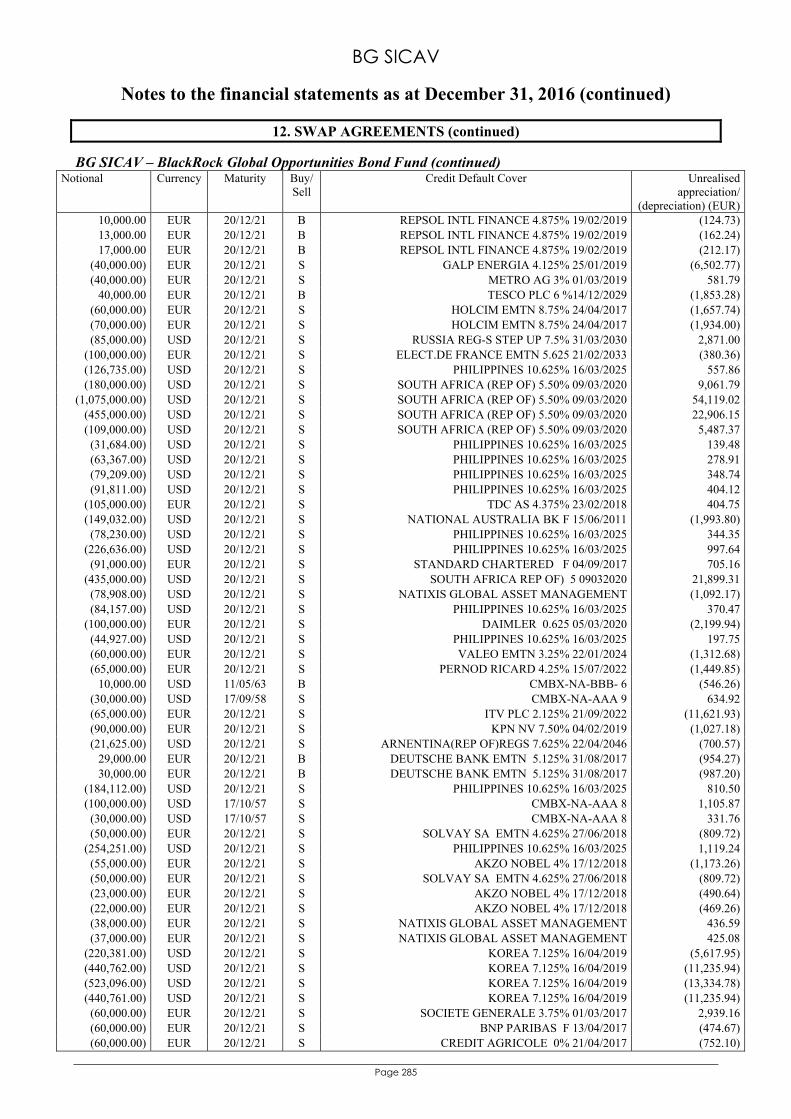
BG SICAV
Notes to the financial statements as at December 31, 2016 (continued)
Page 285
12. SWAP AGREEMENTS (continued)
BG SICAV – BlackRock Global Opportunities Bond Fund (continued) Notional Currency Maturity Buy/
Sell Credit Default Cover Unrealised
appreciation/(depreciation) (EUR)
10,000.00 EUR 20/12/21 B REPSOL INTL FINANCE 4.875% 19/02/2019 (124.73)13,000.00 EUR 20/12/21 B REPSOL INTL FINANCE 4.875% 19/02/2019 (162.24)17,000.00 EUR 20/12/21 B REPSOL INTL FINANCE 4.875% 19/02/2019 (212.17)
(40,000.00) EUR 20/12/21 S GALP ENERGIA 4.125% 25/01/2019 (6,502.77)(40,000.00) EUR 20/12/21 S METRO AG 3% 01/03/2019 581.79
40,000.00 EUR 20/12/21 B TESCO PLC 6 %14/12/2029 (1,853.28)(60,000.00) EUR 20/12/21 S HOLCIM EMTN 8.75% 24/04/2017 (1,657.74)(70,000.00) EUR 20/12/21 S HOLCIM EMTN 8.75% 24/04/2017 (1,934.00)(85,000.00) USD 20/12/21 S RUSSIA REG-S STEP UP 7.5% 31/03/2030 2,871.00
(100,000.00) EUR 20/12/21 S ELECT.DE FRANCE EMTN 5.625 21/02/2033 (380.36)(126,735.00) USD 20/12/21 S PHILIPPINES 10.625% 16/03/2025 557.86(180,000.00) USD 20/12/21 S SOUTH AFRICA (REP OF) 5.50% 09/03/2020 9,061.79
(1,075,000.00) USD 20/12/21 S SOUTH AFRICA (REP OF) 5.50% 09/03/2020 54,119.02(455,000.00) USD 20/12/21 S SOUTH AFRICA (REP OF) 5.50% 09/03/2020 22,906.15(109,000.00) USD 20/12/21 S SOUTH AFRICA (REP OF) 5.50% 09/03/2020 5,487.37(31,684.00) USD 20/12/21 S PHILIPPINES 10.625% 16/03/2025 139.48(63,367.00) USD 20/12/21 S PHILIPPINES 10.625% 16/03/2025 278.91(79,209.00) USD 20/12/21 S PHILIPPINES 10.625% 16/03/2025 348.74(91,811.00) USD 20/12/21 S PHILIPPINES 10.625% 16/03/2025 404.12
(105,000.00) EUR 20/12/21 S TDC AS 4.375% 23/02/2018 404.75(149,032.00) USD 20/12/21 S NATIONAL AUSTRALIA BK F 15/06/2011 (1,993.80)(78,230.00) USD 20/12/21 S PHILIPPINES 10.625% 16/03/2025 344.35
(226,636.00) USD 20/12/21 S PHILIPPINES 10.625% 16/03/2025 997.64(91,000.00) EUR 20/12/21 S STANDARD CHARTERED F 04/09/2017 705.16
(435,000.00) USD 20/12/21 S SOUTH AFRICA REP OF) 5 09032020 21,899.31(78,908.00) USD 20/12/21 S NATIXIS GLOBAL ASSET MANAGEMENT (1,092.17)(84,157.00) USD 20/12/21 S PHILIPPINES 10.625% 16/03/2025 370.47
(100,000.00) EUR 20/12/21 S DAIMLER 0.625 05/03/2020 (2,199.94)(44,927.00) USD 20/12/21 S PHILIPPINES 10.625% 16/03/2025 197.75(60,000.00) EUR 20/12/21 S VALEO EMTN 3.25% 22/01/2024 (1,312.68)(65,000.00) EUR 20/12/21 S PERNOD RICARD 4.25% 15/07/2022 (1,449.85)
10,000.00 USD 11/05/63 B CMBX-NA-BBB- 6 (546.26)(30,000.00) USD 17/09/58 S CMBX-NA-AAA 9 634.92(65,000.00) EUR 20/12/21 S ITV PLC 2.125% 21/09/2022 (11,621.93)(90,000.00) EUR 20/12/21 S KPN NV 7.50% 04/02/2019 (1,027.18)(21,625.00) USD 20/12/21 S ARNENTINA(REP OF)REGS 7.625% 22/04/2046 (700.57)
29,000.00 EUR 20/12/21 B DEUTSCHE BANK EMTN 5.125% 31/08/2017 (954.27)30,000.00 EUR 20/12/21 B DEUTSCHE BANK EMTN 5.125% 31/08/2017 (987.20)
(184,112.00) USD 20/12/21 S PHILIPPINES 10.625% 16/03/2025 810.50(100,000.00) USD 17/10/57 S CMBX-NA-AAA 8 1,105.87(30,000.00) USD 17/10/57 S CMBX-NA-AAA 8 331.76(50,000.00) EUR 20/12/21 S SOLVAY SA EMTN 4.625% 27/06/2018 (809.72)
(254,251.00) USD 20/12/21 S PHILIPPINES 10.625% 16/03/2025 1,119.24(55,000.00) EUR 20/12/21 S AKZO NOBEL 4% 17/12/2018 (1,173.26)(50,000.00) EUR 20/12/21 S SOLVAY SA EMTN 4.625% 27/06/2018 (809.72)(23,000.00) EUR 20/12/21 S AKZO NOBEL 4% 17/12/2018 (490.64)(22,000.00) EUR 20/12/21 S AKZO NOBEL 4% 17/12/2018 (469.26)(38,000.00) EUR 20/12/21 S NATIXIS GLOBAL ASSET MANAGEMENT 436.59(37,000.00) EUR 20/12/21 S NATIXIS GLOBAL ASSET MANAGEMENT 425.08
(220,381.00) USD 20/12/21 S KOREA 7.125% 16/04/2019 (5,617.95)(440,762.00) USD 20/12/21 S KOREA 7.125% 16/04/2019 (11,235.94)(523,096.00) USD 20/12/21 S KOREA 7.125% 16/04/2019 (13,334.78)(440,761.00) USD 20/12/21 S KOREA 7.125% 16/04/2019 (11,235.94)(60,000.00) EUR 20/12/21 S SOCIETE GENERALE 3.75% 01/03/2017 2,939.16(60,000.00) EUR 20/12/21 S BNP PARIBAS F 13/04/2017 (474.67)(60,000.00) EUR 20/12/21 S CREDIT AGRICOLE 0% 21/04/2017 (752.10)
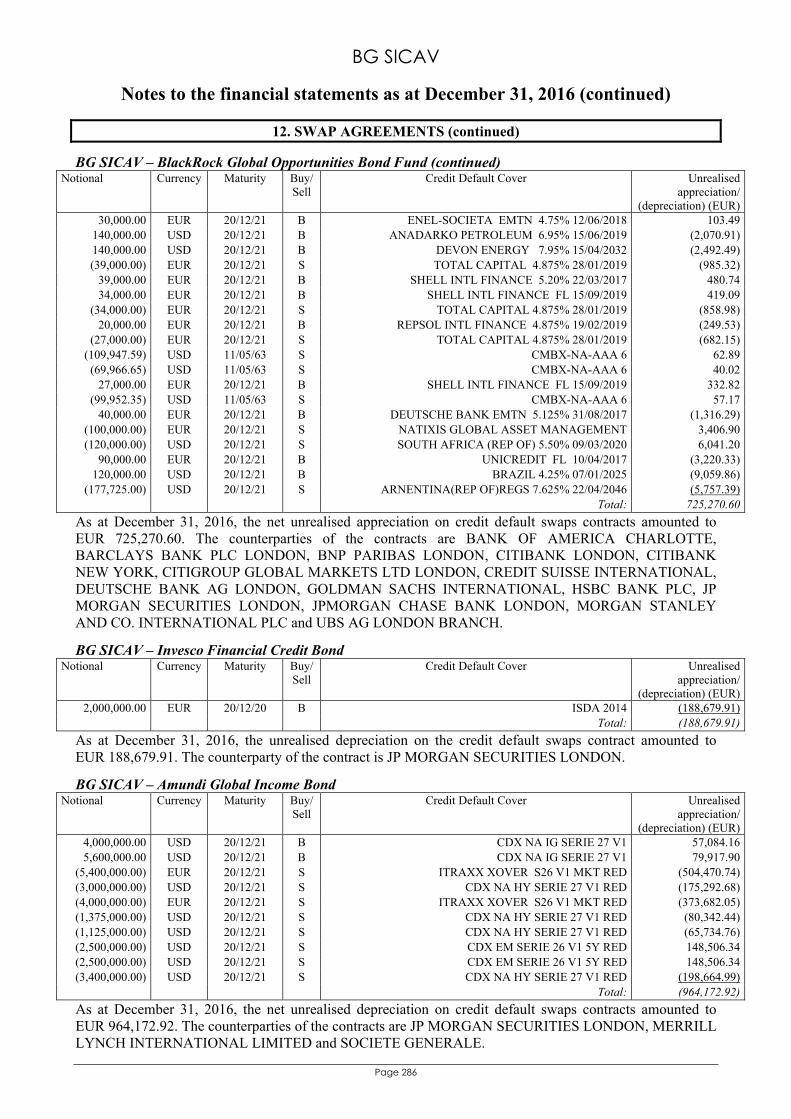
BG SICAV
Notes to the financial statements as at December 31, 2016 (continued)
Page 286
12. SWAP AGREEMENTS (continued)
BG SICAV – BlackRock Global Opportunities Bond Fund (continued) Notional Currency Maturity Buy/
Sell Credit Default Cover Unrealised
appreciation/(depreciation) (EUR)
30,000.00 EUR 20/12/21 B ENEL-SOCIETA EMTN 4.75% 12/06/2018 103.49140,000.00 USD 20/12/21 B ANADARKO PETROLEUM 6.95% 15/06/2019 (2,070.91)140,000.00 USD 20/12/21 B DEVON ENERGY 7.95% 15/04/2032 (2,492.49)(39,000.00) EUR 20/12/21 S TOTAL CAPITAL 4.875% 28/01/2019 (985.32)
39,000.00 EUR 20/12/21 B SHELL INTL FINANCE 5.20% 22/03/2017 480.7434,000.00 EUR 20/12/21 B SHELL INTL FINANCE FL 15/09/2019 419.09
(34,000.00) EUR 20/12/21 S TOTAL CAPITAL 4.875% 28/01/2019 (858.98)20,000.00 EUR 20/12/21 B REPSOL INTL FINANCE 4.875% 19/02/2019 (249.53)
(27,000.00) EUR 20/12/21 S TOTAL CAPITAL 4.875% 28/01/2019 (682.15)(109,947.59) USD 11/05/63 S CMBX-NA-AAA 6 62.89(69,966.65) USD 11/05/63 S CMBX-NA-AAA 6 40.02
27,000.00 EUR 20/12/21 B SHELL INTL FINANCE FL 15/09/2019 332.82(99,952.35) USD 11/05/63 S CMBX-NA-AAA 6 57.17
40,000.00 EUR 20/12/21 B DEUTSCHE BANK EMTN 5.125% 31/08/2017 (1,316.29)(100,000.00) EUR 20/12/21 S NATIXIS GLOBAL ASSET MANAGEMENT 3,406.90(120,000.00) USD 20/12/21 S SOUTH AFRICA (REP OF) 5.50% 09/03/2020 6,041.20
90,000.00 EUR 20/12/21 B UNICREDIT FL 10/04/2017 (3,220.33)120,000.00 USD 20/12/21 B BRAZIL 4.25% 07/01/2025 (9,059.86)
(177,725.00) USD 20/12/21 S ARNENTINA(REP OF)REGS 7.625% 22/04/2046 (5,757.39) Total: 725,270.60
As at December 31, 2016, the net unrealised appreciation on credit default swaps contracts amounted to EUR 725,270.60. The counterparties of the contracts are BANK OF AMERICA CHARLOTTE, BARCLAYS BANK PLC LONDON, BNP PARIBAS LONDON, CITIBANK LONDON, CITIBANK NEW YORK, CITIGROUP GLOBAL MARKETS LTD LONDON, CREDIT SUISSE INTERNATIONAL, DEUTSCHE BANK AG LONDON, GOLDMAN SACHS INTERNATIONAL, HSBC BANK PLC, JP MORGAN SECURITIES LONDON, JPMORGAN CHASE BANK LONDON, MORGAN STANLEY AND CO. INTERNATIONAL PLC and UBS AG LONDON BRANCH.
BG SICAV – Invesco Financial Credit Bond Notional Currency Maturity Buy/
Sell Credit Default Cover Unrealised
appreciation/(depreciation) (EUR)
2,000,000.00 EUR 20/12/20 B ISDA 2014 (188,679.91) Total: (188,679.91)
As at December 31, 2016, the unrealised depreciation on the credit default swaps contract amounted to EUR 188,679.91. The counterparty of the contract is JP MORGAN SECURITIES LONDON.
BG SICAV – Amundi Global Income Bond Notional Currency Maturity Buy/
Sell Credit Default Cover Unrealised
appreciation/(depreciation) (EUR)
4,000,000.00 USD 20/12/21 B CDX NA IG SERIE 27 V1 57,084.165,600,000.00 USD 20/12/21 B CDX NA IG SERIE 27 V1 79,917.90
(5,400,000.00) EUR 20/12/21 S ITRAXX XOVER S26 V1 MKT RED (504,470.74)(3,000,000.00) USD 20/12/21 S CDX NA HY SERIE 27 V1 RED (175,292.68)(4,000,000.00) EUR 20/12/21 S ITRAXX XOVER S26 V1 MKT RED (373,682.05)(1,375,000.00) USD 20/12/21 S CDX NA HY SERIE 27 V1 RED (80,342.44)(1,125,000.00) USD 20/12/21 S CDX NA HY SERIE 27 V1 RED (65,734.76)(2,500,000.00) USD 20/12/21 S CDX EM SERIE 26 V1 5Y RED 148,506.34(2,500,000.00) USD 20/12/21 S CDX EM SERIE 26 V1 5Y RED 148,506.34(3,400,000.00) USD 20/12/21 S CDX NA HY SERIE 27 V1 RED (198,664.99)
Total: (964,172.92)
As at December 31, 2016, the net unrealised depreciation on credit default swaps contracts amounted to EUR 964,172.92. The counterparties of the contracts are JP MORGAN SECURITIES LONDON, MERRILL LYNCH INTERNATIONAL LIMITED and SOCIETE GENERALE.
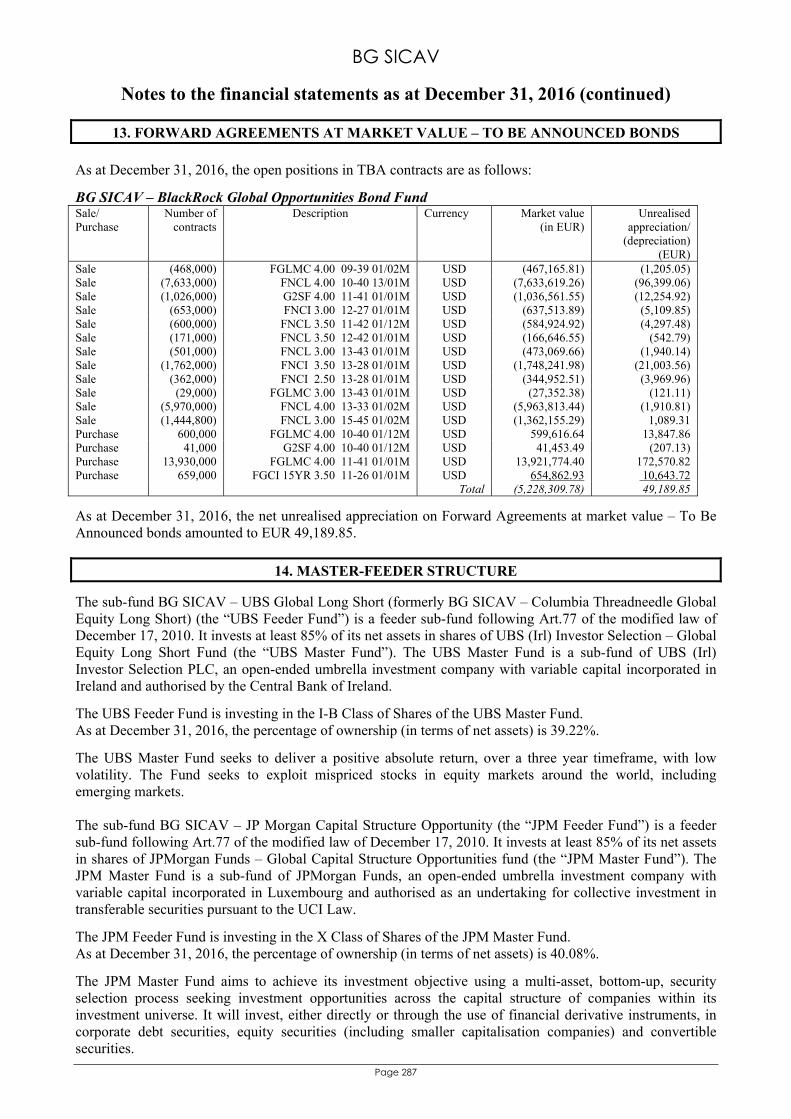
BG SICAV
Notes to the financial statements as at December 31, 2016 (continued)
Page 287
13. FORWARD AGREEMENTS AT MARKET VALUE – TO BE ANNOUNCED BONDS As at December 31, 2016, the open positions in TBA contracts are as follows:
BG SICAV – BlackRock Global Opportunities Bond Fund Sale/ Purchase
Number of contracts
Description Currency Market value (in EUR)
Unrealised appreciation/
(depreciation) (EUR)
Sale (468,000) FGLMC 4.00 09-39 01/02M USD (467,165.81) (1,205.05) Sale (7,633,000) FNCL 4.00 10-40 13/01M USD (7,633,619.26) (96,399.06) Sale (1,026,000) G2SF 4.00 11-41 01/01M USD (1,036,561.55) (12,254.92) Sale (653,000) FNCI 3.00 12-27 01/01M USD (637,513.89) (5,109.85) Sale (600,000) FNCL 3.50 11-42 01/12M USD (584,924.92) (4,297.48) Sale (171,000) FNCL 3.50 12-42 01/01M USD (166,646.55) (542.79) Sale (501,000) FNCL 3.00 13-43 01/01M USD (473,069.66) (1,940.14) Sale (1,762,000) FNCI 3.50 13-28 01/01M USD (1,748,241.98) (21,003.56) Sale (362,000) FNCI 2.50 13-28 01/01M USD (344,952.51) (3,969.96) Sale (29,000) FGLMC 3.00 13-43 01/01M USD (27,352.38) (121.11) Sale (5,970,000) FNCL 4.00 13-33 01/02M USD (5,963,813.44) (1,910.81) Sale (1,444,800) FNCL 3.00 15-45 01/02M USD (1,362,155.29) 1,089.31 Purchase 600,000 FGLMC 4.00 10-40 01/12M USD 599,616.64 13,847.86 Purchase 41,000 G2SF 4.00 10-40 01/12M USD 41,453.49 (207.13) Purchase 13,930,000 FGLMC 4.00 11-41 01/01M USD 13,921,774.40 172,570.82 Purchase 659,000 FGCI 15YR 3.50 11-26 01/01M USD 654,862.93 10,643.72 Total (5,228,309.78) 49,189.85
As at December 31, 2016, the net unrealised appreciation on Forward Agreements at market value – To Be Announced bonds amounted to EUR 49,189.85.
14. MASTER-FEEDER STRUCTURE
The sub-fund BG SICAV – UBS Global Long Short (formerly BG SICAV – Columbia Threadneedle Global Equity Long Short) (the “UBS Feeder Fund”) is a feeder sub-fund following Art.77 of the modified law of December 17, 2010. It invests at least 85% of its net assets in shares of UBS (Irl) Investor Selection – Global Equity Long Short Fund (the “UBS Master Fund”). The UBS Master Fund is a sub-fund of UBS (Irl) Investor Selection PLC, an open-ended umbrella investment company with variable capital incorporated in Ireland and authorised by the Central Bank of Ireland.
The UBS Feeder Fund is investing in the I-B Class of Shares of the UBS Master Fund. As at December 31, 2016, the percentage of ownership (in terms of net assets) is 39.22%.
The UBS Master Fund seeks to deliver a positive absolute return, over a three year timeframe, with low volatility. The Fund seeks to exploit mispriced stocks in equity markets around the world, including emerging markets. The sub-fund BG SICAV – JP Morgan Capital Structure Opportunity (the “JPM Feeder Fund”) is a feeder sub-fund following Art.77 of the modified law of December 17, 2010. It invests at least 85% of its net assets in shares of JPMorgan Funds – Global Capital Structure Opportunities fund (the “JPM Master Fund”). The JPM Master Fund is a sub-fund of JPMorgan Funds, an open-ended umbrella investment company with variable capital incorporated in Luxembourg and authorised as an undertaking for collective investment in transferable securities pursuant to the UCI Law.
The JPM Feeder Fund is investing in the X Class of Shares of the JPM Master Fund. As at December 31, 2016, the percentage of ownership (in terms of net assets) is 40.08%.
The JPM Master Fund aims to achieve its investment objective using a multi-asset, bottom-up, security selection process seeking investment opportunities across the capital structure of companies within its investment universe. It will invest, either directly or through the use of financial derivative instruments, in corporate debt securities, equity securities (including smaller capitalisation companies) and convertible securities.
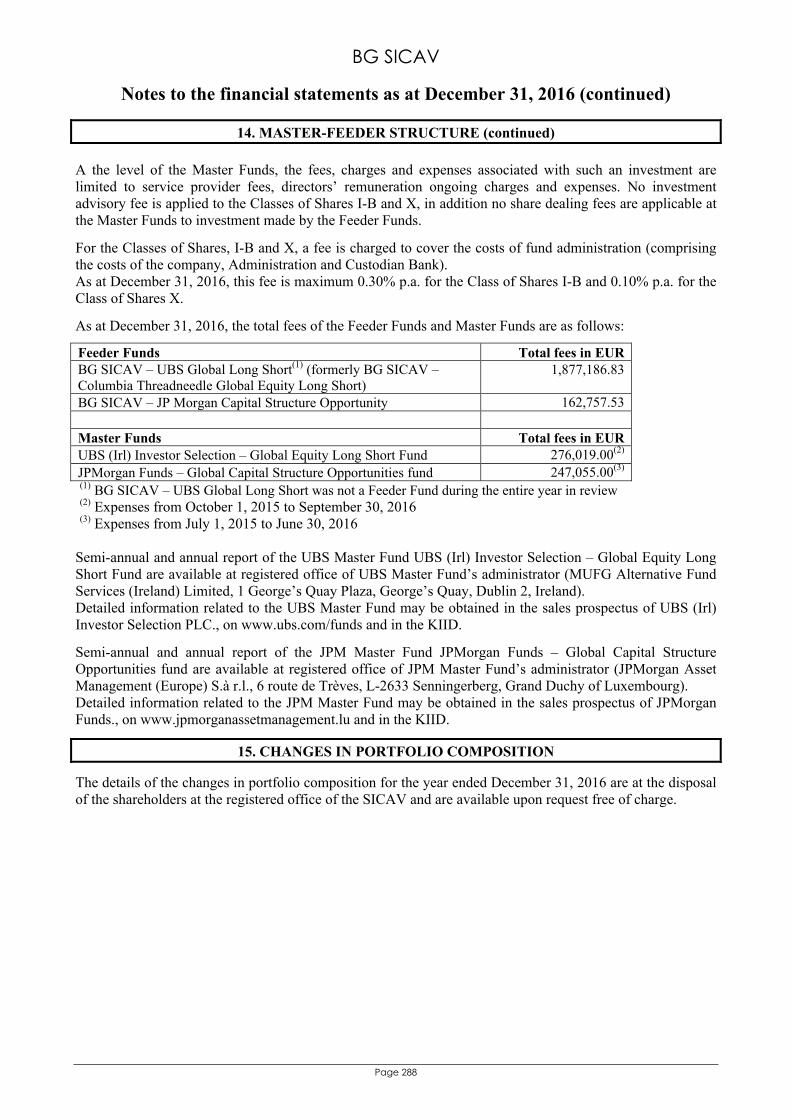
BG SICAV
Notes to the financial statements as at December 31, 2016 (continued)
Page 288
14. MASTER-FEEDER STRUCTURE (continued) A the level of the Master Funds, the fees, charges and expenses associated with such an investment are limited to service provider fees, directors’ remuneration ongoing charges and expenses. No investment advisory fee is applied to the Classes of Shares I-B and X, in addition no share dealing fees are applicable at the Master Funds to investment made by the Feeder Funds.
For the Classes of Shares, I-B and X, a fee is charged to cover the costs of fund administration (comprising the costs of the company, Administration and Custodian Bank). As at December 31, 2016, this fee is maximum 0.30% p.a. for the Class of Shares I-B and 0.10% p.a. for the Class of Shares X.
As at December 31, 2016, the total fees of the Feeder Funds and Master Funds are as follows:
Feeder Funds Total fees in EUR BG SICAV – UBS Global Long Short(1) (formerly BG SICAV – Columbia Threadneedle Global Equity Long Short)
1,877,186.83
BG SICAV – JP Morgan Capital Structure Opportunity 162,757.53 Master Funds Total fees in EUR UBS (Irl) Investor Selection – Global Equity Long Short Fund 276,019.00(2) JPMorgan Funds – Global Capital Structure Opportunities fund 247,055.00(3) (1) BG SICAV – UBS Global Long Short was not a Feeder Fund during the entire year in review (2) Expenses from October 1, 2015 to September 30, 2016 (3) Expenses from July 1, 2015 to June 30, 2016
Semi-annual and annual report of the UBS Master Fund UBS (Irl) Investor Selection – Global Equity Long Short Fund are available at registered office of UBS Master Fund’s administrator (MUFG Alternative Fund Services (Ireland) Limited, 1 George’s Quay Plaza, George’s Quay, Dublin 2, Ireland). Detailed information related to the UBS Master Fund may be obtained in the sales prospectus of UBS (Irl) Investor Selection PLC., on www.ubs.com/funds and in the KIID.
Semi-annual and annual report of the JPM Master Fund JPMorgan Funds – Global Capital Structure Opportunities fund are available at registered office of JPM Master Fund’s administrator (JPMorgan Asset Management (Europe) S.à r.l., 6 route de Trèves, L-2633 Senningerberg, Grand Duchy of Luxembourg). Detailed information related to the JPM Master Fund may be obtained in the sales prospectus of JPMorgan Funds., on www.jpmorganassetmanagement.lu and in the KIID.
15. CHANGES IN PORTFOLIO COMPOSITION
The details of the changes in portfolio composition for the year ended December 31, 2016 are at the disposal of the shareholders at the registered office of the SICAV and are available upon request free of charge.
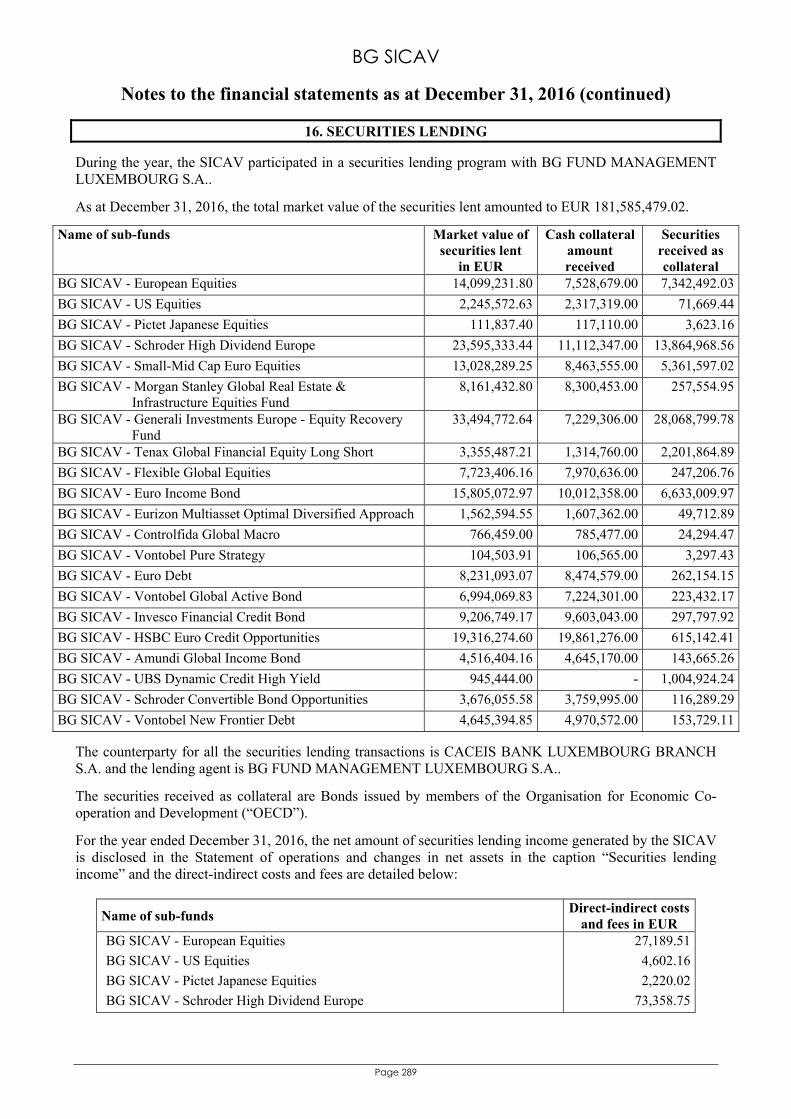
BG SICAV
Notes to the financial statements as at December 31, 2016 (continued)
Page 289
16. SECURITIES LENDING
During the year, the SICAV participated in a securities lending program with BG FUND MANAGEMENT LUXEMBOURG S.A..
As at December 31, 2016, the total market value of the securities lent amounted to EUR 181,585,479.02.
Name of sub-funds Market value of securities lent
in EUR
Cash collateral amount received
Securities received as collateral
BG SICAV - European Equities 14,099,231.80 7,528,679.00 7,342,492.03
BG SICAV - US Equities 2,245,572.63 2,317,319.00 71,669.44
BG SICAV - Pictet Japanese Equities 111,837.40 117,110.00 3,623.16
BG SICAV - Schroder High Dividend Europe 23,595,333.44 11,112,347.00 13,864,968.56
BG SICAV - Small-Mid Cap Euro Equities 13,028,289.25 8,463,555.00 5,361,597.02
BG SICAV - Morgan Stanley Global Real Estate & Infrastructure Equities Fund
8,161,432.80 8,300,453.00 257,554.95
BG SICAV - Generali Investments Europe - Equity Recovery Fund
33,494,772.64 7,229,306.00 28,068,799.78
BG SICAV - Tenax Global Financial Equity Long Short 3,355,487.21 1,314,760.00 2,201,864.89
BG SICAV - Flexible Global Equities 7,723,406.16 7,970,636.00 247,206.76
BG SICAV - Euro Income Bond 15,805,072.97 10,012,358.00 6,633,009.97
BG SICAV - Eurizon Multiasset Optimal Diversified Approach 1,562,594.55 1,607,362.00 49,712.89
BG SICAV - Controlfida Global Macro 766,459.00 785,477.00 24,294.47
BG SICAV - Vontobel Pure Strategy 104,503.91 106,565.00 3,297.43
BG SICAV - Euro Debt 8,231,093.07 8,474,579.00 262,154.15
BG SICAV - Vontobel Global Active Bond 6,994,069.83 7,224,301.00 223,432.17
BG SICAV - Invesco Financial Credit Bond 9,206,749.17 9,603,043.00 297,797.92
BG SICAV - HSBC Euro Credit Opportunities 19,316,274.60 19,861,276.00 615,142.41
BG SICAV - Amundi Global Income Bond 4,516,404.16 4,645,170.00 143,665.26
BG SICAV - UBS Dynamic Credit High Yield 945,444.00 - 1,004,924.24
BG SICAV - Schroder Convertible Bond Opportunities 3,676,055.58 3,759,995.00 116,289.29
BG SICAV - Vontobel New Frontier Debt 4,645,394.85 4,970,572.00 153,729.11
The counterparty for all the securities lending transactions is CACEIS BANK LUXEMBOURG BRANCH S.A. and the lending agent is BG FUND MANAGEMENT LUXEMBOURG S.A..
The securities received as collateral are Bonds issued by members of the Organisation for Economic Co-operation and Development (“OECD”).
For the year ended December 31, 2016, the net amount of securities lending income generated by the SICAV is disclosed in the Statement of operations and changes in net assets in the caption “Securities lending income” and the direct-indirect costs and fees are detailed below:
Name of sub-funds Direct-indirect costs
and fees in EUR BG SICAV - European Equities 27,189.51
BG SICAV - US Equities 4,602.16
BG SICAV - Pictet Japanese Equities 2,220.02
BG SICAV - Schroder High Dividend Europe 73,358.75
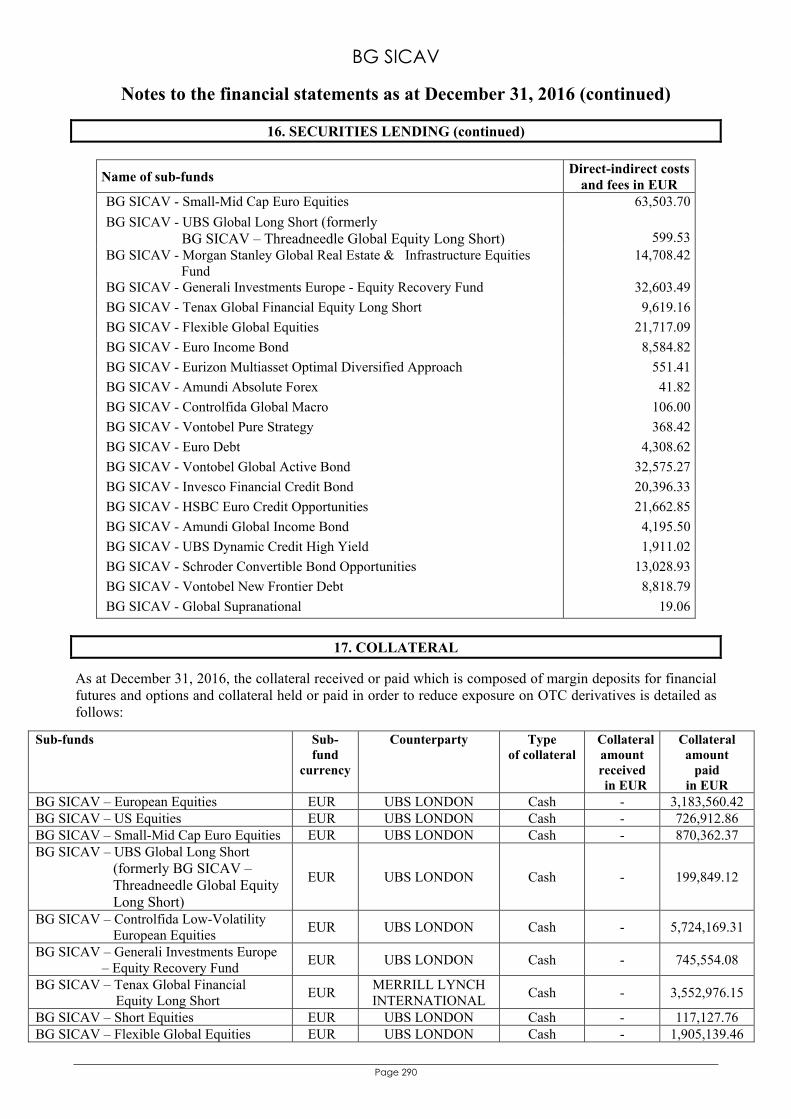
BG SICAV
Notes to the financial statements as at December 31, 2016 (continued)
Page 290
16. SECURITIES LENDING (continued)
Name of sub-funds Direct-indirect costs
and fees in EUR BG SICAV - Small-Mid Cap Euro Equities 63,503.70
BG SICAV - UBS Global Long Short (formerly BG SICAV – Threadneedle Global Equity Long Short) 599.53 BG SICAV - Morgan Stanley Global Real Estate & Infrastructure Equities
Fund 14,708.42
BG SICAV - Generali Investments Europe - Equity Recovery Fund 32,603.49
BG SICAV - Tenax Global Financial Equity Long Short 9,619.16
BG SICAV - Flexible Global Equities 21,717.09
BG SICAV - Euro Income Bond 8,584.82
BG SICAV - Eurizon Multiasset Optimal Diversified Approach 551.41
BG SICAV - Amundi Absolute Forex 41.82
BG SICAV - Controlfida Global Macro 106.00
BG SICAV - Vontobel Pure Strategy 368.42
BG SICAV - Euro Debt 4,308.62
BG SICAV - Vontobel Global Active Bond 32,575.27
BG SICAV - Invesco Financial Credit Bond 20,396.33
BG SICAV - HSBC Euro Credit Opportunities 21,662.85
BG SICAV - Amundi Global Income Bond 4,195.50
BG SICAV - UBS Dynamic Credit High Yield 1,911.02
BG SICAV - Schroder Convertible Bond Opportunities 13,028.93
BG SICAV - Vontobel New Frontier Debt 8,818.79
BG SICAV - Global Supranational 19.06
17. COLLATERAL
As at December 31, 2016, the collateral received or paid which is composed of margin deposits for financial futures and options and collateral held or paid in order to reduce exposure on OTC derivatives is detailed as follows:
Sub-funds Sub-fund
currency
Counterparty Type of collateral
Collateral amount received in EUR
Collateral amount
paid in EUR
BG SICAV – European Equities EUR UBS LONDON Cash - 3,183,560.42 BG SICAV – US Equities EUR UBS LONDON Cash - 726,912.86 BG SICAV – Small-Mid Cap Euro Equities EUR UBS LONDON Cash - 870,362.37 BG SICAV – UBS Global Long Short
(formerly BG SICAV – Threadneedle Global Equity Long Short)
EUR UBS LONDON Cash - 199,849.12
BG SICAV – Controlfida Low-Volatility European Equities
EUR UBS LONDON Cash - 5,724,169.31
BG SICAV – Generali Investments Europe – Equity Recovery Fund
EUR UBS LONDON Cash - 745,554.08
BG SICAV – Tenax Global Financial Equity Long Short
EUR MERRILL LYNCH INTERNATIONAL
Cash - 3,552,976.15
BG SICAV – Short Equities EUR UBS LONDON Cash - 117,127.76 BG SICAV – Flexible Global Equities EUR UBS LONDON Cash - 1,905,139.46
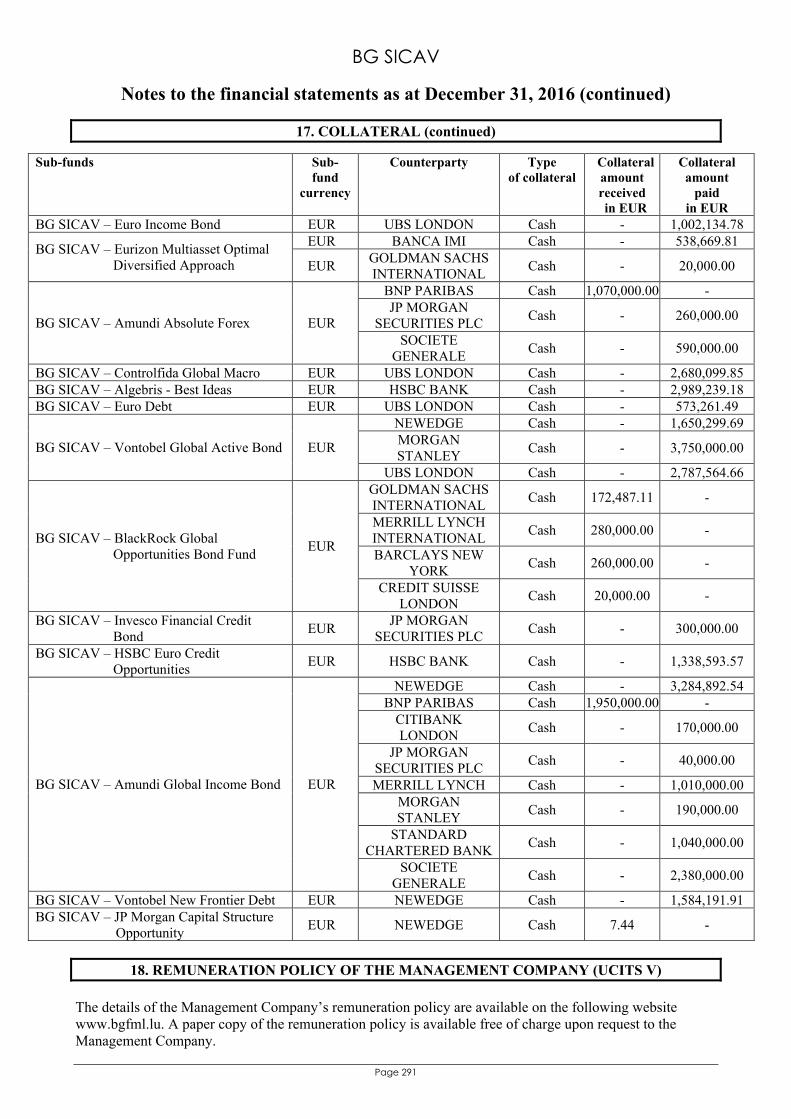
BG SICAV
Notes to the financial statements as at December 31, 2016 (continued)
Page 291
17. COLLATERAL (continued)
Sub-funds Sub-fund
currency
Counterparty Type of collateral
Collateral amount received in EUR
Collateral amount
paid in EUR
BG SICAV – Euro Income Bond EUR UBS LONDON Cash - 1,002,134.78 EUR BANCA IMI Cash - 538,669.81
BG SICAV – Eurizon Multiasset Optimal Diversified Approach EUR
GOLDMAN SACHS INTERNATIONAL
Cash - 20,000.00
BNP PARIBAS Cash 1,070,000.00 - JP MORGAN
SECURITIES PLC Cash - 260,000.00 BG SICAV – Amundi Absolute Forex EUR
SOCIETE GENERALE
Cash - 590,000.00
BG SICAV – Controlfida Global Macro EUR UBS LONDON Cash - 2,680,099.85 BG SICAV – Algebris - Best Ideas EUR HSBC BANK Cash - 2,989,239.18 BG SICAV – Euro Debt EUR UBS LONDON Cash - 573,261.49
NEWEDGE Cash - 1,650,299.69 MORGAN STANLEY
Cash - 3,750,000.00 BG SICAV – Vontobel Global Active Bond EUR
UBS LONDON Cash - 2,787,564.66 GOLDMAN SACHS INTERNATIONAL
Cash 172,487.11 -
MERRILL LYNCH INTERNATIONAL
Cash 280,000.00 -
BARCLAYS NEW YORK
Cash 260,000.00 -
BG SICAV – BlackRock Global Opportunities Bond Fund
EUR
CREDIT SUISSE LONDON
Cash 20,000.00 -
BG SICAV – Invesco Financial Credit Bond
EUR JP MORGAN
SECURITIES PLC Cash - 300,000.00
BG SICAV – HSBC Euro Credit Opportunities
EUR HSBC BANK Cash - 1,338,593.57
NEWEDGE Cash - 3,284,892.54 BNP PARIBAS Cash 1,950,000.00 -
CITIBANK LONDON
Cash - 170,000.00
JP MORGAN SECURITIES PLC
Cash - 40,000.00
MERRILL LYNCH Cash - 1,010,000.00 MORGAN STANLEY
Cash - 190,000.00
STANDARD CHARTERED BANK
Cash - 1,040,000.00
BG SICAV – Amundi Global Income Bond EUR
SOCIETE GENERALE
Cash - 2,380,000.00
BG SICAV – Vontobel New Frontier Debt EUR NEWEDGE Cash - 1,584,191.91 BG SICAV – JP Morgan Capital Structure Opportunity
EUR NEWEDGE Cash 7.44 -
18. REMUNERATION POLICY OF THE MANAGEMENT COMPANY (UCITS V)
The details of the Management Company’s remuneration policy are available on the following website www.bgfml.lu. A paper copy of the remuneration policy is available free of charge upon request to the Management Company.
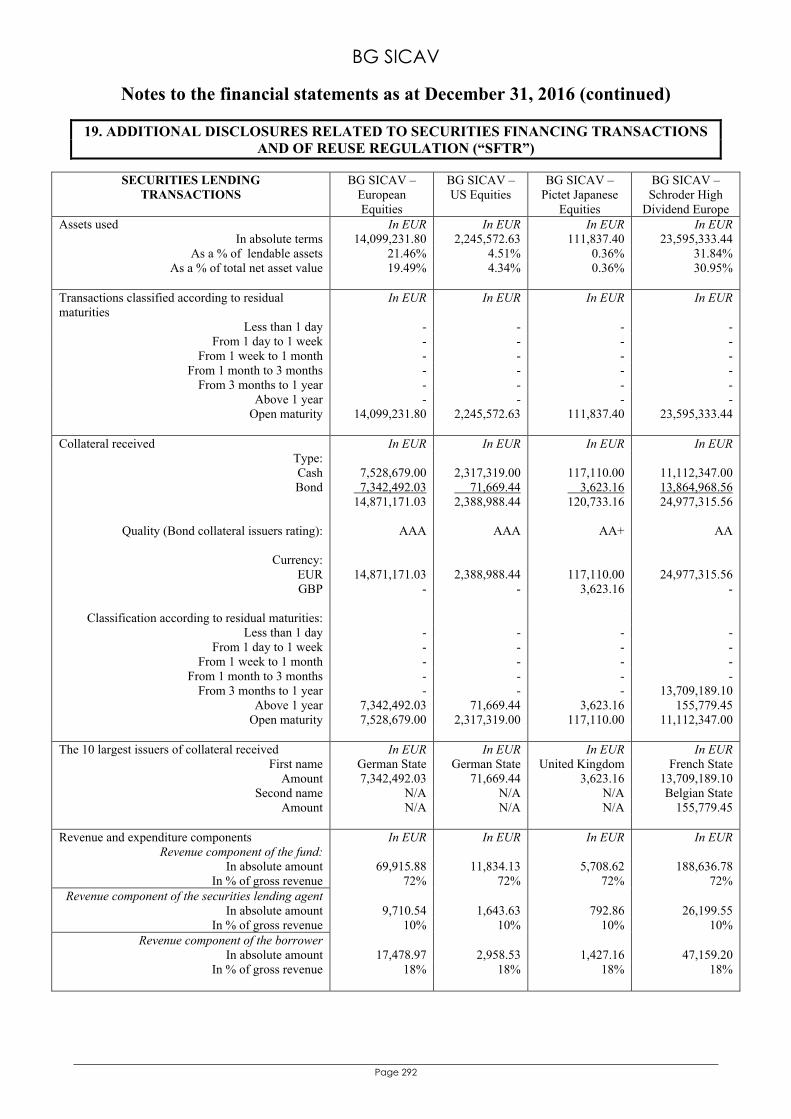
BG SICAV
Notes to the financial statements as at December 31, 2016 (continued)
Page 292
19. ADDITIONAL DISCLOSURES RELATED TO SECURITIES FINANCING TRANSACTIONS AND OF REUSE REGULATION (“SFTR”)
SECURITIES LENDING TRANSACTIONS
BG SICAV – European Equities
BG SICAV – US Equities
BG SICAV – Pictet Japanese
Equities
BG SICAV – Schroder High
Dividend Europe Assets used In EUR In EUR In EUR In EUR
In absolute terms 14,099,231.80 2,245,572.63 111,837.40 23,595,333.44 As a % of lendable assets 21.46% 4.51% 0.36% 31.84%
As a % of total net asset value 19.49% 4.34% 0.36% 30.95% Transactions classified according to residual maturities
In EUR In EUR In EUR In EUR
Less than 1 day - - - - From 1 day to 1 week - - - -
From 1 week to 1 month - - - - From 1 month to 3 months - - - -
From 3 months to 1 year - - - - Above 1 year - - - -
Open maturity 14,099,231.80 2,245,572.63 111,837.40 23,595,333.44 Collateral received In EUR In EUR In EUR In EUR
Type: Cash Bond
7,528,679.00
7,342,492.03 14,871,171.03
2,317,319.00 71,669.44 2,388,988.44
117,110.00 3,623.16 120,733.16
11,112,347.00 13,864,968.56 24,977,315.56
Quality (Bond collateral issuers rating): AAA
AAA
AA+
AA
Currency:
EUR GBP
14,871,171.03
-
2,388,988.44
-
117,110.00
3,623.16
24,977,315.56
-
Classification according to residual maturities: Less than 1 day - - - -
From 1 day to 1 week - - - - From 1 week to 1 month - - - -
From 1 month to 3 months - - - - From 3 months to 1 year - - - 13,709,189.10
Above 1 year 7,342,492.03 71,669.44 3,623.16 155,779.45 Open maturity 7,528,679.00 2,317,319.00 117,110.00 11,112,347.00
The 10 largest issuers of collateral received In EUR In EUR In EUR In EUR
First name German State German State United Kingdom French State Amount 7,342,492.03 71,669.44 3,623.16 13,709,189.10
Second name N/A N/A N/A Belgian State Amount N/A N/A N/A 155,779.45
Revenue and expenditure components In EUR In EUR In EUR In EUR
Revenue component of the fund: In absolute amount 69,915.88 11,834.13 5,708.62 188,636.78
In % of gross revenue 72% 72% 72% 72% Revenue component of the securities lending agent
In absolute amount 9,710.54 1,643.63 792.86 26,199.55 In % of gross revenue 10% 10% 10% 10%
Revenue component of the borrower In absolute amount 17,478.97 2,958.53 1,427.16 47,159.20
In % of gross revenue 18% 18% 18% 18%
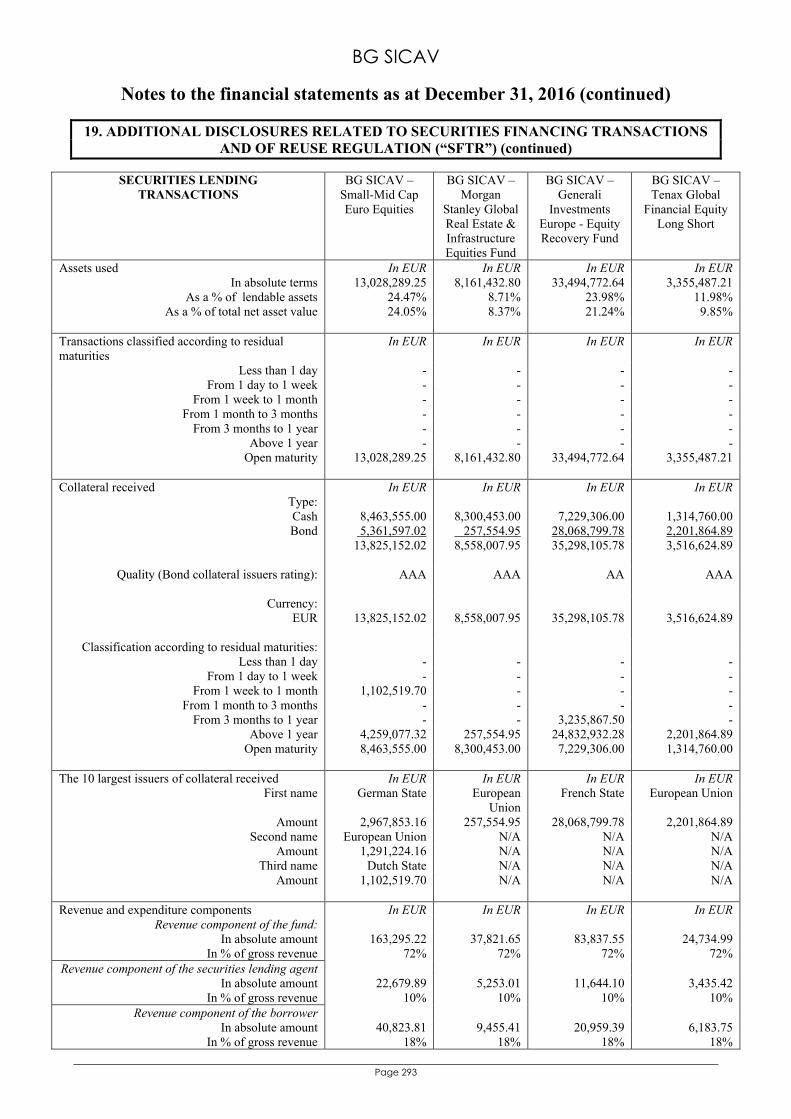
BG SICAV
Notes to the financial statements as at December 31, 2016 (continued)
Page 293
19. ADDITIONAL DISCLOSURES RELATED TO SECURITIES FINANCING TRANSACTIONS AND OF REUSE REGULATION (“SFTR”) (continued)
SECURITIES LENDING TRANSACTIONS
BG SICAV – Small-Mid Cap Euro Equities
BG SICAV – Morgan
Stanley Global Real Estate & Infrastructure Equities Fund
BG SICAV – Generali
Investments Europe - Equity Recovery Fund
BG SICAV – Tenax Global
Financial Equity Long Short
Assets used In EUR In EUR In EUR In EUR In absolute terms 13,028,289.25 8,161,432.80 33,494,772.64 3,355,487.21
As a % of lendable assets 24.47% 8.71% 23.98% 11.98% As a % of total net asset value 24.05% 8.37% 21.24% 9.85%
Transactions classified according to residual maturities
In EUR In EUR In EUR In EUR
Less than 1 day - - - - From 1 day to 1 week - - - -
From 1 week to 1 month - - - - From 1 month to 3 months - - - -
From 3 months to 1 year - - - - Above 1 year - - - -
Open maturity 13,028,289.25 8,161,432.80 33,494,772.64 3,355,487.21 Collateral received In EUR In EUR In EUR In EUR
Type: Cash Bond
8,463,555.00 5,361,597.02 13,825,152.02
8,300,453.00 257,554.95 8,558,007.95
7,229,306.00
28,068,799.78 35,298,105.78
1,314,760.00 2,201,864.89 3,516,624.89
Quality (Bond collateral issuers rating): AAA AAA
AA AAA
Currency:
EUR
13,825,152.02
8,558,007.95
35,298,105.78
3,516,624.89
Classification according to residual maturities:
Less than 1 day - - - - From 1 day to 1 week - - - -
From 1 week to 1 month 1,102,519.70 - - - From 1 month to 3 months - - - -
From 3 months to 1 year - - 3,235,867.50 - Above 1 year 4,259,077.32 257,554.95 24,832,932.28 2,201,864.89
Open maturity 8,463,555.00 8,300,453.00 7,229,306.00 1,314,760.00
The 10 largest issuers of collateral received In EUR In EUR In EUR In EUR First name German State European
Union French State European Union
Amount 2,967,853.16 257,554.95 28,068,799.78 2,201,864.89 Second name European Union N/A N/A N/A
Amount 1,291,224.16 N/A N/A N/A Third name Dutch State N/A N/A N/A
Amount 1,102,519.70 N/A N/A N/A
Revenue and expenditure components In EUR In EUR In EUR In EUR Revenue component of the fund:
In absolute amount 163,295.22 37,821.65 83,837.55 24,734.99 In % of gross revenue 72% 72% 72% 72%
Revenue component of the securities lending agent In absolute amount 22,679.89 5,253.01 11,644.10 3,435.42
In % of gross revenue 10% 10% 10% 10% Revenue component of the borrower
In absolute amount 40,823.81 9,455.41 20,959.39 6,183.75 In % of gross revenue 18% 18% 18% 18%
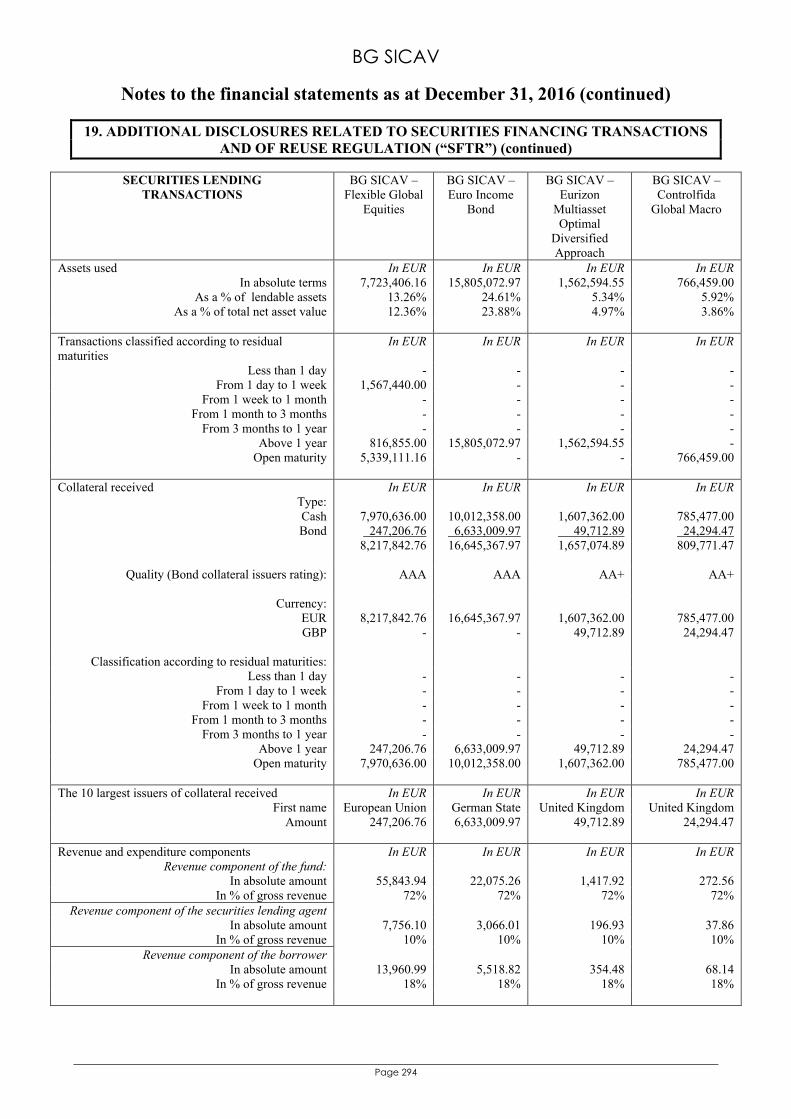
BG SICAV
Notes to the financial statements as at December 31, 2016 (continued)
Page 294
19. ADDITIONAL DISCLOSURES RELATED TO SECURITIES FINANCING TRANSACTIONS AND OF REUSE REGULATION (“SFTR”) (continued)
SECURITIES LENDING TRANSACTIONS
BG SICAV – Flexible Global
Equities
BG SICAV – Euro Income
Bond
BG SICAV – Eurizon
Multiasset Optimal
Diversified Approach
BG SICAV – Controlfida
Global Macro
Assets used In EUR In EUR In EUR In EUR In absolute terms 7,723,406.16 15,805,072.97 1,562,594.55 766,459.00
As a % of lendable assets 13.26% 24.61% 5.34% 5.92% As a % of total net asset value 12.36% 23.88% 4.97% 3.86%
Transactions classified according to residual maturities
In EUR In EUR In EUR In EUR
Less than 1 day - - - - From 1 day to 1 week 1,567,440.00 - - -
From 1 week to 1 month - - - - From 1 month to 3 months - - - -
From 3 months to 1 year - - - - Above 1 year 816,855.00 15,805,072.97 1,562,594.55 -
Open maturity 5,339,111.16 - - 766,459.00 Collateral received In EUR In EUR In EUR In EUR
Type: Cash Bond
7,970,636.00 247,206.76 8,217,842.76
10,012,358.00 6,633,009.97 16,645,367.97
1,607,362.00 49,712.89 1,657,074.89
785,477.00 24,294.47 809,771.47
Quality (Bond collateral issuers rating): AAA AAA
AA+
AA+
Currency:
EUR GBP
8,217,842.76
-
16,645,367.97
-
1,607,362.00
49,712.89
785,477.00 24,294.47
Classification according to residual maturities:
Less than 1 day - - - - From 1 day to 1 week - - - -
From 1 week to 1 month - - - - From 1 month to 3 months - - - -
From 3 months to 1 year - - - - Above 1 year 247,206.76 6,633,009.97 49,712.89 24,294.47
Open maturity 7,970,636.00 10,012,358.00 1,607,362.00 785,477.00
The 10 largest issuers of collateral received In EUR In EUR In EUR In EUR First name European Union German State United Kingdom United Kingdom
Amount 247,206.76 6,633,009.97 49,712.89 24,294.47
Revenue and expenditure components In EUR In EUR In EUR In EUR Revenue component of the fund:
In absolute amount 55,843.94 22,075.26 1,417.92 272.56 In % of gross revenue 72% 72% 72% 72%
Revenue component of the securities lending agent In absolute amount 7,756.10 3,066.01 196.93 37.86
In % of gross revenue 10% 10% 10% 10% Revenue component of the borrower
In absolute amount 13,960.99 5,518.82 354.48 68.14 In % of gross revenue 18% 18% 18% 18%
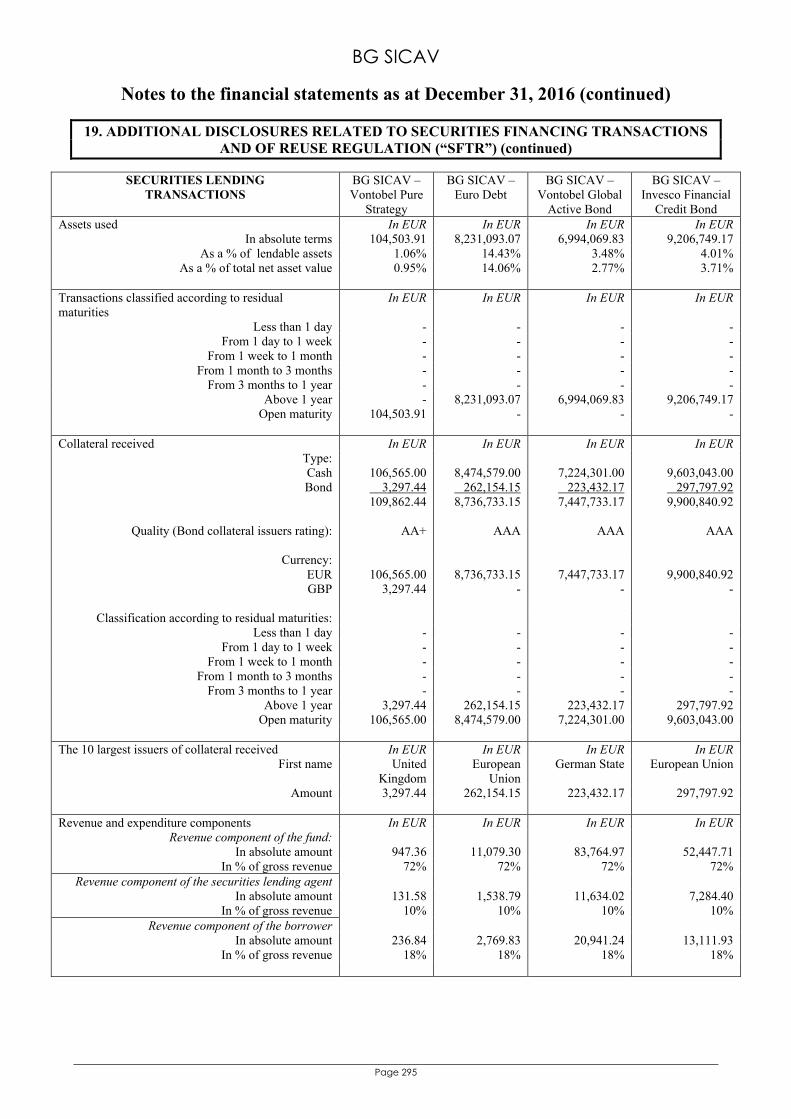
BG SICAV
Notes to the financial statements as at December 31, 2016 (continued)
Page 295
19. ADDITIONAL DISCLOSURES RELATED TO SECURITIES FINANCING TRANSACTIONS AND OF REUSE REGULATION (“SFTR”) (continued)
SECURITIES LENDING TRANSACTIONS
BG SICAV – Vontobel Pure
Strategy
BG SICAV – Euro Debt
BG SICAV – Vontobel Global
Active Bond
BG SICAV – Invesco Financial
Credit Bond Assets used In EUR In EUR In EUR In EUR
In absolute terms 104,503.91 8,231,093.07 6,994,069.83 9,206,749.17 As a % of lendable assets 1.06% 14.43% 3.48% 4.01%
As a % of total net asset value 0.95% 14.06% 2.77% 3.71% Transactions classified according to residual maturities
In EUR In EUR In EUR In EUR
Less than 1 day - - - - From 1 day to 1 week - - - -
From 1 week to 1 month - - - - From 1 month to 3 months - - - -
From 3 months to 1 year - - - - Above 1 year - 8,231,093.07 6,994,069.83 9,206,749.17
Open maturity 104,503.91 - - - Collateral received In EUR In EUR In EUR In EUR
Type: Cash Bond
106,565.00 3,297.44 109,862.44
8,474,579.00 262,154.15 8,736,733.15
7,224,301.00 223,432.17 7,447,733.17
9,603,043.00 297,797.92 9,900,840.92
Quality (Bond collateral issuers rating): AA+
AAA
AAA
AAA
Currency:
EUR GBP
106,565.00
3,297.44
8,736,733.15
-
7,447,733.17
-
9,900,840.92
-
Classification according to residual maturities: Less than 1 day - - - -
From 1 day to 1 week - - - - From 1 week to 1 month - - - -
From 1 month to 3 months - - - - From 3 months to 1 year - - - -
Above 1 year 3,297.44 262,154.15 223,432.17 297,797.92 Open maturity 106,565.00 8,474,579.00 7,224,301.00 9,603,043.00
The 10 largest issuers of collateral received In EUR In EUR In EUR In EUR
First name United Kingdom
European Union
German State European Union
Amount 3,297.44 262,154.15 223,432.17 297,797.92
Revenue and expenditure components In EUR In EUR In EUR In EUR Revenue component of the fund:
In absolute amount 947.36 11,079.30 83,764.97 52,447.71 In % of gross revenue 72% 72% 72% 72%
Revenue component of the securities lending agent In absolute amount 131.58 1,538.79 11,634.02 7,284.40
In % of gross revenue 10% 10% 10% 10% Revenue component of the borrower
In absolute amount 236.84 2,769.83 20,941.24 13,111.93 In % of gross revenue 18% 18% 18% 18%
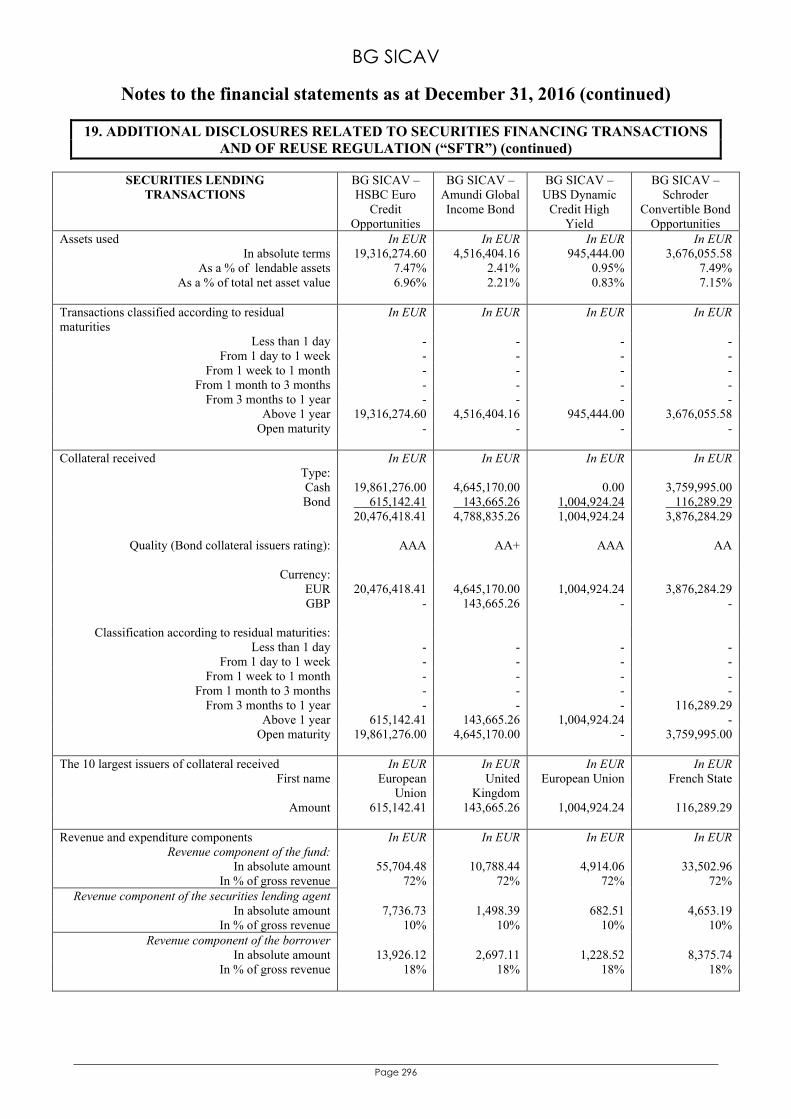
BG SICAV
Notes to the financial statements as at December 31, 2016 (continued)
Page 296
19. ADDITIONAL DISCLOSURES RELATED TO SECURITIES FINANCING TRANSACTIONS AND OF REUSE REGULATION (“SFTR”) (continued)
SECURITIES LENDING TRANSACTIONS
BG SICAV – HSBC Euro
Credit Opportunities
BG SICAV – Amundi Global Income Bond
BG SICAV – UBS Dynamic
Credit High Yield
BG SICAV – Schroder
Convertible Bond Opportunities
Assets used In EUR In EUR In EUR In EUR In absolute terms 19,316,274.60 4,516,404.16 945,444.00 3,676,055.58
As a % of lendable assets 7.47% 2.41% 0.95% 7.49% As a % of total net asset value 6.96% 2.21% 0.83% 7.15%
Transactions classified according to residual maturities
In EUR In EUR In EUR In EUR
Less than 1 day - - - - From 1 day to 1 week - - - -
From 1 week to 1 month - - - - From 1 month to 3 months - - - -
From 3 months to 1 year - - - - Above 1 year 19,316,274.60 4,516,404.16 945,444.00 3,676,055.58
Open maturity - - - - Collateral received In EUR In EUR In EUR In EUR
Type: Cash Bond
19,861,276.00 615,142.41 20,476,418.41
4,645,170.00 143,665.26 4,788,835.26
0.00 1,004,924.24 1,004,924.24
3,759,995.00 116,289.29 3,876,284.29
Quality (Bond collateral issuers rating): AAA
AA+
AAA
AA
Currency:
EUR GBP
20,476,418.41
-
4,645,170.00 143,665.26
1,004,924.24
-
3,876,284.29
-
Classification according to residual maturities: Less than 1 day - - - -
From 1 day to 1 week - - - - From 1 week to 1 month - - - -
From 1 month to 3 months - - - - From 3 months to 1 year - - - 116,289.29
Above 1 year 615,142.41 143,665.26 1,004,924.24 - Open maturity 19,861,276.00 4,645,170.00 - 3,759,995.00
The 10 largest issuers of collateral received In EUR In EUR In EUR In EUR
First name European Union
United Kingdom
European Union French State
Amount 615,142.41 143,665.26 1,004,924.24 116,289.29
Revenue and expenditure components In EUR In EUR In EUR In EUR Revenue component of the fund:
In absolute amount 55,704.48 10,788.44 4,914.06 33,502.96 In % of gross revenue 72% 72% 72% 72%
Revenue component of the securities lending agent In absolute amount 7,736.73 1,498.39 682.51 4,653.19
In % of gross revenue 10% 10% 10% 10% Revenue component of the borrower
In absolute amount 13,926.12 2,697.11 1,228.52 8,375.74 In % of gross revenue 18% 18% 18% 18%
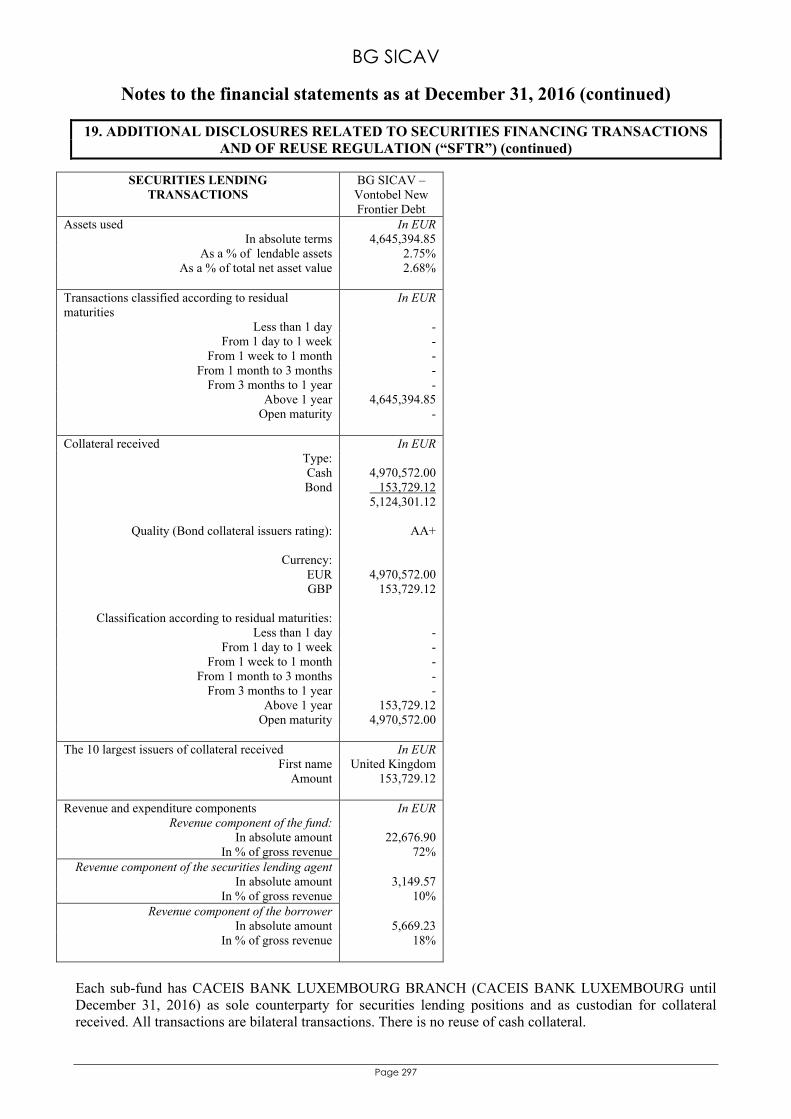
BG SICAV
Notes to the financial statements as at December 31, 2016 (continued)
Page 297
19. ADDITIONAL DISCLOSURES RELATED TO SECURITIES FINANCING TRANSACTIONS AND OF REUSE REGULATION (“SFTR”) (continued)
SECURITIES LENDING TRANSACTIONS
BG SICAV – Vontobel New Frontier Debt
Assets used In EUR In absolute terms 4,645,394.85
As a % of lendable assets 2.75% As a % of total net asset value 2.68%
Transactions classified according to residual maturities
In EUR
Less than 1 day - From 1 day to 1 week -
From 1 week to 1 month - From 1 month to 3 months -
From 3 months to 1 year - Above 1 year 4,645,394.85
Open maturity - Collateral received In EUR
Type: Cash Bond
4,970,572.00 153,729.12 5,124,301.12
Quality (Bond collateral issuers rating): AA+
Currency:
EUR GBP
4,970,572.00
153,729.12
Classification according to residual maturities: Less than 1 day -
From 1 day to 1 week - From 1 week to 1 month -
From 1 month to 3 months - From 3 months to 1 year -
Above 1 year 153,729.12 Open maturity 4,970,572.00
The 10 largest issuers of collateral received In EUR
First name United Kingdom Amount 153,729.12
Revenue and expenditure components In EUR
Revenue component of the fund: In absolute amount 22,676.90
In % of gross revenue 72% Revenue component of the securities lending agent
In absolute amount 3,149.57 In % of gross revenue 10%
Revenue component of the borrower In absolute amount 5,669.23
In % of gross revenue 18%
Each sub-fund has CACEIS BANK LUXEMBOURG BRANCH (CACEIS BANK LUXEMBOURG until December 31, 2016) as sole counterparty for securities lending positions and as custodian for collateral received. All transactions are bilateral transactions. There is no reuse of cash collateral.
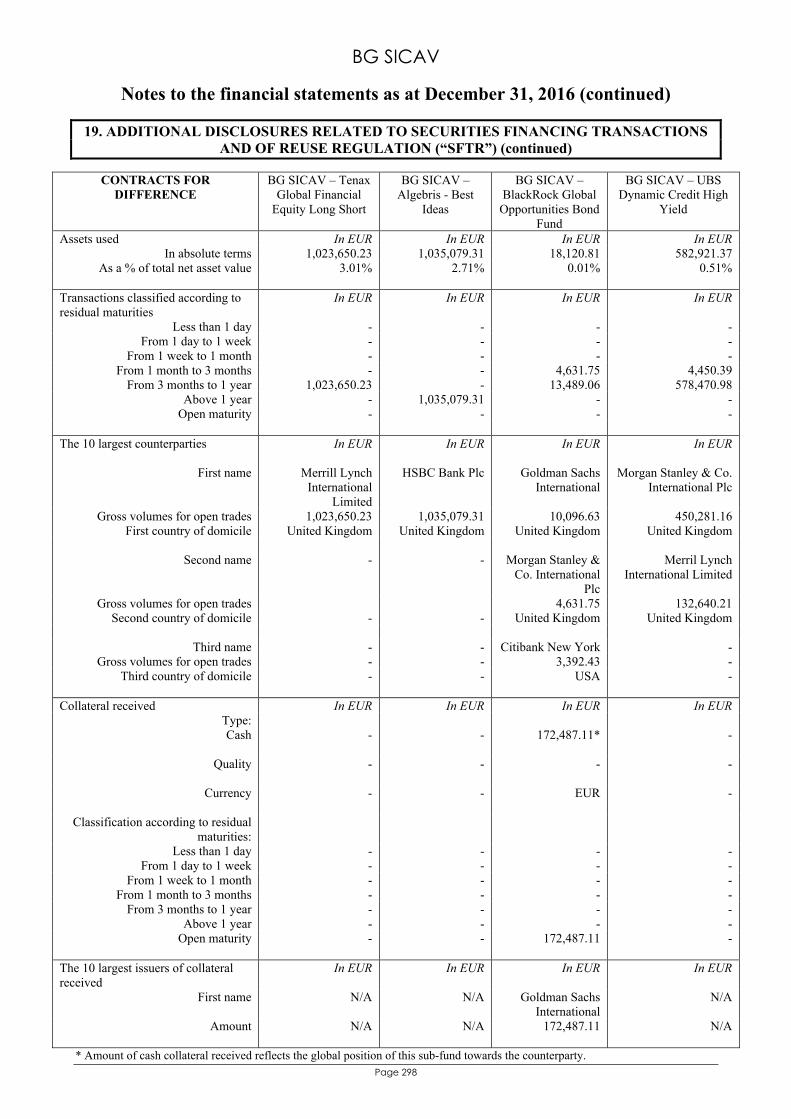
BG SICAV
Notes to the financial statements as at December 31, 2016 (continued)
Page 298
19. ADDITIONAL DISCLOSURES RELATED TO SECURITIES FINANCING TRANSACTIONS AND OF REUSE REGULATION (“SFTR”) (continued)
CONTRACTS FOR DIFFERENCE
BG SICAV – Tenax Global Financial
Equity Long Short
BG SICAV – Algebris - Best
Ideas
BG SICAV – BlackRock Global
Opportunities Bond Fund
BG SICAV – UBS Dynamic Credit High
Yield
Assets used In EUR In EUR In EUR In EUR In absolute terms 1,023,650.23 1,035,079.31 18,120.81 582,921.37
As a % of total net asset value 3.01% 2.71% 0.01% 0.51% Transactions classified according to residual maturities
In EUR In EUR In EUR In EUR
Less than 1 day - - - - From 1 day to 1 week - - - -
From 1 week to 1 month - - - - From 1 month to 3 months - - 4,631.75 4,450.39
From 3 months to 1 year 1,023,650.23 - 13,489.06 578,470.98 Above 1 year - 1,035,079.31 - -
Open maturity - - - - The 10 largest counterparties In EUR
In EUR In EUR In EUR
First name Merrill Lynch International
Limited
HSBC Bank Plc Goldman Sachs International
Morgan Stanley & Co. International Plc
Gross volumes for open trades 1,023,650.23 1,035,079.31 10,096.63 450,281.16 First country of domicile United Kingdom United Kingdom United Kingdom United Kingdom
Second name - - Morgan Stanley &
Co. International Plc
Merril Lynch International Limited
Gross volumes for open trades 4,631.75 132,640.21 Second country of domicile - - United Kingdom United Kingdom
Third name - - Citibank New York -
Gross volumes for open trades - - 3,392.43 - Third country of domicile - - USA -
Collateral received In EUR In EUR In EUR In EUR
Type: Cash
-
-
172,487.11*
-
Quality
- - - -
Currency
- - EUR -
Classification according to residual maturities:
Less than 1 day - - - - From 1 day to 1 week - - - -
From 1 week to 1 month - - - - From 1 month to 3 months - - - -
From 3 months to 1 year - - - - Above 1 year - - - -
Open maturity - - 172,487.11 -
The 10 largest issuers of collateral received
In EUR In EUR In EUR In EUR
First name N/A N/A Goldman Sachs International
N/A
Amount N/A N/A 172,487.11 N/A
* Amount of cash collateral received reflects the global position of this sub-fund towards the counterparty.
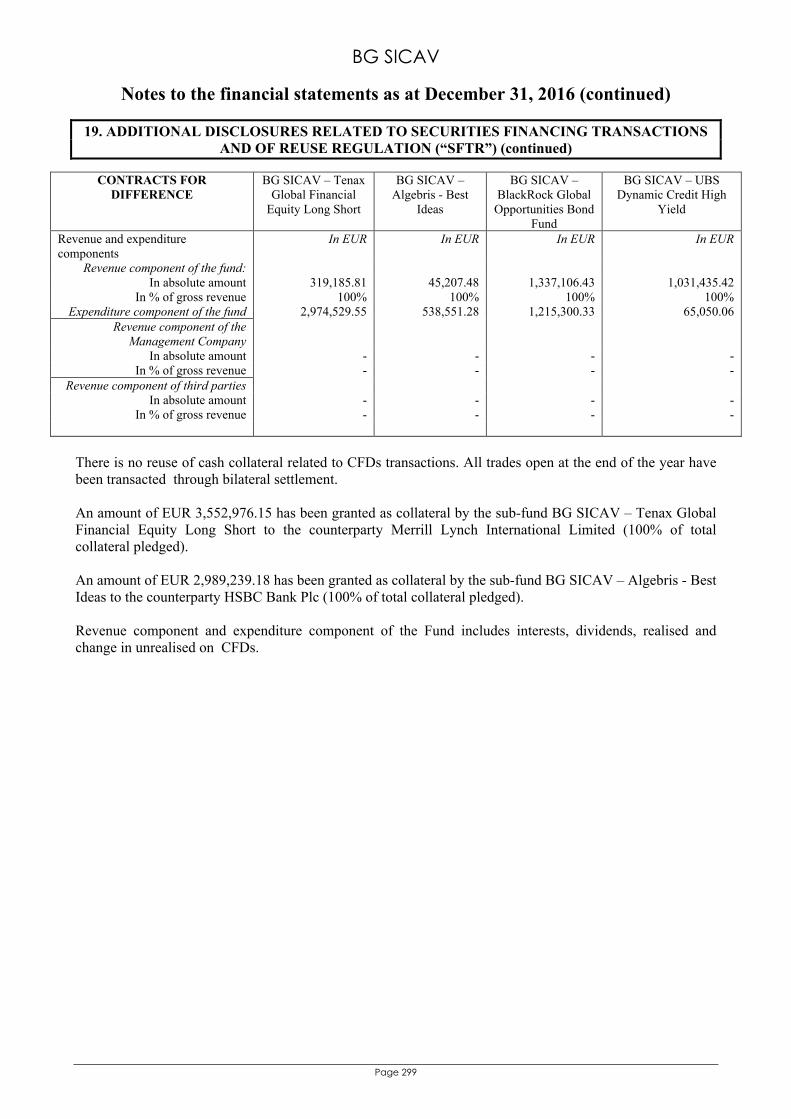
BG SICAV
Notes to the financial statements as at December 31, 2016 (continued)
Page 299
19. ADDITIONAL DISCLOSURES RELATED TO SECURITIES FINANCING TRANSACTIONS AND OF REUSE REGULATION (“SFTR”) (continued)
CONTRACTS FOR DIFFERENCE
BG SICAV – Tenax Global Financial
Equity Long Short
BG SICAV – Algebris - Best
Ideas
BG SICAV – BlackRock Global
Opportunities Bond Fund
BG SICAV – UBS Dynamic Credit High
Yield
Revenue and expenditure components
In EUR In EUR In EUR In EUR
Revenue component of the fund: In absolute amount 319,185.81 45,207.48 1,337,106.43 1,031,435.42
In % of gross revenue 100% 100% 100% 100% Expenditure component of the fund 2,974,529.55 538,551.28 1,215,300.33 65,050.06
Revenue component of the Management Company
In absolute amount - - - - In % of gross revenue - - - -
Revenue component of third parties In absolute amount - - - -
In % of gross revenue - - - -
There is no reuse of cash collateral related to CFDs transactions. All trades open at the end of the year have been transacted through bilateral settlement. An amount of EUR 3,552,976.15 has been granted as collateral by the sub-fund BG SICAV – Tenax Global Financial Equity Long Short to the counterparty Merrill Lynch International Limited (100% of total collateral pledged). An amount of EUR 2,989,239.18 has been granted as collateral by the sub-fund BG SICAV – Algebris - Best Ideas to the counterparty HSBC Bank Plc (100% of total collateral pledged). Revenue component and expenditure component of the Fund includes interests, dividends, realised and change in unrealised on CFDs.
BG SICAV
Global exposure calculation method (unaudited information)
Page 300
The commitment approach
The following sub-funds use the commitment approach in order to monitor and measure the global exposure:
- BG SICAV – European Equities
- BG SICAV – US Equities
- BG SICAV – Pictet Japanese Equities
- BG SICAV – Schroder High Dividend Europe
- BG SICAV – Small-Mid Cap Euro Equities
- BG SICAV – Morgan Stanley Global Real Estate & Infrastructure Equities Fund
- BG SICAV – Generali Investments Europe - Equity Recovery Fund
- BG SICAV – Flexible Global Equities
- BG SICAV – Euro Income Bond
- BG SICAV – Euro Debt
- BG SICAV – Invesco Financial Credit Bond
- BG SICAV – HSBC Euro Credit Opportunities
- BG SICAV – UBS Dynamic Credit High Yield
- BG SICAV – Schroder Convertible Bond Opportunities
- BG SICAV – Vontobel New Frontier Debt
- BG SICAV – Global Supranational
The global exposure of the sub-funds is calculated based on the commitment approach in accordance with the methodology described in the ESMA's guidelines 10-788. The absolute VaR approach
The sub-funds BG SICAV – UBS Global Long Short (formerly Columbia Threadneedle Global Equity Long Short), BG SICAV – Controlfida Low-Volatility European Equities, BG SICAV – Tenax Global Financial Equity Long Short, BG SICAV – Short Equities, BG SICAV – Eurizon Multiasset Optimal Diversified Approach, BG SICAV – Amundi Absolute Forex, BG SICAV – Controlfida Global Macro, BG SICAV – Vontobel Pure Strategy, BG SICAV – Vontobel Global Active Bond, BG SICAV – BlackRock Global Opportunities Bond Fund, BG SICAV – Amundi Global Income Bond, BG SICAV – JP Morgan Capital Structure Opportunity, BG SICAV – Algebris - Best Ideas and BG SICAV – Muzinich Credit Alternative Fund use the absolute Value at Risk (VaR) approach in order to monitor and measure the global exposure.
BG SICAV
Global exposure calculation method (unaudited information) (continued)
Page 301
The absolute VaR approach (continued) BG SICAV – UBS Global Long Short (formerly BG SICAV – Columbia Threadneedle Global Equity Long Short)
The limit is set at 8%.
The utilisation of the VaR limit during the financial year was as follows: - Lowest utilisation : 0.03% - Highest utilisation : 88.61% - Average utilisation : 31.19%
The VaR figures have been calculated based on the following input data: - Model used: Monte-Carlo - Confidence level: 99% - Holding period: 20 days - Length of data history: 3 years
The average level of leverage calculated using the sum of notionals approach was 67%. BG SICAV – Controlfida Low-Volatility European Equities
The limit is set at 13%.
The utilisation of the VaR limit during the financial year was as follows: - Lowest utilisation : 32.73% - Highest utilisation : 165.53% - Average utilisation : 66.94%
The VaR figures have been calculated based on the following input data: - Model used: Monte-Carlo - Confidence level: 99% - Holding period: 20 days - Length of data history: 3 years
The average level of leverage calculated using the sum of notionals approach was 122%. BG SICAV – Tenax Global Financial Equity Long Short
The limit is set at 10%.
The utilisation of the VaR limit during the financial year was as follows: - Lowest utilisation : 13.90% - Highest utilisation : 120.95% - Average utilisation : 36.84%
The VaR figures have been calculated based on the following input data: - Model used: Monte-Carlo - Confidence level: 99% - Holding period: 20 days - Length of data history: 3 years
The average level of leverage calculated using the sum of notionals approach was 55%.
BG SICAV
Global exposure calculation method (unaudited information) (continued)
Page 302
The absolute VaR approach (continued) BG SICAV – Eurizon Multiasset Optimal Diversified Approach
The limit is set at 8%.
The utilisation of the VaR limit during the financial year was as follows: - Lowest utilisation : 14.80% - Highest utilisation : 70.90% - Average utilisation : 39.33%
The VaR figures have been calculated based on the following input data: - Model used: Monte-Carlo - Confidence level: 99% - Holding period: 20 days - Length of data history: 3 years
The average level of leverage calculated using the sum of notionals approach was 153%. BG SICAV – Amundi Absolute Forex
The limit is set at 4%.
The utilisation of the VaR limit during the financial year was as follows: - Lowest utilisation : 23.02% - Highest utilisation : 73.87% - Average utilisation : 46.63%
The VaR figures have been calculated based on the following input data: - Model used: Monte-Carlo - Confidence level: 99% - Holding period: 20 days - Length of data history: 3 years
The average level of leverage calculated using the sum of notionals approach was 578%. BG SICAV – Controlfida Global Macro
The limit is set at 13%.
The utilisation of the VaR limit during the financial year was as follows: - Lowest utilisation : 15.41% - Highest utilisation : 166.73% - Average utilisation : 52.35%
The VaR figures have been calculated based on the following input data: - Model used: Monte-Carlo - Confidence level: 99% - Holding period: 20 days - Length of data history: 3 years
The average level of leverage calculated using the sum of notionals approach was 397%.
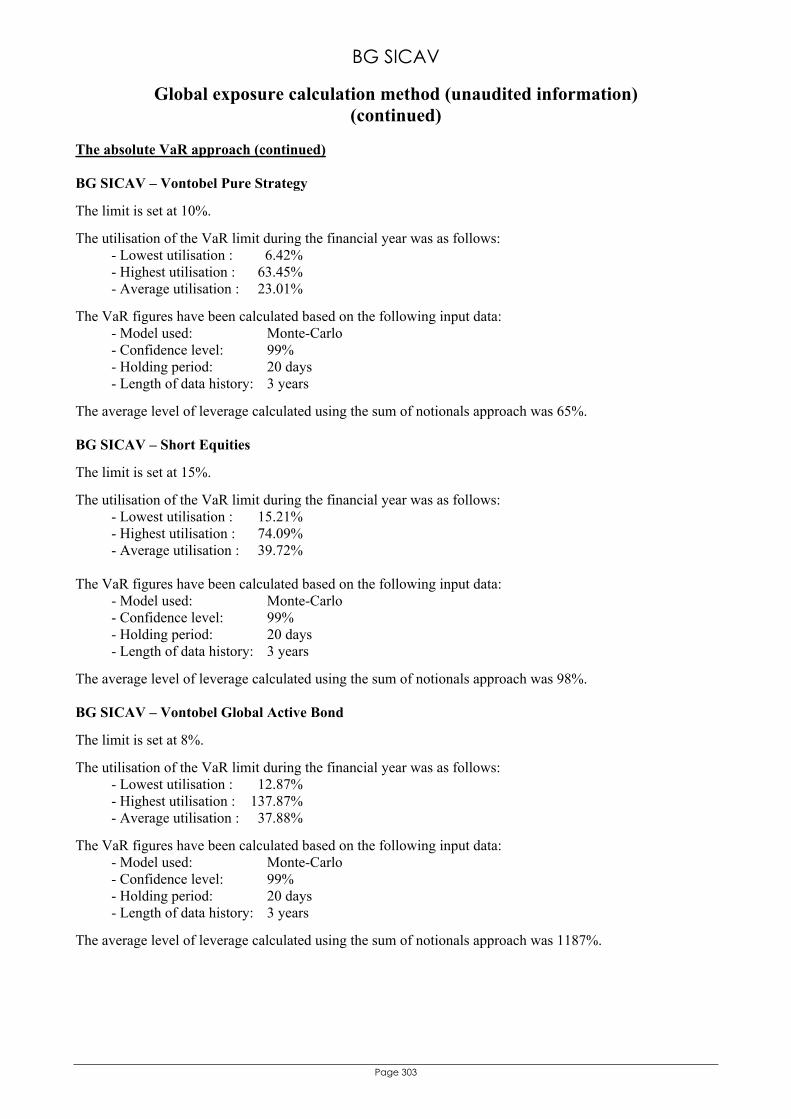
BG SICAV
Global exposure calculation method (unaudited information) (continued)
Page 303
The absolute VaR approach (continued) BG SICAV – Vontobel Pure Strategy
The limit is set at 10%.
The utilisation of the VaR limit during the financial year was as follows: - Lowest utilisation : 6.42% - Highest utilisation : 63.45% - Average utilisation : 23.01%
The VaR figures have been calculated based on the following input data: - Model used: Monte-Carlo - Confidence level: 99% - Holding period: 20 days - Length of data history: 3 years
The average level of leverage calculated using the sum of notionals approach was 65%. BG SICAV – Short Equities
The limit is set at 15%.
The utilisation of the VaR limit during the financial year was as follows: - Lowest utilisation : 15.21% - Highest utilisation : 74.09% - Average utilisation : 39.72%
The VaR figures have been calculated based on the following input data:
- Model used: Monte-Carlo - Confidence level: 99% - Holding period: 20 days - Length of data history: 3 years
The average level of leverage calculated using the sum of notionals approach was 98%. BG SICAV – Vontobel Global Active Bond
The limit is set at 8%.
The utilisation of the VaR limit during the financial year was as follows: - Lowest utilisation : 12.87% - Highest utilisation : 137.87% - Average utilisation : 37.88%
The VaR figures have been calculated based on the following input data: - Model used: Monte-Carlo - Confidence level: 99% - Holding period: 20 days - Length of data history: 3 years
The average level of leverage calculated using the sum of notionals approach was 1187%.
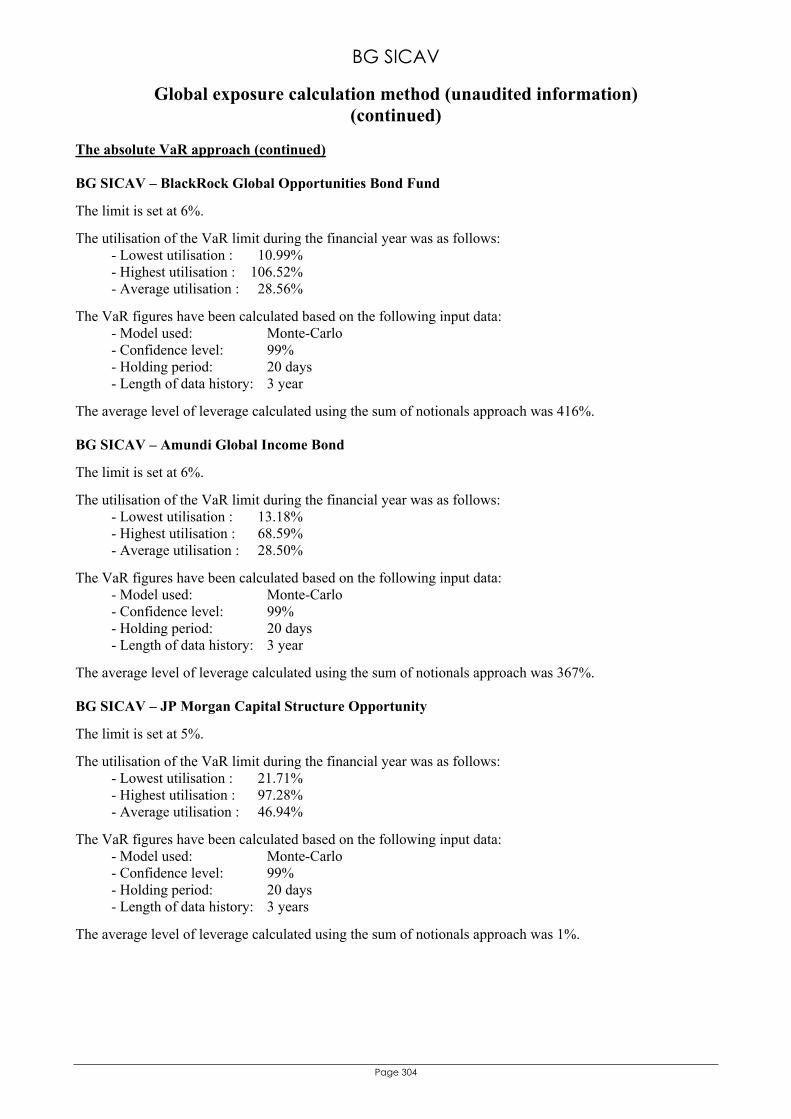
BG SICAV
Global exposure calculation method (unaudited information) (continued)
Page 304
The absolute VaR approach (continued) BG SICAV – BlackRock Global Opportunities Bond Fund
The limit is set at 6%.
The utilisation of the VaR limit during the financial year was as follows: - Lowest utilisation : 10.99% - Highest utilisation : 106.52% - Average utilisation : 28.56%
The VaR figures have been calculated based on the following input data: - Model used: Monte-Carlo - Confidence level: 99% - Holding period: 20 days - Length of data history: 3 year
The average level of leverage calculated using the sum of notionals approach was 416%. BG SICAV – Amundi Global Income Bond
The limit is set at 6%.
The utilisation of the VaR limit during the financial year was as follows: - Lowest utilisation : 13.18% - Highest utilisation : 68.59% - Average utilisation : 28.50%
The VaR figures have been calculated based on the following input data: - Model used: Monte-Carlo - Confidence level: 99% - Holding period: 20 days - Length of data history: 3 year
The average level of leverage calculated using the sum of notionals approach was 367%. BG SICAV – JP Morgan Capital Structure Opportunity
The limit is set at 5%.
The utilisation of the VaR limit during the financial year was as follows: - Lowest utilisation : 21.71% - Highest utilisation : 97.28% - Average utilisation : 46.94%
The VaR figures have been calculated based on the following input data: - Model used: Monte-Carlo - Confidence level: 99% - Holding period: 20 days - Length of data history: 3 years
The average level of leverage calculated using the sum of notionals approach was 1%.
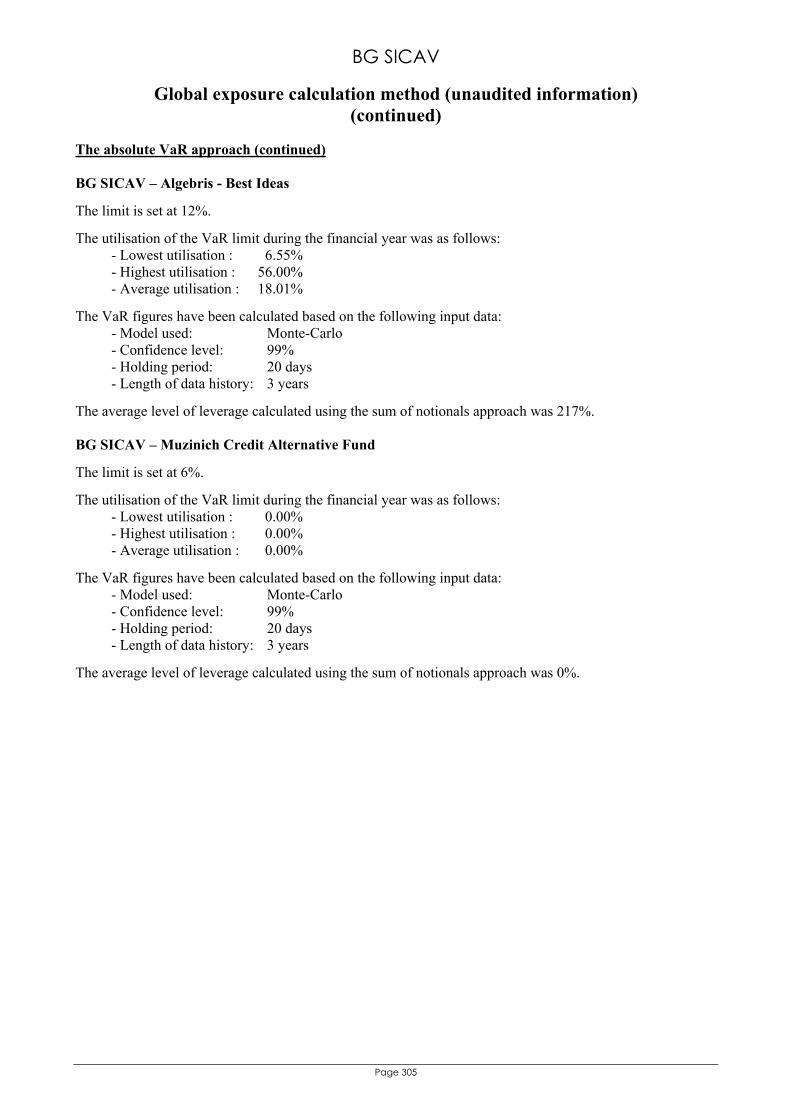
BG SICAV
Global exposure calculation method (unaudited information) (continued)
Page 305
The absolute VaR approach (continued) BG SICAV – Algebris - Best Ideas
The limit is set at 12%.
The utilisation of the VaR limit during the financial year was as follows: - Lowest utilisation : 6.55% - Highest utilisation : 56.00% - Average utilisation : 18.01%
The VaR figures have been calculated based on the following input data: - Model used: Monte-Carlo - Confidence level: 99% - Holding period: 20 days - Length of data history: 3 years
The average level of leverage calculated using the sum of notionals approach was 217%. BG SICAV – Muzinich Credit Alternative Fund
The limit is set at 6%.
The utilisation of the VaR limit during the financial year was as follows: - Lowest utilisation : 0.00% - Highest utilisation : 0.00% - Average utilisation : 0.00%
The VaR figures have been calculated based on the following input data: - Model used: Monte-Carlo - Confidence level: 99% - Holding period: 20 days - Length of data history: 3 years
The average level of leverage calculated using the sum of notionals approach was 0%.


![jflif{sk|ltj]bg - ADBL](https://static.fdokumen.com/doc/165x107/631b1bb6e422e895e602b689/jflifskltjbg-adbl.jpg)


