DANSKE INVEST SICAV Société d'Investissement à Capital ...
125
-
Upload
khangminh22 -
Category
Documents
-
view
0 -
download
0
Transcript of DANSKE INVEST SICAV Société d'Investissement à Capital ...

DANSKE INVEST SICAV
Société d'Investissement à Capital Variable
Unaudited Semi-Annual Report
as at June 30, 2016
R.C.S B161867
Subscriptions shall only be valid if made on the basis of the KIID (Key Investor Information Document) or thecurrent prospectus accompanied by the most recent audited annual report as well as by the semi-annualreport if published more recently than the most recent annual report, including Audited FinancialStatements. No one is authorised to state other information than the one contained in the Prospectus aswell as in the documents herein mentioned, which are available to the public.

Table of contents
PageManagement and Administration 4Information to Shareholders 6Directors' Report 7Unaudited Combined Statement of Net Assets 10Unaudited Combined Statement of Operations and Changes in Net Assets 18Eastern Europe
Statement of Investments 24Geographical and Economic Portfolio Breakdowns 27
Emerging and Frontier MarketsStatement of Investments 28Geographical and Economic Portfolio Breakdowns 35
Emerging Markets Debt Hard CurrencyStatement of Investments 36Geographical and Economic Portfolio Breakdowns 41
Euro High Yield BondStatement of Investments 42Geographical and Economic Portfolio Breakdowns 48
EuropeStatement of Investments 49Geographical and Economic Portfolio Breakdowns 52
Europe AbsoluteStatement of Investments 53Geographical and Economic Portfolio Breakdowns 55
Europe Long-Short DynamicStatement of Investments 56Geographical and Economic Portfolio Breakdowns 59
Europe Long-Short Dynamic PlusStatement of Investments 60Geographical and Economic Portfolio Breakdowns 63
European Corporate Sustainable Bond*Statement of Investments 64Geographical and Economic Portfolio Breakdowns 66
GermanyStatement of Investments 67Geographical and Economic Portfolio Breakdowns 68
Global High DividendStatement of Investments 69Geographical and Economic Portfolio Breakdowns 71
Global Inflation Linked BondStatement of Investments 72Geographical and Economic Portfolio Breakdowns 75
Global Inflation Linked Bond Short DurationStatement of Investments 76Geographical and Economic Portfolio Breakdowns 78
Nordic Corporate BondStatement of Investments 79Geographical and Economic Portfolio Breakdowns 84
US High Yield BondStatement of Investments 85Geographical and Economic Portfolio Breakdowns 88
Notes to the Unaudited Financial Statements 89Information for Investors in Switzerland (non audited) 123
DANSKE INVEST SICAV
3
* See Note 1
Management and Administration
Board of Directors:
Chairman
Robert MikkelstrupHead of Investment Risk & ImplementationDanske Wealth ManagementDanske Bank A/SKongens LungbyDenmark
Members
Morten RastenManaging DirectorDanske Invest Management A/SKongens LyngbyDenmark
Henrik Rye PetersenHead of Fund DistributionDanske InvestKongens Lyngby,Denmark
Registered Office:
13, rue Edward SteichenL-2540 LuxembourgGrand Duchy of Luxembourg
Management Company:
DANSKE INVEST MANAGEMENT COMPANY13, rue Edward Steichen,L-2540 Luxembourg,Grand Duchy of Luxembourg
Board of Directors of the Management Company:
Chairman
Morten RastenManaging DirectorDanske Invest Management A/SKongens LyngbyDenmark
Members
Johnny BisgaardHead of Private Banking LuxembourgDanske Bank International S.A.LuxembourgGrand-Duchy of Luxembourg
Lone Mortensen (resigned as per May 31, 2016)Member of Executive BoardDanske Invest Management A/SKongens LyngbyDenmark
Thomas Borg Dideriksen (co-opted May 31, 2016subject to CSSF approval)Managing DirectorDanske Bank International S.A.LuxembourgGrand Duchy of Luxembourg
Investment Managers:
Danske Bank A/S17, ParallelvejDK-2800 Kgs. LyngbyDenmark
Danske Capital AB16, KungsträdgårdsgatanSE-111 47 StockholmSweden
Sub-Investment Managers:
DDJ Capital Management LLC(for Sub-Fund US High Yield Bond)Stony Brook Office Park130 Turner StreetBuilding 3, Suite 600Waltham, MA 02453U.S.A.
William Blair & Company LLC (until May 25, 2016)(for Sub-Fund Global Emerging Markets Leaders)222 West Adams StreetChicago, Illinois 60606U.S.A.
Sub-Investment Advisors:
Aventicum Capital Management (Qatar) LLCTornado Tower - 32 floorWest Bay, P.O. Box 23146DohaQatar
Blackhorse Asset Management Pte. ltd156 Cecil Street#06-01 Far Eastern Bank BuildingSingapore 069544
Claritas Administração de Recursos Ltda.Avenida Brigadeiro Faria Lima, 4221, 4th floor04538-133, São PauloBrazil
Compass Group LLC35 East 57th Street,New York, NY 10022U.S.A.
Fullerton Fund Management Company Ltd60B Orchard Road, 5th floor Tower 2,The Atrium, Singapore 238891
Imara Asset Management LtdLevel 12, Nexteracom Tower 1Cybercity, EbeneRepublic of Mauritius
JK Capital Management LimitedSuite 1101, 11th floor, 34-37 Connaught RoadCentral,Hong KongChina
Karma Capital Advisors Private Limited408, Oberoi Chambers 1, Off Link Road, AndheriWest,Mumbai 400053India
DANSKE INVEST SICAV
4

Custodian andCentral Administration:
RBC Investor Services Bank S.A.14, Porte de FranceL-4360 Esch-sur-AlzetteGrand Duchy of Luxembourg
Registrar Agent:
RBC Investor Services Bank S.A.14, Porte de FranceL-4360 Esch-sur-AlzetteGrand Duchy of Luxembourg
Principal Paying Agent:
RBC Investor Services Bank S.A.14, Porte de FranceL-4360 Esch-sur-AlzetteGrand Duchy of Luxembourg
Auditor:
Deloitte Audit S.à r.l560, rue de NeudorfL-2220 LuxembourgGrand Duchy of Luxembourg
Domiciliary Agent
DANSKE INVEST MANAGEMENT COMPANY13, rue Edward SteichenL-2540 LuxembourgGrand Duchy of Luxembourg
Swiss Representative
Carnegie Fund Services S.A.11, rue du General - Dufour1204 Geneva,Switzerland
Swiss Paying Agent
Banque Cantonale de Geneve17, Quai de L'lle1204 Geneva,Switzerland
German Information and Paying Agent
Danske Bank A/S,Zweigniederlassung HamburgGeorgsplatz 1Postfach 101522D-20099 Hamburg,Germany
DANSKE INVEST SICAV
5
Management and Administration (continued)

Information to Shareholders
Information about the Net Asset Value of the shares of each Sub-Fund and the subscription and redemptionprices is available at all times at the registered office of the Fund.
Copies of the annual report, including Audited Financial Statements and unaudited semi-annual reports maybe obtained by holders of shares from the registered office of the Fund.
A detailed schedule of portfolio changes is available free of charge upon request at the registered office ofthe Fund.
The current prospectus, KIID and articles of association are also available from the German Information andPaying Agent.
The Fund’s prospectus, KIID, articles of association, annual report, including Audited Financial Statementsand unaudited semi-annual reports – each in their respective latest version approved by the Swiss FinancialMarket Supervisory Authority, in German – and the net asset value per share as well as the subscription,redemption and possible conversion price of shares and a list of changes to the investment portfolio areavailable free of charge at the office of the Swiss Representative.
All information available to shareholders at the head office of the management company is also available tothe public free of charge, upon request from the Swiss Representative.
Swiss Representative:
Carnegie Fund Services S.A.11, rue du General - Dufour1204 Geneva, SWITZERLAND
DANSKE INVEST SICAV
6

Directors’ ReportSignificant events during the first half-year 2016:
Board of Directors:
The Annual General Meeting of Danske Invest SICAV took place on April 19, 2016.
The General Assembly took note of the expiry of the mandate for all the current Board Members asof April 19, 2016 and noted that there is no remuneration fee for Board Members from Danske Bank Group.The General Assembly agreed to elect the following Board Members - Mr. Robert Mikkelstrup, Mr. MortenRasten, and Mr. Henrik Rye Petersen - for a one year period until the next Annual General Meeting will beheld in 2017.
Deloitte Audit S.à.r.l. Luxembourg was elected as Statutory Auditor for another one year period until the nextAnnual General Meeting which will be held in 2017.
Mandates held by the current Board of Directors of Danske Invest SICAV
Mr. Robert Mikkelstrup has the following mandates in addition to the Director mandate and Chairman ofDanske Invest SICAV.Board membership: Danske Invest Allocation and Danske Invest SICAV-SIF (Luxembourg).
Mr. Henrik Rye Petersen has the following mandates in addition to the Director mandate of Danske InvestSICAV.Board membership: Danske Invest Allocation and Danske Invest SICAV-SIF (Luxembourg).
Mr. Morten Rasten has the following mandates and engagements (in addition to the director mandate ofDanske Invest SICAV):Board membership: Danske Invest Fund Management Ltd (Finland), Danske Capital AB (Sweden), DanskeCapital AS Norway, Danske Invest SICAV SIF, Danske Invest Allocation and Danske Invest ManagementCompany (Luxembourg).Management position: Managing Director in Danske Invest Management A/S (Denmark).
Danske Invest SICAV Prospectus March 2016
In line with the ambition to merge existing UCITS funds domiciled in Sweden into Danske Invest Allocationand Danske Invest SICAV, the Prospectus was updated and was filed with the CSSF on January 27, 2016.On April 11, 2016 the CSSF issued the visa stamped Prospectus which reflected the addition of eleven newSwedish Sub-Funds as listed below together with a new external Investment Manager - Danske Capital ABSweden.
• Aktiv Förmögenhetsforvaltning• Europa• Sverige• Sverige Europa• Sverige Fokus• Sverige Kort Ränta• Sverige Ränta,• Sverige Real Ränta,• Global Index• SRI Global• Sverige Beta
Danske Invest SICAV Prospectus May 2016
The Prospectus was updated to include a new Sub-Fund called Danske Invest SICAV - European CorporateSustainable Bond and the CSSF approved this on May 23, 2016.
The main changes to the Prospectus are listed below:
• Definitions has been updated to include the definition of Environmental, Social and Governance issues –ESG;• The “Investment objective, Investment policy and Risks” of the Sub-Fund Danske Invest SICAV - EmergingMarkets Debt Hard Currency has been updated to reflect that the Sub-Fund will invest in transferablesecurities, mainly bonds issued or guaranteed by governments or by companies in Emerging Marketcountries and other debt instruments. Please note that we see these updates as a further precision of thecurrent text and not a change that would require a Notice to Shareholders;• Create two new share classes together with their fee analysis in the Sub-Fund Danske Invest SICAV –Europe Long Short Dynamic Class A dp and Class I-USD;
DANSKE INVEST SICAV
7

• Insert a Risk-Free rate in USD in the Appendix in the Sub-Fund Danske Invest SICAV – Europe Long ShortDynamic;• Create a new Sub-Fund Danske Invest SICAV - European Corporate Sustainable Bond whose details aredescribed under the relevant appendix in the Prospectus.
UCITS V Directive Prospectus update
The UCITS V Directive was adopted by the Luxembourg Parliament on April 21, 2016. Updates to theDanske Invest SICAV Prospectus on Depositary functions (including new Depositary Agreement andRemuneration Policy requirements will be filed with the CSSF during Q3 2016.
KIID
All the Key Investor Information Documents - the KIIDs - are available and published on the website www.danskeinvest.com. The annual KIID update for the ongoing charges and past performance was completed inFebruary 2016.
Changes to Objective and Investment Policy text in KIIDs for two Sub-Funds
At the end of February 2016, the Sales organisation in Danske Capital, Denmark approached DIMC with therequest to have the Objective and Investment Policy text in the KIIDs for the Danske Invest SICAV EuropeLong-Short Dynamic and Danske Invest SICAV Europe Long-Short Dynamic Plus changed. The CSSFapproved these updates on April 22, 2016 and the updated KIIDs were published on April 25, 2016.
Launch of new Sub-Fund Danske Invest SICAV - Global Emerging Markets Leaders
The following classes were activated in the Sub-Fund Danske Invest SICAV Global Emerging MarketsLeaders
- Class A (ISIN code LU1204912700) at the initial issue price of USD 10- Class I (ISIN code LU1204912965) at the initial issue price of USD 10
on January 7, 2016 (the initial subscription date). The initial subscription payment was January 11, 2016and the first net asset value calculation of this Sub-Fund took place on January 8, 2016.
Launch of new class in Danske Invest SICAV - Europe Long-Short Dynamic Plus class A-sek hp
The following new share class in the Sub-Fund Danske Invest SICAV- Europe Long-Short Dynamic Plus wasactivated
- Class A-sek hp (ISIN code LU1204912296) at the initial issue price of SEK 100
on February 26, 2016 (the initial subscription date). The initial subscription payment wason March 1, 2016 and the first net asset value calculation of this share class took placeon February 29, 2016.
Launch of new share class in Danske Invest SICAV - Euro High Yield Bond Class I
The following share class Euro High Yield Bond class I was launched on April 13, 2016 (initial subscriptiondate) at the initial issue price of EUR 10 and the first net asset value calculation of this share class tookplace on April 14, 2016.
Launch of new Sub-Fund Danske Invest SICAV - European Corporate Sustainable Bond
The following classes were activated in the new Sub-Fund Danske Invest SICAV - European CorporateSustainable Bond
- Class A (ISIN code LU1399304283) at the initial issue price of EUR 10- Class A d (ISIN code LU1399304366) at the initial issue price of EUR 10- Class I (ISIN code LU1399305330) at the initial issue price of EUR 10- Class A-sek h (ISIN code LU1399304879) at the initial issue price of SEK 100
on June 15, 2016 (the initial subscription date). The initial subscription payment was on June 20, 2016 andthe first net asset value calculation of this Sub-Fund took place on June 16, 2016.
DANSKE INVEST SICAV
8
Directors’ Report (continued)

Launch of new share class in Danske Invest SICAV - Europe Long-Short Dynamic class A dp
A new share class in the Sub-Fund Danske Invest SICAV - Europe Long-Short Dynamic was activated
- Class A dp (ISIN code LU1399304010) at the initial issue price of EUR 10
on June 21, 2016 (the initial subscription date). The initial subscription payment was on June 24, 2016 andthe first net asset value calculation of this share class took place on June 22, 2016.
Sub-Fund Closure - Danske Invest SICAV Global Emerging Markets Leaders
Full redemption orders were provided to the registrar agent on May 22, 2016 in relation to the two shareclasses listed below in the Sub-Fund Danske Invest SICAV Global Emerging Markets Leaders
- Class A (ISIN code LU1204912700)- Class I (ISIN code LU1204912965)
Consequently the final Net Asset Value of these classes was calculated on May 26, 2016 and the Sub-Fundwas closed.
DANSKE INVEST SICAV
9
Directors’ Report (continued)

Unaudited Combined Statement of Net Assetsas at June 30, 2016
Eastern Europe Emerging andFrontierMarkets
EmergingMarkets DebtHard Currency
Euro High YieldBond
Note EUR EUR USD EUR
ASSETS
Investment portfolio at market value (3) 3,008,679 67,435,929 18,877,462 121,399,662Cash at bank 54,861 3,175,749 405,409 6,854,964Amounts receivable on sale ofinvestments 13,048 234,085 186,996 -Amounts receivable on subscriptions - 6,714 - 70,120Formation expenses, net (3) - - - -Interest and dividend receivable, net (3) 3,493 134,816 311,546 2,133,377Net unrealised profit on forward foreignexchange contracts (3), (8) - - 27,807 -Net unrealised profit on CFDs (3), (9) - - - -Other assets 310 64,668 - -
TOTAL ASSETS 3,080,391 71,051,961 19,809,220 130,458,123
LIABILITIES
Bank overdraft - 114 - -Interest payable on CFDs (3) - - - -Amounts payable on purchase ofinvestments - 129,803 - 450,000Amounts payable on redemptions - 33,138 - 1,046Net unrealised loss on forward foreignexchange contracts (3), (8) - - - 110,201Net unrealised loss on futures contracts (3), (10) - - - -Net unrealised loss on CFDs (3), (9) - - - -Performance fees payable (4) - - - -Investment management fees payable (4) 2,298 86,024 9,634 106,629Marketing fees payable (4) 8 84 6 10,572Operating and Administrative feespayable 746 84,681 2,399 12,929Taxes and expenses payable 86 1,845 500 15,731Unrealised capital gain tax oninvestments - 2,311 - -Other liabilities - 476 - -
TOTAL LIABILITIES 3,138 338,476 12,539 707,108
TOTAL NETASSETS 3,077,253 70,713,485 19,796,681 129,751,015
DANSKE INVEST SICAV
The accompanying notes form an integral part of these financial statements.
10

Eastern Europe Emerging andFrontierMarkets
EmergingMarkets DebtHard Currency
Euro High YieldBond
Note EUR EUR USD EUR
Net asset value per share
Class A and Ap 9.289 10.534 10.880 11.553Class A d - - - 10.003Class A-dkk d - 104.990 - -Class A-dp - - - -Class A-eur h - - - -Class A-nok d - - - -Class A-nok h - - - -Class A-nok - 105.610 - -Class A-sek d - - - -Class A-sek h - - - 99.750Class A-sek hp - - - -Class A-sek - 104.970 - -Class I and Ip 8.941 10.566 10.954 10.080Class Y - - - -
Number of shares outstanding
Class A and Ap 9,955.8489 54,373.3004 7,292.7839 10,902,361.5603Class A d - - - 2,068.6789Class A-dkk d - 8,506.8936 - -Class A-dp - - - -Class A-eur h - - - -Class A-nok d - - - -Class A-nok h - - - -Class A-nok - 20,848.3148 - -Class A-sek d - - - -Class A-sek h - - - 9,736.6008Class A-sek hp - - - -Class A-sek - 5,833.1791 - -Class I and Ip 333,820.4494 6,598,292.5956 1,800,000.0000 363,800.0000Class Y - - - -
DANSKE INVEST SICAV
The accompanying notes form an integral part of these financial statements.
11
Unaudited Combined Statement of Net Assetsas at June 30, 2016 (continued)
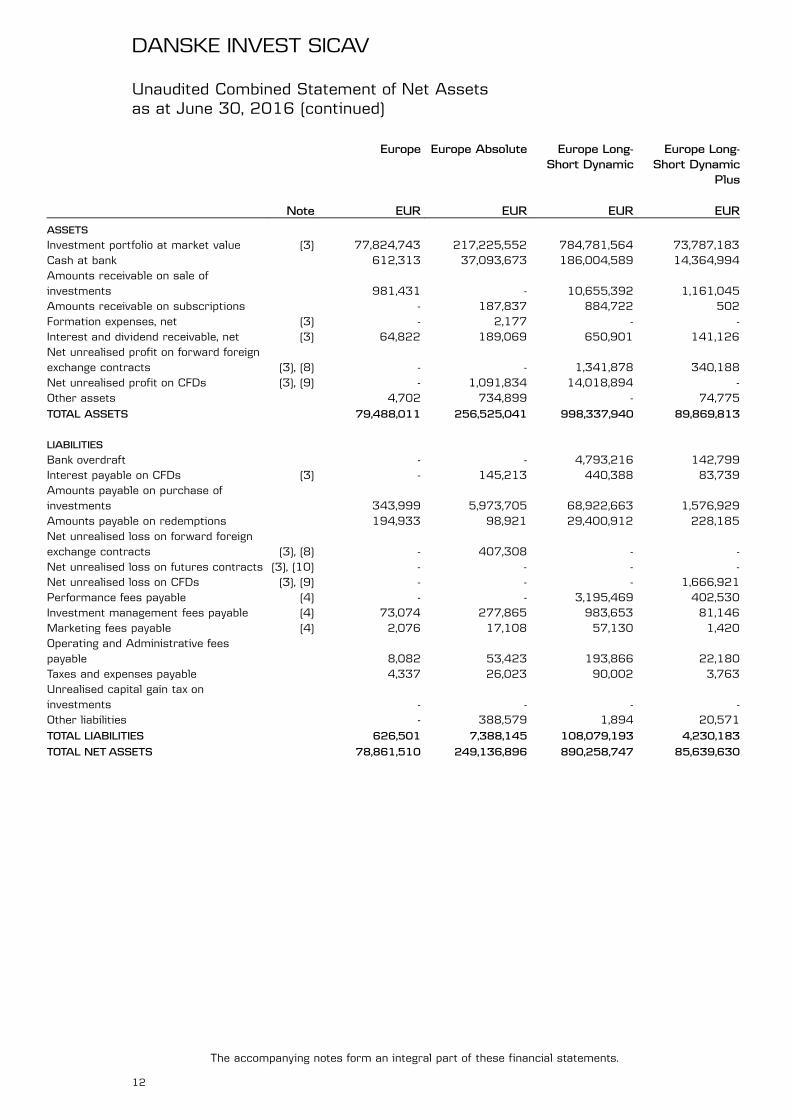
Europe Europe Absolute Europe Long-Short Dynamic
Europe Long-Short Dynamic
Plus
Note EUR EUR EUR EUR
ASSETS
Investment portfolio at market value (3) 77,824,743 217,225,552 784,781,564 73,787,183Cash at bank 612,313 37,093,673 186,004,589 14,364,994Amounts receivable on sale ofinvestments 981,431 - 10,655,392 1,161,045Amounts receivable on subscriptions - 187,837 884,722 502Formation expenses, net (3) - 2,177 - -Interest and dividend receivable, net (3) 64,822 189,069 650,901 141,126Net unrealised profit on forward foreignexchange contracts (3), (8) - - 1,341,878 340,188Net unrealised profit on CFDs (3), (9) - 1,091,834 14,018,894 -Other assets 4,702 734,899 - 74,775
TOTAL ASSETS 79,488,011 256,525,041 998,337,940 89,869,813
LIABILITIES
Bank overdraft - - 4,793,216 142,799Interest payable on CFDs (3) - 145,213 440,388 83,739Amounts payable on purchase ofinvestments 343,999 5,973,705 68,922,663 1,576,929Amounts payable on redemptions 194,933 98,921 29,400,912 228,185Net unrealised loss on forward foreignexchange contracts (3), (8) - 407,308 - -Net unrealised loss on futures contracts (3), (10) - - - -Net unrealised loss on CFDs (3), (9) - - - 1,666,921Performance fees payable (4) - - 3,195,469 402,530Investment management fees payable (4) 73,074 277,865 983,653 81,146Marketing fees payable (4) 2,076 17,108 57,130 1,420Operating and Administrative feespayable 8,082 53,423 193,866 22,180Taxes and expenses payable 4,337 26,023 90,002 3,763Unrealised capital gain tax oninvestments - - - -Other liabilities - 388,579 1,894 20,571
TOTAL LIABILITIES 626,501 7,388,145 108,079,193 4,230,183
TOTAL NETASSETS 78,861,510 249,136,896 890,258,747 85,639,630
DANSKE INVEST SICAV
The accompanying notes form an integral part of these financial statements.
12
Unaudited Combined Statement of Net Assetsas at June 30, 2016 (continued)

Europe Europe Absolute Europe Long-Short Dynamic
Europe Long-Short Dynamic
Plus
Note EUR EUR EUR EUR
Net asset value per share
Class A and Ap 13.834 12.115 11.335 10.081Class A d - - - -Class A-dkk d - - - -Class A-dp - - 9.883 -Class A-eur h - - - -Class A-nok d - - - -Class A-nok h - - 97.750 -Class A-nok - - - -Class A-sek d - - - -Class A-sek h - - - 89.680Class A-sek hp - 123.340 111.890 -Class A-sek - - - -Class I and Ip 14.174 12.420 11.549 10.148Class Y - - - -
Number of shares outstanding
Class A and Ap 1,741,649.5313 14,411,972.1055 47,304,641.4450 1,602,425.7071Class A d - - - -Class A-dkk d - - - -Class A-dp - - 100.0000 -Class A-eur h - - - -Class A-nok d - - - -Class A-nok h - - 1,000.0000 -Class A-nok - - - -Class A-sek d - - - -Class A-sek h - - - 1,000.0000Class A-sek hp - 1,896,204.2814 9,489,606.1242 -Class A-sek - - - -Class I and Ip 3,863,858.8285 4,000,734.3979 20,888,840.4577 6,846,030.1986Class Y - - - -
DANSKE INVEST SICAV
The accompanying notes form an integral part of these financial statements.
13
Unaudited Combined Statement of Net Assetsas at June 30, 2016 (continued)

EuropeanCorporate
SustainableBond*
Germany Global HighDividend
Global InflationLinked Bond
Note EUR EUR EUR EUR
ASSETS
Investment portfolio at market value (3) 39,012,385 8,588,337 11,352,230 12,150,247Cash at bank 9,075,272 353,990 422,984 24,904Amounts receivable on sale ofinvestments - - - 1,102,091Amounts receivable on subscriptions - 53 18,271 396,300Formation expenses, net (3) - - - -Interest and dividend receivable, net (3) 324,419 - 15,660 45,867Net unrealised profit on forward foreignexchange contracts (3), (8) - - - 64,937Net unrealised profit on CFDs (3), (9) - - - -Other assets - - 34,271 -
TOTAL ASSETS 48,412,076 8,942,380 11,843,416 13,784,346
LIABILITIES
Bank overdraft - - - -Interest payable on CFDs (3) - - - -Amounts payable on purchase ofinvestments 2,089,566 - 373,825 1,238,698Amounts payable on redemptions - 195,678 255 -Net unrealised loss on forward foreignexchange contracts (3), (8) 365,902 - - -Net unrealised loss on futures contracts (3), (10) - - - -Net unrealised loss on CFDs (3), (9) - - - -Performance fees payable (4) - - - -Investment management fees payable (4) 16,171 9,767 8,754 7,690Marketing fees payable (4) 2,021 465 88 961Operating and Administrative feespayable 3,032 1,240 1,085 1,154Taxes and expenses payable 5,797 1,448 420 1,152Unrealised capital gain tax oninvestments - - - -Other liabilities - 95 866 39
TOTAL LIABILITIES 2,482,489 208,693 385,293 1,249,694
TOTAL NETASSETS 45,929,587 8,733,687 11,458,123 12,534,652
DANSKE INVEST SICAV
The accompanying notes form an integral part of these financial statements.
14
Unaudited Combined Statement of Net Assetsas at June 30, 2016 (continued)
* See Note 1

EuropeanCorporate
SustainableBond*
Germany Global HighDividend
Global InflationLinked Bond
Note EUR EUR EUR EUR
Net asset value per share
Class A and Ap 10.006 10.689 9.973 11.024Class A d 10.006 - - 10.628Class A-dkk d - - - -Class A-dp - - - -Class A-eur h - - - -Class A-nok d - - 107.500 -Class A-nok h - - - -Class A-nok - 101.460 107.500 -Class A-sek d - - 103.050 -Class A-sek h - - - 106.270Class A-sek hp - - - -Class A-sek 100.070 96.290 103.050 -Class I and Ip 10.009 10.799 10.064 10.636Class Y - - - 10.861
Number of shares outstanding
Class A and Ap 10.0000 505,912.5311 139,713.0023 1,135,722.4704Class A d 10.0000 - - 100.0000Class A-dkk d - - - -Class A-dp - - - -Class A-eur h - - - -Class A-nok d - - 10.0000 -Class A-nok h - - - -Class A-nok - 10.0000 10.0000 -Class A-sek d - - 10.0000 -Class A-sek h - - - 1,000.0000Class A-sek hp - - - -Class A-sek 4,330,000.0000 3,064.4080 10.0000 -Class I and Ip 10.0000 305,079.6936 1,000,000.0000 100.0000Class Y - - - 100.0000
DANSKE INVEST SICAV
The accompanying notes form an integral part of these financial statements.
15
Unaudited Combined Statement of Net Assetsas at June 30, 2016 (continued)
* See Note 1
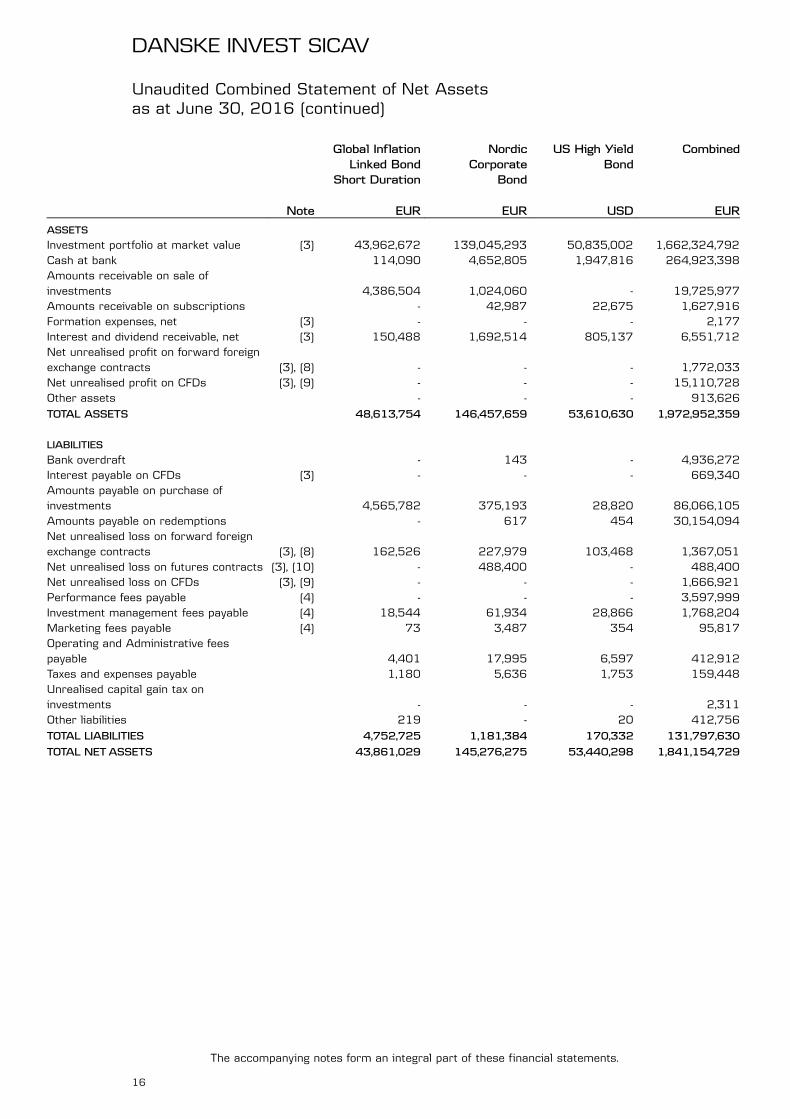
Global InflationLinked Bond
Short Duration
NordicCorporate
Bond
US High YieldBond
Combined
Note EUR EUR USD EUR
ASSETS
Investment portfolio at market value (3) 43,962,672 139,045,293 50,835,002 1,662,324,792Cash at bank 114,090 4,652,805 1,947,816 264,923,398Amounts receivable on sale ofinvestments 4,386,504 1,024,060 - 19,725,977Amounts receivable on subscriptions - 42,987 22,675 1,627,916Formation expenses, net (3) - - - 2,177Interest and dividend receivable, net (3) 150,488 1,692,514 805,137 6,551,712Net unrealised profit on forward foreignexchange contracts (3), (8) - - - 1,772,033Net unrealised profit on CFDs (3), (9) - - - 15,110,728Other assets - - - 913,626
TOTAL ASSETS 48,613,754 146,457,659 53,610,630 1,972,952,359
LIABILITIES
Bank overdraft - 143 - 4,936,272Interest payable on CFDs (3) - - - 669,340Amounts payable on purchase ofinvestments 4,565,782 375,193 28,820 86,066,105Amounts payable on redemptions - 617 454 30,154,094Net unrealised loss on forward foreignexchange contracts (3), (8) 162,526 227,979 103,468 1,367,051Net unrealised loss on futures contracts (3), (10) - 488,400 - 488,400Net unrealised loss on CFDs (3), (9) - - - 1,666,921Performance fees payable (4) - - - 3,597,999Investment management fees payable (4) 18,544 61,934 28,866 1,768,204Marketing fees payable (4) 73 3,487 354 95,817Operating and Administrative feespayable 4,401 17,995 6,597 412,912Taxes and expenses payable 1,180 5,636 1,753 159,448Unrealised capital gain tax oninvestments - - - 2,311Other liabilities 219 - 20 412,756
TOTAL LIABILITIES 4,752,725 1,181,384 170,332 131,797,630
TOTAL NETASSETS 43,861,029 145,276,275 53,440,298 1,841,154,729
DANSKE INVEST SICAV
The accompanying notes form an integral part of these financial statements.
16
Unaudited Combined Statement of Net Assetsas at June 30, 2016 (continued)

Global InflationLinked Bond
Short Duration
NordicCorporate
Bond
US High YieldBond
Note EUR EUR USD EUR
Net asset value per share
Class A and Ap 10.160 9.911 -Class A d 10.181 9.808 -Class A-dkk d - - -Class A-dp - - -Class A-eur h - - 9.316Class A-nok d - - -Class A-nok h - - -Class A-nok - - -Class A-sek d - - -Class A-sek h - - -Class A-sek hp - - -Class A-sek - 97.890 -Class I and Ip 10.231 10.001 9.642Class Y - - -
Number of shares outstanding
Class A and Ap 82,095.0000 2,446,218.4002 -Class A d 100.0000 100.0000 -Class A-dkk d - - -Class A-dp - - -Class A-eur h - - 412,414.2350Class A-nok d - - -Class A-nok h - - -Class A-nok - - -Class A-sek d - - -Class A-sek h - - -Class A-sek hp - - -Class A-sek - 1,718,195.3192 -Class I and Ip 4,205,484.8506 10,315,362.0000 5,100,000.0000Class Y - - -
DANSKE INVEST SICAV
The accompanying notes form an integral part of these financial statements.
17
Unaudited Combined Statement of Net Assetsas at June 30, 2016 (continued)
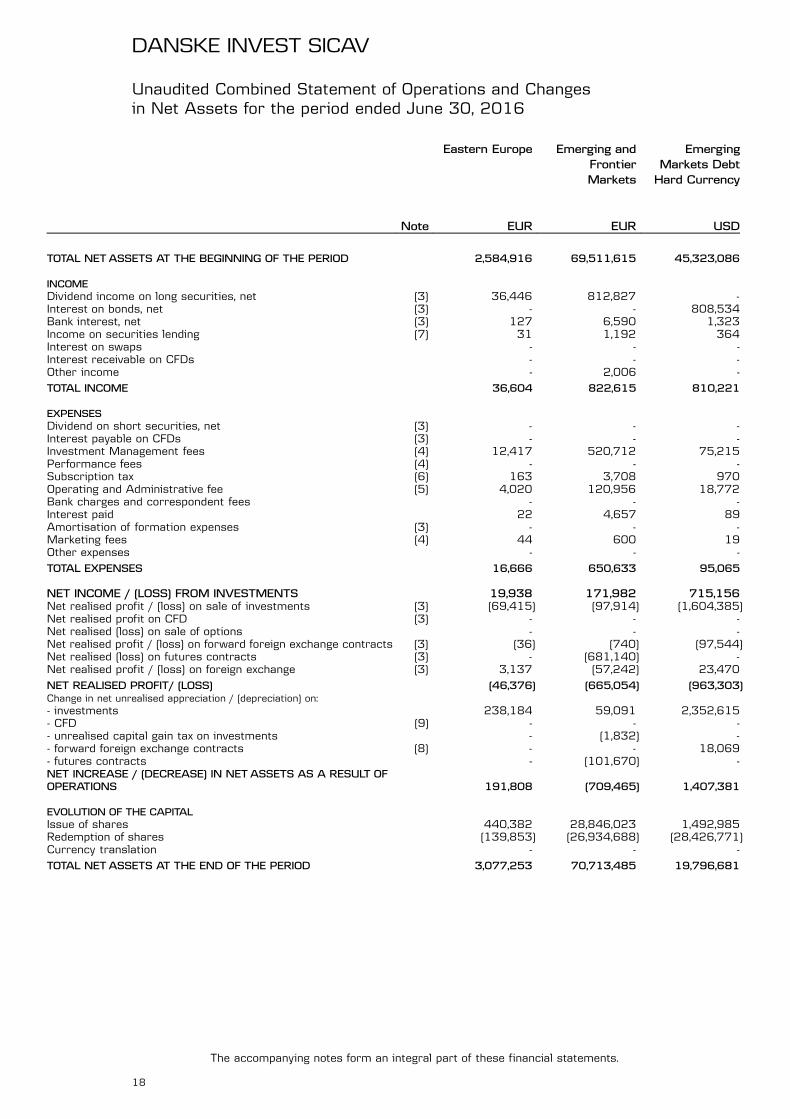
Unaudited Combined Statement of Operations and Changesin Net Assets for the period ended June 30, 2016
Eastern Europe Emerging andFrontierMarkets
EmergingMarkets DebtHard Currency
Note EUR EUR USD
TOTAL NETASSETS AT THE BEGINNING OF THE PERIOD 2,584,916 69,511,615 45,323,086
INCOMEDividend income on long securities, net (3) 36,446 812,827 -Interest on bonds, net (3) - - 808,534Bank interest, net (3) 127 6,590 1,323Income on securities lending (7) 31 1,192 364Interest on swaps - - -Interest receivable on CFDs - - -Other income - 2,006 -
TOTAL INCOME 36,604 822,615 810,221
EXPENSESDividend on short securities, net (3) - - -Interest payable on CFDs (3) - - -Investment Management fees (4) 12,417 520,712 75,215Performance fees (4) - - -Subscription tax (6) 163 3,708 970Operating and Administrative fee (5) 4,020 120,956 18,772Bank charges and correspondent fees - - -Interest paid 22 4,657 89Amortisation of formation expenses (3) - - -Marketing fees (4) 44 600 19Other expenses - - -
TOTAL EXPENSES 16,666 650,633 95,065
NET INCOME / (LOSS) FROM INVESTMENTS 19,938 171,982 715,156Net realised profit / (loss) on sale of investments (3) (69,415) (97,914) (1,604,385)Net realised profit on CFD (3) - - -Net realised (loss) on sale of options - - -Net realised profit / (loss) on forward foreign exchange contracts (3) (36) (740) (97,544)Net realised (loss) on futures contracts (3) - (681,140) -Net realised profit / (loss) on foreign exchange (3) 3,137 (57,242) 23,470
NET REALISED PROFIT/ (LOSS) (46,376) (665,054) (963,303)Change in net unrealised appreciation / (depreciation) on:- investments 238,184 59,091 2,352,615- CFD (9) - - -- unrealised capital gain tax on investments - (1,832) -- forward foreign exchange contracts (8) - - 18,069- futures contracts - (101,670) -NET INCREASE / (DECREASE) IN NET ASSETS AS A RESULT OFOPERATIONS 191,808 (709,465) 1,407,381
EVOLUTION OF THE CAPITALIssue of shares 440,382 28,846,023 1,492,985Redemption of shares (139,853) (26,934,688) (28,426,771)Currency translation - - -
TOTAL NETASSETS AT THE END OF THE PERIOD 3,077,253 70,713,485 19,796,681
DANSKE INVEST SICAV
The accompanying notes form an integral part of these financial statements.
18

Euro High YieldBond
Europe Europe Absolute
Note EUR EUR EUR
TOTAL NETASSETS AT THE BEGINNING OF THE PERIOD 155,908,546 102,331,202 246,341,057
INCOMEDividend income on long securities, net (3) - 1,888,421 2,749,530Interest on bonds, net (3) 3,563,352 - -Bank interest, net (3) 2,210 163 9,196Income on securities lending (7) 42,260 27,634 291,344Interest on swaps - - -Interest receivable on CFDs - - -Other income - 5,315 5,517
TOTAL INCOME 3,607,822 1,921,533 3,055,587
EXPENSESDividend on short securities, net (3) - - 5,036,022Interest payable on CFDs (3) - - 809,091Investment Management fees (4) 696,882 515,022 1,620,481Performance fees (4) - - -Subscription tax (6) 31,624 10,812 53,154Operating and Administrative fee (5) 83,759 54,934 313,064Bank charges and correspondent fees - - -Interest paid 8,208 3,844 85,233Amortisation of formation expenses (3) - - 3,266Marketing fees (4) 69,598 17,170 98,690Other expenses - - -
TOTAL EXPENSES 890,071 601,782 8,019,001
NET INCOME / (LOSS) FROM INVESTMENTS 2,717,751 1,319,751 (4,963,414)Net realised profit / (loss) on sale of investments (3) (4,232,958) (579,255) (7,353,701)Net realised profit on CFD (3) - - 8,988,558Net realised (loss) on sale of options - - -Net realised profit / (loss) on forward foreign exchange contracts (3) 353,368 (16,094) 121,442Net realised (loss) on futures contracts (3) - - -Net realised profit / (loss) on foreign exchange (3) (309,705) 33,933 (5,189)
NET REALISED PROFIT/ (LOSS) (1,471,544) 758,335 (3,212,304)Change in net unrealised appreciation / (depreciation) on:- investments 2,635,596 (9,550,021) (30,032,599)- CFD (9) - - (146,394)- unrealised capital gain tax on investments - - -- forward foreign exchange contracts (8) 193,291 - (675,407)- futures contracts - - -NET INCREASE / (DECREASE) IN NET ASSETS AS A RESULT OFOPERATIONS 1,357,343 (8,791,686) (34,066,704)
EVOLUTION OF THE CAPITALIssue of shares 10,836,213 11,938,228 44,572,346Redemption of shares (38,351,087) (26,616,234) (7,709,803)Currency translation - - -
TOTAL NETASSETS AT THE END OF THE PERIOD 129,751,015 78,861,510 249,136,896
DANSKE INVEST SICAV
The accompanying notes form an integral part of these financial statements.
19
Unaudited Combined Statement of Operations and Changesin Net Assets for the period ended June 30, 2016 (continued)

Europe Long-Short Dynamic
Europe Long-Short Dynamic
Plus
EuropeanCorporate
SustainableBond*
Note EUR EUR EUR
TOTAL NETASSETS AT THE BEGINNING OF THE PERIOD 568,789,151 30,888,138 -
INCOMEDividend income on long securities, net (3) 12,678,901 1,010,618 -Interest on bonds, net (3) 137,042 35,760 19,950Bank interest, net (3) 5,177 1,135 4Income on securities lending (7) 346,676 17,175 -Interest on swaps - 125 -Interest receivable on CFDs - 5 -Other income 45,440 - -
TOTAL INCOME 13,213,236 1,064,818 19,954
EXPENSESDividend on short securities, net (3) 17,358,543 1,784,212 -Interest payable on CFDs (3) 2,108,879 442,689 -Investment Management fees (4) 5,155,493 456,328 16,171Performance fees (4) 3,195,469 402,530 -Subscription tax (6) 175,241 7,786 5,797Operating and Administrative fee (5) 1,007,017 124,209 3,032Bank charges and correspondent fees 21 - -Interest paid 340,068 27,670 1,112Amortisation of formation expenses (3) - - -Marketing fees (4) 306,103 8,292 2,021Other expenses - - -
TOTAL EXPENSES 29,646,834 3,253,716 28,133
NET INCOME / (LOSS) FROM INVESTMENTS (16,433,598) (2,188,898) (8,179)Net realised profit / (loss) on sale of investments (3) (24,904,436) (1,477,860) -Net realised profit on CFD (3) 36,216,193 2,347,639 -Net realised (loss) on sale of options (3) - -Net realised profit / (loss) on forward foreign exchange contracts (3) 5,776,218 463,921 -Net realised (loss) on futures contracts (3) - - -Net realised profit / (loss) on foreign exchange (3) 198,499 (139,190) (7,946)
NET REALISED PROFIT/ (LOSS) 852,873 (994,388) (16,125)Change in net unrealised appreciation / (depreciation) on:- investments (71,638,698) (7,210,317) 23,882- CFD (9) 26,027,114 (1,230,093) -- unrealised capital gain tax on investments - - -- forward foreign exchange contracts (8) 345,009 345,288 (365,902)- futures contracts - - -NET INCREASE / (DECREASE) IN NET ASSETS AS A RESULT OFOPERATIONS (44,413,702) (9,089,510) (358,145)
EVOLUTION OF THE CAPITALIssue of shares 482,783,126 65,568,340 46,287,732Redemption of shares (116,899,828) (1,727,338) -Currency translation - - -
TOTAL NETASSETS AT THE END OF THE PERIOD 890,258,747 85,639,630 45,929,587
DANSKE INVEST SICAV
The accompanying notes form an integral part of these financial statements.
20
Unaudited Combined Statement of Operations and Changesin Net Assets for the period ended June 30, 2016 (continued)
* See Note 1

Germany Global EmergingMarketsLeaders*
Global HighDividend
Note EUR USD EUR
TOTAL NETASSETS AT THE BEGINNING OF THE PERIOD 11,911,687 - 10,506,161
INCOMEDividend income on long securities, net (3) 135,085 64,897 266,784Interest on bonds, net (3) - - -Bank interest, net (3) - 300 62Income on securities lending (7) 1,987 232 1,341Interest on swaps - - -Interest receivable on CFDs - - -Other income - - -
TOTAL INCOME 137,072 65,429 268,187
EXPENSESDividend on short securities, net (3) - - -Interest payable on CFDs (3) - - -Investment Management fees (4) 63,587 35,646 49,794Performance fees (4) - - -Subscription tax (6) 1,477 270 768Operating and Administrative fee (5) 8,063 9,901 6,244Bank charges and correspondent fees - - -Interest paid 314 215 179Amortisation of formation expenses (3) - - -Marketing fees (4) 3,042 - 423Other expenses - - -
TOTAL EXPENSES 76,483 46,032 57,408
NET INCOME / (LOSS) FROM INVESTMENTS 60,589 19,397 210,779Net realised profit / (loss) on sale of investments (3) (88,768) (29,384) (91,083)Net realised profit on CFD (3) - - -Net realised (loss) on sale of options - - -Net realised profit / (loss) on forward foreign exchange contracts (3) - - 147Net realised (loss) on futures contracts (3) - - -Net realised profit / (loss) on foreign exchange (3) (10) 27,569 (6,974)
NET REALISED PROFIT/ (LOSS) (28,189) 17,582 112,869Change in net unrealised appreciation / (depreciation) on:- investments (878,042) 566,318 141,733- CFD (9) - - -- unrealised capital gain tax on investments - - -- forward foreign exchange contracts (8) - - -- futures contracts - - -NET INCREASE / (DECREASE) IN NET ASSETS AS A RESULT OFOPERATIONS (906,231) 583,900 254,602
EVOLUTION OF THE CAPITALIssue of shares 835,513 10,001,000 1,265,938Redemption of shares (3,107,282) (10,584,900) (568,578)Currency translation - - -
TOTAL NETASSETS AT THE END OF THE PERIOD 8,733,687 - 11,458,123
DANSKE INVEST SICAV
The accompanying notes form an integral part of these financial statements.
21
Unaudited Combined Statement of Operations and Changesin Net Assets for the period ended June 30, 2016 (continued)
* See Note 1
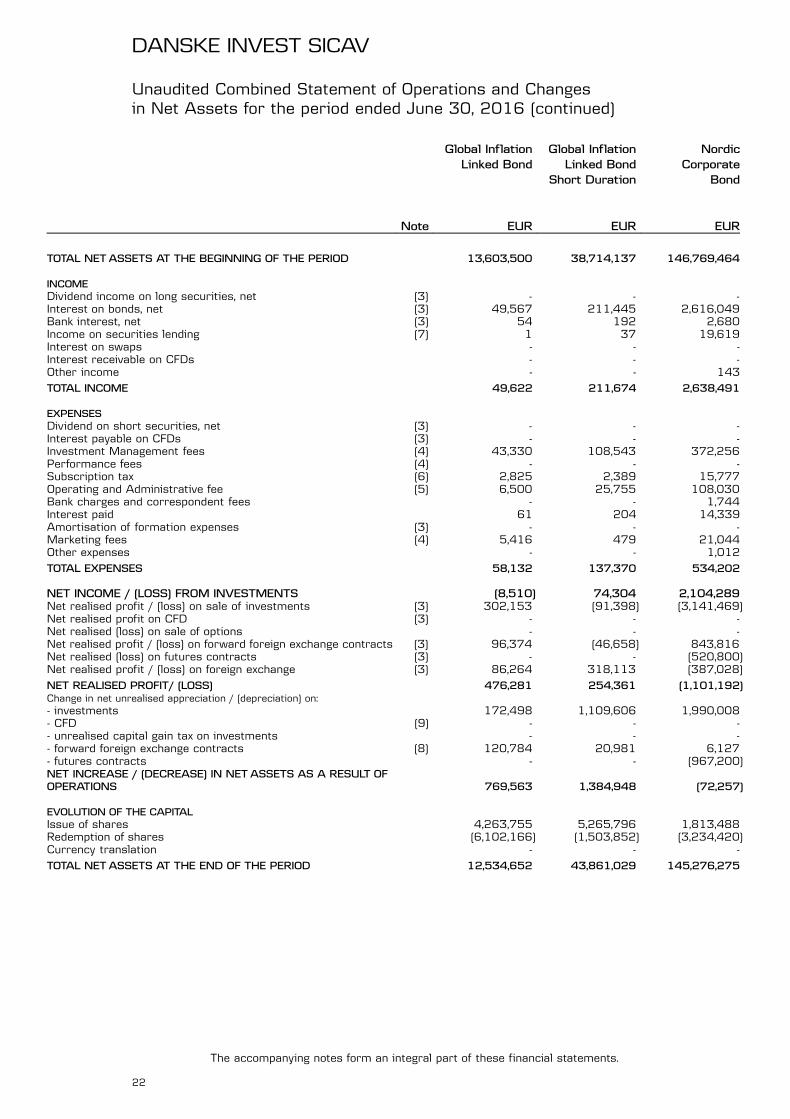
Global InflationLinked Bond
Global InflationLinked Bond
Short Duration
NordicCorporate
Bond
Note EUR EUR EUR
TOTAL NETASSETS AT THE BEGINNING OF THE PERIOD 13,603,500 38,714,137 146,769,464
INCOMEDividend income on long securities, net (3) - - -Interest on bonds, net (3) 49,567 211,445 2,616,049Bank interest, net (3) 54 192 2,680Income on securities lending (7) 1 37 19,619Interest on swaps - - -Interest receivable on CFDs - - -Other income - - 143
TOTAL INCOME 49,622 211,674 2,638,491
EXPENSESDividend on short securities, net (3) - - -Interest payable on CFDs (3) - - -Investment Management fees (4) 43,330 108,543 372,256Performance fees (4) - - -Subscription tax (6) 2,825 2,389 15,777Operating and Administrative fee (5) 6,500 25,755 108,030Bank charges and correspondent fees - - 1,744Interest paid 61 204 14,339Amortisation of formation expenses (3) - - -Marketing fees (4) 5,416 479 21,044Other expenses - - 1,012
TOTAL EXPENSES 58,132 137,370 534,202
NET INCOME / (LOSS) FROM INVESTMENTS (8,510) 74,304 2,104,289Net realised profit / (loss) on sale of investments (3) 302,153 (91,398) (3,141,469)Net realised profit on CFD (3) - - -Net realised (loss) on sale of options - - -Net realised profit / (loss) on forward foreign exchange contracts (3) 96,374 (46,658) 843,816Net realised (loss) on futures contracts (3) - - (520,800)Net realised profit / (loss) on foreign exchange (3) 86,264 318,113 (387,028)
NET REALISED PROFIT/ (LOSS) 476,281 254,361 (1,101,192)Change in net unrealised appreciation / (depreciation) on:- investments 172,498 1,109,606 1,990,008- CFD (9) - - -- unrealised capital gain tax on investments - - -- forward foreign exchange contracts (8) 120,784 20,981 6,127- futures contracts - - (967,200)NET INCREASE / (DECREASE) IN NET ASSETS AS A RESULT OFOPERATIONS 769,563 1,384,948 (72,257)
EVOLUTION OF THE CAPITALIssue of shares 4,263,755 5,265,796 1,813,488Redemption of shares (6,102,166) (1,503,852) (3,234,420)Currency translation - - -
TOTAL NETASSETS AT THE END OF THE PERIOD 12,534,652 43,861,029 145,276,275
DANSKE INVEST SICAV
The accompanying notes form an integral part of these financial statements.
22
Unaudited Combined Statement of Operations and Changesin Net Assets for the period ended June 30, 2016 (continued)
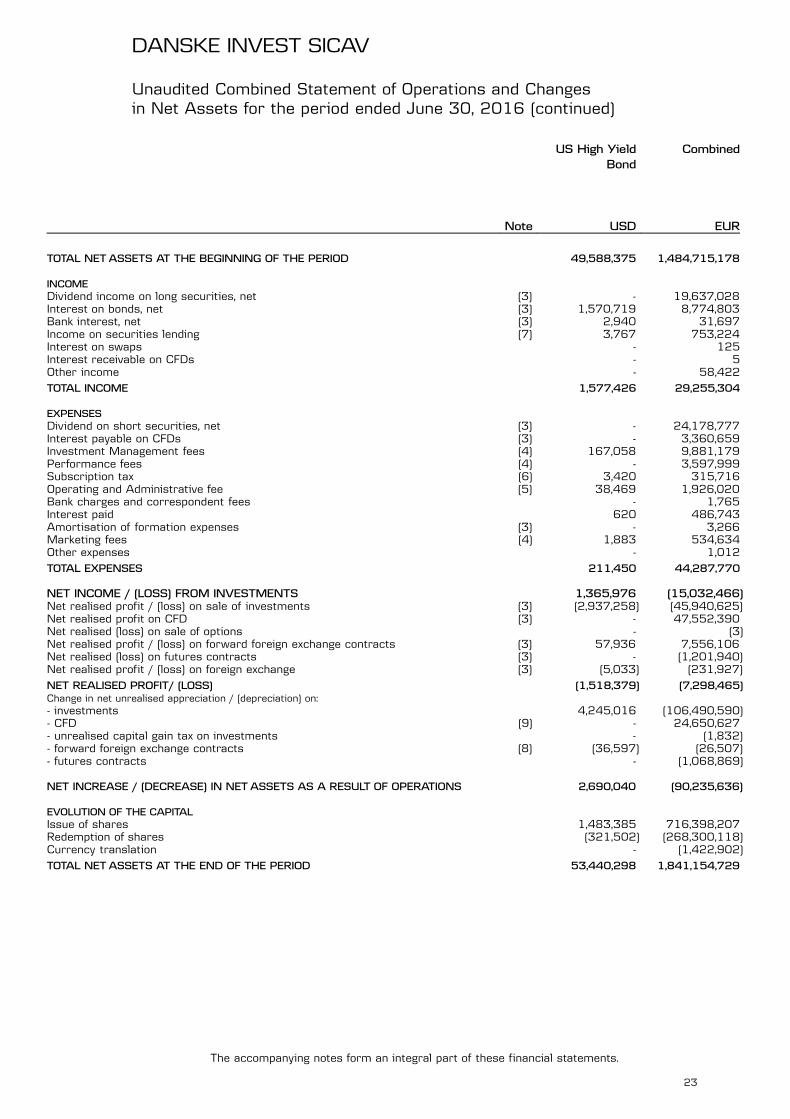
US High YieldBond
Combined
Note USD EUR
TOTAL NETASSETS AT THE BEGINNING OF THE PERIOD 49,588,375 1,484,715,178
INCOMEDividend income on long securities, net (3) - 19,637,028Interest on bonds, net (3) 1,570,719 8,774,803Bank interest, net (3) 2,940 31,697Income on securities lending (7) 3,767 753,224Interest on swaps - 125Interest receivable on CFDs - 5Other income - 58,422
TOTAL INCOME 1,577,426 29,255,304
EXPENSESDividend on short securities, net (3) - 24,178,777Interest payable on CFDs (3) - 3,360,659Investment Management fees (4) 167,058 9,881,179Performance fees (4) - 3,597,999Subscription tax (6) 3,420 315,716Operating and Administrative fee (5) 38,469 1,926,020Bank charges and correspondent fees - 1,765Interest paid 620 486,743Amortisation of formation expenses (3) - 3,266Marketing fees (4) 1,883 534,634Other expenses - 1,012
TOTAL EXPENSES 211,450 44,287,770
NET INCOME / (LOSS) FROM INVESTMENTS 1,365,976 (15,032,466)Net realised profit / (loss) on sale of investments (3) (2,937,258) (45,940,625)Net realised profit on CFD (3) - 47,552,390Net realised (loss) on sale of options - (3)Net realised profit / (loss) on forward foreign exchange contracts (3) 57,936 7,556,106Net realised (loss) on futures contracts (3) - (1,201,940)Net realised profit / (loss) on foreign exchange (3) (5,033) (231,927)
NET REALISED PROFIT/ (LOSS) (1,518,379) (7,298,465)Change in net unrealised appreciation / (depreciation) on:- investments 4,245,016 (106,490,590)- CFD (9) - 24,650,627- unrealised capital gain tax on investments - (1,832)- forward foreign exchange contracts (8) (36,597) (26,507)- futures contracts - (1,068,869)
NET INCREASE / (DECREASE) IN NET ASSETS AS A RESULT OF OPERATIONS 2,690,040 (90,235,636)
EVOLUTION OF THE CAPITALIssue of shares 1,483,385 716,398,207Redemption of shares (321,502) (268,300,118)Currency translation - (1,422,902)
TOTAL NETASSETS AT THE END OF THE PERIOD 53,440,298 1,841,154,729
DANSKE INVEST SICAV
The accompanying notes form an integral part of these financial statements.
23
Unaudited Combined Statement of Operations and Changesin Net Assets for the period ended June 30, 2016 (continued)
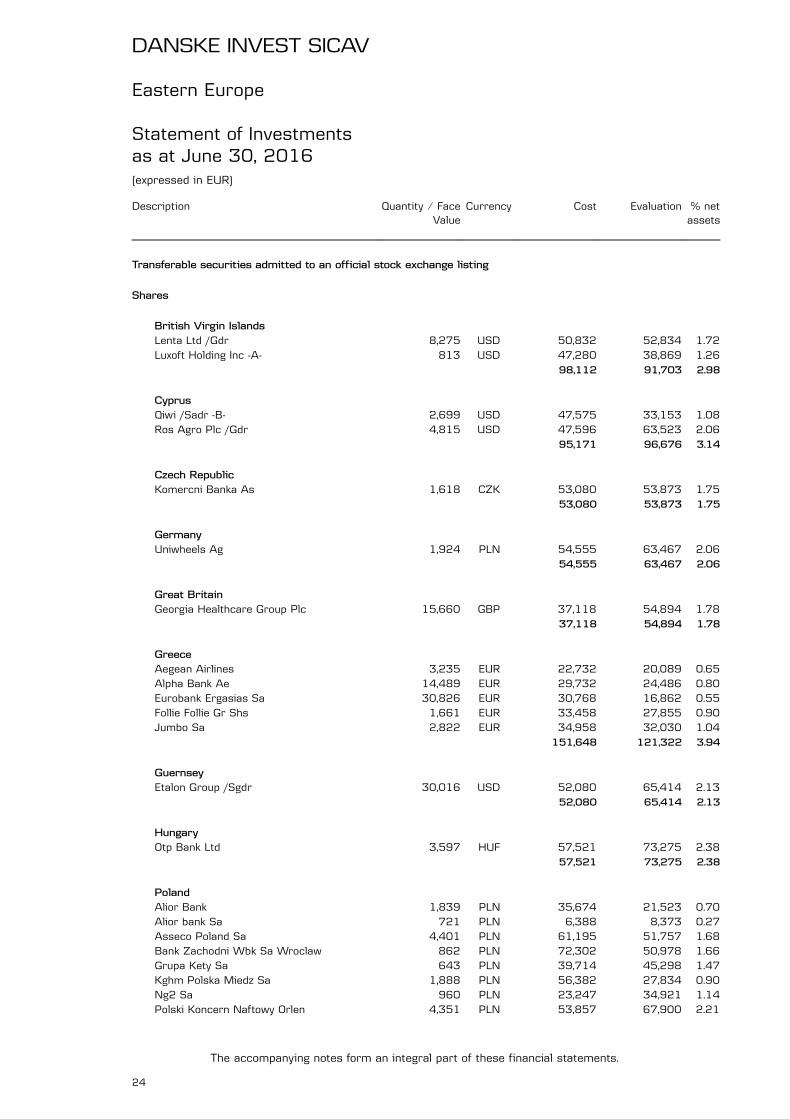
Eastern Europe
Statement of Investmentsas at June 30, 2016(expressed in EUR)
Description Quantity ⁄ FaceValue
Currency Cost Evaluation % netassets
Transferable securities admitted to an official stock exchange listing
Shares
British Virgin IslandsLenta Ltd /Gdr 8,275 USD 50,832 52,834 1.72Luxoft Holding Inc -A- 813 USD 47,280 38,869 1.26
98,112 91,703 2.98
CyprusQiwi /Sadr -B- 2,699 USD 47,575 33,153 1.08Ros Agro Plc /Gdr 4,815 USD 47,596 63,523 2.06
95,171 96,676 3.14
Czech RepublicKomercni Banka As 1,618 CZK 53,080 53,873 1.75
53,080 53,873 1.75
GermanyUniwheels Ag 1,924 PLN 54,555 63,467 2.06
54,555 63,467 2.06
Great BritainGeorgia Healthcare Group Plc 15,660 GBP 37,118 54,894 1.78
37,118 54,894 1.78
GreeceAegean Airlines 3,235 EUR 22,732 20,089 0.65Alpha Bank Ae 14,489 EUR 29,732 24,486 0.80Eurobank Ergasias Sa 30,826 EUR 30,768 16,862 0.55Follie Follie Gr Shs 1,661 EUR 33,458 27,855 0.90Jumbo Sa 2,822 EUR 34,958 32,030 1.04
151,648 121,322 3.94
GuernseyEtalon Group /Sgdr 30,016 USD 52,080 65,414 2.13
52,080 65,414 2.13
HungaryOtp Bank Ltd 3,597 HUF 57,521 73,275 2.38
57,521 73,275 2.38
PolandAlior Bank 1,839 PLN 35,674 21,523 0.70Alior bank Sa 721 PLN 6,388 8,373 0.27Asseco Poland Sa 4,401 PLN 61,195 51,757 1.68Bank Zachodni Wbk Sa Wroclaw 862 PLN 72,302 50,978 1.66Grupa Kety Sa 643 PLN 39,714 45,298 1.47Kghm Polska Miedz Sa 1,888 PLN 56,382 27,834 0.90Ng2 Sa 960 PLN 23,247 34,921 1.14Polski Koncern Naftowy Orlen 4,351 PLN 53,857 67,900 2.21
DANSKE INVEST SICAV
The accompanying notes form an integral part of these financial statements.
24
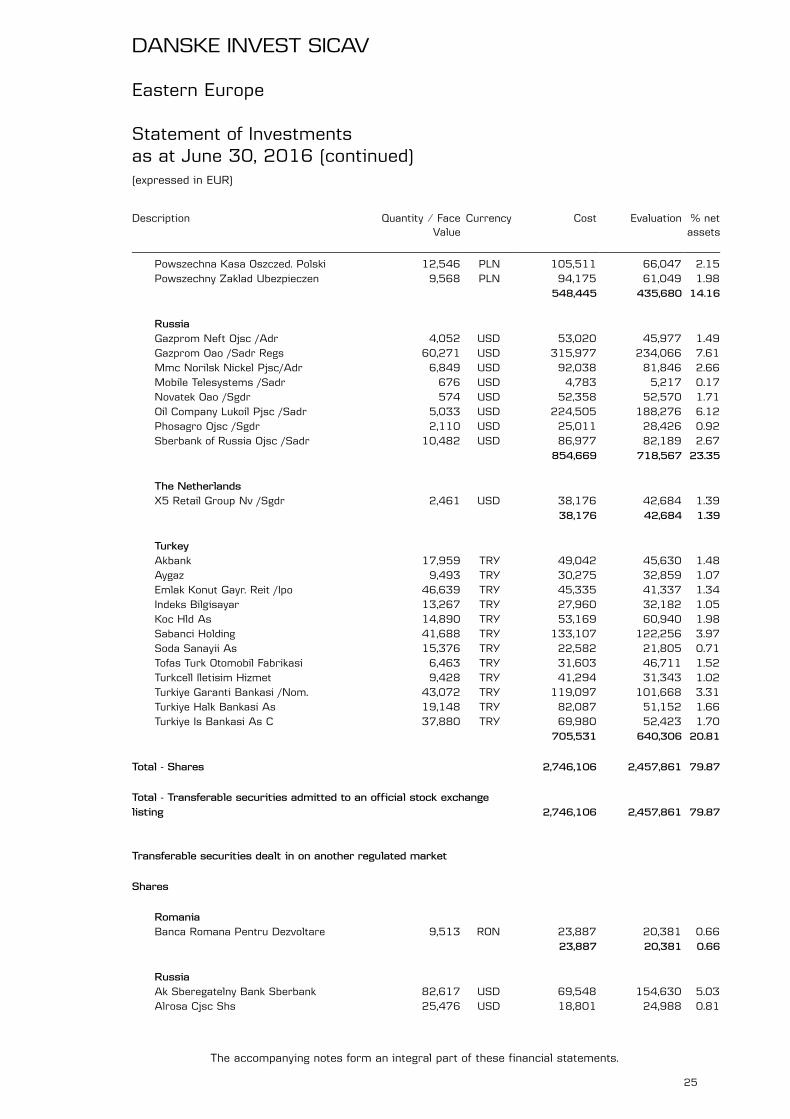
Description Quantity ⁄ FaceValue
Currency Cost Evaluation % netassets
Powszechna Kasa Oszczed. Polski 12,546 PLN 105,511 66,047 2.15Powszechny Zaklad Ubezpieczen 9,568 PLN 94,175 61,049 1.98
548,445 435,680 14.16
RussiaGazprom Neft Ojsc /Adr 4,052 USD 53,020 45,977 1.49Gazprom Oao /Sadr Regs 60,271 USD 315,977 234,066 7.61Mmc Norilsk Nickel Pjsc/Adr 6,849 USD 92,038 81,846 2.66Mobile Telesystems /Sadr 676 USD 4,783 5,217 0.17Novatek Oao /Sgdr 574 USD 52,358 52,570 1.71Oil Company Lukoil Pjsc /Sadr 5,033 USD 224,505 188,276 6.12Phosagro Ojsc /Sgdr 2,110 USD 25,011 28,426 0.92Sberbank of Russia Ojsc /Sadr 10,482 USD 86,977 82,189 2.67
854,669 718,567 23.35
The NetherlandsX5 Retail Group Nv /Sgdr 2,461 USD 38,176 42,684 1.39
38,176 42,684 1.39
TurkeyAkbank 17,959 TRY 49,042 45,630 1.48Aygaz 9,493 TRY 30,275 32,859 1.07Emlak Konut Gayr. Reit /Ipo 46,639 TRY 45,335 41,337 1.34Indeks Bilgisayar 13,267 TRY 27,960 32,182 1.05Koc Hld As 14,890 TRY 53,169 60,940 1.98Sabanci Holding 41,688 TRY 133,107 122,256 3.97Soda Sanayii As 15,376 TRY 22,582 21,805 0.71Tofas Turk Otomobil Fabrikasi 6,463 TRY 31,603 46,711 1.52Turkcell Iletisim Hizmet 9,428 TRY 41,294 31,343 1.02Turkiye Garanti Bankasi /Nom. 43,072 TRY 119,097 101,668 3.31Turkiye Halk Bankasi As 19,148 TRY 82,087 51,152 1.66Turkiye Is Bankasi As C 37,880 TRY 69,980 52,423 1.70
705,531 640,306 20.81
Total - Shares 2,746,106 2,457,861 79.87
Total - Transferable securities admitted to an official stock exchangelisting 2,746,106 2,457,861 79.87
Transferable securities dealt in on another regulated market
Shares
RomaniaBanca Romana Pentru Dezvoltare 9,513 RON 23,887 20,381 0.66
23,887 20,381 0.66
RussiaAk Sberegatelny Bank Sberbank 82,617 USD 69,548 154,630 5.03Alrosa Cjsc Shs 25,476 USD 18,801 24,988 0.81
DANSKE INVEST SICAV
The accompanying notes form an integral part of these financial statements.
25
Eastern Europe
Statement of Investmentsas at June 30, 2016 (continued)(expressed in EUR)
Description Quantity ⁄ FaceValue
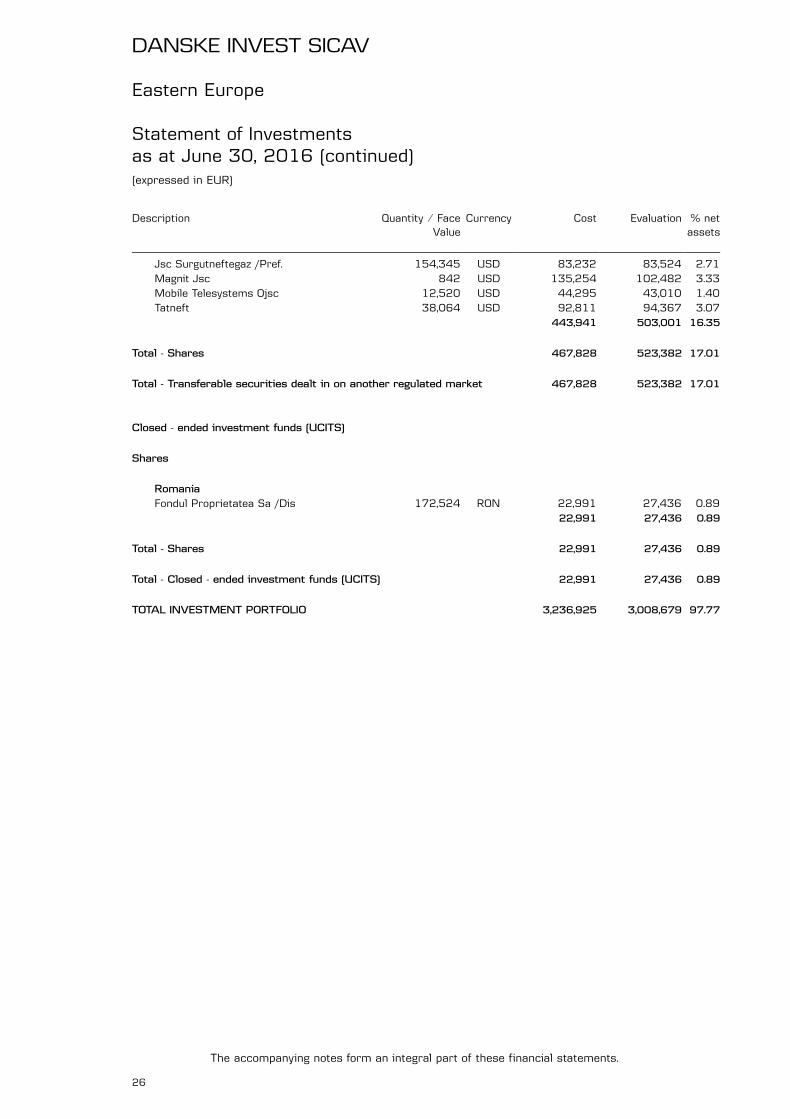
Currency Cost Evaluation % netassets
Jsc Surgutneftegaz /Pref. 154,345 USD 83,232 83,524 2.71Magnit Jsc 842 USD 135,254 102,482 3.33Mobile Telesystems Ojsc 12,520 USD 44,295 43,010 1.40Tatneft 38,064 USD 92,811 94,367 3.07
443,941 503,001 16.35
Total - Shares 467,828 523,382 17.01
Total - Transferable securities dealt in on another regulated market 467,828 523,382 17.01
Closed - ended investment funds (UCITS)
Shares
RomaniaFondul Proprietatea Sa /Dis 172,524 RON 22,991 27,436 0.89
22,991 27,436 0.89
Total - Shares 22,991 27,436 0.89
Total - Closed - ended investment funds (UCITS) 22,991 27,436 0.89
TOTAL INVESTMENT PORTFOLIO 3,236,925 3,008,679 97.77
DANSKE INVEST SICAV
The accompanying notes form an integral part of these financial statements.
26
Eastern Europe
Statement of Investmentsas at June 30, 2016 (continued)(expressed in EUR)
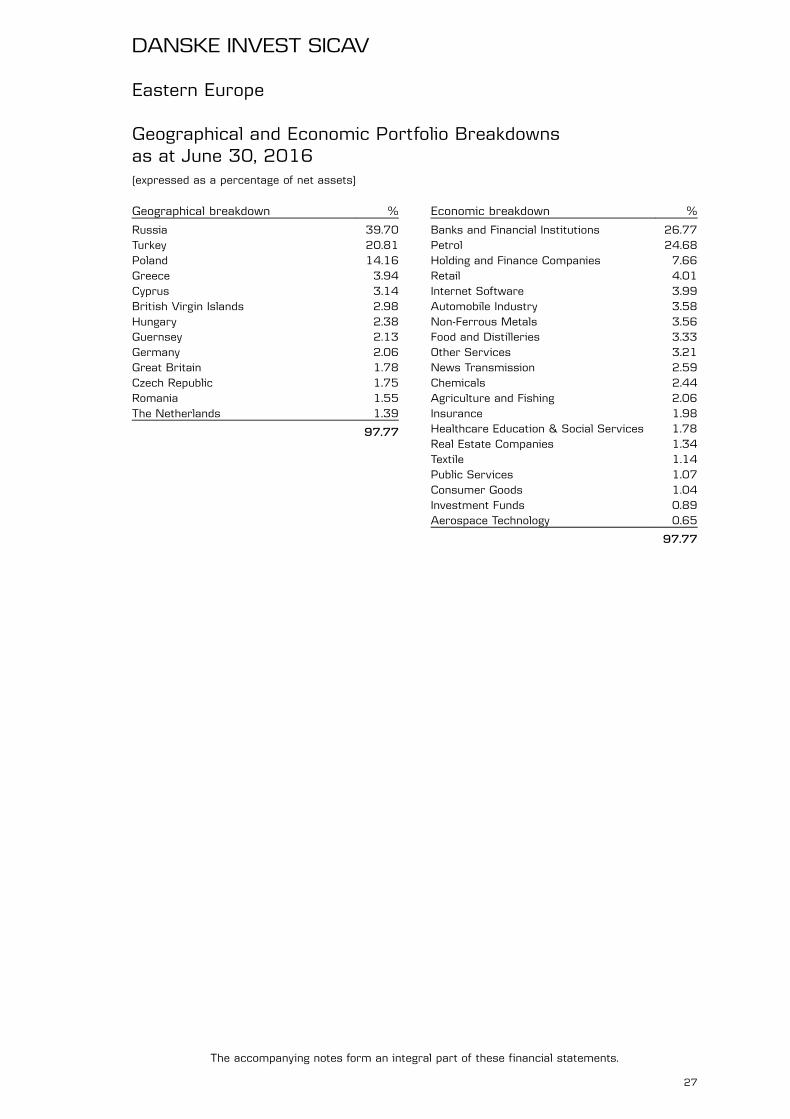
Eastern Europe
Geographical and Economic Portfolio Breakdownsas at June 30, 2016(expressed as a percentage of net assets)
Geographical breakdown %
Russia 39.70Turkey 20.81Poland 14.16Greece 3.94Cyprus 3.14British Virgin Islands 2.98Hungary 2.38Guernsey 2.13Germany 2.06Great Britain 1.78Czech Republic 1.75Romania 1.55The Netherlands 1.39
97.77
Economic breakdown %
Banks and Financial Institutions 26.77Petrol 24.68Holding and Finance Companies 7.66Retail 4.01Internet Software 3.99Automobile Industry 3.58Non-Ferrous Metals 3.56Food and Distilleries 3.33Other Services 3.21News Transmission 2.59Chemicals 2.44Agriculture and Fishing 2.06Insurance 1.98Healthcare Education & Social Services 1.78Real Estate Companies 1.34Textile 1.14Public Services 1.07Consumer Goods 1.04Investment Funds 0.89Aerospace Technology 0.65
97.77
DANSKE INVEST SICAV
The accompanying notes form an integral part of these financial statements.
27
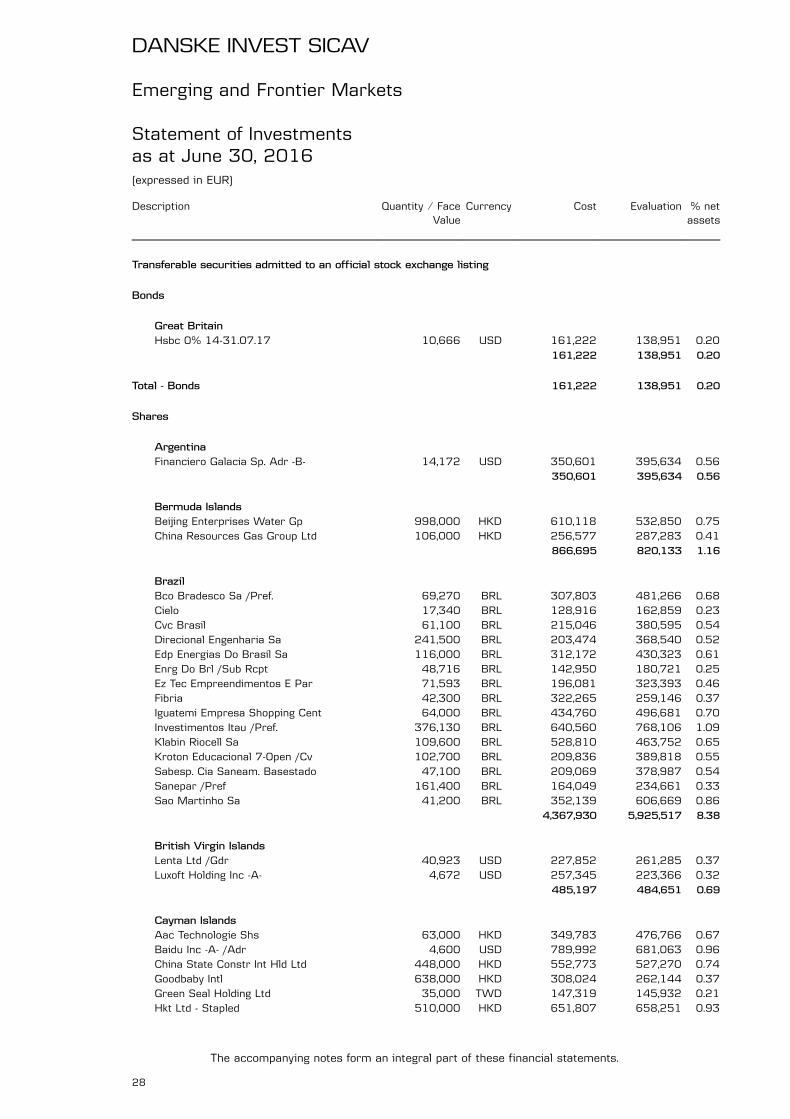
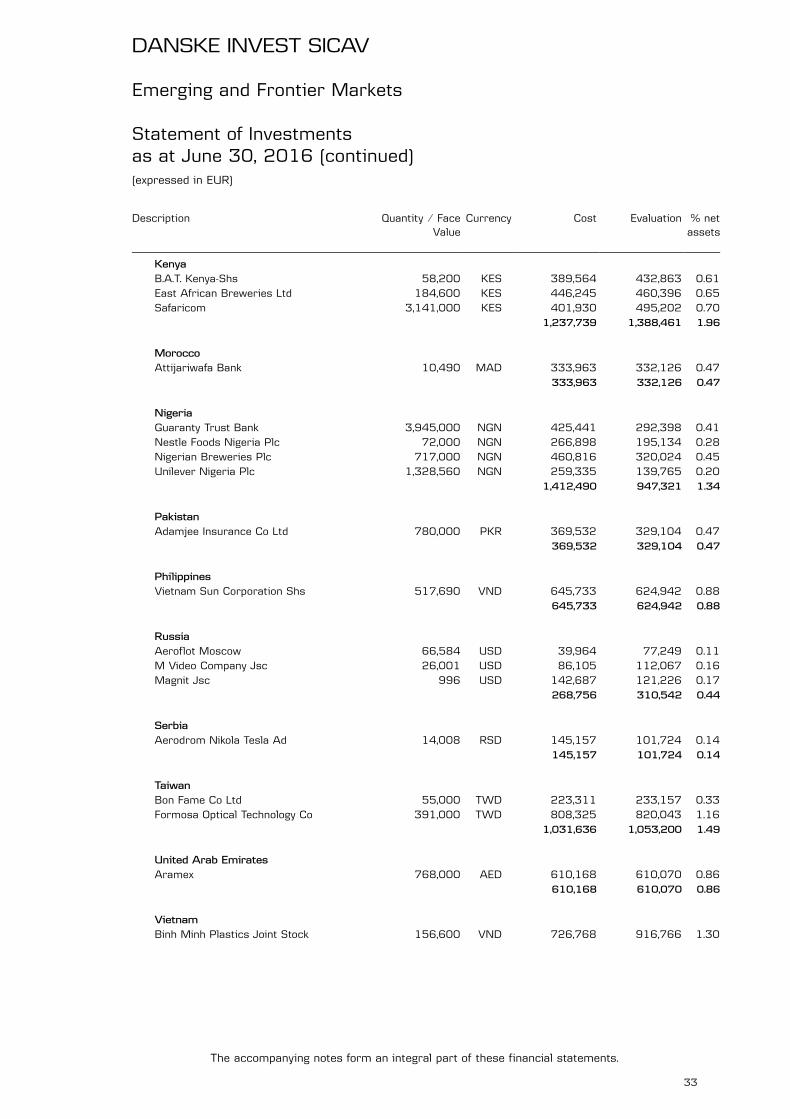
Emerging and Frontier Markets
Statement of Investmentsas at June 30, 2016(expressed in EUR)
Description Quantity ⁄ FaceValue
Currency Cost Evaluation % netassets
Transferable securities admitted to an official stock exchange listing
Bonds
Great BritainHsbc 0% 14-31.07.17 10,666 USD 161,222 138,951 0.20
161,222 138,951 0.20
Total - Bonds 161,222 138,951 0.20
Shares
ArgentinaFinanciero Galacia Sp. Adr -B- 14,172 USD 350,601 395,634 0.56
350,601 395,634 0.56
Bermuda IslandsBeijing Enterprises Water Gp 998,000 HKD 610,118 532,850 0.75China Resources Gas Group Ltd 106,000 HKD 256,577 287,283 0.41
866,695 820,133 1.16
BrazilBco Bradesco Sa /Pref. 69,270 BRL 307,803 481,266 0.68Cielo 17,340 BRL 128,916 162,859 0.23Cvc Brasil 61,100 BRL 215,046 380,595 0.54Direcional Engenharia Sa 241,500 BRL 203,474 368,540 0.52Edp Energias Do Brasil Sa 116,000 BRL 312,172 430,323 0.61Enrg Do Brl /Sub Rcpt 48,716 BRL 142,950 180,721 0.25Ez Tec Empreendimentos E Par 71,593 BRL 196,081 323,393 0.46Fibria 42,300 BRL 322,265 259,146 0.37Iguatemi Empresa Shopping Cent 64,000 BRL 434,760 496,681 0.70Investimentos Itau /Pref. 376,130 BRL 640,560 768,106 1.09Klabin Riocell Sa 109,600 BRL 528,810 463,752 0.65Kroton Educacional 7-Open /Cv 102,700 BRL 209,836 389,818 0.55Sabesp. Cia Saneam. Basestado 47,100 BRL 209,069 378,987 0.54Sanepar /Pref 161,400 BRL 164,049 234,661 0.33Sao Martinho Sa 41,200 BRL 352,139 606,669 0.86
4,367,930 5,925,517 8.38
British Virgin IslandsLenta Ltd /Gdr 40,923 USD 227,852 261,285 0.37Luxoft Holding Inc -A- 4,672 USD 257,345 223,366 0.32
485,197 484,651 0.69
Cayman IslandsAac Technologie Shs 63,000 HKD 349,783 476,766 0.67Baidu Inc -A- /Adr 4,600 USD 789,992 681,063 0.96China State Constr Int Hld Ltd 448,000 HKD 552,773 527,270 0.74Goodbaby Intl 638,000 HKD 308,024 262,144 0.37Green Seal Holding Ltd 35,000 TWD 147,319 145,932 0.21Hkt Ltd - Stapled 510,000 HKD 651,807 658,251 0.93
DANSKE INVEST SICAV
The accompanying notes form an integral part of these financial statements.
28
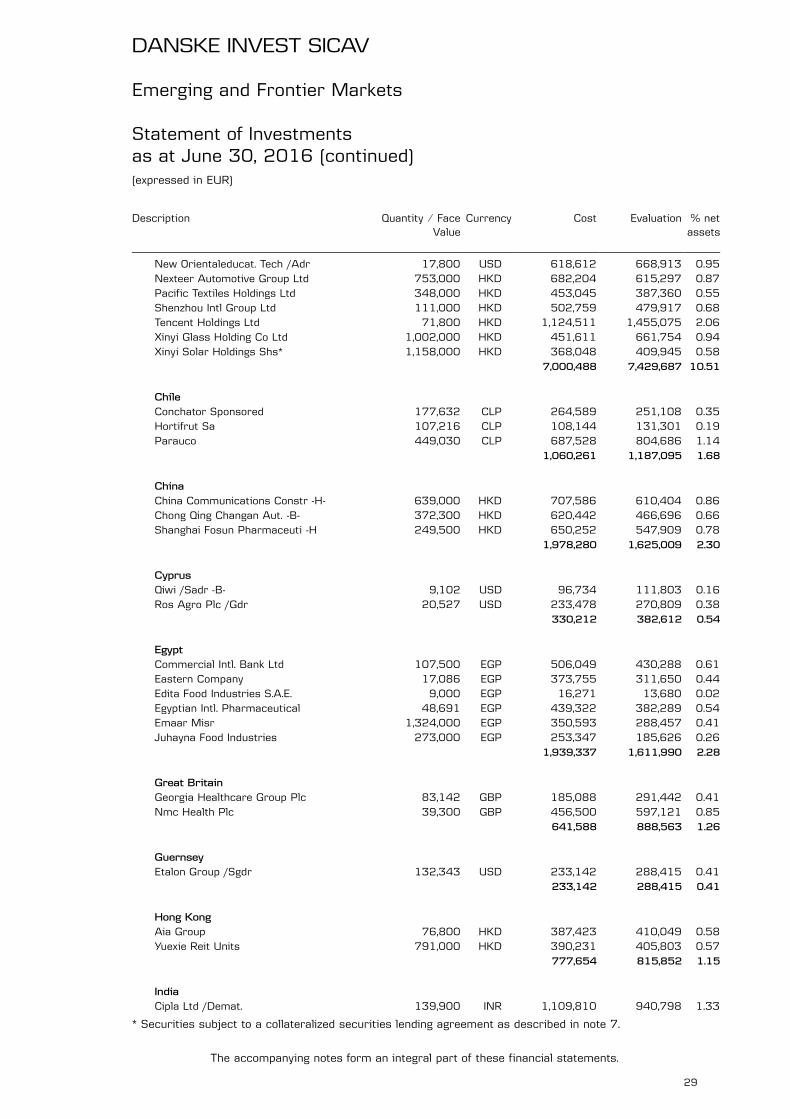
Description Quantity ⁄ FaceValue
Currency Cost Evaluation % netassets
New Orientaleducat. Tech /Adr 17,800 USD 618,612 668,913 0.95Nexteer Automotive Group Ltd 753,000 HKD 682,204 615,297 0.87Pacific Textiles Holdings Ltd 348,000 HKD 453,045 387,360 0.55Shenzhou Intl Group Ltd 111,000 HKD 502,759 479,917 0.68Tencent Holdings Ltd 71,800 HKD 1,124,511 1,455,075 2.06Xinyi Glass Holding Co Ltd 1,002,000 HKD 451,611 661,754 0.94Xinyi Solar Holdings Shs* 1,158,000 HKD 368,048 409,945 0.58
7,000,488 7,429,687 10.51
ChileConchator Sponsored 177,632 CLP 264,589 251,108 0.35Hortifrut Sa 107,216 CLP 108,144 131,301 0.19Parauco 449,030 CLP 687,528 804,686 1.14
1,060,261 1,187,095 1.68
ChinaChina Communications Constr -H- 639,000 HKD 707,586 610,404 0.86Chong Qing Changan Aut. -B- 372,300 HKD 620,442 466,696 0.66Shanghai Fosun Pharmaceuti -H 249,500 HKD 650,252 547,909 0.78
1,978,280 1,625,009 2.30
CyprusQiwi /Sadr -B- 9,102 USD 96,734 111,803 0.16Ros Agro Plc /Gdr 20,527 USD 233,478 270,809 0.38
330,212 382,612 0.54
EgyptCommercial Intl. Bank Ltd 107,500 EGP 506,049 430,288 0.61Eastern Company 17,086 EGP 373,755 311,650 0.44Edita Food Industries S.A.E. 9,000 EGP 16,271 13,680 0.02Egyptian Intl. Pharmaceutical 48,691 EGP 439,322 382,289 0.54Emaar Misr 1,324,000 EGP 350,593 288,457 0.41Juhayna Food Industries 273,000 EGP 253,347 185,626 0.26
1,939,337 1,611,990 2.28
Great BritainGeorgia Healthcare Group Plc 83,142 GBP 185,088 291,442 0.41Nmc Health Plc 39,300 GBP 456,500 597,121 0.85
641,588 888,563 1.26
GuernseyEtalon Group /Sgdr 132,343 USD 233,142 288,415 0.41
233,142 288,415 0.41
Hong KongAia Group 76,800 HKD 387,423 410,049 0.58Yuexie Reit Units 791,000 HKD 390,231 405,803 0.57
777,654 815,852 1.15
IndiaCipla Ltd /Demat. 139,900 INR 1,109,810 940,798 1.33
DANSKE INVEST SICAV
The accompanying notes form an integral part of these financial statements.
29
Emerging and Frontier Markets
Statement of Investmentsas at June 30, 2016 (continued)(expressed in EUR)
* Securities subject to a collateralized securities lending agreement as described in note 7.

Description Quantity ⁄ FaceValue
Currency Cost Evaluation % netassets
Eros International Media 132,000 INR 745,575 372,164 0.53Exide Industries Ltd 50,000 INR 81,503 109,959 0.15Future Lifestyle Fashions 236,904 INR 244,498 378,159 0.53Future Retail Shs 520,500 INR 150,402 174,076 0.25Gujarat Fertilizers & Chemicals 294,850 INR 273,488 313,705 0.44Hikal Ltd 199,000 INR 299,319 431,936 0.61Hindustan Petr. /Dematerialised 27,000 INR 285,474 355,296 0.50Ht Media Ltd 597,772 INR 659,022 617,281 0.87Il Fs Trans 907,432 INR 1,036,955 889,892 1.26Indian Hotels Co Ltd /Demat. 340,900 INR 412,691 586,406 0.83Jagran Prakashan 213,000 INR 402,161 515,538 0.73Jubilant Life Sciences Ltd 191,850 INR 939,239 806,120 1.14L&T Finance Holdings Ltd 381,000 INR 345,029 394,196 0.56Raymond Ltd /Dematerialised 102,505 INR 583,401 633,804 0.90Tata Communications Ltd 191,600 INR 1,063,816 1,234,602 1.75Tata Global Beverages Ltd 633,401 INR 1,081,848 1,096,732 1.55The Federal Bank Ltd 183,750 INR 146,298 140,168 0.20Tv 18 Broadcast Ltd Shs 2,550,152 INR 1,158,391 1,491,681 2.11
11,018,920 11,482,513 16.24
IndonesiaMitra Pinasthika Mustika Pt 10,164,900 IDR 314,323 302,804 0.43Pt Ace Hardware Indonesia Tbk 12,320,000 IDR 486,313 774,408 1.09Pt Arwana Citramulia Tbk 20,891,500 IDR 771,132 856,430 1.21Pt Bank Pan Indonesia Tbk 12,578,900 IDR 701,117 661,766 0.94Pt Hexindo Adiperkasa Tbk 263,900 IDR 32,122 33,717 0.05Pt Mitra Adiperkasa Tbk 4,414,500 IDR 902,462 1,251,701 1.77
3,207,469 3,880,826 5.49
JerseyInt Diagnos 107,800 USD 566,673 383,457 0.54
566,673 383,457 0.54
LuxembourgAdecoagro Sa 36,480 USD 361,055 349,869 0.49
361,055 349,869 0.49
MauritiusMcb Group Limited 73,400 MUR 390,780 392,760 0.56
390,780 392,760 0.56
MexicoAlsea Sab De Cv 190,800 MXN 542,293 646,624 0.91Banregio Grupo Financiero Sab 154,300 MXN 757,175 763,303 1.08Bolsa Mexicana Shs A 334,600 MXN 470,831 455,758 0.65Grupo Aeroportuario -B- 38,140 MXN 513,099 529,448 0.75Grupo Rotoplas Sab De Cv 299,894 MXN 462,716 479,545 0.68Volaris /Adr 7,800 USD 126,925 130,158 0.18
2,873,039 3,004,836 4.25
PanamaInretail Peru Corp 33,870 USD 387,810 498,389 0.70
DANSKE INVEST SICAV
The accompanying notes form an integral part of these financial statements.
30
Emerging and Frontier Markets
Statement of Investmentsas at June 30, 2016 (continued)(expressed in EUR)
Description Quantity ⁄ FaceValue
Currency Cost Evaluation % netassets
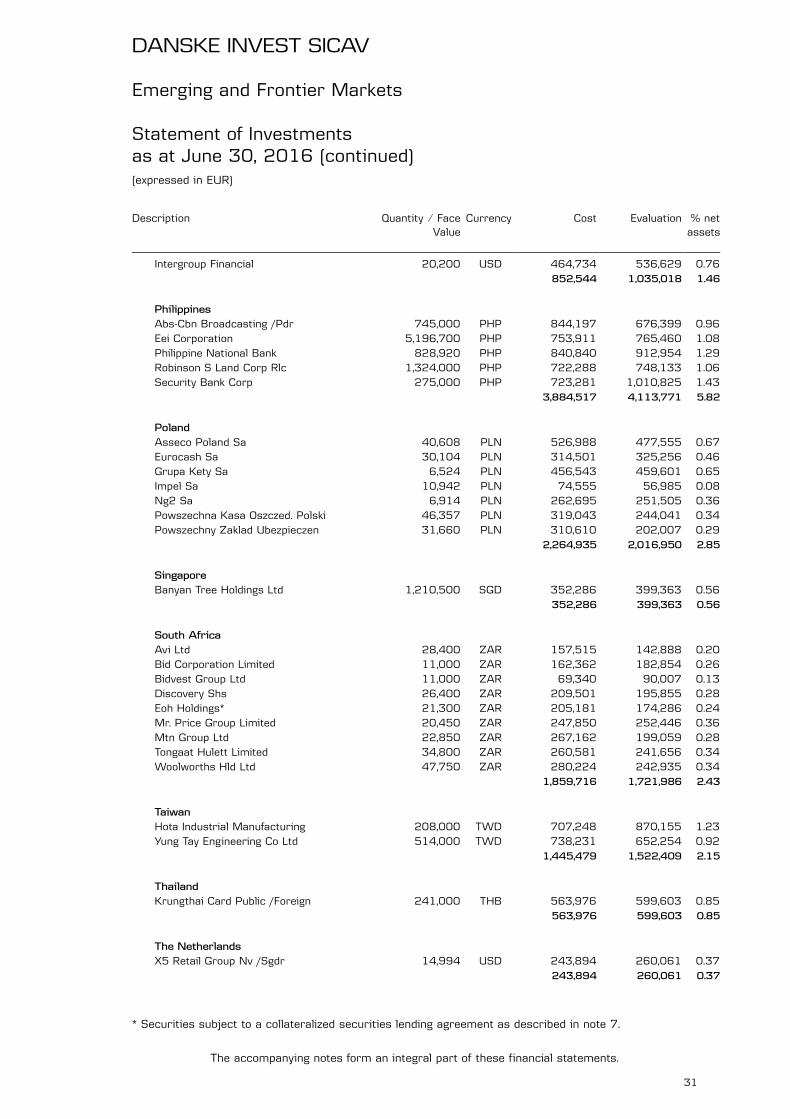
Intergroup Financial 20,200 USD 464,734 536,629 0.76852,544 1,035,018 1.46
PhilippinesAbs-Cbn Broadcasting /Pdr 745,000 PHP 844,197 676,399 0.96Eei Corporation 5,196,700 PHP 753,911 765,460 1.08Philippine National Bank 828,920 PHP 840,840 912,954 1.29Robinson S Land Corp Rlc 1,324,000 PHP 722,288 748,133 1.06Security Bank Corp 275,000 PHP 723,281 1,010,825 1.43
3,884,517 4,113,771 5.82
PolandAsseco Poland Sa 40,608 PLN 526,988 477,555 0.67Eurocash Sa 30,104 PLN 314,501 325,256 0.46Grupa Kety Sa 6,524 PLN 456,543 459,601 0.65Impel Sa 10,942 PLN 74,555 56,985 0.08Ng2 Sa 6,914 PLN 262,695 251,505 0.36Powszechna Kasa Oszczed. Polski 46,357 PLN 319,043 244,041 0.34Powszechny Zaklad Ubezpieczen 31,660 PLN 310,610 202,007 0.29
2,264,935 2,016,950 2.85
SingaporeBanyan Tree Holdings Ltd 1,210,500 SGD 352,286 399,363 0.56
352,286 399,363 0.56
South AfricaAvi Ltd 28,400 ZAR 157,515 142,888 0.20Bid Corporation Limited 11,000 ZAR 162,362 182,854 0.26Bidvest Group Ltd 11,000 ZAR 69,340 90,007 0.13Discovery Shs 26,400 ZAR 209,501 195,855 0.28Eoh Holdings* 21,300 ZAR 205,181 174,286 0.24Mr. Price Group Limited 20,450 ZAR 247,850 252,446 0.36Mtn Group Ltd 22,850 ZAR 267,162 199,059 0.28Tongaat Hulett Limited 34,800 ZAR 260,581 241,656 0.34Woolworths Hld Ltd 47,750 ZAR 280,224 242,935 0.34
1,859,716 1,721,986 2.43
TaiwanHota Industrial Manufacturing 208,000 TWD 707,248 870,155 1.23Yung Tay Engineering Co Ltd 514,000 TWD 738,231 652,254 0.92
1,445,479 1,522,409 2.15
ThailandKrungthai Card Public /Foreign 241,000 THB 563,976 599,603 0.85
563,976 599,603 0.85
The NetherlandsX5 Retail Group Nv /Sgdr 14,994 USD 243,894 260,061 0.37
243,894 260,061 0.37
DANSKE INVEST SICAV
The accompanying notes form an integral part of these financial statements.
31
Emerging and Frontier Markets
Statement of Investmentsas at June 30, 2016 (continued)(expressed in EUR)
* Securities subject to a collateralized securities lending agreement as described in note 7.
Description Quantity ⁄ FaceValue
Currency Cost Evaluation % netassets
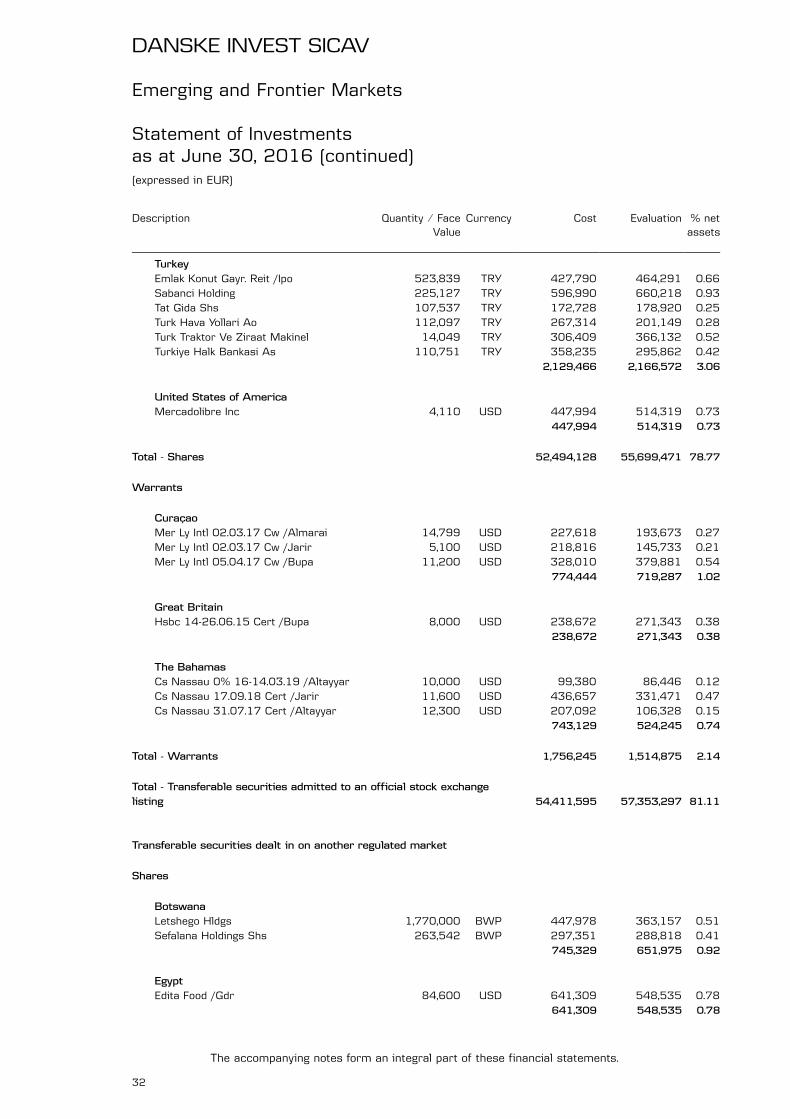
TurkeyEmlak Konut Gayr. Reit /Ipo 523,839 TRY 427,790 464,291 0.66Sabanci Holding 225,127 TRY 596,990 660,218 0.93Tat Gida Shs 107,537 TRY 172,728 178,920 0.25Turk Hava Yollari Ao 112,097 TRY 267,314 201,149 0.28Turk Traktor Ve Ziraat Makinel 14,049 TRY 306,409 366,132 0.52Turkiye Halk Bankasi As 110,751 TRY 358,235 295,862 0.42
2,129,466 2,166,572 3.06
United States of AmericaMercadolibre Inc 4,110 USD 447,994 514,319 0.73
447,994 514,319 0.73
Total - Shares 52,494,128 55,699,471 78.77
Warrants
CuraçaoMer Ly Intl 02.03.17 Cw /Almarai 14,799 USD 227,618 193,673 0.27Mer Ly Intl 02.03.17 Cw /Jarir 5,100 USD 218,816 145,733 0.21Mer Ly Intl 05.04.17 Cw /Bupa 11,200 USD 328,010 379,881 0.54
774,444 719,287 1.02
Great BritainHsbc 14-26.06.15 Cert /Bupa 8,000 USD 238,672 271,343 0.38
238,672 271,343 0.38
The BahamasCs Nassau 0% 16-14.03.19 /Altayyar 10,000 USD 99,380 86,446 0.12Cs Nassau 17.09.18 Cert /Jarir 11,600 USD 436,657 331,471 0.47Cs Nassau 31.07.17 Cert /Altayyar 12,300 USD 207,092 106,328 0.15
743,129 524,245 0.74
Total - Warrants 1,756,245 1,514,875 2.14
Total - Transferable securities admitted to an official stock exchangelisting 54,411,595 57,353,297 81.11
Transferable securities dealt in on another regulated market
Shares
BotswanaLetshego Hldgs 1,770,000 BWP 447,978 363,157 0.51Sefalana Holdings Shs 263,542 BWP 297,351 288,818 0.41
745,329 651,975 0.92
EgyptEdita Food /Gdr 84,600 USD 641,309 548,535 0.78
641,309 548,535 0.78
DANSKE INVEST SICAV
The accompanying notes form an integral part of these financial statements.
32
Emerging and Frontier Markets
Statement of Investmentsas at June 30, 2016 (continued)(expressed in EUR)
Description Quantity ⁄ FaceValue
Currency Cost Evaluation % netassets
KenyaB.A.T. Kenya-Shs 58,200 KES 389,564 432,863 0.61East African Breweries Ltd 184,600 KES 446,245 460,396 0.65Safaricom 3,141,000 KES 401,930 495,202 0.70
1,237,739 1,388,461 1.96
MoroccoAttijariwafa Bank 10,490 MAD 333,963 332,126 0.47
333,963 332,126 0.47
NigeriaGuaranty Trust Bank 3,945,000 NGN 425,441 292,398 0.41Nestle Foods Nigeria Plc 72,000 NGN 266,898 195,134 0.28Nigerian Breweries Plc 717,000 NGN 460,816 320,024 0.45Unilever Nigeria Plc 1,328,560 NGN 259,335 139,765 0.20
1,412,490 947,321 1.34
PakistanAdamjee Insurance Co Ltd 780,000 PKR 369,532 329,104 0.47
369,532 329,104 0.47
PhilippinesVietnam Sun Corporation Shs 517,690 VND 645,733 624,942 0.88
645,733 624,942 0.88
RussiaAeroflot Moscow 66,584 USD 39,964 77,249 0.11M Video Company Jsc 26,001 USD 86,105 112,067 0.16Magnit Jsc 996 USD 142,687 121,226 0.17
268,756 310,542 0.44
SerbiaAerodrom Nikola Tesla Ad 14,008 RSD 145,157 101,724 0.14
145,157 101,724 0.14
TaiwanBon Fame Co Ltd 55,000 TWD 223,311 233,157 0.33Formosa Optical Technology Co 391,000 TWD 808,325 820,043 1.16
1,031,636 1,053,200 1.49
United Arab EmiratesAramex 768,000 AED 610,168 610,070 0.86
610,168 610,070 0.86
VietnamBinh Minh Plastics Joint Stock 156,600 VND 726,768 916,766 1.30
DANSKE INVEST SICAV
The accompanying notes form an integral part of these financial statements.
33
Emerging and Frontier Markets
Statement of Investmentsas at June 30, 2016 (continued)(expressed in EUR)

Description Quantity ⁄ FaceValue
Currency Cost Evaluation % netassets
Refrigeration Elect Engin Corp 163,654 VND 152,613 135,450 0.19879,381 1,052,216 1.49
Total - Shares 8,321,193 7,950,216 11.24
Total - Transferable securities dealt in on another regulated market 8,321,193 7,950,216 11.24
Other Transferable securities
Shares
Cayman IslandsXinyi Aut 125,250 HKD 6,982 10,176 0.01
6,982 10,176 0.01
IndiaBharti Retail Dm2 Unlisted 520,500 INR 744,904 908,526 1.29Crompton 145,000 INR 215,595 270,001 0.38
960,499 1,178,527 1.67
NigeriaGuiness Nigeria 276,000 NGN 191,673 93,617 0.13Stanbic Ibtc Holdings Plc Shs 3,530,000 NGN 371,150 182,303 0.26
562,823 275,920 0.39
VietnamVndirect Secur 1,413,700 VND 673,055 667,793 0.95
673,055 667,793 0.95
Total - Shares 2,203,359 2,132,416 3.02
Total - Other Transferable securities 2,203,359 2,132,416 3.02
TOTAL INVESTMENT PORTFOLIO 64,936,147 67,435,929 95.37
DANSKE INVEST SICAV
The accompanying notes form an integral part of these financial statements.
34
Emerging and Frontier Markets
Statement of Investmentsas at June 30, 2016 (continued)(expressed in EUR)

Emerging and Frontier Markets
Geographical and Economic Portfolio Breakdownsas at June 30, 2016(expressed as a percentage of net assets)
Geographical breakdown %
India 17.91Cayman Islands 10.52Brazil 8.38Philippines 6.70Indonesia 5.49Mexico 4.25Taiwan 3.64Egypt 3.06Turkey 3.06Poland 2.85Vietnam 2.44South Africa 2.43China 2.30Kenya 1.96Great Britain 1.84Nigeria 1.73Chile 1.68Panama 1.46Bermuda Islands 1.16Hong Kong 1.15Curaçao 1.02Botswana 0.92United Arab Emirates 0.86Thailand 0.85The Bahamas 0.74United States of America 0.73British Virgin Islands 0.69Argentina 0.56Mauritius 0.56Singapore 0.56Cyprus 0.54Jersey 0.54Luxembourg 0.49Morocco 0.47Pakistan 0.47Russia 0.44Guernsey 0.41The Netherlands 0.37Serbia 0.14
95.37
Economic breakdown %
Banks and Financial Institutions 10.08Holding and Finance Companies 8.25Other Services 7.75Internet Software 4.98Miscellaneous 4.73Real Estate Companies 4.54Textile 4.03Transportation 4.01News Transmission 3.92Food and Distilleries 3.85Business Houses 3.68Chemicals 3.49Mechanics, Machinery 3.16Retail 3.06Healthcare Education & Social Services 2.75Automobile Industry 2.69Pharmaceuticals and Cosmetics 2.65Electronics and Electrical Equipment 2.31Leisure 2.30Tobacco and Spirits 2.02Construction, Building Material 1.73Electronic Semiconductor 1.61Graphic Art, Publishing 1.40Public Services 1.40Insurance 1.34Agriculture and Fishing 1.06Forest Products and Paper Industry 1.02Consumer Goods 0.70Petrol 0.65Packaging and Container Industry 0.21
95.37
DANSKE INVEST SICAV
The accompanying notes form an integral part of these financial statements.
35
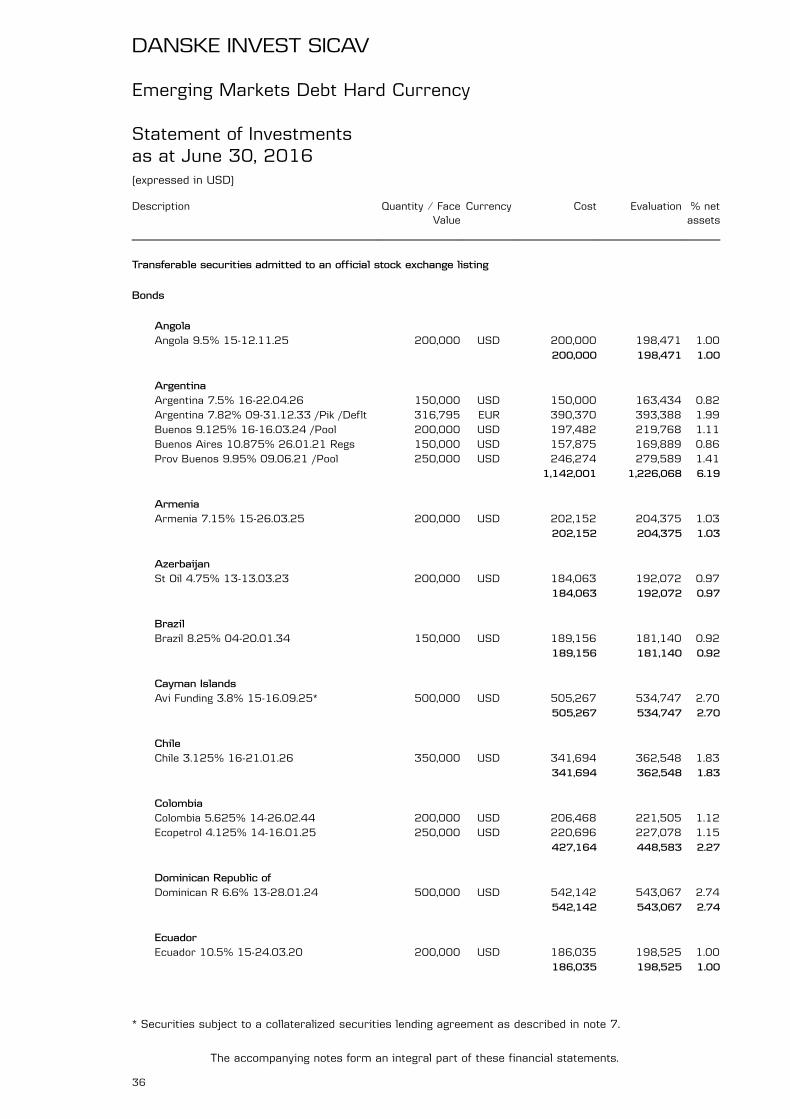
Emerging Markets Debt Hard Currency
Statement of Investmentsas at June 30, 2016(expressed in USD)
Description Quantity ⁄ FaceValue
Currency Cost Evaluation % netassets
Transferable securities admitted to an official stock exchange listing
Bonds
AngolaAngola 9.5% 15-12.11.25 200,000 USD 200,000 198,471 1.00
200,000 198,471 1.00
ArgentinaArgentina 7.5% 16-22.04.26 150,000 USD 150,000 163,434 0.82Argentina 7.82% 09-31.12.33 /Pik /Deflt 316,795 EUR 390,370 393,388 1.99Buenos 9.125% 16-16.03.24 /Pool 200,000 USD 197,482 219,768 1.11Buenos Aires 10.875% 26.01.21 Regs 150,000 USD 157,875 169,889 0.86Prov Buenos 9.95% 09.06.21 /Pool 250,000 USD 246,274 279,589 1.41
1,142,001 1,226,068 6.19
ArmeniaArmenia 7.15% 15-26.03.25 200,000 USD 202,152 204,375 1.03
202,152 204,375 1.03
AzerbaijanSt Oil 4.75% 13-13.03.23 200,000 USD 184,063 192,072 0.97
184,063 192,072 0.97
BrazilBrazil 8.25% 04-20.01.34 150,000 USD 189,156 181,140 0.92
189,156 181,140 0.92
Cayman IslandsAvi Funding 3.8% 15-16.09.25* 500,000 USD 505,267 534,747 2.70
505,267 534,747 2.70
ChileChile 3.125% 16-21.01.26 350,000 USD 341,694 362,548 1.83
341,694 362,548 1.83
ColombiaColombia 5.625% 14-26.02.44 200,000 USD 206,468 221,505 1.12Ecopetrol 4.125% 14-16.01.25 250,000 USD 220,696 227,078 1.15
427,164 448,583 2.27
Dominican Republic ofDominican R 6.6% 13-28.01.24 500,000 USD 542,142 543,067 2.74
542,142 543,067 2.74
EcuadorEcuador 10.5% 15-24.03.20 200,000 USD 186,035 198,525 1.00
186,035 198,525 1.00
DANSKE INVEST SICAV
The accompanying notes form an integral part of these financial statements.
36
* Securities subject to a collateralized securities lending agreement as described in note 7.
Description Quantity ⁄ FaceValue
Currency Cost Evaluation % netassets
El SalvadorEl Salvador 5.875% 12-30.01.25 300,000 USD 288,032 260,829 1.32
288,032 260,829 1.32
GeorgiaBk Georgia 7.75% 12-05.07.17 200,000 USD 208,250 207,464 1.05Grail 7.75% 12-11.07.22 200,000 USD 210,125 221,810 1.12
418,375 429,274 2.17
GhanaGhana 7.875% 13-07.08.23 Regs 200,000 USD 172,744 173,525 0.88
172,744 173,525 0.88
HungaryHungary 5.375% 14-25.03.24 400,000 USD 441,106 447,568 2.26
441,106 447,568 2.26
IndiaBk of India 3.125% 15-06.05.20 400,000 USD 397,404 396,862 2.01
397,404 396,862 2.01
IndonesiaIndonesia 2.625% 16-14.06.23 200,000 EUR 225,289 225,014 1.14Indonesia 3.375% 30.07.25 Regs 300,000 EUR 323,050 342,724 1.73Pertamina 6.45% 14-30.05.44 200,000 USD 189,000 213,527 1.08
737,339 781,265 3.95
IrelandScfru 5.375% 16-16.06.23 200,000 USD 200,000 202,133 1.02Veb Finance 5.942% 13-21.11.23 800,000 USD 757,397 838,716 4.24
957,397 1,040,849 5.26
KazakhstanKazagro 4.625% 24.05.23 Regs 600,000 USD 507,257 550,920 2.78
507,257 550,920 2.78
MacedoniaFyr Macedon 3.975% 14-24.07.21 250,000 EUR 273,840 270,571 1.37
273,840 270,571 1.37
MalaysiaSsg Resources 4.25% 12-04.10.22 300,000 USD 302,304 316,806 1.60
302,304 316,806 1.60
MexicoCemex 5.7% 14-11.01.25 250,000 USD 236,205 237,667 1.20Pemex 5.5% 12-27.06.44 200,000 USD 186,250 179,197 0.91Pemex 6.875% 16-04.08.26 250,000 USD 249,538 277,910 1.40
671,993 694,774 3.51
DANSKE INVEST SICAV
The accompanying notes form an integral part of these financial statements.
37
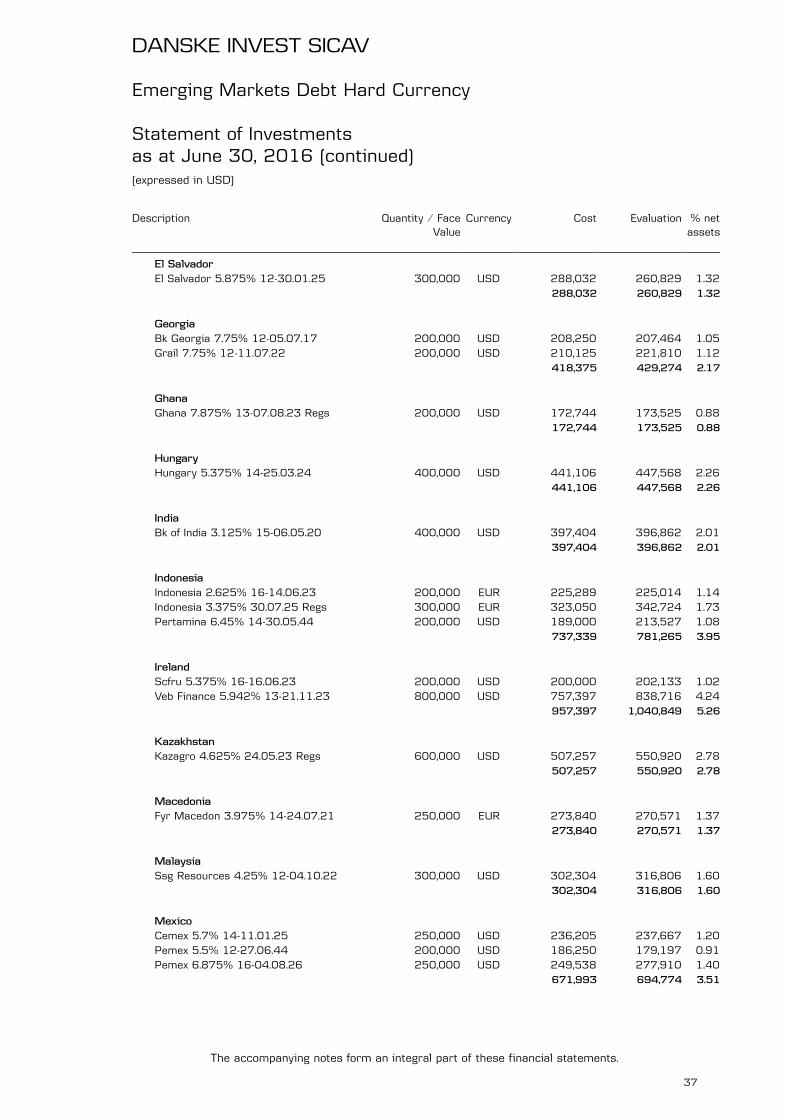
Emerging Markets Debt Hard Currency
Statement of Investmentsas at June 30, 2016 (continued)(expressed in USD)
Description Quantity ⁄ FaceValue
Currency Cost Evaluation % netassets
MongoliaDev Bk Mon 9.375% 15-19.05.20 300,000 USD 285,000 295,905 1.49
285,000 295,905 1.49
OmanOman Intrnl 4.75% 16-15.06.26 200,000 USD 199,654 198,395 1.00
199,654 198,395 1.00
PakistanPakistan 6.75% 14-03.12.19 250,000 USD 260,003 262,178 1.32
260,003 262,178 1.32
PanamaPanama 3.875% 16-17.03.28 200,000 USD 198,030 211,320 1.07Panama 6.7% 06-26.01.36 100,000 USD 124,317 132,250 0.67
322,347 343,570 1.74
ParaguayParaguay 5% 16-15.04.26 200,000 USD 199,994 210,638 1.06
199,994 210,638 1.06
PeruPeru 8.75% 03-21.11.33 150,000 USD 227,591 233,850 1.18
227,591 233,850 1.18
PhilippinesPhilipp. 9.5% 05-02.02.30 200,000 USD 326,363 343,945 1.74Philippines 3.7% 16-01.03.41 600,000 USD 600,000 671,838 3.39
926,363 1,015,783 5.13
PolandPoland 3.25% 16-06.04.26 500,000 USD 496,245 509,287 2.57
496,245 509,287 2.57
RomaniaRomania 4.375% 13-22.08.23 450,000 USD 472,946 481,792 2.43
472,946 481,792 2.43
SenegalSenegal 6.25% 14-30.07.24 200,000 USD 186,675 191,614 0.97
186,675 191,614 0.97
SerbiaSerbia 7.25% 11-28.09.21 400,000 USD 448,600 458,384 2.32
448,600 458,384 2.32
South AfricaEskom Holdi 7.125% 15-11.02.25 200,000 USD 200,269 197,595 1.00
200,269 197,595 1.00
DANSKE INVEST SICAV
The accompanying notes form an integral part of these financial statements.
38
Emerging Markets Debt Hard Currency
Statement of Investmentsas at June 30, 2016 (continued)(expressed in USD)

Description Quantity ⁄ FaceValue
Currency Cost Evaluation % netassets
Sri LankaNat Savings 8.875% 13-18.09.18 300,000 USD 321,375 320,369 1.62Sri Lanka 6.25% 10-04.10.20 350,000 USD 358,311 357,838 1.81
679,686 678,207 3.43
The Ivory CoastIvory Coast 3.75% 09-32 270,000 USD 246,896 251,994 1.27
246,896 251,994 1.27
The NetherlandsPetro Gbl F 4.875% 14-17.03.20 250,000 USD 204,219 233,997 1.18Petro Gbl F 6.25% 14-17.03.24 150,000 USD 120,375 133,164 0.68Petrobras 8.75% 16-23.05.26 150,000 USD 147,561 150,911 0.76
472,155 518,072 2.62
TogoBoad 5.5% 16-06.05.21 200,000 USD 197,854 207,951 1.05
197,854 207,951 1.05
TurkeyTurkey 6.625% 14-17.02.45 200,000 USD 235,562 243,855 1.23Turkey 7.375% 05-05.02.25 500,000 USD 600,540 618,500 3.13
836,102 862,355 4.36
UkraineUkraine 7.75% 15-01.09.20 129,000 USD 72,691 126,136 0.64Ukraine 7.75% 15-01.09.21 117,000 USD 65,677 113,859 0.57Ukraine 7.75% 15-01.09.22 117,000 USD 65,486 113,262 0.57
203,854 353,257 1.78
UruguayUruguay 4.375% 27.10.27 /Pool 400,000 USD 397,710 423,600 2.14Uruguay 5.1% 14-18.06.50 /Pool 100,000 USD 96,419 99,625 0.50
494,129 523,225 2.64
VenezuelaPdvsa 6% 13-15.11.26 /Pool 200,000 USD 72,100 70,397 0.36Petroleos 8.5% 10-02.11.17 /Pool 133,333 USD 83,833 94,001 0.47Venezuela 11.75% 11-21.10.26 400,000 USD 181,686 191,760 0.97
337,619 356,158 1.80
Total - Bonds 16,781,447 17,603,049 88.92
Total - Transferable securities admitted to an official stock exchangelisting 16,781,447 17,603,049 88.92
DANSKE INVEST SICAV
The accompanying notes form an integral part of these financial statements.
39
Emerging Markets Debt Hard Currency
Statement of Investmentsas at June 30, 2016 (continued)(expressed in USD)

Description Quantity ⁄ FaceValue
Currency Cost Evaluation % netassets
Transferable securities dealt in on another regulated market
Bonds
Costa RicaCosta Rica 7.158% 15-12.03.45 200,000 USD 189,085 199,402 1.01
189,085 199,402 1.01
PeruFondo Miv 3.375% 14-02.04.19 1,000,000 USD 1,001,000 1,029,365 5.20
1,001,000 1,029,365 5.20
UkraineUkraine Frn 15-31.05.40 140,000 USD 38,616 45,646 0.23
38,616 45,646 0.23
Total - Bonds 1,228,701 1,274,413 6.44
Total - Transferable securities dealt in on another regulated market 1,228,701 1,274,413 6.44
TOTAL INVESTMENT PORTFOLIO 18,010,148 18,877,462 95.36
DANSKE INVEST SICAV
The accompanying notes form an integral part of these financial statements.
40
Emerging Markets Debt Hard Currency
Statement of Investmentsas at June 30, 2016 (continued)(expressed in USD)

Emerging Markets Debt Hard Currency
Geographical and Economic Portfolio Breakdownsas at June 30, 2016(expressed as a percentage of net assets)
Geographical breakdown %
Peru 6.38Argentina 6.19Ireland 5.26Philippines 5.13Turkey 4.36Indonesia 3.95Mexico 3.51Sri Lanka 3.43Kazakhstan 2.78Dominican Republic of 2.74Cayman Islands 2.70Uruguay 2.64The Netherlands 2.62Poland 2.57Romania 2.43Serbia 2.32Colombia 2.27Hungary 2.26Georgia 2.17India 2.01Ukraine 2.01Chile 1.83Venezuela 1.80Panama 1.74Malaysia 1.60Mongolia 1.49Macedonia 1.37El Salvador 1.32Pakistan 1.32The Ivory Coast 1.27Paraguay 1.06Togo 1.05Armenia 1.03Costa Rica 1.01Angola 1.00Ecuador 1.00Oman 1.00South Africa 1.00Azerbaijan 0.97Senegal 0.97Brazil 0.92Ghana 0.88
95.36
Economic breakdown %
States, Provinces and Municipalities 58.32Holding and Finance Companies 9.44Petrol 8.96Banks and Financial Institutions 8.87Agriculture and Fishing 2.78Transportation 2.14Miscellaneous 1.60Construction, Building Material 1.20Supranational 1.05Public Services 1.00
95.36
DANSKE INVEST SICAV
The accompanying notes form an integral part of these financial statements.
41

Euro High Yield Bond
Statement of Investmentsas at June 30, 2016(expressed in EUR)
Description Quantity ⁄ FaceValue
Currency Cost Evaluation % netassets
Transferable securities admitted to an official stock exchange listing
Bonds
AustriaErste Bk 8.875% 16-Perp 600,000 EUR 600,000 584,721 0.45
600,000 584,721 0.45
BelgiumEthias Sa 5% 15-14.01.26 1,000,000 EUR 837,125 842,815 0.65Ontex Group 4.75% 14-15.11.21* 850,000 EUR 904,144 904,391 0.70
1,741,269 1,747,206 1.35
Bermuda IslandsNorth Atlan 6.25% 14-01.02.19 1,750,000 USD 1,192,233 354,720 0.27
1,192,233 354,720 0.27
CanadaBombardier 7.5% 10-15.03.18 Regs 500,000 USD 420,625 467,261 0.36Cott Financ 5.5% 16-01.07.24 450,000 EUR 450,000 458,460 0.35
870,625 925,721 0.71
Cayman IslandsUpcb Financ 4% 15-15.01.27 550,000 EUR 550,000 534,091 0.41
550,000 534,091 0.41
DenmarkDsk Bk 5.75% 14-Perp 100,000 EUR 101,530 98,599 0.08Dsk Bk 5.875% 15-Perp 1,000,000 EUR 1,000,000 986,910 0.76Tdc 3.5% 15-26.02.15 500,000 EUR 500,000 470,215 0.36
1,601,530 1,555,724 1.20
FinlandStora Enso 2.125% 16-16.06.23 650,000 EUR 648,122 650,078 0.50
648,122 650,078 0.50
FranceArkema 4.75% 14-Perp 300,000 EUR 296,949 311,237 0.24Bisoho Sas 5.875% 16-01.05.23 350,000 EUR 352,750 361,188 0.28Bnpp 7.781% 08-Perp* 600,000 EUR 682,727 670,182 0.52Bpce 6.117% 07-Perp* 550,000 EUR 603,625 581,130 0.45Bpce Frn 09-Perp* 250,000 EUR 333,125 330,869 0.25Casino Gp 4.87% 13-Perp* 400,000 EUR 335,000 369,734 0.28Dexia Clf 4.375% 12.02.19 Sub 1,250,000 EUR 1,051,601 1,056,556 0.81Dexia Clf Frn 09.07.17 Sub 1,000,000 EUR 887,250 970,615 0.75Ephios Bond 6.25% 15-01.07.22 1,200,000 EUR 1,216,000 1,270,962 0.98Faurecia 3.125% 15-15.06.22 900,000 EUR 900,656 903,870 0.70Faurecia 3.625% 16-15.06.23 859,000 EUR 862,100 870,717 0.67Groupama 6.298% (Tv) 07-Perp* 1,300,000 EUR 1,338,650 1,252,322 0.97Groupama 6.375% (Frn) 14-Perp* 900,000 EUR 913,900 795,501 0.61
DANSKE INVEST SICAV
The accompanying notes form an integral part of these financial statements.
42
* Securities subject to a collateralized securities lending agreement as described in note 7.
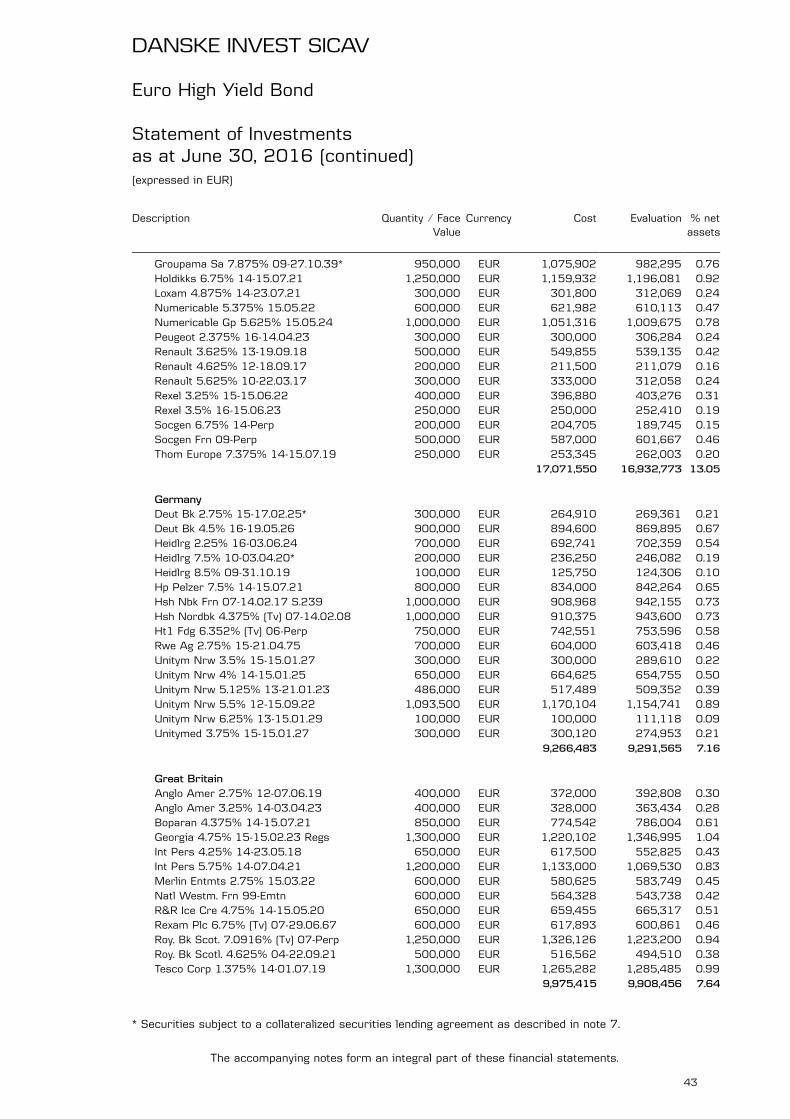
Description Quantity ⁄ FaceValue
Currency Cost Evaluation % netassets
Groupama Sa 7.875% 09-27.10.39* 950,000 EUR 1,075,902 982,295 0.76Holdikks 6.75% 14-15.07.21 1,250,000 EUR 1,159,932 1,196,081 0.92Loxam 4.875% 14-23.07.21 300,000 EUR 301,800 312,069 0.24Numericable 5.375% 15.05.22 600,000 EUR 621,982 610,113 0.47Numericable Gp 5.625% 15.05.24 1,000,000 EUR 1,051,316 1,009,675 0.78Peugeot 2.375% 16-14.04.23 300,000 EUR 300,000 306,284 0.24Renault 3.625% 13-19.09.18 500,000 EUR 549,855 539,135 0.42Renault 4.625% 12-18.09.17 200,000 EUR 211,500 211,079 0.16Renault 5.625% 10-22.03.17 300,000 EUR 333,000 312,058 0.24Rexel 3.25% 15-15.06.22 400,000 EUR 396,880 403,276 0.31Rexel 3.5% 16-15.06.23 250,000 EUR 250,000 252,410 0.19Socgen 6.75% 14-Perp 200,000 EUR 204,705 189,745 0.15Socgen Frn 09-Perp 500,000 EUR 587,000 601,667 0.46Thom Europe 7.375% 14-15.07.19 250,000 EUR 253,345 262,003 0.20
17,071,550 16,932,773 13.05
GermanyDeut Bk 2.75% 15-17.02.25* 300,000 EUR 264,910 269,361 0.21Deut Bk 4.5% 16-19.05.26 900,000 EUR 894,600 869,895 0.67Heidlrg 2.25% 16-03.06.24 700,000 EUR 692,741 702,359 0.54Heidlrg 7.5% 10-03.04.20* 200,000 EUR 236,250 246,082 0.19Heidlrg 8.5% 09-31.10.19 100,000 EUR 125,750 124,306 0.10Hp Pelzer 7.5% 14-15.07.21 800,000 EUR 834,000 842,264 0.65Hsh Nbk Frn 07-14.02.17 S.239 1,000,000 EUR 908,968 942,155 0.73Hsh Nordbk 4.375% (Tv) 07-14.02.08 1,000,000 EUR 910,375 943,600 0.73Ht1 Fdg 6.352% (Tv) 06-Perp 750,000 EUR 742,551 753,596 0.58Rwe Ag 2.75% 15-21.04.75 700,000 EUR 604,000 603,418 0.46Unitym Nrw 3.5% 15-15.01.27 300,000 EUR 300,000 289,610 0.22Unitym Nrw 4% 14-15.01.25 650,000 EUR 664,625 654,755 0.50Unitym Nrw 5.125% 13-21.01.23 486,000 EUR 517,489 509,352 0.39Unitym Nrw 5.5% 12-15.09.22 1,093,500 EUR 1,170,104 1,154,741 0.89Unitym Nrw 6.25% 13-15.01.29 100,000 EUR 100,000 111,118 0.09Unitymed 3.75% 15-15.01.27 300,000 EUR 300,120 274,953 0.21
9,266,483 9,291,565 7.16
Great BritainAnglo Amer 2.75% 12-07.06.19 400,000 EUR 372,000 392,808 0.30Anglo Amer 3.25% 14-03.04.23 400,000 EUR 328,000 363,434 0.28Boparan 4.375% 14-15.07.21 850,000 EUR 774,542 786,004 0.61Georgia 4.75% 15-15.02.23 Regs 1,300,000 EUR 1,220,102 1,346,995 1.04Int Pers 4.25% 14-23.05.18 650,000 EUR 617,500 552,825 0.43Int Pers 5.75% 14-07.04.21 1,200,000 EUR 1,133,000 1,069,530 0.83Merlin Entmts 2.75% 15.03.22 600,000 EUR 580,625 583,749 0.45Natl Westm. Frn 99-Emtn 600,000 EUR 564,328 543,738 0.42R&R Ice Cre 4.75% 14-15.05.20 650,000 EUR 659,455 665,317 0.51Rexam Plc 6.75% (Tv) 07-29.06.67 600,000 EUR 617,893 600,861 0.46Roy. Bk Scot. 7.0916% (Tv) 07-Perp 1,250,000 EUR 1,326,126 1,223,200 0.94Roy. Bk Scotl. 4.625% 04-22.09.21 500,000 EUR 516,562 494,510 0.38Tesco Corp 1.375% 14-01.07.19 1,300,000 EUR 1,265,282 1,285,485 0.99
9,975,415 9,908,456 7.64
DANSKE INVEST SICAV
The accompanying notes form an integral part of these financial statements.
43
Euro High Yield Bond
Statement of Investmentsas at June 30, 2016 (continued)(expressed in EUR)
* Securities subject to a collateralized securities lending agreement as described in note 7.
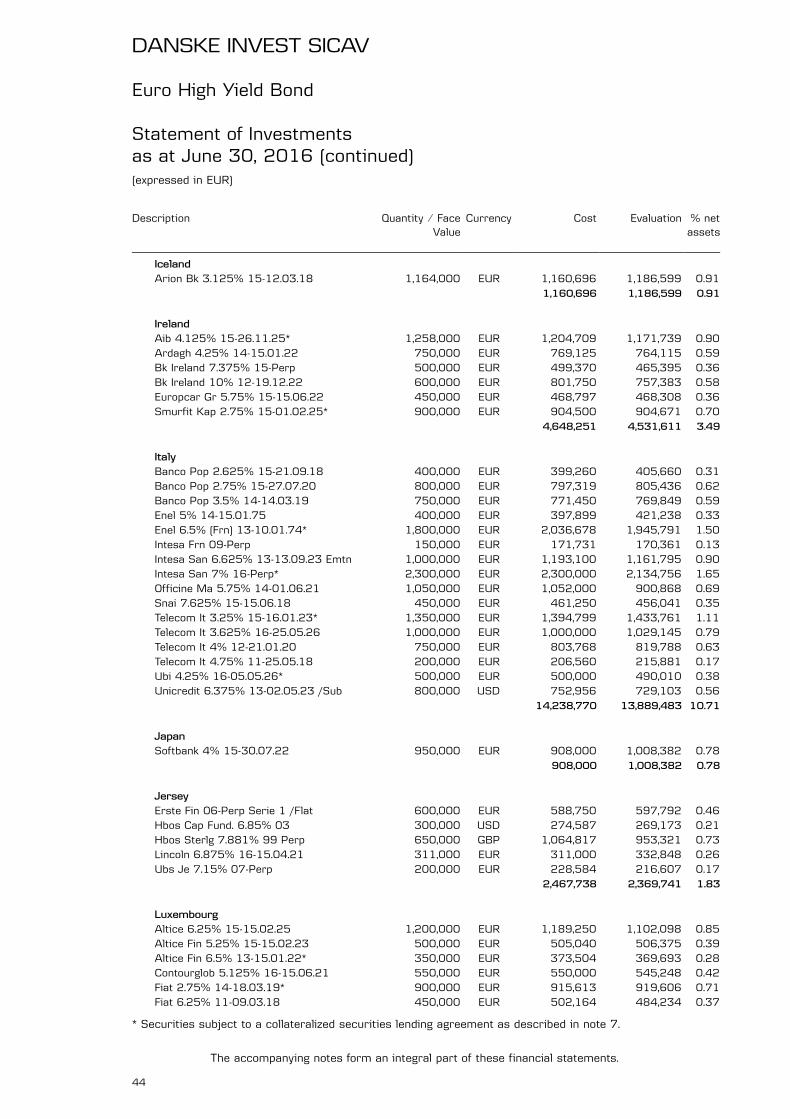
Description Quantity ⁄ FaceValue
Currency Cost Evaluation % netassets
IcelandArion Bk 3.125% 15-12.03.18 1,164,000 EUR 1,160,696 1,186,599 0.91
1,160,696 1,186,599 0.91
IrelandAib 4.125% 15-26.11.25* 1,258,000 EUR 1,204,709 1,171,739 0.90Ardagh 4.25% 14-15.01.22 750,000 EUR 769,125 764,115 0.59Bk Ireland 7.375% 15-Perp 500,000 EUR 499,370 465,395 0.36Bk Ireland 10% 12-19.12.22 600,000 EUR 801,750 757,383 0.58Europcar Gr 5.75% 15-15.06.22 450,000 EUR 468,797 468,308 0.36Smurfit Kap 2.75% 15-01.02.25* 900,000 EUR 904,500 904,671 0.70
4,648,251 4,531,611 3.49
ItalyBanco Pop 2.625% 15-21.09.18 400,000 EUR 399,260 405,660 0.31Banco Pop 2.75% 15-27.07.20 800,000 EUR 797,319 805,436 0.62Banco Pop 3.5% 14-14.03.19 750,000 EUR 771,450 769,849 0.59Enel 5% 14-15.01.75 400,000 EUR 397,899 421,238 0.33Enel 6.5% (Frn) 13-10.01.74* 1,800,000 EUR 2,036,678 1,945,791 1.50Intesa Frn 09-Perp 150,000 EUR 171,731 170,361 0.13Intesa San 6.625% 13-13.09.23 Emtn 1,000,000 EUR 1,193,100 1,161,795 0.90Intesa San 7% 16-Perp* 2,300,000 EUR 2,300,000 2,134,756 1.65Officine Ma 5.75% 14-01.06.21 1,050,000 EUR 1,052,000 900,868 0.69Snai 7.625% 15-15.06.18 450,000 EUR 461,250 456,041 0.35Telecom It 3.25% 15-16.01.23* 1,350,000 EUR 1,394,799 1,433,761 1.11Telecom It 3.625% 16-25.05.26 1,000,000 EUR 1,000,000 1,029,145 0.79Telecom It 4% 12-21.01.20 750,000 EUR 803,768 819,788 0.63Telecom It 4.75% 11-25.05.18 200,000 EUR 206,560 215,881 0.17Ubi 4.25% 16-05.05.26* 500,000 EUR 500,000 490,010 0.38Unicredit 6.375% 13-02.05.23 /Sub 800,000 USD 752,956 729,103 0.56
14,238,770 13,889,483 10.71
JapanSoftbank 4% 15-30.07.22 950,000 EUR 908,000 1,008,382 0.78
908,000 1,008,382 0.78
JerseyErste Fin 06-Perp Serie 1 /Flat 600,000 EUR 588,750 597,792 0.46Hbos Cap Fund. 6.85% 03 300,000 USD 274,587 269,173 0.21Hbos Sterlg 7.881% 99 Perp 650,000 GBP 1,064,817 953,321 0.73Lincoln 6.875% 16-15.04.21 311,000 EUR 311,000 332,848 0.26Ubs Je 7.15% 07-Perp 200,000 EUR 228,584 216,607 0.17
2,467,738 2,369,741 1.83
LuxembourgAltice 6.25% 15-15.02.25 1,200,000 EUR 1,189,250 1,102,098 0.85Altice Fin 5.25% 15-15.02.23 500,000 EUR 505,040 506,375 0.39Altice Fin 6.5% 13-15.01.22* 350,000 EUR 373,504 369,693 0.28Contourglob 5.125% 16-15.06.21 550,000 EUR 550,000 545,248 0.42Fiat 2.75% 14-18.03.19* 900,000 EUR 915,613 919,606 0.71Fiat 6.25% 11-09.03.18 450,000 EUR 502,164 484,234 0.37
DANSKE INVEST SICAV
The accompanying notes form an integral part of these financial statements.
44
Euro High Yield Bond
Statement of Investmentsas at June 30, 2016 (continued)(expressed in EUR)
* Securities subject to a collateralized securities lending agreement as described in note 7.
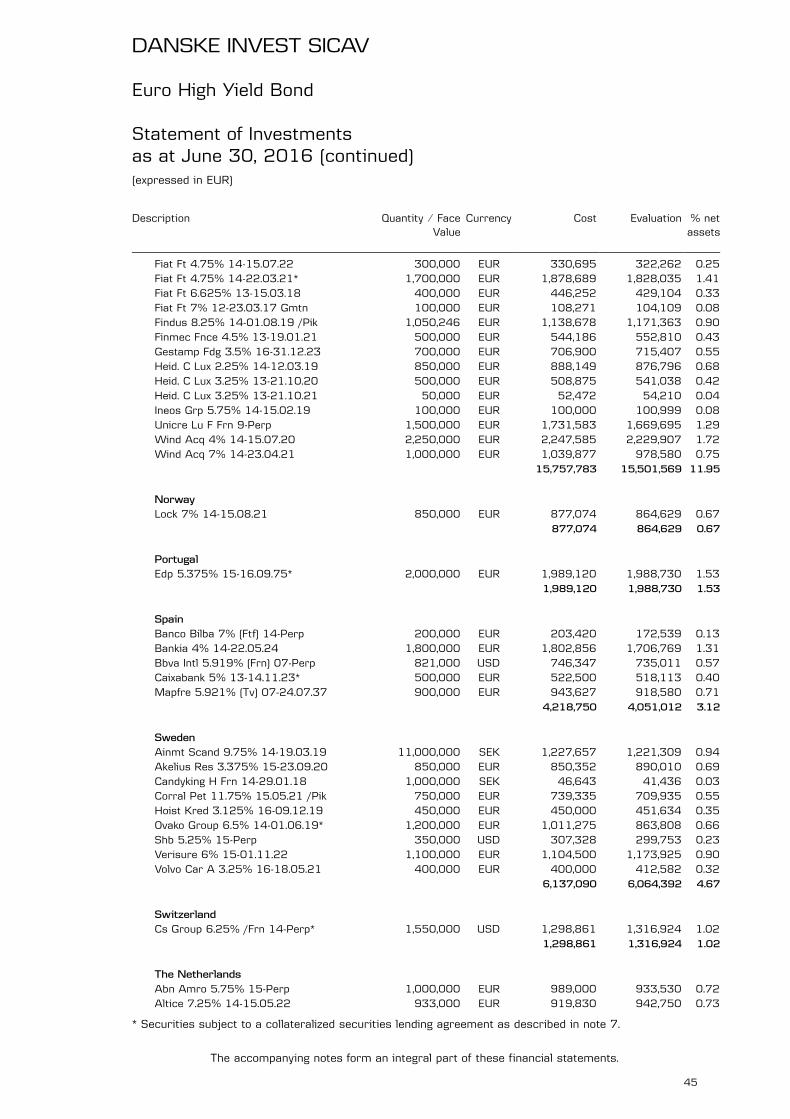
Description Quantity ⁄ FaceValue
Currency Cost Evaluation % netassets
Fiat Ft 4.75% 14-15.07.22 300,000 EUR 330,695 322,262 0.25Fiat Ft 4.75% 14-22.03.21* 1,700,000 EUR 1,878,689 1,828,035 1.41Fiat Ft 6.625% 13-15.03.18 400,000 EUR 446,252 429,104 0.33Fiat Ft 7% 12-23.03.17 Gmtn 100,000 EUR 108,271 104,109 0.08Findus 8.25% 14-01.08.19 /Pik 1,050,246 EUR 1,138,678 1,171,363 0.90Finmec Fnce 4.5% 13-19.01.21 500,000 EUR 544,186 552,810 0.43Gestamp Fdg 3.5% 16-31.12.23 700,000 EUR 706,900 715,407 0.55Heid. C Lux 2.25% 14-12.03.19 850,000 EUR 888,149 876,796 0.68Heid. C Lux 3.25% 13-21.10.20 500,000 EUR 508,875 541,038 0.42Heid. C Lux 3.25% 13-21.10.21 50,000 EUR 52,472 54,210 0.04Ineos Grp 5.75% 14-15.02.19 100,000 EUR 100,000 100,999 0.08Unicre Lu F Frn 9-Perp 1,500,000 EUR 1,731,583 1,669,695 1.29Wind Acq 4% 14-15.07.20 2,250,000 EUR 2,247,585 2,229,907 1.72Wind Acq 7% 14-23.04.21 1,000,000 EUR 1,039,877 978,580 0.75
15,757,783 15,501,569 11.95
NorwayLock 7% 14-15.08.21 850,000 EUR 877,074 864,629 0.67
877,074 864,629 0.67
PortugalEdp 5.375% 15-16.09.75* 2,000,000 EUR 1,989,120 1,988,730 1.53
1,989,120 1,988,730 1.53
SpainBanco Bilba 7% (Ftf) 14-Perp 200,000 EUR 203,420 172,539 0.13Bankia 4% 14-22.05.24 1,800,000 EUR 1,802,856 1,706,769 1.31Bbva Intl 5.919% (Frn) 07-Perp 821,000 USD 746,347 735,011 0.57Caixabank 5% 13-14.11.23* 500,000 EUR 522,500 518,113 0.40Mapfre 5.921% (Tv) 07-24.07.37 900,000 EUR 943,627 918,580 0.71
4,218,750 4,051,012 3.12
SwedenAinmt Scand 9.75% 14-19.03.19 11,000,000 SEK 1,227,657 1,221,309 0.94Akelius Res 3.375% 15-23.09.20 850,000 EUR 850,352 890,010 0.69Candyking H Frn 14-29.01.18 1,000,000 SEK 46,643 41,436 0.03Corral Pet 11.75% 15.05.21 /Pik 750,000 EUR 739,335 709,935 0.55Hoist Kred 3.125% 16-09.12.19 450,000 EUR 450,000 451,634 0.35Ovako Group 6.5% 14-01.06.19* 1,200,000 EUR 1,011,275 863,808 0.66Shb 5.25% 15-Perp 350,000 USD 307,328 299,753 0.23Verisure 6% 15-01.11.22 1,100,000 EUR 1,104,500 1,173,925 0.90Volvo Car A 3.25% 16-18.05.21 400,000 EUR 400,000 412,582 0.32
6,137,090 6,064,392 4.67
SwitzerlandCs Group 6.25% /Frn 14-Perp* 1,550,000 USD 1,298,861 1,316,924 1.02
1,298,861 1,316,924 1.02
The NetherlandsAbn Amro 5.75% 15-Perp 1,000,000 EUR 989,000 933,530 0.72Altice 7.25% 14-15.05.22 933,000 EUR 919,830 942,750 0.73
DANSKE INVEST SICAV
The accompanying notes form an integral part of these financial statements.
45
Euro High Yield Bond
Statement of Investmentsas at June 30, 2016 (continued)(expressed in EUR)
* Securities subject to a collateralized securities lending agreement as described in note 7.

Description Quantity ⁄ FaceValue
Currency Cost Evaluation % netassets
Delta Lloyd 4.375% 14-Perp 1,521,000 EUR 1,293,058 1,143,807 0.88Gas Nat Fen 3.375% 15-29.12.49 700,000 EUR 693,343 624,764 0.48Gas Nat Fen 4.125% 14-30.11.49* 900,000 EUR 884,217 885,713 0.68Generali Fin 4.596% 14-Perp 1,000,000 EUR 1,001,375 934,105 0.72Grupo Antol 5.125% 15-30.06.22 1,150,000 EUR 1,165,244 1,203,314 0.93Heidel Fin 9.5% 11-15.12.18 400,000 EUR 511,500 485,254 0.37Repsm 4.5% 15-25.03.75 1,390,000 EUR 1,389,559 1,180,923 0.91Schaeff Fin 2.75% 14-15.05.19* 1,300,000 EUR 1,312,489 1,317,537 1.02Schaeff Fin 3.25% 15-15.05.25 100,000 EUR 98,920 102,378 0.08Schaeff Fin 4.25% 13-15.05.18 400,000 EUR 411,667 406,302 0.31Selecta 6.5% 14-15.06.20* 750,000 EUR 722,760 612,821 0.47Sm Mth Auto 4.125% 14-15.07.21 600,000 EUR 594,818 603,984 0.47Sns 3.75% 15-05.11.25 700,000 EUR 695,128 687,043 0.53Srlev Nv 9% (Frn) 11-15.04.41 1,170,000 EUR 1,480,750 1,197,290 0.92Telefonic 5% 14-Perp 1,500,000 EUR 1,607,250 1,515,322 1.17Telefonica 4.2% 14-Perp* 1,400,000 EUR 1,457,166 1,393,259 1.07Telefonica 6.5% /Frn 13-Perp 200,000 EUR 218,875 209,992 0.16Univeg Hold 7.875% 13-15.11.20 950,000 EUR 952,823 988,409 0.76Upc Hold 6.375% 12-15.09.22 300,000 EUR 326,100 318,152 0.25Upc Hold 6.75% 13-15.03.23 100,000 EUR 109,813 107,584 0.08
18,835,685 17,794,233 13.71
United States of AmericaHanesbrand 3.5% 16-15.06.24 550,000 EUR 551,350 554,086 0.43Hypo Real 5.864% (Tv) 07-Perp 450,000 EUR 432,000 443,221 0.34Zf Na Cap 2.25% 15-26.04.19 300,000 EUR 298,587 307,998 0.24Zf Na Capit 2.75% 15-27.04.23 500,000 EUR 496,000 513,283 0.39
1,777,937 1,818,588 1.40
Total - Bonds 117,832,982 114,870,948 88.53
Total - Transferable securities admitted to an official stock exchangelisting 117,832,982 114,870,948 88.53
Transferable securities dealt in on another regulated market
Bonds
Great BritainGenel Energy 7.5% 14-14.05.19 1,600,000 USD 1,255,249 1,089,324 0.84
1,255,249 1,089,324 0.84
ItalySnai 12% 13-15.12.18 100,000 EUR 98,500 102,440 0.08Snai 7.625% 13-15.06.18 1,100,000 EUR 1,139,184 1,135,964 0.87
1,237,684 1,238,404 0.95
JapanSoftbank 4.75% 15-30.07.25 100,000 EUR 100,000 107,844 0.08
100,000 107,844 0.08
DANSKE INVEST SICAV
The accompanying notes form an integral part of these financial statements.
46
Euro High Yield Bond
Statement of Investmentsas at June 30, 2016 (continued)(expressed in EUR)
* Securities subject to a collateralized securities lending agreement as described in note 7.
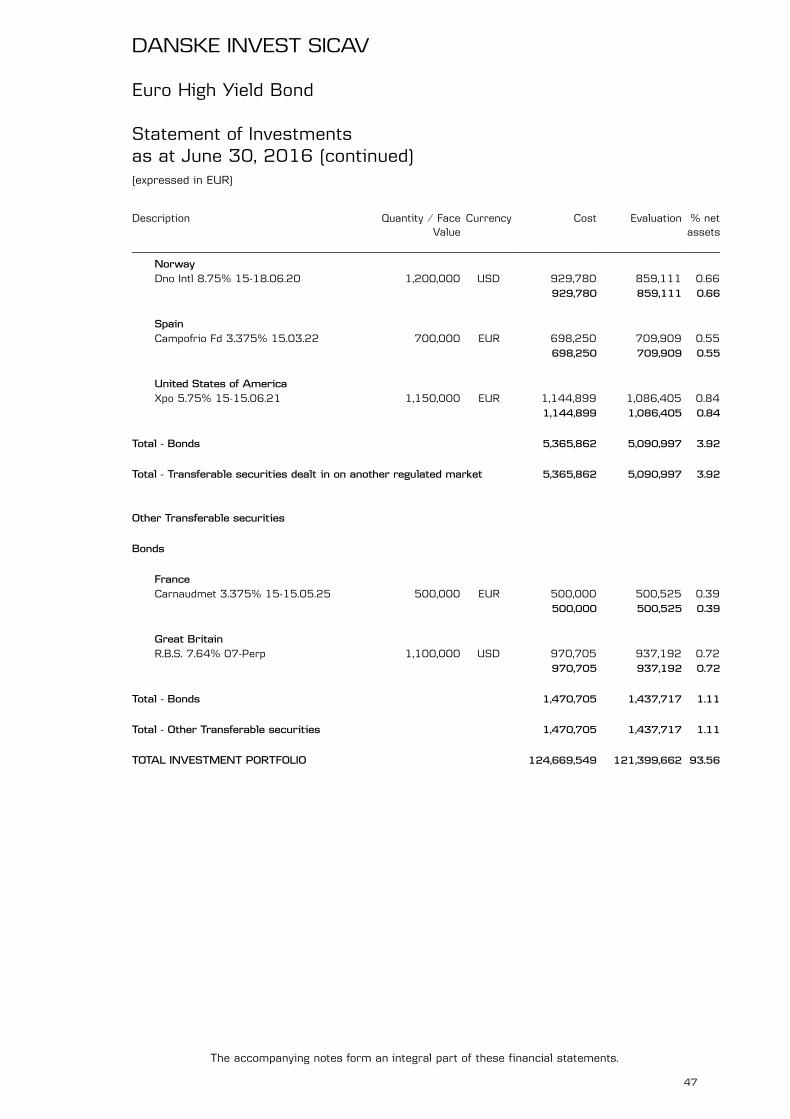
Description Quantity ⁄ FaceValue
Currency Cost Evaluation % netassets
NorwayDno Intl 8.75% 15-18.06.20 1,200,000 USD 929,780 859,111 0.66
929,780 859,111 0.66
SpainCampofrio Fd 3.375% 15.03.22 700,000 EUR 698,250 709,909 0.55
698,250 709,909 0.55
United States of AmericaXpo 5.75% 15-15.06.21 1,150,000 EUR 1,144,899 1,086,405 0.84
1,144,899 1,086,405 0.84
Total - Bonds 5,365,862 5,090,997 3.92
Total - Transferable securities dealt in on another regulated market 5,365,862 5,090,997 3.92
Other Transferable securities
Bonds
FranceCarnaudmet 3.375% 15-15.05.25 500,000 EUR 500,000 500,525 0.39
500,000 500,525 0.39
Great BritainR.B.S. 7.64% 07-Perp 1,100,000 USD 970,705 937,192 0.72
970,705 937,192 0.72
Total - Bonds 1,470,705 1,437,717 1.11
Total - Other Transferable securities 1,470,705 1,437,717 1.11
TOTAL INVESTMENT PORTFOLIO 124,669,549 121,399,662 93.56
DANSKE INVEST SICAV
The accompanying notes form an integral part of these financial statements.
47
Euro High Yield Bond
Statement of Investmentsas at June 30, 2016 (continued)(expressed in EUR)

Euro High Yield Bond
Geographical and Economic Portfolio Breakdownsas at June 30, 2016(expressed as a percentage of net assets)
Geographical breakdown %
The Netherlands 13.71France 13.44Luxembourg 11.95Italy 11.66Great Britain 9.20Germany 7.16Sweden 4.67Spain 3.67Ireland 3.49United States of America 2.24Jersey 1.83Portugal 1.53Belgium 1.35Norway 1.33Denmark 1.20Switzerland 1.02Iceland 0.91Japan 0.86Canada 0.71Finland 0.50Austria 0.45Cayman Islands 0.41Bermuda Islands 0.27
93.56
Economic breakdown %
Holding and Finance Companies 26.82Banks and Financial Institutions 23.75News Transmission 9.05Insurance 5.50Public Services 4.24Other Services 3.99Automobile Industry 3.40Miscellaneous 3.01Internet Software 1.90Food and Distilleries 1.85Leisure 1.75Packaging and Container Industry 1.44Mechanics, Machinery 1.05Real Estate Companies 1.03Petrol 0.93Transportation 0.84Mines, Heavy Industries 0.66Construction, Building Material 0.54Electronics and Electrical Equipment 0.50Forest Products and Paper Industry 0.50Chemicals 0.32Retail 0.28Mortgage and Funding Institutions 0.21
93.56
DANSKE INVEST SICAV
The accompanying notes form an integral part of these financial statements.
48

Europe
Statement of Investmentsas at June 30, 2016(expressed in EUR)
Description Quantity ⁄ FaceValue
Currency Cost Evaluation % netassets
Transferable securities admitted to an official stock exchange listing
Shares
BelgiumBelgacom Npv 12,369 EUR 343,999 346,827 0.44
343,999 346,827 0.44
Bermuda IslandsHiscox Ltd 56,446 GBP 622,366 674,100 0.85
622,366 674,100 0.85
DenmarkDsv A/S 41,077 DKK 1,209,829 1,517,626 1.93Genmab A/S 7,048 DKK 513,359 1,104,876 1.40Novo Nordisk A/S /-B- 53,106 DKK 2,228,045 2,528,956 3.21Pandora A/S 13,109 DKK 1,090,741 1,594,143 2.02Topdanmark A/S 34,333 DKK 811,635 718,703 0.91
5,853,609 7,464,304 9.47
FranceAxa 64,883 EUR 1,296,799 1,143,563 1.45Iliad 4,643 EUR 918,419 837,133 1.06Michelin B /Nom. 13,766 EUR 1,112,163 1,158,960 1.47Publicis Groupe Sa 28,546 EUR 1,917,633 1,720,467 2.18Schneider Electric Sa 15,905 EUR 900,967 811,632 1.03
6,145,981 5,671,755 7.19
GermanyAdidas — Namen-Akt 8,358 EUR 600,838 1,053,944 1.34Allianz Se /Nam. Vinkuliert 14,258 EUR 2,005,161 1,795,795 2.28Basf Namen-Akt. 30,085 EUR 2,179,307 2,022,314 2.56Bmw-Bayer. Motorenwerke 9,591 EUR 825,207 625,717 0.79Brenntag 25,070 EUR 1,141,488 1,062,717 1.35Continental Ag 5,316 EUR 1,045,134 889,898 1.13Gea Group Ag 18,478 EUR 631,383 763,049 0.97Henkel /Vorzug 14,147 EUR 1,237,770 1,534,242 1.95Sap Ag 24,272 EUR 1,518,054 1,627,680 2.06United Intern. &Co /Namensakt 22,654 EUR 1,024,397 822,227 1.04
12,208,739 12,197,583 15.47
Great BritainAntofagasta Plc* 181,601 GBP 1,429,987 959,694 1.22British American Tobacco (25p) 52,679 GBP 2,467,093 2,997,839 3.80Bt Group Plc 420,047 GBP 2,524,728 2,055,542 2.61Diageo Plc 63,971 GBP 1,548,261 1,537,212 1.95Direct Line 194,948 GBP 955,772 803,540 1.02Glaxosmithkline Plc 89,469 GBP 1,695,933 1,668,679 2.12Lloyds Banking Group Plc 2,424,294 GBP 2,291,463 1,594,697 2.02Merlin Entertainments Plc 122,810 GBP 683,658 637,724 0.81Pearson Plc 68,249 GBP 988,769 784,945 0.99
DANSKE INVEST SICAV
The accompanying notes form an integral part of these financial statements.
49
* Securities subject to a collateralized securities lending agreement as described in note 7.

Description Quantity ⁄ FaceValue
Currency Cost Evaluation % netassets
Prudential Plc 92,144 GBP 1,840,212 1,392,231 1.76Spectris Plc 49,720 GBP 1,245,982 1,070,359 1.36Unilever Plc 74,308 GBP 3,006,856 3,103,259 3.93
20,678,714 18,605,721 23.59
IrelandCrh Plc 53,739 GBP 1,020,587 1,368,732 1.74
1,020,587 1,368,732 1.74
ItalyIntesa Sanpaolo Spa* 774,998 EUR 2,322,812 1,213,647 1.54
2,322,812 1,213,647 1.54
JerseyPetrofac Ltd 96,943 GBP 1,167,952 860,682 1.09Shire Plc 37,093 GBP 2,203,189 2,005,063 2.54Wolselley Plc 33,893 GBP 1,598,493 1,554,324 1.97
4,969,634 4,420,069 5.60
NorwayGjensidige Forsikring 66,352 NOK 916,033 978,722 1.24Statoilhydro Asa 114,872 NOK 1,678,266 1,764,603 2.24Telenor As 95,383 NOK 1,604,640 1,377,289 1.75
4,198,939 4,120,614 5.23
SpainAmadeus It Holding Sr. A 37,737 EUR 1,243,671 1,472,875 1.87
1,243,671 1,472,875 1.87
SwedenAtlas Copco Ab 46,463 SEK 948,158 960,654 1.22Lundin Petroleum Ab* 71,948 SEK 952,724 1,145,874 1.45Skandinav. Ensk. Banken A 226,648 SEK 2,348,585 1,742,237 2.21Skf Ab B 88,406 SEK 1,400,707 1,248,313 1.58
5,650,174 5,097,078 6.46
SwitzerlandBaloise Holding /Namen* 6,491 CHF 684,340 639,291 0.81Nestle Sa 60,532 CHF 3,648,992 4,142,098 5.25Partners Group Holding 3,813 CHF 865,078 1,444,580 1.83Roche Holding Ag /Genussschein 14,830 CHF 3,255,113 3,443,891 4.37
8,453,523 9,669,860 12.26
The NetherlandsAalberts Industries Nv 33,967 EUR 963,786 906,070 1.15Heineken Nv 17,185 EUR 1,176,828 1,394,734 1.77Ing Groep Nv /Cert. of Shs 166,801 EUR 1,863,473 1,490,367 1.89
DANSKE INVEST SICAV
The accompanying notes form an integral part of these financial statements.
50
Europe
Statement of Investmentsas at June 30, 2016 (continued)(expressed in EUR)
* Securities subject to a collateralized securities lending agreement as described in note 7.

Description Quantity ⁄ FaceValue
Currency Cost Evaluation % netassets
Koninklijke Vopak 38,514 EUR 1,494,840 1,710,407 2.175,498,927 5,501,578 6.98
Total - Shares 79,211,675 77,824,743 98.69
Total - Transferable securities admitted to an official stock exchangelisting 79,211,675 77,824,743 98.69
TOTAL INVESTMENT PORTFOLIO 79,211,675 77,824,743 98.69
DANSKE INVEST SICAV
The accompanying notes form an integral part of these financial statements.
51
Europe
Statement of Investmentsas at June 30, 2016 (continued)(expressed in EUR)

Europe
Geographical and Economic Portfolio Breakdownsas at June 30, 2016(expressed as a percentage of net assets)
Geographical breakdown %
Great Britain 23.59Germany 15.47Switzerland 12.26Denmark 9.47France 7.19The Netherlands 6.98Sweden 6.46Jersey 5.60Norway 5.23Spain 1.87Ireland 1.74Italy 1.54Bermuda Islands 0.85Belgium 0.44
98.69
Economic breakdown %
Pharmaceuticals and Cosmetics 9.70Insurance 9.47Food and Distilleries 9.18Banks and Financial Institutions 7.66Tobacco and Spirits 7.52Internet Software 6.03Mechanics, Machinery 4.92News Transmission 4.80Transportation 4.10Consumer Goods 3.97Biotechnology 3.94Chemicals 3.91Construction, Building Material 3.71Petrol 3.69Graphic Art, Publishing 3.17Holding and Finance Companies 2.68Tyres & Rubber 2.60Electronic Semiconductor 1.36Textile 1.34Non-Ferrous Metals 1.22Mines, Heavy Industries 1.09Electronics and Electrical Equipment 1.03Leisure 0.81Automobile Industry 0.79
98.69
DANSKE INVEST SICAV
The accompanying notes form an integral part of these financial statements.
52

Europe Absolute
Statement of Investmentsas at June 30, 2016(expressed in EUR)
Description Quantity ⁄ FaceValue
Currency Cost Evaluation % netassets
Transferable securities admitted to an official stock exchange listing
Shares
AustriaAms Ag 397,181 CHF 11,082,165 9,642,770 3.87Zumtobel Ag* 138,186 EUR 2,244,737 1,498,627 0.60
13,326,902 11,141,397 4.47
DenmarkBavarian Nordic* 85,076 DKK 2,573,761 2,653,654 1.06Genmab A/S 40,953 DKK 5,787,939 6,419,976 2.58
8,361,700 9,073,630 3.64
FinlandFerratum Finland Oy* 85,676 EUR 1,670,380 1,570,441 0.63Nokia Oy 1,014,956 EUR 6,196,981 5,135,677 2.06
7,867,361 6,706,118 2.69
FranceCriteo Sa /Sadr 221,500 USD 7,132,928 9,006,011 3.62Europcar Groupe Sa 715,000 EUR 6,491,432 5,472,610 2.20Soitec. Bernin* 1,199,630 EUR 2,258,463 623,808 0.25Technicolor /Prov .Regrpmt 1,056,129 EUR 5,886,010 5,817,158 2.33Ubisoft Entertainment 190,460 EUR 3,491,213 6,277,562 2.52
25,260,046 27,197,149 10.92
GermanyAxel Springer Se N Namen-Akt. V* 135,700 EUR 6,620,942 6,388,077 2.56Bertrandt Ag* 35,000 EUR 3,835,932 3,061,450 1.23Infineon Technologies /Nam. 840,696 EUR 9,549,297 10,786,130 4.33K+S Aktiengesellschaft* 247,000 EUR 5,725,166 4,457,115 1.79Mtu Aero Engines N Namen-Akt 65,000 EUR 5,303,581 5,385,250 2.16Rocket Internet Se* 495,466 EUR 13,531,650 8,343,647 3.35Sap Ag 93,876 EUR 6,052,128 6,295,325 2.53Scout24 Holding Gmbh* 151,000 EUR 4,783,859 5,223,845 2.10Sixt Se* 133,900 EUR 4,757,910 6,169,443 2.47Wacker Chemie Ag Muenchen* 93,000 EUR 7,730,038 7,195,410 2.89Zalando Se* 452,600 EUR 13,412,377 10,837,507 4.35
81,302,880 74,143,199 29.76
Great BritainArm Holdings Plc 499,695 GBP 6,837,680 6,571,556 2.64Asos Plc 190,258 GBP 7,656,896 8,833,271 3.55Blinkx Plc 7,552,431 GBP 5,349,963 2,738,687 1.10Dialog Semiconductor* 339,221 EUR 9,958,626 8,977,484 3.60Easyjet Plc 378,676 GBP 8,132,236 4,882,284 1.96Telit Communication Plc* 1,961,293 GBP 5,942,462 5,368,156 2.15
43,877,863 37,371,438 15.00
DANSKE INVEST SICAV
The accompanying notes form an integral part of these financial statements.
53
* Securities subject to a collateralized securities lending agreement as described in note 7.

Description Quantity ⁄ FaceValue
Currency Cost Evaluation % netassets
IsraelCompugen Ltd* 408,575 USD 2,799,832 2,402,625 0.96Nice Systems Ltd /Sadr 139,278 USD 6,019,989 7,866,645 3.16
8,819,821 10,269,270 4.12
ItalyAnima Holding Spa 1,097,000 EUR 7,476,550 4,493,312 1.80Banca Ifis Spa 253,330 EUR 5,227,101 4,534,607 1.82Cerv Info 524,462 EUR 3,571,221 3,747,281 1.51
16,274,872 12,775,200 5.13
SpainBco De Sabadell Sa/Nom.* 3,580,000 EUR 5,566,533 4,213,660 1.69Gowex Shs 140,000 EUR 640,997 - -Promotora De Informaciones Sa* 640,000 EUR 4,899,199 3,040,000 1.22
11,106,729 7,253,660 2.91
The NetherlandsIng Groep Nv /Cert. of Shs 679,078 EUR 6,614,397 6,067,562 2.44Roy. Philips Electr. /Eur 0.2 305,715 EUR 7,047,826 6,711,973 2.69
13,662,223 12,779,535 5.13
United States of AmericaNuance Communications Inc 360,988 USD 5,339,876 4,993,269 2.01Rambus Inc (Del)* 336,256 USD 3,847,519 3,521,687 1.41
9,187,395 8,514,956 3.42
Total - Shares 239,047,792 217,225,552 87.19
Total - Transferable securities admitted to an official stock exchangelisting 239,047,792 217,225,552 87.19
TOTAL INVESTMENT PORTFOLIO 239,047,792 217,225,552 87.19
DANSKE INVEST SICAV
The accompanying notes form an integral part of these financial statements.
54
Europe Absolute
Statement of Investmentsas at June 30, 2016 (continued)(expressed in EUR)
* Securities subject to a collateralized securities lending agreement as described in note 7.

Europe Absolute
Geographical and Economic Portfolio Breakdownsas at June 30, 2016(expressed as a percentage of net assets)
Geographical breakdown %
Germany 29.76Great Britain 15.00France 10.92Italy 5.13The Netherlands 5.13Austria 4.47Israel 4.12Denmark 3.64United States of America 3.42Spain 2.91Finland 2.69
87.19
Economic breakdown %
Electronic Semiconductor 21.12Internet Software 11.51News Transmission 7.37Transportation 6.63Banks and Financial Institutions 6.58Chemicals 4.68Textile 4.35Graphic Art, Publishing 3.78Biotechnology 3.64Office Equipment, Computers 3.62Retail 3.55Holding and Finance Companies 3.31Aerospace Technology 2.16Other Services 2.10Automobile Industry 1.23Pharmaceuticals and Cosmetics 0.96Electronics and Electrical Equipment 0.60
87.19
DANSKE INVEST SICAV
The accompanying notes form an integral part of these financial statements.
55

Europe Long-Short Dynamic
Statement of Investmentsas at June 30, 2016(expressed in EUR)
Description Quantity ⁄ FaceValue
Currency Cost Evaluation % netassets
Transferable securities admitted to an official stock exchange listing
Bonds
DenmarkNykredit 1% 15-01.01.17 298,000,000 DKK 40,295,709 40,298,605 4.53Nykredit Frn 13-01.10.16 410,000,000 DKK 55,215,914 55,035,377 6.18
95,511,623 95,333,982 10.71
Total - Bonds 95,511,623 95,333,982 10.71
Shares
BelgiumDelhaize Group 138,439 EUR 12,599,111 12,798,686 1.44
12,599,111 12,798,686 1.44
DenmarkA.P. Moeller-Maersk A/S A 9,115 DKK 11,354,799 10,055,054 1.13A.P. Moeller-Maersk A/S B 4,872 DKK 5,910,749 5,603,720 0.63Danske Bank As 1,867,513 DKK 46,509,846 43,662,880 4.91Dfds A/S 66,950 DKK 1,116,579 2,596,842 0.29Dsv A/S 333,205 DKK 10,585,977 12,310,549 1.38Iss A/S 291,263 DKK 9,353,313 9,758,488 1.10Nkt Holding (Dkk 20) 302,700 DKK 14,918,640 13,299,755 1.50Novo Nordisk A/S /-B- 310,805 DKK 14,625,214 14,800,818 1.66Pandora A/S 340,650 DKK 36,329,765 41,425,344 4.65Per Aarsleff A/S 220,330 DKK 4,091,552 4,191,594 0.47Royal Unibrew A/S 292,904 DKK 8,337,215 11,506,803 1.29Topdanmark A/S 447,551 DKK 9,823,445 9,368,721 1.05Tryg A/S 590,704 DKK 9,839,379 9,363,385 1.05Vestas Wind Systems As /Reg 1,084,810 DKK 62,006,254 65,004,808 7.30
244,802,727 252,948,761 28.41
FinlandHuhtamaki Oy 339,286 EUR 11,002,859 12,478,939 1.40Wartsila Corporation -B- 197,000 EUR 7,010,785 7,086,090 0.80
18,013,644 19,565,029 2.20
FranceAxa 432,000 EUR 9,186,160 7,614,000 0.86Peugeot Sa* 826,798 EUR 11,947,096 9,061,706 1.02Renault Sa 538,041 EUR 43,250,761 36,237,062 4.07Schneider Electric Sa 272,807 EUR 15,189,163 13,921,341 1.56
79,573,180 66,834,109 7.51
GermanyAllianz Se /Nam. Vinkuliert 262,655 EUR 37,141,329 33,081,397 3.72Continental Ag 38,468 EUR 7,418,881 6,439,543 0.72Deutsche Post Ag. Bonn 110,000 EUR 2,479,184 2,725,250 0.31
DANSKE INVEST SICAV
The accompanying notes form an integral part of these financial statements.
56
* Securities subject to a collateralized securities lending agreement as described in note 7.

Description Quantity ⁄ FaceValue
Currency Cost Evaluation % netassets
Kion Group 293,986 EUR 12,662,137 12,791,331 1.44Siemens Ag /Nam. 68,500 EUR 6,276,755 6,193,770 0.69
65,978,286 61,231,291 6.88
Great BritainJ. Sainsbury Plc* 4,430,000 GBP 15,364,127 12,090,994 1.36Lloyds Banking Group Plc 19,089,707 GBP 19,221,143 12,557,180 1.41Optimal Payments Plc* 13,693,551 GBP 60,162,181 63,767,150 7.16Rio Tinto Plc /Reg. 40,400 GBP 1,261,615 1,068,228 0.12Weir Group Plc 80,900 GBP 1,283,160 1,394,448 0.16
97,292,226 90,878,000 10.21
JerseyGlencore Xstrata Plc 575,700 GBP 1,256,276 1,013,888 0.11
1,256,276 1,013,888 0.11
LuxembourgGrand City Properties 1,339,111 EUR 21,737,176 24,452,167 2.75Senvion S.A. 294,349 EUR 4,545,462 3,529,244 0.39
26,282,638 27,981,411 3.14
NorwayGjensidige Forsikring 549,518 NOK 8,123,220 8,105,634 0.91
8,123,220 8,105,634 0.91
SpainBco Pop Esp Iss.13* 10,300,000 EUR 16,055,832 12,009,800 1.35
16,055,832 12,009,800 1.35
SwedenNordea Bank Ab /Finn. Dep. Rec 1,553,944 EUR 12,834,379 11,607,962 1.30Skandinav. Ensk. Banken A 1,330,700 SEK 12,877,359 10,229,053 1.15Skf Ab B 1,774,500 SEK 27,226,023 25,056,345 2.82Swedbank Ab -A- 981,190 SEK 17,992,693 18,274,764 2.05
70,930,454 65,168,124 7.32
SwitzerlandPartners Group Holding 52,200 CHF 16,906,822 19,776,310 2.22
16,906,822 19,776,310 2.22
The NetherlandsKoninklijke Ahold Nv 970,600 EUR 17,905,989 19,048,025 2.14
DANSKE INVEST SICAV
The accompanying notes form an integral part of these financial statements.
57
Europe Long-Short Dynamic
Statement of Investmentsas at June 30, 2016 (continued)(expressed in EUR)
* Securities subject to a collateralized securities lending agreement as described in note 7.
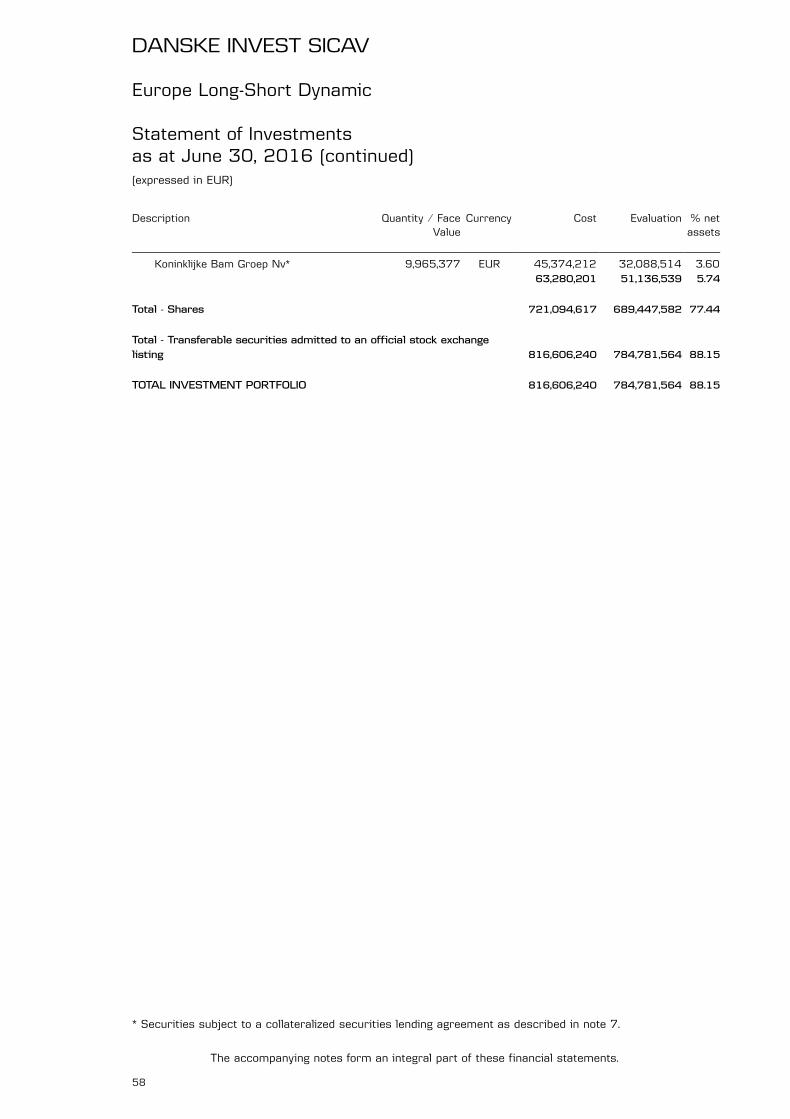
Description Quantity ⁄ FaceValue
Currency Cost Evaluation % netassets
Koninklijke Bam Groep Nv* 9,965,377 EUR 45,374,212 32,088,514 3.6063,280,201 51,136,539 5.74
Total - Shares 721,094,617 689,447,582 77.44
Total - Transferable securities admitted to an official stock exchangelisting 816,606,240 784,781,564 88.15
TOTAL INVESTMENT PORTFOLIO 816,606,240 784,781,564 88.15
DANSKE INVEST SICAV
The accompanying notes form an integral part of these financial statements.
58
Europe Long-Short Dynamic
Statement of Investmentsas at June 30, 2016 (continued)(expressed in EUR)
* Securities subject to a collateralized securities lending agreement as described in note 7.

Europe Long-Short Dynamic
Geographical and Economic Portfolio Breakdownsas at June 30, 2016(expressed as a percentage of net assets)
Geographical breakdown %
Denmark 39.12Great Britain 10.21France 7.51Sweden 7.32Germany 6.88The Netherlands 5.74Luxembourg 3.14Switzerland 2.22Finland 2.20Belgium 1.44Spain 1.35Norway 0.91Jersey 0.11
88.15
Economic breakdown %
Banks and Financial Institutions 12.17Mortgage and Funding Institutions 10.71Public Services 7.69Insurance 7.59Miscellaneous 7.16Consumer Goods 6.05Mechanics, Machinery 5.22Automobile Industry 5.09Retail 4.94Construction, Building Material 4.07Electronics and Electrical Equipment 3.75Transportation 3.74Real Estate Companies 2.75Holding and Finance Companies 2.22Pharmaceuticals and Cosmetics 1.66Tobacco and Spirits 1.29Other Services 1.10Tyres & Rubber 0.72Non-Ferrous Metals 0.12Business Houses 0.11
88.15
DANSKE INVEST SICAV
The accompanying notes form an integral part of these financial statements.
59
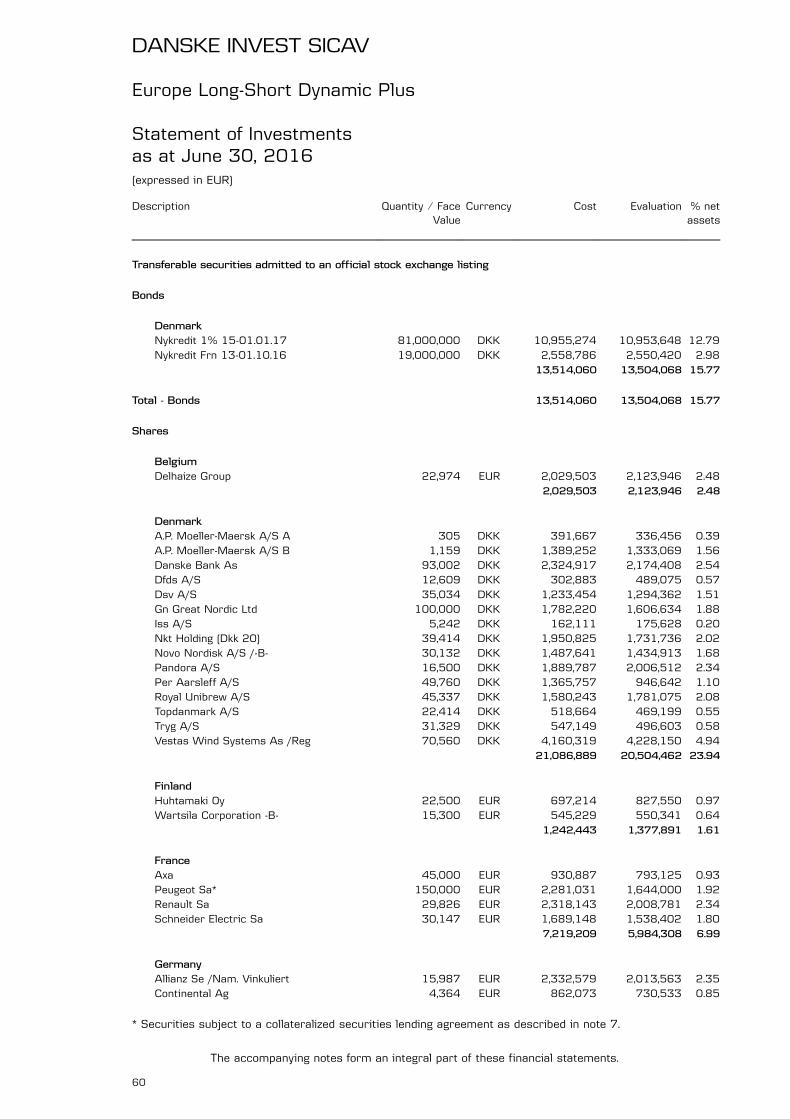
Europe Long-Short Dynamic Plus
Statement of Investmentsas at June 30, 2016(expressed in EUR)
Description Quantity ⁄ FaceValue
Currency Cost Evaluation % netassets
Transferable securities admitted to an official stock exchange listing
Bonds
DenmarkNykredit 1% 15-01.01.17 81,000,000 DKK 10,955,274 10,953,648 12.79Nykredit Frn 13-01.10.16 19,000,000 DKK 2,558,786 2,550,420 2.98
13,514,060 13,504,068 15.77
Total - Bonds 13,514,060 13,504,068 15.77
Shares
BelgiumDelhaize Group 22,974 EUR 2,029,503 2,123,946 2.48
2,029,503 2,123,946 2.48
DenmarkA.P. Moeller-Maersk A/S A 305 DKK 391,667 336,456 0.39A.P. Moeller-Maersk A/S B 1,159 DKK 1,389,252 1,333,069 1.56Danske Bank As 93,002 DKK 2,324,917 2,174,408 2.54Dfds A/S 12,609 DKK 302,883 489,075 0.57Dsv A/S 35,034 DKK 1,233,454 1,294,362 1.51Gn Great Nordic Ltd 100,000 DKK 1,782,220 1,606,634 1.88Iss A/S 5,242 DKK 162,111 175,628 0.20Nkt Holding (Dkk 20) 39,414 DKK 1,950,825 1,731,736 2.02Novo Nordisk A/S /-B- 30,132 DKK 1,487,641 1,434,913 1.68Pandora A/S 16,500 DKK 1,889,787 2,006,512 2.34Per Aarsleff A/S 49,760 DKK 1,365,757 946,642 1.10Royal Unibrew A/S 45,337 DKK 1,580,243 1,781,075 2.08Topdanmark A/S 22,414 DKK 518,664 469,199 0.55Tryg A/S 31,329 DKK 547,149 496,603 0.58Vestas Wind Systems As /Reg 70,560 DKK 4,160,319 4,228,150 4.94
21,086,889 20,504,462 23.94
FinlandHuhtamaki Oy 22,500 EUR 697,214 827,550 0.97Wartsila Corporation -B- 15,300 EUR 545,229 550,341 0.64
1,242,443 1,377,891 1.61
FranceAxa 45,000 EUR 930,887 793,125 0.93Peugeot Sa* 150,000 EUR 2,281,031 1,644,000 1.92Renault Sa 29,826 EUR 2,318,143 2,008,781 2.34Schneider Electric Sa 30,147 EUR 1,689,148 1,538,402 1.80
7,219,209 5,984,308 6.99
GermanyAllianz Se /Nam. Vinkuliert 15,987 EUR 2,332,579 2,013,563 2.35Continental Ag 4,364 EUR 862,073 730,533 0.85
DANSKE INVEST SICAV
The accompanying notes form an integral part of these financial statements.
60
* Securities subject to a collateralized securities lending agreement as described in note 7.

Description Quantity ⁄ FaceValue
Currency Cost Evaluation % netassets
Deutsche Post Ag. Bonn 25,000 EUR 563,451 619,375 0.72Kion Group 28,704 EUR 1,238,235 1,248,911 1.46Siemens Ag /Nam. 9,250 EUR 853,883 836,385 0.98
5,850,221 5,448,767 6.36
Great BritainJ. Sainsbury Plc 505,000 GBP 1,750,639 1,378,319 1.61Lloyds Banking Group Plc 2,201,000 GBP 2,095,690 1,447,814 1.69Optimal Payments Plc 907,951 GBP 4,405,082 4,228,081 4.94Rio Tinto Plc /Reg. 8,500 GBP 265,440 224,751 0.26Weir Group Plc 17,000 GBP 269,639 293,024 0.34
8,786,490 7,571,989 8.84
JerseyGlencore Xstrata Plc 125,000 GBP 272,771 220,143 0.26
272,771 220,143 0.26
LuxembourgGrand City Properties 119,135 EUR 2,103,149 2,175,405 2.54Senvion S.A. 28,151 EUR 443,378 337,531 0.39
2,546,527 2,512,936 2.93
NorwayGjensidige Forsikring 35,867 NOK 532,559 529,054 0.62
532,559 529,054 0.62
SpainBanco Popular Espagnol Sa* 970,000 EUR 1,513,299 1,131,020 1.32
1,513,299 1,131,020 1.32
SwedenNordea Bank Ab /Finn. Dep. Rec 78,054 EUR 705,493 583,064 0.68Skandinav. Ensk. Banken A 153,050 SEK 1,398,711 1,176,491 1.38Skf Ab B 152,950 SEK 2,330,610 2,159,689 2.52Swedbank Ab -A- 75,100 SEK 1,364,374 1,398,745 1.63
5,799,188 5,317,989 6.21
SwitzerlandPartners Group Holding 4,896 CHF 1,593,474 1,854,881 2.17
1,593,474 1,854,881 2.17
The NetherlandsKoninklijke Ahold Nv 105,676 EUR 2,035,320 2,073,891 2.42
DANSKE INVEST SICAV
The accompanying notes form an integral part of these financial statements.
61
Europe Long-Short Dynamic Plus
Statement of Investmentsas at June 30, 2016 (continued)(expressed in EUR)
* Securities subject to a collateralized securities lending agreement as described in note 7.

Description Quantity ⁄ FaceValue
Currency Cost Evaluation % netassets
Koninklijke Bam Groep Nv* 1,127,900 EUR 5,178,386 3,631,838 4.247,213,706 5,705,729 6.66
Total - Shares 65,686,279 60,283,115 70.39
Total - Transferable securities admitted to an official stock exchangelisting 79,200,339 73,787,183 86.16
TOTAL INVESTMENT PORTFOLIO 79,200,339 73,787,183 86.16
DANSKE INVEST SICAV
The accompanying notes form an integral part of these financial statements.
62
Europe Long-Short Dynamic Plus
Statement of Investmentsas at June 30, 2016 (continued)(expressed in EUR)
* Securities subject to a collateralized securities lending agreement as described in note 7.

Europe Long-Short Dynamic Plus
Geographical and Economic Portfolio Breakdownsas at June 30, 2016(expressed as a percentage of net assets)
Geographical breakdown %
Denmark 39.71Great Britain 8.84France 6.99The Netherlands 6.66Germany 6.36Sweden 6.21Luxembourg 2.93Belgium 2.48Switzerland 2.17Finland 1.61Spain 1.32Norway 0.62Jersey 0.26
86.16
Economic breakdown %
Mortgage and Funding Institutions 15.77Banks and Financial Institutions 14.18Retail 6.51Construction, Building Material 5.34Public Services 5.33Insurance 5.03Mechanics, Machinery 4.96Electronics and Electrical Equipment 4.80Transportation 4.75Automobile Industry 4.26Consumer Goods 3.31Real Estate Companies 2.54Holding and Finance Companies 2.17Tobacco and Spirits 2.08News Transmission 1.88Pharmaceuticals and Cosmetics 1.68Tyres & Rubber 0.85Business Houses 0.26Non-Ferrous Metals 0.26Other Services 0.20
86.16
DANSKE INVEST SICAV
The accompanying notes form an integral part of these financial statements.
63

European Corporate Sustainable Bond*
Statement of Investmentsas at June 30, 2016(expressed in EUR)
Description Quantity ⁄ FaceValue
Currency Cost Evaluation % netassets
Transferable securities admitted to an official stock exchange listing
Bonds
DenmarkDanfoss A/S 1.375% 14-23.02.22 1,000,000 EUR 1,038,500 1,037,055 2.26Danica Pens 4.375% 15-29.09.45 650,000 EUR 650,585 646,747 1.41Iss Global 2.125% 14-02.12.24 800,000 EUR 858,344 859,500 1.87Vestas Wind 2.75% 15-11.03.22 1,250,000 EUR 1,281,987 1,284,862 2.80
3,829,416 3,828,164 8.34
FinlandKesko Oyj 2.75% 12-11.09.18 800,000 EUR 835,280 834,276 1.82Outotec Oyj 3.75% 13-16.09.20 650,000 EUR 648,687 649,379 1.41Tieto Corp 2.875% 13-23.05.19 500,000 EUR 530,000 528,700 1.15
2,013,967 2,012,355 4.38
FranceAxa 3.875% 14-Perp 1,000,000 EUR 997,500 985,840 2.15Edf Frn 13-Pert /Ftf Emtn 1,100,000 EUR 1,091,926 1,090,034 2.37Gecina 1.5% 15-20.01.25 600,000 EUR 624,000 627,906 1.37Orange 4% 14-Perp 800,000 EUR 824,000 832,384 1.81Schneid El 1.5% 15-08.09.23 800,000 EUR 858,320 857,892 1.87Socgen 0.75% 15-25.11.20 1,300,000 EUR 1,329,770 1,329,315 2.89
5,725,516 5,723,371 12.46
GermanyAllianz Se 4.75% 13-Perp 1,000,000 EUR 1,085,000 1,071,065 2.33Daimler 0.5% 16-09.09.19 850,000 EUR 862,452 863,439 1.88Sap Ag 1.75% 14-22.02.27 800,000 EUR 875,200 881,372 1.92
2,822,652 2,815,876 6.13
Great BritainUbs Ag Lond 1.25% 14-03.09.21 1,100,000 EUR 1,151,381 1,153,499 2.51
1,151,381 1,153,499 2.51
ItalyAutostrade 1.125% 15-04.11.21 1,000,000 EUR 1,038,750 1,039,160 2.26
1,038,750 1,039,160 2.26
LuxembourgCnh Ind Fin 2.875% 16-17.05.23 1,000,000 EUR 1,001,250 1,001,200 2.18Michln Fin 2.75% 20.06.19 Emtn 400,000 EUR 433,748 433,748 0.95
1,434,998 1,434,948 3.13
NorwayDnb Bank As 5.75% 15-Perp 1,000,000 USD 852,108 854,536 1.86
852,108 854,536 1.86
DANSKE INVEST SICAV
The accompanying notes form an integral part of these financial statements.
64
* See Note 1
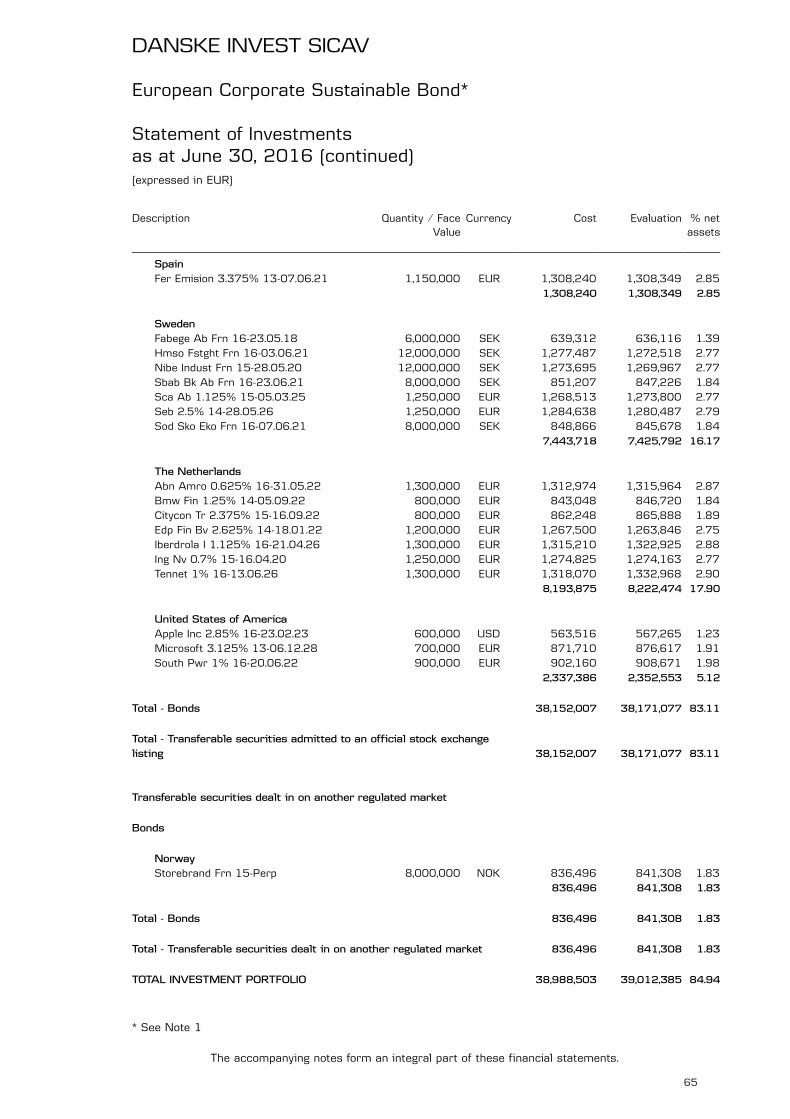
Description Quantity ⁄ FaceValue
Currency Cost Evaluation % netassets
SpainFer Emision 3.375% 13-07.06.21 1,150,000 EUR 1,308,240 1,308,349 2.85
1,308,240 1,308,349 2.85
SwedenFabege Ab Frn 16-23.05.18 6,000,000 SEK 639,312 636,116 1.39Hmso Fstght Frn 16-03.06.21 12,000,000 SEK 1,277,487 1,272,518 2.77Nibe Indust Frn 15-28.05.20 12,000,000 SEK 1,273,695 1,269,967 2.77Sbab Bk Ab Frn 16-23.06.21 8,000,000 SEK 851,207 847,226 1.84Sca Ab 1.125% 15-05.03.25 1,250,000 EUR 1,268,513 1,273,800 2.77Seb 2.5% 14-28.05.26 1,250,000 EUR 1,284,638 1,280,487 2.79Sod Sko Eko Frn 16-07.06.21 8,000,000 SEK 848,866 845,678 1.84
7,443,718 7,425,792 16.17
The NetherlandsAbn Amro 0.625% 16-31.05.22 1,300,000 EUR 1,312,974 1,315,964 2.87Bmw Fin 1.25% 14-05.09.22 800,000 EUR 843,048 846,720 1.84Citycon Tr 2.375% 15-16.09.22 800,000 EUR 862,248 865,888 1.89Edp Fin Bv 2.625% 14-18.01.22 1,200,000 EUR 1,267,500 1,263,846 2.75Iberdrola I 1.125% 16-21.04.26 1,300,000 EUR 1,315,210 1,322,925 2.88Ing Nv 0.7% 15-16.04.20 1,250,000 EUR 1,274,825 1,274,163 2.77Tennet 1% 16-13.06.26 1,300,000 EUR 1,318,070 1,332,968 2.90
8,193,875 8,222,474 17.90
United States of AmericaApple Inc 2.85% 16-23.02.23 600,000 USD 563,516 567,265 1.23Microsoft 3.125% 13-06.12.28 700,000 EUR 871,710 876,617 1.91South Pwr 1% 16-20.06.22 900,000 EUR 902,160 908,671 1.98
2,337,386 2,352,553 5.12
Total - Bonds 38,152,007 38,171,077 83.11
Total - Transferable securities admitted to an official stock exchangelisting 38,152,007 38,171,077 83.11
Transferable securities dealt in on another regulated market
Bonds
NorwayStorebrand Frn 15-Perp 8,000,000 NOK 836,496 841,308 1.83
836,496 841,308 1.83
Total - Bonds 836,496 841,308 1.83
Total - Transferable securities dealt in on another regulated market 836,496 841,308 1.83
TOTAL INVESTMENT PORTFOLIO 38,988,503 39,012,385 84.94
DANSKE INVEST SICAV
The accompanying notes form an integral part of these financial statements.
65
* See Note 1
European Corporate Sustainable Bond*
Statement of Investmentsas at June 30, 2016 (continued)(expressed in EUR)

European Corporate Sustainable Bond*
Geographical and Economic Portfolio Breakdownsas at June 30, 2016(expressed as a percentage of net assets)
Geographical breakdown %
The Netherlands 17.90Sweden 16.17France 12.46Denmark 8.34Germany 6.13United States of America 5.12Finland 4.38Norway 3.69Luxembourg 3.13Spain 2.85Great Britain 2.51Italy 2.26
84.94
Economic breakdown %
Banks and Financial Institutions 17.53Holding and Finance Companies 12.51Insurance 7.72Public Services 7.15Real Estate Companies 5.53Transportation 5.11Internet Software 4.98Electronics and Electrical Equipment 4.75Forest Products and Paper Industry 2.77Mechanics, Machinery 2.77Electronic Semiconductor 2.26Automobile Industry 1.88Other Services 1.87Investment Funds 1.84Retail 1.82News Transmission 1.81Non-Ferrous Metals 1.41Office Equipment, Computers 1.23
84.94
* See Note 1
DANSKE INVEST SICAV
The accompanying notes form an integral part of these financial statements.
66
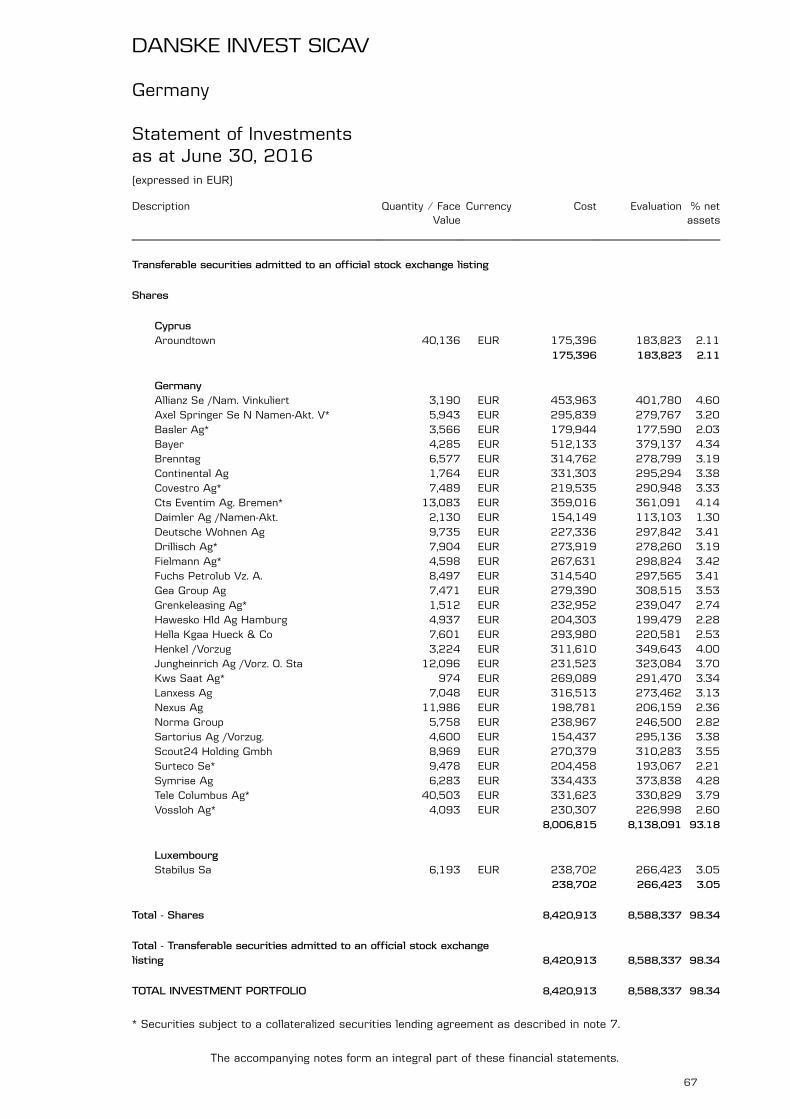
Germany
Statement of Investmentsas at June 30, 2016(expressed in EUR)
Description Quantity ⁄ FaceValue
Currency Cost Evaluation % netassets
Transferable securities admitted to an official stock exchange listing
Shares
CyprusAroundtown 40,136 EUR 175,396 183,823 2.11
175,396 183,823 2.11
GermanyAllianz Se /Nam. Vinkuliert 3,190 EUR 453,963 401,780 4.60Axel Springer Se N Namen-Akt. V* 5,943 EUR 295,839 279,767 3.20Basler Ag* 3,566 EUR 179,944 177,590 2.03Bayer 4,285 EUR 512,133 379,137 4.34Brenntag 6,577 EUR 314,762 278,799 3.19Continental Ag 1,764 EUR 331,303 295,294 3.38Covestro Ag* 7,489 EUR 219,535 290,948 3.33Cts Eventim Ag. Bremen* 13,083 EUR 359,016 361,091 4.14Daimler Ag /Namen-Akt. 2,130 EUR 154,149 113,103 1.30Deutsche Wohnen Ag 9,735 EUR 227,336 297,842 3.41Drillisch Ag* 7,904 EUR 273,919 278,260 3.19Fielmann Ag* 4,598 EUR 267,631 298,824 3.42Fuchs Petrolub Vz. A. 8,497 EUR 314,540 297,565 3.41Gea Group Ag 7,471 EUR 279,390 308,515 3.53Grenkeleasing Ag* 1,512 EUR 232,952 239,047 2.74Hawesko Hld Ag Hamburg 4,937 EUR 204,303 199,479 2.28Hella Kgaa Hueck & Co 7,601 EUR 293,980 220,581 2.53Henkel /Vorzug 3,224 EUR 311,610 349,643 4.00Jungheinrich Ag /Vorz. O. Sta 12,096 EUR 231,523 323,084 3.70Kws Saat Ag* 974 EUR 269,089 291,470 3.34Lanxess Ag 7,048 EUR 316,513 273,462 3.13Nexus Ag 11,986 EUR 198,781 206,159 2.36Norma Group 5,758 EUR 238,967 246,500 2.82Sartorius Ag /Vorzug. 4,600 EUR 154,437 295,136 3.38Scout24 Holding Gmbh 8,969 EUR 270,379 310,283 3.55Surteco Se* 9,478 EUR 204,458 193,067 2.21Symrise Ag 6,283 EUR 334,433 373,838 4.28Tele Columbus Ag* 40,503 EUR 331,623 330,829 3.79Vossloh Ag* 4,093 EUR 230,307 226,998 2.60
8,006,815 8,138,091 93.18
LuxembourgStabilus Sa 6,193 EUR 238,702 266,423 3.05
238,702 266,423 3.05
Total - Shares 8,420,913 8,588,337 98.34
Total - Transferable securities admitted to an official stock exchangelisting 8,420,913 8,588,337 98.34
TOTAL INVESTMENT PORTFOLIO 8,420,913 8,588,337 98.34
DANSKE INVEST SICAV
The accompanying notes form an integral part of these financial statements.
67
* Securities subject to a collateralized securities lending agreement as described in note 7.

Germany
Geographical and Economic Portfolio Breakdownsas at June 30, 2016(expressed as a percentage of net assets)
Geographical breakdown %
Germany 93.18Luxembourg 3.05Cyprus 2.11
98.34
Economic breakdown %
Chemicals 18.27Mechanics, Machinery 16.03Graphic Art, Publishing 7.34News Transmission 6.98Real Estate Companies 5.52Internet Software 5.10Insurance 4.60Consumer Goods 4.00Automobile Industry 3.83Other Services 3.55Retail 3.42Petrol 3.41Tyres & Rubber 3.38Agriculture and Fishing 3.34Holding and Finance Companies 3.05Tobacco and Spirits 2.28Various Capital Goods 2.21Electronic Semiconductor 2.03
98.34
DANSKE INVEST SICAV
The accompanying notes form an integral part of these financial statements.
68

Global High Dividend
Statement of Investmentsas at June 30, 2016(expressed in EUR)
Description Quantity ⁄ FaceValue
Currency Cost Evaluation % netassets
Transferable securities admitted to an official stock exchange listing
Shares
AustraliaInsurance Australia Group Ltd 46,535 AUD 183,954 169,363 1.48Telstra Corporation Ltd 53,201 AUD 225,057 197,531 1.72
409,011 366,894 3.20
CanadaToronto Dominion Bk 7,933 CAD 304,214 305,988 2.67
304,214 305,988 2.67
FinlandSampo Plc A* 7,971 EUR 341,159 285,840 2.50
341,159 285,840 2.50
FranceMichelin B /Nom. 3,138 EUR 298,557 264,188 2.31Sanofi-Aventis 3,823 EUR 324,094 280,800 2.45
622,651 544,988 4.76
GermanyBasf Namen-Akt. 5,171 EUR 402,973 347,595 3.04Siemens Ag /Nam. 2,982 EUR 284,500 269,632 2.35
687,473 617,227 5.39
Great BritainAstrazeneca Plc 5,406 SEK 320,019 282,158 2.46British American Tobacco (25p) 8,137 GBP 417,561 463,058 4.04Direct Line 64,257 GBP 331,082 264,856 2.31National Grid Plc 26,813 GBP 326,785 343,546 3.00Royal Dutch Shell /-B- 20,406 GBP 517,838 492,573 4.30
1,913,285 1,846,191 16.11
ItalySnam Rete Gas Spa 66,975 EUR 314,596 347,600 3.03
314,596 347,600 3.03
SwedenSkandinav. Ensk. Banken A 36,946 SEK 371,513 284,003 2.48Skf Ab B 18,273 SEK 276,460 258,019 2.25Teliasonera Ab 62,679 SEK 315,510 258,986 2.26
963,483 801,008 6.99
SwitzerlandBaloise Holding /Namen 2,859 CHF 305,788 281,580 2.46Nestle Sa 6,545 CHF 441,145 447,863 3.91Zurich Insurance Group /Nam 1,438 CHF 383,390 312,820 2.73
1,130,323 1,042,263 9.10
DANSKE INVEST SICAV
The accompanying notes form an integral part of these financial statements.
69
* Securities subject to a collateralized securities lending agreement as described in note 7.

Description Quantity ⁄ FaceValue
Currency Cost Evaluation % netassets
The NetherlandsUnilever Cert. of Shs 10,152 EUR 397,546 417,349 3.64
397,546 417,349 3.64
United States of AmericaAltria Group 7,948 USD 363,792 485,490 4.24Chevron Corporation 4,236 USD 318,417 394,513 3.44Cisco Systems Inc. 18,156 USD 461,358 462,054 4.03Cms Energy Corp. 7,956 USD 235,752 321,263 2.80Conocophillips 6,101 USD 311,008 241,249 2.11Duke Energy 3,720 USD 239,421 281,902 2.46Edison International 5,220 USD 288,585 357,731 3.12Johnson & Johnson 4,857 USD 437,631 521,938 4.56Mcdonald S Corp. 2,950 USD 263,707 317,435 2.77Merck 9,042 USD 467,401 464,538 4.05Pfizer Inc. 14,853 USD 452,859 468,282 4.09Procter & Gamble Co. 6,094 USD 433,240 460,487 4.02
4,273,171 4,776,882 41.69
Total - Shares 11,356,912 11,352,230 99.08
Total - Transferable securities admitted to an official stock exchangelisting 11,356,912 11,352,230 99.08
TOTAL INVESTMENT PORTFOLIO 11,356,912 11,352,230 99.08
DANSKE INVEST SICAV
The accompanying notes form an integral part of these financial statements.
70
Global High Dividend
Statement of Investmentsas at June 30, 2016 (continued)(expressed in EUR)

Global High Dividend
Geographical and Economic Portfolio Breakdownsas at June 30, 2016(expressed as a percentage of net assets)
Geographical breakdown %
United States of America 41.69Great Britain 16.11Switzerland 9.10Sweden 6.99Germany 5.39France 4.76The Netherlands 3.64Australia 3.20Italy 3.03Canada 2.67Finland 2.50
99.08
Economic breakdown %
Pharmaceuticals and Cosmetics 17.61Public Services 11.95Insurance 11.48Petrol 9.85Tobacco and Spirits 8.28Food and Distilleries 7.55Banks and Financial Institutions 5.15Office Equipment, Computers 4.03Consumer Goods 4.02News Transmission 3.98Chemicals 3.04Leisure 2.77Holding and Finance Companies 2.46Electronics and Electrical Equipment 2.35Tyres & Rubber 2.31Mechanics, Machinery 2.25
99.08
DANSKE INVEST SICAV
The accompanying notes form an integral part of these financial statements.
71

Global Inflation Linked Bond
Statement of Investmentsas at June 30, 2016(expressed in EUR)
Description Quantity ⁄ FaceValue
Currency Cost Evaluation % netassets
Transferable securities admitted to an official stock exchange listing
Bonds
AustraliaAustralia 1.25% 21.08.40 /Infl 50,000 AUD 36,032 37,908 0.30Australia 2.5% 10-20.09.30 /Cpi 30,000 AUD 26,231 29,141 0.23
62,263 67,049 0.53
DenmarkDenmark 0.1% 12-15.11.23 /Infl 240,479 DKK 33,542 34,383 0.27
33,542 34,383 0.27
FranceFrance 0.25% 25.07.24 Oat /Infl 112,038 EUR 121,091 122,120 0.98France 1% 05-25.07.17 Var /Infl 227,754 EUR 232,315 232,287 1.85France 1.8% 07-25.07.40 S. Oat 63,156 EUR 89,425 99,579 0.80France 1.85% 25.07.27 Oat /Infl 96,465 EUR 124,590 124,612 0.99France 2.25% 03-25.07.20 /Infl 269,166 EUR 305,313 305,680 2.44France 3.15% 02-25.07.32 Oat 117,766 EUR 171,761 191,935 1.53
1,044,495 1,076,213 8.59
GermanyGermany 0.1% 12-15.04.23 /Infl 124,581 EUR 131,622 133,832 1.07Germany 0.5% 14-15.04.30 /Infl 40,526 EUR 46,425 48,890 0.39
178,047 182,722 1.46
Great BritainGreat Brit. 1.875% 07-22.11.22 101,947 GBP 156,024 153,804 1.23UK 0.125% 12-22.03.24 /Infl 270,272 GBP 388,491 372,098 2.97UK 0.125% 13-22.03.68 /Infl 26,239 GBP 69,774 69,757 0.56UK 0.125% 13-22.11.19 /Infl 83,930 GBP 114,000 109,503 0.87UK 0.375% 11-22.03.62 /Infl 205,590 GBP 353,037 535,118 4.27UK 0.625% 10-22.03.40 /Infl 163,403 GBP 302,255 304,062 2.42UK 0.75% 07-22.11.47 /Infl 157,675 GBP 322,364 341,807 2.73UK 1.25% 08-22.11.32 /Infl 30,175 GBP 52,345 53,914 0.43UK 1.8% 11-22.03.29 /Infl 171,097 GBP 257,902 248,364 1.98UK 2% 02-26.01.35 /Infl 140,000 GBP 395,913 425,137 3.39
2,412,105 2,613,564 20.85
ItalyItaly 2.1% 06-15.09.17 /Infl 361,243 EUR 375,029 371,081 2.96Italy 2.1% 10-15.09.21 /Infl 162,942 EUR 182,035 180,719 1.44Italy 2.55% 09-15.09.41 248,374 EUR 319,600 320,012 2.56Italy 3.1% 11-15.09.26 Btp /Infl 95,698 EUR 121,670 117,955 0.94
998,334 989,767 7.90
United States of AmericaUSA 0.125% 12-15.01.22 /Infl 1,273,536 USD 1,137,202 1,161,641 9.27USA 0.375% 13-15.07.23 /Infl 1,259,248 USD 1,100,861 1,166,538 9.31
DANSKE INVEST SICAV
The accompanying notes form an integral part of these financial statements.
72

Description Quantity ⁄ FaceValue
Currency Cost Evaluation % netassets
USA 0.625% 13-15.02.43 /Infl 438,803 USD 314,410 384,348 3.062,552,473 2,712,527 21.64
Total - Bonds 7,281,259 7,676,225 61.24
Total - Transferable securities admitted to an official stock exchangelisting 7,281,259 7,676,225 61.24
Transferable securities dealt in on another regulated market
Bonds
CanadaCanada 1.25% 13-01.12.47 /Infl* 177,575 CAD 148,796 156,479 1.25Canada 2% 07-01.12.41 /Infl 81,056 CAD 75,517 79,000 0.63Canada 4% 99-01.12.31 /Infl 42,278 CAD 43,162 46,432 0.37
267,475 281,911 2.25
FranceFrance 1.1% 09-25.07.22 Oat 304,539 EUR 340,448 342,391 2.73
340,448 342,391 2.73
Great BritainUK 0.5% 09-22.03.50 /Infl 233,339 GBP 379,875 497,285 3.97UK 0.625% 09-22.11.42 /Ukrpi 111,016 GBP 213,641 216,134 1.72
593,516 713,419 5.69
ItalyItaly 1.25% 15-15.09.32 /Infl 50,078 EUR 51,735 52,532 0.42Italy 2.35% 14-15.09.24 Btp 90,686 EUR 106,395 103,799 0.83
158,130 156,331 1.25
JapanJapan 0.1% 13-10.09.23 /Infl 27,783,000 JPY 206,832 256,414 2.04
206,832 256,414 2.04
New ZealandNew Zealand 2% 12-20.09.25 /Cpi 75,000 NZD 45,392 51,680 0.41New Zealand 2.5% 20.09.35 /Infl 130,000 NZD 91,193 93,463 0.75
136,585 145,143 1.16
SpainSpain B 0.55% 30.11.19 /Infl 150,600 EUR 154,063 154,950 1.24Spain I /L B 1% 30.11.30 /Infl 28,035 EUR 27,615 28,851 0.23
181,678 183,801 1.47
United States of AmericaUSA 0.125% 14-15.07.24 /Infl 768,831 USD 661,744 696,014 5.55USA 0.125% 15-15.04.20 /Infl 97,443 USD 88,259 89,159 0.71
DANSKE INVEST SICAV
The accompanying notes form an integral part of these financial statements.
73
Global Inflation Linked Bond
Statement of Investmentsas at June 30, 2016 (continued)(expressed in EUR)
* Securities subject to a collateralized securities lending agreement as described in note 7.

Description Quantity ⁄ FaceValue
Currency Cost Evaluation % netassets
USA 0.625% 16-15.01.26 /Infl 101,091 USD 93,336 95,399 0.76USA 2% 06-15.01.26 Tsy /Infl. Idx 387,277 USD 394,979 408,375 3.26USA 2.125% 10-15.02.40 /Infl 233,381 USD 256,272 274,393 2.19USA 2.375% 07-15.01.27 Tbo 536,000 USD 504,741 589,650 4.70USA 2.5% 09-15.01.29 Tbo /Infl 134,255 USD 144,441 152,667 1.22USA 3.375% 01-15.04.32 Inflation 67,664 USD 83,110 88,955 0.71
2,226,882 2,394,612 19.10
Total - Bonds 4,111,546 4,474,022 35.69
Total - Transferable securities dealt in on another regulated market 4,111,546 4,474,022 35.69
TOTAL INVESTMENT PORTFOLIO 11,392,805 12,150,247 96.93
DANSKE INVEST SICAV
The accompanying notes form an integral part of these financial statements.
74
Global Inflation Linked Bond
Statement of Investmentsas at June 30, 2016 (continued)(expressed in EUR)

Global Inflation Linked Bond
Geographical and Economic Portfolio Breakdownsas at June 30, 2016(expressed as a percentage of net assets)
Geographical breakdown %
United States of America 40.74Great Britain 26.54France 11.32Italy 9.15Canada 2.25Japan 2.04Spain 1.47Germany 1.46New Zealand 1.16Australia 0.53Denmark 0.27
96.93
Economic breakdown %
States, Provinces and Municipalities 96.93
96.93
DANSKE INVEST SICAV
The accompanying notes form an integral part of these financial statements.
75

Global Inflation Linked Bond Short Duration
Statement of Investmentsas at June 30, 2016(expressed in EUR)
Description Quantity ⁄ FaceValue
Currency Cost Evaluation % netassets
Transferable securities admitted to an official stock exchange listing
Bonds
AustraliaAustralia 1.25% 12-21.02.22 /Infl 350,000 AUD 279,022 266,643 0.61Australia 3% 09-20.09.25 /Infl 330,000 AUD 320,799 319,783 0.73
599,821 586,426 1.34
CanadaCanada 4.25% 91-01.12.21 /Infl 775,085 CAD 671,177 674,497 1.54
671,177 674,497 1.54
DenmarkDenmark 0.1% 12-15.11.23 /Infl 1,327,861 DKK 186,298 189,852 0.43
186,298 189,852 0.43
FranceFrance 0.25% 25.07.24 Oat /Infl 1,008,345 EUR 1,092,876 1,099,083 2.51France 1% 05-25.07.17 Var /Infl 1,264,034 EUR 1,289,266 1,289,192 2.94France 1.8% 07-25.07.40 S. Oat 264,109 EUR 370,353 416,424 0.95
2,752,495 2,804,699 6.40
GermanyGermany 0.1% 15-15.04.26 /Infl 159,612 EUR 172,442 176,387 0.40
172,442 176,387 0.40
Great BritainGreat Brit. 1.875% 07-22.11.22 892,038 GBP 1,376,966 1,345,784 3.07UK 0.125% 13-22.11.19 /Infl 671,437 GBP 929,533 876,023 2.00UK 0.75% 07-22.11.47 /Infl 189,210 GBP 411,712 410,168 0.93UK 2.5% 86-17.07.24 /Infl 160,000 GBP 716,025 686,875 1.57
3,434,236 3,318,850 7.57
ItalyItaly 1.7% 13-15.09.18 /Cptfemu 192,591 EUR 203,648 200,984 0.46Italy 2.1% 06-15.09.17 /Infl 2,435,477 EUR 2,536,042 2,501,803 5.70Italy 2.1% 10-15.09.21 /Infl 977,652 EUR 1,081,361 1,084,316 2.47
3,821,051 3,787,103 8.63
United States of AmericaUSA 0.125% 12-15.01.22 /Infl 2,090,722 USD 1,843,564 1,907,028 4.35USA 0.375% 13-15.07.23 /Infl 722,519 USD 645,900 669,325 1.52
2,489,464 2,576,353 5.87
Total - Bonds 14,126,984 14,114,167 32.18
Total - Transferable securities admitted to an official stock exchangelisting 14,126,984 14,114,167 32.18
DANSKE INVEST SICAV
The accompanying notes form an integral part of these financial statements.
76
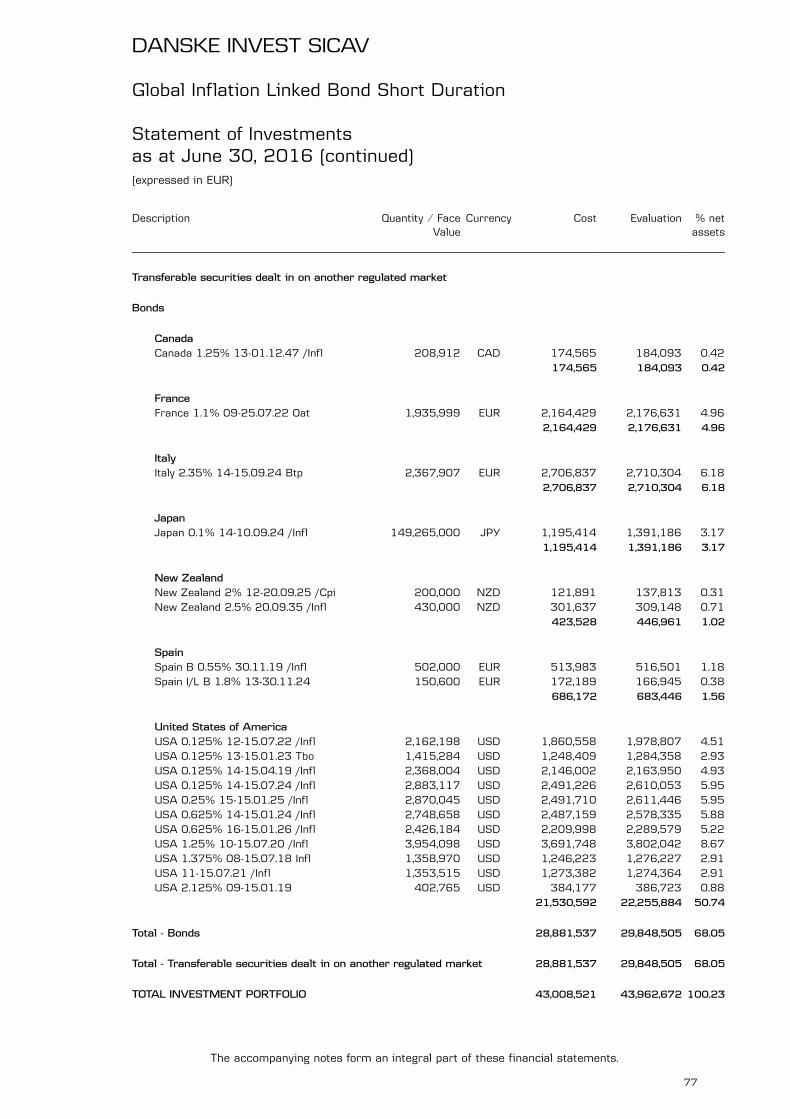
Description Quantity ⁄ FaceValue
Currency Cost Evaluation % netassets
Transferable securities dealt in on another regulated market
Bonds
CanadaCanada 1.25% 13-01.12.47 /Infl 208,912 CAD 174,565 184,093 0.42
174,565 184,093 0.42
FranceFrance 1.1% 09-25.07.22 Oat 1,935,999 EUR 2,164,429 2,176,631 4.96
2,164,429 2,176,631 4.96
ItalyItaly 2.35% 14-15.09.24 Btp 2,367,907 EUR 2,706,837 2,710,304 6.18
2,706,837 2,710,304 6.18
JapanJapan 0.1% 14-10.09.24 /Infl 149,265,000 JPY 1,195,414 1,391,186 3.17
1,195,414 1,391,186 3.17
New ZealandNew Zealand 2% 12-20.09.25 /Cpi 200,000 NZD 121,891 137,813 0.31New Zealand 2.5% 20.09.35 /Infl 430,000 NZD 301,637 309,148 0.71
423,528 446,961 1.02
SpainSpain B 0.55% 30.11.19 /Infl 502,000 EUR 513,983 516,501 1.18Spain I/L B 1.8% 13-30.11.24 150,600 EUR 172,189 166,945 0.38
686,172 683,446 1.56
United States of AmericaUSA 0.125% 12-15.07.22 /Infl 2,162,198 USD 1,860,558 1,978,807 4.51USA 0.125% 13-15.01.23 Tbo 1,415,284 USD 1,248,409 1,284,358 2.93USA 0.125% 14-15.04.19 /Infl 2,368,004 USD 2,146,002 2,163,950 4.93USA 0.125% 14-15.07.24 /Infl 2,883,117 USD 2,491,226 2,610,053 5.95USA 0.25% 15-15.01.25 /Infl 2,870,045 USD 2,491,710 2,611,446 5.95USA 0.625% 14-15.01.24 /Infl 2,748,658 USD 2,487,159 2,578,335 5.88USA 0.625% 16-15.01.26 /Infl 2,426,184 USD 2,209,998 2,289,579 5.22USA 1.25% 10-15.07.20 /Infl 3,954,098 USD 3,691,748 3,802,042 8.67USA 1.375% 08-15.07.18 Infl 1,358,970 USD 1,246,223 1,276,227 2.91USA 11-15.07.21 /Infl 1,353,515 USD 1,273,382 1,274,364 2.91USA 2.125% 09-15.01.19 402,765 USD 384,177 386,723 0.88
21,530,592 22,255,884 50.74
Total - Bonds 28,881,537 29,848,505 68.05
Total - Transferable securities dealt in on another regulated market 28,881,537 29,848,505 68.05
TOTAL INVESTMENT PORTFOLIO 43,008,521 43,962,672 100.23
DANSKE INVEST SICAV
The accompanying notes form an integral part of these financial statements.
77
Global Inflation Linked Bond Short Duration
Statement of Investmentsas at June 30, 2016 (continued)(expressed in EUR)

Global Inflation Linked Bond Short Duration
Geographical and Economic Portfolio Breakdownsas at June 30, 2016(expressed as a percentage of net assets)
Geographical breakdown %
United States of America 56.61Italy 14.81France 11.36Great Britain 7.57Japan 3.17Canada 1.96Spain 1.56Australia 1.34New Zealand 1.02Denmark 0.43Germany 0.40
100.23
Economic breakdown %
States, Provinces and Municipalities 100.23
100.23
DANSKE INVEST SICAV
The accompanying notes form an integral part of these financial statements.
78

Nordic Corporate Bond
Statement of Investmentsas at June 30, 2016(expressed in EUR)
Description Quantity ⁄ FaceValue
Currency Cost Evaluation % netassets
Transferable securities admitted to an official stock exchange listing
Bonds
Bermuda IslandsBw Offshore Frn 15-16.06.20 11,000,000 NOK 1,255,541 837,216 0.58North Atlan 6.25% 14-01.02.19 1,284,000 USD 806,883 260,263 0.18
2,062,424 1,097,479 0.76
DenmarkArla Fd 2.625% 14-28.05.19 2,000,000 SEK 222,663 222,736 0.15Arla Foods Fin Frn 04.06.18 Emtn 4,600,000 SEK 499,113 495,205 0.34Danica Pens 4.375% 15-29.09.45* 1,775,000 EUR 1,770,895 1,761,954 1.21Dong Energy 3% Perp 1,150,000 EUR 1,141,483 1,130,416 0.78Dong Energy 4.875% /Frn Perp 1,990,000 EUR 2,146,113 2,095,480 1.44Dong Energy Frn 70-Perp 1,900,000 EUR 2,270,500 2,080,053 1.43Dsk Bk 3.875% /Frn 13-04.10.23 1,362,000 EUR 1,477,126 1,445,361 1.00Dsk Bk 5.75% 14-Perp 400,000 EUR 406,120 394,396 0.27Dsk Bk 5.875% 15-Perp 700,000 EUR 700,000 690,837 0.48Dsv 3.5% 13-24.06.20 6,040,000 DKK 889,073 872,944 0.60Dsv 3.5% 14-18.03.22 13,290,000 DKK 1,956,862 1,935,865 1.33Hesalight 7% 14-12.12.19 700,000 EUR 700,000 420,000 0.29Iss Global 2.125% 14-02.12.24 2,690,000 EUR 2,782,283 2,886,182 1.99Nykredit 2.75% 15-17.11.27* 2,414,000 EUR 2,393,218 2,381,797 1.64Nykredit 4% 14-03.06.36 1,885,000 EUR 1,889,620 1,842,785 1.27Spanor Frn 13-18.12.23 1,000,000 DKK 142,022 137,135 0.10Tdc 3.5% 15-26.02.15 2,200,000 EUR 2,184,041 2,068,946 1.42Vestas Wind 2.75% 15-11.03.22 1,900,000 EUR 1,873,333 1,950,151 1.34
25,444,465 24,812,243 17.08
FinlandAmer Sports Frn 13-06.11.18 1,000,000 SEK 105,783 107,793 0.07Eagle Ind 8.25% 13.03.20 /Pool 300,000 EUR 300,000 300,750 0.21Fortum 4% 11-24.05.21 Emtn 527,000 EUR 626,030 618,664 0.43Kemira Oyj 2.25% 15-13.05.22 950,000 EUR 970,798 989,415 0.68Kesko Oyj 2.75% 12-11.09.18 1,250,000 EUR 1,307,689 1,303,744 0.90Metso 2.75% 12-04.10.19 857,000 EUR 933,212 910,995 0.63Muni Fin 4.5% 15-Perp 800,000 EUR 800,000 848,360 0.58Neste Oil 2.125% 15-17.03.22 300,000 EUR 298,401 309,130 0.21Neste Oil 4% 12-28.03.17 522,000 EUR 550,440 535,692 0.37Outoku Oyj 7.25% 16-16.06.21 300,000 EUR 300,000 298,994 0.21Outotec Oyj 3.75% 13-16.09.20 200,000 EUR 203,982 199,812 0.14Outotec Oyj 7.375% 16-Perp 1,400,000 EUR 1,400,000 1,431,500 0.98Pkc Group 4.25% 13-20.09.18 730,000 EUR 760,832 767,318 0.53Pohjola Bk 0.75% 15-03.03.22 1,000,000 EUR 996,540 1,021,095 0.70Pohjola Bk 2% 14-03.03.21 (Regs) 963,000 EUR 1,039,523 1,044,065 0.72Pohjola Bk 5.75% 12-28.02.22 1,157,000 EUR 1,489,035 1,419,732 0.98Pohjola Bk Frn 15-25.08.25 9,000,000 SEK 949,458 921,570 0.63Sampo Bk 1.5% 14-16.09.21 200,000 EUR 207,360 210,773 0.14Sato 2.375% 16-24.03.21 1,000,000 EUR 997,860 1,031,015 0.71Sponda 2.375% 15-20.05.20 1,000,000 EUR 998,510 1,017,100 0.70
DANSKE INVEST SICAV
The accompanying notes form an integral part of these financial statements.
79
* Securities subject to a collateralized securities lending agreement as described in note 7.

Description Quantity ⁄ FaceValue
Currency Cost Evaluation % netassets
Sponda 3.375% 13-09.10.18 300,000 EUR 314,412 314,905 0.22Stora Enso 2.125% 16-16.06.23 650,000 EUR 648,121 650,078 0.45Technopolis 3.75% 15-28.05.20 900,000 EUR 898,227 920,253 0.63Tieto Corp 2.875% 13-23.05.19 800,000 EUR 834,150 845,992 0.58Tvo Power 2.5% 14-17.03.21 1,983,000 EUR 2,023,443 2,020,449 1.39Tvo Power Co 4.625% 12-04.02.19 268,000 EUR 302,474 291,250 0.20Tvo Power Frn 14-17.03.20 1,000,000 SEK 104,539 100,746 0.07
20,360,819 20,431,190 14.06
Great BritainG4s 2.625% 12-06.12.18 1,189,000 EUR 1,271,334 1,243,141 0.86G4s 2.875% 12-05.02.17 865,000 EUR 909,771 883,070 0.61Rsa Ins Grp 5.125% 14-10.10.45 843,000 GBP 1,185,177 972,649 0.67Rsa Insura. 6.701% (Tv) 06-Perp 2,264,000 GBP 3,252,208 2,793,586 1.92
6,618,490 5,892,446 4.06
IcelandArion 2.5% 16-26.04.19 200,000 EUR 199,566 201,366 0.14Arion Bk 3.125% 15-12.03.18 1,664,000 EUR 1,660,185 1,696,307 1.17Landsbknn 3% 15-19.10.18 2,000,000 EUR 1,995,820 2,040,220 1.40N Islandsbk 2.875% 15-27.07.18 1,600,000 EUR 1,595,866 1,622,936 1.12
5,451,437 5,560,829 3.83
NorwayAustevoll Frn 15-04.05.21 3,000,000 NOK 356,099 308,727 0.21Avinor 1% 15-29.04.25 900,000 EUR 899,064 930,492 0.64Avinor 1.75% 14-20.03.21 1,498,000 EUR 1,592,457 1,609,713 1.11Bkk Frn 14-22.05.18 5,000,000 NOK 565,001 533,822 0.37Dnb 4.75% 12-08.03.22 /Sub 786,000 EUR 843,379 806,817 0.56Dnb Bank As 3% 13-26.09.23 527,000 EUR 553,316 546,001 0.38Dnb Bank As 5.75% 15-Perp 2,550,000 USD 2,366,426 2,182,306 1.50Dnb Bank As Frn 15-28.05.25 5,000,000 SEK 539,428 508,679 0.35Dnb Norbank 6.0116% (Tv) 07-Perp 1,100,000 GBP 1,437,494 1,342,868 0.92Gjensid For Frn 14-03.10.44 7,000,000 NOK 791,205 701,611 0.48Kommun Land 4.25% 15-10.06.45 2,735,000 EUR 2,709,072 2,652,977 1.83Norwegian A 7.25% 15-11.12.19 600,000 EUR 600,000 614,751 0.42Norwegian Frn 15-20.05.18 8,000,000 NOK 930,173 861,743 0.59Sparebank 1 1.5% 14-20.05.19 800,000 EUR 830,181 826,192 0.57Sparebank 1 Frn 13-Perp 3,000,000 NOK 352,120 318,416 0.22Spbk 1 Sr 2.125% 14-14.04.21 890,000 EUR 944,013 955,321 0.66Statkraft 6.625% 09-02.04.19 656,000 EUR 819,290 773,795 0.53Telenor 4.125% 10-26.03.20 221,000 EUR 260,883 254,651 0.17
17,389,601 16,728,882 11.51
SwedenAinmt Scand 9.75% 14-19.03.19 16,000,000 SEK 1,787,202 1,776,450 1.22Akelius Res 3.375% 15-23.09.20 2,100,000 EUR 2,095,527 2,198,847 1.51Alfa Laval 1.375% 14-12.09.22* 1,354,000 EUR 1,395,702 1,410,286 0.97Alfa Laval Frn 14-12.09.19 1,219,000 EUR 1,227,307 1,213,124 0.84Candyking H Frn 14-29.01.18 35,000,000 SEK 1,902,734 1,450,272 1.00Castellum Frn 13-26.09.18 400,000 SEK 42,966 42,883 0.03
DANSKE INVEST SICAV
The accompanying notes form an integral part of these financial statements.
80
Nordic Corporate Bond
Statement of Investmentsas at June 30, 2016 (continued)(expressed in EUR)
* Securities subject to a collateralized securities lending agreement as described in note 7.

Description Quantity ⁄ FaceValue
Currency Cost Evaluation % netassets
Castellum Frn 14-07.06.19 1,000,000 SEK 105,628 105,801 0.07Castellum Frn 15-13.03.20 3,000,000 SEK 326,445 312,636 0.22Consilium Frn 15-25.03.20 8,000,000 SEK 884,254 892,475 0.61Corral Pet 11.75% 15.05.21 /Pik 400,000 EUR 385,156 378,632 0.26Fabege Ab Frn 16-23.05.18 6,000,000 SEK 643,908 637,590 0.44Getinge 3.5% 13-21.05.18 1,000,000 SEK 107,999 110,672 0.08Hmso Fstght Frn 16-03.06.21 9,000,000 SEK 971,361 957,963 0.66Hoist Kred 3.125% 16-09.12.19 1,100,000 EUR 1,100,000 1,103,993 0.76Hufvudstad 2.1% 15-24.08.22 3,000,000 SEK 317,619 326,263 0.22Ica Gruppen Frn 14-17.06.19 1,400,000 SEK 148,417 151,000 0.10Investor 3.25% 10-17.09.18 1,600,000 EUR 1,749,115 1,717,336 1.18Investor 4.875% 09-18.11.21 1,300,000 EUR 1,643,466 1,612,722 1.11Molnlycke H 1.5% 14-28.02.22 3,079,000 EUR 3,167,329 3,212,521 2.21Nibe Indust Frn 15-28.05.20 7,000,000 SEK 752,514 739,341 0.51Nordea 1.125% 15-12.02.25 400,000 EUR 399,588 416,166 0.29Nordea 4.625% (Frn) 12-15.02.22 472,000 EUR 506,993 483,361 0.33Nordea 5.5% 14-Perp 1,682,000 USD 1,426,718 1,444,306 0.99Nordea Bank 1.875% 15-10.11.25 500,000 EUR 497,170 504,748 0.35Nordea Bank 5.25% 15-Perp 900,000 USD 744,403 756,573 0.52Ovako Group 6.5% 14-01.06.19* 970,000 EUR 942,906 698,245 0.48Resurs Bank Frn 15-03.04.18 4,000,000 SEK 430,391 429,629 0.30Sca Ab 1.125% 15-05.03.25 1,350,000 EUR 1,346,828 1,373,382 0.95Sca An 2.5% 13-09.06.23 677,000 EUR 760,155 762,972 0.53Seb 2.5% 14-28.05.26 709,000 EUR 731,759 725,860 0.50Seb 4% 12-12.09.22 766,000 EUR 823,069 795,472 0.55Seb 5.75% 14-Perp 3,400,000 USD 3,052,235 2,916,385 2.01Seb 7.0922% (Frn) 07-Perp 635,000 EUR 688,023 684,825 0.47Securitas 1.25% 16-15.03.22 290,000 EUR 289,565 295,616 0.20Securitas 2.25% 14.03.18 Emtn 691,000 EUR 725,683 716,114 0.49Securitas 2.625% 13-22.02.21 1,148,000 EUR 1,244,264 1,253,254 0.86Shb 2.25% 13-27.08.20 Regs 659,000 EUR 716,696 716,537 0.49Shb 2.656% 14-15.01.24 2,102,000 EUR 2,203,701 2,178,965 1.50Shb 5.25% 15-Perp* 1,850,000 USD 1,655,237 1,584,408 1.09Skf 2.375% 13-29.10.20 840,000 EUR 911,148 905,453 0.62Sod Sko Eko Frn 16-07.06.21 5,000,000 SEK 538,838 531,235 0.37Swedbank 1% 15-01.06.22 700,000 EUR 695,870 727,906 0.50Swedbank 2.375% 14-26.02.24* 1,264,000 EUR 1,308,576 1,299,373 0.89Swedbank 3% (Frn) 05.12.22 Emtn 743,000 EUR 783,753 766,185 0.53Tele2 Ab Frn 16-11.05.21 7,000,000 SEK 762,678 747,563 0.52Vattenfall 3% 15-19.03.77 1,900,000 EUR 1,879,750 1,560,936 1.07Volvo Tsy 2.375% 26.11.19 Emtn 500,000 EUR 538,000 535,875 0.37Volvo Tsy 5% 07-31.05.17 413,000 EUR 455,393 431,951 0.30
47,814,039 46,594,102 32.07
The NetherlandsCitycon Tr 2.375% 15-16.09.22 800,000 EUR 798,624 865,296 0.59
DANSKE INVEST SICAV
The accompanying notes form an integral part of these financial statements.
81
Nordic Corporate Bond
Statement of Investmentsas at June 30, 2016 (continued)(expressed in EUR)
* Securities subject to a collateralized securities lending agreement as described in note 7.
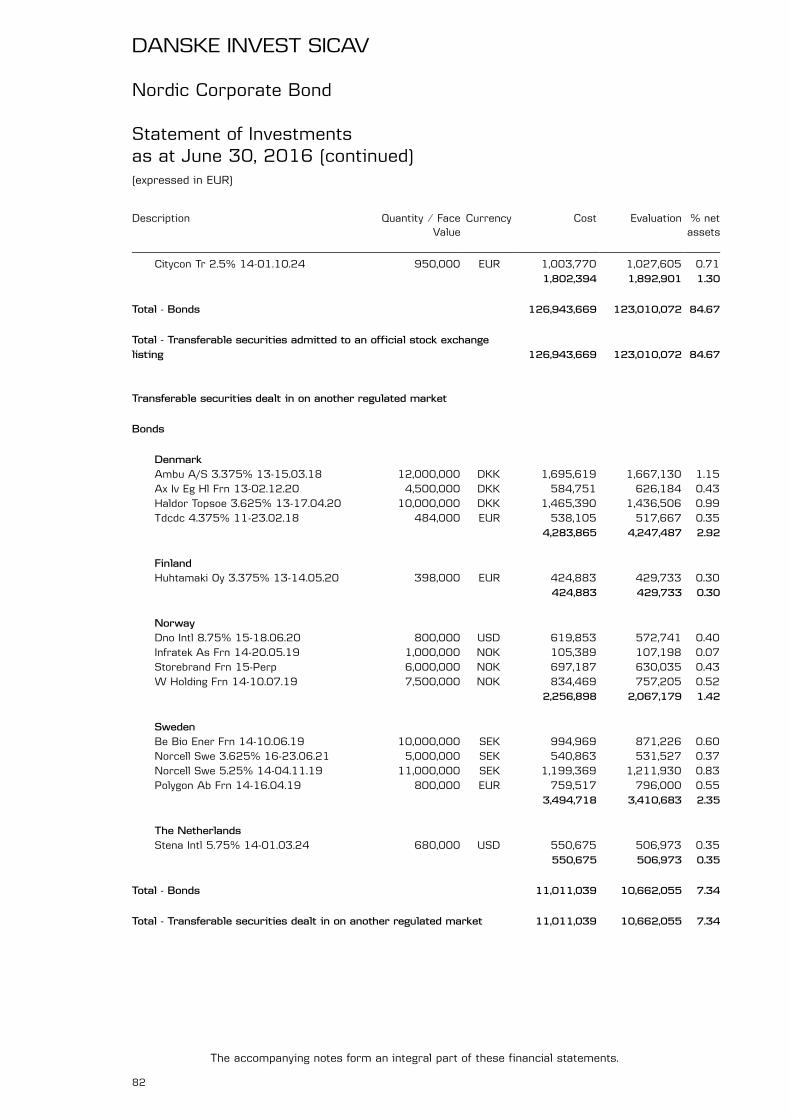
Description Quantity ⁄ FaceValue
Currency Cost Evaluation % netassets
Citycon Tr 2.5% 14-01.10.24 950,000 EUR 1,003,770 1,027,605 0.711,802,394 1,892,901 1.30
Total - Bonds 126,943,669 123,010,072 84.67
Total - Transferable securities admitted to an official stock exchangelisting 126,943,669 123,010,072 84.67
Transferable securities dealt in on another regulated market
Bonds
DenmarkAmbu A/S 3.375% 13-15.03.18 12,000,000 DKK 1,695,619 1,667,130 1.15Ax Iv Eg Hl Frn 13-02.12.20 4,500,000 DKK 584,751 626,184 0.43Haldor Topsoe 3.625% 13-17.04.20 10,000,000 DKK 1,465,390 1,436,506 0.99Tdcdc 4.375% 11-23.02.18 484,000 EUR 538,105 517,667 0.35
4,283,865 4,247,487 2.92
FinlandHuhtamaki Oy 3.375% 13-14.05.20 398,000 EUR 424,883 429,733 0.30
424,883 429,733 0.30
NorwayDno Intl 8.75% 15-18.06.20 800,000 USD 619,853 572,741 0.40Infratek As Frn 14-20.05.19 1,000,000 NOK 105,389 107,198 0.07Storebrand Frn 15-Perp 6,000,000 NOK 697,187 630,035 0.43W Holding Frn 14-10.07.19 7,500,000 NOK 834,469 757,205 0.52
2,256,898 2,067,179 1.42
SwedenBe Bio Ener Frn 14-10.06.19 10,000,000 SEK 994,969 871,226 0.60Norcell Swe 3.625% 16-23.06.21 5,000,000 SEK 540,863 531,527 0.37Norcell Swe 5.25% 14-04.11.19 11,000,000 SEK 1,199,369 1,211,930 0.83Polygon Ab Frn 14-16.04.19 800,000 EUR 759,517 796,000 0.55
3,494,718 3,410,683 2.35
The NetherlandsStena Intl 5.75% 14-01.03.24 680,000 USD 550,675 506,973 0.35
550,675 506,973 0.35
Total - Bonds 11,011,039 10,662,055 7.34
Total - Transferable securities dealt in on another regulated market 11,011,039 10,662,055 7.34
DANSKE INVEST SICAV
The accompanying notes form an integral part of these financial statements.
82
Nordic Corporate Bond
Statement of Investmentsas at June 30, 2016 (continued)(expressed in EUR)

Description Quantity ⁄ FaceValue
Currency Cost Evaluation % netassets
Other Transferable securities
Bonds
FinlandDna 2.875% 14-12.03.21 420,000 EUR 433,290 444,383 0.31Localtap 3.625% 14-26.11.24 200,000 EUR 198,880 200,044 0.14
632,170 644,427 0.45
NorwayB2 Holding Frn 15-08.12.20 600,000 EUR 600,000 612,000 0.42Pioneer Pub Frn 16-28.05.21 3,500,000 NOK 378,863 376,131 0.26Protector F Frn 16-19.04.46 3,000,000 NOK 317,753 321,604 0.22
1,296,616 1,309,735 0.90
SwedenD Carnegie Frn 16-20.04.19 8,000,000 SEK 870,564 856,096 0.59Husqvarna Frn 16-03.05.21 5,000,000 SEK 545,239 536,598 0.37Lansbk Frn 16-26.04.26 2,000,000 SEK 217,966 213,013 0.15Moberg Phar Frn 16-29.01.21 3,000,000 SEK 323,646 321,928 0.22Nordax Bank Frn 16-16.03.19 4,000,000 SEK 429,777 423,926 0.29Stromma Frn 16-27.05.21 3,000,000 SEK 320,733 322,725 0.22Vict Park Frn 16-17.06.20 4,000,000 SEK 432,691 425,961 0.29Wallenstam Frn 16-30.05.18 3,000,000 SEK 320,733 318,757 0.22
3,461,349 3,419,004 2.35
Total - Bonds 5,390,135 5,373,166 3.70
Total - Other Transferable securities 5,390,135 5,373,166 3.70
TOTAL INVESTMENT PORTFOLIO 143,344,843 139,045,293 95.71
DANSKE INVEST SICAV
The accompanying notes form an integral part of these financial statements.
83
Nordic Corporate Bond
Statement of Investmentsas at June 30, 2016 (continued)(expressed in EUR)

Nordic Corporate Bond
Geographical and Economic Portfolio Breakdownsas at June 30, 2016(expressed as a percentage of net assets)
Geographical breakdown %
Sweden 36.77Denmark 20.00Finland 14.81Norway 13.83Great Britain 4.06Iceland 3.83The Netherlands 1.65Bermuda Islands 0.76
95.71
Economic breakdown %
Banks and Financial Institutions 25.62Real Estate Companies 6.77Holding and Finance Companies 6.35Petrol 5.82Other Services 5.59Public Services 5.57Insurance 5.21News Transmission 5.19Mechanics, Machinery 4.55Transportation 4.03Pharmaceuticals and Cosmetics 3.66Mortgage and Funding Institutions 2.91Miscellaneous 2.83Forest Products and Paper Industry 1.93States, Provinces and Municipalities 1.83Non-Ferrous Metals 1.33Retail 1.19Food and Distilleries 1.10Aerospace Technology 1.01Chemicals 0.68Internet Software 0.58Electronics and Electrical Equipment 0.53Mines, Heavy Industries 0.48Consumer Goods 0.37Investment Funds 0.37Agriculture and Fishing 0.21
95.71
DANSKE INVEST SICAV
The accompanying notes form an integral part of these financial statements.
84

US High Yield Bond
Statement of Investmentsas at June 30, 2016(expressed in USD)
Description Quantity ⁄ FaceValue
Currency Cost Evaluation % netassets
Transferable securities admitted to an official stock exchange listing
Bonds
United States of AmericaAcadia Hlth 5.125% 14-01.07.22 404,000 USD 394,405 398,156 0.74Am Tire Dis 10.25% 15-01.03.22 380,000 USD 380,000 334,400 0.63Amsurg Corp 5.625% 13-30.11.20 564,000 USD 578,100 583,035 1.09Ashtead Cap 5.625% 14-01.10.24 340,000 USD 331,550 341,700 0.64Ashtead Cap 6.5% 12-15.07.22 250,000 USD 254,375 261,185 0.49Beacon Roof 6.375% 16-01.10.23 230,000 USD 230,000 240,925 0.45Cent Alu Cy 7.5% 13-01.06.21 1,150,000 USD 1,188,812 1,035,000 1.94Concho Res In 7% 10-15.01.21 70,000 USD 69,098 72,812 0.14Cont Res 4.5% 13-15.04.23 370,000 USD 288,975 344,627 0.64Cont Res 5.0% 12-15.09.22 30,000 USD 21,525 28,999 0.05Cyrus 6.375% 13-15.11.22 860,000 USD 881,266 896,928 1.68Enpro Indus 5.875% 15-15.09.22 324,000 USD 321,325 325,620 0.61Envision 5.125% 14-01.07.22 160,000 USD 155,775 160,800 0.30First Cash 6.75% 14-01.04.21 1,007,000 USD 1,047,280 1,017,070 1.90First Quality 4.625% 13-15.05.21 533,000 USD 492,359 499,688 0.93Goodyear Ti 5% 16-31.05.26 140,000 USD 140,000 142,864 0.27Gulfport En 6.625% 15-01.05.23 220,000 USD 208,000 216,260 0.40Hrg Group 7.75% 14-15.01.22 2,315,000 USD 2,342,037 2,302,129 4.31Lifepoint 5.875% 15-01.12.23 230,000 USD 230,000 239,891 0.45Lvlt 5.75% 14-01.12.22 190,000 USD 191,363 191,501 0.36Mercer Intl 7% 14-01.12.19 110,000 USD 112,269 111,100 0.21Mercer Intl 7.75% 14-01.12.22 95,000 USD 97,019 95,000 0.18Multi Color 6.125 14-01.12.22 411,000 USD 412,798 419,220 0.78Nuance Com 5.375% 12-15.08.20 1,235,000 USD 1,242,719 1,254,612 2.35Nuance Com 6% 16-01.07.24 460,000 USD 460,200 457,700 0.86Performance 5.5% 16-01.06.24 130,000 USD 130,000 130,975 0.24Plantronics 0% -31.05.23 380,000 USD 380,000 375,250 0.70Rackspace 6.5% 15-15.01.24 144A 1,260,000 USD 1,248,525 1,244,250 2.33Real Alloy 10% 15.01.19 144A 428,000 USD 412,485 426,395 0.80Rsp Permian 6.625% 15-01.10.22 190,000 USD 185,488 196,650 0.37Sabine Pass 5.625% 14-01.02.21 468,000 USD 455,715 469,226 0.88Sprint nex. 8.375% 09-15.08.17 1,210,000 USD 1,187,937 1,241,980 2.32Tesoro Corp 6.375% 16-01.05.24 90,000 USD 90,000 93,375 0.17Zayo 6.375% 15-15.05.25 1,450,000 USD 1,404,663 1,489,426 2.79
17,566,063 17,638,749 33.00
Total - Bonds 17,566,063 17,638,749 33.00
Total - Transferable securities admitted to an official stock exchangelisting 17,566,063 17,638,749 33.00
DANSKE INVEST SICAV
The accompanying notes form an integral part of these financial statements.
85

Description Quantity ⁄ FaceValue
Currency Cost Evaluation % netassets
Transferable securities dealt in on another regulated market
Bonds
CanadaAts Auto 6.5% 15-15.06.23 260,000 USD 260,000 264,550 0.49Gibson Engy 6.75% 15.07.21 144A 874,000 USD 872,908 869,630 1.63Mdc Partner 6.5% 16-01.05.24 280,000 USD 281,806 275,800 0.52Norbord 6.25% 15-15.04.23 560,000 USD 560,000 572,600 1.07Teine Energ 6.875% 14-30.09.22 230,000 USD 195,800 224,250 0.42
2,170,514 2,206,830 4.13
Great BritainSignet Uk 4.7% 14-15.06.24 610,000 USD 601,642 596,245 1.12Snst Tchfin 6.25% 15-15.02.26 370,000 USD 370,000 381,100 0.71
971,642 977,345 1.83
IrelandJames Hardi 5.875% 15-15.02.23 840,000 USD 847,123 858,900 1.61
847,123 858,900 1.61
LuxembourgConvatec H 10.5%-15.12.18 144A 430,000 USD 439,675 440,926 0.82
439,675 440,926 0.82
United States of AmericaAleris Int 7.875% 12-01.11.20 242,000 USD 237,916 212,887 0.40Amer Bld 5.75% 15-15.12.23 160,000 USD 160,000 165,200 0.31Amsurg Corp 5.625% 15-15.07.22 300,000 USD 294,750 307,589 0.58Cable One 5.75% 15-15.06.22 410,000 USD 410,000 420,250 0.79Cco Hldgs 5.75% 15-15.02.26 160,000 USD 156,763 164,000 0.31Cco Hldgs 5.875% 16-01.04.24 220,000 USD 220,000 229,647 0.43Cheniere Co 7% 16-30.06.24 230,000 USD 230,000 235,507 0.44Clear Ch Wld 6.5% 13-15.11.22 1,091,000 USD 1,117,593 1,050,087 1.96Clear Ch Wld 6.5% 15.11.22 -B- 520,000 USD 537,225 520,926 0.97Com Metals 4.875% 13-15.05.23 70,000 USD 66,325 66,150 0.12Diebold Inc 8.5% 16-15.04.24 690,000 USD 700,487 684,825 1.28Dmn1 7.125% 16-15.06.24 320,000 USD 323,750 332,773 0.62Emi Msc 7.625% 16-15.06.24 70,000 USD 70,563 71,925 0.13Equinix Inc 5.375% 01.04.23 561,000 USD 573,622 574,753 1.08Equinix Inc 5.375% 14-01.01.22 255,000 USD 261,216 263,507 0.49Equinix Inc 5.875% 15-15.01.26 100,000 USD 100,000 103,948 0.19Foresight En 7.875% 15.08.21 144A 2,391,000 USD 2,349,157 1,649,790 3.09Forum Ener 6.25% 14-01.10.21 812,000 USD 766,240 751,100 1.41H&E Equip 7% 13-01.09.22 960,000 USD 963,200 994,411 1.86Hca 5.25% 16-15.06.26 430,000 USD 430,000 446,882 0.84Jt Ry 11% 16-15.05.22 420,000 USD 420,000 434,700 0.81Klx Inc 5.875% 14-01.12.22 584,000 USD 583,317 567,940 1.06Level 3 Fin 5.125% 15-01.05.23 900,000 USD 897,000 892,084 1.67Live Nation 7% 12-01.09.20 144A 589,000 USD 612,136 615,166 1.15Lkq Corp 4.75% 14-15.05.23 564,000 USD 537,615 551,310 1.03
DANSKE INVEST SICAV
The accompanying notes form an integral part of these financial statements.
86
US High Yield Bond
Statement of Investmentsas at June 30, 2016 (continued)(expressed in USD)

Description Quantity ⁄ FaceValue
Currency Cost Evaluation % netassets
Mednax Inc 5.25% 15-01.12.23 300,000 USD 300,000 303,000 0.57Midcontinen 6.875% 15-15.08.23 540,000 USD 540,000 553,500 1.04Mobile Mini 5.875% 16-01.07.24 160,000 USD 160,000 164,499 0.31Mph Merger 7.125% 16-01.06.24 150,000 USD 151,738 157,500 0.29Ncr Corp 5.875% 14-15.12.21 160,000 USD 158,800 164,182 0.31Ncr Corp 6.375% 14-15.12.23 210,000 USD 214,350 212,936 0.40Opal Acquis 8.875% 13-15.12.21 500,000 USD 425,825 380,000 0.71Pinnacle Fo 5.875% 16-15.01.24 170,000 USD 170,000 177,650 0.33Pnk Entet 5.625% 16-01.05.24 200,000 USD 199,750 197,168 0.37Pq Corp 6.75% 16-15.11.22 70,000 USD 70,000 72,275 0.14Realogy Gr 5.25% 14-01.12.21 350,000 USD 350,875 358,750 0.67Regional 8.25% 16-01.05.23 770,000 USD 791,500 787,325 1.47Rev Con Pro 5.75% 13-15.02.21 979,000 USD 978,321 952,768 1.78Rice Energy 6.25% 14-01.05.22 300,000 USD 225,900 297,768 0.56Rice Energy 7.25% 15-01.05.23 180,000 USD 166,950 183,455 0.34Sabine Pass 5.625% 15-01.03.25 370,000 USD 349,650 365,020 0.68Sabine Pass 5.75% 14-15.05.24 370,000 USD 362,500 366,737 0.69Sabine Pass 5.875% 16-30.06.26 200,000 USD 200,000 199,559 0.37Serta Smm 8.125% 01.10.20 144A 1,000,000 USD 1,041,425 1,032,415 1.93Sesi Llc 6.375% 11-01.05.19 290,000 USD 269,700 280,576 0.53Sesi Llc 7.125% 12-15.12.21 40,000 USD 37,763 38,502 0.07Sirius Xm 5.375% 16-15.07.26 200,000 USD 200,000 197,500 0.37Sprint Corp 7.875% 13-15.09.23 130,000 USD 129,324 107,150 0.20Steel Dyn 6.375% 13-15.08.22 95,000 USD 101,650 99,833 0.19Summit Mid 5.5% 14-15.08.22 204,000 USD 195,840 174,420 0.33Summit Mid 7.5% 14-01.07.21 917,000 USD 958,265 871,150 1.63Surgery 8.875% 16-15.04.21 350,000 USD 350,000 359,625 0.67Surgical Care 6% 15-01.04.23 170,000 USD 165,750 173,400 0.32Svu 6.75% 13-01.06.21 220,000 USD 225,174 186,934 0.35Svu 7.75% 14-15.11.22 310,000 USD 330,002 261,274 0.49Team Health 7.25% 15-15.12.23 880,000 USD 892,400 935,000 1.75Tempur Seal 5.5% 16-15.06.26 320,000 USD 320,000 313,600 0.59Tesoro 6.125% 13-15.10.21 40,000 USD 40,100 41,595 0.08Transdigm 6.375% 16-15.06.26 480,000 USD 480,000 470,400 0.88US Foods 5.875% 16-15.06.24 540,000 USD 540,000 549,102 1.03Vista Out 5.875% 15-01.10.23 340,000 USD 340,000 354,450 0.66Vizient Inc 10.375% 01.03.24 540,000 USD 561,100 579,150 1.08Wesco Dis 5.375% 14-15.12.21 620,000 USD 606,050 624,163 1.17Wmg Acq 6.75% 14-15.04.22 1,036,000 USD 937,580 1,044,806 1.96Wolver Wrld 6.125% 13-15.10.20 556,000 USD 585,190 579,380 1.08Wpx Energy 5.25% 11-15.01.17 590,000 USD 554,500 596,997 1.12Xpo 6.5% 15-15.06.22 670,000 USD 657,136 639,381 1.20
29,353,983 28,712,252 53.73
Total - Bonds 33,782,937 33,196,253 62.12
Total - Transferable securities dealt in on another regulated market 33,782,937 33,196,253 62.12
TOTAL INVESTMENT PORTFOLIO 51,349,000 50,835,002 95.12
DANSKE INVEST SICAV
The accompanying notes form an integral part of these financial statements.
87
US High Yield Bond
Statement of Investmentsas at June 30, 2016 (continued)(expressed in USD)
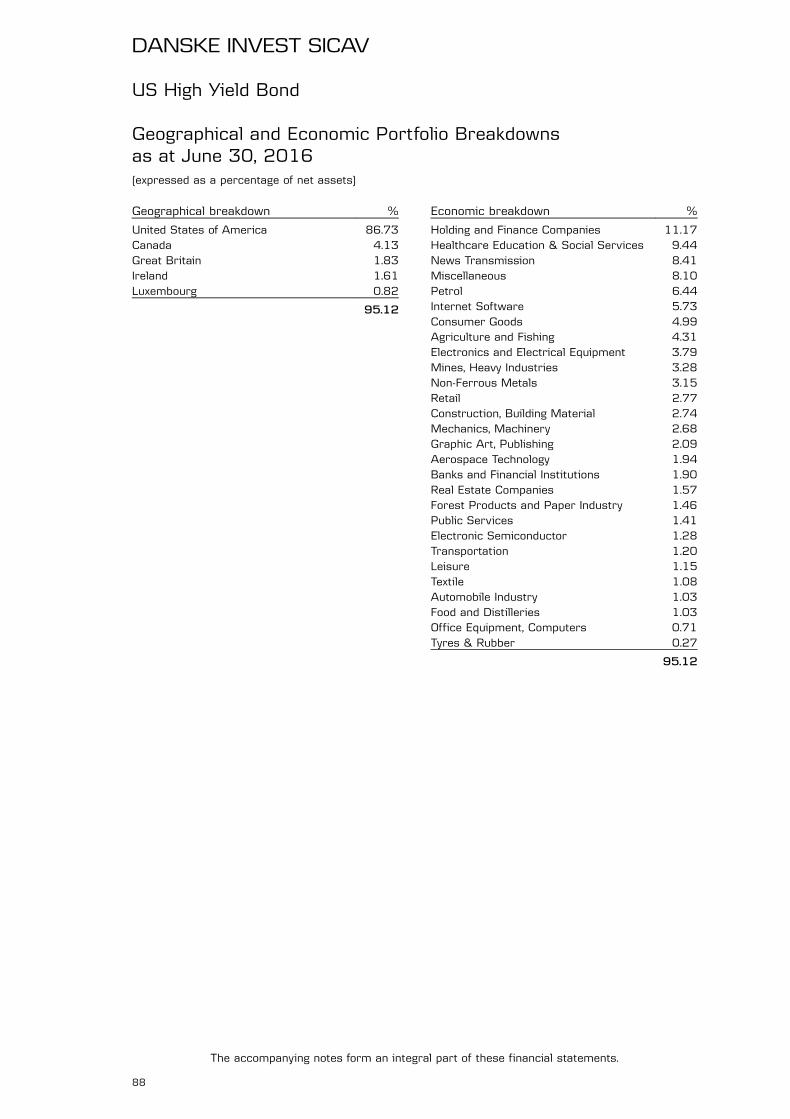
US High Yield Bond
Geographical and Economic Portfolio Breakdownsas at June 30, 2016(expressed as a percentage of net assets)
Geographical breakdown %
United States of America 86.73Canada 4.13Great Britain 1.83Ireland 1.61Luxembourg 0.82
95.12
Economic breakdown %
Holding and Finance Companies 11.17Healthcare Education & Social Services 9.44News Transmission 8.41Miscellaneous 8.10Petrol 6.44Internet Software 5.73Consumer Goods 4.99Agriculture and Fishing 4.31Electronics and Electrical Equipment 3.79Mines, Heavy Industries 3.28Non-Ferrous Metals 3.15Retail 2.77Construction, Building Material 2.74Mechanics, Machinery 2.68Graphic Art, Publishing 2.09Aerospace Technology 1.94Banks and Financial Institutions 1.90Real Estate Companies 1.57Forest Products and Paper Industry 1.46Public Services 1.41Electronic Semiconductor 1.28Transportation 1.20Leisure 1.15Textile 1.08Automobile Industry 1.03Food and Distilleries 1.03Office Equipment, Computers 0.71Tyres & Rubber 0.27
95.12
DANSKE INVEST SICAV
The accompanying notes form an integral part of these financial statements.
88

Notes to the unaudited Financial Statementsas at June 30, 2016
NOTE 1 – GENERAL
Danske Invest SICAV is an investment company incorporated under the laws of the Grand Duchy ofLuxembourg as a Société d'Investissement à Capital Variable (the "Fund") subject to Part I of the amendedLaw of December 17, 2010 relating to the undertakings for collective investment (the "2010 Law"). TheFund's purpose is to invest in all kinds of transferable securities, units or shares of other open-ended UCI orUCIs, as well as derivatives on transferable securities and other financial instruments authorised by the2010 Law.
The Fund was incorporated on June 30, 2011 for an unlimited period of time and is governed by the law ofAugust 10, 1915 on commercial companies, as amended, and by the 2010 Law.
The Fund’s Articles were published on July 8, 2011 in the Luxembourg Official Gazette, the Mémorial C,Recueil des Sociétés et Associations (the "Mémorial") and registered with the Luxembourg Registre deCommerce et des Sociétés, where they may be consulted and where copies may be obtained upon paymentof the applicable charges. Copies are available on request at the registered office of the Fund.
The registered office of the Fund is established at 13, rue Edward Steichen, L-2540 Luxembourg. The Fundis recorded at the Luxembourg "Registre de Commerce et des Sociétés" under the number B 161867.
The Board of Directors of the Fund has appointed Danske Invest Management Company as the ManagementCompany of the Fund, and to serve as its designated management company under chapter 15 of the 2010Law and pursuant to the Management Company Agreement dated December 9, 2014 entered into betweenthe Fund and the Management Company. Danske Invest Management Company has also been appointed toact as Management Company for the following investment funds: Danske Invest, Danske Fund of Funds andDanske Invest Allocation.
The Fund is an umbrella Fund and as such provides investors with the choice of investment in a range ofseveral separate Sub-Funds each of which relates to a separate portfolio of liquid assets and othersecurities and assets permitted by the 2010 Law with specific investment objectives, as described in therelevant Appendix to the Prospectus. Each Appendix forms an integral part of the Prospectus.
On June 30, 2016, fifteen Sub-Funds are operational:
— Danske Invest SICAV - Eastern Europe— Danske Invest SICAV - Emerging and Frontier Markets— Danske Invest SICAV - Emerging Markets Debt Hard Currency— Danske Invest SICAV - Euro High Yield Bond— Danske Invest SICAV - Europe— Danske Invest SICAV - Europe Absolute— Danske Invest SICAV - Europe Long-Short Dynamic— Danske Invest SICAV - Europe Long-Short Dynamic Plus— Danske Invest SICAV - European Corporate Sustainable Bond (launched on June 15, 2016)— Danske Invest SICAV - Germany— Danske Invest SICAV - Global Emerging Markets Leaders (launched on January 7, 2016 and liquidated onMay 26, 2016)— Danske Invest SICAV - Global High Dividend— Danske Invest SICAV - Global Inflation Linked Bond— Danske Invest SICAV - Global Inflation Linked Bond Short Duration— Danske Invest SICAV - Nordic Corporate Bond— Danske Invest SICAV - US High Yield Bond
NOTE 2 – INVESTMENT OBJECTIVES
The investment objectives of the Fund and each Sub-Fund are to achieve a high total return as compatiblewith a sound diversification of risks.
The investment objective of the Sub-Fund Danske Invest SICAV - Eastern Europe is to obtain an over-performance to the relevant market. This Sub-Fund will invest in transferable securities, mainly equities andequity-related securities admitted or dealt in on a Regulated Market and issued by companies domiciled in,or with main activity, in Eastern Europe or in Turkey. A small part may be invested in equities and equity-related securities issued by companies domiciled in countries bordering to Eastern Europe.
DANSKE INVEST SICAV
89

NOTE 2 – INVESTMENT OBJECTIVES (continued)
The Investment objective of the Sub-Fund Danske Invest SICAV - Emerging and Frontier Markets is to obtainan over-performance to the relevant market, this Sun-Funds will invest in transferable securities admitted toor dealt on a Regulated Market, mainly equities but also equity-related instruments like warrants and P-notesand financial derivatives instruments.
The Investment objective of the Sub-Fund Danske Invest SICAV - Emerging Markets Debt Hard Currency isto obtain an over-performance to the relevant market. This Sub-Fund will invest in transferable securities, inforeign bonds issued or guaranteed by governments or by companies in Emerging Market countries,admitted to or dealt in on a Regulated Market. The Sub-Fund may invest in bonds denominated in USD, EUR,GBP, CAD, CHF, JPY or in local currencies of the countries that are constituents of the Sub-Fund'sbenchmark, JP Morgan’s EMBI Global Diversified Composite index.
The investment objective of the Sub-Fund Danske Invest SICAV - Euro High Yield Bond is to obtain an over-performance to the relevant market. This Sub-Fund will invest in transferable securities, mainly bonds,contingency bonds, convertible bonds and other debt instruments which are admitted to or dealt in on aRegulated Market and issued by companies located in any member state of the European Union or theOECD, or any other country of Western or Eastern Europe, Asia, Oceania, the American continents or Africa.
The investment objective of the Sub-Fund Danske Invest SICAV - Europe is to obtain an over-performance tothe relevant market. This Sub-Fund will invest in transferable securities, mainly equities and equity-relatedsecurities admitted to or dealt in on a Regulated Market in Europe or in companies domiciled in, or with mainactivity in Europe but admitted to or dealt in on a Regulated Market outside Europe. A small part may beinvested in securities, mainly equities and equity related securities, issued by companies domiciled in ortraded on market places in countries in Eastern Europe or bordering to Eastern Europe (Azerbaijan, Georgia,Kazakhstan and Turkey).
The investment objective of the Sub-Fund Danske Invest SICAV - Europe Absolute is to generate absolutereturns, investing in long and short positions in transferable securities, mainly equities and equity-relatedsecurities admitted to or dealt in on a Regulated Market and issued by companies domiciled in, or with mainactivity, in all countries of Europe. The investments will be made according to expected performance;sectors, countries and currencies may be overweighted or underweighted accordingly. The short positionswill only be taken via financial derivative instruments. The investments in this Sub-Fund will be made usingfocused investment style.
The investment objective of the Sub-Fund Danske Invest SICAV - Europe Long-Short Dynamic is to generateabsolute returns, investing in long and short positions in transferable securities, mainly equities and equity-related securities admitted to or dealt in on a Regulated Market in Europe or in companies domiciled in, orwith main activity in Europe but admitted to or dealt in on a Regulated Market outside Europe. A small partmay be invested in transferable securities, mainly equities and equity related securities, issued bycompanies domiciled in or traded on Regulated Markets in countries outside Europe. In this context Europeshall be defined as countries represented in the MSCI Europe index.
The investment objective of the Sub-Fund Danske Invest SICAV - Europe Long-Short Dynamic Plus is togenerate absolute returns, investing in long and short positions in transferable securities, mainly equitiesand equity-related securities admitted to or dealt in on a Regulated Market in Europe or in companiesdomiciled in, or with main activity in Europe but admitted to or dealt in on a Regulated Market outsideEurope. A small part may be invested in transferable securities, mainly equities and equity related securities,issued by companies domiciled in or traded on Regulated Markets in countries outside Europe. In thiscontext Europe shall be defined as countries represented in the MSCI Europe index.
The investment objective of the Sub-Fund Danske Invest SICAV - European Corporate Sustainable Bond(launched on June 15, 2016) is to obtain an over-performance to the relevant market. This Sub-Fund is toinvest in transferable securities, mainly corporate bonds and in a lesser portion other debt instruments,which are admitted to or dealt on a Regulated Market and issued by companies located in any Member Stateof the OECD, but mainly in Europe.
The investment objective of the Sub-Fund Danske Invest SICAV - Germany is to obtain an over-performanceto the relevant market. This Sub-Fund will invest in transferable securities (mainly equities and equity-relatedsecurities) of companies domiciled in, or with their main activity in Germany and admitted to or dealt in on aRegulated Market.
DANSKE INVEST SICAV
90
Notes to the unaudited Financial Statementsas at June 30, 2016 (continued)

NOTE 2 – INVESTMENT OBJECTIVES (continued)
The investment objective of the Sub-Fund Danske Invest SICAV - Global Emerging Markets Leaders(launched on January 7, 2016 and liquidated on May 26, 2016) is to obtain over-performance to therelevant market. This Sub-Fund will invest in transferable securities, mainly equities and equity-relatedsecurities like P-notes trading on the exchanges within, or companies domiciled in, or with main activity inEmerging Markets and admitted to or dealt in on a Regulated Market. Furthermore the Sub-Fund may investin equities or equity-related securities defined as Emerging Markets by the index provider and with a focuson high quality companies that are leaders in their countries, industry or globally in terms of products,services and execution.
The Investment objective of the Sub-Fund Danske Invest SICAV - Global High Dividend is to obtain an over-performance to the relevant market. This Sub-Fund will invest in transferable securities, mainly equities andequity-related securities admitted to or dealt in on a Regulated Market globally. The investments will bemade in companies, which are expected to generate high levels of direct dividends. The companies chosen inthis Sub-Fund will typically have been existing for a number of years and furthermore have a well establishedposition in the relevant market for their product and/or services.
The investment objective of the Sub-Fund Danske Invest SICAV - Global Inflation Linked Bond is to obtain anover-performance to the relevant market. This Sub-Fund will invest in transferable securities, mainly inbonds and other debt instruments admitted to or dealt in on a Regulated Market and issued by an OECDcountry or guaranteed by an OECD country (Agencies) or OECD countries jointly (supranational) where thereturn is linked to inflation indices within the OECD. The Sub-Fund will invest in "investment grade" bonds, i.e.bonds with a rating of Baa3/BBB- or higher. Bonds, which the Sub-Fund has invested in and subsequently isdowngraded to a rating category lower than Baa3/BBB- will be sold within 3 months after the downgradedate. Occasionally the Sub-Fund may also invest in money market instruments.
The investment objective of the Sub-Fund Danske Invest SICAV - Global Inflation Linked Bond Short Durationis to obtain an over-performance to the relevant market. This Sub-Fund will invest in transferable securities,mainly in bonds and other debt instruments admitted to or dealt in on a Regulated Market and issued by anOECD country or guaranteed by an OECD country or OECD countries jointly (supranational) where the returnis linked to inflation indices within the OECD. The Sub-Fund will invest in "investment grade" bonds, i.e. bondswith a rating of Baa3/BBB- or higher. Occasionally the Sub-Fund may also invest in money marketinstruments.
The investment objective of the Sub-Fund Danske Invest SICAV - Nordic Corporate Bond is to obtain an over-performance to the relevant market. This Sub-Fund will invest in transferable securities, mainly bonds,Convertible Bonds, Contingent Convertible Bonds and other debt instruments which are admitted to or dealtin on a Regulated Market and issued by companies located, or with its main business activity, in any Nordiccountry. On an ancillary basis, the Sub-Fund may invest in money market instruments. The Sub-Fund Investsmainly in corporate bonds, however may invest up to 25% of its assets in Covered Bonds issued by Nordiccredit institutions. At least 75% of assets should be invested in bonds denominated in EUR , NOK, SEK orDKK. Investments in Convertible Bonds and Contingent Convertible Bonds should not exceed 20% of netasset value at any time. If converted to equities, these shall be sold within 3 months from the conversiondate.
The Investment objective of the Sub-Fund Danske Invest SICAV - US High Yield Bond is to obtain an over-performance to the relevant market, this Sub-Fund will invest in transferable securities, mainly ingovernment bonds issued by countries and corporate bonds issued by companies, all having credit ratingbelow BBB - (Standard & Poor’s and Fitch) or Baa3 (Moody’s), admitted to or dealt in on a Regulated Market.The bonds shall be denominated in USD, however the Sub-Fund may invest 25% of its assets in bondsdenominated in CAD, EUR (including the national Euroland currencies), GBP, CHF, SEK or NOK.
NOTE 3 – SIGNIFICANTACCOUNTING POLICIES
The financial statements have been prepared in accordance with generally accepted accounting principlesand laws and regulations in force in the Grand Duchy of Luxembourg applicable to UCITS.
a) Valuation of investments in portfolio
(i) The value of any cash on hand or on deposit, bills and demand notes and accounts receivable, prepaidexpenses, cash dividends and interest declared or accrued as aforesaid and not yet received is deemed to bethe full amount thereof, unless in any case the same is unlikely to be paid or received in full, in which case thevalue thereof is arrived at after making such discount as may be considered appropriate in such case toreflect the true value thereof.
(ii) The value of assets which are listed or dealt in on any stock exchange is based on the last available priceon the stock exchange which is normally the principal market for such assets.
(iii) The value of assets dealt in on any other Regulated Market is based on the last available price.
DANSKE INVEST SICAV
91
Notes to the unaudited Financial Statementsas at June 30, 2016 (continued)

NOTE 3 – SIGNIFICANTACCOUNTING POLICIES (continued)
(iv) In the event that any assets are not listed or dealt in on any stock exchange or on any other RegulatedMarket, or if, with respect to assets listed or dealt in on any stock exchange, or other Regulated Market asaforesaid, the price as determined pursuant to sub-paragraph (ii) or (iii) is not representative of the fairmarket value of the relevant assets, the value of such assets will be based on the reasonably foreseeablesales price determined prudently and in good faith by the Board of Directors of the Fund.
(v) The liquidating value of option contracts not traded on exchanges or on other Regulated Markets shallmean their net liquidating value determined, pursuant to the policies established by the Board of Directors ofthe Fund, on a basis consistently applied for each different variety of contracts. The liquidating value offutures, forward or options contracts traded on exchanges or on other Regulated Markets shall be basedupon the last available settlement prices of these contracts on exchanges and Regulated Markets on whichthe particular futures, forward or option contracts are traded by the Fund; provided that if a futures, forwardor options contract could not be liquidated on the day with respect to which net assets are being determined,the basis for determining the liquidating value of such contract shall be such value as the Board of Directorsof the Fund may deem fair and reasonable. Swaps will be valued at their market value established byreference to the applicable interest rates' curve.
(vi) Units or shares of open-ended UCIs will be valued at their last determined and available net asset valueor, if such price is not representative of the fair market value of such assets, then the price shall bedetermined by the Board of Directors of the Fund on a fair and equitable basis.
(vii) The credit default swap positions and the contracts for differences are valued in accordance withvaluation principles decided by the Board of Directors of the Fund on the basis of their Marked to Marketprice by using standard market practices.
(viii) All other securities and other assets will be valued at fair market value as determined in good faithpursuant to the procedures established by the Board of Directors of the Fund.
(ix) The Board of Directors of the Fund valued the following security GOWEX at zero based on therecommendation of the Investment Manager and in view of the fact that the company had gone intovoluntary insolvency on July 6, 2014. The security is held in the Danske Invest SICAV - Europe Absolute Sub-Fund.
b) Realised profit / (loss) on sale of securities
Profit and loss on investment securities sold are computed on the basis of average cost.
c) Foreign exchange conversion
The net asset value of the Sub-Funds are expressed as follows:
Danske Invest SICAV - Eastern Europe in EURDanske Invest SICAV - Emerging and Frontier Markets in EURDanske Invest SICAV - Emerging Markets Debt Hard Currency in USDDanske Invest SICAV - Euro High Yield Bond in EURDanske Invest SICAV - Europe in EURDanske Invest SICAV - Europe Absolute in EURDanske Invest SICAV - Europe Long-Short Dynamic in EURDanske Invest SICAV - Europe Long-Short Dynamic Plus in EURDanske Invest SICAV - European Corporate Sustainable Bond* in EURDanske Invest SICAV - Germany in EURDanske Invest SICAV - Global Emerging Markets Leaders* in USDDanske Invest SICAV - Global High Dividend in EURDanske Invest SICAV - Global Inflation Linked Bond in EURDanske Invest SICAV - Global Inflation Linked Bond Short Duration in EURDanske Invest SICAV - Nordic Corporate Bond in EURDanske Invest SICAV - US High Yield Bond in USD
All assets valued in a currency other than the base currency of the Sub-Fund are converted to the basecurrency at the exchange rates prevailing at June 30, 2016.
DANSKE INVEST SICAV
92
Notes to the unaudited Financial Statementsas at June 30, 2016 (continued)
* See Note 1
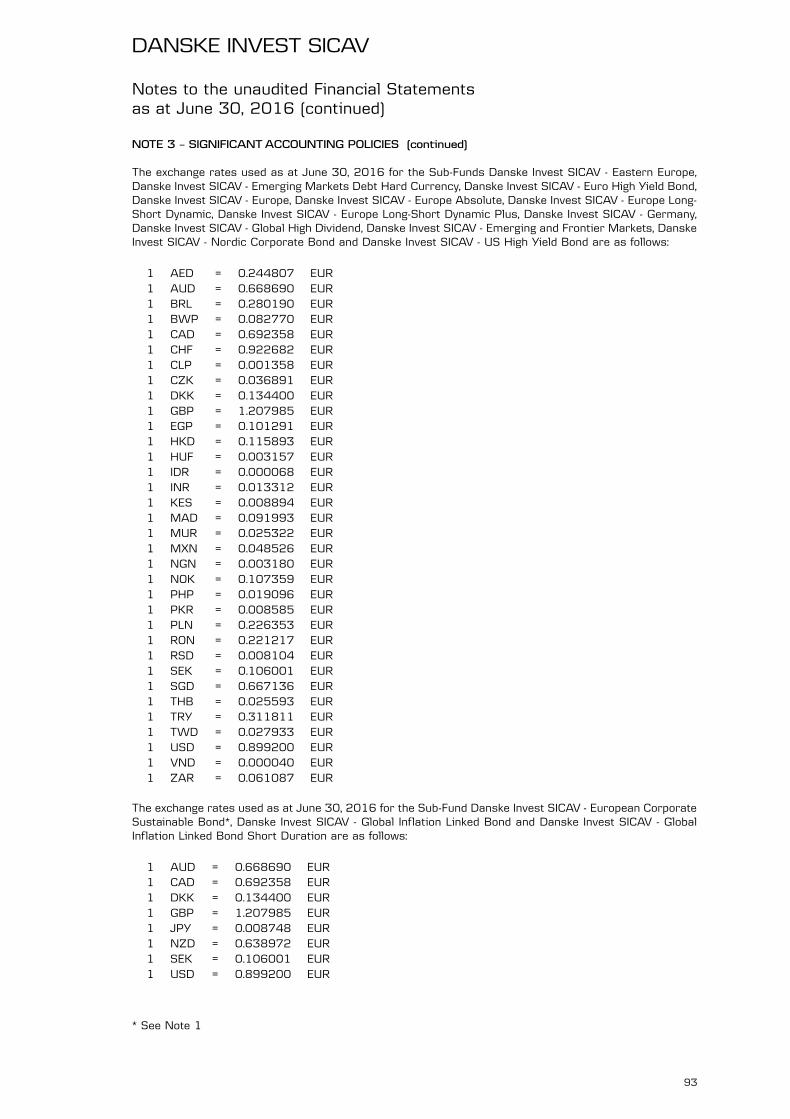
NOTE 3 – SIGNIFICANTACCOUNTING POLICIES (continued)
The exchange rates used as at June 30, 2016 for the Sub-Funds Danske Invest SICAV - Eastern Europe,Danske Invest SICAV - Emerging Markets Debt Hard Currency, Danske Invest SICAV - Euro High Yield Bond,Danske Invest SICAV - Europe, Danske Invest SICAV - Europe Absolute, Danske Invest SICAV - Europe Long-Short Dynamic, Danske Invest SICAV - Europe Long-Short Dynamic Plus, Danske Invest SICAV - Germany,Danske Invest SICAV - Global High Dividend, Danske Invest SICAV - Emerging and Frontier Markets, DanskeInvest SICAV - Nordic Corporate Bond and Danske Invest SICAV - US High Yield Bond are as follows:
1 AED = 0.244807 EUR1 AUD = 0.668690 EUR1 BRL = 0.280190 EUR1 BWP = 0.082770 EUR1 CAD = 0.692358 EUR1 CHF = 0.922682 EUR1 CLP = 0.001358 EUR1 CZK = 0.036891 EUR1 DKK = 0.134400 EUR1 GBP = 1.207985 EUR1 EGP = 0.101291 EUR1 HKD = 0.115893 EUR1 HUF = 0.003157 EUR1 IDR = 0.000068 EUR1 INR = 0.013312 EUR1 KES = 0.008894 EUR1 MAD = 0.091993 EUR1 MUR = 0.025322 EUR1 MXN = 0.048526 EUR1 NGN = 0.003180 EUR1 NOK = 0.107359 EUR1 PHP = 0.019096 EUR1 PKR = 0.008585 EUR1 PLN = 0.226353 EUR1 RON = 0.221217 EUR1 RSD = 0.008104 EUR1 SEK = 0.106001 EUR1 SGD = 0.667136 EUR1 THB = 0.025593 EUR1 TRY = 0.311811 EUR1 TWD = 0.027933 EUR1 USD = 0.899200 EUR1 VND = 0.000040 EUR1 ZAR = 0.061087 EUR
The exchange rates used as at June 30, 2016 for the Sub-Fund Danske Invest SICAV - European CorporateSustainable Bond*, Danske Invest SICAV - Global Inflation Linked Bond and Danske Invest SICAV - GlobalInflation Linked Bond Short Duration are as follows:
1 AUD = 0.668690 EUR1 CAD = 0.692358 EUR1 DKK = 0.134400 EUR1 GBP = 1.207985 EUR1 JPY = 0.008748 EUR1 NZD = 0.638972 EUR1 SEK = 0.106001 EUR1 USD = 0.899200 EUR
DANSKE INVEST SICAV
93
Notes to the unaudited Financial Statementsas at June 30, 2016 (continued)
* See Note 1

NOTE 3 – SIGNIFICANTACCOUNTING POLICIES (continued)
Income and expenses expressed in a currency other than the base currency of the Sub-Fund are convertedat the applicable exchange rate prevailing at the transaction date.
d) Cost of investment securities
The acquisition cost of investment securities in each Sub-Fund expressed in currencies other than thecurrency of denomination is converted to the base currency at the exchange rates prevailing at the purchasedate.
e) Income/charges from investments
Dividends are recognized as income on the date the securities are first quoted ex-dividend, to the extentinformation thereon is reasonably available to the Fund. Bank interest, interest on fixed income securitiesand interest on Contracts for difference are accrued for each net asset valuation.
f) Forward foreign exchange contracts
Profit and loss arising from un-matured forward foreign exchange contracts are determined on the basis ofthe applicable forward exchange rates at the valuation date, and are recorded in the combined statement ofnet assets. Realised profit or loss on forward foreign exchange contracts are recorded in the statement ofoperations and changes in net assets.
g) Formation expenses
The costs and expenses incurred in connection with the formation of the Fund and the initial issue of Sharesby the Fund, all legal and printing costs, certain launch expenses (including advertising costs) andpreliminary expenses are amortized over a five year period.
h) Swing Pricing
The investment manager needs to undertake transactions in order to maintain the desired asset allocationas a result of subscriptions or redemptions, which may generate additional costs for the fund and itsshareholders. As a consequence, in order to protect the existing investors’ interest, from these capitalmovements, when net capital movements exceed a threshold pre-defined by the Board of Directors of theSICAV, the valuation of the underlying securities is adjusted on a line by line basis to reflect these costs. Thisadjustment reflects the estimated tax and dealing costs that may be incurred by the fund as a result of thesetransactions, and the estimated bid-offer spread of the assets in which the fund invests. A periodical reviewis undertaken in order to verify the appropriateness of the swing factor being applied.
As at period end, swing pricing was applied on the Sub-Fund Danske Invest SICAV - Global High Dividend.
i) Realised loss on Contract For Difference ("CFD")
Realised profit/loss on CFDs are computed on the basis of average cost, and recorded in the statement ofoperations and changes in net assets.
j) Combined financial statements of the Fund
The combined financial statements of the Fund are expressed in EUR. The combined statement of net assetsequals the sum of the corresponding items in the financial statements of each Sub-Fund converted to EUR atthe exchange rates prevailing at the closing date.
DANSKE INVEST SICAV
94
Notes to the unaudited Financial Statementsas at June 30, 2016 (continued)

NOTE 4 – MANAGEMENT FEES, MARKETING FEE AND PERFORMANCE FEE
Management fees
The Management Company receives the management fee from the net assets of each class, payablequartely in arrears.
Marketing fees
In addition the Fund pays the Management Company a marketing fee (the "Marketing Fee") amounting to apercentage of maximum 0.10% p.a. of the Net Asset Value determined in respect of each Sub-Fund and/orclass in the relevant Sub-Fund’s appendix of the Prospectus.
No marketing fees are applicable on Class I.
Performance fees
The Investment Manager is also entitled to receive a performance fee from the Sub-Funds Danske InvestSICAV - Europe Absolute, Danske Invest SICAV - Europe Long-Short Dynamic and Danske Invest SICAV -Europe Long-Short Dynamic Plus calculated, accrued and locked on each Valuation Day and paid annually inarrears on or after the last Valuation Day in each financial year. If a performance fee is payable in relation toa relevant Class, the performance fee shall be an amount equal to 20% of the Outperformance.
Between two successive calculation dates the Outperformance will be calculated for each relevant Class asthe Net Asset Value per Share before additional performance fee accruals minus the higher of:
– The Net Asset Value per Share at the end of the immediately preceding Valuation Day, accrued with theHurdle Rate (as defined below) and
– The High Water Mark Net Asset Value (as defined below) accrued with the Hurdle Rate (as definedbelow).
The Hurdle Rate is the Risk-free Rate on a pro rate temporis basis up to the relevant calculation date.Risk-free Rate EUR: Defined as the European Central Bank’s lending rate (the repo rate);Risk-free Rate NOK: Defined as Norges Bank’s sight deposit rate (the repo rate);Risk-free Rate SEK: Defined as Sveriges Riksbank’s lending rate (the repo rate);
The High Water Mark Net Asset Value per Share is defined as the greater of:
– The Net Asset Value per Share of the relevant Class being the Subscription Price at which Shares of theClass was issued on the launch of the Sub Class; and
– The Net Asset Value per Share of the relevant Class at the end of the immediately preceding ValuationDay, on which a performance fee was charged.
Each time the Sub-Fund outperforms, the outperformance is locked in favour of the Investment Manager.Whenever a positive outperformance level, previously reached, is not achieved thereafter, a High WaterMark Net Asset Value per Share is memorised for the purpose of the performance fee calculation.
In case a performance fee has not been paid for a 3 year period, a reset will be done at the year end of thethird year, in order to define the High Water Mark as the Net Asset Value per Share of the relevant Class atthe end of the year.
Since the performance fees are calculated, accrued and locked on each valuation day and paid annually it ispossible that the value of the Shares of Shareholders may reflect performance fees accrued during a part ofa year even though they may incur overall losses during such year as a result of the time at which theysubscribe or redeem Shares.
DANSKE INVEST SICAV
95
Notes to the unaudited Financial Statementsas at June 30, 2016 (continued)

NOTE 4 – MANAGEMENT FEES, MARKETING FEE AND PERFORMANCE FEE (continued)
Sub Funds Management Feein per cent per
annum
Marketing Feein per cent per
annum
Performance Feein per cent per
annum
Eastern Europe - Class A 1.70% 0.10% N/A
Eastern Europe - Class I 0.90% 0.00% N/A
Emerging and Frontier Markets - Class A 1.80% 0.10% N/A
Emerging and Frontier Markets - Class A-dkk 1.80% 0.10% N/A
Emerging and Frontier Markets - Class A-nok 1.80% 0.10% N/A
Emerging and Frontier Markets - Class A-sek 1.80% 0.10% N/A
Emerging and Frontier Markets - Class I 1.50% 0.00% N/A
Emerging Markets Debt Hard Currency - Class A 1.20% 0.10% N/A
Emerging Markets Debt Hard Currency - Class I 0.60% 0.00% N/A
Euro High Yield Bond - Class A 1.00% 0.10% N/A
Euro High Yield Bond - Class A d 1.00% 0.10% N/A
Euro High Yield Bond - Class A-sek h 1.00% 0.10% N/A
Euro High Yield Bond - Class I 0.45% 0.00% N/A
Euro High Yield Bond - Class Y 1.00% 0.10% N/A
Europe Absolute - Class A p 1.40% 0.10% 20% of theOutperformance asdescribed in theProspectus
Europe Absolute - Class A-sek hp 1.40% 0.10%
Europe Absolute - Class I p 0.90% 0.00%
Europe - Class A 1.50% 0.10% N/A
Europe - Class I 0.90% 0.00% N/A
Europe Long-Short Dynamic - Class A dp 1.40% 0.10%20% of the
Outperformance asdescribed in theProspectus
Europe Long-Short Dynamic - Class A p 1.40% 0.10%
Europe Long-Short Dynamic - Class A-nok hp 1.40% 0.10%
Europe Long-Short Dynamic - Class A-sek hp 1.40% 0.10%
Europe Long-Short Dynamic - Class I p 0.90% 0.00%
Europe Long-Short Dynamic Plus - Class A p 1.55% 0.10% 20% of theOutperformance asdescribed in theProspectus
Europe Long-Short Dynamic Plus - Class A-sek hp 1.55% 0.10%
Europe Long-Short Dynamic Plus - Class I p 0.99% 0.00%
European Corporate Sustainable Bond* - Class A-sek h 0.80% 0.10% N/A
European Corporate Sustainable Bond* - Class I 0.40% 0.00% N/A
European Corporate Sustanable Bond* - Class A 0.80% 0.10% N/A
European Corporate Sustanable Bond* - Class A d 0.80% 0.10% N/A
Germany - Class A 1.40% 0.10% N/A
Germany - Class A-nok 1.40% 0.10% N/A
Germany - Class A-sek 1.40% 0.10% N/A
Germany - Class I 0.90% 0.00% N/A
DANSKE INVEST SICAV
96
Notes to the unaudited Financial Statementsas at June 30, 2016 (continued)
* See Note 1.
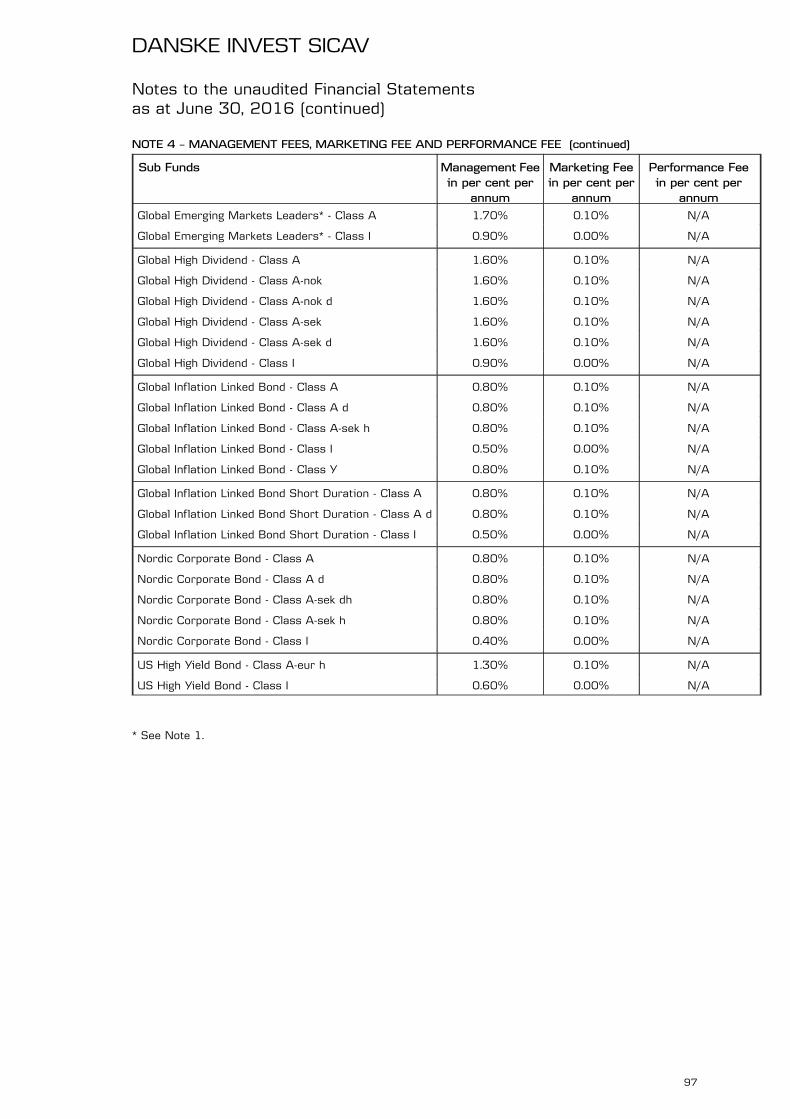
NOTE 4 – MANAGEMENT FEES, MARKETING FEE AND PERFORMANCE FEE (continued)
Sub Funds Management Feein per cent per
annum
Marketing Feein per cent per
annum
Performance Feein per cent per
annum
Global Emerging Markets Leaders* - Class A 1.70% 0.10% N/A
Global Emerging Markets Leaders* - Class I 0.90% 0.00% N/A
Global High Dividend - Class A 1.60% 0.10% N/A
Global High Dividend - Class A-nok 1.60% 0.10% N/A
Global High Dividend - Class A-nok d 1.60% 0.10% N/A
Global High Dividend - Class A-sek 1.60% 0.10% N/A
Global High Dividend - Class A-sek d 1.60% 0.10% N/A
Global High Dividend - Class I 0.90% 0.00% N/A
Global Inflation Linked Bond - Class A 0.80% 0.10% N/A
Global Inflation Linked Bond - Class A d 0.80% 0.10% N/A
Global Inflation Linked Bond - Class A-sek h 0.80% 0.10% N/A
Global Inflation Linked Bond - Class I 0.50% 0.00% N/A
Global Inflation Linked Bond - Class Y 0.80% 0.10% N/A
Global Inflation Linked Bond Short Duration - Class A 0.80% 0.10% N/A
Global Inflation Linked Bond Short Duration - Class A d 0.80% 0.10% N/A
Global Inflation Linked Bond Short Duration - Class I 0.50% 0.00% N/A
Nordic Corporate Bond - Class A 0.80% 0.10% N/A
Nordic Corporate Bond - Class A d 0.80% 0.10% N/A
Nordic Corporate Bond - Class A-sek dh 0.80% 0.10% N/A
Nordic Corporate Bond - Class A-sek h 0.80% 0.10% N/A
Nordic Corporate Bond - Class I 0.40% 0.00% N/A
US High Yield Bond - Class A-eur h 1.30% 0.10% N/A
US High Yield Bond - Class I 0.60% 0.00% N/A
* See Note 1.
DANSKE INVEST SICAV
97
Notes to the unaudited Financial Statementsas at June 30, 2016 (continued)

NOTE 5 – CUSTODIAN FEES, CENTRAL ADMINISTRATION FEES, TRANSFER AGENT FEES ANDOPERATING AND ADMINISTRATIVE EXPENSES
The Fund pays the Management Company operating and administrative expenses (the “Operating andAdministrative Expenses”) amounting to a percentage of maximum 0.40% p.a. of the Net Asset Value asdetermined in respect of each Sub-Fund and/or Class. The Operating and Administrative Expenses are fixed,and the actual annual rates applied on June 30, 2016 are as follows:
Sub Funds Operating andAdministrative
ExpensesEastern Europe - Class A 0.30%Eastern Europe - Class I 0.30%Emerging and Frontier Markets - Class A 0.35%Emerging and Frontier Markets - Class A-dkk 0.35%Emerging and Frontier Markets - Class A-nok 0.35%Emerging and Frontier Markets - Class A-sek 0.35%Emerging and Frontier Markets - Class I 0.35%Emerging Markets Debt Hard Currency - Class A 0.15%Emerging Markets Debt Hard Currency - Class I 0.15%Euro High Yield Bond - Class A 0.12%Euro High Yield Bond - Class A d 0.12%Euro High Yield Bond - Class A-sek h 0.12%Euro High Yield Bond - Class I 0.12%Euro High Yield Bond - Class Y 0.12%Europe Absolute - Class A p 0.25%Europe Absolute - Class A-sek hp 0.25%Europe Absolute - Class I p 0.25%Europe - Class A 0.12%Europe - Class I 0.12%Europe Long-Short Dynamic - Class A dp 0.25%Europe Long-Short Dynamic - Class A p 0.25%Europe Long-Short Dynamic - Class A-nok hp 0.25%Europe Long-Short Dynamic - Class A-sek hp 0.25%Europe Long-Short Dynamic - Class I p 0.25%Europe Long-Short Dynamic Plus - Class A p 0.30%Europe Long-Short Dynamic Plus - Class A-sek hp 0.30%Europe Long-Short Dynamic Plus - Class I p 0.30%European Corporate Sustainable Bond* - Class A-sek h 0.15%European Corporate Sustainable Bond* - Class I 0.15%European Corporate Sustanable Bond* - Class A 0.15%European Corporate Sustanable Bond* - Class A d 0.15%Germany - Class A 0.15%Germany - Class A-nok 0.15%Germany - Class A-sek 0.15%Germany - Class I 0.15%Global Emerging Markets Leaders* - Class A 0.25%Global Emerging Markets Leaders* - Class I 0.25%Global High Dividend - Class A 0.12%Global High Dividend - Class A-nok 0.12%Global High Dividend - Class A-nok d 0.12%Global High Dividend - Class A-sek 0.12%Global High Dividend - Class A-sek d 0.12%Global High Dividend - Class I 0.12%Global Inflation Linked Bond - Class A 0.12%Global Inflation Linked Bond - Class A d 0.12%Global Inflation Linked Bond - Class A-sek h 0.12%Global Inflation Linked Bond - Class I 0.12%Global Inflation Linked Bond - Class Y 0.12%
DANSKE INVEST SICAV
98
Notes to the unaudited Financial Statementsas at June 30, 2016 (continued)
* See Note 1

NOTE 5 – CUSTODIAN FEES, CENTRAL ADMINISTRATION FEES, TRANSFER AGENT FEES ANDOPERATING AND ADMINISTRATIVE EXPENSES (continued)
Sub Funds Operating andAdministrative
ExpensesGlobal Inflation Linked Bond Short Duration - Class A 0.12%Global Inflation Linked Bond Short Duration - Class A d 0.12%Global Inflation Linked Bond Short Duration - Class I 0.12%Nordic Corporate Bond - Class A 0.15%Nordic Corporate Bond - Class A d 0.15%Nordic Corporate Bond - Class A-sek dh 0.15%Nordic Corporate Bond - Class A-sek h 0.15%Nordic Corporate Bond - Class I 0.15%US High Yield Bond - Class A-eur h 0.15%US High Yield Bond - Class I 0.15%
This means that the Management Company shall bear the excess in actual expenses to any Operating andAdministrative Expenses charged to the Sub-Fund and/or Class. On the other hand the ManagementCompany is entitled to retain any amount of the Operating and Administrative Expenses charged to the Sub-Fund and/or Class, which exceeds the actual related expenses incurred by the respective Sub-Fund and/orClass.
The Operating and Administrative Expenses covers the administration and safe-keeping of assets and inaddition other ongoing operating and administrative expenses as follows:
– Remuneration of the Custodian and its transaction charges and such part of any fees or charges of alocal correspondent as may exceed the Custodian's remuneration; remuneration of the CentralAdministration; remuneration of the Registrar Agent; remuneration of the Principal Paying Agent and ofany paying agent. The fees and reasonable out-of-pocket expenses incurred by the Board of Directors ofthe Fund (no fees are paid to the Directors who are also employed by the directors or employees of theDanske Bank group) as well as auditors’ fees and expenses;
– A fund servicing fee, remaining part of the Operating and Administrative Expenses after deduction of theexpenses detailed under the section above, paid to the Management Company for administrative andrelated services including but limited to:
. the cost of ordinary legal advice received by the Management Company, the Custodian, the CentralAdministration Agent or the Registrar Agent when acting in the interest of the Shareholders;
. the costs of printing, preparing, translating and distributing financial reports, KIIDs, and Prospectus;
. any fees of registration of the Sub-Funds in different jurisdictions including fees due to thesupervisory authorities in such countries;
. the cost of publishing the Offer Price and Redemption Price and any notices to Shareholders;
. other customary administration and publication expenses arising from the Fund's operations;
. risk and compliance monitoring support;
. operational support relating to securities lending;
. the costs and expenses incurred in connection with the formation of the Fund and the initial issue ofShares by the Fund.
In case a portion of the above mentioned fees of the Service Providers is paid directly from the assets of theSub-Fund and/or Class, the Operating and Administrative Expenses due to the Management Company isreduced accordingly. The Operating and Administrative Expenses do not include the following fees andexpenses, which are payable by the Fund:
1) brokerage fees and commissions
2) interest and bank charges or other transaction related expenses such as taxes payable in relation to thetransaction
3) extraordinary expenses such as litigation expenses and any tax, levy duty or similar charge and anyunforeseen charges imposed on the Sub-Fund or its assets that would not be considered as ordinaryexpenses
4) the payment of the Luxembourg subscription tax ("taxe d'abonnement") as described in note 6 to theFinancial Statements.
The above mentioned fees are calculated on each Valuation Day on the net assets of the relevant Sub-Fundand/or class and are paid quarterly in arrears.
DANSKE INVEST SICAV
99
Notes to the unaudited Financial Statementsas at June 30, 2016 (continued)

NOTE 6 – SUBSCRIPTION TAX
Under current law and practice, the Fund is liable, to an annual subscription tax of 0.05% (exceptthose Sub-Funds or Share Classes, which may benefit from the lower rate of 0.01% as more fully describedin article 174 of the 2010 Laws. No such tax is due on the portion of assets of the Fund invested in otherLuxembourg UCITS or UCIs (if any) provided that such assets have already been subject to the subscriptiontax. This tax is payable quarterly and calculated on the basis of the Fund’s net assets at the end of therelevant quarter.
NOTE 7 – COLLATERIZED SECURITIES
The Fund had entered into fully collateralized securities lending agreements through a high quality financialinstitution as described in the Prospectus.
On June 30, 2016, the overall value of the collaterized securities amounted by the Sub-Funds to:
Danske Invest SICAV - Emerging and Frontier Markets 444,873 EURDanske Invest SICAV - Emerging Markets Debt Hard Currency 194,181 USDDanske Invest SICAV - Euro High Yield Bond 19,238,739 EURDanske Invest SICAV - Europe 2,595,685 EURDanske Invest SICAV - Europe Absolute 55,730,708 EURDanske Invest SICAV - Europe Long-Short Dynamic 40,189,724 EURDanske Invest SICAV - Europe Long-Short Dynamic Plus 1,020,329 EURDanske Invest SICAV - Germany 2,089,709 EURDanske Invest SICAV - Global High Dividend 237,310 EURDanske Invest SICAV - Global Inflation Linked Bond 118,399 EURDanske Invest SICAV - Nordic Corporate Bond 4,619,835 EUR
The transaction revenue amounts are included under the heading Income on Securities Lending in theStatement of Operations and Changes in Net Assets.
NOTE 8 – FORWARD FOREIGN EXCHANGE CONTRACTS
As at June 30, 2016, the following forward foreign exchange contracts were outstanding:
Danske Invest SICAV - Emerging Markets Debt Hard Currency
Purchase Sale Maturity
Unrealisedgain/(loss)
(USD)
EUR 46,000 USD 52,293 08/07/2016 USD (1,201)USD 1,334,069 EUR 1,175,000 08/07/2016 USD 29,008
27,807
Danske Invest SICAV - Euro High Yield Bond
Purchase Sale Maturity
Unrealisedgain/(loss)
(EUR)
EUR 1,326,723 SEK 12,289,000 08/07/2016 EUR 21,018EUR 10,337,096 USD 11,727,000 08/07/2016 EUR (221,300)EUR 3,210,446 GBP 2,500,000 08/07/2016 EUR 189,218GBP 1,397,000 EUR 1,810,342 08/07/2016 EUR (122,060)SEK 977,378 EUR 104,706 08/07/2016 EUR (860)USD 1,949,000 EUR 1,730,990 08/07/2016 EUR 23,783
(110,201)
DANSKE INVEST SICAV
100
Notes to the unaudited Financial Statementsas at June 30, 2016 (continued)

NOTE 8 – FORWARD FOREIGN EXCHANGE CONTRACTS (continued)
Danske Invest SICAV - Europe Absolute
Purchase Sale Maturity
Unrealisedgain/(loss)
(EUR)
EUR 3,606,122 SEK 33,595,938 08/07/2016 EUR 36,556SEK 262,033,927 EUR 28,284,944 08/07/2016 EUR (443,864)
(407,308)
Danske Invest SICAV - Europe Long-Short Dynamic
Purchase Sale Maturity
Unrealisedgain/(loss)
(EUR)
EUR 207,505 SEK 1,955,154 01/07/2016 EUR (226)SEK 1,574,411 EUR 167,096 01/07/2016 EUR 182EUR 7,997,040 DKK 59,469,000 08/07/2016 EUR 1,790EUR 41,447,441 CHF 45,128,000 08/07/2016 EUR 17,058EUR 101,165,435 GBP 81,328,000 08/07/2016 EUR 2,880,627EUR 7,118,391 NOK 67,074,000 08/07/2016 EUR (69,652)EUR 67,749,704 SEK 627,367,577 08/07/2016 EUR 1,091,935GBP 11,109,000 EUR 14,068,941 08/07/2016 EUR (643,659)NOK 3,452,000 EUR 371,334 08/07/2016 EUR (1,399)SEK 1,171,333,178 EUR 126,388,818 08/07/2016 EUR (1,934,778)
1,341,878
Danske Invest SICAV - Europe Long-Short Dynamic Plus
Purchase Sale Maturity
Unrealisedgain/(loss)
(EUR)
CHF 2,932,505 EUR 2,703,824 08/07/2016 EUR (11,598)EUR 516,190 NOK 4,880,000 08/07/2016 EUR (6,780)EUR 4,674,353 CHF 5,089,000 08/07/2016 EUR 2,326EUR 5,595,895 SEK 51,745,000 08/07/2016 EUR 97,992EUR 11,424,969 GBP 9,148,000 08/07/2016 EUR 369,629GBP 1,975,000 EUR 2,498,535 08/07/2016 EUR (111,738)NOK 2,327,000 EUR 249,436 08/07/2016 EUR (62)SEK 4,098,000 EUR 434,994 08/07/2016 EUR 419
340,188
Danske Invest SICAV – European Corporate Sustainable Bond*
Purchase Sale Maturity
Unrealisedgain/(loss)
(EUR)
EUR 1,433,223 USD 1,599,000 08/07/2016 EUR (4,292)EUR 835,727 NOK 7,892,000 08/07/2016 EUR (11,317)EUR 5,882,285 SEK 55,151,000 08/07/2016 EUR 35,805NOK 240,000 EUR 25,569 08/07/2016 EUR 190SEK 433,971,000 EUR 46,390,350 08/07/2016 EUR (385,716)USD 51,000 EUR 46,422 08/07/2016 EUR (572)
(365,902)
DANSKE INVEST SICAV
101
Notes to the unaudited Financial Statementsas at June 30, 2016 (continued)
* See Note 1
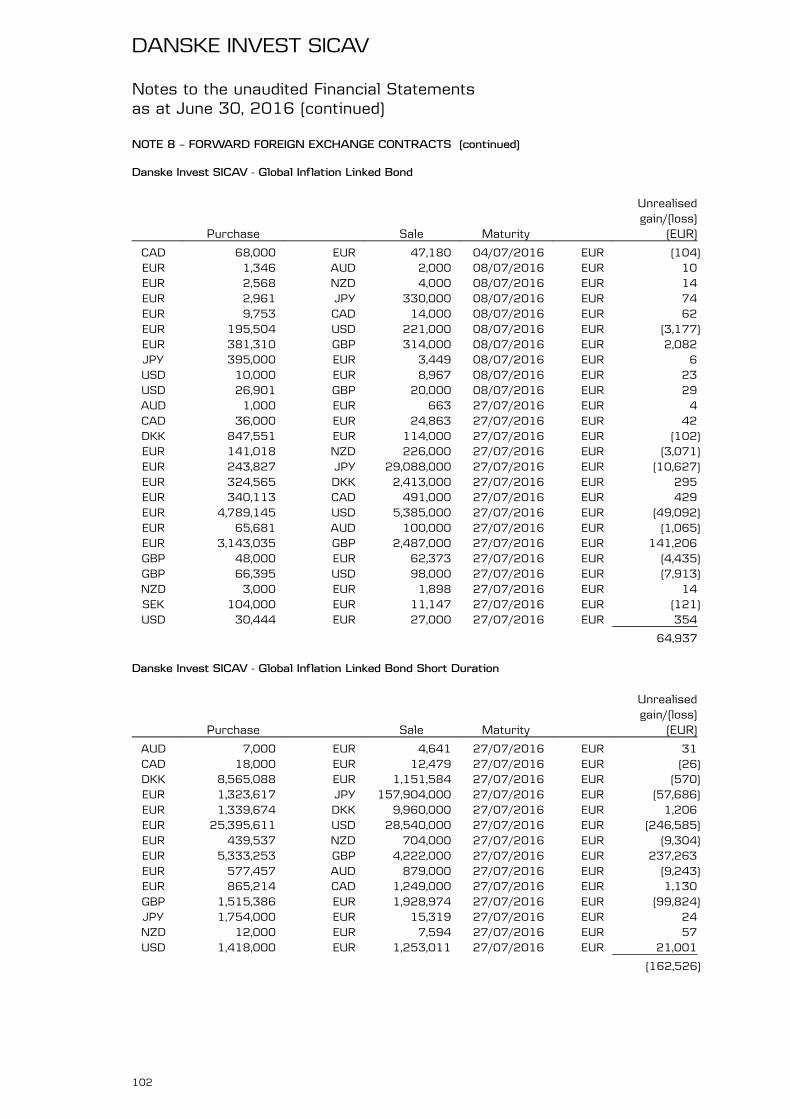
NOTE 8 – FORWARD FOREIGN EXCHANGE CONTRACTS (continued)
Danske Invest SICAV - Global Inflation Linked Bond
Purchase Sale Maturity
Unrealisedgain/(loss)
(EUR)
CAD 68,000 EUR 47,180 04/07/2016 EUR (104)EUR 1,346 AUD 2,000 08/07/2016 EUR 10EUR 2,568 NZD 4,000 08/07/2016 EUR 14EUR 2,961 JPY 330,000 08/07/2016 EUR 74EUR 9,753 CAD 14,000 08/07/2016 EUR 62EUR 195,504 USD 221,000 08/07/2016 EUR (3,177)EUR 381,310 GBP 314,000 08/07/2016 EUR 2,082JPY 395,000 EUR 3,449 08/07/2016 EUR 6USD 10,000 EUR 8,967 08/07/2016 EUR 23USD 26,901 GBP 20,000 08/07/2016 EUR 29AUD 1,000 EUR 663 27/07/2016 EUR 4CAD 36,000 EUR 24,863 27/07/2016 EUR 42DKK 847,551 EUR 114,000 27/07/2016 EUR (102)EUR 141,018 NZD 226,000 27/07/2016 EUR (3,071)EUR 243,827 JPY 29,088,000 27/07/2016 EUR (10,627)EUR 324,565 DKK 2,413,000 27/07/2016 EUR 295EUR 340,113 CAD 491,000 27/07/2016 EUR 429EUR 4,789,145 USD 5,385,000 27/07/2016 EUR (49,092)EUR 65,681 AUD 100,000 27/07/2016 EUR (1,065)EUR 3,143,035 GBP 2,487,000 27/07/2016 EUR 141,206GBP 48,000 EUR 62,373 27/07/2016 EUR (4,435)GBP 66,395 USD 98,000 27/07/2016 EUR (7,913)NZD 3,000 EUR 1,898 27/07/2016 EUR 14SEK 104,000 EUR 11,147 27/07/2016 EUR (121)USD 30,444 EUR 27,000 27/07/2016 EUR 354
64,937
Danske Invest SICAV - Global Inflation Linked Bond Short Duration
Purchase Sale Maturity
Unrealisedgain/(loss)
(EUR)
AUD 7,000 EUR 4,641 27/07/2016 EUR 31CAD 18,000 EUR 12,479 27/07/2016 EUR (26)DKK 8,565,088 EUR 1,151,584 27/07/2016 EUR (570)EUR 1,323,617 JPY 157,904,000 27/07/2016 EUR (57,686)EUR 1,339,674 DKK 9,960,000 27/07/2016 EUR 1,206EUR 25,395,611 USD 28,540,000 27/07/2016 EUR (246,585)EUR 439,537 NZD 704,000 27/07/2016 EUR (9,304)EUR 5,333,253 GBP 4,222,000 27/07/2016 EUR 237,263EUR 577,457 AUD 879,000 27/07/2016 EUR (9,243)EUR 865,214 CAD 1,249,000 27/07/2016 EUR 1,130GBP 1,515,386 EUR 1,928,974 27/07/2016 EUR (99,824)JPY 1,754,000 EUR 15,319 27/07/2016 EUR 24NZD 12,000 EUR 7,594 27/07/2016 EUR 57USD 1,418,000 EUR 1,253,011 27/07/2016 EUR 21,001
(162,526)
DANSKE INVEST SICAV
102
Notes to the unaudited Financial Statementsas at June 30, 2016 (continued)
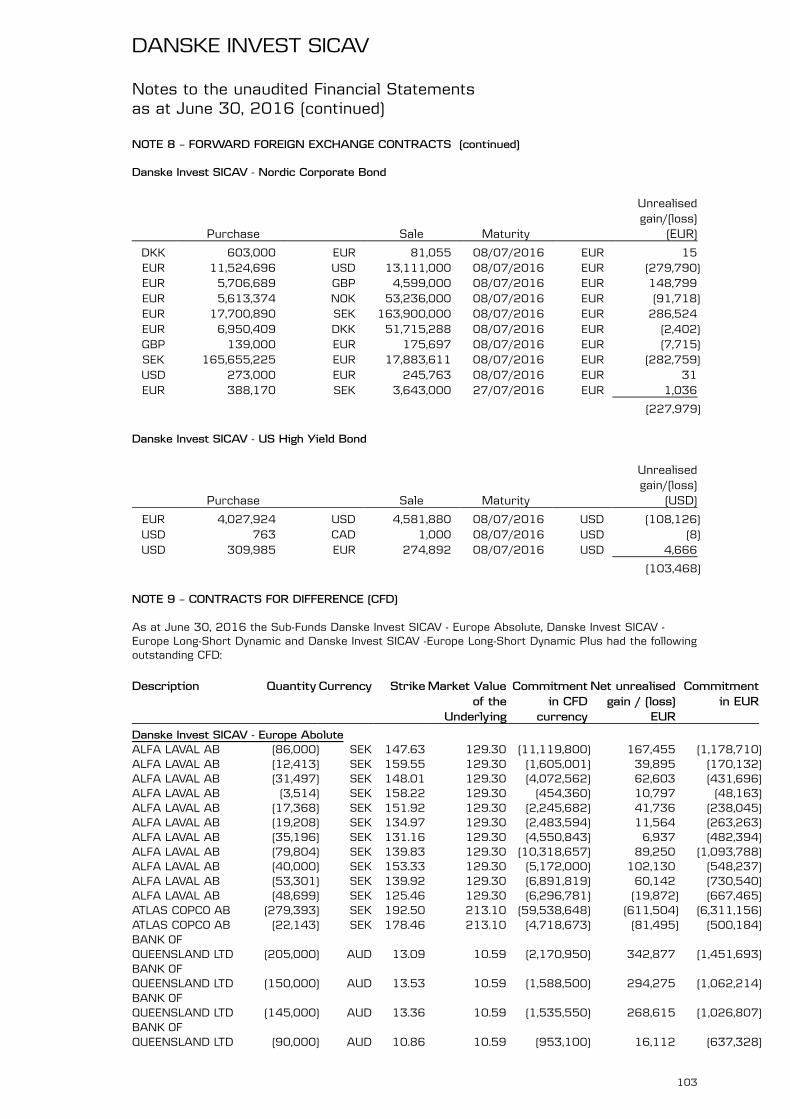
NOTE 8 – FORWARD FOREIGN EXCHANGE CONTRACTS (continued)
Danske Invest SICAV - Nordic Corporate Bond
Purchase Sale Maturity
Unrealisedgain/(loss)
(EUR)
DKK 603,000 EUR 81,055 08/07/2016 EUR 15EUR 11,524,696 USD 13,111,000 08/07/2016 EUR (279,790)EUR 5,706,689 GBP 4,599,000 08/07/2016 EUR 148,799EUR 5,613,374 NOK 53,236,000 08/07/2016 EUR (91,718)EUR 17,700,890 SEK 163,900,000 08/07/2016 EUR 286,524EUR 6,950,409 DKK 51,715,288 08/07/2016 EUR (2,402)GBP 139,000 EUR 175,697 08/07/2016 EUR (7,715)SEK 165,655,225 EUR 17,883,611 08/07/2016 EUR (282,759)USD 273,000 EUR 245,763 08/07/2016 EUR 31EUR 388,170 SEK 3,643,000 27/07/2016 EUR 1,036
(227,979)
Danske Invest SICAV - US High Yield Bond
Purchase Sale Maturity
Unrealisedgain/(loss)
(USD)
EUR 4,027,924 USD 4,581,880 08/07/2016 USD (108,126)USD 763 CAD 1,000 08/07/2016 USD (8)USD 309,985 EUR 274,892 08/07/2016 USD 4,666
(103,468)
NOTE 9 – CONTRACTS FOR DIFFERENCE (CFD)
As at June 30, 2016 the Sub-Funds Danske Invest SICAV - Europe Absolute, Danske Invest SICAV -Europe Long-Short Dynamic and Danske Invest SICAV -Europe Long-Short Dynamic Plus had the followingoutstanding CFD:
Description Quantity Currency StrikeMarket Valueof the
Underlying
Commitmentin CFD
currency
Net unrealisedgain / (loss)
EUR
Commitmentin EUR
Danske Invest SICAV - Europe AboluteALFA LAVAL AB (86,000) SEK 147.63 129.30 (11,119,800) 167,455 (1,178,710)ALFA LAVAL AB (12,413) SEK 159.55 129.30 (1,605,001) 39,895 (170,132)ALFA LAVAL AB (31,497) SEK 148.01 129.30 (4,072,562) 62,603 (431,696)ALFA LAVAL AB (3,514) SEK 158.22 129.30 (454,360) 10,797 (48,163)ALFA LAVAL AB (17,368) SEK 151.92 129.30 (2,245,682) 41,736 (238,045)ALFA LAVAL AB (19,208) SEK 134.97 129.30 (2,483,594) 11,564 (263,263)ALFA LAVAL AB (35,196) SEK 131.16 129.30 (4,550,843) 6,937 (482,394)ALFA LAVAL AB (79,804) SEK 139.83 129.30 (10,318,657) 89,250 (1,093,788)ALFA LAVAL AB (40,000) SEK 153.33 129.30 (5,172,000) 102,130 (548,237)ALFA LAVAL AB (53,301) SEK 139.92 129.30 (6,891,819) 60,142 (730,540)ALFA LAVAL AB (48,699) SEK 125.46 129.30 (6,296,781) (19,872) (667,465)ATLAS COPCO AB (279,393) SEK 192.50 213.10 (59,538,648) (611,504) (6,311,156)ATLAS COPCO AB (22,143) SEK 178.46 213.10 (4,718,673) (81,495) (500,184)BANK OFQUEENSLAND LTD (205,000) AUD 13.09 10.59 (2,170,950) 342,877 (1,451,693)BANK OFQUEENSLAND LTD (150,000) AUD 13.53 10.59 (1,588,500) 294,275 (1,062,214)BANK OFQUEENSLAND LTD (145,000) AUD 13.36 10.59 (1,535,550) 268,615 (1,026,807)BANK OFQUEENSLAND LTD (90,000) AUD 10.86 10.59 (953,100) 16,112 (637,328)
DANSKE INVEST SICAV
103
Notes to the unaudited Financial Statementsas at June 30, 2016 (continued)

NOTE 9 – CONTRACTS FOR DIFFERENCE (CFD) (continued)
Description Quantity Currency StrikeMarket Valueof the
Underlying
Commitmentin CFD
currency
Net unrealisedgain / (loss)
EUR
Commitmentin EUR
BANK OFQUEENSLAND LTD (140,000) AUD 10.57 10.59 (1,482,600) (1,905) (991,400)CARREFOUR S.A. (15,646) EUR 25.37 21.64 (338,501) 58,511 (338,501)CARREFOUR S.A. (13,385) EUR 31.42 21.64 (289,584) 131,029 (289,584)CARREFOUR S.A. (8,254) EUR 30.30 21.64 (178,575) 71,500 (178,575)CARREFOUR S.A. (6,731) EUR 28.25 21.64 (145,625) 44,501 (145,625)CARREFOUR S.A. (34,000) EUR 26.65 21.64 (735,590) 170,588 (735,590)CARREFOUR S.A. (30,000) EUR 27.56 21.64 (649,050) 177,770 (649,050)CARREFOUR S.A. (16,652) EUR 26.09 21.64 (360,266) 74,255 (360,266)CARREFOUR S.A. (13,723) EUR 25.92 21.64 (296,897) 58,860 (296,897)CARREFOUR S.A. (41,609) EUR 22.41 21.64 (900,211) 32,268 (900,211)CARREFOUR S.A. (40,000) EUR 23.27 21.64 (865,400) 65,272 (865,400)CARREFOUR S.A. (22,000) EUR 24.36 21.64 (475,970) 60,039 (475,970)CARREFOUR S.A. (7,040) EUR 0.00 21.64 (152,310) (152,310) (152,310)DOW JONES EUROSTOXX 50/PR.IND (3,846) EUR 3,076.89 2,809.53 (10,805,452) 1,028,261 (10,805,452)DOW JONES EUROSTOXX 50/PR.IND (39) EUR 2,981.94 2,809.53 (109,572) 6,724 (109,572)DOW JONES EUROSTOXX 50/PR.IND (3,618) EUR 2,776.94 2,809.53 (10,164,880) (117,902) (10,164,880)DOW JONES EUROSTOXX 50/PR.IND (2,592) EUR 2,791.95 2,809.53 (7,282,302) (45,556) (7,282,302)DOW JONES EUROSTOXX 50/PR.IND (3,399) EUR 2,679.46 2,809.53 (9,549,592) (442,119) (9,549,592)DOW JONES EUROSTOXX 50/PR.IND (3,772) EUR 2,678.66 2,809.53 (10,597,547) (493,627) (10,597,547)ENEL (634,182) EUR 4.26 3.86 (2,446,674) 255,060 (2,446,674)FLSMIDTH & CO. A/SB (86,128) DKK 246.00 237.20 (20,429,562) 101,900 (2,745,733)FLSMIDTH & CO. A/SB (26,878) DKK 223.93 237.20 (6,375,462) (47,956) (856,862)FLSMIDTH & CO. A/SB (16,000) DKK 249.55 237.20 (3,795,200) 26,575 (510,075)FLSMIDTH & CO. A/SB (25,000) DKK 240.85 237.20 (5,930,000) 12,281 (796,992)FLSMIDTH & CO. A/SB (34,308) DKK 224.94 237.20 (8,137,858) (56,532) (1,093,728)FLSMIDTH & CO. A/SB (8,691) DKK 215.12 237.20 (2,061,505) (25,795) (277,066)HANG SENG BANKLTD (155,000) HKD 128.70 131.60 (20,398,000) (52,248) (2,363,985)HSBC HOLDINGS PLC (1,038,203) GBP 4.20 4.51 (4,684,372) (389,653) (5,658,651)HSBC HOLDINGS PLC (7,840) GBP 4.20 4.51 (35,374) (2,942) (42,731)HSBC HOLDINGS PLC (219,957) GBP 4.28 4.51 (992,446) (62,274) (1,198,860)HSBC HOLDINGS PLC (16,404) GBP 0.00 4.51 (74,015) (89,465) (89,409)HSBC HOLDINGS PLC (123) GBP 0.00 4.51 (555) (671) (670)J.M.AB (39,837) SEK 222.73 207.20 (8,254,226) 65,716 (874,956)J.M.AB (42,432) SEK 236.51 207.20 (8,791,910) 132,129 (931,951)J.M.AB (6,294) SEK 226.91 207.20 (1,304,117) 13,182 (138,238)J.M.AB (8,215) SEK 230.14 207.20 (1,702,148) 20,024 (180,429)J.M.AB (18,859) SEK 227.78 207.20 (3,907,585) 41,239 (414,208)J.M.AB (38,363) SEK 221.84 207.20 (7,948,814) 59,674 (842,582)J.M.AB (21,000) SEK 255.89 207.20 (4,351,200) 108,626 (461,232)J.M.AB (19,204) SEK 242.28 207.20 (3,979,069) 71,570 (421,785)J.M.AB (33,796) SEK 187.90 207.20 (7,002,531) (69,317) (742,275)J.M.AB (23,066) SEK 198.57 207.20 (4,779,275) (21,143) (506,608)KOMAX HOLDING AG (1,255) CHF 217.80 200.50 (251,628) 19,924 (232,172)KOMAX HOLDING AG (2,857) CHF 217.73 200.50 (572,829) 45,172 (528,539)
DANSKE INVEST SICAV
104
Notes to the unaudited Financial Statementsas at June 30, 2016 (continued)
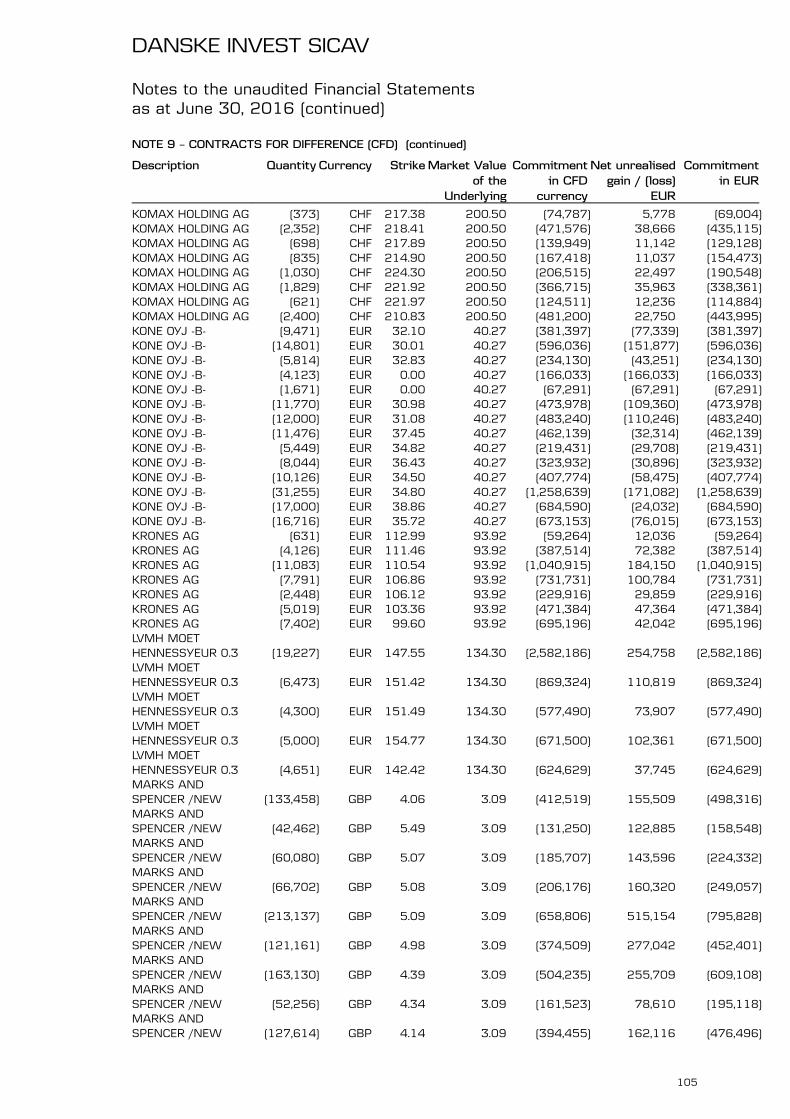
NOTE 9 – CONTRACTS FOR DIFFERENCE (CFD) (continued)
Description Quantity Currency StrikeMarket Valueof the
Underlying
Commitmentin CFD
currency
Net unrealisedgain / (loss)
EUR
Commitmentin EUR
KOMAX HOLDING AG (373) CHF 217.38 200.50 (74,787) 5,778 (69,004)KOMAX HOLDING AG (2,352) CHF 218.41 200.50 (471,576) 38,666 (435,115)KOMAX HOLDING AG (698) CHF 217.89 200.50 (139,949) 11,142 (129,128)KOMAX HOLDING AG (835) CHF 214.90 200.50 (167,418) 11,037 (154,473)KOMAX HOLDING AG (1,030) CHF 224.30 200.50 (206,515) 22,497 (190,548)KOMAX HOLDING AG (1,829) CHF 221.92 200.50 (366,715) 35,963 (338,361)KOMAX HOLDING AG (621) CHF 221.97 200.50 (124,511) 12,236 (114,884)KOMAX HOLDING AG (2,400) CHF 210.83 200.50 (481,200) 22,750 (443,995)KONE OYJ -B- (9,471) EUR 32.10 40.27 (381,397) (77,339) (381,397)KONE OYJ -B- (14,801) EUR 30.01 40.27 (596,036) (151,877) (596,036)KONE OYJ -B- (5,814) EUR 32.83 40.27 (234,130) (43,251) (234,130)KONE OYJ -B- (4,123) EUR 0.00 40.27 (166,033) (166,033) (166,033)KONE OYJ -B- (1,671) EUR 0.00 40.27 (67,291) (67,291) (67,291)KONE OYJ -B- (11,770) EUR 30.98 40.27 (473,978) (109,360) (473,978)KONE OYJ -B- (12,000) EUR 31.08 40.27 (483,240) (110,246) (483,240)KONE OYJ -B- (11,476) EUR 37.45 40.27 (462,139) (32,314) (462,139)KONE OYJ -B- (5,449) EUR 34.82 40.27 (219,431) (29,708) (219,431)KONE OYJ -B- (8,044) EUR 36.43 40.27 (323,932) (30,896) (323,932)KONE OYJ -B- (10,126) EUR 34.50 40.27 (407,774) (58,475) (407,774)KONE OYJ -B- (31,255) EUR 34.80 40.27 (1,258,639) (171,082) (1,258,639)KONE OYJ -B- (17,000) EUR 38.86 40.27 (684,590) (24,032) (684,590)KONE OYJ -B- (16,716) EUR 35.72 40.27 (673,153) (76,015) (673,153)KRONES AG (631) EUR 112.99 93.92 (59,264) 12,036 (59,264)KRONES AG (4,126) EUR 111.46 93.92 (387,514) 72,382 (387,514)KRONES AG (11,083) EUR 110.54 93.92 (1,040,915) 184,150 (1,040,915)KRONES AG (7,791) EUR 106.86 93.92 (731,731) 100,784 (731,731)KRONES AG (2,448) EUR 106.12 93.92 (229,916) 29,859 (229,916)KRONES AG (5,019) EUR 103.36 93.92 (471,384) 47,364 (471,384)KRONES AG (7,402) EUR 99.60 93.92 (695,196) 42,042 (695,196)LVMH MOETHENNESSYEUR 0.3 (19,227) EUR 147.55 134.30 (2,582,186) 254,758 (2,582,186)LVMH MOETHENNESSYEUR 0.3 (6,473) EUR 151.42 134.30 (869,324) 110,819 (869,324)LVMH MOETHENNESSYEUR 0.3 (4,300) EUR 151.49 134.30 (577,490) 73,907 (577,490)LVMH MOETHENNESSYEUR 0.3 (5,000) EUR 154.77 134.30 (671,500) 102,361 (671,500)LVMH MOETHENNESSYEUR 0.3 (4,651) EUR 142.42 134.30 (624,629) 37,745 (624,629)MARKS ANDSPENCER /NEW (133,458) GBP 4.06 3.09 (412,519) 155,509 (498,316)MARKS ANDSPENCER /NEW (42,462) GBP 5.49 3.09 (131,250) 122,885 (158,548)MARKS ANDSPENCER /NEW (60,080) GBP 5.07 3.09 (185,707) 143,596 (224,332)MARKS ANDSPENCER /NEW (66,702) GBP 5.08 3.09 (206,176) 160,320 (249,057)MARKS ANDSPENCER /NEW (213,137) GBP 5.09 3.09 (658,806) 515,154 (795,828)MARKS ANDSPENCER /NEW (121,161) GBP 4.98 3.09 (374,509) 277,042 (452,401)MARKS ANDSPENCER /NEW (163,130) GBP 4.39 3.09 (504,235) 255,709 (609,108)MARKS ANDSPENCER /NEW (52,256) GBP 4.34 3.09 (161,523) 78,610 (195,118)MARKS ANDSPENCER /NEW (127,614) GBP 4.14 3.09 (394,455) 162,116 (476,496)
DANSKE INVEST SICAV
105
Notes to the unaudited Financial Statementsas at June 30, 2016 (continued)

NOTE 9 – CONTRACTS FOR DIFFERENCE (CFD) (continued)
Description Quantity Currency StrikeMarket Valueof the
Underlying
Commitmentin CFD
currency
Net unrealisedgain / (loss)
EUR
Commitmentin EUR
MARKS ANDSPENCER /NEW (266,457) GBP 4.01 3.09 (823,619) 296,870 (994,919)MARKS ANDSPENCER /NEW (234,543) GBP 2.78 3.09 (724,972) (88,862) (875,756)NEXT PLC (83,095) GBP 48.37 48.23 (4,007,672) 13,570 (4,841,207)NORMA GROUP (10,000) EUR 43.87 42.81 (428,100) 10,612 (428,100)NORMA GROUP (21,177) EUR 43.32 42.81 (906,587) 10,824 (906,587)NORMA GROUP (3,348) EUR 44.09 42.81 (143,328) 4,297 (143,328)NORMA GROUP (13,875) EUR 43.34 42.81 (593,989) 7,329 (593,989)NORMA GROUP (4,100) EUR 41.74 42.81 (175,521) (4,386) (175,521)SANDVIK AB (697,507) SEK 64.55 82.10 (57,265,325) (1,300,596) (6,070,182)SANDVIK AB (57,701) SEK 82.03 82.10 (4,737,252) (433) (502,153)SCHAEFFLER AG/PFD (7,059) EUR 14.32 11.89 (83,896) 17,156 (83,896)SCHAEFFLER AG/PFD (61,330) EUR 13.90 11.89 (728,907) 123,754 (728,907)SCHAEFFLER AG/PFD (11,611) EUR 13.95 11.89 (137,997) 23,967 (137,997)SCHAEFFLER AG/PFD (25,794) EUR 14.08 11.89 (306,562) 56,635 (306,562)SCHAEFFLER AG/PFD (84,206) EUR 13.52 11.89 (1,000,788) 138,004 (1,000,788)SIEMENS AG /NAM. (9,499) EUR 80.35 90.42 (858,900) (95,687) (858,900)SIEMENS AG /NAM. (1,488) EUR 83.52 90.42 (134,545) (10,262) (134,545)SIEMENS AG /NAM. (4,706) EUR 83.84 90.42 (425,517) (30,960) (425,517)SIEMENS AG /NAM. (6,488) EUR 91.68 90.42 (586,645) 8,149 (586,645)SIEMENS AG /NAM. (1,554) EUR 87.42 90.42 (140,513) (4,663) (140,513)SIEMENS AG /NAM. (6,710) EUR 86.00 90.42 (606,718) (29,689) (606,718)SIEMENS AG /NAM. (22,518) EUR 83.24 90.42 (2,036,078) (161,587) (2,036,078)SIEMENS AG /NAM. (4,418) EUR 90.81 90.42 (399,476) 1,716 (399,476)SKF ABB (86,761) SEK 125.90 132.90 (11,530,537) (64,565) (1,222,248)SKF ABB (333,773) SEK 127.90 132.90 (44,358,432) (177,312) (4,702,038)SKF ABB (49,880) SEK 137.44 132.90 (6,629,052) 24,034 (702,686)STANDARDCHARTERED PLC (703,090) GBP 3.87 5.48 (3,855,042) (1,373,792) (4,656,833)STANDARDCHARTERED PLC (286,910) GBP 5.12 5.48 (1,573,128) (126,994) (1,900,314)STATOIL ASA (20,925) NOK 122.35 143.30 (2,998,553) (46,995) (321,922)STATOIL ASA (69,725) NOK 103.70 143.30 (9,991,593) (295,997) (1,072,687)STATOIL ASA (184,909) NOK 121.68 143.30 (26,497,460) (428,505) (2,844,741)STATOIL ASA (89,441) NOK 119.12 143.30 (12,816,895) (231,825) (1,376,009)STATOIL ASA (90,000) NOK 119.09 143.30 (12,897,000) (233,589) (1,384,609)STATOIL ASA (6,305) NOK 0.00 143.30 (903,507) (96,854) (97,000)THE SWATCH GROUPAG (7,914) CHF 370.40 277.30 (2,194,552) 676,291 (2,024,874)THE SWATCH GROUPAG (1,225) CHF 371.46 277.30 (339,693) 105,870 (313,428)THE SWATCH GROUPAG (1,764) CHF 354.62 277.30 (489,157) 125,200 (451,337)THE SWATCH GROUPAG (3,700) CHF 364.76 277.30 (1,026,010) 297,021 (946,681)THE SWATCH GROUPAG (1,397) CHF 355.33 277.30 (387,388) 100,050 (357,436)THE SWATCH GROUPAG (2,907) CHF 327.33 277.30 (806,111) 133,499 (743,784)THE SWATCH GROUPAG (856) CHF 337.66 277.30 (237,369) 47,422 (219,017)
DANSKE INVEST SICAV
106
Notes to the unaudited Financial Statementsas at June 30, 2016 (continued)

NOTE 9 – CONTRACTS FOR DIFFERENCE (CFD) (continued)
Description Quantity Currency StrikeMarket Valueof the
Underlying
Commitmentin CFD
currency
Net unrealisedgain / (loss)
EUR
Commitmentin EUR
THE SWATCH GROUPAG (1,184) CHF 288.03 277.30 (328,323) 11,665 (302,938)THE SWATCH GROUPAG (2,053) CHF 291.84 277.30 (569,297) 27,402 (525,280)Total 1,091,834 (166,138,620)
As at June 30, 2016, the net unrealised gain on CFD was EUR 1,091,834.
Description Quantity Currency Strike Market Valueof the
Underlying
Commitmentin CFD
currency
Net unrealisedgain / (loss)
EUR
Commitmentin EUR
Danske Invest SICAV - Europe Long-Short DynamicABB LTD ZUERICH/NAMEN. (156,041) CHF 20.29 18.93 (2,953,856) 195,334 (2,725,470)ALFA LAVAL AB (286,599) SEK 137.21 129.30 (37,057,251) 240,922 (3,928,106)ALFA LAVAL AB (84,453) SEK 135.44 129.30 (10,919,773) 55,087 (1,157,507)ALFA LAVAL AB (200,000) SEK 134.31 129.30 (25,860,000) 106,417 (2,741,186)ALFA LAVAL AB (377,229) SEK 133.80 129.30 (48,775,710) 180,358 (5,170,274)ALFA LAVAL AB (50,000) SEK 135.08 129.30 (6,465,000) 30,701 (685,296)ALFA LAVAL AB (28,948) SEK 132.51 129.30 (3,742,976) 9,871 (396,759)ALFA LAVAL AB (100,000) SEK 133.00 129.30 (12,930,000) 39,307 (1,370,593)ALFA LAVAL AB (213,998) SEK 126.41 129.30 (27,669,941) (65,648) (2,933,041)ALFA LAVAL AB (173,002) SEK 125.31 129.30 (22,369,159) (73,361) (2,371,153)ALFA LAVAL AB (40,000) SEK 137.37 129.30 (5,172,000) 34,293 (548,237)ALFA LAVAL AB (100,000) SEK 126.44 129.30 (12,930,000) (30,416) (1,370,593)ALFA LAVAL AB (279,094) SEK 125.98 129.30 (36,086,854) (98,502) (3,825,243)ALFA LAVAL AB (270,000) SEK 124.72 129.30 (34,911,000) (131,316) (3,700,601)ATLAS COPCO AB (350,000) SEK 204.30 213.10 (74,585,000) (327,241) (7,906,085)ATLAS COPCO AB (339,328) SEK 204.30 213.10 (72,310,797) (317,263) (7,665,017)ATLAS COPCO AB (150,000) SEK 202.89 213.10 (31,965,000) (162,754) (3,388,322)AXFOOD AB (73,613) SEK 131.70 159.50 (11,741,274) (217,428) (1,244,587)AXFOOD AB (129,000) SEK 146.60 159.50 (20,575,500) (176,784) (2,181,024)BANKIA S.A. (3,805,132) EUR 0.77 0.63 (2,393,428) 537,075 (2,393,428)BANKIA S.A. (894,868) EUR 0.76 0.63 (562,872) 120,788 (562,872)BANKINTER SA (648,612) EUR 5.98 5.72 (3,710,709) 166,374 (3,710,709)BANKINTER SA (21,388) EUR 6.01 5.72 (122,361) 6,138 (122,361)BANKINTER SA (239,449) EUR 6.31 5.72 (1,369,888) 140,078 (1,369,888)BANKINTER SA (335,551) EUR 6.28 5.72 (1,919,687) 187,405 (1,919,687)BCO BILBAO VIZ.ARGENTARIA/NAM. (641,000) EUR 5.66 4.96 (3,178,719) 446,604 (3,178,719)CAIXABANK (1,600,000) EUR 2.27 1.95 (3,123,200) 511,870 (3,123,200)DEUTSCHE ANN/NAMEN (50,000) EUR 29.11 32.71 (1,635,500) (180,080) (1,635,500)DEUTSCHE ANN/NAMEN (20,000) EUR 29.41 32.71 (654,200) (66,084) (654,200)DEUTSCHE ANN/NAMEN (60,000) EUR 27.84 32.71 (1,962,600) (292,023) (1,962,600)DEUTSCHE ANN/NAMEN (7,700) EUR 28.63 32.71 (251,867) (31,444) (251,867)DEUTSCHE ANN/NAMEN (100,000) EUR 30.66 32.71 (3,271,000) (205,495) (3,271,000)DEUTSCHE ANN/NAMEN (50,000) EUR 30.88 32.71 (1,635,500) (91,335) (1,635,500)DEUTSCHE WOHNENAG (140,000) EUR 26.83 30.60 (4,283,300) (527,429) (4,283,300)DJ EURO STOXX/BANKS/PRICE IND (34,000) EUR 107.55 81.20 (2,760,800) 895,867 (2,760,800)
DANSKE INVEST SICAV
107
Notes to the unaudited Financial Statementsas at June 30, 2016 (continued)

NOTE 9 – CONTRACTS FOR DIFFERENCE (CFD) (continued)
Description Quantity Currency Strike Market Valueof the
Underlying
Commitmentin CFD
currency
Net unrealisedgain / (loss)
EUR
Commitmentin EUR
DJ EURO STOXX/BANKS/PRICE IND (45,000) EUR 101.34 81.20 (3,654,000) 906,103 (3,654,000)DJ EUROPE STOXX600 INDUST G&S (15,000) EUR 386.37 401.98 (6,029,700) (234,165) (6,029,700)DJ EUROPE STOXX600 INDUST G&S (30,000) EUR 417.70 401.98 (12,059,400) 471,657 (12,059,400)DJ EUROPE STOXX600 INDUST G&S (25,000) EUR 416.76 401.98 (10,049,500) 369,597 (10,049,500)DJ EUROPE STOXX600 INDUST G&S (20,000) EUR 417.70 401.98 (8,039,600) 314,438 (8,039,600)DJ EUROPE STOXX600 INDUST G&S (11,000) EUR 435.40 401.98 (4,421,780) 367,608 (4,421,780)DJ EUROPE STOXX600 INDUST G&S (10,000) EUR 435.80 401.98 (4,019,800) 338,206 (4,019,800)DJ EUROPE STOXX600 INDUST G&S (24,000) EUR 403.19 401.98 (9,647,520) 28,995 (9,647,520)DJ EUROPE STOXX600 INDUST G&S (35,000) EUR 408.35 401.98 (14,069,300) 223,043 (14,069,300)DJ EUROPE STOXX600 INDUST G&S (6,000) EUR 400.21 401.98 (2,411,880) (10,614) (2,411,880)DJ EUROPE STOXX600 INDUST G&S (23,870) EUR 385.42 401.98 (9,595,263) (395,239) (9,595,263)DJ EUROPE STOXX600 INDUST G&S (21,130) EUR 392.57 401.98 (8,493,837) (198,799) (8,493,837)DJ EUROPE STOXX600 INSUR.IND (61,231) EUR 224.54 218.39 (13,372,238) 376,571 (13,372,238)DJ EUROPE STOXX600 INSUR.IND (50,000) EUR 233.67 218.39 (10,919,500) 763,910 (10,919,500)DJ EUROPE STOXX600 INSUR.IND (20,000) EUR 222.84 218.39 (4,367,800) 88,952 (4,367,800)DJ EUROPE STOXX600 INSUR.IND (15,400) EUR 235.52 218.39 (3,363,206) 263,780 (3,363,206)DJ EUROPE STOXX600 INSUR.IND (40,000) EUR 243.30 218.39 (8,735,600) 996,225 (8,735,600)DJ STOXX 600HEALTH CARE (8,489) EUR 661.25 738.85 (6,272,098) (658,746) (6,272,098)DJ STOXX 600 RETAIL (61,800) EUR 299.74 286.94 (17,732,892) 791,040 (17,732,892)DJ STOXX 600 TLCM (7,000) EUR 376.76 298.22 (2,087,540) 549,788 (2,087,540)DJ STOXX 600 TLCM (2,350) EUR 351.17 298.22 (700,817) 124,429 (700,817)DONG ENERGYA/S (210,000) DKK 256.81 241.00 (50,610,000) 446,494 (6,801,984)DONG ENERGYA/S (135,000) DKK 257.00 241.00 (32,535,000) 290,326 (4,372,704)DONG ENERGYA/S (300,000) DKK 239.82 241.00 (72,300,000) (47,635) (9,717,120)DOW JONES 600-CONS.& MAT. (35,097) EUR 333.59 360.76 (12,661,594) (953,585) (12,661,594)DOW JONES 600-CONS.& MAT. (4,434) EUR 378.11 360.76 (1,599,610) 76,913 (1,599,610)DOW JONES 600-CONS.& MAT. (1,887) EUR 386.16 360.76 (680,754) 47,925 (680,754)DOW JONES 600-CONS.& MAT. (5,000) EUR 393.71 360.76 (1,803,800) 164,725 (1,803,800)DOW JONES 600-CONS.& MAT. (5,000) EUR 393.92 360.76 (1,803,800) 165,778 (1,803,800)DOW JONES 600-CONS.& MAT. (20,000) EUR 365.82 360.76 (7,215,200) 101,112 (7,215,200)DOW JONES EUROSTOXX UTILITY (10,100) EUR 287.22 249.04 (2,515,304) 385,618 (2,515,304)DOW JONES EUROSTOXX UTILITY (2,300) EUR 282.02 249.04 (572,792) 75,851 (572,792)
DANSKE INVEST SICAV
108
Notes to the unaudited Financial Statementsas at June 30, 2016 (continued)
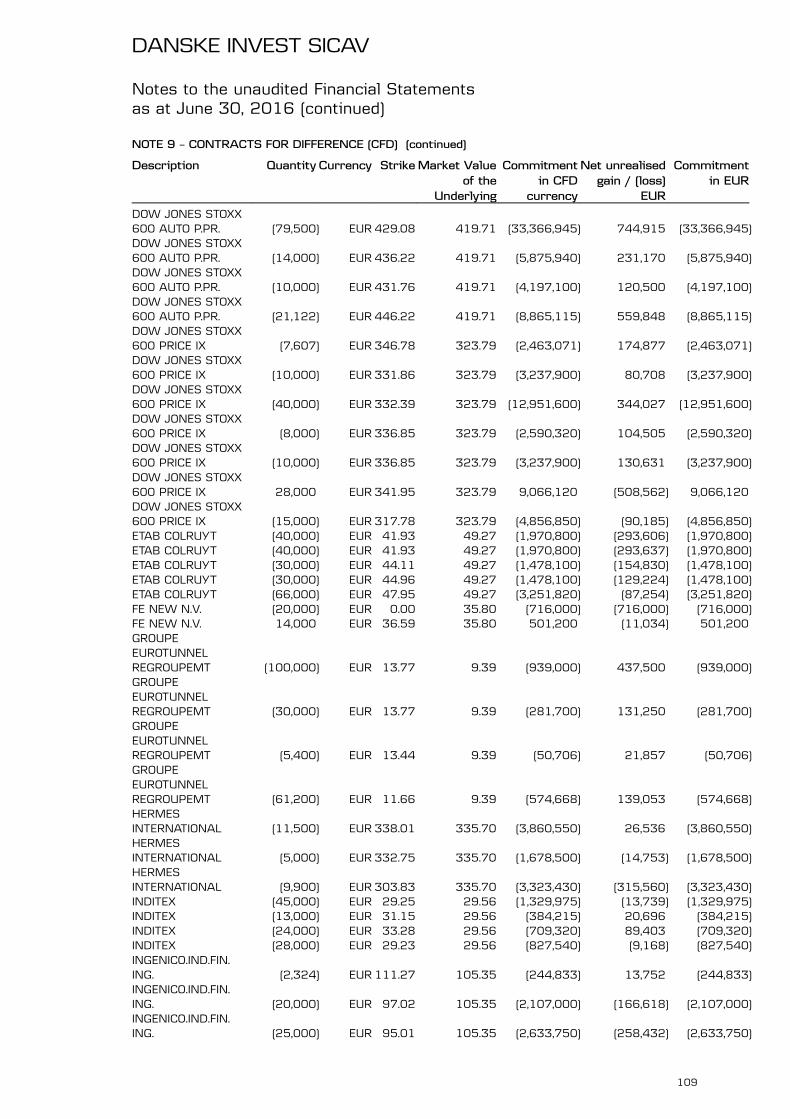
NOTE 9 – CONTRACTS FOR DIFFERENCE (CFD) (continued)
Description Quantity Currency Strike Market Valueof the
Underlying
Commitmentin CFD
currency
Net unrealisedgain / (loss)
EUR
Commitmentin EUR
DOW JONES STOXX600 AUTO P.PR. (79,500) EUR 429.08 419.71 (33,366,945) 744,915 (33,366,945)DOW JONES STOXX600 AUTO P.PR. (14,000) EUR 436.22 419.71 (5,875,940) 231,170 (5,875,940)DOW JONES STOXX600 AUTO P.PR. (10,000) EUR 431.76 419.71 (4,197,100) 120,500 (4,197,100)DOW JONES STOXX600 AUTO P.PR. (21,122) EUR 446.22 419.71 (8,865,115) 559,848 (8,865,115)DOW JONES STOXX600 PRICE IX (7,607) EUR 346.78 323.79 (2,463,071) 174,877 (2,463,071)DOW JONES STOXX600 PRICE IX (10,000) EUR 331.86 323.79 (3,237,900) 80,708 (3,237,900)DOW JONES STOXX600 PRICE IX (40,000) EUR 332.39 323.79 (12,951,600) 344,027 (12,951,600)DOW JONES STOXX600 PRICE IX (8,000) EUR 336.85 323.79 (2,590,320) 104,505 (2,590,320)DOW JONES STOXX600 PRICE IX (10,000) EUR 336.85 323.79 (3,237,900) 130,631 (3,237,900)DOW JONES STOXX600 PRICE IX 28,000 EUR 341.95 323.79 9,066,120 (508,562) 9,066,120DOW JONES STOXX600 PRICE IX (15,000) EUR 317.78 323.79 (4,856,850) (90,185) (4,856,850)ETAB COLRUYT (40,000) EUR 41.93 49.27 (1,970,800) (293,606) (1,970,800)ETAB COLRUYT (40,000) EUR 41.93 49.27 (1,970,800) (293,637) (1,970,800)ETAB COLRUYT (30,000) EUR 44.11 49.27 (1,478,100) (154,830) (1,478,100)ETAB COLRUYT (30,000) EUR 44.96 49.27 (1,478,100) (129,224) (1,478,100)ETAB COLRUYT (66,000) EUR 47.95 49.27 (3,251,820) (87,254) (3,251,820)FE NEW N.V. (20,000) EUR 0.00 35.80 (716,000) (716,000) (716,000)FE NEW N.V. 14,000 EUR 36.59 35.80 501,200 (11,034) 501,200GROUPEEUROTUNNELREGROUPEMT (100,000) EUR 13.77 9.39 (939,000) 437,500 (939,000)GROUPEEUROTUNNELREGROUPEMT (30,000) EUR 13.77 9.39 (281,700) 131,250 (281,700)GROUPEEUROTUNNELREGROUPEMT (5,400) EUR 13.44 9.39 (50,706) 21,857 (50,706)GROUPEEUROTUNNELREGROUPEMT (61,200) EUR 11.66 9.39 (574,668) 139,053 (574,668)HERMESINTERNATIONAL (11,500) EUR 338.01 335.70 (3,860,550) 26,536 (3,860,550)HERMESINTERNATIONAL (5,000) EUR 332.75 335.70 (1,678,500) (14,753) (1,678,500)HERMESINTERNATIONAL (9,900) EUR 303.83 335.70 (3,323,430) (315,560) (3,323,430)INDITEX (45,000) EUR 29.25 29.56 (1,329,975) (13,739) (1,329,975)INDITEX (13,000) EUR 31.15 29.56 (384,215) 20,696 (384,215)INDITEX (24,000) EUR 33.28 29.56 (709,320) 89,403 (709,320)INDITEX (28,000) EUR 29.23 29.56 (827,540) (9,168) (827,540)INGENICO.IND.FIN.ING. (2,324) EUR 111.27 105.35 (244,833) 13,752 (244,833)INGENICO.IND.FIN.ING. (20,000) EUR 97.02 105.35 (2,107,000) (166,618) (2,107,000)INGENICO.IND.FIN.ING. (25,000) EUR 95.01 105.35 (2,633,750) (258,432) (2,633,750)
DANSKE INVEST SICAV
109
Notes to the unaudited Financial Statementsas at June 30, 2016 (continued)

NOTE 9 – CONTRACTS FOR DIFFERENCE (CFD) (continued)
Description Quantity Currency Strike Market Valueof the
Underlying
Commitmentin CFD
currency
Net unrealisedgain / (loss)
EUR
Commitmentin EUR
INGENICO.IND.FIN.ING. (30,000) EUR 103.36 105.35 (3,160,500) (59,584) (3,160,500)INGENICO.IND.FIN.ING. (367) EUR 0.00 105.35 (38,663) (38,663) (38,663)INGENICO.IND.FIN.ING. (440) EUR 0.00 105.35 (46,354) (46,354) (46,354)INGENICO.IND.FIN.ING. (293) EUR 0.00 105.35 (30,868) (30,867) (30,868)INGENICO.IND.FIN.ING. (34) EUR 0.00 105.35 (3,582) (3,582) (3,582)INGENICO.IND.FIN.ING. (70,000) EUR 96.46 105.35 (7,374,500) (622,239) (7,374,500)JERONIMO MARTINSSGPS SA (38,853) EUR 12.98 13.85 (538,114) (33,783) (538,114)JERONIMO MARTINSSGPS SA (150,000) EUR 13.03 13.85 (2,077,500) (122,717) (2,077,500)JERONIMO MARTINSSGPS SA (20,755) EUR 13.04 13.85 (287,457) (16,710) (287,457)JERONIMO MARTINSSGPS SA (38,462) EUR 13.63 13.85 (532,699) (8,288) (532,699)JERONIMO MARTINSSGPS SA (122,599) EUR 13.64 13.85 (1,697,996) (25,623) (1,697,996)JERONIMO MARTINSSGPS SA (38,939) EUR 13.67 13.85 (539,305) (6,990) (539,305)KONE OYJ -B- (57,506) EUR 40.33 40.27 (2,315,767) 3,302 (2,315,767)KUEHNE +NAGELINTERNATIONAL (10,000) CHF 141.44 134.30 (1,343,000) 65,572 (1,239,162)KUEHNE +NAGELINTERNATIONAL (45,000) CHF 133.00 134.30 (6,043,500) (53,696) (5,576,229)KUEHNE +NAGELINTERNATIONAL (14,000) CHF 131.56 134.30 (1,880,200) (35,213) (1,734,827)KUEHNE +NAGELINTERNATIONAL (5,100) CHF 131.05 134.30 (684,930) (15,211) (631,973)KUEHNE +NAGELINTERNATIONAL (6,822) CHF 125.95 134.30 (916,195) (52,255) (845,356)KUEHNE +NAGELINTERNATIONAL (4,900) CHF 137.56 134.30 (658,070) 14,668 (607,189)KUEHNE +NAGELINTERNATIONAL (39,855) CHF 135.11 134.30 (5,352,527) 29,606 (4,938,680)KUEHNE +NAGELINTERNATIONAL (10,145) CHF 135.25 134.30 (1,362,474) 8,804 (1,257,130)KUEHNE +NAGELINTERNATIONAL (28,000) CHF 135.70 134.30 (3,760,400) 35,860 (3,469,653)KUEHNE +NAGELINTERNATIONAL (20,000) CHF 135.11 134.30 (2,686,000) 14,958 (2,478,324)KUEHNE +NAGELINTERNATIONAL (3,516) CHF 137.62 134.30 (472,199) 10,706 (435,689)KUEHNE +NAGELINTERNATIONAL (26,484) CHF 137.44 134.30 (3,556,801) 76,336 (3,281,796)KUEHNE +NAGELINTERNATIONAL (15,000) CHF 140.40 134.30 (2,014,500) 83,938 (1,858,743)KUEHNE +NAGELINTERNATIONAL (20,000) CHF 137.66 134.30 (2,686,000) 61,724 (2,478,324)KUEHNE +NAGELINTERNATIONAL (15,000) CHF 138.32 134.30 (2,014,500) 55,307 (1,858,743)KUEHNE +NAGELINTERNATIONAL (5,666) CHF 139.00 134.30 (760,944) 24,441 (702,109)
DANSKE INVEST SICAV
110
Notes to the unaudited Financial Statementsas at June 30, 2016 (continued)

NOTE 9 – CONTRACTS FOR DIFFERENCE (CFD) (continued)
Description Quantity Currency Strike Market Valueof the
Underlying
Commitmentin CFD
currency
Net unrealisedgain / (loss)
EUR
Commitmentin EUR
KUEHNE +NAGELINTERNATIONAL (19,334) CHF 139.49 134.30 (2,596,556) 92,169 (2,395,796)KUEHNE +NAGELINTERNATIONAL (80,000) CHF 132.13 134.30 (10,744,000) (159,109) (9,913,295)LEGRAND HOLDINGACT.PROV.OPO (25,000) EUR 50.35 45.22 (1,130,500) 128,293 (1,130,500)LEGRAND HOLDINGACT.PROV.OPO (25,000) EUR 49.91 45.22 (1,130,500) 117,263 (1,130,500)LEGRAND HOLDINGACT.PROV.OPO (3,660) EUR 54.03 45.22 (165,505) 32,250 (165,505)LEGRAND HOLDINGACT.PROV.OPO (83,300) EUR 49.77 45.22 (3,766,826) 379,015 (3,766,826)LLOYDS BANKINGGROUP PLC (8,000,000) GBP 0.64 0.54 (4,353,600) 936,409 (5,259,083)LVMH MOETHENNESSYEUR 0.3 (3,800) EUR 168.69 134.30 (510,340) 130,671 (510,340)LVMH MOETHENNESSYEUR 0.3 (5,700) EUR 152.38 134.30 (765,510) 103,057 (765,510)LVMH MOETHENNESSYEUR 0.3 (2,500) EUR 158.31 134.30 (335,750) 60,030 (335,750)LVMH MOETHENNESSYEUR 0.3 (5,400) EUR 151.53 134.30 (725,220) 93,041 (725,220)LVMH MOETHENNESSYEUR 0.3 (4,200) EUR 144.00 134.30 (564,060) 40,744 (564,060)METRO AG (35,000) EUR 28.50 26.95 (943,250) 54,250 (943,250)METRO AG (35,000) EUR 29.03 26.95 (943,250) 72,870 (943,250)METRO AG (80,000) EUR 29.14 26.95 (2,156,000) 174,805 (2,156,000)METRO AG (55,000) EUR 25.97 26.95 (1,482,250) (53,642) (1,482,250)METRO AG (172,500) EUR 25.83 26.95 (4,648,875) (192,665) (4,648,875)METRO AG (87,400) EUR 23.08 26.95 (2,355,430) (338,451) (2,355,430)NORDEA BANK AB (300,000) SEK 74.38 70.35 (21,105,000) 128,545 (2,237,151)NORDEA BANK AB (657,000) SEK 69.91 70.35 (46,219,950) (30,623) (4,899,361)NORDEX SEROSTOCK/KONV (144,253) EUR 24.06 25.45 (3,671,239) (200,056) (3,671,239)NORDEX SEROSTOCK/KONV (145,747) EUR 24.60 25.45 (3,709,261) (123,250) (3,709,261)ORKLA ASA (380,446) NOK 62.70 73.60 (28,000,826) (444,535) (3,006,141)ROYAL BANK OFSCOTLAND GROUP (1,283,537) GBP 2.48 1.72 (2,210,251) 1,173,685 (2,669,950)ROYAL BANK OFSCOTLAND GROUP (716,463) GBP 2.49 1.72 (1,233,749) 661,726 (1,490,351)ROYAL BANK OFSCOTLAND GROUP (1,200,000) GBP 2.14 1.72 (2,066,400) 611,776 (2,496,180)SAMPO PLCA (425,000) EUR 39.88 35.86 (15,240,500) 1,706,862 (15,240,500)SAMPO PLCA (175,598) EUR 40.28 35.86 (6,296,944) 775,662 (6,296,944)SAMPO PLCA (513,870) EUR 35.30 35.86 (18,427,378) (287,153) (18,427,378)SKANDINAV.ENSK.BANKENA (437,000) SEK 82.81 72.35 (31,616,950) 485,766 (3,351,428)SKANDINAV.ENSK.BANKENA (602,107) SEK 76.20 72.35 (43,562,441) 246,204 (4,617,662)SKANDINAV.ENSK.BANKENA (77,893) SEK 76.16 72.35 (5,635,559) 31,539 (597,375)SKANDINAV.ENSK.BANKENA (300,000) SEK 73.05 72.35 (21,705,000) 22,319 (2,300,752)SKANSKAB (115,000) SEK 168.60 172.00 (19,780,000) (41,543) (2,096,700)SKANSKAB (50,000) SEK 181.83 172.00 (8,600,000) 52,204 (911,609)SPIRAX-SARCOENGINEERING PLC (10,601) GBP 32.94 36.79 (390,011) (49,395) (471,127)
DANSKE INVEST SICAV
111
Notes to the unaudited Financial Statementsas at June 30, 2016 (continued)

NOTE 9 – CONTRACTS FOR DIFFERENCE (CFD) (continued)
Description Quantity Currency Strike Market Valueof the
Underlying
Commitmentin CFD
currency
Net unrealisedgain / (loss)
EUR
Commitmentin EUR
SPIRAX-SARCOENGINEERING PLC (22,483) GBP 27.70 36.79 (827,150) (247,107) (999,184)SPIRAX-SARCOENGINEERING PLC (57,517) GBP 26.92 36.79 (2,116,050) (686,355) (2,556,157)STATOIL ASA (308,243) NOK 129.28 143.30 (44,171,222) (463,356) (4,742,178)STATOIL ASA (58,044) NOK 129.21 143.30 (8,317,705) (87,696) (892,981)STATOIL ASA (5,076) NOK 0.00 143.30 (727,391) (77,975) (78,092)SVENSKAHANDELSBANKENAB (528,000) SEK 96.90 99.65 (52,615,200) (154,271) (5,577,264)SVENSKAHANDELSBANKENAB (552,700) SEK 96.90 99.65 (55,076,555) (161,488) (5,838,170)SVENSKAHANDELSBANKENAB (232,000) SEK 103.89 99.65 (23,118,800) 104,560 (2,450,616)SVENSKAHANDELSBANKENAB (240,000) SEK 101.18 99.65 (23,916,000) 38,906 (2,535,120)SVENSKAHANDELSBANKENAB (329,000) SEK 109.32 99.65 (32,784,850) 337,895 (3,475,226)SVENSKAHANDELSBANKENAB (350,000) SEK 105.01 99.65 (34,877,500) 199,443 (3,697,050)SVENSKAHANDELSBANKENAB (250,000) SEK 101.53 99.65 (24,912,500) 49,949 (2,640,750)SVENSKAHANDELSBANKENAB (250,000) SEK 101.53 99.65 (24,912,500) 49,949 (2,640,750)TESCO PLC (1,700,000) GBP 1.82 1.69 (2,870,450) 278,563 (3,467,460)TESCO PLC (500,000) GBP 1.90 1.69 (844,250) 130,577 (1,019,840)UBS GROUP AG (203,562) CHF 14.91 12.47 (2,538,418) 455,303 (2,342,152)UBS GROUP AG (2,938) CHF 14.99 12.47 (36,637) 6,785 (33,804)VALEO SA (369,780) EUR 44.62 40.09 (14,822,631) 1,675,720 (14,822,631)WORLDLINE SA (34,475) EUR 18.94 25.12 (866,012) (213,185) (866,012)WORLDLINE SA (39,718) EUR 19.39 25.12 (997,716) (227,714) (997,716)WORLDLINE SA (25,160) EUR 19.08 25.12 (632,019) (152,003) (632,019)WORLDLINE SA (2,201) EUR 19.05 25.12 (55,289) (13,369) (55,289)WORLDLINE SA (4,566) EUR 19.01 25.12 (114,698) (27,895) (114,698)WORLDPAY GROUPPLC (1,960,000) GBP 2.66 2.65 (5,194,000) 25,080 (6,274,274)WORLDPAY GROUPPLC (840,000) GBP 2.67 2.65 (2,226,000) 23,134 (2,688,975)WORLDPAY GROUPPLC (785,000) GBP 2.70 2.65 (2,080,250) 45,906 (2,512,911)WORLDPAY GROUPPLC (582,227) GBP 2.59 2.65 (1,542,902) (43,455) (1,863,802)Total 14,018,894 (645,353,788)
As at June 30, 2016, the net unrealised gain on CFD was EUR 14,018,894.
DANSKE INVEST SICAV
112
Notes to the unaudited Financial Statementsas at June 30, 2016 (continued)

NOTE 9 – CONTRACTS FOR DIFFERENCE (CFD) (continued)
Description Quantity Currency Strike Market Valueof the
Underlying
Commitmentin CFD
currency
Net unrealisedgain / (loss)
EUR
Commitmentin EUR
Danske Invest SICAV - Europe Long-Short Dynamic PlusA.P. MOELLER -MAERSK A/SB 245 DKK 8,803.07 8,555.00 2,095,975 (8,171) 281,699A.P. MOELLER -MAERSK A/SB 227 DKK 8,978.02 8,555.00 1,941,985 (12,910) 261,003A.P. MOELLER -MAERSK A/SB 600 DKK 8,917.18 8,555.00 5,133,000 (29,216) 689,875ABB LTD ZUERICH/NAMEN. (29,657) CHF 20.29 18.93 (561,407) 37,125 (518,000)ALFA LAVAL AB (24,281) SEK 135.44 129.30 (3,139,533) 15,838 (332,794)ALFA LAVAL AB (93,844) SEK 133.80 129.30 (12,134,029) 44,868 (1,286,219)ALFA LAVAL AB (8,322) SEK 132.51 129.30 (1,076,035) 2,838 (114,061)ALFA LAVAL AB (25,000) SEK 135.08 129.30 (3,232,500) 15,350 (342,648)ALFA LAVAL AB (47,002) SEK 126.41 129.30 (6,077,359) (14,419) (644,206)ALFA LAVAL AB (37,998) SEK 125.31 129.30 (4,913,141) (16,113) (520,798)ALFA LAVAL AB (15,000) SEK 126.44 129.30 (1,939,500) (4,562) (205,589)ALFA LAVAL AB (15,000) SEK 125.98 129.30 (1,939,500) (5,294) (205,589)ALFA LAVAL AB (45,000) SEK 124.16 129.30 (5,818,500) (24,568) (616,767)ALLIANZ SE/NAM.VINKULIERT 80 EUR 140.30 125.95 10,076 (1,148) 10,076ALLIANZ SE/NAM.VINKULIERT 307 EUR 145.57 125.95 38,667 (6,022) 38,667ALLIANZ SE/NAM.VINKULIERT 600 EUR 138.18 125.95 75,570 (7,338) 75,570ALLIANZ SE/NAM.VINKULIERT 550 EUR 158.35 125.95 69,273 (17,820) 69,273ALLIANZ SE/NAM.VINKULIERT 9,500 EUR 148.01 125.95 1,196,525 (209,560) 1,196,525ALLIANZ SE/NAM.VINKULIERT 1,450 EUR 142.88 125.95 182,628 (24,543) 182,628ALLIANZ SE/NAM.VINKULIERT 1,450 EUR 138.08 125.95 182,628 (17,590) 182,628ATLAS COPCO AB (75,000) SEK 204.30 213.10 (15,982,500) (70,123) (1,694,161)ATLAS COPCO AB (62,000) SEK 204.30 213.10 (13,212,200) (57,968) (1,400,506)ATLAS COPCO AB (17,200) SEK 199.95 213.10 (3,665,320) (24,022) (388,528)ATLAS COPCO AB (20,000) SEK 221.81 213.10 (4,262,000) 18,498 (451,776)ATLAS COPCO AB (13,000) SEK 210.14 213.10 (2,770,300) (4,093) (293,655)AXA 45,000 EUR 20.65 17.63 793,125 (136,165) 793,125AXFOOD AB (9,604) SEK 139.40 159.50 (1,531,838) (20,510) (162,376)AXFOOD AB (29,000) SEK 146.60 159.50 (4,625,500) (39,742) (490,308)BANKIA S.A. (734,257) EUR 0.77 0.63 (461,848) 103,637 (461,848)BANKIA S.A. (255,571) EUR 0.79 0.63 (160,754) 41,202 (160,754)BANKIA S.A. (170,172) EUR 0.76 0.63 (107,038) 22,905 (107,038)BANKINTER SA (98,765) EUR 5.98 5.72 (565,035) 25,334 (565,035)BANKINTER SA (5,235) EUR 6.01 5.72 (29,949) 1,502 (29,949)BANKINTER SA (61,858) EUR 6.28 5.72 (353,890) 34,548 (353,890)BANKINTER SA (44,142) EUR 6.31 5.72 (252,536) 25,823 (252,536)BCO BILBAO VIZ.ARGENTARIA/NAM. (119,000) EUR 5.66 4.96 (590,121) 82,911 (590,121)BCO POP ESP ISS.13 328,065 EUR 1.60 1.17 382,524 (143,956) 382,524BCO POP ESP ISS.13 234,435 EUR 1.68 1.17 273,351 (120,410) 273,351BCO POP ESP ISS.13 364,759 EUR 1.46 1.17 425,309 (105,780) 425,309BCO POP ESP ISS.13 42,741 EUR 1.45 1.17 49,836 (11,985) 49,836CAIXABANK (297,000) EUR 2.27 1.95 (579,744) 95,016 (579,744)CONTINENTAL AG 4,359 EUR 194.25 167.40 729,697 (117,039) 729,697DANSKE BANK AS 6,453 DKK 213.81 173.90 1,122,177 (34,625) 150,821DANSKE BANK AS 1,350 DKK 203.30 173.90 234,765 (5,337) 31,552
DANSKE INVEST SICAV
113
Notes to the unaudited Financial Statementsas at June 30, 2016 (continued)

NOTE 9 – CONTRACTS FOR DIFFERENCE (CFD) (continued)
Description Quantity Currency Strike Market Valueof the
Underlying
Commitmentin CFD
currency
Net unrealisedgain / (loss)
EUR
Commitmentin EUR
DANSKE BANK AS 2,950 DKK 203.56 173.90 513,005 (11,764) 68,948DANSKE BANK AS 2,500 DKK 199.48 173.90 434,750 (8,599) 58,430DANSKE BANK AS 3,524 DKK 182.51 173.90 612,824 (4,081) 82,363DANSKE BANK AS 2,750 DKK 184.98 173.90 478,225 (4,096) 64,273DANSKE BANK AS 1,900 DKK 185.95 173.90 330,410 (3,077) 44,407DANSKE BANK AS 55,000 DKK 183.13 173.90 9,564,500 (68,282) 1,285,469DANSKE BANK AS 2,350 DKK 180.12 173.90 408,665 (1,967) 54,925DANSKE BANK AS 2,225 DKK 190.47 173.90 386,928 (4,957) 52,003DELHAIZE GROUP 558 EUR 71.80 92.45 51,587 11,523 51,587DELHAIZE GROUP 3,908 EUR 80.00 92.45 361,295 48,648 361,295DELHAIZE GROUP 2,000 EUR 80.87 92.45 184,900 23,155 184,900DELHAIZE GROUP 733 EUR 92.30 92.45 67,766 111 67,766DELHAIZE GROUP 650 EUR 88.03 92.45 60,093 2,876 60,093DELHAIZE GROUP 11,000 EUR 91.90 92.45 1,016,950 6,040 1,016,950DELHAIZE GROUP 4,125 EUR 91.75 92.45 381,356 2,899 381,356DEUTSCHE ANN/NAMEN (23,200) EUR 27.23 32.71 (758,872) (127,156) (758,872)DEUTSCHE ANN/NAMEN (35,000) EUR 30.66 32.71 (1,144,850) (71,923) (1,144,850)DEUTSCHE POST AG.BONN 25,000 EUR 22.51 24.78 619,375 56,535 619,375DEUTSCHE WOHNENAG (35,000) EUR 26.83 30.60 (1,070,825) (131,857) (1,070,825)DFDS A/S 2,600 DKK 230.20 288.50 750,100 20,379 100,813DJ EURO STOXX/BANKS/PRICE IND (4,556) EUR 106.56 81.20 (369,947) 115,550 (369,947)DJ EURO STOXX/BANKS/PRICE IND (3,900) EUR 103.02 81.20 (316,680) 85,114 (316,680)DJ EUROPE STOXX600 INDUST G&S (800) EUR 423.71 401.98 (321,584) 17,384 (321,584)DJ EUROPE STOXX600 INDUST G&S (1,500) EUR 426.50 401.98 (602,970) 36,785 (602,970)DJ EUROPE STOXX600 INDUST G&S (5,000) EUR 395.22 401.98 (2,009,900) (33,804) (2,009,900)DJ EUROPE STOXX600 INDUST G&S (7,500) EUR 417.84 401.98 (3,014,850) 118,986 (3,014,850)DJ EUROPE STOXX600 INDUST G&S (9,200) EUR 435.94 401.98 (3,698,216) 312,418 (3,698,216)DJ EUROPE STOXX600 INDUST G&S (4,500) EUR 404.27 401.98 (1,808,910) 10,299 (1,808,910)DJ EUROPE STOXX600 INDUST G&S (6,000) EUR 408.28 401.98 (2,411,880) 37,826 (2,411,880)DJ EUROPE STOXX600 INDUST G&S (2,082) EUR 425.32 401.98 (836,922) 48,590 (836,922)DJ EUROPE STOXX600 INSUR.IND (16,860) EUR 218.94 218.39 (3,682,055) 9,273 (3,682,055)DJ EUROPE STOXX600 INSUR.IND (7,400) EUR 237.03 218.39 (1,616,086) 137,957 (1,616,086)DJ STOXX 600HEALTH CARE (1,700) EUR 749.47 738.85 (1,256,045) 18,046 (1,256,045)DJ STOXX 600HEALTH CARE (2,300) EUR 714.42 738.85 (1,699,355) (56,188) (1,699,355)DJ STOXX 600 TLCM (1,000) EUR 375.27 298.22 (298,220) 77,050 (298,220)DJ STOXX 600 TLCM (1,650) EUR 327.97 298.22 (492,063) 49,089 (492,063)DONG ENERGYA/S (38,000) DKK 256.81 241.00 (9,158,000) 80,794 (1,230,835)DONG ENERGYA/S (25,000) DKK 257.00 241.00 (6,025,000) 53,764 (809,760)DONG ENERGYA/S (55,000) DKK 239.82 241.00 (13,255,000) (8,733) (1,781,472)
DANSKE INVEST SICAV
114
Notes to the unaudited Financial Statementsas at June 30, 2016 (continued)
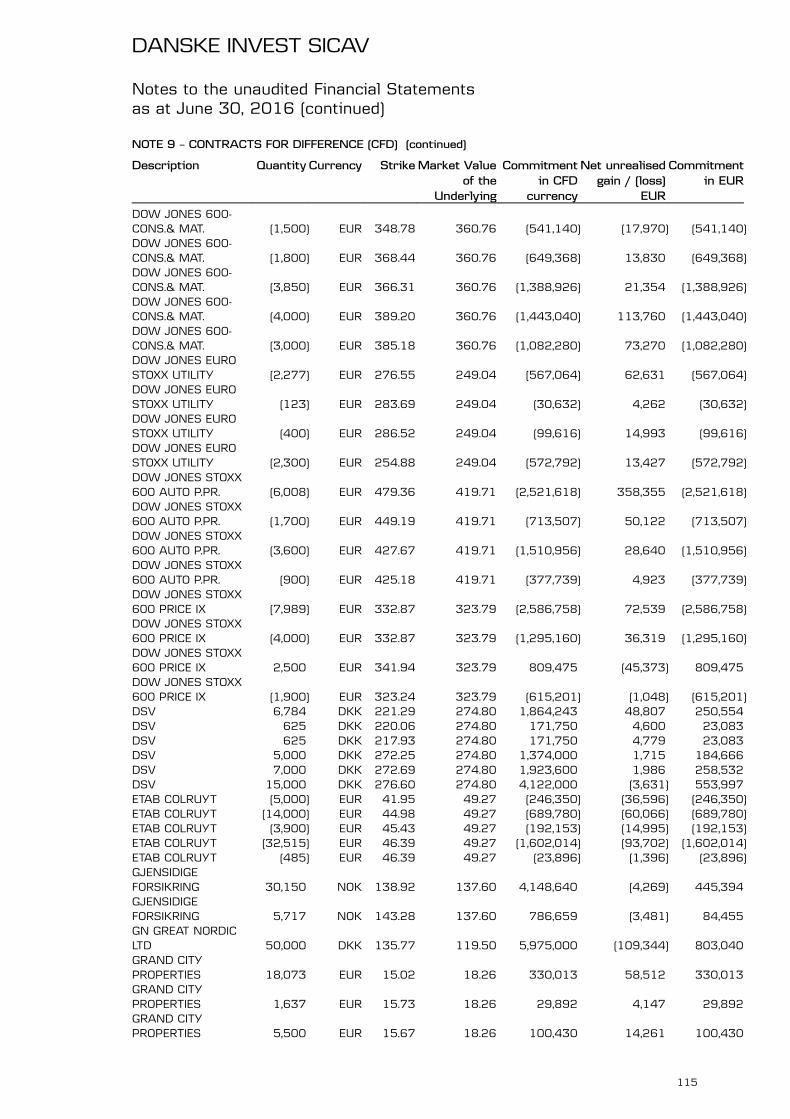
NOTE 9 – CONTRACTS FOR DIFFERENCE (CFD) (continued)
Description Quantity Currency Strike Market Valueof the
Underlying
Commitmentin CFD
currency
Net unrealisedgain / (loss)
EUR
Commitmentin EUR
DOW JONES 600-CONS.& MAT. (1,500) EUR 348.78 360.76 (541,140) (17,970) (541,140)DOW JONES 600-CONS.& MAT. (1,800) EUR 368.44 360.76 (649,368) 13,830 (649,368)DOW JONES 600-CONS.& MAT. (3,850) EUR 366.31 360.76 (1,388,926) 21,354 (1,388,926)DOW JONES 600-CONS.& MAT. (4,000) EUR 389.20 360.76 (1,443,040) 113,760 (1,443,040)DOW JONES 600-CONS.& MAT. (3,000) EUR 385.18 360.76 (1,082,280) 73,270 (1,082,280)DOW JONES EUROSTOXX UTILITY (2,277) EUR 276.55 249.04 (567,064) 62,631 (567,064)DOW JONES EUROSTOXX UTILITY (123) EUR 283.69 249.04 (30,632) 4,262 (30,632)DOW JONES EUROSTOXX UTILITY (400) EUR 286.52 249.04 (99,616) 14,993 (99,616)DOW JONES EUROSTOXX UTILITY (2,300) EUR 254.88 249.04 (572,792) 13,427 (572,792)DOW JONES STOXX600 AUTO P.PR. (6,008) EUR 479.36 419.71 (2,521,618) 358,355 (2,521,618)DOW JONES STOXX600 AUTO P.PR. (1,700) EUR 449.19 419.71 (713,507) 50,122 (713,507)DOW JONES STOXX600 AUTO P.PR. (3,600) EUR 427.67 419.71 (1,510,956) 28,640 (1,510,956)DOW JONES STOXX600 AUTO P.PR. (900) EUR 425.18 419.71 (377,739) 4,923 (377,739)DOW JONES STOXX600 PRICE IX (7,989) EUR 332.87 323.79 (2,586,758) 72,539 (2,586,758)DOW JONES STOXX600 PRICE IX (4,000) EUR 332.87 323.79 (1,295,160) 36,319 (1,295,160)DOW JONES STOXX600 PRICE IX 2,500 EUR 341.94 323.79 809,475 (45,373) 809,475DOW JONES STOXX600 PRICE IX (1,900) EUR 323.24 323.79 (615,201) (1,048) (615,201)DSV 6,784 DKK 221.29 274.80 1,864,243 48,807 250,554DSV 625 DKK 220.06 274.80 171,750 4,600 23,083DSV 625 DKK 217.93 274.80 171,750 4,779 23,083DSV 5,000 DKK 272.25 274.80 1,374,000 1,715 184,666DSV 7,000 DKK 272.69 274.80 1,923,600 1,986 258,532DSV 15,000 DKK 276.60 274.80 4,122,000 (3,631) 553,997ETAB COLRUYT (5,000) EUR 41.95 49.27 (246,350) (36,596) (246,350)ETAB COLRUYT (14,000) EUR 44.98 49.27 (689,780) (60,066) (689,780)ETAB COLRUYT (3,900) EUR 45.43 49.27 (192,153) (14,995) (192,153)ETAB COLRUYT (32,515) EUR 46.39 49.27 (1,602,014) (93,702) (1,602,014)ETAB COLRUYT (485) EUR 46.39 49.27 (23,896) (1,396) (23,896)GJENSIDIGEFORSIKRING 30,150 NOK 138.92 137.60 4,148,640 (4,269) 445,394GJENSIDIGEFORSIKRING 5,717 NOK 143.28 137.60 786,659 (3,481) 84,455GN GREAT NORDICLTD 50,000 DKK 135.77 119.50 5,975,000 (109,344) 803,040GRAND CITYPROPERTIES 18,073 EUR 15.02 18.26 330,013 58,512 330,013GRAND CITYPROPERTIES 1,637 EUR 15.73 18.26 29,892 4,147 29,892GRAND CITYPROPERTIES 5,500 EUR 15.67 18.26 100,430 14,261 100,430
DANSKE INVEST SICAV
115
Notes to the unaudited Financial Statementsas at June 30, 2016 (continued)
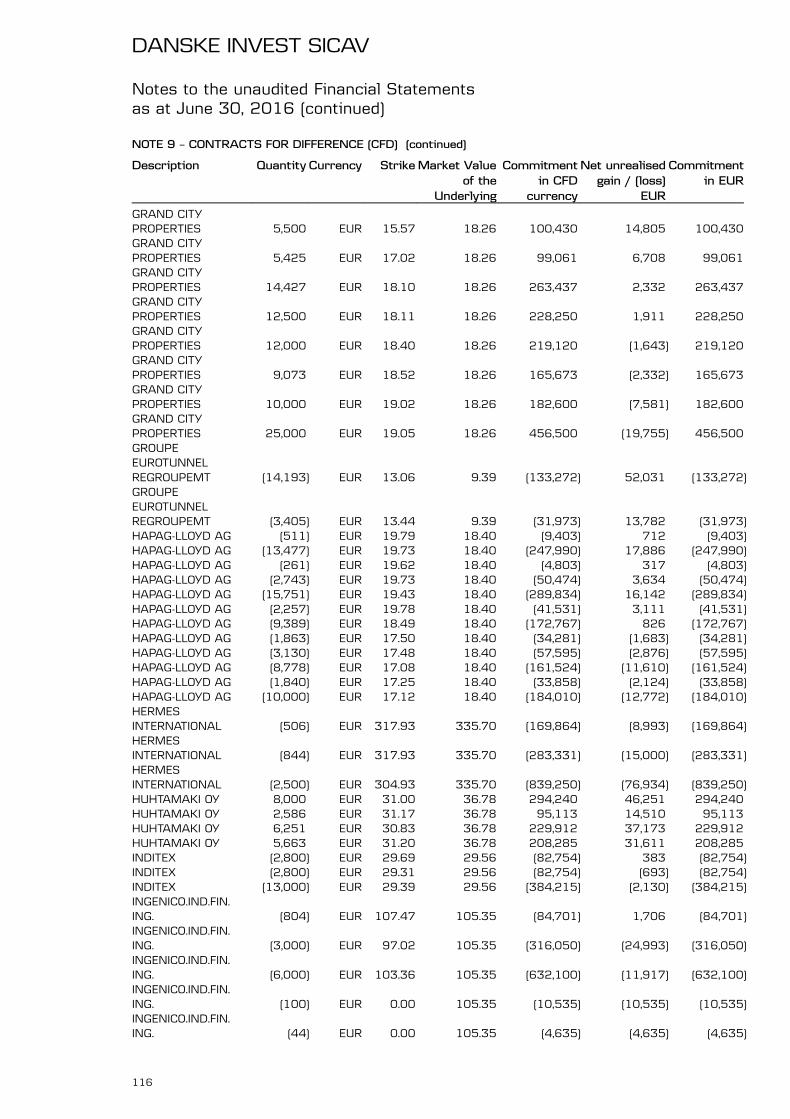
NOTE 9 – CONTRACTS FOR DIFFERENCE (CFD) (continued)
Description Quantity Currency Strike Market Valueof the
Underlying
Commitmentin CFD
currency
Net unrealisedgain / (loss)
EUR
Commitmentin EUR
GRAND CITYPROPERTIES 5,500 EUR 15.57 18.26 100,430 14,805 100,430GRAND CITYPROPERTIES 5,425 EUR 17.02 18.26 99,061 6,708 99,061GRAND CITYPROPERTIES 14,427 EUR 18.10 18.26 263,437 2,332 263,437GRAND CITYPROPERTIES 12,500 EUR 18.11 18.26 228,250 1,911 228,250GRAND CITYPROPERTIES 12,000 EUR 18.40 18.26 219,120 (1,643) 219,120GRAND CITYPROPERTIES 9,073 EUR 18.52 18.26 165,673 (2,332) 165,673GRAND CITYPROPERTIES 10,000 EUR 19.02 18.26 182,600 (7,581) 182,600GRAND CITYPROPERTIES 25,000 EUR 19.05 18.26 456,500 (19,755) 456,500GROUPEEUROTUNNELREGROUPEMT (14,193) EUR 13.06 9.39 (133,272) 52,031 (133,272)GROUPEEUROTUNNELREGROUPEMT (3,405) EUR 13.44 9.39 (31,973) 13,782 (31,973)HAPAG-LLOYD AG (511) EUR 19.79 18.40 (9,403) 712 (9,403)HAPAG-LLOYD AG (13,477) EUR 19.73 18.40 (247,990) 17,886 (247,990)HAPAG-LLOYD AG (261) EUR 19.62 18.40 (4,803) 317 (4,803)HAPAG-LLOYD AG (2,743) EUR 19.73 18.40 (50,474) 3,634 (50,474)HAPAG-LLOYD AG (15,751) EUR 19.43 18.40 (289,834) 16,142 (289,834)HAPAG-LLOYD AG (2,257) EUR 19.78 18.40 (41,531) 3,111 (41,531)HAPAG-LLOYD AG (9,389) EUR 18.49 18.40 (172,767) 826 (172,767)HAPAG-LLOYD AG (1,863) EUR 17.50 18.40 (34,281) (1,683) (34,281)HAPAG-LLOYD AG (3,130) EUR 17.48 18.40 (57,595) (2,876) (57,595)HAPAG-LLOYD AG (8,778) EUR 17.08 18.40 (161,524) (11,610) (161,524)HAPAG-LLOYD AG (1,840) EUR 17.25 18.40 (33,858) (2,124) (33,858)HAPAG-LLOYD AG (10,000) EUR 17.12 18.40 (184,010) (12,772) (184,010)HERMESINTERNATIONAL (506) EUR 317.93 335.70 (169,864) (8,993) (169,864)HERMESINTERNATIONAL (844) EUR 317.93 335.70 (283,331) (15,000) (283,331)HERMESINTERNATIONAL (2,500) EUR 304.93 335.70 (839,250) (76,934) (839,250)HUHTAMAKI OY 8,000 EUR 31.00 36.78 294,240 46,251 294,240HUHTAMAKI OY 2,586 EUR 31.17 36.78 95,113 14,510 95,113HUHTAMAKI OY 6,251 EUR 30.83 36.78 229,912 37,173 229,912HUHTAMAKI OY 5,663 EUR 31.20 36.78 208,285 31,611 208,285INDITEX (2,800) EUR 29.69 29.56 (82,754) 383 (82,754)INDITEX (2,800) EUR 29.31 29.56 (82,754) (693) (82,754)INDITEX (13,000) EUR 29.39 29.56 (384,215) (2,130) (384,215)INGENICO.IND.FIN.ING. (804) EUR 107.47 105.35 (84,701) 1,706 (84,701)INGENICO.IND.FIN.ING. (3,000) EUR 97.02 105.35 (316,050) (24,993) (316,050)INGENICO.IND.FIN.ING. (6,000) EUR 103.36 105.35 (632,100) (11,917) (632,100)INGENICO.IND.FIN.ING. (100) EUR 0.00 105.35 (10,535) (10,535) (10,535)INGENICO.IND.FIN.ING. (44) EUR 0.00 105.35 (4,635) (4,635) (4,635)
DANSKE INVEST SICAV
116
Notes to the unaudited Financial Statementsas at June 30, 2016 (continued)

NOTE 9 – CONTRACTS FOR DIFFERENCE (CFD) (continued)
Description Quantity Currency Strike Market Valueof the
Underlying
Commitmentin CFD
currency
Net unrealisedgain / (loss)
EUR
Commitmentin EUR
INGENICO.IND.FIN.ING. (88) EUR 0.00 105.35 (9,271) (9,271) (9,271)INGENICO.IND.FIN.ING. (10,300) EUR 96.49 105.35 (1,085,105) (91,234) (1,085,105)ISS A/S 5,242 DKK 236.84 249.20 1,306,306 8,710 175,568J.SAINSBURY PLC 280,000 GBP 2.59 2.26 632,240 (111,121) 763,736J.SAINSBURY PLC 64,043 GBP 2.80 2.26 144,609 (41,969) 174,686J.SAINSBURY PLC 36,760 GBP 2.79 2.26 83,004 (23,602) 100,268J.SAINSBURY PLC 124,197 GBP 2.80 2.26 280,437 (81,233) 338,763JERONIMO MARTINSSGPS SA (13,106) EUR 12.64 13.85 (181,518) (15,852) (181,518)JERONIMO MARTINSSGPS SA (15,500) EUR 11.60 13.85 (214,675) (34,925) (214,675)JERONIMO MARTINSSGPS SA (63,000) EUR 11.42 13.85 (872,550) (153,106) (872,550)JERONIMO MARTINSSGPS SA (30,500) EUR 12.10 13.85 (422,425) (53,463) (422,425)JERONIMO MARTINSSGPS SA (11,538) EUR 13.63 13.85 (159,801) (2,486) (159,801)JERONIMO MARTINSSGPS SA (11,682) EUR 13.67 13.85 (161,796) (2,097) (161,796)JERONIMO MARTINSSGPS SA (36,780) EUR 13.64 13.85 (509,403) (7,687) (509,403)KION GROUP 9,808 EUR 44.12 43.51 426,746 (6,025) 426,746KION GROUP 15,092 EUR 44.36 43.51 656,653 (12,865) 656,653KION GROUP 3,000 EUR 47.98 43.51 130,530 (13,416) 130,530KONE OYJ -B- (11,020) EUR 40.33 40.27 (443,775) 633 (443,775)KONINKLIJKE AHOLDNV 8,000 EUR 16.34 19.63 157,000 26,320 157,000KONINKLIJKE AHOLDNV 21,250 EUR 17.79 19.63 417,031 39,100 417,031KONINKLIJKE AHOLDNV 3,476 EUR 20.22 19.63 68,217 (2,052) 68,217KONINKLIJKE AHOLDNV 3,300 EUR 19.09 19.63 64,763 1,763 64,763KONINKLIJKE AHOLDNV 52,000 EUR 19.88 19.63 1,020,500 (13,304) 1,020,500KONINKLIJKE AHOLDNV 17,650 EUR 19.88 19.63 346,381 (4,449) 346,381KONINKLIJKE BAMGROEP NV 37,957 EUR 4.45 3.22 122,222 (46,560) 122,222KONINKLIJKE BAMGROEP NV 19,000 EUR 4.46 3.22 61,180 (23,645) 61,180KONINKLIJKE BAMGROEP NV 6,043 EUR 4.44 3.22 19,458 (7,375) 19,458KONINKLIJKE BAMGROEP NV 20,000 EUR 4.72 3.22 64,400 (29,991) 64,400KONINKLIJKE BAMGROEP NV 12,000 EUR 4.48 3.22 38,640 (15,140) 38,640KONINKLIJKE BAMGROEP NV 45,000 EUR 4.60 3.22 144,900 (62,092) 144,900KONINKLIJKE BAMGROEP NV 17,000 EUR 4.54 3.22 54,740 (22,403) 54,740KONINKLIJKE BAMGROEP NV 13,000 EUR 4.56 3.22 41,860 (17,480) 41,860KONINKLIJKE BAMGROEP NV 11,000 EUR 4.94 3.22 35,420 (18,883) 35,420
DANSKE INVEST SICAV
117
Notes to the unaudited Financial Statementsas at June 30, 2016 (continued)
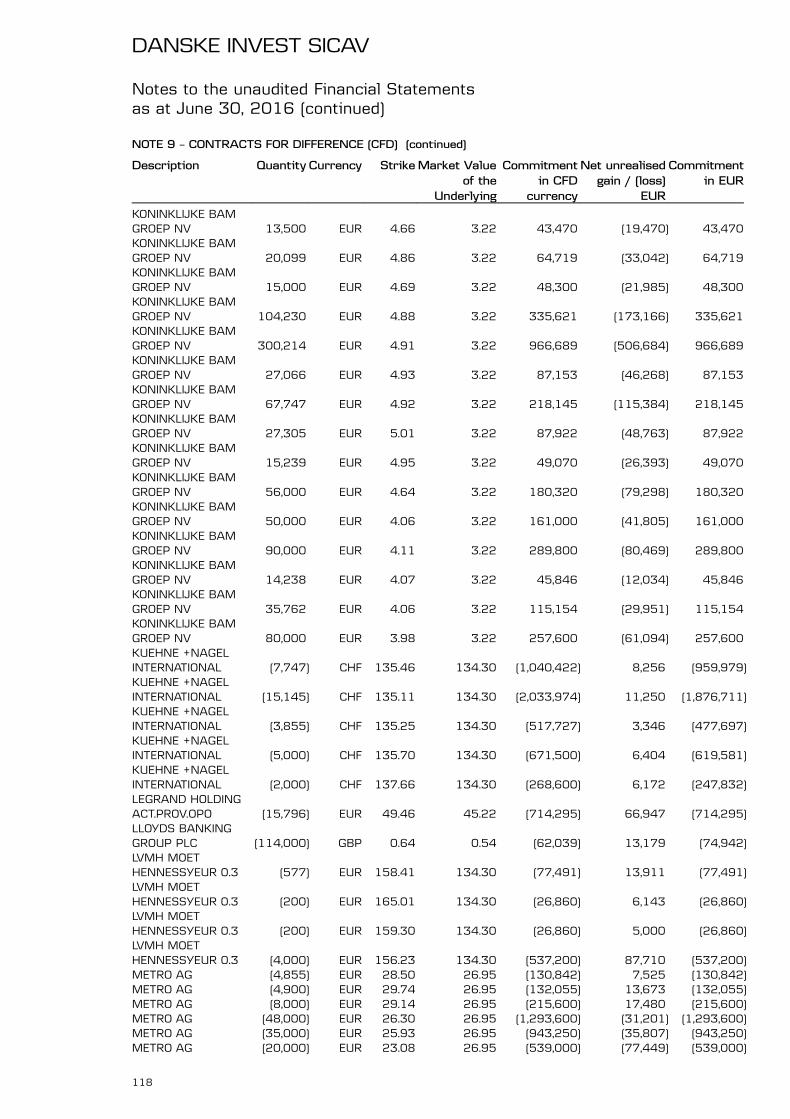
NOTE 9 – CONTRACTS FOR DIFFERENCE (CFD) (continued)
Description Quantity Currency Strike Market Valueof the
Underlying
Commitmentin CFD
currency
Net unrealisedgain / (loss)
EUR
Commitmentin EUR
KONINKLIJKE BAMGROEP NV 13,500 EUR 4.66 3.22 43,470 (19,470) 43,470KONINKLIJKE BAMGROEP NV 20,099 EUR 4.86 3.22 64,719 (33,042) 64,719KONINKLIJKE BAMGROEP NV 15,000 EUR 4.69 3.22 48,300 (21,985) 48,300KONINKLIJKE BAMGROEP NV 104,230 EUR 4.88 3.22 335,621 (173,166) 335,621KONINKLIJKE BAMGROEP NV 300,214 EUR 4.91 3.22 966,689 (506,684) 966,689KONINKLIJKE BAMGROEP NV 27,066 EUR 4.93 3.22 87,153 (46,268) 87,153KONINKLIJKE BAMGROEP NV 67,747 EUR 4.92 3.22 218,145 (115,384) 218,145KONINKLIJKE BAMGROEP NV 27,305 EUR 5.01 3.22 87,922 (48,763) 87,922KONINKLIJKE BAMGROEP NV 15,239 EUR 4.95 3.22 49,070 (26,393) 49,070KONINKLIJKE BAMGROEP NV 56,000 EUR 4.64 3.22 180,320 (79,298) 180,320KONINKLIJKE BAMGROEP NV 50,000 EUR 4.06 3.22 161,000 (41,805) 161,000KONINKLIJKE BAMGROEP NV 90,000 EUR 4.11 3.22 289,800 (80,469) 289,800KONINKLIJKE BAMGROEP NV 14,238 EUR 4.07 3.22 45,846 (12,034) 45,846KONINKLIJKE BAMGROEP NV 35,762 EUR 4.06 3.22 115,154 (29,951) 115,154KONINKLIJKE BAMGROEP NV 80,000 EUR 3.98 3.22 257,600 (61,094) 257,600KUEHNE +NAGELINTERNATIONAL (7,747) CHF 135.46 134.30 (1,040,422) 8,256 (959,979)KUEHNE +NAGELINTERNATIONAL (15,145) CHF 135.11 134.30 (2,033,974) 11,250 (1,876,711)KUEHNE +NAGELINTERNATIONAL (3,855) CHF 135.25 134.30 (517,727) 3,346 (477,697)KUEHNE +NAGELINTERNATIONAL (5,000) CHF 135.70 134.30 (671,500) 6,404 (619,581)KUEHNE +NAGELINTERNATIONAL (2,000) CHF 137.66 134.30 (268,600) 6,172 (247,832)LEGRAND HOLDINGACT.PROV.OPO (15,796) EUR 49.46 45.22 (714,295) 66,947 (714,295)LLOYDS BANKINGGROUP PLC (114,000) GBP 0.64 0.54 (62,039) 13,179 (74,942)LVMH MOETHENNESSYEUR 0.3 (577) EUR 158.41 134.30 (77,491) 13,911 (77,491)LVMH MOETHENNESSYEUR 0.3 (200) EUR 165.01 134.30 (26,860) 6,143 (26,860)LVMH MOETHENNESSYEUR 0.3 (200) EUR 159.30 134.30 (26,860) 5,000 (26,860)LVMH MOETHENNESSYEUR 0.3 (4,000) EUR 156.23 134.30 (537,200) 87,710 (537,200)METRO AG (4,855) EUR 28.50 26.95 (130,842) 7,525 (130,842)METRO AG (4,900) EUR 29.74 26.95 (132,055) 13,673 (132,055)METRO AG (8,000) EUR 29.14 26.95 (215,600) 17,480 (215,600)METRO AG (48,000) EUR 26.30 26.95 (1,293,600) (31,201) (1,293,600)METRO AG (35,000) EUR 25.93 26.95 (943,250) (35,807) (943,250)METRO AG (20,000) EUR 23.08 26.95 (539,000) (77,449) (539,000)
DANSKE INVEST SICAV
118
Notes to the unaudited Financial Statementsas at June 30, 2016 (continued)

NOTE 9 – CONTRACTS FOR DIFFERENCE (CFD) (continued)
Description Quantity Currency Strike Market Valueof the
Underlying
Commitmentin CFD
currency
Net unrealisedgain / (loss)
EUR
Commitmentin EUR
NKT HOLDING(DKK20) 6,500 DKK 383.92 326.80 2,124,200 (49,916) 285,492NKT HOLDING(DKK20) 1,700 DKK 393.83 326.80 555,560 (15,321) 74,667NKT HOLDING(DKK20) 3,000 DKK 370.86 326.80 980,400 (17,772) 131,766NKT HOLDING(DKK20) 1,614 DKK 344.11 326.80 527,455 (3,757) 70,890NKT HOLDING(DKK20) 2,500 DKK 326.50 326.80 817,000 101 109,805NKT HOLDING(DKK20) 12,864 DKK 375.03 326.80 4,203,955 (83,416) 565,012NKT HOLDING(DKK20) 176 DKK 373.22 326.80 57,517 (1,098) 7,730NKT HOLDING(DKK20) 760 DKK 377.18 326.80 248,368 (5,148) 33,381NKT HOLDING(DKK20) 5,283 DKK 361.26 326.80 1,726,484 (24,475) 232,040NKT HOLDING(DKK20) 4,717 DKK 358.42 326.80 1,541,516 (20,054) 207,180NORDEA BANK AB (55,000) SEK 73.81 70.35 (3,869,250) 20,242 (410,144)NORDEA BANK AB/FINN.DEP.REC 46,000 EUR 9.17 7.47 343,620 (78,290) 343,620NORDEA BANK AB/FINN.DEP.REC 32,054 EUR 8.85 7.47 239,443 (44,142) 239,443NORDEX SEROSTOCK/KONV (26,524) EUR 23.96 25.45 (675,036) (39,430) (675,036)NORDEX SEROSTOCK/KONV (13,976) EUR 24.26 25.45 (355,689) (16,589) (355,689)NOVO NORDISK A/S/-B- 30,132 DKK 351.07 354.20 10,672,754 12,663 1,434,418OPTIMAL PAYMENTSPLC 362,117 GBP 4.13 3.85 1,395,068 (119,888) 1,685,222OPTIMAL PAYMENTSPLC 18,047 GBP 4.06 3.85 69,527 (4,440) 83,987OPTIMAL PAYMENTSPLC 31,953 GBP 4.05 3.85 123,100 (7,479) 148,703OPTIMAL PAYMENTSPLC 150,000 GBP 3.51 3.85 577,880 62,851 698,071OPTIMAL PAYMENTSPLC 12,834 GBP 4.01 3.85 49,443 (2,404) 59,727OPTIMAL PAYMENTSPLC 72,000 GBP 4.01 3.85 277,383 (13,564) 335,074OPTIMAL PAYMENTSPLC 50,000 GBP 3.72 3.85 192,627 7,896 232,690OPTIMAL PAYMENTSPLC 91,000 GBP 3.76 3.85 350,581 9,710 423,496OPTIMAL PAYMENTSPLC 148,967 GBP 3.79 3.85 573,901 12,007 693,263ORKLA ASA (50,072) NOK 62.85 73.60 (3,685,299) (57,702) (395,650)PANDORA A/S 5,569 DKK 885.04 904.50 5,037,161 14,573 676,994PANDORA A/S 7,431 DKK 886.53 904.50 6,721,340 17,952 903,348PANDORA A/S 3,000 DKK 826.28 904.50 2,713,500 31,550 364,694PARTNERS GROUPHOLDING 400 CHF 349.36 412.75 165,100 23,272 152,335PARTNERS GROUPHOLDING 146 CHF 351.00 412.75 60,262 8,275 55,602
DANSKE INVEST SICAV
119
Notes to the unaudited Financial Statementsas at June 30, 2016 (continued)
NOTE 9 – CONTRACTS FOR DIFFERENCE (CFD) (continued)
Description Quantity Currency Strike Market Valueof the
Underlying
Commitmentin CFD
currency
Net unrealisedgain / (loss)
EUR
Commitmentin EUR
PARTNERS GROUPHOLDING 4,350 CHF 358.96 412.75 1,795,463 214,763 1,656,641PER AARSLEFF A/S 15,280 DKK 250.10 141.50 2,162,120 (223,101) 290,589PER AARSLEFF A/S 4,000 DKK 213.32 141.50 566,000 (38,623) 76,070PER AARSLEFF A/S 2,100 DKK 188.31 141.50 297,150 (13,215) 39,937PER AARSLEFF A/S 2,900 DKK 190.53 141.50 410,350 (19,117) 55,151PER AARSLEFF A/S 2,960 DKK 201.50 141.50 418,840 (23,879) 56,292PER AARSLEFF A/S 4,580 DKK 202.02 141.50 648,070 (37,267) 87,101PER AARSLEFF A/S 1,420 DKK 205.75 141.50 200,930 (12,267) 27,005PER AARSLEFF A/S 2,810 DKK 202.72 141.50 397,615 (23,130) 53,439PER AARSLEFF A/S 10,000 DKK 212.77 141.50 1,415,000 (95,815) 190,176PER AARSLEFF A/S 4,230 DKK 201.80 141.50 598,545 (34,294) 80,444PEUGEOT SA 4,250 EUR 14.99 10.96 46,580 (17,134) 46,580PEUGEOT SA 4,750 EUR 15.10 10.96 52,060 (19,674) 52,060PEUGEOT SA 9,000 EUR 16.09 10.96 98,640 (46,167) 98,640PEUGEOT SA 7,000 EUR 15.63 10.96 76,720 (32,690) 76,720PEUGEOT SA 9,000 EUR 14.96 10.96 98,640 (36,030) 98,640PEUGEOT SA 140,000 EUR 13.84 10.96 1,534,400 (403,701) 1,534,400PEUGEOT SA 76,000 EUR 13.59 10.96 832,960 (199,848) 832,960RENAULT SA 13,876 EUR 78.89 67.35 934,549 (160,184) 934,549RENAULT SA 3,500 EUR 72.97 67.35 235,725 (19,671) 235,725RENAULT SA 2,250 EUR 79.06 67.35 151,538 (26,348) 151,538RENAULT SA 10,200 EUR 67.88 67.35 686,970 (5,433) 686,970ROYAL BANK OFSCOTLAND GROUP (256,708) GBP 2.48 1.72 (442,051) 234,738 (533,991)ROYAL BANK OFSCOTLAND GROUP (143,292) GBP 2.49 1.72 (246,749) 132,345 (298,069)ROYAL BANK OFSCOTLAND GROUP (208,000) GBP 2.13 1.72 (358,176) 101,639 (432,671)ROYAL UNIBREW A/S 12,243 DKK 232.27 292.20 3,577,405 98,651 480,803ROYAL UNIBREW A/S 2,500 DKK 222.51 292.20 730,500 23,423 98,179ROYAL UNIBREW A/S 3,000 DKK 218.63 292.20 876,600 29,675 117,815ROYAL UNIBREW A/S 250 DKK 217.13 292.20 73,050 2,523 9,818ROYAL UNIBREW A/S 13,500 DKK 276.31 292.20 3,944,700 28,838 530,168ROYAL UNIBREW A/S 9,000 DKK 277.28 292.20 2,629,800 18,051 353,445ROYAL UNIBREW A/S 4,844 DKK 299.02 292.20 1,415,417 (4,445) 190,232SAMPO PLCA (81,600) EUR 40.04 35.86 (2,926,176) 341,315 (2,926,176)SAMPO PLCA (27,788) EUR 40.31 35.86 (996,478) 123,632 (996,478)SCHNEIDERELECTRIC SA 8,000 EUR 52.71 51.03 408,240 (13,456) 408,240SCHNEIDERELECTRIC SA 14,215 EUR 57.04 51.03 725,391 (85,381) 725,391SCHNEIDERELECTRIC SA 7,932 EUR 57.28 51.03 404,770 (49,584) 404,770SENVION S.A. 27,500 EUR 15.75 11.99 329,725 (103,400) 329,725SIEMENS AG /NAM. 4,750 EUR 89.02 90.42 429,495 6,647 429,495SKANDINAV.ENSK.BANKENA 149,550 SEK 80.10 72.35 10,819,943 (123,211) 1,146,925SKANDINAV.ENSK.BANKENA 3,500 SEK 79.30 72.35 253,225 (2,584) 26,842SKANDINAV.ENSK.BANKENA (72,030) SEK 82.81 72.35 (5,211,371) 80,068 (552,410)SKANDINAV.ENSK.BANKENA (55,000) SEK 72.66 72.35 (3,979,250) 1,790 (421,804)SKANSKAB (17,455) SEK 168.40 172.00 (3,002,260) (6,672) (318,243)SKANSKAB (3,500) SEK 156.64 172.00 (602,000) (5,714) (63,813)SKANSKAB (30,000) SEK 181.78 172.00 (5,160,000) 31,177 (546,965)SKF ABB 56,850 SEK 139.20 132.90 7,555,365 (38,053) 800,876
DANSKE INVEST SICAV
120
Notes to the unaudited Financial Statementsas at June 30, 2016 (continued)

NOTE 9 – CONTRACTS FOR DIFFERENCE (CFD) (continued)
Description Quantity Currency Strike Market Valueof the
Underlying
Commitmentin CFD
currency
Net unrealisedgain / (loss)
EUR
Commitmentin EUR
SKF ABB 67,100 SEK 139.20 132.90 8,917,590 (44,914) 945,273SPIRAX-SARCOENGINEERING PLC (20,800) GBP 29.75 36.79 (765,232) (177,117) (924,389)STATOIL ASA (1,183) NOK 118.84 143.30 (169,524) (3,101) (18,200)STATOIL ASA (64,408) NOK 129.28 143.30 (9,229,666) (96,819) (990,888)STATOIL ASA (10,592) NOK 129.21 143.30 (1,517,834) (16,003) (162,953)STATOIL ASA (12,552) NOK 119.63 143.30 (1,798,702) (31,844) (193,107)STATOIL ASA (16) NOK 0.00 143.30 (2,293) (246) (246)STATOIL ASA (173) NOK 0.00 143.30 (24,791) (2,658) (2,662)STATOIL ASA (892) NOK 0.00 143.30 (127,824) (13,702) (13,723)STATOIL ASA (146) NOK 0.00 143.30 (20,922) (2,243) (2,246)SVENSKAHANDELSBANKENAB (4,613) SEK 127.50 99.65 (459,685) 13,651 (48,727)SVENSKAHANDELSBANKENAB (16,800) SEK 111.70 99.65 (1,674,120) 21,509 (177,458)SVENSKAHANDELSBANKENAB (3,677) SEK 111.70 99.65 (366,413) 4,708 (38,840)SVENSKAHANDELSBANKENAB (21,400) SEK 110.73 99.65 (2,132,510) 25,183 (226,048)SVENSKAHANDELSBANKENAB (11,200) SEK 106.74 99.65 (1,116,080) 8,434 (118,306)SVENSKAHANDELSBANKENAB (62,000) SEK 101.42 99.65 (6,178,300) 11,673 (654,906)SVENSKAHANDELSBANKENAB (92,000) SEK 101.42 99.65 (9,167,800) 17,266 (971,796)SVENSKAHANDELSBANKENAB (19,600) SEK 102.63 99.65 (1,953,140) 6,208 (207,035)SVENSKAHANDELSBANKENAB (57,000) SEK 109.32 99.65 (5,680,050) 58,541 (602,091)SVENSKAHANDELSBANKENAB (61,000) SEK 112.02 99.65 (6,078,650) 80,192 (644,343)SWEDBANK AB -A- 25,100 SEK 164.52 175.30 4,400,030 28,738 466,408SWEDBANK AB -A- 50,000 SEK 169.43 175.30 8,765,000 31,182 929,099TESCO PLC (396,000) GBP 1.82 1.69 (668,646) 61,743 (807,714)TOPDANMARK A/S 19,250 DKK 170.68 155.70 2,997,225 (38,780) 402,827TOPDANMARK A/S 3,164 DKK 184.11 155.70 492,635 (12,087) 66,210TRYG A/S 14,667 DKK 129.94 117.90 1,729,239 (23,739) 232,410TRYG A/S 10,833 DKK 130.08 117.90 1,277,211 (17,742) 171,657TRYG A/S 5,829 DKK 131.17 117.90 687,239 (10,402) 92,365UBS GROUP AG (38,389) CHF 14.91 12.47 (478,711) 85,864 (441,698)UBS GROUP AG (611) CHF 14.99 12.47 (7,619) 1,411 (7,030)VALEO SA (78,219) EUR 44.62 40.09 (3,135,409) 354,462 (3,135,409)VESTAS WINDSYSTEMS AS / REG 558 DKK 319.54 445.70 248,701 9,465 33,425VESTAS WINDSYSTEMS AS / REG 2,000 DKK 330.99 445.70 891,400 30,845 119,804VESTAS WINDSYSTEMS AS / REG 500 DKK 348.00 445.70 222,850 6,567 29,951
DANSKE INVEST SICAV
121
Notes to the unaudited Financial Statementsas at June 30, 2016 (continued)

NOTE 9 – CONTRACTS FOR DIFFERENCE (CFD) (continued)
Description Quantity Currency Strike Market Valueof the
Underlying
Commitmentin CFD
currency
Net unrealisedgain / (loss)
EUR
Commitmentin EUR
VESTAS WINDSYSTEMS AS / REG 1,300 DKK 349.08 445.70 579,410 16,886 77,873VESTAS WINDSYSTEMS AS / REG 2,250 DKK 332.62 445.70 1,002,825 34,208 134,780VESTAS WINDSYSTEMS AS / REG 2,150 DKK 478.35 445.70 958,255 (9,437) 128,789VESTAS WINDSYSTEMS AS / REG 900 DKK 424.52 445.70 401,130 2,563 53,912VESTAS WINDSYSTEMS AS / REG 18,000 DKK 432.25 445.70 8,022,600 32,555 1,078,237VESTAS WINDSYSTEMS AS / REG 6,250 DKK 443.57 445.70 2,785,625 1,791 374,388VESTAS WINDSYSTEMS AS / REG 2,250 DKK 412.17 445.70 1,002,825 10,144 134,780VESTAS WINDSYSTEMS AS / REG 25,989 DKK 464.50 445.70 11,583,297 (65,701) 1,556,795VESTAS WINDSYSTEMS AS / REG 8,413 DKK 477.65 445.70 3,749,674 (36,135) 503,956WARTSILACORPORATION -B- 15,300 EUR 35.66 35.97 550,341 4,677 550,341WILLIAM DEMANTHOLDING A/S (100,000) DKK 137.96 130.60 (13,060,000) 99,006 (1,755,264)WILLIAM DEMANTHOLDING A/S (50,000) DKK 136.38 130.60 (6,530,000) 38,868 (877,632)WORLDLINE SA (4,509) EUR 18.94 25.12 (113,266) (27,883) (113,266)WORLDLINE SA (7,282) EUR 19.39 25.12 (182,924) (41,750) (182,924)WORLDLINE SA (4,613) EUR 19.08 25.12 (115,879) (27,869) (115,879)WORLDLINE SA (837) EUR 19.01 25.12 (21,025) (5,114) (21,025)WORLDLINE SA (403) EUR 19.05 25.12 (10,123) (2,448) (10,123)WORLDPAY GROUPPLC (466,227) GBP 2.66 2.65 (1,235,502) 5,966 (1,492,467)WORLDPAY GROUPPLC (116,000) GBP 2.70 2.65 (307,400) 7,624 (371,335)Total (1,666,921) (47,366,576)
As at June 30, 2016, the net unrealised loss on CFD was EUR (1,666,921).
NOTE 10 – FINANCIAL FUTURES CONTRACTS
As at June 30, 2016, the following financial futures contracts were outstanding:
Danske Invest Sicav - Nordic Corporate Bond
ContractsNumber ofcontracts
Commitment(EUR)
Maturitydate
CurrencyUnrealised
(loss)(EUR)
SALE EURO BOBL (370) (49,409,800) 08/09/2016 EUR (488,400)
(488,400)
DANSKE INVEST SICAV
122
Notes to the unaudited Financial Statementsas at June 30, 2016 (continued)

INFORMATION FOR INVESTORS IN SWITZERLAND (non audited)as at June 30, 20161) Danske Invest SICAV - Total Expense Ratio (TER) as per June 30, 2016
Sub-Fund Name Currency Isin Code
TER ratioexcludingPerfor-mancefee
TER ratioincludingPerfor-mancefee
Eastern Europe EUR
Eastern Europe Class I LU0727216912 1.21% 1.21%
Eastern Europe Class A LU0727216755 2.15% 2.15%
Europe EUR
Europe Class I LU0727217134 1.03% 1.03%
Europe Class A LU0727217050 1.77% 1.77%
Europe Absolute EUR
Europe Absolute Class A p LU0644011495 1.80% 3.09%
Europe Absolute Class I p LU0644011735 1.16% 1.83%
Europe Absolute Class A-sek hp LU0644011651 1.80% 2.92%
Global Inflation Linked Bond EUR
Global Inflation Linked Bond Class A LU0727217308 1.07% 1.07%
Global Inflation Linked Bond Class I LU0727217480 0.63% 0.63%
Global Inflation Linked Bond Class Y LU0790898422 1.07% 1.07%
Global Inflation Linked Bond Class A d LU0727217647 1.07% 1.07%
Global Inflation Linked Bond Class A-sek h LU1204914821 1.07% 1.07%
Euro High Yield Bond EUR
Euro High Yield Bond Class A LU0923469943 1.27% 1.27%
Euro High Yield Bond Class A-sek h LU1204911645 1.27% 1.27%
Euro High Yield Bond Class A d LU1204911728 1.27% 1.27%
Euro High Yield Bond Class I1 LU0923470016 0.58% 0.58%
Europe Long-Short Dynamic EUR
Europe Long-Short Dynamic A p LU0861185303 1.80% 2.96%
Europe Long-Short Dynamic I p LU0861186293 1.16% 2.45%
Europe Long-Short Dynamic A-sek hp LU0861185998 1.80% 2.70%
Europe Long-Short Dynamic A-nok hp LU0861185642 1.80% 3.08%
Europe Long-Short Dynamic A dp2 LU1399304010 1.80% 1.80%
Europe Long-Short Dynamic Plus EUR
Europe Long-Short Dynamic Plus A p LU1204911991 2.00% 3.92%
Europe Long-Short Dynamic Plus I p LU1204912452 1.30% 2.95%
Europe Long-Short Dynamic Plus A-sek hp3 LU1204912296 2.00% 2.00%
Germany EUR
Germany Class A LU1116403517 1.70% 1.70%
Germany Class I LU1116403780 1.06% 1.06%
Germany Class A-sek LU1204912536 1.70% 1.70%
Germany Class A-nok LU1204912619 1.70% 1.70%
DANSKE INVEST SICAV
123

Sub-Fund Name Currency Isin Code
TER ratioexcludingPerfor-mancefee
TER ratioincludingPerfor-mancefee
Global High Dividend EUR
Global High Dividend Class A LU1204913773 1.87% 1.87%
Global High Dividend Class A-sek LU1204914078 1.87% 1.87%
Global High Dividend Class A-nok LU1204914151 1.87% 1.87%
Global High Dividend Class A-sek d LU1204914318 1.87% 1.87%
Global High Dividend Class A-nok d LU1204914409 1.87% 1.87%
Global High Dividend Class I LU1204914581 1.03% 1.03%
Global Inflation Linked Bond Short Duration EUR
Global Inflation Linked Bond Short Duration Class A LU1116403947 1.07% 1.07%
Global Inflation Linked Bond Short Duration Class I LU1116404168 0.63% 0.63%
Global Inflation Linked Bond Short Duration Class A d LU1204915042 1.07% 1.07%
Nordic Corporate Bond EUR
Nordic Corporate Bond Class A LU1116404325 1.10% 1.10%
Nordic Corporate Bond Class I LU1116404671 0.56% 0.56%
Nordic Corporate Bond Class A-sek d h LU1116404838 1.10% 1.10%
Nordic Corporate Bond Class A d LU1204915398 1.10% 1.10%
US High Yield Bond USD
US High Yield Bond Class I LU1116405215 0.76% 0.76%
US High Yield Bond Class A-eur h LU1116406023 1.60% 1.60%
Emerging and Frontier Markets EUR
Emerging and Frontier Markets Class A LU1116403194 2.30% 2.30%
Emerging and Frontier Markets Class A-dkk LU1204910597 2.30% 2.30%
Emerging and Frontier Markets Class A-sek LU1204910670 2.30% 2.30%
Emerging and Frontier Markets Class A-nok LU1204910753 2.30% 2.30%
Emerging and Frontier Markets Class I LU1116403350 1.86% 1.86%
Emerging Markets Debt Hard Currency USD
Emerging Markets Debt Hard Currency Class A LU1204910837 1.50% 1.50%
Emerging Markets Debt Hard Currency Class I LU1204911488 0.76% 0.76%
Global Emerging Markets Leaders4 USD
Global Emerging Markets Leaders Class A LU1204912700 2.10% 2.10%
Global Emerging Markets Leaders Class I LU1204912965 1.16% 1.16%
European Corporate Sustainable Bond5 EUR
European Corporate Sustainable Bond Class A LU1399304283 1.10% 1.10%
European Corporate Sustainable Bond Class A d LU1399304366 1.10% 1.10%
European Corporate Sustainable Bond Class I LU1399305330 0.56% 0.56%
European Corporate Sustainable Bond Class A-sek h LU1399304879 1.10% 1.10%
1 This share class was launched on April 13, 2016.2 This share class was launched on June 21, 2016.3 This share class was launched on February 26, 2016.4 This Sub-Fund was launched on January 7, 2016 and closed on May 26, 2016.5 This Sub-Fund was launched on June 15, 2016.
The figures above are not audited.
DANSKE INVEST SICAV
124
INFORMATION FOR INVESTORS IN SWITZERLAND (non audited)as at June 30, 2016 (continued)