Gartmore SICAV Unaudited Semi-Annual Report - Fundsquare
118
Gartmore SICAV Unaudited Semi-Annual Report for the period ended 31 March 2009 SICAV
-
Upload
khangminh22 -
Category
Documents
-
view
2 -
download
0
Transcript of Gartmore SICAV Unaudited Semi-Annual Report - Fundsquare
Gartmore SICAV
Unaudited Semi-Annual Report
for the period ended 31 March 2009
SICAV

Gartmore SICAV Semi-Annual Report
Contents
General Information 2
Board of Directors 4
Management and Administration 5
Chairman’s Statement 6
Important Fund Information 7
Investment Report 8
Balance Sheet, Income Statement, Cash-flow Statement, Statement of Changes in Net Assets Attributable to Holders of Redeemable Ordinary Shares, Supplementary Information, Schedule of Investments
Equity Funds Gartmore SICAV Asia Pacific Fund 11
Gartmore SICAV China Opportunities Fund 15
Gartmore SICAV Continental European Fund 18
Gartmore SICAV Continental European Smaller Companies Fund 22
Gartmore SICAV Emerging Markets Fund 25
Gartmore SICAV Eurobloc Fund 29
Gartmore SICAV European Absolute Return Fund 32
Gartmore SICAV Global Focus Fund 35
Gartmore SICAV Japanese Fund 38
Gartmore SICAV Latin American Fund 42
Gartmore SICAV Pan European Fund 45
Gartmore SICAV Pan European Smaller Companies Fund 48
Gartmore SICAV United Kingdom Fund 52
Gartmore SICAV US Opportunities Fund 56
Gartmore SICAV US Smaller Companies Fund 59
Bond Funds Gartmore SICAV Global Bond Fund 64
Gartmore SICAV Sterling Corporate Bond Fund 67
Money Funds Gartmore SICAV Euro Money Fund 71
Gartmore SICAV Sterling Money Fund 74
Gartmore SICAV US Dollar Money Fund 77
Combined Gartmore SICAV Combined Statements 80
Notes to the Financial Statements 81
1
General Information
Registered Office (*)Gartmore SICAV40, avenue MontereyL-2163 LuxembourgGrand Duchy of Luxembourg
IncorporationGartmore SICAV (“the Company”) is an investment company incorporated under the laws of the Grand Duchy of Luxembourg in the form of a société anonyme, organised as a “Société d’Investissement à Capital Variable” (SICAV) with multiple Funds. The Company was incorporated on 26 September 2000.
The articles of incorporation were deposited with the Registry of the Luxembourg District Court and published in the Mémorial on 27 October 2000.
Information to ShareholdersAudited annual reports are sent to Shareholders and will be made available at the registered office of the Company, at the offices of the representatives and distributors and at www.gartmore.com within four months of the close of the accounting year. Unaudited semi-annual reports will also be made available in the same manner within two months at the end of the period to which they refer.
No subscription can be received on the basis of financial reports. Subscriptions are only valid if made on the basis of the current Prospectus that will be accompanied by a copy of the latest annual report or a copy of the latest semi-annual report, if published after such annual report.
Information for Investors in AustriaThe Austrian Paying Agent is located at the following address: UniCredit Bank Austria AG, Schottengasse 6-8, A- 1010 Wien.
Information for Investors in GermanyA copy of the list of changes in the investment portfolios during the reference period may be obtained free of charge at the address of the Company, the Custodian or, in Germany, at the Paying Agent or InformationAgent.
The German Paying Agent is located at the following address: J.P. Morgan AG, Junghofstrasse 14, D-60311 Frankfurt am Main.
The German Information Agent is located at the following address: Gartmore Investment Services GmbH, Oberlindau 80-82, D-60323 Frankfurt am Main.
Information for Investors in SwitzerlandGartmore SICAV is a limited company constituted under the laws of Luxembourg as a “Société d’Investissement à Capital Variable” (SICAV) with multiple Funds and “Undertakings for Collective Investment in Transferable Securities” (UCITS) status, with registered office in Luxembourg, Grand Duchy of Luxembourg.
Fortis Banque (Suisse) S.A with registered office in Geneva, is the Swiss Representative of the Company and the Paying Agent in relation to the distribution of shares in the Company in or from Switzerland. All activities of Fortis Banque (Suisse) S.A. with respect to the Company are carried out exclusively by its Zurich branch, Rennweg 57, PO Box 8023, Zurich, which address is also the place of performance and place of payment for the shares distributed in or from Switzerland. Investors in Switzerland may direct requests for information to that address.
(*) Effective 30 April 2009, the registered office address of the Company changed from 40, avenue Monterey, L – 2163 Luxembourg to 16, boulevard d’Avranches, L – 1160 Luxembourg.
2

General Information continued
The Prospectus, the Simplified Prospectus (both are also available to prospective investors), the articles of incorporation with the changes or addenda where applicable, as well as the last annual and (should these be more recent) semi-annual reports of the Company and the list of changes in the investment portfolio of the Company may be obtained free of charge at the above address in Zurich of Fortis Banque (Suisse) S.A., Zurich branch.
All official publications in respect of the Company and the Funds will be made in the “Swiss Official Trade Gazette” and in the “Neue Zurcher Zeitung”. The issue and redemption prices of the shares (net asset value with the words “plus commissions”) of each Fund’s shares are published jointly in the “Neue Zurcher Zeitung” periodically but at least twice a month, as well as upon each issue and redemption of shares.
3
Board of Directors and Dirigeants
Directors Les Aitkenhead (Chairman)Gartmore Investment Management LimitedGartmore House8 Fenchurch PlaceLondon EC3M 4PBUnited Kingdom
Kerstin BehnkeGartmore Investment Services GmbHOberlindau 80-8260323 Frankfurt am MainGermany
Ulrich HockerDSW e.V.Hamborner Strasse 5340472 DüsseldorfGermany
Victoria HuertaGartmore Investment LimitedSucursal en EspañaC/Manuel González Longorianº7-1º derechaMadrid 28010Spain
Claude NiednerArendt & Medernach14, rue Erasme2082 LuxembourgGrand Duchy of Luxembourg
Nigel ParkerTemplar HouseDon RoadSt HelierJersey JE4 8WHChannel Islands
Peter Pearson2/58 Albert CourtPrince Consort RoadLondon SW7 2BEUnited Kingdom
Dirigeants Chris BusbyGartmore Investment Management LimitedGartmore House8 Fenchurch PlaceLondon EC3M 4PBUnited Kingdom(approved by the CSSF on 18 December 2008)
Keith HewettGartmore Investment Management LimitedGartmore House8 Fenchurch PlaceLondon EC3M 4PBUnited Kingdom
Justin WillottGartmore Investment Management LimitedGartmore House8 Fenchurch PlaceLondon EC3M 4PBUnited Kingdom(approved by the CSSF on 18 December 2008)
Nigel ParkerTemplar HouseDon RoadSt HelierJerseyJE4 8WHChannel Islands(approved by the CSSF on 18 December 2008)
4
Management and Administration
Registered Office (*)Gartmore SICAV40, avenue Monterey L - 2163 LuxembourgGrand Duchy of Luxembourg
Investment ManagerGartmore Investment LimitedGartmore House8 Fenchurch PlaceLondon EC3M 4PBUnited Kingdom
Sub- Investment ManagerMarsico Capital Management, LLC S.A.(Gartmore SICAV US Opportunities Fund)1200 17th Street, Suite 1600Denver, Colorado 80202United States
Aberdeen Asset Management Inc(Gartmore SICAV US Smaller Companies Fund)1795 Market Street – 37th FloorPhiladelphia, Pennsylvania 19103United States
Central Administration Agent, Listing Agent, Domiciliary and Corporate Agent (*)HSBC Securities Services (Luxembourg) S.A.40, avenue MontereyL - 2163 LuxembourgGrand Duchy of Luxembourg
Independent AuditorPricewaterhouseCoopers S.à r.l.Réviseur d’entreprises400 route d’EschBP 1443L - 1014 LuxembourgGrand Duchy of Luxembourg
Registrar and Transfer AgentRBC Dexia Investor Services Bank S.A.14 rue Porte de FranceL - 4360 Esch-sur-AlzetteGrand Duchy of Luxembourg
Legal AdvisorArendt & Medernach14 rue ErasmeL - 2082 LuxembourgGrand Duchy of Luxembourg
Custodian and Paying Agent (*)HSBC Securities Services (Luxembourg)40, avenue Monterey L - 2163 Luxembourg Grand Duchy of Luxembourg
Principal DistributorGartmore Investment LimitedGartmore House8 Fenchurch PlaceLondon EC3M 4PBUnited Kingdom
(*) Effective 30 April 2009, the registered office address of the Company changed from 40, avenue Monterey, L – 2163 Luxembourg to 16, boulevard d’Avranches, L – 1160 Luxembourg.
5
Chairman’s Statement
Key DevelopmentsEven though the Company was facing strong market challenges within the last year with an overall decrease of assets under management, the interest in Gartmore SICAV funds remained strong, resulting in the successful launch of two new funds. The Gartmore SICAV China Opportunities Fund launched on 30 January 2009, with new investment opportunities in the Far Eastern region. Additionally, the Company introduced a new range of absolute return funds with the launch of the Gartmore SICAV European AbsoluteReturn Fund on 27 February 2009.
The number of jurisdictions Gartmore SICAV is registered in for distribution remained at 22, in addition to Luxembourg.
Proposed New FundsThe Company has received approval from the CSSF to close the Gartmore SICAV US Dollar Money Fund and the Gartmore SICAV Eurobloc Fund with effect of 15 May 2009. All shareholders were notified of theseclosures by mail on 6 April 2009.
The CSSF further approved the closure of the Gartmore SICAV US Smaller Companies Fund and the mergerof the Gartmore SICAV Continental European Smaller Companies Fund into the Gartmore SICAV Pan European Smaller Companies Fund on 21 August 2009. Shareholders affected by this change were notifiedby mail on 21 May 2009. These decisions for the closures and merger were following a strategic review of our fund range. The Board believes that the funds in question were not envisaged to grow substantially andover the medium to long-term would be less attractive to investors.
PerformanceThe performance of five of our funds ranked in the top quartile against their respective peer groups in the last six months, despite the strong challenges of market volatility within this period as outlined within the investment report. The following funds achieved top quartile ranking within the last six months: Gartmore SICAV Continental European Fund, Gartmore SICAV Continental European Smaller Companies Fund and Gartmore SICAV Euro Money Fund, as well as Gartmore SICAV Latin American Fund and Gartmore SICAV Global Bond Fund which were top decile.
Over the last six months, performance was strong across a number of our funds, in particular with Gartmore SICAV Continental European Fund, Gartmore SICAV Continental European Smaller Companies Fund, Gartmore SICAV Euro Money Fund, Gartmore SICAV Global Bond Fund, Gartmore SICAV Global Focus Fund, Gartmore SICAV Latin American Fund, Gartmore SICAV Pan European Smaller Companies Fund, Gartmore SICAV Sterling Money Fund and Gartmore SICAV US Dollar Money Fund, all outperforming their respective sector averages over six months.
The Board and DirigeantsThere were no further changes to the Board during the period under review.
As previously stated within the Annual Report and Accounts (30 September 2008), the CSSF approved the appointment of the below Dirigeants in addition to existing Dirigeant, Keith Hewett, Head of Fund Operations, Gartmore Investment Management Limited.
Chris Busby – Senior Business Consultant, Gartmore Investment Management LimitedNigel Parker – Director of Gartmore SICAV and Director of Gartmore Services LimitedJustin Willott – Deputy Chief Compliance Officer, Gartmore Investment Management Limited
On behalf of the Gartmore SICAV Board, I would like to thank you for your continued support.
Les AitkenheadChairman20 May 2009
Note: The information stated in this report is historical and not necessarily indicative of future performance.
6
Important Fund Information
Fund Closures with effect of 15 May 2009
Gartmore SICAV US Dollar Money FundThe Gartmore SICAV US Dollar Money Fund was closed on 15 May 2009. The reason for the closure of theFund was the very low yield generated from the US Dollar denominated Cash deposits and Money Market instruments which resulted in the Fund becoming less attractive to investors. All shareholders with holdings in this Fund have been informed by written notification on 6 April 2009.
Gartmore SICAV Eurobloc FundThe Gartmore SICAV Eurobloc Fund was closed on 15 May 2009. The reason for the closure of this Fund is the very small size (1.9 Million Euro as at 31 January 2009) which made the management of the Fund less attractive to investors. All shareholders with holdings in this Fund have been informed by written notification on 6 April 2009.
Fund Closure and Merger with effect of 21 August 2009
Gartmore SICAV US Smaller Companies FundThe Gartmore SICAV US Smaller Companies Fund will be closed on 21 August 2009. The closure of the Fund is following a strategic review of the Gartmore SICAV Fund range which concluded that the Fund was not envisaged to grow substantially and over the medium to long-term would be less attractive to investors. All shareholders with holdings in this Fund have been informed by written notification on 21 May2009.
Gartmore SICAV Continental European Smaller Companies FundThe Gartmore SICAV Continental European Smaller Companies Fund will be merged into the Gartmore SICAV Pan European Smaller Companies Fund on 21 August 2009. The merger of the Fund is following a strategic review of the Gartmore SICAV Fund range which concluded that the Fund was is not envisaged to grow substantially and over the medium to long-term would be less attractive to investors. All shareholderswith holdings in this Fund have been informed by written notification on 21 May 2009.
7
Investment Report
UKSystemic problems in the financial system – their worst impact possibly halted by timely government action - came to afflict the broader economy. Many households had to deal with the blow of unemployment, while advertisers were increasingly reflecting the gloomier economic times with referencesto the ‘credit crunch’ in their copy.
The UK officially entered recession for the first time since 1991, after the economy shrank at the fastest pace (-1.6%) for nearly 30 years in the fourth quarter of 2008. This followed a 0.6% slump in the third quarter - two or more consecutive quarters of contraction are regarded as constituting a recession.
Amid exceptional instability across the world’s financial markets in October, the government announced it was providing financial support to the banking industry. The UK initiative of bank recapitalisations and support for lending set the tone for similar responses around the globe. Later, the authorities were pushed into another round of bank bail-outs, with the Royal Bank of Scotland effectively nationalised.
The Bank of England (BoE) reduced its benchmark interest rate in a number of dramatic cuts to 0.5% - the lowest point in its 315-year history. It also announced it is expanding the amount of money in the system by £75 billion - a policy called quantitative easing - in an attempt to boost bank lending. Mervyn King, BoE Governor, commented that "nothing in life is ever certain, but these measures we think will work in the longterm."
Although government expenditure may be able to mitigate partially the impact of the economic downturn, such intervention comes at a cost, namely the increase in public debt to record levels and the prospect thatlong-term interest rates may end up being higher. The most favourable outcome would be a gentle stabilisation of the economy.
USThe then presidential candidate Barack Obama summed up the spirit of the American people in three simple words – ‘yes, we can.’
Now as President, Obama has demonstrated readiness to use the levers of government to revive the financial sector and the economy. He signed into law his $787 billion stimulus package, one of the largest economic rescue programmes since Franklin Roosevelt's New Deal.
The challenges were manifold. The recent cumulative loss in jobs is the worst since troops were demobilised at the end of the World War II - the unemployment rate has risen to 8.5%. The US economy contracted at an annual rate of -6.3% in the fourth quarter of 2008, compared with the ’advance’ estimate of -3.8%. This was the fourth worst quarter since the Great Depression, with bigger drops only recorded in 1982, 1980 and 1957. The sharp downturn in output would appear to be continuing.
As if underscoring the challenges ahead, Wall Street disobligingly greeted Obama’s investiture with its worst inauguration day ever against the backdrop of the world’s banks in free fall.
Amid the welter of bad news, it only seemed to take an internal memo from Citigroup’s CEO - revealing thatthe beleaguered bank was off to a good start in 2009 - to trigger a very sharp bounce in equity markets globally. Arguably, the real catalyst was that markets had simply become oversold, a point at which they may have hit three weeks prior, with sentiment indicators reaching extreme lows.
The rally was given further impetus by positive reactions to the Federal Reserve’s programme of quantitative easing, a new rescue plan for the banks from US Treasury Secretary Timothy Geithner and a smattering of better-than-expected US macroeconomic data releases, notably unexpected growth in durable-goods orders and new-home sales.
8
Investment Report continued
EuropeFaced with evidence of a painful economic contraction in the 16-nation eurozone, the European Central Bank (ECB) went into rate-cutting mode, while generally refraining from dramatic cuts in the manner of the Bank of England (BoE) or the US Federal Reserve. However, its main interest rate of 1.25% is the lowest since the creation of the common European currency and the ECB’s birth a decade ago.
After resisting political pressure to opt for quantitative easing – memories of the Weimar Republic's disastrous hyperinflation still resonate, the ECB could embrace the policy as the eurozone economy is facing a severe contraction and deflation. (The ECB is expected to start buying up corporate debt.)
The recession has hit Germany hard given the country’s focus on exports. The euro’s strength has damaged its competitiveness, while its fastest growing export markets – Spain, Ireland, Central Europe andRussia – have all contracted markedly.
Concerns mounted about how developments resulting from the vulnerabilities in Emerging Europe might affect the eurozone. If Emerging Europe were to suffer a significant downturn, corporates that export a lot to the region would experience weaker demand; eurozone banks that have extended credit in Emerging Europe could experience losses and companies with direct investment might see weaker repatriated profits.
JapanAs the rest of world moved to ‘Japan-style’ low interest rates and risk aversion heightened, Japan’s retail investors repatriated their money and institutions reversed the ‘carry trade into high yielding assets’. This had the effect of buoying the yen, whose strength is hurting exporters. The stronger yen was a factor in economic output shrinking by 3.3% in the last quarter of 2008, compared with the previous three months.
With Japan facing a prolonged recession and a collapse in corporate earnings, investor concerns intensified. At the end of December 2008, the TOPIX was as oversold as at any time it has been in the post-war period.
The fear surrounding the prospects for Japan arguably was reflected in some stock valuations, which would appear to suggest that companies are being priced for bankruptcy as if they had loans that could be terminated at a moment’s notice. However, Japanese companies have reduced their fixed costs and are now acting quickly to reduce the variable ones as well. With a greater use of temporary staff in recent years, some element of the wage bill is now a variable cost.
Additionally, some signs of stabilisation – mainly in manufacturing indicators - began to appear. However, perception of excess inventories, production capacity and labour (particularly among small firms) could prove to be a drag on recovery.
After the close of the review period, Japan outlined its latest stimulus package, the government's third in the past year. This record £105 billion stimulus package is worth about 3% of its gross domestic product.
9
Investment Report continued
Emerging Markets & Pacific RimEmerging markets have, of late, been benefiting from the relative strength of their financial institutions, compared to those in the developed world. as well as from the significant easing of monetary policy and expectations for Chinese growth. Signs of growth in China have been sufficient to help stabilise commodityprices. Generally, operating conditions remained challenging, characterised by severe disruption in global credit markets and a slowdown in global trading flows.
China’s approximately £400 billion economic stimulus package is intended to address slower demand for China’s exports. Exports in February plunged 25.7% from a year earlier, worse than January’s 17.5% decline, according to customs data. The spending package focuses on infrastructure investment combinedwith extremely high levels of educational and social security outlays. Other features include sweeping tax cuts, industrial reform and agricultural deregulation.
In recent years, the Chinese Communist Party has based its claim to legitimacy, in large part, on its ability to deliver strong economic growth. The sharp slowdown in growth, mainly due to a deceleration in exports and a downturn in the real estate market, caused the ruling party alarm, prompting warnings that dissent and threats to social stability would be crushed.
Fixed IncomeCorporate bonds fell over the six month period, reflecting further declines among equities. More recently, many corporate debt instruments have begun to offer returns similar in magnitude to the long-run historicalreturns from equities but with less capital risk.
For much of the period, government bonds registered gains, as investors sought shelter from riskier assets. Latterly, prices fell back, particularly as President Barack Obama unveiled a US$3.55 trillion budgetfor 2010 aimed at lifting the US economy out of recession.
Inflationary pressures in the major industrialised economies dissipated and economic indicators continued to weaken. Notably, eurozone industrial output plunged by 3.5% in January, compared with the previous month, the biggest decline since records began in 1990. These developments are, by and large, reflected by government bond markets, where yields remain low compared to their long-term averages.
The continuing strain on government finances imposed by recessionary conditions and the adoption of quantitative easing intended to foster economic recovery pose inflationary risks over the medium-term - any signs of a resurgence in inflation could unsettle government bond markets.
Gartmore’s outlookAround the globe, fiscal stimulus is the order of the day, promoted by China, Japan, the European Union and the US. Investors can draw some comfort from the supportive character of the policy action by governments and monetary authorities. More recently, the central banks of the US and UK have been usingless orthodox ways to pump money into the economy, so-called ‘quantitative easing.’
Despite these initiatives and an incremental improvement in news flow, the first quarter reporting season could present some near-term difficulties as some company announcements are likely to disappoint. Emerging from this, we believe it may be possible to discern a bottoming of the markets and the outlook could well become more positive as the year unfolds.
Gartmore Investment LimitedInvestment Manager29 May 2009
Note: The information stated in this report is historical and not necessarily indicative of future performance.
10

Gartmore SICAV Asia Pacific Fundfor the period ended 31 March 2009
BALANCE SHEETUSD Note 31.03.09 30.09.08CURRENT ASSETS
Cash and cash equivalents 2.8 380,919 1,248,800
Margin accounts 2.5(b), 9 - -
Due from brokers 2.10 6,275 400,305
Subscriptions receivable 2.12 9,409 300,922
Financial investments at fair value through profit or loss 2.3, 2.5, 4, 5, 6, 7, 8 11,678,719 20,701,757Dividend receivable 2.4, 2.12 73,820 89,189
Interest receivable 2.4, 2.12 - 16,552
Other accrued income and prepaid expenses 944 260,291
Total assets 12,150,086 23,017,816
CURRENT LIABILITIES
Bank overdraft 2.8 - 29
Due to brokers 2.10 6,274 198,728
Redemptions payable 2.12 9,963 1,327,111
Distributions payable to holders of redeemable ordinary shares 12 - 291,804Accrued interest 2.4, 2.12 - -
Accrued expenses 2.12 33,024 201,045
Liabilities (excluding net assets attributable to holders of redeemable ordinary shares) 49,261 2,018,717Net assets attributable to holders of redeemableordinary shares 12,100,825 20,999,099
CASH-FLOW STATEMENTUSD Note 31.03.09 31.03.08CASH-FLOW FROM OPERATING ACTIVITIES
Increase/(decrease) in net assets attributable toholders of redeemable ordinary shares from operations (4,742,381) (19,340,568)
Adjustment for:
Interest income 2.6 (339) (8,226)
Interest expense 2.6 - -
Dividend income 2.6 (201,856) (785,056)
Investments interest 2.6 - -
Securities lending revenue 2.7, 14 - -
Taxation 2.9 12,446 65,084
Distributions to holders of redeemable ordinary shares 12 - -
Operating profit/(loss) before working capital changes (4,932,130) (20,068,766)Net decrease/(increase) in other accrued income and prepaid expenses 259,347 (58,523)Net decrease/(increase) in due from brokers 394,030 (421,336)
Net (decrease)/increase in due to brokers (192,454) 425,553
Net increase/(decrease) in accrued expenses (168,021) (152,697)
Net (increase)/decrease in financial investments at fair value through profit or loss 9,023,038 140,313,567Interest received 2.6, 2.12 16,891 8,226
Interest paid 2.6, 2.12 - -
Dividend received 2.6, 2.12 217,225 1,552,902
Investments interest received 2.6 - -
Securities lending commission received 2.7, 14 - -
Tax paid 2.9 (12,446) (65,084)
Net cash generated from/(used in) operating activities 4,605,480 121,533,842
CASH-FLOW FROM FINANCING ACTIVITIES
Distributions paid to holders of redeemable ordinary shares 12 (291,804) (1,581,428)Cash received on shares issued 649,944 18,131,061
Cash paid out on shares redeemed (5,831,472) (138,113,682)
Net cash generated from/(used in) financing activities (5,473,332) (121,564,049)Net increase/(decrease) in cash and cash equivalents (867,852) (30,207)Opening cash and cash equivalents 1,248,771 588,642Closing cash and cash equivalents 380,919 558,435
INCOME STATEMENTUSD Note 31.03.09 31.03.08REVENUE
Deposit interest 2.6 339 8,226
Dividend income 2.6 201,856 785,056
Investments interest 2.6 - -
Securities lending revenue 2.7, 14 - -
Net gains/(losses) on financial investments at fair value through profit or loss 2.3 (4,805,436) (19,407,121)Other income 17,854 569,634
Total investment income (4,585,387) (18,044,205)
EXPENSES
Management fees 13 92,000 705,911
Performance fees 13 - -
Administration fees 13 21,288 62,967
Transaction charges 17 28,744 452,369
Service fees 13 267 1,165
Interest expense 2.6 - -
Other expenses 2,249 8,867
Total operating expenses 144,548 1,231,279Operating profit/(loss) (4,729,935) (19,275,484)
FINANCE COSTS
Distributions to holders of redeemable ordinary shares 12 - -
Total finance costs - -Net profit/(loss) before tax (4,729,935) (19,275,484)Taxation 2.9 12,446 65,084
Increase/(decrease) in net assets attributable toholders of redeemable ordinary shares from operations (4,742,381) (19,340,568)
STATEMENT OF CHANGES IN NET ASSETS ATTRIBUTABLE TO HOLDERS OF REDEEMABLE ORDINARY SHARESUSD Note 31.03.09 31.03.08Net assets attributable to holders of redeemableordinary shares at beginning of the period 20,999,099 172,891,776Increase/(decrease) in net assets attributable toholders of redeemable ordinary shares from operations (4,742,381) (19,340,568)Proceeds from shares issued 358,431 16,464,499
Payments for shares redeemed (4,514,324) (137,724,144)
Currency translation adjustment 2.2 - -
Net assets attributable to holders of redeemableordinary shares at end of the period 12,100,825 32,291,563
The accompanying notes 1 to 19 found on pages 81 to 115 form an integral part of the financial statements.
11
Gartmore SICAV Asia Pacific Fundfor the period ended 31 March 2009 continued
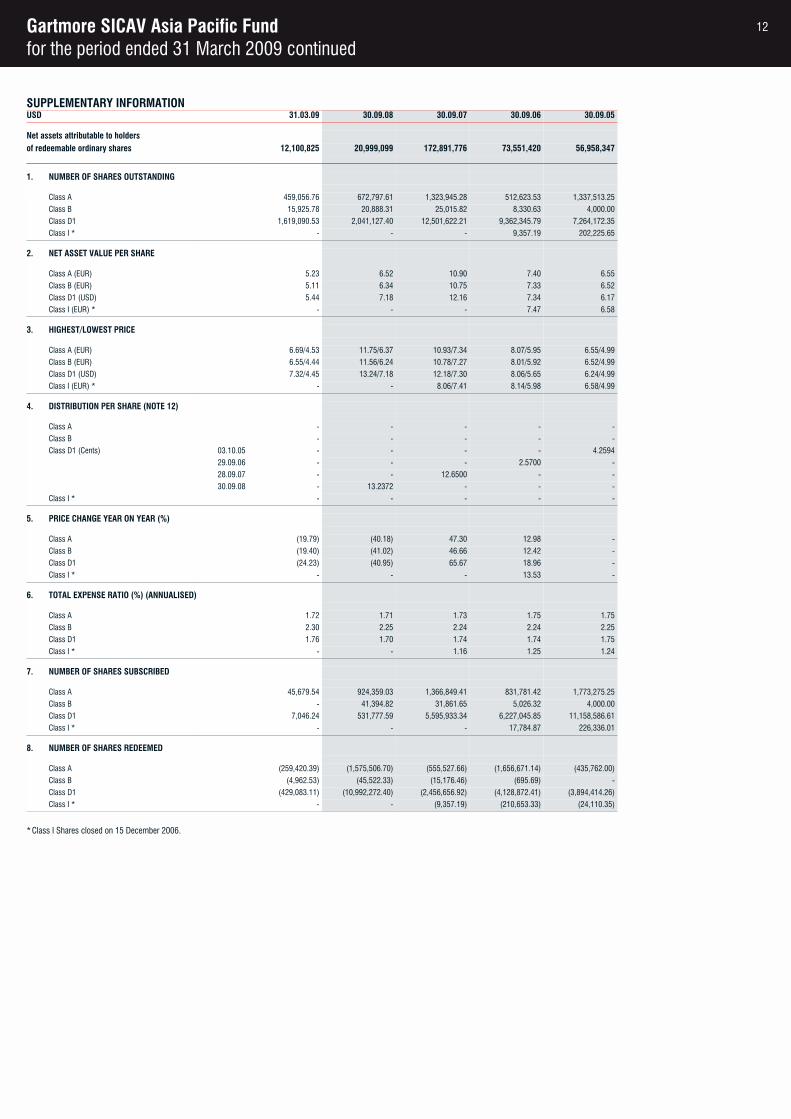
SUPPLEMENTARY INFORMATIONUSD 31.03.09 30.09.08 30.09.07 30.09.06 30.09.05
Net assets attributable to holdersof redeemable ordinary shares 12,100,825 20,999,099 172,891,776 73,551,420 56,958,347
1. NUMBER OF SHARES OUTSTANDING
Class A 459,056.76 672,797.61 1,323,945.28 512,623.53 1,337,513.25
Class B 15,925.78 20,888.31 25,015.82 8,330.63 4,000.00
Class D1 1,619,090.53 2,041,127.40 12,501,622.21 9,362,345.79 7,264,172.35
Class I * - - - 9,357.19 202,225.65
2. NET ASSET VALUE PER SHARE
Class A (EUR) 5.23 6.52 10.90 7.40 6.55
Class B (EUR) 5.11 6.34 10.75 7.33 6.52
Class D1 (USD) 5.44 7.18 12.16 7.34 6.17
Class I (EUR) * - - - 7.47 6.58
3. HIGHEST/LOWEST PRICE
Class A (EUR) 6.69/4.53 11.75/6.37 10.93/7.34 8.07/5.95 6.55/4.99
Class B (EUR) 6.55/4.44 11.56/6.24 10.78/7.27 8.01/5.92 6.52/4.99
Class D1 (USD) 7.32/4.45 13.24/7.18 12.18/7.30 8.06/5.65 6.24/4.99
Class I (EUR) * - - 8.06/7.41 8.14/5.98 6.58/4.99
4. DISTRIBUTION PER SHARE (NOTE 12)
Class A - - - - -
Class B - - - - -
Class D1 (Cents) 03.10.05 - - - - 4.2594
29.09.06 - - - 2.5700 -
28.09.07 - - 12.6500 - -
30.09.08 - 13.2372 - - -
Class I * - - - - -
5. PRICE CHANGE YEAR ON YEAR (%)
Class A (19.79) (40.18) 47.30 12.98 -
Class B (19.40) (41.02) 46.66 12.42 -
Class D1 (24.23) (40.95) 65.67 18.96 -
Class I * - - - 13.53 -
6. TOTAL EXPENSE RATIO (%) (ANNUALISED)
Class A 1.72 1.71 1.73 1.75 1.75
Class B 2.30 2.25 2.24 2.24 2.25
Class D1 1.76 1.70 1.74 1.74 1.75
Class I * - - 1.16 1.25 1.24
7. NUMBER OF SHARES SUBSCRIBED
Class A 45,679.54 924,359.03 1,366,849.41 831,781.42 1,773,275.25
Class B - 41,394.82 31,861.65 5,026.32 4,000.00
Class D1 7,046.24 531,777.59 5,595,933.34 6,227,045.85 11,158,586.61
Class I * - - - 17,784.87 226,336.01
8. NUMBER OF SHARES REDEEMED
Class A (259,420.39) (1,575,506.70) (555,527.66) (1,656,671.14) (435,762.00)
Class B (4,962.53) (45,522.33) (15,176.46) (695.69) -
Class D1 (429,083.11) (10,992,272.40) (2,456,656.92) (4,128,872.41) (3,894,414.26)
Class I * - - (9,357.19) (210,653.33) (24,110.35)
*Class I Shares closed on 15 December 2006.
12
Gartmore SICAV Asia Pacific Fundfor the period ended 31 March 2009 continued
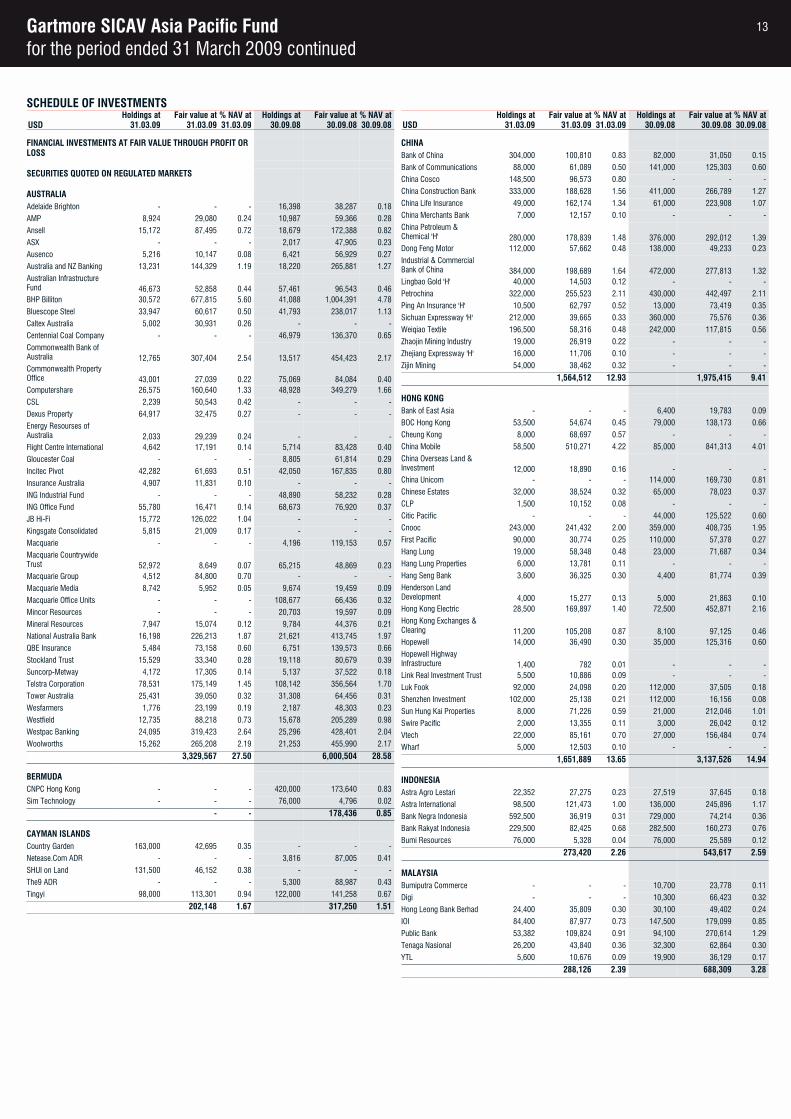
SCHEDULE OF INVESTMENTSHoldings at Fair value at % NAV at Holdings at Fair value at % NAV at
USD 31.03.09 31.03.09 31.03.09 30.09.08 30.09.08 30.09.08
FINANCIAL INVESTMENTS AT FAIR VALUE THROUGH PROFIT OR LOSS
SECURITIES QUOTED ON REGULATED MARKETS
AUSTRALIAAdelaide Brighton - - - 16,398 38,287 0.18
AMP 8,924 29,080 0.24 10,987 59,366 0.28
Ansell 15,172 87,495 0.72 18,679 172,388 0.82
ASX - - - 2,017 47,905 0.23
Ausenco 5,216 10,147 0.08 6,421 56,929 0.27
Australia and NZ Banking 13,231 144,329 1.19 18,220 265,881 1.27
Australian Infrastructure Fund 46,673 52,858 0.44 57,461 96,543 0.46BHP Billiton 30,572 677,815 5.60 41,088 1,004,391 4.78
Bluescope Steel 33,947 60,617 0.50 41,793 238,017 1.13
Caltex Australia 5,002 30,931 0.26 - - -
Centennial Coal Company - - - 46,979 136,370 0.65
Commonwealth Bank of Australia 12,765 307,404 2.54 13,517 454,423 2.17Commonwealth Property Office 43,001 27,039 0.22 75,069 84,084 0.40Computershare 26,575 160,640 1.33 48,928 349,279 1.66
CSL 2,239 50,543 0.42 - - -
Dexus Property 64,917 32,475 0.27 - - -
Energy Resourses of Australia 2,033 29,239 0.24 - - -Flight Centre International 4,642 17,191 0.14 5,714 83,428 0.40
Gloucester Coal - - - 8,805 61,814 0.29
Incitec Pivot 42,282 61,693 0.51 42,050 167,835 0.80
Insurance Australia 4,907 11,831 0.10 - - -
ING Industrial Fund - - - 48,890 58,232 0.28
ING Office Fund 55,780 16,471 0.14 68,673 76,920 0.37
JB Hi-Fi 15,772 126,022 1.04 - - -
Kingsgate Consolidated 5,815 21,009 0.17 - - -
Macquarie - - - 4,196 119,153 0.57
Macquarie Countrywide Trust 52,972 8,649 0.07 65,215 48,869 0.23Macquarie Group 4,512 84,800 0.70 - - -
Macquarie Media 8,742 5,952 0.05 9,674 19,459 0.09
Macquarie Office Units - - - 108,677 66,436 0.32
Mincor Resources - - - 20,703 19,597 0.09
Mineral Resources 7,947 15,074 0.12 9,784 44,376 0.21
National Australia Bank 16,198 226,213 1.87 21,621 413,745 1.97
QBE Insurance 5,484 73,158 0.60 6,751 139,573 0.66
Stockland Trust 15,529 33,340 0.28 19,118 80,679 0.39
Suncorp-Metway 4,172 17,305 0.14 5,137 37,522 0.18
Telstra Corporation 78,531 175,149 1.45 108,142 356,564 1.70
Tower Australia 25,431 39,050 0.32 31,308 64,456 0.31
Wesfarmers 1,776 23,199 0.19 2,187 48,303 0.23
Westfield 12,735 88,218 0.73 15,678 205,289 0.98
Westpac Banking 24,095 319,423 2.64 25,296 428,401 2.04
Woolworths 15,262 265,208 2.19 21,253 455,990 2.17
3,329,567 27.50 6,000,504 28.58
BERMUDACNPC Hong Kong - - - 420,000 173,640 0.83
Sim Technology - - - 76,000 4,796 0.02
- - 178,436 0.85
CAYMAN ISLANDSCountry Garden 163,000 42,695 0.35 - - -
Netease.Com ADR - - - 3,816 87,005 0.41
SHUI on Land 131,500 46,152 0.38 - - -
The9 ADR - - - 5,300 88,987 0.43
Tingyi 98,000 113,301 0.94 122,000 141,258 0.67
202,148 1.67 317,250 1.51
Holdings at Fair value at % NAV at Holdings at Fair value at % NAV atUSD 31.03.09 31.03.09 31.03.09 30.09.08 30.09.08 30.09.08
CHINABank of China 304,000 100,810 0.83 82,000 31,050 0.15
Bank of Communications 88,000 61,089 0.50 141,000 125,303 0.60
China Cosco 148,500 96,573 0.80 - - -
China Construction Bank 333,000 188,628 1.56 411,000 266,789 1.27
China Life Insurance 49,000 162,174 1.34 61,000 223,908 1.07
China Merchants Bank 7,000 12,157 0.10 - - -
China Petroleum & Chemical 'H' 280,000 178,839 1.48 376,000 292,012 1.39Dong Feng Motor 112,000 57,662 0.48 138,000 49,233 0.23
Industrial & Commercial Bank of China 384,000 198,689 1.64 472,000 277,813 1.32Lingbao Gold 'H' 40,000 14,503 0.12 - - -
Petrochina 322,000 255,523 2.11 430,000 442,497 2.11
Ping An Insurance 'H' 10,500 62,797 0.52 13,000 73,419 0.35
Sichuan Expressway 'H' 212,000 39,665 0.33 360,000 75,576 0.36
Weiqiao Textile 196,500 58,316 0.48 242,000 117,815 0.56
Zhaojin Mining Industry 19,000 26,919 0.22 - - -
Zhejiang Expressway 'H' 16,000 11,706 0.10 - - -
Zijin Mining 54,000 38,462 0.32 - - -
1,564,512 12.93 1,975,415 9.41
HONG KONGBank of East Asia - - - 6,400 19,783 0.09
BOC Hong Kong 53,500 54,674 0.45 79,000 138,173 0.66
Cheung Kong 8,000 68,697 0.57 - - -
China Mobile 58,500 510,271 4.22 85,000 841,313 4.01
China Overseas Land & Investment 12,000 18,890 0.16 - - -China Unicom - - - 114,000 169,730 0.81
Chinese Estates 32,000 38,524 0.32 65,000 78,023 0.37
CLP 1,500 10,152 0.08 - - -
Citic Pacific - - - 44,000 125,522 0.60
Cnooc 243,000 241,432 2.00 359,000 408,735 1.95
First Pacific 90,000 30,774 0.25 110,000 57,378 0.27
Hang Lung 19,000 58,348 0.48 23,000 71,687 0.34
Hang Lung Properties 6,000 13,781 0.11 - - -
Hang Seng Bank 3,600 36,325 0.30 4,400 81,774 0.39
Henderson Land Development 4,000 15,277 0.13 5,000 21,863 0.10Hong Kong Electric 28,500 169,897 1.40 72,500 452,871 2.16
Hong Kong Exchanges & Clearing 11,200 105,208 0.87 8,100 97,125 0.46Hopewell 14,000 36,490 0.30 35,000 125,316 0.60
Hopewell Highway Infrastructure 1,400 782 0.01 - - -Link Real Investment Trust 5,500 10,886 0.09 - - -
Luk Fook 92,000 24,098 0.20 112,000 37,505 0.18
Shenzhen Investment 102,000 25,138 0.21 112,000 16,156 0.08
Sun Hung Kai Properties 8,000 71,226 0.59 21,000 212,046 1.01
Swire Pacific 2,000 13,355 0.11 3,000 26,042 0.12
Vtech 22,000 85,161 0.70 27,000 156,484 0.74
Wharf 5,000 12,503 0.10 - - -
1,651,889 13.65 3,137,526 14.94
INDONESIAAstra Agro Lestari 22,352 27,275 0.23 27,519 37,645 0.18
Astra International 98,500 121,473 1.00 136,000 245,896 1.17
Bank Negra Indonesia 592,500 36,919 0.31 729,000 74,214 0.36
Bank Rakyat Indonesia 229,500 82,425 0.68 282,500 160,273 0.76
Bumi Resources 76,000 5,328 0.04 76,000 25,589 0.12
273,420 2.26 543,617 2.59
MALAYSIABumiputra Commerce - - - 10,700 23,778 0.11
Digi - - - 10,300 66,423 0.32
Hong Leong Bank Berhad 24,400 35,809 0.30 30,100 49,402 0.24
IOI 84,400 87,977 0.73 147,500 179,099 0.85
Public Bank 53,382 109,824 0.91 94,100 270,614 1.29
Tenaga Nasional 26,200 43,840 0.36 32,300 62,864 0.30
YTL 5,600 10,676 0.09 19,900 36,129 0.17
288,126 2.39 688,309 3.28
13
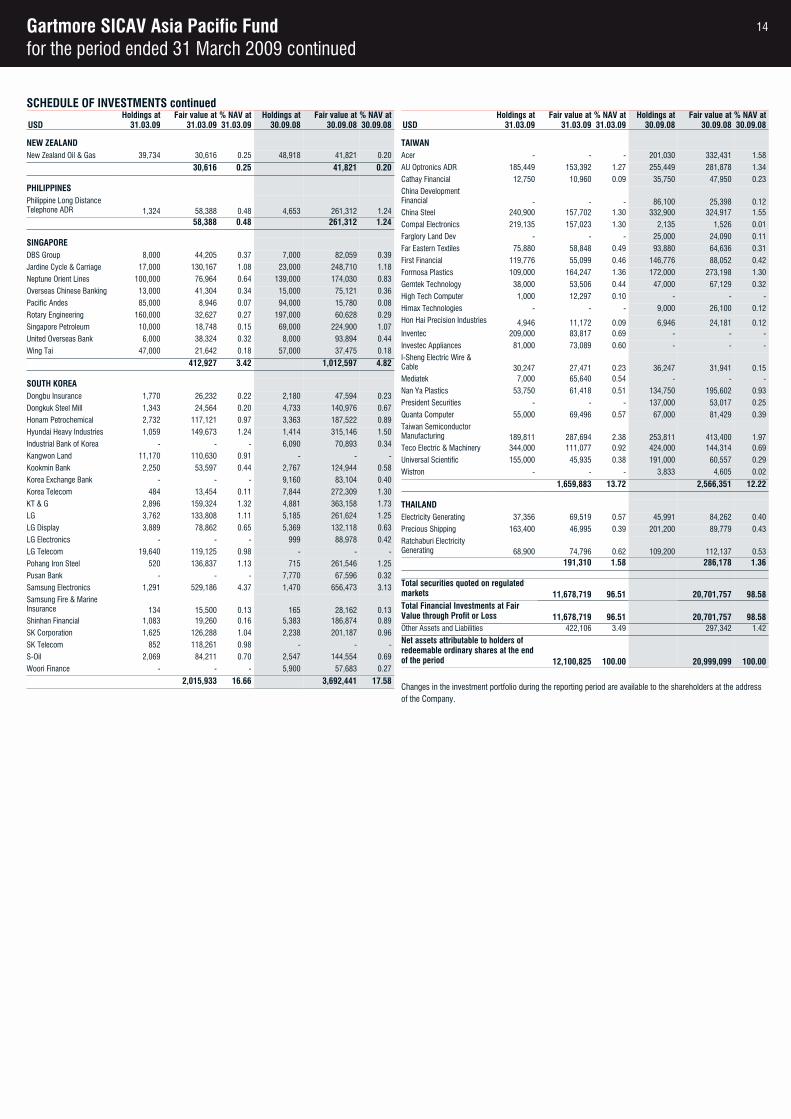
Gartmore SICAV Asia Pacific Fundfor the period ended 31 March 2009 continued
SCHEDULE OF INVESTMENTS continuedHoldings at Fair value at % NAV at Holdings at Fair value at % NAV at
USD 31.03.09 31.03.09 31.03.09 30.09.08 30.09.08 30.09.08
NEW ZEALAND New Zealand Oil & Gas 39,734 30,616 0.25 48,918 41,821 0.20
30,616 0.25 41,821 0.20
PHILIPPINESPhilippine Long Distance Telephone ADR 1,324 58,388 0.48 4,653 261,312 1.24
58,388 0.48 261,312 1.24
SINGAPOREDBS Group 8,000 44,205 0.37 7,000 82,059 0.39
Jardine Cycle & Carriage 17,000 130,167 1.08 23,000 248,710 1.18
Neptune Orient Lines 100,000 76,964 0.64 139,000 174,030 0.83
Overseas Chinese Banking 13,000 41,304 0.34 15,000 75,121 0.36
Pacific Andes 85,000 8,946 0.07 94,000 15,780 0.08
Rotary Engineering 160,000 32,627 0.27 197,000 60,628 0.29
Singapore Petroleum 10,000 18,748 0.15 69,000 224,900 1.07
United Overseas Bank 6,000 38,324 0.32 8,000 93,894 0.44
Wing Tai 47,000 21,642 0.18 57,000 37,475 0.18
412,927 3.42 1,012,597 4.82
SOUTH KOREADongbu Insurance 1,770 26,232 0.22 2,180 47,594 0.23
Dongkuk Steel Mill 1,343 24,564 0.20 4,733 140,976 0.67
Honam Petrochemical 2,732 117,121 0.97 3,363 187,522 0.89
Hyundai Heavy Industries 1,059 149,673 1.24 1,414 315,146 1.50
Industrial Bank of Korea - - - 6,090 70,893 0.34
Kangwon Land 11,170 110,630 0.91 - - -
Kookmin Bank 2,250 53,597 0.44 2,767 124,944 0.58
Korea Exchange Bank - - - 9,160 83,104 0.40
Korea Telecom 484 13,454 0.11 7,844 272,309 1.30
KT & G 2,896 159,324 1.32 4,881 363,158 1.73
LG 3,762 133,808 1.11 5,185 261,624 1.25
LG Display 3,889 78,862 0.65 5,369 132,118 0.63
LG Electronics - - - 999 88,978 0.42
LG Telecom 19,640 119,125 0.98 - - -
Pohang Iron Steel 520 136,837 1.13 715 261,546 1.25
Pusan Bank - - - 7,770 67,596 0.32
Samsung Electronics 1,291 529,186 4.37 1,470 656,473 3.13
Samsung Fire & Marine Insurance 134 15,500 0.13 165 28,162 0.13Shinhan Financial 1,083 19,260 0.16 5,383 186,874 0.89
SK Corporation 1,625 126,288 1.04 2,238 201,187 0.96
SK Telecom 852 118,261 0.98 - - -
S-Oil 2,069 84,211 0.70 2,547 144,554 0.69
Woori Finance - - - 5,900 57,683 0.27
2,015,933 16.66 3,692,441 17.58
Holdings at Fair value at % NAV at Holdings at Fair value at % NAV atUSD 31.03.09 31.03.09 31.03.09 30.09.08 30.09.08 30.09.08
TAIWANAcer - - - 201,030 332,431 1.58
AU Optronics ADR 185,449 153,392 1.27 255,449 281,878 1.34
Cathay Financial 12,750 10,960 0.09 35,750 47,950 0.23
China Development Financial - - - 86,100 25,398 0.12China Steel 240,900 157,702 1.30 332,900 324,917 1.55
Compal Electronics 219,135 157,023 1.30 2,135 1,526 0.01
Farglory Land Dev - - - 25,000 24,090 0.11
Far Eastern Textiles 75,880 58,848 0.49 93,880 64,636 0.31
First Financial 119,776 55,099 0.46 146,776 88,052 0.42
Formosa Plastics 109,000 164,247 1.36 172,000 273,198 1.30
Gemtek Technology 38,000 53,506 0.44 47,000 67,129 0.32
High Tech Computer 1,000 12,297 0.10 - - -
Himax Technologies - - - 9,000 26,100 0.12
Hon Hai Precision Industries 4,946 11,172 0.09 6,946 24,181 0.12Inventec 209,000 83,817 0.69 - - -
Investec Appliances 81,000 73,089 0.60 - - -
I-Sheng Electric Wire & Cable 30,247 27,471 0.23 36,247 31,941 0.15Mediatek 7,000 65,640 0.54 - - -
Nan Ya Plastics 53,750 61,418 0.51 134,750 195,602 0.93
President Securities - - - 137,000 53,017 0.25
Quanta Computer 55,000 69,496 0.57 67,000 81,429 0.39
Taiwan Semiconductor Manufacturing 189,811 287,694 2.38 253,811 413,400 1.97Teco Electric & Machinery 344,000 111,077 0.92 424,000 144,314 0.69
Universal Scientific 155,000 45,935 0.38 191,000 60,557 0.29
Wistron - - - 3,833 4,605 0.02
1,659,883 13.72 2,566,351 12.22
THAILAND Electricity Generating 37,356 69,519 0.57 45,991 84,262 0.40
Precious Shipping 163,400 46,995 0.39 201,200 89,779 0.43
Ratchaburi Electricity Generating 68,900 74,796 0.62 109,200 112,137 0.53
191,310 1.58 286,178 1.36
Total securities quoted on regulated markets 11,678,719 96.51 20,701,757 98.58Total Financial Investments at Fair Value through Profit or Loss 11,678,719 96.51 20,701,757 98.58Other Assets and Liabilities 422,106 3.49 297,342 1.42
Net assets attributable to holders of redeemable ordinary shares at the end of the period 12,100,825 100.00 20,999,099 100.00
Changes in the investment portfolio during the reporting period are available to the shareholders at the address of the Company.
14
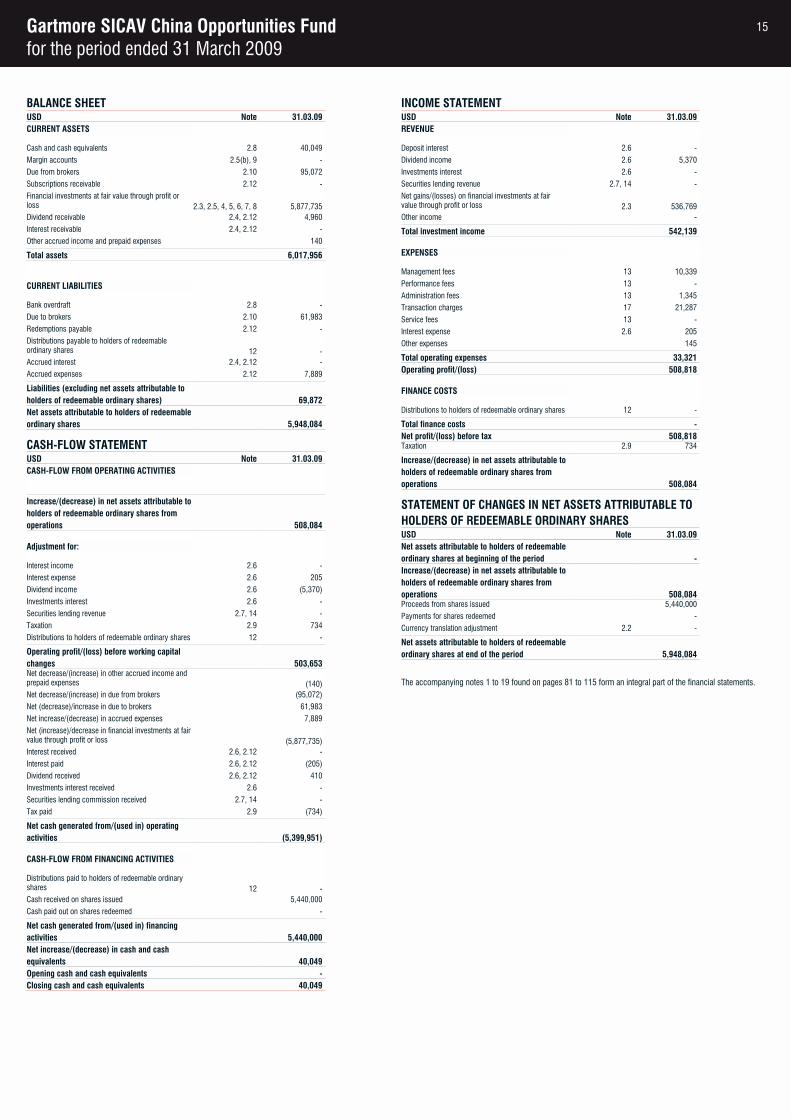
Gartmore SICAV China Opportunities Fundfor the period ended 31 March 2009
BALANCE SHEETUSD Note 31.03.09 30.09.08
CURRENT ASSETS
Cash and cash equivalents 2.8 40,049
Margin accounts 2.5(b), 9 -
Due from brokers 2.10 95,072
Subscriptions receivable 2.12 -
Financial investments at fair value through profit or loss 2.3, 2.5, 4, 5, 6, 7, 8 5,877,735Dividend receivable 2.4, 2.12 4,960
Interest receivable 2.4, 2.12 -
Other accrued income and prepaid expenses 140
Total assets 6,017,956
CURRENT LIABILITIES
Bank overdraft 2.8 -
Due to brokers 2.10 61,983
Redemptions payable 2.12 -
Distributions payable to holders of redeemable ordinary shares 12 -Accrued interest 2.4, 2.12 -
Accrued expenses 2.12 7,889
Liabilities (excluding net assets attributable to holders of redeemable ordinary shares) 69,872Net assets attributable to holders of redeemableordinary shares 5,948,084
CASH-FLOW STATEMENTUSD Note 31.03.09 31.03.08
CASH-FLOW FROM OPERATING ACTIVITIES
Increase/(decrease) in net assets attributable toholders of redeemable ordinary shares from operations 508,084
Adjustment for:
Interest income 2.6 -
Interest expense 2.6 205
Dividend income 2.6 (5,370)
Investments interest 2.6 -
Securities lending revenue 2.7, 14 -
Taxation 2.9 734
Distributions to holders of redeemable ordinary shares 12 -
Operating profit/(loss) before working capital changes 503,653Net decrease/(increase) in other accrued income and prepaid expenses (140)Net decrease/(increase) in due from brokers (95,072)
Net (decrease)/increase in due to brokers 61,983
Net increase/(decrease) in accrued expenses 7,889
Net (increase)/decrease in financial investments at fair value through profit or loss (5,877,735)Interest received 2.6, 2.12 -
Interest paid 2.6, 2.12 (205)
Dividend received 2.6, 2.12 410
Investments interest received 2.6 -
Securities lending commission received 2.7, 14 -
Tax paid 2.9 (734)
Net cash generated from/(used in) operating activities (5,399,951)
CASH-FLOW FROM FINANCING ACTIVITIES
Distributions paid to holders of redeemable ordinary shares 12 -Cash received on shares issued 5,440,000
Cash paid out on shares redeemed -
Net cash generated from/(used in) financing activities 5,440,000Net increase/(decrease) in cash and cash equivalents 40,049Opening cash and cash equivalents -Closing cash and cash equivalents 40,049
INCOME STATEMENTUSD Note 31.03.09 31.03.08
REVENUE
Deposit interest 2.6 -
Dividend income 2.6 5,370
Investments interest 2.6 -
Securities lending revenue 2.7, 14 -
Net gains/(losses) on financial investments at fair value through profit or loss 2.3 536,769Other income -
Total investment income 542,139
EXPENSES
Management fees 13 10,339
Performance fees 13 -
Administration fees 13 1,345
Transaction charges 17 21,287
Service fees 13 -
Interest expense 2.6 205
Other expenses 145
Total operating expenses 33,321Operating profit/(loss) 508,818
FINANCE COSTS
Distributions to holders of redeemable ordinary shares 12 -
Total finance costs -Net profit/(loss) before tax 508,818Taxation 2.9 734
Increase/(decrease) in net assets attributable toholders of redeemable ordinary shares from operations 508,084
STATEMENT OF CHANGES IN NET ASSETS ATTRIBUTABLE TO HOLDERS OF REDEEMABLE ORDINARY SHARESUSD Note 31.03.09 31.03.08
Net assets attributable to holders of redeemableordinary shares at beginning of the period -Increase/(decrease) in net assets attributable toholders of redeemable ordinary shares from operations 508,084Proceeds from shares issued 5,440,000
Payments for shares redeemed -
Currency translation adjustment 2.2 -
Net assets attributable to holders of redeemableordinary shares at end of the period 5,948,084
The accompanying notes 1 to 19 found on pages 81 to 115 form an integral part of the financial statements.
15
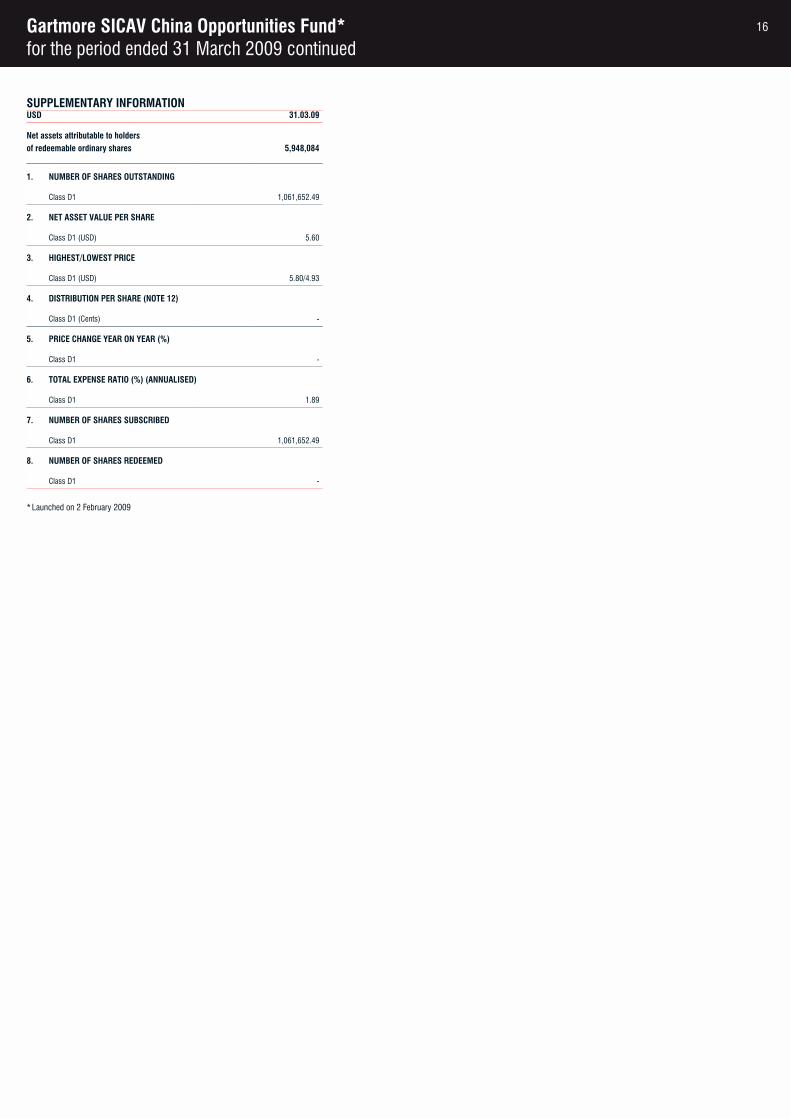
Gartmore SICAV China Opportunities Fund*for the period ended 31 March 2009 continued
SUPPLEMENTARY INFORMATIONUSD 31.03.09
Net assets attributable to holdersof redeemable ordinary shares 5,948,084
1. NUMBER OF SHARES OUTSTANDING
Class D1 1,061,652.49
2. NET ASSET VALUE PER SHARE
Class D1 (USD) 5.60
3. HIGHEST/LOWEST PRICE
Class D1 (USD) 5.80/4.93
4. DISTRIBUTION PER SHARE (NOTE 12)
Class D1 (Cents) -
5. PRICE CHANGE YEAR ON YEAR (%)
Class D1 -
6. TOTAL EXPENSE RATIO (%) (ANNUALISED)
Class D1 1.89
7. NUMBER OF SHARES SUBSCRIBED
Class D1 1,061,652.49
8. NUMBER OF SHARES REDEEMED
Class D1 -
*Launched on 2 February 2009
16
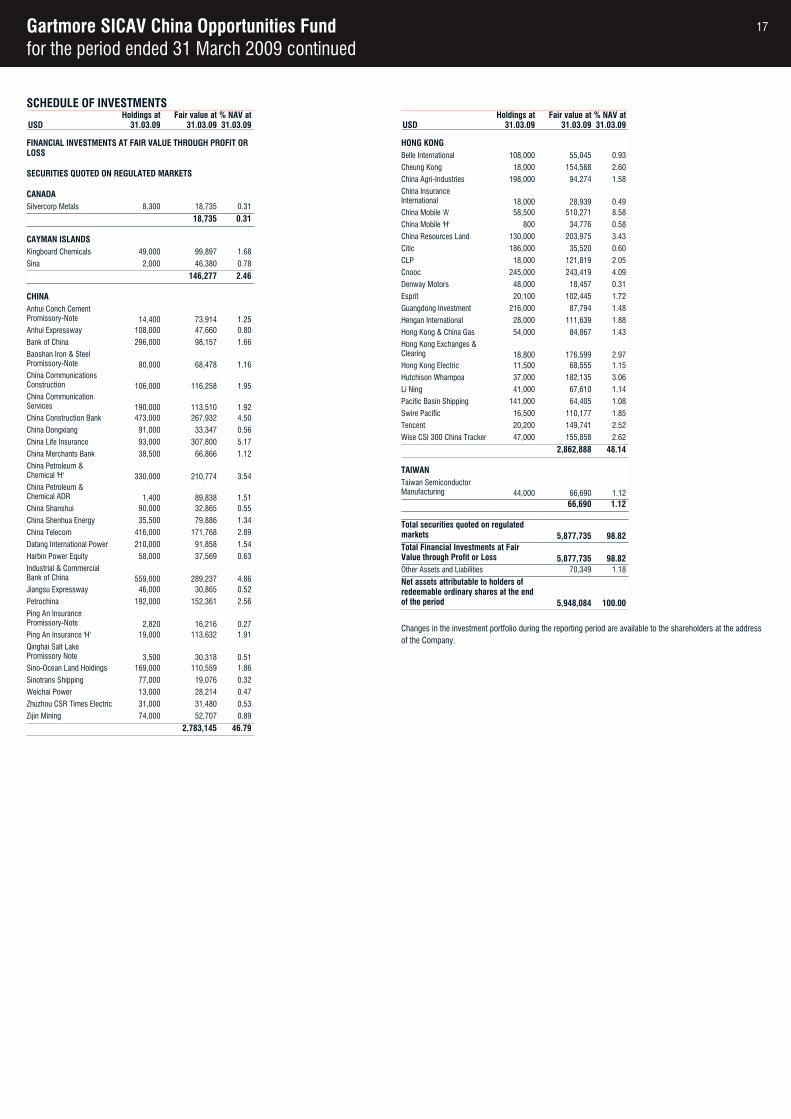
Gartmore SICAV China Opportunities Fundfor the period ended 31 March 2009 continued
SCHEDULE OF INVESTMENTSHoldings at Fair value at % NAV at
USD 31.03.09 31.03.09 31.03.09
FINANCIAL INVESTMENTS AT FAIR VALUE THROUGH PROFIT OR LOSS
SECURITIES QUOTED ON REGULATED MARKETS
CANADASilvercorp Metals 8,300 18,735 0.31
18,735 0.31
CAYMAN ISLANDSKingboard Chemicals 49,000 99,897 1.68
Sina 2,000 46,380 0.78
146,277 2.46
CHINAAnhui Conch Cement Promissory-Note 14,400 73,914 1.25Anhui Expressway 108,000 47,660 0.80
Bank of China 296,000 98,157 1.66
Baoshan Iron & Steel Promissory-Note 80,000 68,478 1.16China Communications Construction 106,000 116,258 1.95China Communication Services 190,000 113,510 1.92China Construction Bank 473,000 267,932 4.50
China Dongxiang 91,000 33,347 0.56
China Life Insurance 93,000 307,800 5.17
China Merchants Bank 38,500 66,866 1.12
China Petroleum & Chemical 'H' 330,000 210,774 3.54China Petroleum & Chemical ADR 1,400 89,838 1.51China Shanshui 90,000 32,865 0.55
China Shenhua Energy 35,500 79,886 1.34
China Telecom 416,000 171,768 2.89
Datang International Power 210,000 91,858 1.54
Harbin Power Equity 58,000 37,569 0.63
Industrial & Commercial Bank of China 559,000 289,237 4.86Jiangsu Expressway 46,000 30,865 0.52
Petrochina 192,000 152,361 2.56
Ping An Insurance Promissory-Note 2,820 16,216 0.27Ping An Insurance 'H' 19,000 113,632 1.91
Qinghai Salt Lake Promissory Note 3,500 30,318 0.51Sino-Ocean Land Holdings 169,000 110,559 1.86
Sinotrans Shipping 77,000 19,076 0.32
Weichai Power 13,000 28,214 0.47
Zhuzhou CSR Times Electric 31,000 31,480 0.53
Zijin Mining 74,000 52,707 0.89
2,783,145 46.79
Holdings at Fair value at % NAV atUSD 31.03.09 31.03.09 31.03.09
HONG KONGBelle International 108,000 55,045 0.93
Cheung Kong 18,000 154,568 2.60
China Agri-Industries 198,000 94,274 1.58
China Insurance International 18,000 28,939 0.49China Mobile 'A' 58,500 510,271 8.58
China Mobile 'H' 800 34,776 0.58
China Resources Land 130,000 203,975 3.43
Citic 186,000 35,520 0.60
CLP 18,000 121,819 2.05
Cnooc 245,000 243,419 4.09
Denway Motors 48,000 18,457 0.31
Esprit 20,100 102,445 1.72
Guangdong Investment 216,000 87,794 1.48
Hengan International 28,000 111,639 1.88
Hong Kong & China Gas 54,000 84,867 1.43
Hong Kong Exchanges & Clearing 18,800 176,599 2.97Hong Kong Electric 11,500 68,555 1.15
Hutchison Whampoa 37,000 182,135 3.06
Li Ning 41,000 67,610 1.14
Pacific Basin Shipping 141,000 64,405 1.08
Swire Pacific 16,500 110,177 1.85
Tencent 20,200 149,741 2.52
Wise CSI 300 China Tracker 47,000 155,858 2.62
2,862,888 48.14
TAIWANTaiwan Semiconductor Manufacturing 44,000 66,690 1.12
66,690 1.12
Total securities quoted on regulated markets 5,877,735 98.82Total Financial Investments at Fair Value through Profit or Loss 5,877,735 98.82Other Assets and Liabilities 70,349 1.18
Net assets attributable to holders of redeemable ordinary shares at the end of the period 5,948,084 100.00
Changes in the investment portfolio during the reporting period are available to the shareholders at the address of the Company.
17
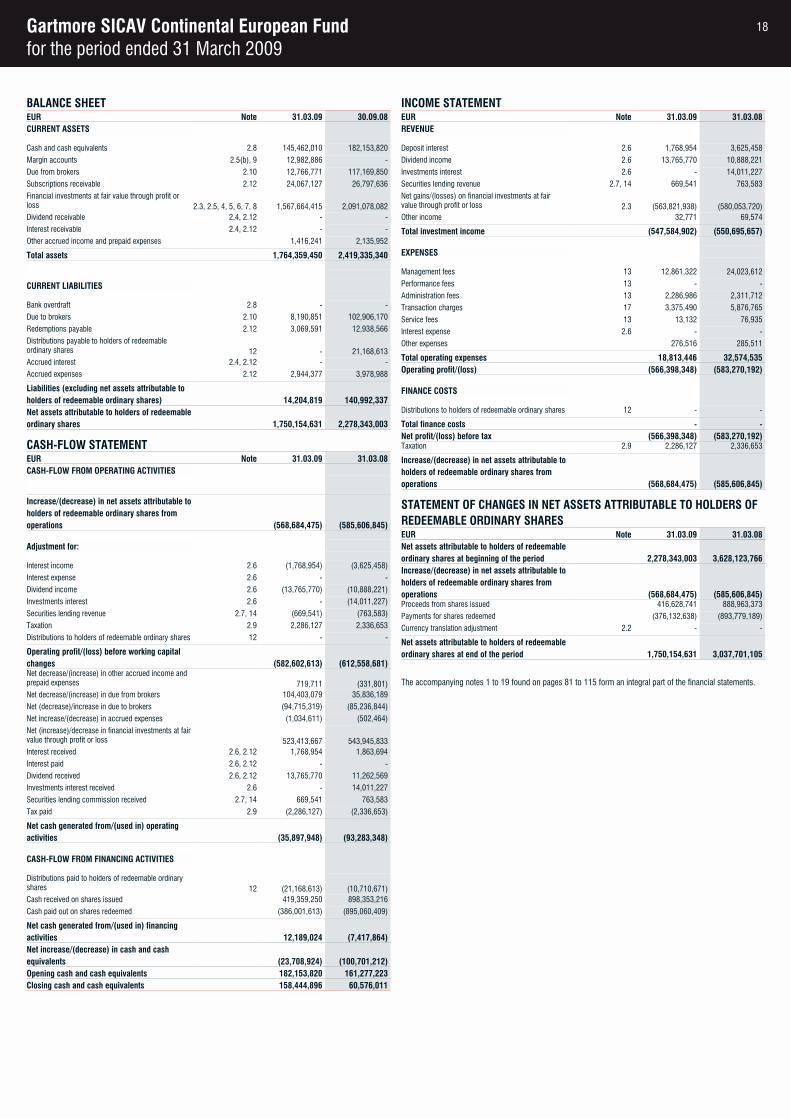
Gartmore SICAV Continental European Fundfor the period ended 31 March 2009
BALANCE SHEETEUR Note 31.03.09 30.09.08CURRENT ASSETS
Cash and cash equivalents 2.8 145,462,010 182,153,820
Margin accounts 2.5(b), 9 12,982,886 -
Due from brokers 2.10 12,766,771 117,169,850
Subscriptions receivable 2.12 24,067,127 26,797,636
Financial investments at fair value through profit or loss 2.3, 2.5, 4, 5, 6, 7, 8 1,567,664,415 2,091,078,082Dividend receivable 2.4, 2.12 - -
Interest receivable 2.4, 2.12 - -
Other accrued income and prepaid expenses 1,416,241 2,135,952
Total assets 1,764,359,450 2,419,335,340
CURRENT LIABILITIES
Bank overdraft 2.8 - -
Due to brokers 2.10 8,190,851 102,906,170
Redemptions payable 2.12 3,069,591 12,938,566
Distributions payable to holders of redeemable ordinary shares 12 - 21,168,613Accrued interest 2.4, 2.12 - -
Accrued expenses 2.12 2,944,377 3,978,988
Liabilities (excluding net assets attributable to holders of redeemable ordinary shares) 14,204,819 140,992,337Net assets attributable to holders of redeemableordinary shares 1,750,154,631 2,278,343,003
CASH-FLOW STATEMENTEUR Note 31.03.09 31.03.08CASH-FLOW FROM OPERATING ACTIVITIES
Increase/(decrease) in net assets attributable toholders of redeemable ordinary shares from operations (568,684,475) (585,606,845)
Adjustment for:
Interest income 2.6 (1,768,954) (3,625,458)
Interest expense 2.6 - -
Dividend income 2.6 (13,765,770) (10,888,221)
Investments interest 2.6 - (14,011,227)
Securities lending revenue 2.7, 14 (669,541) (763,583)
Taxation 2.9 2,286,127 2,336,653
Distributions to holders of redeemable ordinary shares 12 - -
Operating profit/(loss) before working capital changes (582,602,613) (612,558,681)Net decrease/(increase) in other accrued income and prepaid expenses 719,711 (331,801)Net decrease/(increase) in due from brokers 104,403,079 35,836,189
Net (decrease)/increase in due to brokers (94,715,319) (85,236,844)
Net increase/(decrease) in accrued expenses (1,034,611) (502,464)
Net (increase)/decrease in financial investments at fair value through profit or loss 523,413,667 543,945,833Interest received 2.6, 2.12 1,768,954 1,863,694
Interest paid 2.6, 2.12 - -
Dividend received 2.6, 2.12 13,765,770 11,262,569
Investments interest received 2.6 - 14,011,227
Securities lending commission received 2.7, 14 669,541 763,583
Tax paid 2.9 (2,286,127) (2,336,653)
Net cash generated from/(used in) operating activities (35,897,948) (93,283,348)
CASH-FLOW FROM FINANCING ACTIVITIES
Distributions paid to holders of redeemable ordinary shares 12 (21,168,613) (10,710,671)Cash received on shares issued 419,359,250 898,353,216
Cash paid out on shares redeemed (386,001,613) (895,060,409)
Net cash generated from/(used in) financing activities 12,189,024 (7,417,864)Net increase/(decrease) in cash and cash equivalents (23,708,924) (100,701,212)Opening cash and cash equivalents 182,153,820 161,277,223Closing cash and cash equivalents 158,444,896 60,576,011
INCOME STATEMENTEUR Note 31.03.09 31.03.08REVENUE
Deposit interest 2.6 1,768,954 3,625,458
Dividend income 2.6 13,765,770 10,888,221
Investments interest 2.6 - 14,011,227
Securities lending revenue 2.7, 14 669,541 763,583
Net gains/(losses) on financial investments at fair value through profit or loss 2.3 (563,821,938) (580,053,720)Other income 32,771 69,574
Total investment income (547,584,902) (550,695,657)
EXPENSES
Management fees 13 12,861,322 24,023,612
Performance fees 13 - -
Administration fees 13 2,286,986 2,311,712
Transaction charges 17 3,375,490 5,876,765
Service fees 13 13,132 76,935
Interest expense 2.6 - -
Other expenses 276,516 285,511
Total operating expenses 18,813,446 32,574,535Operating profit/(loss) (566,398,348) (583,270,192)
FINANCE COSTS
Distributions to holders of redeemable ordinary shares 12 - -
Total finance costs - -Net profit/(loss) before tax (566,398,348) (583,270,192)Taxation 2.9 2,286,127 2,336,653
Increase/(decrease) in net assets attributable toholders of redeemable ordinary shares from operations (568,684,475) (585,606,845)
STATEMENT OF CHANGES IN NET ASSETS ATTRIBUTABLE TO HOLDERS OF REDEEMABLE ORDINARY SHARESEUR Note 31.03.09 31.03.08Net assets attributable to holders of redeemableordinary shares at beginning of the period 2,278,343,003 3,628,123,766Increase/(decrease) in net assets attributable toholders of redeemable ordinary shares from operations (568,684,475) (585,606,845)Proceeds from shares issued 416,628,741 888,963,373
Payments for shares redeemed (376,132,638) (893,779,189)
Currency translation adjustment 2.2 - -
Net assets attributable to holders of redeemableordinary shares at end of the period 1,750,154,631 3,037,701,105
The accompanying notes 1 to 19 found on pages 81 to 115 form an integral part of the financial statements.
18
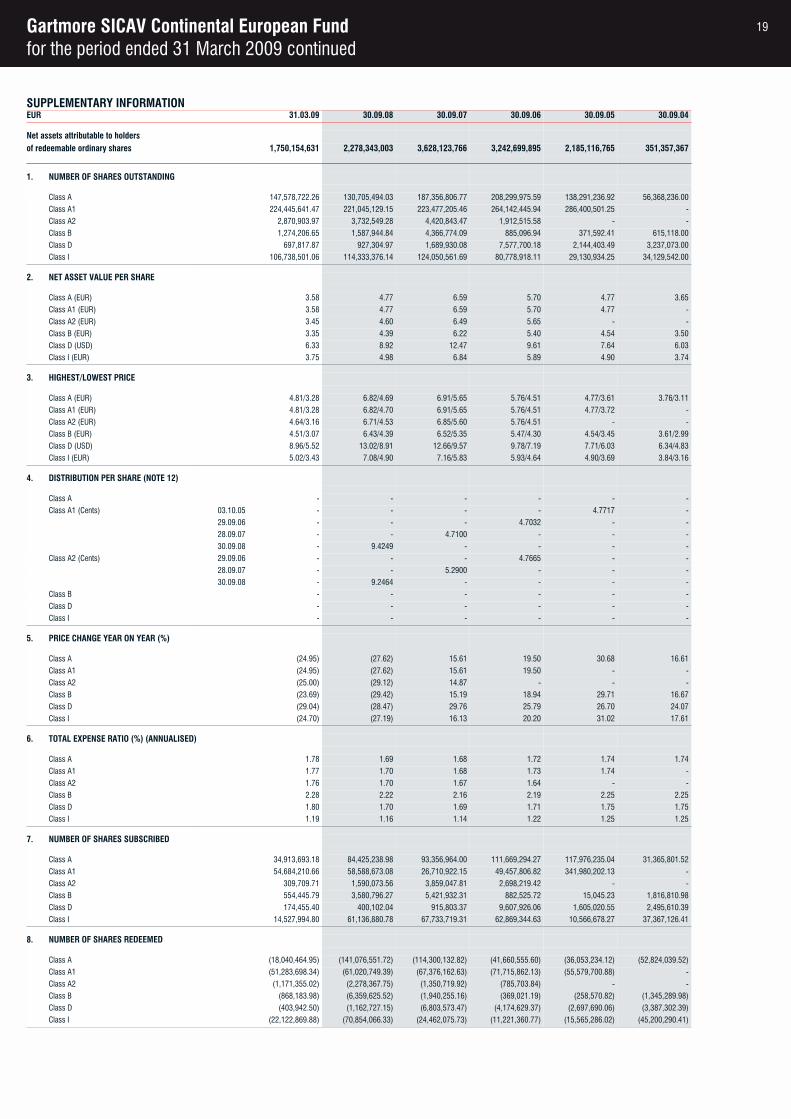
Gartmore SICAV Continental European Fundfor the period ended 31 March 2009 continued
SUPPLEMENTARY INFORMATIONEUR 31.03.09 30.09.08 30.09.07 30.09.06 30.09.05 30.09.04
Net assets attributable to holdersof redeemable ordinary shares 1,750,154,631 2,278,343,003 3,628,123,766 3,242,699,895 2,185,116,765 351,357,367
1. NUMBER OF SHARES OUTSTANDING
Class A 147,578,722.26 130,705,494.03 187,356,806.77 208,299,975.59 138,291,236.92 56,368,236.00
Class A1 224,445,641.47 221,045,129.15 223,477,205.46 264,142,445.94 286,400,501.25 -
Class A2 2,870,903.97 3,732,549.28 4,420,843.47 1,912,515.58 - -
Class B 1,274,206.65 1,587,944.84 4,366,774.09 885,096.94 371,592.41 615,118.00
Class D 697,817.87 927,304.97 1,689,930.08 7,577,700.18 2,144,403.49 3,237,073.00
Class I 106,738,501.06 114,333,376.14 124,050,561.69 80,778,918.11 29,130,934.25 34,129,542.00
2. NET ASSET VALUE PER SHARE
Class A (EUR) 3.58 4.77 6.59 5.70 4.77 3.65
Class A1 (EUR) 3.58 4.77 6.59 5.70 4.77 -
Class A2 (EUR) 3.45 4.60 6.49 5.65 - -
Class B (EUR) 3.35 4.39 6.22 5.40 4.54 3.50
Class D (USD) 6.33 8.92 12.47 9.61 7.64 6.03
Class I (EUR) 3.75 4.98 6.84 5.89 4.90 3.74
3. HIGHEST/LOWEST PRICE
Class A (EUR) 4.81/3.28 6.82/4.69 6.91/5.65 5.76/4.51 4.77/3.61 3.76/3.11
Class A1 (EUR) 4.81/3.28 6.82/4.70 6.91/5.65 5.76/4.51 4.77/3.72 -
Class A2 (EUR) 4.64/3.16 6.71/4.53 6.85/5.60 5.76/4.51 - -
Class B (EUR) 4.51/3.07 6.43/4.39 6.52/5.35 5.47/4.30 4.54/3.45 3.61/2.99
Class D (USD) 8.96/5.52 13.02/8.91 12.66/9.57 9.78/7.19 7.71/6.03 6.34/4.83
Class I (EUR) 5.02/3.43 7.08/4.90 7.16/5.83 5.93/4.64 4.90/3.69 3.84/3.16
4. DISTRIBUTION PER SHARE (NOTE 12)
Class A - - - - - -
Class A1 (Cents) 03.10.05 - - - - 4.7717 -
29.09.06 - - - 4.7032 - -
28.09.07 - - 4.7100 - - -
30.09.08 - 9.4249 - - - -
Class A2 (Cents) 29.09.06 - - - 4.7665 - -
28.09.07 - - 5.2900 - - -
30.09.08 - 9.2464 - - - -
Class B - - - - - -
Class D - - - - - -
Class I - - - - - -
5. PRICE CHANGE YEAR ON YEAR (%)
Class A (24.95) (27.62) 15.61 19.50 30.68 16.61
Class A1 (24.95) (27.62) 15.61 19.50 - -
Class A2 (25.00) (29.12) 14.87 - - -
Class B (23.69) (29.42) 15.19 18.94 29.71 16.67
Class D (29.04) (28.47) 29.76 25.79 26.70 24.07
Class I (24.70) (27.19) 16.13 20.20 31.02 17.61
6. TOTAL EXPENSE RATIO (%) (ANNUALISED)
Class A 1.78 1.69 1.68 1.72 1.74 1.74
Class A1 1.77 1.70 1.68 1.73 1.74 -
Class A2 1.76 1.70 1.67 1.64 - -
Class B 2.28 2.22 2.16 2.19 2.25 2.25
Class D 1.80 1.70 1.69 1.71 1.75 1.75
Class I 1.19 1.16 1.14 1.22 1.25 1.25
7. NUMBER OF SHARES SUBSCRIBED
Class A 34,913,693.18 84,425,238.98 93,356,964.00 111,669,294.27 117,976,235.04 31,365,801.52
Class A1 54,684,210.66 58,588,673.08 26,710,922.15 49,457,806.82 341,980,202.13 -
Class A2 309,709.71 1,590,073.56 3,859,047.81 2,698,219.42 - -
Class B 554,445.79 3,580,796.27 5,421,932.31 882,525.72 15,045.23 1,816,810.98
Class D 174,455.40 400,102.04 915,803.37 9,607,926.06 1,605,020.55 2,495,610.39
Class I 14,527,994.80 61,136,880.78 67,733,719.31 62,869,344.63 10,566,678.27 37,367,126.41
8. NUMBER OF SHARES REDEEMED
Class A (18,040,464.95) (141,076,551.72) (114,300,132.82) (41,660,555.60) (36,053,234.12) (52,824,039.52)
Class A1 (51,283,698.34) (61,020,749.39) (67,376,162.63) (71,715,862.13) (55,579,700.88) -
Class A2 (1,171,355.02) (2,278,367.75) (1,350,719.92) (785,703.84) - -
Class B (868,183.98) (6,359,625.52) (1,940,255.16) (369,021.19) (258,570.82) (1,345,289.98)
Class D (403,942.50) (1,162,727.15) (6,803,573.47) (4,174,629.37) (2,697,690.06) (3,387,302.39)
Class I (22,122,869.88) (70,854,066.33) (24,462,075.73) (11,221,360.77) (15,565,286.02) (45,200,290.41)
19
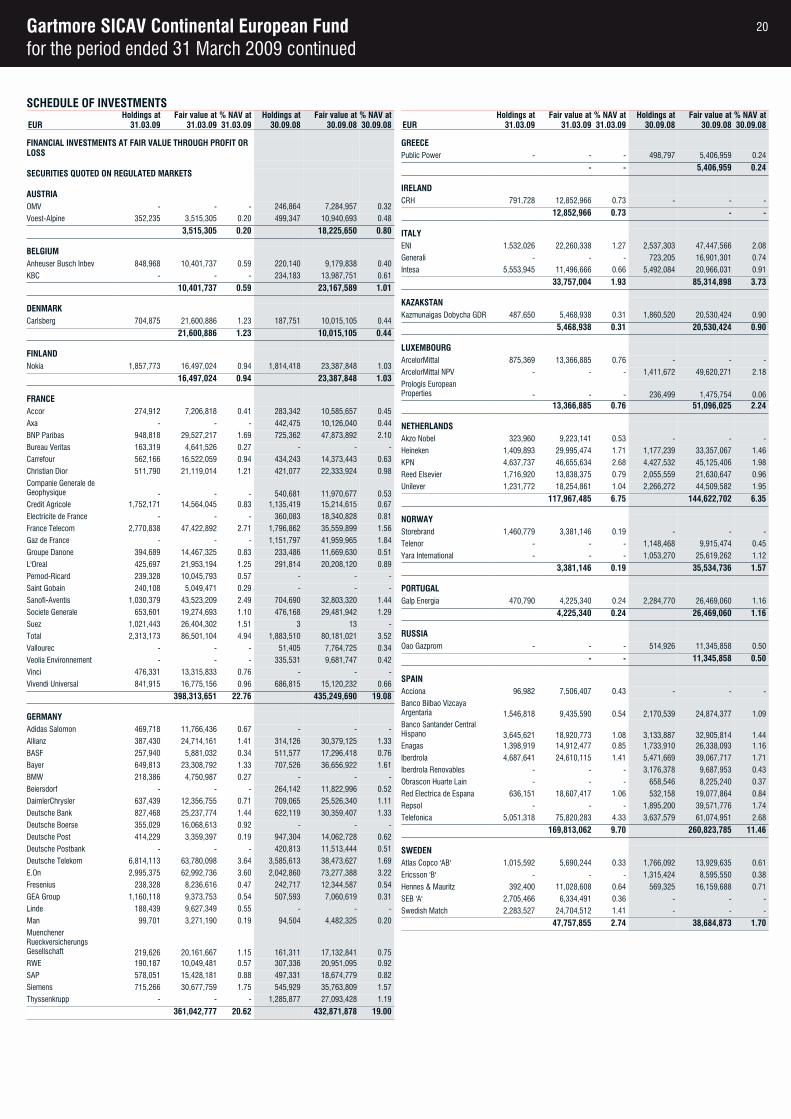
Gartmore SICAV Continental European Fundfor the period ended 31 March 2009 continued
SCHEDULE OF INVESTMENTSHoldings at Fair value at % NAV at Holdings at Fair value at % NAV at
EUR 31.03.09 31.03.09 31.03.09 30.09.08 30.09.08 30.09.08
FINANCIAL INVESTMENTS AT FAIR VALUE THROUGH PROFIT OR LOSS
SECURITIES QUOTED ON REGULATED MARKETS
AUSTRIAOMV - - - 246,864 7,284,957 0.32
Voest-Alpine 352,235 3,515,305 0.20 499,347 10,940,693 0.48
3,515,305 0.20 18,225,650 0.80
BELGIUMAnheuser Busch Inbev 848,968 10,401,737 0.59 220,140 9,179,838 0.40
KBC - - - 234,183 13,987,751 0.61
10,401,737 0.59 23,167,589 1.01
DENMARKCarlsberg 704,875 21,600,886 1.23 187,751 10,015,105 0.44
21,600,886 1.23 10,015,105 0.44
FINLANDNokia 1,857,773 16,497,024 0.94 1,814,418 23,387,848 1.03
16,497,024 0.94 23,387,848 1.03
FRANCEAccor 274,912 7,206,818 0.41 283,342 10,585,657 0.45
Axa - - - 442,475 10,126,040 0.44
BNP Paribas 948,818 29,527,217 1.69 725,362 47,873,892 2.10
Bureau Veritas 163,319 4,641,526 0.27 - - -
Carrefour 562,166 16,522,059 0.94 434,243 14,373,443 0.63
Christian Dior 511,790 21,119,014 1.21 421,077 22,333,924 0.98
Companie Generale de Geophysique - - - 540,681 11,970,677 0.53Credit Agricole 1,752,171 14,564,045 0.83 1,135,419 15,214,615 0.67
Electricite de France - - - 360,083 18,340,828 0.81
France Telecom 2,770,838 47,422,892 2.71 1,796,862 35,559,899 1.56
Gaz de France - - - 1,151,797 41,959,965 1.84
Groupe Danone 394,689 14,467,325 0.83 233,486 11,669,630 0.51
L'Oreal 425,697 21,953,194 1.25 291,814 20,208,120 0.89
Pernod-Ricard 239,328 10,045,793 0.57 - - -
Saint Gobain 240,108 5,049,471 0.29 - - -
Sanofi-Aventis 1,030,379 43,523,209 2.49 704,690 32,803,320 1.44
Societe Generale 653,601 19,274,693 1.10 476,168 29,481,942 1.29
Suez 1,021,443 26,404,302 1.51 3 13 -
Total 2,313,173 86,501,104 4.94 1,883,510 80,181,021 3.52
Vallourec - - - 51,405 7,764,725 0.34
Veolia Environnement - - - 335,531 9,681,747 0.42
Vinci 476,331 13,315,833 0.76 - - -
Vivendi Universal 841,915 16,775,156 0.96 686,815 15,120,232 0.66
398,313,651 22.76 435,249,690 19.08
GERMANYAdidas Salomon 469,718 11,766,436 0.67 - - -
Allianz 387,430 24,714,161 1.41 314,126 30,379,125 1.33
BASF 257,940 5,881,032 0.34 511,577 17,296,418 0.76
Bayer 649,813 23,308,792 1.33 707,526 36,656,922 1.61
BMW 218,386 4,750,987 0.27 - - -
Beiersdorf - - - 264,142 11,822,996 0.52
DaimlerChrysler 637,439 12,356,755 0.71 709,065 25,526,340 1.11
Deutsche Bank 827,468 25,237,774 1.44 622,119 30,359,407 1.33
Deutsche Boerse 355,029 16,068,613 0.92 - - -
Deutsche Post 414,229 3,359,397 0.19 947,304 14,062,728 0.62
Deutsche Postbank - - - 420,813 11,513,444 0.51
Deutsche Telekom 6,814,113 63,780,098 3.64 3,585,613 38,473,627 1.69
E.On 2,995,375 62,992,736 3.60 2,042,860 73,277,388 3.22
Fresenius 238,328 8,236,616 0.47 242,717 12,344,587 0.54
GEA Group 1,160,118 9,373,753 0.54 507,593 7,060,619 0.31
Linde 188,439 9,627,349 0.55 - - -
Man 99,701 3,271,190 0.19 94,504 4,482,325 0.20
Muenchener Rueckversicherungs Gesellschaft 219,626 20,161,667 1.15 161,311 17,132,841 0.75RWE 190,187 10,049,481 0.57 307,336 20,951,095 0.92
SAP 578,051 15,428,181 0.88 497,331 18,674,779 0.82
Siemens 715,266 30,677,759 1.75 545,929 35,763,809 1.57
Thyssenkrupp - - - 1,285,877 27,093,428 1.19
361,042,777 20.62 432,871,878 19.00
Holdings at Fair value at % NAV at Holdings at Fair value at % NAV atEUR 31.03.09 31.03.09 31.03.09 30.09.08 30.09.08 30.09.08
GREECEPublic Power - - - 498,797 5,406,959 0.24
- - 5,406,959 0.24
IRELANDCRH 791,728 12,852,966 0.73 - - -
12,852,966 0.73 - -
ITALYENI 1,532,026 22,260,338 1.27 2,537,303 47,447,566 2.08
Generali - - - 723,205 16,901,301 0.74
Intesa 5,553,945 11,496,666 0.66 5,492,084 20,966,031 0.91
33,757,004 1.93 85,314,898 3.73
KAZAKSTANKazmunaigas Dobycha GDR 487,650 5,468,938 0.31 1,860,520 20,530,424 0.90
5,468,938 0.31 20,530,424 0.90
LUXEMBOURGArcelorMittal 875,369 13,366,885 0.76 - - -
ArcelorMittal NPV - - - 1,411,672 49,620,271 2.18
Prologis European Properties - - - 236,499 1,475,754 0.06
13,366,885 0.76 51,096,025 2.24
NETHERLANDSAkzo Nobel 323,960 9,223,141 0.53 - - -
Heineken 1,409,893 29,995,474 1.71 1,177,239 33,357,067 1.46
KPN 4,637,737 46,655,634 2.68 4,427,532 45,125,406 1.98
Reed Elsevier 1,716,920 13,838,375 0.79 2,055,559 21,630,647 0.96
Unilever 1,231,772 18,254,861 1.04 2,266,272 44,509,582 1.95
117,967,485 6.75 144,622,702 6.35
NORWAYStorebrand 1,460,779 3,381,146 0.19 - - -
Telenor - - - 1,148,468 9,915,474 0.45
Yara International - - - 1,053,270 25,619,262 1.12
3,381,146 0.19 35,534,736 1.57
PORTUGALGalp Energia 470,790 4,225,340 0.24 2,284,770 26,469,060 1.16
4,225,340 0.24 26,469,060 1.16
RUSSIAOao Gazprom - - - 514,926 11,345,858 0.50
- - 11,345,858 0.50
SPAINAcciona 96,982 7,506,407 0.43 - - -
Banco Bilbao Vizcaya Argentaria 1,546,818 9,435,590 0.54 2,170,539 24,874,377 1.09Banco Santander Central Hispano 3,645,621 18,920,773 1.08 3,133,887 32,905,814 1.44Enagas 1,398,919 14,912,477 0.85 1,733,910 26,338,093 1.16
Iberdrola 4,687,641 24,610,115 1.41 5,471,669 39,067,717 1.71
Iberdrola Renovables - - - 3,176,378 9,687,953 0.43
Obrascon Huarte Lain - - - 658,546 8,225,240 0.37
Red Electrica de Espana 636,151 18,607,417 1.06 532,158 19,077,864 0.84
Repsol - - - 1,895,200 39,571,776 1.74
Telefonica 5,051,318 75,820,283 4.33 3,637,579 61,074,951 2.68
169,813,062 9.70 260,823,785 11.46
SWEDENAtlas Copco 'AB' 1,015,592 5,690,244 0.33 1,766,092 13,929,635 0.61
Ericsson 'B' - - - 1,315,424 8,595,550 0.38
Hennes & Mauritz 392,400 11,028,608 0.64 569,325 16,159,688 0.71
SEB 'A' 2,705,466 6,334,491 0.36 - - -
Swedish Match 2,283,527 24,704,512 1.41 - - -
47,757,855 2.74 38,684,873 1.70
20
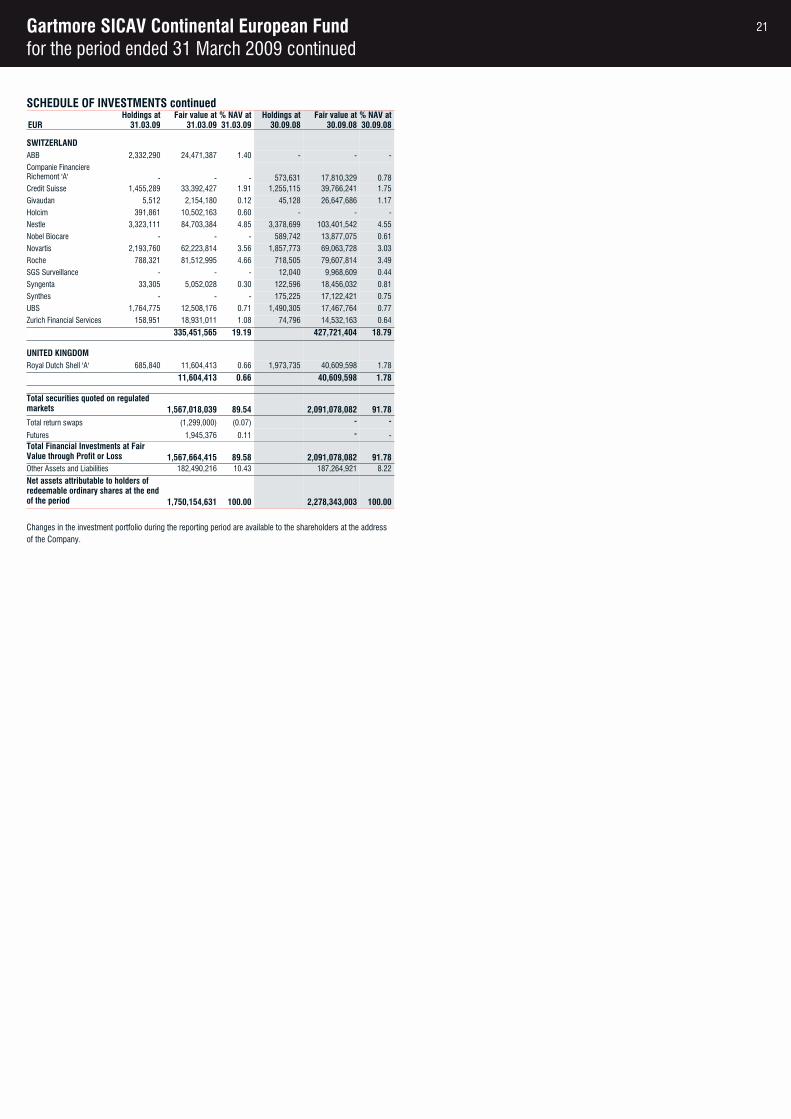
Gartmore SICAV Continental European Fundfor the period ended 31 March 2009 continued
SCHEDULE OF INVESTMENTS continuedHoldings at Fair value at % NAV at Holdings at Fair value at % NAV at
EUR 31.03.09 31.03.09 31.03.09 30.09.08 30.09.08 30.09.08
SWITZERLANDABB 2,332,290 24,471,387 1.40 - - -
Companie Financiere Richemont 'A' - - - 573,631 17,810,329 0.78Credit Suisse 1,455,289 33,392,427 1.91 1,255,115 39,766,241 1.75
Givaudan 5,512 2,154,180 0.12 45,128 26,647,686 1.17
Holcim 391,861 10,502,163 0.60 - - -
Nestle 3,323,111 84,703,384 4.85 3,378,699 103,401,542 4.55
Nobel Biocare - - - 589,742 13,877,075 0.61
Novartis 2,193,760 62,223,814 3.56 1,857,773 69,063,728 3.03
Roche 788,321 81,512,995 4.66 718,505 79,607,814 3.49
SGS Surveillance - - - 12,040 9,968,609 0.44
Syngenta 33,305 5,052,028 0.30 122,596 18,456,032 0.81
Synthes - - - 175,225 17,122,421 0.75
UBS 1,764,775 12,508,176 0.71 1,490,305 17,467,764 0.77
Zurich Financial Services 158,951 18,931,011 1.08 74,796 14,532,163 0.64
335,451,565 19.19 427,721,404 18.79
UNITED KINGDOMRoyal Dutch Shell 'A' 685,840 11,604,413 0.66 1,973,735 40,609,598 1.78
11,604,413 0.66 40,609,598 1.78
Total securities quoted on regulated markets 1,567,018,039 89.54 2,091,078,082 91.78Total return swaps (1,299,000) (0.07) - -
Futures 1,945,376 0.11 - -Total Financial Investments at Fair Value through Profit or Loss 1,567,664,415 89.58 2,091,078,082 91.78Other Assets and Liabilities 182,490,216 10.43 187,264,921 8.22
Net assets attributable to holders of redeemable ordinary shares at the end of the period 1,750,154,631 100.00 2,278,343,003 100.00
Changes in the investment portfolio during the reporting period are available to the shareholders at the address of the Company.
21
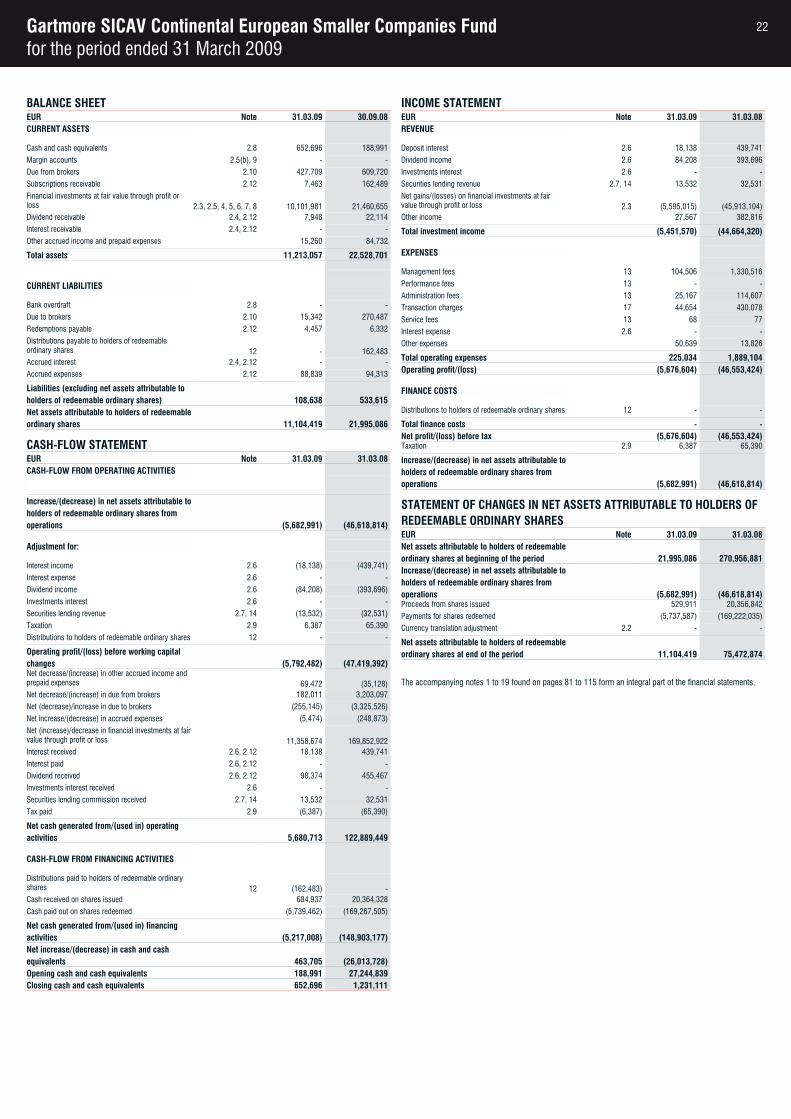
Gartmore SICAV Continental European Smaller Companies Fundfor the period ended 31 March 2009
BALANCE SHEETEUR Note 31.03.09 30.09.08CURRENT ASSETS
Cash and cash equivalents 2.8 652,696 188,991
Margin accounts 2.5(b), 9 - -
Due from brokers 2.10 427,709 609,720
Subscriptions receivable 2.12 7,463 162,489
Financial investments at fair value through profit or loss 2.3, 2.5, 4, 5, 6, 7, 8 10,101,981 21,460,655Dividend receivable 2.4, 2.12 7,948 22,114
Interest receivable 2.4, 2.12 - -
Other accrued income and prepaid expenses 15,260 84,732
Total assets 11,213,057 22,528,701
CURRENT LIABILITIES
Bank overdraft 2.8 - -
Due to brokers 2.10 15,342 270,487
Redemptions payable 2.12 4,457 6,332
Distributions payable to holders of redeemable ordinary shares 12 - 162,483Accrued interest 2.4, 2.12 - -
Accrued expenses 2.12 88,839 94,313
Liabilities (excluding net assets attributable to holders of redeemable ordinary shares) 108,638 533,615Net assets attributable to holders of redeemableordinary shares 11,104,419 21,995,086
CASH-FLOW STATEMENTEUR Note 31.03.09 31.03.08CASH-FLOW FROM OPERATING ACTIVITIES
Increase/(decrease) in net assets attributable toholders of redeemable ordinary shares from operations (5,682,991) (46,618,814)
Adjustment for:
Interest income 2.6 (18,138) (439,741)
Interest expense 2.6 - -
Dividend income 2.6 (84,208) (393,696)
Investments interest 2.6 - -
Securities lending revenue 2.7, 14 (13,532) (32,531)
Taxation 2.9 6,387 65,390
Distributions to holders of redeemable ordinary shares 12 - -
Operating profit/(loss) before working capital changes (5,792,482) (47,419,392)Net decrease/(increase) in other accrued income and prepaid expenses 69,472 (35,128)Net decrease/(increase) in due from brokers 182,011 3,203,097
Net (decrease)/increase in due to brokers (255,145) (3,325,526)
Net increase/(decrease) in accrued expenses (5,474) (248,873)
Net (increase)/decrease in financial investments at fair value through profit or loss 11,358,674 169,852,922Interest received 2.6, 2.12 18,138 439,741
Interest paid 2.6, 2.12 - -
Dividend received 2.6, 2.12 98,374 455,467
Investments interest received 2.6 - -
Securities lending commission received 2.7, 14 13,532 32,531
Tax paid 2.9 (6,387) (65,390)
Net cash generated from/(used in) operating activities 5,680,713 122,889,449
CASH-FLOW FROM FINANCING ACTIVITIES
Distributions paid to holders of redeemable ordinary shares 12 (162,483) -Cash received on shares issued 684,937 20,364,328
Cash paid out on shares redeemed (5,739,462) (169,267,505)
Net cash generated from/(used in) financing activities (5,217,008) (148,903,177)Net increase/(decrease) in cash and cash equivalents 463,705 (26,013,728)Opening cash and cash equivalents 188,991 27,244,839Closing cash and cash equivalents 652,696 1,231,111
INCOME STATEMENTEUR Note 31.03.09 31.03.08REVENUE
Deposit interest 2.6 18,138 439,741
Dividend income 2.6 84,208 393,696
Investments interest 2.6 - -
Securities lending revenue 2.7, 14 13,532 32,531
Net gains/(losses) on financial investments at fair value through profit or loss 2.3 (5,595,015) (45,913,104)Other income 27,567 382,816
Total investment income (5,451,570) (44,664,320)
EXPENSES
Management fees 13 104,506 1,330,516
Performance fees 13 - -
Administration fees 13 25,167 114,607
Transaction charges 17 44,654 430,078
Service fees 13 68 77
Interest expense 2.6 - -
Other expenses 50,639 13,826
Total operating expenses 225,034 1,889,104Operating profit/(loss) (5,676,604) (46,553,424)
FINANCE COSTS
Distributions to holders of redeemable ordinary shares 12 - -
Total finance costs - -Net profit/(loss) before tax (5,676,604) (46,553,424)Taxation 2.9 6,387 65,390
Increase/(decrease) in net assets attributable toholders of redeemable ordinary shares from operations (5,682,991) (46,618,814)
STATEMENT OF CHANGES IN NET ASSETS ATTRIBUTABLE TO HOLDERS OF REDEEMABLE ORDINARY SHARESEUR Note 31.03.09 31.03.08Net assets attributable to holders of redeemableordinary shares at beginning of the period 21,995,086 270,956,881Increase/(decrease) in net assets attributable toholders of redeemable ordinary shares from operations (5,682,991) (46,618,814)Proceeds from shares issued 529,911 20,356,842
Payments for shares redeemed (5,737,587) (169,222,035)
Currency translation adjustment 2.2 - -
Net assets attributable to holders of redeemableordinary shares at end of the period 11,104,419 75,472,874
The accompanying notes 1 to 19 found on pages 81 to 115 form an integral part of the financial statements.
22
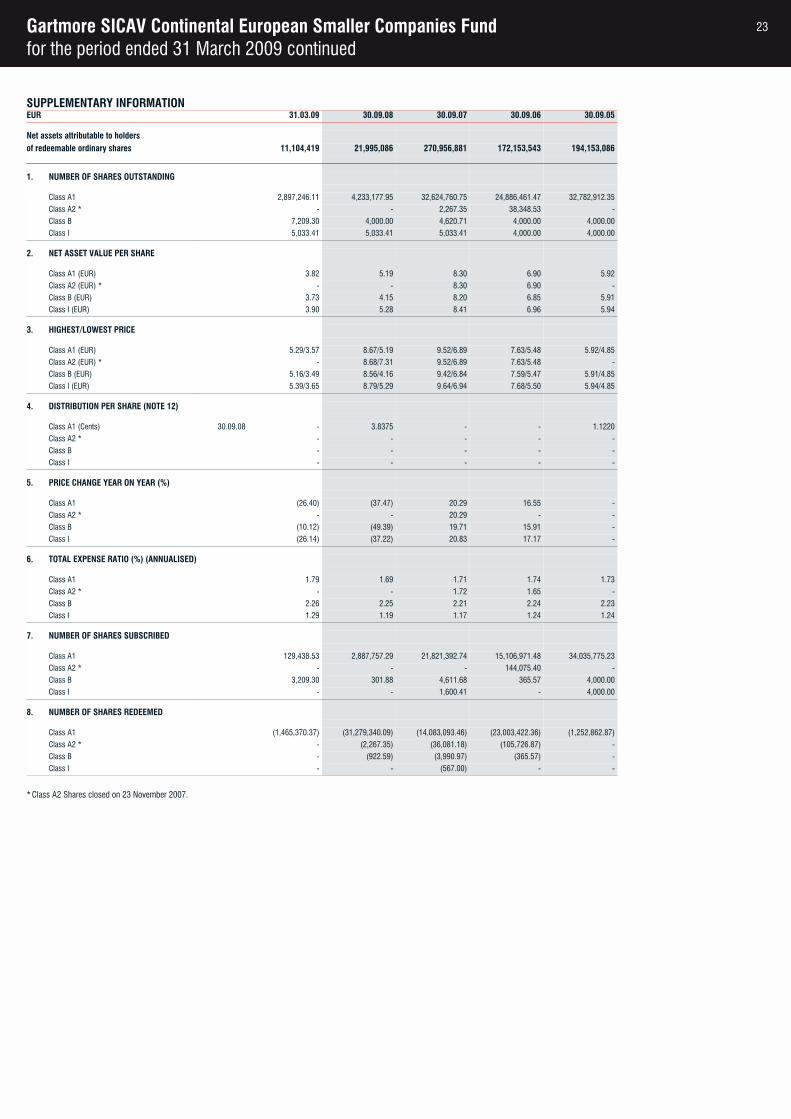
Gartmore SICAV Continental European Smaller Companies Fundfor the period ended 31 March 2009 continued
SUPPLEMENTARY INFORMATIONEUR 31.03.09 30.09.08 30.09.07 30.09.06 30.09.05
Net assets attributable to holdersof redeemable ordinary shares 11,104,419 21,995,086 270,956,881 172,153,543 194,153,086
1. NUMBER OF SHARES OUTSTANDING
Class A1 2,897,246.11 4,233,177.95 32,624,760.75 24,886,461.47 32,782,912.35
Class A2 * - - 2,267.35 38,348.53 -
Class B 7,209.30 4,000.00 4,620.71 4,000.00 4,000.00
Class I 5,033.41 5,033.41 5,033.41 4,000.00 4,000.00
2. NET ASSET VALUE PER SHARE
Class A1 (EUR) 3.82 5.19 8.30 6.90 5.92
Class A2 (EUR) * - - 8.30 6.90 -
Class B (EUR) 3.73 4.15 8.20 6.85 5.91
Class I (EUR) 3.90 5.28 8.41 6.96 5.94
3. HIGHEST/LOWEST PRICE
Class A1 (EUR) 5.29/3.57 8.67/5.19 9.52/6.89 7.63/5.48 5.92/4.85
Class A2 (EUR) * - 8.68/7.31 9.52/6.89 7.63/5.48 -
Class B (EUR) 5.16/3.49 8.56/4.16 9.42/6.84 7.59/5.47 5.91/4.85
Class I (EUR) 5.39/3.65 8.79/5.29 9.64/6.94 7.68/5.50 5.94/4.85
4. DISTRIBUTION PER SHARE (NOTE 12)
Class A1 (Cents) 30.09.08 - 3.8375 - - 1.1220
Class A2 * - - - - -
Class B - - - - -
Class I - - - - -
5. PRICE CHANGE YEAR ON YEAR (%)
Class A1 (26.40) (37.47) 20.29 16.55 -
Class A2 * - - 20.29 - -
Class B (10.12) (49.39) 19.71 15.91 -
Class I (26.14) (37.22) 20.83 17.17 -
6. TOTAL EXPENSE RATIO (%) (ANNUALISED)
Class A1 1.79 1.69 1.71 1.74 1.73
Class A2 * - - 1.72 1.65 -
Class B 2.26 2.25 2.21 2.24 2.23
Class I 1.29 1.19 1.17 1.24 1.24
7. NUMBER OF SHARES SUBSCRIBED
Class A1 129,438.53 2,887,757.29 21,821,392.74 15,106,971.48 34,035,775.23
Class A2 * - - - 144,075.40 -
Class B 3,209.30 301.88 4,611.68 365.57 4,000.00
Class I - - 1,600.41 - 4,000.00
8. NUMBER OF SHARES REDEEMED
Class A1 (1,465,370.37) (31,279,340.09) (14,083,093.46) (23,003,422.36) (1,252,862.87)
Class A2 * - (2,267.35) (36,081.18) (105,726.87) -
Class B - (922.59) (3,990.97) (365.57) -
Class I - - (567.00) - -
*Class A2 Shares closed on 23 November 2007.
23
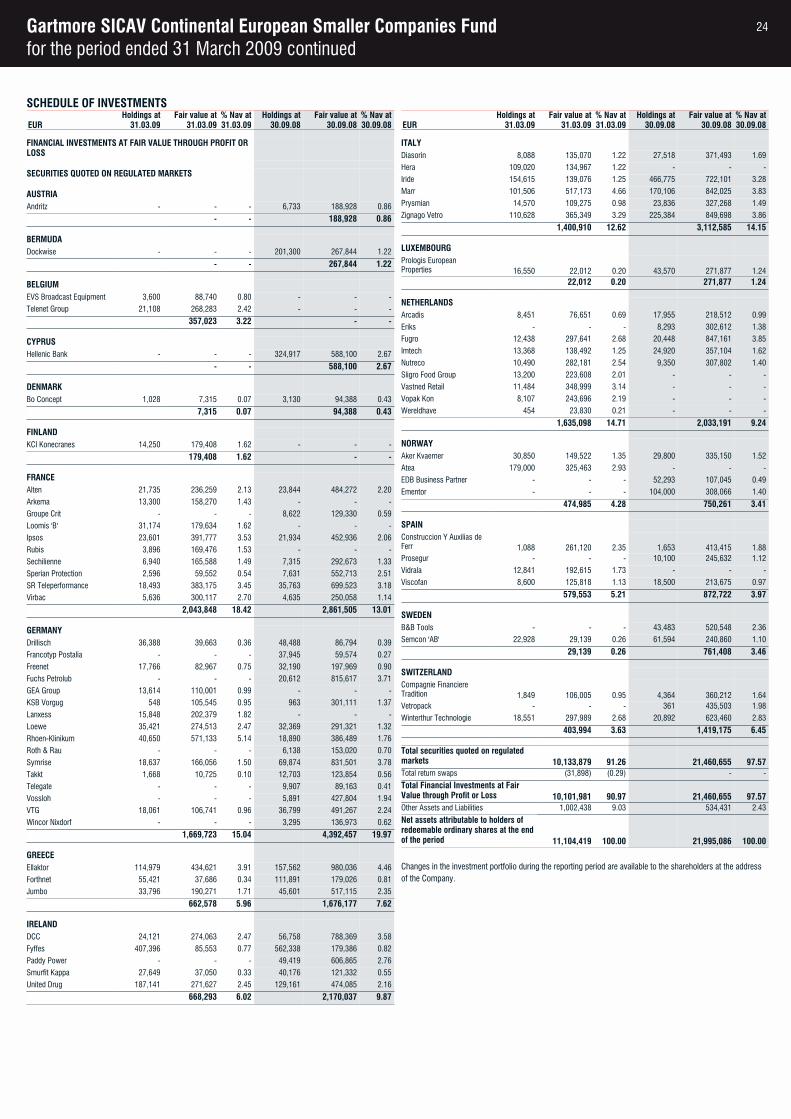
Gartmore SICAV Continental European Smaller Companies Fundfor the period ended 31 March 2009 continued
SCHEDULE OF INVESTMENTSHoldings at Fair value at % Nav at Holdings at Fair value at % Nav at
EUR 31.03.09 31.03.09 31.03.09 30.09.08 30.09.08 30.09.08
FINANCIAL INVESTMENTS AT FAIR VALUE THROUGH PROFIT OR LOSS
SECURITIES QUOTED ON REGULATED MARKETS
AUSTRIAAndritz - - - 6,733 188,928 0.86
- - 188,928 0.86
BERMUDADockwise - - - 201,300 267,844 1.22
- - 267,844 1.22
BELGIUMEVS Broadcast Equipment 3,600 88,740 0.80 - - -
Telenet Group 21,108 268,283 2.42 - - -
357,023 3.22 - -
CYPRUSHellenic Bank - - - 324,917 588,100 2.67
- - 588,100 2.67
DENMARKBo Concept 1,028 7,315 0.07 3,130 94,388 0.43
7,315 0.07 94,388 0.43
FINLANDKCI Konecranes 14,250 179,408 1.62 - - -
179,408 1.62 - -
FRANCEAlten 21,735 236,259 2.13 23,844 484,272 2.20
Arkema 13,300 158,270 1.43 - - -
Groupe Crit - - - 8,622 129,330 0.59
Loomis 'B' 31,174 179,634 1.62 - - -
Ipsos 23,601 391,777 3.53 21,934 452,936 2.06
Rubis 3,896 169,476 1.53 - - -
Sechilienne 6,940 165,588 1.49 7,315 292,673 1.33
Sperian Protection 2,596 59,552 0.54 7,631 552,713 2.51
SR Teleperformance 18,493 383,175 3.45 35,763 699,523 3.18
Virbac 5,636 300,117 2.70 4,635 250,058 1.14
2,043,848 18.42 2,861,505 13.01
GERMANYDrillisch 36,388 39,663 0.36 48,488 86,794 0.39
Francotyp Postalia - - - 37,945 59,574 0.27
Freenet 17,766 82,967 0.75 32,190 197,969 0.90
Fuchs Petrolub - - - 20,612 815,617 3.71
GEA Group 13,614 110,001 0.99 - - -
KSB Vorgug 548 105,545 0.95 963 301,111 1.37
Lanxess 15,848 202,379 1.82 - - -
Loewe 35,421 274,513 2.47 32,369 291,321 1.32
Rhoen-Klinikum 40,650 571,133 5.14 18,890 386,489 1.76
Roth & Rau - - - 6,138 153,020 0.70
Symrise 18,637 166,056 1.50 69,874 831,501 3.78
Takkt 1,668 10,725 0.10 12,703 123,854 0.56
Telegate - - - 9,907 89,163 0.41
Vossloh - - - 5,891 427,804 1.94
VTG 18,061 106,741 0.96 36,799 491,267 2.24
Wincor Nixdorf - - - 3,295 136,973 0.62
1,669,723 15.04 4,392,457 19.97
GREECEEllaktor 114,979 434,621 3.91 157,562 980,036 4.46
Forthnet 55,421 37,686 0.34 111,891 179,026 0.81
Jumbo 33,796 190,271 1.71 45,601 517,115 2.35
662,578 5.96 1,676,177 7.62
IRELANDDCC 24,121 274,063 2.47 56,758 788,369 3.58
Fyffes 407,396 85,553 0.77 562,338 179,386 0.82
Paddy Power - - - 49,419 606,865 2.76
Smurfit Kappa 27,649 37,050 0.33 40,176 121,332 0.55
United Drug 187,141 271,627 2.45 129,161 474,085 2.16
668,293 6.02 2,170,037 9.87
Holdings at Fair value at % Nav at Holdings at Fair value at % Nav atEUR 31.03.09 31.03.09 31.03.09 30.09.08 30.09.08 30.09.08
ITALYDiasorin 8,088 135,070 1.22 27,518 371,493 1.69
Hera 109,020 134,967 1.22 - - -
Iride 154,615 139,076 1.25 466,775 722,101 3.28
Marr 101,506 517,173 4.66 170,106 842,025 3.83
Prysmian 14,570 109,275 0.98 23,836 327,268 1.49
Zignago Vetro 110,628 365,349 3.29 225,384 849,698 3.86
1,400,910 12.62 3,112,585 14.15
LUXEMBOURGPrologis European Properties 16,550 22,012 0.20 43,570 271,877 1.24
22,012 0.20 271,877 1.24
NETHERLANDSArcadis 8,451 76,651 0.69 17,955 218,512 0.99
Eriks - - - 8,293 302,612 1.38
Fugro 12,438 297,641 2.68 20,448 847,161 3.85
Imtech 13,368 138,492 1.25 24,920 357,104 1.62
Nutreco 10,490 282,181 2.54 9,350 307,802 1.40
Sligro Food Group 13,200 223,608 2.01 - - -
Vastned Retail 11,484 348,999 3.14 - - -
Vopak Kon 8,107 243,696 2.19 - - -
Wereldhave 454 23,830 0.21 - - -
1,635,098 14.71 2,033,191 9.24
NORWAYAker Kvaerner 30,850 149,522 1.35 29,800 335,150 1.52
Atea 179,000 325,463 2.93 - - -
EDB Business Partner - - - 52,293 107,045 0.49
Ementor - - - 104,000 308,066 1.40
474,985 4.28 750,261 3.41
SPAINConstruccion Y Auxilias de Ferr 1,088 261,120 2.35 1,653 413,415 1.88Prosegur - - - 10,100 245,632 1.12
Vidrala 12,841 192,615 1.73 - - -
Viscofan 8,600 125,818 1.13 18,500 213,675 0.97
579,553 5.21 872,722 3.97
SWEDENB&B Tools - - - 43,483 520,548 2.36
Semcon 'AB' 22,928 29,139 0.26 61,594 240,860 1.10
29,139 0.26 761,408 3.46
SWITZERLANDCompagnie Financiere Tradition 1,849 106,005 0.95 4,364 360,212 1.64Vetropack - - - 361 435,503 1.98
Winterthur Technologie 18,551 297,989 2.68 20,892 623,460 2.83
403,994 3.63 1,419,175 6.45
Total securities quoted on regulated markets 10,133,879 91.26 21,460,655 97.57Total return swaps (31,898) (0.29) - -
Total Financial Investments at Fair Value through Profit or Loss 10,101,981 90.97 21,460,655 97.57Other Assets and Liabilities 1,002,438 9.03 534,431 2.43
Net assets attributable to holders of redeemable ordinary shares at the end of the period 11,104,419 100.00 21,995,086 100.00
Changes in the investment portfolio during the reporting period are available to the shareholders at the address of the Company.
24

Gartmore SICAV Emerging Markets Fundfor the period ended 31 March 2009
BALANCE SHEETUSD Note 31.03.09 30.09.08CURRENT ASSETS
Cash and cash equivalents 2.8 5,143,894 5,669,928
Margin accounts 2.5(b), 9 - -
Due from brokers 2.10 946,552 15,802,189
Subscriptions receivable 2.12 172,487 2,484,169
Financial investments at fair value through profit or loss 2.3, 2.5, 4, 5, 6, 7, 8 352,665,564 640,228,411Dividend receivable 2.4, 2.12 2,090,430 2,632,033
Interest receivable 2.4, 2.12 16,251 -
Other accrued income and prepaid expenses 2,033 243,920
Total assets 361,037,211 667,060,650
CURRENT LIABILITIES
Bank overdraft 2.8 - 2,558,420
Due to brokers 2.10 3,367,022 1,963,143
Redemptions payable 2.12 232,822 5,874,772
Distributions payable to holders of redeemable ordinary shares 12 - 2,111,674Accrued interest 2.4, 2.12 - 11,047
Accrued expenses 2.12 667,659 1,403,996
Liabilities (excluding net assets attributable to holders of redeemable ordinary shares) 4,267,503 13,923,052Net assets attributable to holders of redeemableordinary shares 356,769,708 653,137,598
CASH-FLOW STATEMENTUSD Note 31.03.09 31.03.08CASH-FLOW FROM OPERATING ACTIVITIES
Increase/(decrease) in net assets attributable toholders of redeemable ordinary shares from operations (216,274,046) (122,660,470)
Adjustment for:
Interest income 2.6 (6,180) (45,803)
Interest expense 2.6 - -
Dividend income 2.6 (3,509,310) (6,386,099)
Investments interest 2.6 (26,693) (39,493)
Securities lending revenue 2.7, 14 - -
Taxation 2.9 682,473 559,832
Distributions to holders of redeemable ordinary shares 12 - -
Operating profit/(loss) before working capital changes (219,133,756) (128,572,033)Net decrease/(increase) in other accrued income and prepaid expenses 241,887 -Net decrease/(increase) in due from brokers 14,855,637 19,303,120
Net (decrease)/increase in due to brokers 1,403,879 (15,059,771)
Net increase/(decrease) in accrued expenses (736,337) (46,184)
Net (increase)/decrease in financial investments at fair value through profit or loss 287,562,847 26,106,031Interest received 2.6, 2.12 (10,071) 45,803
Interest paid 2.6, 2.12 (11,047) 1,277
Dividend received 2.6, 2.12 4,050,913 5,846,820
Investments interest received 2.6 26,693 39,493
Securities lending commission received 2.7, 14 - -
Tax paid 2.9 (682,473) (559,832)
Net cash generated from/(used in) operating activities 87,568,172 (92,895,276)
CASH-FLOW FROM FINANCING ACTIVITIES
Distributions paid to holders of redeemable ordinary shares 12 (2,111,674) (1,043,655)Cash received on shares issued 53,109,628 641,722,350
Cash paid out on shares redeemed (136,533,740) (560,560,804)
Net cash generated from/(used in) financing activities (85,535,786) 80,117,891Net increase/(decrease) in cash and cash equivalents 2,032,386 (12,777,385)Opening cash and cash equivalents 3,111,508 21,824,665Closing cash and cash equivalents 5,143,894 9,047,280
INCOME STATEMENTUSD Note 31.03.09 31.03.08REVENUE
Deposit interest 2.6 6,180 45,803
Dividend income 2.6 3,509,310 6,386,099
Investments interest 2.6 26,693 39,493
Securities lending revenue 2.7, 14 - -
Net gains/(losses) on financial investments at fair value through profit or loss 2.3 (214,919,337) (118,460,619)Other income - 249,539
Total investment income (211,377,154) (111,739,685)
EXPENSES
Management fees 13 2,603,537 7,125,005
Performance fees 13 - -
Administration fees 13 405,056 678,213
Transaction charges 17 1,168,868 2,428,511
Service fees 13 3,104 24,899
Interest expense 2.6 - -
Other expenses 33,854 104,325
Total operating expenses 4,214,419 10,360,953Operating profit/(loss) (215,591,573) (122,100,638)
FINANCE COSTS
Distributions to holders of redeemable ordinary shares 12 - -
Total finance costs - -Net profit/(loss) before tax (215,591,573) (122,100,638)Taxation 2.9 682,473 559,832
Increase/(decrease) in net assets attributable toholders of redeemable ordinary shares from operations (216,274,046) (122,660,470)
STATEMENT OF CHANGES IN NET ASSETS ATTRIBUTABLE TO HOLDERS OF REDEEMABLE ORDINARY SHARESUSD Note 31.03.09 31.03.08Net assets attributable to holders of redeemableordinary shares at beginning of the period 653,137,598 939,684,121Increase/(decrease) in net assets attributable toholders of redeemable ordinary shares from operations (216,274,046) (122,660,470)Proceeds from shares issued 50,797,946 633,674,684
Payments for shares redeemed (130,891,790) (551,820,895)
Currency translation adjustment 2.2 - -
Net assets attributable to holders of redeemableordinary shares at end of the period 356,769,708 898,877,440
The accompanying notes 1 to 19 found on pages 81 to 115 form an integral part of the financial statements.
25
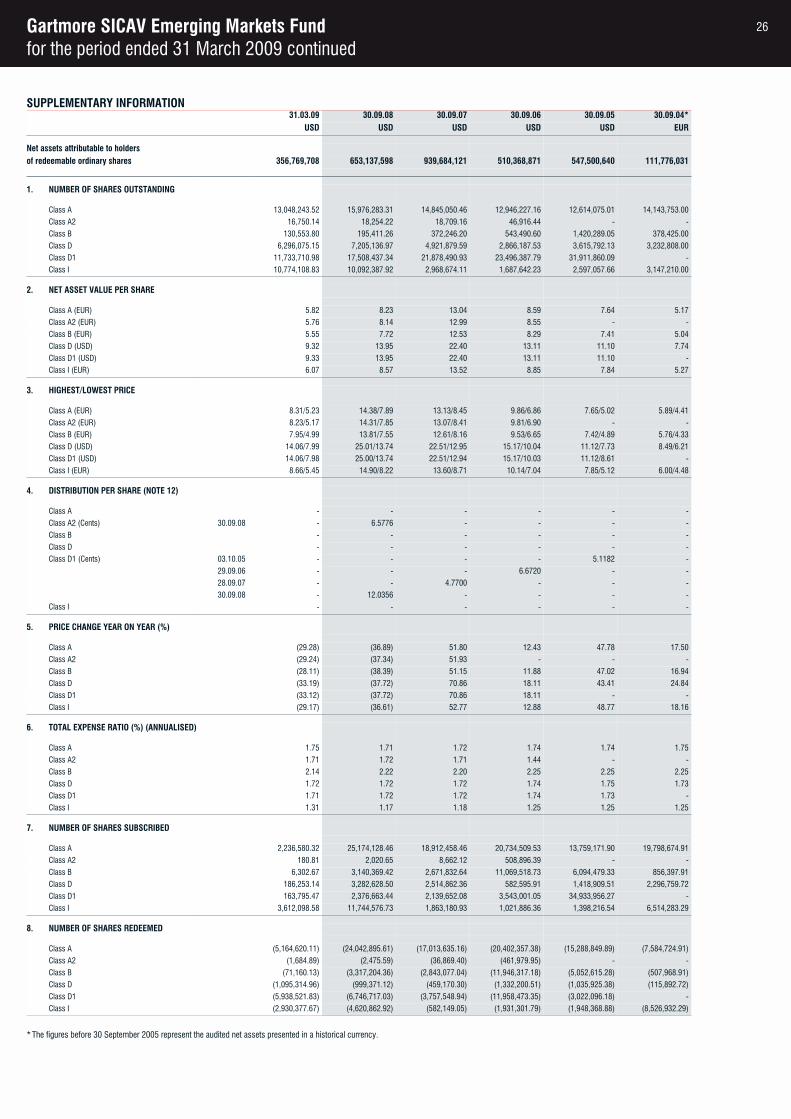
Gartmore SICAV Emerging Markets Fundfor the period ended 31 March 2009 continued
SUPPLEMENTARY INFORMATION31.03.09 30.09.08 30.09.07 30.09.06 30.09.05 30.09.04*
USD USD USD USD USD EUR
Net assets attributable to holdersof redeemable ordinary shares 356,769,708 653,137,598 939,684,121 510,368,871 547,500,640 111,776,031
1. NUMBER OF SHARES OUTSTANDING
Class A 13,048,243.52 15,976,283.31 14,845,050.46 12,946,227.16 12,614,075.01 14,143,753.00
Class A2 16,750.14 18,254.22 18,709.16 46,916.44 - -
Class B 130,553.80 195,411.26 372,246.20 543,490.60 1,420,289.05 378,425.00
Class D 6,296,075.15 7,205,136.97 4,921,879.59 2,866,187.53 3,615,792.13 3,232,808.00
Class D1 11,733,710.98 17,508,437.34 21,878,490.93 23,496,387.79 31,911,860.09 -
Class I 10,774,108.83 10,092,387.92 2,968,674.11 1,687,642.23 2,597,057.66 3,147,210.00
2. NET ASSET VALUE PER SHARE
Class A (EUR) 5.82 8.23 13.04 8.59 7.64 5.17
Class A2 (EUR) 5.76 8.14 12.99 8.55 - -
Class B (EUR) 5.55 7.72 12.53 8.29 7.41 5.04
Class D (USD) 9.32 13.95 22.40 13.11 11.10 7.74
Class D1 (USD) 9.33 13.95 22.40 13.11 11.10 -
Class I (EUR) 6.07 8.57 13.52 8.85 7.84 5.27
3. HIGHEST/LOWEST PRICE
Class A (EUR) 8.31/5.23 14.38/7.89 13.13/8.45 9.86/6.86 7.65/5.02 5.89/4.41
Class A2 (EUR) 8.23/5.17 14.31/7.85 13.07/8.41 9.81/6.90 - -
Class B (EUR) 7.95/4.99 13.81/7.55 12.61/8.16 9.53/6.65 7.42/4.89 5.76/4.33
Class D (USD) 14.06/7.99 25.01/13.74 22.51/12.95 15.17/10.04 11.12/7.73 8.49/6.21
Class D1 (USD) 14.06/7.98 25.00/13.74 22.51/12.94 15.17/10.03 11.12/8.61 -
Class I (EUR) 8.66/5.45 14.90/8.22 13.60/8.71 10.14/7.04 7.85/5.12 6.00/4.48
4. DISTRIBUTION PER SHARE (NOTE 12)
Class A - - - - - -
Class A2 (Cents) 30.09.08 - 6.5776 - - - -
Class B - - - - - -
Class D - - - - - -
Class D1 (Cents) 03.10.05 - - - - 5.1182 -
29.09.06 - - - 6.6720 - -
28.09.07 - - 4.7700 - - -
30.09.08 - 12.0356 - - - -
Class I - - - - - -
5. PRICE CHANGE YEAR ON YEAR (%)
Class A (29.28) (36.89) 51.80 12.43 47.78 17.50
Class A2 (29.24) (37.34) 51.93 - - -
Class B (28.11) (38.39) 51.15 11.88 47.02 16.94
Class D (33.19) (37.72) 70.86 18.11 43.41 24.84
Class D1 (33.12) (37.72) 70.86 18.11 - -
Class I (29.17) (36.61) 52.77 12.88 48.77 18.16
6. TOTAL EXPENSE RATIO (%) (ANNUALISED)
Class A 1.75 1.71 1.72 1.74 1.74 1.75
Class A2 1.71 1.72 1.71 1.44 - -
Class B 2.14 2.22 2.20 2.25 2.25 2.25
Class D 1.72 1.72 1.72 1.74 1.75 1.73
Class D1 1.71 1.72 1.72 1.74 1.73 -
Class I 1.31 1.17 1.18 1.25 1.25 1.25
7. NUMBER OF SHARES SUBSCRIBED
Class A 2,236,580.32 25,174,128.46 18,912,458.46 20,734,509.53 13,759,171.90 19,798,674.91
Class A2 180.81 2,020.65 8,662.12 508,896.39 - -
Class B 6,302.67 3,140,369.42 2,671,832.64 11,069,518.73 6,094,479.33 856,397.91
Class D 186,253.14 3,282,628.50 2,514,862.36 582,595.91 1,418,909.51 2,296,759.72
Class D1 163,795.47 2,376,663.44 2,139,652.08 3,543,001.05 34,933,956.27 -
Class I 3,612,098.58 11,744,576.73 1,863,180.93 1,021,886.36 1,398,216.54 6,514,283.29
8. NUMBER OF SHARES REDEEMED
Class A (5,164,620.11) (24,042,895.61) (17,013,635.16) (20,402,357.38) (15,288,849.89) (7,584,724.91)
Class A2 (1,684.89) (2,475.59) (36,869.40) (461,979.95) - -
Class B (71,160.13) (3,317,204.36) (2,843,077.04) (11,946,317.18) (5,052,615.28) (507,968.91)
Class D (1,095,314.96) (999,371.12) (459,170.30) (1,332,200.51) (1,035,925.38) (115,892.72)
Class D1 (5,938,521.83) (6,746,717.03) (3,757,548.94) (11,958,473.35) (3,022,096.18) -
Class I (2,930,377.67) (4,620,862.92) (582,149.05) (1,931,301.79) (1,948,368.88) (8,526,932.29)
*The figures before 30 September 2005 represent the audited net assets presented in a historical currency.
26
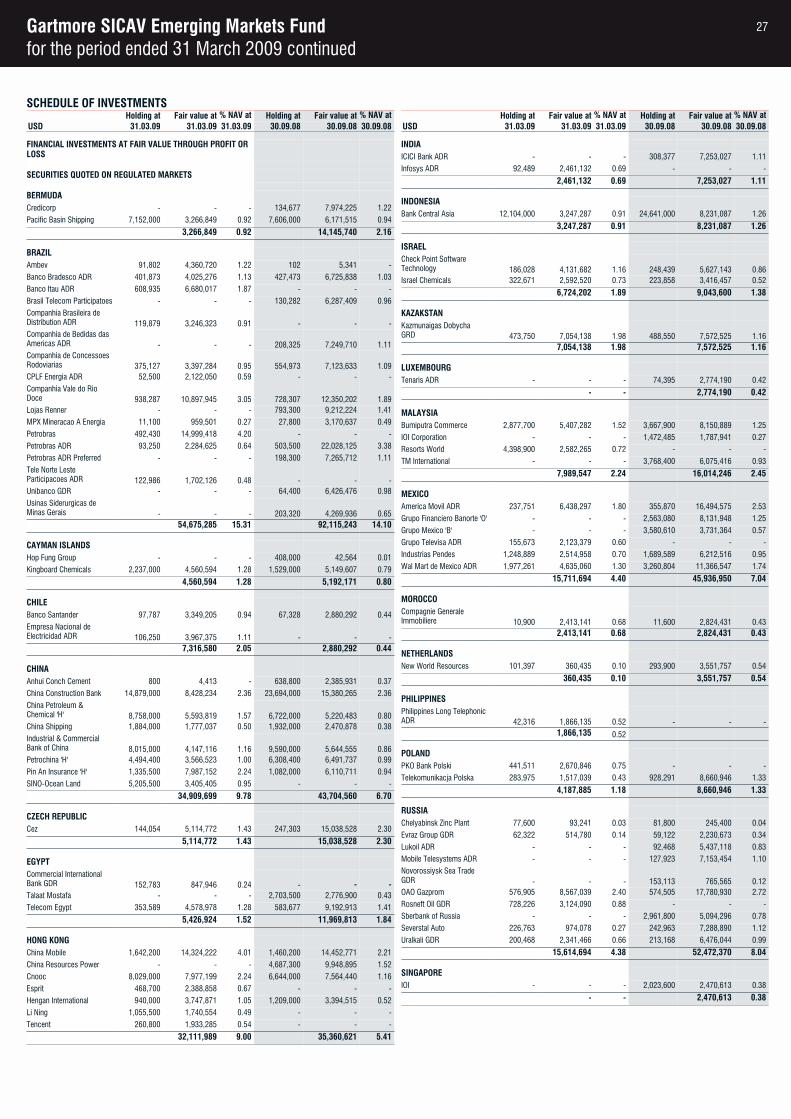
Gartmore SICAV Emerging Markets Fundfor the period ended 31 March 2009 continued
SCHEDULE OF INVESTMENTSHolding at Fair value at % NAV at Holding at Fair value at % NAV at
USD 31.03.09 31.03.09 31.03.09 30.09.08 30.09.08 30.09.08
FINANCIAL INVESTMENTS AT FAIR VALUE THROUGH PROFIT OR LOSS
SECURITIES QUOTED ON REGULATED MARKETS
BERMUDACredicorp - - - 134,677 7,974,225 1.22
Pacific Basin Shipping 7,152,000 3,266,849 0.92 7,606,000 6,171,515 0.94
3,266,849 0.92 14,145,740 2.16
BRAZILAmbev 91,802 4,360,720 1.22 102 5,341 -
Banco Bradesco ADR 401,873 4,025,276 1.13 427,473 6,725,838 1.03
Banco Itau ADR 608,935 6,680,017 1.87 - - -
Brasil Telecom Participatoes - - - 130,282 6,287,409 0.96
Companhia Brasileira de Distribution ADR 119,879 3,246,323 0.91 - - -Companhia de Bedidas das Americas ADR - - - 208,325 7,249,710 1.11Companhia de Concessoes Rodoviarias 375,127 3,397,284 0.95 554,973 7,123,633 1.09CPLF Energia ADR 52,500 2,122,050 0.59 - - -
Companhia Vale do Rio Doce 938,287 10,897,945 3.05 728,307 12,350,202 1.89Lojas Renner - - - 793,300 9,212,224 1.41
MPX Mineracao A Energia 11,100 959,501 0.27 27,800 3,170,637 0.49
Petrobras 492,430 14,999,418 4.20 - - -
Petrobras ADR 93,250 2,284,625 0.64 503,500 22,028,125 3.38
Petrobras ADR Preferred - - - 198,300 7,265,712 1.11
Tele Norte Leste Participacoes ADR 122,986 1,702,126 0.48 - - -Unibanco GDR - - - 64,400 6,426,476 0.98
Usinas Siderurgicas de Minas Gerais - - - 203,320 4,269,936 0.65
54,675,285 15.31 92,115,243 14.10
CAYMAN ISLANDSHop Fung Group - - - 408,000 42,564 0.01
Kingboard Chemicals 2,237,000 4,560,594 1.28 1,529,000 5,149,607 0.79
4,560,594 1.28 5,192,171 0.80
CHILEBanco Santander 97,787 3,349,205 0.94 67,328 2,880,292 0.44
Empresa Nacional de Electricidad ADR 106,250 3,967,375 1.11 - - -
7,316,580 2.05 2,880,292 0.44
CHINAAnhui Conch Cement 800 4,413 - 638,800 2,385,931 0.37
China Construction Bank 14,879,000 8,428,234 2.36 23,694,000 15,380,265 2.36
China Petroleum & Chemical 'H' 8,758,000 5,593,819 1.57 6,722,000 5,220,483 0.80China Shipping 1,884,000 1,777,037 0.50 1,932,000 2,470,878 0.38
Industrial & Commercial Bank of China 8,015,000 4,147,116 1.16 9,590,000 5,644,555 0.86Petrochina 'H' 4,494,400 3,566,523 1.00 6,308,400 6,491,737 0.99
Pin An Insurance 'H' 1,335,500 7,987,152 2.24 1,082,000 6,110,711 0.94
SINO-Ocean Land 5,205,500 3,405,405 0.95 - - -
34,909,699 9.78 43,704,560 6.70
CZECH REPUBLICCez 144,054 5,114,772 1.43 247,303 15,038,528 2.30
5,114,772 1.43 15,038,528 2.30
EGYPTCommercial International Bank GDR 152,783 847,946 0.24 - - -Talaat Mostafa - - - 2,703,500 2,776,900 0.43
Telecom Egypt 353,589 4,578,978 1.28 583,677 9,192,913 1.41
5,426,924 1.52 11,969,813 1.84
HONG KONGChina Mobile 1,642,200 14,324,222 4.01 1,460,200 14,452,771 2.21
China Resources Power - - - 4,687,300 9,948,895 1.52
Cnooc 8,029,000 7,977,199 2.24 6,644,000 7,564,440 1.16
Esprit 468,700 2,388,858 0.67 - - -
Hengan International 940,000 3,747,871 1.05 1,209,000 3,394,515 0.52
Li Ning 1,055,500 1,740,554 0.49 - - -
Tencent 260,800 1,933,285 0.54 - - -
32,111,989 9.00 35,360,621 5.41
Holding at Fair value at % NAV at Holding at Fair value at % NAV atUSD 31.03.09 31.03.09 31.03.09 30.09.08 30.09.08 30.09.08
INDIA ICICI Bank ADR - - - 308,377 7,253,027 1.11
Infosys ADR 92,489 2,461,132 0.69 - - -
2,461,132 0.69 7,253,027 1.11
INDONESIABank Central Asia 12,104,000 3,247,287 0.91 24,641,000 8,231,087 1.26
3,247,287 0.91 8,231,087 1.26
ISRAELCheck Point Software Technology 186,028 4,131,682 1.16 248,439 5,627,143 0.86Israel Chemicals 322,671 2,592,520 0.73 223,858 3,416,457 0.52
6,724,202 1.89 9,043,600 1.38
KAZAKSTANKazmunaigas Dobycha GRD 473,750 7,054,138 1.98 488,550 7,572,525 1.16
7,054,138 1.98 7,572,525 1.16
LUXEMBOURGTenaris ADR - - - 74,395 2,774,190 0.42
- - 2,774,190 0.42
MALAYSIA Bumiputra Commerce 2,877,700 5,407,282 1.52 3,667,900 8,150,889 1.25
IOI Corporation - - - 1,472,485 1,787,941 0.27
Resorts World 4,398,900 2,582,265 0.72 - - -
TM International - - - 3,768,400 6,075,416 0.93
7,989,547 2.24 16,014,246 2.45
MEXICOAmerica Movil ADR 237,751 6,438,297 1.80 355,870 16,494,575 2.53
Grupo Financiero Banorte 'O' - - - 2,563,080 8,131,948 1.25
Grupo Mexico 'B' - - - 3,580,610 3,731,364 0.57
Grupo Televisa ADR 155,673 2,123,379 0.60 - - -
Industrias Pendes 1,248,889 2,514,958 0.70 1,689,589 6,212,516 0.95
Wal Mart de Mexico ADR 1,977,261 4,635,060 1.30 3,260,804 11,366,547 1.74
15,711,694 4.40 45,936,950 7.04
MOROCCOCompagnie Generale Immobiliere 10,900 2,413,141 0.68 11,600 2,824,431 0.43
2,413,141 0.68 2,824,431 0.43
NETHERLANDSNew World Resources 101,397 360,435 0.10 293,900 3,551,757 0.54
360,435 0.10 3,551,757 0.54
PHILIPPINESPhilippines Long TelephonicADR 42,316 1,866,135 0.52 - - -
1,866,135 0.52
POLANDPKO Bank Polski 441,511 2,670,846 0.75 - - -
Telekomunikacja Polska 283,975 1,517,039 0.43 928,291 8,660,946 1.33
4,187,885 1.18 8,660,946 1.33
RUSSIAChelyabinsk Zinc Plant 77,600 93,241 0.03 81,800 245,400 0.04
Evraz Group GDR 62,322 514,780 0.14 59,122 2,230,673 0.34
Lukoil ADR - - - 92,468 5,437,118 0.83
Mobile Telesystems ADR - - - 127,923 7,153,454 1.10
Novorossiysk Sea Trade GDR - - - 153,113 765,565 0.12OAO Gazprom 576,905 8,567,039 2.40 574,505 17,780,930 2.72
Rosneft Oil GDR 728,226 3,124,090 0.88 - - -
Sberbank of Russia - - - 2,961,800 5,094,296 0.78
Severstal Auto 226,763 974,078 0.27 242,963 7,288,890 1.12
Uralkali GDR 200,468 2,341,466 0.66 213,168 6,476,044 0.99
15,614,694 4.38 52,472,370 8.04
SINGAPOREIOI - - - 2,023,600 2,470,613 0.38
- - 2,470,613 0.38
27
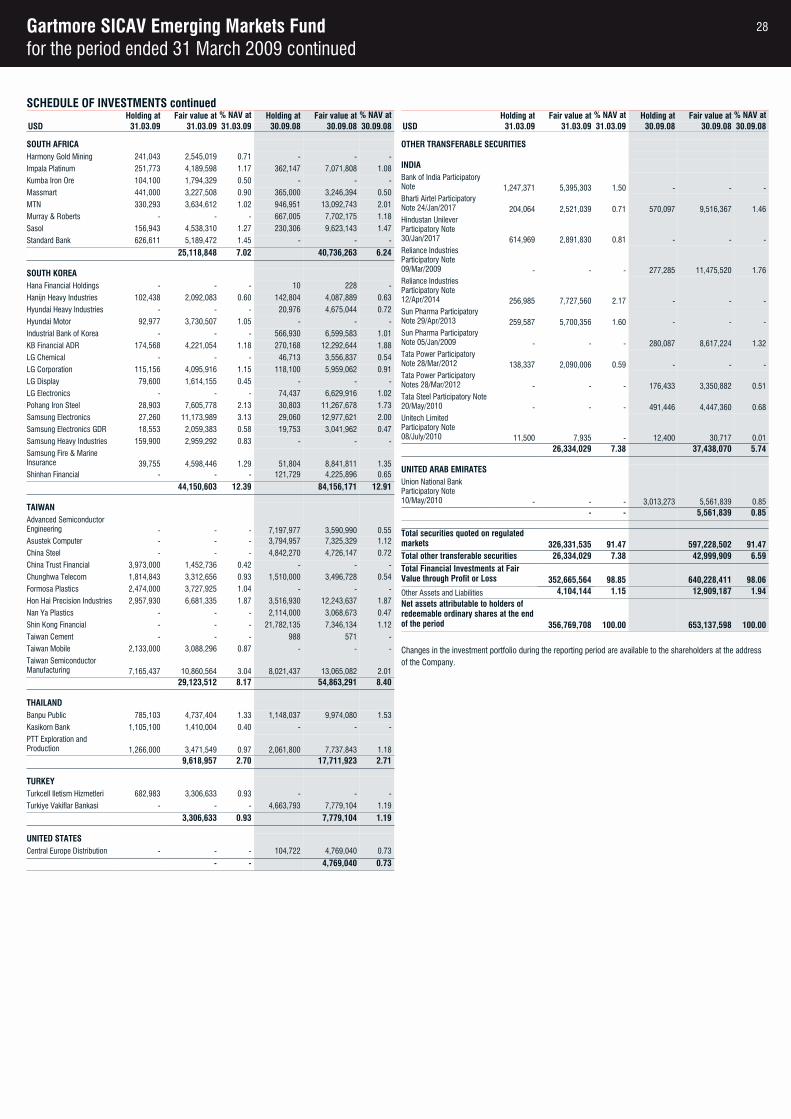
Gartmore SICAV Emerging Markets Fundfor the period ended 31 March 2009 continued
SCHEDULE OF INVESTMENTS continuedHolding at Fair value at % NAV at Holding at Fair value at % NAV at
USD 31.03.09 31.03.09 31.03.09 30.09.08 30.09.08 30.09.08
SOUTH AFRICAHarmony Gold Mining 241,043 2,545,019 0.71 - - -
Impala Platinum 251,773 4,189,598 1.17 362,147 7,071,808 1.08
Kumba Iron Ore 104,100 1,794,329 0.50 - - -
Massmart 441,000 3,227,508 0.90 365,000 3,246,394 0.50
MTN 330,293 3,634,612 1.02 946,951 13,092,743 2.01
Murray & Roberts - - - 667,005 7,702,175 1.18
Sasol 156,943 4,538,310 1.27 230,306 9,623,143 1.47
Standard Bank 626,611 5,189,472 1.45 - - -
25,118,848 7.02 40,736,263 6.24
SOUTH KOREAHana Financial Holdings - - - 10 228 -
Hanijn Heavy Industries 102,438 2,092,083 0.60 142,804 4,087,889 0.63
Hyundai Heavy Industries - - - 20,976 4,675,044 0.72
Hyundai Motor 92,977 3,730,507 1.05 - - -
Industrial Bank of Korea - - - 566,930 6,599,583 1.01
KB Financial ADR 174,568 4,221,054 1.18 270,168 12,292,644 1.88
LG Chemical - - - 46,713 3,556,837 0.54
LG Corporation 115,156 4,095,916 1.15 118,100 5,959,062 0.91
LG Display 79,600 1,614,155 0.45 - - -
LG Electronics - - - 74,437 6,629,916 1.02
Pohang Iron Steel 28,903 7,605,778 2.13 30,803 11,267,678 1.73
Samsung Electronics 27,260 11,173,989 3.13 29,060 12,977,621 2.00
Samsung Electronics GDR 18,553 2,059,383 0.58 19,753 3,041,962 0.47
Samsung Heavy Industries 159,900 2,959,292 0.83 - - -
Samsung Fire & Marine Insurance 39,755 4,598,446 1.29 51,804 8,841,811 1.35Shinhan Financial - - - 121,729 4,225,896 0.65
44,150,603 12.39 84,156,171 12.91
TAIWANAdvanced Semiconductor Engineering - - - 7,197,977 3,590,990 0.55Asustek Computer - - - 3,794,957 7,325,329 1.12
China Steel - - - 4,842,270 4,726,147 0.72
China Trust Financial 3,973,000 1,452,736 0.42 - - -
Chunghwa Telecom 1,814,843 3,312,656 0.93 1,510,000 3,496,728 0.54
Formosa Plastics 2,474,000 3,727,925 1.04 - - -
Hon Hai Precision Industries 2,957,930 6,681,335 1.87 3,516,930 12,243,637 1.87
Nan Ya Plastics - - - 2,114,000 3,068,673 0.47
Shin Kong Financial - - - 21,782,135 7,346,134 1.12
Taiwan Cement - - - 988 571 -
Taiwan Mobile 2,133,000 3,088,296 0.87 - - -
Taiwan Semiconductor Manufacturing 7,165,437 10,860,564 3.04 8,021,437 13,065,082 2.01
29,123,512 8.17 54,863,291 8.40
THAILANDBanpu Public 785,103 4,737,404 1.33 1,148,037 9,974,080 1.53
Kasikorn Bank 1,105,100 1,410,004 0.40 - - -
PTT Exploration and Production 1,266,000 3,471,549 0.97 2,061,800 7,737,843 1.18
9,618,957 2.70 17,711,923 2.71
TURKEYTurkcell Iletism Hizmetleri 682,983 3,306,633 0.93 - - -
Turkiye Vakiflar Bankasi - - - 4,663,793 7,779,104 1.19
3,306,633 0.93 7,779,104 1.19
UNITED STATESCentral Europe Distribution - - - 104,722 4,769,040 0.73
- - 4,769,040 0.73
Holding at Fair value at % NAV at Holding at Fair value at % NAV atUSD 31.03.09 31.03.09 31.03.09 30.09.08 30.09.08 30.09.08
OTHER TRANSFERABLE SECURITIES
INDIA Bank of India Participatory Note 1,247,371 5,395,303 1.50 - - -Bharti Airtel Participatory Note 24/Jan/2017 204,064 2,521,039 0.71 570,097 9,516,367 1.46Hindustan Unilever Participatory Note 30/Jan/2017 614,969 2,891,830 0.81 - - -Reliance Industries Participatory Note 09/Mar/2009 - - - 277,285 11,475,520 1.76Reliance Industries Participatory Note 12/Apr/2014 256,985 7,727,560 2.17 - - -Sun Pharma Participatory Note 29/Apr/2013 259,587 5,700,356 1.60 - - -Sun Pharma Participatory Note 05/Jan/2009 - - - 280,087 8,617,224 1.32Tata Power Participatory Note 28/Mar/2012 138,337 2,090,006 0.59 - - -Tata Power Participatory Notes 28/Mar/2012 - - - 176,433 3,350,882 0.51Tata Steel Participatory Note20/May/2010 - - - 491,446 4,447,360 0.68Unitech Limited Participatory Note 08/July/2010 11,500 7,935 - 12,400 30,717 0.01
26,334,029 7.38 37,438,070 5.74
UNITED ARAB EMIRATESUnion National Bank Participatory Note 10/May/2010 - - - 3,013,273 5,561,839 0.85
- - 5,561,839 0.85
Total securities quoted on regulated markets 326,331,535 91.47 597,228,502 91.47Total other transferable securities 26,334,029 7.38 42,999,909 6.59Total Financial Investments at Fair Value through Profit or Loss 352,665,564 98.85 640,228,411 98.06Other Assets and Liabilities 4,104,144 1.15 12,909,187 1.94Net assets attributable to holders of redeemable ordinary shares at the end of the period 356,769,708 100.00 653,137,598 100.00
Changes in the investment portfolio during the reporting period are available to the shareholders at the address of the Company.
28

Gartmore SICAV Eurobloc Fundfor the period ended 31 March 2009
BALANCE SHEETEUR Note 31.03.09 30.09.08CURRENT ASSETS
Cash and cash equivalents 2.8 132,836 114,038
Margin accounts 2.5(b), 9 - -
Due from brokers 2.10 5 259,262
Subscriptions receivable 2.12 - 63,293
Financial investments at fair value through profit or loss 2.3, 2.5, 4, 5, 6, 7, 8 1,633,780 3,815,765Dividend receivable 2.4, 2.12 1,212 320
Interest receivable 2.4, 2.12 - -
Other accrued income and prepaid expenses 12,883 78,825
Total assets 1,780,716 4,331,503
CURRENT LIABILITIES
Bank overdraft 2.8 - -
Due to brokers 2.10 - 128,713
Redemptions payable 2.12 269 -
Distributions payable to holders of redeemable ordinary shares 12 - 62,097Accrued interest 2.4, 2.12 - -
Accrued expenses 2.12 8,123 38,191
Liabilities (excluding net assets attributable to holders of redeemable ordinary shares) 8,392 229,001Net assets attributable to holders of redeemableordinary shares 1,772,324 4,102,502
CASH-FLOW STATEMENTEUR Note 31.03.09 31.03.08CASH-FLOW FROM OPERATING ACTIVITIES
Increase/(decrease) in net assets attributable toholders of redeemable ordinary shares from operations (1,311,504) (1,405,300)
Adjustment for:
Interest income 2.6 (963) (1,032)
Interest expense 2.6 - -
Dividend income 2.6 (33,896) (24,158)
Investments interest 2.6 - -
Securities lending revenue 2.7, 14 (739) (1,049)
Taxation 2.9 5,511 6,505
Distributions to holders of redeemable ordinary shares 12 - -
Operating profit/(loss) before working capital changes (1,341,591) (1,425,034)Net decrease/(increase) in other accrued income and prepaid expenses 65,942 (20,171)Net decrease/(increase) in due from brokers 259,257 273,251
Net (decrease)/increase in due to brokers (128,713) -
Net increase/(decrease) in accrued expenses (30,068) 3,560
Net (increase)/decrease in financial investments at fair value through profit or loss 2,181,985 4,770,866Interest received 2.6, 2.12 963 1,032
Interest paid 2.6, 2.12 - -
Dividend received 2.6, 2.12 33,004 24,158
Investments interest received 2.6 - -
Securities lending commission received 2.7, 14 739 1,049
Tax paid 2.9 (5,511) (6,505)
Net cash generated from/(used in) operating activities 1,036,007 3,622,206
CASH-FLOW FROM FINANCING ACTIVITIES
Distributions paid to holders of redeemable ordinary shares 12 (62,097) (68,410)Cash received on shares issued 339,213 771,817
Cash paid out on shares redeemed (1,294,325) (4,073,694)
Net cash generated from/(used in) financing activities (1,017,209) (3,370,287)Net increase/(decrease) in cash and cash equivalents 18,798 251,919Opening cash and cash equivalents 114,038 (82,305)Closing cash and cash equivalents 132,836 169,614
INCOME STATEMENTEUR Note 31.03.09 31.03.08REVENUE
Deposit interest 2.6 963 1,032
Dividend income 2.6 33,896 24,158
Investments interest 2.6 - -
Securities lending revenue 2.7, 14 739 1,049
Net gains/(losses) on financial investments at fair value through profit or loss 2.3 (1,286,434) (1,359,175)Other income 1,891 4,356
Total investment income (1,248,945) (1,328,580)
EXPENSES
Management fees 13 18,857 51,647
Performance fees 13 - -
Administration fees 13 4,401 5,479
Transaction charges 17 31,084 12,446
Service fees 13 225 69
Interest expense 2.6 - -
Other expenses 2,481 574
Total operating expenses 57,048 70,215Operating profit/(loss) (1,305,993) (1,398,795)
FINANCE COSTS
Distributions to holders of redeemable ordinary shares 12 - -
Total finance costs - -Net profit/(loss) before tax (1,305,993) (1,398,795)Taxation 2.9 5,511 6,505
Increase/(decrease) in net assets attributable toholders of redeemable ordinary shares from operations (1,311,504) (1,405,300)
STATEMENT OF CHANGES IN NET ASSETS ATTRIBUTABLE TO HOLDERS OF REDEEMABLE ORDINARY SHARESEUR Note 31.03.09 31.03.08Net assets attributable to holders of redeemableordinary shares at beginning of the period 4,102,502 10,249,283Increase/(decrease) in net assets attributable toholders of redeemable ordinary shares from operations (1,311,504) (1,405,300)Proceeds from shares issued 275,920 703,147
Payments for shares redeemed (1,294,594) (4,115,589)
Currency translation adjustment 2.2 - -
Net assets attributable to holders of redeemableordinary shares at end of the period 1,772,324 5,431,541
The accompanying notes 1 to 19 found on pages 81 to 115 form an integral part of the financial statements.
29
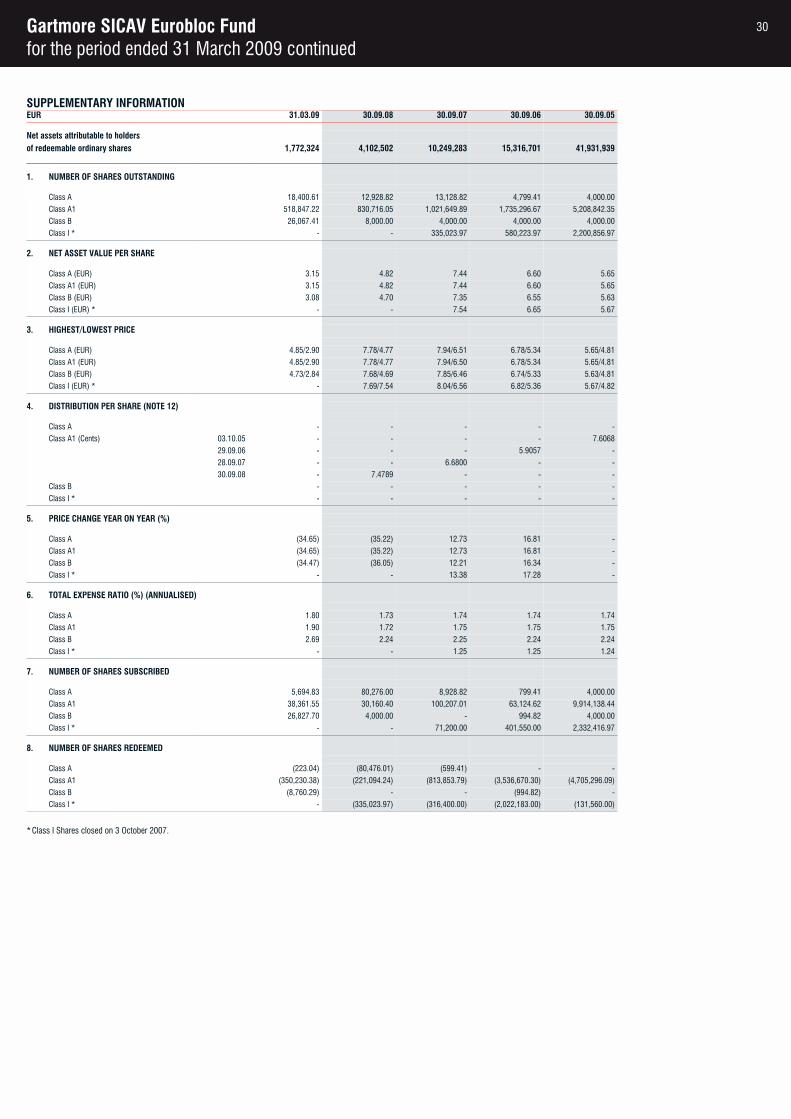
Gartmore SICAV Eurobloc Fundfor the period ended 31 March 2009 continued
SUPPLEMENTARY INFORMATIONEUR 31.03.09 30.09.08 30.09.07 30.09.06 30.09.05
Net assets attributable to holdersof redeemable ordinary shares 1,772,324 4,102,502 10,249,283 15,316,701 41,931,939
1. NUMBER OF SHARES OUTSTANDING
Class A 18,400.61 12,928.82 13,128.82 4,799.41 4,000.00
Class A1 518,847.22 830,716.05 1,021,649.89 1,735,296.67 5,208,842.35
Class B 26,067.41 8,000.00 4,000.00 4,000.00 4,000.00
Class I * - - 335,023.97 580,223.97 2,200,856.97
2. NET ASSET VALUE PER SHARE
Class A (EUR) 3.15 4.82 7.44 6.60 5.65
Class A1 (EUR) 3.15 4.82 7.44 6.60 5.65
Class B (EUR) 3.08 4.70 7.35 6.55 5.63
Class I (EUR) * - - 7.54 6.65 5.67
3. HIGHEST/LOWEST PRICE
Class A (EUR) 4.85/2.90 7.78/4.77 7.94/6.51 6.78/5.34 5.65/4.81
Class A1 (EUR) 4.85/2.90 7.78/4.77 7.94/6.50 6.78/5.34 5.65/4.81
Class B (EUR) 4.73/2.84 7.68/4.69 7.85/6.46 6.74/5.33 5.63/4.81
Class I (EUR) * - 7.69/7.54 8.04/6.56 6.82/5.36 5.67/4.82
4. DISTRIBUTION PER SHARE (NOTE 12)
Class A - - - - -
Class A1 (Cents) 03.10.05 - - - - 7.6068
29.09.06 - - - 5.9057 -
28.09.07 - - 6.6800 - -
30.09.08 - 7.4789 - - -
Class B - - - - -
Class I * - - - - -
5. PRICE CHANGE YEAR ON YEAR (%)
Class A (34.65) (35.22) 12.73 16.81 -
Class A1 (34.65) (35.22) 12.73 16.81 -
Class B (34.47) (36.05) 12.21 16.34 -
Class I * - - 13.38 17.28 -
6. TOTAL EXPENSE RATIO (%) (ANNUALISED)
Class A 1.80 1.73 1.74 1.74 1.74
Class A1 1.90 1.72 1.75 1.75 1.75
Class B 2.69 2.24 2.25 2.24 2.24
Class I * - - 1.25 1.25 1.24
7. NUMBER OF SHARES SUBSCRIBED
Class A 5,694.83 80,276.00 8,928.82 799.41 4,000.00
Class A1 38,361.55 30,160.40 100,207.01 63,124.62 9,914,138.44
Class B 26,827.70 4,000.00 - 994.82 4,000.00
Class I * - - 71,200.00 401,550.00 2,332,416.97
8. NUMBER OF SHARES REDEEMED
Class A (223.04) (80,476.01) (599.41) - -
Class A1 (350,230.38) (221,094.24) (813,853.79) (3,536,670.30) (4,705,296.09)
Class B (8,760.29) - - (994.82) -
Class I * - (335,023.97) (316,400.00) (2,022,183.00) (131,560.00)
*Class I Shares closed on 3 October 2007.
30
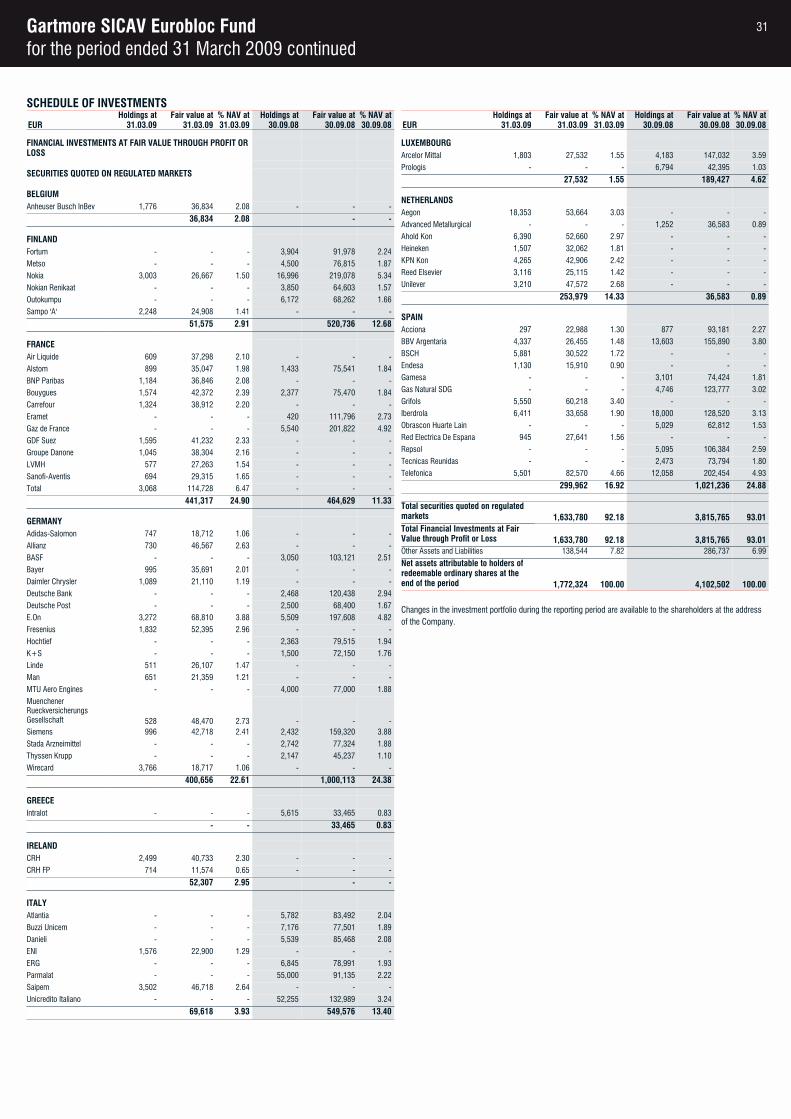
Gartmore SICAV Eurobloc Fundfor the period ended 31 March 2009 continued
SCHEDULE OF INVESTMENTSHoldings at Fair value at % NAV at Holdings at Fair value at % NAV at
EUR 31.03.09 31.03.09 31.03.09 30.09.08 30.09.08 30.09.08
FINANCIAL INVESTMENTS AT FAIR VALUE THROUGH PROFIT OR LOSS
SECURITIES QUOTED ON REGULATED MARKETS
BELGIUMAnheuser Busch InBev 1,776 36,834 2.08 - - -
36,834 2.08 - -
FINLANDFortum - - - 3,904 91,978 2.24
Metso - - - 4,500 76,815 1.87
Nokia 3,003 26,667 1.50 16,996 219,078 5.34
Nokian Renikaat - - - 3,850 64,603 1.57
Outokumpu - - - 6,172 68,262 1.66
Sampo 'A' 2,248 24,908 1.41 - - -
51,575 2.91 520,736 12.68
FRANCEAir Liquide 609 37,298 2.10 - - -
Alstom 899 35,047 1.98 1,433 75,541 1.84
BNP Paribas 1,184 36,846 2.08 - - -
Bouygues 1,574 42,372 2.39 2,377 75,470 1.84
Carrefour 1,324 38,912 2.20 - - -
Eramet - - - 420 111,796 2.73
Gaz de France - - - 5,540 201,822 4.92
GDF Suez 1,595 41,232 2.33 - - -
Groupe Danone 1,045 38,304 2.16 - - -
LVMH 577 27,263 1.54 - - -
Sanofi-Aventis 694 29,315 1.65 - - -
Total 3,068 114,728 6.47 - - -
441,317 24.90 464,629 11.33
GERMANYAdidas-Salomon 747 18,712 1.06 - - -
Allianz 730 46,567 2.63 - - -
BASF - - - 3,050 103,121 2.51
Bayer 995 35,691 2.01 - - -
Daimler Chrysler 1,089 21,110 1.19 - - -
Deutsche Bank - - - 2,468 120,438 2.94
Deutsche Post - - - 2,500 68,400 1.67
E.On 3,272 68,810 3.88 5,509 197,608 4.82
Fresenius 1,832 52,395 2.96 - - -
Hochtief - - - 2,363 79,515 1.94
K+S - - - 1,500 72,150 1.76
Linde 511 26,107 1.47 - - -
Man 651 21,359 1.21 - - -
MTU Aero Engines - - - 4,000 77,000 1.88
Muenchener Rueckversicherungs Gesellschaft 528 48,470 2.73 - - -Siemens 996 42,718 2.41 2,432 159,320 3.88
Stada Arzneimittel - - - 2,742 77,324 1.88
Thyssen Krupp - - - 2,147 45,237 1.10
Wirecard 3,766 18,717 1.06 - - -
400,656 22.61 1,000,113 24.38
GREECEIntralot - - - 5,615 33,465 0.83
- - 33,465 0.83
IRELANDCRH 2,499 40,733 2.30 - - -
CRH FP 714 11,574 0.65 - - -
52,307 2.95 - -
ITALYAtlantia - - - 5,782 83,492 2.04
Buzzi Unicem - - - 7,176 77,501 1.89
Danieli - - - 5,539 85,468 2.08
ENI 1,576 22,900 1.29 - - -
ERG - - - 6,845 78,991 1.93
Parmalat - - - 55,000 91,135 2.22
Saipem 3,502 46,718 2.64 - - -
Unicredito Italiano - - - 52,255 132,989 3.24
69,618 3.93 549,576 13.40
Holdings at Fair value at % NAV at Holdings at Fair value at % NAV atEUR 31.03.09 31.03.09 31.03.09 30.09.08 30.09.08 30.09.08
LUXEMBOURGArcelor Mittal 1,803 27,532 1.55 4,183 147,032 3.59
Prologis - - - 6,794 42,395 1.03
27,532 1.55 189,427 4.62
NETHERLANDSAegon 18,353 53,664 3.03 - - -
Advanced Metallurgical - - - 1,252 36,583 0.89
Ahold Kon 6,390 52,660 2.97 - - -
Heineken 1,507 32,062 1.81 - - -
KPN Kon 4,265 42,906 2.42 - - -
Reed Elsevier 3,116 25,115 1.42 - - -
Unilever 3,210 47,572 2.68 - - -
253,979 14.33 36,583 0.89
SPAINAcciona 297 22,988 1.30 877 93,181 2.27
BBV Argentaria 4,337 26,455 1.48 13,603 155,890 3.80
BSCH 5,881 30,522 1.72 - - -
Endesa 1,130 15,910 0.90 - - -
Gamesa - - - 3,101 74,424 1.81
Gas Natural SDG - - - 4,746 123,777 3.02
Grifols 5,550 60,218 3.40 - - -
Iberdrola 6,411 33,658 1.90 18,000 128,520 3.13
Obrascon Huarte Lain - - - 5,029 62,812 1.53
Red Electrica De Espana 945 27,641 1.56 - - -
Repsol - - - 5,095 106,384 2.59
Tecnicas Reunidas - - - 2,473 73,794 1.80
Telefonica 5,501 82,570 4.66 12,058 202,454 4.93
299,962 16.92 1,021,236 24.88
Total securities quoted on regulated markets 1,633,780 92.18 3,815,765 93.01Total Financial Investments at Fair Value through Profit or Loss 1,633,780 92.18 3,815,765 93.01Other Assets and Liabilities 138,544 7.82 286,737 6.99
Net assets attributable to holders of redeemable ordinary shares at the end of the period 1,772,324 100.00 4,102,502 100.00
Changes in the investment portfolio during the reporting period are available to the shareholders at the address of the Company.
31
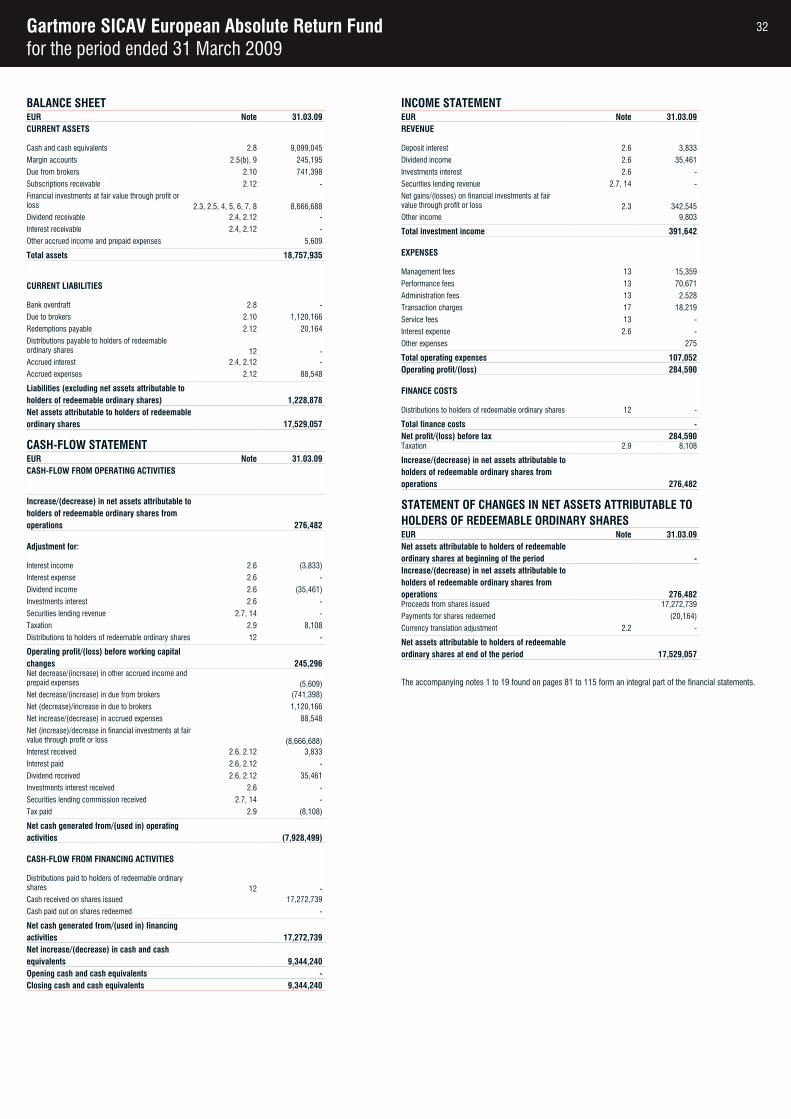
Gartmore SICAV European Absolute Return Fundfor the period ended 31 March 2009
BALANCE SHEETEUR Note 31.03.09 30.09.08
CURRENT ASSETS
Cash and cash equivalents 2.8 9,099,045
Margin accounts 2.5(b), 9 245,195
Due from brokers 2.10 741,398
Subscriptions receivable 2.12 -
Financial investments at fair value through profit or loss 2.3, 2.5, 4, 5, 6, 7, 8 8,666,688Dividend receivable 2.4, 2.12 -
Interest receivable 2.4, 2.12 -
Other accrued income and prepaid expenses 5,609
Total assets 18,757,935
CURRENT LIABILITIES
Bank overdraft 2.8 -
Due to brokers 2.10 1,120,166
Redemptions payable 2.12 20,164
Distributions payable to holders of redeemable ordinary shares 12 -Accrued interest 2.4, 2.12 -
Accrued expenses 2.12 88,548
Liabilities (excluding net assets attributable to holders of redeemable ordinary shares) 1,228,878Net assets attributable to holders of redeemableordinary shares 17,529,057
CASH-FLOW STATEMENTEUR Note 31.03.09 31.03.08
CASH-FLOW FROM OPERATING ACTIVITIES
Increase/(decrease) in net assets attributable toholders of redeemable ordinary shares from operations 276,482
Adjustment for:
Interest income 2.6 (3,833)
Interest expense 2.6 -
Dividend income 2.6 (35,461)
Investments interest 2.6 -
Securities lending revenue 2.7, 14 -
Taxation 2.9 8,108
Distributions to holders of redeemable ordinary shares 12 -
Operating profit/(loss) before working capital changes 245,296Net decrease/(increase) in other accrued income and prepaid expenses (5,609)Net decrease/(increase) in due from brokers (741,398)
Net (decrease)/increase in due to brokers 1,120,166
Net increase/(decrease) in accrued expenses 88,548
Net (increase)/decrease in financial investments at fair value through profit or loss (8,666,688)Interest received 2.6, 2.12 3,833
Interest paid 2.6, 2.12 -
Dividend received 2.6, 2.12 35,461
Investments interest received 2.6 -
Securities lending commission received 2.7, 14 -
Tax paid 2.9 (8,108)
Net cash generated from/(used in) operating activities (7,928,499)
CASH-FLOW FROM FINANCING ACTIVITIES
Distributions paid to holders of redeemable ordinary shares 12 -Cash received on shares issued 17,272,739
Cash paid out on shares redeemed -
Net cash generated from/(used in) financing activities 17,272,739Net increase/(decrease) in cash and cash equivalents 9,344,240Opening cash and cash equivalents -Closing cash and cash equivalents 9,344,240
INCOME STATEMENTEUR Note 31.03.09 31.03.08
REVENUE
Deposit interest 2.6 3,833
Dividend income 2.6 35,461
Investments interest 2.6 -
Securities lending revenue 2.7, 14 -
Net gains/(losses) on financial investments at fair value through profit or loss 2.3 342,545Other income 9,803
Total investment income 391,642
EXPENSES
Management fees 13 15,359
Performance fees 13 70,671
Administration fees 13 2,528
Transaction charges 17 18,219
Service fees 13 -
Interest expense 2.6 -
Other expenses 275
Total operating expenses 107,052Operating profit/(loss) 284,590
FINANCE COSTS
Distributions to holders of redeemable ordinary shares 12 -
Total finance costs -Net profit/(loss) before tax 284,590Taxation 2.9 8,108
Increase/(decrease) in net assets attributable toholders of redeemable ordinary shares from operations 276,482
STATEMENT OF CHANGES IN NET ASSETS ATTRIBUTABLE TO HOLDERS OF REDEEMABLE ORDINARY SHARESEUR Note 31.03.09 31.03.08
Net assets attributable to holders of redeemableordinary shares at beginning of the period -Increase/(decrease) in net assets attributable toholders of redeemable ordinary shares from operations 276,482Proceeds from shares issued 17,272,739
Payments for shares redeemed (20,164)
Currency translation adjustment 2.2 -
Net assets attributable to holders of redeemableordinary shares at end of the period 17,529,057
The accompanying notes 1 to 19 found on pages 81 to 115 form an integral part of the financial statements.
32
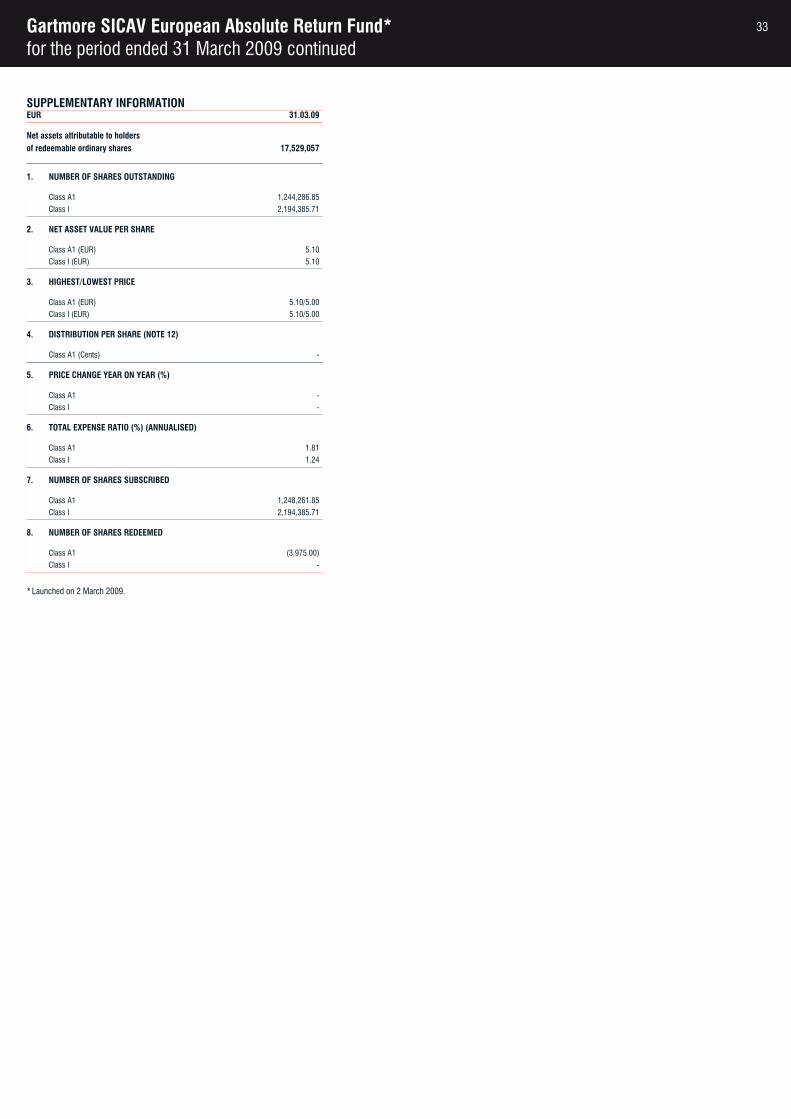
Gartmore SICAV European Absolute Return Fund*for the period ended 31 March 2009 continued
SUPPLEMENTARY INFORMATIONEUR 31.03.09
Net assets attributable to holdersof redeemable ordinary shares 17,529,057
1. NUMBER OF SHARES OUTSTANDING
Class A1 1,244,286.85
Class I 2,194,385.71
2. NET ASSET VALUE PER SHARE
Class A1 (EUR) 5.10
Class I (EUR) 5.10
3. HIGHEST/LOWEST PRICE
Class A1 (EUR) 5.10/5.00
Class I (EUR) 5.10/5.00
4. DISTRIBUTION PER SHARE (NOTE 12)
Class A1 (Cents) -
5. PRICE CHANGE YEAR ON YEAR (%)
Class A1 -
Class I -
6. TOTAL EXPENSE RATIO (%) (ANNUALISED)
Class A1 1.81
Class I 1.24
7. NUMBER OF SHARES SUBSCRIBED
Class A1 1,248,261.85
Class I 2,194,385.71
8. NUMBER OF SHARES REDEEMED
Class A1 (3,975.00)
Class I -
*Launched on 2 March 2009.
33
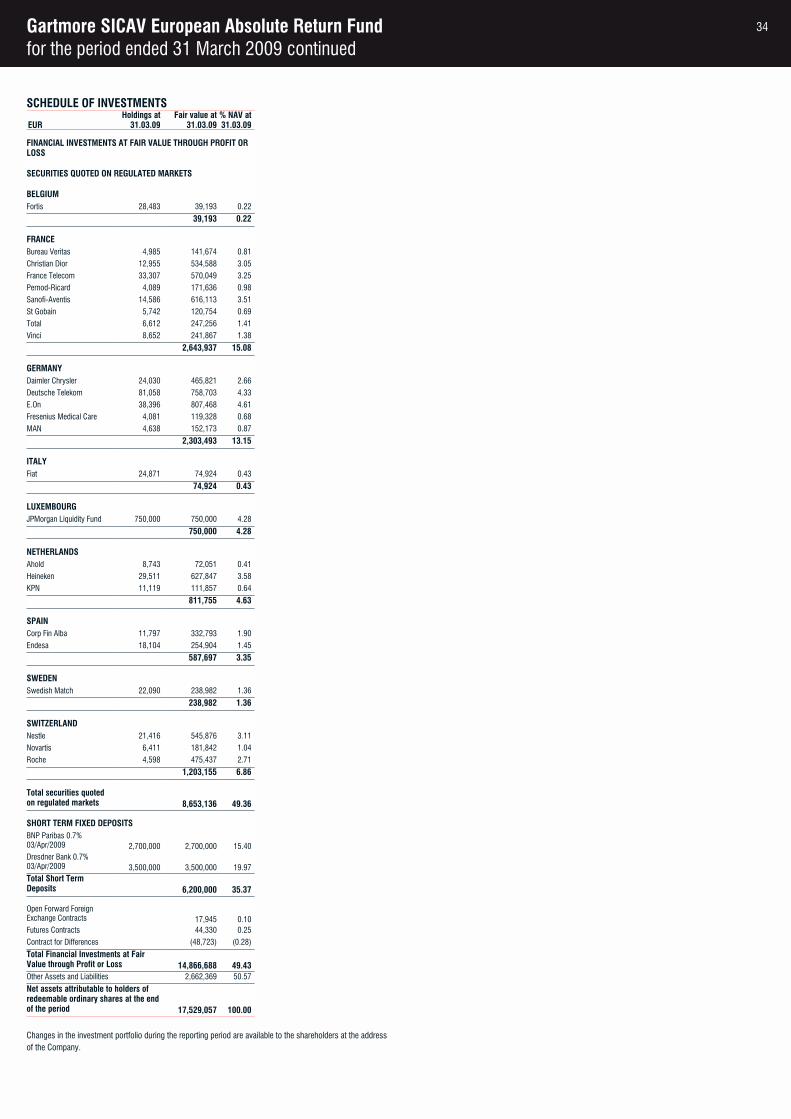
Gartmore SICAV European Absolute Return Fundfor the period ended 31 March 2009 continued
SCHEDULE OF INVESTMENTSHoldings at Fair value at % NAV at
EUR 31.03.09 31.03.09 31.03.09
FINANCIAL INVESTMENTS AT FAIR VALUE THROUGH PROFIT OR LOSS
SECURITIES QUOTED ON REGULATED MARKETS
BELGIUMFortis 28,483 39,193 0.22
39,193 0.22
FRANCEBureau Veritas 4,985 141,674 0.81
Christian Dior 12,955 534,588 3.05
France Telecom 33,307 570,049 3.25
Pernod-Ricard 4,089 171,636 0.98
Sanofi-Aventis 14,586 616,113 3.51
St Gobain 5,742 120,754 0.69
Total 6,612 247,256 1.41
Vinci 8,652 241,867 1.38
2,643,937 15.08
GERMANYDaimler Chrysler 24,030 465,821 2.66
Deutsche Telekom 81,058 758,703 4.33
E.On 38,396 807,468 4.61
Fresenius Medical Care 4,081 119,328 0.68
MAN 4,638 152,173 0.87
2,303,493 13.15
ITALYFiat 24,871 74,924 0.43
74,924 0.43
LUXEMBOURGJPMorgan Liquidity Fund 750,000 750,000 4.28
750,000 4.28
NETHERLANDSAhold 8,743 72,051 0.41
Heineken 29,511 627,847 3.58
KPN 11,119 111,857 0.64
811,755 4.63
SPAINCorp Fin Alba 11,797 332,793 1.90
Endesa 18,104 254,904 1.45
587,697 3.35
SWEDENSwedish Match 22,090 238,982 1.36
238,982 1.36
SWITZERLANDNestle 21,416 545,876 3.11
Novartis 6,411 181,842 1.04
Roche 4,598 475,437 2.71
1,203,155 6.86
Total securities quoted on regulated markets 8,653,136 49.36
SHORT TERM FIXED DEPOSITSBNP Paribas 0.7% 03/Apr/2009 2,700,000 2,700,000 15.40Dresdner Bank 0.7% 03/Apr/2009 3,500,000 3,500,000 19.97Total Short Term Deposits 6,200,000 35.37
Open Forward Foreign Exchange Contracts 17,945 0.10Futures Contracts 44,330 0.25
Contract for Differences (48,723) (0.28)
Total Financial Investments at Fair Value through Profit or Loss 14,866,688 49.43Other Assets and Liabilities 2,662,369 50.57
Net assets attributable to holders of redeemable ordinary shares at the end of the period 17,529,057 100.00
Changes in the investment portfolio during the reporting period are available to the shareholders at the address of the Company.
34
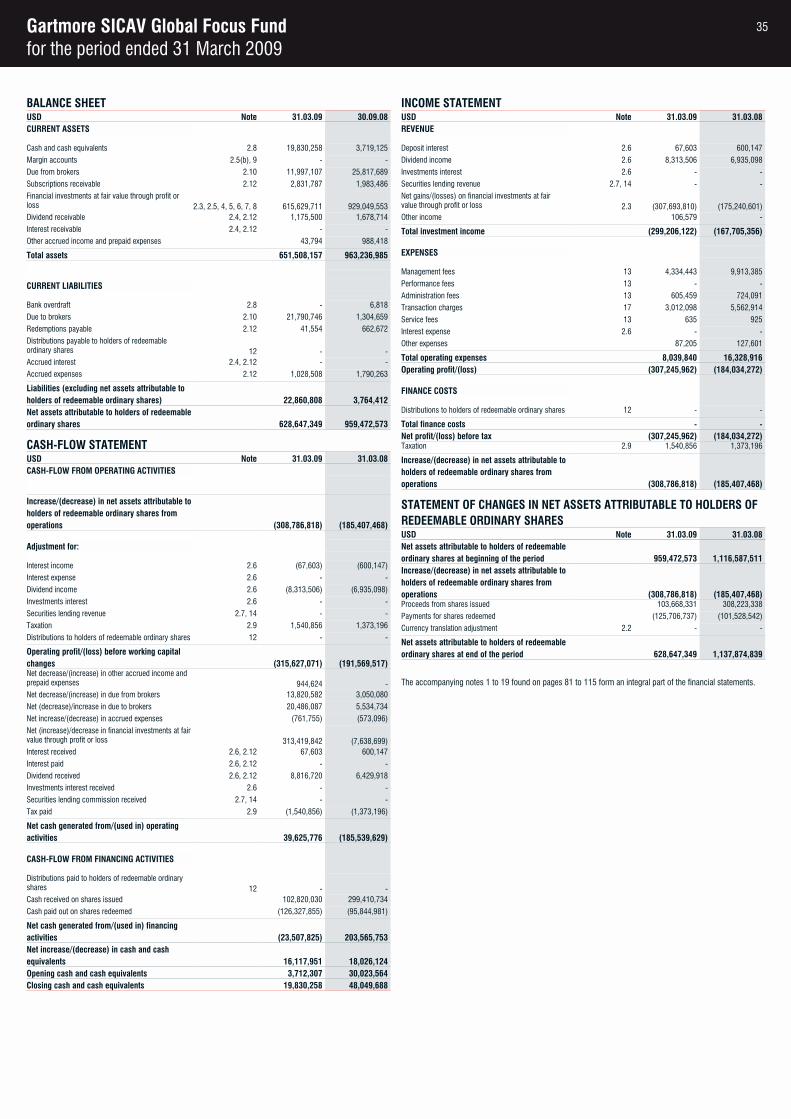
Gartmore SICAV Global Focus Fundfor the period ended 31 March 2009
BALANCE SHEETUSD Note 31.03.09 30.09.08CURRENT ASSETS
Cash and cash equivalents 2.8 19,830,258 3,719,125
Margin accounts 2.5(b), 9 - -
Due from brokers 2.10 11,997,107 25,817,689
Subscriptions receivable 2.12 2,831,787 1,983,486
Financial investments at fair value through profit or loss 2.3, 2.5, 4, 5, 6, 7, 8 615,629,711 929,049,553Dividend receivable 2.4, 2.12 1,175,500 1,678,714
Interest receivable 2.4, 2.12 - -
Other accrued income and prepaid expenses 43,794 988,418
Total assets 651,508,157 963,236,985
CURRENT LIABILITIES
Bank overdraft 2.8 - 6,818
Due to brokers 2.10 21,790,746 1,304,659
Redemptions payable 2.12 41,554 662,672
Distributions payable to holders of redeemable ordinary shares 12 - -Accrued interest 2.4, 2.12 - -
Accrued expenses 2.12 1,028,508 1,790,263
Liabilities (excluding net assets attributable to holders of redeemable ordinary shares) 22,860,808 3,764,412Net assets attributable to holders of redeemableordinary shares 628,647,349 959,472,573
CASH-FLOW STATEMENTUSD Note 31.03.09 31.03.08CASH-FLOW FROM OPERATING ACTIVITIES
Increase/(decrease) in net assets attributable toholders of redeemable ordinary shares from operations (308,786,818) (185,407,468)
Adjustment for:
Interest income 2.6 (67,603) (600,147)
Interest expense 2.6 - -
Dividend income 2.6 (8,313,506) (6,935,098)
Investments interest 2.6 - -
Securities lending revenue 2.7, 14 - -
Taxation 2.9 1,540,856 1,373,196
Distributions to holders of redeemable ordinary shares 12 - -
Operating profit/(loss) before working capital changes (315,627,071) (191,569,517)Net decrease/(increase) in other accrued income and prepaid expenses 944,624 -Net decrease/(increase) in due from brokers 13,820,582 3,050,080
Net (decrease)/increase in due to brokers 20,486,087 5,534,734
Net increase/(decrease) in accrued expenses (761,755) (573,096)
Net (increase)/decrease in financial investments at fair value through profit or loss 313,419,842 (7,638,699)Interest received 2.6, 2.12 67,603 600,147
Interest paid 2.6, 2.12 - -
Dividend received 2.6, 2.12 8,816,720 6,429,918
Investments interest received 2.6 - -
Securities lending commission received 2.7, 14 - -
Tax paid 2.9 (1,540,856) (1,373,196)
Net cash generated from/(used in) operating activities 39,625,776 (185,539,629)
CASH-FLOW FROM FINANCING ACTIVITIES
Distributions paid to holders of redeemable ordinary shares 12 - -Cash received on shares issued 102,820,030 299,410,734
Cash paid out on shares redeemed (126,327,855) (95,844,981)
Net cash generated from/(used in) financing activities (23,507,825) 203,565,753Net increase/(decrease) in cash and cash equivalents 16,117,951 18,026,124Opening cash and cash equivalents 3,712,307 30,023,564Closing cash and cash equivalents 19,830,258 48,049,688
INCOME STATEMENTUSD Note 31.03.09 31.03.08REVENUE
Deposit interest 2.6 67,603 600,147
Dividend income 2.6 8,313,506 6,935,098
Investments interest 2.6 - -
Securities lending revenue 2.7, 14 - -
Net gains/(losses) on financial investments at fair value through profit or loss 2.3 (307,693,810) (175,240,601)Other income 106,579 -
Total investment income (299,206,122) (167,705,356)
EXPENSES
Management fees 13 4,334,443 9,913,385
Performance fees 13 - -
Administration fees 13 605,459 724,091
Transaction charges 17 3,012,098 5,562,914
Service fees 13 635 925
Interest expense 2.6 - -
Other expenses 87,205 127,601
Total operating expenses 8,039,840 16,328,916Operating profit/(loss) (307,245,962) (184,034,272)
FINANCE COSTS
Distributions to holders of redeemable ordinary shares 12 - -
Total finance costs - -Net profit/(loss) before tax (307,245,962) (184,034,272)Taxation 2.9 1,540,856 1,373,196
Increase/(decrease) in net assets attributable toholders of redeemable ordinary shares from operations (308,786,818) (185,407,468)
STATEMENT OF CHANGES IN NET ASSETS ATTRIBUTABLE TO HOLDERS OF REDEEMABLE ORDINARY SHARESUSD Note 31.03.09 31.03.08Net assets attributable to holders of redeemableordinary shares at beginning of the period 959,472,573 1,116,587,511Increase/(decrease) in net assets attributable toholders of redeemable ordinary shares from operations (308,786,818) (185,407,468)Proceeds from shares issued 103,668,331 308,223,338
Payments for shares redeemed (125,706,737) (101,528,542)
Currency translation adjustment 2.2 - -
Net assets attributable to holders of redeemableordinary shares at end of the period 628,647,349 1,137,874,839
The accompanying notes 1 to 19 found on pages 81 to 115 form an integral part of the financial statements.
35
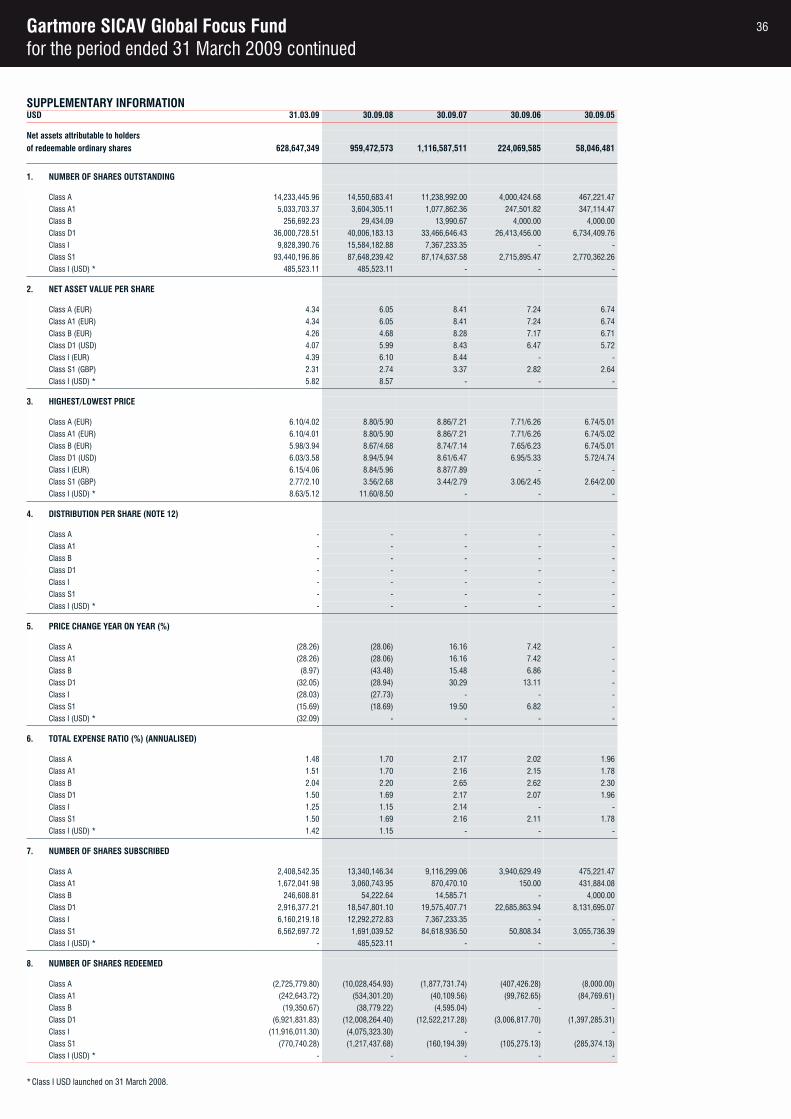
Gartmore SICAV Global Focus Fundfor the period ended 31 March 2009 continued
SUPPLEMENTARY INFORMATIONUSD 31.03.09 30.09.08 30.09.07 30.09.06 30.09.05
Net assets attributable to holdersof redeemable ordinary shares 628,647,349 959,472,573 1,116,587,511 224,069,585 58,046,481
1. NUMBER OF SHARES OUTSTANDING
Class A 14,233,445.96 14,550,683.41 11,238,992.00 4,000,424.68 467,221.47
Class A1 5,033,703.37 3,604,305.11 1,077,862.36 247,501.82 347,114.47
Class B 256,692.23 29,434.09 13,990.67 4,000.00 4,000.00
Class D1 36,000,728.51 40,006,183.13 33,466,646.43 26,413,456.00 6,734,409.76
Class I 9,828,390.76 15,584,182.88 7,367,233.35 - -
Class S1 93,440,196.86 87,648,239.42 87,174,637.58 2,715,895.47 2,770,362.26
Class I (USD) * 485,523.11 485,523.11 - - -
2. NET ASSET VALUE PER SHARE
Class A (EUR) 4.34 6.05 8.41 7.24 6.74
Class A1 (EUR) 4.34 6.05 8.41 7.24 6.74
Class B (EUR) 4.26 4.68 8.28 7.17 6.71
Class D1 (USD) 4.07 5.99 8.43 6.47 5.72
Class I (EUR) 4.39 6.10 8.44 - -
Class S1 (GBP) 2.31 2.74 3.37 2.82 2.64
Class I (USD) * 5.82 8.57 - - -
3. HIGHEST/LOWEST PRICE
Class A (EUR) 6.10/4.02 8.80/5.90 8.86/7.21 7.71/6.26 6.74/5.01
Class A1 (EUR) 6.10/4.01 8.80/5.90 8.86/7.21 7.71/6.26 6.74/5.02
Class B (EUR) 5.98/3.94 8.67/4.68 8.74/7.14 7.65/6.23 6.74/5.01
Class D1 (USD) 6.03/3.58 8.94/5.94 8.61/6.47 6.95/5.33 5.72/4.74
Class I (EUR) 6.15/4.06 8.84/5.96 8.87/7.89 - -
Class S1 (GBP) 2.77/2.10 3.56/2.68 3.44/2.79 3.06/2.45 2.64/2.00
Class I (USD) * 8.63/5.12 11.60/8.50 - - -
4. DISTRIBUTION PER SHARE (NOTE 12)
Class A - - - - -
Class A1 - - - - -
Class B - - - - -
Class D1 - - - - -
Class I - - - - -
Class S1 - - - - -
Class I (USD) * - - - - -
5. PRICE CHANGE YEAR ON YEAR (%)
Class A (28.26) (28.06) 16.16 7.42 -
Class A1 (28.26) (28.06) 16.16 7.42 -
Class B (8.97) (43.48) 15.48 6.86 -
Class D1 (32.05) (28.94) 30.29 13.11 -
Class I (28.03) (27.73) - - -
Class S1 (15.69) (18.69) 19.50 6.82 -
Class I (USD) * (32.09) - - - -
6. TOTAL EXPENSE RATIO (%) (ANNUALISED)
Class A 1.48 1.70 2.17 2.02 1.96
Class A1 1.51 1.70 2.16 2.15 1.78
Class B 2.04 2.20 2.65 2.62 2.30
Class D1 1.50 1.69 2.17 2.07 1.96
Class I 1.25 1.15 2.14 - -
Class S1 1.50 1.69 2.16 2.11 1.78
Class I (USD) * 1.42 1.15 - - -
7. NUMBER OF SHARES SUBSCRIBED
Class A 2,408,542.35 13,340,146.34 9,116,299.06 3,940,629.49 475,221.47
Class A1 1,672,041.98 3,060,743.95 870,470.10 150.00 431,884.08
Class B 246,608.81 54,222.64 14,585.71 - 4,000.00
Class D1 2,916,377.21 18,547,801.10 19,575,407.71 22,685,863.94 8,131,695.07
Class I 6,160,219.18 12,292,272.83 7,367,233.35 - -
Class S1 6,562,697.72 1,691,039.52 84,618,936.50 50,808.34 3,055,736.39
Class I (USD) * - 485,523.11 - - -
8. NUMBER OF SHARES REDEEMED
Class A (2,725,779.80) (10,028,454.93) (1,877,731.74) (407,426.28) (8,000.00)
Class A1 (242,643.72) (534,301.20) (40,109.56) (99,762.65) (84,769.61)
Class B (19,350.67) (38,779.22) (4,595.04) - -
Class D1 (6,921,831.83) (12,008,264.40) (12,522,217.28) (3,006,817.70) (1,397,285.31)
Class I (11,916,011.30) (4,075,323.30) - - -
Class S1 (770,740.28) (1,217,437.68) (160,194.39) (105,275.13) (285,374.13)
Class I (USD) * - - - - -
*Class I USD launched on 31 March 2008.
36
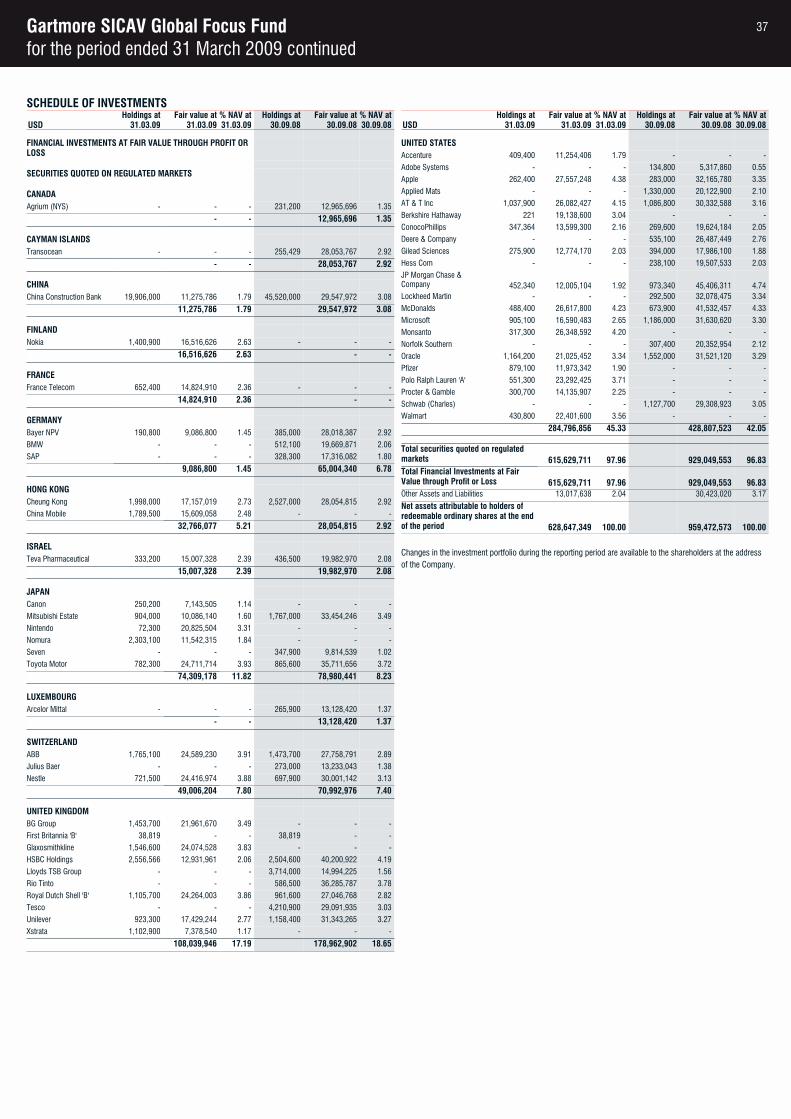
Gartmore SICAV Global Focus Fundfor the period ended 31 March 2009 continued
SCHEDULE OF INVESTMENTSHoldings at Fair value at % NAV at Holdings at Fair value at % NAV at
USD 31.03.09 31.03.09 31.03.09 30.09.08 30.09.08 30.09.08
FINANCIAL INVESTMENTS AT FAIR VALUE THROUGH PROFIT OR LOSS
SECURITIES QUOTED ON REGULATED MARKETS
CANADA Agrium (NYS) - - - 231,200 12,965,696 1.35
- - 12,965,696 1.35
CAYMAN ISLANDSTransocean - - - 255,429 28,053,767 2.92
- - 28,053,767 2.92
CHINAChina Construction Bank 19,906,000 11,275,786 1.79 45,520,000 29,547,972 3.08
11,275,786 1.79 29,547,972 3.08
FINLANDNokia 1,400,900 16,516,626 2.63 - - -
16,516,626 2.63 - -
FRANCEFrance Telecom 652,400 14,824,910 2.36 - - -
14,824,910 2.36 - -
GERMANYBayer NPV 190,800 9,086,800 1.45 385,000 28,018,387 2.92
BMW - - - 512,100 19,669,871 2.06
SAP - - - 328,300 17,316,082 1.80
9,086,800 1.45 65,004,340 6.78
HONG KONGCheung Kong 1,998,000 17,157,019 2.73 2,527,000 28,054,815 2.92
China Mobile 1,789,500 15,609,058 2.48 - - -
32,766,077 5.21 28,054,815 2.92
ISRAELTeva Pharmaceutical 333,200 15,007,328 2.39 436,500 19,982,970 2.08
15,007,328 2.39 19,982,970 2.08
JAPANCanon 250,200 7,143,505 1.14 - - -
Mitsubishi Estate 904,000 10,086,140 1.60 1,767,000 33,454,246 3.49
Nintendo 72,300 20,825,504 3.31 - - -
Nomura 2,303,100 11,542,315 1.84 - - -
Seven - - - 347,900 9,814,539 1.02
Toyota Motor 782,300 24,711,714 3.93 865,600 35,711,656 3.72
74,309,178 11.82 78,980,441 8.23
LUXEMBOURGArcelor Mittal - - - 265,900 13,128,420 1.37
- - 13,128,420 1.37
SWITZERLANDABB 1,765,100 24,589,230 3.91 1,473,700 27,758,791 2.89
Julius Baer - - - 273,000 13,233,043 1.38
Nestle 721,500 24,416,974 3.88 697,900 30,001,142 3.13
49,006,204 7.80 70,992,976 7.40
UNITED KINGDOMBG Group 1,453,700 21,961,670 3.49 - - -
First Britannia 'B' 38,819 - - 38,819 - -
Glaxosmithkline 1,546,600 24,074,528 3.83 - - -
HSBC Holdings 2,556,566 12,931,961 2.06 2,504,600 40,200,922 4.19
Lloyds TSB Group - - - 3,714,000 14,994,225 1.56
Rio Tinto - - - 586,500 36,285,787 3.78
Royal Dutch Shell 'B' 1,105,700 24,264,003 3.86 961,600 27,046,768 2.82
Tesco - - - 4,210,900 29,091,935 3.03
Unilever 923,300 17,429,244 2.77 1,158,400 31,343,265 3.27
Xstrata 1,102,900 7,378,540 1.17 - - -
108,039,946 17.19 178,962,902 18.65
Holdings at Fair value at % NAV at Holdings at Fair value at % NAV atUSD 31.03.09 31.03.09 31.03.09 30.09.08 30.09.08 30.09.08
UNITED STATESAccenture 409,400 11,254,406 1.79 - - -
Adobe Systems - - - 134,800 5,317,860 0.55
Apple 262,400 27,557,248 4.38 283,000 32,165,780 3.35
Applied Mats - - - 1,330,000 20,122,900 2.10
AT & T Inc 1,037,900 26,082,427 4.15 1,086,800 30,332,588 3.16
Berkshire Hathaway 221 19,138,600 3.04 - - -
ConocoPhillips 347,364 13,599,300 2.16 269,600 19,624,184 2.05
Deere & Company - - - 535,100 26,487,449 2.76
Gilead Sciences 275,900 12,774,170 2.03 394,000 17,986,100 1.88
Hess Com - - - 238,100 19,507,533 2.03
JP Morgan Chase & Company 452,340 12,005,104 1.92 973,340 45,406,311 4.74Lockheed Martin - - - 292,500 32,078,475 3.34
McDonalds 488,400 26,617,800 4.23 673,900 41,532,457 4.33
Microsoft 905,100 16,590,483 2.65 1,186,000 31,630,620 3.30
Monsanto 317,300 26,348,592 4.20 - - -
Norfolk Southern - - - 307,400 20,352,954 2.12
Oracle 1,164,200 21,025,452 3.34 1,552,000 31,521,120 3.29
Pfizer 879,100 11,973,342 1.90 - - -
Polo Ralph Lauren 'A' 551,300 23,292,425 3.71 - - -
Procter & Gamble 300,700 14,135,907 2.25 - - -
Schwab (Charles) - - - 1,127,700 29,308,923 3.05
Walmart 430,800 22,401,600 3.56 - - -
284,796,856 45.33 428,807,523 42.05
Total securities quoted on regulated markets 615,629,711 97.96 929,049,553 96.83Total Financial Investments at Fair Value through Profit or Loss 615,629,711 97.96 929,049,553 96.83Other Assets and Liabilities 13,017,638 2.04 30,423,020 3.17
Net assets attributable to holders of redeemable ordinary shares at the end of the period 628,647,349 100.00 959,472,573 100.00
Changes in the investment portfolio during the reporting period are available to the shareholders at the address of the Company.
37
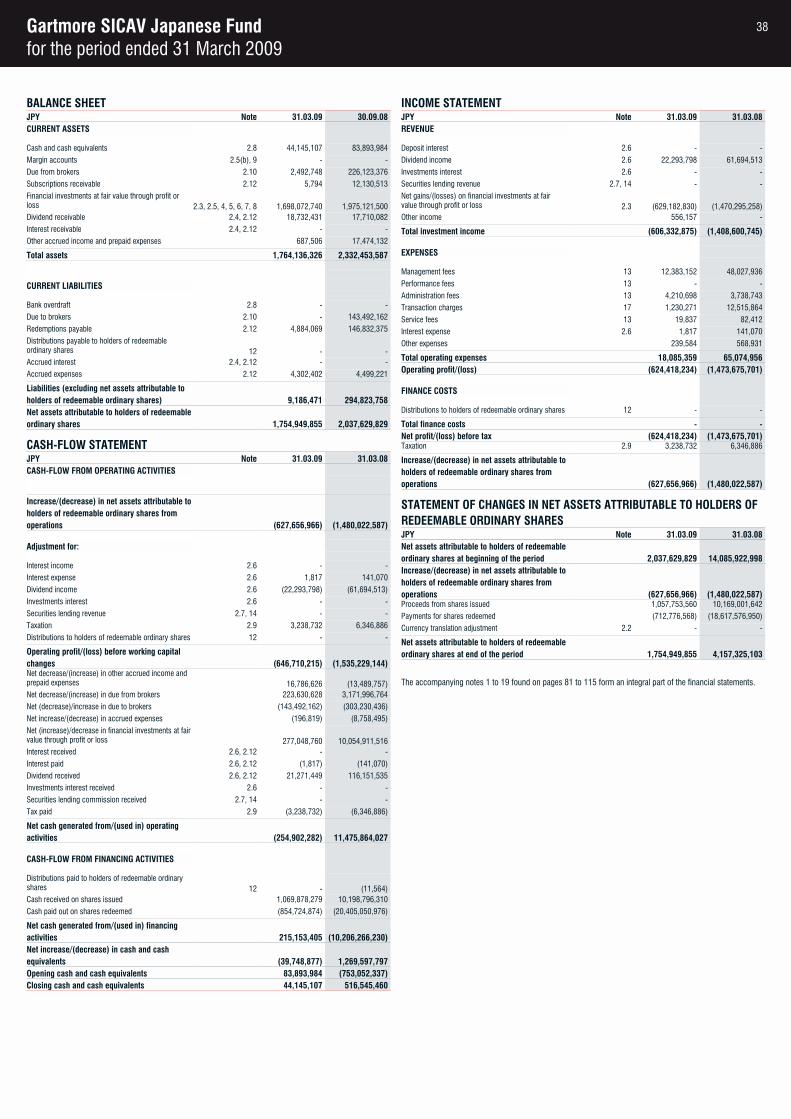
Gartmore SICAV Japanese Fundfor the period ended 31 March 2009
BALANCE SHEETJPY Note 31.03.09 30.09.08CURRENT ASSETS
Cash and cash equivalents 2.8 44,145,107 83,893,984
Margin accounts 2.5(b), 9 - -
Due from brokers 2.10 2,492,748 226,123,376
Subscriptions receivable 2.12 5,794 12,130,513
Financial investments at fair value through profit or loss 2.3, 2.5, 4, 5, 6, 7, 8 1,698,072,740 1,975,121,500Dividend receivable 2.4, 2.12 18,732,431 17,710,082
Interest receivable 2.4, 2.12 - -
Other accrued income and prepaid expenses 687,506 17,474,132
Total assets 1,764,136,326 2,332,453,587
CURRENT LIABILITIES
Bank overdraft 2.8 - -
Due to brokers 2.10 - 143,492,162
Redemptions payable 2.12 4,884,069 146,832,375
Distributions payable to holders of redeemable ordinary shares 12 - -Accrued interest 2.4, 2.12 - -
Accrued expenses 2.12 4,302,402 4,499,221
Liabilities (excluding net assets attributable to holders of redeemable ordinary shares) 9,186,471 294,823,758Net assets attributable to holders of redeemableordinary shares 1,754,949,855 2,037,629,829
CASH-FLOW STATEMENTJPY Note 31.03.09 31.03.08CASH-FLOW FROM OPERATING ACTIVITIES
Increase/(decrease) in net assets attributable toholders of redeemable ordinary shares from operations (627,656,966) (1,480,022,587)
Adjustment for:
Interest income 2.6 - -
Interest expense 2.6 1,817 141,070
Dividend income 2.6 (22,293,798) (61,694,513)
Investments interest 2.6 - -
Securities lending revenue 2.7, 14 - -
Taxation 2.9 3,238,732 6,346,886
Distributions to holders of redeemable ordinary shares 12 - -
Operating profit/(loss) before working capital changes (646,710,215) (1,535,229,144)Net decrease/(increase) in other accrued income and prepaid expenses 16,786,626 (13,489,757)Net decrease/(increase) in due from brokers 223,630,628 3,171,996,764
Net (decrease)/increase in due to brokers (143,492,162) (303,230,436)
Net increase/(decrease) in accrued expenses (196,819) (8,758,495)
Net (increase)/decrease in financial investments at fair value through profit or loss 277,048,760 10,054,911,516Interest received 2.6, 2.12 - -
Interest paid 2.6, 2.12 (1,817) (141,070)
Dividend received 2.6, 2.12 21,271,449 116,151,535
Investments interest received 2.6 - -
Securities lending commission received 2.7, 14 - -
Tax paid 2.9 (3,238,732) (6,346,886)
Net cash generated from/(used in) operating activities (254,902,282) 11,475,864,027
CASH-FLOW FROM FINANCING ACTIVITIES
Distributions paid to holders of redeemable ordinary shares 12 - (11,564)Cash received on shares issued 1,069,878,279 10,198,796,310
Cash paid out on shares redeemed (854,724,874) (20,405,050,976)
Net cash generated from/(used in) financing activities 215,153,405 (10,206,266,230)Net increase/(decrease) in cash and cash equivalents (39,748,877) 1,269,597,797Opening cash and cash equivalents 83,893,984 (753,052,337)Closing cash and cash equivalents 44,145,107 516,545,460
INCOME STATEMENTJPY Note 31.03.09 31.03.08REVENUE
Deposit interest 2.6 - -
Dividend income 2.6 22,293,798 61,694,513
Investments interest 2.6 - -
Securities lending revenue 2.7, 14 - -
Net gains/(losses) on financial investments at fair value through profit or loss 2.3 (629,182,830) (1,470,295,258)Other income 556,157 -
Total investment income (606,332,875) (1,408,600,745)
EXPENSES
Management fees 13 12,383,152 48,027,936
Performance fees 13 - -
Administration fees 13 4,210,698 3,738,743
Transaction charges 17 1,230,271 12,515,864
Service fees 13 19,837 82,412
Interest expense 2.6 1,817 141,070
Other expenses 239,584 568,931
Total operating expenses 18,085,359 65,074,956Operating profit/(loss) (624,418,234) (1,473,675,701)
FINANCE COSTS
Distributions to holders of redeemable ordinary shares 12 - -
Total finance costs - -Net profit/(loss) before tax (624,418,234) (1,473,675,701)Taxation 2.9 3,238,732 6,346,886
Increase/(decrease) in net assets attributable toholders of redeemable ordinary shares from operations (627,656,966) (1,480,022,587)
STATEMENT OF CHANGES IN NET ASSETS ATTRIBUTABLE TO HOLDERS OF REDEEMABLE ORDINARY SHARESJPY Note 31.03.09 31.03.08Net assets attributable to holders of redeemableordinary shares at beginning of the period 2,037,629,829 14,085,922,998Increase/(decrease) in net assets attributable toholders of redeemable ordinary shares from operations (627,656,966) (1,480,022,587)Proceeds from shares issued 1,057,753,560 10,169,001,642
Payments for shares redeemed (712,776,568) (18,617,576,950)
Currency translation adjustment 2.2 - -
Net assets attributable to holders of redeemableordinary shares at end of the period 1,754,949,855 4,157,325,103
The accompanying notes 1 to 19 found on pages 81 to 115 form an integral part of the financial statements.
38
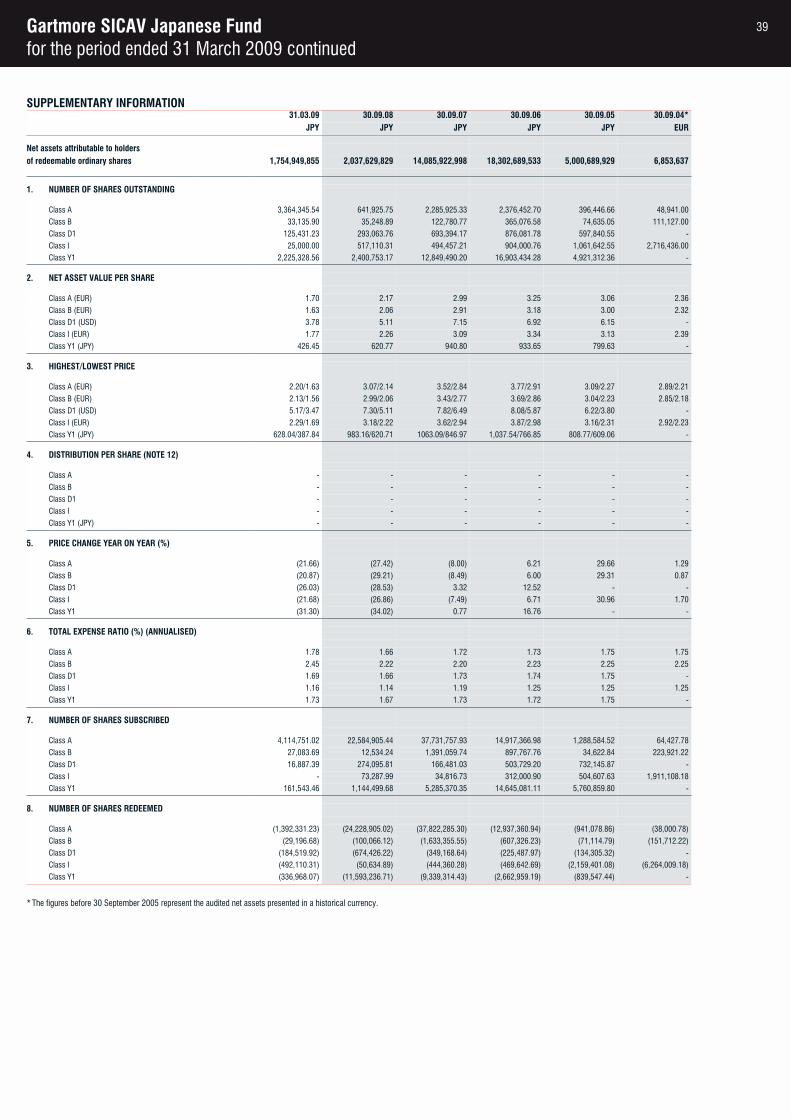
Gartmore SICAV Japanese Fundfor the period ended 31 March 2009 continued
SUPPLEMENTARY INFORMATION31.03.09 30.09.08 30.09.07 30.09.06 30.09.05 30.09.04*
JPY JPY JPY JPY JPY EUR
Net assets attributable to holdersof redeemable ordinary shares 1,754,949,855 2,037,629,829 14,085,922,998 18,302,689,533 5,000,689,929 6,853,637
1. NUMBER OF SHARES OUTSTANDING
Class A 3,364,345.54 641,925.75 2,285,925.33 2,376,452.70 396,446.66 48,941.00
Class B 33,135.90 35,248.89 122,780.77 365,076.58 74,635.05 111,127.00
Class D1 125,431.23 293,063.76 693,394.17 876,081.78 597,840.55 -
Class I 25,000.00 517,110.31 494,457.21 904,000.76 1,061,642.55 2,716,436.00
Class Y1 2,225,328.56 2,400,753.17 12,849,490.20 16,903,434.28 4,921,312.36 -
2. NET ASSET VALUE PER SHARE
Class A (EUR) 1.70 2.17 2.99 3.25 3.06 2.36
Class B (EUR) 1.63 2.06 2.91 3.18 3.00 2.32
Class D1 (USD) 3.78 5.11 7.15 6.92 6.15 -
Class I (EUR) 1.77 2.26 3.09 3.34 3.13 2.39
Class Y1 (JPY) 426.45 620.77 940.80 933.65 799.63 -
3. HIGHEST/LOWEST PRICE
Class A (EUR) 2.20/1.63 3.07/2.14 3.52/2.84 3.77/2.91 3.09/2.27 2.89/2.21
Class B (EUR) 2.13/1.56 2.99/2.06 3.43/2.77 3.69/2.86 3.04/2.23 2.85/2.18
Class D1 (USD) 5.17/3.47 7.30/5.11 7.82/6.49 8.08/5.87 6.22/3.80 -
Class I (EUR) 2.29/1.69 3.18/2.22 3.62/2.94 3.87/2.98 3.16/2.31 2.92/2.23
Class Y1 (JPY) 628.04/387.84 983.16/620.71 1063.09/846.97 1,037.54/766.85 808.77/609.06 -
4. DISTRIBUTION PER SHARE (NOTE 12)
Class A - - - - - -
Class B - - - - - -
Class D1 - - - - - -
Class I - - - - - -
Class Y1 (JPY) - - - - - -
5. PRICE CHANGE YEAR ON YEAR (%)
Class A (21.66) (27.42) (8.00) 6.21 29.66 1.29
Class B (20.87) (29.21) (8.49) 6.00 29.31 0.87
Class D1 (26.03) (28.53) 3.32 12.52 - -
Class I (21.68) (26.86) (7.49) 6.71 30.96 1.70
Class Y1 (31.30) (34.02) 0.77 16.76 - -
6. TOTAL EXPENSE RATIO (%) (ANNUALISED)
Class A 1.78 1.66 1.72 1.73 1.75 1.75
Class B 2.45 2.22 2.20 2.23 2.25 2.25
Class D1 1.69 1.66 1.73 1.74 1.75 -
Class I 1.16 1.14 1.19 1.25 1.25 1.25
Class Y1 1.73 1.67 1.73 1.72 1.75 -
7. NUMBER OF SHARES SUBSCRIBED
Class A 4,114,751.02 22,584,905.44 37,731,757.93 14,917,366.98 1,288,584.52 64,427.78
Class B 27,083.69 12,534.24 1,391,059.74 897,767.76 34,622.84 223,921.22
Class D1 16,887.39 274,095.81 166,481.03 503,729.20 732,145.87 -
Class I - 73,287.99 34,816.73 312,000.90 504,607.63 1,911,108.18
Class Y1 161,543.46 1,144,499.68 5,285,370.35 14,645,081.11 5,760,859.80 -
8. NUMBER OF SHARES REDEEMED
Class A (1,392,331.23) (24,228,905.02) (37,822,285.30) (12,937,360.94) (941,078.86) (38,000.78)
Class B (29,196.68) (100,066.12) (1,633,355.55) (607,326.23) (71,114.79) (151,712.22)
Class D1 (184,519.92) (674,426.22) (349,168.64) (225,487.97) (134,305.32) -
Class I (492,110.31) (50,634.89) (444,360.28) (469,642.69) (2,159,401.08) (6,264,009.18)
Class Y1 (336,968.07) (11,593,236.71) (9,339,314.43) (2,662,959.19) (839,547.44) -
*The figures before 30 September 2005 represent the audited net assets presented in a historical currency.
39
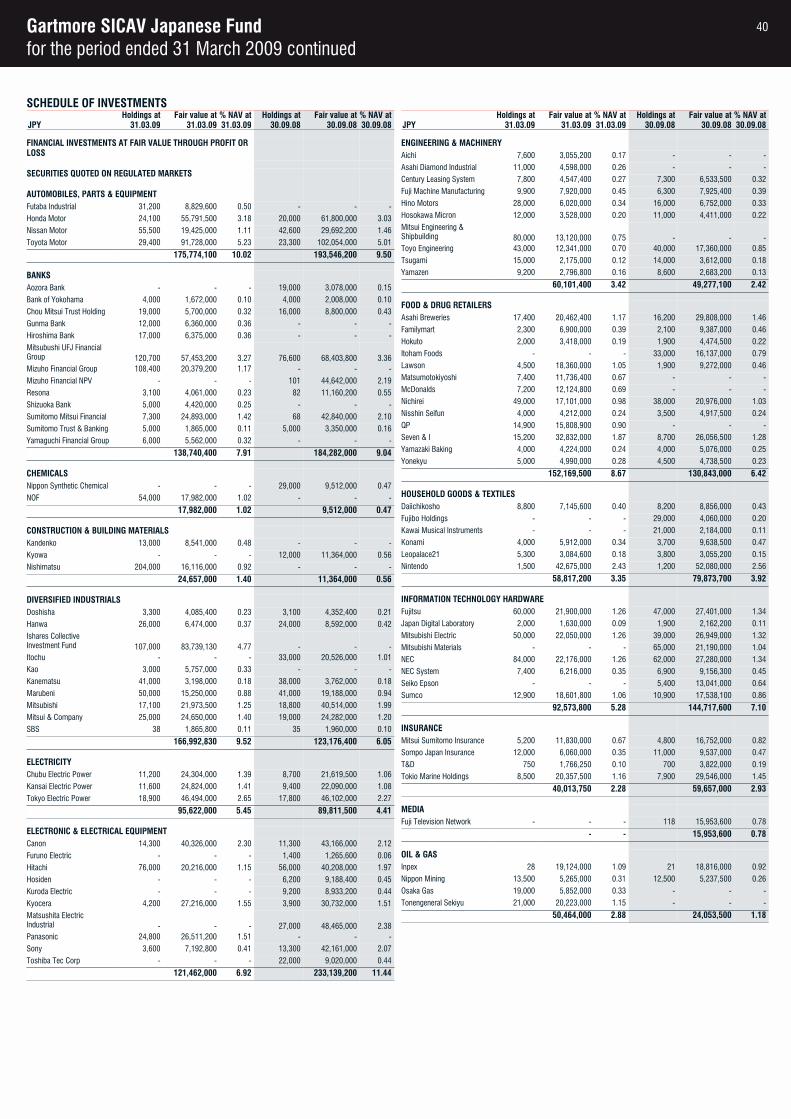
Gartmore SICAV Japanese Fundfor the period ended 31 March 2009 continued
SCHEDULE OF INVESTMENTSHoldings at Fair value at % NAV at Holdings at Fair value at % NAV at
JPY 31.03.09 31.03.09 31.03.09 30.09.08 30.09.08 30.09.08
FINANCIAL INVESTMENTS AT FAIR VALUE THROUGH PROFIT OR LOSS
SECURITIES QUOTED ON REGULATED MARKETS
AUTOMOBILES, PARTS & EQUIPMENTFutaba Industrial 31,200 8,829,600 0.50 - - -
Honda Motor 24,100 55,791,500 3.18 20,000 61,800,000 3.03
Nissan Motor 55,500 19,425,000 1.11 42,600 29,692,200 1.46
Toyota Motor 29,400 91,728,000 5.23 23,300 102,054,000 5.01
175,774,100 10.02 193,546,200 9.50
BANKSAozora Bank - - - 19,000 3,078,000 0.15
Bank of Yokohama 4,000 1,672,000 0.10 4,000 2,008,000 0.10
Chou Mitsui Trust Holding 19,000 5,700,000 0.32 16,000 8,800,000 0.43
Gunma Bank 12,000 6,360,000 0.36 - - -
Hiroshima Bank 17,000 6,375,000 0.36 - - -
Mitsubushi UFJ Financial Group 120,700 57,453,200 3.27 76,600 68,403,800 3.36Mizuho Financial Group 108,400 20,379,200 1.17 - - -
Mizuho Financial NPV - - - 101 44,642,000 2.19
Resona 3,100 4,061,000 0.23 82 11,160,200 0.55
Shizuoka Bank 5,000 4,420,000 0.25 - - -
Sumitomo Mitsui Financial 7,300 24,893,000 1.42 68 42,840,000 2.10
Sumitomo Trust & Banking 5,000 1,865,000 0.11 5,000 3,350,000 0.16
Yamaguchi Financial Group 6,000 5,562,000 0.32 - - -
138,740,400 7.91 184,282,000 9.04
CHEMICALSNippon Synthetic Chemical - - - 29,000 9,512,000 0.47
NOF 54,000 17,982,000 1.02 - - -
17,982,000 1.02 9,512,000 0.47
CONSTRUCTION & BUILDING MATERIALSKandenko 13,000 8,541,000 0.48 - - -
Kyowa - - - 12,000 11,364,000 0.56
Nishimatsu 204,000 16,116,000 0.92 - - -
24,657,000 1.40 11,364,000 0.56
DIVERSIFIED INDUSTRIALSDoshisha 3,300 4,085,400 0.23 3,100 4,352,400 0.21
Hanwa 26,000 6,474,000 0.37 24,000 8,592,000 0.42
Ishares Collective Investment Fund 107,000 83,739,130 4.77 - - -Itochu - - - 33,000 20,526,000 1.01
Kao 3,000 5,757,000 0.33 - - -
Kanematsu 41,000 3,198,000 0.18 38,000 3,762,000 0.18
Marubeni 50,000 15,250,000 0.88 41,000 19,188,000 0.94
Mitsubishi 17,100 21,973,500 1.25 18,800 40,514,000 1.99
Mitsui & Company 25,000 24,650,000 1.40 19,000 24,282,000 1.20
SBS 38 1,865,800 0.11 35 1,960,000 0.10
166,992,830 9.52 123,176,400 6.05
ELECTRICITYChubu Electric Power 11,200 24,304,000 1.39 8,700 21,619,500 1.06
Kansai Electric Power 11,600 24,824,000 1.41 9,400 22,090,000 1.08
Tokyo Electric Power 18,900 46,494,000 2.65 17,800 46,102,000 2.27
95,622,000 5.45 89,811,500 4.41
ELECTRONIC & ELECTRICAL EQUIPMENTCanon 14,300 40,326,000 2.30 11,300 43,166,000 2.12
Furuno Electric - - - 1,400 1,265,600 0.06
Hitachi 76,000 20,216,000 1.15 56,000 40,208,000 1.97
Hosiden - - - 6,200 9,188,400 0.45
Kuroda Electric - - - 9,200 8,933,200 0.44
Kyocera 4,200 27,216,000 1.55 3,900 30,732,000 1.51
Matsushita Electric Industrial - - - 27,000 48,465,000 2.38Panasonic 24,800 26,511,200 1.51 - - -
Sony 3,600 7,192,800 0.41 13,300 42,161,000 2.07
Toshiba Tec Corp - - - 22,000 9,020,000 0.44
121,462,000 6.92 233,139,200 11.44
Holdings at Fair value at % NAV at Holdings at Fair value at % NAV atJPY 31.03.09 31.03.09 31.03.09 30.09.08 30.09.08 30.09.08
ENGINEERING & MACHINERYAichi 7,600 3,055,200 0.17 - - -
Asahi Diamond Industrial 11,000 4,598,000 0.26 - - -
Century Leasing System 7,800 4,547,400 0.27 7,300 6,533,500 0.32
Fuji Machine Manufacturing 9,900 7,920,000 0.45 6,300 7,925,400 0.39
Hino Motors 28,000 6,020,000 0.34 16,000 6,752,000 0.33
Hosokawa Micron 12,000 3,528,000 0.20 11,000 4,411,000 0.22
Mitsui Engineering & Shipbuilding 80,000 13,120,000 0.75 - - -Toyo Engineering 43,000 12,341,000 0.70 40,000 17,360,000 0.85
Tsugami 15,000 2,175,000 0.12 14,000 3,612,000 0.18
Yamazen 9,200 2,796,800 0.16 8,600 2,683,200 0.13
60,101,400 3.42 49,277,100 2.42
FOOD & DRUG RETAILERSAsahi Breweries 17,400 20,462,400 1.17 16,200 29,808,000 1.46
Familymart 2,300 6,900,000 0.39 2,100 9,387,000 0.46
Hokuto 2,000 3,418,000 0.19 1,900 4,474,500 0.22
Itoham Foods - - - 33,000 16,137,000 0.79
Lawson 4,500 18,360,000 1.05 1,900 9,272,000 0.46
Matsumotokiyoshi 7,400 11,736,400 0.67 - - -
McDonalds 7,200 12,124,800 0.69 - - -
Nichirei 49,000 17,101,000 0.98 38,000 20,976,000 1.03
Nisshin Seifun 4,000 4,212,000 0.24 3,500 4,917,500 0.24
QP 14,900 15,808,900 0.90 - - -
Seven & I 15,200 32,832,000 1.87 8,700 26,056,500 1.28
Yamazaki Baking 4,000 4,224,000 0.24 4,000 5,076,000 0.25
Yonekyu 5,000 4,990,000 0.28 4,500 4,738,500 0.23
152,169,500 8.67 130,843,000 6.42
HOUSEHOLD GOODS & TEXTILESDaiichikosho 8,800 7,145,600 0.40 8,200 8,856,000 0.43
Fujibo Holdings - - - 29,000 4,060,000 0.20
Kawai Musical Instruments - - - 21,000 2,184,000 0.11
Konami 4,000 5,912,000 0.34 3,700 9,638,500 0.47
Leopalace21 5,300 3,084,600 0.18 3,800 3,055,200 0.15
Nintendo 1,500 42,675,000 2.43 1,200 52,080,000 2.56
58,817,200 3.35 79,873,700 3.92
INFORMATION TECHNOLOGY HARDWAREFujitsu 60,000 21,900,000 1.26 47,000 27,401,000 1.34
Japan Digital Laboratory 2,000 1,630,000 0.09 1,900 2,162,200 0.11
Mitsubishi Electric 50,000 22,050,000 1.26 39,000 26,949,000 1.32
Mitsubishi Materials - - - 65,000 21,190,000 1.04
NEC 84,000 22,176,000 1.26 62,000 27,280,000 1.34
NEC System 7,400 6,216,000 0.35 6,900 9,156,300 0.45
Seiko Epson - - - 5,400 13,041,000 0.64
Sumco 12,900 18,601,800 1.06 10,900 17,538,100 0.86
92,573,800 5.28 144,717,600 7.10
INSURANCEMitsui Sumitomo Insurance 5,200 11,830,000 0.67 4,800 16,752,000 0.82
Sompo Japan Insurance 12,000 6,060,000 0.35 11,000 9,537,000 0.47
T&D 750 1,766,250 0.10 700 3,822,000 0.19
Tokio Marine Holdings 8,500 20,357,500 1.16 7,900 29,546,000 1.45
40,013,750 2.28 59,657,000 2.93
MEDIAFuji Television Network - - - 118 15,953,600 0.78
- - 15,953,600 0.78
OIL & GASInpex 28 19,124,000 1.09 21 18,816,000 0.92
Nippon Mining 13,500 5,265,000 0.31 12,500 5,237,500 0.26
Osaka Gas 19,000 5,852,000 0.33 - - -
Tonengeneral Sekiyu 21,000 20,223,000 1.15 - - -
50,464,000 2.88 24,053,500 1.18
40
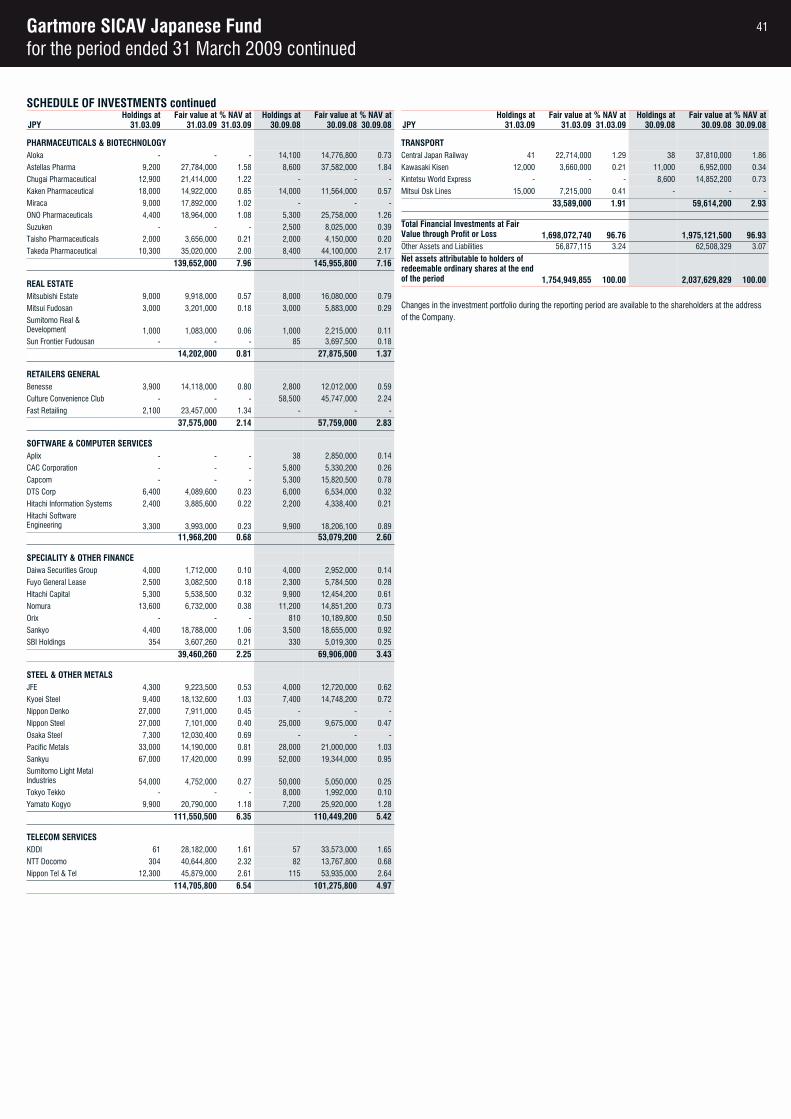
Gartmore SICAV Japanese Fundfor the period ended 31 March 2009 continued
SCHEDULE OF INVESTMENTS continuedHoldings at Fair value at % NAV at Holdings at Fair value at % NAV at
JPY 31.03.09 31.03.09 31.03.09 30.09.08 30.09.08 30.09.08
PHARMACEUTICALS & BIOTECHNOLOGYAloka - - - 14,100 14,776,800 0.73
Astellas Pharma 9,200 27,784,000 1.58 8,600 37,582,000 1.84
Chugai Pharmaceutical 12,900 21,414,000 1.22 - - -
Kaken Pharmaceutical 18,000 14,922,000 0.85 14,000 11,564,000 0.57
Miraca 9,000 17,892,000 1.02 - - -
ONO Pharmaceuticals 4,400 18,964,000 1.08 5,300 25,758,000 1.26
Suzuken - - - 2,500 8,025,000 0.39
Taisho Pharmaceuticals 2,000 3,656,000 0.21 2,000 4,150,000 0.20
Takeda Pharmaceutical 10,300 35,020,000 2.00 8,400 44,100,000 2.17
139,652,000 7.96 145,955,800 7.16
REAL ESTATEMitsubishi Estate 9,000 9,918,000 0.57 8,000 16,080,000 0.79
Mitsui Fudosan 3,000 3,201,000 0.18 3,000 5,883,000 0.29
Sumitomo Real & Development 1,000 1,083,000 0.06 1,000 2,215,000 0.11Sun Frontier Fudousan - - - 85 3,697,500 0.18
14,202,000 0.81 27,875,500 1.37
RETAILERS GENERALBenesse 3,900 14,118,000 0.80 2,800 12,012,000 0.59
Culture Convenience Club - - - 58,500 45,747,000 2.24
Fast Retailing 2,100 23,457,000 1.34 - - -
37,575,000 2.14 57,759,000 2.83
SOFTWARE & COMPUTER SERVICESAplix - - - 38 2,850,000 0.14
CAC Corporation - - - 5,800 5,330,200 0.26
Capcom - - - 5,300 15,820,500 0.78
DTS Corp 6,400 4,089,600 0.23 6,000 6,534,000 0.32
Hitachi Information Systems 2,400 3,885,600 0.22 2,200 4,338,400 0.21
Hitachi Software Engineering 3,300 3,993,000 0.23 9,900 18,206,100 0.89
11,968,200 0.68 53,079,200 2.60
SPECIALITY & OTHER FINANCEDaiwa Securities Group 4,000 1,712,000 0.10 4,000 2,952,000 0.14
Fuyo General Lease 2,500 3,082,500 0.18 2,300 5,784,500 0.28
Hitachi Capital 5,300 5,538,500 0.32 9,900 12,454,200 0.61
Nomura 13,600 6,732,000 0.38 11,200 14,851,200 0.73
Orix - - - 810 10,189,800 0.50
Sankyo 4,400 18,788,000 1.06 3,500 18,655,000 0.92
SBI Holdings 354 3,607,260 0.21 330 5,019,300 0.25
39,460,260 2.25 69,906,000 3.43
STEEL & OTHER METALSJFE 4,300 9,223,500 0.53 4,000 12,720,000 0.62
Kyoei Steel 9,400 18,132,600 1.03 7,400 14,748,200 0.72
Nippon Denko 27,000 7,911,000 0.45 - - -
Nippon Steel 27,000 7,101,000 0.40 25,000 9,675,000 0.47
Osaka Steel 7,300 12,030,400 0.69 - - -
Pacific Metals 33,000 14,190,000 0.81 28,000 21,000,000 1.03
Sankyu 67,000 17,420,000 0.99 52,000 19,344,000 0.95
Sumitomo Light Metal Industries 54,000 4,752,000 0.27 50,000 5,050,000 0.25Tokyo Tekko - - - 8,000 1,992,000 0.10
Yamato Kogyo 9,900 20,790,000 1.18 7,200 25,920,000 1.28
111,550,500 6.35 110,449,200 5.42
TELECOM SERVICESKDDI 61 28,182,000 1.61 57 33,573,000 1.65
NTT Docomo 304 40,644,800 2.32 82 13,767,800 0.68
Nippon Tel & Tel 12,300 45,879,000 2.61 115 53,935,000 2.64
114,705,800 6.54 101,275,800 4.97
Holdings at Fair value at % NAV at Holdings at Fair value at % NAV atJPY 31.03.09 31.03.09 31.03.09 30.09.08 30.09.08 30.09.08
TRANSPORTCentral Japan Railway 41 22,714,000 1.29 38 37,810,000 1.86
Kawasaki Kisen 12,000 3,660,000 0.21 11,000 6,952,000 0.34
Kintetsu World Express - - - 8,600 14,852,200 0.73
Mitsui Osk Lines 15,000 7,215,000 0.41 - - -
33,589,000 1.91 59,614,200 2.93
Total Financial Investments at Fair Value through Profit or Loss 1,698,072,740 96.76 1,975,121,500 96.93Other Assets and Liabilities 56,877,115 3.24 62,508,329 3.07
Net assets attributable to holders of redeemable ordinary shares at the end of the period 1,754,949,855 100.00 2,037,629,829 100.00
Changes in the investment portfolio during the reporting period are available to the shareholders at the address of the Company.
41

Gartmore SICAV Latin American Fundfor the period ended 31 March 2009
BALANCE SHEETUSD Note 31.03.09 30.09.08CURRENT ASSETS
Cash and cash equivalents 2.8 24,873,076 7,963,523
Margin accounts 2.5(b), 9 - -
Due from brokers 2.10 915,903 32,734,182
Subscriptions receivable 2.12 313,647 13,756,620
Financial investments at fair value through profit or loss 2.3, 2.5, 4, 5, 6, 7, 8 933,318,532 891,144,477Dividend receivable 2.4, 2.12 7,918,876 2,506,681
Interest receivable 2.4, 2.12 - -
Other accrued income and prepaid expenses 80,136 1,188,165
Total assets 967,420,170 949,293,648
CURRENT LIABILITIES
Bank overdraft 2.8 - -
Due to brokers 2.10 15,881,100 10,176,108
Redemptions payable 2.12 2,718,743 9,249,576
Distributions payable to holders of redeemable ordinary shares 12 - 8,936,525Accrued interest 2.4, 2.12 - -
Accrued expenses 2.12 1,913,016 1,893,378
Liabilities (excluding net assets attributable to holders of redeemable ordinary shares) 20,512,859 30,255,587Net assets attributable to holders of redeemableordinary shares 946,907,311 919,038,061
CASH-FLOW STATEMENTUSD Note 31.03.09 31.03.08CASH-FLOW FROM OPERATING ACTIVITIES
Increase/(decrease) in net assets attributable toholders of redeemable ordinary shares from operations (292,754,615) 1,920,333
Adjustment for:
Interest income 2.6 (56,615) (296,387)
Interest expense 2.6 - -
Dividend income 2.6 (13,892,173) (14,763,030)
Investments interest 2.6 - -
Securities lending revenue 2.7, 14 - -
Taxation 2.9 734,988 1,046,702
Distributions to holders of redeemable ordinary shares 12 - -
Operating profit/(loss) before working capital changes (305,968,415) (12,092,382)Net decrease/(increase) in other accrued income and prepaid expenses 1,108,029 -Net decrease/(increase) in due from brokers 31,818,279 16,909,728
Net (decrease)/increase in due to brokers 5,704,992 (16,898,389)
Net increase/(decrease) in accrued expenses 19,638 144,939
Net (increase)/decrease in financial investments at fair value through profit or loss (42,174,055) (82,590,103)Interest received 2.6, 2.12 56,615 296,387
Interest paid 2.6, 2.12 - -
Dividend received 2.6, 2.12 8,479,978 12,161,337
Investments interest received 2.6 - -
Securities lending commission received 2.7, 14 - -
Tax paid 2.9 (734,988) (1,046,702)
Net cash generated from/(used in) operating activities (301,689,927) (83,115,185)
CASH-FLOW FROM FINANCING ACTIVITIES
Distributions paid to holders of redeemable ordinary shares 12 (8,936,525) (3,594,712)Cash received on shares issued 457,100,230 661,877,632
Cash paid out on shares redeemed (129,564,225) (565,964,503)
Net cash generated from/(used in) financing activities 318,599,480 92,318,417Net increase/(decrease) in cash and cash equivalents 16,909,553 9,203,232Opening cash and cash equivalents 7,963,523 13,372,726Closing cash and cash equivalents 24,873,076 22,575,958
INCOME STATEMENTUSD Note 31.03.09 31.03.08REVENUE
Deposit interest 2.6 56,615 296,387
Dividend income 2.6 13,892,173 14,763,030
Investments interest 2.6 - -
Securities lending revenue 2.7, 14 - -
Net gains/(losses) on financial investments at fair value through profit or loss 2.3 (299,468,258) (2,354,680)Other income 1,376,365 286,999
Total investment income (284,143,105) 12,991,736
EXPENSES
Management fees 13 5,827,891 8,064,834
Performance fees 13 - -
Administration fees 13 720,448 714,174
Transaction charges 17 831,946 1,027,634
Service fees 13 88,070 48,480
Interest expense 2.6 - -
Other expenses 408,167 169,579
Total operating expenses 7,876,522 10,024,701Operating profit/(loss) (292,019,627) 2,967,035
FINANCE COSTS
Distributions to holders of redeemable ordinary shares 12 - -
Total finance costs - -Net profit/(loss) before tax (292,019,627) 2,967,035Taxation 2.9 734,988 1,046,702
Increase/(decrease) in net assets attributable toholders of redeemable ordinary shares from operations (292,754,615) 1,920,333
STATEMENT OF CHANGES IN NET ASSETS ATTRIBUTABLE TO HOLDERS OF REDEEMABLE ORDINARY SHARESUSD Note 31.03.09 31.03.08Net assets attributable to holders of redeemableordinary shares at beginning of the period 919,038,061 980,689,103Increase/(decrease) in net assets attributable toholders of redeemable ordinary shares from operations (292,754,615) 1,920,333Proceeds from shares issued 443,657,257 661,184,865
Payments for shares redeemed (123,033,392) (588,962,662)
Currency translation adjustment 2.2 - -
Net assets attributable to holders of redeemableordinary shares at end of the period 946,907,311 1,054,831,639
The accompanying notes 1 to 19 found on pages 81 to 115 form an integral part of the financial statements.
42
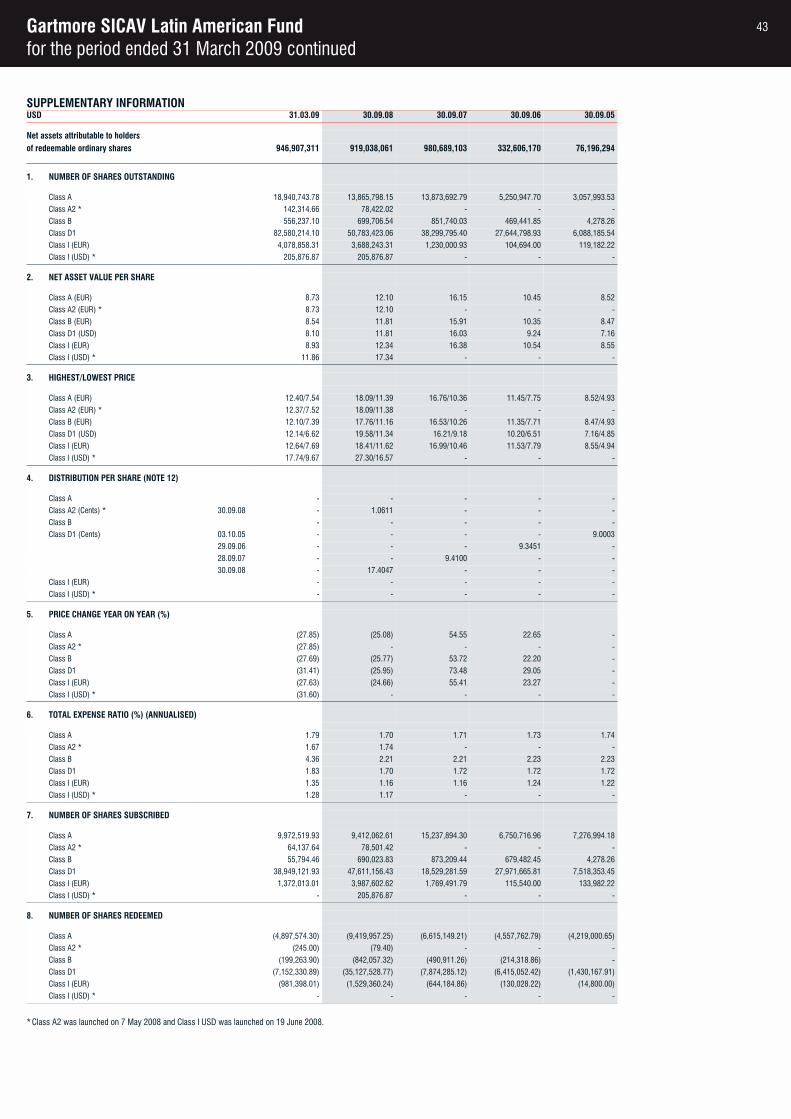
Gartmore SICAV Latin American Fundfor the period ended 31 March 2009 continued
SUPPLEMENTARY INFORMATIONUSD 31.03.09 30.09.08 30.09.07 30.09.06 30.09.05
Net assets attributable to holdersof redeemable ordinary shares 946,907,311 919,038,061 980,689,103 332,606,170 76,196,294
1. NUMBER OF SHARES OUTSTANDING
Class A 18,940,743.78 13,865,798.15 13,873,692.79 5,250,947.70 3,057,993.53
Class A2 * 142,314.66 78,422.02 - - -
Class B 556,237.10 699,706.54 851,740.03 469,441.85 4,278.26
Class D1 82,580,214.10 50,783,423.06 38,299,795.40 27,644,798.93 6,088,185.54
Class I (EUR) 4,078,858.31 3,688,243.31 1,230,000.93 104,694.00 119,182.22
Class I (USD) * 205,876.87 205,876.87 - - -
2. NET ASSET VALUE PER SHARE
Class A (EUR) 8.73 12.10 16.15 10.45 8.52
Class A2 (EUR) * 8.73 12.10 - - -
Class B (EUR) 8.54 11.81 15.91 10.35 8.47
Class D1 (USD) 8.10 11.81 16.03 9.24 7.16
Class I (EUR) 8.93 12.34 16.38 10.54 8.55
Class I (USD) * 11.86 17.34 - - -
3. HIGHEST/LOWEST PRICE
Class A (EUR) 12.40/7.54 18.09/11.39 16.76/10.36 11.45/7.75 8.52/4.93
Class A2 (EUR) * 12.37/7.52 18.09/11.38 - - -
Class B (EUR) 12.10/7.39 17.76/11.16 16.53/10.26 11.35/7.71 8.47/4.93
Class D1 (USD) 12.14/6.62 19.58/11.34 16.21/9.18 10.20/6.51 7.16/4.85
Class I (EUR) 12.64/7.69 18.41/11.62 16.99/10.46 11.53/7.79 8.55/4.94
Class I (USD) * 17.74/9.67 27.30/16.57 - - -
4. DISTRIBUTION PER SHARE (NOTE 12)
Class A - - - - -
Class A2 (Cents) * 30.09.08 - 1.0611 - - -
Class B - - - - -
Class D1 (Cents) 03.10.05 - - - - 9.0003
29.09.06 - - - 9.3451 -
28.09.07 - - 9.4100 - -
30.09.08 - 17.4047 - - -
Class I (EUR) - - - - -
Class I (USD) * - - - - -
5. PRICE CHANGE YEAR ON YEAR (%)
Class A (27.85) (25.08) 54.55 22.65 -
Class A2 * (27.85) - - - -
Class B (27.69) (25.77) 53.72 22.20 -
Class D1 (31.41) (25.95) 73.48 29.05 -
Class I (EUR) (27.63) (24.66) 55.41 23.27 -
Class I (USD) * (31.60) - - - -
6. TOTAL EXPENSE RATIO (%) (ANNUALISED)
Class A 1.79 1.70 1.71 1.73 1.74
Class A2 * 1.67 1.74 - - -
Class B 4.36 2.21 2.21 2.23 2.23
Class D1 1.83 1.70 1.72 1.72 1.72
Class I (EUR) 1.35 1.16 1.16 1.24 1.22
Class I (USD) * 1.28 1.17 - - -
7. NUMBER OF SHARES SUBSCRIBED
Class A 9,972,519.93 9,412,062.61 15,237,894.30 6,750,716.96 7,276,994.18
Class A2 * 64,137.64 78,501.42 - - -
Class B 55,794.46 690,023.83 873,209.44 679,482.45 4,278.26
Class D1 38,949,121.93 47,611,156.43 18,529,281.59 27,971,665.81 7,518,353.45
Class I (EUR) 1,372,013.01 3,987,602.62 1,769,491.79 115,540.00 133,982.22
Class I (USD) * - 205,876.87 - - -
8. NUMBER OF SHARES REDEEMED
Class A (4,897,574.30) (9,419,957.25) (6,615,149.21) (4,557,762.79) (4,219,000.65)
Class A2 * (245.00) (79.40) - - -
Class B (199,263.90) (842,057.32) (490,911.26) (214,318.86) -
Class D1 (7,152,330.89) (35,127,528.77) (7,874,285.12) (6,415,052.42) (1,430,167.91)
Class I (EUR) (981,398.01) (1,529,360.24) (644,184.86) (130,028.22) (14,800.00)
Class I (USD) * - - - - -
*Class A2 was launched on 7 May 2008 and Class I USD was launched on 19 June 2008.
43
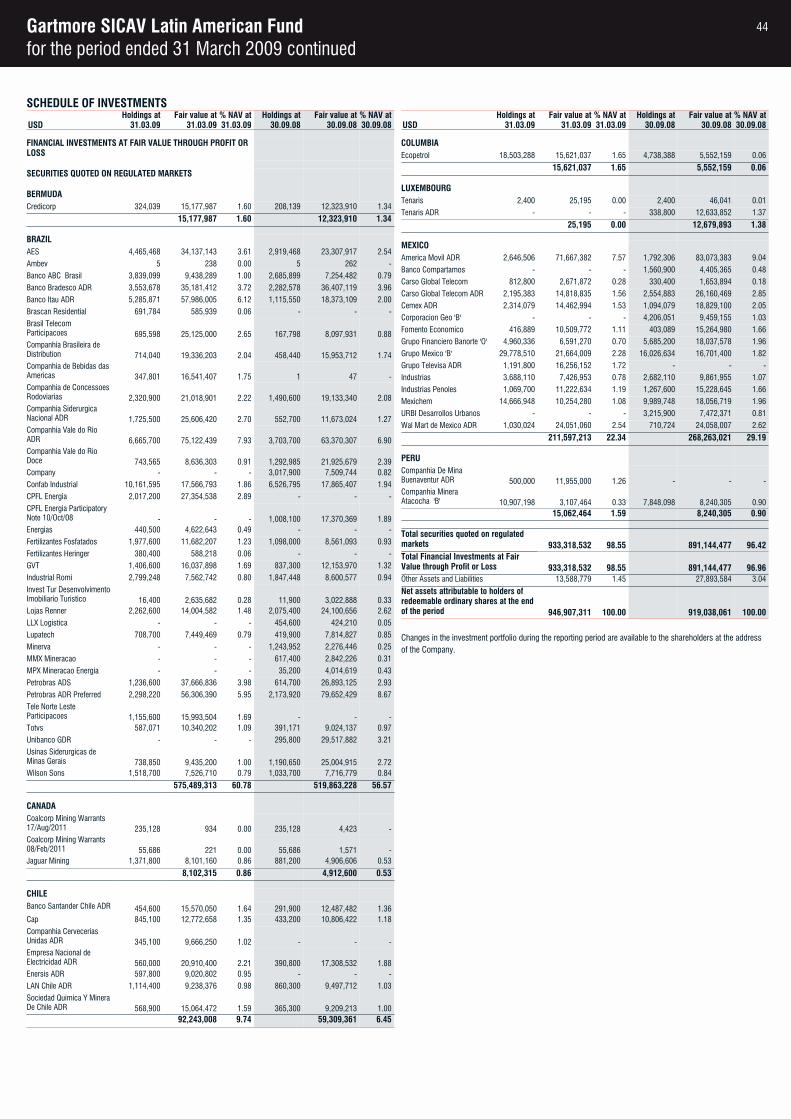
Gartmore SICAV Latin American Fundfor the period ended 31 March 2009 continued
SCHEDULE OF INVESTMENTSHoldings at Fair value at % NAV at Holdings at Fair value at % NAV at
USD 31.03.09 31.03.09 31.03.09 30.09.08 30.09.08 30.09.08
FINANCIAL INVESTMENTS AT FAIR VALUE THROUGH PROFIT OR LOSS
SECURITIES QUOTED ON REGULATED MARKETS
BERMUDACredicorp 324,039 15,177,987 1.60 208,139 12,323,910 1.34
15,177,987 1.60 12,323,910 1.34
BRAZILAES 4,465,468 34,137,143 3.61 2,919,468 23,307,917 2.54
Ambev 5 238 0.00 5 262 -
Banco ABC Brasil 3,839,099 9,438,289 1.00 2,685,899 7,254,482 0.79
Banco Bradesco ADR 3,553,678 35,181,412 3.72 2,282,578 36,407,119 3.96
Banco Itau ADR 5,285,871 57,986,005 6.12 1,115,550 18,373,109 2.00
Brascan Residential 691,784 585,939 0.06 - - -
Brasil Telecom Participacoes 695,598 25,125,000 2.65 167,798 8,097,931 0.88Companhia Brasileira de Distribution 714,040 19,336,203 2.04 458,440 15,953,712 1.74Companhia de Bebidas das Americas 347,801 16,541,407 1.75 1 47 -Companhia de Concessoes Rodoviarias 2,320,900 21,018,901 2.22 1,490,600 19,133,340 2.08Companhia Siderurgica Nacional ADR 1,725,500 25,606,420 2.70 552,700 11,673,024 1.27Companhia Vale do Rio ADR 6,665,700 75,122,439 7.93 3,703,700 63,370,307 6.90Companhia Vale do Rio Doce 743,565 8,636,303 0.91 1,292,985 21,925,679 2.39Company - - - 3,017,900 7,509,744 0.82
Confab Industrial 10,161,595 17,566,793 1.86 6,526,795 17,865,407 1.94
CPFL Energia 2,017,200 27,354,538 2.89 - - -
CPFL Energia Participatory Note 10/Oct/08 - - - 1,008,100 17,370,369 1.89Energias 440,500 4,622,643 0.49 - - -
Fertilizantes Fosfatados 1,977,600 11,682,207 1.23 1,098,000 8,561,093 0.93
Fertilizantes Heringer 380,400 588,218 0.06 - - -
GVT 1,406,600 16,037,898 1.69 837,300 12,153,970 1.32
Industrial Romi 2,799,248 7,562,742 0.80 1,847,448 8,600,577 0.94
Invest Tur Desenvolvimento Imobiliario Turistico 16,400 2,635,682 0.28 11,900 3,022,888 0.33Lojas Renner 2,262,600 14,004,582 1.48 2,075,400 24,100,656 2.62
LLX Logistica - - - 454,600 424,210 0.05
Lupatech 708,700 7,449,469 0.79 419,900 7,814,827 0.85
Minerva - - - 1,243,952 2,276,446 0.25
MMX Mineracao - - - 617,400 2,842,226 0.31
MPX Mineracao Energia - - - 35,200 4,014,619 0.43
Petrobras ADS 1,236,600 37,666,836 3.98 614,700 26,893,125 2.93
Petrobras ADR Preferred 2,298,220 56,306,390 5.95 2,173,920 79,652,429 8.67
Tele Norte Leste Participacoes 1,155,600 15,993,504 1.69 - - -Totvs 587,071 10,340,202 1.09 391,171 9,024,137 0.97
Unibanco GDR - - - 295,800 29,517,882 3.21
Usinas Siderurgicas de Minas Gerais 738,850 9,435,200 1.00 1,190,650 25,004,915 2.72Wilson Sons 1,518,700 7,526,710 0.79 1,033,700 7,716,779 0.84
575,489,313 60.78 519,863,228 56.57
CANADACoalcorp Mining Warrants 17/Aug/2011 235,128 934 0.00 235,128 4,423 -Coalcorp Mining Warrants 08/Feb/2011 55,686 221 0.00 55,686 1,571 -Jaguar Mining 1,371,800 8,101,160 0.86 881,200 4,906,606 0.53
8,102,315 0.86 4,912,600 0.53
CHILEBanco Santander Chile ADR 454,600 15,570,050 1.64 291,900 12,487,482 1.36Cap 845,100 12,772,658 1.35 433,200 10,806,422 1.18
Companhia Cervecerias Unidas ADR 345,100 9,666,250 1.02 - - -Empresa Nacional de Electricidad ADR 560,000 20,910,400 2.21 390,800 17,308,532 1.88Enersis ADR 597,800 9,020,802 0.95 - - -
LAN Chile ADR 1,114,400 9,238,376 0.98 860,300 9,497,712 1.03
Sociedad Quimica Y Minera De Chile ADR 568,900 15,064,472 1.59 365,300 9,209,213 1.00
92,243,008 9.74 59,309,361 6.45
Holdings at Fair value at % NAV at Holdings at Fair value at % NAV atUSD 31.03.09 31.03.09 31.03.09 30.09.08 30.09.08 30.09.08
COLUMBIAEcopetrol 18,503,288 15,621,037 1.65 4,738,388 5,552,159 0.06
15,621,037 1.65 5,552,159 0.06
LUXEMBOURGTenaris 2,400 25,195 0.00 2,400 46,041 0.01
Tenaris ADR - - - 338,800 12,633,852 1.37
25,195 0.00 12,679,893 1.38
MEXICOAmerica Movil ADR 2,646,506 71,667,382 7.57 1,792,306 83,073,383 9.04
Banco Compartamos - - - 1,560,900 4,405,365 0.48
Carso Global Telecom 812,800 2,671,872 0.28 330,400 1,653,894 0.18
Carso Global Telecom ADR 2,195,383 14,818,835 1.56 2,554,883 26,160,469 2.85
Cemex ADR 2,314,079 14,462,994 1.53 1,094,079 18,829,100 2.05
Corporacion Geo 'B' - - - 4,206,051 9,459,155 1.03
Fomento Economico 416,889 10,509,772 1.11 403,089 15,264,980 1.66
Grupo Financiero Banorte 'O' 4,960,336 6,591,270 0.70 5,685,200 18,037,578 1.96
Grupo Mexico 'B' 29,778,510 21,664,009 2.28 16,026,634 16,701,400 1.82
Grupo Televisa ADR 1,191,800 16,256,152 1.72 - - -
Industrias 3,688,110 7,426,953 0.78 2,682,110 9,861,955 1.07
Industrias Penoles 1,069,700 11,222,634 1.19 1,267,600 15,228,645 1.66
Mexichem 14,666,948 10,254,280 1.08 9,989,748 18,056,719 1.96
URBI Desarrollos Urbanos - - - 3,215,900 7,472,371 0.81
Wal Mart de Mexico ADR 1,030,024 24,051,060 2.54 710,724 24,058,007 2.62
211,597,213 22.34 268,263,021 29.19
PERUCompanhia De Mina Buenaventur ADR 500,000 11,955,000 1.26 - - -Companhia Minera Atacocha 'B' 10,907,198 3,107,464 0.33 7,848,098 8,240,305 0.90
15,062,464 1.59 8,240,305 0.90
Total securities quoted on regulated markets 933,318,532 98.55 891,144,477 96.42Total Financial Investments at Fair Value through Profit or Loss 933,318,532 98.55 891,144,477 96.96Other Assets and Liabilities 13,588,779 1.45 27,893,584 3.04
Net assets attributable to holders of redeemable ordinary shares at the end of the period 946,907,311 100.00 919,038,061 100.00
Changes in the investment portfolio during the reporting period are available to the shareholders at the address of the Company.
44
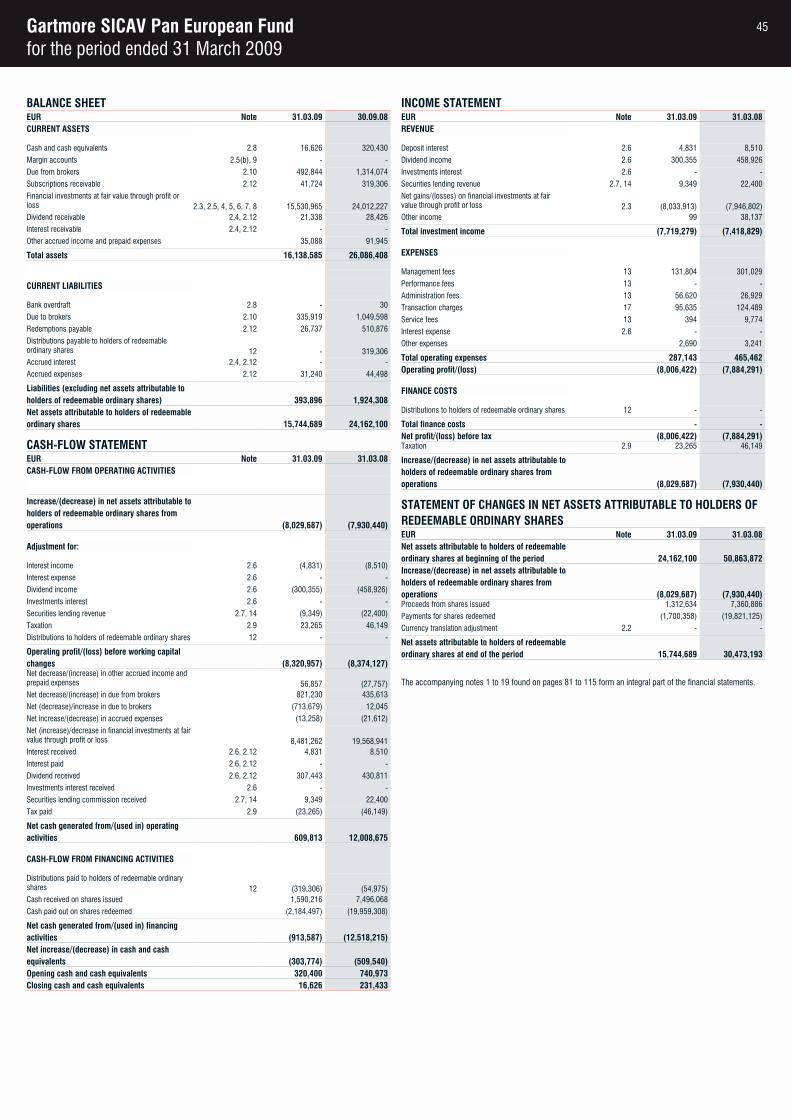
Gartmore SICAV Pan European Fundfor the period ended 31 March 2009
BALANCE SHEETEUR Note 31.03.09 30.09.08CURRENT ASSETS
Cash and cash equivalents 2.8 16,626 320,430
Margin accounts 2.5(b), 9 - -
Due from brokers 2.10 492,844 1,314,074
Subscriptions receivable 2.12 41,724 319,306
Financial investments at fair value through profit or loss 2.3, 2.5, 4, 5, 6, 7, 8 15,530,965 24,012,227Dividend receivable 2.4, 2.12 21,338 28,426
Interest receivable 2.4, 2.12 - -
Other accrued income and prepaid expenses 35,088 91,945
Total assets 16,138,585 26,086,408
CURRENT LIABILITIES
Bank overdraft 2.8 - 30
Due to brokers 2.10 335,919 1,049,598
Redemptions payable 2.12 26,737 510,876
Distributions payable to holders of redeemable ordinary shares 12 - 319,306Accrued interest 2.4, 2.12 - -
Accrued expenses 2.12 31,240 44,498
Liabilities (excluding net assets attributable to holders of redeemable ordinary shares) 393,896 1,924,308Net assets attributable to holders of redeemableordinary shares 15,744,689 24,162,100
CASH-FLOW STATEMENTEUR Note 31.03.09 31.03.08CASH-FLOW FROM OPERATING ACTIVITIES
Increase/(decrease) in net assets attributable toholders of redeemable ordinary shares from operations (8,029,687) (7,930,440)
Adjustment for:
Interest income 2.6 (4,831) (8,510)
Interest expense 2.6 - -
Dividend income 2.6 (300,355) (458,926)
Investments interest 2.6 - -
Securities lending revenue 2.7, 14 (9,349) (22,400)
Taxation 2.9 23,265 46,149
Distributions to holders of redeemable ordinary shares 12 - -
Operating profit/(loss) before working capital changes (8,320,957) (8,374,127)Net decrease/(increase) in other accrued income and prepaid expenses 56,857 (27,757)Net decrease/(increase) in due from brokers 821,230 435,613
Net (decrease)/increase in due to brokers (713,679) 12,045
Net increase/(decrease) in accrued expenses (13,258) (21,612)
Net (increase)/decrease in financial investments at fair value through profit or loss 8,481,262 19,568,941Interest received 2.6, 2.12 4,831 8,510
Interest paid 2.6, 2.12 - -
Dividend received 2.6, 2.12 307,443 430,811
Investments interest received 2.6 - -
Securities lending commission received 2.7, 14 9,349 22,400
Tax paid 2.9 (23,265) (46,149)
Net cash generated from/(used in) operating activities 609,813 12,008,675
CASH-FLOW FROM FINANCING ACTIVITIES
Distributions paid to holders of redeemable ordinary shares 12 (319,306) (54,975)Cash received on shares issued 1,590,216 7,496,068
Cash paid out on shares redeemed (2,184,497) (19,959,308)
Net cash generated from/(used in) financing activities (913,587) (12,518,215)Net increase/(decrease) in cash and cash equivalents (303,774) (509,540)Opening cash and cash equivalents 320,400 740,973Closing cash and cash equivalents 16,626 231,433
INCOME STATEMENTEUR Note 31.03.09 31.03.08REVENUE
Deposit interest 2.6 4,831 8,510
Dividend income 2.6 300,355 458,926
Investments interest 2.6 - -
Securities lending revenue 2.7, 14 9,349 22,400
Net gains/(losses) on financial investments at fair value through profit or loss 2.3 (8,033,913) (7,946,802)Other income 99 38,137
Total investment income (7,719,279) (7,418,829)
EXPENSES
Management fees 13 131,804 301,029
Performance fees 13 - -
Administration fees 13 56,620 26,929
Transaction charges 17 95,635 124,489
Service fees 13 394 9,774
Interest expense 2.6 - -
Other expenses 2,690 3,241
Total operating expenses 287,143 465,462Operating profit/(loss) (8,006,422) (7,884,291)
FINANCE COSTS
Distributions to holders of redeemable ordinary shares 12 - -
Total finance costs - -Net profit/(loss) before tax (8,006,422) (7,884,291)Taxation 2.9 23,265 46,149
Increase/(decrease) in net assets attributable toholders of redeemable ordinary shares from operations (8,029,687) (7,930,440)
STATEMENT OF CHANGES IN NET ASSETS ATTRIBUTABLE TO HOLDERS OF REDEEMABLE ORDINARY SHARESEUR Note 31.03.09 31.03.08Net assets attributable to holders of redeemableordinary shares at beginning of the period 24,162,100 50,863,872Increase/(decrease) in net assets attributable toholders of redeemable ordinary shares from operations (8,029,687) (7,930,440)Proceeds from shares issued 1,312,634 7,360,886
Payments for shares redeemed (1,700,358) (19,821,125)
Currency translation adjustment 2.2 - -
Net assets attributable to holders of redeemableordinary shares at end of the period 15,744,689 30,473,193
The accompanying notes 1 to 19 found on pages 81 to 115 form an integral part of the financial statements.
45
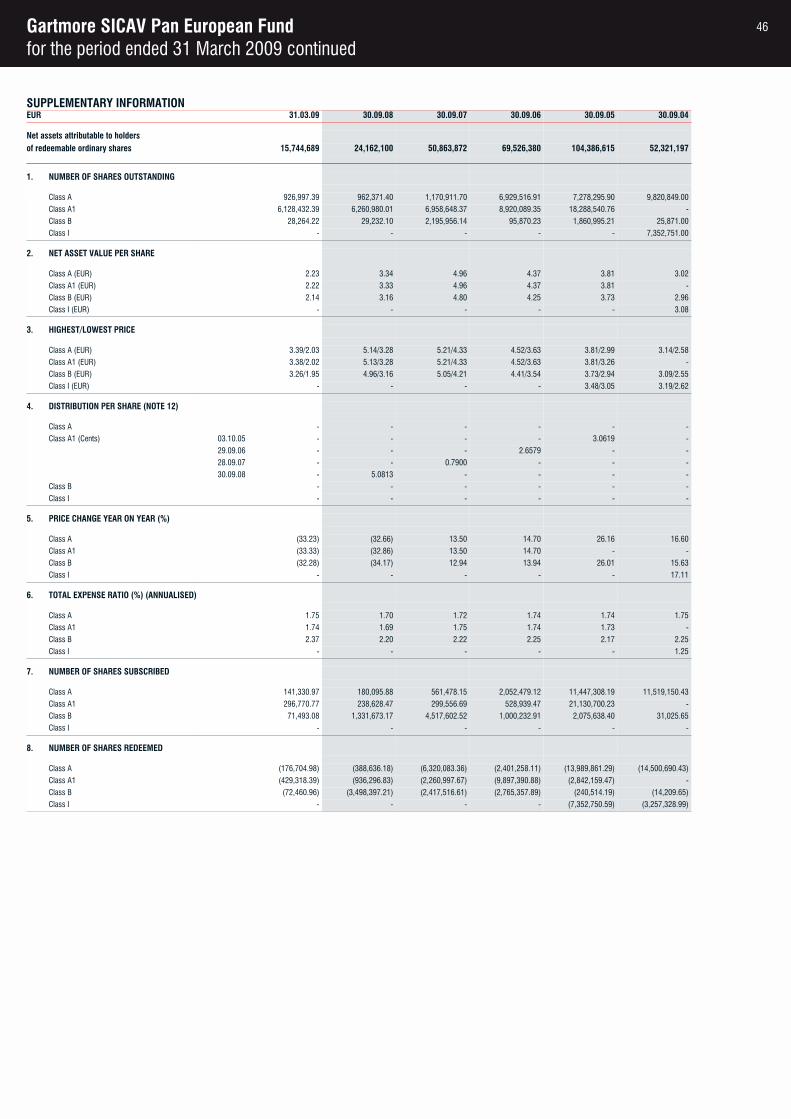
Gartmore SICAV Pan European Fundfor the period ended 31 March 2009 continued
SUPPLEMENTARY INFORMATIONEUR 31.03.09 30.09.08 30.09.07 30.09.06 30.09.05 30.09.04
Net assets attributable to holdersof redeemable ordinary shares 15,744,689 24,162,100 50,863,872 69,526,380 104,386,615 52,321,197
1. NUMBER OF SHARES OUTSTANDING
Class A 926,997.39 962,371.40 1,170,911.70 6,929,516.91 7,278,295.90 9,820,849.00
Class A1 6,128,432.39 6,260,980.01 6,958,648.37 8,920,089.35 18,288,540.76 -
Class B 28,264.22 29,232.10 2,195,956.14 95,870.23 1,860,995.21 25,871.00
Class I - - - - - 7,352,751.00
2. NET ASSET VALUE PER SHARE
Class A (EUR) 2.23 3.34 4.96 4.37 3.81 3.02
Class A1 (EUR) 2.22 3.33 4.96 4.37 3.81 -
Class B (EUR) 2.14 3.16 4.80 4.25 3.73 2.96
Class I (EUR) - - - - - 3.08
3. HIGHEST/LOWEST PRICE
Class A (EUR) 3.39/2.03 5.14/3.28 5.21/4.33 4.52/3.63 3.81/2.99 3.14/2.58
Class A1 (EUR) 3.38/2.02 5.13/3.28 5.21/4.33 4.52/3.63 3.81/3.26 -
Class B (EUR) 3.26/1.95 4.96/3.16 5.05/4.21 4.41/3.54 3.73/2.94 3.09/2.55
Class I (EUR) - - - - 3.48/3.05 3.19/2.62
4. DISTRIBUTION PER SHARE (NOTE 12)
Class A - - - - - -
Class A1 (Cents) 03.10.05 - - - - 3.0619 -
29.09.06 - - - 2.6579 - -
28.09.07 - - 0.7900 - - -
30.09.08 - 5.0813 - - - -
Class B - - - - - -
Class I - - - - - -
5. PRICE CHANGE YEAR ON YEAR (%)
Class A (33.23) (32.66) 13.50 14.70 26.16 16.60
Class A1 (33.33) (32.86) 13.50 14.70 - -
Class B (32.28) (34.17) 12.94 13.94 26.01 15.63
Class I - - - - - 17.11
6. TOTAL EXPENSE RATIO (%) (ANNUALISED)
Class A 1.75 1.70 1.72 1.74 1.74 1.75
Class A1 1.74 1.69 1.75 1.74 1.73 -
Class B 2.37 2.20 2.22 2.25 2.17 2.25
Class I - - - - - 1.25
7. NUMBER OF SHARES SUBSCRIBED
Class A 141,330.97 180,095.88 561,478.15 2,052,479.12 11,447,308.19 11,519,150.43
Class A1 296,770.77 238,628.47 299,556.69 528,939.47 21,130,700.23 -
Class B 71,493.08 1,331,673.17 4,517,602.52 1,000,232.91 2,075,638.40 31,025.65
Class I - - - - - -
8. NUMBER OF SHARES REDEEMED
Class A (176,704.98) (388,636.18) (6,320,083.36) (2,401,258.11) (13,989,861.29) (14,500,690.43)
Class A1 (429,318.39) (936,296.83) (2,260,997.67) (9,897,390.88) (2,842,159.47) -
Class B (72,460.96) (3,498,397.21) (2,417,516.61) (2,765,357.89) (240,514.19) (14,209.65)
Class I - - - - (7,352,750.59) (3,257,328.99)
46
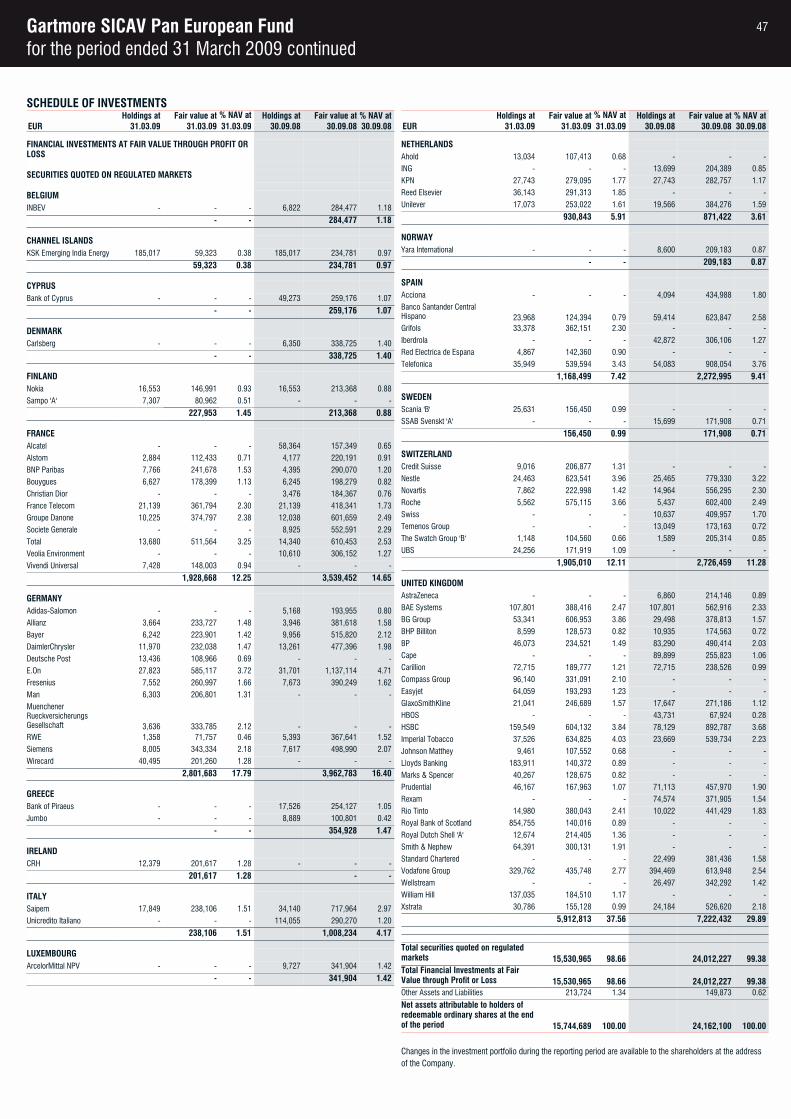
Gartmore SICAV Pan European Fundfor the period ended 31 March 2009 continued
SCHEDULE OF INVESTMENTSHoldings at Fair value at % NAV at Holdings at Fair value at % NAV at
EUR 31.03.09 31.03.09 31.03.09 30.09.08 30.09.08 30.09.08
FINANCIAL INVESTMENTS AT FAIR VALUE THROUGH PROFIT OR LOSS
SECURITIES QUOTED ON REGULATED MARKETS
BELGIUMINBEV - - - 6,822 284,477 1.18
- - 284,477 1.18
CHANNEL ISLANDSKSK Emerging India Energy 185,017 59,323 0.38 185,017 234,781 0.97
59,323 0.38 234,781 0.97
CYPRUSBank of Cyprus - - - 49,273 259,176 1.07
- - 259,176 1.07
DENMARKCarlsberg - - - 6,350 338,725 1.40
- - 338,725 1.40
FINLANDNokia 16,553 146,991 0.93 16,553 213,368 0.88
Sampo 'A' 7,307 80,962 0.51 - - -
227,953 1.45 213,368 0.88
FRANCE Alcatel - - - 58,364 157,349 0.65
Alstom 2,884 112,433 0.71 4,177 220,191 0.91
BNP Paribas 7,766 241,678 1.53 4,395 290,070 1.20
Bouygues 6,627 178,399 1.13 6,245 198,279 0.82
Christian Dior - - - 3,476 184,367 0.76
France Telecom 21,139 361,794 2.30 21,139 418,341 1.73
Groupe Danone 10,225 374,797 2.38 12,038 601,659 2.49
Societe Generale - - - 8,925 552,591 2.29
Total 13,680 511,564 3.25 14,340 610,453 2.53
Veolia Environment - - - 10,610 306,152 1.27
Vivendi Universal 7,428 148,003 0.94 - - -
1,928,668 12.25 3,539,452 14.65
GERMANYAdidas-Salomon - - - 5,168 193,955 0.80
Allianz 3,664 233,727 1.48 3,946 381,618 1.58
Bayer 6,242 223,901 1.42 9,956 515,820 2.12
DaimlerChrysler 11,970 232,038 1.47 13,261 477,396 1.98
Deutsche Post 13,436 108,966 0.69 - - -
E.On 27,823 585,117 3.72 31,701 1,137,114 4.71
Fresenius 7,552 260,997 1.66 7,673 390,249 1.62
Man 6,303 206,801 1.31 - - -
Muenchener Rueckversicherungs Gesellschaft 3,636 333,785 2.12 - - -RWE 1,358 71,757 0.46 5,393 367,641 1.52
Siemens 8,005 343,334 2.18 7,617 498,990 2.07
Wirecard 40,495 201,260 1.28 - - -
2,801,683 17.79 3,962,783 16.40
GREECEBank of Piraeus - - - 17,526 254,127 1.05
Jumbo - - - 8,889 100,801 0.42
- - 354,928 1.47
IRELANDCRH 12,379 201,617 1.28 - - -
201,617 1.28 - -
ITALYSaipem 17,849 238,106 1.51 34,140 717,964 2.97
Unicredito Italiano - - - 114,055 290,270 1.20
238,106 1.51 1,008,234 4.17
LUXEMBOURGArcelorMittal NPV - - - 9,727 341,904 1.42
- - 341,904 1.42
Holdings at Fair value at % NAV at Holdings at Fair value at % NAV atEUR 31.03.09 31.03.09 31.03.09 30.09.08 30.09.08 30.09.08
NETHERLANDSAhold 13,034 107,413 0.68 - - -
ING - - - 13,699 204,389 0.85
KPN 27,743 279,095 1.77 27,743 282,757 1.17
Reed Elsevier 36,143 291,313 1.85 - - -
Unilever 17,073 253,022 1.61 19,566 384,276 1.59
930,843 5.91 871,422 3.61
NORWAYYara International - - - 8,600 209,183 0.87
- - 209,183 0.87
SPAINAcciona - - - 4,094 434,988 1.80
Banco Santander Central Hispano 23,968 124,394 0.79 59,414 623,847 2.58Grifols 33,378 362,151 2.30 - - -
Iberdrola - - - 42,872 306,106 1.27
Red Electrica de Espana 4,867 142,360 0.90 - - -
Telefonica 35,949 539,594 3.43 54,083 908,054 3.76
1,168,499 7.42 2,272,995 9.41
SWEDENScania 'B' 25,631 156,450 0.99 - - -
SSAB Svenskt 'A' - - - 15,699 171,908 0.71
156,450 0.99 171,908 0.71
SWITZERLANDCredit Suisse 9,016 206,877 1.31 - - -
Nestle 24,463 623,541 3.96 25,465 779,330 3.22
Novartis 7,862 222,998 1.42 14,964 556,295 2.30
Roche 5,562 575,115 3.66 5,437 602,400 2.49
Swiss - - - 10,637 409,957 1.70
Temenos Group - - - 13,049 173,163 0.72
The Swatch Group 'B' 1,148 104,560 0.66 1,589 205,314 0.85
UBS 24,256 171,919 1.09 - - -
1,905,010 12.11 2,726,459 11.28
UNITED KINGDOMAstraZeneca - - - 6,860 214,146 0.89
BAE Systems 107,801 388,416 2.47 107,801 562,916 2.33
BG Group 53,341 606,953 3.86 29,498 378,813 1.57
BHP Billiton 8,599 128,573 0.82 10,935 174,563 0.72
BP 46,073 234,521 1.49 83,290 490,414 2.03
Cape - - - 89,899 255,823 1.06
Carillion 72,715 189,777 1.21 72,715 238,526 0.99
Compass Group 96,140 331,091 2.10 - - -
Easyjet 64,059 193,293 1.23 - - -
GlaxoSmithKline 21,041 246,689 1.57 17,647 271,186 1.12
HBOS - - - 43,731 67,924 0.28
HSBC 159,549 604,132 3.84 78,129 892,787 3.68
Imperial Tobacco 37,526 634,825 4.03 23,669 539,734 2.23
Johnson Matthey 9,461 107,552 0.68 - - -
Lloyds Banking 183,911 140,372 0.89 - - -
Marks & Spencer 40,267 128,675 0.82 - - -
Prudential 46,167 167,963 1.07 71,113 457,970 1.90
Rexam - - - 74,574 371,905 1.54
Rio Tinto 14,980 380,043 2.41 10,022 441,429 1.83
Royal Bank of Scotland 854,755 140,016 0.89 - - -
Royal Dutch Shell 'A' 12,674 214,405 1.36 - - -
Smith & Nephew 64,391 300,131 1.91 - - -
Standard Chartered - - - 22,499 381,436 1.58
Vodafone Group 329,762 435,748 2.77 394,469 613,948 2.54
Wellstream - - - 26,497 342,292 1.42
William Hill 137,035 184,510 1.17 - - -
Xstrata 30,786 155,128 0.99 24,184 526,620 2.18
5,912,813 37.56 7,222,432 29.89
Total securities quoted on regulated markets 15,530,965 98.66 24,012,227 99.38Total Financial Investments at Fair Value through Profit or Loss 15,530,965 98.66 24,012,227 99.38Other Assets and Liabilities 213,724 1.34 149,873 0.62
Net assets attributable to holders of redeemable ordinary shares at the end of the period 15,744,689 100.00 24,162,100 100.00
Changes in the investment portfolio during the reporting period are available to the shareholders at the address of the Company.
47
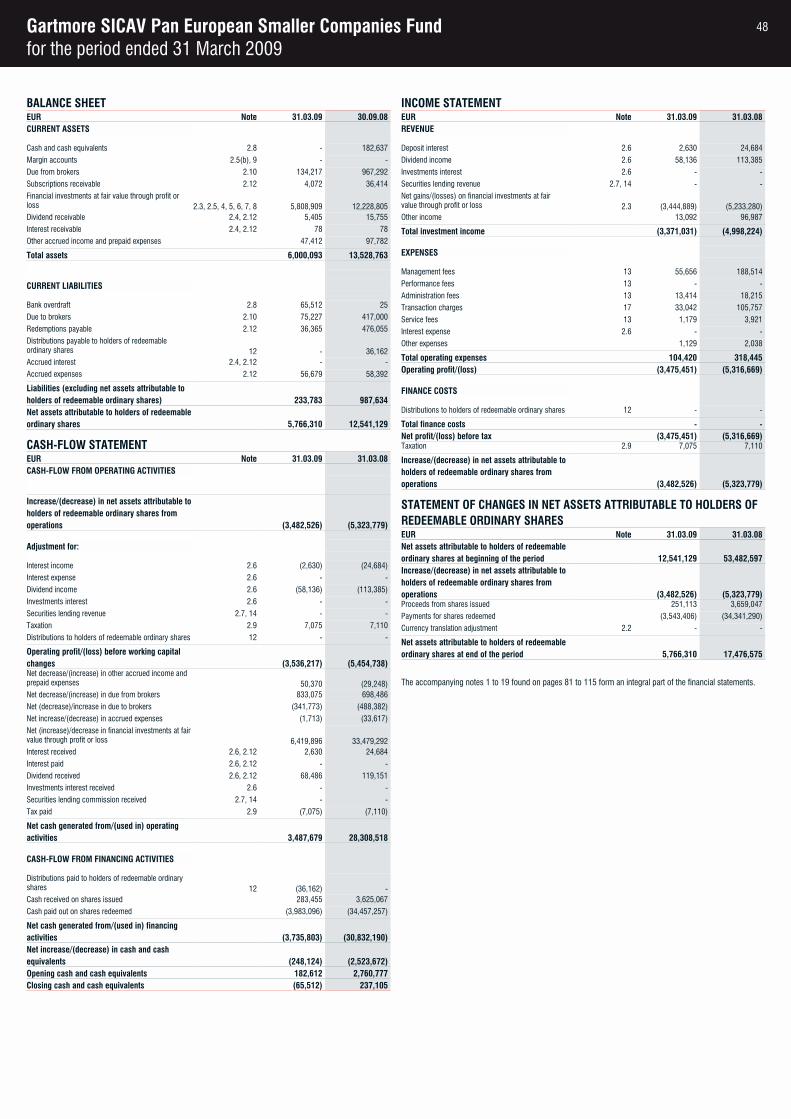
Gartmore SICAV Pan European Smaller Companies Fundfor the period ended 31 March 2009
BALANCE SHEETEUR Note 31.03.09 30.09.08CURRENT ASSETS
Cash and cash equivalents 2.8 - 182,637
Margin accounts 2.5(b), 9 - -
Due from brokers 2.10 134,217 967,292
Subscriptions receivable 2.12 4,072 36,414
Financial investments at fair value through profit or loss 2.3, 2.5, 4, 5, 6, 7, 8 5,808,909 12,228,805Dividend receivable 2.4, 2.12 5,405 15,755
Interest receivable 2.4, 2.12 78 78
Other accrued income and prepaid expenses 47,412 97,782
Total assets 6,000,093 13,528,763
CURRENT LIABILITIES
Bank overdraft 2.8 65,512 25
Due to brokers 2.10 75,227 417,000
Redemptions payable 2.12 36,365 476,055
Distributions payable to holders of redeemable ordinary shares 12 - 36,162Accrued interest 2.4, 2.12 - -
Accrued expenses 2.12 56,679 58,392
Liabilities (excluding net assets attributable to holders of redeemable ordinary shares) 233,783 987,634Net assets attributable to holders of redeemableordinary shares 5,766,310 12,541,129
CASH-FLOW STATEMENTEUR Note 31.03.09 31.03.08CASH-FLOW FROM OPERATING ACTIVITIES
Increase/(decrease) in net assets attributable toholders of redeemable ordinary shares from operations (3,482,526) (5,323,779)
Adjustment for:
Interest income 2.6 (2,630) (24,684)
Interest expense 2.6 - -
Dividend income 2.6 (58,136) (113,385)
Investments interest 2.6 - -
Securities lending revenue 2.7, 14 - -
Taxation 2.9 7,075 7,110
Distributions to holders of redeemable ordinary shares 12 - -
Operating profit/(loss) before working capital changes (3,536,217) (5,454,738)Net decrease/(increase) in other accrued income and prepaid expenses 50,370 (29,248)Net decrease/(increase) in due from brokers 833,075 698,486
Net (decrease)/increase in due to brokers (341,773) (488,382)
Net increase/(decrease) in accrued expenses (1,713) (33,617)
Net (increase)/decrease in financial investments at fair value through profit or loss 6,419,896 33,479,292Interest received 2.6, 2.12 2,630 24,684
Interest paid 2.6, 2.12 - -
Dividend received 2.6, 2.12 68,486 119,151
Investments interest received 2.6 - -
Securities lending commission received 2.7, 14 - -
Tax paid 2.9 (7,075) (7,110)
Net cash generated from/(used in) operating activities 3,487,679 28,308,518
CASH-FLOW FROM FINANCING ACTIVITIES
Distributions paid to holders of redeemable ordinary shares 12 (36,162) -Cash received on shares issued 283,455 3,625,067
Cash paid out on shares redeemed (3,983,096) (34,457,257)
Net cash generated from/(used in) financing activities (3,735,803) (30,832,190)Net increase/(decrease) in cash and cash equivalents (248,124) (2,523,672)Opening cash and cash equivalents 182,612 2,760,777Closing cash and cash equivalents (65,512) 237,105
INCOME STATEMENTEUR Note 31.03.09 31.03.08REVENUE
Deposit interest 2.6 2,630 24,684
Dividend income 2.6 58,136 113,385
Investments interest 2.6 - -
Securities lending revenue 2.7, 14 - -
Net gains/(losses) on financial investments at fair value through profit or loss 2.3 (3,444,889) (5,233,280)Other income 13,092 96,987
Total investment income (3,371,031) (4,998,224)
EXPENSES
Management fees 13 55,656 188,514
Performance fees 13 - -
Administration fees 13 13,414 18,215
Transaction charges 17 33,042 105,757
Service fees 13 1,179 3,921
Interest expense 2.6 - -
Other expenses 1,129 2,038
Total operating expenses 104,420 318,445Operating profit/(loss) (3,475,451) (5,316,669)
FINANCE COSTS
Distributions to holders of redeemable ordinary shares 12 - -
Total finance costs - -Net profit/(loss) before tax (3,475,451) (5,316,669)Taxation 2.9 7,075 7,110
Increase/(decrease) in net assets attributable toholders of redeemable ordinary shares from operations (3,482,526) (5,323,779)
STATEMENT OF CHANGES IN NET ASSETS ATTRIBUTABLE TO HOLDERS OF REDEEMABLE ORDINARY SHARESEUR Note 31.03.09 31.03.08Net assets attributable to holders of redeemableordinary shares at beginning of the period 12,541,129 53,482,597Increase/(decrease) in net assets attributable toholders of redeemable ordinary shares from operations (3,482,526) (5,323,779)Proceeds from shares issued 251,113 3,659,047
Payments for shares redeemed (3,543,406) (34,341,290)
Currency translation adjustment 2.2 - -
Net assets attributable to holders of redeemableordinary shares at end of the period 5,766,310 17,476,575
The accompanying notes 1 to 19 found on pages 81 to 115 form an integral part of the financial statements.
48
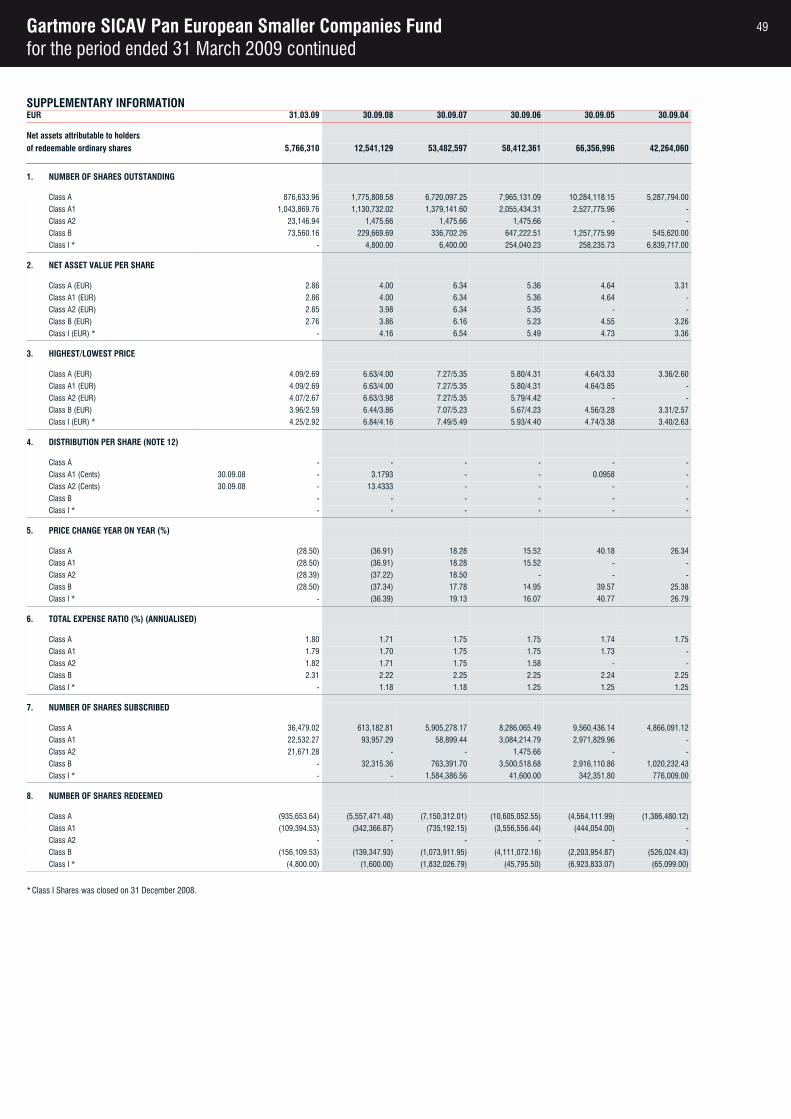
Gartmore SICAV Pan European Smaller Companies Fundfor the period ended 31 March 2009 continued
SUPPLEMENTARY INFORMATIONEUR 31.03.09 30.09.08 30.09.07 30.09.06 30.09.05 30.09.04
Net assets attributable to holdersof redeemable ordinary shares 5,766,310 12,541,129 53,482,597 58,412,361 66,356,996 42,264,060
1. NUMBER OF SHARES OUTSTANDING
Class A 876,633.96 1,775,808.58 6,720,097.25 7,965,131.09 10,284,118.15 5,287,794.00
Class A1 1,043,869.76 1,130,732.02 1,379,141.60 2,055,434.31 2,527,775.96 -
Class A2 23,146.94 1,475.66 1,475.66 1,475.66 - -
Class B 73,560.16 229,669.69 336,702.26 647,222.51 1,257,775.99 545,620.00
Class I * - 4,800.00 6,400.00 254,040.23 258,235.73 6,839,717.00
2. NET ASSET VALUE PER SHARE
Class A (EUR) 2.86 4.00 6.34 5.36 4.64 3.31
Class A1 (EUR) 2.86 4.00 6.34 5.36 4.64 -
Class A2 (EUR) 2.85 3.98 6.34 5.35 - -
Class B (EUR) 2.76 3.86 6.16 5.23 4.55 3.26
Class I (EUR) * - 4.16 6.54 5.49 4.73 3.36
3. HIGHEST/LOWEST PRICE
Class A (EUR) 4.09/2.69 6.63/4.00 7.27/5.35 5.80/4.31 4.64/3.33 3.36/2.60
Class A1 (EUR) 4.09/2.69 6.63/4.00 7.27/5.35 5.80/4.31 4.64/3.85 -
Class A2 (EUR) 4.07/2.67 6.63/3.98 7.27/5.35 5.79/4.42 - -
Class B (EUR) 3.96/2.59 6.44/3.86 7.07/5.23 5.67/4.23 4.56/3.28 3.31/2.57
Class I (EUR) * 4.25/2.92 6.84/4.16 7.49/5.49 5.93/4.40 4.74/3.38 3.40/2.63
4. DISTRIBUTION PER SHARE (NOTE 12)
Class A - - - - - -
Class A1 (Cents) 30.09.08 - 3.1793 - - 0.0958 -
Class A2 (Cents) 30.09.08 - 13.4333 - - - -
Class B - - - - - -
Class I * - - - - - -
5. PRICE CHANGE YEAR ON YEAR (%)
Class A (28.50) (36.91) 18.28 15.52 40.18 26.34
Class A1 (28.50) (36.91) 18.28 15.52 - -
Class A2 (28.39) (37.22) 18.50 - - -
Class B (28.50) (37.34) 17.78 14.95 39.57 25.38
Class I * - (36.39) 19.13 16.07 40.77 26.79
6. TOTAL EXPENSE RATIO (%) (ANNUALISED)
Class A 1.80 1.71 1.75 1.75 1.74 1.75
Class A1 1.79 1.70 1.75 1.75 1.73 -
Class A2 1.82 1.71 1.75 1.58 - -
Class B 2.31 2.22 2.25 2.25 2.24 2.25
Class I * - 1.18 1.18 1.25 1.25 1.25
7. NUMBER OF SHARES SUBSCRIBED
Class A 36,479.02 613,182.81 5,905,278.17 8,286,065.49 9,560,436.14 4,866,091.12
Class A1 22,532.27 93,957.29 58,899.44 3,084,214.79 2,971,829.96 -
Class A2 21,671.28 - - 1,475.66 - -
Class B - 32,315.36 763,391.70 3,500,518.68 2,916,110.86 1,020,232.43
Class I * - - 1,584,386.56 41,600.00 342,351.80 776,009.00
8. NUMBER OF SHARES REDEEMED
Class A (935,653.64) (5,557,471.48) (7,150,312.01) (10,605,052.55) (4,564,111.99) (1,386,480.12)
Class A1 (109,394.53) (342,366.87) (735,192.15) (3,556,556.44) (444,054.00) -
Class A2 - - - - - -
Class B (156,109.53) (139,347.93) (1,073,911.95) (4,111,072.16) (2,203,954.87) (526,024.43)
Class I * (4,800.00) (1,600.00) (1,832,026.79) (45,795.50) (6,923,833.07) (65,099.00)
*Class I Shares was closed on 31 December 2008.
49
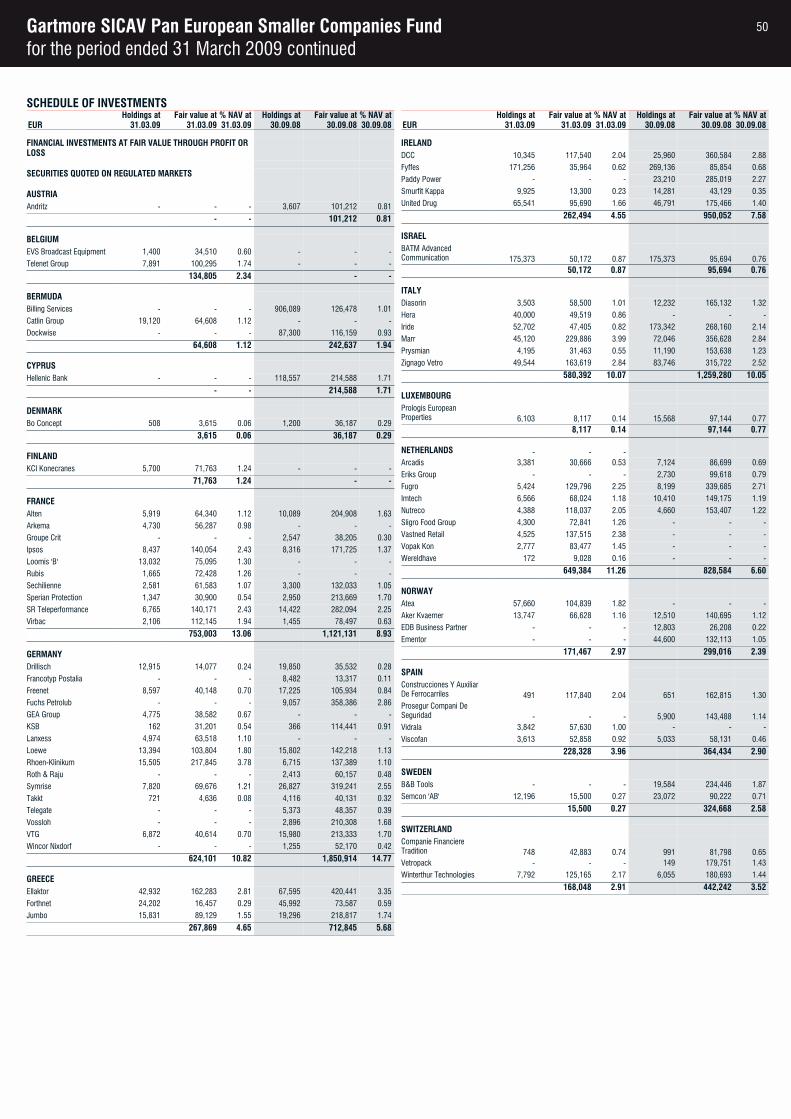
Gartmore SICAV Pan European Smaller Companies Fundfor the period ended 31 March 2009 continued
SCHEDULE OF INVESTMENTSHoldings at Fair value at % NAV at Holdings at Fair value at % NAV at
EUR 31.03.09 31.03.09 31.03.09 30.09.08 30.09.08 30.09.08
FINANCIAL INVESTMENTS AT FAIR VALUE THROUGH PROFIT OR LOSS
SECURITIES QUOTED ON REGULATED MARKETS
AUSTRIAAndritz - - - 3,607 101,212 0.81
- - 101,212 0.81
BELGIUMEVS Broadcast Equipment 1,400 34,510 0.60 - - -
Telenet Group 7,891 100,295 1.74 - - -
134,805 2.34 - -
BERMUDABilling Services - - - 906,089 126,478 1.01
Catlin Group 19,120 64,608 1.12 - - -
Dockwise - - - 87,300 116,159 0.93
64,608 1.12 242,637 1.94
CYPRUSHellenic Bank - - - 118,557 214,588 1.71
- - 214,588 1.71
DENMARKBo Concept 508 3,615 0.06 1,200 36,187 0.29
3,615 0.06 36,187 0.29
FINLANDKCI Konecranes 5,700 71,763 1.24 - - -
71,763 1.24 - -
FRANCEAlten 5,919 64,340 1.12 10,089 204,908 1.63
Arkema 4,730 56,287 0.98 - - -
Groupe Crit - - - 2,547 38,205 0.30
Ipsos 8,437 140,054 2.43 8,316 171,725 1.37
Loomis 'B' 13,032 75,095 1.30 - - -
Rubis 1,665 72,428 1.26 - - -
Sechilienne 2,581 61,583 1.07 3,300 132,033 1.05
Sperian Protection 1,347 30,900 0.54 2,950 213,669 1.70
SR Teleperformance 6,765 140,171 2.43 14,422 282,094 2.25
Virbac 2,106 112,145 1.94 1,455 78,497 0.63
753,003 13.06 1,121,131 8.93
GERMANYDrillisch 12,915 14,077 0.24 19,850 35,532 0.28
Francotyp Postalia - - - 8,482 13,317 0.11
Freenet 8,597 40,148 0.70 17,225 105,934 0.84
Fuchs Petrolub - - - 9,057 358,386 2.86
GEA Group 4,775 38,582 0.67 - - -
KSB 162 31,201 0.54 366 114,441 0.91
Lanxess 4,974 63,518 1.10 - - -
Loewe 13,394 103,804 1.80 15,802 142,218 1.13
Rhoen-Klinikum 15,505 217,845 3.78 6,715 137,389 1.10
Roth & Raju - - - 2,413 60,157 0.48
Symrise 7,820 69,676 1.21 26,827 319,241 2.55
Takkt 721 4,636 0.08 4,116 40,131 0.32
Telegate - - - 5,373 48,357 0.39
Vossloh - - - 2,896 210,308 1.68
VTG 6,872 40,614 0.70 15,980 213,333 1.70
Wincor Nixdorf - - - 1,255 52,170 0.42
624,101 10.82 1,850,914 14.77
GREECEEllaktor 42,932 162,283 2.81 67,595 420,441 3.35
Forthnet 24,202 16,457 0.29 45,992 73,587 0.59
Jumbo 15,831 89,129 1.55 19,296 218,817 1.74
267,869 4.65 712,845 5.68
Holdings at Fair value at % NAV at Holdings at Fair value at % NAV atEUR 31.03.09 31.03.09 31.03.09 30.09.08 30.09.08 30.09.08
IRELANDDCC 10,345 117,540 2.04 25,960 360,584 2.88
Fyffes 171,256 35,964 0.62 269,136 85,854 0.68
Paddy Power - - - 23,210 285,019 2.27
Smurfit Kappa 9,925 13,300 0.23 14,281 43,129 0.35
United Drug 65,541 95,690 1.66 46,791 175,466 1.40
262,494 4.55 950,052 7.58
ISRAELBATM Advanced Communication 175,373 50,172 0.87 175,373 95,694 0.76
50,172 0.87 95,694 0.76
ITALYDiasorin 3,503 58,500 1.01 12,232 165,132 1.32
Hera 40,000 49,519 0.86 - - -
Iride 52,702 47,405 0.82 173,342 268,160 2.14
Marr 45,120 229,886 3.99 72,046 356,628 2.84
Prysmian 4,195 31,463 0.55 11,190 153,638 1.23
Zignago Vetro 49,544 163,619 2.84 83,746 315,722 2.52
580,392 10.07 1,259,280 10.05
LUXEMBOURGPrologis European Properties 6,103 8,117 0.14 15,568 97,144 0.77
8,117 0.14 97,144 0.77
NETHERLANDS - - -Arcadis 3,381 30,666 0.53 7,124 86,699 0.69
Eriks Group - - - 2,730 99,618 0.79
Fugro 5,424 129,796 2.25 8,199 339,685 2.71
Imtech 6,566 68,024 1.18 10,410 149,175 1.19
Nutreco 4,388 118,037 2.05 4,660 153,407 1.22
Sligro Food Group 4,300 72,841 1.26 - - -
Vastned Retail 4,525 137,515 2.38 - - -
Vopak Kon 2,777 83,477 1.45 - - -
Wereldhave 172 9,028 0.16 - - -
649,384 11.26 828,584 6.60
NORWAYAtea 57,660 104,839 1.82 - - -
Aker Kvaerner 13,747 66,628 1.16 12,510 140,695 1.12
EDB Business Partner - - - 12,803 26,208 0.22
Ementor - - - 44,600 132,113 1.05
171,467 2.97 299,016 2.39
SPAINConstrucciones Y Auxiliar De Ferrocarriles 491 117,840 2.04 651 162,815 1.30Prosegur Compani De Seguridad - - - 5,900 143,488 1.14Vidrala 3,842 57,630 1.00 - - -
Viscofan 3,613 52,858 0.92 5,033 58,131 0.46
228,328 3.96 364,434 2.90
SWEDENB&B Tools - - - 19,584 234,446 1.87
Semcon 'AB' 12,196 15,500 0.27 23,072 90,222 0.71
15,500 0.27 324,668 2.58
SWITZERLANDCompanie Financiere Tradition 748 42,883 0.74 991 81,798 0.65Vetropack - - - 149 179,751 1.43
Winterthur Technologies 7,792 125,165 2.17 6,055 180,693 1.44
168,048 2.91 442,242 3.52
50
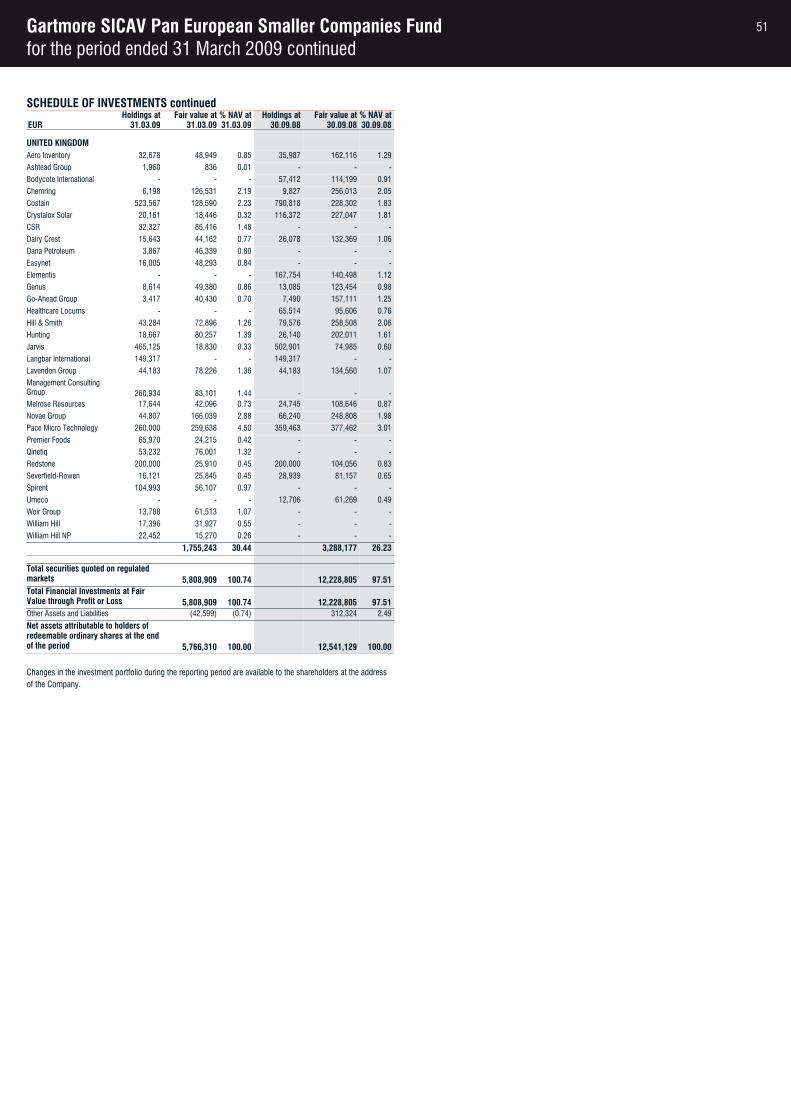
Gartmore SICAV Pan European Smaller Companies Fundfor the period ended 31 March 2009 continued
SCHEDULE OF INVESTMENTS continuedHoldings at Fair value at % NAV at Holdings at Fair value at % NAV at
EUR 31.03.09 31.03.09 31.03.09 30.09.08 30.09.08 30.09.08
UNITED KINGDOMAero Inventory 32,678 48,949 0.85 35,987 162,116 1.29
Ashtead Group 1,960 836 0.01 - - -
Bodycote International - - - 57,412 114,199 0.91
Chemring 6,198 126,531 2.19 9,827 256,013 2.05
Costain 523,567 128,590 2.23 790,818 228,302 1.83
Crystalox Solar 20,161 18,446 0.32 116,372 227,047 1.81
CSR 32,327 85,416 1.48 - - -
Dairy Crest 15,643 44,162 0.77 26,078 132,369 1.06
Dana Petroleum 3,867 46,339 0.80 - - -
Easynet 16,005 48,293 0.84 - - -
Elementis - - - 167,754 140,498 1.12
Genus 8,614 49,380 0.86 13,085 123,454 0.98
Go-Ahead Group 3,417 40,430 0.70 7,490 157,111 1.25
Healthcare Locums - - - 65,514 95,606 0.76
Hill & Smith 43,284 72,896 1.26 79,576 258,508 2.06
Hunting 18,667 80,257 1.39 26,140 202,011 1.61
Jarvis 465,125 18,830 0.33 502,901 74,985 0.60
Langbar International 149,317 - - 149,317 - -
Lavendon Group 44,183 78,226 1.36 44,183 134,560 1.07
Management Consulting Group 260,934 83,101 1.44 - - -Melrose Resources 17,644 42,096 0.73 24,745 108,646 0.87
Novae Group 44,807 166,039 2.88 66,240 248,808 1.98
Pace Micro Technology 260,000 259,638 4.50 359,463 377,462 3.01
Premier Foods 65,970 24,215 0.42 - - -
Qinetiq 53,232 76,001 1.32 - - -
Redstone 200,000 25,910 0.45 200,000 104,056 0.83
Severfield-Rowen 16,121 25,845 0.45 28,939 81,157 0.65
Spirent 104,993 56,107 0.97 - - -
Umeco - - - 12,706 61,269 0.49
Weir Group 13,788 61,513 1.07 - - -
William Hill 17,396 31,927 0.55 - - -
William Hill NP 22,452 15,270 0.26 - - -
1,755,243 30.44 3,288,177 26.23
Total securities quoted on regulated markets 5,808,909 100.74 12,228,805 97.51Total Financial Investments at Fair Value through Profit or Loss 5,808,909 100.74 12,228,805 97.51Other Assets and Liabilities (42,599) (0.74) 312,324 2.49
Net assets attributable to holders of redeemable ordinary shares at the end of the period 5,766,310 100.00 12,541,129 100.00
Changes in the investment portfolio during the reporting period are available to the shareholders at the address of the Company.
51

Gartmore SICAV United Kingdom Fundfor the period ended 31 March 2009
BALANCE SHEETGBP Note 31.03.09 30.09.08CURRENT ASSETS
Cash and cash equivalents 2.8 749,055 873,261
Margin accounts 2.5(b), 9 - -
Due from brokers 2.10 398,781 684,061
Subscriptions receivable 2.12 187,348 935,672
Financial investments at fair value through profit or loss 2.3, 2.5, 4, 5, 6, 7, 8 24,111,195 30,362,497Dividend receivable 2.4, 2.12 129,244 161,784
Interest receivable 2.4, 2.12 - -
Other accrued income and prepaid expenses 508 55,293
Total assets 25,576,131 33,072,568
CURRENT LIABILITIES
Bank overdraft 2.8 - -
Due to brokers 2.10 815,692 971,300
Redemptions payable 2.12 12,916 2,078
Distributions payable to holders of redeemable ordinary shares 12 - 888,770Accrued interest 2.4, 2.12 - -
Accrued expenses 2.12 55,358 68,809
Liabilities (excluding net assets attributable to holders of redeemable ordinary shares) 883,966 1,930,957Net assets attributable to holders of redeemableordinary shares 24,692,165 31,141,611
CASH-FLOW STATEMENTGBP Note 31.03.09 31.03.08CASH-FLOW FROM OPERATING ACTIVITIES
Increase/(decrease) in net assets attributable toholders of redeemable ordinary shares from operations (8,007,686) (7,089,916)
Adjustment for:
Interest income 2.6 (8,924) (144)
Interest expense 2.6 - -
Dividend income 2.6 (533,555) (905,940)
Investments interest 2.6 - -
Securities lending revenue 2.7, 14 - -
Taxation 2.9 8,699 83,770
Distributions to holders of redeemable ordinary shares 12 - -
Operating profit/(loss) before working capital changes (8,541,466) (7,912,230)Net decrease/(increase) in other accrued income and prepaid expenses 54,785 (24,442)Net decrease/(increase) in due from brokers 285,280 807,033
Net (decrease)/increase in due to brokers (155,608) (1,659,646)
Net increase/(decrease) in accrued expenses (13,451) (15,734)
Net (increase)/decrease in financial investments at fair value through profit or loss 6,251,302 24,880,011Interest received 2.6, 2.12 8,924 144
Interest paid 2.6, 2.12 - -
Dividend received 2.6, 2.12 566,095 826,814
Investments interest received 2.6 - -
Securities lending commission received 2.7, 14 - -
Tax paid 2.9 (8,699) (83,770)
Net cash generated from/(used in) operating activities (1,552,838) 16,818,180
CASH-FLOW FROM FINANCING ACTIVITIES
Distributions paid to holders of redeemable ordinary shares 12 (888,770) (883,862)Cash received on shares issued 4,504,080 4,244,875
Cash paid out on shares redeemed (2,186,678) (21,388,530)
Net cash generated from/(used in) financing activities 1,428,632 (18,027,517)Net increase/(decrease) in cash and cash equivalents (124,206) (1,209,337)Opening cash and cash equivalents 873,261 985,456Closing cash and cash equivalents 749,055 (223,881)
INCOME STATEMENTGBP Note 31.03.09 31.03.08REVENUE
Deposit interest 2.6 8,924 144
Dividend income 2.6 533,555 905,940
Investments interest 2.6 - -
Securities lending revenue 2.7, 14 - -
Net gains/(losses) on financial investments at fair value through profit or loss 2.3 (8,194,203) (7,239,575)Other income 19,597 77
Total investment income (7,632,127) (6,333,414)
EXPENSES
Management fees 13 196,421 406,324
Performance fees 13 - -
Administration fees 13 23,320 30,953
Transaction charges 17 143,193 231,061
Service fees 13 - -
Interest expense 2.6 - -
Other expenses 3,926 4,394
Total operating expenses 366,860 672,732Operating profit/(loss) (7,998,987) (7,006,146)
FINANCE COSTS
Distributions to holders of redeemable ordinary shares 12 - -
Total finance costs - -Net profit/(loss) before tax (7,998,987) (7,006,146)Taxation 2.9 8,699 83,770
Increase/(decrease) in net assets attributable toholders of redeemable ordinary shares from operations (8,007,686) (7,089,916)
STATEMENT OF CHANGES IN NET ASSETS ATTRIBUTABLE TO HOLDERS OF REDEEMABLE ORDINARY SHARESGBP Note 31.03.09 31.03.08Net assets attributable to holders of redeemableordinary shares at beginning of the period 31,141,611 67,576,937Increase/(decrease) in net assets attributable toholders of redeemable ordinary shares from operations (8,007,686) (7,089,916)Proceeds from shares issued 3,755,756 3,269,906
Payments for shares redeemed (2,197,516) (22,483,827)
Currency translation adjustment 2.2 - -
Net assets attributable to holders of redeemableordinary shares at end of the period 24,692,165 41,273,100
The accompanying notes 1 to 19 found on pages 81 to 115 form an integral part of the financial statements.
52
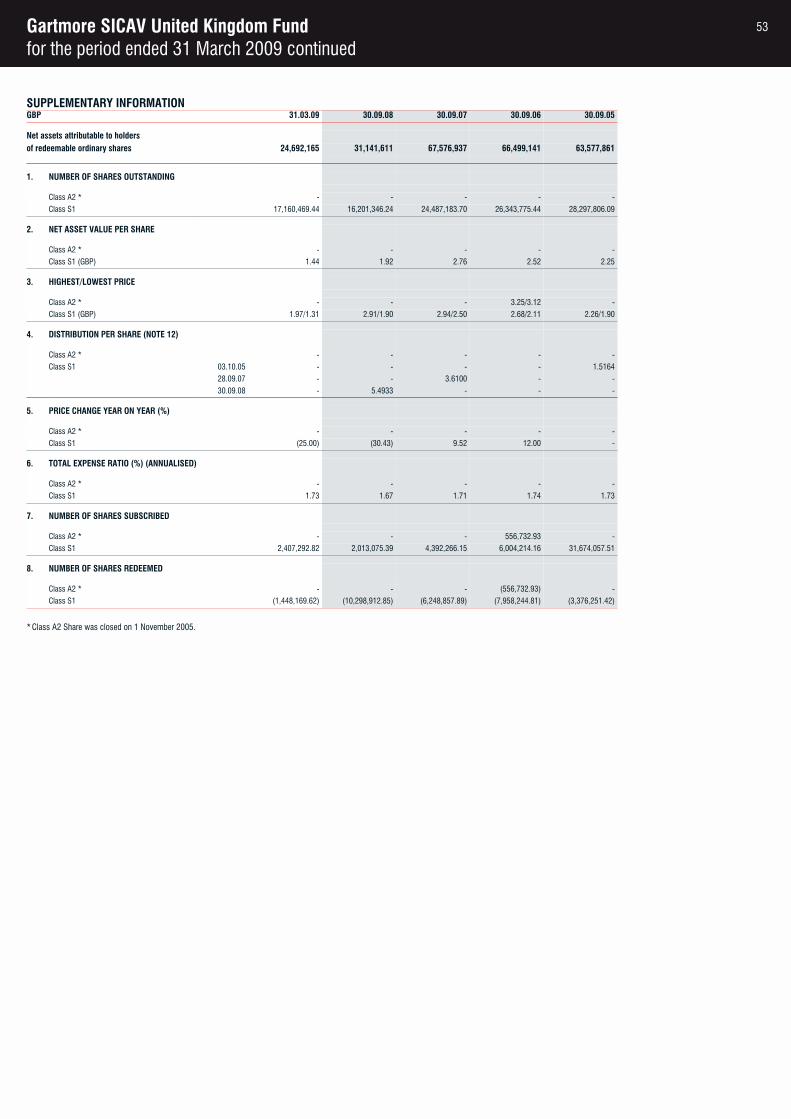
Gartmore SICAV United Kingdom Fundfor the period ended 31 March 2009 continued
SUPPLEMENTARY INFORMATIONGBP 31.03.09 30.09.08 30.09.07 30.09.06 30.09.05
Net assets attributable to holdersof redeemable ordinary shares 24,692,165 31,141,611 67,576,937 66,499,141 63,577,861
1. NUMBER OF SHARES OUTSTANDING
Class A2 * - - - - -
Class S1 17,160,469.44 16,201,346.24 24,487,183.70 26,343,775.44 28,297,806.09
2. NET ASSET VALUE PER SHARE
Class A2 * - - - - -
Class S1 (GBP) 1.44 1.92 2.76 2.52 2.25
3. HIGHEST/LOWEST PRICE
Class A2 * - - - 3.25/3.12 -
Class S1 (GBP) 1.97/1.31 2.91/1.90 2.94/2.50 2.68/2.11 2.26/1.90
4. DISTRIBUTION PER SHARE (NOTE 12)
Class A2 * - - - - -
Class S1 03.10.05 - - - - 1.5164
28.09.07 - - 3.6100 - -
30.09.08 - 5.4933 - - -
5. PRICE CHANGE YEAR ON YEAR (%)
Class A2 * - - - - -
Class S1 (25.00) (30.43) 9.52 12.00 -
6. TOTAL EXPENSE RATIO (%) (ANNUALISED)
Class A2 * - - - - -
Class S1 1.73 1.67 1.71 1.74 1.73
7. NUMBER OF SHARES SUBSCRIBED
Class A2 * - - - 556,732.93 -
Class S1 2,407,292.82 2,013,075.39 4,392,266.15 6,004,214.16 31,674,057.51
8. NUMBER OF SHARES REDEEMED
Class A2 * - - - (556,732.93) -
Class S1 (1,448,169.62) (10,298,912.85) (6,248,857.89) (7,958,244.81) (3,376,251.42)
*Class A2 Share was closed on 1 November 2005.
53
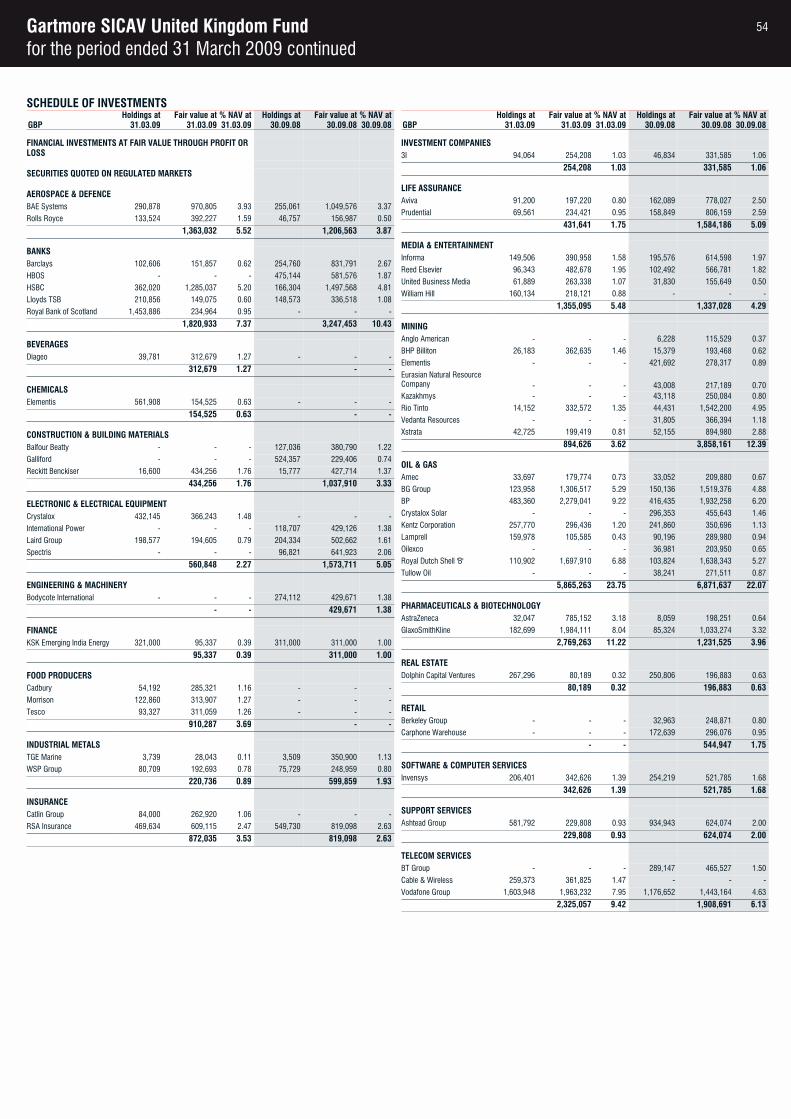
Gartmore SICAV United Kingdom Fundfor the period ended 31 March 2009 continued
SCHEDULE OF INVESTMENTSHoldings at Fair value at % NAV at Holdings at Fair value at % NAV at
GBP 31.03.09 31.03.09 31.03.09 30.09.08 30.09.08 30.09.08
FINANCIAL INVESTMENTS AT FAIR VALUE THROUGH PROFIT OR LOSS
SECURITIES QUOTED ON REGULATED MARKETS
AEROSPACE & DEFENCEBAE Systems 290,878 970,805 3.93 255,061 1,049,576 3.37
Rolls Royce 133,524 392,227 1.59 46,757 156,987 0.50
1,363,032 5.52 1,206,563 3.87
BANKSBarclays 102,606 151,857 0.62 254,760 831,791 2.67
HBOS - - - 475,144 581,576 1.87
HSBC 362,020 1,285,037 5.20 166,304 1,497,568 4.81
Lloyds TSB 210,856 149,075 0.60 148,573 336,518 1.08
Royal Bank of Scotland 1,453,886 234,964 0.95 - - -
1,820,933 7.37 3,247,453 10.43
BEVERAGESDiageo 39,781 312,679 1.27 - - -
312,679 1.27 - -
CHEMICALSElementis 561,908 154,525 0.63 - - -
154,525 0.63 - -
CONSTRUCTION & BUILDING MATERIALSBalfour Beatty - - - 127,036 380,790 1.22
Galliford - - - 524,357 229,406 0.74
Reckitt Benckiser 16,600 434,256 1.76 15,777 427,714 1.37
434,256 1.76 1,037,910 3.33
ELECTRONIC & ELECTRICAL EQUIPMENTCrystalox 432,145 366,243 1.48 - - -
International Power - - - 118,707 429,126 1.38
Laird Group 198,577 194,605 0.79 204,334 502,662 1.61
Spectris - - - 96,821 641,923 2.06
560,848 2.27 1,573,711 5.05
ENGINEERING & MACHINERYBodycote International - - - 274,112 429,671 1.38
- - 429,671 1.38
FINANCEKSK Emerging India Energy 321,000 95,337 0.39 311,000 311,000 1.00
95,337 0.39 311,000 1.00
FOOD PRODUCERSCadbury 54,192 285,321 1.16 - - -
Morrison 122,860 313,907 1.27 - - -
Tesco 93,327 311,059 1.26 - - -
910,287 3.69 - -
INDUSTRIAL METALSTGE Marine 3,739 28,043 0.11 3,509 350,900 1.13
WSP Group 80,709 192,693 0.78 75,729 248,959 0.80
220,736 0.89 599,859 1.93
INSURANCECatlin Group 84,000 262,920 1.06 - - -
RSA Insurance 469,634 609,115 2.47 549,730 819,098 2.63
872,035 3.53 819,098 2.63
Holdings at Fair value at % NAV at Holdings at Fair value at % NAV atGBP 31.03.09 31.03.09 31.03.09 30.09.08 30.09.08 30.09.08
INVESTMENT COMPANIES3I 94,064 254,208 1.03 46,834 331,585 1.06
254,208 1.03 331,585 1.06
LIFE ASSURANCEAviva 91,200 197,220 0.80 162,089 778,027 2.50
Prudential 69,561 234,421 0.95 158,849 806,159 2.59
431,641 1.75 1,584,186 5.09
MEDIA & ENTERTAINMENTInforma 149,506 390,958 1.58 195,576 614,598 1.97
Reed Elsevier 96,343 482,678 1.95 102,492 566,781 1.82
United Business Media 61,889 263,338 1.07 31,830 155,649 0.50
William Hill 160,134 218,121 0.88 - - -
1,355,095 5.48 1,337,028 4.29
MININGAnglo American - - - 6,228 115,529 0.37
BHP Billiton 26,183 362,635 1.46 15,379 193,468 0.62
Elementis - - - 421,692 278,317 0.89
Eurasian Natural Resource Company - - - 43,008 217,189 0.70Kazakhmys - - - 43,118 250,084 0.80
Rio Tinto 14,152 332,572 1.35 44,431 1,542,200 4.95
Vedanta Resources - - - 31,805 366,394 1.18
Xstrata 42,725 199,419 0.81 52,155 894,980 2.88
894,626 3.62 3,858,161 12.39
OIL & GASAmec 33,697 179,774 0.73 33,052 209,880 0.67
BG Group 123,958 1,306,517 5.29 150,136 1,519,376 4.88
BP 483,360 2,279,041 9.22 416,435 1,932,258 6.20
Crystalox Solar - - - 296,353 455,643 1.46
Kentz Corporation 257,770 296,436 1.20 241,860 350,696 1.13
Lamprell 159,978 105,585 0.43 90,196 289,980 0.94
Oilexco - - - 36,981 203,950 0.65
Royal Dutch Shell 'B' 110,902 1,697,910 6.88 103,824 1,638,343 5.27
Tullow Oil - - - 38,241 271,511 0.87
5,865,263 23.75 6,871,637 22.07
PHARMACEUTICALS & BIOTECHNOLOGYAstraZeneca 32,047 785,152 3.18 8,059 198,251 0.64
GlaxoSmithKline 182,699 1,984,111 8.04 85,324 1,033,274 3.32
2,769,263 11.22 1,231,525 3.96
REAL ESTATEDolphin Capital Ventures 267,296 80,189 0.32 250,806 196,883 0.63
80,189 0.32 196,883 0.63
RETAILBerkeley Group - - - 32,963 248,871 0.80
Carphone Warehouse - - - 172,639 296,076 0.95
- - 544,947 1.75
SOFTWARE & COMPUTER SERVICESInvensys 206,401 342,626 1.39 254,219 521,785 1.68
342,626 1.39 521,785 1.68
SUPPORT SERVICESAshtead Group 581,792 229,808 0.93 934,943 624,074 2.00
229,808 0.93 624,074 2.00
TELECOM SERVICESBT Group - - - 289,147 465,527 1.50
Cable & Wireless 259,373 361,825 1.47 - - -
Vodafone Group 1,603,948 1,963,232 7.95 1,176,652 1,443,164 4.63
2,325,057 9.42 1,908,691 6.13
54
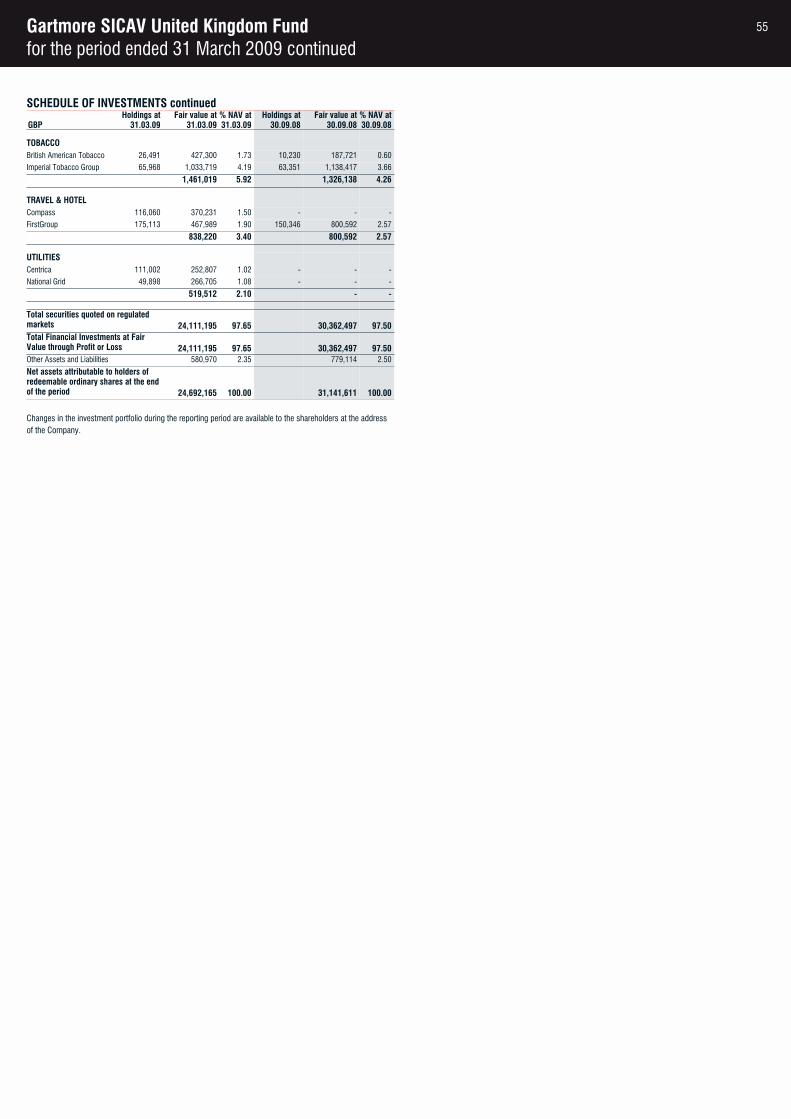
Gartmore SICAV United Kingdom Fundfor the period ended 31 March 2009 continued
SCHEDULE OF INVESTMENTS continuedHoldings at Fair value at % NAV at Holdings at Fair value at % NAV at
GBP 31.03.09 31.03.09 31.03.09 30.09.08 30.09.08 30.09.08
TOBACCOBritish American Tobacco 26,491 427,300 1.73 10,230 187,721 0.60
Imperial Tobacco Group 65,968 1,033,719 4.19 63,351 1,138,417 3.66
1,461,019 5.92 1,326,138 4.26
TRAVEL & HOTELCompass 116,060 370,231 1.50 - - -
FirstGroup 175,113 467,989 1.90 150,346 800,592 2.57
838,220 3.40 800,592 2.57
UTILITIESCentrica 111,002 252,807 1.02 - - -
National Grid 49,898 266,705 1.08 - - -
519,512 2.10 - -
Total securities quoted on regulated markets 24,111,195 97.65 30,362,497 97.50Total Financial Investments at Fair Value through Profit or Loss 24,111,195 97.65 30,362,497 97.50Other Assets and Liabilities 580,970 2.35 779,114 2.50
Net assets attributable to holders of redeemable ordinary shares at the end of the period 24,692,165 100.00 31,141,611 100.00
Changes in the investment portfolio during the reporting period are available to the shareholders at the address of the Company.
55

Gartmore SICAV US Opportunities Fundfor the period ended 31 March 2009
BALANCE SHEETUSD Note 31.03.09 30.09.08CURRENT ASSETS
Cash and cash equivalents 2.8 604,970 36,536,533
Margin accounts 2.5(b), 9 - -
Due from brokers 2.10 312,656 10,711,082
Subscriptions receivable 2.12 1,839,337 1,056,666
Financial investments at fair value through profit or loss 2.3, 2.5, 4, 5, 6, 7, 8 36,585,417 168,755,512Dividend receivable 2.4, 2.12 11,896 52,164
Interest receivable 2.4, 2.12 - -
Other accrued income and prepaid expenses 1,133 49,999
Total assets 39,355,409 217,161,956
CURRENT LIABILITIES
Bank overdraft 2.8 - 3,599,519
Due to brokers 2.10 63,018 3,760,339
Redemptions payable 2.12 354,592 6,056,478
Distributions payable to holders of redeemable ordinary shares 12 - -Accrued interest 2.4, 2.12 - -
Accrued expenses 2.12 121,911 450,570
Liabilities (excluding net assets attributable to holders of redeemable ordinary shares) 539,521 13,866,906Net assets attributable to holders of redeemableordinary shares 38,815,888 203,295,050
CASH-FLOW STATEMENTUSD Note 31.03.09 31.03.08CASH-FLOW FROM OPERATING ACTIVITIES
Increase/(decrease) in net assets attributable toholders of redeemable ordinary shares from operations (51,026,246) (60,525,222)
Adjustment for:
Interest income 2.6 (36,789) (730,625)
Interest expense 2.6 - -
Dividend income 2.6 (797,925) (2,797,953)
Investments interest 2.6 - (43,751)
Securities lending revenue 2.7, 14 - -
Taxation 2.9 232,310 924,273
Distributions to holders of redeemable ordinary shares 12 - -
Operating profit/(loss) before working capital changes (51,628,650) (63,173,278)Net decrease/(increase) in other accrued income and prepaid expenses 48,866 (45,365)Net decrease/(increase) in due from brokers 10,398,426 8,807
Net (decrease)/increase in due to brokers (3,697,321) 8,506,364
Net increase/(decrease) in accrued expenses (328,659) 438,594
Net (increase)/decrease in financial investments at fair value through profit or loss 132,170,095 (194,417,577)Interest received 2.6, 2.12 36,789 730,625
Interest paid 2.6, 2.12 - -
Dividend received 2.6, 2.12 838,193 2,714,616
Investments interest received 2.6 - 43,751
Securities lending commission received 2.7, 14 - -
Tax paid 2.9 (232,310) (924,273)
Net cash generated from/(used in) operating activities 87,605,429 (246,117,736)
CASH-FLOW FROM FINANCING ACTIVITIES
Distributions paid to holders of redeemable ordinary shares 12 - -Cash received on shares issued 18,194,348 445,593,748
Cash paid out on shares redeemed (138,131,821) (160,811,413)
Net cash generated from/(used in) financing activities (119,937,473) 284,782,335Net increase/(decrease) in cash and cash equivalents (32,332,044) 38,664,599Opening cash and cash equivalents 32,937,014 24,525,937Closing cash and cash equivalents 604,970 63,190,536
INCOME STATEMENTUSD Note 31.03.09 31.03.08REVENUE
Deposit interest 2.6 36,789 730,625
Dividend income 2.6 797,925 2,797,953
Investments interest 2.6 - 43,751
Securities lending revenue 2.7, 14 - -
Net gains/(losses) on financial investments at fair value through profit or loss 2.3 (51,002,054) (59,668,334)Other income 97,199 158,817
Total investment income (50,070,141) (55,937,188)
EXPENSES
Management fees 13 517,159 2,944,932
Performance fees 13 - -
Administration fees 13 10,851 247,212
Transaction charges 17 157,825 326,915
Service fees 13 25,699 111,925
Interest expense 2.6 - -
Other expenses 12,261 32,777
Total operating expenses 723,795 3,663,761Operating profit/(loss) (50,793,936) (59,600,949)
FINANCE COSTS
Distributions to holders of redeemable ordinary shares 12 - -
Total finance costs - -Net profit/(loss) before tax (50,793,936) (59,600,949)Taxation 2.9 232,310 924,273
Increase/(decrease) in net assets attributable toholders of redeemable ordinary shares from operations (51,026,246) (60,525,222)
STATEMENT OF CHANGES IN NET ASSETS ATTRIBUTABLE TO HOLDERS OF REDEEMABLE ORDINARY SHARESUSD Note 31.03.09 31.03.08Net assets attributable to holders of redeemableordinary shares at beginning of the period 203,295,050 214,318,761Increase/(decrease) in net assets attributable toholders of redeemable ordinary shares from operations (51,026,246) (60,525,222)Proceeds from shares issued 18,977,019 419,116,769
Payments for shares redeemed (132,429,935) (164,286,816)
Currency translation adjustment 2.2 - -
Net assets attributable to holders of redeemableordinary shares at end of the period 38,815,888 408,623,492
The accompanying notes 1 to 19 found on pages 81 to 115 form an integral part of the financial statements.
56
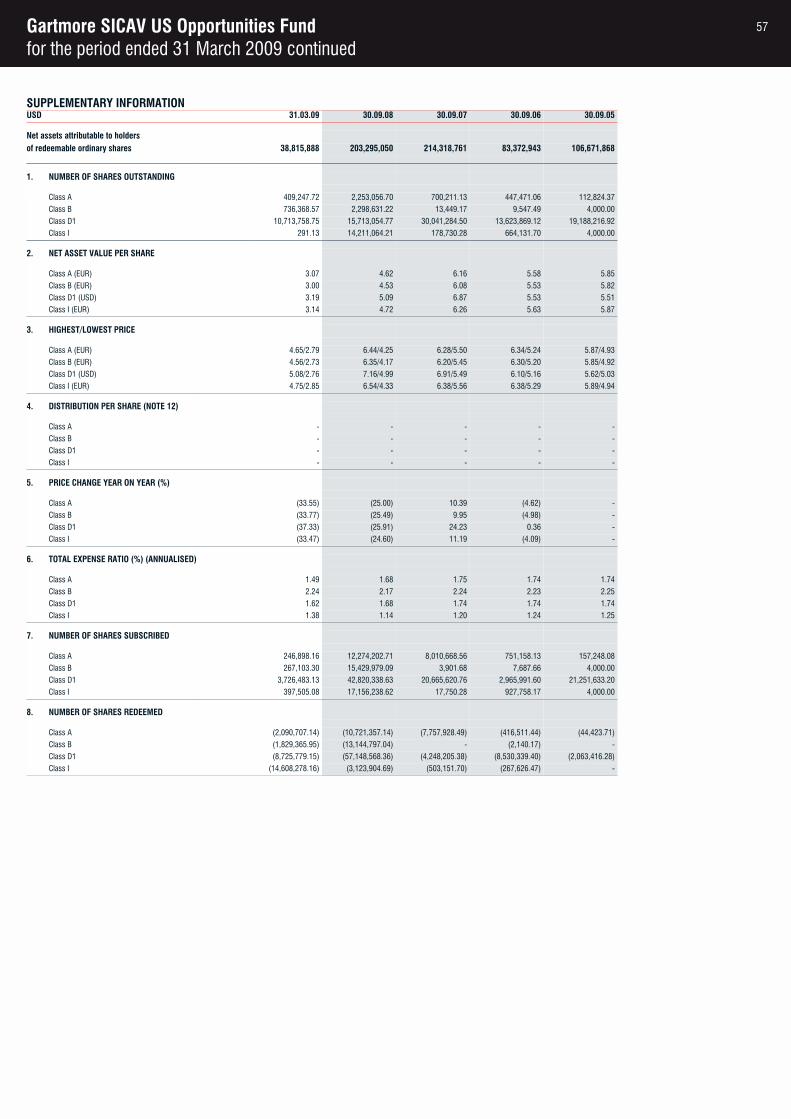
Gartmore SICAV US Opportunities Fundfor the period ended 31 March 2009 continued
SUPPLEMENTARY INFORMATIONUSD 31.03.09 30.09.08 30.09.07 30.09.06 30.09.05
Net assets attributable to holdersof redeemable ordinary shares 38,815,888 203,295,050 214,318,761 83,372,943 106,671,868
1. NUMBER OF SHARES OUTSTANDING
Class A 409,247.72 2,253,056.70 700,211.13 447,471.06 112,824.37
Class B 736,368.57 2,298,631.22 13,449.17 9,547.49 4,000.00
Class D1 10,713,758.75 15,713,054.77 30,041,284.50 13,623,869.12 19,188,216.92
Class I 291.13 14,211,064.21 178,730.28 664,131.70 4,000.00
2. NET ASSET VALUE PER SHARE
Class A (EUR) 3.07 4.62 6.16 5.58 5.85
Class B (EUR) 3.00 4.53 6.08 5.53 5.82
Class D1 (USD) 3.19 5.09 6.87 5.53 5.51
Class I (EUR) 3.14 4.72 6.26 5.63 5.87
3. HIGHEST/LOWEST PRICE
Class A (EUR) 4.65/2.79 6.44/4.25 6.28/5.50 6.34/5.24 5.87/4.93
Class B (EUR) 4.56/2.73 6.35/4.17 6.20/5.45 6.30/5.20 5.85/4.92
Class D1 (USD) 5.08/2.76 7.16/4.99 6.91/5.49 6.10/5.16 5.62/5.03
Class I (EUR) 4.75/2.85 6.54/4.33 6.38/5.56 6.38/5.29 5.89/4.94
4. DISTRIBUTION PER SHARE (NOTE 12)
Class A - - - - -
Class B - - - - -
Class D1 - - - - -
Class I - - - - -
5. PRICE CHANGE YEAR ON YEAR (%)
Class A (33.55) (25.00) 10.39 (4.62) -
Class B (33.77) (25.49) 9.95 (4.98) -
Class D1 (37.33) (25.91) 24.23 0.36 -
Class I (33.47) (24.60) 11.19 (4.09) -
6. TOTAL EXPENSE RATIO (%) (ANNUALISED)
Class A 1.49 1.68 1.75 1.74 1.74
Class B 2.24 2.17 2.24 2.23 2.25
Class D1 1.62 1.68 1.74 1.74 1.74
Class I 1.38 1.14 1.20 1.24 1.25
7. NUMBER OF SHARES SUBSCRIBED
Class A 246,898.16 12,274,202.71 8,010,668.56 751,158.13 157,248.08
Class B 267,103.30 15,429,979.09 3,901.68 7,687.66 4,000.00
Class D1 3,726,483.13 42,820,338.63 20,665,620.76 2,965,991.60 21,251,633.20
Class I 397,505.08 17,156,238.62 17,750.28 927,758.17 4,000.00
8. NUMBER OF SHARES REDEEMED
Class A (2,090,707.14) (10,721,357.14) (7,757,928.49) (416,511.44) (44,423.71)
Class B (1,829,365.95) (13,144,797.04) - (2,140.17) -
Class D1 (8,725,779.15) (57,148,568.36) (4,248,205.38) (8,530,339.40) (2,063,416.28)
Class I (14,608,278.16) (3,123,904.69) (503,151.70) (267,626.47) -
57
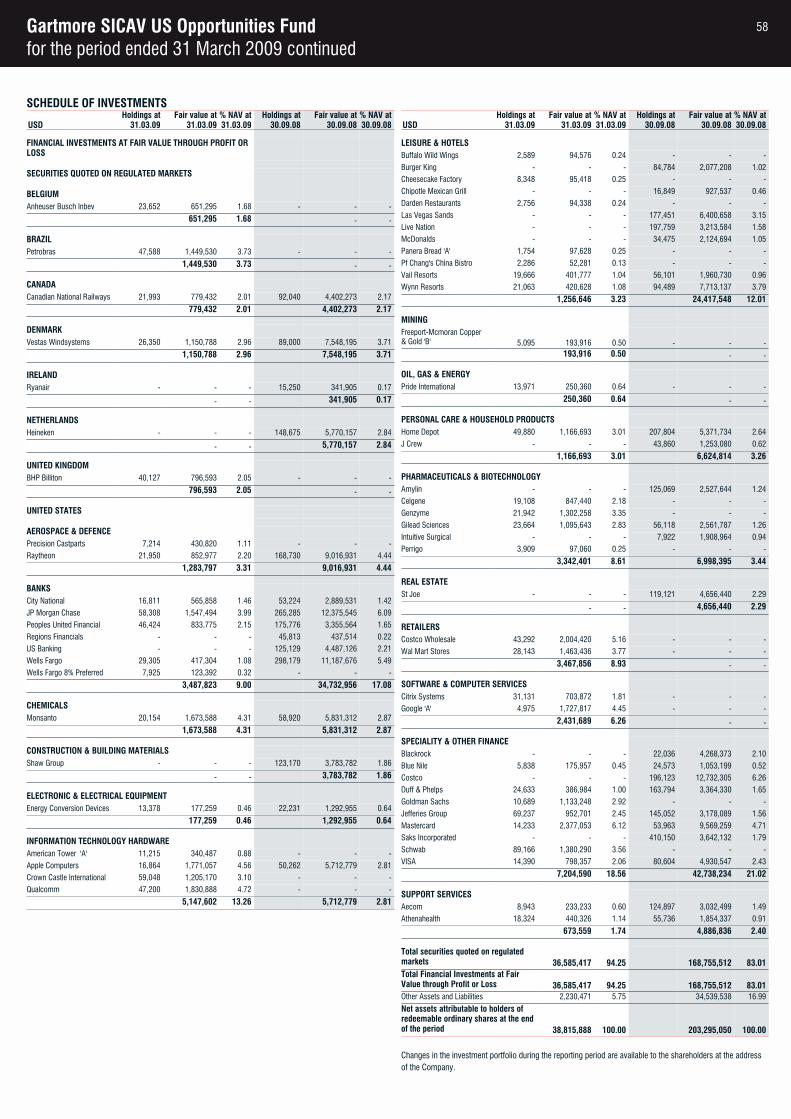
Gartmore SICAV US Opportunities Fundfor the period ended 31 March 2009 continued
SCHEDULE OF INVESTMENTSHoldings at Fair value at % NAV at Holdings at Fair value at % NAV at
USD 31.03.09 31.03.09 31.03.09 30.09.08 30.09.08 30.09.08
FINANCIAL INVESTMENTS AT FAIR VALUE THROUGH PROFIT OR LOSS
SECURITIES QUOTED ON REGULATED MARKETS
BELGIUMAnheuser Busch Inbev 23,652 651,295 1.68 - - -
651,295 1.68 - -
BRAZILPetrobras 47,588 1,449,530 3.73 - - -
1,449,530 3.73 - -
CANADACanadian National Railways 21,993 779,432 2.01 92,040 4,402,273 2.17
779,432 2.01 4,402,273 2.17
DENMARKVestas Windsystems 26,350 1,150,788 2.96 89,000 7,548,195 3.71
1,150,788 2.96 7,548,195 3.71
IRELANDRyanair - - - 15,250 341,905 0.17
- - 341,905 0.17
NETHERLANDSHeineken - - - 148,675 5,770,157 2.84
- - 5,770,157 2.84
UNITED KINGDOMBHP Billiton 40,127 796,593 2.05 - - -
796,593 2.05 - -
UNITED STATES
AEROSPACE & DEFENCEPrecision Castparts 7,214 430,820 1.11 - - -
Raytheon 21,950 852,977 2.20 168,730 9,016,931 4.44
1,283,797 3.31 9,016,931 4.44
BANKSCity National 16,811 565,858 1.46 53,224 2,889,531 1.42
JP Morgan Chase 58,308 1,547,494 3.99 265,285 12,375,545 6.09
Peoples United Financial 46,424 833,775 2.15 175,776 3,355,564 1.65
Regions Financials - - - 45,813 437,514 0.22
US Banking - - - 125,129 4,487,126 2.21
Wells Fargo 29,305 417,304 1.08 298,179 11,187,676 5.49
Wells Fargo 8% Preferred 7,925 123,392 0.32 - - -
3,487,823 9.00 34,732,956 17.08
CHEMICALSMonsanto 20,154 1,673,588 4.31 58,920 5,831,312 2.87
1,673,588 4.31 5,831,312 2.87
CONSTRUCTION & BUILDING MATERIALSShaw Group - - - 123,170 3,783,782 1.86
- - 3,783,782 1.86
ELECTRONIC & ELECTRICAL EQUIPMENTEnergy Conversion Devices 13,378 177,259 0.46 22,231 1,292,955 0.64
177,259 0.46 1,292,955 0.64
INFORMATION TECHNOLOGY HARDWAREAmerican Tower 'A' 11,215 340,487 0.88 - - -
Apple Computers 16,864 1,771,057 4.56 50,262 5,712,779 2.81
Crown Castle International 59,048 1,205,170 3.10 - - -
Qualcomm 47,200 1,830,888 4.72 - - -
5,147,602 13.26 5,712,779 2.81
Holdings at Fair value at % NAV at Holdings at Fair value at % NAV atUSD 31.03.09 31.03.09 31.03.09 30.09.08 30.09.08 30.09.08
LEISURE & HOTELSBuffalo Wild Wings 2,589 94,576 0.24 - - -
Burger King - - - 84,784 2,077,208 1.02
Cheesecake Factory 8,348 95,418 0.25 - - -
Chipotle Mexican Grill - - - 16,849 927,537 0.46
Darden Restaurants 2,756 94,338 0.24 - - -
Las Vegas Sands - - - 177,451 6,400,658 3.15
Live Nation - - - 197,759 3,213,584 1.58
McDonalds - - - 34,475 2,124,694 1.05
Panera Bread 'A' 1,754 97,628 0.25 - - -
Pf Chang's China Bistro 2,286 52,281 0.13 - - -
Vail Resorts 19,666 401,777 1.04 56,101 1,960,730 0.96
Wynn Resorts 21,063 420,628 1.08 94,489 7,713,137 3.79
1,256,646 3.23 24,417,548 12.01
MINING Freeport-Mcmoran Copper & Gold 'B' 5,095 193,916 0.50 - - -
193,916 0.50 - -
OIL, GAS & ENERGYPride International 13,971 250,360 0.64 - - -
250,360 0.64 - -
PERSONAL CARE & HOUSEHOLD PRODUCTSHome Depot 49,880 1,166,693 3.01 207,804 5,371,734 2.64
J Crew - - - 43,860 1,253,080 0.62
1,166,693 3.01 6,624,814 3.26
PHARMACEUTICALS & BIOTECHNOLOGYAmylin - - - 125,069 2,527,644 1.24
Celgene 19,108 847,440 2.18 - - -
Genzyme 21,942 1,302,258 3.35 - - -
Gilead Sciences 23,664 1,095,643 2.83 56,118 2,561,787 1.26
Intuitive Surgical - - - 7,922 1,908,964 0.94
Perrigo 3,909 97,060 0.25 - - -
3,342,401 8.61 6,998,395 3.44
REAL ESTATESt Joe - - - 119,121 4,656,440 2.29
- - 4,656,440 2.29
RETAILERSCostco Wholesale 43,292 2,004,420 5.16 - - -
Wal Mart Stores 28,143 1,463,436 3.77 - - -
3,467,856 8.93 - -
SOFTWARE & COMPUTER SERVICESCitrix Systems 31,131 703,872 1.81 - - -
Google 'A' 4,975 1,727,817 4.45 - - -
2,431,689 6.26 - -
SPECIALITY & OTHER FINANCEBlackrock - - - 22,036 4,268,373 2.10
Blue Nile 5,838 175,957 0.45 24,573 1,053,199 0.52
Costco - - - 196,123 12,732,305 6.26
Duff & Phelps 24,633 386,984 1.00 163,794 3,364,330 1.65
Goldman Sachs 10,689 1,133,248 2.92 - - -
Jefferies Group 69,237 952,701 2.45 145,052 3,178,089 1.56
Mastercard 14,233 2,377,053 6.12 53,963 9,569,259 4.71
Saks Incorporated - - - 410,150 3,642,132 1.79
Schwab 89,166 1,380,290 3.56 - - -
VISA 14,390 798,357 2.06 80,604 4,930,547 2.43
7,204,590 18.56 42,738,234 21.02
SUPPORT SERVICESAecom 8,943 233,233 0.60 124,897 3,032,499 1.49
Athenahealth 18,324 440,326 1.14 55,736 1,854,337 0.91
673,559 1.74 4,886,836 2.40
Total securities quoted on regulated markets 36,585,417 94.25 168,755,512 83.01Total Financial Investments at Fair Value through Profit or Loss 36,585,417 94.25 168,755,512 83.01Other Assets and Liabilities 2,230,471 5.75 34,539,538 16.99
Net assets attributable to holders of redeemable ordinary shares at the end of the period 38,815,888 100.00 203,295,050 100.00
Changes in the investment portfolio during the reporting period are available to the shareholders at the address of the Company.
58
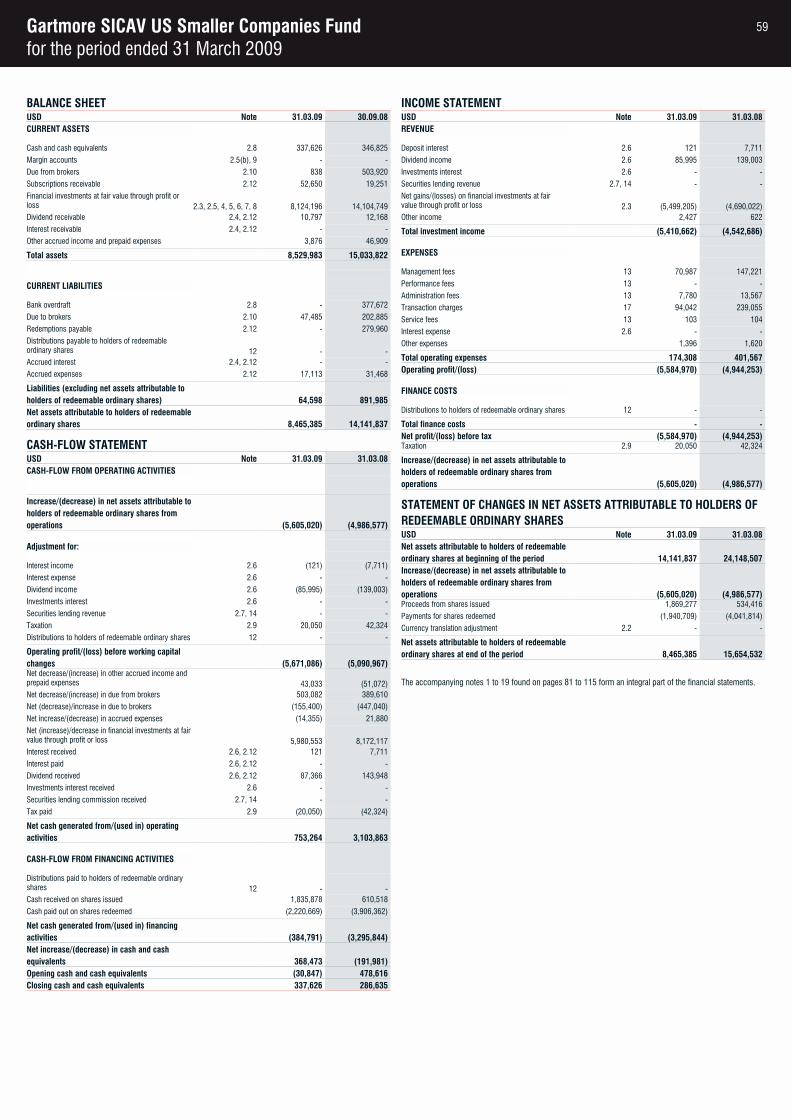
Gartmore SICAV US Smaller Companies Fundfor the period ended 31 March 2009
BALANCE SHEETUSD Note 31.03.09 30.09.08CURRENT ASSETS
Cash and cash equivalents 2.8 337,626 346,825
Margin accounts 2.5(b), 9 - -
Due from brokers 2.10 838 503,920
Subscriptions receivable 2.12 52,650 19,251
Financial investments at fair value through profit or loss 2.3, 2.5, 4, 5, 6, 7, 8 8,124,196 14,104,749Dividend receivable 2.4, 2.12 10,797 12,168
Interest receivable 2.4, 2.12 - -
Other accrued income and prepaid expenses 3,876 46,909
Total assets 8,529,983 15,033,822
CURRENT LIABILITIES
Bank overdraft 2.8 - 377,672
Due to brokers 2.10 47,485 202,885
Redemptions payable 2.12 - 279,960
Distributions payable to holders of redeemable ordinary shares 12 - -Accrued interest 2.4, 2.12 - -
Accrued expenses 2.12 17,113 31,468
Liabilities (excluding net assets attributable to holders of redeemable ordinary shares) 64,598 891,985Net assets attributable to holders of redeemableordinary shares 8,465,385 14,141,837
CASH-FLOW STATEMENTUSD Note 31.03.09 31.03.08CASH-FLOW FROM OPERATING ACTIVITIES
Increase/(decrease) in net assets attributable toholders of redeemable ordinary shares from operations (5,605,020) (4,986,577)
Adjustment for:
Interest income 2.6 (121) (7,711)
Interest expense 2.6 - -
Dividend income 2.6 (85,995) (139,003)
Investments interest 2.6 - -
Securities lending revenue 2.7, 14 - -
Taxation 2.9 20,050 42,324
Distributions to holders of redeemable ordinary shares 12 - -
Operating profit/(loss) before working capital changes (5,671,086) (5,090,967)Net decrease/(increase) in other accrued income and prepaid expenses 43,033 (51,072)Net decrease/(increase) in due from brokers 503,082 389,610
Net (decrease)/increase in due to brokers (155,400) (447,040)
Net increase/(decrease) in accrued expenses (14,355) 21,880
Net (increase)/decrease in financial investments at fair value through profit or loss 5,980,553 8,172,117Interest received 2.6, 2.12 121 7,711
Interest paid 2.6, 2.12 - -
Dividend received 2.6, 2.12 87,366 143,948
Investments interest received 2.6 - -
Securities lending commission received 2.7, 14 - -
Tax paid 2.9 (20,050) (42,324)
Net cash generated from/(used in) operating activities 753,264 3,103,863
CASH-FLOW FROM FINANCING ACTIVITIES
Distributions paid to holders of redeemable ordinary shares 12 - -Cash received on shares issued 1,835,878 610,518
Cash paid out on shares redeemed (2,220,669) (3,906,362)
Net cash generated from/(used in) financing activities (384,791) (3,295,844)Net increase/(decrease) in cash and cash equivalents 368,473 (191,981)Opening cash and cash equivalents (30,847) 478,616Closing cash and cash equivalents 337,626 286,635
INCOME STATEMENTUSD Note 31.03.09 31.03.08REVENUE
Deposit interest 2.6 121 7,711
Dividend income 2.6 85,995 139,003
Investments interest 2.6 - -
Securities lending revenue 2.7, 14 - -
Net gains/(losses) on financial investments at fair value through profit or loss 2.3 (5,499,205) (4,690,022)Other income 2,427 622
Total investment income (5,410,662) (4,542,686)
EXPENSES
Management fees 13 70,987 147,221
Performance fees 13 - -
Administration fees 13 7,780 13,567
Transaction charges 17 94,042 239,055
Service fees 13 103 104
Interest expense 2.6 - -
Other expenses 1,396 1,620
Total operating expenses 174,308 401,567Operating profit/(loss) (5,584,970) (4,944,253)
FINANCE COSTS
Distributions to holders of redeemable ordinary shares 12 - -
Total finance costs - -Net profit/(loss) before tax (5,584,970) (4,944,253)Taxation 2.9 20,050 42,324
Increase/(decrease) in net assets attributable toholders of redeemable ordinary shares from operations (5,605,020) (4,986,577)
STATEMENT OF CHANGES IN NET ASSETS ATTRIBUTABLE TO HOLDERS OF REDEEMABLE ORDINARY SHARESUSD Note 31.03.09 31.03.08Net assets attributable to holders of redeemableordinary shares at beginning of the period 14,141,837 24,148,507Increase/(decrease) in net assets attributable toholders of redeemable ordinary shares from operations (5,605,020) (4,986,577)Proceeds from shares issued 1,869,277 534,416
Payments for shares redeemed (1,940,709) (4,041,814)
Currency translation adjustment 2.2 - -
Net assets attributable to holders of redeemableordinary shares at end of the period 8,465,385 15,654,532
The accompanying notes 1 to 19 found on pages 81 to 115 form an integral part of the financial statements.
59
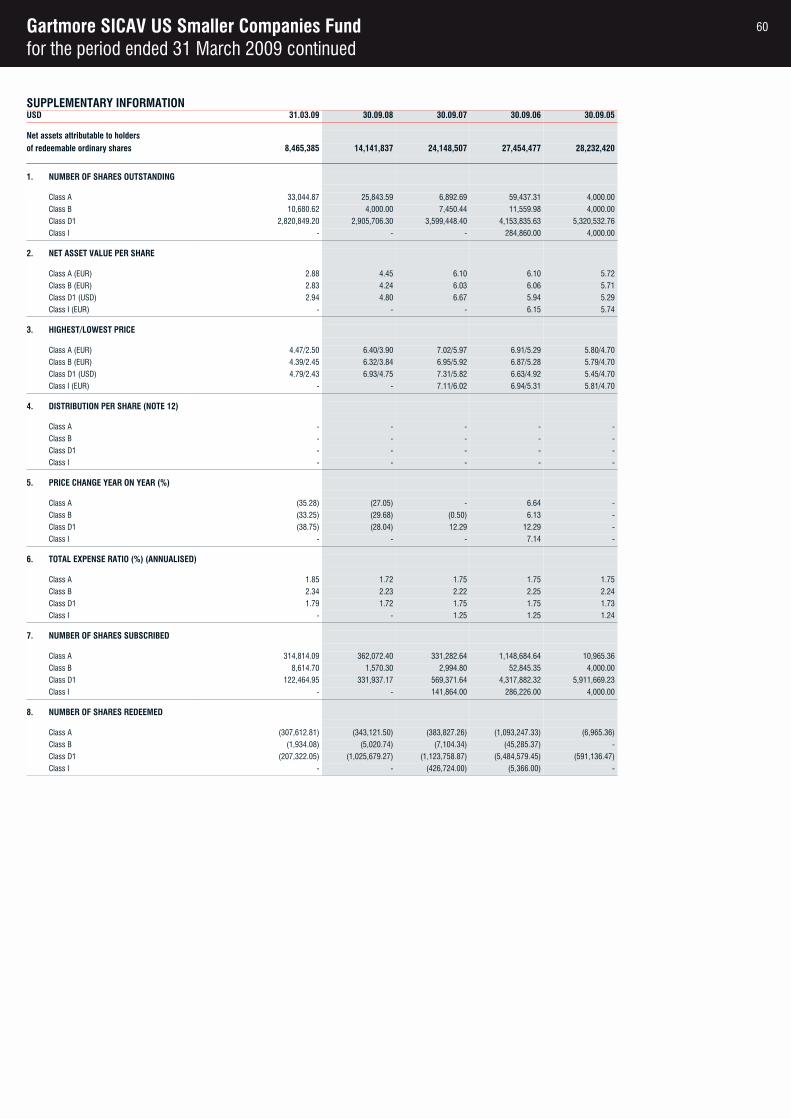
Gartmore SICAV US Smaller Companies Fundfor the period ended 31 March 2009 continued
SUPPLEMENTARY INFORMATIONUSD 31.03.09 30.09.08 30.09.07 30.09.06 30.09.05
Net assets attributable to holdersof redeemable ordinary shares 8,465,385 14,141,837 24,148,507 27,454,477 28,232,420
1. NUMBER OF SHARES OUTSTANDING
Class A 33,044.87 25,843.59 6,892.69 59,437.31 4,000.00
Class B 10,680.62 4,000.00 7,450.44 11,559.98 4,000.00
Class D1 2,820,849.20 2,905,706.30 3,599,448.40 4,153,835.63 5,320,532.76
Class I - - - 284,860.00 4,000.00
2. NET ASSET VALUE PER SHARE
Class A (EUR) 2.88 4.45 6.10 6.10 5.72
Class B (EUR) 2.83 4.24 6.03 6.06 5.71
Class D1 (USD) 2.94 4.80 6.67 5.94 5.29
Class I (EUR) - - - 6.15 5.74
3. HIGHEST/LOWEST PRICE
Class A (EUR) 4.47/2.50 6.40/3.90 7.02/5.97 6.91/5.29 5.80/4.70
Class B (EUR) 4.39/2.45 6.32/3.84 6.95/5.92 6.87/5.28 5.79/4.70
Class D1 (USD) 4.79/2.43 6.93/4.75 7.31/5.82 6.63/4.92 5.45/4.70
Class I (EUR) - - 7.11/6.02 6.94/5.31 5.81/4.70
4. DISTRIBUTION PER SHARE (NOTE 12)
Class A - - - - -
Class B - - - - -
Class D1 - - - - -
Class I - - - - -
5. PRICE CHANGE YEAR ON YEAR (%)
Class A (35.28) (27.05) - 6.64 -
Class B (33.25) (29.68) (0.50) 6.13 -
Class D1 (38.75) (28.04) 12.29 12.29 -
Class I - - - 7.14 -
6. TOTAL EXPENSE RATIO (%) (ANNUALISED)
Class A 1.85 1.72 1.75 1.75 1.75
Class B 2.34 2.23 2.22 2.25 2.24
Class D1 1.79 1.72 1.75 1.75 1.73
Class I - - 1.25 1.25 1.24
7. NUMBER OF SHARES SUBSCRIBED
Class A 314,814.09 362,072.40 331,282.64 1,148,684.64 10,965.36
Class B 8,614.70 1,570.30 2,994.80 52,845.35 4,000.00
Class D1 122,464.95 331,937.17 569,371.64 4,317,882.32 5,911,669.23
Class I - - 141,864.00 286,226.00 4,000.00
8. NUMBER OF SHARES REDEEMED
Class A (307,612.81) (343,121.50) (383,827.26) (1,093,247.33) (6,965.36)
Class B (1,934.08) (5,020.74) (7,104.34) (45,285.37) -
Class D1 (207,322.05) (1,025,679.27) (1,123,758.87) (5,484,579.45) (591,136.47)
Class I - - (426,724.00) (5,366.00) -
60
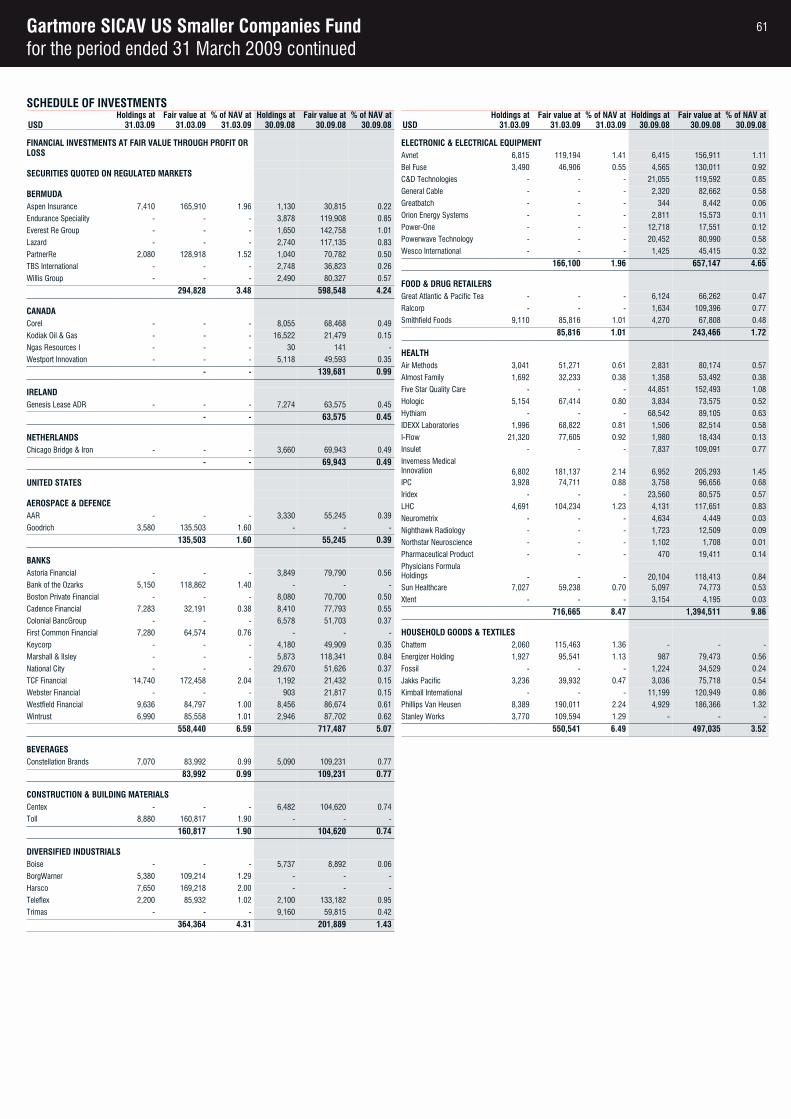
Gartmore SICAV US Smaller Companies Fundfor the period ended 31 March 2009 continued
SCHEDULE OF INVESTMENTSHoldings at Fair value at % of NAV at Holdings at Fair value at % of NAV at
USD 31.03.09 31.03.09 31.03.09 30.09.08 30.09.08 30.09.08
FINANCIAL INVESTMENTS AT FAIR VALUE THROUGH PROFIT OR LOSS
SECURITIES QUOTED ON REGULATED MARKETS
BERMUDAAspen Insurance 7,410 165,910 1.96 1,130 30,815 0.22
Endurance Speciality - - - 3,878 119,908 0.85
Everest Re Group - - - 1,650 142,758 1.01
Lazard - - - 2,740 117,135 0.83
PartnerRe 2,080 128,918 1.52 1,040 70,782 0.50
TBS International - - - 2,748 36,823 0.26
Willis Group - - - 2,490 80,327 0.57
294,828 3.48 598,548 4.24
CANADACorel - - - 8,055 68,468 0.49
Kodiak Oil & Gas - - - 16,522 21,479 0.15
Ngas Resources I - - - 30 141 -
Westport Innovation - - - 5,118 49,593 0.35
- - 139,681 0.99
IRELANDGenesis Lease ADR - - - 7,274 63,575 0.45
- - 63,575 0.45
NETHERLANDSChicago Bridge & Iron - - - 3,660 69,943 0.49
- - 69,943 0.49
UNITED STATES
AEROSPACE & DEFENCEAAR - - - 3,330 55,245 0.39
Goodrich 3,580 135,503 1.60 - - -
135,503 1.60 55,245 0.39
BANKSAstoria Financial - - - 3,849 79,790 0.56
Bank of the Ozarks 5,150 118,862 1.40 - - -
Boston Private Financial - - - 8,080 70,700 0.50
Cadence Financial 7,283 32,191 0.38 8,410 77,793 0.55
Colonial BancGroup - - - 6,578 51,703 0.37
First Common Financial 7,280 64,574 0.76 - - -
Keycorp - - - 4,180 49,909 0.35
Marshall & Ilsley - - - 5,873 118,341 0.84
National City - - - 29,670 51,626 0.37
TCF Financial 14,740 172,458 2.04 1,192 21,432 0.15
Webster Financial - - - 903 21,817 0.15
Westfield Financial 9,636 84,797 1.00 8,456 86,674 0.61
Wintrust 6,990 85,558 1.01 2,946 87,702 0.62
558,440 6.59 717,487 5.07
BEVERAGESConstellation Brands 7,070 83,992 0.99 5,090 109,231 0.77
83,992 0.99 109,231 0.77
CONSTRUCTION & BUILDING MATERIALSCentex - - - 6,482 104,620 0.74
Toll 8,880 160,817 1.90 - - -
160,817 1.90 104,620 0.74
DIVERSIFIED INDUSTRIALSBoise - - - 5,737 8,892 0.06
BorgWarner 5,380 109,214 1.29 - - -
Harsco 7,650 169,218 2.00 - - -
Teleflex 2,200 85,932 1.02 2,100 133,182 0.95
Trimas - - - 9,160 59,815 0.42
364,364 4.31 201,889 1.43
Holdings at Fair value at % of NAV at Holdings at Fair value at % of NAV atUSD 31.03.09 31.03.09 31.03.09 30.09.08 30.09.08 30.09.08
ELECTRONIC & ELECTRICAL EQUIPMENTAvnet 6,815 119,194 1.41 6,415 156,911 1.11
Bel Fuse 3,490 46,906 0.55 4,565 130,011 0.92
C&D Technologies - - - 21,055 119,592 0.85
General Cable - - - 2,320 82,662 0.58
Greatbatch - - - 344 8,442 0.06
Orion Energy Systems - - - 2,811 15,573 0.11
Power-One - - - 12,718 17,551 0.12
Powerwave Technology - - - 20,452 80,990 0.58
Wesco International - - - 1,425 45,415 0.32
166,100 1.96 657,147 4.65
FOOD & DRUG RETAILERSGreat Atlantic & Pacific Tea - - - 6,124 66,262 0.47
Ralcorp - - - 1,634 109,396 0.77
Smithfield Foods 9,110 85,816 1.01 4,270 67,808 0.48
85,816 1.01 243,466 1.72
HEALTHAir Methods 3,041 51,271 0.61 2,831 80,174 0.57
Almost Family 1,692 32,233 0.38 1,358 53,492 0.38
Five Star Quality Care - - - 44,851 152,493 1.08
Hologic 5,154 67,414 0.80 3,834 73,575 0.52
Hythiam - - - 68,542 89,105 0.63
IDEXX Laboratories 1,996 68,822 0.81 1,506 82,514 0.58
I-Flow 21,320 77,605 0.92 1,980 18,434 0.13
Insulet - - - 7,837 109,091 0.77
Inverness Medical Innovation 6,802 181,137 2.14 6,952 205,293 1.45IPC 3,928 74,711 0.88 3,758 96,656 0.68
Iridex - - - 23,560 80,575 0.57
LHC 4,691 104,234 1.23 4,131 117,651 0.83
Neurometrix - - - 4,634 4,449 0.03
Nighthawk Radiology - - - 1,723 12,509 0.09
Northstar Neuroscience - - - 1,102 1,708 0.01
Pharmaceutical Product - - - 470 19,411 0.14
Physicians Formula Holdings - - - 20,104 118,413 0.84Sun Healthcare 7,027 59,238 0.70 5,097 74,773 0.53
Xtent - - - 3,154 4,195 0.03
716,665 8.47 1,394,511 9.86
HOUSEHOLD GOODS & TEXTILESChattem 2,060 115,463 1.36 - - -
Energizer Holding 1,927 95,541 1.13 987 79,473 0.56
Fossil - - - 1,224 34,529 0.24
Jakks Pacific 3,236 39,932 0.47 3,036 75,718 0.54
Kimball International - - - 11,199 120,949 0.86
Phillips Van Heusen 8,389 190,011 2.24 4,929 186,366 1.32
Stanley Works 3,770 109,594 1.29 - - -
550,541 6.49 497,035 3.52
61
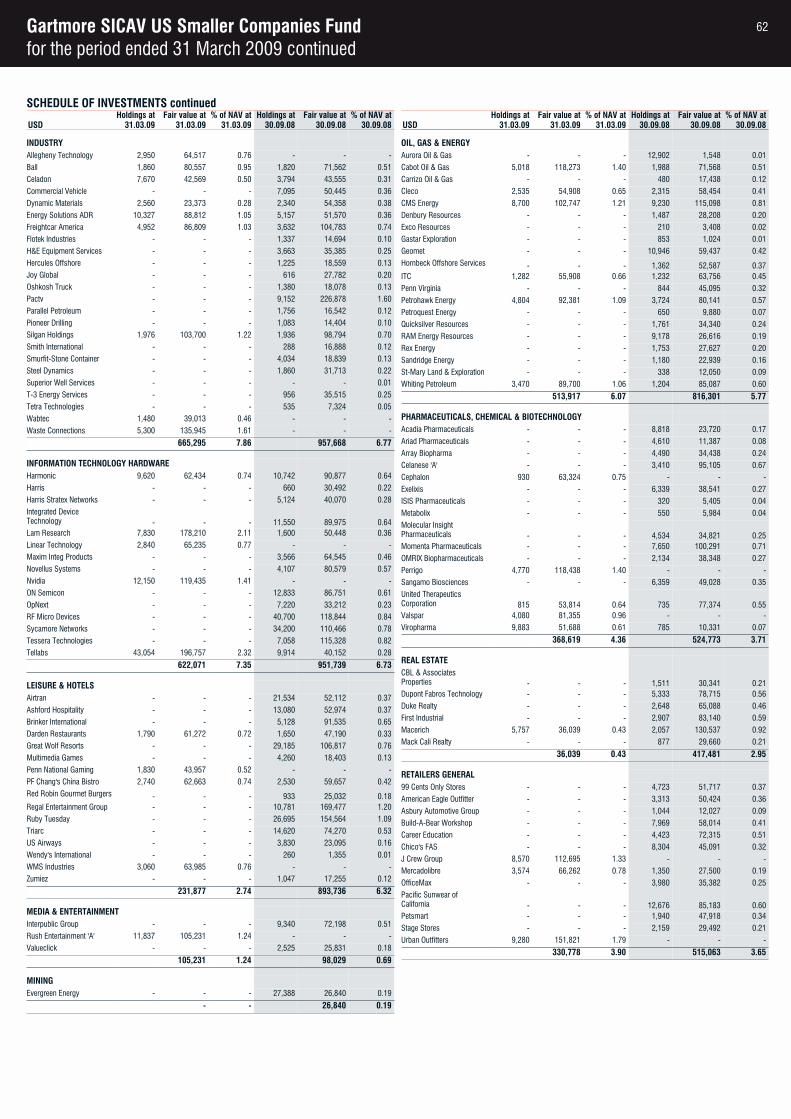
Gartmore SICAV US Smaller Companies Fundfor the period ended 31 March 2009 continued
SCHEDULE OF INVESTMENTS continuedHoldings at Fair value at % of NAV at Holdings at Fair value at % of NAV at
USD 31.03.09 31.03.09 31.03.09 30.09.08 30.09.08 30.09.08
INDUSTRYAllegheny Technology 2,950 64,517 0.76 - - -
Ball 1,860 80,557 0.95 1,820 71,562 0.51
Celadon 7,670 42,569 0.50 3,794 43,555 0.31
Commercial Vehicle - - - 7,095 50,445 0.36
Dynamic Materials 2,560 23,373 0.28 2,340 54,358 0.38
Energy Solutions ADR 10,327 88,812 1.05 5,157 51,570 0.36
Freightcar America 4,952 86,809 1.03 3,632 104,783 0.74
Flotek Industries - - - 1,337 14,694 0.10
H&E Equipment Services - - - 3,663 35,385 0.25
Hercules Offshore - - - 1,225 18,559 0.13
Joy Global - - - 616 27,782 0.20
Oshkosh Truck - - - 1,380 18,078 0.13
Pactv - - - 9,152 226,878 1.60
Parallel Petroleum - - - 1,756 16,542 0.12
Pioneer Drilling - - - 1,083 14,404 0.10
Silgan Holdings 1,976 103,700 1.22 1,936 98,794 0.70
Smith International - - - 288 16,888 0.12
Smurfit-Stone Container - - - 4,034 18,839 0.13
Steel Dynamics - - - 1,860 31,713 0.22
Superior Well Services - - - - - 0.01
T-3 Energy Services - - - 956 35,515 0.25
Tetra Technologies - - - 535 7,324 0.05
Wabtec 1,480 39,013 0.46 - - -
Waste Connections 5,300 135,945 1.61 - - -
665,295 7.86 957,668 6.77
INFORMATION TECHNOLOGY HARDWAREHarmonic 9,620 62,434 0.74 10,742 90,877 0.64
Harris - - - 660 30,492 0.22
Harris Stratex Networks - - - 5,124 40,070 0.28
Integrated Device Technology - - - 11,550 89,975 0.64Lam Research 7,830 178,210 2.11 1,600 50,448 0.36
Linear Technology 2,840 65,235 0.77 - - -
Maxim Integ Products - - - 3,566 64,545 0.46
Novellus Systems - - - 4,107 80,579 0.57
Nvidia 12,150 119,435 1.41 - - -
ON Semicon - - - 12,833 86,751 0.61
OpNext - - - 7,220 33,212 0.23
RF Micro Devices - - - 40,700 118,844 0.84
Sycamore Networks - - - 34,200 110,466 0.78
Tessera Technologies - - - 7,058 115,328 0.82
Tellabs 43,054 196,757 2.32 9,914 40,152 0.28
622,071 7.35 951,739 6.73
LEISURE & HOTELSAirtran - - - 21,534 52,112 0.37
Ashford Hospitality - - - 13,080 52,974 0.37
Brinker International - - - 5,128 91,535 0.65
Darden Restaurants 1,790 61,272 0.72 1,650 47,190 0.33
Great Wolf Resorts - - - 29,185 106,817 0.76
Multimedia Games - - - 4,260 18,403 0.13
Penn National Gaming 1,830 43,957 0.52 - - -
PF Chang's China Bistro 2,740 62,663 0.74 2,530 59,657 0.42
Red Robin Gourmet Burgers - - - 933 25,032 0.18Regal Entertainment Group - - - 10,781 169,477 1.20
Ruby Tuesday - - - 26,695 154,564 1.09
Triarc - - - 14,620 74,270 0.53
US Airways - - - 3,830 23,095 0.16
Wendy's International - - - 260 1,355 0.01
WMS Industries 3,060 63,985 0.76 - - -
Zumiez - - - 1,047 17,255 0.12
231,877 2.74 893,736 6.32
MEDIA & ENTERTAINMENTInterpublic Group - - - 9,340 72,198 0.51
Rush Entertainment 'A' 11,837 105,231 1.24 - - -
Valueclick - - - 2,525 25,831 0.18
105,231 1.24 98,029 0.69
MININGEvergreen Energy - - - 27,388 26,840 0.19
- - 26,840 0.19
Holdings at Fair value at % of NAV at Holdings at Fair value at % of NAV atUSD 31.03.09 31.03.09 31.03.09 30.09.08 30.09.08 30.09.08
OIL, GAS & ENERGY Aurora Oil & Gas - - - 12,902 1,548 0.01
Cabot Oil & Gas 5,018 118,273 1.40 1,988 71,568 0.51
Carrizo Oil & Gas - - - 480 17,438 0.12
Cleco 2,535 54,908 0.65 2,315 58,454 0.41
CMS Energy 8,700 102,747 1.21 9,230 115,098 0.81
Denbury Resources - - - 1,487 28,208 0.20
Exco Resources - - - 210 3,408 0.02
Gastar Exploration - - - 853 1,024 0.01
Geomet - - - 10,946 59,437 0.42
Hornbeck Offshore Services - - - 1,362 52,587 0.37ITC 1,282 55,908 0.66 1,232 63,756 0.45
Penn Virginia - - - 844 45,095 0.32
Petrohawk Energy 4,804 92,381 1.09 3,724 80,141 0.57
Petroquest Energy - - - 650 9,880 0.07
Quicksilver Resources - - - 1,761 34,340 0.24
RAM Energy Resources - - - 9,178 26,616 0.19
Rex Energy - - - 1,753 27,627 0.20
Sandridge Energy - - - 1,180 22,939 0.16
St-Mary Land & Exploration - - - 338 12,050 0.09
Whiting Petroleum 3,470 89,700 1.06 1,204 85,087 0.60
513,917 6.07 816,301 5.77
PHARMACEUTICALS, CHEMICAL & BIOTECHNOLOGYAcadia Pharmaceuticals - - - 8,818 23,720 0.17
Ariad Pharmaceuticals - - - 4,610 11,387 0.08
Array Biopharma - - - 4,490 34,438 0.24
Celanese 'A' - - - 3,410 95,105 0.67
Cephalon 930 63,324 0.75 - - -
Exelixis - - - 6,339 38,541 0.27
ISIS Pharmaceuticals - - - 320 5,405 0.04
Metabolix - - - 550 5,984 0.04
Molecular Insight Pharmaceuticals - - - 4,534 34,821 0.25Momenta Pharmaceuticals - - - 7,650 100,291 0.71
OMRIX Biopharmaceuticals - - - 2,134 38,348 0.27
Perrigo 4,770 118,438 1.40 - - -
Sangamo Biosciences - - - 6,359 49,028 0.35
United Therapeutics Corporation 815 53,814 0.64 735 77,374 0.55Valspar 4,080 81,355 0.96 - - -
Viropharma 9,883 51,688 0.61 785 10,331 0.07
368,619 4.36 524,773 3.71
REAL ESTATECBL & Associates Properties - - - 1,511 30,341 0.21Dupont Fabros Technology - - - 5,333 78,715 0.56
Duke Realty - - - 2,648 65,088 0.46
First Industrial - - - 2,907 83,140 0.59
Macerich 5,757 36,039 0.43 2,057 130,537 0.92
Mack Cali Realty - - - 877 29,660 0.21
36,039 0.43 417,481 2.95
RETAILERS GENERAL99 Cents Only Stores - - - 4,723 51,717 0.37
American Eagle Outfitter - - - 3,313 50,424 0.36
Asbury Automotive Group - - - 1,044 12,027 0.09
Build-A-Bear Workshop - - - 7,969 58,014 0.41
Career Education - - - 4,423 72,315 0.51
Chico's FAS - - - 8,304 45,091 0.32
J Crew Group 8,570 112,695 1.33 - - -
Mercadolibre 3,574 66,262 0.78 1,350 27,500 0.19
OfficeMax - - - 3,980 35,382 0.25
Pacific Sunwear of California - - - 12,676 85,183 0.60Petsmart - - - 1,940 47,918 0.34
Stage Stores - - - 2,159 29,492 0.21
Urban Outfitters 9,280 151,821 1.79 - - -
330,778 3.90 515,063 3.65
62
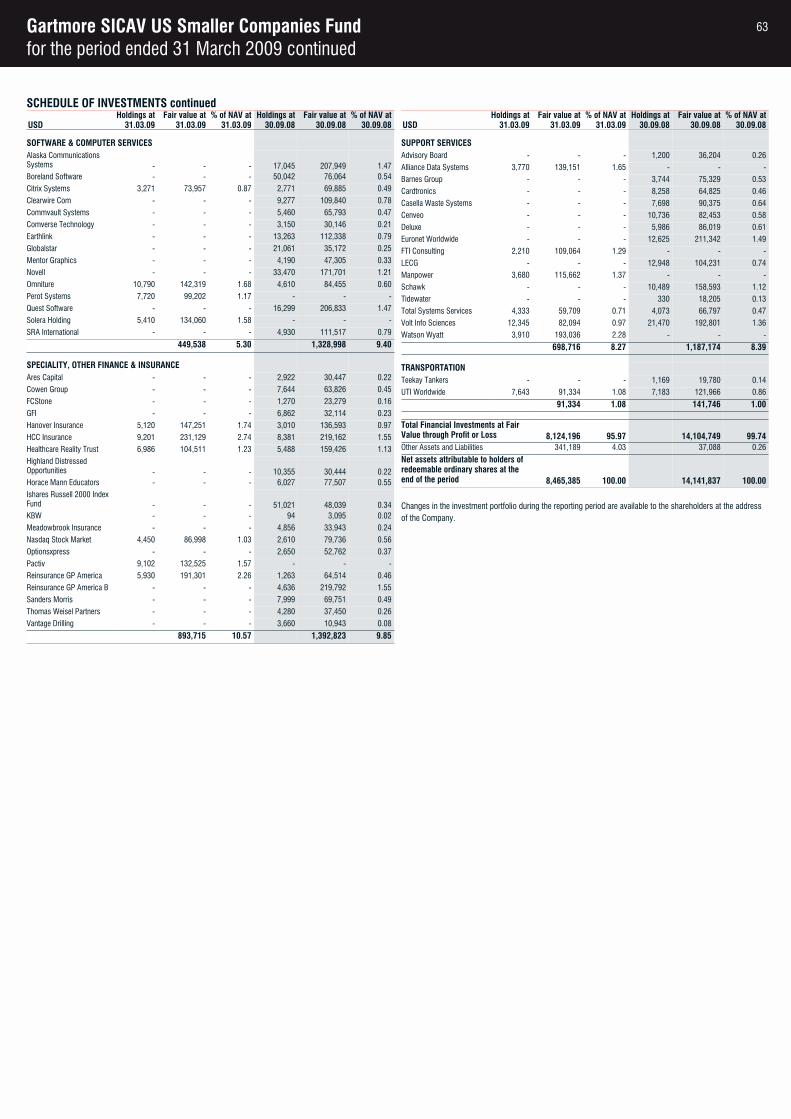
Gartmore SICAV US Smaller Companies Fundfor the period ended 31 March 2009 continued
SCHEDULE OF INVESTMENTS continuedHoldings at Fair value at % of NAV at Holdings at Fair value at % of NAV at
USD 31.03.09 31.03.09 31.03.09 30.09.08 30.09.08 30.09.08
SOFTWARE & COMPUTER SERVICESAlaska Communications Systems - - - 17,045 207,949 1.47Boreland Software - - - 50,042 76,064 0.54
Citrix Systems 3,271 73,957 0.87 2,771 69,885 0.49
Clearwire Com - - - 9,277 109,840 0.78
Commvault Systems - - - 5,460 65,793 0.47
Comverse Technology - - - 3,150 30,146 0.21
Earthlink - - - 13,263 112,338 0.79
Globalstar - - - 21,061 35,172 0.25
Mentor Graphics - - - 4,190 47,305 0.33
Novell - - - 33,470 171,701 1.21
Omniture 10,790 142,319 1.68 4,610 84,455 0.60
Perot Systems 7,720 99,202 1.17 - - -
Quest Software - - - 16,299 206,833 1.47
Solera Holding 5,410 134,060 1.58 - - -
SRA International - - - 4,930 111,517 0.79
449,538 5.30 1,328,998 9.40
SPECIALITY, OTHER FINANCE & INSURANCEAres Capital - - - 2,922 30,447 0.22
Cowen Group - - - 7,644 63,826 0.45
FCStone - - - 1,270 23,279 0.16
GFI - - - 6,862 32,114 0.23
Hanover Insurance 5,120 147,251 1.74 3,010 136,593 0.97
HCC Insurance 9,201 231,129 2.74 8,381 219,162 1.55
Healthcare Reality Trust 6,986 104,511 1.23 5,488 159,426 1.13
Highland Distressed Opportunities - - - 10,355 30,444 0.22Horace Mann Educators - - - 6,027 77,507 0.55
Ishares Russell 2000 Index Fund - - - 51,021 48,039 0.34KBW - - - 94 3,095 0.02
Meadowbrook Insurance - - - 4,856 33,943 0.24
Nasdaq Stock Market 4,450 86,998 1.03 2,610 79,736 0.56
Optionsxpress - - - 2,650 52,762 0.37
Pactiv 9,102 132,525 1.57 - - -
Reinsurance GP America 5,930 191,301 2.26 1,263 64,514 0.46
Reinsurance GP America B - - - 4,636 219,792 1.55
Sanders Morris - - - 7,999 69,751 0.49
Thomas Weisel Partners - - - 4,280 37,450 0.26
Vantage Drilling - - - 3,660 10,943 0.08
893,715 10.57 1,392,823 9.85
Holdings at Fair value at % of NAV at Holdings at Fair value at % of NAV atUSD 31.03.09 31.03.09 31.03.09 30.09.08 30.09.08 30.09.08
SUPPORT SERVICESAdvisory Board - - - 1,200 36,204 0.26
Alliance Data Systems 3,770 139,151 1.65 - - -
Barnes Group - - - 3,744 75,329 0.53
Cardtronics - - - 8,258 64,825 0.46
Casella Waste Systems - - - 7,698 90,375 0.64
Cenveo - - - 10,736 82,453 0.58
Deluxe - - - 5,986 86,019 0.61
Euronet Worldwide - - - 12,625 211,342 1.49
FTI Consulting 2,210 109,064 1.29 - - -
LECG - - - 12,948 104,231 0.74
Manpower 3,680 115,662 1.37 - - -
Schawk - - - 10,489 158,593 1.12
Tidewater - - - 330 18,205 0.13
Total Systems Services 4,333 59,709 0.71 4,073 66,797 0.47
Volt Info Sciences 12,345 82,094 0.97 21,470 192,801 1.36
Watson Wyatt 3,910 193,036 2.28 - - -
698,716 8.27 1,187,174 8.39
TRANSPORTATIONTeekay Tankers - - - 1,169 19,780 0.14
UTI Worldwide 7,643 91,334 1.08 7,183 121,966 0.86
91,334 1.08 141,746 1.00
Total Financial Investments at Fair Value through Profit or Loss 8,124,196 95.97 14,104,749 99.74Other Assets and Liabilities 341,189 4.03 37,088 0.26
Net assets attributable to holders of redeemable ordinary shares at the end of the period 8,465,385 100.00 14,141,837 100.00
Changes in the investment portfolio during the reporting period are available to the shareholders at the address of the Company.
63
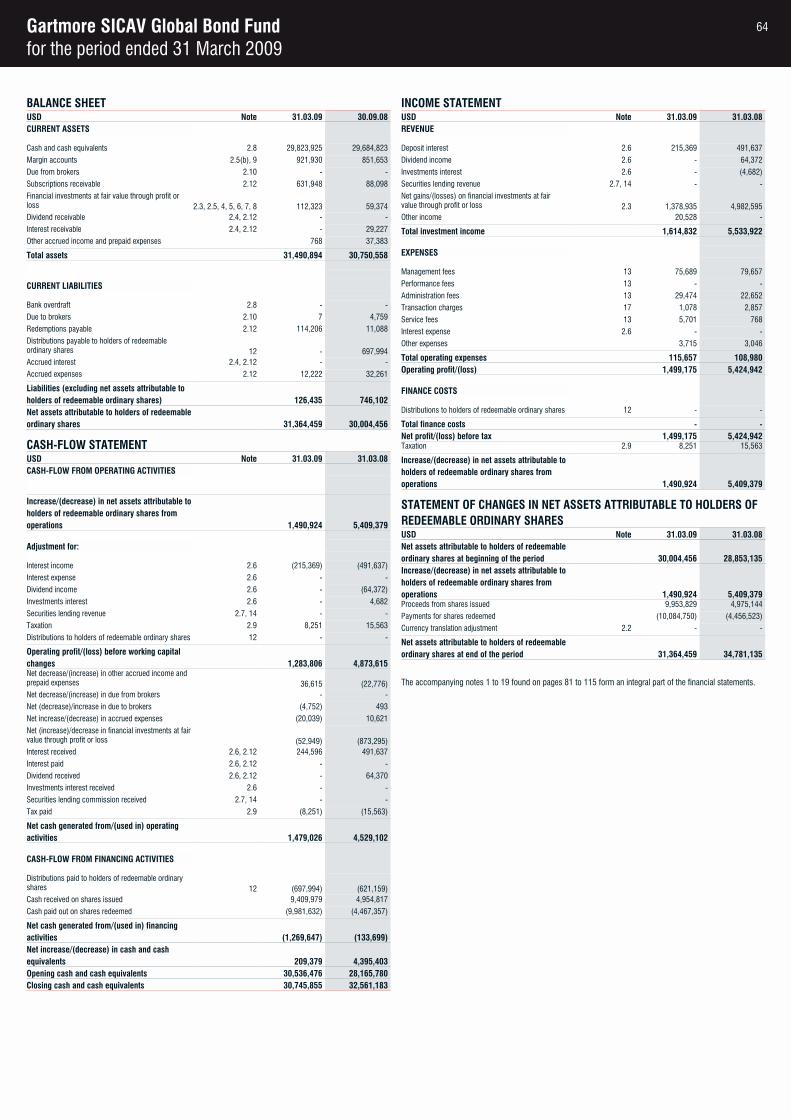
Gartmore SICAV Global Bond Fundfor the period ended 31 March 2009
BALANCE SHEETUSD Note 31.03.09 30.09.08CURRENT ASSETS
Cash and cash equivalents 2.8 29,823,925 29,684,823
Margin accounts 2.5(b), 9 921,930 851,653
Due from brokers 2.10 - -
Subscriptions receivable 2.12 631,948 88,098
Financial investments at fair value through profit or loss 2.3, 2.5, 4, 5, 6, 7, 8 112,323 59,374Dividend receivable 2.4, 2.12 - -
Interest receivable 2.4, 2.12 - 29,227
Other accrued income and prepaid expenses 768 37,383
Total assets 31,490,894 30,750,558
CURRENT LIABILITIES
Bank overdraft 2.8 - -
Due to brokers 2.10 7 4,759
Redemptions payable 2.12 114,206 11,088
Distributions payable to holders of redeemable ordinary shares 12 - 697,994Accrued interest 2.4, 2.12 - -
Accrued expenses 2.12 12,222 32,261
Liabilities (excluding net assets attributable to holders of redeemable ordinary shares) 126,435 746,102Net assets attributable to holders of redeemableordinary shares 31,364,459 30,004,456
CASH-FLOW STATEMENTUSD Note 31.03.09 31.03.08CASH-FLOW FROM OPERATING ACTIVITIES
Increase/(decrease) in net assets attributable toholders of redeemable ordinary shares from operations 1,490,924 5,409,379
Adjustment for:
Interest income 2.6 (215,369) (491,637)
Interest expense 2.6 - -
Dividend income 2.6 - (64,372)
Investments interest 2.6 - 4,682
Securities lending revenue 2.7, 14 - -
Taxation 2.9 8,251 15,563
Distributions to holders of redeemable ordinary shares 12 - -
Operating profit/(loss) before working capital changes 1,283,806 4,873,615Net decrease/(increase) in other accrued income and prepaid expenses 36,615 (22,776)Net decrease/(increase) in due from brokers - -
Net (decrease)/increase in due to brokers (4,752) 493
Net increase/(decrease) in accrued expenses (20,039) 10,621
Net (increase)/decrease in financial investments at fair value through profit or loss (52,949) (873,295)Interest received 2.6, 2.12 244,596 491,637
Interest paid 2.6, 2.12 - -
Dividend received 2.6, 2.12 - 64,370
Investments interest received 2.6 - -
Securities lending commission received 2.7, 14 - -
Tax paid 2.9 (8,251) (15,563)
Net cash generated from/(used in) operating activities 1,479,026 4,529,102
CASH-FLOW FROM FINANCING ACTIVITIES
Distributions paid to holders of redeemable ordinary shares 12 (697,994) (621,159)Cash received on shares issued 9,409,979 4,954,817
Cash paid out on shares redeemed (9,981,632) (4,467,357)
Net cash generated from/(used in) financing activities (1,269,647) (133,699)Net increase/(decrease) in cash and cash equivalents 209,379 4,395,403Opening cash and cash equivalents 30,536,476 28,165,780Closing cash and cash equivalents 30,745,855 32,561,183
INCOME STATEMENTUSD Note 31.03.09 31.03.08REVENUE
Deposit interest 2.6 215,369 491,637
Dividend income 2.6 - 64,372
Investments interest 2.6 - (4,682)
Securities lending revenue 2.7, 14 - -
Net gains/(losses) on financial investments at fair value through profit or loss 2.3 1,378,935 4,982,595Other income 20,528 -
Total investment income 1,614,832 5,533,922
EXPENSES
Management fees 13 75,689 79,657
Performance fees 13 - -
Administration fees 13 29,474 22,652
Transaction charges 17 1,078 2,857
Service fees 13 5,701 768
Interest expense 2.6 - -
Other expenses 3,715 3,046
Total operating expenses 115,657 108,980Operating profit/(loss) 1,499,175 5,424,942
FINANCE COSTS
Distributions to holders of redeemable ordinary shares 12 - -
Total finance costs - -Net profit/(loss) before tax 1,499,175 5,424,942Taxation 2.9 8,251 15,563
Increase/(decrease) in net assets attributable toholders of redeemable ordinary shares from operations 1,490,924 5,409,379
STATEMENT OF CHANGES IN NET ASSETS ATTRIBUTABLE TO HOLDERS OF REDEEMABLE ORDINARY SHARESUSD Note 31.03.09 31.03.08Net assets attributable to holders of redeemableordinary shares at beginning of the period 30,004,456 28,853,135Increase/(decrease) in net assets attributable toholders of redeemable ordinary shares from operations 1,490,924 5,409,379Proceeds from shares issued 9,953,829 4,975,144
Payments for shares redeemed (10,084,750) (4,456,523)
Currency translation adjustment 2.2 - -
Net assets attributable to holders of redeemableordinary shares at end of the period 31,364,459 34,781,135
The accompanying notes 1 to 19 found on pages 81 to 115 form an integral part of the financial statements.
64
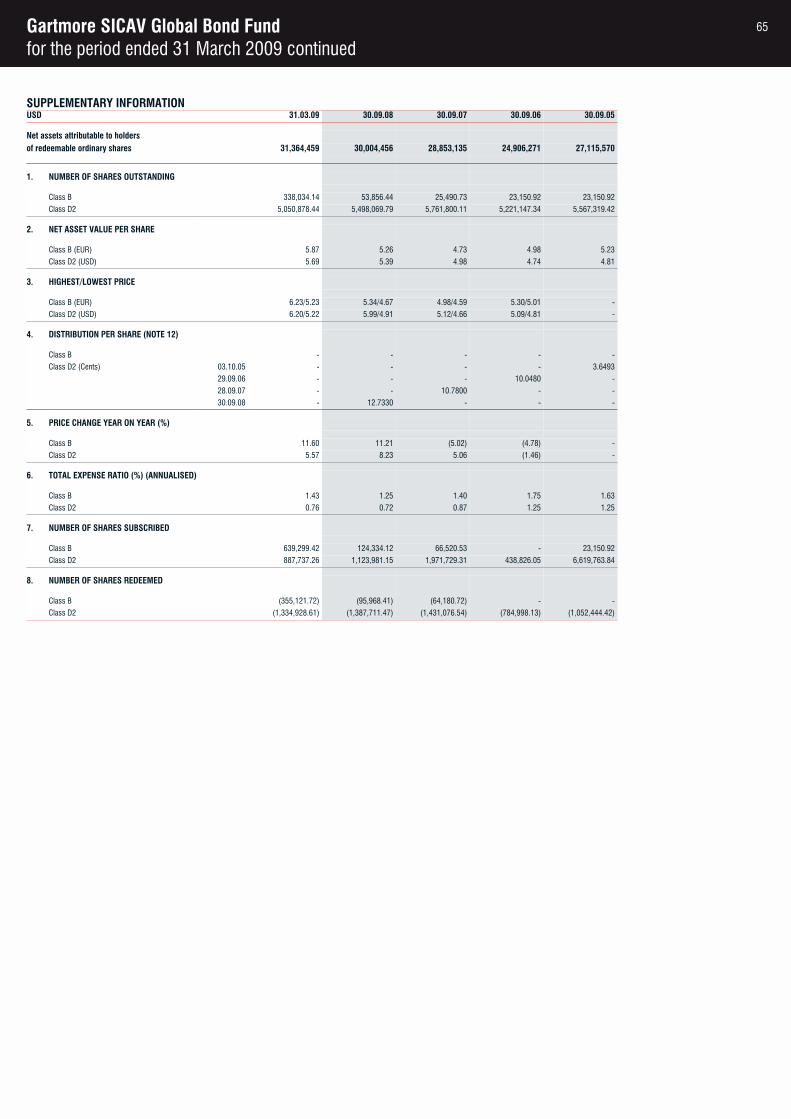
Gartmore SICAV Global Bond Fundfor the period ended 31 March 2009 continued
SUPPLEMENTARY INFORMATIONUSD 31.03.09 30.09.08 30.09.07 30.09.06 30.09.05
Net assets attributable to holdersof redeemable ordinary shares 31,364,459 30,004,456 28,853,135 24,906,271 27,115,570
1. NUMBER OF SHARES OUTSTANDING
Class B 338,034.14 53,856.44 25,490.73 23,150.92 23,150.92
Class D2 5,050,878.44 5,498,069.79 5,761,800.11 5,221,147.34 5,567,319.42
2. NET ASSET VALUE PER SHARE
Class B (EUR) 5.87 5.26 4.73 4.98 5.23
Class D2 (USD) 5.69 5.39 4.98 4.74 4.81
3. HIGHEST/LOWEST PRICE
Class B (EUR) 6.23/5.23 5.34/4.67 4.98/4.59 5.30/5.01 -
Class D2 (USD) 6.20/5.22 5.99/4.91 5.12/4.66 5.09/4.81 -
4. DISTRIBUTION PER SHARE (NOTE 12)
Class B - - - - -
Class D2 (Cents) 03.10.05 - - - - 3.6493
29.09.06 - - - 10.0480 -
28.09.07 - - 10.7800 - -
30.09.08 - 12.7330 - - -
5. PRICE CHANGE YEAR ON YEAR (%)
Class B 11.60 11.21 (5.02) (4.78) -
Class D2 5.57 8.23 5.06 (1.46) -
6. TOTAL EXPENSE RATIO (%) (ANNUALISED)
Class B 1.43 1.25 1.40 1.75 1.63
Class D2 0.76 0.72 0.87 1.25 1.25
7. NUMBER OF SHARES SUBSCRIBED
Class B 639,299.42 124,334.12 66,520.53 - 23,150.92
Class D2 887,737.26 1,123,981.15 1,971,729.31 438,826.05 6,619,763.84
8. NUMBER OF SHARES REDEEMED
Class B (355,121.72) (95,968.41) (64,180.72) - -
Class D2 (1,334,928.61) (1,387,711.47) (1,431,076.54) (784,998.13) (1,052,444.42)
65
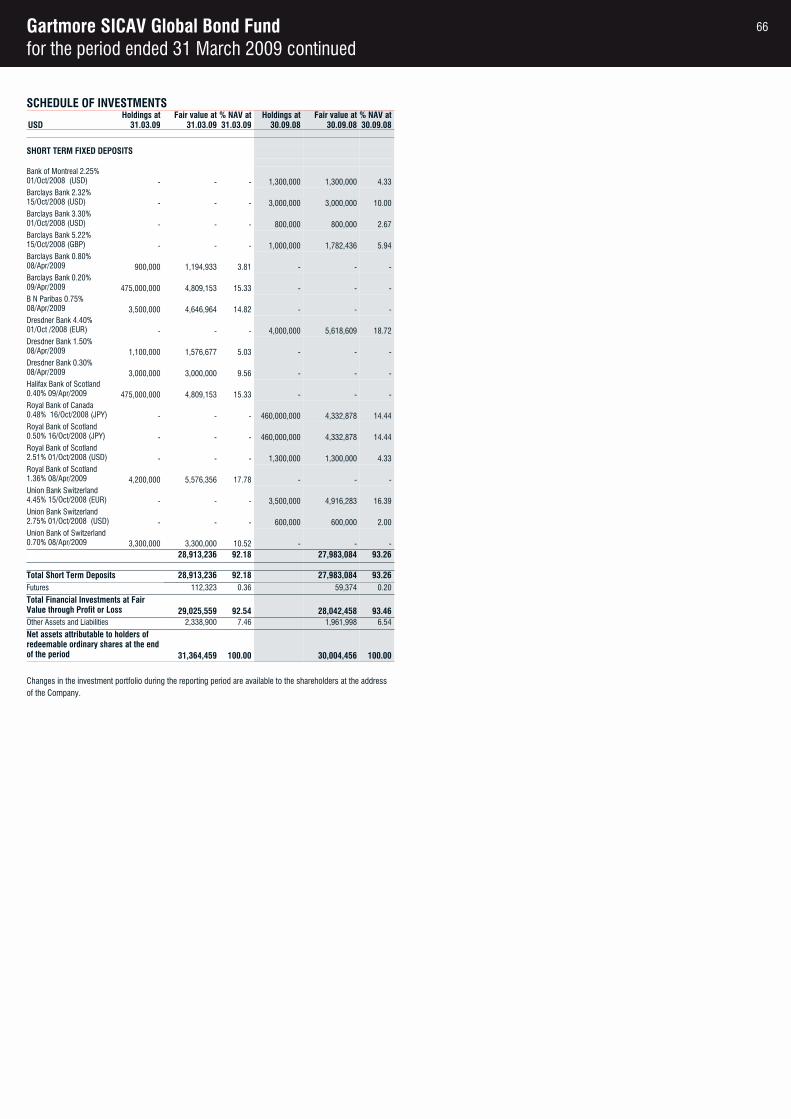
Gartmore SICAV Global Bond Fundfor the period ended 31 March 2009 continued
SCHEDULE OF INVESTMENTSHoldings at Fair value at % NAV at Holdings at Fair value at % NAV at
USD 31.03.09 31.03.09 31.03.09 30.09.08 30.09.08 30.09.08
SHORT TERM FIXED DEPOSITS
Bank of Montreal 2.25% 01/Oct/2008 (USD) - - - 1,300,000 1,300,000 4.33Barclays Bank 2.32% 15/Oct/2008 (USD) - - - 3,000,000 3,000,000 10.00Barclays Bank 3.30% 01/Oct/2008 (USD) - - - 800,000 800,000 2.67Barclays Bank 5.22% 15/Oct/2008 (GBP) - - - 1,000,000 1,782,436 5.94Barclays Bank 0.80% 08/Apr/2009 900,000 1,194,933 3.81 - - -Barclays Bank 0.20% 09/Apr/2009 475,000,000 4,809,153 15.33 - - -B N Paribas 0.75% 08/Apr/2009 3,500,000 4,646,964 14.82 - - -Dresdner Bank 4.40% 01/Oct /2008 (EUR) - - - 4,000,000 5,618,609 18.72Dresdner Bank 1.50% 08/Apr/2009 1,100,000 1,576,677 5.03 - - -Dresdner Bank 0.30% 08/Apr/2009 3,000,000 3,000,000 9.56 - - -Halifax Bank of Scotland 0.40% 09/Apr/2009 475,000,000 4,809,153 15.33 - - -Royal Bank of Canada 0.48% 16/Oct/2008 (JPY) - - - 460,000,000 4,332,878 14.44Royal Bank of Scotland 0.50% 16/Oct/2008 (JPY) - - - 460,000,000 4,332,878 14.44Royal Bank of Scotland 2.51% 01/Oct/2008 (USD) - - - 1,300,000 1,300,000 4.33Royal Bank of Scotland 1.36% 08/Apr/2009 4,200,000 5,576,356 17.78 - - -Union Bank Switzerland 4.45% 15/Oct/2008 (EUR) - - - 3,500,000 4,916,283 16.39Union Bank Switzerland 2.75% 01/Oct/2008 (USD) - - - 600,000 600,000 2.00Union Bank of Switzerland 0.70% 08/Apr/2009 3,300,000 3,300,000 10.52 - - -
28,913,236 92.18 27,983,084 93.26
Total Short Term Deposits 28,913,236 92.18 27,983,084 93.26Futures 112,323 0.36 59,374 0.20
Total Financial Investments at Fair Value through Profit or Loss 29,025,559 92.54 28,042,458 93.46Other Assets and Liabilities 2,338,900 7.46 1,961,998 6.54
Net assets attributable to holders of redeemable ordinary shares at the end of the period 31,364,459 100.00 30,004,456 100.00
Changes in the investment portfolio during the reporting period are available to the shareholders at the address of the Company.
66
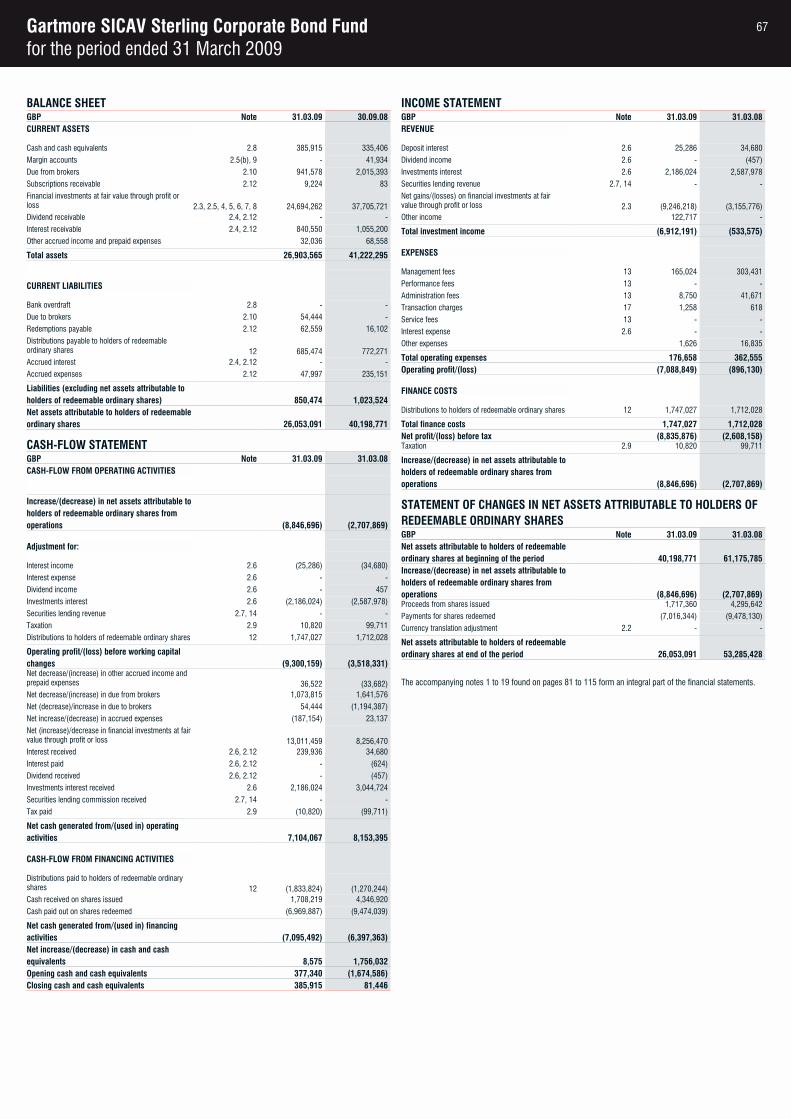
Gartmore SICAV Sterling Corporate Bond Fundfor the period ended 31 March 2009
BALANCE SHEETGBP Note 31.03.09 30.09.08CURRENT ASSETS
Cash and cash equivalents 2.8 385,915 335,406
Margin accounts 2.5(b), 9 - 41,934
Due from brokers 2.10 941,578 2,015,393
Subscriptions receivable 2.12 9,224 83
Financial investments at fair value through profit or loss 2.3, 2.5, 4, 5, 6, 7, 8 24,694,262 37,705,721Dividend receivable 2.4, 2.12 - -
Interest receivable 2.4, 2.12 840,550 1,055,200
Other accrued income and prepaid expenses 32,036 68,558
Total assets 26,903,565 41,222,295
CURRENT LIABILITIES
Bank overdraft 2.8 - -
Due to brokers 2.10 54,444 -
Redemptions payable 2.12 62,559 16,102
Distributions payable to holders of redeemable ordinary shares 12 685,474 772,271Accrued interest 2.4, 2.12 - -
Accrued expenses 2.12 47,997 235,151
Liabilities (excluding net assets attributable to holders of redeemable ordinary shares) 850,474 1,023,524Net assets attributable to holders of redeemableordinary shares 26,053,091 40,198,771
CASH-FLOW STATEMENTGBP Note 31.03.09 31.03.08CASH-FLOW FROM OPERATING ACTIVITIES
Increase/(decrease) in net assets attributable toholders of redeemable ordinary shares from operations (8,846,696) (2,707,869)
Adjustment for:
Interest income 2.6 (25,286) (34,680)
Interest expense 2.6 - -
Dividend income 2.6 - 457
Investments interest 2.6 (2,186,024) (2,587,978)
Securities lending revenue 2.7, 14 - -
Taxation 2.9 10,820 99,711
Distributions to holders of redeemable ordinary shares 12 1,747,027 1,712,028
Operating profit/(loss) before working capital changes (9,300,159) (3,518,331)Net decrease/(increase) in other accrued income and prepaid expenses 36,522 (33,682)Net decrease/(increase) in due from brokers 1,073,815 1,641,576
Net (decrease)/increase in due to brokers 54,444 (1,194,387)
Net increase/(decrease) in accrued expenses (187,154) 23,137
Net (increase)/decrease in financial investments at fair value through profit or loss 13,011,459 8,256,470Interest received 2.6, 2.12 239,936 34,680
Interest paid 2.6, 2.12 - (624)
Dividend received 2.6, 2.12 - (457)
Investments interest received 2.6 2,186,024 3,044,724
Securities lending commission received 2.7, 14 - -
Tax paid 2.9 (10,820) (99,711)
Net cash generated from/(used in) operating activities 7,104,067 8,153,395
CASH-FLOW FROM FINANCING ACTIVITIES
Distributions paid to holders of redeemable ordinary shares 12 (1,833,824) (1,270,244)Cash received on shares issued 1,708,219 4,346,920
Cash paid out on shares redeemed (6,969,887) (9,474,039)
Net cash generated from/(used in) financing activities (7,095,492) (6,397,363)Net increase/(decrease) in cash and cash equivalents 8,575 1,756,032Opening cash and cash equivalents 377,340 (1,674,586)Closing cash and cash equivalents 385,915 81,446
INCOME STATEMENTGBP Note 31.03.09 31.03.08REVENUE
Deposit interest 2.6 25,286 34,680
Dividend income 2.6 - (457)
Investments interest 2.6 2,186,024 2,587,978
Securities lending revenue 2.7, 14 - -
Net gains/(losses) on financial investments at fair value through profit or loss 2.3 (9,246,218) (3,155,776)Other income 122,717 -
Total investment income (6,912,191) (533,575)
EXPENSES
Management fees 13 165,024 303,431
Performance fees 13 - -
Administration fees 13 8,750 41,671
Transaction charges 17 1,258 618
Service fees 13 - -
Interest expense 2.6 - -
Other expenses 1,626 16,835
Total operating expenses 176,658 362,555Operating profit/(loss) (7,088,849) (896,130)
FINANCE COSTS
Distributions to holders of redeemable ordinary shares 12 1,747,027 1,712,028
Total finance costs 1,747,027 1,712,028Net profit/(loss) before tax (8,835,876) (2,608,158)Taxation 2.9 10,820 99,711
Increase/(decrease) in net assets attributable toholders of redeemable ordinary shares from operations (8,846,696) (2,707,869)
STATEMENT OF CHANGES IN NET ASSETS ATTRIBUTABLE TO HOLDERS OF REDEEMABLE ORDINARY SHARESGBP Note 31.03.09 31.03.08Net assets attributable to holders of redeemableordinary shares at beginning of the period 40,198,771 61,175,785Increase/(decrease) in net assets attributable toholders of redeemable ordinary shares from operations (8,846,696) (2,707,869)Proceeds from shares issued 1,717,360 4,295,642
Payments for shares redeemed (7,016,344) (9,478,130)
Currency translation adjustment 2.2 - -
Net assets attributable to holders of redeemableordinary shares at end of the period 26,053,091 53,285,428
The accompanying notes 1 to 19 found on pages 81 to 115 form an integral part of the financial statements.
67
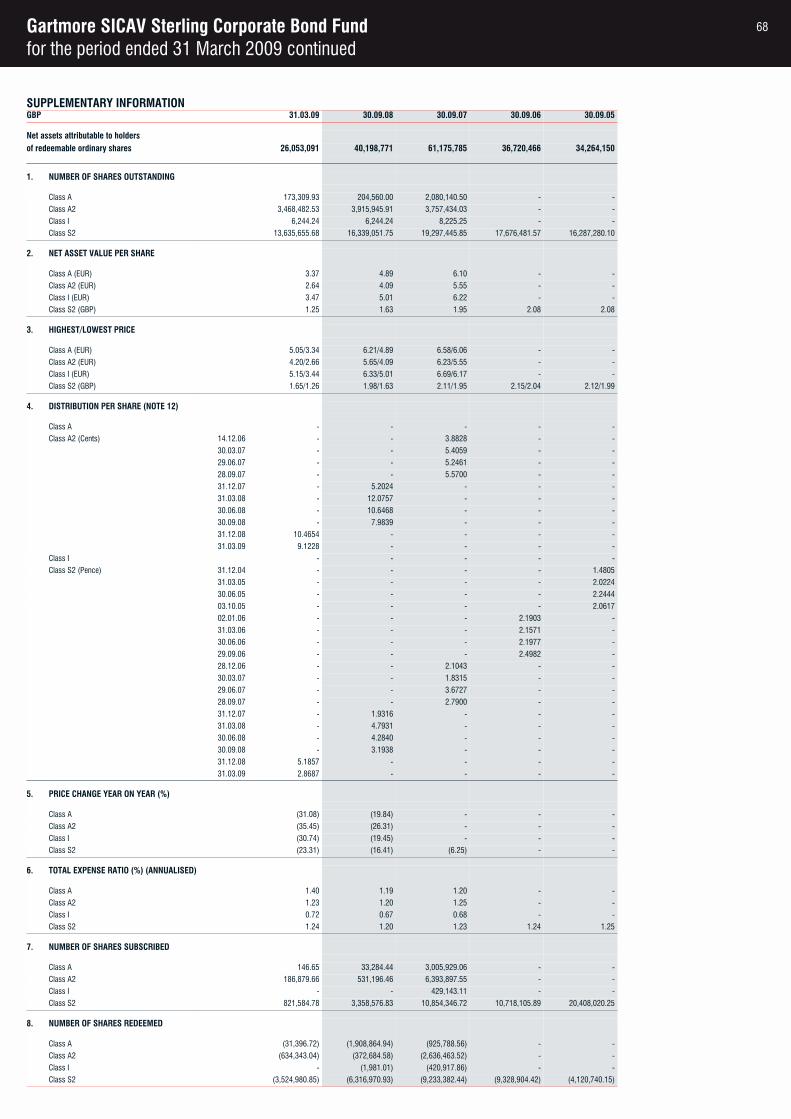
Gartmore SICAV Sterling Corporate Bond Fundfor the period ended 31 March 2009 continued
SUPPLEMENTARY INFORMATIONGBP 31.03.09 30.09.08 30.09.07 30.09.06 30.09.05
Net assets attributable to holdersof redeemable ordinary shares 26,053,091 40,198,771 61,175,785 36,720,466 34,264,150
1. NUMBER OF SHARES OUTSTANDING
Class A 173,309.93 204,560.00 2,080,140.50 - -
Class A2 3,468,482.53 3,915,945.91 3,757,434.03 - -
Class I 6,244.24 6,244.24 8,225.25 - -
Class S2 13,635,655.68 16,339,051.75 19,297,445.85 17,676,481.57 16,287,280.10
2. NET ASSET VALUE PER SHARE
Class A (EUR) 3.37 4.89 6.10 - -
Class A2 (EUR) 2.64 4.09 5.55 - -
Class I (EUR) 3.47 5.01 6.22 - -
Class S2 (GBP) 1.25 1.63 1.95 2.08 2.08
3. HIGHEST/LOWEST PRICE
Class A (EUR) 5.05/3.34 6.21/4.89 6.58/6.06 - -
Class A2 (EUR) 4.20/2.66 5.65/4.09 6.23/5.55 - -
Class I (EUR) 5.15/3.44 6.33/5.01 6.69/6.17 - -
Class S2 (GBP) 1.65/1.26 1.98/1.63 2.11/1.95 2.15/2.04 2.12/1.99
4. DISTRIBUTION PER SHARE (NOTE 12)
Class A - - - - -
Class A2 (Cents) 14.12.06 - - 3.8828 - -
30.03.07 - - 5.4059 - -
29.06.07 - - 5.2461 - -
28.09.07 - - 5.5700 - -
31.12.07 - 5.2024 - - -
31.03.08 - 12.0757 - - -
30.06.08 - 10.6468 - - -
30.09.08 - 7.9839 - - -
31.12.08 10.4654 - - - -
31.03.09 9.1228 - - - -
Class I - - - - -
Class S2 (Pence) 31.12.04 - - - - 1.4805
31.03.05 - - - - 2.0224
30.06.05 - - - - 2.2444
03.10.05 - - - - 2.0617
02.01.06 - - - 2.1903 -
31.03.06 - - - 2.1571 -
30.06.06 - - - 2.1977 -
29.09.06 - - - 2.4982 -
28.12.06 - - 2.1043 - -
30.03.07 - - 1.8315 - -
29.06.07 - - 3.6727 - -
28.09.07 - - 2.7900 - -
31.12.07 - 1.9316 - - -
31.03.08 - 4.7931 - - -
30.06.08 - 4.2840 - - -
30.09.08 - 3.1938 - - -
31.12.08 5.1857 - - - -
31.03.09 2.8687 - - - -
5. PRICE CHANGE YEAR ON YEAR (%)
Class A (31.08) (19.84) - - -
Class A2 (35.45) (26.31) - - -
Class I (30.74) (19.45) - - -
Class S2 (23.31) (16.41) (6.25) - -
6. TOTAL EXPENSE RATIO (%) (ANNUALISED)
Class A 1.40 1.19 1.20 - -
Class A2 1.23 1.20 1.25 - -
Class I 0.72 0.67 0.68 - -
Class S2 1.24 1.20 1.23 1.24 1.25
7. NUMBER OF SHARES SUBSCRIBED
Class A 146.65 33,284.44 3,005,929.06 - -
Class A2 186,879.66 531,196.46 6,393,897.55 - -
Class I - - 429,143.11 - -
Class S2 821,584.78 3,358,576.83 10,854,346.72 10,718,105.89 20,408,020.25
8. NUMBER OF SHARES REDEEMED
Class A (31,396.72) (1,908,864.94) (925,788.56) - -
Class A2 (634,343.04) (372,684.58) (2,636,463.52) - -
Class I - (1,981.01) (420,917.86) - -
Class S2 (3,524,980.85) (6,316,970.93) (9,233,382.44) (9,328,904.42) (4,120,740.15)
68
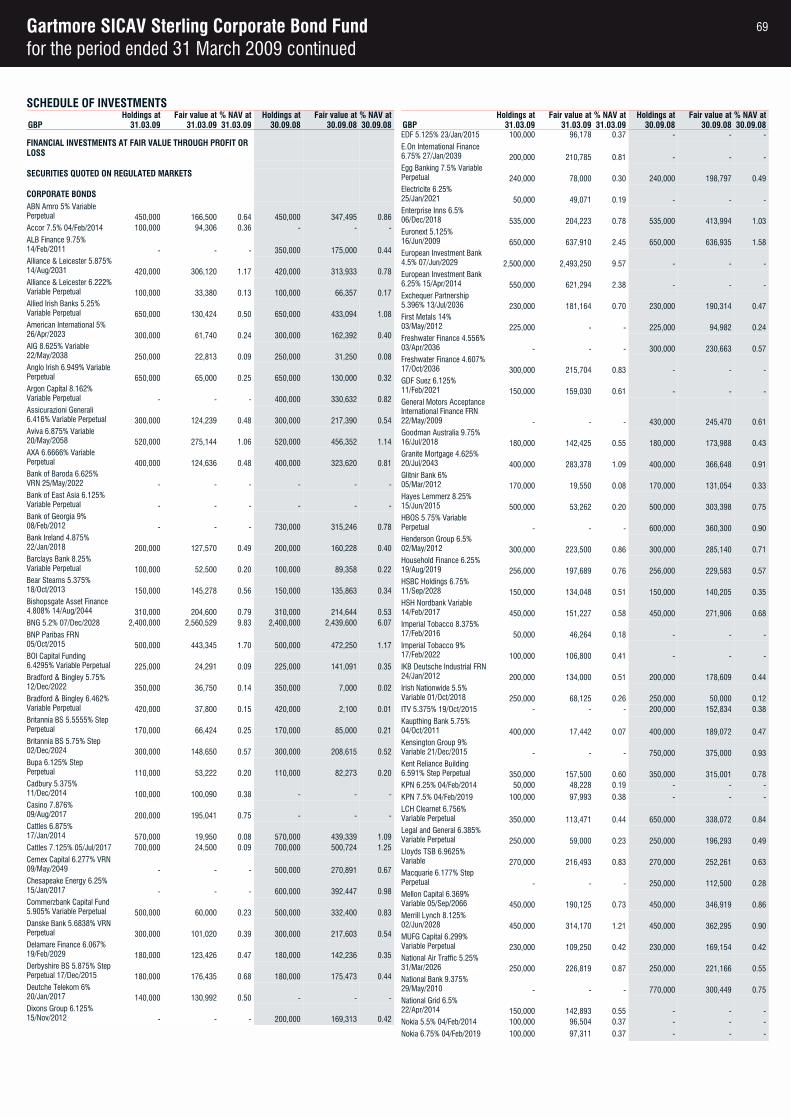
Gartmore SICAV Sterling Corporate Bond Fundfor the period ended 31 March 2009 continued
SCHEDULE OF INVESTMENTSHoldings at Fair value at % NAV at Holdings at Fair value at % NAV at
GBP 31.03.09 31.03.09 31.03.09 30.09.08 30.09.08 30.09.08
FINANCIAL INVESTMENTS AT FAIR VALUE THROUGH PROFIT OR LOSS
SECURITIES QUOTED ON REGULATED MARKETS
CORPORATE BONDSABN Amro 5% Variable Perpetual 450,000 166,500 0.64 450,000 347,495 0.86Accor 7.5% 04/Feb/2014 100,000 94,306 0.36 - - -
ALB Finance 9.75% 14/Feb/2011 - - - 350,000 175,000 0.44Alliance & Leicester 5.875%14/Aug/2031 420,000 306,120 1.17 420,000 313,933 0.78Alliance & Leicester 6.222%Variable Perpetual 100,000 33,380 0.13 100,000 66,357 0.17Allied Irish Banks 5.25% Variable Perpetual 650,000 130,424 0.50 650,000 433,094 1.08American International 5% 26/Apr/2023 300,000 61,740 0.24 300,000 162,392 0.40AIG 8.625% Variable 22/May/2038 250,000 22,813 0.09 250,000 31,250 0.08Anglo Irish 6.949% Variable Perpetual 650,000 65,000 0.25 650,000 130,000 0.32Argon Capital 8.162% Variable Perpetual - - - 400,000 330,632 0.82Assicurazioni Generali 6.416% Variable Perpetual 300,000 124,239 0.48 300,000 217,390 0.54Aviva 6.875% Variable 20/May/2058 520,000 275,144 1.06 520,000 456,352 1.14AXA 6.6666% Variable Perpetual 400,000 124,636 0.48 400,000 323,620 0.81Bank of Baroda 6.625% VRN 25/May/2022 - - - - - -Bank of East Asia 6.125% Variable Perpetual - - - - - -Bank of Georgia 9% 08/Feb/2012 - - - 730,000 315,246 0.78Bank Ireland 4.875% 22/Jan/2018 200,000 127,570 0.49 200,000 160,228 0.40Barclays Bank 8.25% Variable Perpetual 100,000 52,500 0.20 100,000 89,358 0.22Bear Stearns 5.375% 18/Oct/2013 150,000 145,278 0.56 150,000 135,863 0.34Bishopsgate Asset Finance 4.808% 14/Aug/2044 310,000 204,600 0.79 310,000 214,644 0.53BNG 5.2% 07/Dec/2028 2,400,000 2,560,529 9.83 2,400,000 2,439,600 6.07
BNP Paribas FRN 05/Oct/2015 500,000 443,345 1.70 500,000 472,250 1.17BOI Capital Funding 6.4295% Variable Perpetual 225,000 24,291 0.09 225,000 141,091 0.35Bradford & Bingley 5.75% 12/Dec/2022 350,000 36,750 0.14 350,000 7,000 0.02Bradford & Bingley 6.462% Variable Perpetual 420,000 37,800 0.15 420,000 2,100 0.01Britannia BS 5.5555% Step Perpetual 170,000 66,424 0.25 170,000 85,000 0.21Britannia BS 5.75% Step 02/Dec/2024 300,000 148,650 0.57 300,000 208,615 0.52Bupa 6.125% Step Perpetual 110,000 53,222 0.20 110,000 82,273 0.20Cadbury 5.375% 11/Dec/2014 100,000 100,090 0.38 - - -Casino 7.876% 09/Aug/2017 200,000 195,041 0.75 - - -Cattles 6.875% 17/Jan/2014 570,000 19,950 0.08 570,000 439,339 1.09Cattles 7.125% 05/Jul/2017 700,000 24,500 0.09 700,000 500,724 1.25
Cemex Capital 6.277% VRN09/May/2049 - - - 500,000 270,891 0.67Chesapeake Energy 6.25% 15/Jan/2017 - - - 600,000 392,447 0.98Commerzbank Capital Fund 5.905% Variable Perpetual 500,000 60,000 0.23 500,000 332,400 0.83Danske Bank 5.6838% VRNPerpetual 300,000 101,020 0.39 300,000 217,603 0.54Delamare Finance 6.067% 19/Feb/2029 180,000 123,426 0.47 180,000 142,236 0.35Derbyshire BS 5.875% StepPerpetual 17/Dec/2015 180,000 176,435 0.68 180,000 175,473 0.44Deutche Telekom 6% 20/Jan/2017 140,000 130,992 0.50 - - -Dixons Group 6.125% 15/Nov/2012 - - - 200,000 169,313 0.42
Holdings at Fair value at % NAV at Holdings at Fair value at % NAV atGBP 31.03.09 31.03.09 31.03.09 30.09.08 30.09.08 30.09.08EDF 5.125% 23/Jan/2015 100,000 96,178 0.37 - - -
E.On International Finance 6.75% 27/Jan/2039 200,000 210,785 0.81 - - -Egg Banking 7.5% Variable Perpetual 240,000 78,000 0.30 240,000 198,797 0.49Electricite 6.25% 25/Jan/2021 50,000 49,071 0.19 - - -Enterprise Inns 6.5% 06/Dec/2018 535,000 204,223 0.78 535,000 413,994 1.03Euronext 5.125% 16/Jun/2009 650,000 637,910 2.45 650,000 636,935 1.58European Investment Bank 4.5% 07/Jun/2029 2,500,000 2,493,250 9.57 - - -European Investment Bank 6.25% 15/Apr/2014 550,000 621,294 2.38 - - -Exchequer Partnership 5.396% 13/Jul/2036 230,000 181,164 0.70 230,000 190,314 0.47First Metals 14% 03/May/2012 225,000 - - 225,000 94,982 0.24Freshwater Finance 4.556% 03/Apr/2036 - - - 300,000 230,663 0.57Freshwater Finance 4.607% 17/Oct/2036 300,000 215,704 0.83 - - -GDF Suez 6.125% 11/Feb/2021 150,000 159,030 0.61 - - -General Motors Acceptance International Finance FRN 22/May/2009 - - - 430,000 245,470 0.61Goodman Australia 9.75% 16/Jul/2018 180,000 142,425 0.55 180,000 173,988 0.43Granite Mortgage 4.625% 20/Jul/2043 400,000 283,378 1.09 400,000 366,648 0.91Glitnir Bank 6% 05/Mar/2012 170,000 19,550 0.08 170,000 131,054 0.33Hayes Lemmerz 8.25% 15/Jun/2015 500,000 53,262 0.20 500,000 303,398 0.75HBOS 5.75% Variable Perpetual - - - 600,000 360,300 0.90Henderson Group 6.5% 02/May/2012 300,000 223,500 0.86 300,000 285,140 0.71Household Finance 6.25% 19/Aug/2019 256,000 197,689 0.76 256,000 229,583 0.57HSBC Holdings 6.75% 11/Sep/2028 150,000 134,048 0.51 150,000 140,205 0.35HSH Nordbank Variable 14/Feb/2017 450,000 151,227 0.58 450,000 271,906 0.68Imperial Tobacco 8.375% 17/Feb/2016 50,000 46,264 0.18 - - -Imperial Tobacco 9% 17/Feb/2022 100,000 106,800 0.41 - - -IKB Deutsche Industrial FRN24/Jan/2012 200,000 134,000 0.51 200,000 178,609 0.44Irish Nationwide 5.5% Variable 01/Oct/2018 250,000 68,125 0.26 250,000 50,000 0.12ITV 5.375% 19/Oct/2015 - - - 200,000 152,834 0.38
Kaupthing Bank 5.75% 04/Oct/2011 400,000 17,442 0.07 400,000 189,072 0.47Kensington Group 9% Variable 21/Dec/2015 - - - 750,000 375,000 0.93Kent Reliance Building 6.591% Step Perpetual 350,000 157,500 0.60 350,000 315,001 0.78KPN 6.25% 04/Feb/2014 50,000 48,228 0.19 - - -
KPN 7.5% 04/Feb/2019 100,000 97,993 0.38 - - -
LCH Clearnet 6.756% Variable Perpetual 350,000 113,471 0.44 650,000 338,072 0.84Legal and General 6.385% Variable Perpetual 250,000 59,000 0.23 250,000 196,293 0.49Lloyds TSB 6.9625% Variable 270,000 216,493 0.83 270,000 252,261 0.63Macquarie 6.177% Step Perpetual - - - 250,000 112,500 0.28Mellon Capital 6.369% Variable 05/Sep/2066 450,000 190,125 0.73 450,000 346,919 0.86Merrill Lynch 8.125% 02/Jun/2028 450,000 314,170 1.21 450,000 362,295 0.90MUFG Capital 6.299% Variable Perpetual 230,000 109,250 0.42 230,000 169,154 0.42National Air Traffic 5.25% 31/Mar/2026 250,000 226,819 0.87 250,000 221,166 0.55National Bank 9.375% 29/May/2010 - - - 770,000 300,449 0.75National Grid 6.5% 22/Apr/2014 150,000 142,893 0.55 - - -Nokia 5.5% 04/Feb/2014 100,000 96,504 0.37 - - -
Nokia 6.75% 04/Feb/2019 100,000 97,311 0.37 - - -
69
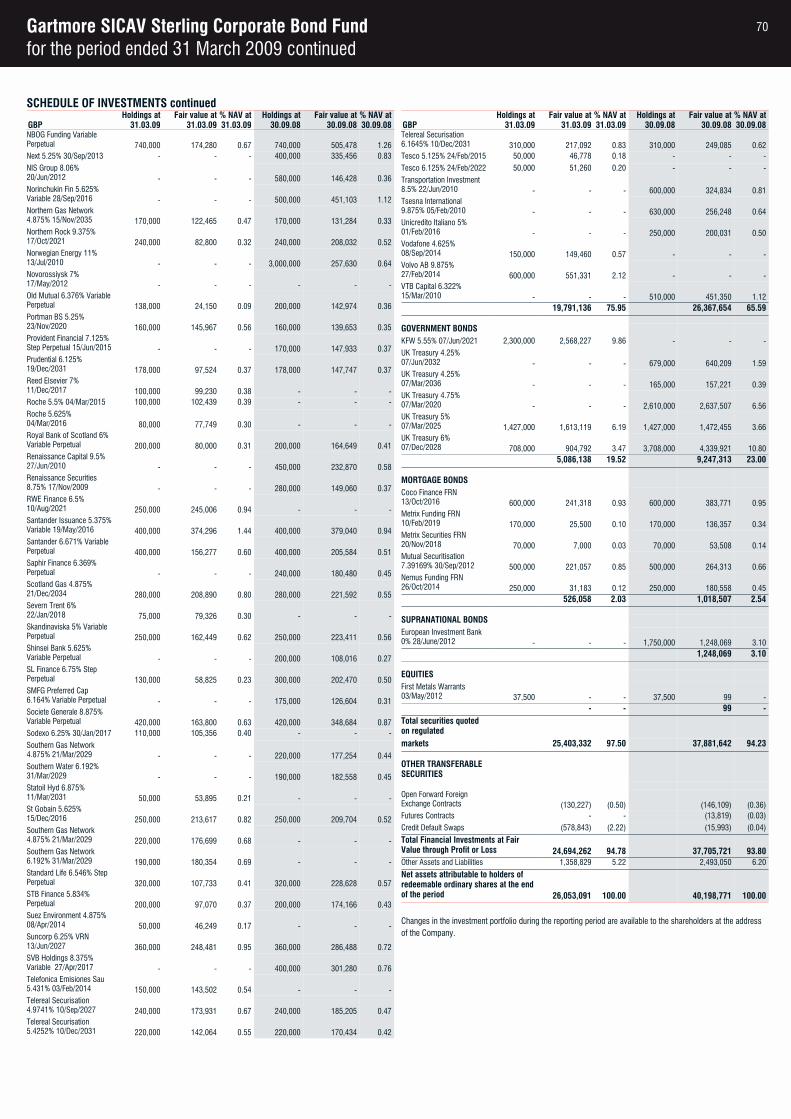
Gartmore SICAV Sterling Corporate Bond Fundfor the period ended 31 March 2009 continued
SCHEDULE OF INVESTMENTS continuedHoldings at Fair value at % NAV at Holdings at Fair value at % NAV at
GBP 31.03.09 31.03.09 31.03.09 30.09.08 30.09.08 30.09.08NBOG Funding Variable Perpetual 740,000 174,280 0.67 740,000 505,478 1.26Next 5.25% 30/Sep/2013 - - - 400,000 335,456 0.83
NIS Group 8.06% 20/Jun/2012 - - - 580,000 146,428 0.36Norinchukin Fin 5.625% Variable 28/Sep/2016 - - - 500,000 451,103 1.12Northern Gas Network 4.875% 15/Nov/2035 170,000 122,465 0.47 170,000 131,284 0.33Northern Rock 9.375% 17/Oct/2021 240,000 82,800 0.32 240,000 208,032 0.52Norwegian Energy 11% 13/Jul/2010 - - - 3,000,000 257,630 0.64Novorossiysk 7% 17/May/2012 - - - - - -Old Mutual 6.376% Variable Perpetual 138,000 24,150 0.09 200,000 142,974 0.36Portman BS 5.25% 23/Nov/2020 160,000 145,967 0.56 160,000 139,653 0.35Provident Financial 7.125% Step Perpetual 15/Jun/2015 - - - 170,000 147,933 0.37Prudential 6.125% 19/Dec/2031 178,000 97,524 0.37 178,000 147,747 0.37Reed Elsevier 7% 11/Dec/2017 100,000 99,230 0.38 - - -Roche 5.5% 04/Mar/2015 100,000 102,439 0.39 - - -
Roche 5.625% 04/Mar/2016 80,000 77,749 0.30 - - -Royal Bank of Scotland 6% Variable Perpetual 200,000 80,000 0.31 200,000 164,649 0.41Renaissance Capital 9.5% 27/Jun/2010 - - - 450,000 232,870 0.58Renaissance Securities 8.75% 17/Nov/2009 - - - 280,000 149,060 0.37RWE Finance 6.5% 10/Aug/2021 250,000 245,006 0.94 - - -Santander Issuance 5.375%Variable 19/May/2016 400,000 374,296 1.44 400,000 379,040 0.94Santander 6.671% Variable Perpetual 400,000 156,277 0.60 400,000 205,584 0.51Saphir Finance 6.369% Perpetual - - - 240,000 180,480 0.45Scotland Gas 4.875% 21/Dec/2034 280,000 208,890 0.80 280,000 221,592 0.55Severn Trent 6% 22/Jan/2018 75,000 79,326 0.30 - - -Skandinaviska 5% Variable Perpetual 250,000 162,449 0.62 250,000 223,411 0.56Shinsei Bank 5.625% Variable Perpetual - - - 200,000 108,016 0.27SL Finance 6.75% Step Perpetual 130,000 58,825 0.23 300,000 202,470 0.50SMFG Preferred Cap 6.164% Variable Perpetual - - - 175,000 126,604 0.31Societe Generale 8.875% Variable Perpetual 420,000 163,800 0.63 420,000 348,684 0.87Sodexo 6.25% 30/Jan/2017 110,000 105,356 0.40 - - -
Southern Gas Network 4.875% 21/Mar/2029 - - - 220,000 177,254 0.44Southern Water 6.192% 31/Mar/2029 - - - 190,000 182,558 0.45Statoil Hyd 6.875% 11/Mar/2031 50,000 53,895 0.21 - - -St Gobain 5.625% 15/Dec/2016 250,000 213,617 0.82 250,000 209,704 0.52Southern Gas Network 4.875% 21/Mar/2029 220,000 176,699 0.68 - - -Southern Gas Network 6.192% 31/Mar/2029 190,000 180,354 0.69 - - -Standard Life 6.546% Step Perpetual 320,000 107,733 0.41 320,000 228,628 0.57STB Finance 5.834% Perpetual 200,000 97,070 0.37 200,000 174,166 0.43Suez Environment 4.875% 08/Apr/2014 50,000 46,249 0.17 - - -Suncorp 6.25% VRN 13/Jun/2027 360,000 248,481 0.95 360,000 286,488 0.72SVB Holdings 8.375% Variable 27/Apr/2017 - - - 400,000 301,280 0.76Telefonica Emisiones Sau 5.431% 03/Feb/2014 150,000 143,502 0.54 - - -Telereal Securisation 4.9741% 10/Sep/2027 240,000 173,931 0.67 240,000 185,205 0.47Telereal Securisation 5.4252% 10/Dec/2031 220,000 142,064 0.55 220,000 170,434 0.42
Holdings at Fair value at % NAV at Holdings at Fair value at % NAV atGBP 31.03.09 31.03.09 31.03.09 30.09.08 30.09.08 30.09.08Telereal Securisation 6.1645% 10/Dec/2031 310,000 217,092 0.83 310,000 249,085 0.62Tesco 5.125% 24/Feb/2015 50,000 46,778 0.18 - - -
Tesco 6.125% 24/Feb/2022 50,000 51,260 0.20 - - -
Transportation Investment 8.5% 22/Jun/2010 - - - 600,000 324,834 0.81Tsesna International 9.875% 05/Feb/2010 - - - 630,000 256,248 0.64Unicredito Italiano 5% 01/Feb/2016 - - - 250,000 200,031 0.50Vodafone 4.625% 08/Sep/2014 150,000 149,460 0.57 - - -Volvo AB 9.875% 27/Feb/2014 600,000 551,331 2.12 - - -VTB Capital 6.322% 15/Mar/2010 - - - 510,000 451,350 1.12
19,791,136 75.95 26,367,654 65.59
GOVERNMENT BONDSKFW 5.55% 07/Jun/2021 2,300,000 2,568,227 9.86 - - -
UK Treasury 4.25% 07/Jun/2032 - - - 679,000 640,209 1.59UK Treasury 4.25% 07/Mar/2036 - - - 165,000 157,221 0.39UK Treasury 4.75% 07/Mar/2020 - - - 2,610,000 2,637,507 6.56UK Treasury 5% 07/Mar/2025 1,427,000 1,613,119 6.19 1,427,000 1,472,455 3.66UK Treasury 6% 07/Dec/2028 708,000 904,792 3.47 3,708,000 4,339,921 10.80
5,086,138 19.52 9,247,313 23.00
MORTGAGE BONDSCoco Finance FRN 13/Oct/2016 600,000 241,318 0.93 600,000 383,771 0.95Metrix Funding FRN 10/Feb/2019 170,000 25,500 0.10 170,000 136,357 0.34Metrix Securities FRN 20/Nov/2018 70,000 7,000 0.03 70,000 53,508 0.14Mutual Securitisation 7.39169% 30/Sep/2012 500,000 221,057 0.85 500,000 264,313 0.66Nemus Funding FRN 26/Oct/2014 250,000 31,183 0.12 250,000 180,558 0.45
526,058 2.03 1,018,507 2.54
SUPRANATIONAL BONDSEuropean Investment Bank 0% 28/June/2012 - - - 1,750,000 1,248,069 3.10
1,248,069 3.10
EQUITIESFirst Metals Warrants 03/May/2012 37,500 - - 37,500 99 -
- - 99 -Total securities quoted on regulated markets 25,403,332 97.50 37,881,642 94.23
OTHER TRANSFERABLE SECURITIES
Open Forward Foreign Exchange Contracts (130,227) (0.50) (146,109) (0.36)Futures Contracts - - (13,819) (0.03)
Credit Default Swaps (578,843) (2.22) (15,993) (0.04)
Total Financial Investments at Fair Value through Profit or Loss 24,694,262 94.78 37,705,721 93.80Other Assets and Liabilities 1,358,829 5.22 2,493,050 6.20
Net assets attributable to holders of redeemable ordinary shares at the end of the period 26,053,091 100.00 40,198,771 100.00
Changes in the investment portfolio during the reporting period are available to the shareholders at the address of the Company.
70

Gartmore SICAV Euro Money Fundfor the period ended 31 March 2009
BALANCE SHEETEUR Note 31.03.09 30.09.08CURRENT ASSETS
Cash and cash equivalents 2.8 21,719,471 57,874,507
Margin accounts 2.5(b), 9 - -
Due from brokers 2.10 - -
Subscriptions receivable 2.12 393,775 -
Financial investments at fair value through profit or loss 2.3, 2.5, 4, 5, 6, 7, 8 - -Dividend receivable 2.4, 2.12 - -
Interest receivable 2.4, 2.12 15,034 -
Other accrued income and prepaid expenses 1,590 (30,798)
Total assets 22,129,870 57,843,709
CURRENT LIABILITIES
Bank overdraft 2.8 - -
Due to brokers 2.10 - -
Redemptions payable 2.12 574,940 8,274,622
Distributions payable to holders of redeemable ordinary shares 12 - 1,746,376Accrued interest 2.4, 2.12 - -
Accrued expenses 2.12 28,717 37,107
Liabilities (excluding net assets attributable to holders of redeemable ordinary shares) 603,657 10,058,105Net assets attributable to holders of redeemableordinary shares 21,526,213 47,785,604
CASH-FLOW STATEMENTEUR Note 31.03.09 31.03.08CASH-FLOW FROM OPERATING ACTIVITIES
Increase/(decrease) in net assets attributable toholders of redeemable ordinary shares from operations 517,992 809,450
Adjustment for:
Interest income 2.6 (647,075) (969,125)
Interest expense 2.6 - -
Dividend income 2.6 - -
Investments interest 2.6 - -
Securities lending revenue 2.7, 14 - -
Taxation 2.9 11,866 3,006
Distributions to holders of redeemable ordinary shares 12 - -
Operating profit/(loss) before working capital changes (117,217) (156,669)Net decrease/(increase) in other accrued income and prepaid expenses (32,388) (15,401)Net decrease/(increase) in due from brokers - -
Net (decrease)/increase in due to brokers - -
Net increase/(decrease) in accrued expenses (8,390) 32,819
Net (increase)/decrease in financial investments at fair value through profit or loss - -Interest received 2.6, 2.12 632,041 813,501
Interest paid 2.6, 2.12 - -
Dividend received 2.6, 2.12 - -
Investments interest received 2.6 - -
Securities lending commission received 2.7, 14 - -
Tax paid 2.9 (11,866) (3,006)
Net cash generated from/(used in) operating activities 462,180 671,244
CASH-FLOW FROM FINANCING ACTIVITIES
Distributions paid to holders of redeemable ordinary shares 12 (1,746,376) (659,582)Cash received on shares issued 9,465,181 73,642,224
Cash paid out on shares redeemed (44,336,021) (18,915,931)
Net cash generated from/(used in) financing activities (36,617,216) 54,066,711Net increase/(decrease) in cash and cash equivalents (36,155,036) 54,737,955Opening cash and cash equivalents 57,874,507 21,644,632Closing cash and cash equivalents 21,719,471 76,382,587
INCOME STATEMENTEUR Note 31.03.09 31.03.08REVENUE
Deposit interest 2.6 647,075 969,125
Dividend income 2.6 - -
Investments interest 2.6 - -
Securities lending revenue 2.7, 14 - -
Net gains/(losses) on financial investments at fair value through profit or loss 2.3 - -Other income 4,453 -
Total investment income 651,528 969,125
EXPENSES
Management fees 13 80,153 123,173
Performance fees 13 - -
Administration fees 13 38,625 29,063
Transaction charges 17 - -
Service fees 13 1,947 -
Interest expense 2.6 - -
Other expenses 945 4,433
Total operating expenses 121,670 156,669Operating profit/(loss) 529,858 812,456
FINANCE COSTS
Distributions to holders of redeemable ordinary shares 12 - -
Total finance costs - -Net profit/(loss) before tax 529,858 812,456Taxation 2.9 11,866 3,006
Increase/(decrease) in net assets attributable toholders of redeemable ordinary shares from operations 517,992 809,450
STATEMENT OF CHANGES IN NET ASSETS ATTRIBUTABLE TO HOLDERS OF REDEEMABLE ORDINARY SHARESEUR Note 31.03.09 31.03.08Net assets attributable to holders of redeemableordinary shares at beginning of the period 47,785,604 21,825,730Increase/(decrease) in net assets attributable toholders of redeemable ordinary shares from operations 517,992 809,450Proceeds from shares issued 9,858,956 73,428,924
Payments for shares redeemed (36,636,339) (18,879,628)
Currency translation adjustment 2.2 - -
Net assets attributable to holders of redeemableordinary shares at end of the period 21,526,213 77,184,476
The accompanying notes 1 to 19 found on pages 81 to 115 form an integral part of the financial statements.
71
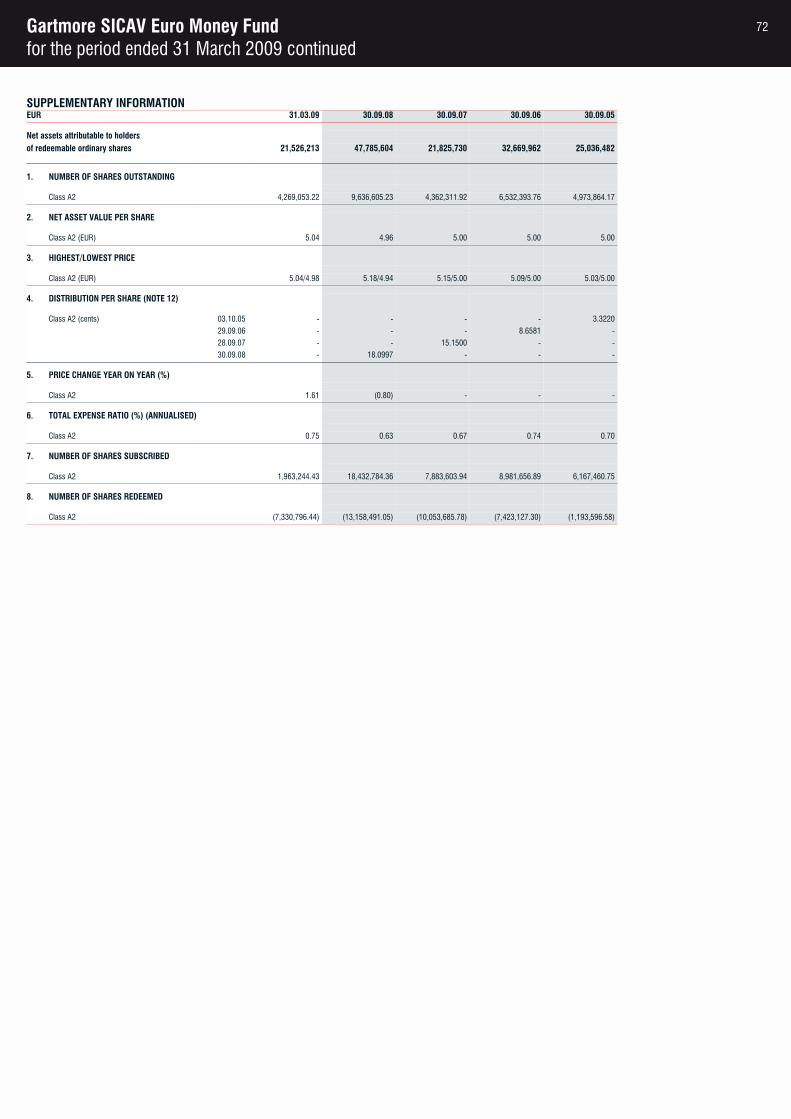
Gartmore SICAV Euro Money Fundfor the period ended 31 March 2009 continued
SUPPLEMENTARY INFORMATIONEUR 31.03.09 30.09.08 30.09.07 30.09.06 30.09.05
Net assets attributable to holdersof redeemable ordinary shares 21,526,213 47,785,604 21,825,730 32,669,962 25,036,482
1. NUMBER OF SHARES OUTSTANDING
Class A2 4,269,053.22 9,636,605.23 4,362,311.92 6,532,393.76 4,973,864.17
2. NET ASSET VALUE PER SHARE
Class A2 (EUR) 5.04 4.96 5.00 5.00 5.00
3. HIGHEST/LOWEST PRICE
Class A2 (EUR) 5.04/4.98 5.18/4.94 5.15/5.00 5.09/5.00 5.03/5.00
4. DISTRIBUTION PER SHARE (NOTE 12)
Class A2 (cents) 03.10.05 - - - - 3.3220
29.09.06 - - - 8.6581 -
28.09.07 - - 15.1500 - -
30.09.08 - 18.0997 - - -
5. PRICE CHANGE YEAR ON YEAR (%)
Class A2 1.61 (0.80) - - -
6. TOTAL EXPENSE RATIO (%) (ANNUALISED)
Class A2 0.75 0.63 0.67 0.74 0.70
7. NUMBER OF SHARES SUBSCRIBED
Class A2 1,963,244.43 18,432,784.36 7,883,603.94 8,981,656.89 6,167,460.75
8. NUMBER OF SHARES REDEEMED
Class A2 (7,330,796.44) (13,158,491.05) (10,053,685.78) (7,423,127.30) (1,193,596.58)
72
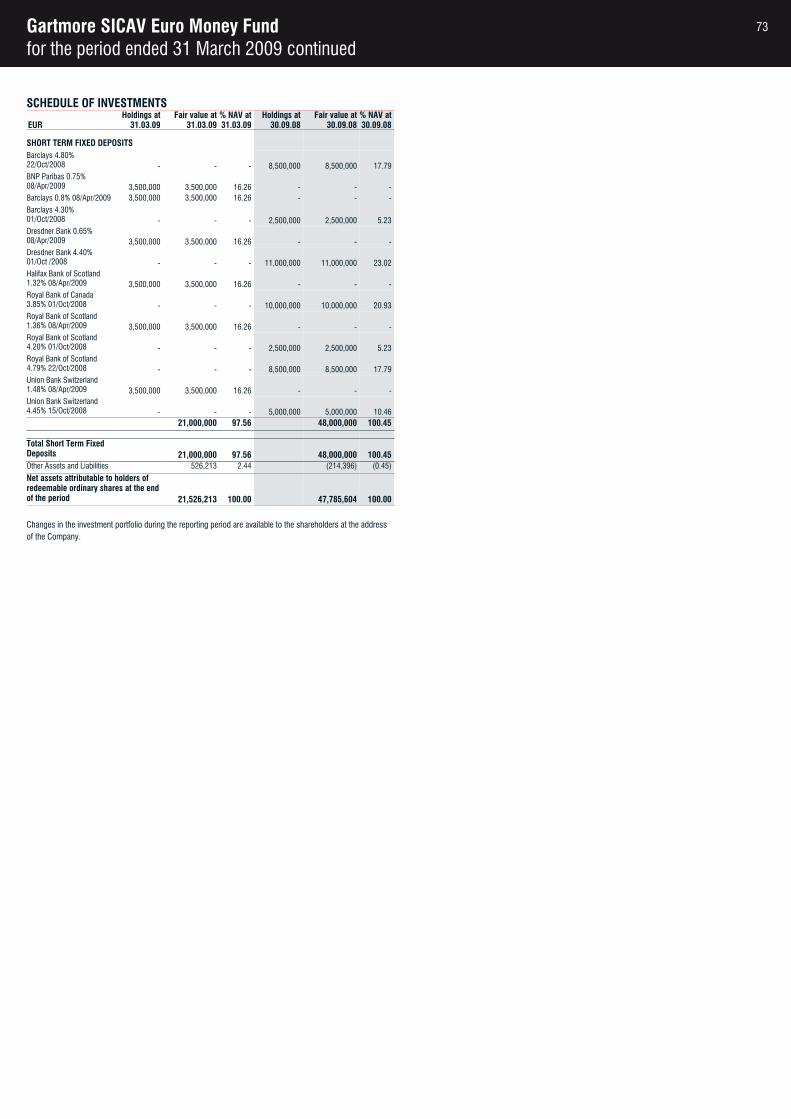
Gartmore SICAV Euro Money Fundfor the period ended 31 March 2009 continued
SCHEDULE OF INVESTMENTSHoldings at Fair value at % NAV at Holdings at Fair value at % NAV at
EUR 31.03.09 31.03.09 31.03.09 30.09.08 30.09.08 30.09.08
SHORT TERM FIXED DEPOSITSBarclays 4.80% 22/Oct/2008 - - - 8,500,000 8,500,000 17.79BNP Paribas 0.75% 08/Apr/2009 3,500,000 3,500,000 16.26 - - -Barclays 0.8% 08/Apr/2009 3,500,000 3,500,000 16.26 - - -
Barclays 4.30% 01/Oct/2008 - - - 2,500,000 2,500,000 5.23Dresdner Bank 0.65% 08/Apr/2009 3,500,000 3,500,000 16.26 - - -Dresdner Bank 4.40% 01/Oct /2008 - - - 11,000,000 11,000,000 23.02Halifax Bank of Scotland 1.32% 08/Apr/2009 3,500,000 3,500,000 16.26 - - -Royal Bank of Canada 3.85% 01/Oct/2008 - - - 10,000,000 10,000,000 20.93Royal Bank of Scotland 1.36% 08/Apr/2009 3,500,000 3,500,000 16.26 - - -Royal Bank of Scotland 4.20% 01/Oct/2008 - - - 2,500,000 2,500,000 5.23Royal Bank of Scotland 4.79% 22/Oct/2008 - - - 8,500,000 8,500,000 17.79Union Bank Switzerland 1.48% 08/Apr/2009 3,500,000 3,500,000 16.26 - - -Union Bank Switzerland 4.45% 15/Oct/2008 - - - 5,000,000 5,000,000 10.46
21,000,000 97.56 48,000,000 100.45
Total Short Term Fixed Deposits 21,000,000 97.56 48,000,000 100.45Other Assets and Liabilities 526,213 2.44 (214,396) (0.45)
Net assets attributable to holders of redeemable ordinary shares at the end of the period 21,526,213 100.00 47,785,604 100.00
Changes in the investment portfolio during the reporting period are available to the shareholders at the address of the Company.
73
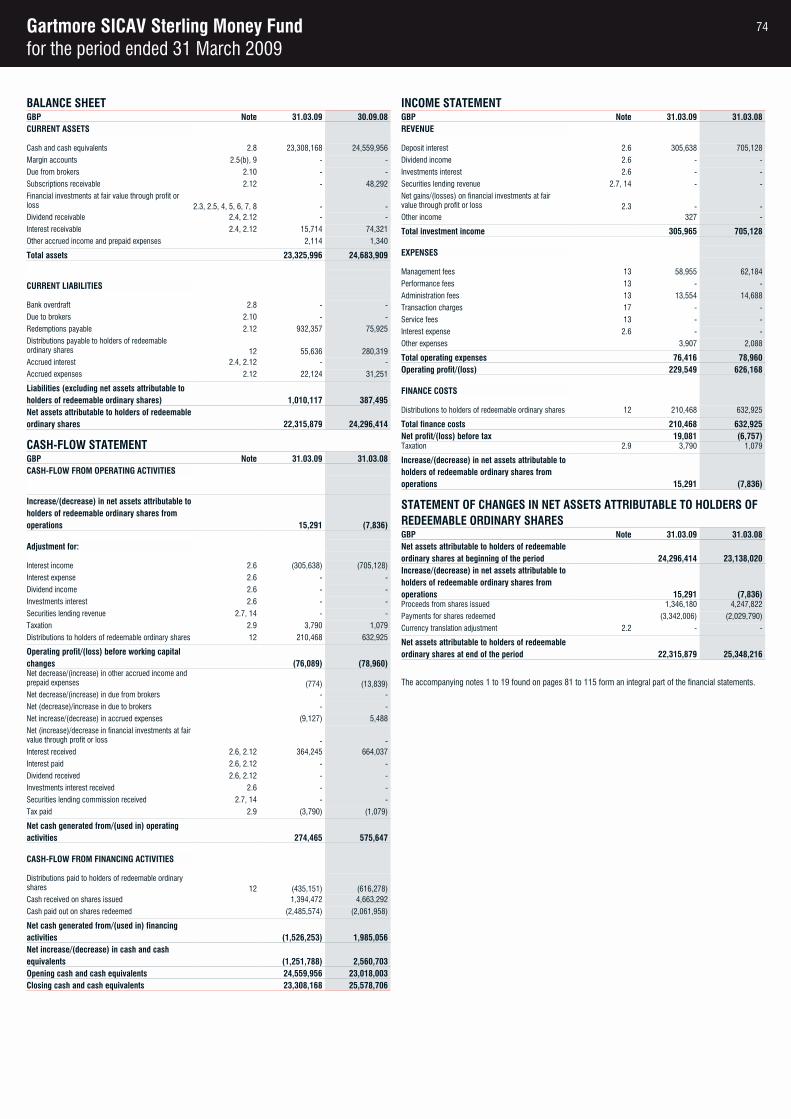
Gartmore SICAV Sterling Money Fundfor the period ended 31 March 2009
BALANCE SHEETGBP Note 31.03.09 30.09.08CURRENT ASSETS
Cash and cash equivalents 2.8 23,308,168 24,559,956
Margin accounts 2.5(b), 9 - -
Due from brokers 2.10 - -
Subscriptions receivable 2.12 - 48,292
Financial investments at fair value through profit or loss 2.3, 2.5, 4, 5, 6, 7, 8 - -Dividend receivable 2.4, 2.12 - -
Interest receivable 2.4, 2.12 15,714 74,321
Other accrued income and prepaid expenses 2,114 1,340
Total assets 23,325,996 24,683,909
CURRENT LIABILITIES
Bank overdraft 2.8 - -
Due to brokers 2.10 - -
Redemptions payable 2.12 932,357 75,925
Distributions payable to holders of redeemable ordinary shares 12 55,636 280,319Accrued interest 2.4, 2.12 - -
Accrued expenses 2.12 22,124 31,251
Liabilities (excluding net assets attributable to holders of redeemable ordinary shares) 1,010,117 387,495Net assets attributable to holders of redeemableordinary shares 22,315,879 24,296,414
CASH-FLOW STATEMENTGBP Note 31.03.09 31.03.08CASH-FLOW FROM OPERATING ACTIVITIES
Increase/(decrease) in net assets attributable toholders of redeemable ordinary shares from operations 15,291 (7,836)
Adjustment for:
Interest income 2.6 (305,638) (705,128)
Interest expense 2.6 - -
Dividend income 2.6 - -
Investments interest 2.6 - -
Securities lending revenue 2.7, 14 - -
Taxation 2.9 3,790 1,079
Distributions to holders of redeemable ordinary shares 12 210,468 632,925
Operating profit/(loss) before working capital changes (76,089) (78,960)Net decrease/(increase) in other accrued income and prepaid expenses (774) (13,839)Net decrease/(increase) in due from brokers - -
Net (decrease)/increase in due to brokers - -
Net increase/(decrease) in accrued expenses (9,127) 5,488
Net (increase)/decrease in financial investments at fair value through profit or loss - -Interest received 2.6, 2.12 364,245 664,037
Interest paid 2.6, 2.12 - -
Dividend received 2.6, 2.12 - -
Investments interest received 2.6 - -
Securities lending commission received 2.7, 14 - -
Tax paid 2.9 (3,790) (1,079)
Net cash generated from/(used in) operating activities 274,465 575,647
CASH-FLOW FROM FINANCING ACTIVITIES
Distributions paid to holders of redeemable ordinary shares 12 (435,151) (616,278)Cash received on shares issued 1,394,472 4,663,292
Cash paid out on shares redeemed (2,485,574) (2,061,958)
Net cash generated from/(used in) financing activities (1,526,253) 1,985,056Net increase/(decrease) in cash and cash equivalents (1,251,788) 2,560,703Opening cash and cash equivalents 24,559,956 23,018,003Closing cash and cash equivalents 23,308,168 25,578,706
INCOME STATEMENTGBP Note 31.03.09 31.03.08REVENUE
Deposit interest 2.6 305,638 705,128
Dividend income 2.6 - -
Investments interest 2.6 - -
Securities lending revenue 2.7, 14 - -
Net gains/(losses) on financial investments at fair value through profit or loss 2.3 - -Other income 327 -
Total investment income 305,965 705,128
EXPENSES
Management fees 13 58,955 62,184
Performance fees 13 - -
Administration fees 13 13,554 14,688
Transaction charges 17 - -
Service fees 13 - -
Interest expense 2.6 - -
Other expenses 3,907 2,088
Total operating expenses 76,416 78,960Operating profit/(loss) 229,549 626,168
FINANCE COSTS
Distributions to holders of redeemable ordinary shares 12 210,468 632,925
Total finance costs 210,468 632,925Net profit/(loss) before tax 19,081 (6,757)Taxation 2.9 3,790 1,079
Increase/(decrease) in net assets attributable toholders of redeemable ordinary shares from operations 15,291 (7,836)
STATEMENT OF CHANGES IN NET ASSETS ATTRIBUTABLE TO HOLDERS OF REDEEMABLE ORDINARY SHARESGBP Note 31.03.09 31.03.08Net assets attributable to holders of redeemableordinary shares at beginning of the period 24,296,414 23,138,020Increase/(decrease) in net assets attributable toholders of redeemable ordinary shares from operations 15,291 (7,836)Proceeds from shares issued 1,346,180 4,247,822
Payments for shares redeemed (3,342,006) (2,029,790)
Currency translation adjustment 2.2 - -
Net assets attributable to holders of redeemableordinary shares at end of the period 22,315,879 25,348,216
The accompanying notes 1 to 19 found on pages 81 to 115 form an integral part of the financial statements.
74
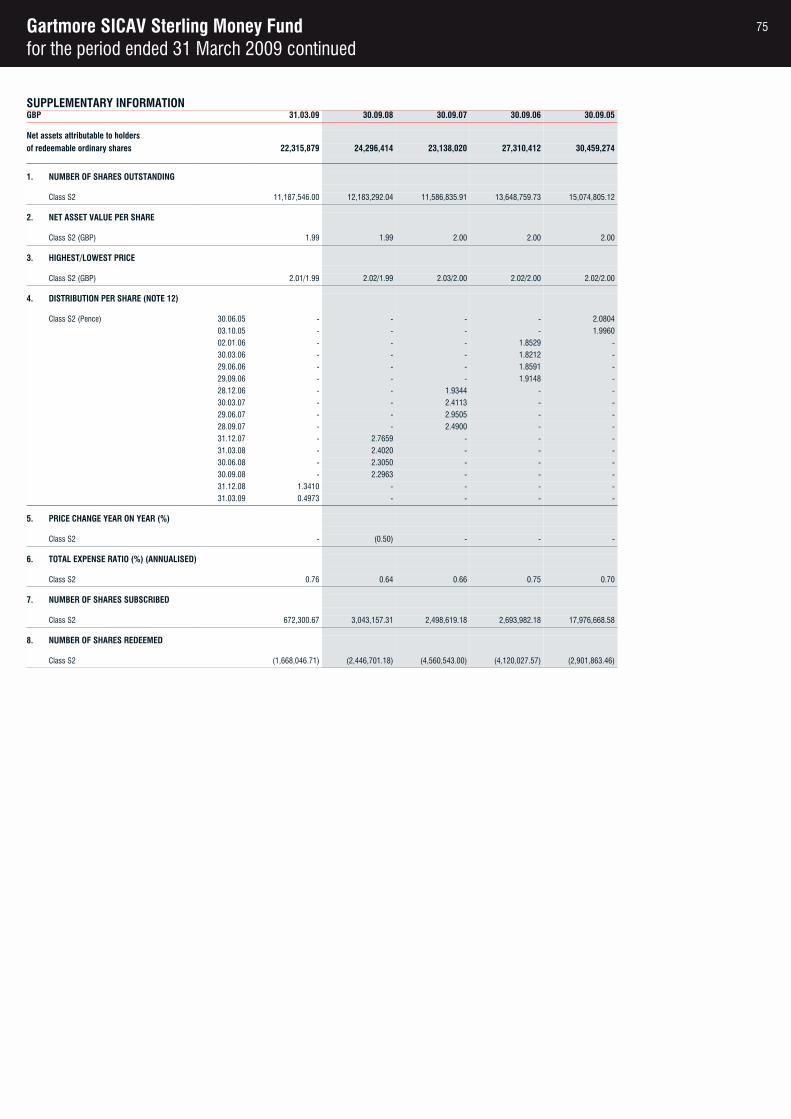
Gartmore SICAV Sterling Money Fundfor the period ended 31 March 2009 continued
SUPPLEMENTARY INFORMATIONGBP 31.03.09 30.09.08 30.09.07 30.09.06 30.09.05
Net assets attributable to holdersof redeemable ordinary shares 22,315,879 24,296,414 23,138,020 27,310,412 30,459,274
1. NUMBER OF SHARES OUTSTANDING
Class S2 11,187,546.00 12,183,292.04 11,586,835.91 13,648,759.73 15,074,805.12
2. NET ASSET VALUE PER SHARE
Class S2 (GBP) 1.99 1.99 2.00 2.00 2.00
3. HIGHEST/LOWEST PRICE
Class S2 (GBP) 2.01/1.99 2.02/1.99 2.03/2.00 2.02/2.00 2.02/2.00
4. DISTRIBUTION PER SHARE (NOTE 12)
Class S2 (Pence) 30.06.05 - - - - 2.0804
03.10.05 - - - - 1.9960
02.01.06 - - - 1.8529 -
30.03.06 - - - 1.8212 -
29.06.06 - - - 1.8591 -
29.09.06 - - - 1.9148 -
28.12.06 - - 1.9344 - -
30.03.07 - - 2.4113 - -
29.06.07 - - 2.9505 - -
28.09.07 - - 2.4900 - -
31.12.07 - 2.7659 - - -
31.03.08 - 2.4020 - - -
30.06.08 - 2.3050 - - -
30.09.08 - 2.2963 - - -
31.12.08 1.3410 - - - -
31.03.09 0.4973 - - - -
5. PRICE CHANGE YEAR ON YEAR (%)
Class S2 - (0.50) - - -
6. TOTAL EXPENSE RATIO (%) (ANNUALISED)
Class S2 0.76 0.64 0.66 0.75 0.70
7. NUMBER OF SHARES SUBSCRIBED
Class S2 672,300.67 3,043,157.31 2,498,619.18 2,693,982.18 17,976,668.58
8. NUMBER OF SHARES REDEEMED
Class S2 (1,668,046.71) (2,446,701.18) (4,560,543.00) (4,120,027.57) (2,901,863.46)
75
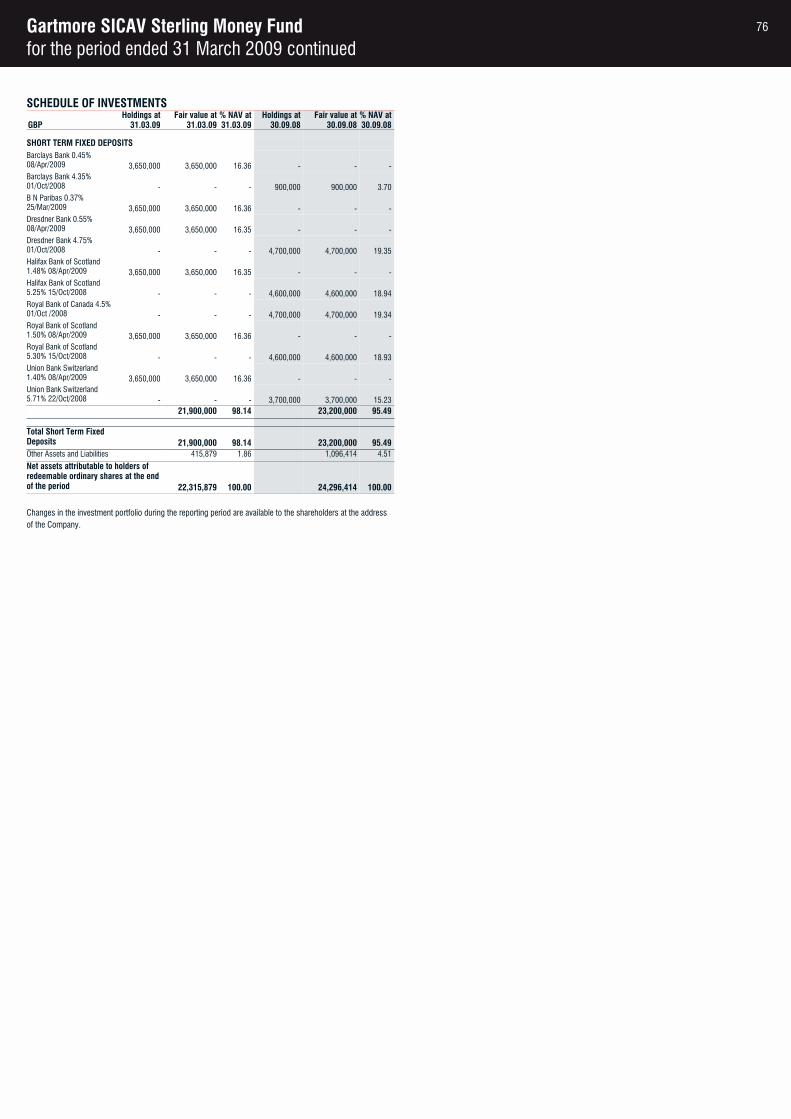
Gartmore SICAV Sterling Money Fundfor the period ended 31 March 2009 continued
SCHEDULE OF INVESTMENTSHoldings at Fair value at % NAV at Holdings at Fair value at % NAV at
GBP 31.03.09 31.03.09 31.03.09 30.09.08 30.09.08 30.09.08
SHORT TERM FIXED DEPOSITSBarclays Bank 0.45% 08/Apr/2009 3,650,000 3,650,000 16.36 - - -Barclays Bank 4.35% 01/Oct/2008 - - - 900,000 900,000 3.70B N Paribas 0.37% 25/Mar/2009 3,650,000 3,650,000 16.36 - - -Dresdner Bank 0.55% 08/Apr/2009 3,650,000 3,650,000 16.35 - - -Dresdner Bank 4.75% 01/Oct/2008 - - - 4,700,000 4,700,000 19.35Halifax Bank of Scotland 1.48% 08/Apr/2009 3,650,000 3,650,000 16.35 - - -Halifax Bank of Scotland 5.25% 15/Oct/2008 - - - 4,600,000 4,600,000 18.94Royal Bank of Canada 4.5%01/Oct /2008 - - - 4,700,000 4,700,000 19.34Royal Bank of Scotland 1.50% 08/Apr/2009 3,650,000 3,650,000 16.36 - - -Royal Bank of Scotland 5.30% 15/Oct/2008 - - - 4,600,000 4,600,000 18.93Union Bank Switzerland 1.40% 08/Apr/2009 3,650,000 3,650,000 16.36 - - -Union Bank Switzerland 5.71% 22/Oct/2008 - - - 3,700,000 3,700,000 15.23
21,900,000 98.14 23,200,000 95.49
Total Short Term Fixed Deposits 21,900,000 98.14 23,200,000 95.49Other Assets and Liabilities 415,879 1.86 1,096,414 4.51
Net assets attributable to holders of redeemable ordinary shares at the end of the period 22,315,879 100.00 24,296,414 100.00
Changes in the investment portfolio during the reporting period are available to the shareholders at the address of the Company.
76
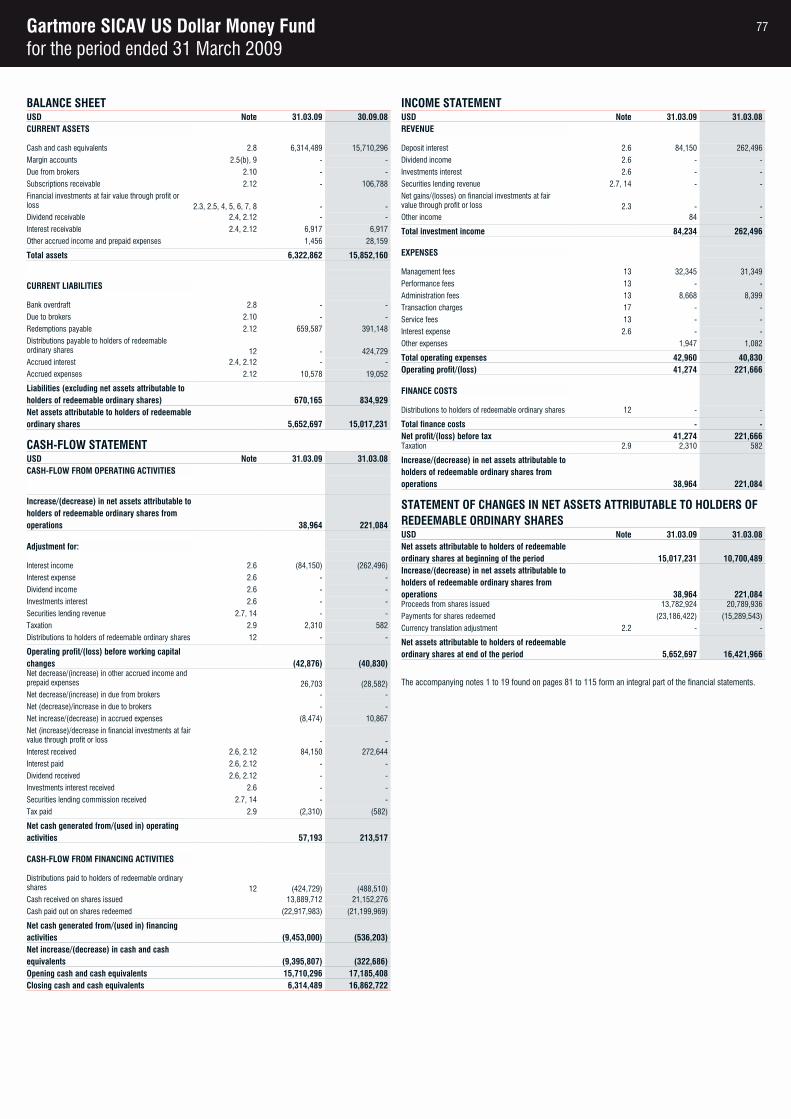
Gartmore SICAV US Dollar Money Fundfor the period ended 31 March 2009
BALANCE SHEETUSD Note 31.03.09 30.09.08CURRENT ASSETS
Cash and cash equivalents 2.8 6,314,489 15,710,296
Margin accounts 2.5(b), 9 - -
Due from brokers 2.10 - -
Subscriptions receivable 2.12 - 106,788
Financial investments at fair value through profit or loss 2.3, 2.5, 4, 5, 6, 7, 8 - -Dividend receivable 2.4, 2.12 - -
Interest receivable 2.4, 2.12 6,917 6,917
Other accrued income and prepaid expenses 1,456 28,159
Total assets 6,322,862 15,852,160
CURRENT LIABILITIES
Bank overdraft 2.8 - -
Due to brokers 2.10 - -
Redemptions payable 2.12 659,587 391,148
Distributions payable to holders of redeemable ordinary shares 12 - 424,729Accrued interest 2.4, 2.12 - -
Accrued expenses 2.12 10,578 19,052
Liabilities (excluding net assets attributable to holders of redeemable ordinary shares) 670,165 834,929Net assets attributable to holders of redeemableordinary shares 5,652,697 15,017,231
CASH-FLOW STATEMENTUSD Note 31.03.09 31.03.08CASH-FLOW FROM OPERATING ACTIVITIES
Increase/(decrease) in net assets attributable toholders of redeemable ordinary shares from operations 38,964 221,084
Adjustment for:
Interest income 2.6 (84,150) (262,496)
Interest expense 2.6 - -
Dividend income 2.6 - -
Investments interest 2.6 - -
Securities lending revenue 2.7, 14 - -
Taxation 2.9 2,310 582
Distributions to holders of redeemable ordinary shares 12 - -
Operating profit/(loss) before working capital changes (42,876) (40,830)Net decrease/(increase) in other accrued income and prepaid expenses 26,703 (28,582)Net decrease/(increase) in due from brokers - -
Net (decrease)/increase in due to brokers - -
Net increase/(decrease) in accrued expenses (8,474) 10,867
Net (increase)/decrease in financial investments at fair value through profit or loss - -Interest received 2.6, 2.12 84,150 272,644
Interest paid 2.6, 2.12 - -
Dividend received 2.6, 2.12 - -
Investments interest received 2.6 - -
Securities lending commission received 2.7, 14 - -
Tax paid 2.9 (2,310) (582)
Net cash generated from/(used in) operating activities 57,193 213,517
CASH-FLOW FROM FINANCING ACTIVITIES
Distributions paid to holders of redeemable ordinary shares 12 (424,729) (488,510)Cash received on shares issued 13,889,712 21,152,276
Cash paid out on shares redeemed (22,917,983) (21,199,969)
Net cash generated from/(used in) financing activities (9,453,000) (536,203)Net increase/(decrease) in cash and cash equivalents (9,395,807) (322,686)Opening cash and cash equivalents 15,710,296 17,185,408Closing cash and cash equivalents 6,314,489 16,862,722
INCOME STATEMENTUSD Note 31.03.09 31.03.08REVENUE
Deposit interest 2.6 84,150 262,496
Dividend income 2.6 - -
Investments interest 2.6 - -
Securities lending revenue 2.7, 14 - -
Net gains/(losses) on financial investments at fair value through profit or loss 2.3 - -Other income 84 -
Total investment income 84,234 262,496
EXPENSES
Management fees 13 32,345 31,349
Performance fees 13 - -
Administration fees 13 8,668 8,399
Transaction charges 17 - -
Service fees 13 - -
Interest expense 2.6 - -
Other expenses 1,947 1,082
Total operating expenses 42,960 40,830Operating profit/(loss) 41,274 221,666
FINANCE COSTS
Distributions to holders of redeemable ordinary shares 12 - -
Total finance costs - -Net profit/(loss) before tax 41,274 221,666Taxation 2.9 2,310 582
Increase/(decrease) in net assets attributable toholders of redeemable ordinary shares from operations 38,964 221,084
STATEMENT OF CHANGES IN NET ASSETS ATTRIBUTABLE TO HOLDERS OF REDEEMABLE ORDINARY SHARESUSD Note 31.03.09 31.03.08Net assets attributable to holders of redeemableordinary shares at beginning of the period 15,017,231 10,700,489Increase/(decrease) in net assets attributable toholders of redeemable ordinary shares from operations 38,964 221,084Proceeds from shares issued 13,782,924 20,789,936
Payments for shares redeemed (23,186,422) (15,289,543)
Currency translation adjustment 2.2 - -
Net assets attributable to holders of redeemableordinary shares at end of the period 5,652,697 16,421,966
The accompanying notes 1 to 19 found on pages 81 to 115 form an integral part of the financial statements.
77
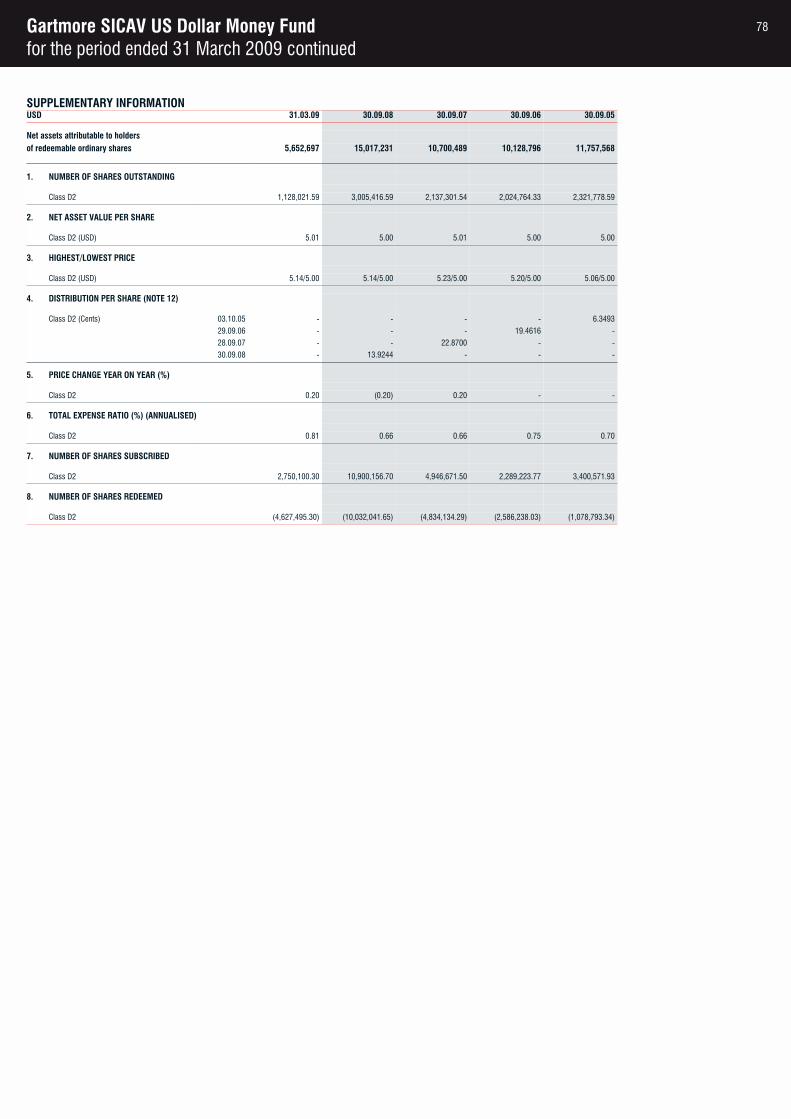
Gartmore SICAV US Dollar Money Fundfor the period ended 31 March 2009 continued
SUPPLEMENTARY INFORMATIONUSD 31.03.09 30.09.08 30.09.07 30.09.06 30.09.05
Net assets attributable to holdersof redeemable ordinary shares 5,652,697 15,017,231 10,700,489 10,128,796 11,757,568
1. NUMBER OF SHARES OUTSTANDING
Class D2 1,128,021.59 3,005,416.59 2,137,301.54 2,024,764.33 2,321,778.59
2. NET ASSET VALUE PER SHARE
Class D2 (USD) 5.01 5.00 5.01 5.00 5.00
3. HIGHEST/LOWEST PRICE
Class D2 (USD) 5.14/5.00 5.14/5.00 5.23/5.00 5.20/5.00 5.06/5.00
4. DISTRIBUTION PER SHARE (NOTE 12)
Class D2 (Cents) 03.10.05 - - - - 6.3493
29.09.06 - - - 19.4616 -
28.09.07 - - 22.8700 - -
30.09.08 - 13.9244 - - -
5. PRICE CHANGE YEAR ON YEAR (%)
Class D2 0.20 (0.20) 0.20 - -
6. TOTAL EXPENSE RATIO (%) (ANNUALISED)
Class D2 0.81 0.66 0.66 0.75 0.70
7. NUMBER OF SHARES SUBSCRIBED
Class D2 2,750,100.30 10,900,156.70 4,946,671.50 2,289,223.77 3,400,571.93
8. NUMBER OF SHARES REDEEMED
Class D2 (4,627,495.30) (10,032,041.65) (4,834,134.29) (2,586,238.03) (1,078,793.34)
78
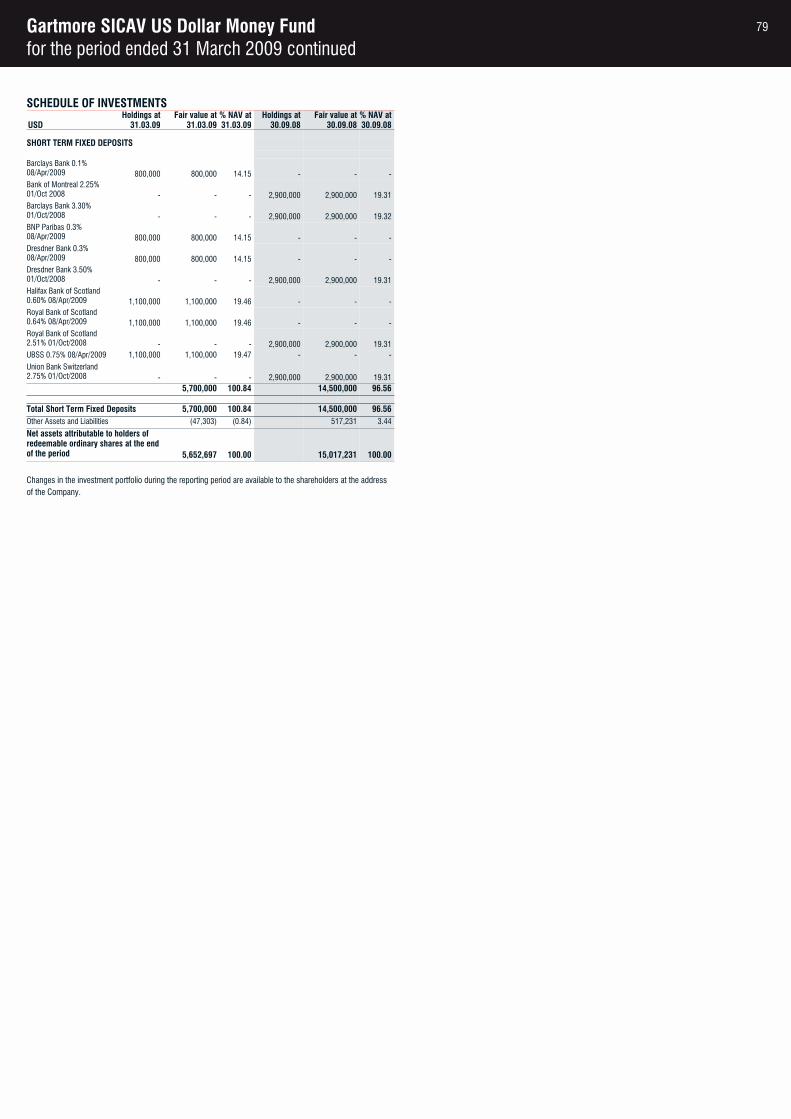
Gartmore SICAV US Dollar Money Fundfor the period ended 31 March 2009 continued
SCHEDULE OF INVESTMENTSHoldings at Fair value at % NAV at Holdings at Fair value at % NAV at
USD 31.03.09 31.03.09 31.03.09 30.09.08 30.09.08 30.09.08
SHORT TERM FIXED DEPOSITS
Barclays Bank 0.1% 08/Apr/2009 800,000 800,000 14.15 - - -Bank of Montreal 2.25% 01/Oct 2008 - - - 2,900,000 2,900,000 19.31Barclays Bank 3.30% 01/Oct/2008 - - - 2,900,000 2,900,000 19.32BNP Paribas 0.3% 08/Apr/2009 800,000 800,000 14.15 - - -Dresdner Bank 0.3% 08/Apr/2009 800,000 800,000 14.15 - - -Dresdner Bank 3.50% 01/Oct/2008 - - - 2,900,000 2,900,000 19.31Halifax Bank of Scotland 0.60% 08/Apr/2009 1,100,000 1,100,000 19.46 - - -Royal Bank of Scotland 0.64% 08/Apr/2009 1,100,000 1,100,000 19.46 - - -Royal Bank of Scotland 2.51% 01/Oct/2008 - - - 2,900,000 2,900,000 19.31UBSS 0.75% 08/Apr/2009 1,100,000 1,100,000 19.47 - - -
Union Bank Switzerland 2.75% 01/Oct/2008 - - - 2,900,000 2,900,000 19.31
5,700,000 100.84 14,500,000 96.56
Total Short Term Fixed Deposits 5,700,000 100.84 14,500,000 96.56Other Assets and Liabilities (47,303) (0.84) 517,231 3.44
Net assets attributable to holders of redeemable ordinary shares at the end of the period 5,652,697 100.00 15,017,231 100.00
Changes in the investment portfolio during the reporting period are available to the shareholders at the address of the Company.
79
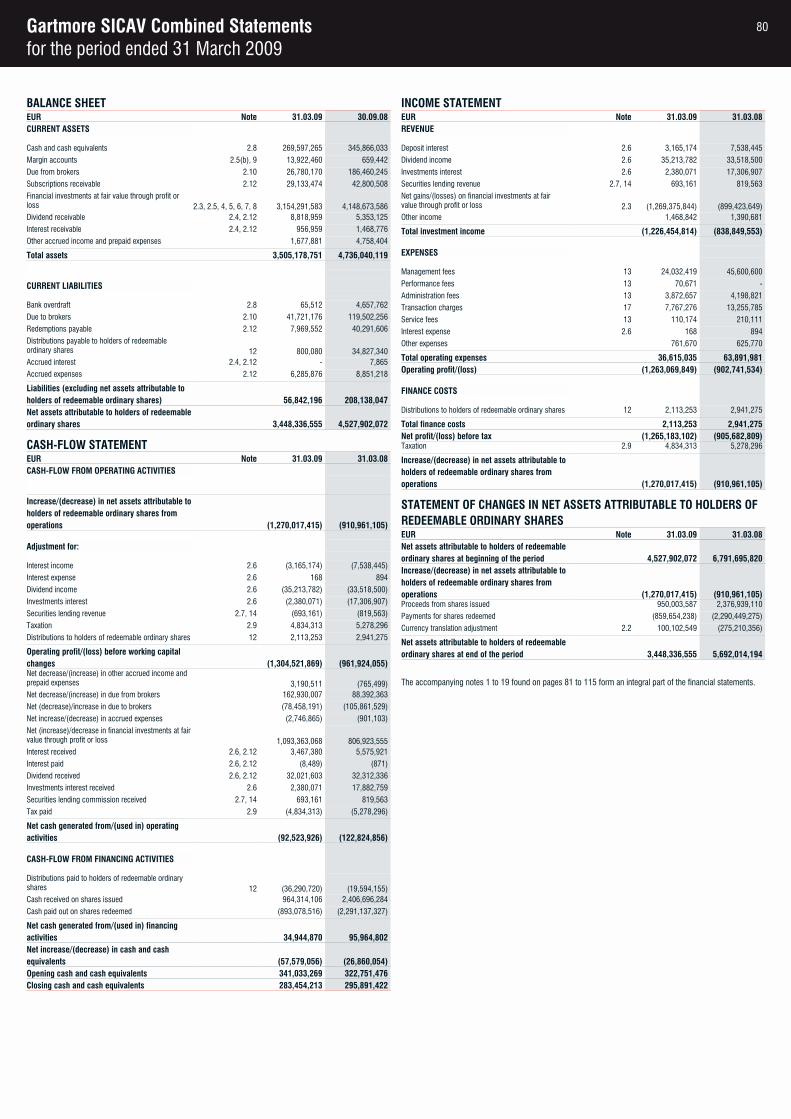
Gartmore SICAV Combined Statementsfor the period ended 31 March 2009
BALANCE SHEETEUR Note 31.03.09 30.09.08CURRENT ASSETS
Cash and cash equivalents 2.8 269,597,265 345,866,033
Margin accounts 2.5(b), 9 13,922,460 659,442
Due from brokers 2.10 26,780,170 186,460,245
Subscriptions receivable 2.12 29,133,474 42,800,508
Financial investments at fair value through profit or loss 2.3, 2.5, 4, 5, 6, 7, 8 3,154,291,583 4,148,673,586Dividend receivable 2.4, 2.12 8,818,959 5,353,125
Interest receivable 2.4, 2.12 956,959 1,468,776
Other accrued income and prepaid expenses 1,677,881 4,758,404
Total assets 3,505,178,751 4,736,040,119
CURRENT LIABILITIES
Bank overdraft 2.8 65,512 4,657,762
Due to brokers 2.10 41,721,176 119,502,256
Redemptions payable 2.12 7,969,552 40,291,606
Distributions payable to holders of redeemable ordinary shares 12 800,080 34,827,340Accrued interest 2.4, 2.12 - 7,865
Accrued expenses 2.12 6,285,876 8,851,218
Liabilities (excluding net assets attributable to holders of redeemable ordinary shares) 56,842,196 208,138,047Net assets attributable to holders of redeemableordinary shares 3,448,336,555 4,527,902,072
CASH-FLOW STATEMENTEUR Note 31.03.09 31.03.08CASH-FLOW FROM OPERATING ACTIVITIES
Increase/(decrease) in net assets attributable toholders of redeemable ordinary shares from operations (1,270,017,415) (910,961,105)
Adjustment for:
Interest income 2.6 (3,165,174) (7,538,445)
Interest expense 2.6 168 894
Dividend income 2.6 (35,213,782) (33,518,500)
Investments interest 2.6 (2,380,071) (17,306,907)
Securities lending revenue 2.7, 14 (693,161) (819,563)
Taxation 2.9 4,834,313 5,278,296
Distributions to holders of redeemable ordinary shares 12 2,113,253 2,941,275
Operating profit/(loss) before working capital changes (1,304,521,869) (961,924,055)Net decrease/(increase) in other accrued income and prepaid expenses 3,190,511 (765,499)Net decrease/(increase) in due from brokers 162,930,007 88,392,363
Net (decrease)/increase in due to brokers (78,458,191) (105,861,529)
Net increase/(decrease) in accrued expenses (2,746,865) (901,103)
Net (increase)/decrease in financial investments at fair value through profit or loss 1,093,363,068 806,923,555Interest received 2.6, 2.12 3,467,380 5,575,921
Interest paid 2.6, 2.12 (8,489) (871)
Dividend received 2.6, 2.12 32,021,603 32,312,336
Investments interest received 2.6 2,380,071 17,882,759
Securities lending commission received 2.7, 14 693,161 819,563
Tax paid 2.9 (4,834,313) (5,278,296)
Net cash generated from/(used in) operating activities (92,523,926) (122,824,856)
CASH-FLOW FROM FINANCING ACTIVITIES
Distributions paid to holders of redeemable ordinary shares 12 (36,290,720) (19,594,155)Cash received on shares issued 964,314,106 2,406,696,284
Cash paid out on shares redeemed (893,078,516) (2,291,137,327)
Net cash generated from/(used in) financing activities 34,944,870 95,964,802Net increase/(decrease) in cash and cash equivalents (57,579,056) (26,860,054)Opening cash and cash equivalents 341,033,269 322,751,476Closing cash and cash equivalents 283,454,213 295,891,422
INCOME STATEMENTEUR Note 31.03.09 31.03.08REVENUE
Deposit interest 2.6 3,165,174 7,538,445
Dividend income 2.6 35,213,782 33,518,500
Investments interest 2.6 2,380,071 17,306,907
Securities lending revenue 2.7, 14 693,161 819,563
Net gains/(losses) on financial investments at fair value through profit or loss 2.3 (1,269,375,844) (899,423,649)Other income 1,468,842 1,390,681
Total investment income (1,226,454,814) (838,849,553)
EXPENSES
Management fees 13 24,032,419 45,600,600
Performance fees 13 70,671 -
Administration fees 13 3,872,657 4,198,821
Transaction charges 17 7,767,276 13,255,785
Service fees 13 110,174 210,111
Interest expense 2.6 168 894
Other expenses 761,670 625,770
Total operating expenses 36,615,035 63,891,981Operating profit/(loss) (1,263,069,849) (902,741,534)
FINANCE COSTS
Distributions to holders of redeemable ordinary shares 12 2,113,253 2,941,275
Total finance costs 2,113,253 2,941,275Net profit/(loss) before tax (1,265,183,102) (905,682,809)Taxation 2.9 4,834,313 5,278,296
Increase/(decrease) in net assets attributable toholders of redeemable ordinary shares from operations (1,270,017,415) (910,961,105)
STATEMENT OF CHANGES IN NET ASSETS ATTRIBUTABLE TO HOLDERS OF REDEEMABLE ORDINARY SHARESEUR Note 31.03.09 31.03.08Net assets attributable to holders of redeemableordinary shares at beginning of the period 4,527,902,072 6,791,695,820Increase/(decrease) in net assets attributable toholders of redeemable ordinary shares from operations (1,270,017,415) (910,961,105)Proceeds from shares issued 950,003,587 2,376,939,110
Payments for shares redeemed (859,654,238) (2,290,449,275)
Currency translation adjustment 2.2 100,102,549 (275,210,356)
Net assets attributable to holders of redeemableordinary shares at end of the period 3,448,336,555 5,692,014,194
The accompanying notes 1 to 19 found on pages 81 to 115 form an integral part of the financial statements.
80
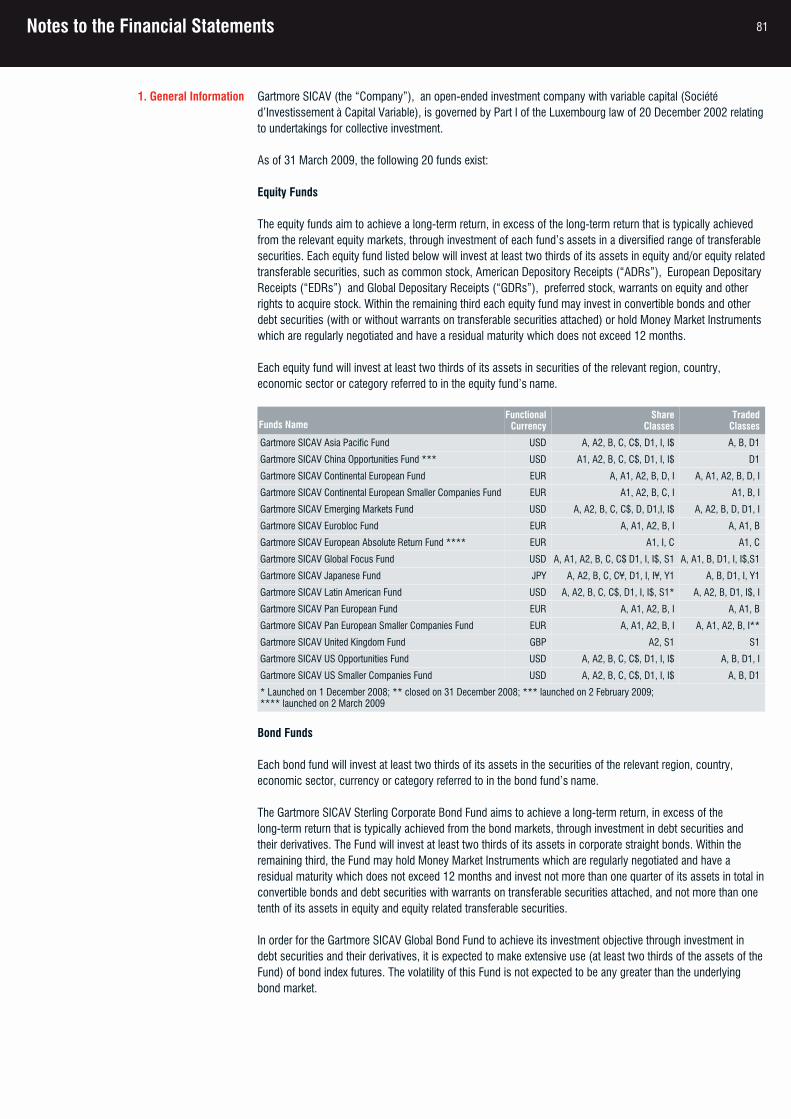
Notes to the Financial Statements
1. General Information Gartmore SICAV (the “Company”), an open-ended investment company with variable capital (Société d’Investissement à Capital Variable), is governed by Part I of the Luxembourg law of 20 December 2002 relatingto undertakings for collective investment.
As of 31 March 2009, the following 20 funds exist:
Equity Funds
The equity funds aim to achieve a long-term return, in excess of the long-term return that is typically achieved from the relevant equity markets, through investment of each fund’s assets in a diversified range of transferable securities. Each equity fund listed below will invest at least two thirds of its assets in equity and/or equity relatedtransferable securities, such as common stock, American Depository Receipts (“ADRs”), European Depositary Receipts (“EDRs”) and Global Depositary Receipts (“GDRs”), preferred stock, warrants on equity and other rights to acquire stock. Within the remaining third each equity fund may invest in convertible bonds and other debt securities (with or without warrants on transferable securities attached) or hold Money Market Instruments which are regularly negotiated and have a residual maturity which does not exceed 12 months.
Each equity fund will invest at least two thirds of its assets in securities of the relevant region, country, economic sector or category referred to in the equity fund’s name.
Funds NameFunctional
CurrencyShare
ClassesTraded
Classes
Gartmore SICAV Asia Pacific Fund USD A, A2, B, C, C$, D1, I, I$ A, B, D1
Gartmore SICAV China Opportunities Fund *** USD A1, A2, B, C, C$, D1, I, I$ D1
Gartmore SICAV Continental European Fund EUR A, A1, A2, B, D, I A, A1, A2, B, D, I
Gartmore SICAV Continental European Smaller Companies Fund EUR A1, A2, B, C, I A1, B, I
Gartmore SICAV Emerging Markets Fund USD A, A2, B, C, C$, D, D1,I, I$ A, A2, B, D, D1, I
Gartmore SICAV Eurobloc Fund EUR A, A1, A2, B, I A, A1, B
Gartmore SICAV European Absolute Return Fund **** EUR A1, I, C A1, C
Gartmore SICAV Global Focus Fund USD A, A1, A2, B, C, C$ D1, I, I$, S1 A, A1, B, D1, I, I$,S1
Gartmore SICAV Japanese Fund JPY A, A2, B, C, C¥, D1, I, I¥, Y1 A, B, D1, I, Y1
Gartmore SICAV Latin American Fund USD A, A2, B, C, C$, D1, I, I$, S1* A, A2, B, D1, I$, I
Gartmore SICAV Pan European Fund EUR A, A1, A2, B, I A, A1, B
Gartmore SICAV Pan European Smaller Companies Fund EUR A, A1, A2, B, I A, A1, A2, B, I**
Gartmore SICAV United Kingdom Fund GBP A2, S1 S1
Gartmore SICAV US Opportunities Fund USD A, A2, B, C, C$, D1, I, I$ A, B, D1, I
Gartmore SICAV US Smaller Companies Fund USD A, A2, B, C, C$, D1, I, I$ A, B, D1
* Launched on 1 December 2008; ** closed on 31 December 2008; *** launched on 2 February 2009; **** launched on 2 March 2009
Bond Funds
Each bond fund will invest at least two thirds of its assets in the securities of the relevant region, country, economic sector, currency or category referred to in the bond fund’s name.
The Gartmore SICAV Sterling Corporate Bond Fund aims to achieve a long-term return, in excess of the long-term return that is typically achieved from the bond markets, through investment in debt securities and their derivatives. The Fund will invest at least two thirds of its assets in corporate straight bonds. Within the remaining third, the Fund may hold Money Market Instruments which are regularly negotiated and have a residual maturity which does not exceed 12 months and invest not more than one quarter of its assets in total inconvertible bonds and debt securities with warrants on transferable securities attached, and not more than one tenth of its assets in equity and equity related transferable securities.
In order for the Gartmore SICAV Global Bond Fund to achieve its investment objective through investment in debt securities and their derivatives, it is expected to make extensive use (at least two thirds of the assets of theFund) of bond index futures. The volatility of this Fund is not expected to be any greater than the underlying bond market.
81
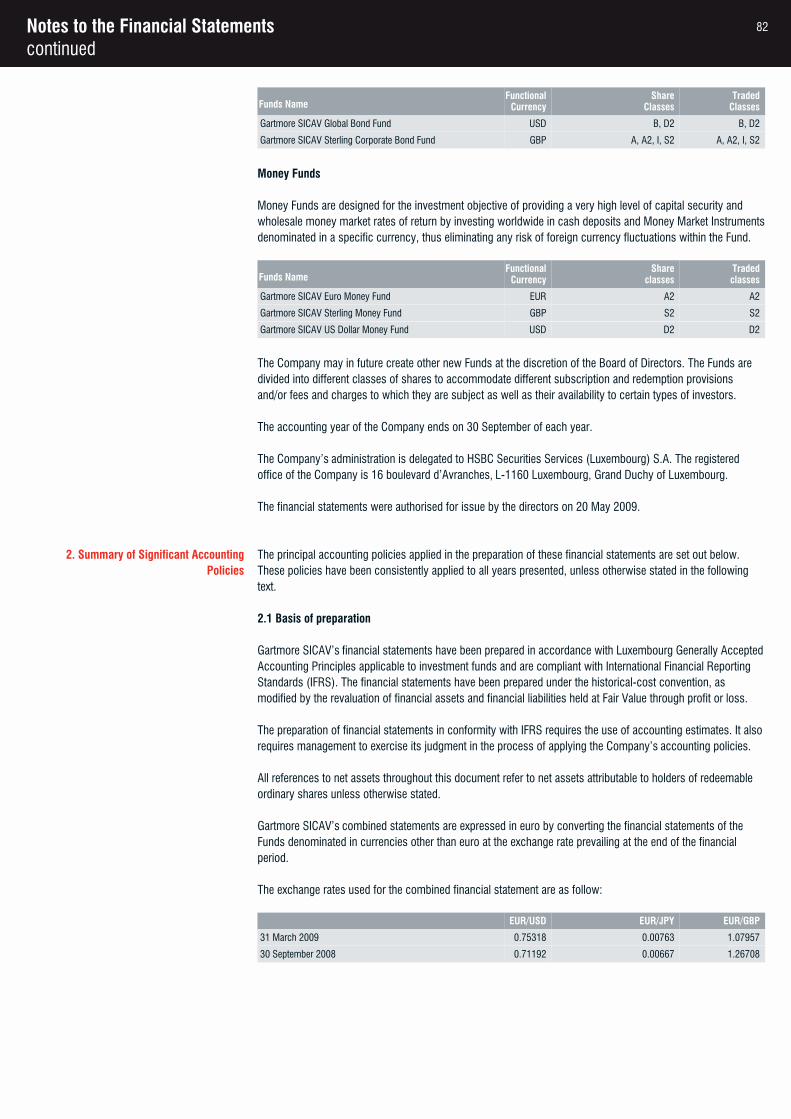
Notes to the Financial Statementscontinued
Funds NameFunctional
CurrencyShare
ClassesTraded
Classes
Gartmore SICAV Global Bond Fund USD B, D2 B, D2
Gartmore SICAV Sterling Corporate Bond Fund GBP A, A2, I, S2 A, A2, I, S2
Money Funds
Money Funds are designed for the investment objective of providing a very high level of capital security and wholesale money market rates of return by investing worldwide in cash deposits and Money Market Instrumentsdenominated in a specific currency, thus eliminating any risk of foreign currency fluctuations within the Fund.
Funds NameFunctional
CurrencyShare
classesTradedclasses
Gartmore SICAV Euro Money Fund EUR A2 A2
Gartmore SICAV Sterling Money Fund GBP S2 S2
Gartmore SICAV US Dollar Money Fund USD D2 D2
The Company may in future create other new Funds at the discretion of the Board of Directors. The Funds are divided into different classes of shares to accommodate different subscription and redemption provisions and/or fees and charges to which they are subject as well as their availability to certain types of investors.
The accounting year of the Company ends on 30 September of each year.
The Company’s administration is delegated to HSBC Securities Services (Luxembourg) S.A. The registered office of the Company is 16 boulevard d’Avranches, L-1160 Luxembourg, Grand Duchy of Luxembourg.
The financial statements were authorised for issue by the directors on 20 May 2009.
2. Summary of Significant Accounting Policies
The principal accounting policies applied in the preparation of these financial statements are set out below. These policies have been consistently applied to all years presented, unless otherwise stated in the following text.
2.1 Basis of preparation
Gartmore SICAV’s financial statements have been prepared in accordance with Luxembourg Generally AcceptedAccounting Principles applicable to investment funds and are compliant with International Financial Reporting Standards (IFRS). The financial statements have been prepared under the historical-cost convention, as modified by the revaluation of financial assets and financial liabilities held at Fair Value through profit or loss. The preparation of financial statements in conformity with IFRS requires the use of accounting estimates. It alsorequires management to exercise its judgment in the process of applying the Company’s accounting policies.
All references to net assets throughout this document refer to net assets attributable to holders of redeemable ordinary shares unless otherwise stated.
Gartmore SICAV’s combined statements are expressed in euro by converting the financial statements of the Funds denominated in currencies other than euro at the exchange rate prevailing at the end of the financial period.
The exchange rates used for the combined financial statement are as follow:
EUR/USD EUR/JPY EUR/GBP
31 March 2009 0.75318 0.00763 1.07957
30 September 2008 0.71192 0.00667 1.26708
82
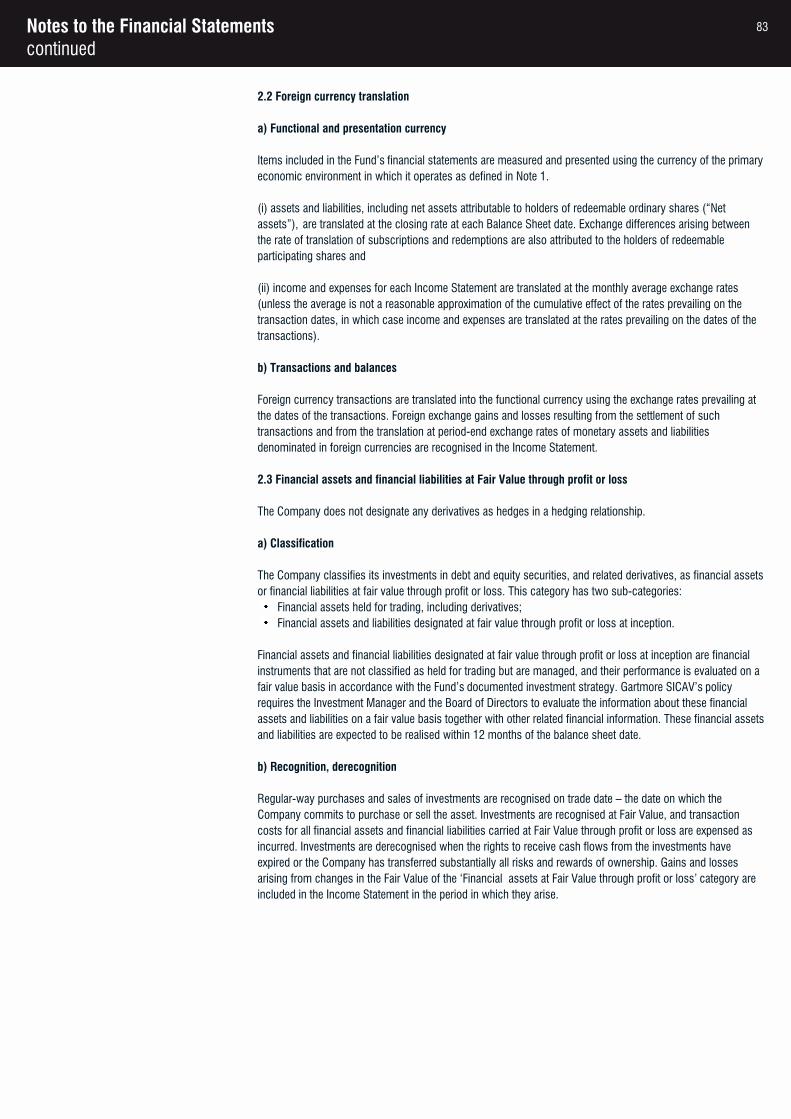
Notes to the Financial Statementscontinued
2.2 Foreign currency translation
a) Functional and presentation currency
Items included in the Fund’s financial statements are measured and presented using the currency of the primaryeconomic environment in which it operates as defined in Note 1.
(i) assets and liabilities, including net assets attributable to holders of redeemable ordinary shares (“Net assets”), are translated at the closing rate at each Balance Sheet date. Exchange differences arising between the rate of translation of subscriptions and redemptions are also attributed to the holders of redeemable participating shares and
(ii) income and expenses for each Income Statement are translated at the monthly average exchange rates (unless the average is not a reasonable approximation of the cumulative effect of the rates prevailing on the transaction dates, in which case income and expenses are translated at the rates prevailing on the dates of the transactions).
b) Transactions and balances
Foreign currency transactions are translated into the functional currency using the exchange rates prevailing at the dates of the transactions. Foreign exchange gains and losses resulting from the settlement of such transactions and from the translation at period-end exchange rates of monetary assets and liabilities denominated in foreign currencies are recognised in the Income Statement.
2.3 Financial assets and financial liabilities at Fair Value through profit or loss
The Company does not designate any derivatives as hedges in a hedging relationship.
a) Classification
The Company classifies its investments in debt and equity securities, and related derivatives, as financial assetsor financial liabilities at fair value through profit or loss. This category has two sub-categories:
Financial assets held for trading, including derivatives;Financial assets and liabilities designated at fair value through profit or loss at inception.
Financial assets and financial liabilities designated at fair value through profit or loss at inception are financial instruments that are not classified as held for trading but are managed, and their performance is evaluated on a fair value basis in accordance with the Fund’s documented investment strategy. Gartmore SICAV’s policy requires the Investment Manager and the Board of Directors to evaluate the information about these financial assets and liabilities on a fair value basis together with other related financial information. These financial assetsand liabilities are expected to be realised within 12 months of the balance sheet date.
b) Recognition, derecognition
Regular-way purchases and sales of investments are recognised on trade date – the date on which the Company commits to purchase or sell the asset. Investments are recognised at Fair Value, and transaction costs for all financial assets and financial liabilities carried at Fair Value through profit or loss are expensed as incurred. Investments are derecognised when the rights to receive cash flows from the investments have expired or the Company has transferred substantially all risks and rewards of ownership. Gains and losses arising from changes in the Fair Value of the ‘Financial assets at Fair Value through profit or loss’ category are included in the Income Statement in the period in which they arise.
83
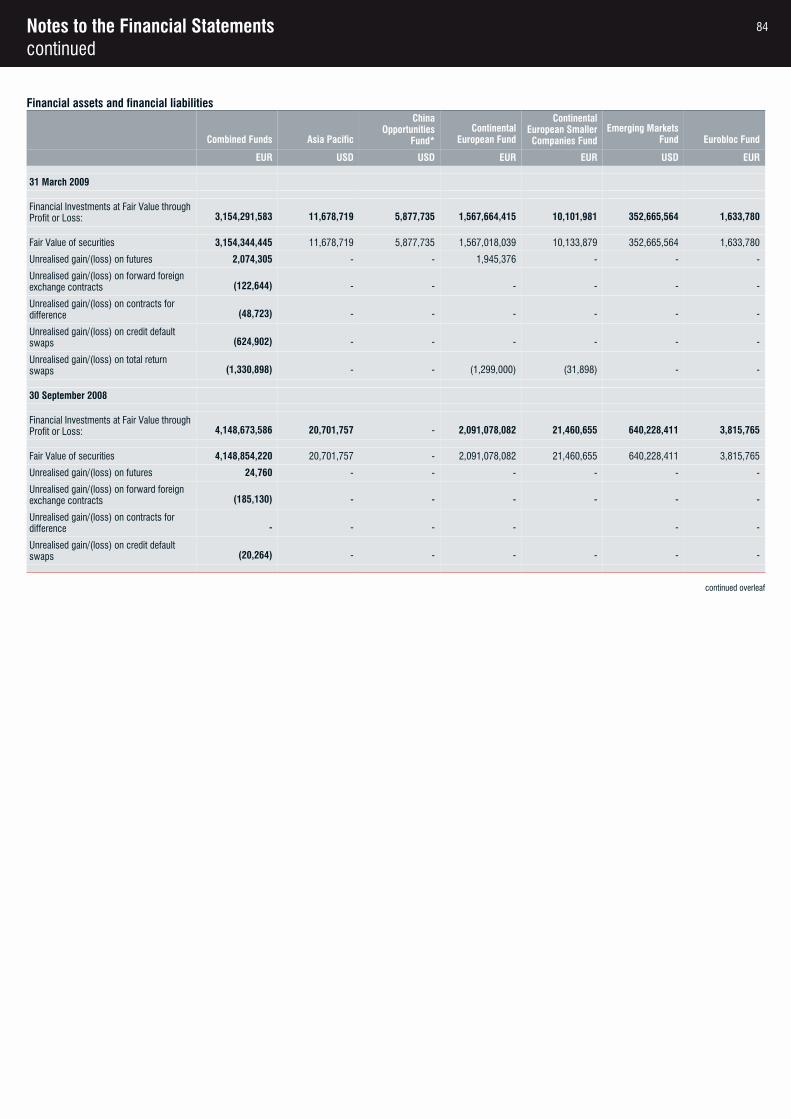
Notes to the Financial Statementscontinued
Financial assets and financial liabilities
Combined Funds Asia Pacific
China Opportunities
Fund*Continental
European Fund
Continental European Smaller Companies Fund
Emerging Markets Fund Eurobloc Fund
EUR USD USD EUR EUR USD EUR
31 March 2009
Financial Investments at Fair Value through Profit or Loss: 3,154,291,583 11,678,719 5,877,735 1,567,664,415 10,101,981 352,665,564 1,633,780
Fair Value of securities 3,154,344,445 11,678,719 5,877,735 1,567,018,039 10,133,879 352,665,564 1,633,780
Unrealised gain/(loss) on futures 2,074,305 - - 1,945,376 - - -
Unrealised gain/(loss) on forward foreign exchange contracts (122,644) - - - - - -
Unrealised gain/(loss) on contracts for difference (48,723) - - - - - -
Unrealised gain/(loss) on credit default swaps (624,902) - - - - - -
Unrealised gain/(loss) on total return swaps (1,330,898) - - (1,299,000) (31,898) - -
30 September 2008
Financial Investments at Fair Value through Profit or Loss: 4,148,673,586 20,701,757 - 2,091,078,082 21,460,655 640,228,411 3,815,765
Fair Value of securities 4,148,854,220 20,701,757 - 2,091,078,082 21,460,655 640,228,411 3,815,765
Unrealised gain/(loss) on futures 24,760 - - - - - -
Unrealised gain/(loss) on forward foreign exchange contracts (185,130) - - - - - -
Unrealised gain/(loss) on contracts for difference - - - - - -
Unrealised gain/(loss) on credit default swaps (20,264) - - - - - -
continued overleaf
84
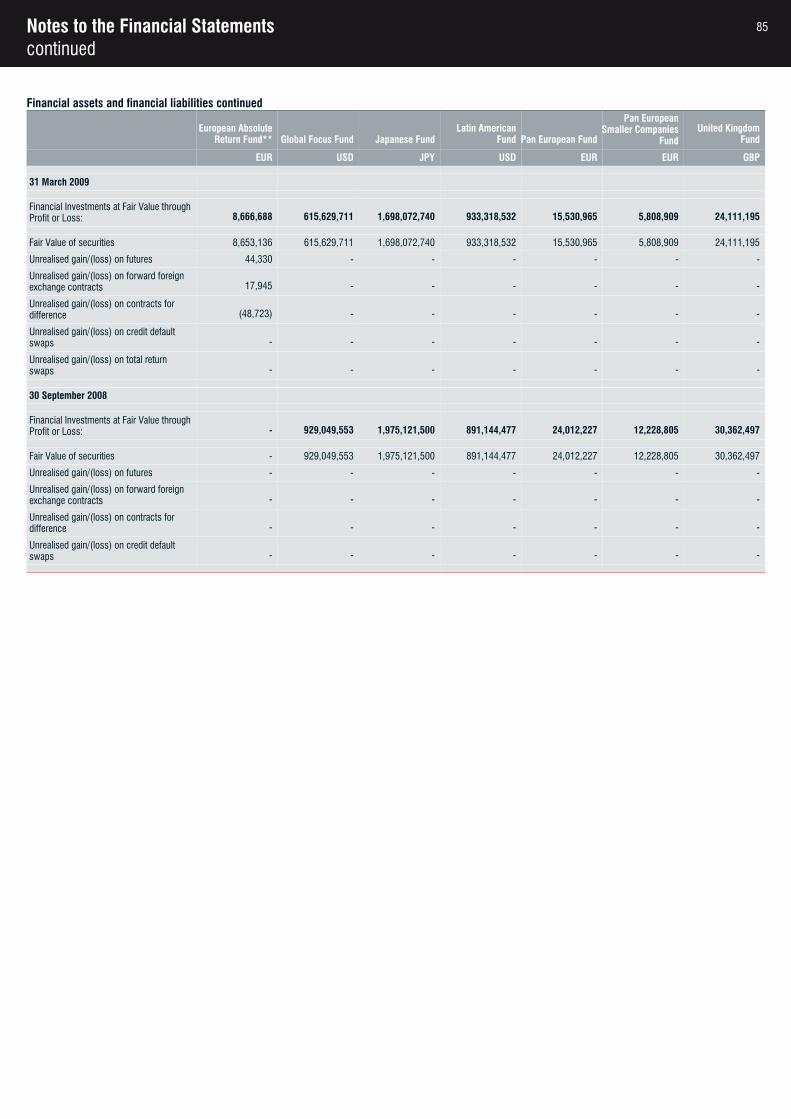
Notes to the Financial Statementscontinued
Financial assets and financial liabilities continued
European Absolute Return Fund** Global Focus Fund Japanese Fund
Latin American Fund Pan European Fund
Pan European Smaller Companies
FundUnited Kingdom
Fund
EUR USD JPY USD EUR EUR GBP
31 March 2009
Financial Investments at Fair Value through Profit or Loss: 8,666,688 615,629,711 1,698,072,740 933,318,532 15,530,965 5,808,909 24,111,195
Fair Value of securities 8,653,136 615,629,711 1,698,072,740 933,318,532 15,530,965 5,808,909 24,111,195
Unrealised gain/(loss) on futures 44,330 - - - - - -
Unrealised gain/(loss) on forward foreign exchange contracts 17,945 - - - - - -
Unrealised gain/(loss) on contracts for difference (48,723) - - - - - -
Unrealised gain/(loss) on credit default swaps - - - - - - -
Unrealised gain/(loss) on total return swaps - - - - - - -
30 September 2008
Financial Investments at Fair Value through Profit or Loss: - 929,049,553 1,975,121,500 891,144,477 24,012,227 12,228,805 30,362,497
Fair Value of securities - 929,049,553 1,975,121,500 891,144,477 24,012,227 12,228,805 30,362,497
Unrealised gain/(loss) on futures - - - - - - -
Unrealised gain/(loss) on forward foreign exchange contracts - - - - - - -
Unrealised gain/(loss) on contracts for difference - - - - - - -
Unrealised gain/(loss) on credit default swaps - - - - - - -
85
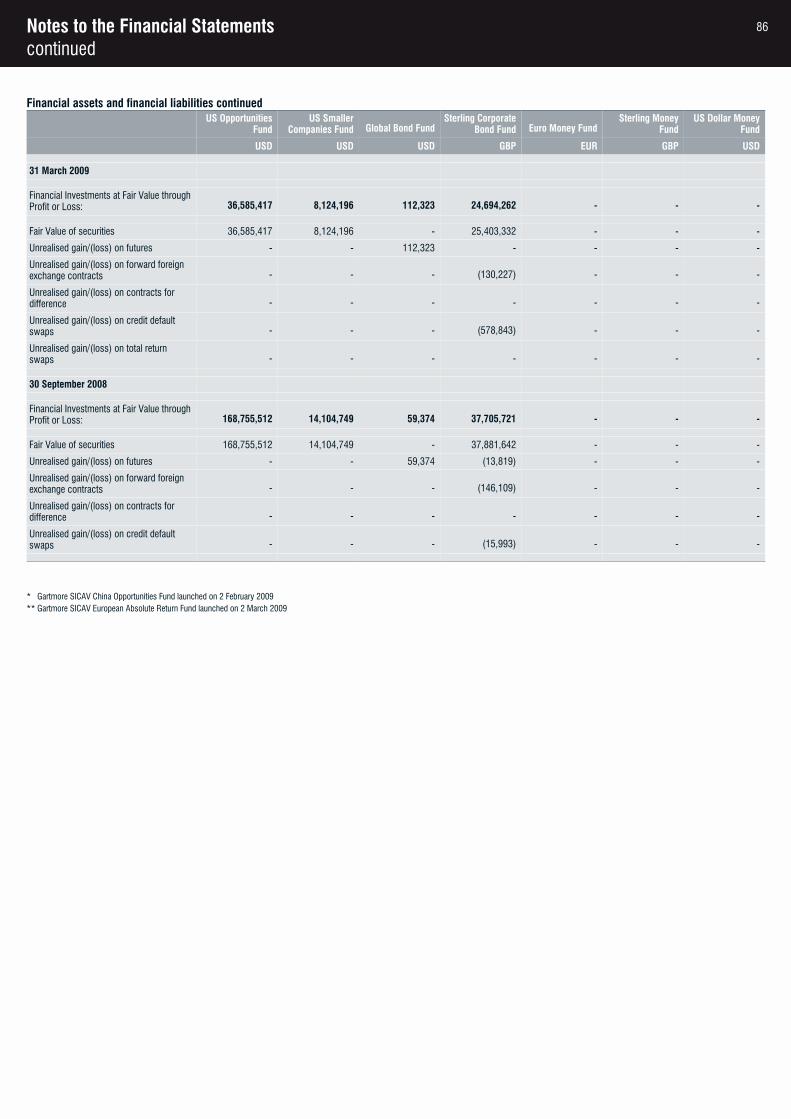
Notes to the Financial Statementscontinued
Financial assets and financial liabilities continuedUS Opportunities
FundUS Smaller
Companies Fund Global Bond FundSterling Corporate
Bond Fund Euro Money Fund Sterling Money
FundUS Dollar Money
Fund
USD USD USD GBP EUR GBP USD
31 March 2009
Financial Investments at Fair Value through Profit or Loss: 36,585,417 8,124,196 112,323 24,694,262 - - -
Fair Value of securities 36,585,417 8,124,196 - 25,403,332 - - -
Unrealised gain/(loss) on futures - - 112,323 - - - -
Unrealised gain/(loss) on forward foreign exchange contracts - - - (130,227) - - -
Unrealised gain/(loss) on contracts for difference - - - - - - -
Unrealised gain/(loss) on credit default swaps - - - (578,843) - - -
Unrealised gain/(loss) on total return swaps - - - - - - -
30 September 2008
Financial Investments at Fair Value through Profit or Loss: 168,755,512 14,104,749 59,374 37,705,721 - - -
Fair Value of securities 168,755,512 14,104,749 - 37,881,642 - - -
Unrealised gain/(loss) on futures - - 59,374 (13,819) - - -
Unrealised gain/(loss) on forward foreign exchange contracts - - - (146,109) - - -
Unrealised gain/(loss) on contracts for difference - - - - - - -
Unrealised gain/(loss) on credit default swaps - - - (15,993) - - -
* Gartmore SICAV China Opportunities Fund launched on 2 February 2009** Gartmore SICAV European Absolute Return Fund launched on 2 March 2009
86
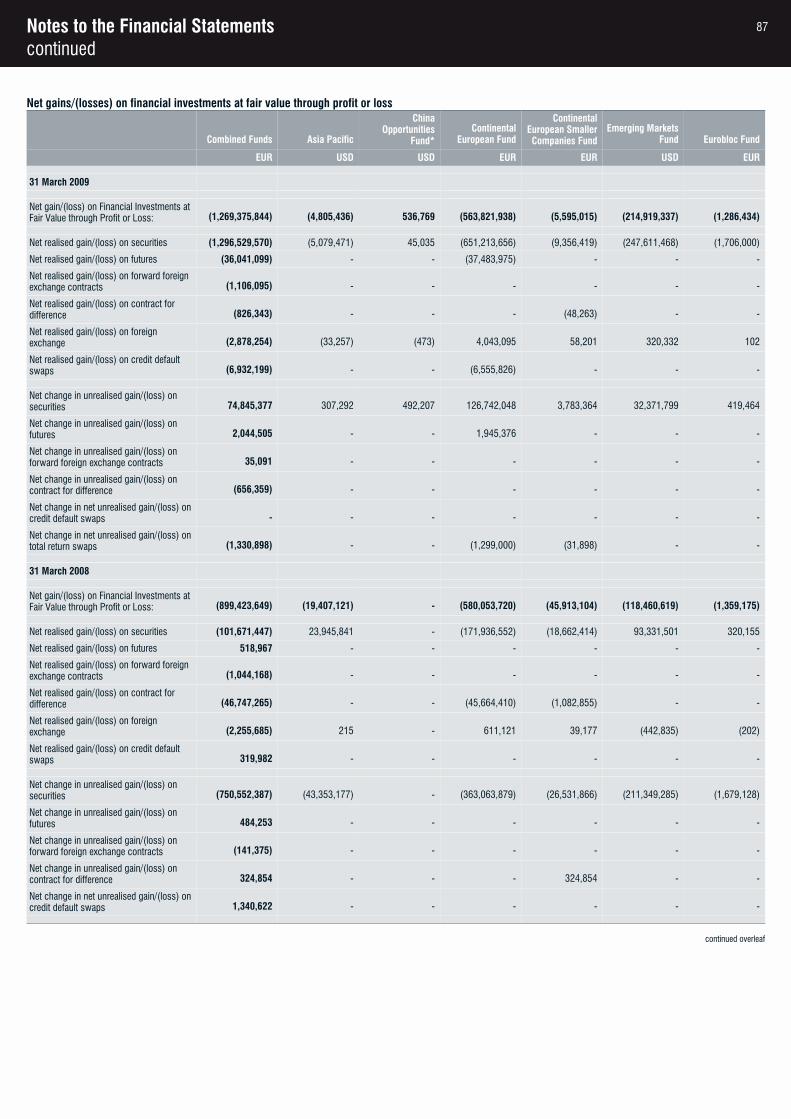
Notes to the Financial Statementscontinued
Net gains/(losses) on financial investments at fair value through profit or loss
Combined Funds Asia Pacific
China Opportunities
Fund*Continental
European Fund
Continental European Smaller Companies Fund
Emerging Markets Fund Eurobloc Fund
EUR USD USD EUR EUR USD EUR
31 March 2009
Net gain/(loss) on Financial Investments at Fair Value through Profit or Loss: (1,269,375,844) (4,805,436) 536,769 (563,821,938) (5,595,015) (214,919,337) (1,286,434)
Net realised gain/(loss) on securities (1,296,529,570) (5,079,471) 45,035 (651,213,656) (9,356,419) (247,611,468) (1,706,000)
Net realised gain/(loss) on futures (36,041,099) - - (37,483,975) - - -
Net realised gain/(loss) on forward foreign exchange contracts (1,106,095) - - - - - -
Net realised gain/(loss) on contract for difference (826,343) - - - (48,263) - -
Net realised gain/(loss) on foreign exchange (2,878,254) (33,257) (473) 4,043,095 58,201 320,332 102
Net realised gain/(loss) on credit default swaps (6,932,199) - - (6,555,826) - - -
Net change in unrealised gain/(loss) on securities 74,845,377 307,292 492,207 126,742,048 3,783,364 32,371,799 419,464
Net change in unrealised gain/(loss) on futures 2,044,505 - - 1,945,376 - - -
Net change in unrealised gain/(loss) on forward foreign exchange contracts 35,091 - - - - - -
Net change in unrealised gain/(loss) on contract for difference (656,359) - - - - - -
Net change in net unrealised gain/(loss) on credit default swaps - - - - - - -
Net change in net unrealised gain/(loss) on total return swaps (1,330,898) - - (1,299,000) (31,898) - -
31 March 2008
Net gain/(loss) on Financial Investments at Fair Value through Profit or Loss: (899,423,649) (19,407,121) - (580,053,720) (45,913,104) (118,460,619) (1,359,175)
Net realised gain/(loss) on securities (101,671,447) 23,945,841 - (171,936,552) (18,662,414) 93,331,501 320,155
Net realised gain/(loss) on futures 518,967 - - - - - -
Net realised gain/(loss) on forward foreign exchange contracts (1,044,168) - - - - - -
Net realised gain/(loss) on contract for difference (46,747,265) - - (45,664,410) (1,082,855) - -
Net realised gain/(loss) on foreign exchange (2,255,685) 215 - 611,121 39,177 (442,835) (202)
Net realised gain/(loss) on credit default swaps 319,982 - - - - - -
Net change in unrealised gain/(loss) on securities (750,552,387) (43,353,177) - (363,063,879) (26,531,866) (211,349,285) (1,679,128)
Net change in unrealised gain/(loss) on futures 484,253 - - - - - -
Net change in unrealised gain/(loss) on forward foreign exchange contracts (141,375) - - - - - -
Net change in unrealised gain/(loss) on contract for difference 324,854 - - - 324,854 - -
Net change in net unrealised gain/(loss) on credit default swaps 1,340,622 - - - - - -
continued overleaf
87
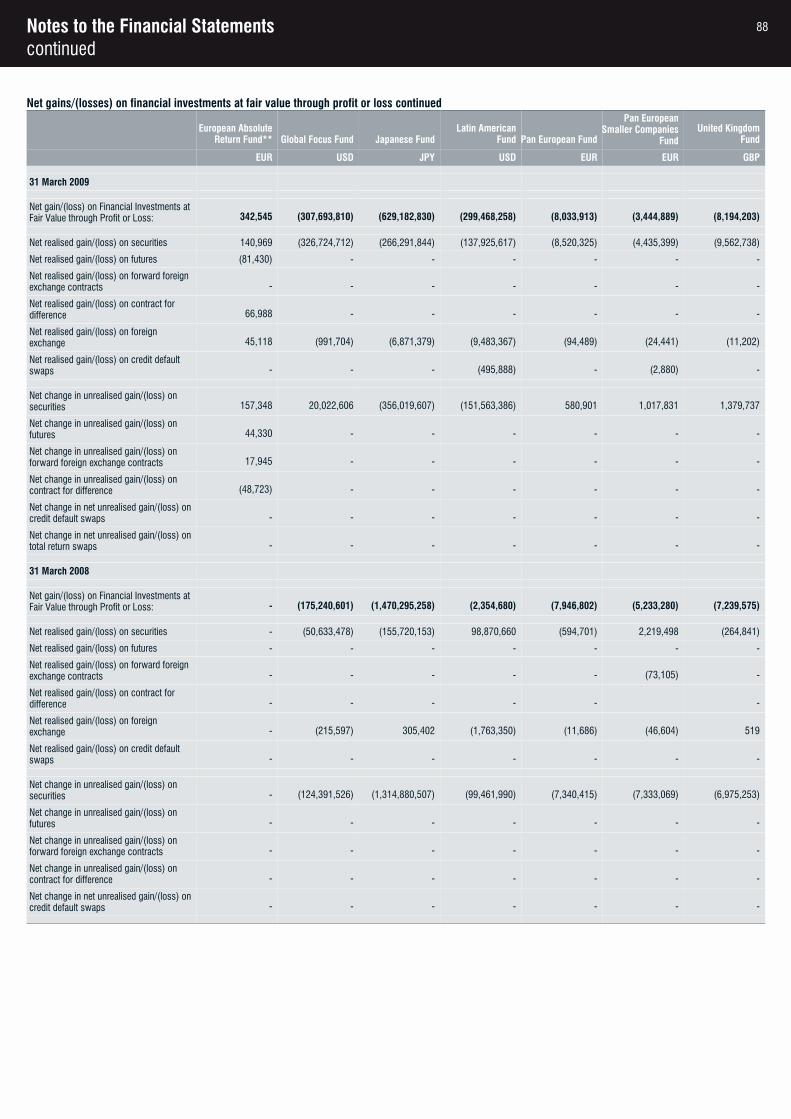
Notes to the Financial Statementscontinued
Net gains/(losses) on financial investments at fair value through profit or loss continued
European Absolute Return Fund** Global Focus Fund Japanese Fund
Latin American Fund Pan European Fund
Pan European Smaller Companies
FundUnited Kingdom
Fund
EUR USD JPY USD EUR EUR GBP
31 March 2009
Net gain/(loss) on Financial Investments at Fair Value through Profit or Loss: 342,545 (307,693,810) (629,182,830) (299,468,258) (8,033,913) (3,444,889) (8,194,203)
Net realised gain/(loss) on securities 140,969 (326,724,712) (266,291,844) (137,925,617) (8,520,325) (4,435,399) (9,562,738)
Net realised gain/(loss) on futures (81,430) - - - - - -
Net realised gain/(loss) on forward foreign exchange contracts - - - - - - -
Net realised gain/(loss) on contract for difference 66,988 - - - - - -
Net realised gain/(loss) on foreign exchange 45,118 (991,704) (6,871,379) (9,483,367) (94,489) (24,441) (11,202)
Net realised gain/(loss) on credit default swaps - - - (495,888) - (2,880) -
Net change in unrealised gain/(loss) on securities 157,348 20,022,606 (356,019,607) (151,563,386) 580,901 1,017,831 1,379,737
Net change in unrealised gain/(loss) on futures 44,330 - - - - - -
Net change in unrealised gain/(loss) on forward foreign exchange contracts 17,945 - - - - - -
Net change in unrealised gain/(loss) on contract for difference (48,723) - - - - - -
Net change in net unrealised gain/(loss) on credit default swaps - - - - - - -
Net change in net unrealised gain/(loss) on total return swaps - - - - - - -
31 March 2008
Net gain/(loss) on Financial Investments at Fair Value through Profit or Loss: - (175,240,601) (1,470,295,258) (2,354,680) (7,946,802) (5,233,280) (7,239,575)
Net realised gain/(loss) on securities - (50,633,478) (155,720,153) 98,870,660 (594,701) 2,219,498 (264,841)
Net realised gain/(loss) on futures - - - - - - -
Net realised gain/(loss) on forward foreign exchange contracts - - - - - (73,105) -
Net realised gain/(loss) on contract for difference - - - - - -
Net realised gain/(loss) on foreign exchange - (215,597) 305,402 (1,763,350) (11,686) (46,604) 519
Net realised gain/(loss) on credit default swaps - - - - - - -
Net change in unrealised gain/(loss) on securities - (124,391,526) (1,314,880,507) (99,461,990) (7,340,415) (7,333,069) (6,975,253)
Net change in unrealised gain/(loss) on futures - - - - - - -
Net change in unrealised gain/(loss) on forward foreign exchange contracts - - - - - - -
Net change in unrealised gain/(loss) on contract for difference - - - - - - -
Net change in net unrealised gain/(loss) on credit default swaps - - - - - - -
88
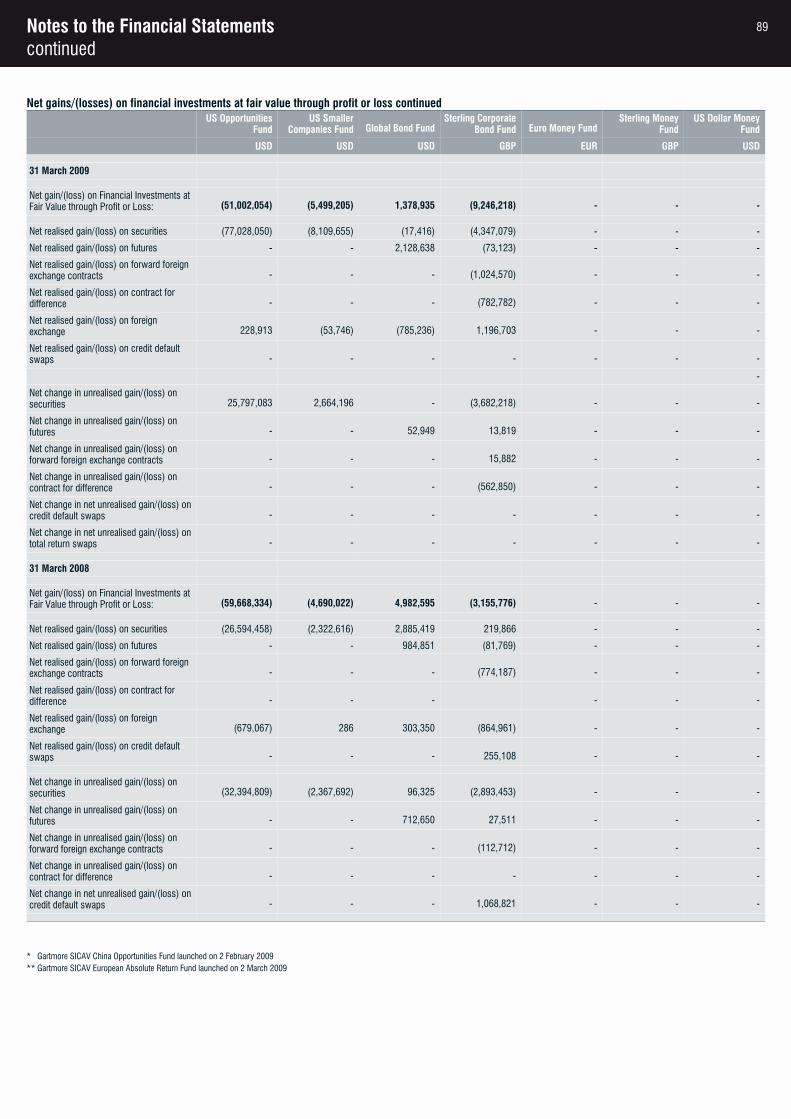
Notes to the Financial Statementscontinued
Net gains/(losses) on financial investments at fair value through profit or loss continuedUS Opportunities
FundUS Smaller
Companies Fund Global Bond FundSterling Corporate
Bond Fund Euro Money Fund Sterling Money
FundUS Dollar Money
Fund
USD USD USD GBP EUR GBP USD
31 March 2009
Net gain/(loss) on Financial Investments at Fair Value through Profit or Loss: (51,002,054) (5,499,205) 1,378,935 (9,246,218) - - -
Net realised gain/(loss) on securities (77,028,050) (8,109,655) (17,416) (4,347,079) - - -
Net realised gain/(loss) on futures - - 2,128,638 (73,123) - - -
Net realised gain/(loss) on forward foreign exchange contracts - - - (1,024,570) - - -
Net realised gain/(loss) on contract for difference - - - (782,782) - - -
Net realised gain/(loss) on foreign exchange 228,913 (53,746) (785,236) 1,196,703 - - -
Net realised gain/(loss) on credit default swaps - - - - - - -
-
Net change in unrealised gain/(loss) on securities 25,797,083 2,664,196 - (3,682,218) - - -
Net change in unrealised gain/(loss) on futures - - 52,949 13,819 - - -
Net change in unrealised gain/(loss) on forward foreign exchange contracts - - - 15,882 - - -
Net change in unrealised gain/(loss) on contract for difference - - - (562,850) - - -
Net change in net unrealised gain/(loss) on credit default swaps - - - - - - -
Net change in net unrealised gain/(loss) on total return swaps - - - - - - -
31 March 2008
Net gain/(loss) on Financial Investments at Fair Value through Profit or Loss: (59,668,334) (4,690,022) 4,982,595 (3,155,776) - - -
Net realised gain/(loss) on securities (26,594,458) (2,322,616) 2,885,419 219,866 - - -
Net realised gain/(loss) on futures - - 984,851 (81,769) - - -
Net realised gain/(loss) on forward foreign exchange contracts - - - (774,187) - - -
Net realised gain/(loss) on contract for difference - - - - - -
Net realised gain/(loss) on foreign exchange (679,067) 286 303,350 (864,961) - - -
Net realised gain/(loss) on credit default swaps - - - 255,108 - - -
Net change in unrealised gain/(loss) on securities (32,394,809) (2,367,692) 96,325 (2,893,453) - - -
Net change in unrealised gain/(loss) on futures - - 712,650 27,511 - - -
Net change in unrealised gain/(loss) on forward foreign exchange contracts - - - (112,712) - - -
Net change in unrealised gain/(loss) on contract for difference - - - - - - -
Net change in net unrealised gain/(loss) on credit default swaps - - - 1,068,821 - - -
* Gartmore SICAV China Opportunities Fund launched on 2 February 2009** Gartmore SICAV European Absolute Return Fund launched on 2 March 2009
89
Notes to the Financial Statementscontinued
2.4 Fair Value estimation
The Fair Value of financial instruments traded in active markets (including publicly traded derivatives) is based on quoted market prices at the Balance Sheet date. The quoted market price used for financial assets held by the Company is the current bid price; the appropriate quoted market price for financial liabilities is the current ask price.
The Company may from time to time invest in financial instruments that are not traded in an active market. The Fair Value of such instruments is determined by using appropriate valuation techniques. The Company uses a variety of methods and makes assumptions that are based on market conditions existing at each Balance Sheet date. Valuation techniques used include the use of comparable recent arm’s length transactions, discounted cash flow analysis, option pricing models and other valuation techniques commonly used by market participants.
2.5 Derivative financial instruments
a) Forward foreign exchange contracts
Outstanding forward foreign exchange contracts are Fair Valued at the reporting date by reference to the forwardrate of exchange applicable to the outstanding life of the contract. The unrealised gain or loss on forward foreignexchange contracts is calculated as the difference between the contract rate and the rate to close out the contract. The unrealised gain/(loss) on these contracts is disclosed in the Balance Sheet under the heading “Financial investments at Fair Value through profit or loss”.
b) Futures
Outstanding futures contracts are Fair Valued at the reporting date at the quoted market price of the instruments.The unrealised gain/(loss) on futures contracts is included in the Balance Sheet under the heading “Financial investments at Fair Value through profit or loss”. All margins are included in “Margin accounts” in the Balance Sheet.
c) Options
Outstanding options are Fair Valued at the reporting date at the quoted market price of the instruments. As of 31March 2009 and 30 September 2008, no option contracts were outstanding.
d) Contracts for difference
Equity contracts for differences are fair valued using the local daily price of the underlying listed equity, converted into the currency of the unlisted asset as appropriate. The unrealised gain/(loss) on contracts for difference is included in the Balance Sheet under the heading “Financial investments at Fair Value through profit or loss”.
e) Credit Default Swaps
The credit default swaps are priced using a specialist third party vendor. This value is validated for reasonableness against the mark-to-market value applied by the clearing broker for margining purposes. The unrealised gain/(loss) on credit default swaps is included in the Balance Sheet under the heading “Financial investments at Fair Value through profit or loss”.
f) Total Return Swaps
The total return swaps are priced using a specialist third party vendor. This value is validated for reasonableness against the mark-to-market value applied by the clearing broker for margining purposes. The unrealised gain/(loss) on total return swaps is included in the Balance Sheet under the heading “Financial investments at Fair Value through profit or loss”.
2.6 Dividend income, investment interest, interest income and interest expense
Dividend income is recognized on an ex-dividend basis and is reported gross of withholding tax. Investments interest, interest income and interest expenses are accrued daily and are recognised in the Income Statement using the effective interest rate.
90
Notes to the Financial Statementscontinued
2.7 Securities lending
The Company enters into securities lending transactions in accordance with the rules set out in Appendix 2 of the current Prospectus. The income earned from the securities lending programme is recognised on an accrual basis and disclosed in the income statement under “Securities lending revenue”.
2.8 Cash and cash equivalents
Cash and cash equivalents includes cash in hand, short-term fixed deposits with banks, investments with original maturities of three months or less, and bank overdrafts.
2.9 Taxation
Under current Luxembourg Law, the Company is not subject to any tax except to the tax on Luxembourg undertakings for collective investment (“subscription tax”).
Class A, A1, A2, B, D, D1, D2, S1, S2 and Y1 shares of the Company are subject to the tax on Luxembourg undertakings for collective investment at the rate of 0.05% per annum of the value of the total net assets of suchClass on the last day of each calendar quarter, whereas Class C, C$, C¥ and Class I, I$, I¥ of the Company (reserved to Institutional Investors within the meaning of the 2007 Luxembourg Law) will be subject to the tax on Luxembourg undertakings for collective investment at the rate of 0.01% per annum of the value of the total net assets of such Class on the last day of each calendar quarter.
Dividends, interest and capital gains on securities distributed in other countries may be subject to withholding tax or other taxes imposed by such countries.
2.10 Amounts due to/from brokers
Amounts due to/from brokers represent payables for securities and currencies purchased and receivables for securities and currencies sold that have been contracted for but not yet settled or delivered on the balance sheetdate.
2.11 Redeemable ordinary shares
Redeemable ordinary shares (“ordinary shares”) are redeemable at the shareholder’s option and are classified as financial liabilities. The distribution on these ordinary shares is authorized by the Board of Directors and is recognised in the Income Statement as finance costs.
The ordinary share can be put back to the Company at any time for cash equal to a proportionate share of the fund’s net asset value. The ordinary share is carried at the redemption amount that is payable at the Balance Sheet date if the shareholder exercised its right to put the share back to the Company.
2.12 Receivables and payables
Receivables may include amounts for dividends and interest where settlements have not yet occurred. Dividends are accrued when the right to receive payment is established. Interest is accrued at the reporting datefrom the time of last payment. The payables represent liabilities for amounts owing by the Fund at period end which are unpaid.
2.13 Distributions to Holders of Redeemable Ordinary Shares
Proposed distributions to Holders of Redeemable Ordinary Shares are recognised in the income statement whenthey are appropriately authorised by the Board of Directors. The distribution on the Redeemable Ordinary Sharesis recognised as a finance cost in the income statement.
2.14 Critical accounting estimates and judgements
a) Critical accounting estimates and assumptions
Management makes estimates and assumptions concerning the future. The resulting accounting estimates will, by definition, seldom equal the related actual results. The estimates and assumptions that have a significant riskof causing a material adjustment to the carrying amounts of assets and liabilities within the next financial year are outlined below.
91
Notes to the Financial Statementscontinued
Fair value of derivative financial instruments
The Fund may, from time to time, hold financial instruments that are not quoted in active markets, such as over-the-counter derivatives. Fair values of such instruments are determined by using valuation techniques. Where valuation techniques (for example, models) are used to determine fair values, they are validated and periodically reviewed by experienced personnel at Gartmore Investment Limited, independent of the party that created them. Models are calibrated by back testing to actual transactions to ensure that outputs are reliable. Models use observable data, to the extent practicable. However, areas such as credit risk (both own and counterparty), volatilities and correlations require management to make estimates. Changes in assumptions about these factors could affect the reported fair value of financial instruments. All the Fund’s financial assets and financial liabilities are held for the purpose of being traded or are designated at fair value through profit and loss and are expected to be realised within one year.
b) Critical judgements
Functional currency
The Board of Directors considers the functional currency in the above tables in note 1 to be the currency which most faithfully represents the economic effect of the underlying transactions, events and conditions. This is the currency in which the Fund measures its performance and reports its results.
3. Financial Instruments and Associated Risks
The Fund’s activities expose it to a variety of financial risks: market risk (including currency risk, interest rate risk and price risk), credit risk and liquidity risk.
The Fund’s overall risk management program seeks to maximize the returns derived for the level of risk to whichthe Fund is exposed and seeks to minimize potential adverse effects on the Fund’s financial performance. The Fund’s policy allows it to use derivative financial instruments to both moderate and create certain risk exposures.
All securities investments present a risk of loss of capital. The maximum loss of capital on purchased options, long equity, debt securities and long derivative instruments is limited to the fair value of those positions. The maximum loss on written options, short futures positions and other short derivatives instruments can be unlimited.
The management of these risks is carried out by the investment manager under policies approved by the Board of Directors.
Market Risk
Market risk embodies the potential for both losses and gains and includes currency risk, interest rate risk and price risk.
a) Price Risk
The Funds are exposed to securities price risk and derivative price risk. This arises from investments held by theFund for which prices in the future are uncertain. Where non-monetary financial instruments – for example, equity securities – are denominated in currencies other than the functional currency, the price initially expressedin foreign currency and then converted into the functional currency will also fluctuate because of changes in foreign exchange rates. Paragraph (b) ‘Foreign exchange risk’ below sets out how this component of price risk is managed and measured.
The Fund’s policy requires that the overall market position is monitored on a daily basis by the Fund’s Investment Manager and is reviewed on a quarterly basis by the Board of Directors. Compliance with the Fund’sinvestment policies are reported to the Board on a monthly basis.
The Fund’s policy is further to manage price risk through diversification and selection of securities and other financial instruments within the limits specified by the UCITS regulations, limiting maximum position size to 10%of one Fund’s assets and all security holdings over 5% must not exceed 40% of assets.
The Equity Funds manage their exposures to price risk by analysing the investment portfolio by individual stock weight, sector weight, industry weight and country weight. These exposures are managed relative to the equivalent relevant benchmark-index weight. In addition to individual sector and issuer weights, the Bond Funds will also consider their duration and maturity profiles compared to those of the relevant benchmark index.
92
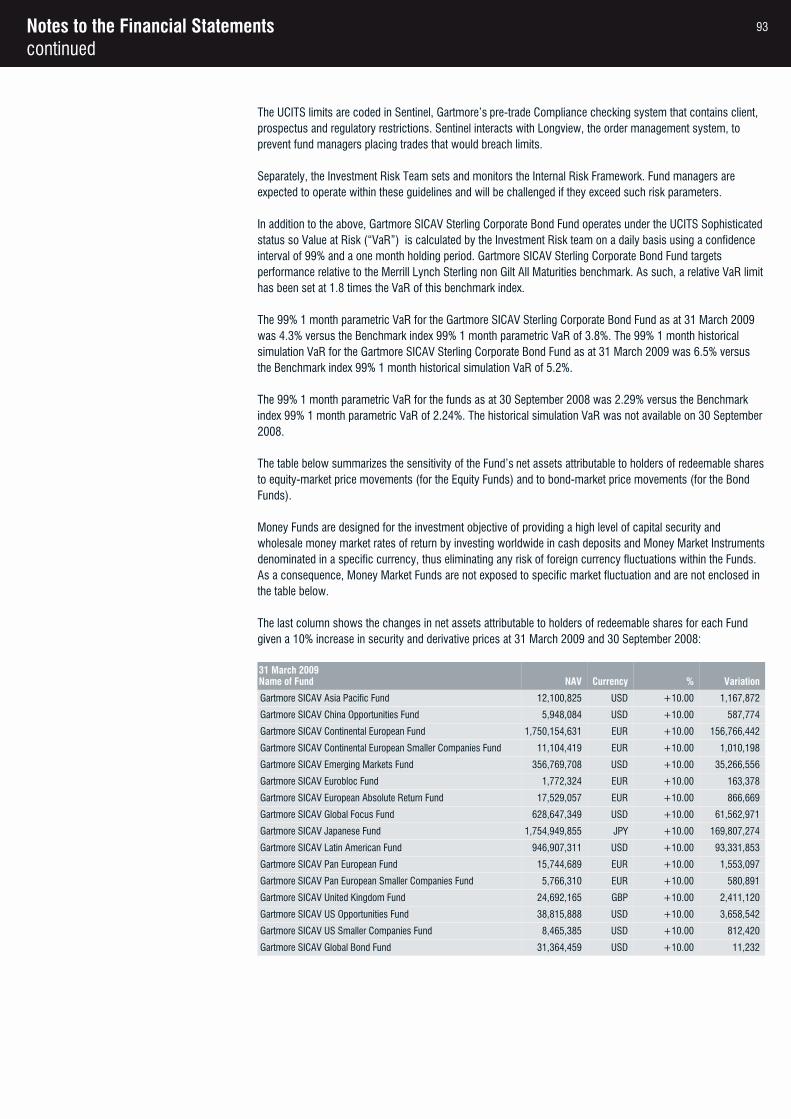
Notes to the Financial Statementscontinued
The UCITS limits are coded in Sentinel, Gartmore’s pre-trade Compliance checking system that contains client, prospectus and regulatory restrictions. Sentinel interacts with Longview, the order management system, to prevent fund managers placing trades that would breach limits.
Separately, the Investment Risk Team sets and monitors the Internal Risk Framework. Fund managers are expected to operate within these guidelines and will be challenged if they exceed such risk parameters.
In addition to the above, Gartmore SICAV Sterling Corporate Bond Fund operates under the UCITS Sophisticatedstatus so Value at Risk (“VaR”) is calculated by the Investment Risk team on a daily basis using a confidence interval of 99% and a one month holding period. Gartmore SICAV Sterling Corporate Bond Fund targets performance relative to the Merrill Lynch Sterling non Gilt All Maturities benchmark. As such, a relative VaR limithas been set at 1.8 times the VaR of this benchmark index.
The 99% 1 month parametric VaR for the Gartmore SICAV Sterling Corporate Bond Fund as at 31 March 2009 was 4.3% versus the Benchmark index 99% 1 month parametric VaR of 3.8%. The 99% 1 month historical simulation VaR for the Gartmore SICAV Sterling Corporate Bond Fund as at 31 March 2009 was 6.5% versus the Benchmark index 99% 1 month historical simulation VaR of 5.2%.
The 99% 1 month parametric VaR for the funds as at 30 September 2008 was 2.29% versus the Benchmark index 99% 1 month parametric VaR of 2.24%. The historical simulation VaR was not available on 30 September2008.
The table below summarizes the sensitivity of the Fund’s net assets attributable to holders of redeemable sharesto equity-market price movements (for the Equity Funds) and to bond-market price movements (for the Bond Funds).
Money Funds are designed for the investment objective of providing a high level of capital security and wholesale money market rates of return by investing worldwide in cash deposits and Money Market Instrumentsdenominated in a specific currency, thus eliminating any risk of foreign currency fluctuations within the Funds.As a consequence, Money Market Funds are not exposed to specific market fluctuation and are not enclosed in the table below.
The last column shows the changes in net assets attributable to holders of redeemable shares for each Fund given a 10% increase in security and derivative prices at 31 March 2009 and 30 September 2008:
31 March 2009Name of Fund NAV Currency % Variation
Gartmore SICAV Asia Pacific Fund 12,100,825 USD +10.00 1,167,872
Gartmore SICAV China Opportunities Fund 5,948,084 USD +10.00 587,774
Gartmore SICAV Continental European Fund 1,750,154,631 EUR +10.00 156,766,442
Gartmore SICAV Continental European Smaller Companies Fund 11,104,419 EUR +10.00 1,010,198
Gartmore SICAV Emerging Markets Fund 356,769,708 USD +10.00 35,266,556
Gartmore SICAV Eurobloc Fund 1,772,324 EUR +10.00 163,378
Gartmore SICAV European Absolute Return Fund 17,529,057 EUR +10.00 866,669
Gartmore SICAV Global Focus Fund 628,647,349 USD +10.00 61,562,971
Gartmore SICAV Japanese Fund 1,754,949,855 JPY +10.00 169,807,274
Gartmore SICAV Latin American Fund 946,907,311 USD +10.00 93,331,853
Gartmore SICAV Pan European Fund 15,744,689 EUR +10.00 1,553,097
Gartmore SICAV Pan European Smaller Companies Fund 5,766,310 EUR +10.00 580,891
Gartmore SICAV United Kingdom Fund 24,692,165 GBP +10.00 2,411,120
Gartmore SICAV US Opportunities Fund 38,815,888 USD +10.00 3,658,542
Gartmore SICAV US Smaller Companies Fund 8,465,385 USD +10.00 812,420
Gartmore SICAV Global Bond Fund 31,364,459 USD +10.00 11,232
93
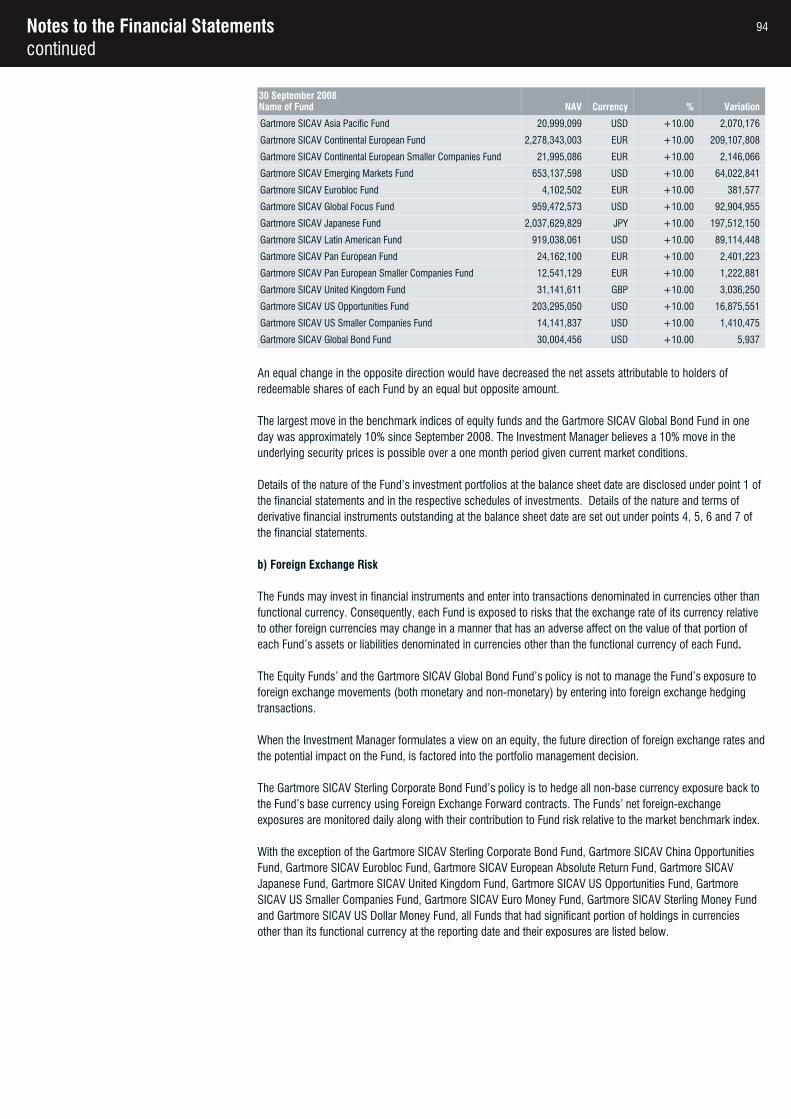
Notes to the Financial Statementscontinued
30 September 2008Name of Fund NAV Currency % Variation
Gartmore SICAV Asia Pacific Fund 20,999,099 USD +10.00 2,070,176
Gartmore SICAV Continental European Fund 2,278,343,003 EUR +10.00 209,107,808
Gartmore SICAV Continental European Smaller Companies Fund 21,995,086 EUR +10.00 2,146,066
Gartmore SICAV Emerging Markets Fund 653,137,598 USD +10.00 64,022,841
Gartmore SICAV Eurobloc Fund 4,102,502 EUR +10.00 381,577
Gartmore SICAV Global Focus Fund 959,472,573 USD +10.00 92,904,955
Gartmore SICAV Japanese Fund 2,037,629,829 JPY +10.00 197,512,150
Gartmore SICAV Latin American Fund 919,038,061 USD +10.00 89,114,448
Gartmore SICAV Pan European Fund 24,162,100 EUR +10.00 2,401,223
Gartmore SICAV Pan European Smaller Companies Fund 12,541,129 EUR +10.00 1,222,881
Gartmore SICAV United Kingdom Fund 31,141,611 GBP +10.00 3,036,250
Gartmore SICAV US Opportunities Fund 203,295,050 USD +10.00 16,875,551
Gartmore SICAV US Smaller Companies Fund 14,141,837 USD +10.00 1,410,475
Gartmore SICAV Global Bond Fund 30,004,456 USD +10.00 5,937
An equal change in the opposite direction would have decreased the net assets attributable to holders of redeemable shares of each Fund by an equal but opposite amount.
The largest move in the benchmark indices of equity funds and the Gartmore SICAV Global Bond Fund in one day was approximately 10% since September 2008. The Investment Manager believes a 10% move in the underlying security prices is possible over a one month period given current market conditions.
Details of the nature of the Fund’s investment portfolios at the balance sheet date are disclosed under point 1 of the financial statements and in the respective schedules of investments. Details of the nature and terms of derivative financial instruments outstanding at the balance sheet date are set out under points 4, 5, 6 and 7 of the financial statements.
b) Foreign Exchange Risk
The Funds may invest in financial instruments and enter into transactions denominated in currencies other than functional currency. Consequently, each Fund is exposed to risks that the exchange rate of its currency relative to other foreign currencies may change in a manner that has an adverse affect on the value of that portion of each Fund’s assets or liabilities denominated in currencies other than the functional currency of each Fund.
The Equity Funds’ and the Gartmore SICAV Global Bond Fund’s policy is not to manage the Fund’s exposure to foreign exchange movements (both monetary and non-monetary) by entering into foreign exchange hedging transactions.
When the Investment Manager formulates a view on an equity, the future direction of foreign exchange rates andthe potential impact on the Fund, is factored into the portfolio management decision.
The Gartmore SICAV Sterling Corporate Bond Fund’s policy is to hedge all non-base currency exposure back to the Fund’s base currency using Foreign Exchange Forward contracts. The Funds’ net foreign-exchange exposures are monitored daily along with their contribution to Fund risk relative to the market benchmark index.
With the exception of the Gartmore SICAV Sterling Corporate Bond Fund, Gartmore SICAV China Opportunities Fund, Gartmore SICAV Eurobloc Fund, Gartmore SICAV European Absolute Return Fund, Gartmore SICAV Japanese Fund, Gartmore SICAV United Kingdom Fund, Gartmore SICAV US Opportunities Fund, Gartmore SICAV US Smaller Companies Fund, Gartmore SICAV Euro Money Fund, Gartmore SICAV Sterling Money Fund and Gartmore SICAV US Dollar Money Fund, all Funds that had significant portion of holdings in currencies other than its functional currency at the reporting date and their exposures are listed below.
94
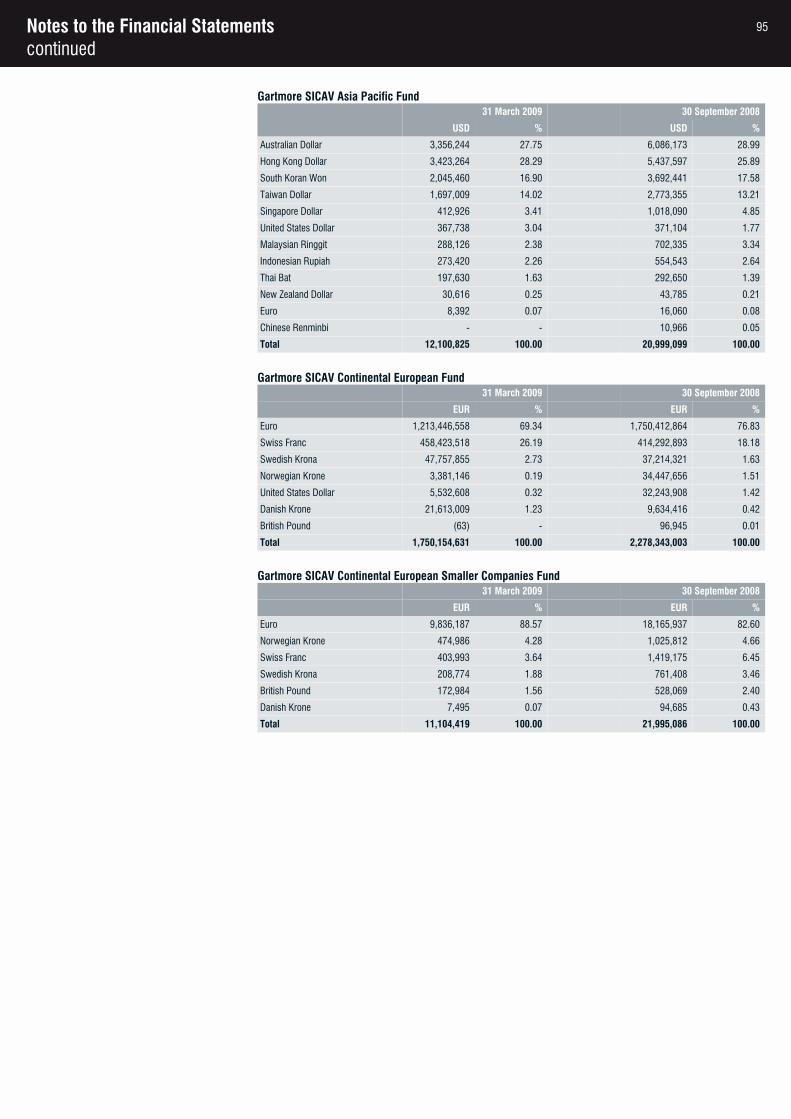
Notes to the Financial Statementscontinued
Gartmore SICAV Asia Pacific Fund 31 March 2009 30 September 2008
USD % USD %
Australian Dollar 3,356,244 27.75 6,086,173 28.99
Hong Kong Dollar 3,423,264 28.29 5,437,597 25.89
South Koran Won 2,045,460 16.90 3,692,441 17.58
Taiwan Dollar 1,697,009 14.02 2,773,355 13.21
Singapore Dollar 412,926 3.41 1,018,090 4.85
United States Dollar 367,738 3.04 371,104 1.77
Malaysian Ringgit 288,126 2.38 702,335 3.34
Indonesian Rupiah 273,420 2.26 554,543 2.64
Thai Bat 197,630 1.63 292,650 1.39
New Zealand Dollar 30,616 0.25 43,785 0.21
Euro 8,392 0.07 16,060 0.08
Chinese Renminbi - - 10,966 0.05
Total 12,100,825 100.00 20,999,099 100.00
Gartmore SICAV Continental European Fund 31 March 2009 30 September 2008
EUR % EUR %
Euro 1,213,446,558 69.34 1,750,412,864 76.83
Swiss Franc 458,423,518 26.19 414,292,893 18.18
Swedish Krona 47,757,855 2.73 37,214,321 1.63
Norwegian Krone 3,381,146 0.19 34,447,656 1.51
United States Dollar 5,532,608 0.32 32,243,908 1.42
Danish Krone 21,613,009 1.23 9,634,416 0.42
British Pound (63) - 96,945 0.01
Total 1,750,154,631 100.00 2,278,343,003 100.00
Gartmore SICAV Continental European Smaller Companies Fund 31 March 2009 30 September 2008
EUR % EUR %
Euro 9,836,187 88.57 18,165,937 82.60
Norwegian Krone 474,986 4.28 1,025,812 4.66
Swiss Franc 403,993 3.64 1,419,175 6.45
Swedish Krona 208,774 1.88 761,408 3.46
British Pound 172,984 1.56 528,069 2.40
Danish Krone 7,495 0.07 94,685 0.43
Total 11,104,419 100.00 21,995,086 100.00
95
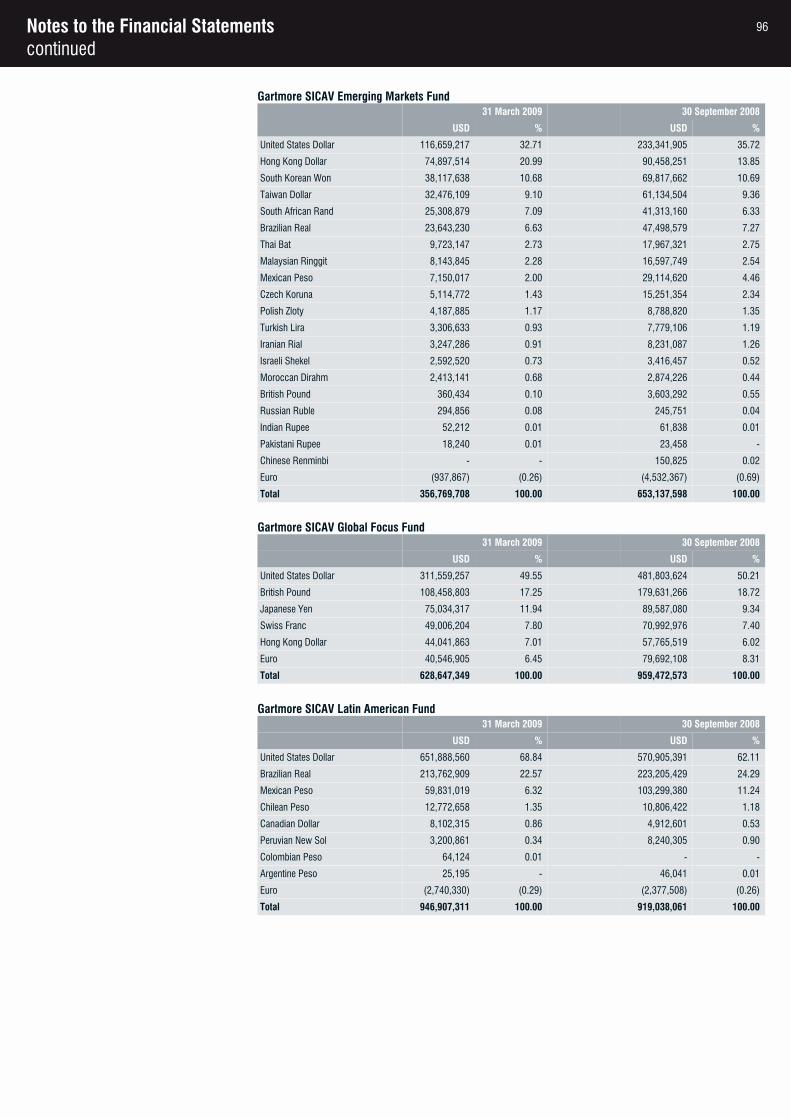
Notes to the Financial Statementscontinued
Gartmore SICAV Emerging Markets Fund 31 March 2009 30 September 2008
USD % USD %
United States Dollar 116,659,217 32.71 233,341,905 35.72
Hong Kong Dollar 74,897,514 20.99 90,458,251 13.85
South Korean Won 38,117,638 10.68 69,817,662 10.69
Taiwan Dollar 32,476,109 9.10 61,134,504 9.36
South African Rand 25,308,879 7.09 41,313,160 6.33
Brazilian Real 23,643,230 6.63 47,498,579 7.27
Thai Bat 9,723,147 2.73 17,967,321 2.75
Malaysian Ringgit 8,143,845 2.28 16,597,749 2.54
Mexican Peso 7,150,017 2.00 29,114,620 4.46
Czech Koruna 5,114,772 1.43 15,251,354 2.34
Polish Zloty 4,187,885 1.17 8,788,820 1.35
Turkish Lira 3,306,633 0.93 7,779,106 1.19
Iranian Rial 3,247,286 0.91 8,231,087 1.26
Israeli Shekel 2,592,520 0.73 3,416,457 0.52
Moroccan Dirahm 2,413,141 0.68 2,874,226 0.44
British Pound 360,434 0.10 3,603,292 0.55
Russian Ruble 294,856 0.08 245,751 0.04
Indian Rupee 52,212 0.01 61,838 0.01
Pakistani Rupee 18,240 0.01 23,458 -
Chinese Renminbi - - 150,825 0.02
Euro (937,867) (0.26) (4,532,367) (0.69)
Total 356,769,708 100.00 653,137,598 100.00
Gartmore SICAV Global Focus Fund 31 March 2009 30 September 2008
USD % USD %
United States Dollar 311,559,257 49.55 481,803,624 50.21
British Pound 108,458,803 17.25 179,631,266 18.72
Japanese Yen 75,034,317 11.94 89,587,080 9.34
Swiss Franc 49,006,204 7.80 70,992,976 7.40
Hong Kong Dollar 44,041,863 7.01 57,765,519 6.02
Euro 40,546,905 6.45 79,692,108 8.31
Total 628,647,349 100.00 959,472,573 100.00
Gartmore SICAV Latin American Fund 31 March 2009 30 September 2008
USD % USD %
United States Dollar 651,888,560 68.84 570,905,391 62.11
Brazilian Real 213,762,909 22.57 223,205,429 24.29
Mexican Peso 59,831,019 6.32 103,299,380 11.24
Chilean Peso 12,772,658 1.35 10,806,422 1.18
Canadian Dollar 8,102,315 0.86 4,912,601 0.53
Peruvian New Sol 3,200,861 0.34 8,240,305 0.90
Colombian Peso 64,124 0.01 - -
Argentine Peso 25,195 - 46,041 0.01
Euro (2,740,330) (0.29) (2,377,508) (0.26)
Total 946,907,311 100.00 919,038,061 100.00
96
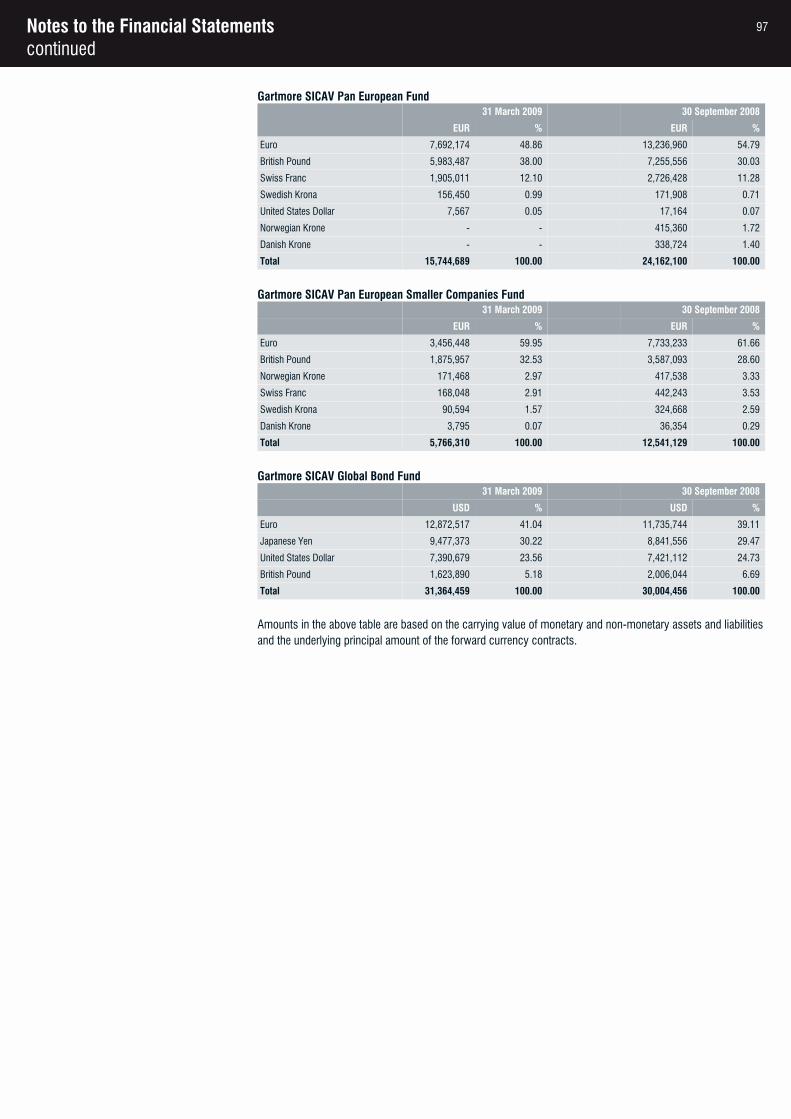
Notes to the Financial Statementscontinued
Gartmore SICAV Pan European Fund 31 March 2009 30 September 2008
EUR % EUR %
Euro 7,692,174 48.86 13,236,960 54.79
British Pound 5,983,487 38.00 7,255,556 30.03
Swiss Franc 1,905,011 12.10 2,726,428 11.28
Swedish Krona 156,450 0.99 171,908 0.71
United States Dollar 7,567 0.05 17,164 0.07
Norwegian Krone - - 415,360 1.72
Danish Krone - - 338,724 1.40
Total 15,744,689 100.00 24,162,100 100.00
Gartmore SICAV Pan European Smaller Companies Fund 31 March 2009 30 September 2008
EUR % EUR %
Euro 3,456,448 59.95 7,733,233 61.66
British Pound 1,875,957 32.53 3,587,093 28.60
Norwegian Krone 171,468 2.97 417,538 3.33
Swiss Franc 168,048 2.91 442,243 3.53
Swedish Krona 90,594 1.57 324,668 2.59
Danish Krone 3,795 0.07 36,354 0.29
Total 5,766,310 100.00 12,541,129 100.00
Gartmore SICAV Global Bond Fund 31 March 2009 30 September 2008
USD % USD %
Euro 12,872,517 41.04 11,735,744 39.11
Japanese Yen 9,477,373 30.22 8,841,556 29.47
United States Dollar 7,390,679 23.56 7,421,112 24.73
British Pound 1,623,890 5.18 2,006,044 6.69
Total 31,364,459 100.00 30,004,456 100.00
Amounts in the above table are based on the carrying value of monetary and non-monetary assets and liabilitiesand the underlying principal amount of the forward currency contracts.
97
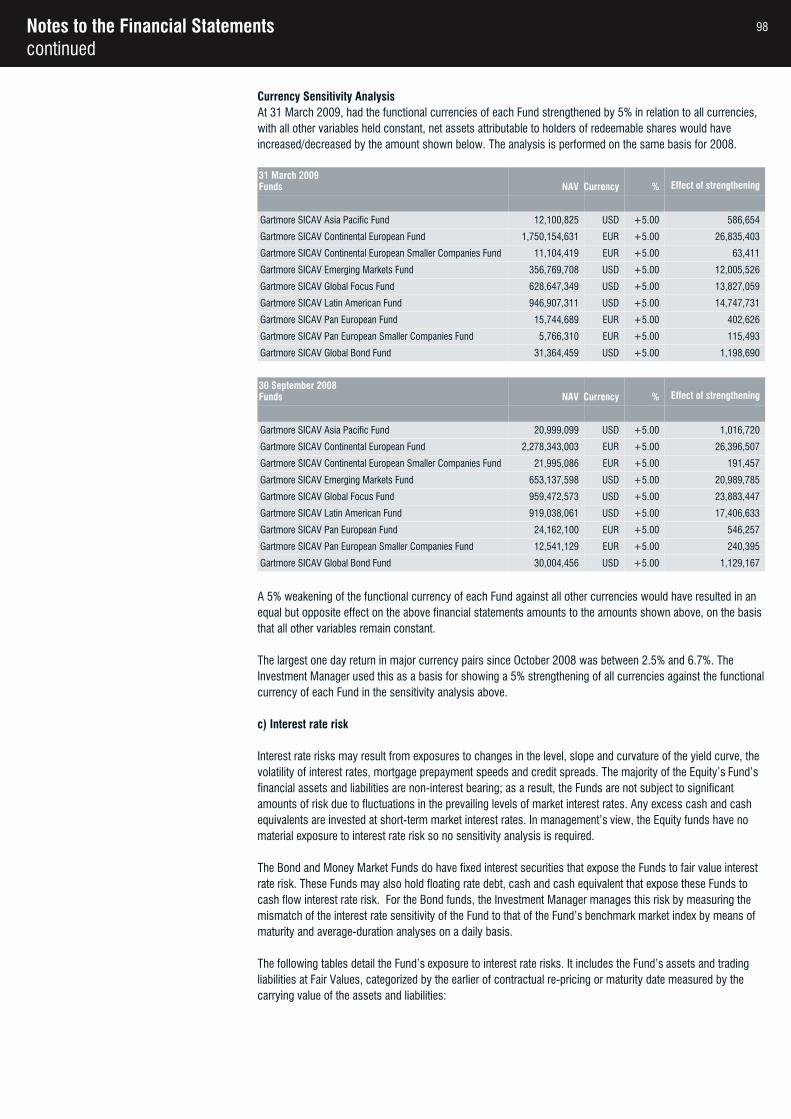
Notes to the Financial Statementscontinued
Currency Sensitivity AnalysisAt 31 March 2009, had the functional currencies of each Fund strengthened by 5% in relation to all currencies, with all other variables held constant, net assets attributable to holders of redeemable shares would have increased/decreased by the amount shown below. The analysis is performed on the same basis for 2008.
31 March 2009Funds NAV Currency % Effect of strengthening
Gartmore SICAV Asia Pacific Fund 12,100,825 USD +5.00 586,654
Gartmore SICAV Continental European Fund 1,750,154,631 EUR +5.00 26,835,403
Gartmore SICAV Continental European Smaller Companies Fund 11,104,419 EUR +5.00 63,411
Gartmore SICAV Emerging Markets Fund 356,769,708 USD +5.00 12,005,526
Gartmore SICAV Global Focus Fund 628,647,349 USD +5.00 13,827,059
Gartmore SICAV Latin American Fund 946,907,311 USD +5.00 14,747,731
Gartmore SICAV Pan European Fund 15,744,689 EUR +5.00 402,626
Gartmore SICAV Pan European Smaller Companies Fund 5,766,310 EUR +5.00 115,493
Gartmore SICAV Global Bond Fund 31,364,459 USD +5.00 1,198,690
30 September 2008Funds NAV Currency % Effect of strengthening
Gartmore SICAV Asia Pacific Fund 20,999,099 USD +5.00 1,016,720
Gartmore SICAV Continental European Fund 2,278,343,003 EUR +5.00 26,396,507
Gartmore SICAV Continental European Smaller Companies Fund 21,995,086 EUR +5.00 191,457
Gartmore SICAV Emerging Markets Fund 653,137,598 USD +5.00 20,989,785
Gartmore SICAV Global Focus Fund 959,472,573 USD +5.00 23,883,447
Gartmore SICAV Latin American Fund 919,038,061 USD +5.00 17,406,633
Gartmore SICAV Pan European Fund 24,162,100 EUR +5.00 546,257
Gartmore SICAV Pan European Smaller Companies Fund 12,541,129 EUR +5.00 240,395
Gartmore SICAV Global Bond Fund 30,004,456 USD +5.00 1,129,167
A 5% weakening of the functional currency of each Fund against all other currencies would have resulted in an equal but opposite effect on the above financial statements amounts to the amounts shown above, on the basis that all other variables remain constant.
The largest one day return in major currency pairs since October 2008 was between 2.5% and 6.7%. The Investment Manager used this as a basis for showing a 5% strengthening of all currencies against the functionalcurrency of each Fund in the sensitivity analysis above.
c) Interest rate risk
Interest rate risks may result from exposures to changes in the level, slope and curvature of the yield curve, the volatility of interest rates, mortgage prepayment speeds and credit spreads. The majority of the Equity’s Fund’s financial assets and liabilities are non-interest bearing; as a result, the Funds are not subject to significant amounts of risk due to fluctuations in the prevailing levels of market interest rates. Any excess cash and cash equivalents are invested at short-term market interest rates. In management’s view, the Equity funds have no material exposure to interest rate risk so no sensitivity analysis is required.
The Bond and Money Market Funds do have fixed interest securities that expose the Funds to fair value interest rate risk. These Funds may also hold floating rate debt, cash and cash equivalent that expose these Funds to cash flow interest rate risk. For the Bond funds, the Investment Manager manages this risk by measuring the mismatch of the interest rate sensitivity of the Fund to that of the Fund’s benchmark market index by means of maturity and average-duration analyses on a daily basis.
The following tables detail the Fund’s exposure to interest rate risks. It includes the Fund’s assets and trading liabilities at Fair Values, categorized by the earlier of contractual re-pricing or maturity date measured by the carrying value of the assets and liabilities:
98
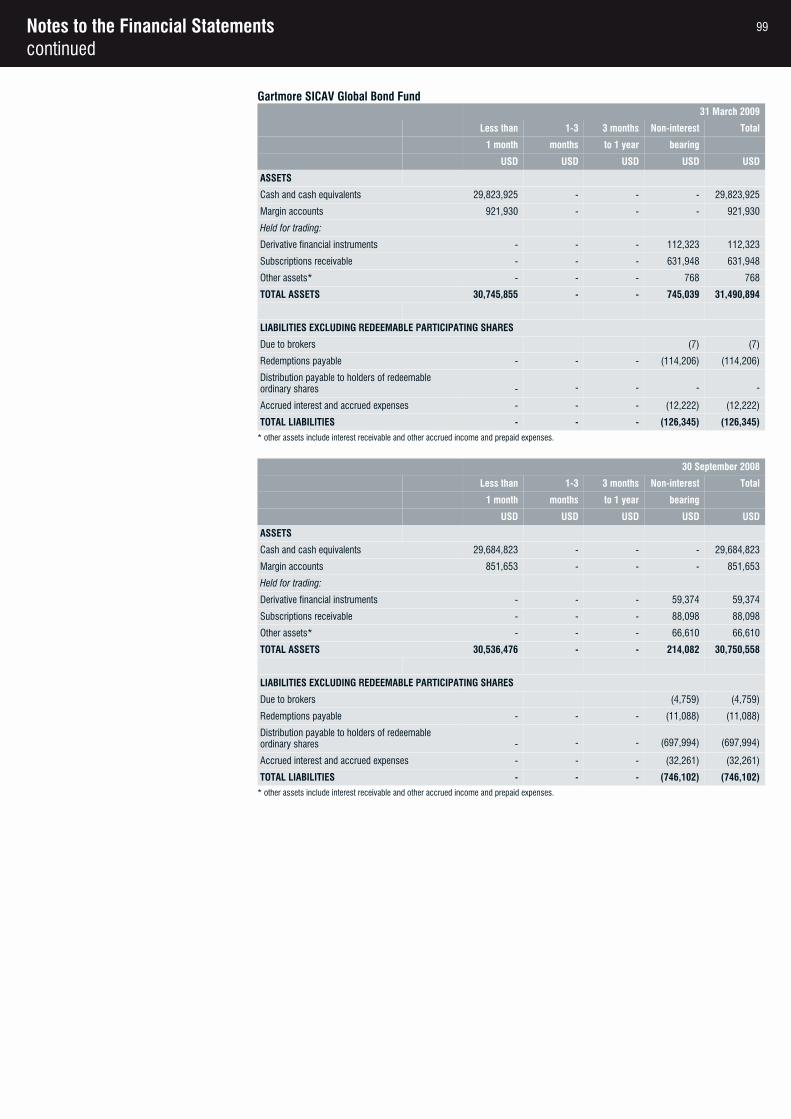
Notes to the Financial Statementscontinued
Gartmore SICAV Global Bond Fund31 March 2009
Less than 1-3 3 months Non-interest Total
1 month months to 1 year bearing
USD USD USD USD USD
ASSETS
Cash and cash equivalents 29,823,925 - - - 29,823,925
Margin accounts 921,930 - - - 921,930
Held for trading:
Derivative financial instruments - - - 112,323 112,323
Subscriptions receivable - - - 631,948 631,948
Other assets* - - - 768 768
TOTAL ASSETS 30,745,855 - - 745,039 31,490,894
LIABILITIES EXCLUDING REDEEMABLE PARTICIPATING SHARES
Due to brokers (7) (7)
Redemptions payable - - - (114,206) (114,206)
Distribution payable to holders of redeemable ordinary shares - - - - -
Accrued interest and accrued expenses - - - (12,222) (12,222)
TOTAL LIABILITIES - - - (126,345) (126,345)
* other assets include interest receivable and other accrued income and prepaid expenses.
30 September 2008
Less than 1-3 3 months Non-interest Total
1 month months to 1 year bearing
USD USD USD USD USD
ASSETS
Cash and cash equivalents 29,684,823 - - - 29,684,823
Margin accounts 851,653 - - - 851,653
Held for trading:
Derivative financial instruments - - - 59,374 59,374
Subscriptions receivable - - - 88,098 88,098
Other assets* - - - 66,610 66,610
TOTAL ASSETS 30,536,476 - - 214,082 30,750,558
LIABILITIES EXCLUDING REDEEMABLE PARTICIPATING SHARES
Due to brokers (4,759) (4,759)
Redemptions payable - - - (11,088) (11,088)
Distribution payable to holders of redeemable ordinary shares - - - (697,994) (697,994)
Accrued interest and accrued expenses - - - (32,261) (32,261)
TOTAL LIABILITIES - - - (746,102) (746,102)
* other assets include interest receivable and other accrued income and prepaid expenses.
99
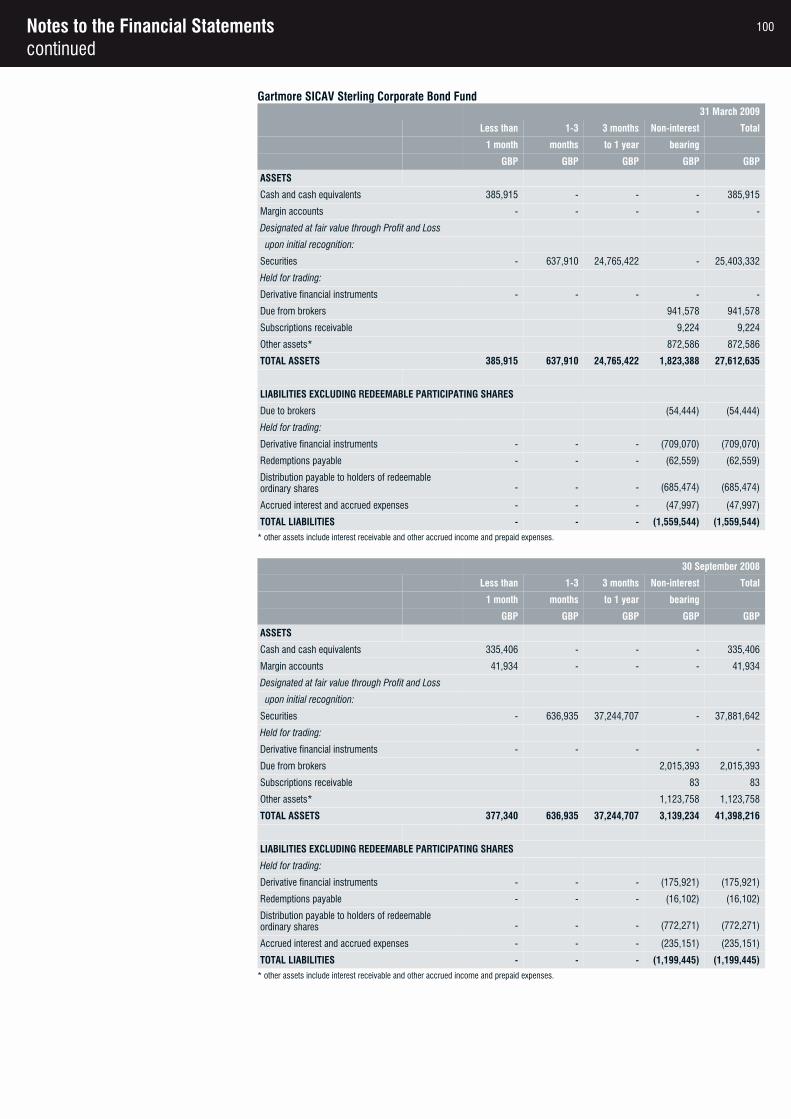
Notes to the Financial Statementscontinued
Gartmore SICAV Sterling Corporate Bond Fund31 March 2009
Less than 1-3 3 months Non-interest Total
1 month months to 1 year bearing
GBP GBP GBP GBP GBP
ASSETS
Cash and cash equivalents 385,915 - - - 385,915
Margin accounts - - - - -
Designated at fair value through Profit and Loss
upon initial recognition:
Securities - 637,910 24,765,422 - 25,403,332
Held for trading:
Derivative financial instruments - - - - -
Due from brokers 941,578 941,578
Subscriptions receivable 9,224 9,224
Other assets* 872,586 872,586
TOTAL ASSETS 385,915 637,910 24,765,422 1,823,388 27,612,635
LIABILITIES EXCLUDING REDEEMABLE PARTICIPATING SHARES
Due to brokers (54,444) (54,444)
Held for trading:
Derivative financial instruments - - - (709,070) (709,070)
Redemptions payable - - - (62,559) (62,559)
Distribution payable to holders of redeemable ordinary shares - - - (685,474) (685,474)
Accrued interest and accrued expenses - - - (47,997) (47,997)
TOTAL LIABILITIES - - - (1,559,544) (1,559,544)
* other assets include interest receivable and other accrued income and prepaid expenses.
30 September 2008
Less than 1-3 3 months Non-interest Total
1 month months to 1 year bearing
GBP GBP GBP GBP GBP
ASSETS
Cash and cash equivalents 335,406 - - - 335,406
Margin accounts 41,934 - - - 41,934
Designated at fair value through Profit and Loss
upon initial recognition:
Securities - 636,935 37,244,707 - 37,881,642
Held for trading:
Derivative financial instruments - - - - -
Due from brokers 2,015,393 2,015,393
Subscriptions receivable 83 83
Other assets* 1,123,758 1,123,758
TOTAL ASSETS 377,340 636,935 37,244,707 3,139,234 41,398,216
LIABILITIES EXCLUDING REDEEMABLE PARTICIPATING SHARES
Held for trading:
Derivative financial instruments - - - (175,921) (175,921)
Redemptions payable - - - (16,102) (16,102)
Distribution payable to holders of redeemable ordinary shares - - - (772,271) (772,271)
Accrued interest and accrued expenses - - - (235,151) (235,151)
TOTAL LIABILITIES - - - (1,199,445) (1,199,445)
* other assets include interest receivable and other accrued income and prepaid expenses.
100
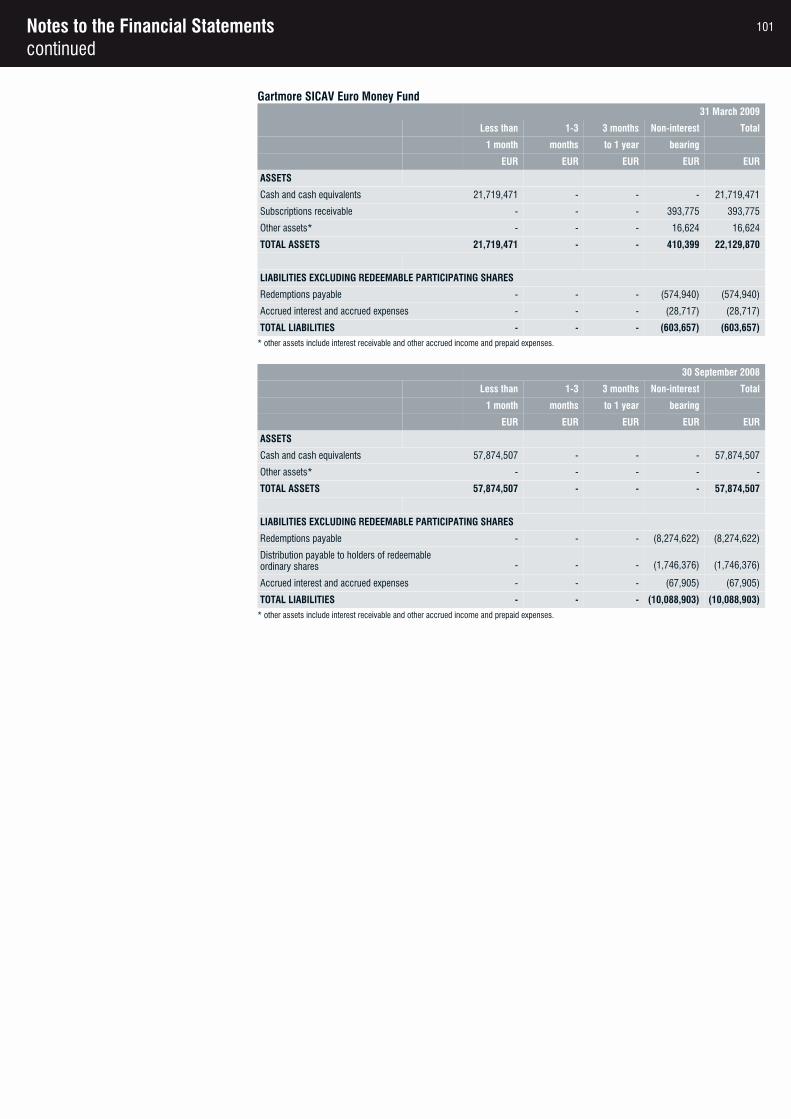
Notes to the Financial Statementscontinued
Gartmore SICAV Euro Money Fund31 March 2009
Less than 1-3 3 months Non-interest Total
1 month months to 1 year bearing
EUR EUR EUR EUR EUR
ASSETS
Cash and cash equivalents 21,719,471 - - - 21,719,471
Subscriptions receivable - - - 393,775 393,775
Other assets* - - - 16,624 16,624
TOTAL ASSETS 21,719,471 - - 410,399 22,129,870
LIABILITIES EXCLUDING REDEEMABLE PARTICIPATING SHARES
Redemptions payable - - - (574,940) (574,940)
Accrued interest and accrued expenses - - - (28,717) (28,717)
TOTAL LIABILITIES - - - (603,657) (603,657)
* other assets include interest receivable and other accrued income and prepaid expenses.
30 September 2008
Less than 1-3 3 months Non-interest Total
1 month months to 1 year bearing
EUR EUR EUR EUR EUR
ASSETS
Cash and cash equivalents 57,874,507 - - - 57,874,507
Other assets* - - - - -
TOTAL ASSETS 57,874,507 - - - 57,874,507
LIABILITIES EXCLUDING REDEEMABLE PARTICIPATING SHARES
Redemptions payable - - - (8,274,622) (8,274,622)
Distribution payable to holders of redeemable ordinary shares - - - (1,746,376) (1,746,376)
Accrued interest and accrued expenses - - - (67,905) (67,905)
TOTAL LIABILITIES - - - (10,088,903) (10,088,903)
* other assets include interest receivable and other accrued income and prepaid expenses.
101
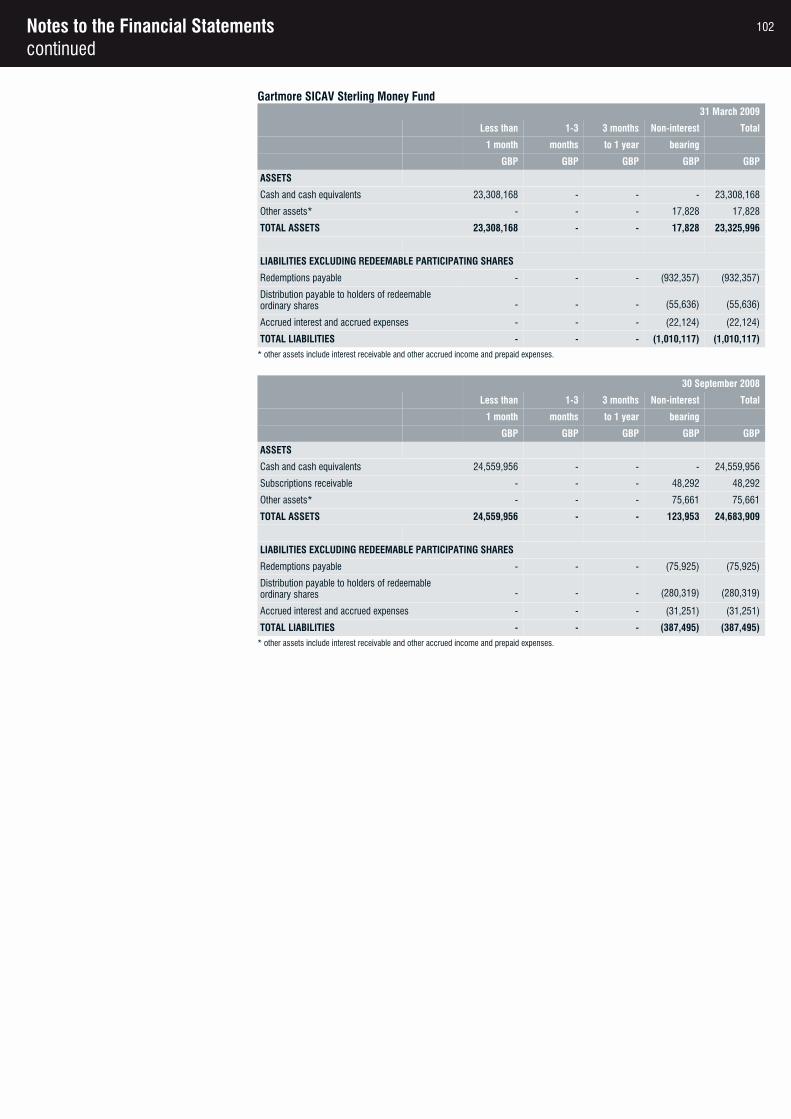
Notes to the Financial Statementscontinued
Gartmore SICAV Sterling Money Fund31 March 2009
Less than 1-3 3 months Non-interest Total
1 month months to 1 year bearing
GBP GBP GBP GBP GBP
ASSETS
Cash and cash equivalents 23,308,168 - - - 23,308,168
Other assets* - - - 17,828 17,828
TOTAL ASSETS 23,308,168 - - 17,828 23,325,996
LIABILITIES EXCLUDING REDEEMABLE PARTICIPATING SHARES
Redemptions payable - - - (932,357) (932,357)
Distribution payable to holders of redeemable ordinary shares - - - (55,636) (55,636)
Accrued interest and accrued expenses - - - (22,124) (22,124)
TOTAL LIABILITIES - - - (1,010,117) (1,010,117)
* other assets include interest receivable and other accrued income and prepaid expenses.
30 September 2008
Less than 1-3 3 months Non-interest Total
1 month months to 1 year bearing
GBP GBP GBP GBP GBP
ASSETS
Cash and cash equivalents 24,559,956 - - - 24,559,956
Subscriptions receivable - - - 48,292 48,292
Other assets* - - - 75,661 75,661
TOTAL ASSETS 24,559,956 - - 123,953 24,683,909
LIABILITIES EXCLUDING REDEEMABLE PARTICIPATING SHARES
Redemptions payable - - - (75,925) (75,925)
Distribution payable to holders of redeemable ordinary shares - - - (280,319) (280,319)
Accrued interest and accrued expenses - - - (31,251) (31,251)
TOTAL LIABILITIES - - - (387,495) (387,495)
* other assets include interest receivable and other accrued income and prepaid expenses.
102
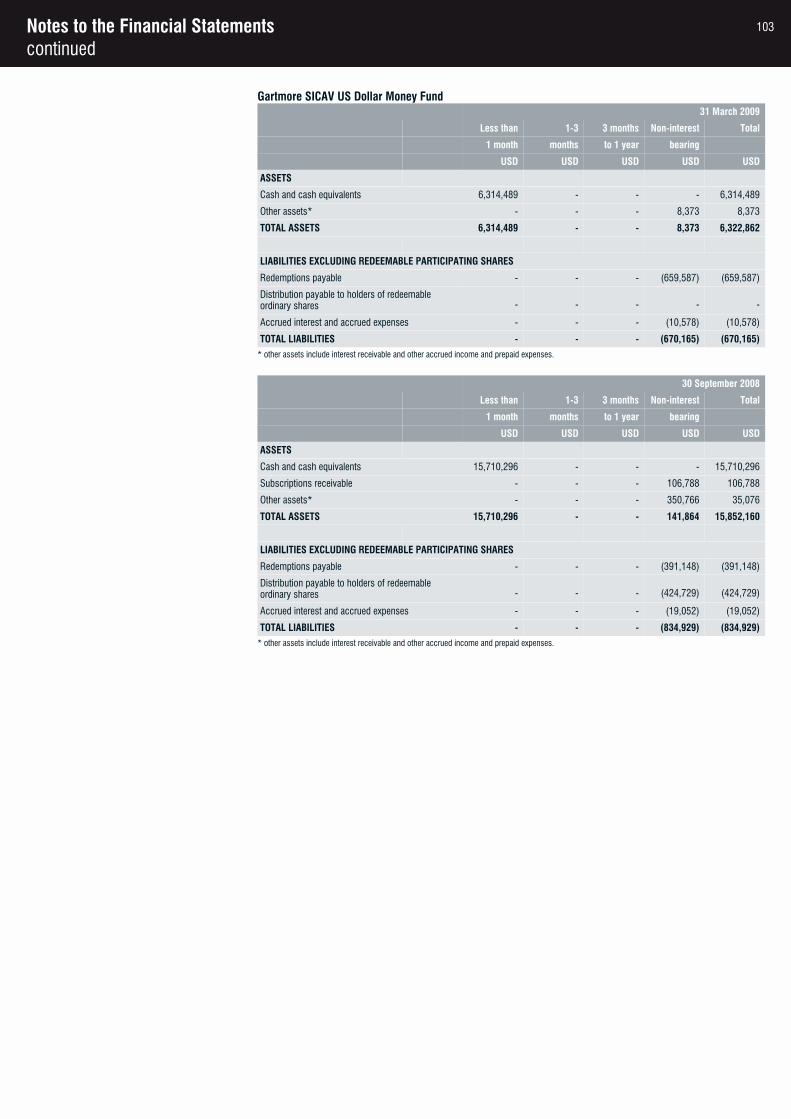
Notes to the Financial Statementscontinued
Gartmore SICAV US Dollar Money Fund31 March 2009
Less than 1-3 3 months Non-interest Total
1 month months to 1 year bearing
USD USD USD USD USD
ASSETS
Cash and cash equivalents 6,314,489 - - - 6,314,489
Other assets* - - - 8,373 8,373
TOTAL ASSETS 6,314,489 - - 8,373 6,322,862
LIABILITIES EXCLUDING REDEEMABLE PARTICIPATING SHARES
Redemptions payable - - - (659,587) (659,587)
Distribution payable to holders of redeemable ordinary shares - - - - -
Accrued interest and accrued expenses - - - (10,578) (10,578)
TOTAL LIABILITIES - - - (670,165) (670,165)
* other assets include interest receivable and other accrued income and prepaid expenses.
30 September 2008
Less than 1-3 3 months Non-interest Total
1 month months to 1 year bearing
USD USD USD USD USD
ASSETS
Cash and cash equivalents 15,710,296 - - - 15,710,296
Subscriptions receivable - - - 106,788 106,788
Other assets* - - - 350,766 35,076
TOTAL ASSETS 15,710,296 - - 141,864 15,852,160
LIABILITIES EXCLUDING REDEEMABLE PARTICIPATING SHARES
Redemptions payable - - - (391,148) (391,148)
Distribution payable to holders of redeemable ordinary shares - - - (424,729) (424,729)
Accrued interest and accrued expenses - - - (19,052) (19,052)
TOTAL LIABILITIES - - - (834,929) (834,929)
* other assets include interest receivable and other accrued income and prepaid expenses.
103
Notes to the Financial Statementscontinued
Credit Risk
The Fund is exposed to credit risk, which is the risk that a counterparty will be unable to pay amounts in full when they fall due. The main concentration to which the Fund is exposed arises from the Fund’s investments indebt securities (Investment Credit Risk). The Fund is also exposed to Counterparty Credit Risk on trading derivative products, cash and cash equivalents, amounts due from brokers and other receivable balances.
a) Investment Credit Risk
The investment policy of the Equity funds, Global Bond Fund or Money Market funds does not generally subject them to credit risk however the investment policy of the Sterling Corporate Bond Fund does subject this Fund to investment credit risk.
The Sterling Corporate Bond Fund’s policy is to manage credit risk through diversification, with reference to the relevant market benchmark index. This Fund has internal limits on the minimum number of different individual issuers that must be held within the portfolio along with controls on the maximum %-of-NAV exposures that canbe held in any issuer compared to the relevant benchmark index. There is also an internal limit on the amount ofHigh Yield exposure in the Fund.
b) Counterparty Credit Risk
Counterparty risk is the risk that a counterparty to a financial instrument trade or contract will fail to discharge an obligation or commitment that it has entered into with the Fund.
The Fund manages counterparty risk in several ways.
1. Legal requirements
UCITS III regulation restricts the amount of counterparty exposure the Fund can take as follows:
Only 5% of NAV can be exposed to a single broker in OTC derivatives; only 10% of NAV can be exposed to a single bank in OTC derivatives. The Fund's NAV can be no more than 20% exposed to one counterparty in a combination of OTC derivatives, cash deposits and investment in that counterparty's securities e.g. shares.
The Investment Manager monitors and manages this exposure independently of the Investment process on a daily basis.
2. Counterparty Management
The Investment Manager's counterparty approval and monitoring process is well established and includes the provision of risk exposure limits for each group counterparty relationship. These trigger levels are driven by a combination of signals and daily financial news, including credit ratings and review of financial statements. Counterparty exposure is calculated on a conservative basis and utilisation is monitored daily against those trigger levels set. Only counterparty's approved for dealing independently of the Investment process can be usedfor Trading.
The Fund also restricts its exposure to credit losses on the derivative instruments it holds by entering into ISDA master netting arrangements with counterparties (approved brokers) with whom it undertakes transactions whereby if an event of default occurs, all amounts with the counterparty are terminated and settled on a net basis.
The majority of transactions in listed securities are settled on a "delivery versus payment" basis where the risk of default is limited to market movement prior to settlement as the trade will fail if either party fails to meet its obligation.
104
Notes to the Financial Statementscontinued
The three Money Markets Funds and Gartmore SICAV Global Bond Fund excepted, substantially all of the cash and assets held by the Fund is held by HSBC Securities Services (Luxembourg) S.A. Bankruptcy or insolvency of HSBC Securities Services (Luxembourg) S.A. may cause the Fund’s rights with respect to the cash held by that bank to be delayed or limited. The Fund monitors its risk by monitoring the credit rating of HSBC Securities Services (Luxembourg) S.A. on a periodic basis. If the credit quality or the financial position of HSBC Securities Services (Luxembourg) S.A. deteriorates significantly the Investment Manager will move the cash holdings to another bank.
For the three Money Markets Funds and for Gartmore SICAV Global Bond Fund, the term deposits are held by different counterparties, in order to split the counterparty risk in different issuers and to minimize the risk that counterparty falls insolvent or in bankruptcy.
Liquidity Risk
Liquidity risk is the risk that the Funds may not be able to generate sufficient cash resources to settle their obligations in full as they fall due or can only do so on terms that are materially disadvantageous.
The Fund’s Prospectus provides for the daily creation and cancellation of shares and it is therefore exposed to the liquidity risk of meeting shareholder redemptions at any time. The Funds have the ability to borrow up to 10 % of the Net Asset Value on a temporary basis.
In order to manage the Fund’s overall liquidity, the Funds also have the ability to defer any daily redemption over10% of the Net Asset Value until the following Dealing Day. The Fund did not withhold any redemption during 2008 and 2007.
The Funds are exposed to the daily settlement of margin calls on derivatives as well as to daily cash redemptions of redeemable shares. Their policy is therefore to invest the majority of their assets in investments that are traded in an active market and can be readily disposed.
The Funds may periodically invest in derivative contracts traded over the counter “OTC”, which are not traded in an organised market and may be illiquid. As a result, the Funds may not be able to liquidate quickly their investments in these instruments at an amount close to their fair value to meet its liquidity requirements, or be able to respond to specific events such as deterioration in the creditworthiness of any particular issuer. At 31 March 2009, only Gartmore SICAV Continental European Smaller Companies Fund, Gartmore SICAV European Absolute Return Fund and Gartmore SICAV Sterling Corporate Bond Fund (30 September 2008: the Sterling Corporate Bond Fund) held OTC investments that could be considered illiquid.
The application of the Swinging Prices Policy functions as further protection to the Fund and the underlying Shareholders based on the calculation of the dilution levy reflecting current market liquidity (please see further details under note 11).
The Funds’ listed securities are considered to be readily realizable as they are all listed on major stock exchanges.
In accordance with the Fund’s policy, the Investment Manager monitors the Fund’s liquidity position on a daily basis, and the Board of Directors reviews it at each Board Meeting. The table below analyses the Fund’s financial liabilities and net settled derivative financial liabilities into relevant maturity groupings based on the remaining period at the balance sheet date to the contractual maturity date. The amounts in the table are the contractual undiscounted cash flows excluding gross settled derivatives.
Residual contractual maturities of financial liabilities including net assets attributable to holders of redeemable shares:
105
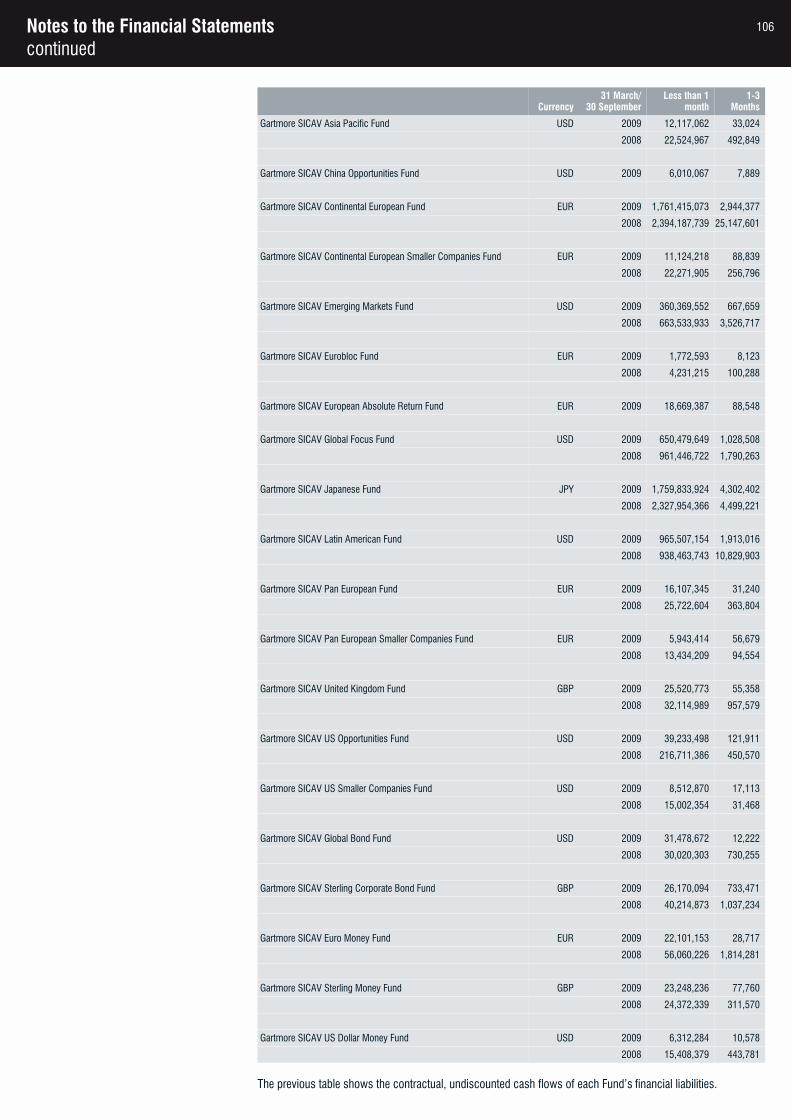
Notes to the Financial Statementscontinued
Currency31 March/
30 SeptemberLess than 1
month1-3
Months
Gartmore SICAV Asia Pacific Fund USD 2009 12,117,062 33,024
2008 22,524,967 492,849
Gartmore SICAV China Opportunities Fund USD 2009 6,010,067 7,889
Gartmore SICAV Continental European Fund EUR 2009 1,761,415,073 2,944,377
2008 2,394,187,739 25,147,601
Gartmore SICAV Continental European Smaller Companies Fund EUR 2009 11,124,218 88,839
2008 22,271,905 256,796
Gartmore SICAV Emerging Markets Fund USD 2009 360,369,552 667,659
2008 663,533,933 3,526,717
Gartmore SICAV Eurobloc Fund EUR 2009 1,772,593 8,123
2008 4,231,215 100,288
Gartmore SICAV European Absolute Return Fund EUR 2009 18,669,387 88,548
Gartmore SICAV Global Focus Fund USD 2009 650,479,649 1,028,508
2008 961,446,722 1,790,263
Gartmore SICAV Japanese Fund JPY 2009 1,759,833,924 4,302,402
2008 2,327,954,366 4,499,221
Gartmore SICAV Latin American Fund USD 2009 965,507,154 1,913,016
2008 938,463,743 10,829,903
Gartmore SICAV Pan European Fund EUR 2009 16,107,345 31,240
2008 25,722,604 363,804
Gartmore SICAV Pan European Smaller Companies Fund EUR 2009 5,943,414 56,679
2008 13,434,209 94,554
Gartmore SICAV United Kingdom Fund GBP 2009 25,520,773 55,358
2008 32,114,989 957,579
Gartmore SICAV US Opportunities Fund USD 2009 39,233,498 121,911
2008 216,711,386 450,570
Gartmore SICAV US Smaller Companies Fund USD 2009 8,512,870 17,113
2008 15,002,354 31,468
Gartmore SICAV Global Bond Fund USD 2009 31,478,672 12,222
2008 30,020,303 730,255
Gartmore SICAV Sterling Corporate Bond Fund GBP 2009 26,170,094 733,471
2008 40,214,873 1,037,234
Gartmore SICAV Euro Money Fund EUR 2009 22,101,153 28,717
2008 56,060,226 1,814,281
Gartmore SICAV Sterling Money Fund GBP 2009 23,248,236 77,760
2008 24,372,339 311,570
Gartmore SICAV US Dollar Money Fund USD 2009 6,312,284 10,578
2008 15,408,379 443,781
The previous table shows the contractual, undiscounted cash flows of each Fund’s financial liabilities.
106
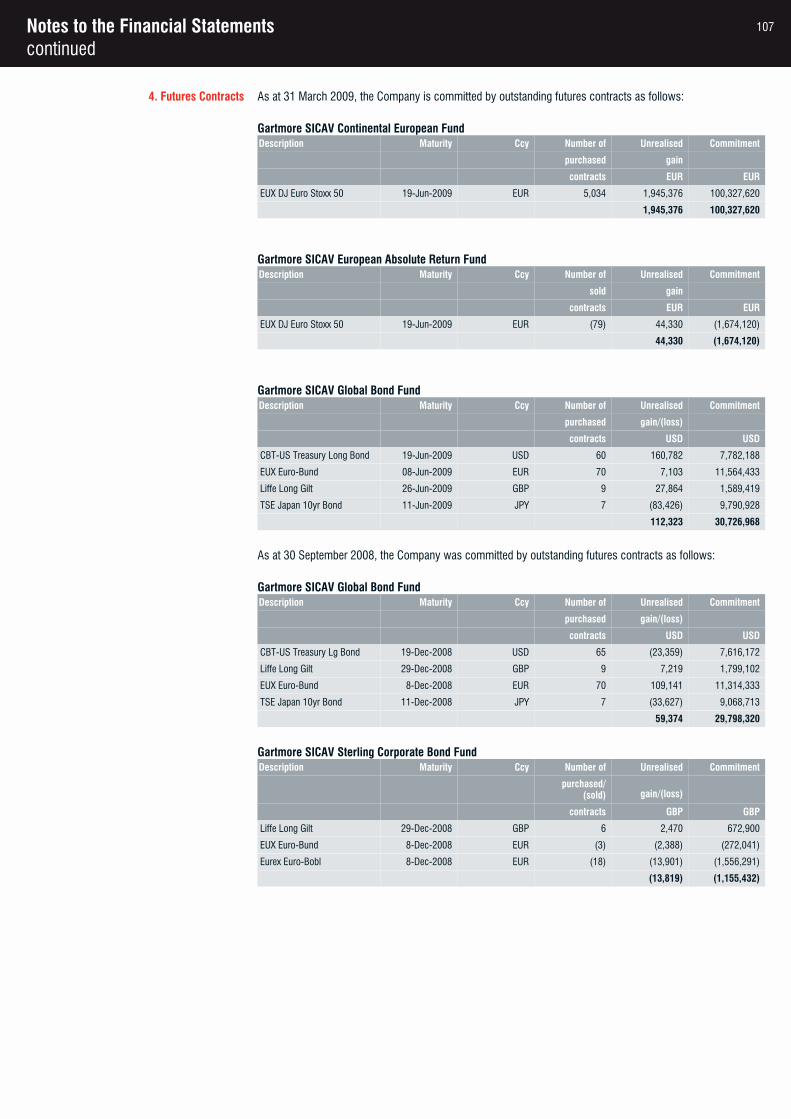
Notes to the Financial Statementscontinued
4. Futures Contracts As at 31 March 2009, the Company is committed by outstanding futures contracts as follows:
Gartmore SICAV Continental European FundDescription Maturity Ccy Number of Unrealised Commitment
purchased gain
contracts EUR EUR
EUX DJ Euro Stoxx 50 19-Jun-2009 EUR 5,034 1,945,376 100,327,620
1,945,376 100,327,620
Gartmore SICAV European Absolute Return FundDescription Maturity Ccy Number of Unrealised Commitment
sold gain
contracts EUR EUR
EUX DJ Euro Stoxx 50 19-Jun-2009 EUR (79) 44,330 (1,674,120)
44,330 (1,674,120)
Gartmore SICAV Global Bond FundDescription Maturity Ccy Number of Unrealised Commitment
purchased gain/(loss)
contracts USD USD
CBT-US Treasury Long Bond 19-Jun-2009 USD 60 160,782 7,782,188
EUX Euro-Bund 08-Jun-2009 EUR 70 7,103 11,564,433
Liffe Long Gilt 26-Jun-2009 GBP 9 27,864 1,589,419
TSE Japan 10yr Bond 11-Jun-2009 JPY 7 (83,426) 9,790,928
112,323 30,726,968
As at 30 September 2008, the Company was committed by outstanding futures contracts as follows:
Gartmore SICAV Global Bond FundDescription Maturity Ccy Number of Unrealised Commitment
purchased gain/(loss)
contracts USD USD
CBT-US Treasury Lg Bond 19-Dec-2008 USD 65 (23,359) 7,616,172
Liffe Long Gilt 29-Dec-2008 GBP 9 7,219 1,799,102
EUX Euro-Bund 8-Dec-2008 EUR 70 109,141 11,314,333
TSE Japan 10yr Bond 11-Dec-2008 JPY 7 (33,627) 9,068,713
59,374 29,798,320
Gartmore SICAV Sterling Corporate Bond FundDescription Maturity Ccy Number of Unrealised Commitment
purchased/
(sold) gain/(loss)
contracts GBP GBP
Liffe Long Gilt 29-Dec-2008 GBP 6 2,470 672,900
EUX Euro-Bund 8-Dec-2008 EUR (3) (2,388) (272,041)
Eurex Euro-Bobl 8-Dec-2008 EUR (18) (13,901) (1,556,291)
(13,819) (1,155,432)
107
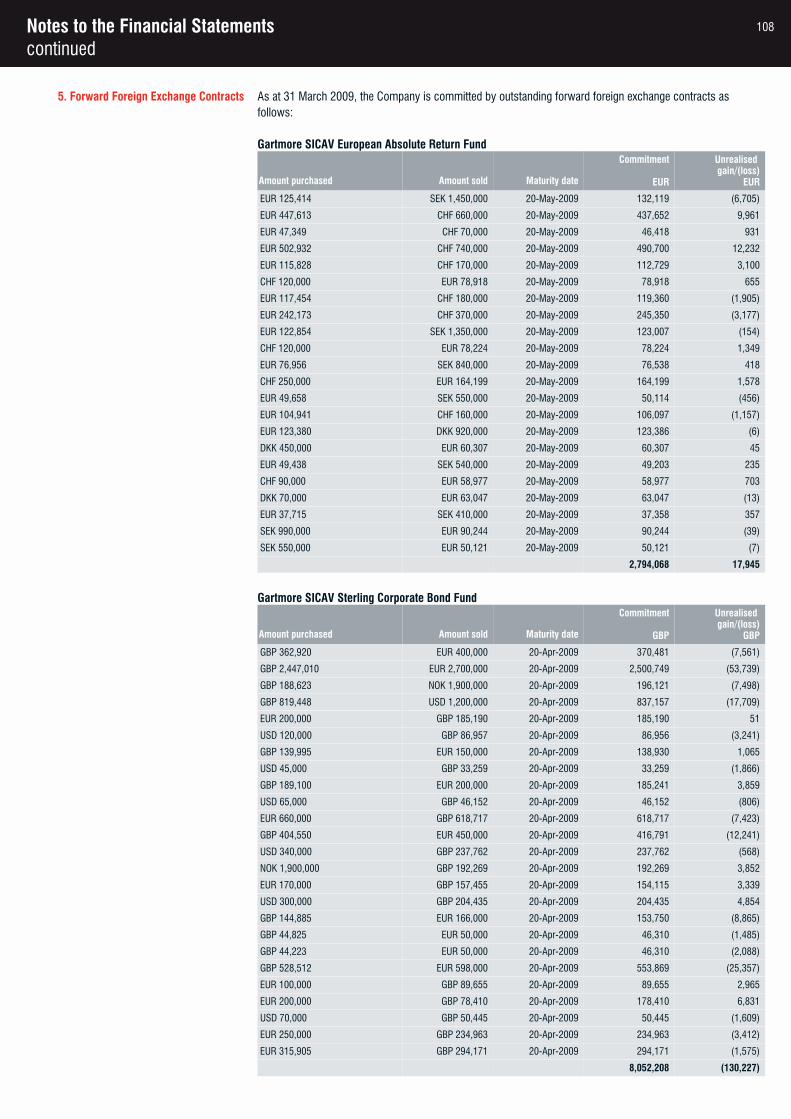
Notes to the Financial Statementscontinued
5. Forward Foreign Exchange Contracts As at 31 March 2009, the Company is committed by outstanding forward foreign exchange contracts as follows:
Gartmore SICAV European Absolute Return Fund
Amount purchased Amount sold Maturity date
Commitment
EUR
Unrealised gain/(loss)
EUR
EUR 125,414 SEK 1,450,000 20-May-2009 132,119 (6,705)
EUR 447,613 CHF 660,000 20-May-2009 437,652 9,961
EUR 47,349 CHF 70,000 20-May-2009 46,418 931
EUR 502,932 CHF 740,000 20-May-2009 490,700 12,232
EUR 115,828 CHF 170,000 20-May-2009 112,729 3,100
CHF 120,000 EUR 78,918 20-May-2009 78,918 655
EUR 117,454 CHF 180,000 20-May-2009 119,360 (1,905)
EUR 242,173 CHF 370,000 20-May-2009 245,350 (3,177)
EUR 122,854 SEK 1,350,000 20-May-2009 123,007 (154)
CHF 120,000 EUR 78,224 20-May-2009 78,224 1,349
EUR 76,956 SEK 840,000 20-May-2009 76,538 418
CHF 250,000 EUR 164,199 20-May-2009 164,199 1,578
EUR 49,658 SEK 550,000 20-May-2009 50,114 (456)
EUR 104,941 CHF 160,000 20-May-2009 106,097 (1,157)
EUR 123,380 DKK 920,000 20-May-2009 123,386 (6)
DKK 450,000 EUR 60,307 20-May-2009 60,307 45
EUR 49,438 SEK 540,000 20-May-2009 49,203 235
CHF 90,000 EUR 58,977 20-May-2009 58,977 703
DKK 70,000 EUR 63,047 20-May-2009 63,047 (13)
EUR 37,715 SEK 410,000 20-May-2009 37,358 357
SEK 990,000 EUR 90,244 20-May-2009 90,244 (39)
SEK 550,000 EUR 50,121 20-May-2009 50,121 (7)
2,794,068 17,945
Gartmore SICAV Sterling Corporate Bond Fund
Amount purchased Amount sold Maturity date
Commitment
GBP
Unrealised gain/(loss)
GBP
GBP 362,920 EUR 400,000 20-Apr-2009 370,481 (7,561)
GBP 2,447,010 EUR 2,700,000 20-Apr-2009 2,500,749 (53,739)
GBP 188,623 NOK 1,900,000 20-Apr-2009 196,121 (7,498)
GBP 819,448 USD 1,200,000 20-Apr-2009 837,157 (17,709)
EUR 200,000 GBP 185,190 20-Apr-2009 185,190 51
USD 120,000 GBP 86,957 20-Apr-2009 86,956 (3,241)
GBP 139,995 EUR 150,000 20-Apr-2009 138,930 1,065
USD 45,000 GBP 33,259 20-Apr-2009 33,259 (1,866)
GBP 189,100 EUR 200,000 20-Apr-2009 185,241 3,859
USD 65,000 GBP 46,152 20-Apr-2009 46,152 (806)
EUR 660,000 GBP 618,717 20-Apr-2009 618,717 (7,423)
GBP 404,550 EUR 450,000 20-Apr-2009 416,791 (12,241)
USD 340,000 GBP 237,762 20-Apr-2009 237,762 (568)
NOK 1,900,000 GBP 192,269 20-Apr-2009 192,269 3,852
EUR 170,000 GBP 157,455 20-Apr-2009 154,115 3,339
USD 300,000 GBP 204,435 20-Apr-2009 204,435 4,854
GBP 144,885 EUR 166,000 20-Apr-2009 153,750 (8,865)
GBP 44,825 EUR 50,000 20-Apr-2009 46,310 (1,485)
GBP 44,223 EUR 50,000 20-Apr-2009 46,310 (2,088)
GBP 528,512 EUR 598,000 20-Apr-2009 553,869 (25,357)
EUR 100,000 GBP 89,655 20-Apr-2009 89,655 2,965
EUR 200,000 GBP 78,410 20-Apr-2009 178,410 6,831
USD 70,000 GBP 50,445 20-Apr-2009 50,445 (1,609)
EUR 250,000 GBP 234,963 20-Apr-2009 234,963 (3,412)
EUR 315,905 GBP 294,171 20-Apr-2009 294,171 (1,575)
8,052,208 (130,227)
108
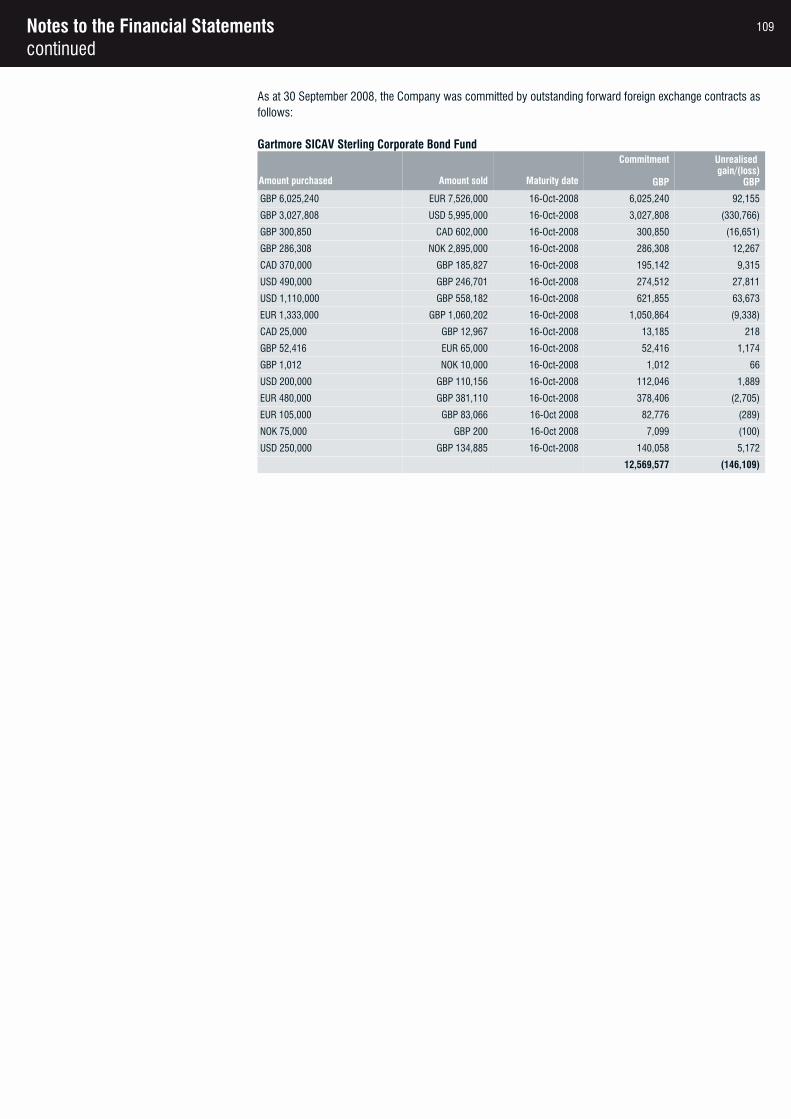
Notes to the Financial Statementscontinued
As at 30 September 2008, the Company was committed by outstanding forward foreign exchange contracts as follows:
Gartmore SICAV Sterling Corporate Bond Fund
Amount purchased Amount sold Maturity date
Commitment
GBP
Unrealised gain/(loss)
GBP
GBP 6,025,240 EUR 7,526,000 16-Oct-2008 6,025,240 92,155
GBP 3,027,808 USD 5,995,000 16-Oct-2008 3,027,808 (330,766)
GBP 300,850 CAD 602,000 16-Oct-2008 300,850 (16,651)
GBP 286,308 NOK 2,895,000 16-Oct-2008 286,308 12,267
CAD 370,000 GBP 185,827 16-Oct-2008 195,142 9,315
USD 490,000 GBP 246,701 16-Oct-2008 274,512 27,811
USD 1,110,000 GBP 558,182 16-Oct-2008 621,855 63,673
EUR 1,333,000 GBP 1,060,202 16-Oct-2008 1,050,864 (9,338)
CAD 25,000 GBP 12,967 16-Oct-2008 13,185 218
GBP 52,416 EUR 65,000 16-Oct-2008 52,416 1,174
GBP 1,012 NOK 10,000 16-Oct-2008 1,012 66
USD 200,000 GBP 110,156 16-Oct-2008 112,046 1,889
EUR 480,000 GBP 381,110 16-Oct-2008 378,406 (2,705)
EUR 105,000 GBP 83,066 16-Oct 2008 82,776 (289)
NOK 75,000 GBP 200 16-Oct 2008 7,099 (100)
USD 250,000 GBP 134,885 16-Oct-2008 140,058 5,172
12,569,577 (146,109)
109
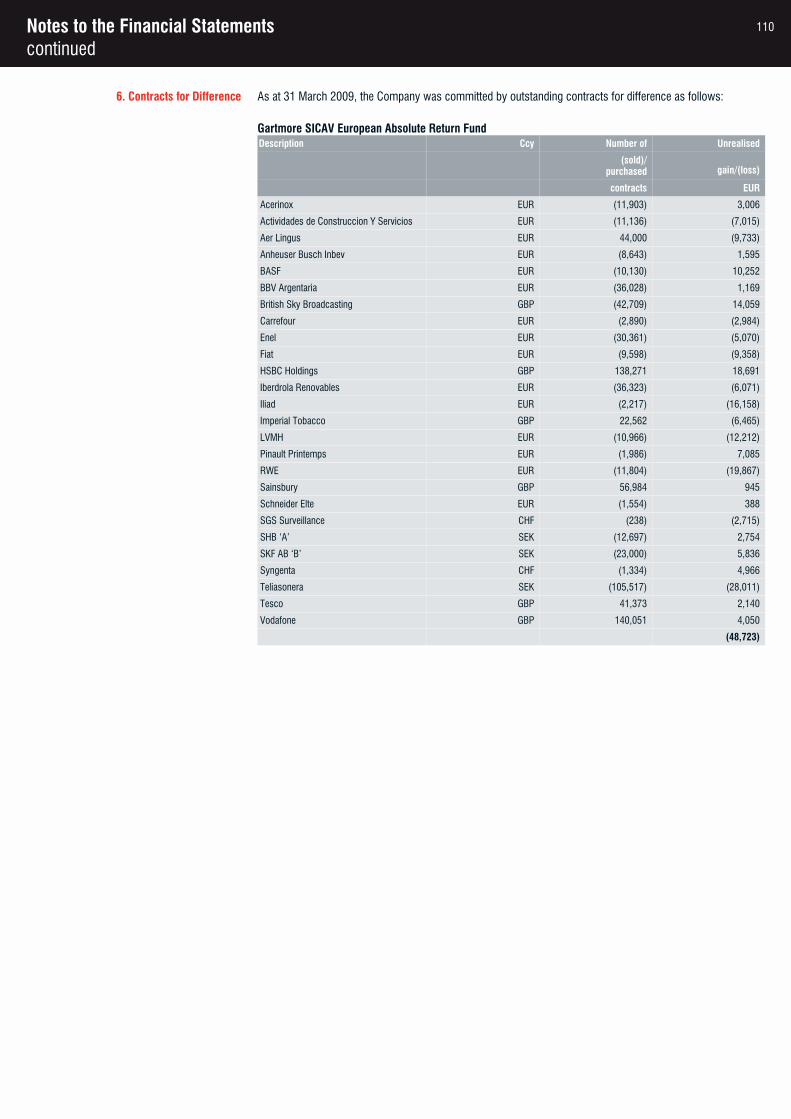
Notes to the Financial Statementscontinued
6. Contracts for Difference As at 31 March 2009, the Company was committed by outstanding contracts for difference as follows:
Gartmore SICAV European Absolute Return FundDescription Ccy Number of Unrealised
(sold)/
purchased gain/(loss)
contracts EUR
Acerinox EUR (11,903) 3,006
Actividades de Construccion Y Servicios EUR (11,136) (7,015)
Aer Lingus EUR 44,000 (9,733)
Anheuser Busch Inbev EUR (8,643) 1,595
BASF EUR (10,130) 10,252
BBV Argentaria EUR (36,028) 1,169
British Sky Broadcasting GBP (42,709) 14,059
Carrefour EUR (2,890) (2,984)
Enel EUR (30,361) (5,070)
Fiat EUR (9,598) (9,358)
HSBC Holdings GBP 138,271 18,691
Iberdrola Renovables EUR (36,323) (6,071)
Iliad EUR (2,217) (16,158)
Imperial Tobacco GBP 22,562 (6,465)
LVMH EUR (10,966) (12,212)
Pinault Printemps EUR (1,986) 7,085
RWE EUR (11,804) (19,867)
Sainsbury GBP 56,984 945
Schneider Elte EUR (1,554) 388
SGS Surveillance CHF (238) (2,715)
SHB ‘A’ SEK (12,697) 2,754
SKF AB ‘B’ SEK (23,000) 5,836
Syngenta CHF (1,334) 4,966
Teliasonera SEK (105,517) (28,011)
Tesco GBP 41,373 2,140
Vodafone GBP 140,051 4,050
(48,723)
110
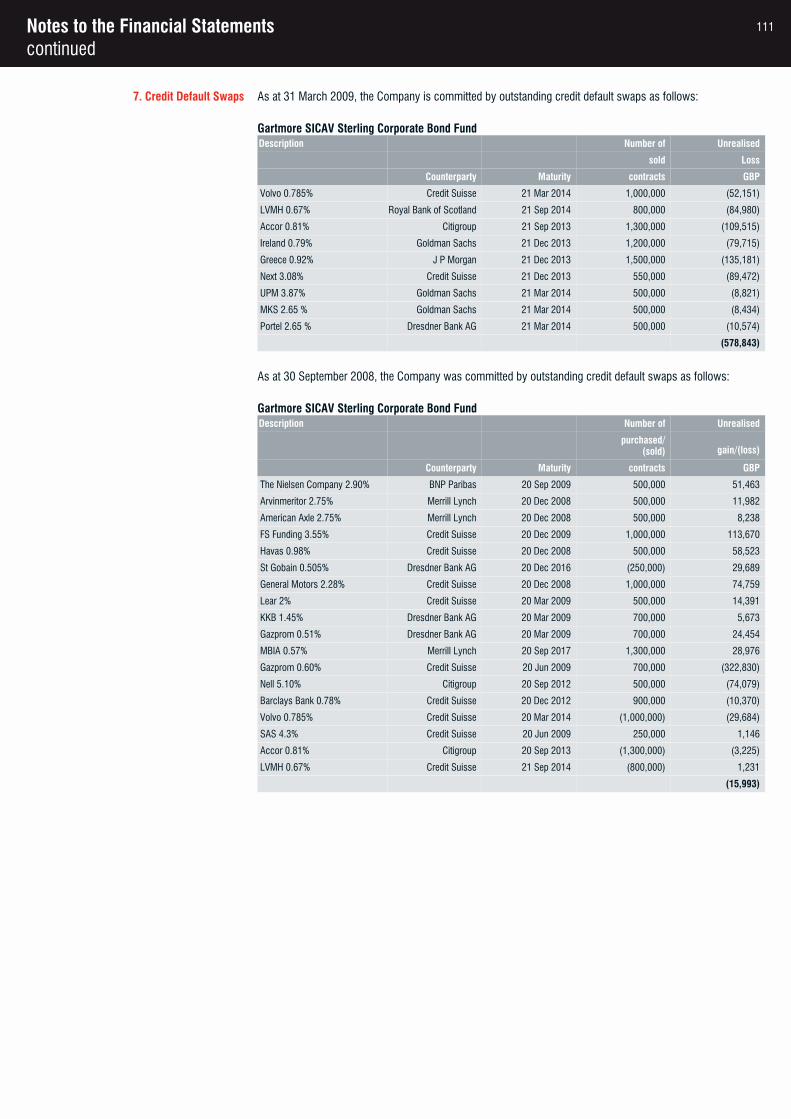
Notes to the Financial Statementscontinued
7. Credit Default Swaps As at 31 March 2009, the Company is committed by outstanding credit default swaps as follows:
Gartmore SICAV Sterling Corporate Bond FundDescription Number of Unrealised
sold Loss
Counterparty Maturity contracts GBP
Volvo 0.785% Credit Suisse 21 Mar 2014 1,000,000 (52,151)
LVMH 0.67% Royal Bank of Scotland 21 Sep 2014 800,000 (84,980)
Accor 0.81% Citigroup 21 Sep 2013 1,300,000 (109,515)
Ireland 0.79% Goldman Sachs 21 Dec 2013 1,200,000 (79,715)
Greece 0.92% J P Morgan 21 Dec 2013 1,500,000 (135,181)
Next 3.08% Credit Suisse 21 Dec 2013 550,000 (89,472)
UPM 3.87% Goldman Sachs 21 Mar 2014 500,000 (8,821)
MKS 2.65 % Goldman Sachs 21 Mar 2014 500,000 (8,434)
Portel 2.65 % Dresdner Bank AG 21 Mar 2014 500,000 (10,574)
(578,843)
As at 30 September 2008, the Company was committed by outstanding credit default swaps as follows:
Gartmore SICAV Sterling Corporate Bond FundDescription Number of Unrealised
purchased/
(sold) gain/(loss)
Counterparty Maturity contracts GBP
The Nielsen Company 2.90% BNP Paribas 20 Sep 2009 500,000 51,463
Arvinmeritor 2.75% Merrill Lynch 20 Dec 2008 500,000 11,982
American Axle 2.75% Merrill Lynch 20 Dec 2008 500,000 8,238
FS Funding 3.55% Credit Suisse 20 Dec 2009 1,000,000 113,670
Havas 0.98% Credit Suisse 20 Dec 2008 500,000 58,523
St Gobain 0.505% Dresdner Bank AG 20 Dec 2016 (250,000) 29,689
General Motors 2.28% Credit Suisse 20 Dec 2008 1,000,000 74,759
Lear 2% Credit Suisse 20 Mar 2009 500,000 14,391
KKB 1.45% Dresdner Bank AG 20 Mar 2009 700,000 5,673
Gazprom 0.51% Dresdner Bank AG 20 Mar 2009 700,000 24,454
MBIA 0.57% Merrill Lynch 20 Sep 2017 1,300,000 28,976
Gazprom 0.60% Credit Suisse 20 Jun 2009 700,000 (322,830)
Nell 5.10% Citigroup 20 Sep 2012 500,000 (74,079)
Barclays Bank 0.78% Credit Suisse 20 Dec 2012 900,000 (10,370)
Volvo 0.785% Credit Suisse 20 Mar 2014 (1,000,000) (29,684)
SAS 4.3% Credit Suisse 20 Jun 2009 250,000 1,146
Accor 0.81% Citigroup 20 Sep 2013 (1,300,000) (3,225)
LVMH 0.67% Credit Suisse 21 Sep 2014 (800,000) 1,231
(15,993)
111
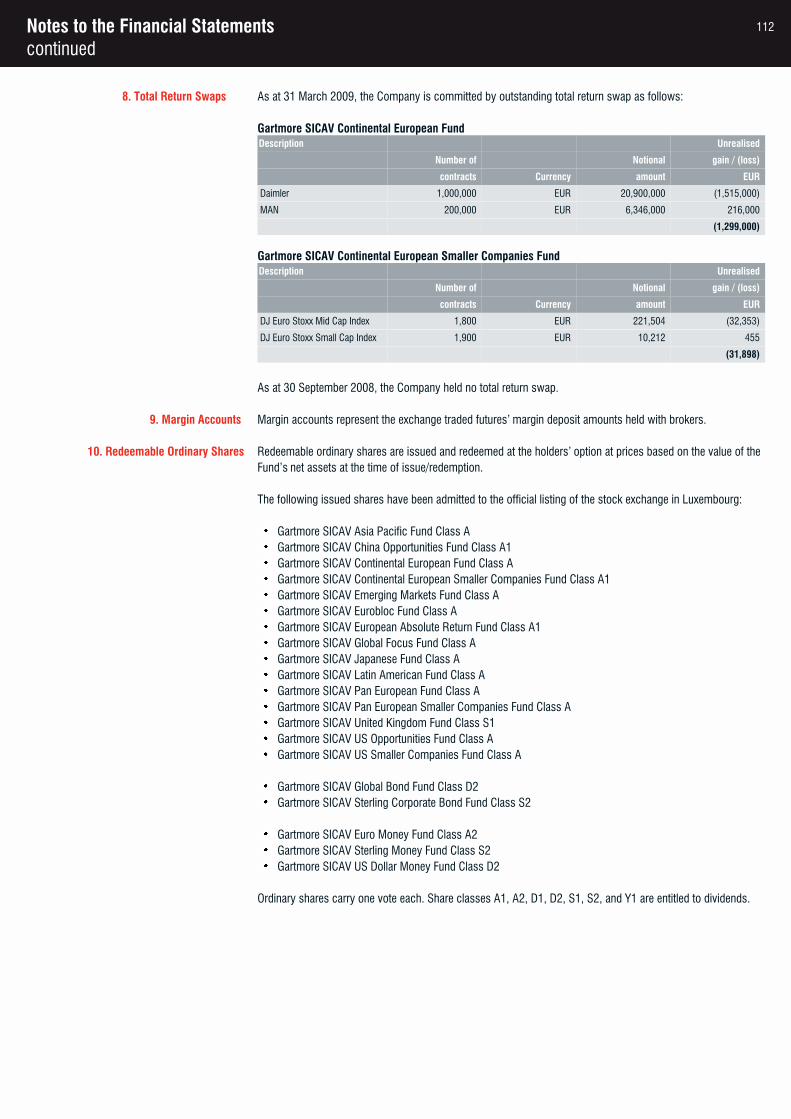
Notes to the Financial Statementscontinued
8. Total Return Swaps As at 31 March 2009, the Company is committed by outstanding total return swap as follows:
Gartmore SICAV Continental European FundDescription Unrealised
Number of Notional gain / (loss)
contracts Currency amount EUR
Daimler 1,000,000 EUR 20,900,000 (1,515,000)
MAN 200,000 EUR 6,346,000 216,000
(1,299,000)
Gartmore SICAV Continental European Smaller Companies FundDescription Unrealised
Number of Notional gain / (loss)
contracts Currency amount EUR
DJ Euro Stoxx Mid Cap Index 1,800 EUR 221,504 (32,353)
DJ Euro Stoxx Small Cap Index 1,900 EUR 10,212 455
(31,898)
As at 30 September 2008, the Company held no total return swap.
9. Margin Accounts Margin accounts represent the exchange traded futures’ margin deposit amounts held with brokers.
10. Redeemable Ordinary Shares Redeemable ordinary shares are issued and redeemed at the holders’ option at prices based on the value of the Fund’s net assets at the time of issue/redemption.
The following issued shares have been admitted to the official listing of the stock exchange in Luxembourg:
Gartmore SICAV Asia Pacific Fund Class AGartmore SICAV China Opportunities Fund Class A1Gartmore SICAV Continental European Fund Class AGartmore SICAV Continental European Smaller Companies Fund Class A1Gartmore SICAV Emerging Markets Fund Class AGartmore SICAV Eurobloc Fund Class AGartmore SICAV European Absolute Return Fund Class A1Gartmore SICAV Global Focus Fund Class AGartmore SICAV Japanese Fund Class AGartmore SICAV Latin American Fund Class AGartmore SICAV Pan European Fund Class AGartmore SICAV Pan European Smaller Companies Fund Class AGartmore SICAV United Kingdom Fund Class S1Gartmore SICAV US Opportunities Fund Class AGartmore SICAV US Smaller Companies Fund Class A
Gartmore SICAV Global Bond Fund Class D2Gartmore SICAV Sterling Corporate Bond Fund Class S2
Gartmore SICAV Euro Money Fund Class A2Gartmore SICAV Sterling Money Fund Class S2Gartmore SICAV US Dollar Money Fund Class D2
Ordinary shares carry one vote each. Share classes A1, A2, D1, D2, S1, S2, and Y1 are entitled to dividends.
112
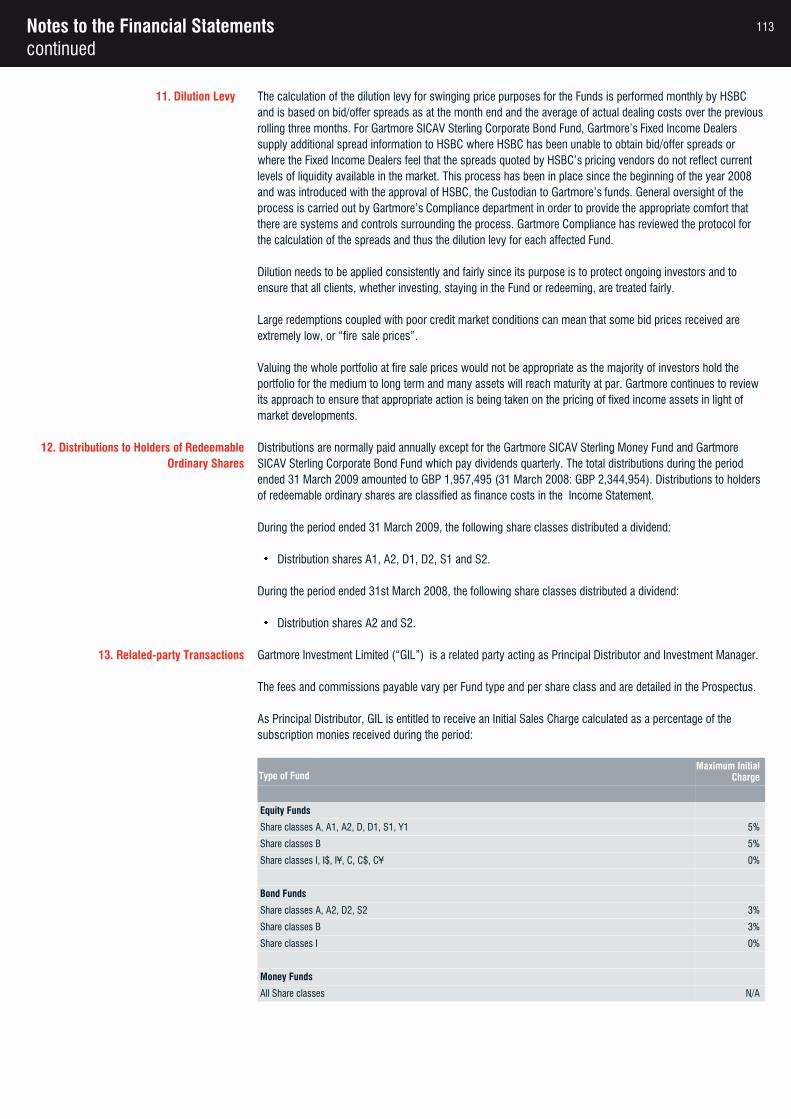
Notes to the Financial Statementscontinued
11. Dilution Levy The calculation of the dilution levy for swinging price purposes for the Funds is performed monthly by HSBC and is based on bid/offer spreads as at the month end and the average of actual dealing costs over the previousrolling three months. For Gartmore SICAV Sterling Corporate Bond Fund, Gartmore’s Fixed Income Dealers supply additional spread information to HSBC where HSBC has been unable to obtain bid/offer spreads or where the Fixed Income Dealers feel that the spreads quoted by HSBC’s pricing vendors do not reflect current levels of liquidity available in the market. This process has been in place since the beginning of the year 2008 and was introduced with the approval of HSBC, the Custodian to Gartmore’s funds. General oversight of the process is carried out by Gartmore’s Compliance department in order to provide the appropriate comfort that there are systems and controls surrounding the process. Gartmore Compliance has reviewed the protocol for the calculation of the spreads and thus the dilution levy for each affected Fund.
Dilution needs to be applied consistently and fairly since its purpose is to protect ongoing investors and to ensure that all clients, whether investing, staying in the Fund or redeeming, are treated fairly.
Large redemptions coupled with poor credit market conditions can mean that some bid prices received are extremely low, or “fire sale prices”.
Valuing the whole portfolio at fire sale prices would not be appropriate as the majority of investors hold the portfolio for the medium to long term and many assets will reach maturity at par. Gartmore continues to review its approach to ensure that appropriate action is being taken on the pricing of fixed income assets in light of market developments.
12. Distributions to Holders of Redeemable Ordinary Shares
Distributions are normally paid annually except for the Gartmore SICAV Sterling Money Fund and Gartmore SICAV Sterling Corporate Bond Fund which pay dividends quarterly. The total distributions during the period ended 31 March 2009 amounted to GBP 1,957,495 (31 March 2008: GBP 2,344,954). Distributions to holders of redeemable ordinary shares are classified as finance costs in the Income Statement.
During the period ended 31 March 2009, the following share classes distributed a dividend:
Distribution shares A1, A2, D1, D2, S1 and S2.
During the period ended 31st March 2008, the following share classes distributed a dividend:
Distribution shares A2 and S2.
13. Related-party Transactions Gartmore Investment Limited (“GIL”) is a related party acting as Principal Distributor and Investment Manager.
The fees and commissions payable vary per Fund type and per share class and are detailed in the Prospectus.
As Principal Distributor, GIL is entitled to receive an Initial Sales Charge calculated as a percentage of the subscription monies received during the period:
Type of FundMaximum Initial
Charge
Equity Funds
Share classes A, A1, A2, D, D1, S1, Y1 5%
Share classes B 5%
Share classes I, I$, I¥, C, C$, C¥ 0%
Bond Funds
Share classes A, A2, D2, S2 3%
Share classes B 3%
Share classes I 0%
Money Funds
All Share classes N/A
113
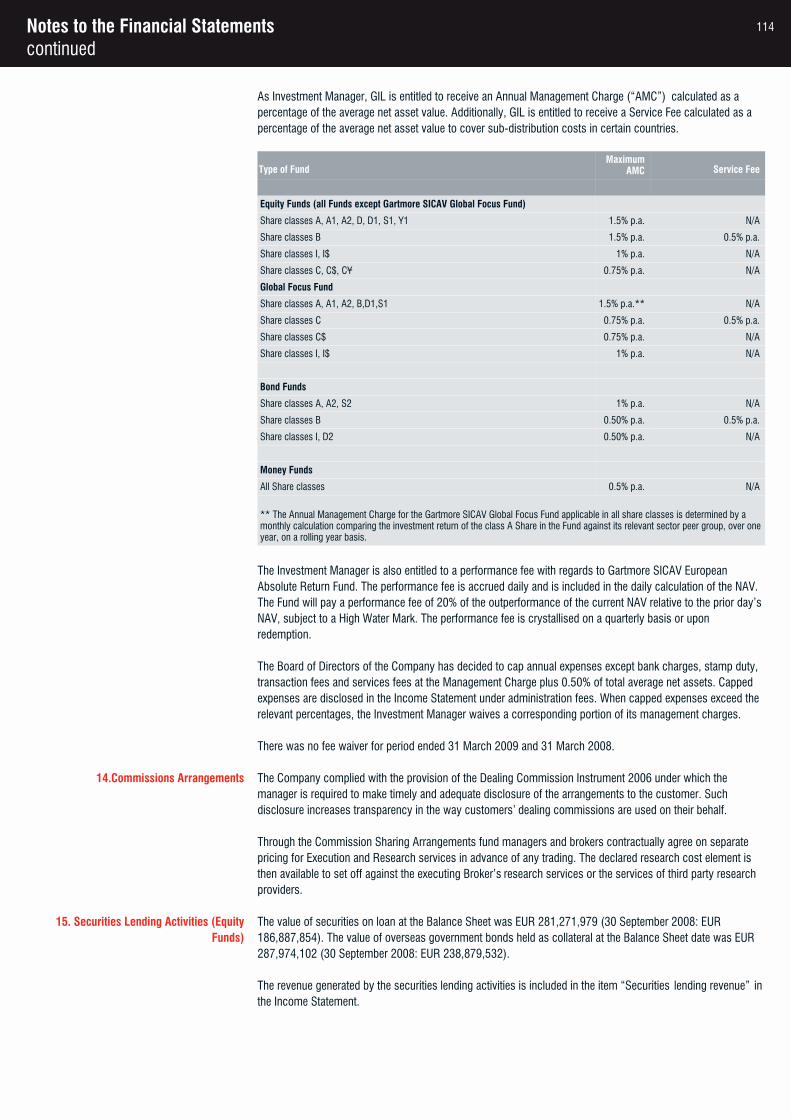
Notes to the Financial Statementscontinued
As Investment Manager, GIL is entitled to receive an Annual Management Charge (“AMC”) calculated as a percentage of the average net asset value. Additionally, GIL is entitled to receive a Service Fee calculated as a percentage of the average net asset value to cover sub-distribution costs in certain countries.
Type of FundMaximum
AMC Service Fee
Equity Funds (all Funds except Gartmore SICAV Global Focus Fund)
Share classes A, A1, A2, D, D1, S1, Y1 1.5% p.a. N/A
Share classes B 1.5% p.a. 0.5% p.a.
Share classes I, I$ 1% p.a. N/A
Share classes C, C$, C¥ 0.75% p.a. N/A
Global Focus Fund
Share classes A, A1, A2, B,D1,S1 1.5% p.a.** N/A
Share classes C 0.75% p.a. 0.5% p.a.
Share classes C$ 0.75% p.a. N/A
Share classes I, I$ 1% p.a. N/A
Bond Funds
Share classes A, A2, S2 1% p.a. N/A
Share classes B 0.50% p.a. 0.5% p.a.
Share classes I, D2 0.50% p.a. N/A
Money Funds
All Share classes 0.5% p.a. N/A
** The Annual Management Charge for the Gartmore SICAV Global Focus Fund applicable in all share classes is determined by a monthly calculation comparing the investment return of the class A Share in the Fund against its relevant sector peer group, over oneyear, on a rolling year basis.
The Investment Manager is also entitled to a performance fee with regards to Gartmore SICAV European Absolute Return Fund. The performance fee is accrued daily and is included in the daily calculation of the NAV. The Fund will pay a performance fee of 20% of the outperformance of the current NAV relative to the prior day’s NAV, subject to a High Water Mark. The performance fee is crystallised on a quarterly basis or upon redemption.
The Board of Directors of the Company has decided to cap annual expenses except bank charges, stamp duty, transaction fees and services fees at the Management Charge plus 0.50% of total average net assets. Capped expenses are disclosed in the Income Statement under administration fees. When capped expenses exceed the relevant percentages, the Investment Manager waives a corresponding portion of its management charges.
There was no fee waiver for period ended 31 March 2009 and 31 March 2008.
14.Commissions Arrangements The Company complied with the provision of the Dealing Commission Instrument 2006 under which the manager is required to make timely and adequate disclosure of the arrangements to the customer. Such disclosure increases transparency in the way customers’ dealing commissions are used on their behalf.
Through the Commission Sharing Arrangements fund managers and brokers contractually agree on separate pricing for Execution and Research services in advance of any trading. The declared research cost element is then available to set off against the executing Broker’s research services or the services of third party research providers.
15. Securities Lending Activities (Equity Funds)
The value of securities on loan at the Balance Sheet was EUR 281,271,979 (30 September 2008: EUR 186,887,854). The value of overseas government bonds held as collateral at the Balance Sheet date was EUR 287,974,102 (30 September 2008: EUR 238,879,532).
The revenue generated by the securities lending activities is included in the item “Securities lending revenue” inthe Income Statement.
114
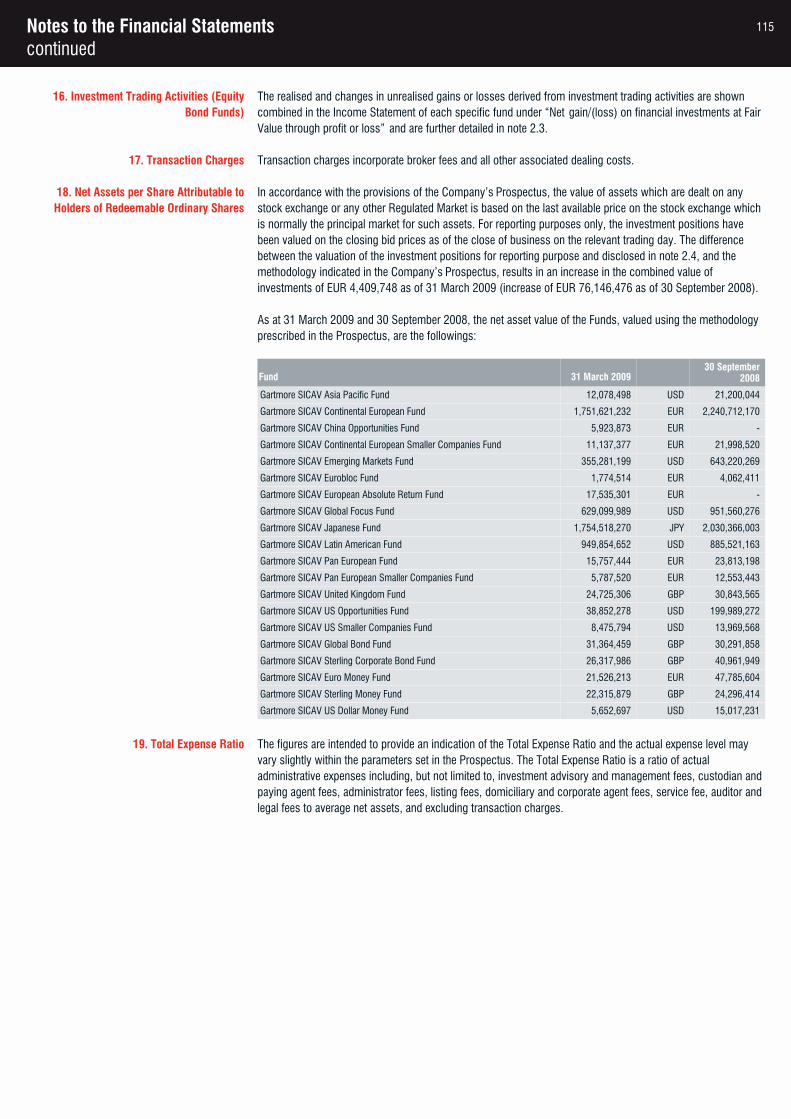
Notes to the Financial Statementscontinued
16. Investment Trading Activities (Equity Bond Funds)
The realised and changes in unrealised gains or losses derived from investment trading activities are shown combined in the Income Statement of each specific fund under “Net gain/(loss) on financial investments at Fair Value through profit or loss” and are further detailed in note 2.3.
17. Transaction Charges Transaction charges incorporate broker fees and all other associated dealing costs.
18. Net Assets per Share Attributable to Holders of Redeemable Ordinary Shares
In accordance with the provisions of the Company’s Prospectus, the value of assets which are dealt on any stock exchange or any other Regulated Market is based on the last available price on the stock exchange which is normally the principal market for such assets. For reporting purposes only, the investment positions have been valued on the closing bid prices as of the close of business on the relevant trading day. The difference between the valuation of the investment positions for reporting purpose and disclosed in note 2.4, and the methodology indicated in the Company’s Prospectus, results in an increase in the combined value of investments of EUR 4,409,748 as of 31 March 2009 (increase of EUR 76,146,476 as of 30 September 2008).
As at 31 March 2009 and 30 September 2008, the net asset value of the Funds, valued using the methodology prescribed in the Prospectus, are the followings:
Fund 31 March 2009 30 September
2008
Gartmore SICAV Asia Pacific Fund 12,078,498 USD 21,200,044
Gartmore SICAV Continental European Fund 1,751,621,232 EUR 2,240,712,170
Gartmore SICAV China Opportunities Fund 5,923,873 EUR -
Gartmore SICAV Continental European Smaller Companies Fund 11,137,377 EUR 21,998,520
Gartmore SICAV Emerging Markets Fund 355,281,199 USD 643,220,269
Gartmore SICAV Eurobloc Fund 1,774,514 EUR 4,062,411
Gartmore SICAV European Absolute Return Fund 17,535,301 EUR -
Gartmore SICAV Global Focus Fund 629,099,989 USD 951,560,276
Gartmore SICAV Japanese Fund 1,754,518,270 JPY 2,030,366,003
Gartmore SICAV Latin American Fund 949,854,652 USD 885,521,163
Gartmore SICAV Pan European Fund 15,757,444 EUR 23,813,198
Gartmore SICAV Pan European Smaller Companies Fund 5,787,520 EUR 12,553,443
Gartmore SICAV United Kingdom Fund 24,725,306 GBP 30,843,565
Gartmore SICAV US Opportunities Fund 38,852,278 USD 199,989,272
Gartmore SICAV US Smaller Companies Fund 8,475,794 USD 13,969,568
Gartmore SICAV Global Bond Fund 31,364,459 GBP 30,291,858
Gartmore SICAV Sterling Corporate Bond Fund 26,317,986 GBP 40,961,949
Gartmore SICAV Euro Money Fund 21,526,213 EUR 47,785,604
Gartmore SICAV Sterling Money Fund 22,315,879 GBP 24,296,414
Gartmore SICAV US Dollar Money Fund 5,652,697 USD 15,017,231
19. Total Expense Ratio The figures are intended to provide an indication of the Total Expense Ratio and the actual expense level may vary slightly within the parameters set in the Prospectus. The Total Expense Ratio is a ratio of actual administrative expenses including, but not limited to, investment advisory and management fees, custodian and paying agent fees, administrator fees, listing fees, domiciliary and corporate agent fees, service fee, auditor and legal fees to average net assets, and excluding transaction charges.
115