APPENDIX IV UNAUDITED CONSOLIDATED FINANCIAL ...
135
REVIEW REPORT [ ●] To The Shareholders of Huaxin Cement Co., Ltd. Introduction We have reviewed the accompanying interim financial statements of Huaxin Cement Co., Ltd. (the “Company”), which comprise the consolidated and Company’s balance sheets as at 30 June 2021, and the interim consolidated and Company’s income statements, the interim consolidated and Company’s cash flow statements, and the interim consolidated and Company’s statements of changes in shareholders’ equity for the six months ended 30 June 2021, and the notes to the financial statements. The management of the Company is responsible for the preparation and presentation of the interim financial statements in accordance with the China Accounting Standards for Business Enterprises issued by the Ministry of Finance of the People’s Republic of China. Our responsibility is to express a conclusion on these interim financial statements based on our review. Scope of Review We conducted our review in accordance with International Standard on Review Engagement 2410 “Review of Interim Financial Information Performed by the Independent Auditor of the Entity”. A review of the interim financial statements consists of making inquiries (primarily of persons responsible for financial and accounting matters), and applying analytical and other review procedures. A review is substantially less in scope than an audit conducted in accordance with International Standards on Auditing and consequently does not enable us to obtain assurance that we would become aware of all significant matters that might be identified in an audit. Accordingly we do not express an audit opinion. Conclusion Based on our review, nothing has come to our attention that causes us to believe that the accompanying interim financial information does not present fairly, in all material respects, the financial position of the consolidated and Company as at 30 June 2021, and of its financial performance and its cash flows for the six-month period then ended in accordance with China Accounting Standards for Business Enterprises. Deloitte Touche Tohmatsu CPALLP Shanghai, China Chinese Certified Public Accountant: Chinese Certified Public Accountant: [ ●] The review report and the accompanying consolidated interim financial statements are English translations of the Chinese review report and consolidated interim financial statements prepared under China Accounting Standards for Business Enterprises. These consolidated interim financial statements are not intended to present the financial position and results of operations and cash flows in accordance with accounting principles and practices generally accepted in other countries and jurisdictions. In case the English version does not conform to the Chinese version, the Chinese version prevails. THIS DOCUMENT IS IN DRAFT FORM, INCOMPLETE AND SUBJECT TO CHANGE AND THE INFORMATION MUST BE READ IN CONJUNCTION WITH THE SECTION HEADED “WARNING” ON THE COVER OF THIS DOCUMENT APPENDIX IV UNAUDITED CONSOLIDATED FINANCIAL STATEMENTS FOR THE SIX MONTHS ENDED 30 JUNE 2021 – IV-1 –
-
Upload
khangminh22 -
Category
Documents
-
view
1 -
download
0
Transcript of APPENDIX IV UNAUDITED CONSOLIDATED FINANCIAL ...

REVIEW REPORT
[●]
To The Shareholders of Huaxin Cement Co., Ltd.
Introduction
We have reviewed the accompanying interim financial statements of HuaxinCement Co., Ltd. (the “Company”), which comprise the consolidated and Company’sbalance sheets as at 30 June 2021, and the interim consolidated and Company’s incomestatements, the interim consolidated and Company’s cash flow statements, and theinterim consolidated and Company’s statements of changes in shareholders’ equity for thesix months ended 30 June 2021, and the notes to the financial statements. The managementof the Company is responsible for the preparation and presentation of the interimfinancial statements in accordance with the China Accounting Standards for BusinessEnterprises issued by the Ministry of Finance of the People’s Republic of China. Ourresponsibility is to express a conclusion on these interim financial statements based on ourreview.
Scope of Review
We conducted our review in accordance with International Standard on ReviewEngagement 2410 “Review of Interim Financial Information Performed by theIndependent Auditor of the Entity”. A review of the interim financial statements consistsof making inquiries (primarily of persons responsible for financial and accountingmatters), and applying analytical and other review procedures. A review is substantiallyless in scope than an audit conducted in accordance with International Standards onAuditing and consequently does not enable us to obtain assurance that we would becomeaware of all significant matters that might be identified in an audit. Accordingly we do notexpress an audit opinion.
Conclusion
Based on our review, nothing has come to our attention that causes us to believe thatthe accompanying interim financial information does not present fairly, in all materialrespects, the financial position of the consolidated and Company as at 30 June 2021, and ofits financial performance and its cash flows for the six-month period then ended inaccordance with China Accounting Standards for Business Enterprises.
Deloitte Touche Tohmatsu CPA LLPShanghai, China
Chinese Certified Public Accountant:
Chinese Certified Public Accountant:
[●]
The review report and the accompanying consolidated interim financial statements areEnglish translations of the Chinese review report and consolidated interim financial statementsprepared under China Accounting Standards for Business Enterprises. These consolidated interimfinancial statements are not intended to present the financial position and results of operationsand cash flows in accordance with accounting principles and practices generally accepted in othercountries and jurisdictions. In case the English version does not conform to the Chinese version,the Chinese version prevails.
THIS DOCUMENT IS IN DRAFT FORM, INCOMPLETE AND SUBJECT TO CHANGE AND THE INFORMATION MUST BEREAD IN CONJUNCTION WITH THE SECTION HEADED “WARNING” ON THE COVER OF THIS DOCUMENT
APPENDIX IV UNAUDITED CONSOLIDATED FINANCIAL STATEMENTSFOR THE SIX MONTHS ENDED 30 JUNE 2021
– IV-1 –

CONSOLIDATED BALANCE SHEETAs at 30 June 2021
RMB
Item NotesBalance at
30 June 2021
Balance at31 December
2020
Current AssetsCash and bank balances V(1) 7,429,933,411 8,641,612,847Held-for-trading financial assets V(2) – 1,004,581,752Notes receivable V(3) 124,033,871 79,939,117Accounts receivable V(4) 1,066,639,655 653,219,779Financing with receivables V(5) 937,354,912 1,020,306,419Prepayments V(6) 321,890,888 378,619,350Other receivables V(7) 371,520,100 375,253,958
Including: Interest receivable 79,399 641,915Inventories V(8) 2,898,132,495 2,349,156,189Other current assets V(9) 582,942,575 631,922,798
Total Current Assets 13,732,447,907 15,134,612,209
Non-current AssetsDebt investments 7,500,000 7,500,000Long-term receivables 34,638,462 29,141,216Long-term equity investments V(10) 593,779,530 512,281,201Other equity instrument investments V(11) 35,180,864 33,774,995Other non-current financial assets V(12) 28,086,810 32,827,254Fixed assets V(13) 19,481,730,637 19,185,630,257Construction in progress V(14) 4,070,807,952 3,104,429,340Right-of-use assets V(15) 189,547,925 –Intangible assets V(16) 4,505,047,843 4,267,008,181Development expenditure 6,991,441 2,050,090Goodwill V(17) 611,050,112 476,084,798Long-term prepaid expenses V(18) 333,510,201 363,760,774Deferred tax assets V(19) 431,550,520 437,800,338Other non-current assets 470,749,883 341,608,498
Total Non-current Assets 30,800,172,180 28,793,896,942
Total Assets 44,532,620,087 43,928,509,151
THIS DOCUMENT IS IN DRAFT FORM, INCOMPLETE AND SUBJECT TO CHANGE AND THE INFORMATION MUST BEREAD IN CONJUNCTION WITH THE SECTION HEADED “WARNING” ON THE COVER OF THIS DOCUMENT
APPENDIX IV UNAUDITED CONSOLIDATED FINANCIAL STATEMENTSFOR THE SIX MONTHS ENDED 30 JUNE 2021
– IV-2 –

RMB
Item NotesBalance at
30 June 2021
Balance at31 December
2020
Current LiabilitiesShort-term borrowings V(21) 500,500,000 625,000,000Held-for-trading financial liabilities 3,587,852 –Notes payable V(22) 222,804,276 472,696,537Accounts payable V(23) 5,911,035,705 5,297,633,770Contract liabilities V(24) 669,790,684 830,492,042Employee benefits payable V(25) 320,633,241 529,877,921Taxes payable V(26) 978,007,767 1,186,166,143Other payables V(27) 938,759,531 786,246,239
Including: Interest payable 58,646,797 30,026,120Dividend payable 142,391,012 63,842,709
Non-current liabilities duewithin one year V(28) 2,147,153,103 1,874,484,159
Total Current Liabilities 11,692,272,159 11,602,596,811
Non-current LiabilitiesLong-term borrowings V(29) 3,511,168,528 3,504,279,973Bonds payable V(30) 1,925,779,933 1,943,763,447Lease liabilities V(31) 159,840,888 –Long-term payables V(32) 352,968,294 191,011,663Long-term employee benefits payable V(33) 57,260,817 127,205,104Provisions V(34) 225,803,850 233,393,286Deferred income V(35) 287,902,969 301,399,766Deferred tax liabilities V(19) 290,097,580 284,920,603
Total Non-current Liabilities 6,810,822,859 6,585,973,842
TOTAL LIABILITIES 18,503,095,018 18,188,570,653
THIS DOCUMENT IS IN DRAFT FORM, INCOMPLETE AND SUBJECT TO CHANGE AND THE INFORMATION MUST BEREAD IN CONJUNCTION WITH THE SECTION HEADED “WARNING” ON THE COVER OF THIS DOCUMENT
APPENDIX IV UNAUDITED CONSOLIDATED FINANCIAL STATEMENTSFOR THE SIX MONTHS ENDED 30 JUNE 2021
– IV-3 –

RMB
Item NotesBalance at
30 June 2021
Balance at31 December
2020
Shareholders’ EquityShare capital V(36) 2,096,599,855 2,096,599,855Capital reserve V(37) 2,004,254,965 1,943,538,052Less: Treasury shares V(38) 610,051,971 610,051,971Other comprehensive income V(40) (310,345,610) (275,292,763)Surplus reserve V(39) 1,111,880,257 1,111,880,257Retained profits V(41) 19,480,480,298 19,304,701,887
Total equity attributableto shareholders of the Company 23,772,817,794 23,571,375,317
Minority interests 2,256,707,275 2,168,563,181
Total Shareholders’ Equity 26,029,525,069 25,739,938,498
TOTAL LIABILITIES ANDSHAREHOLDERS’ EQUITY 44,532,620,087 43,928,509,151
Mr. Li YeqingLegal representative
Mr. Chen QianPrincipal in charge of accounting
Mr. Wu XinHead of accounting department
THIS DOCUMENT IS IN DRAFT FORM, INCOMPLETE AND SUBJECT TO CHANGE AND THE INFORMATION MUST BEREAD IN CONJUNCTION WITH THE SECTION HEADED “WARNING” ON THE COVER OF THIS DOCUMENT
APPENDIX IV UNAUDITED CONSOLIDATED FINANCIAL STATEMENTSFOR THE SIX MONTHS ENDED 30 JUNE 2021
– IV-4 –

BALANCE SHEET OF THE COMPANY
As at 30 June 2021
RMB
Item NotesBalance at 30
June 2021
Balance at 31December
2020
Current AssetsCash and bank balances 3,798,083,283 4,650,418,319Held-for-trading financial assets – 1,004,581,752Notes receivable 500,000 100,000Accounts receivable XV(1) 859,343,209 545,749,566Financing with receivables 142,591,980 151,473,769Prepayments 190,920,146 226,396,232Other receivables XV(2) 4,998,140,893 4,396,614,326
Including:Interest receivable 449,563,031 –Inventories 500,267,408 320,998,776Non-current assets due within one year 1,580,000 1,580,000Other current assets 22,170,189 18,886,995
Total Current Assets 10,513,597,108 11,316,799,735
Non-current AssetsLong-term receivables 68,579,132 18,738,952Long-term equity investments XV(3) 11,613,708,765 11,119,516,523Other equity instrument investments 35,180,864 33,774,995Other non-current financial assets 28,086,810 32,827,254Fixed assets 424,590,637 437,139,833Construction in progress 275,355,289 209,773,010Right-of-use assets 64,602,155 –Intangible assets 39,424,810 40,397,874Long-term prepaid expenses 14,223,466 15,339,306Deferred tax assets 35,206,310 17,350,047
Total Non-current Assets 12,598,958,238 11,924,857,794
TOTAL ASSETS 23,112,555,346 23,241,657,529
THIS DOCUMENT IS IN DRAFT FORM, INCOMPLETE AND SUBJECT TO CHANGE AND THE INFORMATION MUST BEREAD IN CONJUNCTION WITH THE SECTION HEADED “WARNING” ON THE COVER OF THIS DOCUMENT
APPENDIX IV UNAUDITED CONSOLIDATED FINANCIAL STATEMENTSFOR THE SIX MONTHS ENDED 30 JUNE 2021
– IV-5 –

RMB
Item NotesBalance at 30
June 2021
Balance at 31December
2020
Current LiabilitiesShort-term borrowings – 300,000,000Held-for-trading financial liabilities 3,587,852 –Notes payable – 24,246,455Accounts payable 401,350,111 410,565,470Contract liabilities 22,004,605 14,795,403Employee benefits payable 13,847,228 63,346,794Taxes payable 228,569,452 234,439,071Other payables 6,969,422,147 7,224,579,499Including: Interest payable 51,000,144 22,543,588
Dividend payable 44,488,081 23,821,382Non-current liabilities due
within one year 1,374,413,010 1,321,867,253
Total Current Liabilities 9,013,194,405 9,593,839,945
Non-current LiabilitiesLong-term borrowings 1,458,850,000 1,202,780,000Lease liabilities 48,686,086Long-term employee benefits payable 90,846,929 99,997,218Provisions 7,472,518 8,282,611Deferred income 10,639,500 12,085,332
Total Non-current Liabilities 1,616,495,033 1,323,145,161
TOTAL LIABILITIES 10,629,689,438 10,916,985,106
THIS DOCUMENT IS IN DRAFT FORM, INCOMPLETE AND SUBJECT TO CHANGE AND THE INFORMATION MUST BEREAD IN CONJUNCTION WITH THE SECTION HEADED “WARNING” ON THE COVER OF THIS DOCUMENT
APPENDIX IV UNAUDITED CONSOLIDATED FINANCIAL STATEMENTSFOR THE SIX MONTHS ENDED 30 JUNE 2021
– IV-6 –

RMB
Item NotesBalance at 30
June 2021
Balance at 31December
2020
Owners’ (or Shareholders’) EquityPaid-up capital (or share capital) 2,096,599,855 2,096,599,855Capital reserve 2,402,598,249 2,341,881,336Less: Treasury shares 610,051,971 610,051,971Other comprehensive income 14,816,548 13,762,146Surplus reserve 1,111,880,257 1,111,880,257Retained profits 7,467,022,970 7,370,600,800
Total Owners’ (or Shareholders’) Equity 12,482,865,908 12,324,672,423
TOTAL LIABILITIES AND OWNERS’(OR SHAREHOLDERS’) EQUITY 23,112,555,346 23,241,657,529
Mr. Li YeqingLegal representative
Mr. Chen QianPrincipal in charge of accounting
Mr. Wu XinHead of accounting department
THIS DOCUMENT IS IN DRAFT FORM, INCOMPLETE AND SUBJECT TO CHANGE AND THE INFORMATION MUST BEREAD IN CONJUNCTION WITH THE SECTION HEADED “WARNING” ON THE COVER OF THIS DOCUMENT
APPENDIX IV UNAUDITED CONSOLIDATED FINANCIAL STATEMENTSFOR THE SIX MONTHS ENDED 30 JUNE 2021
– IV-7 –

CONSOLIDATED INCOME STATEMENTFor the period from 1 January 2021 to 30 June 2021
RMB
Item Notes
For the sixmonths ended
30 June 2021
For the sixmonths ended
30 June 2020
I. Total operating income 14,744,386,072 12,564,947,176Including: Operating income V(42) 14,744,386,072 12,564,947,176
II. Total operating costs 11,438,418,665 9,557,609,709Including: Operating costs V(42) 9,307,552,289 7,667,011,135
Taxes and levies V(43) 278,083,038 203,702,287Selling and distribution
expenses V(44) 1,048,956,699 862,846,359General and administrative
expenses V(45) 677,883,399 725,182,057Research and development
expense 23,001,179 8,441,524Financial expenses V(46) 102,942,061 90,426,347Including: Interest expenses 134,691,908 91,575,780
Interest income 54,748,194 26,422,427Add: Other income V(47) 112,778,854 106,085,591
Investment income V(48) 28,068,456 33,824,872Including: Income from
investments inassociates and jointventures 11,240,371 30,991,838
Losses on changes in fair value V(49) (12,910,048) (7,446,328)Impairment losses on credit V(50) (15,190,828) (27,159,259)Impairment losses on assets V(51) (21,803,772) (4,569,536)(Losses) Gains on disposal of
assets V(52) (3,377,758) 9,013,143
III. Operating profit 3,393,532,311 3,117,085,950Add: Non-operating income V(53) 19,409,089 6,722,864Less: Non-operating expenses V(54) 36,022,596 40,916,878
IV. Profit before tax 3,376,918,804 3,082,891,936Less: Income tax expenses V(55) 711,280,078 627,229,329
V. Net profit (loss) 2,665,638,726 2,455,662,607(i) Classified by the continuity of
operation1. Net profit from continuing
operations 2,665,638,726 2,455,662,6072. Net profit from discontinued
operations(ii) Classified by the ownership
1. Net profit attributable toshareholders of the Company 2,438,324,279 2,251,974,011
2. Profit or loss attributable tominority interests 227,314,447 203,688,596
THIS DOCUMENT IS IN DRAFT FORM, INCOMPLETE AND SUBJECT TO CHANGE AND THE INFORMATION MUST BEREAD IN CONJUNCTION WITH THE SECTION HEADED “WARNING” ON THE COVER OF THIS DOCUMENT
APPENDIX IV UNAUDITED CONSOLIDATED FINANCIAL STATEMENTSFOR THE SIX MONTHS ENDED 30 JUNE 2021
– IV-8 –

RMB
Item Notes
For the sixmonths ended
30 June 2021
For the sixmonths ended
30 June 2020
VI. Other comprehensive income,net of tax (42,086,008) (64,615,963)
(i) Other comprehensive incomeattributable to owners of theCompany, net of tax (35,052,847) (56,167,300)1. Other comprehensive income
that cannot be reclassified toprofit or loss 1,054,402 (3,341,329)(1) Changes in
re-measurement ofdefined benefit plans
(2) Other comprehensiveincome that cannot bereclassified to profit orloss under the equitymethod
(3) Changes in fair value ofinvestments in otherequity instruments 1,054,402 (3,341,329)
2. Other comprehensive incomethat will be reclassified toprofit or loss (36,107,249) (52,825,971)(1) Other comprehensive
income that can bereclassified to profit orloss under the equitymethod
(2) Changes in the fair valueof other debtinvestments
(3) Amount of financialassets reclassified toother comprehensiveincome
(4) Provision for creditimpairment of otherdebt investments
(5) Reserve for cash flowhedges (36,107,249) (52,825,971)
(ii) Other comprehensive incomeattributable to minorityinterests, net of tax (7,033,161) (8,448,663)
THIS DOCUMENT IS IN DRAFT FORM, INCOMPLETE AND SUBJECT TO CHANGE AND THE INFORMATION MUST BEREAD IN CONJUNCTION WITH THE SECTION HEADED “WARNING” ON THE COVER OF THIS DOCUMENT
APPENDIX IV UNAUDITED CONSOLIDATED FINANCIAL STATEMENTSFOR THE SIX MONTHS ENDED 30 JUNE 2021
– IV-9 –

RMB
Item Notes
For the sixmonths ended
30 June 2021
For the sixmonths ended
30 June 2020
VII. Total comprehensive income 2,623,552,718 2,391,046,644Total comprehensive income
attributable to owners of theCompany 2,403,271,432 2,195,806,711
Total comprehensive incomeattributable to minority interests 220,281,286 195,239,933
VIII. Earnings per share(i) Basic earnings per share (RMB) 1.18 1.08(ii) Diluted earnings per share (RMB) 1.18 1.08
Mr. Li YeqingLegal representative
Mr. Chen QianPrincipal in charge of accounting
Mr. Wu XinHead of accounting department
THIS DOCUMENT IS IN DRAFT FORM, INCOMPLETE AND SUBJECT TO CHANGE AND THE INFORMATION MUST BEREAD IN CONJUNCTION WITH THE SECTION HEADED “WARNING” ON THE COVER OF THIS DOCUMENT
APPENDIX IV UNAUDITED CONSOLIDATED FINANCIAL STATEMENTSFOR THE SIX MONTHS ENDED 30 JUNE 2021
– IV-10 –

INCOME STATEMENT OF THE COMPANYFor the period from 1 January 2021 to 30 June 2021
RMB
Item Notes
For the sixmonths ended
30 June 2021
For the sixmonths ended
30 June 2020
I. Operating income XV(4) 2,092,362,300 1,597,282,876Less: Operating costs XV(4) 1,898,769,539 1,398,379,989
Taxes and levies 4,585,329 7,879,108Selling and distribution
expenses 27,223,758 35,270,956General and administrative
expenses 131,017,453 171,142,944Research and development
expense 10,179,493 2,705,214Financial expenses 45,804,582 11,008,263Including: Interest expenses 115,741,796 104,943,099
Interest income 90,294,263 78,419,015Add: Other income 3,728,301 2,129,972
Investment income XV(5) 2,376,125,614 1,738,080,189Including: Income from
investments inassociates and jointventures 6,934,284 25,240,749
Income (loss) fromderecognition offinancial assetsmeasured atamortized cost
Net exposure hedging gains(losses)
Losses on changes in fair value (12,910,050) (7,446,328)Impairment gains (losses) on
credit 30,391 (1,377,388)Impairment losses on assets (316,939) (37,766)Gains on disposal of assets 348,827 58,295
II. Operating profit 2,341,788,290 1,702,303,376Add: Non-operating income 10,805,174 9,713Less: Non-operating expenses 1,142,300 7,056,418
III. Profit before tax 2,351,451,164 1,695,256,671Less: Income tax expenses (7,516,874) (11,412,381)
IV. Net profit 2,358,968,038 1,706,669,052(i) Net profit from continuing
operations 2,358,968,038 1,706,669,052(ii) Net profit from discontinued
operations
THIS DOCUMENT IS IN DRAFT FORM, INCOMPLETE AND SUBJECT TO CHANGE AND THE INFORMATION MUST BEREAD IN CONJUNCTION WITH THE SECTION HEADED “WARNING” ON THE COVER OF THIS DOCUMENT
APPENDIX IV UNAUDITED CONSOLIDATED FINANCIAL STATEMENTSFOR THE SIX MONTHS ENDED 30 JUNE 2021
– IV-11 –

RMB
Item Notes
For the sixmonths ended
30 June 2021
For the sixmonths ended
30 June 2020
V. Other comprehensive income, net oftax 1,054,402 (3,341,329)
(i) Other comprehensive income thatcannot be reclassified to profit orloss 1,054,402 (3,341,329)1. Changes from re-measurement
of defined benefit plans2. Other comprehensive income
that cannot be reclassified toprofit or loss under theequity method
3. Changes in fair value ofinvestments in other equityinstruments 1,054,402 (3,341,329)
4. Changes in fair value of theenterprise’s credit risk
(ii) Other comprehensive income thatwill be reclassified to profit orloss – –1. Other comprehensive income
that can be reclassified toprofit or loss under theequity method
2. Changes in the fair value ofother debt investments
3. Amount of financial assetsreclassified to othercomprehensive income
4. Provision for creditimpairment of other debtinvestments
5. Reserve for cash flow hedges6. Exchange differences on
translation of financialstatements denominated inforeign currencies
7. Others
VI. Total comprehensive income 2,360,022,440 1,703,327,723
Mr. Li YeqingLegal representative
Mr. Chen QianPrincipal in charge of accounting
Mr. Wu XinHead of accounting department
THIS DOCUMENT IS IN DRAFT FORM, INCOMPLETE AND SUBJECT TO CHANGE AND THE INFORMATION MUST BEREAD IN CONJUNCTION WITH THE SECTION HEADED “WARNING” ON THE COVER OF THIS DOCUMENT
APPENDIX IV UNAUDITED CONSOLIDATED FINANCIAL STATEMENTSFOR THE SIX MONTHS ENDED 30 JUNE 2021
– IV-12 –

CONSOLIDATED CASH FLOW STATEMENT
For the period from 1 January 2021 to 30 June 2021
RMB
Item Notes
For the sixmonths ended
30 June 2021
For the sixmonths ended
30 June 2020
I. Cash Flows from Operating Activities:Cash receipts from the sale of goods
and the rendering of services 14,241,433,968 14,212,636,697Receipts of tax refunds 50,431,431 88,156,749Other cash receipts relating to
operating activities V(56)(1) 251,549,612 147,919,775
Sub-total of cash inflows fromoperating activities 14,543,415,011 14,448,713,221
Cash payments for goods purchasedand services received 8,438,918,378 7,835,803,386
Cash payments to and on behalf ofemployees 1,598,886,397 1,331,025,807
Payments of various types of taxes 1,874,457,133 1,449,767,278Other cash payments relating to
operating activities V(56)(2) 339,068,463 331,142,066
Sub-total of cash outflows fromoperating activities 12,251,330,371 10,947,738,537
Net Cash Flow from OperatingActivities V(57)(1) 2,292,084,640 3,500,974,684
THIS DOCUMENT IS IN DRAFT FORM, INCOMPLETE AND SUBJECT TO CHANGE AND THE INFORMATION MUST BEREAD IN CONJUNCTION WITH THE SECTION HEADED “WARNING” ON THE COVER OF THIS DOCUMENT
APPENDIX IV UNAUDITED CONSOLIDATED FINANCIAL STATEMENTSFOR THE SIX MONTHS ENDED 30 JUNE 2021
– IV-13 –

RMB
Item Notes
For the sixmonths ended
30 June 2021
For the sixmonths ended
30 June 2020
II. Cash Flows from Investing Activities:Cash receipts from disposal and
recovery of investments 1,000,000,000 500,070,000Cash receipts from investment income 14,890,816 2,518,544Net cash received from disposal of
fixed assets, intangible assets andother long-term assets 19,214,294 4,383,289
Net cash receipts from disposal ofsubsidiaries and other businessunits 22,000 –
Other cash receipts relating toinvesting activities V(56)(3) 5,602,256 40,918,268
Sub-total of cash inflows frominvesting activities 1,039,729,366 547,890,101
Cash payments to acquire or constructfixed assets, intangible assets andother long-term assets 1,863,103,382 1,819,958,508
Cash payments to acquire investments 70,000,000 528,304,258Net cash payments for acquisition of
subsidiaries and other businessunits V(57)(2) 231,262,607 7,100,000
Other cash payments relating toinvesting activities V(56)(4) – 654,896,092
Sub-total of cash outflows frominvesting activities 2,164,365,989 3,010,258,858
Net Cash Flow used in InvestingActivities (1,124,636,623) (2,462,368,757)
THIS DOCUMENT IS IN DRAFT FORM, INCOMPLETE AND SUBJECT TO CHANGE AND THE INFORMATION MUST BEREAD IN CONJUNCTION WITH THE SECTION HEADED “WARNING” ON THE COVER OF THIS DOCUMENT
APPENDIX IV UNAUDITED CONSOLIDATED FINANCIAL STATEMENTSFOR THE SIX MONTHS ENDED 30 JUNE 2021
– IV-14 –

RMB
Item Notes
For the sixmonths ended
30 June 2021
For the sixmonths ended
30 June 2020
III. Cash Flows from Financing Activities:Cash receipts from capital
contributions 2,000,000 106,160,000Cash receipts from borrowings 757,500,000 2,238,224,814Other cash receipts relating to
financing activities – –
Sub-total of cash inflows fromfinancing activities 759,500,000 2,344,384,814
Cash repayments of borrowings 692,294,746 640,007,835Cash payments for distribution of
dividends or profits or settlement ofinterest expenses 2,365,422,870 128,544,252
Other cash payments relating tofinancing activities V(56)(5) 50,146,934 180,865,306
Sub-total of cash outflows fromfinancing activities 3,107,864,550 949,417,393
Net Cash Flow (used in) fromFinancing Activities (2,348,364,550) 1,394,967,421
IV. Effect of Foreign Exchange RateChanges on Cash and CashEquivalents (12,737,649) (3,338,154)
V. Net (Decrease) Increase in Cash andCash Equivalents (1,193,654,182) 2,430,235,194
Add: Opening balance of cash andcash equivalents 8,420,246,369 4,918,296,452
VI. Closing Balance of Cash and CashEquivalents V(57)(3) 7,226,592,187 7,348,531,646
Mr. Li YeqingLegal representative
Mr. Chen QianPrincipal in charge of accounting
Mr. Wu XinHead of accounting department
THIS DOCUMENT IS IN DRAFT FORM, INCOMPLETE AND SUBJECT TO CHANGE AND THE INFORMATION MUST BEREAD IN CONJUNCTION WITH THE SECTION HEADED “WARNING” ON THE COVER OF THIS DOCUMENT
APPENDIX IV UNAUDITED CONSOLIDATED FINANCIAL STATEMENTSFOR THE SIX MONTHS ENDED 30 JUNE 2021
– IV-15 –

CASH FLOW STATEMENT OF THE COMPANY
For the period from 1 January 2021 to 30 June 2021
RMB
Item NOTES
For the sixmonths ended
30 June 2021
For the sixmonths ended
30 June 2020
I. Cash Flows from Operating Activities:Cash receipts from the sale of goods
and the rendering of services 1,642,363,399 1,775,804,019Receipts of tax refunds 2,844,644 –Other cash receipts relating to
operating activities 639,550,893 900,405,421
Sub-total of cash inflows fromoperating activities 2,284,758,936 2,676,209,440
Cash payments for goods purchasedand services received 1,820,506,301 1,654,513,295
Cash payments to and on behalf ofemployees 176,051,844 368,233,167
Payments of various types of taxes 75,687,605 26,785,929Other cash payments relating to
operating activities 273,355,468 489,199,630
Sub-total of cash outflows fromoperating activities 2,345,601,218 2,538,732,021
Net Cash Flow (used in)/fromOperating Activities (60,842,282) 137,477,419
THIS DOCUMENT IS IN DRAFT FORM, INCOMPLETE AND SUBJECT TO CHANGE AND THE INFORMATION MUST BEREAD IN CONJUNCTION WITH THE SECTION HEADED “WARNING” ON THE COVER OF THIS DOCUMENT
APPENDIX IV UNAUDITED CONSOLIDATED FINANCIAL STATEMENTSFOR THE SIX MONTHS ENDED 30 JUNE 2021
– IV-16 –

RMB
Item NOTES
For the sixmonths ended
30 June 2021
For the sixmonths ended
30 June 2020
II. Cash Flows from Investing Activities:Cash receipts from disposal and
recovery of investments 1,000,000,000 500,000,000Cash receipts from investment income 1,919,628,299 1,404,208,431Net cash received from disposal of
fixed assets, intangible assets andother long-term assets 16,019,269 2,042,758
Other cash receipts relating toinvesting activities 1,563,347,992 84,297,793
Sub-total of cash inflows frominvesting activities 4,498,995,560 1,990,548,982
Cash payments to acquire or constructfixed assets, intangible assets andother long-term assets 24,761,597 60,147,680
Cash payments to acquire investments – 500,000,000Net cash payments for acquisition of
subsidiaries and other businessunits 487,000,000 600,000,000
Other cash payments relating toinvesting activities 1,613,252,566 –
Sub-total of cash outflows frominvesting activities 2,125,014,163 1,160,147,680
Net Cash Flow from InvestingActivities 2,373,981,397 830,401,302
THIS DOCUMENT IS IN DRAFT FORM, INCOMPLETE AND SUBJECT TO CHANGE AND THE INFORMATION MUST BEREAD IN CONJUNCTION WITH THE SECTION HEADED “WARNING” ON THE COVER OF THIS DOCUMENT
APPENDIX IV UNAUDITED CONSOLIDATED FINANCIAL STATEMENTSFOR THE SIX MONTHS ENDED 30 JUNE 2021
– IV-17 –

RMB
Item NOTES
For the sixmonths ended
30 June 2021
For the sixmonths ended
30 June 2020
III. Cash Flows from Financing Activities:Cash receipts from borrowings 400,000,000 900,000,000Other cash receipts relating to
financing activities – 5,657,201,026
Sub-total of cash inflows fromfinancing activities 400,000,000 6,557,201,026
Cash repayments of borrowings 403,652,662 534,705,887Cash payments for distribution of
dividends or profits or settlement ofinterest expenses 2,259,013,377 25,573,619
Other cash payments relating tofinancing activities 894,143,889 5,767,658,206
Sub-total of cash outflows fromfinancing activities 3,556,809,928 6,327,937,712
Net Cash Flow (used in)/fromFinancing Activities (3,156,809,928) 229,263,314
IV. Effect of Foreign Exchange RateChanges on Cash and CashEquivalents (2,362,015) (779,349)
V. Net (Decrease) Increase in Cash andCash Equivalents (846,032,828) 1,196,362,686
Add: Opening balance of cash andcash equivalents 4,624,314,323 3,141,838,852
VI. Closing Balance of Cash and CashEquivalents 3,778,281,495 4,338,201,538
Mr. Li YeqingLegal representative
Mr. Chen QianPrincipal in charge of accounting
Mr. Wu XinHead of accounting department
THIS DOCUMENT IS IN DRAFT FORM, INCOMPLETE AND SUBJECT TO CHANGE AND THE INFORMATION MUST BEREAD IN CONJUNCTION WITH THE SECTION HEADED “WARNING” ON THE COVER OF THIS DOCUMENT
APPENDIX IV UNAUDITED CONSOLIDATED FINANCIAL STATEMENTSFOR THE SIX MONTHS ENDED 30 JUNE 2021
– IV-18 –

CONSOLIDATED STATEMENT OF CHANGES IN SHAREHOLDERS’ EQUITY
For the period from 1 January 2021 to 30 June 2021
RMB
For the six months ended 30 June 2021
Attributable to owners of the parent Company
Item Share capitalCapitalreserve
Less:Treasury
share
OtherComprehensive
incomeSurplusreserve
Retainedprofits Sub-total
Minorityinterests
Totalowners’
equity
Balance at 31 December2020 2,096,599,855 1,943,538,052 610,051,971 (275,292,763) 1,111,880,257 19,304,701,887 23,571,375,317 2,168,563,181 25,739,938,498
Balance at 1 January 2021 2,096,599,855 1,943,538,052 610,051,971 (275,292,763) 1,111,880,257 19,304,701,887 23,571,375,317 2,168,563,181 25,739,938,498Changes in the period – 60,716,913 – (35,052,847) – 175,778,411 201,442,477 88,144,094 289,586,571(i) Total comprehensive
income – – – (35,052,847) – 2,438,324,279 2,403,271,432 220,281,286 2,623,552,718(ii) Owners’ contributions
and reduction incapital – 60,716,913 – – – – 60,716,913 2,000,000 62,716,913
1. Ordinary sharescontributed byowners – – – – – – – 2,000,000 2,000,000
2. Capital contributionfrom holders ofother equityinstruments – – – – – – – – –
3. Share-basedpaymentrecognized inowners’ equity – 60,458,955 – – – – 60,458,955 – 60,458,955
4. Others – 257,958 – – – – 257,958 – 257,958(iii) Profit distribution – – – – – (2,262,545,868) (2,262,545,868) (134,137,192) (2,396,683,060)
1. Withdrawl othersurplus reserve – – – – – – – – –
2. Transfer to generalrisk reserve – – – – – – – – –
3. Distribution toowners (orshareholders) – – – – – (2,262,545,868) (2,262,545,868) (134,137,192) (2,396,683,060)
4. Others – – – – – – – – –(iv) Transfers within
owners’ equity – – – – – – – – –(v) Special reserve – – – – – – – – –(vi) Others – – – – – – – – –
Balance at 30 June 2021 2,096,599,855 2,004,254,965 610,051,971 (310,345,610) 1,111,880,257 19,480,480,298 23,772,817,794 2,256,707,275 26,029,525,069
THIS DOCUMENT IS IN DRAFT FORM, INCOMPLETE AND SUBJECT TO CHANGE AND THE INFORMATION MUST BEREAD IN CONJUNCTION WITH THE SECTION HEADED “WARNING” ON THE COVER OF THIS DOCUMENT
APPENDIX IV UNAUDITED CONSOLIDATED FINANCIAL STATEMENTSFOR THE SIX MONTHS ENDED 30 JUNE 2021
– IV-19 –

RMB
For the six months ended 30 June 2020
Attributable to shareholders of the Company
ITEM Share capitalCapitalreserve
Less:Treasury
share
Othercomprehensive
incomeSurplusreserve
Retainedprofits Sub-total
Minorityinterests
Totalshareholders’
equity
Balance at 31 December2019 2,096,599,855 1,913,438,767 – (17,416,212) 1,111,880,257 16,204,540,023 21,309,042,690 2,058,640,055 23,367,682,745
Balance at 1 January 2020 2,096,599,855 1,913,438,767 – (17,416,212) 1,111,880,257 16,204,540,023 21,309,042,690 2,058,640,055 23,367,682,745Changes in the period – 1,403,795 122,533,983 (56,167,300) – (284,911,814) (462,209,302) 169,326,327 (292,882,975)(i) Total comprehensive
income – – – (56,167,300) – 2,251,974,011 2,195,806,711 195,239,933 2,391,046,644(ii) Owners’ contributions
and reduction incapital – 1,403,795 122,533,983 – – – (121,130,188) 106,160,000 (14,970,188)1. Ordinary shares
contributed byowners – – 122,533,983 – – – (122,533,983) 106,160,000 (16,373,983)
2. Capital contributionfrom holders ofother equityinstruments – – – – – – – – –
3. Share-basedpaymentrecognized inowners’ equity – – – – – – – – –
4. Others – 1,403,795 – – – – 1,403,795 – 1,403,795(iii) Profit distribution – – – – – (2,536,885,825) (2,536,885,825) (132,073,606) (2,668,959,431)
1. Withdrawl othersurplus reserve – – – – – – – – –
2. Transfer to generalrisk reserve – – – – – – – – –
3. Distribution toowners (orshareholders) – – – – – (2,536,885,825) (2,536,885,825) (132,073,606) (2,668,959,431)
4. Others – – – – – – – – –(iv) Transfers within
owners’ equity – – – – – – – – –(v) Special reserve – – – – – – – – –(vi) Others – – – – – – – – –
Balance at 30 June 2020 2,096,599,855 1,914,842,562 122,533,983 (73,583,512) 1,111,880,257 15,919,628,209 20,846,833,388 2,227,966,382 23,074,799,770
THIS DOCUMENT IS IN DRAFT FORM, INCOMPLETE AND SUBJECT TO CHANGE AND THE INFORMATION MUST BEREAD IN CONJUNCTION WITH THE SECTION HEADED “WARNING” ON THE COVER OF THIS DOCUMENT
APPENDIX IV UNAUDITED CONSOLIDATED FINANCIAL STATEMENTSFOR THE SIX MONTHS ENDED 30 JUNE 2021
– IV-20 –

THE COMPANY’S STATEMENT OF CHANGES IN SHAREHOLDERS’ EQUITY
For the period from 1 January 2021 to 30 June 2021
RMB
For the six months ended 30 June 2021
Item Share capitalCapitalreserve
Less:Treasury
share
Othercomprehensive
incomeSurplusreserve
Retainedprofits
Totalshareholders’
equity
I. Balance at 31 December 2020 2,096,599,855 2,341,881,336 610,051,971 13,762,146 1,111,880,257 7,370,600,800 12,324,672,423II. Balance at 1 January 2021 2,096,599,855 2,341,881,336 610,051,971 13,762,146 1,111,880,257 7,370,600,800 12,324,672,423III. Changes in the period – 60,716,913 – 1,054,402 – 96,422,170 158,193,485
(i) Total comprehensive income – – – 1,054,402 – 2,358,968,038 2,360,022,440(ii) Owners’ contributions and
reduction in capital – 60,716,913 – – – – 60,716,9131. Ordinary shares contributed
by owners – 60,458,955 – – – – 60,458,9552. Capital contribution from
holders of other equityinstruments – 257,958 – – – – 257,958
3. Share-based paymentrecognized in owners’equity – – – – – –
4. Others – – – – – –(iii) Profit distribution – – – – – (2,262,545,868) (2,262,545,868)
1. Transfer to surplus reserve – – – – – – –2. Distribution to owners
(shareholders) – – – – – (2,262,545,868) (2,262,545,868)3. Others – – – – – – –
(iv) Transfers within owners’ equity – – – – – – –1. Capitalization of capital
reserve – – – – – – –2. Capitalization of surplus
reserve – – – – – – –3. Loss offset by surplus
reserve – – – – – – –4. Retained earnings carried
forward from changes indefined benefit plans – – – – – – –
5. Retained earnings carriedforward from othercomprehensive income – – – – – – –
6. Others – – – – – – –(v) Special reserve – – – – – – –(vi) Others – – – – – – –
IV. Balance at 30 June 2021 2,096,599,855 2,402,598,249 610,051,971 14,816,548 1,111,880,257 7,467,022,970 12,482,865,908
THIS DOCUMENT IS IN DRAFT FORM, INCOMPLETE AND SUBJECT TO CHANGE AND THE INFORMATION MUST BEREAD IN CONJUNCTION WITH THE SECTION HEADED “WARNING” ON THE COVER OF THIS DOCUMENT
APPENDIX IV UNAUDITED CONSOLIDATED FINANCIAL STATEMENTSFOR THE SIX MONTHS ENDED 30 JUNE 2021
– IV-21 –

RMB
For the six months ended 30 June 2020
Item Share capitalCapitalreserve
Less:Treasury
share
Othercomprehensive
incomeSurplusreserve
Retainedprofits
Totalshareholders’
equity
I. Balance at 31 December 2020 2,096,599,855 2,311,782,051 – 17,103,476 1,111,880,257 6,745,724,011 12,283,089,650Add: Changes in accounting
policies – – – – – – –Corrections of prior period
errors – – – – – – –Others – – – – – – –
II. Balance at 1 January 2021 2,096,599,855 2,311,782,051 – 17,103,476 1,111,880,257 6,745,724,011 12,283,089,650III. Changes in the period – 1,403,795 122,533,983 (3,341,329) – (830,216,773) (954,688,290)
(i) Total comprehensive income – – – (3,341,329) – 1,706,669,052 1,703,327,723(ii) Owners’ contributions and
reduction in capital – 1,403,795 122,533,983 – – – (121,130,188)1. Ordinary shares contributed
by owners – – 122,533,983 – – – (122,533,983)2. Capital contribution
received from noncontrolling interests – – – – – – –
3. Capital contribution fromShare-based payment – – – – – – –
4. Others – 1,403,795 – – – – 1,403,795(iii) Profit distribution – – – – – (2,536,885,825) (2,536,885,825)
1. Transfer to surplus reserve – – – – – –2. Distribution to owners
(shareholders) – – – – – (2,536,885,825) (2,536,885,825)3. Others – – – – – – –
(iv) Transfers within owners’ equity – – – – – – –1. Capitalization of capital
reserve – – – – – – –2. Capitalization of surplus
reserve – – – – – – –3. Loss offset by surplus
reserve – – – – – – –4. Retained earnings carried
forward from changes indefined benefit plans – – – – – – –
5. Retained earnings carriedforward from othercomprehensive income – – – – – – –
6. Others – – – – – – –(v) Special reserve – – – – – – –(vi) Others – – – – – – –
IV. Balance at 30 June 2021 2,096,599,855 2,313,185,846 122,533,983 13,762,147 1,111,880,257 5,915,507,238 11,328,401,360
Mr. Li YeqingLegal representative
Mr. Chen QianPrincipal in charge of accounting
Mr. Wu XinHead of accounting department
THIS DOCUMENT IS IN DRAFT FORM, INCOMPLETE AND SUBJECT TO CHANGE AND THE INFORMATION MUST BEREAD IN CONJUNCTION WITH THE SECTION HEADED “WARNING” ON THE COVER OF THIS DOCUMENT
APPENDIX IV UNAUDITED CONSOLIDATED FINANCIAL STATEMENTSFOR THE SIX MONTHS ENDED 30 JUNE 2021
– IV-22 –

NOTES TO THE FINANCIAL STATEMENTSFor the period from 1 January 2021 to 30 June 2021
I. BASIC INFORMATION ABOUT THE COMPANY
1. Company profile
Huaxin Cement Co., Ltd. (the “Company”) is a limited company established in the People’s Republic ofChina (the “PRC”). In 1994, as approved by Hubei Provincial People’s Government, the Company’sshares were listed on the Shanghai Stock Exchange. In 2006, as approved by the Ministry of Commerce* ofthe PRC, the legal status of the Company was changed to a foreign-invested limited company. In April2019, based on its total share capital of 1,497,571,325 shares at the end of 2018, the Company allottedshares from its capital reserve or surplus reserve at 4 shares for every 10 shares, amounting toRMB599,028,530. As a result, the total shares of the Company increased to 2,096,599,855, including1,361,879,855 RMB ordinary shares (A shares) and 734,720,000 RMB foreign shares (“B shares”), both ofwhich are issued domestically.
The Company and its subsidiaries (collectively referred to as the “Group”) are principally engaged inmanufacturing and sales of cement, concrete, clinker, aggregate and other construction materials. Theaddress of the Company’s registered office is No. 600, East Daqi Avenue, Huangshi City, Hubei Provinceand the office address of the headquarter is Huaxin Plaza, No. 426 Gaoxin Avenue, Donghu NewTechnology Development District, Wuhan City, Hubei Province.
The Company’s and consolidated financial statements were authorized for issue by the Company’s Boardof Directors on 28 August 2021.
2. Scope of consolidated financial statements
Principal subsidiaries included in the scope of consolidation are listed in Note VII “Equity Interests inOther Entities”. For the detailed changes in the scope of the consolidated financial statements in thecurrent year, are included in Note VII “Changes in Scope of Consolidation”.
II. BASIS OF PREPARATION OF FINANCIAL STATEMENTS
1. Basis of Preparation
The Group adopts China Accounting Standard for Business Enterprises and relevant regulations issuedby the Ministry of Finance. In addition, the Group also discloses financial information in accordance withthe Preparation Convention of Information Disclosure by Companies Offering Securities to the PublicNo.15 - General Rules on Financial Reporting (Revised in 2014).
2. Going concern
The Group assessed its ability to continue as a going concern for the 12 months from 30 June 2021 and didnot notice any events or circumstances that may cast significant doubt upon its ability to continue as agoing concern. Therefore, the financial statements have been prepared on a going concern basis.
3. Basis of accounting and principle of measurement
The accrual basis of accounting has been adopted. Except for certain financial instruments which aremeasured at fair value, the Group adopts the historical cost as the principle of measurement in thefinancial statements. Where assets are impaired, provisions for asset impairment are made in accordancewith relevant requirements.
Where the historical cost is adopted as the measurement basis, assets are recorded at the amount of cashand cash equivalents paid or the fair value of the consideration given to acquire them at the time of theiracquisition. Liabilities are recorded at the amount of proceeds or assets received or the contractualamounts for assuming the present obligation, or, at the amounts of cash and cash equivalents expected tobe paid to settle the liabilities in the normal course of business.
THIS DOCUMENT IS IN DRAFT FORM, INCOMPLETE AND SUBJECT TO CHANGE AND THE INFORMATION MUST BEREAD IN CONJUNCTION WITH THE SECTION HEADED “WARNING” ON THE COVER OF THIS DOCUMENT
APPENDIX IV UNAUDITED CONSOLIDATED FINANCIAL STATEMENTSFOR THE SIX MONTHS ENDED 30 JUNE 2021
– IV-23 –

Fair value is the price that would be received to sell an asset or paid to transfer a liability in an orderlytransaction between market participants at the measurement date. Regardless of whether that price isdirectly observable or estimated using another valuation technique, fair value for measurement anddisclosure purposes in these financial statements is determined on such a basis.
In the measurement of non-financial assets at fair value, market participants’ ability to best utilize suchassets to generate most economic benefits, or the ability to sell such assets to other market participantswho are able to best utilize the assets to generate economic benefits is taken into account.
For financial assets which are transacted at fair value on initial recognition, and a valuation techniqueinvolving unobservable input is used in subsequent measurement, the valuation technique is calibratedso that at initial recognition the results of the valuation technique equal the transaction price.
Fair value measurements are categorized into Level 1, 2 or 3 based on the degree to which the inputs tothe fair value measurements are observable and the significance of the inputs to the fair valuemeasurement in its entirety:
• Level 1 inputs are quoted prices (unadjusted) in active markets for identical assets or liabilitiesthat the entity can access at the measurement date;
• Level 2 inputs are inputs, other than inputs within Level 1, that are observable for the asset orliability , either directly or indirectly; and
• Level 3 inputs are unobservable inputs for the asset or liability.
III. SIGNIFICANT ACCOUNTING POLICIES AND ACCOUNTING ESTIMATES
Tips on specific accounting policies and accounting estimates:
The Group determines specific accounting policies and accounting estimates based on actual businessoperation characteristics, including provision of expected credit loss for receivables (Note III(10)), thedepreciation of fixed assets and the amortization of intangible assets (Note III (16), (19)) and the timepoint of time of revenue recognition(Note III (26)) etc.
The key judgement made by the Group in determining significant accounting policies are detailed inNote III (31).
1. Statement of compliance with the CASBEs
The financial statements of the Group have been prepared in accordance with China AccountingStandards for Business Enterprises (“CASBEs”), and present truly and completely, the Group’sconsolidated and the Company’s financial position as at 30 June 2021, and consolidated and theCompany’s results of operations, changes in shareholders’ equity and cash flows for the six monthsended 30 June 2021.
2. Accounting period
The Group has adopted the calendar year as its accounting year, i.e. from 1 January to 31 December. Thefinancial statement covers the period from 1 January 2021 to 30 June 2021.
3. Operating cycle
An operating cycle refers to the period since an enterprise purchases assets for processing purpose till therealization of those assets in cash or cash equivalents. The Group’s operating cycle is 12 months.
THIS DOCUMENT IS IN DRAFT FORM, INCOMPLETE AND SUBJECT TO CHANGE AND THE INFORMATION MUST BEREAD IN CONJUNCTION WITH THE SECTION HEADED “WARNING” ON THE COVER OF THIS DOCUMENT
APPENDIX IV UNAUDITED CONSOLIDATED FINANCIAL STATEMENTSFOR THE SIX MONTHS ENDED 30 JUNE 2021
– IV-24 –
4. Functional currency
Renminbi (“RMB”) is the currency of the primary economic environment in which the Company and itsdomestic subsidiaries operate. Therefore, the Company and its domestic subsidiaries choose RMB astheir functional currency. The Company’s foreign subsidiaries, namely, Huaxin Gayur (Sogd) CementLLC, Huaxin Yovon Cement LLC, Cambodian Cement Chakrey Ting Factory Co., Ltd.,Yuzhno-Kyrgyzskyi Cement CJSC, Huaxin Cement Dzizak Co., Ltd. and Maweni Limestone Ltddetermine TJS, TJS, USD, SOM, UZS and shilling as their functional currencies based on the currency ofthe primary economic environment in which they operate. The Company adopts RMB to present itsfinancial statements.
5. The accounting treatment of business combinations involving enterprises under common control andbusiness combinations not involving enterprises under common control
Business combinations are classified into business combinations involving enterprises under commoncontrol and business combinations not involving enterprises under common control. The Group has onlybusiness combinations not involving enterprises under common control.
5.1 Business combinations not involving enterprises under common control and goodwill
A business combination not involving enterprises under common control is a businesscombination in which all of the combining enterprises are not ultimately controlled by the sameparty or parties before and after the combination.
The cost of combination is the aggregate of the fair values, at the acquisition date, of the assetsgiven, liabilities incurred or assumed, and equity securities issued by the acquirer in exchange forcontrol of the acquiree. The intermediary expenses incurred by the acquirer in respect ofreviewing, legal services, valuation and consultancy services, etc. and other associatedadministrative expenses attributable to the business combination are recognized in profit or losswhen they are incurred.
The acquiree’s identifiable assets, liabilities and contingent liabilities, acquired by the acquirer ina business combination, that meet the recognition criteria shall be measured at fair value at theacquisition date.
Where the cost of combination exceeds the acquirer ’s interest in the fair value of the acquiree’sidentifiable net assets, the difference is treated as an asset and recognized as goodwill, which ismeasured at cost on initial recognition. Where the cost of combination is less than the acquirer ’sinterest in the fair value of the acquiree’s identifiable net assets, the acquirer firstly reassesses themeasurement of the fair value of the acquiree’s identifiable assets, liabilities and contingentliabilities and measurement of the cost of combination. If after that reassessment, the cost ofcombination is still less than the acquirer ’s interest in the fair value of the acquiree’s identifiablenet assets, the acquirer recognizes the remaining difference immediately in profit or loss for thecurrent period.
Goodwill arising on a business combination is measured at cost less accumulated impairmentlosses, and is presented separately in the consolidated financial statements.
6. Preparation of consolidated financial statements
The scope of consolidated financial statements is determined on the basis of control. Control is the powerover the investee, exposures or rights to variable returns from its involvement with the investee, and theability to use its power over the investee to affect the amount of the investor ’s returns. The Groupreassesses whether or not it controls an investee if facts and circumstances indicate that there are changesof the above elements of the definition of control.
Consolidation of a subsidiary begins when the Group obtains control over the subsidiary and ceaseswhen the Group loses control of the subsidiary.
THIS DOCUMENT IS IN DRAFT FORM, INCOMPLETE AND SUBJECT TO CHANGE AND THE INFORMATION MUST BEREAD IN CONJUNCTION WITH THE SECTION HEADED “WARNING” ON THE COVER OF THIS DOCUMENT
APPENDIX IV UNAUDITED CONSOLIDATED FINANCIAL STATEMENTSFOR THE SIX MONTHS ENDED 30 JUNE 2021
– IV-25 –

For a subsidiary disposed of by the Group, the operating results and cash flows before the date ofdisposal (the date when control is lost) are included in the consolidated income statement andconsolidated cash flow statement, as appropriate.
For a subsidiary acquired through a business combination not involving enterprises under commoncontrol, the operating results and cash flows from the acquisition date (the date when control is obtained)are included in the consolidated income statement and consolidated cash flow statement, as appropriate.
The significant accounting policies and accounting periods adopted by the subsidiaries are determinedbased on the uniform accounting policies and accounting periods set out by the Company.
The portion of subsidiaries’ equity that is not attributable to the Company is treated as minority interestsand presented as “minority interests” in the consolidated balance sheet within shareholders’ equity. Theportion of net profits or losses of subsidiaries and other comprehensive income for the periodattributable to minority interests is presented as “Profit or loss attributable to minority interests” in theconsolidated income statement below the “Net profit” and “Other comprehensive income attributable tominority interests, net of tax” in the consolidated income statement below the “Other comprehensiveincome, net of tax” line item.
When the amount of loss for the period attributable to the minority shareholders of a subsidiary exceedsthe opening balance of the minority shareholders’ portion of the owners’ equity of the subsidiary, theexcess amount are still allocated against minority interests.
All significant balances of receivables and payables, transactions and unrealized profits within the groupare offset when the consolidated financial statements are prepared. The unrealized internal transactiongains and losses arising from the sale of assets by the Company to its subsidiaries shall fully offset the netprofits attributable to the shareholders of the parent company; the unrealized internal transaction gainsand losses arising from the sale of assets by the subsidiaries to the Company shall be proportionally offsetbetween the net profits attributable to the shareholders of the parent company and the gains and losses ofminority shareholders based on distribution ratio of the Company to its subsidiaries. The unrealizedinternal transaction gains and losses arising from the sale of assets between subsidiaries shall be offset bythe distribution proportion of the parent company to the subsidiaries of the seller between the net profitsattributable to the shareholders of the parent company and the gains and losses of minority shareholders.
If the identification of the same transaction with the Group as the accounting entity and the Company orsubsidiary as the accounting entity is different, the transaction shall be adjusted from the perspective ofthe Group.
7. Classification of joint venture arrangement and accounting treatment of joint venture
A joint venture arrangement is divided into joint operation and joint venture. The classification isdetermined according to the rights and obligations of the parties to the joint venture arrangement byconsidering the structure, legal form and contractual terms of the arrangement. Joint operation means ajoint venture arrangement in which the assets and liabilities related to the arrangement are enjoyed bythe joint venture party. A joint venture is an arrangement in which the parties are entitled only to the netassets of the arrangement.
The Group’s investment in the joint venture shall be accounted by the equity method. For details, seeNote (3) “15.3.2 Long-term Equity Investment as measured by the Equity Method.”
8. Cash and cash equivalents
Cash comprises cash on hand and deposits that can be readily withdrawn on demand. Cash equivalentsare the Group’s short-term, highly liquid investments that are readily convertible to known amounts ofcash and which are subject to an insignificant risk of changes in value. Restricted bank deposits are notregarded as cash or cash equivalents in the preparation of cash flow statements.
THIS DOCUMENT IS IN DRAFT FORM, INCOMPLETE AND SUBJECT TO CHANGE AND THE INFORMATION MUST BEREAD IN CONJUNCTION WITH THE SECTION HEADED “WARNING” ON THE COVER OF THIS DOCUMENT
APPENDIX IV UNAUDITED CONSOLIDATED FINANCIAL STATEMENTSFOR THE SIX MONTHS ENDED 30 JUNE 2021
– IV-26 –

9. Translation of transactions and financial statements denominated in foreign currencies
9.1 Transactions denominated in foreign currencies
A foreign currency transaction is translated into RMB, on initial recognition, by applying the spotexchange rate on the date of the transaction.
At the balance sheet date, foreign currency monetary items are translated into RMB using the spotexchange rates at the balance sheet date. Exchange differences arising from the differencesbetween the spot exchange rates prevailing at the balance sheet date and those on initialrecognition or at the previous balance sheet date are recognized in profit or loss for the period,except that exchange differences related to a specific-purpose borrowing denominated in foreigncurrency that qualify for capitalization are capitalized as part of the cost of the qualifying assetduring the capitalization period.
Foreign currency non-monetary items measured at historical cost are translated into functionalcurrency at the spot exchange rates on the dates of the transactions and the amounts in functionalcurrency remain unchanged.
9.2 Translation of financial statements denominated in foreign currencies
For the purpose of preparing the consolidated financial statements, financial statements of aforeign operation are translated from the foreign currency into RMB using the following method:assets and liabilities on the balance sheet are translated at the spot exchange rate prevailing at thebalance sheet date; shareholders’ equity items are translated at the spot exchange rates at thedates on which such items arose; all items in the income statement as well as items reflecting thedistribution of profits are translated at the spot exchange rates on the dates of the transactions.The difference between the translated assets and the aggregate of liabilities and shareholders’equity items is recognized as other comprehensive income and included in shareholders’ equity.
Cash flows arising from a transaction in foreign currency and the cash flows of a foreignsubsidiary are translated at the spot exchange rate on the date of the cash flows. The effect ofexchange rate changes on cash and cash equivalents is regarded as a reconciling item andpresented separately in the cash flow statement as “Effect of exchange rate changes on cash andcash equivalents”.
The opening balances and the comparative figures of previous year are presented at the translatedamounts in the previous year ’s financial statements.
10. Financial instruments
Financial assets and financial liabilities are recognized when the Group becomes a party to thecontractual provisions of the instrument.
For regular way purchase or sale of financial assets, assets to be received or liabilities to be assumed arerecognized on the trade date, or assets already sold are derecognized on the trade date.
Financial assets and financial liabilities are initially measured at fair value. For financial assets andfinancial liabilities at fair value through profit or loss, transaction costs are immediately recognized inprofit or loss. For other financial assets and financial liabilities, transaction costs are recognized in theirinitially recognized amounts. When the Group initially recognizes accounts receivable without asignificant financing component or without considering a significant financing component in thecontract of 1 year or less in accordance with the CASBEs No.14-Revenue (the “revenue standard”), theaccounts receivable are initially measured at the transaction price defined in the revenue standard.
The effective interest method is a method of calculating the amortized cost of a financial asset or afinancial liability and of allocating the interest income or interest expense over the relevant period.
THIS DOCUMENT IS IN DRAFT FORM, INCOMPLETE AND SUBJECT TO CHANGE AND THE INFORMATION MUST BEREAD IN CONJUNCTION WITH THE SECTION HEADED “WARNING” ON THE COVER OF THIS DOCUMENT
APPENDIX IV UNAUDITED CONSOLIDATED FINANCIAL STATEMENTSFOR THE SIX MONTHS ENDED 30 JUNE 2021
– IV-27 –

The effective interest rate is the rate that exactly discounts estimated future cash flows through theexpected life of the financial asset or financial liability to the carrying amount of a financial asset or to theamortized cost of a financial liability. When calculating the effective interest rate, the Group estimatesfuture cash flows by considering all the contractual terms of the financial asset or financial liability (forexample, early repayment, extension, call option or other similar options) but does not consider theexpected credit losses.
The amortized cost of a financial asset or a financial liability is the amount of a financial asset or afinancial liability measured at initial recognition minus principal repayment, plus or minus cumulativeamortization of any difference between that initial amount and the maturity amount using the effectiveinterest method, adjusted from any cumulative loss allowance (only applicable to financial assets).
10.1 Classification, recognition and measurement of financial assets
Subsequent to initial recognition, the Group’s financial assets of various categories aresubsequently measured at amortized cost, at fair value through other comprehensive income or atfair value through profit or loss, respectively.
If contractual terms of the financial asset give rise on specified dates to cash flows that are solelypayments of principal and interest on the principal amount outstanding, and the financial asset isheld within a business model whose objective is to collect contractual cash flows, such asset isclassified as subsequently measured at amortized cost, which include cash and bank balances,notes receivable, accounts receivable, other receivables, debt investments, and long-termreceivables etc.
Financial assets that meet the following conditions are classified as at fair value through othercomprehensive income (“FVTOCI”): and the contractual terms of the financial asset give rise onspecified dates to cash flows that are solely payments of principal and interest on the principalamount outstanding and the financial asset is held within a business model whose objective isachieved by both collecting contractual cash flows and selling the financial assets. Financialassets subsequently measured at FVTOCI include Notes receivable classified as at FVTOCI uponacquisition which are presented as financing with receivables.
On initial recognition, the Group may irrevocably designate an equity instrument, as financialassets at FVTOCI on an individual basis, if that equity instrument is neither held for trading norcontingent consideration recognized through business combination not involving enterprisesunder common control. Such financial assets at FVTOCI are presented as other equity instrumentinvestments.
A financial asset is classified as held-for-trading if one of the following conditions is satisfied:
• It has been acquired principally for the purpose of selling in the near term; or
• On initial recognition, it is part of a portfolio of identified financial instruments that theGroup manages together and there is objective evidence that the Group has a recent actualpattern of short-term profit-taking.
• It is a derivative that is not designated as a financial guarantee contract and effective as ahedging instrument.
Financial assets that do not meet the conditions of being classified as financial assets at amortizedcost or financial assets at FVTCOI are classified as financial assets at FVTPL. Such financial assetsmainly include money market funds and stock investments in the secondary market, etc.
The financial assets at FVTPL are presented as held-for-trading financial assets and those dueafter one year from the balance sheet date (or with no fixed term) and expected to be held for morethan one year are presented as other non-current financial assets.
THIS DOCUMENT IS IN DRAFT FORM, INCOMPLETE AND SUBJECT TO CHANGE AND THE INFORMATION MUST BEREAD IN CONJUNCTION WITH THE SECTION HEADED “WARNING” ON THE COVER OF THIS DOCUMENT
APPENDIX IV UNAUDITED CONSOLIDATED FINANCIAL STATEMENTSFOR THE SIX MONTHS ENDED 30 JUNE 2021
– IV-28 –

10.1.1 Financial assets measured at amortized cost
The financial assets measured at amortized cost are subsequently measured at amortizedcost using the effective interest method. Gain or loss arising from impairment orderecognition is recognized in profit or loss.
The Group recognizes interest income from financial assets classified as financial assets atamortized cost using the effective interest method. The Group calculates and recognizesinterest income through account balance of financial assets multiplying effective interest,except for the following circumstances:
• For purchased or originated credit-impaired financial assets, the Group calculatesand recognizes its interest income based on amortized cost of the financial assetand the effective interest through credit adjustment since initial recognition.
• For purchased or originated financial assets without credit impairment incurredwhile with credit impairment incurred in subsequent periods, the Groupcalculates and recognizes its interest income based on amortized cost of thefinancial asset and the effective interest in subsequent periods. If the credit risk ofthe financial asset is reduced during subsequent periods and credit impairmentdoes not exist, and the improvement can be related to an event occurring afterapplication of aforesaid provisions, the Group shall calculate and recognizeinterest income through account balance of financial assets multiplying effectiveinterest.
10.1.2 Financial assets classified as at fair value through other comprehensive income (FVTOCI)
Impairment losses or gains related to financial assets at FVTOCI, interest incomemeasured using effective interest method are recognized into profit or loss for the currentperiod, except for the above circumstances, changes in fair value of the financial assets areincluded in other comprehensive income. Amounts charged to profit or loss for everyperiod equal to the amount charged to profit or loss as it is measured at amortized costs.When the financial asset is derecognized, the cumulative gains or losses previouslyrecognized in other comprehensive income shall be removed from other comprehensiveincome and recognized in profit or loss.
10.1.3 Financial assets designated as at fair value through other comprehensive income
Subsequent to the designation of non-trading equity investments to financial assets atFVTOCI, the changes in fair value of such financial asset is recognized in othercomprehensive income. Upon derecognition of the financial asset, the cumulative gains orlosses previously recognized in other comprehensive income are transferred and includedin retained earnings. During the period in which the Group holds the non-trading equityinstrument, revenue from dividends is recognized in profit or loss for the current periodwhen (1) the Group has established the right of collecting dividends; (2) it is probable thatthe associated economic benefits will flow to the Group; and (3) the amount of dividendscan be measured reliably.
10.1.4 Financial assets at fair value through profit or loss (“FVTPL”)
Financial assets at FVTPL are subsequently measured at fair value. Any gains or lossesarising from changes in the fair value and any dividend or interest income earned on thefinancial assets are recognized in profit or loss.
THIS DOCUMENT IS IN DRAFT FORM, INCOMPLETE AND SUBJECT TO CHANGE AND THE INFORMATION MUST BEREAD IN CONJUNCTION WITH THE SECTION HEADED “WARNING” ON THE COVER OF THIS DOCUMENT
APPENDIX IV UNAUDITED CONSOLIDATED FINANCIAL STATEMENTSFOR THE SIX MONTHS ENDED 30 JUNE 2021
– IV-29 –

10.2 Impairment of financial instruments
The Group recognizes loss allowance for financial assets classified as at amortized cost andfinancial assets at FVOCI based on ECL.
The Group measures loss allowance for notes receivable and accounts receivable arising fromtransactions regulated by the revenue standard based on the amount of lifetime ECL.
For other financial instruments, except for the purchased or originated credit-impaired financialassets, at each balance sheet date, the Group assesses changes in credit risk of relevant financialinstruments since initial recognition. If the credit risk of the above financial instruments hasincreased significantly since initial recognition, the Group measures loss allowance based on theamount of lifetime ECL; if credit risk of the financial instrument has not increased significantlysince initial recognition, the Group recognizes loss allowance based on 12-month ECL of thefinancial instrument. Increase in or reversal of credit loss allowance is included in profit or loss asloss/gain on impairment, except for financial assets classified as at fair value through othercomprehensive income. The Group recognizes credit loss allowance for financial assets atFVTOCI in other comprehensive income and recognizes loss/gain on impairment in profit or lossfor the period, without reducing the carrying amount of the financial assets presented in thebalance sheet.
The Group measured loss allowance at the full lifetime ECL of the financial instruments in theprior accounting period, while as at the balance sheet date for the current period, for the abovefinancial instruments, due to failure to qualify as significant increase in credit risk since initialrecognition, the Group measures loss allowance for the financial instrument at 12-month ECL atthe balance sheet date for the current period. Relevant reversal of loss allowance is included inprofit or loss as gain on impairment.
10.2.1 Significant increase in credit risk
In assessing whether the credit risk has increased significantly since initial recognition,the Group compares the risk of a default occurring on the financial instrument as at thebalance sheet date with the risk of a default occurring on the financial instrument as at thedate of initial recognition.
In particular, the following information is taken into account when assessing whethercredit risk has increased significantly:
(1) Existing or forecast adverse changes in business, financial or economic conditionsthat are expected to cause a significant change in the borrower’s ability to meet itsdebt obligations;
(2) An actual or expected significant change in the operating results of the borrower;
(3) An actual or expected significant adverse change in the regulatory, economic, ortechnological environment of the borrower;
(4) Significant changes in the value of the collateral supporting the obligation or in thequality of third-party guarantees, which are expected to reduce the borrower’seconomic incentive to make scheduled contractual payments or to otherwise havean effect on the probability of a default occurring;
(5) Significant changes that are expected to reduce the borrower’s economic incentiveto make scheduled contractual payments;
(6) Expected changes in the loan documentation including an expected breach ofcontract that may lead to covenant waivers or amendments, interest rate step-ups,requiring additional collateral or guarantees, or other changes to the contractualframework of the instrument;
THIS DOCUMENT IS IN DRAFT FORM, INCOMPLETE AND SUBJECT TO CHANGE AND THE INFORMATION MUST BEREAD IN CONJUNCTION WITH THE SECTION HEADED “WARNING” ON THE COVER OF THIS DOCUMENT
APPENDIX IV UNAUDITED CONSOLIDATED FINANCIAL STATEMENTSFOR THE SIX MONTHS ENDED 30 JUNE 2021
– IV-30 –

(7) Significant changes in the expected performance and behavior of the borrower;
(8) Changes in the Group’s credit management approach in relation to the financialinstrument.
Irrespective of whether the credit risk has increased significantly after the aboveassessment, taking into account the characteristics of the industries and the contractualstipulations, the Group considers that when the contractual payment for the financialinstruments is overdue for 180 (inclusive) days, it indicates that the credit risk on thefinancial instruments has increased significantly.
The Group assumes that the credit risk on a financial instrument has not increasedsignificantly since initial recognition if the financial instrument is determined to havelower credit risk at the balance sheet date. A financial instrument is determined to havelower credit risk if: i) it has a lower risk of default, ii) the borrower has a strong capacity tomeet its contractual cash flow obligations in the near term and iii) adverse changes ineconomic and business conditions in the longer term may, but will not necessarily, reducethe ability of the borrower to fulfil its contractual cash flow obligations.
10.2.2 Credit-impaired financial asset
A financial asset is credit-impaired when one or more events that have a detrimentalimpact on the estimated future cash flows of that financial asset have occurred. Evidencethat a financial asset is credit-impaired includes observable data about the followingevents:
(1) significant financial difficulty of the issuer or the borrower;
(2) a breach of contract by the debtor, such as a default or delinquency in interest orprincipal payments;
(3) the lender(s) of the borrower, for economic or contractual reasons relating to theborrower’s financial difficulty, having granted to the borrower a concession(s) thatthe lender(s) would not otherwise consider;
(4) it is becoming probable that the borrower will enter bankruptcy or other financialreorganization.
Based on the Group’s internal credit risk management, if the information acquiredinternally or externally indicates that the debtor of the financial instrument is not able torepay the creditor (including the Group) in full regardless of any guarantees obtained, theGroup believes that the default has occurred.
10.2.3 Determination of expected credit loss
The Group recognizes the credit loss on other receivables, contract assets, long-termreceivables and debt investments as well as credit-impaired accounts receivable, etc. on anindividual basis, and the remaining accounts receivable with impairment matrix on acollective basis. The Group classifies the remaining accounts receivable into differentgroups based on different types.
The Group determines expected credit losses of relevant financial instruments using thefollowing methods:
• For a financial asset, the credit loss is the present value of difference between thecontractual cash flow receivable and the expected cash flows to be received.
THIS DOCUMENT IS IN DRAFT FORM, INCOMPLETE AND SUBJECT TO CHANGE AND THE INFORMATION MUST BEREAD IN CONJUNCTION WITH THE SECTION HEADED “WARNING” ON THE COVER OF THIS DOCUMENT
APPENDIX IV UNAUDITED CONSOLIDATED FINANCIAL STATEMENTSFOR THE SIX MONTHS ENDED 30 JUNE 2021
– IV-31 –

• For credit-impaired financial assets other than the purchased or originatedcredit-impaired financial assets at the balance sheet date, credit loss is thedifference between the account balance of financial assets and the present value ofexpected future cash flows discounted at original effective interest rate.
The Group’s measurement of ECL of financial instruments reflects factors includingunbiased probability weighted average amount recognized by assessing a series ofpossible results, time value of money, reasonable and supportable information related tohistorical events, current condition and forecast of future economic position that isavailable without undue cost or effort at the balance sheet date.
10.2.4 Write-off of financial assets
The Group shall directly reduce the account balance of a financial asset when the Grouphas no reasonable expectations of recovering a financial asset in its entirety or a portionthereof. A write-off constitutes a derecognition event.
10.3 Transfer of financial assets
The Group derecognizes a financial asset if one of the following conditions is satisfied: (1) thecontractual rights to the cash flows from the financial asset expire; (2) the financial asset has beentransferred and substantially all the risks and rewards of ownership of the financial asset istransferred to the transferee, or (3) The financial asset has been transferred. Although the Groupneither transfers nor retains almost all the risks and rewards of the ownership of the financialasset, it does not retain control over the financial asset.
For a transfer of a financial asset in its entirety that satisfies the derecognition criteria, thedifference between (1) the carrying amount of the financial asset transferred at the derecognitiondate; and (2) the sum of the consideration received from the transfer of financial assets and anycumulative gain or loss allocated to the part derecognized which has been previously recognizedin other comprehensive income, is recognized in profit or loss. If the financial assets transferredby the Group are designated as equity instrument investments at fair value through othercomprehensive income that are not held for trading, the cumulative gains or losses previouslyrecognized in other comprehensive income are transferred out and included in retained earnings.
If a part of the transferred financial asset qualifies for derecognition, the overall carrying amountof the financial asset prior to transfer is allocated between the part that continues to be recognizedand the part that is derecognized, based on the respective fair value of those parts at the date oftransfer. The difference between (1) the carrying amount allocated to the part derecognized on thedate of derecognition; and (2) the sum of the consideration received for the part derecognized andany cumulative gain or loss allocated to the part derecognized which has been previouslyrecognized in other comprehensive income, is recognized in profit or loss. If the financial assetstransferred by the Group are designated as equity instrument investments at fair value throughother comprehensive income that are not held for trading, the cumulative gains or lossespreviously recognized in other comprehensive income are transferred out and included inretained earnings.
For a transfer of a financial asset in its entirety that does not satisfy the derecognition criteria, theGroup will continue to recognize the transferred financial asset in its entirety and recognize theconsideration received as financial liabilities.
10.4 Classification of liabilities and equity
On initial recognition, financial instruments or their components issued by the Group areclassified into financial liabilities or equity instruments on the basis of the substance of thecontractual arrangements and the economic nature not only its legal form, together with thedefinition of financial liability and equity instruments.
THIS DOCUMENT IS IN DRAFT FORM, INCOMPLETE AND SUBJECT TO CHANGE AND THE INFORMATION MUST BEREAD IN CONJUNCTION WITH THE SECTION HEADED “WARNING” ON THE COVER OF THIS DOCUMENT
APPENDIX IV UNAUDITED CONSOLIDATED FINANCIAL STATEMENTSFOR THE SIX MONTHS ENDED 30 JUNE 2021
– IV-32 –

10.4.1 Classification and measurement of financial liabilities
On initial recognition, financial liabilities are classified into financial liabilities at fairvalue through profit or loss and other financial liabilities.
10.4.1.1 Financial liabilities measured at fair value and whose changes are included incurrent profit and loss
Financial liabilities measured at fair value and whose changes are included in thecurrent profit and loss, including trading financial liabilities (includingderivatives of financial liabilities) and financial liabilities designated as measuredat fair value and whose changes are included in the current profit and loss. Exceptfor the separate presentation of derivative financial liabilities, the financialliabilities measured at fair value and whose changes are included in the currentprofit and loss are listed as trading financial liabilities.
The financial liability meets one of the following conditions, indicating that theGroup undertakes the financial liability for transactional purposes:
• The purpose of taking on the relevant financial liabilities is mainly for thenear term repurchase.
• The underlying financial liability is part of a centrally managed portfolio ofidentifiable financial instruments at the time of initial recognition, andthere is objective evidence of actual short-term profit patterns in the nearterm.
• The underlying financial liability is a derivative. However, derivatives thatmeet the definition of financial security contracts and those designated aseffective hedging instruments are excluded.
The financial liabilities of the Group that meet one of the following conditions canbe designated as the financial liabilities measured at fair value and whose changesare recorded into the profit and loss of the current period at the initialrecognition:(1) the designation can eliminate or significantly reduce accountingmismatches; (2) According to the risk management or investment strategy set forthin the formal written documents of the Group, manage and evaluate the financialliabilities portfolio or financial assets and financial liabilities portfolio on the basisof fair value, and report to key management personnel within the Group on thisbasis; (3) Qualified hybrid contracts containing embedded derivatives.
The fair value is adopted for the subsequent measurement of trading financialliabilities, and the gains or losses formed by the change of fair value and thedividends or interest expense related to such financial liabilities are booked intothe current profit and loss.
For the financial liabilities that are designated to be measured at fair value andwhose changes are included in the profit and loss of the current period, the fairvalue changes caused by the Group’s own credit risk changes are included in othercomprehensive income, and other fair value changes are included in the profit andloss of the current period. When the recognition of such financial liability isterminated, the accumulated change in fair value caused by the change in its owncredit risk previously included in other comprehensive income shall be transferredinto retained earnings. Dividends or interest expenses related to such financialliabilities are included in the current profit and loss. If the treatment of the impactof the change of its own credit risk of such financial liability in the above way willcause or expand the accounting misallocation in the profit and loss, the Group willinclude all the profit and loss of the financial liability (including the amountaffected by the change of its own credit risk) into the profit and loss of the currentperiod.
THIS DOCUMENT IS IN DRAFT FORM, INCOMPLETE AND SUBJECT TO CHANGE AND THE INFORMATION MUST BEREAD IN CONJUNCTION WITH THE SECTION HEADED “WARNING” ON THE COVER OF THIS DOCUMENT
APPENDIX IV UNAUDITED CONSOLIDATED FINANCIAL STATEMENTSFOR THE SIX MONTHS ENDED 30 JUNE 2021
– IV-33 –

10.4.1.2 Other financial liabilities
Other financial liabilities except for the financial liabilities arising from thetransferred financial assets that do not qualify for derecognition or financialliabilities arising from continuing involvement in the transferred financial asset,and financial guarantee contracts, are classified as financial liabilities measured atamortized cost, and are subsequently measured at amortized cost, with gain orloss arising from derecognition or amortization recognized in profit or loss.
If the Group modifies or renegotiates the contract with the counterparty and thefinancial liability subsequently measured at amortized cost is not derecognized,but the cash flow of the contract changes, the Group shall re-calculate the carryingamount of the financial liability and recognize the relevant gains or losses in profitor loss of the period. The re-calculated carrying amount of the financial liabilityshall be determined by the Group according to the cash flow of the renegotiated ormodified contract based on the present value discounted at the original effectiveinterest rate of the financial liability. For all the costs or expenses arising from themodification or renegotiation of the contract, the Group shall adjust the modifiedcarrying amount of the financial liability and amortize them within the remainingterm of the financial liability.
10.4.2 Derecognition of financial liabilities
The Group derecognizes a financial liability (or part of it) when the underlying presentobligation (or part of it) is discharged. An agreement between the Group (an existingborrower) and an existing lender to replace the original financial liability with a newfinancial liability with substantially different terms is accounted for as an extinguishmentof the original financial liability and the recognition of a new financial liability.
When the Group derecognizes a financial liability or a part of it, it recognizes thedifference between the carrying amount of the financial liability (or part of the financialliability) derecognized and the consideration paid (including any non-cash assetstransferred or new financial liabilities assumed) in profit or loss.
10.4.3 Equity instruments
An equity instrument is any contract that evidences a residual interest in the assets of theGroup after deducting all of its liabilities. Equity instruments issued (includingrefinanced), repurchased, sold and cancelled by the Group are recognized as changes inequity. Change in fair value of equity instruments is not recognized by the Group.Transaction costs related to equity transactions are deducted from equity.
The Group recognizes the distribution to holders of the equity instruments as distributionof profits, and dividends paid do not affect total amount of shareholders’ equity.
10.5 Offsetting financial assets and financial liabilities
Where the Group has a legal right that is currently enforceable to set off the recognized financialassets and financial liabilities, and intends either to settle on a net basis, or to realize the financialasset and settle the financial liability simultaneously, a financial asset and a financial liabilityshall be offset and the net amount is presented in the balance sheet. Except for the abovecircumstances, financial assets and financial liabilities shall be presented separately in thebalance sheet and shall not be offseted.
THIS DOCUMENT IS IN DRAFT FORM, INCOMPLETE AND SUBJECT TO CHANGE AND THE INFORMATION MUST BEREAD IN CONJUNCTION WITH THE SECTION HEADED “WARNING” ON THE COVER OF THIS DOCUMENT
APPENDIX IV UNAUDITED CONSOLIDATED FINANCIAL STATEMENTSFOR THE SIX MONTHS ENDED 30 JUNE 2021
– IV-34 –

11. Financing with receivables
For the notes receivable classified as at fair value through other comprehensive income, the portionwithin one year (inclusive) since acquisition is presented as financing with receivables. For the relevantaccounting policies, refer to Note III(10.1),(10.2) and(10.3).
12. Inventories
12.1 Categories of inventories
The Group’s inventories mainly include raw materials, work in progress, finished goods, spareparts, auxiliary materials, etc. Inventories are initially measured at cost. Cost of inventoriescomprises all costs of purchase, costs of conversion and other expenditures incurred in bringingthe inventories to their present location and condition.
12.2 Valuation method of inventories upon delivery
The actual cost of inventories upon delivery is calculated using the weighted average method.
12.3 Basis for determining net realizable value of inventories
At the balance sheet date, inventories are measured at the lower of cost and net realizable value.If the net realizable value is below the cost of inventories, a provision for decline in value ofinventories is made.
Net realizable value is the estimated selling price in the ordinary course of business less theestimated costs of completion, the estimated costs necessary to make the sale and relevant taxes.Net realizable value is determined on the basis of solid evidence obtained, and takes intoconsideration the purposes of holding inventories and effect of post balance sheet events.
Provision for decline in value of inventories is made based on the excess of cost of inventory overits net realizable value. After the provision for decline in value of inventories is made, if thecircumstances that previously caused inventories to be written down below cost no longer existso that the net realizable value of inventories is higher than their cost, the original provision fordecline in value is reversed and the reversal is included in profit or loss for the period.
12.4 Inventory count system
The perpetual inventory system is maintained.
12.5 Amortization method for spare parts and auxiliary materials
Spare parts and auxiliary materials are amortized using the immediate write-off method.
13. Contract assets
13.1 Methods and standards for the recognition of contract assets
Contract assets are the rights of the Group to receive consideration for goods or services whichhave been transferred to a customer and which are subject to factors other than the passage oftime. The Group’s rights to collect consideration from customers, unconditional (i.e., dependentonly on the passage of time), are shown separately as receivables.
13.2 The determination of expected credit losses and accounting treatment regarding to contractassets
The determination of expected credit losses and accounting treatment regarding to contractassets,please refer to note III 10.2 “Impairment of Financial Instruments”.
THIS DOCUMENT IS IN DRAFT FORM, INCOMPLETE AND SUBJECT TO CHANGE AND THE INFORMATION MUST BEREAD IN CONJUNCTION WITH THE SECTION HEADED “WARNING” ON THE COVER OF THIS DOCUMENT
APPENDIX IV UNAUDITED CONSOLIDATED FINANCIAL STATEMENTSFOR THE SIX MONTHS ENDED 30 JUNE 2021
– IV-35 –

14. Assets held-for-sale
When the Group recovers the carrying amount of an asset mainly by selling rather than continuing to usea non-current asset or disposal group, it is classified as assets held-for-sale.
Non-current assets or disposal groups classified as assets held-for-sale need to satisfy the followingconditions: (1) according to the usual practice of selling such assets or disposal groups in similartransaction, they can be sold immediately in the current situation; (2) the probability of being sold ishigh, which means the Group has made a resolution on a sale plan and obtained a definite purchasecommitment, and the sale is expected to be completed within one year.
The Group records the non-current assets or disposal groups classified as held for sale at the lower oftheir carrying amount and fair value less costs to sell. Where the carrying amount is higher than the netamount of fair value less costs to sell, carrying amount should be reduced to the net amount of fair valueless costs to sell, and such reduction is recognized in impairment loss of assets and included in profit orloss for the period. Meanwhile, provision for impairment of assets held-for-sale is made. When there is anincrease in the net amount of fair value of non-current assets held for sale less costs to sell at thesubsequent balance sheet date, the original deduction should be reversed in impairment loss of assetsrecognized after the classification of held-for-sale category, and the reverse amount is included in profitor loss for the period. The impairment loss of assets recognized before the classification of assetsheld-for-sale category will not be reversed.
Non-current assets classified as held-for-sale or non-current assets in disposal groups are not depreciatedor amortized, and the interest and other expenses of liabilities of disposal groups classified as continue tobe recognized on a recurring basis.
15. Long-term equity investments
15.1 Criteria for determining joint control and significant influence
Control exists when the investor has power over the investee; is exposed, or has rights, to variablereturns from its involvement with the investee; and has the ability to use its power over theinvestee to affect its returns. Joint control is the contractually agreed sharing of control over aneconomic activity, and exists only when the strategic financial and operating policy decisionsrelating to the activity require the unanimous consent of the parties sharing control. Significantinfluence is the power to participate in the financial and operating policy decisions of the investeebut is not control or joint control over those policies. When determining whether an investingenterprise is able to exercise control or significant influence over an investee, the effect ofpotential voting rights of the investee (for example, warrants and convertible debts) held by theinvesting enterprises or other parties that are currently exercisable or convertible shall beconsidered.
15.2 Determination of initial investment cost
For a long-term equity investment acquired through business combination not involvingenterprises under common control, the investment cost of the long-term equity investment is thecost of acquisition.
The intermediary expenses incurred by the acquirer in respect of review, legal services, valuationand consultancy services, etc. and other associated administrative expenses attributable to thebusiness combination are recognized in profit or loss when they are incurred.
Long-term equity investment acquired otherwise than through a business combination is initiallymeasured at its cost.
THIS DOCUMENT IS IN DRAFT FORM, INCOMPLETE AND SUBJECT TO CHANGE AND THE INFORMATION MUST BEREAD IN CONJUNCTION WITH THE SECTION HEADED “WARNING” ON THE COVER OF THIS DOCUMENT
APPENDIX IV UNAUDITED CONSOLIDATED FINANCIAL STATEMENTSFOR THE SIX MONTHS ENDED 30 JUNE 2021
– IV-36 –
15.3 Subsequent measurement and recognition of profit or loss
15.3.1 Long-term equity investment accounted for using the cost method
The Company’s separate financial statements adopt cost method to account for thelong-term equity investments of subsidiaries. A subsidiary is an investee that is controlledby the Group.
Under the cost method, a long-term equity investment is measured at initial investmentcost. When additional investment is made or the investment is recouped, the cost of thelong-term equity investment is adjusted accordingly. Investment income is recognized inthe period in accordance with the attributable share of cash dividends or profitdistributions declared by the investee.
15.3.2 Long-term equity investment accounted for using the equity method
The Group accounts for investment in associates and joint venture using the equitymethod. An associate is an entity over which the Group has significant influence, a jointventure refers to a joint venture arrangement in which the Group has rights only to the netassets of the arrangement.
Under the equity method, where the initial investment cost of a long-term equityinvestment exceeds the Group’s share of the fair value of the investee’s identifiable netassets at the time of acquisition, no adjustment is made to the initial investment cost.Where the initial investment cost is less than the Group’s share of the fair value of theinvestee’s identifiable net assets at the time of acquisition, the difference is recognized inprofit or loss for the period, and the cost of the long-term equity investment is adjustedaccordingly.
Under the equity method, the Group recognizes its share of the net profit or loss and othercomprehensive income of the investee for the period as investment income and othercomprehensive income for the period. Meanwhile, carrying amount of long-term equityinvestment is adjusted: the carrying amount of long-term equity investment is decreasedin accordance with its share of the investee’s declared profit or cash dividends; Otherchanges in owners’ equity of the investee other than net profit or loss and othercomprehensive income are correspondingly adjusted to the carrying amount of thelong-term equity investment, and recognized in the capital reserve. The Group recognizesits share of the investee’s net profit or loss based on the fair value of the investee’sindividual identifiable assets, etc. at the acquisition date after making appropriateadjustments. When the investees’ accounting policies and accounting period areinconsistent with those of the Company, the Company recognizes investment income andother comprehensive income after making appropriate adjustments to conform to theCompany’s accounting policies and accounting period. However, unrealized gains orlosses resulting from the Group’s transactions with its associates and joint ventures,which do not constitute a business, are eliminated based on the proportion attributable tothe Group and then investment gains or losses are recognized.
However, unrealized losses resulting from the Group’s transactions with its associatesand joint ventures which represent impairment losses on the transferred assets are noteliminated.
15.4 Disposal of long-term equity investments
On disposal of a long term equity investment, the difference between the proceeds actuallyreceived and receivable and the carrying amount is recognized in profit or loss for the period.
THIS DOCUMENT IS IN DRAFT FORM, INCOMPLETE AND SUBJECT TO CHANGE AND THE INFORMATION MUST BEREAD IN CONJUNCTION WITH THE SECTION HEADED “WARNING” ON THE COVER OF THIS DOCUMENT
APPENDIX IV UNAUDITED CONSOLIDATED FINANCIAL STATEMENTSFOR THE SIX MONTHS ENDED 30 JUNE 2021
– IV-37 –
16. Fixed assets
16.1 Recognition criteria for fixed assets
Fixed assets are tangible assets that are held for use in the production or supply of goods orservices, for rental to others, or for administrative purposes, and have useful lives of more thanone accounting year. Fixed assets comprise buildings, machinery and equipment, officeequipment and motor vehicles. A fixed asset is recognized only when it is probable that economicbenefits associated with the asset will flow to the Group and the cost of the asset can be measuredreliably. Fixed assets are initially measured at cost.
Subsequent expenditures incurred for the fixed asset are included in the cost of the fixed asset andif it is probable that economic benefits associated with the asset will flow to the Group and thesubsequent expenditures can be measured reliably. Meanwhile the carrying amount of thereplaced part is derecognized. Other subsequent expenditures are recognized in profit or loss inthe period in which they are incurred.
16.2 Depreciation method
A fixed asset is depreciated over its useful life using the straight-line method since the monthsubsequent to the one in which it is ready for intended use. The depreciation method, useful life,estimated net residual value rate and annual depreciation rate of each category of fixed assets areas follows:
The useful life, estimated net residual value rate and annual depreciation rate of fixed assets areas follows:
CategoryDepreciationmethod
Depreciationperiod
Residualvalue rate
Annualdepreciationrate
Buildings Depreciation bycomposite lifemethod
25-40 years 4% 2.4% to 3.8%
Machinery andequipment
Depreciation bycomposite lifemethod
5-18 years 4% 5.3% to 19.2%
Officeequipment
Depreciation bycomposite lifemethod
5-10 years 4% 9.6% to 19.2%
Transportationvehicles
Depreciation bycomposite lifemethod
4-12 years 4% 8.0% to 24.0%
Estimated net residual value of a fixed asset is the estimated amount that the Group wouldcurrently obtain from disposal of the asset, after deducting the estimated costs of disposal, if theasset were already of the age and in the condition expected at the end of its useful life.
16.3 Other explanations
If a fixed asset is upon disposal or no future economic benefits are expected to be generated fromits use or disposal, the fixed asset is derecognized. When a fixed asset is sold, transferred, retiredor damaged, the amount of any proceeds on disposal of the asset net of the carrying amount andrelated taxes is recognized in profit or loss for the period.
The Group reviews the useful life and estimated net residual value of a fixed asset and thedepreciation method applied at least once at each financial year-end, and accounts for any changeas a change in accounting estimate.
THIS DOCUMENT IS IN DRAFT FORM, INCOMPLETE AND SUBJECT TO CHANGE AND THE INFORMATION MUST BEREAD IN CONJUNCTION WITH THE SECTION HEADED “WARNING” ON THE COVER OF THIS DOCUMENT
APPENDIX IV UNAUDITED CONSOLIDATED FINANCIAL STATEMENTSFOR THE SIX MONTHS ENDED 30 JUNE 2021
– IV-38 –

17. Construction in progress
Construction in progress is measured at its actual costs. The actual costs include various constructionexpenditures during the construction period, borrowing costs capitalized before it is ready for intendeduse and other relevant costs. Construction in progress is not depreciated. Construction in progress istransferred to a fixed asset when it is ready for intended use.
18. Borrowing costs
Borrowing costs directly attributable to the acquisition, construction or production of qualifying asset arecapitalized when expenditures for such asset and borrowing costs are incurred and activities relating tothe acquisition, construction or production of the asset that are necessary to prepare the asset for itsintended use or sale have commenced. Capitalization of borrowing costs ceases when the qualifying assetbeing acquired, constructed or produced becomes ready for its intended use or sale. If the assets eligiblefor capitalization are abnormally interrupted in the process of acquisition and construction orproduction, and the interruption continues for more than 3 months, the capitalization of borrowing costsshall be suspended until the acquisition and construction of assets or production activities restart. Otherborrowing costs are recognized as expense in the period in which they are incurred.
Where funds are borrowed under a specific-purpose borrowing, the amount of interest to be capitalizedis the actual interest expense incurred on that borrowing for the period less any bank interest earned fromdepositing the borrowed funds before being used on the asset or any investment income on thetemporary investment of those funds. Where funds are borrowed under general-purpose borrowings, theGroup determines the amount of interest to be capitalized on such borrowings by applying acapitalization rate to the weighted average of the excess of cumulative expenditures on the asset over theamounts of specific-purpose borrowings. The capitalization rate is the weighted average of the interestrates applicable to the general-purpose borrowings.
19. Intangible assets
19.1 Measurement method, useful life and test on impairment of intangible assets
Intangible assets include land use rights, concession right, mining rights, mine restoration fees,computer software and others, etc.
An intangible asset is measured initially at cost. When an intangible asset with finite useful life isavailable for use, its original cost is amortized over its estimated useful life using the straight-linemethod. The estimated useful life of each category of intangible assets is as follows:
Category Estimated useful life
Land use rights 40-50 yearsConcession right 10-20 yearsMining rights and mine restoration fees 5-50 yearsComputer software and others 5-10 years
For an intangible asset with finite useful life, the Group reviews the useful life and amortizationmethod at the end of the period, and makes adjustments when necessary.
THIS DOCUMENT IS IN DRAFT FORM, INCOMPLETE AND SUBJECT TO CHANGE AND THE INFORMATION MUST BEREAD IN CONJUNCTION WITH THE SECTION HEADED “WARNING” ON THE COVER OF THIS DOCUMENT
APPENDIX IV UNAUDITED CONSOLIDATED FINANCIAL STATEMENTSFOR THE SIX MONTHS ENDED 30 JUNE 2021
– IV-39 –

20. Impairment of long-term assets
The Group reviews the long-term equity investments, fixed assets, construction in progress andintangible assets with finite useful lives at each balance sheet date to determine whether there is anyindication that they have suffered an impairment loss. If any such indication exists, the recoverableamount will be estimated. Intangible assets with indefinite useful life and intangible assets not yetavailable for use are tested for impairment annually, irrespective of whether there is any indication thatthe assets may be impaired.
Recoverable amount is estimated on an individual basis. If it is not practical to estimate the recoverableamount of an individual asset, the recoverable amount of the asset group to which the asset belongs willbe estimated. The recoverable amount of an asset or asset group is the higher of its fair value less costs ofdisposal and the present value of the future cash flows expected to be derived from the asset.
If the recoverable amount of the asset is less than its carrying amount, an impairment loss provision isrecognized in profit and loss for the amount by which the asset’s carrying amount exceeds its recoverableamount.
When determining the impairment loss of the assets related to the contract cost, it shall first determinethe impairment loss of the other assets related to the contract that are recognized in accordance with theaccounting standards of other relevant enterprises. Then, for the assets related to the contract cost, if thebook value is higher than the difference between the following two items, the excess part shall bewithdrawn as impairment provision and recognized as the impairment loss of the asset:(1) the remainingconsideration that the Group is expected to obtain from the transfer of the commodities or servicesrelated to the asset; (2) Estimate the costs to be incurred for the transfer of the relevant goods or services.
Goodwill is tested for impairment at least at the end of each year. For the purpose of impairment testing,goodwill is considered together with the related asset groups and portfolios, i.e., goodwill is reasonablyallocated to the related asset groups and portfolios or each of asset group or portfolio expected to benefitfrom the synergies of the combination. An impairment loss is recognized if the recoverable amount of theasset groups and portfolios (including goodwill) is less than its carrying amount. The impairment loss isfirstly allocated to reduce the carrying amount of any goodwill allocated to such asset groups andportfolios, and then to the other assets of the group pro-rata on the basis of the carrying amount of eachasset (other than goodwill) in the group.
Except for the impairment loss of assets related to the contract cost, the above-mentioned impairmentloss of assets, once recognized, it is not be reversed in any subsequent period. The impairment lossrelated to the contract costs can be reversed in subsequent periods. If the previous impairment conditionsno longer exist or have improved, resulting in the difference between them is higher than the book valueof asset and included in the current profits and losses. However, the increased carrying amount of theasset should not exceed the amount that would have been determined (net of amortization) if noimpairment loss had been recognized previously.
21. Long-term prepaid expenses
Long-term prepaid expenses represent expenses incurred that should be borne and amortized over thecurrent and subsequent periods (together of more than one year), including mine development costs andso on. Mine development costs are expenditures in connection with infrastructure, exploitationpreparation and removal of debris and trees on mines, removal of non-mining raw materials andimpurities from ores, after obtaining the right of mining, so as to make it ready for exploitation, and arecapitalized in the period in which they are incurred. Long-term prepaid expenses are amortized using thestraight-line method over the expected periods in which benefits are derived.
THIS DOCUMENT IS IN DRAFT FORM, INCOMPLETE AND SUBJECT TO CHANGE AND THE INFORMATION MUST BEREAD IN CONJUNCTION WITH THE SECTION HEADED “WARNING” ON THE COVER OF THIS DOCUMENT
APPENDIX IV UNAUDITED CONSOLIDATED FINANCIAL STATEMENTSFOR THE SIX MONTHS ENDED 30 JUNE 2021
– IV-40 –

22. Contract Liabilities
Contract liabilities refer to the obligations of the Group to transfer goods or services to clients forconsideration received or receivable from clients. Contract assets and contract liabilities under the samecontract are shown on a net basis.
23. Employee benefits
23.1 Accounting treatment of short-term benefits
Short-term benefits include salaries or wages, bonuses and allowances, staff welfare, socialinsurance including medical insurance, injury insurance, maternity insurance, housing funds,labor unions funds and employee education fee. In an accounting period in which an employeehas rendered service to the Group, the Group recognizes the short-term employee benefits for thatservice as a liability, and the related expenditures are either charged to profit or loss in the periodwhen they are incurred or included in cost of related assets. Employee benefits in non-monetaryassets are measured at fair value.
23.2 Accounting treatment of post-employment benefits
Post-employment benefits are classified into defined contribution plans and defined benefitplans.
The Group’s defined contribution plan includes subsidies for retirees and benefits for earlyretired employees, etc. The defined contribution plan set by the group includes retiree subsidyand retiree welfare. In an accounting period in which an employee has rendered service to theGroup, the amount payable calculated in accordance with the defined contribution plan isrecognized as a liability and charged to profit or loss in the period, or included in cost of relatedassets. For defined benefit plan, the Group attributes benefits obligations arising from the definedbenefit plan to the period in which employees render services based on the formula determinedby the expected accumulated benefits unit method, and includes such obligations in profit or lossfor the period or cost of related assets. Costs of employee benefits arising from the defined benefitplan are classified into the following components:
• Service cost (including the current service cost, past service cost and gain and loss fromsettlement);
• Net interest from net liabilities/assets of the defined benefit plan (including interestincome of the plan assets, interest expenses on obligations of the defined benefit plan, andinterest affected by the ceiling of assets); and
• Changes arising from re-measurement of net liabilities/assets of the defined benefit plan.
Service cost and net interest on net liabilities/assets of the defined benefit plan are included inprofit or loss for the period or cost of related assets. Changes arising from re-measurement of netliabilities/assets of the defined benefit plan (including actuarial gains/ losses, returns from planassets net of the amount included in net interest on net liabilities/assets on the defined benefitplan, changes in the maximum effect of assets net of the amount included in net interest on netliabilities/assets of the defined benefit plan are recognized in other comprehensive income.
THIS DOCUMENT IS IN DRAFT FORM, INCOMPLETE AND SUBJECT TO CHANGE AND THE INFORMATION MUST BEREAD IN CONJUNCTION WITH THE SECTION HEADED “WARNING” ON THE COVER OF THIS DOCUMENT
APPENDIX IV UNAUDITED CONSOLIDATED FINANCIAL STATEMENTSFOR THE SIX MONTHS ENDED 30 JUNE 2021
– IV-41 –

23.3 Accounting treatment of termination benefits
A liability for a termination benefit is recognized in profit or loss at the earlier of when the Groupcannot unilaterally withdraw from the termination plan or the redundancy offer and when itrecognizes any related restructuring costs.
Early retirement benefits
The Group provides early retirement benefits to employees who accept voluntary redundancy inexchange for these benefits. Early retirement benefits are the payments of wages or salaries andsocial insurance for the employees who accept termination plan before the normal retire age. Theearly retirement benefits plan covers the period from the starting date of termination benefit planto the normal retire age. When the Group terminates the employment relationship withemployees before the end of the employment contract, a provision for early retirement benefitsfor the compensation arising from termination of the employment relationship with employees tothe retire age is recognized as liabilities, with a corresponding charge to profit or loss. Thedifference from change of actuarial assumptions and adjustment on benefit is recognized in profitor loss for the period.
Termination benefits required to be paid within one year starting from the balance sheet date arepresented as current liabilities.
24. Provisions
Provisions are recognized when the Group has a present obligation related to a contingency (pendinglitigation or mine restoration), it is probable that an outflow of economic benefits will be required tosettle the obligation, and the amount of the obligation can be measured reliably.
The amount recognized as a provision is the best estimate of the consideration required to settle thepresent obligation at the balance sheet date, taking into account factors pertaining to a contingency suchas the risks, uncertainties and time value of money. Where the effect of the time value of money ismaterial, the amount of the provision is determined by the best estimation of discounting the relatedfuture cash outflows.
25. Share-based payment
A share-based payment is a transaction which the Group grants equity instruments, or incurs liabilitiesfor amounts that are determined based on the price of equity instruments, in return for services renderedby employees.
25.1 Equity-settled share-based payments
Equity-settled share-based payments in exchange for services rendered by employees aremeasured at the fair value of the equity instruments granted to employees at the grant date. Suchamount is recognized as related costs or expenses on a straight-line basis over the vesting period,based on the best estimate of the number of equity instruments expected to vest, with acorresponding increase in capital reserve.
At each balance sheet date during the vesting period, the Group makes the best estimateaccording to the subsequent latest information of change in the number of employees who aregranted with options that may vest, etc. and revises the number of equity instruments expected tovest. The effect of the above estimate is recognized as related costs or expenses, with acorresponding adjustment to capital reserve.
THIS DOCUMENT IS IN DRAFT FORM, INCOMPLETE AND SUBJECT TO CHANGE AND THE INFORMATION MUST BEREAD IN CONJUNCTION WITH THE SECTION HEADED “WARNING” ON THE COVER OF THIS DOCUMENT
APPENDIX IV UNAUDITED CONSOLIDATED FINANCIAL STATEMENTSFOR THE SIX MONTHS ENDED 30 JUNE 2021
– IV-42 –

25.2 Cash-settled share-based payments
Cash-settled share-based payments are measured at the fair value of the liabilities incurred by theGroup, which are determined based on the price of the share or other equity instruments. Untilthe liability is settled, the Group re-measures the fair value of the liability at each balance sheetdate and at the date of settlement, with any changes in fair value recognized in profit or loss forthe period.
26. Revenue
26.1 Accounting policies used for revenue recognition and measurement
The Group’s revenue is mainly from sales of building materials including cement, concrete,clinker and aggregate, etc.
The Group recognizes revenue based on transaction price allocated to the performance obligationwhen the Group satisfies a performance obligation in the Contract, namely, when the customerobtains control of relevant goods or services. Performance obligations refer to commitment of theGroup to transfer a distinct good or service to the customer. The transaction price is the amount ofconsideration to which the Group expects to be entitled in exchange for transferring promisedgoods or services to a customer, excluding amounts collected on behalf of third parties andamounts expected to be refunded to a customer.
It is a performance obligation satisfied during a period of time if one of the following conditionsis met, the Group will recognize revenue during a period of time based on the progress ofperformance: (i) the customer simultaneously receives and consumes economic benefits as theGroup performs; (ii) the customer is able to control goods in progress during the process of theGroup’s performance; (iii) goods generated during the Group’s performance have irreplaceableutilization, and the Group is entitled to the payment for performance completed to date.Otherwise the Group will recognize revenue at the point in time when the customer obtainscontrol of relative goods or services.
The Group recognizes revenue at the point in time when the customer obtains control of relativegood or service. When judging whether the customer has obtain control of the good or service, theGroup considers the following indications: (i) the Group has a present right to payment for thegood or service; (ii) the Group has transferred physical possession of the good to the customer;(iii) the Group has transferred the legal title or the significant risks and rewards of ownership ofthe good to the customer; (iv) the customer has accepted the good or service, etc.
If there are two or more of performance obligations included in the contract, at the contractinception, the Group allocates the transaction price to each performance obligation on the base ofrelative stand-alone selling price of good or service promised. However, if there is conclusiveevidence indicating that the contract discount or variable consideration relates one or more (notall) performance obligations in a contract, the Group allocates the contract discount or variableconsideration to one or more performance obligation related. Stand-alone selling price refers tothe price at which sales of goods or services separately to a customer. If the stand-alone sellingprice is not directly observable, the Group estimates the stand-alone selling price throughcomprehensive consideration of all reasonably available information and maximize the use ofobservable inputs.
In case of the existence of variable consideration (such as sales discount etc.) in the contract, theGroup determines the best estimate of variable consideration based on the expected value or themost likely amount. The transaction price includs variable consideration only to the extent that itis highly probable that a significant reversal in the amount of cumulative revenue recognized willnot occur when the uncertainty is subsequently resolved. At each balance sheet date, the Groupre-estimates the amount of variable consideration which should be included in transaction price.
THIS DOCUMENT IS IN DRAFT FORM, INCOMPLETE AND SUBJECT TO CHANGE AND THE INFORMATION MUST BEREAD IN CONJUNCTION WITH THE SECTION HEADED “WARNING” ON THE COVER OF THIS DOCUMENT
APPENDIX IV UNAUDITED CONSOLIDATED FINANCIAL STATEMENTSFOR THE SIX MONTHS ENDED 30 JUNE 2021
– IV-43 –

For a sale attached with quality warranty terms, if such quality warranty provides a customerwith a separate service in addition to the assurance that the good or service complies withagreed-upon specifications, such quality warranty constitutes a performance obligation,otherwise, the Group accounts for quality warranty in accordance with the Accounting Standard
for Business Enterprises No. 13 — Contingencies.
In case of the existence of a significant financing component in the contract, the Group determinesthe transaction price at an amount that a customer would have paid if the customer had paid cashwhen obtaining the control of the good or service. The difference between the transaction priceand contract consideration is amortized using effective interest method during the contract life.At contract inception, the Group estimates the period between the customer obtains the control ofgood or service and the time customer pays for that good or service is one year or less, and doesnot consider the significant financing component in the contract.
When a customer pays consideration in advance for a good or service, the advance payment isfirst recognized as a contract liability and then transferred to revenue when the relatedperformance obligation is satisfied. When the advance payment is non-refundable and thecustomer may not exercise all or part of its contractual rights, the Group recognizes the expectedamount as revenue in proportion to the pattern of rights exercised by the customer, if the Groupexpects to be entitled to the amounts relating to the customer’s unexercised contractual rights,otherwise, the Group recognizes the expected amount as revenue when the likehood of thecustomer’s demanding to satisfy the remaining performance obligation becomes remote.
27. Contract Cost
27.1 Costs of obtaining a contract
The incremental costs of obtaining a contract (i.e. it would not have incurred if the contract hadnot been obtained) are recognized as an asset if they are expected to be recovered, and amortizedto profit and loss on the basis that is consistent with the revenue recognition of good or service towhich the asset relates. If the amortization period of the asset that the entity otherwise wouldhave recognized is less than one year, it will be recognised in profit or loss when incurred. Othercosts incurred to obtain a contract are recognised in profit or loss when incurred, unless thosecosts are explicitly chargeable to the customer.
27.2 Costs to fulfil a contract
If the costs incurred in fulfilling a contract are not within the scope of accounting standards forbusiness enterprises other than the revenue standard, the costs will be recognized as an asset onlyif those costs meet all of the following creteria: (i) the costs relate directly to a contract or to ananticipated contract; (ii) the costs enhance resources of the Group that will be used in satisfyingperformance obligations in the future; (iii) the costs are expected to be recovered. The aforesaidassets are amortized on the basis that is consistent with the revenue recognition of good or serviceto which the asset relates.
28. Government grants
Government grants are transfer of monetary assets and non-monetary assets from the government to theGroup at no consideration. A government grant is recognized only when the Group can comply with theconditions attaching to the grant and the Group will receive the grant.
If a government grant is in the form of a monetary asset, it is measured at the amount received orreceivable.
THIS DOCUMENT IS IN DRAFT FORM, INCOMPLETE AND SUBJECT TO CHANGE AND THE INFORMATION MUST BEREAD IN CONJUNCTION WITH THE SECTION HEADED “WARNING” ON THE COVER OF THIS DOCUMENT
APPENDIX IV UNAUDITED CONSOLIDATED FINANCIAL STATEMENTSFOR THE SIX MONTHS ENDED 30 JUNE 2021
– IV-44 –

28.1 Determining basis and accounting treatment for government grants related to assets
The government grants related to assets refer to the government grants obtained by the Group forpurchase or construction or forming the long-term assets by other ways.
Government grants related to assets are recognized as deferred income, and systematicallyamortized to profit or loss within the useful life of the related asset. The Group adopts samepresentation method for the same category of government grants.
28.2 Determining basis and accounting treatment for government grants related to income
The government grants related to income are all the government grants except those related toassets.
For government grants related to income, where the grants are a compensation for relatedexpenses or losses to be incurred by the Group in the subsequent periods, the grants arerecognized as deferred income, and included in profit or loss over the periods in which the relatedcosts are recognized; where the grants are a compensation for related expenses or losses alreadyincurred by the Group, the grants are recognized immediately in profit or loss in the currentperiod.
A government grant related to the Group’s daily activities is recognized in other income based onthe substance of economic activities. A government grant not related to the Group’s dailyactivities is recognized in non-operating income and expenses.
Finance discount received by the Group are deducted in borrowing expenses.
29. Deferred tax assets/ deferred tax liabilities
The income tax expenses include current income tax and deferred income tax.
29.1 Current income tax
At the balance sheet date, current income tax liabilities (or assets) for the current and priorperiods are measured at the amount expected to be paid (or recovered) according to therequirements of tax laws.
29.2 Deferred tax assets and deferred tax liabilities
For temporary differences between the carrying amounts of certain assets or liabilities and theirtax base, or between the nil carrying amount of those items that are not recognized as assets orliabilities and their tax base that can be determined according to tax laws, deferred tax assets andliabilities are recognized using the balance sheet liability method.
Deferred tax is generally recognized for all temporary differences. Deferred tax assets fordeductible temporary differences are recognized to the extent that it is probable that taxableprofits will be available against which the deductible temporary differences can be utilized.However, for temporary differences associated with the initial recognition of goodwill and theinitial recognition of an asset or liability arising from a transaction (not a business combination)that affects neither the accounting profit nor taxable profits (or deductible losses) at the time oftransaction, no deferred tax asset or liability is recognized.
For deductible losses and tax credits that can be carried forward, deferred tax assets arerecognized to the extent that it is probable that future taxable profits will be available againstwhich the deductible losses and tax credits can be utilized.
THIS DOCUMENT IS IN DRAFT FORM, INCOMPLETE AND SUBJECT TO CHANGE AND THE INFORMATION MUST BEREAD IN CONJUNCTION WITH THE SECTION HEADED “WARNING” ON THE COVER OF THIS DOCUMENT
APPENDIX IV UNAUDITED CONSOLIDATED FINANCIAL STATEMENTSFOR THE SIX MONTHS ENDED 30 JUNE 2021
– IV-45 –

Deferred tax liabilities are recognized for taxable temporary differences associated withinvestments in subsidiaries and associates, except where the Group is able to control the timing ofthe reversal of the temporary difference and it is probable that the temporary difference will notreverse in the foreseeable future. Deferred tax assets arising from deductible temporarydifferences associated with investments in subsidiaries, associates and joint ventures are onlyrecognized to the extent that it is probable that there will be taxable profits against which toutilize the benefits of the temporary differences and they are expected to reverse in theforeseeable future.
At the balance sheet date, deferred tax assets and liabilities are measured at the tax rates,according to tax laws, that are expected to apply in the period in which the asset is realized or theliability is settled.
Current and deferred tax expenses or income are recognized in profit or loss for the period, exceptwhen they arise from transactions or events that are directly recognized in other comprehensiveincome or in shareholders’ equity, in which case they are recognized in other comprehensiveincome or in shareholders’ equity; and when they arise from business combinations, in which casethey adjust the carrying amount of goodwill.
At the balance sheet date, the carrying amount of deferred tax assets is reviewed and reduced if itis no longer probable that sufficient taxable profits will be available in the future to allow thebenefit of deferred tax assets to be utilized. Such reduction in amount is reversed when it becomesprobable that sufficient taxable profits will be available.
29.3 Offsetting income tax
When the Group has a legal right to settle on a net basis and intends either to settle on a net basisor to realize the assets and settle the liabilities simultaneously, current tax assets and current taxliabilities are offset and presented on a net basis.
When the Group has a legal right to settle current tax assets and liabilities on a net basis, anddeferred tax assets and deferred tax liabilities related to income taxes levied by the same taxationauthority on either the same taxable entity or different taxable entities which intend either tosettle current tax assets and liabilities on a net basis or to realize the assets and liabilitiessimultaneously, in each future period in which significant amounts of deferred tax assets orliabilities are expected to be reversed, deferred tax assets and deferred tax liabilities are offset andpresented on a net basis.
30. Leases
Lease refers to a contract in which the lessor conveys the right to use an asset for a period of time to thelessee in exchange for consideration.
At inception of a contract, the Group assesses whether the contract is, or contains, a lease. The Groupreassesses whether a contract is a lease or contains a lease only if the terms and conditions of the contractare changed.
30.1 As a lessee
30.1.1 Lease split
If a contract contains one or more lease components and non-lease components at thesame time, the Group separates each lease component and non-lease components, andallocates the consideration in the contract on the basis of the relative stand-alone price ofthe lease component and the aggregate stand-alone price of the non-lease components.
THIS DOCUMENT IS IN DRAFT FORM, INCOMPLETE AND SUBJECT TO CHANGE AND THE INFORMATION MUST BEREAD IN CONJUNCTION WITH THE SECTION HEADED “WARNING” ON THE COVER OF THIS DOCUMENT
APPENDIX IV UNAUDITED CONSOLIDATED FINANCIAL STATEMENTSFOR THE SIX MONTHS ENDED 30 JUNE 2021
– IV-46 –

30.1.2 Right-of-use asset
Except for short-term leases and low-value asset leases, the Group recognizes aright-of-use asset for lease at the commencement date of the lease term. Thescommencement date of the lease term is the date on which a lessor makes an underlyingasset available for use by the Group. Right-of-use assets are initially measured at cost.This cost comprise:
• the amount of the initial measurement of the lease liability;
• lease payments made at or before the commencement date of the lease term, lesslease incentives received if there is any;
The Group refers to relevant depreciation requirements in the CASBEs No.4 — FixedAssets to depreciate the right-of-use of asset. Right-of-use of assets in whichthe Group isreasonably certain to obtain ownership of the leased asset at the end of the lease term aredepreciated over the remaining useful life of the leased asset. Otherwise, right-of-use ofassets are depreciated over the shorter of the lease term and its remaining useful life.
The Group determines whether the right-of-use asset is impaired and accounts for it inaccordance with the relevant provisions of the “CASBEs No. 8 — Asset Impairment”.
30.1.3 Lease liability
Except for short-term leases and leases of low-value assets, at the commencement date ofthe lease term, the Group initially measures lease liabilities at the present value of theunpaid lease payments at that day. In calculating the present value of lease payments, theGroup uses the interest rate implicit in the lease as the discount rate. If that rate cannot bedetermined, the incremental borrowing interest rate is used as the discount rate.
Lease payments refer to the payments made by the Group to the lessor relating to the rightto use the leased assets during the lease term, including:
• Fixed payment and in-substance fixed payment, less any lease incentives, if thereis any;
After the commencement date of lease term, the Group calculates the interest expense ofthe lease liability in each period during the lease term using a constant periodic rate ofinterest, and recognises it in the current period profit or loss or the cost of related asset.
After the commencement date of lease term, due to a change in the lease term or a changein the assessment the purchase option, the Group remeasures the lease liability bydiscounting the revised lease payments using a revised discount rate, and adjusts thecorresponding right-of-use asset. If the carrying amount of the right-of-use asset isreduced to zero and there is a further reduction in the measurement of the lease liabilityGroup recognizes any difference in the current period profit and loss.
30.1.4 Short-term leases and low-value asset leases
The Group elects not to recognize right-of-use assets and lease liabilities to short-termleases of machinery and equipment, properties and buildings, and leases of low-valueassets. Short-term lease refers to a lease that, at the commencement date of lease term, hasa lease term of 12 months or less and does not contain a purchase option. Low-value assetlease refers to a lease for which the leased asset is of low value when it is new. The Grouprecognises the lease payments associated with short-term leases and low-value assetleases in the current period profit and loss or the cost of related asset costs on astraight-line basis in each period during the lease term.
THIS DOCUMENT IS IN DRAFT FORM, INCOMPLETE AND SUBJECT TO CHANGE AND THE INFORMATION MUST BEREAD IN CONJUNCTION WITH THE SECTION HEADED “WARNING” ON THE COVER OF THIS DOCUMENT
APPENDIX IV UNAUDITED CONSOLIDATED FINANCIAL STATEMENTSFOR THE SIX MONTHS ENDED 30 JUNE 2021
– IV-47 –

30.1.5 Lease modifications
The Group accounts for a lease modification as a separate lease if both:
• the modification increase the scope of the lease by adding the right to use one ormore underlying assets;
• the consideration increased by an amount commensurate with the stand-aloneprice for the increase in scope adjusted for the circumstances of the contract.
If the lease modification is not accounted for as a separate lease, on the effective date ofthe lease modification, the Group allocates the consideration in the modified contract,redetermines the lease term and remeasures the lease liability by discounting the revisedlease payment using a revised discount rate.
If the lease modification results in the reduction of the scope of lease or the shortening ofthe lease term, the Group decreases the carrying amount of the right-of-use assetaccordingly, and recognizes in current period profit and loss any gain or loss relating topartial or full termination of the lease. The Group adjusts the carrying amount theright-of-use asset accordingly if the lease liability is remeasured for all other leasemodifications.
30.2 As a lessor
30.2.1 Classification of leases
The Group records the operating lease business as a lessor
In each period during the lease term, the Group recognizes lease receipts from operatingleases as rental income on a straight-line basis. The initial direct costs related to operatingleases are capitalized when incurred, and amortized on the same basis as the recognitionof rental income over the lease term, and recognised in the current period profit and lossesby installments.
The variable lease receipts from operating leases obtained by the Group that are notrecognised in the lease receipts are recognised in the current period profit and losses whenthey actually occur.
30.2.2 Sale and leaseback transactions
The Group as the seller-lessee
The Group applies the requirement of CASBEs No. 14 — Revenue to assess whether thetransfer of asset in the sale and leaseback transaction constitutes a sale. If the transfer ofthe asset does not satisfy the requirement as a sale, the Group continues to recognize thetransferred asset, and at the same time recognize a financial liability equal to the transferproceeds, and account for the financial liability in accordance with the CASBEs No. 22 —Recognition and Measurement of Financial Instruments. If the transfer of the assetsatisfies the requirement as a sale, the Group measures the right-of-use asset arising fromthe leaseback at the proportion of the previous carrying amount of the asset that relates tothe right of use retained by the seller, and recognise the amount of any gain or loss thatrelates to the rights transferred to the lessor.
THIS DOCUMENT IS IN DRAFT FORM, INCOMPLETE AND SUBJECT TO CHANGE AND THE INFORMATION MUST BEREAD IN CONJUNCTION WITH THE SECTION HEADED “WARNING” ON THE COVER OF THIS DOCUMENT
APPENDIX IV UNAUDITED CONSOLIDATED FINANCIAL STATEMENTSFOR THE SIX MONTHS ENDED 30 JUNE 2021
– IV-48 –

31. Other significant accounting policies and accounting estimates
The Group continually evaluates the critical accounting estimates and key judgments applied based onhistorical experience and other factors, including expectations of future events that are believed to bereasonable.
The critical accounting estimates and key judgements that have a significant risk of causing a materialadjustment to the carrying amounts of assets and liabilities within the next financial year are outlinedbelow:
Changes in the estimate of key parameters or assumptions such as the revenue growth rate, the grossprofit margin and the discount rate adopted by the management in the calculation of the future cashflows of the asset group(s) may cause significant adjustments to the result of impairment of goodwill.
(1) Accounting estimate on impairment of goodwill
In assessing the impairment of goodwill, it is required to calculate the present value of expectedfuture cash flows arising from the corresponding assets group(s) portfolio, including theestimation of the future cash flows of the assets group(s), and apply the appropriate pre-taxdiscount rate, which is able to reflect current market assessments of the time value of money andthe risks specific to the asset group(s). The management reviews the significant estimates andassumptions at the end of each year, and recognizes the impairment of goodwill in profit or loss ofthe period.
If the effective gross profit margin, the growth rate or the pre-tax discount rate is above or belowthe management’s estimate, the provision for impairment losses of goodwill that has beenpreviously made cannot be reversed by the Group.
(2) Provision for ECL of accounts receivable
The Group uses the ECL model to assess the impairment of accounts receivable. The applicationof the ECL model requires significant judgments and estimations, and all reasonable andevidenced information, including forward-looking information, should be considered. In makingsuch judgments and estimations, the Group infers the expected changes in the debtor ’s credit riskbased on aging of the accounts receivable, historical recovery rates, etc., in combination withforward looking information including macro-economic environment, market and industry risks.The Group regularly monitors and reviews the assumptions used in the ECL model.
(3) Deferred taxation
Deferred tax assets arising from related accumulated deductible tax losses, and deductibletemporary differences have been recognized on respective balance sheet dates. The estimate fordeferred tax assets requires an estimate of taxable income and applicable tax rates in future years.The realization of deferred tax assets depends on whether the Group is likely to obtain sufficienttaxable income and taxable temporary differences in the future. Income tax expense (income) andbalance of deferred tax may be variable to changes of applicable tax rates and reversal oftemporary differences. Changes of estimation mentioned above may cause significant adjustmentof deferred tax.
THIS DOCUMENT IS IN DRAFT FORM, INCOMPLETE AND SUBJECT TO CHANGE AND THE INFORMATION MUST BEREAD IN CONJUNCTION WITH THE SECTION HEADED “WARNING” ON THE COVER OF THIS DOCUMENT
APPENDIX IV UNAUDITED CONSOLIDATED FINANCIAL STATEMENTSFOR THE SIX MONTHS ENDED 30 JUNE 2021
– IV-49 –

32. Changes in significant accounting policies and accounting estimates
The content and reason ofaccounting policy change Approval procedures Starting time
Remarks(SignificantlyAffected ReportItem Name andAmount)
The Ministry of Finance of thePeople’s Republic of Chinaissued a notice on the revisionand issuance of the “CASBEsNo. 21 — Leasing” on 13December 2018, and requiredthe enterprises adoptingCASBEs to implement thenotice on 1 January 2021 otherthan the enterprises listeddomestically and abroadsimultaneously and those listedabroad and adopting IFRS orCASBEs to prepare thefinancial statements.
The changes inaccounting policieschanges were reviewedand approved by theBoard of Directors ofthe Company on 27March, 2021.
1 January 2021 Notes V.(15), (31)
The company makescorresponding changes to thecompany’s accounting policiesin accordance with therequirements of theabove-mentioned newstandards.
In accordance with the“CASBEs No. 21 — Leasing”,the company that obtains theuse right of leased assetswithin a certain period of timeis required to fully reflect therights and obligations acquireddue to lease transactions in thefinancial statements (except forshort-term leases andlow-value asset leases).Therefore, “right-of-use assets”and “lease liabilities” need tobe recognized in accounting.
New Lease Standards
The Group implements the “CASBEs No. 21 — Leasing” amended by the Ministry of Finance in 2018(hereinafter referred to as the “New Lease Standards”, and the Leasing Standards before the revision asthe “Original Leasing Standards”) from 1 January 2021 (the “first implementation date”), and thechanges in accounting policies have been reviewed and approved by the Group’s Board of Directors on 27March 2021. The New Lease Standards complete the definition of a lease, and introduce the content oflease identification, separation and merger, etc.; cancel the classification of lessee operating leases andfinance leases; require recognition of right-of-use assets and lease liabilities, and separate recognition ofdepreciation and interest costs for all leases (except for short-term leases and low-value asset leases) onthe commencement date of the lease period; improve the subsequent measurement of the lease by alessee; add the re-assessment on selection rights and the accounting treatment for a lease change as wellas relevant disclosure requirements. In addition, the Standards also enrich the disclosure content of alessor. The Group’s revised accounting policies for the recognition and measurement of leases as lesseeand lessor are set out in Note (III), 30.
THIS DOCUMENT IS IN DRAFT FORM, INCOMPLETE AND SUBJECT TO CHANGE AND THE INFORMATION MUST BEREAD IN CONJUNCTION WITH THE SECTION HEADED “WARNING” ON THE COVER OF THIS DOCUMENT
APPENDIX IV UNAUDITED CONSOLIDATED FINANCIAL STATEMENTSFOR THE SIX MONTHS ENDED 30 JUNE 2021
– IV-50 –

For contracts that existed before the first implementation date, the Group chose not to re-assess whetherthey were leases or contained leases on the first implementation date.
The Group as the lessee
The Group adjusts the amount of retained earnings and other related items in the financial statements onthe first implementation date based on the cumulative impact of the first implementation of the new leasestandard, and does not adjust the comparable period information.
For operating leases other than low-value leases before the first implementation date, the Group choosesto adopt one or more of the following simplified treatments according to each lease:
• Leases that will be completed within 12 months from the date of first implementation are treatedas short-term leases;
• When measuring lease liabilities, leases with similar characteristics use the same discount rate;
• The measurement of right-of-use assets does not include initial direct costs;
• If there is an option to renew or terminate the lease, the Group shall determine the lease termaccording to the actual exercise of the option prior to the first exercise and other latest conditions;
• If a lease change occurs before the first implementation date, the Group will perform accountingtreatment according to the final arrangement of the lease change;
• As an alternative to the impairment test of the right-of-use assets, the Group assesses whether thecontract containing the lease is an onerous contract before the first implementation dateaccording to the “CASBEs No. 13 — Contingencies”, and adjusts the right-of-use assets based onthe provision for losses included in assets and liabilities before the first implementation date.
• For operating leases before the first implementation date, the Group measures the lease liabilitiesat the present value of remaining lease payments discounted by the lessee’s incrementalborrowing interest rate on the first implementation date, and measures the right-of-use assets atthe amount equal to the lease liabilities based on necessary adjustments to the advance rentpayments.
On 1 January 2021, the Group recognized the lease liabilities of RMB159,162,026 and the right-of-useassets of RMB165,832,759. For the operating lease prior to the first implementation date, the Groupmeasures the lease liabilities by using the present value discounted by the incremental borrowing interestrate on the first implementation date. The weighted average of the incremental borrowing interest ratefor 1 to 5 years is 4.75%, and the weighted average of the incremental borrowing interest rate for morethan 5 years is 4.90%.
The impact of the implementation of the New Lease Standards on the items in the Company’s balancesheet as at 1 January 2021 is shown below:
Item 31 December 2020 Adjustment 1 January 2021
Current assetsPrepayments 378,619,350 (6,670,733) 371,948,617Non-current assets:Right-of-use assets – 165,832,759 165,832,759Current liabilities:Non-current assets due within
one year 1,874,484,159 30,331,816 1,904,815,975Non-current liabilities:Lease liabilities – 128,830,210 128,830,210
THIS DOCUMENT IS IN DRAFT FORM, INCOMPLETE AND SUBJECT TO CHANGE AND THE INFORMATION MUST BEREAD IN CONJUNCTION WITH THE SECTION HEADED “WARNING” ON THE COVER OF THIS DOCUMENT
APPENDIX IV UNAUDITED CONSOLIDATED FINANCIAL STATEMENTSFOR THE SIX MONTHS ENDED 30 JUNE 2021
– IV-51 –

Information on the difference between the Group’s lease liabilities recognised at 1 January 2021 and thesignificant operating lease commitments disclosed in the 2020 financial statements is as follows:
Item 31 December 2020
Operating lease commitment on 31 December 2020 204,486,359Less: Effect of adjustments to borrowing interest rate on 1 January 2021 44,268,836
Lease liabilities calculated at the discount by the incremental borrowing interestrate at the first implementation date 160,217,523
Less: Confirmation of exemption — short-term leases 702,304Confirmation of exemption — leases of low-value assets 353,194
Lease liabilities related to the original operating lease recognized in accordancewith the New Lease Standards 159,162,026
Lease liabilities on 1 January 2021 159,162,026Listed as follows:Other non-current liabilities due within one year 30,331,816Lease liabilities 128,830,210
The carrying amount of the right-of-use assets on 1 January 2021 consists of:
Item 1 January 2021
Right-of-use assets:The right-of-use assets recognized for the operating lease prior to the
first implementation date 159,162,026Reclassification of prepaid rent (Note I) 6,670,733
Total 165,832,759
According to the categories:
Item 1 January 2021
Land and mine use right 78,272,699Buildings and related facilities 80,855,915Machinery and equipment 6,704,145
Total 165,832,759
Note I: The pre-paid rent of RMB6,670,733 in the Group leases was reported as prepayment at 31December 2020 and was reclassified to right-of-use assets on the first implementation date.
The Group acts as the lessor
The Group has no connection adjustments for the lease as the lessor, and will make accounting treatmentsin accordance with the New Lease Standards from the first implementation date. The implementation ofthe New Lease Standards has no significant impact on the Group’s balance sheet as at 1 January 2021.
THIS DOCUMENT IS IN DRAFT FORM, INCOMPLETE AND SUBJECT TO CHANGE AND THE INFORMATION MUST BEREAD IN CONJUNCTION WITH THE SECTION HEADED “WARNING” ON THE COVER OF THIS DOCUMENT
APPENDIX IV UNAUDITED CONSOLIDATED FINANCIAL STATEMENTSFOR THE SIX MONTHS ENDED 30 JUNE 2021
– IV-52 –

IV. TAXES
1. Major categories of taxes and tax rates
Category of tax Taxation basis Tax rate
Enterprise income tax (Note I) Taxable income 10%, 13%, 15%, 20%,25%, 30%
VAT (Note II) Taxable value added amount(tax payable is calculated at thebalance of taxable salesmultiplied by applicable tax rateless deductible VAT input for theperiod)
3%, 9%, 10%, 12%, 13%,15%, 18%
Note I: The Group’s subsidiaries Huaxin Yovon Cement LLC and Huaxin Gayur (Sogd) Cement LLC arelocated in Tajikistan. According to local tax laws, they are subject to an applicable enterpriseincome tax rate of 13% (last year: 13%)
The Group’s subsidiary Yuzhno-Kyrgyzskyi Cement CJSC is located in Kyrgyzstan. Accordingto local tax laws, it is subject to an applicable enterprise income tax rate of 10% (last year: 10%).
The Group’s subsidiary Cambodian Cement Chakrey Ting Factory Co., Ltd. is located inCambodia. According to local tax laws, it is subject to an applicable enterprise income tax rate of20% (last year: 20%).
The Group’s subsidiary Maweni limestone limited is located in Tanzania. According to local taxlaws, it is subject to an applicable enterprise income tax rate of 30%.
Except for above-mentioned subsidiaries and companies mentioned in Note IV (2) that enjoy thepreferential enterprise income tax rate, other companies shall pay the enterprise income tax at25%.
Note II: Some subsidiaries of the Group are engaged in concrete and aggregate business, the VAT forwhose product sales is paid at 3% by the simple approach.
The Group’s subsidiary Yuzhno-Kyrgyzskyi Cement CJSC is located in Kyrgyzstan and subjectto an applicable VAT rate of 12%.
The Group’s subsidiary Huaxin Cement Dzizak Co., Ltd. is located in Uzbekistan and subject toan applicable VAT rate of 15%.
The Group’s subsidiaries Huaxin Yovon Cement LLC and Huaxin Gayur (Sogd) Cement LLC arelocated in Tajikistan Republic (“Tajikistan”) and subject to an applicable VAT rate of 18%.
The Group’s subsidiaries Maweni limestone limited is located in Tanzania and subject to anapplicable VAT rate of 18%.
The Group’s subsidiary Cambodian Cement Chakrey Ting Factory Co., Ltd. is located inCambodia and subject to an applicable VAT rate of 10%.
Except for the above subsidiaries, other companies of the Group are subject to VAT rate of 13%for goods sales, and 9% for transportation services.
THIS DOCUMENT IS IN DRAFT FORM, INCOMPLETE AND SUBJECT TO CHANGE AND THE INFORMATION MUST BEREAD IN CONJUNCTION WITH THE SECTION HEADED “WARNING” ON THE COVER OF THIS DOCUMENT
APPENDIX IV UNAUDITED CONSOLIDATED FINANCIAL STATEMENTSFOR THE SIX MONTHS ENDED 30 JUNE 2021
– IV-53 –

2. Tax preferences
2.1 Enterprise income tax
The Group’s subsidiary Huaxin Cement (Huangshi) Equipment Manufacturing Co., Ltd. wasgranted Certificate of High and New Technological Enterprise by Hubei Provincial Science &Technology Department in 2018. Pursuant to the Enterprise Income Tax Law of the PRC, the abovecompany is subject to a reduced tax rate of 15% for the period (last year: 15%).
The Group’s subsidiary Huaxin Environmental Engineering Co., Ltd. was granted Certificate ofHigh and New Technological Enterprise by Hubei Provincial Science & Technology Departmentin 2019. Pursuant to the Enterprise Income Tax Law of the PRC, the above company is subject to areduced tax rate of 15% for the period (last year: 25%).The Group’s subsidiary Huaxin CementTechnology Management (Wuhan) Co., Ltd. was granted Certificate of High and NewTechnological Enterprise by Hubei Provincial Science & Technology Department in 2020.Pursuant to the Enterprise Income Tax Law of the PRC, the above company is subject to a reducedtax rate of 15% (last year: 25%) for the period.
The Group’s subsidiaries Huaxin Cement Chongqing Fuling Co., Ltd., Huaxin Cement (Enshi)Co., Ltd., Huaxin Cement (Quxian) Co., Ltd., Huaxin Cement (Wanyuan) Co., Ltd., HuaxinCement (Lijiang) Co., Ltd., Huaxin Cement (Dongjun) Co., Ltd., Huaxin Guizhou DingxiaoSpecial Cement Co., Ltd., Huaxin Cement (Zhaotong) Co., Ltd., Huaxin Hongta Cement(Jinghong) Co., Ltd., Huaxin Cement (Jianchuan) Co., Ltd., Huaxin Cement (KunmingDongchuan) Co., Ltd., Huaxin Cement (Lincang) Co., Ltd., Huaxin Cement (Honghe) Co., Ltd.,Chongqing Huaxin Diwei Cement Co., Ltd., Chongqing Huaxin Shentian Cement Co., Ltd. andGuizhou Shuicheng Shui On Cement Co., Ltd., Huaxin Cement (Fumin) Co., Ltd aremanufacturing enterprises established in western development zone of the PRC. Pursuant to CaiShui [2020] No. 23 Announcement on the Continuation of the Enterprise Income Tax Policy for Western
China Development, the applicable enterprise income tax rate of these subsidiaries for the yearsfrom 2021 to 2030 is reduced to 15%.
The Group’s subsidiary Huaxin Cement (Tibet) Co., Ltd. is a manufacturing enterpriseestablished in western development zone of the PRC and belongs to one of encouraged industriesin the State’s Western China Development Policy. Pursuant to Zang Zheng Fa [2011] No. 14 Noticeof the People’s Government of Tibet Autonomous Region on Issues Concerning the EnterpriseIncome Tax Rate in the Region, the applicable enterprise income tax rate for Huaxin Cement(Tibet) Co., Ltd. is reduced to 15% from 2011 to 2020. Pursuant to Cai Shui [2020] No. 23Announcement on the Continuation of the Enterprise Income Tax Policy for Western China Development,the applicable enterprise income tax rate of Huaxin Cement (Tibet) Co., Ltd. for the years from2021 to 2030 is reduced to 15%.
For the Group’s subsidiaries engaged in the business of environment engineering, their profitsgenerated from the business of environment protection and energy and water conservation areexempted from enterprise income tax in the first three years starting from date of firstlygenerating revenue, and can enjoy a 50% reduction from the fourth year to the sixth year.
2.2 VAT
Based on regulations in VAT Preference Items for Resource Comprehensively Utilized Products and
Labor (Cai Shui [2015] No. 78), certain subsidiaries of the Group are entitled to preference policyof VAT refunding upon paying with refunded ratio at 70%.
THIS DOCUMENT IS IN DRAFT FORM, INCOMPLETE AND SUBJECT TO CHANGE AND THE INFORMATION MUST BEREAD IN CONJUNCTION WITH THE SECTION HEADED “WARNING” ON THE COVER OF THIS DOCUMENT
APPENDIX IV UNAUDITED CONSOLIDATED FINANCIAL STATEMENTSFOR THE SIX MONTHS ENDED 30 JUNE 2021
– IV-54 –

V. NOTES TO THE CONSOLIDATED FINANCIAL STATEMENTS
1. Cash and bank balances
RMB
ItemClosingbalance
Openingbalance
Cash on hand 630,140 620,098Bank balances 7,225,962,047 8,419,626,271Other monetary assets 203,341,224 221,366,478
Total 7,429,933,411 8,641,612,847Including: Cash deposited overseas 1,031,026,480 906,642,344
Other instructions
As at 30 June 2021, other monetary assets include mine reclamation deposits of RMB74,882,830, letter ofguarantee security deposits of RMB21,819,503, notes and L/C security deposits of RMB66,184,341, saleand leaseback financing lease deposits of RMB15,000,000 and deposits of other nature of RMB25,454,550amounting to RMB203,341,224 (31 December 2020: RMB221,366,478). The restricted cash is not regardedas cash when preparing the cash flow statements.
2. Held-for-trading financial assets
RMB
ItemClosingbalance
Openingbalance
Financial assets at fair value through profit or loss – 1,004,581,752Including: Money market fund (Note) – 1,004,581,752
Total – 1,004,581,752
Note: Money market fund is issued by China International Fund Management Co., Ltd. andAegon-Industrial Fund Management Co., Ltd., which can be redeemed whenever necessary. Thefair value of this product is determined based on the market value of the latest trading price.
3. Notes receivable
3.1 Notes receivable
(1) Classification of notes receivable
RMB
ItemClosingbalance
Openingbalance
Bank acceptance 124,033,871 79,939,117
Total 124,033,871 79,939,117
THIS DOCUMENT IS IN DRAFT FORM, INCOMPLETE AND SUBJECT TO CHANGE AND THE INFORMATION MUST BEREAD IN CONJUNCTION WITH THE SECTION HEADED “WARNING” ON THE COVER OF THIS DOCUMENT
APPENDIX IV UNAUDITED CONSOLIDATED FINANCIAL STATEMENTSFOR THE SIX MONTHS ENDED 30 JUNE 2021
– IV-55 –

(2) The Group has no pledged notes receivable at the end of the period.
(3) Notes receivable of the Group that have been endorsed but were not yet due as at the balance sheet
date
RMB
ItemDerecognized
amountUnrecognized
amount
Bank acceptance – 63,565,747
(4) Disclosure by classification of bad debt provision methods
The Group believes that the credit rating of the accepting bank that holds the bankacceptance is relatively high and free of significant credit risk, thus no provision for losshas been made.
4. Accounts receivable
(1) The aging analysis of accounts receivable is as follows:
RMB
AgingClosingbalance
Openingbalance
Within 1 yearIncluding: divided into two partsWithin 6 months 835,456,293 563,211,0996 – 12 months 181,118,675 44,891,100
Subtotal 1,016,574,968 608,102,199
1 – 2 years 64,409,185 55,070,6812 – 3 years 29,193,634 43,490,378More than 3 years 111,202,960 94,919,838Less: Provision for credit loss 154,741,092 148,363,317
Total 1,066,639,655 653,219,779
THIS DOCUMENT IS IN DRAFT FORM, INCOMPLETE AND SUBJECT TO CHANGE AND THE INFORMATION MUST BEREAD IN CONJUNCTION WITH THE SECTION HEADED “WARNING” ON THE COVER OF THIS DOCUMENT
APPENDIX IV UNAUDITED CONSOLIDATED FINANCIAL STATEMENTSFOR THE SIX MONTHS ENDED 30 JUNE 2021
– IV-56 –

(2) Disclosure by bad debt provision methods
RMB
Category
Closing balance Opening balance
Account balance Bad debt provision
Carryingamount
Account balance Bad debt provision
CarryingamountAmount Proportion Amount
Proportionof
provision Amount Proportion Amount
Proportionof
provision
(%) (%) (%) (%)
Receivables forwhich bad debtprovision isassessed on anindividual basis 100,973,718 8 81,809,704 81 19,164,014 113,760,104 14 91,331,013 80 22,429,091
Receivables forwhich bad debtprovision isassessed on aportfolio basis 1,120,407,029 92 72,931,388 7 1,047,475,641 687,822,992 86 57,032,304 8 630,790,688
Total 1,221,380,747 100 154,741,092 13 1,066,639,655 801,583,096 100 148,363,317 19 653,219,779
Receivables for which bad debt provision is individually assessed:
RMB
Accounts receivable(by client)
Closing balance
Accountbalance
Bad debtprovision
Proportionof
provisionReasons for theprovision
(%)
Client A 10,327,052 10,327,052 100 RecoverabilityClient B 9,028,779 9,028,779 100 RecoverabilityClient C 6,047,509 6,047,509 100 RecoverabilityClient D 5,526,755 5,526,755 100 RecoverabilityClient E 5,470,688 5,470,688 100 RecoverabilityOthers 64,572,935 45,408,921 70 Recoverability
Total 100,973,718 81,809,704 81
THIS DOCUMENT IS IN DRAFT FORM, INCOMPLETE AND SUBJECT TO CHANGE AND THE INFORMATION MUST BEREAD IN CONJUNCTION WITH THE SECTION HEADED “WARNING” ON THE COVER OF THIS DOCUMENT
APPENDIX IV UNAUDITED CONSOLIDATED FINANCIAL STATEMENTSFOR THE SIX MONTHS ENDED 30 JUNE 2021
– IV-57 –

Portfolios that aging analysis is used for bad debt provision
Category of cement receivable:
RMB
Name
Closing balance
Accountsreceivable
Bad debtprovision
Expected averageloss rate
(%)
Within 6 months 179,685,137 3,702,380 26 – 12 months 11,705,962 1,615,423 141 – 2 years 933,544 376,218 402 – 3 years 5,284,742 3,334,672 63More than 3 years 16,445,395 15,293,376 93
Total 214,054,780 24,322,069
Category of concrete receivable:
RMB
Name
Closing balance
Accountsreceivable
Bad debtprovision
Expected averageloss rate
(%)
Within 6 months 400,511,075 10,012,777 36 – 12 months 132,969,526 5,584,720 41 – 2 years 49,591,223 10,810,887 222 – 3 years 3,717,435 2,557,595 69More than 3 years 8,560,353 8,147,678 95
Total 595,349,612 37,113,657
Category of other business receivable:
RMB
Name
Closing balance
Accountsreceivable
Bad debtprovision
Expected averageloss rate
(%)
Within 6 months 255,260,079 262,109 0.16 – 12 months 35,470,651 496,589 11 – 2 years 4,583,047 595,796 132 – 3 years 6,302,431 3,189,030 51More than 3 years 9,386,429 6,952,138 74
Total 311,002,637 11,495,662
THIS DOCUMENT IS IN DRAFT FORM, INCOMPLETE AND SUBJECT TO CHANGE AND THE INFORMATION MUST BEREAD IN CONJUNCTION WITH THE SECTION HEADED “WARNING” ON THE COVER OF THIS DOCUMENT
APPENDIX IV UNAUDITED CONSOLIDATED FINANCIAL STATEMENTSFOR THE SIX MONTHS ENDED 30 JUNE 2021
– IV-58 –

(3) Bad debt provision
RMB
CategoryOpening
balance
Changes for the period
ClosingbalanceProvision
Recovery orreversal
Write-off orelimination
Otherchanges
Bad debtprovision foraccountsreceivable 148,363,317 19,369,513 (7,134,322) (5,857,416) – 154,741,092
Total 148,363,317 19,369,513 (7,134,322) (5,857,416) – 154,741,092
(4) Accounts receivable written off in the reporting period
RMB
Item Write-off amount
Accounts receivable written off 5,857,416
(5) Top five entities with the largest balances of accounts receivable:
RMB
Item
Closing balanceof accounts
receivable % of total balance
Closing balanceof bad debt
provision
Client K 35,198,802 3 98,751Client L 23,414,324 2 2,082,955Client M 20,857,437 2 1,017,146Client N 19,986,955 2 399,739Client O 19,984,824 2 648,370
Total 119,442,342 4,246,961
5. Financing with receivables
RMB
Item Closing balance Opening balance
Bank acceptance notes 937,354,912 1,020,306,419
Total 937,354,912 1,020,306,419
THIS DOCUMENT IS IN DRAFT FORM, INCOMPLETE AND SUBJECT TO CHANGE AND THE INFORMATION MUST BEREAD IN CONJUNCTION WITH THE SECTION HEADED “WARNING” ON THE COVER OF THIS DOCUMENT
APPENDIX IV UNAUDITED CONSOLIDATED FINANCIAL STATEMENTSFOR THE SIX MONTHS ENDED 30 JUNE 2021
– IV-59 –

Other explanation:
Financing with receivables of the Company pledged at the end of the period
RMB
ItemAmount pledged
at the end of the period
Bank acceptance notes 98,631,671
Financing with receivables of the Company that has been endorsed but has not yet expired as at thebalance sheet date
RMB
ItemDerecognized
amountNon-derecognized
amount
Bank acceptance — endorsed but not yet expired as at thebalance sheet date 1,357,639,983 –
6. Prepayments
(1) Aging analysis of prepayments is as follows:
RMB
Item
Closing balance Opening balance
Amount Proportion Amount Proportion
(%) (%)
Within 1 year 298,516,404 93 356,458,523 941 – 2 years 8,835,715 3 13,999,597 42 – 3 years 6,406,982 1 1,669,076 –Over 3 years 8,131,787 3 6,492,154 2
Total 321,890,888 100 378,619,350 100
(2) Top five entities with the largest balances of prepayment:
RMB
Name of supplier Amount % of total balance
Supplier A 44,972,889 14Supplier B 25,896,830 8Supplier C 23,417,454 7Supplier D 20,000,000 6Supplier E 19,903,448 6
Total 134,190,621 41
THIS DOCUMENT IS IN DRAFT FORM, INCOMPLETE AND SUBJECT TO CHANGE AND THE INFORMATION MUST BEREAD IN CONJUNCTION WITH THE SECTION HEADED “WARNING” ON THE COVER OF THIS DOCUMENT
APPENDIX IV UNAUDITED CONSOLIDATED FINANCIAL STATEMENTSFOR THE SIX MONTHS ENDED 30 JUNE 2021
– IV-60 –

7. Other receivables
7.1 Summary of other receivables
RMB
Item Closing balance Opening balance
Interest receivable 79,399 641,915Other receivables 371,440,701 374,612,043
Total 371,520,100 375,253,958
7.2 Portfolios that aging analysis is used for bad debt provision
(1) Disclosure by aging
RMB
Aging Closing balance Opening balance
Within 1 year 178,356,988 205,052,6221 – 2 years 72,226,981 45,334,6012 – 3 years 28,679,928 42,287,372Over 3 years 195,426,161 182,262,818Less: Credit impairment allowance 103,249,357 100,325,370
Total 371,440,701 374,612,043
(2) Disclosure of other receivables by categories
RMB
Nature Closing balance Opening balance
Margin and deposits 265,943,065 278,131,546Loans and out-of-pocket expenses 154,613,886 152,945,422Petty cash 7,345,070 3,381,797Others 46,788,037 40,478,648
Total 474,690,058 474,937,413
THIS DOCUMENT IS IN DRAFT FORM, INCOMPLETE AND SUBJECT TO CHANGE AND THE INFORMATION MUST BEREAD IN CONJUNCTION WITH THE SECTION HEADED “WARNING” ON THE COVER OF THIS DOCUMENT
APPENDIX IV UNAUDITED CONSOLIDATED FINANCIAL STATEMENTSFOR THE SIX MONTHS ENDED 30 JUNE 2021
– IV-61 –

(3) Bad debt provision
RMB
CategoryOpening
balance
Changes for the period
ClosingbalanceProvision
Recovery orreversal
Write-off orelimination
Otherchanges
Bad debtprovision forotherreceivables 100,325,370 4,342,284 (1,386,647) (31,650) – 103,249,357
Total 100,325,370 4,342,284 (1,386,647) (31,650) – 103,249,357
(4) Other receivables written off in the current period
RMB
Item Write-off amount
Other receivables written off 31,650
(5) Top five entities with the largest balances of other receivables
RMB
Companyname Nature of receivables
Closingbalance Aging
(%) of totalbalance
Closingbalance of
bad debtprovision
Client P Project deposits 66,892,000 Within 1 year 14 –Client Q Advance money on
behalf of thegovernment
38,927,223 Over 3 years 8 38,927,223
Client R Security deposit ofmine restoration
30,763,691 Over 3 years 6 –
Client S Withholding amounts 27,045,327 Within 1 year,1-2 years,2-3 yearsand over 3years
6 22,349,477
Client T Inter-company loans 27,027,341 Over 3 years 6 27,027,341
Total / 190,655,582 / 40 88,304,041
THIS DOCUMENT IS IN DRAFT FORM, INCOMPLETE AND SUBJECT TO CHANGE AND THE INFORMATION MUST BEREAD IN CONJUNCTION WITH THE SECTION HEADED “WARNING” ON THE COVER OF THIS DOCUMENT
APPENDIX IV UNAUDITED CONSOLIDATED FINANCIAL STATEMENTSFOR THE SIX MONTHS ENDED 30 JUNE 2021
– IV-62 –

8. Inventories
(1) Categories of inventories
RMB
Item
Closing balance Opening balance
Accountbalance
Provision fordecline in
value ofinventories
Carryingamount
Accountbalance
Provision fordecline in
value ofinventories
Carryingamount
Raw materials 1,085,336,815 763,072 1,084,573,743 873,139,368 763,072 872,376,296Work in progress 647,190,030 165,122 647,024,908 587,286,515 165,122 587,121,393Finished goods 683,903,798 – 683,903,798 495,705,006 – 495,705,006Spare parts 570,714,976 88,084,930 482,630,046 481,868,753 87,915,259 393,953,494
Total 2,987,145,619 89,013,124 2,898,132,495 2,437,999,642 88,843,453 2,349,156,189
(2) Provision for decline in value of inventories
RMB
ItemOpening
balance
Increase Decrease
ClosingbalanceProvision Others
Reversal orwrite-off Others
Raw materials 763,072 – – – – 763,072Work in progress 165,122 – – – – 165,122Spare parts 87,915,259 4,052,757 – 3,883,086 – 88,084,930
Total 88,843,453 4,052,757 – 3,883,086 – 89,013,124
9. Other current assets
RMB
Closing balance Opening balance
Retained VAT 321,218,875 377,511,753Prepaid income tax 9,040,768 4,831,943Payments related to equity merger and acquisition 233,727,269 236,071,742Others 18,955,663 13,507,360
Total 582,942,575 631,922,798
THIS DOCUMENT IS IN DRAFT FORM, INCOMPLETE AND SUBJECT TO CHANGE AND THE INFORMATION MUST BEREAD IN CONJUNCTION WITH THE SECTION HEADED “WARNING” ON THE COVER OF THIS DOCUMENT
APPENDIX IV UNAUDITED CONSOLIDATED FINANCIAL STATEMENTSFOR THE SIX MONTHS ENDED 30 JUNE 2021
– IV-63 –

10. Long-term equity investments
RMB
investeeOpening
balance
Changes for the period
Closingbalance
Closingbalance of
impairmentprovision
Increase ininvestment
Investmentincome/
losses underequity
methodOther equity
changes
I. Joint ventureHuaxin Traffic Investment
(Chibi) New BuildingMaterials Co., Ltd. 60,791,825 – 5,132,795 – 65,924,620 –
Sub total 60,791,825 – 5,132,795 – 65,924,620 –
II. AssociatesTibet High-tech Building
Materials GroupCo., Ltd. 356,279,532 – 7,189,320 257,958 363,726,810 –
Shanghai Wan’an HuaxinCement Co., Ltd. 92,413,957 – (255,036) – 92,158,921 –
Zhangjiajie TianziConcrete Co., Ltd. 2,750,887 – (826,708) – 1,924,179 –
Chenfeng IntelligentEquipment HubeiCo., Ltd 45,000 – – – 45,000 –
Yangxin County FuhuaHandling Co., Ltd. – 70,000,000 – – 70,000,000 –
Sub total 451,489,376 70,000,000 6,107,576 257,958 527,854,910 –
Total 512,281,201 70,000,000 11,240,371 257,958 593,779,530 –
Note: On 18 January, 2021, the Group and Yangxin County Transportation Investment Co., Ltd. jointlyinvested to set up Yangxin County Fuhua Handling Co., Ltd. The Group holds 35% of the sharesand Yangxin County Transportation Investment Co., Ltd. holds 65% of the shares.
THIS DOCUMENT IS IN DRAFT FORM, INCOMPLETE AND SUBJECT TO CHANGE AND THE INFORMATION MUST BEREAD IN CONJUNCTION WITH THE SECTION HEADED “WARNING” ON THE COVER OF THIS DOCUMENT
APPENDIX IV UNAUDITED CONSOLIDATED FINANCIAL STATEMENTSFOR THE SIX MONTHS ENDED 30 JUNE 2021
– IV-64 –

11. Other equity instrument investments
(1) Other equity instrument investments
RMB
Item Closing balance Opening balance
Investments in equity instruments 35,180,864 33,774,995
Total 35,180,864 33,774,995
(2) Investments in non-trading equity instruments
RMB
Item
Dividendincome
recognizedfor the period
Accumulatedgains
Accumulatedlosses
Amount ofretainedearnings
transferredfrom other
comprehensiveincome
Reasons for thetransfer
Investments inequityinstruments
– 23,456,198 2,775,600 – /
Total – 23,456,198 2,775,600 – /
12. Other non-current financial assets
RMB
Item Closing balance Opening balance
Investments in equity instruments 28,086,810 32,827,254
Total 28,086,810 32,827,254
13. Fixed assets
Categories
RMB
Item Closing balance Opening balance
Fixed assets 19,472,859,746 19,174,711,857Disposal of fixed assets 8,870,891 10,918,400
Total 19,481,730,637 19,185,630,257
THIS DOCUMENT IS IN DRAFT FORM, INCOMPLETE AND SUBJECT TO CHANGE AND THE INFORMATION MUST BEREAD IN CONJUNCTION WITH THE SECTION HEADED “WARNING” ON THE COVER OF THIS DOCUMENT
APPENDIX IV UNAUDITED CONSOLIDATED FINANCIAL STATEMENTSFOR THE SIX MONTHS ENDED 30 JUNE 2021
– IV-65 –

(1) Fixed assets
RMB
BuildingsMachinery and
equipmentOffice
equipmentTransportation
vehicles Total
I. Cost1. Opening balance 15,206,895,171 18,442,775,075 286,841,213 486,683,014 34,423,194,4732. Addition 496,439,322 662,686,259 5,750,486 56,578,308 1,221,454,375
(1) Purchase 1,936,971 13,250,022 2,676,270 9,337,082 27,200,345(2) Transferred from
construction in progress 442,892,891 605,247,992 2,346,541 29,829,159 1,080,316,583(3) Increase due to business
combination 51,609,460 44,188,245 727,675 17,412,067 113,937,4473. Reduction 18,868,420 76,963,174 2,013,162 42,678,068 140,522,824
(1) Disposal or retirement 17,177,518 76,757,842 1,865,257 42,678,068 138,478,685(2) Disposal of subsidiaries 1,690,902 205,332 147,905 – 2,044,139
4. Translation differences offinancial statementsdenominated in foreigncurrencies (20,040,008) (28,850,747) (218,081) (1,052,961) (50,161,797)
5. Closing balance 15,664,426,065 18,999,647,413 290,360,456 499,530,293 35,453,964,227II. Accumulated depreciation
1. Opening balance 4,068,881,305 10,155,129,191 208,320,679 368,652,941 14,800,984,1162. Addition 249,855,139 550,811,180 9,029,159 25,849,504 835,544,982
(1) Provision made during theyear 249,855,139 550,811,180 9,029,159 25,849,504 835,544,982
3. Reductions 4,708,299 64,566,404 1,942,706 40,562,886 111,780,295(1) Disposal or retirement 3,487,770 64,421,922 1,810,840 40,562,886 110,283,418(2) Disposal of subsidiaries 1,220,529 144,482 131,866 – 1,496,877
4. Translation differences offinancial statementsdenominated in foreigncurrencies (4,178,525) (5,274,132) (90,154) (798,416) (10,341,227)
5. Closing balance 4,309,849,620 10,636,099,835 215,316,978 353,141,143 15,514,407,576III. Provision for impairment losses
1. Opening balance 263,419,885 183,778,033 129,918 170,664 447,498,5002. Addition 16,791,806 2,679,864 104,647 22,351 19,598,668
(1) Provision made during theyear 16,791,806 2,679,864 104,647 22,351 19,598,668
3. Reductions 9,280 377,828 13,155 – 400,263(1) Disposal or retirement 9,280 377,828 13,155 – 400,263
4. Closing balance 280,202,411 186,080,069 221,410 193,015 466,696,905IV. Net book value
1. Closing balance 11,074,374,034 8,177,467,509 74,822,068 146,196,135 19,472,859,7462. Opening balance 10,874,593,981 8,103,867,851 78,390,616 117,859,409 19,174,711,857
As at 30 June 2021, buildings and machinery and equipment with carrying amount ofRMB5,801,615 (cost of RMB8,083,098) (31 December 2020: the of net book value RMB5,896,890 andthe cost of RMB8,083,098) are treated as the collateral for short-term borrowings. Details are setout in Note V (21).
THIS DOCUMENT IS IN DRAFT FORM, INCOMPLETE AND SUBJECT TO CHANGE AND THE INFORMATION MUST BEREAD IN CONJUNCTION WITH THE SECTION HEADED “WARNING” ON THE COVER OF THIS DOCUMENT
APPENDIX IV UNAUDITED CONSOLIDATED FINANCIAL STATEMENTSFOR THE SIX MONTHS ENDED 30 JUNE 2021
– IV-66 –

(2) Fixed assets leased through sale and leaseback
RMB
Item CostAccumulateddepreciation
Impairmentprovision
Carryingamount
Machinery andequipment 290,000,000 201,388,889 – 88,611,111
The above finance lease of fixed assets is a sale-leaseback transaction, and the Group has notderecognized the relevant fixed assets.
(3) Fixed assets leased at under operating lease
RMB
Item Closing balance
Concrete batching plant 16,548,662
14. Construction in progress
Categories
RMB
Item Closing balance Opening balance
Construction in progress 3,995,356,858 2,967,890,214Materials for construction of fixed assets 75,451,094 136,539,126
Total 4,070,807,952 3,104,429,340
THIS DOCUMENT IS IN DRAFT FORM, INCOMPLETE AND SUBJECT TO CHANGE AND THE INFORMATION MUST BEREAD IN CONJUNCTION WITH THE SECTION HEADED “WARNING” ON THE COVER OF THIS DOCUMENT
APPENDIX IV UNAUDITED CONSOLIDATED FINANCIAL STATEMENTSFOR THE SIX MONTHS ENDED 30 JUNE 2021
– IV-67 –
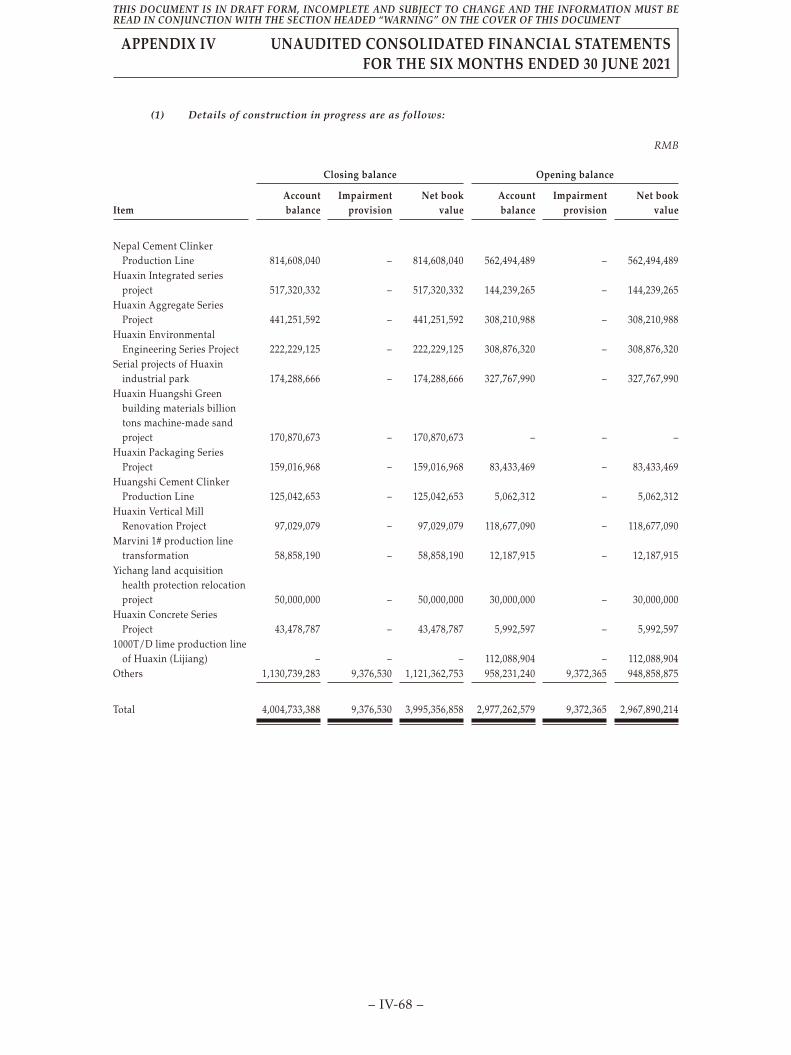
(1) Details of construction in progress are as follows:
RMB
Item
Closing balance Opening balance
Accountbalance
Impairmentprovision
Net bookvalue
Accountbalance
Impairmentprovision
Net bookvalue
Nepal Cement ClinkerProduction Line 814,608,040 – 814,608,040 562,494,489 – 562,494,489
Huaxin Integrated seriesproject 517,320,332 – 517,320,332 144,239,265 – 144,239,265
Huaxin Aggregate SeriesProject 441,251,592 – 441,251,592 308,210,988 – 308,210,988
Huaxin EnvironmentalEngineering Series Project 222,229,125 – 222,229,125 308,876,320 – 308,876,320
Serial projects of Huaxinindustrial park 174,288,666 – 174,288,666 327,767,990 – 327,767,990
Huaxin Huangshi Greenbuilding materials billiontons machine-made sandproject 170,870,673 – 170,870,673 – – –
Huaxin Packaging SeriesProject 159,016,968 – 159,016,968 83,433,469 – 83,433,469
Huangshi Cement ClinkerProduction Line 125,042,653 – 125,042,653 5,062,312 – 5,062,312
Huaxin Vertical MillRenovation Project 97,029,079 – 97,029,079 118,677,090 – 118,677,090
Marvini 1# production linetransformation 58,858,190 – 58,858,190 12,187,915 – 12,187,915
Yichang land acquisitionhealth protection relocationproject 50,000,000 – 50,000,000 30,000,000 – 30,000,000
Huaxin Concrete SeriesProject 43,478,787 – 43,478,787 5,992,597 – 5,992,597
1000T/D lime production lineof Huaxin (Lijiang) – – – 112,088,904 – 112,088,904
Others 1,130,739,283 9,376,530 1,121,362,753 958,231,240 9,372,365 948,858,875
Total 4,004,733,388 9,376,530 3,995,356,858 2,977,262,579 9,372,365 2,967,890,214
THIS DOCUMENT IS IN DRAFT FORM, INCOMPLETE AND SUBJECT TO CHANGE AND THE INFORMATION MUST BEREAD IN CONJUNCTION WITH THE SECTION HEADED “WARNING” ON THE COVER OF THIS DOCUMENT
APPENDIX IV UNAUDITED CONSOLIDATED FINANCIAL STATEMENTSFOR THE SIX MONTHS ENDED 30 JUNE 2021
– IV-68 –

(2)
Cha
nges
insi
gnif
ican
tco
nstr
ucti
onin
prog
ress
:
RM
B
Proj
ectn
ame
Budg
etO
peni
ngba
lanc
eAd
ditio
nTr
ansf
erto
fixed
asse
tsO
ther
redu
ction
sCl
osin
gba
lanc
e
Accu
mul
ated
cost
incu
rred
outo
fbud
get
Cons
tructi
onPr
ogre
ss
Accu
mul
ated
capi
taliz
edin
tere
st
Inclu
ding
:Ca
pita
lized
inte
rest
for
thep
erio
d
Inte
rest
capi
taliz
atio
nra
tefo
rthe
perio
dSo
urce
offu
nds
(%)
(%)
(%)
Nepa
lCem
entC
linke
rPr
oduc
tion
Line
949,6
34,70
056
2,494
,489
252,1
13,55
1–
–81
4,608
,040
8686
2,809
,489
––
Self-
owne
dfu
ndsa
ndba
nkbo
rrowi
ngs
Huax
inIn
tegr
ated
serie
spr
oject
1,288
,254,2
0014
4,239
,265
473,2
78,77
494
,102,1
396,0
95,56
851
7,320
,332
N/A
N/A
––
–Se
lf-ow
ned
fund
s
Huax
inAg
greg
ateS
eries
Proje
ct1,1
63,57
7,418
308,2
10,98
824
0,006
,361
104,9
42,84
52,0
22,91
244
1,251
,592
N/A
N/A
4,931
,937
3,590
,257
3.00
Self-
owne
dfu
ndsa
ndba
nkbo
rrowi
ngs
Huax
inEn
viro
nmen
tal
Engi
neer
ing
Serie
sPr
oject
846,4
87,95
730
8,876
,320
52,10
5,582
121,3
88,17
917
,364,5
9822
2,229
,125
N/A
N/A
––
–Se
lf-ow
ned
fund
s
Seria
lpro
jects
ofHu
axin
indu
strial
park
440,0
77,00
032
7,767
,990
7,512
,239
160,9
91,56
3–
174,2
88,66
6N/
AN/
A–
––
Self-
owne
dfu
nds
Huax
inHu
angs
hiGr
een
build
ing
mat
erial
sbi
llion
tons
mac
hine
-m
ades
and
proje
ct
9,957
,000,0
00–
171,2
58,29
238
7,619
–17
0,870
,673
22
––
–Se
lf-ow
ned
fund
s
Huax
inPa
ckag
ing
Serie
sPr
oject
401,2
27,47
283
,433,4
6982
,437,3
626,4
94,59
335
9,270
159,0
16,96
8N/
AN/
A–
––
Self-
owne
dfu
nds
Huan
gshi
Cem
entC
linke
rPr
oduc
tion
Line
2,208
,039,8
005,0
62,31
224
1,774
,993
121,7
94,65
2–
125,0
42,65
382
8256
,984,8
26–
–Se
lf-ow
ned
fund
sand
bank
borro
wing
sHu
axin
Verti
calM
illRe
nova
tion
Proje
ct30
9,373
,940
118,6
77,09
05,2
75,12
812
3,894
26,79
9,245
97,02
9,079
N/A
N/A
––
–Se
lf-ow
ned
fund
s
Mar
vini
1#pr
oduc
tion
line
trans
form
atio
n22
5,473
,850
12,18
7,915
46,67
0,275
––
58,85
8,190
2626
––
–Se
lf-ow
ned
fund
s
Yich
ang
land
acqu
isitio
nhe
alth
prot
ectio
nre
loca
tion
proje
ct
63,00
0,000
30,00
0,000
20,00
0,000
––
50,00
0,000
7979
––
–Se
lf-ow
ned
fund
s
Huax
inCo
ncre
teSe
ries
Proje
ct32
3,142
,567
5,992
,597
39,84
3,757
2,357
,567
–43
,478,7
87N/
AN/
A–
––
Self-
owne
dfu
nds
1000
T/D
limep
rodu
ction
lineo
fHua
xin
(Liji
ang)
155,0
11,38
711
2,088
,904
40,20
4,840
152,2
93,74
4–
100
100
Self-
owne
dfu
nds
Othe
rs94
8,858
,875
498,5
16,39
531
5,439
,788
10,57
2,729
1,121
,362,7
53N/
AN/
A11
,537,9
02–
–Se
lf-ow
ned
fund
sand
bank
borro
wing
s
Tota
l2,9
67,89
0,214
2,170
,997,5
491,0
80,31
6,583
63,21
4,322
3,995
,356,8
5876
,264,1
543,5
90,25
7/
Not
e:A
sth
ere
are
man
yp
roje
cts
un
der
con
stru
ctio
nof
the
sam
en
atu
rein
som
ebu
sin
ess
segm
ents
,th
eyar
em
erge
din
toa
seri
esof
pro
ject
sfo
rd
iscl
osu
re;T
he
bud
get,
actu
alin
ves
tmen
tan
dp
roje
ctp
rogr
ess
can
not
bed
iscl
osed
one
byon
e,so
the
pro
por
tion
ofcu
mu
lati
ve
inv
estm
ent
inth
ebu
dge
tan
dp
roje
ctp
rogr
ess
for
ase
ries
ofp
roje
cts
is“N
/A
”;A
tth
esa
me
tim
e,th
ere
lev
ant
cap
ital
ized
inte
rest
amou
nt
isge
ner
ated
byth
ep
roje
ctw
ith
ban
klo
ans
inth
ese
ries
ofp
roje
cts.
THIS DOCUMENT IS IN DRAFT FORM, INCOMPLETE AND SUBJECT TO CHANGE AND THE INFORMATION MUST BEREAD IN CONJUNCTION WITH THE SECTION HEADED “WARNING” ON THE COVER OF THIS DOCUMENT
APPENDIX IV UNAUDITED CONSOLIDATED FINANCIAL STATEMENTSFOR THE SIX MONTHS ENDED 30 JUNE 2021
– IV-69 –

(3) Changes in provision for impariment losses for construction in progress are as follows:
RMB
ItemOpening
balance Provision ReductionsClosingbalance Reason for provision
Fangxian CountyProject of HuaxinEnvironmentEngineering
1,520,583 – – 1,520,583 The project has not been approved by thegovernment and some of thesub-projects have been suspended bythe management.
Loudi Project ofHuaxin EnvironmentEngineering
5,473,353 4,165 – 5,477,518 The project has been suspended due toinvalidation of initial planning
Mining rights projectof Enping Company
1,892,993 – – 1,892,993 The project has been suspended due toinvalidation of safe production limit ofmining
Mining rights ofHeshangbao, Zigui
485,436 – – 485,436 The project has been suspended due toinvalidation of initial planning
Total 9,372,365 4,165 – 9,376,530 /
Materials for construction of fixed assets
RMB
Item
Closing balance Opening balance
Accountbalance
Impairmentprovision
Net bookvalue
Accountbalance
Impairmentprovision
Net bookvalue
Specialequipment 75,451,094 – 75,451,094 136,539,126 – 136,539,126
Total 75,451,094 – 75,451,094 136,539,126 – 136,539,126
THIS DOCUMENT IS IN DRAFT FORM, INCOMPLETE AND SUBJECT TO CHANGE AND THE INFORMATION MUST BEREAD IN CONJUNCTION WITH THE SECTION HEADED “WARNING” ON THE COVER OF THIS DOCUMENT
APPENDIX IV UNAUDITED CONSOLIDATED FINANCIAL STATEMENTSFOR THE SIX MONTHS ENDED 30 JUNE 2021
– IV-70 –

15. Right-of-use assets
RMB
Items
Land use rightand mine use
right (Note)Buildings and
related facilitiesMachinery and
equipment
Automobilesand
transportationequipment Total
I. Cost1. Opening Balance 78,272,699 80,855,915 6,704,145 – 165,832,7592. Addition 32,420,822 5,169,571 1,423,658 234,587 39,248,638
(1) Rent 32,420,822 5,169,571 1,423,658 234,587 39,248,6383. Closing balance 110,693,521 86,025,486 8,127,803 234,587 205,081,397
II. Accumulateddepreciation
1. Opening Balance – – – – –2. Addition 8,071,731 6,440,875 958,386 62,480 15,533,472
(1) Provisionmade duringthe year 8,071,731 6,440,875 958,386 62,480 15,533,472
3. Closing balance 8,071,731 6,440,875 958,386 62,480 15,533,472III. Net book value
1. Closing balance 102,621,790 79,584,611 7,169,417 172,107 189,547,9252. Opening balance 78,272,699 80,855,915 6,704,145 – 165,832,759
Note: The project includes the mine use right leased by the Group and the land use right leasedoverseas.
Other explanation:
In the current period, the cost of short-term lease and the cost of lease of low-value assets included in thesimplified treatment of current profit and loss amounted to RMB8,088,088. The total lease related cashoutflow for the period was RMB20,615,022, of which the cash outflow of lease liabilities wasRMB12,526,934. The right to use assets are restricted assets because they cannot be disposed of.
THIS DOCUMENT IS IN DRAFT FORM, INCOMPLETE AND SUBJECT TO CHANGE AND THE INFORMATION MUST BEREAD IN CONJUNCTION WITH THE SECTION HEADED “WARNING” ON THE COVER OF THIS DOCUMENT
APPENDIX IV UNAUDITED CONSOLIDATED FINANCIAL STATEMENTSFOR THE SIX MONTHS ENDED 30 JUNE 2021
– IV-71 –

16. Intangible assets
(1) Intangible assets
RMB
ItemLand use
rightsMining
rights
Minerestoration
feesConcession
rightsSoftware
and others Total
I. Cost1. Opening Balance 2,767,588,560 1,922,911,508 314,133,148 168,200,597 215,056,226 5,387,890,0392. Addition 35,356,376 355,937,906 – – 5,619,212 396,913,494
(1) Purchase 3,866,782 355,937,906 – – 5,575,414 365,380,102(2) Increase due to
businesscombination 31,489,594 – – – 43,798 31,533,392
3. Reduction 235,771 – – – 1,148,974 1,384,745(1) Disposal of
subsidiaries 235,771 – – – 125,191 360,962(2) Disposal and
retirement – – – – 1,023,783 1,023,7834. Translation differences
of financialstatementsdenominated inforeign currencies (34,074) (8,752,710) (1,447) – (607,562) (9,395,793)
5. Closing Balance 2,802,675,091 2,270,096,704 314,131,701 168,200,597 218,918,902 5,774,022,995II. Accumulated amortization
1. Opening Balance 466,407,889 310,936,427 84,075,882 34,234,743 201,701,948 1,097,356,8892. Addition 32,088,857 92,790,176 6,967,458 7,316,184 10,714,293 149,876,968
(1) Provision 32,088,857 92,790,176 6,967,458 7,316,184 10,714,293 149,876,9683. Reduction 72,309 – – – 1,141,287 1,213,596
(1) Disposal ofsubsidiaries 72,309 – – – 125,191 197,500
(2) Disposal andretirement – – – – 1,016,096 1,016,096
4. Translation differencesof financialstatementsdenominated inforeign currencies (3,264) (519,343) – – (47,471) (570,078)
5. Closing Balance 498,421,173 403,207,260 91,043,340 41,550,927 211,227,483 1,245,450,183III. Impairment provision
1. Opening Balance – 23,524,969 – – – 23,524,9692. Addition – – – – – –
(1) Provision – – – – – –3. Reduction – – – – – –
(1) Disposal – – – – – –4. Closing Balance – 23,524,969 – – – 23,524,969
IV. Net book value1. Closing Balance 2,304,253,918 1,843,364,475 223,088,361 126,649,670 7,691,419 4,505,047,8432. Opening Balance 2,301,180,671 1,588,450,112 230,057,266 133,965,854 13,354,278 4,267,008,181
Other explanation:
As at 30 June 2021, the land use rights with carrying amount of RMB6,168,325 (the cost ofRMB8,497,487) (31 December 2020: the carrying amount of RMB6,254,797 and the cost ofRMB8,497,487) are treated as collaterals for short-term borrowings. Details are set out in Note V.(21).
THIS DOCUMENT IS IN DRAFT FORM, INCOMPLETE AND SUBJECT TO CHANGE AND THE INFORMATION MUST BEREAD IN CONJUNCTION WITH THE SECTION HEADED “WARNING” ON THE COVER OF THIS DOCUMENT
APPENDIX IV UNAUDITED CONSOLIDATED FINANCIAL STATEMENTSFOR THE SIX MONTHS ENDED 30 JUNE 2021
– IV-72 –

17. Goodwill
(1) Original carrying amount of goodwill
RMB
Name of investee ormatters that formsgoodwill
OpeningBalance
Addition Reduction
ClosingBalance
Goodwillarising from
businesscombinations Disposal
Huaxin Cement(Daye) Co., Ltd. 189,057,605 – – 189,057,605
Cambodian CementChakrey TingFactory Co., Ltd. 125,767,908 – – 125,767,908
Huaxin JinlongCement (Yunxian)Co., Ltd. 101,685,698 – – 101,685,698
Success Eagle Cement(Hong Kong)Limited and itssubsidiaries 69,557,768 – – 69,557,768
Huaxin Cement(E’zhou) Co., Ltd. 21,492,135 – – 21,492,135
NETNIX LIMITED 59,573,587 – – 59,573,587Hainan Xinhongda
Building MaterialsCo., LTD – 134,965,314 – 134,965,314
Total 567,134,701 134,965,314 – 702,100,015
(2) Provision for impairment of goodwill
RMB
Name of investee ormatters that formsgoodwill
OpeningBalance
Addition Reduction ClosingBalanceProvision Disposal
Success Eagle Cement(Hong Kong)Limited and itssubsidiaries 69,557,768 – – 69,557,768
Huaxin Cement(E’zhou) Co., Ltd. 21,492,135 – – 21,492,135
Total 91,049,903 – – 91,049,903
THIS DOCUMENT IS IN DRAFT FORM, INCOMPLETE AND SUBJECT TO CHANGE AND THE INFORMATION MUST BEREAD IN CONJUNCTION WITH THE SECTION HEADED “WARNING” ON THE COVER OF THIS DOCUMENT
APPENDIX IV UNAUDITED CONSOLIDATED FINANCIAL STATEMENTSFOR THE SIX MONTHS ENDED 30 JUNE 2021
– IV-73 –

18. Long-term prepaid expenses
RMB
ItemOpeningBalance Addition Amortization
Otherreduction
ClosingBalance
Mine developmentcost 275,372,670 – 14,950,379 – 260,422,291
Others 88,388,104 – 15,300,194 – 73,087,910
Total 363,760,774 – 30,250,573 – 333,510,201
19. Deferred tax assets/Deferred tax liabilities
(1) Details of deferred tax assets before offsetting
RMB
Item
Closing Balance Opening Balance
Deductibletemporary
differencesDeferred tax
assets
Deductibletemporary
differencesDeferred tax
assets
Provision forimpairment ofassets 326,581,350 65,396,503 330,765,172 67,387,562
Difference betweenthe fair value andthe tax cost ofidentifiable assetsof businesscombination 586,055,584 174,288,228 663,906,512 194,457,607
Temporary differencearising fromexpense recognition 392,330,702 89,868,323 394,662,984 92,044,072
Unrealized profitarising fromintra-grouptransactions 239,864,306 59,966,076 224,685,679 56,171,420
Deductible tax losses 63,494,078 15,413,527 54,756,858 13,689,215Provision for staff
welfare 96,222,262 21,992,795 63,638,841 13,973,057Others 55,341,073 17,672,852 56,275,616 12,831,370
Total 1,759,889,355 444,598,304 1,788,691,662 450,554,303
THIS DOCUMENT IS IN DRAFT FORM, INCOMPLETE AND SUBJECT TO CHANGE AND THE INFORMATION MUST BEREAD IN CONJUNCTION WITH THE SECTION HEADED “WARNING” ON THE COVER OF THIS DOCUMENT
APPENDIX IV UNAUDITED CONSOLIDATED FINANCIAL STATEMENTSFOR THE SIX MONTHS ENDED 30 JUNE 2021
– IV-74 –

(2) Details of deferred tax liabilities before offsetting
RMB
Item
Closing Balance Opening Balance
Taxabletemporary
differencesDeferred tax
liabilities
Taxabletemporary
differencesDeferred tax
liabilities
Capitalization ofinterest on generalborrowings 72,249,478 18,062,370 77,046,476 19,261,619
Changes in fair valueof other equityinstrumentinvestments 23,456,198 5,864,050 22,050,329 5,512,583
Changes in fair valueof other non-current assets 24,225,085 6,056,271 28,965,529 7,241,382
Valuationappreciation onassets in businesscombination 817,745,364 160,356,428 801,224,558 153,428,806
Depreciationdifference of fixedassets betweenaccounting and taxbasis 514,817,683 92,470,733 511,353,931 91,833,095
Others 153,964,235 20,335,512 154,374,699 20,397,083
Total 1,606,458,043 303,145,364 1,595,015,522 297,674,568
(3) Amounts of deferred tax assets and deferred tax liabilities after offsetting
RMB
Item
The amountoffset at the
end of theperiod
Deferred taxassets or
liabilitiesafter
offsetting atthe end of the
period
The amountoffset at the
beginning ofthe period
Deferred taxassets or
liabilitiesafter
offsetting atthe beginning
of the period
Deferred tax assets 13,047,784 431,550,520 12,753,965 437,800,338Deferred tax
liabilities 13,047,784 290,097,580 12,753,965 284,920,603
THIS DOCUMENT IS IN DRAFT FORM, INCOMPLETE AND SUBJECT TO CHANGE AND THE INFORMATION MUST BEREAD IN CONJUNCTION WITH THE SECTION HEADED “WARNING” ON THE COVER OF THIS DOCUMENT
APPENDIX IV UNAUDITED CONSOLIDATED FINANCIAL STATEMENTSFOR THE SIX MONTHS ENDED 30 JUNE 2021
– IV-75 –

(4) Deferred tax assets are not recognized for the following deductible temporary differences anddeductible tax losses
RMB
Item Closing Balance Opening Balance
Deductible temporary differences 2,956,686,211 2,891,063,013Deductible tax losses 789,568,651 794,131,021
Total 3,746,254,862 3,685,194,034
(5) The deductible tax losses which are not recognized as deferred tax assets will expire in thefollowing years:
RMB
Year Closing Balance Opening Balance
2021 106,676,668 148,438,7662022 136,238,194 153,614,2892023 75,573,906 85,361,2382024 114,387,613 144,409,7552025 192,557,727 218,197,2922026 133,507,684 –2029 2,109,309 15,592,1312030 28,517,550 28,517,550
Total 789,568,651 794,131,021
20. Provision for impairment of assets
RMB
ItemOpeningBalance
Addition Reduction
ClosingBalanceProvision Reversal Write-off
Otherchanges
Bad-debt provision 248,688,687 23,711,797 8,520,969 5,889,066 – 257,990,449Including:Bad-debt provision for
accounts receivable 148,363,317 19,369,513 7,134,322 5,857,416 154,741,092Bad-debt provision for other
receivables 100,325,370 4,342,284 1,386,647 31,650 – 103,249,357Provision for decline in value
of inventories 88,843,453 4,052,757 1,851,818 2,031,268 – 89,013,124Provision for impairment of
debt investment 2,000,000 – – – – 2,000,000Provision for impairment of
fixed assets 447,498,500 19,598,668 400,263 466,696,905Provision for impairment of
construction in progress 9,372,365 4,165 – – – 9,376,530Provision for impairment of
intangible assets 23,524,969 – – – – 23,524,969
Total 819,927,974 47,367,387 10,372,787 7,920,334 400,263 848,601,977
THIS DOCUMENT IS IN DRAFT FORM, INCOMPLETE AND SUBJECT TO CHANGE AND THE INFORMATION MUST BEREAD IN CONJUNCTION WITH THE SECTION HEADED “WARNING” ON THE COVER OF THIS DOCUMENT
APPENDIX IV UNAUDITED CONSOLIDATED FINANCIAL STATEMENTSFOR THE SIX MONTHS ENDED 30 JUNE 2021
– IV-76 –
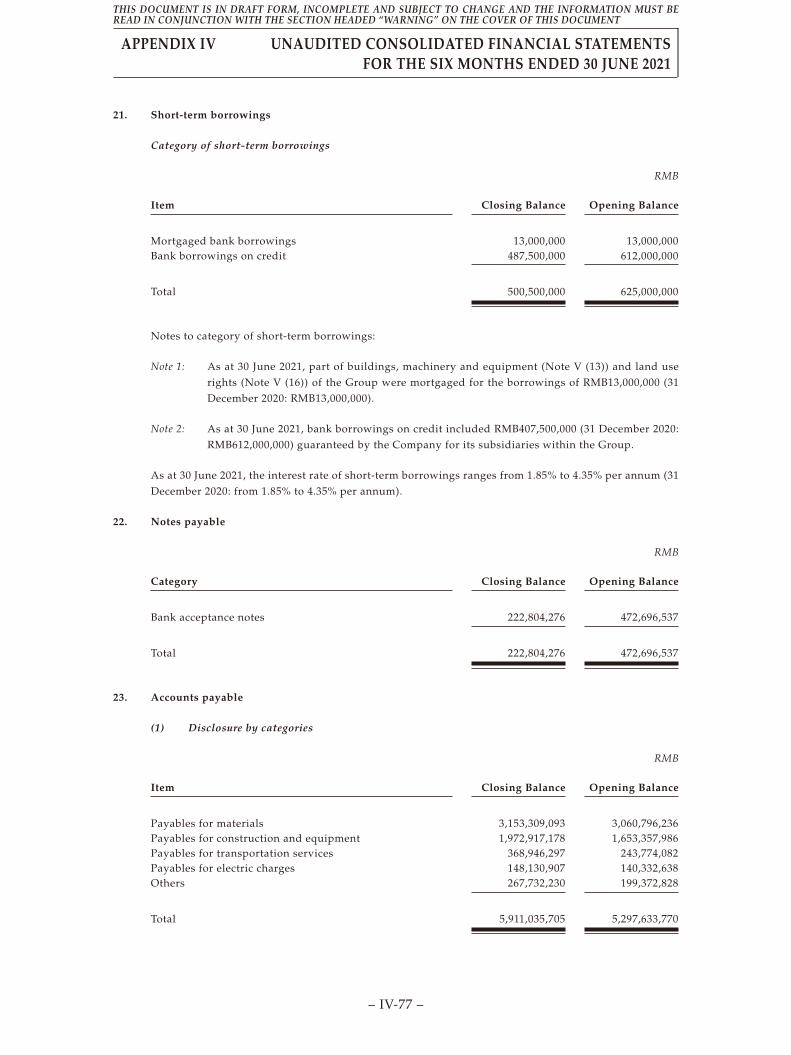
21. Short-term borrowings
Category of short-term borrowings
RMB
Item Closing Balance Opening Balance
Mortgaged bank borrowings 13,000,000 13,000,000Bank borrowings on credit 487,500,000 612,000,000
Total 500,500,000 625,000,000
Notes to category of short-term borrowings:
Note 1: As at 30 June 2021, part of buildings, machinery and equipment (Note V (13)) and land userights (Note V (16)) of the Group were mortgaged for the borrowings of RMB13,000,000 (31December 2020: RMB13,000,000).
Note 2: As at 30 June 2021, bank borrowings on credit included RMB407,500,000 (31 December 2020:RMB612,000,000) guaranteed by the Company for its subsidiaries within the Group.
As at 30 June 2021, the interest rate of short-term borrowings ranges from 1.85% to 4.35% per annum (31December 2020: from 1.85% to 4.35% per annum).
22. Notes payable
RMB
Category Closing Balance Opening Balance
Bank acceptance notes 222,804,276 472,696,537
Total 222,804,276 472,696,537
23. Accounts payable
(1) Disclosure by categories
RMB
Item Closing Balance Opening Balance
Payables for materials 3,153,309,093 3,060,796,236Payables for construction and equipment 1,972,917,178 1,653,357,986Payables for transportation services 368,946,297 243,774,082Payables for electric charges 148,130,907 140,332,638Others 267,732,230 199,372,828
Total 5,911,035,705 5,297,633,770
THIS DOCUMENT IS IN DRAFT FORM, INCOMPLETE AND SUBJECT TO CHANGE AND THE INFORMATION MUST BEREAD IN CONJUNCTION WITH THE SECTION HEADED “WARNING” ON THE COVER OF THIS DOCUMENT
APPENDIX IV UNAUDITED CONSOLIDATED FINANCIAL STATEMENTSFOR THE SIX MONTHS ENDED 30 JUNE 2021
– IV-77 –

(2) Significant accounts payable aged over one year
RMB
Item Closing BalanceReasons for being outstanding orcarried forward
Payables for construction andequipment
109,856,496 Part of project is under constructionand related amounts have notbeen settled.
Total 109,856,496 /
24. Contract liabilities
RMB
Item Closing Balance Opening Balance
Advance from customers 669,790,684 830,492,042
Total 669,790,684 830,492,042
Note:
(1) Contract liabilities are mainly the advance received by the Group in accordance with the salescontract of building materials, and the relevant income of the contract will be recognized after theGroup performs its performance obligations.
(2) The contract liabilities at the end of the period are expected to be recognized as revenue in 2022.
25. Employee benefits payable
(1) Summary of employee benefits payable
RMB
ItemOpeningBalance Addition Reduction
ClosingBalance
I. Short-termemployeebenefits 412,881,300 1,160,800,799 1,351,114,749 222,567,350
II. Post-employmentbenefits-Definedcontributionplan 11,692,136 133,204,750 136,313,140 8,583,746
III. Other benefitsdue within oneyear 105,304,485 95,636,168 111,458,508 89,482,145
Total 529,877,921 1,389,641,717 1,598,886,397 320,633,241
THIS DOCUMENT IS IN DRAFT FORM, INCOMPLETE AND SUBJECT TO CHANGE AND THE INFORMATION MUST BEREAD IN CONJUNCTION WITH THE SECTION HEADED “WARNING” ON THE COVER OF THIS DOCUMENT
APPENDIX IV UNAUDITED CONSOLIDATED FINANCIAL STATEMENTSFOR THE SIX MONTHS ENDED 30 JUNE 2021
– IV-78 –

(2) Short-term employee benefits
RMB
ItemOpeningBalance Addition Reduction
ClosingBalance
I. Salaries or wages,bonuses andallowances 386,054,058 787,786,017 1,058,462,736 115,377,339
II. Staff welfare 117,585 171,811,055 122,124,645 49,803,995III. Social insurance 3,813,663 105,873,717 84,138,791 25,548,589
Including:Medical insurance 3,329,030 97,103,522 75,625,059 24,807,493Injury insurance 428,842 7,986,298 7,757,073 658,067Maternity
insurance 55,791 783,897 756,659 83,029IV. Housing funds 1,303,664 65,810,880 63,390,274 3,724,270V. Labor union
funds andemployeeeducation fee 21,592,330 29,519,130 22,998,303 28,113,157
Total 412,881,300 1,160,800,799 1,351,114,749 222,567,350
(3) Defined contribution plan
RMB
ItemOpeningBalance Addition Reduction
ClosingBalance
1. Basic pensioninsurance 10,920,195 128,128,841 130,830,353 8,218,683
2. Unemploymentinsurance 771,941 5,075,909 5,482,787 365,063
Total 11,692,136 133,204,750 136,313,140 8,583,746
THIS DOCUMENT IS IN DRAFT FORM, INCOMPLETE AND SUBJECT TO CHANGE AND THE INFORMATION MUST BEREAD IN CONJUNCTION WITH THE SECTION HEADED “WARNING” ON THE COVER OF THIS DOCUMENT
APPENDIX IV UNAUDITED CONSOLIDATED FINANCIAL STATEMENTSFOR THE SIX MONTHS ENDED 30 JUNE 2021
– IV-79 –

26. Taxes payable
RMB
Item Closing Balance Opening Balance
Enterprise income tax 487,335,176 662,119,248VAT 158,213,815 223,034,704Resource tax 29,076,349 28,857,087Environmental protection tax 19,721,001 28,299,652Individual income tax 29,797,505 28,505,648Others 253,863,921 215,349,804
Total 978,007,767 1,186,166,143
27. Other payables
Summary of other payables
RMB
Item Closing Balance Opening Balance
Interest payable 58,646,797 30,026,120Dividends payable 142,391,012 63,842,709Other payables 737,721,722 692,377,410
Total 938,759,531 786,246,239
Dividends payable
RMB
Item Closing Balance Opening Balance
Dividends of ordinary shares 44,488,080 23,821,382Minority interests– Yunnan Hongta Dianxi Cement Co., Ltd. 78,181,932 –– Hanjiang Water Conservancy and Hydropower (Group)
Co. LTD 12,000,000 –– Fumin Shengwei Industrial Co., LTD 7,721,000 –– Gede Hong Kong International Investment &
Development Co., Ltd. – 40,021,327
Total 142,391,012 63,842,709
THIS DOCUMENT IS IN DRAFT FORM, INCOMPLETE AND SUBJECT TO CHANGE AND THE INFORMATION MUST BEREAD IN CONJUNCTION WITH THE SECTION HEADED “WARNING” ON THE COVER OF THIS DOCUMENT
APPENDIX IV UNAUDITED CONSOLIDATED FINANCIAL STATEMENTSFOR THE SIX MONTHS ENDED 30 JUNE 2021
– IV-80 –

(1) Details of other payables
RMB
Item Closing Balance Opening Balance
Payables for acquisition of equity interests 226,183,017 218,043,450Amounts due to minority interests 181,816,411 187,605,900Margin and deposits 211,739,429 178,109,274Withholding amounts 13,035,451 13,628,805Borrowings from government 5,000,000 5,000,000Others 99,947,414 89,989,981
Total 737,721,722 692,377,410
(2) Description of significant other payables aged more than one year
RMB
Item Closing BalanceReasons for being outstanding orcarried forward
Amount due to minorityinterests
181,755,346 Repayment time has been agreed.
Payables for acquisition ofequity interests
94,272,136 Payment criteria of equityacquisition is not met
Total 276,027,482 /
28. Non-current liabilities due within one year
RMB
Item Closing Balance Opening Balance
Long-term borrowings due within one year 706,672,037 524,266,910Bonds payable due within one year 1,199,897,799 1,199,284,590Long-term payables due within one year 217,465,579 150,932,659Lease liability due within one year 23,117,688 –
Total 2,147,153,103 1,874,484,159
THIS DOCUMENT IS IN DRAFT FORM, INCOMPLETE AND SUBJECT TO CHANGE AND THE INFORMATION MUST BEREAD IN CONJUNCTION WITH THE SECTION HEADED “WARNING” ON THE COVER OF THIS DOCUMENT
APPENDIX IV UNAUDITED CONSOLIDATED FINANCIAL STATEMENTSFOR THE SIX MONTHS ENDED 30 JUNE 2021
– IV-81 –
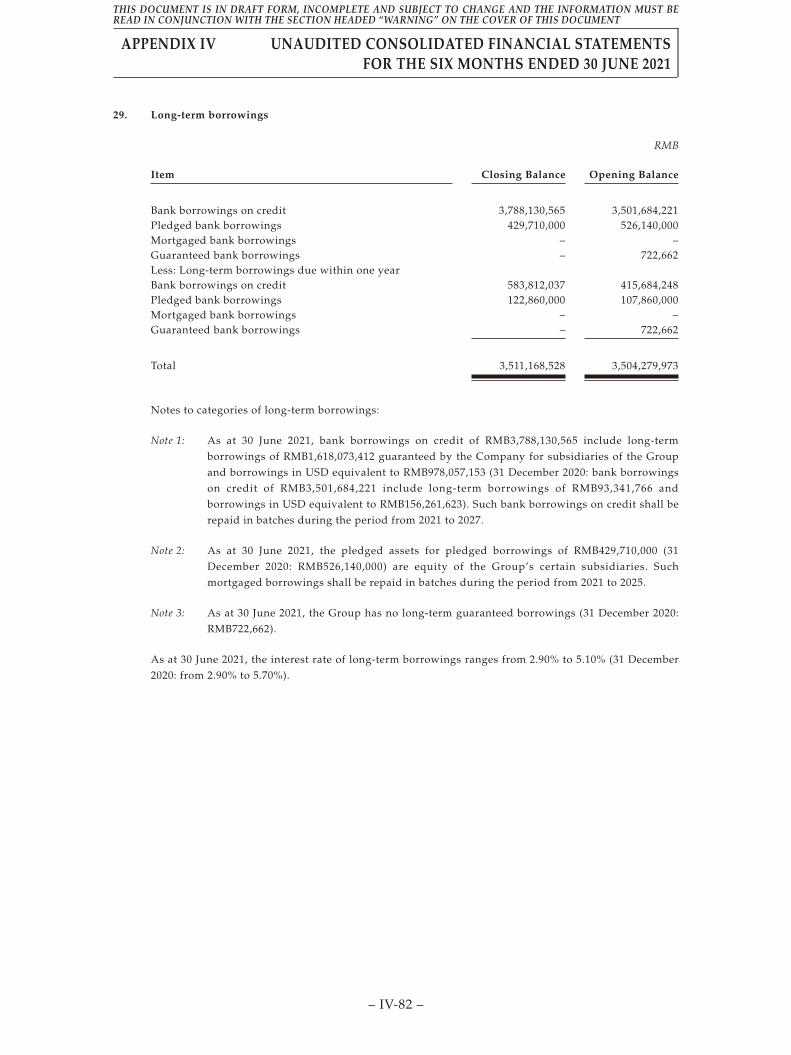
29. Long-term borrowings
RMB
Item Closing Balance Opening Balance
Bank borrowings on credit 3,788,130,565 3,501,684,221Pledged bank borrowings 429,710,000 526,140,000Mortgaged bank borrowings – –Guaranteed bank borrowings – 722,662Less: Long-term borrowings due within one yearBank borrowings on credit 583,812,037 415,684,248Pledged bank borrowings 122,860,000 107,860,000Mortgaged bank borrowings – –Guaranteed bank borrowings – 722,662
Total 3,511,168,528 3,504,279,973
Notes to categories of long-term borrowings:
Note 1: As at 30 June 2021, bank borrowings on credit of RMB3,788,130,565 include long-termborrowings of RMB1,618,073,412 guaranteed by the Company for subsidiaries of the Groupand borrowings in USD equivalent to RMB978,057,153 (31 December 2020: bank borrowingson credit of RMB3,501,684,221 include long-term borrowings of RMB93,341,766 andborrowings in USD equivalent to RMB156,261,623). Such bank borrowings on credit shall berepaid in batches during the period from 2021 to 2027.
Note 2: As at 30 June 2021, the pledged assets for pledged borrowings of RMB429,710,000 (31December 2020: RMB526,140,000) are equity of the Group’s certain subsidiaries. Suchmortgaged borrowings shall be repaid in batches during the period from 2021 to 2025.
Note 3: As at 30 June 2021, the Group has no long-term guaranteed borrowings (31 December 2020:RMB722,662).
As at 30 June 2021, the interest rate of long-term borrowings ranges from 2.90% to 5.10% (31 December2020: from 2.90% to 5.70%).
THIS DOCUMENT IS IN DRAFT FORM, INCOMPLETE AND SUBJECT TO CHANGE AND THE INFORMATION MUST BEREAD IN CONJUNCTION WITH THE SECTION HEADED “WARNING” ON THE COVER OF THIS DOCUMENT
APPENDIX IV UNAUDITED CONSOLIDATED FINANCIAL STATEMENTSFOR THE SIX MONTHS ENDED 30 JUNE 2021
– IV-82 –

30. Bonds payable
(1) Bonds payable
RMB
Item Closing Balance Opening Balance
Overseas bonds issued in 2020 (Note 2) 1,925,779,933 1,943,763,447
Total 1,925,779,933 1,943,763,447
(2) Changes in bonds payable
RMB
Name of bond Par value Issue dateTerm ofbond Issue amount
Openingbalance
Amortizationof discount
Exchangegain or loss
Closingbalance
Balance ofaccruedinterest
Phase-I corporatebonds issued in2016
(Note 1)
100 19 August2016
5 years 1,200,000,000 1,199,284,590 613,209 – 1,199,897,799 49,496,667
Phase-II Overseasbonds issued in2020
(Note 2)
100 19 November2020
5 years 1,973,460,000 1,943,763,447 1,326,986 (19,310,500) 1,925,779,933 5,087,329
Less:Bondspayable duewithin one year
1,199,284,590 613,209 – 1,199,897,799 49,496,667
Total / / / 3,173,460,000 1,943,763,447 1,326,986 (19,310,500) 1,925,779,933 5,087,329
Note 1: Pursuant to Zheng Jian Xu Ke [2016] No. 1255 of China Securities RegulatoryCommission, the Company issued a total amount of RMB1.2 billion of phase-Icorporate bonds on 19 August 2016 at a coupon rate of 4.79%. The corporate bonds arecalculated at simple annual interest which is paid on an annual basis and with a periodof five years.
Note 2: As filed by Fa Gai Ban Wai Zi Bei [2020] No. 160 of the National Development andReform Commission of China, the Company issued a total amount of USD 300 millionof corporate bonds at Singapore Exchange (SGX) on 19 November 2020 at a couponrate of 2.25%. The corporate bonds are calculated at simple monthly interest which ispaid on a half-year basis and with a period of five years.
31. Lease liabilities
RMB
Item Closing Balance Opening Balance
Lease liabilities 182,958,576 –Less: reclassified into non-current liabilities which due
within one year 23,117,688 –
Net value 159,840,888 –
THIS DOCUMENT IS IN DRAFT FORM, INCOMPLETE AND SUBJECT TO CHANGE AND THE INFORMATION MUST BEREAD IN CONJUNCTION WITH THE SECTION HEADED “WARNING” ON THE COVER OF THIS DOCUMENT
APPENDIX IV UNAUDITED CONSOLIDATED FINANCIAL STATEMENTSFOR THE SIX MONTHS ENDED 30 JUNE 2021
– IV-83 –

32. Long-term payables
Summary of long-term payables
RMB
Item Closing Balance Opening Balance
Long-term payables 352,968,294 191,011,663
Total 352,968,294 191,011,663
Long-term payables
RMB
Item Closing Balance Opening Balance
Transaction fees of mining right paid by installments 517,378,894 253,712,506Sale and leaseback financing payables 53,054,979 84,155,203Others – 4,076,613Less: Transaction fees of mining right paid by installments
due within one year 164,410,600 87,382,509Sale and leaseback financing payable due within one
year 53,054,979 63,550,150
Total 352,968,294 191,011,663
Other explanation:
As at 30 June 2021, sale and leaseback financing payables amounted to RMB53,054,979 wereguaranteed by the sale and leaseback financing borrowings of RMB15,000,000 (Note V (1)).
Sale and leaseback financing payables are the balance of the Group’s fixed assets under sale andleaseback financing. The future repayment plan is as follows:
RMB
Closing Balance Opening Balance
1st year subsequent to the balance sheet date 53,054,979 63,550,1502nd year subsequent to the balance sheet date – 23,258,6733rd year subsequent to the balance sheet date – –
Total future repayments 53,054,979 86,808,823Interest costs – 2,653,620
Sale and leaseback financing payables 53,054,979 84,155,203Including: Sale and leaseback financing payables due
within one year 53,054,979 63,550,150
Sale and leaseback financing payables due after one year – 20,605,053
THIS DOCUMENT IS IN DRAFT FORM, INCOMPLETE AND SUBJECT TO CHANGE AND THE INFORMATION MUST BEREAD IN CONJUNCTION WITH THE SECTION HEADED “WARNING” ON THE COVER OF THIS DOCUMENT
APPENDIX IV UNAUDITED CONSOLIDATED FINANCIAL STATEMENTSFOR THE SIX MONTHS ENDED 30 JUNE 2021
– IV-84 –

33. Long-term employee benefits payable
Long-term employee benefits payable by nature
RMB
Item Closing Balance Opening Balance
I. Compensation for retired staff 35,795,274 29,834,608II. Early-retired employee benefits 34,435,366 30,917,902III. Long-term employee incentives 76,512,322 171,757,079Less: To be paid within one year 89,482,145 105,304,485
Total 57,260,817 127,205,104
Other explanation:
Note 1: Compensation for retired staff: Pursuant to the Group’s policies, the Company and its certainsubsidiaries are obliged to pay basic pension insurance, allowances and material andsupplementary medical insurance to certain retired employees until they pass away.
Management determines the provision for employee benefits based on expected accumulated benefit unitmethod.
At the balance sheet date, the key assumptions for the calculation of Group’s retired staff compensationpayable are as follows:
ItemAt the end of the
periodAt the beginning
of the period
Discount rate 2.36%~3.75% 2.36%~3.75%Salary/wage growth rate 10% 10%Average life expectancy 77 77
Note 2: Early-retired employee benefits: Pursuant to the Group’s policies, the Company and certainsubsidiaries are obliged to pay the basic wage and social insurance payments for eligibleearly-retired employees, until the employee reach the statutory retirement age.
Note 3: Long-term employee incentives: Long-term employee benefits represents a three batches ofthree-year long-term incentive plan for core management. The amount of awards granted tothe core management under this incentive plan is based on the virtual shares of the Company.(Note XI.(2)).
34. Provisions
RMB
Item Opening Balance Closing Balance Underlying reason
Provision for mine restoration 230,271,485 222,682,049 Mine restorationobligation
Others 3,121,801 3,121,801 Pending litigation
Total 233,393,286 225,803,850 /
THIS DOCUMENT IS IN DRAFT FORM, INCOMPLETE AND SUBJECT TO CHANGE AND THE INFORMATION MUST BEREAD IN CONJUNCTION WITH THE SECTION HEADED “WARNING” ON THE COVER OF THIS DOCUMENT
APPENDIX IV UNAUDITED CONSOLIDATED FINANCIAL STATEMENTSFOR THE SIX MONTHS ENDED 30 JUNE 2021
– IV-85 –

35. Deferred income
RMB
ItemOpeningBalance Addition Reduction
ClosingBalance Underlying reason
Government grants 301,399,766 475,000 13,971,797 287,902,969 Government grantsrelated to assets
Total 301,399,766 475,000 13,971,797 287,902,969 /
Items involving government grants:
RMB
Items of liabilitiesOpeningBalance
Amount ofnew grants
for theperiod
Amortizationrecognized
in otherincome
ClosingBalance
Related to assets/income
Cement kiln line infrastructure 238,903,045 415,000 9,686,159 229,631,886 Related to assetsEnergy saving technological
transformation62,496,721 60,000 4,285,638 58,271,083 Related to assets
Total 301,399,766 475,000 13,971,797 287,902,969
36. Share capital
RMB
OpeningBalance
Changes for the period
ClosingBalance
Transfer fromreserve funds
to sharecapital Sub-total
Listed shares withoutrestriction of trading
RMB ordinary share 1,361,879,855 – – 1,361,879,855Overseas listed foreign
shares 734,720,000 – – 734,720,000
Total share capital 2,096,599,855 – – 2,096,599,855
THIS DOCUMENT IS IN DRAFT FORM, INCOMPLETE AND SUBJECT TO CHANGE AND THE INFORMATION MUST BEREAD IN CONJUNCTION WITH THE SECTION HEADED “WARNING” ON THE COVER OF THIS DOCUMENT
APPENDIX IV UNAUDITED CONSOLIDATED FINANCIAL STATEMENTSFOR THE SIX MONTHS ENDED 30 JUNE 2021
– IV-86 –

37. Capital reserve
RMB
ItemOpeningBalance Addition Reduction
ClosingBalance
Share premium 1,811,326,903 – – 1,811,326,903Equity incentive 33,373,950 60,458,955 – 93,832,905Transferred from capital
reserve recognized underthe previous accountingsystem 45,377,303 – – 45,377,303
Compensation from thegovernment for plantrelocation 7,553,919 – – 7,553,919
Government grants forcapital investments 42,818,800 – – 42,818,800
Changes in special reserve ofassociates 3,087,177 257,958 – 3,345,135
Total 1,943,538,052 60,716,913 – 2,004,254,965
38. Treasury share
RMB
ItemOpeningBalance Addition Reduction
ClosingBalance
Treasury share for equityincentive plan 610,051,971 – – 610,051,971
Total 610,051,971 – – 610,051,971
Other explanations, including changes for the period, and explanations of the reasons for the changes:
At 30 June 2021, the Company has accumulatively repurchased 22,689,338 shares and accumulativelypaid RMB610,051,971 for the employee incentive plan.
39. Surplus reserve
RMB
ItemOpeningBalance Addition Reduction
ClosingBalance
Statutory surplus reserve 1,048,299,928 – – 1,048,299,928Discretionary surplus reserve 63,580,329 – – 63,580,329
Total 1,111,880,257 – – 1,111,880,257
THIS DOCUMENT IS IN DRAFT FORM, INCOMPLETE AND SUBJECT TO CHANGE AND THE INFORMATION MUST BEREAD IN CONJUNCTION WITH THE SECTION HEADED “WARNING” ON THE COVER OF THIS DOCUMENT
APPENDIX IV UNAUDITED CONSOLIDATED FINANCIAL STATEMENTSFOR THE SIX MONTHS ENDED 30 JUNE 2021
– IV-87 –

40. Other comprehensive income
RMB
ItemOpeningBalance
Amount for the current period
ClosingBalance
Amountsincurred
beforeincome tax
for the periodLess: Incometax expenses
Attributableto the parent
companyafter tax
Attributableto the
minorityinterest after
tax
I. Other comprehensiveincome that cannot bereclassified to profit orloss 13,762,146 1,405,869 (351,467) 1,054,402 – 14,816,548
Including:Changes in fair value of
other equityinstrumentinvestments 13,762,146 1,405,869 (351,467) 1,054,402 – 14,816,548
II. Other comprehensiveincome that will bereclassified to profit orloss (289,054,909) (43,140,410) – (36,107,249) (7,033,161) (325,162,158)
Including:Exchange differences on
translation of financialstatementsdenominated inforeign currencies (289,054,909) (43,140,410) – (36,107,249) (7,033,161) (325,162,158)
Total (275,292,763) (41,734,541) (351,467) (35,052,847) (7,033,161) (310,345,610)
41. Retained profits
RMB
ItemAmount for the
current periodAmount for the
prior period
Opening balance before adjustment 19,304,701,887 16,204,540,023Adjustments of retained profits – –
Opening balance after adjustment 19,304,701,887 16,204,540,023Add: Net profit attributable to the owner of the parent
company in the period 2,438,324,279 2,251,974,011Less: Ordinary share dividends payable 2,262,545,868 2,536,885,825
Closing Balance 19,480,480,298 15,919,628,209
Note: According to the shareholders’ meeting on 28 April 2021, the Company distributed a total ofRMB2,262,545,868 of cash dividends to the whole shareholders.
THIS DOCUMENT IS IN DRAFT FORM, INCOMPLETE AND SUBJECT TO CHANGE AND THE INFORMATION MUST BEREAD IN CONJUNCTION WITH THE SECTION HEADED “WARNING” ON THE COVER OF THIS DOCUMENT
APPENDIX IV UNAUDITED CONSOLIDATED FINANCIAL STATEMENTSFOR THE SIX MONTHS ENDED 30 JUNE 2021
– IV-88 –
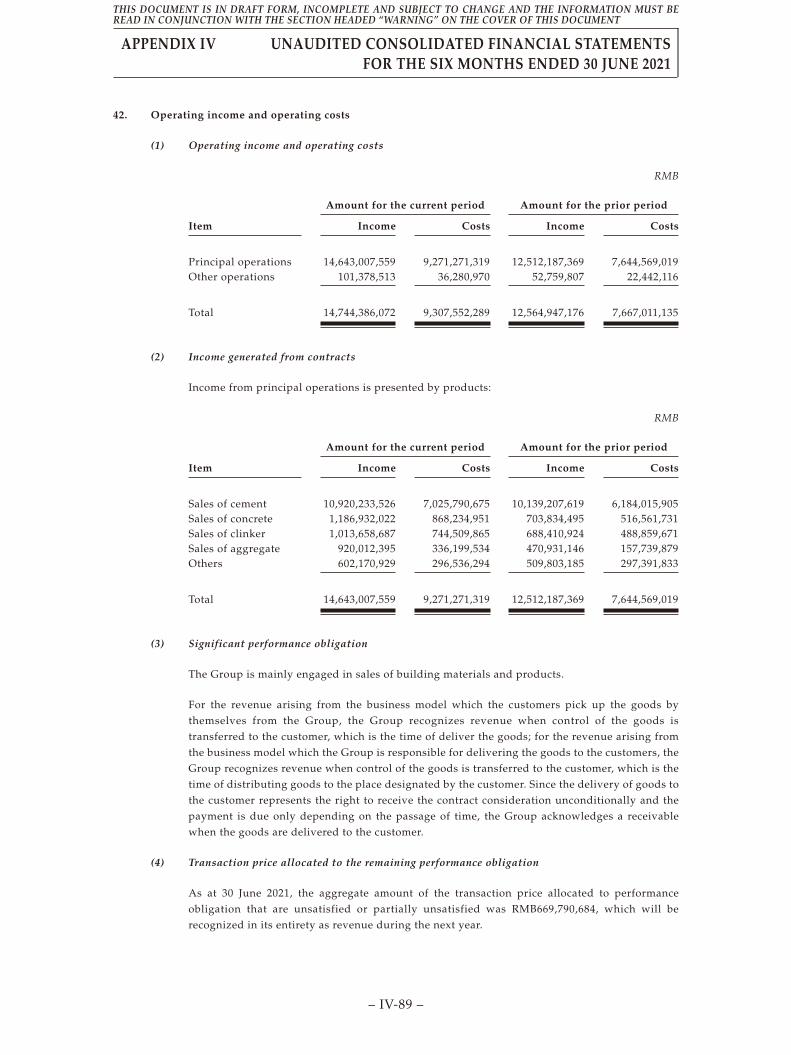
42. Operating income and operating costs
(1) Operating income and operating costs
RMB
Item
Amount for the current period Amount for the prior period
Income Costs Income Costs
Principal operations 14,643,007,559 9,271,271,319 12,512,187,369 7,644,569,019Other operations 101,378,513 36,280,970 52,759,807 22,442,116
Total 14,744,386,072 9,307,552,289 12,564,947,176 7,667,011,135
(2) Income generated from contracts
Income from principal operations is presented by products:
RMB
Item
Amount for the current period Amount for the prior period
Income Costs Income Costs
Sales of cement 10,920,233,526 7,025,790,675 10,139,207,619 6,184,015,905Sales of concrete 1,186,932,022 868,234,951 703,834,495 516,561,731Sales of clinker 1,013,658,687 744,509,865 688,410,924 488,859,671Sales of aggregate 920,012,395 336,199,534 470,931,146 157,739,879Others 602,170,929 296,536,294 509,803,185 297,391,833
Total 14,643,007,559 9,271,271,319 12,512,187,369 7,644,569,019
(3) Significant performance obligation
The Group is mainly engaged in sales of building materials and products.
For the revenue arising from the business model which the customers pick up the goods bythemselves from the Group, the Group recognizes revenue when control of the goods istransferred to the customer, which is the time of deliver the goods; for the revenue arising fromthe business model which the Group is responsible for delivering the goods to the customers, theGroup recognizes revenue when control of the goods is transferred to the customer, which is thetime of distributing goods to the place designated by the customer. Since the delivery of goods tothe customer represents the right to receive the contract consideration unconditionally and thepayment is due only depending on the passage of time, the Group acknowledges a receivablewhen the goods are delivered to the customer.
(4) Transaction price allocated to the remaining performance obligation
As at 30 June 2021, the aggregate amount of the transaction price allocated to performanceobligation that are unsatisfied or partially unsatisfied was RMB669,790,684, which will berecognized in its entirety as revenue during the next year.
THIS DOCUMENT IS IN DRAFT FORM, INCOMPLETE AND SUBJECT TO CHANGE AND THE INFORMATION MUST BEREAD IN CONJUNCTION WITH THE SECTION HEADED “WARNING” ON THE COVER OF THIS DOCUMENT
APPENDIX IV UNAUDITED CONSOLIDATED FINANCIAL STATEMENTSFOR THE SIX MONTHS ENDED 30 JUNE 2021
– IV-89 –

(5) External revenue by geographical area of source:
RMB
Amount for thecurrent period
Amount for theprior period
China 13,509,982,921 11,852,269,547Central Asia 826,501,205 415,325,072Cambodia 264,541,570 297,352,557Tanzania 143,360,376 –
Total 14,744,386,072 12,564,947,176
43. Taxes and levies
RMB
ItemAmount for the
current periodAmount for the
prior period
City maintenance and construction tax 31,418,712 31,678,448Educational surcharge 18,171,555 18,201,578Resource tax 125,577,380 67,585,317Property tax 18,206,971 11,960,613Land use tax 26,221,410 18,372,819Environmental protection tax 32,653,000 35,780,987Others 25,834,010 20,122,525
Total 278,083,038 203,702,287
44. Selling and distribution expenses
RMB
ItemAmount for the
current periodAmount for the
prior period
Transportation, carriage and handling labor expenses 391,194,687 281,361,154Material costs 235,584,428 252,310,450Staff costs 226,379,927 169,813,986Depreciation and amortization expenses 43,155,468 36,836,816Electric charge 38,562,758 38,215,735Entertainment expenses 18,624,382 12,156,804Traveling expenses 15,242,021 11,997,586Rental expenses 7,667,941 5,732,458Repair expenses 19,905,632 18,941,864Others 52,639,455 35,479,506
Total 1,048,956,699 862,846,359
THIS DOCUMENT IS IN DRAFT FORM, INCOMPLETE AND SUBJECT TO CHANGE AND THE INFORMATION MUST BEREAD IN CONJUNCTION WITH THE SECTION HEADED “WARNING” ON THE COVER OF THIS DOCUMENT
APPENDIX IV UNAUDITED CONSOLIDATED FINANCIAL STATEMENTSFOR THE SIX MONTHS ENDED 30 JUNE 2021
– IV-90 –

45. General and administrative expenses
RMB
ItemAmount for the
current periodAmount for the
prior period
Staff costs 389,756,839 400,923,435Depreciation and amortization expenses 88,240,634 103,302,253Entertainment expenses 30,198,000 17,653,499Traveling expenses 20,634,185 12,612,042Office and meeting expenses 17,163,905 19,251,655Outsourced labor expenses 19,255,191 19,004,996Consulting and audit expenses 20,645,257 30,752,326Rental expenses 420,148 15,664,589Utilities expenses 5,808,373 10,749,748Property insurance expenses 6,066,394 5,788,354Environmental protection costs 4,900,439 3,172,217Communication expenses 5,264,302 5,466,219Others 69,529,732 80,840,724
Total 677,883,399 725,182,057
46. Financial expenses
RMB
ItemAmount for the
current periodAmount for the
prior period
Interest expenditure 134,691,908 91,575,780Less: Interest income 54,748,194 26,422,427Exchange gains or losses 6,876,943 17,955,080Others 16,121,404 7,317,914
Total 102,942,061 90,426,347
47. Other income
RMB
ItemAmount for the
current periodAmount for the
prior period
Tax refunds from comprehensive utilization of resources 47,586,787 65,099,131Amortization of deferred income 13,971,797 17,248,660Government grants 51,220,270 23,737,800
Total 112,778,854 106,085,591
Other explanation:
Other income recorded in non-recurring profit or loss amounted to RMB65,192,067 in the current period.
THIS DOCUMENT IS IN DRAFT FORM, INCOMPLETE AND SUBJECT TO CHANGE AND THE INFORMATION MUST BEREAD IN CONJUNCTION WITH THE SECTION HEADED “WARNING” ON THE COVER OF THIS DOCUMENT
APPENDIX IV UNAUDITED CONSOLIDATED FINANCIAL STATEMENTSFOR THE SIX MONTHS ENDED 30 JUNE 2021
– IV-91 –

48. Investment income
RMB
ItemAmount for the
current periodAmount for the
prior period
Investment income of held-for-trading financial assetsduring the hold period 13,691,597 1,213,034
Investment income from long-term equity investmentsunder equity method 11,240,371 30,991,838
Investment income from disposal of subsidiaries 2,499,787 –Interest income of debt investments during the holding period 900,000 900,000Others (263,299) 720,000
Total 28,068,456 33,824,872
49. Gains from changes in fair value
RMB
ItemAmount for the
current periodAmount for the
prior period
Other non-current financial assets (4,740,444) (7,446,328)Held-for-trading financial liabilities (3,587,852) –Held-for-trading financial assets (4,581,752) –
Total (12,910,048) (7,446,328)
50. Impairment losses on credit
RMB
ItemAmount for the
current periodAmount for the
prior period
Bad debt loss for accounts receivable 12,235,191 26,306,323Bad debt loss for other receivables 2,955,637 852,936
Total 15,190,828 27,159,259
51. Impairment losses on assets
RMB
ItemAmount for the
current periodAmount for the
prior period
I. Losses on decline in value of inventories 2,200,939 4,569,536II. Impairment losses on fixed assets 19,598,668 –III. Impairment losses on construction in progress 4,165 –
Total 21,803,772 4,569,536
THIS DOCUMENT IS IN DRAFT FORM, INCOMPLETE AND SUBJECT TO CHANGE AND THE INFORMATION MUST BEREAD IN CONJUNCTION WITH THE SECTION HEADED “WARNING” ON THE COVER OF THIS DOCUMENT
APPENDIX IV UNAUDITED CONSOLIDATED FINANCIAL STATEMENTSFOR THE SIX MONTHS ENDED 30 JUNE 2021
– IV-92 –
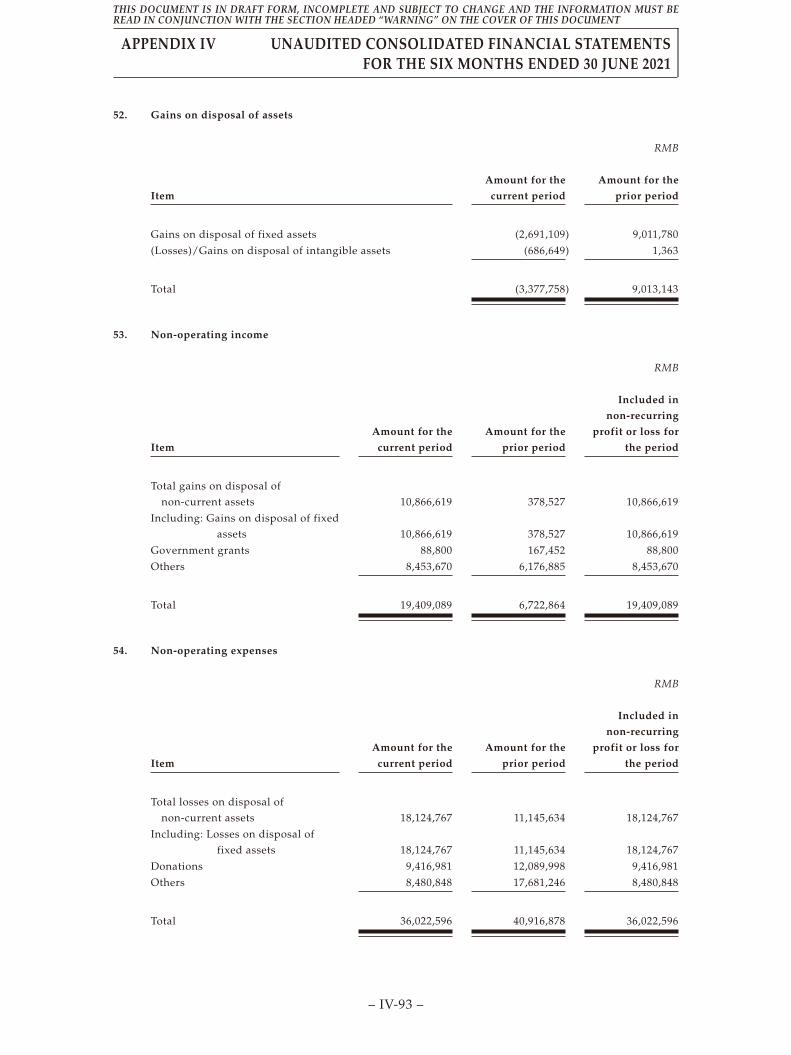
52. Gains on disposal of assets
RMB
Item
Amount for the
current period
Amount for the
prior period
Gains on disposal of fixed assets (2,691,109) 9,011,780
(Losses)/Gains on disposal of intangible assets (686,649) 1,363
Total (3,377,758) 9,013,143
53. Non-operating income
RMB
Item
Amount for the
current period
Amount for the
prior period
Included in
non-recurring
profit or loss for
the period
Total gains on disposal ofnon-current assets 10,866,619 378,527 10,866,619
Including: Gains on disposal of fixedassets 10,866,619 378,527 10,866,619
Government grants 88,800 167,452 88,800
Others 8,453,670 6,176,885 8,453,670
Total 19,409,089 6,722,864 19,409,089
54. Non-operating expenses
RMB
Item
Amount for the
current period
Amount for the
prior period
Included in
non-recurring
profit or loss for
the period
Total losses on disposal ofnon-current assets 18,124,767 11,145,634 18,124,767
Including: Losses on disposal offixed assets 18,124,767 11,145,634 18,124,767
Donations 9,416,981 12,089,998 9,416,981
Others 8,480,848 17,681,246 8,480,848
Total 36,022,596 40,916,878 36,022,596
THIS DOCUMENT IS IN DRAFT FORM, INCOMPLETE AND SUBJECT TO CHANGE AND THE INFORMATION MUST BEREAD IN CONJUNCTION WITH THE SECTION HEADED “WARNING” ON THE COVER OF THIS DOCUMENT
APPENDIX IV UNAUDITED CONSOLIDATED FINANCIAL STATEMENTSFOR THE SIX MONTHS ENDED 30 JUNE 2021
– IV-93 –

55. Income tax expenses
(1) Table of income tax expenses
RMB
ItemAmount for the
current periodAmount for the
prior period
Current tax expenses 717,031,261 629,461,424Deferred tax expenses (5,751,183) (2,232,095)
Total 711,280,078 627,229,329
(2) Reconciliations of profit before tax and income tax expense
RMB
ItemAmount for the
current periodAmount for the
prior period
Profit before tax 3,376,918,804 3,082,891,936Income tax expenses calculated at
statutory/applicable tax rate 844,229,701 770,722,984Effect of different tax rates applicable to
subsidiaries (145,533,189) (133,867,189)Effect of non-taxable income (2,810,093) (8,456,218)Effect of non-deductible cost, expense and loss 15,727,481 4,704,891Effect of utilizing deductible losses for which
deferred tax assets are not recognized for theprior period (40,150,622) (23,323,456)
Effect of deductible temporary differences ordeductible losses for which deferred tax assetsare not recognized for the current period 57,030,997 17,448,317
Others (17,214,197) –
Total 711,280,078 627,229,329
56. Items in the cash flow statement
(1) Other cash receipts relating to operating activities
RMB
ItemAmount for the
current periodAmount for the
prior period
Margin and deposits 132,904,050 67,951,648Government subsidies 51,784,070 41,972,352Interest income 54,748,194 23,569,277Others 12,113,298 14,426,498
Total 251,549,612 147,919,775
THIS DOCUMENT IS IN DRAFT FORM, INCOMPLETE AND SUBJECT TO CHANGE AND THE INFORMATION MUST BEREAD IN CONJUNCTION WITH THE SECTION HEADED “WARNING” ON THE COVER OF THIS DOCUMENT
APPENDIX IV UNAUDITED CONSOLIDATED FINANCIAL STATEMENTSFOR THE SIX MONTHS ENDED 30 JUNE 2021
– IV-94 –

(2) Other cash payments relating to operating activities
RMB
ItemAmount for the
current periodAmount for the
prior period
Sales expense, travelling expenses andtransportation fees 35,876,207 58,707,264
Margin and deposits 62,453,474 61,308,365Entertainment expenses 48,822,383 29,810,303Consulting expenses 20,645,257 34,445,279Rental expenses 8,088,088 27,040,838Donations and other social responsibility expenses 38,244,325 35,785,580Third party personnel costs 19,255,191 19,192,837Afforestation, environmental protection and
education fees 11,558,823 10,039,030Office and meeting expenses 17,163,905 20,526,093Insurance expenses 6,066,394 11,143,081Others 70,894,416 23,143,396
Total 339,068,463 331,142,066
(3) Other cash receipts relating to investing activities
RMB
ItemAmount for the
current periodAmount for the
prior period
Receipt of project margins – 918,268Receipt of refund of equity margins 5,602,256 20,000,000Receipt of deposits for disposal of subsidiary – 20,000,000
Total 5,602,256 40,918,268
(4) Other cash payments relating to investing activities
RMB
ItemAmount for the
current periodAmount for the
prior period
Payments related to equity merger and acquisition – 654,896,092
Total – 654,896,092
(5) Other cash payments relating to financing activities
RMB
ItemAmount for the
current periodAmount for the
prior period
Fees and underwriting fees – 6,475,559Payment of financing funds for sale and leaseback 31,000,000 45,000,000Payment of lease 12,526,934 –Payment of share repurchases – 122,533,983Others 6,620,000 6,855,764
Total 50,146,934 180,865,306
THIS DOCUMENT IS IN DRAFT FORM, INCOMPLETE AND SUBJECT TO CHANGE AND THE INFORMATION MUST BEREAD IN CONJUNCTION WITH THE SECTION HEADED “WARNING” ON THE COVER OF THIS DOCUMENT
APPENDIX IV UNAUDITED CONSOLIDATED FINANCIAL STATEMENTSFOR THE SIX MONTHS ENDED 30 JUNE 2021
– IV-95 –

57. Supplementary information to the cash flow statement
(1) Supplementary information to the cash flow statement
RMB
Supplementary informationAmount for the
current periodAmount for the
prior period
1. Reconciliation of net profit to cash flows fromoperating activities:
Net profit 2,665,638,726 2,455,662,607Add: Provision for impairment losses of assets 21,803,772 4,569,536
Losses on credit impairment 15,190,828 27,159,259Depreciation of fixed assets 835,544,982 788,806,420Depreciation of right-of-use assets 15,533,472 –Amortization of intangible assets 149,876,968 82,735,299Amortization of long-term prepaid
expenses 30,250,573 24,640,810Losses on disposal of fixed assets,
intangible assets and other long-termassets 3,377,758 10,767,107
Losses (income) on retirement of fixedassets 7,258,148 (9,013,143)
Losses on changes in fair value 12,910,048 7,446,328Financial expenses 134,691,908 116,848,774Investment income (28,068,456) (33,824,872)(Decrease) increase in deferred tax assets (266,555) 14,056,583Decrease in deferred tax liabilities (5,484,628) (16,288,678)Increase in inventories (545,088,120) (272,205,787)(Increase)Decrease in operating receivables (414,897,523) 56,848,640(Decrease)Increase in operating payables (592,215,464) 260,832,902Others (13,971,797) (18,067,101)
Net cash flow from operating activities 2,292,084,640 3,500,974,6842. Significant investing and financing activities
not involving cash receipt and payment:Conversion of debt into capitalConvertible corporate bonds due within one yearFixed assets under finance lease
3. Net changes in cash and cash equivalents:Balance at 30 June 2021 of cash 7,226,592,187 7,348,531,646Less: Balance at 31 December 2020 of cash 8,420,246,369 4,918,296,452Add: Balance at 30 June 2021 of cash equivalentsLess: Balance at 31 December 2020 of cash
equivalents
Net (decrease) increase in cash and cashequivalents (1,193,654,182) 2,430,235,194
(2) Net cash paid for acquisition of subsidiaries and other business units
RMB
Amount
Cash or cash equivalents paid for business combination in the currentperiod 233,936,090
Less: Cash and cash equivalents held by subsidiary at the date ofpurchase 2,673,483
Net cash payments for acquisition of subsidiaries 231,262,607
THIS DOCUMENT IS IN DRAFT FORM, INCOMPLETE AND SUBJECT TO CHANGE AND THE INFORMATION MUST BEREAD IN CONJUNCTION WITH THE SECTION HEADED “WARNING” ON THE COVER OF THIS DOCUMENT
APPENDIX IV UNAUDITED CONSOLIDATED FINANCIAL STATEMENTSFOR THE SIX MONTHS ENDED 30 JUNE 2021
– IV-96 –

(3) Composition of cash and cash equivalents
RMB
Item Closing Balance Opening Balance
I. Cash 7,226,592,187 8,420,246,369Including: Cash on hand 630,140 620,098
Cash at bank without restriction 7,225,962,047 8,419,626,271II. Cash equivalents – –III. Balance at 30 June 2021 of cash and cash
equivalents 7,226,592,187 8,420,246,369Including: Cash and cash equivalents with
limited use right of the parentcompany or subsidiaries withinthe Group – –
58. Assets with limited ownership or use right
RMB
Item Closing Balance Opening Balance
Cash and bank balances 203,341,224 221,366,478Notes receivable – 7,000,000Financing with receivables 98,631,671 94,904,632Fixed assets 5,801,615 5,896,890Intangible assets 6,168,325 6,254,797Right-of-use assets 189,547,925 –
Total 503,490,760 335,422,797
Other explanation:
The equity of certain subsidiaries of the Group is pledged to the bank for long-term borrowings(Note V(29). As at 30 June 2021, the net book value of such equity amounted to approximatelyRMB4,821,381,052 (31 December 2020: approximately RMB4,526,129,297).
THIS DOCUMENT IS IN DRAFT FORM, INCOMPLETE AND SUBJECT TO CHANGE AND THE INFORMATION MUST BEREAD IN CONJUNCTION WITH THE SECTION HEADED “WARNING” ON THE COVER OF THIS DOCUMENT
APPENDIX IV UNAUDITED CONSOLIDATED FINANCIAL STATEMENTSFOR THE SIX MONTHS ENDED 30 JUNE 2021
– IV-97 –

59. Foreign currency monetary items
(1) Foreign currency monetary items
RMB
Item
Closing balanceof foreign
currency Exchange rate RMB balance
Cash and bank balancesIncluding: USD 214,807,004 6.4601 1,387,674,730
RMB 35,074,402 1.0000 35,074,402EUR 55,783 7.6862 428,758HKD 63,670 0.8321 52,979
Accounts payableIncluding: USD 1,359,631 6.4601 8,783,353
RMB 172,720 1.0000 172,720Other payablesIncluding: USD 357,903 6.4601 2,312,088
EUR 647 7.6862 4,973Non-current liabilities due
within one yearIncluding: USD 31,420,000 6.4601 202,976,342Long-term borrowingsIncluding: USD 107,320,000 6.4601 693,297,932
VI. CHANGES IN SCOPE OF CONSOLIDATION
1. Changes in scope of consolidation for other reason
Describe other reasons for changes in the scope of consolidation (e.g., new subsidiaries, liquidatingsubsidiaries, etc.) and related circumstances.
New companies established during the period mainly include: Fumin Park New Building Co., Ltd,Huaxin Concrete (Shishou) Co., Ltd., Huaxin Concrete (Suizhou) Co., Ltd, Huaxin New Material (Enshi)Co., Ltd., Huaxin Gangcheng Building Materials (Huangshi) Co., Ltd, Huaxin New Building Materials(Yidu) Co., Ltd, Hainan Baihuitong Supply Chain Technology Co., Ltd., and Huaxin Cambodia TradingCo., Ltd.
2. Disposal of subsidiary
As at 14 January 2021, the Group entered into an equity transfer agreement with Yidu Baishui PortIndustry and Trade Co., Ltd. to sell 100% equity interest of Huaxin Yidu Packaging Co., Ltd. totally heldby the Group. Huaxin Yidu Packaging Co., Ltd. will no longer included in the consolidation scope. Gainsfrom disposal of RMB2,499,787 are recognized in investment income.
THIS DOCUMENT IS IN DRAFT FORM, INCOMPLETE AND SUBJECT TO CHANGE AND THE INFORMATION MUST BEREAD IN CONJUNCTION WITH THE SECTION HEADED “WARNING” ON THE COVER OF THIS DOCUMENT
APPENDIX IV UNAUDITED CONSOLIDATED FINANCIAL STATEMENTSFOR THE SIX MONTHS ENDED 30 JUNE 2021
– IV-98 –

3. Business combination not involving enterprise under common control
(1) Business combination not involving enterprise under common control
RMB
Name of acquireeAcquisition
consideration
Proportionacquired of
equity interest ConsiderationAcquisitiondate
Determinationbasis ofacquisition date
Revenue of theacquiree from
the date ofacquisition to
the period-end
Net loss of theacquiree from
the date ofacquisition to
the period-end
Yidu Honghua XintongLogistics Co., LTD.
58,800,000 100% Cash 9 March2021
Date of changein control
2,341,825 783,612
Hainan XinhongdaBuilding MaterialsCo., Ltd
186,696,200 100% Cash 5 February2020
Date of changein control
25,072,216 8,716,012
(2) Acquisition consideration and goodwill
RMB
Acquisition consideration
Yidu HonghuaXintong Logistics
Co., LTD.
– Cash 56,574,700– Fair value of liabilities assumed 2,225,300
Total combination consideration 58,800,000Less: Share of fair value of identifiable net asset acquired 58,800,000
Amount of acquisition consideration less than fair value of identifiablenet assets –
RMB
Acquisition consideration
HainanXinhongda
BuildingMaterials Co., Ltd
– Cash 177,361,390– Fair value of liabilities assumed 9,334,810
Total combination consideration 186,696,200Less: Share of fair value of identifiable net asset acquired 51,730,886
Amount of acquisition consideration less than fair value of identifiablenet assets 134,965,314
THIS DOCUMENT IS IN DRAFT FORM, INCOMPLETE AND SUBJECT TO CHANGE AND THE INFORMATION MUST BEREAD IN CONJUNCTION WITH THE SECTION HEADED “WARNING” ON THE COVER OF THIS DOCUMENT
APPENDIX IV UNAUDITED CONSOLIDATED FINANCIAL STATEMENTSFOR THE SIX MONTHS ENDED 30 JUNE 2021
– IV-99 –
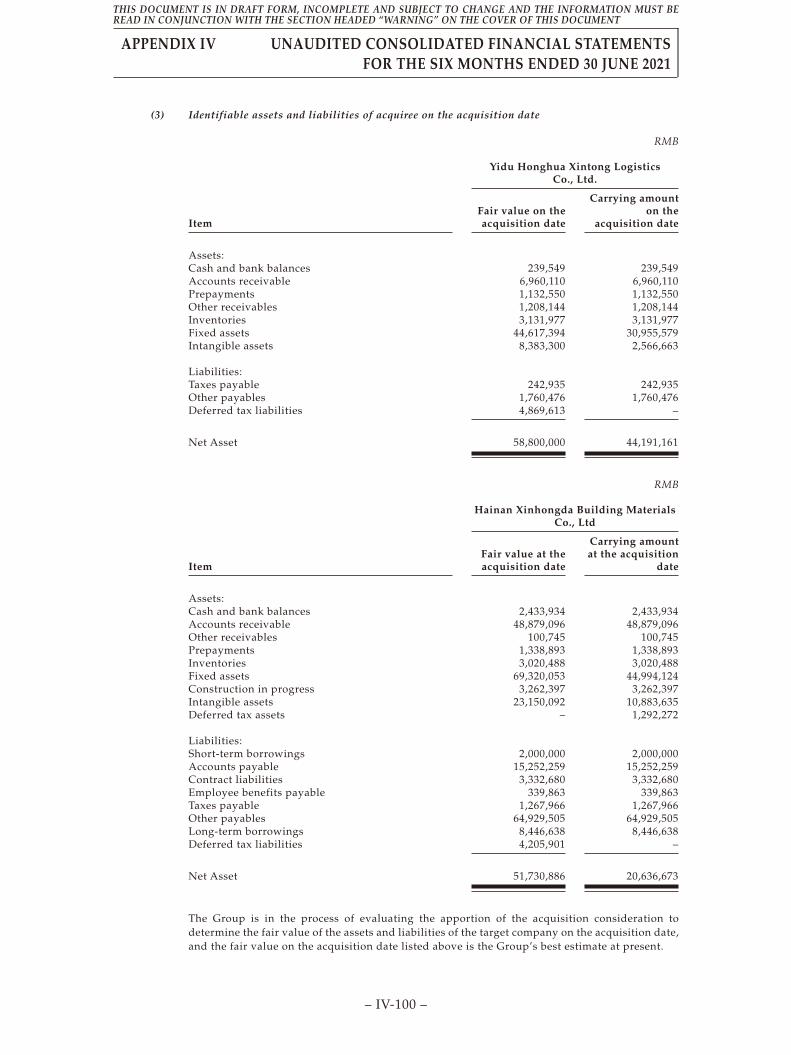
(3) Identifiable assets and liabilities of acquiree on the acquisition date
RMB
Item
Yidu Honghua Xintong LogisticsCo., Ltd.
Fair value on theacquisition date
Carrying amounton the
acquisition date
Assets:Cash and bank balances 239,549 239,549Accounts receivable 6,960,110 6,960,110Prepayments 1,132,550 1,132,550Other receivables 1,208,144 1,208,144Inventories 3,131,977 3,131,977Fixed assets 44,617,394 30,955,579Intangible assets 8,383,300 2,566,663
Liabilities:Taxes payable 242,935 242,935Other payables 1,760,476 1,760,476Deferred tax liabilities 4,869,613 –
Net Asset 58,800,000 44,191,161
RMB
Item
Hainan Xinhongda Building MaterialsCo., Ltd
Fair value at theacquisition date
Carrying amountat the acquisition
date
Assets:Cash and bank balances 2,433,934 2,433,934Accounts receivable 48,879,096 48,879,096Other receivables 100,745 100,745Prepayments 1,338,893 1,338,893Inventories 3,020,488 3,020,488Fixed assets 69,320,053 44,994,124Construction in progress 3,262,397 3,262,397Intangible assets 23,150,092 10,883,635Deferred tax assets – 1,292,272
Liabilities:Short-term borrowings 2,000,000 2,000,000Accounts payable 15,252,259 15,252,259Contract liabilities 3,332,680 3,332,680Employee benefits payable 339,863 339,863Taxes payable 1,267,966 1,267,966Other payables 64,929,505 64,929,505Long-term borrowings 8,446,638 8,446,638Deferred tax liabilities 4,205,901 –
Net Asset 51,730,886 20,636,673
The Group is in the process of evaluating the apportion of the acquisition consideration todetermine the fair value of the assets and liabilities of the target company on the acquisition date,and the fair value on the acquisition date listed above is the Group’s best estimate at present.
THIS DOCUMENT IS IN DRAFT FORM, INCOMPLETE AND SUBJECT TO CHANGE AND THE INFORMATION MUST BEREAD IN CONJUNCTION WITH THE SECTION HEADED “WARNING” ON THE COVER OF THIS DOCUMENT
APPENDIX IV UNAUDITED CONSOLIDATED FINANCIAL STATEMENTSFOR THE SIX MONTHS ENDED 30 JUNE 2021
– IV-100 –

VII. EQUITY INTERESTS IN OTHER ENTITIES
1. Equity interests in subsidiaries
(1) Components of the Group
SubsidiariesPlace ofbusiness
Place ofregistration Nature of business
Proportion ofownership interest (%) Acquisition
methodDirectly Indirectly
Fumin Park New BuildingCo., Ltd. (Note 3)
Fumin Fumin Production and sale ofnew materials
– 70 Set up
Huaxin Concrete (Shishou)Co., Ltd. (Note 3)
Shishou Shishou Production and sale ofcement
– 100 Set up
Huaxin Concrete (Suizhou)Co., Ltd. (Note 3)
Suizhou Suizhou Production and sale ofcement
– 100 Set up
Huaxin New Material (Enshi)Co., Ltd. (Note 3)
Enshi Enshi Production and sale ofnew materials
– 100 Set up
Hainan Xinhongda BuildingMaterials Co., Ltd. (Note 3)
Haikou Haikou Production and sale ofnew materials
– 100 Businesscombination
Yidu Honghua Xintong LogisticsCo., LTD. (Note 3)
Yidu Yidu Loading and unloading,warehousing andother services
– 100 Businesscombination
Huaxin Gangcheng BuildingMaterials (Huangshi)Co., Ltd. (Note 3)
Huangshi Huangshi Production and sale ofaggregate
– 51 Set up
Huaxin New Building Materials(Yidu) Co., Ltd. (Note 3)
Yidu Yidu Production and sale ofnew materials
– 100 Set up
Hainan Baihuitong Supply ChainTechnology Co., Ltd. (Note 3)
Haikou Haikou Loading and unloading,warehousing andother services
– 100 Set up
Huaxin Cambodia TradingCo., LTD. (Note 3)
Cambodia Cambodia Cement import andExport trade
– 100 Set up
Huangshi Huaxin Green BuildingMaterials Co., Ltd.
Huangshi Huangshi Production and sale ofaggregate
60 – Set up
Maweni limestone limited Tanzania Tanzania Production and sale ofcement
– 100 Businesscombination
Huaxin Concrete (Huanggang)Co., Ltd.
Huanggang Huanggang Production and sale ofcement
– 100 Set up
Huaxin Concrete (Macheng)Co., Ltd.
Macheng Macheng Production and sale ofcement
– 100 Set up
Chongqing Huaxin RenewableResource Utilization Co., Ltd.
Chongqing Chongqing Industrial solid wastes – 100 Set up
Huaxin EnvironmentalEngineering (Hefeng) Co., Ltd.
Hefeng Hefeng Environmental designand construction andwaste disposal
– 100 Set up
Huaxin New Building Materials(Luonan) Co., Ltd.
Luonan Luonan Production and sale ofnew materials
– 55 Set up
Cambodia Concrete Chakrey TingCo., Ltd.
Cambodia Cambodia Production and sale ofcement
– 100 Set up
Changzhou Huaxin ConcreteCo., Ltd.
Changzhou Changzhou Production and sale ofcement
– 100 Set up
Huaxin Cement InternationalFinance Company Limited.
Hong Kong Hong Kong Investment – 100 Set up
Huaxin New Building Materials(Kunming) Co., Ltd.
Kunming Kunming Production and sale ofnew materials
– 100 Set up
THIS DOCUMENT IS IN DRAFT FORM, INCOMPLETE AND SUBJECT TO CHANGE AND THE INFORMATION MUST BEREAD IN CONJUNCTION WITH THE SECTION HEADED “WARNING” ON THE COVER OF THIS DOCUMENT
APPENDIX IV UNAUDITED CONSOLIDATED FINANCIAL STATEMENTSFOR THE SIX MONTHS ENDED 30 JUNE 2021
– IV-101 –

SubsidiariesPlace ofbusiness
Place ofregistration Nature of business
Proportion ofownership interest (%) Acquisition
methodDirectly Indirectly
Huaxin (Hainan) InvestmentCo., Ltd.
Haikou Haikou Investment 60 40 Set up
Huaxin Cement (Yangxin) Co., Ltd. Yangxin Yangxin Production and sale ofcement
100 – Set up
Huaxin Cement (Wuxue) Co., Ltd. Wuxue Wuxue Production and sale ofcement
100 – Set up
Huaxin Cement (Chibi) Co., Ltd. Chibi Chibi Production and sale ofcement
100 – Set up
Huaxin Cement (Yichang) Co., Ltd. Yichang Yichang Production and sale ofcement
100 – Set up
Huaxin Cement (Xiangyang) Co.,Ltd.
Xiangyang Xiangyang Production and sale ofcement
100 – Set up
Huaxin Cement (Enshi) Co., Ltd. Enshi Enshi Production and sale ofcement
67 33 Set up
Huaxin Cement (Zhaotong) Co.,Ltd.
Zhaotong Zhaotong Production and sale ofcement
60 40 Set up
Huaxin Cement (Tibet) Co., Ltd. Tibet Tibet Production and sale ofcement
79 – Set up
Huaxin Cement (Wuhan) Co., Ltd. Wuhan Wuhan Production and sale ofcement
70 30 Set up
Huaxin Cement (Xiantao) Co., Ltd. Xiantao Xiantao Production and sale ofcement
80 – Set up
Huaxin Cement (Yueyang)Co., Ltd.
Yueyang Yueyang Production and sale ofcement
100 – Set up
Huaxin Cement (Henan Xinyang)Co., Ltd.
Xinyang Xinyang Production and sale ofcement
100 – Set up
Huaxin Cement (Zigui) Co., Ltd. Zigui Zigui Production and sale ofcement
100 – Set up
Huaxin Cement (Zhuzhou)Co., Ltd.
Zhuzhou Zhuzhou Production and sale ofcement
100 – Set up
Huaxin Cement (Chenzhou)Co., Ltd.
Chenzhou Chenzhou Production and sale ofcement
100 – Set up
Huaxin Cement (Macheng)Co., Ltd.
Macheng Macheng Production and sale ofcement
100 – Set up
Huaxin Cement (Hefeng) NationalMaterials Co., Ltd.
Hefeng Hefeng Production and sale ofcement
51 – Businesscombination
Huaxin Cement XiangyangXiangcheng Co., Ltd.
Xiangyang Xiangyang Production and sale ofcement
100 – Set up
Huaxin Cement (Quxian) Co., Ltd. Quxian Quxian Production and sale ofcement
100 – Set up
Huaxin Cement (Wanyuan)Co., Ltd.
Wanyuan Wanyuan Production and sale ofcement
100 – Set up
Huaxin Cement Chongqing FulingCo., Ltd.
Fuling Fuling Production and sale ofcement
100 – Set up
Huaxin Hongta Cement (Jinghong)Co., Ltd.
Jinghong Jinghong Production and sale ofcement
51 – Businesscombination
Huaxin Cement (Changyang)Co., Ltd.
Changyang Changyang Production and sale ofcement
100 – Businesscombination
Huaxin Cement (Daoxian) Co., Ltd. Daoxian Daoxian Production and sale ofcement
100 – Set up
Huaxin Cement (KunmingDongchuan) Co., Ltd.
Kunming Kunming Production and sale ofcement
100 – Set up
THIS DOCUMENT IS IN DRAFT FORM, INCOMPLETE AND SUBJECT TO CHANGE AND THE INFORMATION MUST BEREAD IN CONJUNCTION WITH THE SECTION HEADED “WARNING” ON THE COVER OF THIS DOCUMENT
APPENDIX IV UNAUDITED CONSOLIDATED FINANCIAL STATEMENTSFOR THE SIX MONTHS ENDED 30 JUNE 2021
– IV-102 –

SubsidiariesPlace ofbusiness
Place ofregistration Nature of business
Proportion ofownership interest (%) Acquisition
methodDirectly Indirectly
Huaxin Cement (Jingzhou)Co., Ltd.
Jingzhou Jingzhou Production and sale ofcement
100 – Businesscombination
Huaxin Cement (Fangxian)Co., Ltd.
Fangxian Fangxian Production and sale ofcement
70 – Businesscombination
Huaxin Cement (Danjiangkou)Co., Ltd.
Danjiangkou Danjiangkou Production and sale ofcement
– 70 Businesscombination
Huaxin Cement (Lengshuijiang)Co., Ltd.
Lengshuijiang
Lengshuijiang
Production and sale ofcement
90 – Set up
Huaxin Cement (Diqing) Co., Ltd. Diqing Diqing Production and sale ofcement
69 – Businesscombination
Huaxin Jinlong Cement (Yunxian)Co., Ltd.
Yunxian Yunxian Production and sale ofcement
80 – Businesscombination
Huaxin Cement (Suizhou) Co., Ltd. Suizhou Suizhou Production and sale ofcement
60 – Businesscombination
Huaxin Cement (Sangzhi) Co., Ltd. Sangzhi Sangzhi Production and sale ofcement
80 – Set up
Huaxin Yovon Cement LLC Tajikistan Tajikistan Production and sale ofcement
– 75 Set up
Huaxin Gayur (Sogd) CementCo., Ltd.
Tajikistan Tajikistan Production and sale ofcement
– 95 Set up
Huaxin Gayur Logistics Co., Ltd. Tajikistan Tajikistan Loading and unloading,warehousing andother services
– 100 Set up
Huaxin Cement (Daye) Co., Ltd. Daye Daye Production and sale ofcement
70 – Businesscombination
Huaxin Cement (E’zhou) Co., Ltd. Ezhou Ezhou Production and sale ofcement
70 – Businesscombination
Huaxin Cement (Enping) Co., Ltd. Enping Enping Production and sale ofcement
0.2 99.8 Businesscombination
Cambodian Cement Chakrey TingFactory Co., Ltd.
Cambodia Cambodia Production and sale ofcement
– 68 Businesscombination
Huaxin Cement (Fumin) Co., Ltd. Fumin Fumin Production and sale ofcement
– 100 Businesscombination
Yunnan Huaxin Dongjun Co., Ltd. Kunming Kunming Production and sale ofcement
– 100 Businesscombination
Huaxin Cement (Lijiang) Co., Ltd. Lijiang Lijiang Production and sale ofcement
– 100 Businesscombination
Huaxin Cement (Honghe) Co., Ltd. Honghe Honghe Production and sale ofcement
– 100 Businesscombination
Huaxin Cement (Chuxiong)Co., Ltd.
Chuxiong Chuxiong Production and sale ofcement
– 100 Businesscombination
Yanshan County Yuanda HongheCo., Ltd.
Honghe Honghe Production and sale ofcement
– 100 Businesscombination
Huaxin Cement (Jianchuan)Co., Ltd.
Jianchuan Jianchuan Production and sale ofcement
– 100 Businesscombination
Huaxin Cement (Yunlong) Co., Ltd. Yunlong Yunlong Production and sale ofcement
– 100 Businesscombination
Huaxin Cement (Lincang) Co., Ltd. Lincang Lincang Production and sale ofcement
– 100 Businesscombination
Panzhihua Huaxin CementCo., Ltd.
Panzhihua Panzhihua Production and sale ofcement
– 100 Businesscombination
THIS DOCUMENT IS IN DRAFT FORM, INCOMPLETE AND SUBJECT TO CHANGE AND THE INFORMATION MUST BEREAD IN CONJUNCTION WITH THE SECTION HEADED “WARNING” ON THE COVER OF THIS DOCUMENT
APPENDIX IV UNAUDITED CONSOLIDATED FINANCIAL STATEMENTSFOR THE SIX MONTHS ENDED 30 JUNE 2021
– IV-103 –

SubsidiariesPlace ofbusiness
Place ofregistration Nature of business
Proportion ofownership interest (%) Acquisition
methodDirectly Indirectly
Kunming Chongde CementCo., Ltd.
Kunming Kunming Production and sale ofcement
– 100 Businesscombination
Yunnan State-owned CementKunming Co., Ltd.
Kunming Kunming Production and sale ofcement
– 100 Businesscombination
Chongqing Huaxin Yanjing CementCo., Ltd.
Chongqing Chongqing Production and sale ofcement
80 – Businesscombination
Chongqing Huaxin Diwei CementCo., Ltd.
Chongqing Chongqing Production and sale ofcement
97 – Businesscombination
Chongqing Huaxin ShentianCement Co., Ltd.
Chongqing Chongqing Production and sale ofcement
100 – Businesscombination
Huaxin Guizhou Dingxiao SpecialCement Co., Ltd.
Guizhou Guizhou Production and sale ofcement
– 100 Businesscombination
Guizhou Shuicheng Shui OnCement Co., Ltd.
Guizhou Guizhou Production and sale ofcement
– 70 Businesscombination
Huaxin Narayani Cement Co., Ltd. Narayani Narayani Production and sale ofcement
– 100 Set up
Huaxin Cement (Huangshi)Co., Ltd.
Huangshi Huangshi Production and sale ofcement
80 20 Set up
Wuhan Wugang Huaxin CementCo., Ltd. (Note 1)
Wuhan Wuhan Production and sale ofcement and scoria
50 – Set up
Huaxin Concrete (Wuhan) Co., Ltd. Wuhan Wuhan Production and sale ofcement
100 – Set up
Huaxin Concrete (Huangshi)Co., Ltd.
Huangshi Huangshi Production and sale ofcement
– 100 Set up
Huaxin Concrete (Jingmen)Co., Ltd.
Jingmen Jingmen Production and sale ofcement
– 100 Businesscombination
Xinyang Huaxin Concrete Co., Ltd. Xinyang Xinyang Production and sale ofcement
– 100 Set up
Tibet Huaxin ConstructionMaterials Co., Ltd.
Tibet Tibet Production and sale ofcement
– 71.43 Set up
Jiujiang Huaxin Concrete Co., Ltd. Jiujiang Jiujiang Production and sale ofcement
– 100 Set up
Jiujiang Rongda Energy SavingAnd Environmental ProtectionBuilding Materials Co., Ltd.
Jiujiang Jiujiang Production and sale ofcement
– 100 Set up
Huaxin Concrete (Xiaogan)Co., Ltd.
Xiaogan Xiaogan Production and sale ofcement
– 100 Set up
Huaxin Concrete XiangyangFancheng District Co., Ltd.
Xiangyang Xiangyang Production and sale ofcement
– 100 Set up
Huaxin Building MaterialsXiangyang Xiangcheng DistrictCo., Ltd.
Xiangyang Xiangyang Production and sale ofcement
– 100 Set up
Huaxin Concrete (XiangyangNanzhang) Co., Ltd.
Xiangyang Xiangyang Production and sale ofcement
– 100 Businesscombination
Zaoyang Huaxin Concrete Co., Ltd. Zaoyang Zaoyang Production and sale ofcement
– 100 Businesscombination
Huaxin Concrete (Yueyang)Co., Ltd.
Yueyang Yueyang Production and sale ofcement
– 100 Set up
Huaxin Concrete (Zhuzhou)Co., Ltd.
Zhuzhou Zhuzhou Production and sale ofcement
– 100 Set up
Hubei Zhushen Building MaterialsCo., Ltd.
Wuhan Wuhan Production and sale ofcement
– 100 Businesscombination
THIS DOCUMENT IS IN DRAFT FORM, INCOMPLETE AND SUBJECT TO CHANGE AND THE INFORMATION MUST BEREAD IN CONJUNCTION WITH THE SECTION HEADED “WARNING” ON THE COVER OF THIS DOCUMENT
APPENDIX IV UNAUDITED CONSOLIDATED FINANCIAL STATEMENTSFOR THE SIX MONTHS ENDED 30 JUNE 2021
– IV-104 –

SubsidiariesPlace ofbusiness
Place ofregistration Nature of business
Proportion ofownership interest (%) Acquisition
methodDirectly Indirectly
Huaxin Concrete (Enshi) Co., Ltd. Enshi Enshi Production and sale ofcement
– 100 Set up
Huaxin Concrete (E’zhou) Co., Ltd. Ezhou Ezhou Production and sale ofcement
– 100 Set up
Huaxin Concrete (Jianli) Co., Ltd. Jianli Jianli Production and sale ofcement
– 100 Set up
Huaxin Concrete (Jingzhou)Co., Ltd.
Jingzhou Jingzhou Production and sale ofcement
– 100 Set up
Huaxin Concrete (Chongyang)Co., Ltd.
Xianning Xianning Production and sale ofcement
– 51 Businesscombination
Huaxin Concrete (Daoxian)Co., Ltd.
Daoxian Daoxian Production and sale ofcement
– 100 Set up
Huaxin Concrete (Changyang)Co., Ltd.
Changyang Changyang Production and sale ofcement
– 100 Set up
Huaxin Concrete (Xiangyang)Co., Ltd.
Xiangyang Xiangyang Production and sale ofcement
– 84 Businesscombination
Chongqing Huaxin Phoenix LakeConcrete Co., Ltd.
Chongqing Chongqing Production and sale ofcement
100 – Businesscombination
Chongqing Huaxin TianchengConcrete Co., Ltd.
Chongqing Chongqing Production and sale ofcement
100 – Businesscombination
Huaxin Concrete Yangxin NewMaterial Co., Ltd.
Yangxin Yangxin Production and sale ofcement
– 100 Set up
Huaxin Environment Engineering(Wuxue) Co., Ltd.
Wuxue Wuxue Environmental designand construction andwaste disposal
– 100 Set up
Huaxin Environment EngineeringCo., Ltd.
Wuhan Wuhan Environmental designand construction andwaste disposal
100 – Set up
Huaxin Environment Engineering(Huangshi) Co., Ltd.
Huangshi Huangshi Environmental designand construction andwaste disposal
– 70 Set up
Huaxin Environment Engineering(Zhuzhou) Co., Ltd.
Zhuzhou Zhuzhou Environmental designand construction andwaste disposal
– 100 Set up
Huaxin Environment Engineering(Xinyang) Co., Ltd.
Xinyang Xinyang Environmental designand construction andwaste disposal
– 100 Set up
Huaxin Environment Engineering(Fengjie) Co., Ltd.
Fengjie Fengjie Environmental designand construction andwaste disposal
– 100 Set up
Huaxin Environment Engineering(Nanzhang) Co., Ltd.
Nanzhang Nanzhang Environmental designand construction andwaste disposal
– 100 Set up
Huaxin Environment Engineering(Zhuha) Co., Ltd.
Zhuhai Zhuhai Environmental designand construction andwaste disposal
– 80 Set up
Huaxin Environment Engineering(Fangxian) Co., Ltd.
Fangxian Fangxian Environmental designand construction andwaste disposal
– 100 Set up
Huaxin Environment Engineering(E’zhou) Co., Ltd.
Ezhou Ezhou Environmental designand construction andwaste disposal
– 100 Set up
THIS DOCUMENT IS IN DRAFT FORM, INCOMPLETE AND SUBJECT TO CHANGE AND THE INFORMATION MUST BEREAD IN CONJUNCTION WITH THE SECTION HEADED “WARNING” ON THE COVER OF THIS DOCUMENT
APPENDIX IV UNAUDITED CONSOLIDATED FINANCIAL STATEMENTSFOR THE SIX MONTHS ENDED 30 JUNE 2021
– IV-105 –

SubsidiariesPlace ofbusiness
Place ofregistration Nature of business
Proportion ofownership interest (%) Acquisition
methodDirectly Indirectly
Huaxin Environment Engineering(Yingcheng) Co., Ltd.
Yingcheng Yingcheng Environmental designand construction andwaste disposal
– 100 Set up
Enping Huaxin EnvironmentEngineering Co., Ltd.
Enping Enping Environmental designand construction andwaste disposal
– 100 Set up
Huaxin Environment Engineering(Zigui) Co., Ltd.
Zigui Zigui Environmental designand construction andwaste disposal
– 100 Set up
Huaxin Environment Engineering(Youxian) Co., Ltd.
Youxian Youxian Environmental designand construction andwaste disposal
– 100 Set up
Huaxin Environment Engineering(Wanyuan) Co., Ltd.
Wanyuan Wanyuan Environmental designand construction andwaste disposal
– 100 Set up
Huaxin Environment Engineering(Zhaotong) Co., Ltd.
Zhaotong Zhaotong Environmental designand construction andwaste disposal
– 100 Set up
Huaxin Environment Engineering(Daye) Co., Ltd.
Daye Daye Environmental designand construction andwaste disposal
– 100 Set up
Huaxin Environment Engineering(Loudi) Co., Ltd.
Loudi Loudi Environmental designand construction andwaste disposal
– 100 Set up
Huaxin Environment Engineering(Yunyang) Co., Ltd.
Yunyang Yunyang Environmental designand construction andwaste disposal
– 100 Set up
Huaxin Environment Engineering(Shiyan) Co., Ltd.
Shiyan Shiyan Environmental designand construction andwaste disposal
– 100 Businesscombination
Wuhan Dragon Mouth HuaxinEnvironment EngineeringCo., Ltd.
Wuhan Wuhan Environmental designand construction andwaste disposal
– 100 Set up
Huaxin Environment Engineering(Yidu) Co., Ltd.
Yidu Yidu Environmental designand construction andwaste disposal
– 100 Set up
Chongqing Fulin HuaxinEnvironment EngineeringCo., Ltd.
Chongqing Chongqing Environmental designand construction andwaste disposal
– 100 Set up
Huaxin Environment Engineering(Jianchuan) Co., Ltd.
Jianchuan Jianchuan Environmental designand construction andwaste disposal
– 100 Set up
Huaxin Environment Engineering(Lijiang) Co., Ltd.
Lijiang Lijiang Environmental designand construction andwaste disposal
– 100 Set up
Huaxin Environment Engineering(Yichang) Co., Ltd.
Yichang Yichang Environmental designand construction andwaste disposal
100 – Set up
Huaxin Environment (Shiyan)Renewable Resources UtilizationCo., Ltd.
Shiyan Shiyan Environmental designand construction andwaste disposal
– 100 Set up
THIS DOCUMENT IS IN DRAFT FORM, INCOMPLETE AND SUBJECT TO CHANGE AND THE INFORMATION MUST BEREAD IN CONJUNCTION WITH THE SECTION HEADED “WARNING” ON THE COVER OF THIS DOCUMENT
APPENDIX IV UNAUDITED CONSOLIDATED FINANCIAL STATEMENTSFOR THE SIX MONTHS ENDED 30 JUNE 2021
– IV-106 –

SubsidiariesPlace ofbusiness
Place ofregistration Nature of business
Proportion ofownership interest (%) Acquisition
methodDirectly Indirectly
Zhuzhou Huaxin EnvironmentalHazardous Waste DisposalCo., Ltd.
Zhuzhou Zhuzhou Environmental designand construction andwaste disposal
– 80 Set up
Huaxin Environment (Yangxin)Renewable Resources UtilizationCo., Ltd.
Yangxin Yangxin Environmental designand construction andwaste disposal
– 100 Set up
Huaxin (Nanzhang) RenewableResources Utilization Co., Ltd.
Nanzhang Nanzhang Industrial solid waste,hazardous wastedisposal and recycling
– 100 Set up
Huaxin Aggregate (Wuxue)Co., Ltd.
Wuxue Wuxue Production and sale ofaggregate
– 100 Set up
Huaxin Aggregate (Yangxin)Co., Ltd.
Yangxin Yangxin Production and sale ofaggregate
– 100 Set up
Huaxin New Building MaterialsCo., Ltd.
Wuhan Wuhan Production and sale ofnew materials
100 – Set up
Chongqing Huaxin New BuildingMaterials Co., Ltd.
Chongqing Chongqing Production and sale ofnew materials
– 100 Set up
Huaxin New Building Materials(Wuhan) Co., Ltd.
Wuhan Wuhan Production and sale ofnew materials
– 60 Set up
Huaxin New Building Materials(Changyang) Co., Ltd.
Changyang Changyang Production and sale ofnew materials
– 100 Set up
Huaxin New Building Materials(Fumin) Co., Ltd.
Fumin Fumin Production and sale ofnew materials
– 65 Set up
Huangshi Huaxin New PackagingCo., Ltd.
Huangshi Huangshi Production, sale ofcement packagingbags
100 – Set up
Huaxin Packaging (Chibi) Co., Ltd. Chibi Chibi Production, sale ofcement packagingbags
– 100 Set up
Huaxin Packaging (Yidu) Co., Ltd Yidu Yidu Production, sale ofcement packagingbags
– 100 Set up
Huaxin Packaging (E’zhou)Co., Ltd
Ezhou Ezhou Production, sale ofcement packagingbags
– 100 Set up
Huaxin Packaging (Zhuzhou)Co., Ltd
Zhuzhou Zhuzhou Production, sale ofcement packagingbags
– 100 Set up
Huaxin Packaging (Nanzhang)Co., Ltd
Nanzhang Nanzhang Production, sale ofcement packagingbags
– 100 Set up
Huaxin Packaging (Quxian)Co., Ltd
Quxian Quxian Production, sale ofcement packagingbags
– 100 Set up
Cambodia Zoretta PackagingCo., Ltd.
Cambodia Cambodia Production, sale ofcement packagingbags
– 100 Set up
Huaixn Cement (Huangshi) BulkStorage And TransportationCo., Ltd.
Huangshi Huangshi Loading and unloading,warehousing andother services
100 – Set up
THIS DOCUMENT IS IN DRAFT FORM, INCOMPLETE AND SUBJECT TO CHANGE AND THE INFORMATION MUST BEREAD IN CONJUNCTION WITH THE SECTION HEADED “WARNING” ON THE COVER OF THIS DOCUMENT
APPENDIX IV UNAUDITED CONSOLIDATED FINANCIAL STATEMENTSFOR THE SIX MONTHS ENDED 30 JUNE 2021
– IV-107 –

SubsidiariesPlace ofbusiness
Place ofregistration Nature of business
Proportion ofownership interest (%) Acquisition
methodDirectly Indirectly
Xiangyang Huaxin LogisticsCo., Ltd.
Xiangyang Xiangyang Loading and unloading,warehousing andother services
– 100 Set up
Kunming Huaxin LogisticsCo., Ltd.
Kunming Kunming Loading and unloading,warehousing andother services
– 100 Businesscombination
Chongqing Huaxin LogisticsCo., Ltd.
Chongqing Chongqing Loading and unloading,warehousing andother services
– 100 Businesscombination
Huaxin Logistics (Zigui) Co., Ltd. Zigui Zigui Loading and unloading,warehousing andother services
– 100 Set up
Zhuzhou Huaxin LogisticsCo., Ltd.
Zhuzhou Zhuzhou Loading and unloading,warehousing andother services
– 100 Set up
Huaxin Central Asia Investment(Wuhan) Co., Ltd.
Wuhan Wuhan Investment 100 – Set up
Huaxin Concrete Co., Ltd. Wuhan Wuhan Investment 100 – Set upHuaxin Aggregate Co., Ltd. Wuhan Wuhan Investment 100 – Set upHuaxin (Hong Kong) International
Holdings Co., Ltd.Hong Kong Hong Kong Investment 100 – Set up
Success Eagle Cement (HongKong) Co., Ltd.
Hong Kong Hong Kong Investment – 65 Businesscombination
Huaxin Hong Kong (Cambodia)Investment Co., Ltd.
Hong Kong Hong Kong Investment – 100 Set up
Huaxin Hong Kong (Central Asia)Investment Co., Ltd. (Note 2)
Hong Kong Hong Kong Investment – 51 Set up
Huaxin Narayani Investment(Shanghai) Co., Ltd.
Shanghai Shanghai Investment 100 – Set up
Yunnan Huaxin Building MaterialsInvestment Co., Ltd.
Kunming Kunming Investment 100 – Businesscombination
Somerset Mauritius InvestmentCo., Ltd.
Mauritius Mauritius Investment 100 – Businesscombination
Huangshi Huaxin CementScientific Research and DesignCo., Ltd.
Huangshi Huangshi Building materialsengineering design,etc.
99 – Set up
Huaxin Cement TechnologyManagement (Wuhan) Co., Ltd.
Wuhan Wuhan R&D and consultingservice
100 – Set up
Huaxin Cement (Huangshi)Equipment ManufacturingCo., Ltd.
Huangshi Huangshi Manufacturing,maintenance andinstallation ofmechanical &electrical tools
– 100 Set up
Huaxin Equipment EngineeringCo., Ltd.
Huangshi Huangshi Manufacturing,maintenance andinstallation ofmechanical &electrical tools
100 – Set up
THIS DOCUMENT IS IN DRAFT FORM, INCOMPLETE AND SUBJECT TO CHANGE AND THE INFORMATION MUST BEREAD IN CONJUNCTION WITH THE SECTION HEADED “WARNING” ON THE COVER OF THIS DOCUMENT
APPENDIX IV UNAUDITED CONSOLIDATED FINANCIAL STATEMENTSFOR THE SIX MONTHS ENDED 30 JUNE 2021
– IV-108 –
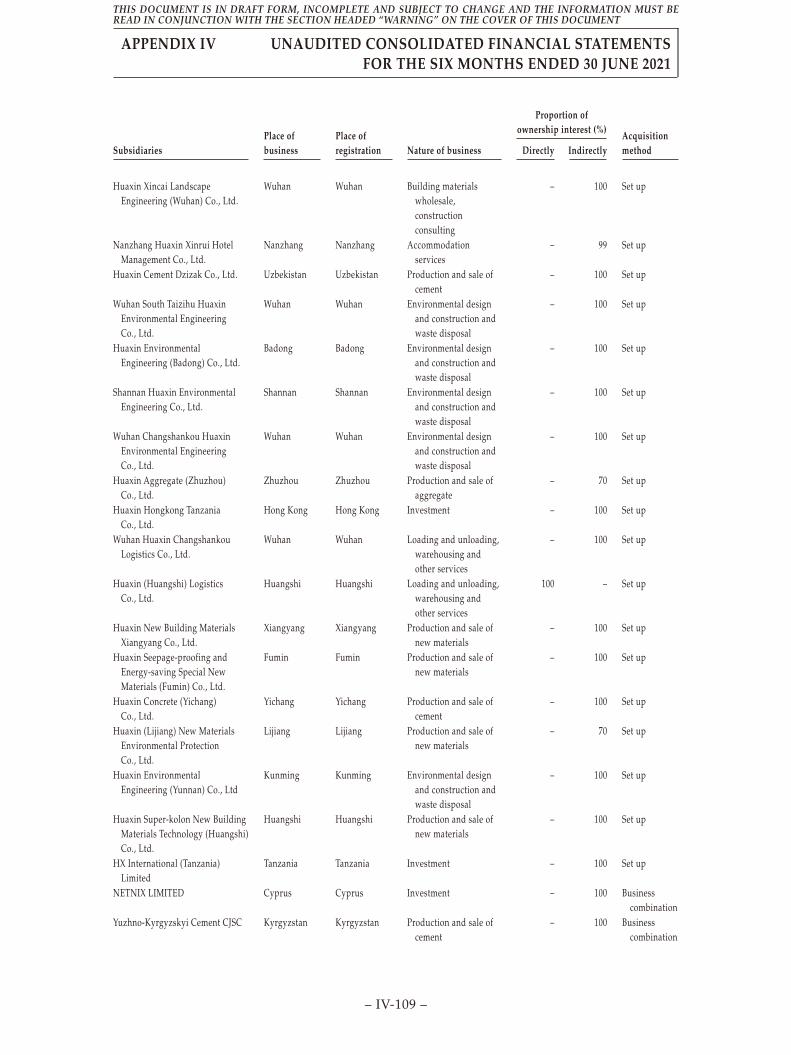
SubsidiariesPlace ofbusiness
Place ofregistration Nature of business
Proportion ofownership interest (%) Acquisition
methodDirectly Indirectly
Huaxin Xincai LandscapeEngineering (Wuhan) Co., Ltd.
Wuhan Wuhan Building materialswholesale,constructionconsulting
– 100 Set up
Nanzhang Huaxin Xinrui HotelManagement Co., Ltd.
Nanzhang Nanzhang Accommodationservices
– 99 Set up
Huaxin Cement Dzizak Co., Ltd. Uzbekistan Uzbekistan Production and sale ofcement
– 100 Set up
Wuhan South Taizihu HuaxinEnvironmental EngineeringCo., Ltd.
Wuhan Wuhan Environmental designand construction andwaste disposal
– 100 Set up
Huaxin EnvironmentalEngineering (Badong) Co., Ltd.
Badong Badong Environmental designand construction andwaste disposal
– 100 Set up
Shannan Huaxin EnvironmentalEngineering Co., Ltd.
Shannan Shannan Environmental designand construction andwaste disposal
– 100 Set up
Wuhan Changshankou HuaxinEnvironmental EngineeringCo., Ltd.
Wuhan Wuhan Environmental designand construction andwaste disposal
– 100 Set up
Huaxin Aggregate (Zhuzhou)Co., Ltd.
Zhuzhou Zhuzhou Production and sale ofaggregate
– 70 Set up
Huaxin Hongkong TanzaniaCo., Ltd.
Hong Kong Hong Kong Investment – 100 Set up
Wuhan Huaxin ChangshankouLogistics Co., Ltd.
Wuhan Wuhan Loading and unloading,warehousing andother services
– 100 Set up
Huaxin (Huangshi) LogisticsCo., Ltd.
Huangshi Huangshi Loading and unloading,warehousing andother services
100 – Set up
Huaxin New Building MaterialsXiangyang Co., Ltd.
Xiangyang Xiangyang Production and sale ofnew materials
– 100 Set up
Huaxin Seepage-proofing andEnergy-saving Special NewMaterials (Fumin) Co., Ltd.
Fumin Fumin Production and sale ofnew materials
– 100 Set up
Huaxin Concrete (Yichang)Co., Ltd.
Yichang Yichang Production and sale ofcement
– 100 Set up
Huaxin (Lijiang) New MaterialsEnvironmental ProtectionCo., Ltd.
Lijiang Lijiang Production and sale ofnew materials
– 70 Set up
Huaxin EnvironmentalEngineering (Yunnan) Co., Ltd
Kunming Kunming Environmental designand construction andwaste disposal
– 100 Set up
Huaxin Super-kolon New BuildingMaterials Technology (Huangshi)Co., Ltd.
Huangshi Huangshi Production and sale ofnew materials
– 100 Set up
HX International (Tanzania)Limited
Tanzania Tanzania Investment – 100 Set up
NETNIX LIMITED Cyprus Cyprus Investment – 100 Businesscombination
Yuzhno-Kyrgyzskyi Cement CJSC Kyrgyzstan Kyrgyzstan Production and sale ofcement
– 100 Businesscombination
THIS DOCUMENT IS IN DRAFT FORM, INCOMPLETE AND SUBJECT TO CHANGE AND THE INFORMATION MUST BEREAD IN CONJUNCTION WITH THE SECTION HEADED “WARNING” ON THE COVER OF THIS DOCUMENT
APPENDIX IV UNAUDITED CONSOLIDATED FINANCIAL STATEMENTSFOR THE SIX MONTHS ENDED 30 JUNE 2021
– IV-109 –

SubsidiariesPlace ofbusiness
Place ofregistration Nature of business
Proportion ofownership interest (%) Acquisition
methodDirectly Indirectly
Stone Group LLC Kyrgyzstan Kyrgyzstan Management and staffdispatch services
– 100 Businesscombination
Power Assets LLC Kyrgyzstan Kyrgyzstan Land and house leaseservices
– 100 Businesscombination
Hubei Huaxin EnvironmentalLogistics Co., LTD
Huangshi Huangshi Loading and unloading,warehousing,transporting, andother services
– 100 Set up
Yunwei Baoshan Organic ChemicalCo., Ltd.
Baoshan Baoshan Production and sale ofcement
– 80 Businesscombination
Huaxin Cement (Songming)Co., Ltd.
Songming Songming Production and sale ofcement
– 100 Set up
Huaxin EnvironmentalEngineering (Changyang)Co., Ltd.
Changyang Changyang Environmental designand construction andwaste disposal
– 100 Set up
Huaxin (Changyang) RenewableResource Utilization Co., Ltd.
Changyang Changyang Industrial solid wastes – 100 Set up
Other explanation:
Note 1: Wuhan Wugang Huaxin Cement Co., Ltd. is included in the scope of consolidationsince the Group has the right to govern its operation decision making.
Note 2: The Group effectively holds 51% equity interest of Huaxin Hong Kong (Central Asia)Investment Co., Ltd.. The approval mechanism of the board of directors of HuaxinHong Kong (Central Asia) Investment Co., Ltd. is simple majority, and the Group iseligible to assign three out of the five directors. Hence, the Group obtains control ofHuaxin Hong Kong (Central Asia) Investment Co., Ltd..
Note 3: These companies are established or acquired by the Group in 2021, and are included inthe scope since 2021.
(2) Significant non-wholly subsidiaries
RMB
Subsidiaries
Shareholdingproportion by
minorityinterests
Profit or lossattributable to
minorityinterests for
the currentperiod
Dividendsannounced
fordistributionto minorityinterests inthe current
period
Closingbalance of
minorityinterest
Huaxin Hong Kong (CentralAsia) Investment Co., Ltd. 49% 94,388,177 18,274,260 407,272,822
Cambodia Cement CharkreyTing Factory Co., Ltd. 32% 13,504,445 – 293,314,916
Huaxin Cement (Daye) Co.,Ltd. 30% 11,276,218 – 222,835,924
Huaxin Hongta Cement(Jinghong) Co., Ltd. 49% 14,526,143 78,181,932 146,743,797
Huaxin Cement (Tibet) Co.,Ltd. 21% 28,102,037 – 235,893,399
THIS DOCUMENT IS IN DRAFT FORM, INCOMPLETE AND SUBJECT TO CHANGE AND THE INFORMATION MUST BEREAD IN CONJUNCTION WITH THE SECTION HEADED “WARNING” ON THE COVER OF THIS DOCUMENT
APPENDIX IV UNAUDITED CONSOLIDATED FINANCIAL STATEMENTSFOR THE SIX MONTHS ENDED 30 JUNE 2021
– IV-110 –
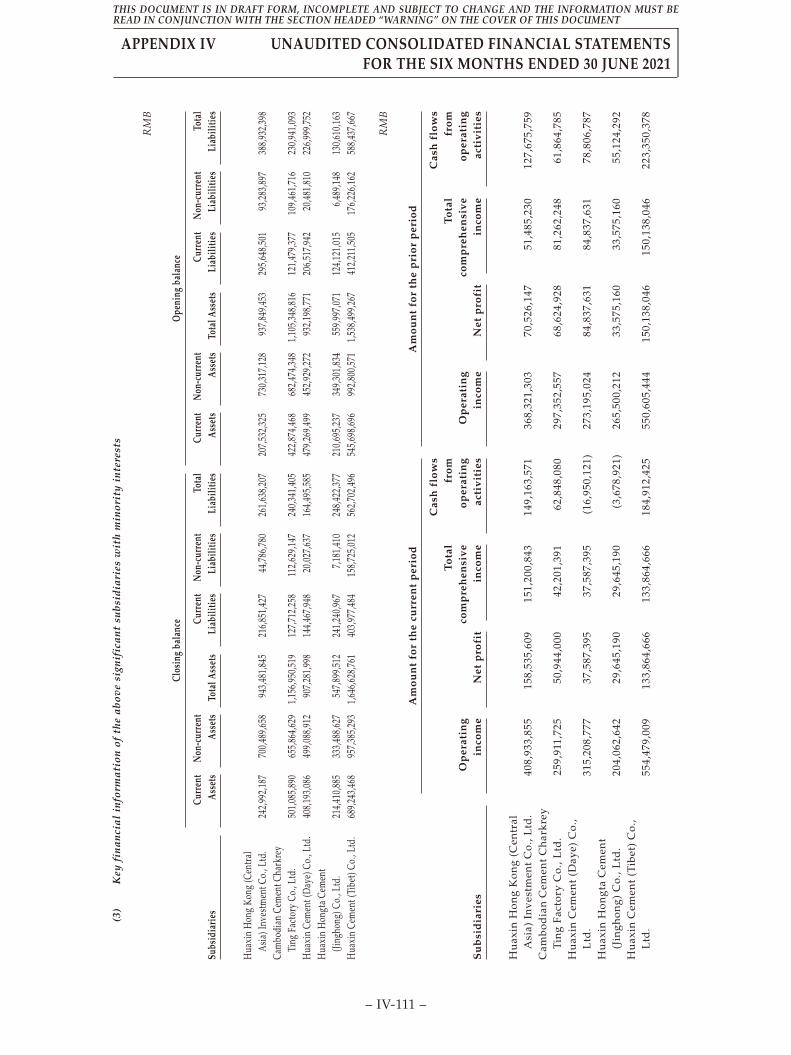
(3)
Key
fina
ncia
lin
form
atio
nof
the
abov
esi
gnif
ican
tsu
bsid
iari
esw
ith
min
orit
yin
tere
sts
RM
B
Subs
idia
ries
Clos
ing
bala
nce
Ope
ning
bala
nce
Curr
ent
Ass
ets
Non
-cur
rent
Ass
ets
Tota
lAss
ets
Curr
ent
Liab
ilitie
sN
on-c
urre
ntLi
abili
ties
Tota
lLi
abili
ties
Curr
ent
Ass
ets
Non
-cur
rent
Ass
ets
Tota
lAss
ets
Curr
ent
Liab
ilitie
sN
on-c
urre
ntLi
abili
ties
Tota
lLi
abili
ties
Hua
xin
Hon
gKo
ng(C
entra
lA
sia)I
nves
tmen
tCo.
,Ltd
.24
2,99
2,18
770
0,48
9,65
894
3,48
1,84
521
6,85
1,42
744
,786
,780
261,
638,
207
207,
532,
325
730,
317,
128
937,
849,
453
295,
648,
501
93,2
83,8
9738
8,93
2,39
8Ca
mbo
dian
Cem
entC
hark
rey
Ting
Fact
ory
Co.,
Ltd.
501,
085,
890
655,
864,
629
1,15
6,95
0,51
912
7,71
2,25
811
2,62
9,14
724
0,34
1,40
542
2,87
4,46
868
2,47
4,34
81,
105,
348,
816
121,
479,
377
109,
461,
716
230,
941,
093
Hua
xin
Cem
ent(
Day
e)Co
.,Lt
d.40
8,19
3,08
649
9,08
8,91
290
7,28
1,99
814
4,46
7,94
820
,027
,637
164,
495,
585
479,
269,
499
452,
929,
272
932,
198,
771
206,
517,
942
20,4
81,8
1022
6,99
9,75
2H
uaxi
nH
ongt
aCe
men
t(Ji
ngho
ng)C
o.,L
td.
214,
410,
885
333,
488,
627
547,
899,
512
241,
240,
967
7,18
1,41
024
8,42
2,37
721
0,69
5,23
734
9,30
1,83
455
9,99
7,07
112
4,12
1,01
56,
489,
148
130,
610,
163
Hua
xin
Cem
ent(
Tibe
t)Co
.,Lt
d.68
9,24
3,46
895
7,38
5,29
31,
646,
628,
761
403,
977,
484
158,
725,
012
562,
702,
496
545,
698,
696
992,
800,
571
1,53
8,49
9,26
741
2,21
1,50
517
6,22
6,16
258
8,43
7,66
7
RM
B
Su
bsi
dia
ries
Am
ou
nt
for
the
curr
ent
per
iod
Am
ou
nt
for
the
pri
or
per
iod
Op
erat
ing
inco
me
Net
pro
fit
To
tal
com
pre
hen
siv
ein
com
e
Cas
hfl
ow
sfr
om
op
erat
ing
acti
vit
ies
Op
erat
ing
inco
me
Net
pro
fit
To
tal
com
pre
hen
siv
ein
com
e
Cas
hfl
ow
sfr
om
op
erat
ing
acti
vit
ies
Hu
axin
Hon
gK
ong
(Cen
tral
Asi
a)In
ves
tmen
tC
o.,L
td.
408,
933,
855
158,
535,
609
151,
200,
843
149,
163,
571
368,
321,
303
70,5
26,1
4751
,485
,230
127,
675,
759
Cam
bod
ian
Cem
ent
Ch
arkr
eyTi
ng
Fact
ory
Co.
,Ltd
.25
9,91
1,72
550
,944
,000
42,2
01,3
9162
,848
,080
297,
352,
557
68,6
24,9
2881
,262
,248
61,8
64,7
85H
uax
inC
emen
t(D
aye)
Co.
,L
td.
315,
208,
777
37,5
87,3
9537
,587
,395
(16,
950,
121)
273,
195,
024
84,8
37,6
3184
,837
,631
78,8
06,7
87H
uax
inH
ongt
aC
emen
t(J
ingh
ong)
Co.
,Ltd
.20
4,06
2,64
229
,645
,190
29,6
45,1
90(3
,678
,921
)26
5,50
0,21
233
,575
,160
33,5
75,1
6055
,124
,292
Hu
axin
Cem
ent
(Tib
et)
Co.
,L
td.
554,
479,
009
133,
864,
666
133,
864,
666
184,
912,
425
550,
605,
444
150,
138,
046
150,
138,
046
223,
350,
378
THIS DOCUMENT IS IN DRAFT FORM, INCOMPLETE AND SUBJECT TO CHANGE AND THE INFORMATION MUST BEREAD IN CONJUNCTION WITH THE SECTION HEADED “WARNING” ON THE COVER OF THIS DOCUMENT
APPENDIX IV UNAUDITED CONSOLIDATED FINANCIAL STATEMENTSFOR THE SIX MONTHS ENDED 30 JUNE 2021
– IV-111 –

2. Equity interests in joint ventures or associates
(1) Significant joint ventures or associates
RMB
Associates or joint venturesPlace ofbusiness
Place ofregistration Nature of business
Proportion ofownership interest (%)
Accountingtreatment forinvestment inassociates orjoint venturesDirect Indirect
Tibet High-tech Building MaterialsCo., Ltd.
Tibet Tibet Production and sale ofcement
43 0 Equity method
(2) Key financial information of significant associates
RMB
Closing balance/Amountfor the current period
Openingbalance/Amount
for the prior period
Tibet High-tech BuildingMaterials Co., Ltd.
Tibet High-tech BuildingMaterials Co., Ltd.
Current Assets 624,144,939 709,248,857Non-current Assets 859,642,674 877,725,350
Total Assets 1,483,787,613 1,586,974,207
Current Liabilities 281,430,411 347,374,337Non-current Liabilities 211,949,072 270,793,670
Total Liabilities 493,379,483 618,168,007
Minority interests 129,628,714 125,346,036Equity interest attributable to the
shareholders of the parentcompany 860,779,416 843,460,164
Share of net assets calculated basedon the proportion of shareholding 370,135,149 362,687,871
Adjustment (6,408,339) (6,408,339)– Unrealized profits from internal
transactions (6,408,339) (6,408,339)
Carrying amount of equityinvestments in associates 363,726,810 356,279,532
The fair value of equity investmentsin associates with a publiclyquoted price
Operating income 320,946,808 404,861,730Net profit 17,319,252 59,721,044Other comprehensive income – –
Total comprehensive income 17,319,252 59,721,044Dividends received from associates
in the current year – –
THIS DOCUMENT IS IN DRAFT FORM, INCOMPLETE AND SUBJECT TO CHANGE AND THE INFORMATION MUST BEREAD IN CONJUNCTION WITH THE SECTION HEADED “WARNING” ON THE COVER OF THIS DOCUMENT
APPENDIX IV UNAUDITED CONSOLIDATED FINANCIAL STATEMENTSFOR THE SIX MONTHS ENDED 30 JUNE 2021
– IV-112 –

(3) Summarized financial information of insignificant joint ventures or associates
RMB
Closing balance/Amount
for the current period
Opening
balance/Amount
for the current period
Joint ventures
Gross carrying amount ofinvestments 65,924,620 60,791,825
Total amounts calculated based onproportion of ownership interest:
– Net profit 5,132,795 9,791,825
– Other comprehensive income – –
– Total comprehensive income 5,132,795 9,791,825
Associates
Gross carrying amount ofinvestments 164,128,100 95,209,844
Total amounts calculated based onproportion of ownership interest:
– Net profit (1,081,744) (1,087,410)
– Other comprehensive income – –
– Total comprehensive income (1,081,744) (1,087,410)
THIS DOCUMENT IS IN DRAFT FORM, INCOMPLETE AND SUBJECT TO CHANGE AND THE INFORMATION MUST BEREAD IN CONJUNCTION WITH THE SECTION HEADED “WARNING” ON THE COVER OF THIS DOCUMENT
APPENDIX IV UNAUDITED CONSOLIDATED FINANCIAL STATEMENTSFOR THE SIX MONTHS ENDED 30 JUNE 2021
– IV-113 –

VIII. RISKS ASSOCIATED WITH FINANCIAL INSTRUMENTS
The Group’s major financial instruments include cash and bank balances, held-for-trading financialassets, notes receivable, financing with receivables, accounts receivable, other receivables, debtinvestments, long-term receivables, other equity instrument investments, other non-current financialassets, borrowings, held-for-trading financial liabilities, notes payable, accounts payable, other payables,bonds payable and long-term payables, etc. Details of these financial instruments are disclosed in Note V.The risks associated with these financial instruments and the policies on how to mitigate these risks areset out below. Management manages and monitors these exposures to ensure the risks are monitored at acertain level.
RMB
Closing balance Opening balance
Financial assetsMeasured at FVTPL
Held-for-trading financial assets – 1,004,581,752Other non-current financial assets 28,086,810 32,827,254
Measured at FVTOCIFinancing with receivables 937,354,912 1,020,306,419Other equity instrument investments 35,180,864 33,774,995
Measured at amortized costNotes receivable 124,033,871 79,939,117Accounts receivable 1,066,639,655 653,219,779Other receivables 371,520,100 375,253,958Debt investments 7,500,000 7,500,000Long-term receivables 34,638,462 29,141,216
Financial liabilitiesMeasured at FVTPL
Held-for-trading financial liabilities 3,587,852 –
Measured at amortized costShort-term borrowings 500,500,000 625,000,000Notes payable 222,804,276 472,696,537Accounts payable 5,911,035,705 5,297,633,770Other payables 938,759,531 786,246,239Non-current liabilities due within one year 2,147,153,103 1,874,484,159Long-term borrowings 3,511,168,528 3,504,279,973Bonds payable 1,925,779,933 1,943,763,447Long-term payables 352,968,294 191,011,663
The Group adopts sensitivity analysis technique to analyze how the profit and loss for the period andshareholders’ equity would have been affected by reasonably possible changes in the relevant riskvariables. As it is unlikely that risk variables will change in an isolated manner, and the interdependenceamong risk variables will have significant effect on the amount ultimately influenced by the changes in asingle risk variable, the followings are based on the assumption that the change in each risk variable is ona stand-alone basis.
THIS DOCUMENT IS IN DRAFT FORM, INCOMPLETE AND SUBJECT TO CHANGE AND THE INFORMATION MUST BEREAD IN CONJUNCTION WITH THE SECTION HEADED “WARNING” ON THE COVER OF THIS DOCUMENT
APPENDIX IV UNAUDITED CONSOLIDATED FINANCIAL STATEMENTSFOR THE SIX MONTHS ENDED 30 JUNE 2021
– IV-114 –

1. Risk management objectives and policies
The Group’s risk management objectives are to achieve a proper balance between risks and yield,minimize the adverse impacts of risks on the Group’s operation performance, and maximize the benefitsof the shareholders and other stakeholders. Based on these risk management objectives, the Group’s basicrisk management strategy is to identify and analyze the Group’s exposure to various risks, establish anappropriate maximum tolerance to risk, implement risk management, and monitors regularly andeffectively these exposures to ensure the risks are monitored at a certain level.
1.1 Market risk
1.1.1. Currency risk
Currency risk is the risk that losses will occur because of changes in foreign exchangerates. Several of the Group’s subsidiaries have purchases and sales denominated in USDwhile the Group’s other principal activities are denominated and settled in RMB. Thebalance of other foreign currencies is insignificant, including HKD, EUR and DKK, andhas no significant impact on the Group’s foreign exchange risk.
The finance department of the headquarter of the Group monitors the Group’s foreigncurrency transactions and the scale of foreign currency assets and liabilities, to minimizethe foreign exchange risks; therefore, the Group is likely to avoid currency risks bysigning forward foreign exchange contracts or currency swaps. During January to June2021 and in 2020, the Group did not enter into any forward foreign exchange contracts orcurrency swaps.
As at 30 June 2021 and 31 December 2020, for companies of the Group whose functionalcurrency is not USD, the financial assets and financial liabilities denominated in USD aretranslated into RMB as follows:
RMB
Closing balance Opening balance
Cash and bank balances 1,387,674,730 1,159,655,707Accounts payable 8,783,353 1,490,643Other payables 2,312,088 2,348,997Borrowings 896,274,274 156,206,106
Sensitivity analysis on currency risk
Where all other variables are held constant, the reasonably possible changes in the foreignexchange rate may have the following pre-tax effect on the profit or loss for the period andshareholders’ equity:
RMB
Item Change in exchange rate
Current period Prior period
Effect on profitbefore tax
Effect onshareholders’
equityEffect on profit
before tax
Effect onshareholders’
equity
USD 5% appreciation 24,015,251 18,011,438 49,980,498 37,170,197USD 5% depreciation (24,015,251) (18,011,438) (49,980,498) (37,170,197)
THIS DOCUMENT IS IN DRAFT FORM, INCOMPLETE AND SUBJECT TO CHANGE AND THE INFORMATION MUST BEREAD IN CONJUNCTION WITH THE SECTION HEADED “WARNING” ON THE COVER OF THIS DOCUMENT
APPENDIX IV UNAUDITED CONSOLIDATED FINANCIAL STATEMENTSFOR THE SIX MONTHS ENDED 30 JUNE 2021
– IV-115 –

1.1.2. Interest rate risk — risk of changes in cash flows
The Group’s cash flow interest rate risk of financial instruments relates primarily tovariable-rate bank borrowings. As at 30 June 2021, the balance of the Group’s long-termborrowings at variable-rate was RMB4,221,840,565(31 December 2020: RMB4,107,824,221)(please refer to Note V. (21) and Note V. (29) for details). Financial liabilities withvariable-rate expose the Group to cash flow interest rate risk, and financial liabilities withfixed interest rates expose the Group to fair value interest rate risk. The financedepartment of the headquarter of the Group continues to monitor the Group’s interest ratelevel. Increase in interest rates will increase the costs of new interest-bearing liabilitiesand the interest expenses with respect to the Group’s outstanding floating rate liabilities,and therefore have a material adverse effect on the Group’s financial results. Themanagement will make adjustments which are likely to mitigate interest rate risksthrough interest rate swaps in accordance with the latest market conditions. During thisperiod, the Group signed interest rate swap agreements with China Merchants Bank HongKong Branch and HSBC Bank Hong Kong Branch respectively.
The sensitivity analysis on interest rate risk
As at 30 June 2021, where all other variables are held constant, the variable interest ratehad been 100 basis points higher or lower, the effect on the pre-tax profit andshareholders’ equity is set out as below:
RMB
Change ininterest rate
Current period Prior period
Effect onprofit
before tax
Effect onshareholders’
equity
Effect onprofit
before tax
Effect onshareholders’
equity
Benchmark interestrate increased by 1% (42,218,406) (31,663,804) (31,807,773) (23,855,830)
Benchmark interestrate reduced by 1% 42,218,406 31,663,804 31,807,773 23,855,830
1.1.3. Other price risk
The Group’s investments classified as other equity investments and other non-currentfinancial assets are measured at fair value at each balance sheet date. As at 30 June 2021,the other equity investments and other non-current financial assets held by the Groupwere not significant, therefore, the risk level of changes in the securities market the Groupexposed to was not significant.
1.2 Credit risk
As at 30 June 2021, the Group’s maximum exposure to credit risk which will cause a financial lossto the Group is due to the failure to discharge an obligation by the counterparties, whichspecifically includes cash and bank balances (Note V(1)), notes receivable (Note V(3)), accountsreceivable (Note V(4)), financing with receivables (Note V(5)), other receivables (Note V(7)),long-term receivables and debt investments, etc. At the balance sheet date, the carrying amount ofthe Group’s financial assets has represented its maximum credit risk exposure.
The Group’s risk exposure is distributed in many different regions and involves a number ofcustomers, therefore, the Group does not have significant concentration of credit risks. As at 30June 2021, the balance of amounts due from the Group’s top five customers is amounted toRMB119,442,342 (31 December 2020: RMB111,267,028), representing 10% (31 December 2020: 14%)
THIS DOCUMENT IS IN DRAFT FORM, INCOMPLETE AND SUBJECT TO CHANGE AND THE INFORMATION MUST BEREAD IN CONJUNCTION WITH THE SECTION HEADED “WARNING” ON THE COVER OF THIS DOCUMENT
APPENDIX IV UNAUDITED CONSOLIDATED FINANCIAL STATEMENTSFOR THE SIX MONTHS ENDED 30 JUNE 2021
– IV-116 –

of the balance of the Group’s accounts receivable. In addition, the Group does not have othercredit risk exposure concentrated on a single financial asset or a portfolio of financial assetssharing similar characteristics.
The table below details the credit risk exposure of the Group’s financial assets and other items:
RMB
Item Note
12-month or lifetime ECL
Category Account balance
Financial assets at amortizedcost– Cash and bank balances Note V(1) 12-month ECL 7,429,933,411– Notes receivable Note V(3) 12-month ECL 124,033,871– Accounts receivable Note V(4) Lifetime ECL (not
credit-impaired)1,120,407,029
Lifetime ECL(credit-impaired)
100,973,718
Sub-total 1,221,380,747– Other receivables Note V(7) 12-month ECL 342,890,039
Lifetime ECL(credit-impaired)
131,800,019
Sub-total 474,690,058– Long-term receivables Lifetime ECL (not
credit-impaired)34,638,462
– Debt investments Lifetime ECL (notcredit-impaired)
7,500,000
Lifetime ECL(credit-impaired)
2,000,000
Financial assets at FVTOCI– Financing with receivables Note V(5) 12-month ECL 937,354,912
The Group manages credit risks by portfolios, which mainly refer to accounts receivable.
The Group’s bank deposits are mainly deposited in banks with high credit rating. The Groupbelieves that there is lower credit risk and there will be no significant losses due to the default ofthe counterparties.
The Group believes that the accepting bank for the bank acceptance has a high credit rating andthere is no significant credit risk.
For other receivables, most of them are security fund, deposits, deposits for equity acquisitionand petty cash for employees, etc. The Group believes that the credit risk is low and there will beno significant losses due to the default of the counterparties. For loans and advances, the Grouphas made appropriate provision for expected credit losses based on the repayment abilities andwillingness of the counterparties.
The Group designs relevant policies for accounts receivable to control credit risk exposure. TheGroup assesses the credit qualification of the customer and sets up the corresponding creditperiod and credit limit based on the financial status of the customer, the possibility of obtainingguarantee from a third party, credit record and other factors such as the current marketconditions. The Group will regularly monitor the credit records of customers. For customers withpoor credit records, the Group will use written reminders, shorten credit period or cancel creditlimit to ensure that the Group’s overall credit risk is controlled at a certain level.
THIS DOCUMENT IS IN DRAFT FORM, INCOMPLETE AND SUBJECT TO CHANGE AND THE INFORMATION MUST BEREAD IN CONJUNCTION WITH THE SECTION HEADED “WARNING” ON THE COVER OF THIS DOCUMENT
APPENDIX IV UNAUDITED CONSOLIDATED FINANCIAL STATEMENTSFOR THE SIX MONTHS ENDED 30 JUNE 2021
– IV-117 –

1.3 Liquidity risk
Each subsidiary within the Group is responsible for its own cash flow forecast. Based on the cashflow forecast of each subsidiary, the finance department of the headquarter of the Groupcontinuously monitors the short-term and long-term capital demands at the Group level to ensurethe maintenance of sufficient cash reserves. At the same time, it continuously monitorscompliance with the provisions of the loan agreement and acquires the loan commitment from themajor financial insitutes to meet short-term and long-term capital demands.
The following is the maturity analysis for financial liabilities held by the Group which is based onundiscounted remaining contractual obligations:
RMB
Within 1 year 1 – 2 years 2 – 5 years Over 5 years Total
Short-termborrowings 509,442,278 – – – 509,442,278
Notes payable 222,804,276 – – – 222,804,276Accounts payable 5,911,035,705 – – – 5,911,035,705Other payables 938,759,531 – – – 938,759,531Long-term
borrowings 839,538,355 1,352,851,730 2,251,700,505 82,578,054 4,526,668,644Bonds payable 1,252,174,621 44,402,850 2,031,860,167 – 3,328,437,638Long-term
payables 219,837,140 145,275,600 242,456,800 5,954,000 613,523,540Lease liabilities 29,066,650 29,066,650 82,022,860 93,014,523 233,170,683
Total 9,922,658,556 1,571,596,830 4,608,040,332 181,546,577 16,283,842,295
THIS DOCUMENT IS IN DRAFT FORM, INCOMPLETE AND SUBJECT TO CHANGE AND THE INFORMATION MUST BEREAD IN CONJUNCTION WITH THE SECTION HEADED “WARNING” ON THE COVER OF THIS DOCUMENT
APPENDIX IV UNAUDITED CONSOLIDATED FINANCIAL STATEMENTSFOR THE SIX MONTHS ENDED 30 JUNE 2021
– IV-118 –

IX. DISCLOSURE OF FAIR VALUE
1. Closing fair value of assets and liabilities measured at fair value
RMB
Closing balance
Item Level 1 Level 2 Level 3 Total
I. Continuous fair valuemeasurement
(I) Financial assets at fairvalue through profit orloss 28,086,810 – – 28,086,8101. Other non-current
financial assets 28,086,810 – – 28,086,810(1) Equity instrument
investments 28,086,810 – – 28,086,810(II) Financing with
receivables – – 937,354,912 937,354,912(III) Other equity instrument
investments – – 35,180,864 35,180,864
Total assets continuouslymeasured at fair value 28,086,810 – 972,535,776 1,000,622,586
II. Continuous fair valuemeasurement
(I) Financial liabilities at fairvalue throughprofit or loss – 3,587,852 – 3,587,8521. Held for trading
liabilities – 3,587,852 – 3,587,852(1) Interest rate swap – 3,587,852 – 3,587,852
Total liabilities continuouslymeasured at fair value – 3,587,852 – 3,587,852
2. Basis for determining the market price of Level 1 fair value measurement items on recurring and
non-recurring bases
The market prices of the above items measured at Level 1 fair value are determined based on the closingprice of stock on 30 June 2021.
3. Valuation techniques and qualitative and quantitative information of key inputs adopted for Level 2
fair value measurement items on recurring and non-recurring bases
The fair value of the interest rate swap product was determined based on the market value notice dated30 June 2021.
THIS DOCUMENT IS IN DRAFT FORM, INCOMPLETE AND SUBJECT TO CHANGE AND THE INFORMATION MUST BEREAD IN CONJUNCTION WITH THE SECTION HEADED “WARNING” ON THE COVER OF THIS DOCUMENT
APPENDIX IV UNAUDITED CONSOLIDATED FINANCIAL STATEMENTSFOR THE SIX MONTHS ENDED 30 JUNE 2021
– IV-119 –

4. Valuation techniques and qualitative and quantitative information of key inputs adopted for Level 3
fair value measurement items on recurring and non-recurring bases
For fair value of the above other equity investment, the Group refers to the price-to-book ratio of thelisted controlling shareholder of the investee and considers a discount for lack of marketability forvaluation.
5. Level 3 fair value measurement items on a recurring basis, adjustment information between
beginning and ending book value and sensitivity analysis of unobservable parameters
RMB
Item31 December
2020
Total lossesfor the period
30 June 2021
Changes inunrealized
gains orlosses
included inprofit or lossin respect of
the assetsheld at theend of thereporting
period
Included inother
comprehensiveincome
Financial assets measured atfair value through othercomprehensive income
– Other equity instrumentinvestments 33,774,995 1,405,869 35,180,864 –
6. Fair value of financial assets and financial liabilities not measured at fair value
The Group’s financial assets and liabilities not measured at fair value mainly include: cash and bankbalances, notes receivable, accounts receivable, other receivables, debt investments, long-termreceivables, bank borrowings, accounts payable, bonds payable and other financial liabilities, etc. As at30 June 2021, there is no significant difference between the carrying amount and the fair value of theGroup’s financial assets and financial liabilities.
THIS DOCUMENT IS IN DRAFT FORM, INCOMPLETE AND SUBJECT TO CHANGE AND THE INFORMATION MUST BEREAD IN CONJUNCTION WITH THE SECTION HEADED “WARNING” ON THE COVER OF THIS DOCUMENT
APPENDIX IV UNAUDITED CONSOLIDATED FINANCIAL STATEMENTSFOR THE SIX MONTHS ENDED 30 JUNE 2021
– IV-120 –

X. RELATED PARTY RELATIONSHIPS AND RELATED PARTY TRANSACTIONS
1. Information of major shareholders of the Company
NamePlace ofregistration Nature of business
Registeredcapital
Proportion ofshareholdings
in theCompany
Proportion ofvoting rights
in theCompany
Holchin B.V. Amsterdam,Holland
Establishing companiesand other enterprises;acquiring, managing,supervising, andtransferring the equityand other interests oflegal persons,companies, andenterprises
100,000 Euros 39.85% 41.84%
Huaxin GroupCo., Ltd.
Huangshi City,HubeiProvince
Production and sales ofcement, relatedmachinery and spareparts, real estatedevelopment, tradingand rendering of serviceetc.
RMB340,000,000 16.01% 16.01%
Other explanation:
Holchin B.V. is the Company’s largest shareholder and its ultimate holding shareholder is Holcim Ltd.,Holpac Limited., The person acting in concert of Holchin B.V., holds 1.99% equity of the Company.Therefore, Holchin B.V. maintains 41.84% voting rights of the Company.
2. The Company’s subsidiaries
See Note VII for details of the Company’s subsidiaries.
3. The Company’s joint ventures and associates
See Note VII for details of the Company’s significant joint ventures or associates.
4. Other related parties
Other related parties Relationship with the Company
LafargeHolcim Energy Solutions S.A.S. Controlled by Holcim Ltd.Lafarge Holcim Construction Material (China) Co., Ltd. Controlled by Holcim Ltd.LAFARGE ASIA SDN BHD Controlled by Holcim Ltd.Holcim Philippines, Inc. Controlled by Holcim Ltd.LafargeHolcim distribution Controlled by Holcim Ltd.Hubei Huaxin Real Estate Co., Ltd. Related parties of associated natural
personsHuaxin Trading (Chibi) New Building Materials Co., LTD Joint venture of the GroupChenfeng Intelligent Equipment Hubei Co., LTD Associate of the GroupShanghai Wan’an Huaxin Cement Co., Ltd. Associate of the GroupTibet Shigatse High-tech Xuelian Cement Co., Ltd. Subsidiary of the Group’s associate
THIS DOCUMENT IS IN DRAFT FORM, INCOMPLETE AND SUBJECT TO CHANGE AND THE INFORMATION MUST BEREAD IN CONJUNCTION WITH THE SECTION HEADED “WARNING” ON THE COVER OF THIS DOCUMENT
APPENDIX IV UNAUDITED CONSOLIDATED FINANCIAL STATEMENTSFOR THE SIX MONTHS ENDED 30 JUNE 2021
– IV-121 –

5. Related party transactions
(1) Sales and purchase of goods, provision and receipt of services
Purchases of goods/receipts of services
RMB
Related parties Nature of transaction
Amount forthe current
period
Amount forthe prior
period
Holcim Technology Ltd. Technical services – 7,425,605Huaxin Group Co., Ltd. Receipts of integrated
managementservices
3,113,208 3,113,208
Huaxin Trading (Chibi) NewBuilding Materials Co., Ltd.
Purchase of materials 1,374,081 –
LafargeHolcim distribution Purchase of materials 3,515,429 –Lafarge Holcim Construction
Material (China) Co., Ltd.Labor dispatch
service188,679 283,019
Sales of goods/provision of services
RMB
Related parties Nature of transaction
Amount forthe current
period
Amount forthe prior
period
Tibet Shigatse High-tech XuelianCement Co., Ltd.
Sale of spare parts 12,306,136 2,351,127
Tibet Shigatse High-tech XuelianCement Co., Ltd.
Technical services 681,935 –
Tibet Shigatse High-tech XuelianCement Co., Ltd.
Provide labor services – 398,330
Huaxin Trading (Chibi) NewBuilding Materials Co., Ltd.
Sale of goods 472,549 –
Huaxin Trading (Chibi) NewBuilding Materials Co., Ltd.
Social securitypayments
516,120 –
(2) Leases with related parties
Leases where the Company is the lessee
RMB
Related party Nature of transaction
Amount forthe current
period
Amount forthe prior
period
Hubei Huaxin Real Estate Co., Ltd. Rent of officebuilding
6,557,559 5,967,101
THIS DOCUMENT IS IN DRAFT FORM, INCOMPLETE AND SUBJECT TO CHANGE AND THE INFORMATION MUST BEREAD IN CONJUNCTION WITH THE SECTION HEADED “WARNING” ON THE COVER OF THIS DOCUMENT
APPENDIX IV UNAUDITED CONSOLIDATED FINANCIAL STATEMENTSFOR THE SIX MONTHS ENDED 30 JUNE 2021
– IV-122 –

(3) Remuneration of key management
RMB
ItemAmount for the
current periodAmount for the
prior period
Remuneration of key management 40,866,650 47,308,898
6. Amounts due to/from related parties
(1) Amounts due from related parties
RMB
Closing balance Opening balance
Accounts Related partiesBook
balanceBad debt
provisionBook
balanceBad debt
provision
Accounts receivable Tibet Shigatse High-techXuelian Cement Co., Ltd.
9,747,368 16,207,703
Accounts receivable Shanghai Wan’an HuaxinCement Co., Ltd.
1,009,216 1,009,216
Accounts receivable Huaxin Trading (Chibi) NewBuilding Materials Co., Ltd.
435,363 –
Prepayments Chenfeng IntelligentEquipment HubeiCo., Ltd.
– 4,480,000
Other receivables Huaxin Trading (Chibi) NewBuilding Materials Co., Ltd.
503,392 –
Other receivables Tibet Shigatse High-techXuelian CementCo., Ltd.
314,328 3,618,968
Other receivables Shanghai Wan’an HuaxinCement Co., Ltd.
– 22,365
THIS DOCUMENT IS IN DRAFT FORM, INCOMPLETE AND SUBJECT TO CHANGE AND THE INFORMATION MUST BEREAD IN CONJUNCTION WITH THE SECTION HEADED “WARNING” ON THE COVER OF THIS DOCUMENT
APPENDIX IV UNAUDITED CONSOLIDATED FINANCIAL STATEMENTSFOR THE SIX MONTHS ENDED 30 JUNE 2021
– IV-123 –

(2) Amounts due to related parties
RMB
Accounts Related parties
Closingbook
balance
Openingbook
balance
Accounts payable LafargeHolcimdistribution
2,556,574 –
Accounts payable Huaxin Trading(Chibi) NewBuilding MaterialsCo., Ltd.
1,180,522 –
Other payables Tibet ShigatseHigh-tech XuelianCement Co., Ltd.
4,251,694 15,224,013
Other payables Huaxin Group Co.LTD
23,684 23,684
Other payables LAFARGE ASIA SDNBHD
409,394 409,394
XI. SHARE-BASED PAYMENTS
1. Equity-settled share-based payments
RMB
The method for determining the fair value of theequity instrument on the grant date
The fair value is determined based on the shareprice granted to the Japanese company.
The basis for determining the number of feasibleequity instruments
At each balance sheet day during the vestingperiod, the Group makes the best estimateaccording to the subsequent latest informationof the changes in the number of employees whoare granted with options that may lock, thecompany’s performance conditions and theindividual performance evaluation of theincentive object, and revises the estimatednumber of equity instruments expected to beunlocked. At the date expected to be unlocked,the number of equity instruments finallyexpected to be unlocked is consistent with thenumber of equity instruments actually to beunlocked.
Reasons for the significant differences betweenthe estimate and in the current period and thatin the prior period
None
The cumulative amount of equity-settledshare-based payments into capital reserves
89,686,340
The total amount of recognized expenses paid byequity settled shares in the current period
60,458,955
THIS DOCUMENT IS IN DRAFT FORM, INCOMPLETE AND SUBJECT TO CHANGE AND THE INFORMATION MUST BEREAD IN CONJUNCTION WITH THE SECTION HEADED “WARNING” ON THE COVER OF THIS DOCUMENT
APPENDIX IV UNAUDITED CONSOLIDATED FINANCIAL STATEMENTSFOR THE SIX MONTHS ENDED 30 JUNE 2021
– IV-124 –
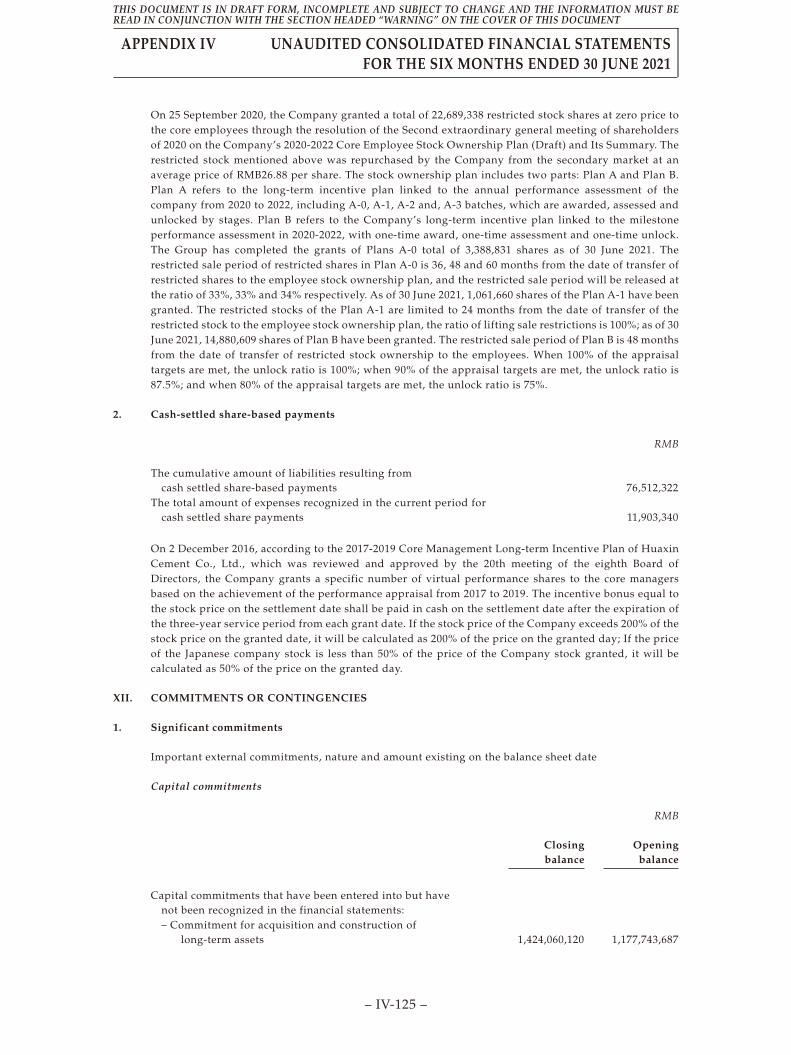
On 25 September 2020, the Company granted a total of 22,689,338 restricted stock shares at zero price tothe core employees through the resolution of the Second extraordinary general meeting of shareholdersof 2020 on the Company’s 2020-2022 Core Employee Stock Ownership Plan (Draft) and Its Summary. Therestricted stock mentioned above was repurchased by the Company from the secondary market at anaverage price of RMB26.88 per share. The stock ownership plan includes two parts: Plan A and Plan B.Plan A refers to the long-term incentive plan linked to the annual performance assessment of thecompany from 2020 to 2022, including A-0, A-1, A-2 and, A-3 batches, which are awarded, assessed andunlocked by stages. Plan B refers to the Company’s long-term incentive plan linked to the milestoneperformance assessment in 2020-2022, with one-time award, one-time assessment and one-time unlock.The Group has completed the grants of Plans A-0 total of 3,388,831 shares as of 30 June 2021. Therestricted sale period of restricted shares in Plan A-0 is 36, 48 and 60 months from the date of transfer ofrestricted shares to the employee stock ownership plan, and the restricted sale period will be released atthe ratio of 33%, 33% and 34% respectively. As of 30 June 2021, 1,061,660 shares of the Plan A-1 have beengranted. The restricted stocks of the Plan A-1 are limited to 24 months from the date of transfer of therestricted stock to the employee stock ownership plan, the ratio of lifting sale restrictions is 100%; as of 30June 2021, 14,880,609 shares of Plan B have been granted. The restricted sale period of Plan B is 48 monthsfrom the date of transfer of restricted stock ownership to the employees. When 100% of the appraisaltargets are met, the unlock ratio is 100%; when 90% of the appraisal targets are met, the unlock ratio is87.5%; and when 80% of the appraisal targets are met, the unlock ratio is 75%.
2. Cash-settled share-based payments
RMB
The cumulative amount of liabilities resulting fromcash settled share-based payments 76,512,322
The total amount of expenses recognized in the current period forcash settled share payments 11,903,340
On 2 December 2016, according to the 2017-2019 Core Management Long-term Incentive Plan of HuaxinCement Co., Ltd., which was reviewed and approved by the 20th meeting of the eighth Board ofDirectors, the Company grants a specific number of virtual performance shares to the core managersbased on the achievement of the performance appraisal from 2017 to 2019. The incentive bonus equal tothe stock price on the settlement date shall be paid in cash on the settlement date after the expiration ofthe three-year service period from each grant date. If the stock price of the Company exceeds 200% of thestock price on the granted date, it will be calculated as 200% of the price on the granted day; If the priceof the Japanese company stock is less than 50% of the price of the Company stock granted, it will becalculated as 50% of the price on the granted day.
XII. COMMITMENTS OR CONTINGENCIES
1. Significant commitments
Important external commitments, nature and amount existing on the balance sheet date
Capital commitments
RMB
Closingbalance
Openingbalance
Capital commitments that have been entered into but havenot been recognized in the financial statements:– Commitment for acquisition and construction of
long-term assets 1,424,060,120 1,177,743,687
THIS DOCUMENT IS IN DRAFT FORM, INCOMPLETE AND SUBJECT TO CHANGE AND THE INFORMATION MUST BEREAD IN CONJUNCTION WITH THE SECTION HEADED “WARNING” ON THE COVER OF THIS DOCUMENT
APPENDIX IV UNAUDITED CONSOLIDATED FINANCIAL STATEMENTSFOR THE SIX MONTHS ENDED 30 JUNE 2021
– IV-125 –

2. Pending litigation
(1) In September 2020, Moncement Building Materials LLC (“Moncement Building Materials”)applied for arbitration with ICC, claiming that the Group entered into EPC agreements andrelevant supplementary agreements for the general contracting of construction project of cementproduction line of Moncement Building Materials from 2013 to 2017, however, breached itsobligations of quality assurance obligations and maintenance obligations, which caused damagesagainst Moncement Building Materials. Moncement Building Materials demanded the Group tocompensate it for the amount of damages and all arbitration costs, and to pay interest at the rateof 10% per annum from the date of the arbitration application to the date of actual payment. As ofthe date of approving issuance of these financial statements, the management of the Companyconsidered that the outcome was not yet predictable and made no provision.
(2) On 27 July 2020, the Group sued the Fengjie County Government, claiming that the FengjieCounty Government violated Fengjie County municipal solid waste disposal cooperationagreement signed in August 2012, requiring it to pay the waste disposal fee of RMB12,273,373Yuan, compensate for interest losses and bear all litigation costs of the case. On 26 October 2020,Fengjie County Government filed a lawsuit to require the group to pay RMB59,455,842 Yuan forthe expenses incurred in transporting the domestic waste of Fengjie County to the surroundingcounties for disposal.As of the date of approving issuance of these financial statements, themanagement of the Company considered that the outcome was not yet predictable and made noprovision.
XIII. EVENTS AFTER THE BALANCE SHEET DATE
1. Other statements after the balance sheet date
Registered and approved by the China Securities Regulatory Commission ([2021] No. 2628), theCompany issued the first phase of corporate bonds with a total amount of RMB1.3 billion on 25 August2021, with a coupon rate of 3.26%, and will calculate and pay interest once a year for a period of threeyears.
XIV. OTHER IMPORTANT MATTERS
1. Segment information
(1) Report division determination basis and accounting policy
As the Group’s operating income, expenses, assets and liabilities are mainly related to theproduction and sale of cement and its related products, the Group considers that the businesses ofvarious companies in the Group have obvious similarities. Thus, after considering factors such asinternal organizational structure, management requirements and internal reporting system, theoperating segment report is not prepared.
THIS DOCUMENT IS IN DRAFT FORM, INCOMPLETE AND SUBJECT TO CHANGE AND THE INFORMATION MUST BEREAD IN CONJUNCTION WITH THE SECTION HEADED “WARNING” ON THE COVER OF THIS DOCUMENT
APPENDIX IV UNAUDITED CONSOLIDATED FINANCIAL STATEMENTSFOR THE SIX MONTHS ENDED 30 JUNE 2021
– IV-126 –

(2) Financial information of reporting segments
Non-current assets by geographical locations (Note)
RMB
Closingbalance
Openingbalance
China 26,254,881,110 24,408,221,749Central Asia 1,736,431,635 1,828,399,859Cambodia 759,989,855 682,081,096Nepal 827,276,444 689,076,875Tanzania 684,636,480 645,073,560
Total 30,263,215,524 28,252,853,139
Note: The above non-current assets do not include debt investments, other equity instrumentinvestments, other non-current financial assets, long-term receivables and deferred taxassets.
Dependence on key customers:
No single customer accounted for more than 10% of the Group’s operating revenue in 2021.
XV. NOTES TO MAIN ITEMS IN THE PARENT COMPANY’S FINANCIAL STATEMENTS
1. Accounts receivable
(1) Disclosure by aging
RMB
AgingClosingbalance
Openingbalance
Within 1 yearIncluding: divided into two parts1 – 6 months 777,150,032 520,489,4176 – 12 months 56,419,932 940,457
Sub-total 833,569,964 521,429,874
1 – 2 years 5,148,908 25,185,6822 – 3 years 21,020,319 294,243Over 3 years 20,029,690 20,277,245Less: Provision for credit loss 20,425,672 21,437,478
Total 859,343,209 545,749,566
THIS DOCUMENT IS IN DRAFT FORM, INCOMPLETE AND SUBJECT TO CHANGE AND THE INFORMATION MUST BEREAD IN CONJUNCTION WITH THE SECTION HEADED “WARNING” ON THE COVER OF THIS DOCUMENT
APPENDIX IV UNAUDITED CONSOLIDATED FINANCIAL STATEMENTSFOR THE SIX MONTHS ENDED 30 JUNE 2021
– IV-127 –

(2) Disclosure by bad debt provision method
RMB
Closing balance Opening balance
Account balance Bad debt provision Account balance Bad debt provision
Category AmountProportion
(%) Amount
Proportionof
provision(%)
Carryingamount Amount
Proportion(%) Amount
Proportionof
provision(%)
Carryingamount
Receivables for which bad debtprovision is assessed on anindividual basis 867,038,326 99 20,249,354 2 846,788,972 552,623,510 97 21,201,797 4 531,421,713
Receivables for which bad debtprovision is assessed on aportfolio basis 12,730,555 1 176,318 1 12,554,237 14,563,534 3 235,681 2 14,327,853
Total 879,768,881 100 20,425,672 2 859,343,209 567,187,044 100 21,437,478 4 545,749,566
Receivables for which bad debt provision is assessed on a portfolio basis
Category of cement receivable:
RMB
Closing balance
NameAccounts
receivableBad debt
provisionProportion ofprovision (%)
1 – 6 months 7,453,528 – –6 – 12 months 1,241,194 104,718 81 – 2 years 617,857 71,600 122 – 3 years – – –Over 3 years – – –
Total 9,312,579 176,318 –
Category of other receivables:
RMB
Closing balance
NameAccounts
receivableBad debt
provisionProportion ofprovision (%)
1 – 6 months 3,417,976 – –6 – 12 months – – –
Total 3,417,976 – –
THIS DOCUMENT IS IN DRAFT FORM, INCOMPLETE AND SUBJECT TO CHANGE AND THE INFORMATION MUST BEREAD IN CONJUNCTION WITH THE SECTION HEADED “WARNING” ON THE COVER OF THIS DOCUMENT
APPENDIX IV UNAUDITED CONSOLIDATED FINANCIAL STATEMENTSFOR THE SIX MONTHS ENDED 30 JUNE 2021
– IV-128 –

(3) Bad debt provision
RMB
Changes for the period
CategoryOpening
balance ProvisionRecovery
or reversal
Write-offor
eliminationOther
changesClosingbalance
Bad debt provision foraccounts receivable 21,437,478 – (58,261) (953,545) – 20,425,672
Total 21,437,478 – (58,261) (953,545) – 20,425,672
(4) Amounts due from top five clients are summarized as below:
RMB
Item
Closingbalance of
accountsreceivable
% of totalbalance
Closingbalance of baddebt provision
Subsidiary U 44,467,256 5 –Subsidiary O 35,525,843 4 –Subsidiary V 34,459,908 4 –Subsidiary A 31,853,936 4 –Subsidiary W 30,241,993 3 –
Total 176,548,936 20 –
2. Other receivables
2.1 Item presentation
RMB
ItemClosingbalance
Openingbalance
Dividends receivable 449,563,031 –Other receivables 4,548,577,862 4,396,614,326
Total 4,998,140,893 4,396,614,326
THIS DOCUMENT IS IN DRAFT FORM, INCOMPLETE AND SUBJECT TO CHANGE AND THE INFORMATION MUST BEREAD IN CONJUNCTION WITH THE SECTION HEADED “WARNING” ON THE COVER OF THIS DOCUMENT
APPENDIX IV UNAUDITED CONSOLIDATED FINANCIAL STATEMENTSFOR THE SIX MONTHS ENDED 30 JUNE 2021
– IV-129 –

2.2 Other receivables
(1) Disclosure by aging
RMB
AgingClosingbalance
Openingbalance
Within 1 year 1,705,737,635 2,056,247,3331 – 2 years 1,644,817,878 1,243,904,5622 – 3 years 275,850,388 437,314,641Over 3 years 969,094,500 706,042,459Less: Provision for credit loss 46,922,539 46,894,669
Total 4,548,577,862 4,396,614,326
(2) Classification by nature of receivables
RMB
Nature of receivablesClosingbalance
Openingbalance
Receivables from related parties 4,573,396,512 4,422,786,704Margin and deposits 18,278,347 17,237,489Others 3,825,542 3,484,802
Total 4,595,500,401 4,443,508,995
(3) Bad debt provision
RMB
Changes for the period
CategoryOpening
balanceClosingbalance Provision
Recoveryor reversal
Write-offor
eliminationOther
changes
Bad debt provision forother receivables 46,894,669 27,870 – – – 46,922,539
Total 46,894,669 27,870 – – – 46,922,539
THIS DOCUMENT IS IN DRAFT FORM, INCOMPLETE AND SUBJECT TO CHANGE AND THE INFORMATION MUST BEREAD IN CONJUNCTION WITH THE SECTION HEADED “WARNING” ON THE COVER OF THIS DOCUMENT
APPENDIX IV UNAUDITED CONSOLIDATED FINANCIAL STATEMENTSFOR THE SIX MONTHS ENDED 30 JUNE 2021
– IV-130 –

(4) Amounts due from top five debtors are summarized as below:
RMB
Company nameNature ofreceivables
Closingbalance Aging
(%) of totalbalance
Closingbalance of
bad debtprovision
Client W Amounts duefromsubsidiaries
519,913,566 1- 2 years 11 –
Client X Amounts duefromsubsidiaries
347,749,067 Within 1 yea 8 –
Client Y Amounts duefromsubsidiaries
331,567,388 2 – 3 years 7 –
Client Z Amounts duefromsubsidiaries
322,516,785 1 – 2 years 7 –
Client α Amounts duefromsubsidiaries
269,850,026 Within 1year
6 –
Total –/ 1,791,596,832 / 39 –
3. Long-term equity investments
RMB
Closing balance Opening balance
Item Book balanceProvision for
impairmentCarrying
amount Book balanceProvision for
impairmentCarrying
amount
Subsidiaries 11,199,823,034 42,000,000 11,157,823,034 10,712,823,034 42,000,000 10,670,823,034Associates and joint venture 455,885,731 – 455,885,731 448,693,489 – 448,693,489
Total 11,655,708,765 42,000,000 11,613,708,765 11,161,516,523 42,000,000 11,119,516,523
(1) Investments in subsidiaries
RMB
InvesteeOpening
balance Addition ReductionClosingbalance
Balance ofimpairment
provision
Huaxin Aggregate Co., Ltd. 258,100,000 – – 258,100,000 –Huaxin Hongta Cement
(Jinghong) Co., Ltd. 91,601,080 – – 91,601,080 –Huaxin Environment Engineering
(Yichang) Co., Ltd. 20,000,000 – – 20,000,000 –Huaxin Environment Engineering Co., Ltd. 1,000,000,000 – – 1,000,000,000 –
THIS DOCUMENT IS IN DRAFT FORM, INCOMPLETE AND SUBJECT TO CHANGE AND THE INFORMATION MUST BEREAD IN CONJUNCTION WITH THE SECTION HEADED “WARNING” ON THE COVER OF THIS DOCUMENT
APPENDIX IV UNAUDITED CONSOLIDATED FINANCIAL STATEMENTSFOR THE SIX MONTHS ENDED 30 JUNE 2021
– IV-131 –
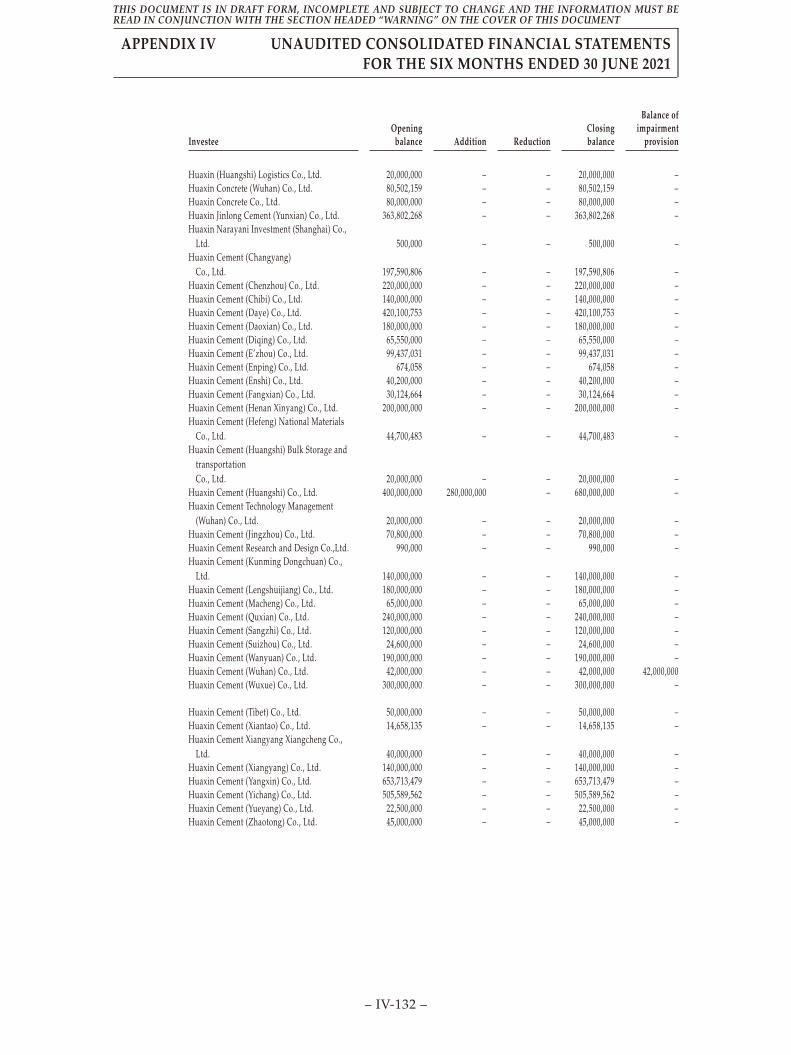
InvesteeOpening
balance Addition ReductionClosingbalance
Balance ofimpairment
provision
Huaxin (Huangshi) Logistics Co., Ltd. 20,000,000 – – 20,000,000 –Huaxin Concrete (Wuhan) Co., Ltd. 80,502,159 – – 80,502,159 –Huaxin Concrete Co., Ltd. 80,000,000 – – 80,000,000 –Huaxin Jinlong Cement (Yunxian) Co., Ltd. 363,802,268 – – 363,802,268 –Huaxin Narayani Investment (Shanghai) Co.,
Ltd. 500,000 – – 500,000 –Huaxin Cement (Changyang)
Co., Ltd. 197,590,806 – – 197,590,806 –Huaxin Cement (Chenzhou) Co., Ltd. 220,000,000 – – 220,000,000 –Huaxin Cement (Chibi) Co., Ltd. 140,000,000 – – 140,000,000 –Huaxin Cement (Daye) Co., Ltd. 420,100,753 – – 420,100,753 –Huaxin Cement (Daoxian) Co., Ltd. 180,000,000 – – 180,000,000 –Huaxin Cement (Diqing) Co., Ltd. 65,550,000 – – 65,550,000 –Huaxin Cement (E’zhou) Co., Ltd. 99,437,031 – – 99,437,031 –Huaxin Cement (Enping) Co., Ltd. 674,058 – – 674,058 –Huaxin Cement (Enshi) Co., Ltd. 40,200,000 – – 40,200,000 –Huaxin Cement (Fangxian) Co., Ltd. 30,124,664 – – 30,124,664 –Huaxin Cement (Henan Xinyang) Co., Ltd. 200,000,000 – – 200,000,000 –Huaxin Cement (Hefeng) National Materials
Co., Ltd. 44,700,483 – – 44,700,483 –Huaxin Cement (Huangshi) Bulk Storage and
transportationCo., Ltd. 20,000,000 – – 20,000,000 –
Huaxin Cement (Huangshi) Co., Ltd. 400,000,000 280,000,000 – 680,000,000 –Huaxin Cement Technology Management
(Wuhan) Co., Ltd. 20,000,000 – – 20,000,000 –Huaxin Cement (Jingzhou) Co., Ltd. 70,800,000 – – 70,800,000 –Huaxin Cement Research and Design Co.,Ltd. 990,000 – – 990,000 –Huaxin Cement (Kunming Dongchuan) Co.,
Ltd. 140,000,000 – – 140,000,000 –Huaxin Cement (Lengshuijiang) Co., Ltd. 180,000,000 – – 180,000,000 –Huaxin Cement (Macheng) Co., Ltd. 65,000,000 – – 65,000,000 –Huaxin Cement (Quxian) Co., Ltd. 240,000,000 – – 240,000,000 –Huaxin Cement (Sangzhi) Co., Ltd. 120,000,000 – – 120,000,000 –Huaxin Cement (Suizhou) Co., Ltd. 24,600,000 – – 24,600,000 –Huaxin Cement (Wanyuan) Co., Ltd. 190,000,000 – – 190,000,000 –Huaxin Cement (Wuhan) Co., Ltd. 42,000,000 – – 42,000,000 42,000,000Huaxin Cement (Wuxue) Co., Ltd. 300,000,000 – – 300,000,000 –
Huaxin Cement (Tibet) Co., Ltd. 50,000,000 – – 50,000,000 –Huaxin Cement (Xiantao) Co., Ltd. 14,658,135 – – 14,658,135 –Huaxin Cement Xiangyang Xiangcheng Co.,
Ltd. 40,000,000 – – 40,000,000 –Huaxin Cement (Xiangyang) Co., Ltd. 140,000,000 – – 140,000,000 –Huaxin Cement (Yangxin) Co., Ltd. 653,713,479 – – 653,713,479 –Huaxin Cement (Yichang) Co., Ltd. 505,589,562 – – 505,589,562 –Huaxin Cement (Yueyang) Co., Ltd. 22,500,000 – – 22,500,000 –Huaxin Cement (Zhaotong) Co., Ltd. 45,000,000 – – 45,000,000 –
THIS DOCUMENT IS IN DRAFT FORM, INCOMPLETE AND SUBJECT TO CHANGE AND THE INFORMATION MUST BEREAD IN CONJUNCTION WITH THE SECTION HEADED “WARNING” ON THE COVER OF THIS DOCUMENT
APPENDIX IV UNAUDITED CONSOLIDATED FINANCIAL STATEMENTSFOR THE SIX MONTHS ENDED 30 JUNE 2021
– IV-132 –

InvesteeOpening
balance Addition ReductionClosingbalance
Balance ofimpairment
provision
Huaxin Cement Chongqing Fuling Co., Ltd. 200,000,000 – – 200,000,000 –Huaxin Cement (Zhuzhou) Co., Ltd. 340,000,000 – – 340,000,000 –Huaxin Cement (Zigui) Co., Ltd. 240,000,000 – – 240,000,000 –Huaxin (Hong Kong) International Holdings
Limited 157,935,219 – – 157,935,219 –Huaxin New Building Materials
Co., Ltd. 50,000,000 – – 50,000,000 –Huaxin Central Asia Investment (Wuhan) Co.,
Ltd. 388,623,689 – – 388,623,689 –Huaxin Equipment Engineering
Co., Ltd. 190,000,000 – – 190,000,000 –Huangshi Huaxin Packaging Co., Ltd. 60,229,648 – – 60,229,648 –Mauritus Somerset Investment
Co., Ltd. 252,000,000 – – 252,000,000 –Wuhan Wugang Huaxin Cement
Co., Ltd. 20,000,000 – – 20,000,000 –Yunnan Huaxin Construction Materials
Investment Holding Ltd. 977,000,000 – – 977,000,000 –Chongqing Huaxin Cantian Cement Co., Ltd. 253,300,000 – – 253,300,000 –Chongqing Huaxin Diwei Cement Co., Ltd. 73,000,000 – – 73,000,000 –Chongqing Huaxin Phoenix Lake Concrete Co.,
Ltd. 40,000,000 – – 40,000,000 –Chongqing Huaxin Tiancheng Concrete Co.,
Ltd. 29,000,000 – – 29,000,000 –Chongqing Huaxin Yanjing Cement Co., Ltd. 4,000,000 – – 4,000,000 –Huangshi Huaxin Green Building Materials Co.,
Ltd. 600,000,000 – – 600,000,000 –Huaxin (Hainan) Investment Co., Ltd. – 207,000,000 – 207,000,000 –
Total 10,712,823,034 487,000,000 – 11,199,823,034 42,000,000
THIS DOCUMENT IS IN DRAFT FORM, INCOMPLETE AND SUBJECT TO CHANGE AND THE INFORMATION MUST BEREAD IN CONJUNCTION WITH THE SECTION HEADED “WARNING” ON THE COVER OF THIS DOCUMENT
APPENDIX IV UNAUDITED CONSOLIDATED FINANCIAL STATEMENTSFOR THE SIX MONTHS ENDED 30 JUNE 2021
– IV-133 –

(2) Investments in associates and joint ventures
RMB
Changes for the period
Investee Opening balance
Investmentprofit or loss
recognizedunder equity
methodOther equity
changesClosingbalance
Closingbalance of
impairmentprovision
I. AssociatesTibet High-tech Building
Materials Co., Ltd.356,279,532 7,189,320 257,958 363,726,810 –
Shanghai Wan’an HuaxinCement Co., Ltd.
92,413,957 (255,036) – 92,158,921 –
Total 448,693,489 6,934,284 257,958 455,885,731 –
4. Operating income and operating costs
RMB
Amount for thecurrent period Amount for the prior period
Item Income Costs Income Costs
Principal operations 403,237,277 353,325,406 440,084,321 313,113,187Other operations 1,689,125,023 1,545,444,133 1,157,198,555 1,085,266,802
Total 2,092,362,300 1,898,769,539 1,597,282,876 1,398,379,989
5. Investment income
RMB
Item
Amount forthe current
period
Amount forthe prior
period
Income from long-term equity investments under cost method 2,355,763,032 1,710,906,406Investment income of held-for-trading financial assets during
the holding period 13,691,597 1,213,034Income from long-term equity investments under equity method 6,934,284 25,240,749Others (263,299) 720,000
Total 2,376,125,614 1,738,080,189
THIS DOCUMENT IS IN DRAFT FORM, INCOMPLETE AND SUBJECT TO CHANGE AND THE INFORMATION MUST BEREAD IN CONJUNCTION WITH THE SECTION HEADED “WARNING” ON THE COVER OF THIS DOCUMENT
APPENDIX IV UNAUDITED CONSOLIDATED FINANCIAL STATEMENTSFOR THE SIX MONTHS ENDED 30 JUNE 2021
– IV-134 –

XVI. SUPPLEMENTARY INFORMATION
1. Breakdown of non-recurring profit or loss for the current period
RMB
Item Amount
Profit or loss on disposal of non-current assets (8,136,120)Government grants recognized in profit or loss (other than grants which are
closely related to the Company’s business and are either in fixed amounts ordetermined under quantitative methods in accordance with the nationalstandard) 65,280,067
Profit or loss on changes in fair value of held-for-trading financial assets,derivative financial assets, held-for-trading financial liabilities and derivativefinancial liabilities and investment income on disposal of held-for-tradingfinancial assets, derivative financial assets, held-for-trading financialliabilities, derivative financial liabilities and other debt investment, other thanthose used in the effective hedging activities relating to normal operatingbusiness 781,547
Reversal of provision for impairment of receivables and contract assets that havebeen separately tested for impairment 3,663,891
Other non-operating income or expenses other than the above (9,355,358)Effect of income tax (11,583,403)Effect of minority interests 1,763,037
Total 42,413,661
2. Return on net assets and earnings per share (“EPS”)
EPS
Profit for the reporting period
Weightedaverage
return on netassets (%) Basic EPS Diluted EPS
Net profit attributable to ordinary shareholdersof the Company 9.83 1.18 1.18
Net profit attributable to ordinary shareholdersof the Company after deduction ofnon-recurring profits or losses 9.66 1.16 1.16
THIS DOCUMENT IS IN DRAFT FORM, INCOMPLETE AND SUBJECT TO CHANGE AND THE INFORMATION MUST BEREAD IN CONJUNCTION WITH THE SECTION HEADED “WARNING” ON THE COVER OF THIS DOCUMENT
APPENDIX IV UNAUDITED CONSOLIDATED FINANCIAL STATEMENTSFOR THE SIX MONTHS ENDED 30 JUNE 2021
– IV-135 –