30 September 2021 Semi-Annual Report, including Unaudited ...
74
Société d’investissement à Capital Variable Luxembourg RCS Luxembourg B 151 275 ASIA FIXED INCOME STRATEGIES Asia Total Return Bond Fund Asia Credit Opportunities Fund ASIA GROWTH AND INCOME STRATEGIES Asia Dividend Fund Asia ex Japan Dividend Fund China Dividend Fund ASIA GROWTH STRATEGIES Pacific Tiger Fund Asia Innovative Growth Fund China Fund India Fund Japan Fund ASIA SMALL COMPANY STRATEGIES Asia Small Companies Fund China Small Companies Fund '21 Matthews Asia Funds | 30 September 2021 Semi-Annual Report, including Unaudited Financial Statements
-
Upload
khangminh22 -
Category
Documents
-
view
0 -
download
0
Transcript of 30 September 2021 Semi-Annual Report, including Unaudited ...
Société d’investissement à Capital VariableLuxembourgRCS Luxembourg B 151 275
ASIA FIXED INCOME STRATEGIES
Asia Total Return Bond Fund
Asia Credit Opportunities Fund
ASIA GROWTH AND INCOME STRATEGIES
Asia Dividend Fund
Asia ex Japan Dividend Fund
China Dividend Fund
ASIA GROWTH STRATEGIES
Pacific Tiger Fund
Asia Innovative Growth Fund
China Fund
India Fund
Japan Fund
ASIA SMALL COMPANY STRATEGIES
Asia Small Companies Fund
China Small Companies Fund
'21
Matthews Asia Funds | 30 September 2021
Semi-Annual Report, including Unaudited Financial Statements

Special Notice to Hong Kong InvestorsPlease note that the Annual Report, including audited financial statements and unaudited Semi Annual Report are global documents and therefore also contain information concerning the Asia Total Return Bond Fund, the Asia Credit Opportunities Fund and the Asia Innovative Growth Fund, which are not authorized in Hong Kong and are not available to the public in Hong Kong, as well as information concerning certain share classes which are also not available to the public in Hong Kong.
The Hong Kong Offering Document of the Matthews Asia Funds (which comprises the Prospectus, Supplement for Hong Kong Investors, and Product Key Facts Statements), the latest annual reports, including audited financial statements, and unaudited semi-annual reports, are available free of charge from the Hong Kong Representative (contact details are provided below) or on the Fund’s website at hk.matthewsasia.com.
Brown Brothers Harriman (Hong Kong) Limited13/F Man Yee Building68 Des Voeux Road CentralHong KongPhone: +852 3756 1755
Please note that the website mentioned in the Annual Report, including audited financial statements, and unaudited Semi Annual Report has not been reviewed by the Securities and Futures Commission and may contain information in respect of funds which are not authorized in Hong Kong and may not be offered to the public in Hong Kong.

General InformationMatthews International Capital Management, LLC (“Matthews”), formed under the laws of Delaware and regulated by the U.S. Securities and Exchange Com-mission, acts as Investment Manager to the Matthews Asia Funds (the “Fund”). Matthews believes in the long-term growth of Asia. Since Matthews was founded in 1991 by Paul Matthews, the firm has focused its efforts and exper-tise within the Asian region, investing through a variety of market environ-ments. As an independent, privately owned firm, Matthews is the largest dedicated Asia investment specialist in the United States.
The Fund has an “umbrella” structure comprising a number of separate sub-funds. As at the closing date, 12 Sub-Funds were available for investment: Asia Total Return Bond Fund, Asia Credit Opportunities Fund, Asia Dividend Fund, Asia ex Japan Dividend Fund, China Dividend Fund, Pacific Tiger Fund, Asia Innovative Growth Fund, China Fund, India Fund, Japan Fund, Asia Small Com-panies Fund and China Small Companies Fund (each a “Sub-Fund,” and together the “Sub-Funds”). This report covers the period from 1 April 2021 to 30 Septem-ber 2021. The last day on which official prices were calculated was 30 Septem-ber 2021. The figures presented in the financial statements are as at that date.
The annual general meeting of Shareholders will be held in accordance with the Articles of Incorporation, the law of 17 December 2010 relating to under-takings for collective investment, and the law of 10 August 1915 on commercial companies (together referred to as the “Luxembourg Laws”). Notices of all general meetings will be published to the extent required by Luxembourg Laws in RESA (“Recueil Electronique des Sociétés et Associations”), and in such other newspaper as the Board of Directors of the Fund shall determine and will be sent to the Shareholders of registered Shares in accordance with Luxembourg Laws to their addresses shown on the register of Shareholders. Such notices should include the agenda and will specify the time and place of the meeting and the conditions of admission. They will also refer to the rules of quorum and majorities required by Luxembourg Laws.
Each Share confers the right to one vote. The vote on the payment of a divi-dend on a particular Class requires a separate majority vote from the meeting of Shareholders of the Class concerned. Any change in the Articles of Incorpora-tion affecting the rights of a Sub-Fund must be approved by a resolution of both the Shareholders at the general meeting of the Fund and the Shareholders of the Sub-Fund concerned.
Annual reports, including audited financial statements shall be published within four months following the end of the accounting year and unaudited semi-annual reports shall be published within two months following the period to which they refer. The annual reports, including audited financial statements and the unaudited semi-annual reports shall be made available at the registered office of the Fund during ordinary office hours.
The Fund’s accounting year ends on 31 March each year.
The Base Currency of the Fund is U.S. dollars (USD). The aforesaid reports will comprise combined financial statements of the Fund expressed in USD as well as individual information on each Sub-Fund expressed in the Base Currency of each Sub-Fund.
Shares have not been registered under the United States Securities Act of 1933, as amended, nor the Investment Companies Act of 1940, as amended, and may not be offered directly or indirectly in the United States of America (including its terri-tories and possessions) to nationals or residents thereof or to persons normally resi-dent therein, or to any partnership or persons connected thereto unless pursuant to any applicable statute, rule or interpretation available under United States Law.

This page intentionally left blank.
global.matthewsasia.com 1
Contents
Management and Administration 2
Other Information 3
Investment Manager’s Report 4
Schedules of Investments:
ASIA FIXED INCOME STRATEGIESAsia Total Return Bond Fund 6Asia Credit Opportunities Fund 9
ASIA GROWTH AND INCOME STRATEGIESAsia Dividend Fund 12Asia ex Japan Dividend Fund 14China Dividend Fund 16
ASIA GROWTH STRATEGIESPacific Tiger Fund 19Asia Innovative Growth Fund 21China Fund 23India Fund 26Japan Fund 29
ASIA SMALL COMPANY STRATEGIESAsia Small Companies Fund 32China Small Companies Fund 34
Statement of Assets and Liabilities 38
Statement of Operations and Changes in Net Assets 41
Statement of Changes in Number of Shares 44
Statement of Net Asset Value (NAV) Per Share and Net Asset Statistics 49
Notes to Financial Statements 54
Performance and Expenses 65
Securities Financing Transactions Regulation 68
Disclosures and Index Definitions 69
Cover photo: Asian Palace.
This report does not constitute or form part of any offer of shares or an invitation to subscribe for shares of the Funds. Subscriptions are to be made on the basis of the Key Investor Information Documents (KIIDs) accompanied by the current full prospectus, and supplemented by the latest Annual Report, including Audited Financial Statements, or the most recent unaudited Semi-Annual Report.
The views and opinions in this report were current as at 30 September 2021. They are not guarantees of performance or investment results and should not be taken as investment advice. Investment decisions reflect a variety of factors, and the managers reserve the right to change their views about individual stocks, sectors and the markets at any time. As a result, the views expressed should not be relied upon as a forecast of a Fund’s future investment intent.
The subject matter contained herein has been derived from several sources believed to be reliable and accurate at the time of compilation. Matthews does not accept any liability for losses either direct or consequential caused by the use of this information.
The most current Key Investor Information Documents, full prospectus, and most recent unaudited Semi-Annual Report and Annual Report, including Audited Financial Statements for the Fund, can be found at global.matthewsasia.com. Please read the Key Investor Information Documents and current full prospectus carefully before investing.
In Singapore, this document is available to, and intended for Institutional Investors under Section 304 of the SFA (Securities and Futures Act), and to Relevant Persons pursuant to section 305 of the SFA, as those terms are used under the SFA.

2 MATTHEWS ASIA FUNDS
Matthews Asia Funds
Management and Administration
BOARD OF DIRECTORS OF THE FUNDChairmanRichard Goddard, Independent Director The Directors’ Office, S.A. 19, rue de Bitbourg, L-1273 Luxembourg Grand Duchy of Luxembourg
DirectorsHanna Esmee Duer, Independent Director80, route d’Esch L-1470 LuxembourgGrand Duchy of Luxembourg
William J. Hackett, Chief Executive Officer Matthews International Capital Management, LLC Four Embarcadero Center, Suite 550 San Francisco, CA 94111, United States of America
John P. McGowan, Head of Fund AdministrationMatthews International Capital Management, LLCFour Embarcadero Center, Suite 550 San Francisco, CA 94111, United States of America
Jonathan Schuman, Global Head of Sales and Client ServiceMatthews International Capital Management, LLCFour Embarcadero Center, Suite 550San Francisco, CA 94111, United States of America
MANAGEMENT COMPANYCarne Global Fund Managers (Luxembourg) S.A.3, rue Jean PiretL-2350 LuxembourgGrand Duchy of Luxembourg
BOARD OF DIRECTORS OF THE MANAGEMENT COMPANYWilliam BlackwellJohn AlldisJohn DonohoeDavid McGowanVeronica BuffoniMartin Dobbins
INVESTMENT MANAGER AND GLOBAL DISTRIBUTORMatthews International Capital Management, LLCFour Embarcadero Center, Suite 550San Francisco, CA 94111, United States of America
SUB-INVESTMENT MANAGERMatthews Global Investors (Hong Kong) Ltd.Suite 3602Two Pacific Place88 QueenswayAdmiralty, Hong Kong
DEPOSITARY, ADMINISTRATIVE AGENT, DOMICILIARY AGENT, REGISTRAR AND TRANSFER AGENT AND PAYING AGENTBrown Brothers Harriman (Luxembourg) S.C.A. 80, route d’Esch L-1470 Luxembourg Grand Duchy of Luxembourg
INDEPENDENT AUDITORDeloitte Audit Société à responsabilité limitée20, Boulevard de Kockelscheuer L-1821 LuxembourgGrand Duchy of Luxembourg
LEGAL ADVISORArendt & Medernach S.A. 41A, avenue J.F. KennedyL-2082 LuxembourgGrand Duchy of Luxembourg
REGISTERED OFFICEBrown Brothers Harriman (Luxembourg) S.C.A. 80, route d’Esch L-1470 Luxembourg Grand Duchy of Luxembourg

global.matthewsasia.com 3
Matthews Asia Funds
Other Information
THE PAYING AND INFORMATION AGENT IN AUSTRIAErste Bank AM Belvedere 11100 ViennaAustria
CENTRALIZING CORRESPONDENT AND PAYING AGENT IN FRANCECACEIS Bank France1-3 Place ValhubertF-75013 ParisFrance
PAYING AND INFORMATION AGENT IN GERMANYBNP Paribas Securities Services S.C.A. (terminated as of 2 August 2021)ZweigniederlassungEuropa-Allee 12D-60327 Frankfurt am MainGermany
THE FACILITIES AGENT IN IRELANDMaples Fund Services (Ireland) Limited32 Molesworth Street Dublin 2Ireland
REPRESENTATIVE IN SPAINAllfunds Bank S.A.C/ Estafeta 6, La Moraleja28109 AlcobendasMadridSpain
PAYING AND INFORMATION AGENT IN SWEDEN MFEX Mutual Funds Exchange ABGrev Turegatan 19, Box 5378SE-102 49 StockholmSweden
FACILITIES AND INFORMATION AGENT IN UNITED KINGDOMBNP Paribas Securities Services10 Harewood AvenueLondon, NW1 6AAUnited Kingdom
REPRESENTATIVE IN SWITZERLAND1741 Fund Solutions AGBurggraben 16 CH-9000 St. Gallen Switzerland
PAYING AGENT IN SWITZERLAND Tellco AG Bahnhofstrasse 4 6430 Schwyz Switzerland
4 MATTHEWS ASIA FUNDS
There have been few years where the short-term swings in the markets have been (to my eyes at least) more in conflict with long-term trends: a sell-off in tech sectors and health care, a rise in cyclical businesses as opposed to secular growth, and dramatic rallies favouring one country over another.
For the shorter term, 2021 has seen the long-awaited value rotation. In a disin-flationary environment, mega-cap growth stocks tend to do well; when econo-mies reflate and yields rise, these growth stocks have their valuations questioned. Cyclical businesses like banks and materials bounce back. Smaller companies enjoy the more liquid environment—all of these effects have been present this year and we have endeavored to take advantage where we can.
The year has been a good one for India, with the one year performance differen-tial with China reaching 60 percentage points (as of September 30, 2021). Why has India been so strong? Well, it’s partly a recovery in earnings growth from the nadir of the pandemic. However, this is not a sufficient explanation, for earn-ings-per-share have bounced back to a point that seems to me to be above trend. India has seen strong growth in manufactured exports, notably the automotive sector, as demand has recovered in Southeast Asia and Latin America. Is this cyclical? Or is it the start of a growing manufacturing prowess? If the latter, then the recent rise in valuations is well-deserved. And yet it is impossible to know for sure. One should also note that India’s liquidity environment has been helped by the world’s disinflation and by the swing from current account deficit to surplus, which has also supported the rupee. These are all vulnerable to a more reflationary environment and so some caution is warranted.
Japan had a difficult start to the year but as the reflationary pressures have grown, the market got into its stride a bit more. It has been helped by the global rebuild of inventories, as Japan’s manufacturing bias has supported the rebound in factory production. Ongoing trends of automation to improve factory yields also play to the strengths of many Japanese companies. In light of these current trends, Japanese equities have undemanding valuations.
In the rest of Asia and in the emerging markets, it has been the more cyclical busi-ness and economies that have tended to do well. As is often the case, Russia has done well as China has faltered. Latin America has rallied, partly because of raw material price rises but also because of some of the same current account effects that India has enjoyed. It is undeniable, though, that Mexico has done much to bolster their external position within the context of a manageable budget deficit.
But it is China that dominates headlines. Over the past few weeks and months, the Chinese stock market has been put under increasing pressure. Relations between U.S. and China continue to be fraught. China’s own regulators have imposed regulatory costs on some businesses—in some cases to the extent that the vast majority of a business’ profits may disappear. U.S. politicians of all polit-ical leanings have denounced financial investments in China and to these polemics has been added the cry that China is uninvestible! Indeed, this is not the China I once knew as a young student in Beijing in the late 1980s.
But is that a bad thing? Either for China or for investors? Not at all. For the China I knew was still centrally-controlled. Educators (my professors) earned only enough to seek out a basic life. Students in graduating class were allocated jobs. My roommate, one of the brighter ones in his class, was allocated a job at the state publishing house, no doubt turning out tedious tomes of tortured tweaks on Marxist-Leninist thought.
But he escaped all that—and China did too. His generation is overwhelmingly employed in private industry (over three quarters of urban employment is in small and medium-sized private enterprise). Incomes have soared, along with home ownership, the ability to own a car, to have access to foreign media, to travel. To be middle class. The stock market averages, burdened as they were for so long with the listed vestiges of old China, do not reflect this incredible story
Investment Manager’s Report

global.matthewsasia.com 5
of growth and discovery. But a sensitive, active investor could be part of this wealth creation by selecting businesses in the domestic demand areas of the economy—consumption, technology, health care, financial services and other sectors have all bred domestic champions.
All this effort and determination has been greeted not by applause for the allevia-tion of mass poverty, rather by fear and suspicion. The West, so long a model for China’s reforms, now seeks to contain China. And China has reacted by reaching out to its neighbors and neighbors once and twice removed to offer the same kind of growth plan—infrastructure, manufacturing, trade, middle class development.
And that is where China finds itself now. After having been told for so long that its growth was a mirage (“it’s just low wage exports”), China finds itself facing the demands of citizens that have belied such wrongheaded analysis and who now work jobs in the service industries, finance, health care and technology and who live lives which, in the face of it, are not so very different from our own.
So the current regulatory actions are an attempt to answer the criticism that China’s growth has been oblivious to environmental damage, to health, or that it lacks the right kind of education (too focused on rote learning!) to develop truly creative minds. The Chinese government has reacted by addressing issues around access to health care, fairness in market transactions and equality in edu-cational provision. It will no doubt continue to target these areas as well as financial speculation—it has already taken moves against crypto-currencies.
In so doing, the Chinese do not act wildly or without forewarning. They do not have the same involved and public consultation process that the West has before they act—and they act. It is undeniable, as we have pointed out before, that pro-labor policy has been a headwind for profits and that regulatory initia-tives may also cause extra burdens to be imposed on corporates. But the cry that China is against capitalism and is uninvestible is ignorant of the fact that China knows its great wealth creation is due to private enterprise. Its efforts to improve quality of life would be impossible without the capitalist. China recognized this for decades and formally ratified it at the Party Congress 20 years ago.
So, how does one invest in this environment? Well, be mindful of monopolistic profits and how you price them. Be mindful of speculative business models. Invest in those firms that create goods and services in China for Chinese to enjoy. Invest in those businesses that will increase health care access, produce the productivity enhancing capital goods, provide at a reasonable cost the retail services China’s middle class demands, and develop the financial architecture that supports long-term growth and wealth protection.
Years like this are always challenging to navigate. Partly, it is done by being pre-pared—balancing the secular and cyclical aspects of an investment portfolio. What one might lose in being less exposed to materials, one can gain by having a small-cap exposure. Partly, however, it is done by recognizing the long-term value that has emerged in some cyclical businesses—materials, manufacturing and banking. And a secular growth business may exhibit more cyclical behaviour if the economy in which it operates is by nature cyclical. We can take advantage of this on your behalf. But we do not follow around cyclical movements—rather we look for the long-term opportunities they may create. And we are not focused on the macro—rather we look to buy businesses we can hold for the long run.
Robert Horrocks, PhD Chief Investment Officer Matthews International Capital Management, LLC
Investment Manager’s Report (continued)

6 MATTHEWS ASIA FUNDS
Asia Total Return Bond Fund 30 September 2021
Schedule of Investments
Transferable securities and money market instruments admitted to an official exchange listing
BONDS
Investments Currency Quantity/ Nominal Value
Market Value USD
% of Net Assets
CHINA/HONG KONG
China Development Bank, 3.800%, 01/25/2036 CNY 20,000,000 3,208,050 4.20
Wanda Properties International Co., Ltd., 7.250%, 01/29/2024 USD 3,066,000 2,958,690 3.88
KWG Group Holdings, Ltd., 7.400%, 01/13/2027 USD 2,800,000 2,590,000 3.39
Times China Holdings, Ltd., 6.200%, 03/22/2026 USD 2,700,000 2,430,000 3.18
Sino-Ocean Land Treasure III, Ltd., 4.900%, 12/29/2049 USD 2,800,000 2,359,000 3.09
Franshion Brilliant, Ltd., 6.000%, 12/29/2049 USD 2,300,000 2,300,000 3.01
Kasikornbank Public Co., Ltd., 5.275%, 12/29/2049 USD 2,200,000 2,291,300 3.00
China Cinda Asset Management Co., Ltd., 3.900%, 03/05/2030 CNY 10,000,000 1,542,576 2.02
ESR Cayman Ltd., 5.650%, 12/29/2049 SGD 2,000,000 1,498,501 1.96
Huarong Finance 2019 Co., Ltd., 4.250%, 12/29/2049 USD 1,600,000 1,348,000 1.76
Huarong Finance 2017 Co., Ltd., 4.000%, 12/29/2049 USD 1,400,000 1,281,000 1.68
China SCE Group Holdings, Ltd., 7.000%, 05/02/2025 USD 1,200,000 1,129,500 1.48
China SCE Group Holdings, Ltd., 6.000%, 02/04/2026 USD 1,100,000 979,000 1.28
Sunac China Holdings, Ltd., 6.500%, 01/26/2026 USD 1,200,000 978,000 1.28
FWD Group, Ltd., 6.375%, 12/29/2049 USD 800,000 820,000 1.07
FWD Group, Ltd., 0.000%, 12/29/2049 USD 800,000 769,000 1.01
Honghua Group, Ltd., 6.375%, 08/01/2022 USD 650,000 633,750 0.83
Huarong Finance 2017 Co., Ltd., 4.500%, 12/29/2049 USD 600,000 573,000 0.75
Logan Group Co., Ltd., 4.500%, 01/13/2028 USD 554,000 505,525 0.66
CIFI Holdings Group Co., Ltd., 6.700%, 04/23/2022 CNH 3,000,000 457,926 0.60
Times China Holdings, Ltd., 5.750%, 01/14/2027 USD 400,000 354,000 0.46
31,006,818 40.59
Investments Currency Quantity/ Nominal Value
Market Value USD
% of Net Assets
SINGAPORE
ABJA Investment Co. Pte, Ltd., 5.450%, 01/24/2028 USD 2,391,000 2,591,246 3.39
Indika Energy Capital III Pte, Ltd., 5.875%, 11/09/2024 USD 2,200,000 2,211,000 2.90
4,802,246 6.29
INDONESIA
Indonesia Treasury Bond, 7.000%, 05/15/2027 IDR 36,500,000,000 2,739,955 3.59
Indonesia Treasury Bond, 9.000%, 03/15/2029 IDR 13,000,000,000 1,063,888 1.39
3,803,843 4.98
VIETNAM
Debt & Asset Trading Corp., 1.000%, 10/10/2025 USD 3,550,000 3,208,313 4.20
3,208,313 4.20
MAURITIUS
Network i2i, Ltd., 5.650%, 12/29/2049 USD 2,900,000 3,088,500 4.05
3,088,500 4.05
UNITED STATES
Periama Holdings LLC, 5.950%, 04/19/2026 USD 2,200,000 2,359,500 3.09
2,359,500 3.09
INDIA
Tata Motors, Ltd., 5.875%, 05/20/2025 USD 2,100,000 2,254,875 2.95
2,254,875 2.95
NETHERLANDS
PB International BV, 7.625%, 01/26/2022 USD 3,000,000 1,470,000 1.93
Royal Capital BV, 4.875%, 12/29/2049 USD 337,000 350,901 0.46
1,820,901 2.39
PHILIPPINES
Philippine Government International Bond, 3.900%, 11/26/2022 PHP 77,000,000 1,517,323 1.99
1,517,323 1.99
The accompanying notes form an integral part of these financial statements.

global.matthewsasia.com 7
BONDS (CONTINUED)
Investments Currency Quantity/ Nominal Value
Market Value USD
% of Net Assets
UNITED KINGDOM
ICICI Bank UK PLC, 5.375%, 09/26/2028 SGD 1,000,000 765,733 1.00
765,733 1.00
TOTAL BONDS 54,628,052 71.53
CONVERTIBLE BONDS
CHINA/HONG KONG
Luye Pharma Group, Ltd., Cnv., 1.500%, 07/09/2024 USD 2,600,000 2,655,666 3.48
Pharmaron Beijing Co., Ltd., Cnv., 0.000%, 06/18/2026 USD 1,100,000 1,175,625 1.54
Hansoh Pharmaceutical Group Co., Ltd., Cnv., 0.000%, 01/22/2026 USD 1,100,000 976,844 1.28
Meituan, Cnv., 0.000%, 04/27/2028 USD 400,000 381,500 0.50
5,189,635 6.80
MALAYSIA
Cerah Capital, Ltd., Cnv., 0.000%, 08/08/2024 USD 1,200,000 1,193,244 1.56
1,193,244 1.56
BRITISH VIRGIN ISLANDS
Weimob Investment, Ltd., Cnv. 06/07/2026 USD 1,100,000 1,009,250 1.32
1,009,250 1.32
SOUTH KOREA
Kakao Corp., Cnv., 0.000%, 04/28/2023 USD 400,000 493,964 0.65
493,964 0.65
TOTAL CONVERTIBLE BONDS 7,886,093 10.33
TOTAL TRANSFERABLE SECURITIES AND MONEY MARKET INSTRUMENTS ADMITTED TO AN OFFICIAL EXCHANGE LISTING 62,514,145 81.86
Transferable securities and money market instruments dealt in on another regulated market
CONVERTIBLE BONDS
Investments Currency Quantity/ Nominal Value
Market Value USD
% of Net Assets
CAYMAN ISLANDS
Baozun, Inc., Cnv., 1.625%, 05/01/2024 USD 2,600,000 2,383,119 3.12
2,383,119 3.12
CHINA/HONG KONG
iQIYI, Inc., Cnv., 2.000%, 04/01/2025 USD 1,000,000 852,980 1.12
NIO, Inc., Cnv., 0.500%, 02/01/2027 USD 1,000,000 818,342 1.07
Pinduoduo, Inc., Cnv., 0.000%, 12/01/2025 USD 350,000 321,782 0.42
1,993,104 2.61
TOTAL CONVERTIBLE BONDS 4,376,223 5.73
TOTAL TRANSFERABLE SECURITIES AND MONEY MARKET INSTRUMENTS DEALT IN ON ANOTHER REGULATED MARKET 4,376,223 5.73
Other transferable securities and money market instruments
BONDS
MALAYSIA
Malaysia Government Bond, 4.642%, 11/07/2033 MYR 7,400,000 1,900,951 2.49
Malaysia Government Bond, 3.478%, 06/14/2024 MYR 2,700,000 661,982 0.87
Malaysia Government Investment Issue, 3.422%, 09/30/2027 MYR 2,000,000 481,983 0.63
3,044,916 3.99
Asia Total Return Bond Fund 30 September 2021
Schedule of Investments (continued)
The accompanying notes form an integral part of these financial statements.

8 MATTHEWS ASIA FUNDS
BONDS (CONTINUED)
Investments Currency Quantity/ Nominal Value
Market Value USD
% of Net Assets
THAILAND
Thailand Government Bond, 2.875%, 12/17/2028 THB 45,000,000 1,458,805 1.91
Thailand Government Bond, 1.600%, 12/17/2029 THB 40,000,000 1,177,099 1.54
2,635,904 3.45
TOTAL BONDS 5,680,820 7.44
TOTAL OTHER TRANSFERABLE SECURI-TIES AND MONEY MARKET INSTRUMENTS 5,680,820 7.44
TOTAL INVESTMENTS 72,571,188 95.03
CASH AND OTHER ASSETS, LESS LIABILITIES 3,796,340 4.97
TOTAL NET ASSETS 76,367,528 100.00
Country Allocation % of Net Assets
China/Hong Kong 50.00Singapore 6.29Malaysia 5.55Indonesia 4.98Vietnam 4.20Mauritius 4.05Thailand 3.45Cayman Islands 3.12United States 3.09India 2.95Netherlands 2.39Philippines 1.99British Virgin Islands 1.32United Kingdom 1.00South Korea 0.65
Total Investments 95.03
Cash and Other Assets, Less Liabilities 4.97
Total 100.00
The following table represents movements in the portfolio holdings:
% of Net Assets as at
30 September 2021
% of Net Assets as at
31 March 2021
TRANSFERABLE SECURITIES AND MONEY MARKET INSTRUMENTS ADMITTED TO AN OFFICIAL EXCHANGE LISTING 81.86 91.86
BONDS 71.53 80.90
China/Hong Kong 40.59 37.06Singapore 6.29 13.38Indonesia 4.98 3.39Vietnam 4.20 7.43Mauritius 4.05 5.71United States 3.09 2.85India 2.95 4.79Netherlands 2.39 4.03Philippines 1.99 -United Kingdom 1.00 -Thailand - 2.26
CONVERTIBLE BONDS 10.33 10.96
China/Hong Kong 6.80 6.19Malaysia 1.56 2.28British Virgin Islands 1.32 -South Korea 0.65 1.61
New Zealand - 0.88
TRANSFERABLE SECURITIES AND MONEY MARKET INSTRUMENTS DEALT IN ON ANOTHER REGULATED MARKET 5.73 7.37
BONDS - 3.34
China/Hong Kong - 3.34
CONVERTIBLE BONDS 5.73 4.03
Cayman Islands 3.12 -
China/Hong Kong 2.61 4.03
OTHER TRANSFERABLE SECURITIES AND MONEY MARKET INSTRUMENTS 7.44 -
BONDS 7.44 -
Malaysia 3.99 -Thailand 3.45 -China/Hong Kong - -Netherlands - -Germany - -
Total Investments 95.03 99.23
Cash and Other Assets, Less Liabilities 4.97 0.77
Total 100.00 100.00
Asia Total Return Bond Fund 30 September 2021
Schedule of Investments (continued)
The accompanying notes form an integral part of these financial statements.
global.matthewsasia.com 9
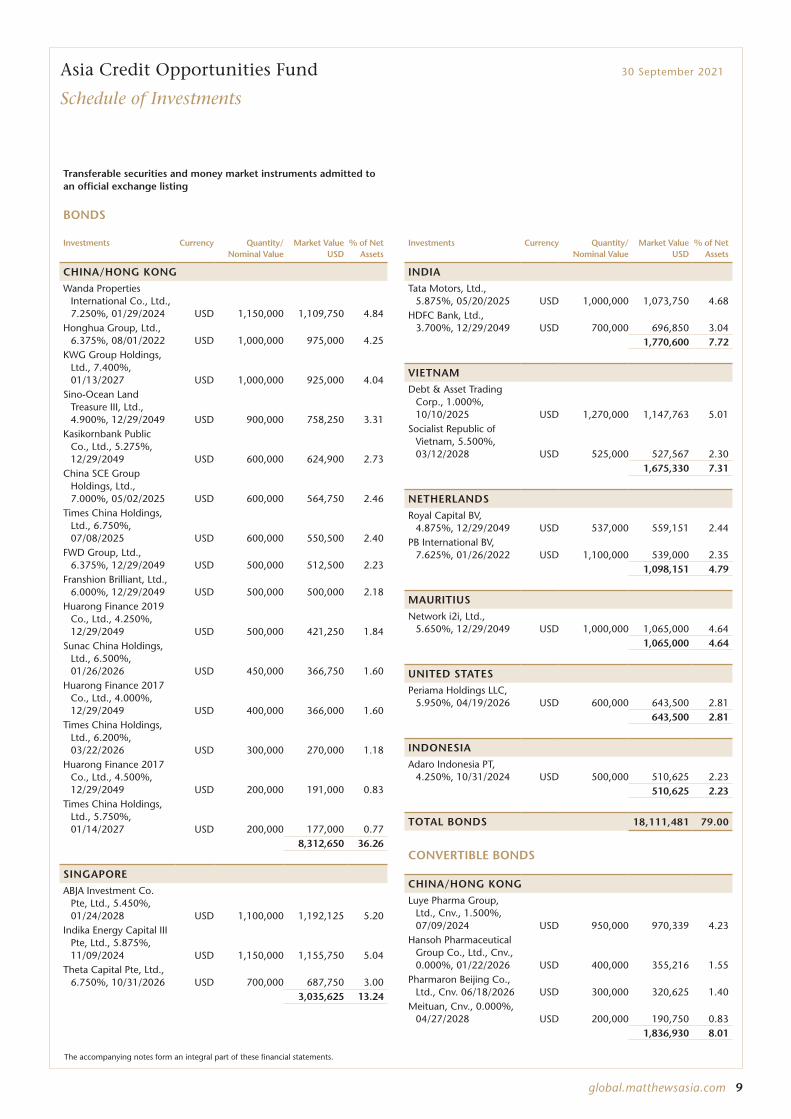
Asia Credit Opportunities Fund 30 September 2021
Schedule of Investments
Transferable securities and money market instruments admitted to an official exchange listing
BONDS
Investments Currency Quantity/ Nominal Value
Market Value USD
% of Net Assets
CHINA/HONG KONG
Wanda Properties International Co., Ltd., 7.250%, 01/29/2024 USD 1,150,000 1,109,750 4.84
Honghua Group, Ltd., 6.375%, 08/01/2022 USD 1,000,000 975,000 4.25
KWG Group Holdings, Ltd., 7.400%, 01/13/2027 USD 1,000,000 925,000 4.04
Sino-Ocean Land Treasure III, Ltd., 4.900%, 12/29/2049 USD 900,000 758,250 3.31
Kasikornbank Public Co., Ltd., 5.275%, 12/29/2049 USD 600,000 624,900 2.73
China SCE Group Holdings, Ltd., 7.000%, 05/02/2025 USD 600,000 564,750 2.46
Times China Holdings, Ltd., 6.750%, 07/08/2025 USD 600,000 550,500 2.40
FWD Group, Ltd., 6.375%, 12/29/2049 USD 500,000 512,500 2.23
Franshion Brilliant, Ltd., 6.000%, 12/29/2049 USD 500,000 500,000 2.18
Huarong Finance 2019 Co., Ltd., 4.250%, 12/29/2049 USD 500,000 421,250 1.84
Sunac China Holdings, Ltd., 6.500%, 01/26/2026 USD 450,000 366,750 1.60
Huarong Finance 2017 Co., Ltd., 4.000%, 12/29/2049 USD 400,000 366,000 1.60
Times China Holdings, Ltd., 6.200%, 03/22/2026 USD 300,000 270,000 1.18
Huarong Finance 2017 Co., Ltd., 4.500%, 12/29/2049 USD 200,000 191,000 0.83
Times China Holdings, Ltd., 5.750%, 01/14/2027 USD 200,000 177,000 0.77
8,312,650 36.26
SINGAPORE
ABJA Investment Co. Pte, Ltd., 5.450%, 01/24/2028 USD 1,100,000 1,192,125 5.20
Indika Energy Capital III Pte, Ltd., 5.875%, 11/09/2024 USD 1,150,000 1,155,750 5.04
Theta Capital Pte, Ltd., 6.750%, 10/31/2026 USD 700,000 687,750 3.00
3,035,625 13.24
Investments Currency Quantity/ Nominal Value
Market Value USD
% of Net Assets
INDIA
Tata Motors, Ltd., 5.875%, 05/20/2025 USD 1,000,000 1,073,750 4.68
HDFC Bank, Ltd., 3.700%, 12/29/2049 USD 700,000 696,850 3.04
1,770,600 7.72
VIETNAM
Debt & Asset Trading Corp., 1.000%, 10/10/2025 USD 1,270,000 1,147,763 5.01
Socialist Republic of Vietnam, 5.500%, 03/12/2028 USD 525,000 527,567 2.30
1,675,330 7.31
NETHERLANDS
Royal Capital BV, 4.875%, 12/29/2049 USD 537,000 559,151 2.44
PB International BV, 7.625%, 01/26/2022 USD 1,100,000 539,000 2.35
1,098,151 4.79
MAURITIUS
Network i2i, Ltd., 5.650%, 12/29/2049 USD 1,000,000 1,065,000 4.64
1,065,000 4.64
UNITED STATES
Periama Holdings LLC, 5.950%, 04/19/2026 USD 600,000 643,500 2.81
643,500 2.81
INDONESIA
Adaro Indonesia PT, 4.250%, 10/31/2024 USD 500,000 510,625 2.23
510,625 2.23
TOTAL BONDS 18,111,481 79.00
CONVERTIBLE BONDS
CHINA/HONG KONG
Luye Pharma Group, Ltd., Cnv., 1.500%, 07/09/2024 USD 950,000 970,339 4.23
Hansoh Pharmaceutical Group Co., Ltd., Cnv., 0.000%, 01/22/2026 USD 400,000 355,216 1.55
Pharmaron Beijing Co., Ltd., Cnv. 06/18/2026 USD 300,000 320,625 1.40
Meituan, Cnv., 0.000%, 04/27/2028 USD 200,000 190,750 0.83
1,836,930 8.01
The accompanying notes form an integral part of these financial statements.

10 MATTHEWS ASIA FUNDS
Asia Credit Opportunities Fund 30 September 2021
Schedule of Investments (continued)
Transferable securities and money market instruments admitted to an official exchange listing
CONVERTIBLE BONDS
Investments Currency Quantity/ Nominal Value
Market Value USD
% of Net Assets
MALAYSIA
Cerah Capital, Ltd., Cnv., 0.000%, 08/08/2024 USD 500,000 497,185 2.17
497,185 2.17
BRITISH VIRGIN ISLANDS
Weimob Investment, Ltd., Cnv., 0.000%, 06/07/2026 USD 400,000 367,000 1.60
367,000 1.60
TOTAL CONVERTIBLE BONDS 2,701,115 11.78
TOTAL TRANSFERABLE SECURITIES AND MONEY MARKET INSTRUMENTS ADMITTED TO AN OFFICIAL EXCHANGE LISTING 20,812,596 90.78
Transferable securities and money market instruments dealt in on another regulated market
BONDS
Investments Currency Quantity/ Nominal Value
Market Value USD
% of Net Assets
CHINA/HONG KONG
King Talent Management, Ltd., 5.600%, 12/29/2049 USD 450,000 425,250 1.85
425,250 1.85
TOTAL BONDS 425,250 1.85
CONVERTIBLE BONDS
CHINA/HONG KONG
Baozun, Inc., Cnv., 1.625%, 05/01/2024 USD 800,000 733,267 3.20
iQIYI, Inc., Cnv., 2.000%, 04/01/2025 USD 300,000 255,894 1.12
NIO, Inc., Cnv., 0.500%, 02/01/2027 USD 300,000 245,503 1.07
Pinduoduo, Inc.,, 0.000%, Cnv. 12/01/2025 USD 100,000 91,938 0.40
1,326,602 5.79
TOTAL CONVERTIBLE BONDS 1,326,602 5.79
TOTAL TRANSFERABLE SECURITIES AND MONEY MARKET INSTRUMENTS DEALT IN ON ANOTHER REGULATED MARKET 1,751,852 7.64
TOTAL INVESTMENTS 22,564,448 98.42
CASH AND OTHER ASSETS, LESS LIABILITIES 363,020 1.58
TOTAL NET ASSETS 22,927,468 100.00
The accompanying notes form an integral part of these financial statements.

global.matthewsasia.com 11
Country Allocation % of Net Assets
China/Hong Kong 51.91Singapore 13.24India 7.72Vietnam 7.31Netherlands 4.79Mauritius 4.64United States 2.81Indonesia 2.23Malaysia 2.17British Virgin Islands 1.60
Total Investments 98.42
Cash and Other Assets, Less Liabilities 1.58
Total 100.00
The following table represents movements in the portfolio holdings:
% of Net Assets as at
30 September 2021
% of Net Assets as at
31 March 2021
TRANSFERABLE SECURITIES AND MONEY MARKET INSTRUMENTS ADMITTED TO AN OFFICIAL EXCHANGE LISTING 90.78 91.86
BONDS 79.00 80.90
China/Hong Kong 36.26 37.06Singapore 13.24 13.38India 7.72 4.79Vietnam 7.31 7.43Netherlands 4.79 4.03Mauritius 4.64 5.71United States 2.81 2.85Indonesia 2.23 3.39Thailand - 2.26
CONVERTIBLE BONDS 11.78 10.96
China/Hong Kong 8.01 6.19
Malaysia 2.17 2.28British Virgin Islands 1.60 1.61New Zealand - 0.88
TRANSFERABLE SECURITIES AND MONEY MARKET INSTRUMENTS DEALT IN ON ANOTHER REGULATED MARKET 7.64 7.37
BONDS 1.85 3.34
China/Hong Kong 1.85 3.34
CONVERTIBLE BONDS 5.79 4.03
China/Hong Kong 5.79 4.03
Total Investments 98.42 99.23
Cash and Other Assets, Less Liabilities 1.58 0.77
Total 100.00 100.00
Asia Credit Opportunities Fund 30 September 2021
Schedule of Investments (continued)
The accompanying notes form an integral part of these financial statements.

12 MATTHEWS ASIA FUNDS
Asia Dividend Fund 30 September 2021
Schedule of Investments
The accompanying notes form an integral part of these financial statements.
Transferable securities and money market instruments admitted to an official exchange listing
EQUITIES
Investments Quantity/ Nominal Value
Market Value USD
% of Net Assets
JAPAN
MISUMI Group, Inc. 153,800 6,531,623 2.74Katitas Co., Ltd. 176,500 6,245,245 2.62LIXIL Group Corp. 193,000 5,615,578 2.35Rakus Co., Ltd. 157,900 5,564,344 2.33Hoya Corp. 28,900 4,503,324 1.89Shiseido Co., Ltd. 62,200 4,189,551 1.76AGC, Inc. 79,900 4,126,481 1.73Olympus Corp. 185,600 4,068,922 1.71Oriental Land Co., Ltd. 24,200 3,915,940 1.64Anritsu Corp. 210,400 3,755,571 1.57Daifuku Co., Ltd. 38,700 3,637,997 1.53Disco Corp. 12,500 3,496,164 1.47Dai-ichi Life Holdings, Inc. 152,800 3,381,223 1.42Bandai Namco Holdings, Inc. 44,700 3,351,148 1.40Nintendo Co., Ltd. 5,900 2,859,908 1.20The Japan Steel Works, Ltd. 90,900 2,369,974 0.99Simplex Holdings, Inc. 129,400 2,329,304 0.98Bell System24 Holdings, Inc. 133,400 1,989,745 0.83MANI, Inc. 87,000 1,659,256 0.70
73,591,298 30.86
CHINA/HONG KONG
Minth Group, Ltd. 2,548,000 8,709,104 3.65Tencent Holdings, Ltd. 109,600 6,498,396 2.73Pharmaron Beijing Co., Ltd.
A Shares 152,400 5,067,459 2.12Link, REIT 582,800 4,994,161 2.09Shenzhou International
Group Holdings, Ltd. 225,400 4,793,906 2.01OPT Machine Vision Tech
Co., Ltd. A Shares 78,000 4,539,613 1.90Helens International Holdings
Co. ltd 1,249,500 3,649,733 1.53China Education Group
Holdings, Ltd. 2,102,000 3,623,414 1.52Autel Intelligent Technology
Corp., Ltd. A Shares 310,721 3,399,484 1.43AIA Group, Ltd. 284,800 3,287,101 1.38Jinxin Fertility Group, Ltd. 2,066,000 3,078,094 1.29Zhejiang HangKe Technology,
Inc. Co. A Shares 235,638 3,005,118 1.26EC Healthcare 2,013,000 2,724,129 1.14Postal Savings Bank of China
Co., Ltd. H Shares 3,419,000 2,360,725 0.99Baidu, Inc. A Shares 123,350 2,350,263 0.99Zhou Hei Ya International
Holdings Co., Ltd. 2,290,000 2,322,769 0.97Pharmaron Beijing Co., Ltd.
H Shares 70,500 1,684,772 0.7166,088,241 27.71
Investments Quantity/ Nominal Value
Market Value USD
% of Net Assets
VIETNAM
FPT Corp. 1,304,875 5,326,720 2.23Asia Commercial Bank JSC 3,494,500 4,842,830 2.03Hoa Phat Group JSC 1,908,805 4,436,546 1.86Vinhomes JSC 1,171,560 4,030,454 1.69
18,636,550 7.81
SOUTH KOREA
LG Chem, Ltd., Pfd. 12,480 3,957,973 1.66POSCO 12,475 3,464,433 1.45Samsung Electronics Co.,
Ltd., Pfd. 50,237 2,946,878 1.24Hugel, Inc. 20,026 2,917,407 1.22KakaoBank Corp. 36,510 2,109,192 0.89Samsung Electronics Co., Ltd. 24,878 1,552,475 0.65
16,948,358 7.11
TAIWAN
Taiwan Semiconductor Manufacturing Co., Ltd. 352,000 7,302,422 3.06
Sinbon Electronics Co., Ltd. 431,000 3,631,689 1.52Taiwan Semiconductor
Manufacturing Co., Ltd. ADR 32,239 3,611,767 1.52
Brighten Optix Corp. 179,000 2,338,651 0.9816,884,529 7.08
AUSTRALIA
IDP Education, Ltd. 225,035 5,523,225 2.32Breville Group, Ltd. 234,068 4,872,428 2.04QBE Insurance Group, Ltd. 312,876 2,604,503 1.09
13,000,156 5.45
INDIA
Minda Industries, Ltd. 565,518 5,627,943 2.36HDFC Bank, Ltd. 224,989 4,834,411 2.03
10,462,354 4.39
SINGAPORE
BOC Aviation, Ltd. 451,200 3,777,114 1.58NetLink NBN Trust 3,905,200 2,855,434 1.20Ascendas India Trust, REIT 2,650,500 2,785,284 1.17
9,417,832 3.95
MALAYSIA
CTOS Digital BHD 5,241,400 2,528,993 1.062,528,993 1.06
BANGLADESH
GrameenPhone, Ltd. 545,241 2,420,746 1.022,420,746 1.02

global.matthewsasia.com 13
Asia Dividend Fund 30 September 2021
Schedule of Investments (continued)
EQUITIES (CONTINUED)
Investments Quantity/ Nominal Value
Market Value USD
% of Net Assets
INDONESIA
PT Bank Rakyat Indonesia Persero 1,415,451 380,178 0.16
380,178 0.16
TOTAL EQUITIES 230,359,235 96.60
TOTAL TRANSFERABLE SECURITIES AND MONEY MARKET INSTRUMENTS ADMITTED TO AN OFFICIAL EXCHANGE LISTING 230,359,235 96.60
TOTAL INVESTMENTS 230,359,235 96.60
CASH AND OTHER ASSETS, LESS LIABILITIES 8,110,589 3.40
TOTAL NET ASSETS 238,469,824 100.00
A Shares: Shares traded through the Shanghai-Hong Kong and/or Shenzhen- Hong Kong Stock Connect programs
ADR: American Depositary Receipt
BHD: Berhad
H Shares: Mainland China companies listed on the Stock Exchange of Hong Kong but incor-porated in mainland China
Pfd: Preferred shares
REIT: Real Estate Investment Trust
Country Allocation % of Net Assets
Japan 30.86China/Hong Kong 27.71Vietnam 7.81South Korea 7.11Taiwan 7.08Australia 5.45India 4.39Singapore 3.95Malaysia 1.06Bangladesh 1.02Indonesia 0.16
Total Investments 96.60
Cash and Other Assets, Less Liabilities 3.40
Total 100.00
The following table represents movements in the portfolio holdings:
% of Net Assets as at
30 September 2021
% of Net Assets as at
31 March 2021
TRANSFERABLE SECURITIES AND MONEY MARKET INSTRUMENTS ADMITTED TO AN OFFICIAL EXCHANGE LISTING 96.60 98.90
EQUITIES 96.60 98.90
Japan 30.86 30.38China/Hong Kong 27.71 25.38Vietnam 7.81 3.00South Korea 7.11 14.15Taiwan 7.08 4.02Australia 5.45 9.28India 4.39 3.07Singapore 3.95 5.78Malaysia 1.06 -Indonesia 0.16 1.58Bangladesh 1.02 0.91Philippines - 1.35
Total Investments 96.60 98.90
Cash and Other Assets, Less Liabilities 3.40 1.10
Total 100.00 100.00
The accompanying notes form an integral part of these financial statements.
14 MATTHEWS ASIA FUNDS
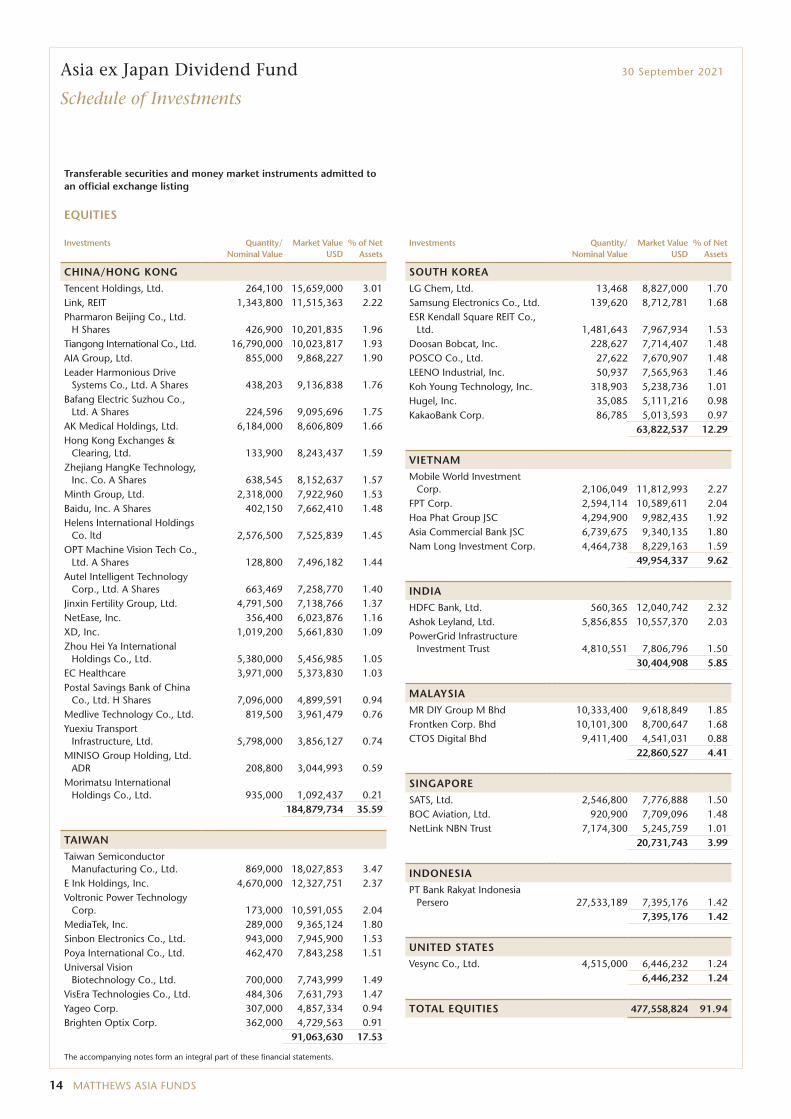
Asia ex Japan Dividend Fund 30 September 2021
Schedule of Investments
Transferable securities and money market instruments admitted to an official exchange listing
EQUITIES
Investments Quantity/ Nominal Value
Market Value USD
% of Net Assets
CHINA/HONG KONG
Tencent Holdings, Ltd. 264,100 15,659,000 3.01Link, REIT 1,343,800 11,515,363 2.22Pharmaron Beijing Co., Ltd.
H Shares 426,900 10,201,835 1.96Tiangong International Co., Ltd. 16,790,000 10,023,817 1.93AIA Group, Ltd. 855,000 9,868,227 1.90Leader Harmonious Drive
Systems Co., Ltd. A Shares 438,203 9,136,838 1.76Bafang Electric Suzhou Co.,
Ltd. A Shares 224,596 9,095,696 1.75AK Medical Holdings, Ltd. 6,184,000 8,606,809 1.66Hong Kong Exchanges &
Clearing, Ltd. 133,900 8,243,437 1.59Zhejiang HangKe Technology,
Inc. Co. A Shares 638,545 8,152,637 1.57Minth Group, Ltd. 2,318,000 7,922,960 1.53Baidu, Inc. A Shares 402,150 7,662,410 1.48Helens International Holdings
Co. ltd 2,576,500 7,525,839 1.45OPT Machine Vision Tech Co.,
Ltd. A Shares 128,800 7,496,182 1.44Autel Intelligent Technology
Corp., Ltd. A Shares 663,469 7,258,770 1.40Jinxin Fertility Group, Ltd. 4,791,500 7,138,766 1.37NetEase, Inc. 356,400 6,023,876 1.16XD, Inc. 1,019,200 5,661,830 1.09Zhou Hei Ya International
Holdings Co., Ltd. 5,380,000 5,456,985 1.05EC Healthcare 3,971,000 5,373,830 1.03Postal Savings Bank of China
Co., Ltd. H Shares 7,096,000 4,899,591 0.94Medlive Technology Co., Ltd. 819,500 3,961,479 0.76Yuexiu Transport
Infrastructure, Ltd. 5,798,000 3,856,127 0.74MINISO Group Holding, Ltd.
ADR 208,800 3,044,993 0.59Morimatsu International
Holdings Co., Ltd. 935,000 1,092,437 0.21184,879,734 35.59
TAIWAN
Taiwan Semiconductor Manufacturing Co., Ltd. 869,000 18,027,853 3.47
E Ink Holdings, Inc. 4,670,000 12,327,751 2.37Voltronic Power Technology
Corp. 173,000 10,591,055 2.04MediaTek, Inc. 289,000 9,365,124 1.80Sinbon Electronics Co., Ltd. 943,000 7,945,900 1.53Poya International Co., Ltd. 462,470 7,843,258 1.51Universal Vision
Biotechnology Co., Ltd. 700,000 7,743,999 1.49VisEra Technologies Co., Ltd. 484,306 7,631,793 1.47Yageo Corp. 307,000 4,857,334 0.94Brighten Optix Corp. 362,000 4,729,563 0.91
91,063,630 17.53
Investments Quantity/ Nominal Value
Market Value USD
% of Net Assets
SOUTH KOREA
LG Chem, Ltd. 13,468 8,827,000 1.70Samsung Electronics Co., Ltd. 139,620 8,712,781 1.68ESR Kendall Square REIT Co.,
Ltd. 1,481,643 7,967,934 1.53Doosan Bobcat, Inc. 228,627 7,714,407 1.48POSCO Co., Ltd. 27,622 7,670,907 1.48LEENO Industrial, Inc. 50,937 7,565,963 1.46Koh Young Technology, Inc. 318,903 5,238,736 1.01Hugel, Inc. 35,085 5,111,216 0.98KakaoBank Corp. 86,785 5,013,593 0.97
63,822,537 12.29
VIETNAM
Mobile World Investment Corp. 2,106,049 11,812,993 2.27
FPT Corp. 2,594,114 10,589,611 2.04Hoa Phat Group JSC 4,294,900 9,982,435 1.92Asia Commercial Bank JSC 6,739,675 9,340,135 1.80Nam Long Investment Corp. 4,464,738 8,229,163 1.59
49,954,337 9.62
INDIA
HDFC Bank, Ltd. 560,365 12,040,742 2.32Ashok Leyland, Ltd. 5,856,855 10,557,370 2.03PowerGrid Infrastructure
Investment Trust 4,810,551 7,806,796 1.5030,404,908 5.85
MALAYSIA
MR DIY Group M Bhd 10,333,400 9,618,849 1.85Frontken Corp. Bhd 10,101,300 8,700,647 1.68CTOS Digital Bhd 9,411,400 4,541,031 0.88
22,860,527 4.41
SINGAPORE
SATS, Ltd. 2,546,800 7,776,888 1.50BOC Aviation, Ltd. 920,900 7,709,096 1.48NetLink NBN Trust 7,174,300 5,245,759 1.01
20,731,743 3.99
INDONESIA
PT Bank Rakyat Indonesia Persero 27,533,189 7,395,176 1.42
7,395,176 1.42
UNITED STATES
Vesync Co., Ltd. 4,515,000 6,446,232 1.246,446,232 1.24
TOTAL EQUITIES 477,558,824 91.94
The accompanying notes form an integral part of these financial statements.
global.matthewsasia.com 15
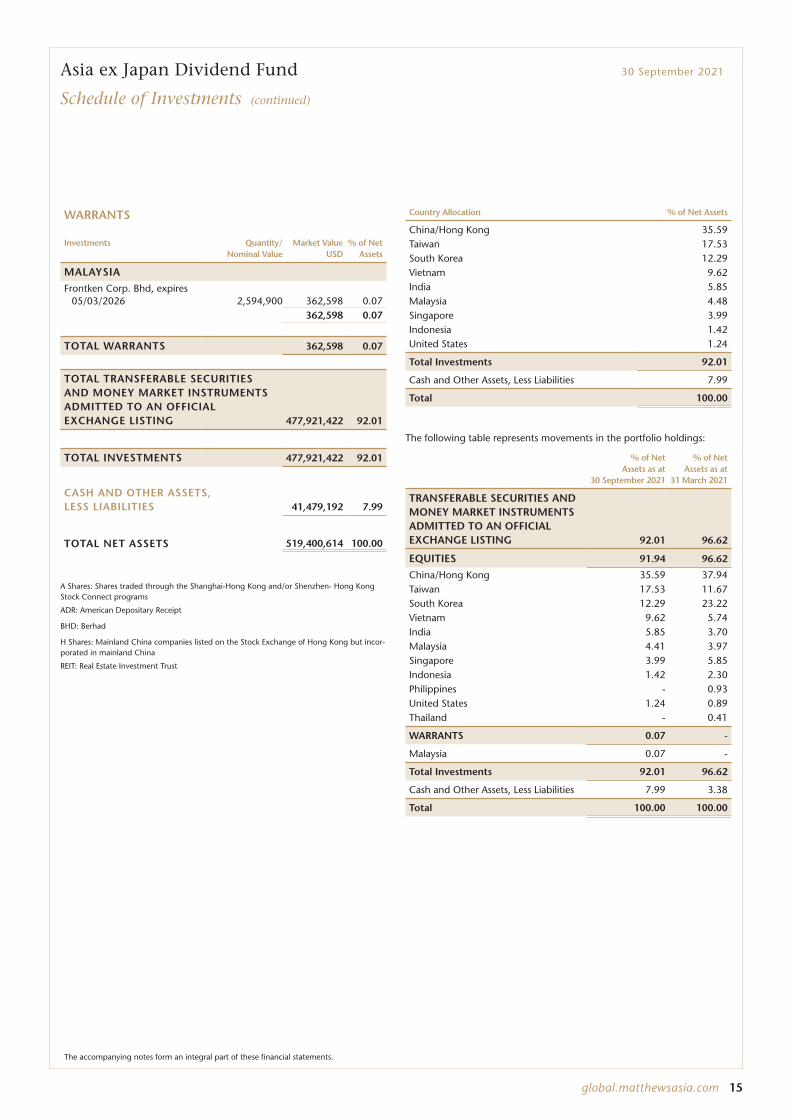
Asia ex Japan Dividend Fund 30 September 2021
Schedule of Investments (continued)
WARRANTS
Investments Quantity/ Nominal Value
Market Value USD
% of Net Assets
MALAYSIA
Frontken Corp. Bhd, expires 05/03/2026 2,594,900 362,598 0.07
362,598 0.07
TOTAL WARRANTS 362,598 0.07
TOTAL TRANSFERABLE SECURITIES AND MONEY MARKET INSTRUMENTS ADMITTED TO AN OFFICIAL EXCHANGE LISTING 477,921,422 92.01
TOTAL INVESTMENTS 477,921,422 92.01
CASH AND OTHER ASSETS, LESS LIABILITIES 41,479,192 7.99
TOTAL NET ASSETS 519,400,614 100.00
A Shares: Shares traded through the Shanghai-Hong Kong and/or Shenzhen- Hong Kong Stock Connect programs
ADR: American Depositary Receipt
BHD: Berhad
H Shares: Mainland China companies listed on the Stock Exchange of Hong Kong but incor-porated in mainland China
REIT: Real Estate Investment Trust
Country Allocation % of Net Assets
China/Hong Kong 35.59Taiwan 17.53South Korea 12.29Vietnam 9.62India 5.85Malaysia 4.48Singapore 3.99Indonesia 1.42United States 1.24
Total Investments 92.01
Cash and Other Assets, Less Liabilities 7.99
Total 100.00
The following table represents movements in the portfolio holdings:
% of Net Assets as at
30 September 2021
% of Net Assets as at
31 March 2021
TRANSFERABLE SECURITIES AND MONEY MARKET INSTRUMENTS ADMITTED TO AN OFFICIAL EXCHANGE LISTING 92.01 96.62
EQUITIES 91.94 96.62
China/Hong Kong 35.59 37.94Taiwan 17.53 11.67South Korea 12.29 23.22Vietnam 9.62 5.74India 5.85 3.70Malaysia 4.41 3.97Singapore 3.99 5.85Indonesia 1.42 2.30Philippines - 0.93United States 1.24 0.89Thailand - 0.41
WARRANTS 0.07 -
Malaysia 0.07 -
Total Investments 92.01 96.62
Cash and Other Assets, Less Liabilities 7.99 3.38
Total 100.00 100.00
The accompanying notes form an integral part of these financial statements.

16 MATTHEWS ASIA FUNDS
China Dividend Fund 30 September 2021
Schedule of Investments
Transferable securities and money market instruments admitted to an official exchange listing
EQUITIES
Investments Quantity/ Nominal Value
Market Value USD
% of Net Assets
CONSUMER DISCRETIONARY
Diversified Consumer ServicesChina Education Group
Holdings, Ltd. 293,000 505,072 2.58EC Healthcare 240,000 324,784 1.66
829,856 4.24
AutomobilesBYD Co., Ltd. H Shares 15,000 467,982 2.39Yadea Group Holdings, Ltd. 192,000 313,568 1.60
781,550 3.99
Textiles, Apparel & Luxury GoodsBosideng International
Holdings, Ltd. 680,000 482,858 2.47482,858 2.47
Internet & Direct Marketing RetailAlibaba Group Holding, Ltd. 19,600 358,141 1.83
358,141 1.83
Specialty RetailChina Yongda Automobiles
Services Holdings, Ltd. 233,000 336,044 1.72336,044 1.72
Hotels, Restaurants & LeisureHelens International Holdings
Co. ltd 114,000 332,989 1.70332,989 1.70
Household DurablesQingdao Haier Co., Ltd. D
Shares 189,660 323,368 1.65323,368 1.65
Auto ComponentsMinth Group, Ltd. 86,000 293,949 1.50
293,949 1.50Total Consumer Discretionary 3,738,755 19.10
Investments Quantity/ Nominal Value
Market Value USD
% of Net Assets
INDUSTRIALS
MachineryYangzijiang Shipbuilding
Holdings, Ltd. 444,500 450,326 2.30Weichai Power Co., Ltd.
A Shares 141,800 375,179 1.92Leader Harmonious Drive
Systems Co., Ltd. A Shares 12,600 262,719 1.341,088,224 5.56
MarineSITC International Holdings
Co., Ltd. 136,000 487,133 2.49487,133 2.49
Industrial ConglomeratesCK Hutchison Holdings, Ltd. 59,000 393,430 2.01
393,430 2.01
Transportation InfrastructureHainan Meilan International
Airport Co., Ltd. H Shares 91,000 380,262 1.94380,262 1.94
Air Freight & LogisticsJD Logistics, Inc. 25,900 107,761 0.55
107,761 0.55Total Industrials 2,456,810 12.55
INFORMATION TECHNOLOGY
SoftwareShanghai Baosight Software
Co., Ltd. B Shares 212,652 795,579 4.07795,579 4.07
Electronic Equipment, Instruments & ComponentsOPT Machine Vision Tech
Co., Ltd. A Shares 6,400 372,481 1.90E Ink Holdings, Inc. 128,000 337,892 1.73
710,373 3.63
Semiconductors & Semiconductor EquipmentSilergy Corp. 4,000 587,374 3.00
587,374 3.00
IT ServicesTravelSky Technology, Ltd.
H Shares 105,000 202,320 1.03202,320 1.03
Total Information Technology 2,295,646 11.73
The accompanying notes form an integral part of these financial statements.

global.matthewsasia.com 17
China Dividend Fund 30 September 2021
Schedule of Investments (continued)
EQUITIES (CONTINUED)
Investments Quantity/ Nominal Value
Market Value USD
% of Net Assets
COMMUNICATION SERVICES
Interactive Media & ServicesTencent Holdings, Ltd. 19,500 1,156,193 5.91
1,156,193 5.91
Diversified Telecommunication ServicesCITIC Telecom International
Holdings, Ltd. 1,746,000 593,741 3.03593,741 3.03
EntertainmentXD, Inc. 28,600 158,878 0.81
158,878 0.81Total Communication Services 1,908,812 9.75
CONSUMER STAPLES
BeveragesYantai Changyu Pioneer Wine
Co., Ltd. B Shares 199,700 364,860 1.86Tsingtao Brewery Co., Ltd.
H Shares 44,000 344,484 1.76709,344 3.62
Food ProductsUni-President China Holdings,
Ltd. 390,000 370,779 1.90WH Group, Ltd. 316,332 225,263 1.15
596,042 3.05
Food & Staples RetailingJiajiayue Group Co., Ltd.
A Shares 114,100 265,080 1.35265,080 1.35
Total Consumer Staples 1,570,466 8.02
FINANCIALS
BanksPostal Savings Bank of China
Co., Ltd. H Shares 923,000 637,306 3.26BOC Hong Kong Holdings,
Ltd. 110,000 331,528 1.69Ping An Bank Co., Ltd.
A Shares 111,700 309,575 1.581,278,409 6.53
Total Financials 1,278,409 6.53
Investments Quantity/ Nominal Value
Market Value USD
% of Net Assets
MATERIALS
Construction MaterialsHuaxin Cement Co., Ltd. B
Shares 226,036 415,906 2.13China Jushi Co., Ltd. A Shares 97,000 262,840 1.34
678,746 3.47
Metals & MiningTiangong International Co.,
Ltd. 524,000 312,834 1.60312,834 1.60
Containers & PackagingGreatview Aseptic Packaging
Co., Ltd. 692,000 257,660 1.31257,660 1.31
Total Materials 1,249,240 6.38
ENERGY
Oil, Gas & Consumable FuelsChina Suntien Green Energy
Corp., Ltd. H Shares 1,201,000 1,201,058 6.131,201,058 6.13
Total Energy 1,201,058 6.13
HEALTH CARE
Life Sciences Tools & ServicesPharmaron Beijing Co., Ltd.
H Shares 24,400 583,098 2.98583,098 2.98
PharmaceuticalsCSPC Pharmaceutical Group,
Ltd. 394,000 471,918 2.41471,918 2.41
Health Care TechnologyMedlive Technology Co., Ltd. 30,000 145,021 0.74
145,021 0.74Total Health Care 1,200,037 6.13
REAL ESTATE
Real Estate Management & DevelopmentShimao Services Holdings,
Ltd. 247,000 510,074 2.60K Wah International Holdings,
Ltd. 381,000 154,454 0.79664,528 3.39
Equity Real Estate Investment Trusts (REITs)Fortune Real Estate
Investment Trust, REIT 417,000 414,401 2.12414,401 2.12
Total Real Estate 1,078,929 5.51
The accompanying notes form an integral part of these financial statements.
18 MATTHEWS ASIA FUNDS
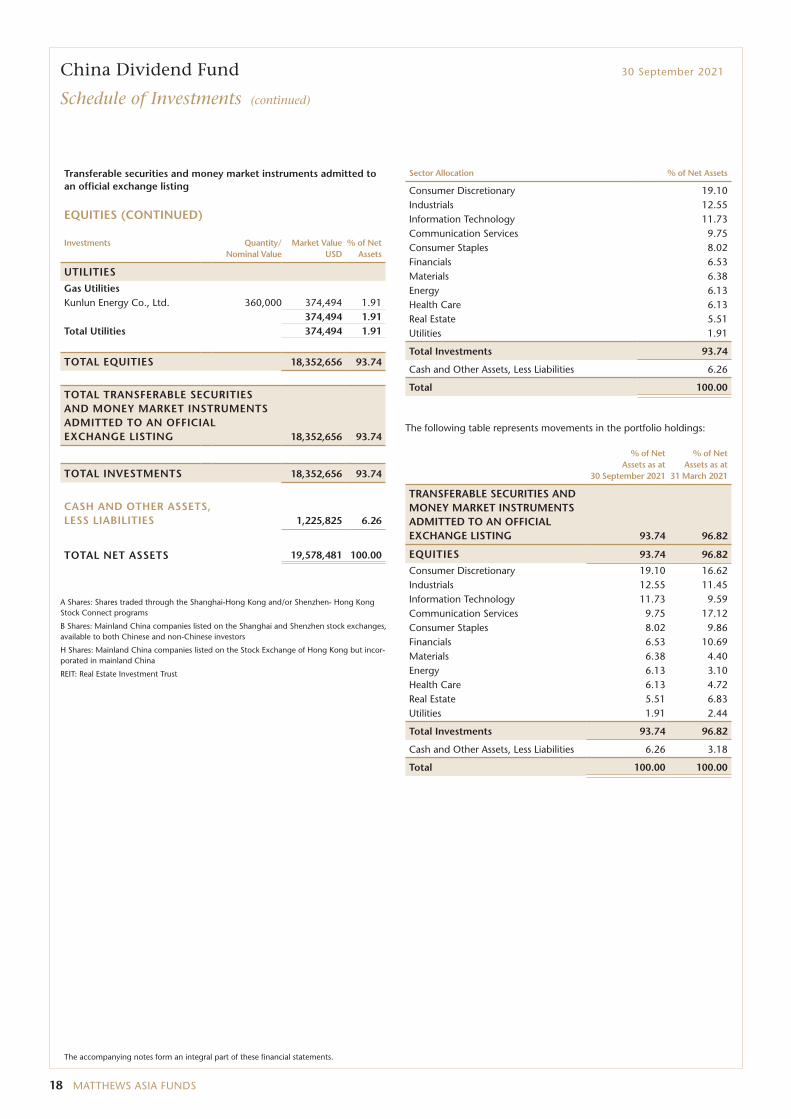
China Dividend Fund 30 September 2021
Schedule of Investments (continued)
Transferable securities and money market instruments admitted to an official exchange listing
EQUITIES (CONTINUED)
Investments Quantity/ Nominal Value
Market Value USD
% of Net Assets
UTILITIES
Gas UtilitiesKunlun Energy Co., Ltd. 360,000 374,494 1.91
374,494 1.91Total Utilities 374,494 1.91
TOTAL EQUITIES 18,352,656 93.74
TOTAL TRANSFERABLE SECURITIES AND MONEY MARKET INSTRUMENTS ADMITTED TO AN OFFICIAL EXCHANGE LISTING 18,352,656 93.74
TOTAL INVESTMENTS 18,352,656 93.74
CASH AND OTHER ASSETS, LESS LIABILITIES 1,225,825 6.26
TOTAL NET ASSETS 19,578,481 100.00
A Shares: Shares traded through the Shanghai-Hong Kong and/or Shenzhen- Hong Kong Stock Connect programs
B Shares: Mainland China companies listed on the Shanghai and Shenzhen stock exchanges, available to both Chinese and non-Chinese investors
H Shares: Mainland China companies listed on the Stock Exchange of Hong Kong but incor-porated in mainland China
REIT: Real Estate Investment Trust
Sector Allocation % of Net Assets
Consumer Discretionary 19.10Industrials 12.55Information Technology 11.73Communication Services 9.75Consumer Staples 8.02Financials 6.53Materials 6.38Energy 6.13Health Care 6.13Real Estate 5.51Utilities 1.91
Total Investments 93.74
Cash and Other Assets, Less Liabilities 6.26
Total 100.00
The following table represents movements in the portfolio holdings:
% of Net Assets as at
30 September 2021
% of Net Assets as at
31 March 2021
TRANSFERABLE SECURITIES AND MONEY MARKET INSTRUMENTS ADMITTED TO AN OFFICIAL EXCHANGE LISTING 93.74 96.82
EQUITIES 93.74 96.82
Consumer Discretionary 19.10 16.62Industrials 12.55 11.45Information Technology 11.73 9.59Communication Services 9.75 17.12Consumer Staples 8.02 9.86Financials 6.53 10.69Materials 6.38 4.40Energy 6.13 3.10Health Care 6.13 4.72Real Estate 5.51 6.83Utilities 1.91 2.44
Total Investments 93.74 96.82
Cash and Other Assets, Less Liabilities 6.26 3.18
Total 100.00 100.00
The accompanying notes form an integral part of these financial statements.

global.matthewsasia.com 19
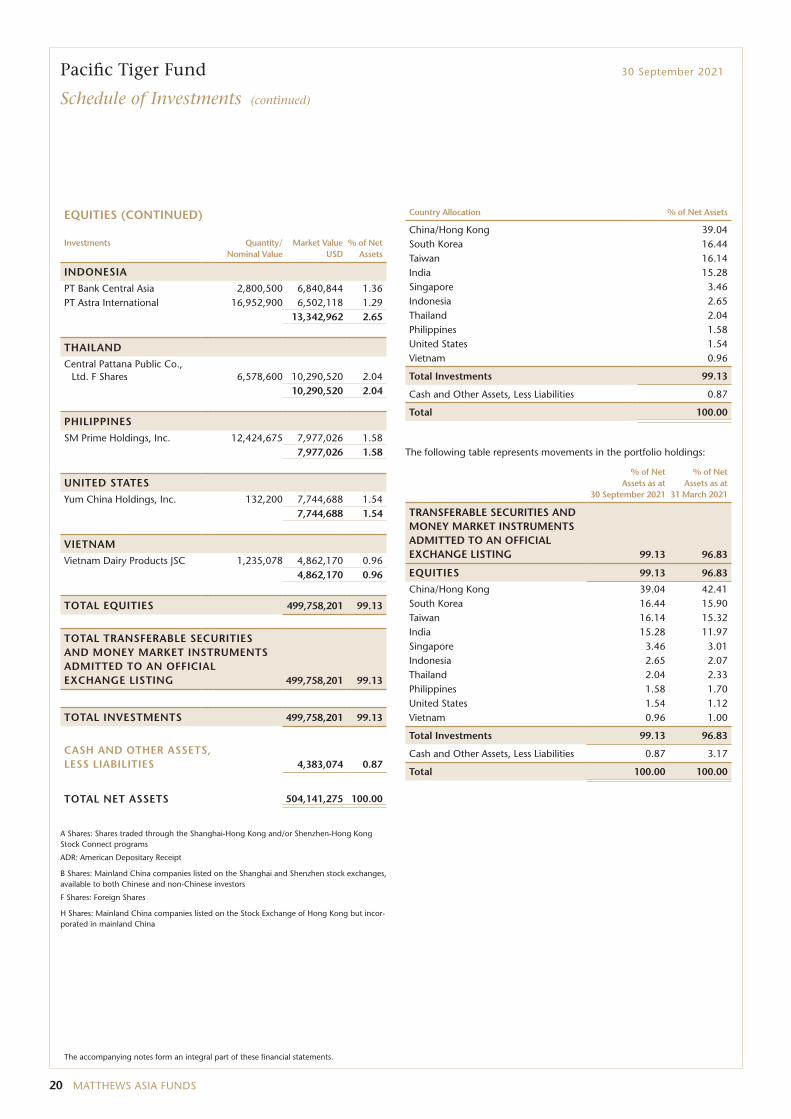
Pacific Tiger Fund 30 September 2021
Schedule of Investments
Transferable securities and money market instruments admitted to an official exchange listing
EQUITIES
Investments Quantity/ Nominal Value
Market Value USD
% of Net Assets
CHINA/HONG KONG
Tencent Holdings, Ltd. 384,700 22,809,607 4.52Alibaba Group Holding, Ltd. 773,072 14,125,948 2.80AIA Group, Ltd. 1,202,000 13,873,227 2.75Hong Kong Exchanges &
Clearing, Ltd. 188,700 11,617,152 2.30Wuxi Biologics Cayman, Inc. 638,000 10,367,796 2.06Meituan Dianping B Shares 289,600 9,164,141 1.82Kweichow Moutai Co., Ltd.
A Shares 28,320 7,999,997 1.59CITIC Securities Co., Ltd.
H Shares 3,002,500 7,643,697 1.52StarPower Semiconductor,
Ltd. A Shares 119,639 7,529,996 1.49Xinyi Solar Holdings, Ltd. 3,584,000 7,341,383 1.46ENN Energy Holdings, Ltd. 421,900 6,952,690 1.38China Resources Mixc Lifestyle
Services, Ltd. 1,098,700 6,100,070 1.21CSPC Pharmaceutical Group,
Ltd. 5,054,000 6,053,489 1.20China Resources Beer
Holdings Co., Ltd. 777,086 5,735,489 1.14Ming Yuan Cloud Group
Holdings, Ltd. 1,446,825 5,015,137 0.99Topsports International
Holdings, Ltd. 4,346,000 4,962,115 0.98China Lesso Group Holdings,
Ltd. 2,873,000 4,603,558 0.91Shandong Sinocera Functional
Material Co., Ltd. A Shares 680,976 4,321,333 0.86Baidu, Inc. A Shares 226,400 4,313,737 0.86OPT Machine Vision Tech Co.,
Ltd. A Shares 70,721 4,115,974 0.82JD.com, Inc. ADR 55,300 3,981,090 0.79JD Logistics, Inc. 944,900 3,931,404 0.78Will Semiconductor Co., Ltd.
Shanghai A Shares 98,400 3,680,709 0.73WH Group, Ltd. 4,643,514 3,306,692 0.66Sany Heavy Industry Co., Ltd.
A Shares A Shares 774,100 3,038,259 0.60Shenzhen Inovance
Technology Co., Ltd. A Shares 287,100 2,791,175 0.55
China East Education Holdings, Ltd. 2,499,000 2,576,471 0.51
Suofeiya Home Collection Co., Ltd. A Shares 955,988 2,457,320 0.49
JD.com, Inc. A Shares 63,400 2,308,484 0.46TravelSky Technology, Ltd.
H Shares 1,104,000 2,127,250 0.42Angelalign Technology, Inc. 46,000 1,969,806 0.39
196,815,196 39.04
Investments Quantity/ Nominal Value
Market Value USD
% of Net Assets
SOUTH KOREA
Samsung Electronics Co., Ltd. 364,904 22,771,297 4.52Naver Corp. 28,867 9,439,664 1.87SK IE Technology Co., Ltd. 32,792 6,259,284 1.24KoMiCo, Ltd. 96,317 6,191,190 1.23LEENO Industrial, Inc. 41,088 6,103,035 1.21Big Hit Entertainment Co.,
Ltd. 24,244 6,099,050 1.21SOLUM Co., Ltd. 227,690 5,372,923 1.07Doosan Bobcat, Inc. 134,112 4,525,251 0.90Mando Corp. 93,863 4,512,121 0.89Krafton, Inc. 8,788 3,725,993 0.74Unid Co., Ltd. 32,172 3,563,785 0.71LG Chem, Ltd. 4,796 3,143,324 0.62Amorepacific Corp. 7,875 1,184,340 0.23
82,891,257 16.44
TAIWAN
Taiwan Semiconductor Manufacturing Co., Ltd. 1,562,000 32,404,495 6.43
Chailease Holding Co., Ltd. 931,750 8,214,013 1.63MediaTek, Inc. 234,000 7,582,834 1.50Pan Jit International, Inc. 1,994,000 6,367,036 1.26Delta Electronics, Inc. 638,032 5,752,152 1.14Eclat Textile Co., Ltd. 256,000 5,577,502 1.11CHROMA ATE, Inc. 841,000 5,308,047 1.05Uni-President Enterprises
Corp. 2,153,000 5,270,446 1.05Yageo Corp. 310,000 4,904,800 0.97
81,381,325 16.14
INDIA
The Tata Power Co., Ltd. 5,815,215 12,436,972 2.47Titan Co., Ltd. 353,498 10,295,506 2.04Housing Development
Finance Corp., Ltd. 229,483 8,515,241 1.69Crompton Greaves Consumer
Electricals, Ltd. 1,173,643 7,572,094 1.50ICICI Bank, Ltd. 764,313 7,216,581 1.43Dabur India, Ltd. 818,215 6,801,786 1.35PVR, Ltd. 310,638 6,693,192 1.33Tata Consultancy Services,
Ltd. 128,850 6,553,900 1.30Pidilite Industries, Ltd. 179,759 5,768,441 1.14PI Industries, Ltd. 120,645 5,165,903 1.03
77,019,616 15.28
SINGAPORE
Sea, Ltd. ADR 27,413 8,640,216 1.72SATS, Ltd. 2,099,000 6,409,490 1.27Aztech Global, Ltd. 3,123,500 2,383,735 0.47
17,433,441 3.46
The accompanying notes form an integral part of these financial statements.
20 MATTHEWS ASIA FUNDS
Pacific Tiger Fund 30 September 2021
Schedule of Investments (continued)
EQUITIES (CONTINUED)
Investments Quantity/ Nominal Value
Market Value USD
% of Net Assets
INDONESIA
PT Bank Central Asia 2,800,500 6,840,844 1.36PT Astra International 16,952,900 6,502,118 1.29
13,342,962 2.65
THAILAND
Central Pattana Public Co., Ltd. F Shares 6,578,600 10,290,520 2.04
10,290,520 2.04
PHILIPPINES
SM Prime Holdings, Inc. 12,424,675 7,977,026 1.587,977,026 1.58
UNITED STATES
Yum China Holdings, Inc. 132,200 7,744,688 1.547,744,688 1.54
VIETNAM
Vietnam Dairy Products JSC 1,235,078 4,862,170 0.964,862,170 0.96
TOTAL EQUITIES 499,758,201 99.13
TOTAL TRANSFERABLE SECURITIES AND MONEY MARKET INSTRUMENTS ADMITTED TO AN OFFICIAL EXCHANGE LISTING 499,758,201 99.13
TOTAL INVESTMENTS 499,758,201 99.13
CASH AND OTHER ASSETS, LESS LIABILITIES 4,383,074 0.87
TOTAL NET ASSETS 504,141,275 100.00
A Shares: Shares traded through the Shanghai-Hong Kong and/or Shenzhen-Hong Kong Stock Connect programs
ADR: American Depositary Receipt
B Shares: Mainland China companies listed on the Shanghai and Shenzhen stock exchanges, available to both Chinese and non-Chinese investors
F Shares: Foreign Shares
H Shares: Mainland China companies listed on the Stock Exchange of Hong Kong but incor-porated in mainland China
Country Allocation % of Net Assets
China/Hong Kong 39.04South Korea 16.44Taiwan 16.14India 15.28Singapore 3.46Indonesia 2.65Thailand 2.04Philippines 1.58United States 1.54Vietnam 0.96
Total Investments 99.13
Cash and Other Assets, Less Liabilities 0.87
Total 100.00
The following table represents movements in the portfolio holdings:
% of Net Assets as at
30 September 2021
% of Net Assets as at
31 March 2021
TRANSFERABLE SECURITIES AND MONEY MARKET INSTRUMENTS ADMITTED TO AN OFFICIAL EXCHANGE LISTING 99.13 96.83
EQUITIES 99.13 96.83
China/Hong Kong 39.04 42.41South Korea 16.44 15.90Taiwan 16.14 15.32India 15.28 11.97Singapore 3.46 3.01Indonesia 2.65 2.07Thailand 2.04 2.33Philippines 1.58 1.70United States 1.54 1.12Vietnam 0.96 1.00
Total Investments 99.13 96.83
Cash and Other Assets, Less Liabilities 0.87 3.17
Total 100.00 100.00
The accompanying notes form an integral part of these financial statements.

global.matthewsasia.com 21
Asia Innovative Growth Fund 30 September 2021
Schedule of Investments
Transferable securities and money market instruments admitted to an official exchange listing
EQUITIES
Investments Quantity/ Nominal Value
Market Value USD
% of Net Assets
CHINA/HONG KONG
Meituan Dianping B Shares 77,700 2,458,749 5.94Silergy Corp. 14,000 2,055,809 4.97Bilibili, Inc. ADR 31,600 2,043,614 4.94Tencent Holdings, Ltd. 33,600 1,992,209 4.81Wuxi Biologics Cayman, Inc. 120,500 1,958,181 4.73JD.com, Inc. A Shares 39,050 1,421,866 3.43Alibaba Group Holding, Ltd. 67,400 1,231,566 2.98China Mengniu Dairy Co.,
Ltd. 167,000 1,075,000 2.60Innovent Biologics, Inc. 96,000 930,597 2.25China Merchants Bank Co.,
Ltd. H Shares 113,000 899,366 2.17XPeng, Inc. ADR A Shares 24,900 871,354 2.11Shenzhou International
Group Holdings, Ltd. 38,200 812,454 1.96Huazhu Group, Ltd. ADR 17,400 807,104 1.95WuXi AppTec Co., Ltd.
H Shares 28,940 676,631 1.63Pinduoduo, Inc. ADR 6,400 573,132 1.38LONGi Green Energy
Technology Co., Ltd. A Shares 41,400 526,440 1.27
Jacobio Pharmaceuticals Group Co., Ltd. 136,500 328,783 0.79
JD Logistics, Inc. 73,300 304,976 0.74Medlive Technology Co., Ltd. 42,500 205,446 0.50Estun Automation Co., Ltd.
A Shares 53,268 180,148 0.4421,353,425 51.59
INDIA
Bajaj Finance, Ltd. 17,664 1,824,786 4.41ICICI Bank, Ltd. 193,237 1,824,528 4.41HDFC Bank, Ltd. 77,389 1,662,882 4.02Reliance Industries, Ltd. 33,001 1,120,040 2.70Dabur India, Ltd. 116,410 967,711 2.34Crompton Greaves Consumer
Electricals, Ltd. 105,731 682,154 1.65Maruti Suzuki India, Ltd. 5,367 530,576 1.28Metropolis Healthcare, Ltd. 14,426 524,897 1.27Zomato, Ltd. 259,007 476,647 1.15
9,614,221 23.23
SINGAPORE
Sea, Ltd. ADR 8,600 2,710,607 6.552,710,607 6.55
SOUTH KOREA
LG Chem, Ltd. 1,317 863,169 2.08SK Innovation Co., Ltd. 2,859 637,731 1.54Naver Corp. 1,277 417,586 1.01
1,918,486 4.63
Investments Quantity/ Nominal Value
Market Value USD
% of Net Assets
TAIWAN
Alchip Technologies, Ltd. 31,000 1,030,530 2.49Taiwan Semiconductor
Manufacturing Co., Ltd. 22,000 456,401 1.101,486,931 3.59
UNITED STATES
Airbnb, Inc. A Shares 5,600 948,498 2.29948,498 2.29
NETHERLANDS
ASML Holding NV REG Shares 900 682,005 1.65682,005 1.65
FRANCE
LVMH, Louis Vuitton Moët Hennessy 821 596,585 1.44
596,585 1.44
VIETNAM
Mobile World Investment Corp. 87,200 489,111 1.18
489,111 1.18
TOTAL EQUITIES 39,799,869 96.15
TOTAL TRANSFERABLE SECURITIES AND MONEY MARKET INSTRUMENTS ADMITTED TO AN OFFICIAL EXCHANGE LISTING 39,799,869 96.15
TOTAL INVESTMENTS 39,799,869 96.15
CASH AND OTHER ASSETS, LESS LIABILITIES 1,594,437 3.85
TOTAL NET ASSETS 41,394,306 100.00
A Shares: Shares traded through the Shanghai-Hong Kong and/or Shenzhen- Hong Kong Stock Connect programs
ADR: American Depositary Receipt
B Shares: Mainland China companies listed on the Shanghai and Shenzhen stock exchanges, available to both Chinese and non-Chinese investors
H Shares: Mainland China companies listed on the Stock Exchange of Hong Kong but incor-porated in mainland China
The accompanying notes form an integral part of these financial statements.

22 MATTHEWS ASIA FUNDS
Asia Innovative Growth Fund 30 September 2021
Schedule of Investments (continued)
Country Allocation % of Net Assets
China/Hong Kong 51.59India 23.23Singapore 6.55South Korea 4.63Taiwan 3.59United States 2.29Netherlands 1.65France 1.44Vietnam 1.18
Total Investments 96.15
Cash and Other Assets, Less Liabilities 3.85
Total 100.00
The following table represents movements in the portfolio holdings:
% of Net Assets as at
30 September 2021
% of Net Assets as at
31 March 2021
TRANSFERABLE SECURITIES AND MONEY MARKET INSTRUMENTS ADMITTED TO AN OFFICIAL EXCHANGE LISTING 96.15 95.03
EQUITIES 96.15 95.03
China/Hong Kong 51.59 57.63India 23.23 14.29Singapore 6.55 5.27South Korea 4.63 5.95Taiwan 3.59 3.80United States 2.29 -Netherlands 1.65 -France 1.44 2.44Vietnam 1.18 -Thailand - 2.18Indonesia - 1.98Australia - 1.49
Total Investments 96.15 95.03
Cash and Other Assets, Less Liabilities 3.85 4.97
Total 100.00 100.00
The accompanying notes form an integral part of these financial statements.

global.matthewsasia.com 23
China Fund 30 September 2021
Schedule of Investments
Transferable securities and money market instruments admitted to an official exchange listing
EQUITIES
Investments Quantity/ Nominal Value
Market Value USD
% of Net Assets
CONSUMER DISCRETIONARY
Internet & Direct Marketing RetailAlibaba Group Holding, Ltd. 574,000 10,488,407 7.36JD.com, Inc. A Shares 261,950 9,537,974 6.69Meituan Dianping B Shares 188,500 5,964,919 4.19Pinduoduo, Inc. ADR 17,900 1,602,979 1.13
27,594,279 19.37
Specialty RetailZhongsheng Group Holdings,
Ltd. 326,000 2,622,158 1.84China Yongda Automobiles
Services Holdings, Ltd. 1,646,000 2,373,942 1.674,996,100 3.51
Household DurablesMidea Group Co., Ltd.
A Shares 202,215 2,172,824 1.522,172,824 1.52
Total Consumer Discretionary 34,763,203 24.40
FINANCIALS
Capital MarketsChina International Capital
Corp., Ltd. H Shares 2,089,600 5,483,901 3.85CITIC Securities Co., Ltd.
H Shares 1,703,000 4,335,460 3.04China Merchants Securities
Co., Ltd. H Shares 1,856,000 2,968,983 2.08Hong Kong Exchanges &
Clearing, Ltd. 45,800 2,819,637 1.98Futu Holdings, Ltd. ADR 12,100 1,090,931 0.77
16,698,912 11.72
BanksChina Merchants Bank Co.,
Ltd. H Shares 763,500 6,076,690 4.26China Construction Bank
Corp. H Shares 3,056,340 2,187,897 1.548,264,587 5.80
InsuranceAIA Group, Ltd. 185,600 2,142,156 1.50Ping An Insurance Group Co.
of China, Ltd. H Shares 151,500 1,034,667 0.733,176,823 2.23
Total Financials 28,140,322 19.75
Investments Quantity/ Nominal Value
Market Value USD
% of Net Assets
COMMUNICATION SERVICES
Interactive Media & ServicesTencent Holdings, Ltd. 234,400 13,898,029 9.75
13,898,029 9.75
EntertainmentKingsoft Corp., Ltd. 458,200 1,825,757 1.28
1,825,757 1.28Total Communication Services 15,723,786 11.03
INFORMATION TECHNOLOGY
Semiconductors & Semiconductor EquipmentGigadevice Semiconductor
Beijing, Inc. A Shares 109,100 2,438,643 1.71LONGi Green Energy
Technology Co., Ltd. A Shares 168,760 2,145,944 1.51
Shenzhen SC New Energy Technology Corp. A Shares 41,400 877,001 0.61
NAURA Technology Group Co., Ltd. A Shares 13,703 772,187 0.54
6,233,775 4.37
Electronic Equipment, Instruments & ComponentsWuxi Lead Intelligent
Equipment Co., Ltd. A Shares 236,800 2,549,802 1.79
Wingtech Technology Co., Ltd. A Shares 147,733 2,132,145 1.50
4,681,947 3.29
SoftwareThunder Software Technology
Co., Ltd. A Shares 101,900 1,967,281 1.38Kingdee International
Software Group Co., Ltd. 217,000 725,036 0.51Sangfor Technologies, Inc.
A Shares 19,300 698,407 0.493,390,724 2.38
Total Information Technology 14,306,446 10.04
The accompanying notes form an integral part of these financial statements.

24 MATTHEWS ASIA FUNDS
China Fund 30 September 2021
Schedule of Investments (continued)
Transferable securities and money market instruments admitted to an official exchange listing
EQUITIES (CONTINUED)
Investments Quantity/ Nominal Value
Market Value USD
% of Net Assets
INDUSTRIALS
Electrical EquipmentSungrow Power Supply Co.,
Ltd. A Shares 146,900 3,369,224 2.37Sunwoda Electronic Co., Ltd.
A Shares 225,000 1,297,383 0.91Gotion High-tech Co., Ltd.
A Shares 89,700 657,554 0.465,324,161 3.74
MachineryEstun Automation Co., Ltd.
A Shares 533,632 1,804,704 1.27Weichai Power Co., Ltd.
A Shares 590,407 1,562,120 1.10Jiangsu Hengli Hydraulic Co.,
Ltd. A Shares 110,600 1,444,799 1.014,811,623 3.38
Building ProductsXinyi Glass Holdings, Ltd. 563,000 1,683,166 1.18
1,683,166 1.18
Air Freight & LogisticsJD Logistics, Inc. 372,800 1,551,092 1.09
1,551,092 1.09
Industrial ConglomeratesChina Baoan Group Co., Ltd.
A Shares 203,600 603,614 0.42603,614 0.42
Total Industrials 13,973,656 9.81
MATERIALS
Metals & MiningAluminum Corp. of China,
Ltd. H Shares 2,440,000 1,842,387 1.29MMG, Ltd. 3,708,000 1,559,855 1.10Zijin Mining Group Co., Ltd.
H Shares 1,068,000 1,313,937 0.92Angang Steel Co., Ltd.
H Shares 1,484,000 914,573 0.645,630,752 3.95
ChemicalsSinoma Science & Technology
Co., Ltd. A Shares 472,810 2,580,566 1.81Shandong Sinocera
Functional Material Co., Ltd. A Shares 276,600 1,755,246 1.23
Wanhua Chemical Group Co., Ltd. A Shares 43,814 721,524 0.51
5,057,336 3.55
Construction MaterialsChina Jushi Co., Ltd. A Shares 499,271 1,352,871 0.95Anhui Conch Cement Co.,
Ltd. A Shares 107,701 678,451 0.482,031,322 1.43
Total Materials 12,719,410 8.93
Investments Quantity/ Nominal Value
Market Value USD
% of Net Assets
HEALTH CARE
Life Sciences Tools & ServicesPharmaron Beijing Co., Ltd.
H Shares 145,200 3,469,915 2.44Wuxi Biologics Cayman, Inc. 98,000 1,592,545 1.12Hangzhou Tigermed
Consulting Co., Ltd. A Shares 55,400 1,487,903 1.04
6,550,363 4.60
BiotechnologyShenzhen New Industries
Biomedical Engineering Co., Ltd. A Shares 196,388 1,482,387 1.04
Innovent Biologics, Inc. 127,000 1,231,102 0.862,713,489 1.90
Health Care Providers & ServicesTopchoice Medical Corp.
A Shares 16,232 757,220 0.53Dian Diagnostics Group Co.,
Ltd. A Shares 148,611 678,375 0.481,435,595 1.01
Health Care Equipment & SuppliesShenzhen Mindray Bio-
Medical Electronics Co., Ltd. A Shares 12,200 725,188 0.51
725,188 0.51Total Health Care 11,424,635 8.02
REAL ESTATE
Real Estate Management & DevelopmentCIFI Holdings Group Co., Ltd. 4,460,000 3,033,080 2.13Times China Holdings, Ltd. 2,781,000 2,307,989 1.62KE Holdings, Inc. ADR 70,600 1,255,619 0.88KWG Living Group Holdings,
Ltd. 1,131,000 836,447 0.597,433,135 5.22
Total Real Estate 7,433,135 5.22
UTILITIES
Gas UtilitiesENN Energy Holdings, Ltd. 92,400 1,522,703 1.07
1,522,703 1.07Total Utilities 1,522,703 1.07
CONSUMER STAPLES
BeveragesWuliangye Yibin Co., Ltd.
A Shares 32,894 1,113,544 0.781,113,544 0.78
Total Consumer Staples 1,113,544 0.78
The accompanying notes form an integral part of these financial statements.

global.matthewsasia.com 25
Transferable securities and money market instruments admitted to an official exchange listing
EQUITIES (CONTINUED)
Investments Quantity/ Nominal Value
Market Value USD
% of Net Assets
TOTAL EQUITIES 141,120,840 99.05
TOTAL TRANSFERABLE SECURITIES AND MONEY MARKET INSTRUMENTS ADMITTED TO AN OFFICIAL EXCHANGE LISTING 141,120,840 99.05
TOTAL INVESTMENTS 141,120,840 99.05
CASH AND OTHER ASSETS, LESS LIABILITIES 1,357,280 0.95
TOTAL NET ASSETS 142,478,120 100.00
A Shares: Shares traded through the Shanghai-Hong Kong and/or Shenzhen- Hong Kong Stock Connect programs
ADR: American Depositary Receipt
B Shares: Mainland China companies listed on the Shanghai and Shenzhen stock exchanges, available to both Chinese and non-Chinese investors
H Shares: Mainland China companies listed on the Stock Exchange of Hong Kong but incor-porated in mainland China
Country Allocation % of Net Assets
Consumer Discretionary 24.40Financials 19.75Communication Services 11.03Information Technology 10.04Industrials 9.81Materials 8.93Health Care 8.02Real Estate 5.22Utilities 1.07Consumer Staples 0.78
Total Investments 99.05
Cash and Other Assets, Less Liabilities 0.95
Total 100.00
The following table represents movements in the portfolio holdings:
% of Net Assets as at
30 September 2021
% of Net Assets as at
31 March 2021
TRANSFERABLE SECURITIES AND MONEY MARKET INSTRUMENTS ADMITTED TO AN OFFICIAL EXCHANGE LISTING 99.05 98.53
EQUITIES 99.05 98.53
Financials 19.75 26.4Consumer Discretionary 24.40 22.74Communication Services 11.03 12.62Information Technology 10.04 10.24Materials 8.93 6.94Health Care 8.02 6.94Industrials 9.81 6.53Real Estate 5.22 4.16Utilities 1.07 0.96Consumer Staples 0.78 1
Total Investments 99.05 98.53
Cash and Other Assets, Less Liabilities 0.95 1.47
Total 100 100
China Fund 30 September 2021
Schedule of Investments (continued)
The accompanying notes form an integral part of these financial statements.

26 MATTHEWS ASIA FUNDS
India Fund 30 September 2021
Schedule of Investments
Transferable securities and money market instruments admitted to an official exchange listing
EQUITIES
Investments Quantity/ Nominal Value
Market Value USD
% of Net Assets
FINANCIALS
BanksHDFC Bank, Ltd. 105,445 2,265,730 7.09ICICI Bank, Ltd. 165,329 1,561,023 4.89Kotak Mahindra Bank, Ltd. 42,034 1,135,687 3.55Axis Bank, Ltd. 82,613 853,147 2.67Bandhan Bank, Ltd. 211,073 804,738 2.52IndusInd Bank, Ltd. 20,745 310,752 0.97
6,931,077 21.69
Consumer FinanceBajaj Finance, Ltd. 14,132 1,459,912 4.57Shriram City Union Finance,
Ltd. 29,722 814,149 2.55SBI Cards & Payment Services,
Ltd. 20,816 288,736 0.902,562,797 8.02
Thrifts & Mortgage FinanceHousing Development
Finance Corp., Ltd. 28,006 1,039,196 3.251,039,196 3.25
Total Financials 10,533,070 32.96
INFORMATION TECHNOLOGY
IT ServicesInfosys, Ltd. 79,437 1,792,770 5.61Tata Consultancy Services,
Ltd. 21,391 1,088,044 3.40HCL Technologies, Ltd. 43,745 754,086 2.36Persistent Systems, Ltd. 11,571 579,318 1.81Larsen & Toubro Infotech,
Ltd. 5,945 461,740 1.45Tech Mahindra, Ltd. 23,762 441,963 1.38Mindtree, Ltd. 5,674 321,059 1.01
5,438,980 17.02
SoftwareBirlasoft, Ltd. 77,189 425,994 1.33
425,994 1.33Total Information Technology 5,864,974 18.35
Investments Quantity/ Nominal Value
Market Value USD
% of Net Assets
CONSUMER DISCRETIONARY
Specialty RetailShankara Building Products,
Ltd. 60,843 485,007 1.52Thanga Mayil Jewellery, Ltd. 29,970 448,919 1.40
933,926 2.92
Household DurablesCrompton Greaves Consumer
Electricals, Ltd. 80,961 522,343 1.63522,343 1.63
AutomobilesMaruti Suzuki India, Ltd. 5,227 516,736 1.62
516,736 1.62
Auto ComponentsBosch, Ltd. 1,910 398,185 1.25
398,185 1.25
Multiline RetailTrent, Ltd. 24,546 339,234 1.06
339,234 1.06
Textiles, Apparel & Luxury GoodsVaibhav Global, Ltd. 33,883 319,304 1.00
319,304 1.00Total Consumer Discretionary 3,029,728 9.48
CONSUMER STAPLES
Food & Staples RetailingAvenue Supermarts, Ltd. 16,625 951,932 2.98
951,932 2.98
Food ProductsZydus Wellness, Ltd. 20,207 644,261 2.01
644,261 2.01
Personal ProductsDabur India, Ltd. 71,370 593,296 1.86
593,296 1.86
Household ProductsHindustan Unilever, Ltd. 13,076 475,952 1.49
475,952 1.49Total Consumer Staples 2,665,441 8.34
ENERGY
Oil, Gas & Consumable FuelsReliance Industries, Ltd. 64,253 2,180,720 6.83Reliance Industries, Ltd.
(Partly Paid Shares) 4,854 122,361 0.382,303,081 7.21
Total Energy 2,303,081 7.21
The accompanying notes form an integral part of these financial statements.

global.matthewsasia.com 27
India Fund 30 September 2021
Schedule of Investments (continued)
EQUITIES (CONTINUED)
Investments Quantity/ Nominal Value
Market Value USD
% of Net Assets
INDUSTRIALS
MachineryAshok Leyland, Ltd. 269,914 486,538 1.52Cummins India, Ltd. 23,334 311,827 0.98Schaeffler India, Ltd. 2,918 297,138 0.93Shaily Engineering Plastics,
Ltd. 9,630 255,490 0.801,350,993 4.23
Professional ServicesQuess Corp., Ltd. 33,528 413,841 1.29
413,841 1.29
Transportation InfrastructureGujarat Pipavav Port, Ltd. 156,612 233,354 0.73
233,354 0.73
Trading Companies & DistributorsIndiaMart InterMesh, Ltd. 1,918 216,506 0.68
216,506 0.68Total Industrials 2,214,694 6.93
HEALTH CARE
PharmaceuticalsLaurus Labs, Ltd. 68,612 569,814 1.78Amrutanjan Health Care, Ltd. 39,301 442,211 1.39Neuland Laboratories, Ltd. 18,327 384,119 1.20
1,396,144 4.37
Health Care Providers & ServicesMetropolis Healthcare, Ltd. 9,067 329,907 1.03
329,907 1.03
Life Sciences Tools & ServicesDivi’s Laboratories, Ltd. 4,316 279,023 0.87
279,023 0.87
Health Care Equipment & SuppliesPoly Medicure, Ltd. 12,761 159,393 0.50
159,393 0.50Total Health Care 2,164,467 6.77
COMMUNICATION SERVICES
Interactive Media & ServicesInfo Edge India, Ltd. 12,346 1,069,712 3.35Matrimony.com, Ltd. 26,780 350,501 1.10
1,420,213 4.45Total Communication Services 1,420,213 4.45
Investments Quantity/ Nominal Value
Market Value USD
% of Net Assets
MATERIALS
ChemicalsPidilite Industries, Ltd. 11,802 378,725 1.18Carborundum Universal, Ltd. 26,938 322,102 1.01
700,827 2.19
Construction MaterialsThe Ramco Cements, Ltd. 25,104 333,012 1.04Ambuja Cements, Ltd. 44,855 241,837 0.76
574,849 1.80Total Materials 1,275,676 3.99
TOTAL EQUITIES 31,471,344 98.48
BONDS
CONSUMER STAPLES
Food ProductsBritannia Industries, Ltd.,
5.500%, 06/03/2024 88,392 1,198 0.001,198 0.00
Total Consumer Staples 1,198 0.00
TOTAL BONDS 1,198 0.00
TOTAL TRANSFERABLE SECURITIES AND MONEY MARKET INSTRUMENTS ADMITTED TO AN OFFICIAL EXCHANGE LISTING 31,472,542 98.48
TOTAL INVESTMENTS 31,472,542 98.48
CASH AND OTHER ASSETS, LESS LIABILITIES 485,305 1.52
TOTAL NET ASSETS 31,957,847 100.00
The accompanying notes form an integral part of these financial statements.
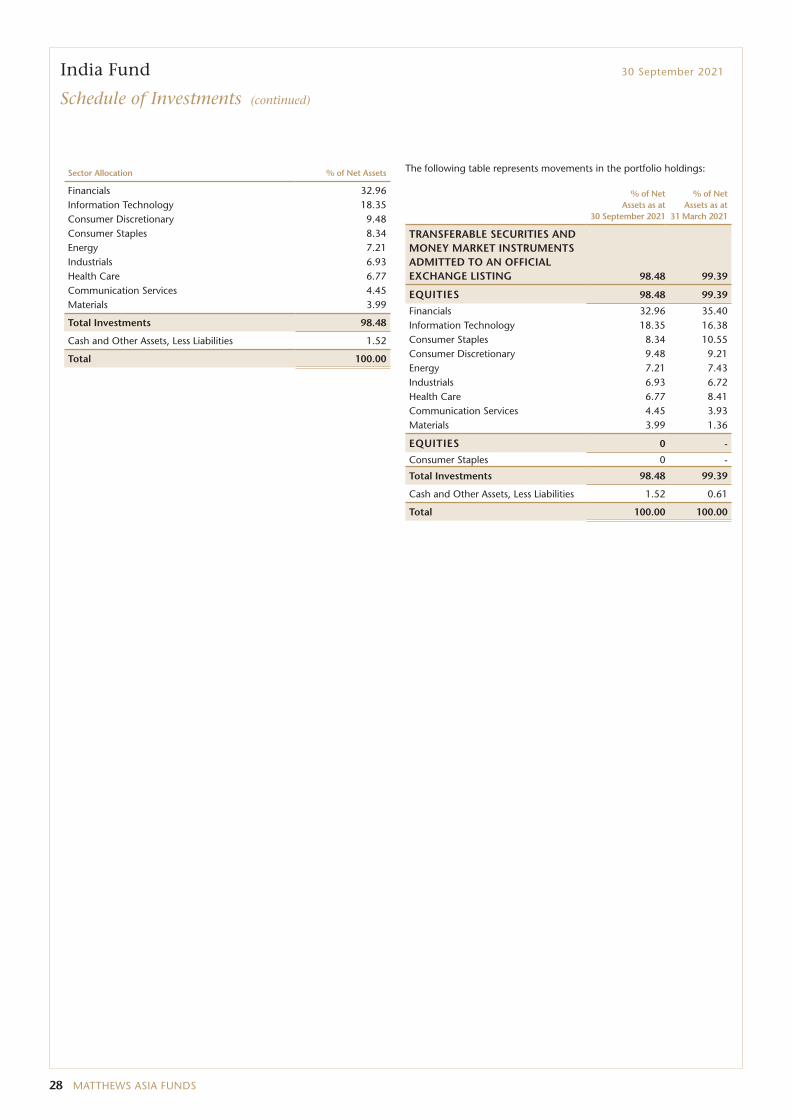
28 MATTHEWS ASIA FUNDS
Sector Allocation % of Net Assets
Financials 32.96Information Technology 18.35Consumer Discretionary 9.48Consumer Staples 8.34Energy 7.21Industrials 6.93Health Care 6.77Communication Services 4.45Materials 3.99
Total Investments 98.48
Cash and Other Assets, Less Liabilities 1.52
Total 100.00
The following table represents movements in the portfolio holdings:
% of Net Assets as at
30 September 2021
% of Net Assets as at
31 March 2021
TRANSFERABLE SECURITIES AND MONEY MARKET INSTRUMENTS ADMITTED TO AN OFFICIAL EXCHANGE LISTING 98.48 99.39
EQUITIES 98.48 99.39
Financials 32.96 35.40Information Technology 18.35 16.38Consumer Staples 8.34 10.55Consumer Discretionary 9.48 9.21Energy 7.21 7.43Industrials 6.93 6.72Health Care 6.77 8.41Communication Services 4.45 3.93Materials 3.99 1.36
EQUITIES 0 -
Consumer Staples 0 -
Total Investments 98.48 99.39
Cash and Other Assets, Less Liabilities 1.52 0.61
Total 100.00 100.00
India Fund 30 September 2021
Schedule of Investments (continued)

global.matthewsasia.com 29
Japan Fund 30 September 2021
Schedule of Investments
Transferable securities and money market instruments admitted to an official exchange listing
EQUITIES
Investments Quantity/ Nominal Value
Market Value USD
% of Net Assets
INDUSTRIALS
Professional ServicesRecruit Holdings Co., Ltd. 143,700 8,778,531 3.98SMS Co., Ltd. 144,700 5,271,882 2.39Persol Holdings Co., Ltd. 49,400 1,239,731 0.56
15,290,144 6.93
Building ProductsAGC, Inc. 96,900 5,004,456 2.27Daikin Industries, Ltd. 17,200 3,761,502 1.70
8,765,958 3.97
MachinerySMC Corp. 7,300 4,571,705 2.07The Japan Steel Works, Ltd. 120,500 3,141,715 1.42
7,713,420 3.49
Electrical EquipmentUshio, Inc. 178,000 3,344,315 1.52Nidec Corp. 20,700 2,294,956 1.04
5,639,271 2.56
Air Freight & LogisticsYamato Holdings Co., Ltd. 148,500 3,757,026 1.70
3,757,026 1.70Total Industrials 41,165,819 18.65
INFORMATION TECHNOLOGY
Electronic Equipment, Instruments & ComponentsKeyence Corp. 9,500 5,684,375 2.57Ibiden Co., Ltd. 96,100 5,312,345 2.41TDK Corp. 43,800 1,581,752 0.72
12,578,472 5.70
SoftwareSansan, Inc.. 32,700 3,143,192 1.42Safie, Inc. 80,000 2,603,688 1.18Appier Group, Inc. 186,700 2,395,174 1.08Simplex Holdings, Inc. 98,800 1,778,479 0.81Freee KK 21,100 1,535,727 0.70OBIC Business Consultants
Co., Ltd. 21,600 1,097,616 0.5012,553,876 5.69
Semiconductors & Semiconductor EquipmentRenesas Electronics Corp. 296,700 3,696,629 1.67Advantest Corp. 31,400 2,809,987 1.27Mitsui High-Tec, Inc. 30,200 2,066,528 0.94
8,573,144 3.88
IT ServicesObic Co., Ltd. 26,100 4,968,726 2.25GMO Payment Gateway, Inc. 18,300 2,312,950 1.05
7,281,676 3.30Total Information Technology 40,987,168 18.57
Investments Quantity/ Nominal Value
Market Value USD
% of Net Assets
CONSUMER DISCRETIONARY
Household DurablesSony Corp. 100,000 11,113,069 5.03
11,113,069 5.03
AutomobilesToyota Motor Corp. 433,500 7,752,356 3.51
7,752,356 3.51
Auto ComponentsToyota Industries Corp. 73,300 6,031,498 2.73
6,031,498 2.73
Specialty RetailNitori Holdings Co., Ltd. 16,800 3,313,706 1.50Hikari Tsushin, Inc. 13,800 2,327,659 1.06
5,641,365 2.56
Leisure ProductsBandai Namco Holdings, Inc. 31,700 2,376,541 1.08Roland Corp. 44,400 2,037,615 0.92
4,414,156 2.00
Multiline RetailPan Pacific International
Holdings Corp. 124,300 2,571,104 1.172,571,104 1.17
Total Consumer Discretionary 37,523,548 17.00
HEALTH CARE
Health Care Equipment & SuppliesHoya Corp. 39,200 6,108,315 2.77Olympus Corp. 263,000 5,765,767 2.61Terumo Corp. 105,500 4,979,589 2.26Sysmex Corp. 19,800 2,462,752 1.11
19,316,423 8.75
PharmaceuticalsDaiichi Sankyo Co., Ltd. 166,600 4,435,595 2.01Eisai Co., Ltd. 26,200 1,966,183 0.89
6,401,778 2.90
Health Care TechnologyJMDC, Inc. 66,600 4,575,323 2.07
4,575,323 2.07
BiotechnologyPeptiDream, Inc. 52,800 1,717,055 0.78
1,717,055 0.78Total Health Care 32,010,579 14.50
The accompanying notes form an integral part of these financial statements.

30 MATTHEWS ASIA FUNDS
Japan Fund 30 September 2021
Schedule of Investments (continued)
EQUITIES (CONTINUED)
Investments Quantity/ Nominal Value
Market Value USD
% of Net Assets
COMMUNICATION SERVICES
EntertainmentCapcom Co., Ltd. 139,900 3,875,928 1.76Nintendo Co., Ltd. 7,900 3,829,368 1.73
7,705,296 3.49
MediaKadokawa Corp. 73,600 4,083,141 1.85Direct Marketing MiX, Inc. 66,500 2,574,740 1.16
6,657,881 3.01
Wireless Telecommunication ServicesSoftBank Group Corp. 99,400 5,757,532 2.61
5,757,532 2.61
Interactive Media & ServicesKakaku.com, Inc. 74,400 2,406,845 1.09
2,406,845 1.09Total Communication Services 22,527,554 10.20
MATERIALS
ChemicalsShin-Etsu Chemical Co., Ltd. 51,000 8,613,201 3.90JSR Corp. 159,600 5,779,575 2.62Sumitomo Bakelite Co., Ltd. 75,400 3,496,829 1.58Nissan Chemical Corp. 39,200 2,291,169 1.04
20,180,774 9.14Total Materials 20,180,774 9.14
FINANCIALS
Diversified Financial ServicesORIX Corp. 317,100 5,980,860 2.71eGuarantee, Inc. 162,800 3,611,307 1.64Tokyo Century Corp. 18,700 1,059,009 0.48
10,651,176 4.83
InsuranceDai-ichi Life Holdings, Inc. 220,800 4,885,955 2.21
4,885,955 2.21Total Financials 15,537,131 7.04
Investments Quantity/ Nominal Value
Market Value USD
% of Net Assets
CONSUMER STAPLES
Food ProductsMorinaga Milk Industry Co.,
Ltd. 51,600 3,221,280 1.463,221,280 1.46
BeveragesSuntory Beverage & Food,
Ltd. 51,500 2,137,160 0.972,137,160 0.97
Total Consumer Staples 5,358,440 2.43
TOTAL EQUITIES 215,291,013 97.53
TOTAL TRANSFERABLE SECURITIES AND MONEY MARKET INSTRUMENTS ADMITTED TO AN OFFICIAL EXCHANGE LISTING 215,291,013 97.53
TOTAL INVESTMENTS 215,291,013 97.53
CASH AND OTHER ASSETS, LESS LIABILITIES 5,462,589 2.47
TOTAL NET ASSETS 220,753,602 100.00
The accompanying notes form an integral part of these financial statements.

global.matthewsasia.com 31
Sector Allocation % of Net Assets
Industrials 18.65Information Technology 18.57Consumer Discretionary 17.00Health Care 14.50Communication Services 10.20Materials 9.14Financials 7.04Consumer Staples 2.43
Total Investments 97.53
Cash and Other Assets, Less Liabilities 2.47
Total 100.00
The following table represents movements in the portfolio holdings:
% of Net Assets as at
30 September 2021
% of Net Assets as at
31 March 2021
"TRANSFERABLE SECURITIES AND MONEY MARKET INSTRUMENTS ADMITTED TO AN OFFICIAL EXCHANGE LISTING" 97.53 90.27
EQUITIES 97.53 90.27
Industrials 18.65 15.82Information Technology 18.57 19.12Consumer Discretionary 17.00 17.34Health Care 14.50 11.20Communication Services 10.20 8.54Materials 9.14 7.35Financials 7.04 9.92Consumer Staples 2.43 0.98
Total Investments 97.53 90.27
Cash and Other Assets, Less Liabilities 2.47 9.73
Total 100.00 100.00
Japan Fund 30 September 2021
Schedule of Investments (continued)
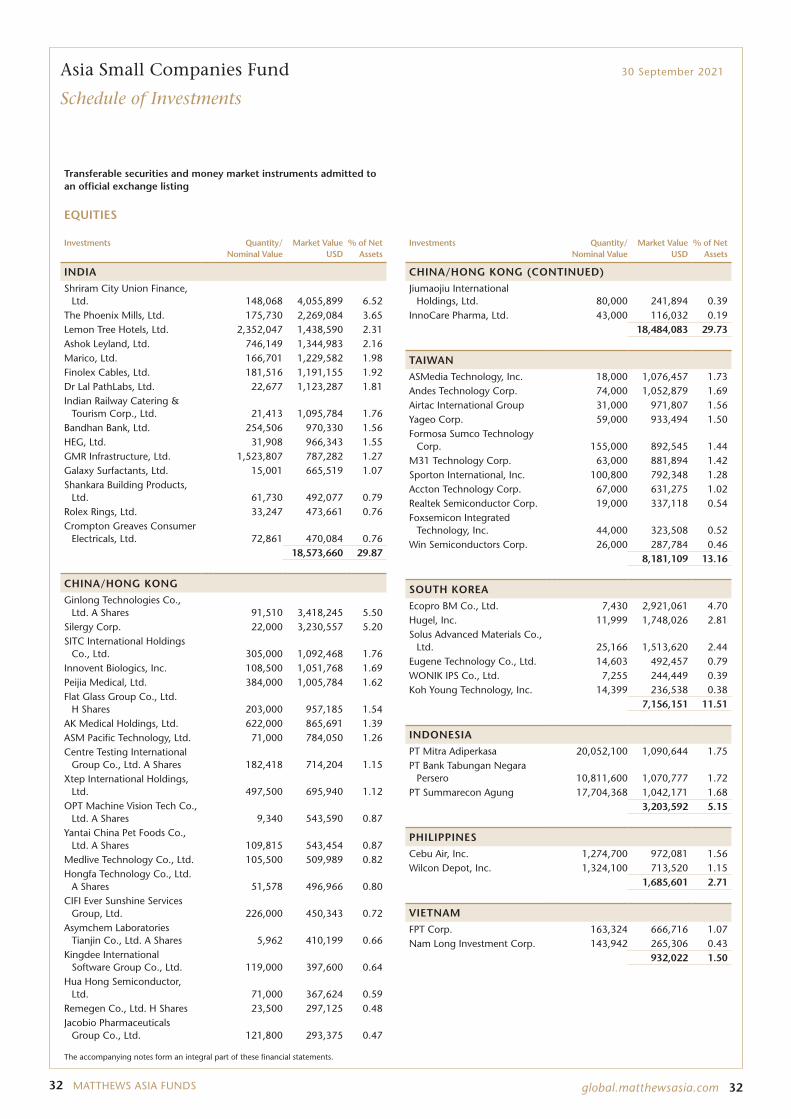
32 MATTHEWS ASIA FUNDS global.matthewsasia.com 32
Transferable securities and money market instruments admitted to an official exchange listing
EQUITIES
Investments Quantity/ Nominal Value
Market Value USD
% of Net Assets
INDIA
Shriram City Union Finance, Ltd. 148,068 4,055,899 6.52
The Phoenix Mills, Ltd. 175,730 2,269,084 3.65Lemon Tree Hotels, Ltd. 2,352,047 1,438,590 2.31Ashok Leyland, Ltd. 746,149 1,344,983 2.16Marico, Ltd. 166,701 1,229,582 1.98Finolex Cables, Ltd. 181,516 1,191,155 1.92Dr Lal PathLabs, Ltd. 22,677 1,123,287 1.81Indian Railway Catering &
Tourism Corp., Ltd. 21,413 1,095,784 1.76Bandhan Bank, Ltd. 254,506 970,330 1.56HEG, Ltd. 31,908 966,343 1.55GMR Infrastructure, Ltd. 1,523,807 787,282 1.27Galaxy Surfactants, Ltd. 15,001 665,519 1.07Shankara Building Products,
Ltd. 61,730 492,077 0.79Rolex Rings, Ltd. 33,247 473,661 0.76Crompton Greaves Consumer
Electricals, Ltd. 72,861 470,084 0.7618,573,660 29.87
CHINA/HONG KONG
Ginlong Technologies Co., Ltd. A Shares 91,510 3,418,245 5.50
Silergy Corp. 22,000 3,230,557 5.20SITC International Holdings
Co., Ltd. 305,000 1,092,468 1.76Innovent Biologics, Inc. 108,500 1,051,768 1.69Peijia Medical, Ltd. 384,000 1,005,784 1.62Flat Glass Group Co., Ltd.
H Shares 203,000 957,185 1.54AK Medical Holdings, Ltd. 622,000 865,691 1.39ASM Pacific Technology, Ltd. 71,000 784,050 1.26Centre Testing International
Group Co., Ltd. A Shares 182,418 714,204 1.15Xtep International Holdings,
Ltd. 497,500 695,940 1.12OPT Machine Vision Tech Co.,
Ltd. A Shares 9,340 543,590 0.87Yantai China Pet Foods Co.,
Ltd. A Shares 109,815 543,454 0.87Medlive Technology Co., Ltd. 105,500 509,989 0.82Hongfa Technology Co., Ltd.
A Shares 51,578 496,966 0.80CIFI Ever Sunshine Services
Group, Ltd. 226,000 450,343 0.72Asymchem Laboratories
Tianjin Co., Ltd. A Shares 5,962 410,199 0.66Kingdee International
Software Group Co., Ltd. 119,000 397,600 0.64Hua Hong Semiconductor,
Ltd. 71,000 367,624 0.59Remegen Co., Ltd. H Shares 23,500 297,125 0.48Jacobio Pharmaceuticals
Group Co., Ltd. 121,800 293,375 0.47
Investments Quantity/ Nominal Value
Market Value USD
% of Net Assets
CHINA/HONG KONG (CONTINUED)
Jiumaojiu International Holdings, Ltd. 80,000 241,894 0.39
InnoCare Pharma, Ltd. 43,000 116,032 0.1918,484,083 29.73
TAIWAN
ASMedia Technology, Inc. 18,000 1,076,457 1.73Andes Technology Corp. 74,000 1,052,879 1.69Airtac International Group 31,000 971,807 1.56Yageo Corp. 59,000 933,494 1.50Formosa Sumco Technology
Corp. 155,000 892,545 1.44M31 Technology Corp. 63,000 881,894 1.42Sporton International, Inc. 100,800 792,348 1.28Accton Technology Corp. 67,000 631,275 1.02Realtek Semiconductor Corp. 19,000 337,118 0.54Foxsemicon Integrated
Technology, Inc. 44,000 323,508 0.52Win Semiconductors Corp. 26,000 287,784 0.46
8,181,109 13.16
SOUTH KOREA
Ecopro BM Co., Ltd. 7,430 2,921,061 4.70Hugel, Inc. 11,999 1,748,026 2.81Solus Advanced Materials Co.,
Ltd. 25,166 1,513,620 2.44Eugene Technology Co., Ltd. 14,603 492,457 0.79WONIK IPS Co., Ltd. 7,255 244,449 0.39Koh Young Technology, Inc. 14,399 236,538 0.38
7,156,151 11.51
INDONESIA
PT Mitra Adiperkasa 20,052,100 1,090,644 1.75PT Bank Tabungan Negara
Persero 10,811,600 1,070,777 1.72PT Summarecon Agung 17,704,368 1,042,171 1.68
3,203,592 5.15
PHILIPPINES
Cebu Air, Inc. 1,274,700 972,081 1.56Wilcon Depot, Inc. 1,324,100 713,520 1.15
1,685,601 2.71
VIETNAM
FPT Corp. 163,324 666,716 1.07Nam Long Investment Corp. 143,942 265,306 0.43
932,022 1.50
Asia Small Companies Fund 30 September 2021
Schedule of Investments
The accompanying notes form an integral part of these financial statements.

global.matthewsasia.com 33
Asia Small Companies Fund 30 September 2021
Schedule of Investments (continued)
The accompanying notes form an integral part of these financial statements.
EQUITIES (CONTINUED)
Investments Quantity/ Nominal Value
Market Value USD
% of Net Assets
UNITED STATES
Legend Biotech Corp. ADR 16,970 803,228 1.29803,228 1.29
MALAYSIA
MR DIY Group M BHD 335,500 312,300 0.50CTOS Digital BHD 347,200 167,525 0.27
479,825 0.77
THAILAND
Kasikornbank Public Co., Ltd. F Shares 121,100 477,627 0.77
477,627 0.77
SINGAPORE
Aztech Global, Ltd. 341,400 260,543 0.42260,543 0.42
TOTAL EQUITIES 60,237,441 96.88
TOTAL TRANSFERABLE SECURITIES AND MONEY MARKET INSTRUMENTS ADMITTED TO AN OFFICIAL EXCHANGE LISTING 60,237,441 96.88
TOTAL INVESTMENTS 60,237,441 96.88
CASH AND OTHER ASSETS, LESS LIABILITIES 1,939,597 3.12
TOTAL NET ASSETS 62,177,038 100.00
A Shares: Shares traded through the Shanghai-Hong Kong and/or Shenzhen- Hong Kong Stock Connect programs
ADR: American Depositary Receipt
BHD: Berhad
F Shares: Foreign Shares
H Shares: Mainland China companies listed on the Stock Exchange of Hong Kong but incorporated in mainland China
Country Allocation % of Net Assets
India 29.87China/Hong Kong 29.73Taiwan 13.16South Korea 11.51Indonesia 5.15Philippines 2.71Vietnam 1.50United States 1.29Malaysia 0.77Thailand 0.77Singapore 0.42
Total Investments 96.88
Cash and Other Assets, Less Liabilities 3.12
Total 100.00
The following table represents movements in the portfolio holdings:
% of Net Assets as at
30 September 2021
% of Net Assets as at
31 March 2021
TRANSFERABLE SECURITIES AND MONEY MARKET INSTRUMENTS ADMITTED TO AN OFFICIAL EXCHANGE LISTING 96.88 93.83
EQUITIES 96.88 93.83
India 29.87 22.84China/Hong Kong 29.73 32.40Taiwan 13.16 16.56South Korea 11.51 9.31Indonesia 5.15 4.26Philippines 2.71 2.28Vietnam 1.50 1.45United States 1.29 1.11Malaysia 0.77 0.82Thailand 0.77 1.26Singapore 0.42 1.54
Total Investments 96.88 93.83
Cash and Other Assets, Less Liabilities 3.12 6.17
Total 100.00 100.00

34 MATTHEWS ASIA FUNDS
China Small Companies Fund 30 September 2021
Schedule of Investments
Transferable securities and money market instruments admitted to an official exchange listing
EQUITIES
Investments Quantity/ Nominal Value
Market Value USD
% of Net Assets
INFORMATION TECHNOLOGY
Semiconductors & Semiconductor EquipmentAlchip Technologies, Ltd. 818,000 27,192,683 4.20ACM Research, Inc. Class A 173,800 18,242,070 2.82Pan Jit International, Inc. 4,902,000 15,652,563 2.42Silergy Corp. 85,000 12,481,697 1.93Flat Glass Group Co., Ltd.
H Shares 1,918,000 9,043,744 1.40Amazing Microelectronic
Corp. 1,140,000 8,146,606 1.26StarPower Semiconductor,
Ltd. A Shares 129,278 8,136,668 1.2698,896,031 15.29
IT ServicesChinasoft International, Ltd. 7,110,000 12,554,048 1.94
12,554,048 1.94
SoftwareWeimob, Inc. 3,873,000 5,606,669 0.87Longshine Technology Group
Co., Ltd. A Shares 826,133 3,292,667 0.51Kingdee International
Software Group Co., Ltd. 728,000 2,432,378 0.3711,331,714 1.75
Communications EquipmentAccton Technology Corp. 1,126,000 10,609,182 1.64
10,609,182 1.64
Electronic Equipment, Instruments & ComponentsKingboard Holdings, Ltd. 1,629,000 7,365,476 1.14
7,365,476 1.14Total Information Technology 140,756,451 21.76
Investments Quantity/ Nominal Value
Market Value USD
% of Net Assets
INDUSTRIALS
MachineryAirtac International Group 394,000 12,351,357 1.91Estun Automation Co., Ltd.
A Shares 2,254,828 7,625,664 1.18Hefei Meiya Optoelectronic
Technology, Inc. A Shares 928,758 5,452,970 0.84Shenzhen Colibri
Technologies Co., Ltd. A Shares 1,601,769 5,360,316 0.83
Leader Harmonious Drive Systems Co., Ltd. A Shares 246,189 5,133,212 0.79
35,923,519 5.55
Transportation InfrastructureHainan Meilan International
Airport Co., Ltd. H Shares 3,231,000 13,501,393 2.08Yuexiu Transport
Infrastructure, Ltd. 15,654,000 10,411,145 1.6123,912,538 3.69
Electrical EquipmentZhejiang HangKe Technology,
Inc. Co. A Shares 801,157 10,228,789 1.58Ginlong Technologies Co.,
Ltd. A Shares 194,033 7,247,868 1.12Hongfa Technology Co., Ltd.
A Shares 590,220 5,686,901 0.8823,163,558 3.58
Professional ServicesChina Building Material Test
& Certification Group Co., Ltd. A Shares 3,495,924 10,471,431 1.62
10,471,431 1.62
MarineSITC International Holdings
Co., Ltd. 2,343,000 8,392,302 1.308,392,302 1.30
Total Industrials 101,863,348 15.74
The accompanying notes form an integral part of these financial statements.
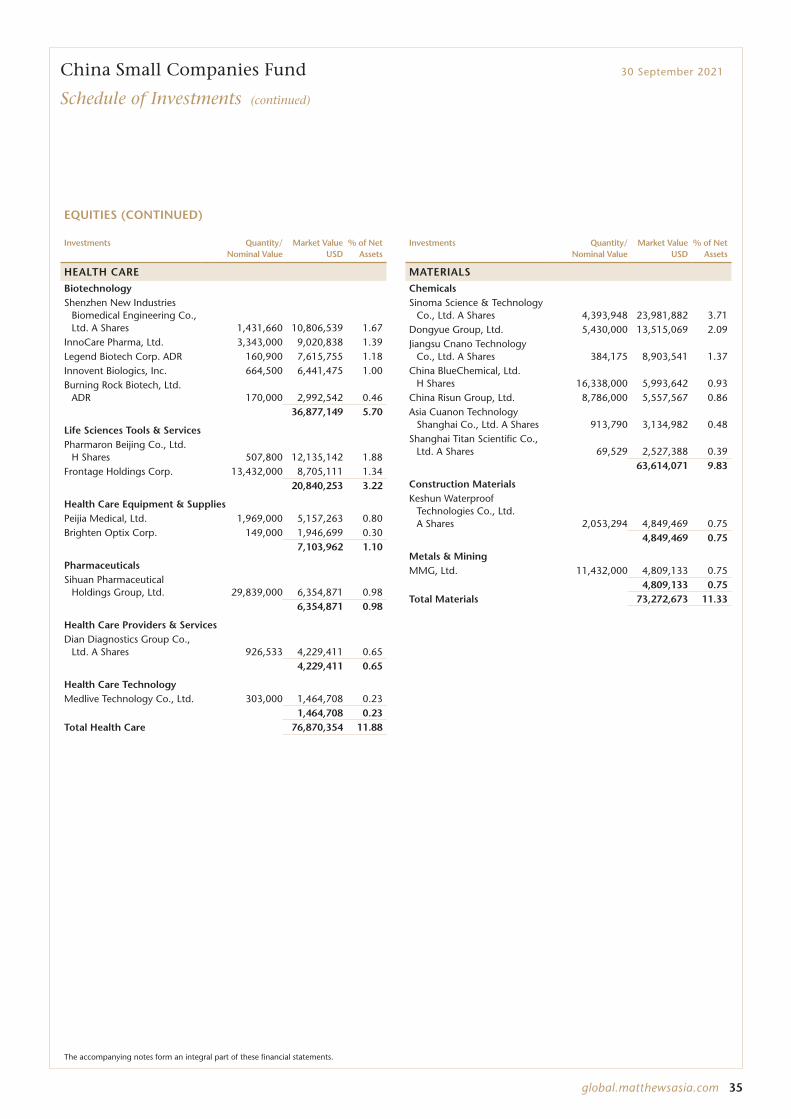
global.matthewsasia.com 35
China Small Companies Fund 30 September 2021
Schedule of Investments (continued)
EQUITIES (CONTINUED)
Investments Quantity/ Nominal Value
Market Value USD
% of Net Assets
HEALTH CARE
BiotechnologyShenzhen New Industries
Biomedical Engineering Co., Ltd. A Shares 1,431,660 10,806,539 1.67
InnoCare Pharma, Ltd. 3,343,000 9,020,838 1.39Legend Biotech Corp. ADR 160,900 7,615,755 1.18Innovent Biologics, Inc. 664,500 6,441,475 1.00Burning Rock Biotech, Ltd.
ADR 170,000 2,992,542 0.4636,877,149 5.70
Life Sciences Tools & ServicesPharmaron Beijing Co., Ltd.
H Shares 507,800 12,135,142 1.88Frontage Holdings Corp. 13,432,000 8,705,111 1.34
20,840,253 3.22
Health Care Equipment & SuppliesPeijia Medical, Ltd. 1,969,000 5,157,263 0.80Brighten Optix Corp. 149,000 1,946,699 0.30
7,103,962 1.10
PharmaceuticalsSihuan Pharmaceutical
Holdings Group, Ltd. 29,839,000 6,354,871 0.986,354,871 0.98
Health Care Providers & ServicesDian Diagnostics Group Co.,
Ltd. A Shares 926,533 4,229,411 0.654,229,411 0.65
Health Care TechnologyMedlive Technology Co., Ltd. 303,000 1,464,708 0.23
1,464,708 0.23Total Health Care 76,870,354 11.88
Investments Quantity/ Nominal Value
Market Value USD
% of Net Assets
MATERIALS
ChemicalsSinoma Science & Technology
Co., Ltd. A Shares 4,393,948 23,981,882 3.71Dongyue Group, Ltd. 5,430,000 13,515,069 2.09Jiangsu Cnano Technology
Co., Ltd. A Shares 384,175 8,903,541 1.37China BlueChemical, Ltd.
H Shares 16,338,000 5,993,642 0.93China Risun Group, Ltd. 8,786,000 5,557,567 0.86Asia Cuanon Technology
Shanghai Co., Ltd. A Shares 913,790 3,134,982 0.48Shanghai Titan Scientific Co.,
Ltd. A Shares 69,529 2,527,388 0.3963,614,071 9.83
Construction MaterialsKeshun Waterproof
Technologies Co., Ltd. A Shares 2,053,294 4,849,469 0.75
4,849,469 0.75
Metals & MiningMMG, Ltd. 11,432,000 4,809,133 0.75
4,809,133 0.75Total Materials 73,272,673 11.33
The accompanying notes form an integral part of these financial statements.

36 MATTHEWS ASIA FUNDS
China Small Companies Fund 30 September 2021
Schedule of Investments (continued)
EQUITIES (CONTINUED)
Investments Quantity/ Nominal Value
Market Value USD
% of Net Assets
CONSUMER DISCRETIONARY
Specialty RetailChina Yongda Automobiles
Services Holdings, Ltd. 13,464,000 19,418,445 3.00China Meidong Auto
Holdings, Ltd. 2,172,000 10,913,208 1.6930,331,653 4.69
Diversified Consumer ServicesChina Yuhua Education Corp.,
Ltd. 21,114,000 10,247,212 1.5810,247,212 1.58
Textiles, Apparel & Luxury GoodsXtep International Holdings,
Ltd. 5,901,000 8,254,759 1.288,254,759 1.28
Hotels, Restaurants & LeisureBTG Hotels Group Co., Ltd.
A Shares 1,687,010 5,675,981 0.88Jiumaojiu International
Holdings, Ltd. 595,000 1,799,083 0.287,475,064 1.16
Auto ComponentsZhejiang Shuanghuan
Driveline Co., Ltd. A Shares 1,908,304 6,925,736 1.076,925,736 1.07
Household DurablesQ Technology Group Co., Ltd. 3,809,000 5,487,665 0.85
5,487,665 0.85
AutomobilesNiu Technologies ADR 81,302 1,898,292 0.29
1,898,292 0.29
Internet & Direct Marketing RetailMaoyan Entertainment 1,445,800 1,753,659 0.27
1,753,659 0.27Total Consumer Discretionary 72,374,040 11.19
Investments Quantity/ Nominal Value
Market Value USD
% of Net Assets
FINANCIALS
Capital MarketsHaitong International
Securities Group, Ltd. 33,204,000 8,769,982 1.36China Renaissance Holdings,
Ltd. 3,025,000 7,522,393 1.16China Merchants Securities
Co., Ltd. H Shares 4,137,200 6,618,144 1.0222,910,519 3.54
Diversified Financial ServicesChailease Holding Co., Ltd. 1,768,200 15,587,892 2.41
15,587,892 2.41
Consumer Finance360 DigiTech, Inc. ADR 467,300 9,334,353 1.44
9,334,353 1.44Total Financials 47,832,764 7.39
REAL ESTATE
Real Estate Management & DevelopmentKWG Living Group Holdings,
Ltd. 21,077,500 15,588,162 2.41Times China Holdings, Ltd. 15,512,000 12,873,615 1.99KWG Property Holding, Ltd. 12,646,500 12,356,583 1.91
40,818,360 6.31Total Real Estate 40,818,360 6.31
COMMUNICATION SERVICES
EntertainmentKingsoft Corp., Ltd. 3,161,600 12,597,800 1.95XD, Inc. 1,090,600 6,058,469 0.93
18,656,269 2.88Total Communication Services 18,656,269 2.88
CONSUMER STAPLES
Food ProductsYantai China Pet Foods Co.,
Ltd. A Shares 1,364,230 6,751,325 1.04China Modern Dairy
Holdings, Ltd. 35,410,000 6,712,994 1.04COFCO Joycome Foods, Ltd. 12,728,000 4,018,919 0.62
17,483,238 2.70Total Consumer Staples 17,483,238 2.70
The accompanying notes form an integral part of these financial statements.

global.matthewsasia.com 37
EQUITIES (CONTINUED)
Investments Quantity/ Nominal Value
Market Value USD
% of Net Assets
UTILITIES
Gas UtilitiesENN Ecological Holdings Co.,
Ltd. A Shares 4,407,657 12,438,954 1.9212,438,954 1.92
Total Utilities 12,438,954 1.92
TOTAL EQUITIES 602,366,451 93.10
TOTAL TRANSFERABLE SECURITIES AND MONEY MARKET INSTRUMENTS ADMITTED TO AN OFFICIAL EXCHANGE LISTING 602,366,451 93.10
TOTAL INVESTMENTS 602,366,451 93.10
CASH AND OTHER ASSETS, LESS LIABILITIES 44,652,654 6.90
TOTAL NET ASSETS 647,019,105 100.00
A Shares: Shares traded through the Shanghai-Hong Kong and/or Shenzhen- Hong Kong Stock Connect programs
ADR: American Depositary Receipt
H Shares: Mainland China companies listed on the Stock Exchange of Hong Kong but incorporated in mainland China
Country Allocation % of Net Assets
Information Technology 21.76Industrials 15.74Health Care 11.88Materials 11.33Consumer Discretionary 11.19Financials 7.39Real Estate 6.31Communication Services 2.88Consumer Staples 2.70Utilities 1.92
Total Investments 93.10
Cash and Other Assets, Less Liabilities 6.90
Total 100.00
The following table represents movements in the portfolio holdings:
% of Net Assets as at
30 September 2021
% of Net Assets as at
31 March 2021
TRANSFERABLE SECURITIES AND MONEY MARKET INSTRUMENTS ADMITTED TO AN OFFICIAL EXCHANGE LISTING 93.10 96.68
EQUITIES 93.10 96.68
Information Technology 21.76 19.07Industrials 15.74 15.36Health Care 11.88 10.08Materials 11.33 11.48Consumer Discretionary 11.19 13.28Financials 7.39 10.09Real Estate 6.31 10.34Communication Services 2.88 3.66Consumer Staples 2.70 3.32Utilities 1.92 -
Total Investments 93.10 96.68
Cash and Other Assets, Less Liabilities 6.90 3.32
Total 100.00 100.00
China Small Companies Fund 30 September 2021
Schedule of Investments (continued)
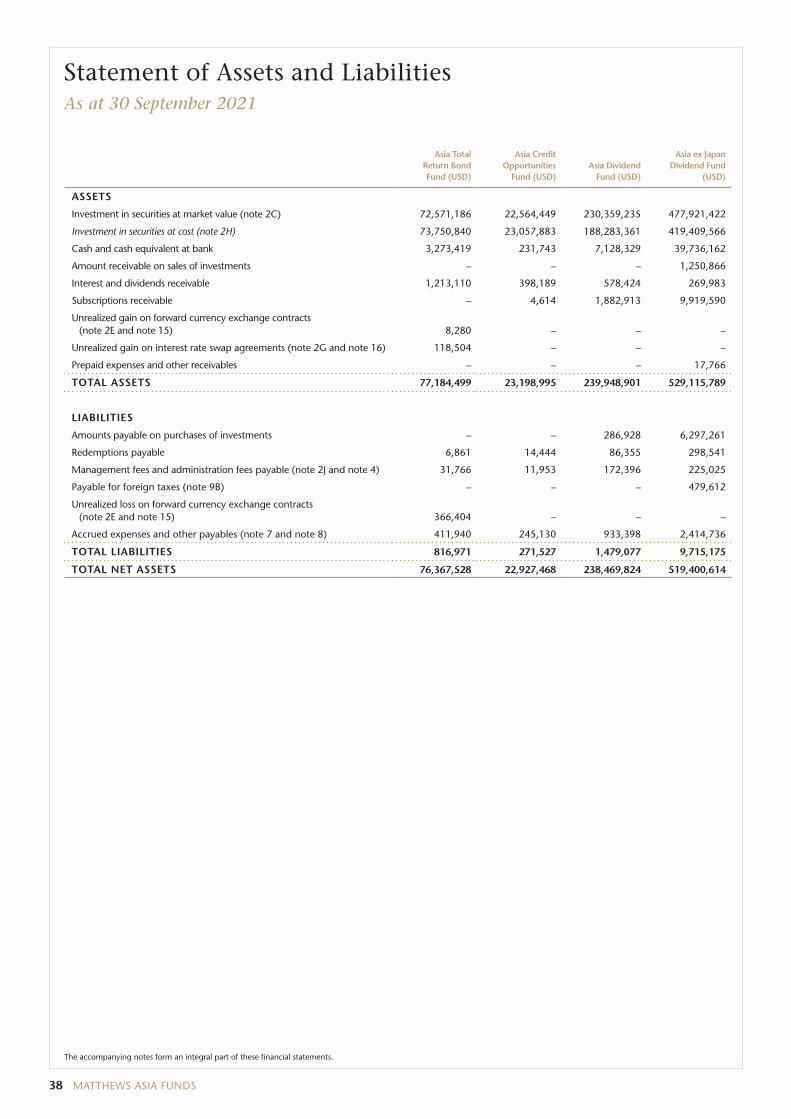
38 MATTHEWS ASIA FUNDS
Statement of Assets and LiabilitiesAs at 30 September 2021
Asia Total Return Bond Fund (USD)
Asia Credit Opportunities
Fund (USD)Asia Dividend
Fund (USD)
Asia ex Japan Dividend Fund
(USD)
ASSETS
Investment in securities at market value (note 2C) 72,571,186 22,564,449 230,359,235 477,921,422
Investment in securities at cost (note 2H) 73,750,840 23,057,883 188,283,361 419,409,566
Cash and cash equivalent at bank 3,273,419 231,743 7,128,329 39,736,162
Amount receivable on sales of investments – – – 1,250,866
Interest and dividends receivable 1,213,110 398,189 578,424 269,983
Subscriptions receivable – 4,614 1,882,913 9,919,590
Unrealized gain on forward currency exchange contracts (note 2E and note 15) 8,280 – – –
Unrealized gain on interest rate swap agreements (note 2G and note 16) 118,504 – – –
Prepaid expenses and other receivables – – – 17,766
TOTAL ASSETS 77,184,499 23,198,995 239,948,901 529,115,789
LIABILITIES
Amounts payable on purchases of investments – – 286,928 6,297,261
Redemptions payable 6,861 14,444 86,355 298,541
Management fees and administration fees payable (note 2J and note 4) 31,766 11,953 172,396 225,025
Payable for foreign taxes (note 9B) – – – 479,612
Unrealized loss on forward currency exchange contracts (note 2E and note 15) 366,404 – – –
Accrued expenses and other payables (note 7 and note 8) 411,940 245,130 933,398 2,414,736
TOTAL LIABILITIES 816,971 271,527 1,479,077 9,715,175
TOTAL NET ASSETS 76,367,528 22,927,468 238,469,824 519,400,614
The accompanying notes form an integral part of these financial statements.

global.matthewsasia.com 39
Statement of Assets and Liabilities (continued)
As at 30 September 2021
China Dividend Fund (USD)
Pacific Tiger Fund (USD)
Asia Innovative Growth Fund (USD)
China Fund (USD)
ASSETS
Investment in securities at market value (note 2C) 18,352,656 499,758,201 39,799,869 141,120,840
Investment in securities at cost (note 2H) 16,330,361 401,906,194 40,029,290 138,442,329
Cash and cash equivalent at bank 1,280,708 10,156,680 1,253,551 2,392,918
Amount receivable on sales of investments 119,067 538,326 1,551,841 –
Interest and dividends receivable 26,924 626,089 9,871 21,845
Subscriptions receivable 117,020 112,363 5,378 610,402
Unrealized gain on forward currency exchange contracts (note 2E and note 15) – – – –
Unrealized gain on interest rate swap agreements (note 2G and note 16) – – – –
Prepaid expenses and other receivables – – – –
TOTAL ASSETS 19,896,375 511,191,659 42,620,510 144,146,005
LIABILITIES
Amounts payable on purchases of investments 195,286 300,323 849,857 1,278,698
Redemptions payable 13,893 5,691,143 1,416 209,342
Management fees and administration fees payable (note 2J and note 4) 511 306,408 (367) 75,439
Payable for foreign taxes (note 9B) – – 117,264 –
Unrealized loss on forward currency exchange contracts (note 2E and note 15) 13 – – –
Accrued expenses and other payables (note 7 and note 8) 108,191 752,510 258,034 104,406
TOTAL LIABILITIES 317,894 7,050,384 1,226,204 1,667,885
TOTAL NET ASSETS 19,578,481 504,141,275 41,394,306 142,478,120
The accompanying notes form an integral part of these financial statements.
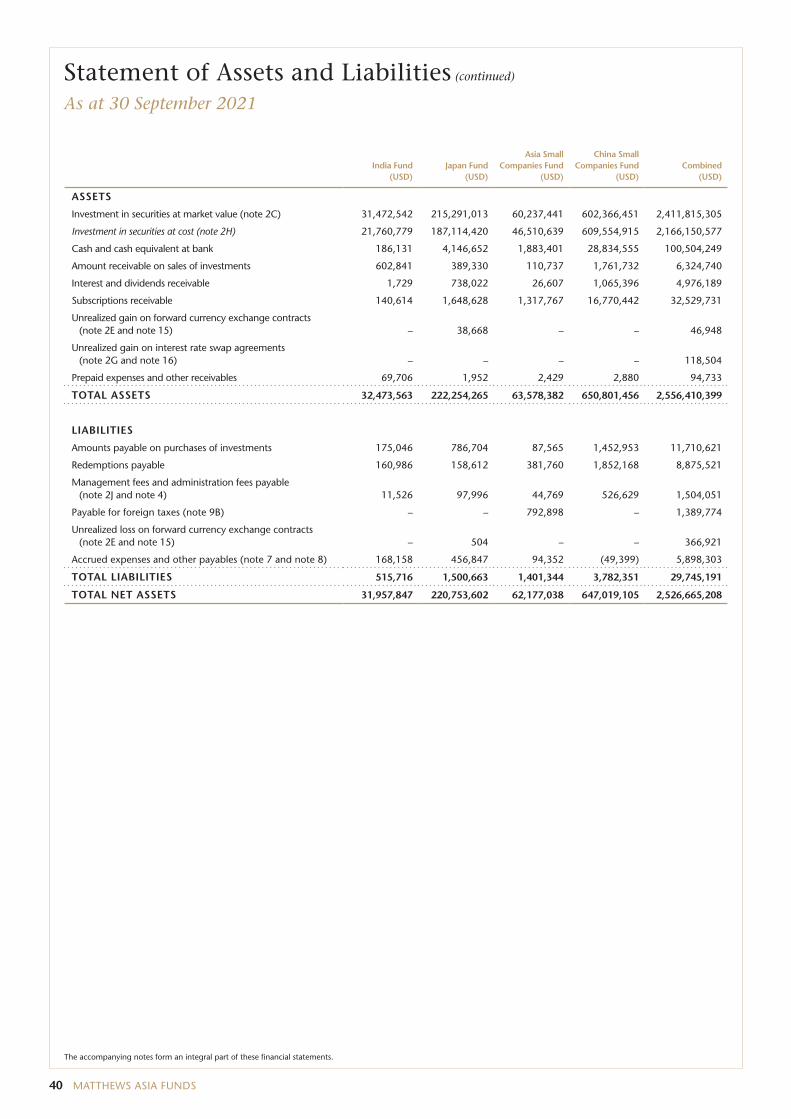
40 MATTHEWS ASIA FUNDS
Statement of Assets and Liabilities (continued)
As at 30 September 2021
India Fund (USD)
Japan Fund (USD)
Asia Small Companies Fund
(USD)
China Small Companies Fund
(USD)Combined
(USD)
ASSETS
Investment in securities at market value (note 2C) 31,472,542 215,291,013 60,237,441 602,366,451 2,411,815,305
Investment in securities at cost (note 2H) 21,760,779 187,114,420 46,510,639 609,554,915 2,166,150,577
Cash and cash equivalent at bank 186,131 4,146,652 1,883,401 28,834,555 100,504,249
Amount receivable on sales of investments 602,841 389,330 110,737 1,761,732 6,324,740
Interest and dividends receivable 1,729 738,022 26,607 1,065,396 4,976,189
Subscriptions receivable 140,614 1,648,628 1,317,767 16,770,442 32,529,731
Unrealized gain on forward currency exchange contracts (note 2E and note 15) – 38,668 – – 46,948
Unrealized gain on interest rate swap agreements (note 2G and note 16) – – – – 118,504
Prepaid expenses and other receivables 69,706 1,952 2,429 2,880 94,733
TOTAL ASSETS 32,473,563 222,254,265 63,578,382 650,801,456 2,556,410,399
LIABILITIES
Amounts payable on purchases of investments 175,046 786,704 87,565 1,452,953 11,710,621
Redemptions payable 160,986 158,612 381,760 1,852,168 8,875,521
Management fees and administration fees payable (note 2J and note 4) 11,526 97,996 44,769 526,629 1,504,051
Payable for foreign taxes (note 9B) – – 792,898 – 1,389,774
Unrealized loss on forward currency exchange contracts (note 2E and note 15) – 504 – – 366,921
Accrued expenses and other payables (note 7 and note 8) 168,158 456,847 94,352 (49,399) 5,898,303
TOTAL LIABILITIES 515,716 1,500,663 1,401,344 3,782,351 29,745,191
TOTAL NET ASSETS 31,957,847 220,753,602 62,177,038 647,019,105 2,526,665,208
The accompanying notes form an integral part of these financial statements.
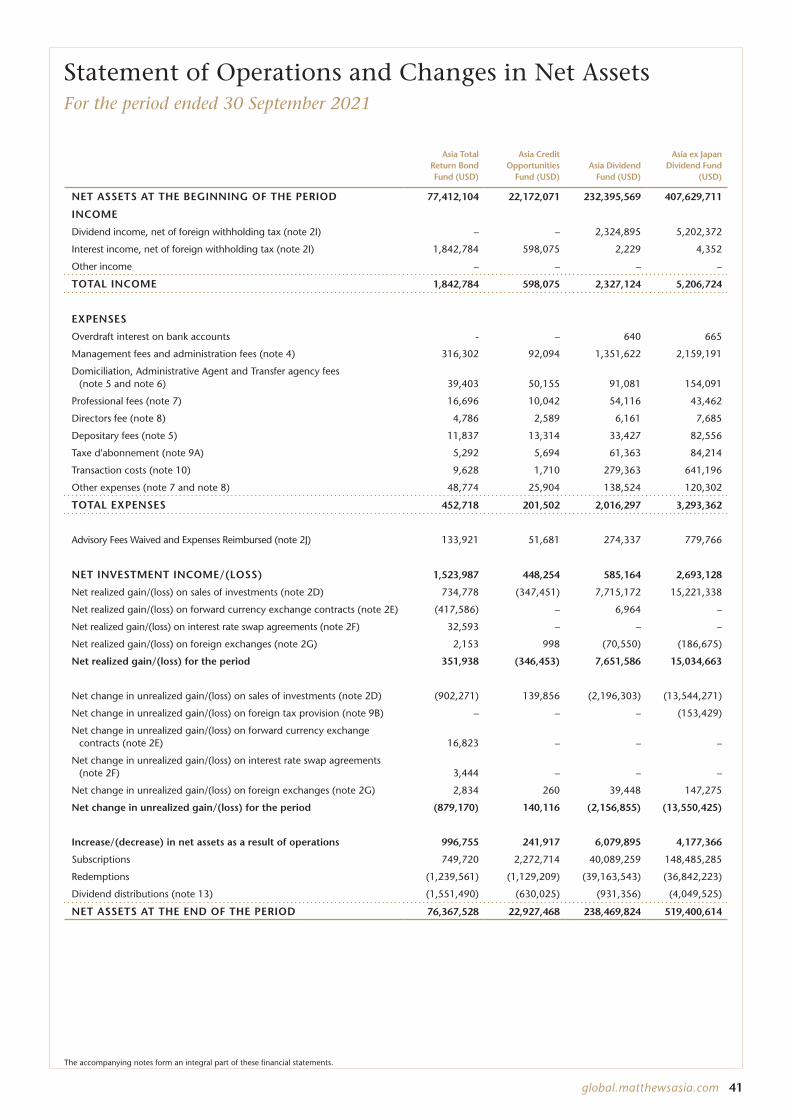
global.matthewsasia.com 41
Statement of Operations and Changes in Net AssetsFor the period ended 30 September 2021
Asia Total Return Bond Fund (USD)
Asia Credit Opportunities
Fund (USD)Asia Dividend
Fund (USD)
Asia ex Japan Dividend Fund
(USD)
NET ASSETS AT THE BEGINNING OF THE PERIOD 77,412,104 22,172,071 232,395,569 407,629,711
INCOME
Dividend income, net of foreign withholding tax (note 2I) – – 2,324,895 5,202,372
Interest income, net of foreign withholding tax (note 2I) 1,842,784 598,075 2,229 4,352
Other income – – – –
TOTAL INCOME 1,842,784 598,075 2,327,124 5,206,724
EXPENSES
Overdraft interest on bank accounts - – 640 665
Management fees and administration fees (note 4) 316,302 92,094 1,351,622 2,159,191
Domiciliation, Administrative Agent and Transfer agency fees (note 5 and note 6) 39,403 50,155 91,081 154,091
Professional fees (note 7) 16,696 10,042 54,116 43,462
Directors fee (note 8) 4,786 2,589 6,161 7,685
Depositary fees (note 5) 11,837 13,314 33,427 82,556
Taxe d'abonnement (note 9A) 5,292 5,694 61,363 84,214
Transaction costs (note 10) 9,628 1,710 279,363 641,196
Other expenses (note 7 and note 8) 48,774 25,904 138,524 120,302
TOTAL EXPENSES 452,718 201,502 2,016,297 3,293,362
Advisory Fees Waived and Expenses Reimbursed (note 2J) 133,921 51,681 274,337 779,766
NET INVESTMENT INCOME/(LOSS) 1,523,987 448,254 585,164 2,693,128
Net realized gain/(loss) on sales of investments (note 2D) 734,778 (347,451) 7,715,172 15,221,338
Net realized gain/(loss) on forward currency exchange contracts (note 2E) (417,586) – 6,964 –
Net realized gain/(loss) on interest rate swap agreements (note 2F) 32,593 – – –
Net realized gain/(loss) on foreign exchanges (note 2G) 2,153 998 (70,550) (186,675)
Net realized gain/(loss) for the period 351,938 (346,453) 7,651,586 15,034,663
Net change in unrealized gain/(loss) on sales of investments (note 2D) (902,271) 139,856 (2,196,303) (13,544,271)
Net change in unrealized gain/(loss) on foreign tax provision (note 9B) – – – (153,429)
Net change in unrealized gain/(loss) on forward currency exchange contracts (note 2E) 16,823 – – –
Net change in unrealized gain/(loss) on interest rate swap agreements (note 2F) 3,444 – – –
Net change in unrealized gain/(loss) on foreign exchanges (note 2G) 2,834 260 39,448 147,275
Net change in unrealized gain/(loss) for the period (879,170) 140,116 (2,156,855) (13,550,425)
Increase/(decrease) in net assets as a result of operations 996,755 241,917 6,079,895 4,177,366
Subscriptions 749,720 2,272,714 40,089,259 148,485,285
Redemptions (1,239,561) (1,129,209) (39,163,543) (36,842,223)
Dividend distributions (note 13) (1,551,490) (630,025) (931,356) (4,049,525)
NET ASSETS AT THE END OF THE PERIOD 76,367,528 22,927,468 238,469,824 519,400,614
The accompanying notes form an integral part of these financial statements.

42 MATTHEWS ASIA FUNDS
Statement of Operations and Changes in Net Assets (continued)
For the period ended 30 September 2021
China Dividend Fund (USD)
Pacific Tiger Fund (USD)
Asia Innovative Growth Fund
(USD)China Fund
(USD)
NET ASSETS AT THE BEGINNING OF THE PERIOD 19,150,586 526,354,276 9,792,057 153,845,923
INCOME
Dividend income, net of foreign withholding tax (note 2I) 633,652 4,260,230 61,223 1,670,495
Interest income, net of foreign withholding tax (note 2I) 95 1,762 218 522
Other income – 22,854 – 35,367
TOTAL INCOME 633,747 4,284,846 61,441 1,706,384
EXPENSES
Overdraft interest on bank accounts – – 173 353
Management fees and administration fees (note 4) 110,667 2,548,549 102,677 722,830
Domiciliation, Administrative Agent and Transfer agency fees (note 5 and note 6) 40,871 149,343 46,438 62,065
Professional fees (note 7) 9,323 108,622 187,644 25,564
Directors fee (note 8) 14,969 25,541 2,373 4,500
Depositary fees (note 5) 8,777 95,228 17,151 27,453
Taxe d'abonnement (note 9A) 5,143 131,985 5,388 21,080
Transaction costs (note 10) 33,611 606,366 137,943 158,298
Other expenses (note 7 and note 8) 32,685 187,522 48,162 75,492
TOTAL EXPENSES 256,046 3,853,156 547,949 1,097,635
Advisory Fees Waived and Expenses Reimbursed (note 2J) 108,924 646,778 333,810 242,467
NET INVESTMENT INCOME/(LOSS) 486,625 1,078,468 (152,698) 851,216
Net realized gain/(loss) on sales of investments (note 2D) 743,295 23,261,315 (1,827,842) 3,571,854
Net realized gain/(loss) on forward currency exchange contracts (note 2E) – – – –
Net realized gain/(loss) on interest rate swap agreements (note 2F) – – – –
Net realized gain/(loss) on foreign exchanges (note 2G) 901 22,120 (14,710) 2,692
Net realized gain/(loss) for the period 744,196 23,283,435 (1,842,552) 3,574,546
Net change in unrealized gain/(loss) on sales of investments (note 2D) (932,256) (37,449,546) (41,677) (18,085,458)
Net change in unrealized gain/(loss) on foreign tax provision (note 9B) – – (114,961) –
Net change in unrealized gain/(loss) on forward currency exchange contracts (note 2E) (13) – – –
Net change in unrealized gain/(loss) on interest rate swap agreements (note 2F) – – – –
Net change in unrealized gain/(loss) on foreign exchanges (note 2G) 477 39,254 332 5,734
Net change in unrealized gain/(loss) for the period (931,792) (37,410,292) (156,306) (18,079,724)
Increase/(decrease) in net assets as a result of operations 299,029 (13,048,389) (2,151,556) (13,653,962)
Subscriptions 1,826,959 51,283,792 33,755,225 23,806,415
Redemptions (1,628,368) (60,448,404) (1,420) (21,520,256)
Dividend distributions (note 13) (69,725) – – –
NET ASSETS AT THE END OF THE PERIOD 19,578,481 504,141,275 41,394,306 142,478,120
The accompanying notes form an integral part of these financial statements.

global.matthewsasia.com 43
Statement of Operations and Changes in Net Assets (continued)
For the period ended 30 September 2021
India Fund (USD)
Japan Fund (USD)
Asia Small Companies Fund (USD)
China Small Companies Fund (USD)
Combined (USD)
NET ASSETS AT THE BEGINNING OF THE PERIOD 29,007,979 187,100,761 40,425,540 538,770,209 2,244,056,786
INCOME
Dividend income, net of foreign withholding tax (note 2I) 135,554 1,122,927 343,697 9,948,655 25,703,700
Interest income, net of foreign withholding tax (note 2I) 158 216 285 15,902 2,466,598
Other income – – – – 58,221
TOTAL INCOME 135,712 1,123,143 343,982 9,964,557 28,228,519
EXPENSES
Overdraft interest on bank accounts 157 – 253 759 3,000
Management fees and administration fees (note 4) 174,110 952,790 354,593 3,858,782 12,744,207
Domiciliation, Administrative Agent and Transfer agency fees (note 5 and note 6) 40,071 95,866 45,706 177,147 992,237
Professional fees (note 7) 28,510 40,047 16,999 52,546 593,571
Directors fee (note 8) 3,332 14,823 2,749 19,017 108,525
Depositary fees (note 5) 13,783 15,932 18,279 79,604 417,341
Taxe d'abonnement (note 9A) 8,127 53,375 14,620 139,442 535,723
Transaction costs (note 10) 64,369 100,398 68,510 629,682 2,731,074
Other expenses (note 7 and note 8) 44,003 110,219 36,917 124,860 993,364
TOTAL EXPENSES 376,462 1,383,450 558,626 5,081,839 19,119,042
Advisory Fees Waived and Expenses Reimbursed (note 2J) 134,401 433,748 130,745 734,273 4,004,851
NET INVESTMENT INCOME/(LOSS) (106,349) 173,441 (83,899) 5,616,991 13,114,328
Net realized gain/(loss) on sales of investments (note 2D) 3,894,757 5,917,332 763,273 15,063,995 74,711,816
Net realized gain/(loss) on forward currency exchange contracts (note 2E) – 37,920 – – (372,702)
Net realized gain/(loss) on interest rate swap agreements (note 2F) – – – – 32,593
Net realized gain/(loss) on foreign exchanges (note 2G) (18,618) (89,175) (19,125) 11,783 (358,206)
Net realized gain/(loss) for the period 3,876,139 5,866,077 744,148 15,075,778 74,013,501
Net change in unrealized gain/(loss) on sales of investments (note 2D) 2,766,764 6,034,920 8,321,483 (23,947,203) (79,835,962)
Net change in unrealized gain/(loss) on foreign tax provision (note 9B) 58,458 – (582,422) – (792,354)
Net change in unrealized gain/(loss) on forward currency exchange contracts (note 2E) – (45,463) – – (28,653)
Net change in unrealized gain/(loss) on interest rate swap agreements (note 2F) – – – – 3,444
Net change in unrealized gain/(loss) on foreign exchanges (note 2G) (883) 19,440 429 72,452 327,052
Net change in unrealized gain/(loss) for the period 2,824,339 6,008,897 7,739,490 (23,874,751) (80,326,473)
Increase/(decrease) in net assets as a result of operations 6,594,129 12,048,415 8,399,739 (3,181,982) 6,801,356
Subscriptions 4,979,400 55,542,772 24,690,638 273,047,714 660,529,893
Redemptions (8,623,661) (33,938,346) (11,338,879) (161,616,836) (377,490,706)
Dividend distributions (note 13) – – – – (7,232,121)
NET ASSETS AT THE END OF THE PERIOD 31,957,847 220,753,602 62,177,038 647,019,105 2,526,665,208
The accompanying notes form an integral part of these financial statements.

44 MATTHEWS ASIA FUNDS
Statement of Changes in Number of SharesFor the period ended 30 September 2021
ASIA TOTAL RETURN BOND FUND
Class I Acc (USD) Class I Dist (USD)
Shares outstanding at the beginning of the period 160,939 Shares outstanding at the beginning of the period 213,590
Shares subscribed 19,651 Shares subscribed 51,018
Shares redeemed 1,333 Shares redeemed 46,248
Shares outstanding at the end of the period 179,257 Shares outstanding at the end of the period 218,360
Class A Acc (USD) Class A Dist (USD)
Shares outstanding at the beginning of the period 173,726 Shares outstanding at the beginning of the period 133,599
Shares subscribed 4,044 Shares subscribed 125
Shares redeemed 37 Shares redeemed 118
Shares outstanding at the end of the period 177,733 Shares outstanding at the end of the period 133,606
Class S Dist (USD) Class S Acc (JPY)
Shares outstanding at the beginning of the period 4,970,679 Shares outstanding at the beginning of the period 2,113,000
Shares subscribed – Shares subscribed –
Shares redeemed – Shares redeemed 89,185
Shares outstanding at the end of the period 4,970,679 Shares outstanding at the end of the period 2,023,815
ASIA CREDIT OPPORTUNITIES FUND
Class I Dist (USD) Class A Dist (USD)
Shares outstanding at the beginning of the period 1,405,875 Shares outstanding at the beginning of the period 384,604
Shares subscribed – Shares subscribed –
Shares redeemed – Shares redeemed –
Shares outstanding at the end of the period 1,405,875 Shares outstanding at the end of the period 384,604
Class I Dist (GBP)
Shares outstanding at the beginning of the period 371,829
Shares subscribed 160,914
Shares redeemed 80,060
Shares outstanding at the end of the period 452,683
ASIA DIVIDEND FUND
Class I Acc (USD) Class I Dist (USD)
Shares outstanding at the beginning of the period 2,914,737 Shares outstanding at the beginning of the period 975,058
Shares subscribed 231,301 Shares subscribed 327,892
Shares redeemed 277,698 Shares redeemed 71,184
Shares outstanding at the end of the period 2,868,340 Shares outstanding at the end of the period 1,231,766
Class A Acc (USD) Class A Dist (USD)
Shares outstanding at the beginning of the period 2,433,449 Shares outstanding at the beginning of the period 757,662
Shares subscribed 864,301 Shares subscribed 105,948
Shares redeemed 901,019 Shares redeemed 55,588
Shares outstanding at the end of the period 2,396,731 Shares outstanding at the end of the period 808,022
Class I Acc (GBP) Class I Dist (GBP)
Shares outstanding at the beginning of the period 225,653 Shares outstanding at the beginning of the period 1,949,986
Shares subscribed 30,640 Shares subscribed 92,673
Shares redeemed 29,976 Shares redeemed 121,497
Shares outstanding at the end of the period 226,317 Shares outstanding at the end of the period 1,921,162
The accompanying notes form an integral part of these financial statements.
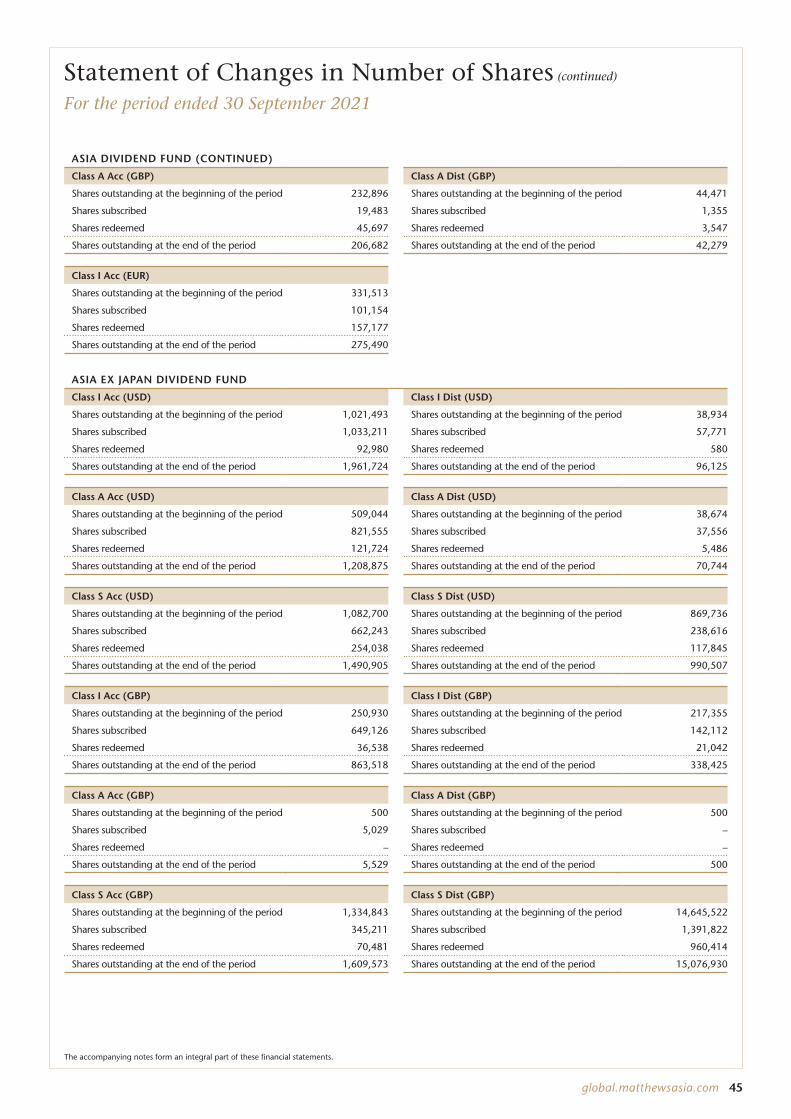
global.matthewsasia.com 45
Statement of Changes in Number of Shares (continued)
For the period ended 30 September 2021
ASIA DIVIDEND FUND (CONTINUED)
Class A Acc (GBP) Class A Dist (GBP)
Shares outstanding at the beginning of the period 232,896 Shares outstanding at the beginning of the period 44,471
Shares subscribed 19,483 Shares subscribed 1,355
Shares redeemed 45,697 Shares redeemed 3,547
Shares outstanding at the end of the period 206,682 Shares outstanding at the end of the period 42,279
Class I Acc (EUR)
Shares outstanding at the beginning of the period 331,513
Shares subscribed 101,154
Shares redeemed 157,177
Shares outstanding at the end of the period 275,490
ASIA EX JAPAN DIVIDEND FUND
Class I Acc (USD) Class I Dist (USD)
Shares outstanding at the beginning of the period 1,021,493 Shares outstanding at the beginning of the period 38,934
Shares subscribed 1,033,211 Shares subscribed 57,771
Shares redeemed 92,980 Shares redeemed 580
Shares outstanding at the end of the period 1,961,724 Shares outstanding at the end of the period 96,125
Class A Acc (USD) Class A Dist (USD)
Shares outstanding at the beginning of the period 509,044 Shares outstanding at the beginning of the period 38,674
Shares subscribed 821,555 Shares subscribed 37,556
Shares redeemed 121,724 Shares redeemed 5,486
Shares outstanding at the end of the period 1,208,875 Shares outstanding at the end of the period 70,744
Class S Acc (USD) Class S Dist (USD)
Shares outstanding at the beginning of the period 1,082,700 Shares outstanding at the beginning of the period 869,736
Shares subscribed 662,243 Shares subscribed 238,616
Shares redeemed 254,038 Shares redeemed 117,845
Shares outstanding at the end of the period 1,490,905 Shares outstanding at the end of the period 990,507
Class I Acc (GBP) Class I Dist (GBP)
Shares outstanding at the beginning of the period 250,930 Shares outstanding at the beginning of the period 217,355
Shares subscribed 649,126 Shares subscribed 142,112
Shares redeemed 36,538 Shares redeemed 21,042
Shares outstanding at the end of the period 863,518 Shares outstanding at the end of the period 338,425
Class A Acc (GBP) Class A Dist (GBP)
Shares outstanding at the beginning of the period 500 Shares outstanding at the beginning of the period 500
Shares subscribed 5,029 Shares subscribed –
Shares redeemed – Shares redeemed –
Shares outstanding at the end of the period 5,529 Shares outstanding at the end of the period 500
Class S Acc (GBP) Class S Dist (GBP)
Shares outstanding at the beginning of the period 1,334,843 Shares outstanding at the beginning of the period 14,645,522
Shares subscribed 345,211 Shares subscribed 1,391,822
Shares redeemed 70,481 Shares redeemed 960,414
Shares outstanding at the end of the period 1,609,573 Shares outstanding at the end of the period 15,076,930
The accompanying notes form an integral part of these financial statements.

46 MATTHEWS ASIA FUNDS
1 Commenced operations on 27 May 2021.
ASIA EX JAPAN DIVIDEND FUND (CONTINUED)
Class I Acc (EUR) Class S Acc (EUR)
Shares outstanding at the beginning of the period 115,653 Shares outstanding at the beginning of the period 556
Shares subscribed 149,172 Shares subscribed 999,492
Shares redeemed 98,333 Shares redeemed –
Shares outstanding at the end of the period 166,492 Shares outstanding at the end of the period 1,000,048
CHINA DIVIDEND FUND
Class I Acc (USD) Class I Dist (USD)
Shares outstanding at the beginning of the period 512,274 Shares outstanding at the beginning of the period 88,499
Shares subscribed 40,883 Shares subscribed 10,015
Shares redeemed 41,426 Shares redeemed 4,687
Shares outstanding at the end of the period 511,731 Shares outstanding at the end of the period 93,827
Class A Acc (USD) Class A Dist (USD)
Shares outstanding at the beginning of the period 229,756 Shares outstanding at the beginning of the period 71,493
Shares subscribed 23,158 Shares subscribed 9,303
Shares redeemed 20,475 Shares redeemed 7,460
Shares outstanding at the end of the period 232,439 Shares outstanding at the end of the period 73,336
PACIFIC TIGER FUND
Class I Acc (USD) Class I Dist (USD)
Shares outstanding at the beginning of the period 13,001,642 Shares outstanding at the beginning of the period 429,051
Shares subscribed 1,043,520 Shares subscribed 1,904
Shares redeemed 1,374,829 Shares redeemed 5,860
Shares outstanding at the end of the period 12,670,333 Shares outstanding at the end of the period 425,095
Class A Acc (USD) Class I Acc (GBP)
Shares outstanding at the beginning of the period 1,801,250 Shares outstanding at the beginning of the period 1,770,035
Shares subscribed 375,404 Shares subscribed 59,501
Shares redeemed 387,308 Shares redeemed 290,048
Shares outstanding at the end of the period 1,789,346 Shares outstanding at the end of the period 1,539,488
Class I Dist (GBP) Class A Acc (GBP)
Shares outstanding at the beginning of the period 1,257,947 Shares outstanding at the beginning of the period 88,994
Shares subscribed 128,521 Shares subscribed 39,880
Shares redeemed 66,992 Shares redeemed 3,833
Shares outstanding at the end of the period 1,319,476 Shares outstanding at the end of the period 125,041
Class I Acc (EUR) Class I Acc (JPY)
Shares outstanding at the beginning of the period 19,000 Shares outstanding at the beginning of the period 3,281,334
Shares subscribed 7,843 Shares subscribed 566,742
Shares redeemed 16,000 Shares redeemed 219,522
Shares outstanding at the end of the period 10,843 Shares outstanding at the end of the period 3,628,554
ASIA INNOVATIVE GROWTH FUND
Class I Acc (USD) Class S Acc (USD)1
Shares outstanding at the beginning of the period 999,000 Shares outstanding at the beginning of the period –
Shares subscribed 516,372 Shares subscribed 2,591,280
Shares redeemed – Shares redeemed –
Shares outstanding at the end of the period 1,515,372 Shares outstanding at the end of the period 2,591,280
Statement of Changes in Number of Shares (continued)
For the period ended 30 September 2021
The accompanying notes form an integral part of these financial statements.
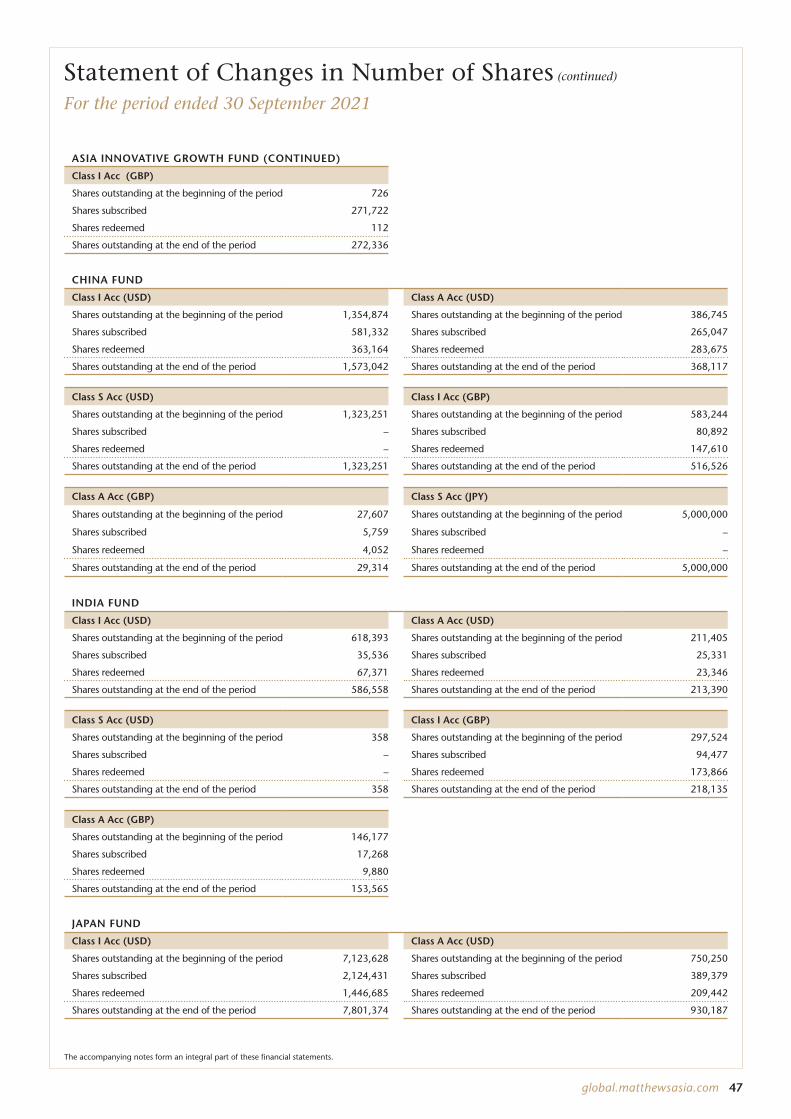
global.matthewsasia.com 47
ASIA INNOVATIVE GROWTH FUND (CONTINUED)
Class I Acc (GBP)
Shares outstanding at the beginning of the period 726
Shares subscribed 271,722
Shares redeemed 112
Shares outstanding at the end of the period 272,336
CHINA FUND
Class I Acc (USD) Class A Acc (USD)
Shares outstanding at the beginning of the period 1,354,874 Shares outstanding at the beginning of the period 386,745
Shares subscribed 581,332 Shares subscribed 265,047
Shares redeemed 363,164 Shares redeemed 283,675
Shares outstanding at the end of the period 1,573,042 Shares outstanding at the end of the period 368,117
Class S Acc (USD) Class I Acc (GBP)
Shares outstanding at the beginning of the period 1,323,251 Shares outstanding at the beginning of the period 583,244
Shares subscribed – Shares subscribed 80,892
Shares redeemed – Shares redeemed 147,610
Shares outstanding at the end of the period 1,323,251 Shares outstanding at the end of the period 516,526
Class A Acc (GBP) Class S Acc (JPY)
Shares outstanding at the beginning of the period 27,607 Shares outstanding at the beginning of the period 5,000,000
Shares subscribed 5,759 Shares subscribed –
Shares redeemed 4,052 Shares redeemed –
Shares outstanding at the end of the period 29,314 Shares outstanding at the end of the period 5,000,000
INDIA FUND
Class I Acc (USD) Class A Acc (USD)
Shares outstanding at the beginning of the period 618,393 Shares outstanding at the beginning of the period 211,405
Shares subscribed 35,536 Shares subscribed 25,331
Shares redeemed 67,371 Shares redeemed 23,346
Shares outstanding at the end of the period 586,558 Shares outstanding at the end of the period 213,390
Class S Acc (USD) Class I Acc (GBP)
Shares outstanding at the beginning of the period 358 Shares outstanding at the beginning of the period 297,524
Shares subscribed – Shares subscribed 94,477
Shares redeemed – Shares redeemed 173,866
Shares outstanding at the end of the period 358 Shares outstanding at the end of the period 218,135
Class A Acc (GBP)
Shares outstanding at the beginning of the period 146,177
Shares subscribed 17,268
Shares redeemed 9,880
Shares outstanding at the end of the period 153,565
JAPAN FUND
Class I Acc (USD) Class A Acc (USD)
Shares outstanding at the beginning of the period 7,123,628 Shares outstanding at the beginning of the period 750,250
Shares subscribed 2,124,431 Shares subscribed 389,379
Shares redeemed 1,446,685 Shares redeemed 209,442
Shares outstanding at the end of the period 7,801,374 Shares outstanding at the end of the period 930,187
Statement of Changes in Number of Shares (continued)
For the period ended 30 September 2021
The accompanying notes form an integral part of these financial statements.

48 MATTHEWS ASIA FUNDS
Statement of Changes in Number of Shares (continued)
For the period ended 30 September 2021
JAPAN FUND (CONTINUED)
Class S Acc (USD) Class I Acc (USD) Hedged
Shares outstanding at the beginning of the period 432 Shares outstanding at the beginning of the period 141,014
Shares subscribed – Shares subscribed 89,541
Shares redeemed – Shares redeemed 47,450
Shares outstanding at the end of the period 432 Shares outstanding at the end of the period 183,105
Class I Acc (GBP) Class I Acc (EUR) Hedged
Shares outstanding at the beginning of the period 1,790,681 Shares outstanding at the beginning of the period 9,552
Shares subscribed 345,839 Shares subscribed –
Shares redeemed 126,816 Shares redeemed –
Shares outstanding at the end of the period 2,009,704 Shares outstanding at the end of the period 9,552
ASIA SMALL COMPANIES FUND
Class I Acc (USD) Class A Acc (USD)
Shares outstanding at the beginning of the period 646,843 Shares outstanding at the beginning of the period 757,465
Shares subscribed 408,737 Shares subscribed 60,640
Shares redeemed 241,920 Shares redeemed 33,335
Shares outstanding at the end of the period 813,660 Shares outstanding at the end of the period 784,770
Class I Acc (GBP) Class I Acc (EUR)
Shares outstanding at the beginning of the period 264,284 Shares outstanding at the beginning of the period 496,942
Shares subscribed 387,725 Shares subscribed 81,030
Shares redeemed 150,405 Shares redeemed 8,985
Shares outstanding at the end of the period 501,604 Shares outstanding at the end of the period 568,987
CHINA SMALL COMPANIES FUND
Class I Acc (USD) Class A Acc (USD)
Shares outstanding at the beginning of the period 6,109,864 Shares outstanding at the beginning of the period 3,088,399
Shares subscribed 2,328,893 Shares subscribed 1,422,884
Shares redeemed 2,416,876 Shares redeemed 999,097
Shares outstanding at the end of the period 6,021,881 Shares outstanding at the end of the period 3,512,186
Class S Acc (USD) Class I Acc (GBP)
Shares outstanding at the beginning of the period 6,592,119 Shares outstanding at the beginning of the period 2,044,174
Shares subscribed 5,062,043 Shares subscribed 1,194,150
Shares redeemed 681,346 Shares redeemed 620,563
Shares outstanding at the end of the period 10,972,816 Shares outstanding at the end of the period 2,617,761
Class S Acc (GBP) Class A Acc (EUR)2
Shares outstanding at the beginning of the period 1,478,874 Shares outstanding at the beginning of the period –
Shares subscribed 268,593 Shares subscribed 29,054
Shares redeemed 150,516 Shares redeemed –
Shares outstanding at the end of the period 1,596,951 Shares outstanding at the end of the period 29,054
Class S Acc (EUR)2
Shares outstanding at the beginning of the period –
Shares subscribed 22,242
Shares redeemed –
Shares outstanding at the end of the period 22,242
2 Commenced operations on 15 July 2021.
The accompanying notes form an integral part of these financial statements.

global.matthewsasia.com 49
Statement of Net Asset Value (NAV) Per Share and Net Asset Statistics
Values per share in Share Class currency
As at 30 September 2021 As at 31 March 2021 As at 31 March 2020
ASIA TOTAL RETURN BOND FUNDNet Assets 76,367,528 77,412,104 56,161,456
NAV Per Share
I Acc (USD) 12.81 12.66 10.81
I Dist (USD) 8.60 8.75 7.87
A Acc (USD) 12.35 12.25 10.52
A Dist (USD) 8.25 8.42 7.64
S Dist (USD) 10.09 10.25 9.22
S Acc (JPY)1 1,036.74 1,011.69 n.a.
Shares Outstanding
I Acc (USD) 179,257 160,939 263,458
I Dist (USD) 218,360 213,590 302,610
A Acc (USD) 177,733 173,726 280,452
A Dist (USD) 133,606 133,599 283,572
S Dist (USD) 4,970,679 4,970,679 4,970,679
S Acc (JPY)1 2,023,815 2,113,000 n.a.
ASIA CREDIT OPPORTUNITIES FUNDNet Assets 22,927,468 22,172,071 19,512,223
NAV Per Share
I Dist (USD) 9.32 9.48 8.87
A Dist (USD) 8.98 9.16 8.61
I Dist (GBP) 10.46 10.39 10.83
Shares Outstanding
I Dist (USD) 1,405,875 1,405,875 1,458,673
A Dist (USD) 384,604 384,604 374,362
I Dist (GBP) 452,683 371,829 250,763
ASIA DIVIDEND FUNDNet Assets 238,469,824 232,395,569 189,438,553
NAV Per Share
I Acc (USD) 24.54 23.89 15.18
I Dist (USD) 18.75 18.44 12.00
A Acc (USD) 22.97 22.47 14.38
A Dist (USD) 17.96 17.74 11.61
I Acc (GBP) 27.42 26.09 18.47
I Dist (GBP) 21.03 20.20 14.62
A Acc (GBP) 25.83 24.68 17.61
A Dist (GBP) 20.07 19.38 14.14
I Acc (EUR) 13.94 13.40 9.11
Shares Outstanding
I Acc (USD) 2,868,340 2,914,737 4,086,286
I Dist (USD) 1,231,766 975,058 1,436,939
A Acc (USD) 2,396,731 2,433,449 3,328,709
A Dist (USD) 808,022 757,662 863,909
I Acc (GBP) 226,317 225,653 185,065
I Dist (GBP) 1,921,162 1,949,986 2,257,372
A Acc (GBP) 206,682 232,896 244,205
A Dist (GBP) 42,279 44,471 74,194
I Acc (EUR) 275,490 331,513 66,317
1 Commenced operations on 22 March 2021.
The accompanying notes form an integral part of these financial statements.

50 MATTHEWS ASIA FUNDS
Statement of Net Asset Value (NAV) Per Share and Net Asset Statistics (continued)
Values per share in Share Class currency
As at 30 September 2021 As at 31 March 2021 As at 31 March 2020
ASIA EX JAPAN DIVIDEND FUNDNet Assets 519,400,614 407,629,711 71,090,831
NAV Per Share
I Acc (USD) 25.16 24.79 13.78
I Dist (USD) 21.37 21.31 12.05
A Acc (USD) 24.23 23.97 13.42
A Dist (USD) 19.75 19.75 11.26
S Acc (USD) 16.41 16.15 8.95
S Dist (USD) 14.81 14.75 8.32
I Acc (GBP) 28.09 27.02 16.74
I Dist (GBP) 24.04 23.36 14.69
A Acc (GBP)2 12.78 12.35 n.a.
A Dist (GBP)2 12.53 12.26 n.a.
S Acc (GBP) 16.29 15.66 9.67
S Dist (GBP) 14.84 14.44 9.05
I Acc (EUR)2 13.50 13.13 n.a.
S Acc (EUR)2 13.53 13.14 n.a.
Shares Outstanding
I Acc (USD) 1,961,724 1,021,493 431,793
I Dist (USD) 96,125 38,934 17,230
A Acc (USD) 1,208,875 509,044 108,893
A Dist (USD) 70,744 38,674 24,495
S Acc (USD) 1,490,905 1,082,700 101,600
S Dist (USD) 990,507 869,736 685,845
I Acc (GBP) 863,518 250,930 68,916
I Dist (GBP) 338,425 217,355 30,585
A Acc (GBP)2 5,529 500 n.a.
A Dist (GBP)2 500 500 n.a.
S Acc (GBP) 1,609,573 1,334,843 626,760
S Dist (GBP) 15,076,930 14,645,522 4,213,869
I Acc (EUR)2 166,492 115,653 n.a.
S Acc (EUR)2 1,000,048 556 n.a.
CHINA DIVIDEND FUNDNet Assets 19,578,481 19,150,586 14,012,212
NAV Per Share
I Acc (USD) 22.71 22.32 15.58
I Dist (USD) 18.17 18.25 13.11
A Acc (USD) 21.57 21.28 14.97
A Dist (USD) 16.87 16.99 12.32
Shares Outstanding
I Acc (USD) 511,731 512,274 479,631
I Dist (USD) 93,827 88,499 69,541
A Acc (USD) 232,439 229,756 284,705
A Dist (USD) 73,336 71,493 111,014
2 Commenced operations on 31 July 2020.
The accompanying notes form an integral part of these financial statements.

global.matthewsasia.com 51
Statement of Net Asset Value (NAV) Per Share and Net Asset Statistics (continued)
Values per share in Share Class currency
As at 30 September 2021 As at 31 March 2021 As at 31 March 2020
PACIFIC TIGER FUNDNet Assets 504,141,275 526,354,276 516,327,342
NAV Per Share
I Acc (USD) 24.60 25.21 15.11
I Dist (USD) 14.66 15.03 9.11
A Acc (USD) 22.15 22.80 13.77
I Acc (GBP) 27.56 27.59 18.43
I Dist (GBP) 18.39 18.40 12.47
A Acc (GBP) 25.88 26.01 17.51
I Acc (EUR) 12.76 12.90 8.28
I Acc (JPY) 1,616.66 1,638.19 962.43
Shares Outstanding
I Acc (USD) 12,670,333 13,001,642 23,215,235
I Dist (USD) 425,095 429,051 592,011
A Acc (USD) 1,789,346 1,801,250 1,146,866
I Acc (GBP) 1,539,488 1,770,035 2,834,215
I Dist (GBP) 1,319,476 1,257,947 1,562,463
A Acc (GBP) 125,041 88,994 47,701
I Acc (EUR) 10,843 19,000 500
I Acc (JPY) 3,628,554 3,281,334 6,180,321
ASIA INNOVATIVE GROWTH FUND*
Net Assets 41,394,306 9,792,057 n.a.
NAV Per Share
I Acc (USD)3 9.24 9.79 n.a.
I Acc (GBP)3 9.48 9.81 n.a.
S Acc (USD)4 9.23 n.a. n.a.
Shares Outstanding
I Acc (USD)3 1,515,372 999,000 n.a.
I Acc (GBP)3 272,336 726 n.a.
S Acc (USD)4 2,591,280 n.a. n.a.
CHINA FUNDNet Assets 142,478,120 153,845,923 62,754,804
NAV Per Share
I Acc (USD) 23.80 26.19 16.25
A Acc (USD) 20.98 23.17 14.48
S Acc (USD)5 13.47 14.80 n.a.
I Acc (GBP) 25.38 27.27 18.86
A Acc (GBP) 23.82 25.70 17.90
S Acc (JPY) 1,364.51 1,482.73 898.53
Shares Outstanding
I Acc (USD) 1,573,042 1,354,874 856,459
A Acc (USD) 368,117 386,745 109,237
S Acc (USD)5 1,323,251 1,323,251 n.a.
I Acc (GBP) 516,526 583,244 239,854
A Acc (GBP) 29,314 27,607 12,858
S Acc (JPY) 5,000,000 5,000,000 5,000,000
* The Sub-Fund launched on 23 March 2021.
3 Commenced operations on 23 March 2021.
4 Commenced operations on 27 May 2021.
5 Commenced operations on 30 April 2021.
The accompanying notes form an integral part of these financial statements.

52 MATTHEWS ASIA FUNDS
Statement of Net Asset Value (NAV) Per Share and Net Asset Statistics (continued)
Values per share in Share Class currency
As at 30 September 2021 As at 31 March 2021 As at 31 March 2020
INDIA FUNDNet Assets 31,957,847 29,007,979 36,306,562
NAV Per Share
I Acc (USD) 23.35 19.13 10.27
A Acc (USD) 21.98 18.08 9.78
S Acc (USD) 20.45 16.73 8.95
I Acc (GBP) 27.81 22.26 13.32
A Acc (GBP) 26.17 21.03 12.68
Shares Outstanding
I Acc (USD) 586,558 618,393 2,488,861
A Acc (USD) 213,390 211,405 209,593
S Acc (USD) 358 358 358
I Acc (GBP) 218,135 297,524 336,285
A Acc (GBP) 153,565 146,177 202,274
JAPAN FUNDNet Assets 220,753,602 187,100,761 326,903,160
NAV Per Share
I Acc (USD) 18.45 17.42 11.49
A Acc (USD) 17.71 16.79 11.16
S Acc (USD) 18.94 17.88 11.76
I Acc (USD) Hedged 17.42 16.26 10.49
I Acc (GBP) 21.09 19.45 14.31
I Acc (EUR) Hedged 15.92 14.91 9.76
Shares Outstanding
I Acc (USD) 7,801,374 7,123,628 26,121,338
A Acc (USD) 930,187 750,250 612,111
S Acc (USD) 432 432 1,003,532
I Acc (USD) Hedged 183,105 141,014 150,224
I Acc (GBP) 2,009,704 1,790,681 31,123
I Acc (EUR) Hedged 9,552 9,552 559,452
ASIA SMALL COMPANIES FUNDNet Assets 62,177,038 40,425,540 13,611,322
NAV Per Share
I Acc (USD) 22.85 19.17 10.73
A Acc (USD) 21.69 18.27 10.31
I Acc (GBP) 26.92 22.05 13.76
I Acc (EUR)6 12.77 10.57 n.a.
Shares Outstanding
I Acc (USD) 813,660 646,843 183,644
A Acc (USD) 784,770 757,465 1,040,849
I Acc (GBP) 501,604 264,284 53,643
I Acc (EUR)6 568,987 496,942 n.a.
6 Commenced operations on 30 December 2020.
The accompanying notes form an integral part of these financial statements.

global.matthewsasia.com 53
Statement of Net Asset Value (NAV) Per Share and Net Asset Statistics (continued)
Values per share in Share Class currency
As at 30 September 2021 As at 31 March 2021 As at 31 March 2020
CHINA SMALL COMPANIES FUND
Net Assets 647,019,105 538,770,209 72,972,206
NAV Per Share
I Acc (USD) 37.49 37.41 23.06
A Acc (USD) 35.46 35.51 22.04
S Acc (USD) 18.02 17.93 10.99
I Acc (GBP) 16.84 16.42 11.28
S Acc (GBP) 18.23 17.72 12.11
S Acc (EUR)7 9.12 n.a. n.a.
A Acc (EUR)7 9.10 n.a. n.a.
Shares Outstanding
I Acc (USD) 6,021,881 6,109,864 658,614
A Acc (USD) 3,512,186 3,088,399 609,400
S Acc (USD) 10,972,816 6,592,119 2,168,248
I Acc (GBP) 2,617,761 2,044,174 4,341
S Acc (GBP) 1,596,951 1,478,874 1,367,619
S Acc (EUR)7 22,242 n.a. n.a.
A Acc (EUR)7 29,054 n.a. n.a.
7 Commenced operations on 15 July 2021.
The accompanying notes form an integral part of these financial statements.
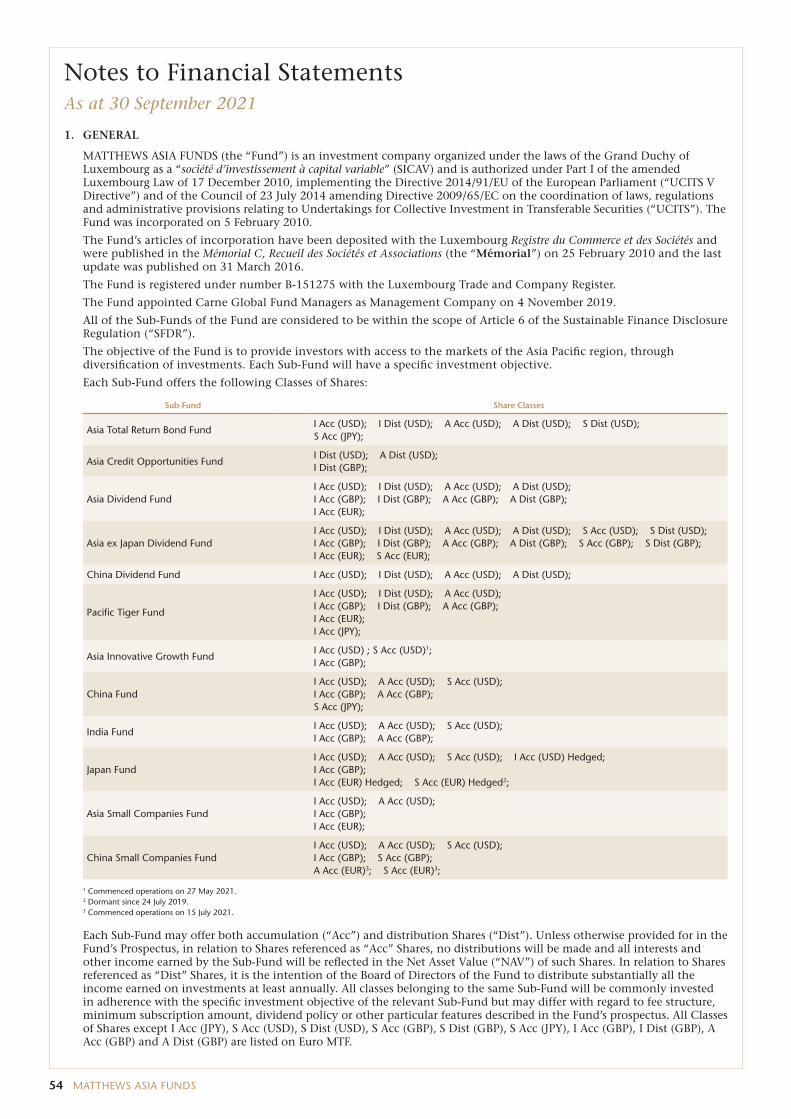
54 MATTHEWS ASIA FUNDS
Notes to Financial Statements As at 30 September 2021
1. GENERAL
MATTHEWS ASIA FUNDS (the “Fund”) is an investment company organized under the laws of the Grand Duchy of Luxembourg as a “société d’investissement à capital variable” (SICAV) and is authorized under Part I of the amended Luxembourg Law of 17 December 2010, implementing the Directive 2014/91/EU of the European Parliament (“UCITS V Directive”) and of the Council of 23 July 2014 amending Directive 2009/65/EC on the coordination of laws, regulations and administrative provisions relating to Undertakings for Collective Investment in Transferable Securities (“UCITS”). The Fund was incorporated on 5 February 2010.
The Fund’s articles of incorporation have been deposited with the Luxembourg Registre du Commerce et des Sociétés and were published in the Mémorial C, Recueil des Sociétés et Associations (the “Mémorial”) on 25 February 2010 and the last update was published on 31 March 2016.
The Fund is registered under number B-151275 with the Luxembourg Trade and Company Register.
The Fund appointed Carne Global Fund Managers as Management Company on 4 November 2019.
All of the Sub-Funds of the Fund are considered to be within the scope of Article 6 of the Sustainable Finance Disclosure Regulation (“SFDR”).
The objective of the Fund is to provide investors with access to the markets of the Asia Pacific region, through diversification of investments. Each Sub-Fund will have a specific investment objective.
Each Sub-Fund offers the following Classes of Shares:
Sub-Fund Share Classes
Asia Total Return Bond Fund I Acc (USD); I Dist (USD); A Acc (USD); A Dist (USD); S Dist (USD); S Acc (JPY);
Asia Credit Opportunities Fund I Dist (USD); A Dist (USD); I Dist (GBP);
Asia Dividend Fund I Acc (USD); I Dist (USD); A Acc (USD); A Dist (USD); I Acc (GBP); I Dist (GBP); A Acc (GBP); A Dist (GBP); I Acc (EUR);
Asia ex Japan Dividend Fund I Acc (USD); I Dist (USD); A Acc (USD); A Dist (USD); S Acc (USD); S Dist (USD); I Acc (GBP); I Dist (GBP); A Acc (GBP); A Dist (GBP); S Acc (GBP); S Dist (GBP); I Acc (EUR); S Acc (EUR);
China Dividend Fund I Acc (USD); I Dist (USD); A Acc (USD); A Dist (USD);
Pacific Tiger Fund
I Acc (USD); I Dist (USD); A Acc (USD); I Acc (GBP); I Dist (GBP); A Acc (GBP); I Acc (EUR); I Acc (JPY);
Asia Innovative Growth Fund I Acc (USD) ; S Acc (USD)1; I Acc (GBP);
China Fund I Acc (USD); A Acc (USD); S Acc (USD); I Acc (GBP); A Acc (GBP); S Acc (JPY);
India Fund I Acc (USD); A Acc (USD); S Acc (USD); I Acc (GBP); A Acc (GBP);
Japan Fund I Acc (USD); A Acc (USD); S Acc (USD); I Acc (USD) Hedged; I Acc (GBP); I Acc (EUR) Hedged; S Acc (EUR) Hedged2;
Asia Small Companies Fund I Acc (USD); A Acc (USD); I Acc (GBP); I Acc (EUR);
China Small Companies Fund I Acc (USD); A Acc (USD); S Acc (USD); I Acc (GBP); S Acc (GBP); A Acc (EUR)3; S Acc (EUR)3;
1 Commenced operations on 27 May 2021.2 Dormant since 24 July 2019.3 Commenced operations on 15 July 2021.
Each Sub-Fund may offer both accumulation (“Acc”) and distribution Shares (“Dist”). Unless otherwise provided for in the Fund’s Prospectus, in relation to Shares referenced as “Acc” Shares, no distributions will be made and all interests and other income earned by the Sub-Fund will be reflected in the Net Asset Value (“NAV”) of such Shares. In relation to Shares referenced as “Dist” Shares, it is the intention of the Board of Directors of the Fund to distribute substantially all the income earned on investments at least annually. All classes belonging to the same Sub-Fund will be commonly invested in adherence with the specific investment objective of the relevant Sub-Fund but may differ with regard to fee structure, minimum subscription amount, dividend policy or other particular features described in the Fund’s prospectus. All Classes of Shares except I Acc (JPY), S Acc (USD), S Dist (USD), S Acc (GBP), S Dist (GBP), S Acc (JPY), I Acc (GBP), I Dist (GBP), A Acc (GBP) and A Dist (GBP) are listed on Euro MTF.

global.matthewsasia.com 55
2. SUMMARY OF SIGNIFICANT ACCOUNTING POLICIES
A) PRESENTATION OF FINANCIAL STATEMENTS
The financial statements are prepared in accordance with Luxembourg law and regulations relating to UCITS and generally accepted accounting principles in Luxembourg.
B) COMBINED FINANCIAL STATEMENTS
The Combined Financial Statements equal the sum of the financial statements of all Sub-Funds.
The Combined Statement of Assets and Liabilities and Combined Statement of Operations and Changes in Net Assets are expressed in USD. The currency of all Sub-Funds is USD and therefore there is no currency translation adjustment.
C) VALUATION OF THE INVESTMENTS IN SECURITIES AND MONEY MARKET INSTRUMENTS
The Fund’s equity securities are valued based on market quotations or at fair value as determined in good faith by or under the direction of the Board of Directors of the Fund when no market quotations are available or when market quotations have become unreliable.
Market values for equity securities are determined based on the last sale price on the principal (or most advantageous) market on which the security is traded. If a reliable last sale price is not available, market values for equity securities are determined using the mean between the last available bid and ask price. Securities are valued through valuations obtained from a commercial pricing service or at the most recent mean of the bid and ask prices provided by investment dealers in accordance with the Fund’s Pricing Policies.
Securities that trade in over-the-counter markets, including most debt securities (bonds), may be valued by other third-party vendors or by using indicative bid quotations from dealers or market makers, or other available market information.
Events affecting the value of foreign investments may occur between the time at which they are determined and the Fund’s valuation point of 2:00 p.m. Luxembourg time. When such events occur, each Sub-Fund may apply a model-derived factor, as provided by an independent pricing service, to the closing price of equity securities traded on foreign securities exchanges. Notwithstanding the foregoing, the Fund may determine not to fair value securities where it believes that the impact of doing so would not have a material impact on the calculation of a Sub-Fund’s NAV on that day.
The Board of Directors of the Fund has delegated the fair value analysis and assessment to the Investment Manager’s Valuation Committee (the “Valuation Committee”), subject to the Fund’s Pricing and Valuation Policy and Procedures (the “Pricing Policies”). The Fund has retained third-party pricing services that may be utilized by the Valuation Committee under circumstances described in the Pricing Policies to provide fair value prices for certain securities held by the Fund. To propose the fair value price of the suspended securities, the Valuation Committee may use techniques such as analysis of the price movements of selected proxies / indices whose performance might indicate valuation changes of the suspended securities.
When fair value pricing is used, the prices of securities used by a Sub-Fund to calculate its Net Asset Value differ from quoted or published prices for the same securities for that day. All fair value determinations are made subject to the Board of Directors of the Fund’s oversight.
D) NET REALIZED GAIN/(LOSS) ON SALES OF INVESTMENTS AND CHANGE IN UNREALIZED GAIN/(LOSS) ON INVESTMENTS
Net realized gain or loss on sales of investments are calculated on the basis of first in first out cost method of the investments sold. At period end, holdings in securities have been valued at their last available prices on the main market for the relevant security. The net realized gain or loss and net change in unrealized gain or loss are included within the Statement of Operations and Changes in Net Assets.
E) FORWARD CURRENCY EXCHANGE CONTRACTS
A forward currency exchange contract is an agreement to buy or sell a specific amount of foreign currency at a certain rate, on or before a certain date. Outstanding forward currency exchange contracts are valued by reference to the forward rate of exchange applicable to the maturity of the contracts.
The unrealized gain and loss are shown in the Statement of Assets and Liabilities under “Unrealized gain on forward currency exchange contracts” and “Unrealized loss on forward currency exchange contracts.”
Net realized gain/(loss) and net change in unrealized gain/(loss) as a result thereof are included in the Statement of Operations and Changes in Net Assets under “Net realized gain/(loss) on forward currency exchange contracts” and “Net change in unrealized gain/(loss) on forward currency exchange contracts,” respectively.
Notes to Financial Statements (continued)
As at 30 September 2021

56 MATTHEWS ASIA FUNDS
2. SUMMARY OF SIGNIFICANT ACCOUNTING POLICIES (continued)
F) INTEREST RATE SWAP AGREEMENTS
An interest rate swap agreement is a bilateral agreement in which each party agrees to exchange a series of interest payments for another series for interest payments (usually fixed/floating) based on a notional amount that serves as a computation basis and that is usually not exchanged. Dirty pricing is utilized for all interest rate swap agreements where the floating rate index resets daily.
The unrealized gain and loss as shown in the Statement of Assets and Liabilities under “Unrealized gain on interest rate swap agreements” and “Unrealized loss on interest rate swap agreements.”
Net change in unrealized gain/(loss) as result thereof is included in the Statement of Operations and Changes in Net Assets under “Net change in unrealized gain/(loss) on interest rate swap agreements.”
In case of settlements of the interest rate swap agreements, the net realized gain/(loss) as a result thereof is included in the Statement of Operations and Changes in Net Assets under “Net realized gain/(loss) on interest rate swap agreement.”
G) CONVERSION OF FOREIGN CURRENCIES
The books and records of the Fund are maintained in USD.
Transactions denominated in foreign currencies are recorded at the current prevailing exchange rates on the transaction date. All assets and liabilities denominated in foreign currencies are translated into USD at the exchange rate as at 30 September 2021.
Conversion gains or losses resulting from changes in the exchange rate during the period and realized gains and losses on the settlement of foreign currency transactions are reported in the Statement of Operations and Changes in Net Assets for the current period.
The Fund does not isolate that portion of gains and losses on investments in equity securities that are due to changes in the foreign exchange rate from those that are due to changes in market prices of equity securities.
The accounting records and the financial statements of each Sub-Fund are expressed in USD.
Bank accounts, other net assets and market value of the investments in securities expressed in currencies other than the currency of a Sub-Fund are converted at the exchange rates prevailing on the date of the Statement of Assets and Liabilities. Income and expenses in currencies other than the currency of a Sub-Fund are converted at the rate of exchange prevailing at the transaction date.
Net realized gain and loss on foreign exchanges and net change in unrealized gain and loss on foreign exchanges represent: (i) foreign exchange gains and losses from the sale and holding of foreign currencies; (ii) gains and losses between trade date and settlement date on securities transactions and (iii) gains and losses arising from the difference between amounts of dividends and interest recorded and the amounts actually received.
H) COST OF INVESTMENTS IN SECURITIES
Cost of investments in securities in currencies other than the currency of a Sub-Fund is converted into the Sub-Fund’s currency at the exchange rate applicable at purchase date.
I) INCOME
Interest income is accrued on a daily basis and may include the amortization of premiums and accretions of discounts. Bank and time deposits interest income are recognized on an accrual basis.
Dividends are credited to income on the date upon which the relevant securities are first listed as ‘ex dividend’ provided that the amount of a dividend is known with reasonable certainty.
J) FEE WAIVER
The Investment Manager may, for such time as it considers appropriate, choose to waive all or part of the fees that it is entitled to receive, or to reimburse a Sub-Fund for other expenses, in order to reduce the impact such fees and expenses may have on the performance of the Share Class. The Investment Manager will reimburse on a monthly basis the amount of the fee waiver or expense reimbursement to the respective Sub-Fund. Fees that have been previously waived and expenses that have been previously reimbursed may be recovered by the Investment Manager.
The waived fees are settled monthly on a net basis with management and administration fees and therefore they are presented as one line item in the Statement of Assets and Liabilities under “Management fees and administration fees payable.”
The amounts of the fees waived for the current period is separately disclosed as “Fees Waived and Expenses Reimbursed” in the Statement of Operations and Changes in Net Assets.
K) USE OF ESTIMATES
The preparation of financial statements in conformity with generally accepted accounting principles requires management to make estimates and assumptions that affect the amounts reported in the financial statements and accompanying notes. Actual results may differ from those estimates.
Notes to Financial Statements (continued)
As at 30 September 2021

global.matthewsasia.com 57
3. EXCHANGE RATES
The exchange rates to 1 USD used in the financial statements as at 30 September 2021 are:
Australian Dollar (AUD) 1.3898 Hong Kong Dollar (HKD) 7.78860 Philippines Peso (PHP) 51.0100
Bangladesh Taka (BDT) 85.635 Indonesian Rupiah (IDR) 14,313 Singapore Dollar (SGD) 1.3608
Chinese Yuan Renminbi (CNH) 6.4695 Indian Rupee (INR) 74.2275 Thai Bhat (THB) 33.835
Chinese Yuan (CNY) 6.4622 Japanese Yen (JPY) 111.995 Taiwan New Dollar (TWD) 27.861
Euro (EUR) 0.8638 South Korean Won (KRW) 1,184.0 Vietnamese Dong (VND) 22,760
British Pound (GBP) 0.7435 Malaysian Ringgit (MYR) 4.18650
4. MANAGEMENT FEES AND ADMINISTRATION FEES
The Management Company receives an amount corresponding to the Management Company Fee, which may be up to 0.02% per annum of the NAV of the relevant Sub-Fund calculated on each Valuation Day. The fee is accrued daily and is payable monthly in arrears.
The Investment Manager receives an amount corresponding to the Management Fee, which may be up to 1.50% per annum of the NAV of the Sub-Fund calculated on each Valuation Day. The Management fees in the table represent the maximum effective fees paid to the Investment Manager.
Management Fees Share Classes
Asia Total Return Bond Fund
0.55% I Acc (USD); I Dist (USD);
0.65% S Dist (USD); S Acc (JPY);
1.20% A Acc (USD); A Dist (USD);
Asia Credit Opportunities Fund 0.55%
I Dist (USD); I Dist (GBP);
1.20% A Dist (USD);
Asia Dividend Fund
0.75%I Acc (USD); I Dist (USD); I Acc (GBP); I Dist (GBP); I Acc (EUR);
1.25%A Acc (USD); A Dist (USD); A Acc (GBP); A Dist (GBP);
Asia ex Japan Dividend Fund
0.75%I Acc (USD); I Dist (USD); S Acc (USD); S Dist (USD); I Acc (GBP); I Dist (GBP); S Acc (GBP); S Dist (GBP); I Acc (EUR); S Acc (EUR);
1.25%A Acc (USD); A Dist (USD); A Acc (GBP); A Dist (GBP);
China Dividend Fund 0.75% I Acc (USD); I Dist (USD);
1.25% A Acc (USD); A Dist (USD);
Pacific Tiger Fund
0.75%I Acc (USD); I Dist (USD); I Acc (GBP); I Dist (GBP); I Acc (JPY); I Acc (EUR);
1.25%A Acc (USD); A Acc (GBP);
Asia Innovative Growth Fund 0.75%I Acc (USD); S Acc (USD)*; I Acc (GBP);
China Fund
0.75%I Acc (USD); S Acc (USD); I Acc (GBP); S Acc (JPY);
1.25%A Acc (USD); A Acc (GBP);
India Fund
0.75%I Acc (USD); S Acc (USD); I Acc (GBP);
1.25%A Acc (USD); A Acc (GBP);
Japan Fund 0.75%
I Acc (USD); S Acc (USD); I Acc (USD) Hedged; I Acc (GBP); I Acc (EUR) Hedged;
1.25% A Acc (USD);
Notes to Financial Statements (continued)
As at 30 September 2021

58 MATTHEWS ASIA FUNDS
Notes to Financial Statements (continued)
As at 30 September 2021
4. MANAGEMENT FEES AND ADMINISTRATION FEES (continued)
Management Fees Share Classes
Asia Small Companies Fund 1.00%
I Acc (USD); I Acc (EUR); I Acc (GBP);
1.50% A Acc (USD);
China Small Companies Fund
1.00%I Acc (USD); S Acc (USD); I Acc (GBP); S Acc (GBP); S Acc (EUR)*;
1.50%A Acc (USD); A Acc (EUR)*;
* The details of the dates on which the share classes were launched during the reporting period are included in Note 1.
In addition, the Investment Manager receives an Administration Fee payable monthly in arrears, which may be up to 0.25% per annum of the NAV of the Sub-Fund calculated on each Valuation Day for each Share Class. The Administration Fee is for administrative services provided to each Sub-Fund.
5. DEPOSITARY AND ADMINISTRATIVE AGENT FEES
The Depositary and the Administrative Agent receive from the Fund aggregate fees that amount to a maximum of 2% per annum of the total net assets of each Sub-Fund. The fees effectively charged to each Sub-Fund are disclosed in the Statement of Operations and Changes in Net Assets of the Sub-Fund. The Depositary and Administrative Agent fees are payable monthly in arrears. Transaction costs are charged separately.
6. TRANSFER AGENCY FEES
The Transfer Agent receives a minimum annual fee of USD 3,000 per Sub-Fund. The fees effectively charged to each Sub-Fund are disclosed in the Statement of Operations and Changes in Net Assets of the Sub-Fund. The Transfer agency fees are payable monthly.
7. OTHER EXPENSES
The Fund bears its operational costs including but not limited to governmental fees, taxes, professional fees (legal and auditing), infrastructure fees, publishing and printing expenses, the cost of preparing the explanatory memoranda, financial reports and other documents for the Shareholders.
Professional fees are disclosed in the Statement of Operations and Changes in Net Assets of the Sub-Fund.
In addition to the fees paid to the Fund’s transfer agent, the relevant Sub-Funds bear the cost of fees paid to certain service providers, such as distributors or financial intermediaries, which provide transfer agency, record-keeping and shareholder servicing to certain shareholders. Such fees accrued to pay these service providers are a component of “accrued expenses and other payables” on the Statement of Assets and Liabilities as well as included in “other expenses” in the Statement of Operations and Changes in Net Assets.
8. COMPENSATION OF THE FUND’S IDENTIFIED STAFF
The Fund has no employees and has identified members whose professional activities have a material impact on its risk profile (the “Identified Staff”). The Fund’s Identified Staff is composed of the five members of its Board of Directors. Two members of the Board of Directors each receives fixed remuneration for their responsibilities. The three other directors are employees of the Investment Manager and do not receive additional compensation in respect of their roles as directors of the Fund.
None of the Identified Staff of the Fund receives any variable remuneration in exchange for professional services rendered to the Fund.
The aggregate compensation of the Fund’s Identified Staff, all of which is composed of fixed remuneration, for the period from 1 April 2021 to 30 September 2021 was EUR 30,192.
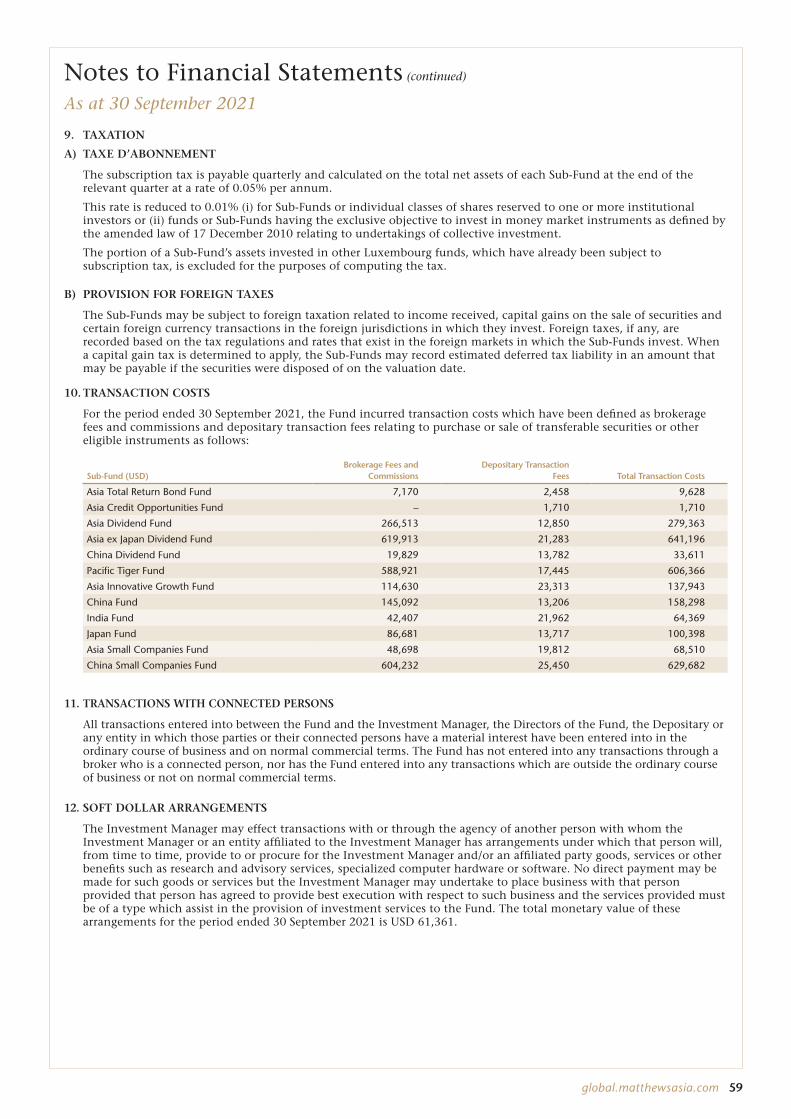
global.matthewsasia.com 59
9. TAXATION
A) TAXE D’ABONNEMENT
The subscription tax is payable quarterly and calculated on the total net assets of each Sub-Fund at the end of the relevant quarter at a rate of 0.05% per annum.
This rate is reduced to 0.01% (i) for Sub-Funds or individual classes of shares reserved to one or more institutional investors or (ii) funds or Sub-Funds having the exclusive objective to invest in money market instruments as defined by the amended law of 17 December 2010 relating to undertakings of collective investment.
The portion of a Sub-Fund’s assets invested in other Luxembourg funds, which have already been subject to subscription tax, is excluded for the purposes of computing the tax.
B) PROVISION FOR FOREIGN TAXES
The Sub-Funds may be subject to foreign taxation related to income received, capital gains on the sale of securities and certain foreign currency transactions in the foreign jurisdictions in which they invest. Foreign taxes, if any, are recorded based on the tax regulations and rates that exist in the foreign markets in which the Sub-Funds invest. When a capital gain tax is determined to apply, the Sub-Funds may record estimated deferred tax liability in an amount that may be payable if the securities were disposed of on the valuation date.
10. TRANSACTION COSTS
For the period ended 30 September 2021, the Fund incurred transaction costs which have been defined as brokerage fees and commissions and depositary transaction fees relating to purchase or sale of transferable securities or other eligible instruments as follows:
Sub-Fund (USD)Brokerage Fees and
CommissionsDepositary Transaction
Fees Total Transaction Costs
Asia Total Return Bond Fund 7,170 2,458 9,628
Asia Credit Opportunities Fund – 1,710 1,710
Asia Dividend Fund 266,513 12,850 279,363
Asia ex Japan Dividend Fund 619,913 21,283 641,196
China Dividend Fund 19,829 13,782 33,611
Pacific Tiger Fund 588,921 17,445 606,366
Asia Innovative Growth Fund 114,630 23,313 137,943
China Fund 145,092 13,206 158,298
India Fund 42,407 21,962 64,369
Japan Fund 86,681 13,717 100,398
Asia Small Companies Fund 48,698 19,812 68,510
China Small Companies Fund 604,232 25,450 629,682
11. TRANSACTIONS WITH CONNECTED PERSONS
All transactions entered into between the Fund and the Investment Manager, the Directors of the Fund, the Depositary or any entity in which those parties or their connected persons have a material interest have been entered into in the ordinary course of business and on normal commercial terms. The Fund has not entered into any transactions through a broker who is a connected person, nor has the Fund entered into any transactions which are outside the ordinary course of business or not on normal commercial terms.
12. SOFT DOLLAR ARRANGEMENTS
The Investment Manager may effect transactions with or through the agency of another person with whom the Investment Manager or an entity affiliated to the Investment Manager has arrangements under which that person will, from time to time, provide to or procure for the Investment Manager and/or an affiliated party goods, services or other benefits such as research and advisory services, specialized computer hardware or software. No direct payment may be made for such goods or services but the Investment Manager may undertake to place business with that person provided that person has agreed to provide best execution with respect to such business and the services provided must be of a type which assist in the provision of investment services to the Fund. The total monetary value of these arrangements for the period ended 30 September 2021 is USD 61,361.
Notes to Financial Statements (continued)
As at 30 September 2021

60 MATTHEWS ASIA FUNDS
Notes to Financial Statements (continued)
As at 30 September 2021
1 This Share Class is not authorized in Hong Kong, therefore disclosure of the portion paid out of distributable income and out of capital is not required.2 The Fund distributes dividends on a monthly basis.
13. DIVIDENDS
The Fund intends to declare and distribute dividends representing substantially all of the investment income attributable to distribution Shares. Dividends in respect of these Shares will normally be payable at least annually, will be declared in the currency of denomination of the relevant share class and will be recorded on ex-date. Interim dividends in respect of the distribution Shares of any particular Fund may be paid from the attributable net investment income and realized capital gains with a frequency and at such intervals as the Board of Directors of the Fund may decide.
The monthly distributing funds, which are Asia Total Return Bond Fund and Asia Credit Opportunities Fund, are based on a fixed factor determined at the beginning of the calendar year based on prevailing yields.
The Securities and Futures Commission of Hong Kong (“SFC”) requires disclosure of the composition of dividends distributed by SFC authorized funds. This disclosure includes the amount of the distribution per share as well as the portion of the dividend paid out of capital or effectively out of capital on a rolling twelve-month period.
The following dividend payments were made during the twelve months ended 30 September 2021:
Ex-DateDate of Dividend
PaymentDividend per
Share
Dividend Paid out of Net Distributable Income for
the period (%)
Dividend Paid out of Capital or Effectively Out
of Capital (%)
ASIA TOTAL RETURN BOND FUND2
I Dist (USD) 12/16/20 12/31/20 0.102933 n.a. 1 n.a. 1
I Dist (USD) 01/26/21 02/02/21 0.041983 n.a. 1 n.a. 1
I Dist (USD) 02/23/21 03/02/21 0.041983 n.a. 1 n.a. 1
I Dist (USD) 03/25/21 04/01/21 0.041983 n.a. 1 n.a. 1
I Dist (USD) 04/27/21 05/04/21 0.041983 n.a. 1 n.a. 1
I Dist (USD) 05/26/21 06/02/21 0.041983 n.a. 1 n.a. 1
I Dist (USD) 06/29/21 07/06/21 0.041983 n.a. 1 n.a. 1
I Dist (USD) 07/27/21 08/03/21 0.041983 n.a. 1 n.a. 1
I Dist (USD) 08/26/21 09/02/21 0.041983 n.a. 1 n.a. 1
I Dist (USD) 09/28/21 10/05/21 0.041983 n.a. 1 n.a. 1
A Dist (USD) 12/16/20 12/31/20 0.121055 n.a. 1 n.a. 1
A Dist (USD) 01/26/21 02/02/21 0.040471 n.a. 1 n.a. 1
A Dist (USD) 02/23/21 03/02/21 0.040471 n.a. 1 n.a. 1
A Dist (USD) 03/25/21 04/01/21 0.040471 n.a. 1 n.a. 1
A Dist (USD) 04/27/21 05/04/21 0.040471 n.a. 1 n.a. 1
A Dist (USD) 05/26/21 06/02/21 0.040471 n.a. 1 n.a. 1
A Dist (USD) 06/29/21 07/06/21 0.040471 n.a. 1 n.a. 1
A Dist (USD) 07/27/21 08/03/21 0.040471 n.a. 1 n.a. 1
A Dist (USD) 08/26/21 09/02/21 0.040471 n.a. 1 n.a. 1
A Dist (USD) 09/28/21 10/05/21 0.040471 n.a. 1 n.a. 1
S Dist (USD) 12/16/20 12/31/20 0.146799 n.a. 1 n.a. 1
S Dist (USD) 01/26/21 02/02/21 0.049133 n.a. 1 n.a. 1
S Dist (USD) 02/23/21 03/02/21 0.049133 n.a. 1 n.a. 1
S Dist (USD) 03/25/21 04/01/21 0.049133 n.a. 1 n.a. 1
S Dist (USD) 04/27/21 05/04/21 0.049133 n.a. 1 n.a. 1
S Dist (USD) 05/26/21 06/02/21 0.049133 n.a. 1 n.a. 1
S Dist (USD) 06/29/21 07/06/21 0.049133 n.a. 1 n.a. 1
S Dist (USD) 07/27/21 08/03/21 0.049133 n.a. 1 n.a. 1
S Dist (USD) 08/26/21 09/02/21 0.049133 n.a. 1 n.a. 1
S Dist (USD) 09/28/21 10/05/21 0.049133 n.a. 1 n.a. 1

global.matthewsasia.com 61
13. DIVIDENDS (continued)
Ex-DateDate of Dividend
PaymentDividend per
Share
Dividend Paid out of Net Distributable Income for
the period (%)
Dividend Paid out of Capital or Effectively Out
of Capital (%)
ASIA CREDIT OPPORTUNITIES FUND2
I Dist (USD) 12/16/20 12/31/20 0.148231 n.a. 1 n.a. 1
I Dist (USD) 01/26/21 02/02/21 0.043225 n.a. 1 n.a. 1
I Dist (USD) 02/23/21 03/02/21 0.043225 n.a. 1 n.a. 1
I Dist (USD) 03/25/21 04/01/21 0.043225 n.a. 1 n.a. 1
I Dist (USD) 04/27/21 05/04/21 0.043225 n.a. 1 n.a. 1
I Dist (USD) 05/26/21 06/02/21 0.043225 n.a. 1 n.a. 1
I Dist (USD) 06/29/21 07/06/21 0.043225 n.a. 1 n.a. 1
I Dist (USD) 07/27/21 08/03/21 0.043225 n.a. 1 n.a. 1
I Dist (USD) 08/26/21 09/02/21 0.043225 n.a. 1 n.a. 1
I Dist (USD) 09/28/21 10/05/21 0.043225 n.a. 1 n.a. 1
A Dist (USD) 12/16/20 12/31/20 0.143492 n.a. 1 n.a. 1
A Dist (USD) 01/26/21 02/02/21 0.041825 n.a. 1 n.a. 1
A Dist (USD) 02/23/21 03/02/21 0.041825 n.a. 1 n.a. 1
A Dist (USD) 03/25/21 04/01/21 0.041825 n.a. 1 n.a. 1
A Dist (USD) 04/27/21 05/04/21 0.041825 n.a. 1 n.a. 1
A Dist (USD) 05/26/21 06/02/21 0.041825 n.a. 1 n.a. 1
A Dist (USD) 06/29/21 07/06/21 0.041825 n.a. 1 n.a. 1
A Dist (USD) 07/27/21 08/03/21 0.041825 n.a. 1 n.a. 1
A Dist (USD) 08/26/21 09/02/21 0.041825 n.a. 1 n.a. 1
A Dist (USD) 09/28/21 10/05/21 0.041825 n.a. 1 n.a. 1
I Dist (GBP) 12/16/20 12/31/20 0.164011 n.a. 1 n.a. 1
I Dist (GBP) 01/26/21 02/02/21 0.047775 n.a. 1 n.a. 1
I Dist (GBP) 02/23/21 03/02/21 0.047775 n.a. 1 n.a. 1
I Dist (GBP) 03/25/21 04/01/21 0.047775 n.a. 1 n.a. 1
I Dist (GBP) 04/27/21 05/04/21 0.047775 n.a. 1 n.a. 1
I Dist (GBP) 05/26/21 06/02/21 0.047775 n.a. 1 n.a. 1
I Dist (GBP) 06/29/21 07/06/21 0.047775 n.a. 1 n.a. 1
I Dist (GBP) 07/27/21 08/03/21 0.047775 n.a. 1 n.a. 1
I Dist (GBP) 08/26/21 09/02/21 0.047775 n.a. 1 n.a. 1
I Dist (GBP) 09/28/21 10/05/21 0.047775 n.a. 1 n.a. 1
Notes to Financial Statements (continued)
As at 30 September 2021
1 This Share Class is not authorized in Hong Kong, therefore disclosure of the portion paid out of distributable income and out of capital is not required.2 The Fund distributes dividends on a monthly basis.

62 MATTHEWS ASIA FUNDS
Ex-DateDate of Dividend
PaymentDividend per
Share
Dividend Paid out of Net Distributable Income for
the period (%)
Dividend Paid out of Capital or Effectively Out
of Capital (%)
ASIA DIVIDEND FUND3
I Dist (USD) 12/16/20 12/31/20 0.049630 19.30% 80.70%
I Dist (USD) 03/25/21 04/01/21 0.102663 62.42% 37.58%
I Dist (USD) 06/29/21 07/06/21 0.101996 58.97% 41.03%
I Dist (USD) 09/28/21 10/05/21 0.087751 49.60% 50.40%
A Dist (USD) 12/16/20 12/31/20 0.047582 0.00% 100.00%
A Dist (USD) 03/25/21 04/01/21 0.105861 23.51% 76.49%
A Dist (USD) 06/29/21 07/06/21 0.097519 18.23% 81.77%
A Dist (USD) 09/28/21 10/05/21 0.086267 0.00% 100.00%
I Dist (GBP) 12/16/20 12/31/20 0.057081 20.05% 79.95%
I Dist (GBP) 03/25/21 04/01/21 0.123615 61.40% 38.60%
I Dist (GBP) 06/29/21 07/06/21 0.114482 58.76% 41.24%
I Dist (GBP) 09/28/21 10/05/21 0.096465 48.22% 51.78%
A Dist (GBP) 12/16/20 12/31/20 0.054102 0.00% 100.00%
A Dist (GBP) 03/25/21 04/01/21 0.132937 19.98% 80.02%
A Dist (GBP) 06/29/21 07/06/21 0.108185 18.51% 81.49%
A Dist (GBP) 09/28/21 10/05/21 0.096511 00.00% 100.00%
ASIA EX JAPAN DIVIDEND FUND3
I Dist (USD) 12/16/20 12/31/20 0.042714 19.27% 80.73%
I Dist (USD) 03/25/21 04/01/21 0.054417 10.68% 89.32%
I Dist (USD) 06/29/21 07/06/21 0.107058 53.29% 46.71%
I Dist (USD) 09/28/21 10/05/21 0.159330 69.63% 30.37%
A Dist (USD) 12/16/20 12/31/20 0.043903 0.00% 100.00%
A Dist (USD) 03/25/21 04/01/21 0.068428 0.00% 100.00%
A Dist (USD) 06/29/21 07/06/21 0.076755 8.71% 91.29%
A Dist (USD) 09/28/21 10/05/21 0.143135 39.67% 60.33%
S Dist (USD) 12/16/20 12/31/20 0.032248 n.a. 1 n.a. 1
S Dist (USD) 03/25/21 04/01/21 0.041035 n.a. 1 n.a. 1
S Dist (USD) 06/29/21 07/06/21 0.083283 n.a. 1 n.a. 1
S Dist (USD) 09/28/21 10/05/21 0.105390 n.a. 1 n.a. 1
I Dist (GBP) 12/16/20 12/31/20 0.050043 21.94% 78.06%
I Dist (GBP) 03/25/21 04/01/21 0.051993 8.36% 91.64%
I Dist (GBP) 06/29/21 07/06/21 0.115862 55.24% 44.76%
I Dist (GBP) 09/28/21 10/05/21 0.125234 67.01% 32.99%
A Dist (GBP) 12/16/20 12/31/20 0.029156 0.00% 100.00%
A Dist (GBP) 03/25/21 04/01/21 0.031598 0.00% 100.00%
A Dist (GBP) 06/29/21 07/06/21 0.063282 13.38% 86.62%
A Dist (GBP) 09/28/21 10/05/21 0.090495 40.45% 59.55%
S Dist (GBP) 12/16/20 12/31/20 0.033847 n.a. 1 n.a. 1
S Dist (GBP) 03/25/21 04/01/21 0.036917 n.a. 1 n.a. 1
S Dist (GBP) 06/29/21 07/06/21 0.074029 n.a. 1 n.a. 1
S Dist (GBP) 09/28/21 10/05/21 0.107216 n.a. 1 n.a. 1
CHINA DIVIDEND FUND4
I Dist (USD) 12/16/20 12/31/20 0.217152 80.87% 19.13%
I Dist (USD) 06/29/21 07/06/21 0.433961 89.15% 10.85%
A Dist (USD) 12/16/20 12/16/20 0.213554 68.21% 31.79%
A Dist (USD) 06/29/21 07/06/21 0.388594 80.17% 19.83%
PACIFIC TIGER FUND5
I Dist (USD) 12/16/20 12/31/20 0.173197 83.21% 16.79%
I Dist (GBP) 12/16/20 12/31/20 0.254699 83.52% 16.48%
Notes to Financial Statements (continued)
As at 30 September 2021
1 This Share Class is not authorized in Hong Kong, therefore disclosure of the portion paid out of distributable income and out of capital is not required.3 The Fund distributes dividends on a quarterly basis.4 The Fund distributes dividends on a semi-annual basis.5 The Fund distributes dividends on an annual basis.

global.matthewsasia.com 63
14. SWING PRICING
The Board of Directors of the Fund implemented a price adjustment policy in order to protect the interests of the Fund’s Shareholders. The purpose of the price adjustment policy is to allocate the costs associated with large inflows and outflows to investors transacting that day, thereby protecting the long-term Shareholders from the worst effects of dilution. It achieves this purpose by adjusting the price at which deals in a Sub-Fund are transacted. In other words, Sub-Funds’ prices may be adjusted up (when there are large net capital inflows) or down (when there are large net capital outflows) depending on the level and type of investor transactions on a particular day. In this way the existing and remaining Shareholders do not suffer an inappropriate level of dilution. The Fund will only trigger an adjustment in the price when there are net capital flows.
The Board of Directors of the Fund have applied partial swing pricing method for the period. Accordingly, rather than setting a single swing threshold with a single swing factor for each Sub-Fund, the Board of Directors of the Fund has chosen to deploy a more refined approach, with multiple thresholds and multiple factors. The application of swing pricing, the thresholds and factors may vary from Sub-Fund to Sub-Fund. If on any Valuation Day the aggregate transactions in Shares of a Sub-Fund result in a net increase or decrease of Shares which exceeds such threshold preset by the Board of Directors from time to time for that Sub-Fund (relating to the cost of market dealing for that Sub-Fund), the Net Asset Value of the Sub-Fund will be adjusted by an amount not exceeding 2% of that Net Asset Value, which reflects both the estimated fiscal charges and dealing costs that may be incurred by the Sub-Fund and the estimated bid/offer spread of the assets in which the Sub-Fund invests. Once an adjustment is made to the price, that price is the official price for that Sub-Fund for all deals that day.
Effective as of 10 August 2020, the Board of Directors of the Fund determined to only apply an adjustment in the price when there are net capital outflows to a Sub-Fund.
During the period ended 30 September 2021, India Fund and Asia Small Companies Fund have applied swing pricing.
Upon request, the Fund will also provide investors the impact of swing pricing on a day in which that investor has transacted, with an appropriate lag before such information is provided. Investors should be aware that the Board of Directors of the Fund may change the swing thresholds and swing factors at any time without notice to investors, so the information provided may not be indicative of the impact that swing pricing may have on future transactions in the shares of the Sub-Fund.
A periodic review is undertaken in order to verify the appropriateness of swing factor being applied.
15. FORWARD CURRENCY EXCHANGE CONTRACTS
As at 30 September 2021, Asia Total Return Bond Fund has outstanding forward currency exchange contracts as follows:
Currency Purchased
Amount Purchased Currency Sold Amount Sold Maturity Date Counterparty
Unrealized Gain/(Loss) USD % of Net Assets
Unrealized Gain on Forward Currency Exchange Contracts
CNY 7,879,200 USD 1,200,000 01/10/22 Merrill Lynch 8,071 0.01
CNY 10,241,110 USD 1,570,000 01/10/22 Merrill Lynch 209 0.00
Total Unrealized Gain on Forward Currency Exchange Contracts 8,280 0.01
Unrealized Loss on Forward Currency Exchange Contracts
USD 190,546 SGD 260,000 01/10/22 Merrill Lynch (477) (0.00)
CNY 2,605,600 USD 400,000 01/10/22 Merrill Lynch (499) (0.00)
USD 579,689 SGD 790,000 01/10/22 Merrill Lynch (727) (0.00)
USD 806,747 SGD 1,100,000 01/10/22 Merrill Lynch (1,426) (0.00)
PHP 70,854,000 USD 1,400,000 01/10/22 Merrill Lynch (26,506) (0.04)
SGD 5,390,000 USD 4,000,000 01/10/22 Merrill Lynch (39,950) (0.05)
KRW 8,073,410,000 USD 7,100,000 01/10/22 Merrill Lynch (296,819) (0.39)
Total Unrealized Loss on Forward Currency Contracts (366,404) (0.48)
Net Unrealized Loss on Forward Currency Exchange Contracts (358,124) (0.47)
Notes to Financial Statements (continued)
As at 30 September 2021

64 MATTHEWS ASIA FUNDS
15. FORWARD CURRENCY EXCHANGE CONTRACTS (continued)
As at 30 September 2021, China Dividend Fund has outstanding hedge share class forward currency exchange contracts as follows:
Currency Purchased
Amount Purchased Currency Sold Amount Sold Maturity Date Counterparty
Unrealized Gain/(Loss) USD % of Net Assets
Unrealized Loss on Forward Currency Exchange Contracts
HKD 126,975 USD 16,316 10/08/21 Brown Brothers Harriman & Co. New York
(13) (0.00)
Total Unrealized Loss on Forward Currency Contracts (13) (0.00)
Net Unrealized Loss on Forward Currency Exchange Contracts (13) (0.00)
As at 30 September 2021, Japan Fund has outstanding hedge share class forward currency exchange contracts as follows:
Currency Purchased
Amount Purchased
Currency Sold Amount Sold Maturity Date Counterparty Share Class
Unrealized Gain/(Loss) USD
% of Net Assets
Unrealized Gain on Forward Currency Exchange Contracts
USD 2,235,984 JPY 246,208,710 10/18/21 Brown Brothers Harriman & Co. New York
I Acc (USD) Hedged
37,374 0.02
USD 970,010 JPY 108,480,510 10/18/21 Brown Brothers Harriman & Co. New York
I Acc (USD) Hedged
1,294 0.00
Total Unrealized Gain on Forward Currency Exchange Contracts 38,668 0.02
Unrealized Loss on Forward Currency Exchange Contracts
EUR 9,313 JPY 1,208,469 10/18/21 Brown Brothers Harriman & Co. New York
I Acc (EUR) Hedged
(8) (0.00)
EUR 149,207 JPY 19,403,941 10/18/21 Brown Brothers Harriman & Co. New York
I Acc (EUR) Hedged
(496) (0.00)
Total Unrealized Loss on Forward Currency Contracts (504) (0.00)
Net Unrealized Gain on Forward Currency Exchange Contracts 38,164 0.02
16. INTEREST RATE SWAP AGREEMENTS
As at 30 September 2021, Asia Total Return Bond Fund has outstanding interest rate swap contracts as follows:
Nominal Amount CurrencyFixed Rate
% Settlement Date Counterparty Receive/PayFloating Rate
IndexUnrealized
Gain/(Loss) % of Net
Assets
115,000,000 THB 1.27 09/04/24 Bank of America Pay 6M THBFIX 59,379 0.08
7,000,000 MYR 3.30 06/19/24 Bank of America Pay 3M KLIBOR 40,177 0.05
24,000,000 THB 1.61 06/21/24 Bank of America Pay 6M THBFIX 18,948 0.02
Total Unrealized Gain on Interest Rate Swap Contracts 118,504 0.15
17. STATEMENT OF CHANGES IN SECURITIES PORTFOLIO
A copy of the changes in the securities portfolio for the period is available free of charge at the registered office of the Fund.
18. ADDITIONAL RISK FACTORS
Pandemics and other local, national, and international public health emergencies, such as the current outbreak of the novel coronavirus (“COVID-19”), can result, and in the case of COVID-19 is resulting, in market volatility and disruption, and negatively impact the national, regional or global economy and business activity in the countries in which the Fund invests and thereby adversely affect the performance of the Fund’s investments. The pandemic and the measures taken to contain and control COVID-19, including the development and roll out of vaccines globally, continue to affect economies and markets globally. While the full economic impact of the ongoing global outbreak of COVID-19 is presently uncertain, such future emergencies may materially adversely impact economic production, activity and securities markets in ways that cannot be predicted, all of which could result in substantial investment losses for the Fund.
19. SUBSEQUENT EVENTS
Management has evaluated the impact of all subsequent events on the Fund through the date the financial statements were issued, and has determined that there were no subsequent events that require recognition or disclosure in the financial statements.
Notes to Financial Statements (continued)
As at 30 September 2021

global.matthewsasia.com 65
Performance and Expenses As at 30 September 2021
Average Annual Total Return 1
3 months 1 year 3 years 5 years 10 yearsSince
Inception Inception Date
Portfolio Turnover
Ratio 2
Total Expense
Ratio 3
ASIA TOTAL RETURN BOND FUND
I Acc (USD) 0.08% 3.14% 5.18% 3.68% n.a. 3.56% 29 Aug 2014 39.12% 1.08%
I Dist (USD) 0.07% 3.06% 5.16% 3.67% n.a. 3.55% 29 Aug 2014 39.12% 1.12%
A Acc (USD) -0.16% 2.49% 4.60% 3.14% n.a. 3.02% 29 Aug 2014 39.12% 1.75%
A Dist (USD) -0.10% 2.50% 4.61% 3.14% n.a. 3.03% 29 Aug 2014 39.12% 1.75%
S Dist (USD) 0.07% 3.57% n.a. n.a. n.a. 6.53% 10 Dec 2018 39.12% 0.75%
S Acc (JPY) 1.44% n.a. n.a. n.a. n.a. 3.67% 22 Mar 2021 39.12% 0.75%
Markit iBoxx Asian Local Bond Index (USD)4, 5 -0.97% 1.36% 5.85% 3.26% n.a. 2.88%6
50% Markit iBoxx Asian Local Bond Index, 50% J.P. Morgan Asia Credit Index4, 5 -0.97% 1.04% 5.76% 3.43% n.a. 3.59%6
ASIA CREDIT OPPORTUNITIES FUND
I Dist (USD) 0.86% 2.36% 3.82% 2.99% n.a. 4.78% 30 Sept 2015 32.68% 1.25%
A Dist (USD) 0.73% 1.81% 3.29% 2.47% n.a. 4.26% 30 Sept 2015 32.68% 1.75%
I Dist (GBP) 3.99% -2.31% 2.76% 2.23% n.a. 6.92% 30 Sept 2015 32.68% 1.25%
J.P. Morgan Asia Credit Index (USD)5 -0.98% 0.69% 5.63% 3.57% n.a. 4.71%7
ASIA DIVIDEND FUND
I Acc (USD) -2.97% 15.32% 9.27% 9.60% 9.57% 8.18% 30 Apr 2010 25.30% 0.90%
I Dist (USD) -2.95% 15.30% 9.27% 9.60% 9.57% 8.41% 26 Aug 2010 25.30% 0.90%
A Acc (USD) -3.20% 14.28% 8.47% 8.87% 8.92% 7.78% 26 Aug 2010 25.30% 1.80%
A Dist (USD) -3.19% 14.29% 8.47% 8.87% 8.92% 7.78% 26 Aug 2010 25.30% 1.80%
I Acc (GBP) 0.00% 9.90% 8.13% 8.77% 11.19% 10.00% 28 Feb 2011 25.30% 0.90%
I Dist (GBP) 0.03% 9.96% 8.15% 8.80% 11.20% 10.00% 28 Feb 2011 25.30% 0.90%
A Acc (GBP) -0.19% 8.99% 7.38% 8.10% 10.55% 9.38% 28 Feb 2011 25.30% 1.80%
A Dist (GBP) -0.21% 8.94% 7.33% 8.06% 10.55% 9.36% 28 Feb 2011 25.30% 1.80%
I Acc (EUR) -0.29% 16.65% 9.32% n.a. n.a. 7.88% 15 May 2017 25.30% 0.90%
MSCI All Country Asia Pacific Index (USD)5 -4.30% 18.61% 8.82% 9.96% 8.59% 7.75%6
ASIA EX JAPAN DIVIDEND FUND
I Acc (USD) -6.12% 24.49% 18.50% 17.07% n.a. 17.14% 30 Nov 2015 21.58% 0.90%
I Dist (USD) -6.15% 24.47% 18.50% 17.06% n.a. 17.14% 30 Nov 2015 21.58% 0.90%
A Acc (USD) -6.34% 23.43% 17.62% 16.30% n.a. 16.38% 30 Nov 2015 21.58% 1.74%
A Dist (USD) -6.34% 23.44% 17.58% 16.27% n.a. 16.37% 30 Nov 2015 21.58% 1.74%
S Acc (USD) -6.07% 24.79% 18.95% n.a. n.a. 13.93% 13 Dec 2017 21.58% 0.75%
S Dist (USD) -6.08% 24.76% 18.96% n.a. n.a. 13.94% 13 Dec 2017 21.58% 0.75%
I Acc (GBP) -3.20% 18.77% 17.31% 16.22% n.a. 19.37% 30 Nov 2015 21.58% 0.90%
I Dist (GBP) -3.18% 18.79% 17.29% 16.20% n.a. 19.37% 30 Nov 2015 21.58% 0.90%
A Acc (GBP) -3.40% 17.79% n.a. n.a. n.a. 23.39% 31 Jul 2020 21.58% 1.72%
A Dist (GBP) -3.43% 17.70% n.a. n.a. n.a. 23.39% 31 Jul 2020 21.58% 1.71%
S Acc (GBP) -3.15% 18.91% 17.70% n.a. n.a. 13.71% 13 Dec 2017 21.58% 0.75%
S Dist (GBP) -3.19% 18.96% 17.70% n.a. n.a. 13.71% 13 Dec 2017 21.58% 0.75%
I Acc (EUR) -3.57% 25.93% n.a. n.a. n.a. 29.32% 31 Jul 2020 21.58% 0.90%
S Acc (EUR) -3.56% 26.10% n.a. n.a. n.a. 29.57% 31 Jul 2020 21.58% 0.75%
MSCI All Country Asia ex Japan Index (USD)5 -9.23% 14.73% 9.50% 10.44% n.a. 11.08%6
1 Annualised performance for periods of at least one year, otherwise cumulative.2 The Portfolio Turnover Ratio is calculated in accordance with the CSSF Circular 03/122 i.e. the aggregated sales and purchases less aggregated subscriptions and redemptions, divided by aver-
age net assets of the period/year. The portfolio turnover ratio may be negative as a result of shareholder transactions exceeding the investment transactions for the accounting period/year.3 The Total Expense Ratio includes such fees as the Management and Administration fee, Domiciliation, Administration and Transfer agency fees, Professional fees, Depositary fees and Taxe
d’abonnement. The Total Expense Ratio reported is for the 12 month period ended 30 September 2021 and is annualised for periods of less than 12 months.4 Effective 25 May 2020, the Sub-Fund changed its benchmark to a blended benchmark comprised of 50% Markit iBoxx Asian Local Bond Index and 50% J.P. Morgan Asia Credit Index. Prior
to 25 May 2020, the Sub-Fund’s benchmark was the Markit iBoxx Asian Local Bond Index. Matthews believes that the blended benchmark is more appropriate in light of the Sub-Fund’s current investment strategy.
5 Benchmarks are indicated for performance comparison only. Each Sub-Fund is actively managed and does not aim to replicate or track its benchmark. Consequently, the Investment Man-ager may freely select the securities in which it invests, and each Sub-Fund’s portfolio composition and performance may deviate materially from its benchmark.
6 Based on the Inception Date of the I Acc (USD) Share Class.7 Based on the Inception Date of the I Dist (USD) Share Class.

66 MATTHEWS ASIA FUNDS
Average Annual Total Return 1
3 months 1 year 3 years 5 years 10 yearsSince
Inception Inception Date
Portfolio Turnover
Ratio 2
Total Expense
Ratio 3
CHINA DIVIDEND FUND
I Acc (USD) -8.72% 14.99% 10.86% 11.68% n.a. 9.93% 31 Jan 2013 28.45% 1.00%
I Dist (USD) -8.69% 14.98% 10.84% 11.69% n.a. 9.93% 31 Jan 2013 28.45% 1.00%
A Acc (USD) -8.87% 14.13% 10.01% 10.93% n.a. 9.28% 31 Jan 2013 28.45% 1.80%
A Dist (USD) -8.86% 14.14% 10.01% 10.92% n.a. 9.29% 31 Jan 2013 28.45% 1.80%
MSCI China Index (USD)4 -18.13% -7.24% 6.09% 9.28% n.a. 6.27%5
PACIFIC TIGER FUND
I Acc (USD) -7.90% 19.88% 11.47% 10.11% 9.53% 8.20% 30 Apr 2010 29.30% 0.90%
I Dist (USD) -7.91% 19.85% 11.45% 10.10% n.a. 8.09% 31 Oct 2014 29.30% 0.90%
A Acc (USD) -8.09% 18.83% 10.65% 9.36% 8.87% 7.43% 26 Aug 2010 29.30% 1.79%
I Acc (GBP) -5.03% 14.31% 10.31% 9.30% 11.16% 10.05% 28 Feb 2011 29.30% 0.90%
I Dist (GBP) -5.01% 14.30% 10.32% 9.28% n.a. 10.80% 31 Oct 2014 29.30% 0.90%
A Acc (GBP) -5.24% 13.31% 9.50% 8.58% 10.49% 9.40% 28 Feb 2011 29.30% 1.79%
I Acc (EUR) -5.41% 21.18% n.a. n.a. n.a. 10.60% 30 Apr 2019 29.30% 0.90%
I Acc (JPY) -6.68% 26.99% 11.01% n.a. n.a. 11.23% 27 Mar 2017 29.30% 0.90%
MSCI All Country Asia ex Japan Index (USD)4 -9.23% 14.73% 9.50% 10.44% 8.80% 7.00%5
ASIA INNOVATIVE GROWTH FUND
I Acc (USD) -11.49% n.a. n.a. n.a. n.a. -7.60% 23 Mar 2021 180.16% 0.90%
S Acc (USD) -11.51% n.a. n.a. n.a. n.a. -7.70% 27 May 2021 180.16% 0.75%
I Acc (GBP) -8.76% n.a. n.a. n.a. n.a. -5.20% 23 Mar 2021 180.16% 0.90%
MSCI All Country Asia ex Japan Index (USD)4 -9.23% n.a. n.a. n.a. n.a. -6.82%5
CHINA FUND
I Acc (USD) -13.74% 6.92% 15.89% 16.02% 10.06% 7.77% 26 Feb 2010 29.81% 1.00%
A Acc (USD) -13.91% 6.07% 15.04% 15.27% 9.42% 6.91% 26 Aug 2010 29.81% 1.80%
S Acc (USD) -13.65% 7.25% n.a. n.a. n.a. 23.35% 30 Apr 2020 29.81% 0.75%
I Acc (GBP) -11.04% 2.01% 14.72% 15.18% 11.71% 9.20% 28 Feb 2011 29.81% 1.00%
A Acc (GBP) -11.22% 1.19% 13.85% 14.39% 11.03% 8.54% 28 Feb 2011 29.81% 1.80%
S Acc (JPY) -12.54% 13.58% n.a. n.a. n.a. 19.04% 18 Dec 2019 29.81% 0.75%
MSCI China Index (USD)4 -18.13% -7.24% 6.09% 9.28% 8.90% 6.13%5
INDIA FUND
I Acc (USD) 11.56% 58.31% 17.48% 12.27% 11.09% 8.62% 30 June 2011 26.21% 1.00%
A Acc (USD) 11.35% 57.00% 16.59% 11.51% 10.43% 7.98% 30 June 2011 26.21% 1.80%
S Acc (USD) 11.63% 58.65% 17.83% 12.64% n.a. 13.50% 5 Feb 2016 26.21% 0.75%
I Acc (GBP) 15.01% 50.90% 16.28% 11.43% 12.73% 10.49% 30 June 2011 26.21% 1.00%
A Acc (GBP) 14.78% 49.71% 15.37% 10.66% 12.06% 9.84% 30 June 2011 26.21% 1.80%
S&P Bombay Stock Exchange 100 Index (USD)4 12.23% 57.47% 17.65% 14.05% 10.49% 7.89%5
Performance and Expenses (continued) As at 30 September 2021
1 Annualised performance for periods of at least one year, otherwise cumulative.2 The Portfolio Turnover Ratio is calculated in accordance with the CSSF Circular 03/122 i.e. the aggregated sales and purchases less aggregated subscriptions and redemptions, divided by aver-
age net assets of the period/year. The portfolio turnover ratio may be negative as a result of shareholder transactions exceeding the investment transactions for the accounting period/year.3 The Total Expense Ratio includes such fees as the Management and Administration fee, Domiciliation, Administration and Transfer agency fees, Professional fees, Depositary fees and Taxe
d’abonnement. The Total Expense Ratio reported is for the 12 month period ended 30 September 2021 and is annualised for periods of less than 12 months.4 Benchmarks are indicated for performance comparison only. Each Sub-Fund is actively managed and does not aim to replicate or track its benchmark. Consequently, the Investment Man-
ager may freely select the securities in which it invests, and each Sub-Fund’s portfolio composition and performance may deviate materially from its benchmark.5 Based on the Inception Date of the I Acc (USD) Share Class.

global.matthewsasia.com 67
Performance and Expenses (continued) As at 30 September 2021
Average Annual Total Return 1
3 months 1 year 3 years 5 years 10 yearsSince
Inception Inception Date
Portfolio Turnover
Ratio 2
Total Expense
Ratio 3
JAPAN FUND
I Acc (USD) 5.61% 16.99% 10.06% 10.40% n.a. 10.01% 30 Apr 2015 28.06% 0.80%
A Acc (USD) 5.35% 16.06% 9.25% 9.68% n.a. 9.31% 30 Apr 2015 28.06% 1.60%
S Acc (USD) 5.63% 17.06% 10.23% 10.69% n.a. 11.80% 8 Jan 2016 28.06% 0.75%
I Acc (USD) Hedged 6.87% 24.07% 10.42% n.a. n.a. 13.15% 3 Apr 2017 28.06% 0.80%
I Acc (GBP) 8.88% 11.53% 8.88% 9.53% n.a. 12.33% 30 Apr 2015 28.06% 0.80%
I Acc (EUR) Hedged 6.85% 22.74% 8.37% n.a. n.a. 10.90% 3 Apr 2017 28.06% 0.80%
MSCI Japan Index (USD)4 4.70% 22.46% 7.93% 9.74% n.a. 7.33%5
ASIA SMALL COMPANIES FUND
I Acc (USD) 2.15% 47.90% 23.50% 16.04% n.a. 10.31% 30 Apr 2013 -19.91% 1.15%
A Acc (USD) 1.93% 46.55% 22.53% 15.24% n.a. 9.63% 30 Apr 2013 -19.91% 2.05%
I Acc (EUR) 5.32% 41.02% 22.26% 15.18% n.a. 14.28% 30 Dec 2020 -19.91% 1.15%
I Acc (GBP) 4.93% n.a. n.a. n.a. n.a. 27.70% 30 Apr 2014 -19.91% 1.15%
MSCI All Country Asia ex Japan Small Cap Index (USD)4 -1.68% 41.35% 13.80% 10.23% n.a. 6.34%5
CHINA SMALL COMPANIES FUND
I Acc (USD) -10.57% 16.28% 27.97% 22.48% n.a. 14.78% 29 Feb 2012 -4.28% 1.25%
A Acc (USD) -10.70% 15.43% 27.03% 21.69% n.a. 14.12% 29 Feb 2012 -4.28% 1.95%
S Acc (USD) -10.44% 16.86% 28.61% n.a. n.a. 19.83% 2 July 2018 -4.28% 0.75%
I Acc (GBP) -7.78% 10.86% n.a. n.a. n.a. 36.74% 30 Jun 2020 -4.28% 1.25%
S Acc (GBP) -7.65% 11.43% 27.33% n.a. n.a. 19.39% 14 May 2018 -4.28% 0.75%
A Acc (EUR) n.a. n.a. n.a. n.a. n.a. -9.00% 15 July 2021 -4.28% 2.05%
S Acc (EUR) n.a. n.a. n.a. n.a. n.a. -8.80% 15 July 2021 -4.28% 0.75%
MSCI China Small Cap Index (USD)4 12.34% 64.63% 6.03% 9.56% n.a. 6.65%5
1 Annualised performance for periods of at least one year, otherwise cumulative.2 The Portfolio Turnover Ratio is calculated in accordance with the CSSF Circular 03/122 i.e. the aggregated sales and purchases less aggregated subscriptions and redemptions, divided by aver-
age net assets of the period/year. The portfolio turnover ratio may be negative as a result of shareholder transactions exceeding the investment transactions for the accounting period/year.3 The Total Expense Ratio includes such fees as the Management and Administration fee, Domiciliation, Administration and Transfer agency fees, Professional fees, Depositary fees and Taxe
d’abonnement. The Total Expense Ratio reported is for the 12 month period ended 30 September 2021 and is annualised for periods of less than 12 months.4 Benchmarks are indicated for performance comparison only. Each Sub-Fund is actively managed and does not aim to replicate or track its benchmark. Consequently, the Investment Man-
ager may freely select the securities in which it invests, and each Sub-Fund’s portfolio composition and performance may deviate materially from its benchmark.5 Based on the Inception Date of the I Acc (USD) Share Class.

68 MATTHEWS ASIA FUNDS
As at 30 September 2021, the Sub-Funds do not hold any instruments falling into the scope of the Luxembourg Law of 6 June 2018 implementing the Securities Financing Transactions Regulation (EU) 2015/2365 (“SFT Regulation“).
Securities Financing Transactions Regulation (Unaudited)
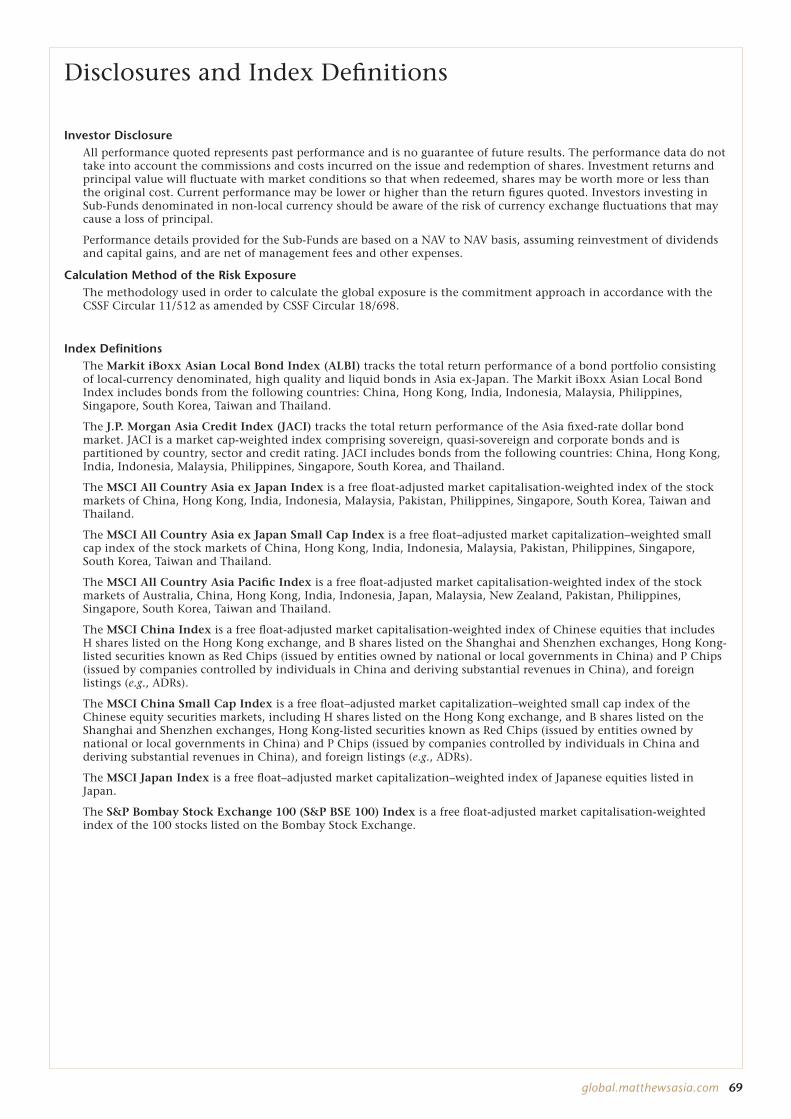
global.matthewsasia.com 69
Investor Disclosure All performance quoted represents past performance and is no guarantee of future results. The performance data do not
take into account the commissions and costs incurred on the issue and redemption of shares. Investment returns and principal value will fluctuate with market conditions so that when redeemed, shares may be worth more or less than the original cost. Current performance may be lower or higher than the return figures quoted. Investors investing in Sub-Funds denominated in non-local currency should be aware of the risk of currency exchange fluctuations that may cause a loss of principal.
Performance details provided for the Sub-Funds are based on a NAV to NAV basis, assuming reinvestment of dividends and capital gains, and are net of management fees and other expenses.
Calculation Method of the Risk Exposure The methodology used in order to calculate the global exposure is the commitment approach in accordance with the
CSSF Circular 11/512 as amended by CSSF Circular 18/698.
Index Definitions The Markit iBoxx Asian Local Bond Index (ALBI) tracks the total return performance of a bond portfolio consisting
of local-currency denominated, high quality and liquid bonds in Asia ex-Japan. The Markit iBoxx Asian Local Bond Index includes bonds from the following countries: China, Hong Kong, India, Indonesia, Malaysia, Philippines, Singapore, South Korea, Taiwan and Thailand.
The J.P. Morgan Asia Credit Index (JACI) tracks the total return performance of the Asia fixed-rate dollar bond market. JACI is a market cap-weighted index comprising sovereign, quasi-sovereign and corporate bonds and is partitioned by country, sector and credit rating. JACI includes bonds from the following countries: China, Hong Kong, India, Indonesia, Malaysia, Philippines, Singapore, South Korea, and Thailand.
The MSCI All Country Asia ex Japan Index is a free float-adjusted market capitalisation-weighted index of the stock markets of China, Hong Kong, India, Indonesia, Malaysia, Pakistan, Philippines, Singapore, South Korea, Taiwan and Thailand.
The MSCI All Country Asia ex Japan Small Cap Index is a free float–adjusted market capitalization–weighted small cap index of the stock markets of China, Hong Kong, India, Indonesia, Malaysia, Pakistan, Philippines, Singapore, South Korea, Taiwan and Thailand.
The MSCI All Country Asia Pacific Index is a free float-adjusted market capitalisation-weighted index of the stock markets of Australia, China, Hong Kong, India, Indonesia, Japan, Malaysia, New Zealand, Pakistan, Philippines, Singapore, South Korea, Taiwan and Thailand.
The MSCI China Index is a free float-adjusted market capitalisation-weighted index of Chinese equities that includes H shares listed on the Hong Kong exchange, and B shares listed on the Shanghai and Shenzhen exchanges, Hong Kong-listed securities known as Red Chips (issued by entities owned by national or local governments in China) and P Chips (issued by companies controlled by individuals in China and deriving substantial revenues in China), and foreign listings (e.g., ADRs).
The MSCI China Small Cap Index is a free float–adjusted market capitalization–weighted small cap index of the Chinese equity securities markets, including H shares listed on the Hong Kong exchange, and B shares listed on the Shanghai and Shenzhen exchanges, Hong Kong-listed securities known as Red Chips (issued by entities owned by national or local governments in China) and P Chips (issued by companies controlled by individuals in China and deriving substantial revenues in China), and foreign listings (e.g., ADRs).
The MSCI Japan Index is a free float–adjusted market capitalization–weighted index of Japanese equities listed in Japan.
The S&P Bombay Stock Exchange 100 (S&P BSE 100) Index is a free float-adjusted market capitalisation-weighted index of the 100 stocks listed on the Bombay Stock Exchange.
Disclosures and Index Definitions

global.matthewsasia.com G-SAR001-0921
©2021 Matthews Asia Funds (SICAV)