Semi-Annual Report and Unaudited Financial Statements
622
Semi-Annual Report and Unaudited Financial Statements For the financial period ended 31 May 2021 Dimensional Funds plc Authorised and Regulated by the Central Bank of Ireland
-
Upload
khangminh22 -
Category
Documents
-
view
0 -
download
0
Transcript of Semi-Annual Report and Unaudited Financial Statements

Semi-Annual Report andUnaudited Financial Statements
For the financial period ended 31 May 2021
Dimensional Funds plcAuthorised and Regulated by the Central Bank of Ireland

No marketing notification has been submitted in Germany for the following Funds of Dimensional Funds plc:
Emerging Markets Value II FundEuropean Core Equity FundGlobal Core Equity II FundGlobal Core Fixed Income FundGlobal Short Fixed Income II FundGlobal Value FundJapan Core Equity FundSterling Inflation Linked Intermediate Duration Fixed Income FundU.S. Core Equity FundU.S. Small Companies II FundU.S. Value Fund
Accordingly, these Funds must not be publicly marketed in Germany.

Table of Contents
General Information 2
Investment Manager’s Reports 3
Statement of Financial Position 9
Statement of Comprehensive Income 18
Statement of Changes in Net Assets Attributable to Holders of Redeemable Shares 27
Portfolio of Investments
Emerging Markets Large Cap Core Equity Fund 30
Emerging Markets Value Fund 40
Euro Inflation Linked Intermediate Duration Fixed Income Fund 65
European Small Companies Fund 66
European Value Fund 78
Global Core Equity Fund 81
Global Core Fixed Income Fund 145
Global Short Fixed Income Fund 152
Global Short-Term Investment Grade Fixed Income Fund 158
Global Small Companies Fund 164
Global Sustainability Core Equity Fund 215
Global Sustainability Fixed Income Fund 262
Global Targeted Value Fund 268
Global Ultra Short Fixed Income Fund 305
Global Value Fund 309
Pacific Basin Small Companies Fund 317
Sterling Inflation Linked Intermediate Duration Fixed Income Fund 340
U.S. Core Equity Fund 341
U.S. Small Companies Fund 356
World Allocation 20/80 Fund 371
World Allocation 40/60 Fund 373
World Allocation 60/40 Fund 374
World Allocation 80/20 Fund 426
World Equity Fund 427
Notes to the Financial Statements 526
Statement of Portfolio Changes 554
Securities Financing Transactions 582
Dimensional Fund Advisors Semi-Annual Report and Unaudited Financial Statements, 31 May 2021 1

Board of Directors:Peter Blessing (Irish)* **Nathan Lacaze (Italian & Australian)**Catherine L. Newell (American)**Victoria Parry (British)* **Gerard O’Reilly (Irish)**John Romiza (American)** ***
Investment Manager:Dimensional Fund Advisors Ltd.20 Triton StreetRegent’s PlaceLondon, NW1 3BFEngland
Investment Sub-Advisor:(All Funds)
Dimensional Fund Advisors LP6300 Bee Cave Road, Building 1Austin, TX 78746USA
Investment Sub-Advisor:(All Funds)
DFA Australia LimitedLevel 431 Macquarie PlaceSydney NSW 2000Australia
Investment Sub-Advisor:(All Funds)
Dimensional Fund Advisors Pte. Ltd.8 Marina ViewAsia Square Tower 1Suite 33-01Singapore 018960
Investment Sub-Advisor:(All Funds)
Dimensional Japan Ltd.Kokusai BuildingSuite 8083-1-1 MarunouchiChiyoda-kuTokyo 100–0005Japan
* Independent Directors** Non-executive Directors*** Chairperson
Independent Auditors:PricewaterhouseCoopersChartered Accountants and Statutory Audit FirmOne Spencer DockNorth Wall QuayDublin 1Ireland
Registered Office:25/28 North Wall QuayDublin 1Ireland
Administrator:State Street Fund Services (Ireland) Limited78 Sir John Rogerson’s QuayDublin 2Ireland
Depositary:State Street Custodial Services (Ireland) Limited78 Sir John Rogerson’s QuayDublin 2Ireland
Listing Sponsor:A&L Listing25/28 North Wall QuayDublin 1Ireland
Legal Advisers in Ireland:A&L GoodbodyInternational Financial Services CentreNorth Wall QuayDublin 1Ireland
Secretary:Goodbody Secretarial Limited25/28 North Wall QuayDublin 1Ireland
General Information
Dimensional Fund Advisors Semi-Annual Report and Unaudited Financial Statements, 31 May 2021 2

Emerging Markets Large Cap Core Equity FundThe Emerging Markets Large Cap Core Equity Fund (the “Fund”)
invests in large-cap companies with increased exposure to companies
with smaller relative market capitalisations, lower relative prices, and
higher profitability across emerging markets. As at 31 May 2021, the
Fund had holdings in approximately 1,150 companies. This reflects our
approach of seeking to deliver highly diversified exposure to emerging
markets large-cap companies.
Over the six-month period ending 31 May 2021, the total return of the
Fund in U.S. dollars (the base currency of the Fund) was 20.51%. This
compares to a total return of 15.15% for the MSCI Emerging Markets
Index (the "Index"). With low relative price (value) stocks outperforming
high relative price (growth) stocks, the Fund's greater emphasis on
value stocks contributed positively to relative performance. The Fund’s
greater emphasis on small- and mid-cap stocks also contributed
positively to relative performance, as small- and mid-cap stocks
outperformed large-cap stocks. The Index has been included for
market context purposes only.
Emerging Markets Value FundThe Emerging Markets Value Fund (the “Fund”) invests in low relative
price (value) companies across emerging markets. As at 31 May 2021,
the Fund had holdings in approximately 2,830 companies. This reflects
our approach of seeking to deliver highly diversified exposure to
emerging markets value companies.
Over the six-month period ending 31 May 2021, the total return of the
Fund in U.S. dollars (the base currency of the Fund) was 23.87%. This
compares to a total return of 20.09% for the MSCI Emerging Markets
Value Index (the "Index"). The Fund’s greater emphasis on low relative
price (value) stocks contributed positively to performance relative to
the Index, as these stocks generally outperformed. The Index has
been included for market context purposes only.
Euro Inflation Linked Intermediate Duration Fixed IncomeFundThe Euro Inflation Linked Intermediate Duration Fixed Income Fund
(the “Fund”) invests in EUR inflation linked issues of Eurozone
governments with maturities between three and twenty years. As at
31 May 2021, the Fund’s (EUR) average real yield to maturity was
-1.39%.
Over the six-month period ending 31 May 2021, the total return of the
Fund in euro (the base currency of the Fund) was 1.80%. This
compares to a return of 2.38% for the blended Index composed of 50%
Bloomberg Barclays France Government EMU HICP Linked 5-15 Year
Bond Index and 50% Bloomberg Barclays Germany Government
Inflation Linked 5-15 Year Index (the "Index"). Intermediate French
inflation-linked bonds, and intermediate German inflation-linked bonds
experienced positive returns for the period, with intermediate German
inflation-linked bonds outperforming their French counterparts. As
such, the Fund’s overweight to intermediate French inflation-linked
bonds and underweight to intermediate German inflation-linked bonds
detracted from relative performance. The Index has been included for
market context purposes only.
European Small Companies FundThe European Small Companies Fund (the “Fund”) invests in
small-cap companies across Europe. As at 31 May 2021, the Fund had
holdings in approximately 1,330 companies. This reflects our approach
of seeking to deliver highly diversified exposure to European small-cap
companies.
Over the six-month period ending 31 May 2021, the total return of the
Fund in euros (the base currency of the Fund) was 24.24%. This
compares to a return of 23.01% for the MSCI Europe Small Cap Index
(the "Index"). The Fund’s exclusion of stocks with the lowest
profitability and highest relative price contributed positively to
performance relative to the Index, as those securities underperformed.
The Fund’s greater emphasis on small-cap stocks and lesser
allocation to mid-cap stocks also contributed positively to relative
performance, as small-cap stocks outperformed mid-cap stocks held
by the Index. The Index has been included for market context purposes
only.
European Value FundThe European Value Fund (the “Fund”) invests in large-cap low relative
price (value) companies across Europe. As at 31 May 2021, the Fund
had holdings in approximately 180 companies. This reflects our
approach of seeking to deliver highly diversified exposure to European
large-cap value companies.
Over the six-month period ending 31 May 2021, the total return of the
Fund in euros (the base currency of the Fund) was 22.98%. Thiscompares to a return of 16.41% for the MSCI Europe Value Index (the"Index"). The Fund’s greater emphasis on low relative price (value)stocks contributed positively to relative performance, as these stocksgenerally outperformed. The Index has been included for marketcontext purposes only.
Global Core Equity FundThe Global Core Equity Fund (the “Fund”) invests in companies withincreased exposure to companies with smaller market capitalisations,lower relative prices, and higher profitability across developedmarkets. As at 31 May 2021, the Fund had holdings inapproximately 7,720 companies. This reflects our approach of seekingto deliver highly diversified exposure to developed marketscompanies.
Over the six-month period ending 31 May 2021, the total return of theFund in U.S. dollars (the base currency of the Fund) was 20.69%. Thiscompares to a total return of 16.11% for the MSCI World Index (the"Index"). With low relative price (value) stocks outperforming highrelative price (growth) stocks, the Fund’s greater emphasis on valuestocks contributed positively to relative performance. The Fund'sinclusion of and emphasis on small-cap stocks also contributedpositively to performance relative to the Index (which is primarilycomposed of large- and mid-cap stocks), as small-cap stocksoutperformed large-cap stocks. The Index has been included formarket context purposes only.
Global Core Fixed Income FundThe Global Core Fixed Income Fund (the “Fund”) invests in fixedincome instruments within the investment grade spectrum and mayalso invest in securities rated BB+ through BB-. As at 31 May 2021, theFund was diversified across issuers from 19 countries, as well as
Investment Manager’s Reports
Dimensional Fund Advisors Semi-Annual Report and Unaudited Financial Statements, 31 May 2021 3

Global Core Fixed Income Fund (continued)supranational organisations, and invested in 9 currencies. The
weighted average duration of the Fund at the end of May was at
7.33 years, and the Fund had an (GBP) average yield to maturity of
1.75%.
Over the six-month period ending 31 May 2021, the total return of the
Fund in British pounds (the base currency of the Fund) was -2.34%.
This compares to a return of -1.82% for the Bloomberg Barclays Global
Aggregate Bond Index (hedged to GBP) (the "Index"). Yield curves
were upwardly sloped along the intermediate- to long-maturity
segments in many developed markets at the beginning of the period,
indicating positive expected term premiums. As such, the Fund was
underweight short-term bonds and overweight intermediate-term
Australian dollar-, British pound-, Canadian dollar-, and US
dollar-denominated bonds. Yield curves, however, generally
steepened during the period as intermediate- and long-term interest
rates increased. As a result, realised term premiums were generally
negative with longer-term bonds underperforming their shorter-term
counterparts. The Fund’s underweight to shorter-term bonds and
overweight to intermediate-term Australian dollar-, British pound-,
Canadian dollar-, and US dollar-denominated bonds detracted from
relative performance.
Realised credit premiums were generally positive across developed
markets for the period as corporate bonds outperformed government
bonds. As such, the Fund’s overweight to corporate bonds rated BBB,
and inclusion of corporate bonds rated BB contributed positively to
relative performance. However, the Fund’s exclusion of securitized
bonds detracted from relative performance.
The Fund’s underweight to Japanese-yen denominated bonds also
detracted from relative performance. The Index has been included for
market context purposes only.
Global Short Fixed Income FundThe Global Short Fixed Income Fund (the “Fund”) invests in
high-quality fixed income instruments with maturities at or below five
years. As at 31 May 2021, the Fund was diversified across issuers from
18 countries, as well as supranational organisations. Investments were
made in 8 currencies. As at 31 May 2021, the Fund’s (EUR) average
yield to maturity was 0.09%.
Over the six-month period ending 31 May 2021, the total return of theFund in Euro (the base currency of the Fund) was -0.15%. Thiscompares to a return of -0.55% for the FTSE World Government BondIndex 1-5 Years (hedged to EUR) (the "Index"). Global developed yieldcurves were generally flat along their short-term segments at thebeginning of the period but generally steepened toward the end of theperiod, producing increasingly positive expected term premiums. Assuch, the Fund’s duration was maintained at the shorter-end of itseligible range from the beginning to middle of the period and increasedtoward the end of the period. As at the end of May, the Fund’s weightedaverage duration was 3.5 years whereas the Index’s weighted averageduration was 2.8 years. Realised term premiums were generallynegative in developed markets as longer-term bonds underperformedshorter-term bonds. As such, the Fund’s shorter duration during mostof the period relative to its Index contributed positively to relativeperformance. The Index has been included for market contextpurposes only.
Global Short-Term Investment Grade Fixed Income FundThe Global Short-Term Investment Grade Fixed Income Fund (the
“Fund”) invests in high-quality fixed income instruments with maturities
at or below five years. As at 31 May 2021, the Fund was diversified
across issuers from 18 countries, as well as supranational
organisations. Investments were made in 7 currencies. As at 31 May
2021, the Fund’s (USD) average yield to maturity was 0.85%.
Over the six-month period ending 31 May 2021, the total return of theFund in U.S. dollars (the base currency of the Fund) was 0.52%. Thiscompares to a return of 0.54% for the Bloomberg Barclays GlobalAggregate Credit 1-5 Years (hedged to USD) (the "Index"). Globaldeveloped yield curves were generally flat along their short-termsegments at the beginning of the period but generally steepenedtoward the end of the period, producing increasingly positive expectedterm premiums. As such, the Fund’s duration was maintained at theshorter-end of its eligible range from the beginning to middle of theperiod and increased toward the end of the period. As at the end ofMay, the Fund’s weighted average duration was 2.4 years whereas theIndex’s weighted average duration was 2.9 years. Realised termpremiums were generally negative in developed markets aslonger-term bonds underperformed shorter-term bonds. As such, theFund’s underweight to longer-term euro- and U.S. dollar-denominatedgovernment bonds and overweight to shorter-term bonds contributedpositively to relative performance. The Index has been included formarket context purposes only.
Global Small Companies FundThe Global Small Companies Fund (the “Fund”) invests in small-capcompanies across developed markets. As at 31 May 2021, the Fundhad holdings in approximately 6,090 companies. This reflects ourapproach of seeking to deliver highly diversified exposure to small-capcompanies in developed markets.
Over the six-month period ending 31 May 2021, the total return of theFund in U.S. dollars (the base currency of the Fund) was 25.94%. Thiscompares to a return of 23.08% for the MSCI World Small Cap Index(the "Index"). The Fund’s greater emphasis on small-cap stocks andlesser allocation to mid-cap stocks contributed positively to relativeperformance, as small-cap stocks outperformed mid-cap stocks heldby the Index. The Fund’s exclusion of stocks with the lowestprofitability and highest relative price also contributed positively torelative performance, as those securities underperformed. The Indexhas been included for market context purposes only.
Global Sustainability Core Equity FundThe Global Sustainability Core Equity Fund (the “Fund”) invests incompanies with increased exposure to companies with smaller marketcapitalisations, lower relative prices, and higher profitability acrossdeveloped markets, while also adjusting the composition of the Fundbased on environmental and sustainability impact considerations. Asat 31 May 2021, the Fund had holdings inapproximately 5,560 companies. This reflects our approach of seekingto deliver highly diversified exposure to developed marketscompanies.
Over the six-month period ending 31 May 2021, the total return of theFund in U.S. dollars (the base currency of the Fund) was 19.34%. Thiscompares to a total return of 16.11% for the MSCI World Index (the"Index"). With low relative price (value) stocks outperforming highrelative price (growth) stocks, the Fund’s greater emphasis on value
Investment Manager’s Reports (continued)
Dimensional Fund Advisors Semi-Annual Report and Unaudited Financial Statements, 31 May 2021 4

Global Sustainability Core Equity Fund (continued)stocks contributed positively to relative performance. The Fund's
inclusion of and emphasis on small-cap stocks also contributed
positively to performance relative to the Index (which is primarily
composed of large- and mid-cap stocks), as small-cap stocks
outperformed large-cap stocks. The Index has been included for
market context purposes only.
Global Sustainability Fixed Income FundThe Global Sustainability Fixed Income Fund (the “Fund”) invests in
fixed income instruments within the investment grade spectrum withmaturities at or below 15 years. As at 31 May 2021, the Fund wasdiversified across issuers from 21 countries, as well as supranationalorganisations, and invested in 9 currencies. The weighted averageduration of the Fund at the end of May was 7.38 years, and the Fundhad an (GBP) average yield to maturity of 1.73%.
Over the six-month period ending 31 May 2021, the total return of theFund in British pounds (the base currency of the Fund) was -2.54%.This compares to a return of -1.82% for the Bloomberg Barclays GlobalAggregate Bond Index (hedged to GBP) (the "Index").
Yield curves were upwardly sloped along the intermediate- tolong-maturity segments in many developed markets at the beginningof the period, indicating positive expected term premiums. As such, theFund was underweight short-term bonds and overweightintermediate-term Australian dollar-, British pound-, Canadian dollar-,and US dollar-denominated bonds. Yield curves, however, generallysteepened during the period as intermediate- and long-term interestrates increased. As a result, realised term premiums were generallynegative with longer-term bonds underperforming their shorter-termcounterparts. The Fund’s underweight to shorter-term bonds andoverweight to intermediate-term Australian dollar-, British pound-,Canadian dollar-, and US dollar-denominated bonds detracted fromrelative performance.
Realised credit premiums were generally positive across developedmarkets for the period as corporate bonds outperformed governmentbonds. As such, the Fund’s overweight to corporate bonds rated BBBcontributed positively to relative performance. However, the Fund’sexclusion of securitized bonds detracted from relative performance.
The Fund’s underweight to Japanese-yen denominated bonds alsodetracted from relative performance. The Index has been included formarket context purposes only.
Global Targeted Value FundThe Global Targeted Value Fund (the “Fund”) invests in small- andmid-cap low relative price (value) companies across developedmarkets. As at 31 May 2021, the Fund had holdings inapproximately 4,350 companies. This reflects our approach of seekingto deliver highly diversified exposure to small- and mid-cap developedmarkets value companies.
Over the six-month period ending 31 May 2021, the total return of theFund in U.S. dollars (the base currency of the Fund) was 34.17%. Thiscompares to a total return of 25.42% for the MSCI World SMID ValueIndex (the "Index"). The Fund’s greater emphasis on the low relativeprice (value) stocks contributed positively to relative performance, asthese stocks generally outperformed high relative price (growth)stocks. The Fund's greater emphasis on small- and micro-cap stocks
and lesser allocation to mid-cap stocks also contributed positively to
relative performance, as small- and micro-cap value stocks
outperformed mid-cap value stocks. At the sector level, the Fund’s
general exclusion of real estate investment trusts (REITs) and highly
regulated utilities had a positive impact on relative performance, as
REITs and utilities underperformed the overall Index. The Index has
been included for market context purposes only.
Global Ultra Short Fixed Income FundThe Global Ultra Short Fixed Income Fund (the “Fund”) invests inhigh-quality fixed income instruments with maturities up to two years.As at 31 May 2021, the Fund’s (GBP) average yield to maturity was0.36%.
Over the six-month period ending 31 May 2021, the total return of theFund in British pounds (the base currency of the Fund) was 0.09%.This compares to a return of 0.02% for the ICE BofA British Pound1-Month Deposit Offered Rate Constant Maturity Index (the "Index").Global developed yield curves were generally flat along theirultra-short-term segments at the beginning of the period but generallysteepened toward the end of the period, producing increasinglypositive expected term premiums. As such, the Fund’s duration wasincreased from 0.60 year to 0.78 year at the end of the period. Realisedcredit premiums were generally positive for the period as corporatebonds outperformed government bonds. As such, the Fund’s inclusionof corporate bonds rated single-A and BBB was the primary contributorto relative performance as corporate bonds outperformed the baserate Index. The Index has been included for market context purposesonly.
Global Value FundThe Global Value Fund (the “Fund”) invests in large-cap low relativeprice (value) companies across developed markets. As at 31 May2021, the Fund had holdings in approximately 740 companies. Thisreflects our approach of seeking to deliver highly diversified exposureto large-cap value companies in developed markets.
Over the six-month period ending 31 May 2021, the total return of theFund in U.S. dollars (the base currency of the Fund) was 25.11%. Thiscompares to a return of 20.48% for the MSCI World Value Index (the"Index"). The Fund’s greater emphasis on low relative price (value)stocks contributed positively to relative performance, as these stocksoutperformed. The Fund’s greater emphasis on small- and mid-capstocks also contributed positively to relative performance, as small-and mid-cap stocks outperformed large-cap stocks. At the sector level,the Fund’s general exclusion of highly regulated utilities alsocontributed positively to relative performance, as utilitiesunderperformed the overall index. The Index has been included formarket context purposes only.
Pacific Basin Small Companies FundThe Pacific Basin Small Companies Fund (the “Fund”) invests insmall-cap companies across Pacific Basin markets. As at 31 May2021, the Fund had holdings in approximately 2,750 companies. Thisreflects our approach of seeking to deliver highly diversified exposureto Pacific Basin small-cap companies.
Over the six-month period ending 31 May 2021, the total return of theFund in U.S. dollars (the base currency of the Fund) was 12.40%. Thiscompares to a total return of 9.13% for the MSCI Pacific Small CapIndex (the "Index"). The Fund’s inclusion of Korea and Taiwan
Investment Manager’s Reports (continued)
Dimensional Fund Advisors Semi-Annual Report and Unaudited Financial Statements, 31 May 2021 5

Pacific Basin Small Companies Fund (continued)contributed positively to relative performance, as stocks from those
countries outperformed. The Fund’s exclusion of stocks with the lowest
profitability and highest relative price also contributed positively to
performance relative to the Index, as those securities underperformed.
The Index has been included for market context purposes only.
Sterling Inflation Linked Intermediate Duration FixedIncome FundThe Sterling Inflation Linked Intermediate Fund (the “Fund”) invests in
sterling inflation linked issues of the U.K. government with maturities
between three and twenty years. As at 31 May 2021, the Fund’s (GBP)
average real yield to maturity was -2.58%.
Over the six-month period ending 31 May 2021, the total return of the
Fund in British pounds (the base currency of the Fund) was -1.65%.
This compares to the return of -1.64% for the Bloomberg Barclays UK
Government Inflation Linked 5-15 Year Bond Index (the "Index").
Realised real term premiums were generally negative in British pound
inflation-linked bonds for the period as longer-term inflation-linked
bonds underperformed their shorter-term counterparts. As such, the
Fund’s allocation to inflation-linked bonds in the three- to four-year
maturity range contributed positively to performance relative to the
five- to 15-year Index. Conversely, the Fund’s allocation to
inflation-linked bonds in the fifteen- to twenty-year maturity range,
detracted from performance relative to the five to 15-year Index. The
Index has been included for market context purposes only.
U.S. Core Equity FundThe U.S. Core Equity Fund (the “Fund”) invests in U.S. companies with
increased exposure to companies with smaller market capitalisations,
lower relative prices, and higher profitability. As at 31 May 2021, the
Fund had holdings in approximately 1,740 companies. This reflects our
approach of seeking to deliver highly diversified exposure to
U.S. companies.
Over the six-month period ending 31 May 2021, the total return of the
Fund in U.S. dollars (the base currency of the Fund) was 22.95%. This
compares to a total return of 17.15% for the Russell 3000 Index (the
"Index"). With low relative price (value) stocks outperforming high
relative price (growth) stocks, the Fund’s greater emphasis on value
stocks contributed positively to relative performance. The Fund's
greater emphasis on small-cap stocks also contributed positively to
performance relative to the Index, as small-cap stocks outperformed
large-cap stocks. The Index has been included for market context
purposes only.
U.S. Small Companies FundThe U.S Small Companies Fund (the “Fund”) invests in U.S. small
companies. As at 31 May 2021, the Fund had holdings in
approximately 1,760 companies. This reflects our approach of seeking
to deliver highly diversified exposure to U.S. small companies.
Over the six-month period ending 31 May 2021, the total return of theFund in U.S. dollars (the base currency of the Fund) was 34.93%. Thiscompares to a total return of 25.10% for the Russell 2000 Index (the"Index"). The Fund’s exclusion of stocks with the lowest profitabilityand highest relative price contributed positively to relativeperformance, as those securities underperformed. The Fund’s
exclusion of stocks with high asset growth also contributed positively to
relative performance, as those securities underperformed. The Index
has been included for market context purposes only.
World Allocation 20/80 FundThe World Allocation 20/80 Fund (the “Fund”) invests in equity
securities of companies across developed and emerging markets and
fixed income securities of issuers in developed markets. The equity
component of the Fund will generally have increased exposure to
companies with smaller market capitalisations, lower relative prices,
and higher profitability. The fixed income component generally invests
in high-quality fixed income issues with maturities at or below fiveyears. The aggregate exposure to equity and fixed income securities isapproximately 20% and 80%, respectively.
As at 31 May 2021, the equity component of the Fund had holdings inapproximately 13,110 companies. This reflects our approach ofseeking to deliver highly diversified holdings in developed andemerging markets companies.
As at 31 May 2021, the total return of the World Allocation 20/80 Fundin British pounds (the base currency of the Fund) was 2.83%. Thiscompares to a return of 1.57% for the 20% MSCI All Country WorldIndex /80% FTSE World Government Bond Index 1-5 Years (the"Index"). With low relative price (value) stocks outperforming highrelative price (growth) stocks, the equity component’s greateremphasis on value stocks contributed positively to relativeperformance. The equity component’s inclusion of and emphasis onsmall-cap stocks also contributed positively to performance relative tothe Index (which is composed primarily of large- and mid-cap stocks),as small-cap stocks outperformed large-cap stocks.
As at 31 May 2021, the fixed income component of the WorldAllocation 20/80 Fund was diversified across approximately 721 bondsfrom 21 different countries as well as supranational organisations.
Global developed yield curves were generally flat along their short- tointermediate-term segments at the beginning of the period butgenerally steepened toward the end of the period, producingincreasingly positive expected term premiums. As such, the Fund’sduration was increased toward the end of period but remained shorterrelative to the Index. As at the end of May, the Fund’s weightedaverage duration was 2.18 years whereas the Index’s weightedaverage duration was 2.84 years. Realised term premiums weregenerally negative in developed markets as longer-term bondsunderperformed shorter-term bonds. As such, the Fund’s shorterduration relative to its Index contributed positively to relativeperformance. Realised credit premiums were generally positive inglobal developed markets for the six-month period. As such the Fund’sexposure to euro- and US-dollar denominated corporate bondscontributed positively to relative performance. The Index has beenincluded for market context purposes only.
World Allocation 40/60 FundThe World Allocation 40/60 Fund (the “Fund”) invests in equitysecurities of companies across developed and emerging markets andfixed income securities of issuers in developed markets. The equitycomponent of the Fund will generally have increased exposure tocompanies with smaller market capitalisations, lower relative prices,and higher profitability. The fixed income component generally investsin fixed income instruments with maturities at or below fifteen years
Investment Manager’s Reports (continued)
Dimensional Fund Advisors Semi-Annual Report and Unaudited Financial Statements, 31 May 2021 6

World Allocation 40/60 Fund (continued)within the investment grade spectrum and may also invest in securities
rated BB+ through BB-. The aggregate exposure to equity and fixed
income securities is approximately 40% and 60%, respectively.
As at 31 May 2021, the equity component of the World Allocation
40/60 Fund had holdings in approximately 15,120 companies. This
reflects our approach of seeking to deliver highly diversified exposure
to developed and emerging markets companies.
As at 31 May 2021, the total return of the Fund in British pounds (the
base currency of the Fund) was 5.73%. This compares to a return of
3.38% for the 40% MSCI All Country World Index / 60% FTSE World
Government Bond Index 1-5 Years (the "Index"). With low relative price
(value) stocks outperforming high relative price (growth) stocks, the
equity component’s greater emphasis on value stocks contributedpositively to relative performance. The equity component’s inclusion ofand emphasis on small-cap stocks also contributed positively toperformance relative to the Index (which is composed primarily oflarge- and mid-cap stocks), as small-cap stocks outperformedlarge-cap stocks.
As at 31 May 2021, the fixed income component of the WorldAllocation 40/60 Fund was diversified acrossapproximately 1,165 bonds from 22 different countries as well assupranational organisations.
Global developed yield curves were generally flat along their short- tointermediate-term segments at the beginning of the period butgenerally steepened toward the end of the period, producingincreasingly positive expected term premiums. As such, the Fund’sduration was maintained at the shorter-end of its eligible range fromthe beginning to middle of the period and increased toward the end ofthe period. As at the end of May, the Fund’s weighted average durationwas 2.85 years whereas the Index’s weighted average duration was2.84 years. Realised term premiums were generally negative indeveloped markets as longer-term bonds underperformedshorter-term bonds. As such, the Fund’s shorter duration during mostof the period relative to its Index contributed positively to relativeperformance. Realised credit premiums were generally positive inglobal developed markets for the six-month period. As such, the Fund’sexposure to euro- and US-dollar denominated corporate bondscontributed positively to relative performance. The Index has beenincluded for market context purposes only.
World Allocation 60/40 FundThe World Allocation 60/40 Fund (the “Fund”) invests in equitysecurities of companies across developed and emerging markets andfixed income securities of issuers in developed markets. The equitycomponent of the Fund will generally have increased exposure tocompanies with smaller market capitalisations, lower relative prices,and higher profitability. The fixed income component generally investsin fixed income instruments with maturities at or below fifteen yearswithin the investment grade spectrum and may also invest in securitiesrated BB+ through BB-. The aggregate exposure to equity and fixedincome securities is approximately 60% and 40%, respectively.
As at 31 May 2021, the equity component of the Fund had holdings inapproximately 12,950 companies. This reflects our approach ofseeking to deliver a highly diversified exposure to developed andemerging markets companies.
As at 31 May 2021, the total return of the World Allocation 60/40 Fund
in British pounds (the base currency of the Fund) was 8.43%. This
compares to a return of 5.22% for the 60% MSCI All Country World
Index / 40% FTSE World Government Bond Index 1-5 Years (the
"Index"). With low relative price (value) stocks outperforming high
relative price (growth) stocks, the equity component’s greater
emphasis on value stocks contributed positively to relative
performance. The equity component’s inclusion of and emphasis on
small-cap stocks also contributed positively to performance relative to
the Index (which is composed primarily of large- and mid-cap stocks),
as small-cap stocks outperformed large-cap stocks.
As at 31 May 2021, the fixed income component of the World
Allocation 60/40 Fund was diversified across
approximately 1,165 bonds from 22 different countries as well as
supranational organisations.
Global developed yield curves were generally flat along their short- to
intermediate-term segments at the beginning of the period but
generally steepened toward the end of the period, producing
increasingly positive expected term premiums. As such, the Fund’s
duration was maintained at the shorter-end of its eligible range from
the beginning to middle of the period and increased toward the end of
the period. As at the end of May, the Fund’s weighted average duration
was 3.43 years whereas the Index’s weighted average duration was
2.84 years. Realised term premiums were generally negative in
developed markets as longer-term bonds underperformed
shorter-term bonds. As such, the Fund’s shorter duration during most
of the period relative to its Index contributed positively to relative
performance. Realised credit premiums were generally positive in
global developed markets for the six-month period. As such the Fund’s
exposure to euro- and US-dollar denominated corporate bonds
contributed positively to relative performance. The Index has been
included for market context purposes only.
World Allocation 80/20 FundThe World Allocation 80/20 Fund (the “Fund”) invests in equity
securities of companies across developed and emerging markets and
fixed income securities of issuers in developed markets. The equity
component of the Fund will generally have increased exposure tocompanies with smaller market capitalisations, lower relative prices,and higher profitability. The fixed income component generally investsin fixed income instruments with maturities at or below fifteen yearswithin the investment grade spectrum and may also invest in securitiesrated BB+ through BB-. The aggregate exposure to equity and fixedincome securities is approximately 80% and 20%, respectively.
As at 31 May 2021, the equity component of the Fund had holdings inapproximately 14,870 companies. This reflects our approach ofseeking to deliver highly diversified exposure to developed andemerging markets companies.
As at 31 May 2021, the total return of the World Allocation 80/20 Fundin British pounds (the base currency of the Fund) was 11.20%. Thiscompares to a return of 7.07% for the 80% MSCI All Country WorldIndex / 20% FTSE World Government Bond Index 1-5 Years (the"Index"). With low relative price (value) stocks outperforming highrelative price (growth) stocks, the equity component’s greateremphasis on value stocks contributed positively to relativeperformance. The equity component’s inclusion of and emphasis on
Investment Manager’s Reports (continued)
Dimensional Fund Advisors Semi-Annual Report and Unaudited Financial Statements, 31 May 2021 7

World Allocation 80/20 Fund (continued)small-cap stocks also contributed positively to performance relative tothe Index (which is composed primarily of large- and mid-cap stocks),as small-cap stocks outperformed large-cap stocks.
As at 31 May 2021, the fixed income component of the WorldAllocation 80/20 Fund was diversified across approximately 823 bondsfrom 21 different countries as well as supranational organisations.
Yield curves were upwardly sloped along the intermediate- tolong-maturity segments in many developed markets for the period,indicating positive expected term premiums for intermediate-termbonds. As such, the Fund’s duration was maintained at the longer endof its eligible range. As at the end of May, the Fund’s weighted averageduration was 4.87 years whereas the Index’s weighted averageduration was 2.84 years. Realised term premiums were, however,generally negative in developed markets as longer-term bondsunderperformed shorter-term bonds. As such, the Fund’s longerduration during the period relative to its Index detracted from relativeperformance. Realised credit premiums were generally positive duringthe six-month period as corporate bonds generally outperformed theirduration matched government bonds. While the Fund’s overweight tocorporate bonds contributed positively to relative performance, thelonger-duration of the Fund’s corporate bonds detracted from relativeperformance. The Index has been included for market contextpurposes only.
World Equity FundThe World Equity Fund (the “Fund”) invests in companies withincreased exposure to companies with smaller market capitalisations,lower relative prices, and higher profitability across developed andemerging markets.
As at 31 May 2021, the Fund had holdings inapproximately 11,810 companies. This reflects our approach ofdelivering highly diversified exposure to developed and emergingmarkets companies.
Over the six-month period ending 31 May 2021, the return of the Fundin British pounds (the base currency of the Fund) was 14.54%. Thiscompares to a return of 8.93% for the MSCI All Country World Index(the "Index"). With low relative price (value) stocks outperforming highrelative price (growth) stocks, the Fund’s greater emphasis on valuestocks contributed positively to relative performance. The Fund’sinclusion of and emphasis on small-cap stocks also contributedpositively to performance relative to the Index (which is composedprimarily of large- and mid-cap stocks), as small-cap stocksoutperformed large-cap stocks. The Index has been included formarket context purposes only.
Dimensional Fund Advisors Ltd.22 July 2021
Investment Manager’s Reports (continued)
Dimensional Fund Advisors Semi-Annual Report and Unaudited Financial Statements, 31 May 2021 8

Emerging MarketsLarge Cap Core
Equity FundEmerging Markets
Value Fund
Euro Inflation LinkedIntermediate Duration Fixed
Income Fund
Note
31 May 2021UnauditedUSD '000
30 Nov 2020Audited
USD '000
31 May 2021UnauditedUSD '000
30 Nov 2020Audited
USD '000
31 May 2021UnauditedEUR '000
30 Nov 2020Audited
EUR '000
Assets
Financial assets at fair value through profit or loss 812,685 601,216 1,392,858 1,156,696 55,833 48,497
Cash and cash equivalents 3,840 1,449 4,987 2,648 308 158
Cash collateral received 4 1,511 5,346 3,373 2,609 - -
Unrealised gain on forward contracts - - - - - -
Receivable for shares sold 624 1,189 838 46,773 14 292
Receivable for securities sold 1,683 396 1,901 284 - -
Interest and tax reclaims receivable - - - - 385 145
Dividends and tax reclaims receivable 2,147 177 2,831 546 - -
Amounts receivable from Investment Manager - - - - 3 3
Prepaid fees - - 19 18 1 -
Total Assets 822,490 609,773 1,406,807 1,209,574 56,544 49,095
Liabilities
Unrealised loss on forward contracts - - - - - -
Payable under securities loan agreements 4 (1,511) (5,346) (3,373) (2,609) - -
Management fees payable (167) (171) (984) (1,315) (14) (20)
Payable for shares repurchased (158) (99) (613) (1,274) (8) (101)
Payable for securities purchased (2,225) - (1,816) (5) - -
Distributions payable - (185) (464) (6,085) - -
Capital gains tax payable (2,603) (1,602) (9,314) (5,322) - -
Accrued expenses (523) (391) (413) (409) (19) (18)
Total Liabilities (excluding net assetsattributable to holders of redeemable shares) (7,187) (7,794) (16,977) (17,019) (41) (139)
Net assets attributable to holders ofredeemable shares 815,303 601,979 1,389,830 1,192,555 56,503 48,956
The accompanying notes form an integral part of the financial statements.
Statement of Financial Positionas at 31 May 2021 and 30 November 2020
Dimensional Fund Advisors Semi-Annual Report and Unaudited Financial Statements, 31 May 2021 9

European SmallCompanies Fund
EuropeanValue Fund
Global CoreEquity Fund
Note
31 May 2021UnauditedEUR '000
30 Nov 2020Audited
EUR '000
31 May 2021UnauditedEUR '000
30 Nov 2020Audited
EUR '000
31 May 2021UnauditedUSD '000
30 Nov 2020Audited
USD '000
Assets
Financial assets at fair value through profit or loss 167,086 171,012 91,202 59,125 4,453,613 4,339,543
Cash and cash equivalents 677 470 400 123 10,886 11,193
Cash collateral received 4 2,638 2,150 603 344 10,325 9,783
Unrealised gain on forward contracts - - - - - -
Receivable for shares sold 104 122 604 21 4,993 5,152
Receivable for securities sold 46 285 4 138 306 6,589
Interest and tax reclaims receivable - - - - - -
Dividends and tax reclaims receivable 692 470 250 168 8,365 6,869
Amounts receivable from Investment Manager - - - - - -
Prepaid fees 2 2 2 1 14 9
Total Assets 171,245 174,511 93,065 59,920 4,488,502 4,379,138
Liabilities
Unrealised loss on forward contracts - - - - - -
Payable under securities loan agreements 4 (2,638) (2,150) (603) (344) (10,325) (9,783)
Management fees payable (130) (200) (43) (47) (1,643) (2,552)
Payable for shares repurchased (159) (255) (136) (119) (4,769) (14,351)
Payable for securities purchased (153) (6) - - (162) (45)
Distributions payable (120) (896) (22) (369) (5,196) (22,187)
Capital gains tax payable - - - - - -
Accrued expenses (75) (70) (30) (27) (888) (929)
Total Liabilities (excluding net assetsattributable to holders of redeemable shares) (3,275) (3,577) (834) (906) (22,983) (49,847)
Net assets attributable to holders ofredeemable shares 167,970 170,934 92,231 59,014 4,465,519 4,329,291
The accompanying notes form an integral part of the financial statements.
Statement of Financial Positionas at 31 May 2021 and 30 November 2020 (continued)
Dimensional Fund Advisors Semi-Annual Report and Unaudited Financial Statements, 31 May 2021 10

Global Core FixedIncome Fund
Global Short FixedIncome Fund
Global Short-Term InvestmentGrade Fixed Income Fund
Note
31 May 2021UnauditedGBP '000
30 Nov 2020Audited
GBP '000
31 May 2021UnauditedEUR '000
30 Nov 2020Audited
EUR '000
31 May 2021UnauditedUSD '000
30 Nov 2020Audited
USD '000
Assets
Financial assets at fair value through profit or loss 387,101 233,907 2,662,013 2,483,207 1,411,361 1,270,903
Cash and cash equivalents 5,112 1,374 42,100 31,640 36,163 29,721
Cash collateral received 4 9,048 1,973 6,356 - 7,839 10,900
Unrealised gain on forward contracts 5,145 2,459 22,254 8,401 17,059 13,543
Receivable for shares sold 1,832 2,927 37,837 7,413 2,113 1,745
Receivable for securities sold - - 10,725 - - -
Interest and tax reclaims receivable 3,009 2,106 6,775 7,273 7,439 7,326
Dividends and tax reclaims receivable - - - - - -
Amounts receivable from Investment Manager 1 22 - - 1 1
Prepaid fees 11 - 17 8 7 1
Total Assets 411,259 244,768 2,788,077 2,537,942 1,481,982 1,334,140
Liabilities
Unrealised loss on forward contracts (2,371) (1,668) (28,441) (16,280) (8,812) (12,464)
Payable under securities loan agreements 4 (9,048) (1,973) (6,356) - (7,839) (10,900)
Management fees payable (149) (129) (946) (1,425) (508) (734)
Payable for shares repurchased (656) (193) (2,968) (2,373) (2,739) (3,890)
Payable for securities purchased - - (24,657) - (17,426) -
Distributions payable (1,222) (1,053) (417) (894) (2,167) (2,861)
Capital gains tax payable - - - - - -
Accrued expenses (69) (60) (617) (604) (308) (298)
Total Liabilities (excluding net assetsattributable to holders of redeemable shares) (13,515) (5,076) (64,402) (21,576) (39,799) (31,147)
Net assets attributable to holders ofredeemable shares 397,744 239,692 2,723,675 2,516,366 1,442,183 1,302,993
The accompanying notes form an integral part of the financial statements.
Statement of Financial Positionas at 31 May 2021 and 30 November 2020 (continued)
Dimensional Fund Advisors Semi-Annual Report and Unaudited Financial Statements, 31 May 2021 11

Global SmallCompanies Fund
Global SustainabilityCore Equity Fund
Global SustainabilityFixed Income Fund
Note
31 May 2021UnauditedUSD '000
30 Nov 2020Audited
USD '000
31 May 2021UnauditedUSD '000
30 Nov 2020Audited
USD '000
31 May 2021UnauditedGBP '000
30 Nov 2020Audited
GBP '000
Assets
Financial assets at fair value through profit or loss 1,018,160 798,525 1,461,127 759,897 287,193 107,075
Cash and cash equivalents 4,453 2,419 3,400 160 2,785 1,171
Cash collateral received 4 6,356 5,375 5,557 1,842 - 264
Unrealised gain on forward contracts - - - - 3,026 586
Receivable for shares sold 1,408 1,541 8,800 9,869 2,281 1,897
Receivable for securities sold 173 441 37 53 - -
Interest and tax reclaims receivable - - - - 2,158 935
Dividends and tax reclaims receivable 1,712 1,267 2,094 929 - -
Amounts receivable from Investment Manager - - 10 10 3 34
Prepaid fees 6 5 - - 8 -
Total Assets 1,032,268 809,573 1,481,025 772,760 297,454 111,962
Liabilities
Unrealised loss on forward contracts - - - - (2,520) (375)
Payable under securities loan agreements 4 (6,356) (5,375) (5,557) (1,842) - (264)
Management fees payable (610) (710) (544) (461) (106) (64)
Payable for shares repurchased (1,051) (1,475) (1,046) (1,811) (197) (225)
Payable for securities purchased (836) (45) (3,647) - (633) (861)
Distributions payable (787) (2,468) (1,169) (2,104) (630) (553)
Capital gains tax payable - - - - - -
Accrued expenses (181) (173) (158) (142) (54) (46)
Total Liabilities (excluding net assetsattributable to holders of redeemable shares) (9,821) (10,246) (12,121) (6,360) (4,140) (2,388)
Net assets attributable to holders ofredeemable shares 1,022,447 799,327 1,468,904 766,400 293,314 109,574
The accompanying notes form an integral part of the financial statements.
Statement of Financial Positionas at 31 May 2021 and 30 November 2020 (continued)
Dimensional Fund Advisors Semi-Annual Report and Unaudited Financial Statements, 31 May 2021 12

Global TargetedValue Fund
Global Ultra ShortFixed Income Fund
Global ValueFund
Note
31 May 2021UnauditedUSD '000
30 Nov 2020Audited
USD '000
31 May 2021UnauditedGBP '000
30 Nov 2020Audited
GBP '000
31 May 2021UnauditedUSD '000
30 Nov 2020Audited
USD '000
Assets
Financial assets at fair value through profit or loss 3,906,890 3,089,306 530,313 599,089 751,644 568,668
Cash and cash equivalents 12,030 7,418 3,042 14,855 4,564 1,313
Cash collateral received 4 16,295 13,842 459 200 605 995
Unrealised gain on forward contracts - - 4,442 4,987 - -
Receivable for shares sold 4,981 10,937 955 1,812 1,233 6,161
Receivable for securities sold 4,947 189 - 5,046 1,833 566
Interest and tax reclaims receivable - - 3,331 4,370 - -
Dividends and tax reclaims receivable 8,194 5,893 - - 1,825 1,176
Amounts receivable from Investment Manager - - 45 42 - -
Prepaid fees 29 17 6 3 - -
Total Assets 3,953,366 3,127,602 542,593 630,404 761,704 578,879
Liabilities
Unrealised loss on forward contracts - - (1,519) (1,687) - -
Payable under securities loan agreements 4 (16,295) (13,842) (459) (200) (605) (995)
Management fees payable (2,879) (3,519) (182) (313) (365) (399)
Payable for shares repurchased (4,535) (7,890) (693) (2,658) (2,006) (1,391)
Payable for securities purchased (4,358) (60) - - (1,801) (873)
Distributions payable (2,773) (9,780) - (192) (1,045) (2,402)
Capital gains tax payable - - - - - -
Accrued expenses (686) (644) (163) (174) (111) (114)
Total Liabilities (excluding net assetsattributable to holders of redeemable shares) (31,526) (35,735) (3,016) (5,224) (5,933) (6,174)
Net assets attributable to holders ofredeemable shares 3,921,840 3,091,867 539,577 625,180 755,771 572,705
The accompanying notes form an integral part of the financial statements.
Statement of Financial Positionas at 31 May 2021 and 30 November 2020 (continued)
Dimensional Fund Advisors Semi-Annual Report and Unaudited Financial Statements, 31 May 2021 13

Pacific Basin SmallCompanies Fund
Sterling InflationLinked Intermediate Duration
Fixed Income FundU.S. Core Equity
Fund
Note
31 May 2021UnauditedUSD '000
30 Nov 2020Audited
USD '000
31 May 2021UnauditedGBP '000
30 Nov 2020Audited
GBP '000
31 May 2021UnauditedUSD '000
30 Nov 2020Audited
USD '000
Assets
Financial assets at fair value through profit or loss 107,293 95,121 910,173 874,150 20,928 18,707
Cash and cash equivalents 757 844 4,946 5,272 79 60
Cash collateral received 4 1,796 1,650 - - - 9
Unrealised gain on forward contracts - - - - - -
Receivable for shares sold 120 83 2,295 1,501 - -
Receivable for securities sold 52 40 - - - -
Interest and tax reclaims receivable - - 3,431 3,468 - -
Dividends and tax reclaims receivable 595 291 - - 18 22
Amounts receivable from Investment Manager 61 61 - - 6 6
Prepaid fees 1 1 7 3 1 -
Total Assets 110,675 98,091 920,852 884,394 21,032 18,804
Liabilities
Unrealised loss on forward contracts - - - - - -
Payable under securities loan agreements 4 (1,796) (1,650) - - - (9)
Management fees payable (133) (166) (216) (329) (8) (9)
Payable for shares repurchased (182) (111) (1,813) (1,486) - (55)
Payable for securities purchased (3) (9) - - - -
Distributions payable (108) (404) - (1,023) - -
Capital gains tax payable - - - - - -
Accrued expenses (42) (51) (188) (203) (15) (16)
Total Liabilities (excluding net assetsattributable to holders of redeemable shares) (2,264) (2,391) (2,217) (3,041) (23) (89)
Net assets attributable to holders ofredeemable shares 108,411 95,700 918,635 881,353 21,009 18,715
The accompanying notes form an integral part of the financial statements.
Statement of Financial Positionas at 31 May 2021 and 30 November 2020 (continued)
Dimensional Fund Advisors Semi-Annual Report and Unaudited Financial Statements, 31 May 2021 14

U.S. Small CompaniesFund
World Allocation20/80 Fund
World Allocation40/60 Fund
Note
31 May 2021UnauditedUSD '000
30 Nov 2020Audited
USD '000
31 May 2021UnauditedGBP '000
30 Nov 2020Audited
GBP '000
31 May 2021UnauditedGBP '000
30 Nov 2020Audited
GBP '000
Assets
Financial assets at fair value through profit or loss 173,969 166,563 100,216 97,796 822,718 763,843
Cash and cash equivalents 728 390 37 204 724 1,365
Cash collateral received 4 232 859 - - - -
Unrealised gain on forward contracts - - 53 29 - 7
Receivable for shares sold 260 87 242 457 4,879 1,938
Receivable for securities sold 184 23,552 - - - 618
Interest and tax reclaims receivable - - 100 150 - -
Dividends and tax reclaims receivable 108 207 126 247 1,503 3,125
Amounts receivable from Investment Manager - - 41 57 324 483
Prepaid fees 2 2 1 - 5 1
Total Assets 175,483 191,660 100,816 98,940 830,153 771,380
Liabilities
Unrealised loss on forward contracts - - (230) (135) (324) (157)
Payable under securities loan agreements 4 (232) (859) - - - -
Management fees payable (100) (164) (43) (63) (346) (500)
Payable for shares repurchased (249) (24,348) (51) (101) (2,509) (1,058)
Payable for securities purchased (306) - - (303) (1,750) (830)
Distributions payable (55) (183) (18) (43) (279) (602)
Capital gains tax payable - - - - - -
Accrued expenses (61) (69) (31) (27) (176) (159)
Total Liabilities (excluding net assetsattributable to holders of redeemable shares) (1,003) (25,623) (373) (672) (5,384) (3,306)
Net assets attributable to holders ofredeemable shares 174,480 166,037 100,443 98,268 824,769 768,074
The accompanying notes form an integral part of the financial statements.
Statement of Financial Positionas at 31 May 2021 and 30 November 2020 (continued)
Dimensional Fund Advisors Semi-Annual Report and Unaudited Financial Statements, 31 May 2021 15

World Allocation60/40 Fund
World Allocation80/20 Fund
World EquityFund
Note
31 May 2021UnauditedGBP '000
30 Nov 2020Audited
GBP '000
31 May 2021UnauditedGBP '000
30 Nov 2020Audited
GBP '000
31 May 2021UnauditedGBP '000
30 Nov 2020Audited
GBP '000
Assets
Financial assets at fair value through profit or loss 1,808,946 1,562,889 390,829 319,533 1,911,121 1,915,241
Cash and cash equivalents 2,613 3,054 287 542 6,263 5,402
Cash collateral received 4 3,203 - - - 5,954 4,498
Unrealised gain on forward contracts 3 8 1 - - -
Receivable for shares sold 4,001 3,781 1,476 385 2,153 4,045
Receivable for securities sold 8 - - - 139 2,137
Interest and tax reclaims receivable - - - - - -
Dividends and tax reclaims receivable 2,864 6,887 1,066 2,010 3,565 2,770
Amounts receivable from Investment Manager 379 1,078 212 265 - -
Prepaid fees 8 2 3 - 2 2
Total Assets 1,822,025 1,577,699 393,874 322,735 1,929,197 1,934,095
Liabilities
Unrealised loss on forward contracts (687) (381) (92) (49) - -
Payable under securities loan agreements 4 (3,203) - - - (5,954) (4,498)
Management fees payable (846) (1,138) (222) (282) (983) (1,643)
Payable for shares repurchased (1,903) (2,714) (298) (486) (1,036) (5,304)
Payable for securities purchased (15) (895) (500) - (29) (23)
Distributions payable (686) (1,565) (268) (478) (1,640) (9,708)
Capital gains tax payable - - - - (2,107) (990)
Accrued expenses (346) (263) (68) (60) (422) (453)
Total Liabilities (excluding net assetsattributable to holders of redeemable shares) (7,686) (6,956) (1,448) (1,355) (12,171) (22,619)
Net assets attributable to holders ofredeemable shares 1,814,339 1,570,743 392,426 321,380 1,917,026 1,911,476
The accompanying notes form an integral part of the financial statements.
Statement of Financial Positionas at 31 May 2021 and 30 November 2020 (continued)
Dimensional Fund Advisors Semi-Annual Report and Unaudited Financial Statements, 31 May 2021 16

DimensionalFunds plc
Note
31 May 2021UnauditedEUR '000
30 Nov 2020Audited
EUR '000
Assets
Financial assets at fair value through profit or loss 22,126,224 18,453,598
Cash and cash equivalents 140,671 117,840
Cash collateral received 4 75,509 54,852
Unrealised gain on forward contracts 50,988 28,780
Receivable for shares sold 82,771 98,827
Receivable for securities sold 20,062 36,060
Interest and tax reclaims receivable 27,259 25,886
Dividends and tax reclaims receivable 34,430 32,013
Amounts receivable from Investment Manager 1,237 2,282
Prepaid fees 146 68
Total Assets 22,559,297 18,850,206
Liabilities
Unrealised loss on forward contracts (44,678) (31,705)
Payable under securities loan agreements 4 (75,509) (54,852)
Management fees payable (11,244) (15,229)
Payable for shares repurchased (28,153) (66,275)
Payable for securities purchased (54,933) (4,129)
Distributions payable (17,366) (59,958)
Capital gains tax payable (12,224) (6,911)
Accrued expenses (5,283) (5,047)
Total Liabilities (excluding net assetsattributable to holders of redeemable shares) (249,390) (244,106)
Net assets attributable to holders ofredeemable shares 22,309,907 18,606,100
All the intercompany balances due to cross investments within the Company have been eliminated in the Company total. Refer to Note 8 for further details.
The accompanying notes form an integral part of the financial statements.
Statement of Financial Positionas at 31 May 2021 and 30 November 2020 (continued)
Dimensional Fund Advisors Semi-Annual Report and Unaudited Financial Statements, 31 May 2021 17

Emerging MarketsLarge Cap Core
Equity FundEmerging Markets
Value Fund
Euro Inflation LinkedIntermediate Duration Fixed
Income Fund
Note
31 May 2021UnauditedUSD '000
31 May 2020UnauditedUSD '000
31 May 2021UnauditedUSD '000
31 May 2020UnauditedUSD '000
31 May 2021UnauditedEUR '000
31 May 2020UnauditedEUR '000
Income
Interest income - 2 - 6 - 34
Dividend income 7,904 6,866 14,177 17,123 - -
Securities lending income 156 174 516 454 - -
Net gain/(loss) on financial assets at fair valuethrough profit or loss 123,770 (92,928) 275,709 (278,149) 960 (1,979)
Net income/(loss) 131,830 (85,886) 290,402 (260,566) 960 (1,945)
Expenses
Management fees (484) (504) (3,062) (3,185) (39) (36)
Administration and depositary fees (105) (85) (362) (442) (11) (10)
Audit and legal fees (13) (13) (20) (23) (1) (1)
Other expenses (59) (38) (84) (110) (3) (4)
Total operating expenses before waivers (661) (640) (3,528) (3,760) (54) (51)
Waivers and reimbursements - - - - - -
Total operating expenses (661) (640) (3,528) (3,760) (54) (51)
Net income/(loss) from operations beforefinance costs 131,169 (86,526) 286,874 (264,326) 906 (1,996)
Finance costs
Interest expense (2) - (5) (2) (1) (2)
Distributions to redeemable shareholders - - (543) (603) - -
Total finance costs (2) - (548) (605) (1) (2)
Net income/(loss) from operations before tax 131,167 (86,526) 286,326 (264,931) 905 (1,998)
Withholding tax on dividends and other taxation 5 (1,977) 298 (7,025) 428 - -
Net income/(loss) from operations after tax 129,190 (86,228) 279,301 (264,503) 905 (1,998)
Increase/(decrease) in net assets attributableto holders of redeemable shares 129,190 (86,228) 279,301 (264,503) 905 (1,998)
Gains and losses arose solely from continuing operations. There were no gains or losses other than those dealt with in the Statement of Comprehensive Income.
The accompanying notes form an integral part of the financial statements.
Statement of Comprehensive Incomefor the financial periods ended 31 May 2021 and 31 May 2020
Dimensional Fund Advisors Semi-Annual Report and Unaudited Financial Statements, 31 May 2021 18

European SmallCompanies Fund
EuropeanValue Fund
Global CoreEquity Fund
Note
31 May 2021UnauditedEUR '000
31 May 2020UnauditedEUR '000
31 May 2021UnauditedEUR '000
31 May 2020UnauditedEUR '000
31 May 2021UnauditedUSD '000
31 May 2020UnauditedUSD '000
Income
Interest income - - - - 1 26
Dividend income 2,525 1,881 1,689 883 46,706 43,674
Securities lending income 127 166 14 20 644 779
Net gain/(loss) on financial assets at fair valuethrough profit or loss 36,725 (33,702) 12,834 (23,110) 781,514 (389,117)
Net income/(loss) 39,377 (31,655) 14,537 (22,207) 828,865 (344,638)
Expenses
Management fees (432) (425) (117) (133) (5,214) (5,258)
Administration and depositary fees (47) (45) (18) (20) (625) (579)
Audit and legal fees (3) (3) (1) (2) (95) (87)
Other expenses (22) (22) (17) (11) (139) (138)
Total operating expenses before waivers (504) (495) (153) (166) (6,073) (6,062)
Waivers and reimbursements - - - - - -
Total operating expenses (504) (495) (153) (166) (6,073) (6,062)
Net income/(loss) from operations beforefinance costs 38,873 (32,150) 14,384 (22,373) 822,792 (350,700)
Finance costs
Interest expense (2) (2) (1) (2) (4) (2)
Distributions to redeemable shareholders (224) (73) (24) (13) (6,391) (5,659)
Total finance costs (226) (75) (25) (15) (6,395) (5,661)
Net income/(loss) from operations before tax 38,647 (32,225) 14,359 (22,388) 816,397 (356,361)
Withholding tax on dividends and other taxation 5 (239) (239) (143) (121) (8,650) (10,296)
Net income/(loss) from operations after tax 38,408 (32,464) 14,216 (22,509) 807,747 (366,657)
Increase/(decrease) in net assets attributableto holders of redeemable shares 38,408 (32,464) 14,216 (22,509) 807,747 (366,657)
Gains and losses arose solely from continuing operations. There were no gains or losses other than those dealt with in the Statement of Comprehensive Income.
The accompanying notes form an integral part of the financial statements.
Statement of Comprehensive Incomefor the financial periods ended 31 May 2021 and 31 May 2020 (continued)
Dimensional Fund Advisors Semi-Annual Report and Unaudited Financial Statements, 31 May 2021 19

Global Core FixedIncome Fund
Global Short FixedIncome Fund
Global Short-Term InvestmentGrade Fixed Income Fund
Note
31 May 2021UnauditedGBP '000
31 May 2020UnauditedGBP '000
31 May 2021UnauditedEUR '000
31 May 2020UnauditedEUR '000
31 May 2021UnauditedUSD '000
31 May 2020UnauditedUSD '000
Income
Interest income 2,777 656 5,577 6,029 6,077 4,162
Dividend income - 2 1 - - -
Securities lending income 1 - 2 1 1 15
Net (loss)/gain on financial assets at fair valuethrough profit or loss (19,126) 4,290 (40,639) (30,536) 62,536 (48,152)
Net (loss)/income (16,348) 4,948 (35,059) (24,506) 68,614 (43,975)
Expenses
Management fees (397) (95) (2,861) (3,323) (1,538) (1,533)
Administration and depositary fees (51) (15) (426) (449) (241) (223)
Audit and legal fees (6) (5) (60) (61) (30) (28)
Other expenses (11) (4) (71) (78) (51) (50)
Total operating expenses before waivers (465) (119) (3,418) (3,911) (1,860) (1,834)
Waivers and reimbursements 3 6 - - - -
Total operating expenses (462) (113) (3,418) (3,911) (1,860) (1,834)
Net (loss)/income from operations beforefinance costs (16,810) 4,835 (38,477) (28,417) 66,754 (45,809)
Finance costs
Interest expense - - (116) (256) (8) (6)
Distributions to redeemable shareholders (996) (56) (475) (768) (2,078) (1,067)
Total finance costs (996) (56) (591) (1,024) (2,086) (1,073)
Net (loss)/income from operations before tax (17,806) 4,779 (39,068) (29,441) 64,668 (46,882)
Withholding tax on dividends and other taxation 5 - - - - - -
Net (loss)/income from operations after tax (17,806) 4,779 (39,068) (29,441) 64,668 (46,882)
(Decrease)/increase in net assets attributableto holders of redeemable shares (17,806) 4,779 (39,068) (29,441) 64,668 (46,882)
Gains and losses arose solely from continuing operations. There were no gains or losses other than those dealt with in the Statement of Comprehensive Income.
The accompanying notes form an integral part of the financial statements.
Statement of Comprehensive Incomefor the financial periods ended 31 May 2021 and 31 May 2020 (continued)
Dimensional Fund Advisors Semi-Annual Report and Unaudited Financial Statements, 31 May 2021 20

Global SmallCompanies Fund
Global SustainabilityCore Equity Fund
Global SustainabilityFixed Income Fund
Note
31 May 2021UnauditedUSD '000
31 May 2020UnauditedUSD '000
31 May 2021UnauditedUSD '000
31 May 2020UnauditedUSD '000
31 May 2021UnauditedGBP '000
31 May 2020UnauditedGBP '000
Income
Interest income - 5 - 1 1,369 254
Dividend income 8,554 6,282 10,944 4,200 - -
Securities lending income 327 319 141 79 - -
Net gain/(loss) on financial assets at fair valuethrough profit or loss 201,597 (101,295) 178,186 (26,350) (11,476) 301
Net income/(loss) 210,478 (94,689) 189,271 (22,070) (10,107) 555
Expenses
Management fees (1,796) (1,258) (1,429) (604) (245) (50)
Administration and depositary fees (154) (122) (167) (71) (33) (6)
Audit and legal fees (12) (10) (14) (5) (1) (4)
Other expenses (37) (34) (42) (22) (3) (3)
Total operating expenses before waivers (1,999) (1,424) (1,652) (702) (282) (63)
Waivers and reimbursements - - - - - 4
Total operating expenses (1,999) (1,424) (1,652) (702) (282) (59)
Net income/(loss) from operations beforefinance costs 208,479 (96,113) 187,619 (22,772) (10,389) 496
Finance costs
Interest expense (1) (1) (15) (3) - -
Distributions to redeemable shareholders (806) (523) (593) (247) (442) (143)
Total finance costs (807) (524) (608) (250) (442) (143)
Net income/(loss) from operations before tax 207,672 (96,637) 187,011 (23,022) (10,831) 353
Withholding tax on dividends and other taxation 5 (1,694) (1,146) (2,044) (911) - -
Net income/(loss) from operations after tax 205,978 (97,783) 184,967 (23,933) (10,831) 353
Increase/(decrease) in net assets attributableto holders of redeemable shares 205,978 (97,783) 184,967 (23,933) (10,831) 353
Gains and losses arose solely from continuing operations. There were no gains or losses other than those dealt with in the Statement of Comprehensive Income.
The accompanying notes form an integral part of the financial statements.
Statement of Comprehensive Incomefor the financial periods ended 31 May 2021 and 31 May 2020 (continued)
Dimensional Fund Advisors Semi-Annual Report and Unaudited Financial Statements, 31 May 2021 21

Global TargetedValue Fund
Global Ultra ShortFixed Income Fund
Global ValueFund
Note
31 May 2021UnauditedUSD '000
31 May 2020UnauditedUSD '000
31 May 2021UnauditedGBP '000
31 May 2020UnauditedGBP '000
31 May 2021UnauditedUSD '000
31 May 2020UnauditedUSD '000
Income
Interest income 1 14 867 2,715 - 2
Dividend income 36,300 32,373 - 1 9,452 4,774
Securities lending income 953 1,281 - 1 99 51
Net gain/(loss) on financial assets at fair valuethrough profit or loss 991,686 (703,434) (6,022) 251 142,737 (68,541)
Net income/(loss) 1,028,940 (669,766) (5,155) 2,968 152,288 (63,714)
Expenses
Management fees (8,529) (7,016) (440) (609) (1,076) (507)
Administration and depositary fees (524) (452) (123) (140) (101) (64)
Audit and legal fees (64) (68) (13) (12) (7) (5)
Other expenses (121) (84) (28) (26) (33) (22)
Total operating expenses before waivers (9,238) (7,620) (604) (787) (1,217) (598)
Waivers and reimbursements - - 16 - - -
Total operating expenses (9,238) (7,620) (588) (787) (1,217) (598)
Net income/(loss) from operations beforefinance costs 1,019,702 (677,386) (5,743) 2,181 151,071 (64,312)
Finance costs
Interest expense (3) (2) (15) (10) (1) -
Distributions to redeemable shareholders (3,069) (2,359) - (1,208) (1,013) (509)
Total finance costs (3,072) (2,361) (15) (1,218) (1,014) (509)
Net income/(loss) from operations before tax 1,016,630 (679,747) (5,758) 963 150,057 (64,821)
Withholding tax on dividends and other taxation 5 (6,975) (6,774) - - (1,724) (1,035)
Net income/(loss) from operations after tax 1,009,655 (686,521) (5,758) 963 148,333 (65,856)
Increase/(decrease) in net assets attributableto holders of redeemable shares 1,009,655 (686,521) (5,758) 963 148,333 (65,856)
Gains and losses arose solely from continuing operations. There were no gains or losses other than those dealt with in the Statement of Comprehensive Income.
The accompanying notes form an integral part of the financial statements.
Statement of Comprehensive Incomefor the financial periods ended 31 May 2021 and 31 May 2020 (continued)
Dimensional Fund Advisors Semi-Annual Report and Unaudited Financial Statements, 31 May 2021 22

Pacific Basin SmallCompanies Fund
Sterling InflationLinked Intermediate Duration
Fixed Income FundU.S. Core Equity
Fund
Note
31 May 2021UnauditedUSD '000
31 May 2020UnauditedUSD '000
31 May 2021UnauditedGBP '000
31 May 2020UnauditedGBP '000
31 May 2021UnauditedUSD '000
31 May 2020UnauditedUSD '000
Income
Interest income - - 898 5,375 - -
Dividend income 1,321 1,062 - - 148 275
Securities lending income 43 45 - - 1 2
Net gain/(loss) on financial assets at fair valuethrough profit or loss 10,926 (8,237) (14,561) 31,140 3,924 (2,432)
Net income/(loss) 12,290 (7,130) (13,663) 36,515 4,073 (2,155)
Expenses
Management fees (252) (196) (657) (742) (16) (27)
Administration and depositary fees (34) (31) (135) (151) (4) (4)
Audit and legal fees (2) (2) (14) (15) - -
Other expenses (22) (23) (37) (40) (2) (3)
Total operating expenses before waivers (310) (252) (843) (948) (22) (34)
Waivers and reimbursements - - - - - -
Total operating expenses (310) (252) (843) (948) (22) (34)
Net income/(loss) from operations beforefinance costs 11,980 (7,382) (14,506) 35,567 4,051 (2,189)
Finance costs
Interest expense - - - - - -
Distributions to redeemable shareholders (112) (93) - (805) - -
Total finance costs (112) (93) - (805) - -
Net income/(loss) from operations before tax 11,868 (7,475) (14,506) 34,762 4,051 (2,189)
Withholding tax on dividends and other taxation 5 (139) (126) - - (40) (90)
Net income/(loss) from operations after tax 11,729 (7,601) (14,506) 34,762 4,011 (2,279)
Increase/(decrease) in net assets attributableto holders of redeemable shares 11,729 (7,601) (14,506) 34,762 4,011 (2,279)
Gains and losses arose solely from continuing operations. There were no gains or losses other than those dealt with in the Statement of Comprehensive Income.
The accompanying notes form an integral part of the financial statements.
Statement of Comprehensive Incomefor the financial periods ended 31 May 2021 and 31 May 2020 (continued)
Dimensional Fund Advisors Semi-Annual Report and Unaudited Financial Statements, 31 May 2021 23

U.S. Small CompaniesFund
World Allocation20/80 Fund
World Allocation40/60 Fund
Note
31 May 2021UnauditedUSD '000
31 May 2020UnauditedUSD '000
31 May 2021UnauditedGBP '000
31 May 2020UnauditedGBP '000
31 May 2021UnauditedGBP '000
31 May 2020UnauditedGBP '000
Income
Interest income - 1 8 52 - 2
Dividend income 1,185 1,268 140 164 1,922 2,063
Securities lending income 35 59 - - - -
Net gain/(loss) on financial assets at fair valuethrough profit or loss 54,737 (32,329) 1,233 253 40,737 (18,088)
Net income/(loss) 55,957 (31,001) 1,381 469 42,659 (16,023)
Expenses
Management fees (323) (290) (117) (104) (1,055) (985)
Administration and depositary fees (36) (34) (13) (14) (23) (23)
Audit and legal fees (3) (3) (3) (3) (22) (22)
Other expenses (28) (24) (7) (3) (25) (19)
Total operating expenses before waivers (390) (351) (140) (124) (1,125) (1,049)
Waivers and reimbursements - - 104 91 1,011 936
Total operating expenses (390) (351) (36) (33) (114) (113)
Net income/(loss) from operations beforefinance costs 55,567 (31,352) 1,345 436 42,545 (16,136)
Finance costs
Interest expense - - - - - -
Distributions to redeemable shareholders (61) (60) (17) (17) (275) (273)
Total finance costs (61) (60) (17) (17) (275) (273)
Net income/(loss) from operations before tax 55,506 (31,412) 1,328 419 42,270 (16,409)
Withholding tax on dividends and other taxation 5 (346) (331) - - - -
Net income/(loss) from operations after tax 55,160 (31,743) 1,328 419 42,270 (16,409)
Increase/(decrease) in net assets attributableto holders of redeemable shares 55,160 (31,743) 1,328 419 42,270 (16,409)
Gains and losses arose solely from continuing operations. There were no gains or losses other than those dealt with in the Statement of Comprehensive Income.
The accompanying notes form an integral part of the financial statements.
Statement of Comprehensive Incomefor the financial periods ended 31 May 2021 and 31 May 2020 (continued)
Dimensional Fund Advisors Semi-Annual Report and Unaudited Financial Statements, 31 May 2021 24

World Allocation60/40 Fund
World Allocation80/20 Fund
World EquityFund
Note
31 May 2021UnauditedGBP '000
31 May 2020UnauditedGBP '000
31 May 2021UnauditedGBP '000
31 May 2020UnauditedGBP '000
31 May 2021UnauditedGBP '000
31 May 2020UnauditedGBP '000
Income
Interest income - 5 - 1 - 4
Dividend income 10,877 6,606 2,049 1,605 20,052 20,494
Securities lending income 48 - - - 308 408
Net gain/(loss) on financial assets at fair valuethrough profit or loss 124,387 (78,516) 34,571 (16,806) 245,926 (111,755)
Net income/(loss) 135,312 (71,905) 36,620 (15,200) 266,286 (90,849)
Expenses
Management fees (2,485) (2,271) (566) (427) (3,118) (3,177)
Administration and depositary fees (113) (34) (16) (15) (327) (303)
Audit and legal fees (33) (30) (9) (8) (42) (36)
Other expenses (54) (42) (15) (10) (76) (51)
Total operating expenses before waivers (2,685) (2,377) (606) (460) (3,563) (3,567)
Waivers and reimbursements 1,271 2,135 525 414 - -
Total operating expenses (1,414) (242) (81) (46) (3,563) (3,567)
Net income/(loss) from operations beforefinance costs 133,898 (72,147) 36,539 (15,246) 262,723 (94,416)
Finance costs
Interest expense (2) (1) (1) - (5) (4)
Distributions to redeemable shareholders (649) (640) (238) (169) (1,977) (2,304)
Total finance costs (651) (641) (239) (169) (1,982) (2,308)
Net income/(loss) from operations before tax 133,247 (72,788) 36,300 (15,415) 260,741 (96,724)
Withholding tax on dividends and other taxation 5 (1,588) - - - (4,680) (3,571)
Net income/(loss) from operations after tax 131,659 (72,788) 36,300 (15,415) 256,061 (100,295)
Increase/(decrease) in net assets attributableto holders of redeemable shares 131,659 (72,788) 36,300 (15,415) 256,061 (100,295)
Gains and losses arose solely from continuing operations. There were no gains or losses other than those dealt with in the Statement of Comprehensive Income.
The accompanying notes form an integral part of the financial statements.
Statement of Comprehensive Incomefor the financial periods ended 31 May 2021 and 31 May 2020 (continued)
Dimensional Fund Advisors Semi-Annual Report and Unaudited Financial Statements, 31 May 2021 25

DimensionalFunds plc
Note
31 May 2021UnauditedEUR '000
31 May 2020UnauditedEUR '000
Income
Interest income 17,395 20,353
Dividend income 153,241 139,021
Securities lending income 2,973 3,603
Net gain/(loss) on financial assets at fair valuethrough profit or loss 2,699,658 (1,782,974)
Net income/(loss) 2,873,267 (1,619,997)
Expenses
Management fees (33,532) (32,109)
Administration and depositary fees (3,410) (3,238)
Audit and legal fees (444) (441)
Other expenses (919) (845)
Total operating expenses before waivers (38,305) (36,633)
Waivers and reimbursements 3,351 4,144
Total operating expenses (34,954) (32,489)
Net income/(loss) from operations beforefinance costs 2,838,313 (1,652,486)
Finance costs
Interest expense (179) (295)
Distributions to redeemable shareholders (13,589) (11,340)
Total finance costs (13,768) (11,635)
Net income/(loss) from operations before tax 2,824,545 (1,664,121)
Withholding tax on dividends and other taxation 5 (32,975) (22,551)
Net income/(loss) from operations after tax 2,791,570 (1,686,672)
Increase/(decrease) in net assets attributableto holders of redeemable shares 2,791,570 (1,686,672)
All the intercompany balances due to cross investments within the Company have been eliminated in the Company total. Refer to Note 8 for further details.
Gains and losses arose solely from continuing operations. There were no gains or losses other than those dealt with in the Statement of Comprehensive Income.
The accompanying notes form an integral part of the financial statements.
Statement of Comprehensive Incomefor the financial periods ended 31 May 2021 and 31 May 2020 (continued)
Dimensional Fund Advisors Semi-Annual Report and Unaudited Financial Statements, 31 May 2021 26

Emerging MarketsLarge Cap Core
Equity FundEmerging Markets
Value Fund
Euro Inflation LinkedIntermediate Duration Fixed
Income Fund31 May 2021UnauditedUSD '000
31 May 2020UnauditedUSD '000
31 May 2021UnauditedUSD '000
31 May 2020UnauditedUSD '000
31 May 2021UnauditedEUR '000
31 May 2020UnauditedEUR '000
Net assets attributable to holders of redeemableshares at the start of the financial period 601,979 563,637 1,192,555 1,478,882 48,956 47,239
Increase/(decrease) in net assets attributable toholders of redeemable shares 129,190 (86,228) 279,301 (264,503) 905 (1,998)
Issue of redeemable shares during the financialperiod 99,126 130,508 157,807 156,082 12,499 14,851
Redemption of redeemable shares during thefinancial period (14,992) (52,819) (239,833) (253,939) (5,857) (5,512)
Currency translation - - - - - -
Net assets attributable to holders ofredeemable shares at the end of the financialperiod 815,303 555,098 1,389,830 1,116,522 56,503 54,580
European SmallCompanies Fund
EuropeanValue Fund
Global CoreEquity Fund
31 May 2021UnauditedEUR '000
31 May 2020UnauditedEUR '000
31 May 2021UnauditedEUR '000
31 May 2020UnauditedEUR '000
31 May 2021UnauditedUSD '000
31 May 2020UnauditedUSD '000
Net assets attributable to holders of redeemableshares at the start of the financial period 170,934 190,852 59,014 80,914 4,329,291 3,852,769
Increase/(decrease) in net assets attributable toholders of redeemable shares 38,408 (32,464) 14,216 (22,509) 807,747 (366,657)
Issue of redeemable shares during the financialperiod 9,433 18,841 24,945 18,969 554,874 602,285
Redemption of redeemable shares during thefinancial period (50,805) (21,692) (5,944) (26,896) (1,226,393) (428,562)
Currency translation - - - - - -
Net assets attributable to holders ofredeemable shares at the end of the financialperiod 167,970 155,537 92,231 50,478 4,465,519 3,659,835
Global Core FixedIncome Fund
Global Short FixedIncome Fund
Global Short-Term InvestmentGrade Fixed Income Fund
31 May 2021UnauditedGBP '000
31 May 2020UnauditedGBP '000
31 May 2021UnauditedEUR '000
31 May 2020UnauditedEUR '000
31 May 2021UnauditedUSD '000
31 May 2020UnauditedUSD '000
Net assets attributable to holders of redeemableshares at the start of the financial period 239,692 62,200 2,516,366 2,842,571 1,302,993 1,291,333
(Decrease)/increase in net assets attributable toholders of redeemable shares (17,806) 4,779 (39,068) (29,441) 64,668 (46,882)
Issue of redeemable shares during the financialperiod 198,550 90,531 850,261 410,499 214,429 183,936
Redemption of redeemable shares during thefinancial period (22,692) (15,173) (603,884) (628,770) (139,907) (215,001)
Currency translation - - - - - -
Net assets attributable to holders ofredeemable shares at the end of the financialperiod 397,744 142,337 2,723,675 2,594,859 1,442,183 1,213,386
The accompanying notes form an integral part of the financial statements.
Statement of Changes in Net Assets Attributable to Holders of Redeemable Sharesfor the financial periods ended 31 May 2021 and 31 May 2020
Dimensional Fund Advisors Semi-Annual Report and Unaudited Financial Statements, 31 May 2021 27

Global SmallCompanies Fund
Global SustainabilityCore Equity Fund
Global SustainabilityFixed Income Fund
31 May 2021UnauditedUSD '000
31 May 2020UnauditedUSD '000
31 May 2021UnauditedUSD '000
31 May 2020UnauditedUSD '000
31 May 2021UnauditedGBP '000
31 May 2020UnauditedGBP '000
Net assets attributable to holders of redeemableshares at the start of the financial period 799,327 654,445 766,400 346,156 109,574 24,393
Increase/(decrease) in net assets attributable toholders of redeemable shares 205,978 (97,783) 184,967 (23,933) (10,831) 353
Issue of redeemable shares during the financialperiod 127,071 124,060 622,491 159,884 205,105 30,444
Redemption of redeemable shares during thefinancial period (109,929) (82,628) (104,954) (32,484) (10,534) (5,078)
Currency translation - - - - - -
Net assets attributable to holders ofredeemable shares at the end of the financialperiod 1,022,447 598,094 1,468,904 449,623 293,314 50,112
Global TargetedValue Fund
Global Ultra ShortFixed Income Fund
Global ValueFund
31 May 2021UnauditedUSD '000
31 May 2020UnauditedUSD '000
31 May 2021UnauditedGBP '000
31 May 2020UnauditedGBP '000
31 May 2021UnauditedUSD '000
31 May 2020UnauditedUSD '000
Net assets attributable to holders of redeemableshares at the start of the financial period 3,091,867 3,168,701 625,180 812,144 572,705 305,086
Increase/(decrease) in net assets attributable toholders of redeemable shares 1,009,655 (686,521) (5,758) 963 148,333 (65,856)
Issue of redeemable shares during the financialperiod 389,602 555,717 176,955 140,310 125,164 120,618
Redemption of redeemable shares during thefinancial period (569,284) (337,388) (256,800) (219,605) (90,431) (20,116)
Currency translation - - - - - -
Net assets attributable to holders ofredeemable shares at the end of the financialperiod 3,921,840 2,700,509 539,577 733,812 755,771 339,732
Pacific Basin SmallCompanies Fund
Sterling InflationLinked Intermediate Duration
Fixed Income FundU.S. Core Equity
Fund31 May 2021UnauditedUSD '000
31 May 2020UnauditedUSD '000
31 May 2021UnauditedGBP '000
31 May 2020UnauditedGBP '000
31 May 2021UnauditedUSD '000
31 May 2020UnauditedUSD '000
Net assets attributable to holders of redeemableshares at the start of the financial period 95,700 85,728 881,353 1,043,986 18,715 30,986
Increase/(decrease) in net assets attributable toholders of redeemable shares 11,729 (7,601) (14,506) 34,762 4,011 (2,279)
Issue of redeemable shares during the financialperiod 19,527 7,543 150,939 131,411 2,208 1,874
Redemption of redeemable shares during thefinancial period (18,545) (5,246) (99,151) (338,456) (3,925) (4,173)
Currency translation - - - - - -
Net assets attributable to holders ofredeemable shares at the end of the financialperiod 108,411 80,424 918,635 871,703 21,009 26,408
The accompanying notes form an integral part of the financial statements.
Statement of Changes in Net Assets Attributable to Holders of Redeemable Sharesfor the financial periods ended 31 May 2021 and 31 May 2020 (continued)
Dimensional Fund Advisors Semi-Annual Report and Unaudited Financial Statements, 31 May 2021 28

U.S. Small CompaniesFund
World Allocation20/80 Fund
World Allocation40/60 Fund
31 May 2021UnauditedUSD '000
31 May 2020UnauditedUSD '000
31 May 2021UnauditedGBP '000
31 May 2020UnauditedGBP '000
31 May 2021UnauditedGBP '000
31 May 2020UnauditedGBP '000
Net assets attributable to holders of redeemableshares at the start of the financial period 166,037 184,418 98,268 82,213 768,074 672,091
Increase/(decrease) in net assets attributable toholders of redeemable shares 55,160 (31,743) 1,328 419 42,270 (16,409)
Issue of redeemable shares during the financialperiod 14,270 25,634 23,526 15,800 106,862 89,300
Redemption of redeemable shares during thefinancial period (60,987) (17,427) (22,679) (9,584) (92,437) (44,936)
Currency translation - - - - - -
Net assets attributable to holders ofredeemable shares at the end of the financialperiod 174,480 160,882 100,443 88,848 824,769 700,046
World Allocation60/40 Fund
World Allocation80/20 Fund
World EquityFund
31 May 2021UnauditedGBP '000
31 May 2020UnauditedGBP '000
31 May 2021UnauditedGBP '000
31 May 2020UnauditedGBP '000
31 May 2021UnauditedGBP '000
31 May 2020UnauditedGBP '000
Net assets attributable to holders of redeemableshares at the start of the financial period 1,570,743 1,472,570 321,380 242,257 1,911,476 1,705,046
Increase/(decrease) in net assets attributable toholders of redeemable shares 131,659 (72,788) 36,300 (15,415) 256,061 (100,295)
Issue of redeemable shares during the financialperiod 268,151 190,494 78,362 55,130 226,065 450,870
Redemption of redeemable shares during thefinancial period (156,214) (223,022) (43,616) (19,242) (476,576) (177,791)
Currency translation - - - - - -
Net assets attributable to holders ofredeemable shares at the end of the financialperiod 1,814,339 1,367,254 392,426 262,730 1,917,026 1,877,830
DimensionalFunds plc
31 May 2021UnauditedEUR '000
31 May 2020UnauditedEUR '000
Net assets attributable to holders of redeemableshares at the start of the financial period 18,606,100 18,998,111
Increase/(decrease) in net assets attributable toholders of redeemable shares 2,791,570 (1,686,672)
Issue of redeemable shares during the financialperiod 4,214,870 3,231,807
Redemption of redeemable shares during thefinancial period (3,266,167) (2,794,381)
Currency translation (36,466) (336,893)
Net assets attributable to holders ofredeemable shares at the end of the financialperiod 22,309,907 17,411,972
All the intercompany balances due to cross investments within the Company have been eliminated in the Company total. Refer to Note 8 for further details.
The accompanying notes form an integral part of the financial statements.
Statement of Changes in Net Assets Attributable to Holders of Redeemable Sharesfor the financial periods ended 31 May 2021 and 31 May 2020 (continued)
Dimensional Fund Advisors Semi-Annual Report and Unaudited Financial Statements, 31 May 2021 29

Shares (000's)
Value(000's)
USD
% of NetAssetValue
Investment Funds
India - 4.58%
5,312 iShares MSCI India UCITS ETF 37,320 4.58
37,320 4.58
Total Investment Funds - 4.58% (30 November 2020: 4.22%) 37,320 4.58
Common Stock
Brazil - 4.86%
180 Ambev SA, ADR 622 0.08
31 Atacadao SA 132 0.02
148 B3 SA - Brasil Bolsa Balcao 496 0.06
61 Banco Bradesco SA 268 0.03
18 Banco BTG Pactual SA 416 0.05
35 Banco do Brasil SA 223 0.03
20 Banco Santander Brasil SA 154 0.02
32 BB Seguridade Participacoes SA 144 0.02
5 Braskem SA, ADR 106 0.01
205 BRF SA 1,010 0.12
4 BRF SA, ADR 18 -
312 CCR SA 829 0.10
9 Centrais Eletricas Brasileiras SA 70 0.01
36 Cia Brasileira de Distribuicao 269 0.03
13 Cia de Saneamento Basico do Estado de Sao Paulo 98 0.01
2 Cia Paranaense de Energia 9 -
6 Cia Paranaense de Energia 38 -
198 Cia Siderurgica Nacional SA 1,698 0.21
113 Cia Siderurgica Nacional SA, ADR 965 0.12
68 Cosan SA 286 0.04
7 Energisa SA 64 0.01
9 Engie Brasil Energia SA 68 0.01
34 Equatorial Energia SA 168 0.02
72 Gerdau SA, ADR 449 0.06
24 Hapvida Participacoes e Investimentos SA 73 0.01
12 Hypera SA 86 0.01
14 Itau Unibanco Holding SA 73 0.01
545 JBS SA 3,151 0.39
120 Klabin SA 604 0.07
26 Localiza Rent a Car SA 311 0.04
11 Lojas Americanas SA 39 -
110 Lojas Renner SA 1,003 0.12
63 Magazine Luiza SA 246 0.03
22 Natura & Co Holding SA 210 0.03
28 Notre Dame Intermedica Participacoes SA 469 0.06
37 Petrobras Distribuidora SA 180 0.02
728 Petroleo Brasileiro SA 3,730 0.46
47 Petroleo Brasileiro SA, ADR (non-voting rights) 487 0.06
99 Petroleo Brasileiro SA, ADR (voting rights) 1,005 0.12
56 Porto Seguro SA 567 0.07
71 Raia Drogasil SA 372 0.05
187 Rumo SA 750 0.09
36 Sendas Distribuidora SA 615 0.08
4 Sul America SA 30 -
61 Suzano SA 721 0.09
12 Telefonica Brasil SA 105 0.01
436 TIM SA 1,012 0.12
2 TIM SA ADR 26 -
92 Ultrapar Participacoes SA 338 0.04
21 Usinas Siderurgicas de Minas Gerais SA Usiminas 80 0.01
676 Vale SA 14,473 1.78
38 WEG SA 254 0.03
39,610 4.86
Chile - 0.39%
7 Banco de Chile, ADR 139 0.02
4 Banco de Credito e Inversiones SA 211 0.03
Shares (000's)
Value(000's)
USD
% of NetAssetValue
Common Stock (continued)
Chile - 0.39% (continued)
7 Banco Santander Chile, ADR 139 0.02
5 CAP SA 83 0.01
275 Cencosud SA 535 0.06
10 Cia Cervecerias Unidas SA, ADR 177 0.02
399 Colbun SA 55 0.01
2 Embotelladora Andina SA, ADR 33 -
87 Empresa Nacional de Telecomunicaciones SA 464 0.06
41 Empresas CMPC SA 103 0.01
16 Empresas COPEC SA 164 0.02
407 Enel Americas SA 55 0.01
76 Enel Americas SA, ADR 516 0.06
10 Enel Chile SA, ADR 31 -
22 Falabella SA 96 0.01
19 Plaza SA 31 -
9 Sociedad Quimica y Minera de Chile SA, ADR 378 0.05
3,210 0.39
China - 36.42%
1 51job Inc, ADR 86 0.01
272 Agile Group Holdings Ltd 384 0.05
4,157 Agricultural Bank of China Ltd 1,687 0.21
10 Aier Eye Hospital Group Co Ltd 127 0.02
152 Air China Ltd 127 0.02
392 Alibaba Group Holding Ltd 10,476 1.28
40 Alibaba Group Holding Ltd, ADR 8,573 1.05
1,850 Aluminum Corp of China Ltd 1,087 0.13
11 Angel Yeast Co Ltd 116 0.01
543 Anhui Conch Cement Co Ltd 3,365 0.41
1 Anhui Gujing Distillery Co Ltd 50 0.01
9 Anhui Kouzi Distillery Co Ltd 92 0.01
8 Anhui Yingjia Distillery Co Ltd 56 0.01
44 ANTA Sports Products Ltd 888 0.11
11 Apeloa Pharmaceutical Co Ltd 41 -
7 Avary Holding Shenzhen Co Ltd 36 -
8 AVIC Jonhon Optronic Technology Co Ltd 96 0.01
6 Baidu Inc, ADR 1,247 0.15
36 Bank of Changsha Co Ltd 54 0.01
40 Bank of Chengdu Co Ltd 84 0.01
10,444 Bank of China Ltd 3,957 0.49
1,730 Bank of Communications Co Ltd 1,168 0.14
39 Bank of Hangzhou Co Ltd 102 0.01
145 Bank of Jiangsu Co Ltd 174 0.02
63 Bank of Nanjing Co Ltd 101 0.01
24 Bank of Ningbo Co Ltd 160 0.02
49 Bank of Shanghai Co Ltd 66 0.01
101 Baoshan Iron & Steel Co Ltd 125 0.02
4 BeiGene Ltd 112 0.01
100 Beijing Capital Co Ltd 46 0.01
35 Beijing Dabeinong Technology Group Co Ltd 45 0.01
16 Beijing New Building Materials PLC 111 0.01
24 Beijing Oriental Yuhong Waterproof Technology CoLtd 213 0.03
27 Beijing Sinnet Technology Co Ltd 64 0.01
8 BGI Genomics Co Ltd 150 0.02
39 Blue Sail Medical Co Ltd 131 0.02
152 BOE Technology Group Co Ltd 150 0.02
18 Bright Dairy & Food Co Ltd 47 0.01
47 BYD Co Ltd 1,069 0.13
280 BYD Electronic International Co Ltd 1,782 0.22
15 By-health Co Ltd 85 0.01
14 C&S Paper Co Ltd 76 0.01
152 CGN Power Co Ltd 34 -
9 Chacha Food Co Ltd 77 0.01
Emerging Markets Large Cap Core Equity FundPortfolio of Investments as at 31 May 2021
Dimensional Fund Advisors Semi-Annual Report and Unaudited Financial Statements, 31 May 2021 30

Shares (000's)
Value(000's)
USD
% of NetAssetValue
Common Stock (continued)
China - 36.42% (continued)
1 Changchun High & New Technology Industry GroupInc 75 0.01
1 Changzhou Xingyu Automotive Lighting Systems CoLtd 24 -
12 Chaozhou Three-Circle Group Co Ltd 70 0.01
283 China Cinda Asset Management Co Ltd 61 0.01
974 China CITIC Bank Corp Ltd 532 0.07
634 China Coal Energy Co Ltd 385 0.05
38 China Conch Venture Holdings Ltd 173 0.02
14,995 China Construction Bank Corp 12,355 1.52
1,222 China Eastern Airlines Corp Ltd 575 0.07
2 China Eastern Airlines Corp Ltd, ADR 50 0.01
190 China Energy Engineering Corp Ltd 19 -
813 China Everbright Bank Co Ltd 347 0.04
769 China Evergrande Group 1,198 0.15
149 China Fortune Land Development Co Ltd 128 0.02
700 China Galaxy Securities Co Ltd 442 0.05
1,299 China Gas Holdings Ltd 4,940 0.61
52 China Gezhouba Group Co Ltd 58 0.01
895 China Hongqiao Group Ltd 1,444 0.18
292 China International Capital Corp Ltd 858 0.11
61 China Jushi Co Ltd 155 0.02
457 China Life Insurance Co Ltd 969 0.12
2 China Literature Ltd 21 -
583 China Mengniu Dairy Co Ltd 3,451 0.42
605 China Merchants Bank Co Ltd 5,602 0.69
31 China Merchants Securities Co Ltd 49 0.01
10 China Merchants Shekou Industrial Zone HoldingsCo Ltd 18 -
537 China Minsheng Banking Corp Ltd 286 0.03
204 China Molybdenum Co Ltd 137 0.02
3,194 China National Building Material Co Ltd 4,230 0.52
9 China National Medicines Corp Ltd 48 0.01
285 China National Nuclear Power Co Ltd 235 0.03
730 China Oilfield Services Ltd 680 0.08
2,078 China Overseas Land & Investment Ltd 5,037 0.62
1,016 China Pacific Insurance Group Co Ltd 3,861 0.47
2,882 China Petroleum & Chemical Corp 1,560 0.19
1,313 China Railway Group Ltd 693 0.08
221 China Railway Signal & Communication Corp Ltd 90 0.01
120 China Resources Beer Holdings Co Ltd 1,065 0.13
1,572 China Resources Cement Holdings Ltd 1,669 0.20
480 China Resources Gas Group Ltd 2,976 0.36
1,224 China Resources Land Ltd 5,783 0.71
16 China Resources Sanjiu Medical & PharmaceuticalCo Ltd 65 0.01
1,267 China Shenhua Energy Co Ltd 2,798 0.34
1,258 China Southern Airlines Co Ltd 895 0.11
- China Southern Airlines Co Ltd, ADR 17 -
197 China State Construction Engineering Corp Ltd 152 0.02
318 China Taiping Insurance Holdings Co Ltd 594 0.07
2 China Tourism Group Duty Free Corp Ltd 81 0.01
20,248 China Tower Corp Ltd 2,766 0.34
13 China TransInfo Technology Co Ltd 31 -
810 China Vanke Co Ltd 2,791 0.34
18 China Yangtze Power Co Ltd 56 0.01
56 China Zheshang Bank Co Ltd 27 -
9 Chongqing Fuling Zhacai Group Co Ltd 58 0.01
710 Chongqing Rural Commercial Bank Co Ltd 327 0.04
4 Chongqing Zhifei Biological Products Co Ltd 130 0.02
519 CIFI Holdings Group Co Ltd 453 0.06
579 CITIC Ltd 681 0.08
Shares (000's)
Value(000's)
USD
% of NetAssetValue
Common Stock (continued)
China - 36.42% (continued)
162 CITIC Securities Co Ltd 449 0.05
31 CNHTC Jinan Truck Co Ltd 155 0.02
4 Contemporary Amperex Technology Co Ltd 277 0.03
1,263 COSCO SHIPPING Holdings Co Ltd 2,638 0.32
3,643 Country Garden Holdings Co Ltd 4,645 0.57
66 Country Garden Services Holdings Co Ltd 671 0.08
101 CSC Financial Co Ltd 132 0.02
3,372 CSPC Pharmaceutical Group Ltd 5,071 0.62
12 Da An Gene Co Ltd of Sun Yat-Sen University 42 -
1,176 Dali Foods Group Co Ltd 747 0.09
76 Daqin Railway Co Ltd 83 0.01
3 DaShenLin Pharmaceutical Group 39 -
14 Dian Diagnostics Group Co 88 0.01
138 Dongfeng Motor Group Co Ltd 131 0.02
38 ENN Ecological Holdings Co Ltd 102 0.01
20 ENN Energy Holdings Ltd 373 0.05
4 Eve Energy Co Ltd 72 0.01
85 Fangda Special Steel Technology Co Ltd 123 0.01
27 FAW Jiefang Group Co Ltd 46 0.01
11 Flat Glass Group Co Ltd 31 -
71 Focus Media Information Technology Co Ltd 116 0.01
4 Foshan Haitian Flavouring & Food Co Ltd 89 0.01
430 Fosun International Ltd 693 0.08
58 Fujian Sunner Development Co Ltd 230 0.03
150 Fuyao Glass Industry Group Co Ltd 940 0.12
2 G-bits Network Technology Xiamen Co Ltd 131 0.02
- GDS Holdings Ltd, ADR 20 -
2,110 Geely Automobile Holdings Ltd 5,343 0.66
26 GEM Co Ltd 44 0.01
22 Gemdale Corp 38 -
531 GF Securities Co Ltd 766 0.09
23 GoerTek Inc 138 0.02
662 Great Wall Motor Co Ltd 1,838 0.23
24 Gree Electric Appliances Inc of Zhuhai 212 0.03
149 Greenland Holdings Corp Ltd 135 0.02
8 Guangdong Haid Group Co Ltd 95 0.01
72 Guangdong Investment Ltd 107 0.01
12 Guangdong Xinbao Electrical Appliances HoldingsCo Ltd 62 0.01
119 Guanghui Energy Co Ltd 60 0.01
135 Guangzhou Automobile Group Co Ltd 117 0.01
9 Guangzhou Baiyun International Airport Co Ltd 17 -
42 Guangzhou Baiyunshan Pharmaceutical HoldingsCo Ltd 122 0.01
3 Guangzhou Shiyuan Electronic Technology Co Ltd 59 0.01
5 Guangzhou Wondfo Biotech Co Ltd 53 0.01
46 Guotai Junan Securities Co Ltd 70 0.01
26 Haier Smart Home Co Ltd 125 0.02
930 Haier Smart Home Co Ltd 3,907 0.48
11 Haisco Pharmaceutical Group Co Ltd 41 -
254 Haitong Securities Co Ltd 243 0.03
25 Hang Zhou Great Star Industrial Co Ltd 135 0.02
20 Hangzhou Oxygen Plant Group Co Ltd 102 0.01
16 Hangzhou Robam Appliances Co Ltd 111 0.01
6 Han's Laser Technology Industry Group Co Ltd 36 -
7 Hefei Meiya Optoelectronic Technology Inc 54 0.01
20 Henan Shuanghui Investment & Development CoLtd 112 0.01
416 Hengan International Group Co Ltd 2,805 0.34
26 Hengdian Group DMEGC Magnetics Co Ltd 54 0.01
42 Hengli Petrochemical Co Ltd 189 0.02
56 Hengyi Petrochemical Co Ltd 111 0.01
Emerging Markets Large Cap Core Equity FundPortfolio of Investments as at 31 May 2021 (continued)
Dimensional Fund Advisors Semi-Annual Report and Unaudited Financial Statements, 31 May 2021 31

Shares (000's)
Value(000's)
USD
% of NetAssetValue
Common Stock (continued)
China - 36.42% (continued)
485 Hesteel Co Ltd 192 0.02
2 Hithink RoyalFlush Information Network Co Ltd 39 -
11 Hongfa Technology Co Ltd 93 0.01
51 Hopson Development Holdings 245 0.03
8 Hua Hong Semiconductor Ltd 43 0.01
40 Huadong Medicine Co Ltd 320 0.04
6 Hualan Biological Engineering 36 -
120 Huaneng Power International Inc 43 0.01
49 Huatai Securities Co Ltd 76 0.01
55 Huaxia Bank Co Ltd 55 0.01
39 Huaxin Cement Co Ltd 137 0.02
11 Huayu Automotive Systems Co Ltd 40 -
7 Huazhu Group Ltd, ADR 411 0.05
322 Hunan Valin Steel Co Ltd 348 0.04
76 Huolinhe Opencut Coal Industry Corp Ltd of InnerMongolia 125 0.02
9 Iflytek Co Ltd 92 0.01
9,474 Industrial & Commercial Bank of China Ltd 6,220 0.76
85 Industrial Bank Co Ltd 310 0.04
15 Inner Mongolia Eerduosi Resources Co Ltd 44 0.01
43 Inner Mongolia Junzheng Energy & ChemicalIndustry Group Co Ltd 38 -
19 Inner Mongolia Yili Industrial Group Co Ltd 123 0.01
13 iQIYI 181 0.02
2 Jason Furniture Hangzhou Co Ltd 28 -
7 JD.com Inc 254 0.03
6 JD.com Inc, ADR 456 0.06
56 Jiangsu Expressway Co Ltd 67 0.01
7 Jiangsu Hengli Hydraulic Co Ltd 94 0.01
5 Jiangsu Hengrui Medicine Co Ltd 64 0.01
13 Jiangsu King's Luck Brewery JSC Ltd 125 0.02
28 Jiangsu Shagang Co Ltd 43 0.01
11 Jiangsu Yanghe Brewery Joint-Stock Co Ltd 377 0.05
6 Jiangsu Yangnong Chemical Co Ltd 95 0.01
21 Jiangsu Yuyue Medical Equipment & Supply Co Ltd 98 0.01
43 Jiangsu Zhongtian Technology Co Ltd 70 0.01
60 Jiangxi Copper Co Ltd 140 0.02
71 Jiangxi Zhengbang Technology Co Ltd 144 0.02
23 Joincare Pharmaceutical Group Industry Co Ltd 54 0.01
17 Jointown Pharmaceutical Group Co Ltd 46 0.01
4 Jonjee Hi-Tech Industrial And Commercial HoldingCo Ltd 29 -
20 Joyoung Co Ltd 99 0.01
2 JOYY Inc, ADR 153 0.02
11 Kingdee International Software Group Co Ltd 42 -
31 Kingsoft Corp Ltd 209 0.03
2,700 Kunlun Energy Co Ltd 3,066 0.38
2 Kweichow Moutai Co Ltd 701 0.09
20 KWG Living Group Holdings Ltd 20 -
6 Lao Feng Xiang Co Ltd 54 0.01
7 Laobaixing Pharmacy Chain JSC 62 0.01
4,766 Lenovo Group Ltd 5,747 0.70
42 Lens Technology Co Ltd 194 0.02
28 Lepu Medical Technology Beijing Co Ltd 150 0.02
248 Li Ning Co Ltd 2,280 0.28
75 Lingyi iTech Guangdong Co 100 0.01
943 Logan Property Holdings Co Ltd 1,511 0.19
33 Lomon Billions Group Co Ltd 175 0.02
686 Longfor Group Holdings Ltd 4,023 0.49
25 LONGi Green Energy Technology Co Ltd 378 0.05
39 Luenmei Quantum Co Ltd 57 0.01
67 Luxi Chemical Group Co Ltd 172 0.02
Shares (000's)
Value(000's)
USD
% of NetAssetValue
Common Stock (continued)
China - 36.42% (continued)
22 Luxshare Precision Industry Co Ltd 137 0.02
4 Luzhou Laojiao Co Ltd 190 0.02
7 Maccura Biotechnology Co Ltd 51 0.01
7 Mango Excellent Media Co Ltd 83 0.01
29 Meituan 1,023 0.13
422 Metallurgical Corp of China Ltd 103 0.01
49 Midea Group Co Ltd 637 0.08
14 Ming Yang Smart Energy Group Ltd 34 -
28 MLS Co Ltd 63 0.01
34 Muyuan Foodstuff Co Ltd 476 0.06
53 NanJi E-Commerce Co Ltd 81 0.01
60 Nanjing Iron & Steel Co Ltd 35 -
17 Nanjing King-Friend Biochemical Pharmaceutical CoLtd 114 0.01
16 NARI Technology Co Ltd 77 0.01
63 NetEase Inc, ADR 7,474 0.92
449 New China Life Insurance Co Ltd 1,690 0.21
35 New Hope Liuhe Co Ltd 83 0.01
49 New Oriental Education & Technology Group Inc,ADR 499 0.06
4 NIO Inc, ADR 148 0.02
120 OFILM Group Co Ltd 165 0.02
5 Oppein Home Group Inc 118 0.01
228 People's Insurance Co Group of China Ltd 85 0.01
3,812 PetroChina Co Ltd 1,559 0.19
3,592 PICC Property & Casualty Co Ltd 3,506 0.43
1 Pinduoduo Inc, ADR 145 0.02
75 Ping An Bank Co Ltd 288 0.04
1,128 Ping An Insurance Group Co of China Ltd 12,321 1.51
1,493 Postal Savings Bank of China Co Ltd 1,072 0.13
162 RiseSun Real Estate Development Co Ltd 161 0.02
41 Rongsheng Petro Chemical Co Ltd 175 0.02
16 SAIC Motor Corp Ltd 50 0.01
96 Sailun Group Co Ltd 167 0.02
40 Sansteel Minguang Co Ltd Fujian 47 0.01
83 Sany Heavy Industry Co Ltd 401 0.05
48 Seazen Holdings Co Ltd 367 0.04
22 SF Holding Co Ltd 240 0.03
245 Shaanxi Coal Industry Co Ltd 455 0.06
32 Shandong Buchang Pharmaceuticals Co Ltd 114 0.01
149 Shandong Gold Mining Co Ltd 325 0.04
17 Shandong Himile Mechanical Science & TechnologyCo Ltd 79 0.01
44 Shandong Hualu Hengsheng Chemical Co Ltd 197 0.02
36 Shandong Linglong Tyre Co Ltd 280 0.03
90 Shandong Sun Paper Industry JSC Ltd 200 0.02
884 Shandong Weigao Group Medical Polymer Co Ltd 1,838 0.23
5 Shanghai Bairun Investment Holding Group Co Ltd 99 0.01
5 Shanghai Baosight Software Co Ltd 51 0.01
208 Shanghai Electric Group Co Ltd 68 0.01
24 Shanghai Fosun Pharmaceutical Group Co Ltd 198 0.02
24 Shanghai Lujiazui Finance & Trade ZoneDevelopment Co Ltd 42 -
6 Shanghai M&G Stationery Inc 75 0.01
71 Shanghai Pharmaceuticals Holding Co Ltd 156 0.02
116 Shanghai Pudong Development Bank Co Ltd 189 0.02
4 Shanghai Putailai New Energy Technology Co Ltd 61 0.01
21 Shanghai Yuyuan Tourist Mart Group Co Ltd 47 0.01
43 Shanxi Lu'an Environmental Energy DevelopmentCo Ltd 69 0.01
39 Shanxi Meijin Energy Co Ltd 46 0.01
57 Shanxi Taigang Stainless Steel Co Ltd 60 0.01
2 Shanxi Xinghuacun Fen Wine Factory Co Ltd 121 0.01
Emerging Markets Large Cap Core Equity FundPortfolio of Investments as at 31 May 2021 (continued)
Dimensional Fund Advisors Semi-Annual Report and Unaudited Financial Statements, 31 May 2021 32

Shares (000's)
Value(000's)
USD
% of NetAssetValue
Common Stock (continued)
China - 36.42% (continued)
23 Shanxi Xishan Coal & Electricity Power Co Ltd 24 -
31 Shengyi Technology Co Ltd 111 0.01
4 Shennan Circuits Co Ltd 55 0.01
7 Shenzhen Goodix Technology Co Ltd 131 0.02
1 Shenzhen Mindray Bio-Medical Electronics Co Ltd 92 0.01
109 Shenzhen MTC Co Ltd 96 0.01
89 Shenzhen Overseas Chinese Town Co Ltd 116 0.01
14 Shenzhen Sunlord Electronics Co Ltd 73 0.01
20 Shenzhen Sunway Communication Co Ltd 86 0.01
15 Shenzhen YUTO Packaging Technology Co Ltd 67 0.01
87 Shenzhou International Group Holdings Ltd 2,296 0.28
11 Shijiazhuang Yiling Pharmaceutical Co Ltd 49 0.01
701 Shimao Property Holdings Ltd 2,011 0.25
10 Sichuan Kelun Pharmaceutical Co Ltd 36 -
5,157 Sino Biopharmaceutical Ltd 5,716 0.70
35 Sinoma Science & Technology Co Ltd 117 0.01
920 Sinopharm Group Co Ltd 3,067 0.38
227 Sinotruk Hong Kong Ltd 544 0.07
1,440 Sunac China Holdings Ltd 5,295 0.65
36 Sunac Services Holdings Ltd 106 0.01
2 Sungrow Power Supply Co Ltd 30 -
33 Suning.com Co Ltd 35 -
33 Sunny Optical Technology Group Co Ltd 828 0.10
15 Sunwoda Electronic Co Ltd 69 0.01
27 Suzhou Dongshan Precision Manufacturing Co Ltd 77 0.01
52 Suzhou Gold Mantis Construction Decoration Co Ltd 73 0.01
1 TAL Education Group, ADR 40 -
82 Tech-Bank Food Co Ltd 96 0.01
292 Tencent Holdings Ltd 22,844 2.80
5 Tencent Music Entertainment Group ADR 86 0.01
15 Tianjin Zhonghuan Semiconductor Co Ltd 62 0.01
20 Tianshui Huatian Technology Co Ltd 40 -
1,226 Tingyi Cayman Islands Holding Corp 2,332 0.29
8 Toly Bread Co 45 0.01
23 TongFu Microelectronics Co Ltd 72 0.01
21 Tongkun Group Co Ltd 70 0.01
10 Tongwei Co Ltd 59 0.01
16 Trip.com Group Ltd, ADR 685 0.08
96 Tsingtao Brewery Co Ltd 1,020 0.12
5 Unigroup Guoxin Microelectronics Co Ltd 94 0.01
160 United Energy Group Ltd 30 -
111 Vipshop Holdings Ltd, ADR 2,560 0.31
23 Wanhua Chemical Group Co Ltd 393 0.05
2,442 Want Want China Holdings Ltd 1,813 0.22
26 Weibo Corp, ADR 1,315 0.16
983 Weichai Power Co Ltd 2,278 0.28
3 Weihai Guangwei Composites Co Ltd 36 -
77 Wens Foodstuffs Group Co Ltd 170 0.02
1 Will Semiconductor Co Ltd Shanghai 54 0.01
3 Wingtech Technology Co Ltd 46 0.01
62 Wuchan Zhongda Group Co Ltd 65 0.01
5 Wuhan Guide Infrared Co Ltd 29 -
50 Wuhu Sanqi Interactive Entertainment NetworkTechnology Group Co Ltd 189 0.02
15 Wuhu Token Science Co Ltd 19 -
11 Wuliangye Yibin Co Ltd 566 0.07
44 WUS Printed Circuit Kunshan Co Ltd 107 0.01
5 WuXi AppTec Co Ltd 104 0.01
17 Wuxi Biologics Cayman Inc 245 0.03
91 XCMG Construction Machinery Co Ltd 96 0.01
45 Xiamen C & D Inc 57 0.01
3 Xiamen Faratronic Co Ltd 67 0.01
Shares (000's)
Value(000's)
USD
% of NetAssetValue
Common Stock (continued)
China - 36.42% (continued)
22 Xiamen Intretech Inc 147 0.02
6 Xiamen Kingdomway Group Co 43 0.01
19 Xiamen Tungsten Co Ltd 56 0.01
17 Xinfengming Group Co Ltd 51 0.01
29 Xinjiang Goldwind Science & Technology Co Ltd 49 0.01
907 Xinyi Solar Holdings Ltd 1,610 0.20
39 Xinyu Iron & Steel Co Ltd 36 -
42 Yango Group Co Ltd 37 -
16 Yantai Jereh Oilfield Services Group Co Ltd 101 0.01
962 Yanzhou Coal Mining Co Ltd 1,225 0.15
3 Yealink Network Technology Corp Ltd 34 -
19 Yifan Pharmaceutical Co Ltd 56 0.01
21 Yihai International Holding Ltd 166 0.02
31 Yintai Gold Co Ltd 50 0.01
88 Yonghui Superstores Co Ltd 79 0.01
87 Yum China Holdings Inc 5,870 0.72
59 Yunda Holding Co Ltd 134 0.02
59 Yunnan Aluminium Co Ltd 132 0.02
3 Yunnan Baiyao Group Co Ltd 61 0.01
68 Yunnan Copper Co Ltd 154 0.02
25 Yunnan Tin Co Ltd 64 0.01
32 Zhefu Holding Group Co Ltd 26 -
51 Zhejiang Century Huatong Group Co Ltd 53 0.01
19 Zhejiang Chint Electrics Co Ltd 93 0.01
36 Zhejiang Dahua Technology Co Ltd 131 0.02
2 Zhejiang Dingli Machinery Co Ltd 16 -
61 Zhejiang Huafeng Spandex Co Ltd 120 0.01
21 Zhejiang Huahai Pharmaceutical Co Ltd 67 0.01
66 Zhejiang Longsheng Group Co Ltd 149 0.02
34 Zhejiang NHU Co Ltd 170 0.02
12 Zhejiang Sanhua Intelligent Controls Co Ltd 43 0.01
18 Zhejiang Semir Garment Co Ltd 34 -
4 Zhejiang Supor Co Ltd 50 0.01
16 Zhejiang Weiming Environment Protection Co Ltd 58 0.01
37 Zhejiang Weixing New Building Materials Co Ltd 135 0.02
38 ZhongAn Online P&C Insurance Co Ltd 187 0.02
309 Zhongsheng Group Holdings Ltd 2,570 0.31
90 Zhuzhou Kibing Group Co Ltd 229 0.03
1,522 Zijin Mining Group Co Ltd 2,355 0.29
660 Zoomlion Heavy Industry Science and TechnologyCo Ltd 821 0.10
156 ZTE Corp 422 0.05
74 ZTO Express Cayman Inc, ADR 2,381 0.29
296,895 36.42
Colombia - 0.13%
9 Banco de Bogota SA 173 0.02
18 Bancolombia SA 128 0.02
7 Bancolombia SA, ADR 204 0.03
268 Ecopetrol SA 160 0.02
34 Grupo Argos SA 95 0.01
20 Grupo Aval Acciones y Valores SA, ADR 115 0.01
7 Grupo de Inversiones Suramericana SA 40 -
24 Grupo Energia Bogota SA ESP 15 -
9 Grupo Nutresa SA 51 0.01
20 Interconexion Electrica SA ESP 109 0.01
1,090 0.13
Czech Republic - 0.09%
20 CEZ AS 600 0.07
3 Komercni Banka AS 100 0.01
4 O2 Czech Republic AS 59 0.01
759 0.09
Emerging Markets Large Cap Core Equity FundPortfolio of Investments as at 31 May 2021 (continued)
Dimensional Fund Advisors Semi-Annual Report and Unaudited Financial Statements, 31 May 2021 33

Shares (000's)
Value(000's)
USD
% of NetAssetValue
Common Stock (continued)
Egypt - 0.06%
129 Commercial International Bank Egypt SAE, GDR 451 0.06
15 Egyptian Financial Group-Hermes Holding Co, GDR 25 -
476 0.06
Greece - 0.19%
63 Alpha Bank AE 82 0.01
318 Eurobank Ergasias SA 298 0.04
2 Hellenic Petroleum SA 16 -
18 Hellenic Telecommunications Organization SA 318 0.04
8 JUMBO SA 144 0.02
2 Motor Oil Hellas Corinth Refineries SA 38 -
5 Mytilineos SA 96 0.01
50 National Bank of Greece SA 150 0.02
14 OPAP SA 219 0.03
2 Terna Energy SA 25 -
8 Titan Cement International SA 180 0.02
1,566 0.19
Hungary - 0.26%
198 MOL Hungarian Oil & Gas PLC 1,590 0.20
9 OTP Bank Nyrt 503 0.06
2,093 0.26
India - 3.76%
10 Axis Bank Ltd, GDR 491 0.06
20 Dr Reddy's Laboratories Ltd, ADR 1,399 0.17
19 GAIL India Ltd, GDR 247 0.03
133 ICICI Bank Ltd, ADR 2,401 0.30
250 Infosys Ltd, ADR 4,837 0.59
70 Mahindra & Mahindra Ltd, GDR 828 0.10
120 Reliance Industries Ltd, GDR 6,935 0.85
8 State Bank of India, GDR 439 0.06
311 Tata Motors Ltd, ADR 6,749 0.83
156 Tata Steel Ltd, GDR 2,341 0.29
226 Vedanta Ltd, ADR 3,354 0.41
76 Wipro Ltd 601 0.07
30,622 3.76
Indonesia - 1.22%
1,948 Adaro Energy Tbk PT 160 0.02
2,313 Astra International Tbk PT 833 0.10
503 Bank Central Asia Tbk PT 1,116 0.14
757 Bank Mandiri Persero Tbk PT 307 0.04
243 Bank Negara Indonesia Persero Tbk PT 89 0.01
4,974 Bank Rakyat Indonesia Persero Tbk PT 1,417 0.17
837 Charoen Pokphand Indonesia Tbk PT 392 0.05
332 Gudang Garam Tbk PT 764 0.09
396 Indah Kiat Pulp & Paper Corp Tbk PT 232 0.03
34 Indocement Tunggal Prakarsa Tbk PT 28 -
204 Indofood CBP Sukses Makmur Tbk PT 116 0.01
1,839 Indofood Sukses Makmur Tbk PT 801 0.10
3,586 Kalbe Farma Tbk PT 361 0.04
492 Mayora Indah Tbk PT 90 0.01
743 Merdeka Copper Gold Tbk PT 135 0.02
1,898 Sarana Menara Nusantara Tbk PT 156 0.02
598 Semen Indonesia Persero Tbk PT 404 0.05
12 Telekomunikasi Indonesia Persero Tbk PT, ADR 287 0.04
359 Tower Bersama Infrastructure Tbk PT 60 0.01
348 Unilever Indonesia Tbk PT 141 0.02
1,294 United Tractors Tbk PT 1,976 0.24
206 Vale Indonesia Tbk PT 68 0.01
9,933 1.22
Korea, Republic of - 15.01%
1 Amorepacific Corp 245 0.03
1 Amorepacific Group 80 0.01
Shares (000's)
Value(000's)
USD
% of NetAssetValue
Common Stock (continued)
Korea, Republic of - 15.01% (continued)
1 BGF retail Co Ltd 116 0.01
10 BNK Financial Group Inc 73 0.01
3 Celltrion Inc 723 0.09
11 Cheil Worldwide Inc 228 0.03
2 CJ CheilJedang Corp 937 0.12
10 CJ Corp 1,001 0.12
6 CJ ENM Co Ltd 896 0.11
2 CJ Logistics Corp 280 0.03
1 Com2uS Corp 67 0.01
8 Coway Co Ltd 581 0.07
3 Daelim Industrial Co Ltd 247 0.03
30 Daewoo Engineering & Construction Co Ltd 218 0.03
3 Daewoo Shipbuilding & Marine Engineering Co Ltd 100 0.01
2 DB HiTek Co Ltd 83 0.01
50 DB Insurance Co Ltd 2,255 0.28
4 DL E&C Co Ltd 499 0.06
4 Doosan Bobcat Inc 170 0.02
51 Doosan Infracore Co Ltd 570 0.07
1 Douzone Bizon Co Ltd 84 0.01
1 E-MART Inc 89 0.01
3 Fila Korea Ltd 164 0.02
20 GS Engineering & Construction Corp 805 0.10
18 GS Holdings Corp 743 0.09
20 GS Retail Co Ltd 653 0.08
55 Hana Financial Group Inc 2,243 0.28
20 Hankook Tire & Technology Co Ltd 878 0.11
11 Hanon Systems 169 0.02
20 Hanwha Chemical Corp 794 0.10
51 Hanwha Life Insurance Co Ltd 180 0.02
4 Hite Jinro Co Ltd 147 0.02
2 Hyundai Engineering & Construction Co Ltd 93 0.01
7 Hyundai Glovis Co Ltd 1,159 0.14
3 Hyundai Heavy Industries Holdings Co Ltd 198 0.02
72 Hyundai Marine & Fire Insurance Co Ltd 1,582 0.19
38 Hyundai Merchant Marine Co Ltd 1,670 0.20
2 Hyundai Mobis Co Ltd 518 0.06
5 Hyundai Motor Co 1,097 0.13
3 Hyundai Steel Co 152 0.02
47 Industrial Bank of Korea 458 0.06
1 Kakao Corp 149 0.02
58 KB Financial Group Inc 2,955 0.36
15 KB Financial Group Inc, ADR 753 0.09
1 KCC Glass Corp 31 -
22 Kia Motors Corp 1,631 0.20
13 KIWOOM Securities Co Ltd 1,422 0.17
1 KMW Co Ltd 48 0.01
3 Korea Electric Power Corp 65 0.01
5 Korea Electric Power Corp, ADR 53 0.01
1 Korea Gas Corp 17 -
11 Korea Investment Holdings Co Ltd 1,048 0.13
1 Korea Shipbuilding & Offshore Engineering Co Ltd 165 0.02
2 Korea Zinc Co Ltd 863 0.11
129 Korean Air Lines Co Ltd 3,679 0.45
19 KT&G Corp 1,435 0.18
3 Kumho Petrochemical Co Ltd 715 0.09
1 LG Chem Ltd 844 0.10
3 LG Corp 250 0.03
207 LG Display Co Ltd 4,342 0.53
3 LG Display Co Ltd, ADR 31 -
87 LG Electronics Inc 11,884 1.46
- LG Household & Health Care Ltd 477 0.06
5 LG Innotek Co Ltd 978 0.12
Emerging Markets Large Cap Core Equity FundPortfolio of Investments as at 31 May 2021 (continued)
Dimensional Fund Advisors Semi-Annual Report and Unaudited Financial Statements, 31 May 2021 34

Shares (000's)
Value(000's)
USD
% of NetAssetValue
Common Stock (continued)
Korea, Republic of - 15.01% (continued)
193 LG Uplus Corp 2,576 0.32
- Lotte Chemical Corp 114 0.01
2 Lotte Corp 61 0.01
1 Lotte Shopping Co Ltd 76 0.01
1 LX Holdings Corp 14 -
11 Macquarie Korea Infrastructure Fund 123 0.02
1 Mando Corp 41 0.01
26 Meritz Fire & Marine Insurance Co Ltd 423 0.05
86 Meritz Securities Co Ltd 343 0.04
55 Mirae Asset Daewoo Co Ltd 487 0.06
2 NAVER Corp 541 0.07
1 NCSoft Corp 468 0.06
21 NH Investment & Securities Co Ltd 251 0.03
- Orion Corp 36 -
- Ottogi Corp 58 0.01
59 Pan Ocean Co Ltd 366 0.04
2 Pearl Abyss Corp 78 0.01
2 POSCO 735 0.09
33 POSCO International Corp 637 0.08
1 POSCO, ADR 70 0.01
3 S-1 Corp 190 0.02
- Samsung Biologics Co Ltd 80 0.01
3 Samsung C&T Corp 337 0.04
3 Samsung Card Co Ltd 79 0.01
8 Samsung Electro-Mechanics Co Ltd 1,156 0.14
442 Samsung Electronics Co Ltd 31,714 3.89
3 Samsung Electronics Co Ltd, GDR 6,274 0.77
79 Samsung Engineering Co Ltd 1,371 0.17
8 Samsung Fire & Marine Insurance Co Ltd 1,514 0.19
18 Samsung Heavy Industries Co Ltd 95 0.01
1 Samsung Life Insurance Co Ltd 104 0.01
- Samsung SDI Co Ltd 218 0.03
1 Samsung SDS Co Ltd 168 0.02
15 Samsung Securities Co Ltd 619 0.08
1 Seegene Inc 53 0.01
48 Shinhan Financial Group Co Ltd 1,829 0.22
1 Shinsegae Inc 353 0.04
4 SK Holdings Co Ltd 927 0.11
80 SK Hynix Inc 8,936 1.10
1 SK Innovation Co Ltd 293 0.04
- SK Materials Co Ltd 109 0.01
1 SK Telecom Co Ltd 162 0.02
1 SKC Co Ltd 72 0.01
1 S-Oil Corp 51 0.01
- Soulbrain Co Ltd 78 0.01
17 Ssangyong Cement Industrial Co Ltd 118 0.01
90 Woori Financial Group Inc 891 0.11
1 Woori Financial Group Inc, ADR 27 -
122,396 15.01
Malaysia - 1.32%
227 AMMB Holdings Bhd 159 0.02
342 Axiata Group Bhd 306 0.04
8 Batu Kawan Bhd 35 -
217 BIMB Holdings Bhd 202 0.02
15 Bursa Malaysia Bhd 30 -
8 Carlsberg Brewery Malaysia Bhd 41 0.01
334 CIMB Group Holdings Bhd 351 0.04
195 Dialog Group Bhd 138 0.02
169 DiGi.Com Bhd 175 0.02
11 Fraser & Neave Holdings Bhd 70 0.01
93 Gamuda Bhd 74 0.01
130 Genting Bhd 155 0.02
Shares (000's)
Value(000's)
USD
% of NetAssetValue
Common Stock (continued)
Malaysia - 1.32% (continued)
188 Genting Malaysia Bhd 126 0.02
18 HAP Seng Consolidated Bhd 36 -
85 Hartalega Holdings Bhd 189 0.02
11 Heineken Malaysia Bhd 65 0.01
16 Hong Leong Bank Bhd 70 0.01
19 Hong Leong Financial Group Bhd 80 0.01
51 IHH Healthcare Bhd 66 0.01
64 IJM Corp Bhd 28 -
185 Inari Amertron Bhd 141 0.02
18 IOI Corp Bhd 18 -
80 IOI Properties Group Bhd 25 -
239 Kossan Rubber Industries 237 0.03
3 Kuala Lumpur Kepong Bhd 18 -
405 Malayan Banking Bhd 803 0.10
192 Malaysia Airports Holdings Bhd 256 0.03
110 Maxis Bhd 126 0.02
125 MISC Bhd 209 0.03
5 Nestle Malaysia Bhd 155 0.02
265 Petronas Chemicals Group Bhd 521 0.06
28 Petronas Dagangan Bhd 130 0.02
25 Petronas Gas Bhd 99 0.01
18 PPB Group Bhd 83 0.01
267 Press Metal Aluminium Holdings Bhd 336 0.04
2,601 Public Bank Bhd 2,687 0.33
66 QL Resources Bhd 96 0.01
366 RHB Bank Bhd 476 0.06
412 Serba Dinamik Holdings Bhd 160 0.02
1,718 Sime Darby Bhd 947 0.12
61 Sime Darby Plantation Bhd 68 0.01
78 Sunway Bhd 30 -
31 Supermax Corp Bhd 32 -
45 Telekom Malaysia Bhd 67 0.01
79 Tenaga Nasional Bhd 190 0.02
24 TIME dotCom Bhd 80 0.01
190 Top Glove Corp Bhd 234 0.03
70 Westports Holdings Bhd 73 0.01
371 YTL Corp Bhd 61 0.01
10,754 1.32
Mexico - 1.93%
1,203 Alfa SAB de CV 842 0.10
1,028 America Movil SAB de CV 789 0.10
49 America Movil SAB de CV, ADR 755 0.09
43 Arca Continental SAB de CV 240 0.03
60 Cemex SAB de CV, ADR 494 0.06
3 Coca-Cola Femsa SAB de CV 13 -
6 Coca-Cola Femsa SAB de CV, ADR 282 0.04
681 Controladora Nemak SAB de CV 107 0.01
10 El Puerto de Liverpool SAB de CV 43 0.01
43 Fomento Economico Mexicano SAB de CV 354 0.04
2 Fomento Economico Mexicano SAB de CV, ADR 191 0.02
56 Gruma SAB de CV 599 0.07
37 Grupo Aeroportuario del Pacifico SAB de CV 389 0.05
- Grupo Aeroportuario del Sureste SAB de CV, ADR 42 0.01
349 Grupo Bimbo SAB de CV 759 0.09
31 Grupo Carso SAB de CV 92 0.01
1 Grupo Elektra SAB de CV 76 0.01
454 Grupo Financiero Banorte SAB de CV 3,095 0.38
119 Grupo Financiero Inbursa SAB de CV 117 0.01
269 Grupo Mexico SAB de CV 1,290 0.16
17 Grupo Sanborns SAB de CV 17 -
841 Grupo Televisa SAB 2,189 0.27
53 Grupo Televisa SAB, ADR 689 0.08
Emerging Markets Large Cap Core Equity FundPortfolio of Investments as at 31 May 2021 (continued)
Dimensional Fund Advisors Semi-Annual Report and Unaudited Financial Statements, 31 May 2021 35

Shares (000's)
Value(000's)
USD
% of NetAssetValue
Common Stock (continued)
Mexico - 1.93% (continued)
12 Industrias Penoles SAB de CV 184 0.02
15 Infraestructura Energetica Nova SAB de CV 62 0.01
91 Kimberly-Clark de Mexico SAB de CV 164 0.02
479 Orbia Advance Corp SAB de CV 1,352 0.17
169 Wal-Mart de Mexico SAB de CV 538 0.07
15,764 1.93
Peru - 0.13%
17 Aenza SAA, ADR 26 -
2 Cementos Pacasmayo SAA, ADR 17 -
8 Credicorp Ltd 1,020 0.13
1,063 0.13
Philippines - 0.63%
67 Aboitiz Equity Ventures Inc 56 0.01
26 Aboitiz Power Corp 13 -
9 Ayala Corp 140 0.02
417 Ayala Land Inc 301 0.04
505 Bank of the Philippine Islands 886 0.11
629 BDO Unibank Inc 1,340 0.16
116 Emperador Inc 24 -
3 Globe Telecom Inc 97 0.01
121 International Container Terminal Services Inc 369 0.04
197 JG Summit Holdings Inc 240 0.03
12 Manila Electric Co 70 0.01
210 Metropolitan Bank & Trust Co 215 0.03
19 PLDT Inc, ADR 537 0.07
18 Puregold Price Club Inc 15 -
130 San Miguel Corp 317 0.04
14 San Miguel Food and Beverage Inc 21 -
4 SM Investments Corp 74 0.01
380 SM Prime Holdings Inc 293 0.04
41 Universal Robina Corp 121 0.01
5,129 0.63
Poland - 0.70%
5 Bank Polska Kasa Opieki SA 129 0.02
1 CD Projekt SA 40 -
72 Cyfrowy Polsat SA 604 0.07
2 Dino Polska SA 135 0.02
4 Grupa Lotos SA 60 0.01
2 ING Bank Slaski SA 127 0.02
21 KGHM Polska Miedz SA 1,136 0.14
- LPP SA 452 0.05
2 mBank SA 130 0.02
30 Orange Polska SA 56 0.01
145 PGE Polska Grupa Energetyczna SA 400 0.05
76 Polski Koncern Naftowy ORLEN SA 1,648 0.20
38 Polskie Gornictwo Naftowe i Gazownictwo SA 68 0.01
26 Powszechna Kasa Oszczednosci Bank Polski SA 277 0.03
20 Powszechny Zaklad Ubezpieczen SA 204 0.02
3 Santander Bank Polska SA 226 0.03
5,692 0.70
Russia - 1.25%
145 Gazprom PJSC, ADR 1,031 0.13
41 LUKOIL PJSC, ADR 3,328 0.41
25 Magnitogorsk Iron & Steel Works PJSC, GDR 274 0.03
20 MMC Norilsk Nickel PJSC, ADR 725 0.09
21 Mobile TeleSystems PJSC, ADR 196 0.02
1 Novatek PJSC, GDR 115 0.01
4 Novolipetskiy Metallurgicheskiy Kombinat PAO,GDR 140 0.02
2 PhosAgro PJSC, GDR 36 0.01
2 Polyus PJSC, GDR 168 0.02
118 Rosneft Oil Co PJSC, GDR 836 0.10
Shares (000's)
Value(000's)
USD
% of NetAssetValue
Common Stock (continued)
Russia - 1.25% (continued)
123 Sberbank of Russia PJSC, ADR 2,070 0.25
8 Severstal PJSC, GDR 193 0.02
14 Tatneft PJSC, ADR 580 0.07
285 VTB Bank PJSC, GDR 379 0.05
1 X5 Retail Group NV, GDR (Germany listing) 37 0.01
4 X5 Retail Group NV, GDR (UK listing) 109 0.01
10,217 1.25
Saudi Arabia - 2.35%
2 Abdullah Al Othaim Markets Co 74 0.01
7 Advanced Petrochemical Co 143 0.02
67 Al Rajhi Bank 1,851 0.23
212 Alinma Bank 1,132 0.14
56 Almarai Co JSC 811 0.10
68 Arab National Bank 400 0.05
6 Arabian Centres Co Ltd 43 -
43 Bank AlBilad 441 0.05
55 Bank AlJazira 271 0.03
2 Banque Saudi Fransi 22 -
9 Bupa Arabia for Cooperative Insurance Co 273 0.03
2 Co for Cooperative Insurance 41 -
339 Etihad Etisalat Co 2,984 0.37
3 Jarir Marketing Co 172 0.02
481 Mobile Telecommunications Co Saudi Arabia 1,859 0.23
1 Mouwasat Medical Services Co 68 0.01
179 National Commercial Bank 2,570 0.31
3 National Petrochemical Co 40 -
14 Rabigh Refining & Petrochemical Co 84 0.01
104 Riyad Bank 727 0.09
41 Sahara International Petrochemical Co 321 0.04
8 Saudi Arabian Fertilizer Co 203 0.02
46 Saudi Arabian Mining Co 700 0.09
24 Saudi Basic Industries Corp 793 0.10
6 Saudi British Bank 46 0.01
26 Saudi Electricity Co 170 0.02
7 Saudi Industrial Investment Group 73 0.01
9 Saudi Investment Bank 44 0.01
100 Saudi Kayan Petrochemical Co 469 0.06
41 Saudi Telecom Co 1,347 0.16
66 Savola Group 720 0.09
2 Southern Province Cement Co 46 0.01
13 Yanbu National Petrochemical Co 244 0.03
19,182 2.35
South Africa - 4.05%
165 Absa Group Ltd 1,708 0.21
36 African Rainbow Minerals Ltd 682 0.08
2 Anglo American Platinum Ltd 309 0.04
35 AngloGold Ashanti Ltd, ADR 822 0.10
61 Aspen Pharmacare Holdings Ltd 725 0.09
25 Bid Corp Ltd 527 0.07
69 Bidvest Group Ltd 976 0.12
2 Capitec Bank Holdings Ltd 268 0.03
10 Clicks Group Ltd 195 0.02
127 Discovery Ltd 1,321 0.16
84 Exxaro Resources Ltd 930 0.11
580 FirstRand Ltd 2,376 0.29
152 Gold Fields Ltd, ADR 1,839 0.23
126 Impala Platinum Holdings Ltd 2,181 0.27
4 Kumba Iron Ore Ltd 182 0.02
795 MTN Group Ltd 5,844 0.72
38 MultiChoice Group 380 0.05
6 Naspers Ltd 1,305 0.16
131 Nedbank Group Ltd 1,516 0.19
Emerging Markets Large Cap Core Equity FundPortfolio of Investments as at 31 May 2021 (continued)
Dimensional Fund Advisors Semi-Annual Report and Unaudited Financial Statements, 31 May 2021 36

Shares (000's)
Value(000's)
USD
% of NetAssetValue
Common Stock (continued)
South Africa - 4.05% (continued)
5 NEPI Rockcastle PLC 33 -
24 Ninety One Ltd 81 0.01
14 Northam Platinum Ltd 223 0.03
621 Old Mutual Ltd 644 0.08
16 Pepkor Holdings Ltd 24 -
18 PSG Group Ltd 103 0.01
459 Sanlam Ltd 1,963 0.24
29 Sasol Ltd 473 0.06
18 Sasol Ltd, ADR 294 0.04
40 Shoprite Holdings Ltd 443 0.05
334 Sibanye Stillwater Ltd 1,523 0.19
250 Standard Bank Group Ltd 2,411 0.30
72 Vodacom Group Ltd 688 0.08
32,989 4.05
Taiwan - 16.11%
38 Accton Technology Corp 402 0.05
778 Acer Inc 890 0.11
21 Advantech Co Ltd 252 0.03
3 Airtac International Group 119 0.01
633 ASE Technology Holding Co Ltd 2,517 0.31
3 ASE Technology Holding Co Ltd, ADR 21 -
631 Asia Cement Corp 1,148 0.14
39 Asustek Computer Inc 550 0.07
1,666 AU Optronics Corp 1,400 0.17
177 Catcher Technology Co Ltd 1,165 0.14
601 Cathay Financial Holding Co Ltd 1,201 0.15
423 Chailease Holding Co Ltd 3,198 0.39
264 Chang Hwa Commercial Bank Ltd 161 0.02
494 Cheng Shin Rubber Industry Co Ltd 844 0.10
133 Chicony Electronics Co Ltd 372 0.05
3,120 China Airlines Ltd 2,028 0.25
519 China Development Financial Holding Corp 230 0.03
25 China Life Insurance Co Ltd 22 -
741 China Steel Corp 976 0.12
46 Chroma ATE Inc 317 0.04
25 Chunghwa Telecom Co Ltd 102 0.01
8 Chunghwa Telecom Co Ltd, ADR 336 0.04
1,086 Compal Electronics Inc 912 0.11
539 Compeq Manufacturing Co Ltd 743 0.09
3,746 CTBC Financial Holding Co Ltd 3,103 0.38
201 Delta Electronics Inc 2,112 0.26
1,533 E.Sun Financial Holding Co Ltd 1,403 0.17
14 Eclat Textile Co Ltd 334 0.04
24 Elan Microelectronics Corp 181 0.02
2,382 Eva Airways Corp 1,494 0.18
1,101 Evergreen Marine Corp Taiwan Ltd 3,821 0.47
224 Far Eastern New Century Corp 252 0.03
554 Far EasTone Telecommunications Co Ltd 1,289 0.16
31 Feng TAY Enterprise Co Ltd 271 0.03
383 First Financial Holding Co Ltd 302 0.04
150 Formosa Chemicals & Fibre Corp 461 0.06
55 Formosa Petrochemical Corp 196 0.02
131 Formosa Plastics Corp 479 0.06
16 Formosa Sumco Technology Corp 96 0.01
49 Formosa Taffeta Co Ltd 54 0.01
73 Foxconn Technology Co Ltd 169 0.02
691 Fubon Financial Holding Co Ltd 1,793 0.22
4 Genius Electronic Optical Co Ltd 66 0.01
48 Giant Manufacturing Co Ltd 577 0.07
55 Gigabyte Technology Co Ltd 214 0.03
88 Globalwafers Co Ltd 2,530 0.31
49 Highwealth Construction Corp 75 0.01
Shares (000's)
Value(000's)
USD
% of NetAssetValue
Common Stock (continued)
Taiwan - 16.11% (continued)
40 Hiwin Technologies Corp 524 0.06
531 Hon Hai Precision Industry Co Ltd 2,121 0.26
37 Hotai Motor Co Ltd 752 0.09
264 Hua Nan Financial Holdings Co Ltd 172 0.02
1,412 Innolux Corp 1,132 0.14
1 International Games System Co Ltd 34 -
530 Inventec Corp 490 0.06
13 Largan Precision Co Ltd 1,362 0.17
509 Lite-On Technology Corp 1,204 0.15
4 Lotes Co Ltd 85 0.01
619 Macronix International 946 0.12
44 MediaTek Inc 1,520 0.19
349 Mega Financial Holding Co Ltd 417 0.05
22 Merida Industry Co Ltd 254 0.03
159 Micro-Star International Co Ltd 951 0.12
197 Nan Ya Plastics Corp 594 0.07
18 Nan Ya Printed Circuit Board Corp 202 0.02
61 Nantex Industry Co Ltd 288 0.04
193 Nanya Technology Corp 559 0.07
58 Nien Made Enterprise Co Ltd 852 0.10
67 Novatek Microelectronics Corp 1,217 0.15
5 Parade Technologies Ltd 270 0.03
584 Pegatron Corp 1,541 0.19
16 Phison Electronics Corp 269 0.03
213 Pou Chen Corp 294 0.04
603 Powertech Technology Inc 2,304 0.28
121 President Chain Store Corp 1,143 0.14
289 Qisda Corp 313 0.04
429 Quanta Computer Inc 1,360 0.17
100 Radiant Opto-Electronics Corp 425 0.05
57 Realtek Semiconductor Corp 1,020 0.13
71 Ruentex Development Co Ltd 134 0.02
131 Shanghai Commercial & Savings Bank Ltd 214 0.03
861 Shin Kong Financial Holding Co Ltd 308 0.04
2 Silergy Corp 251 0.03
36 Simplo Technology Co Ltd 478 0.06
21 Sinbon Electronics Co Ltd 198 0.02
250 Sino-American Silicon Products Inc 1,484 0.18
431 SinoPac Financial Holdings Co Ltd 209 0.03
44 Standard Foods Corp 83 0.01
202 Synnex Technology International Corp 428 0.05
605 Taishin Financial Holding Co Ltd 320 0.04
286 Taiwan Business Bank 99 0.01
1,412 Taiwan Cement Corp 2,576 0.32
319 Taiwan Cooperative Financial Holding Co Ltd 240 0.03
31 Taiwan Fertilizer Co Ltd 62 0.01
71 Taiwan High Speed Rail Corp 74 0.01
498 Taiwan Mobile Co Ltd 1,790 0.22
1,003 Taiwan Semiconductor Manufacturing Co Ltd 21,296 2.61
123 Taiwan Semiconductor Manufacturing Co Ltd, ADR 14,478 1.78
51 Tatung Co Ltd 46 0.01
89 Teco Electric and Machinery Co Ltd 106 0.01
91 Tripod Technology Corp 415 0.05
273 Unimicron Technology Corp 1,025 0.13
625 Uni-President Enterprises Corp 1,640 0.20
2,221 United Microelectronics Corp 4,174 0.51
272 Vanguard International Semiconductor Corp 1,146 0.14
6 Voltronic Power Technology Corp 293 0.04
108 Walsin Lihwa Corp 98 0.01
104 Walsin Technology Corp 776 0.10
128 Wan Hai Lines Ltd 713 0.09
53 Win Semiconductors Corp 624 0.08
Emerging Markets Large Cap Core Equity FundPortfolio of Investments as at 31 May 2021 (continued)
Dimensional Fund Advisors Semi-Annual Report and Unaudited Financial Statements, 31 May 2021 37

Shares (000's)
Value(000's)
USD
% of NetAssetValue
Common Stock (continued)
Taiwan - 16.11% (continued)
1,128 Winbond Electronics Corp 1,372 0.17
1,045 Wistron Corp 1,151 0.14
41 Wiwynn Corp 1,342 0.16
398 WPG Holdings Ltd 739 0.09
66 Yageo Corp 1,162 0.14
723 Yang Ming Marine Transport Corp 2,808 0.34
62 YFY Inc 84 0.01
530 Yuanta Financial Holding Co Ltd 489 0.06
171 Zhen Ding Technology Holding Ltd 597 0.07
131,315 16.11
Thailand - 2.12%
64 Advanced Info Service PCL 344 0.04
114 Airports of Thailand PCL 227 0.03
32 B Grimm Power PCL 44 0.01
13 Bangkok Bank PCL, NVDR 47 0.01
9 Bangkok Bank PCL, NVDR (voting rights) 35 -
79 Bangkok Chain Hospital PCL 52 0.01
85 Bangkok Commercial Asset Management 51 0.01
860 Bangkok Dusit Medical Services PCL 592 0.07
1,169 Bangkok Expressway & Metro PCL 301 0.04
50 Bangkok Life Assurance PCL, NVDR 49 0.01
239 Banpu PCL 99 0.01
516 Berli Jucker PCL 570 0.07
115 BTS Group Holdings PCL 33 -
73 Bumrungrad Hospital PCL 306 0.04
18 Carabao Group PCL 75 0.01
68 Central Pattana PCL 110 0.01
223 Central Retail Corp PCL 237 0.03
1,315 Charoen Pokphand Foods PCL 1,147 0.14
24 Com7 PCL 58 0.01
308 CP ALL PCL 599 0.07
14 Delta Electronics Thailand PCL 242 0.03
7 Electricity Generating PCL 37 -
101 Energy Absolute PCL 193 0.02
19 Global Power Synergy PCL 43 -
40 Hana Microelectronics PCL 75 0.01
469 Home Product Center PCL 207 0.03
290 Indorama Ventures PCL 422 0.05
27 Intouch Holdings PCL 56 0.01
745 IRPC PCL 98 0.01
30 Kasikornbank PCL 114 0.01
27 Kasikornbank PCL, NVDR 104 0.01
153 KCE Electronics PCL 344 0.04
70 Kiatnakin Bank PCL 125 0.02
224 Krung Thai Bank PCL 77 0.01
109 Krungthai Card PCL 256 0.03
520 Land & Houses PCL 133 0.02
163 Land & Houses PCL, NVDR 42 -
98 Minor International PCL 100 0.01
77 Muangthai Capital PCL 152 0.02
43 Osotspa PCL 50 0.01
439 PTT Exploration & Production PCL 1,649 0.20
125 PTT Global Chemical PCL 252 0.03
1,324 PTT PCL 1,695 0.21
25 Ratch Group PCL 40 -
49 Siam Cement PCL 696 0.09
31 Siam City Cement PCL 179 0.02
117 Siam Commercial Bank PCL 381 0.05
160 Siam Global House PCL 107 0.01
578 Sri Trang Agro-Industry PCL 815 0.10
246 Srisawad Corp PCL 592 0.07
79 Thai Oil PCL 151 0.02
Shares (000's)
Value(000's)
USD
% of NetAssetValue
Common Stock (continued)
Thailand - 2.12% (continued)
1,444 Thai Union Group PCL 818 0.10
110 Tisco Financial Group PCL 314 0.04
2,083 TMB Bank PCL 75 0.01
58 TOA Paint Thailand PCL 69 0.01
229 Total Access Communication PCL 227 0.03
12,031 True Corp PCL 1,301 0.16
45 Vinythai PCL 54 0.01
17,261 2.12
Turkey - 0.29%
368 Akbank TAS 226 0.03
49 Anadolu Efes Biracilik Ve Malt Sanayii AS 130 0.02
26 Arcelik AS 97 0.01
22 Aselsan Elektronik Sanayi Ve Ticaret AS 38 -
15 BIM Birlesik Magazalar AS 114 0.01
16 Coca-Cola Icecek AS 141 0.02
40 Enka Insaat ve Sanayi AS 40 -
59 Eregli Demir ve Celik Fabrikalari TAS 133 0.02
2 Ford Otomotiv Sanayi AS 41 -
5 Koza Altin Isletmeleri AS 67 0.01
58 Petkim Petrokimya Holding AS 42 0.01
7 Tofas Turk Otomobil Fabrikasi AS 23 -
287 Turk Hava Yollari AO 434 0.05
62 Turk Telekomunikasyon AS 50 0.01
123 Turkcell Iletisim Hizmetleri AS 228 0.03
286 Turkiye Garanti Bankasi AS 267 0.03
108 Turkiye Is Bankasi AS 64 0.01
57 Turkiye Sise ve Cam Fabrikalari AS 53 0.01
178 Turkiye Vakiflar Bankasi TAO 74 0.01
389 Yapi ve Kredi Bankasi AS 98 0.01
2,360 0.29
United Arab Emirates - 0.64%
386 Abu Dhabi Commercial Bank PJSC 717 0.09
415 Abu Dhabi Islamic Bank PJSC 639 0.08
162 Aldar Properties PJSC 164 0.02
92 Dubai Islamic Bank PJSC 121 0.01
167 Emaar Malls PJSC 90 0.01
159 Emaar Properties PJSC 175 0.02
620 Emirates NBD Bank PJSC 2,279 0.28
65 Emirates Telecommunications Group Co PJSC 379 0.05
152 First Abu Dhabi Bank PJSC 687 0.08
5,251 0.64
Total Common Stock - 93.91% (30 November 2020: 94.37%) 765,627 93.91
Preferred Stock
Brazil - 1.16%
197 Banco Bradesco SA 1,005 0.12
7 Braskem SA 67 0.01
7 Centrais Eletricas Brasileiras SA 61 0.01
22 Cia Energetica de Minas Gerais 57 0.01
91 Gerdau SA 568 0.07
143 Itau Unibanco Holding SA 812 0.10
28 Lojas Americanas SA 109 0.01
1,157 Petroleo Brasileiro SA 5,993 0.74
198 Usinas Siderurgicas de Minas Gerais SA Usiminas 743 0.09
9,415 1.16
Colombia - 0.01%
7 Banco Davivienda SA 53 0.01
24 Grupo Argos SA 52 -
2 Grupo de Inversiones Suramericana SA 12 -
117 0.01
Total Preferred Stock - 1.17% (30 November 2020: 1.25%) 9,532 1.17
Emerging Markets Large Cap Core Equity FundPortfolio of Investments as at 31 May 2021 (continued)
Dimensional Fund Advisors Semi-Annual Report and Unaudited Financial Statements, 31 May 2021 38

Shares (000's)
Value(000's)
USD
% of NetAssetValue
Real Estate Investment Trust
Malaysia - 0.00%
87 IGB Real Estate Investment Trust 35 -
35 -
Mexico - 0.02%
111 Fibra Uno Administracion SA de CV 130 0.02
130 0.02
South Africa - 0.00%
38 Growthpoint Properties Ltd 40 -
40 -
Total Real Estate Investment Trust - 0.02% (30 November2020: 0.03%) 205 0.02
Shares (000's)
Value(000's)
USD
% of NetAssetValue
Warrants
Thailand - 0.00%
4 Minor International PCL 1 -
3 Minor International PCL - -
1 -
Total Warrants - 0.00% (30 November 2020: 0.00%) 1 -
Total Investments - 99.68% (30 November 2020: 99.87%) 812,685 99.68
Value (000's)USD
% of NetAssetValue
Cash and Cash Equivalents - 0.47% (30 November 2020: 0.24%) 3,840 0.47Other Liabilities in Excess of Other Assets - (0.15)% (30 November 2020: (0.11)%) (1,222) (0.15)
Total Net Assets 815,303 100.00
Amounts designated as “- “ are either $0, less than $500 or less than 500 shares.
Analysis of Total Assets % of Total Assets
Transferable securities admitted to an official exchange listing 94.27
Investment Funds 4.54
Current Assets 1.19
Total Assets 100.00
Emerging Markets Large Cap Core Equity FundPortfolio of Investments as at 31 May 2021 (continued)
Dimensional Fund Advisors Semi-Annual Report and Unaudited Financial Statements, 31 May 2021 39

Shares (000's)
Value(000's)
USD
% of NetAssetValue
Common Stock
Brazil - 3.87%
31 Alliar Medicos A Frente SA 67 -
186 Banco Bradesco SA 818 0.06
239 Banco do Brasil SA 1,536 0.11
73 Banco Santander Brasil SA 575 0.04
27 BrasilAgro - Co Brasileira de Propriedades Agricolas 162 0.01
55 BRF SA 273 0.02
56 Camil Alimentos SA 106 0.01
29 Cia Hering 185 0.01
191 Cia Siderurgica Nacional SA 1,639 0.12
946 Cogna Educacao 773 0.06
19 CSU Cardsystem SA 90 0.01
29 Cyrela Brazil Realty SA Empreendimentos eParticipacoes 132 0.01
16 Direcional Engenharia SA 40 -
91 Duratex SA 362 0.03
107 Embraer SA 360 0.03
60 Enauta Participacoes SA 178 0.01
27 Even Construtora e Incorporadora SA 54 -
134 Gerdau SA 709 0.05
410 Gerdau SA, ADR 2,560 0.18
16 Guararapes Confeccoes SA 59 -
11 Hypera SA 74 0.01
23 Industrias Romi SA 119 0.01
156 International Meal Co Alimentacao SA 118 0.01
55 Iochpe Maxion SA 181 0.01
305 JBS SA 1,761 0.13
127 JHSF Participacoes SA 186 0.01
4 Kepler Weber SA 37 -
15 M Dias Branco SA 80 0.01
23 Marcopolo SA 11 -
73 Marisa Lojas SA 103 0.01
143 MRV Engenharia e Participacoes SA 482 0.03
268 Petro Rio SA 1,011 0.07
75 Petrobras Distribuidora SA 370 0.03
1,590 Petroleo Brasileiro SA 8,149 0.59
6 Restoque Comercio e Confeccoes de Roupas SA 4 -
78 Rumo SA 313 0.02
19 Sao Carlos Empreendimentos e Participacoes SA 156 0.01
15 Sao Martinho SA 101 0.01
18 Ser Educacional SA 53 -
41 SLC Agricola SA 400 0.03
8 Smiles Fidelidade SA 34 -
79 Sul America SA 524 0.04
108 TIM SA 251 0.02
19 Trisul SA 37 -
37 Tupy SA 173 0.01
65 Usinas Siderurgicas de Minas Gerais SA Usiminas 252 0.02
1,311 Vale SA 28,078 2.02
41 Valid Solucoes e Servicos de Seguranca em Meiosde Pagamento e Identificacao SA 80 0.01
22 Vulcabras Azaleia SA 38 -
53,854 3.87
Chile - 0.42%
1 Banco de Credito e Inversiones SA 33 -
66 Besalco SA 37 -
22 CAP SA 388 0.03
59 Cementos BIO BIO SA 62 -
767 Cencosud SA 1,494 0.11
24 Cristalerias de Chile SA 107 0.01
74 Empresa Nacional de Telecomunicaciones SA 394 0.03
252 Empresas CMPC SA 631 0.05
98 Empresas COPEC SA 979 0.07
Shares (000's)
Value(000's)
USD
% of NetAssetValue
Common Stock (continued)
Chile - 0.42% (continued)
145 Empresas Hites SA 31 -
44 Enel Chile SA, ADR 131 0.01
17 Falabella SA 73 -
587 Grupo Security SA 110 0.01
162 Inversiones Aguas Metropolitanas SA 90 0.01
58,490 Itau CorpBanca 180 0.01
125 PAZ Corp SA 92 0.01
534 Ripley Corp SA 153 0.01
208 Salfacorp SA 126 0.01
250 Sigdo Koppers SA 254 0.02
166 SMU SA 23 -
3,924 Sociedad Matriz SAAM SA 284 0.02
376 Socovesa SA 98 0.01
120 SONDA SA 72 -
5,842 0.42
China - 34.53%
87 360 Security Technology Inc 167 0.01
482 361 Degrees International Ltd 219 0.02
592 3SBio Inc 679 0.05
35 5I5J Holding Group Co Ltd 28 -
299 AAC Technologies Holdings Inc 1,813 0.13
131 AAG Energy Holdings Ltd 21 -
27 Accelink Technologies Co 102 0.01
32 Advanced Technology & Materials Co Ltd 38 -
20 AECC Aero-Engine Control Co Ltd 64 0.01
35 AECC Aviation Power Co Ltd 278 0.02
18 Aerospace CH UAV Co Ltd 60 -
23 Aerospace Hi-Tech Holdings Grp Ltd 31 -
830 Agile Group Holdings Ltd 1,171 0.08
9,845 Agricultural Bank of China Ltd 3,995 0.29
770 Air China Ltd 641 0.05
55 Aisino Corp 109 0.01
378 Ajisen China Holdings Ltd 71 0.01
1,920 Aluminum Corp of China Ltd 1,128 0.08
925 Angang Steel Co Ltd 610 0.04
605 Anhui Conch Cement Co Ltd 3,746 0.27
89 Anhui Construction Engineering Group Co Ltd 56 -
16 Anhui Guangxin Agrochemical Co Ltd 70 0.01
68 Anhui Hengyuan Coal Industry and Electricity PowerCo Ltd 65 0.01
16 Anhui Truchum Advanced Materials & TechnologyCo Ltd 20 -
30 Anhui Xinhua Media Co Ltd 24 -
13 Anhui Yingjia Distillery Co Ltd 89 0.01
62 Anhui Zhongding Sealing Parts Co Ltd 111 0.01
1,486 Anton Oilfield Services Group 99 0.01
3 Aoshikang Technology Co Ltd 29 -
196 APT Satellite Holdings Ltd 66 0.01
321 Asia Cement China Holdings Corp 306 0.02
28 AsiaInfo Technologies Ltd 48 -
279 Ausnutria Dairy Corp Ltd 438 0.03
22 Avary Holding Shenzhen Co Ltd 111 0.01
195 Avic Capital Co Ltd 123 0.01
1,655 AviChina Industry & Technology Co Ltd 1,108 0.08
37 BAIC BluePark New Energy Technology Co Ltd 95 0.01
1,137 BAIC Motor Corp Ltd 423 0.03
59 Baidu Inc, ADR 11,570 0.83
318 BAIOO Family Interactive Ltd 70 0.01
519 Bank of Beijing Co Ltd 401 0.03
59 Bank of Changsha Co Ltd 88 0.01
107 Bank of Chengdu Co Ltd 222 0.02
28,306 Bank of China Ltd 10,726 0.77
Emerging Markets Value FundPortfolio of Investments as at 31 May 2021
Dimensional Fund Advisors Semi-Annual Report and Unaudited Financial Statements, 31 May 2021 40

Shares (000's)
Value(000's)
USD
% of NetAssetValue
Common Stock (continued)
China - 34.53% (continued)
379 Bank of Chongqing Co Ltd 257 0.02
3,701 Bank of Communications Co Ltd 2,499 0.18
157 Bank of Hangzhou Co Ltd 410 0.03
427 Bank of Jiangsu Co Ltd 514 0.04
301 Bank of Nanjing Co Ltd 486 0.04
159 Bank of Ningbo Co Ltd 1,066 0.08
358 Bank of Shanghai Co Ltd 478 0.03
44 Bank of Suzhou Co Ltd 53 -
242 Bank of Zhengzhou Co Ltd 64 0.01
629 Baoshan Iron & Steel Co Ltd 779 0.06
47 Baosheng Science and Technology Innovation CoLtd 31 -
142 Baoye Group Co Ltd 81 0.01
1,613 BBMG Corp 316 0.02
31 Befar Group Co Ltd 33 -
24 Beibuwan Port Co Ltd 33 -
25 Beijing Aosaikang Pharmaceutical Co Ltd 53 -
251 Beijing Capital Co Ltd 116 0.01
24 Beijing Capital Development Co Ltd 21 -
1,158 Beijing Capital International Airport Co Ltd 785 0.06
414 Beijing Capital Land Ltd 58 -
114 Beijing Dabeinong Technology Group Co Ltd 147 0.01
506 Beijing Energy International Holding Co Ltd 18 -
43 Beijing Enlight Media Co Ltd 84 0.01
1,100 Beijing Enterprises Clean Energy Group Ltd 14 -
295 Beijing Enterprises Holdings Ltd 1,030 0.07
474 Beijing Enterprises Medical & Health Group Ltd 6 -
2,874 Beijing Enterprises Water Group Ltd 1,148 0.08
22 Beijing Forever Technology Co Ltd 27 -
22 Beijing GeoEnviron Engineering & Technology Inc 64 0.01
61 Beijing Jetsen Technology Co Ltd 38 -
10 Beijing Konruns Pharmaceutical Co Ltd 55 -
19 Beijing Kunlun Tech Co Ltd 55 -
57 Beijing New Building Materials PLC 390 0.03
554 Beijing North Star Co Ltd 104 0.01
122 Beijing Orient Landscape & Environment Co Ltd 72 0.01
41 Beijing Orient National Communication Science &Technology Co Ltd 62 -
55 Beijing Originwater Technology Co Ltd 62 -
57 Beijing Sanju Environmental Protection and NewMaterial Co Ltd 53 -
13 Beijing Shiji Information Technology Co Ltd 77 0.01
42 Beijing Sinnet Technology Co Ltd 99 0.01
39 Beijing SL Pharmaceutical Co Ltd 71 0.01
54 Beijing SPC Environment Protection Tech Co Ltd 45 -
33 Beijing Thunisoft Corp Ltd 97 0.01
88 Beijing Urban Construction Design & DevelopmentGroup Co Ltd 26 -
105 Beijing Yanjing Brewery Co Ltd 126 0.01
23 Beijing Zhong Ke San Huan High-Tech Co Ltd 34 -
82 Better Life Commercial Chain Share Co Ltd 97 0.01
20 Biem.L.Fdlkk Garment Co Ltd 68 0.01
45 Blue Sail Medical Co Ltd 149 0.01
76 Bluefocus Intelligent Communications Group Co Ltd 75 0.01
955 BOE Technology Group Co Ltd 946 0.07
256 Bohai Leasing Co Ltd 100 0.01
1,690 Bosideng International Holdings Ltd 920 0.07
224 Boyaa Interactive International Ltd 17 -
41 Bright Dairy & Food Co Ltd 108 0.01
141 Bright Real Estate Group Co Ltd 56 -
1,426 Brilliance China Automotive Holdings Ltd 1,341 0.10
32 BTG Hotels Group Co Ltd 140 0.01
Shares (000's)
Value(000's)
USD
% of NetAssetValue
Common Stock (continued)
China - 34.53% (continued)
363 BYD Electronic International Co Ltd 2,310 0.17
616 C C Land Holdings Ltd 151 0.01
22 C&D International Investment Group Ltd 41 -
22 C&D Property Management Group 13 -
165 CA Cultural Technology Group Ltd 70 0.01
170 Cabbeen Fashion Ltd 71 0.01
85 Caitong Securities Co Ltd 152 0.01
37 Camel Group Co Ltd 69 0.01
35 Canny Elevator Co Ltd 51 -
1,192 Capital Environment Holdings Ltd 22 -
41 CECEP Guozhen EnvironmentalProtection Technology Co Ltd 52 -
87 CECEP Solar Energy Co Ltd 91 0.01
103 CECEP Wind-Power Corp 66 0.01
646 Central China Management Co Ltd 129 0.01
646 Central China Real Estate Ltd 181 0.01
930 CGN Meiya Power Holdings Co Ltd 283 0.02
17 CGN Nuclear Technology Development Co Ltd 29 -
65 Changjiang Securities Co Ltd 80 0.01
378 Chaowei Power Holdings Ltd 134 0.01
29 Cheetah Mobile Inc, ADR 66 0.01
20 Chengdu Fusen Noble-House Industrial Co Ltd 40 -
75 Chengdu Hongqi Chain Co Ltd 71 0.01
1,220 China Aerospace International Holdings Ltd 113 0.01
44 China Aerospace Times Electronics Co Ltd 51 -
174 China Aircraft Leasing Group Holdings Ltd 140 0.01
757 China Aoyuan Group Ltd 888 0.06
93 China Beststudy Education Group 22 -
1,266 China BlueChemical Ltd 400 0.03
66 China Boton Group Co Ltd 40 -
4,361 China Cinda Asset Management Co Ltd 933 0.07
3,623 China CITIC Bank Corp Ltd 1,981 0.14
1,335 China Coal Energy Co Ltd 810 0.06
1,505 China Communications Services Corp Ltd 632 0.05
599 China Conch Venture Holdings Ltd 2,758 0.20
36,837 China Construction Bank Corp 30,351 2.18
26 China CSSC Holdings Ltd 73 0.01
24 China CYTS Tours Holding Co Ltd 43 -
78 China Development Bank Financial Leasing Co Ltd 11 -
30 China Dili Group 8 -
1,088 China Dongxiang Group Co Ltd 137 0.01
986 China Eastern Airlines Corp Ltd 464 0.03
4 China Eastern Airlines Corp Ltd, ADR 96 0.01
105 China Education Group Holdings Ltd 265 0.02
1,352 China Electronics Optics Valley Union Holding CoLtd 73 0.01
1,160 China Energy Engineering Corp Ltd 114 0.01
1,396 China Everbright Bank Co Ltd 596 0.04
357 China Everbright Greentech Ltd 138 0.01
608 China Everbright Ltd 766 0.06
1,155 China Evergrande Group 1,800 0.13
42 China Film Co Ltd 85 0.01
450 China Foods Ltd 184 0.01
126 China Fortune Land Development Co Ltd 108 0.01
1,485 China Galaxy Securities Co Ltd 938 0.07
1,325 China Gas Holdings Ltd 5,039 0.36
90 China Gezhouba Group Co Ltd 100 0.01
66 China Glass Holdings Ltd 10 -
149 China Grand Automotive Services Group Co Ltd 67 0.01
288 China Grand Pharmaceutical and HealthcareHoldings Ltd 297 0.02
38 China Great Wall Securities Co Ltd 63 0.01
Emerging Markets Value FundPortfolio of Investments as at 31 May 2021 (continued)
Dimensional Fund Advisors Semi-Annual Report and Unaudited Financial Statements, 31 May 2021 41

Shares (000's)
Value(000's)
USD
% of NetAssetValue
Common Stock (continued)
China - 34.53% (continued)
514 China Harmony New Energy Auto Holding Ltd 237 0.02
83 China High Precision Automation Group Ltd 2 -
137 China High Speed Transmission Equipment GroupCo Ltd 90 0.01
1,114 China Hongqiao Group Ltd 1,798 0.13
5,496 China Huarong Asset Management Co Ltd 722 0.05
364 China International Capital Corp Ltd 1,069 0.08
329 China International Marine Containers Group Co Ltd 628 0.05
2,456 China Jinmao Holdings Group Ltd 949 0.07
137 China Jushi Co Ltd 345 0.03
272 China Kepei Education Group Ltd 210 0.02
710 China Lesso Group Holdings Ltd 1,799 0.13
1,157 China Life Insurance Co Ltd 2,454 0.18
214 China Lilang Ltd 137 0.01
81 China Literature Ltd 857 0.06
213 China Longevity Group Co Ltd 7 -
115 China Lumena New Materials Corp - -
629 China Machinery Engineering Corp 281 0.02
1,016 China Maple Leaf Educational Systems Ltd 214 0.02
568 China Medical System Holdings Ltd 1,418 0.10
20 China Meheco Co Ltd 41 -
389 China Mengniu Dairy Co Ltd 2,302 0.17
1,463 China Merchants Bank Co Ltd 13,536 0.97
932 China Merchants Land Ltd 134 0.01
866 China Merchants Port Holdings Co Ltd 1,430 0.10
204 China Merchants Securities Co Ltd 323 0.02
130 China Merchants Shekou Industrial Zone HoldingsCo Ltd 238 0.02
580 China Metal Recycling Holdings Ltd - -
2,378 China Minsheng Banking Corp Ltd 1,265 0.09
1,111 China Modern Dairy Holdings Ltd 286 0.02
1,038 China Molybdenum Co Ltd 695 0.05
21 China National Accord Medicines Corp Ltd 129 0.01
2,359 China National Building Material Co Ltd 3,124 0.23
40 China National Medicines Corp Ltd 227 0.02
538 China National Nuclear Power Co Ltd 443 0.03
251 China New Higher Education Group Ltd 190 0.01
2,840 China Oil & Gas Group Ltd 154 0.01
1,084 China Oilfield Services Ltd 1,009 0.07
712 China Oriental Group Co Ltd 233 0.02
1,140 China Overseas Grand Oceans Group Ltd 722 0.05
2,238 China Overseas Land & Investment Ltd 5,425 0.39
1,129 China Pacific Insurance Group Co Ltd 4,293 0.31
6,014 China Petroleum & Chemical Corp 3,256 0.23
77 China Petroleum & Chemical Corp, ADR 4,167 0.30
138 China Pioneer Pharma Holdings Ltd 17 -
2,101 China Railway Group Ltd 1,109 0.08
710 China Railway Signal & Communication Corp Ltd 288 0.02
36 China Railway Tielong Container Logistics Co Ltd 29 -
2,224 China Reinsurance Group Corp 243 0.02
1,596 China Resources Cement Holdings Ltd 1,695 0.12
33 China Resources Double Crane Pharmaceutical CoLtd 62 -
308 China Resources Gas Group Ltd 1,910 0.14
1,880 China Resources Land Ltd 8,883 0.64
548 China Resources Medical Holdings Co Ltd 555 0.04
1,080 China Resources Pharmaceutical Group Ltd 768 0.06
55 China Resources Sanjiu Medical & PharmaceuticalCo Ltd 224 0.02
505 China Sanjiang Fine Chemicals Co Ltd 212 0.02
1,300 China SCE Group Holdings Ltd 591 0.04
29 China Science Publishing & Media Ltd 43 -
Shares (000's)
Value(000's)
USD
% of NetAssetValue
Common Stock (continued)
China - 34.53% (continued)
187 China Shanshui Cement Group Ltd 49 -
1,857 China Shenhua Energy Co Ltd 4,100 0.30
251 China Shineway Pharmaceutical Group Ltd 262 0.02
584 China Silver Group Ltd 74 0.01
2,956 China South City Holdings Ltd 328 0.02
54 China South Publishing & Media Group Co Ltd 83 0.01
1,230 China Southern Airlines Co Ltd 875 0.06
1,320 China Starch Holdings Ltd 30 -
1,668 China State Construction Engineering Corp Ltd 1,285 0.09
228 China Sunshine Paper Holdings Co Ltd 54 -
996 China Taiping Insurance Holdings Co Ltd 1,860 0.13
6 China Tianrui Group Cement Co Ltd 5 -
125 China Tianying Inc 96 0.01
17,568 China Tower Corp Ltd 2,400 0.17
1,940 China Traditional Chinese Medicine Holdings Co Ltd 1,247 0.09
44 China TransInfo Technology Co Ltd 106 0.01
1,466 China Travel International Investment Hong KongLtd 244 0.02
788 China Vanke Co Ltd 2,717 0.20
203 China Vast Industrial Urban Development Co Ltd 77 0.01
29 China West Construction Group Co Ltd 37 -
96 China Wood Optimization Holding Ltd 11 -
81 China Xinhua Education Group Ltd 24 -
276 China XLX Fertiliser Ltd 123 0.01
573 China Yongda Automobiles Services Holdings Ltd 1,012 0.07
962 China ZhengTong Auto Services Holdings Ltd 74 0.01
82 China Zheshang Bank Co Ltd 39 -
90 China Zhonghua Geotechnical Engineering GroupCo Ltd 41 -
1,198 China Zhongwang Holdings Ltd 302 0.02
460 Chinasoft International Ltd 591 0.04
62 Chinese Universe Publishing and Media Group CoLtd 105 0.01
111 Chongqing Changan Automobile Co Ltd 402 0.03
12 Chongqing Department Store Co Ltd 65 0.01
63 Chongqing Dima Industry Co Ltd 28 -
1,664 Chongqing Rural Commercial Bank Co Ltd 767 0.06
30 Chongqing Zongshen Power Machinery Co Ltd 32 -
254 Chu Kong Shipping Enterprises Group Co Ltd 35 -
1,784 CIFI Holdings Group Co Ltd 1,555 0.11
378 CIMC Enric Holdings Ltd 346 0.03
87 Cinda Real Estate Co Ltd 51 -
42 Cisen Pharmaceutical Co Ltd 88 0.01
2,128 CITIC Ltd 2,502 0.18
2,146 CITIC Resources Holdings Ltd 90 0.01
475 CITIC Securities Co Ltd 1,313 0.09
408 Citychamp Watch & Jewellery Group Ltd 89 0.01
59 CMST Development Co Ltd 47 -
20 CNHTC Jinan Truck Co Ltd 98 0.01
74 CNNC Hua Yuan Titanium Dioxide Co Ltd 153 0.01
37 COFCO Biotechnology Co Ltd 59 -
111 Cogobuy Group 31 -
222 Colour Life Services Group Co Ltd 98 0.01
56 Comba Telecom Systems Holdings Ltd 14 -
4,140 Concord New Energy Group Ltd 282 0.02
265 Consun Pharmaceutical Group Ltd 193 0.01
1,542 COSCO SHIPPING Development Co Ltd 306 0.02
874 COSCO SHIPPING Energy Transportation Co Ltd 408 0.03
679 COSCO SHIPPING Holdings Co Ltd 1,419 0.10
1,181 COSCO SHIPPING Ports Ltd 960 0.07
40 Cosmo Lady China Holdings Co Ltd 5 -
3,864 Country Garden Holdings Co Ltd 4,926 0.35
Emerging Markets Value FundPortfolio of Investments as at 31 May 2021 (continued)
Dimensional Fund Advisors Semi-Annual Report and Unaudited Financial Statements, 31 May 2021 42

Shares (000's)
Value(000's)
USD
% of NetAssetValue
Common Stock (continued)
China - 34.53% (continued)
1,920 CP Pokphand Co Ltd 245 0.02
393 CPMC Holdings Ltd 236 0.02
69 CQ Pharmaceutical Holding Co Ltd 58 -
47 CSG Holding Co Ltd 75 0.01
3,258 CSPC Pharmaceutical Group Ltd 4,899 0.35
626 CT Environmental Group Ltd 5 -
16 D&O Home Collection Co Ltd 43 -
75 DaFa Properties Group Ltd 60 -
447 Dali Foods Group Co Ltd 284 0.02
56 Dalian Huarui Heavy Industry Group Co Ltd 32 -
572 Daqin Railway Co Ltd 622 0.05
10 Dashang Co Ltd 33 -
83 Datong Coal Industry Co Ltd 91 0.01
334 Dawnrays Pharmaceutical Holdings Ltd 80 0.01
14 Dazzle Fashion Co Ltd 43 -
44 DBG Technology Co Ltd 70 0.01
28 Deppon Logistics Co Ltd 52 -
208 Dexin China Holdings Co Ltd 83 0.01
101 DHC Software Co Ltd 117 0.01
1,222 Differ Group Holding Co Ltd 334 0.02
25 Digital China Group Co Ltd 71 0.01
273 Digital China Holdings Ltd 185 0.01
23 Dong-E-E-Jiao Co Ltd 131 0.01
215 Dongfang Electric Corp Ltd 196 0.01
48 Dongfang Electronics Co Ltd 35 -
1,146 Dongfeng Motor Group Co Ltd 1,089 0.08
60 Dongxing Securities Co Ltd 108 0.01
839 Dongyue Group Ltd 639 0.05
36 Doushen Beijing Education & Technology Inc 34 -
17 Easysight Supply Chain Management Co Ltd 16 -
708 E-Commodities Holdings Ltd 36 -
40 E-House China Enterprise Holdings Ltd 41 -
44 Enjoyor Co Ltd 53 -
25 ENN Ecological Holdings Co Ltd 68 0.01
96 Essex Bio-Technology Ltd 66 0.01
594 EVA Precision Industrial Holdings Ltd 54 -
125 Everbright Securities Co Ltd 110 0.01
3 Fang Holdings Ltd, ADR 31 -
44 Fangda Carbon New Material Co Ltd 60 -
36 Fangda Special Steel Technology Co Ltd 52 -
1,069 Fantasia Holdings Group Co Ltd 143 0.01
1,262 Far East Horizon Ltd 1,381 0.10
85 FAW Jiefang Group Co Ltd 148 0.01
38 FiberHome Telecommunication Technologies Co Ltd 106 0.01
521 FIH Mobile Ltd 79 0.01
52 Financial Street Holdings Co Ltd 61 -
17 FinVolution Group, ADR 126 0.01
17 Focused Photonics Hangzhou Inc 30 -
21 Foshan Nationstar Optoelectronics Co Ltd 29 -
1,027 Fosun International Ltd 1,658 0.12
100 Founder Securities Co Ltd 162 0.01
375 Fu Shou Yuan International Group Ltd 402 0.03
44 Fuan Pharmaceutical Group Co Ltd 30 -
978 Fufeng Group Ltd 324 0.02
26 Fujian Longking Co Ltd 35 -
20 Fujian Longma Environmental Sanitation EquipmentCo Ltd 51 -
12 Fujian Star-net Communication Co Ltd 37 -
55 Fujian Sunner Development Co Ltd 217 0.02
36 Fuyao Glass Industry Group Co Ltd 229 0.02
17 Gansu Qilianshan Cement Group Co Ltd 33 -
29 Gansu Shangfeng Cement Co Ltd 100 0.01
Shares (000's)
Value(000's)
USD
% of NetAssetValue
Common Stock (continued)
China - 34.53% (continued)
10,042 GCL-Poly Energy Holdings Ltd 2,562 0.18
44 GDS Holdings Ltd, ADR 405 0.03
3,020 Geely Automobile Holdings Ltd 7,647 0.55
103 GEM Co Ltd 176 0.01
110 Gemdale Corp 188 0.01
3,076 Gemdale Properties & Investment Corp Ltd 452 0.03
596 Genertec Universal Medical Group Co Ltd 538 0.04
78 Genimous Technology Co Ltd 81 0.01
628 GF Securities Co Ltd 905 0.07
20 Giant Network Group Co Ltd 44 -
23 Goldcard Smart Group Co Ltd 39 -
16 Golden Eagle Retail Group Ltd 14 -
335 Goldlion Holdings Ltd 77 0.01
131 Goldpac Group Ltd 33 -
52 Gosuncn Technology Group Co Ltd 35 -
11 Gotion High-Tech Co Ltd 58 -
557 Grand Baoxin Auto Group Ltd 47 -
54 Grandjoy Holdings Group Co Ltd 33 -
865 Great Wall Motor Co Ltd 2,400 0.17
95 Greattown Holdings Ltd 54 -
461 Greatview Aseptic Packaging Co Ltd 224 0.02
109 Gree Electric Appliances Inc of Zhuhai 973 0.07
314 Greenland Holdings Corp Ltd 285 0.02
577 Greenland Hong Kong Holdings Ltd 197 0.01
480 Greentown China Holdings Ltd 548 0.04
59 GRG Banking Equipment Co Ltd 112 0.01
46 Guangdong Dongfang Precision Science &Technology Co Ltd 31 -
27 Guangdong Ellington Electronics Technology Co Ltd 30 -
15 Guangdong Great River Smarter Logistics 37 -
100 Guangdong HEC Technology Holding Co Ltd 72 0.01
59 Guangdong Huatie Tongda High-speed RailwayEquipment Corp 49 -
24 Guangdong Tapai Group Co Ltd 41 -
39 Guangdong Zhongsheng Pharmaceutical Co Ltd 53 -
273 Guanghui Energy Co Ltd 139 0.01
204 Guangshen Railway Co Ltd 44 -
17 Guangshen Railway Co Ltd, ADR 179 0.01
38 Guangxi Liugong Machinery Co Ltd 52 -
11 Guangxi Liuzhou Pharmaceutical Co Ltd 36 -
89 Guangxi Wuzhou Zhongheng Group Co Ltd 41 -
1,084 Guangzhou Automobile Group Co Ltd 938 0.07
67 Guangzhou Baiyun International Airport Co Ltd 124 0.01
84 Guangzhou Baiyunshan Pharmaceutical HoldingsCo Ltd 245 0.02
56 Guangzhou Haige Communications Group Inc Co 88 0.01
979 Guangzhou R&F Properties Co Ltd 1,322 0.10
48 Guangzhou Yuexiu Financial Holdings Group Co Ltd 99 0.01
27 Guangzhou Zhujiang Brewery Co Ltd 51 -
48 Guizhou Broadcasting & TV Information Network CoLtd 35 -
36 Guizhou Gas Group Corp Ltd 53 -
90 Guizhou Panjiang Refined Coal Co Ltd 97 0.01
34 Guizhou Xinbang Pharmaceutical Co Ltd 60 -
51 Guomai Technologies Inc 49 -
683 Guorui Properties Ltd 26 -
80 Guosen Securities Co Ltd 143 0.01
220 Guotai Junan Securities Co Ltd 331 0.02
81 Guoyuan Securities Co Ltd 104 0.01
807 Haichang Ocean Park Holdings Ltd 66 0.01
214 Haier Smart Home Co Ltd 1,033 0.07
115 Haier Smart Home Co Ltd 484 0.04
Emerging Markets Value FundPortfolio of Investments as at 31 May 2021 (continued)
Dimensional Fund Advisors Semi-Annual Report and Unaudited Financial Statements, 31 May 2021 43

Shares (000's)
Value(000's)
USD
% of NetAssetValue
Common Stock (continued)
China - 34.53% (continued)
77 Hainan Meilan International Airport Co Ltd 328 0.02
175 Haitian International Holdings Ltd 633 0.05
948 Haitong Securities Co Ltd 907 0.07
47 Hand Enterprise Solutions Co Ltd 51 -
22 Hang Zhou Great Star Industrial Co Ltd 116 0.01
24 Hangcha Group Co Ltd 73 0.01
67 Hangxiao Steel Structure Co Ltd 38 -
45 Hangzhou Century Co Ltd 49 -
15 Hangzhou Oxygen Plant Group Co Ltd 75 0.01
320 Harbin Bank Co Ltd 41 -
545 Harbin Electric Co Ltd 154 0.01
318 HC Group Inc 41 -
65 Health & Happiness H&H International Holdings Ltd 252 0.02
51 Hebei Chengde Lolo Co 78 0.01
8 Hebei Construction Group Corp Ltd 3 -
23 Hebei Hengshui Laobaigan Liquor Co Ltd 101 0.01
20 Hebei Sitong New Metal Material Co Ltd 39 -
35 Heilongjiang Agriculture Co Ltd 85 0.01
28 Henan Lingrui Pharmaceutical Co Ltd 46 -
37 Henan Pinggao Electric Co Ltd 35 -
53 Henan Shenhuo Coal & Power Co Ltd 96 0.01
45 Henan Yuguang Gold & Lead Co Ltd 41 -
45 Henan Zhongyuan Expressway Co Ltd 24 -
309 Hengan International Group Co Ltd 2,083 0.15
24 Hengdian Group DMEGC Magnetics Co Ltd 50 -
170 Hengli Petrochemical Co Ltd 772 0.06
58 Hengtong Optic-Electric Co Ltd 108 0.01
160 Hengyi Petrochemical Co Ltd 319 0.02
95 Hesteel Co Ltd 38 -
10 Hexing Electrical Co Ltd 19 -
1,125 Hi Sun Technology China Ltd 212 0.02
88 Hisense Home Appliances Group Co Ltd 132 0.01
112 HKC Holdings Ltd 117 0.01
112 Holitech Technology Co Ltd 60 -
103 Hongda Xingye Co Ltd 69 0.01
1,781 Honghua Group Ltd 58 -
110 Honworld Group Ltd 44 -
718 Hope Education Group Co Ltd 213 0.02
68 Hopefluent Group Holdings Ltd 29 -
464 Hopson Development Holdings 2,250 0.16
180 Hua Hong Semiconductor Ltd 977 0.07
70 Huaan Securities Co Ltd 71 0.01
55 Huadong Medicine Co Ltd 440 0.03
85 Huafu Fashion Co Ltd 70 0.01
12 Huagong Tech Co Ltd 39 -
52 Huapont Life Sciences Co Ltd 58 -
461 Huatai Securities Co Ltd 714 0.05
93 Huawen Media Group 40 -
60 Huaxi Securities Co Ltd 95 0.01
316 Huaxia Bank Co Ltd 320 0.02
48 Huaxin Cement Co Ltd 166 0.01
101 Huayu Automotive Systems Co Ltd 384 0.03
204 Huazhong In-Vehicle Holdings Co Ltd 50 -
91 Hubei Biocause Pharmaceutical Co Ltd 57 -
50 Hubei Jumpcan Pharmaceutical Co Ltd 143 0.01
21 Hubei Kaile Science & Technology Co Ltd 28 -
27 Hubei Xingfa Chemicals Group Co Ltd 76 0.01
380 Huishang Bank Corp Ltd 125 0.01
11 Hunan Aihua Group Co Ltd 50 -
24 Hunan Gold Corp Ltd 33 -
40 Hunan New Wellful Co Ltd 40 -
165 Hunan Valin Steel Co Ltd 178 0.01
Shares (000's)
Value(000's)
USD
% of NetAssetValue
Common Stock (continued)
China - 34.53% (continued)
68 Huolinhe Opencut Coal Industry Corp Ltd of InnerMongolia 112 0.01
34 Hytera Communications Corp Ltd 27 -
150 iDreamSky Technology Holdings Ltd 81 0.01
30 IKD Co Ltd 63 -
26,357 Industrial & Commercial Bank of China Ltd 17,304 1.25
777 Industrial Bank Co Ltd 2,842 0.20
141 Industrial Securities Co Ltd 246 0.02
44 Infore Environment Technology Group Co Ltd 55 -
1,046 Inner Mongolia BaoTou Steel Union Co Ltd 263 0.02
32 Inner Mongolia Eerduosi Resources Co Ltd 98 0.01
27 Inner Mongolia First Machinery Group Co Ltd 45 -
274 Inner Mongolia Junzheng Energy & ChemicalIndustry Group Co Ltd 245 0.02
31 Inner Mongolia Yitai Coal Co Ltd 21 -
145 Inner Mongolia Yuan Xing Energy Co Ltd 91 0.01
150 Inspur International Ltd 40 -
64 JD.com Inc 2,343 0.17
19 Jiajiayue Group Co Ltd 60 -
27 Jiangling Motors Corp Ltd 101 0.01
638 Jiangnan Group Ltd 32 -
71 Jiangsu Changshu Rural Commercial Bank Co Ltd 77 0.01
34 Jiangsu Eastern Shenghong Co Ltd 94 0.01
78 Jiangsu Etern Co Ltd 42 -
26 Jiangsu Guotai International Group Co Ltd 29 -
46 Jiangsu Jiangyin Rural Commercial Bank Co Ltd 29 -
55 Jiangsu Kanion Pharmaceutical Co Ltd 95 0.01
50 Jiangsu Leike Defense Technology Co Ltd 51 -
25 Jiangsu Nhwa Pharmaceutical Co Ltd 61 -
42 Jiangsu Provincial Agricultural Reclamation andDevelopment Corp 73 0.01
27 Jiangsu Yuyue Medical Equipment & Supply Co Ltd 126 0.01
23 Jiangsu Zhangjiagang Rural Commercial Bank CoLtd 20 -
83 Jiangsu Zhongnan Construction Group Co Ltd 90 0.01
92 Jiangsu Zhongtian Technology Co Ltd 150 0.01
66 Jiangsu Zijin Rural Commercial Bank Co Ltd 40 -
42 Jiangxi Bank Co Ltd 17 -
478 Jiangxi Copper Co Ltd 1,118 0.08
21 Jiangxi Wannianqing Cement Co Ltd 43 -
94 Jiangxi Zhengbang Technology Co Ltd 192 0.01
22 Jiangzhong Pharmaceutical Co Ltd 39 -
661 Jiayuan International Group Ltd 336 0.02
23 Jilin Aodong Pharmaceutical Group Co Ltd 57 -
64 Jilin Zixin Pharmaceutical Industrial Co Ltd 30 -
24 Jinduicheng Molybdenum Co Ltd 23 -
285 Jingrui Holdings Ltd 83 0.01
25 JinkoSolar Holding Co Ltd, ADR 919 0.07
19 Jinneng Science&Technology Co Ltd 59 -
34 Jinyuan EP Co Ltd 41 -
49 Jiuzhitang Co Ltd 73 0.01
59 JNBY Design Ltd 109 0.01
109 Joincare Pharmaceutical Group Industry Co Ltd 254 0.02
85 Jointown Pharmaceutical Group Co Ltd 227 0.02
2,270 Joy City Property Ltd 145 0.01
35 JOYY Inc, ADR 2,683 0.19
31 JSTI Group 27 -
672 Ju Teng International Holdings Ltd 155 0.01
22 Juneyao Airlines Co Ltd 57 -
180 Jutal Offshore Oil Services 32 -
2,021 Kaisa Group Holdings Ltd 927 0.07
21 Kaisa Prosperity Holdings Ltd 74 0.01
Emerging Markets Value FundPortfolio of Investments as at 31 May 2021 (continued)
Dimensional Fund Advisors Semi-Annual Report and Unaudited Financial Statements, 31 May 2021 44

Shares (000's)
Value(000's)
USD
% of NetAssetValue
Common Stock (continued)
China - 34.53% (continued)
453 Kangda International Environmental Co Ltd 41 -
361 Kasen International Holdings Ltd 35 -
21 Kehua Data Co Ltd 54 -
417 Kingboard Holdings Ltd 2,305 0.17
592 Kingboard Laminates Holdings Ltd 1,281 0.09
250 Kingsoft Corp Ltd 1,688 0.12
19 KPC Pharmaceuticals Inc 29 -
2,604 Kunlun Energy Co Ltd 2,957 0.21
883 KWG Group Holdings Ltd 1,344 0.10
462 KWG Living Group Holdings Ltd 468 0.03
7 Lao Feng Xiang Co Ltd 63 0.01
894 Lee & Man Paper Manufacturing Ltd 811 0.06
162 Lee's Pharmaceutical Holdings Ltd 100 0.01
343 Legend Holdings Corp 542 0.04
3,282 Lenovo Group Ltd 3,958 0.29
139 Lens Technology Co Ltd 639 0.05
206 Leo Group Co Ltd 76 0.01
55 Leyard Optoelectronic Co Ltd 63 0.01
36 Liaoning Cheng Da Co Ltd 124 0.01
55 Liaoning Wellhope Agri-Tech JSC Ltd 94 0.01
81 LingNan Eco&Culture-Tourism Co Ltd 43 -
40 Liuzhou Iron & Steel Co Ltd 42 -
52 Livzon Pharmaceutical Group Inc 264 0.02
486 Logan Property Holdings Co Ltd 779 0.06
57 Lomon Billions Group Co Ltd 302 0.02
32 Loncin Motor Co Ltd 17 -
48 Long Yuan Construction Group Co Ltd 38 -
774 Longfor Group Holdings Ltd 4,536 0.33
53 Longhua Technology Group Luoyang Co Ltd 52 -
22 Longshine Technology Group Co Ltd 59 -
1,407 Lonking Holdings Ltd 511 0.04
63 Luenmei Quantum Co Ltd 92 0.01
30 Luolai Lifestyle Technology Co Ltd 67 0.01
38 Luoniushan Co Ltd 51 -
36 Luoyang Glass Co Ltd 27 -
37 Luxi Chemical Group Co Ltd 96 0.01
884 Luye Pharma Group Ltd 599 0.04
394 LVGEM China Real Estate Investment Co Ltd 108 0.01
152 Maanshan Iron & Steel Co Ltd 74 0.01
114 Macrolink Culturaltainment Development Co Ltd 55 -
1,063 Maoye International Holdings Ltd 46 -
50 Markor International Home Furnishings Co Ltd 37 -
17 Mayinglong Pharmaceutical Group 59 -
1,267 Metallurgical Corp of China Ltd 308 0.02
20 Ming Yang Smart Energy Group Ltd 48 -
1,058 Minmetals Land Ltd 115 0.01
206 Minsheng Education Group Co Ltd 34 -
342 Minth Group Ltd 1,446 0.10
46 Misho Ecology & Landscape Co Ltd 22 -
50 MLS Co Ltd 115 0.01
1,084 MMG Ltd 659 0.05
325 MOBI Development Co Ltd 22 -
492 Modern Land China Co Ltd 50 -
80 Momo Inc, ADR 1,122 0.08
78 Myhome Real Estate Development Group Co Ltd 23 -
38 MYS Group Co Ltd 23 -
29 Nanjing Sample Technology Co Ltd 18 -
56 Nanjing Xinjiekou Department Store Co Ltd 102 0.01
135 NARI Technology Co Ltd 644 0.05
281 Nature Home Holding Co Ltd 51 -
96 NetDragon Websoft Holdings Ltd 278 0.02
338 New China Life Insurance Co Ltd 1,274 0.09
Shares (000's)
Value(000's)
USD
% of NetAssetValue
Common Stock (continued)
China - 34.53% (continued)
108 New Hope Liuhe Co Ltd 259 0.02
193 New World Department Store China Ltd 44 -
19 Newland Digital Technology Co Ltd 44 -
602 Nexteer Automotive Group Ltd 758 0.06
1,099 Nine Dragons Paper Holdings Ltd 1,735 0.13
25 Ninestar Corp 100 0.01
16 Ningbo Huaxiang Electronic Co Ltd 43 -
47 Ningbo Joyson Electronic Corp 129 0.01
37 Ningbo Sanxing Medical Electric Co Ltd 102 0.01
51 Ningbo Yunsheng Co Ltd 51 -
222 Ningbo Zhoushan Port Co Ltd 144 0.01
39 Norinco International Cooperation Ltd 47 -
25 Northeast Pharmaceutical Group Co Ltd 19 -
73 Northeast Securities Co Ltd 103 0.01
1,261 NVC Lighting Holding Ltd 33 -
35 Oceanwide Holdings Co Ltd 16 -
75 Offshore Oil Engineering Co Ltd 52 -
69 OFILM Group Co Ltd 96 0.01
60 ORG Technology Co Ltd 50 -
303 Orient Securities Co Ltd 210 0.02
79 Oriental Pearl Group Co Ltd 112 0.01
97 Ourpalm Co Ltd 67 0.01
118 Overseas Chinese Town Asia Holdings Ltd 25 -
529 PAX Global Technology Ltd 661 0.05
40 PCI-Suntek Technology Co Ltd 40 -
2,328 People's Insurance Co Group of China Ltd 864 0.06
32 Perfect World Co Ltd 110 0.01
13,822 PetroChina Co Ltd 5,652 0.41
2,910 PICC Property & Casualty Co Ltd 2,840 0.20
649 Ping An Bank Co Ltd 2,499 0.18
2,225 Ping An Insurance Group Co of China Ltd 24,310 1.75
91 Pingdingshan Tianan Coal Mining Co Ltd 102 0.01
25 Polaris Bay Group Co Ltd 45 -
1,551 Poly Property Group Co Ltd 443 0.03
3,207 Postal Savings Bank of China Co Ltd 2,303 0.17
1,332 Pou Sheng International Holdings Ltd 334 0.02
398 Power Construction Corp of China Ltd 245 0.02
887 Powerlong Real Estate Holdings Ltd 863 0.06
34 Prinx Chengshan Cayman Holding Ltd 39 -
139 Q Technology Group Co Ltd 238 0.02
31 Qingdao East Steel Tower Stock Co Ltd 35 -
22 Qingdao Eastsoft Communication Technology CoLtd 49 -
13 Qingdao Gon Technology Co 52 -
186 Qingdao Port International Co Ltd 106 0.01
74 Qingdao Rural Commercial Bank 53 -
19 Qingdao Topscomm Communication Inc 22 -
404 Qingling Motors Co Ltd 91 0.01
39 Qudian Inc, ADR 81 0.01
1,017 Qunxing Paper Holdings Co Ltd - -
63 Rainbow Digital Commercial Co Ltd 69 0.01
19 Raisecom Technology Co Ltd 25 -
88 Rastar Group 48 -
46 Realcan Pharmaceutical Group Co Ltd 34 -
280 Red Star Macalline Group Corp Ltd 171 0.01
206 Redco Properties Group Ltd 71 0.01
272 Redsun Properties Group Ltd 94 0.01
41 Renhe Pharmacy Co Ltd 75 0.01
2 RISE Education Cayman Ltd 7 -
131 RiseSun Real Estate Development Co Ltd 130 0.01
370 Ronshine China Holdings Ltd 257 0.02
7 Runjian Co Ltd 27 -
Emerging Markets Value FundPortfolio of Investments as at 31 May 2021 (continued)
Dimensional Fund Advisors Semi-Annual Report and Unaudited Financial Statements, 31 May 2021 45

Shares (000's)
Value(000's)
USD
% of NetAssetValue
Common Stock (continued)
China - 34.53% (continued)
154 SAIC Motor Corp Ltd 492 0.04
125 Sailun Group Co Ltd 218 0.02
66 Sanan Optoelectronics Co Ltd 285 0.02
30 SanFeng Intelligent Equipment Group Co Ltd 15 -
473 Sany Heavy Equipment International Holdings CoLtd 528 0.04
28 Saurer Intelligent Technology Co Ltd 13 -
170 Sealand Securities Co Ltd 121 0.01
372 Seazen Group Ltd 422 0.03
77 Seazen Holdings Co Ltd 588 0.04
89 SGIS Songshan Co Ltd 70 0.01
316 Shaanxi Coal Industry Co Ltd 587 0.04
47 Shandong Buchang Pharmaceuticals Co Ltd 170 0.01
211 Shandong Chenming Paper Holdings Ltd 174 0.01
281 Shandong Gold Mining Co Ltd 611 0.04
24 Shandong Himile Mechanical Science & TechnologyCo Ltd 110 0.01
71 Shandong Hualu Hengsheng Chemical Co Ltd 317 0.02
22 Shandong Jincheng Pharmaceutical Group Co Ltd 71 0.01
35 Shandong Linglong Tyre Co Ltd 271 0.02
15 Shandong Minhe Animal Husbandry Co Ltd 34 -
258 Shandong Nanshan Aluminum Co Ltd 164 0.01
13 Shandong New Beiyang Information Technology CoLtd 18 -
94 Shandong Sun Paper Industry JSC Ltd 210 0.02
1,032 Shandong Weigao Group Medical Polymer Co Ltd 2,146 0.15
72 Shandong Xinhua Pharmaceutical Co Ltd 42 -
33 Shandong Yisheng Livestock & Poultry Breeding CoLtd 51 -
182 Shanghai 2345 Network Holding Group Co Ltd 58 -
50 Shanghai AJ Group Co Ltd 56 -
15 Shanghai Daimay Automotive Interior Co Ltd 56 -
958 Shanghai Electric Group Co Ltd 312 0.02
22 Shanghai Environment Group Co Ltd 40 -
14 Shanghai Fengyuzhu Culture and Technology CoLtd 61 -
166 Shanghai Fosun Pharmaceutical Group Co Ltd 1,369 0.10
9 Shanghai Haohai Biological Technology Co Ltd 106 0.01
26 Shanghai Industrial Development Co Ltd 20 -
346 Shanghai Industrial Holdings Ltd 548 0.04
1,517 Shanghai Industrial Urban Development Group Ltd 150 0.01
15 Shanghai International Airport Co Ltd 112 0.01
235 Shanghai International Port Group Co Ltd 176 0.01
1,002 Shanghai Jin Jiang Capital Co Ltd 243 0.02
14 Shanghai Jinjiang International Hotels Co Ltd 133 0.01
32 Shanghai Kinetic Medical Co Ltd 69 0.01
11 Shanghai Lujiazui Finance & Trade ZoneDevelopment Co Ltd 20 -
27 Shanghai Maling Aquarius Co Ltd 38 -
28 Shanghai Mechanical and Electrical Industry Co Ltd 82 0.01
419 Shanghai Pharmaceuticals Holding Co Ltd 916 0.07
22 Shanghai Phichem Material Co Ltd 54 -
801 Shanghai Pudong Development Bank Co Ltd 1,303 0.09
48 Shanghai Pudong Road & Bridge Construction CoLtd 49 -
156 Shanghai RAAS Blood Products Co Ltd 186 0.01
90 Shanghai Shimao Co Ltd 60 -
28 Shanghai Shyndec Pharmaceutical Co Ltd 46 -
9 Shanghai Sinyang Semiconductor Materials Co Ltd 58 -
32 Shanghai Tongji Science & Technology Industrial CoLtd 43 -
102 Shanghai Tunnel Engineering Co Ltd 84 0.01
Shares (000's)
Value(000's)
USD
% of NetAssetValue
Common Stock (continued)
China - 34.53% (continued)
9 Shanghai Waigaoqiao Free Trade Zone Group CoLtd 19 -
99 Shanghai Yuyuan Tourist Mart Group Co Ltd 220 0.02
27 Shanghai Zhangjiang High-Tech Park DevelopmentCo Ltd 82 0.01
74 Shanghai Zijiang Enterprise Group Co Ltd 58 -
17 Shanxi Blue Flame Holding Co Ltd 17 -
156 Shanxi Lu'an Environmental Energy DevelopmentCo Ltd 251 0.02
144 Shanxi Meijin Energy Co Ltd 167 0.01
58 Shanxi Securities Co Ltd 65 0.01
112 Shanxi Taigang Stainless Steel Co Ltd 118 0.01
122 Shanxi Xishan Coal & Electricity Power Co Ltd 128 0.01
95 Shanying International Holding Co Ltd 57 -
18 Shenghe Resources Holding Co Ltd 48 -
79 Shengjing Bank Co Ltd 70 0.01
376 Shenwan Hongyuan Group Co Ltd 113 0.01
91 Shenzhen Agricultural Products Group Co Ltd 83 0.01
47 Shenzhen Airport Co Ltd 59 -
47 Shenzhen Aisidi Co Ltd 61 -
21 Shenzhen Center Power Tech Co Ltd 54 -
47 Shenzhen Fastprint Circuit Tech Co Ltd 72 0.01
19 Shenzhen FRD Science & Technology Co Ltd 44 -
76 Shenzhen Gas Corp Ltd 86 0.01
20 Shenzhen Gongjin Electronics Co Ltd 28 -
53 Shenzhen Hepalink Pharmaceutical Group Co Ltd 134 0.01
124 Shenzhen Heungkong Holding Co Ltd 37 -
764 Shenzhen International Holdings Ltd 1,164 0.08
2,083 Shenzhen Investment Ltd 746 0.05
24 Shenzhen Jinjia Group Co Ltd 42 -
67 Shenzhen Jufei Optoelectronics Co Ltd 51 -
20 Shenzhen Kinwong Electronic 82 0.01
164 Shenzhen MTC Co Ltd 145 0.01
68 Shenzhen Neptunus Bioengineering Co Ltd 36 -
298 Shenzhen Overseas Chinese Town Co Ltd 390 0.03
40 Shenzhen Suntak Circuit Technology Co Ltd 73 0.01
74 Shenzhen Tagen Group Co Ltd 74 0.01
44 Shenzhen Woer Heat-Shrinkable Material Co Ltd 48 -
51 Shenzhen World Union Group Inc 53 -
65 Shenzhen Yan Tian Port Holding Co Ltd 56 -
23 Shenzhen Yinghe Technology 71 0.01
29 Shenzhen Ysstech Info-Tech Co Ltd 45 -
19 Shenzhen Zhenye Group Co Ltd 16 -
77 Shenzhen Zhongjin Lingnan Nonfemet Co Ltd 59 -
71 Shijiazhuang Changshan BeiMing Technology CoLtd 106 0.01
49 Shijiazhuang Yiling Pharmaceutical Co Ltd 221 0.02
860 Shimao Property Holdings Ltd 2,469 0.18
9 Shinva Medical Instrument Co Ltd 27 -
1,459 Shougang Fushan Resources Group Ltd 392 0.03
1,930 Shui On Land Ltd 326 0.02
66 Siasun Robot & Automation Co Ltd 101 0.01
200 Sichuan Hebang Biotechnology Co Ltd 63 0.01
67 Sichuan Kelun Pharmaceutical Co Ltd 232 0.02
129 Sichuan Languang Development Co Ltd 79 0.01
9 Sieyuan Electric Co Ltd 41 -
1,786 Sihuan Pharmaceutical Holdings Group Ltd 790 0.06
2,945 Sino Biopharmaceutical Ltd 3,264 0.24
56 Sinochem International Corp 61 -
1,426 Sinofert Holdings Ltd 195 0.01
49 Sinolink Securities Co Ltd 101 0.01
42 Sinoma International Engineering Co 62 -
Emerging Markets Value FundPortfolio of Investments as at 31 May 2021 (continued)
Dimensional Fund Advisors Semi-Annual Report and Unaudited Financial Statements, 31 May 2021 46

Shares (000's)
Value(000's)
USD
% of NetAssetValue
Common Stock (continued)
China - 34.53% (continued)
42 Sinoma Science & Technology Co Ltd 141 0.01
2,178 Sino-Ocean Group Holding Ltd 463 0.03
914 Sinopec Engineering Group Co Ltd 579 0.04
756 Sinopec Kantons Holdings Ltd 302 0.02
1,044 Sinopec Oilfield Service Corp 102 0.01
2,002 Sinopec Shanghai Petrochemical Co Ltd 500 0.04
860 Sinopharm Group Co Ltd 2,869 0.21
280 Sinosoft Technology Group Ltd 67 0.01
1,354 Sinotrans Ltd 642 0.05
478 Sinotruk Hong Kong Ltd 1,146 0.08
102 Skyfame Realty Holdings Ltd 13 -
59 Skyworth Digital Co Ltd 78 0.01
651 Skyworth Group Ltd 186 0.01
25 Sogou Inc, ADR 208 0.02
1,518 SOHO China Ltd 466 0.03
488 Solargiga Energy Holdings Ltd 24 -
54 SooChow Securities Co Ltd 76 0.01
208 Sou Yu Te Group Co Ltd 58 -
387 South Manganese Investment Ltd 26 -
71 Southwest Securities Co Ltd 55 -
19 Spring Airlines Co Ltd 199 0.01
510 SPT Energy Group Inc 19 -
516 SSY Group Ltd 344 0.03
200 Sun King Power Electronics Group 68 0.01
1,245 Sunac China Holdings Ltd 4,578 0.33
39 Sunac Services Holdings Ltd 116 0.01
18 Sunflower Pharmaceutical Group Co Ltd 43 -
16 Sunfly Intelligent Technology Co Ltd 25 -
79 Suning Universal Co Ltd 131 0.01
166 Suning.com Co Ltd 179 0.01
286 Sunshine 100 China Holdings Ltd 46 -
26 Sunward Intelligent Equipment Co Ltd 33 -
70 Suzhou Chunxing Precision Mechanical Co Ltd 39 -
58 Suzhou Dongshan Precision Manufacturing Co Ltd 166 0.01
64 Suzhou Gold Mantis Construction Decoration Co Ltd 89 0.01
680 Symphony Holdings Ltd 74 0.01
35 Tangshan Jidong Cement Co Ltd 76 0.01
170 TangShan Port Group Co Ltd 66 0.01
47 Tangshan Sanyou Chemical Industries Co Ltd 77 0.01
14 Tasly Pharmaceutical Group Co Ltd 32 -
80 TBEA Co Ltd 149 0.01
520 TCL Electronics Holdings Ltd 348 0.03
203 TCL Technology Group Corp 259 0.02
107 Tech-Bank Food Co Ltd 126 0.01
323 Tian An China Investment Co Ltd 192 0.01
67 Tian Di Science & Technology Co Ltd 37 -
310 Tian Ge Interactive Holdings Ltd 56 -
48 Tian Shan Development Holding Ltd 12 -
370 Tiangong International Co Ltd 167 0.01
118 Tianjin Capital Environmental Protection Group CoLtd 46 -
168 Tianjin Chase Sun Pharmaceutical Co Ltd 114 0.01
59 Tianjin Guangyu Development Co Ltd 52 -
1,488 Tianjin Port Development Holdings Ltd 130 0.01
79 Tianjin Teda Co Ltd 60 -
55 Tianjin Zhonghuan Semiconductor Co Ltd 235 0.02
8 Tianjin ZhongXin Pharmaceutical Group Corp Ltd 29 -
76 Tianma Microelectronics Co Ltd 163 0.01
480 Tianneng Power International Ltd 865 0.06
77 Tianshui Huatian Technology Co Ltd 153 0.01
28 Tibet Tianlu Co Ltd 31 -
896 Tingyi Cayman Islands Holding Corp 1,704 0.12
Shares (000's)
Value(000's)
USD
% of NetAssetValue
Common Stock (continued)
China - 34.53% (continued)
48 Titan Wind Energy Suzhou Co Ltd 63 0.01
477 Tomson Group Ltd 122 0.01
300 Tong Ren Tang Technologies Co Ltd 317 0.02
243 Tongcheng-Elong Holdings Ltd 654 0.05
2,860 Tongda Group Holdings Ltd 225 0.02
40 TongFu Microelectronics Co Ltd 123 0.01
65 Tongkun Group Co Ltd 218 0.02
98 Tongling Jingda Special Magnet Wire Co Ltd 80 0.01
145 Tongling Nonferrous Metals Group Co Ltd 67 0.01
26 Tongwei Co Ltd 157 0.01
113 Tongyu Heavy Industry Co 54 -
36 Top Spring International Holdings Ltd 7 -
7 Topsec Technologies Group Inc 21 -
33 Transfar Zhilian Co Ltd 33 -
62 TravelSky Technology Ltd 134 0.01
650 Trigiant Group Ltd 63 0.01
156 Trip.com Group Ltd, ADR 6,521 0.47
2,178 Trony Solar Holdings Co Ltd - -
39 TRS Information Technology Co Ltd 60 -
50 Truly International Holdings Ltd 10 -
122 Tsingtao Brewery Co Ltd 1,296 0.09
32 Tunghsu Optoelectronic Technology Co Ltd 10 -
33 Tus Environmental Science And TechnologyDevelopment Co Ltd 28 -
33 Unilumin Group Co Ltd 42 -
292 Uni-President China Holdings Ltd 319 0.02
75 Unisplendour Corp Ltd 224 0.02
1,126 United Energy Group Ltd 209 0.02
54 Universal Scientific Industrial Shanghai Co Ltd 139 0.01
24 Valiant Co Ltd 63 -
60 Vatti Corp Ltd 69 0.01
188 Vinda International Holdings Ltd 592 0.04
6 Viomi Technology Co Ltd 46 -
63 Vipshop Holdings Ltd, ADR 1,461 0.11
87 Virscend Education Co Ltd 14 -
41 Wanda Film Holding Co Ltd 109 0.01
21 Wangfujing Group Co Ltd 104 0.01
65 Wangsu Science & Technology Co Ltd 57 -
2,056 Want Want China Holdings Ltd 1,526 0.11
100 Wanxiang Qianchao Co Ltd 79 0.01
356 Wasion Holdings Ltd 118 0.01
26 Wasu Media Holding Co Ltd 31 -
18 Weibo Corp, ADR 935 0.07
805 Weichai Power Co Ltd 1,866 0.13
5 Weidai Ltd, ADR 6 -
11 Weifu High-Technology Group Co Ltd 41 -
332 Weiqiao Textile Co 88 0.01
272 Wens Foodstuffs Group Co Ltd 602 0.04
1,468 West China Cement Ltd 252 0.02
54 Western Securities Co Ltd 75 0.01
164 Wharf Holdings Ltd 565 0.04
260 Wisdom Education International Holdings Co Ltd 83 0.01
25 Wolong Electric Group Co Ltd 44 -
151 Wuchan Zhongda Group Co Ltd 158 0.01
23 Wuhan Department Store Group Co Ltd 44 -
42 Wuhan P&S Information Technology Co Ltd 27 -
62 Wuhu Token Science Co Ltd 79 0.01
61 Wuxi Taiji Industry Co Ltd 77 0.01
264 XCMG Construction Machinery Co Ltd 278 0.02
61 Xiamen C & D Inc 78 0.01
31 Xiamen Comfort Science & Technology Group CoLtd 84 0.01
Emerging Markets Value FundPortfolio of Investments as at 31 May 2021 (continued)
Dimensional Fund Advisors Semi-Annual Report and Unaudited Financial Statements, 31 May 2021 47

Shares (000's)
Value(000's)
USD
% of NetAssetValue
Common Stock (continued)
China - 34.53% (continued)
558 Xiamen International Port Co Ltd 84 0.01
39 Xiamen ITG Group Corp Ltd 44 -
23 Xiamen Tungsten Co Ltd 67 0.01
42 Xiamen Xiangyu Co Ltd 42 -
75 Xiandai Investment Co Ltd 51 -
19 Xilinmen Furniture Co Ltd 82 0.01
12 Xinfengming Group Co Ltd 37 -
759 Xingda International Holdings Ltd 200 0.01
136 Xinhu Zhongbao Co Ltd 68 0.01
153 Xinhua Winshare Publishing and Media Co Ltd 112 0.01
289 Xinjiang Goldwind Science & Technology Co Ltd 483 0.04
19 Xinjiang Tianshan Cement Co Ltd 45 -
49 Xinjiang Zhongtai Chemical Co Ltd 78 0.01
68 Xinxing Ductile Iron Pipes Co Ltd 42 -
20 Xinyangfeng Agricultural Technology Co Ltd 46 -
42 Xinyi Solar Holdings Ltd 75 0.01
105 Xinyu Iron & Steel Co Ltd 98 0.01
31 Xinyuan Real Estate Co Ltd, ADR 72 0.01
827 Xtep International Holdings Ltd 910 0.07
20 Xuji Electric Co Ltd 42 -
27 YaGuang Technology Group Co Ltd 43 -
111 Yang Quan Coal Industry Group Co Ltd 102 0.01
150 Yango Group Co Ltd 131 0.01
19 Yantai Changyu Pioneer Wine Co Ltd 119 0.01
33 Yantai Jereh Oilfield Services Group Co Ltd 203 0.02
1,170 Yanzhou Coal Mining Co Ltd 1,490 0.11
165 YiChang HEC ChangJiang Pharmaceutical Co Ltd 157 0.01
40 Yifan Pharmaceutical Co Ltd 118 0.01
77 Yintai Gold Co Ltd 124 0.01
132 Yip's Chemical Holdings Ltd 75 0.01
24 Yiren Digital Ltd, ADR 90 0.01
193 Yonghui Superstores Co Ltd 172 0.01
71 Yotrio Group Co Ltd 40 -
95 Youngor Group Co Ltd 111 0.01
25 Youzu Interactive Co Ltd 76 0.01
4,761 Yuexiu Property Co Ltd 1,177 0.09
110 Yum China Holdings Inc 7,440 0.54
80 Yunda Holding Co Ltd 183 0.01
64 Yunnan Aluminium Co Ltd 143 0.01
33 Yunnan Baiyao Group Co Ltd 639 0.05
46 Yunnan Copper Co Ltd 105 0.01
45 Yunnan Tin Co Ltd 114 0.01
1,194 Yuzhou Properties Co Ltd 352 0.03
144 Zhaojin Mining Industry Co Ltd 150 0.01
197 Zhejiang Century Huatong Group Co Ltd 206 0.02
72 Zhejiang Chint Electrics Co Ltd 362 0.03
59 Zhejiang Communications Technology Co Ltd 50 -
23 Zhejiang Crystal-Optech Co Ltd 46 -
80 Zhejiang Dahua Technology Co Ltd 295 0.02
23 Zhejiang Garden Bio-Chemical High-tech Co Ltd 49 -
155 Zhejiang Glass Co Ltd - -
59 Zhejiang Hailiang Co Ltd 95 0.01
34 Zhejiang Hangmin Group Co Ltd 29 -
72 Zhejiang Hisoar Pharmaceutical Co Ltd 102 0.01
56 Zhejiang Huafeng Spandex Co Ltd 111 0.01
28 Zhejiang Jiahua Energy Chemical Industry Co Ltd 39 -
17 Zhejiang Jianfeng Group Co Ltd 34 -
34 Zhejiang Jingu Co Ltd 34 -
24 Zhejiang Jingxin Pharmaceutical Co Ltd 33 -
42 Zhejiang Juhua Co Ltd 64 0.01
123 Zhejiang Longsheng Group Co Ltd 277 0.02
40 Zhejiang Medicine Co Ltd 107 0.01
Shares (000's)
Value(000's)
USD
% of NetAssetValue
Common Stock (continued)
China - 34.53% (continued)
22 Zhejiang Narada Power Source Co Ltd 36 -
54 Zhejiang NHU Co Ltd 274 0.02
87 Zhejiang Orient Financial Holdings Group Co Ltd 79 0.01
29 Zhejiang Runtu Co Ltd 44 -
21 Zhejiang Sanmei Chemical Industry Co Ltd 54 -
25 Zhejiang Satellite Petrochemical Co Ltd 175 0.01
78 Zhejiang Semir Garment Co Ltd 148 0.01
63 Zhejiang Wanfeng Auto Wheel Co Ltd 53 -
32 Zhejiang Wanliyang Co Ltd 39 -
29 Zhejiang Xianju Pharmaceutical Co Ltd 60 -
36 Zhejiang Xinan Chemical Industrial Group Co Ltd 87 0.01
53 Zhejiang Yankon Group Co Ltd 35 -
39 Zhejiang Yasha Decoration Co Ltd 42 -
19 Zhejiang Yongtai Technology Co Ltd 35 -
115 Zhengzhou Coal Mining Machinery Group Co Ltd 134 0.01
46 Zhengzhou Yutong Bus Co Ltd 96 0.01
249 Zhenro Properties Group Ltd 160 0.01
1,261 Zhong An Group Ltd 62 -
16 Zhongji Innolight Co Ltd 103 0.01
169 Zhongjin Gold Corp Ltd 254 0.02
67 Zhongshan Broad Ocean Motor Co Ltd 56 -
108 Zhongsheng Group Holdings Ltd 898 0.07
142 Zhongtian Financial Group Co Ltd 66 0.01
32 Zhongyuan Environment-Protection Co Ltd 32 -
279 Zhou Hei Ya International Holdings Co Ltd 357 0.03
60 Zhuhai Holdings Investment Group Ltd 24 -
181 Zhuzhou CRRC Times Electric Co Ltd 871 0.06
51 Zhuzhou Kibing Group Co Ltd 128 0.01
35 Zibo Qixiang Tengda Chemical Co Ltd 61 -
587 Zoomlion Heavy Industry Science and TechnologyCo Ltd 730 0.05
273 ZTE Corp 737 0.05
1 ZTO Express Cayman Inc 27 -
68 ZTO Express Cayman Inc, ADR 2,185 0.16
479,841 34.53
Colombia - 0.12%
128 Cementos Argos SA 176 0.01
10 Corp Financiera Colombiana SA 78 0.01
237 Grupo Argos SA 656 0.05
124 Grupo de Inversiones Suramericana SA 680 0.05
12 Mineros SA 13 -
1,603 0.12
Czech Republic - 0.10%
34 CEZ AS 1,018 0.07
11 Komercni Banka AS 402 0.03
1,420 0.10
Greece - 0.21%
446 Alpha Bank AE 585 0.04
4 Bank of Greece 79 0.01
45 Ellaktor SA 78 0.01
619 Eurobank Ergasias SA 580 0.04
10 Hellenic Petroleum SA 80 0.01
37 Intracom Holdings SA 65 -
6 LAMDA Development SA 50 -
34 Mytilineos SA 633 0.05
242 National Bank of Greece SA 730 0.05
10 Piraeus Financial Holdings 17 -
2 Titan Cement International SA 48 -
2,945 0.21
Hong Kong - 0.09%
59 Atlas Corp 815 0.06
88 GR Properties Ltd 12 -
Emerging Markets Value FundPortfolio of Investments as at 31 May 2021 (continued)
Dimensional Fund Advisors Semi-Annual Report and Unaudited Financial Statements, 31 May 2021 48

Shares (000's)
Value(000's)
USD
% of NetAssetValue
Common Stock (continued)
Hong Kong - 0.09% (continued)
562 Karce International Holdings Co Ltd - -
1,470 Mingyuan Medicare Development Co Ltd 8 -
329 Real Gold Mining Ltd 11 -
716 Taihan Fiberoptics Co Ltd 5 -
335 Tenwow International Holdings Ltd 6 -
164 Texhong Textile Group Ltd 254 0.02
3,364 Untrade Hua Han Health Ltd 130 0.01
684 Untrade Huiyuan Juice 31 -
310 Untrade.Youyuan Holdings - -
1,272 0.09
Hungary - 0.15%
261 MOL Hungarian Oil & Gas PLC 2,093 0.15
2,093 0.15
India - 11.67%
5 Aarti Drugs Ltd 50 -
27 ACC Ltd 743 0.05
92 Adani Enterprises Ltd 1,652 0.12
8 Adani Gas Ltd 155 0.01
62 Adani Green Energy Ltd 1,063 0.08
44 Adani Ports & Special Economic Zone Ltd 474 0.03
301 Adani Power Ltd 383 0.03
15 Adani Transmission Ltd 297 0.02
229 Aditya Birla Capital Ltd 388 0.03
62 Alembic Ltd 111 0.01
49 Allcargo Logistics Ltd 88 0.01
267 Ambuja Cements Ltd 1,200 0.09
78 Amtek Auto Ltd 1 -
126 Apollo Tyres Ltd 390 0.03
6 Arvind Fashions 5 -
34 Arvind Fashions Ltd 68 0.01
67 Arvind Ltd 72 0.01
306 Ashok Leyland Ltd 526 0.04
9 Aster DM Healthcare Ltd 18 -
162 Aurobindo Pharma Ltd 2,279 0.16
575 Axis Bank Ltd 5,892 0.42
18 Bajaj Holdings & Investment Ltd 867 0.06
51 Balmer Lawrie & Co Ltd 97 0.01
71 Balrampur Chini Mills Ltd 289 0.02
354 Bank of Baroda 409 0.03
532 Bharat Electronics Ltd 1,064 0.08
171 Bharti Airtel Ltd 1,235 0.09
21 Bharti Infratel Ltd 68 0.01
13 Birla Corp Ltd 218 0.02
72 Birlasoft India Ltd 316 0.02
6 Bodal Chemicals Ltd 9 -
39 Brigade Enterprises Ltd 142 0.01
9 BSE Ltd 118 0.01
90 Cadila Healthcare Ltd 769 0.06
105 Canara Bank 234 0.02
3 Capacit'e Infraprojects Ltd 8 -
3 Caplin Point Laboratories Ltd 21 -
12 Ceat Ltd 221 0.02
20 Century Textiles & Industries Ltd 140 0.01
70 Chambal Fertilizers and Chemicals Ltd 277 0.02
307 Chennai Super Kings Cricket Ltd 2 -
35 Cholamandalam Financial Holdings Ltd 306 0.02
159 Cipla Ltd 2,042 0.15
18 City Union Bank Ltd 44 -
10 Cochin Shipyard Ltd 55 -
79 Container Corp Of India Ltd 724 0.05
38 Cyient Ltd 432 0.03
27 Dalmia Bharat Ltd 672 0.05
Shares (000's)
Value(000's)
USD
% of NetAssetValue
Common Stock (continued)
India - 11.67% (continued)
21 DB Corp Ltd 28 -
105 DCB Bank Ltd 151 0.01
29 DCM Shriram Ltd 274 0.02
15 Deepak Fertilisers & Petrochemicals Corp Ltd 63 -
29 Delta Corp Ltd 68 0.01
23 Dhampur Sugar Mills Ltd 97 0.01
5 Dilip Buildcon Ltd 39 -
50 Dishman Carbogen Amcis Ltd 144 0.01
208 DLF Ltd 817 0.06
- DRC Systems India Ltd 1 -
155 Edelweiss Financial Services Ltd 139 0.01
44 EID Parry India Ltd 254 0.02
43 Engineers India Ltd 51 -
19 Escorts Ltd 306 0.02
124 Exide Industries Ltd 328 0.02
12 FDC Ltd 57 -
821 Federal Bank Ltd 1,003 0.07
25 Finolex Cables Ltd 157 0.01
69 Finolex Industries Ltd 164 0.01
132 Firstsource Solutions Ltd 257 0.02
142 Fortis Healthcare Ltd 452 0.03
739 GAIL India Ltd 1,560 0.11
45 Gateway Distriparks Ltd 187 0.01
15 General Insurance Corp of India 41 -
31 GHCL Ltd 115 0.01
88 Glenmark Pharmaceuticals Ltd 742 0.05
8 Godfrey Phillips India Ltd 99 0.01
3 Godrej Industries Ltd 25 -
79 Granules India Ltd 343 0.02
6 Graphite India Ltd 61 -
118 Grasim Industries Ltd 2,384 0.17
41 Great Eastern Shipping Co Ltd 234 0.02
10 Greenply Industries Ltd 29 -
19 Gujarat Alkalies & Chemicals Ltd 109 0.01
46 Gujarat Ambuja Exports Ltd 106 0.01
30 Gujarat Fluorochemicals Ltd 342 0.02
27 Gujarat Narmada Valley Fertilizers & Chemicals Ltd 143 0.01
101 Gujarat Pipavav Port Ltd 148 0.01
51 Gujarat State Fertilizers & Chemicals Ltd 80 0.01
93 Gujarat State Petronet Ltd 358 0.03
15 HeidelbergCement India Ltd 52 -
295 HFCL Ltd 185 0.01
35 Hikal Ltd 202 0.01
2 HIL Ltd 161 0.01
24 Himadri Speciality Chemical Ltd 18 -
4 Himatsingka Seide Ltd 9 -
887 Hindalco Industries Ltd 4,741 0.34
9 Hinduja Global Solutions Ltd 216 0.02
8 Hindustan Aeronautics Ltd 109 0.01
3 Huhtamaki India Ltd 12 -
1,463 ICICI Bank Ltd 13,077 0.94
47 ICICI Bank Ltd, ADR 848 0.06
937 IDFC First Bank Ltd 764 0.06
493 IDFC Ltd 388 0.03
75 IIFL Finance Ltd 261 0.02
178 IIFL Securities Ltd 188 0.01
15 IIFL Wealth Management Ltd 252 0.02
101 India Cements Ltd 253 0.02
147 Indiabulls Housing Finance Ltd 452 0.03
133 Indiabulls Real Estate Ltd 180 0.01
64 Indian Bank 126 0.01
23 Indo Count Industries Ltd 45 -
Emerging Markets Value FundPortfolio of Investments as at 31 May 2021 (continued)
Dimensional Fund Advisors Semi-Annual Report and Unaudited Financial Statements, 31 May 2021 49

Shares (000's)
Value(000's)
USD
% of NetAssetValue
Common Stock (continued)
India - 11.67% (continued)
112 IndusInd Bank Ltd 1,577 0.11
2 INEOS Styrolution India Ltd 35 -
239 Infibeam Avenues Ltd 150 0.01
6 ITD Cementation India Ltd 7 -
67 Jagran Prakashan Ltd 53 -
57 Jammu & Kashmir Bank Ltd 23 -
15 Jindal Poly Films Ltd 184 0.01
90 Jindal Saw Ltd 122 0.01
9 Jindal Stainless Hisar Ltd 21 -
97 Jindal Stainless Ltd 123 0.01
224 Jindal Steel & Power Ltd 1,222 0.09
27 JK Lakshmi Cement Ltd 196 0.01
51 JK Paper Ltd 107 0.01
76 JK Tyre & Industries Ltd 133 0.01
168 JM Financial Ltd 204 0.01
216 JSW Energy Ltd 346 0.03
480 JSW Steel Ltd 4,565 0.33
62 Jubilant Ingrevia Ltd 412 0.03
62 Jubilant Life Sciences Ltd 751 0.05
15 Just Dial Ltd 185 0.01
31 Kalpataru Power Transmission Ltd 184 0.01
16 Kalyani Steels Ltd 84 0.01
89 Karnataka Bank Ltd 79 0.01
189 Karur Vysya Bank Ltd 151 0.01
8 Kaveri Seed Co Ltd 79 0.01
7 KEI Industries Ltd 56 -
10 Kiri Industries Ltd 66 0.01
27 KNR Constructions Ltd 81 0.01
86 KPIT Technologies Ltd 287 0.02
9 KPR Mill Ltd 200 0.01
11 KRBL Ltd 33 -
2 KSB Ltd 21 -
35 Laurus Labs Ltd 249 0.02
170 LIC Housing Finance Ltd 1,068 0.08
71 LT Foods Ltd 73 0.01
95 Lupin Ltd 1,581 0.11
51 Magma Fincorp Ltd 91 0.01
1 Maharashtra Scooters Ltd 59 -
25 Maharashtra Seamless Ltd 101 0.01
295 Mahindra & Mahindra Financial Services Ltd 650 0.05
331 Mahindra & Mahindra Ltd 3,869 0.28
10 Mahindra & Mahindra Ltd, GDR 118 0.01
72 Mahindra CIE Automotive Ltd 191 0.01
188 Manappuram Finance Ltd 407 0.03
120 Marksans Pharma Ltd 122 0.01
2 Mastek Ltd 50 -
22 Max Healthcare Institute Ltd 67 0.01
2 Max India Ltd 2 -
74 Meghmani Organics Ltd 140 0.01
35 MOIL Ltd 84 0.01
155 Motherson Sumi Systems Ltd 501 0.04
28 Mphasis Ltd 763 0.06
1 MRF Ltd 839 0.06
427 National Aluminium Co Ltd 424 0.03
47 Nava Bharat Ventures Ltd 57 -
121 NCC Ltd 139 0.01
34 NIIT Ltd 89 0.01
3 Nilkamal Ltd 78 0.01
265 NMDC Ltd 653 0.05
26 NOCIL Ltd 73 0.01
7 Nucleus Software Exports Ltd 59 -
44 Oberoi Realty Ltd 351 0.03
Shares (000's)
Value(000's)
USD
% of NetAssetValue
Common Stock (continued)
India - 11.67% (continued)
22 Omaxe Ltd 24 -
45 Orient Cement Ltd 90 0.01
1 Paisalo Digital Ltd 5 -
9 Parag Milk Foods Ltd 18 -
24 PC Jeweller Ltd 9 -
24 Persistent Systems Ltd 812 0.06
7 Petronet LNG Ltd 21 -
37 Phillips Carbon Black Ltd 116 0.01
31 Piramal Enterprises Ltd 763 0.06
28 PNB Housing Finance Ltd 170 0.01
25 PNC Infratech Ltd 88 0.01
10 Polyplex Corp Ltd 160 0.01
503 Power Finance Corp Ltd 835 0.06
96 Prestige Estates Projects Ltd 362 0.03
243 PTC India Financial Services Ltd 62 -
92 PTC India Ltd 114 0.01
428 Punjab National Bank 250 0.02
3 Quess Corp Ltd 32 -
68 Rain Industries Ltd 167 0.01
38 Rajesh Exports Ltd 270 0.02
28 Ramco Industries Ltd 106 0.01
86 Rashtriya Chemicals & Fertilizers Ltd 99 0.01
18 Raymond Ltd 94 0.01
181 RBL Bank Ltd 539 0.04
404 REC Ltd 815 0.06
174 Redington India Ltd 526 0.04
1,245 Reliance Industries Ltd 35,946 2.59
104 Reliance Power Ltd 12 -
41 Sequent Scientific Ltd 154 0.01
21 SH Kelkar & Co Ltd 47 -
2 Sharda Cropchem Ltd 10 -
9 Shilpa Medicare Ltd 65 -
66 Shipping Corp of India Ltd 107 0.01
8 Shriram City Union Finance Ltd 200 0.01
81 Shriram Transport Finance Co Ltd 1,632 0.12
34 Sobha Ltd 223 0.02
3 Solara Active Pharma Sciences Ltd 60 -
15 Somany Home Innovation Ltd 66 -
419 South Indian Bank Ltd 60 -
14 Srikalahasthi Pipes Ltd 37 -
548 State Bank of India 3,185 0.23
5 State Bank of India, GDR 269 0.02
391 Steel Authority of India Ltd 652 0.05
23 Strides Pharma Science Ltd 256 0.02
265 Sun Pharmaceutical Industries Ltd 2,463 0.18
37 Sun TV Network Ltd 278 0.02
1 Sundaram Finance Ltd 25 -
21 Sunteck Realty Ltd 85 0.01
16 Suvidhaa Infoserve PVT Ltd 5 -
45 TAKE Solutions Ltd 43 -
73 Tata Chemicals Ltd 709 0.05
156 Tata Global Beverages Ltd 1,406 0.10
1 Tata Metaliks Ltd 22 -
902 Tata Motors Ltd 3,971 0.29
102 Tata Steel Bsl Ltd 138 0.01
287 Tata Steel Ltd 4,377 0.32
73 Tech Mahindra Ltd 1,037 0.07
8 Techno Electric & Engineering Co Ltd 34 -
18 Thomas Cook India Ltd 14 -
- Tide Water Oil Co India Ltd 15 -
67 Time Technoplast Ltd 81 0.01
15 Transport Corp of India Ltd 85 0.01
Emerging Markets Value FundPortfolio of Investments as at 31 May 2021 (continued)
Dimensional Fund Advisors Semi-Annual Report and Unaudited Financial Statements, 31 May 2021 50

Shares (000's)
Value(000's)
USD
% of NetAssetValue
Common Stock (continued)
India - 11.67% (continued)
907 Trident Ltd 204 0.01
52 Triveni Engineering & Industries Ltd 101 0.01
28 Tube Investments of India Ltd 452 0.03
324 TV18 Broadcast Ltd 187 0.01
24 Uflex Ltd 146 0.01
13 Ujjivan Financial Services Ltd 39 -
17 Unichem Laboratories Ltd 86 0.01
150 UPL Ltd 1,682 0.12
2 VA Tech Wabag Ltd 9 -
9 Vardhman Textiles Ltd 151 0.01
2 Varroc Engineering Ltd 13 -
161 Vedanta Ltd, ADR 2,386 0.17
2 Venky's India Ltd 65 -
4 Vindhya Telelinks Ltd 53 -
2,994 Vodafone Idea Ltd 359 0.03
46 Welspun Corp Ltd 93 0.01
59 Welspun Enterprises Ltd 87 0.01
233 Welspun India Ltd 291 0.02
20 West Coast Paper Mills Ltd 61 -
525 Wipro Ltd 3,889 0.28
20 Wockhardt Ltd 181 0.01
1,880 Yes Bank Ltd 347 0.03
337 Zee Entertainment Enterprises Ltd 983 0.07
50 Zensar Technologies Ltd 198 0.01
162,193 11.67
Indonesia - 1.16%
7,469 Adaro Energy Tbk PT 612 0.04
637 Adhi Karya Persero Tbk PT 44 -
373 AKR Corporindo Tbk PT 85 0.01
9,301 Alam Sutera Realty Tbk PT 116 0.01
237 Astra Agro Lestari Tbk PT 146 0.01
7,605 Astra International Tbk PT 2,739 0.20
292 Astra Otoparts Tbk PT 23 -
39,396 Bakrie Telecom Tbk PT 26 -
680 Bank Danamon Indonesia Tbk PT 111 0.01
4,065 Bank Mandiri Persero Tbk PT 1,648 0.12
2,379 Bank Negara Indonesia Persero Tbk PT 866 0.06
1,967 Bank Pan Indonesia Tbk PT 119 0.01
1,502 Bank Pembangunan Daerah Jawa Barat DanBanten Tbk PT 145 0.01
1,807 Bank Pembangunan Daerah Jawa Timur Tbk PT 95 0.01
2,111 Bank Tabungan Negara Persero Tbk PT 235 0.02
3,668 Bekasi Fajar Industrial Estate Tbk PT 37 -
1,107 BISI International Tbk PT 89 0.01
208 Blue Bird Tbk PT 18 -
1,621 Buana Lintas Lautan Tbk PT 34 -
1,651 Bukit Asam Tbk PT 253 0.02
1,847 Bumi Serpong Damai Tbk PT 144 0.01
849 Catur Sentosa Adiprana Tbk PT 22 -
5,736 Ciputra Development Tbk PT 427 0.03
1,629 Delta Dunia Makmur Tbk PT 40 -
6,589 Eagle High Plantations Tbk PT 48 -
2,123 Elnusa Tbk PT 45 -
4,575 Erajaya Swasembada Tbk PT 189 0.01
1,135 Gajah Tunggal Tbk PT 69 -
123 Gudang Garam Tbk PT 283 0.02
1,235 Indah Kiat Pulp & Paper Corp Tbk PT 724 0.05
1,064 Indika Energy Tbk PT 95 0.01
234 Indo Tambangraya Megah Tbk PT 212 0.02
2,114 Indofood Sukses Makmur Tbk PT 921 0.07
25 Indo-Rama Synthetics Tbk PT 8 -
216 Inovisi Infracom Tbk PT - -
Shares (000's)
Value(000's)
USD
% of NetAssetValue
Common Stock (continued)
Indonesia - 1.16% (continued)
564 Intiland Development Tbk PT 8 -
2,308 Japfa Comfeed Indonesia Tbk PT 328 0.02
2,515 Jaya Real Property Tbk PT 93 0.01
8,608 Kawasan Industri Jababeka Tbk PT 111 0.01
979 Lippo Cikarang Tbk PT 69 -
22,620 Lippo Karawaci Tbk PT 240 0.02
505 Malindo Feedmill Tbk PT 31 -
3,350 Medco Energi Internasional Tbk PT 159 0.01
2,279 Media Nusantara Citra Tbk PT 150 0.01
880 Metrodata Electronics Tbk PT 105 0.01
5,678 MNC Investama Tbk PT 23 -
7,470 MNC Land Tbk PT 58 -
284 Pabrik Kertas Tjiwi Kimia Tbk PT 178 0.01
4,083 Pan Brothers Tbk PT 43 -
1,584 Perusahaan Perkebunan London Sumatra IndonesiaTbk PT 132 0.01
1,215 PP Persero Tbk PT 93 0.01
435 Ramayana Lestari Sentosa Tbk PT 20 -
2,604 Salim Ivomas Pratama Tbk PT 95 0.01
719 Sampoerna Agro Tbk PT 93 0.01
1,140 Semen Indonesia Persero Tbk PT 770 0.06
135 Siloam International Hospitals Tbk PT 80 0.01
61 Sinar Mas Multiartha Tbk PT 49 -
5,526 Sri Rejeki Isman Tbk PT 56 -
1,682 Surya Esa Perkasa Tbk PT 41 -
2,314 Surya Semesta Internusa Tbk PT 69 0.01
159 Tempo Scan Pacific Tbk PT 17 -
6,889 Tiga Pilar Sejahtera Food Tbk 117 0.01
597 Tiphone Mobile Indonesia Tbk PT 1 -
18,871 Trada Alam Minera Tbk PT 12 -
19,342 Truba Alam Manunggal Engineering PT - -
1,525 Tunas Baru Lampung Tbk PT 91 0.01
1,222 Tunas Ridean Tbk PT 101 0.01
769 United Tractors Tbk PT 1,174 0.08
787 Vale Indonesia Tbk PT 258 0.02
6,917 Waskita Beton Precast Tbk PT 85 0.01
1,434 Wijaya Karya Persero Tbk PT 121 0.01
2,243 XL Axiata Tbk PT 370 0.03
16,109 1.16
Korea, Republic of - 14.38%
7 ABco Electronics Co Ltd 44 -
3 Aekyung Petrochemical Co Ltd 36 -
8 AJ Networks Co Ltd 44 -
7 AJ Rent A Car Co Ltd 91 0.01
11 Ajin Industrial Co Ltd 37 -
2 AK Holdings Inc 77 0.01
9 ALUKO Co Ltd 43 -
7 Amorepacific Group 501 0.04
27 Aprogen KIC Inc 52 -
64 Aprogen pharmaceuticals Inc 69 0.01
1 Asia Cement Co Ltd 116 0.01
1 ASIA Holdings Co Ltd 95 0.01
2 Asia Paper Manufacturing Co Ltd 116 0.01
23 AUK Corp 49 -
11 Austem Co Ltd 33 -
3 Autech Corp 40 -
6 Avaco Co Ltd 68 0.01
8 BGF Co Ltd 48 -
8 BH Co Ltd 130 0.01
1 Binggrae Co Ltd 54 -
132 BNK Financial Group Inc 943 0.07
1 Bookook Securities Co Ltd 20 -
Emerging Markets Value FundPortfolio of Investments as at 31 May 2021 (continued)
Dimensional Fund Advisors Semi-Annual Report and Unaudited Financial Statements, 31 May 2021 51

Shares (000's)
Value(000's)
USD
% of NetAssetValue
Common Stock (continued)
Korea, Republic of - 14.38% (continued)
1 Busan City Gas Co Ltd 34 -
- BYC Co Ltd 43 -
14 Byucksan Corp 52 -
17 CammSys Corp 34 -
15 Capro Corp 63 -
13 Chinyang Holdings Corp 36 -
1 Chongkundang Holdings Corp 132 0.01
1 Chosun Refractories Co Ltd 101 0.01
4 CJ CheilJedang Corp 1,831 0.13
10 CJ Corp 953 0.07
3 CJ ENM Co Ltd 379 0.03
2 CJ Freshway Corp 51 -
13 CJ Hello Co Ltd 58 -
4 CJ Logistics Corp 676 0.05
7 Crownhaitai Holdings Co Ltd 78 0.01
- Cuckoo Holdings Co Ltd 53 -
6 Dae Dong Industrial Co Ltd 73 0.01
1 Dae Han Flour Mills Co Ltd 95 0.01
23 Dae Hyun Co Ltd 59 -
28 Dae Won Kang Up Co Ltd 108 0.01
1 Daechang Forging Co Ltd 12 -
12 Daeduck Co Ltd 94 0.01
15 Daeduck Electronics Co Ltd 202 0.01
5 Daehan Steel Co Ltd 98 0.01
8 Daekyo Co Ltd 33 -
7 Daelim Industrial Co Ltd 519 0.04
12 Daesang Corp 326 0.02
9 Daesang Holdings Co Ltd 97 0.01
3 Daesung Holdings Co Ltd 87 0.01
3 Daewon Pharmaceutical Co Ltd 39 -
9 Daewon San Up Co Ltd 60 -
110 Daewoo Engineering & Construction Co Ltd 784 0.06
47 Daewoo Shipbuilding & Marine Engineering Co Ltd 1,431 0.10
1 Dahaam E-Tec Co Ltd 26 -
2 Daihan Pharmaceutical Co Ltd 60 -
18 Daishin Securities Co Ltd 288 0.02
10 Daou Data Corp 134 0.01
15 Daou Technology Inc 368 0.03
20 DB Financial Investment Co Ltd 129 0.01
19 DB Inc 17 -
23 DB Insurance Co Ltd 1,048 0.08
5 DCM Corp 88 0.01
8 Deutsch Motors Inc 59 -
5 Development Advance Solution Co Ltd 24 -
102 DGB Financial Group Inc 861 0.06
6 DHP Korea Co Ltd 42 -
1 DI Dong Il Corp 137 0.01
9 DL E&C Co Ltd 1,049 0.08
3 DMS Co Ltd 22 -
7 Dong A Eltek Co Ltd 68 0.01
6 Dong Ah Tire & Rubber Co Ltd 69 0.01
- Dong-A Socio Holdings Co Ltd 23 -
2 Dong-A ST Co Ltd 126 0.01
3 Dong-Ah Geological Engineering Co Ltd 69 0.01
7 Dongbu Corp 77 0.01
- Dongil Industries Co Ltd 31 -
14 Dongkuk Industries Co Ltd 50 -
37 Dongkuk Steel Mill Co Ltd 757 0.05
4 DONGSUNG Corp 21 -
5 Dongwha Pharm Co Ltd 59 -
23 Dongwon Development Co Ltd 125 0.01
1 Dongwon F&B Co Ltd 122 0.01
Shares (000's)
Value(000's)
USD
% of NetAssetValue
Common Stock (continued)
Korea, Republic of - 14.38% (continued)
1 Dongwon Industries Co Ltd 236 0.02
10 Dongwoo Farm To Table Co Ltd 31 -
5 Dongyang E&P Inc 81 0.01
22 Doosan Bobcat Inc 991 0.07
3 Doosan Co Ltd 239 0.02
5 Doosan Fuel Cell Co Ltd 193 0.01
40 Doosan Heavy Industries & Construction Co Ltd 647 0.05
85 Doosan Infracore Co Ltd 940 0.07
8 Doosan Solus Co Ltd 366 0.03
3 DoubleUGames Co Ltd 187 0.01
2 DTR Automotive Corp 74 0.01
10 DY Corp 57 -
1 e Tec E&C Ltd 29 -
2 Eagon Industrial Ltd 25 -
31 Easy Holdings Co Ltd 141 0.01
18 Ehwa Technologies Information Co Ltd 42 -
5 e-LITECOM Co Ltd 44 -
6 E-MART Inc 890 0.06
4 EM-Tech Co Ltd 70 0.01
25 Eugene Corp 131 0.01
44 Eugene Investment & Securities Co Ltd 191 0.01
12 Eusu Holdings Co Ltd 90 0.01
16 E-World Ltd 52 -
6 Farmsco 37 -
32 FarmStory Co Ltd 61 -
2 Fila Korea Ltd 105 0.01
1 Gamevil Inc 42 -
3 Global Standard Technology Co Ltd 70 0.01
1 GOLFZON Co Ltd 71 0.01
3 Golfzon Newdin Holdings Co Ltd 25 -
36 GS Engineering & Construction Corp 1,422 0.10
26 GS Global Corp 67 0.01
27 GS Holdings Corp 1,111 0.08
- GS Home Shopping Inc 13 -
10 GS Retail Co Ltd 323 0.02
- Gwangju Shinsegae Co Ltd 95 0.01
3 Haitai Confectionery & Foods Co Ltd 28 -
17 Halla Corp 88 0.01
4 Halla Holdings Corp 166 0.01
5 Han Kuk Carbon Co Ltd 51 -
142 Hana Financial Group Inc 5,813 0.42
2 Hana Pharm Co Ltd 43 -
5 Hancom Inc 88 0.01
2 Handok Inc 46 -
7 Handsome Co Ltd 298 0.02
5 Hanil Holdings Co Ltd 65 0.01
5 Hanjin Heavy Industries & Construction Co Ltd 34 -
4 Hanjin Transportation Co Ltd 148 0.01
40 Hankook Tire & Technology Co Ltd 1,728 0.12
2 Hansae Yes24 Holdings Co Ltd 17 -
5 Hanshin Construction 103 0.01
19 Hansol Holdings Co Ltd 78 0.01
33 Hansol HomeDeco Co Ltd 63 -
9 Hansol Paper Co Ltd 129 0.01
11 Hansol Technics Co Ltd 83 0.01
50 Hanwha Chemical Corp 2,009 0.15
26 Hanwha General Insurance Co Ltd 110 0.01
64 Hanwha Investment & Securities Co Ltd 277 0.02
153 Hanwha Life Insurance Co Ltd 536 0.04
6 Hanyang Eng Co Ltd 94 0.01
20 Harim Holdings Co Ltd 191 0.01
Emerging Markets Value FundPortfolio of Investments as at 31 May 2021 (continued)
Dimensional Fund Advisors Semi-Annual Report and Unaudited Financial Statements, 31 May 2021 52

Shares (000's)
Value(000's)
USD
% of NetAssetValue
Common Stock (continued)
Korea, Republic of - 14.38% (continued)
3 HDC Hyundai Development Co-Engineering &Construction 82 0.01
8 HDC Hyundai Engineering Plastics Co Ltd 42 -
42 Heungkuk Fire & Marine Insurance Co Ltd 171 0.01
5 Hitejinro Holdings Co Ltd 88 0.01
15 HS Industries Co Ltd 110 0.01
14 HS R&A Co Ltd 29 -
6 HSD Engine Co Ltd 62 -
7 Huchems Fine Chemical Corp 128 0.01
11 Humax Co Ltd 43 -
2 Huons Global Co Ltd 107 0.01
7 Huvis Corp 69 0.01
12 Hwa Shin Co Ltd 76 0.01
- Hwacheon Machine Tool Co Ltd 16 -
5 Hwaseung R&A Co Ltd 27 -
6 HwaSung Industrial Co Ltd 69 0.01
3 Hy-Lok Corp 53 -
- Hyosung Chemical Corp 102 0.01
4 Hyosung Corp 392 0.03
1 Hyosung Heavy Industries Corp 49 -
7 Hyundai BNG Steel Co Ltd 135 0.01
6 Hyundai Construction Equipment Co Ltd 323 0.02
2 Hyundai Corp 32 -
5 Hyundai Corp Holdings Inc 63 -
8 Hyundai Department Store Co Ltd 618 0.04
2 Hyundai Electric & Energy System Co Ltd 47 -
26 Hyundai Engineering & Construction Co Ltd 1,319 0.10
8 Hyundai Glovis Co Ltd 1,431 0.10
22 Hyundai Greenfood Co Ltd 216 0.02
15 Hyundai Heavy Industries Holdings Co Ltd 966 0.07
3 Hyundai Home Shopping Network Corp 271 0.02
28 Hyundai Hy Communications & Network Co Ltd 115 0.01
9 Hyundai Livart Furniture Co Ltd 142 0.01
38 Hyundai Marine & Fire Insurance Co Ltd 826 0.06
9 Hyundai Mipo Dockyard Co Ltd 668 0.05
21 Hyundai Mobis Co Ltd 5,184 0.37
44 Hyundai Motor Co 9,203 0.66
7 Hyundai Motor Securities Co Ltd 84 0.01
27 Hyundai Steel Co 1,276 0.09
9 Hyundai Wia Corp 645 0.05
4 ICD Co Ltd 47 -
1 IDIS Holdings Co Ltd 11 -
2 Il Dong Pharmaceutical Co Ltd 22 -
12 Iljin Holdings Co Ltd 57 -
- Ilshin Spinning Co Ltd 20 -
10 iMarketKorea Inc 99 0.01
2 InBody Co Ltd 63 -
117 Industrial Bank of Korea 1,136 0.08
3 INITECH Co Ltd 16 -
3 Innocean Worldwide Inc 183 0.01
1 Intelligent Digital Integrated Security Co Ltd 37 -
4 Interflex Co Ltd 39 -
2 Interojo Co Ltd 48 -
31 Interpark Holdings Corp 144 0.01
8 INTOPS Co Ltd 202 0.02
17 INZI Display Co Ltd 50 -
4 Iones Co Ltd 31 -
2 ISC Co Ltd 44 -
2 i-SENS Inc 47 -
4 ISU Chemical Co Ltd 41 -
5 Jahwa Electronics Co Ltd 80 0.01
70 JB Financial Group Co Ltd 485 0.04
Shares (000's)
Value(000's)
USD
% of NetAssetValue
Common Stock (continued)
Korea, Republic of - 14.38% (continued)
2 JNTC Co Ltd 18 -
19 Kangwon Land Inc 467 0.03
4 KAON Media Co Ltd 39 -
201 KB Financial Group Inc, ADR 10,324 0.74
5 KC Co Ltd 117 0.01
15 KC Green Holdings Co Ltd 67 0.01
2 KC Tech Co Ltd 53 -
2 KCC Corp 533 0.04
7 KCC Engineering & Construction Co Ltd 63 -
6 KCC Glass Corp 327 0.02
55 KEC Corp 105 0.01
2 KEPCO Engineering & Construction Co Inc 111 0.01
2 KG Chemical Corp 46 -
4 Kginicis Co Ltd 82 0.01
5 KGMobilians Co Ltd 42 -
17 KH FEELUX Co Ltd 49 -
88 Kia Motors Corp 6,693 0.48
11 KISCO Corp 99 0.01
6 KISCO Holdings Co Ltd 108 0.01
6 KISWIRE Ltd 142 0.01
6 KIWOOM Securities Co Ltd 691 0.05
32 KMH Hitech Co Ltd 54 -
4 Kolmar Korea Holdings Co Ltd 113 0.01
4 Kolon Corp 100 0.01
5 Kolon Global Corp 106 0.01
10 Kolon Industries Inc 568 0.04
5 Komelon Corp 61 -
9 Korea Alcohol Industrial Co Ltd 119 0.01
3 Korea Cast Iron Pipe Industries Co Ltd 26 -
6 Korea Circuit Co Ltd 68 0.01
3 Korea Electric Terminal Co Ltd 239 0.02
18 Korea Investment Holdings Co Ltd 1,684 0.12
75 Korea Line Corp 228 0.02
2 Korea Petrochemical Ind Co Ltd 486 0.04
96 Korea Real Estate Investment & Trust Co Ltd 207 0.02
11 Korea Shipbuilding & Offshore Engineering Co Ltd 1,461 0.11
4 Korea Zinc Co Ltd 1,675 0.12
93 Korean Air Lines Co Ltd 2,653 0.19
49 Korean Reinsurance Co 427 0.03
8 Kortek Corp 84 0.01
2 KPX Chemical Co Ltd 89 0.01
8 KSS LINE Ltd 86 0.01
15 KT Skylife Co Ltd 131 0.01
14 KT Submarine Co Ltd 106 0.01
42 KT&G Corp 3,124 0.23
31 KTB Investment & Securities Co Ltd 164 0.01
20 Ktis Corp 58 -
2 Kukdo Chemical Co Ltd 106 0.01
4 Kukdong Oil & Chemicals Co Ltd 17 -
5 Kumho Industrial Co Ltd 51 -
59 Kumho Tire Co Inc 263 0.02
9 Kumkang Kind Co Ltd 65 0.01
11 Kwang Dong Pharmaceutical Co Ltd 89 0.01
3 Kyeryong Construction Industrial Co Ltd 104 0.01
11 Kyobo Securities Co Ltd 87 0.01
6 Kyungbang Co Ltd 87 0.01
2 Kyungdong Pharm Co Ltd 23 -
7 Kyung-In Synthetic Corp 42 -
12 LEADCORP Inc 98 0.01
10 LF Corp 186 0.01
25 LG Corp 2,402 0.17
76 LG Display Co Ltd 1,590 0.11
Emerging Markets Value FundPortfolio of Investments as at 31 May 2021 (continued)
Dimensional Fund Advisors Semi-Annual Report and Unaudited Financial Statements, 31 May 2021 53

Shares (000's)
Value(000's)
USD
% of NetAssetValue
Common Stock (continued)
Korea, Republic of - 14.38% (continued)
111 LG Display Co Ltd, ADR 1,179 0.09
54 LG Electronics Inc 7,391 0.53
4 LG Hausys Ltd 326 0.02
17 LG International Corp 490 0.04
118 LG Uplus Corp 1,572 0.11
3 LMS Co Ltd 33 -
5 Lotte Chemical Corp 1,277 0.09
3 Lotte Chilsung Beverage Co Ltd 379 0.03
1 Lotte Confectionery Co Ltd 121 0.01
10 Lotte Corp 330 0.02
1 Lotte Data Communication Co 43 -
12 LOTTE Fine Chemical Co Ltd 695 0.05
- Lotte Food Co Ltd 129 0.01
6 LOTTE Himart Co Ltd 202 0.01
52 Lotte Non-Life Insurance Co Ltd 94 0.01
4 Lotte Shopping Co Ltd 453 0.03
9 LS Corp 585 0.04
8 LS Industrial Systems Co Ltd 412 0.03
12 LX Holdings Corp 133 0.01
1 Maeil Dairies Co Ltd 56 -
6 Maeil Holdings Co Ltd 60 -
10 Mando Corp 563 0.04
24 Meritz Financial Group Inc 412 0.03
24 Meritz Fire & Marine Insurance Co Ltd 378 0.03
153 Meritz Securities Co Ltd 611 0.04
1 Mi Chang Oil Industrial Co Ltd 62 -
167 Mirae Asset Daewoo Co Ltd 1,471 0.11
42 Mirae Asset Life Insurance Co Ltd 153 0.01
5 MK Electron Co Ltd 53 -
11 MNTech Co Ltd 44 -
14 Moorim P&P Co Ltd 67 0.01
29 Moorim Paper Co Ltd 74 0.01
11 Muhak Co Ltd 91 0.01
5 Namhae Chemical Corp 45 -
- Namyang Dairy Products Co Ltd 81 0.01
5 Neowiz 113 0.01
3 Neowiz Holdings Corp 85 0.01
16 Nexen Corp 71 0.01
25 Nexen Tire Corp 184 0.01
54 NH Investment & Securities Co Ltd 645 0.05
6 NHN Corp 362 0.03
3 NICE Holdings Co Ltd 47 -
1 Nice Information & Telecommunication Inc 37 -
2 Nong Shim Holdings Co Ltd 116 0.01
1 Nongshim Co Ltd 387 0.03
6 NOROO Paint & Coatings Co Ltd 71 0.01
10 NS Shopping Co Ltd 127 0.01
6 OCI Co Ltd 657 0.05
4 Opto Device Technology Co Ltd 24 -
14 Orion Holdings Corp 215 0.02
12 Osung Advanced Materials Co Ltd 38 -
- Ottogi Corp 21 -
20 Paik Kwang Industrial Co Ltd 98 0.01
137 Pan Ocean Co Ltd 850 0.06
20 Pan-Pacific Co Ltd 48 -
24 Paradise Co Ltd 419 0.03
9 Partron Co Ltd 82 0.01
7 POSCO 2,351 0.17
32 POSCO International Corp 610 0.04
81 POSCO, ADR 6,517 0.47
11 Power Logics Co Ltd 76 0.01
3 Pulmuone Co Ltd 52 -
Shares (000's)
Value(000's)
USD
% of NetAssetValue
Common Stock (continued)
Korea, Republic of - 14.38% (continued)
6 Pyeong Hwa Automotive Co Ltd 66 0.01
6 S&T Motiv Co Ltd 329 0.02
3 Sajodaerim Corp 80 0.01
2 Sam Yung Trading Co Ltd 27 -
6 Sambo Motors Co Ltd 38 -
15 Samho Development Co Ltd 83 0.01
3 Samho International Co Ltd 107 0.01
6 SAMHWA Paints Industrial Co Ltd 64 0.01
20 Samick Musical Instruments Co Ltd 33 -
2 Samji Electronics Co Ltd 29 -
16 Samjin LND Co Ltd 53 -
2 Samjin Pharmaceutical Co Ltd 36 -
12 Samkee Automotive Co Ltd 44 -
6 Sammok S-Form Co Ltd 93 0.01
15 SAMPYO Cement Co Ltd 72 0.01
24 Samsung C&T Corp 3,018 0.22
13 Samsung Card Co Ltd 373 0.03
211 Samsung Electronics Co Ltd 15,171 1.09
15 Samsung Fire & Marine Insurance Co Ltd 2,784 0.20
153 Samsung Heavy Industries Co Ltd 804 0.06
21 Samsung Life Insurance Co Ltd 1,550 0.11
20 Samsung Securities Co Ltd 835 0.06
21 SAMT Co Ltd 70 0.01
2 Samyang Corp 129 0.01
2 Samyang Holdings Corp 200 0.01
1 Samyang Tongsang Co Ltd 81 0.01
22 Sangsangin Co Ltd 157 0.01
15 Savezone I&C Corp 55 -
6 Seah Besteel Corp 181 0.01
1 SeAH Holdings Corp 72 0.01
1 SeAH Steel Corp 79 0.01
1 SeAH Steel Holdings Corp 69 0.01
3 Sebang Co Ltd 39 -
3 Sebang Global Battery Co Ltd 275 0.02
6 Sejong Industrial Co Ltd 45 -
7 S-Energy Co Ltd 30 -
3 Seobu T&D 22 -
56 Seohan Co Ltd 90 0.01
16 Seoul Semiconductor Co Ltd 284 0.02
3 SEOWONINTECH Co Ltd 21 -
6 Seoyon Co Ltd 103 0.01
1 Shindaeyang Paper Co Ltd 109 0.01
108 Shinhan Financial Group Co Ltd 4,110 0.30
69 Shinhan Financial Group Co Ltd, ADR 2,636 0.19
1 Shinsegae Engineering & Construction Co Ltd 43 -
3 Shinsegae Inc 928 0.07
1 Shinsegae Information & Communication Co Ltd 80 0.01
20 Shinsung Tongsang Co Ltd 37 -
17 Shinwha Intertek Corp 54 -
21 Shinwon Corp 36 -
3 Shinyoung Securities Co Ltd 160 0.01
35 Signetics Corp 50 -
7 Silla Co Ltd 85 0.01
3 Sindoh Co Ltd 100 0.01
2 SK D&D Co Ltd 64 0.01
6 SK Discovery Co Ltd 275 0.02
2 SK Gas Ltd 153 0.01
13 SK Holdings Co Ltd 3,183 0.23
72 SK Hynix Inc 8,019 0.58
11 SK Innovation Co Ltd 2,689 0.19
92 SK Networks Co Ltd 491 0.04
7 SL Corp 192 0.01
Emerging Markets Value FundPortfolio of Investments as at 31 May 2021 (continued)
Dimensional Fund Advisors Semi-Annual Report and Unaudited Financial Statements, 31 May 2021 54

Shares (000's)
Value(000's)
USD
% of NetAssetValue
Common Stock (continued)
Korea, Republic of - 14.38% (continued)
3 SM Entertainment Co Ltd 109 0.01
76 S-MAC Co Ltd 98 0.01
14 SNU Precision Co Ltd 52 -
7 S-Oil Corp 601 0.04
9 Songwon Industrial Co Ltd 157 0.01
1 Soulbrain Holdings Co Ltd 43 -
1 Spigen Korea Co Ltd 44 -
2 Suheung Co Ltd 87 0.01
3 Sun Kwang Co Ltd 90 0.01
8 Sung Kwang Bend Co Ltd 67 0.01
10 Sungshin Cement Co Ltd 107 0.01
23 Sungwoo Hitech Co Ltd 140 0.01
6 Sunjin Co Ltd 95 0.01
5 Tae Kyung Industrial Co Ltd 28 -
- Taekwang Industrial Co Ltd 201 0.01
13 Taeyoung Engineering & Construction Co Ltd 155 0.01
6 Theragen Etex Co Ltd 42 -
5 Thinkware Systems Corp 65 0.01
11 TK Chemical Corp 59 -
36 Tongyang Inc 45 -
29 Tongyang Life Insurance Co Ltd 149 0.01
4 Top Engineering Co Ltd 34 -
6 Toptec Co Ltd 69 0.01
13 Tovis Co Ltd 97 0.01
35 TS Corp 106 0.01
8 Tuksu Construction Co Ltd 111 0.01
18 TY Holdings Co Ltd 472 0.03
2 Uju Electronics Co Ltd 42 -
3 Unid Co Ltd 208 0.02
4 Uniquest Corp 41 -
2 Value Added Technology Co Ltd 49 -
6 Visang Education Inc 54 -
2 Whanin Pharmaceutical Co Ltd 44 -
36 WillBes & Co 78 0.01
7 WiSoL Co Ltd 78 0.01
23 Wonik Holdings Co Ltd 139 0.01
1 Wonik Materials Co Ltd 39 -
10 Woojin Inc 55 -
10 Woongjin Thinkbig Co Ltd 41 -
227 Woori Financial Group Inc 2,249 0.16
51 Woori Investment Bank Co Ltd 42 -
29 Woorison F&G Co Ltd 61 -
8 Y G-1 Co Ltd 68 0.01
3 Y-entec Co Ltd 40 -
2 Youlchon Chemical Co Ltd 40 -
- Young Poong Corp 137 0.01
14 Youngone Corp 576 0.04
4 Youngone Holdings Co Ltd 173 0.01
47 Yuanta Securities Korea Co Ltd 191 0.01
3 Zeus Co Ltd 74 0.01
199,900 14.38
Malaysia - 1.54%
150 AEON Co M Bhd 46 -
275 AFFIN Bank Bhd 114 0.01
776 Alliance Bank Malaysia Bhd 498 0.04
24 Allianz Malaysia Bhd 77 0.01
1,119 AMMB Holdings Bhd 782 0.06
108 Batu Kawan Bhd 502 0.04
366 Berjaya Assets Bhd 25 -
1,306 Berjaya Corp Bhd 92 0.01
29 BIMB Holdings Bhd 27 -
203 Boustead Holdings Bhd 29 -
Shares (000's)
Value(000's)
USD
% of NetAssetValue
Common Stock (continued)
Malaysia - 1.54% (continued)
520 Boustead Plantations Bhd 73 0.01
513 Bumi Armada Bhd 54 -
293 Cahya Mata Sarawak Bhd 115 0.01
77 Can-One Bhd 52 -
2,485 CIMB Group Holdings Bhd 2,615 0.19
224 Cypark Resources Bhd 63 -
269 Dayang Enterprise Holdings Bhd 90 0.01
688 DRB-Hicom Bhd 308 0.02
551 Eco World Development Group Bhd 82 0.01
954 Ekovest Bhd 95 0.01
566 Gadang Holdings Bhd 54 -
830 Gamuda Bhd 654 0.05
856 Genting Bhd 1,017 0.07
1,016 Genting Malaysia Bhd 680 0.05
150 George Kent Malaysia Bhd 27 -
127 HAP Seng Consolidated Bhd 255 0.02
85 Hengyuan Refining Co Bhd 117 0.01
347 HeveaBoard Bhd 46 -
141 Hong Leong Financial Group Bhd 609 0.04
6 Hong Leong Industries Bhd 13 -
75 IGB Bhd 51 -
1,686 IJM Corp Bhd 733 0.05
354 Insas Bhd 71 0.01
679 IOI Properties Group Bhd 212 0.02
171 Jaya Tiasa Holdings Bhd 29 -
61 Keck Seng Malaysia Bhd 52 -
971 KNM Group Bhd 39 -
59 Kumpulan Fima Bhd 28 -
1,307 Land & General Bhd 38 -
402 LBS Bina Group Bhd 45 -
112 Leong Hup International 20 -
270 Lotte Chemical Titan Holding Bhd 199 0.01
616 Magnum Bhd 296 0.02
762 Mah Sing Group Bhd 171 0.01
1,016 Malayan Banking Bhd 2,015 0.15
450 Malayan Flour Mills Bhd 95 0.01
84 Malaysia Airports Holdings Bhd 111 0.01
1,407 Malaysia Building Society Bhd 214 0.02
1,505 Malaysian Resources Corp Bhd 162 0.01
269 Matrix Concepts Holdings Bhd 132 0.01
28 Mega First Corp Bhd 49 -
643 MISC Bhd 1,070 0.08
270 MKH Bhd 88 0.01
231 MMC Corp Bhd 65 0.01
74 MNRB Holdings Bhd 21 -
77 MPHB Capital Bhd 23 -
69 Muda Holdings Bhd 45 -
294 Muhibbah Engineering M Bhd 67 0.01
202 Oriental Holdings Bhd 253 0.02
617 OSK Holdings Bhd 133 0.01
479 Pantech Group Holdings Bhd 58 -
105 Paramount Corp Bhd 21 -
31 Petron Malaysia Refining & Marketing Bhd 34 -
232 Pos Malaysia Bhd 44 -
188 PPB Group Bhd 845 0.06
894 RHB Bank Bhd 1,161 0.08
5,559 Sapura Energy Bhd 174 0.01
120 Sarawak Oil Palms Bhd 113 0.01
1,718 Sime Darby Bhd 947 0.07
1,113 Sime Darby Property Bhd 167 0.01
1,044 SP Setia Bhd Group 263 0.02
699 Sunway Bhd 269 0.02
Emerging Markets Value FundPortfolio of Investments as at 31 May 2021 (continued)
Dimensional Fund Advisors Semi-Annual Report and Unaudited Financial Statements, 31 May 2021 55

Shares (000's)
Value(000's)
USD
% of NetAssetValue
Common Stock (continued)
Malaysia - 1.54% (continued)
201 Suria Capital Holdings Bhd 51 -
110 Ta Ann Holdings Bhd 77 0.01
227 Tan Chong Motor Holdings Bhd 64 0.01
153 Thong Guan Industries Bhd 100 0.01
350 Tropicana Corp Bhd 77 0.01
101 Tune Protect Group Bhd 10 -
1,113 UEM Sunrise Bhd 112 0.01
79 UMW Holdings Bhd 61 -
101 United Malacca Bhd 125 0.01
233 UOA Development Bhd 103 0.01
576 Velesto Energy Bhd 19 -
252 Vivocom International Holdings Bhd 43 -
458 WCT Holdings Bhd 52 -
55 Yinson Holdings Bhd 66 0.01
290 YNH Property Bhd 194 0.01
2,301 YTL Corp Bhd 378 0.03
21,366 1.54
Mexico - 2.04%
39 ALEATICA SAB de CV 40 -
1,691 Alfa SAB de CV 1,183 0.09
196 Alpek SAB de CV 222 0.02
111 Arca Continental SAB de CV 615 0.04
364 Banco del Bajio SA 624 0.05
328 Cemex SAB de CV, ADR 2,715 0.20
38 Coca-Cola Femsa SAB de CV 184 0.01
1 Coca-Cola Femsa SAB de CV, ADR 39 -
1,533 Controladora Nemak SAB de CV 240 0.02
127 Corp Interamericana de Entretenimiento SAB de CV 60 -
155 Credito Real SAB de CV SOFOM ER 51 -
43 El Puerto de Liverpool SAB de CV 179 0.01
67 Fomento Economico Mexicano SAB de CV 549 0.04
538 Gentera SAB de CV 304 0.02
150 Grupo Carso SAB de CV 450 0.03
82 Grupo Cementos de Chihuahua SAB de CV 601 0.04
176 Grupo Comercial Chedraui SA de CV 281 0.02
3 Grupo Elektra SAB de CV 275 0.02
721 Grupo Financiero Banorte SAB de CV 4,920 0.35
697 Grupo Financiero Inbursa SAB de CV 689 0.05
639 Grupo Gigante SAB de CV 813 0.06
175 Grupo Industrial Saltillo SAB de CV 264 0.02
114 Grupo KUO SAB De CV 269 0.02
1,003 Grupo Mexico SAB de CV 4,816 0.35
86 Grupo Rotoplas SAB de CV 143 0.01
375 Grupo Sanborns SAB de CV 372 0.03
5 Grupo Simec SAB de CV, ADR 98 0.01
40 Grupo Sports World SAB de CV 10 -
659 Grupo Televisa SAB 1,715 0.12
79 Industrias Bachoco SAB de CV 306 0.02
161 Industrias CH SAB de CV 1,176 0.08
44 Industrias Penoles SAB de CV 652 0.05
22 La Comer SAB de CV 41 -
3 Medica Sur SAB de CV 5 -
333 Minera Frisco SAB de CV, Class A1 70 0.01
361 Minera Frisco SAB de CV, Class A2 69 0.01
300 Nemak SAB de CV 100 0.01
473 Orbia Advance Corp SAB de CV 1,336 0.10
1,255 Organizacion Soriana SAB de CV 1,206 0.09
52 Promotora y Operadora de Infraestructura SAB deCV 415 0.03
5 Promotora y Operadora de Infraestructura SAB deCV, Class L 26 -
Shares (000's)
Value(000's)
USD
% of NetAssetValue
Common Stock (continued)
Mexico - 2.04% (continued)
131 Unifin Financiera SAB de CV 154 0.01
52 Vitro SAB de CV 65 -
28,342 2.04
Philippines - 0.72%
1,760 Alliance Global Group Inc 376 0.03
502 Apex Mining Co Inc 18 -
608 Atlas Consolidated Mining & Development Corp 97 0.01
27 Ayala Corp 437 0.03
370 Bank of the Philippine Islands 650 0.05
657 BDO Unibank Inc 1,399 0.10
191 Belle Corp 6 -
136 Cebu Air Inc 126 0.01
1,702 CEMEX Holdings Philippines Inc 44 -
572 China Banking Corp 293 0.02
1,133 Cosco Capital Inc 121 0.01
1,269 DMCI Holdings Inc 148 0.01
412 East West Banking Corp 80 0.01
368 EEI Corp 54 -
94 Filinvest Development Corp 16 -
4,202 Filinvest Land Inc 93 0.01
122 First Philippine Holdings Corp 174 0.01
1,221 Global Ferronickel Holdings Inc 65 -
8 GT Capital Holdings Inc 97 0.01
200 Integrated Micro-Electronics Inc 37 -
927 JG Summit Holdings Inc 1,128 0.08
851 LT Group Inc 251 0.02
5,482 Megaworld Corp 359 0.03
779 Metropolitan Bank & Trust Co 797 0.06
1,507 Nickel Asia Corp 164 0.01
1,558 Petron Corp 100 0.01
479 Philex Mining Corp 74 -
175 Philippine National Bank 78 0.01
13 Philtown Properties Inc - -
108 Phoenix Petroleum Philippines Inc 29 -
108 Pilipinas Shell Petroleum Corp 47 -
27 Pnb Holdings Corporation - -
1,219 Premium Leisure Corp 11 -
570 RFM Corp 57 -
371 Rizal Commercial Banking Corp 139 0.01
1,488 Robinsons Land Corp 533 0.04
109 Robinsons Retail Holdings Inc 119 0.01
378 San Miguel Corp 919 0.07
108 Security Bank Corp 278 0.02
80 Semirara Mining & Power Corp 22 -
27 Top Frontier Investment Holdings Inc 76 0.01
218 Union Bank of the Philippines 342 0.02
2,629 Vista Land & Lifescapes Inc 209 0.01
10,063 0.72
Poland - 0.80%
39 Alior Bank SA 358 0.03
1 Amica SA 35 -
188 Bank Millennium SA 257 0.02
38 Bank Polska Kasa Opieki SA 989 0.07
24 Boryszew SA 21 -
15 Ciech SA 192 0.01
43 Cyfrowy Polsat SA 361 0.03
145 Develia SA 124 0.01
149 Enea SA 347 0.02
20 Famur SA 13 -
31 Grupa Azoty SA 288 0.02
30 Grupa Lotos SA 413 0.03
31 Jastrzebska Spolka Weglowa SA 306 0.02
Emerging Markets Value FundPortfolio of Investments as at 31 May 2021 (continued)
Dimensional Fund Advisors Semi-Annual Report and Unaudited Financial Statements, 31 May 2021 56

Shares (000's)
Value(000's)
USD
% of NetAssetValue
Common Stock (continued)
Poland - 0.80% (continued)
32 Kernel Holding SA 503 0.04
20 KGHM Polska Miedz SA 1,119 0.08
11 Lubelski Wegiel Bogdanka SA 72 -
5 mBank SA 414 0.03
77 Netia SA 126 0.01
352 PGE Polska Grupa Energetyczna SA 974 0.07
24 PKP Cargo SA 135 0.01
143 Polski Koncern Naftowy ORLEN SA 3,114 0.22
5 Santander Bank Polska SA 379 0.03
692 Tauron Polska Energia SA 638 0.05
11,178 0.80
Qatar - 0.51%
1,210 Aamal co 328 0.02
97 Al Khaleej Takaful Group Co 120 0.01
255 Al Khalij Commercial Bank PQSC 154 0.01
161 Alijarah Holding Co QPSC 52 -
916 Barwa Real Estate Company QPSC 824 0.06
593 Commercial Bank of Qatar PSQC 872 0.06
470 Doha Bank QPSC 364 0.03
92 Doha Insurance Co QPSC 50 -
518 Gulf International Services QPSC 209 0.02
131 Gulf Warehousing Co QPSC 185 0.01
232 Industries of Qatar 823 0.06
15 Mannai Corp QSC 15 -
145 Mazaya Real Estate Development QPSC 46 -
992 Mesaieed Petrochemical Holding Co 518 0.04
390 Ooredoo 742 0.05
13 Qatar Fuel Co 67 0.01
7 Qatar Industrial Manufacturing Co QSC 6 -
433 Qatar Insurance Co 298 0.02
44 Qatar National Cement Co 60 0.01
127 Qatar Navigation 250 0.02
321 Salam International Investment Ltd 89 0.01
1,103 United Development Co QPSC 474 0.03
1,082 Vodafone Qatar Group PLC 523 0.04
7,069 0.51
Russia - 1.08%
44 Etalon Group PLC, GDR 71 0.01
885 Gazprom PJSC, ADR 6,283 0.45
93 LUKOIL PJSC, ADR 7,544 0.54
381 RusHydro PJSC, ADR 413 0.03
505 VTB Bank PJSC, GDR 671 0.05
14,982 1.08
Saudi Arabia - 2.56%
12 Al Abdullatif Industrial Investment Co 98 0.01
49 Al Jouf Cement Co 183 0.01
11 Al Khaleej Training and Education Co 76 0.01
12 Al-Babtain Power and Telecommunication Co 130 0.01
21 Al-Hassan Ghazi Ibrahim Shaker Co 136 0.01
519 Alinma Bank 2,773 0.20
188 Arab National Bank 1,105 0.08
31 Arabian Cement Co Ltd 381 0.03
14 Arabian Pipes Co 77 0.01
55 Arriyadh Development Co 350 0.03
35 Aseer Trading Tourism and Manufacturing Co 242 0.02
23 Astra Industrial Group Co 233 0.02
149 Bank AlJazira 736 0.05
146 Banque Saudi Fransi 1,412 0.10
7 Basic Chemical Industries Co 70 -
32 City Cement Co 262 0.02
215 Dar Al Arkan Real Estate Development Co 599 0.04
29 Eastern Province Cement Co 394 0.03
Shares (000's)
Value(000's)
USD
% of NetAssetValue
Common Stock (continued)
Saudi Arabia - 2.56% (continued)
158 Emaar Economic City 467 0.03
239 Etihad Etisalat Co 2,104 0.15
33 Hail Cement Co 169 0.01
22 Middle East Paper Co 150 0.01
195 Mobile Telecommunications Co Saudi Arabia 752 0.05
49 Najran Cement Co 313 0.02
272 National Commercial Bank 3,902 0.28
10 National Gypsum Co 99 0.01
58 Northern Region Cement Co 279 0.02
430 Riyad Bank 3,014 0.22
192 Sahara International Petrochemical Co 1,500 0.11
108 Saudi Arabian Mining Co 1,642 0.12
165 Saudi Basic Industries Corp 5,477 0.39
265 Saudi British Bank 2,215 0.16
21 Saudi Chemical Holding Co 211 0.01
59 Saudi Industrial Investment Group 603 0.04
88 Saudi Investment Bank 411 0.03
322 Saudi Kayan Petrochemical Co 1,515 0.11
6 Saudi Printing & Packaging Co 49 -
29 Saudi Re for Cooperative Reinsurance Co 117 0.01
86 Seera Group Holding 489 0.04
24 Tabuk Cement Co 127 0.01
61 Yamama Cement Co 551 0.04
14 Zamil Industrial Investment Co 112 0.01
35,525 2.56
South Africa - 3.84%
228 Absa Group Ltd 2,365 0.17
19 Adcock Ingram Holdings Ltd 60 -
92 Advtech Ltd 92 0.01
56 AECI Ltd 411 0.03
38 African Rainbow Minerals Ltd 724 0.05
628 Alexander Forbes Group Holdings Ltd 184 0.01
43 AngloGold Ashanti Ltd, ADR 1,018 0.07
123 Aspen Pharmacare Holdings Ltd 1,463 0.11
25 Astral Foods Ltd 272 0.02
106 Balwin Properties Ltd 34 -
126 Barloworld Ltd 1,090 0.08
50 Bidvest Group Ltd 706 0.05
320 Blue Label Telecoms Ltd 107 0.01
3 Cashbuild Ltd 66 -
165 Caxton and CTP Publishers and Printers Ltd 89 0.01
42 City Lodge Hotels Ltd 13 -
126 DataTec Ltd 281 0.02
85 Discovery Ltd 886 0.06
3 Distell Group Holdings Ltd 38 -
100 Exxaro Resources Ltd 1,102 0.08
841 FirstRand Ltd 3,445 0.25
35 Foschini Group Ltd 335 0.02
158 Gold Fields Ltd, ADR 1,907 0.14
104 Grindrod Ltd 36 -
114 Harmony Gold Mining Co Ltd 587 0.04
17 Hudaco Industries Ltd 143 0.01
276 Impala Platinum Holdings Ltd 4,761 0.34
102 Imperial Logistics Ltd 370 0.03
139 Investec Ltd 587 0.04
1,572 KAP Industrial Holdings Ltd 511 0.04
65 Lewis Group Ltd 162 0.01
63 Liberty Holdings Ltd 311 0.02
729 Life Healthcare Group Holdings Ltd 1,158 0.08
316 Long4Life Ltd 107 0.01
49 Massmart Holdings Ltd 232 0.02
113 Metair Investments Ltd 189 0.01
Emerging Markets Value FundPortfolio of Investments as at 31 May 2021 (continued)
Dimensional Fund Advisors Semi-Annual Report and Unaudited Financial Statements, 31 May 2021 57

Shares (000's)
Value(000's)
USD
% of NetAssetValue
Common Stock (continued)
South Africa - 3.84% (continued)
556 Momentum Metropolitan Holdings 793 0.06
122 Motus Holdings Ltd 835 0.06
141 Mpact Ltd 226 0.02
902 MTN Group Ltd 6,637 0.48
313 Murray & Roberts Holdings Ltd 238 0.02
433 Nampak Ltd 92 0.01
121 Nedbank Group Ltd 1,407 0.10
115 Netcare Ltd 128 0.01
70 Ninety One Ltd 232 0.02
30 Oceana Group Ltd 159 0.01
1,447 Old Mutual Ltd 1,501 0.11
121 Omnia Holdings Ltd 440 0.03
219 Pepkor Holdings Ltd 319 0.02
1,510 PPC Ltd 378 0.03
101 Raubex Group Ltd 242 0.02
41 RCL Foods Ltd 28 -
100 Reunert Ltd 386 0.03
13 Rhodes Food Group Pty Ltd 14 -
17 Royal Bafokeng Platinum Ltd 124 0.01
72 Sanlam Ltd 309 0.02
383 Sappi Ltd 1,191 0.09
195 Sasol Ltd 3,187 0.23
192 Sibanye Stillwater Ltd 876 0.06
470 Standard Bank Group Ltd 4,535 0.33
828 Steinhoff International Holdings NV 112 0.01
10 Sun International Ltd 14 -
231 Super Group Ltd 522 0.04
168 Telkom SA SOC Ltd 593 0.04
32 Tiger Brands Ltd 524 0.04
67 Tongaat Hulett Ltd 43 -
60 Tsogo Sun Gaming Ltd 36 -
500 Tsogo Sun Hotels Ltd 87 0.01
103 Vodacom Group Ltd 988 0.07
34 Wilson Bayly Holmes-Ovcon Ltd 285 0.02
53,323 3.84
Taiwan - 16.47%
20 ABC Taiwan Electronics Corp 19 -
101 AcBel Polytech Inc 96 0.01
1,215 Acer Inc 1,390 0.10
67 ACES Electronic Co Ltd 105 0.01
138 Acon Holding Inc 52 -
7 Acter Group Corp Ltd 47 -
59 A-DATA Technology Co Ltd 214 0.02
46 Advanced International Multitech Co Ltd 121 0.01
191 Advancetek Enterprise Co Ltd 119 0.01
214 Aerospace Industrial Development Corp 213 0.02
125 AGV Products Corp 55 -
130 Allis Electric Co Ltd 112 0.01
22 Alltek Technology Corp 23 -
62 Alpha Networks Inc 62 -
156 Altek Corp 203 0.01
187 Ambassador Hotel 189 0.01
24 Ampire Co Ltd 20 -
64 AMPOC Far-East Co Ltd 86 0.01
197 AmTRAN Technology Co Ltd 125 0.01
54 Apacer Technology Inc 88 0.01
112 APCB Inc 76 0.01
23 Apex Biotechnology Corp 20 -
45 Apex International Co Ltd 90 0.01
23 Arcadyan Technology Corp 79 0.01
218 Ardentec Corp 334 0.02
1,296 ASE Technology Holding Co Ltd 5,151 0.37
Shares (000's)
Value(000's)
USD
% of NetAssetValue
Common Stock (continued)
Taiwan - 16.47% (continued)
1,181 Asia Cement Corp 2,147 0.15
31 Asia Electronic Material Co Ltd 26 -
426 Asia Pacific Telecom Co Ltd 135 0.01
200 Asia Polymer Corp 218 0.02
11 Asia Tech Image Inc 21 -
175 Asia Vital Components Co Ltd 451 0.03
277 Asustek Computer Inc 3,905 0.28
14 Aten International Co Ltd 42 -
317 AU Optronics Corp 2,724 0.20
54 Audix Corp 104 0.01
51 Avermedia Technologies 80 0.01
108 AVY Precision Technology Inc 109 0.01
10 Axiomtek Co Ltd 20 -
116 Bank of Kaohsiung Co Ltd 46 -
35 Basso Industry Corp 60 -
61 BenQ Materials Corp 58 -
35 Bin Chuan Enterprise Co Ltd 32 -
104 Biostar Microtech International Corp 93 0.01
92 Bright Led Electronics Corp 61 -
18 Browave Corp 29 -
13 Capital Futures Corp 20 -
929 Capital Securities Corp 590 0.04
181 Career Technology MFG. Co Ltd 194 0.01
414 Catcher Technology Co Ltd 2,726 0.20
12 Cathay Chemical Works 10 -
3,677 Cathay Financial Holding Co Ltd 7,348 0.53
355 Cathay Real Estate Development Co Ltd 253 0.02
12 Cayman Engley Industrial Co Ltd 40 -
13 Celxpert Energy Corp 21 -
90 Central Reinsurance Co Ltd 83 0.01
193 Champion Building Materials Co Ltd 81 0.01
1,944 Chang Hwa Commercial Bank Ltd 1,184 0.09
66 Channel Well Technology Co Ltd 122 0.01
39 Chant Sincere Co Ltd 44 -
63 Charoen Pokphand Enterprise 177 0.01
75 CHC Healthcare Group 98 0.01
10 CHC Resources Corp 17 -
49 Chen Full International Co Ltd 73 0.01
453 Cheng Loong Corp 673 0.05
732 Cheng Shin Rubber Industry Co Ltd 1,250 0.09
240 Cheng Uei Precision Industry Co Ltd 346 0.03
71 Chia Chang Co Ltd 108 0.01
11 Chian Hsing Forging Industrial Co Ltd 18 -
80 Chicony Electronics Co Ltd 223 0.02
32 Chien Kuo Construction Co Ltd 15 -
143 Chilisin Electronics Corp 510 0.04
14 Chime Ball Technology Co Ltd 15 -
1,677 China Airlines Ltd 1,090 0.08
467 China Bills Finance Corp 269 0.02
167 China Chemical & Pharmaceutical Co Ltd 140 0.01
4,326 China Development Financial Holding Corp 1,916 0.14
54 China Electric Manufacturing Corp 22 -
48 China General Plastics Corp 60 -
282 China Life Insurance Co Ltd 251 0.02
680 China Man-Made Fiber Corp 249 0.02
192 China Metal Products 228 0.02
125 China Motor Corp 306 0.02
1,816 China Petrochemical Development Corp 843 0.06
4,184 China Steel Corp 5,510 0.40
37 China Steel Structure Co Ltd 57 -
17 China Wire & Cable Co Ltd 19 -
64 Chinese Maritime Transport Ltd 104 0.01
Emerging Markets Value FundPortfolio of Investments as at 31 May 2021 (continued)
Dimensional Fund Advisors Semi-Annual Report and Unaudited Financial Statements, 31 May 2021 58

Shares (000's)
Value(000's)
USD
% of NetAssetValue
Common Stock (continued)
Taiwan - 16.47% (continued)
22 Ching Feng Home Fashions Co Ltd 18 -
206 Chin-Poon Industrial Co Ltd 215 0.02
205 Chipbond Technology Corp 503 0.04
360 ChipMOS Technologies Inc 582 0.04
51 Chong Hong Construction Co Ltd 145 0.01
287 Chun Yuan Steel Industry Co Ltd 213 0.02
383 Chung Hung Steel Corp 672 0.05
312 Chung Hwa Pulp Corp 268 0.02
179 Chung-Hsin Electric & Machinery ManufacturingCorp 330 0.02
40 Chyang Sheng Dyeing & Finishing Co Ltd 20 -
724 CMC Magnetics Corp 266 0.02
68 Collins Co Ltd 38 -
8 Compal Broadband Networks Inc 8 -
2,341 Compal Electronics Inc 1,966 0.14
533 Compeq Manufacturing Co Ltd 735 0.05
20 Compucase Enterprise 30 -
148 Concord Securities Co Ltd 94 0.01
18 Concraft Holding Co Ltd 39 -
200 Continental Holdings Corp 180 0.01
126 Contrel Technology Co Ltd 73 0.01
1 Coremax Corp 3 -
197 Coretronic Corp 409 0.03
110 Creative Sensor Inc 86 0.01
9,126 CTBC Financial Holding Co Ltd 7,560 0.54
48 CTCI Corp 65 0.01
54 CviLux Corp 79 0.01
11 CyberPower Systems Inc 32 -
196 DA CIN Construction Co Ltd 235 0.02
74 Darfon Electronics Corp 114 0.01
247 Darwin Precisions Corp 121 0.01
73 De Licacy Industrial Co Ltd 46 -
72 Depo Auto Parts Ind Co Ltd 146 0.01
14 Dimerco Express Corp 40 -
108 D-Link Corp 75 0.01
202 Dynamic Electronics Co Ltd 141 0.01
98 Dynapack International Technology Corp 385 0.03
357 E Ink Holdings Inc 790 0.06
152 Eastern Media International Corp 95 0.01
36 Edimax Technology Co Ltd 15 -
20 Edison Opto Corp 14 -
129 Edom Technology Co Ltd 162 0.01
18 Elite Advanced Laser Corp 37 -
184 Elite Semiconductor Memory Technology Inc 895 0.06
74 Elitegroup Computer Systems Co Ltd 64 -
47 Emerging Display Technologies Corp 36 -
5 Ennoconn Corp 38 -
337 ENNOSTAR Inc 921 0.07
363 EnTie Commercial Bank Co Ltd 192 0.01
50 Eson Precision Ind Co Ltd 108 0.01
86 Eternal Materials Co Ltd 125 0.01
1,420 Eva Airways Corp 891 0.06
253 Everest Textile Co Ltd 110 0.01
359 Evergreen International Storage & Transport Corp 292 0.02
962 Evergreen Marine Corp Taiwan Ltd 3,337 0.24
309 Everlight Chemical Industrial Corp 214 0.02
243 Everlight Electronics Co Ltd 403 0.03
49 Excelsior Medical Co Ltd 103 0.01
30 EZconn Corp 36 -
625 Far Eastern Department Stores Ltd 502 0.04
1,292 Far Eastern International Bank 491 0.04
1,615 Far Eastern New Century Corp 1,818 0.13
Shares (000's)
Value(000's)
USD
% of NetAssetValue
Common Stock (continued)
Taiwan - 16.47% (continued)
87 Farglory F T Z Investment Holding Co Ltd 102 0.01
161 Farglory Land Development Co Ltd 319 0.02
123 Federal Corp 127 0.01
9 Feedback Technology Corp 20 -
22 Feng Hsin Steel Co Ltd 59 -
3,895 First Financial Holding Co Ltd 3,070 0.22
170 First Insurance Co Ltd 80 0.01
429 First Steamship Co Ltd 199 0.01
126 FLEXium Interconnect Inc 524 0.04
23 Flytech Technology Co Ltd 52 -
27 FOCI Fiber Optic Communications Inc 25 -
91 Formosa Advanced Technologies Co Ltd 128 0.01
886 Formosa Chemicals & Fibre Corp 2,725 0.20
58 Formosa Laboratories Inc 203 0.01
6 Formosa Optical Technology Co Ltd 13 -
546 Formosa Plastics Corp 1,997 0.14
280 Formosa Taffeta Co Ltd 312 0.02
53 Formosan Rubber Group Inc 46 -
243 Formosan Union Chemical 156 0.01
140 Founding Construction & Development Co Ltd 81 0.01
361 Foxconn Technology Co Ltd 839 0.06
86 Froch Enterprise Co Ltd 62 -
30 FSP Technology Inc 47 -
3,221 Fubon Financial Holding Co Ltd 8,355 0.60
238 Fulltech Fiber Glass Corp 135 0.01
79 Fwusow Industry Co Ltd 66 0.01
129 G Shank Enterprise Co Ltd 165 0.01
27 Gamania Digital Entertainment Co Ltd 63 -
15 GEM Services Inc 41 -
86 Gemtek Technology Corp 92 0.01
110 General Interface Solution Holding Ltd 385 0.03
28 GeoVision Inc 28 -
90 Getac Technology Corp 169 0.01
164 Giantplus Technology Co Ltd 82 0.01
119 Gigabyte Technology Co Ltd 462 0.03
21 Ginko International Co Ltd 130 0.01
148 Global Brands Manufacture Ltd 168 0.01
8 Global View Co Ltd 15 -
149 Globe Union Industrial Corp 89 0.01
205 Gloria Material Technology Corp 144 0.01
22 GMI Technology Inc 16 -
217 Gold Circuit Electronics Ltd 415 0.03
6 Golden Friends Corp 12 -
512 Goldsun Building Materials Co Ltd 462 0.03
154 Grand Fortune Securities Co Ltd 95 0.01
93 Grand Ocean Retail Group Ltd 65 -
464 Grand Pacific Petrochemical 437 0.03
119 Great China Metal Industry 111 0.01
244 Great Wall Enterprise Co Ltd 498 0.04
67 Greatek Electronics Inc 171 0.01
297 Green Energy Technology Inc 1 -
13 Group Up Industrial Co Ltd 32 -
85 GTM Holdings Corp 75 0.01
215 HannStar Board Corp 343 0.03
1,484 HannStar Display Corp 1,137 0.08
259 HannsTouch Solution Inc 116 0.01
14 Hanpin Electron Co Ltd 15 -
89 Harvatek Corp 66 0.01
8 Heran Co Ltd 34 -
65 Hey Song Corp 82 0.01
13 Highlight Tech Corp 19 -
136 Highwealth Construction Corp 209 0.02
Emerging Markets Value FundPortfolio of Investments as at 31 May 2021 (continued)
Dimensional Fund Advisors Semi-Annual Report and Unaudited Financial Statements, 31 May 2021 59

Shares (000's)
Value(000's)
USD
% of NetAssetValue
Common Stock (continued)
Taiwan - 16.47% (continued)
41 Hiroca Holdings Ltd 93 0.01
63 Hitron Technology Inc 47 -
593 Ho Tung Chemical Corp 239 0.02
14 Holiday Entertainment Co Ltd 31 -
59 Holy Stone Enterprise Co Ltd 279 0.02
3,746 Hon Hai Precision Industry Co Ltd 14,969 1.08
132 Hong Pu Real Estate Development Co Ltd 102 0.01
37 Hong TAI Electric Industrial 33 -
121 Hong YI Fiber Industry Co 108 0.01
122 Hsing TA Cement Co 114 0.01
194 HTC Corp 254 0.02
140 HUA ENG Wire & Cable Co Ltd 135 0.01
2,839 Hua Nan Financial Holdings Co Ltd 1,858 0.13
17 Huaku Development Co Ltd 57 -
16 Huang Hsiang Construction Corp 23 -
23 Hung Ching Development & Construction Co Ltd 19 -
300 Hung Sheng Construction Ltd 213 0.02
27 Hwa Fong Rubber Industrial Co Ltd 19 -
1,446 IBF Financial Holdings Co Ltd 890 0.06
140 Ichia Technologies Inc 87 0.01
80 I-Chiun Precision Industry Co Ltd 86 0.01
36 IEI Integration Corp 65 0.01
2,818 Innolux Corp 2,259 0.16
41 Inpaq Technology Co Ltd 87 0.01
7 Intai Technology Corp 21 -
33 Integrated Service Technology Inc 60 -
420 International CSRC Investment Holdings Co 376 0.03
579 Inventec Corp 536 0.04
15 I-Sheng Electric Wire & Cable Co Ltd 24 -
13 ITE Technology Inc 57 -
36 Jarllytec Co Ltd 94 0.01
33 Jean Co Ltd 12 -
63 Jess-Link Products Co Ltd 86 0.01
176 Jinli Group Holdings Ltd 80 0.01
115 K Laser Technology Inc 89 0.01
24 Kaimei Electronic Corp 92 0.01
11 Kaori Heat Treatment Co Ltd 18 -
27 Kaulin Manufacturing Co Ltd 14 -
204 Kenda Rubber Industrial Co Ltd 302 0.02
13 Kerry TJ Logistics Co Ltd 29 -
176 Kindom Development Co Ltd 240 0.02
12 King Chou Marine Technology Co Ltd 17 -
10 King Slide Works Co Ltd 136 0.01
650 King Yuan Electronics Co Ltd 999 0.07
542 King's Town Bank Co Ltd 807 0.06
63 King's Town Construction Co Ltd 79 0.01
20 Kinik Co 46 -
733 Kinpo Electronics 363 0.03
181 Kinsus Interconnect Technology Corp 680 0.05
18 KS Terminals Inc 47 -
109 Kung Sing Engineering Corp 40 -
123 Kuo Toong International Co Ltd 121 0.01
57 Kuoyang Construction Co Ltd 63 -
27 Kwong Lung Enterprise Co Ltd 43 -
43 KYE Systems Corp 20 -
120 L&K Engineering Co Ltd 124 0.01
19 Lanner Electronics Inc 41 -
16 Laser Tek Taiwan Co Ltd 16 -
79 Leader Electronics Inc 44 -
405 Lealea Enterprise Co Ltd 184 0.01
95 LEE CHI Enterprises Co Ltd 88 0.01
20 Lelon Electronics Corp 46 -
Shares (000's)
Value(000's)
USD
% of NetAssetValue
Common Stock (continued)
Taiwan - 16.47% (continued)
21 Li Cheng Enterprise Co Ltd 19 -
264 Li Peng Enterprise Co Ltd 120 0.01
13 Lida Holdings Ltd 14 -
92 Lien Hwa Industrial Holdings Corp 163 0.01
260 Lingsen Precision Industries Ltd 164 0.01
1,174 Lite-On Technology Corp 2,782 0.20
66 Long Bon International Co Ltd 45 -
46 Long Da Construction & Development Corp 37 -
459 Longchen Paper & Packaging Co Ltd 386 0.03
23 Longwell Co 51 -
24 Lotus Pharmaceutical Co Ltd 82 0.01
8 Lu Hai Holding Corp 13 -
20 Lucky Cement Corp 10 -
9 Lumax International Corp Ltd 23 -
9 Lung Yen Life Service Corp 19 -
13 Macauto Industrial Co Ltd 42 -
1,055 Macronix International 1,611 0.12
10 Materials Analysis Technology Inc 44 -
104 Mayer Steel Pipe Corp 131 0.01
3,199 Mega Financial Holding Co Ltd 3,816 0.27
103 Mercuries & Associates Holding Ltd 80 0.01
357 Mercuries Life Insurance Co Ltd 121 0.01
82 Merry Electronics Co Ltd 316 0.02
10 Mildef Crete Inc 21 -
32 Mirle Automation Corp 51 -
183 Mitac Holdings Corp 186 0.01
68 MOSA Industrial Corp 104 0.01
47 MPI Corp 185 0.01
13 Nak Sealing Technologies Corp 42 -
24 Namchow Holdings Co Ltd 49 -
8 Nan Pao Resins Chemical Co 43 -
60 Nan Ren Lake Leisure Amusement Co Ltd 28 -
1,154 Nan Ya Plastics Corp 3,477 0.25
118 Nan Ya Printed Circuit Board Corp 1,326 0.10
14 Nang Kuang Pharmaceutical 20 -
659 Nanya Technology Corp 1,910 0.14
11 Netronix Inc 18 -
14 Nexcom International Co Ltd 12 -
45 Nichidenbo Corp 86 0.01
112 Nien Hsing Textile Co Ltd 92 0.01
23 Niko Semiconductor Co Ltd 52 -
18 Nishoku Technology Inc 89 0.01
818 O-Bank Co Ltd 207 0.02
25 Ocean Plastics Co Ltd 32 -
210 OptoTech Corp 205 0.02
152 Orient Semiconductor Electronics Ltd 98 0.01
161 Oriental Union Chemical Corp 124 0.01
46 O-TA Precision Industry Co Ltd 238 0.02
16 Pacific Hospital Supply Co Ltd 46 -
10 Paiho Shih Holdings Corp 17 -
6 Pan German Universal Motors 48 -
105 Pan Jit International Inc 191 0.01
295 Pan-International Industrial Corp 415 0.03
1,051 Pegatron Corp 2,774 0.20
80 Plastron Precision Co Ltd 36 -
21 Plotech Co Ltd 21 -
787 Pou Chen Corp 1,085 0.08
138 Powertech Technology Inc 527 0.04
471 President Securities Corp 486 0.04
90 Primax Electronics Ltd 173 0.01
549 Prince Housing & Development Corp 235 0.02
31 Promate Electronic Co Ltd 44 -
Emerging Markets Value FundPortfolio of Investments as at 31 May 2021 (continued)
Dimensional Fund Advisors Semi-Annual Report and Unaudited Financial Statements, 31 May 2021 60

Shares (000's)
Value(000's)
USD
% of NetAssetValue
Common Stock (continued)
Taiwan - 16.47% (continued)
24 Prosperity Dielectrics Co Ltd 53 -
920 Qisda Corp 997 0.07
7 QST International Corp 17 -
67 Qualipoly Chemical Corp 81 0.01
5 Quang Viet Enterprise Co Ltd 23 -
616 Quanta Computer Inc 1,953 0.14
110 Quanta Storage Inc 162 0.01
181 Quintain Steel Co Ltd 152 0.01
133 Radiant Opto-Electronics Corp 565 0.04
454 Radium Life Tech Co Ltd 182 0.01
44 Rechi Precision Co Ltd 32 -
376 Rich Development Co Ltd 129 0.01
8 Rich Honour International Designs 13 -
244 Ritek Corp 86 0.01
150 Roo Hsing Co Ltd 53 -
275 Ruentex Development Co Ltd 520 0.04
162 Ruentex Industries Ltd 482 0.04
18 Sakura Development Co Ltd 20 -
174 Sampo Corp 185 0.01
25 San Fang Chemical Industry Co Ltd 20 -
199 San Far Property Ltd 109 0.01
16 San Shing Fastech Corp 35 -
183 Sanyang Motor Co Ltd 184 0.01
16 Senao International Co Ltd 19 -
5 Senao Networks Inc 16 -
63 Sercomm Corp 150 0.01
133 Sesoda Corp 130 0.01
333 Shanghai Commercial & Savings Bank Ltd 543 0.04
62 Shan-Loong Transportation Co Ltd 80 0.01
28 Sharehope Medicine Co Ltd 32 -
92 Sheng Yu Steel Co Ltd 114 0.01
42 ShenMao Technology Inc 65 0.01
27 Shih Her Technologies Inc 51 -
127 Shih Wei Navigation Co Ltd 166 0.01
222 Shihlin Electric & Engineering Corp 409 0.03
4,085 Shin Kong Financial Holding Co Ltd 1,462 0.11
62 Shin Zu Shing Co Ltd 250 0.02
113 Shining Building Business Co Ltd 50 -
133 Shinkong Insurance Co Ltd 191 0.01
630 Shinkong Synthetic Fibers Corp 488 0.04
10 ShunSin Technology Holding Ltd 40 -
78 Shuttle Inc 37 -
236 Sigurd Microelectronics Corp 427 0.03
23 Simplo Technology Co Ltd 302 0.02
235 Sincere Navigation Corp 224 0.02
43 Sinher Technology Inc 75 0.01
6 Sinmag Equipment Corp 23 -
271 Sinon Corp 211 0.02
4,932 SinoPac Financial Holdings Co Ltd 2,390 0.17
77 Sirtec International Co Ltd 81 0.01
124 Siward Crystal Technology Co Ltd 127 0.01
17 Soft-World International Corp 65 0.01
24 Solar Applied Materials Technology Co 40 -
78 Solomon Technology Corp 48 -
110 Southeast Cement Co Ltd 63 -
11 Spirox Corp 12 -
18 St Shine Optical Co Ltd 182 0.01
14 Standard Chemical & Pharmaceutical Co Ltd 19 -
14 Stark Technology Inc 35 -
26 Sunko INK Co Ltd 9 -
131 Sunplus Technology Co Ltd 139 0.01
51 Sunrex Technology Corp 103 0.01
Shares (000's)
Value(000's)
USD
% of NetAssetValue
Common Stock (continued)
Taiwan - 16.47% (continued)
64 Sunspring Metal Corp 64 -
107 Supreme Electronics Co Ltd 153 0.01
115 Sweeten Real Estate Development Co Ltd 102 0.01
18 Syncmold Enterprise Corp 54 -
51 Synmosa Biopharma Corp 46 -
752 Synnex Technology International Corp 1,590 0.11
14 Sysage Technology Co Ltd 21 -
14 Systex Corp 44 -
356 TA Chen Stainless Pipe 577 0.04
267 Ta Ya Electric Wire & Cable 271 0.02
46 TA-I Technology Co Ltd 115 0.01
121 Tai Tung Communication Co Ltd 74 0.01
2,433 Taichung Commercial Bank Co Ltd 995 0.07
125 Taiflex Scientific Co Ltd 215 0.02
22 Taimide Tech Inc 36 -
28 Tainan Enterprises Co Ltd 18 -
566 Tainan Spinning Co Ltd 578 0.04
4,082 Taishin Financial Holding Co Ltd 2,163 0.16
153 Taita Chemical Co Ltd 225 0.02
1,879 Taiwan Business Bank 648 0.05
2,787 Taiwan Cement Corp 5,085 0.37
73 Taiwan Chinsan Electronic Industrial Co Ltd 125 0.01
51 Taiwan Cogeneration Corp 71 0.01
3,264 Taiwan Cooperative Financial Holding Co Ltd 2,453 0.18
266 Taiwan Fertilizer Co Ltd 534 0.04
174 Taiwan Fire & Marine Insurance Co Ltd 130 0.01
88 Taiwan FU Hsing Industrial Co Ltd 141 0.01
574 Taiwan Glass Industry Corp 669 0.05
161 Taiwan Hon Chuan Enterprise Co Ltd 410 0.03
132 Taiwan Hopax Chemicals Manufacturing Co Ltd 147 0.01
495 Taiwan Kolin Co Ltd - -
169 Taiwan Navigation Co Ltd 234 0.02
52 Taiwan Paiho Ltd 177 0.01
161 Taiwan PCB Techvest Co Ltd 277 0.02
25 Taiwan Sakura Corp 59 -
26 Taiwan Sanyo Electric Co Ltd 32 -
57 Taiwan Semiconductor Co Ltd 99 0.01
73 Taiwan Shin Kong Security Co Ltd 101 0.01
101 Taiwan Styrene Monomer 71 0.01
91 Taiwan Surface Mounting Technology Corp 385 0.03
32 Taiwan Union Technology Corp 112 0.01
89 Taiyen Biotech Co Ltd 102 0.01
823 Tatung Co Ltd 738 0.05
9 TBI Motion Technology Co Ltd 17 -
38 Te Chang Construction Co Ltd 42 -
656 Teco Electric and Machinery Co Ltd 779 0.06
35 Test Research Inc 72 0.01
26 Test Rite International Co Ltd 25 -
12 Thye Ming Industrial Co Ltd 13 -
557 Ton Yi Industrial Corp 269 0.02
239 Tong Yang Industry Co Ltd 282 0.02
154 Tong-Tai Machine & Tool Co Ltd 86 0.01
15 TOPBI International Holdings Ltd 8 -
39 Topco Scientific Co Ltd 184 0.01
8 Topco Technologies Corp 22 -
110 Topoint Technology Co Ltd 156 0.01
13 Toung Loong Textile Manufacturing 19 -
203 TPK Holding Co Ltd 337 0.02
29 Transcend Information Inc 74 0.01
77 Tripod Technology Corp 351 0.03
101 Tsann Kuen Enterprise Co Ltd 101 0.01
3 TSC Auto ID Technology Co Ltd 23 -
Emerging Markets Value FundPortfolio of Investments as at 31 May 2021 (continued)
Dimensional Fund Advisors Semi-Annual Report and Unaudited Financial Statements, 31 May 2021 61

Shares (000's)
Value(000's)
USD
% of NetAssetValue
Common Stock (continued)
Taiwan - 16.47% (continued)
221 TSRC Corp 245 0.02
4 TST Group Holding Ltd 21 -
458 Tung Ho Steel Enterprise Corp 789 0.06
13 TURVO International Co Ltd 51 -
136 TXC Corp 504 0.04
89 TYC Brother Industrial Co Ltd 69 0.01
297 Tycoons Group Enterprise 147 0.01
56 Tyntek Corp 55 -
55 UDE Corp 57 -
242 U-Ming Marine Transport Corp 526 0.04
42 Unic Technology Corp 38 -
602 Unimicron Technology Corp 2,260 0.16
1,085 Union Bank Of Taiwan 458 0.03
71 Unitech Computer Co Ltd 74 0.01
366 Unitech Printed Circuit Board Corp 272 0.02
4,612 United Microelectronics Corp 8,667 0.62
22 United Orthopedic Corp 26 -
156 Unity Opto Technology Co Ltd 4 -
113 Unizyx Holding Corp 124 0.01
421 UPC Technology Corp 386 0.03
453 USI Corp 556 0.04
107 Ve Wong Corp 136 0.01
13 Ventec International Group 49 -
124 Victory New Materials Ltd Co 48 -
114 Wafer Works Corp 208 0.02
106 Waffer Technology Corp 70 0.01
51 Wah Hong Industrial Corp 61 -
98 Wah Lee Industrial Corp 272 0.02
1,312 Walsin Lihwa Corp 1,192 0.09
119 Walton Advanced Engineering Inc 65 0.01
312 Wan Hai Lines Ltd 1,738 0.13
54 We & Win Development Co Ltd 18 -
100 Wei Chuan Foods Corp 77 0.01
225 Weikeng Industrial Co Ltd 186 0.01
55 Well Shin Technology Co Ltd 100 0.01
33 Wholetech System Hitech Ltd 50 -
1,743 Winbond Electronics Corp 2,120 0.15
1,627 Wintek Corp 20 -
220 Wisdom Marine Lines Co Ltd 542 0.04
1,635 Wistron Corp 1,801 0.13
13 Wistron Information Technology & Services 46 -
127 Wistron NeWeb Corp 303 0.02
884 WPG Holdings Ltd 1,642 0.12
244 WT Microelectronics Co Ltd 476 0.03
22 Xxentria Technology Materials Corp 53 -
516 Yang Ming Marine Transport Corp 2,004 0.14
188 YC INOX Co Ltd 220 0.02
134 Yea Shin International Development Co Ltd 108 0.01
270 Yem Chio Co Ltd 181 0.01
16 Yen Sun Technology Corp 18 -
46 Yeong Guan Energy Technology Group Co Ltd 120 0.01
15 YFC-Boneagle Electric Co Ltd 13 -
659 YFY Inc 895 0.06
552 Yieh Phui Enterprise Co Ltd 450 0.03
82 Youngtek Electronics Corp 229 0.02
4,804 Yuanta Financial Holding Co Ltd 4,432 0.32
351 Yulon Motor Co Ltd 501 0.04
12 Yungshin Construction & Development Co Ltd 21 -
40 YungShin Global Holding Corp 62 -
18 Yungtay Engineering Co Ltd 40 -
12 Zeng Hsing Industrial Co Ltd 71 0.01
92 Zenitron Corp 93 0.01
Shares (000's)
Value(000's)
USD
% of NetAssetValue
Common Stock (continued)
Taiwan - 16.47% (continued)
26 Zero One Technology Co Ltd 44 -
258 Zhen Ding Technology Holding Ltd 901 0.07
155 Zig Sheng Industrial Co Ltd 148 0.01
15 Zippy Technology Corp 20 -
113 ZongTai Real Estate Development Co Ltd 160 0.01
228,898 16.47
Thailand - 1.85%
106 AAPICO Hitech PCL, NVDR 80 0.01
1,324 AP Thailand PCL 364 0.03
333 Asia Aviation PCL, NVDR 28 -
1,357 Asia Plus Group Holdings PCL 157 0.01
529 Bangchak Corp PCL 427 0.03
505 Bangkok Airways PCL 118 0.01
165 Bangkok Bank PCL, NVDR 604 0.04
8 Bangkok Insurance PCL 72 0.01
5,617 Bangkok Land PCL 203 0.01
234 Bangkok Life Assurance PCL, NVDR 231 0.02
172 Bangkok Ranch PCL 15 -
1,894 Banpu PCL 782 0.06
365 Berli Jucker PCL 403 0.03
2,985 Better World Green PCL 75 0.01
1,688 Cal-Comp Electronics Thailand PCL 173 0.01
1,432 Charoen Pokphand Foods PCL 1,249 0.09
283 GFPT PCL 97 0.01
73 ICC International PCL 74 0.01
497 Indorama Ventures PCL 724 0.05
3,476 IRPC PCL 456 0.03
2,894 Italian-Thai Development PCL 256 0.02
520 Kasikornbank PCL, NVDR 1,988 0.14
596 Khon Kaen Sugar Industry PCL 80 0.01
132 Kiatnakin Bank PCL 237 0.02
1,165 Krung Thai Bank PCL 403 0.03
3,227 LH Financial Group PCL 107 0.01
744 LPN Development PCL 119 0.01
258 MBK PCL 112 0.01
954 Millcon Steel PCL 45 -
184 Nava Nakorn PCL 16 -
1,576 Nawarat Patanakarn PCL 57 -
164 Polyplex Thailand PCL 147 0.01
300 Power Solution Technologies PCL 21 -
3,018 Property Perfect PCL 47 -
407 Pruksa Holding PCL 178 0.01
476 PTT Exploration & Production PCL 1,788 0.13
518 PTT Global Chemical PCL 1,044 0.08
4,760 PTT PCL 6,092 0.44
4,426 Quality Houses PCL 326 0.02
538 Rojana Industrial Park PCL 124 0.01
725 Sahakol Equipment PCL 71 -
94 Saha-Union PCL 107 0.01
6,653 Sansiri PCL 279 0.02
937 SC Asset Corp PCL 91 0.01
16 Siam City Cement PCL 93 0.01
290 Siam Commercial Bank PCL 947 0.07
226 Siam Future Development PCL 53 -
705 Singha Estate PCL 49 -
66 SNC Former PCL 31 -
187 Somboon Advance Technology PCL 125 0.01
170 SPCG PCL 107 0.01
308 Sri Trang Agro-Industry PCL 434 0.03
1,169 Srithai Superware PCL 43 -
593 STP & I PCL 87 0.01
825 Supalai PCL 557 0.04
Emerging Markets Value FundPortfolio of Investments as at 31 May 2021 (continued)
Dimensional Fund Advisors Semi-Annual Report and Unaudited Financial Statements, 31 May 2021 62

Shares (000's)
Value(000's)
USD
% of NetAssetValue
Common Stock (continued)
Thailand - 1.85% (continued)
7,231 Super Energy Corp PCL 222 0.02
605 Susco PCL 62 -
960 Syntec Construction PCL 66 -
302 Thai Oil PCL 572 0.04
12 Thai Stanley Electric PCL 70 -
540 Thai Union Group PCL 306 0.02
132 Thanachart Capital PCL 144 0.01
121 Thitikorn PCL 38 -
8,606 TMB Bank PCL 308 0.02
3,408 TPI Polene PCL 218 0.02
958 TPI Polene Power PCL 137 0.01
6,624 True Corp PCL 717 0.05
107 Unique Engineering & Construction PCL 27 -
685 Univentures PCL 83 0.01
145 Vinythai PCL 176 0.01
25,739 1.85
Turkey - 0.50%
1,523 Akbank TAS 934 0.07
- Akenerji Elektrik Uretim AS - -
- Aksa Akrilik Kimya Sanayii AS - -
60 Aksa Enerji Uretim AS 92 0.01
- Alarko Holding AS - -
443 Albaraka Turk Katilim Bankasi AS 82 0.01
- Anadolu Anonim Turk Sigorta Sirketi - -
74 Anadolu Efes Biracilik Ve Malt Sanayii AS 199 0.01
- Anadolu Isuzu Otomotiv Sanayi Ve Ticaret AS - -
- Arcelik AS - -
- Aygaz AS - -
- Baticim Bati Anadolu Cimento Sanayii AS - -
- BatiSoke Soke Cimento Sanayii TAS - -
88 Bera Holding AS 278 0.02
- Cemtas Celik Makina Sanayi Ve Ticaret AS - -
40 Cimsa Cimento Sanayi VE Ticaret AS 105 0.01
- Deva Holding AS - -
515 Dogan Sirketler Grubu Holding AS 176 0.01
390 Enka Insaat ve Sanayi AS 386 0.03
355 Eregli Demir ve Celik Fabrikalari TAS 799 0.06
- Gentas Genel Metal Sanayi ve Ticaret AS - -
153 GSD Holding AS 32 -
- Haci Omer Sabanci Holding AS - -
- Hektas Ticaret TAS - -
- Is Finansal Kiralama AS - -
- Is Yatirim Menkul Degerler AS - -
- Izmir Demir Celik Sanayi AS - -
- Kardemir Karabuk Demir Celik Sanayi ve Ticaret AS,Class A - -
- Kardemir Karabuk Demir Celik Sanayi ve Ticaret AS,Class B - -
- Kardemir Karabuk Demir Celik Sanayi ve Ticaret AS,Class D - -
152 KOC Holding AS 329 0.02
- Marti Otel Isletmeleri AS - -
- Menderes Tekstil Sanayi ve Ticaret AS - -
- Petkim Petrokimya Holding AS - -
6 Pinar SUT Mamulleri Sanayii 13 -
- Sekerbank Turk AS - -
- Selcuk Ecza Deposu Ticaret ve Sanayi AS - -
- Tat Gida Sanayi AS - -
54 Tekfen Holding AS 97 0.01
- Turcas Petrol AS - -
336 Turk Hava Yollari AO 508 0.04
- Turker proje Gayrimenkul ve Yatirim Gelistirme AS - -
Shares (000's)
Value(000's)
USD
% of NetAssetValue
Common Stock (continued)
Turkey - 0.50% (continued)
1,275 Turkiye Garanti Bankasi AS 1,188 0.08
228 Turkiye Halk Bankasi AS 122 0.01
792 Turkiye Is Bankasi AS 471 0.03
1,018 Turkiye Sinai Kalkinma Bankasi AS 156 0.01
401 Turkiye Sise ve Cam Fabrikalari AS 371 0.03
521 Turkiye Vakiflar Bankasi TAO 216 0.02
- Ulker Biskuvi Sanayi AS - -
- Uzel Makina Sanayii AS - -
- Vestel Elektronik Sanayi ve Ticaret AS - -
1,363 Yapi ve Kredi Bankasi AS 344 0.02
6,898 0.50
United Arab Emirates - 0.52%
950 Abu Dhabi Commercial Bank PJSC 1,763 0.13
1,702 Aldar Properties PJSC 1,719 0.12
828 Amanat Holdings PJSC 221 0.02
672 DAMAC Properties Dubai Co PJSC 256 0.02
369 Dana Gas PJSC 82 -
1,401 Deyaar Development PJSC 116 0.01
831 Dubai Investments PJSC 389 0.03
410 Emaar Development PJSC 404 0.03
798 Emaar Malls PJSC 430 0.03
1,380 Emaar Properties PJSC 1,519 0.11
29 Emirates NBD Bank PJSC 106 0.01
841 Eshraq Investments PJSC 76 -
528 Manazel Real Estate PJSC 51 -
616 RAK Properties PJSC 94 0.01
7,226 0.52
Total Common Stock - 99.13% (30 November 2020: 95.75%) 1,377,681 99.13
Preferred Stock
Brazil - 1.04%
45 Banco ABC Brasil SA (non-voting rights) 146 0.01
683 Banco Bradesco SA 3,478 0.25
103 Banco do Estado do Rio Grande do Sul SA 264 0.02
28 Cia Ferro Ligas da Bahia - Ferbasa 200 0.02
26 Eucatex SA Industria e Comercio 52 -
2 Grazziotin SA 14 -
267 Marcopolo SA 139 0.01
1,821 Petroleo Brasileiro SA 9,432 0.68
45 Schulz SA 90 0.01
151 Usinas Siderurgicas de Minas Gerais SA Usiminas 570 0.04
14,385 1.04
Colombia - 0.04%
140 Grupo Argos SA 301 0.02
50 Grupo de Inversiones Suramericana SA 236 0.02
537 0.04
Philippines - 0.00%
74 Cebu Air Inc 65 -
65 -
Total Preferred Stock - 1.08% (30 November 2020: 1.23%) 14,987 1.08
Real Estate Investment Trust
Korea, Republic of - 0.01%
38 Korea Asset In Trust Co Ltd 169 0.01
169 0.01
Turkey - 0.00%
- Is Gayrimenkul Yatirim Ortakligi AS - -
- -
Total Real Estate Investment Trust - 0.01% (30 November2020: 0.01%) 169 0.01
Emerging Markets Value FundPortfolio of Investments as at 31 May 2021 (continued)
Dimensional Fund Advisors Semi-Annual Report and Unaudited Financial Statements, 31 May 2021 63

Shares (000's)
Value(000's)
USD
% of NetAssetValue
Rights
Korea, Republic of - 0.00%
4 Humax Co Ltd 4 -
19 Korea Line Corp 13 -
17 -
Taiwan - 0.00%
18 Grand Fortune Securities Co Ltd 2 -
2 -
Total Rights - 0.00% (30 November 2020: 0.00%) 19 -
Shares (000's)
Value(000's)
USD
% of NetAssetValue
Warrants
Thailand - 0.00%
5 Mbk W2 Wrts 2 -
179 Millcon Steel PCL - -
2 -
Total Warrants - 0.00% (30 November 2020: 0.00%) 2 -
Total Investments - 100.22% (30 November 2020: 96.99%) 1,392,858 100.22
Value (000's)USD
% of NetAssetValue
Cash and Cash Equivalents - 0.36% (30 November 2020: 0.22%) 4,987 0.36Other Liabilities in Excess of Other Assets - (0.58)% (30 November 2020: 2.79%) (8,015) (0.58)
Total Net Assets 1,389,830 100.00
Amounts designated as “- “ are either $0, less than $500 or less than 500 shares.
Analysis of Total Assets % of Total Assets
Transferable securities admitted to an official exchange listing 99.01
Current Assets 0.99
Total Assets 100.00
Emerging Markets Value FundPortfolio of Investments as at 31 May 2021 (continued)
Dimensional Fund Advisors Semi-Annual Report and Unaudited Financial Statements, 31 May 2021 64

Face Value(000's)
CouponRate %
MaturityDate
Value (000's)EUR
% of NetAssetValue
Government Bonds
France - 85.33%
25 French Republic GovernmentBond OAT 1.100 25/07/2022 30 0.05
959 French Republic GovernmentBond OAT 0.250 25/07/2024 1,108 1.96
2,641 French Republic GovernmentBond OAT 0.100 01/03/2026 2,912 5.15
7,768 French Republic GovernmentBond OAT 1.850 25/07/2027 10,840 19.18
6,054 French Republic GovernmentBond OAT 0.100 01/03/2029 6,981 12.36
6,699 French Republic GovernmentBond OAT 0.700 25/07/2030 8,599 15.22
929 French Republic GovernmentBond OAT 0.100 25/07/2031 1,085 1.92
4,605 French Republic GovernmentBond OAT 3.150 25/07/2032 9,287 16.44
2,700 French Republic GovernmentBond OAT 0.000 25/07/2036 3,349 5.93
2,096 French Republic GovernmentBond OAT 1.800 25/07/2040 4,024 7.12
48,215 85.33
Face Value(000's)
CouponRate %
MaturityDate
Value (000's)EUR
% of NetAssetValue
Government Bonds (continued)
Germany - 13.48%
2,008 Deutsche BundesrepublikInflation Linked Bond 0.100 15/04/2023 2,271 4.02
2,172 Deutsche BundesrepublikInflation Linked Bond 0.100 15/04/2026 2,545 4.50
1,860 Deutsche BundesrepublikInflation Linked Bond 0.500 15/04/2030 2,404 4.26
325 Deutsche BundesrepublikInflation Linked Bond 0.101 15/04/2033 398 0.70
7,618 13.48
Total Government Bonds - 98.81% (30 November2020: 99.06%) 55,833 98.81
Total Investments - 98.81% (30 November 2020: 99.06%) 55,833 98.81
Value (000's)EUR
% of NetAssetValue
Cash and Cash Equivalents - 0.55% (30 November 2020: 0.32%) 308 0.55Other Assets in Excess of Other Liabilities - 0.64% (30 November 2020: 0.62%) 362 0.64
Total Net Assets 56,503 100.00
Analysis of Total Assets % of Total Assets
Transferable securities admitted to an official exchange listing 98.74
Current Assets 1.26
Total Assets 100.00
Euro Inflation Linked Intermediate Duration Fixed Income FundPortfolio of Investments as at 31 May 2021
Dimensional Fund Advisors Semi-Annual Report and Unaudited Financial Statements, 31 May 2021 65

Shares (000's)
Value(000's)
EUR
% of NetAssetValue
Common Stock
Austria - 2.34%
2 Agrana Beteiligungs AG 34 0.02
7 Andritz AG 313 0.19
4 AT&S Austria Technologie & Systemtechnik AG 115 0.07
20 Atrium European Real Estate Ltd 63 0.04
7 BAWAG Group AG 337 0.20
1 DO & CO AG 86 0.05
3 EVN AG 63 0.04
2 FACC AG 21 0.01
1 Flughafen Wien AG 34 0.02
9 Immofinanz AG 158 0.09
1 Kapsch TrafficCom AG 12 0.01
2 Lenzing AG 238 0.14
1 Mayr Melnhof Karton AG 128 0.08
2 Oberbank AG 161 0.10
5 Oesterreichische Post AG 229 0.14
2 Palfinger AG 61 0.04
2 POLYTEC Holding AG 27 0.02
1 Porr AG 12 0.01
19 Raiffeisen Bank International AG 370 0.22
- Rosenbauer International AG 25 0.01
7 S IMMO AG 164 0.10
1 Schoeller-Bleckmann Oilfield Equipment AG 37 0.02
2 Semperit AG Holding 66 0.04
1 Strabag SE 43 0.02
17 Telekom Austria AG 122 0.07
1 UBM Development AG 39 0.02
13 UNIQA Insurance Group AG 95 0.06
4 Vienna Insurance Group AG Wiener VersicherungGruppe 85 0.05
11 Voestalpine AG 407 0.24
11 Wienerberger AG 354 0.21
3 Zumtobel Group AG 25 0.01
3,924 2.34
Belgium - 2.50%
3 Ackermans & van Haaren NV 351 0.21
20 AGFA-Gevaert NV 78 0.05
1 Atenor 39 0.02
- Banque Nationale de Belgique 44 0.03
8 Barco NV 173 0.10
5 Bekaert SA 212 0.13
5 Biocartis NV 21 0.01
12 bpost SA 132 0.08
1 Celyad SA 3 -
1 Cie d'Entreprises CFE 127 0.07
13 Deceuninck NV 38 0.02
4 D'ieteren SA 364 0.22
20 Econocom Group SA 66 0.04
3 Elia System Operator SA 277 0.16
20 Euronav NV 157 0.09
1 EVS Broadcast Equipment SA 20 0.01
5 Exmar NV 19 0.01
7 Fagron 132 0.08
3 Gimv NV 134 0.08
4 Greenyard NV 32 0.02
1 Immobel SA 49 0.03
3 Ion Beam Applications 57 0.03
1 Jensen-Group NV 16 0.01
2 Kinepolis Group NV 94 0.06
- Lotus Bakeries NV 197 0.12
7 MDxHealth 9 -
2 Melexis NV 187 0.11
1 Mithra Pharmaceuticals SA 30 0.02
Shares (000's)
Value(000's)
EUR
% of NetAssetValue
Common Stock (continued)
Belgium - 2.50% (continued)
7 Ontex Group NV 79 0.05
5 Oxurion NV 13 0.01
- Picanol 25 0.01
17 Proximus SADP 280 0.17
4 Recticel SA 65 0.04
- Resilux 28 0.02
1 Roularta Media Group NV 12 0.01
2 Shurgard Self Storage SA 102 0.06
1 Sipef NV 54 0.03
6 Telenet Group Holding NV 200 0.12
- TER Beke SA 13 0.01
2 Tessenderlo Group SA 67 0.04
1 Van de Velde NV 26 0.01
1 VGP NV 133 0.08
12 Viohalco SA 54 0.03
4,209 2.50
Denmark - 3.58%
1 ALK-Abello AS 259 0.15
9 Alm Brand AS 75 0.04
16 Bang & Olufsen AS 67 0.04
8 Bavarian Nordic AS 300 0.18
1 Brodrene Hartmann AS 42 0.02
1 cBrain A/S 19 0.01
1 Chemometec AS 111 0.07
10 Columbus AS 15 0.01
4 D/S Norden AS 84 0.05
4 Dfds AS 186 0.11
- Djurslands Bank AS 14 0.01
5 FLSmidth & Co AS 153 0.09
5 H Lundbeck AS 121 0.07
2 H&H International AS 62 0.04
18 ISS AS 308 0.18
1 Jeudan AS 43 0.02
9 Jyske Bank AS 366 0.22
- Lan & Spar Bank 17 0.01
3 Maersk Drilling AS 94 0.06
4 Matas AS 60 0.04
4 Netcompany Group AS 419 0.25
4 Nilfisk Holding AS 119 0.07
5 NKT AS 179 0.11
2 NNIT AS 31 0.02
1 Orphazyme AS 7 -
2 Per Aarsleff Holding AS 70 0.04
3 Ringkjoebing Landbobank AS 273 0.16
- Rockwool International AS, Class A 95 0.06
7 Royal Unibrew AS 785 0.47
1 RTX AS 17 0.01
8 Scandinavian Tobacco Group AS 132 0.08
1 Schouw & Co AS 127 0.08
5 SimCorp AS 494 0.29
1 Solar AS 74 0.04
- SP Group AS 11 0.01
9 Spar Nord Bank AS 82 0.05
9 Sydbank AS 235 0.14
- Tivoli AS 44 0.03
5 Topdanmark AS 212 0.13
3 TORM PLC 26 0.01
- United International Enterprises 65 0.04
80 Vestjysk Bank AS 37 0.02
3 Zealand Pharma AS 86 0.05
6,016 3.58
European Small Companies FundPortfolio of Investments as at 31 May 2021
Dimensional Fund Advisors Semi-Annual Report and Unaudited Financial Statements, 31 May 2021 66

Shares (000's)
Value(000's)
EUR
% of NetAssetValue
Common Stock (continued)
Finland - 4.38%
5 Aktia Bank Oyj 59 0.03
1 Alandsbanken Abp 29 0.02
3 Alma Media Oyj 28 0.02
3 Altia Oyj 31 0.02
1 Apetit Oyj 15 0.01
2 Asiakastieto Group Oyj 68 0.04
4 Aspo Oyj 36 0.02
2 Atria Oyj 23 0.01
1 BasWare Oyj 41 0.02
4 Bittium Oyj 28 0.02
4 Cargotec Oyj 189 0.11
10 Caverion Oyj 63 0.04
6 Citycon Oyj 42 0.02
2 Digia Oyj 13 0.01
97 Finnair Oyj 70 0.04
2 Fiskars Oyj Abp 42 0.02
12 F-Secure Oyj 50 0.03
- Harvia Oyj 18 0.01
5 HKScan Oyj 12 0.01
16 Huhtamaki Oyj 601 0.36
1 Kamux Corp 17 0.01
10 Kemira Oyj 130 0.08
12 Kojamo Oyj 224 0.13
6 Konecranes Oyj 221 0.13
3 Lassila & Tikanoja Oyj 36 0.02
3 Lehto Group Oyj 5 -
19 Metsa Board Oyj 185 0.11
- Musti Group Oyj 9 0.01
18 Neles Oyj 221 0.13
13 Nokian Renkaat Oyj 413 0.25
2 Olvi Oyj 89 0.05
4 Oriola Oyj, Class A 9 0.01
15 Oriola Oyj, Class B 27 0.02
4 Orion Oyj, Class A 135 0.08
7 Orion Oyj, Class B 260 0.15
53 Outokumpu Oyj 240 0.14
84 Outotec Oyj 818 0.49
2 Pihlajalinna Oyj 20 0.01
1 Ponsse Oyj 58 0.03
2 QT Group Oyj 206 0.12
12 Raisio Oyj 50 0.03
2 Revenio Group Oyj 129 0.08
4 Rovio Entertainment Oyj 24 0.01
7 Sanoma Oyj 101 0.06
2 Teleste Oyj 14 0.01
9 Terveystalo Oyj 111 0.07
10 Tieto Oyj 259 0.15
6 Tikkurila Oyj 204 0.12
6 Tokmanni Group Corp 145 0.09
8 Uponor Oyj 194 0.12
2 Vaisala Oyj 80 0.05
19 Valmet Oyj 690 0.41
1 Viking Line Abp 12 0.01
45 Wartsila Oyj Abp 500 0.30
13 YIT Oyj 66 0.04
7,360 4.38
France - 7.62%
3 ABC arbitrage 21 0.01
2 Akka Technologies 43 0.03
2 AKWEL 43 0.03
3 Albioma SA 105 0.06
3 ALD SA 41 0.02
Shares (000's)
Value(000's)
EUR
% of NetAssetValue
Common Stock (continued)
France - 7.62% (continued)
3 Alten SA 353 0.21
3 Amplitude Surgical SAS 7 -
1 Assystem SA 23 0.01
1 Aubay 36 0.02
1 Axway Software SA 30 0.02
- Bastide le Confort Medical 16 0.01
7 Beneteau SA 95 0.06
2 Bigben Interactive 39 0.02
1 Boiron SA 27 0.02
2 Bonduelle SCA 46 0.03
- Burelle SA 40 0.02
5 Casino Guichard Perrachon SA 143 0.09
1 Cegedim SA 29 0.02
103 CGG SA 90 0.05
2 Chargeurs SA 45 0.03
1 Cie des Alpes 34 0.02
7 Cie Plastic Omnium SA 197 0.12
3 Claranova SADIR 25 0.01
14 Coface SA 141 0.08
16 Derichebourg SA 138 0.08
- Electricite de Strasbourg SA 33 0.02
16 Elior Group SA 106 0.06
23 Elis SA 364 0.22
2 Eramet 100 0.06
- Esso SA Francaise 6 -
6 Etablissements Maurel et Prom SA 12 0.01
4 Eurazeo SA 320 0.19
9 Euronext NV 774 0.46
40 Europcar Mobility Group 16 0.01
22 Eutelsat Communications SA 223 0.13
11 Faurecia SE 494 0.29
2 Fnac Darty SA 125 0.07
3 Gaztransport Et Technigaz SA 182 0.11
2 GL Events 30 0.02
1 Groupe Crit 39 0.02
1 Guerbet 18 0.01
3 Haulotte Group SA 16 0.01
1 Hexaom 26 0.02
- ID Logistics Group 75 0.04
5 Imerys SA 234 0.14
1 Infotel SA 26 0.02
2 Innate Pharma SA 5 -
6 IPSOS 217 0.13
3 Jacquet Metal Service SA 57 0.03
11 JCDecaux SA 265 0.16
2 Kaufman & Broad SA 85 0.05
8 Korian SA 250 0.15
6 Lagardere SCA 132 0.08
- Laurent-Perrier 38 0.02
- LDC SA 12 0.01
5 Lectra 149 0.09
1 Linedata Services 24 0.01
3 LISI 84 0.05
1 LNA Sante SA 36 0.02
1 Lumibird 10 0.01
6 Maisons du Monde SA 128 0.08
2 Manitou BF SA 42 0.03
- Manutan International 27 0.02
2 Mersen SA 70 0.04
4 Metropole Television SA 65 0.04
4 Neoen SA 155 0.09
5 Nexans SA 359 0.21
European Small Companies FundPortfolio of Investments as at 31 May 2021 (continued)
Dimensional Fund Advisors Semi-Annual Report and Unaudited Financial Statements, 31 May 2021 67

Shares (000's)
Value(000's)
EUR
% of NetAssetValue
Common Stock (continued)
France - 7.62% (continued)
7 Nexity SA 280 0.17
3 Nicox 13 0.01
3 NRJ Group 19 0.01
3 Oeneo SA 32 0.02
8 Onxeo SA 5 -
1 Orpea 96 0.06
- Pharmagest Inter@ctive 17 0.01
1 Plastivaloire 9 0.01
5 Quadient 111 0.07
3 Rallye SA 21 0.01
2 Recylex SA 1 -
36 Rexel SA 603 0.36
- Robertet SA 22 0.01
5 Rothschild & Co 155 0.09
11 Rubis SCA 442 0.26
- Samse SA 15 0.01
1 Savencia SA 42 0.03
19 SCOR SE 495 0.29
1 Seche Environnement SA 33 0.02
48 SES SA 327 0.19
3 Societe BIC SA 181 0.11
- Societe Marseillaise du Tunnel Prado-Carenage SA 6 -
1 Societe pour l'Informatique Industrielle 22 0.01
3 SOITEC 428 0.25
16 Solocal Group 39 0.02
1 Somfy SA 182 0.11
2 Sopra Steria Group 298 0.18
14 SPIE SA 278 0.17
- Stef SA 47 0.03
1 Sword Group 33 0.02
1 Synergie SA 53 0.03
4 Tarkett SA 90 0.05
2 Technicolor SA 6 -
8 Television Francaise 1 66 0.04
1 Thermador Groupe 108 0.06
5 Tikehau Capital SCA 133 0.08
- Total Gabon 16 0.01
1 Trigano SA 186 0.11
1 Union Financiere de France BQE SA 12 0.01
1 Vallourec SA 34 0.02
6 Valneva SE 59 0.04
1 Verallia 41 0.02
- Vetoquinol SA 45 0.03
3 Vicat SA 145 0.09
5 VIEL & Cie SA 29 0.02
1 Vilmorin & Cie SA 52 0.03
- Virbac SA 141 0.08
1 Vranken-Pommery Monopole SA 10 0.01
1 Wavestone 26 0.02
8 X-Fab Silicon Foundries SE 62 0.04
12,802 7.62
Germany - 11.91%
5 1&1 Drillisch AG 137 0.08
5 7C Solarparken AG 19 0.01
7 Aareal Bank AG 141 0.08
- ADO Properties SA 12 0.01
8 ADVA Optical Networking SE 81 0.05
19 Aixtron SE 313 0.19
- All for One Group AG 14 0.01
1 Allgeier SE 18 0.01
- Amadeus Fire AG 21 0.01
- Atoss Software AG 59 0.04
Shares (000's)
Value(000's)
EUR
% of NetAssetValue
Common Stock (continued)
Germany - 11.91% (continued)
1 Aumann AG 22 0.01
4 Aurubis AG 302 0.18
1 Basler AG 75 0.04
2 Bauer AG 19 0.01
2 BayWa AG 89 0.05
1 Bechtle AG 125 0.07
2 Befesa SA 141 0.08
1 Bertrandt AG 40 0.02
1 bet-at-home.com AG 29 0.02
1 Bijou Brigitte AG 22 0.01
5 Bilfinger SE 132 0.08
6 Borussia Dortmund GmbH & Co KGaA 38 0.02
4 CANCOM SE 218 0.13
17 Ceconomy AG 80 0.05
1 CENIT AG 17 0.01
1 Cewe Stiftung & Co KGaA 84 0.05
108 Commerzbank AG 714 0.43
3 CompuGroup Medical SE & Co KgaA 179 0.11
2 Corestate Capital Holding SA 28 0.02
3 CropEnergies AG 33 0.02
6 CTS Eventim AG & Co KGaA 342 0.20
- Data Modul AG Produktion Und Vertrieb VonElektronischen Systemen 16 0.01
2 Dermapharm Holding SE 118 0.07
2 Deutsche Beteiligungs AG 70 0.04
8 Deutsche EuroShop AG 151 0.09
18 Deutsche Lufthansa AG 196 0.12
23 Deutsche Pfandbriefbank AG 220 0.13
18 Deutz AG 125 0.07
11 Dialog Semiconductor PLC 742 0.44
9 DIC Asset AG 132 0.08
- DMG Mori AG 16 0.01
1 Dr Hoenle AG 33 0.02
- Draegerwerk AG & Co KGaA 21 0.01
6 Duerr AG 193 0.12
2 Eckert & Ziegler Strahlen- und Medizintechnik AG 176 0.11
1 EDAG Engineering Group AG 13 0.01
2 Elmos Semiconductor AG 58 0.03
4 ElringKlinger AG 62 0.04
6 Encavis AG 91 0.05
1 Energiekontor AG 35 0.02
16 Evotec SE 585 0.35
2 Ferratum Oyj 8 0.01
3 Fielmann AG 192 0.11
1 First Sensor AG 35 0.02
2 flatexDEGIRO AG 243 0.14
- FORTEC Elektronik AG 7 -
5 Fraport AG Frankfurt Airport Services Worldwide 308 0.18
14 Freenet AG 325 0.19
3 Fuchs Petrolub SE 120 0.07
26 GEA Group AG 917 0.55
4 Gerresheimer AG 322 0.19
2 Gesco AG 37 0.02
3 GFT Technologies SE 58 0.03
1 Grammer AG 16 0.01
12 Grand City Properties SA 292 0.17
2 GRENKE AG 77 0.05
3 H&R GmbH & Co KGaA 19 0.01
3 Hamburger Hafen und Logistik AG 70 0.04
- Hawesko Holding AG 11 0.01
43 Heidelberger Druckmaschinen AG 80 0.05
4 Hella GmbH & Co KGaA 220 0.13
European Small Companies FundPortfolio of Investments as at 31 May 2021 (continued)
Dimensional Fund Advisors Semi-Annual Report and Unaudited Financial Statements, 31 May 2021 68

Shares (000's)
Value(000's)
EUR
% of NetAssetValue
Common Stock (continued)
Germany - 11.91% (continued)
8 HolidayCheck Group AG 26 0.02
1 Home24 SE 14 0.01
1 Hornbach Baumarkt AG 34 0.02
1 Hornbach Holding AG & Co KGaA 115 0.07
9 Hugo Boss AG 428 0.26
- Hypoport AG 195 0.12
3 Indus Holding AG 88 0.05
5 Instone Real Estate Group AG 132 0.08
1 IVU Traffic Technologies AG 21 0.01
6 Jenoptik AG 140 0.08
2 JOST Werke AG 128 0.08
22 K&S AG 255 0.15
14 Kloeckner & Co SE 159 0.09
2 Koenig & Bauer AG 55 0.03
2 Krones AG 132 0.08
- KSB SE & Co KGaA 16 0.01
2 KWS Saat SE & Co KGaA 117 0.07
9 Lanxess AG 580 0.35
2 Leifheit AG 94 0.06
6 Leoni AG 74 0.04
3 LPKF Laser & Electronics AG 68 0.04
1 Manz AG 49 0.03
2 Medigene AG 8 0.01
26 METRO AG 280 0.17
6 MLP SE 48 0.03
1 Nagarro SE 64 0.04
- New Work SE 82 0.05
2 Nexus AG 149 0.09
11 Nordex SE 213 0.13
4 Norma Group SE 187 0.11
1 OHB SE 35 0.02
6 Patrizia AG 132 0.08
1 Pfeiffer Vacuum Technology AG 125 0.07
6 PNE AG 43 0.03
- Progress-Werk Oberkirch AG 11 0.01
34 ProSiebenSat.1 Media SE 626 0.37
1 PSI Software AG 40 0.02
2 PVA TePla AG 52 0.03
17 QSC AG 32 0.02
1 R Stahl AG 13 0.01
5 Rheinmetall AG 430 0.26
1 RTL Group SA 39 0.02
6 S&T AG 117 0.07
8 SAF-Holland SE 109 0.07
7 Salzgitter AG 175 0.10
- Schloss Wachenheim AG 2 -
6 Scout24 AG 387 0.23
- Secunet Security Networks AG 40 0.02
9 SGL Carbon SE 61 0.04
4 Siltronic AG 492 0.29
2 Sixt SE 291 0.17
1 SMA Solar Technology AG 47 0.03
- SNP Schneider-Neureither & Partner SE 13 0.01
1 Softing AG 4 -
6 Software AG 208 0.12
3 Stabilus SA 195 0.12
1 Stratec SE 96 0.06
3 Stroeer SE & Co KGaA 214 0.13
8 Suedzucker AG 106 0.06
3 SUESS MicroTec SE 75 0.04
1 Surteco Group SE 36 0.02
1 Syzygy AG 4 -
Shares (000's)
Value(000's)
EUR
% of NetAssetValue
Common Stock (continued)
Germany - 11.91% (continued)
18 TAG Immobilien AG 461 0.27
4 Takkt AG 49 0.03
1 Technotrans SE 37 0.02
37 thyssenkrupp AG 356 0.21
1 Traffic Systems SE 33 0.02
1 United Internet AG 34 0.02
4 VERBIO Vereinigte BioEnergie AG 176 0.11
1 Vossloh AG 39 0.02
2 Wacker Chemie AG 245 0.15
3 Wacker Neuson SE 80 0.05
1 Washtec AG 67 0.04
- Westwing Group AG 8 0.01
2 Wuestenrot & Wuerttembergische AG 46 0.03
2 Zeal Network SE 61 0.04
1 zooplus AG 157 0.09
20,004 11.91
Ireland - 0.91%
73 AIB Group PLC 200 0.12
145 Bank of Ireland Group PLC 769 0.46
80 Cairn Homes PLC 85 0.05
4 Datalex PLC 2 -
4 FBD Holdings PLC 36 0.02
24 Glanbia PLC 324 0.19
14 Glenveagh Properties PLC 14 0.01
19 Irish Continental Group PLC 85 0.05
6 Permanent TSB Group Holdings PLC 9 0.01
1,524 0.91
Italy - 5.73%
184 A2A SpA 315 0.19
7 ACEA SpA 128 0.08
35 Anima Holding SpA 150 0.09
2 Aquafil SpA 12 0.01
14 Arnoldo Mondadori Editore SpA 23 0.01
14 Ascopiave SpA 51 0.03
23 Autogrill SpA 162 0.10
2 Avio SpA 21 0.01
12 Azimut Holding SpA 251 0.15
2 Banca Carige SpA 1 -
20 Banca Farmafactoring SpA 155 0.09
7 Banca Generali SpA 222 0.13
3 Banca IFIS SpA 40 0.02
16 Banca Mediolanum SpA 128 0.08
34 Banca Monte dei Paschi di Siena SpA 41 0.02
77 Banca Popolare di Sondrio SCpA 311 0.19
15 Banca Profilo SpA 3 -
12 Banca Sistema SpA 24 0.01
174 Banco BPM SpA 505 0.30
7 Banco di Desio e della Brianza SpA 23 0.01
11 BE SpA 18 0.01
1 Biesse SpA 18 0.01
171 BPER Banca 347 0.21
5 Brunello Cucinelli SpA 256 0.15
11 Buzzi Unicem SpA 267 0.16
14 Cairo Communication SpA 25 0.02
4 Carel Industries SpA 94 0.06
6 Cementir Holding NV 58 0.04
23 Cerved Group SpA 221 0.13
102 CIR SpA-Compagnie Industriali 51 0.03
9 Credito Emiliano SpA 50 0.03
72 d'Amico International Shipping SA 7 -
2 Danieli & C Officine Meccaniche SpA 50 0.03
11 De' Longhi SpA 411 0.25
European Small Companies FundPortfolio of Investments as at 31 May 2021 (continued)
Dimensional Fund Advisors Semi-Annual Report and Unaudited Financial Statements, 31 May 2021 69
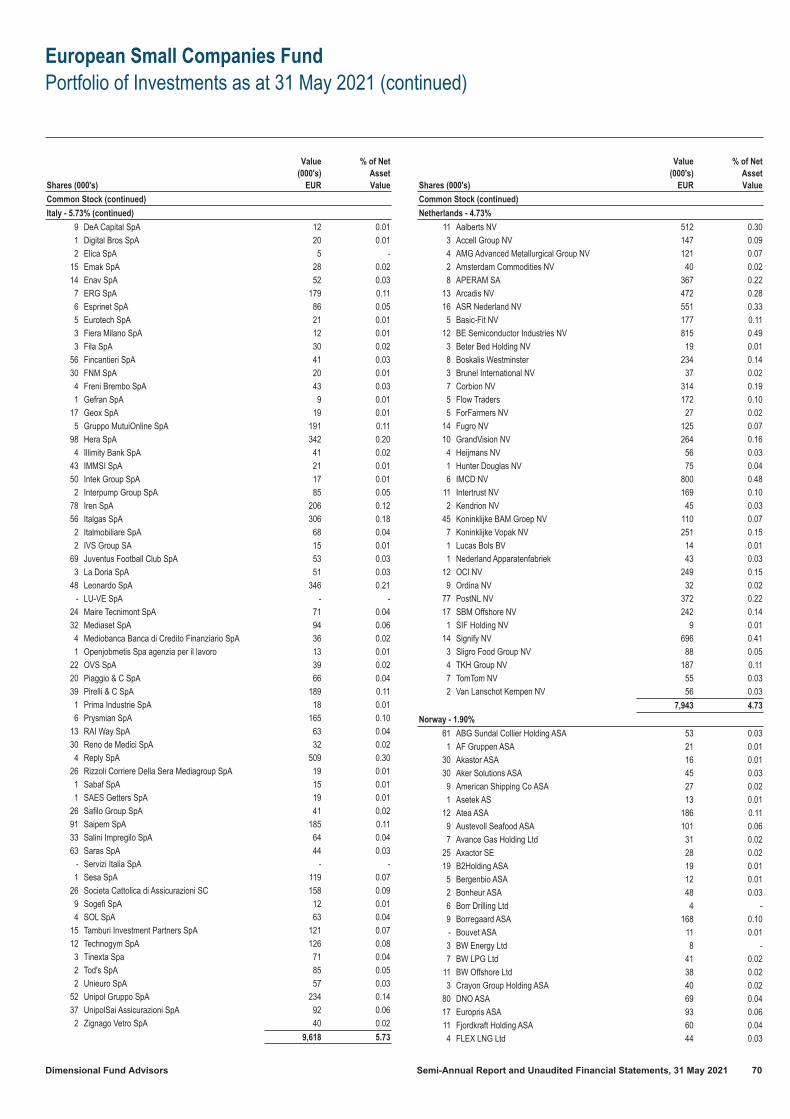
Shares (000's)
Value(000's)
EUR
% of NetAssetValue
Common Stock (continued)
Italy - 5.73% (continued)
9 DeA Capital SpA 12 0.01
1 Digital Bros SpA 20 0.01
2 Elica SpA 5 -
15 Emak SpA 28 0.02
14 Enav SpA 52 0.03
7 ERG SpA 179 0.11
6 Esprinet SpA 86 0.05
5 Eurotech SpA 21 0.01
3 Fiera Milano SpA 12 0.01
3 Fila SpA 30 0.02
56 Fincantieri SpA 41 0.03
30 FNM SpA 20 0.01
4 Freni Brembo SpA 43 0.03
1 Gefran SpA 9 0.01
17 Geox SpA 19 0.01
5 Gruppo MutuiOnline SpA 191 0.11
98 Hera SpA 342 0.20
4 Illimity Bank SpA 41 0.02
43 IMMSI SpA 21 0.01
50 Intek Group SpA 17 0.01
2 Interpump Group SpA 85 0.05
78 Iren SpA 206 0.12
56 Italgas SpA 306 0.18
2 Italmobiliare SpA 68 0.04
2 IVS Group SA 15 0.01
69 Juventus Football Club SpA 53 0.03
3 La Doria SpA 51 0.03
48 Leonardo SpA 346 0.21
- LU-VE SpA - -
24 Maire Tecnimont SpA 71 0.04
32 Mediaset SpA 94 0.06
4 Mediobanca Banca di Credito Finanziario SpA 36 0.02
1 Openjobmetis Spa agenzia per il lavoro 13 0.01
22 OVS SpA 39 0.02
20 Piaggio & C SpA 66 0.04
39 Pirelli & C SpA 189 0.11
1 Prima Industrie SpA 18 0.01
6 Prysmian SpA 165 0.10
13 RAI Way SpA 63 0.04
30 Reno de Medici SpA 32 0.02
4 Reply SpA 509 0.30
26 Rizzoli Corriere Della Sera Mediagroup SpA 19 0.01
1 Sabaf SpA 15 0.01
1 SAES Getters SpA 19 0.01
26 Safilo Group SpA 41 0.02
91 Saipem SpA 185 0.11
33 Salini Impregilo SpA 64 0.04
63 Saras SpA 44 0.03
- Servizi Italia SpA - -
1 Sesa SpA 119 0.07
26 Societa Cattolica di Assicurazioni SC 158 0.09
9 Sogefi SpA 12 0.01
4 SOL SpA 63 0.04
15 Tamburi Investment Partners SpA 121 0.07
12 Technogym SpA 126 0.08
3 Tinexta Spa 71 0.04
2 Tod's SpA 85 0.05
2 Unieuro SpA 57 0.03
52 Unipol Gruppo SpA 234 0.14
37 UnipolSai Assicurazioni SpA 92 0.06
2 Zignago Vetro SpA 40 0.02
9,618 5.73
Shares (000's)
Value(000's)
EUR
% of NetAssetValue
Common Stock (continued)
Netherlands - 4.73%
11 Aalberts NV 512 0.30
3 Accell Group NV 147 0.09
4 AMG Advanced Metallurgical Group NV 121 0.07
2 Amsterdam Commodities NV 40 0.02
8 APERAM SA 367 0.22
13 Arcadis NV 472 0.28
16 ASR Nederland NV 551 0.33
5 Basic-Fit NV 177 0.11
12 BE Semiconductor Industries NV 815 0.49
3 Beter Bed Holding NV 19 0.01
8 Boskalis Westminster 234 0.14
3 Brunel International NV 37 0.02
7 Corbion NV 314 0.19
5 Flow Traders 172 0.10
5 ForFarmers NV 27 0.02
14 Fugro NV 125 0.07
10 GrandVision NV 264 0.16
4 Heijmans NV 56 0.03
1 Hunter Douglas NV 75 0.04
6 IMCD NV 800 0.48
11 Intertrust NV 169 0.10
2 Kendrion NV 45 0.03
45 Koninklijke BAM Groep NV 110 0.07
7 Koninklijke Vopak NV 251 0.15
1 Lucas Bols BV 14 0.01
1 Nederland Apparatenfabriek 43 0.03
12 OCI NV 249 0.15
9 Ordina NV 32 0.02
77 PostNL NV 372 0.22
17 SBM Offshore NV 242 0.14
1 SIF Holding NV 9 0.01
14 Signify NV 696 0.41
3 Sligro Food Group NV 88 0.05
4 TKH Group NV 187 0.11
7 TomTom NV 55 0.03
2 Van Lanschot Kempen NV 56 0.03
7,943 4.73
Norway - 1.90%
61 ABG Sundal Collier Holding ASA 53 0.03
1 AF Gruppen ASA 21 0.01
30 Akastor ASA 16 0.01
30 Aker Solutions ASA 45 0.03
9 American Shipping Co ASA 27 0.02
1 Asetek AS 13 0.01
12 Atea ASA 186 0.11
9 Austevoll Seafood ASA 101 0.06
7 Avance Gas Holding Ltd 31 0.02
25 Axactor SE 28 0.02
19 B2Holding ASA 19 0.01
5 Bergenbio ASA 12 0.01
2 Bonheur ASA 48 0.03
6 Borr Drilling Ltd 4 -
9 Borregaard ASA 168 0.10
- Bouvet ASA 11 0.01
3 BW Energy Ltd 8 -
7 BW LPG Ltd 41 0.02
11 BW Offshore Ltd 38 0.02
3 Crayon Group Holding ASA 40 0.02
80 DNO ASA 69 0.04
17 Europris ASA 93 0.06
11 Fjordkraft Holding ASA 60 0.04
4 FLEX LNG Ltd 44 0.03
European Small Companies FundPortfolio of Investments as at 31 May 2021 (continued)
Dimensional Fund Advisors Semi-Annual Report and Unaudited Financial Statements, 31 May 2021 70

Shares (000's)
Value(000's)
EUR
% of NetAssetValue
Common Stock (continued)
Norway - 1.90% (continued)
9 Frontline Ltd 61 0.04
13 Golden Ocean Group Ltd 102 0.06
5 Grieg Seafood ASA 43 0.03
9 Hexagon Composites ASA 33 0.02
35 IDEX Biometrics ASA 8 -
11 Kitron ASA 23 0.01
26 Kongsberg Automotive ASA 7 -
1 Medistim ASA 15 0.01
6 Nordic Nanovector ASA 14 0.01
20 Nordic Semiconductor ASA 456 0.27
1 Norway Royal Salmon ASA 17 0.01
1 Norwegian Energy Co SA 10 0.01
20 Norwegian Finans Holding ASA 196 0.12
3 Norwegian Property ASA 4 -
4 NRC Group ASA 6 -
11 Ocean Yield ASA 32 0.02
18 Odfjell Drilling Ltd 37 0.02
2 Odfjell SE 5 -
3 Olav Thon Eiendomsselskap ASA 50 0.03
13 Otello Corp ASA 41 0.02
1 PCI Biotech Holding ASA 4 -
70 PGS ASA 36 0.02
1 PhotoCure ASA 16 0.01
9 Protector Forsikring ASA 78 0.05
33 REC Silicon ASA 56 0.03
13 Sbanken ASA 127 0.08
6 Selvaag Bolig ASA 38 0.02
2 Solon Eiendom ASA 9 0.01
4 SpareBank 1 SR-Bank ASA 42 0.02
4 Stolt-Nielsen Ltd 52 0.03
11 TGS NOPEC Geophysical Co ASA 126 0.07
5 Treasure ASA 9 0.01
10 Veidekke ASA 126 0.07
16 Wallenius Wilhelmsen ASA 52 0.03
1 Wilh Wilhelmsen Holding ASA (non-voting rights) 10 0.01
2 Wilh Wilhelmsen Holding ASA (voting rights) 43 0.03
18 XXL ASA 38 0.02
3,198 1.90
Portugal - 0.41%
9 Altri SGPS SA 54 0.03
974 Banco Comercial Portugues SA 155 0.09
4 Corticeira Amorim SGPS SA 44 0.03
16 CTT-Correios de Portugal SA 65 0.04
4 Ibersol SGPS SA 23 0.01
24 Navigator Co SA 71 0.04
26 NOS SGPS SA 78 0.05
46 REN-Redes Energeticas Nacionais SGPS SA 106 0.06
3 Semapa-Sociedade de Investimento e Gestao 39 0.02
73 Sonae SGPS SA 58 0.04
693 0.41
Spain - 3.89%
1 Acciona SA 141 0.08
26 Acerinox SA 301 0.18
2 Adveo Group International SA - -
2 Alantra Partners SA 32 0.02
8 Almirall SA 107 0.06
124 Amper SA 23 0.01
16 Applus Services SA 139 0.08
10 Atresmedia Corp de Medios de Comunicacion SA 39 0.02
3 Azkoyen SA 16 0.01
722 Banco de Sabadell SA 455 0.27
109 Bankinter SA 512 0.30
Shares (000's)
Value(000's)
EUR
% of NetAssetValue
Common Stock (continued)
Spain - 3.89% (continued)
7 Cia de Distribucion Integral Logista Holdings SA 134 0.08
7 CIE Automotive SA 168 0.10
2 Construcciones y Auxiliar de Ferrocarriles SA 91 0.05
300 Distribuidora Internacional de Alimentacion SA 24 0.01
7 Ebro Foods SA 129 0.08
11 eDreams ODIGEO SA 60 0.04
6 Elecnor SA 59 0.03
28 Enagas SA 530 0.32
23 Ence Energia y Celulosa SA 80 0.05
8 Ercros SA 28 0.02
9 Euskaltel SA 94 0.06
35 Faes Farma SA 118 0.07
9 Fluidra SA 302 0.18
10 Fomento de Construcciones y Contratas SA 102 0.06
25 Gestamp Automocion SA 113 0.07
12 Global Dominion Access SA 55 0.03
7 Grupo Catalana Occidente SA 244 0.15
5 Grupo Empresarial San Jose SA 29 0.02
45 Grupo Ezentis SA 17 0.01
2 Iberpapel Gestion SA 29 0.02
15 Indra Sistemas SA 108 0.06
2 Laboratorios Farmaceuticos Rovi SA 106 0.06
201 Liberbank SA 66 0.04
109 Linea Directa Aseguradora SA Cia de Seguros yReaseguros 175 0.10
122 Mapfre SA 228 0.14
26 Mediaset Espana Comunicacion SA 149 0.09
17 Melia Hotels International SA 117 0.07
6 Metrovacesa SA 46 0.03
2 Miquel y Costas & Miquel SA 32 0.02
8 Neinor Homes SA 81 0.05
22 Obrascon Huarte Lain SA 14 0.01
2 Pharma Mar SA 122 0.07
2 Prim SA 25 0.01
35 Promotora de Informaciones SA 31 0.02
36 Prosegur Cash SA 28 0.02
24 Prosegur Cia de Seguridad SA 62 0.04
46 Realia Business SA 32 0.02
40 Sacyr SA 88 0.05
6 Solaria Energia y Medio Ambiente SA 100 0.06
10 Talgo SA 49 0.03
4 Tecnicas Reunidas SA 51 0.03
15 Tubacex SA 26 0.02
82 Unicaja Banco SA 76 0.04
2 Vidrala SA (voting rights) 191 0.11
4 Viscofan SA 234 0.14
9 Vocento SA 10 0.01
20 Zardoya Otis SA 116 0.07
6,534 3.89
Sweden - 6.79%
11 AcadeMedia AB 83 0.05
5 Adapteo Oyj 89 0.05
8 AddLife AB 172 0.10
4 AddNode Group AB 124 0.07
- AddTech AB 6 -
- AF POYRY AB - -
5 Alimak Group AB 65 0.04
7 Ambea AB 46 0.03
3 Annehem Fastigheter 11 0.01
- AQ Group AB 14 0.01
3 Arise AB 14 0.01
34 Arjo AB 279 0.17
European Small Companies FundPortfolio of Investments as at 31 May 2021 (continued)
Dimensional Fund Advisors Semi-Annual Report and Unaudited Financial Statements, 31 May 2021 71

Shares (000's)
Value(000's)
EUR
% of NetAssetValue
Common Stock (continued)
Sweden - 6.79% (continued)
5 Atrium Ljungberg AB 102 0.06
14 Attendo AB 56 0.03
7 Beijer Alma AB 121 0.07
4 Beijer Electronics Group AB 19 0.01
4 Bergman & Beving AB 57 0.03
12 Betsson AB 4 -
12 Betsson AB 90 0.05
1 Better Collective A/S 14 0.01
7 BHG Group AB 118 0.07
15 Bilia AB 229 0.14
2 BioGaia AB 89 0.05
9 Biotage AB 155 0.09
13 Bonava AB 138 0.08
4 Boozt AB 76 0.05
32 Bravida Holding AB 397 0.24
5 Bufab AB 120 0.07
2 Bulten AB 24 0.01
7 Bure Equity AB 256 0.15
10 Byggmax Group AB 77 0.05
2 Calliditas Therapeutics AB 18 0.01
6 Catella AB 16 0.01
3 Catena AB 132 0.08
9 Cavotec SA 25 0.01
- Cellavision AB 9 0.01
5 Clas Ohlson AB 51 0.03
29 Cloetta AB 78 0.05
4 Collector AB 12 0.01
6 Concentric AB 115 0.07
8 Coor Service Management Holding AB 56 0.03
1 CTT Systems AB 15 0.01
11 Dios Fastigheter AB 91 0.05
5 Doro AB 28 0.02
4 Duni AB 44 0.03
8 Dustin Group AB 82 0.05
2 Eastnine AB 31 0.02
1 Elanders AB 14 0.01
22 Electrolux Professional AB 121 0.07
14 Eltel AB 36 0.02
2 Enea AB 39 0.02
2 Eolus Vind AB 33 0.02
2 eWork Group AB 16 0.01
11 Fagerhult AB 76 0.04
5 FastPartner AB 51 0.03
1 Fenix Outdoor International AG 83 0.05
51 Fingerprint Cards AB 173 0.10
2 GARO AB 20 0.01
17 Granges AB 185 0.11
5 Haldex AB 30 0.02
4 Heba Fastighets AB 54 0.03
2 Hexatronic Group AB 35 0.02
2 HMS Networks AB 62 0.04
9 Hoist Finance AB 32 0.02
1 Hufvudstaden AB 18 0.01
5 Humana AB 34 0.02
2 Instalco AB 59 0.03
1 INVISIO AB 16 0.01
9 Inwido AB 135 0.08
5 ITAB Shop Concept AB 10 0.01
7 JM AB 217 0.13
32 Kindred Group PLC, SDR 453 0.27
76 Klovern AB 125 0.07
2 KNOW IT AB 68 0.04
Shares (000's)
Value(000's)
EUR
% of NetAssetValue
Common Stock (continued)
Sweden - 6.79% (continued)
30 Kungsleden AB 314 0.19
28 Lagercrantz Group AB 260 0.15
7 LeoVegas AB 28 0.02
1 Lime Technologies AB 35 0.02
10 Lindab International AB 192 0.11
10 Loomis AB 250 0.15
5 Medicover AB 110 0.07
7 Mekonomen AB 107 0.06
2 MIPS AB 158 0.09
13 Modern Times Group MTG AB 151 0.09
4 Momentum Group AB 68 0.04
1 Munters Group AB 9 0.01
11 Mycronic AB 276 0.16
1 NCAB Group AB 28 0.02
9 NCC AB 144 0.09
3 Nederman Holding AB 45 0.03
2 Nelly Group AB 8 -
56 Net Insight AB 14 0.01
8 New Wave Group AB 81 0.05
18 Nobia AB 133 0.08
15 Nobina AB 124 0.07
26 Nolato AB 226 0.13
2 Nordic Entertainment Group AB 88 0.05
6 Nordic Waterproofing Holding AB 94 0.06
4 NP3 Fastigheter AB 73 0.04
25 Nyfosa AB 276 0.16
8 OEM International AB 100 0.06
1 Orexo AB 5 -
8 Pandox AB 117 0.07
19 Peab AB 219 0.13
8 Platzer Fastigheter Holding AB 94 0.06
21 Pricer AB 62 0.04
5 Proact IT Group AB 41 0.02
2 Qliro AB 10 0.01
35 Ratos AB 182 0.11
3 RaySearch Laboratories AB 24 0.01
17 Resurs Holding AB 75 0.04
17 Rottneros AB 15 0.01
426 SAS AB 81 0.05
7 Scandi Standard AB 43 0.03
3 Sectra AB 166 0.10
3 Semcon AB 32 0.02
84 Sensys Gatso Group AB 10 0.01
6 SkiStar AB 78 0.05
3 Systemair AB 93 0.06
4 Tethys Oil AB 26 0.02
4 Tethys Oil AB 1 -
6 Troax Group AB 180 0.11
2 VBG Group AB 37 0.02
21 Wihlborgs Fastigheter AB 384 0.23
11,410 6.79
Switzerland - 10.82%
1 Adecco Group AG 40 0.02
2 Allreal Holding AG 333 0.20
1 ALSO Holding AG 179 0.11
25 ams AG 404 0.24
- APG SGA SA 49 0.03
9 Arbonia AG 133 0.08
199 Aryzta AG 219 0.13
3 Ascom Holding AG 47 0.03
- Autoneum Holding AG 64 0.04
1 Bachem Holding AG 237 0.14
European Small Companies FundPortfolio of Investments as at 31 May 2021 (continued)
Dimensional Fund Advisors Semi-Annual Report and Unaudited Financial Statements, 31 May 2021 72

Shares (000's)
Value(000's)
EUR
% of NetAssetValue
Common Stock (continued)
Switzerland - 10.82% (continued)
- Baloise Holding AG 57 0.03
- Banque Cantonale de Geneve 41 0.02
- Banque Cantonale Vaudoise 22 0.01
1 Belimo Holding AG 404 0.24
- Bell Food Group AG 58 0.03
1 Bellevue Group AG 49 0.03
1 Berner Kantonalbank AG 94 0.06
2 BKW AG 221 0.13
1 Bobst Group SA 60 0.04
1 Bossard Holding AG 189 0.11
1 Bucher Industries AG 499 0.30
- Burckhardt Compression Holding AG 145 0.09
- Burkhalter Holding AG 27 0.02
1 Calida Holding AG 25 0.01
- Carlo Gavazzi Holding AG 21 0.01
4 Cembra Money Bank AG 394 0.23
- Cicor Technologies Ltd 12 0.01
- Cie Financiere Tradition SA 35 0.02
22 Clariant AG 396 0.24
1 Coltene Holding AG 74 0.04
1 Comet Holding AG 158 0.09
- Conzzeta AG 274 0.16
- COSMO Pharmaceuticals NV 26 0.02
1 Daetwyler Holding AG 145 0.09
4 DKSH Holding AG 264 0.16
- dormakaba Holding AG 194 0.12
11 Dufry AG 578 0.34
15 EFG International AG 96 0.06
- Emmi AG 210 0.13
3 Energiedienst Holding AG 107 0.06
108 Evolva Holding SA 18 0.01
- Feintool International Holding AG 24 0.01
3 Flughafen Zurich AG 418 0.25
- Forbo Holding AG 205 0.12
1 Fundamenta Real Estate AG 15 0.01
5 Galenica AG 310 0.18
31 GAM Holding AG 64 0.04
1 Georg Fischer AG 727 0.43
- Gurit Holding AG 96 0.06
6 Helvetia Holding AG 522 0.31
1 Hiag Immobilien Holding AG 109 0.07
- HOCHDORF Holding AG 9 0.01
2 Huber & Suhner AG 109 0.07
- Hypothekarbank Lenzburg AG 24 0.01
2 Implenia AG 42 0.03
1 Ina Invest Holding AG 11 0.01
- Inficon Holding AG 216 0.13
- Interroll Holding AG 237 0.14
- Intershop Holding AG 95 0.06
1 Investis Holding SA 41 0.02
1 Jungfraubahn Holding AG 77 0.05
1 Kardex AG 120 0.07
- Komax Holding AG 86 0.05
8 Kudelski SA 28 0.02
3 Landis&Gyr Group AG 153 0.09
1 Lastminute.com NV 36 0.02
- LEM Holding SA 98 0.06
2 Liechtensteinische Landesbank AG 73 0.04
1 Luzerner Kantonalbank AG 227 0.14
1 Meier Tobler Group AG 9 0.01
- Metall Zug AG 55 0.03
5 Mobilezone Holding AG 53 0.03
Shares (000's)
Value(000's)
EUR
% of NetAssetValue
Common Stock (continued)
Switzerland - 10.82% (continued)
1 Mobimo Holding AG 228 0.14
30 OC Oerlikon Corp AG 280 0.17
2 Orascom Development Holding AG 22 0.01
- Orell Fuessli Holding AG 10 0.01
1 Orior AG 71 0.04
- Peach Property Group AG 14 0.01
- Phoenix Mecano AG 32 0.02
- Plazza AG 51 0.03
5 PSP Swiss Property AG 555 0.33
1 Rieter Holding AG 95 0.06
- Romande Energie Holding SA 62 0.04
- Schaffner Holding AG 21 0.01
76 Schmolz & Bickenbach AG 31 0.02
- Schweiter Technologies AG 149 0.09
- Sensirion Holding AG 17 0.01
2 SFS Group AG 272 0.16
1 Siegfried Holding AG 474 0.28
30 SIG Combibloc Group AG 643 0.38
6 Softwareone Holding AG 130 0.08
- St Galler Kantonalbank AG 138 0.08
3 Sulzer AG 326 0.19
9 Swiss Prime Site AG 788 0.47
2 Swissquote Group Holding SA 204 0.12
1 Tamedia AG 35 0.02
- Tecan Group AG 99 0.06
- Thurgauer Kantonalbank 10 0.01
1 u-blox Holding AG 45 0.03
2 Valiant Holding AG 159 0.09
- Valora Holding AG 73 0.04
1 Varia US Properties AG 23 0.01
4 VAT Group AG 1,031 0.61
- Vaudoise Assurances Holding SA 50 0.03
2 Vetropack Holding AG 79 0.05
11 Von Roll Holding AG 8 -
5 Vontobel Holding AG 316 0.19
1 VP Bank AG 58 0.03
2 VZ Holding AG 109 0.06
- V-ZUG Holding AG 38 0.02
1 Walliser Kantonalbank 81 0.05
- Warteck Invest AG 57 0.03
- Ypsomed Holding AG 39 0.02
2 Zehnder Group AG 126 0.08
- Zug Estates Holding AG 86 0.05
- Zuger Kantonalbank AG 149 0.09
18,171 10.82
United Kingdom - 25.81%
3 4imprint Group PLC 112 0.07
41 888 Holdings PLC 189 0.11
19 Advanced Medical Solutions Group PLC 61 0.04
14 AG Barr PLC 83 0.05
46 Aggreko PLC 460 0.27
10 Airtel Africa PLC 9 0.01
20 AJ Bell PLC 100 0.06
59 Alliance Pharma PLC 68 0.04
24 Anglo Pacific Group PLC 40 0.02
4 Anglo-Eastern Plantations PLC 31 0.02
13 Appreciate Group PLC 6 -
1 Aptitude Software Group PLC 10 0.01
30 Arrow Global Group PLC 106 0.06
46 Ascential PLC 196 0.12
44 Ashmore Group PLC 202 0.12
4 Avon Rubber PLC 127 0.08
European Small Companies FundPortfolio of Investments as at 31 May 2021 (continued)
Dimensional Fund Advisors Semi-Annual Report and Unaudited Financial Statements, 31 May 2021 73

Shares (000's)
Value(000's)
EUR
% of NetAssetValue
Common Stock (continued)
United Kingdom - 25.81% (continued)
57 Babcock International Group PLC 197 0.12
15 Bakkavor Group PLC 24 0.01
76 Balfour Beatty PLC 275 0.16
5 Bank of Georgia Group PLC 73 0.04
70 Beazley PLC 245 0.15
10 Begbies Traynor Group PLC 16 0.01
3 Bellway PLC 109 0.06
36 Biffa PLC 121 0.07
7 Bloomsbury Publishing PLC 27 0.02
35 Bodycote PLC 347 0.21
15 Boot Henry PLC 50 0.03
4 Braemar Shipping Services PLC 10 0.01
33 Brewin Dolphin Holdings PLC 130 0.08
29 Britvic PLC 308 0.18
30 Burford Capital Ltd 293 0.17
5 Bytes Technology Group PLC 30 0.02
39 C&C Group PLC 110 0.07
52 Cairn Energy PLC 99 0.06
145 Capita PLC 68 0.04
57 Card Factory PLC 45 0.03
10 CareTech Holdings PLC 65 0.04
16 Carr's Group PLC 30 0.02
8 Castings PLC 33 0.02
136 Centamin PLC 173 0.10
26 Centaur Media PLC 12 0.01
32 Central Asia Metals PLC 103 0.06
644 Centrica PLC 409 0.24
6 Charles Stanley Group PLC 26 0.02
34 Chemring Group PLC 119 0.07
15 Chesnara PLC 50 0.03
161 Cineworld Group PLC 173 0.10
35 Circassia Pharmaceuticals PLC 14 0.01
3 Clarkson PLC 119 0.07
16 Clinigen Healthcare Ltd 157 0.09
6 Clipper Logistics PLC 51 0.03
18 Close Brothers Group PLC 344 0.20
20 CLS Holdings PLC 58 0.03
15 CMC Markets PLC 83 0.05
104 Coats Group PLC 80 0.05
9 Computacenter PLC 279 0.17
9 ContourGlobal PLC 19 0.01
26 Costain Group PLC 18 0.01
88 Countryside Properties PLC 522 0.31
6 Cranswick PLC 282 0.17
42 Crest Nicholson Holdings PLC 226 0.13
7 CVS Group PLC 188 0.11
17 Daily Mail & General Trust PLC 178 0.11
15 Dart Group PLC 235 0.14
25 De La Rue PLC 53 0.03
157 Debenhams PLC - -
15 Devro PLC 36 0.02
28 DFS Furniture PLC 92 0.05
5 Dialight PLC 21 0.01
5 Dignity PLC 41 0.02
20 Diploma PLC 663 0.39
11 DiscoverIE Group PLC 100 0.06
38 Diversified Gas & Oil PLC 47 0.03
124 Dixons Carphone PLC 196 0.12
51 Domino's Pizza Group PLC 216 0.13
5 dotdigital Group PLC 13 0.01
78 Drax Group PLC 395 0.24
11 Dunelm Group PLC 190 0.11
Shares (000's)
Value(000's)
EUR
% of NetAssetValue
Common Stock (continued)
United Kingdom - 25.81% (continued)
8 Dyson Group PLC - -
22 Electrocomponents PLC 251 0.15
93 Elementis PLC 170 0.10
5 EMIS Group PLC 75 0.04
277 EnQuest PLC 55 0.03
6 Epwin Group PLC 8 -
45 Equiniti Group PLC 94 0.06
12 Euromoney Institutional Investor PLC 146 0.09
8 European Home Retail PLC - -
10 FDM Group Holdings PLC 119 0.07
58 Ferrexpo PLC 302 0.18
11 Fevertree Drinks PLC 340 0.20
53 Filtrona PLC 191 0.11
199 Firstgroup PLC 189 0.11
8 Flowtech Fluidpower PLC 12 0.01
27 Forterra PLC 92 0.05
50 Foxtons Group PLC 34 0.02
1 Frontier Developments PLC 24 0.01
5 Fuller Smith & Turner PLC 48 0.03
12 Future PLC 393 0.23
23 Galliford Try Holdings PLC 34 0.02
3 Games Workshop Group PLC 471 0.28
10 Gamesys Group PLC 221 0.13
4 Gamma Communications PLC 99 0.06
1 GB Group PLC 12 0.01
21 Gem Diamonds Ltd 17 0.01
14 Genel Energy PLC 23 0.01
6 Genus PLC 378 0.23
3 Georgia Capital PLC 21 0.01
9 Go-Ahead Group PLC 125 0.07
- Goodwin PLC 11 0.01
38 Grafton Group PLC 519 0.31
79 Grainger PLC 264 0.16
75 Greencore Group PLC 123 0.07
16 Greggs PLC 462 0.28
42 Gulf Keystone Petroleum Ltd 82 0.05
21 Gym Group PLC 68 0.04
4 H&T Group PLC 12 0.01
34 Halfords Group PLC 151 0.09
170 Harbour Energy PLC 41 0.02
223 Hays PLC 449 0.27
16 Headlam Group PLC 89 0.05
13 Helical PLC 65 0.04
7 Helios Towers PLC 14 0.01
10 Hill & Smith Holdings PLC 174 0.10
8 Hilton Food Group PLC 106 0.06
39 Hiscox Ltd 358 0.21
34 Hochschild Mining PLC 77 0.05
23 Hollywood Bowl Group PLC 69 0.04
8 Hostelworld Group PLC 9 0.01
26 Hunting PLC 78 0.05
45 Hyve Group PLC 69 0.04
47 Ibstock PLC 126 0.07
21 IDOX PLC 15 0.01
46 IG Group Holdings PLC 455 0.27
32 IMI PLC 614 0.37
2 Impax Asset Management Group PLC 32 0.02
66 Inchcape PLC 602 0.36
112 Indivior PLC 203 0.12
22 IntegraFin Holdings PLC 142 0.08
50 International Personal Finance PLC 78 0.05
69 Investec PLC 249 0.15
European Small Companies FundPortfolio of Investments as at 31 May 2021 (continued)
Dimensional Fund Advisors Semi-Annual Report and Unaudited Financial Statements, 31 May 2021 74

Shares (000's)
Value(000's)
EUR
% of NetAssetValue
Common Stock (continued)
United Kingdom - 25.81% (continued)
11 iomart Group PLC 33 0.02
113 IP Group PLC 162 0.10
19 IQE PLC 12 0.01
98 IWG PLC 412 0.25
6 James Fisher & Sons PLC 66 0.04
6 James Halstead PLC 34 0.02
12 JD Wetherspoon PLC 182 0.11
78 John Laing Group PLC 365 0.22
13 John Menzies PLC 46 0.03
76 John Wood Group PLC 216 0.13
42 Johnson Service Group PLC 82 0.05
4 Joules Group PLC 12 0.01
3 JTC PLC 25 0.01
53 Jupiter Fund Management PLC 171 0.10
175 Just Group PLC 224 0.13
9 Kainos Group PLC 144 0.09
9 Keller Group PLC 83 0.05
3 Keywords Studios PLC 96 0.06
29 Kier Group PLC 38 0.02
25 Kier Group PLC 9 0.01
30 Kin & Carta PLC 69 0.04
45 Lamprell PLC 33 0.02
29 Lancashire Holdings Ltd 214 0.13
29 Learning Technologies Group PLC 57 0.03
2 Liontrust Asset Management PLC 36 0.02
66 Lookers PLC 52 0.03
11 LSL Property Services PLC 59 0.04
15 Luceco PLC 59 0.04
6 M&C Saatchi PLC 8 -
170 Man Group PLC 352 0.21
323 Marks & Spencer Group PLC 619 0.37
22 Marshalls PLC 192 0.11
115 Marston's PLC 122 0.07
23 McBride PLC 24 0.01
18 Mears Group PLC 39 0.02
46 Mediclinic International PLC 173 0.10
120 Meggitt PLC 708 0.42
10 Metro Bank PLC 13 0.01
35 Michael Page International PLC 247 0.15
42 Micro Focus International PLC 251 0.15
51 Mitchells & Butlers PLC 181 0.11
194 Mitie Group PLC 154 0.09
7 MJ Gleeson PLC 69 0.04
62 Moneysupermarket.com Group PLC 194 0.12
47 Morgan Crucible Co PLC 181 0.11
7 Morgan Sindall Group PLC 175 0.10
5 Morses Club PLC 4 -
2 Mortgage Advice Bureau Holdings Ltd 29 0.02
8 Motorpoint group PLC 25 0.01
43 N Brown Group PLC 33 0.02
8 Naked Wines PLC 73 0.04
97 National Express Group PLC 342 0.20
33 NCC Group PLC 114 0.07
9 Next Fifteen Communications Group PLC 86 0.05
3 Nichols PLC 47 0.03
38 Ninety One PLC 105 0.06
12 Norcros PLC 41 0.02
34 Northgate PLC 152 0.09
6 Numis Corp PLC 26 0.02
18 On the Beach Group PLC 85 0.05
37 OSB Group PLC 201 0.12
6 Oxford Instruments PLC 145 0.09
Shares (000's)
Value(000's)
EUR
% of NetAssetValue
Common Stock (continued)
United Kingdom - 25.81% (continued)
205 Pan African Resources PLC 55 0.03
31 Paragon Group of Cos PLC 175 0.10
5 Parkmead Group PLC 2 -
8 PayPoint PLC 52 0.03
182 Pendragon PLC 39 0.02
43 Petrofac Ltd 67 0.04
294 Petropavlovsk PLC 86 0.05
60 Pets at Home Group PLC 312 0.19
37 Pharos Energy PLC 11 0.01
46 Photo-Me International PLC 37 0.02
35 Playtech PLC 186 0.11
10 Plus500 Ltd 174 0.10
10 Polar Capital Holdings PLC 94 0.06
36 Polypipe Group PLC 273 0.16
4 Porvair PLC 28 0.02
2 PPHE Hotel Group Ltd 45 0.03
84 Premier Foods PLC 104 0.06
30 Provident Financial PLC 83 0.05
18 PureTech Health PLC 81 0.05
28 PZ Cussons PLC 83 0.05
65 QinetiQ Group PLC 267 0.16
198 Quilter PLC 354 0.21
31 Rank Group PLC 72 0.04
10 Rathbone Brothers PLC 213 0.13
44 Raven Property Group Ltd 15 0.01
62 Reach PLC 171 0.10
11 Redcentric PLC 19 0.01
32 Redrow PLC 253 0.15
10 Renew Holdings PLC 71 0.04
- Renishaw PLC 17 0.01
32 Renold PLC 10 0.01
45 Restaurant Group PLC 63 0.04
1 Rhi Magnesita NV (Austria listing) 61 0.04
5 Rhi Magnesita NV (UK listing) 238 0.14
8 Ricardo PLC 43 0.03
12 RM PLC 29 0.02
11 Robert Walters PLC 85 0.05
53 Rockhopper Exploration PLC 6 -
101 Rotork PLC 397 0.24
70 Royal Mail PLC 474 0.28
41 RPS Group PLC 46 0.03
22 RWS Holdings PLC 162 0.10
- S&U PLC 10 0.01
33 Sabre Insurance Group PLC 99 0.06
12 Saga PLC 54 0.03
11 Sanne Group PLC 98 0.06
16 Savills PLC 223 0.13
1 Secure Trust Bank PLC 18 0.01
73 Senior PLC 135 0.08
45 Serco Group PLC 70 0.04
43 Severfield PLC 40 0.02
162 Shanks Group PLC 102 0.06
129 SIG PLC 93 0.06
142 Signature Aviation PLC 653 0.39
10 Sirius Real Estate Ltd 12 0.01
12 Smart Metering Systems PLC 125 0.07
13 Softcat PLC 283 0.17
100 SolGold PLC 40 0.02
14 Spectris PLC 512 0.30
51 Speedy Hire PLC 45 0.03
29 Spire Healthcare Group PLC 84 0.05
71 Spirent Communications PLC 205 0.12
European Small Companies FundPortfolio of Investments as at 31 May 2021 (continued)
Dimensional Fund Advisors Semi-Annual Report and Unaudited Financial Statements, 31 May 2021 75

Shares (000's)
Value(000's)
EUR
% of NetAssetValue
Common Stock (continued)
United Kingdom - 25.81% (continued)
16 Sportech PLC 6 -
24 Sports Direct International PLC 165 0.10
102 SSP Group PLC 350 0.21
24 St Modwen Properties PLC 156 0.09
69 Stagecoach Group PLC 69 0.04
16 SThree PLC 78 0.05
59 Stobart Group Ltd 23 0.01
20 Stock Spirits Group PLC 63 0.04
16 Strix Group PLC 55 0.03
9 Studio Retail Group PLC 28 0.02
6 STV Group PLC 24 0.01
9 SuperGroup PLC 39 0.02
38 Synthomer PLC 234 0.14
46 Tate & Lyle PLC 413 0.25
4 TBC Bank Group PLC 60 0.04
9 TClarke PLC 15 0.01
8 Ted Baker PLC 16 0.01
7 Telecom Plus PLC 94 0.06
6 Telit Communications PLC 17 0.01
25 TI Fluid Systems PLC 88 0.05
34 Topps Tiles PLC 29 0.02
150 TP ICAP Group PLC 372 0.22
27 Travis Perkins PLC 512 0.30
1 Treatt PLC 11 0.01
3 Tremor International Ltd 24 0.01
17 Trifast PLC 31 0.02
30 TT Electronics plc 90 0.05
14 TUI AG 69 0.04
306 Tullow Oil PLC 182 0.11
25 Tyman PLC 143 0.09
26 U & I Group PLC 29 0.02
30 UDG Healthcare PLC 366 0.22
8 Ultra Electronics Holdings PLC 199 0.12
71 Vectura Group PLC 132 0.08
48 Vertu Motors PLC 24 0.01
30 Vesuvius PLC 195 0.12
10 Victrex PLC 277 0.16
183 Virgin Money UK PLC 450 0.27
35 Vistry Group PLC 542 0.32
7 Vitec Group PLC 112 0.07
37 Vivo Energy PLC 43 0.03
14 Volex PLC 56 0.03
27 Volution Group PLC 136 0.08
4 Vp PLC 38 0.02
33 Watkin Jones PLC 87 0.05
18 WH Smith PLC 371 0.22
30 Wickes Group PLC 90 0.05
10 Wilmington PLC 22 0.01
22 Wincanton PLC 113 0.07
14 Xaar PLC 34 0.02
2 XP Power Ltd 110 0.07
3 Young & Co's Brewery PLC, Class A 51 0.03
5 Zotefoams PLC 26 0.02
43,350 25.81
Total Common Stock - 93.32% (30 November 2020: 93.92%) 156,756 93.32
Preferred Stock
Germany - 0.62%
2 Biotest AG 70 0.04
1 Draegerwerk AG & Co KGaA 76 0.05
8 Fuchs Petrolub SE 350 0.21
6 Jungheinrich AG 232 0.14
Shares (000's)
Value(000's)
EUR
% of NetAssetValue
Preferred Stock (continued)
Germany - 0.62% (continued)
3 Sixt SE 225 0.13
- STO SE & Co KGaA 54 0.03
2 Villeroy & Boch AG 33 0.02
1,040 0.62
Italy - 0.05%
6 Danieli & C Officine Meccaniche SpA 88 0.05
88 0.05
Total Preferred Stock - 0.67% (30 November 2020: 0.85%) 1,128 0.67
Real Estate Investment Trust
Belgium - 1.23%
4 Aedifica SA 395 0.24
1 Ascencio 35 0.02
3 Befimmo SA 103 0.06
3 Care Property Invest NV 86 0.05
3 Cofinimmo SA 409 0.24
- Home Invest Belgium SA 25 0.01
3 Intervest Offices & Warehouses NV 65 0.04
- Leasinvest Real Estate SCA 21 0.01
1 Montea CVA 110 0.07
1 Retail Estates NV 78 0.05
22 Warehouses De Pauw CVA 689 0.41
1 Wereldhave Belgium Comm VA 25 0.01
1 Xior Student Housing NV 31 0.02
2,072 1.23
France - 0.94%
- Altarea SCA 77 0.05
2 ARGAN SA 165 0.10
8 Carmila SA 107 0.06
5 Covivio 357 0.21
- Covivio Hotels SACA 8 -
4 ICADE 261 0.16
21 Klepierre SA 501 0.30
8 Mercialys SA 83 0.05
1 Societe de la Tour Eiffel 24 0.01
1,583 0.94
Germany - 0.24%
19 alstria office REIT AG 280 0.17
12 Hamborner REIT AG 115 0.07
395 0.24
Ireland - 0.11%
82 Hibernia REIT PLC 98 0.06
53 Irish Residential Properties REIT PLC 83 0.05
181 0.11
Italy - 0.03%
4 COIMA RES SpA 25 0.01
8 Immobiliare Grande Distribuzione SIIQ SpA 34 0.02
59 0.03
Netherlands - 0.24%
7 Eurocommercial Properties NV 159 0.10
4 NSI NV 124 0.07
1 Vastned Retail NV 35 0.02
5 Wereldhave NV 77 0.05
395 0.24
Spain - 0.43%
31 Inmobiliaria Colonial Socimi SA 279 0.16
9 Lar Espana Real Estate Socimi SA 51 0.03
42 Merlin Properties Socimi SA 400 0.24
730 0.43
United Kingdom - 2.25%
309 Assura PLC 267 0.16
European Small Companies FundPortfolio of Investments as at 31 May 2021 (continued)
Dimensional Fund Advisors Semi-Annual Report and Unaudited Financial Statements, 31 May 2021 76

Shares (000's)
Value(000's)
EUR
% of NetAssetValue
Real Estate Investment Trust (continued)
United Kingdom - 2.25% (continued)
18 Big Yellow Group PLC 277 0.16
104 Capital & Counties Properties PLC 210 0.13
48 Custodian Reit PLC 54 0.03
3 Derwent London PLC 130 0.08
24 Ediston Property Investment Co PLC 19 0.01
80 Empiric Student Property PLC 82 0.05
52 GCP Student Living PLC 105 0.06
27 Great Portland Estates PLC 227 0.14
662 Hammerson PLC 307 0.18
134 Intu Properties PLC - -
99 LondonMetric Property PLC 270 0.16
17 LXI REIT plc 27 0.02
13 McKay Securities PLC 34 0.02
45 NewRiver REIT PLC 51 0.03
151 Primary Health Properties PLC 269 0.16
44 Regional REIT Ltd 45 0.03
25 Safestore Holdings PLC 277 0.16
69 Schroder Real Estate Investment Trust Ltd 37 0.02
21 Secure Income REIT PLC 93 0.06
22 Shaftesbury PLC 157 0.09
54 Standard Life Investment Property Income Trust Ltd 41 0.02
120 Target Healthcare REIT PLC 160 0.10
208 Tritax Big Box REIT PLC 477 0.28
15 Workspace Group PLC 163 0.10
3,779 2.25
Total Real Estate Investment Trust - 5.47% (30 November2020: 5.25%) 9,194 5.47
Shares (000's)
Value(000's)
EUR
% of NetAssetValue
Rights
Austria - 0.00%
11 CA Immobilien Anlagen AG - -
6 Intercell AG - -
- -
France - 0.00%
1 Covivio Hotels SACA - -
- -
Italy - 0.00%
4 Freni Brembo SpA - -
- -
Spain - 0.00%
8 Almirall SA 1 -
1 -
United Kingdom - 0.01%
10 C&C Group PLC 7 0.01
7 0.01
Total Rights - 0.01% (30 November 2020: 0.03%) 8 0.01
Total Investments - 99.47% (30 November 2020: 100.05%) 167,086 99.47
Value (000's)EUR
% of NetAssetValue
Cash and Cash Equivalents - 0.40% (30 November 2020: 0.27%) 677 0.40Other Assets in Excess of Other Liabilities - 0.13% (30 November 2020: (0.32)%) 207 0.13
Total Net Assets 167,970 100.00
Amounts designated as “- “ are either €0, less than €500 or less than 500 shares.
Analysis of Total Assets % of Total Assets
Transferable securities admitted to an official exchange listing 97.57
Current Assets 2.43
Total Assets 100.00
European Small Companies FundPortfolio of Investments as at 31 May 2021 (continued)
Dimensional Fund Advisors Semi-Annual Report and Unaudited Financial Statements, 31 May 2021 77

Shares (000's)
Value(000's)
EUR
% of NetAssetValue
Common Stock
Austria - 0.33%
8 Erste Group Bank AG 261 0.28
2 Raiffeisen Bank International AG 43 0.05
304 0.33
Belgium - 0.61%
7 Ageas 350 0.38
2 KBC Group NV 160 0.17
- Solvay SA 52 0.06
562 0.61
Denmark - 3.01%
- AP Moller - Maersk AS, Class A 123 0.13
- AP Moller - Maersk AS, Class B 190 0.21
6 Carlsberg AS 853 0.92
12 Danske Bank AS 193 0.21
3 DSV Panalpina AS 563 0.61
3 H Lundbeck AS 84 0.09
- Rockwool International AS, Class A 81 0.09
- Rockwool International AS, Class B 91 0.10
2 Tryg AS 35 0.04
18 Vestas Wind Systems 562 0.61
2,775 3.01
Finland - 1.97%
23 Fortum Oyj 544 0.59
100 Nokia Oyj 426 0.46
45 Nordea Bank Abp 402 0.44
27 Stora Enso Oyj 401 0.43
2 UPM-Kymmene Oyj 48 0.05
1,821 1.97
France - 16.76%
2 Accor SA 69 0.07
4 Arkema SA 406 0.44
4 Atos SE 235 0.25
22 AXA SA 510 0.55
27 BNP Paribas SA 1,525 1.65
34 Bollore SA 145 0.16
14 Bouygues SA 451 0.49
40 Carrefour SA 660 0.72
26 Cie de Saint-Gobain 1,425 1.55
10 Cie Generale des Etablissements Michelin SCA 1,270 1.38
6 CNP Assurances 95 0.10
11 Credit Agricole SA 135 0.15
4 Eiffage SA 361 0.39
20 Electricite de France SA 236 0.26
39 Engie SA 482 0.52
2 EssilorLuxottica SA 260 0.28
1 Faurecia 60 0.07
1 Faurecia SE 39 0.04
21 Natixis SA 85 0.09
102 Orange SA 1,070 1.16
1 Orpea 135 0.15
14 Publicis Groupe SA 758 0.82
11 Renault SA 361 0.39
2 Sanofi 146 0.16
29 Societe Generale SA 766 0.83
92 TOTAL SA 3,509 3.80
9 Vivendi SA 265 0.29
15,459 16.76
Germany - 11.95%
7 Allianz SE 1,543 1.67
9 Bayer AG 455 0.49
12 Bayerische Motoren Werke AG 1,082 1.17
4 Commerzbank AG 28 0.03
Shares (000's)
Value(000's)
EUR
% of NetAssetValue
Common Stock (continued)
Germany - 11.95% (continued)
4 Continental AG 479 0.52
4 Covestro AG 233 0.25
37 Daimler AG 2,837 3.08
49 Deutsche Bank AG 607 0.66
4 Evonik Industries AG 123 0.13
4 Fresenius Medical Care AG & Co KGaA 259 0.28
16 Fresenius SE & Co KGaA 694 0.75
7 HeidelbergCement AG 518 0.56
1 Muenchener Rueckversicherungs-Gesellschaft AGin Muenchen 258 0.28
25 RWE AG 789 0.86
10 Siemens Energy AG 251 0.27
2 Talanx AG 52 0.06
67 Telefonica Deutschland Holding AG 151 0.16
8 thyssenkrupp AG 74 0.08
4 Uniper SE 135 0.15
2 United Internet AG 59 0.07
1 Volkswagen AG 393 0.43
11,020 11.95
Ireland - 1.28%
13 AIB Group PLC 36 0.04
27 CRH PLC 1,148 1.24
1,184 1.28
Italy - 4.74%
81 Eni SpA 818 0.89
330 Intesa Sanpaolo SpA 795 0.86
129 Stellantis 2,072 2.25
313 Telecom Italia SpA 137 0.15
52 UniCredit SpA 545 0.59
4,367 4.74
Netherlands - 5.76%
10 ABN AMRO Bank NV 110 0.12
30 Aegon NV 119 0.13
23 ArcelorMittal SA 620 0.67
10 Coca-Cola European Partners PLC 473 0.51
5 Heineken NV 485 0.52
61 ING Groep NV 698 0.76
39 Koninklijke Ahold Delhaize NV 940 1.02
5 Koninklijke DSM NV 735 0.80
11 Koninklijke Philips NV 525 0.57
6 NN Group NV 230 0.25
6 Randstad NV 381 0.41
5,316 5.76
Norway - 1.48%
3 Austevoll Seafood ASA 32 0.03
20 DNB ASA 372 0.40
7 Equinor ASA 116 0.13
60 Norsk Hydro ASA 319 0.35
7 SpareBank 1 SR-Bank ASA 79 0.09
11 Storebrand ASA 90 0.10
7 Subsea 7 SA 57 0.06
7 Yara International ASA 296 0.32
1,361 1.48
Portugal - 0.15%
136 Banco Espirito Santo SA - -
4 EDP Renovaveis SA 72 0.08
7 Galp Energia SGPS SA 67 0.07
139 0.15
Spain - 4.23%
136 Banco Bilbao Vizcaya Argentaria SA 695 0.75
709 Banco Santander SA 2,451 2.66
European Value FundPortfolio of Investments as at 31 May 2021
Dimensional Fund Advisors Semi-Annual Report and Unaudited Financial Statements, 31 May 2021 78

Shares (000's)
Value(000's)
EUR
% of NetAssetValue
Common Stock (continued)
Spain - 4.23% (continued)
66 CaixaBank SA 188 0.20
52 Repsol SA 570 0.62
3,904 4.23
Sweden - 5.43%
1 Annehem Fastigheter 3 -
3 BillerudKorsnas AB 57 0.06
14 Boliden 446 0.48
13 Boliden 8 0.01
2 Bure Equity AB 62 0.07
10 Dometic Group AB 140 0.15
4 Getinge AB 119 0.13
2 Holmen AB 84 0.09
3 Husqvarna AB, Class B 33 0.04
2 ICA Gruppen AB 74 0.08
3 Intrum AB 89 0.10
5 Millicom International Cellular SA 194 0.21
1 Pandox AB 16 0.02
5 Peab AB 55 0.06
3 Saab AB 63 0.07
11 Securitas AB 145 0.16
29 Skandinaviska Enskilda Banken AB 312 0.34
20 Skanska AB 457 0.50
12 SKF AB 259 0.28
4 SSAB AB, Class A 18 0.02
14 SSAB AB, Class B 58 0.06
10 Svenska Cellulosa AB SCA 132 0.14
29 Svenska Handelsbanken AB 269 0.29
9 Swedbank AB 143 0.15
2 Swedish Orphan Biovitrum AB 34 0.04
13 Tele2 AB 143 0.16
65 Telia Co AB 238 0.26
9 Trelleborg AB 189 0.20
10 Volvo AB, Class A 212 0.23
44 Volvo AB, Class B 952 1.03
5,004 5.43
Switzerland - 15.35%
31 ABB Ltd 874 0.95
5 Adecco Group AG 314 0.34
10 Alcon Inc 576 0.62
1 Baloise Holding AG 141 0.15
14 Cie Financiere Richemont SA 1,422 1.54
95 Credit Suisse Group AG 849 0.92
4 Julius Baer Group Ltd 225 0.24
28 LafargeHolcim Ltd 1,387 1.50
44 Novartis AG 3,185 3.45
7 SIG Combibloc Group AG 144 0.16
1 Swatch Group AG (Bearer) 238 0.26
2 Swatch Group AG (Registered) 119 0.13
1 Swiss Life Holding AG 406 0.44
1 Swiss Prime Site AG 109 0.12
6 Swiss Re AG 439 0.48
Shares (000's)
Value(000's)
EUR
% of NetAssetValue
Common Stock (continued)
Switzerland - 15.35% (continued)
2 Swisscom AG 718 0.78
128 UBS Group AG 1,713 1.86
2 Vifor Pharma AG 187 0.20
3 Zurich Insurance Group AG 1,114 1.21
14,160 15.35
United Kingdom - 23.18%
14 Anglo American PLC 507 0.55
7 Antofagasta PLC 135 0.15
158 Aviva PLC 753 0.82
474 Barclays PLC 1,009 1.09
24 Barratt Developments PLC 209 0.23
3 Bellway PLC 108 0.12
814 BP PLC 2,907 3.15
54 British American Tobacco PLC 1,693 1.84
641 BT Group PLC 1,301 1.41
3 Carnival PLC 61 0.07
46 DS Smith PLC 225 0.24
357 Glencore PLC 1,331 1.44
266 HSBC Holdings PLC 1,411 1.53
4 Informa PLC 23 0.02
120 J Sainsbury PLC 372 0.40
148 Kingfisher PLC 616 0.67
2,218 Lloyds Banking Group PLC 1,286 1.39
102 Melrose Industries PLC 204 0.22
4 Ninety One PLC 12 0.01
17 Pearson PLC 162 0.18
137 Royal Bank of Scotland Group PLC 329 0.36
230 Royal Dutch Shell PLC 3,434 3.72
29 Royal Mail PLC 196 0.21
64 Standard Chartered PLC 379 0.41
84 Standard Life Aberdeen PLC 268 0.29
- Takeaway.com NV 16 0.02
1,189 Vodafone Group PLC 1,768 1.92
73 WM Morrison Supermarkets PLC 150 0.16
45 WPP PLC 514 0.56
21,379 23.18
Total Common Stock - 96.23% (30 November 2020: 97.48%) 88,755 96.23
Preferred Stock
Germany - 2.54%
2 Bayerische Motoren Werke AG 157 0.17
4 Porsche Automobil Holding SE 375 0.40
8 Volkswagen AG 1,816 1.97
2,348 2.54
Italy - 0.11%
212 Telecom Italia SpA 99 0.11
99 0.11
Total Preferred Stock - 2.65% (30 November 2020: 2.64%) 2,447 2.65
Total Investments - 98.88% (30 November 2020: 100.19%) 91,202 98.88
Value (000's)EUR
% of NetAssetValue
Cash and Cash Equivalents - 0.43% (30 November 2020: 0.21%) 400 0.43Other Assets in Excess of Other Liabilities - 0.69% (30 November 2020: (0.40)%) 629 0.69
Total Net Assets 92,231 100.00
Amounts designated as “- “ are either €0, less than €500 or less than 500 shares.
European Value FundPortfolio of Investments as at 31 May 2021 (continued)
Dimensional Fund Advisors Semi-Annual Report and Unaudited Financial Statements, 31 May 2021 79

Analysis of Total Assets % of Total Assets
Transferable securities admitted to an official exchange listing 98.00
Current Assets 2.00
Total Assets 100.00
European Value FundPortfolio of Investments as at 31 May 2021 (continued)
Dimensional Fund Advisors Semi-Annual Report and Unaudited Financial Statements, 31 May 2021 80

Shares (000's)
Value(000's)
USD
% of NetAssetValue
Investment Funds
Australia - 0.00%
10 WAM Capital Ltd 17 -
17 -
Total Investment Funds - 0.00% (30 November 2020: 0.00%) 17 -
Common Stock
Australia - 2.19%
15 3P Learning Ltd 15 -
20 A2B Australia Ltd 20 -
34 Accent Group Ltd 71 -
29 Adairs Ltd 106 -
67 Adelaide Brighton Ltd 171 -
1 Afterpay Touch Group Ltd 97 -
47 AGL Energy Ltd 299 0.01
8 Ainsworth Game Technology Ltd 5 -
51 Alkane Resources Ltd 35 -
14 Alliance Aviation Services Ltd 47 -
52 ALS Ltd 487 0.01
11 Altium Ltd 234 0.01
227 Alumina Ltd 298 0.01
65 AMA Group Ltd 28 -
466 AMP Ltd 423 0.01
19 Ampol Ltd 427 0.01
14 Ansell Ltd 449 0.01
20 AP Eagers Ltd 235 0.01
86 APA Group 612 0.01
9 Appen Ltd 90 -
157 Arafura Resources Ltd 20 -
9 ARB Corp Ltd 284 0.01
54 Ardent Leisure Group Ltd 42 -
25 Aristocrat Leisure Ltd 805 0.02
44 Asaleo Care Ltd 48 -
8 ASX Ltd 461 0.01
73 Atlas Arteria Ltd 347 0.01
6 AUB Group Ltd 90 -
145 Aurelia Metals Ltd 50 -
212 Aurizon Holdings Ltd 598 0.01
197 AusNet Services 266 0.01
46 Austal Ltd 84 -
65 Austin Engineering Ltd 7 -
107 Australia & New Zealand Banking Group Ltd 2,380 0.05
47 Australian Agricultural Co Ltd 45 -
25 Australian Finance Group Ltd 53 -
87 Australian Pharmaceutical Industries Ltd 77 -
17 Australian Strategic Materials Ltd 60 -
17 Australian Vintage Ltd 10 -
3 Auswide Bank Ltd 17 -
11 Baby Bunting Group Ltd 51 -
87 Bank of Queensland Ltd 606 0.01
52 Bapcor Ltd 321 0.01
96 Base Resources Ltd 22 -
16 BCI Minerals Ltd 5 -
421 Beach Energy Ltd 414 0.01
47 Bega Cheese Ltd 208 0.01
15 Bell Financial Group Ltd 20 -
31 Bellevue Gold Ltd 22 -
60 Bendigo & Adelaide Bank Ltd 485 0.01
180 BHP Group Ltd 6,662 0.15
54 Bingo Industries Ltd 142 -
1 Blackmores Ltd 44 -
4 Blue Sky Alternative Investments Ltd - -
49 BlueScope Steel Ltd 808 0.02
137 Boral Ltd 725 0.02
Shares (000's)
Value(000's)
USD
% of NetAssetValue
Common Stock (continued)
Australia - 2.19% (continued)
125 Brambles Ltd 1,047 0.02
31 Bravura Solutions Ltd 78 -
9 Breville Group Ltd 194 0.01
13 Brickworks Ltd 214 0.01
16 BWX Ltd 64 -
49 Byron Energy Ltd 4 -
102 Capitol Health Ltd 28 -
38 Cardno Ltd 20 -
36 carsales.com Ltd 544 0.01
57 Cash Converters International Ltd 10 -
6 Cedar Woods Properties Ltd 32 -
80 Challenger Ltd 321 0.01
32 Champion Iron Ltd 162 -
11 CIMIC Group Ltd 181 -
27 City Chic Collective Ltd 98 -
10 Class Ltd 13 -
7 Clean Seas Seafood Ltd 3 -
221 Cleanaway Waste Management Ltd 471 0.01
3 Clinuvel Pharmaceuticals Ltd 73 -
20 Clover Corp Ltd 24 -
4 Cochlear Ltd 773 0.02
15 Codan Ltd 225 0.01
86 Coles Group Ltd 1,103 0.03
24 Collection House Ltd 4 -
21 Collins Foods Ltd 206 0.01
83 Commonwealth Bank of Australia 6,424 0.14
52 Computershare Ltd 645 0.02
232 Cooper Energy Ltd 51 -
9 Corporate Travel Management Ltd 152 -
52 Costa Group Holdings Ltd 132 -
8 Credit Corp Group Ltd 182 0.01
21 Crown Resorts Ltd 207 0.01
23 CSL Ltd 5,078 0.11
97 CSR Ltd 416 0.01
22 Dacian Gold Ltd 5 -
17 Data#3 Ltd 81 -
20 Decmil Group Ltd 8 -
49 Deterra Royalties Ltd 159 -
8 Dicker Data Ltd 65 -
23 Domain Holdings Australia Ltd 91 -
7 Domino's Pizza Enterprises Ltd 614 0.01
144 Downer EDI Ltd 631 0.02
37 Earlypay Ltd 14 -
78 Eclipx Group Ltd 128 -
10 Elanor Investor Group 14 -
24 Elders Ltd 207 0.01
62 Emeco Holdings Ltd 43 -
140 Energy World Corp Ltd 9 -
3 EQT Holdings Ltd 52 -
16 Estia Health Ltd 31 -
8 Euroz Ltd 10 -
9 EVENT Hospitality and Entertainment Ltd 86 -
160 Evolution Mining Ltd 651 0.02
289 FAR Ltd 1 -
21 Fleetwood Corp Ltd 40 -
12 Flight Centre Travel Group Ltd 144 -
121 Fortescue Metals Group Ltd 2,060 0.05
12 Freedom Foods Group Ltd 4 -
152 G8 Education Ltd 119 -
28 Galaxy Resources Ltd (voting rights) 82 -
35 Genworth Mortgage Insurance Australia Ltd 74 -
104 Gold Road Resources Ltd 120 -
Global Core Equity FundPortfolio of Investments as at 31 May 2021
Dimensional Fund Advisors Semi-Annual Report and Unaudited Financial Statements, 31 May 2021 81

Shares (000's)
Value(000's)
USD
% of NetAssetValue
Common Stock (continued)
Australia - 2.19% (continued)
38 GrainCorp Ltd 146 -
125 Grange Resources Ltd 49 -
3 GTN Ltd 1 -
13 GUD Holdings Ltd 115 -
27 GWA Group Ltd 61 -
17 Hansen Technologies Ltd 69 -
94 Harvey Norman Holdings Ltd 380 0.01
87 Healius Ltd 277 0.01
6 Helloworld Travel Ltd 9 -
8 Highfield Resources Ltd 5 -
29 HT&E Ltd 38 -
3 HUB24 Ltd 57 -
70 Humm Group Ltd 55 -
4 Huon Aquaculture Group Ltd 7 -
21 IDP Education Ltd 367 0.01
113 IGO Ltd 663 0.02
72 Iluka Resources Ltd 429 0.01
69 Imdex Ltd 111 -
196 Incitec Pivot Ltd 349 0.01
42 Infomedia Ltd 45 -
42 Inghams Group Ltd 110 -
119 Insurance Australia Group Ltd 459 0.01
38 Intega Group Ltd 13 -
14 Integral Diagnostics Ltd 54 -
13 Integrated Research Ltd 24 -
14 InvoCare Ltd 115 -
86 ioneer Ltd 24 -
87 IOOF Holdings Ltd 263 0.01
22 IPH Ltd 112 -
24 IRESS Ltd 201 0.01
20 IVE Group Ltd 23 -
35 James Hardie Industries PLC 1,140 0.03
39 Japara Healthcare Ltd 35 -
16 JB Hi-Fi Ltd 597 0.01
8 Johns Lyng Group Ltd 26 -
4 Jumbo Interactive Ltd 46 -
9 Juno Minerals Ltd 1 -
146 Jupiter Mines Ltd 33 -
85 Karoon Energy Ltd 80 -
7 Kogan.com Ltd 53 -
44 Lendlease Group 420 0.01
9 Lifestyle Communities Ltd 102 -
86 Link Administration Holdings Ltd 363 0.01
7 Lovisa Holdings Ltd 78 -
2 Lycopodium Ltd 7 -
33 Lynas Corp Ltd 142 -
64 MACA Ltd 40 -
113 Macmahon Holdings Ltd 17 -
17 Macquarie Group Ltd 1,948 0.04
1 Macquarie Telecom Group Ltd 30 -
11 Magellan Financial Group Ltd 416 0.01
274 Mayne Pharma Group Ltd 78 -
8 McMillan Shakespeare Ltd 77 -
20 McPherson's Ltd 22 -
276 Medibank Pvt Ltd 666 0.02
44 Medusa Mining Ltd 29 -
44 Mesoblast Ltd 68 -
64 Metals X Ltd 13 -
179 Metcash Ltd 487 0.01
17 Michael Hill International Ltd 11 -
24 Mineral Resources Ltd 854 0.02
5 MNF Group Ltd 20 -
Shares (000's)
Value(000's)
USD
% of NetAssetValue
Common Stock (continued)
Australia - 2.19% (continued)
3 Moelis Australia Ltd 11 -
11 Monadelphous Group Ltd 84 -
63 Monash IVF Group Ltd 41 -
26 Money3 Corp Ltd 65 -
12 Mortgage Choice Ltd 18 -
86 Mount Gibson Iron Ltd 55 -
131 Myer Holdings Ltd 32 -
- Mystate Ltd 2 -
9 MyState Ltd 34 -
150 National Australia Bank Ltd 3,147 0.07
18 Navigator Global Investments Ltd 22 -
15 nearmap Ltd 21 -
12 Netwealth Group Ltd 133 -
11 New Energy Solar Ltd 7 -
41 New Hope Corp Ltd 46 -
57 Newcrest Mining Ltd 1,223 0.03
15 NEXTDC Ltd 127 -
51 nib holdings Ltd 247 0.01
9 Nick Scali Ltd 76 -
107 Nickel Mines Ltd 84 -
253 Nine Entertainment Co Holdings Ltd 578 0.01
118 Northern Star Resources Ltd 1,041 0.02
85 NRW Holdings Ltd 112 -
48 Nufarm Ltd 180 -
2 Objective Corp Ltd 27 -
21 OFX Group Ltd 23 -
216 Oil Search Ltd 620 0.01
26 OM Holdings Ltd 17 -
24 Omni Bridgeway Ltd 73 -
86 oOh!media Ltd 113 -
39 Orica Ltd 409 0.01
190 Origin Energy Ltd 597 0.01
23 Orocobre Ltd 117 -
149 Orora Ltd 362 0.01
4 Over the Wire Holdings Ltd 14 -
44 OZ Minerals Ltd 855 0.02
5 Pacific Current Group Ltd 20 -
45 Pact Group Holdings Ltd 127 -
92 Pantoro Ltd 17 -
71 Peet Ltd 64 -
47 Pendal Group Ltd 291 0.01
6 People Infrastructure Ltd 22 -
127 Perenti Global Ltd 65 -
7 Perpetual Ltd 218 0.01
206 Perseus Mining Ltd 222 0.01
69 Pilbara Minerals Ltd 65 -
39 Platinum Asset Management Ltd 141 -
41 Praemium Ltd 30 -
13 Premier Investments Ltd 259 0.01
7 Pro Medicus Ltd 230 0.01
9 Probiotec Ltd 14 -
6 Propel Funeral Partners Ltd 16 -
7 PWR Holdings Ltd 35 -
49 Qantas Airways Ltd 184 0.01
12 QANTM Intellectual Property Ltd 10 -
92 QBE Insurance Group Ltd 781 0.02
157 Qube Holdings Ltd 368 0.01
140 Ramelius Resources Ltd 211 0.01
17 Ramsay Health Care Ltd 834 0.02
4 REA Group Ltd 530 0.01
6 ReadyTech Holdings Ltd 10 -
301 Red 5 Ltd 37 -
Global Core Equity FundPortfolio of Investments as at 31 May 2021 (continued)
Dimensional Fund Advisors Semi-Annual Report and Unaudited Financial Statements, 31 May 2021 82

Shares (000's)
Value(000's)
USD
% of NetAssetValue
Common Stock (continued)
Australia - 2.19% (continued)
29 Redcape Hotel Group 24 -
12 Reece Ltd 189 0.01
27 Regis Healthcare Ltd 41 -
114 Regis Resources Ltd 230 0.01
9 Reject Shop Ltd 43 -
85 Reliance Worldwide Corp Ltd 340 0.01
62 Resolute Mining Ltd 28 -
54 Ridley Corp Ltd 50 -
21 Rio Tinto Ltd 2,014 0.05
38 Sandfire Resources NL 211 0.01
218 Santos Ltd 1,160 0.03
19 SEEK Ltd 450 0.01
22 Select Harvests Ltd 98 -
28 Senex Energy Ltd 68 -
12 Servcorp Ltd 33 -
64 Service Stream Ltd 48 -
7 Seven Group Holdings Ltd 111 -
103 Seven West Media Ltd 33 -
12 SG Fleet Group Ltd 29 -
104 Sigma Healthcare Ltd 50 -
140 Silver Lake Resources Ltd 213 0.01
29 Sims Metal Management Ltd 349 0.01
17 SmartGroup Corp Ltd 89 -
38 Sonic Healthcare Ltd 1,015 0.02
294 South32 Ltd 681 0.02
34 Southern Cross Electrical Engineering Ltd 14 -
27 Southern Cross Media Group Ltd 40 -
188 Spark Infrastructure Group 317 0.01
44 SpeedCast International Ltd - -
23 SRG Global Ltd 9 -
134 St Barbara Ltd 195 0.01
140 Star Entertainment Grp Ltd 439 0.01
118 Steadfast Group Ltd 368 0.01
76 Suncorp Group Ltd 660 0.02
5 Sunrise Energy Metals Ltd 9 -
33 Super Retail Group Ltd 326 0.01
17 Superloop Ltd 13 -
78 Sydney Airport 357 0.01
72 Syrah Resources Ltd 58 -
137 Tabcorp Holdings Ltd 547 0.01
40 Tassal Group Ltd 115 -
38 Technology One Ltd 272 0.01
447 Telstra Corp Ltd 1,205 0.03
4 Temple & Webster Group Ltd 32 -
43 TPG Telecom Ltd 176 -
64 Transurban Group 686 0.02
48 Treasury Wine Estates Ltd 434 0.01
1 Tribune Resources Ltd 3 -
22 Tuas Ltd 11 -
43 United Malt Group Ltd 147 -
14 Virtus Health Ltd 67 -
24 Vita Group Ltd 17 -
136 Viva Energy Group Ltd 217 0.01
105 Vocus Group Ltd 440 0.01
37 Webjet Ltd 148 -
54 Wesfarmers Ltd 2,320 0.05
28 Western Areas Ltd 54 -
60 Westgold Resources Ltd 104 -
139 Westpac Banking Corp 2,838 0.06
161 Whitehaven Coal Ltd 198 0.01
2 WiseTech Global Ltd 37 -
58 Woodside Petroleum Ltd 987 0.02
Shares (000's)
Value(000's)
USD
% of NetAssetValue
Common Stock (continued)
Australia - 2.19% (continued)
75 Woolworths Group Ltd 2,421 0.06
37 Worley Ltd 302 0.01
6 Xero Ltd 634 0.02
97,908 2.19
Austria - 0.16%
2 Agrana Beteiligungs AG 55 -
9 Andritz AG 539 0.01
5 AT&S Austria Technologie & Systemtechnik AG 175 -
10 Atrium European Real Estate Ltd 37 -
8 BAWAG Group AG 448 0.01
- DO & CO AG 37 -
17 Erste Group Bank AG 690 0.02
6 EVN AG 136 -
1 FACC AG 16 -
1 Flughafen Wien AG 22 -
10 Immofinanz AG 214 0.01
1 Kapsch TrafficCom AG 10 -
1 Lenzing AG 198 0.01
1 Mayr Melnhof Karton AG 193 -
- Oberbank AG 25 -
5 Oesterreichische Post AG 249 0.01
15 OMV AG 895 0.02
2 Palfinger AG 83 -
2 POLYTEC Holding AG 25 -
2 Porr AG 31 -
27 Raiffeisen Bank International AG 652 0.02
1 Rosenbauer International AG 50 -
5 S IMMO AG 143 -
1 Schoeller-Bleckmann Oilfield Equipment AG 45 -
1 Semperit AG Holding 54 -
2 Strabag SE 111 -
24 Telekom Austria AG 209 0.01
1 UBM Development AG 48 -
19 UNIQA Insurance Group AG 173 -
3 Verbund AG 254 0.01
7 Vienna Insurance Group AG Wiener VersicherungGruppe 189 -
22 Voestalpine AG 1,010 0.02
6 Wienerberger AG 252 0.01
4 Zumtobel Group AG 39 -
7,307 0.16
Belgium - 0.38%
3 Ackermans & van Haaren NV 573 0.01
24 Ageas 1,533 0.03
12 AGFA-Gevaert NV 56 -
48 Anheuser-Busch InBev SA 3,604 0.08
1 Argenx SE 232 0.01
1 Atenor 42 -
- Banque Nationale de Belgique 13 -
3 Barco NV 91 -
7 Bekaert SA 315 0.01
2 Biocartis NV 9 -
21 bpost SA 282 0.01
- Celyad SA 3 -
2 Cie d'Entreprises CFE 228 0.01
7 Colruyt SA 432 0.01
7 Deceuninck NV 25 -
4 D'ieteren SA 447 0.01
19 Econocom Group SA 76 -
3 Elia System Operator SA 346 0.01
39 Euronav NV 369 0.01
2 EVS Broadcast Equipment SA 45 -
Global Core Equity FundPortfolio of Investments as at 31 May 2021 (continued)
Dimensional Fund Advisors Semi-Annual Report and Unaudited Financial Statements, 31 May 2021 83

Shares (000's)
Value(000's)
USD
% of NetAssetValue
Common Stock (continued)
Belgium - 0.38% (continued)
7 Exmar NV 33 -
8 Fagron 193 -
1 Galapagos NV 61 -
3 Gimv NV 218 0.01
1 Immobel SA 76 -
2 Ion Beam Applications 36 -
1 Jensen-Group NV 23 -
15 KBC Group NV 1,205 0.03
2 Kinepolis Group NV 137 -
- Lotus Bakeries NV 281 0.01
2 MDxHealth 4 -
3 Melexis NV 281 0.01
1 Mithra Pharmaceuticals SA 28 -
12 Ontex Group NV 157 -
- Oxurion NV - -
- Picanol 19 -
28 Proximus SADP 566 0.01
10 Recticel SA 189 -
- Resilux 26 -
- Roularta Media Group NV 5 -
2 Shurgard Self Storage SA 90 -
1 Sipef NV 61 -
15 Solvay SA 1,996 0.05
6 Telenet Group Holding NV 226 0.01
- TER Beke SA 9 -
5 Tessenderlo Group SA 232 0.01
5 UCB SA 482 0.01
22 Umicore SA 1,327 0.03
1 Van de Velde NV 38 -
1 VGP NV 174 -
2 Viohalco SA 9 -
16,903 0.38
Brazil - 0.00%
7 Natura & Co Holding SA, ADR 137 -
137 -
Canada - 3.48%
11 5N Plus Inc 26 -
5 Absolute Software Corp 76 -
1 Acadian Timber Corp 15 -
29 Advantage Energy Ltd 85 -
13 Aecon Group Inc 204 0.01
24 Africa Oil Corp 24 -
1 Ag Growth International Inc 27 -
10 AGF Management Ltd 64 -
24 Agnico Eagle Mines Ltd 1,729 0.04
12 Aimia Inc 48 -
5 Air Canada 104 -
2 AirBoss of America Corp 54 -
58 Alamos Gold Inc 529 0.01
4 Alaris Equity Partners Income 59 -
4 Alcanna Inc 21 -
2 Algoma Central Corp 29 -
28 Algonquin Power & Utilities Corp 428 0.01
51 Alimentation Couche-Tard Inc 1,864 0.04
41 AltaGas Ltd 811 0.02
3 Altius Minerals Corp 43 -
3 Altus Group Ltd 135 -
3 Americas Gold & Silver Corp 6 -
17 Amerigo Resources Ltd 20 -
5 Andrew Peller Ltd 48 -
147 ARC Resources Ltd 1,117 0.03
37 Argonaut Gold Inc 93 -
Shares (000's)
Value(000's)
USD
% of NetAssetValue
Common Stock (continued)
Canada - 3.48% (continued)
11 Aritzia Inc 265 0.01
17 Ascot Resources Ltd 19 -
8 Atco Ltd 275 0.01
50 Athabasca Oil Corp 30 -
6 ATS Automation Tooling Systems Inc 151 -
5 Aurora Cannabis Inc 49 -
3 AutoCanada Inc 89 -
7 Avino Silver & Gold Mines Ltd 9 -
202 B2Gold Corp 1,032 0.02
4 Badger Infrastructure Solution 114 -
34 Bank of Montreal 3,522 0.08
61 Bank of Nova Scotia 4,124 0.09
82 Barrick Gold Corp 1,983 0.05
36 Bausch Health Cos Inc 1,164 0.03
10 BCE Inc 473 0.01
52 Birchcliff Energy Ltd 147 -
4 Bird Construction Inc 35 -
6 Black Diamond Group Ltd 22 -
3 BlackBerry Ltd 28 -
34 BlackBerry Ltd 338 0.01
4 Bonterra Energy Corp 14 -
5 Boralex Inc 152 -
1 Bridgemarq Real Estate Services 15 -
12 Brookfield Asset Management Inc 579 0.01
2 Brookfield Asset Management Inc 106 -
4 BRP Inc 349 0.01
15 CAE Inc 465 0.01
1 Calian Group Ltd 41 -
51 Cameco Corp 1,021 0.02
19 Canaccord Genuity Group Inc 211 0.01
26 Canacol Energy Ltd 70 -
8 Canada Goose Holdings Inc 311 0.01
32 Canadian Imperial Bank of Commerce (Canadalisting) 3,768 0.09
3 Canadian Imperial Bank of Commerce (US listing) 303 0.01
37 Canadian National Railway Co 4,194 0.09
113 Canadian Natural Resources Ltd 3,929 0.09
35 Canadian Pacific Railway Ltd 2,862 0.06
5 Canadian Tire Corp Ltd 863 0.02
10 Canadian Utilities Ltd, Class A 300 0.01
1 Canadian Utilities Ltd, Class B 14 -
16 Canadian Western Bank 472 0.01
12 Canfor Corp 300 0.01
8 Canfor Pulp Products Inc 58 -
6 Canopy Growth Corp 169 -
8 CanWel Building Materials Group Ltd 56 -
11 Capital Power Corp 339 0.01
59 Capstone Mining Corp 272 0.01
17 Cardinal Energy Ltd 46 -
19 Cascades Inc 210 0.01
13 CCL Industries Inc 752 0.02
25 Celestica Inc 217 0.01
153 Cenovus Energy Inc 1,240 0.03
44 Centerra Gold Inc 354 0.01
2 Cervus Equipment Corp 26 -
36 CES Energy Solutions Corp 52 -
26 CGI Inc 2,346 0.05
11 Chartwell Retirement Residences 119 -
30 China Gold International Resources Corp Ltd 102 -
32 CI Financial Corp 603 0.01
2 Cogeco Communications Inc 236 0.01
1 Cogeco Inc 105 -
Global Core Equity FundPortfolio of Investments as at 31 May 2021 (continued)
Dimensional Fund Advisors Semi-Annual Report and Unaudited Financial Statements, 31 May 2021 84

Shares (000's)
Value(000's)
USD
% of NetAssetValue
Common Stock (continued)
Canada - 3.48% (continued)
5 Colliers International Group Inc 554 0.01
12 Computer Modelling Group Ltd 54 -
1 Constellation Software Inc 1,671 0.04
24 Copper Mountain Mining Corp 86 -
2 Corby Spirit and Wine Ltd 25 -
37 Corus Entertainment Inc 189 0.01
107 Crescent Point Energy Corp 438 0.01
15 Crew Energy Inc 15 -
12 Cronos Group Inc 106 -
63 Denison Mines Corp 79 -
3 Descartes Systems Group Inc 191 0.01
6 Dexterra Group Inc 33 -
5 DIRTT Environmental Solutions 18 -
25 Dollarama Inc 1,078 0.02
3 Dorel Industries Inc 31 -
7 DREAM Unlimited Corp 140 -
26 Dundee Precious Metals Inc 187 0.01
7 Dynacor Gold Mines Inc 16 -
33 ECN Capital Corp 229 0.01
- E-L Financial Corp Ltd 147 -
28 Eldorado Gold Corp 333 0.01
84 Element Fleet Management Corp 944 0.02
12 Emera Inc 579 0.01
24 Empire Co Ltd 806 0.02
52 Enbridge Inc (Canada listing) 1,998 0.05
- Enbridge Inc (US listing) 15 -
31 Endeavour Mining Corp 737 0.02
8 Endeavour Silver Corp 59 -
20 Enerflex Ltd 135 -
12 Energy Fuels Inc 79 -
28 Enerplus Corp 182 -
5 Enghouse Systems Ltd 233 0.01
23 Ensign Energy Services Inc 24 -
5 Equinox Gold Corp 45 -
2 Equitable Group Inc 179 -
9 ERO Copper Corp 198 0.01
4 Evertz Technologies Ltd 47 -
2 Exchange Income Corp 61 -
4 Exco Technologies Ltd 34 -
3 EXFO Inc 10 -
13 Extendicare Inc 84 -
2 Fairfax Financial Holdings Ltd 818 0.02
8 Fiera Capital Corp 72 -
23 Finning International Inc 577 0.01
4 Firm Capital Mortgage Investment Corp 55 -
14 First Capital Real Estate Investment Trust 208 0.01
8 First Majestic Silver Corp 142 -
36 First Mining Gold Corp 12 -
3 First National Financial Corp 112 -
37 First Quantum Minerals Ltd 922 0.02
5 FirstService Corp 807 0.02
45 Fission Uranium Corp 23 -
25 Fortis Inc (Canada listing) 1,133 0.03
5 Fortis Inc (US listing) 213 0.01
24 Fortuna Silver Mines Inc 165 -
3 Franco-Nevada Corp 406 0.01
19 Freehold Royalties Ltd 142 -
6 Frontera Energy Corp 31 -
25 Galiano Gold Inc 34 -
2 Gamehost Inc 14 -
1 GDI Integrated Facility Services Inc 48 -
10 George Weston Ltd 975 0.02
Shares (000's)
Value(000's)
USD
% of NetAssetValue
Common Stock (continued)
Canada - 3.48% (continued)
20 Gibson Energy Inc 404 0.01
10 Gildan Activewear Inc 369 0.01
1 goeasy Ltd 109 -
11 Gold Standard Ventures Corp 7 -
10 Golden Star Resources Ltd 33 -
10 GoldMoney Inc 22 -
67 Gran Tierra Energy Inc 43 -
7 Great Canadian Gaming Corp 270 0.01
19 Great-West Lifeco Inc 586 0.01
3 Guardian Capital Group Ltd 77 -
1 Hardwoods Distribution Inc 35 -
4 Heroux-Devtek Inc 55 -
3 High Liner Foods Inc 37 -
2 HLS Therapeutics Inc 28 -
10 Home Capital Group Inc 299 0.01
47 Hudbay Minerals Inc 357 0.01
15 Hydro One Ltd 389 0.01
10 i-80 Gold Corp 21 -
16 iA Financial Corp Inc 910 0.02
79 IAMGOLD Corp 286 0.01
4 IBI Group Inc 35 -
11 IGM Financial Inc 400 0.01
4 Imperial Metals Corp 18 -
16 Imperial Oil Ltd 525 0.01
2 Information Services Corp 38 -
4 Innergex Renewable Energy Inc 67 -
10 Intact Financial Corp 1,399 0.03
60 Inter Pipeline Ltd 873 0.02
13 Interfor Corp 333 0.01
13 Intertape Polymer Group Inc 324 0.01
5 Invesque Inc 14 -
20 Ivanhoe Mines Ltd 145 -
4 Jamieson Wellness Inc 136 -
1 K-Bro Linen Inc 28 -
25 Kelt Exploration Ltd 65 -
23 Keyera Corp 581 0.01
1 Kinaxis Inc 132 -
234 Kinross Gold Corp 1,900 0.04
29 Kirkland Lake Gold Ltd 1,246 0.03
20 Knight Therapeutics Inc 87 -
1 KP Tissue Inc 8 -
6 Labrador Iron Ore Royalty Corp 233 0.01
2 Largo Resources Ltd 34 -
- Lassonde Industries Inc 32 -
7 Laurentian Bank of Canada 264 0.01
6 Leon's Furniture Ltd 118 -
7 LifeWorks Inc 196 0.01
2 Lightspeed POS Inc 130 -
11 Linamar Corp 689 0.02
21 Loblaw Cos Ltd 1,318 0.03
1 Logistec Corp 17 -
58 Lucara Diamond Corp 38 -
3 Lundin Gold Inc 28 -
111 Lundin Mining Corp 1,195 0.03
2 MAG Silver Corp 43 -
2 Magellan Aerospace Corp 20 -
19 Magna International Inc 1,863 0.04
- Mainstreet Equity Corp 29 -
11 Major Drilling Group International Inc 100 -
2 Mandalay Resources Corp 6 -
89 Manulife Financial Corp 1,860 0.04
13 Maple Leaf Foods Inc 288 0.01
Global Core Equity FundPortfolio of Investments as at 31 May 2021 (continued)
Dimensional Fund Advisors Semi-Annual Report and Unaudited Financial Statements, 31 May 2021 85

Shares (000's)
Value(000's)
USD
% of NetAssetValue
Common Stock (continued)
Canada - 3.48% (continued)
24 Martinrea International Inc 273 0.01
3 Mav Beauty Brands Inc 13 -
1 MDF Commerce Inc 12 -
5 Medical Facilities Corp 31 -
37 MEG Energy Corp 247 0.01
2 Melcor Developments Ltd 17 -
6 Methanex Corp 217 0.01
19 Metro Inc 918 0.02
1 Morguard Corp 72 -
10 Mountain Province Diamonds Inc 4 -
1 MTY Food Group Inc 75 -
21 Mullen Group Ltd 227 0.01
33 National Bank of Canada 2,540 0.06
112 New Gold Inc 237 0.01
2 New Pacific Metals Corp 12 -
6 NFI Group Inc 122 -
4 Nighthawk Gold Corp 4 -
8 North American Construction Group Ltd 105 -
8 North West Co Inc 250 0.01
20 Northland Power Inc 671 0.02
31 Nutrien Ltd 1,938 0.04
33 NuVista Energy Ltd 81 -
106 OceanaGold Corp 225 0.01
11 Onex Corp 817 0.02
30 Open Text Corp 1,415 0.03
16 Organigram Holdings Inc 51 -
13 Osisko Gold Royalties Ltd 185 -
21 Osisko Mining Inc 61 -
18 Pan American Silver Corp 593 0.01
8 Paramount Resources Ltd 99 -
37 Parex Resources Inc 628 0.01
3 Park Lawn Corp 87 -
22 Parkland Corp 708 0.02
13 Pason Systems Inc 92 -
54 Pembina Pipeline Corp 1,735 0.04
24 Peyto Exploration & Development Corp 108 -
16 Photon Control Inc 47 -
7 PHX Energy Services Corp 23 -
6 Pizza Pizza Royalty Corp 50 -
3 Polaris Infrastructure Inc 41 -
1 Pollard Banknote Ltd 56 -
28 PrairieSky Royalty Ltd 308 0.01
2 Precision Drilling Corp 74 -
4 Premium Brands Holdings Corp 368 0.01
23 Pretium Resources Inc 263 0.01
19 Primo Water Corp 332 0.01
28 Quarterhill Inc 55 -
23 Quebecor Inc 627 0.01
40 Questerre Energy Corp 6 -
5 Real Matters Inc 72 -
2 Recipe Unlimited Corp 33 -
12 Restaurant Brands International Inc (Canada listing) 824 0.02
6 Restaurant Brands International Inc (US listing) 429 0.01
6 RF Capital Group Inc 10 -
6 Richelieu Hardware Ltd 215 0.01
13 Ritchie Bros Auctioneers Inc 752 0.02
39 Rogers Communications Inc 2,028 0.05
13 Rogers Sugar Inc 62 -
11 Roxgold Inc 22 -
108 Royal Bank of Canada (Canada listing) 11,239 0.25
4 Royal Bank of Canada (US listing) 431 0.01
9 Russel Metals Inc 236 0.01
Shares (000's)
Value(000's)
USD
% of NetAssetValue
Common Stock (continued)
Canada - 3.48% (continued)
26 Sabina Gold & Silver Corp 37 -
17 Sandstorm Gold Ltd 150 -
18 Saputo Inc 624 0.01
4 Savaria Corp 58 -
27 Secure Energy Services Inc 93 -
65 Shaw Communications Inc 1,934 0.04
11 ShawCor Ltd 53 -
1 Shopify Inc 691 0.02
5 Sienna Senior Living Inc 65 -
7 Sierra Metals Inc 24 -
4 Sierra Wireless Inc (Canada listing) 68 -
2 Slate Grocery REIT 25 -
8 Sleep Country Canada Holdings Inc 196 0.01
19 SNC-Lavalin Group Inc 527 0.01
2 Spin Master Corp 75 -
2 Sprott Inc 78 -
35 SSR Mining Inc 656 0.02
13 Stantec Inc 564 0.01
2 Stelco Holdings Inc 59 -
9 Stella-Jones Inc 343 0.01
13 Storm Resources Ltd 39 -
31 Sun Life Financial Inc 1,647 0.04
53 Suncor Energy Inc 1,229 0.03
3 Suncor Energy Inc 79 -
2 SunOpta Inc 27 -
39 Superior Plus Corp 488 0.01
47 Tamarack Valley Energy Ltd 99 -
75 Taseko Mines Ltd 185 -
54 TC Energy Corp 2,771 0.06
28 Teck Resources Ltd 684 0.02
1 Teck Resources Ltd 12 -
- TECSYS Inc 9 -
6 TELUS Corp 128 -
1 TeraGo Inc 5 -
1 TerraVest Industries Inc 16 -
1 Tervita Corp 6 -
16 TFI International Inc 1,569 0.04
6 Thomson Reuters Corp 597 0.01
37 Tidewater Midstream and Infrastructure Ltd 36 -
2 Tilray Inc 35 -
13 Timbercreek Financial Corp 104 -
4 TMX Group Ltd 445 0.01
3 Topicus.com Inc 178 -
18 Torex Gold Resources Inc 264 0.01
9 Toromont Industries Ltd 851 0.02
87 Toronto-Dominion Bank 6,237 0.14
7 Total Energy Services Inc 21 -
47 Tourmaline Oil Corp 1,149 0.03
61 TransAlta Corp 551 0.01
12 TransAlta Renewables Inc 198 0.01
16 Transcontinental Inc 306 0.01
77 Trevali Mining Corp 16 -
47 Trican Well Service Ltd 89 -
1 Trisura Group Ltd 91 -
14 Turquoise Hill Resources Ltd 247 0.01
6 Uni-Select Inc 81 -
34 Vermilion Energy Inc 265 0.01
2 VersaBank 22 -
3 Viemed Healthcare Inc 21 -
7 Wajax Corp 133 -
2 Waste Connections Inc (Canada listing) 241 0.01
6 Waste Connections Inc (US listing) 742 0.02
Global Core Equity FundPortfolio of Investments as at 31 May 2021 (continued)
Dimensional Fund Advisors Semi-Annual Report and Unaudited Financial Statements, 31 May 2021 86

Shares (000's)
Value(000's)
USD
% of NetAssetValue
Common Stock (continued)
Canada - 3.48% (continued)
16 Wesdome Gold Mines Ltd 146 -
12 West Fraser Timber Co Ltd 892 0.02
60 Western Forest Products Inc 110 -
4 Westport Fuel Systems Inc 28 -
11 Westshore Terminals Investment Corp 165 -
9 Wheaton Precious Metals Corp 410 0.01
96 Whitecap Resources Inc 453 0.01
- WildBrain Ltd - -
4 Winpak Ltd 141 -
10 WSP Global Inc 1,091 0.03
152 Yamana Gold Inc 797 0.02
11 Yangarra Resources Ltd 10 -
155,288 3.48
China - 0.00%
32 Camsing International Holding Ltd 1 -
591 FIH Mobile Ltd 90 -
42 TK Group Holdings Ltd 17 -
108 -
Denmark - 0.75%
1 ALK-Abello AS 306 0.01
9 Alm Brand AS 95 -
6 Ambu AS 210 0.01
- AP Moller - Maersk AS, Class A 393 0.01
- AP Moller - Maersk AS, Class B 543 0.01
12 Bang & Olufsen AS 60 -
1 BankNordik P/F 26 -
7 Bavarian Nordic AS 328 0.01
1 Brodrene Hartmann AS 55 -
9 Carlsberg AS 1,602 0.04
1 cBrain A/S 33 -
1 Chemometec AS 125 -
8 Chr Hansen Holding AS 676 0.02
6 Coloplast AS 992 0.02
11 Columbus AS 20 -
5 D/S Norden AS 130 -
42 Danske Bank AS 786 0.02
9 Demant AS 474 0.01
5 Dfds AS 300 0.01
7 DSV Panalpina AS 1,734 0.04
7 FLSmidth & Co AS 276 0.01
3 Genmab AS 1,419 0.03
13 GN Store Nord AS 1,104 0.03
- GronlandsBANKEN AS 15 -
11 H Lundbeck AS 338 0.01
4 H&H International AS 135 -
20 ISS AS 420 0.01
1 Jeudan AS 34 -
8 Jyske Bank AS 399 0.01
3 Maersk Drilling AS 140 -
6 Matas AS 114 -
4 Netcompany Group AS 479 0.01
5 Nilfisk Holding AS 165 -
4 NKT AS 203 -
3 NNIT AS 59 -
97 Novo Nordisk AS 7,663 0.17
17 Novozymes AS 1,249 0.03
5 Orsted AS 705 0.02
18 Pandora AS 2,439 0.05
3 Per Aarsleff Holding AS 167 -
4 Ringkjoebing Landbobank AS 425 0.01
1 Rockwool International AS, Class A 291 0.01
1 Rockwool International AS, Class B 433 0.01
Shares (000's)
Value(000's)
USD
% of NetAssetValue
Common Stock (continued)
Denmark - 0.75% (continued)
7 Royal Unibrew AS 955 0.02
1 RTX AS 38 -
11 Scandinavian Tobacco Group AS 234 0.01
2 Schouw & Co AS 235 0.01
6 SimCorp AS 764 0.02
1 Solar AS 87 -
1 SP Group AS 49 -
16 Spar Nord Bank AS 179 -
10 Sydbank AS 329 0.01
- Tivoli AS 53 -
8 Topdanmark AS 438 0.01
5 TORM PLC 47 -
21 Tryg AS 507 0.01
- United International Enterprises 72 -
46 Vestas Wind Systems 1,786 0.04
89 Vestjysk Bank AS 50 -
1 Zealand Pharma AS 38 -
33,421 0.75
Finland - 0.51%
9 Aktia Bank Oyj 128 -
- Alandsbanken Abp 13 -
4 Alma Media Oyj 43 -
1 Altia Oyj 15 -
1 Apetit Oyj 20 -
2 Asiakastieto Group Oyj 67 -
4 Aspo Oyj 42 -
2 Atria Oyj 32 -
1 BasWare Oyj 28 -
4 Bittium Oyj 34 -
5 Cargotec Oyj 278 0.01
15 Caverion Oyj 116 -
7 Citycon Oyj 64 -
4 Digia Oyj 36 -
17 Elisa Oyj 1,002 0.02
137 Finnair Oyj 119 -
4 Fiskars Oyj Abp 77 -
37 Fortum Oyj 1,065 0.02
10 F-Secure Oyj 50 -
2 Harvia Oyj 84 -
5 HKScan Oyj 14 -
11 Huhtamaki Oyj 536 0.01
3 Ilkka-Yhtyma Oyj 19 -
2 Kamux Corp 36 -
20 Kemira Oyj 332 0.01
16 Kesko Oyj, Class A 499 0.01
35 Kesko Oyj, Class B 1,213 0.03
12 Kojamo Oyj 281 0.01
17 Kone Oyj 1,375 0.03
8 Konecranes Oyj 372 0.01
5 Lassila & Tikanoja Oyj 83 -
2 Lehto Group Oyj 3 -
22 Metsa Board Oyj 255 0.01
13 Neles Oyj 196 0.01
19 Neste Oyj 1,286 0.03
438 Nokia Oyj 2,287 0.05
14 Nokian Renkaat Oyj 569 0.01
137 Nordea Bank Abp 1,482 0.03
2 Olvi Oyj 119 -
5 Oriola Oyj, Class A 11 -
17 Oriola Oyj, Class B 38 -
3 Orion Oyj, Class A 145 -
15 Orion Oyj, Class B 651 0.02
Global Core Equity FundPortfolio of Investments as at 31 May 2021 (continued)
Dimensional Fund Advisors Semi-Annual Report and Unaudited Financial Statements, 31 May 2021 87

Shares (000's)
Value(000's)
USD
% of NetAssetValue
Common Stock (continued)
Finland - 0.51% (continued)
52 Outokumpu Oyj 292 0.01
68 Outotec Oyj 811 0.02
1 Pihlajalinna Oyj 13 -
1 Ponsse Oyj 69 -
1 QT Group Oyj 162 -
13 Raisio Oyj 67 -
3 Rapala VMC Oyj 30 -
2 Revenio Group Oyj 183 0.01
21 Sampo Oyj 993 0.02
10 Sanoma Oyj 176 0.01
3 Stockmann Oyj Abp 6 -
43 Stora Enso Oyj 772 0.02
3 Teleste Oyj 21 -
5 Terveystalo Oyj 66 -
18 Tieto Oyj 576 0.01
5 Tikkurila Oyj 196 0.01
8 Tokmanni Group Corp 211 0.01
28 UPM-Kymmene Oyj 1,068 0.02
8 Uponor Oyj 235 0.01
2 Vaisala Oyj 100 -
19 Valmet Oyj 814 0.02
1 Verkkokauppa.com Oyj 11 -
47 Wartsila Oyj Abp 639 0.02
26 YIT Oyj 163 -
22,789 0.51
France - 2.74%
3 ABC arbitrage 30 -
12 Accor SA 484 0.01
2 Aeroports de Paris 229 0.01
20 Air Liquide SA 3,443 0.08
29 Airbus SE 3,817 0.09
2 Akka Technologies 49 -
2 AKWEL 63 -
4 Albioma SA 159 -
2 ALD SA 26 -
10 Alstom SA 574 0.01
4 Alten SA 473 0.01
3 Amplitude Surgical SAS 7 -
4 Amundi SA 359 0.01
12 Arkema SA 1,645 0.04
1 Assystem SA 31 -
14 Atos SE 965 0.02
1 Aubay 59 -
71 AXA SA 1,986 0.05
1 Axway Software SA 46 -
1 Bastide le Confort Medical 33 -
8 Beneteau SA 141 -
3 Bigben Interactive 66 -
1 BioMerieux 118 -
43 BNP Paribas SA 2,939 0.07
1 Boiron SA 49 -
100 Bollore SA 515 0.01
4 Bonduelle SCA 95 -
30 Bouygues SA 1,211 0.03
35 Bureau Veritas SA 1,078 0.02
- Burelle SA 34 -
14 Capgemini SE 2,658 0.06
84 Carrefour SA 1,703 0.04
5 Casino Guichard Perrachon SA 165 -
3 CBo Territoria 12 -
1 Cegedim SA 32 -
151 CGG SA 160 -
Shares (000's)
Value(000's)
USD
% of NetAssetValue
Common Stock (continued)
France - 2.74% (continued)
3 Chargeurs SA 83 -
42 Cie de Saint-Gobain 2,797 0.06
2 Cie des Alpes 66 -
16 Cie Generale des Etablissements Michelin SCA 2,415 0.05
11 Cie Plastic Omnium SA 393 0.01
4 Claranova SADIR 35 -
19 CNP Assurances 351 0.01
15 Coface SA 183 -
50 Credit Agricole SA 751 0.02
42 Danone SA 3,026 0.07
- Dassault Aviation SA 237 0.01
2 Dassault Systemes SE 387 0.01
21 Derichebourg SA 220 0.01
19 Edenred 1,018 0.02
17 Eiffage SA 1,875 0.04
1 Ekinops 11 -
63 Electricite de France SA 885 0.02
- Electricite de Strasbourg SA 11 -
16 Elior Group SA 129 -
39 Elis SA 740 0.02
94 Engie SA 1,406 0.03
2 Eramet 118 -
8 EssilorLuxottica SA 1,466 0.03
- Esso SA Francaise 7 -
11 Etablissements Maurel et Prom SA 25 -
14 Eurofins Scientific SE 1,517 0.03
11 Euronext NV 1,147 0.03
41 Europcar Mobility Group 20 -
40 Eutelsat Communications SA 497 0.01
- Exel Industries 10 -
2 Faurecia 125 -
23 Faurecia SE 1,240 0.03
3 Fnac Darty SA 210 0.01
3 Gaztransport Et Technigaz SA 255 0.01
18 Getlink SE 290 0.01
2 GL Events 44 -
1 Groupe Crit 37 -
1 Groupe Gorge 17 -
1 Guerbet 49 -
2 Haulotte Group SA 13 -
2 Hermes International 2,134 0.05
- Hexaom 20 -
- ID Logistics Group 104 -
4 Iliad SA 605 0.01
6 Imerys SA 305 0.01
3 Innate Pharma SA 9 -
5 Ipsen SA 537 0.01
7 IPSOS 282 0.01
3 Jacquet Metal Service SA 86 -
18 JCDecaux SA 536 0.01
3 Kaufman & Broad SA 122 -
4 Kering SA 3,562 0.08
12 Korian SA 455 0.01
8 Lagardere SCA 195 0.01
- Laurent-Perrier 26 -
- LDC SA 11 -
3 Lectra 132 -
20 Legrand SA 2,065 0.05
- Linedata Services 23 -
4 LISI 126 -
1 LNA Sante SA 41 -
5 L'Oreal SA 2,118 0.05
Global Core Equity FundPortfolio of Investments as at 31 May 2021 (continued)
Dimensional Fund Advisors Semi-Annual Report and Unaudited Financial Statements, 31 May 2021 88

Shares (000's)
Value(000's)
USD
% of NetAssetValue
Common Stock (continued)
France - 2.74% (continued)
1 Lumibird 24 -
15 LVMH Moet Hennessy Louis Vuitton SE 12,141 0.27
9 Maisons du Monde SA 245 0.01
2 Manitou BF SA 68 -
- Manutan International 31 -
3 Mersen SA 115 -
6 Metropole Television SA 127 -
106 Natixis SA 521 0.01
3 Nexans SA 307 0.01
8 Nexity SA 432 0.01
1 Nicox 6 -
3 NRJ Group 23 -
4 Oeneo SA 52 -
4 OL Groupe SA 11 -
4 Onxeo SA 3 -
324 Orange SA 4,134 0.09
6 Orpea 794 0.02
4 Pernod Ricard SA 875 0.02
1 Plastivaloire 10 -
36 Publicis Groupe SA 2,460 0.06
6 Quadient 187 0.01
3 Rallye SA 25 -
2 Recylex SA 1 -
1 Remy Cointreau SA 185 -
21 Renault SA 886 0.02
31 Rexel SA 627 0.01
- Robertet SA 84 -
4 Rothschild & Co 152 -
10 Rubis SCA 460 0.01
8 Safran SA 1,231 0.03
- Samse SA 13 -
27 Sanofi 2,931 0.07
2 Sartorius Stedim Biotech 727 0.02
1 Savencia SA 75 -
13 Schneider Electric SE 2,013 0.05
22 SCOR SE 716 0.02
3 SEB SA 639 0.02
1 Seche Environnement SA 65 -
45 SES SA 374 0.01
3 Societe BIC SA 246 0.01
1 Societe des Bains de Mer et du Cercle desEtrangers a Monaco 42 -
50 Societe Generale SA 1,612 0.04
1 Societe pour l'Informatique Industrielle 29 -
8 Sodexo SA 765 0.02
2 SOITEC 501 0.01
14 Solocal Group 42 -
1 Somfy SA 142 -
3 Sopra Steria Group 596 0.01
20 SPIE SA 478 0.01
1 Stef SA 65 -
30 STMicroelectronics NV 1,112 0.03
27 Suez 653 0.02
1 Sword Group 38 -
1 Synergie SA 54 -
7 Tarkett SA 182 -
2 Technicolor SA 9 -
10 Technip Energies NV 147 -
5 Teleperformance 2,021 0.05
9 Television Francaise 1 90 -
- TFF Group 7 -
12 Thales SA 1,225 0.03
Shares (000's)
Value(000's)
USD
% of NetAssetValue
Common Stock (continued)
France - 2.74% (continued)
1 Thermador Groupe 81 -
2 Tikehau Capital SCA 52 -
- Total Gabon 30 -
135 TOTAL SA 6,298 0.14
1 Trigano SA 215 0.01
12 Ubisoft Entertainment SA 842 0.02
- Union Financiere de France BQE SA 9 -
44 Valeo SA 1,431 0.03
1 Vallourec SA 39 -
5 Valneva SE 62 -
40 Veolia Environnement SA 1,253 0.03
- Verallia 17 -
- Vetoquinol SA 52 -
4 Vicat SA 205 0.01
2 VIEL & Cie SA 13 -
1 Vilmorin & Cie SA 99 -
25 Vinci SA 2,847 0.06
1 Virbac SA 182 -
22 Vivendi SA 806 0.02
- Vranken-Pommery Monopole SA 9 -
11 Worldline SA 1,065 0.02
6 X-Fab Silicon Foundries SE 55 -
122,542 2.74
Germany - 2.43%
8 1&1 Drillisch AG 239 0.01
- 3U Holding AG 1 -
7 7C Solarparken AG 34 -
10 Aareal Bank AG 242 0.01
9 adidas AG 3,273 0.07
7 ADO Properties SA 221 0.01
12 ADVA Optical Networking SE 153 -
7 Aixtron SE 148 -
- All for One Group AG 19 -
1 Allgeier SE 31 -
14 Allianz SE 3,812 0.09
1 Amadeus Fire AG 139 -
75 Aroundtown SA 634 0.01
1 Atoss Software AG 105 -
6 Aurubis AG 550 0.01
35 BASF SE 2,897 0.07
1 Basler AG 73 -
3 Bauer AG 46 -
68 Bayer AG 4,342 0.10
42 Bayerische Motoren Werke AG 4,493 0.10
3 BayWa AG 150 -
4 Bechtle AG 739 0.02
2 Befesa SA 163 -
2 Beiersdorf AG 258 0.01
1 Bertrandt AG 53 -
1 bet-at-home.com AG 25 -
1 Bijou Brigitte AG 17 -
5 Bilfinger SE 157 -
- BioNTech SE, ADR 63 -
9 Borussia Dortmund GmbH & Co KGaA 64 -
19 Brenntag AG 1,759 0.04
5 CANCOM SE 278 0.01
1 Carl Zeiss Meditec AG 222 0.01
31 Ceconomy AG 174 -
2 CENIT AG 28 -
1 Cewe Stiftung & Co KGaA 151 -
102 Commerzbank AG 822 0.02
3 CompuGroup Medical SE & Co KgaA 281 0.01
Global Core Equity FundPortfolio of Investments as at 31 May 2021 (continued)
Dimensional Fund Advisors Semi-Annual Report and Unaudited Financial Statements, 31 May 2021 89

Shares (000's)
Value(000's)
USD
% of NetAssetValue
Common Stock (continued)
Germany - 2.43% (continued)
11 Continental AG 1,612 0.04
2 Corestate Capital Holding SA 36 -
22 Covestro AG 1,517 0.03
6 CropEnergies AG 80 -
5 CTS Eventim AG & Co KGaA 311 0.01
89 Daimler AG 8,283 0.19
1 Delivery Hero SE 161 -
2 Dermapharm Holding SE 188 0.01
120 Deutsche Bank AG 1,809 0.04
3 Deutsche Beteiligungs AG 112 -
11 Deutsche Boerse AG 1,727 0.04
6 Deutsche EuroShop AG 133 -
14 Deutsche Lufthansa AG 178 -
23 Deutsche Pfandbriefbank AG 274 0.01
63 Deutsche Post AG 4,245 0.10
369 Deutsche Telekom AG 7,674 0.17
14 Deutsche Wohnen SE 913 0.02
14 Deutz AG 117 -
6 Dialog Semiconductor PLC 444 0.01
1 DIC Asset AG 25 -
1 Dr Hoenle AG 39 -
1 Draegerwerk AG & Co KGaA 61 -
5 Duerr AG 189 0.01
119 E.ON SE 1,447 0.03
2 Eckert & Ziegler Strahlen- und Medizintechnik AG 206 0.01
1 EDAG Engineering Group AG 13 -
1 Elmos Semiconductor AG 58 -
6 ElringKlinger AG 111 -
1 Energiekontor AG 64 -
16 Evonik Industries AG 579 0.01
2 Evotec SE 90 -
- Ferratum Oyj 3 -
3 Fielmann AG 280 0.01
1 First Sensor AG 52 -
2 flatexDEGIRO AG 247 0.01
3 Francotyp-Postalia Holding AG 11 -
6 Fraport AG Frankfurt Airport Services Worldwide 442 0.01
26 Freenet AG 706 0.02
22 Fresenius Medical Care AG & Co KGaA 1,724 0.04
37 Fresenius SE & Co KGaA 2,028 0.05
4 Fuchs Petrolub SE 157 -
17 GEA Group AG 726 0.02
4 Gerresheimer AG 492 0.01
2 Gesco AG 59 -
3 GFT Technologies SE 78 -
- Grammer AG 13 -
6 Grand City Properties SA 183 -
2 H&R GmbH & Co KGaA 13 -
5 Hamburger Hafen und Logistik AG 132 -
3 Hannover Rueck SE 523 0.01
3 Hapag-Lloyd AG 557 0.01
- Hawesko Holding AG 17 -
12 HeidelbergCement AG 1,134 0.03
26 Heidelberger Druckmaschinen AG 60 -
4 Hella GmbH & Co KGaA 281 0.01
16 HelloFresh SE 1,474 0.03
2 Henkel AG & Co KGaA 245 0.01
2 Hornbach Baumarkt AG 79 -
2 Hornbach Holding AG & Co KGaA 241 0.01
9 Hugo Boss AG 536 0.01
- Hypoport AG 102 -
4 Indus Holding AG 152 -
Shares (000's)
Value(000's)
USD
% of NetAssetValue
Common Stock (continued)
Germany - 2.43% (continued)
19 Infineon Technologies AG 778 0.02
4 Instone Real Estate Group AG 130 -
2 IVU Traffic Technologies AG 40 -
6 Jenoptik AG 178 -
2 JOST Werke AG 153 -
31 K&S AG 433 0.01
12 KION Group AG 1,241 0.03
12 Kloeckner & Co SE 161 -
6 Knorr-Bremse AG 727 0.02
3 Koenig & Bauer AG 93 -
2 Krones AG 149 -
- KSB SE & Co KGaA 9 -
2 KWS Saat SE & Co KGaA 143 -
11 Lanxess AG 832 0.02
5 LEG Immobilien AG 665 0.02
1 Leifheit AG 36 -
4 Leoni AG 73 -
2 LPKF Laser & Electronics AG 64 -
- Manz AG 30 -
1 Medigene AG 6 -
3 Merck KGaA 553 0.01
35 METRO AG 460 0.01
7 MLP SE 63 -
3 MTU Aero Engines AG 831 0.02
6 Muenchener Rueckversicherungs-Gesellschaft AGin Muenchen 1,712 0.04
1 Nagarro SE 102 -
8 Nemetschek SE 559 0.01
- New Work SE 126 -
2 Nexus AG 136 -
6 Nordex SE 149 -
4 Norma Group SE 204 0.01
1 OHB SE 38 -
6 Patrizia AG 173 -
- Pfeiffer Vacuum Technology AG 88 -
6 PNE AG 57 -
- Progress-Werk Oberkirch AG 13 -
41 ProSiebenSat.1 Media SE 914 0.02
1 PSI Software AG 27 -
5 Puma SE 604 0.01
2 PVA TePla AG 60 -
7 QIAGEN NV 332 0.01
16 QSC AG 36 -
- Rational AG 345 0.01
7 Rheinmetall AG 777 0.02
6 RTL Group SA 355 0.01
52 RWE AG 1,982 0.05
7 S&T AG 169 -
10 SAF-Holland SE 160 -
7 Salzgitter AG 212 0.01
34 SAP SE 4,825 0.11
1 Schaltbau Holding AG 33 -
4 Scout24 AG 309 0.01
- Secunet Security Networks AG 63 -
- Serviceware SE 9 -
5 SGL Carbon SE 40 -
14 Siemens AG 2,300 0.05
17 Siemens Energy AG 546 0.01
3 Siltronic AG 488 0.01
3 Sixt SE 406 0.01
6 Software AG 284 0.01
3 Stabilus SA 293 0.01
Global Core Equity FundPortfolio of Investments as at 31 May 2021 (continued)
Dimensional Fund Advisors Semi-Annual Report and Unaudited Financial Statements, 31 May 2021 90

Shares (000's)
Value(000's)
USD
% of NetAssetValue
Common Stock (continued)
Germany - 2.43% (continued)
- Stemmer Imaging AG 10 -
1 Stratec SE 78 -
4 Stroeer SE & Co KGaA 332 0.01
13 Suedzucker AG 208 0.01
2 SUESS MicroTec SE 60 -
1 Surteco Group SE 48 -
9 Symrise AG 1,166 0.03
13 TAG Immobilien AG 421 0.01
5 Takkt AG 79 -
6 Talanx AG 261 0.01
1 TeamViewer AG 24 -
1 Technotrans SE 24 -
231 Telefonica Deutschland Holding AG 637 0.02
52 thyssenkrupp AG 616 0.01
1 Traffic Systems SE 24 -
11 Uniper SE 406 0.01
16 United Internet AG 674 0.02
5 VERBIO Vereinigte BioEnergie AG 280 0.01
3 Volkswagen AG 1,258 0.03
20 Vonovia SE 1,235 0.03
1 Vossloh AG 60 -
3 Wacker Chemie AG 497 0.01
4 Wacker Neuson SE 135 -
2 Washtec AG 122 -
4 Wuestenrot & Wuerttembergische AG 102 -
4 Zalando SE 421 0.01
1 Zeal Network SE 49 -
1 zooplus AG 190 0.01
108,490 2.43
Hong Kong - 0.90%
370 Aceso Life Science Group Ltd 10 -
32 AEON Credit Service Asia Co Ltd 21 -
657 AIA Group Ltd 8,765 0.20
100 APAC Resources Ltd 18 -
188 Apollo Future Mobility Group Ltd 11 -
150 Applied Development Holdings Ltd 3 -
99 Asia Standard International Group Ltd 17 -
29 Asiasec Properties Ltd 4 -
22 ASM Pacific Technology Ltd 294 0.01
2 Associated International Hotels Ltd 4 -
157 Bank of East Asia Ltd 322 0.01
142 Blue River Holdings Ltd 7 -
47 BOC Aviation Ltd 426 0.01
175 BOC Hong Kong Holdings Ltd 645 0.02
120 BOCOM International Holdings Co Ltd 28 -
106 BOE Varitronix Ltd 57 -
242 Brightoil Petroleum Holdings Ltd 9 -
90 Build King Holdings Ltd 13 -
440 Burwill Holdings Ltd 1 -
51 Cafe de Coral Holdings Ltd 111 -
260 Cathay Pacific Airways Ltd 227 0.01
184 Century City International Holdings Ltd 11 -
205 CGN Mining Co Ltd 18 -
11 Chevalier International Holdings Ltd 13 -
328 China Energy Development Holdings Ltd 4 -
2 China Motor Bus Co Ltd 34 -
140 China Star Entertainment Ltd 23 -
2,415 China Strategic Holdings Ltd 39 -
76 Chinese Estates Holdings Ltd 37 -
19 Chong Hing Bank Ltd 50 -
62 Chow Sang Sang Holdings International Ltd 108 -
178 Chow Tai Fook Jewellery Group Ltd 333 0.01
Shares (000's)
Value(000's)
USD
% of NetAssetValue
Common Stock (continued)
Hong Kong - 0.90% (continued)
96 Chuang's Consortium International Ltd 13 -
318 CITIC Telecom International Holdings Ltd 106 -
149 CK Asset Holdings Ltd 1,012 0.02
143 CK Hutchison Holdings Ltd 1,143 0.03
42 CK Infrastructure Holdings Ltd 267 0.01
72 CLP Holdings Ltd 746 0.02
50 Convenience Retail Asia Ltd 5 -
34 Crystal International Group Ltd 15 -
960 CSI Properties Ltd 32 -
74 Dah Sing Banking Group Ltd 85 -
26 Dah Sing Financial Holdings Ltd 92 -
52 Dickson Concepts International Ltd 28 -
1,650 Digital Domain Holdings Ltd 15 -
28 Eagle Nice International Holdings Ltd 17 -
45 EC Healthcare 75 -
62 EcoGreen International Group Ltd 15 -
420 Emperor Capital Group Ltd 7 -
75 Emperor Entertainment Hotel Ltd 11 -
244 Emperor International Holdings Ltd 36 -
360 Emperor Watch & Jewellery Ltd 8 -
136 ENM Holdings Ltd 12 -
453 Esprit Holdings Ltd 46 -
8 Fairwood Holdings Ltd 18 -
237 Far East Consortium International Ltd 85 -
433 First Pacific Co Ltd 151 -
104 First Shanghai Investments Ltd 4 -
117 FIT Hon Teng Ltd 33 -
14 FSE Lifestyle Services Ltd 13 -
13 Galaxy Entertainment Group Ltd 109 -
246 Giordano International Ltd 55 -
124 Glorious Sun Enterprises Ltd 13 -
120 Golden Resources Development International Ltd 10 -
60 Gold-Finance Holdings Ltd - -
145 Goodbaby International Holdings Ltd 36 -
68 GR Properties Ltd 9 -
39 Great Eagle Holdings Ltd 134 -
7,680 Greater Bay Area Investments Group Holdings Ltd 10 -
3,833 G-Resources Group Ltd 23 -
9 Guoco Group Ltd 108 -
385 Guotai Junan International Holdings Ltd 70 -
462 Haitong International Securities Group Ltd 143 -
121 Hang Lung Group Ltd 299 0.01
198 Hang Lung Properties Ltd 513 0.01
34 Hang Seng Bank Ltd 717 0.02
86 Hanison Construction Holdings Ltd 15 -
3 Harbour Centre Development Ltd 3 -
90 Henderson Land Development Co Ltd 432 0.01
208 HK Electric Investments & HK Electric InvestmentsLtd 211 0.01
142 HKBN Ltd 193 0.01
163 HKR International Ltd 80 -
664 HKT Trust & HKT Ltd 906 0.02
16 Hon Kwok Land Investment Co Ltd 7 -
247 Hong Kong & China Gas Co Ltd 434 0.01
57 Hong Kong Exchanges & Clearing Ltd 3,502 0.08
27 Hong Kong Ferry Holdings Co Ltd 21 -
26 Hong Kong Television Network Ltd 31 -
74 Hongkong & Shanghai Hotels Ltd 74 -
46 Hongkong Chinese Ltd 4 -
17 Honma Golf Ltd 10 -
54 Hung Hing Printing Group Ltd 9 -
Global Core Equity FundPortfolio of Investments as at 31 May 2021 (continued)
Dimensional Fund Advisors Semi-Annual Report and Unaudited Financial Statements, 31 May 2021 91

Shares (000's)
Value(000's)
USD
% of NetAssetValue
Common Stock (continued)
Hong Kong - 0.90% (continued)
282 Hutchison Telecommunications Hong Kong HoldingsLtd 53 -
62 Hysan Development Co Ltd 245 0.01
116 IGG Inc 173 0.01
55 International Housewares Retail Co Ltd 20 -
802 IRC Ltd 35 -
174 Jacobson Pharma Corp Ltd 17 -
22 JBM Healthcare Ltd 5 -
87 Johnson Electric Holdings Ltd 232 0.01
179 K Wah International Holdings Ltd 88 -
80 Karrie International Holdings Ltd 19 -
22 Keck Seng Investments 12 -
149 Kerry Logistics Network Ltd 444 0.01
91 Kerry Properties Ltd 315 0.01
44 Kingmaker Footwear Holdings Ltd 5 -
470 Kingston Financial Group Ltd 35 -
73 Kowloon Development Co Ltd 91 -
371 KuangChi Science Ltd 11 -
36 Kwoon Chung Bus Holdings Ltd 11 -
33 Lai Sun Development Co Ltd 24 -
31 Lai Sun Garment International Ltd 24 -
197 Landing International Development Ltd 7 -
124 Landsea Green Group Co Ltd 8 -
217 Langham Hospitality Investments and LanghamHospitality Investments Ltd 27 -
44 Lifestyle International Holdings Ltd 37 -
410 Lippo China Resources Ltd 6 -
26 Liu Chong Hing Investment Ltd 28 -
73 L'Occitane International SA 244 0.01
48 Luk Fook Holdings International Ltd 135 -
42 Lung Kee Bermuda Holdings 20 -
191 Man Wah Holdings Ltd 431 0.01
4,691 Mason Group Holdings Ltd 19 -
26 MECOM Power and Construction 17 -
198 Meilleure Health International Industry Group Ltd 11 -
93 Melco International Development Ltd 170 0.01
58 Midland Holdings Ltd 9 -
34 Miramar Hotel & Investment 65 -
41 Modern Dental Group Ltd 35 -
50 MTR Corp Ltd 284 0.01
222 NagaCorp Ltd 232 0.01
56 Nameson Holdings Ltd 4 -
107 New World Development Co Ltd 581 0.01
116 NewOcean Energy Holdings Ltd 7 -
40 Nissin Foods Co Ltd 32 -
230 NWS Holdings Ltd 261 0.01
122 Oriental Press Group Ltd 9 -
58 Oriental Watch Holdings 28 -
578 Oshidori International Holdings Ltd 43 -
777 Pacific Basin Shipping Ltd 293 0.01
104 Pacific Century Premium Developments Ltd 10 -
195 Pacific Textiles Holdings Ltd 130 -
56 Paliburg Holdings Ltd 15 -
68 Paradise Entertainment Ltd 9 -
791 PCCW Ltd 437 0.01
68 Pentamaster International Ltd 15 -
56 Perfect Shape Medical Ltd 58 -
156 Pico Far East Holdings Ltd 28 -
80 Playmates Holdings Ltd 9 -
83 Power Assets Holdings Ltd 519 0.01
68 PRADA SpA 467 0.01
246 PT International Development Co Ltd 12 -
Shares (000's)
Value(000's)
USD
% of NetAssetValue
Common Stock (continued)
Hong Kong - 0.90% (continued)
56 Public Financial Holdings Ltd 19 -
46 Regal Hotels International Holdings Ltd 24 -
43 Regina Miracle International Holdings Ltd 13 -
72 Renco Holdings Group Ltd 2 -
18 Safety Godown Co Ltd 8 -
22 Sands China Ltd 99 -
26 SEA Holdings Ltd 28 -
166 Shangri-La Asia Ltd 155 0.01
75 Shenwan Hongyuan HK Ltd 10 -
228 Shun Tak Holdings Ltd 73 -
64 Sing Tao News Corp Ltd 7 -
220 Singamas Container Holdings Ltd 18 -
360 Sino Land Co Ltd 574 0.01
198 SITC International Holdings Co Ltd 698 0.02
210 SJM Holdings Ltd 240 0.01
80 SmarTone Telecommunications Holdings Ltd 47 -
14 Soundwill Holdings Ltd 16 -
78 Stella International Holdings Ltd 95 -
88 Sun Hung Kai & Co Ltd 49 -
52 Sun Hung Kai Properties Ltd 813 0.02
121 SUNeVision Holdings Ltd 126 -
56 Swire Pacific Ltd, Class A 439 0.01
104 Swire Pacific Ltd, Class B 128 -
66 Swire Properties Ltd 199 0.01
50 TAI Cheung Holdings Ltd 31 -
54 Tao Heung Holdings Ltd 7 -
87 Techtronic Industries Co Ltd 1,642 0.04
54 Television Broadcasts Ltd 54 -
8 Texhong Textile Group Ltd 12 -
178 Texwinca Holdings Ltd 46 -
370 Theme International Holdings Ltd 42 -
104 Tradelink Electronic Commerce Ltd 16 -
30 Transport International Holdings Ltd 60 -
170 United Laboratories International Holdings Ltd 155 -
552 Untrade Convoy 2 -
219 Value Partners Group Ltd 149 -
96 Vitasoy International Holdings Ltd 374 0.01
7 Vobile Group Ltd 32 -
130 VPower Group International Holdings Ltd 30 -
138 VSTECS Holdings Ltd 135 -
23 VTech Holdings Ltd 235 0.01
44 Wai Kee Holdings Ltd 23 -
1,500 Wang On Group Ltd 14 -
44 Wealthking Investments Ltd 4 -
1,178 WH Group Ltd 1,016 0.02
84 Wharf Real Estate Investment Co Ltd 508 0.01
5 Wing On Co International Ltd 12 -
44 Wing Tai Properties Ltd 27 -
139 Wynn Macau Ltd 241 0.01
137 Xinyi Glass Holdings Ltd 536 0.01
34 YTO Express Holdings Ltd 21 -
153 Yue Yuen Industrial Holdings Ltd 399 0.01
710 Zensun Enterprises Ltd 58 -
40,306 0.90
Ireland - 0.29%
85 AIB Group PLC 283 0.01
139 Bank of Ireland Group PLC 899 0.02
80 Cairn Homes PLC 105 -
94 CRH PLC 4,919 0.11
6 Datalex PLC 3 -
7 FBD Holdings PLC 74 -
5 Flutter Entertainment PLC (Ireland listing) 855 0.02
Global Core Equity FundPortfolio of Investments as at 31 May 2021 (continued)
Dimensional Fund Advisors Semi-Annual Report and Unaudited Financial Statements, 31 May 2021 92

Shares (000's)
Value(000's)
USD
% of NetAssetValue
Common Stock (continued)
Ireland - 0.29% (continued)
6 Flutter Entertainment PLC (UK listing) 1,197 0.03
23 Glanbia PLC 392 0.01
24 Irish Continental Group PLC 133 -
5 Kerry Group PLC 679 0.02
16 Kingspan Group PLC 1,501 0.03
17 Permanent TSB Group Holdings PLC 30 -
36 Smurfit Kappa Group PLC 1,890 0.04
12,960 0.29
Israel - 0.24%
13 Adgar Investment and Development Ltd 25 -
1 AFI Properties Ltd 59 -
- Africa Israel Residences Ltd 13 -
7 Airport City Ltd 118 -
3 Allot Ltd 48 -
12 Alony Hetz Properties & Investments Ltd 177 0.01
1 Alrov Properties and Lodgings Ltd 47 -
16 Amot Investments Ltd 111 -
1 Arad Ltd 19 -
3 Ashtrom Group Ltd 62 -
2 AudioCodes Ltd 52 -
12 Avgol Industries 1953 Ltd 11 -
10 Azorim-Investment Development & Construction CoLtd 42 -
1 Azrieli Group Ltd 78 -
48 Bank Hapoalim BM 423 0.01
67 Bank Leumi Le-Israel BM 534 0.01
11 Bayside Land Corp 107 -
- Bet Shemesh Engines Holdings 1997 Ltd 10 -
173 Bezeq The Israeli Telecommunication Corp Ltd 193 0.01
- Big Shopping Centers Ltd 59 -
1 Blue Square Real Estate Ltd 45 -
- Brack Capital Properties NV 23 -
1 Camtek Ltd 53 -
7 Carasso Motors Ltd 37 -
18 Cellcom Israel Ltd 71 -
7 Clal Insurance Enterprises Holdings Ltd 138 0.01
4 Compugen Ltd 30 -
1 Danel Adir Yeoshua Ltd 146 0.01
7 Delek Automotive Systems Ltd 92 -
2 Delek Group Ltd 80 -
1 Delta Galil Industries Ltd 46 -
1 Dor Alon Energy in Israel 1988 Ltd 23 -
- Duniec Brothers Ltd 19 -
2 Electra Consumer Products 1970 Ltd 81 -
- Electra Ltd 132 0.01
- Ellomay Capital Ltd 7 -
10 Energix-Renewable Energies Ltd 40 -
42 Enlight Renewable Energy Ltd 89 -
4 Equital Ltd 116 -
7 First International Bank Of Israel Ltd 231 0.01
- FMS Enterprises Migun Ltd 9 -
1 Formula Systems 1985 Ltd 111 -
1 Fox Wizel Ltd 115 -
3 Gilat Satellite Networks Ltd 27 -
1 Hadera Paper Ltd 57 -
25 Harel Insurance Investments & Financial ServicesLtd 261 0.01
2 Hilan Ltd 109 -
1 IDI Insurance Co Ltd 28 -
- IES Holdings Ltd 20 -
24 Industrial Buildings Corp Ltd 71 -
12 Inrom Construction Industries Ltd 61 -
Shares (000's)
Value(000's)
USD
% of NetAssetValue
Common Stock (continued)
Israel - 0.24% (continued)
3 Isracard Ltd 13 -
10 Israel Canada T.R Ltd 40 -
29 Israel Chemicals Ltd 206 0.01
108 Israel Discount Bank Ltd 552 0.01
2 Israel Land Development - Urban Renewal Ltd 21 -
- Isras Investment Co Ltd 69 -
1 Issta Lines Ltd 14 -
4 Kamada Ltd 22 -
3 Kenon Holdings Ltd 93 -
1 Kerur Holdings Ltd 22 -
- Klil Industries Ltd 14 -
- Levinstein Properties Ltd 11 -
2 Magic Software Enterprises Ltd 41 -
1 Malam - Team Ltd 37 -
5 Matrix IT Ltd 121 -
7 Maytronics Ltd 127 0.01
10 Mediterranean Towers Ltd 31 -
1 Mega Or Holdings Ltd 37 -
- Mehadrin Ltd 6 -
6 Meitav Dash Investments Ltd 37 -
2 Melisron Ltd 127 0.01
5 Menora Mivtachim Holdings Ltd 110 -
68 Migdal Insurance & Financial Holdings Ltd 98 -
1 Mivtach Shamir Holdings Ltd 27 -
15 Mizrahi Tefahot Bank Ltd 447 0.01
7 Naphtha Israel Petroleum Corp Ltd 32 -
2 Nawi Brothers Ltd 17 -
1 Neto Malinda Trading Ltd 24 -
1 Neto ME Holdings Ltd 22 -
3 Nice Ltd 631 0.02
3 Nova Measuring Instruments Ltd 315 0.01
21 Novolog Ltd 20 -
296 Oil Refineries Ltd 80 -
1 One Software Technologies Ltd 87 -
8 OPC Energy Ltd 83 -
2 Palram Industries 1990 Ltd 21 -
21 Partner Communications Co Ltd 101 -
2 Paz Oil Co Ltd 223 0.01
3 Perion Network Ltd 45 -
21 Phoenix Holdings Ltd 204 0.01
- Plasson Industries Ltd 12 -
1 Prashkovsky Investments and Construction Ltd 19 -
1 Priortech Ltd 18 -
1 Rami Levy Chain Stores Hashikma Marketing2006 Ltd 81 -
1 Rapac Communication & Infrastructure 9 -
1 Scope Metals Group Ltd 22 -
15 Shapir Engineering and Industry Ltd 117 -
31 Shikun & Binui Ltd 208 0.01
15 Shufersal Ltd 130 0.01
6 Strauss Group Ltd 162 0.01
- Tadiran Holdings Ltd 43 -
44 Teva Pharmaceutical Industries Ltd 465 0.01
15 Tower Semiconductor Ltd 404 0.01
1 Victory Supermarket Chain Ltd 24 -
1 Vitania Ltd 7 -
1 YH Dimri Construction & Development Ltd 52 -
10,557 0.24
Italy - 0.96%
285 A2A SpA 595 0.01
11 ACEA SpA 260 0.01
6 Aeffe SpA 13 -
Global Core Equity FundPortfolio of Investments as at 31 May 2021 (continued)
Dimensional Fund Advisors Semi-Annual Report and Unaudited Financial Statements, 31 May 2021 93

Shares (000's)
Value(000's)
USD
% of NetAssetValue
Common Stock (continued)
Italy - 0.96% (continued)
17 Amplifon SpA 781 0.02
41 Anima Holding SpA 217 0.01
2 Aquafil SpA 13 -
18 Arnoldo Mondadori Editore SpA 38 -
8 Ascopiave SpA 36 -
65 Assicurazioni Generali SpA 1,336 0.03
27 Atlantia SpA 520 0.01
16 Autogrill SpA 136 -
- Autostrade Meridionali SpA 11 -
3 Avio SpA 46 -
15 Azimut Holding SpA 380 0.01
2 Banca Carige SpA 1 -
19 Banca Farmafactoring SpA 175 -
11 Banca Generali SpA 442 0.01
5 Banca IFIS SpA 75 -
28 Banca Mediolanum SpA 269 0.01
1 Banca Monte dei Paschi di Siena SpA 2 -
56 Banca Popolare di Sondrio SCpA 277 0.01
9 Banca Sistema SpA 22 -
210 Banco BPM SpA 742 0.02
5 Banco di Desio e della Brianza SpA 21 -
9 BE SpA 18 -
2 Biesse SpA 71 -
135 BPER Banca 336 0.01
5 Brunello Cucinelli SpA 272 0.01
13 Buzzi Unicem SpA 361 0.01
18 Cairo Communication SpA 42 -
2 Carel Industries SpA 69 -
6 Cementir Holding NV 72 -
28 Cerved Group SpA 327 0.01
95 CIR SpA-Compagnie Industriali 58 -
140 CNH Industrial NV 2,405 0.05
15 Credito Emiliano SpA 100 -
66 d'Amico International Shipping SA 8 -
3 Danieli & C Officine Meccaniche SpA 67 -
15 Davide Campari-Milano NV 197 0.01
6 De' Longhi SpA 248 0.01
21 DeA Capital SpA 34 -
2 DiaSorin SpA 275 0.01
13 Emak SpA 31 -
15 Enav SpA 72 -
385 Enel SpA 3,821 0.09
130 Eni SpA 1,600 0.04
9 ERG SpA 264 0.01
8 Esprinet SpA 143 -
5 Eurotech SpA 28 -
7 Ferrari NV 1,436 0.03
1 Fiera Milano SpA 5 -
3 Fila SpA 34 -
66 Fincantieri SpA 58 -
50 FinecoBank Banca Fineco SpA 838 0.02
17 FNM SpA 14 -
6 Freni Brembo SpA 83 -
4 Gruppo MutuiOnline SpA 202 0.01
112 Hera SpA 476 0.01
6 Illimity Bank SpA 74 -
40 IMMSI SpA 23 -
25 Infrastrutture Wireless Italiane SpA 277 0.01
29 Intek Group SpA 12 -
10 Interpump Group SpA 566 0.01
676 Intesa Sanpaolo SpA 1,984 0.05
75 Iren SpA 240 0.01
Shares (000's)
Value(000's)
USD
% of NetAssetValue
Common Stock (continued)
Italy - 0.96% (continued)
54 Italgas SpA 359 0.01
2 Italmobiliare SpA 78 -
3 IVS Group SA 20 -
75 Juventus Football Club SpA 70 -
1 La Doria SpA 31 -
55 Leonardo SpA 479 0.01
1 LU-VE SpA 21 -
21 Maire Tecnimont SpA 76 -
51 Mediaset SpA 183 -
68 Mediobanca Banca di Credito Finanziario SpA 812 0.02
22 Moncler SpA 1,572 0.04
10 Nexi SpA 196 -
1 Openjobmetis Spa agenzia per il lavoro 11 -
36 OVS SpA 80 -
31 Piaggio & C SpA 121 -
50 Pirelli & C SpA 296 0.01
43 Poste Italiane SpA 604 0.01
1 Prima Industrie SpA 17 -
12 Prysmian SpA 422 0.01
11 RAI Way SpA 67 -
12 Recordati SpA 652 0.02
30 Reno de Medici SpA 39 -
2 Reply SpA 341 0.01
27 Rizzoli Corriere Della Sera Mediagroup SpA 23 -
1 Sabaf SpA 21 -
13 Safilo Group SpA 25 -
78 Saipem SpA 195 -
22 Salini Impregilo SpA 52 -
94 Saras SpA 81 -
2 Servizi Italia SpA 6 -
1 Sesa SpA 134 -
82 Snam SpA 485 0.01
25 Societa Cattolica di Assicurazioni SC 181 -
11 Sogefi SpA 17 -
6 SOL SpA 112 -
338 Stellantis 6,623 0.15
13 Tamburi Investment Partners SpA 122 -
14 Technogym SpA 176 -
1,440 Telecom Italia SpA 771 0.02
50 Tenaris SA 568 0.01
84 Terna Rete Elettrica Nazionale SpA 646 0.02
3 Tinexta Spa 107 -
1 Tod's SpA 44 -
123 UniCredit SpA 1,577 0.04
2 Unieuro SpA 52 -
66 Unipol Gruppo SpA 363 0.01
61 UnipolSai Assicurazioni SpA 183 -
4 Zignago Vetro SpA 75 -
42,835 0.96
Japan - 7.25%
9 77 Bank Ltd 108 -
1 A&A Material Corp 8 -
3 A&D Co Ltd 33 -
2 ABC-Mart Inc 121 -
- Abist Co Ltd 10 -
2 Achilles Corp 30 -
26 Acom Co Ltd 118 -
2 AD Works Co Ltd 3 -
3 Adastria Co Ltd 47 -
14 ADEKA Corp 259 0.01
1 Ad-Sol Nissin Corp 26 -
2 Advan Co Ltd 19 -
Global Core Equity FundPortfolio of Investments as at 31 May 2021 (continued)
Dimensional Fund Advisors Semi-Annual Report and Unaudited Financial Statements, 31 May 2021 94

Shares (000's)
Value(000's)
USD
% of NetAssetValue
Common Stock (continued)
Japan - 7.25% (continued)
1 Advance Create Co Ltd 11 -
2 Advanced Media Inc 18 -
2 Advantage Risk Management Co Ltd 12 -
13 Advantest Corp 1,101 0.03
40 AEON Co Ltd 1,092 0.03
3 AEON Delight Co Ltd 107 -
1 AEON Fantasy Co Ltd 24 -
21 AEON Financial Service Co Ltd 253 0.01
2 AEON Hokkaido Corp 14 -
9 AEON Mall Co Ltd 150 -
1 Aeria Inc 7 -
2 AFC-HD AMS Life Science Co Ltd 17 -
20 AGC Inc 861 0.02
1 Agro-Kanesho Co Ltd 16 -
5 Ahresty Corp 20 -
5 Ai Holdings Corp 91 -
4 Aica Kogyo Co Ltd 163 0.01
2 Aichi Bank Ltd 44 -
6 Aichi Corp 51 -
2 Aichi Steel Corp 51 -
1 Aichi Tokei Denki Co Ltd 20 -
7 Aida Engineering Ltd 60 -
23 Aiful Corp 78 -
2 Ain Holdings Inc 127 -
1 Ainavo Holdings Co Ltd 12 -
1 Aiphone Co Ltd 25 -
29 Air Water Inc 487 0.01
2 Airport Facilities Co Ltd 14 -
1 Airtech Japan Ltd 16 -
7 Aisan Industry Co Ltd 55 -
15 Aisin Seiki Co Ltd 661 0.02
4 Aizawa Securities Co Ltd 44 -
39 Ajinomoto Co Inc 913 0.02
1 Ajis Co Ltd 26 -
6 Akatsuki Corp 18 -
2 Akatsuki Inc 52 -
9 Akebono Brake Industry Co Ltd 15 -
2 Akita Bank Ltd 32 -
1 Albis Co Ltd 21 -
5 Alconix Corp 68 -
21 Alfresa Holdings Corp 318 0.01
4 Alinco Inc 39 -
2 Alleanza Holdings Co Ltd 27 -
3 Alpen Co Ltd 76 -
1 Alpha Corp 12 -
1 Alpha Systems Inc 20 -
27 Alps Alpine Co Ltd 296 0.01
2 Alps Logistics Co Ltd 16 -
3 Altech Corp 48 -
39 Amada Holdings Co Ltd 423 0.01
5 Amano Corp 144 -
- Amiyaki Tei Co Ltd 10 -
1 Amuse Inc 30 -
1 Amvis Holdings Inc 35 -
7 ANA Holdings Inc 164 0.01
2 Anabuki Kosan Inc 35 -
4 Anest Iwata Corp 41 -
3 Anicom Holdings Inc 32 -
17 Anritsu Corp 316 0.01
1 AOI Electronics Co Ltd 11 -
4 AOI TYO Holdings Inc 30 -
7 AOKI Holdings Inc 42 -
Shares (000's)
Value(000's)
USD
% of NetAssetValue
Common Stock (continued)
Japan - 7.25% (continued)
3 Aomori Bank Ltd 71 -
8 Aoyama Trading Co Ltd 60 -
2 Aoyama Zaisan Networks Co Ltd 28 -
15 Aozora Bank Ltd 342 0.01
3 Apaman Co Ltd 14 -
3 Arakawa Chemical Industries Ltd 30 -
3 Arata Corp 98 -
2 Arcland Sakamoto Co Ltd 30 -
2 Arcland Service Holdings Co Ltd 41 -
6 Arcs Co Ltd 127 -
3 Arealink Co Ltd 38 -
2 Argo Graphics Inc 50 -
1 Ariake Japan Co Ltd 70 -
3 Arisawa Manufacturing Co Ltd 23 -
4 ARTERIA Networks Corp 62 -
5 Artnature Inc 32 -
1 ArtSpark Holdings Inc 30 -
- As One Corp 46 -
2 Asahi Broadcasting Group Holdings Corp 11 -
3 Asahi Co Ltd 37 -
9 Asahi Diamond Industrial Co Ltd 41 -
23 Asahi Group Holdings Ltd 1,105 0.03
13 Asahi Holdings Inc 292 0.01
16 Asahi Intecc Co Ltd 388 0.01
123 Asahi Kasei Corp 1,378 0.03
- Asahi Kogyosha Co Ltd 11 -
2 Asahi Net Inc 11 -
1 Asahi Printing Co Ltd 12 -
2 Asahi Yukizai Corp 28 -
1 Asante Inc 10 -
1 Asanuma Corp 29 -
2 Asax Co Ltd 11 -
1 Ascentech KK 7 -
1 Ashimori Industry Co Ltd 11 -
4 Asia Pile Holdings Corp 20 -
7 Asics Corp 174 0.01
3 ASKA Pharmaceutical Holdings 34 -
4 ASKUL Corp 68 -
42 Astellas Pharma Inc 675 0.02
1 Asti Corp 16 -
2 Ateam Inc 28 -
8 Atom Corp 55 -
2 Atrae Inc 23 -
3 Atsugi Co Ltd 18 -
1 Aucnet Inc 11 -
11 Autobacs Seven Co Ltd 149 -
3 Avant Corp 39 -
4 Avex Inc 56 -
6 Awa Bank Ltd 107 -
3 Axial Retailing Inc 91 -
1 Axyz Co Ltd 16 -
7 Azbil Corp 272 0.01
10 Bandai Namco Holdings Inc 694 0.02
7 Bando Chemical Industries Ltd 52 -
3 Bank of Iwate Ltd 47 -
1 Bank of Kochi Ltd 9 -
7 Bank of Kyoto Ltd 344 0.01
2 Bank of Nagoya Ltd 44 -
4 Bank of Okinawa Ltd 98 -
2 Bank of Saga Ltd 27 -
7 Bank of the Ryukyus Ltd 43 -
1 Bank of Toyama Ltd 14 -
Global Core Equity FundPortfolio of Investments as at 31 May 2021 (continued)
Dimensional Fund Advisors Semi-Annual Report and Unaudited Financial Statements, 31 May 2021 95

Shares (000's)
Value(000's)
USD
% of NetAssetValue
Common Stock (continued)
Japan - 7.25% (continued)
2 Baroque Japan Ltd 12 -
2 BayCurrent Consulting Inc 492 0.01
1 Beenos Inc 29 -
2 Belc Co Ltd 107 -
6 Bell System24 Holdings Inc 90 -
9 Belluna Co Ltd 94 -
9 Benefit One Inc 267 0.01
9 Benesse Holdings Inc 202 0.01
- Bengo4.com Inc 16 -
10 Bic Camera Inc 96 -
1 Biofermin Pharmaceutical Co Ltd 23 -
2 B-Lot Co Ltd 10 -
3 BML Inc 92 -
1 Bourbon Corp 14 -
1 BP Castrol KK 18 -
4 Br Holdings Corp 17 -
- BrainPad Inc 18 -
39 Bridgestone Corp 1,732 0.04
10 Broadband Tower Inc 21 -
7 Broadleaf Co Ltd 35 -
28 Brother Industries Ltd 587 0.01
2 Bull-Dog Sauce Co Ltd 38 -
12 Bunka Shutter Co Ltd 121 -
- Business Engineering Corp 12 -
1 C Uyemura & Co Ltd 70 -
2 CAC Holdings Corp 22 -
8 Calbee Inc 197 0.01
1 Can Do Co Ltd 27 -
1 Canare Electric Co Ltd 13 -
3 Canon Electronics Inc 47 -
26 Canon Inc 619 0.02
6 Canon Marketing Japan Inc 145 -
11 Capcom Co Ltd 356 0.01
- Carenet, Inc 29 -
2 Carlit Holdings Co Ltd 15 -
2 Carta Holdings Inc 23 -
12 Casio Computer Co Ltd 217 0.01
2 Cawachi Ltd 49 -
1 CDS Co Ltd 12 -
1 Central Automotive Products Ltd 40 -
6 Central Glass Co Ltd 111 -
4 Central Japan Railway Co 627 0.02
2 Central Security Patrols Co Ltd 40 -
1 Central Sports Co Ltd 27 -
1 Ceres Inc 21 -
4 Change Inc 98 -
1 Charm Care Corp KK 15 -
2 Chatwork Co Ltd 18 -
39 Chiba Bank Ltd 250 0.01
12 Chiba Kogyo Bank Ltd 29 -
4 Chilled & Frozen Logistics Holdings Co Ltd 59 -
1 Chino Corp 16 -
3 Chiyoda Co Ltd 22 -
2 Chiyoda Integre Co Ltd 37 -
1 Chodai Co Ltd 22 -
3 Chofu Seisakusho Co Ltd 60 -
2 Chori Co Ltd 31 -
29 Chubu Electric Power Co Inc 343 0.01
3 Chubu Shiryo Co Ltd 35 -
5 Chudenko Corp 117 -
1 Chuetsu Pulp & Paper Co Ltd 14 -
27 Chugai Pharmaceutical Co Ltd 1,022 0.02
Shares (000's)
Value(000's)
USD
% of NetAssetValue
Common Stock (continued)
Japan - 7.25% (continued)
1 Chugai Ro Co Ltd 17 -
21 Chugoku Bank Ltd 168 0.01
23 Chugoku Electric Power Co Inc 223 0.01
7 Chugoku Marine Paints Ltd 55 -
1 Chukyo Bank Ltd 19 -
2 Chuo Spring Co Ltd 25 -
1 Chuo Warehouse Co Ltd 11 -
7 CI Takiron Corp 40 -
48 Citizen Watch Co Ltd 192 0.01
5 CKD Corp 111 -
1 CK-San-Etsu Co Ltd 20 -
3 Cleanup Corp 13 -
1 CMC Corp 12 -
2 CMIC Holdings Co Ltd 31 -
8 CMK Corp 33 -
14 Coca-Cola Bottlers Japan Holdings Inc 229 0.01
1 Cocokara fine Inc 73 -
5 COLOPL Inc 40 -
1 Comany Inc 10 -
4 Computer Engineering & Consulting Ltd 48 -
3 Computer Institute of Japan Ltd 26 -
11 COMSYS Holdings Corp 330 0.01
3 Comture Corp 55 -
84 Concordia Financial Group Ltd 317 0.01
4 CONEXIO Corp 49 -
1 Core Corp 16 -
2 Corona Corp 21 -
4 Cosel Co Ltd 41 -
8 Cosmo Energy Holdings Co Ltd 175 0.01
2 Cosmos Pharmaceutical Corp 331 0.01
2 Cota Co Ltd 26 -
- Create Medic Co Ltd 3 -
13 Create Restaurants Holdings Inc 98 -
3 Create SD Holdings Co Ltd 99 -
28 Credit Saison Co Ltd 350 0.01
2 Creek & River Co Ltd 25 -
1 Cresco Ltd 19 -
2 CTI Engineering Co Ltd 54 -
3 CTS Co Ltd 27 -
1 Curves Holdings Co Ltd 8 -
35 CyberAgent Inc 697 0.02
3 Cybernet Systems Co Ltd 21 -
3 Cybozu Inc 66 -
15 Dai Nippon Printing Co Ltd 315 0.01
3 Dai Nippon Toryo Co Ltd 21 -
6 Daibiru Corp 67 -
31 Daicel Corp 245 0.01
2 Dai-Dan Co Ltd 49 -
1 Daido Kogyo Co Ltd 14 -
9 Daido Metal Co Ltd 47 -
5 Daido Steel Co Ltd 245 0.01
3 Daidoh Ltd 5 -
5 Daifuku Co Ltd 435 0.01
2 Daihatsu Diesel Manufacturing Co Ltd 9 -
3 Daihen Corp 149 -
3 Daiho Corp 113 -
2 Dai-Ichi Cutter Kogyo KK 27 -
1 Daiichi Jitsugyo Co Ltd 59 -
3 Daiichi Kigenso Kagaku-Kogyo Co Ltd 46 -
44 Dai-ichi Life Holdings Inc 913 0.02
11 Daiichi Sankyo Co Ltd 248 0.01
1 Dai-ichi Seiko Co Ltd 30 -
Global Core Equity FundPortfolio of Investments as at 31 May 2021 (continued)
Dimensional Fund Advisors Semi-Annual Report and Unaudited Financial Statements, 31 May 2021 96

Shares (000's)
Value(000's)
USD
% of NetAssetValue
Common Stock (continued)
Japan - 7.25% (continued)
4 Daiichikosho Co Ltd 148 -
2 Daiken Corp 39 -
2 Daiken Medical Co Ltd 9 -
7 Daiki Aluminium Industry Co Ltd 73 -
11 Daikin Industries Ltd 2,147 0.05
1 Daikoku Denki Co Ltd 7 -
1 Daikokutenbussan Co Ltd 41 -
4 Daikyonishikawa Corp 31 -
1 Dainichi Co Ltd 9 -
2 Dainichiseika Color & Chemicals Manufacturing CoLtd 43 -
13 Daio Paper Corp 207 0.01
1 Daiohs Corp 9 -
3 Daiseki Co Ltd 127 -
6 Daishi Hokuetsu Financial Group Inc 140 -
1 Daishinku Corp 30 -
2 Daisue Construction Co Ltd 20 -
2 Daito Pharmaceutical Co Ltd 63 -
7 Daito Trust Construction Co Ltd 806 0.02
1 Daitron Co Ltd 20 -
57 Daiwa House Industry Co Ltd 1,652 0.04
6 Daiwa Industries Ltd 57 -
86 Daiwa Securities Group Inc 498 0.01
19 Daiwabo Holdings Co Ltd 297 0.01
19 DCM Holdings Co Ltd 173 0.01
5 Dear Life Co Ltd 20 -
10 DeNA Co Ltd 206 0.01
15 Denka Co Ltd 578 0.01
2 Denki Kogyo Co Ltd 38 -
1 Densan System Co Ltd 19 -
13 Denso Corp 857 0.02
11 Dentsu Inc 385 0.01
3 Denyo Co Ltd 49 -
12 Dexerials Corp 235 0.01
17 DIC Corp 424 0.01
2 Digital Arts Inc 114 -
3 Digital Garage Inc 132 -
1 Digital Hearts Holdings Co Ltd 15 -
1 Digital Information Technologies Corp 21 -
4 Dip Corp 126 -
2 Disco Corp 550 0.01
2 DKK-Toa Corp 12 -
1 DKS Co Ltd 40 -
16 DMG Mori Co Ltd 284 0.01
3 Doshisha Co Ltd 41 -
- Double Standard Inc 13 -
5 Doutor Nichires Holdings Co Ltd 75 -
9 Dowa Holdings Co Ltd 362 0.01
2 Drecom Co Ltd 10 -
6 DTS Corp 136 -
6 Duskin Co Ltd 132 -
2 DyDo Group Holdings Inc 90 -
5 Eagle Industry Co Ltd 49 -
2 Earth Corp 94 -
9 East Japan Railway Co 638 0.02
1 EAT&Co Ltd 12 -
8 Ebara Corp 383 0.01
1 Ebara Foods Industry Inc 14 -
1 Ebara Jitsugyo Co Ltd 35 -
2 Ebase Co Ltd 19 -
1 eBook Initiative Japan Co Ltd 12 -
1 Eco's Co Ltd 22 -
Shares (000's)
Value(000's)
USD
% of NetAssetValue
Common Stock (continued)
Japan - 7.25% (continued)
14 EDION Corp 142 -
3 EF-ON Inc 30 -
3 eGuarantee Inc 59 -
1 E-Guardian Inc 25 -
6 Ehime Bank Ltd 43 -
4 Eidai Co Ltd 11 -
3 Eiken Chemical Co Ltd 57 -
8 Eisai Co Ltd 506 0.01
3 Eizo Corp 125 -
4 Elan Corp 50 -
6 Elecom Co Ltd 108 -
9 Electric Power Development Co Ltd 122 -
2 Elematec Corp 28 -
2 Endo Lighting Corp 12 -
4 Enigmo Inc 45 -
5 en-japan Inc 168 0.01
1 Enomoto Co Ltd 18 -
1 Enplas Corp 23 -
4 EPS Holdings Inc 58 -
3 eRex Co Ltd 51 -
1 ES-Con Japan Ltd 7 -
3 Escrow Agent Japan Inc 8 -
1 Eslead Corp 22 -
3 ESPEC Corp 53 -
5 Exedy Corp 73 -
4 Ezaki Glico Co Ltd 164 0.01
7 F@N Communications Inc 25 -
2 Faith Inc 14 -
1 Falco Holdings Co Ltd 21 -
4 Fancl Corp 135 -
2 FANUC Corp 425 0.01
3 Fast Retailing Co Ltd 2,513 0.06
7 FCC Co Ltd 105 -
1 FDK Corp 10 -
5 Feed One Co Ltd 37 -
8 Ferrotec Holdings Corp 189 0.01
1 Fibergate Inc 13 -
26 FIDEA Holdings Co Ltd 30 -
2 Fields Corp 9 -
2 FINDEX Inc 19 -
10 First Bank of Toyama Ltd 26 -
2 First Brothers Co Ltd 15 -
2 First Corp Inc 15 -
2 First Juken Co Ltd 18 -
2 Fixstars Corp 16 -
3 FJ Next Co Ltd 28 -
2 Focus Systems Corp 13 -
1 Forval Corp 10 -
4 Foster Electric Co Ltd 37 -
5 FP Corp 176 0.01
3 France Bed Holdings Co Ltd 24 -
3 Freebit Co Ltd 22 -
1 Freund Corp 8 -
3 Fronteo Inc 22 -
4 F-Tech Inc 23 -
1 FTGroup Co Ltd 10 -
3 Fudo Tetra Corp 53 -
3 Fuji Co Ltd 61 -
2 Fuji Corp 27 -
8 Fuji Corp (Aichi) 195 0.01
5 Fuji Corp Ltd 30 -
2 Fuji Die Co Ltd 9 -
Global Core Equity FundPortfolio of Investments as at 31 May 2021 (continued)
Dimensional Fund Advisors Semi-Annual Report and Unaudited Financial Statements, 31 May 2021 97

Shares (000's)
Value(000's)
USD
% of NetAssetValue
Common Stock (continued)
Japan - 7.25% (continued)
12 Fuji Electric Co Ltd 551 0.01
1 Fuji Kyuko Co Ltd 42 -
6 Fuji Media Holdings Inc 67 -
8 Fuji Oil Co Ltd 21 -
8 Fuji Oil Holdings Inc 207 0.01
2 Fuji Pharma Co Ltd 22 -
9 Fuji Seal International Inc 203 0.01
3 Fuji Soft Inc 165 0.01
2 Fujibo Holdings Inc 68 -
3 Fujicco Co Ltd 47 -
16 FUJIFILM Holdings Corp 1,082 0.03
4 Fujikura Kasei Co Ltd 21 -
51 Fujikura Ltd 221 0.01
3 Fujimori Kogyo Co Ltd 104 -
12 Fujisash Co Ltd 9 -
1 Fujishoji Co Ltd 12 -
7 Fujitec Co Ltd 144 -
6 Fujitsu General Ltd 145 -
13 Fujitsu Ltd 2,055 0.05
1 Fujiya Co Ltd 25 -
2 FuKoKu Co Ltd 16 -
1 Fukuda Corp 45 -
1 Fukuda Denshi Co Ltd 101 -
1 Fukui Bank Ltd 18 -
1 Fukui Computer Holdings Inc 52 -
21 Fukuoka Financial Group Inc 400 0.01
2 Fukushima Bank Ltd 4 -
2 Fukushima Industries Corp 62 -
5 Fukuyama Transporting Co Ltd 174 0.01
3 FULLCAST Holdings Co Ltd 53 -
5 Funai Soken Holdings Inc 99 -
1 Furukawa Battery Co Ltd 16 -
6 Furukawa Co Ltd 65 -
14 Furukawa Electric Co Ltd 389 0.01
4 Furuno Electric Co Ltd 42 -
2 Furusato Industries Ltd 29 -
- Furuya Metal Co Ltd 20 -
3 Furyu Corp 31 -
3 Fuso Chemical Co Ltd 100 -
1 Fuso Pharmaceutical Industries Ltd 24 -
5 Futaba Corp 40 -
16 Futaba Industrial Co Ltd 73 -
2 Future Corp 33 -
5 Fuyo General Lease Co Ltd 317 0.01
2 G-7 Holdings Inc 53 -
2 Gakken Holdings Co Ltd 30 -
1 Gakkyusha Co Ltd 17 -
4 GCA Corp 31 -
2 Gecoss Corp 15 -
1 Genki Sushi Co Ltd 12 -
1 Genky DrugStores Co Ltd 43 -
9 Geo Holdings Corp 89 -
2 Geostr Corp 8 -
1 giftee Inc 25 -
- Giken Ltd 4 -
1 GL Sciences Inc 20 -
2 Globeride Inc 63 -
8 Glory Ltd 161 0.01
2 Glosel Co Ltd 8 -
1 GMO Cloud KK 23 -
6 GMO Financial Holdings Inc 47 -
9 GMO Internet Inc 250 0.01
Shares (000's)
Value(000's)
USD
% of NetAssetValue
Common Stock (continued)
Japan - 7.25% (continued)
4 GMO Payment Gateway Inc 446 0.01
- GMO Pepabo Inc 20 -
2 GNI Group Ltd 30 -
2 Godo Steel Ltd 32 -
3 Goldcrest Co Ltd 54 -
2 Goldwin Inc 131 -
1 Golf Digest Online Inc 10 -
1 Good Com Asset Co Ltd 18 -
2 Grace Technology Inc 41 -
2 Grandy House Corp 9 -
13 Gree Inc 67 -
6 GS Yuasa Corp 177 0.01
4 G-Tekt Corp 60 -
1 Gun-Ei Chemical Industry Co Ltd 11 -
7 GungHo Online Entertainment Inc 129 -
55 Gunma Bank Ltd 182 0.01
3 Gunze Ltd 103 -
15 H2O Retailing Corp 121 -
- HABA Laboratories Inc 8 -
53 Hachijuni Bank Ltd 182 0.01
2 Hagihara Industries Inc 24 -
1 Hagiwara Electric Holdings Co Ltd 29 -
2 Hakudo Co Ltd 25 -
13 Hakuhodo DY Holdings Inc 228 0.01
2 Hakuto Co Ltd 31 -
1 Halows Co Ltd 38 -
3 Hamakyorex Co Ltd 98 -
3 Hamamatsu Photonics KK 159 0.01
1 Handsman Co Ltd 15 -
12 Hankyu Hanshin Holdings Inc 364 0.01
5 Hanwa Co Ltd 161 0.01
3 Happinet Corp 34 -
2 Hard Off Corp Co Ltd 11 -
2 Harima Chemicals Group Inc 17 -
2 Haruyama Holdings Inc 10 -
51 Haseko Corp 730 0.02
37 Hazama Ando Corp 286 0.01
8 Heiwa Corp 128 -
4 Heiwa Real Estate Co Ltd 143 -
5 Heiwado Co Ltd 115 -
2 Helios Techno Holding Co Ltd 7 -
3 Hibiya Engineering Ltd 59 -
1 Hikari Tsushin Inc 289 0.01
4 HI-LEX Corp 60 -
10 Hino Motors Ltd 99 -
1 Hinokiya Group Co Ltd 25 -
1 Hioki EE Corp 38 -
2 Hirakawa Hewtech Corp 24 -
3 Hiramatsu Inc 5 -
1 Hirano Tecseed Co Ltd 30 -
41 Hirogin Holdings Inc 225 0.01
2 Hirose Electric Co Ltd 221 0.01
1 Hirose Tusyo Inc 12 -
9 Hiroshima Gas Co Ltd 30 -
3 Hisaka Works Ltd 24 -
1 Hisamitsu Pharmaceutical Co Inc 50 -
12 Hitachi Construction Machinery Co Ltd 391 0.01
105 Hitachi Ltd 5,522 0.13
13 Hitachi Metals Ltd 259 0.01
9 Hitachi Transport System Ltd 282 0.01
34 Hitachi Zosen Corp 228 0.01
1 Hito Communications Holdings Inc 26 -
Global Core Equity FundPortfolio of Investments as at 31 May 2021 (continued)
Dimensional Fund Advisors Semi-Annual Report and Unaudited Financial Statements, 31 May 2021 98

Shares (000's)
Value(000's)
USD
% of NetAssetValue
Common Stock (continued)
Japan - 7.25% (continued)
2 Hochiki Corp 24 -
1 Hodogaya Chemical Co Ltd 32 -
3 Hogy Medical Co Ltd 84 -
- Hokkaido Coca-Cola Bottling Co Ltd 15 -
22 Hokkaido Electric Power Co Inc 101 -
2 Hokkaido Gas Co Ltd 28 -
1 Hokkan Holdings Ltd 19 -
4 Hokko Chemical Industry Co Ltd 30 -
3 Hokkoku Bank Ltd 69 -
8 Hokuetsu Corp 45 -
5 Hokuetsu Industries Co Ltd 49 -
19 Hokuhoku Financial Group Inc 158 0.01
1 Hokuriku Electric Industry Co Ltd 10 -
18 Hokuriku Electric Power Co 104 -
2 Hokuriku Electrical Construction Co Ltd 17 -
5 Hokuto Corp 90 -
57 Honda Motor Co Ltd 1,770 0.04
2 Honda Tsushin Kogyo Co Ltd 8 -
3 H-One Co Ltd 24 -
2 Honeys Holdings Co Ltd 21 -
8 Hoosiers Holdings 53 -
3 Horiba Ltd 204 0.01
1 Hoshizaki Corp 54 -
9 Hosiden Corp 89 -
1 Hosokawa Micron Corp 60 -
2 Hotland Co Ltd 23 -
1 House Do Co Ltd 12 -
5 House Foods Group Inc 144 -
2 Howa Machinery Ltd 12 -
18 Hoya Corp 2,398 0.06
33 Hulic Co Ltd 371 0.01
38 Hyakugo Bank Ltd 109 -
4 Hyakujushi Bank Ltd 60 -
7 Ibiden Co Ltd 315 0.01
3 IBJ Inc 27 -
1 Ichibanya Co Ltd 47 -
42 Ichigo Inc 133 -
1 Ichiken Co Ltd 17 -
5 Ichikoh Industries Ltd 36 -
1 Ichimasa Kamaboko Co Ltd 10 -
5 Ichinen Holdings Co Ltd 59 -
6 Ichiyoshi Securities Co Ltd 34 -
2 Icom Inc 33 -
2 ID Holdings Corp 18 -
1 IDEA Consultants Inc 13 -
4 Idec Corp 75 -
12 Idemitsu Kosan Co Ltd 292 0.01
13 IDOM Inc 72 -
2 Ihara Science Corp 27 -
32 IHI Corp 779 0.02
11 Iida Group Holdings Co Ltd 297 0.01
14 Iino Kaiun Kaisha Ltd 58 -
4 IJTT Co Ltd 26 -
2 I'll Inc 25 -
2 Imagica Group Inc 10 -
1 Imasen Electric Industrial 5 -
1 i-mobile Co Ltd 11 -
1 Imuraya Group Co Ltd 13 -
6 Inaba Denki Sangyo Co Ltd 131 -
2 Inaba Seisakusho Co Ltd 20 -
7 Inabata & Co Ltd 107 -
3 Inageya Co Ltd 44 -
Shares (000's)
Value(000's)
USD
% of NetAssetValue
Common Stock (continued)
Japan - 7.25% (continued)
3 Ines Corp 36 -
2 I-Net Corp 30 -
3 Infocom Corp 77 -
27 Infomart Corp 228 0.01
3 Information Services International-Dentsu Ltd 92 -
3 Innotech Corp 40 -
100 Inpex Corp 684 0.02
2 Insource Co Ltd 50 -
6 Intage Holdings Inc 88 -
1 Inter Action Corp 26 -
12 Internet Initiative Japan Inc 320 0.01
2 Inui Global Logistics Co Ltd 17 -
1 I-O Data Device Inc 12 -
1 IPS Inc 28 -
1 IR Japan Holdings Ltd 162 0.01
1 Iriso Electronics Co Ltd 51 -
1 I'rom Group Co Ltd 15 -
2 ISB Corp 27 -
3 Iseki & Co Ltd 41 -
43 Isetan Mitsukoshi Holdings Ltd 312 0.01
1 Ishihara Chemical Co Ltd 24 -
3 Ishihara Sangyo Kaisha Ltd 26 -
1 Ishizuka Glass Co Ltd 11 -
1 Isolite Insulating Products Co Ltd 3 -
51 Isuzu Motors Ltd 690 0.02
2 Itfor Inc 14 -
1 ITmedia Inc 13 -
3 Ito En Ltd 198 0.01
64 ITOCHU Corp 1,918 0.04
13 Itochu Enex Co Ltd 121 -
6 Itochu Techno-Solutions Corp 187 0.01
1 Itochu-Shokuhin Co Ltd 41 -
24 Itoham Yonekyu Holdings Inc 153 -
7 Itoki Corp 23 -
4 IwaiCosmo Holdings Inc 66 -
3 Iwaki & Co Ltd 22 -
2 Iwaki Co Ltd 13 -
1 Iwasaki Electric Co Ltd 9 -
7 Iwatani Corp 425 0.01
1 Iwatsuka Confectionery Co Ltd 22 -
21 Iyo Bank Ltd 110 -
5 Izumi Co Ltd 185 0.01
33 J Front Retailing Co Ltd 323 0.01
12 J Trust Co Ltd 40 -
2 JAC Recruitment Co Ltd 32 -
5 Jaccs Co Ltd 109 -
5 Jafco Co Ltd 392 0.01
1 Jalux Inc 14 -
2 Jamco Corp 20 -
2 Janome Sewing Machine Co Ltd 19 -
16 Japan Airlines Co Ltd 355 0.01
1 Japan Airport Terminal Co Ltd 55 -
3 Japan Asia Group Ltd 27 -
10 Japan Aviation Electronics Industry Ltd 171 0.01
2 Japan Best Rescue System Co Ltd 11 -
4 Japan Cash Machine Co Ltd 20 -
80 Japan Display Inc 29 -
1 Japan Electronic Materials Corp 26 -
5 Japan Elevator Service Holdings Co Ltd 100 -
41 Japan Exchange Group Inc 947 0.02
4 Japan Foundation Engineering Co Ltd 18 -
1 Japan Hospice Holdings Inc 14 -
Global Core Equity FundPortfolio of Investments as at 31 May 2021 (continued)
Dimensional Fund Advisors Semi-Annual Report and Unaudited Financial Statements, 31 May 2021 99

Shares (000's)
Value(000's)
USD
% of NetAssetValue
Common Stock (continued)
Japan - 7.25% (continued)
1 Japan Investment Adviser Co Ltd 15 -
7 Japan Lifeline Co Ltd 92 -
8 Japan Material Co Ltd 91 -
2 Japan Meat Co Ltd 42 -
2 Japan Medical Dynamic Marketing Inc 44 -
1 Japan Oil Transportation Co Ltd 21 -
4 Japan Petroleum Exploration Co Ltd 72 -
47 Japan Post Holdings Co Ltd 392 0.01
14 Japan Post Insurance Co Ltd 273 0.01
2 Japan Property Management Center Co Ltd 18 -
2 Japan Pulp & Paper Co Ltd 79 -
15 Japan Securities Finance Co Ltd 125 -
10 Japan Steel Works Ltd 261 0.01
89 Japan Tobacco Inc 1,762 0.04
6 Japan Transcity Corp 30 -
9 Japan Wool Textile Co Ltd 78 -
2 Jastec Co Ltd 19 -
2 JBCC Holdings Inc 28 -
5 JCR Pharmaceuticals Co Ltd 138 -
3 JCU Corp 100 -
4 Jeol Ltd 170 0.01
35 JFE Holdings Inc 467 0.01
1 JFE Systems Inc 15 -
26 JGC Holdings Corp 250 0.01
- JIG-SAW Inc 31 -
2 Jimoto Holdings Inc 14 -
2 JINS Holdings Inc 148 -
2 JK Holdings Co Ltd 15 -
- JMDC Inc 13 -
2 JMS Co Ltd 20 -
1 Joban Kosan Co Ltd 14 -
3 J-Oil Mills Inc 58 -
3 Joshin Denki Co Ltd 75 -
4 Joyful Honda Co Ltd 54 -
6 JP-Holdings Inc 16 -
2 JSP Corp 38 -
5 JSR Corp 164 0.01
32 JTEKT Corp 337 0.01
4 Juki Corp 31 -
5 Juroku Bank Ltd 90 -
4 Justsystems Corp 211 0.01
47 JVCKenwood Corp 98 -
141 JXTG Holdings Inc 583 0.01
2 K&O Energy Group Inc 27 -
1 Kadokawa Dwango 48 -
- Kadoya Sesame Mills Inc 11 -
3 Kaga Electronics Co Ltd 70 -
5 Kagome Co Ltd 144 -
49 Kajima Corp 681 0.02
11 Kakaku.com Inc 319 0.01
5 Kaken Pharmaceutical Co Ltd 219 0.01
1 Kakiyasu Honten Co Ltd 18 -
1 Kameda Seika Co Ltd 62 -
4 Kamei Corp 38 -
13 Kamigumi Co Ltd 266 0.01
2 Kanaden Corp 24 -
2 Kanagawa Chuo Kotsu Co Ltd 50 -
3 Kanamic Network Co Ltd 16 -
8 Kanamoto Co Ltd 194 0.01
17 Kandenko Co Ltd 140 -
8 Kaneka Corp 338 0.01
1 Kaneko Seeds Co Ltd 15 -
Shares (000's)
Value(000's)
USD
% of NetAssetValue
Common Stock (continued)
Japan - 7.25% (continued)
16 Kanematsu Corp 221 0.01
1 Kanematsu Electronics Ltd 40 -
37 Kansai Electric Power Co Inc 351 0.01
4 Kansai Paint Co Ltd 114 -
2 Kansai Super Market Ltd 15 -
11 Kanto Denka Kogyo Co Ltd 97 -
25 Kao Corp 1,546 0.04
4 Katakura Industries Co Ltd 53 -
5 Katitas Co Ltd 151 -
3 Kato Sangyo Co Ltd 84 -
2 Kato Works Co Ltd 16 -
1 Kawada Technologies Inc 28 -
1 Kawai Musical Instruments Manufacturing Co Ltd 34 -
27 Kawasaki Heavy Industries Ltd 646 0.02
3 Kawasaki Kisen Kaisha Ltd 76 -
1 Kawata Manufacturing Co Ltd 8 -
182 KDDI Corp 6,200 0.14
2 KeePer Technical Laboratory Co Ltd 37 -
6 Keihan Holdings Co Ltd 189 0.01
4 Keihanshin Building Co Ltd 52 -
10 Keikyu Corp 133 -
4 Keio Corp 239 0.01
8 Keisei Electric Railway Co Ltd 243 0.01
17 Keiyo Bank Ltd 63 -
6 Keiyo Co Ltd 38 -
2 Kenko Mayonnaise Co Ltd 29 -
12 Kewpie Corp 277 0.01
2 Keyence Corp 1,106 0.03
1 KeyHolder Inc 12 -
2 KFC Holdings Japan Ltd 53 -
1 KFC Ltd 15 -
3 KH Neochem Co Ltd 69 -
8 Kikkoman Corp 528 0.01
16 Kinden Corp 267 0.01
2 King Co Ltd 10 -
3 King Jim Co Ltd 23 -
- Kinki Sharyo Co Ltd 2 -
1 Kintetsu Department Store Co Ltd 14 -
9 Kintetsu Group Holdings Co Ltd 332 0.01
7 Kintetsu World Express Inc 169 0.01
29 Kirin Holdings Co Ltd 580 0.01
5 Kissei Pharmaceutical Co Ltd 97 -
1 Ki-Star Real Estate Co Ltd 56 -
2 Kitagawa Corp 22 -
1 Kita-Nippon Bank Ltd 14 -
1 Kitano Construction Corp 13 -
6 Kitanotatsujin Corp 25 -
4 Kito Corp 62 -
9 Kitz Corp 65 -
10 Kiyo Bank Ltd 133 -
3 KLab Inc 20 -
5 Koa Corp 75 -
5 Koatsu Gas Kogyo Co Ltd 29 -
1 Kobayashi Pharmaceutical Co Ltd 69 -
13 Kobe Bussan Co Ltd 332 0.01
1 Kobe Electric Railway Co Ltd 22 -
27 Kobe Steel Ltd 184 0.01
6 Kohnan Shoji Co Ltd 154 -
1 Kohsoku Corp 18 -
5 Koito Manufacturing Co Ltd 341 0.01
5 Kojima Co Ltd 40 -
5 Kokusai Pulp & Paper Co Ltd 11 -
Global Core Equity FundPortfolio of Investments as at 31 May 2021 (continued)
Dimensional Fund Advisors Semi-Annual Report and Unaudited Financial Statements, 31 May 2021 100

Shares (000's)
Value(000's)
USD
% of NetAssetValue
Common Stock (continued)
Japan - 7.25% (continued)
14 Kokuyo Co Ltd 216 0.01
40 Komatsu Ltd 1,211 0.03
4 Komatsu Matere Co Ltd 39 -
1 Komatsu Wall Industry Co Ltd 16 -
6 KOMEDA Holdings Co Ltd 118 -
1 Komehyo Co Ltd 15 -
6 Komeri Co Ltd 143 -
8 Komori Corp 62 -
5 Konaka Co Ltd 15 -
7 Konami Holdings Corp 463 0.01
3 Kondotec Inc 28 -
49 Konica Minolta Inc 273 0.01
5 Konishi Co Ltd 74 -
5 Konoike Transport Co Ltd 48 -
1 Konoshima Chemical Co Ltd 13 -
3 Kosaido Co Ltd 26 -
- Kose Corp 64 -
8 Koshidaka Holdings Co Ltd 48 -
1 Krosaki Harima Corp 46 -
1 KRS Corp 15 -
26 K's Holdings Corp 308 0.01
3 KU Holdings Co Ltd 23 -
26 Kubota Corp 608 0.02
8 Kumagai Gumi Co Ltd 207 0.01
10 Kumiai Chemical Industry Co Ltd 77 -
1 Kunimine Industries Co Ltd 13 -
3 Kurabo Industries Ltd 50 -
59 Kuraray Co Ltd 624 0.02
2 Kureha Corp 108 -
2 Kurimoto Ltd 25 -
6 Kurita Water Industries Ltd 307 0.01
3 Kuriyama Holdings Corp 17 -
2 Kusuri no Aoki Holdings Co Ltd 147 -
3 KYB Corp 101 -
14 Kyocera Corp 835 0.02
4 Kyoden Co Ltd 11 -
2 Kyodo Printing Co Ltd 40 -
3 Kyoei Steel Ltd 44 -
1 Kyokuto Boeki Kaisha Ltd 16 -
2 Kyokuto Kaihatsu Kogyo Co Ltd 40 -
4 Kyokuto Securities Co Ltd 30 -
2 Kyokuyo Co Ltd 47 -
5 KYORIN Holdings Inc 75 -
2 Kyoritsu Maintenance Co Ltd 53 -
4 Kyoritsu Printing Co Ltd 5 -
6 Kyosan Electric Manufacturing Co Ltd 23 -
3 Kyowa Electronic Instruments Co Ltd 11 -
8 Kyowa Exeo Corp 195 0.01
3 Kyowa Kirin Co Ltd 79 -
2 Kyowa Leather Cloth Co Ltd 14 -
7 Kyudenko Corp 204 0.01
32 Kyushu Electric Power Co Inc 263 0.01
46 Kyushu Financial Group Inc 176 0.01
3 Kyushu Leasing Service Co Ltd 17 -
13 Kyushu Railway Co 292 0.01
2 LAC Co Ltd 23 -
1 Lacto Japan Co Ltd 29 -
5 Laox Co Ltd 8 -
5 Lasertec Corp 849 0.02
9 Lawson Inc 428 0.01
5 LEC Inc 54 -
2 Lecip Holdings Corp 8 -
Shares (000's)
Value(000's)
USD
% of NetAssetValue
Common Stock (continued)
Japan - 7.25% (continued)
3 Life Corp 92 -
8 Lifull Co Ltd 28 -
1 Like Co Ltd 23 -
1 Linical Co Ltd 10 -
3 Link And Motivation Inc 17 -
7 Lintec Corp 161 0.01
17 Lion Corp 295 0.01
1 LITALICO Inc 53 -
24 LIXIL Group Corp 663 0.02
1 Look Holdings Inc 19 -
2 M&A Capital Partners Co Ltd 77 -
21 M3 Inc 1,423 0.03
2 Mabuchi Motor Co Ltd 79 -
8 Macnica Fuji Electronics Holdings Inc 171 0.01
6 Macromill Inc 50 -
25 Maeda Corp 219 0.01
2 Maeda Kosen Co Ltd 73 -
7 Maeda Road Construction Co Ltd 148 -
2 Maezawa Kasei Industries Co Ltd 25 -
3 Maezawa Kyuso Industries Co Ltd 28 -
4 Makino Milling Machine Co Ltd 164 0.01
3 Makita Corp 165 0.01
3 Mandom Corp 52 -
2 Mani Inc 54 -
2 MarkLines Co Ltd 44 -
3 Mars Group Holdings Corp 38 -
100 Marubeni Corp 892 0.02
3 Marubun Corp 18 -
3 Marudai Food Co Ltd 51 -
9 Maruha Nichiro Corp 199 0.01
19 Marui Group Co Ltd 359 0.01
6 Maruichi Steel Tube Ltd 148 -
1 Maruka Corp 19 -
1 Marumae Co Ltd 20 -
9 Marusan Securities Co Ltd 59 -
1 Maruwa Co Ltd 91 -
4 Maruwa Unyu Kikan Co Ltd 62 -
3 Maruzen CHI Holdings Co Ltd 13 -
1 Maruzen Co Ltd 20 -
2 Maruzen Showa Unyu Co Ltd 62 -
2 Marvelous Inc 13 -
1 Matching Service Japan Co Ltd 10 -
2 Matsuda Sangyo Co Ltd 43 -
3 Matsui Construction Co Ltd 20 -
7 Matsui Securities Co Ltd 58 -
4 Matsumotokiyoshi Holdings Co Ltd 165 0.01
1 Matsuoka Corp 9 -
1 Matsuyafoods Holdings Co Ltd 41 -
4 Max Co Ltd 56 -
9 Maxell Holdings Ltd 99 -
1 Maxvalu Tokai Co Ltd 22 -
46 Mazda Motor Corp 401 0.01
6 McDonald's Holdings Co Japan Ltd 281 0.01
10 MCJ Co Ltd 97 -
118 Mebuki Financial Group Inc 256 0.01
2 MEC Co Ltd 52 -
1 Media Do Holdings Co Ltd 55 -
4 Medical Data Vision Co Ltd 72 -
5 Medical System Network Co Ltd 31 -
- Medikit Co Ltd 11 -
11 Medipal Holdings Corp 213 0.01
1 MedPeer Inc 62 -
Global Core Equity FundPortfolio of Investments as at 31 May 2021 (continued)
Dimensional Fund Advisors Semi-Annual Report and Unaudited Financial Statements, 31 May 2021 101

Shares (000's)
Value(000's)
USD
% of NetAssetValue
Common Stock (continued)
Japan - 7.25% (continued)
2 Megachips Corp 57 -
9 Megmilk Snow Brand Co Ltd 167 0.01
7 Meidensha Corp 154 -
13 MEIJI Holdings Co Ltd 780 0.02
4 Meiko Electronics Co Ltd 111 -
2 Meiko Network Japan Co Ltd 13 -
3 Meisei Industrial Co Ltd 23 -
3 Meitec Corp 185 0.01
1 Meito Sangyo Co Ltd 14 -
4 Meiwa Corp 18 -
1 Meiwa Estate Co Ltd 8 -
1 Melco Holdings Inc 31 -
1 Members Co Ltd 18 -
3 Menicon Co Ltd 178 0.01
1 Mercari Inc 66 -
2 Mercuria Investment Co Ltd 11 -
3 Metawater Co Ltd 51 -
3 Michinoku Bank Ltd 26 -
3 Micronics Japan Co Ltd 47 -
11 Mie Kotsu Group Holdings Inc 48 -
6 Mikuni Corp 17 -
2 Milbon Co Ltd 131 -
2 Mimaki Engineering Co Ltd 14 -
4 Mimasu Semiconductor Industry Co Ltd 89 -
29 Minebea Mitsumi Inc 795 0.02
3 Ministop Co Ltd 42 -
10 Miraca Holdings Inc 276 0.01
1 Miraial Co Ltd 14 -
12 Mirait Holdings Corp 221 0.01
3 Miroku Jyoho Service Co Ltd 40 -
11 MISUMI Group Inc 350 0.01
1 Mitani Corp 88 -
4 Mitani Sangyo Co Ltd 14 -
1 Mitani Sekisan Co Ltd 49 -
11 Mito Securities Co Ltd 30 -
8 Mitsuba Corp 67 -
139 Mitsubishi Chemical Holdings Corp 1,126 0.03
55 Mitsubishi Corp 1,507 0.04
89 Mitsubishi Electric Corp 1,388 0.03
54 Mitsubishi Estate Co Ltd 886 0.02
10 Mitsubishi Gas Chemical Co Inc 239 0.01
33 Mitsubishi Heavy Industries Ltd 1,030 0.02
1 Mitsubishi Kakoki Kaisha Ltd 17 -
5 Mitsubishi Logisnext Co Ltd 50 -
6 Mitsubishi Logistics Corp 183 0.01
13 Mitsubishi Materials Corp 276 0.01
73 Mitsubishi Motors Corp 204 0.01
4 Mitsubishi Paper Mills Ltd 12 -
3 Mitsubishi Pencil Co Ltd 45 -
1 Mitsubishi Research Institute Inc 54 -
2 Mitsubishi Shokuhin Co Ltd 63 -
2 Mitsubishi Steel Manufacturing Co Ltd 15 -
434 Mitsubishi UFJ Financial Group Inc 2,490 0.06
151 Mitsubishi UFJ Lease & Finance Co Ltd 852 0.02
4 Mitsuboshi Belting Ltd 69 -
68 Mitsui & Co Ltd 1,504 0.04
22 Mitsui Chemicals Inc 749 0.02
15 Mitsui E&S Holdings Co Ltd 67 -
37 Mitsui Fudosan Co Ltd 865 0.02
3 Mitsui High-Tec Inc 107 -
2 Mitsui Matsushima Holdings Co Ltd 21 -
13 Mitsui Mining & Smelting Co Ltd 378 0.01
Shares (000's)
Value(000's)
USD
% of NetAssetValue
Common Stock (continued)
Japan - 7.25% (continued)
11 Mitsui OSK Lines Ltd 429 0.01
3 Mitsui Sugar Co Ltd 43 -
5 Mitsui-Soko Holdings Co Ltd 104 -
6 Mitsuuroko Group Holdings Co Ltd 64 -
1 Miura Co Ltd 65 -
6 Mixi Inc 154 -
1 Miyaji Engineering Group Inc 22 -
2 Miyazaki Bank Ltd 45 -
1 Miyoshi Oil & Fat Co Ltd 14 -
95 Mizuho Financial Group Inc 1,472 0.03
6 Mizuho Leasing Co Ltd 176 0.01
3 Mizuno Corp 67 -
1 Mobile Factory Inc 9 -
2 Mochida Pharmaceutical Co Ltd 63 -
3 Modec Inc 53 -
3 Molitec Steel Co Ltd 12 -
15 Monex Group Inc 114 -
2 Monogatari Corp 107 -
14 MonotaRO Co Ltd 322 0.01
1 MORESCO Corp 10 -
6 Morinaga & Co Ltd 188 0.01
8 Morinaga Milk Industry Co Ltd 397 0.01
4 Morita Holdings Corp 55 -
3 Morito Co Ltd 15 -
- Morozoff Ltd 14 -
1 Mory Industries Inc 18 -
5 MrMax Holdings Ltd 29 -
19 MS&AD Insurance Group Holdings Inc 579 0.01
4 MTI Ltd 29 -
2 Mugen Estate Co Ltd 10 -
1 M-up Holdings Inc 22 -
1 Murakami Corp 31 -
28 Murata Manufacturing Co Ltd 2,098 0.05
12 Musashi Seimitsu Industry Co Ltd 245 0.01
1 Musashino Bank Ltd 24 -
2 Mynet Inc 13 -
8 Nabtesco Corp 372 0.01
2 NAC Co Ltd 14 -
3 Nachi-Fujikoshi Corp 115 -
1 Nadex Co Ltd 6 -
2 Nafco Co Ltd 30 -
1 Nagano Bank Ltd 15 -
2 Nagano Keiki Co Ltd 23 -
16 Nagase & Co Ltd 241 0.01
2 Nagatanien Holdings Co Ltd 30 -
1 Nagawa Co Ltd 46 -
10 Nagoya Railroad Co Ltd 189 0.01
1 Naigai Trans Line Ltd 15 -
4 Nakabayashi Co Ltd 22 -
1 Nakamoto Packs Co Ltd 13 -
1 Nakamuraya Co Ltd 17 -
4 Nakanishi Inc 95 -
4 Nakayama Steel Works Ltd 16 -
1 Nakayamafuku Co Ltd 3 -
9 Namura Shipbuilding Co Ltd 15 -
11 Nankai Electric Railway Co Ltd 239 0.01
5 Nanto Bank Ltd 84 -
- Narasaki Sangyo Co Ltd 8 -
2 Natori Co Ltd 26 -
23 NEC Corp 1,053 0.03
4 NEC Networks & System Integration Corp 62 -
1 NEOJAPAN Inc 21 -
Global Core Equity FundPortfolio of Investments as at 31 May 2021 (continued)
Dimensional Fund Advisors Semi-Annual Report and Unaudited Financial Statements, 31 May 2021 102

Shares (000's)
Value(000's)
USD
% of NetAssetValue
Common Stock (continued)
Japan - 7.25% (continued)
10 NET One Systems Co Ltd 309 0.01
6 Neturen Co Ltd 29 -
1 New Art Holdings Co Ltd 14 -
5 Nexon Co Ltd 114 -
5 Nextage Co Ltd 74 -
1 NFC Holdings Inc 11 -
23 NGK Insulators Ltd 415 0.01
28 NGK Spark Plug Co Ltd 441 0.01
11 NH Foods Ltd 429 0.01
35 NHK Spring Co Ltd 262 0.01
1 Nicca Chemical Co Ltd 14 -
1 Nice Holdings Inc 18 -
5 Nichia Steel Works Ltd 13 -
10 Nichias Corp 258 0.01
2 Nichiban Co Ltd 24 -
8 Nichicon Corp 84 -
2 Nichiden Corp 44 -
3 Nichiha Corp 90 -
10 Nichi-iko Pharmaceutical Co Ltd 76 -
15 Nichirei Corp 382 0.01
4 Nichireki Co Ltd 49 -
2 Nichirin Co Ltd 28 -
11 Nidec Corp 1,267 0.03
12 Nifco Inc 428 0.01
3 Nihon Chouzai Co Ltd 38 -
3 Nihon Dempa Kogyo Co Ltd 23 -
1 Nihon Dengi Co Ltd 24 -
1 Nihon Denkei Co Ltd 12 -
2 Nihon Flush Co Ltd 27 -
9 Nihon House Holdings Co Ltd 28 -
2 Nihon Kagaku Sangyo Co Ltd 23 -
6 Nihon Kohden Corp 180 0.01
25 Nihon M&A Center Inc 615 0.02
5 Nihon Nohyaku Co Ltd 25 -
11 Nihon Parkerizing Co Ltd 109 -
3 Nihon Plast Co Ltd 19 -
2 Nihon Tokushu Toryo Co Ltd 22 -
9 Nihon Unisys Ltd 279 0.01
1 Nihon Yamamura Glass Co Ltd 8 -
1 Niitaka Co Ltd 17 -
2 Nikkato Corp 10 -
15 Nikkiso Co Ltd 159 0.01
4 Nikko Co Ltd 26 -
10 Nikkon Holdings Co Ltd 206 0.01
34 Nikon Corp 350 0.01
4 Nintendo Co Ltd 2,645 0.06
7 Nippo Corp 172 0.01
4 Nippon Air Conditioning Services Co Ltd 24 -
2 Nippon Aqua Co Ltd 9 -
1 Nippon Beet Sugar Manufacturing Co Ltd 18 -
1 Nippon Carbide Industries Co Inc 18 -
1 Nippon Carbon Co Ltd 47 -
2 Nippon Chemical Industrial Co Ltd 41 -
4 Nippon Chemi-Con Corp 81 -
22 Nippon Coke & Engineering Co Ltd 21 -
3 Nippon Commercial Development Co Ltd 49 -
7 Nippon Concrete Industries Co Ltd 23 -
20 Nippon Denko Co Ltd 60 -
6 Nippon Densetsu Kogyo Co Ltd 99 -
1 Nippon Dry-Chemical Co Ltd 16 -
8 Nippon Electric Glass Co Ltd 202 0.01
10 Nippon Express Co Ltd 796 0.02
Shares (000's)
Value(000's)
USD
% of NetAssetValue
Common Stock (continued)
Japan - 7.25% (continued)
3 Nippon Felt Co Ltd 11 -
3 Nippon Filcon Co Ltd 12 -
2 Nippon Fine Chemical Co Ltd 25 -
7 Nippon Flour Mills Co Ltd 95 -
17 Nippon Gas Co Ltd 258 0.01
4 Nippon Hume Corp 25 -
1 Nippon Kanzai Co Ltd 15 -
24 Nippon Kayaku Co Ltd 223 0.01
1 Nippon Kodoshi Corp 19 -
3 Nippon Koei Co Ltd 75 -
12 Nippon Light Metal Holdings Co Ltd 213 0.01
10 Nippon Paint Holdings Co Ltd 139 -
21 Nippon Paper Industries Co Ltd 250 0.01
25 Nippon Parking Development Co Ltd 35 -
3 Nippon Pillar Packing Co Ltd 53 -
1 Nippon Piston Ring Co Ltd 15 -
1 Nippon Rietec Co Ltd 20 -
1 Nippon Road Co Ltd 68 -
8 Nippon Seiki Co Ltd 83 -
- Nippon Seisen Co Ltd 16 -
1 Nippon Sharyo Ltd 30 -
2 Nippon Shinyaku Co Ltd 124 -
4 Nippon Shokubai Co Ltd 199 0.01
9 Nippon Signal Company Ltd 74 -
4 Nippon Soda Co Ltd 129 -
36 Nippon Steel Corp 689 0.02
3 Nippon Steel Trading Corp 113 -
56 Nippon Suisan Kaisha Ltd 262 0.01
1 Nippon Systemware Co Ltd 23 -
52 Nippon Telegraph & Telephone Corp 1,420 0.03
11 Nippon Thompson Co Ltd 65 -
3 Nippon Yakin Kogyo Co Ltd 64 -
30 Nippon Yusen KK 1,229 0.03
29 Nipro Corp 357 0.01
1 Nishikawa Rubber Co Ltd 19 -
8 Nishimatsu Construction Co Ltd 264 0.01
4 Nishimatsuya Chain Co Ltd 61 -
1 Nishimoto Co Ltd 15 -
22 Nishi-Nippon Financial Holdings Inc 139 -
3 Nishi-Nippon Railroad Co Ltd 82 -
5 Nishio Rent All Co Ltd 160 0.01
11 Nissan Chemical Corp 586 0.01
103 Nissan Motor Co Ltd 518 0.01
10 Nissan Shatai Co Ltd 68 -
6 Nissan Tokyo Sales Holdings Co Ltd 13 -
1 Nissei ASB Machine Co Ltd 39 -
2 Nissei Plastic Industrial Co Ltd 25 -
7 Nissha Co Ltd 106 -
6 Nisshin Fudosan Co 25 -
4 Nisshin Oillio Group Ltd 118 -
10 Nisshin Seifun Group Inc 156 -
26 Nisshinbo Holdings Inc 223 0.01
2 Nissin Corp 26 -
8 Nissin Electric Co Ltd 94 -
4 Nissin Foods Holdings Co Ltd 290 0.01
2 Nissin Sugar Co Ltd 33 -
4 Nisso Corp 30 -
2 Nissui Pharmaceutical Co Ltd 13 -
5 Nitori Holdings Co Ltd 844 0.02
3 Nitta Corp 70 -
3 Nitta Gelatin Inc 15 -
1 Nittetsu Mining Co Ltd 57 -
Global Core Equity FundPortfolio of Investments as at 31 May 2021 (continued)
Dimensional Fund Advisors Semi-Annual Report and Unaudited Financial Statements, 31 May 2021 103

Shares (000's)
Value(000's)
USD
% of NetAssetValue
Common Stock (continued)
Japan - 7.25% (continued)
2 Nitto Boseki Co Ltd 53 -
7 Nitto Denko Corp 528 0.01
- Nitto Fuji Flour Milling Co Ltd 20 -
5 Nitto Kogyo Corp 77 -
2 Nitto Kohki Co Ltd 29 -
5 Nitto Seiko Co Ltd 26 -
5 Nittoc Construction Co Ltd 33 -
1 Noevir Holdings Co Ltd 42 -
6 NOF Corp 341 0.01
3 Nohmi Bosai Ltd 61 -
7 Nojima Corp 197 0.01
13 NOK Corp 159 0.01
144 Nomura Holdings Inc 788 0.02
17 Nomura Real Estate Holdings Inc 457 0.01
18 Nomura Research Institute Ltd 576 0.01
2 Noritake Co Ltd Japan 65 -
1 Noritsu Koki Co Ltd 28 -
5 Noritz Corp 81 -
46 North Pacific Bank Ltd 105 -
2 NPC Inc 15 -
4 NS Solutions Corp 129 -
2 NS Tool Co Ltd 27 -
2 NS United Kaiun Kaisha Ltd 38 -
7 NSD Co Ltd 117 -
21 NSK Ltd 201 0.01
63 NTN Corp 185 0.01
51 NTT Data Corp 823 0.02
9 OAK Capital Corp 9 -
1 Oat Agrio Co Ltd 9 -
2 Obara Group Inc 69 -
59 Obayashi Corp 505 0.01
- OBIC Business Consultants Co Ltd 16 -
2 Obic Co Ltd 387 0.01
1 Ochi Holdings Co Ltd 12 -
16 Odakyu Electric Railway Co Ltd 411 0.01
8 Oenon Holdings Inc 28 -
6 Ogaki Kyoritsu Bank Ltd 100 -
1 Ohara Inc 16 -
2 Ohashi Technica Inc 27 -
2 Ohba Co Ltd 16 -
2 Ohsho Food Service Corp 86 -
4 Oiles Corp 53 -
1 Oisix ra daichi Inc 41 -
2 Oita Bank Ltd 40 -
73 Oji Holdings Corp 435 0.01
6 Okabe Co Ltd 37 -
1 Okada Aiyon Corp 12 -
2 Okamoto Industries Inc 68 -
1 Okamoto Machine Tool Works Ltd 32 -
10 Okamura Corp 126 -
7 Okasan Securities Group Inc 29 -
9 Oki Electric Industry Co Ltd 82 -
2 Okinawa Cellular Telephone Co 113 -
5 Okinawa Electric Power Co Inc 62 -
2 OKUMA Corp 84 -
5 Okumura Corp 132 -
1 Okura Industrial Co Ltd 21 -
4 Okuwa Co Ltd 38 -
61 Olympus Corp 1,296 0.03
5 Omron Corp 388 0.01
9 Ono Pharmaceutical Co Ltd 195 0.01
2 Onoken Co Ltd 26 -
Shares (000's)
Value(000's)
USD
% of NetAssetValue
Common Stock (continued)
Japan - 7.25% (continued)
17 Onward Holdings Co Ltd 46 -
9 Open House Co Ltd 413 0.01
2 Optim Corp 46 -
3 Optorun Co Ltd 64 -
3 Oracle Corp Japan 290 0.01
1 Orchestra Holdings Inc 27 -
1 Organo Corp 65 -
96 Orient Corp 138 -
1 Oriental Consultants Holdings Co Ltd 15 -
2 Oriental Land Co Ltd 242 0.01
10 Oriental Shiraishi Corp 25 -
1 Origin Co Ltd 12 -
64 ORIX Corp 1,129 0.03
1 Oro Co Ltd 32 -
24 Osaka Gas Co Ltd 455 0.01
2 Osaka Organic Chemical Industry Ltd 72 -
3 Osaka Soda Co Ltd 60 -
3 Osaka Steel Co Ltd 28 -
3 Osaka Titanium Technologies Co Ltd 21 -
7 Osaki Electric Co Ltd 37 -
16 OSG Corp 261 0.01
11 Otsuka Corp 612 0.02
16 Otsuka Holdings Co Ltd 670 0.02
1 OUG Holdings Inc 15 -
23 Outsourcing Inc 424 0.01
3 Oyo Corp 35 -
1 Ozu Corp 12 -
11 Pacific Industrial Co Ltd 123 -
3 Pacific Metals Co Ltd 50 -
1 Pack Corp 39 -
3 Paltac Corporation 145 -
26 Pan Pacific International Holdings Corp 519 0.01
216 Panasonic Corp 2,450 0.06
1 Paraca Inc 7 -
6 Paramount Bed Holdings Co Ltd 111 -
3 Paris Miki Holdings Inc 7 -
17 Park24 Co Ltd 346 0.01
3 Parker Corp 14 -
1 Pasco Corp 10 -
4 Pasona Group Inc 76 -
1 PCA Corp 27 -
3 Pegasus Sewing Machine Manufacturing Co Ltd 13 -
56 Penta-Ocean Construction Co Ltd 403 0.01
8 PeptiDream Inc 362 0.01
24 Persol Holdings Co Ltd 466 0.01
1 Pickles Corp 35 -
12 Pigeon Corp 335 0.01
5 Pilot Corp 176 0.01
5 Piolax Inc 72 -
2 Plenus Co Ltd 35 -
2 Pola Orbis Holdings Inc 47 -
4 Poletowin Pitcrew Holdings Inc 42 -
1 Premium Group Co Ltd 40 -
20 Press Kogyo Co Ltd 59 -
3 Pressance Corp 45 -
11 Prestige International Inc 70 -
5 Prima Meat Packers Ltd 152 -
1 Pronexus Inc 12 -
1 Prored Partners Co Ltd 22 -
- Pro-Ship Inc 4 -
37 Prospect Co Ltd 11 -
4 Proto Corp 41 -
Global Core Equity FundPortfolio of Investments as at 31 May 2021 (continued)
Dimensional Fund Advisors Semi-Annual Report and Unaudited Financial Statements, 31 May 2021 104

Shares (000's)
Value(000's)
USD
% of NetAssetValue
Common Stock (continued)
Japan - 7.25% (continued)
7 PS Mitsubishi Construction Co Ltd 45 -
4 Punch Industry Co Ltd 23 -
2 QB Net Holdings Co Ltd 34 -
5 Qol Holdings Co Ltd 74 -
2 Quick Co Ltd 19 -
2 Raccoon Holdings Inc 45 -
6 Raito Kogyo Co Ltd 94 -
4 Raiznext Corp 44 -
11 Rakus Co Ltd 195 0.01
5 Rakuten Inc 53 -
1 Rasa Corp 12 -
2 Rasa Industries Ltd 32 -
3 Raysum Co Ltd 25 -
61 Recruit Holdings Co Ltd 3,122 0.07
4 Relia Inc 49 -
15 Relo Group Inc 289 0.01
54 Renesas Electronics Corp 569 0.01
36 Rengo Co Ltd 304 0.01
3 RENOVA Inc 85 -
154 Resona Holdings Inc 664 0.02
12 Resorttrust Inc 193 0.01
3 Restar Holdings Corp 52 -
2 Retail Partners Co Ltd 22 -
1 Rheon Automatic Machinery Co Ltd 16 -
1 Rhythm Watch Co Ltd 6 -
1 Riberesute Corp 9 -
40 Ricoh Co Ltd 480 0.01
1 Ricoh Leasing Co Ltd 43 -
2 Ride On Express Holdings Co Ltd 22 -
2 Right On Co Ltd 12 -
1 Riken Corp 31 -
2 Riken Keiki Co Ltd 57 -
7 Riken Technos Corp 35 -
3 Riken Vitamin Co Ltd 35 -
2 Rinnai Corp 154 -
1 Rion Co Ltd 28 -
3 Riso Kagaku Corp 51 -
17 Riso Kyoiku Co Ltd 49 -
1 Rix Corp 14 -
3 Rohm Co Ltd 247 0.01
10 Rohto Pharmaceutical Co Ltd 236 0.01
2 Rokko Butter Co Ltd 21 -
1 Roland DG Corp 25 -
1 Rorze Corp 123 -
1 Rozetta Corp 15 -
- RS Technologies Co Ltd 20 -
3 Ryobi Ltd 38 -
2 Ryoden Corp 34 -
23 Ryohin Keikaku Co Ltd 434 0.01
3 Ryosan Co Ltd 64 -
1 Ryoyo Electro Corp 22 -
3 S Foods Inc 98 -
1 S&B Foods Inc 30 -
3 Sac's Bar Holdings Inc 19 -
1 Sagami Rubber Industries Co Ltd 10 -
3 Saibu Gas Co Ltd 75 -
1 Saison Information Systems Co Ltd 15 -
1 Saizeriya Co Ltd 30 -
2 Sakai Chemical Industry Co Ltd 36 -
1 Sakai Heavy Industries Ltd 13 -
2 Sakai Moving Service Co Ltd 81 -
1 Sakai Ovex Co Ltd 16 -
Shares (000's)
Value(000's)
USD
% of NetAssetValue
Common Stock (continued)
Japan - 7.25% (continued)
9 Sakata INX Corp 81 -
1 Sakata Seed Corp 17 -
3 Sakura Internet Inc 16 -
11 Sala Corp 60 -
2 SAMTY Co Ltd 39 -
1 San Holdings Inc 11 -
3 San ju San Financial Group Inc 37 -
2 San-A Co Ltd 93 -
11 San-Ai Oil Co Ltd 115 -
1 Sanei Architecture Planning Co Ltd 22 -
6 Sangetsu Corp 83 -
23 San-In Godo Bank Ltd 113 -
6 Sanix Inc 18 -
7 Sanki Engineering Co Ltd 91 -
4 Sanko Gosei Ltd 15 -
1 Sanko Metal Industrial Co Ltd 13 -
4 Sankyo Co Ltd 105 -
1 Sankyo Frontier Co Ltd 25 -
6 Sankyo Seiko Co Ltd 27 -
4 Sankyo Tateyama Inc 27 -
10 Sankyu Inc 445 0.01
4 Sanoh Industrial Co Ltd 43 -
- Sansan Inc 22 -
1 Sansei Technologies Inc 9 -
2 Sansha Electric Manufacturing Co Ltd 16 -
1 Sanshin Electronics Co Ltd 23 -
24 Santen Pharmaceutical Co Ltd 320 0.01
35 Sanwa Holdings Corp 433 0.01
- Sanyei Corp 7 -
2 Sanyo Chemical Industries Ltd 106 -
1 Sanyo Denki Co Ltd 35 -
2 Sanyo Electric Railway Co Ltd 28 -
1 Sanyo Housing Nagoya Co Ltd 11 -
2 Sanyo Shokai Ltd 16 -
4 Sanyo Special Steel Co Ltd 61 -
4 Sanyo Trading Co Ltd 42 -
11 Sapporo Holdings Ltd 215 0.01
4 Sato Holdings Corp 98 -
2 Sato Shoji Corp 15 -
4 Sawada Holdings Co Ltd 39 -
5 Sawai Group Holdings Co Ltd 213 0.01
1 Saxa Holdings Inc 12 -
1 SB Technology Corp 39 -
16 SBI Holdings Inc 414 0.01
1 SBI Insurance Group Co Ltd 9 -
3 SBS Holdings Inc 85 -
3 Scala Inc 22 -
2 SCREEN Holdings Co Ltd 190 0.01
4 Scroll Corp 38 -
5 SCSK Corp 320 0.01
- SEC Carbon Ltd 12 -
5 Secom Co Ltd 359 0.01
1 Seed Co Ltd 8 -
17 Sega Sammy Holdings Inc 218 0.01
1 Seibu Electric & Machinery Co Ltd 12 -
19 Seibu Holdings Inc 218 0.01
2 Seika Corp 24 -
5 Seikagaku Corp 57 -
8 Seikitokyu Kogyo Co Ltd 66 -
40 Seiko Epson Corp 727 0.02
2 Seiko Holdings Corp 32 -
2 Seiko PMC Corp 15 -
Global Core Equity FundPortfolio of Investments as at 31 May 2021 (continued)
Dimensional Fund Advisors Semi-Annual Report and Unaudited Financial Statements, 31 May 2021 105

Shares (000's)
Value(000's)
USD
% of NetAssetValue
Common Stock (continued)
Japan - 7.25% (continued)
18 Seino Holdings Co Ltd 261 0.01
5 Seiren Co Ltd 86 -
29 Sekisui Chemical Co Ltd 506 0.01
32 Sekisui House Ltd 668 0.02
3 Sekisui Jushi Corp 68 -
3 Sekisui Plastics Co Ltd 19 -
21 Senko Group Holdings Co Ltd 197 0.01
1 Senshu Electric Co Ltd 39 -
38 Senshu Ikeda Holdings Inc 56 -
6 Senshukai Co Ltd 22 -
6 Seria Co Ltd 201 0.01
58 Seven & i Holdings Co Ltd 2,555 0.06
94 Seven Bank Ltd 196 0.01
13 SG Holdings Co Ltd 290 0.01
27 Sharp Corp 500 0.01
1 Shibaura Electronics Co Ltd 65 -
1 Shibaura Mechatronics Corp 47 -
2 Shibusawa Warehouse Co Ltd 28 -
2 Shibuya Corp 49 -
7 Shiga Bank Ltd 124 -
2 Shikibo Ltd 15 -
5 Shikoku Bank Ltd 34 -
6 Shikoku Chemicals Corp 70 -
16 Shikoku Electric Power Co Inc 111 -
4 Shima Seiki Manufacturing Ltd 83 -
13 Shimadzu Corp 448 0.01
2 Shimamura Co Ltd 166 0.01
1 Shimano Inc 205 0.01
2 Shimizu Bank Ltd 28 -
53 Shimizu Corp 429 0.01
2 Shimojima Co Ltd 21 -
2 Shin Nippon Air Technologies Co Ltd 28 -
4 Shin Nippon Biomedical Laboratories Ltd 27 -
1 Shinagawa Refractories Co Ltd 34 -
1 Shindengen Electric Manufacturing Co Ltd 39 -
8 Shin-Etsu Chemical Co Ltd 1,392 0.03
4 Shin-Etsu Polymer Co Ltd 40 -
1 Shin-Keisei Electric Railway Co Ltd 16 -
- Shinki Bus Co Ltd 3 -
6 Shinko Electric Industries Co Ltd 184 0.01
5 Shinko Shoji Co Ltd 36 -
9 Shinmaywa Industries Ltd 84 -
6 Shinnihon Corp 47 -
3 Shin-Nihon Tatemono Co Ltd 11 -
2 Shinobu Foods Products Co Ltd 10 -
5 Shinoken Group Co Ltd 53 -
16 Shinsei Bank Ltd 255 0.01
1 Shinsho Corp 13 -
2 Shinwa Co Ltd 36 -
1 Shinwa Co Ltd, Gifu 9 -
8 Shionogi & Co Ltd 384 0.01
8 Ship Healthcare Holdings Inc 200 0.01
7 Shiseido Co Ltd 476 0.01
3 Shizuki Electric Co Inc 16 -
45 Shizuoka Bank Ltd 362 0.01
9 Shizuoka Gas Co Ltd 82 -
3 SHO-BOND Holdings Co Ltd 110 -
3 Shoei Co Ltd 106 -
1 Shoei Foods Corp 44 -
1 Shofu Inc 15 -
15 Showa Denko KK 467 0.01
2 Showa Sangyo Co Ltd 60 -
Shares (000's)
Value(000's)
USD
% of NetAssetValue
Common Stock (continued)
Japan - 7.25% (continued)
2 SigmaXYZ Inc 30 -
5 Siix Corp 66 -
1 Silver Life Co Ltd 21 -
1 Sinanen Holdings Co Ltd 30 -
4 Sinfonia Technology Co Ltd 52 -
3 Sinko Industries Ltd 56 -
7 Sintokogio Ltd 50 -
2 SK-Electronics Co Ltd 22 -
22 SKY Perfect JSAT Holdings Inc 89 -
27 Skylark Holdings Co Ltd 373 0.01
1 SMC Corp 335 0.01
1 SMK Corp 17 -
10 SMS Co Ltd 265 0.01
1 Snow Peak Inc 29 -
3 Sodick Co Ltd 28 -
1 Soft99 Corp 18 -
82 Softbank Corp 1,048 0.02
63 SoftBank Group Corp 4,772 0.11
1 Softcreate Holdings Corp 15 -
- Software Service Inc 41 -
3 Sohgo Security Services Co Ltd 147 -
146 Sojitz Corp 452 0.01
1 Soken Chemical & Engineering Co Ltd 19 -
7 Solasto Corp 85 -
1 SoldOut Inc 8 -
1 Soliton Systems KK 19 -
16 Sompo Holdings Inc 624 0.02
77 Sony Corp 7,649 0.17
8 Sotetsu Holdings Inc 157 -
1 Sotoh Co Ltd 10 -
2 Space Co Ltd 20 -
9 Space Value Holdings Co Ltd 58 -
9 Sparx Group Co Ltd 22 -
1 SPK Corp 13 -
9 S-Pool Inc 69 -
1 Sprix Ltd 15 -
7 Square Enix Holdings Co Ltd 386 0.01
1 SRA Holdings 29 -
2 ST Corp 30 -
3 St Marc Holdings Co Ltd 44 -
5 Stanley Electric Co Ltd 145 -
1 Star Mica Holdings Co Ltd 11 -
4 Star Micronics Co Ltd 67 -
7 Starts Corp Inc 185 0.01
2 Starzen Co Ltd 42 -
2 St-Care Holding Corp 23 -
2 Stella Chemifa Corp 43 -
1 Step Co Ltd 16 -
2 Strike Co Ltd 66 -
2 Studio Alice Co Ltd 33 -
51 Subaru Corp 1,000 0.02
- Subaru Enterprise Co Ltd 15 -
3 Sugi Holdings Co Ltd 272 0.01
2 Sugimoto & Co Ltd 31 -
27 SUMCO Corp 613 0.02
6 Sumida Corp 61 -
8 Sumiseki Holdings Inc 9 -
4 Sumitomo Bakelite Co Ltd 149 -
169 Sumitomo Chemical Co Ltd 938 0.02
51 Sumitomo Corp 721 0.02
11 Sumitomo Dainippon Pharma Co Ltd 218 0.01
3 Sumitomo Densetsu Co Ltd 61 -
Global Core Equity FundPortfolio of Investments as at 31 May 2021 (continued)
Dimensional Fund Advisors Semi-Annual Report and Unaudited Financial Statements, 31 May 2021 106

Shares (000's)
Value(000's)
USD
% of NetAssetValue
Common Stock (continued)
Japan - 7.25% (continued)
67 Sumitomo Electric Industries Ltd 1,032 0.02
20 Sumitomo Forestry Co Ltd 409 0.01
16 Sumitomo Heavy Industries Ltd 491 0.01
8 Sumitomo Metal Mining Co Ltd 341 0.01
41 Sumitomo Mitsui Construction Co Ltd 176 0.01
48 Sumitomo Mitsui Financial Group Inc 1,753 0.04
20 Sumitomo Mitsui Trust Holdings Inc 693 0.02
6 Sumitomo Osaka Cement Co Ltd 183 0.01
1 Sumitomo Precision Products Co Ltd 11 -
14 Sumitomo Realty & Development Co Ltd 491 0.01
8 Sumitomo Riko Co Ltd 47 -
20 Sumitomo Rubber Industries Ltd 257 0.01
2 Sumitomo Seika Chemicals Co Ltd 62 -
9 Sumitomo Warehouse Co Ltd 122 -
7 Sun Frontier Fudousan Co Ltd 62 -
3 Suncall Corp 14 -
9 Sundrug Co Ltd 321 0.01
14 Suntory Beverage & Food Ltd 519 0.01
1 Sun-Wa Technos Corp 16 -
26 Suruga Bank Ltd 85 -
12 Sushiro Global Holdings Ltd 529 0.01
1 Suzuden Corp 11 -
7 Suzuken Co Ltd Japan 230 0.01
2 Suzuki Co Ltd 21 -
19 Suzuki Motor Corp 849 0.02
7 SWCC Showa Holdings Co Ltd 102 -
7 Sysmex Corp 767 0.02
2 System Information Co Ltd 15 -
1 System Support Inc 16 -
9 Systena Corp 169 0.01
3 Syuppin Co Ltd 22 -
4 T Hasegawa Co Ltd 71 -
2 T RAD Co Ltd 36 -
32 T&D Holdings Inc 435 0.01
3 T&K Toka Co Ltd 24 -
3 Tachibana Eletech Co Ltd 35 -
1 Tachikawa Corp 18 -
5 Tachi-S Co Ltd 63 -
16 Tadano Ltd 157 0.01
3 Taihei Dengyo Kaisha Ltd 70 -
23 Taiheiyo Cement Corp 544 0.01
2 Taiho Kogyo Co Ltd 17 -
3 Taikisha Ltd 93 -
1 Taiko Bank Ltd 14 -
3 Taiko Pharmaceutical Co Ltd 32 -
23 Taisei Corp 798 0.02
1 Taisei Lamick Co Ltd 20 -
1 Taisei Oncho Co Ltd 14 -
2 Taisho Pharmaceutical Holdings Co Ltd 135 -
2 Taiyo Holdings Co Ltd 106 -
20 Taiyo Nippon Sanso Corp 403 0.01
17 Taiyo Yuden Co Ltd 826 0.02
1 Takachiho Koheki Co Ltd 5 -
3 Takamatsu Construction Group Co Ltd 58 -
6 Takamiya Co Ltd 28 -
1 Takano Co Ltd 7 -
2 Takaoka Toko Co Ltd 22 -
2 Takara Bio Inc 43 -
14 Takara Holdings Inc 181 0.01
22 Takara Leben Co Ltd 70 -
2 Takara Printing Co Ltd 24 -
6 Takara Standard Co Ltd 88 -
Shares (000's)
Value(000's)
USD
% of NetAssetValue
Common Stock (continued)
Japan - 7.25% (continued)
2 Takasago International Corp 52 -
6 Takasago Thermal Engineering Co Ltd 98 -
1 Takashima & Co Ltd 11 -
24 Takashimaya Co Ltd 267 0.01
2 Take And Give Needs Co Ltd 14 -
2 Takebishi Corp 23 -
59 Takeda Pharmaceutical Co Ltd 2,025 0.05
6 Takeei Corp 73 -
1 Takemoto Yohki Co Ltd 7 -
6 Takeuchi Manufacturing Co Ltd 167 0.01
1 Takihyo Co Ltd 10 -
1 Takisawa Machine Tool Co Ltd 7 -
8 Takuma Co Ltd 141 -
2 Tama Home Co Ltd 48 -
2 Tamron Co Ltd 47 -
11 Tamura Corp 57 -
8 Tanseisha Co Ltd 58 -
- Taoka Chemical Co Ltd 32 -
7 Tatsuta Electric Wire and Cable Co Ltd 37 -
4 Tayca Corp 42 -
2 Tazmo Co Ltd 25 -
4 TBK Co Ltd 15 -
1 TDC Soft Inc 13 -
8 TDK Corp 990 0.02
1 TeamSpirit Inc 11 -
5 TechMatrix Corp 77 -
- Techno Associe Co Ltd 3 -
1 Techno Medica Co Ltd 10 -
1 Techno Ryowa Ltd 11 -
3 Techno Smart Corp 34 -
5 TechnoPro Holdings Inc 374 0.01
34 Teijin Ltd 562 0.01
1 Teikoku Electric Manufacturing Co Ltd 16 -
2 Teikoku Sen-I Co Ltd 42 -
2 Tekken Corp 38 -
3 Tenma Corp 58 -
2 Teraoka Seisakusho Co Ltd 6 -
2 Terilogy Co Ltd 8 -
25 Terumo Corp 958 0.02
4 T-Gaia Corp 65 -
3 THK Co Ltd 84 -
2 Tigers Polymer Corp 8 -
20 TIS Inc 519 0.01
1 Titan Kogyo Ltd 9 -
3 TKC Corp 98 -
3 Toa Corp (non-voting rights) 70 -
3 Toa Corp (voting rights) 28 -
1 Toa Oil Co Ltd 36 -
1 Toa Road Corp 25 -
17 Toagosei Co Ltd 189 0.01
1 Toba Inc 14 -
4 Tobishima Corp 41 -
8 Tobu Railway Co Ltd 203 0.01
8 TOC Co Ltd 52 -
5 Tocalo Co Ltd 66 -
20 Tochigi Bank Ltd 32 -
33 Toda Corp 243 0.01
1 Toei Animation Co Ltd 133 -
- Toei Co Ltd 62 -
1 Toell Co Ltd 8 -
1 Toenec Corp 47 -
1 Togami Electric Manufacturing Co Ltd 10 -
Global Core Equity FundPortfolio of Investments as at 31 May 2021 (continued)
Dimensional Fund Advisors Semi-Annual Report and Unaudited Financial Statements, 31 May 2021 107

Shares (000's)
Value(000's)
USD
% of NetAssetValue
Common Stock (continued)
Japan - 7.25% (continued)
33 Toho Bank Ltd 63 -
1 Toho Co 16 -
3 Toho Co Ltd 118 -
3 Toho Gas Co Ltd 192 0.01
7 Toho Holdings Co Ltd 111 -
3 Toho Titanium Co Ltd 27 -
3 Toho Zinc Co Ltd 52 -
1 Tohoku Bank Ltd 10 -
33 Tohoku Electric Power Co Inc 273 0.01
4 Tohokushinsha Film Corp 23 -
21 Tokai Carbon Co Ltd 308 0.01
3 Tokai Corp 55 -
17 TOKAI Holdings Corp 139 -
8 Tokai Rika Co Ltd 129 -
35 Tokai Tokyo Financial Holdings Inc 134 -
1 Token Corp 86 -
27 Tokio Marine Holdings Inc 1,267 0.03
2 Tokushu Tokai Paper Co Ltd 60 -
15 Tokuyama Corp 307 0.01
1 Tokyo Base Co Ltd 10 -
3 Tokyo Broadcasting System Holdings Inc 60 -
6 Tokyo Century Corp 355 0.01
115 Tokyo Electric Power Co Holdings Inc 360 0.01
1 Tokyo Electron Device Ltd 54 -
8 Tokyo Electron Ltd 3,390 0.08
3 Tokyo Energy & Systems Inc 27 -
19 Tokyo Gas Co Ltd 373 0.01
2 Tokyo Keiki Inc 14 -
4 Tokyo Kiraboshi Financial Group Inc 44 -
1 Tokyo Ohka Kogyo Co Ltd 76 -
1 Tokyo Rakutenchi Co Ltd 18 -
- Tokyo Rope Manufacturing Co Ltd 4 -
3 Tokyo Sangyo Co Ltd 16 -
5 Tokyo Seimitsu Co Ltd 235 0.01
14 Tokyo Steel Manufacturing Co Ltd 148 -
28 Tokyo Tatemono Co Ltd 422 0.01
1 Tokyo Tekko Co Ltd 14 -
1 Tokyo Theatres Co Inc 10 -
2 Tokyotokeiba Co Ltd 118 -
8 Tokyu Construction Co Ltd 52 -
20 Tokyu Corp 265 0.01
85 Tokyu Fudosan Holdings Corp 512 0.01
- Tokyu Recreation Co Ltd 18 -
7 Toli Corp 15 -
1 Tomato Bank Ltd 10 -
1 Tomen Devices Corp 18 -
3 Tomoe Corp 11 -
1 Tomoe Engineering Co Ltd 23 -
1 Tomoku Co Ltd 24 -
26 TOMONY Holdings Inc 74 -
18 Tomy Co Ltd 156 -
1 Tonami Holdings Co Ltd 45 -
12 Topcon Corp 189 0.01
8 Toppan Forms Co Ltd 77 -
16 Toppan Printing Co Ltd 275 0.01
8 Topre Corp 115 -
3 Topy Industries Ltd 38 -
161 Toray Industries Inc 1,060 0.03
2 Torex Semiconductor Ltd 30 -
6 Toridoll Holdings Corp 96 -
2 Torigoe Co Ltd 13 -
2 Torii Pharmaceutical Co Ltd 49 -
Shares (000's)
Value(000's)
USD
% of NetAssetValue
Common Stock (continued)
Japan - 7.25% (continued)
1 Torikizoku Co Ltd 16 -
3 Torishima Pump Manufacturing Co Ltd 21 -
3 Tosei Corp 28 -
22 Toshiba Corp 912 0.02
3 Toshiba Machine Co Ltd 74 -
4 Toshiba TEC Corp 142 -
2 Tosho Co Ltd 34 -
21 Tosoh Corp 369 0.01
1 Totech Corp 28 -
3 Totetsu Kogyo Co Ltd 68 -
8 TOTO Ltd 435 0.01
1 Totoku Electric Co Ltd 18 -
1 Tottori Bank Ltd 10 -
5 Tow Co Ltd 15 -
6 Towa Bank Ltd 29 -
2 Towa Corp 47 -
6 Towa Pharmaceutical Co Ltd 123 -
17 Toyo Construction Co Ltd 89 -
3 Toyo Corp 35 -
1 Toyo Denki Seizo KK 10 -
4 Toyo Engineering Corp 24 -
1 Toyo Gosei Co Ltd 72 -
6 Toyo Ink SC Holdings Co Ltd 107 -
1 Toyo Kanetsu KK 21 -
4 Toyo Logistics Co Ltd 13 -
3 Toyo Machinery & Metal Co Ltd 12 -
10 Toyo Securities Co Ltd 15 -
18 Toyo Seikan Group Holdings Ltd 252 0.01
8 Toyo Suisan Kaisha Ltd 335 0.01
2 Toyo Tanso Co Ltd 41 -
23 Toyo Tire Corp 478 0.01
1 Toyo Wharf & Warehouse Co Ltd 10 -
18 Toyobo Co Ltd 227 0.01
7 Toyoda Gosei Co Ltd 171 0.01
17 Toyota Boshoku Corp 325 0.01
6 Toyota Industries Corp 543 0.01
154 Toyota Motor Corp 12,770 0.29
11 Toyota Tsusho Corp 497 0.01
5 TPR Co Ltd 68 -
4 Traders Holdings Co Ltd 13 -
1 Trancom Co Ltd 70 -
1 Transaction Co Ltd 15 -
4 Transcosmos Inc 118 -
1 Treasure Factory Co Ltd 9 -
14 Trend Micro Inc 687 0.02
4 Tri Chemical Laboratories Inc 116 -
2 Trinity Industrial Corp 15 -
5 Trusco Nakayama Corp 140 -
8 Trust Tech Inc 89 -
14 TS Tech Co Ltd 199 0.01
10 TSI Holdings Co Ltd 28 -
5 Tsubaki Nakashima Co Ltd 75 -
5 Tsubakimoto Chain Co 133 -
1 Tsubakimoto Kogyo Co Ltd 28 -
1 Tsudakoma Corp 6 -
5 Tsugami Corp 82 -
4 Tsukishima Kikai Co Ltd 42 -
15 Tsukuba Bank Ltd 24 -
4 Tsumura & Co 141 -
3 Tsuruha Holdings Inc 332 0.01
3 Tsurumi Manufacturing Co Ltd 45 -
1 Tsutsumi Jewelry Co Ltd 18 -
Global Core Equity FundPortfolio of Investments as at 31 May 2021 (continued)
Dimensional Fund Advisors Semi-Annual Report and Unaudited Financial Statements, 31 May 2021 108

Shares (000's)
Value(000's)
USD
% of NetAssetValue
Common Stock (continued)
Japan - 7.25% (continued)
1 Tsuzuki Denki Co Ltd 15 -
4 TV Asahi Holdings Corp 64 -
1 Tv Tokyo Holdings Corp 18 -
1 TYK Corp 3 -
6 UACJ Corp 133 -
20 Ube Industries Ltd 434 0.01
1 Ubicom Holdings Inc 22 -
1 Uchida Yoko Co Ltd 39 -
3 Ulvac Inc 152 -
14 Unicharm Corp 576 0.01
1 Uniden Holdings Corp 23 -
1 Union Tool Co 26 -
7 Unipres Corp 66 -
3 United Arrows Ltd 44 -
2 UNITED Inc 22 -
10 United Super Markets Holdings Inc 97 -
11 Unitika Ltd 36 -
3 Universal Entertainment Corp 77 -
- UPR Corp 10 -
2 Usen-Next Holdings Co Ltd 39 -
15 Ushio Inc 220 0.01
17 USS Co Ltd 302 0.01
4 UT Group Co Ltd 119 -
3 Utoc Corp 15 -
2 UUUM Inc 28 -
9 Valor Holdings Co Ltd 176 0.01
3 Valqua Ltd 51 -
1 Value HR Co Ltd 15 -
2 ValueCommerce Co Ltd 58 -
2 V-Cube Inc 34 -
2 Vector Inc 20 -
2 Vertex Corp 49 -
1 VINX Corp 11 -
6 Vital KSK Holdings Inc 42 -
18 VT Holdings Co Ltd 77 -
7 Wacoal Holdings Corp 165 0.01
19 Wacom Co Ltd 121 -
2 Wakachiku Construction Co Ltd 26 -
6 Wakita & Co Ltd 62 -
2 Warabeya Nichiyo Holdings Co Ltd 39 -
1 Waseda Academy Co Ltd 10 -
3 Watahan & Co Ltd 29 -
1 WDB Holdings Co Ltd 34 -
1 Weathernews Inc 30 -
2 Welbe Inc 22 -
9 Welcia Holdings Co Ltd 269 0.01
3 Wellnet Corp 13 -
4 West Holdings Corp 143 -
9 West Japan Railway Co 494 0.01
2 Will Group Inc 13 -
2 WILLs Inc 17 -
2 WIN-Partners Co Ltd 22 -
1 Wood One Co Ltd 14 -
2 Workman Co Ltd 112 -
3 World Co Ltd 39 -
1 World Holdings Co Ltd 32 -
1 Wowow Inc 15 -
4 Xebio Holdings Co Ltd 39 -
1 YAC Holdings Co Ltd 13 -
1 Yachiyo Industry Co Ltd 6 -
1 Yagi & Co Ltd 13 -
4 Yahagi Construction Co Ltd 29 -
Shares (000's)
Value(000's)
USD
% of NetAssetValue
Common Stock (continued)
Japan - 7.25% (continued)
1 Yaizu Suisankagaku Industry Co Ltd 12 -
5 Yakult Honsha Co Ltd 284 0.01
2 YAKUODO Holdings Co Ltd 33 -
7 Yamabiko Corp 81 -
1 Yamada Consulting Group Co Ltd 9 -
48 Yamada Denki Co Ltd 236 0.01
4 Yamagata Bank Ltd 33 -
33 Yamaguchi Financial Group Inc 199 0.01
3 Yamaha Corp 192 0.01
19 Yamaha Motor Co Ltd 560 0.01
4 Yamaichi Electronics Co Ltd 63 -
5 YA-MAN Ltd 75 -
4 Yamanashi Chuo Bank Ltd 34 -
2 Yamatane Corp 25 -
2 Yamato Corp 18 -
16 Yamato Holdings Co Ltd 451 0.01
2 Yamato International Inc 6 -
7 Yamato Kogyo Co Ltd 217 0.01
1 Yamaya Corp 10 -
16 Yamazaki Baking Co Ltd 240 0.01
5 Yamazen Corp 43 -
3 Yaoko Co Ltd 155 -
3 Yashima Denki Co Ltd 24 -
5 Yaskawa Electric Corp 223 0.01
3 Yasuda Logistics Corp 24 -
1 Yasunaga Corp 11 -
3 YE DIGITAL Corp 15 -
6 Yellow Hat Ltd 110 -
3 Yodogawa Steel Works Ltd 73 -
5 Yokogawa Bridge Holdings Corp 95 -
16 Yokogawa Electric Corp 265 0.01
8 Yokohama Reito Co Ltd 61 -
18 Yokohama Rubber Co Ltd 369 0.01
2 Yokowo Co Ltd 40 -
1 Yomeishu Seizo Co Ltd 21 -
1 Yondenko Corp 25 -
2 Yondoshi Holdings Inc 32 -
3 Yorozu Corp 38 -
2 Yoshimura Food Holdings KK 12 -
4 Yotai Refractories Co Ltd 43 -
1 Yuasa Funashoku Co Ltd 13 -
3 Yuasa Trading Co Ltd 83 -
1 Yuken Kogyo Co Ltd 8 -
7 Yurtec Corp 45 -
1 Yushin Precision Equipment Co Ltd 9 -
2 Yushiro Chemical Industry Co Ltd 17 -
- Yutaka Giken Co Ltd 5 -
125 Z Holdings Corp 598 0.01
- Zenitaka Corp 12 -
6 Zenkoku Hosho Co Ltd 244 0.01
6 Zenrin Co Ltd 60 -
11 Zensho Holdings Co Ltd 285 0.01
21 Zeon Corp 315 0.01
8 ZOZO Inc 263 0.01
2 Zuiko Corp 24 -
323,502 7.25
Netherlands - 1.20%
18 Aalberts NV 1,054 0.02
24 ABN AMRO Bank NV 323 0.01
3 Accell Group NV 152 -
- Adyen NV 1,127 0.03
196 Aegon NV 928 0.02
Global Core Equity FundPortfolio of Investments as at 31 May 2021 (continued)
Dimensional Fund Advisors Semi-Annual Report and Unaudited Financial Statements, 31 May 2021 109

Shares (000's)
Value(000's)
USD
% of NetAssetValue
Common Stock (continued)
Netherlands - 1.20% (continued)
15 Akzo Nobel NV 1,918 0.04
1 AMG Advanced Metallurgical Group NV 51 -
3 Amsterdam Commodities NV 87 -
8 APERAM SA 435 0.01
15 Arcadis NV 671 0.02
43 ArcelorMittal SA 1,396 0.03
3 ASM International NV 913 0.02
18 ASML Holding NV (Netherlands listing) 12,246 0.28
- ASML Holding NV (US listing) 304 0.01
21 ASR Nederland NV 911 0.02
4 B&S Group 42 -
5 Basic-Fit NV 244 0.01
10 BE Semiconductor Industries NV 772 0.02
1 Beter Bed Holding NV 10 -
12 Boskalis Westminster 402 0.01
4 Brunel International NV 49 -
17 Coca-Cola European Partners PLC 1,029 0.02
10 Coca-Cola European Partners PLC (US listing) 585 0.01
6 Corbion NV 368 0.01
8 Flow Traders 334 0.01
8 ForFarmers NV 52 -
14 Fugro NV 150 -
7 GrandVision NV 227 0.01
4 Heijmans NV 59 -
12 Heineken NV 1,437 0.03
1 Hunter Douglas NV 67 -
5 IMCD NV 901 0.02
158 ING Groep NV 2,218 0.05
14 Intertrust NV 253 0.01
3 Kendrion NV 84 -
176 Koninklijke Ahold Delhaize NV 5,126 0.12
50 Koninklijke BAM Groep NV 148 -
9 Koninklijke DSM NV 1,721 0.04
575 Koninklijke KPN NV 1,921 0.04
43 Koninklijke Philips NV 2,421 0.05
11 Koninklijke Vopak NV 516 0.01
2 Lucas Bols BV 28 -
1 Nederland Apparatenfabriek 64 -
18 NN Group NV 924 0.02
3 NXP Semiconductors NV 569 0.01
12 OCI NV 306 0.01
16 Ordina NV 74 -
59 PostNL NV 346 0.01
11 Prosus NV 1,140 0.03
11 Randstad NV 885 0.02
20 SBM Offshore NV 347 0.01
1 SIF Holding NV 18 -
24 Signify NV 1,496 0.03
4 Sligro Food Group NV 115 -
8 TKH Group NV 407 0.01
11 TomTom NV 100 -
2 Van Lanschot Kempen NV 51 -
31 Wolters Kluwer NV 2,962 0.07
53,484 1.20
New Zealand - 0.15%
42 a2 Milk Co Ltd 178 0.01
120 Air New Zealand Ltd 145 -
52 Arvida Group Ltd 69 -
48 Auckland International Airport Ltd 254 0.01
5 Briscoe Group Ltd 22 -
5 CBL Corp Ltd - -
92 Chorus Ltd 418 0.01
Shares (000's)
Value(000's)
USD
% of NetAssetValue
Common Stock (continued)
New Zealand - 0.15% (continued)
42 Contact Energy Ltd 234 0.01
1 Delegat Group Ltd 11 -
13 Ebos Group Ltd 295 0.01
22 Fisher & Paykel Healthcare Corp Ltd 463 0.01
85 Fletcher Building Ltd 455 0.01
11 Fonterra Co-operative Group Ltd 31 -
21 Freightways Ltd 173 0.01
40 Genesis Energy Ltd 99 -
4 Gentrack Group Ltd 6 -
12 Hallenstein Glasson Holdings Ltd 61 -
87 Heartland Group Holdings Ltd 122 -
75 Infratil Ltd 407 0.01
86 Kathmandu Holdings Ltd 98 -
6 Mainfreight Ltd 305 0.01
21 Mercury NZ Ltd 97 -
42 Meridian Energy Ltd 158 -
5 Napier Port Holdings Ltd 11 -
8 New Zealand King Salmon Investments Ltd 9 -
25 New Zealand Refining Co Ltd 12 -
17 NZME Ltd 9 -
30 NZX Ltd 45 -
65 Oceania Healthcare Ltd 65 -
3 PGG Wrightson Ltd 7 -
19 Port of Tauranga Ltd 100 -
29 Pushpay Holdings Ltd 36 -
13 Rakon Ltd 9 -
6 Restaurant Brands New Zealand Ltd 56 -
20 Ryman Healthcare Ltd 192 0.01
13 Sanford Ltd 46 -
12 Scales Corp Ltd 40 -
22 Skellerup Holdings Ltd 73 -
293 SKY Network Television Ltd 36 -
123 SKYCITY Entertainment Group Ltd 318 0.01
220 Spark New Zealand Ltd 715 0.02
29 Steel & Tube Holdings Ltd 24 -
40 Summerset Group Holdings Ltd 361 0.01
16 Synlait Milk Ltd 36 -
20 Tourism Holdings Ltd 35 -
74 Tower Ltd 40 -
7 Trustpower Ltd 44 -
5 Turners Automotive Group Ltd 16 -
25 Vector Ltd 72 -
24 Vista Group International Ltd 38 -
18 Warehouse Group Ltd 44 -
83 Z Energy Ltd 154 -
6,744 0.15
Norway - 0.29%
88 ABG Sundal Collier Holding ASA 92 -
1 Adevinta ASA 24 -
6 AF Gruppen ASA 140 -
30 Akastor ASA 20 -
- Aker ASA 35 -
8 Aker BP ASA 232 0.01
34 Aker Solutions ASA 62 -
9 American Shipping Co ASA 34 -
3 Arcus ASA 16 -
11 Atea ASA 211 0.01
13 Austevoll Seafood ASA 166 -
12 Avance Gas Holding Ltd 61 -
25 Axactor SE 33 -
46 B2Holding ASA 58 -
2 Bakkafrost P/F 183 0.01
Global Core Equity FundPortfolio of Investments as at 31 May 2021 (continued)
Dimensional Fund Advisors Semi-Annual Report and Unaudited Financial Statements, 31 May 2021 110

Shares (000's)
Value(000's)
USD
% of NetAssetValue
Common Stock (continued)
Norway - 0.29% (continued)
4 Bonheur ASA 126 -
5 Borr Drilling Ltd 4 -
11 Borregaard ASA 242 0.01
- Bouvet ASA 24 -
11 BW Energy Ltd 32 -
18 BW LPG Ltd 125 -
20 BW Offshore Ltd 84 -
4 Crayon Group Holding ASA 66 -
43 DNB ASA 958 0.02
61 DNO ASA 65 -
33 Elkem ASA 121 -
15 Entra ASA 351 0.01
45 Equinor ASA 971 0.02
22 Europris ASA 149 -
10 Fjordkraft Holding ASA 71 -
5 FLEX LNG Ltd 79 -
20 Frontline Ltd 167 -
11 Gjensidige Forsikring ASA 258 0.01
- Golar LNG Ltd 5 -
14 Golden Ocean Group Ltd 134 -
1 Golden Ocean Group Ltd (Norway listing) 16 -
5 Grieg Seafood ASA 46 -
10 Hexagon Composites ASA 45 -
2 Kid ASA 23 -
42 Kongsberg Automotive ASA 14 -
12 Kongsberg Gruppen ASA 309 0.01
19 Leroy Seafood Group ASA 171 0.01
- Medistim ASA 18 -
19 Mowi ASA 487 0.01
29 NEL ASA 63 -
2 Nordic Nanovector ASA 6 -
11 Nordic Semiconductor ASA 296 0.01
84 Norsk Hydro ASA 542 0.01
1 Norway Royal Salmon ASA 25 -
1 Norwegian Energy Co SA 15 -
28 Norwegian Finans Holding ASA 324 0.01
12 Norwegian Property ASA 22 -
11 Ocean Yield ASA 39 -
27 Odfjell Drilling Ltd 70 -
3 Odfjell SE 10 -
2 Olav Thon Eiendomsselskap ASA 49 -
33 Orkla ASA 343 0.01
9 Otello Corp ASA 37 -
120 PGS ASA 75 -
8 Protector Forsikring ASA 86 -
31 REC Silicon ASA 62 -
6 Salmar ASA 432 0.01
16 Sbanken ASA 193 0.01
9 Scatec Solar ASA 232 0.01
1 Schibsted ASA, Class A 60 -
2 Schibsted ASA, Class B 73 -
7 Selvaag Bolig ASA 49 -
5 Solon Eiendom ASA 23 -
23 SpareBank 1 SR-Bank ASA 321 0.01
5 Stolt-Nielsen Ltd 80 -
38 Storebrand ASA 382 0.01
31 Subsea 7 SA 304 0.01
37 Telenor ASA 638 0.02
11 TGS NOPEC Geophysical Co ASA 145 -
8 Tomra Systems ASA 434 0.01
5 Treasure ASA 11 -
13 Veidekke ASA 189 0.01
Shares (000's)
Value(000's)
USD
% of NetAssetValue
Common Stock (continued)
Norway - 0.29% (continued)
13 Wallenius Wilhelmsen ASA 51 -
2 Wilh Wilhelmsen Holding ASA (voting rights) 44 -
12 XXL ASA 30 -
14 Yara International ASA 752 0.02
13,035 0.29
Portugal - 0.08%
9 Altri SGPS SA 65 -
1,086 Banco Comercial Portugues SA 211 0.01
130 Banco Espirito Santo SA - -
20 CTT-Correios de Portugal SA 102 -
13 EDP Renovaveis SA 303 0.01
150 EDP-Energias de Portugal SA 874 0.02
60 Galp Energia SGPS SA 747 0.02
27 Jeronimo Martins SGPS SA 515 0.01
10 Mota-Engil SGPS SA 18 -
47 Navigator Co SA 173 -
54 NOS SGPS SA 196 0.01
38 REN-Redes Energeticas Nacionais SGPS SA 108 -
6 Semapa-Sociedade de Investimento e Gestao 85 -
130 Sonae SGPS SA 126 -
3,523 0.08
Singapore - 0.32%
122 Accordia Golf Trust 2 -
39 AEM Holdings Ltd 104 -
32 Ascendas India Trust 33 -
52 Banyan Tree Holdings Ltd 11 -
29 Best World International Ltd 5 -
9 Boustead Projects Ltd 8 -
48 Boustead Singapore Ltd 42 -
25 Bukit Sembawang Estates Ltd 93 -
118 CapitaLand Ltd 327 0.01
47 China Aviation Oil Singapore Corp Ltd 38 -
72 China Sunsine Chemical Holdings Ltd 30 -
49 Chip Eng Seng Corp Ltd 16 -
45 Chuan Hup Holdings Ltd 7 -
47 City Developments Ltd 272 0.01
225 ComfortDelGro Corp Ltd 285 0.01
41 COSCO Shipping International Singapore Co Ltd 10 -
67 CSE Global Ltd 27 -
27 Dairy Farm International Holdings Ltd 118 -
78 DBS Group Holdings Ltd 1,789 0.04
102 Del Monte Pacific Ltd 30 -
31 Delfi Ltd 20 -
367 Ezion Holdings Ltd 2 -
356 Ezra Holdings Ltd 1 -
35 Far East Orchard Ltd 28 -
86 First Resources Ltd 88 -
42 Food Empire Holdings Ltd 28 -
17 Fraser and Neave Ltd 18 -
58 Frasers Property Ltd 52 -
54 Frencken Group Ltd 72 -
145 Fu Yu Corp Ltd 35 -
128 Gallant Venture Ltd 13 -
98 Genting Singapore Ltd 63 -
39 Geo Energy Resources Ltd 6 -
1,091 Golden Agri-Resources Ltd 194 0.01
52 Golden Energy & Resources Ltd 7 -
5 Great Eastern Holdings Ltd 84 -
49 GuocoLand Ltd 59 -
58 Halcyon Agri Corp Ltd 11 -
14 Haw Par Corp Ltd 144 -
26 Ho Bee Land Ltd 53 -
Global Core Equity FundPortfolio of Investments as at 31 May 2021 (continued)
Dimensional Fund Advisors Semi-Annual Report and Unaudited Financial Statements, 31 May 2021 111

Shares (000's)
Value(000's)
USD
% of NetAssetValue
Common Stock (continued)
Singapore - 0.32% (continued)
55 Hong Fok Corp Ltd 36 -
25 Hong Leong Asia Ltd 19 -
38 Hong Leong Finance Ltd 70 -
68 Hongkong Land Holdings Ltd 333 0.01
13 Hotel Grand Central Ltd 11 -
75 Hour Glass Ltd 71 -
29 HRnetgroup Ltd 14 -
853 Hutchison Port Holdings Trust 204 0.01
66 Hyflux Ltd 8 -
14 iFAST Corp Ltd 90 -
22 Indofood Agri Resources Ltd 6 -
104 Japfa Ltd 69 -
16 Jardine Cycle & Carriage Ltd 265 0.01
28 k1 Ventures Ltd - -
89 Keppel Corp Ltd 359 0.01
374 Keppel Infrastructure Trust 154 0.01
27 KSH Holdings Ltd 7 -
33 LG Innotek Co Ltd 24 -
31 Lian Beng Group Ltd 11 -
34 Mandarin Oriental International Ltd 66 -
68 Metro Holdings Ltd 42 -
11 Micro-Mechanics Holdings Ltd 25 -
102 Midas Holdings Ltd 3 -
99 mm2 Asia Ltd 5 -
92 NetLink NBN Trust 66 -
1,000 Oceanus Group Ltd 29 -
96 Olam International Ltd 128 -
46 OUE Ltd 47 -
122 Oversea-Chinese Banking Corp Ltd 1,150 0.03
225 Oxley Holdings Ltd 42 -
47 Pacific Century Regional Developments Ltd 12 -
34 Q&M Dental Group Singapore Ltd 17 -
35 QAF Ltd 25 -
122 Raffles Education Corp Ltd 16 -
92 Raffles Medical Group Ltd 75 -
80 Riverstone Holdings Ltd 89 -
22 SATS Ltd 65 -
7 SBS Transit Ltd 17 -
223 Sembcorp Industries Ltd 371 0.01
1,065 Sembcorp Marine Ltd 161 0.01
90 Sheng Siong Group Ltd 109 -
222 SIIC Environment Holdings Ltd 35 -
111 Sinarmas Land Ltd 24 -
52 Sing Holdings Ltd 15 -
71 Singapore Airlines Ltd 267 0.01
88 Singapore Exchange Ltd 688 0.02
195 Singapore Post Ltd 106 -
235 Singapore Press Holdings Ltd 311 0.01
138 Singapore Technologies Engineering Ltd 405 0.01
375 Singapore Telecommunications Ltd 685 0.02
17 Stamford Land Corp Ltd 5 -
78 StarHub Ltd 72 -
15 Straits Trading Co Ltd 31 -
7 Swiber Holdings Ltd - -
106 Tuan Sing Holdings Ltd 34 -
58 UMS Holdings Ltd 62 -
21 United Industrial Corp Ltd 42 -
54 United Overseas Bank Ltd 1,070 0.03
35 UOB-Kay Hian Holdings Ltd 44 -
46 UOL Group Ltd 260 0.01
98 Valuetronics Holdings Ltd 47 -
31 Venture Corp Ltd 448 0.01
Shares (000's)
Value(000's)
USD
% of NetAssetValue
Common Stock (continued)
Singapore - 0.32% (continued)
8 Vicom Ltd 13 -
79 Wilmar International Ltd 286 0.01
66 Wing Tai Holdings Ltd 87 -
429 Yangzijiang Shipbuilding Holdings Ltd 483 0.01
14,056 0.32
Spain - 0.70%
4 Acciona SA 696 0.02
22 Acerinox SA 315 0.01
35 ACS Actividades de Construccion y Servicios SA 1,086 0.02
2 Aena SME SA 289 0.01
2 Alantra Partners SA 47 -
12 Almirall SA 206 0.01
5 Amadeus IT Group SA 407 0.01
87 Amper SA 20 -
10 Applus Services SA 107 -
20 Atresmedia Corp de Medios de Comunicacion SA 96 -
1 Azkoyen SA 8 -
268 Banco Bilbao Vizcaya Argentaria SA 1,672 0.04
928 Banco de Sabadell SA 714 0.02
736 Banco Santander SA 3,100 0.07
68 Bankinter SA 390 0.01
311 CaixaBank SA 1,079 0.02
4 Cellnex Telecom SA 232 0.01
7 Cia de Distribucion Integral Logista Holdings SA 158 -
10 CIE Automotive SA 291 0.01
3 Construcciones y Auxiliar de Ferrocarriles SA 160 -
194 Distribuidora Internacional de Alimentacion SA 19 -
10 Ebro Foods SA 204 0.01
9 eDreams ODIGEO SA 58 -
6 Elecnor SA 72 -
34 Enagas SA 790 0.02
12 Ence Energia y Celulosa SA 52 -
36 Endesa SA 1,027 0.02
10 Ercros SA 43 -
18 Euskaltel SA 237 0.01
39 Faes Farma SA 163 -
6 Ferrovial SA (voting rights) 162 -
6 Fluidra SA 234 0.01
11 Fomento de Construcciones y Contratas SA 137 -
14 Gestamp Automocion SA 75 -
15 Global Dominion Access SA 81 -
15 Grifols SA 424 0.01
6 Grupo Catalana Occidente SA 247 0.01
1 Grupo Empresarial San Jose SA 11 -
20 Grupo Ezentis SA 9 -
413 Iberdrola SA 5,698 0.13
- Iberpapel Gestion SA 8 -
17 Indra Sistemas SA 144 -
55 Industria de Diseno Textil SA 2,138 0.05
3 Laboratorio Reig Jofre SA 22 -
2 Laboratorios Farmaceuticos Rovi SA 137 -
366 Liberbank SA 148 -
68 Linea Directa Aseguradora SA Cia de Seguros yReaseguros 133 -
151 Mapfre SA 346 0.01
22 Mediaset Espana Comunicacion SA 157 -
12 Melia Hotels International SA 98 -
2 Metrovacesa SA 14 -
4 Miquel y Costas & Miquel SA 74 -
31 Naturgy Energy Group SA 805 0.02
4 Neinor Homes SA 54 -
11 Obrascon Huarte Lain SA 8 -
Global Core Equity FundPortfolio of Investments as at 31 May 2021 (continued)
Dimensional Fund Advisors Semi-Annual Report and Unaudited Financial Statements, 31 May 2021 112

Shares (000's)
Value(000's)
USD
% of NetAssetValue
Common Stock (continued)
Spain - 0.70% (continued)
1 Pharma Mar SA 106 -
1 Prim SA 10 -
33 Promotora de Informaciones SA 35 -
15 Prosegur Cash SA 14 -
34 Prosegur Cia de Seguridad SA 105 -
37 Realia Business SA 32 -
34 Red Electrica Corp SA 678 0.02
85 Repsol SA 1,138 0.03
75 Sacyr SA 201 0.01
5 Siemens Gamesa Renewable Energy SA 172 -
4 Solaria Energia y Medio Ambiente SA 78 -
6 Talgo SA 39 -
4 Tecnicas Reunidas SA 54 -
536 Telefonica SA 2,643 0.06
24 Tubacex SA 51 -
128 Unicaja Banco SA 144 -
2 Vidrala SA (voting rights) 236 0.01
5 Viscofan SA 320 0.01
8 Vocento SA 11 -
27 Zardoya Otis SA 189 -
31,358 0.70
Sweden - 1.19%
10 AAK AB 238 0.01
19 AcadeMedia AB 185 0.01
9 Adapteo Oyj 180 -
9 AddLife AB 253 0.01
3 AddNode Group AB 121 -
31 AddTech AB 518 0.01
12 AF POYRY AB 418 0.01
12 Alfa Laval AB 466 0.01
6 Alimak Group AB 104 -
12 Ambea AB 96 -
9 Annehem Fastigheter 34 -
1 AQ Group AB 31 -
41 Arjo AB 405 0.01
23 Assa Abloy AB 704 0.02
34 Atlas Copco AB, Class A 2,056 0.05
20 Atlas Copco AB, Class B 1,033 0.02
5 Atrium Ljungberg AB 126 -
6 Attendo AB 31 -
16 Avanza Bank Holding AB 538 0.01
11 Axfood AB 305 0.01
7 Beijer Alma AB 158 -
4 Beijer Electronics Group AB 27 -
16 Beijer Ref AB 270 0.01
4 Bergman & Beving AB 68 -
1 Besqab AB 15 -
21 Betsson AB 9 -
21 Betsson AB 191 0.01
5 BHG Group AB 88 -
17 Bilia AB 333 0.01
21 BillerudKorsnas AB 415 0.01
2 BioGaia AB 119 -
6 Biotage AB 132 -
6 Bjorn Borg AB 19 -
6 Bjorn Borg AB 1 -
27 Boliden 1,082 0.03
27 Boliden 19 -
12 Bonava AB 152 -
27 Bravida Holding AB 405 0.01
5 Bufab AB 142 -
1 Bulten AB 16 -
Shares (000's)
Value(000's)
USD
% of NetAssetValue
Common Stock (continued)
Sweden - 1.19% (continued)
8 Bure Equity AB 367 0.01
13 Byggmax Group AB 121 -
14 Castellum AB 356 0.01
2 Catena AB 128 -
5 Cavotec SA 15 -
1 CDON AB 29 -
1 Cellavision AB 51 -
6 Clas Ohlson AB 69 -
38 Cloetta AB 124 -
2 Collector AB 9 -
3 Concentric AB 57 -
17 Coor Service Management Holding AB 146 -
9 Dios Fastigheter AB 97 -
33 Dometic Group AB 569 0.01
4 Doro AB 25 -
6 Duni AB 83 -
10 Dustin Group AB 127 -
2 Eastnine AB 35 -
2 Elanders AB 42 -
31 Electrolux AB 884 0.02
42 Electrolux Professional AB 286 0.01
30 Elekta AB 410 0.01
- Elos Medtech AB 12 -
16 Eltel AB 49 -
2 Enea AB 46 -
32 Epiroc AB, Class A 720 0.02
32 Epiroc AB, Class A 11 -
19 Epiroc AB, Class B 396 0.01
19 Epiroc AB, Class B 7 -
1 Essity A 46 -
34 Essity AB 1,167 0.03
10 Evolution Gaming Group AB 1,826 0.04
1 eWork Group AB 14 -
10 Fabege AB 163 -
8 Fagerhult AB 66 -
6 Fastighets AB Balder 372 0.01
4 FastPartner AB 48 -
- Fenix Outdoor International AG 55 -
14 Fingerprint Cards AB 58 -
1 G5 Entertainment AB 64 -
27 Getinge AB 969 0.02
8 GHP Specialty Care AB 27 -
23 Granges AB 307 0.01
8 Haldex AB 55 -
4 Heba Fastighets AB 65 -
43 Hennes & Mauritz AB 1,122 0.03
19 Hexagon AB 269 0.01
34 Hexpol AB 426 0.01
2 HMS Networks AB 105 -
17 Hoist Finance AB 76 -
6 Holmen AB 270 0.01
7 Hufvudstaden AB 124 -
5 Humana AB 42 -
3 Husqvarna AB, Class A 40 -
38 Husqvarna AB, Class B 558 0.01
9 ICA Gruppen AB 458 0.01
21 Indutrade AB 561 0.01
1 Infant Bacterial Therapeutics AB 11 -
2 Instalco AB 94 -
10 International Petroleum Corp 41 -
9 Intrum AB 336 0.01
2 INVISIO AB 41 -
Global Core Equity FundPortfolio of Investments as at 31 May 2021 (continued)
Dimensional Fund Advisors Semi-Annual Report and Unaudited Financial Statements, 31 May 2021 113

Shares (000's)
Value(000's)
USD
% of NetAssetValue
Common Stock (continued)
Sweden - 1.19% (continued)
10 Inwido AB 171 -
6 ITAB Shop Concept AB 12 -
6 JM AB 238 0.01
2 Karnov Group AB 11 -
28 Kindred Group PLC, SDR 484 0.01
29 Klovern AB 59 -
3 KNOW IT AB 117 -
20 Kungsleden AB 250 0.01
24 Lagercrantz Group AB 266 0.01
13 LeoVegas AB 66 -
19 Lifco AB 419 0.01
1 Lime Technologies AB 26 -
14 Lindab International AB 345 0.01
15 Loomis AB 486 0.01
10 Lundin Petroleum AB 337 0.01
15 Maha Energy AB 22 -
3 Medicover AB 78 -
7 Mekonomen AB 128 -
23 Millicom International Cellular SA 1,013 0.02
2 MIPS AB 158 -
11 Modern Times Group MTG AB 158 -
4 Momentum Group AB 74 -
9 Munters Group AB 98 -
7 Mycronic AB 222 0.01
13 NCC AB 253 0.01
3 Nederman Holding AB 59 -
2 Nelly Group AB 7 -
24 Net Insight AB 7 -
8 New Wave Group AB 98 -
20 Nibe Industrier AB 206 0.01
24 Nobia AB 221 0.01
12 Nobina AB 122 -
24 Nolato AB 249 0.01
9 Nordic Entertainment Group AB 433 0.01
5 Nordic Waterproofing Holding AB 95 -
3 NP3 Fastigheter AB 65 -
20 Nyfosa AB 261 0.01
4 OEM International AB 70 -
2 Orexo AB 8 -
13 Pandox AB 238 0.01
39 Peab AB 540 0.01
6 Platzer Fastigheter Holding AB 83 -
10 Pricer AB 36 -
7 Proact IT Group AB 73 -
- Probi AB 22 -
2 Qliro AB 9 -
46 Ratos AB 297 0.01
4 RaySearch Laboratories AB 46 -
21 Resurs Holding AB 113 -
16 Rottneros AB 17 -
9 Saab AB 261 0.01
4 Sagax AB 126 -
94 Samhallsbyggnadsbolaget i Norden AB, Class B 414 0.01
11 Samhallsbyggnadsbolaget i Norden AB, Class D 41 -
26 Sandvik AB 685 0.02
131 SAS AB 30 -
11 Scandi Standard AB 82 -
27 Scandic Hotels Group AB 118 -
3 Sectra AB 224 0.01
41 Securitas AB 679 0.02
3 Semcon AB 35 -
66 Sensys Gatso Group AB 9 -
Shares (000's)
Value(000's)
USD
% of NetAssetValue
Common Stock (continued)
Sweden - 1.19% (continued)
1 Sinch AB 151 -
70 Skandinaviska Enskilda Banken AB 907 0.02
1 Skandinaviska Enskilda Banken AB, Class C 14 -
33 Skanska AB 923 0.02
23 SKF AB 622 0.01
2 SKF AB, Class A 45 -
2 SkiStar AB 36 -
18 SSAB AB, Class A 93 -
46 SSAB AB, Class B 227 0.01
38 Svenska Cellulosa AB SCA 636 0.02
2 Svenska Cellulosa AB SCA, Class A 38 -
65 Svenska Handelsbanken AB 740 0.02
2 Svenska Handelsbanken AB, Class B 20 -
18 Sweco AB 321 0.01
38 Swedbank AB 689 0.02
63 Swedish Match AB 583 0.01
19 Swedish Orphan Biovitrum AB 328 0.01
4 Systemair AB 145 -
51 Tele2 AB 692 0.02
3 Telefonaktiebolaget LM Ericsson, Class A 45 -
112 Telefonaktiebolaget LM Ericsson, Class B 1,497 0.03
120 Telia Co AB 534 0.01
4 Tethys Oil AB 31 -
4 Tethys Oil AB 1 -
5 Thule Group AB 216 0.01
17 Trelleborg AB 427 0.01
6 Troax Group AB 219 0.01
3 VBG Group AB 67 -
2 Vitec Software Group AB 76 -
1 Vitrolife AB 30 -
23 Volvo AB, Class A 612 0.01
142 Volvo AB, Class B 3,745 0.08
11 Wallenstam AB 185 0.01
10 Wihlborgs Fastigheter AB 218 0.01
53,333 1.19
Switzerland - 2.47%
82 ABB Ltd 2,792 0.06
17 Adecco Group AG 1,154 0.03
28 Alcon Inc 1,952 0.04
2 Allreal Holding AG 419 0.01
1 ALSO Holding AG 349 0.01
35 ams AG 693 0.02
- APG SGA SA 50 -
8 Arbonia AG 146 -
144 Aryzta AG 194 0.01
3 Ascom Holding AG 42 -
1 Autoneum Holding AG 118 -
- Bachem Holding AG 137 -
6 Baloise Holding AG 1,053 0.02
- Banque Cantonale de Geneve 54 -
3 Banque Cantonale Vaudoise 307 0.01
- Barry Callebaut AG 658 0.02
1 Belimo Holding AG 433 0.01
- Bell Food Group AG 127 -
1 Bellevue Group AG 57 -
1 Berner Kantonalbank AG 187 -
2 BKW AG 250 0.01
2 Bobst Group SA 107 -
1 Bossard Holding AG 237 0.01
1 Bucher Industries AG 636 0.02
- Burckhardt Compression Holding AG 117 -
1 Burkhalter Holding AG 60 -
Global Core Equity FundPortfolio of Investments as at 31 May 2021 (continued)
Dimensional Fund Advisors Semi-Annual Report and Unaudited Financial Statements, 31 May 2021 114

Shares (000's)
Value(000's)
USD
% of NetAssetValue
Common Stock (continued)
Switzerland - 2.47% (continued)
1 Calida Holding AG 27 -
- Carlo Gavazzi Holding AG 19 -
5 Cembra Money Bank AG 510 0.01
- Chocoladefabriken Lindt & Spruengli AG 601 0.01
- Cicor Technologies Ltd 16 -
18 Cie Financiere Richemont SA 2,178 0.05
- Cie Financiere Tradition SA 43 -
26 Clariant AG 571 0.01
1 Coltene Holding AG 119 -
- Conzzeta AG 342 0.01
- COSMO Pharmaceuticals NV 12 -
146 Credit Suisse Group AG 1,592 0.04
1 Daetwyler Holding AG 304 0.01
6 DKSH Holding AG 473 0.01
- dormakaba Holding AG 284 0.01
13 Dufry AG 846 0.02
17 EFG International AG 133 -
- Emmi AG 375 0.01
- EMS-Chemie Holding AG 270 0.01
- Feintool International Holding AG 17 -
3 Flughafen Zurich AG 513 0.01
- Forbo Holding AG 399 0.01
1 Fundamenta Real Estate AG 16 -
6 Galenica AG 435 0.01
25 GAM Holding AG 64 -
3 Geberit AG 2,471 0.06
1 Georg Fischer AG 816 0.02
- Givaudan SA 1,100 0.03
- Gurit Holding AG 176 -
6 Helvetia Holding AG 623 0.01
1 Hiag Immobilien Holding AG 91 -
- HOCHDORF Holding AG 12 -
3 Huber & Suhner AG 197 0.01
- Hypothekarbank Lenzburg AG 24 -
3 Implenia AG 85 -
1 Ina Invest Holding AG 12 -
- Inficon Holding AG 231 0.01
- Interroll Holding AG 297 0.01
- Intershop Holding AG 94 -
1 Investis Holding SA 55 -
24 Julius Baer Group Ltd 1,652 0.04
1 Jungfraubahn Holding AG 94 -
1 Kardex AG 212 0.01
- Komax Holding AG 101 -
3 Kudelski SA 15 -
6 Kuehne & Nagel International AG 1,893 0.04
31 LafargeHolcim Ltd 1,848 0.04
2 Landis&Gyr Group AG 110 -
1 Lastminute.com NV 48 -
- LEM Holding SA 159 -
2 Liechtensteinische Landesbank AG 120 -
14 Logitech International SA 1,692 0.04
2 Lonza Group AG 1,270 0.03
1 Luzerner Kantonalbank AG 257 0.01
1 MCH Group AG 11 -
1 Meier Tobler Group AG 11 -
- Metall Zug AG 67 -
1 Mikron Holding AG 10 -
5 Mobilezone Holding AG 69 -
1 Mobimo Holding AG 383 0.01
155 Nestle SA 19,125 0.43
1 Newron Pharmaceuticals SpA 3 -
Shares (000's)
Value(000's)
USD
% of NetAssetValue
Common Stock (continued)
Switzerland - 2.47% (continued)
100 Novartis AG 8,856 0.20
36 OC Oerlikon Corp AG 414 0.01
2 Orascom Development Holding AG 26 -
1 Orior AG 132 -
2 Partners Group Holding AG 2,380 0.05
- Phoenix Mecano AG 63 -
- Plazza AG 72 -
3 PSP Swiss Property AG 367 0.01
1 Rieter Holding AG 118 -
38 Roche Holding AG (non-voting rights) 13,229 0.30
1 Roche Holding AG (voting rights) 547 0.01
- Romande Energie Holding SA 56 -
- Schaffner Holding AG 28 -
1 Schindler Holding AG 423 0.01
70 Schmolz & Bickenbach AG 35 -
- Schweiter Technologies AG 288 0.01
- SF Urban Properties AG 15 -
2 SFS Group AG 289 0.01
1 SGS SA 1,597 0.04
1 Siegfried Holding AG 496 0.01
34 SIG Combibloc Group AG 911 0.02
8 Sika AG 2,705 0.06
7 Softwareone Holding AG 177 -
2 Sonova Holding AG 849 0.02
1 St Galler Kantonalbank AG 234 0.01
- Straumann Holding AG 413 0.01
3 Sulzer AG 413 0.01
3 Swatch Group AG (Bearer) 1,127 0.03
6 Swatch Group AG (Registered) 403 0.01
2 Swiss Life Holding AG 992 0.02
10 Swiss Prime Site AG 986 0.02
17 Swiss Re AG 1,612 0.04
4 Swisscom AG 2,365 0.05
2 Swissquote Group Holding SA 257 0.01
- Tamedia AG 38 -
8 Temenos AG 1,243 0.03
- Thurgauer Kantonalbank 14 -
1 Tornos Holding AG 7 -
1 u-blox Holding AG 82 -
143 UBS Group AG 2,328 0.05
2 Valiant Holding AG 209 0.01
1 Valora Holding AG 134 -
1 Varia US Properties AG 21 -
3 VAT Group AG 858 0.02
- Vaudoise Assurances Holding SA 82 -
2 Vetropack Holding AG 118 -
5 Vifor Pharma AG 699 0.02
24 Von Roll Holding AG 20 -
6 Vontobel Holding AG 444 0.01
1 VP Bank AG 77 -
2 VZ Holding AG 157 -
- V-ZUG Holding AG 47 -
- Walliser Kantonalbank 29 -
- Warteck Invest AG 51 -
- Ypsomed Holding AG 28 -
2 Zehnder Group AG 165 -
- Zug Estates Holding AG 70 -
- Zuger Kantonalbank AG 159 -
6 Zurich Insurance Group AG 2,319 0.05
110,196 2.47
United Kingdom - 4.60%
48 3i Group PLC 836 0.02
Global Core Equity FundPortfolio of Investments as at 31 May 2021 (continued)
Dimensional Fund Advisors Semi-Annual Report and Unaudited Financial Statements, 31 May 2021 115

Shares (000's)
Value(000's)
USD
% of NetAssetValue
Common Stock (continued)
United Kingdom - 4.60% (continued)
3 4imprint Group PLC 139 -
39 888 Holdings PLC 220 0.01
22 Admiral Group PLC 898 0.02
13 Advanced Medical Solutions Group PLC 52 -
15 AG Barr PLC 110 -
52 Aggreko PLC 636 0.02
6 Air Partner PLC 7 -
2 AJ Bell PLC 13 -
51 Alliance Pharma PLC 72 -
39 Allied Minds PLC 13 -
53 Anglo American PLC 2,375 0.05
28 Anglo Pacific Group PLC 58 -
2 Anglo-Eastern Plantations PLC 21 -
32 Antofagasta PLC 700 0.02
12 Appreciate Group PLC 6 -
13 Arrow Global Group PLC 58 -
27 Ascential PLC 140 -
48 Ashmore Group PLC 272 0.01
51 Ashtead Group PLC 3,750 0.08
7 ASOS PLC 477 0.01
24 Associated British Foods PLC 789 0.02
7 Aston Martin Lagonda Global Holdings 200 0.01
64 Astrazeneca PLC 7,315 0.16
112 Auto Trader Group PLC 893 0.02
18 Avast PLC 117 -
4 AVEVA Group PLC 196 0.01
262 Aviva PLC 1,527 0.03
2 Avon Rubber PLC 107 -
114 B&M European Value Retail SA 932 0.02
85 Babcock International Group PLC 359 0.01
266 BAE Systems PLC 1,980 0.05
15 Bakkavor Group PLC 29 -
84 Balfour Beatty PLC 372 0.01
8 Bank of Georgia Group PLC 142 -
654 Barclays PLC 1,698 0.04
69 Barratt Developments PLC 744 0.02
61 Beazley PLC 260 0.01
15 Begbies Traynor Group PLC 29 -
12 Bellway PLC 603 0.01
8 Berkeley Group Holdings PLC 526 0.01
123 BHP Group PLC 3,697 0.08
40 Biffa PLC 166 -
12 Bloomsbury Publishing PLC 53 -
32 Bodycote PLC 394 0.01
87 boohoo Group PLC 392 0.01
14 Boot Henry PLC 56 -
1,003 BP PLC 4,367 0.10
5 Braemar Shipping Services PLC 17 -
7 Breedon Group PLC 11 -
41 Brewin Dolphin Holdings PLC 196 0.01
78 British American Tobacco PLC 2,993 0.07
8 British American Tobacco PLC, ADR 327 0.01
40 Britvic PLC 516 0.01
1,274 BT Group PLC 3,153 0.07
25 Bunzl PLC 820 0.02
43 Burberry Group PLC 1,290 0.03
25 Burford Capital Ltd 301 0.01
5 Bytes Technology Group PLC 38 -
38 C&C Group PLC 130 -
97 Cairn Energy PLC 223 0.01
212 Capita PLC 121 -
59 Card Factory PLC 57 -
Shares (000's)
Value(000's)
USD
% of NetAssetValue
Common Stock (continued)
United Kingdom - 4.60% (continued)
9 CareTech Holdings PLC 73 -
12 Carnival PLC 303 0.01
6 Carr's Group PLC 12 -
3 Castings PLC 18 -
184 Centamin PLC 287 0.01
26 Central Asia Metals PLC 101 -
10 CentralNic Group Plc 12 -
1,187 Centrica PLC 919 0.02
33 Chemring Group PLC 143 -
25 Chesnara PLC 99 -
175 Cineworld Group PLC 230 0.01
16 Circassia Pharmaceuticals PLC 8 -
3 Clarkson PLC 142 -
13 Clinigen Healthcare Ltd 155 -
10 Clipper Logistics PLC 107 -
18 Close Brothers Group PLC 424 0.01
18 CLS Holdings PLC 64 -
14 CMC Markets PLC 98 -
184 Coats Group PLC 172 -
17 Coca-Cola HBC AG 617 0.01
49 Compass Group PLC 1,115 0.03
9 Computacenter PLC 341 0.01
4 ContourGlobal PLC 12 -
132 ConvaTec Group PLC 445 0.01
16 Costain Group PLC 13 -
52 Countryside Properties PLC 378 0.01
7 Cranswick PLC 395 0.01
44 Crest Nicholson Holdings PLC 288 0.01
5 Croda International PLC 529 0.01
7 CVS Group PLC 221 0.01
17 Daily Mail & General Trust PLC 219 0.01
18 Dart Group PLC 342 0.01
8 DCC PLC 672 0.02
18 De La Rue PLC 46 -
95 Debenhams PLC - -
1 Dechra Pharmaceuticals PLC 44 -
30 Devro PLC 89 -
34 DFS Furniture PLC 139 -
99 Diageo PLC 4,765 0.11
3 Dialight PLC 13 -
6 Dignity PLC 58 -
12 Diploma PLC 506 0.01
135 Direct Line Insurance Group PLC 569 0.01
11 DiscoverIE Group PLC 119 -
26 Diversified Gas & Oil PLC 39 -
166 Dixons Carphone PLC 321 0.01
61 Domino's Pizza Group PLC 313 0.01
12 dotdigital Group PLC 38 -
66 Drax Group PLC 409 0.01
147 DS Smith PLC 870 0.02
14 Dunelm Group PLC 283 0.01
11 easyJet PLC 160 -
49 Electrocomponents PLC 680 0.02
87 Elementis PLC 195 0.01
7 EMIS Group PLC 124 -
227 EnQuest PLC 55 -
7 Epwin Group PLC 11 -
68 Equiniti Group PLC 174 -
11 Euromoney Institutional Investor PLC 165 -
44 Evraz PLC 402 0.01
60 Experian PLC 2,314 0.05
9 FDM Group Holdings PLC 133 -
Global Core Equity FundPortfolio of Investments as at 31 May 2021 (continued)
Dimensional Fund Advisors Semi-Annual Report and Unaudited Financial Statements, 31 May 2021 116

Shares (000's)
Value(000's)
USD
% of NetAssetValue
Common Stock (continued)
United Kingdom - 4.60% (continued)
24 Ferguson PLC 3,194 0.07
77 Ferrexpo PLC 487 0.01
11 Fevertree Drinks PLC 411 0.01
34 Filtrona PLC 149 -
1 First Derivatives PLC 27 -
277 Firstgroup PLC 321 0.01
32 Forterra PLC 132 -
45 Foxtons Group PLC 37 -
7 Fresnillo PLC 92 -
1 Frontier Developments PLC 53 -
4 Fuller Smith & Turner PLC 47 -
13 Funding Circle Holdings 31 -
2 Future PLC 96 -
3 FW Thorpe PLC 19 -
32 Galliford Try Holdings PLC 58 -
4 Games Workshop Group PLC 695 0.02
5 Gamesys Group PLC 130 -
2 Gamma Communications PLC 51 -
18 Gem Diamonds Ltd 19 -
19 Genel Energy PLC 36 -
4 Genus PLC 308 0.01
4 Georgia Capital PLC 34 -
187 GlaxoSmithKline PLC 3,569 0.08
548 Glencore PLC 2,495 0.06
9 Go-Ahead Group PLC 162 -
1 Gooch & Housego PLC 17 -
- Goodwin PLC 15 -
22 Grafton Group PLC 370 0.01
78 Grainger PLC 315 0.01
61 Greencore Group PLC 121 -
15 Greggs PLC 521 0.01
43 Gulf Keystone Petroleum Ltd 100 -
35 GVC Holdings PLC 823 0.02
15 Gym Group PLC 59 -
3 H&T Group PLC 13 -
35 Halfords Group PLC 188 -
19 Halma PLC 688 0.02
256 Harbour Energy PLC 74 -
26 Hargreaves Lansdown PLC 607 0.01
1 Hargreaves Services PLC 6 -
141 Hays PLC 346 0.01
11 Headlam Group PLC 74 -
20 Helical PLC 122 -
5 Helios Towers PLC 11 -
15 Hikma Pharmaceuticals PLC 529 0.01
9 Hill & Smith Holdings PLC 205 0.01
7 Hilton Food Group PLC 117 -
35 Hiscox Ltd 386 0.01
46 Hochschild Mining PLC 128 -
21 Hollywood Bowl Group PLC 76 -
30 HomeServe PLC 398 0.01
8 Hostelworld Group PLC 11 -
62 Howden Joinery Group PLC 702 0.02
684 HSBC Holdings PLC 4,423 0.10
22 Hunting PLC 82 -
31 Hyve Group PLC 58 -
53 Ibstock PLC 172 -
38 IDOX PLC 33 -
65 IG Group Holdings PLC 791 0.02
38 IMI PLC 888 0.02
1 Impax Asset Management Group PLC 20 -
127 Imperial Tobacco Group PLC 2,887 0.07
Shares (000's)
Value(000's)
USD
% of NetAssetValue
Common Stock (continued)
United Kingdom - 4.60% (continued)
77 Inchcape PLC 854 0.02
98 Indivior PLC 217 0.01
71 Informa PLC 545 0.01
9 IntegraFin Holdings PLC 69 -
12 InterContinental Hotels Group PLC 871 0.02
13 Intermediate Capital Group PLC 373 0.01
56 International Consolidated Airlines Group SA 160 -
23 International Personal Finance PLC 44 -
15 Intertek Group PLC 1,156 0.03
98 Investec PLC 431 0.01
7 iomart Group PLC 28 -
107 IP Group PLC 188 -
453 ITV PLC 823 0.02
131 IWG PLC 670 0.02
251 J Sainsbury PLC 946 0.02
6 James Fisher & Sons PLC 79 -
57 JD Sports Fashion PLC 765 0.02
7 JD Wetherspoon PLC 126 -
49 John Laing Group PLC 280 0.01
12 John Menzies PLC 53 -
102 John Wood Group PLC 355 0.01
19 Johnson Matthey PLC 839 0.02
32 Johnson Service Group PLC 76 -
3 Joules Group PLC 12 -
40 Jupiter Fund Management PLC 157 -
171 Just Group PLC 267 0.01
10 Kainos Group PLC 193 0.01
15 Keller Group PLC 178 -
17 Kier Group PLC 27 -
15 Kier Group PLC 6 -
15 Kin & Carta PLC 41 -
230 Kingfisher PLC 1,167 0.03
14 Lamprell PLC 12 -
24 Lancashire Holdings Ltd 215 0.01
302 Legal & General Group PLC 1,217 0.03
4 Liontrust Asset Management PLC 90 -
3,322 Lloyds Banking Group PLC 2,349 0.05
4 London Stock Exchange Group PLC 398 0.01
48 Lookers PLC 46 -
15 LSL Property Services PLC 97 -
16 Luceco PLC 76 -
5 M&C Saatchi PLC 9 -
350 M&G PLC 1,209 0.03
9 Macfarlane Group PLC 14 -
185 Man Group PLC 469 0.01
302 Marks & Spencer Group PLC 706 0.02
21 Marshalls PLC 224 0.01
110 Marston's PLC 142 -
46 McBride PLC 58 -
22 Mears Group PLC 59 -
62 Mediclinic International PLC 288 0.01
112 Meggitt PLC 803 0.02
310 Melrose Industries PLC 759 0.02
48 Michael Page International PLC 404 0.01
34 Micro Focus International PLC 249 0.01
15 Micro Focus International PLC, ADR 113 -
2 Midwich Group PLC 17 -
45 Mitchells & Butlers PLC 195 0.01
196 Mitie Group PLC 189 -
4 MJ Gleeson PLC 51 -
49 Mondi PLC 1,323 0.03
77 Moneysupermarket.com Group PLC 295 0.01
Global Core Equity FundPortfolio of Investments as at 31 May 2021 (continued)
Dimensional Fund Advisors Semi-Annual Report and Unaudited Financial Statements, 31 May 2021 117

Shares (000's)
Value(000's)
USD
% of NetAssetValue
Common Stock (continued)
United Kingdom - 4.60% (continued)
44 Morgan Crucible Co PLC 207 0.01
7 Morgan Sindall Group PLC 236 0.01
6 Morses Club PLC 5 -
2 Mortgage Advice Bureau Holdings Ltd 26 -
11 Motorpoint group PLC 40 -
2 MP Evans Group PLC 16 -
44 N Brown Group PLC 41 -
7 Naked Wines PLC 79 -
93 National Express Group PLC 400 0.01
70 National Grid PLC 934 0.02
34 NCC Group PLC 142 -
1 Next Fifteen Communications Group PLC 15 -
11 Next PLC 1,313 0.03
52 Ninety One PLC 176 -
8 NMC Health PLC 3 -
11 Norcros PLC 47 -
35 Northgate PLC 193 0.01
6 Numis Corp PLC 34 -
7 Ocado Group PLC 182 -
15 On the Beach Group PLC 85 -
38 OSB Group PLC 254 0.01
6 Oxford Instruments PLC 175 -
314 Pan African Resources PLC 103 -
43 Paragon Group of Cos PLC 294 0.01
17 Parkmead Group PLC 10 -
10 PayPoint PLC 84 -
50 Pearson PLC 578 0.01
298 Pendragon PLC 78 -
28 Pennon Group PLC 423 0.01
23 Persimmon PLC 1,027 0.02
44 Petrofac Ltd 83 -
370 Petropavlovsk PLC 131 -
73 Pets at Home Group PLC 466 0.01
43 Pharos Energy PLC 15 -
69 Phoenix Group Holdings PLC 721 0.02
55 Photo-Me International PLC 55 -
45 Playtech PLC 291 0.01
16 Plus500 Ltd 349 0.01
6 Polar Capital Holdings PLC 64 -
27 Polypipe Group PLC 247 0.01
3 Porvair PLC 27 -
1 PPHE Hotel Group Ltd 30 -
110 Premier Foods PLC 166 -
33 Provident Financial PLC 111 -
76 Prudential PLC 1,619 0.04
19 PureTech Health PLC 107 -
20 PZ Cussons PLC 71 -
46 QinetiQ Group PLC 231 0.01
186 Quilter PLC 404 0.01
30 Rank Group PLC 85 -
6 Rathbone Brothers PLC 147 -
36 Raven Property Group Ltd 15 -
57 Reach PLC 194 0.01
28 Reckitt Benckiser Group PLC 2,531 0.06
28 Redrow PLC 270 0.01
37 RELX PLC (Netherlands listing) 979 0.02
63 RELX PLC (UK listing) 1,647 0.04
4 Renew Holdings PLC 36 -
2 Renishaw PLC 120 -
9 Renold PLC 3 -
133 Rentokil Initial PLC 892 0.02
81 Restaurant Group PLC 140 -
Shares (000's)
Value(000's)
USD
% of NetAssetValue
Common Stock (continued)
United Kingdom - 4.60% (continued)
2 Rhi Magnesita NV (Austria listing) 120 -
4 Rhi Magnesita NV (UK listing) 261 0.01
5 Ricardo PLC 33 -
107 Rightmove PLC 916 0.02
74 Rio Tinto PLC 6,345 0.14
1 River & Mercantile Group PLC 3 -
9 RM PLC 26 -
7 Robert Walters PLC 68 -
589 Rolls-Royce Holdings PLC 892 0.02
96 Rotork PLC 461 0.01
314 Royal Bank of Scotland Group PLC 919 0.02
375 Royal Dutch Shell PLC 6,823 0.15
148 Royal Mail PLC 1,215 0.03
35 RPS Group PLC 48 -
79 RSA Insurance Group PLC 763 0.02
20 RWS Holdings PLC 180 -
1 S&U PLC 29 -
26 Sabre Insurance Group PLC 97 -
11 Saga PLC 60 -
45 Sage Group PLC 421 0.01
3 Sanne Group PLC 33 -
23 Savills PLC 382 0.01
3 Schroders PLC (non-voting rights) 119 -
9 Schroders PLC (voting rights) 431 0.01
3 ScS Group PLC 13 -
1 Secure Trust Bank PLC 14 -
65 Senior PLC 147 -
177 Serco Group PLC 339 0.01
13 Serica Energy PLC 22 -
47 Severfield PLC 53 -
21 Severn Trent PLC 728 0.02
139 Shanks Group PLC 107 -
99 SIG PLC 87 -
111 Signature Aviation PLC 621 0.01
10 Smart Metering Systems PLC 121 -
36 Smith & Nephew PLC 791 0.02
25 Smiths Group PLC 554 0.01
18 Softcat PLC 457 0.01
10 Spectris PLC 466 0.01
102 Speedy Hire PLC 108 -
4 Spirax-Sarco Engineering PLC 785 0.02
47 Spire Healthcare Group PLC 165 -
57 Spirent Communications PLC 200 0.01
12 Sportech PLC 5 -
43 Sports Direct International PLC 350 0.01
119 SSE PLC 2,589 0.06
93 SSP Group PLC 388 0.01
39 St James's Place PLC 762 0.02
35 St Modwen Properties PLC 272 0.01
56 Stagecoach Group PLC 68 -
161 Standard Chartered PLC 1,158 0.03
382 Standard Life Aberdeen PLC 1,485 0.03
22 SThree PLC 128 -
38 Stobart Group Ltd 18 -
24 Stock Spirits Group PLC 90 -
6 Strix Group PLC 26 -
4 Studio Retail Group PLC 17 -
2 STV Group PLC 11 -
10 SuperGroup PLC 56 -
17 Synthomer PLC 128 -
8 Takeaway.com NV 710 0.02
6 Takeaway.com NV (UK listing) 509 0.01
Global Core Equity FundPortfolio of Investments as at 31 May 2021 (continued)
Dimensional Fund Advisors Semi-Annual Report and Unaudited Financial Statements, 31 May 2021 118

Shares (000's)
Value(000's)
USD
% of NetAssetValue
Common Stock (continued)
United Kingdom - 4.60% (continued)
81 Tate & Lyle PLC 876 0.02
241 Taylor Wimpey PLC 584 0.01
1 TBC Bank Group PLC 13 -
6 TClarke PLC 12 -
9 Ted Baker PLC 23 -
7 Telecom Plus PLC 123 -
738 Tesco PLC 2,335 0.05
31 TI Fluid Systems PLC 135 -
35 Topps Tiles PLC 37 -
110 TP ICAP Group PLC 335 0.01
29 Travis Perkins PLC 683 0.02
2 Treatt PLC 39 -
11 Trifast PLC 25 -
22 TT Electronics plc 82 -
35 TUI AG 215 0.01
280 Tullow Oil PLC 203 0.01
22 Tungsten Corp PLC 11 -
25 Tyman PLC 172 -
21 U & I Group PLC 28 -
30 UDG Healthcare PLC 444 0.01
9 Ultra Electronics Holdings PLC 254 0.01
86 Unilever PLC (Nitherland listing) 5,150 0.12
57 Unilever PLC (UK listing) 3,399 0.08
43 United Utilities Group PLC 599 0.01
60 Vectura Group PLC 136 -
88 Vertu Motors PLC 54 -
30 Vesuvius PLC 241 0.01
9 Victrex PLC 294 0.01
180 Virgin Money UK PLC 539 0.01
35 Vistry Group PLC 654 0.02
4 Vitec Group PLC 68 -
63 Vivo Energy PLC 91 -
2,521 Vodafone Group PLC 4,571 0.10
23 Volution Group PLC 146 -
2 Vp PLC 30 -
28 Watkin Jones PLC 91 -
32 Weir Group PLC 864 0.02
8 WH Smith PLC 204 0.01
12 Whitbread PLC 541 0.01
33 Wickes Group PLC 119 -
13 Wincanton PLC 84 -
290 WM Morrison Supermarkets PLC 728 0.02
98 WPP PLC 1,350 0.03
10 Xaar PLC 30 -
1 XP Power Ltd 80 -
2 Young & Co's Brewery PLC, Class A 39 -
3 Zotefoams PLC 17 -
205,466 4.60
United States - 63.13%
2 10X Genomics Inc 373 0.01
5 1-800-Flowers.com Inc 138 -
3 1st Constitution Bancorp 53 -
5 1st Source Corp 245 0.01
7 2U Inc 259 0.01
14 3D Systems Corp 410 0.01
37 3M Co 7,601 0.17
2 A H Belo Corp 4 -
10 A10 Networks Inc 94 -
6 AAON Inc 383 0.01
4 AAR Corp 153 -
6 Aaron's Holdings Co Inc 216 0.01
47 Abbott Laboratories 5,438 0.12
Shares (000's)
Value(000's)
USD
% of NetAssetValue
Common Stock (continued)
United States - 63.13% (continued)
88 AbbVie Inc 10,008 0.22
17 Abeona Therapeutics Inc 29 -
14 Abercrombie & Fitch Co 579 0.01
2 Abiomed Inc 699 0.02
11 ABM Industries Inc 554 0.01
8 Acacia Research Corp 43 -
16 Acadia Healthcare Co Inc 1,003 0.02
10 Acadia Pharmaceuticals Inc 234 0.01
3 Acceleron Pharma Inc 382 0.01
33 Accenture PLC 9,172 0.21
9 ACCO Brands Corp 86 -
17 Accuray Inc 72 -
28 Achillion Pharmaceuticals Inc 40 -
17 ACI Worldwide Inc 634 0.01
1 ACM Research Inc 102 -
1 Acme United Corp 32 -
2 ACNB Corp 43 -
44 Activision Blizzard Inc 4,321 0.10
7 Acuity Brands Inc 1,302 0.03
12 Acushnet Holdings Corp 633 0.01
- Adams Resources & Energy Inc 14 -
1 Adaptive Biotechnologies Corp 48 -
2 Addus HomeCare Corp 182 -
15 Adient PLC 769 0.02
19 Adobe Inc 9,408 0.21
100 ADT Inc 1,036 0.02
6 Adtalem Global Education Inc 217 0.01
8 ADTRAN Inc 149 -
3 Aduro Biotech Inc - -
9 Advance Auto Parts Inc 1,713 0.04
5 Advanced Energy Industries Inc 497 0.01
19 Advanced Micro Devices Inc 1,512 0.03
5 AdvanSix Inc 163 -
20 AECOM 1,315 0.03
3 Aeglea BioTherapeutics Inc 20 -
3 AeroVironment Inc 305 0.01
64 AES Corp 1,639 0.04
9 Affiliated Managers Group Inc 1,409 0.03
40 Aflac Inc 2,254 0.05
13 AGCO Corp 1,820 0.04
14 Agilent Technologies Inc 1,997 0.05
3 Agilysys Inc 139 -
6 Agios Pharmaceuticals Inc 334 0.01
6 AgroFresh Solutions Inc 14 -
19 Air Lease Corp 907 0.02
13 Air Products and Chemicals Inc 3,813 0.09
- Air T Inc 3 -
16 Air Transport Services Group Inc 385 0.01
1 Airgain Inc 20 -
16 Akamai Technologies Inc 1,841 0.04
5 Akazoo SA - -
18 Akebia Therapeutics Inc 64 -
- Akero Therapeutics Inc 2 -
2 Alamo Group Inc 339 0.01
4 Alarm.com Holdings Inc 353 0.01
18 Alaska Air Group Inc 1,250 0.03
11 Alaska Communications Systems Group Inc 37 -
6 Albany International Corp 507 0.01
12 Albemarle Corp 1,987 0.05
2 Albireo Pharma Inc 51 -
26 Alcoa Corp 1,012 0.02
3 Aldeyra Therapeutics Inc 40 -
Global Core Equity FundPortfolio of Investments as at 31 May 2021 (continued)
Dimensional Fund Advisors Semi-Annual Report and Unaudited Financial Statements, 31 May 2021 119

Shares (000's)
Value(000's)
USD
% of NetAssetValue
Common Stock (continued)
United States - 63.13% (continued)
1 Alector Inc 16 -
3 Alerus Financial Corp 95 -
15 Alexion Pharmaceuticals Inc 2,650 0.06
1 Alico Inc 41 -
2 Align Technology Inc 971 0.02
1 Alithya Group Inc 2 -
20 Alkermes PLC 459 0.01
2 Allakos Inc 213 0.01
2 Alleghany Corp 1,349 0.03
20 Allegheny Technologies Inc 495 0.01
3 Allegiance Bancshares Inc 133 -
2 Allegiant Travel Co 421 0.01
12 Allegion PLC 1,703 0.04
5 ALLETE Inc 375 0.01
9 Alliance Data Systems Corp 1,084 0.02
20 Alliant Energy Corp 1,118 0.03
3 Allied Motion Technologies Inc 98 -
21 Allison Transmission Holdings Inc 891 0.02
27 Allscripts Healthcare Solutions Inc 468 0.01
37 Allstate Corp 5,117 0.12
58 Ally Financial Inc 3,152 0.07
3 Alnylam Pharmaceuticals Inc 440 0.01
4 Alpha & Omega Semiconductor Ltd 114 -
3 Alpha Metallurgical Resources 70 -
3 Alpha Pro Tech Ltd 24 -
13 Alphabet Inc, Class A 31,059 0.70
13 Alphabet Inc, Class C 30,950 0.69
2 Alpine Immune Sciences Inc 18 -
3 Altabancorp 154 -
3 Altair Engineering Inc 211 0.01
2 Alteryx Inc 149 -
27 Altice USA Inc 962 0.02
10 Alto Ingredients Inc 64 -
8 Altra Industrial Motion Corp 550 0.01
113 Altria Group Inc 5,558 0.13
2 A-Mark Precious Metals Inc 81 -
20 Amazon.com Inc 65,589 1.47
4 Ambac Financial Group Inc 57 -
4 Ambarella Inc 399 0.01
10 AMC Networks Inc 532 0.01
78 Amcor Ltd 920 0.02
214 Amcor PLC 2,523 0.06
20 Amdocs Ltd 1,583 0.04
3 Amedisys Inc 785 0.02
1 Amerant Bancorp Inc 18 -
3 Amerco 1,925 0.04
16 Ameren Corp 1,323 0.03
5 Ameresco Inc 278 0.01
43 American Airlines Group Inc 1,050 0.02
22 American Axle & Manufacturing Holdings Inc 243 0.01
28 American Eagle Outfitters Inc 988 0.02
26 American Electric Power Co Inc 2,243 0.05
12 American Equity Investment Life Holding Co 365 0.01
44 American Express Co 7,104 0.16
12 American Financial Group Inc 1,584 0.04
54 American International Group Inc 2,846 0.06
2 American National Bankshares Inc 68 -
4 American National Group Inc 615 0.01
2 American Outdoor Brands Inc 56 -
2 American Public Education Inc 65 -
1 American River Bankshares 22 -
4 American Software Inc 89 -
Shares (000's)
Value(000's)
USD
% of NetAssetValue
Common Stock (continued)
United States - 63.13% (continued)
4 American States Water Co 317 0.01
4 American Superconductor Corp 63 -
3 American Vanguard Corp 53 -
11 American Water Works Co Inc 1,693 0.04
3 American Woodmark Corp 302 0.01
1 America's Car-Mart Inc 216 0.01
16 Ameriprise Financial Inc 4,122 0.09
12 Ameris Bancorp 636 0.01
3 AMERISAFE Inc 191 -
16 AmerisourceBergen Corp 1,795 0.04
2 Ames National Corp 44 -
16 AMETEK Inc 2,142 0.05
37 Amgen Inc 8,862 0.20
51 Amkor Technology Inc 1,082 0.02
9 AMN Healthcare Services Inc 778 0.02
24 Amneal Pharmaceuticals Inc 136 -
2 Ampco-Pittsburgh Corp 12 -
8 Amphastar Pharmaceuticals Inc 145 -
44 Amphenol Corp 2,989 0.07
1 Amtech Systems Inc 14 -
23 Analog Devices Inc 3,747 0.08
5 Anaplan Inc 259 0.01
5 AnaptysBio Inc 108 -
7 Andersons Inc 208 0.01
9 ANGI Homeservices Inc 129 -
8 AngioDynamics Inc 174 -
2 ANI Pharmaceuticals Inc 55 -
3 Anika Therapeutics Inc 117 -
2 Ansys Inc 625 0.01
17 Antares Pharma Inc 69 -
2 Anterix Inc 101 -
72 Antero Midstream Corp 689 0.02
42 Antero Resources Corp 542 0.01
13 Anthem Inc 5,189 0.12
17 AO Smith Corp 1,242 0.03
27 Aon PLC 6,740 0.15
43 APA Corp 889 0.02
9 API Group Inc 195 -
5 Apogee Enterprises Inc 173 -
1 Apollo Medical Holdings Inc 25 -
1 Appfolio Inc 84 -
1,024 Apple Inc 127,613 2.86
6 Applied Genetic Technologies Corp 26 -
4 Applied Industrial Technologies Inc 425 0.01
52 Applied Materials Inc 7,142 0.16
1 Applied Optoelectronics Inc 6 -
8 AptarGroup Inc 1,208 0.03
8 Aptinyx Inc 20 -
18 Aptiv PLC 2,704 0.06
6 Apyx Medical Corp 58 -
26 Aramark 971 0.02
3 Aravive Inc 16 -
2 ArcBest Corp 142 -
44 Arch Capital Group Ltd 1,742 0.04
2 Arch Resources Inc 139 -
33 Archer-Daniels-Midland Co 2,202 0.05
26 Archrock Inc 236 0.01
17 Arconic Corp 620 0.01
8 Arcosa Inc 491 0.01
12 Ardelyx Inc 89 -
6 Ardmore Shipping Corp 26 -
6 Arena Pharmaceuticals Inc 374 0.01
Global Core Equity FundPortfolio of Investments as at 31 May 2021 (continued)
Dimensional Fund Advisors Semi-Annual Report and Unaudited Financial Statements, 31 May 2021 120

Shares (000's)
Value(000's)
USD
% of NetAssetValue
Common Stock (continued)
United States - 63.13% (continued)
5 Ares Management Corp 285 0.01
3 Argan Inc 134 -
6 Argo Group International Holdings Ltd 314 0.01
4 Arista Networks Inc 1,283 0.03
- Ark Restaurants Corp 8 -
3 Arko Corp 27 -
10 Arlo Technologies Inc 67 -
4 Armstrong Flooring Inc 23 -
7 Armstrong World Industries Inc 719 0.02
13 Arrow Electronics Inc 1,505 0.03
3 Arrow Financial Corp 99 -
7 Arrowhead Pharmaceuticals Inc 531 0.01
1 Artesian Resources Corp 40 -
16 Arthur J Gallagher & Co 2,282 0.05
8 Artisan Partners Asset Management Inc 393 0.01
3 Arvinas Inc 241 0.01
4 Asbury Automotive Group Inc 817 0.02
8 ASGN Inc 844 0.02
8 Ashland Global Holdings Inc 751 0.02
4 Aspen Aerogels Inc 75 -
3 Aspen Group Inc 17 -
8 Aspen Technology Inc 1,077 0.02
6 Assembly Biosciences Inc 24 -
3 Assetmark Financial Holdings Inc 70 -
23 Associated Banc-Corp 527 0.01
1 Associated Capital Group Inc 23 -
9 Assurant Inc 1,379 0.03
14 Assured Guaranty Ltd 654 0.02
4 Astec Industries Inc 303 0.01
3 Astronics Corp, Class A 53 -
1 Astronics Corp, Class B 23 -
1 AstroNova Inc 10 -
2 Asure Software Inc 15 -
9 At Home Group Inc 352 0.01
390 AT&T Inc 11,488 0.26
11 Atara Biotherapeutics Inc 152 -
26 Athene Holding Ltd 1,619 0.04
7 Athenex Inc 35 -
10 Atkore International Group Inc 744 0.02
4 Atlantic Capital Bancshares Inc 113 -
13 Atlantic Union Bankshares Corp 543 0.01
10 Atlantica Yield PLC 381 0.01
2 Atlanticus Holdings Corp 79 -
2 Atlas Air Worldwide Holdings Inc 153 -
3 Atlassian Corp PLC 619 0.01
9 Atmos Energy Corp 869 0.02
2 ATN International Inc 93 -
4 AtriCure Inc 284 0.01
- Atrion Corp 149 -
- Auburn National BanCorp Inc 11 -
21 Audacy Inc 91 -
10 Autodesk Inc 2,797 0.06
12 Autoliv Inc 1,272 0.03
34 Automatic Data Processing Inc 6,688 0.15
16 AutoNation Inc 1,611 0.04
1 AutoZone Inc 2,097 0.05
2 Avalara Inc 284 0.01
7 Avangrid Inc 381 0.01
8 Avanos Medical Inc 329 0.01
14 Avaya Holdings Corp 413 0.01
11 Avery Dennison Corp 2,448 0.06
2 Aviat Networks Inc 81 -
Shares (000's)
Value(000's)
USD
% of NetAssetValue
Common Stock (continued)
United States - 63.13% (continued)
5 Avid Technology Inc 154 -
14 Avient Corp 716 0.02
9 Avis Budget Group Inc 780 0.02
7 Avista Corp 336 0.01
12 Avnet Inc 527 0.01
5 Aware Inc 18 -
48 AXA Equitable Holdings Inc 1,530 0.03
46 Axalta Coating Systems Ltd 1,477 0.03
6 Axcelis Technologies Inc 231 0.01
5 Axcella Health Inc 17 -
10 Axis Capital Holdings Ltd 533 0.01
4 Axogen Inc 84 -
5 Axon Enterprise Inc 635 0.01
11 Axos Financial Inc 521 0.01
8 AXT Inc 80 -
5 AZZ Inc 255 0.01
3 B Riley Financial Inc 186 -
5 B&G Foods Inc 163 -
4 Badger Meter Inc 364 0.01
48 Baker Hughes Co 1,171 0.03
4 Balchem Corp 472 0.01
31 Ball Corp 2,575 0.06
3 Ballantyne Strong Inc 15 -
3 Bally's Corp 155 -
9 Banc of California Inc 151 -
6 BancFirst Corp 392 0.01
10 Bancorp Inc 244 0.01
17 BancorpSouth Bank 511 0.01
303 Bank of America Corp 12,865 0.29
3 Bank of Commerce Holdings 40 -
7 Bank of Hawaii Corp 621 0.01
2 Bank of Marin Bancorp 80 -
60 Bank of New York Mellon Corp 3,126 0.07
10 Bank of NT Butterfield & Son Ltd 390 0.01
1 Bank of Princeton 29 -
1 Bank of South Carolina Corp 24 -
19 Bank OZK 823 0.02
2 BankFinancial Corp 21 -
15 BankUnited Inc 720 0.02
1 Bankwell Financial Group Inc 36 -
6 Banner Corp 358 0.01
2 Bar Harbor Bankshares 50 -
4 Barnes & Noble Education Inc 31 -
6 Barnes Group Inc 344 0.01
2 Barrett Business Services Inc 113 -
1 Bassett Furniture Industries Inc 33 -
34 Baxter International Inc 2,760 0.06
2 BayCom Corp 33 -
4 BBX Capital Inc 27 -
4 BCB Bancorp Inc 52 -
13 Beacon Roofing Supply Inc 727 0.02
1 Beasley Broadcast Group Inc 3 -
2 Beazer Homes USA Inc 47 -
15 Becton Dickinson and Co 3,643 0.08
17 Bed Bath & Beyond Inc 464 0.01
1 Bel Fuse Inc 19 -
8 Belden Inc 422 0.01
5 Benchmark Electronics Inc 147 -
74 Berkshire Hathaway Inc 21,304 0.48
6 Berkshire Hills Bancorp Inc 169 -
12 Berry Corp 77 -
27 Berry Global Group Inc 1,859 0.04
Global Core Equity FundPortfolio of Investments as at 31 May 2021 (continued)
Dimensional Fund Advisors Semi-Annual Report and Unaudited Financial Statements, 31 May 2021 121

Shares (000's)
Value(000's)
USD
% of NetAssetValue
Common Stock (continued)
United States - 63.13% (continued)
30 Best Buy Co Inc 3,522 0.08
3 Beyond Meat Inc 369 0.01
58 BGC Partners Inc 340 0.01
1 BGSF Inc 17 -
2 Big 5 Sporting Goods Corp 59 -
10 Big Lots Inc 610 0.01
- Biglari Holdings Inc, Class A 30 -
- Biglari Holdings Inc, Class B 54 -
2 Bill.com Holdings Inc 353 0.01
10 BioDelivery Sciences International Inc 36 -
19 Biogen Inc 5,195 0.12
2 BioLife Solutions Inc 79 -
9 BioMarin Pharmaceutical Inc 684 0.02
3 Bio-Rad Laboratories Inc 1,525 0.03
3 Bio-Techne Corp 1,050 0.02
3 BJ's Restaurants Inc 144 -
17 BJ's Wholesale Club Holdings Inc 755 0.02
3 BK Technologies Corp 10 -
7 Black Hills Corp 438 0.01
15 Black Knight Inc 1,133 0.03
4 Blackbaud Inc 298 0.01
4 Blackline Inc 383 0.01
6 BlackRock Inc 5,490 0.12
9 Blackstone Group Inc 877 0.02
13 Bloomin' Brands Inc 377 0.01
5 Blucora Inc 93 -
3 Blue Bird Corp 76 -
10 Bluebird Bio Inc 312 0.01
2 Bluegreen Vacations Holding Corp 44 -
1 BM Technologies Inc 11 -
9 Boingo Wireless Inc 130 -
7 Boise Cascade Co 446 0.01
9 BOK Financial Corp 813 0.02
3 Bonanza Creek Energy Inc 112 -
- Booking Holdings Inc 678 0.02
6 Boot Barn Holdings Inc 450 0.01
19 Booz Allen Hamilton Holding Corp 1,592 0.04
45 BorgWarner Inc 2,311 0.05
1 Boston Beer Co Inc 1,154 0.03
4 Boston Omaha Corp 128 -
15 Boston Private Financial Holdings Inc 229 0.01
42 Boston Scientific Corp 1,767 0.04
5 Bottomline Technologies DE Inc 184 -
9 Box Inc 198 -
7 Brady Corp 380 0.01
2 Bridgebio Pharma Inc 123 -
5 Bridgewater Bancshares Inc 84 -
1 Bridgford Foods Corp 13 -
4 Bright Horizons Family Solutions Inc 499 0.01
4 Brightcove Inc 58 -
13 Brighthouse Financial Inc 639 0.01
14 Brightsphere Investment Group Inc 307 0.01
15 BrightView Holdings Inc 265 0.01
4 Brinker International Inc 249 0.01
7 Brink's Co 510 0.01
93 Bristol-Myers Squibb Co 6,134 0.14
1 Bristow Group Inc 25 -
22 Broadcom Inc 10,372 0.23
14 Broadridge Financial Solutions Inc 2,248 0.05
3 Broadwind Energy Inc 12 -
31 Brookdale Senior Living Inc 212 0.01
22 Brookfield Renewable Corp 959 0.02
Shares (000's)
Value(000's)
USD
% of NetAssetValue
Common Stock (continued)
United States - 63.13% (continued)
13 Brookline Bancorp Inc 226 0.01
8 Brooks Automation Inc 784 0.02
28 Brown & Brown Inc 1,489 0.03
7 Brown-Forman Corp, Class A 511 0.01
30 Brown-Forman Corp, Class B 2,422 0.05
17 Bruker Corp 1,183 0.03
17 Brunswick Corp 1,716 0.04
4 Bryn Mawr Bank Corp 168 -
2 BSQUARE Corp 5 -
11 Buckle Inc 462 0.01
1 Build-A-Bear Workshop Inc 21 -
29 Builders FirstSource Inc 1,313 0.03
22 Bunge Ltd 1,947 0.04
2 Burlington Stores Inc 595 0.01
14 BWX Technologies Inc 849 0.02
6 Byline Bancorp Inc 128 -
1 C&F Financial Corp 30 -
1 Cable One Inc 1,345 0.03
11 Cabot Corp 669 0.02
79 Cabot Oil & Gas Corp 1,292 0.03
4 CACI International Inc 1,050 0.02
7 Cactus Inc 230 0.01
21 Cadence BanCorp 459 0.01
20 Cadence Design Systems Inc 2,582 0.06
14 Caesars Entertainment Inc 1,457 0.03
3 CAI International Inc 112 -
- Caladrius Biosciences Inc - -
4 CalAmp Corp 59 -
3 Calavo Growers Inc 180 -
4 Caleres Inc 113 -
1 California BanCorp Inc 17 -
5 California Water Service Group 297 0.01
11 Calithera Biosciences Inc 25 -
3 Calix Inc 133 -
9 Callaway Golf Co 350 0.01
7 Callon Petroleum Co 259 0.01
8 Cal-Maine Foods Inc 263 0.01
1 Cambium Networks Corp 87 -
1 Cambridge Bancorp 108 -
3 Camden National Corp 139 -
39 Campbell Soup Co 1,880 0.04
4 Camping World Holdings Inc 159 -
14 Cannae Holdings Inc 519 0.01
3 Capital Bancorp Inc 56 -
3 Capital City Bank Group Inc 90 -
28 Capital One Financial Corp 4,426 0.10
26 Capitol Federal Financial Inc 334 0.01
27 Capri Holdings Ltd 1,548 0.04
3 Capstar Financial Holdings Inc 75 -
3 Cara Therapeutics Inc 35 -
38 Cardinal Health Inc 2,132 0.05
3 Cardiovascular Systems Inc 104 -
9 Cardtronics PLC 369 0.01
2 CareDx Inc 126 -
7 Cargurus Inc 207 0.01
7 Carlisle Cos Inc 1,330 0.03
17 CarMax Inc 1,926 0.04
60 Carnival Corp 1,780 0.04
4 Carpenter Technology Corp 212 0.01
3 Carriage Services Inc 111 -
62 Carrier Global Corp 2,865 0.06
9 Carrols Restaurant Group Inc 55 -
Global Core Equity FundPortfolio of Investments as at 31 May 2021 (continued)
Dimensional Fund Advisors Semi-Annual Report and Unaudited Financial Statements, 31 May 2021 122

Shares (000's)
Value(000's)
USD
% of NetAssetValue
Common Stock (continued)
United States - 63.13% (continued)
11 Cars.com Inc 160 -
6 Carter's Inc 610 0.01
1 Carvana Co 250 0.01
10 Casa Systems Inc 83 -
7 Casella Waste Systems Inc 465 0.01
7 Casey's General Stores Inc 1,548 0.04
3 Cass Information Systems Inc 126 -
2 Cassava Sciences Inc 109 -
10 Castlight Health Inc 17 -
3 Catabasis Pharmaceuticals Inc 6 -
18 Catalent Inc 1,899 0.04
4 Catalyst Biosciences Inc 19 -
19 Catalyst Pharmaceuticals Inc 105 -
31 Caterpillar Inc 7,543 0.17
12 Cathay General Bancorp 492 0.01
2 Cato Corp 37 -
1 Cavco Industries Inc 329 0.01
9 CBIZ Inc 286 0.01
14 Cboe Global Markets Inc 1,608 0.04
29 CBRE Group Inc 2,557 0.06
5 CBTX Inc 135 -
13 CDK Global Inc 655 0.02
16 CDW Corp 2,687 0.06
7 CECO Environmental Corp 50 -
13 Celanese Corp 2,176 0.05
2 Celldex Therapeutics Inc 65 -
32 Centene Corp 2,352 0.05
38 Centennial Resource Development Inc 203 0.01
51 CenterPoint Energy Inc 1,280 0.03
7 Central Garden & Pet Co (non-voting rights) 369 0.01
2 Central Garden & Pet Co (voting rights) 120 -
3 Central Pacific Financial Corp 89 -
2 Central Valley Community Bancorp 42 -
16 Century Aluminum Co 218 0.01
1 Century Bancorp Inc 82 -
3 Century Casinos Inc 46 -
4 Century Communities Inc 322 0.01
3 Cerence Inc 331 0.01
6 Ceridian HCM Holding Inc 539 0.01
40 Cerner Corp 3,114 0.07
2 CEVA Inc 107 -
1 CF Bankshares Inc 14 -
29 CF Industries Holdings Inc 1,543 0.04
16 CH Robinson Worldwide Inc 1,539 0.04
37 ChampionX Corp 987 0.02
4 ChannelAdvisor Corp 100 -
4 Charah Solutions Inc 23 -
4 Charles River Laboratories International Inc 1,237 0.03
64 Charles Schwab Corp 4,749 0.11
3 Chart Industries Inc 452 0.01
10 Charter Communications Inc 7,288 0.16
1 Chase Corp 135 -
4 Cheesecake Factory Inc 224 0.01
5 Chefs' Warehouse Inc 160 -
6 Chegg Inc 432 0.01
1 Chembio Diagnostics Inc 4 -
2 Chemed Corp 895 0.02
35 Chemours Co 1,251 0.03
1 Chemung Financial Corp 33 -
25 Cheniere Energy Inc 2,149 0.05
2 Chesapeake Utilities Corp 196 -
69 Chevron Corp 7,159 0.16
Shares (000's)
Value(000's)
USD
% of NetAssetValue
Common Stock (continued)
United States - 63.13% (continued)
2 Chewy Inc 128 -
5 Chiasma Inc 22 -
17 Chico's FAS Inc 81 -
2 Children's Place Inc 140 -
8 Chimerix Inc 59 -
1 Chipotle Mexican Grill Inc 1,150 0.03
6 Choice Hotels International Inc 692 0.02
23 Chubb Ltd 3,838 0.09
24 Church & Dwight Co Inc 2,068 0.05
4 Churchill Downs Inc 819 0.02
3 Chuy's Holdings Inc 124 -
1 Cidara Therapeutics Inc 3 -
23 Ciena Corp 1,204 0.03
19 Cigna Corp 5,000 0.11
15 Cimarex Energy Co 996 0.02
4 Cimpress PLC 384 0.01
5 Cincinnati Bell Inc 83 -
18 Cincinnati Financial Corp 2,193 0.05
18 Cinemark Holdings Inc 404 0.01
8 Cintas Corp 2,747 0.06
3 CIRCOR International Inc 130 -
9 Cirrus Logic Inc 673 0.02
326 Cisco Systems Inc 17,222 0.39
14 CIT Group Inc 765 0.02
2 Citi Trends Inc 141 -
83 Citigroup Inc 6,553 0.15
3 Citizens & Northern Corp 65 -
3 Citizens Community Bancorp Inc 37 -
46 Citizens Financial Group Inc 2,279 0.05
3 Citizens Inc 17 -
13 Citrix Systems Inc 1,539 0.04
3 City Holding Co 243 0.01
2 Civeo Corp 26 -
3 Civista Bancshares Inc 68 -
5 Clarus Corp 124 -
36 Clean Energy Fuels Corp 285 0.01
11 Clean Harbors Inc 1,030 0.02
2 Clearfield Inc 79 -
1 ClearOne Inc 2 -
1 Clearwater Paper Corp 39 -
4 Clearway Energy Inc, Class A 98 -
9 Clearway Energy Inc, Class C 240 0.01
65 Cleveland-Cliffs Inc 1,299 0.03
11 Clorox Co 1,871 0.04
36 Cloudera Inc 457 0.01
6 Cloudflare Inc 498 0.01
4 CMC Materials Inc 564 0.01
18 CME Group Inc 3,930 0.09
21 CMS Energy Corp 1,335 0.03
9 CNA Financial Corp 451 0.01
3 CNB Financial Corp 72 -
6 CNO Financial Group Inc 171 -
34 CNX Resources Corp 469 0.01
1 Coastal Financial Corp 47 -
193 Coca-Cola Co 10,666 0.24
1 Coca-Cola Consolidated Inc 515 0.01
7 Codexis Inc 137 -
2 Codorus Valley Bancorp Inc 35 -
27 Coeur Mining Inc 285 0.01
5 Cogent Communications Holdings Inc 366 0.01
8 Cognex Corp 616 0.01
36 Cognizant Technology Solutions Corp 2,600 0.06
Global Core Equity FundPortfolio of Investments as at 31 May 2021 (continued)
Dimensional Fund Advisors Semi-Annual Report and Unaudited Financial Statements, 31 May 2021 123

Shares (000's)
Value(000's)
USD
% of NetAssetValue
Common Stock (continued)
United States - 63.13% (continued)
10 Cognyte Software Ltd 258 0.01
7 Cohen & Steers Inc 489 0.01
3 Coherent Inc 803 0.02
7 Cohu Inc 259 0.01
18 Colfax Corp 778 0.02
36 Colgate-Palmolive Co 2,979 0.07
7 Collegium Pharmaceutical Inc 163 -
2 Colony Bankcorp Inc 37 -
11 Columbia Banking System Inc 461 0.01
20 Columbia Financial Inc 351 0.01
9 Columbia Sportswear Co 919 0.02
4 Columbus McKinnon Corp 223 0.01
264 Comcast Corp 15,151 0.34
20 Comerica Inc 1,563 0.04
8 Comfort Systems USA Inc 622 0.01
17 Commerce Bancshares Inc 1,324 0.03
17 Commercial Metals Co 531 0.01
5 Commercial Vehicle Group Inc 61 -
32 CommScope Holding Co Inc 646 0.02
8 Community Bank System Inc 657 0.02
5 Community Bankers Trust Corp 42 -
1 Community Financial Corp 36 -
13 Community Health Systems Inc 183 -
3 Community Trust Bancorp Inc 148 -
1 Community West Bancshares 11 -
2 CommVault Systems Inc 179 -
7 Compass Minerals International Inc 476 0.01
3 Computer Programs & Systems Inc 88 -
2 Computer Task Group Inc 16 -
1 CompX International Inc 19 -
16 comScore Inc 62 -
3 Comtech Telecommunications Corp 64 -
67 Conagra Brands Inc 2,552 0.06
9 Concentrix Corp 1,439 0.03
6 Concert Pharmaceuticals Inc 24 -
39 Conduent Inc 297 0.01
3 CONMED Corp 454 0.01
7 ConnectOne Bancorp Inc 200 0.01
6 Conn's Inc 130 -
100 ConocoPhillips 5,598 0.13
5 CONSOL Energy Inc 79 -
22 Consolidated Communications Holdings Inc 203 0.01
17 Consolidated Edison Inc 1,340 0.03
2 Consolidated Water Co Ltd 21 -
11 Constellation Brands Inc 2,655 0.06
5 Construction Partners Inc 170 -
2 Consumer Portfolio Services Inc 9 -
8 Container Store Group Inc 107 -
30 Continental Resources Inc 992 0.02
7 Contra Zagg Inc 1 -
6 Cooper Cos Inc 2,173 0.05
5 Cooper-Standard Holdings Inc 142 -
5 Copa Holdings SA 375 0.01
20 Copart Inc 2,536 0.06
15 Corcept Therapeutics Inc 325 0.01
6 Core Laboratories NV 242 0.01
1 Core Molding Technologies Inc 13 -
14 CoreLogic Inc 1,149 0.03
8 Core-Mark Holding Co Inc 389 0.01
15 Cornerstone Building Brands Inc 259 0.01
3 Cornerstone OnDemand Inc 114 -
67 Corning Inc 2,911 0.07
Shares (000's)
Value(000's)
USD
% of NetAssetValue
Common Stock (continued)
United States - 63.13% (continued)
43 Corteva Inc 1,977 0.04
2 CorVel Corp 294 0.01
2 Corvus Pharmaceuticals Inc 6 -
23 Costamare Inc 245 0.01
2 CoStar Group Inc 1,563 0.04
22 Costco Wholesale Corp 8,191 0.18
112 Coty Inc 1,001 0.02
1 County Bancorp Inc 33 -
2 Coupa Software Inc 458 0.01
18 Covanta Holding Corp 273 0.01
1 Covenant Transportation Group Inc 32 -
17 Covetrus Inc 468 0.01
4 Cowen Inc 149 -
1 CRA International Inc 90 -
4 Cracker Barrel Old Country Store Inc 562 0.01
6 Crane Co 594 0.01
7 Crawford & Co, Class A 67 -
6 Crawford & Co, Class B 51 -
3 Credit Acceptance Corp 1,401 0.03
8 Cree Inc 817 0.02
1 Crinetics Pharmaceuticals Inc 11 -
7 CRISPR Therapeutics AG 831 0.02
9 Crocs Inc 931 0.02
7 Cross Country Healthcare Inc 116 -
2 Crowdstrike Holdings Inc 514 0.01
2 Crown Crafts Inc 13 -
24 Crown Holdings Inc 2,429 0.05
5 CryoLife Inc 144 -
6 CSG Systems International Inc 285 0.01
2 CSW Industrials Inc 244 0.01
64 CSX Corp 6,395 0.14
6 CTS Corp 225 0.01
9 Cullen/Frost Bankers Inc 1,117 0.03
2 Culp Inc 35 -
2 Cumberland Pharmaceuticals Inc 6 -
14 Cummins Inc 3,491 0.08
2 Cumulus Media Inc 25 -
8 Curo Group Holdings Corp 125 -
7 Curtiss-Wright Corp 917 0.02
33 Cushman & Wakefield PLC 618 0.01
6 Customers Bancorp Inc 220 0.01
1 Cutera Inc 22 -
14 CVB Financial Corp 316 0.01
15 CVR Energy Inc 320 0.01
66 CVS Health Corp 5,738 0.13
1 CyberOptics Corp 28 -
14 Cymabay Therapeutics Inc 59 -
2 CytomX Therapeutics Inc 14 -
- Daily Journal Corp 53 -
8 Daktronics Inc 51 -
28 Dana Inc 750 0.02
17 Danaher Corp 4,464 0.10
9 Darden Restaurants Inc 1,268 0.03
32 Darling Ingredients Inc 2,160 0.05
8 Daseke Inc 59 -
7 Dave & Buster's Entertainment Inc 278 0.01
20 DaVita Inc 2,374 0.05
5 Dawson Geophysical Co 13 -
4 Deckers Outdoor Corp 1,318 0.03
17 Deere & Co 6,140 0.14
7 Del Taco Restaurants Inc 73 -
11 Delek US Holdings Inc 246 0.01
Global Core Equity FundPortfolio of Investments as at 31 May 2021 (continued)
Dimensional Fund Advisors Semi-Annual Report and Unaudited Financial Statements, 31 May 2021 124

Shares (000's)
Value(000's)
USD
% of NetAssetValue
Common Stock (continued)
United States - 63.13% (continued)
18 Dell Technologies Inc 1,753 0.04
10 Delta Air Lines Inc 493 0.01
1 Delta Apparel Inc 36 -
7 Deluxe Corp 322 0.01
10 Denali Therapeutics Inc 634 0.01
8 Denny's Corp 137 -
30 Dentsply Sirona Inc 2,011 0.05
13 Designer Brands Inc 234 0.01
84 Devon Energy Corp 2,240 0.05
2 DexCom Inc 747 0.02
12 DHI Group Inc 37 -
27 DHT Holdings Inc 173 -
1 Diamond Hill Investment Group Inc 136 -
25 Diamondback Energy Inc 2,040 0.05
14 Dick's Sporting Goods Inc 1,411 0.03
4 Digi International Inc 75 -
8 Digital Turbine Inc 520 0.01
3 Dillard's Inc 365 0.01
6 Dime Community Bancshares Inc 212 0.01
6 Diodes Inc 471 0.01
28 Discover Financial Services 3,316 0.07
17 Discovery Inc, Class A 533 0.01
30 Discovery Inc, Class C 913 0.02
31 DISH Network Corp 1,358 0.03
2 DLH Holdings Corp 22 -
2 DMC Global Inc 109 -
3 DocuSign Inc 543 0.01
6 Dolby Laboratories Inc 621 0.01
24 Dollar General Corp 4,862 0.11
30 Dollar Tree Inc 2,963 0.07
22 Dominion Energy Inc 1,651 0.04
4 Domino's Pizza Inc 1,512 0.03
8 Domtar Corp 413 0.01
14 Donaldson Co Inc 855 0.02
4 Donegal Group Inc 62 -
7 Donnelley Financial Solutions Inc 215 0.01
5 Dorian LPG Ltd 75 -
4 Dorman Products Inc 445 0.01
3 Douglas Dynamics Inc 149 -
19 Dover Corp 2,842 0.06
57 Dow Inc 3,897 0.09
37 DR Horton Inc 3,560 0.08
6 Dril-Quip Inc 208 0.01
31 Dropbox Inc 849 0.02
4 DSP Group Inc 64 -
13 DTE Energy Co 1,730 0.04
1 Ducommun Inc 51 -
27 Duke Energy Corp 2,692 0.06
18 DuPont de Nemours Inc 1,507 0.03
37 DXC Technology Co 1,407 0.03
1 DXP Enterprises Inc 44 -
5 Dycom Industries Inc 386 0.01
12 Dynatrace Inc 637 0.01
3 DZS Inc 43 -
6 Eagle Bancorp Inc 328 0.01
1 Eagle Bancorp Montana Inc 24 -
1 Eagle Bulk Shipping Inc 68 -
7 Eagle Materials Inc 971 0.02
2 Eagle Pharmaceuticals Inc 82 -
5 Earthstone Energy Inc 50 -
26 East West Bancorp Inc 1,946 0.04
2 Eastern Co 54 -
Shares (000's)
Value(000's)
USD
% of NetAssetValue
Common Stock (continued)
United States - 63.13% (continued)
20 Eastman Chemical Co 2,565 0.06
30 Eaton Corp PLC 4,390 0.10
89 eBay Inc 5,391 0.12
5 Ebix Inc 130 -
4 Echo Global Logistics Inc 129 -
9 EchoStar Corp 228 0.01
13 Ecolab Inc 2,896 0.07
9 Edgewell Personal Care Co 419 0.01
24 Edison International 1,337 0.03
8 Editas Medicine Inc 256 0.01
1 Educational Development Corp 22 -
23 Edwards Lifesciences Corp 2,187 0.05
2 eGain Corp 22 -
3 eHealth Inc 183 -
3 Eiger BioPharmaceuticals Inc 25 -
7 El Pollo Loco Holdings Inc 110 -
6 Elanco Animal Health Inc (non-voting rights) - -
51 Elanco Animal Health Inc (voting rights) 1,820 0.04
4 Elastic NV 446 0.01
1 Electromed Inc 13 -
19 Electronic Arts Inc 2,761 0.06
38 Element Solutions Inc 878 0.02
7 Elevate Credit Inc 26 -
5 elf Beauty Inc 154 -
44 Eli Lilly & Co 8,734 0.20
1 Elmira Savings Bank 8 -
- Eloxx Pharmaceuticals Inc 1 -
- Emclaire Financial Corp 12 -
10 EMCOR Group Inc 1,203 0.03
7 EMCORE Corp 65 -
8 Emerald Holding Inc 46 -
6 Emergent BioSolutions Inc 381 0.01
62 Emerson Electric Co 5,924 0.13
5 Employers Holdings Inc 219 0.01
3 Enanta Pharmaceuticals Inc 166 -
18 Encompass Health Corp 1,525 0.03
6 Encore Capital Group Inc 266 0.01
2 Encore Wire Corp 182 -
26 Endo International PLC 150 -
9 Energizer Holdings Inc 424 0.01
8 Energy Recovery Inc 145 -
8 Enerpac Tool Group Corp 232 0.01
6 EnerSys 563 0.01
1 Eneti Inc 23 -
81 EnLink Midstream LLC 397 0.01
2 Ennis Inc 49 -
8 Enova International Inc 286 0.01
14 Enphase Energy Inc 2,042 0.05
3 EnPro Industries Inc 317 0.01
10 Ensign Group Inc 839 0.02
3 Enstar Group Ltd 657 0.02
15 Entegris Inc 1,748 0.04
13 Entergy Corp 1,366 0.03
2 Enterprise Bancorp Inc 59 -
5 Enterprise Financial Services Corp 225 0.01
9 Entravision Communications Corp 42 -
5 Envestnet Inc 338 0.01
23 Envista Holdings Corp 985 0.02
10 Enzo Biochem Inc 31 -
43 EOG Resources Inc 3,482 0.08
3 EPAM Systems Inc 1,199 0.03
9 Epizyme Inc 77 -
Global Core Equity FundPortfolio of Investments as at 31 May 2021 (continued)
Dimensional Fund Advisors Semi-Annual Report and Unaudited Financial Statements, 31 May 2021 125

Shares (000's)
Value(000's)
USD
% of NetAssetValue
Common Stock (continued)
United States - 63.13% (continued)
3 ePlus Inc 246 0.01
4 Epsilon Energy Ltd 16 -
38 EQT Corp 800 0.02
8 Equifax Inc 1,945 0.04
58 Equitrans Midstream Corp 481 0.01
4 Equity Bancshares Inc 120 -
4 Erie Indemnity Co 773 0.02
2 Escalade Inc 47 -
4 ESCO Technologies Inc 415 0.01
- Espey Manufacturing & Electronics Corp 1 -
2 Esquire Financial Holdings Inc 39 -
2 ESSA Bancorp Inc 24 -
16 Essent Group Ltd 753 0.02
20 Essential Utilities Inc 978 0.02
11 Estee Lauder Cos Inc 3,364 0.08
5 Ethan Allen Interiors Inc 148 -
13 Etsy Inc 2,102 0.05
5 Euronet Worldwide Inc 818 0.02
1 Evans Bancorp Inc 39 -
7 Eventbrite Inc 133 -
1 Everbridge Inc 109 -
9 Evercore Inc 1,283 0.03
6 Everest Re Group Ltd 1,505 0.03
17 Evergy Inc 1,072 0.02
2 Everi Holdings Inc 35 -
18 Eversource Energy 1,454 0.03
1 Everspin Technologies Inc 7 -
10 Evertec Inc 450 0.01
5 Evo Payments Inc 130 -
15 Evolent Health Inc 292 0.01
5 Evolution Petroleum Corp 19 -
19 Evoqua Water Technologies Corp 606 0.01
12 EW Scripps Co 254 0.01
7 Exact Sciences Corp 791 0.02
32 Exelixis Inc 730 0.02
52 Exelon Corp 2,343 0.05
4 ExlService Holdings Inc 403 0.01
2 ExOne Co 37 -
4 Expedia Group Inc 729 0.02
18 Expeditors International of Washington Inc 2,303 0.05
4 Exponent Inc 396 0.01
30 Extended Stay America Inc 590 0.01
9 Exterran Corp 40 -
181 Exxon Mobil Corp 10,566 0.24
6 EZCORP Inc 46 -
8 F5 Networks Inc 1,417 0.03
5 Fabrinet 483 0.01
148 Facebook Inc 48,620 1.09
5 FactSet Research Systems Inc 1,728 0.04
4 Fair Isaac Corp 1,776 0.04
3 Farmer Brothers Co 39 -
2 Farmers & Merchants Bancorp Inc 37 -
5 Farmers National Banc Corp 87 -
2 FARO Technologies Inc 169 -
42 Fastenal Co 2,222 0.05
6 FB Financial Corp 242 0.01
2 Federal Agricultural Mortgage Corp 176 -
8 Federal Signal Corp 351 0.01
19 Federated Investors Inc 604 0.01
25 FedEx Corp 7,997 0.18
3 FedNat Holding Co 13 -
15 Ferro Corp 333 0.01
Shares (000's)
Value(000's)
USD
% of NetAssetValue
Common Stock (continued)
United States - 63.13% (continued)
18 Ferroglobe PLC 91 -
16 Ferroglobe Representation & Warrants InsuranceTrust - -
6 FibroGen Inc 126 -
- Fidelity D&D Bancorp Inc 22 -
48 Fidelity National Financial Inc 2,256 0.05
23 Fidelity National Information Services Inc 3,386 0.08
3 Fiesta Restaurant Group Inc 43 -
45 Fifth Third Bancorp 1,916 0.04
2 Financial Institutions Inc 67 -
25 FireEye Inc 554 0.01
20 First American Financial Corp 1,302 0.03
5 First Bancorp 243 0.01
26 First Bancorp (Puerto Rico listing) 332 0.01
2 First Bancorp Inc 54 -
4 First Bancshares Inc 148 -
4 First Bank 50 -
9 First Busey Corp 251 0.01
2 First Business Financial Services Inc 42 -
1 First Capital Inc 22 -
2 First Choice Bancorp 62 -
1 First Citizens BancShares Inc 1,238 0.03
17 First Commonwealth Financial Corp 255 0.01
3 First Community Bankshares Inc 99 -
1 First Community Corp 27 -
17 First Financial Bancorp 437 0.01
15 First Financial Bankshares Inc 777 0.02
2 First Financial Corp 108 -
2 First Financial Northwest Inc 22 -
9 First Foundation Inc 217 0.01
1 First Guaranty Bancshares Inc 28 -
19 First Hawaiian Inc 539 0.01
84 First Horizon National Corp 1,598 0.04
2 First Internet Bancorp 80 -
6 First Interstate BancSystem Inc 275 0.01
9 First Merchants Corp 439 0.01
3 First Mid Bancshares Inc 129 -
19 First Midwest Bancorp Inc 402 0.01
2 First Northwest Bancorp 38 -
4 First of Long Island Corp 93 -
10 First Republic Bank 1,996 0.05
- First Savings Financial Group Inc 14 -
16 First Solar Inc 1,215 0.03
1 First United Corp 18 -
1 First US Bancshares Inc 11 -
1 First Western Financial Inc 27 -
7 FirstCash Inc 554 0.01
36 FirstEnergy Corp 1,381 0.03
29 Fiserv Inc 3,339 0.08
5 Five Below Inc 930 0.02
12 Five Point Holdings LLC 94 -
5 Five Star Senior Living Inc 30 -
3 Five9 Inc 470 0.01
8 Flagstar Bancorp Inc 365 0.01
8 FleetCor Technologies Inc 2,217 0.05
105 Flex Ltd 1,916 0.04
2 Flexsteel Industries Inc 92 -
11 Floor & Decor Holdings Inc 1,090 0.02
8 Flotek Industries Inc 18 -
27 Flowers Foods Inc 640 0.01
20 Flowserve Corp 829 0.02
12 Fluent Inc 34 -
Global Core Equity FundPortfolio of Investments as at 31 May 2021 (continued)
Dimensional Fund Advisors Semi-Annual Report and Unaudited Financial Statements, 31 May 2021 126

Shares (000's)
Value(000's)
USD
% of NetAssetValue
Common Stock (continued)
United States - 63.13% (continued)
5 Fluidigm Corp 30 -
22 Fluor Corp 414 0.01
5 Flushing Financial Corp 111 -
16 FMC Corp 1,837 0.04
39 FNB Corp 521 0.01
1 FONAR Corp 26 -
18 Foot Locker Inc 1,122 0.03
250 Ford Motor Co 3,631 0.08
8 Forestar Group Inc 179 -
11 FormFactor Inc 382 0.01
2 Forrester Research Inc 97 -
13 Forterra Inc 305 0.01
16 Fortinet Inc 3,428 0.08
5 Fortitude Gold Corp 40 -
37 Fortive Corp 2,661 0.06
23 Fortune Brands Home & Security Inc 2,370 0.05
1 Forum Energy Technologies Inc 20 -
5 Forward Air Corp 443 0.01
9 Fossil Group Inc 126 -
45 Fox Corp, Class A 1,670 0.04
34 Fox Corp, Class B 1,236 0.03
4 Fox Factory Holding Corp 570 0.01
- Franchise Group Inc 11 -
2 Franklin Covey Co 54 -
6 Franklin Electric Co Inc 503 0.01
1 Franklin Financial Services Corp 23 -
71 Franklin Resources Inc 2,435 0.06
33 Frank's International NV 110 -
95 Freeport-McMoRan Inc 4,052 0.09
1 FreightCar America Inc 8 -
2 Frequency Electronics Inc 20 -
4 Fresh Del Monte Produce Inc 135 -
2 Freshpet Inc 365 0.01
8 Frontdoor Inc 450 0.01
2 FRP Holdings Inc 86 -
1 FS Bancorp Inc 55 -
5 FTI Consulting Inc 747 0.02
- Fulcrum Therapeutics Inc 3 -
1 Fulgent Genetics Inc 101 -
4 Full House Resorts Inc 44 -
16 Fulton Financial Corp 278 0.01
7 FutureFuel Corp 70 -
3 FVCBankcorp Inc 55 -
4 G1 Therapeutics Inc 97 -
2 Gaia Inc 28 -
2 GAMCO Investors Inc 56 -
17 Gannett Co Inc 87 -
39 Gap Inc 1,314 0.03
15 Garmin Ltd 2,186 0.05
11 Gartner Inc 2,573 0.06
13 GasLog Ltd 74 -
23 Gates Industrial Corp PLC 422 0.01
5 GATX Corp 531 0.01
13 GCP Applied Technologies Inc 328 0.01
5 Genasys Inc 27 -
8 Genco Shipping & Trading Ltd 124 -
2 Gencor Industries Inc 21 -
8 Generac Holdings Inc 2,521 0.06
301 General Electric Co 4,234 0.10
62 General Mills Inc 3,893 0.09
165 General Motors Co 9,779 0.22
2 Genesco Inc 104 -
Shares (000's)
Value(000's)
USD
% of NetAssetValue
Common Stock (continued)
United States - 63.13% (continued)
3 Genie Energy Ltd 18 -
28 Genpact Ltd 1,289 0.03
33 Gentex Corp 1,187 0.03
6 Gentherm Inc 425 0.01
12 Genuine Parts Co 1,539 0.04
30 Genworth Financial Inc 125 -
2 Geospace Technologies Corp 19 -
4 German American Bancorp Inc 187 -
5 Gibraltar Industries Inc 418 0.01
10 G-III Apparel Group Ltd 320 0.01
66 Gilead Sciences Inc 4,362 0.10
14 Glacier Bancorp Inc 811 0.02
4 Glatfelter Corp 65 -
2 Glaukos Corp 144 -
4 Global Blood Therapeutics Inc 149 -
1 Global Indemnity Group LLC 37 -
18 Global Payments Inc 3,395 0.08
2 Global Water Resources Inc 31 -
3 Globant SA 634 0.01
16 Globe Life Inc 1,730 0.04
8 Globus Medical Inc 548 0.01
8 GlycoMimetics Inc 19 -
7 GMS Inc 338 0.01
16 GoDaddy Inc 1,302 0.03
17 Gold Resource Corp 46 -
15 Goldman Sachs Group Inc 5,449 0.12
4 Goodrich Petroleum Corp 41 -
35 Goodyear Tire & Rubber Co 684 0.02
10 GoPro Inc 115 -
4 Gorman-Rupp Co 155 -
3 GP Strategies Corp 54 -
18 Graco Inc 1,395 0.03
23 GrafTech International Ltd 301 0.01
2 Graham Corp 35 -
1 Graham Holdings Co 409 0.01
7 Grand Canyon Education Inc 591 0.01
7 Granite Construction Inc 294 0.01
63 Graphic Packaging Holding Co 1,120 0.03
18 Gray Television Inc 426 0.01
4 Great Elm Group Inc 10 -
15 Great Lakes Dredge & Dock Corp 220 0.01
3 Great Southern Bancorp Inc 147 -
10 Great Western Bancorp Inc 323 0.01
8 Green Brick Partners Inc 195 -
8 Green Dot Corp 305 0.01
6 Green Plains Inc 189 -
4 Greenbrier Cos Inc 178 -
- Greene County Bancorp Inc 11 -
3 Greenhill & Co Inc 51 -
6 Greenlight Capital Re Ltd 56 -
7 Greif Inc (non-voting rights) 416 0.01
3 Greif Inc (voting rights) 200 0.01
8 Griffon Corp 197 -
4 Gritstone Oncology Inc 34 -
9 Grocery Outlet Holding Corp 300 0.01
3 Group 1 Automotive Inc 427 0.01
2 Groupon Inc 92 -
11 Grubhub Inc 642 0.01
4 GSI Technology Inc 26 -
4 GTT Communications Inc 6 -
6 GTY Technology Holdings Inc 37 -
3 Guaranty Bancshares Inc 96 -
Global Core Equity FundPortfolio of Investments as at 31 May 2021 (continued)
Dimensional Fund Advisors Semi-Annual Report and Unaudited Financial Statements, 31 May 2021 127

Shares (000's)
Value(000's)
USD
% of NetAssetValue
Common Stock (continued)
United States - 63.13% (continued)
1 Guaranty Federal Bancshares Inc 12 -
4 Guardant Health Inc 466 0.01
11 Guess? Inc 327 0.01
6 Guidewire Software Inc 612 0.01
2 Gulf Island Fabrication Inc 8 -
7 H&E Equipment Services Inc 273 0.01
17 H&R Block Inc 425 0.01
4 Hackett Group Inc 75 -
6 Haemonetics Corp 322 0.01
13 Hain Celestial Group Inc 519 0.01
99 Halliburton Co 2,212 0.05
2 Hallmark Financial Services Inc 9 -
8 Halozyme Therapeutics Inc 343 0.01
3 Hamilton Beach Brands Holding Co 67 -
4 Hamilton Lane Inc 362 0.01
14 Hancock Whitney Corp 716 0.02
57 Hanesbrands Inc 1,106 0.03
5 Hanger Inc 135 -
5 Hanmi Financial Corp 96 -
5 Hanover Insurance Group Inc 757 0.02
10 HarborOne Bancorp Inc 153 -
24 Harley-Davidson Inc 1,177 0.03
14 Harmonic Inc 95 -
3 Harpoon Therapeutics Inc 54 -
4 Harrow Health Inc 40 -
12 Harsco Corp 260 0.01
36 Hartford Financial Services Group Inc 2,344 0.05
5 Harvard Bioscience Inc 35 -
13 Hasbro Inc 1,250 0.03
3 Haverty Furniture Cos Inc 154 -
12 Hawaiian Electric Industries Inc 512 0.01
6 Hawaiian Holdings Inc 156 -
4 Hawkins Inc 143 -
1 Hawthorn Bancshares Inc 20 -
1 Haynes International Inc 37 -
9 HB Fuller Co 629 0.01
2 HC2 Holdings Inc 8 -
18 HCA Healthcare Inc 3,815 0.09
1 HCI Group Inc 118 -
8 Healthcare Services Group Inc 250 0.01
8 HealthEquity Inc 671 0.02
5 HealthStream Inc 144 -
15 Heartland Express Inc 272 0.01
6 Heartland Financial USA Inc 311 0.01
51 Hecla Mining Co 459 0.01
5 HEICO Corp, Class A 700 0.02
3 HEICO Corp, Class B 455 0.01
4 Heidrick & Struggles International Inc 153 -
3 Helen of Troy Ltd 640 0.01
6 Helios Technologies Inc 424 0.01
28 Helix Energy Solutions Group Inc 148 -
14 Helmerich & Payne Inc 381 0.01
4 Hemisphere Media Group Inc 46 -
2 Hennessy Advisors Inc 16 -
23 Henry Schein Inc 1,736 0.04
16 Herbalife Nutrition Ltd 816 0.02
8 Herc Holdings Inc 885 0.02
11 Heritage Commerce Corp 130 -
6 Heritage Financial Corp 180 -
6 Heritage Insurance Holdings Inc 50 -
4 Heritage-Crystal Clean Inc 132 -
12 Herman Miller Inc 552 0.01
Shares (000's)
Value(000's)
USD
% of NetAssetValue
Common Stock (continued)
United States - 63.13% (continued)
10 Heron Therapeutics Inc 134 -
17 Hershey Co 2,892 0.07
1 Heska Corp 216 0.01
28 Hess Corp 2,364 0.05
146 Hewlett Packard Enterprise Co 2,327 0.05
11 Hexcel Corp 644 0.01
2 Hibbett Sports Inc 202 0.01
14 Hill International Inc 37 -
11 Hillenbrand Inc 479 0.01
8 Hill-Rom Holdings Inc 929 0.02
8 Hilltop Holdings Inc 300 0.01
8 Hilton Grand Vacations Inc 378 0.01
18 Hilton Worldwide Holdings Inc 2,299 0.05
- Hingham Institution for Savings 132 -
10 HNI Corp 441 0.01
22 HollyFrontier Corp 726 0.02
41 Hologic Inc 2,579 0.06
2 Home Bancorp Inc 61 -
24 Home BancShares Inc 654 0.02
45 Home Depot Inc 14,223 0.32
1 Home Federal Bancorp Inc 21 -
3 HomeStreet Inc 136 -
3 HomeTrust Bancshares Inc 77 -
35 Honeywell International Inc 8,014 0.18
1 Hooker Furniture Corp 32 -
1 Hookipa Pharma Inc 15 -
16 Hope Bancorp Inc 250 0.01
7 Horace Mann Educators Corp 286 0.01
8 Horizon Bancorp Inc 146 -
17 Horizon Therapeutics PLC 1,559 0.04
35 Hormel Foods Corp 1,699 0.04
21 Hostess Brands Inc 323 0.01
14 Houghton Mifflin Harcourt Co 141 -
6 Houlihan Lokey Inc 472 0.01
2 Houston Wire & Cable Co 12 -
1 Hovnanian Enterprises Inc 91 -
2 Howard Bancorp Inc 28 -
8 Howard Hughes Corp 854 0.02
58 Howmet Aerospace Inc 2,071 0.05
86 HP Inc 2,525 0.06
4 Hub Group Inc 314 0.01
10 Hubbell Inc 1,888 0.04
1 HubSpot Inc 708 0.02
10 Humana Inc 4,516 0.10
115 Huntington Bancshares Inc 1,823 0.04
7 Huntington Ingalls Industries Inc 1,574 0.04
32 Huntsman Corp 915 0.02
- Hurco Cos Inc 16 -
4 Huron Consulting Group Inc 230 0.01
6 Hyatt Hotels Corp 453 0.01
2 Hyster-Yale Materials Handling Inc 162 -
2 I3 Verticals Inc 70 -
16 IAA Inc 932 0.02
2 IAC/InterActiveCorp 282 0.01
3 ICF International Inc 275 0.01
4 Ichor Holdings Ltd 217 0.01
3 ICU Medical Inc 568 0.01
4 IDACORP Inc 405 0.01
1 Ideaya Biosciences Inc 22 -
2 Identiv Inc 26 -
8 IDEX Corp 1,675 0.04
7 IDEXX Laboratories Inc 4,030 0.09
Global Core Equity FundPortfolio of Investments as at 31 May 2021 (continued)
Dimensional Fund Advisors Semi-Annual Report and Unaudited Financial Statements, 31 May 2021 128

Shares (000's)
Value(000's)
USD
% of NetAssetValue
Common Stock (continued)
United States - 63.13% (continued)
6 IDT Corp 182 -
1 IEC Electronics Corp 16 -
2 IES Holdings Inc 126 -
1 IF Bancorp Inc 11 -
1 IGM Biosciences Inc 55 -
19 IHS Markit Ltd 1,950 0.04
13 II-VI Inc 903 0.02
16 Illinois Tool Works Inc 3,653 0.08
3 Illumina Inc 1,140 0.03
8 IMAX Corp 180 -
3 Immersion Corp 22 -
3 Impinj Inc 134 -
9 Incyte Corp 721 0.02
- Independence Contract Drilling Inc 2 -
3 Independence Holding Co 120 -
5 Independent Bank Corp (Massachusetts) 417 0.01
4 Independent Bank Corp (Michigan) 92 -
5 Independent Bank Group Inc 361 0.01
20 Infinera Corp 188 -
9 Information Services Group Inc 55 -
3 InfuSystem Holdings Inc 56 -
47 Ingersoll Rand Inc 2,329 0.05
7 Ingevity Corp 544 0.01
1 Ingles Markets Inc 74 -
12 Ingredion Inc 1,134 0.03
1 Inmune Bio Inc 9 -
3 Innodata Inc 17 -
3 Innospec Inc 342 0.01
2 Innovative Solutions & Support Inc 12 -
22 Innoviva Inc 293 0.01
3 Inogen Inc 209 0.01
10 Inovalon Holdings Inc 308 0.01
6 Insight Enterprises Inc 630 0.01
5 Insperity Inc 497 0.01
4 Installed Building Products Inc 520 0.01
4 Insteel Industries Inc 149 -
2 Insulet Corp 440 0.01
5 Integer Holdings Corp 483 0.01
9 Integra LifeSciences Holdings Corp 607 0.01
414 Intel Corp 23,668 0.53
6 Intellia Therapeutics Inc 477 0.01
1 Intelligent Systems Corp 25 -
4 Inter Parfums Inc 280 0.01
2 Interactive Brokers Group Inc 113 -
23 Intercontinental Exchange Inc 2,582 0.06
5 InterDigital Inc 426 0.01
11 Interface Inc 181 -
7 International Bancshares Corp 313 0.01
100 International Business Machines Corp 14,351 0.32
26 International Flavors & Fragrances Inc (US listing) 3,743 0.08
39 International Game Technology PLC 948 0.02
41 International Paper Co 2,562 0.06
5 International Seaways Inc 107 -
74 Interpublic Group of Cos Inc 2,495 0.06
1 Intersect ENT Inc 22 -
2 inTEST Corp 29 -
5 Intevac Inc 37 -
3 Intra-Cellular Therapies Inc 131 -
2 Intrepid Potash Inc 55 -
2 IntriCon Corp 42 -
7 Intuit Inc 2,868 0.06
1 Intuitive Surgical Inc 822 0.02
Shares (000's)
Value(000's)
USD
% of NetAssetValue
Common Stock (continued)
United States - 63.13% (continued)
2 Invacare Corp 19 -
67 Invesco Ltd 1,909 0.04
2 Investar Holding Corp 37 -
35 Investors Bancorp Inc 518 0.01
- Investors Title Co 71 -
11 Ionis Pharmaceuticals Inc 422 0.01
5 IPG Photonics Corp 1,112 0.03
10 IQVIA Holdings Inc 2,303 0.05
1 iRadimed Corp 38 -
1 iRhythm Technologies Inc 86 -
2 IRIDEX Corp 17 -
20 Iridium Communications Inc 765 0.02
3 iRobot Corp 339 0.01
16 Ironwood Pharmaceuticals Inc 190 -
1 Issuer Direct Corp 18 -
7 Iteris Inc 55 -
5 Itron Inc 447 0.01
13 ITT Inc 1,187 0.03
9 IVERIC bio Inc 64 -
3 J Alexander's Holdings Inc 32 -
2 J&J Snack Foods Corp 348 0.01
9 j2 Global Inc 1,167 0.03
37 Jabil Inc 2,087 0.05
9 Jack Henry & Associates Inc 1,314 0.03
3 Jack in the Box Inc 310 0.01
14 Jacobs Engineering Group Inc 1,970 0.04
6 James River Group Holdings Ltd 200 0.01
29 Janus Henderson Group PLC 1,113 0.03
8 Jazz Pharmaceuticals PLC 1,456 0.03
14 JB Hunt Transport Services Inc 2,351 0.05
43 Jefferies Financial Group Inc 1,387 0.03
18 JELD-WEN Holding Inc 497 0.01
42 JetBlue Airways Corp 852 0.02
16 JM Smucker Co 2,176 0.05
2 John B Sanfilippo & Son Inc 164 -
5 John Bean Technologies Corp 729 0.02
7 John Wiley & Sons Inc, Class A 458 0.01
- John Wiley & Sons Inc, Class B 12 -
185 Johnson & Johnson 31,253 0.70
42 Johnson Controls International PLC 2,766 0.06
2 Johnson Outdoors Inc 192 -
2 Joint Corp 121 -
7 Jones Lang LaSalle Inc 1,479 0.03
7 Jounce Therapeutics Inc 54 -
159 JPMorgan Chase & Co 26,101 0.59
46 Juniper Networks Inc 1,217 0.03
2 Kadant Inc 354 0.01
1 Kaiser Aluminum Corp 180 -
3 Kala Pharmaceuticals Inc 18 -
9 Kansas City Southern 2,590 0.06
21 KAR Auction Services Inc 373 0.01
13 KB Home 619 0.01
26 KBR Inc 1,050 0.02
12 Kearny Financial Corp 164 -
37 Kellogg Co 2,424 0.05
3 Kelly Services Inc 87 -
9 Kemper Corp 709 0.02
12 Kennametal Inc 442 0.01
24 Kennedy-Wilson Holdings Inc 480 0.01
49 Keurig Dr Pepper Inc 1,819 0.04
- Kewaunee Scientific Corp 5 -
1 Key Tronic Corp 9 -
Global Core Equity FundPortfolio of Investments as at 31 May 2021 (continued)
Dimensional Fund Advisors Semi-Annual Report and Unaudited Financial Statements, 31 May 2021 129

Shares (000's)
Value(000's)
USD
% of NetAssetValue
Common Stock (continued)
United States - 63.13% (continued)
61 KeyCorp 1,396 0.03
10 Keysight Technologies Inc 1,392 0.03
4 Kforce Inc 263 0.01
2 Kimball Electronics Inc 55 -
7 Kimball International Inc 99 -
19 Kimberly-Clark Corp 2,434 0.06
135 Kinder Morgan Inc 2,481 0.06
7 Kindred Biosciences Inc 36 -
2 Kingstone Cos Inc 19 -
2 Kiniksa Pharmaceuticals Ltd 34 -
2 Kinsale Capital Group Inc 271 0.01
8 Kirby Corp 555 0.01
27 KKR & Co Inc 1,481 0.03
18 KLA Corp 5,688 0.13
24 Knight-Swift Transportation Holdings Inc 1,134 0.03
10 Knoll Inc 268 0.01
16 Knowles Corp 321 0.01
31 Kohl's Corp 1,723 0.04
4 Kontoor Brands Inc 270 0.01
4 Koppers Holdings Inc 124 -
9 Korn Ferry 609 0.01
79 Kosmos Energy Ltd 252 0.01
64 Kraft Heinz Co 2,804 0.06
8 Kraton Corp 270 0.01
12 Kratos Defense & Security Solutions Inc 312 0.01
168 Kroger Co 6,196 0.14
13 Kronos Worldwide Inc 216 0.01
2 Krystal Biotech Inc 147 -
6 Kulicke & Soffa Industries Inc 309 0.01
5 Kura Oncology Inc 122 -
3 KVH Industries Inc 45 -
12 L Brands Inc 840 0.02
13 L3Harris Technologies Inc 2,829 0.06
17 Laboratory Corp of America Holdings 4,627 0.10
8 Lakeland Bancorp Inc 160 -
5 Lakeland Financial Corp 289 0.01
1 Lakeland Industries Inc 25 -
12 Lam Research Corp 7,640 0.17
18 Lamb Weston Holdings Inc 1,472 0.03
3 Lancaster Colony Corp 652 0.02
5 Landec Corp 58 -
1 Landmark Bancorp Inc 29 -
4 Lands' End Inc 111 -
6 Landstar System Inc 945 0.02
8 Lannett Co Inc 33 -
10 Lantheus Holdings Inc 247 0.01
5 Lantronix Inc 26 -
2 Laredo Petroleum Inc 113 -
8 Las Vegas Sands Corp 490 0.01
12 Lattice Semiconductor Corp 645 0.01
19 Laureate Education Inc 280 0.01
1 Lawson Products Inc 86 -
21 Lazard Ltd 1,004 0.02
9 La-Z-Boy Inc 361 0.01
1 Lazydays Holdings Inc 32 -
2 LB Foster Co 33 -
4 LCI Industries 584 0.01
2 LCNB Corp 42 -
11 Lear Corp 2,122 0.05
1 Legacy Housing Corp 27 -
25 Leggett & Platt Inc 1,365 0.03
15 Leidos Holdings Inc 1,496 0.03
Shares (000's)
Value(000's)
USD
% of NetAssetValue
Common Stock (continued)
United States - 63.13% (continued)
3 LeMaitre Vascular Inc 131 -
5 LendingClub Corp 84 -
1 LendingTree Inc 183 -
28 Lennar Corp, Class A 2,758 0.06
2 Lennar Corp, Class B 155 -
4 Lennox International Inc 1,273 0.03
2 LENSAR Inc 15 -
1 Level One Bancorp Inc 32 -
6 Levi Strauss & Co 160 -
4 LGI Homes Inc 737 0.02
3 LHC Group Inc 682 0.02
2 Liberty Broadband Corp, Class A 313 0.01
10 Liberty Broadband Corp, Class C 1,740 0.04
9 Liberty Latin America Ltd, Class A 126 -
29 Liberty Latin America Ltd, Class C 418 0.01
1 Liberty Media Corp-Liberty Braves, Class A 33 -
5 Liberty Media Corp-Liberty Braves, Class C 125 -
4 Liberty Media Corp-Liberty Formula One, Class A 176 -
30 Liberty Media Corp-Liberty Formula One, Class C 1,330 0.03
11 Liberty Media Corp-Liberty SiriusXM, Class A 501 0.01
25 Liberty Media Corp-Liberty SiriusXM, Class C 1,077 0.02
13 Liberty Oilfield Services Inc 196 -
9 Liberty TripAdvisor Holdings Inc 41 -
4 Lifetime Brands Inc 58 -
2 Lifevantage Corp 14 -
1 Lifeway Foods Inc 7 -
2 Ligand Pharmaceuticals Inc 264 0.01
6 LightPath Technologies Inc 15 -
1 Limbach Holdings Inc 13 -
15 Limelight Networks Inc 47 -
1 Limestone Bancorp Inc 18 -
4 Limoneira Co 68 -
3 Lincoln Educational Services Corp 23 -
9 Lincoln Electric Holdings Inc 1,098 0.03
26 Lincoln National Corp 1,812 0.04
3 Lindblad Expeditions Holdings Inc 51 -
23 Linde PLC 6,825 0.15
1 Lindsay Corp 203 0.01
15 Lions Gate Entertainment Corp, Class A 285 0.01
24 Lions Gate Entertainment Corp, Class B 415 0.01
6 Liquidity Services Inc 135 -
4 Lithia Motors Inc 1,530 0.03
3 Littelfuse Inc 695 0.02
5 LivaNova PLC 418 0.01
11 Live Nation Entertainment Inc 997 0.02
6 Live Oak Bancshares Inc 386 0.01
25 Livent Corp 487 0.01
8 LiveRamp Holdings Inc 380 0.01
48 LKQ Corp 2,461 0.06
33 Loews Corp 1,936 0.04
2 LogicBio Therapeutics Inc 7 -
2 Loral Space & Communications Inc 77 -
10 Louisiana-Pacific Corp 665 0.02
38 Lowe's Cos Inc 7,449 0.17
15 LPL Financial Holdings Inc 2,158 0.05
1 LS Starrett Co 7 -
4 LSB Industries Inc 25 -
6 LSI Industries Inc 55 -
3 Luby's Inc 11 -
9 Lululemon Athletica Inc 2,991 0.07
1 Lumber Liquidators Holdings Inc 16 -
213 Lumen Technologies Inc 2,951 0.07
Global Core Equity FundPortfolio of Investments as at 31 May 2021 (continued)
Dimensional Fund Advisors Semi-Annual Report and Unaudited Financial Statements, 31 May 2021 130

Shares (000's)
Value(000's)
USD
% of NetAssetValue
Common Stock (continued)
United States - 63.13% (continued)
8 Lumentum Holdings Inc 689 0.02
8 Luminex Corp 283 0.01
2 Lumos Pharma Inc 17 -
5 Luna Innovations Inc 51 -
9 Luther Burbank Corp 115 -
3 Lydall Inc 118 -
14 Lyft Inc 787 0.02
43 LyondellBasell Industries NV 4,881 0.11
14 M&T Bank Corp 2,214 0.05
2 M/I Homes Inc 152 -
6 Macatawa Bank Corp 62 -
2 Mackinac Financial Corp 39 -
5 MACOM Technology Solutions Holdings Inc 297 0.01
15 Macquarie Infrastructure Corp 509 0.01
6 MacroGenics Inc 191 -
51 Macy's Inc 931 0.02
3 Madison Square Garden Entertainment Corp 247 0.01
1 Madrigal Pharmaceuticals Inc 143 -
4 Magellan Health Inc 346 0.01
8 Magenta Therapeutics Inc 100 -
5 MagnaChip Semiconductor Corp 108 -
7 Maiden Holdings Ltd 26 -
1 MainStreet Bancshares Inc 26 -
4 Malibu Boats Inc 313 0.01
1 Malvern Bancorp Inc 25 -
3 Mammoth Energy Services Inc 11 -
9 Manhattan Associates Inc 1,187 0.03
2 Manitex International Inc 15 -
6 Manitowoc Co Inc 167 -
2 Manning & Napier Inc 17 -
8 ManpowerGroup Inc 964 0.02
5 ManTech International Corp 411 0.01
120 Marathon Oil Corp 1,451 0.03
40 Marathon Petroleum Corp 2,450 0.06
6 Marchex Inc 14 -
7 Marcus & Millichap Inc 274 0.01
4 Marcus Corp 83 -
3 Marine Products Corp 43 -
4 MarineMax Inc 185 -
2 Marinus Pharmaceuticals Inc 37 -
1 Markel Corp 1,781 0.04
10 Marker Therapeutics Inc 31 -
3 MarketAxess Holdings Inc 1,506 0.03
1 Marlin Business Services Corp 22 -
27 Marriott International Inc 3,912 0.09
6 Marriott Vacations Worldwide Corp 1,059 0.02
36 Marsh & McLennan Cos Inc 4,924 0.11
12 Marten Transport Ltd 209 0.01
5 Martin Marietta Materials Inc 1,979 0.04
38 Marvell Technology Inc 1,836 0.04
25 Masco Corp 1,481 0.03
4 Masimo Corp 781 0.02
4 Masonite International Corp 513 0.01
15 MasTec Inc 1,745 0.04
2 Mastech Digital Inc 32 -
46 Mastercard Inc 16,435 0.37
2 MasterCraft Boat Holdings Inc 45 -
19 Matador Resources Co 584 0.01
9 Match Group Inc 1,254 0.03
3 Materion Corp 210 0.01
5 Matrix Service Co 56 -
8 Matson Inc 528 0.01
Shares (000's)
Value(000's)
USD
% of NetAssetValue
Common Stock (continued)
United States - 63.13% (continued)
15 Mattel Inc 325 0.01
5 Matthews International Corp 213 0.01
2 Maui Land & Pineapple Co Inc 19 -
5 Maxar Technologies Inc (Canada listing) 149 -
11 Maxar Technologies Inc (US listing) 357 0.01
24 Maxim Integrated Products Inc 2,427 0.05
10 MAXIMUS Inc 912 0.02
6 MaxLinear Inc 235 0.01
1 Mayville Engineering Co Inc 25 -
13 MBIA Inc 130 -
17 McCormick & Co Inc (non-voting rights) 1,539 0.04
1 McCormick & Co Inc (voting rights) 104 -
27 McDonald's Corp 6,261 0.14
11 McEwen Mining Inc 17 -
6 McGrath RentCorp 474 0.01
11 McKesson Corp 2,198 0.05
10 MDC Holdings Inc 573 0.01
36 MDU Resources Group Inc 1,206 0.03
10 Media General Inc CVR 1 -
- Mediaco Holding Inc 1 -
2 Medifast Inc 538 0.01
12 MEDNAX Inc 374 0.01
4 Medpace Holdings Inc 642 0.01
46 Medtronic PLC 5,779 0.13
1 Mercantile Bank Corp 43 -
12 Mercer International Inc 175 -
5 Merchants Bancorp 212 0.01
142 Merck & Co Inc 10,788 0.24
8 Mercury General Corp 536 0.01
6 Mercury Systems Inc 422 0.01
11 Meredith Corp 358 0.01
9 Meridian Bancorp Inc 190 -
8 Meridian Bioscience Inc 161 -
1 Meridian Corp 19 -
6 Merit Medical Systems Inc 339 0.01
3 Meritage Homes Corp 370 0.01
17 Meritor Inc 454 0.01
2 Merrimack Pharmaceuticals Inc 13 -
2 Mersana Therapeutics Inc 30 -
3 Mesa Air Group Inc 26 -
- Mesa Laboratories Inc 31 -
6 Meta Financial Group Inc 338 0.01
7 Methode Electronics Inc 339 0.01
45 MetLife Inc 2,962 0.07
1 Metropolitan Bank Holding Corp 79 -
2 Mettler-Toledo International Inc 2,984 0.07
4 MGE Energy Inc 281 0.01
51 MGIC Investment Corp 748 0.02
55 MGM Resorts International 2,369 0.05
3 MGP Ingredients Inc 196 -
18 Microchip Technology Inc 2,790 0.06
63 Micron Technology Inc 5,278 0.12
415 Microsoft Corp 103,667 2.32
1 MicroStrategy Inc 344 0.01
1 Mid Penn Bancorp Inc 34 -
8 Middleby Corp 1,256 0.03
1 Middlefield Banc Corp 33 -
2 Middlesex Water Co 160 -
5 Midland States Bancorp Inc 128 -
3 MidWestOne Financial Group Inc 101 -
4 Milestone Pharmaceuticals Inc 25 -
1 Miller Industries Inc 50 -
Global Core Equity FundPortfolio of Investments as at 31 May 2021 (continued)
Dimensional Fund Advisors Semi-Annual Report and Unaudited Financial Statements, 31 May 2021 131

Shares (000's)
Value(000's)
USD
% of NetAssetValue
Common Stock (continued)
United States - 63.13% (continued)
5 Mimecast Ltd 227 0.01
6 Minerals Technologies Inc 503 0.01
4 Minerva Neurosciences Inc 12 -
2 Mirati Therapeutics Inc 304 0.01
4 Mistras Group Inc 46 -
3 Mitek Systems Inc 54 -
8 MKS Instruments Inc 1,469 0.03
1 MMA Capital Holdings Inc 30 -
5 Moderna Inc 981 0.02
11 Modine Manufacturing Co 202 0.01
2 ModivCare Inc 330 0.01
6 Moelis & Co 318 0.01
10 Mohawk Industries Inc 2,136 0.05
10 Molina Healthcare Inc 2,603 0.06
28 Molson Coors Brewing Co 1,626 0.04
- Monarch Casino & Resort Inc 30 -
81 Mondelez International Inc 5,172 0.12
2 MongoDB Inc 518 0.01
2 Monolithic Power Systems Inc 698 0.02
5 Monro Inc 315 0.01
38 Monster Beverage Corp 3,598 0.08
15 Moody's Corp 5,115 0.12
5 Moog Inc 494 0.01
80 Morgan Stanley 7,286 0.16
4 Morningstar Inc 1,048 0.02
54 Mosaic Co 1,951 0.04
3 Motorcar Parts of America Inc 61 -
11 Motorola Solutions Inc 2,291 0.05
1 Movado Group Inc 31 -
16 Mr Cooper Group Inc 537 0.01
16 MRC Global Inc 168 -
3 MSA Safety Inc 578 0.01
8 MSC Industrial Direct Co Inc 776 0.02
6 MSCI Inc 2,584 0.06
7 MSG Networks Inc 104 -
11 Mueller Industries Inc 525 0.01
29 Mueller Water Products Inc 426 0.01
27 Murphy Oil Corp 587 0.01
6 Murphy USA Inc 867 0.02
4 Mustang Bio Inc 13 -
2 MVB Financial Corp 85 -
7 Myers Industries Inc 156 -
3 MYR Group Inc 251 0.01
13 Myriad Genetics Inc 362 0.01
1 Nabors Industries Ltd 87 -
1 NACCO Industries Inc 15 -
2 Napco Security Technologies Inc 55 -
13 Nasdaq Inc 2,207 0.05
3 Natera Inc 317 0.01
- Nathan's Famous Inc 31 -
6 National Bank Holdings Corp 234 0.01
1 National Bankshares Inc 39 -
7 National Beverage Corp 348 0.01
11 National CineMedia Inc 53 -
9 National Fuel Gas Co 454 0.01
3 National HealthCare Corp 194 -
16 National Instruments Corp 642 0.01
3 National Research Corp 164 -
9 National Vision Holdings Inc 431 0.01
1 National Western Life Group Inc 142 -
1 Natural Alternatives International Inc 15 -
1 Natural Gas Services Group Inc 15 -
Shares (000's)
Value(000's)
USD
% of NetAssetValue
Common Stock (continued)
United States - 63.13% (continued)
4 Natural Grocers by Vitamin Cottage Inc 52 -
5 Nature's Sunshine Products Inc 92 -
6 Natus Medical Inc 156 -
4 Nautilus Inc 79 -
37 Navient Corp 681 0.02
2 Navios Maritime Acquisition Corp 9 -
8 Navistar International Corp 360 0.01
8 NBT Bancorp Inc 312 0.01
26 NCR Corp 1,267 0.03
3 Neenah Inc 166 -
19 Nektar Therapeutics 343 0.01
3 Nelnet Inc 231 0.01
6 Neogen Corp 524 0.01
9 NeoGenomics Inc 351 0.01
5 NeoPhotonics Corp 53 -
27 NetApp Inc 2,083 0.05
7 Netflix Inc 3,525 0.08
5 NETGEAR Inc 200 0.01
13 NetScout Systems Inc 380 0.01
1 NetSol Technologies Inc 4 -
3 Network-1 Technologies Inc 10 -
5 Neurocrine Biosciences Inc 521 0.01
3 New Fortress Energy Inc 137 -
2 New Home Co Inc 16 -
14 New Jersey Resources Corp 612 0.01
5 New Relic Inc 298 0.01
67 New York Community Bancorp Inc 806 0.02
18 New York Times Co 775 0.02
20 NewAge Inc 48 -
65 Newell Brands Inc 1,878 0.04
31 Newmark Group Inc 395 0.01
2 NewMarket Corp 563 0.01
60 Newmont Goldcorp Corp 4,386 0.10
11 Newpark Resources Inc 35 -
47 News Corp, Class A 1,270 0.03
29 News Corp, Class B 740 0.02
6 NewStar Financial Inc CVR 1 -
4 Nexa Resources SA 41 -
11 Nexstar Media Group Inc 1,612 0.04
47 NextEra Energy Inc 3,456 0.08
12 NextGen Healthcare Inc 197 -
28 NexTier Oilfield Solutions Inc 119 -
- NGM Biopharmaceuticals Inc 6 -
4 NI Holdings Inc 81 -
2 Nicholas Financial Inc 23 -
2 Nicolet Bankshares Inc 143 -
77 Nielsen Holdings PLC 2,093 0.05
59 NIKE Inc 8,030 0.18
1 Nine Energy Service Inc 3 -
30 NiSource Inc 777 0.02
4 NL Industries Inc 32 -
3 nLight Inc 83 -
13 NMI Holdings Inc 306 0.01
7 NN Inc 52 -
5 Noodles & Co 67 -
28 Nordic American Tankers Ltd 97 -
6 Nordson Corp 1,330 0.03
18 Norfolk Southern Corp 4,940 0.11
2 Northeast Bank 58 -
1 Northern Technologies International Corp 20 -
21 Northern Trust Corp 2,556 0.06
8 Northfield Bancorp Inc 143 -
Global Core Equity FundPortfolio of Investments as at 31 May 2021 (continued)
Dimensional Fund Advisors Semi-Annual Report and Unaudited Financial Statements, 31 May 2021 132

Shares (000's)
Value(000's)
USD
% of NetAssetValue
Common Stock (continued)
United States - 63.13% (continued)
1 Northrim BanCorp Inc 54 -
21 Northwest Bancshares Inc 298 0.01
3 Northwest Natural Holding Co 174 -
1 Northwest Pipe Co 32 -
5 NorthWestern Corp 339 0.01
65 NortonLifeLock Inc 1,791 0.04
42 Norwegian Cruise Line Holdings Ltd 1,341 0.03
1 Norwood Financial Corp 34 -
53 NOV Inc 862 0.02
3 Novanta Inc 419 0.01
2 Novavax Inc 326 0.01
4 Novocure Ltd 820 0.02
10 NOW Inc 101 -
49 NRG Energy Inc 1,591 0.04
12 Nu Skin Enterprises Inc 694 0.02
19 Nuance Communications Inc 1,022 0.02
33 Nucor Corp 3,369 0.08
7 NuVasive Inc 489 0.01
2 NV5 Global Inc 172 -
1 NVE Corp 42 -
25 nVent Electric PLC 822 0.02
9 NVIDIA Corp 5,764 0.13
1 NVR Inc 2,634 0.06
1 Oak Valley Bancorp 21 -
171 Occidental Petroleum Corp 4,437 0.10
2 Ocean Bio-Chem Inc 22 -
12 Oceaneering International Inc 175 -
10 OceanFirst Financial Corp 228 0.01
1 Ocwen Financial Corp 40 -
- Odonate Therapeutics Inc 1 -
9 ODP Corp 408 0.01
7 OFG Bancorp 180 -
20 OGE Energy Corp 681 0.02
1 Ohio Valley Banc Corp 19 -
32 O-I Glass Inc 582 0.01
10 Oil States International Inc 65 -
1 Oil-Dri Corp of America 41 -
2 Okta Inc 412 0.01
12 Old Dominion Freight Line Inc 3,101 0.07
25 Old National Bancorp 472 0.01
- Old Point Financial Corp 7 -
39 Old Republic International Corp 1,033 0.02
4 Old Second Bancorp Inc 59 -
34 Olin Corp 1,658 0.04
7 Ollie's Bargain Outlet Holdings Inc 624 0.01
2 Olympic Steel Inc 64 -
1 Omega Flex Inc 157 -
5 Omnicell Inc 626 0.01
38 Omnicom Group Inc 3,123 0.07
57 ON Semiconductor Corp 2,264 0.05
6 ONE Gas Inc 410 0.01
26 OneMain Holdings Inc 1,497 0.03
44 ONEOK Inc 2,299 0.05
5 OneSpan Inc 136 -
7 Onto Innovation Inc 470 0.01
1 OP Bancorp 14 -
101 OPKO Health Inc 388 0.01
2 Oppenheimer Holdings Inc 119 -
9 Option Care Health Inc 173 -
118 Oracle Corp 9,259 0.21
12 OraSure Technologies Inc 112 -
13 ORBCOMM Inc 142 -
Shares (000's)
Value(000's)
USD
% of NetAssetValue
Common Stock (continued)
United States - 63.13% (continued)
6 O'Reilly Automotive Inc 3,461 0.08
1 Orgenesis Inc 7 -
4 Origin Bancorp Inc 169 -
3 Orion Energy Systems Inc 21 -
4 Orion Group Holdings Inc 23 -
1 Ormat Technologies Inc (Israel listing) 93 -
8 Ormat Technologies Inc (US listing) 560 0.01
1 Orrstown Financial Services Inc 37 -
4 Orthofix Medical Inc 148 -
2 OrthoPediatrics Corp 112 -
12 Oshkosh Corp 1,545 0.04
3 OSI Systems Inc 320 0.01
5 Osmotica Pharmaceuticals PLC 15 -
23 Otis Worldwide Corp 1,785 0.04
5 Otonomy Inc 11 -
4 Otter Tail Corp 214 0.01
20 Overseas Shipholding Group Inc 47 -
51 Ovintiv Inc (Canada listing) 1,367 0.03
13 Ovintiv Inc (US listing) 353 0.01
14 Owens & Minor Inc 644 0.01
15 Owens Corning 1,608 0.04
3 Oxford Industries Inc 295 0.01
27 PACCAR Inc 2,484 0.06
4 Pacific Mercantile Bancorp 37 -
14 Pacific Premier Bancorp Inc 637 0.01
5 Pacira BioSciences Inc 284 0.01
16 Packaging Corp of America 2,348 0.05
18 PacWest Bancorp 791 0.02
1 Palo Alto Networks Inc 511 0.01
1 Palomar Holdings Inc 90 -
1 PAM Transportation Services Inc 71 -
3 Pangaea Logistics Solutions Ltd 14 -
3 Papa John's International Inc 239 0.01
8 Par Pacific Holdings Inc 114 -
- PAR Technology Corp 28 -
4 Park Aerospace Corp 58 -
2 Park National Corp 256 0.01
3 Parke Bancorp Inc 63 -
12 Parker-Hannifin Corp 3,803 0.09
2 Park-Ohio Holdings Corp 78 -
11 Parsons Corp 426 0.01
10 Party City Holdco Inc 91 -
6 Patrick Industries Inc 508 0.01
17 Patterson Cos Inc 553 0.01
32 Patterson-UTI Energy Inc 267 0.01
41 Paychex Inc 4,197 0.09
5 Paycom Software Inc 1,698 0.04
4 Paylocity Holding Corp 673 0.02
28 PayPal Holdings Inc 7,267 0.16
4 Paysign Inc 13 -
16 PBF Energy Inc 257 0.01
5 PC Connection Inc 250 0.01
3 PCB Bancorp 41 -
3 PCSB Financial Corp 50 -
5 PC-Tel Inc 33 -
19 PDC Energy Inc 818 0.02
5 PDF Solutions Inc 88 -
23 PDL BioPharma Inc 58 -
17 Peabody Energy Corp 115 -
4 Peapack Gladstone Financial Corp 126 -
3 Pegasystems Inc 366 0.01
10 Penn National Gaming Inc 814 0.02
Global Core Equity FundPortfolio of Investments as at 31 May 2021 (continued)
Dimensional Fund Advisors Semi-Annual Report and Unaudited Financial Statements, 31 May 2021 133

Shares (000's)
Value(000's)
USD
% of NetAssetValue
Common Stock (continued)
United States - 63.13% (continued)
1 Penn Virginia Corp 27 -
2 Pennant Group Inc 77 -
1 Penns Woods Bancorp Inc 28 -
13 Penske Automotive Group Inc 1,093 0.03
21 Pentair PLC 1,422 0.03
3 Penumbra Inc 634 0.01
3 Peoples Bancorp Inc 96 -
1 Peoples Bancorp of North Carolina Inc 12 -
1 Peoples Financial Services Corp 55 -
62 People's United Financial Inc 1,179 0.03
82 PepsiCo Inc 12,181 0.27
13 Perdoceo Education Corp 160 -
5 Perficient Inc 323 0.01
15 Performance Food Group Co 740 0.02
11 PerkinElmer Inc 1,631 0.04
2 Perma-Fix Environmental Services Inc 16 -
20 Perrigo Co PLC 917 0.02
2 Personalis Inc 35 -
3 PetIQ Inc 117 -
2 PetMed Express Inc 61 -
284 Pfizer Inc 10,988 0.25
2 PFSweb Inc 17 -
78 PG&E Corp 789 0.02
11 PGT Innovations Inc 256 0.01
4 Phibro Animal Health Corp 125 -
55 Philip Morris International Inc 5,309 0.12
26 Phillips 66 2,155 0.05
5 Photronics Inc 63 -
3 PHX Minerals Inc 9 -
6 Pieris Pharmaceuticals Inc 21 -
24 Pilgrim's Pride Corp 585 0.01
12 Pinnacle Financial Partners Inc 1,078 0.02
10 Pinnacle West Capital Corp 888 0.02
8 Pinterest Inc 518 0.01
31 Pioneer Natural Resources Co 4,764 0.11
3 Piper Jaffray Cos 403 0.01
35 Pitney Bowes Inc 290 0.01
5 Pixelworks Inc 18 -
2 PJT Partners Inc 135 -
9 Planet Fitness Inc 678 0.02
19 Playa Hotels & Resorts NV 142 -
3 PlayAGS Inc 34 -
5 Plexus Corp 464 0.01
9 Plug Power Inc 280 0.01
1 Plumas Bancorp 27 -
21 PNC Financial Services Group Inc 4,107 0.09
9 PNM Resources Inc 422 0.01
7 Polaris Inc 857 0.02
2 Ponce de Leon Federal Bank 34 -
5 Pool Corp 2,274 0.05
12 Popular Inc 1,008 0.02
10 Portland General Electric Co 466 0.01
14 Post Holdings Inc 1,658 0.04
5 Potbelly Corp 33 -
2 Powell Industries Inc 68 -
6 Power Integrations Inc 510 0.01
3 Powerfleet Inc 17 -
22 PPG Industries Inc 4,005 0.09
50 PPL Corp 1,459 0.03
10 PQ Group Holdings Inc 165 -
8 PRA Group Inc 315 0.01
12 PRA Health Sciences Inc 1,990 0.05
Shares (000's)
Value(000's)
USD
% of NetAssetValue
Common Stock (continued)
United States - 63.13% (continued)
3 Preferred Bank 201 0.01
1 Preformed Line Products Co 62 -
2 Premier Financial Bancorp Inc 40 -
6 Premier Financial Corp 188 -
20 Premier Inc 657 0.02
9 Prestige Consumer Healthcare Inc 437 0.01
5 PriceSmart Inc 472 0.01
- PrimeEnergy Resources Corp 17 -
8 Primerica Inc 1,298 0.03
4 Primis Financial Corp 56 -
10 Primoris Services Corp 317 0.01
29 Principal Financial Group Inc 1,866 0.04
9 ProAssurance Corp 223 0.01
129 Procter & Gamble Co 17,367 0.39
1 Pro-Dex Inc 34 -
12 PROG Holdings Inc 632 0.01
8 Progenics Pharmaceuticals Inc - -
6 Progress Software Corp 257 0.01
65 Progressive Corp 6,401 0.14
3 Proofpoint Inc 481 0.01
20 ProPetro Holding Corp 195 -
1 ProSight Global Inc 18 -
12 Prosperity Bancshares Inc 916 0.02
5 Protagonist Therapeutics Inc 164 -
2 Protective Insurance Corp 49 -
5 Prothena Corp PLC 159 -
2 Proto Labs Inc 201 0.01
4 Provident Bancorp Inc 60 -
2 Provident Financial Holdings Inc 28 -
8 Provident Financial Services Inc 208 0.01
2 Prudential Bancorp Inc 24 -
23 Prudential Financial Inc 2,482 0.06
1 Psychemedics Corp 6 -
5 PTC Inc 681 0.02
5 PTC Therapeutics Inc 211 0.01
27 Public Service Enterprise Group Inc 1,687 0.04
43 PulteGroup Inc 2,482 0.06
3 Pure Cycle Corp 44 -
16 Pure Storage Inc 306 0.01
2 Purple Innovation Inc 60 -
10 PVH Corp 1,105 0.03
5 Pzena Investment Management Inc 54 -
2 QAD Inc, Class A 127 -
3 QCR Holdings Inc 136 -
12 Qorvo Inc 2,162 0.05
17 Quad/Graphics Inc 56 -
- Quaker Chemical Corp 109 -
58 QUALCOMM Inc 7,868 0.18
3 Qualys Inc 331 0.01
5 Quanex Building Products Corp 126 -
25 Quanta Services Inc 2,356 0.05
19 Quest Diagnostics Inc 2,549 0.06
4 Quidel Corp 476 0.01
6 QuinStreet Inc 105 -
10 Quotient Technology Inc 118 -
69 Qurate Retail Inc 941 0.02
12 R1 RCM Inc 280 0.01
25 Radian Group Inc 577 0.01
12 Radiant Logistics Inc 94 -
10 RadNet Inc 268 0.01
3 Rafael Holdings Inc 131 -
6 Ralph Lauren Corp 690 0.02
Global Core Equity FundPortfolio of Investments as at 31 May 2021 (continued)
Dimensional Fund Advisors Semi-Annual Report and Unaudited Financial Statements, 31 May 2021 134

Shares (000's)
Value(000's)
USD
% of NetAssetValue
Common Stock (continued)
United States - 63.13% (continued)
6 Ramaco Resources Inc 34 -
19 Rambus Inc 380 0.01
1 Randolph Bancorp Inc 16 -
36 Range Resources Corp 488 0.01
1 Ranger Energy Services Inc 11 -
6 Ranpak Holdings Corp 131 -
5 Raven Industries Inc 209 0.01
21 Raymond James Financial Inc 2,807 0.06
8 Rayonier Advanced Materials Inc 60 -
63 Raytheon Technologies Corp 5,613 0.13
4 RBB Bancorp 87 -
2 RBC Bearings Inc 476 0.01
1 RCI Hospitality Holdings Inc 112 -
7 RE/MAX Holdings Inc 246 0.01
3 Reading International Inc 17 -
6 RealNetworks Inc 14 -
17 Realogy Holdings Corp 303 0.01
1 Red River Bancshares Inc 70 -
1 Red Robin Gourmet Burgers Inc 47 -
9 Red Rock Resorts Inc 387 0.01
5 Redfin Corp 296 0.01
6 Regal Beloit Corp 841 0.02
6 Regeneron Pharmaceuticals Inc 3,012 0.07
5 REGENXBIO Inc 170 -
2 Regional Management Corp 93 -
120 Regions Financial Corp 2,803 0.06
3 Regis Corp 30 -
9 Reinsurance Group of America Inc 1,101 0.03
9 Reliance Steel & Aluminum Co 1,584 0.04
2 Reliant Bancorp Inc 49 -
7 RenaissanceRe Holdings Ltd 1,148 0.03
10 Renasant Corp 429 0.01
9 Renewable Energy Group Inc 548 0.01
14 Rent-A-Center Inc 854 0.02
4 Repligen Corp 684 0.02
4 Replimune Group Inc 142 -
3 Republic Bancorp Inc 159 -
9 Republic First Bancorp Inc 36 -
22 Republic Services Inc 2,411 0.05
21 Resideo Technologies Inc 637 0.01
11 ResMed Inc 2,182 0.05
14 Resolute Forest Products Inc 230 0.01
6 Resources Connection Inc 89 -
2 Retractable Technologies Inc 19 -
9 REV Group Inc 175 -
- REX American Resources Corp 46 -
21 Rexnord Corp 1,038 0.02
1 RGC Resources Inc 21 -
3 RH 1,714 0.04
2 Rhythm Pharmaceuticals Inc 39 -
24 Ribbon Communications Inc 177 -
1 Richardson Electronics Ltd 13 -
2 Richmond Mutual BanCorp Inc 37 -
5 Rimini Street Inc 33 -
1 RingCentral Inc 253 0.01
2 Rite Aid Corp 35 -
3 Riverview Bancorp Inc 23 -
7 RLI Corp 707 0.02
1 RMR Group Inc 50 -
17 Robert Half International Inc 1,465 0.03
7 Rocket Pharmaceuticals Inc 290 0.01
10 Rockwell Automation Inc 2,615 0.06
Shares (000's)
Value(000's)
USD
% of NetAssetValue
Common Stock (continued)
United States - 63.13% (continued)
1 Rocky Mountain Chocolate Factory Inc 7 -
2 Rogers Corp 451 0.01
2 Roku Inc 588 0.01
29 Rollins Inc 988 0.02
6 Roper Technologies Inc 2,645 0.06
7 Ross Stores Inc 872 0.02
27 Royal Caribbean Cruises Ltd 2,505 0.06
6 Royal Gold Inc 775 0.02
33 RPC Inc 161 -
15 RPM International Inc 1,369 0.03
8 RR Donnelley & Sons Co 52 -
6 Rush Enterprises Inc 298 0.01
3 Ruth's Hospitality Group Inc 65 -
14 Ryder System Inc 1,114 0.03
13 Ryerson Holding Corp 216 0.01
11 S&P Global Inc 4,129 0.09
6 S&T Bancorp Inc 212 0.01
5 S&W Seed Co 18 -
3 Safeguard Scientifics Inc 23 -
3 Safety Insurance Group Inc 229 0.01
1 Saga Communications Inc 15 -
7 Sage Therapeutics Inc 487 0.01
5 Saia Inc 1,208 0.03
8 SailPoint Technologies Holding Inc 355 0.01
22 salesforce.com Inc 5,133 0.12
1 Salisbury Bancorp Inc 28 -
17 Sally Beauty Holdings Inc 370 0.01
3 Sanderson Farms Inc 515 0.01
2 SandRidge Energy Inc 12 -
8 Sandy Spring Bancorp Inc 377 0.01
15 Sangamo Therapeutics Inc 161 -
9 Sanmina Corp 381 0.01
55 Santander Consumer USA Holdings Inc 2,086 0.05
3 Sapiens International Corp NV (Israel listing) 77 -
7 Sapiens International Corp NV (US listing) 213 0.01
4 Sarepta Therapeutics Inc 291 0.01
10 Savara Inc 18 -
1 SB Financial Group Inc 24 -
2 ScanSource Inc 61 -
134 Schlumberger Ltd 4,195 0.09
18 Schneider National Inc 438 0.01
5 Schnitzer Steel Industries Inc 256 0.01
3 Scholastic Corp 88 -
6 Schweitzer-Mauduit International Inc 235 0.01
8 Science Applications International Corp 730 0.02
10 Scientific Games Corp 734 0.02
2 Sciplay Corp 32 -
11 Scorpio Tankers Inc 239 0.01
8 Scotts Miracle-Gro Co 1,683 0.04
2 Scpharmaceuticals Inc 13 -
- Seaboard Corp 506 0.01
9 Seacoast Banking Corp of Florida 326 0.01
4 SEACOR Marine Holdings Inc 19 -
35 Seagate Technology Holdings 3,335 0.08
7 Seagen Inc 1,148 0.03
17 Sealed Air Corp 954 0.02
5 SeaSpine Holdings Corp 94 -
11 SeaWorld Entertainment Inc 622 0.01
2 SecureWorks Corp 29 -
2 Security National Financial Corp 17 -
18 SEI Investments Co 1,116 0.03
3 Select Bancorp Inc 38 -
Global Core Equity FundPortfolio of Investments as at 31 May 2021 (continued)
Dimensional Fund Advisors Semi-Annual Report and Unaudited Financial Statements, 31 May 2021 135

Shares (000's)
Value(000's)
USD
% of NetAssetValue
Common Stock (continued)
United States - 63.13% (continued)
14 Select Energy Services Inc 81 -
4 Select Interior Concepts Inc 45 -
25 Select Medical Holdings Corp 999 0.02
9 Selective Insurance Group Inc 644 0.01
14 Sempra Energy 1,943 0.04
5 Semtech Corp 303 0.01
1 Seneca Foods Corp 54 -
22 Sensata Technologies Holding PLC 1,327 0.03
5 Sensient Technologies Corp 426 0.01
2 Sensus Healthcare Inc 8 -
27 Service Corp International 1,430 0.03
2 ServiceNow Inc 750 0.02
6 ServiceSource International Inc 8 -
10 ServisFirst Bancshares Inc 666 0.02
2 Severn Bancorp Inc 23 -
22 SFL Corp Ltd 192 -
2 Shake Shack Inc 226 0.01
3 Sharps Compliance Corp 39 -
2 SharpSpring Inc 23 -
9 Shenandoah Telecommunications Co 462 0.01
15 Sherwin-Williams Co 4,130 0.09
1 Shockwave Medical Inc 247 0.01
1 Shoe Carnival Inc 91 -
2 Shore Bancshares Inc 31 -
1 ShotSpotter Inc 51 -
5 Shutterstock Inc 428 0.01
6 Shyft Group Inc 225 0.01
3 SI-BONE Inc 97 -
3 Sierra Bancorp 82 -
2 Sierra Oncology Inc 30 -
9 SIGA Technologies Inc 63 -
8 Signature Bank 1,984 0.04
9 Signet Jewelers Ltd 527 0.01
23 Silgan Holdings Inc 949 0.02
4 Silicon Laboratories Inc 591 0.01
1 SilverBow Resources Inc 25 -
3 Silvercrest Asset Management Group Inc 45 -
11 Simmons First National Corp 337 0.01
14 Simply Good Foods Co 492 0.01
6 Simpson Manufacturing Co Inc 635 0.01
3 Sio Gene Therapies Inc 8 -
120 Sirius XM Holdings Inc 747 0.02
16 SiriusPoint Ltd 166 -
4 SiteOne Landscape Supply Inc 663 0.02
3 SJW Group 204 0.01
20 Skechers U.S.A. Inc 935 0.02
10 Skyline Champion Corp 495 0.01
7 SkyWest Inc 326 0.01
16 Skyworks Solutions Inc 2,760 0.06
11 Slack Technologies Inc 487 0.01
3 Sleep Number Corp 371 0.01
99 SLM Corp 1,998 0.05
26 SM Energy Co 523 0.01
4 SMART Global Holdings Inc 209 0.01
3 Smart Sand Inc 8 -
3 SmartFinancial Inc 69 -
6 Smith & Wesson Brands Inc 134 -
4 Smith Micro Software Inc 22 -
7 Snap Inc 446 0.01
8 Snap-on Inc 2,081 0.05
3 SolarEdge Technologies Inc 900 0.02
5 Solaris Oilfield Infrastructure Inc 52 -
Shares (000's)
Value(000's)
USD
% of NetAssetValue
Common Stock (continued)
United States - 63.13% (continued)
20 SolarWinds Corp 334 0.01
7 Solid Biosciences Inc 26 -
3 Sonic Automotive Inc 155 -
19 Sonoco Products Co 1,311 0.03
8 Sonos Inc 299 0.01
10 South Jersey Industries Inc 269 0.01
1 South Plains Financial Inc 14 -
10 South State Corp 917 0.02
56 Southern Co 3,554 0.08
9 Southern Copper Corp 622 0.01
2 Southern First Bancshares Inc 104 -
2 Southern Missouri Bancorp Inc 75 -
6 Southside Bancshares Inc 247 0.01
29 Southwest Airlines Co 1,780 0.04
6 Southwest Gas Holdings Inc 388 0.01
136 Southwestern Energy Co 704 0.02
4 SP Plus Corp 136 -
2 Spark Energy Inc 18 -
3 SpartanNash Co 53 -
7 Spectrum Brands Holdings Inc 637 0.01
16 Spectrum Pharmaceuticals Inc 54 -
2 Spero Therapeutics Inc 29 -
5 Spire Inc 383 0.01
18 Spirit AeroSystems Holdings Inc 909 0.02
13 Spirit Airlines Inc 471 0.01
1 Spirit of Texas Bancshares Inc 33 -
2 Splunk Inc 203 0.01
2 Spok Holdings Inc 24 -
11 Sportsman's Warehouse Holdings Inc 190 -
1 Spotify Technology SA 273 0.01
1 SpringWorks Therapeutics Inc 56 -
25 Sprouts Farmers Market Inc 673 0.02
4 SPS Commerce Inc 343 0.01
6 SPX Corp 388 0.01
7 SPX FLOW Inc 489 0.01
2 Square Inc 472 0.01
35 SS&C Technologies Holdings Inc 2,598 0.06
10 St Joe Co 482 0.01
1 STAAR Surgical Co 190 -
3 Stamps.com Inc 482 0.01
1 Standard AVB Financial Corp 26 -
4 Standard Motor Products Inc 183 -
2 Standex International Corp 233 0.01
11 Stanley Black & Decker Inc 2,420 0.05
44 Starbucks Corp 4,961 0.11
5 StarTek Inc 29 -
8 State Auto Financial Corp 144 -
29 State Street Corp 2,537 0.06
38 Steel Dynamics Inc 2,355 0.05
17 Steelcase Inc 241 0.01
4 Stepan Co 525 0.01
13 Stericycle Inc 1,033 0.02
8 STERIS PLC 1,603 0.04
29 Sterling Bancorp 766 0.02
6 Sterling Bancorp Inc 29 -
6 Sterling Construction Co Inc 130 -
8 Steven Madden Ltd 337 0.01
4 Stewart Information Services Corp 268 0.01
18 Stifel Financial Corp 1,251 0.03
2 Stitch Fix Inc 103 -
4 Stock Yards Bancorp Inc 216 0.01
4 Stoneridge Inc 111 -
Global Core Equity FundPortfolio of Investments as at 31 May 2021 (continued)
Dimensional Fund Advisors Semi-Annual Report and Unaudited Financial Statements, 31 May 2021 136

Shares (000's)
Value(000's)
USD
% of NetAssetValue
Common Stock (continued)
United States - 63.13% (continued)
4 StoneX Group Inc 242 0.01
9 Stratasys Ltd 198 -
4 Strategic Education Inc 265 0.01
1 Strattec Security Corp 25 -
1 Stratus Properties Inc 37 -
5 Stride Inc 135 -
14 Strongbridge Biopharma PLC 36 -
8 Stryker Corp 2,031 0.05
2 Summit Financial Group Inc 52 -
20 Summit Materials Inc 681 0.02
18 SunCoke Energy Inc 134 -
3 Sunnova Energy International Inc 96 -
20 Sunrun Inc 900 0.02
9 Super Micro Computer Inc 314 0.01
2 Superior Group of Cos Inc 58 -
10 Supernus Pharmaceuticals Inc 288 0.01
4 Support.com Inc 11 -
2 Surface Oncology Inc 18 -
16 Surgalign Holdings Inc 31 -
7 Surgery Partners Inc 431 0.01
2 Surmodics Inc 108 -
1 Sutro Biopharma Inc 20 -
5 SVB Financial Group 2,996 0.07
10 Switch Inc 194 -
2 SWK Holdings Corp 27 -
4 Sykes Enterprises Inc 162 -
1 Synalloy Corp 13 -
4 Synaptics Inc 508 0.01
8 Synchronoss Technologies Inc 22 -
59 Synchrony Financial 2,782 0.06
13 Syneos Health Inc 1,186 0.03
3 Synlogic Inc 12 -
9 SYNNEX Corp 1,193 0.03
6 Synopsys Inc 1,598 0.04
23 Synovus Financial Corp 1,130 0.03
49 Sysco Corp 3,967 0.09
7 Systemax Inc 256 0.01
23 T Rowe Price Group Inc 4,462 0.10
2 Tabula Rasa HealthCare Inc 97 -
2 Tactile Systems Technology Inc 96 -
8 Take-Two Interactive Software Inc 1,492 0.03
14 Talos Energy Inc 200 0.01
3 Tandem Diabetes Care Inc 225 0.01
33 Tapestry Inc 1,475 0.03
44 Targa Resources Corp 1,702 0.04
37 Target Corp 8,377 0.19
5 Taro Pharmaceutical Industries Ltd 351 0.01
18 Taylor Morrison Home Corp 532 0.01
20 TCF Financial Corp 939 0.02
4 TCR2 Therapeutics Inc 83 -
16 TE Connectivity Ltd 2,165 0.05
6 Team Inc 50 -
48 TechnipFMC PLC 416 0.01
1 TechTarget Inc 66 -
4 Tecnoglass Inc 95 -
4 Teekay Corp 15 -
6 Teekay Tankers Ltd 83 -
43 TEGNA Inc 825 0.02
5 Tejon Ranch Co 76 -
8 Teladoc Health Inc 1,235 0.03
6 Teledyne Technologies Inc 2,312 0.05
5 Teleflex Inc 1,881 0.04
Shares (000's)
Value(000's)
USD
% of NetAssetValue
Common Stock (continued)
United States - 63.13% (continued)
19 Telephone & Data Systems Inc 481 0.01
30 Tempur Sealy International Inc 1,140 0.03
11 Tenet Healthcare Corp 709 0.02
3 Tennant Co 218 0.01
8 Tenneco Inc 122 -
12 Teradata Corp 583 0.01
17 Teradyne Inc 2,247 0.05
10 Terex Corp 517 0.01
19 Terminix Global Holdings Inc 957 0.02
2 Territorial Bancorp Inc 45 -
5 Tesla Inc 3,067 0.07
1 TESSCO Technologies Inc 8 -
5 Tetra Tech Inc 607 0.01
- Tetraphase Pharmaceuticals Inc - -
7 Texas Capital Bancshares Inc 509 0.01
50 Texas Instruments Inc 9,506 0.21
4 Texas Roadhouse Inc 451 0.01
9 Textainer Group Holdings Ltd 320 0.01
18 TFS Financial Corp 407 0.01
19 Thermo Fisher Scientific Inc 8,841 0.20
6 Thermon Group Holdings Inc 107 -
9 Thor Industries Inc 1,062 0.02
8 Tidewater Inc 104 -
4 Tilly's Inc 53 -
1 Timberland Bancorp Inc 40 -
15 Timken Co 1,354 0.03
6 TimkenSteel Corp 87 -
6 Tiptree Inc 69 -
10 Titan International Inc 93 -
2 Titan Machinery Inc 75 -
5 Tivity Health Inc 120 -
47 TJX Cos Inc 3,182 0.07
49 T-Mobile US Inc 6,974 0.16
18 Toll Brothers Inc 1,179 0.03
3 Tompkins Financial Corp 216 0.01
5 Tootsie Roll Industries Inc 143 -
5 TopBuild Corp 919 0.02
13 Toro Co 1,477 0.03
12 Towne Bank 396 0.01
3 Townsquare Media Inc 40 -
5 TPI Composites Inc 230 0.01
16 Tractor Supply Co 2,882 0.07
1 Trade Desk Inc 559 0.01
7 Tradeweb Markets Inc 568 0.01
13 Trane Technologies PLC 2,331 0.05
1 TransAct Technologies Inc 10 -
1 Transcat Inc 41 -
4 TransDigm Group Inc 2,335 0.05
2 Transmedics Group Inc 47 -
81 Transocean Ltd 307 0.01
21 TransUnion 2,246 0.05
10 Travel + Leisure Co 674 0.02
2 TravelCenters of America Inc 63 -
31 Travelers Cos Inc 4,973 0.11
1 Travelzoo 24 -
3 Travere Therapeutics Inc 44 -
4 Trecora Resources 31 -
9 TreeHouse Foods Inc 448 0.01
12 Trex Co Inc 1,136 0.03
16 TRI Pointe Group Inc 377 0.01
5 TriCo Bancshares 249 0.01
8 TriMas Corp 269 0.01
Global Core Equity FundPortfolio of Investments as at 31 May 2021 (continued)
Dimensional Fund Advisors Semi-Annual Report and Unaudited Financial Statements, 31 May 2021 137

Shares (000's)
Value(000's)
USD
% of NetAssetValue
Common Stock (continued)
United States - 63.13% (continued)
20 Trimble Inc 1,581 0.04
9 TriNet Group Inc 708 0.02
14 Trinity Industries Inc 393 0.01
2 Trinity Place Holdings Inc 3 -
8 Trinseo SA 493 0.01
12 TripAdvisor Inc 524 0.01
2 Triple-S Management Corp 50 -
5 TriState Capital Holdings Inc 122 -
16 Triton International Ltd 846 0.02
4 Triumph Bancorp Inc 371 0.01
37 Tronox Holdings PLC 865 0.02
7 TrueBlue Inc 194 -
7 TrueCar Inc 43 -
67 Truist Financial Corp 4,126 0.09
3 TrustCo Bank Corp NY 136 -
11 Trustmark Corp 370 0.01
7 TTEC Holdings Inc 759 0.02
14 TTM Technologies Inc 217 0.01
5 Tupperware Brands Corp 128 -
4 Turning Point Brands Inc 151 -
1 Turtle Beach Corp 17 -
9 Tutor Perini Corp 132 -
3 Twilio Inc 909 0.02
2 Twin Disc Inc 22 -
15 Twitter Inc 870 0.02
2 Tyler Technologies Inc 660 0.02
40 Tyson Foods Inc 3,166 0.07
1 Ubiquiti Inc 405 0.01
11 UFP Industries Inc 853 0.02
1 UFP Technologies Inc 75 -
19 UGI Corp 882 0.02
4 Ulta Salon Cosmetics & Fragrance Inc 1,530 0.03
7 Ultra Clean Holdings Inc 378 0.01
7 Ultragenyx Pharmaceutical Inc 671 0.02
3 Ultralife Corp 31 -
7 UMB Financial Corp 681 0.02
28 Umpqua Holdings Corp 540 0.01
23 Under Armour Inc, Class A 509 0.01
27 Under Armour Inc, Class C 510 0.01
1 Unifi Inc 41 -
2 UniFirst Corp 447 0.01
44 Union Pacific Corp 9,983 0.22
7 Unisys Corp 183 -
35 United Airlines Holdings Inc 2,024 0.05
19 United Bankshares Inc 769 0.02
13 United Community Banks Inc 454 0.01
4 United Fire Group Inc 130 -
8 United Insurance Holdings Corp 44 -
10 United Natural Foods Inc 380 0.01
36 United Parcel Service Inc 7,713 0.17
16 United Rentals Inc 5,245 0.12
3 United Security Bancshares 29 -
7 United States Cellular Corp 253 0.01
1 United States Lime & Minerals Inc 156 -
35 United States Steel Corp 900 0.02
8 United Therapeutics Corp 1,444 0.03
1 United-Guardian Inc 15 -
69 UnitedHealth Group Inc 28,345 0.64
2 Unitil Corp 109 -
2 Unity Bancorp Inc 53 -
30 Univar Solutions Inc 822 0.02
3 Universal Corp 189 -
Shares (000's)
Value(000's)
USD
% of NetAssetValue
Common Stock (continued)
United States - 63.13% (continued)
3 Universal Display Corp 711 0.02
2 Universal Electronics Inc 122 -
12 Universal Health Services Inc 1,929 0.04
6 Universal Insurance Holdings Inc 86 -
5 Universal Logistics Holdings Inc 132 -
1 Universal Stainless & Alloy Products Inc 9 -
6 Universal Technical Institute Inc 35 -
5 Univest Financial Corp 148 -
30 Unum Group 916 0.02
3 Upland Software Inc 115 -
10 Upwork Inc 454 0.01
11 Urban Outfitters Inc 429 0.01
67 US Bancorp 4,050 0.09
3 US Concrete Inc 191 -
3 US Ecology Inc 123 -
31 US Foods Holding Corp 1,197 0.03
1 US Physical Therapy Inc 165 -
13 US Silica Holdings Inc 132 -
8 US Xpress Enterprises Inc 93 -
2 USA Truck Inc 36 -
4 USANA Health Sciences Inc 455 0.01
1 Utah Medical Products Inc 43 -
4 Vaalco Energy Inc 12 -
2 Vail Resorts Inc 620 0.01
26 Valero Energy Corp 2,066 0.05
60 Valley National Bancorp 864 0.02
4 Valmont Industries Inc 933 0.02
- Value Line Inc 12 -
20 Valvoline Inc 655 0.02
9 Vanda Pharmaceuticals Inc 165 -
7 Varex Imaging Corp 164 -
15 Vector Group Ltd 208 0.01
2 Vectrus Inc 121 -
9 Veeco Instruments Inc 219 0.01
4 Veeva Systems Inc 1,081 0.02
5 Venator Materials PLC 27 -
3 Venus Concept Inc 6 -
11 Veoneer Inc 258 0.01
3 Vera Bradley Inc 39 -
24 Verastem Inc 93 -
3 Vericel Corp 197 -
8 Verint Systems Inc 367 0.01
8 VeriSign Inc 1,862 0.04
12 Verisk Analytics Inc 2,042 0.05
5 Veritex Holdings Inc 184 -
2 Veritiv Corp 132 -
491 Verizon Communications Inc 27,728 0.62
24 Verra Mobility Corp 347 0.01
1 Verrica Pharmaceuticals Inc 8 -
5 Verso Corp 85 -
9 Vertex Pharmaceuticals Inc 1,806 0.04
3 Veru Inc 27 -
9 VF Corp 746 0.02
3 Viacom Inc, Class A 145 -
61 Viacom Inc, Class B 2,578 0.06
2 Viad Corp 99 -
9 ViaSat Inc 504 0.01
119 Viatris Inc 1,808 0.04
29 Viavi Solutions Inc 506 0.01
2 Vicor Corp 203 0.01
2 Victory Capital Holdings Inc 51 -
4 Vidler Water Resouces Inc 39 -
Global Core Equity FundPortfolio of Investments as at 31 May 2021 (continued)
Dimensional Fund Advisors Semi-Annual Report and Unaudited Financial Statements, 31 May 2021 138

Shares (000's)
Value(000's)
USD
% of NetAssetValue
Common Stock (continued)
United States - 63.13% (continued)
19 ViewRay Inc 112 -
7 Viking Therapeutics Inc 39 -
2 Village Super Market Inc 49 -
3 Vimeo Inc 121 -
2 Vir Biotechnology Inc 97 -
- Virco Manufacturing Corp 1 -
24 Virtu Financial Inc 731 0.02
1 Virtus Investment Partners Inc 383 0.01
86 Visa Inc 19,461 0.44
29 Vishay Intertechnology Inc 691 0.02
2 Vishay Precision Group Inc 75 -
11 Vista Outdoor Inc 499 0.01
1 Visteon Corp 177 -
99 Vistra Energy Corp 1,603 0.04
3 VMware Inc 413 0.01
1 Vocera Communications Inc 42 -
4 Volt Information Sciences Inc 13 -
27 Vonage Holdings Corp 370 0.01
6 Vontier Corp 201 0.01
6 VOXX International Corp 97 -
17 Voya Financial Inc 1,086 0.02
2 VSE Corp 90 -
12 Vulcan Materials Co 2,137 0.05
1 VYNE Therapeutics Inc 5 -
24 W R Berkley Corp 1,845 0.04
15 W&T Offshore Inc 57 -
6 Wabash National Corp 97 -
76 Walgreens Boots Alliance Inc 3,999 0.09
7 Walker & Dunlop Inc 705 0.02
111 Walmart Inc 15,828 0.35
47 Walt Disney Co 8,417 0.19
8 Warrior Met Coal Inc 144 -
7 Washington Federal Inc 218 0.01
3 Washington Trust Bancorp Inc 174 -
39 Waste Management Inc 5,512 0.12
6 Waters Corp 1,940 0.04
5 Waterstone Financial Inc 96 -
3 Watsco Inc 823 0.02
4 Watts Water Technologies Inc 479 0.01
3 Wayfair Inc 985 0.02
1 Wayside Technology Group Inc 17 -
2 WD-40 Co 462 0.01
13 Webster Financial Corp 752 0.02
16 WEC Energy Group Inc 1,548 0.04
5 Weis Markets Inc 250 0.01
19 Welbilt Inc 477 0.01
154 Wells Fargo & Co 7,199 0.16
32 Wendy's Co 745 0.02
15 Werner Enterprises Inc 717 0.02
11 WesBanco Inc 445 0.01
8 WESCO International Inc 835 0.02
3 West Bancorporation Inc 90 -
4 West Pharmaceutical Services Inc 1,309 0.03
5 Westamerica Bancorporation 300 0.01
17 Western Alliance Bancorp 1,740 0.04
32 Western Digital Corp 2,444 0.06
4 Western New England Bancorp Inc 33 -
40 Western Union Co 970 0.02
21 Westinghouse Air Brake Technologies Corp 1,762 0.04
13 Westlake Chemical Corp 1,282 0.03
33 Westrock Co 1,942 0.04
2 Westwood Holdings Group Inc 36 -
Shares (000's)
Value(000's)
USD
% of NetAssetValue
Common Stock (continued)
United States - 63.13% (continued)
4 WEX Inc 712 0.02
2 Weyco Group Inc 39 -
11 Whirlpool Corp 2,678 0.06
- White Mountains Insurance Group Ltd 563 0.01
2 WidePoint Corp 15 -
2 Willdan Group Inc 57 -
99 Williams Cos Inc 2,615 0.06
14 Williams-Sonoma Inc 2,393 0.05
11 Willis Towers Watson PLC 2,841 0.06
39 WillScot Mobile Mini Holdings Corp 1,118 0.03
1 Windtree Therapeutics Inc 2 -
3 Wingstop Inc 426 0.01
1 Winmark Corp 117 -
6 Winnebago Industries Inc 434 0.01
9 Wintrust Financial Corp 690 0.02
26 WisdomTree Investments Inc 177 -
9 Wolverine World Wide Inc 317 0.01
8 Woodward Inc 989 0.02
2 Workday Inc 512 0.01
2 World Acceptance Corp 254 0.01
9 World Fuel Services Corp 272 0.01
6 World Wrestling Entertainment Inc 358 0.01
8 Worthington Industries Inc 498 0.01
9 WR Grace & Co 617 0.01
7 WSFS Financial Corp 395 0.01
5 WW Grainger Inc 2,539 0.06
6 WW International Inc 255 0.01
7 Wyndham Hotels & Resorts Inc 549 0.01
6 Wynn Resorts Ltd 781 0.02
1 X4 Pharmaceuticals Inc 10 -
32 Xcel Energy Inc 2,274 0.05
7 Xencor Inc 254 0.01
26 Xerox Holdings Corp 606 0.01
18 Xilinx Inc 2,240 0.05
12 Xperi Holding Corp 249 0.01
17 XPO Logistics Inc 2,480 0.06
13 Xylem Inc 1,575 0.04
4 Yellow Corp 23 -
10 Yelp Inc 411 0.01
12 YETI Holdings Inc 1,013 0.02
1 York Water Co 72 -
20 Yum! Brands Inc 2,414 0.05
5 Zebra Technologies Corp 2,592 0.06
3 Zendesk Inc 381 0.01
1 Zillow Group Inc, Class A 170 -
4 Zillow Group Inc, Class C 439 0.01
12 Zimmer Biomet Holdings Inc 2,030 0.05
21 Zions Bancorp NA 1,240 0.03
4 Zix Corp 29 -
29 Zoetis Inc 5,122 0.12
5 Zogenix Inc 95 -
4 Zoom Video Communications Inc 1,184 0.03
4 Zovio Inc 9 -
3 Zscaler Inc 556 0.01
4 Zumiez Inc 156 -
107 Zynga Inc 1,163 0.03
2,818,972 63.13
Total Common Stock - 96.41% (30 November 2020: 97.02%) 4,305,220 96.41
Preferred Stock
Germany - 0.24%
6 Bayerische Motoren Werke AG 593 0.01
Global Core Equity FundPortfolio of Investments as at 31 May 2021 (continued)
Dimensional Fund Advisors Semi-Annual Report and Unaudited Financial Statements, 31 May 2021 139

Shares (000's)
Value(000's)
USD
% of NetAssetValue
Preferred Stock (continued)
Germany - 0.24% (continued)
2 Biotest AG 67 -
2 Draegerwerk AG & Co KGaA 174 0.01
8 Fuchs Petrolub SE 420 0.01
4 Henkel AG & Co KGaA 509 0.01
10 Jungheinrich AG 500 0.01
10 Porsche Automobil Holding SE 1,087 0.03
2 Sartorius AG 1,103 0.03
17 Schaeffler AG 160 -
3 Sixt SE 306 0.01
1 STO SE & Co KGaA 137 -
1 Villeroy & Boch AG 21 -
20 Volkswagen AG 5,417 0.12
10,494 0.24
Italy - 0.01%
7 Danieli & C Officine Meccaniche SpA 132 -
924 Telecom Italia SpA 528 0.01
660 0.01
United States - 0.00%
1 Liberty Broadband Corp 21 -
- Qurate Retail Inc 21 -
4 WESCO International Inc 118 -
160 -
Total Preferred Stock - 0.25% (30 November 2020: 0.18%) 11,314 0.25
Real Estate Investment Trust
Australia - 0.16%
26 360 Capital Group Ltd 19 -
50 Abacus Property Group 115 -
11 ALE Property Group 40 -
8 APN Convenience Retail REIT 22 -
22 APN Industria REIT 53 -
39 Arena REIT 104 -
12 Australian Unity Office Fund 23 -
36 Aventus Group 80 -
57 BWP Trust 186 0.01
3 Carindale Property Trust 10 -
46 Centuria Industrial REIT 129 -
49 Centuria Office REIT 85 -
46 Charter Hall Group 505 0.01
50 Charter Hall Long Wale REIT 184 0.01
52 Charter Hall Retail REIT 152 0.01
41 Charter Hall Social Infrastructure REIT 108 -
152 Cromwell Property Group 105 -
78 Dexus 628 0.02
22 Garda Diversified Property Fund 21 -
60 GDI Property Group 50 -
61 Goodman Group 909 0.02
148 GPT Group 531 0.01
28 Growthpoint Properties Australia Ltd 82 -
19 Hotel Property Investments 47 -
33 Ingenia Communities Group 142 -
45 Investec Australia Property Fund 50 -
303 Mirvac Group 657 0.02
94 New South Resources Ltd 150 -
235 Scentre Group 498 0.01
116 Shopping Centres Australasia Property Group 223 0.01
172 Stockland 619 0.02
290 Vicinity Centres 353 0.01
68 Waypoint REIT 135 -
7,015 0.16
Shares (000's)
Value(000's)
USD
% of NetAssetValue
Real Estate Investment Trust (continued)
Belgium - 0.04%
3 Aedifica SA 416 0.01
1 Ascencio 40 -
2 Befimmo SA 105 -
3 Care Property Invest NV 86 -
3 Cofinimmo SA 395 0.01
- Home Invest Belgium SA 21 -
3 Intervest Offices & Warehouses NV 80 -
- Leasinvest Real Estate SCA 32 -
1 Montea CVA 147 0.01
1 Retail Estates NV 74 -
13 Warehouses De Pauw CVA 490 0.01
- Wereldhave Belgium Comm VA 16 -
1,902 0.04
Canada - 0.06%
6 Allied Properties Real Estate Investment Trust 207 0.01
9 Artis Real Estate Investment Trust 83 -
2 Automotive Properties Real Estate Investment Trust 23 -
3 Boardwalk Real Estate Investment Trust 83 -
1 BSR Real Estate Investment Trust 16 -
3 BTB Real Estate Investment Trust 11 -
6 Canadian Apartment Properties REIT 290 0.01
13 Choice Properties Real Estate Investment Trust 151 -
11 Cominar Real Estate Investment Trust 91 -
4 Crombie Real Estate Investment Trust 64 -
5 CT Real Estate Investment Trust 70 -
6 Dream Industrial Real Estate Investment Trust 67 -
3 Dream Office Real Estate Investment Trust 61 -
2 Granite Real Estate Investment Trust 159 0.01
15 H&R Real Estate Investment Trust 198 0.01
1 Inovalis Real Estate Investment Trust 12 -
6 InterRent Real Estate Investment Trust 76 -
5 Killam Apartment Real Estate Investment Trust 74 -
3 Morguard North American Residential Real EstateInvestment Trust 37 -
3 Morguard Real Estate Investment Trust 16 -
8 NorthWest Healthcare Properties Real EstateInvestment Trust 82 -
7 Plaza Retail REIT 25 -
11 RioCan Real Estate Investment Trust 200 0.01
5 Slate Office REIT 20 -
7 SmartCentres Real Estate Investment Trust 165 0.01
7 Summit Industrial Income REIT 87 -
4 True North Commercial Real Estate InvestmentTrust 27 -
4 WPT Industrial Real Estate Investment Trust 61 -
2,456 0.06
France - 0.05%
- Altarea SCA 103 -
1 ARGAN SA 108 -
7 Carmila SA 111 -
6 Covivio 558 0.01
4 Gecina SA 567 0.02
4 ICADE 338 0.01
18 Klepierre SA 519 0.01
6 Mercialys SA 78 -
- Societe de la Tour Eiffel 20 -
2,402 0.05
Germany - 0.01%
16 alstria office REIT AG 293 0.01
9 Hamborner REIT AG 100 -
393 0.01
Global Core Equity FundPortfolio of Investments as at 31 May 2021 (continued)
Dimensional Fund Advisors Semi-Annual Report and Unaudited Financial Statements, 31 May 2021 140

Shares (000's)
Value(000's)
USD
% of NetAssetValue
Real Estate Investment Trust (continued)
Hong Kong - 0.04%
208 Champion REIT 121 -
139 Fortune Real Estate Investment Trust 151 0.01
143 Link REIT 1,383 0.03
130 Prosperity REIT 47 -
94 Regal Real Estate Investment Trust 20 -
129 Sunlight Real Estate Investment Trust 75 -
1,797 0.04
Ireland - 0.01%
74 Hibernia REIT PLC 108 0.01
42 Irish Residential Properties REIT PLC 81 -
189 0.01
Israel - 0.00%
8 Summit Real Estate Holdings Ltd 135 -
135 -
Italy - 0.00%
2 COIMA RES SpA 18 -
8 Immobiliare Grande Distribuzione SIIQ SpA 38 -
56 -
Japan - 0.26%
- Activia Properties Inc 330 0.01
- Advance Residence Investment Corp 362 0.01
- AEON REIT Investment Corp 212 0.01
- Comforia Residential REIT Inc 203 -
- CRE Logistics REIT Inc 48 -
- Daiwa House REIT Investment Corp 347 0.01
- Daiwa Office Investment Corp 239 0.01
- Frontier Real Estate Investment Corp 244 0.01
- Fukuoka REIT Corp 127 -
- Global One Real Estate Investment Corp 127 -
1 GLP J-Reit 464 0.01
- Hankyu Hanshin REIT Inc 87 -
- Health Care & Medical Investment Corp 43 -
- Heiwa Real Estate REIT Inc 141 -
- Hoshino Resorts REIT Inc 165 -
- Hulic Reit Inc 211 0.01
- Ichigo Hotel REIT Investment Corp 32 -
- Ichigo Office REIT Investment 129 -
- Industrial & Infrastructure Fund Investment Corp 261 0.01
1 Invesco Office J-Reit Inc 180 -
1 Invincible Investment Corp 265 0.01
- Japan Excellent Inc 181 -
1 Japan Hotel REIT Investment Corp 272 0.01
- Japan Logistics Fund Inc 247 0.01
- Japan Prime Realty Investment Corp 301 0.01
- Japan Real Estate Investment Corp 418 0.01
- Japan Rental Housing Investments Inc 210 0.01
1 Japan Retail Fund Investment Corp 438 0.01
- Kenedix Office Investment Corp 319 0.01
- Kenedix Residential Next Investment Corp 199 -
- Kenedix Retail REIT Corp 142 -
- LaSalle Logiport REIT 182 -
- Marimo Regional Revitalization REIT Inc 29 -
- Mirai Corp 95 -
- Mitsubishi Estate Logistics REIT Investment Corp 132 -
- Mitsui Fudosan Logistics Park Inc 200 -
- Mori Hills REIT Investment Corp 231 0.01
- Mori Trust Hotel Reit Inc 42 -
- Mori Trust Sogo Reit Inc 146 -
- Nippon Accommodations Fund Inc 275 0.01
- Nippon Building Fund Inc 505 0.01
- Nippon Prologis REIT Inc 427 0.01
Shares (000's)
Value(000's)
USD
% of NetAssetValue
Real Estate Investment Trust (continued)
Japan - 0.26% (continued)
- Nippon REIT Investment Corp 205 0.01
1 Nomura Real Estate Master Fund Inc 461 0.01
- One REIT Inc 64 -
- Ooedo Onsen Reit Investment Corp 23 -
- Orix JREIT Inc 409 0.01
- Premier Investment Corp 193 -
- Samty Residential Investment Corp 41 -
1 Sekisui House Reit Inc 306 0.01
- Star Asia Investment Corp 39 -
- Starts Proceed Investment Corp 63 -
- Takara Leben Real Estate Investment Corp 35 -
- Tokyu REIT Inc 174 -
- Tosei Reit Investment Corp 39 -
1 United Urban Investment Corp 368 0.01
3 Urbanet Corp Co Ltd 9 -
- XYMAX REIT Investment Corp 18 -
11,655 0.26
Netherlands - 0.03%
5 Eurocommercial Properties NV 150 0.01
2 NSI NV 101 -
11 Unibail-Rodamco-Westfield 922 0.02
2 Vastned Retail NV 48 -
4 Wereldhave NV 78 -
1,299 0.03
New Zealand - 0.02%
88 Argosy Property Ltd 96 -
104 Goodman Property Trust 166 0.01
36 Investore Property Ltd 52 -
163 Kiwi Property Group Ltd 142 0.01
114 Precinct Properties New Zealand Ltd 128 -
49 Property for Industry Ltd 100 -
43 Stride Property Group 73 -
47 Vital Healthcare Property Trust 100 -
857 0.02
Singapore - 0.09%
66 AIMS APAC REIT 71 -
218 Ascendas Real Estate Investment Trust 478 0.01
184 Ascott Residence Trust 138 -
103 Cache Logistics Trust 61 -
308 CapitaLand Mall Trust 477 0.01
103 CapitaLand Retail China Trust 105 -
91 CDL Hospitality Trusts 79 -
19 Dasin Retail Trust 10 -
21 EC World Real Estate Investment Trust 13 -
240 ESR-REIT 71 -
97 Far East Hospitality Trust 43 -
108 First Real Estate Investment Trust 21 -
97 Frasers Centrepoint Trust 172 -
83 Frasers Hospitality Trust 32 -
238 Frasers Logistics & Industrial Trust 256 0.01
56 IREIT Global 27 -
113 Keppel DC REIT 220 0.01
69 Keppel Pacific Oak US REIT 52 -
177 Keppel REIT 155 -
505 Lippo Malls Indonesia Retail Trust 24 -
160 Manulife US Real Estate Investment Trust 121 -
190 Mapletree Commercial Trust 297 0.01
142 Mapletree Industrial Trust 296 0.01
140 Mapletree Logistics Trust 209 0.01
239 Mapletree North Asia Commercial Trust 186 0.01
112 OUE Commercial Real Estate Investment Trust 33 -
44 Parkway Life Real Estate Investment Trust 145 -
Global Core Equity FundPortfolio of Investments as at 31 May 2021 (continued)
Dimensional Fund Advisors Semi-Annual Report and Unaudited Financial Statements, 31 May 2021 141

Shares (000's)
Value(000's)
USD
% of NetAssetValue
Real Estate Investment Trust (continued)
Singapore - 0.09% (continued)
97 Sabana Shari'ah Compliant Industrial Real EstateInvestment Trust 31 -
99 SPH REIT 65 -
146 Starhill Global REIT 61 -
217 Suntec Real Estate Investment Trust 238 0.01
4,187 0.09
Spain - 0.02%
31 Inmobiliaria Colonial Socimi SA 344 0.01
6 Lar Espana Real Estate Socimi SA 40 -
37 Merlin Properties Socimi SA 421 0.01
805 0.02
United Kingdom - 0.15%
264 Assura PLC 279 0.01
17 Big Yellow Group PLC 315 0.01
77 British Land Co PLC 556 0.01
78 Capital & Counties Properties PLC 192 -
42 Custodian Reit PLC 58 -
11 Derwent London PLC 533 0.01
15 Ediston Property Investment Co PLC 15 -
66 Empiric Student Property PLC 82 -
36 GCP Student Living PLC 88 -
27 Great Portland Estates PLC 278 0.01
413 Hammerson PLC 233 0.01
77 Intu Properties PLC - -
55 Land Securities Group PLC 548 0.01
93 LondonMetric Property PLC 309 0.01
10 McKay Securities PLC 32 -
39 NewRiver REIT PLC 55 -
6 Palace Capital PLC 21 -
125 Primary Health Properties PLC 272 0.01
44 Regional REIT Ltd 55 -
23 Safestore Holdings PLC 310 0.01
62 Schroder Real Estate Investment Trust Ltd 40 -
3 Secure Income REIT PLC 19 -
84 Segro PLC 1,243 0.03
22 Shaftesbury PLC 189 -
42 Standard Life Investment Property Income Trust Ltd 39 -
168 Tritax Big Box REIT PLC 470 0.01
28 UNITE Group PLC 446 0.01
15 Workspace Group PLC 188 -
6,865 0.15
United States - 2.13%
9 Acadia Realty Trust 188 -
5 Agree Realty Corp 369 0.01
7 Alexander & Baldwin Inc 132 -
1 Alexander's Inc 155 -
10 Alexandria Real Estate Equities Inc 1,711 0.04
6 American Assets Trust Inc 228 0.01
14 American Campus Communities Inc 660 0.02
3 American Finance Trust Inc 23 -
30 American Homes 4 Rent 1,143 0.03
17 American Tower Corp 4,269 0.10
16 Apartment Income REIT Corp 756 0.02
18 Apartment Investment and Management Co 126 -
24 Apple Hospitality REIT Inc 374 0.01
1 Ashford Hospitality Trust Inc 6 -
9 AvalonBay Communities Inc 1,958 0.04
4 Bluerock Residential Growth REIT Inc 35 -
12 Boston Properties Inc 1,394 0.03
3 Braemar Hotels & Resorts Inc 20 -
19 Brandywine Realty Trust 267 0.01
30 Brixmor Property Group Inc 684 0.02
Shares (000's)
Value(000's)
USD
% of NetAssetValue
Real Estate Investment Trust (continued)
United States - 2.13% (continued)
3 Brookfield Property REIT Inc 66 -
2 BRT Apartments Corp 29 -
10 Camden Property Trust 1,210 0.03
10 CareTrust REIT Inc 235 0.01
1 Cedar Realty Trust Inc 18 -
1 Centerspace 97 -
5 Chatham Lodging Trust 67 -
6 City Office REIT Inc 70 -
2 Clipper Realty Inc 15 -
13 Columbia Property Trust Inc 228 0.01
3 Community Healthcare Trust Inc 127 -
2 Condor Hospitality Trust Inc 9 -
6 CorePoint Lodging Inc 63 -
4 CoreSite Realty Corp 474 0.01
12 Corporate Office Properties Trust 334 0.01
15 Cousins Properties Inc 543 0.01
18 Crown Castle International Corp 3,321 0.07
1 CTO Realty Growth Inc 32 -
19 CubeSmart 830 0.02
11 CyrusOne Inc 836 0.02
21 DiamondRock Hospitality Co 203 -
16 Digital Realty Trust Inc 2,372 0.05
27 Diversified Healthcare Trust 96 -
17 Douglas Emmett Inc 598 0.01
35 Duke Realty Corp 1,642 0.04
8 Easterly Government Properties Inc 162 -
4 EastGroup Properties Inc 617 0.01
19 Empire State Realty Trust Inc 220 0.01
8 EPR Properties 397 0.01
4 Equinix Inc 2,884 0.06
13 Equity Commonwealth 358 0.01
17 Equity LifeStyle Properties Inc 1,206 0.03
25 Equity Residential 1,970 0.04
6 Essential Properties Realty Trust Inc 147 -
5 Essex Property Trust Inc 1,447 0.03
10 Extra Space Storage Inc 1,568 0.04
8 Federal Realty Investment Trust 860 0.02
13 First Industrial Realty Trust Inc 660 0.02
7 Four Corners Property Trust Inc 201 -
12 Franklin Street Properties Corp 64 -
22 Gaming and Leisure Properties Inc 1,034 0.02
4 Getty Realty Corp 130 -
3 Gladstone Commercial Corp 74 -
5 Global Medical REIT Inc 67 -
10 Global Net Lease Inc 203 -
14 Healthcare Realty Trust Inc 418 0.01
21 Healthcare Trust of America Inc 589 0.01
41 Healthpeak Properties Inc 1,373 0.03
5 Hersha Hospitality Trust 55 -
10 Highwoods Properties Inc 475 0.01
60 Host Hotels & Resorts Inc 1,034 0.02
16 Hudson Pacific Properties Inc 478 0.01
10 Independence Realty Trust Inc 176 -
- Indus Realty Trust Inc 31 -
10 Industrial Logistics Properties Trust 263 0.01
43 Invitation Homes Inc 1,550 0.04
29 Iron Mountain Inc 1,277 0.03
14 JBG SMITH Properties 444 0.01
11 Kilroy Realty Corp 765 0.02
43 Kimco Realty Corp 921 0.02
9 Kite Realty Group Trust 201 -
9 Lamar Advertising Co 917 0.02
Global Core Equity FundPortfolio of Investments as at 31 May 2021 (continued)
Dimensional Fund Advisors Semi-Annual Report and Unaudited Financial Statements, 31 May 2021 142

Shares (000's)
Value(000's)
USD
% of NetAssetValue
Real Estate Investment Trust (continued)
United States - 2.13% (continued)
30 Lexington Realty Trust 370 0.01
7 Life Storage Inc 697 0.02
4 LTC Properties Inc 173 -
16 Macerich Co 250 0.01
10 Mack-Cali Realty Corp 163 -
42 Medical Properties Trust Inc 887 0.02
10 MGM Growth Properties LLC 343 0.01
9 Mid-America Apartment Communities Inc 1,464 0.03
10 Monmouth Real Estate Investment Corp 189 -
5 National Health Investors Inc 304 0.01
17 National Retail Properties Inc 783 0.02
8 National Storage Affiliates Trust 348 0.01
9 New Senior Investment Group Inc 58 -
3 NexPoint Residential Trust Inc 137 -
6 Office Properties Income Trust 163 -
22 Omega Healthcare Investors Inc 819 0.02
2 One Liberty Properties Inc 54 -
15 Outfront Media Inc 366 0.01
26 Paramount Group Inc 284 0.01
24 Park Hotels & Resorts Inc 493 0.01
17 Pebblebrook Hotel Trust 376 0.01
21 Physicians Realty Trust 388 0.01
14 Piedmont Office Realty Trust Inc 253 0.01
1 Plymouth Industrial REIT Inc 28 -
5 Preferred Apartment Communities Inc 54 -
30 Prologis Inc 3,562 0.08
3 PS Business Parks Inc 442 0.01
9 Public Storage 2,653 0.06
6 QTS Realty Trust Inc 402 0.01
27 Realty Income Corp 1,834 0.04
17 Regency Centers Corp 1,094 0.02
12 Retail Opportunity Investments Corp 220 0.01
22 Retail Properties of America Inc 270 0.01
3 Retail Value Inc 46 -
13 Rexford Industrial Realty Inc 705 0.02
19 RLJ Lodging Trust 291 0.01
10 RPT Realty 122 -
5 Ryman Hospitality Properties Inc 412 0.01
19 Sabra Health Care REIT Inc 330 0.01
3 Saul Centers Inc 118 -
7 SBA Communications Corp 2,110 0.05
4 Seritage Growth Properties 69 -
17 Service Properties Trust 219 0.01
20 Simon Property Group Inc 2,571 0.06
20 SITE Centers Corp 293 0.01
9 SL Green Realty Corp 685 0.02
2 Sotherly Hotels Inc 7 -
4 Spirit MTA REIT 1 -
11 Spirit Realty Capital Inc 501 0.01
15 STAG Industrial Inc 552 0.01
25 STORE Capital Corp 846 0.02
12 Summit Hotel Properties Inc 119 -
8 Sun Communities Inc 1,380 0.03
25 Sunstone Hotel Investors Inc 315 0.01
11 Tanger Factory Outlet Centers Inc 195 -
7 Terreno Realty Corp 430 0.01
26 UDR Inc 1,244 0.03
4 UMH Properties Inc 95 -
18 Uniti Group Inc 194 -
Shares (000's)
Value(000's)
USD
% of NetAssetValue
Real Estate Investment Trust (continued)
United States - 2.13% (continued)
2 Universal Health Realty Income Trust 106 -
13 Urban Edge Properties 253 0.01
1 Urstadt Biddle Properties Inc 9 -
4 Urstadt Biddle Properties Inc, Class A 74 -
29 Ventas Inc 1,584 0.04
21 VEREIT Inc 999 0.02
19 Vornado Realty Trust 900 0.02
2 Washington Prime Group Inc 5 -
9 Washington Real Estate Investment Trust 203 -
14 Weingarten Realty Investors 454 0.01
26 Welltower Inc 1,942 0.04
4 Whitestone REIT 35 -
15 WP Carey Inc 1,163 0.03
13 Xenia Hotels & Resorts Inc 244 0.01
94,991 2.13
Total Real Estate Investment Trust - 3.07% (30 November2020: 3.03%) 137,004 3.07
Rights
Australia - 0.00%
5 carsales.com Ltd - -
4 Charter Hall Long Wale REIT - -
1 Mystate Ltd - -
- -
Austria - 0.00%
7 CA Immobilien Anlagen AG - -
- -
Canada - 0.00%
4 Imperial Metals Corp - -
36 Pan American Silver Corp 33 -
33 -
Italy - 0.00%
6 Freni Brembo SpA - -
- -
Singapore - 0.00%
7 Mapletree Industrial Trust Rig 1 -
149 Singapore Airlines Ltd - -
1 -
Spain - 0.00%
12 Almirall SA 3 -
6 Ferrovial SA 1 -
4 -
United Kingdom - 0.00%
10 C&C Group PLC 8 -
8 -
Total Rights - 0.00% (30 November 2020: 0.01%) 46 -
Warrants
Canada - 0.00%
3 Cenovus Energy Inc 12 -
12 -
Singapore - 0.00%
97 Ezion Holdings Ltd - -
- -
Total Warrants - 0.00% (30 November 2020: 0.00%) 12 -
Total Investments - 99.73% (30 November 2020: 100.24%) 4,453,613 99.73
Global Core Equity FundPortfolio of Investments as at 31 May 2021 (continued)
Dimensional Fund Advisors Semi-Annual Report and Unaudited Financial Statements, 31 May 2021 143

Value (000's)USD
% of NetAssetValue
Cash and Cash Equivalents - 0.24% (30 November 2020: 0.26%) 10,886 0.24Other Assets in Excess of Other Liabilities - 0.03% (30 November 2020: (0.50)%) 1,020 0.03
Total Net Assets 4,465,519 100.00
Amounts designated as “- “ are either $0, less than $500 or less than 500 shares.
Analysis of Total Assets % of Total Assets
Transferable securities admitted to an official exchange listing 99.22
Current Assets 0.78
Total Assets 100.00
Global Core Equity FundPortfolio of Investments as at 31 May 2021 (continued)
Dimensional Fund Advisors Semi-Annual Report and Unaudited Financial Statements, 31 May 2021 144

Face Value(000's)
CouponRate %
MaturityDate
Value (000's)GBP
% of NetAssetValue
Corporate Bonds
Australia - 3.44%
100 BHP Billiton Finance Ltd 3.250 24/09/2027 102 0.03
900 Commonwealth Bank ofAustralia 3.150 19/09/2027 695 0.17
1,400 Commonwealth Bank ofAustralia 3.900 16/03/2028 1,122 0.28
3,000 National Australia Bank Ltd 1.250 18/05/2026 2,744 0.69
300 National Australia Bank Ltd 1.375 30/08/2028 279 0.07
200 Telstra Corp Ltd 1.375 26/03/2029 185 0.05
4,800 Westpac Banking Corp 3.350 08/03/2027 3,751 0.94
200 Westpac Banking Corp 0.875 17/04/2027 179 0.04
1,300 Westpac Banking Corp 1.125 05/09/2027 1,183 0.30
600 Westpac Banking Corp 3.400 25/01/2028 471 0.12
4,000 Westpac Banking Corp 2.650 16/01/2030 2,989 0.75
13,700 3.44
Canada - 1.44%
750 Bank of Montreal 2.700 11/09/2024 462 0.12
700 Bank of Montreal 1.850 01/05/2025 512 0.13
400 Bank of Nova Scotia 2.700 03/08/2026 302 0.08
75 Enbridge Inc 3.190 05/12/2022 45 0.01
650 Fairfax Financial Holdings Ltd 2.750 29/03/2028 609 0.15
250 Honda Canada Finance Inc 3.444 23/05/2025 158 0.04
1,000 Kinross Gold Corp 4.500 15/07/2027 811 0.20
200 Sysco Canada Inc 3.650 25/04/2025 125 0.03
140 Toronto-Dominion Bank 3.005 30/05/2023 86 0.02
2,200 Total Capital Canada Ltd 2.125 18/09/2029 2,168 0.54
770 Toyota Credit Canada Inc 2.700 25/01/2023 464 0.12
5,742 1.44
China - 0.10%
500 Seagate HDD Cayman 4.750 01/01/2025 385 0.10
385 0.10
Denmark - 0.16%
700 AP Moller - Maersk AS 1.750 16/03/2026 647 0.16
647 0.16
Finland - 1.00%
4,667 OP Corporate Bank PLC 0.100 16/11/2027 3,984 1.00
3,984 1.00
France - 3.27%
800 BNP Paribas SA 1.875 14/12/2027 815 0.21
800 BNP Paribas SA 4.400 14/08/2028 645 0.16
1,292 BPCE SA 2.375 14/01/2025 951 0.24
100 Credit Agricole SA 1.875 20/12/2026 93 0.02
3,000 Dexia Credit Local SA 0.000 22/01/2027 2,596 0.65
200 Electricite de France SA 4.625 26/04/2030 233 0.06
600 Electricite de France SA 5.875 18/07/2031 808 0.20
1,600 Electricite de France SA 6.125 02/06/2034 2,303 0.58
400 Sanofi 1.375 21/03/2030 377 0.10
100 SNCF Reseau 1.125 25/05/2030 93 0.02
200 Societe Generale SA 1.375 13/01/2028 179 0.05
1,000 Societe Generale SA 4.750 14/09/2028 818 0.21
1,000 Societe Generale SA 3.000 22/01/2030 726 0.18
200 Total Capital International SA 0.696 31/05/2028 178 0.04
500 Total Capital International SA 0.750 12/07/2028 447 0.11
300 Total Capital International SA 1.375 04/10/2029 281 0.07
600 Total Capital International SA 1.405 03/09/2031 586 0.15
800 Vinci SA 2.750 15/09/2034 893 0.22
13,022 3.27
Germany - 1.00%
500 Albemarle New Holding GmbH 1.625 25/11/2028 457 0.11
80 Daimler AG 1.000 15/11/2027 72 0.02
100 Daimler AG 1.125 08/08/2034 87 0.02
867 Deutsche Bahn Finance GmbH 1.625 16/08/2033 834 0.21
Face Value(000's)
CouponRate %
MaturityDate
Value (000's)GBP
% of NetAssetValue
Corporate Bonds (continued)
Germany - 1.00% (continued)
150 Deutsche Bank AG 3.700 30/05/2024 114 0.03
2,000 Deutsche Bank AG 1.750 17/01/2028 1,807 0.45
400 Merck Financial ServicesGmbH 0.375 05/07/2027 349 0.09
200 NRW Bank 0.875 12/04/2034 184 0.05
70 Volkswagen Bank GmbH 1.250 15/12/2025 63 0.02
3,967 1.00
Ireland - 0.37%
75 Aon PLC 3.875 15/12/2025 59 0.01
2,000 Perrigo Finance Unlimited Co 3.150 15/06/2030 1,418 0.36
1,477 0.37
Italy - 0.57%
100 Eni SpA 3.625 29/01/2029 108 0.03
350 Intesa Sanpaolo SpA 1.750 04/07/2029 319 0.08
1,800 Intesa Sanpaolo SpA 2.500 15/01/2030 1,834 0.46
2,261 0.57
Japan - 1.52%
500 Mitsubishi UFJ Financial GroupInc 3.850 01/03/2026 396 0.10
1,900 Mitsubishi UFJ Financial GroupInc 3.195 18/07/2029 1,441 0.36
750 Mizuho Financial Group Inc 3.170 11/09/2027 576 0.14
400 Mizuho Financial Group Inc 0.402 06/09/2029 338 0.08
2,000 Nomura Holdings Inc 3.103 16/01/2030 1,455 0.37
250 Sumitomo Mitsui FinancialGroup Inc 3.352 18/10/2027 193 0.05
500 Sumitomo Mitsui FinancialGroup Inc 3.544 17/01/2028 388 0.10
1,000 Sumitomo Mitsui FinancialGroup Inc 3.040 16/07/2029 747 0.19
723 Sumitomo Mitsui FinancialGroup Inc 2.750 15/01/2030 530 0.13
6,064 1.52
Jersey, Channel Islands - 0.05%
200 Glencore Finance Europe Ltd 3.125 26/03/2026 214 0.05
214 0.05
Luxembourg - 0.57%
600 ArcelorMittal SA 4.550 11/03/2026 472 0.12
650 CNH Industrial Finance EuropeSA 1.750 25/03/2027 597 0.15
350 CNH Industrial Finance EuropeSA 1.625 03/07/2029 318 0.08
100 DH Europe Finance Sarl 1.200 30/06/2027 90 0.02
800 John Deere Cash ManagementSA 2.200 02/04/2032 808 0.20
2,285 0.57
Netherlands - 4.18%
400 Allianz Finance II BV 1.500 15/01/2030 380 0.10
1,800 Allianz Finance II BV 0.500 14/01/2031 1,563 0.39
65 Bayer Capital Corp BV 1.250 13/11/2023 58 0.01
200 Bayer Capital Corp BV 2.125 15/12/2029 191 0.05
250 BMW Finance NV 1.500 06/02/2029 235 0.06
1,500 Cooperatieve Rabobank UA 1.375 03/02/2027 1,391 0.35
65 Deutsche Telekom InternationalFinance BV 2.000 01/12/2029 63 0.02
1,000 Digital Dutch Finco BV 1.250 01/02/2031 870 0.22
200 ING Groep NV 3.550 09/04/2024 152 0.04
300 ING Groep NV 2.000 20/09/2028 285 0.07
800 ING Groep NV 4.550 02/10/2028 657 0.16
200 Koninklijke KPN NV 5.000 18/11/2026 227 0.06
250 LYB International Finance II BV 1.625 17/09/2031 230 0.06
200 Schlumberger Finance BV 0.500 15/10/2031 169 0.04
Global Core Fixed Income FundPortfolio of Investments as at 31 May 2021
Dimensional Fund Advisors Semi-Annual Report and Unaudited Financial Statements, 31 May 2021 145

Face Value(000's)
CouponRate %
MaturityDate
Value (000's)GBP
% of NetAssetValue
Corporate Bonds (continued)
Netherlands - 4.18% (continued)
927 Shell International Finance BV 2.500 12/09/2026 701 0.18
100 Shell International Finance BV 1.250 12/05/2028 92 0.02
1,600 Shell International Finance BV 0.750 15/08/2028 1,420 0.36
3,600 Shell International Finance BV 2.375 07/11/2029 2,607 0.66
1,000 Shell International Finance BV 2.750 06/04/2030 741 0.19
2,839 Shell International Finance BV 1.000 10/12/2030 2,682 0.67
650 Shell International Finance BV 0.500 08/11/2031 554 0.14
300 SiemensFinancieringsmaatschappij NV 0.125 05/09/2029 256 0.06
35 Telefonica Europe BV 5.875 14/02/2033 46 0.01
150 Unilever NV 1.625 12/02/2033 146 0.04
600 Volkswagen Financial ServicesNV 4.250 09/10/2025 678 0.17
100 Volkswagen InternationalFinance NV 1.875 30/03/2027 93 0.02
100 Volkswagen InternationalFinance NV 4.125 17/11/2031 119 0.03
16,606 4.18
Norway - 1.47%
200 Equinor ASA 1.250 17/02/2027 183 0.05
400 Equinor ASA 3.625 10/09/2028 314 0.08
3,000 Equinor ASA 3.125 06/04/2030 2,273 0.57
1,450 Equinor ASA 6.875 11/03/2031 2,135 0.54
1,000 Equinor ASA 1.375 22/05/2032 924 0.23
5,829 1.47
Singapore - 0.29%
150 Flex Ltd 5.000 15/02/2023 113 0.03
263 Flex Ltd 4.875 15/06/2029 211 0.05
1,000 Flex Ltd 4.875 12/05/2030 811 0.21
1,135 0.29
Supranational - 4.06%
290,000 Asian Development Bank 2.350 21/06/2027 2,152 0.54
1,000 Eurofima 3.350 21/05/2029 603 0.15
300,000 European Investment Bank 1.900 26/01/2026 2,109 0.53
461,400 European Investment Bank 2.150 18/01/2027 3,345 0.84
1,000 European Investment Bank 1.300 27/01/2031 514 0.13
762 Inter-American DevelopmentBank 3.125 18/09/2028 601 0.15
1,200 International Bank forReconstruction & Development 1.375 20/04/2028 850 0.21
500 International Bank forReconstruction & Development 5.750 07/06/2032 737 0.19
700 International Finance Corp 3.200 22/07/2026 422 0.11
1,000 International Finance Corp 3.150 26/06/2029 605 0.15
8,600 International Finance Corp 1.500 15/04/2035 4,200 1.06
16,138 4.06
Switzerland - 0.09%
200 Credit Suisse Group AG 0.650 10/09/2029 168 0.04
200 UBS Group AG 1.250 01/09/2026 180 0.05
348 0.09
United Kingdom - 3.41%
150 AstraZeneca PLC 5.750 13/11/2031 210 0.05
250 Barclays PLC 4.000 26/06/2029 147 0.04
850 Barclays PLC 3.250 17/01/2033 935 0.24
1,700 BAT International Finance PLC 2.250 26/06/2028 1,693 0.43
350 BAT International Finance PLC 2.250 16/01/2030 320 0.08
100 BP Capital Markets PLC 3.119 04/05/2026 76 0.02
200 BP Capital Markets PLC 1.231 08/05/2031 179 0.04
1,000 British TelecommunicationsPLC 5.125 04/12/2028 835 0.21
100 Centrica PLC 4.375 13/03/2029 119 0.03
Face Value(000's)
CouponRate %
MaturityDate
Value (000's)GBP
% of NetAssetValue
Corporate Bonds (continued)
United Kingdom - 3.41% (continued)
150 Coca-Cola European PartnersPLC 1.750 26/05/2028 140 0.04
1,000 Experian Finance PLC 3.250 07/04/2032 1,131 0.28
800 GlaxoSmithKline Capital PLC 5.250 19/12/2033 1,118 0.28
700 GlaxoSmithKline Capital PLC 1.625 12/05/2035 672 0.17
250 HSBC Holdings PLC 4.300 08/03/2026 200 0.05
500 HSBC Holdings PLC 2.625 16/08/2028 530 0.13
1,200 HSBC Holdings PLC 4.950 31/03/2030 1,003 0.25
200 Lloyds Banking Group PLC 1.500 12/09/2027 185 0.05
350 Network Rail InfrastructureFinance PLC 4.375 09/12/2030 456 0.11
2,900 Prudential PLC 3.125 14/04/2030 2,180 0.55
150 Rio Tinto Finance PLC 4.000 11/12/2029 180 0.05
900 Transport for London 4.000 12/09/2033 1,128 0.28
100 Vodafone Group PLC 1.500 24/07/2027 93 0.02
25 Western Power DistributionSouth West PLC 5.875 25/03/2027 31 0.01
13,561 3.41
United States - 44.88%
800 3M Co 3.000 07/08/2025 617 0.16
800 3M Co 2.250 19/09/2026 599 0.15
200 3M Co 2.875 15/10/2027 153 0.04
1,612 3M Co 2.375 26/08/2029 1,177 0.30
200 AbbVie Inc 3.600 14/05/2025 154 0.04
150 AbbVie Inc 2.125 01/06/2029 144 0.04
800 Activision Blizzard Inc 1.350 15/09/2030 518 0.13
300 Affiliated Managers Group Inc 3.500 01/08/2025 230 0.06
1,500 Affiliated Managers Group Inc 3.300 15/06/2030 1,126 0.28
600 Ally Financial Inc 5.125 30/09/2024 479 0.12
1,200 Altria Group Inc 2.200 15/06/2027 1,107 0.28
600 Altria Group Inc 3.400 06/05/2030 442 0.11
1,400 Amazon.com Inc 1.200 03/06/2027 984 0.25
1,300 Amazon.com Inc 3.150 22/08/2027 1,011 0.25
50 American Express Co 3.000 30/10/2024 38 0.01
50 American International GroupInc 5.000 26/04/2023 54 0.01
500 American International GroupInc 4.200 01/04/2028 402 0.10
60 AmerisourceBergen Corp 3.450 15/12/2027 47 0.01
3,100 AmerisourceBergen Corp 2.800 15/05/2030 2,265 0.57
200 Amgen Inc 2.600 19/08/2026 150 0.04
100 Amgen Inc 4.000 13/09/2029 119 0.03
1,000 Amgen Inc 2.450 21/02/2030 717 0.18
800 Amgen Inc 2.300 25/02/2031 560 0.14
1,800 Anthem Inc 2.250 15/05/2030 1,263 0.32
400 Aon Corp 4.500 15/12/2028 328 0.08
450 Aon Corp 2.800 15/05/2030 328 0.08
850 Apple Inc 2.050 11/09/2026 628 0.16
3,000 Apple Inc 2.900 12/09/2027 2,302 0.58
1,900 Apple Inc 3.000 13/11/2027 1,467 0.37
950 Apple Inc 1.375 24/05/2029 892 0.22
2,400 Apple Inc 3.050 31/07/2029 2,750 0.69
1,800 Apple Inc 2.200 11/09/2029 1,301 0.33
50 Arrow Electronics Inc 3.250 08/09/2024 38 0.01
3 Ashland LLC 4.750 15/08/2022 2 -
50 AT&T Inc 5.500 15/03/2027 61 0.02
500 AT&T Inc 2.750 01/06/2031 357 0.09
200 AT&T Inc 5.200 18/11/2033 262 0.07
1,035 Baker Hughes a GE Co LLC /Baker Hughes Co-Obligor Inc 3.337 15/12/2027 800 0.20
150 Bank of America Corp 7.000 31/07/2028 206 0.05
900 Baxter International Inc 1.300 15/05/2029 826 0.21
Global Core Fixed Income FundPortfolio of Investments as at 31 May 2021 (continued)
Dimensional Fund Advisors Semi-Annual Report and Unaudited Financial Statements, 31 May 2021 146

Face Value(000's)
CouponRate %
MaturityDate
Value (000's)GBP
% of NetAssetValue
Corporate Bonds (continued)
United States - 44.88% (continued)
2,400 Berkshire Hathaway FinanceCorp 1.450 15/10/2030 1,626 0.41
2,500 Berkshire Hathaway FinanceInc 1.850 12/03/2030 1,759 0.44
210,000 Berkshire Hathaway Inc 0.440 13/09/2029 1,308 0.33
200,000 Berkshire Hathaway Inc 1.110 16/04/2030 1,336 0.34
170,000 Berkshire Hathaway Inc 0.437 15/04/2031 1,043 0.26
500 Best Buy Co Inc 4.450 01/10/2028 405 0.10
1,430 Biogen Inc 2.250 01/05/2030 995 0.25
1,550 BlackRock Inc 3.200 15/03/2027 1,214 0.31
5,300 BlackRock Inc 3.250 30/04/2029 4,137 1.04
500 BlackRock Inc 2.400 30/04/2030 366 0.09
750 BMW US Capital LLC 3.300 06/04/2027 582 0.15
75 BMW US Capital LLC 1.000 20/04/2027 68 0.02
300 Booking Holdings Inc 3.650 15/03/2025 232 0.06
200 Booking Holdings Inc 1.800 03/03/2027 186 0.05
75 Booking Holdings Inc 3.550 15/03/2028 58 0.01
1,954 Booking Holdings Inc 4.625 13/04/2030 1,611 0.40
500 BP Capital Markets America Inc 4.234 06/11/2028 405 0.10
2,000 Broadcom Inc 4.150 15/11/2030 1,544 0.39
500 Broadcom Inc 3.419 15/04/2033 360 0.09
25 Buckeye Partners LP 3.950 01/12/2026 18 -
50 Bunge Ltd Finance Corp 4.350 15/03/2024 39 0.01
1,800 Camden Property Trust 3.150 01/07/2029 1,358 0.34
50 Campbell Soup Co 4.150 15/03/2028 40 0.01
110 Campbell Soup Co 2.375 24/04/2030 77 0.02
300 Capital One Financial Corp 3.800 31/01/2028 237 0.06
700 Capital One Financial Corp 1.650 12/06/2029 634 0.16
75 Cardinal Health Inc 3.410 15/06/2027 58 0.01
150 CBS Corp 4.000 15/01/2026 118 0.03
25 CF Industries Inc 3.450 01/06/2023 18 -
400 Charles Schwab Corp 4.000 01/02/2029 323 0.08
600 Charles Schwab Corp 4.625 22/03/2030 507 0.13
6,000 Chevron USA Inc 1.018 12/08/2027 4,143 1.04
3,000 Chevron USA Inc 3.250 15/10/2029 2,323 0.58
1,500 Choice Hotels International Inc 3.700 01/12/2029 1,139 0.29
250 Chubb INA Holdings Inc 1.550 15/03/2028 230 0.05
100 Cigna Corp 3.250 15/04/2025 76 0.02
1,100 Cigna Corp 4.375 15/10/2028 895 0.22
1,767 Cigna Corp 2.400 15/03/2030 1,257 0.32
50 Cincinnati Financial Corp 6.920 15/05/2028 46 0.01
125 Cisco Systems Inc 2.500 20/09/2026 95 0.02
500 CIT Group Inc 5.000 01/08/2023 383 0.10
45 Citigroup Inc 5.150 21/05/2026 54 0.01
100 Citigroup Inc 1.500 26/10/2028 92 0.02
1,500 Citrix Systems Inc 3.300 01/03/2030 1,100 0.28
250 CNA Financial Corp 3.900 01/05/2029 196 0.05
2,000 CNO Financial Group Inc 5.250 30/05/2029 1,655 0.42
1,000 Coca-Cola Co 1.000 15/03/2028 680 0.17
200 Colgate-Palmolive Co 1.375 06/03/2034 188 0.05
250 Comcast Corp 3.150 15/02/2028 192 0.05
1,000 Comcast Corp 3.400 01/04/2030 769 0.19
750 Comcast Corp 4.250 15/01/2033 618 0.16
1,100 Comerica Inc 4.000 01/02/2029 876 0.22
35 ConocoPhillips Co 6.950 15/04/2029 33 0.01
1,079 Costco Wholesale Corp 1.375 20/06/2027 765 0.19
2,600 Costco Wholesale Corp 1.600 20/04/2030 1,777 0.45
1,700 Daimler Finance North AmericaLLC 3.750 22/02/2028 1,328 0.33
300 Daimler Finance North AmericaLLC 8.500 18/01/2031 317 0.08
500 Discover Bank 4.650 13/09/2028 409 0.10
Face Value(000's)
CouponRate %
MaturityDate
Value (000's)GBP
% of NetAssetValue
Corporate Bonds (continued)
United States - 44.88% (continued)
500 Discovery CommunicationsLLC 1.900 19/03/2027 461 0.12
150 Dover Corp 1.250 09/11/2026 136 0.03
400 Dow Chemical Co 7.375 01/11/2029 388 0.10
350 DXC Technology Co 1.750 15/01/2026 317 0.08
300 DXC Technology Co 4.750 15/04/2027 242 0.06
560 Eaton Corp 4.000 02/11/2032 455 0.11
700 Edison International 4.950 15/04/2025 550 0.14
1,300 Edison International 4.125 15/03/2028 971 0.24
1,000 EI du Pont de Nemours and Co 2.300 15/07/2030 714 0.18
25 EMC Corp 3.375 01/06/2023 18 -
300 Emerson Electric Co 2.000 15/10/2029 291 0.07
50 Energy Transfer Operating LP 3.600 01/02/2023 37 0.01
1,100 Equitable Holdings Inc 4.350 20/04/2028 881 0.22
1,445 ERP Operating LP 2.500 15/02/2030 1,036 0.26
800 Exelon Generation Co LLC 3.250 01/06/2025 608 0.15
300 Expedia Group Inc 3.800 15/02/2028 228 0.06
160 Exxon Mobil Corp 3.043 01/03/2026 123 0.03
1,000 Exxon Mobil Corp 2.275 16/08/2026 747 0.19
3,100 Exxon Mobil Corp 2.440 16/08/2029 2,262 0.57
1,000 Exxon Mobil Corp 3.482 19/03/2030 780 0.20
200 FedEx Corp 1.625 11/01/2027 184 0.05
75 FedEx Corp 4.900 15/01/2034 65 0.02
500 Fidelity & Guaranty LifeHoldings Inc 5.500 01/05/2025 407 0.10
200 Fiserv Inc 1.625 01/07/2030 184 0.05
1,700 Five Corners Funding Trust II 2.850 15/05/2030 1,245 0.31
1,200 Ford Motor Credit Co LLC 3.810 09/01/2024 880 0.22
50 GATX Corp 3.250 30/03/2025 38 0.01
500 GATX Corp 3.500 15/03/2028 383 0.10
1,000 GE Capital Funding LLC 4.400 15/05/2030 811 0.20
100 General Electric Co 0.875 17/05/2025 88 0.02
300 General Electric Co 6.750 15/03/2032 287 0.07
1,000 General Motors Financial CoInc 3.600 21/06/2030 755 0.19
75 Gilead Sciences Inc 3.650 01/03/2026 58 0.01
300 Goldman Sachs Group Inc 3.500 23/01/2025 230 0.06
80 Goldman Sachs Group Inc 2.000 01/11/2028 76 0.02
800 Goldman Sachs Group Inc 3.125 25/07/2029 887 0.22
400 Goldman Sachs Group Inc 3.800 15/03/2030 314 0.08
17 Halliburton Co 3.800 15/11/2025 13 -
1,075 Hasbro Inc 3.500 15/09/2027 829 0.21
800 Health Care Service Corp AMutual Legal Reserve Co 2.200 01/06/2030 561 0.14
200 Honeywell International Inc 2.250 22/02/2028 195 0.05
500 Howmet Aerospace Inc 5.125 01/10/2024 386 0.10
300 Illinois Tool Works Inc 0.625 05/12/2027 265 0.07
30 Intel Corp 4.000 15/12/2032 25 0.01
200 Intercontinental Exchange Inc 3.750 01/12/2025 157 0.04
1,500 Intercontinental Exchange Inc 3.750 21/09/2028 1,182 0.30
200 International BusinessMachines Corp 1.750 07/03/2028 189 0.05
900 International BusinessMachines Corp 1.950 15/05/2030 625 0.16
100 International BusinessMachines Corp 1.750 31/01/2031 95 0.02
500 Interpublic Group of Cos Inc 4.650 01/10/2028 410 0.10
1,500 Johnson & Johnson 2.900 15/01/2028 1,156 0.29
160 Johnson & Johnson 4.950 15/05/2033 147 0.04
200 JPMorgan Chase & Co 3.900 15/07/2025 157 0.04
300 JPMorgan Chase & Co 3.200 15/06/2026 231 0.06
75 Kellogg Co 7.450 01/04/2031 76 0.02
1,500 Kimco Realty Corp 1.900 01/03/2028 1,053 0.26
Global Core Fixed Income FundPortfolio of Investments as at 31 May 2021 (continued)
Dimensional Fund Advisors Semi-Annual Report and Unaudited Financial Statements, 31 May 2021 147

Face Value(000's)
CouponRate %
MaturityDate
Value (000's)GBP
% of NetAssetValue
Corporate Bonds (continued)
United States - 44.88% (continued)
100 Kraft Heinz Foods Co 2.250 25/05/2028 93 0.02
50 Laboratory Corp of AmericaHoldings 3.600 01/09/2027 39 0.01
3,000 Lam Research Corp 4.000 15/03/2029 2,418 0.61
25 Lear Corp 3.800 15/09/2027 19 -
1,000 Lear Corp 4.250 15/05/2029 790 0.20
75 Legg Mason Inc 4.750 15/03/2026 62 0.02
850 Leggett & Platt Inc 4.400 15/03/2029 677 0.17
150 Liberty Mutual Group Inc 2.750 04/05/2026 144 0.04
2,600 Lincoln National Corp 3.050 15/01/2030 1,926 0.48
500 Lincoln National Corp 3.400 15/01/2031 380 0.10
700 Loews Corp 3.750 01/04/2026 551 0.14
60 Lowe's Cos Inc 2.500 15/04/2026 45 0.01
1,100 Marriott International Inc 4.000 15/04/2028 844 0.21
150 Marsh & McLennan Cos Inc 1.349 21/09/2026 136 0.03
400 Marsh & McLennan Cos Inc 4.375 15/03/2029 329 0.08
1,000 Mastercard Inc 2.950 01/06/2029 761 0.19
1,346 McKesson Corp 3.125 17/02/2029 1,467 0.37
200 Mead Johnson Nutrition Co 4.125 15/11/2025 159 0.04
500 Merck & Co Inc 3.400 07/03/2029 392 0.10
1,600 MetLife Inc 4.550 23/03/2030 1,337 0.34
500 MGM Resorts International 5.750 15/06/2025 388 0.10
800 Microsoft Corp 2.400 08/08/2026 602 0.15
100 Microsoft Corp 3.300 06/02/2027 79 0.02
100 Molson Coors Brewing Co 3.000 15/07/2026 76 0.02
150 Mondelez International Inc 1.625 08/03/2027 139 0.03
200 Morgan Stanley 3.125 27/07/2026 154 0.04
150 Morgan Stanley 2.625 09/03/2027 161 0.04
500 Morgan Stanley 7.250 01/04/2032 505 0.13
1,200 Mosaic Co 4.050 15/11/2027 943 0.24
500 Motorola Solutions Inc 4.600 23/05/2029 405 0.10
684 MPLX LP 4.125 01/03/2027 540 0.14
75 MPLX LP 4.000 15/03/2028 59 0.01
300 Nasdaq Inc 1.750 28/03/2029 279 0.07
50 National Rural UtilitiesCooperative Finance Corp 8.000 01/03/2032 53 0.01
700 Nestle Holdings Inc 3.625 24/09/2028 554 0.14
1,000 NetApp Inc 2.700 22/06/2030 720 0.18
600 Netflix Inc 4.375 15/11/2026 477 0.12
50 NIKE Inc 2.375 01/11/2026 38 0.01
11,400 NIKE Inc 2.850 27/03/2030 8,606 2.16
25 NortonLifeLock Inc 3.950 15/06/2022 18 -
2,300 Novartis Capital Corp 2.200 14/08/2030 1,654 0.42
875 Nucor Corp 3.950 01/05/2028 696 0.17
300 Nucor Corp 2.700 01/06/2030 219 0.06
200 NVIDIA Corp 3.200 16/09/2026 156 0.04
300 Omnicom Group Inc 4.200 01/06/2030 240 0.06
300 Oracle Corp 2.950 15/05/2025 226 0.06
100 Oracle Corp 2.650 15/07/2026 75 0.02
4,440 Oracle Corp 2.950 01/04/2030 3,260 0.82
1,017 Owens Corning 3.875 01/06/2030 796 0.20
75 Parker-Hannifin Corp 3.300 21/11/2024 57 0.01
200 PepsiCo Inc 0.750 18/03/2027 179 0.04
300 PerkinElmer Inc 3.300 15/09/2029 226 0.06
1,550 Pfizer Inc 3.000 15/12/2026 1,202 0.30
100 Pfizer Inc 3.600 15/09/2028 79 0.02
150 Philip Morris International Inc 2.875 14/05/2029 152 0.04
700 Philip Morris International Inc 2.100 01/05/2030 483 0.12
1,400 Philip Morris International Inc 0.800 01/08/2031 1,186 0.30
1,000 Phillips 66 Partners LP 3.550 01/10/2026 768 0.19
1,500 Phillips 66 Partners LP 3.150 15/12/2029 1,097 0.28
100 Plains All American Pipeline LP 4.500 15/12/2026 79 0.02
Face Value(000's)
CouponRate %
MaturityDate
Value (000's)GBP
% of NetAssetValue
Corporate Bonds (continued)
United States - 44.88% (continued)
100 PPG Industries Inc 1.400 13/03/2027 92 0.02
1,000 PPG Industries Inc 2.550 15/06/2030 722 0.18
200 Precision Castparts Corp 3.250 15/06/2025 154 0.04
650 Principal Financial Group Inc 3.400 15/05/2025 498 0.13
100 Principal Financial Group Inc 3.100 15/11/2026 77 0.02
500 Principal Financial Group Inc 3.700 15/05/2029 391 0.10
300 Procter & Gamble Co 2.450 03/11/2026 227 0.06
2,000 Procter & Gamble Co 3.000 25/03/2030 1,537 0.39
1,000 QUALCOMM Inc 1.300 20/05/2028 685 0.17
238 QUALCOMM Inc 1.650 20/05/2032 156 0.04
600 Radian Group Inc 4.500 01/10/2024 447 0.11
3,700 Ralph Lauren Corp 2.950 15/06/2030 2,729 0.69
1,200 Raytheon Technologies Corp 2.250 01/07/2030 844 0.21
2,000 Realty Income Corp 1.800 15/03/2033 1,307 0.33
2,000 Reinsurance Group of AmericaInc 3.150 15/06/2030 1,484 0.37
100 RELX Capital Inc 3.000 22/05/2030 74 0.02
50 Santander Holdings USA Inc 4.500 17/07/2025 39 0.01
675 Simon Property Group LP 3.375 01/12/2027 518 0.13
200 Southwest Gas Corp 2.200 15/06/2030 139 0.03
600 Springleaf Finance Corp 6.875 15/03/2025 478 0.12
1,350 Stanley Black & Decker Inc 2.300 15/03/2030 974 0.24
500 State Street Bank 2.400 24/01/2030 363 0.09
200 Stryker Corp 2.125 30/11/2027 191 0.05
1,000 Stryker Corp 2.625 30/11/2030 1,010 0.25
50 Sysco Corp 3.300 15/07/2026 38 0.01
400 Sysco Corp 3.250 15/07/2027 307 0.08
250 TD Ameritrade Holding Corp 3.300 01/04/2027 194 0.05
500 Toyota Motor Credit Corp 2.150 13/02/2030 355 0.09
500 TRI Pointe Group Inc 5.875 15/06/2024 392 0.10
600 Trinity Industries Inc 4.550 01/10/2024 448 0.11
500 Truist Financial Corp 1.950 05/06/2030 347 0.09
250 TWDC Enterprises 18 Corp 2.758 07/10/2024 154 0.04
50 Union Pacific Corp 3.750 15/07/2025 39 0.01
2,400 Union Pacific Corp 2.400 05/02/2030 1,726 0.43
540 Union Pacific Corp 2.891 06/04/2036 386 0.10
200 United Parcel Service Inc 1.500 15/11/2032 190 0.05
250 UnitedHealth Group Inc 3.850 15/06/2028 201 0.05
600 UnitedHealth Group Inc 4.625 15/07/2035 524 0.13
50 Utah Acquisition Sub Inc 3.950 15/06/2026 39 0.01
1,200 Ventas Realty LP 3.000 15/01/2030 876 0.22
1,300 VF Corp 2.800 23/04/2027 980 0.25
1,600 VF Corp 2.950 23/04/2030 1,181 0.30
450 ViacomCBS Inc 3.500 15/01/2025 343 0.09
400 ViacomCBS Inc 4.200 19/05/2032 318 0.08
50 Visa Inc 2.750 15/09/2027 38 0.01
1,100 VMware Inc 3.900 21/08/2027 862 0.22
100 Walgreens Boots Alliance Inc 2.125 20/11/2026 94 0.02
1,725 Walgreens Boots Alliance Inc 3.200 15/04/2030 1,278 0.32
700 Walmart Inc 3.700 26/06/2028 560 0.14
1,000 Walmart Inc 3.250 08/07/2029 782 0.20
3,100 Walmart Inc 4.875 21/09/2029 3,662 0.92
1,700 Walmart Inc 2.375 24/09/2029 1,261 0.32
99 Walmart Inc 5.750 19/12/2030 139 0.03
569 Walmart Inc 5.625 27/03/2034 839 0.21
1,355 Walmart Inc 5.250 28/09/2035 1,987 0.50
1,000 Walt Disney Co 3.800 22/03/2030 793 0.20
1,000 Walt Disney Co 2.650 13/01/2031 728 0.18
200 Wells Fargo & Co 3.000 23/10/2026 153 0.04
100 Wells Fargo & Co 1.500 24/05/2027 91 0.02
700 Wells Fargo & Co 4.150 24/01/2029 564 0.14
700 Wells Fargo & Co 2.500 02/05/2029 736 0.19
Global Core Fixed Income FundPortfolio of Investments as at 31 May 2021 (continued)
Dimensional Fund Advisors Semi-Annual Report and Unaudited Financial Statements, 31 May 2021 148

Face Value(000's)
CouponRate %
MaturityDate
Value (000's)GBP
% of NetAssetValue
Corporate Bonds (continued)
United States - 44.88% (continued)
400 Wells Fargo & Co 3.500 12/09/2029 452 0.11
600 Westlake Chemical Corp 1.625 17/07/2029 533 0.13
40 Williams Cos Inc 7.875 01/09/2021 29 0.01
800 Williams Cos Inc 3.500 15/11/2030 605 0.15
500 Xerox Corp 3.800 15/05/2024 365 0.09
650 Zimmer Biomet Holdings Inc 3.550 01/04/2025 499 0.13
178,510 44.88
Total Corporate Bonds - 71.87% (30 November 2020: 72.94%) 285,875 71.87
Government Bonds
Australia - 4.06%
1,000 New South Wales TreasuryCorp 3.000 20/04/2029 607 0.15
1,000 New South Wales TreasuryCorp 2.000 08/03/2033 540 0.14
500 Queensland Treasury Corp 3.500 21/08/2030 315 0.08
1,000 Queensland Treasury Corp 1.750 21/08/2031 538 0.14
3,000 Queensland Treasury Corp 1.500 20/08/2032 1,550 0.39
1,800 Queensland Treasury Corp 1.750 20/07/2034 921 0.23
2,500 South Australian GovernmentFinancing Authority 1.750 24/05/2032 1,322 0.33
6,600 Treasury Corp of Victoria 1.500 10/09/2031 3,464 0.87
1,000 Treasury Corp of Victoria 4.250 20/12/2032 672 0.17
6,450 Treasury Corp of Victoria 2.250 20/11/2034 3,499 0.88
1,000 Western Australian TreasuryCorp 2.750 24/07/2029 596 0.15
4,000 Western Australian TreasuryCorp 2.000 24/10/2034 2,109 0.53
16,133 4.06
Canada - 11.74%
4,950 CPPIB Capital Inc 1.125 14/12/2029 4,951 1.25
4,400 Province of Alberta Canada 2.900 20/09/2029 2,752 0.69
9,300 Province of Alberta Canada 2.050 01/06/2030 5,418 1.36
1,200 Province of Alberta Canada 3.900 01/12/2033 810 0.20
1,500 Province of British ColumbiaCanada 5.700 18/06/2029 1,128 0.28
4,500 Province of British ColumbiaCanada 2.200 18/06/2030 2,679 0.67
750 Province of Manitoba Canada 4.400 05/09/2025 498 0.13
1,400 Province of Manitoba Canada 2.050 02/06/2030 818 0.21
3,000 Province of Manitoba Canada 6.300 05/03/2031 2,387 0.60
600 Province of Ontario Canada 6.500 08/03/2029 468 0.12
1,500 Province of Ontario Canada 2.000 02/10/2029 1,081 0.27
4,300 Province of Ontario Canada 1.350 02/12/2030 2,349 0.59
1,700 Province of Ontario Canada 6.200 02/06/2031 1,358 0.34
3,100 Province of Ontario Canada 5.850 08/03/2033 2,466 0.62
1,200 Province of Ontario Canada 5.600 02/06/2035 965 0.24
100 Province of Quebec Canada 0.875 05/07/2028 91 0.02
9,600 Province of Quebec Canada 1.900 01/09/2030 5,556 1.40
3,800 Province of Quebec Canada 6.250 01/06/2032 3,093 0.78
8,800 Province of SaskatchewanCanada 2.200 02/06/2030 5,214 1.31
3,250 Province of SaskatchewanCanada 6.400 05/09/2031 2,631 0.66
46,713 11.74
Denmark - 0.17%
1,150 Kommunekredit 2.900 27/11/2026 682 0.17
682 0.17
Face Value(000's)
CouponRate %
MaturityDate
Value (000's)GBP
% of NetAssetValue
Government Bonds (continued)
France - 3.59%
1,000 Action Logement Services 0.500 30/10/2034 845 0.21
300 Agence France Locale 1.125 20/06/2028 277 0.07
200 French Republic GovernmentBond OAT 1.250 25/05/2034 192 0.05
2,800 SNCF Reseau 5.250 07/12/2028 3,640 0.92
600 SNCF Reseau 0.875 22/01/2029 544 0.14
100 SNCF Reseau 5.000 10/10/2033 132 0.03
2,250 SNCF Reseau 5.250 31/01/2035 3,252 0.82
1,417 Societe Nationale SNCF SA 5.375 18/03/2027 1,756 0.44
1,500 Societe Nationale SNCF SA 1.500 02/02/2029 1,408 0.35
2,500 Societe Nationale SNCF SA 0.625 17/04/2030 2,213 0.56
14,259 3.59
Japan - 0.61%
7,000 Development Bank of JapanInc 1.050 20/06/2023 46 0.01
202,000 Japan Government TwentyYear Bond 1.400 20/09/2034 1,498 0.38
119,000 Japan Government TwentyYear Bond 1.200 20/09/2035 865 0.22
2,409 0.61
New Zealand - 0.50%
3,400 New Zealand GovernmentBond 3.500 14/04/2033 1,996 0.50
1,996 0.50
Norway - 0.22%
10,000 Norway Government Bond 2.000 26/04/2028 883 0.22
883 0.22
Singapore - 0.30%
2,000 Singapore Government Bond 2.875 01/09/2030 1,193 0.30
1,193 0.30
United Kingdom - 0.28%
400 United Kingdom Gilt 4.500 07/09/2034 571 0.14
600 United Kingdom Gilt 0.625 31/07/2035 560 0.14
1,131 0.28
United States - 3.98%
365 Federal Home Loan Banks 3.250 09/06/2028 291 0.07
800 Federal Home Loan Banks 2.125 14/12/2029 594 0.15
125 Federal Home Loan MortgageCorp 6.750 15/03/2031 129 0.03
1,250 Federal Home Loan MortgageCorp 6.250 15/07/2032 1,283 0.32
2,510 Federal National MortgageAssociation 5.375 07/12/2028 3,277 0.82
4,300 Federal National MortgageAssociation 6.250 15/05/2029 4,134 1.04
650 Federal National MortgageAssociation 7.125 15/01/2030 663 0.17
1,300 Federal National MortgageAssociation 7.250 15/05/2030 1,349 0.34
187 Tennessee Valley Authority 5.625 07/06/2032 265 0.07
1,500 United States Treasury Note 0.625 31/12/2027 1,019 0.26
4,000 United States Treasury Note 1.250 31/03/2028 2,823 0.71
15,827 3.98
Total Government Bonds - 25.45% (30 November2020: 24.65%) 101,226 25.45
Total Investments - 97.32% (30 November 2020: 97.59%) 387,101 97.32
Global Core Fixed Income FundPortfolio of Investments as at 31 May 2021 (continued)
Dimensional Fund Advisors Semi-Annual Report and Unaudited Financial Statements, 31 May 2021 149

Forward Currency Contracts
Buy Amount (000's) Sell Amount (000's) Counterparty Maturity Date
UnrealisedAppreciation/(Depreciation)
of Contracts (000's)GBP
% of NetAssetValue
Buy 10 EUR Sell 9 GBP State Street Bank 01/06/2021 - -
Buy 20,851 EUR Sell 18,146 GBP State Street Bank 07/06/2021 (230) (0.06)
Buy 24 EUR Sell 20 GBP State Street Bank 07/06/2021 - -
Buy 22,038 EUR Sell 19,016 GBP State Street Bank 18/06/2021 (74) (0.02)
Buy 11,636 GBP Sell 20,879 AUD State Street Bank 08/06/2021 294 0.07
Buy 12,094 GBP Sell 21,749 AUD State Street Bank 21/06/2021 280 0.07
Buy 25,244 GBP Sell 43,273 CAD Citibank 15/06/2021 4 -
Buy 17,023 GBP Sell 29,018 CAD Citibank 02/07/2021 98 0.03
Buy 6 GBP Sell 7 EUR State Street Bank 02/06/2021 - -
Buy 7 GBP Sell 8 EUR State Street Bank 07/06/2021 - -
Buy 17 GBP Sell 19 EUR State Street Bank 18/06/2021 - -
Buy 27,365 GBP Sell 31,729 EUR State Street Bank 24/06/2021 90 0.02
Buy 27,653 GBP Sell 31,989 EUR State Street Bank 29/06/2021 151 0.04
Buy 13,913 GBP Sell 2,148,103 JPY State Street Bank 30/06/2021 130 0.03
Buy 903 GBP Sell 10,499 NOK State Street Bank 25/06/2021 19 0.01
Buy 2,063 GBP Sell 4,047 NZD State Street Bank 23/06/2021 (3) -
Buy 22 GBP Sell 43 NZD State Street Bank 23/06/2021 - -
Buy 24 GBP Sell 45 SGD State Street Bank 11/06/2021 - -
Buy 1,227 GBP Sell 2,275 SGD State Street Bank 28/06/2021 16 -
Buy 102,465 GBP Sell 142,183 USD Citibank 21/06/2021 2,279 0.57
Buy 14 GBP Sell 20 USD State Street Bank 01/06/2021 - -
Buy 214 GBP Sell 304 USD State Street Bank 02/06/2021 - -
Buy 208 GBP Sell 293 USD State Street Bank 07/06/2021 2 -
Buy 58 GBP Sell 82 USD State Street Bank 16/06/2021 - -
Buy 53,055 GBP Sell 73,280 USD State Street Bank 22/06/2021 1,422 0.36
Buy 53,321 GBP Sell 75,311 USD State Street Bank 29/06/2021 255 0.06
Buy 562,435 JPY Sell 3,738 GBP State Street Bank 04/06/2021 (130) (0.03)
Buy 2,910,815 JPY Sell 19,225 GBP State Street Bank 16/06/2021 (549) (0.14)
Buy 77 NZD Sell 39 GBP State Street Bank 23/06/2021 - -
Buy 101 NZD Sell 52 GBP State Street Bank 23/06/2021 - -
Buy 45 SGD Sell 24 GBP State Street Bank 02/06/2021 - -
Buy 2,441 SGD Sell 1,323 GBP State Street Bank 10/06/2021 (23) (0.01)
Buy 51,358 SGD Sell 27,888 GBP State Street Bank 11/06/2021 (523) (0.13)
Buy 580 SGD Sell 308 GBP State Street Bank 11/06/2021 1 -
Buy 51,852 SGD Sell 27,526 GBP State Street Bank 18/06/2021 99 0.03
Buy 2,311 SGD Sell 1,227 GBP State Street Bank 18/06/2021 5 -
Buy 34 SGD Sell 18 GBP State Street Bank 28/06/2021 - -
Buy 29,737 USD Sell 21,376 GBP State Street Bank 07/06/2021 (423) (0.10)
Buy 28,653 USD Sell 20,594 GBP State Street Bank 16/06/2021 (403) (0.10)
Buy 304 USD Sell 214 GBP State Street Bank 16/06/2021 - -
Buy 5,824 USD Sell 4,117 GBP State Street Bank 21/06/2021 (13) -
Unrealised Appreciation of Forward Currency Contracts 5,145 1.29
Unrealised Depreciation of Forward Currency Contracts (2,371) (0.59)
Net Unrealised Appreciation of Forward Currency Contracts - 0.70% (30 November 2020: 0.33%) 2,774 0.70
Value (000's)GBP
% of NetAssetValue
Cash and Cash Equivalents - 1.29% (30 November 2020: 0.57%) 5,112 1.29Other Assets in Excess of Other Liabilities - 0.69% (30 November 2020: 1.51%) 2,757 0.69
Total Net Assets 397,744 100.00
Amounts designated as “- “ are either £0 or less than £500.
Global Core Fixed Income FundPortfolio of Investments as at 31 May 2021 (continued)
Dimensional Fund Advisors Semi-Annual Report and Unaudited Financial Statements, 31 May 2021 150

Analysis of Total Assets % of Total Assets
Transferable securities admitted to an official exchange listing 77.16
Transferable securities dealt in on another regulated market 9.01
Other transferable securities of the type referred to in Regulations 68 (1)(a), (b) and (c) 7.96
OTC Financial derivative instruments 1.25
Current Assets 4.62
Total Assets 100.00
Global Core Fixed Income FundPortfolio of Investments as at 31 May 2021 (continued)
Dimensional Fund Advisors Semi-Annual Report and Unaudited Financial Statements, 31 May 2021 151

Face Value(000's)
CouponRate %
MaturityDate
Value (000's)EUR
% of NetAssetValue
Corporate Bonds
Australia - 5.53%
1,000 Australia & New ZealandBanking Group Ltd 0.610 29/08/2022 636 0.02
2,000 Australia & New ZealandBanking Group Ltd 0.814 18/01/2023 1,277 0.05
5,000 Australia & New ZealandBanking Group Ltd 0.944 09/05/2023 3,205 0.12
4,500 Australia & New ZealandBanking Group Ltd 1.067 06/12/2023 2,904 0.11
8,500 Australia & New ZealandBanking Group Ltd 1.144 08/02/2024 5,500 0.20
16,500 Australia & New ZealandBanking Group Ltd 0.800 29/08/2024 10,599 0.39
24,160 Australia & New ZealandBanking Group Ltd 0.802 16/01/2025 15,504 0.57
1,000 Commonwealth Bank ofAustralia 0.840 25/04/2023 640 0.02
3,000 Commonwealth Bank ofAustralia 0.969 16/08/2023 1,929 0.07
2,000 Commonwealth Bank ofAustralia 1.170 11/01/2024 1,295 0.05
2,000 National Australia Bank Ltd 0.939 16/05/2023 1,283 0.05
32,500 National Australia Bank Ltd 0.960 26/09/2023 20,897 0.77
5,000 National Australia Bank Ltd 1.080 26/02/2024 3,230 0.12
19,500 National Australia Bank Ltd 0.949 19/06/2024 12,578 0.46
21,683 National Australia Bank Ltd 0.810 21/01/2025 13,920 0.51
12,750 Toyota Finance Australia Ltd 0.250 09/04/2024 12,901 0.47
3,000 Westpac Banking Corp 0.989 16/11/2023 1,931 0.07
15,000 Westpac Banking Corp 1.180 24/04/2024 9,728 0.36
28,200 Westpac Banking Corp 0.919 16/08/2024 18,180 0.67
15,110 Westpac Banking Corp 1.150 03/06/2026 12,397 0.45
150,534 5.53
Austria - 0.27%
9,250 Oesterreichische Kontrollbank 0.500 02/02/2026 7,475 0.27
7,475 0.27
Belgium - 0.12%
3,376 Euroclear Bank SA 0.250 07/09/2022 3,403 0.12
3,403 0.12
Canada - 8.21%
5,000 Bank of Montreal 0.007 28/09/2021 5,009 0.18
9,000 Bank of Montreal 4.609 10/09/2025 6,962 0.26
5,000 Bank of Nova Scotia 1.900 02/12/2021 3,423 0.13
3,571 Bank of Nova Scotia 1.250 08/06/2022 4,198 0.15
10,880 Bank of Nova Scotia 0.957 08/09/2022 6,943 0.25
9,262 Bank of Nova Scotia 1.750 23/12/2022 11,000 0.40
6,000 Bank of Nova Scotia 1.017 07/09/2023 3,850 0.14
4,000 Canadian Imperial Bank ofCommerce 2.900 14/09/2021 2,736 0.10
15,000 Canadian Imperial Bank ofCommerce 2.040 21/03/2022 10,325 0.38
5,000 Canadian Imperial Bank ofCommerce 2.300 11/07/2022 3,466 0.13
17,300 Canadian Imperial Bank ofCommerce 3.300 26/05/2025 12,718 0.47
65,143 Royal Bank of Canada 1.968 02/03/2022 44,776 1.64
24,000 Royal Bank of Canada 2.000 21/03/2022 16,514 0.61
17,000 Royal Bank of Canada 4.930 16/07/2025 13,274 0.49
35,840 Toronto-Dominion Bank 1.994 23/03/2022 24,661 0.90
24,700 Toronto-Dominion Bank 3.005 30/05/2023 17,543 0.64
10,317 Toronto-Dominion Bank 0.750 11/09/2025 8,404 0.31
11,000 Toronto-Dominion Bank 1.128 09/12/2025 7,357 0.27
10,700 Toronto-Dominion Bank 0.750 06/01/2026 8,701 0.32
5,600 Total Capital Canada Ltd 1.125 18/03/2022 5,671 0.21
Face Value(000's)
CouponRate %
MaturityDate
Value (000's)EUR
% of NetAssetValue
Corporate Bonds (continued)
Canada - 8.21% (continued)
6,000 Toyota Credit Canada Inc 2.020 28/02/2022 4,123 0.15
3,000 Toyota Credit Canada Inc 2.350 18/07/2022 2,079 0.08
223,733 8.21
Finland - 0.14%
615 Nordea Bank Abp 0.750 28/08/2025 501 0.02
1,140 OP Corporate Bank PLC 0.375 11/10/2022 1,152 0.04
2,000 OP Corporate Bank PLC 0.375 29/08/2023 2,031 0.08
3,684 0.14
France - 4.44%
14,250 Dexia Credit Local SA 0.250 02/06/2022 14,364 0.53
11,700 Dexia Credit Local SA 1.125 15/06/2022 13,748 0.51
3,000 Dexia Credit Local SA 0.750 25/01/2023 3,063 0.11
58,310 Dexia Credit Local SA 1.125 09/04/2026 48,267 1.77
7,000 Sanofi 0.000 21/03/2022 7,024 0.26
24,800 Sanofi 0.500 21/03/2023 25,156 0.92
118 Total Capital International SA 2.875 17/02/2022 99 -
8,800 Total Capital International SA 2.125 15/03/2023 9,199 0.34
120,920 4.44
Germany - 5.06%
3,500 Deutsche Bahn Finance GmbH 3.750 01/06/2021 3,500 0.13
7,000 FMS Wertmanagement 1.125 07/09/2023 8,307 0.30
140,500 Kreditanstalt fuer Wiederaufbau 1.625 03/04/2024 14,050 0.52
100,000 Kreditanstalt fuer Wiederaufbau 1.125 08/08/2025 9,786 0.36
60,260 Kreditanstalt fuer Wiederaufbau 0.625 22/01/2026 49,101 1.80
8,700 Kreditanstalt fuer Wiederaufbau 0.750 19/02/2026 5,822 0.21
8,775 LandeskreditbankBaden-WuerttembergFoerderbank 0.500 08/12/2025 7,099 0.26
32,300 LandwirtschaftlicheRentenbank 0.875 30/03/2026 26,563 0.98
2,800 LandwirtschaftlicheRentenbank 4.750 06/05/2026 2,090 0.08
14,000 NRW Bank 0.875 09/03/2026 11,477 0.42
137,795 5.06
Luxembourg - 1.93%
1,000 Nestle Finance InternationalLtd 0.750 16/05/2023 1,019 0.04
38,400 Novartis Finance SA 0.500 14/08/2023 39,035 1.43
12,500 Novartis Finance SA 0.125 20/09/2023 12,635 0.46
52,689 1.93
Netherlands - 1.77%
56,000 Cooperatieve Rabobank UA 1.625 20/01/2022 5,532 0.20
5,500 Cooperatieve Rabobank UA 0.500 06/12/2022 5,577 0.20
13,171 Shell International Finance BV 1.250 15/03/2022 13,347 0.49
8,000 Shell International Finance BV 1.000 06/04/2022 8,096 0.30
4,000 Toyota Motor FinanceNetherlands BV 0.163 30/09/2021 4,008 0.15
11,450 Toyota Motor FinanceNetherlands BV 0.625 26/09/2023 11,687 0.43
48,247 1.77
New Zealand - 0.41%
3,750 ASB Finance Ltd 0.500 10/06/2022 3,787 0.14
9,000 Bank of New Zealand 1.000 03/03/2026 7,322 0.27
11,109 0.41
Norway - 0.09%
2,413 Equinor ASA 0.875 17/02/2023 2,456 0.09
2,456 0.09
Singapore - 0.47%
1,000 DBS Bank Ltd 0.667 13/09/2022 636 0.02
10,034 Temasek Financial I Ltd 0.500 01/03/2022 10,091 0.37
Global Short Fixed Income FundPortfolio of Investments as at 31 May 2021
Dimensional Fund Advisors Semi-Annual Report and Unaudited Financial Statements, 31 May 2021 152

Face Value(000's)
CouponRate %
MaturityDate
Value (000's)EUR
% of NetAssetValue
Corporate Bonds (continued)
Singapore - 0.47% (continued)
1,000 Temasek Financial I Ltd 4.625 26/07/2022 1,221 0.05
1,200 United Overseas Bank Ltd 0.570 25/07/2022 762 0.03
12,710 0.47
Supranational - 17.38%
39,500 African Development Bank 0.875 23/03/2026 32,390 1.19
27,650 Asian Development Bank 0.500 04/02/2026 22,369 0.82
65,086 Asian Development Bank 1.000 14/04/2026 53,765 1.97
4,800 Asian Development Bank 0.500 05/05/2026 2,962 0.11
15,773 Asian Infrastructure InvestmentBank 0.500 27/01/2026 12,729 0.47
9,395 Asian Infrastructure InvestmentBank 1.000 06/05/2026 5,941 0.22
17,877 European Bank forReconstruction & Development 0.500 25/11/2025 14,491 0.53
74,312 European Bank forReconstruction & Development 0.500 28/01/2026 60,154 2.21
29,938 European Investment Bank 0.359 15/01/2025 35,083 1.29
5,000 European Investment Bank 1.049 08/09/2025 6,032 0.22
38,500 European Investment Bank 0.375 26/03/2026 30,904 1.13
3,000 Inter-American DevelopmentBank 0.750 15/10/2025 2,010 0.07
800 Inter-American DevelopmentBank 2.750 30/10/2025 548 0.02
8,749Inter-American DevelopmentBank 4.400 26/01/2026 6,814 0.25
85,265 Inter-American DevelopmentBank 0.875 20/04/2026 70,147 2.58
39,883 Inter-American Investment 0.625 10/02/2026 32,284 1.18
82,000 International Bank forReconstruction & Development 0.375 17/07/2023 8,147 0.30
10,000 International Bank forReconstruction & Development 1.750 06/11/2024 1,002 0.04
10,000 International Bank forReconstruction & Development 0.750 02/07/2025 6,720 0.25
14,018 International Bank forReconstruction & Development 0.500 28/10/2025 11,381 0.42
10,000 International Bank forReconstruction & Development 2.900 26/11/2025 6,892 0.25
55,805 International Bank forReconstruction & Development 0.625 14/01/2026 37,102 1.36
85,000 International Bank forReconstruction & Development 1.250 16/03/2026 8,325 0.31
300 International Bank forReconstruction & Development 0.500 18/05/2026 185 0.01
42,450 Nordic Investment Bank 1.875 10/04/2024 4,268 0.16
850 Nordic Investment Bank 0.500 21/01/2026 687 0.02
473,332 17.38
Sweden - 0.10%
1,800 Skandinaviska EnskildaBanken AB 0.850 02/09/2025 1,462 0.06
1,000 Svensk Exportkredit AB 1.375 15/12/2022 1,184 0.04
2,646 0.10
United Kingdom - 0.24%
5,500 Transport for London 2.250 09/08/2022 6,542 0.24
6,542 0.24
United States - 5.60%
14,500 3M Co 0.950 15/05/2023 14,867 0.55
8,000 Amazon.com Inc 1.000 12/05/2026 6,560 0.24
27,787 Apple 0.700 08/02/2026 22,586 0.83
4,450 Apple Inc 1.000 10/11/2022 4,541 0.17
2,197 Apple Inc 1.375 17/01/2024 2,295 0.08
15,890 Berkshire Hathaway Inc 0.625 17/01/2023 16,111 0.59
7,899 Berkshire Hathaway Inc 0.750 16/03/2023 8,025 0.29
Face Value(000's)
CouponRate %
MaturityDate
Value (000's)EUR
% of NetAssetValue
Corporate Bonds (continued)
United States - 5.60% (continued)
8,906 Berkshire Hathaway Inc 1.300 15/03/2024 9,237 0.34
5,000 Berkshire Hathaway Inc 3.125 15/03/2026 4,498 0.17
5,960 Chevron Corp 1.554 11/05/2025 5,049 0.19
458 Chevron USA Inc 0.687 12/08/2025 374 0.01
13,722 Merck & Co Inc 0.750 24/02/2026 11,183 0.41
8,700 National Securities Clearing 1.500 23/04/2025 7,297 0.27
4,050 National Securities Clearing 0.750 07/12/2025 3,285 0.12
6,350 Nestle Holdings Inc 0.625 15/01/2026 5,130 0.19
5,608 Pfizer Inc 0.250 06/03/2022 5,637 0.21
5,100 Procter & Gamble Co 1.125 02/11/2023 5,281 0.19
394 Procter & Gamble Co 1.000 23/04/2026 326 0.01
1,600 Roche Holdings Inc 2.625 15/05/2026 1,410 0.05
3,900 Toyota Motor Credit Corp 0.750 21/07/2022 3,951 0.14
3,000 Toyota Motor Credit Corp 2.375 01/02/2023 3,137 0.12
13,100 Visa Inc 3.150 14/12/2025 11,786 0.43
152,566 5.60
Total Corporate Bonds - 51.76% (30 November 2020: 66.00%) 1,409,841 51.76
Government Bonds
Australia - 3.74%
64,400 Australia Government Bond 0.250 21/11/2025 40,087 1.47
32,800 Australia Government Bond 4.250 21/04/2026 24,294 0.89
4,000 New South Wales Treasury 4.000 20/05/2026 2,922 0.11
55,190 Treasury Corp of Victoria 0.500 20/11/2025 34,585 1.27
101,888 3.74
Canada - 11.52%
2,000 Canada Housing Trust No 1 1.950 15/12/2025 1,411 0.05
117,200 Canadian Government Bond 0.250 01/03/2026 77,111 2.83
14,400 CPPIB Capital Inc 0.375 29/07/2025 11,638 0.43
12,183 Export Development Canada 0.359 29/05/2024 14,240 0.52
50,000 Province of Alberta Canada 2.350 01/06/2025 35,701 1.31
20,000 Province of Manitoba Canada 4.400 05/09/2025 15,446 0.57
850 Province of Manitoba Canada 7.750 22/12/2025 745 0.03
46,500 Province of Ontario Canada 0.485 21/08/2023 31,746 1.17
45,500 Province of Ontario Canada 0.625 21/01/2026 36,869 1.35
19,250 Province of Ontario Canada 1.050 14/04/2026 15,861 0.58
1,900 Province of Ontario Canada 2.500 27/04/2026 1,673 0.06
52,000 Province of Quebec Canada 0.840 13/10/2024 36,034 1.32
48,500 Province of Quebec Canada 2.750 01/09/2025 35,287 1.30
313,762 11.52
Denmark - 1.31%
5,800 Kommunekredit 0.625 10/06/2025 4,747 0.18
38,144 Kommunekredit 0.500 28/01/2026 30,858 1.13
35,605 1.31
Finland - 1.10%
36,714 Kuntarahoitus Oyj 0.625 20/03/2026 29,864 1.10
29,864 1.10
France - 4.59%
40,600 Agence Francaise deDeveloppement EPIC 0.625 22/01/2026 32,906 1.21
69,880Caisse d'Amortissement de laDette Sociale 0.625 18/02/2026 56,812 2.09
28,800 SFIL 0.625 09/02/2026 23,300 0.85
10,000 SNCF Reseau 5.500 01/12/2021 11,942 0.44
124,960 4.59
Germany - 2.45%
80,900 State of NorthRhine-Westphalia Germany 1.000 21/04/2026 66,751 2.45
66,751 2.45
Global Short Fixed Income FundPortfolio of Investments as at 31 May 2021 (continued)
Dimensional Fund Advisors Semi-Annual Report and Unaudited Financial Statements, 31 May 2021 153

Face Value(000's)
CouponRate %
MaturityDate
Value (000's)EUR
% of NetAssetValue
Government Bonds (continued)
Netherlands - 1.95%
30,000 BNG Bank NV 2.375 16/03/2026 26,343 0.97
32,614 BNG Bank NV 0.875 18/05/2026 26,749 0.98
53,092 1.95
New Zealand - 1.41%
25,350 New Zealand GovernmentBond 2.750 15/04/2025 16,150 0.59
38,450 New Zealand GovernmentBond 0.500 15/05/2026 22,167 0.82
38,317 1.41
Norway - 4.72%
13,700 Kommunalbanken 0.500 13/01/2026 11,083 0.41
190,000 Kommunalbanken AS 0.125 21/03/2022 18,791 0.69
205,000 Kommunalbanken AS 1.500 19/04/2022 20,280 0.74
121,000 Norway Government Bond 1.750 13/03/2025 12,226 0.45
662,000 Norway Government Bond 1.500 19/02/2026 66,231 2.43
128,611 4.72
Sweden - 0.35%
95,230 Kommuninvest I Sverige AB 1.000 13/11/2023 9,641 0.35
9,641 0.35
Face Value(000's)
CouponRate %
MaturityDate
Value (000's)EUR
% of NetAssetValue
Government Bonds (continued)
United States - 12.84%
31,905 Federal Home Loan Mortgage 0.375 23/09/2025 25,864 0.95
38,700 Federal National MortgageAssociation 0.375 25/08/2025 31,380 1.15
33,784 Federal National MortgageAssociation 0.500 07/11/2025 27,463 1.01
3,243 Federal National MortgageAssociation 2.125 24/04/2026 2,831 0.10
15,000 United States Treasury Note 0.375 31/12/2025 12,116 0.44
62,000 United States Treasury Note 0.375 31/01/2026 50,001 1.84
39,000 United States Treasury Note 0.500 28/02/2026 31,613 1.16
101,000 United States Treasury Note 0.750 31/03/2026 82,760 3.04
89,000 United States Treasury Note 0.750 30/04/2026 72,858 2.68
15,000 United States Treasury Note 1.625 15/05/2026 12,795 0.47
349,681 12.84
Total Government Bonds - 45.98% (30 November2020: 32.68%) 1,252,172 45.98
Total Investments - 97.74% (30 November 2020: 98.68%) 2,662,013 97.74
Forward Currency Contracts
Buy Amount (000's) Sell Amount (000's) Counterparty Maturity Date
UnrealisedAppreciation/(Depreciation)
of Contracts (000's)EUR
% of NetAssetValue
Buy 8,695 AUD Sell 5,587 EUR State Street Bank 04/06/2021 (90) -
Buy 16,845 CAD Sell 11,417 EUR State Street Bank 15/06/2021 14 -
Buy 11,913 CAD Sell 8,098 EUR State Street Bank 16/06/2021 (14) -
Buy 6,789 CAD Sell 4,618 EUR State Street Bank 12/07/2021 (13) -
Buy 17,290 CHF Sell 15,670 EUR State Street Bank 09/06/2021 94 -
Buy 1,434 CHF Sell 1,309 EUR State Street Bank 09/06/2021 (2) -
Buy 17,417 CHF Sell 15,778 EUR State Street Bank 11/06/2021 102 -
Buy 89 CHF Sell 81 EUR State Street Bank 11/06/2021 - -
Buy 84,526 EUR Sell 133,050 AUD Citibank 01/07/2021 453 0.02
Buy 13,428 EUR Sell 21,008 AUD State Street Bank 04/06/2021 148 -
Buy 89,081 EUR Sell 137,780 AUD State Street Bank 24/06/2021 2,011 0.07
Buy 80,756 EUR Sell 125,602 AUD UBS 04/06/2021 1,359 0.05
Buy 98,156 EUR Sell 146,353 CAD Citibank 16/06/2021 (1,160) (0.04)
Buy 98,063 EUR Sell 144,713 CAD Citibank 02/07/2021 (109) -
Buy 15,191 EUR Sell 22,392 CAD HSBC Bank 11/06/2021 (6) -
Buy 102,429 EUR Sell 151,159 CAD Morgan Stanley 12/07/2021 (95) -
Buy 97,484 EUR Sell 145,354 CAD Natwest Markets 15/06/2021 (1,157) (0.04)
Buy 20,317 EUR Sell 30,029 CAD State Street Bank 11/06/2021 (63) -
Buy 11,591 EUR Sell 17,027 CAD State Street Bank 11/06/2021 35 -
Buy 41,882 EUR Sell 62,698 CAD UBS 11/06/2021 (670) (0.02)
Buy 7 EUR Sell 7 CHF State Street Bank 01/06/2021 - -
Buy 317 EUR Sell 347 CHF State Street Bank 09/06/2021 - -
Buy 62,317 EUR Sell 53,688 GBP Citibank 25/06/2021 (137) -
Buy 4 EUR Sell 4 GBP State Street Bank 01/06/2021 - -
Buy 643 EUR Sell 553 GBP State Street Bank 02/06/2021 - -
Buy 1,353 EUR Sell 1,166 GBP State Street Bank 03/06/2021 (4) -
Buy 344 EUR Sell 299 GBP State Street Bank 07/06/2021 (4) -
Buy 77,981 EUR Sell 67,874 GBP State Street Bank 10/06/2021 (997) (0.04)
Buy 48,434 EUR Sell 42,118 GBP State Street Bank 11/06/2021 (573) (0.02)
Buy 1,216 EUR Sell 1,053 GBP State Street Bank 11/06/2021 (9) -
Buy 2 EUR Sell 2 GBP State Street Bank 11/06/2021 - -
Buy 857 EUR Sell 741 GBP State Street Bank 16/06/2021 (3) -
Global Short Fixed Income FundPortfolio of Investments as at 31 May 2021 (continued)
Dimensional Fund Advisors Semi-Annual Report and Unaudited Financial Statements, 31 May 2021 154

Forward Currency Contracts (continued)
Buy Amount (000's) Sell Amount (000's) Counterparty Maturity Date
UnrealisedAppreciation/(Depreciation)
of Contracts (000's)EUR
% of NetAssetValue
Buy 183 EUR Sell 157 GBP State Street Bank 16/06/2021 - -
Buy 60,126 EUR Sell 51,871 GBP State Street Bank 24/06/2021 (216) (0.01)
Buy 519 EUR Sell 446 GBP State Street Bank 24/06/2021 - -
Buy 24 EUR Sell 20 GBP State Street Bank 24/06/2021 - -
Buy 65,121 EUR Sell 8,687,074 JPY Citibank 01/06/2021 263 0.01
Buy 3,671 EUR Sell 488,700 JPY State Street Bank 01/06/2021 23 -
Buy 69,138 EUR Sell 9,217,853 JPY State Street Bank 01/06/2021 316 0.01
Buy 4,482 EUR Sell 600,250 JPY State Street Bank 02/06/2021 - -
Buy 1,909 EUR Sell 248,388 JPY State Street Bank 07/06/2021 55 -
Buy 2 EUR Sell 293 JPY State Street Bank 07/06/2021 - -
Buy 5,787 EUR Sell 761,483 JPY State Street Bank 10/06/2021 102 -
Buy 363 EUR Sell 48,350 JPY State Street Bank 11/06/2021 2 -
Buy 2,162 EUR Sell 21,884 NOK Bank of America Merrill Lynch 17/06/2021 17 -
Buy 17,140 EUR Sell 174,739 NOK Citibank 01/06/2021 6 -
Buy 123,091 EUR Sell 1,237,769 NOK Citibank 18/06/2021 1,756 0.06
Buy 27,054 EUR Sell 276,210 NOK JPMorgan 01/06/2021 (30) -
Buy 17,328 EUR Sell 173,140 NOK Natwest Markets 17/06/2021 356 0.01
Buy 7 EUR Sell 72 NOK State Street Bank 01/06/2021 - -
Buy 107 EUR Sell 1,090 NOK State Street Bank 02/06/2021 - -
Buy 81 EUR Sell 807 NOK State Street Bank 07/06/2021 2 -
Buy 1,597 EUR Sell 16,353 NOK State Street Bank 17/06/2021 (6) -
Buy 16,356 EUR Sell 27,418 NZD Citibank 15/06/2021 74 -
Buy 2,885 EUR Sell 4,838 NZD Natwest Markets 15/06/2021 12 -
Buy 9,732 EUR Sell 16,297 NZD State Street Bank 15/06/2021 53 -
Buy 9,487 EUR Sell 16,068 NZD State Street Bank 15/06/2021 (55) -
Buy 18,881 EUR Sell 191,059 SEK Bank of America Merrill Lynch 11/06/2021 16 -
Buy 32,423 EUR Sell 330,239 SEK Barclays Bank 29/06/2021 (178) (0.01)
Buy 4 EUR Sell 39 SEK State Street Bank 01/06/2021 - -
Buy 85 EUR Sell 864 SEK State Street Bank 07/06/2021 - -
Buy 33 EUR Sell 337 SEK State Street Bank 11/06/2021 - -
Buy 3 EUR Sell 31 SEK State Street Bank 16/06/2021 - -
Buy 961 EUR Sell 9,740 SEK State Street Bank 29/06/2021 (1) -
Buy 58,761 EUR Sell 93,973 SGD JPMorgan 22/06/2021 518 0.02
Buy 25 EUR Sell 41 SGD State Street Bank 02/06/2021 - -
Buy 2 EUR Sell 4 SGD State Street Bank 11/06/2021 - -
Buy 129 EUR Sell 210 SGD State Street Bank 18/06/2021 (1) -
Buy 112,445 EUR Sell 135,576 USD Bank of America Merrill Lynch 18/06/2021 1,302 0.05
Buy 118,186 EUR Sell 144,977 USD Bank of America Merrill Lynch 01/07/2021 (635) (0.02)
Buy 116,901 EUR Sell 142,660 USD Bank of America Merrill Lynch 07/07/2021 (7) -
Buy 24,325 EUR Sell 29,604 USD Bank of New York Mellon 10/06/2021 52 -
Buy 23,501 EUR Sell 28,578 USD Barclays Bank 10/06/2021 70 -
Buy 20,849 EUR Sell 25,440 USD Barclays Bank 25/06/2021 (4) -
Buy 17,716 EUR Sell 21,671 USD HSBC Bank 16/06/2021 (50) -
Buy 25,620 EUR Sell 31,220 USD HSBC Bank 16/06/2021 25 -
Buy 51,294 EUR Sell 61,657 USD JPMorgan 01/06/2021 733 0.03
Buy 32,108 EUR Sell 39,055 USD JPMorgan 16/06/2021 90 -
Buy 114,696 EUR Sell 139,253 USD Natwest Markets 15/06/2021 531 0.02
Buy 117,564 EUR Sell 141,327 USD Natwest Markets 21/06/2021 1,712 0.06
Buy 56,110 EUR Sell 67,996 USD Royal Bank of Canada 10/06/2021 359 0.01
Buy 67,634 EUR Sell 81,464 USD State Street Bank 01/06/2021 831 0.02
Buy 12 EUR Sell 14 USD State Street Bank 01/06/2021 - -
Buy 124 EUR Sell 152 USD State Street Bank 07/06/2021 (1) -
Buy 68 EUR Sell 82 USD State Street Bank 08/06/2021 - -
Buy 2,619 EUR Sell 3,203 USD State Street Bank 10/06/2021 (7) -
Buy 17,389 EUR Sell 21,196 USD State Street Bank 10/06/2021 11 -
Buy 3 EUR Sell 3 USD State Street Bank 14/06/2021 - -
Global Short Fixed Income FundPortfolio of Investments as at 31 May 2021 (continued)
Dimensional Fund Advisors Semi-Annual Report and Unaudited Financial Statements, 31 May 2021 155

Forward Currency Contracts (continued)
Buy Amount (000's) Sell Amount (000's) Counterparty Maturity Date
UnrealisedAppreciation/(Depreciation)
of Contracts (000's)EUR
% of NetAssetValue
Buy 39 EUR Sell 47 USD State Street Bank 14/06/2021 - -
Buy 23,278 EUR Sell 28,144 USD State Street Bank 16/06/2021 205 0.01
Buy 20,366 EUR Sell 24,910 USD State Street Bank 16/06/2021 (56) -
Buy 112,722 EUR Sell 135,491 USD State Street Bank 17/06/2021 1,646 0.06
Buy 111,642 EUR Sell 135,735 USD State Street Bank 22/06/2021 377 0.01
Buy 117,141 EUR Sell 142,619 USD State Street Bank 24/06/2021 237 0.01
Buy 38,173 EUR Sell 46,692 USD State Street Bank 25/06/2021 (99) -
Buy 120 EUR Sell 146 USD State Street Bank 30/06/2021 - -
Buy 119,196 EUR Sell 145,667 USD UBS 28/06/2021 (196) (0.01)
Buy 82,772 GBP Sell 95,756 EUR Bank of America Merrill Lynch 03/06/2021 569 0.02
Buy 8,576 GBP Sell 9,930 EUR Bank of America Merrill Lynch 11/06/2021 48 -
Buy 17,617 GBP Sell 20,245 EUR Bank of New York Mellon 11/06/2021 254 0.01
Buy 15,925 GBP Sell 18,540 EUR Bank of New York Mellon 11/06/2021 (11) -
Buy 84,006 GBP Sell 96,513 EUR Citibank 11/06/2021 1,234 0.05
Buy 83,695 GBP Sell 96,223 EUR Citibank 14/06/2021 1,157 0.04
Buy 9,990 GBP Sell 11,486 EUR HSBC Bank 10/06/2021 138 0.01
Buy 304 GBP Sell 352 EUR State Street Bank 01/06/2021 2 -
Buy 2,367 GBP Sell 2,732 EUR State Street Bank 03/06/2021 22 -
Buy 530 GBP Sell 617 EUR State Street Bank 03/06/2021 - -
Buy 84,686 GBP Sell 98,120 EUR State Street Bank 07/06/2021 426 0.02
Buy 45,491 GBP Sell 52,642 EUR State Street Bank 10/06/2021 292 0.01
Buy 2,921 GBP Sell 3,401 EUR State Street Bank 10/06/2021 (2) -
Buy 8,436 GBP Sell 9,692 EUR State Street Bank 11/06/2021 121 -
Buy 937 GBP Sell 1,078 EUR State Street Bank 11/06/2021 13 -
Buy 1,133 GBP Sell 1,301 EUR State Street Bank 14/06/2021 17 -
Buy 8,064 GBP Sell 9,278 EUR State Street Bank 16/06/2021 104 -
Buy 84,763 GBP Sell 97,497 EUR State Street Bank 16/06/2021 1,122 0.04
Buy 23 GBP Sell 26 EUR State Street Bank 16/06/2021 - -
Buy 85,241 GBP Sell 98,823 EUR State Street Bank 24/06/2021 338 0.01
Buy 5,904 GBP Sell 6,840 EUR State Street Bank 24/06/2021 28 -
Buy 10,965 GBP Sell 12,725 EUR State Street Bank 25/06/2021 31 -
Buy 9,806,619 JPY Sell 74,920 EUR Bank of New York Mellon 10/06/2021 (1,711) (0.06)
Buy 9,806,619 JPY Sell 74,892 EUR Bank of New York Mellon 11/06/2021 (1,683) (0.06)
Buy 8,250,660 JPY Sell 62,312 EUR Barclays Bank 24/06/2021 (728) (0.03)
Buy 9,152,944 JPY Sell 69,140 EUR Barclays Bank 24/06/2021 (821) (0.03)
Buy 9,188,853 JPY Sell 70,437 EUR Citibank 01/06/2021 (1,832) (0.07)
Buy 8,687,074 JPY Sell 65,095 EUR Citibank 07/07/2021 (263) (0.01)
Buy 7,260,624 JPY Sell 55,657 EUR HSBC Bank 01/06/2021 (1,448) (0.05)
Buy 8,422,481 JPY Sell 64,419 EUR JPMorgan 07/06/2021 (1,540) (0.06)
Buy 10,142,689 JPY Sell 77,559 EUR JPMorgan 07/06/2021 (1,839) (0.07)
Buy 9,185,630 JPY Sell 70,199 EUR Natwest Markets 10/06/2021 (1,625) (0.06)
Buy 8,152,837 JPY Sell 61,987 EUR Natwest Markets 14/06/2021 (1,126) (0.04)
Buy 1,426,450 JPY Sell 10,832 EUR State Street Bank 01/06/2021 (181) -
Buy 29,000 JPY Sell 219 EUR State Street Bank 01/06/2021 (3) -
Buy 725,700 JPY Sell 5,466 EUR State Street Bank 07/06/2021 (48) -
Buy 9,013,804 JPY Sell 69,109 EUR State Street Bank 09/06/2021 (1,818) (0.06)
Buy 22,000 JPY Sell 166 EUR State Street Bank 10/06/2021 (2) -
Buy 838,900 JPY Sell 6,332 EUR State Street Bank 14/06/2021 (70) -
Buy 8,868,655 JPY Sell 67,068 EUR State Street Bank 15/06/2021 (864) (0.03)
Buy 9,055,653 JPY Sell 68,715 EUR State Street Bank 16/06/2021 (1,116) (0.04)
Buy 66,000 JPY Sell 498 EUR State Street Bank 24/06/2021 (4) -
Buy 649,950 JPY Sell 4,895 EUR State Street Bank 24/06/2021 (43) -
Buy 600,250 JPY Sell 4,480 EUR State Street Bank 07/07/2021 - -
Buy 9,217,853 JPY Sell 69,109 EUR State Street Bank 07/07/2021 (316) (0.01)
Buy 127,800 NOK Sell 12,870 EUR Bank of America Merrill Lynch 01/06/2021 (339) (0.01)
Buy 120,397 NOK Sell 12,021 EUR Bank of America Merrill Lynch 07/06/2021 (218) (0.01)
Global Short Fixed Income FundPortfolio of Investments as at 31 May 2021 (continued)
Dimensional Fund Advisors Semi-Annual Report and Unaudited Financial Statements, 31 May 2021 156

Forward Currency Contracts (continued)
Buy Amount (000's) Sell Amount (000's) Counterparty Maturity Date
UnrealisedAppreciation/(Depreciation)
of Contracts (000's)EUR
% of NetAssetValue
Buy 120,233 NOK Sell 11,957 EUR Bank of America Merrill Lynch 09/06/2021 (169) (0.01)
Buy 68,200 NOK Sell 6,809 EUR Bank of America Merrill Lynch 10/06/2021 (122) -
Buy 20,000 NOK Sell 1,999 EUR Barclays Bank 10/06/2021 (38) -
Buy 174,739 NOK Sell 17,130 EUR Citibank 06/07/2021 (6) -
Buy 16,994 NOK Sell 1,696 EUR HSBC Bank 10/06/2021 (30) -
Buy 276,210 NOK Sell 27,050 EUR JPMorgan 10/06/2021 30 -
Buy 46,939 NOK Sell 4,670 EUR State Street Bank 01/06/2021 (68) -
Buy 1,465 NOK Sell 146 EUR State Street Bank 07/06/2021 (3) -
Buy 304 NOK Sell 31 EUR State Street Bank 09/06/2021 (1) -
Buy 91 NOK Sell 9 EUR State Street Bank 09/06/2021 - -
Buy 70,762 NOK Sell 7,011 EUR State Street Bank 10/06/2021 (75) -
Buy 6,250 NOK Sell 612 EUR State Street Bank 10/06/2021 1 -
Buy 1,090 NOK Sell 107 EUR State Street Bank 06/07/2021 - -
Buy 27,853 SEK Sell 2,738 EUR HSBC Bank 16/06/2021 12 -
Buy 124,979 SEK Sell 12,327 EUR Morgan Stanley 07/06/2021 14 -
Buy 9,740 SEK Sell 961 EUR State Street Bank 01/06/2021 1 -
Buy 3,173 SEK Sell 312 EUR State Street Bank 07/06/2021 1 -
Buy 28,057 SEK Sell 2,773 EUR State Street Bank 11/06/2021 (3) -
Buy 39 SEK Sell 4 EUR State Street Bank 11/06/2021 - -
Buy 171,195 SEK Sell 16,810 EUR State Street Bank 29/06/2021 90 -
Buy 150,172 SEK Sell 14,838 EUR State Street Bank 29/06/2021 (14) -
Buy 31,996 SGD Sell 19,977 EUR Bank of New York Mellon 22/06/2021 (147) (0.01)
Buy 39,982 SGD Sell 25,000 EUR Citibank 22/06/2021 (220) (0.01)
Buy 27,507 SGD Sell 17,162 EUR HSBC Bank 11/06/2021 (110) -
Buy 225 SGD Sell 141 EUR State Street Bank 11/06/2021 - -
Buy 203 SGD Sell 124 EUR State Street Bank 11/06/2021 1 -
Buy 28,369 SGD Sell 17,457 EUR State Street Bank 18/06/2021 126 -
Buy 21,996 SGD Sell 13,743 EUR State Street Bank 22/06/2021 (110) -
Buy 143,121 USD Sell 117,360 EUR Bank of America Merrill Lynch 01/06/2021 6 -
Buy 146 USD Sell 120 EUR State Street Bank 02/06/2021 - -
Buy 15,098 USD Sell 12,324 EUR State Street Bank 03/06/2021 57 -
Buy 12,945 USD Sell 10,727 EUR State Street Bank 07/06/2021 (113) -
Buy 68,415 USD Sell 56,757 EUR State Street Bank 08/06/2021 (660) (0.02)
Buy 67,727 USD Sell 55,778 EUR State Street Bank 14/06/2021 (253) (0.01)
Buy 625 USD Sell 512 EUR State Street Bank 14/06/2021 1 -
Buy 12,938 USD Sell 10,574 EUR State Street Bank 30/06/2021 30 -
Unrealised Appreciation of Forward Currency Contracts 22,254 0.74
Unrealised Depreciation of Forward Currency Contracts (28,441) (0.97)
Net Unrealised Depreciation of Forward Currency Contracts - (0.23)% (30 November 2020: (0.31)%) (6,187) (0.23)
Value (000's)EUR
% of NetAssetValue
Cash and Cash Equivalents - 1.55% (30 November 2020: 1.26%) 42,100 1.55Other Assets in Excess of Other Liabilities - 0.94% (30 November 2020: 0.37%) 25,749 0.94
Total Net Assets 2,723,675 100.00
Amounts designated as “- “ are either €0 or less than €500.
Analysis of Total Assets % of Total Assets
Transferable securities admitted to an official exchange listing 75.49
Transferable securities dealt in on another regulated market 8.57
Other transferable securities of the type referred to in Regulations 68 (1)(a), (b) and (c) 11.42
OTC Financial derivative instruments 0.80
Current Assets 3.72
Total Assets 100.00
Global Short Fixed Income FundPortfolio of Investments as at 31 May 2021 (continued)
Dimensional Fund Advisors Semi-Annual Report and Unaudited Financial Statements, 31 May 2021 157

Face Value(000's)
CouponRate %
MaturityDate
Value (000's)USD
% of NetAssetValue
Corporate Bonds
Australia - 1.90%
2,000 Australia & New ZealandBanking Group Ltd 0.800 29/08/2024 1,567 0.11
1,846 BHP Billiton Finance Ltd 0.750 28/10/2022 2,277 0.16
4,000 Commonwealth Bank ofAustralia 0.500 11/07/2022 4,930 0.34
3,670 Macquarie Bank Ltd 2.300 22/01/2025 3,835 0.27
2,000 National Australia Bank Ltd 0.949 19/06/2024 1,573 0.11
4,000 National Australia Bank Ltd 0.810 21/01/2025 3,131 0.22
4,730 Telstra Corp Ltd 2.500 15/09/2023 6,130 0.42
2,000 Westpac Banking Corp 1.180 24/04/2024 1,582 0.11
3,000 Westpac Banking Corp 0.919 16/08/2024 2,358 0.16
27,383 1.90
Canada - 3.06%
5,000 Bank of Montreal 1.027 07/09/2023 3,913 0.27
2,000 Bank of Nova Scotia 3.400 11/02/2024 2,154 0.15
8,200 Bank of Nova Scotia 1.050 02/03/2026 8,148 0.57
2,000 Canadian Imperial Bank ofCommerce 0.375 03/05/2024 2,472 0.17
3,834 Canadian Natural ResourcesLtd 2.950 15/01/2023 3,985 0.28
559 Canadian Natural ResourcesLtd 3.900 01/02/2025 609 0.04
4,776 Canadian Natural ResourcesLtd 2.050 15/07/2025 4,902 0.34
4,000 Enbridge Inc 2.500 15/01/2025 4,204 0.29
750 National Bank of Canada 2.150 07/10/2022 769 0.05
11,100 Royal Bank of Canada 0.875 20/01/2026 10,986 0.76
2,000 Toronto-Dominion Bank 0.750 06/01/2026 1,983 0.14
44,125 3.06
Denmark - 0.58%
200 Danske Bank AS 5.000 12/01/2022 206 0.01
4,800 Danske Bank AS 0.875 22/05/2023 5,963 0.41
2,000 Danske Bank AS 5.375 12/01/2024 2,230 0.16
8,399 0.58
France - 2.16%
1,234 BNP Paribas SA 2.950 23/05/2022 1,266 0.09
2,000 BPCE SA 3.000 22/05/2022 2,053 0.14
2,900 BPCE SA 0.625 26/09/2024 3,607 0.25
5,000 BPCE SA 1.000 20/01/2026 4,951 0.34
4,000 Credit Agricole SA 3.375 10/01/2022 4,075 0.28
2,000 Dexia Credit Local SA 1.125 15/06/2022 2,866 0.20
4,100 Electricite de France SA 3.875 18/01/2022 5,135 0.36
3,000 Societe Generale SA 1.000 01/04/2022 3,701 0.26
1,600 Societe Generale SA 0.500 13/01/2023 1,973 0.14
1,200 Total Capital International SA 2.125 19/11/2021 1,481 0.10
31,108 2.16
Germany - 4.49%
6,925 Deutsche Bank AG 4.250 14/10/2021 7,023 0.49
6,000 Kreditanstalt fuer Wiederaufbau 5.500 09/02/2022 4,798 0.33
78,900 Kreditanstalt fuer Wiederaufbau 0.125 03/06/2022 9,523 0.66
225,450 Kreditanstalt fuer Wiederaufbau 1.625 03/04/2024 27,492 1.91
2,000 LandeskreditbankBaden-WuerttembergFoerderbank 0.875 07/03/2022 2,853 0.20
10,000 LandwirtschaftlicheRentenbank 0.875 30/03/2026 10,029 0.69
800 NRW Bank 0.419 09/10/2024 1,142 0.08
1,500 Volkswagen Financial ServicesAG 0.875 12/04/2023 1,862 0.13
64,722 4.49
Face Value(000's)
CouponRate %
MaturityDate
Value (000's)USD
% of NetAssetValue
Corporate Bonds (continued)
Guernsey - 0.14%
1,700 Credit Suisse Group FundingGuernsey Ltd 1.250 14/04/2022 2,098 0.14
2,098 0.14
Ireland - 0.99%
2,600 AerCap Ireland Capital DAC 6.500 15/07/2025 3,048 0.21
1,800 AerCap Ireland Capital DAC 1.750 30/01/2026 1,773 0.12
100 Aon PLC 3.500 14/06/2024 108 0.01
500 Aon PLC 3.875 15/12/2025 558 0.04
8,000 Perrigo Finance Unlimited Co 4.375 15/03/2026 8,856 0.61
14,343 0.99
Italy - 0.30%
1,000 Eni SpA 0.750 17/05/2022 1,232 0.09
3,000 Intesa Sanpaolo SpA 3.125 14/07/2022 3,086 0.21
4,318 0.30
Japan - 3.93%
5,263 Mitsubishi UFJ Financial GroupInc 0.680 26/01/2023 6,516 0.45
3,000 Mitsubishi UFJ Financial GroupInc 0.980 09/10/2023 3,758 0.26
512 Mitsubishi UFJ Financial GroupInc 3.407 07/03/2024 551 0.04
2,000 Mizuho Financial Group Inc 1.020 11/10/2023 2,507 0.17
7,985 Mizuho Financial Group Inc 0.523 10/06/2024 9,908 0.69
3,000 Nissan Motor Co Ltd 3.522 17/09/2025 3,205 0.22
7,500 Nomura Holdings Inc 2.648 16/01/2025 7,878 0.55
1,350 Nomura Holdings Inc 1.851 16/07/2025 1,374 0.10
5,700 NTT Finance Corp 1.162 03/04/2026 5,685 0.39
7,255 Sumitomo Mitsui FinancialGroup Inc 0.819 23/07/2023 9,045 0.63
5,000 Takeda Pharmaceutical Co Ltd 1.125 21/11/2022 6,218 0.43
56,645 3.93
Jersey, Channel Islands - 0.52%
6,000 Glencore Finance Europe Ltd 0.625 11/09/2024 7,435 0.52
7,435 0.52
Luxembourg - 0.34%
4,000 Medtronic Global Holdings SCA 0.000 02/12/2022 4,905 0.34
4,905 0.34
Netherlands - 3.46%
1,000 Allianz Finance II BV 3.500 14/02/2022 1,254 0.09
3,000 BMW Finance NV 0.375 10/07/2023 3,708 0.26
2,500 BMW Finance NV 0.062 02/10/2023 3,079 0.21
1,736 Daimler International FinanceBV 1.500 13/01/2022 2,480 0.17
4,100 Daimler International FinanceBV 0.625 27/02/2023 5,078 0.35
2,878 Deutsche Telekom InternationalFinance BV 6.500 08/04/2022 4,295 0.30
4,000 Enel Finance International NV 2.875 25/05/2022 4,097 0.28
6,500 ING Groep NV 0.750 09/03/2022 7,998 0.55
7,000 LeasePlan Corp NV 1.000 02/05/2023 8,725 0.61
805 LyondellBasell Industries NV 5.750 15/04/2024 908 0.06
450 Shell International Finance BV 1.000 06/04/2022 555 0.04
4,000SiemensFinancieringsmaatschappij NV 1.200 11/03/2026 4,005 0.28
3,000 Volkswagen InternationalFinance NV 0.875 16/01/2023 3,721 0.26
49,903 3.46
New Zealand - 0.31%
3,000 ANZ New Zealand Int'l Ltd 0.400 01/03/2022 3,682 0.26
600 ASB Finance Ltd 0.500 10/06/2022 739 0.05
4,421 0.31
Global Short-Term Investment Grade Fixed Income FundPortfolio of Investments as at 31 May 2021
Dimensional Fund Advisors Semi-Annual Report and Unaudited Financial Statements, 31 May 2021 158

Face Value(000's)
CouponRate %
MaturityDate
Value (000's)USD
% of NetAssetValue
Corporate Bonds (continued)
Norway - 0.36%
5,000 Aker Solutions ASA 2.875 15/01/2026 5,229 0.36
5,229 0.36
Singapore - 0.15%
2,000 Flex Ltd 5.000 15/02/2023 2,134 0.15
2,134 0.15
Spain - 0.13%
1,000 Banco Santander SA 2.750 12/09/2023 1,482 0.10
300 Telefonica Emisiones SA 1.069 05/02/2024 377 0.03
1,859 0.13
Supranational - 8.90%
11,835 Asian Development Bank 0.299 12/10/2023 16,854 1.17
10,655 Asian Development Bank 0.339 19/03/2024 15,191 1.05
5,750 Asian Development Bank 0.310 28/05/2024 5,752 0.40
3,000 Broadcom Corp / BroadcomCayman Finance Ltd 3.125 15/01/2025 3,208 0.22
5,000 European Bank forReconstruction & Development 0.299 27/02/2023 7,112 0.49
1,200 European Bank forReconstruction & Development 0.349 28/02/2024 1,712 0.12
12,000 European Bank forReconstruction & Development 1.048 20/11/2025 17,669 1.23
16,500 European Investment Bank 0.359 15/01/2025 23,579 1.64
5,000 European Investment Bank 1.049 08/09/2025 7,356 0.51
800 European Investment Bank 0.375 26/03/2026 783 0.05
12,000 Inter-American DevelopmentBank 2.750 30/10/2025 10,015 0.69
6,015 Inter-American DevelopmentBank 0.875 20/04/2026 6,034 0.42
1,000 International Bank forReconstruction & Development 0.319 15/05/2024 1,427 0.10
2,700 International Bank forReconstruction & Development 0.625 14/01/2026 2,189 0.15
8,000 Nordic Investment Bank 5.000 19/04/2022 6,433 0.45
25,000 Nordic Investment Bank 1.875 10/04/2024 3,066 0.21
128,380 8.90
Sweden - 0.67%
2,904 Swedbank AB 0.300 06/09/2022 3,574 0.25
5,000 Swedbank AB 0.250 07/11/2022 6,154 0.42
9,728 0.67
Switzerland - 0.53%
250 Credit Suisse Group AG 3.750 26/03/2025 272 0.02
5,000 UBS Group AG 1.750 16/11/2022 6,282 0.43
1,000 UBS Group AG 4.125 15/04/2026 1,125 0.08
7,679 0.53
United Kingdom - 5.98%
3,550 AstraZeneca PLC 0.875 24/11/2021 4,356 0.30
1,000 AstraZeneca PLC 3.375 16/11/2025 1,100 0.08
4,600 AstraZeneca PLC 0.700 08/04/2026 4,510 0.31
5,000 Barclays PLC 3.125 17/01/2024 7,493 0.52
2,000 Barclays PLC 3.650 16/03/2025 2,175 0.15
3,605 BAT International Finance PLC 3.625 09/11/2021 4,472 0.31
600 BAT International Finance PLC 7.250 12/03/2024 992 0.07
1,500 BAT International Finance PLC 3.950 15/06/2025 1,655 0.11
4,047 BG Energy Capital PLC 1.250 21/11/2022 5,030 0.35
3,000 BP Capital Markets PLC 2.177 28/09/2021 3,690 0.26
8,000 British TelecommunicationsPLC 0.500 23/06/2022 9,821 0.68
500 HSBC Holdings PLC 3.600 25/05/2023 533 0.04
2,000 Lloyds Banking Group PLC 3.100 06/07/2021 2,005 0.14
2,000 Lloyds Banking Group PLC 1.000 09/11/2023 2,507 0.17
2,000 Lloyds Banking Group PLC 4.450 08/05/2025 2,253 0.16
2,000 Nationwide Building Society 0.625 19/04/2023 2,484 0.17
Face Value(000's)
CouponRate %
MaturityDate
Value (000's)USD
% of NetAssetValue
Corporate Bonds (continued)
United Kingdom - 5.98% (continued)
6,579 Natwest Group PLC 2.500 22/03/2023 8,400 0.58
200 NatWest Markets PLC 2.375 21/05/2023 208 0.01
1,000 NatWest Markets PLC 1.000 28/05/2024 1,260 0.09
1,800 Royalty Pharma 1.200 02/09/2025 1,787 0.12
300 Sky Ltd 1.500 15/09/2021 368 0.03
3,600 Standard Chartered PLC 1.625 13/06/2021 4,394 0.30
10,218 Transport for London 2.250 09/08/2022 14,822 1.03
86,315 5.98
United States - 49.08%
2,200 ABB Treasury Center USA Inc 4.000 15/06/2021 2,203 0.15
2,000 AbbVie Inc 3.450 15/03/2022 2,040 0.14
2,906 AbbVie Inc 3.250 01/10/2022 2,998 0.21
3,500 AbbVie Inc 1.500 15/11/2023 4,434 0.31
1,000 Aflac inc 1.125 15/03/2026 1,002 0.07
5,400 Altria Group Inc 1.000 15/02/2023 6,681 0.46
8,225 American Express Credit Corp 0.625 22/11/2021 10,073 0.70
5,000 American Honda Finance Corp 1.375 10/11/2022 6,250 0.43
1,444 American Honda Finance Corp 0.550 17/03/2023 1,787 0.12
1,519 American Honda Finance Corp 1.000 10/09/2025 1,526 0.11
1,500 American International GroupInc 5.000 26/04/2023 2,302 0.16
1,000 American International GroupInc 1.500 08/06/2023 1,255 0.09
5,000 American International GroupInc 4.125 15/02/2024 5,467 0.38
700 American Tower Corp 4.400 15/02/2026 792 0.05
3,500 AmerisourceBergen Corp 3.250 01/03/2025 3,774 0.26
7,737 Amgen Inc 1.250 25/02/2022 9,512 0.66
900 Analog Devices Inc 3.900 15/12/2025 1,005 0.07
7,500 Anthem Inc 1.500 15/03/2026 7,607 0.53
1,000 Ares Capital Corp 3.875 15/01/2026 1,071 0.07
4,000 Arrow Electronics Inc 3.250 08/09/2024 4,287 0.30
1,000 Assurant Inc 4.000 15/03/2023 1,062 0.07
4,000 AT&T Inc 2.500 15/03/2023 5,085 0.35
4,850 AT&T Inc 2.400 15/03/2024 6,289 0.44
2,300 Avnet Inc 4.625 15/04/2026 2,600 0.18
3,300 Bank of America Corp 1.625 14/09/2022 4,127 0.29
3,500 Bank of America Corp 0.750 26/07/2023 4,356 0.30
2,500 Bank of America Corp 4.000 01/04/2024 2,747 0.19
600 Bank of America Corp 3.500 19/04/2026 666 0.05
1,250 Bank of New York Mellon Corp 1.600 24/04/2025 1,288 0.09
2,000 BAT Capital Corp 1.125 16/11/2023 2,496 0.17
7,500 Baxter International Inc 0.400 15/05/2024 9,293 0.64
700 Bayer US Finance II LLC 3.875 15/12/2023 753 0.05
2,000 Bayer US Finance LLC 3.375 08/10/2024 2,165 0.15
1,000 Bemis Co Inc 4.500 15/10/2021 1,004 0.07
3,000 BMW US Capital LLC 0.625 20/04/2022 3,693 0.26
2,200 BMW US Capital LLC 3.900 09/04/2025 2,437 0.17
6,575 Booking Holdings Inc 0.800 10/03/2022 8,080 0.56
500 Broadcom Inc 4.700 15/04/2025 564 0.04
1,000 Broadcom Inc 4.250 15/04/2026 1,121 0.08
7,479 Bunge Ltd Finance Corp 4.350 15/03/2024 8,189 0.57
2,000 Campbell Soup Co 3.950 15/03/2025 2,208 0.15
1,000 Capital One Financial Corp 0.800 12/06/2024 1,246 0.09
2,000 Capital One Financial Corp 3.200 05/02/2025 2,159 0.15
1,375 Cardinal Health Inc 3.200 15/06/2022 1,414 0.10
11,000 Cargill inc 0.750 02/02/2026 10,887 0.75
7,000 Carrier Global Corp 2.242 15/02/2025 7,322 0.51
875 Charles Schwab Corp 0.900 11/03/2026 873 0.06
1,750 Chevron USA Inc 3.900 15/11/2024 1,937 0.13
8,218 Cigna Corp 1.250 15/03/2026 8,241 0.57
1,714 Citigroup Inc 0.750 26/10/2023 2,132 0.15
Global Short-Term Investment Grade Fixed Income FundPortfolio of Investments as at 31 May 2021 (continued)
Dimensional Fund Advisors Semi-Annual Report and Unaudited Financial Statements, 31 May 2021 159

Face Value(000's)
CouponRate %
MaturityDate
Value (000's)USD
% of NetAssetValue
Corporate Bonds (continued)
United States - 49.08% (continued)
3,000 Citigroup Inc 2.750 24/01/2024 4,473 0.31
5,000 Citigroup Inc 3.750 16/06/2024 5,477 0.38
4,000 Citizens Bank NA/ProvidenceRI 3.750 18/02/2026 4,445 0.31
3,000 CNA Financial Corp 3.950 15/05/2024 3,271 0.23
500 CNH Industrial Capital LLC 3.875 15/10/2021 506 0.04
4,700 CNH Industrial Capital LLC 4.375 05/04/2022 4,858 0.34
1,000 CNH Industrial Capital LLC 1.950 02/07/2023 1,029 0.07
480 CNH Industrial Capital LLC 4.200 15/01/2024 522 0.04
5,000 Comcast Corp 3.950 15/10/2025 5,616 0.39
3,352 Conagra Brands Inc 4.300 01/05/2024 3,707 0.26
200 Daimler Finance North AmericaLLC 3.300 19/05/2025 217 0.02
3,000 Daimler Finance North AmericaLLC 1.450 02/03/2026 3,031 0.21
1,474 Discover Financial Services 3.850 21/11/2022 1,547 0.11
3,000 Discover Financial Services 3.950 06/11/2024 3,296 0.23
3,000 Discover Financial Services 3.750 04/03/2025 3,280 0.23
200 Discovery CommunicationsLLC 3.450 15/03/2025 215 0.01
6,025 Dollar Tree Inc 3.700 15/05/2023 6,392 0.44
2,000 DXC Technology Co 4.250 15/04/2024 2,177 0.15
6,100 DXC Technology Co 4.125 15/04/2025 6,715 0.47
3,000 Eastman Chemical Co 1.500 26/05/2023 3,756 0.26
2,500 Eastman Chemical Co 3.800 15/03/2025 2,738 0.19
165 eBay Inc 1.400 10/05/2026 166 0.01
8,200 Edison International 4.950 15/04/2025 9,136 0.63
7,950 Emerson Electric Co 0.375 22/05/2024 9,840 0.68
3,000 Equifax Inc 3.950 15/06/2023 3,203 0.22
3,500 ERAC USA Finance LLC 4.500 16/08/2021 3,530 0.24
3,000 ERAC USA Finance LLC 3.850 15/11/2024 3,294 0.23
3,000 Evernorth Health Inc 3.500 15/06/2024 3,230 0.22
4,000 Exelon Corp 3.400 15/04/2026 4,367 0.30
4,500 Expedia Group Inc 5.000 15/02/2026 5,130 0.36
700 Fidelity & Guaranty LifeHoldings Inc 5.500 01/05/2025 809 0.06
7,900 Fidelity National InformationServices Inc 1.150 01/03/2026 7,844 0.54
9,000 General Electric Co 0.375 17/05/2022 11,033 0.77
1,050 General Motors Financial CoInc 3.450 14/01/2022 1,068 0.07
4,900 General Motors Financial CoInc 3.250 05/01/2023 5,099 0.35
3,086 General Motors Financial CoInc 2.750 20/06/2025 3,263 0.23
1,000 Gilead Sciences Inc 3.700 01/04/2024 1,081 0.08
5,000 Gilead Sciences Inc 3.650 01/03/2026 5,531 0.38
2,400 Glencore Funding LLC 4.625 29/04/2024 2,651 0.18
300 Global Payments inc 1.200 01/03/2026 298 0.02
2,000 Goldman Sachs Group Inc 2.500 18/10/2021 2,467 0.17
2,000 Goldman Sachs Group Inc 4.000 03/03/2024 2,187 0.15
6,000 Goldman Sachs Group Inc 2.125 30/09/2024 7,808 0.54
700 Halliburton Co 3.500 01/08/2023 741 0.05
750 Harley-Davidson FinancialServices Inc 2.550 09/06/2022 762 0.05
2,000 Harley-Davidson FinancialServices Inc 0.900 19/11/2024 2,489 0.17
1,000 Hewlett Packard Enterprise Co 4.450 02/10/2023 1,086 0.08
5,600 Hewlett Packard Enterprise Co 4.650 01/10/2024 6,260 0.43
2,500 Hewlett Packard Enterprise Co 1.750 01/04/2026 2,537 0.18
3,000 Honeywell International Inc 1.300 22/02/2023 3,761 0.26
2,000 HP Inc 2.200 17/06/2025 2,092 0.15
3,250 Humana Inc 3.850 01/10/2024 3,547 0.25
Face Value(000's)
CouponRate %
MaturityDate
Value (000's)USD
% of NetAssetValue
Corporate Bonds (continued)
United States - 49.08% (continued)
3,000 Illinois Tool Works Inc 0.250 05/12/2024 3,705 0.26
4,000 Intercontinental Exchange Inc 3.750 01/12/2025 4,455 0.31
5,000 International BusinessMachines Corp 3.000 15/05/2024 5,363 0.37
1,600 International BusinessMachines Corp 3.300 15/05/2026 1,762 0.12
1,000 Interpublic Group of Cos Inc 4.200 15/04/2024 1,096 0.08
3,500 JPMorgan Chase & Co 2.750 24/08/2022 4,435 0.31
3,834 JPMorgan Chase & Co 0.625 25/01/2024 4,766 0.33
2,000 JPMorgan Chase & Co 3.125 23/01/2025 2,157 0.15
1,000 Juniper Networks Inc 1.200 10/12/2025 995 0.07
7,600 Kellogg Co 0.800 17/11/2022 9,415 0.65
500 Lazard Group LLC 3.750 13/02/2025 548 0.04
6,262 Marathon Petroleum Corp 4.500 01/05/2023 6,706 0.47
1,000 Marathon Petroleum Corp 4.700 01/05/2025 1,134 0.08
2,000 Marriott International Inc 2.125 03/10/2022 2,035 0.14
500 Marsh & McLennan Cos Inc 3.500 03/06/2024 541 0.04
999 McDonald's Corp 0.614 28/10/2021 1,001 0.07
7,000 McDonald's Corp 3.700 30/01/2026 7,789 0.54
1,600 McKesson Corp 0.900 03/12/2025 1,586 0.11
2,000 Merck & Co Inc 1.125 15/10/2021 2,444 0.17
2,690 Micron Technology Inc 2.497 24/04/2023 2,791 0.19
469 Microsoft Corp 2.125 06/12/2021 576 0.04
7,000 Molson Coors Beverage Co 1.250 15/07/2024 8,825 0.61
5,000 Morgan Stanley 1.875 30/03/2023 6,335 0.44
2,500 Morgan Stanley 1.750 11/03/2024 3,204 0.22
6,125 Mosaic Co 3.250 15/11/2022 6,359 0.44
2,500 Mosaic Co 4.250 15/11/2023 2,697 0.19
1,330 MPLX LP 4.875 01/12/2024 1,502 0.10
5,575 National Grid North America Inc 0.750 08/08/2023 6,928 0.48
2,000 Nissan Motor Acceptance Corp 2.000 09/03/2026 2,005 0.14
9,000 Nucor Corp 2.000 01/06/2025 9,368 0.65
450 ONEOK Inc 4.250 01/02/2022 457 0.03
11,633 Oracle Corp 1.650 25/03/2026 11,792 0.82
3,200 Penske Truck Leasing Co LP 3.375 01/02/2022 3,248 0.23
225 Penske Truck Leasing Co LP 4.250 17/01/2023 238 0.02
1,572 Penske Truck Leasing Co LP 4.450 29/01/2026 1,777 0.12
500 Penske Truck Leasing Co LP /PTL Finance Corp 4.125 01/08/2023 536 0.04
757 Philip Morris International inc 0.875 01/05/2026 750 0.05
1,000 Philip Morris International Inc 2.875 30/05/2024 1,327 0.09
2,000 Phillips 66 3.850 09/04/2025 2,208 0.15
200 Phillips 66 Partners LP 2.450 15/12/2024 209 0.01
2,000 Phillips 66 Partners LP 3.605 15/02/2025 2,153 0.15
9,000 PPG Industries Inc 0.875 13/03/2022 11,047 0.77
150 Principal Financial Group Inc 3.300 15/09/2022 156 0.01
1,200 Procter & Gamble Co 2.000 05/11/2021 1,479 0.10
3,000 Procter & Gamble Co 2.000 16/08/2022 3,767 0.26
6,000 Public Storage 0.875 15/02/2026 5,976 0.41
1,500 Roper Technologies Inc 1.000 15/09/2025 1,498 0.10
10,500 Ross Stores Inc 4.600 15/04/2025 11,891 0.82
200 Ryder System Inc 2.875 01/06/2022 205 0.01
1,500 Ryder System Inc 3.400 01/03/2023 1,573 0.11
1,000 Ryder System Inc 2.500 01/09/2024 1,053 0.07
5,500 Ryder System Inc 4.625 01/06/2025 6,256 0.43
3,370 Santander Holdings USA Inc 3.400 18/01/2023 3,513 0.24
750 Santander Holdings USA Inc 3.500 07/06/2024 806 0.06
3,000 Santander Holdings USA Inc 3.450 02/06/2025 3,237 0.22
2,000 Simon Property Group LP 2.000 13/09/2024 2,084 0.14
4,800 Southern Power Co 1.000 20/06/2022 5,932 0.41
1,000 Southwest Airlines Co 4.750 04/05/2023 1,079 0.07
Global Short-Term Investment Grade Fixed Income FundPortfolio of Investments as at 31 May 2021 (continued)
Dimensional Fund Advisors Semi-Annual Report and Unaudited Financial Statements, 31 May 2021 160

Face Value(000's)
CouponRate %
MaturityDate
Value (000's)USD
% of NetAssetValue
Corporate Bonds (continued)
United States - 49.08% (continued)
7,025 Southwestern Electric PowerCo 1.650 15/03/2026 7,143 0.50
1,500 Spectra Energy Partners LP 4.750 15/03/2024 1,655 0.11
1,500 Spectra Energy Partners LP 3.500 15/03/2025 1,625 0.11
100 Steel Dynamics Inc 2.400 15/06/2025 105 0.01
5,000 Stryker Corp 1.125 30/11/2023 6,293 0.44
2,000 Stryker Corp 3.375 15/05/2024 2,162 0.15
8,600 Sysco Corp 3.550 15/03/2025 9,400 0.65
5,000 Toyota Motor Credit Corp 0.750 21/07/2022 6,177 0.43
1,500 TWDC Enterprises 18 Corp 2.125 13/09/2022 1,534 0.11
1,250 UnitedHealth Group Inc 1.150 15/05/2026 1,253 0.09
3,200 Unum Group 4.000 15/03/2024 3,472 0.24
5,000 Unum Group 4.500 15/03/2025 5,614 0.39
8,896 US Bancorp 0.850 07/06/2024 11,153 0.77
9,000 Utah Acquisition Sub Inc 2.250 22/11/2024 11,713 0.81
6,150 Valero Energy Corp 2.850 15/04/2025 6,530 0.45
2,700 Ventas Realty LP 2.650 15/01/2025 2,847 0.20
2,000 Verizon Communications Inc 3.376 15/02/2025 2,181 0.15
6,400 Verizon Communications Inc 1.450 20/03/2026 6,465 0.45
3,435 VF Corp 0.625 20/09/2023 4,259 0.30
6,000 VF Corp 2.400 23/04/2025 6,312 0.44
7,600 ViacomCBS Inc 4.750 15/05/2025 8,629 0.60
500 VMware Inc 2.950 21/08/2022 514 0.04
500 Volkswagen Group of AmericaFinance LLC 4.000 12/11/2021 508 0.04
465 Volkswagen Group of AmericaFinance LLC 2.700 26/09/2022 479 0.03
4,000 Volkswagen Group of AmericaFinance LLC 3.350 13/05/2025 4,335 0.30
4,000 Walt Disney Co 1.750 13/01/2026 4,118 0.29
7,000 Waste Management Inc 0.750 15/11/2025 6,950 0.48
2,600 Wells Fargo & Co 1.375 30/06/2022 3,721 0.26
2,500 Wells Fargo & Co 3.550 29/09/2025 2,760 0.19
2,562 Western Union Co 1.350 15/03/2026 2,551 0.18
95 WestRock RKT LLC 4.900 01/03/2022 98 0.01
3,500 Williams Cos Inc 4.500 15/11/2023 3,807 0.26
2,900 Williams Cos Inc 4.300 04/03/2024 3,173 0.22
1,673 Williams Cos Inc 3.900 15/01/2025 1,836 0.13
670 ZF North America Capital Inc 4.500 29/04/2022 687 0.05
800 Zimmer Biomet Holdings Inc 3.550 01/04/2025 872 0.06
707,779 49.08
Total Corporate Bonds - 87.98% (30 November 2020: 92.78%) 1,268,908 87.98
Government Bonds
Australia - 1.76%
21,300 Australia Government Bond 0.250 21/11/2025 16,168 1.12
12,000 Treasury Corp of Victoria 0.500 20/11/2025 9,170 0.64
25,338 1.76
Face Value(000's)
CouponRate %
MaturityDate
Value (000's)USD
% of NetAssetValue
Government Bonds (continued)
Canada - 2.43%
4,500 Canada GovernmentInternational Bond 0.750 19/05/2026 4,484 0.31
13,775 Canada Housing Trust No 1 0.398 15/03/2025 11,484 0.80
1,000 Export Development Canada 0.359 29/05/2024 1,425 0.10
6,000 Province of Alberta Canada 1.000 15/11/2021 8,545 0.59
3,000 Province of Ontario Canada 2.500 27/04/2026 3,220 0.22
2,725 Province of Quebec Canada 0.840 13/10/2024 2,303 0.16
4,000 Province of Quebec Canada 2.750 01/09/2025 3,549 0.25
35,010 2.43
Denmark - 0.08%
1,200 Kommunekredit 0.500 28/01/2026 1,184 0.08
1,184 0.08
Finland - 0.18%
2,600 Kuntarahoitus Oyj 0.625 20/03/2026 2,579 0.18
2,579 0.18
France - 0.84%
4,200 Agence Francaise deDeveloppement EPIC 0.625 22/01/2026 4,151 0.29
7,000 Caisse d'Amortissement de laDette Sociale 0.625 18/02/2026 6,940 0.48
1,000 SFIL 0.625 09/02/2026 986 0.07
12,077 0.84
Germany - 0.61%
3,000 State of NorthRhine-Westphalia Germany 0.429 15/10/2024 4,283 0.30
4,500 State of NorthRhine-Westphalia Germany 1.000 21/04/2026 4,528 0.31
8,811 0.61
Italy - 0.43%
5,000 Republic of Italy GovernmentInternational Bond 6.875 27/09/2023 5,705 0.39
500 Republic of Italy GovernmentInternational Bond 2.375 17/10/2024 522 0.04
6,227 0.43
Norway - 3.28%
50,000 Kommunalbanken AS 0.125 21/03/2022 6,030 0.42
267,000 Norway Government Bond 3.000 14/03/2024 33,923 2.35
60,000 Norway Government Bond 1.500 19/02/2026 7,320 0.51
47,273 3.28
United States - 0.27%
4,000 United States Treasury Note 0.500 28/02/2026 3,954 0.27
3,954 0.27
Total Government Bonds - 9.88% (30 November 2020: 4.76%) 142,453 9.88
Total Investments - 97.86% (30 November 2020: 97.54%) 1,411,361 97.86
Forward Currency Contracts
Buy Amount (000's) Sell Amount (000's) Counterparty Maturity Date
UnrealisedAppreciation/(Depreciation)
of Contracts (000's)USD
% of NetAssetValue
Buy 10,089 AUD Sell 7,826 USD Bank of America Merrill Lynch 22/06/2021 (48) -
Buy 6,893 CHF Sell 7,557 USD State Street Bank 10/06/2021 108 0.01
Buy 6,227 CHF Sell 6,868 USD State Street Bank 14/06/2021 57 -
Buy 16,094 EUR Sell 19,739 USD Bank of America Merrill Lynch 23/07/2021 (94) (0.01)
Buy 92,392 EUR Sell 112,164 USD Barclays Bank 14/06/2021 529 0.04
Buy 87,875 EUR Sell 106,655 USD Barclays Bank 14/06/2021 529 0.04
Buy 66,234 EUR Sell 80,772 USD Citibank 01/06/2021 (3) -
Global Short-Term Investment Grade Fixed Income FundPortfolio of Investments as at 31 May 2021 (continued)
Dimensional Fund Advisors Semi-Annual Report and Unaudited Financial Statements, 31 May 2021 161

Forward Currency Contracts (continued)
Buy Amount (000's) Sell Amount (000's) Counterparty Maturity Date
UnrealisedAppreciation/(Depreciation)
of Contracts (000's)USD
% of NetAssetValue
Buy 7,515 EUR Sell 9,092 USD State Street Bank 03/06/2021 72 -
Buy 4,208 EUR Sell 5,102 USD State Street Bank 08/06/2021 29 -
Buy 17,865 EUR Sell 21,847 USD State Street Bank 08/06/2021 (59) -
Buy 88,784 EUR Sell 107,318 USD State Street Bank 10/06/2021 966 0.07
Buy 381 EUR Sell 467 USD State Street Bank 10/06/2021 (2) -
Buy 1,047 EUR Sell 1,274 USD State Street Bank 14/06/2021 5 -
Buy 1,099 EUR Sell 1,333 USD State Street Bank 14/06/2021 9 -
Buy 216 EUR Sell 265 USD State Street Bank 14/06/2021 (1) -
Buy 93,211 EUR Sell 112,693 USD State Street Bank 23/06/2021 1,018 0.07
Buy 357 EUR Sell 437 USD State Street Bank 23/06/2021 (1) -
Buy 11,370 EUR Sell 13,901 USD State Street Bank 14/07/2021 (25) -
Buy 6,205 EUR Sell 7,588 USD State Street Bank 21/07/2021 (15) -
Buy 62,934 GBP Sell 87,351 USD Bank of America Merrill Lynch 11/06/2021 1,962 0.14
Buy 73,081 GBP Sell 101,994 USD Bank of America Merrill Lynch 14/06/2021 1,721 0.12
Buy 62,728 GBP Sell 87,537 USD Bank of America Merrill Lynch 14/06/2021 1,484 0.10
Buy 60,451 GBP Sell 85,519 USD Citibank 15/06/2021 271 0.02
Buy 60,375 GBP Sell 83,963 USD Citibank 17/06/2021 1,720 0.12
Buy 63,572 GBP Sell 88,192 USD Citibank 21/06/2021 2,028 0.14
Buy 25 GBP Sell 35 USD State Street Bank 01/06/2021 - -
Buy 327 GBP Sell 464 USD State Street Bank 02/06/2021 (1) -
Buy 57,682 GBP Sell 80,678 USD State Street Bank 07/06/2021 1,184 0.08
Buy 412 GBP Sell 586 USD State Street Bank 07/06/2021 (1) -
Buy 58,251 GBP Sell 81,455 USD State Street Bank 08/06/2021 1,210 0.08
Buy 507 GBP Sell 715 USD State Street Bank 14/06/2021 5 -
Buy 72,970 GBP Sell 103,360 USD State Street Bank 01/07/2021 200 0.01
Buy 60,475 GBP Sell 85,662 USD State Street Bank 01/07/2021 164 0.01
Buy 241,925 JPY Sell 2,244 USD State Street Bank 09/06/2021 (42) -
Buy 223,917 JPY Sell 2,057 USD State Street Bank 11/06/2021 (18) -
Buy 169,488 SEK Sell 20,338 USD Bank of America Merrill Lynch 14/06/2021 74 0.01
Buy 12,335 SEK Sell 1,484 USD State Street Bank 01/06/2021 1 -
Buy 199,988 SEK Sell 23,863 USD State Street Bank 11/06/2021 222 0.01
Buy 5,555 SEK Sell 663 USD State Street Bank 14/06/2021 5 -
Buy 2,800 SEK Sell 339 USD State Street Bank 14/06/2021 (1) -
Buy 7 SGD Sell 5 USD State Street Bank 02/06/2021 - -
Buy 10,614 SGD Sell 7,991 USD State Street Bank 07/06/2021 33 -
Buy 10,377 SGD Sell 7,763 USD State Street Bank 18/06/2021 83 0.01
Buy 69,285 USD Sell 89,140 AUD State Street Bank 22/06/2021 560 0.04
Buy 19,317 USD Sell 23,648 CAD Bank of America Merrill Lynch 07/07/2021 (257) (0.02)
Buy 431 USD Sell 394 CHF State Street Bank 10/06/2021 (6) -
Buy 79,456 USD Sell 66,234 EUR Bank of America Merrill Lynch 01/06/2021 (1,314) (0.09)
Buy 87,475 USD Sell 72,631 EUR Bank of America Merrill Lynch 03/06/2021 (1,097) (0.08)
Buy 81,038 USD Sell 66,406 EUR Citibank 07/07/2021 4 -
Buy 133 USD Sell 109 EUR State Street Bank 01/06/2021 - -
Buy 171 USD Sell 141 EUR State Street Bank 02/06/2021 - -
Buy 87,818 USD Sell 72,820 EUR State Street Bank 08/06/2021 (993) (0.07)
Buy 158 USD Sell 130 EUR State Street Bank 10/06/2021 (1) -
Buy 997 USD Sell 824 EUR State Street Bank 14/06/2021 (7) -
Buy 81 USD Sell 68 EUR State Street Bank 14/06/2021 - -
Buy 285 USD Sell 233 EUR State Street Bank 14/06/2021 1 -
Buy 3,572 USD Sell 2,920 EUR State Street Bank 23/06/2021 10 -
Buy 79,729 USD Sell 66,847 EUR State Street Bank 09/07/2021 (1,845) (0.13)
Buy 81,972 USD Sell 67,785 EUR State Street Bank 14/07/2021 (756) (0.05)
Buy 11,802 USD Sell 9,660 EUR State Street Bank 21/07/2021 11 -
Buy 81,017 USD Sell 67,060 EUR State Street Bank 23/07/2021 (840) (0.06)
Buy 59,421 USD Sell 42,321 GBP Bank of America Merrill Lynch 14/07/2021 (642) (0.04)
Buy 133 USD Sell 94 GBP State Street Bank 01/06/2021 (1) -
Global Short-Term Investment Grade Fixed Income FundPortfolio of Investments as at 31 May 2021 (continued)
Dimensional Fund Advisors Semi-Annual Report and Unaudited Financial Statements, 31 May 2021 162

Forward Currency Contracts (continued)
Buy Amount (000's) Sell Amount (000's) Counterparty Maturity Date
UnrealisedAppreciation/(Depreciation)
of Contracts (000's)USD
% of NetAssetValue
Buy 586 USD Sell 412 GBP State Street Bank 02/06/2021 1 -
Buy 541 USD Sell 385 GBP State Street Bank 11/06/2021 (3) -
Buy 991 USD Sell 710 GBP State Street Bank 14/06/2021 (14) -
Buy 186 USD Sell 131 GBP State Street Bank 14/06/2021 - -
Buy 464 USD Sell 327 GBP State Street Bank 14/06/2021 - -
Buy 1,253 USD Sell 891 GBP State Street Bank 21/06/2021 (10) -
Buy 293 USD Sell 207 GBP State Street Bank 01/07/2021 (1) -
Buy 94,355 USD Sell 66,783 GBP State Street Bank 26/07/2021 (425) (0.03)
Buy 99 USD Sell 10,720 JPY State Street Bank 09/06/2021 1 -
Buy 26,922 USD Sell 222,332 NOK Bank of America Merrill Lynch 25/06/2021 335 0.02
Buy 20,017 USD Sell 164,390 NOK Barclays Bank 25/06/2021 359 0.03
Buy 15,077 USD Sell 125,359 NOK State Street Bank 25/06/2021 87 -
Buy 10,952 USD Sell 92,072 NOK State Street Bank 25/06/2021 (58) -
Buy 15,332 USD Sell 129,189 SEK Bank of America Merrill Lynch 01/06/2021 (226) (0.02)
Buy 339 USD Sell 2,800 SEK State Street Bank 02/06/2021 1 -
Buy 1,485 USD Sell 12,335 SEK State Street Bank 11/06/2021 (1) -
Buy 15,545 USD Sell 129,080 SEK State Street Bank 07/07/2021 (4) -
Buy 18 USD Sell 24 SGD State Street Bank 07/06/2021 - -
Unrealised Appreciation of Forward Currency Contracts 17,059 1.17
Unrealised Depreciation of Forward Currency Contracts (8,812) (0.60)
Net Unrealised Appreciation of Forward Currency Contracts - 0.57% (30 November 2020: 0.08%) 8,247 0.57
Value (000's)USD
% of NetAssetValue
Cash and Cash Equivalents - 2.51% (30 November 2020: 2.28%) 36,163 2.51Other Liabilities in Excess of Other Assets - (0.94)% (30 November 2020: 0.10%) (13,588) (0.94)
Total Net Assets 1,442,183 100.00
Amounts designated as “- “ are either $0 or less than $500.
Analysis of Total Assets % of Total Assets
Transferable securities admitted to an official exchange listing 82.31
Transferable securities dealt in on another regulated market 8.26
Other transferable securities of the type referred to in Regulations 68 (1)(a), (b) and (c) 4.67
OTC Financial derivative instruments 1.15
Current Assets 3.61
Total Assets 100.00
Global Short-Term Investment Grade Fixed Income FundPortfolio of Investments as at 31 May 2021 (continued)
Dimensional Fund Advisors Semi-Annual Report and Unaudited Financial Statements, 31 May 2021 163

Shares (000's)
Value(000's)
USD
% of NetAssetValue
Common Stock
Australia - 2.09%
8 3P Learning Ltd 8 -
15 A2B Australia Ltd 14 -
46 Accent Group Ltd 96 0.01
16 Adairs Ltd 58 0.01
47 Adelaide Brighton Ltd 121 0.01
14 Ainsworth Game Technology Ltd 10 -
55 Alcidion Group Ltd 18 -
46 Alkane Resources Ltd 31 -
6 Alliance Aviation Services Ltd 21 -
17 ALS Ltd 162 0.02
7 Altium Ltd 152 0.02
58 AMA Group Ltd 25 -
16 American Pacific Borates Ltd 18 -
299 AMP Ltd 271 0.03
11 Ansell Ltd 345 0.03
19 AP Eagers Ltd 229 0.02
59 Arafura Resources Ltd 7 -
9 ARB Corp Ltd 284 0.03
52 Ardent Leisure Group Ltd 41 -
41 Asaleo Care Ltd 44 0.01
9 AUB Group Ltd 133 0.01
90 Aurelia Metals Ltd 31 -
39 Austal Ltd 71 0.01
48 Austin Engineering Ltd 5 -
39 Australian Agricultural Co Ltd 37 -
8 Australian Ethical Investment Ltd 57 0.01
21 Australian Finance Group Ltd 46 0.01
58 Australian Pharmaceutical Industries Ltd 52 0.01
10 Australian Strategic Materials Ltd 37 -
3 Auswide Bank Ltd 15 -
11 Baby Bunting Group Ltd 52 0.01
80 Bank of Queensland Ltd 554 0.05
188 Bannerman Resources Ltd 29 -
44 Bapcor Ltd 274 0.03
94 Base Resources Ltd 21 -
145 Beach Energy Ltd 142 0.01
34 Bega Cheese Ltd 151 0.02
14 Bell Financial Group Ltd 18 -
60 Bellevue Gold Ltd 43 -
32 Bendigo & Adelaide Bank Ltd 258 0.03
49 Bingo Industries Ltd 129 0.01
68 Bionomics Ltd 10 -
2 Blackmores Ltd 90 0.01
4 Blue Sky Alternative Investments Ltd - -
230 Boss Energy Ltd 31 -
33 Bravura Solutions Ltd 83 0.01
11 Breville Group Ltd 220 0.02
9 Brickworks Ltd 139 0.01
43 BSA Ltd 11 -
15 BWX Ltd 58 0.01
13 Calix Ltd 28 -
60 Capitol Health Ltd 16 -
15 Capricorn Metals Ltd 22 -
17 Cardno Ltd 9 -
166 Carnarvon Petroleum Ltd 32 -
17 carsales.com Ltd 254 0.03
38 Cash Converters International Ltd 6 -
10 Catapult Group International Ltd 17 -
7 Cedar Woods Properties Ltd 40 -
52 Challenger Ltd 209 0.02
37 Champion Iron Ltd 186 0.02
21 City Chic Collective Ltd 75 0.01
Shares (000's)
Value(000's)
USD
% of NetAssetValue
Common Stock (continued)
Australia - 2.09% (continued)
48 Cleanaway Waste Management Ltd 102 0.01
4 Clinuvel Pharmaceuticals Ltd 95 0.01
19 Clover Corp Ltd 22 -
12 Codan Ltd 180 0.02
16 Collection House Ltd 2 -
12 Collins Foods Ltd 117 0.01
248 Cooper Energy Ltd 54 0.01
14 Corporate Travel Management Ltd 228 0.02
46 Costa Group Holdings Ltd 118 0.01
8 Coventry Group Ltd 9 -
8 Credit Corp Group Ltd 172 0.02
55 CSR Ltd 238 0.02
50 Dacian Gold Ltd 11 -
16 Data#3 Ltd 74 0.01
11 Decmil Group Ltd 5 -
29 Deep Yellow Ltd 19 -
31 Deterra Royalties Ltd 100 0.01
6 Dicker Data Ltd 45 0.01
30 Domain Holdings Australia Ltd 117 0.01
11 Dongfang Modern Agriculture Holding Group Ltd - -
77 Downer EDI Ltd 337 0.03
30 Eclipx Group Ltd 49 0.01
45 Ecograf Ltd 22 -
9 Elanor Investor Group 13 -
17 Elders Ltd 143 0.01
7 Electro Optic Systems Holdings Ltd 21 -
5 Elmo Software Ltd 18 -
41 Emeco Holdings Ltd 29 -
25 EML Payments Ltd 66 0.01
17 Empired Ltd 12 -
72 Energy World Corp Ltd 5 -
2 EQT Holdings Ltd 44 0.01
22 Estia Health Ltd 42 -
12 Euroz Ltd 15 -
10 EVENT Hospitality and Entertainment Ltd 101 0.01
812 FAR Ltd 3 -
1 Finbar Group Ltd - -
13 Fleetwood Corp Ltd 25 -
2 Flight Centre Travel Group Ltd 19 -
15 Freedom Foods Group Ltd 5 -
23 Frontier Digital Ventures 22 -
80 G8 Education Ltd 63 0.01
34 Galaxy Resources Ltd (voting rights) 102 0.01
3 Gascoyne Resources Ltd 1 -
41 Genworth Mortgage Insurance Australia Ltd 88 0.01
83 Gold Road Resources Ltd 96 0.01
27 GrainCorp Ltd 106 0.01
14 Greenland Minerals Ltd 1 -
15 GTN Ltd 4 -
11 GUD Holdings Ltd 101 0.01
19 GWA Group Ltd 42 -
18 Hansen Technologies Ltd 75 0.01
62 Healius Ltd 199 0.02
4 Helloworld Travel Ltd 6 -
22 Highfield Resources Ltd 13 -
25 HT&E Ltd 34 -
7 HUB24 Ltd 139 0.01
56 Humm Group Ltd 44 0.01
4 Huon Aquaculture Group Ltd 8 -
79 IGO Ltd 466 0.05
35 Iluka Resources Ltd 210 0.02
38 Imdex Ltd 61 0.01
Global Small Companies FundPortfolio of Investments as at 31 May 2021
Dimensional Fund Advisors Semi-Annual Report and Unaudited Financial Statements, 31 May 2021 164

Shares (000's)
Value(000's)
USD
% of NetAssetValue
Common Stock (continued)
Australia - 2.09% (continued)
33 Incitec Pivot Ltd 59 0.01
41 Infomedia Ltd 44 0.01
35 Inghams Group Ltd 93 0.01
17 Intega Group Ltd 6 -
14 Integral Diagnostics Ltd 54 0.01
8 Integrated Research Ltd 14 -
17 InvoCare Ltd 138 0.01
111 ioneer Ltd 31 -
70 IOOF Holdings Ltd 211 0.02
21 IPH Ltd 111 0.01
23 IRESS Ltd 188 0.02
12 IVE Group Ltd 13 -
30 Japara Healthcare Ltd 27 -
93 Jervois Mining Ltd 43 -
15 Johns Lyng Group Ltd 48 0.01
4 Jumbo Interactive Ltd 49 0.01
8 Juno Minerals Ltd 1 -
137 Jupiter Mines Ltd 31 -
51 Karoon Energy Ltd 48 0.01
11 KGL Resources Ltd 6 -
7 Kogan.com Ltd 57 0.01
10 Lifestyle Communities Ltd 115 0.01
67 Link Administration Holdings Ltd 280 0.03
5 Lovisa Holdings Ltd 54 0.01
107 Lynas Corp Ltd 457 0.05
23 MACA Ltd 14 -
13 Mach7 Technologies Ltd 11 -
142 Macmahon Holdings Ltd 21 -
1 Macquarie Telecom Group Ltd 29 -
96 Magnis Energy Technologies 22 -
210 Mayne Pharma Group Ltd 60 0.01
7 McMillan Shakespeare Ltd 66 0.01
23 McPherson's Ltd 26 -
2 Medical Developments International 9 -
21 Medusa Mining Ltd 14 -
7 Megaport Ltd 77 0.01
34 Mesoblast Ltd 52 0.01
85 Metals X Ltd 17 -
117 Metcash Ltd 317 0.03
19 Michael Hill International Ltd 12 -
14 Michael Hill International Ltd (New Zealand listing) 9 -
42 Mincor Resources NL 31 -
5 MNF Group Ltd 21 -
5 Moelis Australia Ltd 22 -
11 Monadelphous Group Ltd 85 0.01
32 Monash IVF Group Ltd 21 -
18 Money3 Corp Ltd 44 0.01
5 Mortgage Choice Ltd 8 -
74 Mount Gibson Iron Ltd 48 0.01
64 Myer Holdings Ltd 16 -
1 Mystate Ltd 2 -
11 MyState Ltd 41 -
21 Nanosonics Ltd 89 0.01
20 Navigator Global Investments Ltd 25 -
46 nearmap Ltd 65 0.01
8 Netwealth Group Ltd 89 0.01
116 New Century Resources Ltd 16 -
51 New Energy Solar Ltd 33 -
55 New Hope Corp Ltd 62 0.01
48 nib holdings Ltd 236 0.02
7 Nick Scali Ltd 56 0.01
84 Nickel Mines Ltd 66 0.01
Shares (000's)
Value(000's)
USD
% of NetAssetValue
Common Stock (continued)
Australia - 2.09% (continued)
85 Nine Entertainment Co Holdings Ltd 193 0.02
43 NRW Holdings Ltd 57 0.01
36 Nufarm Ltd 136 0.01
3 Objective Corp Ltd 31 -
30 OFX Group Ltd 32 -
37 OM Holdings Ltd 24 -
26 Omni Bridgeway Ltd 78 0.01
69 oOh!media Ltd 90 0.01
21 Orocobre Ltd 108 0.01
98 Orora Ltd 238 0.02
7 Pacific Current Group Ltd 28 -
23 Pact Group Holdings Ltd 66 0.01
148 Paladin Energy Ltd 59 0.01
25 Panoramic Resources Ltd 3 -
8 Paradigm Biopharmaceuticals 14 -
48 Peet Ltd 44 0.01
27 Pendal Group Ltd 167 0.02
7 People Infrastructure Ltd 24 -
69 Perenti Global Ltd 35 -
6 Perpetual Ltd 184 0.02
145 Perseus Mining Ltd 156 0.02
165 Pilbara Minerals Ltd 156 0.02
3 Pinnacle Investment Management Group 24 -
31 Platinum Asset Management Ltd 114 0.01
2 PPK Group Ltd 22 -
19 Praemium Ltd 14 -
11 Premier Investments Ltd 219 0.02
5 Pro Medicus Ltd 168 0.02
13 Propel Funeral Partners Ltd 35 -
16 PSC Insurance Group Ltd 43 -
9 PWR Holdings Ltd 41 -
92 Ramelius Resources Ltd 138 0.01
8 ReadyTech Holdings Ltd 12 -
15 Reckon Ltd 10 -
150 Red 5 Ltd 18 -
15 Redbubble Ltd 39 -
71 Redcape Hotel Group 57 0.01
13 Regis Healthcare Ltd 20 -
79 Regis Resources Ltd 160 0.02
3 Reject Shop Ltd 13 -
87 Reliance Worldwide Corp Ltd 345 0.03
135 Resolute Mining Ltd 61 0.01
366 Retail Food Group Ltd 21 -
9 Rhipe Ltd 13 -
30 Ridley Corp Ltd 28 -
29 RPMGlobal Holdings Ltd 33 -
15 Sandfire Resources NL 84 0.01
2 SeaLink Travel Group Ltd 15 -
17 Select Harvests Ltd 79 0.01
22 Senex Energy Ltd 52 0.01
5 Servcorp Ltd 13 -
32 Service Stream Ltd 24 -
134 Seven West Media Ltd 43 0.01
16 SG Fleet Group Ltd 37 -
11 Shine Corporate Ltd 8 -
110 Sigma Healthcare Ltd 53 0.01
95 Silver Lake Resources Ltd 144 0.01
22 Sims Metal Management Ltd 267 0.03
14 SmartGroup Corp Ltd 73 0.01
27 Southern Cross Media Group Ltd 39 -
172 Spark Infrastructure Group 290 0.03
22 SpeedCast International Ltd - -
Global Small Companies FundPortfolio of Investments as at 31 May 2021 (continued)
Dimensional Fund Advisors Semi-Annual Report and Unaudited Financial Statements, 31 May 2021 165

Shares (000's)
Value(000's)
USD
% of NetAssetValue
Common Stock (continued)
Australia - 2.09% (continued)
89 St Barbara Ltd 129 0.01
95 Star Entertainment Grp Ltd 298 0.03
101 Steadfast Group Ltd 315 0.03
9 Sunland Group Ltd 17 -
7 Sunrise Energy Metals Ltd 13 -
20 Super Retail Group Ltd 201 0.02
18 Superloop Ltd 14 -
31 Syrah Resources Ltd 25 -
28 Tassal Group Ltd 82 0.01
28 Technology One Ltd 201 0.02
3 Temple & Webster Group Ltd 22 -
31 United Malt Group Ltd 107 0.01
35 Venturex Resources Ltd 22 -
7 Virtus Health Ltd 32 -
11 Vita Group Ltd 8 -
108 Viva Energy Group Ltd 171 0.02
69 Vocus Group Ltd 292 0.03
11 Wagners Holding Co Ltd 21 -
42 Webjet Ltd 170 0.02
42 Western Areas Ltd 81 0.01
45 Westgold Resources Ltd 78 0.01
81 Whitehaven Coal Ltd 100 0.01
21,405 2.09
Austria - 0.42%
1 Addiko Bank AG 12 -
1 Agrana Beteiligungs AG 27 -
8 Andritz AG 478 0.05
3 AT&S Austria Technologie & Systemtechnik AG 106 0.01
20 Atrium European Real Estate Ltd 76 0.01
7 BAWAG Group AG 404 0.04
1 DO & CO AG 73 0.01
5 EVN AG 114 0.01
2 FACC AG 26 -
1 Flughafen Wien AG 35 -
11 Immofinanz AG 242 0.02
1 Kapsch TrafficCom AG 10 -
2 Lenzing AG 213 0.02
1 Mayr Melnhof Karton AG 200 0.02
- Oberbank AG 55 0.01
3 Oesterreichische Post AG 183 0.02
2 Palfinger AG 71 0.01
1 POLYTEC Holding AG 18 -
1 Porr AG 27 -
9 Raiffeisen Bank International AG 219 0.02
- Rosenbauer International AG 24 -
5 S IMMO AG 123 0.01
1 Schoeller-Bleckmann Oilfield Equipment AG 60 0.01
1 Semperit AG Holding 46 0.01
2 Strabag SE 77 0.01
17 Telekom Austria AG 153 0.02
1 UBM Development AG 31 -
13 UNIQA Insurance Group AG 116 0.01
4 Vienna Insurance Group AG Wiener VersicherungGruppe 116 0.01
14 Voestalpine AG 618 0.06
8 Wienerberger AG 305 0.03
4 Zumtobel Group AG 42 -
4,300 0.42
Belgium - 0.45%
3 Ackermans & van Haaren NV 426 0.04
19 AGFA-Gevaert NV 90 0.01
- Atenor 36 -
Shares (000's)
Value(000's)
USD
% of NetAssetValue
Common Stock (continued)
Belgium - 0.45% (continued)
8 Barco NV 214 0.02
4 Bekaert SA 201 0.02
3 Biocartis NV 14 -
11 bpost SA 145 0.02
1 Celyad SA 3 -
1 Cie d'Entreprises CFE 86 0.01
1 Colruyt SA 83 0.01
10 Deceuninck NV 37 -
3 D'ieteren SA 334 0.03
11 Econocom Group SA 46 0.01
3 Elia System Operator SA 319 0.03
23 Euronav NV 221 0.02
2 EVS Broadcast Equipment SA 40 -
3 Exmar NV 13 -
8 Fagron 176 0.02
2 Gimv NV 151 0.02
1 Immobel SA 69 0.01
2 Ion Beam Applications 49 0.01
1 Jensen-Group NV 20 -
2 Kinepolis Group NV 98 0.01
- Lotus Bakeries NV 246 0.02
2 Melexis NV 232 0.02
8 Ontex Group NV 108 0.01
5 Oxurion NV 14 -
16 Proximus SADP 325 0.03
5 Recticel SA 98 0.01
- Resilux 27 -
2 Shurgard Self Storage SA 123 0.01
1 Sipef NV 47 0.01
5 Telenet Group Holding NV 197 0.02
- TER Beke SA 8 -
2 Tessenderlo Group SA 104 0.01
1 Van de Velde NV 22 -
1 VGP NV 186 0.02
3 Viohalco SA 16 -
4,624 0.45
Canada - 3.39%
8 5N Plus Inc 20 -
6 Absolute Software Corp 84 0.01
1 Acadian Timber Corp 14 -
4 AcuityAds Holdings Inc 42 -
22 Advantage Energy Ltd 65 0.01
8 Aecon Group Inc 122 0.01
28 Africa Oil Corp 28 -
2 Ag Growth International Inc 58 0.01
12 AGF Management Ltd 78 0.01
11 Aimia Inc 44 0.01
2 AirBoss of America Corp 46 0.01
44 Alamos Gold Inc 399 0.04
4 Alaris Equity Partners Income 54 0.01
2 Alcanna Inc 13 -
45 Aleafia Health Inc 16 -
10 Alexco Resource Corp 33 -
3 Algoma Central Corp 36 -
29 AltaGas Ltd 576 0.06
5 Altius Minerals Corp 77 0.01
4 Altus Group Ltd 214 0.02
3 Americas Gold & Silver Corp 5 -
12 Amerigo Resources Ltd 14 -
3 Andrew Peller Ltd 31 -
73 ARC Resources Ltd 553 0.05
20 Argonaut Gold Inc 50 0.01
Global Small Companies FundPortfolio of Investments as at 31 May 2021 (continued)
Dimensional Fund Advisors Semi-Annual Report and Unaudited Financial Statements, 31 May 2021 166

Shares (000's)
Value(000's)
USD
% of NetAssetValue
Common Stock (continued)
Canada - 3.39% (continued)
9 Aritzia Inc 212 0.02
20 Ascot Resources Ltd 22 -
6 Atco Ltd 225 0.02
39 Athabasca Oil Corp 24 -
9 ATS Automation Tooling Systems Inc 220 0.02
1 Aura Minerals Inc 19 -
2 AutoCanada Inc 63 0.01
6 Aya Gold & Silver Inc 35 -
4 Badger Infrastructure Solution 132 0.01
9 Ballard Power Systems Inc 162 0.02
32 Birchcliff Energy Ltd 90 0.01
4 Bird Construction Inc 34 -
2 Black Diamond Group Ltd 8 -
40 BlackBerry Ltd 407 0.04
1 BMTC Group Inc 14 -
196 Bombardier Inc 157 0.02
9 Boralex Inc 271 0.03
1 Bridgemarq Real Estate Services 16 -
1 BRP Inc 76 0.01
1 Calian Group Ltd 36 -
37 Cameco Corp 742 0.07
12 Canaccord Genuity Group Inc 127 0.01
14 Canacol Energy Ltd 39 -
6 Canada Goose Holdings Inc 244 0.02
12 Canadian Western Bank 349 0.03
6 Canfor Corp 158 0.02
4 Canfor Pulp Products Inc 26 -
7 CanWel Building Materials Group Ltd 51 0.01
12 Capital Power Corp 381 0.04
33 Capstone Mining Corp 153 0.02
13 Cardinal Energy Ltd 36 -
10 Cascades Inc 115 0.01
16 Celestica Inc 137 0.01
25 Centerra Gold Inc 202 0.02
1 Cervus Equipment Corp 10 -
24 CES Energy Solutions Corp 34 -
7 Chartwell Retirement Residences 75 0.01
30 China Gold International Resources Corp Ltd 102 0.01
20 CI Financial Corp 367 0.04
1 Cogeco Communications Inc 145 0.01
1 Cogeco Inc 47 0.01
4 Colliers International Group Inc 417 0.04
11 Computer Modelling Group Ltd 52 0.01
21 Copper Mountain Mining Corp 77 0.01
1 Corby Spirit and Wine Ltd 17 -
36 Corus Entertainment Inc 180 0.02
58 Crescent Point Energy Corp 239 0.02
11 Cronos Group Inc 103 0.01
61 Denison Mines Corp 76 0.01
9 Descartes Systems Group Inc 518 0.05
4 Dexterra Group Inc 23 -
10 DIRTT Environmental Solutions 33 -
3 Dorel Industries Inc 26 -
4 DREAM Unlimited Corp 87 0.01
20 Dundee Precious Metals Inc 147 0.02
36 ECN Capital Corp 254 0.03
- E-L Financial Corp Ltd 140 0.01
20 Eldorado Gold Corp 242 0.02
43 Element Fleet Management Corp 487 0.05
22 Endeavour Mining Corp 524 0.05
17 Endeavour Silver Corp 125 0.01
10 Enerflex Ltd 64 0.01
Shares (000's)
Value(000's)
USD
% of NetAssetValue
Common Stock (continued)
Canada - 3.39% (continued)
6 Energy Fuels Inc 36 -
26 Enerplus Corp 173 0.02
4 Enghouse Systems Ltd 189 0.02
18 Ensign Energy Services Inc 20 -
1 Equitable Group Inc 162 0.02
8 ERO Copper Corp 179 0.02
3 Evertz Technologies Ltd 34 -
- Exchange Income Corp 16 -
3 Exco Technologies Ltd 25 -
4 EXFO Inc 14 -
10 Extendicare Inc 64 0.01
8 Fiera Capital Corp 69 0.01
18 Finning International Inc 449 0.04
3 Firm Capital Mortgage Investment Corp 32 -
11 First Capital Real Estate Investment Trust 159 0.02
19 First Majestic Silver Corp 338 0.03
2 First National Financial Corp 77 0.01
35 Fission Uranium Corp 18 -
19 Fortuna Silver Mines Inc 130 0.01
12 Freehold Royalties Ltd 88 0.01
8 Frontera Energy Corp 41 -
32 Galiano Gold Inc 43 -
1 Gamehost Inc 6 -
1 GDI Integrated Facility Services Inc 39 -
15 Gibson Energy Inc 301 0.03
4 Global Atomic Corp 11 -
1 goeasy Ltd 109 0.01
20 Gold Standard Ventures Corp 12 -
9 Golden Star Resources Ltd 31 -
6 GoldMoney Inc 14 -
36 Gran Tierra Energy Inc 23 -
5 Great Canadian Gaming Corp 197 0.02
13 Great Panther Mining Ltd 9 -
3 Guardian Capital Group Ltd 68 0.01
1 Hardwoods Distribution Inc 40 -
25 Headwater Exploration Inc 88 0.01
5 Heroux-Devtek Inc 65 0.01
2 High Liner Foods Inc 21 -
2 HLS Therapeutics Inc 25 -
7 Home Capital Group Inc 201 0.02
30 Hudbay Minerals Inc 226 0.02
7 i-80 Gold Corp 14 -
65 IAMGOLD Corp 234 0.02
2 IBI Group Inc 13 -
4 Imperial Metals Corp 18 -
1 Information Services Corp 25 -
11 Innergex Renewable Energy Inc 183 0.02
37 Inter Pipeline Ltd 538 0.05
8 Interfor Corp 196 0.02
3 International Tower Hill Mines Ltd 3 -
8 Intertape Polymer Group Inc 191 0.02
4 Invesque Inc 12 -
72 Ivanhoe Mines Ltd 527 0.05
5 Jamieson Wellness Inc 149 0.02
12 Karora Resources Inc 43 -
2 K-Bro Linen Inc 54 0.01
16 Kelt Exploration Ltd 42 -
21 Keyera Corp 511 0.05
3 Kinaxis Inc 313 0.03
12 Knight Therapeutics Inc 50 0.01
1 KP Tissue Inc 11 -
7 Labrador Iron Ore Royalty Corp 246 0.02
Global Small Companies FundPortfolio of Investments as at 31 May 2021 (continued)
Dimensional Fund Advisors Semi-Annual Report and Unaudited Financial Statements, 31 May 2021 167

Shares (000's)
Value(000's)
USD
% of NetAssetValue
Common Stock (continued)
Canada - 3.39% (continued)
3 Largo Resources Ltd 45 0.01
- Lassonde Industries Inc 79 0.01
5 Laurentian Bank of Canada 187 0.02
5 Leon's Furniture Ltd 88 0.01
6 LifeWorks Inc 170 0.02
6 Linamar Corp 420 0.04
- Logistec Corp 17 -
37 Lucara Diamond Corp 24 -
4 Lundin Gold Inc 43 0.01
3 MAG Silver Corp 59 0.01
2 Magellan Aerospace Corp 20 -
1 Mainstreet Equity Corp 55 0.01
11 Major Drilling Group International Inc 94 0.01
- Manitok Energy Inc - -
9 Maple Leaf Foods Inc 197 0.02
- Marathon Gold Corp - -
11 Martinrea International Inc 119 0.01
2 Mav Beauty Brands Inc 8 -
5 Maverix Metals Inc 31 -
1 MDF Commerce Inc 11 -
3 Medical Facilities Corp 17 -
29 MEG Energy Corp 196 0.02
2 Melcor Developments Ltd 25 -
7 Methanex Corp 242 0.02
1 Morguard Corp 70 0.01
15 Mountain Province Diamonds Inc 6 -
2 MTY Food Group Inc 125 0.01
11 Mullen Group Ltd 113 0.01
2 Neo Performance Materials Inc 31 -
87 New Gold Inc 184 0.02
2 New Pacific Metals Corp 12 -
6 NFI Group Inc 130 0.01
3 North American Construction Group Ltd 34 -
5 North West Co Inc 155 0.02
34 NuVista Energy Ltd 84 0.01
83 OceanaGold Corp 175 0.02
2 Onex Corp 129 0.01
7 Organigram Holdings Inc 22 -
4 Organigram Holdings Inc (US listing) 14 -
13 Osisko Gold Royalties Ltd 179 0.02
7 Osisko Mining Inc 20 -
6 Paramount Resources Ltd 66 0.01
18 Parex Resources Inc 316 0.03
4 Park Lawn Corp 108 0.01
15 Parkland Corp 488 0.05
8 Pason Systems Inc 59 0.01
17 Peyto Exploration & Development Corp 76 0.01
17 Photon Control Inc 51 0.01
2 Pizza Pizza Royalty Corp 17 -
2 Polaris Infrastructure Inc 25 -
1 Pollard Banknote Ltd 46 0.01
1 PolyMet Mining Corp 3 -
20 PrairieSky Royalty Ltd 223 0.02
2 Precision Drilling Corp 52 0.01
4 Premium Brands Holdings Corp 402 0.04
20 Pretium Resources Inc 230 0.02
19 Primo Water Corp 326 0.03
13 Quarterhill Inc 26 -
7 Real Matters Inc 103 0.01
2 Recipe Unlimited Corp 34 -
3 RF Capital Group Inc 5 -
6 Richelieu Hardware Ltd 213 0.02
Shares (000's)
Value(000's)
USD
% of NetAssetValue
Common Stock (continued)
Canada - 3.39% (continued)
1 Ritchie Bros Auctioneers Inc 37 -
9 Rogers Sugar Inc 44 0.01
22 Roxgold Inc 43 -
8 Russel Metals Inc 219 0.02
22 Sabina Gold & Silver Corp 32 -
19 Sandstorm Gold Ltd 168 0.02
5 Savaria Corp 79 0.01
19 Secure Energy Services Inc 66 0.01
7 ShawCor Ltd 35 -
8 Sienna Senior Living Inc 108 0.01
6 Sierra Wireless Inc (Canada listing) 98 0.01
2 Slate Grocery REIT 21 -
4 Sleep Country Canada Holdings Inc 102 0.01
17 SNC-Lavalin Group Inc 473 0.05
3 Spin Master Corp 121 0.01
2 Sprott Inc 95 0.01
24 SSR Mining Inc 452 0.05
11 Stantec Inc 485 0.05
3 Stelco Holdings Inc 79 0.01
6 Stella-Jones Inc 231 0.02
15 Storm Resources Ltd 44 0.01
12 SunOpta Inc 147 0.02
18 Superior Plus Corp 227 0.02
32 Supreme Cannabis Co Inc 9 -
25 Tamarack Valley Energy Ltd 53 0.01
48 Taseko Mines Ltd 118 0.01
- TECSYS Inc 8 -
1 TeraGo Inc 6 -
1 TerraVest Industries Inc 12 -
1 Tervita Corp 3 -
10 TFI International Inc 926 0.09
13 The Valens Co Inc 38 -
48 Tidewater Midstream and Infrastructure Ltd 47 0.01
11 Timbercreek Financial Corp 88 0.01
4 TMX Group Ltd 402 0.04
10 Torex Gold Resources Inc 141 0.01
7 Toromont Industries Ltd 675 0.07
4 Total Energy Services Inc 14 -
31 TransAlta Corp 282 0.03
14 TransAlta Renewables Inc 228 0.02
9 Transcontinental Inc 165 0.02
54 Trevali Mining Corp 11 -
46 Trican Well Service Ltd 87 0.01
1 Trisura Group Ltd 131 0.01
11 Turquoise Hill Resources Ltd 196 0.02
7 Uni-Select Inc 85 0.01
14 Vermilion Energy Inc 110 0.01
2 Viemed Healthcare Inc 12 -
5 Village Farms International Inc 48 0.01
2 Wajax Corp 33 -
1 Wall Financial Corp 10 -
15 Wesdome Gold Mines Ltd 138 0.01
44 Western Forest Products Inc 80 0.01
5 Westport Fuel Systems Inc 34 -
7 Westshore Terminals Investment Corp 110 0.01
56 Whitecap Resources Inc 264 0.03
46 WildBrain Ltd 105 0.01
4 Winpak Ltd 123 0.01
96 Yamana Gold Inc 505 0.05
7 Yangarra Resources Ltd 7 -
1 Yellow Pages Ltd 15 -
34,705 3.39
Global Small Companies FundPortfolio of Investments as at 31 May 2021 (continued)
Dimensional Fund Advisors Semi-Annual Report and Unaudited Financial Statements, 31 May 2021 168

Shares (000's)
Value(000's)
USD
% of NetAssetValue
Common Stock (continued)
China - 0.00%
34 Camsing International Holding Ltd 1 -
233 FIH Mobile Ltd 36 -
18 TK Group Holdings Ltd 7 -
44 -
Denmark - 0.66%
1 ALK-Abello AS 303 0.03
4 Alm Brand AS 39 -
8 Bang & Olufsen AS 42 -
1 BankNordik P/F 33 -
7 Bavarian Nordic AS 304 0.03
- Brodrene Hartmann AS 28 -
1 cBrain A/S 50 0.01
1 Chemometec AS 141 0.01
7 Columbus AS 13 -
3 D/S Norden AS 88 0.01
3 Dfds AS 201 0.02
5 FLSmidth & Co AS 186 0.02
- Gabriel Holding 12 -
5 H Lundbeck AS 161 0.02
2 H&H International AS 63 0.01
16 ISS AS 334 0.03
1 Jeudan AS 42 -
6 Jyske Bank AS 307 0.03
2 Maersk Drilling AS 105 0.01
4 Matas AS 74 0.01
- MT Hoejgaard Holding 12 -
4 Netcompany Group AS 468 0.05
3 Nilfisk Holding AS 94 0.01
5 NKT AS 231 0.02
1 NNIT AS 29 -
2 NTG Nordic Transport Group 87 0.01
1 Pandora AS 101 0.01
2 Per Aarsleff Holding AS 84 0.01
3 Ringkjoebing Landbobank AS 288 0.03
- Rockwool International AS, Class A 160 0.02
1 Rockwool International AS, Class B 304 0.03
5 Royal Unibrew AS 658 0.06
1 RTX AS 22 -
7 Scandinavian Tobacco Group AS 141 0.01
1 Schouw & Co AS 149 0.02
4 SimCorp AS 474 0.05
1 Solar AS 65 0.01
- SP Group AS 20 -
9 Spar Nord Bank AS 100 0.01
6 Sydbank AS 204 0.02
- TCM Group 11 -
- Tivoli AS 29 -
5 Topdanmark AS 240 0.02
5 TORM PLC 48 0.01
- United International Enterprises 60 0.01
64 Vestjysk Bank AS 36 -
2 Zealand Pharma AS 64 0.01
6,705 0.66
Finland - 0.83%
5 Aktia Bank Oyj 71 0.01
- Alandsbanken Abp 12 -
2 Alma Media Oyj 27 -
1 Altia Oyj 19 -
2 Asiakastieto Group Oyj 72 0.01
3 Aspo Oyj 36 -
1 Atria Oyj 18 -
1 BasWare Oyj 48 -
Shares (000's)
Value(000's)
USD
% of NetAssetValue
Common Stock (continued)
Finland - 0.83% (continued)
3 Bittium Oyj 26 -
5 Cargotec Oyj 259 0.03
11 Caverion Oyj 83 0.01
5 Citycon Oyj 43 -
2 Digia Oyj 23 -
75 Finnair Oyj 65 0.01
4 Fiskars Oyj Abp 80 0.01
13 F-Secure Oyj 66 0.01
2 Harvia Oyj 97 0.01
3 HKScan Oyj 8 -
10 Huhtamaki Oyj 489 0.05
2 Kamux Corp 47 -
11 Kemira Oyj 184 0.02
12 Kojamo Oyj 268 0.03
7 Konecranes Oyj 314 0.03
3 Lassila & Tikanoja Oyj 59 0.01
2 Lehto Group Oyj 4 -
- Marimekko Oyj 30 -
19 Metsa Board Oyj 224 0.02
2 Musti Group Oyj 82 0.01
15 Neles Oyj 227 0.02
14 Nokian Renkaat Oyj 565 0.06
2 Olvi Oyj 104 0.01
4 Oriola Oyj, Class A 11 -
14 Oriola Oyj, Class B 30 -
3 Orion Oyj, Class A 114 0.01
10 Orion Oyj, Class B 461 0.05
34 Outokumpu Oyj 188 0.02
73 Outotec Oyj 866 0.08
1 Pihlajalinna Oyj 8 -
1 Ponsse Oyj 53 0.01
2 QT Group Oyj 256 0.03
15 Raisio Oyj 77 0.01
1 Rapala VMC Oyj 14 -
2 Revenio Group Oyj 168 0.02
3 Rovio Entertainment Oyj 27 -
8 Sanoma Oyj 128 0.01
2 Stockmann Oyj Abp 4 -
1 Taaleri Oyj 22 -
3 Talenom Oyj 44 -
2 Teleste Oyj 12 -
9 Terveystalo Oyj 127 0.01
10 Tieto Oyj 319 0.03
4 Tikkurila Oyj 152 0.02
5 Tokmanni Group Corp 145 0.01
7 Uponor Oyj 204 0.02
2 Vaisala Oyj 83 0.01
14 Valmet Oyj 610 0.06
2 Verkkokauppa.com Oyj 20 -
41 Wartsila Oyj Abp 560 0.06
16 YIT Oyj 100 0.01
8,453 0.83
France - 1.30%
3 ABC arbitrage 28 -
1 Akka Technologies 40 -
2 AKWEL 52 0.01
3 Albioma SA 128 0.01
4 ALD SA 58 0.01
3 Alten SA 347 0.03
1 Assystem SA 29 -
29 Atari SA 20 -
1 ATEME SA 13 -
Global Small Companies FundPortfolio of Investments as at 31 May 2021 (continued)
Dimensional Fund Advisors Semi-Annual Report and Unaudited Financial Statements, 31 May 2021 169

Shares (000's)
Value(000's)
USD
% of NetAssetValue
Common Stock (continued)
France - 1.30% (continued)
1 Aubay 36 -
1 Axway Software SA 38 -
- Bastide le Confort Medical 12 -
4 Beneteau SA 74 0.01
2 Bigben Interactive 52 0.01
1 Boiron SA 29 -
2 Bonduelle SCA 52 0.01
4 Casino Guichard Perrachon SA 124 0.01
4 CBo Territoria 18 -
1 Cegedim SA 36 -
91 CGG SA 97 0.01
2 Chargeurs SA 49 0.01
1 Cie des Alpes 25 -
6 Cie Plastic Omnium SA 213 0.02
3 Claranova SADIR 28 -
9 Coface SA 113 0.01
- Delta Plus Group 11 -
14 Derichebourg SA 139 0.01
2 Ekinops 15 -
- Electricite de Strasbourg SA 10 -
8 Elior Group SA 60 0.01
19 Elis SA 359 0.04
1 Eramet 82 0.01
- ESI Group 26 -
- Esso SA Francaise 4 -
3 Etablissements Maurel et Prom SA 8 -
4 Eurazeo SA 352 0.04
8 Euronext NV 816 0.08
26 Europcar Mobility Group 12 -
18 Eutelsat Communications SA 228 0.02
- Exel Industries 22 -
11 Faurecia SE 603 0.06
2 Fnac Darty SA 124 0.01
2 Gaztransport Et Technigaz SA 186 0.02
1 GL Events 23 -
- Groupe Crit 21 -
1 Guerbet 23 -
2 Haulotte Group SA 14 -
- Hexaom 8 -
- ID Logistics Group 74 0.01
3 Imerys SA 162 0.02
1 Infotel SA 29 -
2 Ipsen SA 157 0.02
4 IPSOS 173 0.02
2 Jacquet Metal Service SA 43 -
8 JCDecaux SA 223 0.02
2 Kaufman & Broad SA 89 0.01
7 Korian SA 253 0.03
6 Lagardere SCA 161 0.02
- Laurent-Perrier 29 -
3 Lectra 117 0.01
2 LISI 67 0.01
1 LNA Sante SA 40 -
1 Lumibird 10 -
5 Maisons du Monde SA 148 0.02
1 Manitou BF SA 37 -
- Manutan International 23 -
2 Mersen SA 68 0.01
3 Metropole Television SA 71 0.01
2 Neoen SA 100 0.01
3 Nexans SA 272 0.03
4 Nexity SA 210 0.02
Shares (000's)
Value(000's)
USD
% of NetAssetValue
Common Stock (continued)
France - 1.30% (continued)
2 Nicox 8 -
3 NRJ Group 22 -
2 Oeneo SA 34 -
3 Orpea 392 0.04
- Pharmagest Inter@ctive 19 -
1 Plastivaloire 7 -
3 Quadient 91 0.01
2 Rallye SA 16 -
2 Recylex SA 1 -
25 Rexel SA 515 0.05
- Robertet SA 98 0.01
4 Rothschild & Co 167 0.02
9 Rubis SCA 456 0.05
- Samse SA 14 -
1 Savencia SA 49 0.01
15 SCOR SE 489 0.05
1 Seche Environnement SA 40 -
36 SES SA 298 0.03
2 Societe BIC SA 175 0.02
1 Societe des Bains de Mer et du Cercle desEtrangers a Monaco 72 0.01
- Societe Marseillaise du Tunnel Prado-Carenage SA 6 -
1 Societe pour l'Informatique Industrielle 27 -
2 SOITEC 424 0.04
11 Solocal Group 34 -
1 Somfy SA 102 0.01
2 Sopra Steria Group 303 0.03
11 SPIE SA 275 0.03
- Stef SA 38 -
1 Sword Group 36 -
1 Synergie SA 45 -
3 Tarkett SA 76 0.01
1 Technicolor SA 4 -
8 Technip Energies NV 118 0.01
6 Television Francaise 1 62 0.01
- TFF Group 12 -
1 Thermador Groupe 71 0.01
2 Tikehau Capital SCA 63 0.01
- Total Gabon 26 -
1 Trigano SA 211 0.02
1 Union Financiere de France BQE SA 14 -
9 Valeo SA 282 0.03
1 Vallourec SA 24 -
10 Valneva SE 126 0.01
2 Verallia 82 0.01
- Vetoquinol SA 33 -
2 Vicat SA 117 0.01
1 Vilmorin & Cie SA 62 0.01
- Virbac SA 158 0.02
1 Wavestone 32 -
- Worldline SA - -
7 X-Fab Silicon Foundries SE 67 0.01
13,306 1.30
Germany - 2.17%
6 1&1 Drillisch AG 177 0.02
3 7C Solarparken AG 16 -
7 Aareal Bank AG 181 0.02
- Adesso SE 11 -
3 ADO Properties SA 95 0.01
5 ADVA Optical Networking SE 72 0.01
12 Aixtron SE 241 0.02
- All for One Group AG 20 -
Global Small Companies FundPortfolio of Investments as at 31 May 2021 (continued)
Dimensional Fund Advisors Semi-Annual Report and Unaudited Financial Statements, 31 May 2021 170

Shares (000's)
Value(000's)
USD
% of NetAssetValue
Common Stock (continued)
Germany - 2.17% (continued)
1 Allgeier SE 17 -
- Amadeus Fire AG 56 0.01
- Atoss Software AG 96 0.01
4 Aurubis AG 346 0.03
- Basler AG 51 0.01
1 Bauer AG 20 -
2 BayWa AG 98 0.01
- BayWa AG 9 -
3 Bechtle AG 596 0.06
3 Befesa SA 229 0.02
1 Bertrandt AG 48 -
- bet-at-home.com AG 11 -
1 Bijou Brigitte AG 20 -
4 Bilfinger SE 126 0.01
8 Borussia Dortmund GmbH & Co KGaA 60 0.01
5 CANCOM SE 267 0.03
22 Ceconomy AG 122 0.01
1 CENIT AG 17 -
1 Cewe Stiftung & Co KGaA 131 0.01
98 Commerzbank AG 794 0.08
3 CompuGroup Medical SE & Co KgaA 231 0.02
2 Corestate Capital Holding SA 27 -
4 CropEnergies AG 49 -
6 CTS Eventim AG & Co KGaA 425 0.04
2 Dermapharm Holding SE 143 0.01
2 Deutsche Beteiligungs AG 80 0.01
6 Deutsche EuroShop AG 148 0.01
4 Deutsche Lufthansa AG 57 0.01
17 Deutsche Pfandbriefbank AG 202 0.02
15 Deutz AG 123 0.01
8 Dialog Semiconductor PLC 594 0.06
5 DIC Asset AG 94 0.01
1 Dr Hoenle AG 30 -
1 Draegerwerk AG & Co KGaA 55 0.01
6 Duerr AG 238 0.02
2 Eckert & Ziegler Strahlen- und Medizintechnik AG 176 0.02
1 EDAG Engineering Group AG 5 -
1 Elmos Semiconductor AG 58 0.01
3 ElringKlinger AG 62 0.01
8 Encavis AG 145 0.01
1 Energiekontor AG 76 0.01
12 Evotec SE 534 0.05
- Fabasoft AG 15 -
1 Ferratum Oyj 7 -
2 Fielmann AG 184 0.02
1 First Sensor AG 50 -
2 flatexDEGIRO AG 291 0.03
3 Fraport AG Frankfurt Airport Services Worldwide 235 0.02
14 Freenet AG 380 0.04
3 Fuchs Petrolub SE 145 0.01
3 Gateway Real Estate AG 10 -
17 GEA Group AG 727 0.07
3 Gerresheimer AG 370 0.04
1 Gesco AG 21 -
2 GFT Technologies SE 45 -
4 Global Fashion Group SA 64 0.01
- Grammer AG 9 -
13 Grand City Properties SA 369 0.04
1 H&R GmbH & Co KGaA 10 -
3 Hamburger Hafen und Logistik AG 71 0.01
- Hawesko Holding AG 22 -
26 Heidelberger Druckmaschinen AG 60 0.01
Shares (000's)
Value(000's)
USD
% of NetAssetValue
Common Stock (continued)
Germany - 2.17% (continued)
4 Hella GmbH & Co KGaA 262 0.03
2 Hochtief AG 153 0.02
7 HolidayCheck Group AG 27 -
1 Hornbach Baumarkt AG 69 0.01
2 Hornbach Holding AG & Co KGaA 164 0.02
6 Hugo Boss AG 365 0.04
- Hypoport AG 163 0.02
2 Indus Holding AG 99 0.01
5 Instone Real Estate Group AG 161 0.02
2 IVU Traffic Technologies AG 39 -
6 Jenoptik AG 170 0.02
1 JOST Werke AG 87 0.01
22 K&S AG 302 0.03
11 Kloeckner & Co SE 148 0.01
1 Koenig & Bauer AG 50 -
2 Krones AG 153 0.02
- KSB SE & Co KGaA 4 -
1 KWS Saat SE & Co KGaA 115 0.01
9 Lanxess AG 693 0.07
1 Leifheit AG 83 0.01
3 Leoni AG 50 -
2 LPKF Laser & Electronics AG 65 0.01
1 Manz AG 36 -
1 Medigene AG 6 -
1 Medios AG 41 -
18 METRO AG 231 0.02
7 MLP SE 65 0.01
1 Nagarro SE 60 0.01
- New Work SE 84 0.01
2 Nexus AG 137 0.01
7 Nordex SE 161 0.02
4 Norma Group SE 202 0.02
1 OHB SE 33 -
5 Patrizia AG 150 0.01
1 Pfeiffer Vacuum Technology AG 104 0.01
4 PNE AG 33 -
24 ProSiebenSat.1 Media SE 545 0.05
2 PSI Software AG 53 0.01
2 PVA TePla AG 49 -
12 QSC AG 26 -
- R Stahl AG 3 -
5 Rheinmetall AG 497 0.05
2 RTL Group SA 106 0.01
5 S&T AG 129 0.01
5 SAF-Holland SE 85 0.01
5 Salzgitter AG 149 0.01
1 Schaltbau Holding AG 28 -
5 Scout24 AG 430 0.04
- Secunet Security Networks AG 41 -
1 Serviceware SE 12 -
7 SGL Carbon SE 53 0.01
2 Siltronic AG 377 0.04
2 Sixt SE 248 0.02
1 SMA Solar Technology AG 57 0.01
6 Software AG 253 0.02
3 Stabilus SA 246 0.02
- Stemmer Imaging AG 13 -
1 Stratec SE 79 0.01
3 Stroeer SE & Co KGaA 245 0.02
8 Suedzucker AG 125 0.01
2 SUESS MicroTec SE 59 0.01
1 Surteco Group SE 35 -
Global Small Companies FundPortfolio of Investments as at 31 May 2021 (continued)
Dimensional Fund Advisors Semi-Annual Report and Unaudited Financial Statements, 31 May 2021 171

Shares (000's)
Value(000's)
USD
% of NetAssetValue
Common Stock (continued)
Germany - 2.17% (continued)
17 TAG Immobilien AG 527 0.05
4 Takkt AG 73 0.01
1 Technotrans SE 34 -
24 Telefonica Deutschland Holding AG 65 0.01
41 thyssenkrupp AG 485 0.05
1 Traffic Systems SE 56 0.01
8 United Internet AG 317 0.03
- USU Software AG 12 -
1 Varta AG 177 0.02
3 VERBIO Vereinigte BioEnergie AG 184 0.02
1 Vossloh AG 65 0.01
2 Wacker Chemie AG 292 0.03
3 Wacker Neuson SE 94 0.01
1 Washtec AG 89 0.01
1 Westwing Group AG 82 0.01
3 Wuestenrot & Wuerttembergische AG 78 0.01
1 Zeal Network SE 54 0.01
1 zooplus AG 212 0.02
22,168 2.17
Hong Kong - 0.80%
142 Aceso Life Science Group Ltd 4 -
26 AEON Credit Service Asia Co Ltd 17 -
80 Allied Group Ltd 33 -
33 APAC Resources Ltd 6 -
396 Apollo Future Mobility Group Ltd 24 -
145 Applied Development Holdings Ltd 3 -
28 Asia Financial Holdings Ltd 13 -
50 Asia Standard International Group Ltd 8 -
30 ASM Pacific Technology Ltd 400 0.04
6 Associated International Hotels Ltd 11 -
544 Ban Loong Holdings Ltd 33 -
13 Bank of East Asia Ltd 26 -
53 Blue River Holdings Ltd 3 -
20 BOC Aviation Ltd 176 0.02
78 BOCOM International Holdings Co Ltd 18 -
97 BOE Varitronix Ltd 52 0.01
331 Brightoil Petroleum Holdings Ltd 12 -
312 Burwill Holdings Ltd 1 -
46 Cafe de Coral Holdings Ltd 100 0.01
143 Cathay Pacific Airways Ltd 125 0.01
236 Century City International Holdings Ltd 14 -
265 CGN Mining Co Ltd 24 -
13 Cheuk Nang Holdings Ltd 5 -
6 Chevalier International Holdings Ltd 8 -
488 China Energy Development Holdings Ltd 6 -
2 China Motor Bus Co Ltd 31 -
144 China Star Entertainment Ltd 24 -
1,549 China Strategic Holdings Ltd 25 -
72 Chinese Estates Holdings Ltd 36 0.01
33 Chong Hing Bank Ltd 86 0.01
45 Chow Sang Sang Holdings International Ltd 79 0.01
60 Chuang's Consortium International Ltd 8 -
201 CITIC Telecom International Holdings Ltd 67 0.01
600 CMBC Capital Holdings Ltd 8 -
16 C-Mer Eye Care Holdings Ltd 12 -
46 Convenience Retail Asia Ltd 4 -
24 Crystal International Group Ltd 11 -
520 CSI Properties Ltd 17 -
37 Dah Sing Banking Group Ltd 42 0.01
14 Dah Sing Financial Holdings Ltd 50 0.01
20 Dickson Concepts International Ltd 11 -
1,110 Digital Domain Holdings Ltd 10 -
Shares (000's)
Value(000's)
USD
% of NetAssetValue
Common Stock (continued)
Hong Kong - 0.80% (continued)
20 Dynamic Holdings Ltd 36 -
22 Eagle Nice International Holdings Ltd 14 -
28 EC Healthcare 47 0.01
29 EcoGreen International Group Ltd 7 -
360 Emperor Capital Group Ltd 6 -
25 Emperor Entertainment Hotel Ltd 4 -
104 Emperor International Holdings Ltd 15 -
340 Emperor Watch & Jewellery Ltd 7 -
116 ENM Holdings Ltd 10 -
320 Esprit Holdings Ltd 32 -
9 Fairwood Holdings Ltd 19 -
158 Far East Consortium International Ltd 57 0.01
284 First Pacific Co Ltd 99 0.01
56 First Shanghai Investments Ltd 2 -
136 Genting Hong Kong Ltd 9 -
144 Giordano International Ltd 32 -
60 Gold-Finance Holdings Ltd - -
103 Goodbaby International Holdings Ltd 25 -
96 GR Properties Ltd 13 -
26 Great Eagle Holdings Ltd 87 0.01
2,573 G-Resources Group Ltd 16 -
2 Guoco Group Ltd 24 -
308 Guotai Junan International Holdings Ltd 56 0.01
281 Haitong International Securities Group Ltd 87 0.01
85 Hang Lung Group Ltd 210 0.02
31 Hanison Construction Holdings Ltd 5 -
9 Harbour Centre Development Ltd 9 -
75 HKBN Ltd 101 0.01
81 HKR International Ltd 40 0.01
15 Hong Kong Ferry Holdings Co Ltd 12 -
69 Hong Kong Television Network Ltd 83 0.01
61 Hongkong & Shanghai Hotels Ltd 61 0.01
72 Hongkong Chinese Ltd 6 -
18 Honma Golf Ltd 10 -
396 Hsin Chong Group Holdings Ltd 3 -
420 Huafa Property Services Group 12 -
130 Hutchison Telecommunications Hong Kong HoldingsLtd 24 -
67 Hysan Development Co Ltd 265 0.03
88 IGG Inc 131 0.01
24 Imagi International Holdings 2 -
38 International Housewares Retail Co Ltd 14 -
464 IRC Ltd 20 -
52 Jacobson Pharma Corp Ltd 5 -
7 JBM Healthcare Ltd 2 -
36 Johnson Electric Holdings Ltd 95 0.01
153 K Wah International Holdings Ltd 75 0.01
102 Karrie International Holdings Ltd 24 -
62 Kerry Logistics Network Ltd 185 0.02
80 Kerry Properties Ltd 276 0.03
38 Kowloon Development Co Ltd 47 0.01
26 Lai Sun Development Co Ltd 19 -
5 Lam Soon Hong Kong Ltd 10 -
113 Landing International Development Ltd 4 -
180 Landsea Green Group Co Ltd 12 -
60 Langham Hospitality Investments and LanghamHospitality Investments Ltd 8 -
43 Lifestyle International Holdings Ltd 36 -
250 Lippo China Resources Ltd 4 -
18 Liu Chong Hing Investment Ltd 19 -
37 L'Occitane International SA 123 0.01
44 Luk Fook Holdings International Ltd 124 0.01
Global Small Companies FundPortfolio of Investments as at 31 May 2021 (continued)
Dimensional Fund Advisors Semi-Annual Report and Unaudited Financial Statements, 31 May 2021 172

Shares (000's)
Value(000's)
USD
% of NetAssetValue
Common Stock (continued)
Hong Kong - 0.80% (continued)
232 Magnificent Hotel Investment Ltd 3 -
2,680 Mason Group Holdings Ltd 11 -
18 MECOM Power and Construction 12 -
258 Meilleure Health International Industry Group Ltd 14 -
75 Melco International Development Ltd 136 0.01
49 Midland Holdings Ltd 7 -
29 Miramar Hotel & Investment 56 0.01
28 Modern Dental Group Ltd 24 -
48 Mongolian Mining Corp 16 -
134 NagaCorp Ltd 140 0.02
82 Nameson Holdings Ltd 6 -
126 NewOcean Energy Holdings Ltd 7 -
52 Nissin Foods Co Ltd 42 0.01
156 NWS Holdings Ltd 177 0.02
21 Oriental Watch Holdings 10 -
462 Oshidori International Holdings Ltd 35 -
450 Pacific Andes International Holdings Ltd 2 -
514 Pacific Basin Shipping Ltd 194 0.02
85 Pacific Textiles Holdings Ltd 57 0.01
44 Paradise Entertainment Ltd 6 -
24 PC Partner Group Ltd 12 -
418 PCCW Ltd 231 0.02
52 Pentamaster International Ltd 11 -
32 Perfect Shape Medical Ltd 33 -
84 Pico Far East Holdings Ltd 15 -
60 Playmates Holdings Ltd 7 -
85 PT International Development Co Ltd 4 -
62 Public Financial Holdings Ltd 21 -
22 Regal Hotels International Holdings Ltd 12 -
24 Regina Miracle International Holdings Ltd 7 -
20 SEA Holdings Ltd 22 -
120 Shangri-La Asia Ltd 112 0.01
70 Shenwan Hongyuan HK Ltd 9 -
4 Shun Ho Property Investments Ltd 1 -
162 Shun Tak Holdings Ltd 52 0.01
166 Singamas Container Holdings Ltd 14 -
129 SITC International Holdings Co Ltd 455 0.05
203 SJM Holdings Ltd 232 0.02
25 SmarTone Telecommunications Holdings Ltd 14 -
8 Soundwill Holdings Ltd 9 -
50 Stella International Holdings Ltd 61 0.01
48 Sun Hung Kai & Co Ltd 27 -
88 SUNeVision Holdings Ltd 91 0.01
42 TAI Cheung Holdings Ltd 26 -
42 Tan Chong International Ltd 11 -
35 Television Broadcasts Ltd 35 -
36 Texhong Textile Group Ltd 57 0.01
98 Texwinca Holdings Ltd 25 -
490 Theme International Holdings Ltd 56 0.01
23 Transport International Holdings Ltd 47 0.01
77 United Laboratories International Holdings Ltd 70 0.01
654 Untrade Convoy 3 -
284 Up Energy Development Group Ltd 1 -
123 Value Partners Group Ltd 84 0.01
78 Vitasoy International Holdings Ltd 303 0.03
14 Vobile Group Ltd 63 0.01
67 VPower Group International Holdings Ltd 16 -
74 VSTECS Holdings Ltd 72 0.01
17 VTech Holdings Ltd 173 0.02
24 Wai Kee Holdings Ltd 13 -
520 Wang On Group Ltd 5 -
96 Wealthking Investments Ltd 9 -
Shares (000's)
Value(000's)
USD
% of NetAssetValue
Common Stock (continued)
Hong Kong - 0.80% (continued)
11 Wing On Co International Ltd 25 -
38 Wing Tai Properties Ltd 23 -
71 Yue Yuen Industrial Holdings Ltd 187 0.02
114 Yunfeng Financial Group Ltd 42 0.01
510 Zensun Enterprises Ltd 41 0.01
248 Zhaobangji Properties Holdings Ltd 21 -
8,238 0.80
Ireland - 0.16%
34 AIB Group PLC 114 0.01
108 Bank of Ireland Group PLC 703 0.07
93 Cairn Homes PLC 121 0.01
10 Dalata Hotel Group PLC 55 0.01
3 FBD Holdings PLC 35 -
23 Glanbia PLC 384 0.04
60 Glenveagh Properties PLC 72 0.01
20 Irish Continental Group PLC 106 0.01
14 Permanent TSB Group Holdings PLC 25 -
1,615 0.16
Israel - 0.45%
5 Adgar Investment and Development Ltd 10 -
- Afcon Holdings Ltd 16 -
2 AFI Properties Ltd 90 0.01
- Africa Israel Residences Ltd 23 -
5 Airport City Ltd 96 0.01
1 Albaad Massuot Yitzhak Ltd 13 -
4 Allot Ltd 81 0.01
1 Alrov Properties and Lodgings Ltd 57 0.01
1 Arad Ltd 11 -
5 Ashtrom Group Ltd 108 0.01
1 Atreyu Capital Markets Ltd 11 -
- AudioCodes Ltd 8 -
17 Aura Investments Ltd 18 -
14 Azorim-Investment Development & Construction CoLtd 59 0.01
12 Bayside Land Corp 108 0.01
1 Bet Shemesh Engines Holdings 1997 Ltd 16 -
- Big Shopping Centers Ltd 54 0.01
- Blue Square Real Estate Ltd 34 -
- Brack Capital Properties NV 40 -
2 Camtek Ltd 65 0.01
2 Carasso Motors Ltd 8 -
13 Cellcom Israel Ltd 52 0.01
6 Clal Insurance Enterprises Holdings Ltd 118 0.01
9 Compugen Ltd 70 0.01
1 Danel Adir Yeoshua Ltd 152 0.02
7 Delek Automotive Systems Ltd 85 0.01
1 Delek Group Ltd 36 -
1 Delta Galil Industries Ltd 27 -
1 Dor Alon Energy in Israel 1988 Ltd 27 -
- Duniec Brothers Ltd 15 -
1 Electra Consumer Products 1970 Ltd 53 0.01
- Electra Ltd 105 0.01
4 Electra Real Estate Ltd 44 -
1 Ellomay Capital Ltd 20 -
3 Elron Electronic Industries Ltd 12 -
56 Enlight Renewable Energy Ltd 117 0.01
3 Equital Ltd 72 0.01
3 Evogene Ltd 10 -
1 FMS Enterprises Migun Ltd 15 -
1 Formula Systems 1985 Ltd 92 0.01
1 Fox Wizel Ltd 160 0.02
4 Freshmarket Ltd 16 -
Global Small Companies FundPortfolio of Investments as at 31 May 2021 (continued)
Dimensional Fund Advisors Semi-Annual Report and Unaudited Financial Statements, 31 May 2021 173

Shares (000's)
Value(000's)
USD
% of NetAssetValue
Common Stock (continued)
Israel - 0.45% (continued)
2 Gilat Satellite Networks Ltd 20 -
- Hadera Paper Ltd 23 -
11 Harel Insurance Investments & Financial ServicesLtd 120 0.01
1 Hilan Ltd 72 0.01
1 IDI Insurance Co Ltd 48 0.01
- IES Holdings Ltd 11 -
- Ilex Medical Ltd 12 -
49 Industrial Buildings Corp Ltd 147 0.01
13 Inrom Construction Industries Ltd 65 0.01
17 Isracard Ltd 68 0.01
19 Israel Canada T.R Ltd 79 0.01
1 Israel Land Development - Urban Renewal Ltd 15 -
- Isras Investment Co Ltd 46 0.01
1 Issta Lines Ltd 13 -
4 Kamada Ltd 22 -
3 Kenon Holdings Ltd 91 0.01
1 Kerur Holdings Ltd 22 -
1 Levinstein Properties Ltd 15 -
3 Magic Software Enterprises Ltd 50 0.01
1 Malam - Team Ltd 43 -
4 Matrix IT Ltd 96 0.01
4 Maytronics Ltd 81 0.01
9 Mediterranean Towers Ltd 27 -
1 Mega Or Holdings Ltd 33 -
- Mehadrin Ltd 2 -
3 Meitav Dash Investments Ltd 21 -
3 Menora Mivtachim Holdings Ltd 55 0.01
45 Migdal Insurance & Financial Holdings Ltd 64 0.01
1 Mivtach Shamir Holdings Ltd 27 -
3 Naphtha Israel Petroleum Corp Ltd 15 -
2 Nawi Brothers Ltd 15 -
- Neto Malinda Trading Ltd 10 -
- Neto ME Holdings Ltd 12 -
23 Novolog Ltd 22 -
198 Oil Refineries Ltd 54 0.01
- One Software Technologies Ltd 68 0.01
5 OPC Energy Ltd 52 0.01
18 Partner Communications Co Ltd 87 0.01
1 Paz Oil Co Ltd 137 0.01
3 Perion Network Ltd 46 0.01
1 Plasson Industries Ltd 36 -
3 Pluristem Therapeutics Inc 10 -
1 Prashkovsky Investments and Construction Ltd 22 -
1 Priortech Ltd 31 -
1 Rami Levy Chain Stores Hashikma Marketing2006 Ltd 51 0.01
4 Raval Ics Ltd 12 -
- Sano-Brunos Enterprises Ltd 35 -
- Scope Metals Group Ltd 14 -
10 Shufersal Ltd 84 0.01
- Tadiran Holdings Ltd 43 -
6 Tel Aviv Stock Exchange 36 -
- Telsys 14 -
1 Victory Supermarket Chain Ltd 13 -
2 Vitania Ltd 11 -
1 YH Dimri Construction & Development Ltd 46 0.01
4,588 0.45
Italy - 1.10%
175 A2A SpA 365 0.04
6 ACEA SpA 144 0.01
1 Alerion Cleanpower SpA 22 -
Shares (000's)
Value(000's)
USD
% of NetAssetValue
Common Stock (continued)
Italy - 1.10% (continued)
14 Amplifon SpA 647 0.06
29 Anima Holding SpA 154 0.02
3 Aquafil SpA 23 -
25 Arnoldo Mondadori Editore SpA 51 -
13 Ascopiave SpA 59 0.01
15 Autogrill SpA 125 0.01
2 Avio SpA 26 -
11 Azimut Holding SpA 281 0.03
2 Banca Carige SpA 1 -
15 Banca Farmafactoring SpA 141 0.01
6 Banca Generali SpA 252 0.02
3 Banca IFIS SpA 52 0.01
11 Banca Mediolanum SpA 106 0.01
8 Banca Monte dei Paschi di Siena SpA 12 -
39 Banca Popolare di Sondrio SCpA 190 0.02
4 Banca Sistema SpA 11 -
161 Banco BPM SpA 570 0.06
4 Banco di Desio e della Brianza SpA 15 -
8 BE SpA 16 -
3 Biesse SpA 99 0.01
106 BPER Banca 264 0.03
4 Brunello Cucinelli SpA 226 0.02
11 Buzzi Unicem SpA 315 0.03
8 Cairo Communication SpA 18 -
3 Carel Industries SpA 85 0.01
5 Cementir Holding NV 56 0.01
18 Cerved Group SpA 213 0.02
96 CIR SpA-Compagnie Industriali 59 0.01
12 Credito Emiliano SpA 75 0.01
2 Danieli & C Officine Meccaniche SpA 49 -
8 De' Longhi SpA 345 0.03
18 DeA Capital SpA 29 -
1 Digital Bros SpA 14 -
5 doValue SpA 60 0.01
3 Enav SpA 12 -
6 ERG SpA 188 0.02
3 Esprinet SpA 58 0.01
4 Eurotech SpA 19 -
2 Fiera Milano SpA 9 -
2 Fila SpA 30 -
46 Fincantieri SpA 41 -
18 FNM SpA 15 -
6 Freni Brembo SpA 83 0.01
5 Geox SpA 7 -
3 Gruppo MutuiOnline SpA 169 0.02
88 Hera SpA 375 0.04
5 Illimity Bank SpA 67 0.01
13 IMMSI SpA 8 -
2 Intek Group SpA 1 -
8 Interpump Group SpA 451 0.04
75 Iren SpA 241 0.02
55 Italgas SpA 362 0.04
2 Italmobiliare SpA 59 0.01
1 IVS Group SA 6 -
69 Juventus Football Club SpA 64 0.01
1 La Doria SpA 27 -
43 Leonardo SpA 373 0.04
1 LU-VE SpA 18 -
16 Maire Tecnimont SpA 58 0.01
32 Mediaset SpA 115 0.01
4 Mediobanca Banca di Credito Finanziario SpA 51 0.01
1 Openjobmetis Spa agenzia per il lavoro 15 -
Global Small Companies FundPortfolio of Investments as at 31 May 2021 (continued)
Dimensional Fund Advisors Semi-Annual Report and Unaudited Financial Statements, 31 May 2021 174

Shares (000's)
Value(000's)
USD
% of NetAssetValue
Common Stock (continued)
Italy - 1.10% (continued)
2 Orsero SpA 23 -
31 OVS SpA 69 0.01
15 Piaggio & C SpA 60 0.01
1 Piovan SpA 12 -
43 Pirelli & C SpA 251 0.02
- Prima Industrie SpA 12 -
22 Prysmian SpA 754 0.07
10 RAI Way SpA 57 0.01
21 Reno de Medici SpA 26 -
2 Reply SpA 354 0.03
12 Rizzoli Corriere Della Sera Mediagroup SpA 11 -
- Sabaf SpA 12 -
11 Safilo Group SpA 21 -
73 Saipem SpA 180 0.02
13 Salini Impregilo SpA 30 -
61 Saras SpA 53 0.01
1 Sesa SpA 156 0.02
19 Societa Cattolica di Assicurazioni SC 141 0.01
10 Sogefi SpA 16 -
4 SOL SpA 79 0.01
15 Tamburi Investment Partners SpA 143 0.01
11 Technogym SpA 143 0.01
3 Tinexta Spa 84 0.01
1 Tod's SpA 62 0.01
2 Unieuro SpA 67 0.01
44 Unipol Gruppo SpA 242 0.02
6 UnipolSai Assicurazioni SpA 16 -
3 Zignago Vetro SpA 58 0.01
11,224 1.10
Japan - 6.76%
6 77 Bank Ltd 75 0.01
4 A&D Co Ltd 36 -
2 Access Co Ltd 12 -
1 Achilles Corp 17 -
3 AD Works Co Ltd 4 -
3 Adastria Co Ltd 56 0.01
10 ADEKA Corp 186 0.02
1 Ad-Sol Nissin Corp 26 -
1 Adtec Plasma Technology Co 16 -
4 Advan Co Ltd 35 -
2 Advance Create Co Ltd 14 -
- Adventure Inc 14 -
2 AEON Delight Co Ltd 70 0.01
1 AEON Fantasy Co Ltd 16 -
10 AEON Financial Service Co Ltd 116 0.01
4 AEON Hokkaido Corp 35 -
1 AEON Kyushu Co Ltd 14 -
1 Aeria Inc 6 -
2 AFC-HD AMS Life Science Co Ltd 21 -
2 Agro-Kanesho Co Ltd 33 -
7 Ahresty Corp 27 -
4 Ai Holdings Corp 79 0.01
5 Aica Kogyo Co Ltd 194 0.02
1 Aichi Bank Ltd 39 0.01
5 Aichi Corp 39 0.01
2 Aichi Steel Corp 51 0.01
- Aichi Tokei Denki Co Ltd 16 -
8 Aida Engineering Ltd 62 0.01
38 Aiful Corp 130 0.01
3 Ain Holdings Inc 183 0.02
1 Ainavo Holdings Co Ltd 11 -
1 Aiphone Co Ltd 23 -
Shares (000's)
Value(000's)
USD
% of NetAssetValue
Common Stock (continued)
Japan - 6.76% (continued)
3 Airport Facilities Co Ltd 18 -
4 Aisan Industry Co Ltd 32 -
5 Aizawa Securities Co Ltd 47 0.01
1 Ajis Co Ltd 30 -
4 Akatsuki Corp 12 -
1 Akatsuki Inc 32 -
22 Akebono Brake Industry Co Ltd 35 -
3 Akita Bank Ltd 37 -
1 Albis Co Ltd 30 -
2 Alconix Corp 26 -
2 Alinco Inc 20 -
2 Alleanza Holdings Co Ltd 24 -
19 Allied Telesis Holdings KK 24 -
1 Alpen Co Ltd 27 -
1 Alpha Corp 6 -
1 Alpha Systems Inc 30 -
2 Alps Logistics Co Ltd 19 -
2 Altech Corp 31 -
6 Amano Corp 164 0.02
1 Amiyaki Tei Co Ltd 16 -
1 Amuse Inc 28 -
1 Amvis Holdings Inc 35 -
1 Anabuki Kosan Inc 12 -
3 Anest Iwata Corp 29 -
10 Anicom Holdings Inc 91 0.01
1 AOI Electronics Co Ltd 21 -
2 AOI TYO Holdings Inc 15 -
8 AOKI Holdings Inc 46 0.01
1 Aoki Super Co Ltd 21 -
3 Aomori Bank Ltd 54 0.01
6 Aoyama Trading Co Ltd 50 0.01
1 Aoyama Zaisan Networks Co Ltd 21 -
7 Aozora Bank Ltd 167 0.02
1 Apaman Co Ltd 6 -
2 Arakawa Chemical Industries Ltd 25 -
2 Arata Corp 58 0.01
2 Arcland Sakamoto Co Ltd 23 -
2 Arcland Service Holdings Co Ltd 41 0.01
4 Arcs Co Ltd 96 0.01
1 Arealink Co Ltd 9 -
2 Argo Graphics Inc 67 0.01
4 Arisawa Manufacturing Co Ltd 32 -
2 ARTERIA Networks Corp 35 -
1 Artiza Networks Inc 19 -
1 Artnature Inc 8 -
1 ArtSpark Holdings Inc 27 -
4 Aruhi Corp 64 0.01
2 Asahi Co Ltd 26 -
9 Asahi Diamond Industrial Co Ltd 43 0.01
8 Asahi Holdings Inc 178 0.02
1 Asahi Kogyosha Co Ltd 14 -
3 Asahi Net Inc 18 -
1 Asahi Printing Co Ltd 10 -
2 Asahi Yukizai Corp 22 -
1 Asante Inc 13 -
1 Asanuma Corp 49 0.01
2 Ascentech KK 23 -
3 Asia Pile Holdings Corp 13 -
3 ASKA Pharmaceutical Holdings 25 -
4 ASKUL Corp 68 0.01
1 Ateam Inc 8 -
10 Atom Corp 70 0.01
Global Small Companies FundPortfolio of Investments as at 31 May 2021 (continued)
Dimensional Fund Advisors Semi-Annual Report and Unaudited Financial Statements, 31 May 2021 175

Shares (000's)
Value(000's)
USD
% of NetAssetValue
Common Stock (continued)
Japan - 6.76% (continued)
2 Atrae Inc 21 -
2 Atsugi Co Ltd 11 -
2 Aucnet Inc 23 -
9 Autobacs Seven Co Ltd 124 0.01
1 Aval Data Corp 25 -
3 Avant Corp 41 0.01
5 Avex Inc 76 0.01
4 Awa Bank Ltd 77 0.01
2 Axial Retailing Inc 75 0.01
6 Bando Chemical Industries Ltd 46 0.01
2 Bank of Iwate Ltd 37 -
2 Bank of Nagoya Ltd 37 -
3 Bank of Okinawa Ltd 72 0.01
2 Bank of Saga Ltd 22 -
8 Bank of the Ryukyus Ltd 53 0.01
1 Bank of Toyama Ltd 14 -
2 Baroque Japan Ltd 15 -
- Base Co Ltd 15 -
1 Beauty Garage Inc 23 -
1 Beenos Inc 32 -
1 Belc Co Ltd 61 0.01
3 Bell System24 Holdings Inc 50 0.01
5 Belluna Co Ltd 47 0.01
8 Benesse Holdings Inc 185 0.02
1 Bengo4.com Inc 72 0.01
11 Bic Camera Inc 113 0.01
1 Biofermin Pharmaceutical Co Ltd 20 -
3 BML Inc 95 0.01
1 Bourbon Corp 14 -
1 BP Castrol KK 11 -
4 Br Holdings Corp 18 -
1 BrainPad Inc 27 -
7 Broadband Tower Inc 15 -
12 Broadleaf Co Ltd 58 0.01
1 Broccoli Co Ltd 11 -
1 Bull-Dog Sauce Co Ltd 25 -
6 Bunka Shutter Co Ltd 65 0.01
1 Business Brain Showa-Ota Inc 16 -
1 Business Engineering Corp 21 -
1 C Uyemura & Co Ltd 62 0.01
2 CAC Holdings Corp 25 -
2 Can Do Co Ltd 33 -
1 Canare Electric Co Ltd 13 -
2 Canon Electronics Inc 38 -
1 Careerlink Co Ltd 25 -
1 Carenet, Inc 36 -
2 Carlit Holdings Co Ltd 13 -
1 Carta Holdings Inc 19 -
2 Cawachi Ltd 33 -
- CellSource Co Ltd 32 -
1 Central Automotive Products Ltd 35 -
4 Central Glass Co Ltd 87 0.01
2 Central Security Patrols Co Ltd 48 0.01
1 Central Sports Co Ltd 18 -
1 Ceres Inc 21 -
3 Change Inc 86 0.01
2 Charm Care Corp KK 20 -
2 Chatwork Co Ltd 17 -
8 Chiba Kogyo Bank Ltd 19 -
2 Chilled & Frozen Logistics Holdings Co Ltd 32 -
1 Chino Corp 11 -
3 Chiyoda Co Ltd 25 -
Shares (000's)
Value(000's)
USD
% of NetAssetValue
Common Stock (continued)
Japan - 6.76% (continued)
2 Chiyoda Integre Co Ltd 29 -
2 Chodai Co Ltd 31 -
2 Chofu Seisakusho Co Ltd 47 0.01
2 Chori Co Ltd 37 -
2 Chubu Shiryo Co Ltd 26 -
4 Chudenko Corp 92 0.01
1 Chuetsu Pulp & Paper Co Ltd 15 -
1 Chugai Ro Co Ltd 13 -
14 Chugoku Bank Ltd 116 0.01
6 Chugoku Marine Paints Ltd 48 0.01
2 Chukyo Bank Ltd 29 -
2 Chuo Spring Co Ltd 17 -
2 Chuo Warehouse Co Ltd 19 -
5 CI Takiron Corp 30 -
34 Citizen Watch Co Ltd 137 0.01
5 CKD Corp 123 0.01
1 CK-San-Etsu Co Ltd 17 -
5 Cleanup Corp 23 -
1 CMIC Holdings Co Ltd 21 -
8 CMK Corp 36 -
2 Cocokara fine Inc 162 0.02
7 COLOPL Inc 50 0.01
1 Como Co Ltd 14 -
3 Computer Engineering & Consulting Ltd 37 -
3 Computer Institute of Japan Ltd 23 -
2 Comture Corp 50 0.01
1 CONEXIO Corp 19 -
9 COOKPAD Inc 22 -
1 Core Corp 9 -
2 Corona Corp 20 -
4 Cosel Co Ltd 35 -
6 Cosmo Energy Holdings Co Ltd 133 0.01
2 Cota Co Ltd 27 -
9 Create Restaurants Holdings Inc 66 0.01
3 Create SD Holdings Co Ltd 83 0.01
5 Credit Saison Co Ltd 58 0.01
1 Creek & River Co Ltd 17 -
2 Cresco Ltd 37 -
- CROOZ 8 -
2 CTI Engineering Co Ltd 47 0.01
3 CTS Co Ltd 28 -
2 Curves Holdings Co Ltd 14 -
2 Cyberlinks Co Ltd 25 -
2 Cybernet Systems Co Ltd 13 -
3 Cybozu Inc 64 0.01
3 Dai Nippon Toryo Co Ltd 25 -
7 Daibiru Corp 77 0.01
27 Daicel Corp 213 0.02
1 Dai-Dan Co Ltd 35 -
1 Daido Kogyo Co Ltd 13 -
4 Daido Metal Co Ltd 23 -
3 Daido Steel Co Ltd 170 0.02
3 Daihatsu Diesel Manufacturing Co Ltd 13 -
2 Daihen Corp 102 0.01
2 Daiho Corp 91 0.01
1 Dai-Ichi Cutter Kogyo KK 12 -
1 Daiichi Jitsugyo Co Ltd 39 0.01
1 Daiichi Kensetsu Corp 21 -
2 Daiichi Kigenso Kagaku-Kogyo Co Ltd 24 -
1 Dai-ichi Seiko Co Ltd 26 -
5 Daiichikosho Co Ltd 192 0.02
2 Daiken Corp 28 -
Global Small Companies FundPortfolio of Investments as at 31 May 2021 (continued)
Dimensional Fund Advisors Semi-Annual Report and Unaudited Financial Statements, 31 May 2021 176

Shares (000's)
Value(000's)
USD
% of NetAssetValue
Common Stock (continued)
Japan - 6.76% (continued)
1 Daiken Medical Co Ltd 5 -
5 Daiki Aluminium Industry Co Ltd 54 0.01
1 Daikoku Denki Co Ltd 12 -
1 Daikokutenbussan Co Ltd 47 0.01
4 Daikyonishikawa Corp 26 -
2 Dainichi Co Ltd 14 -
2 Dainichiseika Color & Chemicals Manufacturing CoLtd 43 0.01
5 Daiseki Co Ltd 176 0.02
5 Daishi Hokuetsu Financial Group Inc 102 0.01
2 Daishinku Corp 44 0.01
1 Daisho Co Ltd 12 -
1 Daito Pharmaceutical Co Ltd 45 0.01
1 Daitron Co Ltd 18 -
4 Daiwa Industries Ltd 44 0.01
11 Daiwabo Holdings Co Ltd 173 0.02
15 DCM Holdings Co Ltd 142 0.02
5 Dear Life Co Ltd 22 -
9 DeNA Co Ltd 178 0.02
1 Denki Kogyo Co Ltd 25 -
1 Densan System Co Ltd 30 -
2 Denyo Co Ltd 32 -
6 Dexerials Corp 118 0.01
1 Diamond Electric Holdings Co 23 -
9 DIC Corp 225 0.02
1 Digital Arts Inc 96 0.01
4 Digital Garage Inc 166 0.02
2 Digital Hearts Holdings Co Ltd 20 -
1 Digital Holdings Inc 25 -
2 Digital Information Technologies Corp 32 -
3 Dip Corp 97 0.01
1 DKS Co Ltd 46 0.01
13 DMG Mori Co Ltd 233 0.02
1 DMW Corp 20 -
4 Doshisha Co Ltd 58 0.01
3 Doutor Nichires Holdings Co Ltd 38 0.01
4 Dowa Holdings Co Ltd 168 0.02
5 DTS Corp 125 0.01
5 Duskin Co Ltd 110 0.01
1 DyDo Group Holdings Inc 50 0.01
4 Eagle Industry Co Ltd 46 0.01
2 Earth Corp 112 0.01
1 EAT&Co Ltd 14 -
1 Ebara Foods Industry Inc 16 -
1 Ebara Jitsugyo Co Ltd 52 0.01
2 Ebase Co Ltd 19 -
1 Eco's Co Ltd 15 -
10 EDION Corp 102 0.01
- Edulab Inc 15 -
2 EF-ON Inc 19 -
3 eGuarantee Inc 67 0.01
1 E-Guardian Inc 27 -
4 Ehime Bank Ltd 29 -
5 Eidai Co Ltd 15 -
3 Eiken Chemical Co Ltd 67 0.01
2 Eizo Corp 82 0.01
5 Elan Corp 58 0.01
6 Elecom Co Ltd 107 0.01
3 Elematec Corp 30 -
2 Endo Lighting Corp 11 -
3 Enigmo Inc 36 -
4 en-japan Inc 130 0.01
Shares (000's)
Value(000's)
USD
% of NetAssetValue
Common Stock (continued)
Japan - 6.76% (continued)
1 Enplas Corp 41 0.01
5 EPS Holdings Inc 71 0.01
3 eRex Co Ltd 59 0.01
2 ES-Con Japan Ltd 15 -
1 Eslead Corp 15 -
2 ESPEC Corp 31 -
3 Exedy Corp 48 0.01
1 F&M Co Ltd 12 -
7 F@N Communications Inc 25 -
2 Falco Holdings Co Ltd 25 -
5 FCC Co Ltd 80 0.01
1 FDK Corp 15 -
2 Feed One Co Ltd 17 -
4 Ferrotec Holdings Corp 91 0.01
- FFRI Inc 6 -
31 FIDEA Holdings Co Ltd 35 -
1 Fields Corp 6 -
2 FINDEX Inc 18 -
8 First Bank of Toyama Ltd 20 -
1 First Juken Co Ltd 8 -
1 Fixstars Corp 6 -
1 FJ Next Co Ltd 12 -
1 Focus Systems Corp 10 -
3 Foster Electric Co Ltd 28 -
4 France Bed Holdings Co Ltd 32 -
1 Freund Corp 4 -
2 F-Tech Inc 11 -
1 FTGroup Co Ltd 14 -
2 Fudo Tetra Corp 32 -
2 Fuji Co Ltd 46 0.01
2 Fuji Corp 20 -
7 Fuji Corp (Aichi) 179 0.02
4 Fuji Corp Ltd 22 -
1 Fuji Furukawa Engineering & Construction 24 -
1 Fuji Kosan Co Ltd 12 -
2 Fuji Kyuko Co Ltd 113 0.01
5 Fuji Oil Co Ltd 12 -
2 Fuji Oil Holdings Inc 46 0.01
2 Fuji Pharma Co Ltd 21 -
5 Fuji Seal International Inc 117 0.01
3 Fuji Soft Inc 156 0.02
1 Fujibo Holdings Inc 46 0.01
3 Fujicco Co Ltd 51 0.01
5 Fujikura Composites Inc 23 -
2 Fujikura Kasei Co Ltd 12 -
27 Fujikura Ltd 117 0.01
2 Fujimi Inc 106 0.01
2 Fujimori Kogyo Co Ltd 65 0.01
7 Fujitec Co Ltd 145 0.02
2 Fujiya Co Ltd 39 0.01
2 FuKoKu Co Ltd 15 -
1 Fukuda Corp 41 0.01
1 Fukuda Denshi Co Ltd 101 0.01
3 Fukui Bank Ltd 38 -
1 Fukui Computer Holdings Inc 36 -
2 Fukushima Bank Ltd 5 -
1 Fukushima Industries Corp 54 0.01
3 Fukuyama Transporting Co Ltd 99 0.01
3 FULLCAST Holdings Co Ltd 51 0.01
5 Funai Soken Holdings Inc 106 0.01
2 Furukawa Battery Co Ltd 29 -
4 Furukawa Co Ltd 49 0.01
Global Small Companies FundPortfolio of Investments as at 31 May 2021 (continued)
Dimensional Fund Advisors Semi-Annual Report and Unaudited Financial Statements, 31 May 2021 177

Shares (000's)
Value(000's)
USD
% of NetAssetValue
Common Stock (continued)
Japan - 6.76% (continued)
8 Furukawa Electric Co Ltd 210 0.02
4 Furuno Electric Co Ltd 35 -
2 Furusato Industries Ltd 26 -
1 Furuya Metal Co Ltd 34 -
1 Furyu Corp 14 -
2 Fuso Chemical Co Ltd 75 0.01
2 Fuso Pharmaceutical Industries Ltd 30 -
5 Futaba Corp 37 -
6 Futaba Industrial Co Ltd 28 -
3 Future Corp 63 0.01
2 Fuyo General Lease Co Ltd 127 0.01
1 G-7 Holdings Inc 33 -
4 Gakken Holdings Co Ltd 47 0.01
1 Gakkyusha Co Ltd 10 -
2 Gakujo Co Ltd 21 -
3 GCA Corp 24 -
2 Gecoss Corp 15 -
1 Genki Sushi Co Ltd 12 -
1 Genky DrugStores Co Ltd 24 -
4 Geo Holdings Corp 44 0.01
1 giftee Inc 43 0.01
1 GL Sciences Inc 14 -
1 Globeride Inc 45 0.01
7 Glory Ltd 138 0.01
1 GMO Cloud KK 23 -
7 GMO Financial Holdings Inc 55 0.01
5 GNI Group Ltd 96 0.01
1 Godo Steel Ltd 21 -
3 Goldcrest Co Ltd 49 0.01
1 Golf Digest Online Inc 10 -
3 Grace Technology Inc 55 0.01
14 Gree Inc 74 0.01
9 GS Yuasa Corp 251 0.03
2 G-Tekt Corp 34 -
2 Gumi Inc 26 -
1 Gun-Ei Chemical Industry Co Ltd 21 -
5 GungHo Online Entertainment Inc 89 0.01
46 Gunma Bank Ltd 152 0.02
1 Gunze Ltd 55 0.01
11 H2O Retailing Corp 87 0.01
- HABA Laboratories Inc 15 -
40 Hachijuni Bank Ltd 137 0.01
2 Hagihara Industries Inc 24 -
1 Hagiwara Electric Holdings Co Ltd 20 -
1 Hagoromo Foods Corp 14 -
1 Hakudo Co Ltd 16 -
2 Hakuto Co Ltd 23 -
1 Halows Co Ltd 31 -
2 Hamakyorex Co Ltd 53 0.01
1 Handsman Co Ltd 15 -
4 Hanwa Co Ltd 123 0.01
2 Happinet Corp 32 -
2 Harima Chemicals Group Inc 21 -
1 Hashimoto Sogyo Holdings Co Ltd 14 -
23 Hazama Ando Corp 177 0.02
7 Heiwa Corp 116 0.01
4 Heiwa Real Estate Co Ltd 153 0.02
4 Heiwado Co Ltd 79 0.01
2 Helios Techno Holding Co Ltd 8 -
- Hennge KK 14 -
2 Hibiya Engineering Ltd 40 0.01
2 HI-LEX Corp 39 0.01
Shares (000's)
Value(000's)
USD
% of NetAssetValue
Common Stock (continued)
Japan - 6.76% (continued)
1 Hinokiya Group Co Ltd 27 -
1 Hioki EE Corp 52 0.01
1 Hirakawa Hewtech Corp 11 -
1 Hirano Tecseed Co Ltd 28 -
1 Hirata Corp 78 0.01
33 Hirogin Holdings Inc 179 0.02
2 Hiroshima Electric Railway Co Ltd 19 -
5 Hiroshima Gas Co Ltd 19 -
4 Hisaka Works Ltd 30 -
19 Hitachi Zosen Corp 128 0.01
1 Hito Communications Holdings Inc 19 -
2 Hochiki Corp 26 -
1 Hodogaya Chemical Co Ltd 29 -
3 Hogy Medical Co Ltd 81 0.01
1 Hokkaido Coca-Cola Bottling Co Ltd 23 -
19 Hokkaido Electric Power Co Inc 89 0.01
3 Hokkaido Gas Co Ltd 42 0.01
1 Hokkan Holdings Ltd 18 -
3 Hokko Chemical Industry Co Ltd 23 -
2 Hokkoku Bank Ltd 50 0.01
16 Hokuetsu Corp 85 0.01
2 Hokuetsu Industries Co Ltd 25 -
15 Hokuhoku Financial Group Inc 120 0.01
1 Hokuriku Electric Industry Co Ltd 9 -
22 Hokuriku Electric Power Co 124 0.01
2 Hokuriku Electrical Construction Co Ltd 19 -
3 Hokuto Corp 46 0.01
2 Honda Tsushin Kogyo Co Ltd 10 -
2 H-One Co Ltd 15 -
2 Honeys Holdings Co Ltd 21 -
3 Hoosiers Holdings 22 -
7 Hosiden Corp 64 0.01
1 Hosokawa Micron Corp 60 0.01
2 Hotland Co Ltd 23 -
1 House Do Co Ltd 10 -
2 Howa Machinery Ltd 13 -
1 HPC Systems Inc 28 -
26 Hyakugo Bank Ltd 75 0.01
3 Hyakujushi Bank Ltd 37 -
3 IBJ Inc 28 -
2 Ichibanya Co Ltd 72 0.01
28 Ichigo Inc 89 0.01
1 Ichiken Co Ltd 17 -
4 Ichikoh Industries Ltd 25 -
1 Ichimasa Kamaboko Co Ltd 10 -
2 Ichinen Holdings Co Ltd 27 -
5 Ichiyoshi Securities Co Ltd 26 -
2 Icom Inc 33 -
1 ID Holdings Corp 10 -
4 Idec Corp 70 0.01
7 IDOM Inc 39 0.01
1 Ihara Science Corp 12 -
9 Iino Kaiun Kaisha Ltd 38 -
1 IJTT Co Ltd 9 -
1 I'll Inc 10 -
2 Imagica Group Inc 8 -
3 Imasen Electric Industrial 20 -
1 Impact HD Inc 14 -
1 Imuraya Group Co Ltd 20 -
6 Inaba Denki Sangyo Co Ltd 135 0.01
2 Inaba Seisakusho Co Ltd 28 -
6 Inabata & Co Ltd 102 0.01
Global Small Companies FundPortfolio of Investments as at 31 May 2021 (continued)
Dimensional Fund Advisors Semi-Annual Report and Unaudited Financial Statements, 31 May 2021 178

Shares (000's)
Value(000's)
USD
% of NetAssetValue
Common Stock (continued)
Japan - 6.76% (continued)
2 Inageya Co Ltd 22 -
3 Ines Corp 43 0.01
1 I-Net Corp 13 -
3 Infocom Corp 75 0.01
22 Infomart Corp 188 0.02
3 Information Services International-Dentsu Ltd 103 0.01
3 Innotech Corp 31 -
2 Insource Co Ltd 50 0.01
4 Intage Holdings Inc 50 0.01
1 Inter Action Corp 30 -
6 Internet Initiative Japan Inc 174 0.02
1 I-O Data Device Inc 13 -
1 IPS Inc 23 -
1 IR Japan Holdings Ltd 115 0.01
2 Iriso Electronics Co Ltd 87 0.01
1 I'rom Group Co Ltd 15 -
1 ISB Corp 15 -
2 Iseki & Co Ltd 25 -
1 Ishihara Chemical Co Ltd 14 -
5 Ishihara Sangyo Kaisha Ltd 43 0.01
3 Itfor Inc 20 -
1 ITmedia Inc 11 -
7 Itochu Enex Co Ltd 66 0.01
1 Itochu-Shokuhin Co Ltd 32 -
17 Itoham Yonekyu Holdings Inc 110 0.01
4 Itoki Corp 14 -
1 Itokuro Inc 8 -
3 IwaiCosmo Holdings Inc 42 0.01
4 Iwaki & Co Ltd 24 -
2 Iwaki Co Ltd 15 -
1 Iwasaki Electric Co Ltd 12 -
1 Iwatsuka Confectionery Co Ltd 22 -
26 Iyo Bank Ltd 140 0.01
9 J Trust Co Ltd 31 -
1 JAC Recruitment Co Ltd 23 -
3 Jaccs Co Ltd 60 0.01
4 Jafco Co Ltd 271 0.03
1 Jalux Inc 9 -
2 Jamco Corp 14 -
3 Janome Sewing Machine Co Ltd 21 -
6 Japan Aviation Electronics Industry Ltd 108 0.01
3 Japan Best Rescue System Co Ltd 19 -
5 Japan Cash Machine Co Ltd 25 -
56 Japan Display Inc 21 -
6 Japan Elevator Service Holdings Co Ltd 137 0.01
5 Japan Foundation Engineering Co Ltd 21 -
2 Japan Investment Adviser Co Ltd 19 -
8 Japan Lifeline Co Ltd 106 0.01
6 Japan Material Co Ltd 74 0.01
1 Japan Meat Co Ltd 21 -
2 Japan Medical Dynamic Marketing Inc 33 -
4 Japan Petroleum Exploration Co Ltd 72 0.01
1 Japan Property Management Center Co Ltd 14 -
1 Japan Pulp & Paper Co Ltd 43 0.01
1 Japan Pure Chemical Co Ltd 26 -
11 Japan Securities Finance Co Ltd 87 0.01
7 Japan Steel Works Ltd 192 0.02
4 Japan Transcity Corp 19 -
6 Japan Wool Textile Co Ltd 50 0.01
1 Jastec Co Ltd 14 -
2 JBCC Holdings Inc 28 -
3 JCU Corp 90 0.01
Shares (000's)
Value(000's)
USD
% of NetAssetValue
Common Stock (continued)
Japan - 6.76% (continued)
2 JDC Corp 12 -
4 Jeol Ltd 197 0.02
1 JFE Systems Inc 9 -
- JIG-SAW Inc 31 -
1 Jimoto Holdings Inc 8 -
1 JINS Holdings Inc 104 0.01
1 JK Holdings Co Ltd 10 -
2 JMS Co Ltd 14 -
1 Joban Kosan Co Ltd 12 -
2 J-Oil Mills Inc 38 -
2 Joshin Denki Co Ltd 46 0.01
5 Joyful Honda Co Ltd 59 0.01
5 JP-Holdings Inc 13 -
- JSB Co Ltd 13 -
2 JSP Corp 23 -
- J-Stream Inc 16 -
1 JTOWER Inc 50 0.01
3 Juki Corp 21 -
4 Juroku Bank Ltd 66 0.01
22 JVCKenwood Corp 45 0.01
2 K&O Energy Group Inc 19 -
5 Kadokawa Dwango 206 0.02
- Kadoya Sesame Mills Inc 15 -
2 Kaga Electronics Co Ltd 52 0.01
3 Kaken Pharmaceutical Co Ltd 133 0.01
1 Kakiyasu Honten Co Ltd 23 -
2 Kameda Seika Co Ltd 74 0.01
2 Kamei Corp 24 -
3 Kanaden Corp 28 -
1 Kanagawa Chuo Kotsu Co Ltd 27 -
1 Kaname Kogyo Co Ltd 11 -
2 Kanamic Network Co Ltd 12 -
4 Kanamoto Co Ltd 100 0.01
10 Kandenko Co Ltd 87 0.01
2 Kaneka Corp 74 0.01
1 Kaneko Seeds Co Ltd 14 -
10 Kanematsu Corp 140 0.01
2 Kanematsu Electronics Ltd 59 0.01
1 Kanemi Co Ltd 14 -
2 Kansai Super Market Ltd 20 -
7 Kanto Denka Kogyo Co Ltd 57 0.01
3 Kasai Kogyo Co Ltd 13 -
4 Katakura Industries Co Ltd 50 0.01
5 Katitas Co Ltd 149 0.02
2 Kato Sangyo Co Ltd 75 0.01
1 Kato Works Co Ltd 7 -
- Kawada Technologies Inc 14 -
1 Kawai Musical Instruments Manufacturing Co Ltd 20 -
5 Kawasaki Kisen Kaisha Ltd 135 0.01
2 KeePer Technical Laboratory Co Ltd 46 0.01
6 Keihanshin Building Co Ltd 71 0.01
16 Keiyo Bank Ltd 62 0.01
7 Keiyo Co Ltd 48 0.01
2 Kenko Mayonnaise Co Ltd 26 -
2 KeyHolder Inc 20 -
2 KFC Holdings Japan Ltd 61 0.01
1 KFC Ltd 10 -
3 KH Neochem Co Ltd 90 0.01
8 Kimoto Co Ltd 20 -
3 Kimura Chemical Plants Co Ltd 22 -
1 King Jim Co Ltd 11 -
- Kinki Sharyo Co Ltd 5 -
Global Small Companies FundPortfolio of Investments as at 31 May 2021 (continued)
Dimensional Fund Advisors Semi-Annual Report and Unaudited Financial Statements, 31 May 2021 179

Shares (000's)
Value(000's)
USD
% of NetAssetValue
Common Stock (continued)
Japan - 6.76% (continued)
1 Kintetsu Department Store Co Ltd 23 -
5 Kintetsu World Express Inc 107 0.01
4 Kissei Pharmaceutical Co Ltd 78 0.01
1 Ki-Star Real Estate Co Ltd 48 0.01
1 Kitagawa Corp 18 -
1 Kita-Nippon Bank Ltd 14 -
1 Kitano Construction Corp 13 -
7 Kitanotatsujin Corp 31 -
3 Kito Corp 41 0.01
8 Kitz Corp 56 0.01
8 Kiyo Bank Ltd 112 0.01
4 KLab Inc 23 -
4 Koa Corp 57 0.01
4 Koatsu Gas Kogyo Co Ltd 25 -
1 Kobe Electric Railway Co Ltd 22 -
27 Kobe Steel Ltd 187 0.02
4 Kohnan Shoji Co Ltd 98 0.01
1 Kohsoku Corp 13 -
5 Kojima Co Ltd 40 0.01
1 Kokusai Co Ltd 8 -
4 Kokusai Pulp & Paper Co Ltd 10 -
11 Kokuyo Co Ltd 171 0.02
4 Komatsu Matere Co Ltd 35 -
1 Komatsu Wall Industry Co Ltd 16 -
5 KOMEDA Holdings Co Ltd 84 0.01
1 Komehyo Co Ltd 5 -
4 Komeri Co Ltd 91 0.01
5 Komori Corp 38 0.01
4 Konaka Co Ltd 11 -
3 Kondotec Inc 31 -
41 Konica Minolta Inc 227 0.02
3 Konishi Co Ltd 47 0.01
3 Konoike Transport Co Ltd 36 -
1 Konoshima Chemical Co Ltd 16 -
2 Kosaido Co Ltd 22 -
1 Kozo Keikaku Engineering Inc 21 -
1 Krosaki Harima Corp 29 -
1 KRS Corp 7 -
2 KU Holdings Co Ltd 18 -
5 Kumagai Gumi Co Ltd 129 0.01
9 Kumiai Chemical Industry Co Ltd 67 0.01
2 Kurabo Industries Ltd 35 -
2 Kureha Corp 117 0.01
1 Kurimoto Ltd 17 -
1 Kuriyama Holdings Corp 5 -
2 Kusuri no Aoki Holdings Co Ltd 134 0.01
2 KYB Corp 77 0.01
1 Kyodo Printing Co Ltd 25 -
3 Kyoei Steel Ltd 36 -
1 Kyokuto Boeki Kaisha Ltd 24 -
4 Kyokuto Kaihatsu Kogyo Co Ltd 64 0.01
2 Kyokuto Securities Co Ltd 17 -
1 Kyokuyo Co Ltd 34 -
5 KYORIN Holdings Inc 82 0.01
5 Kyosan Electric Manufacturing Co Ltd 19 -
4 Kyowa Electronic Instruments Co Ltd 14 -
2 Kyowa Leather Cloth Co Ltd 13 -
5 Kyudenko Corp 153 0.02
41 Kyushu Financial Group Inc 158 0.02
2 LAC Co Ltd 14 -
1 Lacto Japan Co Ltd 15 -
3 LEC Inc 31 -
Shares (000's)
Value(000's)
USD
% of NetAssetValue
Common Stock (continued)
Japan - 6.76% (continued)
1 Legs Co Ltd 23 -
2 Life Corp 61 0.01
7 Lifull Co Ltd 23 -
1 Like Co Ltd 25 -
2 Linical Co Ltd 11 -
4 Link And Motivation Inc 22 -
5 Lintec Corp 117 0.01
1 LITALICO Inc 58 0.01
- Look Holdings Inc 5 -
2 M&A Capital Partners Co Ltd 64 0.01
6 Macnica Fuji Electronics Holdings Inc 137 0.01
4 Macromill Inc 34 -
15 Maeda Corp 131 0.01
2 Maeda Kosen Co Ltd 73 0.01
3 Maeda Road Construction Co Ltd 52 0.01
2 Maezawa Kasei Industries Co Ltd 20 -
2 Maezawa Kyuso Industries Co Ltd 18 -
2 Makino Milling Machine Co Ltd 100 0.01
1 Management Solutions Co Ltd 13 -
3 Mandom Corp 52 0.01
8 Mani Inc 176 0.02
2 MarkLines Co Ltd 47 0.01
2 Mars Group Holdings Corp 27 -
4 Marubun Corp 19 -
2 Marudai Food Co Ltd 34 -
5 Maruha Nichiro Corp 111 0.01
7 Maruichi Steel Tube Ltd 173 0.02
1 Maruka Corp 28 -
1 Marumae Co Ltd 23 -
9 Marusan Securities Co Ltd 54 0.01
1 Maruwa Co Ltd 108 0.01
5 Maruwa Unyu Kikan Co Ltd 72 0.01
1 Maruzen Co Ltd 20 -
2 Maruzen Showa Unyu Co Ltd 49 0.01
3 Marvelous Inc 21 -
2 Matching Service Japan Co Ltd 16 -
2 Matsuda Sangyo Co Ltd 31 -
3 Matsui Construction Co Ltd 21 -
14 Matsui Securities Co Ltd 108 0.01
1 Matsuoka Corp 11 -
1 Matsuyafoods Holdings Co Ltd 35 -
3 Max Co Ltd 46 0.01
7 Maxell Holdings Ltd 84 0.01
1 Maxvalu Nishinihon Co Ltd 12 -
1 Maxvalu Tokai Co Ltd 20 -
7 MCJ Co Ltd 75 0.01
2 MEC Co Ltd 50 0.01
1 Media Do Holdings Co Ltd 30 -
3 Medical Data Vision Co Ltd 59 0.01
5 Medical System Network Co Ltd 35 -
1 Medikit Co Ltd 14 -
2 MedPeer Inc 76 0.01
2 Megachips Corp 63 0.01
5 Megmilk Snow Brand Co Ltd 91 0.01
4 Meidensha Corp 91 0.01
1 Meiji Electric Industries Co Ltd 8 -
3 Meiko Electronics Co Ltd 79 0.01
2 Meiko Network Japan Co Ltd 9 -
4 Meisei Industrial Co Ltd 28 -
3 Meitec Corp 170 0.02
3 Meiwa Corp 13 -
1 Melco Holdings Inc 26 -
Global Small Companies FundPortfolio of Investments as at 31 May 2021 (continued)
Dimensional Fund Advisors Semi-Annual Report and Unaudited Financial Statements, 31 May 2021 180

Shares (000's)
Value(000's)
USD
% of NetAssetValue
Common Stock (continued)
Japan - 6.76% (continued)
1 Members Co Ltd 29 -
3 Menicon Co Ltd 202 0.02
3 Metawater Co Ltd 62 0.01
2 Michinoku Bank Ltd 14 -
3 Micronics Japan Co Ltd 41 0.01
- Midac Co Ltd 16 -
7 Mie Kotsu Group Holdings Inc 32 -
4 Mikuni Corp 10 -
3 Milbon Co Ltd 164 0.02
3 Mimaki Engineering Co Ltd 16 -
2 Mimasu Semiconductor Industry Co Ltd 40 0.01
2 Ministop Co Ltd 25 -
1 Minkabu The Infonoid Inc 28 -
7 Miraca Holdings Inc 178 0.02
1 Mirai Industry Co Ltd 11 -
1 Miraial Co Ltd 12 -
10 Mirait Holdings Corp 176 0.02
2 Miroku Jyoho Service Co Ltd 29 -
2 Mitani Corp 107 0.01
3 Mitani Sangyo Co Ltd 12 -
1 Mitani Sekisan Co Ltd 41 0.01
5 Mito Securities Co Ltd 15 -
4 Mitsuba Corp 31 -
1 Mitsubishi Kakoki Kaisha Ltd 22 -
4 Mitsubishi Logisnext Co Ltd 39 0.01
7 Mitsubishi Paper Mills Ltd 22 -
4 Mitsubishi Pencil Co Ltd 51 0.01
1 Mitsubishi Research Institute Inc 50 0.01
2 Mitsubishi Shokuhin Co Ltd 47 0.01
3 Mitsubishi Steel Manufacturing Co Ltd 24 -
3 Mitsuboshi Belting Ltd 42 0.01
9 Mitsui E&S Holdings Co Ltd 41 0.01
3 Mitsui High-Tec Inc 99 0.01
2 Mitsui Matsushima Holdings Co Ltd 15 -
7 Mitsui Mining & Smelting Co Ltd 192 0.02
2 Mitsui Sugar Co Ltd 31 -
2 Mitsui-Soko Holdings Co Ltd 42 0.01
3 Mitsuuroko Group Holdings Co Ltd 33 -
5 Mixi Inc 132 0.01
1 Miyaji Engineering Group Inc 18 -
2 Miyazaki Bank Ltd 41 0.01
1 Miyoshi Oil & Fat Co Ltd 12 -
3 Mizuho Leasing Co Ltd 95 0.01
1 Mizuho Medy Co Ltd 14 -
2 Mizuno Corp 52 0.01
2 Mochida Pharmaceutical Co Ltd 53 0.01
3 Modec Inc 55 0.01
16 Monex Group Inc 127 0.01
1 Monogatari Corp 59 0.01
1 MORESCO Corp 8 -
4 Morinaga & Co Ltd 137 0.01
1 Moriroku Holdings Co Ltd 20 -
4 Morita Holdings Corp 65 0.01
4 Morito Co Ltd 20 -
6 Morningstar Japan K.K. 23 -
- Morozoff Ltd 14 -
2 Mortgage Service Japan Ltd 16 -
1 Mory Industries Inc 15 -
1 MrMax Holdings Ltd 7 -
2 MTI Ltd 13 -
1 Mugen Estate Co Ltd 4 -
1 M-up Holdings Inc 24 -
Shares (000's)
Value(000's)
USD
% of NetAssetValue
Common Stock (continued)
Japan - 6.76% (continued)
1 Murakami Corp 20 -
6 Musashi Seimitsu Industry Co Ltd 124 0.01
4 Musashino Bank Ltd 61 0.01
- Mutoh Holdings Co Ltd 1 -
1 NAC Co Ltd 8 -
1 Nachi-Fujikoshi Corp 58 0.01
1 Nafco Co Ltd 24 -
3 Nagaileben Co Ltd 61 0.01
1 Nagano Bank Ltd 15 -
1 Nagano Keiki Co Ltd 15 -
12 Nagase & Co Ltd 171 0.02
2 Nagatanien Holdings Co Ltd 34 -
1 Nagawa Co Ltd 69 0.01
2 Nakabayashi Co Ltd 9 -
1 Nakamuraya Co Ltd 24 -
4 Nakanishi Inc 84 0.01
- Nakano Refrigerators Co Ltd 15 -
2 Nakayama Steel Works Ltd 10 -
4 Namura Shipbuilding Co Ltd 6 -
7 Nankai Electric Railway Co Ltd 149 0.02
4 Nanto Bank Ltd 65 0.01
1 Natori Co Ltd 23 -
1 NEC Capital Solutions Ltd 22 -
8 NEC Networks & System Integration Corp 123 0.01
6 Neturen Co Ltd 29 -
2 New Art Holdings Co Ltd 20 -
4 Nextage Co Ltd 65 0.01
27 NHK Spring Co Ltd 204 0.02
1 Nice Holdings Inc 16 -
6 Nichias Corp 162 0.02
2 Nichiban Co Ltd 23 -
6 Nichicon Corp 63 0.01
1 Nichiden Corp 26 -
3 Nichiha Corp 87 0.01
6 Nichi-iko Pharmaceutical Co Ltd 47 0.01
2 Nichireki Co Ltd 30 -
1 Nichirin Co Ltd 22 -
1 Nihon Chouzai Co Ltd 12 -
2 Nihon Dempa Kogyo Co Ltd 15 -
1 Nihon Dengi Co Ltd 31 -
1 Nihon Denkei Co Ltd 15 -
2 Nihon Flush Co Ltd 23 -
6 Nihon House Holdings Co Ltd 19 -
1 Nihon Kagaku Sangyo Co Ltd 15 -
8 Nihon Nohyaku Co Ltd 37 -
9 Nihon Parkerizing Co Ltd 96 0.01
1 Nihon Plast Co Ltd 8 -
2 Nihon Tokushu Toryo Co Ltd 14 -
1 Nihon Yamamura Glass Co Ltd 10 -
6 Nikkiso Co Ltd 62 0.01
3 Nikko Co Ltd 22 -
7 Nikkon Holdings Co Ltd 142 0.02
5 Nippon Air Conditioning Services Co Ltd 33 -
1 Nippon Beet Sugar Manufacturing Co Ltd 15 -
- Nippon Carbide Industries Co Inc 5 -
1 Nippon Carbon Co Ltd 51 0.01
1 Nippon Ceramic Co Ltd 35 -
1 Nippon Chemical Industrial Co Ltd 20 -
3 Nippon Chemi-Con Corp 63 0.01
19 Nippon Coke & Engineering Co Ltd 19 -
2 Nippon Commercial Development Co Ltd 29 -
1 Nippon Concept Corp 14 -
Global Small Companies FundPortfolio of Investments as at 31 May 2021 (continued)
Dimensional Fund Advisors Semi-Annual Report and Unaudited Financial Statements, 31 May 2021 181

Shares (000's)
Value(000's)
USD
% of NetAssetValue
Common Stock (continued)
Japan - 6.76% (continued)
5 Nippon Concrete Industries Co Ltd 16 -
14 Nippon Denko Co Ltd 40 0.01
5 Nippon Densetsu Kogyo Co Ltd 82 0.01
9 Nippon Electric Glass Co Ltd 214 0.02
1 Nippon Fine Chemical Co Ltd 17 -
6 Nippon Flour Mills Co Ltd 80 0.01
13 Nippon Gas Co Ltd 205 0.02
4 Nippon Hume Corp 25 -
3 Nippon Kanzai Co Ltd 62 0.01
11 Nippon Kayaku Co Ltd 103 0.01
1 Nippon Kodoshi Corp 25 -
1 Nippon Koei Co Ltd 34 -
6 Nippon Light Metal Holdings Co Ltd 108 0.01
12 Nippon Paper Industries Co Ltd 147 0.02
20 Nippon Parking Development Co Ltd 28 -
3 Nippon Pillar Packing Co Ltd 46 0.01
1 Nippon Piston Ring Co Ltd 12 -
2 Nippon Rietec Co Ltd 28 -
1 Nippon Road Co Ltd 48 0.01
6 Nippon Seiki Co Ltd 65 0.01
- Nippon Seisen Co Ltd 12 -
1 Nippon Sharyo Ltd 16 -
- Nippon Shokubai Co Ltd 15 -
6 Nippon Signal Company Ltd 51 0.01
3 Nippon Soda Co Ltd 90 0.01
2 Nippon Steel Trading Corp 79 0.01
36 Nippon Suisan Kaisha Ltd 169 0.02
1 Nippon Systemware Co Ltd 15 -
10 Nippon Thompson Co Ltd 57 0.01
1 Nippon Yakin Kogyo Co Ltd 28 -
16 Nipro Corp 195 0.02
1 Nishikawa Rubber Co Ltd 17 -
6 Nishimatsu Construction Co Ltd 182 0.02
6 Nishimatsuya Chain Co Ltd 79 0.01
- Nishimoto Co Ltd 10 -
16 Nishi-Nippon Financial Holdings Inc 104 0.01
7 Nishi-Nippon Railroad Co Ltd 169 0.02
2 Nishio Rent All Co Ltd 62 0.01
8 Nissan Shatai Co Ltd 53 0.01
1 Nissei ASB Machine Co Ltd 34 -
2 Nissei Plastic Industrial Co Ltd 25 -
4 Nissha Co Ltd 60 0.01
3 Nisshin Fudosan Co 15 -
3 Nisshin Oillio Group Ltd 88 0.01
14 Nisshinbo Holdings Inc 120 0.01
1 Nissin Corp 19 -
6 Nissin Electric Co Ltd 65 0.01
2 Nissin Sugar Co Ltd 25 -
3 Nisso Corp 23 -
1 Nissui Pharmaceutical Co Ltd 9 -
2 Nitta Corp 55 0.01
1 Nittetsu Mining Co Ltd 34 -
3 Nitto Boseki Co Ltd 90 0.01
- Nitto Fuji Flour Milling Co Ltd 13 -
3 Nitto Kogyo Corp 52 0.01
1 Nitto Kohki Co Ltd 15 -
5 Nitto Seiko Co Ltd 26 -
4 Nittoc Construction Co Ltd 26 -
1 NJS Co Ltd 13 -
1 Noda Corp 7 -
2 Noevir Holdings Co Ltd 75 0.01
2 Nohmi Bosai Ltd 42 0.01
Shares (000's)
Value(000's)
USD
% of NetAssetValue
Common Stock (continued)
Japan - 6.76% (continued)
4 Nojima Corp 103 0.01
9 NOK Corp 119 0.01
1 Nomura Micro Science Co Ltd 21 -
1 Noritake Co Ltd Japan 42 0.01
3 Noritsu Koki Co Ltd 64 0.01
3 Noritz Corp 49 0.01
32 North Pacific Bank Ltd 74 0.01
4 NPC Inc 23 -
2 NS Tool Co Ltd 29 -
1 NS United Kaiun Kaisha Ltd 14 -
8 NSD Co Ltd 126 0.01
50 NTN Corp 145 0.02
2 Obara Group Inc 62 0.01
6 Oenon Holdings Inc 21 -
4 Ogaki Kyoritsu Bank Ltd 70 0.01
- Ohara Inc 4 -
2 Ohashi Technica Inc 25 -
1 Ohba Co Ltd 10 -
- Ohmoto Gumi Co Ltd 15 -
2 Ohsho Food Service Corp 91 0.01
3 Oiles Corp 38 -
3 Oisix ra daichi Inc 78 0.01
2 Oita Bank Ltd 32 -
5 Okabe Co Ltd 28 -
1 Okamoto Industries Inc 49 0.01
7 Okamura Corp 90 0.01
14 Okasan Securities Group Inc 57 0.01
8 Oki Electric Industry Co Ltd 70 0.01
1 Okinawa Cellular Telephone Co 68 0.01
5 Okinawa Electric Power Co Inc 69 0.01
3 OKUMA Corp 152 0.02
3 Okumura Corp 90 0.01
1 Okura Industrial Co Ltd 23 -
2 Okuwa Co Ltd 24 -
1 Oliver Corp 20 -
2 Onoken Co Ltd 18 -
17 Onward Holdings Co Ltd 47 0.01
1 Optim Corp 32 -
2 Optorun Co Ltd 52 0.01
1 Orchestra Holdings Inc 13 -
1 Organo Corp 47 0.01
61 Orient Corp 87 0.01
17 Oriental Shiraishi Corp 45 0.01
1 Origin Co Ltd 13 -
1 Oro Co Ltd 22 -
1 Osaka Organic Chemical Industry Ltd 49 0.01
2 Osaka Soda Co Ltd 37 -
1 Osaka Steel Co Ltd 15 -
3 Osaka Titanium Technologies Co Ltd 24 -
4 Osaki Electric Co Ltd 22 -
9 OSG Corp 142 0.02
1 OUG Holdings Inc 13 -
13 Outsourcing Inc 240 0.02
2 Oyo Corp 23 -
6 Pacific Industrial Co Ltd 61 0.01
2 Pacific Metals Co Ltd 26 -
1 Pack Corp 34 -
2 PAL Group Holdings Co Ltd 32 -
- Papyless Co Ltd 5 -
5 Paramount Bed Holdings Co Ltd 85 0.01
2 Paris Miki Holdings Inc 6 -
2 Pasona Group Inc 28 -
Global Small Companies FundPortfolio of Investments as at 31 May 2021 (continued)
Dimensional Fund Advisors Semi-Annual Report and Unaudited Financial Statements, 31 May 2021 182

Shares (000's)
Value(000's)
USD
% of NetAssetValue
Common Stock (continued)
Japan - 6.76% (continued)
6 PC Depot Corp 23 -
1 PCA Corp 23 -
1 Pegasus Sewing Machine Manufacturing Co Ltd 4 -
31 Penta-Ocean Construction Co Ltd 220 0.02
- Pickles Corp 12 -
3 Pilot Corp 97 0.01
4 Piolax Inc 52 0.01
3 Plenus Co Ltd 46 0.01
3 Poletowin Pitcrew Holdings Inc 27 -
1 PR Times Inc 15 -
2 Premium Group Co Ltd 57 0.01
- Premium Water Holdings Inc 11 -
9 Press Kogyo Co Ltd 26 -
1 Pressance Corp 22 -
12 Prestige International Inc 77 0.01
4 Prima Meat Packers Ltd 101 0.01
2 Pronexus Inc 16 -
- Prored Partners Co Ltd 8 -
1 Pro-Ship Inc 12 -
67 Prospect Co Ltd 19 -
4 Proto Corp 47 0.01
3 PS Mitsubishi Construction Co Ltd 21 -
2 Punch Industry Co Ltd 11 -
2 QB Net Holdings Co Ltd 27 -
3 Qol Holdings Co Ltd 39 0.01
2 Quick Co Ltd 20 -
2 Raccoon Holdings Inc 57 0.01
5 Raito Kogyo Co Ltd 78 0.01
3 Raiznext Corp 29 -
2 Rasa Corp 13 -
1 Rasa Industries Ltd 17 -
2 Raysum Co Ltd 13 -
5 Relia Inc 56 0.01
2 Renaissance Inc 21 -
18 Rengo Co Ltd 155 0.02
3 RENOVA Inc 88 0.01
10 Resorttrust Inc 157 0.02
2 Restar Holdings Corp 42 0.01
2 Retail Partners Co Ltd 23 -
3 Rheon Automatic Machinery Co Ltd 31 -
1 Rhythm Watch Co Ltd 4 -
2 Ricoh Leasing Co Ltd 62 0.01
1 Ride On Express Holdings Co Ltd 18 -
2 Right On Co Ltd 9 -
1 Riken Corp 20 -
1 Riken Keiki Co Ltd 36 -
4 Riken Technos Corp 20 -
2 Riken Vitamin Co Ltd 32 -
1 Rion Co Ltd 14 -
2 Riso Kagaku Corp 35 -
16 Riso Kyoiku Co Ltd 46 0.01
1 Rokko Butter Co Ltd 18 -
2 Roland Corp 85 0.01
2 Roland DG Corp 43 0.01
1 Rorze Corp 97 0.01
1 Rozetta Corp 15 -
1 RS Technologies Co Ltd 49 0.01
2 Ryobi Ltd 36 -
2 Ryoden Corp 25 -
2 Ryosan Co Ltd 41 0.01
2 Ryoyo Electro Corp 60 0.01
2 S Foods Inc 54 0.01
Shares (000's)
Value(000's)
USD
% of NetAssetValue
Common Stock (continued)
Japan - 6.76% (continued)
1 S&B Foods Inc 43 0.01
3 Sac's Bar Holdings Inc 14 -
4 Saibu Gas Co Ltd 91 0.01
1 Saison Information Systems Co Ltd 15 -
2 Saizeriya Co Ltd 46 0.01
1 Sakai Chemical Industry Co Ltd 15 -
- Sakai Heavy Industries Ltd 7 -
1 Sakai Moving Service Co Ltd 71 0.01
1 Sakai Ovex Co Ltd 19 -
4 Sakata INX Corp 41 0.01
2 Sakata Seed Corp 74 0.01
2 Sakura Internet Inc 13 -
7 Sala Corp 36 -
4 SAMTY Co Ltd 77 0.01
1 San Holdings Inc 15 -
2 San ju San Financial Group Inc 29 -
2 San-A Co Ltd 97 0.01
7 San-Ai Oil Co Ltd 79 0.01
2 Sanden Holdings Corp 7 -
1 Sanei Architecture Planning Co Ltd 22 -
6 Sangetsu Corp 81 0.01
18 San-In Godo Bank Ltd 89 0.01
6 Sanki Engineering Co Ltd 71 0.01
3 Sanko Gosei Ltd 12 -
6 Sankyo Co Ltd 145 0.02
- Sankyo Frontier Co Ltd 14 -
5 Sankyo Seiko Co Ltd 24 -
3 Sankyo Tateyama Inc 19 -
3 Sanoh Industrial Co Ltd 34 -
2 Sansan Inc 110 0.01
2 Sansei Technologies Inc 12 -
3 Sansha Electric Manufacturing Co Ltd 22 -
2 Sanshin Electronics Co Ltd 29 -
1 Santec Corp 14 -
1 Sanyo Chemical Industries Ltd 61 0.01
1 Sanyo Denki Co Ltd 77 0.01
2 Sanyo Electric Railway Co Ltd 31 -
1 Sanyo Housing Nagoya Co Ltd 6 -
2 Sanyo Shokai Ltd 12 -
3 Sanyo Special Steel Co Ltd 40 0.01
4 Sanyo Trading Co Ltd 41 0.01
7 Sapporo Holdings Ltd 142 0.02
3 Sato Holdings Corp 74 0.01
1 Sato Shoji Corp 11 -
1 Satori Electric Co Ltd 7 -
3 Sawada Holdings Co Ltd 30 -
4 Sawai Group Holdings Co Ltd 166 0.02
1 Saxa Holdings Inc 9 -
1 SB Technology Corp 34 -
1 SBI Insurance Group Co Ltd 14 -
2 SBS Holdings Inc 57 0.01
3 Scala Inc 22 -
4 Scroll Corp 36 -
- SEC Carbon Ltd 18 -
- Secom Joshinetsu Co Ltd 11 -
1 Seed Co Ltd 8 -
1 Seibu Electric & Machinery Co Ltd 12 -
1 Seika Corp 10 -
4 Seikagaku Corp 46 0.01
5 Seikitokyu Kogyo Co Ltd 40 0.01
2 Seiko Electric Co Ltd 22 -
3 Seiko Holdings Corp 69 0.01
Global Small Companies FundPortfolio of Investments as at 31 May 2021 (continued)
Dimensional Fund Advisors Semi-Annual Report and Unaudited Financial Statements, 31 May 2021 183

Shares (000's)
Value(000's)
USD
% of NetAssetValue
Common Stock (continued)
Japan - 6.76% (continued)
2 Seiko PMC Corp 11 -
5 Seiren Co Ltd 89 0.01
3 Sekisui Jushi Corp 62 0.01
5 Sekisui Plastics Co Ltd 26 -
14 Senko Group Holdings Co Ltd 126 0.01
1 Senshu Electric Co Ltd 27 -
31 Senshu Ikeda Holdings Inc 46 0.01
2 Senshukai Co Ltd 9 -
7 Septeni Holdings Co Ltd 29 -
1 SERAKU Co Ltd 20 -
1 Shibaura Electronics Co Ltd 30 -
1 Shibaura Mechatronics Corp 35 -
2 Shibusawa Warehouse Co Ltd 30 -
1 Shibuya Corp 46 0.01
5 Shiga Bank Ltd 92 0.01
1 Shikibo Ltd 11 -
3 Shikoku Bank Ltd 22 -
4 Shikoku Chemicals Corp 44 0.01
19 Shikoku Electric Power Co Inc 128 0.01
3 Shima Seiki Manufacturing Ltd 54 0.01
1 Shimizu Bank Ltd 19 -
1 Shimojima Co Ltd 11 -
1 Shin Nippon Air Technologies Co Ltd 19 -
4 Shin Nippon Biomedical Laboratories Ltd 27 -
1 Shinagawa Refractories Co Ltd 20 -
1 Shindengen Electric Manufacturing Co Ltd 23 -
5 Shin-Etsu Polymer Co Ltd 48 0.01
1 Shin-Keisei Electric Railway Co Ltd 14 -
- Shinki Bus Co Ltd 12 -
3 Shinko Shoji Co Ltd 19 -
7 Shinmaywa Industries Ltd 67 0.01
2 Shinnihon Corp 18 -
1 Shinnihonseiyaku Co Ltd 13 -
1 Shinsho Corp 15 -
2 Shinwa Co Ltd 31 -
2 Shinwa Co Ltd, Gifu 16 -
9 Ship Healthcare Holdings Inc 206 0.02
2 Shizuki Electric Co Inc 8 -
7 Shizuoka Gas Co Ltd 66 0.01
- SHL-Japan Ltd 12 -
4 SHO-BOND Holdings Co Ltd 163 0.02
3 Shoei Co Ltd 95 0.01
1 Shoei Foods Corp 37 -
1 Shofu Inc 24 -
2 Showa Sangyo Co Ltd 65 0.01
1 SigmaXYZ Inc 27 -
4 Siix Corp 58 0.01
1 Silver Life Co Ltd 14 -
1 Sinanen Holdings Co Ltd 33 -
3 Sinfonia Technology Co Ltd 35 -
2 Sinko Industries Ltd 39 0.01
4 Sintokogio Ltd 26 -
1 SK-Electronics Co Ltd 10 -
19 SKY Perfect JSAT Holdings Inc 77 0.01
- Smaregi Inc 18 -
1 SMK Corp 14 -
8 SMS Co Ltd 225 0.02
1 Snow Peak Inc 26 -
3 SNT Corp 6 -
2 Soda Nikka Co Ltd 11 -
5 Sodick Co Ltd 48 0.01
1 Soft99 Corp 17 -
Shares (000's)
Value(000's)
USD
% of NetAssetValue
Common Stock (continued)
Japan - 6.76% (continued)
1 Softcreate Holdings Corp 29 -
- Software Service Inc 21 -
1 Soiken Holdings Inc 6 -
1 Soken Chemical & Engineering Co Ltd 17 -
6 Solasto Corp 77 0.01
2 Soliton Systems KK 29 -
9 Sotetsu Holdings Inc 171 0.02
15 Sourcenext Corp 40 0.01
1 Space Co Ltd 7 -
2 Space Value Holdings Co Ltd 15 -
11 Sparx Group Co Ltd 28 -
1 SPK Corp 13 -
7 S-Pool Inc 56 0.01
1 SRA Holdings 29 -
1 ST Corp 22 -
2 St Marc Holdings Co Ltd 25 -
2 Star Mica Holdings Co Ltd 21 -
4 Star Micronics Co Ltd 58 0.01
3 Starts Corp Inc 89 0.01
2 Starzen Co Ltd 42 0.01
1 St-Care Holding Corp 11 -
1 Stella Chemifa Corp 32 -
1 Step Co Ltd 12 -
1 Strike Co Ltd 46 0.01
1 Studio Alice Co Ltd 27 -
1 Sugimoto & Co Ltd 23 -
2 Sumida Corp 21 -
- Suminoe Textile Co Ltd 7 -
4 Sumitomo Bakelite Co Ltd 183 0.02
2 Sumitomo Densetsu Co Ltd 40 0.01
20 Sumitomo Mitsui Construction Co Ltd 85 0.01
5 Sumitomo Osaka Cement Co Ltd 130 0.01
7 Sumitomo Riko Co Ltd 46 0.01
1 Sumitomo Seika Chemicals Co Ltd 36 -
8 Sumitomo Warehouse Co Ltd 103 0.01
4 Sun Frontier Fudousan Co Ltd 38 -
3 Suncall Corp 14 -
1 Sun-Wa Technos Corp 10 -
- SuRaLa Net Co Ltd 11 -
14 Suruga Bank Ltd 47 0.01
1 Suzuden Corp 13 -
2 Suzuki Co Ltd 14 -
3 SWCC Showa Holdings Co Ltd 41 0.01
1 System Information Co Ltd 10 -
1 System Research Co Ltd 21 -
7 Systena Corp 134 0.01
2 Syuppin Co Ltd 17 -
4 T Hasegawa Co Ltd 71 0.01
1 T RAD Co Ltd 19 -
3 T&K Toka Co Ltd 26 -
2 Tachibana Eletech Co Ltd 24 -
2 Tachikawa Corp 21 -
3 Tachi-S Co Ltd 32 -
14 Tadano Ltd 141 0.02
1 Taihei Dengyo Kaisha Ltd 36 -
2 Taiho Kogyo Co Ltd 12 -
3 Taikisha Ltd 101 0.01
1 Taiko Bank Ltd 6 -
2 Taiko Pharmaceutical Co Ltd 23 -
1 Taisei Lamick Co Ltd 35 -
2 Taiyo Holdings Co Ltd 107 0.01
2 Takamatsu Construction Group Co Ltd 43 0.01
Global Small Companies FundPortfolio of Investments as at 31 May 2021 (continued)
Dimensional Fund Advisors Semi-Annual Report and Unaudited Financial Statements, 31 May 2021 184

Shares (000's)
Value(000's)
USD
% of NetAssetValue
Common Stock (continued)
Japan - 6.76% (continued)
4 Takamiya Co Ltd 19 -
2 Takaoka Toko Co Ltd 23 -
14 Takara Holdings Inc 186 0.02
11 Takara Leben Co Ltd 36 -
1 Takara Printing Co Ltd 16 -
4 Takara Standard Co Ltd 64 0.01
2 Takasago International Corp 44 0.01
5 Takasago Thermal Engineering Co Ltd 78 0.01
14 Takashimaya Co Ltd 158 0.02
2 Takasho Co Ltd 15 -
1 Take And Give Needs Co Ltd 6 -
1 Takebishi Corp 13 -
2 Takeei Corp 20 -
4 Takeuchi Manufacturing Co Ltd 119 0.01
1 Takihyo Co Ltd 13 -
8 Takuma Co Ltd 133 0.01
2 Tama Home Co Ltd 36 -
1 Tamagawa Holdings Co Ltd 14 -
1 Tamron Co Ltd 29 -
10 Tamura Corp 53 0.01
4 Tanseisha Co Ltd 27 -
- Taoka Chemical Co Ltd 11 -
4 Tatsuta Electric Wire and Cable Co Ltd 24 -
1 Tayca Corp 17 -
2 Tazmo Co Ltd 22 -
3 TBK Co Ltd 10 -
2 TDC Soft Inc 24 -
4 TechMatrix Corp 58 0.01
- Techno Associe Co Ltd 3 -
2 TECHNO HORIZON Co Ltd 30 -
1 Techno Medica Co Ltd 9 -
2 Techno Ryowa Ltd 13 -
4 Tecnos Japan Inc 22 -
3 Teikoku Electric Manufacturing Co Ltd 31 -
2 Teikoku Sen-I Co Ltd 31 -
1 Teikoku Tsushin Kogyo Co Ltd 12 -
2 Tekken Corp 29 -
- Temairazu Inc 24 -
2 Tenma Corp 33 -
2 T-Gaia Corp 33 -
4 TKC Corp 114 0.01
2 Toa Corp (non-voting rights) 41 0.01
2 Toa Corp (voting rights) 19 -
1 Toa Oil Co Ltd 29 -
1 Toa Road Corp 29 -
10 Toagosei Co Ltd 111 0.01
2 Tobishima Corp 16 -
4 TOC Co Ltd 29 -
7 Tocalo Co Ltd 93 0.01
8 Tochigi Bank Ltd 13 -
19 Toda Corp 138 0.01
1 Toda Kogyo Corp 11 -
1 Toenec Corp 27 -
25 Toho Bank Ltd 47 0.01
1 Toho Co 9 -
7 Toho Holdings Co Ltd 106 0.01
5 Toho Titanium Co Ltd 42 0.01
2 Toho Zinc Co Ltd 41 0.01
1 Tohoku Bank Ltd 5 -
3 Tohokushinsha Film Corp 18 -
2 Tokai Corp 45 0.01
10 TOKAI Holdings Corp 81 0.01
Shares (000's)
Value(000's)
USD
% of NetAssetValue
Common Stock (continued)
Japan - 6.76% (continued)
6 Tokai Rika Co Ltd 93 0.01
30 Tokai Tokyo Financial Holdings Inc 114 0.01
1 Token Corp 81 0.01
1 Tokushu Tokai Paper Co Ltd 44 0.01
7 Tokuyama Corp 147 0.02
3 Tokyo Base Co Ltd 21 -
1 Tokyo Electron Device Ltd 33 -
3 Tokyo Energy & Systems Inc 27 -
4 Tokyo Individualized Educational Institute Inc 23 -
1 Tokyo Keiki Inc 9 -
3 Tokyo Kiraboshi Financial Group Inc 34 -
- Tokyo Rakutenchi Co Ltd 15 -
- Tokyo Rope Manufacturing Co Ltd 3 -
4 Tokyo Sangyo Co Ltd 22 -
4 Tokyo Seimitsu Co Ltd 209 0.02
12 Tokyo Steel Manufacturing Co Ltd 132 0.01
2 Tokyo Tekko Co Ltd 29 -
1 Tokyo Theatres Co Inc 10 -
2 Tokyotokeiba Co Ltd 94 0.01
9 Tokyu Construction Co Ltd 60 0.01
3 Toli Corp 8 -
1 Tomato Bank Ltd 7 -
1 Tomen Devices Corp 25 -
3 Tomoe Corp 12 -
1 Tomoe Engineering Co Ltd 22 -
1 Tomoku Co Ltd 24 -
15 TOMONY Holdings Inc 41 0.01
11 Tomy Co Ltd 98 0.01
1 Tonami Holdings Co Ltd 27 -
13 Topcon Corp 212 0.02
7 Toppan Forms Co Ltd 69 0.01
4 Topre Corp 60 0.01
1 Topy Industries Ltd 15 -
1 Torex Semiconductor Ltd 21 -
6 Toridoll Holdings Corp 88 0.01
1 Torigoe Co Ltd 9 -
2 Torii Pharmaceutical Co Ltd 36 -
2 Torishima Pump Manufacturing Co Ltd 17 -
3 Tosei Corp 30 -
2 Toshiba Machine Co Ltd 51 0.01
3 Toshiba TEC Corp 105 0.01
1 Tosho Co Ltd 24 -
1 Totech Corp 26 -
3 Totetsu Kogyo Co Ltd 62 0.01
1 Tottori Bank Ltd 10 -
- Toukei Computer Co Ltd 12 -
6 Tow Co Ltd 18 -
3 Towa Bank Ltd 15 -
2 Towa Corp 45 0.01
4 Towa Pharmaceutical Co Ltd 79 0.01
8 Toyo Construction Co Ltd 39 0.01
3 Toyo Corp 32 -
1 Toyo Denki Seizo KK 9 -
3 Toyo Engineering Corp 18 -
1 Toyo Gosei Co Ltd 72 0.01
5 Toyo Ink SC Holdings Co Ltd 85 0.01
1 Toyo Kanetsu KK 19 -
3 Toyo Logistics Co Ltd 8 -
1 Toyo Machinery & Metal Co Ltd 6 -
7 Toyo Securities Co Ltd 11 -
15 Toyo Seikan Group Holdings Ltd 211 0.02
2 Toyo Tanso Co Ltd 36 -
Global Small Companies FundPortfolio of Investments as at 31 May 2021 (continued)
Dimensional Fund Advisors Semi-Annual Report and Unaudited Financial Statements, 31 May 2021 185

Shares (000's)
Value(000's)
USD
% of NetAssetValue
Common Stock (continued)
Japan - 6.76% (continued)
2 Toyo Tire Corp 39 0.01
9 Toyobo Co Ltd 108 0.01
2 TPR Co Ltd 34 -
1 Trancom Co Ltd 62 0.01
4 Trans Genic Inc 18 -
1 Transaction Co Ltd 14 -
3 Transcosmos Inc 80 0.01
3 Tri Chemical Laboratories Inc 96 0.01
5 Trusco Nakayama Corp 138 0.01
6 Trust Tech Inc 68 0.01
10 TS Tech Co Ltd 144 0.02
6 TSI Holdings Co Ltd 17 -
5 Tsubaki Nakashima Co Ltd 81 0.01
3 Tsubakimoto Chain Co 89 0.01
1 Tsubakimoto Kogyo Co Ltd 19 -
4 Tsugami Corp 65 0.01
1 Tsukada Global Holdings Inc 2 -
3 Tsukishima Kikai Co Ltd 38 -
9 Tsukuba Bank Ltd 15 -
2 Tsurumi Manufacturing Co Ltd 27 -
1 Tsutsumi Jewelry Co Ltd 11 -
3 TV Asahi Holdings Corp 59 0.01
1 Tv Tokyo Holdings Corp 24 -
4 UACJ Corp 91 0.01
10 Ube Industries Ltd 212 0.02
1 Ubicom Holdings Inc 20 -
1 Uchida Yoko Co Ltd 39 0.01
5 Ulvac Inc 254 0.03
1 Uniden Holdings Corp 20 -
1 Union Tool Co 33 -
5 Unipres Corp 40 0.01
4 United Arrows Ltd 63 0.01
1 UNITED Inc 12 -
7 United Super Markets Holdings Inc 69 0.01
10 Unitika Ltd 34 -
3 Universal Entertainment Corp 70 0.01
- User Local Inc 15 -
12 Ushio Inc 171 0.02
3 UT Group Co Ltd 71 0.01
2 Utoc Corp 11 -
1 UUUM Inc 18 -
5 Valor Holdings Co Ltd 99 0.01
2 Valqua Ltd 30 -
1 Value HR Co Ltd 12 -
2 ValueCommerce Co Ltd 53 0.01
1 V-Cube Inc 22 -
4 Vector Inc 34 -
1 Vertex Corp 13 -
1 VisasQ Inc 23 -
5 Vital KSK Holdings Inc 31 -
12 VT Holdings Co Ltd 51 0.01
5 Wacoal Holdings Corp 123 0.01
17 Wacom Co Ltd 105 0.01
1 Wakachiku Construction Co Ltd 18 -
4 Wakita & Co Ltd 46 0.01
2 Warabeya Nichiyo Holdings Co Ltd 44 0.01
1 Watahan & Co Ltd 16 -
1 WDB Holdings Co Ltd 21 -
1 Weathernews Inc 35 -
1 Welbe Inc 12 -
3 Wellnet Corp 14 -
1 West Holdings Corp 48 0.01
Shares (000's)
Value(000's)
USD
% of NetAssetValue
Common Stock (continued)
Japan - 6.76% (continued)
2 Will Group Inc 14 -
1 WIN-Partners Co Ltd 10 -
1 Wood One Co Ltd 12 -
3 World Co Ltd 41 0.01
1 World Holdings Co Ltd 15 -
1 Wowow Inc 17 -
2 Xebio Holdings Co Ltd 22 -
1 Yagi & Co Ltd 8 -
3 Yahagi Construction Co Ltd 18 -
1 Yaizu Suisankagaku Industry Co Ltd 10 -
1 YAKUODO Holdings Co Ltd 28 -
3 Yamabiko Corp 38 0.01
2 Yamada Consulting Group Co Ltd 22 -
2 Yamae Hisano Co Ltd 17 -
3 Yamagata Bank Ltd 21 -
25 Yamaguchi Financial Group Inc 152 0.02
3 Yamaichi Electronics Co Ltd 40 0.01
4 YA-MAN Ltd 61 0.01
3 Yamanashi Chuo Bank Ltd 23 -
1 Yamatane Corp 19 -
2 Yamato Corp 17 -
5 Yamato Kogyo Co Ltd 181 0.02
7 Yamazen Corp 62 0.01
2 Yaoko Co Ltd 129 0.01
1 Yashima Denki Co Ltd 12 -
2 Yasuda Logistics Corp 21 -
1 Yasunaga Corp 9 -
4 Yellow Hat Ltd 65 0.01
3 Yodogawa Steel Works Ltd 60 0.01
4 Yokogawa Bridge Holdings Corp 78 0.01
7 Yokohama Reito Co Ltd 54 0.01
2 Yokowo Co Ltd 40 0.01
1 Yomeishu Seizo Co Ltd 8 -
1 Yondenko Corp 15 -
1 Yondoshi Holdings Inc 24 -
2 Yonex Co Ltd 12 -
3 Yorozu Corp 33 -
2 Yoshimura Food Holdings KK 11 -
2 Yotai Refractories Co Ltd 22 -
2 Yuasa Trading Co Ltd 52 0.01
3 Yurtec Corp 23 -
1 Yushin Precision Equipment Co Ltd 9 -
2 Yushiro Chemical Industry Co Ltd 18 -
1 Yutaka Giken Co Ltd 10 -
1 Zenitaka Corp 20 -
4 Zenrin Co Ltd 39 0.01
2 ZERIA Pharmaceutical Co Ltd 48 0.01
2 Zuiko Corp 25 -
69,076 6.76
Netherlands - 0.77%
11 Aalberts NV 597 0.06
2 Accell Group NV 139 0.01
3 AMG Advanced Metallurgical Group NV 104 0.01
2 Amsterdam Commodities NV 61 0.01
5 APERAM SA 275 0.03
9 Arcadis NV 375 0.04
15 ASR Nederland NV 653 0.06
1 B&S Group 10 -
4 Basic-Fit NV 207 0.02
8 BE Semiconductor Industries NV 612 0.06
2 Beter Bed Holding NV 13 -
10 Boskalis Westminster 326 0.03
Global Small Companies FundPortfolio of Investments as at 31 May 2021 (continued)
Dimensional Fund Advisors Semi-Annual Report and Unaudited Financial Statements, 31 May 2021 186

Shares (000's)
Value(000's)
USD
% of NetAssetValue
Common Stock (continued)
Netherlands - 0.77% (continued)
2 Brunel International NV 27 -
6 Corbion NV 354 0.03
3 Flow Traders 144 0.01
4 ForFarmers NV 28 -
7 Fugro NV 72 0.01
6 GrandVision NV 191 0.02
3 Heijmans NV 54 -
1 Hunter Douglas NV 60 0.01
5 IMCD NV 880 0.09
9 Intertrust NV 169 0.02
1 Kendrion NV 39 -
25 Koninklijke BAM Groep NV 73 0.01
3 Koninklijke Vopak NV 159 0.01
1 Lucas Bols BV 7 -
1 Nederland Apparatenfabriek 39 -
8 OCI NV 198 0.02
12 Ordina NV 56 -
63 PostNL NV 368 0.04
16 SBM Offshore NV 283 0.03
1 SIF Holding NV 13 -
14 Signify NV 895 0.09
2 Sligro Food Group NV 76 0.01
4 TKH Group NV 190 0.02
7 TomTom NV 64 0.01
3 Van Lanschot Kempen NV 91 0.01
7,902 0.77
New Zealand - 0.19%
44 Air New Zealand Ltd 54 0.01
36 Arvida Group Ltd 48 0.01
4 Briscoe Group Ltd 15 -
42 Chorus Ltd 190 0.02
3 Delegat Group Ltd 38 -
14 Freightways Ltd 118 0.01
15 Genesis Energy Ltd 37 -
3 Gentrack Group Ltd 4 -
4 Hallenstein Glasson Holdings Ltd 21 -
35 Heartland Group Holdings Ltd 49 0.01
58 Infratil Ltd 316 0.03
61 Kathmandu Holdings Ltd 70 0.01
6 Napier Port Holdings Ltd 15 -
18 New Zealand Refining Co Ltd 9 -
37 NZME Ltd 20 -
27 NZX Ltd 41 0.01
33 Oceania Healthcare Ltd 33 -
34 Pacific Edge Ltd 29 -
35 Pushpay Holdings Ltd 43 0.01
4 Restaurant Brands New Zealand Ltd 38 0.01
8 Sanford Ltd 26 -
11 Scales Corp Ltd 36 -
5 Serko Ltd 23 -
18 Skellerup Holdings Ltd 58 0.01
99 SKY Network Television Ltd 12 -
65 SKYCITY Entertainment Group Ltd 168 0.02
7 Steel & Tube Holdings Ltd 6 -
20 Summerset Group Holdings Ltd 177 0.02
6 Synlait Milk Ltd 13 -
10 Tourism Holdings Ltd 19 -
23 Tower Ltd 13 -
5 Trustpower Ltd 31 -
10 Turners Automotive Group Ltd 30 -
12 Vista Group International Ltd 18 -
Shares (000's)
Value(000's)
USD
% of NetAssetValue
Common Stock (continued)
New Zealand - 0.19% (continued)
8 Warehouse Group Ltd 21 -
37 Z Energy Ltd 69 0.01
1,908 0.19
Norway - 0.36%
42 ABG Sundal Collier Holding ASA 44 0.01
3 AF Gruppen ASA 69 0.01
18 Akastor ASA 12 -
21 Aker Solutions ASA 38 -
4 American Shipping Co ASA 15 -
5 ArcticZymes Technologies ASA 58 0.01
2 Asetek AS 19 -
8 Atea ASA 154 0.02
6 Atlantic Sapphire ASA 63 0.01
7 Austevoll Seafood ASA 98 0.01
8 Avance Gas Holding Ltd 42 0.01
15 Axactor SE 20 -
26 B2Holding ASA 32 -
5 Bergenbio ASA 15 -
2 Bonheur ASA 49 0.01
8 Borr Drilling Ltd 8 -
10 Borregaard ASA 219 0.02
- Bouvet ASA 29 -
2 BW Energy Ltd 5 -
7 BW LPG Ltd 48 0.01
9 BW Offshore Ltd 35 -
3 Crayon Group Holding ASA 38 -
60 DNO ASA 64 0.01
19 Europris ASA 131 0.01
8 Fjordkraft Holding ASA 54 0.01
3 FLEX LNG Ltd 44 0.01
10 Frontline Ltd 82 0.01
6 Golden Ocean Group Ltd 60 0.01
2 Golden Ocean Group Ltd (Norway listing) 19 -
5 Grieg Seafood ASA 51 0.01
14 Hexagon Composites ASA 63 0.01
126 IDEX Biometrics ASA 37 -
2 Kid ASA 28 -
11 Kitron ASA 29 -
34 Kongsberg Automotive ASA 12 -
1 Medistim ASA 23 -
13 MPC Container Ships ASA 27 -
4 Nordic Nanovector ASA 14 -
14 Nordic Semiconductor ASA 382 0.04
1 Norway Royal Salmon ASA 24 -
2 Norwegian Energy Co SA 27 -
13 Norwegian Finans Holding ASA 158 0.02
10 Norwegian Property ASA 18 -
10 Ocean Yield ASA 34 -
9 Odfjell Drilling Ltd 23 -
2 Olav Thon Eiendomsselskap ASA 47 0.01
8 Otello Corp ASA 31 -
6 Panoro Energy ASA 13 -
3 Pareto Bank ASA 23 -
3 PCI Biotech Holding ASA 9 -
35 PGS ASA 22 -
2 PhotoCure ASA 34 -
9 Protector Forsikring ASA 103 0.01
21 REC Silicon ASA 42 0.01
1 Sandnes Sparebank 11 -
4 SATS Ltd 13 -
9 Sbanken ASA 109 0.01
5 Selvaag Bolig ASA 35 -
Global Small Companies FundPortfolio of Investments as at 31 May 2021 (continued)
Dimensional Fund Advisors Semi-Annual Report and Unaudited Financial Statements, 31 May 2021 187

Shares (000's)
Value(000's)
USD
% of NetAssetValue
Common Stock (continued)
Norway - 0.36% (continued)
2 Solon Eiendom ASA 11 -
1 Sparebank 1 Oestlandet 11 -
7 SpareBank 1 SR-Bank ASA 96 0.01
2 SpareBank 1 SR-Bank ASA 10 -
- Sparebanken More 11 -
3 Stolt-Nielsen Ltd 49 0.01
2 Subsea 7 SA 20 -
12 TGS NOPEC Geophysical Co ASA 157 0.02
6 Treasure ASA 13 -
2 Ultimovacs ASA 17 -
10 Veidekke ASA 145 0.02
5 Vow ASA 24 -
7 Wallenius Wilhelmsen ASA 29 -
1 Wilh Wilhelmsen Holding ASA (voting rights) 19 -
10 XXL ASA 24 -
3,642 0.36
Portugal - 0.09%
11 Altri SGPS SA 76 0.01
947 Banco Comercial Portugues SA 184 0.02
2 Corticeira Amorim SGPS SA 22 -
15 CTT-Correios de Portugal SA 78 0.01
12 Mota-Engil SGPS SA 22 -
33 Navigator Co SA 123 0.01
32 NOS SGPS SA 117 0.01
41 REN-Redes Energeticas Nacionais SGPS SA 114 0.01
3 Semapa-Sociedade de Investimento e Gestao 46 0.01
116 Sonae SGPS SA 112 0.01
894 0.09
Singapore - 0.38%
107 Accordia Golf Trust 2 -
27 AEM Holdings Ltd 72 0.01
84 Ascendas India Trust 86 0.01
34 Avarga Ltd 8 -
21 Best World International Ltd 4 -
52 Boustead Singapore Ltd 46 0.01
20 Bukit Sembawang Estates Ltd 76 0.01
28 China Aviation Oil Singapore Corp Ltd 23 -
39 China Sunsine Chemical Holdings Ltd 16 -
46 Chip Eng Seng Corp Ltd 15 -
24 Chuan Hup Holdings Ltd 4 -
200 ComfortDelGro Corp Ltd 254 0.03
169 COSCO Shipping International Singapore Co Ltd 40 0.01
3 Creative Technology Ltd 6 -
54 CSE Global Ltd 22 -
21 Del Monte Pacific Ltd 6 -
19 Delfi Ltd 12 -
456 Ezion Holdings Ltd 3 -
205 Ezra Holdings Ltd - -
24 Far East Orchard Ltd 19 -
59 First Resources Ltd 60 0.01
20 Food Empire Holdings Ltd 14 -
46 Fragrance Group Ltd 4 -
19 Fraser and Neave Ltd 21 -
18 Frasers Property Ltd 16 -
23 Frencken Group Ltd 30 -
136 Gallant Venture Ltd 13 -
18 GK Goh Holdings Ltd 13 -
855 Golden Agri-Resources Ltd 152 0.02
39 GuocoLand Ltd 48 0.01
14 Halcyon Agri Corp Ltd 3 -
11 Haw Par Corp Ltd 107 0.01
16 Ho Bee Land Ltd 32 -
Shares (000's)
Value(000's)
USD
% of NetAssetValue
Common Stock (continued)
Singapore - 0.38% (continued)
38 Hong Fok Corp Ltd 25 -
32 Hong Leong Asia Ltd 24 -
32 Hong Leong Finance Ltd 59 0.01
17 Hotel Grand Central Ltd 14 -
32 Hour Glass Ltd 30 -
713 Hutchison Port Holdings Trust 171 0.02
15 iFAST Corp Ltd 93 0.01
32 Indofood Agri Resources Ltd 9 -
44 Japfa Ltd 29 -
427 Keppel Infrastructure Trust 176 0.02
19 Lian Beng Group Ltd 7 -
30 Mandarin Oriental International Ltd 59 0.01
49 Metro Holdings Ltd 30 -
34 Mewah International Inc 12 -
5 Micro-Mechanics Holdings Ltd 11 -
109 Midas Holdings Ltd 3 -
124 mm2 Asia Ltd 6 -
284 NetLink NBN Trust 205 0.02
5 NSL Ltd 3 -
1,108 Oceanus Group Ltd 32 -
38 OUE Ltd 38 -
76 Oxley Holdings Ltd 14 -
22 Pan-United Corp Ltd 5 -
209 Place Holdings Ltd/The 23 -
35 Q&M Dental Group Singapore Ltd 18 -
21 QAF Ltd 15 -
111 Raffles Medical Group Ltd 91 0.01
50 Riverstone Holdings Ltd 56 0.01
10 SBS Transit Ltd 23 -
93 Sembcorp Industries Ltd 155 0.02
645 Sembcorp Marine Ltd 97 0.01
74 Sheng Siong Group Ltd 89 0.01
32 SIA Engineering Co Ltd 54 0.01
85 SIIC Environment Holdings Ltd 14 -
126 Sinarmas Land Ltd 27 -
167 Singapore Post Ltd 91 0.01
180 Singapore Press Holdings Ltd 238 0.02
50 Stamford Land Corp Ltd 15 -
58 StarHub Ltd 53 0.01
14 Straits Trading Co Ltd 30 -
47 Swiber Holdings Ltd 1 -
286 Thomson Medical Group Ltd 19 -
49 Tuan Sing Holdings Ltd 16 -
55 UMS Holdings Ltd 59 0.01
13 United Industrial Corp Ltd 26 -
45 UOB-Kay Hian Holdings Ltd 56 0.01
31 Valuetronics Holdings Ltd 15 -
11 Vicom Ltd 17 -
53 Wing Tai Holdings Ltd 70 0.01
214 Yangzijiang Shipbuilding Holdings Ltd 241 0.02
3,891 0.38
Spain - 0.69%
2 Acciona SA 387 0.04
18 Acerinox SA 253 0.03
1 Adveo Group International SA - -
2 Aedas Homes SA 54 0.01
3 Alantra Partners SA 50 0.01
8 Almirall SA 134 0.01
89 Amper SA 21 -
17 Applus Services SA 174 0.02
12 Atresmedia Corp de Medios de Comunicacion SA 58 0.01
4 Audax Renovables SA 11 -
Global Small Companies FundPortfolio of Investments as at 31 May 2021 (continued)
Dimensional Fund Advisors Semi-Annual Report and Unaudited Financial Statements, 31 May 2021 188

Shares (000's)
Value(000's)
USD
% of NetAssetValue
Common Stock (continued)
Spain - 0.69% (continued)
565 Banco de Sabadell SA 435 0.04
74 Bankinter SA 422 0.04
6 Cia de Distribucion Integral Logista Holdings SA 125 0.01
8 CIE Automotive SA 225 0.02
2 Construcciones y Auxiliar de Ferrocarriles SA 104 0.01
124 Distribuidora Internacional de Alimentacion SA 12 -
7 Ebro Foods SA 150 0.02
7 eDreams ODIGEO SA 46 0.01
4 Elecnor SA 51 0.01
22 Enagas SA 517 0.05
16 Ence Energia y Celulosa SA 68 0.01
10 Ercros SA 45 0.01
10 Euskaltel SA 141 0.01
34 Faes Farma SA 140 0.01
6 Fluidra SA 228 0.02
9 Fomento de Construcciones y Contratas SA 118 0.01
20 Gestamp Automocion SA 107 0.01
11 Global Dominion Access SA 58 0.01
4 Grupo Catalana Occidente SA 186 0.02
2 Grupo Empresarial San Jose SA 13 -
24 Grupo Ezentis SA 11 -
1 Iberpapel Gestion SA 31 -
15 Indra Sistemas SA 135 0.01
2 Laboratorios Farmaceuticos Rovi SA 115 0.01
201 Liberbank SA 81 0.01
70 Linea Directa Aseguradora SA Cia de Seguros yReaseguros 137 0.01
81 Mapfre SA 186 0.02
18 Mediaset Espana Comunicacion SA 126 0.01
12 Melia Hotels International SA 102 0.01
3 Metrovacesa SA 23 -
3 Miquel y Costas & Miquel SA 55 0.01
8 Neinor Homes SA 100 0.01
13 Obrascon Huarte Lain SA 9 -
5 Oryzon Genomics 22 -
2 Pharma Mar SA 147 0.01
1 Prim SA 14 -
36 Promotora de Informaciones SA 39 -
32 Prosegur Cash SA 31 -
24 Prosegur Cia de Seguridad SA 75 0.01
33 Realia Business SA 28 -
2 Renta 4 Banco SA 17 -
39 Sacyr SA 104 0.01
9 Solaria Energia y Medio Ambiente SA 163 0.02
- Solarpack Corp Tecnologica 10 -
9 Talgo SA 55 0.01
4 Tecnicas Reunidas SA 56 0.01
18 Tubacex SA 40 -
104 Unicaja Banco SA 117 0.01
2 Vidrala SA (voting rights) 207 0.02
4 Viscofan SA 302 0.03
12 Vocento SA 16 -
19 Zardoya Otis SA 133 0.01
7,020 0.69
Sweden - 1.27%
10 AcadeMedia AB 99 0.01
4 Adapteo Oyj 87 0.01
8 AddLife AB 215 0.02
3 AddNode Group AB 105 0.01
23 AddTech AB 381 0.04
9 AF POYRY AB 306 0.03
4 Alimak Group AB 65 0.01
Shares (000's)
Value(000's)
USD
% of NetAssetValue
Common Stock (continued)
Sweden - 1.27% (continued)
9 Ambea AB 72 0.01
3 Annehem Fastigheter 14 -
1 AQ Group AB 26 -
23 Arjo AB 233 0.02
3 Atrium Ljungberg AB 77 0.01
13 Attendo AB 66 0.01
5 Beijer Alma AB 105 0.01
3 Beijer Electronics Group AB 18 -
3 Bergman & Beving AB 43 -
1 Besqab AB 14 -
10 Betsson AB 5 -
10 Betsson AB 91 0.01
2 Better Collective A/S 40 -
7 BHG Group AB 130 0.01
9 Bilia AB 180 0.02
2 BioGaia AB 103 0.01
8 Biotage AB 167 0.02
10 Bonava AB 122 0.01
4 Boozt AB 97 0.01
1 Boule Diagnostics AB 10 -
22 Bravida Holding AB 336 0.03
1 BTS Group AB 20 -
3 Bufab AB 92 0.01
2 Bulten AB 30 -
7 Bure Equity AB 307 0.03
5 Byggmax Group AB 46 0.01
2 Calliditas Therapeutics AB 36 -
9 Catella AB 29 -
3 Catena AB 154 0.02
7 Catena Media PLC 52 0.01
3 Cavotec SA 9 -
2 Cellavision AB 74 0.01
4 Clas Ohlson AB 42 -
19 Cloetta AB 63 0.01
8 Collector AB 31 -
4 Concentric AB 82 0.01
12 Coor Service Management Holding AB 104 0.01
1 CTT Systems AB 18 -
7 Dios Fastigheter AB 78 0.01
2 Doro AB 12 -
4 Duni AB 50 0.01
6 Dustin Group AB 81 0.01
2 Eastnine AB 28 -
2 Elanders AB 38 -
22 Electrolux Professional AB 154 0.02
1 Elos Medtech AB 12 -
11 Eltel AB 32 -
2 Enea AB 45 -
1 Eolus Vind AB 34 -
- eWork Group AB 3 -
9 Fagerhult AB 71 0.01
1 Fastighets AB Trianon 11 -
4 FastPartner AB 49 0.01
- Fenix Outdoor International AG 70 0.01
1 Ferronordic AB 14 -
11 Fingerprint Cards AB 45 -
1 G5 Entertainment AB 48 0.01
2 GARO AB 27 -
11 Granges AB 145 0.01
9 Haldex AB 65 0.01
3 Heba Fastighets AB 49 0.01
3 Hexatronic Group AB 47 0.01
Global Small Companies FundPortfolio of Investments as at 31 May 2021 (continued)
Dimensional Fund Advisors Semi-Annual Report and Unaudited Financial Statements, 31 May 2021 189

Shares (000's)
Value(000's)
USD
% of NetAssetValue
Common Stock (continued)
Sweden - 1.27% (continued)
3 HMS Networks AB 146 0.01
10 Hoist Finance AB 44 -
7 Hufvudstaden AB 122 0.01
3 Humana AB 30 -
1 IAR Systems Group AB 24 -
4 Instalco AB 154 0.02
8 International Petroleum Corp 33 -
4 INVISIO AB 109 0.01
5 Inwido AB 94 0.01
6 ITAB Shop Concept AB 12 -
6 JM AB 251 0.03
1 John Mattson Fastighetsforetagen 15 -
5 Karnov Group AB 33 -
25 Kindred Group PLC, SDR 422 0.04
67 Klovern AB 135 0.01
2 KNOW IT AB 78 0.01
22 Kungsleden AB 278 0.03
19 Lagercrantz Group AB 210 0.02
8 LeoVegas AB 43 -
1 Lime Technologies AB 42 -
9 Lindab International AB 212 0.02
8 Loomis AB 267 0.03
15 Maha Energy AB 22 -
1 Medcap AB 22 -
3 Medicover AB 88 0.01
4 Mekonomen AB 72 0.01
1 Midsona AB 12 -
2 MIPS AB 198 0.02
9 Modern Times Group MTG AB 126 0.01
2 Momentum Group AB 32 -
8 Munters Group AB 80 0.01
8 Mycronic AB 243 0.02
- NCAB Group AB 13 -
9 NCC AB 169 0.02
2 Nederman Holding AB 40 -
1 Nelly Group AB 3 -
5 New Wave Group AB 56 0.01
10 Nobia AB 92 0.01
9 Nobina AB 91 0.01
24 Nolato AB 250 0.03
6 Nordic Entertainment Group AB 306 0.03
4 Nordic Waterproofing Holding AB 78 0.01
4 NP3 Fastigheter AB 86 0.01
20 Nyfosa AB 270 0.03
4 OEM International AB 69 0.01
3 Orexo AB 16 -
8 Pandox AB 145 0.01
17 Peab AB 239 0.02
6 Platzer Fastigheter Holding AB 91 0.01
14 Pricer AB 51 0.01
4 Proact IT Group AB 45 -
- Probi AB 20 -
1 Qliro AB 4 -
27 Ratos AB 172 0.02
3 RaySearch Laboratories AB 35 -
1 Rejlers AB 24 -
14 Resurs Holding AB 75 0.01
9 Rottneros AB 10 -
6 Saab AB 166 0.02
282 SAS AB 65 0.01
6 Scandi Standard AB 43 -
9 Scandic Hotels Group AB 40 -
Shares (000's)
Value(000's)
USD
% of NetAssetValue
Common Stock (continued)
Sweden - 1.27% (continued)
2 Sectra AB 168 0.02
2 Semcon AB 22 -
47 Sensys Gatso Group AB 7 -
4 SkiStar AB 72 0.01
1 Stendorren Fastigheter AB 13 -
2 Systemair AB 63 0.01
5 Troax Group AB 180 0.02
2 VBG Group AB 39 -
1 Vitec Software Group AB 62 0.01
15 Wihlborgs Fastigheter AB 329 0.03
12,972 1.27
Switzerland - 1.96%
8 Adecco Group AG 558 0.05
1 AEVIS VICTORIA SA 12 -
1 Allreal Holding AG 289 0.03
1 ALSO Holding AG 213 0.02
21 ams AG 406 0.04
- APG SGA SA 47 -
6 Arbonia AG 108 0.01
142 Aryzta AG 191 0.02
4 Ascom Holding AG 59 0.01
1 Autoneum Holding AG 95 0.01
1 Bachem Holding AG 355 0.03
5 Baloise Holding AG 778 0.08
- Banque Cantonale de Geneve 41 -
2 Banque Cantonale Vaudoise 191 0.02
1 Belimo Holding AG 424 0.04
- Bell Food Group AG 76 0.01
1 Bellevue Group AG 56 0.01
1 Berner Kantonalbank AG 118 0.01
2 BKW AG 246 0.02
1 Bobst Group SA 77 0.01
1 Bossard Holding AG 167 0.02
1 Bucher Industries AG 401 0.04
- Burckhardt Compression Holding AG 136 0.01
1 Burkhalter Holding AG 48 -
1 Calida Holding AG 19 -
- Carlo Gavazzi Holding AG 11 -
3 Cembra Money Bank AG 346 0.03
- Cicor Technologies Ltd 20 -
- Cie Financiere Tradition SA 19 -
20 Clariant AG 432 0.04
1 Coltene Holding AG 84 0.01
1 Comet Holding AG 213 0.02
- Conzzeta AG 218 0.02
1 COSMO Pharmaceuticals NV 64 0.01
1 Daetwyler Holding AG 255 0.03
4 DKSH Holding AG 344 0.03
- dormakaba Holding AG 203 0.02
- Dottikon Es Holding AG 17 -
7 Dufry AG 424 0.04
10 EFG International AG 78 0.01
- Emmi AG 232 0.02
4 Energiedienst Holding AG 161 0.02
70 Evolva Holding SA 14 -
- Feintool International Holding AG 14 -
2 Flughafen Zurich AG 374 0.04
- Forbo Holding AG 243 0.02
2 Fundamenta Real Estate AG 51 0.01
5 Galenica AG 348 0.03
20 GAM Holding AG 52 0.01
1 Georg Fischer AG 681 0.07
Global Small Companies FundPortfolio of Investments as at 31 May 2021 (continued)
Dimensional Fund Advisors Semi-Annual Report and Unaudited Financial Statements, 31 May 2021 190
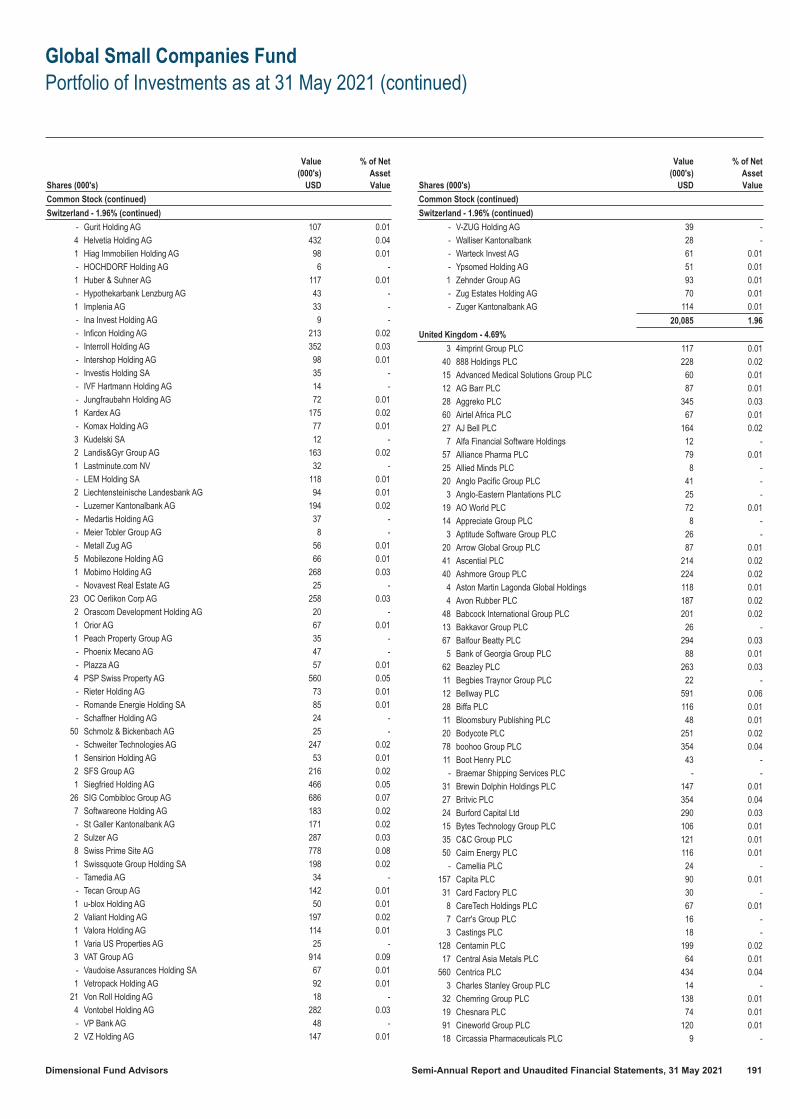
Shares (000's)
Value(000's)
USD
% of NetAssetValue
Common Stock (continued)
Switzerland - 1.96% (continued)
- Gurit Holding AG 107 0.01
4 Helvetia Holding AG 432 0.04
1 Hiag Immobilien Holding AG 98 0.01
- HOCHDORF Holding AG 6 -
1 Huber & Suhner AG 117 0.01
- Hypothekarbank Lenzburg AG 43 -
1 Implenia AG 33 -
- Ina Invest Holding AG 9 -
- Inficon Holding AG 213 0.02
- Interroll Holding AG 352 0.03
- Intershop Holding AG 98 0.01
- Investis Holding SA 35 -
- IVF Hartmann Holding AG 14 -
- Jungfraubahn Holding AG 72 0.01
1 Kardex AG 175 0.02
- Komax Holding AG 77 0.01
3 Kudelski SA 12 -
2 Landis&Gyr Group AG 163 0.02
1 Lastminute.com NV 32 -
- LEM Holding SA 118 0.01
2 Liechtensteinische Landesbank AG 94 0.01
- Luzerner Kantonalbank AG 194 0.02
- Medartis Holding AG 37 -
- Meier Tobler Group AG 8 -
- Metall Zug AG 56 0.01
5 Mobilezone Holding AG 66 0.01
1 Mobimo Holding AG 268 0.03
- Novavest Real Estate AG 25 -
23 OC Oerlikon Corp AG 258 0.03
2 Orascom Development Holding AG 20 -
1 Orior AG 67 0.01
1 Peach Property Group AG 35 -
- Phoenix Mecano AG 47 -
- Plazza AG 57 0.01
4 PSP Swiss Property AG 560 0.05
- Rieter Holding AG 73 0.01
- Romande Energie Holding SA 85 0.01
- Schaffner Holding AG 24 -
50 Schmolz & Bickenbach AG 25 -
- Schweiter Technologies AG 247 0.02
1 Sensirion Holding AG 53 0.01
2 SFS Group AG 216 0.02
1 Siegfried Holding AG 466 0.05
26 SIG Combibloc Group AG 686 0.07
7 Softwareone Holding AG 183 0.02
- St Galler Kantonalbank AG 171 0.02
2 Sulzer AG 287 0.03
8 Swiss Prime Site AG 778 0.08
1 Swissquote Group Holding SA 198 0.02
- Tamedia AG 34 -
- Tecan Group AG 142 0.01
1 u-blox Holding AG 50 0.01
2 Valiant Holding AG 197 0.02
1 Valora Holding AG 114 0.01
1 Varia US Properties AG 25 -
3 VAT Group AG 914 0.09
- Vaudoise Assurances Holding SA 67 0.01
1 Vetropack Holding AG 92 0.01
21 Von Roll Holding AG 18 -
4 Vontobel Holding AG 282 0.03
- VP Bank AG 48 -
2 VZ Holding AG 147 0.01
Shares (000's)
Value(000's)
USD
% of NetAssetValue
Common Stock (continued)
Switzerland - 1.96% (continued)
- V-ZUG Holding AG 39 -
- Walliser Kantonalbank 28 -
- Warteck Invest AG 61 0.01
- Ypsomed Holding AG 51 0.01
1 Zehnder Group AG 93 0.01
- Zug Estates Holding AG 70 0.01
- Zuger Kantonalbank AG 114 0.01
20,085 1.96
United Kingdom - 4.69%
3 4imprint Group PLC 117 0.01
40 888 Holdings PLC 228 0.02
15 Advanced Medical Solutions Group PLC 60 0.01
12 AG Barr PLC 87 0.01
28 Aggreko PLC 345 0.03
60 Airtel Africa PLC 67 0.01
27 AJ Bell PLC 164 0.02
7 Alfa Financial Software Holdings 12 -
57 Alliance Pharma PLC 79 0.01
25 Allied Minds PLC 8 -
20 Anglo Pacific Group PLC 41 -
3 Anglo-Eastern Plantations PLC 25 -
19 AO World PLC 72 0.01
14 Appreciate Group PLC 8 -
3 Aptitude Software Group PLC 26 -
20 Arrow Global Group PLC 87 0.01
41 Ascential PLC 214 0.02
40 Ashmore Group PLC 224 0.02
4 Aston Martin Lagonda Global Holdings 118 0.01
4 Avon Rubber PLC 187 0.02
48 Babcock International Group PLC 201 0.02
13 Bakkavor Group PLC 26 -
67 Balfour Beatty PLC 294 0.03
5 Bank of Georgia Group PLC 88 0.01
62 Beazley PLC 263 0.03
11 Begbies Traynor Group PLC 22 -
12 Bellway PLC 591 0.06
28 Biffa PLC 116 0.01
11 Bloomsbury Publishing PLC 48 0.01
20 Bodycote PLC 251 0.02
78 boohoo Group PLC 354 0.04
11 Boot Henry PLC 43 -
- Braemar Shipping Services PLC - -
31 Brewin Dolphin Holdings PLC 147 0.01
27 Britvic PLC 354 0.04
24 Burford Capital Ltd 290 0.03
15 Bytes Technology Group PLC 106 0.01
35 C&C Group PLC 121 0.01
50 Cairn Energy PLC 116 0.01
- Camellia PLC 24 -
157 Capita PLC 90 0.01
31 Card Factory PLC 30 -
8 CareTech Holdings PLC 67 0.01
7 Carr's Group PLC 16 -
3 Castings PLC 18 -
128 Centamin PLC 199 0.02
17 Central Asia Metals PLC 64 0.01
560 Centrica PLC 434 0.04
3 Charles Stanley Group PLC 14 -
32 Chemring Group PLC 138 0.01
19 Chesnara PLC 74 0.01
91 Cineworld Group PLC 120 0.01
18 Circassia Pharmaceuticals PLC 9 -
Global Small Companies FundPortfolio of Investments as at 31 May 2021 (continued)
Dimensional Fund Advisors Semi-Annual Report and Unaudited Financial Statements, 31 May 2021 191

Shares (000's)
Value(000's)
USD
% of NetAssetValue
Common Stock (continued)
United Kingdom - 4.69% (continued)
3 Clarkson PLC 137 0.01
12 Clinigen Healthcare Ltd 150 0.02
7 Clipper Logistics PLC 80 0.01
16 Close Brothers Group PLC 372 0.04
19 CLS Holdings PLC 68 0.01
13 CMC Markets PLC 87 0.01
159 Coats Group PLC 149 0.01
10 Computacenter PLC 362 0.04
14 ContourGlobal PLC 38 -
118 ConvaTec Group PLC 397 0.04
15 Costain Group PLC 12 -
50 Countryside Properties PLC 362 0.04
5 Cranswick PLC 295 0.03
24 Crest Nicholson Holdings PLC 153 0.02
8 CVS Group PLC 247 0.02
19 Daily Mail & General Trust PLC 237 0.02
11 Dart Group PLC 206 0.02
15 De La Rue PLC 39 -
111 Debenhams PLC - -
22 Devro PLC 65 0.01
32 DFS Furniture PLC 128 0.01
3 Dialight PLC 12 -
5 Dignity PLC 47 0.01
12 Diploma PLC 484 0.05
50 Direct Line Insurance Group PLC 213 0.02
11 DiscoverIE Group PLC 116 0.01
52 Diversified Gas & Oil PLC 77 0.01
109 Dixons Carphone PLC 211 0.02
45 Domino's Pizza Group PLC 230 0.02
23 dotdigital Group PLC 73 0.01
59 Drax Group PLC 363 0.04
10 Dunelm Group PLC 205 0.02
10 DWF Group PLC 15 -
26 EKF Diagnostics Holdings PLC 29 -
42 Electrocomponents PLC 590 0.06
98 Elementis PLC 219 0.02
6 EMIS Group PLC 93 0.01
166 EnQuest PLC 40 -
15 Epwin Group PLC 22 -
47 Equiniti Group PLC 119 0.01
13 Euromoney Institutional Investor PLC 189 0.02
9 FDM Group Holdings PLC 131 0.01
48 Ferrexpo PLC 302 0.03
11 Fevertree Drinks PLC 381 0.04
35 Filtrona PLC 154 0.02
1 First Derivatives PLC 43 -
118 Firstgroup PLC 136 0.01
21 Forterra PLC 89 0.01
35 Foxtons Group PLC 29 -
2 Frontier Developments PLC 82 0.01
4 Fuller Smith & Turner PLC 49 0.01
5 Funding Circle Holdings 12 -
11 Future PLC 447 0.04
3 FW Thorpe PLC 16 -
10 Galliford Try Holdings PLC 18 -
4 Games Workshop Group PLC 594 0.06
7 Gamesys Group PLC 180 0.02
6 Gamma Communications PLC 183 0.02
9 GB Group PLC 121 0.01
8 Gem Diamonds Ltd 8 -
17 Genel Energy PLC 33 -
5 Genus PLC 327 0.03
Shares (000's)
Value(000's)
USD
% of NetAssetValue
Common Stock (continued)
United Kingdom - 4.69% (continued)
3 Georgia Capital PLC 29 -
5 Go-Ahead Group PLC 93 0.01
1 Gooch & Housego PLC 16 -
1 Goodwin PLC 23 -
22 Grafton Group PLC 361 0.04
73 Grainger PLC 294 0.03
44 Greencore Group PLC 88 0.01
9 Greggs PLC 333 0.03
5 Griffin Mining Ltd 9 -
27 Gulf Keystone Petroleum Ltd 63 0.01
14 Gym Group PLC 54 0.01
29 Halfords Group PLC 158 0.02
96 Harbour Energy PLC 28 -
3 Hargreaves Services PLC 16 -
12 Harworth Group PLC 24 -
170 Hays PLC 419 0.04
14 Headlam Group PLC 91 0.01
16 Helical PLC 97 0.01
25 Helios Towers PLC 60 0.01
8 Hill & Smith Holdings PLC 181 0.02
6 Hilton Food Group PLC 106 0.01
30 Hiscox Ltd 335 0.03
31 Hochschild Mining PLC 87 0.01
20 Hollywood Bowl Group PLC 74 0.01
6 HomeServe PLC 74 0.01
6 Hostelworld Group PLC 8 -
38 Howden Joinery Group PLC 428 0.04
15 Hunting PLC 55 0.01
34 Hyve Group PLC 63 0.01
42 Ibstock PLC 137 0.01
36 IDOX PLC 32 -
38 IG Group Holdings PLC 459 0.05
27 IMI PLC 647 0.06
7 Impax Asset Management Group PLC 111 0.01
38 Inchcape PLC 419 0.04
92 Indivior PLC 204 0.02
25 IntegraFin Holdings PLC 189 0.02
23 International Personal Finance PLC 43 -
59 Investec PLC 261 0.03
12 iomart Group PLC 45 -
138 IP Group PLC 243 0.02
24 IQE PLC 18 -
60 IWG PLC 308 0.03
6 James Fisher & Sons PLC 77 0.01
11 James Halstead PLC 75 0.01
7 JD Wetherspoon PLC 139 0.01
52 John Laing Group PLC 296 0.03
10 John Menzies PLC 44 -
67 John Wood Group PLC 232 0.02
47 Johnson Service Group PLC 113 0.01
4 Joules Group PLC 14 -
12 JTC PLC 107 0.01
59 Jupiter Fund Management PLC 232 0.02
102 Just Group PLC 160 0.02
9 Kainos Group PLC 189 0.02
9 Keller Group PLC 108 0.01
4 Keywords Studios PLC 131 0.01
15 Kier Group PLC 24 -
13 Kier Group PLC 6 -
21 Kin & Carta PLC 59 0.01
15 Lamprell PLC 13 -
24 Lancashire Holdings Ltd 217 0.02
Global Small Companies FundPortfolio of Investments as at 31 May 2021 (continued)
Dimensional Fund Advisors Semi-Annual Report and Unaudited Financial Statements, 31 May 2021 192

Shares (000's)
Value(000's)
USD
% of NetAssetValue
Common Stock (continued)
United Kingdom - 4.69% (continued)
38 Learning Technologies Group PLC 91 0.01
2 Liontrust Asset Management PLC 51 0.01
40 Lookers PLC 39 -
8 LSL Property Services PLC 54 0.01
8 Luceco PLC 37 -
2 M&C Saatchi PLC 4 -
18 Macfarlane Group PLC 30 -
151 Man Group PLC 383 0.04
170 Marks & Spencer Group PLC 397 0.04
20 Marshalls PLC 204 0.02
74 Marston's PLC 96 0.01
28 McBride PLC 36 -
18 Mears Group PLC 49 0.01
46 Mediclinic International PLC 212 0.02
54 Meggitt PLC 391 0.04
2 Metro Bank PLC 3 -
32 Michael Page International PLC 274 0.03
36 Micro Focus International PLC 263 0.03
4 Midwich Group PLC 30 -
36 Mitchells & Butlers PLC 157 0.02
143 Mitie Group PLC 138 0.01
6 MJ Gleeson PLC 78 0.01
57 Moneysupermarket.com Group PLC 217 0.02
36 Morgan Crucible Co PLC 170 0.02
5 Morgan Sindall Group PLC 149 0.01
6 Morses Club PLC 6 -
4 Mortgage Advice Bureau Holdings Ltd 70 0.01
5 Motorpoint group PLC 19 -
3 MP Evans Group PLC 31 -
23 N Brown Group PLC 21 -
11 Naked Wines PLC 123 0.01
54 National Express Group PLC 233 0.02
35 NCC Group PLC 145 0.01
2 Network International Holdings 11 -
10 Next Fifteen Communications Group PLC 117 0.01
36 Ninety One PLC 123 0.01
9 Norcros PLC 40 -
22 Northgate PLC 121 0.01
8 Numis Corp PLC 40 -
13 On the Beach Group PLC 77 0.01
36 OSB Group PLC 238 0.02
8 Oxford Instruments PLC 221 0.02
225 Pan African Resources PLC 74 0.01
27 Paragon Group of Cos PLC 184 0.02
6 PayPoint PLC 54 0.01
168 Pendragon PLC 44 -
26 Petrofac Ltd 49 0.01
189 Petropavlovsk PLC 67 0.01
67 Pets at Home Group PLC 428 0.04
17 Pharos Energy PLC 6 -
40 Photo-Me International PLC 39 -
43 Playtech PLC 283 0.03
9 Plus500 Ltd 193 0.02
8 Polar Capital Holdings PLC 95 0.01
23 Polypipe Group PLC 213 0.02
6 Porvair PLC 49 0.01
2 PPHE Hotel Group Ltd 45 -
86 Premier Foods PLC 130 0.01
25 Provident Financial PLC 86 0.01
21 PureTech Health PLC 119 0.01
21 Purplebricks Group PLC 26 -
19 PZ Cussons PLC 67 0.01
Shares (000's)
Value(000's)
USD
% of NetAssetValue
Common Stock (continued)
United Kingdom - 4.69% (continued)
62 QinetiQ Group PLC 311 0.03
183 Quilter PLC 398 0.04
20 Rank Group PLC 56 0.01
7 Rathbone Brothers PLC 175 0.02
50 Raven Property Group Ltd 21 -
49 Reach PLC 164 0.02
10 Record Plc 12 -
11 Redcentric PLC 21 -
25 Redrow PLC 243 0.02
7 Renew Holdings PLC 67 0.01
4 Renishaw PLC 279 0.03
7 Renold PLC 3 -
69 Restaurant Group PLC 119 0.01
1 Rhi Magnesita NV (Austria listing) 56 0.01
3 Rhi Magnesita NV (UK listing) 162 0.02
9 Ricardo PLC 59 0.01
5 River & Mercantile Group PLC 15 -
11 RM PLC 33 -
10 Robert Walters PLC 97 0.01
88 Rotork PLC 421 0.04
123 Royal Mail PLC 1,009 0.10
32 RPS Group PLC 44 -
27 RWS Holdings PLC 241 0.02
1 S&U PLC 48 0.01
18 Sabre Insurance Group PLC 68 0.01
12 Saga PLC 66 0.01
9 Sanne Group PLC 94 0.01
13 Savills PLC 222 0.02
41 Senior PLC 92 0.01
128 Serco Group PLC 245 0.02
8 Serica Energy PLC 14 -
28 Severfield PLC 32 -
104 Shanks Group PLC 80 0.01
90 SIG PLC 78 0.01
84 Signature Aviation PLC 470 0.05
42 Sirius Real Estate Ltd 61 0.01
11 Smart Metering Systems PLC 140 0.01
24 Smiths News PLC 15 -
11 Softcat PLC 288 0.03
12 Spectris PLC 550 0.05
70 Speedy Hire PLC 74 0.01
31 Spire Healthcare Group PLC 107 0.01
62 Spirent Communications PLC 218 0.02
24 Sports Direct International PLC 194 0.02
74 SSP Group PLC 309 0.03
19 St Modwen Properties PLC 152 0.02
46 Stagecoach Group PLC 56 0.01
14 SThree PLC 83 0.01
35 Stobart Group Ltd 16 -
20 Stock Spirits Group PLC 76 0.01
18 Strix Group PLC 78 0.01
4 Studio Retail Group PLC 16 -
5 STV Group PLC 26 -
5 SuperGroup PLC 30 -
45 Synthomer PLC 336 0.03
1 Takeaway.com NV 108 0.01
49 Tate & Lyle PLC 535 0.05
5 Tatton Asset Management PLC 31 -
6 TBC Bank Group PLC 94 0.01
13 Ted Baker PLC 34 -
6 Telecom Plus PLC 96 0.01
6 TEN Entertainment Group PLC 20 -
Global Small Companies FundPortfolio of Investments as at 31 May 2021 (continued)
Dimensional Fund Advisors Semi-Annual Report and Unaudited Financial Statements, 31 May 2021 193

Shares (000's)
Value(000's)
USD
% of NetAssetValue
Common Stock (continued)
United Kingdom - 4.69% (continued)
14 TI Fluid Systems PLC 60 0.01
10 Topps Tiles PLC 10 -
83 TP ICAP Group PLC 251 0.02
23 Travis Perkins PLC 542 0.05
5 Treatt PLC 86 0.01
2 Trellus Health Limited - -
4 Tremor International Ltd 49 0.01
17 Trifast PLC 38 -
22 TT Electronics plc 79 0.01
149 Tullow Oil PLC 108 0.01
24 Tyman PLC 166 0.02
18 U & I Group PLC 24 -
26 UDG Healthcare PLC 397 0.04
7 Ultra Electronics Holdings PLC 193 0.02
59 Vectura Group PLC 132 0.01
23 Vertu Motors PLC 14 -
22 Vesuvius PLC 175 0.02
8 Victrex PLC 284 0.03
117 Virgin Money UK PLC 349 0.03
22 Vistry Group PLC 418 0.04
5 Vitec Group PLC 91 0.01
38 Vivo Energy PLC 55 0.01
19 Volution Group PLC 119 0.01
1 Vp PLC 11 -
17 Watches of Switzerland Group 193 0.02
22 Watkin Jones PLC 71 0.01
16 Weir Group PLC 436 0.04
12 WH Smith PLC 294 0.03
26 Wickes Group PLC 95 0.01
8 Wilmington PLC 22 -
17 Wincanton PLC 107 0.01
7 Xaar PLC 22 -
2 XP Power Ltd 136 0.01
1 Young & Co's Brewery PLC NV 11 -
2 Young & Co's Brewery PLC, Class A 42 -
4 Zotefoams PLC 27 -
47,987 4.69
United States - 61.43%
4 1-800-Flowers.com Inc 121 0.01
2 1st Constitution Bancorp 32 -
3 1st Source Corp 161 0.02
7 2U Inc 264 0.03
16 3D Systems Corp 467 0.05
2 A H Belo Corp 4 -
10 A10 Networks Inc 94 0.01
6 AAON Inc 405 0.04
3 AAR Corp 113 0.01
4 Aaron's Holdings Co Inc 147 0.01
11 Abeona Therapeutics Inc 18 -
6 Abercrombie & Fitch Co 266 0.03
3 Abiomed Inc 813 0.08
8 ABM Industries Inc 409 0.04
7 Acacia Research Corp 39 -
12 Acadia Healthcare Co Inc 761 0.07
14 Acadia Pharmaceuticals Inc 309 0.03
6 Acceleron Pharma Inc 812 0.08
8 ACCO Brands Corp 73 0.01
12 Accuray Inc 53 0.01
20 Achillion Pharmaceuticals Inc 28 -
14 ACI Worldwide Inc 551 0.05
2 ACM Research Inc 144 0.01
- Acme United Corp 9 -
Shares (000's)
Value(000's)
USD
% of NetAssetValue
Common Stock (continued)
United States - 61.43% (continued)
1 ACNB Corp 35 -
5 Acuity Brands Inc 844 0.08
9 Acushnet Holdings Corp 494 0.05
- Adams Resources & Energy Inc 13 -
12 Adaptive Biotechnologies Corp 450 0.04
2 Addus HomeCare Corp 174 0.02
14 Adient PLC 700 0.07
30 ADT Inc 307 0.03
6 Adtalem Global Education Inc 205 0.02
6 ADTRAN Inc 118 0.01
3 Aduro Biotech Inc - -
5 Advance Auto Parts Inc 976 0.10
6 Advanced Drainage Systems Inc 644 0.06
4 Advanced Emissions Solutions Inc 29 -
5 Advanced Energy Industries Inc 470 0.05
4 AdvanSix Inc 111 0.01
18 AECOM 1,149 0.11
5 Aeglea BioTherapeutics Inc 32 -
3 AeroVironment Inc 343 0.03
5 Affiliated Managers Group Inc 896 0.09
8 AGCO Corp 1,173 0.12
3 Agilysys Inc 172 0.02
5 Agios Pharmaceuticals Inc 270 0.03
3 AgroFresh Solutions Inc 8 -
12 Air Lease Corp 573 0.06
8 Air Transport Services Group Inc 203 0.02
1 Airgain Inc 28 -
2 Akazoo SA - -
17 Akebia Therapeutics Inc 61 0.01
1 Alamo Group Inc 218 0.02
6 Alarm.com Holdings Inc 473 0.05
11 Alaska Air Group Inc 733 0.07
12 Alaska Communications Systems Group Inc 39 -
4 Albany International Corp 345 0.03
3 Albemarle Corp 562 0.06
2 Albireo Pharma Inc 74 0.01
21 Alcoa Corp 839 0.08
5 Aldeyra Therapeutics Inc 65 0.01
1 Alector Inc 16 -
3 Alerus Financial Corp 82 0.01
1 Alico Inc 32 -
19 Alkermes PLC 441 0.04
4 Allakos Inc 454 0.04
1 Alleghany Corp 479 0.05
14 Allegheny Technologies Inc 332 0.03
3 Allegiance Bancshares Inc 112 0.01
2 Allegiant Travel Co 416 0.04
7 Allegion PLC 1,024 0.10
6 ALLETE Inc 447 0.04
3 Alliance Data Systems Corp 331 0.03
14 Alliant Energy Corp 802 0.08
2 Allied Motion Technologies Inc 78 0.01
13 Allison Transmission Holdings Inc 540 0.05
23 Allscripts Healthcare Solutions Inc 392 0.04
21 Ally Financial Inc 1,169 0.11
3 Alpha & Omega Semiconductor Ltd 82 0.01
3 Altabancorp 131 0.01
5 Altair Engineering Inc 334 0.03
5 Alteryx Inc 358 0.04
4 Alto Ingredients Inc 24 -
9 Altra Industrial Motion Corp 623 0.06
1 A-Mark Precious Metals Inc 59 0.01
Global Small Companies FundPortfolio of Investments as at 31 May 2021 (continued)
Dimensional Fund Advisors Semi-Annual Report and Unaudited Financial Statements, 31 May 2021 194

Shares (000's)
Value(000's)
USD
% of NetAssetValue
Common Stock (continued)
United States - 61.43% (continued)
5 Ambac Financial Group Inc 71 0.01
4 Ambarella Inc 387 0.04
4 AMC Networks Inc 231 0.02
11 Amdocs Ltd 827 0.08
4 Amedisys Inc 907 0.09
2 Amerant Bancorp Inc 44 -
1 Amerant Bancorp Inc 26 -
2 Amerco 1,027 0.10
5 Ameresco Inc 250 0.02
52 American Airlines Group Inc 1,258 0.12
9 American Axle & Manufacturing Holdings Inc 100 0.01
22 American Eagle Outfitters Inc 770 0.08
6 American Equity Investment Life Holding Co 194 0.02
6 American Financial Group Inc 860 0.08
2 American National Bankshares Inc 59 0.01
3 American National Group Inc 429 0.04
1 American Outdoor Brands Inc 34 -
2 American Public Education Inc 63 0.01
1 American River Bankshares 18 -
5 American Software Inc 91 0.01
4 American States Water Co 343 0.03
3 American Superconductor Corp 45 -
2 American Vanguard Corp 37 -
2 American Woodmark Corp 182 0.02
1 America's Car-Mart Inc 165 0.02
8 Ameris Bancorp 443 0.04
2 AMERISAFE Inc 157 0.02
2 Ames National Corp 40 -
29 Amkor Technology Inc 617 0.06
6 AMN Healthcare Services Inc 510 0.05
13 Amneal Pharmaceuticals Inc 74 0.01
1 Ampco-Pittsburgh Corp 8 -
6 Amphastar Pharmaceuticals Inc 111 0.01
3 Amtech Systems Inc 29 -
12 Anaplan Inc 605 0.06
4 AnaptysBio Inc 86 0.01
5 Andersons Inc 140 0.01
4 ANGI Homeservices Inc 60 0.01
3 AngioDynamics Inc 71 0.01
1 ANI Pharmaceuticals Inc 49 0.01
2 Anika Therapeutics Inc 83 0.01
15 Antares Pharma Inc 61 0.01
2 Anterix Inc 87 0.01
36 Antero Midstream Corp 345 0.03
29 Antero Resources Corp 369 0.04
11 AO Smith Corp 780 0.08
30 APA Corp 619 0.06
3 Apogee Enterprises Inc 126 0.01
2 Apollo Medical Holdings Inc 53 0.01
2 Appfolio Inc 266 0.03
3 Appian Corp 287 0.03
7 Applied Genetic Technologies Corp 27 -
5 Applied Industrial Technologies Inc 446 0.04
1 Applied Optoelectronics Inc 6 -
5 AptarGroup Inc 778 0.08
7 Aptinyx Inc 17 -
4 Apyx Medical Corp 39 -
22 Aramark 810 0.08
2 Aravive Inc 11 -
1 ArcBest Corp 112 0.01
2 Arch Resources Inc 108 0.01
19 Archrock Inc 174 0.02
Shares (000's)
Value(000's)
USD
% of NetAssetValue
Common Stock (continued)
United States - 61.43% (continued)
6 Arcosa Inc 366 0.04
10 Ardelyx Inc 74 0.01
6 Ardmore Shipping Corp 27 -
7 Arena Pharmaceuticals Inc 400 0.04
11 Ares Management Corp 611 0.06
2 Argan Inc 107 0.01
4 Argo Group International Holdings Ltd 226 0.02
2 Arko Corp 19 -
11 Arlo Technologies Inc 72 0.01
2 Armata Pharmaceuticals Inc 8 -
3 Armstrong Flooring Inc 17 -
6 Armstrong World Industries Inc 600 0.06
9 Arrow Electronics Inc 1,092 0.11
2 Arrow Financial Corp 81 0.01
10 Arrowhead Pharmaceuticals Inc 743 0.07
1 Artesian Resources Corp 53 0.01
7 Artisan Partners Asset Management Inc 380 0.04
5 Arvinas Inc 367 0.04
2 Asbury Automotive Group Inc 486 0.05
6 ASGN Inc 649 0.06
7 Ashland Global Holdings Inc 703 0.07
5 Aspen Aerogels Inc 92 0.01
3 Aspen Group Inc 20 -
6 Aspen Technology Inc 777 0.08
4 Assembly Biosciences Inc 17 -
18 Associated Banc-Corp 421 0.04
1 Associated Capital Group Inc 31 -
7 Assurant Inc 1,119 0.11
10 Assured Guaranty Ltd 463 0.05
3 Astec Industries Inc 193 0.02
3 Astronics Corp, Class A 54 0.01
1 Astronics Corp, Class B 25 -
1 AstroNova Inc 14 -
1 Asure Software Inc 7 -
9 At Home Group Inc 346 0.03
9 Atara Biotherapeutics Inc 117 0.01
16 Athene Holding Ltd 1,021 0.10
8 Athenex Inc 38 -
6 Atkore International Group Inc 489 0.05
3 Atlantic Capital Bancshares Inc 89 0.01
10 Atlantic Union Bankshares Corp 403 0.04
13 Atlantica Yield PLC 465 0.05
2 Atlanticus Holdings Corp 91 0.01
2 Atlas Air Worldwide Holdings Inc 142 0.01
9 Atmos Energy Corp 930 0.09
2 ATN International Inc 80 0.01
5 AtriCure Inc 378 0.04
- Atrion Corp 149 0.01
15 Audacy Inc 64 0.01
10 Autoliv Inc 1,072 0.11
11 AutoNation Inc 1,143 0.11
7 Avalara Inc 945 0.09
6 Avanos Medical Inc 236 0.02
10 Avaya Holdings Corp 298 0.03
3 Avery Dennison Corp 579 0.06
2 Aviat Networks Inc 59 0.01
4 Avid Bioservices Inc 95 0.01
7 Avid Technology Inc 207 0.02
12 Avient Corp 618 0.06
8 Avis Budget Group Inc 741 0.07
8 Avista Corp 385 0.04
14 Avnet Inc 610 0.06
Global Small Companies FundPortfolio of Investments as at 31 May 2021 (continued)
Dimensional Fund Advisors Semi-Annual Report and Unaudited Financial Statements, 31 May 2021 195

Shares (000's)
Value(000's)
USD
% of NetAssetValue
Common Stock (continued)
United States - 61.43% (continued)
2 Aware Inc 8 -
38 AXA Equitable Holdings Inc 1,199 0.12
26 Axalta Coating Systems Ltd 845 0.08
4 Axcelis Technologies Inc 149 0.01
4 Axcella Health Inc 11 -
11 Axis Capital Holdings Ltd 563 0.06
5 Axogen Inc 103 0.01
7 Axon Enterprise Inc 937 0.09
1 Axonics Inc 32 -
9 Axos Financial Inc 420 0.04
5 AXT Inc 50 0.01
3 AZZ Inc 173 0.02
5 B&G Foods Inc 143 0.01
3 Badger Meter Inc 332 0.03
4 Balchem Corp 507 0.05
4 Bally's Corp 241 0.02
9 Banc of California Inc 152 0.02
4 BancFirst Corp 284 0.03
8 Bancorp Inc 203 0.02
15 BancorpSouth Bank 455 0.04
3 Bank of Commerce Holdings 50 0.01
5 Bank of Hawaii Corp 437 0.04
2 Bank of Marin Bancorp 62 0.01
6 Bank of NT Butterfield & Son Ltd 246 0.02
1 Bank of Princeton 28 -
1 Bank of South Carolina Corp 11 -
16 Bank OZK 671 0.07
1 Bank7 Corp 21 -
2 BankFinancial Corp 23 -
11 BankUnited Inc 524 0.05
1 Bankwell Financial Group Inc 37 -
4 Banner Corp 246 0.02
2 Bar Harbor Bankshares 62 0.01
4 Barnes & Noble Education Inc 31 -
6 Barnes Group Inc 316 0.03
1 Barrett Business Services Inc 67 0.01
- Bassett Furniture Industries Inc 13 -
2 BayCom Corp 35 -
- BBQ Holdings Inc 6 -
2 BBX Capital Inc 16 -
4 BCB Bancorp Inc 60 0.01
10 Beacon Roofing Supply Inc 573 0.06
4 Beazer Homes USA Inc 102 0.01
10 Bed Bath & Beyond Inc 286 0.03
1 Bel Fuse Inc 18 -
5 Belden Inc 246 0.02
2 Benchmark Electronics Inc 50 0.01
5 Berkshire Hills Bancorp Inc 134 0.01
8 Berry Corp 49 0.01
14 Berry Global Group Inc 966 0.09
5 Beyond Meat Inc 777 0.08
37 BGC Partners Inc 218 0.02
1 BGSF Inc 14 -
2 Big 5 Sporting Goods Corp 70 0.01
5 Big Lots Inc 306 0.03
- Biglari Holdings Inc, Class A 22 -
- Biglari Holdings Inc, Class B 69 0.01
6 Bill.com Holdings Inc 941 0.09
2 Bioceres Crop Solutions Corp 27 -
11 BioDelivery Sciences International Inc 40 -
3 BioLife Solutions Inc 116 0.01
8 BioMarin Pharmaceutical Inc 636 0.06
Shares (000's)
Value(000's)
USD
% of NetAssetValue
Common Stock (continued)
United States - 61.43% (continued)
2 Bio-Techne Corp 832 0.08
2 BJ's Restaurants Inc 136 0.01
16 BJ's Wholesale Club Holdings Inc 719 0.07
8 Black Hills Corp 518 0.05
11 Black Knight Inc 797 0.08
6 Blackbaud Inc 402 0.04
5 Blackline Inc 560 0.06
10 Bloomin' Brands Inc 297 0.03
4 Blucora Inc 65 0.01
3 Blue Bird Corp 71 0.01
7 Bluebird Bio Inc 213 0.02
2 Bluegreen Vacations Holding Corp 45 -
1 BlueLinx Holdings Inc 74 0.01
3 Blueprint Medicines Corp 285 0.03
- BM Technologies Inc 6 -
6 Boingo Wireless Inc 88 0.01
4 Boise Cascade Co 248 0.02
8 BOK Financial Corp 773 0.08
2 Bonanza Creek Energy Inc 101 0.01
3 Boot Barn Holdings Inc 244 0.02
6 Booz Allen Hamilton Holding Corp 495 0.05
21 BorgWarner Inc 1,065 0.10
1 Boston Beer Co Inc 1,014 0.10
3 Boston Omaha Corp 90 0.01
12 Boston Private Financial Holdings Inc 179 0.02
5 Bottomline Technologies DE Inc 197 0.02
1 Box Inc 28 -
7 Boyd Gaming Corp 463 0.05
6 Brady Corp 347 0.03
13 Bridgebio Pharma Inc 789 0.08
3 Bridgewater Bancshares Inc 51 0.01
1 Bridgford Foods Corp 25 -
5 Bright Horizons Family Solutions Inc 636 0.06
6 Brightcove Inc 87 0.01
11 Brighthouse Financial Inc 550 0.05
11 Brightsphere Investment Group Inc 254 0.03
12 BrightView Holdings Inc 214 0.02
5 Brinker International Inc 293 0.03
5 Brink's Co 405 0.04
22 Brookdale Senior Living Inc 148 0.01
15 Brookfield Renewable Corp 635 0.06
11 Brookline Bancorp Inc 181 0.02
9 Brooks Automation Inc 956 0.09
16 Brown & Brown Inc 856 0.08
15 Bruker Corp 1,043 0.10
10 Brunswick Corp 979 0.10
2 Bryn Mawr Bank Corp 103 0.01
2 BSQUARE Corp 4 -
6 Buckle Inc 265 0.03
3 Build-A-Bear Workshop Inc 39 -
26 Builders FirstSource Inc 1,141 0.11
18 Bunge Ltd 1,591 0.16
2 Business First Bancshares Inc 48 -
11 BWX Technologies Inc 658 0.06
5 Byline Bancorp Inc 113 0.01
1 C&F Financial Corp 32 -
- Cable One Inc 757 0.07
7 Cabot Corp 457 0.05
38 Cabot Oil & Gas Corp 623 0.06
3 CACI International Inc 675 0.07
5 Cactus Inc 185 0.02
15 Cadence BanCorp 344 0.03
Global Small Companies FundPortfolio of Investments as at 31 May 2021 (continued)
Dimensional Fund Advisors Semi-Annual Report and Unaudited Financial Statements, 31 May 2021 196

Shares (000's)
Value(000's)
USD
% of NetAssetValue
Common Stock (continued)
United States - 61.43% (continued)
25 Caesars Entertainment Inc 2,659 0.26
1 CAI International Inc 56 0.01
6 CalAmp Corp 79 0.01
2 Calavo Growers Inc 146 0.01
- Caledonia Mining Corp PLC 6 -
3 Caleres Inc 86 0.01
6 California Water Service Group 363 0.04
9 Calithera Biosciences Inc 20 -
8 Calix Inc 343 0.03
12 Callaway Golf Co 432 0.04
2 Callon Petroleum Co 83 0.01
6 Cal-Maine Foods Inc 204 0.02
1 Cambridge Bancorp 89 0.01
2 Camden National Corp 103 0.01
8 Campbell Soup Co 413 0.04
4 Camping World Holdings Inc 200 0.02
12 Cannae Holdings Inc 416 0.04
4 Cantel Medical Corp 351 0.03
1 Capital Bancorp Inc 18 -
2 Capital City Bank Group Inc 63 0.01
16 Capitol Federal Financial Inc 213 0.02
11 Capri Holdings Ltd 650 0.06
4 Capstar Financial Holdings Inc 80 0.01
6 Cara Therapeutics Inc 77 0.01
4 Cardiovascular Systems Inc 170 0.02
5 Cardtronics PLC 190 0.02
4 CareDx Inc 328 0.03
11 Cargurus Inc 299 0.03
4 Carlisle Cos Inc 712 0.07
8 CarParts.com Inc 128 0.01
4 Carpenter Technology Corp 180 0.02
2 Carriage Services Inc 70 0.01
7 Carrols Restaurant Group Inc 41 -
7 Cars.com Inc 103 0.01
5 Carter's Inc 517 0.05
6 Casa Systems Inc 50 0.01
6 Casella Waste Systems Inc 386 0.04
4 Casey's General Stores Inc 823 0.08
2 Cass Information Systems Inc 85 0.01
16 Castlight Health Inc 29 -
5 Catabasis Pharmaceuticals Inc 9 -
2 Catalyst Biosciences Inc 9 -
16 Catalyst Pharmaceuticals Inc 91 0.01
10 Cathay General Bancorp 421 0.04
2 Cato Corp 29 -
1 Cavco Industries Inc 262 0.03
5 CBIZ Inc 158 0.02
7 Cboe Global Markets Inc 779 0.08
3 CBTX Inc 100 0.01
16 CDK Global Inc 859 0.08
3 CECO Environmental Corp 25 -
5 Celsius Holdings Inc 345 0.03
25 Centennial Resource Development Inc 132 0.01
48 CenterPoint Energy Inc 1,218 0.12
5 Central Garden & Pet Co (non-voting rights) 254 0.03
1 Central Garden & Pet Co (voting rights) 64 0.01
2 Central Pacific Financial Corp 59 0.01
2 Central Valley Community Bancorp 36 -
1 Centrus Energy Corp 22 -
16 Century Aluminum Co 213 0.02
1 Century Bancorp Inc 57 0.01
4 Century Communities Inc 287 0.03
Shares (000's)
Value(000's)
USD
% of NetAssetValue
Common Stock (continued)
United States - 61.43% (continued)
4 Cerence Inc 348 0.03
6 Ceridian HCM Holding Inc 564 0.06
3 CEVA Inc 133 0.01
15 CF Industries Holdings Inc 813 0.08
7 CH Robinson Worldwide Inc 696 0.07
1 Champions Oncology Inc 8 -
17 ChampionX Corp 447 0.04
3 ChannelAdvisor Corp 66 0.01
2 Charles River Laboratories International Inc 684 0.07
5 Chart Industries Inc 685 0.07
1 Chase Corp 114 0.01
5 Cheesecake Factory Inc 320 0.03
4 Chefs' Warehouse Inc 110 0.01
11 Chegg Inc 832 0.08
2 Chembio Diagnostics Inc 6 -
1 Chemed Corp 672 0.07
20 Chemours Co 709 0.07
1 Chemung Financial Corp 41 -
2 Chesapeake Utilities Corp 245 0.02
6 Chiasma Inc 23 -
11 Chico's FAS Inc 50 0.01
2 Children's Place Inc 145 0.01
7 Chimerix Inc 55 0.01
7 Choice Hotels International Inc 816 0.08
4 Churchill Downs Inc 849 0.08
2 Chuy's Holdings Inc 79 0.01
16 Ciena Corp 834 0.08
11 Cimarex Energy Co 738 0.07
3 Cimpress PLC 296 0.03
8 Cincinnati Bell Inc 126 0.01
13 Cinemark Holdings Inc 288 0.03
3 CIRCOR International Inc 125 0.01
7 Cirrus Logic Inc 546 0.05
12 CIT Group Inc 639 0.06
2 Citi Trends Inc 143 0.01
2 Citizens & Northern Corp 58 0.01
2 Citizens Community Bancorp Inc 24 -
1 Citizens Holding Co 16 -
6 Citizens Inc 29 -
2 City Holding Co 176 0.02
2 Civeo Corp 25 -
2 Civista Bancshares Inc 59 0.01
28 Clean Energy Fuels Corp 220 0.02
7 Clean Harbors Inc 636 0.06
2 Clearfield Inc 68 0.01
1 Clearwater Paper Corp 41 -
5 Clearway Energy Inc, Class A 118 0.01
10 Clearway Energy Inc, Class C 272 0.03
43 Cleveland-Cliffs Inc 868 0.09
37 Cloudera Inc 474 0.05
3 CMC Materials Inc 510 0.05
2 CNA Financial Corp 85 0.01
2 CNB Financial Corp 50 0.01
3 CNO Financial Group Inc 68 0.01
31 CNX Resources Corp 416 0.04
2 Coastal Financial Corp 48 -
1 Coca-Cola Consolidated Inc 352 0.03
- Coda Octopus Group Inc 2 -
7 Codexis Inc 137 0.01
1 Codorus Valley Bancorp Inc 24 -
30 Coeur Mining Inc 314 0.03
6 Cogent Communications Holdings Inc 430 0.04
Global Small Companies FundPortfolio of Investments as at 31 May 2021 (continued)
Dimensional Fund Advisors Semi-Annual Report and Unaudited Financial Statements, 31 May 2021 197

Shares (000's)
Value(000's)
USD
% of NetAssetValue
Common Stock (continued)
United States - 61.43% (continued)
6 Cognex Corp 516 0.05
8 Cognyte Software Ltd 198 0.02
6 Cohen & Steers Inc 424 0.04
3 Coherent Inc 785 0.08
6 Cohu Inc 205 0.02
15 Colfax Corp 652 0.06
4 Collegium Pharmaceutical Inc 91 0.01
2 Colony Bankcorp Inc 29 -
9 Columbia Banking System Inc 387 0.04
13 Columbia Financial Inc 235 0.02
8 Columbia Sportswear Co 799 0.08
3 Columbus McKinnon Corp 158 0.02
12 Comerica Inc 946 0.09
4 Comfort Systems USA Inc 352 0.03
12 Commerce Bancshares Inc 969 0.10
8 Commercial Metals Co 243 0.02
4 Commercial Vehicle Group Inc 41 -
21 CommScope Holding Co Inc 419 0.04
7 Community Bank System Inc 550 0.05
3 Community Bankers Trust Corp 24 -
1 Community Financial Corp 32 -
15 Community Health Systems Inc 218 0.02
3 Community Trust Bancorp Inc 135 0.01
1 Community West Bancshares 10 -
6 CommVault Systems Inc 425 0.04
4 Compass Minerals International Inc 304 0.03
2 Computer Programs & Systems Inc 62 0.01
1 Computer Task Group Inc 12 -
- CompX International Inc 9 -
10 comScore Inc 40 -
2 Comtech Telecommunications Corp 56 0.01
6 Concentrix Corp 975 0.10
5 Concert Pharmaceuticals Inc 19 -
22 Conduent Inc 168 0.02
7 Conformis Inc 6 -
3 CONMED Corp 431 0.04
5 ConnectOne Bancorp Inc 141 0.01
3 Conn's Inc 75 0.01
3 CONSOL Energy Inc 46 -
9 Consolidated Communications Holdings Inc 87 0.01
3 Consolidated Water Co Ltd 36 -
4 Construction Partners Inc 137 0.01
2 Consumer Portfolio Services Inc 11 -
6 Container Store Group Inc 80 0.01
12 Continental Resources Inc 384 0.04
4 Contra Zagg Inc - -
7 Cooper Tire & Rubber Co 439 0.04
2 Cooper-Standard Holdings Inc 55 0.01
4 Copa Holdings SA 305 0.03
14 Corcept Therapeutics Inc 299 0.03
5 Core Laboratories NV 209 0.02
9 CoreLogic Inc 697 0.07
6 Core-Mark Holding Co Inc 275 0.03
2 Cornerstone Building Brands Inc 33 -
6 Cornerstone OnDemand Inc 282 0.03
2 CorVel Corp 272 0.03
3 Corvus Pharmaceuticals Inc 8 -
15 Costamare Inc 159 0.02
67 Coty Inc 600 0.06
1 County Bancorp Inc 25 -
14 Covanta Holding Corp 213 0.02
2 Covenant Transportation Group Inc 41 -
Shares (000's)
Value(000's)
USD
% of NetAssetValue
Common Stock (continued)
United States - 61.43% (continued)
15 Covetrus Inc 425 0.04
3 Cowen Inc 127 0.01
- CRA International Inc 34 -
3 Cracker Barrel Old Country Store Inc 450 0.04
7 Crane Co 685 0.07
5 Crawford & Co, Class A 46 -
4 Crawford & Co, Class B 40 -
1 Credit Acceptance Corp 319 0.03
10 Cree Inc 1,044 0.10
7 CRISPR Therapeutics AG 831 0.08
8 Crocs Inc 845 0.08
6 Cross Country Healthcare Inc 96 0.01
5 Crown Holdings Inc 478 0.05
5 CryoLife Inc 136 0.01
4 CSG Systems International Inc 169 0.02
2 CSW Industrials Inc 258 0.03
5 CTS Corp 177 0.02
7 Cullen/Frost Bankers Inc 830 0.08
1 Culp Inc 23 -
2 Cumberland Pharmaceuticals Inc 6 -
3 Cumulus Media Inc 33 -
5 Curo Group Holdings Corp 83 0.01
5 Curtiss-Wright Corp 613 0.06
17 Cushman & Wakefield PLC 329 0.03
3 Customers Bancorp Inc 120 0.01
2 Cutera Inc 59 0.01
16 CVB Financial Corp 352 0.03
10 CVR Energy Inc 204 0.02
2 CyberOptics Corp 57 0.01
12 Cymabay Therapeutics Inc 49 0.01
2 CytomX Therapeutics Inc 16 -
- Daily Journal Corp 53 0.01
6 Daktronics Inc 40 -
19 Dana Inc 515 0.05
21 Darling Ingredients Inc 1,430 0.14
12 Daseke Inc 84 0.01
4 Dave & Buster's Entertainment Inc 179 0.02
10 DaVita Inc 1,233 0.12
3 Dawson Geophysical Co 8 -
3 Deckers Outdoor Corp 1,042 0.10
5 Del Taco Restaurants Inc 53 0.01
8 Delek US Holdings Inc 185 0.02
5 Deluxe Corp 218 0.02
7 Denali Therapeutics Inc 460 0.05
3 Denbury Inc 230 0.02
7 Denny's Corp 131 0.01
18 Dentsply Sirona Inc 1,211 0.12
8 Designer Brands Inc 148 0.01
66 Devon Energy Corp 1,753 0.17
12 DHI Group Inc 37 -
21 DHT Holdings Inc 137 0.01
- Diamond Hill Investment Group Inc 87 0.01
18 Diamondback Energy Inc 1,417 0.14
8 Dick's Sporting Goods Inc 800 0.08
2 Digi International Inc 47 -
10 Digital Turbine Inc 656 0.06
2 Dillard's Inc 264 0.03
5 Dime Community Bancshares Inc 167 0.02
7 Diodes Inc 495 0.05
3 DMC Global Inc 136 0.01
7 Dolby Laboratories Inc 661 0.06
5 Domtar Corp 279 0.03
Global Small Companies FundPortfolio of Investments as at 31 May 2021 (continued)
Dimensional Fund Advisors Semi-Annual Report and Unaudited Financial Statements, 31 May 2021 198

Shares (000's)
Value(000's)
USD
% of NetAssetValue
Common Stock (continued)
United States - 61.43% (continued)
13 Donaldson Co Inc 778 0.08
4 Donegal Group Inc 59 0.01
7 Donnelley Financial Solutions Inc 200 0.02
3 Dorian LPG Ltd 47 -
4 Dorman Products Inc 398 0.04
3 Douglas Dynamics Inc 118 0.01
5 Dril-Quip Inc 162 0.02
31 Dropbox Inc 841 0.08
3 DSP Group Inc 52 0.01
1 Ducommun Inc 56 0.01
1 Duluth Holdings Inc 18 -
9 Durect Corp 14 -
24 DXC Technology Co 915 0.09
2 DXP Enterprises Inc 75 0.01
4 Dycom Industries Inc 320 0.03
20 Dynatrace Inc 1,043 0.10
3 DZS Inc 52 0.01
4 Eagle Bancorp Inc 225 0.02
1 Eagle Bancorp Montana Inc 28 -
1 Eagle Bulk Shipping Inc 50 0.01
5 Eagle Materials Inc 742 0.07
2 Eagle Pharmaceuticals Inc 64 0.01
5 Earthstone Energy Inc 47 -
20 East West Bancorp Inc 1,485 0.15
1 Eastern Co 25 -
3 Eastman Chemical Co 316 0.03
3 Ebix Inc 92 0.01
3 Echo Global Logistics Inc 86 0.01
6 EchoStar Corp 155 0.02
7 Edgewell Personal Care Co 322 0.03
5 Editas Medicine Inc 165 0.02
4 eGain Corp 44 -
3 eHealth Inc 197 0.02
4 Eiger BioPharmaceuticals Inc 33 -
4 El Pollo Loco Holdings Inc 61 0.01
5 Elanco Animal Health Inc (non-voting rights) - -
31 Elanco Animal Health Inc (voting rights) 1,123 0.11
7 Elastic NV 879 0.09
1 Electromed Inc 12 -
30 Element Solutions Inc 698 0.07
5 Elevate Credit Inc 18 -
6 elf Beauty Inc 160 0.02
4 Eloxx Pharmaceuticals Inc 6 -
7 EMCOR Group Inc 848 0.08
4 EMCORE Corp 36 -
8 Emerald Holding Inc 44 -
6 Emergent BioSolutions Inc 376 0.04
4 Employers Holdings Inc 176 0.02
3 Enanta Pharmaceuticals Inc 130 0.01
9 Encompass Health Corp 794 0.08
3 Encore Capital Group Inc 159 0.02
2 Encore Wire Corp 130 0.01
26 Endo International PLC 151 0.02
8 Energizer Holdings Inc 365 0.04
8 Energy Recovery Inc 159 0.02
7 Enerpac Tool Group Corp 183 0.02
5 EnerSys 493 0.05
1 Eneti Inc 20 -
52 EnLink Midstream LLC 255 0.03
2 Ennis Inc 44 -
3 Enochian Biosciences Inc 10 -
5 Enova International Inc 188 0.02
Shares (000's)
Value(000's)
USD
% of NetAssetValue
Common Stock (continued)
United States - 61.43% (continued)
3 EnPro Industries Inc 284 0.03
7 Ensign Group Inc 546 0.05
2 Enstar Group Ltd 576 0.06
13 Entegris Inc 1,467 0.14
2 Enterprise Bancorp Inc 59 0.01
4 Enterprise Financial Services Corp 213 0.02
7 Entravision Communications Corp 31 -
2 Envela Corp 8 -
6 Envestnet Inc 432 0.04
20 Envista Holdings Corp 884 0.09
8 Enzo Biochem Inc 24 -
9 Epizyme Inc 72 0.01
2 ePlus Inc 158 0.02
1 Epsilon Energy Ltd 6 -
34 EQT Corp 701 0.07
44 Equitrans Midstream Corp 360 0.04
2 Equity Bancshares Inc 64 0.01
4 Erie Indemnity Co 813 0.08
3 Escalade Inc 75 0.01
3 ESCO Technologies Inc 310 0.03
1 Esquire Financial Holdings Inc 30 -
2 ESSA Bancorp Inc 25 -
11 Essent Group Ltd 543 0.05
19 Essential Utilities Inc 928 0.09
4 Ethan Allen Interiors Inc 110 0.01
5 Euronet Worldwide Inc 698 0.07
1 Evans Bancorp Inc 37 -
3 Eventbrite Inc 62 0.01
3 Everbridge Inc 405 0.04
5 Evercore Inc 748 0.07
3 Everest Re Group Ltd 871 0.09
19 Evergy Inc 1,196 0.12
11 Everi Holdings Inc 218 0.02
1 Everspin Technologies Inc 6 -
8 Evertec Inc 350 0.03
- EVI Industries Inc 9 -
6 Evo Payments Inc 167 0.02
15 Evolent Health Inc 285 0.03
4 Evolution Petroleum Corp 15 -
14 Evoqua Water Technologies Corp 434 0.04
8 EW Scripps Co 164 0.02
29 Exelixis Inc 658 0.06
4 ExlService Holdings Inc 417 0.04
8 eXp World Holdings Inc 270 0.03
6 Exponent Inc 538 0.05
22 Extended Stay America Inc 428 0.04
3 Exterran Corp 15 -
6 EZCORP Inc 45 -
5 F5 Networks Inc 893 0.09
4 Fabrinet 402 0.04
2 FactSet Research Systems Inc 679 0.07
1 Fair Isaac Corp 698 0.07
3 Farmer Brothers Co 34 -
2 Farmers & Merchants Bancorp Inc 34 -
4 Farmers National Banc Corp 67 0.01
2 FARO Technologies Inc 176 0.02
9 Fate Therapeutics Inc 665 0.07
6 FB Financial Corp 244 0.02
1 Federal Agricultural Mortgage Corp 139 0.01
8 Federal Signal Corp 334 0.03
12 Federated Investors Inc 372 0.04
4 FedNat Holding Co 17 -
Global Small Companies FundPortfolio of Investments as at 31 May 2021 (continued)
Dimensional Fund Advisors Semi-Annual Report and Unaudited Financial Statements, 31 May 2021 199

Shares (000's)
Value(000's)
USD
% of NetAssetValue
Common Stock (continued)
United States - 61.43% (continued)
10 Ferro Corp 227 0.02
16 Ferroglobe PLC 82 0.01
7 Ferroglobe Representation & Warrants InsuranceTrust - -
7 FibroGen Inc 145 0.01
- Fidelity D&D Bancorp Inc 27 -
23 Fidelity National Financial Inc 1,097 0.11
4 Fiesta Restaurant Group Inc 50 0.01
1 Financial Institutions Inc 44 -
27 FireEye Inc 600 0.06
13 First American Financial Corp 849 0.08
4 First Bancorp 181 0.02
23 First Bancorp (Puerto Rico listing) 292 0.03
2 First Bancorp Inc 49 0.01
3 First Bancshares Inc 111 0.01
4 First Bank 48 -
7 First Busey Corp 189 0.02
2 First Business Financial Services Inc 49 0.01
- First Capital Inc 13 -
2 First Choice Bancorp 66 0.01
1 First Citizens BancShares Inc 982 0.10
11 First Commonwealth Financial Corp 174 0.02
2 First Community Bankshares Inc 51 0.01
1 First Community Corp 21 -
13 First Financial Bancorp 322 0.03
17 First Financial Bankshares Inc 853 0.08
2 First Financial Corp 69 0.01
1 First Financial Northwest Inc 19 -
6 First Foundation Inc 153 0.02
2 First Guaranty Bancshares Inc 41 -
16 First Hawaiian Inc 441 0.04
63 First Horizon National Corp 1,194 0.12
1 First Internet Bancorp 41 -
5 First Interstate BancSystem Inc 242 0.02
8 First Merchants Corp 367 0.04
3 First Mid Bancshares Inc 112 0.01
13 First Midwest Bancorp Inc 275 0.03
3 First Northwest Bancorp 45 -
3 First of Long Island Corp 78 0.01
- First Savings Financial Group Inc 22 -
12 First Solar Inc 898 0.09
1 First United Corp 22 -
1 First Western Financial Inc 37 -
5 FirstCash Inc 395 0.04
6 Five Below Inc 1,023 0.10
12 Five Point Holdings LLC 95 0.01
6 Five Star Senior Living Inc 36 -
6 Five9 Inc 997 0.10
7 Flagstar Bancorp Inc 315 0.03
56 Flex Ltd 1,025 0.10
1 Flexsteel Industries Inc 59 0.01
10 Floor & Decor Holdings Inc 1,015 0.10
23 Flowers Foods Inc 555 0.05
13 Flowserve Corp 567 0.06
6 Fluent Inc 19 -
9 Fluidigm Corp 49 0.01
14 Fluor Corp 264 0.03
4 Flushing Financial Corp 93 0.01
42 FNB Corp 566 0.06
1 FONAR Corp 16 -
13 Foot Locker Inc 800 0.08
7 Forestar Group Inc 157 0.02
Shares (000's)
Value(000's)
USD
% of NetAssetValue
Common Stock (continued)
United States - 61.43% (continued)
10 FormFactor Inc 352 0.03
2 Forrester Research Inc 90 0.01
11 Forterra Inc 247 0.02
2 Fortitude Gold Corp 20 -
5 Fortune Brands Home & Security Inc 510 0.05
1 Forum Energy Technologies Inc 14 -
4 Forward Air Corp 378 0.04
5 Fossil Group Inc 74 0.01
5 Fox Factory Holding Corp 748 0.07
2 Franklin Covey Co 58 0.01
5 Franklin Electric Co Inc 455 0.04
1 Franklin Financial Services Corp 22 -
43 Franklin Resources Inc 1,462 0.14
27 Frank's International NV 90 0.01
1 FreightCar America Inc 6 -
1 Frequency Electronics Inc 8 -
4 Fresh Del Monte Produce Inc 127 0.01
5 Freshpet Inc 814 0.08
11 Frontdoor Inc 573 0.06
1 FRP Holdings Inc 78 0.01
1 FS Bancorp Inc 42 -
5 FTI Consulting Inc 621 0.06
19 FuelCell Energy Inc 184 0.02
2 Fulgent Genetics Inc 146 0.01
7 Full House Resorts Inc 79 0.01
22 Fulton Financial Corp 386 0.04
1 Funko Inc 30 -
6 FutureFuel Corp 59 0.01
2 FVCBankcorp Inc 29 -
5 G1 Therapeutics Inc 98 0.01
3 Gaia Inc 37 -
1 GAMCO Investors Inc 31 -
12 Gannett Co Inc 61 0.01
32 Gap Inc 1,070 0.10
9 GasLog Ltd 53 0.01
20 Gates Industrial Corp PLC 365 0.04
3 GATX Corp 270 0.03
9 GCP Applied Technologies Inc 225 0.02
4 Genasys Inc 22 -
6 Genco Shipping & Trading Ltd 88 0.01
2 Gencor Industries Inc 23 -
2 Genesco Inc 105 0.01
3 Genie Energy Ltd 19 -
16 Genpact Ltd 752 0.07
22 Gentex Corp 775 0.08
4 Gentherm Inc 306 0.03
32 Genworth Financial Inc 134 0.01
2 Geospace Technologies Corp 16 -
3 German American Bancorp Inc 122 0.01
4 Gibraltar Industries Inc 352 0.03
4 G-III Apparel Group Ltd 132 0.01
12 Glacier Bancorp Inc 696 0.07
3 Glatfelter Corp 49 0.01
1 Glaukos Corp 68 0.01
5 Global Blood Therapeutics Inc 193 0.02
1 Global Indemnity Group LLC 42 -
3 Global Water Resources Inc 59 0.01
4 Globant SA 869 0.09
9 Globe Life Inc 973 0.10
8 Globus Medical Inc 578 0.06
9 GlycoMimetics Inc 23 -
6 GMS Inc 263 0.03
Global Small Companies FundPortfolio of Investments as at 31 May 2021 (continued)
Dimensional Fund Advisors Semi-Annual Report and Unaudited Financial Statements, 31 May 2021 200

Shares (000's)
Value(000's)
USD
% of NetAssetValue
Common Stock (continued)
United States - 61.43% (continued)
10 GoDaddy Inc 787 0.08
8 Gold Resource Corp 23 -
2 Goodrich Petroleum Corp 19 -
27 Goodyear Tire & Rubber Co 542 0.05
10 GoPro Inc 116 0.01
4 Gorman-Rupp Co 134 0.01
3 GP Strategies Corp 48 -
14 Graco Inc 1,041 0.10
24 GrafTech International Ltd 319 0.03
2 Graham Corp 25 -
1 Graham Holdings Co 339 0.03
5 Grand Canyon Education Inc 488 0.05
6 Granite Construction Inc 237 0.02
33 Graphic Packaging Holding Co 588 0.06
9 Gray Television Inc 210 0.02
2 Great Elm Group Inc 4 -
9 Great Lakes Dredge & Dock Corp 131 0.01
2 Great Southern Bancorp Inc 100 0.01
6 Great Western Bancorp Inc 214 0.02
8 Green Brick Partners Inc 197 0.02
7 Green Dot Corp 276 0.03
4 Green Plains Inc 113 0.01
3 Greenbrier Cos Inc 148 0.01
1 Greene County Bancorp Inc 29 -
2 Greenhill & Co Inc 38 -
5 Greenlight Capital Re Ltd 48 0.01
4 GreenSky Inc 23 -
3 Greif Inc (non-voting rights) 191 0.02
2 Greif Inc (voting rights) 103 0.01
4 Griffon Corp 106 0.01
5 Gritstone Oncology Inc 48 -
8 Grocery Outlet Holding Corp 268 0.03
2 Group 1 Automotive Inc 308 0.03
3 Groupon Inc 124 0.01
10 Grubhub Inc 587 0.06
4 GSI Technology Inc 23 -
6 GTT Communications Inc 8 -
2 GTY Technology Holdings Inc 12 -
2 Guaranty Bancshares Inc 75 0.01
- Guaranty Federal Bancshares Inc 12 -
6 Guardant Health Inc 765 0.08
9 Guess? Inc 260 0.03
7 Guidewire Software Inc 684 0.07
2 Gulf Island Fabrication Inc 9 -
5 H&E Equipment Services Inc 170 0.02
24 H&R Block Inc 594 0.06
4 Hackett Group Inc 79 0.01
5 Haemonetics Corp 303 0.03
13 Hain Celestial Group Inc 519 0.05
2 Hallmark Financial Services Inc 11 -
13 Halozyme Therapeutics Inc 519 0.05
1 Hamilton Beach Brands Holding Co 25 -
3 Hamilton Lane Inc 303 0.03
10 Hancock Whitney Corp 494 0.05
35 Hanesbrands Inc 689 0.07
5 Hanger Inc 124 0.01
3 Hanmi Financial Corp 64 0.01
4 Hanover Insurance Group Inc 623 0.06
7 HarborOne Bancorp Inc 102 0.01
17 Harley-Davidson Inc 805 0.08
14 Harmonic Inc 99 0.01
3 Harpoon Therapeutics Inc 70 0.01
Shares (000's)
Value(000's)
USD
% of NetAssetValue
Common Stock (continued)
United States - 61.43% (continued)
5 Harrow Health Inc 48 -
8 Harsco Corp 177 0.02
5 Harvard Bioscience Inc 38 -
9 Hasbro Inc 872 0.09
3 Haverty Furniture Cos Inc 147 0.01
12 Hawaiian Electric Industries Inc 512 0.05
5 Hawaiian Holdings Inc 137 0.01
3 Hawkins Inc 98 0.01
1 Hawthorn Bancshares Inc 34 -
1 Haynes International Inc 31 -
6 HB Fuller Co 436 0.04
1 HCI Group Inc 91 0.01
1 Health Catalyst Inc 79 0.01
8 Healthcare Services Group Inc 250 0.02
6 HealthEquity Inc 487 0.05
4 HealthStream Inc 106 0.01
10 Heartland Express Inc 189 0.02
5 Heartland Financial USA Inc 238 0.02
71 Hecla Mining Co 635 0.06
3 Heidrick & Struggles International Inc 120 0.01
3 Helen of Troy Ltd 587 0.06
4 Helios Technologies Inc 282 0.03
12 Helix Energy Solutions Group Inc 63 0.01
12 Helmerich & Payne Inc 337 0.03
3 Hemisphere Media Group Inc 32 -
1 Hennessy Advisors Inc 12 -
12 Henry Schein Inc 893 0.09
16 Herbalife Nutrition Ltd 818 0.08
3 Herc Holdings Inc 397 0.04
8 Heritage Commerce Corp 98 0.01
4 Heritage Financial Corp 130 0.01
5 Heritage Insurance Holdings Inc 38 -
3 Heritage-Crystal Clean Inc 93 0.01
7 Herman Miller Inc 327 0.03
10 Heron Therapeutics Inc 139 0.01
1 Heska Corp 210 0.02
8 Hexcel Corp 496 0.05
2 Hibbett Sports Inc 193 0.02
9 Hill International Inc 24 -
7 Hill-Rom Holdings Inc 725 0.07
9 Hilltop Holdings Inc 350 0.03
10 Hilton Grand Vacations Inc 435 0.04
- Hingham Institution for Savings 83 0.01
1 HMN Financial Inc 10 -
6 HNI Corp 261 0.03
17 HollyFrontier Corp 561 0.06
1 Home Bancorp Inc 54 0.01
21 Home BancShares Inc 586 0.06
2 HomeStreet Inc 101 0.01
2 HomeTrust Bancshares Inc 61 0.01
1 Hooker Furniture Corp 27 -
14 Hope Bancorp Inc 219 0.02
5 Horace Mann Educators Corp 212 0.02
6 Horizon Bancorp Inc 112 0.01
17 Hostess Brands Inc 267 0.03
15 Houghton Mifflin Harcourt Co 151 0.02
6 Houlihan Lokey Inc 420 0.04
2 Houston Wire & Cable Co 12 -
3 Howard Bancorp Inc 51 0.01
5 Howard Hughes Corp 499 0.05
34 Howmet Aerospace Inc 1,214 0.12
3 Hub Group Inc 217 0.02
Global Small Companies FundPortfolio of Investments as at 31 May 2021 (continued)
Dimensional Fund Advisors Semi-Annual Report and Unaudited Financial Statements, 31 May 2021 201

Shares (000's)
Value(000's)
USD
% of NetAssetValue
Common Stock (continued)
United States - 61.43% (continued)
5 Hubbell Inc 950 0.09
37 Huntington Bancshares Inc 580 0.06
3 Huntington Ingalls Industries Inc 691 0.07
25 Huntsman Corp 701 0.07
1 Hurco Cos Inc 22 -
3 Huron Consulting Group Inc 171 0.02
3 Hyatt Hotels Corp 244 0.02
2 Hyster-Yale Materials Handling Inc 120 0.01
2 I3 Verticals Inc 57 0.01
15 IAA Inc 882 0.09
3 ICF International Inc 241 0.02
3 Ichor Holdings Ltd 180 0.02
3 ICU Medical Inc 545 0.05
6 IDACORP Inc 560 0.06
2 Identiv Inc 32 -
4 IDT Corp 123 0.01
2 IEC Electronics Corp 22 -
2 IES Holdings Inc 131 0.01
3 iHeartMedia Inc 59 0.01
8 II-VI Inc 550 0.05
8 IMAX Corp 162 0.02
4 Immersion Corp 32 -
6 ImmunityBio Inc 104 0.01
3 Impinj Inc 155 0.02
- Independence Contract Drilling Inc 1 -
2 Independence Holding Co 92 0.01
4 Independent Bank Corp (Massachusetts) 345 0.03
2 Independent Bank Corp (Michigan) 49 0.01
5 Independent Bank Group Inc 414 0.04
21 Infinera Corp 205 0.02
7 Information Services Group Inc 41 -
2 InfuSystem Holdings Inc 35 -
5 Ingevity Corp 371 0.04
1 Ingles Markets Inc 86 0.01
7 Ingredion Inc 667 0.07
3 Innospec Inc 312 0.03
3 Innovative Solutions & Support Inc 17 -
13 Innoviva Inc 176 0.02
3 Inogen Inc 176 0.02
8 Inovalon Holdings Inc 266 0.03
4 Insight Enterprises Inc 445 0.04
5 Insperity Inc 456 0.04
4 Installed Building Products Inc 433 0.04
3 Insteel Industries Inc 104 0.01
4 Integer Holdings Corp 367 0.04
9 Integra LifeSciences Holdings Corp 643 0.06
6 Intellia Therapeutics Inc 478 0.05
3 Inter Parfums Inc 261 0.03
4 InterDigital Inc 310 0.03
8 Interface Inc 125 0.01
7 International Bancshares Corp 347 0.03
21 International Game Technology PLC 521 0.05
4 International Seaways Inc 77 0.01
32 Interpublic Group of Cos Inc 1,062 0.10
3 Intersect ENT Inc 56 0.01
3 Intevac Inc 22 -
4 Intra-Cellular Therapies Inc 149 0.01
2 Intrepid Potash Inc 54 0.01
2 IntriCon Corp 37 -
3 Invacare Corp 24 -
39 Invesco Ltd 1,117 0.11
2 Investar Holding Corp 37 -
Shares (000's)
Value(000's)
USD
% of NetAssetValue
Common Stock (continued)
United States - 61.43% (continued)
32 Investors Bancorp Inc 474 0.05
- Investors Title Co 46 -
4 Ionis Pharmaceuticals Inc 159 0.02
13 Iovance Biotherapeutics Inc 232 0.02
4 IPG Photonics Corp 906 0.09
2 iRadimed Corp 49 0.01
2 iRhythm Technologies Inc 187 0.02
16 Iridium Communications Inc 607 0.06
3 iRobot Corp 291 0.03
21 Ironwood Pharmaceuticals Inc 242 0.02
5 Iteris Inc 39 -
5 Itron Inc 468 0.05
10 ITT Inc 963 0.09
6 IVERIC bio Inc 42 -
3 J Alexander's Holdings Inc 38 -
2 J&J Snack Foods Corp 418 0.04
6 j2 Global Inc 700 0.07
17 Jabil Inc 960 0.09
3 Jack Henry & Associates Inc 496 0.05
3 Jack in the Box Inc 353 0.03
4 James River Group Holdings Ltd 150 0.01
22 Janus Henderson Group PLC 854 0.08
5 Jazz Pharmaceuticals PLC 866 0.09
36 Jefferies Financial Group Inc 1,167 0.11
12 JELD-WEN Holding Inc 349 0.03
34 JetBlue Airways Corp 686 0.07
9 JM Smucker Co 1,238 0.12
1 John B Sanfilippo & Son Inc 102 0.01
4 John Bean Technologies Corp 530 0.05
6 John Wiley & Sons Inc, Class A 371 0.04
- John Wiley & Sons Inc, Class B 13 -
1 Johnson Outdoors Inc 160 0.02
3 Joint Corp 185 0.02
5 Jones Lang LaSalle Inc 1,003 0.10
5 Jounce Therapeutics Inc 41 -
24 Juniper Networks Inc 634 0.06
2 Kadant Inc 254 0.03
2 Kaiser Aluminum Corp 215 0.02
1 Kala Pharmaceuticals Inc 3 -
16 KAR Auction Services Inc 278 0.03
- Karuna Therapeutics Inc 30 -
11 KB Home 507 0.05
17 KBR Inc 701 0.07
10 Kearny Financial Corp 129 0.01
3 Kelly Services Inc 65 0.01
8 Kemper Corp 602 0.06
11 Kennametal Inc 400 0.04
17 Kennedy-Wilson Holdings Inc 346 0.03
2 Key Tronic Corp 13 -
3 Kforce Inc 167 0.02
2 Kimball Electronics Inc 49 0.01
5 Kimball International Inc 62 0.01
6 Kindred Biosciences Inc 27 -
1 Kingstone Cos Inc 10 -
3 Kiniksa Pharmaceuticals Ltd 46 -
3 Kinsale Capital Group Inc 445 0.04
7 Kirby Corp 440 0.04
19 Knight-Swift Transportation Holdings Inc 928 0.09
6 Knoll Inc 169 0.02
12 Knowles Corp 243 0.02
10 Kohl's Corp 577 0.06
6 Kontoor Brands Inc 386 0.04
Global Small Companies FundPortfolio of Investments as at 31 May 2021 (continued)
Dimensional Fund Advisors Semi-Annual Report and Unaudited Financial Statements, 31 May 2021 202

Shares (000's)
Value(000's)
USD
% of NetAssetValue
Common Stock (continued)
United States - 61.43% (continued)
3 Koppers Holdings Inc 89 0.01
7 Korn Ferry 455 0.04
48 Kosmos Energy Ltd 154 0.02
3 Kraton Corp 106 0.01
13 Kratos Defense & Security Solutions Inc 318 0.03
10 Kronos Worldwide Inc 158 0.02
2 Krystal Biotech Inc 130 0.01
7 Kulicke & Soffa Industries Inc 385 0.04
6 Kura Oncology Inc 128 0.01
2 KVH Industries Inc 35 -
17 L Brands Inc 1,197 0.12
7 Lakeland Bancorp Inc 141 0.01
3 Lakeland Financial Corp 183 0.02
1 Lakeland Industries Inc 33 -
14 Lamb Weston Holdings Inc 1,124 0.11
3 Lancaster Colony Corp 538 0.05
3 Landec Corp 36 -
- Landmark Bancorp Inc 12 -
5 Lands' End Inc 119 0.01
4 Landstar System Inc 737 0.07
8 Lannett Co Inc 32 -
5 Lantheus Holdings Inc 130 0.01
4 Lantronix Inc 21 -
2 Laredo Petroleum Inc 93 0.01
16 Lattice Semiconductor Corp 829 0.08
14 Laureate Education Inc 211 0.02
1 Lawson Products Inc 70 0.01
13 Lazard Ltd 595 0.06
7 La-Z-Boy Inc 275 0.03
2 LB Foster Co 38 -
3 LCI Industries 455 0.04
2 LCNB Corp 34 -
1 Leaf Group Ltd 9 -
5 Lear Corp 978 0.10
14 Leggett & Platt Inc 764 0.08
3 Leidos Holdings Inc 261 0.03
3 LeMaitre Vascular Inc 129 0.01
13 LendingClub Corp 198 0.02
1 LendingTree Inc 304 0.03
3 Lennox International Inc 1,137 0.11
1 LENSAR Inc 8 -
2 Level One Bancorp Inc 42 -
4 Levi Strauss & Co 119 0.01
3 LGI Homes Inc 583 0.06
4 LHC Group Inc 696 0.07
6 Liberty Latin America Ltd, Class A 85 0.01
21 Liberty Latin America Ltd, Class C 303 0.03
1 Liberty Media Corp-Liberty Braves, Class A 39 -
5 Liberty Media Corp-Liberty Braves, Class C 128 0.01
3 Liberty Media Corp-Liberty Formula One, Class A 103 0.01
21 Liberty Media Corp-Liberty Formula One, Class C 926 0.09
10 Liberty Oilfield Services Inc 151 0.02
8 Liberty TripAdvisor Holdings Inc 37 -
4 Lifetime Brands Inc 57 0.01
2 Lifevantage Corp 20 -
1 Lifeway Foods Inc 4 -
2 Ligand Pharmaceuticals Inc 242 0.02
18 Limelight Networks Inc 55 0.01
1 Limestone Bancorp Inc 11 -
2 Limoneira Co 42 -
3 Lincoln Educational Services Corp 23 -
6 Lincoln Electric Holdings Inc 829 0.08
Shares (000's)
Value(000's)
USD
% of NetAssetValue
Common Stock (continued)
United States - 61.43% (continued)
16 Lincoln National Corp 1,130 0.11
7 Lindblad Expeditions Holdings Inc 112 0.01
1 Lindsay Corp 229 0.02
9 Lions Gate Entertainment Corp, Class A 179 0.02
18 Lions Gate Entertainment Corp, Class B 311 0.03
3 LiqTech International Inc 20 -
6 Liquidity Services Inc 145 0.01
3 Lithia Motors Inc 987 0.10
3 Littelfuse Inc 742 0.07
6 LivaNova PLC 467 0.05
7 Live Oak Bancshares Inc 405 0.04
21 Livent Corp 415 0.04
8 LiveRamp Holdings Inc 416 0.04
25 LKQ Corp 1,289 0.13
11 Loews Corp 619 0.06
2 Loral Space & Communications Inc 92 0.01
13 Louisiana-Pacific Corp 907 0.09
- LoveSac Co 34 -
8 LPL Financial Holdings Inc 1,256 0.12
4 LSB Industries Inc 23 -
7 LSI Industries Inc 63 0.01
2 Luby's Inc 6 -
2 Lumber Liquidators Holdings Inc 36 -
45 Lumen Technologies Inc 628 0.06
8 Lumentum Holdings Inc 674 0.07
6 Luminex Corp 206 0.02
5 Luna Innovations Inc 47 -
6 Luther Burbank Corp 71 0.01
2 Lydall Inc 68 0.01
3 M/I Homes Inc 178 0.02
5 Macatawa Bank Corp 44 -
1 Mackinac Financial Corp 28 -
7 MACOM Technology Solutions Holdings Inc 413 0.04
11 Macquarie Infrastructure Corp 389 0.04
5 MacroGenics Inc 153 0.02
25 Macy's Inc 465 0.05
2 Madison Square Garden Entertainment Corp 173 0.02
2 Madrigal Pharmaceuticals Inc 216 0.02
3 Magellan Health Inc 286 0.03
7 Magenta Therapeutics Inc 85 0.01
5 MagnaChip Semiconductor Corp 116 0.01
4 Magnite Inc 132 0.01
12 Magnolia Oil & Gas Corp 153 0.02
6 Maiden Holdings Ltd 21 -
1 MainStreet Bancshares Inc 21 -
3 Malibu Boats Inc 212 0.02
2 Malvern Bancorp Inc 29 -
- Mammoth Energy Services Inc 2 -
7 Manhattan Associates Inc 954 0.09
2 Manitex International Inc 17 -
6 Manitowoc Co Inc 144 0.01
7 ManpowerGroup Inc 791 0.08
4 ManTech International Corp 308 0.03
73 Marathon Oil Corp 884 0.09
9 Marchex Inc 22 -
5 Marcus & Millichap Inc 200 0.02
3 Marcus Corp 60 0.01
3 Marine Products Corp 52 0.01
4 MarineMax Inc 203 0.02
1 Marinus Pharmaceuticals Inc 25 -
1 Marlin Business Services Corp 31 -
5 Marriott Vacations Worldwide Corp 862 0.08
Global Small Companies FundPortfolio of Investments as at 31 May 2021 (continued)
Dimensional Fund Advisors Semi-Annual Report and Unaudited Financial Statements, 31 May 2021 203

Shares (000's)
Value(000's)
USD
% of NetAssetValue
Common Stock (continued)
United States - 61.43% (continued)
8 Marten Transport Ltd 139 0.01
11 Marvell Technology Inc 541 0.05
2 Masimo Corp 480 0.05
3 Masonite International Corp 368 0.04
8 MasTec Inc 912 0.09
1 Mastech Digital Inc 10 -
2 MasterCraft Boat Holdings Inc 63 0.01
14 Matador Resources Co 432 0.04
2 Materion Corp 177 0.02
4 Matrix Service Co 44 -
6 Matson Inc 394 0.04
41 Mattel Inc 872 0.09
4 Matthews International Corp 144 0.01
3 Maui Land & Pineapple Co Inc 29 -
3 Maxar Technologies Inc (Canada listing) 108 0.01
7 Maxar Technologies Inc (US listing) 210 0.02
7 MAXIMUS Inc 629 0.06
8 MaxLinear Inc 302 0.03
15 MBIA Inc 145 0.01
21 McEwen Mining Inc 31 -
3 McGrath RentCorp 258 0.03
5 MDC Holdings Inc 279 0.03
23 MDU Resources Group Inc 776 0.08
13 Media General Inc CVR 1 -
3 MediciNova Inc 14 -
1 Medifast Inc 391 0.04
10 MEDNAX Inc 329 0.03
4 Medpace Holdings Inc 711 0.07
1 MeiraGTx Holdings PLC 9 -
2 Mercantile Bank Corp 73 0.01
10 Mercer International Inc 143 0.01
4 Merchants Bancorp 184 0.02
7 Mercury General Corp 462 0.05
6 Mercury Systems Inc 401 0.04
5 Meredith Corp 181 0.02
7 Meridian Bancorp Inc 149 0.01
5 Meridian Bioscience Inc 107 0.01
1 Meridian Corp 19 -
7 Merit Medical Systems Inc 430 0.04
3 Meritage Homes Corp 314 0.03
9 Meritor Inc 232 0.02
9 Mersana Therapeutics Inc 131 0.01
5 Mesa Air Group Inc 50 0.01
5 Meta Financial Group Inc 253 0.03
5 Methode Electronics Inc 240 0.02
1 Metropolitan Bank Holding Corp 68 0.01
4 MGE Energy Inc 323 0.03
30 MGIC Investment Corp 435 0.04
2 MGP Ingredients Inc 159 0.02
1 MicroStrategy Inc 475 0.05
1 Mid Penn Bancorp Inc 32 -
6 Middleby Corp 938 0.09
1 Middlefield Banc Corp 22 -
2 Middlesex Water Co 200 0.02
3 Midland States Bancorp Inc 93 0.01
2 MidWestOne Financial Group Inc 52 0.01
1 Miller Industries Inc 44 -
7 Mimecast Ltd 365 0.04
4 Minerals Technologies Inc 370 0.04
5 Minerva Neurosciences Inc 14 -
4 Mirati Therapeutics Inc 698 0.07
3 Mistras Group Inc 33 -
Shares (000's)
Value(000's)
USD
% of NetAssetValue
Common Stock (continued)
United States - 61.43% (continued)
6 Mitek Systems Inc 98 0.01
6 MKS Instruments Inc 1,075 0.11
1 MMA Capital Holdings Inc 35 -
6 Modine Manufacturing Co 97 0.01
2 ModivCare Inc 235 0.02
7 Moelis & Co 363 0.04
7 Mohawk Industries Inc 1,382 0.14
2 Molina Healthcare Inc 507 0.05
18 Molson Coors Brewing Co 1,070 0.10
2 Monarch Casino & Resort Inc 151 0.02
2 MoneyGram International Inc 19 -
4 Monro Inc 253 0.03
4 Moog Inc 318 0.03
4 Morningstar Inc 974 0.10
36 Mosaic Co 1,298 0.13
2 Motorcar Parts of America Inc 42 -
1 Movado Group Inc 36 -
14 Mr Cooper Group Inc 475 0.05
10 MRC Global Inc 105 0.01
4 MSA Safety Inc 693 0.07
5 MSC Industrial Direct Co Inc 501 0.05
6 MSG Networks Inc 98 0.01
7 Mueller Industries Inc 321 0.03
18 Mueller Water Products Inc 265 0.03
19 Murphy Oil Corp 410 0.04
4 Murphy USA Inc 474 0.05
2 MVB Financial Corp 72 0.01
4 Myers Industries Inc 95 0.01
1 MYR Group Inc 108 0.01
9 Myriad Genetics Inc 254 0.03
1 Nabors Industries Ltd 62 0.01
1 Nabriva Therapeutics PLC 1 -
- NACCO Industries Inc 13 -
- NanoString Technologies Inc 15 -
2 Napco Security Technologies Inc 74 0.01
8 Natera Inc 715 0.07
1 Nathan's Famous Inc 47 -
4 National Bank Holdings Corp 154 0.02
1 National Bankshares Inc 32 -
5 National Beverage Corp 273 0.03
9 National CineMedia Inc 43 -
11 National Fuel Gas Co 592 0.06
2 National HealthCare Corp 151 0.02
14 National Instruments Corp 573 0.06
3 National Research Corp 144 0.01
10 National Vision Holdings Inc 491 0.05
- National Western Life Group Inc 85 0.01
2 Natural Gas Services Group Inc 16 -
3 Natural Grocers by Vitamin Cottage Inc 36 -
1 Natural Health Trends Corp 8 -
3 Nature's Sunshine Products Inc 56 0.01
5 Natus Medical Inc 122 0.01
3 Nautilus Inc 48 -
27 Navient Corp 489 0.05
5 Navistar International Corp 206 0.02
6 NBT Bancorp Inc 222 0.02
15 NCR Corp 722 0.07
2 Neenah Inc 123 0.01
20 Nektar Therapeutics 370 0.04
2 Nelnet Inc 178 0.02
6 Neogen Corp 571 0.06
13 NeoGenomics Inc 519 0.05
Global Small Companies FundPortfolio of Investments as at 31 May 2021 (continued)
Dimensional Fund Advisors Semi-Annual Report and Unaudited Financial Statements, 31 May 2021 204

Shares (000's)
Value(000's)
USD
% of NetAssetValue
Common Stock (continued)
United States - 61.43% (continued)
6 NeoPhotonics Corp 62 0.01
11 NetApp Inc 840 0.08
4 NETGEAR Inc 164 0.02
9 NetScout Systems Inc 264 0.03
7 Neurocrine Biosciences Inc 689 0.07
3 Nevro Corp 443 0.04
16 New Fortress Energy Inc 667 0.07
2 New Home Co Inc 12 -
12 New Jersey Resources Corp 527 0.05
7 New Relic Inc 414 0.04
52 New York Community Bancorp Inc 628 0.06
18 New York Times Co 754 0.07
6 NewAge Inc 15 -
47 Newell Brands Inc 1,342 0.13
17 Newmark Group Inc 217 0.02
1 NewMarket Corp 391 0.04
8 Newpark Resources Inc 26 -
40 News Corp, Class A 1,076 0.11
6 News Corp, Class B 148 0.01
5 NewStar Financial Inc CVR - -
12 Nexa Resources SA 133 0.01
5 Nexstar Media Group Inc 700 0.07
5 NextDecade Corp 10 -
8 NextGen Healthcare Inc 139 0.01
27 NexTier Oilfield Solutions Inc 113 0.01
1 NGM Biopharmaceuticals Inc 21 -
3 NI Holdings Inc 48 -
1 Nicholas Financial Inc 9 -
1 Nicolet Bankshares Inc 119 0.01
38 Nielsen Holdings PLC 1,043 0.10
2 Nine Energy Service Inc 4 -
22 NiSource Inc 565 0.06
4 NL Industries Inc 29 -
8 NMI Holdings Inc 197 0.02
7 NN Inc 52 0.01
7 Noodles & Co 96 0.01
18 Nordic American Tankers Ltd 61 0.01
3 Nordson Corp 680 0.07
3 Nordstrom Inc 105 0.01
1 Northeast Bank 25 -
1 Northern Technologies International Corp 16 -
6 Northfield Bancorp Inc 100 0.01
1 Northrim BanCorp Inc 27 -
17 Northwest Bancshares Inc 237 0.02
4 Northwest Natural Holding Co 209 0.02
1 Northwest Pipe Co 18 -
6 NorthWestern Corp 398 0.04
36 NortonLifeLock Inc 1,002 0.10
28 Norwegian Cruise Line Holdings Ltd 895 0.09
1 Norwood Financial Corp 22 -
37 NOV Inc 604 0.06
4 Novanta Inc 573 0.06
6 Novavax Inc 837 0.08
12 NOW Inc 127 0.01
24 NRG Energy Inc 758 0.07
6 Nu Skin Enterprises Inc 367 0.04
30 Nuance Communications Inc 1,608 0.16
6 NuVasive Inc 438 0.04
2 NV5 Global Inc 139 0.01
1 NVE Corp 49 0.01
21 nVent Electric PLC 677 0.07
1 Oak Valley Bancorp 24 -
Shares (000's)
Value(000's)
USD
% of NetAssetValue
Common Stock (continued)
United States - 61.43% (continued)
2 Oasis Petroleum Inc 146 0.01
10 Oceaneering International Inc 136 0.01
8 OceanFirst Financial Corp 174 0.02
- Ocwen Financial Corp 14 -
6 ODP Corp 274 0.03
6 OFG Bancorp 143 0.01
16 OGE Energy Corp 552 0.05
- Ohio Valley Banc Corp 11 -
19 O-I Glass Inc 349 0.03
9 Oil States International Inc 56 0.01
1 Oil-Dri Corp of America 26 -
22 Old National Bancorp 411 0.04
34 Old Republic International Corp 890 0.09
4 Old Second Bancorp Inc 50 0.01
23 Olin Corp 1,103 0.11
7 Ollie's Bargain Outlet Holdings Inc 606 0.06
- Olympic Steel Inc 15 -
1 Omega Flex Inc 139 0.01
5 Omnicell Inc 698 0.07
6 Omnicom Group Inc 511 0.05
27 ON Semiconductor Corp 1,066 0.10
6 ONE Gas Inc 437 0.04
15 OneMain Holdings Inc 855 0.08
5 OneSpan Inc 118 0.01
2 Onto Innovation Inc 152 0.02
93 OPKO Health Inc 356 0.04
1 Oppenheimer Holdings Inc 73 0.01
- OptimizeRx Corp 24 -
8 OraSure Technologies Inc 80 0.01
14 ORBCOMM Inc 157 0.02
4 Origin Bancorp Inc 159 0.02
3 Orion Energy Systems Inc 20 -
3 Orion Group Holdings Inc 20 -
1 Ormat Technologies Inc (Israel listing) 100 0.01
6 Ormat Technologies Inc (US listing) 434 0.04
1 Orrstown Financial Services Inc 38 -
2 Orthofix Medical Inc 86 0.01
2 OrthoPediatrics Corp 99 0.01
8 Oshkosh Corp 1,038 0.10
2 OSI Systems Inc 217 0.02
3 Osmotica Pharmaceuticals PLC 10 -
1 Otonomy Inc 2 -
5 Otter Tail Corp 255 0.03
8 Overseas Shipholding Group Inc 19 -
25 Ovintiv Inc (Canada listing) 677 0.07
9 Owens & Minor Inc 408 0.04
13 Owens Corning 1,379 0.14
2 Oxford Industries Inc 194 0.02
17 Pacific Biosciences of California 461 0.05
2 Pacific Mercantile Bancorp 14 -
12 Pacific Premier Bancorp Inc 572 0.06
5 Pacira BioSciences Inc 314 0.03
8 Packaging Corp of America 1,166 0.11
13 PacWest Bancorp 593 0.06
1 PagerDuty Inc 44 -
1 Palomar Holdings Inc 102 0.01
1 PAM Transportation Services Inc 47 -
5 Pangaea Logistics Solutions Ltd 19 -
4 Papa John's International Inc 395 0.04
6 Par Pacific Holdings Inc 86 0.01
2 Park Aerospace Corp 34 -
2 Park National Corp 274 0.03
Global Small Companies FundPortfolio of Investments as at 31 May 2021 (continued)
Dimensional Fund Advisors Semi-Annual Report and Unaudited Financial Statements, 31 May 2021 205

Shares (000's)
Value(000's)
USD
% of NetAssetValue
Common Stock (continued)
United States - 61.43% (continued)
1 Parke Bancorp Inc 27 -
2 Park-Ohio Holdings Corp 57 0.01
3 Patrick Industries Inc 237 0.02
12 Patterson Cos Inc 403 0.04
23 Patterson-UTI Energy Inc 194 0.02
5 Paylocity Holding Corp 875 0.09
4 Paysign Inc 13 -
14 PBF Energy Inc 223 0.02
3 PC Connection Inc 167 0.02
2 PCB Bancorp 36 -
2 PCSB Financial Corp 42 -
1 PC-Tel Inc 9 -
11 PDC Energy Inc 456 0.04
4 PDF Solutions Inc 75 0.01
13 PDL BioPharma Inc 33 -
11 Peabody Energy Corp 74 0.01
2 Peapack Gladstone Financial Corp 79 0.01
8 Pegasystems Inc 987 0.10
15 Penn National Gaming Inc 1,203 0.12
2 Penn Virginia Corp 30 -
3 Pennant Group Inc 94 0.01
1 Penns Woods Bancorp Inc 18 -
10 Penske Automotive Group Inc 895 0.09
17 Pentair PLC 1,141 0.11
3 Penumbra Inc 843 0.08
2 Peoples Bancorp Inc 69 0.01
1 Peoples Bancorp of North Carolina Inc 16 -
1 Peoples Financial Services Corp 35 -
50 People's United Financial Inc 941 0.09
8 Perdoceo Education Corp 92 0.01
4 Perficient Inc 301 0.03
12 Performance Food Group Co 605 0.06
3 PerkinElmer Inc 455 0.04
2 Perma-Fix Environmental Services Inc 15 -
13 Perrigo Co PLC 594 0.06
2 Personalis Inc 34 -
3 PetIQ Inc 118 0.01
3 PetMed Express Inc 75 0.01
1 PFSweb Inc 9 -
7 PGT Innovations Inc 163 0.02
3 Phibro Animal Health Corp 78 0.01
5 Photronics Inc 65 0.01
2 PHX Minerals Inc 6 -
3 Pieris Pharmaceuticals Inc 11 -
14 Pilgrim's Pride Corp 325 0.03
9 Pinnacle Financial Partners Inc 863 0.08
11 Pinnacle West Capital Corp 944 0.09
2 Piper Jaffray Cos 297 0.03
19 Pitney Bowes Inc 156 0.02
6 Pixelworks Inc 22 -
3 PJT Partners Inc 206 0.02
10 Planet Fitness Inc 766 0.08
15 Playa Hotels & Resorts NV 113 0.01
3 PlayAGS Inc 33 -
4 Plexus Corp 348 0.03
33 Plug Power Inc 999 0.10
- Plumas Bancorp 15 -
10 PNM Resources Inc 497 0.05
6 Polaris Inc 784 0.08
2 Ponce de Leon Federal Bank 32 -
12 Popular Inc 982 0.10
11 Portland General Electric Co 539 0.05
Shares (000's)
Value(000's)
USD
% of NetAssetValue
Common Stock (continued)
United States - 61.43% (continued)
6 Post Holdings Inc 716 0.07
3 Potbelly Corp 20 -
2 Powell Industries Inc 58 0.01
7 Power Integrations Inc 557 0.05
15 PQ Group Holdings Inc 245 0.02
5 PRA Group Inc 211 0.02
6 PRA Health Sciences Inc 1,093 0.11
2 Preferred Bank 127 0.01
1 Preformed Line Products Co 38 -
2 Premier Financial Bancorp Inc 41 -
3 Premier Financial Corp 106 0.01
10 Premier Inc 328 0.03
6 Prestige Consumer Healthcare Inc 292 0.03
4 PriceSmart Inc 326 0.03
- PrimeEnergy Resources Corp 4 -
5 Primerica Inc 742 0.07
4 Primis Financial Corp 53 0.01
6 Primoris Services Corp 195 0.02
7 ProAssurance Corp 174 0.02
8 PROG Holdings Inc 430 0.04
2 Progenics Pharmaceuticals Inc - -
5 Progress Software Corp 215 0.02
5 Proofpoint Inc 936 0.09
11 ProPetro Holding Corp 107 0.01
13 Prosperity Bancshares Inc 972 0.10
3 Protagonist Therapeutics Inc 112 0.01
1 Protective Insurance Corp 32 -
8 Proteostasis Therapeutics Inc - -
6 Prothena Corp PLC 161 0.02
3 Proto Labs Inc 280 0.03
1 Provident Bancorp Inc 24 -
1 Provident Financial Holdings Inc 24 -
8 Provident Financial Services Inc 197 0.02
1 Prudential Bancorp Inc 16 -
- Psychemedics Corp 3 -
7 PTC Therapeutics Inc 256 0.03
10 PulteGroup Inc 591 0.06
3 Pure Cycle Corp 41 -
28 Pure Storage Inc 531 0.05
2 Purple Innovation Inc 44 -
7 PVH Corp 772 0.08
2 Pzena Investment Management Inc 19 -
5 Q2 Holdings Inc 437 0.04
2 QAD Inc, Class A 144 0.01
2 QCR Holdings Inc 96 0.01
4 Quad/Graphics Inc 13 -
1 Quaker Chemical Corp 349 0.03
4 Qualys Inc 423 0.04
3 Quanex Building Products Corp 89 0.01
17 Quanta Services Inc 1,584 0.16
1 Quanterix Corp 69 0.01
4 Quidel Corp 521 0.05
6 QuinStreet Inc 101 0.01
12 Quotient Technology Inc 143 0.01
54 Qurate Retail Inc 741 0.07
24 R1 RCM Inc 563 0.06
19 Radian Group Inc 433 0.04
4 Radiant Logistics Inc 32 -
6 RadNet Inc 148 0.01
2 Rafael Holdings Inc 114 0.01
4 Ralph Lauren Corp 500 0.05
15 Rambus Inc 291 0.03
Global Small Companies FundPortfolio of Investments as at 31 May 2021 (continued)
Dimensional Fund Advisors Semi-Annual Report and Unaudited Financial Statements, 31 May 2021 206

Shares (000's)
Value(000's)
USD
% of NetAssetValue
Common Stock (continued)
United States - 61.43% (continued)
- Randolph Bancorp Inc 10 -
35 Range Resources Corp 479 0.05
5 Raven Industries Inc 201 0.02
4 Raymond James Financial Inc 566 0.06
5 Rayonier Advanced Materials Inc 42 -
2 RBB Bancorp 54 0.01
3 RBC Bearings Inc 598 0.06
3 RE/MAX Holdings Inc 90 0.01
3 Reading International Inc 17 -
4 RealNetworks Inc 10 -
12 Realogy Holdings Corp 205 0.02
1 Red Robin Gourmet Burgers Inc 39 -
7 Red Rock Resorts Inc 307 0.03
10 Redfin Corp 619 0.06
5 Regal Beloit Corp 749 0.07
4 REGENXBIO Inc 158 0.02
1 Regional Management Corp 57 0.01
5 Regis Corp 46 -
6 Reinsurance Group of America Inc 725 0.07
8 Reliance Steel & Aluminum Co 1,266 0.12
4 RenaissanceRe Holdings Ltd 631 0.06
7 Renasant Corp 288 0.03
5 Renewable Energy Group Inc 301 0.03
6 Rent-A-Center Inc 382 0.04
6 Repligen Corp 1,011 0.10
1 Replimune Group Inc 53 0.01
3 Republic Bancorp Inc 116 0.01
6 Republic First Bancorp Inc 24 -
16 Resideo Technologies Inc 492 0.05
11 Resolute Forest Products Inc 177 0.02
4 Resources Connection Inc 55 0.01
4 Retractable Technologies Inc 37 -
7 REV Group Inc 129 0.01
1 REX American Resources Corp 58 0.01
15 Rexnord Corp 740 0.07
1 RGC Resources Inc 24 -
2 RH 1,498 0.15
5 Rhythm Pharmaceuticals Inc 92 0.01
21 Ribbon Communications Inc 155 0.02
1 Richardson Electronics Ltd 7 -
- Riley Exploration Permian Inc 11 -
5 Rimini Street Inc 35 -
2 Riverview Bancorp Inc 14 -
5 RLI Corp 537 0.05
2 RMR Group Inc 72 0.01
11 Robert Half International Inc 976 0.10
6 Rocket Pharmaceuticals Inc 255 0.03
1 Rocky Brands Inc 43 -
2 Rogers Corp 417 0.04
7 Royal Gold Inc 825 0.08
24 RPC Inc 119 0.01
10 RPM International Inc 965 0.09
9 RR Donnelley & Sons Co 57 0.01
4 Rush Enterprises Inc 211 0.02
4 Ruth's Hospitality Group Inc 92 0.01
4 Ryder System Inc 307 0.03
5 Ryerson Holding Corp 87 0.01
5 S&T Bancorp Inc 180 0.02
3 S&W Seed Co 12 -
1 Safeguard Scientifics Inc 10 -
2 Safety Insurance Group Inc 143 0.01
- Saga Communications Inc 7 -
Shares (000's)
Value(000's)
USD
% of NetAssetValue
Common Stock (continued)
United States - 61.43% (continued)
3 Sage Therapeutics Inc 227 0.02
3 Saia Inc 717 0.07
11 SailPoint Technologies Holding Inc 490 0.05
- Salisbury Bancorp Inc 8 -
14 Sally Beauty Holdings Inc 306 0.03
3 Sanderson Farms Inc 450 0.04
3 SandRidge Energy Inc 18 -
6 Sandy Spring Bancorp Inc 256 0.03
16 Sangamo Therapeutics Inc 173 0.02
5 Sanmina Corp 226 0.02
14 Santander Consumer USA Holdings Inc 531 0.05
3 Sapiens International Corp NV (Israel listing) 95 0.01
6 Sapiens International Corp NV (US listing) 179 0.02
- Sarepta Therapeutics Inc 31 -
5 Savara Inc 10 -
1 SB Financial Group Inc 12 -
2 ScanSource Inc 61 0.01
11 Schneider National Inc 257 0.03
3 Schnitzer Steel Industries Inc 155 0.02
3 Scholastic Corp 88 0.01
4 Schweitzer-Mauduit International Inc 178 0.02
5 Science Applications International Corp 489 0.05
11 Scientific Games Corp 775 0.08
3 Sciplay Corp 43 -
8 Scorpio Tankers Inc 182 0.02
5 Scotts Miracle-Gro Co 1,195 0.12
2 Scpharmaceuticals Inc 9 -
- Seaboard Corp 323 0.03
7 Seacoast Banking Corp of Florida 257 0.03
3 SEACOR Marine Holdings Inc 11 -
21 Sealed Air Corp 1,203 0.12
3 SeaSpine Holdings Corp 51 0.01
9 SeaWorld Entertainment Inc 491 0.05
2 SecureWorks Corp 33 -
2 Security National Financial Corp 21 -
9 SEI Investments Co 568 0.06
2 Select Bancorp Inc 22 -
13 Select Energy Services Inc 75 0.01
3 Select Interior Concepts Inc 32 -
17 Select Medical Holdings Corp 670 0.07
7 Selective Insurance Group Inc 555 0.05
7 Semtech Corp 466 0.05
1 Seneca Foods Corp 42 -
12 Sensata Technologies Holding PLC 728 0.07
5 Sensient Technologies Corp 456 0.04
2 Sensus Healthcare Inc 7 -
13 Service Corp International 697 0.07
7 ServiceSource International Inc 9 -
7 ServisFirst Bancshares Inc 483 0.05
2 Severn Bancorp Inc 24 -
18 SFL Corp Ltd 155 0.02
5 Shake Shack Inc 434 0.04
3 Sharps Compliance Corp 36 -
6 Shenandoah Telecommunications Co 287 0.03
4 Shockwave Medical Inc 671 0.07
2 Shoe Carnival Inc 117 0.01
2 Shore Bancshares Inc 29 -
1 ShotSpotter Inc 54 0.01
4 Shutterstock Inc 385 0.04
5 Shyft Group Inc 200 0.02
2 SI-BONE Inc 51 0.01
2 Sierra Bancorp 50 0.01
Global Small Companies FundPortfolio of Investments as at 31 May 2021 (continued)
Dimensional Fund Advisors Semi-Annual Report and Unaudited Financial Statements, 31 May 2021 207

Shares (000's)
Value(000's)
USD
% of NetAssetValue
Common Stock (continued)
United States - 61.43% (continued)
1 Sierra Oncology Inc 18 -
- SIFCO Industries Inc 3 -
8 SIGA Technologies Inc 54 0.01
6 Signature Bank 1,409 0.14
6 Signet Jewelers Ltd 352 0.03
13 Silgan Holdings Inc 552 0.05
5 Silicon Laboratories Inc 628 0.06
1 SilverBow Resources Inc 20 -
1 Silvercrest Asset Management Group Inc 13 -
- Silvergate Capital Corp 17 -
14 Simmons First National Corp 427 0.04
12 Simply Good Foods Co 423 0.04
5 Simpson Manufacturing Co Inc 548 0.05
11 SiriusPoint Ltd 113 0.01
5 SiteOne Landscape Supply Inc 787 0.08
3 SJW Group 215 0.02
16 Skechers U.S.A. Inc 758 0.07
7 Skyline Champion Corp 370 0.04
4 SkyWest Inc 200 0.02
4 Sleep Number Corp 391 0.04
53 SLM Corp 1,064 0.10
15 SM Energy Co 294 0.03
3 SMART Global Holdings Inc 132 0.01
2 SmartFinancial Inc 51 0.01
12 Smartsheet Inc 680 0.07
4 Smith & Wesson Brands Inc 91 0.01
4 Snap-on Inc 998 0.10
5 SolarEdge Technologies Inc 1,332 0.13
3 Solaris Oilfield Infrastructure Inc 34 -
11 SolarWinds Corp 183 0.02
3 Sonic Automotive Inc 132 0.01
11 Sonoco Products Co 747 0.07
12 Sonos Inc 429 0.04
12 South Jersey Industries Inc 317 0.03
8 South State Corp 729 0.07
1 Southern First Bancshares Inc 45 -
1 Southern Missouri Bancorp Inc 35 -
4 Southside Bancshares Inc 192 0.02
7 Southwest Gas Holdings Inc 453 0.04
86 Southwestern Energy Co 447 0.04
3 SP Plus Corp 93 0.01
2 Spark Energy Inc 22 -
3 SpartanNash Co 56 0.01
5 Spectrum Brands Holdings Inc 483 0.05
12 Spectrum Pharmaceuticals Inc 40 -
2 Spero Therapeutics Inc 25 -
7 Spire Inc 468 0.05
7 Spirit AeroSystems Holdings Inc 346 0.03
7 Spirit Airlines Inc 255 0.03
2 Spirit of Texas Bancshares Inc 41 -
2 Spok Holdings Inc 19 -
6 Sportsman's Warehouse Holdings Inc 104 0.01
13 Sprouts Farmers Market Inc 354 0.03
4 SPS Commerce Inc 377 0.04
5 SPX Corp 309 0.03
5 SPX FLOW Inc 350 0.03
8 St Joe Co 385 0.04
5 STAAR Surgical Co 771 0.08
2 Stamps.com Inc 388 0.04
1 Standard AVB Financial Corp 17 -
3 Standard Motor Products Inc 126 0.01
1 Standex International Corp 134 0.01
Shares (000's)
Value(000's)
USD
% of NetAssetValue
Common Stock (continued)
United States - 61.43% (continued)
3 StarTek Inc 20 -
6 State Auto Financial Corp 112 0.01
19 Steel Dynamics Inc 1,202 0.12
10 Steelcase Inc 146 0.01
3 Stepan Co 355 0.04
10 Stericycle Inc 821 0.08
24 Sterling Bancorp 645 0.06
5 Sterling Bancorp Inc 26 -
4 Sterling Construction Co Inc 88 0.01
10 Steven Madden Ltd 405 0.04
4 Stewart Information Services Corp 216 0.02
14 Stifel Financial Corp 999 0.10
5 Stitch Fix Inc 283 0.03
3 Stock Yards Bancorp Inc 144 0.01
2 Stoke Therapeutics Inc 80 0.01
4 Stoneridge Inc 109 0.01
3 StoneX Group Inc 207 0.02
8 Stratasys Ltd 185 0.02
3 Strategic Education Inc 189 0.02
- Strattec Security Corp 25 -
1 Stratus Properties Inc 19 -
4 Stride Inc 116 0.01
11 Strongbridge Biopharma PLC 29 -
2 Summit Financial Group Inc 40 -
15 Summit Materials Inc 514 0.05
13 SunCoke Energy Inc 96 0.01
9 Sunnova Energy International Inc 271 0.03
11 SunPower Corp 266 0.03
- Sunrun Inc 21 -
7 Super Micro Computer Inc 238 0.02
1 Superior Group of Cos Inc 34 -
6 Supernus Pharmaceuticals Inc 190 0.02
9 Surgalign Holdings Inc 17 -
6 Surgery Partners Inc 341 0.03
2 Surmodics Inc 90 0.01
2 Sutro Biopharma Inc 29 -
2 SVMK Inc 29 -
9 Switch Inc 176 0.02
1 SWK Holdings Corp 17 -
3 Sykes Enterprises Inc 136 0.01
1 Synalloy Corp 11 -
4 Synaptics Inc 489 0.05
4 Synchronoss Technologies Inc 11 -
12 Syneos Health Inc 1,012 0.10
3 Synlogic Inc 11 -
6 SYNNEX Corp 808 0.08
17 Synovus Financial Corp 846 0.08
4 Systemax Inc 154 0.02
2 Tabula Rasa HealthCare Inc 95 0.01
2 Tactile Systems Technology Inc 127 0.01
6 Talos Energy Inc 89 0.01
5 Tandem Diabetes Care Inc 446 0.04
21 Tapestry Inc 921 0.09
22 Targa Resources Corp 867 0.09
4 Taro Pharmaceutical Industries Ltd 259 0.03
17 Taylor Morrison Home Corp 499 0.05
16 TCF Financial Corp 737 0.07
3 TCR2 Therapeutics Inc 59 0.01
4 Team Inc 35 -
40 TechnipFMC PLC 340 0.03
3 TechTarget Inc 246 0.02
7 Tecnoglass Inc 147 0.01
Global Small Companies FundPortfolio of Investments as at 31 May 2021 (continued)
Dimensional Fund Advisors Semi-Annual Report and Unaudited Financial Statements, 31 May 2021 208

Shares (000's)
Value(000's)
USD
% of NetAssetValue
Common Stock (continued)
United States - 61.43% (continued)
6 Teekay Corp 23 -
4 Teekay Tankers Ltd 60 0.01
25 TEGNA Inc 487 0.05
3 Tejon Ranch Co 51 0.01
1 Teledyne Technologies Inc 428 0.04
15 Telephone & Data Systems Inc 392 0.04
24 Tempur Sealy International Inc 915 0.09
13 Tenet Healthcare Corp 896 0.09
2 Tennant Co 198 0.02
12 Teradata Corp 598 0.06
9 Terex Corp 447 0.04
14 Terminix Global Holdings Inc 695 0.07
1 Territorial Bancorp Inc 34 -
1 TESSCO Technologies Inc 6 -
6 Tetra Tech Inc 697 0.07
13 TETRA Technologies Inc 45 -
6 Texas Capital Bancshares Inc 398 0.04
8 Texas Roadhouse Inc 789 0.08
10 Textainer Group Holdings Ltd 333 0.03
14 TFS Financial Corp 310 0.03
4 Thermon Group Holdings Inc 73 0.01
5 Thor Industries Inc 671 0.07
5 Tidewater Inc 65 0.01
2 Tilly's Inc 33 -
1 Timberland Bancorp Inc 20 -
9 Timken Co 824 0.08
4 TimkenSteel Corp 58 0.01
3 Tiptree Inc 37 -
6 Titan International Inc 58 0.01
2 Titan Machinery Inc 59 0.01
3 Tivity Health Inc 91 0.01
16 Toll Brothers Inc 1,064 0.10
2 Tompkins Financial Corp 139 0.01
5 Tootsie Roll Industries Inc 152 0.02
4 TopBuild Corp 805 0.08
9 Toro Co 973 0.10
9 Towne Bank 295 0.03
1 Townsquare Media Inc 17 -
4 TPI Composites Inc 188 0.02
1 TransAct Technologies Inc 15 -
1 Transcat Inc 42 -
1 Transmedics Group Inc 13 -
71 Transocean Ltd 269 0.03
10 Travel + Leisure Co 636 0.06
1 TravelCenters of America Inc 26 -
2 Travelzoo 26 -
5 Travere Therapeutics Inc 83 0.01
2 Trecora Resources 18 -
7 TreeHouse Foods Inc 355 0.04
12 Trex Co Inc 1,155 0.11
14 TRI Pointe Group Inc 329 0.03
4 TriCo Bancshares 185 0.02
5 TriMas Corp 158 0.02
8 TriNet Group Inc 597 0.06
14 Trinity Industries Inc 388 0.04
3 Trinity Place Holdings Inc 6 -
5 Trinseo SA 316 0.03
14 TripAdvisor Inc 613 0.06
3 Triple-S Management Corp 70 0.01
3 TriState Capital Holdings Inc 71 0.01
10 Triton International Ltd 540 0.05
3 Triumph Bancorp Inc 238 0.02
Shares (000's)
Value(000's)
USD
% of NetAssetValue
Common Stock (continued)
United States - 61.43% (continued)
18 Tronox Holdings PLC 422 0.04
5 TrueBlue Inc 126 0.01
12 TrueCar Inc 70 0.01
3 Trupanion Inc 268 0.03
2 TrustCo Bank Corp NY 96 0.01
8 Trustmark Corp 268 0.03
5 TTEC Holdings Inc 577 0.06
7 TTM Technologies Inc 110 0.01
6 Tupperware Brands Corp 143 0.01
2 Turning Point Brands Inc 87 0.01
7 Tutor Perini Corp 101 0.01
2 Twin Disc Inc 22 -
8 UFP Industries Inc 597 0.06
1 UFP Technologies Inc 51 0.01
21 UGI Corp 951 0.09
5 Ultra Clean Holdings Inc 260 0.03
6 Ultragenyx Pharmaceutical Inc 611 0.06
2 Ultralife Corp 23 -
6 UMB Financial Corp 613 0.06
26 Umpqua Holdings Corp 499 0.05
26 Under Armour Inc, Class A 598 0.06
23 Under Armour Inc, Class C 435 0.04
1 Unifi Inc 30 -
2 UniFirst Corp 404 0.04
7 Unisys Corp 171 0.02
1 United Bancorp Inc 17 -
17 United Bankshares Inc 688 0.07
10 United Community Banks Inc 354 0.03
4 United Fire Group Inc 110 0.01
6 United Insurance Holdings Corp 32 -
8 United Natural Foods Inc 293 0.03
1 United Security Bancshares 10 -
5 United States Cellular Corp 176 0.02
1 United States Lime & Minerals Inc 99 0.01
18 United States Steel Corp 454 0.04
5 United Therapeutics Corp 953 0.09
2 Unitil Corp 106 0.01
1 Unity Bancorp Inc 26 -
21 Univar Solutions Inc 566 0.06
2 Universal Corp 124 0.01
4 Universal Display Corp 944 0.09
2 Universal Electronics Inc 96 0.01
6 Universal Health Services Inc 975 0.10
4 Universal Insurance Holdings Inc 52 0.01
2 Universal Logistics Holdings Inc 62 0.01
1 Universal Stainless & Alloy Products Inc 12 -
3 Universal Technical Institute Inc 17 -
3 Univest Financial Corp 93 0.01
22 Unum Group 677 0.07
3 Upland Software Inc 105 0.01
13 Upwork Inc 622 0.06
13 Urban Outfitters Inc 518 0.05
2 US Concrete Inc 113 0.01
2 US Ecology Inc 84 0.01
19 US Foods Holding Corp 756 0.07
1 US Physical Therapy Inc 162 0.02
9 US Silica Holdings Inc 87 0.01
4 US Xpress Enterprises Inc 50 0.01
1 USA Truck Inc 11 -
3 USANA Health Sciences Inc 265 0.03
- Utah Medical Products Inc 35 -
3 Vail Resorts Inc 1,000 0.10
Global Small Companies FundPortfolio of Investments as at 31 May 2021 (continued)
Dimensional Fund Advisors Semi-Annual Report and Unaudited Financial Statements, 31 May 2021 209

Shares (000's)
Value(000's)
USD
% of NetAssetValue
Common Stock (continued)
United States - 61.43% (continued)
54 Valley National Bancorp 769 0.08
3 Valmont Industries Inc 643 0.06
- Value Line Inc 12 -
23 Valvoline Inc 744 0.07
7 Vanda Pharmaceuticals Inc 116 0.01
5 Varex Imaging Corp 135 0.01
20 Vector Group Ltd 273 0.03
1 Vectrus Inc 75 0.01
6 Veeco Instruments Inc 132 0.01
6 Venator Materials PLC 31 -
7 Veoneer Inc 175 0.02
3 Vera Bradley Inc 35 -
4 Veracyte Inc 145 0.01
5 Vericel Corp 265 0.03
8 Verint Systems Inc 355 0.04
7 Veritex Holdings Inc 232 0.02
2 Veritiv Corp 103 0.01
16 Verra Mobility Corp 235 0.02
1 Verrica Pharmaceuticals Inc 10 -
4 Verso Corp 63 0.01
3 Veru Inc 26 -
2 Viad Corp 107 0.01
6 ViaSat Inc 323 0.03
4 Viatris Inc 66 0.01
26 Viavi Solutions Inc 452 0.04
4 Vicor Corp 319 0.03
2 Vidler Water Resouces Inc 18 -
5 ViewRay Inc 31 -
10 Viking Therapeutics Inc 54 0.01
1 Village Super Market Inc 29 -
1 Vince Holding Corp 17 -
11 Vir Biotechnology Inc 455 0.04
15 Virgin Galactic Holdings Inc 457 0.05
12 Virtu Financial Inc 362 0.04
1 Virtus Investment Partners Inc 267 0.03
17 Vishay Intertechnology Inc 420 0.04
1 Vishay Precision Group Inc 44 -
7 Vista Outdoor Inc 302 0.03
3 Visteon Corp 409 0.04
49 Vistra Energy Corp 799 0.08
4 Vocera Communications Inc 128 0.01
28 Vonage Holdings Corp 390 0.04
13 Vontier Corp 473 0.05
2 VOXX International Corp 28 -
11 Voya Financial Inc 706 0.07
1 VSE Corp 69 0.01
1 VYNE Therapeutics Inc 6 -
11 W R Berkley Corp 858 0.08
16 W&T Offshore Inc 62 0.01
5 Wabash National Corp 74 0.01
4 Walker & Dunlop Inc 417 0.04
6 Warrior Met Coal Inc 105 0.01
6 Washington Federal Inc 208 0.02
2 Washington Trust Bancorp Inc 110 0.01
4 Waterstone Financial Inc 71 0.01
3 Watsco Inc 809 0.08
3 Watts Water Technologies Inc 452 0.04
1 WaVe Life Sciences Ltd 8 -
1 Wayside Technology Group Inc 23 -
2 WD-40 Co 383 0.04
10 Webster Financial Corp 552 0.05
4 Weis Markets Inc 183 0.02
Shares (000's)
Value(000's)
USD
% of NetAssetValue
Common Stock (continued)
United States - 61.43% (continued)
15 Welbilt Inc 375 0.04
25 Wendy's Co 579 0.06
8 Werner Enterprises Inc 403 0.04
8 WesBanco Inc 327 0.03
5 WESCO International Inc 547 0.05
2 West Bancorporation Inc 48 -
3 Westamerica Bancorporation 201 0.02
12 Western Alliance Bancorp 1,206 0.12
4 Western New England Bancorp Inc 34 -
38 Western Union Co 933 0.09
5 Westlake Chemical Corp 507 0.05
12 Westrock Co 688 0.07
1 Westwood Holdings Group Inc 19 -
3 WEX Inc 680 0.07
1 Weyco Group Inc 27 -
1 Whirlpool Corp 304 0.03
- White Mountains Insurance Group Ltd 477 0.05
1 Willdan Group Inc 41 -
8 Williams-Sonoma Inc 1,383 0.14
30 WillScot Mobile Mini Holdings Corp 859 0.08
4 Wingstop Inc 524 0.05
- Winmark Corp 91 0.01
4 Winnebago Industries Inc 300 0.03
6 Wintrust Financial Corp 519 0.05
17 WisdomTree Investments Inc 114 0.01
10 Wolverine World Wide Inc 347 0.03
6 Woodward Inc 721 0.07
1 World Acceptance Corp 181 0.02
6 World Fuel Services Corp 191 0.02
6 World Wrestling Entertainment Inc 310 0.03
7 Worthington Industries Inc 444 0.04
8 WR Grace & Co 522 0.05
6 WSFS Financial Corp 333 0.03
8 WW International Inc 316 0.03
10 Wyndham Hotels & Resorts Inc 742 0.07
8 Wynn Resorts Ltd 1,091 0.11
7 Xencor Inc 252 0.02
1 Xenon Pharmaceuticals Inc 22 -
22 Xerox Holdings Corp 516 0.05
1 XOMA Corp 41 -
9 Xperi Holding Corp 193 0.02
9 XPO Logistics Inc 1,286 0.13
2 Yellow Corp 14 -
9 Yelp Inc 351 0.03
10 YETI Holdings Inc 871 0.09
2 York Water Co 96 0.01
- Yumanity Therapeutics Inc 6 -
1 Zedge Inc 9 -
14 Zions Bancorp NA 818 0.08
7 Zix Corp 46 -
4 Zogenix Inc 69 0.01
3 Zovio Inc 8 -
3 Zumiez Inc 122 0.01
101 Zynga Inc 1,099 0.11
628,073 61.43
Total Common Stock - 92.41% (30 November 2020: 92.61%) 944,825 92.41
Preferred Stock
Germany - 0.11%
1 Biotest AG 42 -
1 Draegerwerk AG & Co KGaA 93 0.01
8 Fuchs Petrolub SE 378 0.04
Global Small Companies FundPortfolio of Investments as at 31 May 2021 (continued)
Dimensional Fund Advisors Semi-Annual Report and Unaudited Financial Statements, 31 May 2021 210

Shares (000's)
Value(000's)
USD
% of NetAssetValue
Preferred Stock (continued)
Germany - 0.11% (continued)
7 Jungheinrich AG 354 0.03
2 Sixt SE 185 0.02
- STO SE & Co KGaA 72 0.01
1 Villeroy & Boch AG 21 -
1,145 0.11
Italy - 0.01%
5 Danieli & C Officine Meccaniche SpA 95 0.01
95 0.01
United States - 0.01%
1 Liberty Broadband Corp 21 -
2 WESCO International Inc 84 0.01
105 0.01
Total Preferred Stock - 0.13% (30 November 2020: 0.18%) 1,345 0.13
Real Estate Investment Trust
Australia - 0.23%
51 Abacus Property Group 119 0.01
10 ALE Property Group 35 -
14 APN Convenience Retail REIT 39 -
21 APN Industria REIT 50 0.01
34 Arena REIT 89 0.01
3 Aspen Group Ltd 3 -
11 Australian Unity Office Fund 22 -
29 Aventus Group 66 0.01
57 BWP Trust 187 0.02
5 Carindale Property Trust 18 -
6 Centuria Capital Group 12 -
51 Centuria Industrial REIT 141 0.01
57 Centuria Office REIT 98 0.01
59 Charter Hall Long Wale REIT 217 0.02
56 Charter Hall Retail REIT 162 0.02
36 Charter Hall Social Infrastructure REIT 94 0.01
148 Cromwell Property Group 103 0.01
14 Elanor Retail Property Fund 12 -
12 Garda Diversified Property Fund 12 -
47 GDI Property Group 39 -
31 Growthpoint Properties Australia Ltd 93 0.01
15 Hotel Property Investments 36 -
32 Ingenia Communities Group 136 0.01
51 Investec Australia Property Fund 57 0.01
92 New South Resources Ltd 148 0.02
124 Shopping Centres Australasia Property Group 238 0.02
73 Waypoint REIT 145 0.02
2,371 0.23
Belgium - 0.21%
3 Aedifica SA 448 0.04
1 Ascencio 40 0.01
2 Befimmo SA 101 0.01
3 Care Property Invest NV 81 0.01
3 Cofinimmo SA 456 0.05
- Home Invest Belgium SA 29 -
3 Intervest Offices & Warehouses NV 69 0.01
- Leasinvest Real Estate SCA 35 -
1 Montea CVA 127 0.01
1 Retail Estates NV 82 0.01
16 Warehouses De Pauw CVA 603 0.06
- Wereldhave Belgium Comm VA 26 -
2,097 0.21
Canada - 0.21%
6 Allied Properties Real Estate Investment Trust 224 0.02
7 Artis Real Estate Investment Trust 65 0.01
Shares (000's)
Value(000's)
USD
% of NetAssetValue
Real Estate Investment Trust (continued)
Canada - 0.21% (continued)
3 Automotive Properties Real Estate Investment Trust 28 -
2 Boardwalk Real Estate Investment Trust 70 0.01
1 BSR Real Estate Investment Trust 14 -
5 BTB Real Estate Investment Trust 16 -
10 Cominar Real Estate Investment Trust 81 0.01
4 Crombie Real Estate Investment Trust 57 -
5 CT Real Estate Investment Trust 72 0.01
8 Dream Industrial Real Estate Investment Trust 86 0.01
4 Dream Office Real Estate Investment Trust 72 0.01
3 Granite Real Estate Investment Trust 211 0.02
15 H&R Real Estate Investment Trust 194 0.02
2 Inovalis Real Estate Investment Trust 20 -
6 InterRent Real Estate Investment Trust 77 0.01
5 Killam Apartment Real Estate Investment Trust 84 0.01
3 Morguard North American Residential Real EstateInvestment Trust 35 -
3 Morguard Real Estate Investment Trust 15 -
9 NorthWest Healthcare Properties Real EstateInvestment Trust 92 0.01
4 Plaza Retail REIT 14 -
15 RioCan Real Estate Investment Trust 268 0.02
4 Slate Office REIT 15 -
7 SmartCentres Real Estate Investment Trust 172 0.02
8 Summit Industrial Income REIT 108 0.01
4 True North Commercial Real Estate InvestmentTrust 27 -
4 WPT Industrial Real Estate Investment Trust 72 0.01
2,189 0.21
France - 0.15%
- Altarea SCA 91 0.01
1 ARGAN SA 144 0.01
6 Carmila SA 87 0.01
4 Covivio 376 0.04
1 Covivio Hotels SACA 21 -
3 ICADE 286 0.03
15 Klepierre SA 436 0.04
6 Mercialys SA 74 0.01
1 Societe de la Tour Eiffel 25 -
1,540 0.15
Germany - 0.04%
17 alstria office REIT AG 308 0.03
8 Hamborner REIT AG 97 0.01
405 0.04
Hong Kong - 0.04%
188 Champion REIT 110 0.01
159 Fortune Real Estate Investment Trust 172 0.02
120 Prosperity REIT 43 -
103 Regal Real Estate Investment Trust 22 -
111 Sunlight Real Estate Investment Trust 64 0.01
411 0.04
Ireland - 0.02%
67 Hibernia REIT PLC 98 0.01
56 Irish Residential Properties REIT PLC 107 0.01
205 0.02
Israel - 0.01%
4 Summit Real Estate Holdings Ltd 58 0.01
58 0.01
Italy - 0.01%
3 COIMA RES SpA 27 -
7 Immobiliare Grande Distribuzione SIIQ SpA 36 0.01
63 0.01
Global Small Companies FundPortfolio of Investments as at 31 May 2021 (continued)
Dimensional Fund Advisors Semi-Annual Report and Unaudited Financial Statements, 31 May 2021 211

Shares (000's)
Value(000's)
USD
% of NetAssetValue
Real Estate Investment Trust (continued)
Japan - 0.49%
- AEON REIT Investment Corp 78 0.01
- Comforia Residential REIT Inc 234 0.02
- CRE Logistics REIT Inc 97 0.01
- Frontier Real Estate Investment Corp 249 0.02
- Fukuoka REIT Corp 140 0.01
- Global One Real Estate Investment Corp 148 0.01
- Hankyu Hanshin REIT Inc 90 0.01
- Health Care & Medical Investment Corp 46 0.01
- Heiwa Real Estate REIT Inc 132 0.01
- Hoshino Resorts REIT Inc 159 0.02
- Hulic Reit Inc 239 0.02
- Ichigo Hotel REIT Investment Corp 40 -
- Ichigo Office REIT Investment 132 0.01
1 Invesco Office J-Reit Inc 169 0.02
1 Invincible Investment Corp 304 0.03
- Itochu Advance Logistics Investment 16 -
- Japan Excellent Inc 199 0.02
1 Japan Hotel REIT Investment Corp 260 0.03
- Japan Logistics Fund Inc 11 -
1 Japan Rental Housing Investments Inc 226 0.02
- Kenedix Residential Next Investment Corp 234 0.02
- Kenedix Retail REIT Corp 163 0.02
- Marimo Regional Revitalization REIT Inc 17 -
1 Mirai Corp 99 0.01
- Mitsubishi Estate Logistics REIT Investment Corp 186 0.02
- Mitsui Fudosan Logistics Park Inc 92 0.01
- Mori Trust Hotel Reit Inc 44 -
- Mori Trust Sogo Reit Inc 177 0.02
- Nippon REIT Investment Corp 213 0.02
- One REIT Inc 76 0.01
- Ooedo Onsen Reit Investment Corp 25 -
- Premier Investment Corp 222 0.02
- Samty Residential Investment Corp 36 -
- Star Asia Investment Corp 98 0.01
- Starts Proceed Investment Corp 56 0.01
- Takara Leben Real Estate Investment Corp 63 0.01
- Tokyu REIT Inc 172 0.02
- Tosei Reit Investment Corp 46 0.01
- XYMAX REIT Investment Corp 39 -
5,027 0.49
Netherlands - 0.04%
5 Eurocommercial Properties NV 155 0.02
2 NSI NV 107 0.01
2 Vastned Retail NV 51 -
4 Wereldhave NV 71 0.01
384 0.04
New Zealand - 0.06%
71 Argosy Property Ltd 77 0.01
64 Goodman Property Trust 102 0.01
23 Investore Property Ltd 34 -
130 Kiwi Property Group Ltd 113 0.01
81 Precinct Properties New Zealand Ltd 91 0.01
46 Property for Industry Ltd 94 0.01
38 Stride Property Group 63 -
35 Vital Healthcare Property Trust 76 0.01
650 0.06
Singapore - 0.19%
56 AIMS APAC REIT 59 0.01
166 Ascott Residence Trust 125 0.01
169 Cache Logistics Trust 101 0.01
111 CapitaLand Retail China Trust 113 0.01
91 CDL Hospitality Trusts 79 0.01
Shares (000's)
Value(000's)
USD
% of NetAssetValue
Real Estate Investment Trust (continued)
Singapore - 0.19% (continued)
19 Dasin Retail Trust 10 -
24 EC World Real Estate Investment Trust 15 -
212 ESR-REIT 63 0.01
92 Far East Hospitality Trust 41 -
129 First Real Estate Investment Trust 25 -
93 Frasers Centrepoint Trust 164 0.02
73 Frasers Hospitality Trust 29 -
51 IREIT Global 25 -
98 Keppel DC REIT 190 0.02
76 Keppel Pacific Oak US REIT 57 0.01
103 Keppel REIT 90 0.01
398 Lippo Malls Indonesia Retail Trust 19 -
147 Manulife US Real Estate Investment Trust 112 0.01
206 Mapletree North Asia Commercial Trust 161 0.02
141 OUE Commercial Real Estate Investment Trust 42 -
41 Parkway Life Real Estate Investment Trust 136 0.01
76 Sabana Shari'ah Compliant Industrial Real EstateInvestment Trust 24 -
100 SPH REIT 65 0.01
90 Starhill Global REIT 37 -
138 Suntec Real Estate Investment Trust 151 0.02
1,933 0.19
Spain - 0.08%
31 Inmobiliaria Colonial Socimi SA 339 0.03
8 Lar Espana Real Estate Socimi SA 55 0.01
40 Merlin Properties Socimi SA 459 0.04
853 0.08
United Kingdom - 0.47%
269 Assura PLC 284 0.03
20 Big Yellow Group PLC 370 0.04
79 Capital & Counties Properties PLC 195 0.02
34 Civitas Social Housing PLC 58 0.01
50 Custodian Reit PLC 69 0.01
11 Derwent London PLC 549 0.05
19 Ediston Property Investment Co PLC 18 -
78 Empiric Student Property PLC 97 0.01
43 GCP Student Living PLC 105 0.01
25 Great Portland Estates PLC 252 0.03
384 Hammerson PLC 217 0.02
75 Intu Properties PLC - -
84 LondonMetric Property PLC 278 0.03
17 LXI REIT plc 33 -
13 McKay Securities PLC 41 -
31 NewRiver REIT PLC 43 -
5 Palace Capital PLC 19 -
132 Primary Health Properties PLC 288 0.03
57 Regional REIT Ltd 71 0.01
22 Safestore Holdings PLC 301 0.03
59 Schroder Real Estate Investment Trust Ltd 38 -
25 Secure Income REIT PLC 134 0.01
19 Shaftesbury PLC 164 0.02
49 Standard Life Investment Property Income Trust Ltd 44 -
92 Target Healthcare REIT PLC 151 0.02
175 Tritax Big Box REIT PLC 488 0.05
21 UNITE Group PLC 334 0.03
11 Workspace Group PLC 144 0.01
4,785 0.47
United States - 4.79%
10 Acadia Realty Trust 208 0.02
7 Agree Realty Corp 479 0.05
1 Alexander & Baldwin Inc 16 -
1 Alexander's Inc 167 0.02
Global Small Companies FundPortfolio of Investments as at 31 May 2021 (continued)
Dimensional Fund Advisors Semi-Annual Report and Unaudited Financial Statements, 31 May 2021 212

Shares (000's)
Value(000's)
USD
% of NetAssetValue
Real Estate Investment Trust (continued)
United States - 4.79% (continued)
7 American Assets Trust Inc 242 0.02
15 American Campus Communities Inc 728 0.07
15 American Finance Trust Inc 133 0.01
29 American Homes 4 Rent 1,105 0.11
14 Apartment Income REIT Corp 632 0.06
9 Apartment Investment and Management Co 65 0.01
27 Apple Hospitality REIT Inc 427 0.04
1 Ashford Hospitality Trust Inc 6 -
3 Bluerock Residential Growth REIT Inc 31 -
6 Braemar Hotels & Resorts Inc 37 -
22 Brandywine Realty Trust 315 0.03
31 Brixmor Property Group Inc 705 0.07
2 BRT Apartments Corp 36 -
9 Camden Property Trust 1,094 0.11
11 CareTrust REIT Inc 260 0.03
2 Cedar Realty Trust Inc 23 -
2 Centerspace 116 0.01
6 Chatham Lodging Trust 77 0.01
3 CIM Commercial Trust Corp 40 -
4 City Office REIT Inc 45 -
3 Clipper Realty Inc 23 -
14 Columbia Property Trust Inc 249 0.02
3 Community Healthcare Trust Inc 141 0.01
1 Condor Hospitality Trust Inc 4 -
8 CorePoint Lodging Inc 79 0.01
4 CoreSite Realty Corp 458 0.05
14 Corporate Office Properties Trust 374 0.04
19 Cousins Properties Inc 689 0.07
1 CTO Realty Growth Inc 29 -
24 CubeSmart 1,060 0.10
10 CyrusOne Inc 770 0.08
27 DiamondRock Hospitality Co 260 0.03
28 Diversified Healthcare Trust 102 0.01
20 Douglas Emmett Inc 696 0.07
10 Easterly Government Properties Inc 217 0.02
5 EastGroup Properties Inc 772 0.08
21 Empire State Realty Trust Inc 251 0.02
8 EPR Properties 394 0.04
14 Equity Commonwealth 391 0.04
9 Equity LifeStyle Properties Inc 638 0.06
13 Essential Properties Realty Trust Inc 328 0.03
7 Federal Realty Investment Trust 816 0.08
16 First Industrial Realty Trust Inc 805 0.08
9 Four Corners Property Trust Inc 260 0.03
13 Franklin Street Properties Corp 66 0.01
21 Gaming and Leisure Properties Inc 970 0.10
6 Getty Realty Corp 178 0.02
5 Gladstone Commercial Corp 100 0.01
7 Global Medical REIT Inc 103 0.01
10 Global Net Lease Inc 199 0.02
16 Healthcare Realty Trust Inc 474 0.05
21 Healthcare Trust of America Inc 583 0.06
5 Hersha Hospitality Trust 50 0.01
12 Highwoods Properties Inc 551 0.05
65 Host Hotels & Resorts Inc 1,111 0.11
19 Hudson Pacific Properties Inc 537 0.05
11 Independence Realty Trust Inc 188 0.02
1 Indus Realty Trust Inc 47 -
8 Industrial Logistics Properties Trust 190 0.02
27 Iron Mountain Inc 1,169 0.11
15 JBG SMITH Properties 481 0.05
5 Kilroy Realty Corp 329 0.03
Shares (000's)
Value(000's)
USD
% of NetAssetValue
Real Estate Investment Trust (continued)
United States - 4.79% (continued)
40 Kimco Realty Corp 857 0.08
10 Kite Realty Group Trust 202 0.02
8 Lamar Advertising Co 855 0.08
33 Lexington Realty Trust 408 0.04
7 Life Storage Inc 748 0.07
4 LTC Properties Inc 176 0.02
15 Macerich Co 246 0.02
10 Mack-Cali Realty Corp 172 0.02
53 Medical Properties Trust Inc 1,122 0.11
12 MGM Growth Properties LLC 442 0.04
12 Monmouth Real Estate Investment Corp 231 0.02
5 National Health Investors Inc 349 0.03
16 National Retail Properties Inc 746 0.07
9 National Storage Affiliates Trust 406 0.04
10 New Senior Investment Group Inc 67 0.01
3 NexPoint Residential Trust Inc 151 0.02
6 Office Properties Income Trust 183 0.02
21 Omega Healthcare Investors Inc 779 0.08
2 One Liberty Properties Inc 55 0.01
16 Outfront Media Inc 377 0.04
28 Paramount Group Inc 303 0.03
26 Park Hotels & Resorts Inc 532 0.05
15 Pebblebrook Hotel Trust 333 0.03
25 Physicians Realty Trust 457 0.04
15 Piedmont Office Realty Trust Inc 270 0.03
3 Plymouth Industrial REIT Inc 49 0.01
5 Preferred Apartment Communities Inc 51 0.01
3 PS Business Parks Inc 530 0.05
7 QTS Realty Trust Inc 428 0.04
15 Regency Centers Corp 1,002 0.10
14 Retail Opportunity Investments Corp 246 0.02
23 Retail Properties of America Inc 276 0.03
2 Retail Value Inc 44 -
12 Rexford Industrial Realty Inc 676 0.07
18 RLJ Lodging Trust 283 0.03
9 RPT Realty 116 0.01
5 Ryman Hospitality Properties Inc 408 0.04
26 Sabra Health Care REIT Inc 451 0.04
3 Saul Centers Inc 133 0.01
5 Seritage Growth Properties 79 0.01
18 Service Properties Trust 230 0.02
22 SITE Centers Corp 327 0.03
8 SL Green Realty Corp 670 0.07
1 Sotherly Hotels Inc 5 -
4 Spirit MTA REIT 1 -
11 Spirit Realty Capital Inc 499 0.05
15 STAG Industrial Inc 535 0.05
24 STORE Capital Corp 842 0.08
12 Summit Hotel Properties Inc 120 0.01
28 Sunstone Hotel Investors Inc 348 0.03
10 Tanger Factory Outlet Centers Inc 184 0.02
8 Terreno Realty Corp 529 0.05
17 UDR Inc 797 0.08
5 UMH Properties Inc 104 0.01
17 Uniti Group Inc 186 0.02
2 Universal Health Realty Income Trust 128 0.01
15 Urban Edge Properties 296 0.03
1 Urstadt Biddle Properties Inc 12 -
4 Urstadt Biddle Properties Inc, Class A 66 0.01
19 VEREIT Inc 908 0.09
17 Vornado Realty Trust 827 0.08
2 Washington Prime Group Inc 5 -
Global Small Companies FundPortfolio of Investments as at 31 May 2021 (continued)
Dimensional Fund Advisors Semi-Annual Report and Unaudited Financial Statements, 31 May 2021 213

Shares (000's)
Value(000's)
USD
% of NetAssetValue
Real Estate Investment Trust (continued)
United States - 4.79% (continued)
11 Washington Real Estate Investment Trust 253 0.02
15 Weingarten Realty Investors 492 0.05
5 Whitestone REIT 42 -
13 WP Carey Inc 987 0.10
12 Xenia Hotels & Resorts Inc 231 0.02
48,982 4.79
Total Real Estate Investment Trust - 7.04% (30 November2020: 7.10%) 71,953 7.04
Rights
Australia - 0.00%
2 carsales.com Ltd - -
5 Charter Hall Long Wale REIT - -
2 Mystate Ltd - -
- -
Austria - 0.00%
8 CA Immobilien Anlagen AG - -
- -
Canada - 0.00%
4 Imperial Metals Corp - -
30 Pan American Silver Corp 28 -
28 -
Shares (000's)
Value(000's)
USD
% of NetAssetValue
Rights (continued)
France - 0.00%
- Covivio Hotels SACA - -
- -
Italy - 0.00%
6 Freni Brembo SpA - -
- -
Spain - 0.00%
7 Almirall SA 2 -
2 -
United Kingdom - 0.00%
9 C&C Group PLC 7 -
7 -
Total Rights - 0.00% (30 November 2020: 0.01%) 37 -
Warrants
Singapore - 0.00%
54 Ezion Holdings Ltd - -
- -
Total Warrants - 0.00% (30 November 2020: 0.00%) - -
Total Investments - 99.58% (30 November 2020: 99.90%) 1,018,160 99.58
Value (000's)USD
% of NetAssetValue
Cash and Cash Equivalents - 0.44% (30 November 2020: 0.30%) 4,453 0.44Other Liabilities in Excess of Other Assets - (0.02)% (30 November 2020: (0.20)%) (166) (0.02)
Total Net Assets 1,022,447 100.00
Amounts designated as “- “ are either $0, less than $500 or less than 500 shares.
Analysis of Total Assets % of Total Assets
Transferable securities admitted to an official exchange listing 98.63
Current Assets 1.37
Total Assets 100.00
Global Small Companies FundPortfolio of Investments as at 31 May 2021 (continued)
Dimensional Fund Advisors Semi-Annual Report and Unaudited Financial Statements, 31 May 2021 214

Shares (000's)
Value(000's)
USD
% of NetAssetValue
Common Stock
Australia - 1.60%
16 Accent Group Ltd 34 -
8 Adairs Ltd 29 -
1 Afterpay Touch Group Ltd 57 0.01
20 ALS Ltd 185 0.01
3 Altium Ltd 63 0.01
44 AMA Group Ltd 19 -
223 AMP Ltd 202 0.02
12 Ampol Ltd 263 0.02
1 Ansell Ltd 35 -
9 AP Eagers Ltd 108 0.01
12 APA Group 83 0.01
3 Appen Ltd 26 -
2 ARB Corp Ltd 58 0.01
6 Aristocrat Leisure Ltd 202 0.01
20 Atlas Arteria Ltd 95 0.01
3 AUB Group Ltd 46 -
34 Aurelia Metals Ltd 12 -
18 Austal Ltd 33 -
26 Australia & New Zealand Banking Group Ltd 587 0.04
10 Australian Finance Group Ltd 22 -
22 Australian Pharmaceutical Industries Ltd 20 -
6 Baby Bunting Group Ltd 30 -
29 Bank of Queensland Ltd 202 0.01
21 Bapcor Ltd 134 0.01
31 Bellevue Gold Ltd 22 -
1 Blackmores Ltd 27 -
25 Boral Ltd 132 0.01
77 Brambles Ltd 649 0.05
15 Bravura Solutions Ltd 38 -
4 Breville Group Ltd 74 0.01
9 BWX Ltd 36 -
47 Capitol Health Ltd 13 -
16 carsales.com Ltd 234 0.02
3 Cedar Woods Properties Ltd 18 -
41 Challenger Ltd 167 0.01
20 Champion Iron Ltd 100 0.01
4 City Chic Collective Ltd 13 -
1 Clinuvel Pharmaceuticals Ltd 34 -
5 Clover Corp Ltd 6 -
2 Cochlear Ltd 310 0.02
5 Codan Ltd 70 0.01
25 Coles Group Ltd 318 0.02
3 Collins Foods Ltd 27 -
24 Commonwealth Bank of Australia 1,834 0.13
24 Computershare Ltd 301 0.02
3 Corporate Travel Management Ltd 49 -
2 Credit Corp Group Ltd 34 -
2 Crown Resorts Ltd 24 -
5 CSL Ltd 1,083 0.07
33 CSR Ltd 141 0.01
7 Data#3 Ltd 32 -
5 Deterra Royalties Ltd 17 -
2 Dicker Data Ltd 16 -
9 Domain Holdings Australia Ltd 36 -
1 Domino's Pizza Enterprises Ltd 104 0.01
25 Eclipx Group Ltd 41 -
11 Elders Ltd 94 0.01
23 Emeco Holdings Ltd 16 -
6 Enero Group Ltd 12 -
1 EQT Holdings Ltd 10 -
8 Estia Health Ltd 15 -
2 EVENT Hospitality and Entertainment Ltd 22 -
Shares (000's)
Value(000's)
USD
% of NetAssetValue
Common Stock (continued)
Australia - 1.60% (continued)
25 Evolution Mining Ltd 103 0.01
6 Fleetwood Corp Ltd 11 -
4 Flight Centre Travel Group Ltd 42 -
48 Fortescue Metals Group Ltd 827 0.06
11 Galaxy Resources Ltd (voting rights) 33 -
37 Genworth Mortgage Insurance Australia Ltd 78 0.01
26 Gold Road Resources Ltd 29 -
3 GUD Holdings Ltd 26 -
14 GWA Group Ltd 31 -
10 Hansen Technologies Ltd 41 -
15 Harvey Norman Holdings Ltd 60 0.01
25 Healius Ltd 81 0.01
22 HT&E Ltd 29 -
2 HUB24 Ltd 38 -
23 Humm Group Ltd 18 -
40 IGO Ltd 233 0.02
15 Iluka Resources Ltd 88 0.01
40 Imdex Ltd 64 0.01
26 Infomedia Ltd 28 -
49 Insurance Australia Group Ltd 190 0.01
6 Integral Diagnostics Ltd 23 -
8 Integrated Research Ltd 14 -
2 InvoCare Ltd 19 -
37 IOOF Holdings Ltd 111 0.01
8 IPH Ltd 41 -
6 IRESS Ltd 53 -
16 IVE Group Ltd 18 -
11 James Hardie Industries PLC 346 0.02
6 JB Hi-Fi Ltd 234 0.02
4 Johns Lyng Group Ltd 15 -
54 Karoon Energy Ltd 50 -
1 Kogan.com Ltd 10 -
16 Lendlease Group 152 0.01
5 Lifestyle Communities Ltd 56 0.01
21 Link Administration Holdings Ltd 89 0.01
2 Lovisa Holdings Ltd 27 -
21 Lynas Corp Ltd 90 0.01
35 MACA Ltd 22 -
70 Macmahon Holdings Ltd 11 -
6 Macquarie Group Ltd 735 0.05
- Macquarie Telecom Group Ltd 10 -
6 Magellan Financial Group Ltd 217 0.02
5 McMillan Shakespeare Ltd 46 -
13 McPherson's Ltd 14 -
122 Medibank Pvt Ltd 296 0.02
1 Megaport Ltd 12 -
7 Mesoblast Ltd 11 -
123 Metcash Ltd 333 0.02
10 Mineral Resources Ltd 355 0.03
2 MNF Group Ltd 10 -
5 Moelis Australia Ltd 22 -
3 Monadelphous Group Ltd 25 -
8 Money3 Corp Ltd 19 -
40 Mount Gibson Iron Ltd 26 -
4 Nanosonics Ltd 19 -
35 National Australia Bank Ltd 724 0.05
7 Navigator Global Investments Ltd 8 -
7 nearmap Ltd 11 -
4 Netwealth Group Ltd 48 -
7 Newcrest Mining Ltd 149 0.01
20 nib holdings Ltd 99 0.01
1 Nick Scali Ltd 12 -
Global Sustainability Core Equity FundPortfolio of Investments as at 31 May 2021
Dimensional Fund Advisors Semi-Annual Report and Unaudited Financial Statements, 31 May 2021 215

Shares (000's)
Value(000's)
USD
% of NetAssetValue
Common Stock (continued)
Australia - 1.60% (continued)
22 Nickel Mines Ltd 17 -
112 Nine Entertainment Co Holdings Ltd 257 0.02
15 Northern Star Resources Ltd 128 0.01
13 NRW Holdings Ltd 17 -
28 Nufarm Ltd 103 0.01
1 Objective Corp Ltd 12 -
8 Omni Bridgeway Ltd 23 -
52 oOh!media Ltd 68 0.01
8 Orica Ltd 85 0.01
3 Orocobre Ltd 15 -
61 Orora Ltd 149 0.01
12 OZ Minerals Ltd 236 0.02
6 Pacific Current Group Ltd 26 -
14 Pact Group Holdings Ltd 40 -
22 Peet Ltd 20 -
8 Pendal Group Ltd 51 -
42 Perenti Global Ltd 21 -
1 Perpetual Ltd 41 -
41 Perseus Mining Ltd 44 -
3 Pinnacle Investment Management Group 22 -
12 Platinum Asset Management Ltd 44 -
6 Premier Investments Ltd 112 0.01
4 Pro Medicus Ltd 130 0.01
2 PWR Holdings Ltd 11 -
45 QBE Insurance Group Ltd 383 0.03
31 Ramelius Resources Ltd 47 -
5 Ramsay Health Care Ltd 250 0.02
1 REA Group Ltd 184 0.01
151 Red 5 Ltd 19 -
4 Redbubble Ltd 11 -
8 Reece Ltd 131 0.01
9 Regis Resources Ltd 19 -
36 Reliance Worldwide Corp Ltd 146 0.01
62 Resolute Mining Ltd 28 -
196 Retail Food Group Ltd 11 -
3 Rio Tinto Ltd 294 0.02
18 Sandfire Resources NL 98 0.01
9 SEEK Ltd 217 0.02
28 Service Stream Ltd 21 -
6 Seven Group Holdings Ltd 95 0.01
31 Seven West Media Ltd 10 -
7 SG Fleet Group Ltd 15 -
37 Sigma Healthcare Ltd 18 -
23 Silver Lake Resources Ltd 35 -
15 Sims Metal Management Ltd 179 0.01
4 SmartGroup Corp Ltd 19 -
12 Sonic Healthcare Ltd 331 0.02
6 Southern Cross Media Group Ltd 8 -
16 St Barbara Ltd 23 -
34 Steadfast Group Ltd 105 0.01
34 Suncorp Group Ltd 293 0.02
12 Sunland Group Ltd 22 -
7 Super Retail Group Ltd 70 0.01
15 Sydney Airport 69 0.01
66 Tabcorp Holdings Ltd 265 0.02
16 Tassal Group Ltd 48 -
13 Technology One Ltd 92 0.01
2 Temple & Webster Group Ltd 11 -
11 TPG Telecom Ltd 43 -
21 Transurban Group 225 0.02
24 Treasury Wine Estates Ltd 215 0.02
3 Tuas Ltd 1 -
Shares (000's)
Value(000's)
USD
% of NetAssetValue
Common Stock (continued)
Australia - 1.60% (continued)
3 Virtus Health Ltd 17 -
54 Viva Energy Group Ltd 85 0.01
10 Vocus Group Ltd 42 -
12 Webjet Ltd 49 -
23 Western Areas Ltd 44 -
18 Westgold Resources Ltd 31 -
32 Westpac Banking Corp 645 0.05
1 WiseTech Global Ltd 24 -
31 Woolworths Group Ltd 1,012 0.07
24 Worley Ltd 198 0.01
3 Xero Ltd 307 0.02
23,523 1.60
Austria - 0.12%
1 Agrana Beteiligungs AG 17 -
4 Andritz AG 256 0.02
4 BAWAG Group AG 218 0.01
6 Erste Group Bank AG 229 0.02
4 Immofinanz AG 81 0.01
- Lenzing AG 17 -
- Mayr Melnhof Karton AG 77 0.01
1 Oesterreichische Post AG 45 -
1 Palfinger AG 29 -
1 Porr AG 23 -
5 Raiffeisen Bank International AG 117 0.01
- Rosenbauer International AG 16 -
1 S IMMO AG 30 -
1 Schoeller-Bleckmann Oilfield Equipment AG 43 -
- Strabag SE 16 -
5 Telekom Austria AG 41 -
- UBM Development AG 13 -
10 UNIQA Insurance Group AG 90 0.01
1 Verbund AG 136 0.01
2 Vienna Insurance Group AG Wiener VersicherungGruppe 60 -
7 Wienerberger AG 252 0.02
1 Zumtobel Group AG 14 -
1,820 0.12
Belgium - 0.29%
10 Ageas 625 0.04
5 AGFA-Gevaert NV 23 -
4 Anheuser-Busch InBev SA 294 0.02
- Argenx SE 102 0.01
2 Barco NV 48 -
2 Bekaert SA 104 0.01
6 bpost SA 76 0.01
1 Cie d'Entreprises CFE 86 0.01
2 Colruyt SA 109 0.01
7 Deceuninck NV 23 -
1 D'ieteren SA 101 0.01
12 Econocom Group SA 49 -
1 Elia System Operator SA 117 0.01
1 EVS Broadcast Equipment SA 15 -
2 Fagron 50 -
- Galapagos NV 37 -
1 Gimv NV 84 0.01
2 Greenyard NV 23 -
1 Immobel SA 47 -
1 Ion Beam Applications 23 -
3 KBC Group NV 269 0.02
- Kinepolis Group NV 13 -
- Lotus Bakeries NV 11 -
1 Melexis NV 93 0.01
Global Sustainability Core Equity FundPortfolio of Investments as at 31 May 2021 (continued)
Dimensional Fund Advisors Semi-Annual Report and Unaudited Financial Statements, 31 May 2021 216

Shares (000's)
Value(000's)
USD
% of NetAssetValue
Common Stock (continued)
Belgium - 0.29% (continued)
5 Ontex Group NV 69 0.01
10 Proximus SADP 198 0.01
2 Recticel SA 41 -
- Resilux 12 -
1 Telenet Group Holding NV 53 -
2 Tessenderlo Group SA 68 -
4 UCB SA 417 0.03
16 Umicore SA 957 0.07
- Van de Velde NV 13 -
4,250 0.29
Brazil - 0.00%
2 Natura & Co Holding SA, ADR 41 -
41 -
Canada - 3.04%
10 5N Plus Inc 25 -
2 Absolute Software Corp 28 -
1 Acadian Timber Corp 12 -
2 AcuityAds Holdings Inc 17 -
4 Aecon Group Inc 68 0.01
1 Ag Growth International Inc 23 -
9 Agnico Eagle Mines Ltd 653 0.05
3 Aimia Inc 10 -
1 AirBoss of America Corp 35 -
20 Alamos Gold Inc 184 0.01
2 Alamos Gold Inc 23 -
1 Alaris Equity Partners Income 21 -
19 Alimentation Couche-Tard Inc 689 0.05
8 AltaGas Ltd 149 0.01
2 Altus Group Ltd 97 0.01
1 Andlauer Healthcare Group Inc 14 -
1 Andrew Peller Ltd 12 -
17 Argonaut Gold Inc 43 -
5 Aritzia Inc 131 0.01
2 ATS Automation Tooling Systems Inc 58 -
1 Aurora Cannabis Inc 5 -
25 B2Gold Corp 126 0.01
2 Badger Infrastructure Solution 71 0.01
8 Bank of Montreal 875 0.06
21 Bank of Nova Scotia 1,401 0.10
11 Barrick Gold Corp 265 0.02
3 Bausch Health Cos Inc 82 0.01
4 BCE Inc 181 0.01
3 Bird Construction Inc 21 -
4 BlackBerry Ltd 37 -
14 BlackBerry Ltd 144 0.01
84 Bombardier Inc 68 0.01
7 Boralex Inc 201 0.01
24 Brookfield Asset Management Inc 1,215 0.08
1 BRP Inc 113 0.01
7 CAE Inc 220 0.02
- Calian Group Ltd 15 -
21 Cameco Corp 428 0.03
9 Canaccord Genuity Group Inc 101 0.01
3 Canada Goose Holdings Inc 129 0.01
16 Canadian Imperial Bank of Commerce (Canadalisting) 1,887 0.13
3 Canadian Tire Corp Ltd 580 0.04
2 Canadian Utilities Ltd, Class A 55 -
3 Canfor Corp 85 0.01
1 Canopy Growth Corp 39 -
6 CanWel Building Materials Group Ltd 45 -
3 Capstone Mining Corp 16 -
Shares (000's)
Value(000's)
USD
% of NetAssetValue
Common Stock (continued)
Canada - 3.04% (continued)
7 Cascades Inc 81 0.01
9 CCL Industries Inc 508 0.04
7 Celestica Inc 58 -
14 Centerra Gold Inc 110 0.01
2 Cervus Equipment Corp 22 -
22 CES Energy Solutions Corp 32 -
12 CGI Inc 1,038 0.07
1 Chartwell Retirement Residences 12 -
10 CI Financial Corp 187 0.01
1 Cogeco Communications Inc 98 0.01
1 Cogeco Inc 42 -
2 Colliers International Group Inc 267 0.02
9 Computer Modelling Group Ltd 39 -
1 Constellation Software Inc 1,033 0.07
6 Copper Mountain Mining Corp 20 -
1 Corby Spirit and Wine Ltd 19 -
21 Corus Entertainment Inc 109 0.01
7 Cronos Group Inc 62 -
3 Descartes Systems Group Inc 159 0.01
3 DIRTT Environmental Solutions 11 -
10 Dollarama Inc 456 0.03
1 Dorel Industries Inc 11 -
2 DREAM Unlimited Corp 42 -
8 Dundee Precious Metals Inc 56 -
9 ECN Capital Corp 66 0.01
3 EcoSynthetix Inc 12 -
- E-L Financial Corp Ltd 93 0.01
7 Eldorado Gold Corp 88 0.01
33 Element Fleet Management Corp 368 0.03
8 Empire Co Ltd 281 0.02
25 Enbridge Inc (Canada listing) 948 0.07
5 Endeavour Mining Corp 123 0.01
8 Enerflex Ltd 53 -
2 Enghouse Systems Ltd 72 0.01
4 Ensign Energy Services Inc 5 -
1 Equitable Group Inc 107 0.01
3 ERO Copper Corp 80 0.01
1 Evertz Technologies Ltd 14 -
3 Extendicare Inc 17 -
1 Fairfax Financial Holdings Ltd 298 0.02
4 Fiera Capital Corp 33 -
8 Finning International Inc 211 0.01
1 Firm Capital Mortgage Investment Corp 14 -
4 First Capital Real Estate Investment Trust 53 -
5 First Majestic Silver Corp 98 0.01
2 First Majestic Silver Corp 27 -
1 First National Financial Corp 42 -
8 First Quantum Minerals Ltd 203 0.01
2 FirstService Corp 307 0.02
5 Fortuna Silver Mines Inc 32 -
1 Galaxy Digital Holdings Ltd 11 -
1 GDI Integrated Facility Services Inc 28 -
12 Gear Energy Ltd 8 -
6 George Weston Ltd 594 0.04
13 Gibson Energy Inc 266 0.02
1 Great Canadian Gaming Corp 26 -
6 Great-West Lifeco Inc 179 0.01
1 Guardian Capital Group Ltd 15 -
1 Hardwoods Distribution Inc 35 -
1 Heroux-Devtek Inc 15 -
3 Home Capital Group Inc 97 0.01
14 Hudbay Minerals Inc 103 0.01
Global Sustainability Core Equity FundPortfolio of Investments as at 31 May 2021 (continued)
Dimensional Fund Advisors Semi-Annual Report and Unaudited Financial Statements, 31 May 2021 217
Shares (000's)
Value(000's)
USD
% of NetAssetValue
Common Stock (continued)
Canada - 3.04% (continued)
11 Hydro One Ltd 279 0.02
9 iA Financial Corp Inc 505 0.04
14 IAMGOLD Corp 51 -
1 IBI Group Inc 13 -
8 IGM Financial Inc 287 0.02
6 Innergex Renewable Energy Inc 101 0.01
5 Intact Financial Corp 650 0.04
11 Inter Pipeline Ltd 156 0.01
4 Interfor Corp 95 0.01
4 Intertape Polymer Group Inc 104 0.01
8 Ivanhoe Mines Ltd 57 -
2 Jamieson Wellness Inc 54 -
- K-Bro Linen Inc 14 -
3 Keyera Corp 71 0.01
1 Kinaxis Inc 92 0.01
55 Kinross Gold Corp 449 0.03
4 Kirkland Lake Gold Ltd 154 0.01
1 Kirkland Lake Gold Ltd 52 -
2 Knight Therapeutics Inc 8 -
2 Labrador Iron Ore Royalty Corp 66 0.01
- Lassonde Industries Inc 27 -
2 Leon's Furniture Ltd 42 -
4 LifeWorks Inc 99 0.01
1 Lightspeed POS Inc 79 0.01
2 Linamar Corp 155 0.01
9 Loblaw Cos Ltd 580 0.04
13 Lucara Diamond Corp 9 -
16 Lundin Mining Corp 174 0.01
1 MAG Silver Corp 26 -
5 Magna International Inc 511 0.04
4 Martinrea International Inc 45 -
2 Maverix Metals Inc 10 -
2 MEG Energy Corp 14 -
2 Melcor Developments Ltd 19 -
10 Metro Inc 478 0.03
- Morguard Corp 48 -
- MTY Food Group Inc 15 -
4 Mullen Group Ltd 44 -
15 National Bank of Canada 1,177 0.08
1 Neo Performance Materials Inc 21 -
44 New Gold Inc 93 0.01
2 NFI Group Inc 49 -
3 North American Construction Group Ltd 44 -
3 North West Co Inc 77 0.01
5 Nutrien Ltd 301 0.02
45 OceanaGold Corp 96 0.01
15 Open Text Corp 686 0.05
4 Organigram Holdings Inc 12 -
9 Osisko Gold Royalties Ltd 124 0.01
1 Osisko Gold Royalties Ltd 21 -
6 Pan American Silver Corp 214 0.02
10 Parkland Corp 324 0.02
5 Pason Systems Inc 35 -
11 Pembina Pipeline Corp 349 0.02
7 Photon Control Inc 20 -
4 PHX Energy Services Corp 14 -
2 Polaris Infrastructure Inc 35 -
1 Precision Drilling Corp 29 -
1 Premium Brands Holdings Corp 65 0.01
5 Pretium Resources Inc 61 -
4 Primo Water Corp 73 0.01
10 Quarterhill Inc 20 -
Shares (000's)
Value(000's)
USD
% of NetAssetValue
Common Stock (continued)
Canada - 3.04% (continued)
10 Quebecor Inc 279 0.02
4 Real Matters Inc 53 -
4 Restaurant Brands International Inc (Canada listing) 247 0.02
3 Richelieu Hardware Ltd 96 0.01
4 Ritchie Bros Auctioneers Inc 251 0.02
16 Rogers Communications Inc 824 0.06
5 Rogers Sugar Inc 22 -
41 Royal Bank of Canada (Canada listing) 4,298 0.29
- Royal Bank of Canada (US listing) 16 -
3 Russel Metals Inc 87 0.01
4 Sandstorm Gold Ltd 38 -
4 Saputo Inc 148 0.01
1 Savaria Corp 16 -
1 Seabridge Gold Inc 23 -
11 Secure Energy Services Inc 37 -
20 Shaw Communications Inc 591 0.04
7 ShawCor Ltd 33 -
- Shopify Inc 249 0.02
1 Sienna Senior Living Inc 14 -
2 Sierra Wireless Inc (Canada listing) 37 -
1 Sierra Wireless Inc (US listing) 11 -
2 Slate Grocery REIT 19 -
2 Sleep Country Canada Holdings Inc 47 -
10 SNC-Lavalin Group Inc 274 0.02
2 Spin Master Corp 57 -
1 Sprott Inc 30 -
5 SSR Mining Inc 100 0.01
5 Stantec Inc 242 0.02
5 Stella-Jones Inc 199 0.01
15 Sun Life Financial Inc 804 0.06
2 SunOpta Inc 31 -
10 Superior Plus Corp 120 0.01
4 Taiga Building Products Ltd 10 -
7 Taseko Mines Ltd 17 -
- TECSYS Inc 10 -
1 TerraVest Industries Inc 13 -
3 TFI International Inc 252 0.02
3 Thomson Reuters Corp 277 0.02
23 Tidewater Midstream and Infrastructure Ltd 22 -
6 Timbercreek Financial Corp 44 -
1 TMX Group Ltd 103 0.01
1 Topicus.com Inc 50 -
7 Torex Gold Resources Inc 97 0.01
4 Toromont Industries Ltd 409 0.03
32 Toronto-Dominion Bank 2,294 0.16
5 Total Energy Services Inc 15 -
4 Transcontinental Inc 66 0.01
5 Trican Well Service Ltd 10 -
- Trisura Group Ltd 40 -
5 Turquoise Hill Resources Ltd 85 0.01
1 Uni-Select Inc 17 -
1 Viemed Healthcare Inc 9 -
2 Wajax Corp 38 -
3 Wesdome Gold Mines Ltd 24 -
4 West Fraser Timber Co Ltd 277 0.02
27 Western Forest Products Inc 49 -
9 Wheaton Precious Metals Corp 420 0.03
1 Wheaton Precious Metals Corp 24 -
1 Winpak Ltd 41 -
5 WSP Global Inc 567 0.04
Global Sustainability Core Equity FundPortfolio of Investments as at 31 May 2021 (continued)
Dimensional Fund Advisors Semi-Annual Report and Unaudited Financial Statements, 31 May 2021 218

Shares (000's)
Value(000's)
USD
% of NetAssetValue
Common Stock (continued)
Canada - 3.04% (continued)
2 Yamana Gold Inc 11 -
45 Yamana Gold Inc 234 0.02
44,582 3.04
Denmark - 0.83%
- ALK-Abello AS 115 0.01
2 Alm Brand AS 25 -
2 Ambu AS 66 -
7 Bang & Olufsen AS 35 -
4 Bavarian Nordic AS 159 0.01
- Brodrene Hartmann AS 23 -
4 Carlsberg AS 664 0.05
1 cBrain A/S 25 -
1 Chemometec AS 69 0.01
3 Chr Hansen Holding AS 247 0.02
3 Coloplast AS 432 0.03
32 Danske Bank AS 597 0.04
4 Demant AS 226 0.02
3 FLSmidth & Co AS 126 0.01
- Fluegger Group A/S 12 -
1 Genmab AS 571 0.04
3 GN Store Nord AS 230 0.02
6 H Lundbeck AS 181 0.01
11 ISS AS 237 0.02
3 Jyske Bank AS 174 0.01
1 Maersk Drilling AS 56 -
2 Matas AS 37 -
2 Netcompany Group AS 210 0.01
2 Nilfisk Holding AS 68 -
3 NKT AS 124 0.01
1 NNIT AS 12 -
- North Media AS 11 -
42 Novo Nordisk AS 3,317 0.23
7 Novozymes AS 493 0.03
- NTG Nordic Transport Group 25 -
2 Orsted AS 388 0.03
5 Pandora AS 709 0.05
1 Per Aarsleff Holding AS 63 -
3 Ringkjoebing Landbobank AS 270 0.02
3 Royal Unibrew AS 335 0.02
- RTX AS 9 -
- Schouw & Co AS 62 -
1 SimCorp AS 161 0.01
1 Solar AS 64 -
- SP Group AS 15 -
6 Spar Nord Bank AS 71 0.01
2 Sydbank AS 73 0.01
1 TCM Group 16 -
- Tivoli AS 11 -
4 Topdanmark AS 218 0.02
18 Tryg AS 422 0.03
20 Vestas Wind Systems 772 0.05
1 Zealand Pharma AS 18 -
12,244 0.83
Finland - 0.60%
4 Aktia Bank Oyj 56 -
- Alandsbanken Abp 11 -
1 Alma Media Oyj 11 -
1 Altia Oyj 10 -
- Asiakastieto Group Oyj 16 -
1 Aspo Oyj 12 -
- BasWare Oyj 10 -
2 Cargotec Oyj 90 0.01
Shares (000's)
Value(000's)
USD
% of NetAssetValue
Common Stock (continued)
Finland - 0.60% (continued)
7 Caverion Oyj 55 -
6 Elisa Oyj 328 0.02
1 Fiskars Oyj Abp 27 -
7 F-Secure Oyj 36 -
- Harvia Oyj 20 -
3 Huhtamaki Oyj 154 0.01
2 Kamux Corp 28 -
8 Kemira Oyj 130 0.01
9 Kesko Oyj, Class A 295 0.02
25 Kesko Oyj, Class B 875 0.06
1 Kojamo Oyj 32 -
5 Kone Oyj 432 0.03
3 Konecranes Oyj 137 0.01
2 Lassila & Tikanoja Oyj 30 -
- Marimekko Oyj 19 -
7 Metsa Board Oyj 81 0.01
8 Neles Oyj 113 0.01
10 Neste Oyj 652 0.05
146 Nokia Oyj 760 0.05
2 Nokian Renkaat Oyj 86 0.01
67 Nordea Bank Abp 730 0.05
1 Olvi Oyj 47 -
9 Oriola Oyj, Class B 19 -
1 Orion Oyj, Class A 39 -
4 Orion Oyj, Class B 153 0.01
19 Outokumpu Oyj 108 0.01
31 Outotec Oyj 373 0.03
1 Ponsse Oyj 33 -
1 QT Group Oyj 146 0.01
5 Raisio Oyj 28 -
1 Revenio Group Oyj 82 0.01
15 Sampo Oyj 708 0.05
3 Sanoma Oyj 54 -
16 Stora Enso Oyj 289 0.02
2 Talenom Oyj 29 -
7 Terveystalo Oyj 99 0.01
7 Tieto Oyj 239 0.02
2 Tikkurila Oyj 61 -
2 Tokmanni Group Corp 64 0.01
7 UPM-Kymmene Oyj 252 0.02
3 Uponor Oyj 93 0.01
1 Vaisala Oyj 36 -
8 Valmet Oyj 329 0.02
1 Verkkokauppa.com Oyj 11 -
20 Wartsila Oyj Abp 266 0.02
6 YIT Oyj 40 -
8,834 0.60
France - 3.19%
1 ABC arbitrage 12 -
1 Aeroports de Paris 163 0.01
14 Airbus SE 1,862 0.13
1 Akka Technologies 30 -
- AKWEL 10 -
14 ALD SA 207 0.02
5 Alstom SA 261 0.02
3 Alten SA 408 0.03
4 Amundi SA 334 0.02
4 Arkema SA 500 0.03
- Assystem SA 12 -
- ATEME SA 10 -
4 Atos SE 262 0.02
1 Aubay 25 -
Global Sustainability Core Equity FundPortfolio of Investments as at 31 May 2021 (continued)
Dimensional Fund Advisors Semi-Annual Report and Unaudited Financial Statements, 31 May 2021 219

Shares (000's)
Value(000's)
USD
% of NetAssetValue
Common Stock (continued)
France - 3.19% (continued)
42 AXA SA 1,171 0.08
1 Axway Software SA 23 -
- Bastide le Confort Medical 9 -
3 Beneteau SA 45 -
2 Bigben Interactive 40 -
1 BioMerieux 76 0.01
10 BNP Paribas SA 697 0.05
- Boiron SA 11 -
1 Bonduelle SCA 21 -
6 Bouygues SA 236 0.02
15 Bureau Veritas SA 463 0.03
5 Capgemini SE 896 0.06
38 Carrefour SA 783 0.05
1 Casino Guichard Perrachon SA 21 -
1 Cegedim SA 16 -
55 CGG SA 59 -
4 Cie de Saint-Gobain 239 0.02
- Cie des Alpes 12 -
2 Cie Plastic Omnium SA 83 0.01
3 Claranova SADIR 26 -
13 CNP Assurances 231 0.02
4 Coface SA 44 -
21 Credit Agricole SA 322 0.02
15 Danone SA 1,051 0.07
- Dassault Aviation SA 161 0.01
3 Dassault Systemes SE 695 0.05
- Delta Plus Group 11 -
7 Derichebourg SA 70 0.01
11 Edenred 612 0.04
7 Eiffage SA 790 0.05
6 Elior Group SA 51 -
8 Elis SA 150 0.01
- ESI Group 19 -
2 EssilorLuxottica SA 343 0.02
7 Eurofins Scientific SE 771 0.05
3 Euronext NV 278 0.02
6 Europcar Mobility Group 3 -
21 Eutelsat Communications SA 266 0.02
- Exel Industries 13 -
1 Faurecia 62 0.01
5 Faurecia SE 293 0.02
2 Fnac Darty SA 130 0.01
1 Gaztransport Et Technigaz SA 94 0.01
8 Getlink SE 122 0.01
- GL Events 8 -
- Groupe Crit 14 -
1 Guerbet 21 -
1 Hermes International 842 0.06
- Hexaom 11 -
- ID Logistics Group 25 -
1 Iliad SA 156 0.01
1 Imerys SA 48 -
- Infotel SA 26 -
2 Ipsen SA 234 0.02
3 IPSOS 120 0.01
1 Jacquet Metal Service SA 24 -
6 JCDecaux SA 163 0.01
2 Kaufman & Broad SA 93 0.01
2 Kering SA 2,116 0.14
3 Korian SA 105 0.01
3 Lagardere SCA 86 0.01
- Laurent-Perrier 11 -
Shares (000's)
Value(000's)
USD
% of NetAssetValue
Common Stock (continued)
France - 3.19% (continued)
1 Lectra 49 -
8 Legrand SA 844 0.06
- Linedata Services 12 -
1 LISI 27 -
- LNA Sante SA 11 -
5 L'Oreal SA 2,319 0.16
1 Lumibird 10 -
9 LVMH Moet Hennessy Louis Vuitton SE 7,311 0.50
3 Maisons du Monde SA 89 0.01
1 Manitou BF SA 20 -
- Manutan International 11 -
1 Mersen SA 36 -
2 Metropole Television SA 42 -
35 Natixis SA 171 0.01
- Neoen SA 16 -
2 Nexans SA 143 0.01
5 Nexity SA 276 0.02
2 NRJ Group 13 -
113 Orange SA 1,444 0.10
1 Orpea 168 0.01
2 Pernod Ricard SA 523 0.04
- Pharmagest Inter@ctive 30 -
14 Publicis Groupe SA 950 0.07
2 Quadient 56 -
1 Remy Cointreau SA 153 0.01
11 Renault SA 459 0.03
24 Rexel SA 479 0.03
- Robertet SA 15 -
3 Rothschild & Co 108 0.01
6 Rubis SCA 289 0.02
4 Safran SA 626 0.04
- Samse SA 17 -
9 Sanofi 915 0.06
1 Sartorius Stedim Biotech 283 0.02
- Savencia SA 15 -
8 Schneider Electric SE 1,239 0.09
15 SCOR SE 479 0.03
1 SEB SA 229 0.02
21 SES SA 171 0.01
3 SMCP SA 28 -
1 Societe BIC SA 113 0.01
17 Societe Generale SA 553 0.04
1 Societe pour l'Informatique Industrielle 19 -
4 Sodexo SA 381 0.03
3 Solocal Group 9 -
- Somfy SA 52 -
1 Sopra Steria Group 277 0.02
9 SPIE SA 212 0.02
- Stef SA 13 -
10 Suez 241 0.02
1 Sword Group 23 -
1 Synergie SA 39 -
2 Tarkett SA 43 -
5 Technip Energies NV 81 0.01
3 Teleperformance 1,060 0.07
6 Television Francaise 1 63 0.01
6 Thales SA 631 0.04
- Thermador Groupe 43 -
1 Tikehau Capital SCA 25 -
- Trigano SA 101 0.01
3 Ubisoft Entertainment SA 237 0.02
8 Valeo SA 257 0.02
Global Sustainability Core Equity FundPortfolio of Investments as at 31 May 2021 (continued)
Dimensional Fund Advisors Semi-Annual Report and Unaudited Financial Statements, 31 May 2021 220

Shares (000's)
Value(000's)
USD
% of NetAssetValue
Common Stock (continued)
France - 3.19% (continued)
2 Verallia 84 0.01
- Vetoquinol SA 13 -
1 Vilmorin & Cie SA 39 -
12 Vinci SA 1,318 0.09
- Virbac SA 17 -
12 Vivendi SA 443 0.03
1 Wavestone 33 -
7 Worldline SA 638 0.04
46,842 3.19
Germany - 2.44%
4 1&1 Drillisch AG 111 0.01
3 7C Solarparken AG 15 -
4 Aareal Bank AG 94 0.01
- Adesso SE 22 -
6 adidas AG 2,327 0.16
- ADO Properties SA 11 -
5 ADVA Optical Networking SE 66 -
2 Aixtron SE 49 -
- All for One Group AG 19 -
- Allgeier SE 11 -
6 Allianz SE 1,704 0.12
- Amadeus Fire AG 68 0.01
34 Aroundtown SA 285 0.02
- Atoss Software AG 70 0.01
1 Aumann AG 11 -
3 Aurubis AG 306 0.02
- Basler AG 14 -
1 Bauer AG 12 -
14 Bayerische Motoren Werke AG 1,525 0.10
2 BayWa AG 74 0.01
2 Bechtle AG 391 0.03
1 Befesa SA 72 0.01
1 Beiersdorf AG 129 0.01
- Bertrandt AG 22 -
2 Bilfinger SE 64 -
2 Borussia Dortmund GmbH & Co KGaA 17 -
7 Brenntag AG 608 0.04
2 CANCOM SE 113 0.01
1 Carl Zeiss Meditec AG 99 0.01
14 Ceconomy AG 80 0.01
1 CENIT AG 12 -
- Cewe Stiftung & Co KGaA 71 0.01
57 Commerzbank AG 463 0.03
1 CompuGroup Medical SE & Co KgaA 108 0.01
3 Continental AG 373 0.03
- Corestate Capital Holding SA 5 -
10 Covestro AG 728 0.05
1 CropEnergies AG 13 -
2 CTS Eventim AG & Co KGaA 120 0.01
34 Daimler AG 3,136 0.21
1 Delivery Hero SE 137 0.01
1 Dermapharm Holding SE 66 -
14 Deutsche Bank AG 212 0.01
1 Deutsche Beteiligungs AG 30 -
4 Deutsche Boerse AG 699 0.05
2 Deutsche EuroShop AG 43 -
4 Deutsche Pfandbriefbank AG 52 -
14 Deutsche Post AG 927 0.06
87 Deutsche Telekom AG 1,820 0.12
3 Deutsche Wohnen SE 174 0.01
6 Deutz AG 47 -
4 Dialog Semiconductor PLC 352 0.02
Shares (000's)
Value(000's)
USD
% of NetAssetValue
Common Stock (continued)
Germany - 2.44% (continued)
3 DIC Asset AG 53 -
- Dr Hoenle AG 10 -
- Draegerwerk AG & Co KGaA 27 -
2 Duerr AG 99 0.01
1 Eckert & Ziegler Strahlen- und Medizintechnik AG 61 -
2 ElringKlinger AG 28 -
5 Encavis AG 83 0.01
- Energiekontor AG 20 -
3 Evonik Industries AG 101 0.01
3 Evotec SE 113 0.01
- Fabasoft AG 11 -
2 Fielmann AG 156 0.01
1 flatexDEGIRO AG 128 0.01
1 Fraport AG Frankfurt Airport Services Worldwide 75 0.01
10 Freenet AG 263 0.02
4 Fresenius Medical Care AG & Co KGaA 313 0.02
10 Fresenius SE & Co KGaA 522 0.04
1 Fuchs Petrolub SE 43 -
5 GEA Group AG 217 0.02
1 Gesco AG 12 -
1 GFT Technologies SE 19 -
5 Grand City Properties SA 136 0.01
1 GRENKE AG 23 -
1 H&R GmbH & Co KGaA 11 -
1 Hamburger Hafen und Logistik AG 22 -
2 Hannover Rueck SE 314 0.02
- Hawesko Holding AG 11 -
1 Hella GmbH & Co KGaA 72 0.01
9 HelloFresh SE 832 0.06
2 Henkel AG & Co KGaA 173 0.01
1 Hornbach Baumarkt AG 32 -
1 Hornbach Holding AG & Co KGaA 96 0.01
4 Hugo Boss AG 206 0.01
- Hypoport AG 80 0.01
1 Indus Holding AG 43 -
4 Infineon Technologies AG 172 0.01
2 Instone Real Estate Group AG 67 0.01
1 IVU Traffic Technologies AG 17 -
2 Jenoptik AG 70 0.01
1 JOST Werke AG 48 -
9 K&S AG 130 0.01
4 KION Group AG 448 0.03
6 Kloeckner & Co SE 76 0.01
2 Knorr-Bremse AG 293 0.02
1 Koenig & Bauer AG 29 -
2 KPS AG 15 -
1 Krones AG 86 0.01
- KWS Saat SE & Co KGaA 42 -
4 Lanxess AG 276 0.02
1 LEG Immobilien AG 202 0.01
- Leifheit AG 22 -
1 Leoni AG 7 -
1 LPKF Laser & Electronics AG 23 -
- Medios AG 12 -
1 Merck KGaA 130 0.01
9 METRO AG 116 0.01
4 MLP SE 36 -
1 MTU Aero Engines AG 314 0.02
3 Muenchener Rueckversicherungs-Gesellschaft AGin Muenchen 797 0.05
- Nagarro SE 39 -
1 Nemetschek SE 106 0.01
Global Sustainability Core Equity FundPortfolio of Investments as at 31 May 2021 (continued)
Dimensional Fund Advisors Semi-Annual Report and Unaudited Financial Statements, 31 May 2021 221

Shares (000's)
Value(000's)
USD
% of NetAssetValue
Common Stock (continued)
Germany - 2.44% (continued)
- New Work SE 28 -
1 Nexus AG 60 -
5 Nordex SE 105 0.01
1 Norma Group SE 77 0.01
- OHB SE 11 -
2 Patrizia AG 44 -
- Pfeiffer Vacuum Technology AG 30 -
2 PNE AG 21 -
20 ProSiebenSat.1 Media SE 445 0.03
- PSI Software AG 16 -
3 Puma SE 281 0.02
1 PVA TePla AG 13 -
3 QIAGEN NV 162 0.01
1 QIAGEN NV 23 -
- Rational AG 205 0.01
3 Rheinmetall AG 342 0.02
3 RTL Group SA 148 0.01
2 S&T AG 44 -
3 SAF-Holland SE 45 -
- Salzgitter AG 11 -
11 SAP SE 1,576 0.11
- Schaltbau Holding AG 13 -
3 Scout24 AG 261 0.02
- Secunet Security Networks AG 15 -
9 Siemens AG 1,523 0.10
10 Siemens Energy AG 321 0.02
5 Siemens Healthineers AG 264 0.02
1 Sixt SE 144 0.01
- SMA Solar Technology AG 20 -
2 Software AG 77 0.01
1 Stabilus SA 89 0.01
1 Stratec SE 74 0.01
2 Stroeer SE & Co KGaA 134 0.01
1 SUESS MicroTec SE 16 -
- Surteco Group SE 11 -
4 Symrise AG 547 0.04
4 TAG Immobilien AG 140 0.01
2 Takkt AG 40 -
3 Talanx AG 116 0.01
7 TeamViewer AG 273 0.02
- Technotrans SE 12 -
35 Telefonica Deutschland Holding AG 96 0.01
12 thyssenkrupp AG 141 0.01
2 Uniper SE 89 0.01
8 United Internet AG 339 0.02
1 Varta AG 157 0.01
2 VERBIO Vereinigte BioEnergie AG 111 0.01
6 Vonovia SE 389 0.03
- Vossloh AG 14 -
1 Wacker Chemie AG 79 0.01
2 Wacker Neuson SE 69 0.01
- Washtec AG 27 -
1 Westwing Group AG 46 -
2 Wuestenrot & Wuerttembergische AG 36 -
3 Zalando SE 302 0.02
- Zeal Network SE 20 -
- zooplus AG 117 0.01
35,764 2.44
Hong Kong - 0.76%
306 AIA Group Ltd 4,084 0.28
120 APAC Resources Ltd 21 -
5 ASM Pacific Technology Ltd 61 0.01
Shares (000's)
Value(000's)
USD
% of NetAssetValue
Common Stock (continued)
Hong Kong - 0.76% (continued)
22 Bank of East Asia Ltd 46 -
20 BOC Aviation Ltd 182 0.01
67 BOC Hong Kong Holdings Ltd 247 0.02
46 BOCOM International Holdings Co Ltd 11 -
26 China Evergrande New Energy Vehicle Group 125 0.01
60 China Star Entertainment Ltd 10 -
1,480 China Strategic Holdings Ltd 24 -
17 Chinese Estates Holdings Ltd 8 -
9 Chong Hing Bank Ltd 23 -
26 Chow Sang Sang Holdings International Ltd 45 -
97 Chow Tai Fook Jewellery Group Ltd 181 0.01
75 CITIC Telecom International Holdings Ltd 25 -
43 CK Asset Holdings Ltd 296 0.02
194 CK Life Sciences Int'l Holdings Inc 18 -
30 C-Mer Eye Care Holdings Ltd 23 -
48 Crystal International Group Ltd 22 -
14 Dah Sing Banking Group Ltd 17 -
9 Dah Sing Financial Holdings Ltd 33 -
18 EC Healthcare 30 -
164 Esprit Holdings Ltd 16 -
83 Far East Consortium International Ltd 30 -
7 Fosun Tourism Group 15 -
3 Galaxy Entertainment Group Ltd 25 -
94 Giordano International Ltd 21 -
11 Great Eagle Holdings Ltd 38 -
82 Guotai Junan International Holdings Ltd 15 -
160 Haitong International Securities Group Ltd 50 0.01
7 Hang Lung Group Ltd 17 -
13 Hang Seng Bank Ltd 266 0.02
29 Henderson Land Development Co Ltd 141 0.01
38 HKBN Ltd 52 0.01
54 HKR International Ltd 26 -
14 Hong Kong Ferry Holdings Co Ltd 11 -
18 Hong Kong Television Network Ltd 22 -
2 Hongkong & Shanghai Hotels Ltd 2 -
22 Hysan Development Co Ltd 87 0.01
56 IGG Inc 83 0.01
13 Johnson Electric Holdings Ltd 35 -
27 JS Global Lifestyle Co Ltd 78 0.01
98 K Wah International Holdings Ltd 48 -
18 Kerry Logistics Network Ltd 55 0.01
33 Kerry Properties Ltd 114 0.01
90 Kingston Financial Group Ltd 7 -
12 Kowloon Development Co Ltd 15 -
11 Landing International Development Ltd - -
6 Lifestyle International Holdings Ltd 5 -
14 Liu Chong Hing Investment Ltd 15 -
21 L'Occitane International SA 71 0.01
29 Luk Fook Holdings International Ltd 81 0.01
44 Man Wah Holdings Ltd 98 0.01
27 Melco International Development Ltd 49 -
70 Midland Holdings Ltd 11 -
14 MTR Corp Ltd 78 0.01
52 NagaCorp Ltd 54 0.01
47 New World Development Co Ltd 258 0.02
46 NWS Holdings Ltd 52 0.01
52 Oriental Watch Holdings 25 -
58 Pacific Textiles Holdings Ltd 39 -
24 Perfect Shape Medical Ltd 25 -
78 Pico Far East Holdings Ltd 14 -
49 Power Assets Holdings Ltd 307 0.02
21 PRADA SpA 146 0.01
Global Sustainability Core Equity FundPortfolio of Investments as at 31 May 2021 (continued)
Dimensional Fund Advisors Semi-Annual Report and Unaudited Financial Statements, 31 May 2021 222

Shares (000's)
Value(000's)
USD
% of NetAssetValue
Common Stock (continued)
Hong Kong - 0.76% (continued)
90 Sa Sa International Holdings Ltd 22 -
56 Samsonite International SA 106 0.01
72 Shun Tak Holdings Ltd 23 -
97 Sino Land Co Ltd 155 0.01
27 Stella International Holdings Ltd 33 -
20 Sun Hung Kai Properties Ltd 305 0.02
44 SUNeVision Holdings Ltd 46 -
12 Swire Properties Ltd 37 -
18 TAI Cheung Holdings Ltd 11 -
85 Techtronic Industries Co Ltd 1,609 0.11
13 Television Broadcasts Ltd 13 -
11 Texhong Textile Group Ltd 16 -
120 Theme International Holdings Ltd 14 -
4 Transport International Holdings Ltd 8 -
40 United Laboratories International Holdings Ltd 36 -
114 Value Partners Group Ltd 78 0.01
3 Vitasoy International Holdings Ltd 13 -
6 Vobile Group Ltd 27 -
50 VSTECS Holdings Ltd 49 -
4 VTech Holdings Ltd 40 -
22 Wai Kee Holdings Ltd 12 -
36 Wharf Real Estate Investment Co Ltd 218 0.02
27 Wynn Macau Ltd 47 -
30 Xinyi Glass Holdings Ltd 117 0.01
82 Yunfeng Financial Group Ltd 30 -
250 Zensun Enterprises Ltd 20 -
11,214 0.76
Ireland - 0.16%
29 AIB Group PLC 96 0.01
56 Bank of Ireland Group PLC 364 0.03
53 Cairn Homes PLC 69 -
1 FBD Holdings PLC 11 -
3 Flutter Entertainment PLC (Ireland listing) 536 0.04
- Flutter Entertainment PLC (UK listing) 75 0.01
4 Glanbia PLC 59 -
41 Glenveagh Properties PLC 49 -
1 Kerry Group PLC 118 0.01
2 Kingspan Group PLC 183 0.01
6 Permanent TSB Group Holdings PLC 11 -
14 Smurfit Kappa Group PLC 731 0.05
2,302 0.16
Israel - 0.19%
1 AFI Properties Ltd 29 -
3 Airport City Ltd 49 -
1 Allot Ltd 23 -
4 Alony Hetz Properties & Investments Ltd 59 0.01
8 Amot Investments Ltd 56 0.01
1 Ashtrom Group Ltd 12 -
- AudioCodes Ltd 13 -
8 Azorim-Investment Development & Construction CoLtd 33 -
1 Azrieli Group Ltd 50 -
6 Bayside Land Corp 57 0.01
1 Bet Shemesh Engines Holdings 1997 Ltd 18 -
46 Bezeq The Israeli Telecommunication Corp Ltd 51 0.01
- Big Shopping Centers Ltd 33 -
- Blue Square Real Estate Ltd 12 -
- Brack Capital Properties NV 12 -
2 Camtek Ltd 54 0.01
3 Carasso Motors Ltd 16 -
1 Clal Insurance Enterprises Holdings Ltd 21 -
- Danel Adir Yeoshua Ltd 79 0.01
Shares (000's)
Value(000's)
USD
% of NetAssetValue
Common Stock (continued)
Israel - 0.19% (continued)
2 Delek Automotive Systems Ltd 28 -
- Delek Group Ltd 6 -
- Delta Galil Industries Ltd 14 -
- Electra Consumer Products 1970 Ltd 14 -
- Electra Ltd 56 0.01
6 Energix-Renewable Energies Ltd 24 -
27 Enlight Renewable Energy Ltd 57 0.01
1 Formula Systems 1985 Ltd 47 -
- Fox Wizel Ltd 37 -
1 Gilat Satellite Networks Ltd 11 -
- Hadera Paper Ltd 15 -
12 Harel Insurance Investments & Financial ServicesLtd 125 0.01
- Hilan Ltd 16 -
- IDI Insurance Co Ltd 14 -
25 Industrial Buildings Corp Ltd 75 0.01
4 Inrom Construction Industries Ltd 20 -
10 Isracard Ltd 41 -
6 Israel Chemicals Ltd 39 -
16 Israel Discount Bank Ltd 82 0.01
- Isras Investment Co Ltd 28 -
1 Magic Software Enterprises Ltd 23 -
- Malam - Team Ltd 13 -
2 Matrix IT Ltd 50 -
2 Maytronics Ltd 29 -
- Mehadrin Ltd 1 -
1 Melisron Ltd 54 0.01
3 Menora Mivtachim Holdings Ltd 62 0.01
22 Migdal Insurance & Financial Holdings Ltd 32 -
3 Mizrahi Tefahot Bank Ltd 83 0.01
1 Nice Ltd 182 0.01
1 Nova Measuring Instruments Ltd 58 0.01
12 Novolog Ltd 11 -
139 Oil Refineries Ltd 38 -
- One Software Technologies Ltd 35 -
2 OPC Energy Ltd 17 -
1 Paz Oil Co Ltd 99 0.01
1 Perion Network Ltd 12 -
10 Phoenix Holdings Ltd 90 0.01
- Prashkovsky Investments and Construction Ltd 12 -
- Rami Levy Chain Stores Hashikma Marketing2006 Ltd 18 -
1 Scope Metals Group Ltd 13 -
4 Shapir Engineering and Industry Ltd 35 -
7 Shikun & Binui Ltd 49 -
5 Shufersal Ltd 44 -
1 Strauss Group Ltd 31 -
- Tadiran Holdings Ltd 14 -
4 Tel Aviv Stock Exchange 22 -
15 Teva Pharmaceutical Industries Ltd 154 0.01
- YH Dimri Construction & Development Ltd 15 -
2,722 0.19
Italy - 0.80%
5 ACEA SpA 124 0.01
1 Alerion Cleanpower SpA 10 -
7 Amplifon SpA 331 0.02
13 Anima Holding SpA 66 0.01
9 Arnoldo Mondadori Editore SpA 20 -
7 Ascopiave SpA 32 -
35 Assicurazioni Generali SpA 729 0.05
12 Atlantia SpA 237 0.02
8 Autogrill SpA 65 0.01
Global Sustainability Core Equity FundPortfolio of Investments as at 31 May 2021 (continued)
Dimensional Fund Advisors Semi-Annual Report and Unaudited Financial Statements, 31 May 2021 223

Shares (000's)
Value(000's)
USD
% of NetAssetValue
Common Stock (continued)
Italy - 0.80% (continued)
1 Avio SpA 22 -
7 Azimut Holding SpA 170 0.01
7 Banca Farmafactoring SpA 63 -
3 Banca Generali SpA 141 0.01
1 Banca IFIS SpA 21 -
13 Banca Mediolanum SpA 122 0.01
5 Banca Popolare di Sondrio SCpA 24 -
31 Banco BPM SpA 110 0.01
3 BF SpA 13 -
55 BPER Banca 135 0.01
2 Brunello Cucinelli SpA 140 0.01
5 Cairo Communication SpA 10 -
2 Carel Industries SpA 59 -
5 Cerved Group SpA 61 -
41 CNH Industrial NV 699 0.05
2 Credito Emiliano SpA 14 -
1 Danieli & C Officine Meccaniche SpA 15 -
9 Davide Campari-Milano NV 120 0.01
2 De' Longhi SpA 85 0.01
1 DiaSorin SpA 145 0.01
7 Enav SpA 32 -
3 Esprinet SpA 53 -
2 Ferrari NV 451 0.03
19 Fincantieri SpA 17 -
22 FinecoBank Banca Fineco SpA 371 0.03
1 Gruppo MutuiOnline SpA 45 -
75 Hera SpA 317 0.02
1 Illimity Bank SpA 18 -
2 Interpump Group SpA 101 0.01
257 Intesa Sanpaolo SpA 753 0.05
6 Iren SpA 18 -
15 Italgas SpA 98 0.01
- Italmobiliare SpA 11 -
27 Leonardo SpA 233 0.02
7 Maire Tecnimont SpA 27 -
18 Mediaset SpA 63 -
33 Mediobanca Banca di Credito Finanziario SpA 395 0.03
10 Moncler SpA 711 0.05
6 Nexi SpA 133 0.01
10 OVS SpA 22 -
4 Piaggio & C SpA 14 -
3 Prysmian SpA 114 0.01
2 RAI Way SpA 10 -
3 Recordati SpA 181 0.01
11 Reno de Medici SpA 14 -
1 Reply SpA 175 0.01
49 Saipem SpA 122 0.01
30 Saras SpA 26 -
1 Sesa SpA 106 0.01
34 Snam SpA 203 0.01
11 Societa Cattolica di Assicurazioni SC 84 0.01
3 SOL SpA 55 -
120 Stellantis 2,355 0.16
6 Tamburi Investment Partners SpA 55 -
6 Technogym SpA 72 0.01
142 Telecom Italia SpA 76 0.01
4 Tenaris SA 47 -
15 Terna Rete Elettrica Nazionale SpA 115 0.01
1 Tinexta Spa 46 -
1 Unieuro SpA 40 -
Shares (000's)
Value(000's)
USD
% of NetAssetValue
Common Stock (continued)
Italy - 0.80% (continued)
25 Unipol Gruppo SpA 137 0.01
26 UnipolSai Assicurazioni SpA 77 0.01
11,776 0.80
Japan - 6.83%
2 77 Bank Ltd 29 -
1 A&D Co Ltd 8 -
1 ABC-Mart Inc 69 0.01
1 Access Co Ltd 11 -
1 Achilles Corp 17 -
10 Acom Co Ltd 47 -
1 Adastria Co Ltd 16 -
8 ADEKA Corp 142 0.01
- Ad-Sol Nissin Corp 9 -
1 Advan Co Ltd 12 -
4 Advantest Corp 360 0.03
15 AEON Co Ltd 405 0.03
1 AEON Delight Co Ltd 21 -
5 AEON Financial Service Co Ltd 61 0.01
2 AEON Hokkaido Corp 19 -
1 Agro-Kanesho Co Ltd 11 -
1 Ai Holdings Corp 26 -
2 Aica Kogyo Co Ltd 59 0.01
1 Aichi Corp 9 -
- Aichi Steel Corp 11 -
3 Aida Engineering Ltd 22 -
20 Aiful Corp 69 0.01
1 Ain Holdings Inc 86 0.01
12 Air Water Inc 202 0.02
3 Aisan Industry Co Ltd 23 -
1 Akatsuki Inc 19 -
1 Albis Co Ltd 13 -
12 Alfresa Holdings Corp 185 0.01
1 Alinco Inc 11 -
1 Alpen Co Ltd 32 -
- Alpha Systems Inc 13 -
7 Alps Alpine Co Ltd 74 0.01
1 Altech Corp 25 -
13 Amada Holdings Co Ltd 146 0.01
1 Amano Corp 29 -
- Amvis Holdings Inc 24 -
1 Anabuki Kosan Inc 12 -
1 Anest Iwata Corp 9 -
3 Anicom Holdings Inc 23 -
8 Anritsu Corp 153 0.01
1 Aomori Bank Ltd 10 -
1 Aoyama Trading Co Ltd 8 -
1 Aoyama Zaisan Networks Co Ltd 12 -
4 Aozora Bank Ltd 99 0.01
2 Arakawa Chemical Industries Ltd 22 -
1 Arata Corp 23 -
1 Arcland Sakamoto Co Ltd 17 -
2 Arcs Co Ltd 44 -
1 Argo Graphics Inc 19 -
1 ARTERIA Networks Corp 21 -
1 ArtSpark Holdings Inc 18 -
2 Aruhi Corp 23 -
- As One Corp 23 -
2 Asahi Co Ltd 19 -
5 Asahi Diamond Industrial Co Ltd 23 -
9 Asahi Group Holdings Ltd 435 0.03
7 Asahi Holdings Inc 143 0.01
4 Asahi Intecc Co Ltd 107 0.01
Global Sustainability Core Equity FundPortfolio of Investments as at 31 May 2021 (continued)
Dimensional Fund Advisors Semi-Annual Report and Unaudited Financial Statements, 31 May 2021 224

Shares (000's)
Value(000's)
USD
% of NetAssetValue
Common Stock (continued)
Japan - 6.83% (continued)
45 Asahi Kasei Corp 504 0.04
1 Asahi Kogyosha Co Ltd 19 -
1 Asahi Yukizai Corp 7 -
1 Asanuma Corp 21 -
4 Asics Corp 91 0.01
1 ASKA Pharmaceutical Holdings 13 -
3 ASKUL Corp 42 -
21 Astellas Pharma Inc 343 0.02
1 Atom Corp 8 -
1 Atrae Inc 16 -
5 Autobacs Seven Co Ltd 71 0.01
2 Avant Corp 22 -
1 Avex Inc 11 -
1 Awa Bank Ltd 10 -
2 Axial Retailing Inc 54 0.01
2 Azbil Corp 85 0.01
5 Bandai Namco Holdings Inc 337 0.02
2 Bando Chemical Industries Ltd 14 -
1 Bank of Iwate Ltd 10 -
1 Bank of Kyoto Ltd 76 0.01
1 Bank of Nagoya Ltd 20 -
- Bank of Okinawa Ltd 10 -
2 Bank of the Ryukyus Ltd 16 -
1 BayCurrent Consulting Inc 241 0.02
1 Beenos Inc 32 -
1 Belc Co Ltd 46 -
2 Bell System24 Holdings Inc 36 -
4 Belluna Co Ltd 40 -
5 Benefit One Inc 130 0.01
4 Benesse Holdings Inc 93 0.01
- Bengo4.com Inc 24 -
4 Bic Camera Inc 41 -
2 BML Inc 65 0.01
- BrainPad Inc 13 -
4 Broadleaf Co Ltd 18 -
6 Brother Industries Ltd 128 0.01
5 Bunka Shutter Co Ltd 51 -
1 C Uyemura & Co Ltd 47 -
1 CAC Holdings Corp 10 -
2 Calbee Inc 47 -
1 Canon Electronics Inc 17 -
7 Canon Inc 162 0.01
2 Canon Marketing Japan Inc 59 0.01
6 Capcom Co Ltd 190 0.01
1 Careerlink Co Ltd 18 -
1 Carenet, Inc 44 -
2 Carlit Holdings Co Ltd 11 -
4 Casio Computer Co Ltd 73 0.01
1 Cawachi Ltd 16 -
1 Central Automotive Products Ltd 13 -
1 Central Japan Railway Co 150 0.01
1 Central Security Patrols Co Ltd 21 -
1 Ceres Inc 21 -
2 Change Inc 43 -
9 Chiba Bank Ltd 61 0.01
- Chilled & Frozen Logistics Holdings Co Ltd 6 -
1 Chodai Co Ltd 12 -
1 Chofu Seisakusho Co Ltd 21 -
1 Chubu Shiryo Co Ltd 9 -
2 Chudenko Corp 35 -
14 Chugai Pharmaceutical Co Ltd 518 0.04
3 Chugoku Bank Ltd 24 -
Shares (000's)
Value(000's)
USD
% of NetAssetValue
Common Stock (continued)
Japan - 6.83% (continued)
3 Chugoku Marine Paints Ltd 27 -
7 CI Takiron Corp 37 -
7 Citizen Watch Co Ltd 27 -
2 CKD Corp 54 0.01
5 Coca-Cola Bottlers Japan Holdings Inc 92 0.01
1 Cocokara fine Inc 59 0.01
2 COLOPL Inc 18 -
1 Computer Engineering & Consulting Ltd 10 -
7 COMSYS Holdings Corp 201 0.02
1 Comture Corp 32 -
1 CONEXIO Corp 16 -
9 COOKPAD Inc 22 -
2 Cosel Co Ltd 22 -
2 Cosmo Energy Holdings Co Ltd 34 -
1 Cosmos Pharmaceutical Corp 140 0.01
1 CRE Inc 12 -
2 Create Restaurants Holdings Inc 18 -
1 Create SD Holdings Co Ltd 44 -
2 Creek & River Co Ltd 21 -
1 Cresco Ltd 12 -
1 CTI Engineering Co Ltd 27 -
16 CyberAgent Inc 318 0.02
1 Cybernet Systems Co Ltd 10 -
1 Cybozu Inc 29 -
4 Dai Nippon Printing Co Ltd 80 0.01
1 Dai Nippon Toryo Co Ltd 8 -
2 Daibiru Corp 21 -
17 Daicel Corp 136 0.01
1 Dai-Dan Co Ltd 32 -
2 Daido Steel Co Ltd 99 0.01
3 Daifuku Co Ltd 241 0.02
1 Daihen Corp 40 -
1 Daiho Corp 34 -
1 Daiichi Jitsugyo Co Ltd 28 -
2 Daiichi Kigenso Kagaku-Kogyo Co Ltd 35 -
18 Dai-ichi Life Holdings Inc 383 0.03
6 Daiichi Sankyo Co Ltd 129 0.01
1 Daiichikosho Co Ltd 23 -
1 Daiken Corp 21 -
2 Daiki Aluminium Industry Co Ltd 22 -
3 Daikin Industries Ltd 560 0.04
- Daikokutenbussan Co Ltd 27 -
1 Dainichiseika Color & Chemicals Manufacturing CoLtd 30 -
2 Daio Paper Corp 23 -
1 Daiseki Co Ltd 31 -
1 Daishi Hokuetsu Financial Group Inc 20 -
1 Daito Pharmaceutical Co Ltd 18 -
5 Daito Trust Construction Co Ltd 501 0.04
22 Daiwa House Industry Co Ltd 632 0.04
3 Daiwa Industries Ltd 30 -
20 Daiwa Securities Group Inc 116 0.01
6 Daiwabo Holdings Co Ltd 101 0.01
6 DCM Holdings Co Ltd 52 -
3 Dear Life Co Ltd 12 -
4 DeNA Co Ltd 91 0.01
1 Denka Co Ltd 50 -
- Densan System Co Ltd 11 -
3 Denso Corp 212 0.02
6 Dentsu Inc 216 0.02
1 Denyo Co Ltd 15 -
2 Dexerials Corp 37 -
Global Sustainability Core Equity FundPortfolio of Investments as at 31 May 2021 (continued)
Dimensional Fund Advisors Semi-Annual Report and Unaudited Financial Statements, 31 May 2021 225

Shares (000's)
Value(000's)
USD
% of NetAssetValue
Common Stock (continued)
Japan - 6.83% (continued)
6 DIC Corp 149 0.01
1 Digital Arts Inc 51 -
1 Digital Garage Inc 33 -
1 Digital Hearts Holdings Co Ltd 9 -
1 Digital Holdings Inc 10 -
2 Dip Corp 50 -
- Disco Corp 122 0.01
1 DKS Co Ltd 17 -
7 DMG Mori Co Ltd 129 0.01
2 Doshisha Co Ltd 23 -
4 Dowa Holdings Co Ltd 152 0.01
2 DTS Corp 38 -
2 Duskin Co Ltd 58 0.01
1 DyDo Group Holdings Inc 23 -
2 Eagle Industry Co Ltd 21 -
2 East Japan Railway Co 170 0.01
4 Ebara Corp 182 0.01
1 Ebara Foods Industry Inc 12 -
- Ebara Jitsugyo Co Ltd 17 -
1 Ebase Co Ltd 10 -
1 Eco's Co Ltd 19 -
4 EDION Corp 43 -
2 EF-ON Inc 18 -
1 eGuarantee Inc 24 -
1 E-Guardian Inc 16 -
2 Ehime Bank Ltd 12 -
1 Eiken Chemical Co Ltd 24 -
5 Eisai Co Ltd 309 0.02
1 Eizo Corp 43 -
1 EJ Holdings Inc 11 -
1 Elan Corp 11 -
1 Elecom Co Ltd 15 -
3 Elematec Corp 30 -
1 Enigmo Inc 18 -
3 en-japan Inc 96 0.01
2 EPS Holdings Inc 34 -
1 eRex Co Ltd 24 -
4 ES-Con Japan Ltd 27 -
1 ESPEC Corp 16 -
2 Exedy Corp 32 -
2 Ezaki Glico Co Ltd 81 0.01
3 F@N Communications Inc 11 -
1 Falco Holdings Co Ltd 17 -
5 Fancl Corp 143 0.01
1 FANUC Corp 192 0.01
1 Fast Retailing Co Ltd 1,138 0.08
1 FCC Co Ltd 17 -
1 Feed One Co Ltd 8 -
2 Ferrotec Holdings Corp 50 -
1 FINDEX Inc 11 -
1 FJ Next Co Ltd 14 -
1 Foster Electric Co Ltd 12 -
3 FP Corp 128 0.01
2 France Bed Holdings Co Ltd 15 -
- Freee KK 22 -
2 Fronteo Inc 10 -
1 Fudo Tetra Corp 10 -
1 Fuji Co Ltd 23 -
1 Fuji Corp 11 -
3 Fuji Corp (Aichi) 83 0.01
2 Fuji Corp Ltd 10 -
3 Fuji Electric Co Ltd 122 0.01
Shares (000's)
Value(000's)
USD
% of NetAssetValue
Common Stock (continued)
Japan - 6.83% (continued)
1 Fuji Furukawa Engineering & Construction 13 -
3 Fuji Media Holdings Inc 34 -
5 Fuji Seal International Inc 101 0.01
1 Fuji Soft Inc 70 0.01
1 Fujicco Co Ltd 10 -
4 FUJIFILM Holdings Corp 275 0.02
3 Fujikura Kasei Co Ltd 14 -
17 Fujikura Ltd 76 0.01
1 Fujimi Inc 32 -
1 Fujimori Kogyo Co Ltd 53 0.01
3 Fujitec Co Ltd 77 0.01
1 Fujitsu General Ltd 34 -
3 Fujitsu Ltd 440 0.03
1 Fujiya Co Ltd 17 -
1 Fukuda Corp 23 -
- Fukuda Denshi Co Ltd 16 -
1 Fukui Computer Holdings Inc 20 -
4 Fukuoka Financial Group Inc 86 0.01
1 Fukushima Industries Corp 27 -
1 Fukuyama Transporting Co Ltd 48 -
2 FULLCAST Holdings Co Ltd 30 -
2 Funai Soken Holdings Inc 35 -
2 Furukawa Co Ltd 27 -
2 Furukawa Electric Co Ltd 62 0.01
1 Furuno Electric Co Ltd 10 -
2 Furusato Industries Ltd 24 -
2 Furyu Corp 17 -
1 Fuso Chemical Co Ltd 22 -
1 Futaba Corp 11 -
4 Futaba Industrial Co Ltd 18 -
1 Future Corp 13 -
2 Fuyo General Lease Co Ltd 154 0.01
1 G-7 Holdings Inc 22 -
1 Genky DrugStores Co Ltd 18 -
3 Geo Holdings Corp 26 -
- giftee Inc 12 -
1 Giken Ltd 29 -
- Globeride Inc 15 -
3 Glory Ltd 72 0.01
- GMO Cloud KK 18 -
3 GMO Financial Holdings Inc 20 -
4 GMO Internet Inc 120 0.01
2 GMO Payment Gateway Inc 191 0.01
1 GNI Group Ltd 23 -
1 Goldcrest Co Ltd 18 -
2 Goldwin Inc 83 0.01
1 Grace Technology Inc 23 -
7 Gree Inc 34 -
2 GS Yuasa Corp 51 -
2 G-Tekt Corp 22 -
2 Gumi Inc 24 -
3 GungHo Online Entertainment Inc 62 0.01
15 Gunma Bank Ltd 50 -
6 H2O Retailing Corp 51 -
10 Hachijuni Bank Ltd 36 -
1 Hagihara Industries Inc 11 -
7 Hakuhodo DY Holdings Inc 112 0.01
2 Hakuto Co Ltd 30 -
1 Halows Co Ltd 18 -
1 Hamakyorex Co Ltd 20 -
1 Hamamatsu Photonics KK 55 0.01
3 Hankyu Hanshin Holdings Inc 107 0.01
Global Sustainability Core Equity FundPortfolio of Investments as at 31 May 2021 (continued)
Dimensional Fund Advisors Semi-Annual Report and Unaudited Financial Statements, 31 May 2021 226

Shares (000's)
Value(000's)
USD
% of NetAssetValue
Common Stock (continued)
Japan - 6.83% (continued)
3 Hanwa Co Ltd 97 0.01
2 Happinet Corp 26 -
- Harmonic Drive Systems Inc 16 -
28 Haseko Corp 399 0.03
13 Hazama Ando Corp 101 0.01
2 Heiwa Corp 39 -
2 Heiwa Real Estate Co Ltd 73 0.01
2 Heiwado Co Ltd 41 -
- Hennge KK 9 -
1 Hibiya Engineering Ltd 10 -
1 Hikari Tsushin Inc 99 0.01
12 Hino Motors Ltd 117 0.01
1 Hinokiya Group Co Ltd 11 -
- Hioki EE Corp 14 -
1 Hirano Tecseed Co Ltd 14 -
1 Hirata Corp 30 -
1 Hirose Electric Co Ltd 73 0.01
4 Hiroshima Gas Co Ltd 15 -
2 Hisaka Works Ltd 16 -
1 Hisamitsu Pharmaceutical Co Inc 39 -
3 Hitachi Construction Machinery Co Ltd 108 0.01
25 Hitachi Ltd 1,338 0.09
4 Hitachi Metals Ltd 77 0.01
2 Hitachi Transport System Ltd 74 0.01
16 Hitachi Zosen Corp 104 0.01
1 Hochiki Corp 10 -
- Hodogaya Chemical Co Ltd 14 -
1 Hogy Medical Co Ltd 24 -
1 Hokkaido Gas Co Ltd 11 -
2 Hokkan Holdings Ltd 22 -
2 Hokko Chemical Industry Co Ltd 17 -
1 Hokkoku Bank Ltd 19 -
6 Hokuetsu Corp 35 -
1 Hokuetsu Industries Co Ltd 12 -
2 Hokuhoku Financial Group Inc 17 -
1 Hokuriku Electrical Construction Co Ltd 11 -
14 Honda Motor Co Ltd 444 0.03
2 Honeys Holdings Co Ltd 17 -
4 Hoosiers Holdings 30 -
2 Horiba Ltd 128 0.01
1 Hoshizaki Corp 54 0.01
1 Hosokawa Micron Corp 27 -
2 House Foods Group Inc 56 0.01
1 Hoya Corp 118 0.01
15 Hulic Co Ltd 165 0.01
9 Hyakugo Bank Ltd 26 -
1 Hyakujushi Bank Ltd 9 -
1 Ibiden Co Ltd 46 -
14 Ichigo Inc 44 -
2 Ichikoh Industries Ltd 11 -
3 Ichinen Holdings Co Ltd 34 -
1 Icom Inc 20 -
2 Idec Corp 40 -
4 IDOM Inc 24 -
10 IHI Corp 236 0.02
6 Iida Group Holdings Co Ltd 159 0.01
1 I'll Inc 17 -
3 Inaba Denki Sangyo Co Ltd 68 0.01
1 Inaba Seisakusho Co Ltd 11 -
1 Inageya Co Ltd 19 -
2 Ines Corp 20 -
2 Infocom Corp 49 -
Shares (000's)
Value(000's)
USD
% of NetAssetValue
Common Stock (continued)
Japan - 6.83% (continued)
9 Infomart Corp 80 0.01
1 Information Services International-Dentsu Ltd 35 -
2 Insource Co Ltd 34 -
2 Intage Holdings Inc 35 -
1 IR Japan Holdings Ltd 89 0.01
2 ISB Corp 23 -
1 Iseki & Co Ltd 11 -
16 Isetan Mitsukoshi Holdings Ltd 115 0.01
1 Ishihara Sangyo Kaisha Ltd 12 -
15 Isuzu Motors Ltd 198 0.01
2 Itfor Inc 15 -
1 ITmedia Inc 10 -
3 Ito En Ltd 147 0.01
8 Itochu Enex Co Ltd 69 0.01
3 Itochu Techno-Solutions Corp 92 0.01
- Itochu-Shokuhin Co Ltd 14 -
3 Itoki Corp 9 -
4 Iwaki & Co Ltd 25 -
3 Iwatani Corp 168 0.01
9 Iyo Bank Ltd 48 -
1 Izumi Co Ltd 45 -
7 J Front Retailing Co Ltd 67 0.01
1 JAC Recruitment Co Ltd 18 -
1 Jaccs Co Ltd 28 -
2 Jafco Co Ltd 138 0.01
1 Jamco Corp 12 -
1 Japan Airport Terminal Co Ltd 46 -
3 Japan Aviation Electronics Industry Ltd 48 -
3 Japan Elevator Service Holdings Co Ltd 59 0.01
18 Japan Exchange Group Inc 415 0.03
3 Japan Foundation Engineering Co Ltd 13 -
2 Japan Lifeline Co Ltd 20 -
2 Japan Material Co Ltd 18 -
1 Japan Meat Co Ltd 13 -
1 Japan Medical Dynamic Marketing Inc 17 -
6 Japan Post Insurance Co Ltd 115 0.01
1 Japan Pulp & Paper Co Ltd 23 -
6 Japan Securities Finance Co Ltd 48 -
2 Japan Steel Works Ltd 60 0.01
3 Japan Wool Textile Co Ltd 28 -
2 JCR Pharmaceuticals Co Ltd 57 0.01
1 JCU Corp 37 -
2 JDC Corp 11 -
1 Jeol Ltd 72 0.01
9 JGC Holdings Corp 88 0.01
- JINS Holdings Inc 30 -
- JMDC Inc 13 -
1 J-Oil Mills Inc 22 -
2 Joshin Denki Co Ltd 39 -
2 Joyful Honda Co Ltd 29 -
2 JSP Corp 24 -
5 JSR Corp 143 0.01
- J-Stream Inc 8 -
6 JTEKT Corp 64 0.01
- JTOWER Inc 11 -
3 Juki Corp 19 -
1 Juroku Bank Ltd 13 -
2 Justsystems Corp 86 0.01
19 JVCKenwood Corp 39 -
1 Kadokawa Dwango 42 -
1 Kagome Co Ltd 27 -
25 Kajima Corp 341 0.02
Global Sustainability Core Equity FundPortfolio of Investments as at 31 May 2021 (continued)
Dimensional Fund Advisors Semi-Annual Report and Unaudited Financial Statements, 31 May 2021 227

Shares (000's)
Value(000's)
USD
% of NetAssetValue
Common Stock (continued)
Japan - 6.83% (continued)
6 Kakaku.com Inc 173 0.01
1 Kaken Pharmaceutical Co Ltd 62 0.01
1 Kameda Seika Co Ltd 21 -
4 Kamigumi Co Ltd 86 0.01
1 Kanaden Corp 9 -
3 Kanamoto Co Ltd 70 0.01
6 Kandenko Co Ltd 54 0.01
3 Kaneka Corp 107 0.01
6 Kanematsu Corp 80 0.01
1 Kanematsu Electronics Ltd 20 -
3 Kansai Paint Co Ltd 81 0.01
1 Kansai Super Market Ltd 10 -
1 Kanto Denka Kogyo Co Ltd 11 -
7 Kao Corp 448 0.03
1 Katakura Industries Co Ltd 13 -
4 Katitas Co Ltd 102 0.01
1 Kato Sangyo Co Ltd 33 -
8 Kawasaki Heavy Industries Ltd 206 0.02
69 KDDI Corp 2,369 0.16
1 KeePer Technical Laboratory Co Ltd 21 -
2 Keihan Holdings Co Ltd 71 0.01
1 Keihanshin Building Co Ltd 10 -
8 Keikyu Corp 103 0.01
2 Keio Corp 146 0.01
2 Keisei Electric Railway Co Ltd 61 0.01
5 Keiyo Bank Ltd 21 -
2 Keiyo Co Ltd 10 -
4 Kewpie Corp 101 0.01
1 Keyence Corp 494 0.04
1 KFC Holdings Japan Ltd 23 -
1 KH Neochem Co Ltd 26 -
3 Kikkoman Corp 218 0.02
5 Kinden Corp 91 0.01
2 Kintetsu Group Holdings Co Ltd 74 0.01
4 Kintetsu World Express Inc 100 0.01
10 Kirin Holdings Co Ltd 208 0.02
1 Kissei Pharmaceutical Co Ltd 23 -
4 Kitanotatsujin Corp 16 -
2 Kito Corp 26 -
3 Kitz Corp 18 -
2 Kiyo Bank Ltd 29 -
2 KLab Inc 16 -
1 Kobayashi Pharmaceutical Co Ltd 71 0.01
4 Kobe Bussan Co Ltd 102 0.01
1 Koei Tecmo Holdings Co Ltd 30 -
2 Kohnan Shoji Co Ltd 63 0.01
1 Kohsoku Corp 9 -
2 Koito Manufacturing Co Ltd 125 0.01
4 Kojima Co Ltd 27 -
6 Kokuyo Co Ltd 96 0.01
15 Komatsu Ltd 461 0.03
2 Komatsu Matere Co Ltd 21 -
1 KOMEDA Holdings Co Ltd 22 -
1 Komeri Co Ltd 31 -
4 Komori Corp 29 -
2 Konami Holdings Corp 161 0.01
10 Konica Minolta Inc 57 0.01
3 Konishi Co Ltd 41 -
1 Konoike Transport Co Ltd 8 -
- Kose Corp 48 -
- Krosaki Harima Corp 8 -
13 K's Holdings Corp 161 0.01
Shares (000's)
Value(000's)
USD
% of NetAssetValue
Common Stock (continued)
Japan - 6.83% (continued)
17 Kubota Corp 400 0.03
3 Kumagai Gumi Co Ltd 74 0.01
2 Kumiai Chemical Industry Co Ltd 12 -
1 Kurabo Industries Ltd 10 -
7 Kuraray Co Ltd 75 0.01
1 Kureha Corp 53 0.01
1 Kurimoto Ltd 22 -
3 Kurita Water Industries Ltd 166 0.01
2 Kuriyama Holdings Corp 11 -
1 Kusuri no Aoki Holdings Co Ltd 49 -
1 KYB Corp 45 -
3 Kyocera Corp 197 0.01
- Kyodo Printing Co Ltd 10 -
2 Kyokuto Kaihatsu Kogyo Co Ltd 24 -
1 Kyokuyo Co Ltd 13 -
2 KYORIN Holdings Inc 35 -
5 Kyosan Electric Manufacturing Co Ltd 19 -
7 Kyowa Exeo Corp 169 0.01
3 Kyudenko Corp 91 0.01
9 Kyushu Financial Group Inc 34 -
2 Kyushu Railway Co 55 0.01
2 Lasertec Corp 440 0.03
6 Lawson Inc 270 0.02
1 Life Corp 31 -
3 Lifull Co Ltd 9 -
2 Link And Motivation Inc 9 -
5 Lintec Corp 102 0.01
7 Lion Corp 122 0.01
- LITALICO Inc 15 -
6 LIXIL Group Corp 160 0.01
1 M&A Capital Partners Co Ltd 26 -
11 M3 Inc 719 0.05
1 Mabuchi Motor Co Ltd 39 -
4 Macnica Fuji Electronics Holdings Inc 85 0.01
1 Macromill Inc 11 -
8 Maeda Corp 73 0.01
1 Maeda Kosen Co Ltd 25 -
1 Maeda Road Construction Co Ltd 24 -
2 Maezawa Kyuso Industries Co Ltd 21 -
1 Makino Milling Machine Co Ltd 48 -
3 Makita Corp 153 0.01
1 Mandom Corp 12 -
2 Mani Inc 50 -
1 MarkLines Co Ltd 14 -
3 Maruha Nichiro Corp 65 0.01
4 Marui Group Co Ltd 80 0.01
1 Maruichi Steel Tube Ltd 23 -
4 Marusan Securities Co Ltd 28 -
1 Maruwa Unyu Kikan Co Ltd 20 -
- Maruzen Co Ltd 8 -
1 Maruzen Showa Unyu Co Ltd 22 -
3 Marvelous Inc 22 -
1 Matsuda Sangyo Co Ltd 14 -
4 Matsui Securities Co Ltd 29 -
3 Matsumotokiyoshi Holdings Co Ltd 139 0.01
1 Max Co Ltd 21 -
2 Maxell Holdings Ltd 18 -
1 Maxvalu Tokai Co Ltd 20 -
25 Mazda Motor Corp 222 0.02
2 McDonald's Holdings Co Japan Ltd 85 0.01
2 MCJ Co Ltd 17 -
36 Mebuki Financial Group Inc 78 0.01
Global Sustainability Core Equity FundPortfolio of Investments as at 31 May 2021 (continued)
Dimensional Fund Advisors Semi-Annual Report and Unaudited Financial Statements, 31 May 2021 228

Shares (000's)
Value(000's)
USD
% of NetAssetValue
Common Stock (continued)
Japan - 6.83% (continued)
1 MEC Co Ltd 15 -
- Media Do Holdings Co Ltd 20 -
1 Medical Data Vision Co Ltd 26 -
2 Medical System Network Co Ltd 11 -
7 Medipal Holdings Corp 141 0.01
1 MedPeer Inc 44 -
3 Megmilk Snow Brand Co Ltd 52 0.01
2 Meidensha Corp 47 -
5 MEIJI Holdings Co Ltd 292 0.02
2 Meisei Industrial Co Ltd 11 -
2 Meitec Corp 110 0.01
1 Melco Holdings Inc 26 -
1 Members Co Ltd 13 -
1 Menicon Co Ltd 57 0.01
1 Mercari Inc 24 -
1 Metawater Co Ltd 11 -
1 Milbon Co Ltd 61 0.01
1 Mimasu Semiconductor Industry Co Ltd 23 -
6 Minebea Mitsumi Inc 178 0.01
1 Minkabu The Infonoid Inc 21 -
4 Miraca Holdings Inc 105 0.01
6 Mirait Holdings Corp 101 0.01
1 Miroku Jyoho Service Co Ltd 9 -
6 MISUMI Group Inc 184 0.01
1 Mitani Corp 32 -
2 Mitsuba Corp 15 -
35 Mitsubishi Chemical Holdings Corp 286 0.02
32 Mitsubishi Electric Corp 496 0.04
21 Mitsubishi Estate Co Ltd 340 0.02
4 Mitsubishi Gas Chemical Co Inc 96 0.01
12 Mitsubishi Heavy Industries Ltd 370 0.03
3 Mitsubishi Logisnext Co Ltd 32 -
3 Mitsubishi Logistics Corp 79 0.01
27 Mitsubishi Motors Corp 75 0.01
2 Mitsubishi Pencil Co Ltd 34 -
- Mitsubishi Research Institute Inc 15 -
1 Mitsubishi Shokuhin Co Ltd 23 -
191 Mitsubishi UFJ Financial Group Inc 1,098 0.08
37 Mitsubishi UFJ Lease & Finance Co Ltd 211 0.02
1 Mitsuboshi Belting Ltd 11 -
8 Mitsui Chemicals Inc 260 0.02
6 Mitsui E&S Holdings Co Ltd 29 -
15 Mitsui Fudosan Co Ltd 367 0.03
5 Mitsui Mining & Smelting Co Ltd 154 0.01
1 Mitsui-Soko Holdings Co Ltd 15 -
1 Mitsuuroko Group Holdings Co Ltd 11 -
1 Miura Co Ltd 23 -
3 Mixi Inc 76 0.01
1 Miyazaki Bank Ltd 9 -
15 Mizuho Financial Group Inc 228 0.02
2 Mizuho Leasing Co Ltd 64 0.01
2 Mizuno Corp 33 -
1 Mochida Pharmaceutical Co Ltd 33 -
2 Modec Inc 37 -
9 Monex Group Inc 67 0.01
- Monogatari Corp 24 -
9 MonotaRO Co Ltd 200 0.02
3 Morinaga & Co Ltd 81 0.01
1 Morinaga Milk Industry Co Ltd 68 0.01
2 Morita Holdings Corp 26 -
2 MrMax Holdings Ltd 9 -
8 MS&AD Insurance Group Holdings Inc 245 0.02
Shares (000's)
Value(000's)
USD
% of NetAssetValue
Common Stock (continued)
Japan - 6.83% (continued)
1 M-up Holdings Inc 19 -
2 Murata Manufacturing Co Ltd 121 0.01
3 Nabtesco Corp 163 0.01
1 Nachi-Fujikoshi Corp 19 -
1 Nafco Co Ltd 12 -
1 Nagaileben Co Ltd 14 -
7 Nagase & Co Ltd 102 0.01
1 Nagatanien Holdings Co Ltd 18 -
- Nagawa Co Ltd 31 -
6 Nagoya Railroad Co Ltd 119 0.01
4 Nakabayashi Co Ltd 22 -
- Nakanishi Inc 10 -
2 Nankai Electric Railway Co Ltd 34 -
1 Natori Co Ltd 12 -
1 NEC Capital Solutions Ltd 9 -
8 NEC Corp 369 0.03
4 NEC Networks & System Integration Corp 58 0.01
4 NET One Systems Co Ltd 128 0.01
3 Nexon Co Ltd 81 0.01
2 Nextage Co Ltd 33 -
1 NGK Insulators Ltd 27 -
12 NHK Spring Co Ltd 92 0.01
2 Nichias Corp 52 -
1 Nichiden Corp 20 -
1 Nichiha Corp 33 -
1 Nichi-iko Pharmaceutical Co Ltd 7 -
4 Nichirei Corp 108 0.01
1 Nichireki Co Ltd 18 -
1 Nichirin Co Ltd 11 -
7 Nidec Corp 803 0.06
6 Nifco Inc 193 0.01
1 Nihon Chouzai Co Ltd 13 -
1 Nihon Dengi Co Ltd 24 -
1 Nihon Flush Co Ltd 10 -
5 Nihon Kohden Corp 148 0.01
12 Nihon M&A Center Inc 302 0.02
2 Nihon Nohyaku Co Ltd 10 -
8 Nihon Parkerizing Co Ltd 77 0.01
6 Nihon Unisys Ltd 180 0.01
3 Nikkiso Co Ltd 32 -
3 Nikko Co Ltd 21 -
2 Nikkon Holdings Co Ltd 38 -
9 Nikon Corp 92 0.01
4 Nintendo Co Ltd 2,291 0.16
2 Nippo Corp 52 0.01
1 Nippon Chemical Industrial Co Ltd 18 -
1 Nippon Commercial Development Co Ltd 25 -
2 Nippon Densetsu Kogyo Co Ltd 33 -
3 Nippon Express Co Ltd 226 0.02
1 Nippon Fine Chemical Co Ltd 10 -
1 Nippon Flour Mills Co Ltd 20 -
6 Nippon Gas Co Ltd 99 0.01
1 Nippon Kanzai Co Ltd 13 -
11 Nippon Kayaku Co Ltd 100 0.01
1 Nippon Koei Co Ltd 29 -
5 Nippon Light Metal Holdings Co Ltd 94 0.01
2 Nippon Paint Holdings Co Ltd 36 -
2 Nippon Paper Industries Co Ltd 21 -
7 Nippon Parking Development Co Ltd 9 -
2 Nippon Pillar Packing Co Ltd 26 -
- Nippon Rietec Co Ltd 5 -
- Nippon Road Co Ltd 14 -
Global Sustainability Core Equity FundPortfolio of Investments as at 31 May 2021 (continued)
Dimensional Fund Advisors Semi-Annual Report and Unaudited Financial Statements, 31 May 2021 229

Shares (000's)
Value(000's)
USD
% of NetAssetValue
Common Stock (continued)
Japan - 6.83% (continued)
2 Nippon Seiki Co Ltd 20 -
1 Nippon Sharyo Ltd 10 -
1 Nippon Shinyaku Co Ltd 101 0.01
1 Nippon Shokubai Co Ltd 56 0.01
2 Nippon Signal Company Ltd 17 -
1 Nippon Soda Co Ltd 40 -
1 Nippon Steel Trading Corp 40 -
13 Nippon Suisan Kaisha Ltd 62 0.01
1 Nippon Systemware Co Ltd 13 -
16 Nippon Telegraph & Telephone Corp 433 0.03
5 Nippon Thompson Co Ltd 27 -
7 Nipro Corp 83 0.01
3 Nishimatsu Construction Co Ltd 83 0.01
2 Nishimatsuya Chain Co Ltd 23 -
5 Nishi-Nippon Financial Holdings Inc 33 -
2 Nishi-Nippon Railroad Co Ltd 38 -
2 Nishio Rent All Co Ltd 50 -
5 Nissan Chemical Corp 262 0.02
23 Nissan Motor Co Ltd 117 0.01
4 Nissan Shatai Co Ltd 23 -
- Nissei ASB Machine Co Ltd 15 -
2 Nissei Plastic Industrial Co Ltd 18 -
2 Nisshin Fudosan Co 11 -
1 Nisshin Oillio Group Ltd 39 -
3 Nisshin Seifun Group Inc 49 -
4 Nisshinbo Holdings Inc 34 -
1 Nissin Corp 11 -
3 Nissin Electric Co Ltd 35 -
1 Nissin Foods Holdings Co Ltd 44 -
1 Nitori Holdings Co Ltd 207 0.02
1 Nitta Corp 26 -
1 Nitto Boseki Co Ltd 19 -
5 Nitto Denko Corp 371 0.03
1 Nitto Kogyo Corp 19 -
1 Nitto Kohki Co Ltd 10 -
4 Nitto Seiko Co Ltd 20 -
1 Nittoc Construction Co Ltd 10 -
1 NJS Co Ltd 13 -
1 Noevir Holdings Co Ltd 47 -
2 NOF Corp 100 0.01
1 Nohmi Bosai Ltd 11 -
2 Nojima Corp 67 0.01
49 Nomura Holdings Inc 269 0.02
1 Nomura Micro Science Co Ltd 21 -
10 Nomura Real Estate Holdings Inc 257 0.02
6 Nomura Research Institute Ltd 196 0.01
1 Noritake Co Ltd Japan 19 -
1 Noritsu Koki Co Ltd 26 -
2 Noritz Corp 42 -
1 NS Solutions Corp 39 -
2 NSD Co Ltd 38 -
4 NSK Ltd 43 -
12 NTN Corp 34 -
20 NTT Data Corp 319 0.02
- Obara Group Inc 14 -
21 Obayashi Corp 183 0.01
1 OBIC Business Consultants Co Ltd 33 -
1 Obic Co Ltd 225 0.02
3 Odakyu Electric Railway Co Ltd 92 0.01
2 Ogaki Kyoritsu Bank Ltd 28 -
1 Ohki Healthcare Holdings Co Ltd 10 -
- Ohsho Food Service Corp 20 -
Shares (000's)
Value(000's)
USD
% of NetAssetValue
Common Stock (continued)
Japan - 6.83% (continued)
1 Oiles Corp 10 -
1 Oisix ra daichi Inc 23 -
15 Oji Holdings Corp 88 0.01
6 Okabe Co Ltd 36 -
1 Okamoto Industries Inc 19 -
4 Okamura Corp 50 -
10 Okasan Securities Group Inc 40 -
4 Oki Electric Industry Co Ltd 40 -
1 Okinawa Cellular Telephone Co 45 -
1 OKUMA Corp 68 0.01
2 Okumura Corp 42 -
1 Okura Industrial Co Ltd 13 -
2 Okuwa Co Ltd 16 -
27 Olympus Corp 582 0.04
1 Omron Corp 71 0.01
4 Ono Pharmaceutical Co Ltd 98 0.01
2 Onoken Co Ltd 23 -
3 Onward Holdings Co Ltd 9 -
3 Open House Co Ltd 158 0.01
1 Optim Corp 18 -
1 Optorun Co Ltd 22 -
1 Oracle Corp Japan 127 0.01
- Organo Corp 18 -
42 Orient Corp 60 0.01
1 Oriental Land Co Ltd 74 0.01
10 Oriental Shiraishi Corp 26 -
1 Oro Co Ltd 22 -
8 Osaka Gas Co Ltd 147 0.01
1 Osaka Organic Chemical Industry Ltd 38 -
1 Osaka Soda Co Ltd 18 -
4 Osaki Electric Co Ltd 21 -
3 OSG Corp 55 0.01
5 Otsuka Corp 259 0.02
3 Otsuka Holdings Co Ltd 147 0.01
7 Outsourcing Inc 129 0.01
2 Oyo Corp 22 -
1 Pacific Industrial Co Ltd 12 -
1 Pack Corp 36 -
2 Paltac Corporation 101 0.01
7 Pan Pacific International Holdings Corp 150 0.01
40 Panasonic Corp 451 0.03
1 Paramount Bed Holdings Co Ltd 19 -
6 Park24 Co Ltd 119 0.01
1 Pasona Group Inc 26 -
19 Penta-Ocean Construction Co Ltd 137 0.01
3 PeptiDream Inc 143 0.01
15 Persol Holdings Co Ltd 299 0.02
3 Pigeon Corp 98 0.01
2 Pilot Corp 59 0.01
3 Pola Orbis Holdings Inc 70 0.01
2 Poletowin Pitcrew Holdings Inc 24 -
1 Premium Group Co Ltd 14 -
4 Press Kogyo Co Ltd 13 -
2 Pressance Corp 25 -
5 Prestige International Inc 33 -
63 Prospect Co Ltd 18 -
3 Proto Corp 33 -
2 PS Mitsubishi Construction Co Ltd 11 -
1 QB Net Holdings Co Ltd 19 -
2 Qol Holdings Co Ltd 22 -
1 Quick Co Ltd 11 -
3 Raito Kogyo Co Ltd 48 -
Global Sustainability Core Equity FundPortfolio of Investments as at 31 May 2021 (continued)
Dimensional Fund Advisors Semi-Annual Report and Unaudited Financial Statements, 31 May 2021 230

Shares (000's)
Value(000's)
USD
% of NetAssetValue
Common Stock (continued)
Japan - 6.83% (continued)
1 Raiznext Corp 9 -
5 Rakus Co Ltd 94 0.01
4 Rakuten Inc 50 -
1 Rasa Industries Ltd 20 -
1 Raysum Co Ltd 8 -
33 Recruit Holdings Co Ltd 1,676 0.12
1 Relia Inc 14 -
8 Relo Group Inc 161 0.01
15 Rengo Co Ltd 128 0.01
3 RENOVA Inc 101 0.01
1 Retail Partners Co Ltd 9 -
16 Ricoh Co Ltd 188 0.01
1 Ricoh Leasing Co Ltd 47 -
1 Riken Keiki Co Ltd 23 -
2 Riken Technos Corp 12 -
1 Riken Vitamin Co Ltd 9 -
1 Rinnai Corp 70 0.01
1 Rion Co Ltd 14 -
1 Riso Kagaku Corp 14 -
6 Rohto Pharmaceutical Co Ltd 158 0.01
1 Roland Corp 28 -
1 Roland DG Corp 25 -
1 Rorze Corp 44 -
1 Ryobi Ltd 7 -
1 Ryoden Corp 10 -
12 Ryohin Keikaku Co Ltd 233 0.02
1 Ryosan Co Ltd 22 -
1 Ryoyo Electro Corp 24 -
1 S Foods Inc 21 -
- S&B Foods Inc 13 -
1 Saibu Gas Co Ltd 20 -
1 Saizeriya Co Ltd 24 -
- Sakai Moving Service Co Ltd 15 -
5 Sakata INX Corp 48 -
1 Sakata Seed Corp 20 -
3 Sala Corp 15 -
3 SAMTY Co Ltd 53 0.01
1 San-A Co Ltd 43 -
5 San-Ai Oil Co Ltd 59 0.01
3 Sangetsu Corp 38 -
1 San-In Godo Bank Ltd 7 -
4 Sanki Engineering Co Ltd 57 0.01
1 Sankyo Co Ltd 27 -
5 Sankyo Seiko Co Ltd 25 -
2 Sankyu Inc 88 0.01
- Sansan Inc 29 -
1 Sanshin Electronics Co Ltd 12 -
10 Santen Pharmaceutical Co Ltd 135 0.01
17 Sanwa Holdings Corp 214 0.02
1 Sanyo Chemical Industries Ltd 51 -
- Sanyo Denki Co Ltd 21 -
1 Sanyo Trading Co Ltd 14 -
3 Sapporo Holdings Ltd 68 0.01
1 Sato Holdings Corp 29 -
1 Sawai Group Holdings Co Ltd 61 0.01
1 SB Technology Corp 14 -
7 SBI Holdings Inc 168 0.01
2 SBS Holdings Inc 54 0.01
1 SCREEN Holdings Co Ltd 65 0.01
2 Scroll Corp 19 -
2 SCSK Corp 137 0.01
3 Secom Co Ltd 261 0.02
Shares (000's)
Value(000's)
USD
% of NetAssetValue
Common Stock (continued)
Japan - 6.83% (continued)
4 Sega Sammy Holdings Inc 51 -
4 Seibu Holdings Inc 51 -
1 Seika Corp 23 -
1 Seikagaku Corp 8 -
1 Seikitokyu Kogyo Co Ltd 10 -
6 Seiko Epson Corp 111 0.01
1 Seiko Holdings Corp 18 -
2 Seiko PMC Corp 15 -
4 Seino Holdings Co Ltd 62 0.01
1 Seiren Co Ltd 22 -
15 Sekisui House Ltd 309 0.02
1 Sekisui Jushi Corp 29 -
4 Sekisui Plastics Co Ltd 21 -
9 Senko Group Holdings Co Ltd 84 0.01
1 Senshu Electric Co Ltd 24 -
9 Senshu Ikeda Holdings Inc 13 -
3 Septeni Holdings Co Ltd 12 -
2 Seria Co Ltd 76 0.01
14 Seven & i Holdings Co Ltd 638 0.04
44 Seven Bank Ltd 93 0.01
11 SG Holdings Co Ltd 246 0.02
6 Sharp Corp 114 0.01
1 Shibaura Mechatronics Corp 29 -
1 Shibuya Corp 37 -
- SHIFT Inc 55 0.01
2 Shiga Bank Ltd 28 -
4 Shikoku Chemicals Corp 42 -
2 Shima Seiki Manufacturing Ltd 42 -
6 Shimadzu Corp 216 0.02
1 Shimamura Co Ltd 115 0.01
1 Shimano Inc 159 0.01
16 Shimizu Corp 132 0.01
1 Shin Nippon Air Technologies Co Ltd 20 -
- Shinagawa Refractories Co Ltd 13 -
3 Shin-Etsu Chemical Co Ltd 520 0.04
3 Shin-Etsu Polymer Co Ltd 25 -
1 Shinko Electric Industries Co Ltd 48 -
4 Shinmaywa Industries Ltd 37 -
1 Shinnihon Corp 10 -
1 Shinnihonseiyaku Co Ltd 12 -
3 Shinoken Group Co Ltd 36 -
7 Shinsei Bank Ltd 121 0.01
1 Shinwa Co Ltd 12 -
3 Shionogi & Co Ltd 133 0.01
3 Ship Healthcare Holdings Inc 63 0.01
3 Shiseido Co Ltd 246 0.02
12 Shizuoka Bank Ltd 96 0.01
3 Shizuoka Gas Co Ltd 30 -
1 SHO-BOND Holdings Co Ltd 50 -
1 Shoei Co Ltd 36 -
1 Shoei Foods Corp 26 -
4 Showa Denko KK 129 0.01
1 SigmaXYZ Inc 23 -
1 Sinanen Holdings Co Ltd 13 -
1 Sinfonia Technology Co Ltd 11 -
1 Sinko Industries Ltd 25 -
3 Sintokogio Ltd 18 -
- SK Kaken Co Ltd 36 -
10 SKY Perfect JSAT Holdings Inc 40 -
4 Skylark Holdings Co Ltd 50 -
- SMC Corp 180 0.01
5 SMS Co Ltd 126 0.01
Global Sustainability Core Equity FundPortfolio of Investments as at 31 May 2021 (continued)
Dimensional Fund Advisors Semi-Annual Report and Unaudited Financial Statements, 31 May 2021 231

Shares (000's)
Value(000's)
USD
% of NetAssetValue
Common Stock (continued)
Japan - 6.83% (continued)
3 Sodick Co Ltd 30 -
36 SoftBank Group Corp 2,750 0.19
1 Softcreate Holdings Corp 10 -
- Software Service Inc 31 -
2 Sohgo Security Services Co Ltd 112 0.01
1 Soken Chemical & Engineering Co Ltd 16 -
3 Solasto Corp 31 -
1 Soliton Systems KK 19 -
7 Sompo Holdings Inc 290 0.02
27 Sony Corp 2,705 0.19
2 Sotetsu Holdings Inc 37 -
8 Sourcenext Corp 22 -
3 Space Value Holdings Co Ltd 22 -
4 Sparx Group Co Ltd 9 -
5 S-Pool Inc 40 -
2 Square Enix Holdings Co Ltd 134 0.01
1 SRA Holdings 24 -
1 Star Mica Holdings Co Ltd 10 -
2 Star Micronics Co Ltd 30 -
2 Starts Corp Inc 64 0.01
1 Stella Chemifa Corp 21 -
1 Strike Co Ltd 19 -
1 Studio Alice Co Ltd 14 -
15 Subaru Corp 302 0.02
1 Sugi Holdings Co Ltd 110 0.01
1 Sugimoto & Co Ltd 21 -
2 Sumida Corp 21 -
2 Sumitomo Bakelite Co Ltd 102 0.01
76 Sumitomo Chemical Co Ltd 424 0.03
5 Sumitomo Dainippon Pharma Co Ltd 106 0.01
1 Sumitomo Densetsu Co Ltd 27 -
14 Sumitomo Electric Industries Ltd 223 0.02
6 Sumitomo Forestry Co Ltd 114 0.01
5 Sumitomo Heavy Industries Ltd 170 0.01
4 Sumitomo Metal Mining Co Ltd 201 0.02
11 Sumitomo Mitsui Construction Co Ltd 46 -
22 Sumitomo Mitsui Financial Group Inc 808 0.06
8 Sumitomo Mitsui Trust Holdings Inc 283 0.02
7 Sumitomo Realty & Development Co Ltd 231 0.02
1 Sumitomo Seika Chemicals Co Ltd 33 -
1 Sumitomo Warehouse Co Ltd 11 -
2 Sun Frontier Fudousan Co Ltd 14 -
3 Sundrug Co Ltd 102 0.01
5 Suntory Beverage & Food Ltd 202 0.02
8 Suruga Bank Ltd 26 -
3 Sushiro Global Holdings Ltd 129 0.01
3 Suzuken Co Ltd Japan 88 0.01
4 Suzuki Motor Corp 175 0.01
2 SWCC Showa Holdings Co Ltd 34 -
5 Sysmex Corp 560 0.04
4 Systena Corp 67 0.01
2 Syuppin Co Ltd 21 -
1 T Hasegawa Co Ltd 14 -
13 T&D Holdings Inc 184 0.01
1 T&K Toka Co Ltd 9 -
2 Tachi-S Co Ltd 23 -
5 Tadano Ltd 46 -
1 Taihei Dengyo Kaisha Ltd 19 -
3 Taikisha Ltd 78 0.01
1 Taiko Pharmaceutical Co Ltd 14 -
9 Taisei Corp 332 0.02
1 Taisei Lamick Co Ltd 12 -
Shares (000's)
Value(000's)
USD
% of NetAssetValue
Common Stock (continued)
Japan - 6.83% (continued)
1 Taisho Pharmaceutical Holdings Co Ltd 29 -
1 Taiyo Holdings Co Ltd 60 0.01
3 Taiyo Nippon Sanso Corp 55 0.01
1 Takamatsu Construction Group Co Ltd 9 -
2 Takamiya Co Ltd 10 -
1 Takaoka Toko Co Ltd 14 -
1 Takara Bio Inc 22 -
6 Takara Holdings Inc 80 0.01
8 Takara Leben Co Ltd 24 -
1 Takara Printing Co Ltd 13 -
1 Takara Standard Co Ltd 22 -
1 Takasago International Corp 22 -
3 Takasago Thermal Engineering Co Ltd 57 0.01
6 Takashimaya Co Ltd 73 0.01
26 Takeda Pharmaceutical Co Ltd 892 0.06
2 Takeei Corp 19 -
2 Takeuchi Manufacturing Co Ltd 51 -
5 Takuma Co Ltd 85 0.01
1 Tama Home Co Ltd 14 -
3 Tanseisha Co Ltd 26 -
3 Tatsuta Electric Wire and Cable Co Ltd 14 -
1 Tayca Corp 10 -
2 Tazmo Co Ltd 23 -
2 TechMatrix Corp 26 -
3 TechnoPro Holdings Inc 209 0.02
13 Teijin Ltd 207 0.02
1 Teikoku Sen-I Co Ltd 20 -
1 Tekken Corp 22 -
1 Tenma Corp 29 -
7 Terumo Corp 278 0.02
1 T-Gaia Corp 17 -
2 THK Co Ltd 69 0.01
7 TIS Inc 172 0.01
1 TKC Corp 25 -
2 Toa Corp (non-voting rights) 57 0.01
2 Toa Corp (voting rights) 13 -
5 Toagosei Co Ltd 53 0.01
2 Tobishima Corp 21 -
2 Tobu Railway Co Ltd 56 0.01
2 TOC Co Ltd 16 -
4 Tocalo Co Ltd 47 -
10 Toda Corp 77 0.01
- Toei Animation Co Ltd 44 -
- Toei Co Ltd 41 -
1 Toenec Corp 37 -
1 Toho Co Ltd 33 -
2 Toho Gas Co Ltd 122 0.01
5 Toho Holdings Co Ltd 76 0.01
1 Toho Titanium Co Ltd 11 -
1 Toho Zinc Co Ltd 22 -
3 Tokai Carbon Co Ltd 52 -
1 Tokai Corp 17 -
2 Tokai Rika Co Ltd 31 -
8 Tokai Tokyo Financial Holdings Inc 29 -
1 Token Corp 44 -
11 Tokio Marine Holdings Inc 530 0.04
1 Tokushu Tokai Paper Co Ltd 20 -
2 Tokyo Broadcasting System Holdings Inc 36 -
3 Tokyo Century Corp 164 0.01
3 Tokyo Electron Ltd 1,360 0.09
1 Tokyo Energy & Systems Inc 12 -
9 Tokyo Gas Co Ltd 172 0.01
Global Sustainability Core Equity FundPortfolio of Investments as at 31 May 2021 (continued)
Dimensional Fund Advisors Semi-Annual Report and Unaudited Financial Statements, 31 May 2021 232

Shares (000's)
Value(000's)
USD
% of NetAssetValue
Common Stock (continued)
Japan - 6.83% (continued)
1 Tokyo Kiraboshi Financial Group Inc 12 -
2 Tokyo Ohka Kogyo Co Ltd 139 0.01
2 Tokyo Seimitsu Co Ltd 89 0.01
3 Tokyo Steel Manufacturing Co Ltd 27 -
12 Tokyo Tatemono Co Ltd 180 0.01
1 Tokyotokeiba Co Ltd 25 -
4 Tokyu Construction Co Ltd 28 -
11 Tokyu Corp 154 0.01
32 Tokyu Fudosan Holdings Corp 194 0.01
1 Tomoe Engineering Co Ltd 23 -
1 Tomoku Co Ltd 23 -
7 TOMONY Holdings Inc 20 -
7 Tomy Co Ltd 63 0.01
- Tonami Holdings Co Ltd 14 -
6 Topcon Corp 92 0.01
2 Toppan Forms Co Ltd 25 -
4 Toppan Printing Co Ltd 63 0.01
2 Topre Corp 30 -
65 Toray Industries Inc 426 0.03
2 Toridoll Holdings Corp 26 -
1 Torishima Pump Manufacturing Co Ltd 12 -
2 Tosei Corp 18 -
6 Toshiba Corp 261 0.02
1 Toshiba Machine Co Ltd 28 -
1 Toshiba TEC Corp 51 -
1 Tosho Co Ltd 23 -
1 Totech Corp 16 -
2 Totetsu Kogyo Co Ltd 37 -
1 TOTO Ltd 72 0.01
3 Tow Co Ltd 10 -
1 Towa Corp 20 -
1 Towa Pharmaceutical Co Ltd 23 -
5 Toyo Construction Co Ltd 26 -
3 Toyo Engineering Corp 21 -
- Toyo Gosei Co Ltd 21 -
4 Toyo Ink SC Holdings Co Ltd 72 0.01
1 Toyo Kanetsu KK 24 -
6 Toyo Seikan Group Holdings Ltd 80 0.01
3 Toyo Suisan Kaisha Ltd 135 0.01
1 Toyo Tanso Co Ltd 26 -
6 Toyobo Co Ltd 71 0.01
1 Toyoda Gosei Co Ltd 28 -
5 Toyota Boshoku Corp 97 0.01
2 Toyota Industries Corp 138 0.01
2 TPR Co Ltd 30 -
- Trancom Co Ltd 16 -
1 Transaction Co Ltd 12 -
1 Transcosmos Inc 41 -
6 Trend Micro Inc 295 0.02
4 Trusco Nakayama Corp 95 0.01
3 Trust Tech Inc 30 -
5 TS Tech Co Ltd 74 0.01
2 TSI Holdings Co Ltd 6 -
2 Tsubaki Nakashima Co Ltd 26 -
1 Tsubakimoto Chain Co 40 -
- Tsubakimoto Kogyo Co Ltd 13 -
2 Tsugami Corp 35 -
- Tsumura & Co 13 -
1 Tsuruha Holdings Inc 134 0.01
1 Tsurumi Manufacturing Co Ltd 18 -
2 TV Asahi Holdings Corp 28 -
1 Tv Tokyo Holdings Corp 22 -
Shares (000's)
Value(000's)
USD
% of NetAssetValue
Common Stock (continued)
Japan - 6.83% (continued)
2 UACJ Corp 46 -
1 Uchida Yoko Co Ltd 22 -
1 Ulvac Inc 46 -
3 Unicharm Corp 135 0.01
3 Unipres Corp 27 -
1 United Arrows Ltd 10 -
1 UNITED Inc 11 -
5 United Super Markets Holdings Inc 54 0.01
1 Universal Entertainment Corp 13 -
1 Usen-Next Holdings Co Ltd 23 -
5 Ushio Inc 70 0.01
6 USS Co Ltd 100 0.01
2 UT Group Co Ltd 65 0.01
4 Valor Holdings Co Ltd 76 0.01
1 Valqua Ltd 23 -
1 ValueCommerce Co Ltd 28 -
1 V-Cube Inc 13 -
1 Vector Inc 9 -
1 Vital KSK Holdings Inc 9 -
10 VT Holdings Co Ltd 42 -
3 Wacoal Holdings Corp 72 0.01
6 Wacom Co Ltd 41 -
2 Wakachiku Construction Co Ltd 23 -
1 Wakita & Co Ltd 13 -
2 Watahan & Co Ltd 28 -
1 WDB Holdings Co Ltd 21 -
- Weathernews Inc 15 -
4 Welcia Holdings Co Ltd 136 0.01
2 West Holdings Corp 59 0.01
2 West Japan Railway Co 114 0.01
1 Will Group Inc 12 -
1 WIN-Partners Co Ltd 9 -
1 Wood One Co Ltd 15 -
1 Workman Co Ltd 48 -
1 World Co Ltd 12 -
1 World Holdings Co Ltd 17 -
- Wowow Inc 8 -
3 Xebio Holdings Co Ltd 23 -
1 Yahagi Construction Co Ltd 9 -
3 Yakult Honsha Co Ltd 183 0.01
1 YAKUODO Holdings Co Ltd 22 -
2 Yamabiko Corp 24 -
1 Yamada Consulting Group Co Ltd 11 -
38 Yamada Denki Co Ltd 184 0.01
8 Yamaguchi Financial Group Inc 50 -
1 Yamaha Corp 48 -
4 Yamaha Motor Co Ltd 132 0.01
3 YA-MAN Ltd 36 -
2 Yamato Corp 13 -
6 Yamato Holdings Co Ltd 169 0.01
7 Yamazaki Baking Co Ltd 107 0.01
3 Yamazen Corp 27 -
1 Yaoko Co Ltd 65 0.01
3 Yaskawa Electric Corp 137 0.01
2 Yellow Hat Ltd 41 -
2 Yodogawa Steel Works Ltd 37 -
3 Yokogawa Bridge Holdings Corp 56 0.01
5 Yokogawa Electric Corp 83 0.01
2 Yokohama Reito Co Ltd 19 -
1 Yokowo Co Ltd 19 -
1 Yondenko Corp 25 -
1 Yondoshi Holdings Inc 22 -
Global Sustainability Core Equity FundPortfolio of Investments as at 31 May 2021 (continued)
Dimensional Fund Advisors Semi-Annual Report and Unaudited Financial Statements, 31 May 2021 233

Shares (000's)
Value(000's)
USD
% of NetAssetValue
Common Stock (continued)
Japan - 6.83% (continued)
2 Yotai Refractories Co Ltd 18 -
1 Yuasa Trading Co Ltd 22 -
2 Yurtec Corp 16 -
48 Z Holdings Corp 231 0.02
2 Zenkoku Hosho Co Ltd 83 0.01
1 Zenrin Co Ltd 8 -
2 Zensho Holdings Co Ltd 50 -
7 Zeon Corp 105 0.01
1 ZERIA Pharmaceutical Co Ltd 12 -
4 ZOZO Inc 122 0.01
1 Zuiko Corp 11 -
100,277 6.83
Netherlands - 1.56%
4 Aalberts NV 220 0.02
18 ABN AMRO Bank NV 243 0.02
1 Accell Group NV 81 0.01
- Adyen NV 870 0.06
96 Aegon NV 457 0.03
2 Akzo Nobel NV 241 0.02
1 AMG Advanced Metallurgical Group NV 41 -
2 Amsterdam Commodities NV 61 -
4 APERAM SA 194 0.01
6 Arcadis NV 282 0.02
1 ASM International NV 456 0.03
9 ASML Holding NV (Netherlands listing) 6,113 0.42
15 ASR Nederland NV 630 0.04
1 B&S Group 13 -
2 Basic-Fit NV 85 0.01
2 BE Semiconductor Industries NV 161 0.01
2 Brunel International NV 31 -
7 Coca-Cola European Partners PLC 416 0.03
1 Coca-Cola European Partners PLC (US listing) 40 -
3 Corbion NV 156 0.01
3 Flow Traders 145 0.01
2 ForFarmers NV 11 -
6 Fugro NV 65 0.01
- GrandVision NV 14 -
2 Heijmans NV 27 -
4 Heineken NV 503 0.04
2 IMCD NV 390 0.03
111 ING Groep NV 1,549 0.11
5 Intertrust NV 101 0.01
1 Kendrion NV 24 -
47 Koninklijke Ahold Delhaize NV 1,381 0.09
17 Koninklijke BAM Groep NV 49 -
4 Koninklijke DSM NV 732 0.05
277 Koninklijke KPN NV 927 0.06
26 Koninklijke Philips NV 1,444 0.10
3 Koninklijke Vopak NV 120 0.01
- Nederland Apparatenfabriek 20 -
12 NN Group NV 601 0.04
6 Ordina NV 25 -
31 PostNL NV 180 0.01
6 Prosus NV 628 0.04
11 Randstad NV 846 0.06
9 Signify NV 527 0.04
2 Sligro Food Group NV 56 -
2 TKH Group NV 122 0.01
3 TomTom NV 30 -
1 Van Lanschot Kempen NV 24 -
16 Wolters Kluwer NV 1,509 0.10
22,841 1.56
Shares (000's)
Value(000's)
USD
% of NetAssetValue
Common Stock (continued)
New Zealand - 0.13%
17 Arvida Group Ltd 23 -
16 Auckland International Airport Ltd 87 0.01
26 Chorus Ltd 117 0.01
11 Contact Energy Ltd 58 0.01
2 Delegat Group Ltd 24 -
4 Ebos Group Ltd 99 0.01
9 Fisher & Paykel Healthcare Corp Ltd 189 0.01
32 Fletcher Building Ltd 170 0.01
6 Freightways Ltd 53 -
2 Hallenstein Glasson Holdings Ltd 11 -
23 Heartland Group Holdings Ltd 31 -
17 Infratil Ltd 93 0.01
39 Kathmandu Holdings Ltd 44 -
1 Mainfreight Ltd 63 0.01
12 Mercury NZ Ltd 57 -
22 Meridian Energy Ltd 83 0.01
10 NZX Ltd 15 -
23 Oceania Healthcare Ltd 23 -
13 Pacific Edge Ltd 11 -
7 Port of Tauranga Ltd 38 -
5 Ryman Healthcare Ltd 46 -
8 Skellerup Holdings Ltd 27 -
98 SKY Network Television Ltd 12 -
33 SKYCITY Entertainment Group Ltd 85 0.01
89 Spark New Zealand Ltd 290 0.02
5 Summerset Group Holdings Ltd 47 -
4 Tourism Holdings Ltd 8 -
27 Tower Ltd 15 -
4 Trustpower Ltd 22 -
5 Vector Ltd 13 -
7 Vista Group International Ltd 12 -
11 Warehouse Group Ltd 26 -
36 Z Energy Ltd 67 0.01
1,959 0.13
Norway - 0.30%
12 ABG Sundal Collier Holding ASA 12 -
1 Adevinta ASA 23 -
2 AF Gruppen ASA 49 -
27 Aker Solutions ASA 50 -
36 Archer Ltd 20 -
1 ArcticZymes Technologies ASA 13 -
1 Asetek AS 13 -
7 Atea ASA 141 0.01
2 Austevoll Seafood ASA 29 -
1 Bonheur ASA 15 -
1 Borr Drilling Ltd 1 -
5 Borregaard ASA 103 0.01
- Bouvet ASA 31 -
1 BW Energy Ltd 2 -
3 BW Offshore Ltd 12 -
2 Crayon Group Holding ASA 30 -
25 DNB ASA 564 0.04
3 Entra ASA 82 0.01
11 Europris ASA 72 0.01
4 Fjordkraft Holding ASA 26 -
10 Gjensidige Forsikring ASA 229 0.02
1 Grieg Seafood ASA 14 -
2 Kid ASA 22 -
8 Kitron ASA 20 -
68 Kongsberg Automotive ASA 23 -
7 Kongsberg Gruppen ASA 187 0.01
10 Leroy Seafood Group ASA 90 0.01
Global Sustainability Core Equity FundPortfolio of Investments as at 31 May 2021 (continued)
Dimensional Fund Advisors Semi-Annual Report and Unaudited Financial Statements, 31 May 2021 234

Shares (000's)
Value(000's)
USD
% of NetAssetValue
Common Stock (continued)
Norway - 0.30% (continued)
- Medistim ASA 12 -
8 Mowi ASA 202 0.01
10 NEL ASA 22 -
7 Nordic Semiconductor ASA 207 0.01
11 Norsk Hydro ASA 74 0.01
1 Norway Royal Salmon ASA 27 -
1 Norwegian Energy Co SA 18 -
6 Norwegian Finans Holding ASA 67 0.01
2 Ocean Yield ASA 6 -
9 Odfjell Drilling Ltd 23 -
16 Orkla ASA 164 0.01
10 Otello Corp ASA 39 -
4 Pareto Bank ASA 26 -
43 PGS ASA 27 -
4 Protector Forsikring ASA 39 -
3 Salmar ASA 212 0.02
1 Sandnes Sparebank 10 -
6 Sbanken ASA 76 0.01
3 Scatec Solar ASA 86 0.01
2 Schibsted ASA, Class A 77 0.01
2 Schibsted ASA, Class B 82 0.01
4 Selvaag Bolig ASA 26 -
13 SpareBank 1 SR-Bank ASA 180 0.01
28 Storebrand ASA 276 0.02
16 Subsea 7 SA 161 0.01
10 TGS NOPEC Geophysical Co ASA 138 0.01
3 Tomra Systems ASA 134 0.01
6 Veidekke ASA 86 0.01
13 XXL ASA 34 -
4,404 0.30
Portugal - 0.04%
3 Altri SGPS SA 24 -
2 Corticeira Amorim SGPS SA 22 -
7 CTT-Correios de Portugal SA 36 -
5 EDP Renovaveis SA 113 0.01
1 Ibersol SGPS SA 11 -
13 Jeronimo Martins SGPS SA 244 0.02
11 Navigator Co SA 41 -
17 NOS SGPS SA 60 0.01
19 REN-Redes Energeticas Nacionais SGPS SA 54 -
53 Sonae SGPS SA 51 -
656 0.04
Singapore - 0.24%
9 AEM Holdings Ltd 23 -
30 Ascendas India Trust 31 -
17 Bukit Sembawang Estates Ltd 62 0.01
23 CapitaLand Ltd 65 0.01
27 China Sunsine Chemical Holdings Ltd 11 -
33 Chip Eng Seng Corp Ltd 11 -
23 City Developments Ltd 133 0.01
11 Dairy Farm International Holdings Ltd 48 -
31 DBS Group Holdings Ltd 721 0.05
12 Fraser and Neave Ltd 13 -
16 Frasers Property Ltd 14 -
70 Genting Singapore Ltd 45 -
2 Great Eastern Holdings Ltd 33 -
15 GuocoLand Ltd 18 -
40 Hanwell Holdings Ltd 14 -
7 Haw Par Corp Ltd 67 0.01
13 Ho Bee Land Ltd 26 -
22 Hongkong Land Holdings Ltd 107 0.01
222 Hutchison Port Holdings Trust 53 0.01
Shares (000's)
Value(000's)
USD
% of NetAssetValue
Common Stock (continued)
Singapore - 0.24% (continued)
6 iFAST Corp Ltd 35 -
24 Metro Holdings Ltd 15 -
62 NetLink NBN Trust 45 -
15 OUE Ltd 15 -
51 Oversea-Chinese Banking Corp Ltd 482 0.03
112 Oxley Holdings Ltd 21 -
35 Raffles Medical Group Ltd 29 -
7 SATS Ltd 22 -
209 Sembcorp Marine Ltd 31 -
18 Sheng Siong Group Ltd 22 -
8 SIA Engineering Co Ltd 13 -
83 SIIC Environment Holdings Ltd 13 -
32 Singapore Exchange Ltd 252 0.02
105 Singapore Post Ltd 57 0.01
31 Singapore Press Holdings Ltd 41 -
56 Singapore Technologies Engineering Ltd 164 0.01
36 Singapore Telecommunications Ltd 66 0.01
11 StarHub Ltd 10 -
16 Straits Trading Co Ltd 34 -
21 UMS Holdings Ltd 23 -
8 United Industrial Corp Ltd 16 -
11 United Overseas Bank Ltd 211 0.02
12 UOB-Kay Hian Holdings Ltd 15 -
15 UOL Group Ltd 85 0.01
29 Valuetronics Holdings Ltd 14 -
8 Venture Corp Ltd 109 0.01
31 Wing Tai Holdings Ltd 40 -
147 Yangzijiang Shipbuilding Holdings Ltd 166 0.01
3,541 0.24
Spain - 0.68%
2 Acciona SA 345 0.02
13 Acerinox SA 191 0.01
8 ACS Actividades de Construccion y Servicios SA 242 0.02
1 Aedas Homes SA 22 -
1 Aena SME SA 111 0.01
5 Almirall SA 80 0.01
8 Amadeus IT Group SA 575 0.04
5 Applus Services SA 54 -
10 Atresmedia Corp de Medios de Comunicacion SA 51 -
113 Banco Bilbao Vizcaya Argentaria SA 708 0.05
529 Banco de Sabadell SA 407 0.03
284 Banco Santander SA 1,195 0.08
28 Bankinter SA 159 0.01
119 CaixaBank SA 414 0.03
1 CIE Automotive SA 15 -
1 Construcciones y Auxiliar de Ferrocarriles SA 62 0.01
1 Ebro Foods SA 11 -
2 eDreams ODIGEO SA 14 -
1 Elecnor SA 15 -
15 Enagas SA 358 0.03
6 Ence Energia y Celulosa SA 27 -
2 Endesa SA 53 -
5 Euskaltel SA 72 0.01
12 Faes Farma SA 50 -
2 Ferrovial SA (voting rights) 72 0.01
5 Fluidra SA 183 0.01
7 Gestamp Automocion SA 40 -
2 Global Dominion Access SA 11 -
3 Grifols SA 72 0.01
2 Grupo Catalana Occidente SA 100 0.01
68 Iberdrola SA 942 0.07
15 Indra Sistemas SA 128 0.01
Global Sustainability Core Equity FundPortfolio of Investments as at 31 May 2021 (continued)
Dimensional Fund Advisors Semi-Annual Report and Unaudited Financial Statements, 31 May 2021 235

Shares (000's)
Value(000's)
USD
% of NetAssetValue
Common Stock (continued)
Spain - 0.68% (continued)
23 Industria de Diseno Textil SA 889 0.06
1 Laboratorios Farmaceuticos Rovi SA 34 -
60 Liberbank SA 24 -
28 Linea Directa Aseguradora SA Cia de Seguros yReaseguros 54 -
60 Mapfre SA 137 0.01
23 Mediaset Espana Comunicacion SA 159 0.01
3 Metrovacesa SA 27 -
5 Naturgy Energy Group SA 130 0.01
3 Neinor Homes SA 42 -
- Pharma Mar SA 33 -
14 Prosegur Cash SA 13 -
17 Prosegur Cia de Seguridad SA 53 -
11 Red Electrica Corp SA 220 0.02
18 Sacyr SA 47 -
3 Siemens Gamesa Renewable Energy SA 107 0.01
3 Solaria Energia y Medio Ambiente SA 57 -
1 Solarpack Corp Tecnologica 30 -
4 Talgo SA 23 -
2 Tecnicas Reunidas SA 26 -
166 Telefonica SA 818 0.06
7 Tubacex SA 15 -
10 Unicaja Banco SA 11 -
1 Vidrala SA (voting rights) 130 0.01
8 Zardoya Otis SA 58 0.01
9,916 0.68
Sweden - 1.56%
3 Adapteo Oyj 50 -
5 AddLife AB 137 0.01
1 AddNode Group AB 29 -
22 AddTech AB 359 0.03
6 AF POYRY AB 221 0.02
8 Alfa Laval AB 307 0.02
2 Alimak Group AB 31 -
9 Ambea AB 72 0.01
2 Annehem Fastigheter 8 -
- AQ Group AB 13 -
8 Arjo AB 82 0.01
13 Assa Abloy AB 400 0.03
16 Atlas Copco AB, Class A 1,006 0.07
10 Atlas Copco AB, Class B 508 0.04
2 Atrium Ljungberg AB 44 -
10 Attendo AB 48 -
7 Avanza Bank Holding AB 235 0.02
7 Axfood AB 190 0.01
2 Beijer Alma AB 51 -
8 Beijer Ref AB 145 0.01
2 Bergman & Beving AB 28 -
- Besqab AB 5 -
9 Betsson AB 4 -
9 Betsson AB 82 0.01
2 Better Collective A/S 43 -
4 BHG Group AB 74 0.01
9 Bilia AB 171 0.01
13 BillerudKorsnas AB 266 0.02
1 BioGaia AB 44 -
2 Biotage AB 38 -
17 Boliden 670 0.05
9 Boliden 7 -
5 Bonava AB 67 0.01
2 Boozt AB 50 -
8 Bravida Holding AB 124 0.01
Shares (000's)
Value(000's)
USD
% of NetAssetValue
Common Stock (continued)
Sweden - 1.56% (continued)
- BTS Group AB 14 -
2 Bufab AB 49 -
3 Bure Equity AB 156 0.01
10 Byggmax Group AB 90 0.01
4 Castellum AB 103 0.01
3 Catella AB 9 -
1 Catena AB 32 -
4 Catena Media PLC 33 -
- Cellavision AB 21 -
6 Clas Ohlson AB 68 0.01
14 Cloetta AB 45 -
4 Collector AB 16 -
2 Concentric AB 44 -
8 Coor Service Management Holding AB 69 0.01
5 Dios Fastigheter AB 50 -
14 Dometic Group AB 236 0.02
2 Doro AB 12 -
1 Duni AB 12 -
5 Dustin Group AB 63 -
1 Elanders AB 23 -
13 Electrolux AB 366 0.03
13 Electrolux Professional AB 91 0.01
26 Elekta AB 358 0.03
7 Eltel AB 20 -
- Enea AB 12 -
1 Eolus Vind AB 22 -
15 Epiroc AB, Class A 344 0.02
15 Epiroc AB, Class A 5 -
9 Epiroc AB, Class B 186 0.01
9 Epiroc AB, Class B 3 -
2 Evolution Gaming Group AB 354 0.02
12 Fabege AB 202 0.01
6 Fagerhult AB 51 -
3 Fastighets AB Balder 183 0.01
1 FastPartner AB 13 -
1 Ferronordic AB 16 -
2 Fingerprint Cards AB 7 -
1 FormPipe Software AB 2 -
- G5 Entertainment AB 17 -
1 GARO AB 12 -
15 Getinge AB 540 0.04
8 Granges AB 104 0.01
2 Haldex AB 16 -
1 Heba Fastighets AB 13 -
20 Hennes & Mauritz AB 516 0.04
3 Hexagon AB 50 -
1 Hexatronic Group AB 16 -
16 Hexpol AB 199 0.01
2 HMS Networks AB 87 0.01
2 Hoist Finance AB 9 -
4 Holmen AB 175 0.01
4 Hufvudstaden AB 73 0.01
2 Husqvarna AB, Class A 30 -
18 Husqvarna AB, Class B 264 0.02
5 ICA Gruppen AB 243 0.02
6 Indutrade AB 170 0.01
2 Instalco AB 99 0.01
6 Intrum AB 203 0.01
2 INVISIO AB 41 -
4 Inwido AB 64 0.01
5 JM AB 187 0.01
2 Karnov Group AB 11 -
Global Sustainability Core Equity FundPortfolio of Investments as at 31 May 2021 (continued)
Dimensional Fund Advisors Semi-Annual Report and Unaudited Financial Statements, 31 May 2021 236

Shares (000's)
Value(000's)
USD
% of NetAssetValue
Common Stock (continued)
Sweden - 1.56% (continued)
19 Kindred Group PLC, SDR 327 0.02
25 Klovern AB 50 -
1 KNOW IT AB 36 -
8 Kungsleden AB 99 0.01
13 Lagercrantz Group AB 143 0.01
4 LeoVegas AB 22 -
4 Lifco AB 99 0.01
1 Lime Technologies AB 28 -
5 Lindab International AB 125 0.01
4 Loomis AB 117 0.01
2 Medicover AB 56 -
2 Mekonomen AB 45 -
2 Midsona AB 21 -
5 Millicom International Cellular SA 239 0.02
2 MIPS AB 122 0.01
3 Modern Times Group MTG AB 36 -
1 Momentum Group AB 26 -
6 Munters Group AB 59 -
5 Mycronic AB 166 0.01
4 NCC AB 75 0.01
1 Nederman Holding AB 15 -
5 New Wave Group AB 61 -
13 Nibe Industrier AB 135 0.01
7 Nobia AB 67 0.01
4 Nobina AB 36 -
7 Nordic Entertainment Group AB 348 0.02
1 Nordic Waterproofing Holding AB 15 -
1 NP3 Fastigheter AB 17 -
6 Nyfosa AB 80 0.01
2 OEM International AB 35 -
4 Pandox AB 67 0.01
11 Peab AB 147 0.01
4 Platzer Fastigheter Holding AB 52 -
1 Proact IT Group AB 15 -
14 Ratos AB 93 0.01
2 RaySearch Laboratories AB 23 -
- Rejlers AB 10 -
8 Resurs Holding AB 42 -
4 Saab AB 130 0.01
2 Sagax AB 54 -
21 Samhallsbyggnadsbolaget i Norden AB, Class B 90 0.01
18 Sandvik AB 491 0.03
7 Scandic Hotels Group AB 31 -
1 Sectra AB 87 0.01
17 Securitas AB 273 0.02
1 Semcon AB 13 -
- Sinch AB 45 -
34 Skandinaviska Enskilda Banken AB 435 0.03
16 Skanska AB 457 0.03
6 SKF AB 157 0.01
2 SkiStar AB 31 -
17 Svenska Cellulosa AB SCA 284 0.02
1 Svenska Cellulosa AB SCA, Class A 11 -
32 Svenska Handelsbanken AB 368 0.03
1 Svenska Handelsbanken AB, Class B 10 -
5 Sweco AB 82 0.01
17 Swedbank AB 311 0.02
9 Swedish Orphan Biovitrum AB 162 0.01
1 Systemair AB 35 -
2 Telefonaktiebolaget LM Ericsson, Class A 32 -
89 Telefonaktiebolaget LM Ericsson, Class B 1,194 0.08
103 Telia Co AB 456 0.03
Shares (000's)
Value(000's)
USD
% of NetAssetValue
Common Stock (continued)
Sweden - 1.56% (continued)
4 Thule Group AB 195 0.01
4 Trelleborg AB 101 0.01
2 Troax Group AB 68 0.01
1 VBG Group AB 24 -
2 Vitec Software Group AB 77 0.01
2 Vitrolife AB 77 0.01
10 Volvo AB, Class A 273 0.02
51 Volvo AB, Class B 1,353 0.09
6 Wallenstam AB 110 0.01
5 Wihlborgs Fastigheter AB 115 0.01
22,909 1.56
Switzerland - 2.55%
35 ABB Ltd 1,178 0.08
12 Adecco Group AG 824 0.06
11 Alcon Inc 766 0.05
1 Allreal Holding AG 138 0.01
- ALSO Holding AG 97 0.01
11 ams AG 215 0.02
- APG SGA SA 18 -
3 Arbonia AG 49 -
43 Aryzta AG 58 0.01
1 Ascom Holding AG 23 -
- Bachem Holding AG 72 0.01
2 Baloise Holding AG 369 0.03
- Banque Cantonale de Geneve 10 -
1 Banque Cantonale Vaudoise 87 0.01
1 Belimo Holding AG 195 0.01
1 Bellevue Group AG 26 -
- Berner Kantonalbank AG 45 -
1 BKW AG 82 0.01
- Bobst Group SA 22 -
1 Bossard Holding AG 102 0.01
- Bucher Industries AG 187 0.01
- Burckhardt Compression Holding AG 109 0.01
- Burkhalter Holding AG 29 -
- Calida Holding AG 10 -
1 Cembra Money Bank AG 154 0.01
11 Cie Financiere Richemont SA 1,336 0.09
15 Clariant AG 320 0.02
- Coltene Holding AG 37 -
- Comet Holding AG 36 -
- Conzzeta AG 59 0.01
- COSMO Pharmaceuticals NV 12 -
60 Credit Suisse Group AG 658 0.05
- Daetwyler Holding AG 23 -
4 DKSH Holding AG 316 0.02
- dormakaba Holding AG 130 0.01
- Dottikon Es Holding AG 25 -
4 Dufry AG 240 0.02
6 EFG International AG 47 -
- Emmi AG 127 0.01
- EMS-Chemie Holding AG 126 0.01
1 Energiedienst Holding AG 18 -
1 Flughafen Zurich AG 210 0.02
5 Galenica AG 367 0.03
16 GAM Holding AG 40 -
1 Geberit AG 547 0.04
- Georg Fischer AG 172 0.01
- Givaudan SA 1,015 0.07
- Glarner Kantonalbank 11 -
3 Helvetia Holding AG 305 0.02
- Hiag Immobilien Holding AG 16 -
Global Sustainability Core Equity FundPortfolio of Investments as at 31 May 2021 (continued)
Dimensional Fund Advisors Semi-Annual Report and Unaudited Financial Statements, 31 May 2021 237

Shares (000's)
Value(000's)
USD
% of NetAssetValue
Common Stock (continued)
Switzerland - 2.55% (continued)
1 Huber & Suhner AG 64 0.01
1 Implenia AG 32 -
- Ina Invest Holding AG 2 -
- Inficon Holding AG 39 -
- Interroll Holding AG 103 0.01
- Intershop Holding AG 39 -
- Investis Holding SA 39 -
15 Julius Baer Group Ltd 1,039 0.07
- Jungfraubahn Holding AG 22 -
- Kardex AG 50 -
- Komax Holding AG 20 -
2 Kuehne & Nagel International AG 711 0.05
1 Landis&Gyr Group AG 85 0.01
- LEM Holding SA 26 -
1 Liechtensteinische Landesbank AG 48 -
9 Logitech International SA 1,080 0.07
- Lonza Group AG 49 -
- Luzerner Kantonalbank AG 48 -
- Medartis Holding AG 18 -
- Metall Zug AG 11 -
2 Mobilezone Holding AG 28 -
1 Mobimo Holding AG 142 0.01
40 Novartis AG 3,558 0.24
- Novavest Real Estate AG 11 -
15 OC Oerlikon Corp AG 165 0.01
1 Partners Group Holding AG 1,112 0.08
1 Peach Property Group AG 31 -
- Phoenix Mecano AG 23 -
2 PSP Swiss Property AG 202 0.01
- Rieter Holding AG 50 -
13 Roche Holding AG (non-voting rights) 4,571 0.31
1 Roche Holding AG (voting rights) 331 0.02
- Romande Energie Holding SA 13 -
1 Schindler Holding AG 157 0.01
36 Schmolz & Bickenbach AG 18 -
- Schweiter Technologies AG 108 0.01
- Schweizerische Nationalbank 12 -
1 Sensirion Holding AG 40 -
1 SFS Group AG 124 0.01
- SGS SA 665 0.05
- Siegfried Holding AG 30 -
20 SIG Combibloc Group AG 533 0.04
5 Sika AG 1,547 0.11
3 Softwareone Holding AG 78 0.01
2 Sonova Holding AG 514 0.04
- St Galler Kantonalbank AG 40 -
- Straumann Holding AG 293 0.02
1 Sulzer AG 158 0.01
1 Swatch Group AG (Bearer) 439 0.03
3 Swatch Group AG (Registered) 171 0.01
1 Swiss Life Holding AG 632 0.04
4 Swiss Prime Site AG 360 0.03
9 Swiss Re AG 846 0.06
3 Swisscom AG 1,576 0.11
1 Swissquote Group Holding SA 120 0.01
- Tamedia AG 11 -
1 Tecan Group AG 227 0.02
3 Temenos AG 428 0.03
- u-blox Holding AG 9 -
47 UBS Group AG 766 0.05
1 Valiant Holding AG 114 0.01
- Valora Holding AG 75 0.01
Shares (000's)
Value(000's)
USD
% of NetAssetValue
Common Stock (continued)
Switzerland - 2.55% (continued)
1 VAT Group AG 320 0.02
- Vaudoise Assurances Holding SA 29 -
3 Vifor Pharma AG 446 0.03
2 Vontobel Holding AG 180 0.01
- VP Bank AG 17 -
1 VZ Holding AG 37 -
- V-ZUG Holding AG 8 -
- Walliser Kantonalbank 16 -
- Ypsomed Holding AG 27 -
- Zehnder Group AG 35 -
- Zug Estates Holding AG 44 -
- Zuger Kantonalbank AG 30 -
3 Zurich Insurance Group AG 1,344 0.09
37,444 2.55
United Kingdom - 4.31%
20 3i Group PLC 344 0.02
2 4imprint Group PLC 68 0.01
22 888 Holdings PLC 125 0.01
7 Accsys Technologies PLC 15 -
8 Admiral Group PLC 314 0.02
7 Advanced Medical Solutions Group PLC 27 -
5 AG Barr PLC 37 -
48 Airtel Africa PLC 54 -
15 AJ Bell PLC 89 0.01
6 Alfa Financial Software Holdings 10 -
9 Alliance Pharma PLC 12 -
5 Antofagasta PLC 117 0.01
13 AO World PLC 47 -
1 Aptitude Software Group PLC 12 -
4 Arrow Global Group PLC 19 -
13 Ascential PLC 68 0.01
18 Ashmore Group PLC 98 0.01
13 Ashtead Group PLC 975 0.07
5 ASOS PLC 322 0.02
3 Aston Martin Lagonda Global Holdings 81 0.01
15 Astrazeneca PLC 1,671 0.11
8 AstraZeneca PLC 451 0.03
46 Auto Trader Group PLC 369 0.03
27 Avast PLC 182 0.01
2 AVEVA Group PLC 82 0.01
196 Aviva PLC 1,140 0.08
1 Avon Rubber PLC 35 -
48 B&M European Value Retail SA 394 0.03
33 Babcock International Group PLC 140 0.01
146 BAE Systems PLC 1,086 0.07
6 Bakkavor Group PLC 11 -
29 Balfour Beatty PLC 127 0.01
157 Barclays PLC 407 0.03
36 Barratt Developments PLC 381 0.03
28 Beazley PLC 121 0.01
10 Begbies Traynor Group PLC 20 -
5 Bellway PLC 250 0.02
4 Berkeley Group Holdings PLC 278 0.02
4 Bloomsbury Publishing PLC 19 -
51 boohoo Group PLC 230 0.02
3 Boot Henry PLC 12 -
17 Brewin Dolphin Holdings PLC 82 0.01
16 Britvic PLC 208 0.02
501 BT Group PLC 1,240 0.09
15 Bunzl PLC 485 0.03
18 Burberry Group PLC 530 0.04
5 Burford Capital Ltd 60 -
Global Sustainability Core Equity FundPortfolio of Investments as at 31 May 2021 (continued)
Dimensional Fund Advisors Semi-Annual Report and Unaudited Financial Statements, 31 May 2021 238

Shares (000's)
Value(000's)
USD
% of NetAssetValue
Common Stock (continued)
United Kingdom - 4.31% (continued)
9 Bytes Technology Group PLC 64 0.01
18 C&C Group PLC 63 0.01
42 Capita PLC 24 -
34 Card Factory PLC 33 -
4 CareTech Holdings PLC 30 -
6 Carr's Group PLC 13 -
2 Castings PLC 11 -
8 Centamin PLC 13 -
6 Central Asia Metals PLC 22 -
7 Chemring Group PLC 29 -
14 Chesnara PLC 54 -
19 Cineworld Group PLC 25 -
2 Clarkson PLC 84 0.01
7 Clinigen Healthcare Ltd 81 0.01
2 Clipper Logistics PLC 20 -
8 Close Brothers Group PLC 181 0.01
7 CLS Holdings PLC 24 -
4 CMC Markets PLC 26 -
3 Coca-Cola HBC AG 122 0.01
32 Compass Group PLC 725 0.05
7 Computacenter PLC 252 0.02
52 ConvaTec Group PLC 176 0.01
15 Costain Group PLC 12 -
25 Countryside Properties PLC 179 0.01
14 Crest Nicholson Holdings PLC 93 0.01
3 Croda International PLC 293 0.02
- CVS Group PLC 13 -
7 Daily Mail & General Trust PLC 94 0.01
7 DCC PLC 557 0.04
11 De La Rue PLC 28 -
2 Dechra Pharmaceuticals PLC 103 0.01
8 DFS Furniture PLC 31 -
36 Diageo PLC 1,731 0.12
- Diageo PLC, ADR 36 -
1 Dignity PLC 11 -
7 Diploma PLC 265 0.02
46 Direct Line Insurance Group PLC 194 0.01
3 DiscoverIE Group PLC 32 -
91 Dixons Carphone PLC 177 0.01
15 Domino's Pizza Group PLC 76 0.01
8 dotdigital Group PLC 26 -
24 Drax Group PLC 151 0.01
56 DS Smith PLC 333 0.02
5 Dunelm Group PLC 114 0.01
31 Electrocomponents PLC 440 0.03
39 Elementis PLC 87 0.01
5 EMIS Group PLC 85 0.01
8 Epwin Group PLC 12 -
25 Equiniti Group PLC 63 0.01
5 Euromoney Institutional Investor PLC 71 0.01
31 Experian PLC 1,177 0.08
5 FDM Group Holdings PLC 73 0.01
10 Ferguson PLC 1,400 0.10
4 Fevertree Drinks PLC 141 0.01
1 First Derivatives PLC 19 -
3 Forterra PLC 11 -
10 Foxtons Group PLC 9 -
3 Fresnillo PLC 44 -
1 Frontier Developments PLC 29 -
1 Fuller Smith & Turner PLC 13 -
6 Funding Circle Holdings 13 -
1 Future PLC 24 -
Shares (000's)
Value(000's)
USD
% of NetAssetValue
Common Stock (continued)
United Kingdom - 4.31% (continued)
16 Galliford Try Holdings PLC 29 -
2 Games Workshop Group PLC 285 0.02
5 Gamesys Group PLC 123 0.01
2 Gamma Communications PLC 59 -
4 GB Group PLC 47 -
5 Genel Energy PLC 9 -
48 GlaxoSmithKline PLC 925 0.06
2 Go-Ahead Group PLC 29 -
12 Grafton Group PLC 197 0.01
35 Grainger PLC 141 0.01
23 Greencore Group PLC 46 -
2 Greggs PLC 85 0.01
19 GVC Holdings PLC 455 0.03
4 Gym Group PLC 17 -
17 Halfords Group PLC 94 0.01
8 Halma PLC 306 0.02
16 Hargreaves Lansdown PLC 376 0.03
6 Harworth Group PLC 12 -
87 Hays PLC 214 0.02
4 Headlam Group PLC 24 -
4 Helical PLC 27 -
23 Helios Towers PLC 55 -
3 Hikma Pharmaceuticals PLC 102 0.01
4 Hill & Smith Holdings PLC 88 0.01
3 Hilton Food Group PLC 50 -
13 Hiscox Ltd 150 0.01
10 Hochschild Mining PLC 28 -
7 Hollywood Bowl Group PLC 24 -
11 HomeServe PLC 148 0.01
10 Hostelworld Group PLC 14 -
28 Howden Joinery Group PLC 315 0.02
188 HSBC Holdings PLC 1,214 0.08
4 Hunting PLC 15 -
5 Hyve Group PLC 10 -
4 Ibstock PLC 13 -
11 IDOX PLC 10 -
23 IG Group Holdings PLC 279 0.02
11 IMI PLC 268 0.02
2 Impax Asset Management Group PLC 27 -
31 Inchcape PLC 338 0.02
59 Indivior PLC 130 0.01
39 Informa PLC 298 0.02
6 Intermediate Capital Group PLC 192 0.01
4 Intertek Group PLC 307 0.02
21 Investec PLC 92 0.01
5 iomart Group PLC 18 -
56 IP Group PLC 98 0.01
202 ITV PLC 368 0.03
42 IWG PLC 215 0.02
165 J Sainsbury PLC 620 0.04
1 James Fisher & Sons PLC 18 -
4 James Halstead PLC 28 -
23 JD Sports Fashion PLC 301 0.02
2 JD Wetherspoon PLC 34 -
33 John Laing Group PLC 188 0.01
4 John Menzies PLC 18 -
66 John Wood Group PLC 229 0.02
12 Johnson Matthey PLC 528 0.04
22 Johnson Service Group PLC 52 -
37 Jupiter Fund Management PLC 144 0.01
90 Just Group PLC 141 0.01
7 Kainos Group PLC 151 0.01
Global Sustainability Core Equity FundPortfolio of Investments as at 31 May 2021 (continued)
Dimensional Fund Advisors Semi-Annual Report and Unaudited Financial Statements, 31 May 2021 239

Shares (000's)
Value(000's)
USD
% of NetAssetValue
Common Stock (continued)
United Kingdom - 4.31% (continued)
3 Keller Group PLC 39 -
1 Kier Group PLC 2 -
1 Kier Group PLC - -
103 Kingfisher PLC 522 0.04
11 Lamprell PLC 10 -
7 Lancashire Holdings Ltd 63 0.01
17 Learning Technologies Group PLC 40 -
198 Legal & General Group PLC 798 0.06
1 Liontrust Asset Management PLC 24 -
1,275 Lloyds Banking Group PLC 902 0.06
1 London Stock Exchange Group PLC 108 0.01
16 Lookers PLC 15 -
7 LSL Property Services PLC 44 -
3 Luceco PLC 17 -
224 M&G PLC 776 0.05
13 Macfarlane Group PLC 21 -
68 Man Group PLC 172 0.01
130 Marks & Spencer Group PLC 304 0.02
10 Marshalls PLC 102 0.01
10 McBride PLC 12 -
7 Mears Group PLC 19 -
14 Mediclinic International PLC 63 0.01
32 Meggitt PLC 229 0.02
82 Melrose Industries PLC 200 0.01
22 Michael Page International PLC 190 0.01
20 Micro Focus International PLC 145 0.01
79 Mitie Group PLC 77 0.01
3 MJ Gleeson PLC 31 -
10 Mondi PLC 280 0.02
39 Moneysupermarket.com Group PLC 148 0.01
2 Morgan Crucible Co PLC 12 -
3 Morgan Sindall Group PLC 103 0.01
1 Mortgage Advice Bureau Holdings Ltd 16 -
3 Motorpoint group PLC 10 -
12 N Brown Group PLC 11 -
38 National Grid PLC 510 0.04
17 NCC Group PLC 73 0.01
6 Network International Holdings 32 -
4 Next Fifteen Communications Group PLC 53 -
4 Next PLC 509 0.04
17 Ninety One PLC 58 -
- NMC Health PLC - -
3 Norcros PLC 11 -
24 Northgate PLC 129 0.01
2 Numis Corp PLC 11 -
2 Ocado Group PLC 41 -
7 On the Beach Group PLC 41 -
19 OSB Group PLC 129 0.01
2 Oxford Instruments PLC 66 0.01
17 Paragon Group of Cos PLC 120 0.01
4 PayPoint PLC 30 -
22 Pearson PLC 257 0.02
159 Pendragon PLC 42 -
11 Pennon Group PLC 172 0.01
11 Persimmon PLC 474 0.03
10 Petrofac Ltd 18 -
51 Petropavlovsk PLC 18 -
23 Pets at Home Group PLC 143 0.01
35 Phoenix Group Holdings PLC 368 0.03
24 Playtech PLC 155 0.01
1 Plus500 Ltd 19 -
4 Polar Capital Holdings PLC 45 -
Shares (000's)
Value(000's)
USD
% of NetAssetValue
Common Stock (continued)
United Kingdom - 4.31% (continued)
8 Polypipe Group PLC 69 0.01
1 Porvair PLC 11 -
1 PPHE Hotel Group Ltd 14 -
19 Premier Foods PLC 28 -
18 Provident Financial PLC 62 0.01
31 Prudential PLC 670 0.05
11 PureTech Health PLC 64 0.01
8 PZ Cussons PLC 27 -
26 QinetiQ Group PLC 131 0.01
117 Quilter PLC 254 0.02
5 Rank Group PLC 15 -
2 Rathbone Brothers PLC 55 -
19 Reach PLC 65 0.01
10 Reckitt Benckiser Group PLC 887 0.06
15 Redrow PLC 140 0.01
5 RELX PLC (Netherlands listing) 143 0.01
58 RELX PLC (UK listing) 1,500 0.10
1 Relx PLC, ADR 16 -
5 Renew Holdings PLC 43 -
- Renishaw PLC 35 -
21 Rentokil Initial PLC 139 0.01
21 Restaurant Group PLC 37 -
1 Rhi Magnesita NV (UK listing) 35 -
3 Ricardo PLC 17 -
41 Rightmove PLC 348 0.02
12 Rio Tinto PLC 1,066 0.07
6 Robert Walters PLC 59 -
85 Rolls-Royce Holdings PLC 129 0.01
40 Rotork PLC 191 0.01
41 Royal Bank of Scotland Group PLC 120 0.01
39 Royal Mail PLC 324 0.02
15 RPS Group PLC 20 -
21 RSA Insurance Group PLC 206 0.01
4 RWS Holdings PLC 36 -
- S&U PLC 13 -
11 Sabre Insurance Group PLC 41 -
22 Sage Group PLC 208 0.02
3 Sanne Group PLC 29 -
16 Savills PLC 263 0.02
1 Schroders PLC (non-voting rights) 53 -
4 Schroders PLC (voting rights) 201 0.01
1 Secure Trust Bank PLC 14 -
23 Senior PLC 53 -
50 Serco Group PLC 96 0.01
11 Severfield PLC 13 -
6 Severn Trent PLC 224 0.02
53 SIG PLC 46 -
26 Signature Aviation PLC 145 0.01
6 Smart Metering Systems PLC 71 0.01
14 Smith & Nephew PLC 310 0.02
12 Smiths Group PLC 256 0.02
11 Softcat PLC 286 0.02
3 Spectris PLC 123 0.01
39 Speedy Hire PLC 41 -
2 Spirax-Sarco Engineering PLC 281 0.02
23 Spire Healthcare Group PLC 79 0.01
22 Spirent Communications PLC 79 0.01
14 Sports Direct International PLC 113 0.01
19 SSP Group PLC 79 0.01
26 St James's Place PLC 519 0.04
13 St Modwen Properties PLC 101 0.01
38 Standard Chartered PLC 275 0.02
Global Sustainability Core Equity FundPortfolio of Investments as at 31 May 2021 (continued)
Dimensional Fund Advisors Semi-Annual Report and Unaudited Financial Statements, 31 May 2021 240

Shares (000's)
Value(000's)
USD
% of NetAssetValue
Common Stock (continued)
United Kingdom - 4.31% (continued)
145 Standard Life Aberdeen PLC 566 0.04
8 SThree PLC 49 -
21 Stobart Group Ltd 10 -
3 Strix Group PLC 14 -
3 Studio Retail Group PLC 12 -
5 SuperGroup PLC 29 -
17 Synthomer PLC 126 0.01
- Takeaway.com NV 26 -
2 Takeaway.com NV (UK listing) 156 0.01
131 Taylor Wimpey PLC 318 0.02
2 TBC Bank Group PLC 25 -
9 Ted Baker PLC 22 -
3 Telecom Plus PLC 52 -
5 Telit Communications PLC 17 -
175 Tesco PLC 554 0.04
5 TI Fluid Systems PLC 22 -
11 TP ICAP Group PLC 35 -
10 Travis Perkins PLC 234 0.02
3 Treatt PLC 43 -
2 Tremor International Ltd 26 -
4 Trifast PLC 10 -
8 TT Electronics plc 29 -
12 Tullow Oil PLC 9 -
7 Tyman PLC 49 -
22 U & I Group PLC 30 -
13 UDG Healthcare PLC 191 0.01
4 Ultra Electronics Holdings PLC 124 0.01
25 Unilever PLC (Nitherland listing) 1,496 0.10
20 Unilever PLC (UK listing) 1,227 0.08
28 United Utilities Group PLC 386 0.03
26 Vectura Group PLC 59 -
24 Vertu Motors PLC 15 -
6 Vesuvius PLC 51 -
3 Victrex PLC 107 0.01
39 Virgin Money UK PLC 117 0.01
6 Vistry Group PLC 117 0.01
3 Vitec Group PLC 59 -
29 Vivo Energy PLC 41 -
591 Vodafone Group PLC 1,071 0.07
4 Volex PLC 21 -
9 Volution Group PLC 58 -
8 Watches of Switzerland Group 88 0.01
17 Watkin Jones PLC 54 -
6 Weir Group PLC 160 0.01
4 WH Smith PLC 106 0.01
3 Whitbread PLC 149 0.01
11 Wickes Group PLC 41 -
107 WM Morrison Supermarkets PLC 269 0.02
57 WPP PLC 786 0.05
4 Xaar PLC 12 -
1 XP Power Ltd 56 -
2 Zotefoams PLC 13 -
63,329 4.31
United States - 64.10%
1 10X Genomics Inc 152 0.01
3 1-800-Flowers.com Inc 99 0.01
2 1st Source Corp 81 0.01
5 2U Inc 193 0.01
6 3M Co 1,296 0.09
4 A10 Networks Inc 43 -
2 AAON Inc 143 0.01
2 AAR Corp 73 0.01
Shares (000's)
Value(000's)
USD
% of NetAssetValue
Common Stock (continued)
United States - 64.10% (continued)
1 Aaron's Holdings Co Inc 50 -
15 Abbott Laboratories 1,794 0.12
45 AbbVie Inc 5,066 0.35
4 Abercrombie & Fitch Co 172 0.01
1 Abiomed Inc 351 0.02
7 ABM Industries Inc 361 0.03
2 Acadia Pharmaceuticals Inc 52 -
1 Acceleron Pharma Inc 138 0.01
13 Accenture PLC 3,631 0.25
8 ACCO Brands Corp 73 0.01
7 Accuray Inc 29 -
5 Achillion Pharmaceuticals Inc 7 -
6 ACI Worldwide Inc 216 0.02
- Acme United Corp 17 -
20 Activision Blizzard Inc 1,918 0.13
2 Acuity Brands Inc 426 0.03
5 Acushnet Holdings Corp 246 0.02
1 Adams Resources & Energy Inc 18 -
3 Adaptive Biotechnologies Corp 112 0.01
- Adicet Bio Inc 3 -
3 Adient PLC 170 0.01
9 Adobe Inc 4,404 0.30
42 ADT Inc 439 0.03
3 ADTRAN Inc 69 0.01
3 Advance Auto Parts Inc 559 0.04
2 Advanced Drainage Systems Inc 241 0.02
14 Advanced Micro Devices Inc 1,109 0.08
1 AdvanSix Inc 27 -
14 AECOM 881 0.06
2 Aeglea BioTherapeutics Inc 15 -
1 AeroVironment Inc 127 0.01
4 Affiliated Managers Group Inc 697 0.05
24 Aflac Inc 1,379 0.09
4 AGCO Corp 615 0.04
6 Agilent Technologies Inc 804 0.06
1 Agilysys Inc 30 -
- Agios Pharmaceuticals Inc 27 -
4 AgroFresh Solutions Inc 9 -
9 Air Lease Corp 422 0.03
1 Airgain Inc 10 -
10 Akebia Therapeutics Inc 33 -
- Akero Therapeutics Inc 6 -
1 Alamo Group Inc 128 0.01
2 Alarm.com Holdings Inc 125 0.01
2 Albany International Corp 198 0.01
4 Albemarle Corp 594 0.04
1 Albireo Pharma Inc 22 -
2 Alector Inc 29 -
1 Alerus Financial Corp 38 -
4 Alexion Pharmaceuticals Inc 645 0.04
1 Align Technology Inc 393 0.03
1 Allakos Inc 140 0.01
1 Alleghany Corp 770 0.05
7 Allegheny Technologies Inc 179 0.01
1 Allegiance Bancshares Inc 59 -
5 Allegion PLC 669 0.05
4 Alliance Data Systems Corp 532 0.04
1 Allied Motion Technologies Inc 32 -
9 Allison Transmission Holdings Inc 366 0.03
11 Allscripts Healthcare Solutions Inc 192 0.01
17 Allstate Corp 2,322 0.16
23 Ally Financial Inc 1,242 0.08
Global Sustainability Core Equity FundPortfolio of Investments as at 31 May 2021 (continued)
Dimensional Fund Advisors Semi-Annual Report and Unaudited Financial Statements, 31 May 2021 241

Shares (000's)
Value(000's)
USD
% of NetAssetValue
Common Stock (continued)
United States - 64.10% (continued)
2 Alnylam Pharmaceuticals Inc 260 0.02
6 Alphabet Inc, Class A 13,929 0.95
5 Alphabet Inc, Class C 12,707 0.87
1 Alta Equipment Group Inc 20 -
1 Altabancorp 51 -
2 Altair Engineering Inc 102 0.01
1 Alteryx Inc 44 -
14 Altice USA Inc 495 0.03
3 Alto Ingredients Inc 20 -
4 Altra Industrial Motion Corp 254 0.02
1 A-Mark Precious Metals Inc 60 -
4 Amazon.com Inc 13,453 0.92
2 AMC Networks Inc 132 0.01
11 Amcor Ltd 127 0.01
59 Amcor PLC 697 0.05
8 Amdocs Ltd 652 0.04
1 Amedisys Inc 133 0.01
1 Amerant Bancorp Inc 33 -
1 Amerant Bancorp Inc 22 -
1 Amerco 787 0.05
2 Ameresco Inc 103 0.01
1 American Axle & Manufacturing Holdings Inc 9 -
7 American Eagle Outfitters Inc 239 0.02
8 American Equity Investment Life Holding Co 232 0.02
21 American Express Co 3,430 0.23
6 American Financial Group Inc 824 0.06
24 American International Group Inc 1,292 0.09
- American National Bankshares Inc 10 -
1 American National Group Inc 225 0.02
1 American Outdoor Brands Inc 19 -
- American Public Education Inc 11 -
1 American Software Inc 23 -
1 American States Water Co 115 0.01
2 American Superconductor Corp 31 -
2 American Vanguard Corp 42 -
6 American Water Works Co Inc 955 0.07
1 American Woodmark Corp 48 -
- America's Car-Mart Inc 68 0.01
9 Ameriprise Financial Inc 2,433 0.17
3 Ameris Bancorp 171 0.01
2 AMERISAFE Inc 127 0.01
10 AmerisourceBergen Corp 1,179 0.08
6 AMETEK Inc 779 0.05
15 Amgen Inc 3,464 0.24
5 Amkor Technology Inc 101 0.01
4 AMN Healthcare Services Inc 373 0.03
8 Amneal Pharmaceuticals Inc 45 -
2 Ampco-Pittsburgh Corp 15 -
2 Amphastar Pharmaceuticals Inc 36 -
10 Amphenol Corp 662 0.05
1 Amtech Systems Inc 12 -
9 Analog Devices Inc 1,527 0.10
2 Anaplan Inc 91 0.01
2 AnaptysBio Inc 40 -
1 Andersons Inc 32 -
5 ANGI Homeservices Inc 65 -
2 AngioDynamics Inc 51 -
1 ANI Pharmaceuticals Inc 28 -
1 Anika Therapeutics Inc 42 -
1 Ansys Inc 249 0.02
8 Antares Pharma Inc 31 -
10 Anthem Inc 3,856 0.26
Shares (000's)
Value(000's)
USD
% of NetAssetValue
Common Stock (continued)
United States - 64.10% (continued)
7 AO Smith Corp 482 0.03
10 Aon PLC 2,600 0.18
16 API Group Inc 335 0.02
2 Apogee Enterprises Inc 60 -
2 Apollo Global Management Inc 137 0.01
3 Apollo Medical Holdings Inc 94 0.01
- Appfolio Inc 63 -
1 Appian Corp 58 -
482 Apple Inc 60,053 4.09
2 Applied Industrial Technologies Inc 194 0.01
18 Applied Materials Inc 2,546 0.17
5 AptarGroup Inc 765 0.05
7 Aptiv PLC 1,043 0.07
10 Aramark 389 0.03
11 ARC Document Solutions Inc 23 -
1 ArcBest Corp 67 -
23 Arch Capital Group Ltd 913 0.06
13 Archrock Inc 116 0.01
4 Arconic Corp 138 0.01
2 Arcosa Inc 102 0.01
2 Ardelyx Inc 16 -
1 Arena Pharmaceuticals Inc 85 0.01
2 Ares Management Corp 114 0.01
1 Argan Inc 50 -
4 Argo Group International Holdings Ltd 197 0.01
2 Arista Networks Inc 722 0.05
4 Arlo Technologies Inc 24 -
1 Armstrong World Industries Inc 68 0.01
6 Arrow Electronics Inc 668 0.05
1 Arrow Financial Corp 34 -
3 Arrowhead Pharmaceuticals Inc 228 0.02
1 Artesian Resources Corp 30 -
9 Arthur J Gallagher & Co 1,249 0.09
4 Artisan Partners Asset Management Inc 190 0.01
- Arvinas Inc 34 -
2 Asbury Automotive Group Inc 323 0.02
4 ASGN Inc 426 0.03
2 Ashland Global Holdings Inc 175 0.01
2 Aspen Aerogels Inc 41 -
4 Aspen Technology Inc 517 0.04
1 Assembly Biosciences Inc 5 -
2 Assetmark Financial Holdings Inc 57 -
9 Associated Banc-Corp 212 0.01
4 Assurant Inc 634 0.04
5 Assured Guaranty Ltd 247 0.02
2 Astec Industries Inc 104 0.01
1 Astronics Corp, Class A 25 -
- Astronics Corp, Class B 1 -
1 AstroNova Inc 16 -
2 Asure Software Inc 19 -
5 At Home Group Inc 171 0.01
3 Atara Biotherapeutics Inc 45 -
12 Athene Holding Ltd 761 0.05
1 Athenex Inc 4 -
3 Atkore International Group Inc 205 0.01
1 Atlantic Capital Bancshares Inc 20 -
3 Atlantic Union Bankshares Corp 122 0.01
2 Atlanticus Holdings Corp 63 -
1 Atlassian Corp PLC 302 0.02
2 Atmos Energy Corp 222 0.02
- ATN International Inc 8 -
2 Atreca Inc 16 -
Global Sustainability Core Equity FundPortfolio of Investments as at 31 May 2021 (continued)
Dimensional Fund Advisors Semi-Annual Report and Unaudited Financial Statements, 31 May 2021 242

Shares (000's)
Value(000's)
USD
% of NetAssetValue
Common Stock (continued)
United States - 64.10% (continued)
1 AtriCure Inc 109 0.01
- Atrion Corp 47 -
8 Audacy Inc 34 -
9 Autodesk Inc 2,566 0.18
4 Autoliv Inc 376 0.03
16 Automatic Data Processing Inc 3,125 0.21
6 AutoNation Inc 642 0.04
1 AutoZone Inc 768 0.05
2 Avalara Inc 268 0.02
2 Avangrid Inc 99 0.01
3 Avanos Medical Inc 108 0.01
19 Avantor Inc 607 0.04
4 Avaya Holdings Corp 124 0.01
5 Avery Dennison Corp 1,056 0.07
1 Aviat Networks Inc 30 -
2 Avid Technology Inc 59 -
9 Avient Corp 461 0.03
3 Avis Budget Group Inc 227 0.02
7 Avnet Inc 316 0.02
27 AXA Equitable Holdings Inc 846 0.06
22 Axalta Coating Systems Ltd 704 0.05
2 Axcella Health Inc 6 -
8 Axis Capital Holdings Ltd 444 0.03
2 Axogen Inc 32 -
4 Axos Financial Inc 186 0.01
2 AZZ Inc 86 0.01
2 B Riley Financial Inc 171 0.01
- B&G Foods Inc 13 -
47 Baker Hughes Co 1,158 0.08
2 Balchem Corp 254 0.02
8 Ball Corp 689 0.05
- Bally's Corp 22 -
3 Banc of California Inc 47 -
2 BancFirst Corp 147 0.01
4 Bancorp Inc 97 0.01
6 BancorpSouth Bank 190 0.01
82 Bank of America Corp 3,480 0.24
3 Bank of Hawaii Corp 231 0.02
1 Bank of Marin Bancorp 26 -
18 Bank of New York Mellon Corp 950 0.07
5 Bank OZK 194 0.01
6 BankUnited Inc 281 0.02
1 Bankwell Financial Group Inc 18 -
2 Banner Corp 122 0.01
1 Bar Harbor Bankshares 29 -
3 Barnes & Noble Education Inc 22 -
3 Barnes Group Inc 168 0.01
1 Barrett Business Services Inc 59 -
- Bassett Furniture Industries Inc 12 -
- BBX Capital Inc 4 -
3 Beacon Roofing Supply Inc 196 0.01
4 Beazer Homes USA Inc 93 0.01
9 Becton Dickinson and Co 2,063 0.14
7 Bed Bath & Beyond Inc 194 0.01
2 Benchmark Electronics Inc 71 0.01
3 Berkshire Hills Bancorp Inc 85 0.01
5 Berry Global Group Inc 340 0.02
13 Best Buy Co Inc 1,482 0.10
- Beyond Meat Inc 63 -
19 BGC Partners Inc 111 0.01
2 BGSF Inc 22 -
4 Big Lots Inc 214 0.01
Shares (000's)
Value(000's)
USD
% of NetAssetValue
Common Stock (continued)
United States - 64.10% (continued)
- Biglari Holdings Inc, Class B 13 -
2 Bill.com Holdings Inc 331 0.02
2 Bioceres Crop Solutions Corp 35 -
5 BioDelivery Sciences International Inc 18 -
6 Biogen Inc 1,569 0.11
5 BioMarin Pharmaceutical Inc 362 0.03
1 Bio-Rad Laboratories Inc 343 0.02
1 Bio-Techne Corp 391 0.03
1 BJ's Restaurants Inc 41 -
7 BJ's Wholesale Club Holdings Inc 318 0.02
5 Black Knight Inc 347 0.02
2 Blackbaud Inc 111 0.01
2 Blackline Inc 173 0.01
4 BlackRock Inc 3,447 0.24
11 Blackstone Group Inc 976 0.07
3 Bloomin' Brands Inc 86 0.01
- Blucora Inc 6 -
2 Blue Bird Corp 41 -
2 Bluebird Bio Inc 59 -
1 Bluegreen Vacations Holding Corp 29 -
1 BlueLinx Holdings Inc 35 -
- Blueprint Medicines Corp 18 -
- BM Technologies Inc 4 -
- Boingo Wireless Inc 5 -
2 Boise Cascade Co 158 0.01
4 BOK Financial Corp 345 0.02
1 Booking Holdings Inc 1,993 0.14
1 Boot Barn Holdings Inc 103 0.01
7 Booz Allen Hamilton Holding Corp 630 0.04
14 BorgWarner Inc 707 0.05
- Boston Beer Co Inc 377 0.03
3 Boston Omaha Corp 83 0.01
3 Boston Private Financial Holdings Inc 50 -
28 Boston Scientific Corp 1,203 0.08
2 Bottomline Technologies DE Inc 66 -
5 Box Inc 116 0.01
1 Brady Corp 54 -
2 Bridgewater Bancshares Inc 28 -
2 Brightcove Inc 27 -
6 Brighthouse Financial Inc 313 0.02
7 Brightsphere Investment Group Inc 150 0.01
6 BrightView Holdings Inc 100 0.01
1 Brinker International Inc 74 0.01
3 Brink's Co 246 0.02
52 Bristol-Myers Squibb Co 3,412 0.23
1 Bristow Group Inc 19 -
7 Broadcom Inc 3,463 0.24
5 Broadridge Financial Solutions Inc 816 0.06
5 Brookfield Renewable Corp 226 0.02
6 Brookline Bancorp Inc 95 0.01
3 Brooks Automation Inc 326 0.02
10 Brown & Brown Inc 548 0.04
2 Brown-Forman Corp, Class A 184 0.01
9 Brown-Forman Corp, Class B 738 0.05
7 Bruker Corp 469 0.03
3 Brunswick Corp 337 0.02
1 Bryn Mawr Bank Corp 52 -
4 Buckle Inc 158 0.01
11 Builders FirstSource Inc 476 0.03
1 Burlington Stores Inc 470 0.03
1 Business First Bancshares Inc 23 -
5 BWX Technologies Inc 314 0.02
Global Sustainability Core Equity FundPortfolio of Investments as at 31 May 2021 (continued)
Dimensional Fund Advisors Semi-Annual Report and Unaudited Financial Statements, 31 May 2021 243

Shares (000's)
Value(000's)
USD
% of NetAssetValue
Common Stock (continued)
United States - 64.10% (continued)
3 Byline Bancorp Inc 62 -
- Cable One Inc 278 0.02
2 CACI International Inc 541 0.04
3 Cactus Inc 99 0.01
4 Cadence BanCorp 96 0.01
8 Cadence Design Systems Inc 986 0.07
3 CalAmp Corp 40 -
- Calavo Growers Inc 33 -
3 Caleres Inc 66 -
3 California Water Service Group 184 0.01
3 Calix Inc 115 0.01
3 Callaway Golf Co 127 0.01
1 Cambium Networks Corp 82 0.01
- Cambridge Bancorp 19 -
1 Camden National Corp 43 -
8 Campbell Soup Co 381 0.03
3 Camping World Holdings Inc 120 0.01
1 Cantel Medical Corp 103 0.01
1 Capital Bancorp Inc 18 -
1 Capital City Bank Group Inc 27 -
10 Capital One Financial Corp 1,583 0.11
9 Capitol Federal Financial Inc 114 0.01
10 Capri Holdings Ltd 590 0.04
2 Capstar Financial Holdings Inc 43 -
1 Cara Therapeutics Inc 10 -
18 Cardinal Health Inc 1,020 0.07
2 Cardiovascular Systems Inc 60 -
2 Cardtronics PLC 68 0.01
3 Cargurus Inc 98 0.01
1 Carlisle Cos Inc 153 0.01
10 CarMax Inc 1,102 0.08
2 CarParts.com Inc 26 -
38 Carrier Global Corp 1,748 0.12
1 Carrols Restaurant Group Inc 9 -
5 Cars.com Inc 69 0.01
3 Carter's Inc 303 0.02
1 Carvana Co 149 0.01
3 Casa Systems Inc 29 -
3 Casey's General Stores Inc 726 0.05
1 Cass Information Systems Inc 46 -
10 Castlight Health Inc 19 -
2 Catalyst Biosciences Inc 11 -
7 Catalyst Pharmaceuticals Inc 36 -
14 Caterpillar Inc 3,256 0.22
5 Cathay General Bancorp 202 0.01
2 Cato Corp 26 -
1 Cavco Industries Inc 184 0.01
3 CBIZ Inc 101 0.01
4 Cboe Global Markets Inc 431 0.03
19 CBRE Group Inc 1,706 0.12
2 CBTX Inc 51 -
7 CDK Global Inc 368 0.03
7 CDW Corp 1,101 0.08
3 CECO Environmental Corp 21 -
2 Celanese Corp 363 0.03
1 Celldex Therapeutics Inc 40 -
2 Celsius Holdings Inc 103 0.01
16 Centene Corp 1,207 0.08
1 Central Garden & Pet Co (non-voting rights) 66 -
- Central Garden & Pet Co (voting rights) 22 -
- Century Bancorp Inc 22 -
4 Century Communities Inc 302 0.02
Shares (000's)
Value(000's)
USD
% of NetAssetValue
Common Stock (continued)
United States - 64.10% (continued)
2 Cerence Inc 159 0.01
5 Ceridian HCM Holding Inc 408 0.03
15 Cerner Corp 1,162 0.08
1 CEVA Inc 36 -
7 CH Robinson Worldwide Inc 650 0.04
22 ChampionX Corp 586 0.04
2 ChannelAdvisor Corp 45 -
4 Charles & Colvard Ltd 9 -
34 Charles Schwab Corp 2,506 0.17
2 Chart Industries Inc 230 0.02
3 Charter Communications Inc 2,071 0.14
- Chase Corp 33 -
1 Cheesecake Factory Inc 53 -
3 Chefs' Warehouse Inc 100 0.01
- Chesapeake Utilities Corp 41 -
2 Chewy Inc 168 0.01
11 Chico's FAS Inc 50 -
- Children's Place Inc 23 -
- Chipotle Mexican Grill Inc 233 0.02
12 Chubb Ltd 1,958 0.13
8 Church & Dwight Co Inc 724 0.05
12 Ciena Corp 619 0.04
17 Cigna Corp 4,396 0.30
1 Cimpress PLC 93 0.01
6 Cincinnati Financial Corp 763 0.05
2 Cinemark Holdings Inc 56 -
2 Cintas Corp 771 0.05
1 CIRCOR International Inc 46 -
2 Cirrus Logic Inc 145 0.01
125 Cisco Systems Inc 6,622 0.45
2 CIT Group Inc 126 0.01
30 Citigroup Inc 2,389 0.16
- Citizens & Northern Corp 10 -
17 Citizens Financial Group Inc 830 0.06
2 Citrix Systems Inc 226 0.02
1 City Holding Co 78 0.01
1 Civeo Corp 11 -
1 Civista Bancshares Inc 13 -
1 Clarivate PLC 40 -
9 Clean Energy Fuels Corp 68 0.01
- Clearfield Inc 19 -
1 Clearway Energy Inc, Class C 15 -
3 Clorox Co 512 0.04
18 Cloudera Inc 233 0.02
3 Cloudflare Inc 228 0.02
1 CMC Materials Inc 198 0.01
4 CME Group Inc 976 0.07
5 CNA Financial Corp 248 0.02
- CNB Financial Corp 10 -
1 Coastal Financial Corp 18 -
73 Coca-Cola Co 4,039 0.28
1 Coca-Cola Consolidated Inc 232 0.02
2 Codexis Inc 38 -
8 Coeur Mining Inc 83 0.01
3 Cognex Corp 247 0.02
12 Cognizant Technology Solutions Corp 861 0.06
2 Cognyte Software Ltd 64 -
2 Cohen & Steers Inc 130 0.01
1 Coherent Inc 154 0.01
1 Coherus Biosciences Inc 11 -
2 Cohu Inc 92 0.01
8 Colfax Corp 369 0.03
Global Sustainability Core Equity FundPortfolio of Investments as at 31 May 2021 (continued)
Dimensional Fund Advisors Semi-Annual Report and Unaudited Financial Statements, 31 May 2021 244

Shares (000's)
Value(000's)
USD
% of NetAssetValue
Common Stock (continued)
United States - 64.10% (continued)
20 Colgate-Palmolive Co 1,648 0.11
2 Collegium Pharmaceutical Inc 39 -
2 Columbia Banking System Inc 106 0.01
8 Columbia Financial Inc 136 0.01
4 Columbia Sportswear Co 377 0.03
1 Columbus McKinnon Corp 69 0.01
115 Comcast Corp 6,606 0.45
5 Comerica Inc 383 0.03
4 Comfort Systems USA Inc 352 0.02
7 Commerce Bancshares Inc 529 0.04
3 Commercial Vehicle Group Inc 35 -
11 CommScope Holding Co Inc 227 0.02
2 Community Bank System Inc 152 0.01
1 Community Trust Bancorp Inc 39 -
1 CommVault Systems Inc 98 0.01
3 Compass Minerals International Inc 191 0.01
1 Computer Programs & Systems Inc 38 -
1 Computer Task Group Inc 12 -
7 comScore Inc 29 -
1 Comtech Telecommunications Corp 35 -
3 Concentrix Corp 468 0.03
14 Conduent Inc 110 0.01
1 CONMED Corp 176 0.01
3 ConnectOne Bancorp Inc 75 0.01
3 Conn's Inc 68 0.01
- Consolidated Communications Holdings Inc 3 -
4 Consolidated Edison Inc 331 0.02
1 Consolidated Water Co Ltd 12 -
4 Constellation Brands Inc 1,054 0.07
2 Constellation Pharmaceuticals Inc 37 -
2 Construction Partners Inc 68 0.01
2 Container Store Group Inc 32 -
2 Cooper Cos Inc 737 0.05
1 Cooper-Standard Holdings Inc 22 -
- Copa Holdings SA 20 -
8 Copart Inc 998 0.07
3 Corcept Therapeutics Inc 70 0.01
4 Core Laboratories NV 173 0.01
4 CoreLogic Inc 348 0.02
5 Cornerstone Building Brands Inc 80 0.01
1 Cornerstone OnDemand Inc 36 -
15 Corteva Inc 694 0.05
1 CorVel Corp 122 0.01
2 Costamare Inc 26 -
1 CoStar Group Inc 1,013 0.07
9 Costco Wholesale Corp 3,532 0.24
68 Coty Inc 602 0.04
1 Coupa Software Inc 135 0.01
8 Covetrus Inc 211 0.01
1 Cowen Inc 28 -
1 Cracker Barrel Old Country Store Inc 161 0.01
3 Crane Co 259 0.02
4 Crawford & Co, Class A 38 -
2 Crawford & Co, Class B 21 -
1 Credit Acceptance Corp 366 0.03
1 Crinetics Pharmaceuticals Inc 23 -
3 CRISPR Therapeutics AG 375 0.03
3 Crocs Inc 339 0.02
4 Cross Country Healthcare Inc 59 -
4 CrossFirst Bankshares Inc 52 -
1 Crowdstrike Holdings Inc 247 0.02
2 Crown Crafts Inc 17 -
Shares (000's)
Value(000's)
USD
% of NetAssetValue
Common Stock (continued)
United States - 64.10% (continued)
12 Crown Holdings Inc 1,200 0.08
2 CryoLife Inc 69 0.01
2 CSG Systems International Inc 104 0.01
- CSW Industrials Inc 57 -
8 CSX Corp 828 0.06
1 Cue Biopharma Inc 17 -
4 Cullen/Frost Bankers Inc 447 0.03
6 Cummins Inc 1,424 0.10
1 Cumulus Media Inc 7 -
3 Curo Group Holdings Corp 46 -
3 Curtiss-Wright Corp 335 0.02
17 Cushman & Wakefield PLC 330 0.02
2 Customers Bancorp Inc 75 0.01
5 CVB Financial Corp 112 0.01
6 CVR Energy Inc 133 0.01
27 CVS Health Corp 2,323 0.16
1 CyberOptics Corp 18 -
2 Cymabay Therapeutics Inc 8 -
- Daily Journal Corp 15 -
4 Daktronics Inc 25 -
6 Dana Inc 161 0.01
9 Danaher Corp 2,234 0.15
3 Darling Ingredients Inc 185 0.01
7 Daseke Inc 51 -
- Datadog Inc 23 -
1 Dave & Buster's Entertainment Inc 36 -
5 DaVita Inc 582 0.04
2 Deciphera Pharmaceuticals Inc 54 -
2 Deckers Outdoor Corp 661 0.05
6 Deere & Co 2,131 0.15
3 Delek US Holdings Inc 67 -
10 Dell Technologies Inc 1,017 0.07
3 Deluxe Corp 144 0.01
2 Denali Therapeutics Inc 137 0.01
1 Denny's Corp 19 -
7 Dentsply Sirona Inc 470 0.03
4 Designer Brands Inc 70 0.01
1 DexCom Inc 356 0.02
2 DHT Holdings Inc 13 -
- Diamond Hill Investment Group Inc 44 -
3 Dick's Sporting Goods Inc 341 0.02
2 Digi International Inc 45 -
4 Digital Turbine Inc 249 0.02
1 Dillard's Inc 138 0.01
- Dime Community Bancshares Inc 10 -
10 Discover Financial Services 1,137 0.08
8 Discovery Inc, Class A 250 0.02
15 Discovery Inc, Class C 451 0.03
15 DISH Network Corp 636 0.04
3 DLH Holdings Corp 31 -
1 DMC Global Inc 75 0.01
1 DocuSign Inc 175 0.01
4 Dolby Laboratories Inc 367 0.03
8 Dollar General Corp 1,677 0.11
11 Dollar Tree Inc 1,116 0.08
- Domino's Pizza Inc 204 0.01
1 Domtar Corp 52 -
6 Donaldson Co Inc 376 0.03
2 Donegal Group Inc 28 -
3 Donnelley Financial Solutions Inc 100 0.01
1 Dorman Products Inc 103 0.01
1 Douglas Dynamics Inc 39 -
Global Sustainability Core Equity FundPortfolio of Investments as at 31 May 2021 (continued)
Dimensional Fund Advisors Semi-Annual Report and Unaudited Financial Statements, 31 May 2021 245

Shares (000's)
Value(000's)
USD
% of NetAssetValue
Common Stock (continued)
United States - 64.10% (continued)
8 Dover Corp 1,272 0.09
9 Dow Inc 624 0.04
22 DR Horton Inc 2,069 0.14
3 Dril-Quip Inc 92 0.01
18 Dropbox Inc 502 0.03
1 DSP Group Inc 13 -
1 Ducommun Inc 43 -
6 DuPont de Nemours Inc 513 0.04
1 DXP Enterprises Inc 40 -
2 Dycom Industries Inc 186 0.01
8 Dynatrace Inc 413 0.03
1 DZS Inc 16 -
2 Eagle Bancorp Inc 120 0.01
- Eagle Pharmaceuticals Inc 8 -
5 East West Bancorp Inc 367 0.03
- Eastern Co 13 -
10 Eaton Corp PLC 1,409 0.10
35 eBay Inc 2,127 0.15
2 Ebix Inc 52 -
2 Echo Global Logistics Inc 73 0.01
2 EchoStar Corp 49 -
8 Ecolab Inc 1,678 0.11
3 Edgewell Personal Care Co 158 0.01
3 Editas Medicine Inc 104 0.01
1 Educational Development Corp 10 -
8 Edwards Lifesciences Corp 807 0.06
- eGain Corp 4 -
1 eHealth Inc 92 0.01
1 El Pollo Loco Holdings Inc 19 -
20 Elanco Animal Health Inc (voting rights) 731 0.05
2 Elastic NV 193 0.01
7 Electronic Arts Inc 1,034 0.07
17 Element Solutions Inc 387 0.03
4 Elevate Credit Inc 15 -
3 elf Beauty Inc 70 0.01
10 Eli Lilly & Co 2,041 0.14
4 EMCOR Group Inc 510 0.04
2 EMCORE Corp 16 -
1 Emerald Holding Inc 3 -
2 Emergent BioSolutions Inc 117 0.01
23 Emerson Electric Co 2,169 0.15
2 Employers Holdings Inc 94 0.01
1 Enanta Pharmaceuticals Inc 54 -
- Encompass Health Corp 17 -
2 Encore Capital Group Inc 97 0.01
1 Encore Wire Corp 106 0.01
4 Endo International PLC 24 -
5 Energizer Holdings Inc 213 0.01
3 Energy Recovery Inc 55 -
2 Enerpac Tool Group Corp 64 -
3 EnerSys 258 0.02
12 EnLink Midstream LLC 57 -
2 Ennis Inc 37 -
3 Enova International Inc 116 0.01
1 Enphase Energy Inc 131 0.01
1 EnPro Industries Inc 118 0.01
2 Enstar Group Ltd 422 0.03
1 Enterprise Financial Services Corp 74 0.01
5 Entravision Communications Corp 22 -
2 Envestnet Inc 108 0.01
9 Envista Holdings Corp 408 0.03
1 EPAM Systems Inc 642 0.04
Shares (000's)
Value(000's)
USD
% of NetAssetValue
Common Stock (continued)
United States - 64.10% (continued)
2 Epizyme Inc 13 -
1 ePlus Inc 89 0.01
4 Equifax Inc 903 0.06
13 Equitrans Midstream Corp 109 0.01
- Equity Bancshares Inc 7 -
2 Erie Indemnity Co 363 0.03
2 Escalade Inc 45 -
2 ESCO Technologies Inc 143 0.01
1 Esquire Financial Holdings Inc 18 -
9 Essent Group Ltd 435 0.03
11 Essential Utilities Inc 539 0.04
6 Estee Lauder Cos Inc 1,776 0.12
2 Ethan Allen Interiors Inc 47 -
10 Etsy Inc 1,603 0.11
2 Euronet Worldwide Inc 351 0.02
3 Eventbrite Inc 61 -
4 Evercore Inc 514 0.04
3 Everest Re Group Ltd 805 0.06
4 Everi Holdings Inc 78 0.01
8 Eversource Energy 662 0.05
4 Evertec Inc 175 0.01
1 EVI Industries Inc 20 -
2 Evo Payments Inc 52 -
7 Evolent Health Inc 133 0.01
9 Evoqua Water Technologies Corp 278 0.02
3 EW Scripps Co 55 -
2 Exact Sciences Corp 215 0.02
7 Exelixis Inc 169 0.01
1 Exicure Inc 2 -
2 ExlService Holdings Inc 165 0.01
4 eXp World Holdings Inc 138 0.01
2 Expedia Group Inc 432 0.03
11 Expeditors International of Washington Inc 1,410 0.10
2 Exponent Inc 167 0.01
2 Express Inc 10 -
5 Exterran Corp 23 -
3 F5 Networks Inc 547 0.04
96 Facebook Inc 31,437 2.14
1 FactSet Research Systems Inc 273 0.02
1 Fair Isaac Corp 743 0.05
2 Farmer Brothers Co 21 -
1 Farmers National Banc Corp 13 -
1 FARO Technologies Inc 69 0.01
15 Fastenal Co 813 0.06
2 Fate Therapeutics Inc 127 0.01
3 FB Financial Corp 114 0.01
1 Federal Agricultural Mortgage Corp 72 0.01
4 Federal Signal Corp 164 0.01
8 Federated Investors Inc 254 0.02
6 FedEx Corp 1,813 0.12
1 FedNat Holding Co 4 -
5 Ferro Corp 104 0.01
1 Ferroglobe PLC 7 -
1 FibroGen Inc 24 -
19 Fidelity National Financial Inc 909 0.06
9 Fidelity National Information Services Inc 1,337 0.09
2 Fiesta Restaurant Group Inc 24 -
16 Fifth Third Bancorp 673 0.05
11 FireEye Inc 241 0.02
11 First American Financial Corp 718 0.05
2 First Bancorp 74 0.01
14 First Bancorp (Puerto Rico listing) 175 0.01
Global Sustainability Core Equity FundPortfolio of Investments as at 31 May 2021 (continued)
Dimensional Fund Advisors Semi-Annual Report and Unaudited Financial Statements, 31 May 2021 246

Shares (000's)
Value(000's)
USD
% of NetAssetValue
Common Stock (continued)
United States - 64.10% (continued)
1 First Bancshares Inc 38 -
3 First Busey Corp 86 0.01
1 First Choice Bancorp 23 -
- First Citizens BancShares Inc 430 0.03
7 First Commonwealth Financial Corp 101 0.01
1 First Community Bankshares Inc 47 -
6 First Financial Bancorp 145 0.01
6 First Financial Bankshares Inc 309 0.02
- First Financial Corp 11 -
3 First Foundation Inc 78 0.01
7 First Hawaiian Inc 205 0.01
34 First Horizon National Corp 643 0.04
- First Internet Bancorp 17 -
1 First Interstate BancSystem Inc 67 -
2 First Merchants Corp 91 0.01
- First Mid Bancshares Inc 20 -
7 First Midwest Bancorp Inc 149 0.01
1 First of Long Island Corp 31 -
5 First Republic Bank 893 0.06
1 First Western Financial Inc 25 -
2 FirstCash Inc 198 0.01
13 Fiserv Inc 1,470 0.10
2 Five Below Inc 333 0.02
4 Five Point Holdings LLC 31 -
- Five Star Senior Living Inc 1 -
1 Five9 Inc 233 0.02
5 Flagstar Bancorp Inc 215 0.02
3 FleetCor Technologies Inc 875 0.06
23 Flex Ltd 412 0.03
1 Flexsteel Industries Inc 28 -
4 Floor & Decor Holdings Inc 427 0.03
6 Flowers Foods Inc 135 0.01
9 Flowserve Corp 368 0.03
6 Fluent Inc 18 -
4 Fluidigm Corp 23 -
13 Fluor Corp 247 0.02
2 Flushing Financial Corp 38 -
8 FMC Corp 900 0.06
19 FNB Corp 251 0.02
6 Foot Locker Inc 407 0.03
99 Ford Motor Co 1,434 0.10
4 Forestar Group Inc 84 0.01
4 FormFactor Inc 127 0.01
1 Forrester Research Inc 47 -
2 Forterra Inc 43 -
6 Fortinet Inc 1,226 0.08
18 Fortive Corp 1,310 0.09
5 Fortune Brands Home & Security Inc 564 0.04
- Forum Energy Technologies Inc 3 -
1 Forward Air Corp 84 0.01
5 Fossil Group Inc 64 -
17 Fox Corp, Class A 626 0.04
13 Fox Corp, Class B 455 0.03
1 Fox Factory Holding Corp 141 0.01
2 Franchise Group Inc 63 -
1 Franklin Covey Co 28 -
2 Franklin Electric Co Inc 177 0.01
18 Franklin Resources Inc 614 0.04
22 Frank's International NV 72 0.01
- Frequency Therapeutics Inc 4 -
- Fresh Del Monte Produce Inc 11 -
1 Freshpet Inc 109 0.01
Shares (000's)
Value(000's)
USD
% of NetAssetValue
Common Stock (continued)
United States - 64.10% (continued)
3 Frontdoor Inc 178 0.01
1 FRP Holdings Inc 43 -
2 FTI Consulting Inc 290 0.02
1 FTS International Inc 18 -
4 FuelCell Energy Inc 37 -
- Fulcrum Therapeutics Inc 4 -
- Fulgent Genetics Inc 28 -
10 Fulton Financial Corp 178 0.01
1 Funko Inc 26 -
1 FVCBankcorp Inc 11 -
2 G1 Therapeutics Inc 51 -
1 GAMCO Investors Inc 16 -
2 Gannett Co Inc 12 -
15 Gap Inc 487 0.03
7 Garmin Ltd 989 0.07
5 Gartner Inc 1,065 0.07
1 GasLog Ltd 4 -
10 Gates Industrial Corp PLC 188 0.01
1 GATX Corp 144 0.01
2 GCP Applied Technologies Inc 54 -
1 Genasys Inc 8 -
1 Gencor Industries Inc 11 -
2 Generac Holdings Inc 736 0.05
142 General Electric Co 1,991 0.14
18 General Mills Inc 1,131 0.08
35 General Motors Co 2,072 0.14
1 Genesco Inc 65 -
2 Genie Energy Ltd 13 -
9 Genpact Ltd 433 0.03
7 Gentex Corp 243 0.02
1 Gentherm Inc 61 -
9 Genuine Parts Co 1,151 0.08
30 Genworth Financial Inc 125 0.01
1 Geospace Technologies Corp 12 -
2 German American Bancorp Inc 83 0.01
1 Gibraltar Industries Inc 103 0.01
3 G-III Apparel Group Ltd 112 0.01
34 Gilead Sciences Inc 2,275 0.16
6 Glacier Bancorp Inc 375 0.03
2 Glaukos Corp 142 0.01
1 Global Blood Therapeutics Inc 25 -
6 Global Payments Inc 1,254 0.09
1 Global Water Resources Inc 23 -
1 Globant SA 258 0.02
8 Globe Life Inc 832 0.06
4 Globus Medical Inc 302 0.02
3 GMS Inc 149 0.01
6 GoDaddy Inc 446 0.03
6 Goldman Sachs Group Inc 2,091 0.14
5 GoPro Inc 55 -
1 Gorman-Rupp Co 45 -
1 GP Strategies Corp 27 -
7 Graco Inc 516 0.04
11 GrafTech International Ltd 140 0.01
- Graham Holdings Co 72 0.01
3 Granite Construction Inc 111 0.01
12 Graphic Packaging Holding Co 209 0.01
7 Gray Television Inc 169 0.01
6 Great Lakes Dredge & Dock Corp 90 0.01
1 Great Southern Bancorp Inc 46 -
2 Great Western Bancorp Inc 70 0.01
5 Green Brick Partners Inc 118 0.01
Global Sustainability Core Equity FundPortfolio of Investments as at 31 May 2021 (continued)
Dimensional Fund Advisors Semi-Annual Report and Unaudited Financial Statements, 31 May 2021 247

Shares (000's)
Value(000's)
USD
% of NetAssetValue
Common Stock (continued)
United States - 64.10% (continued)
2 Green Dot Corp 89 0.01
2 Greenbrier Cos Inc 84 0.01
1 Greenhill & Co Inc 26 -
2 Greenlight Capital Re Ltd 20 -
2 GreenSky Inc 12 -
1 Greif Inc (non-voting rights) 68 0.01
- Greif Inc (voting rights) 29 -
2 Griffon Corp 50 -
3 Grocery Outlet Holding Corp 100 0.01
2 Group 1 Automotive Inc 287 0.02
1 Groupon Inc 44 -
3 Grubhub Inc 169 0.01
- GTT Communications Inc 1 -
2 GTY Technology Holdings Inc 14 -
- Guaranty Bancshares Inc 17 -
1 Guardant Health Inc 179 0.01
5 Guess? Inc 140 0.01
2 Guidewire Software Inc 200 0.01
4 H&E Equipment Services Inc 138 0.01
4 H&R Block Inc 107 0.01
2 Hackett Group Inc 28 -
2 Haemonetics Corp 106 0.01
6 Hain Celestial Group Inc 251 0.02
7 Halozyme Therapeutics Inc 308 0.02
2 Hamilton Lane Inc 155 0.01
3 Hancock Whitney Corp 160 0.01
22 Hanesbrands Inc 424 0.03
1 Hanger Inc 28 -
1 Hanmi Financial Corp 25 -
3 Hanover Insurance Group Inc 463 0.03
3 HarborOne Bancorp Inc 49 -
9 Harley-Davidson Inc 417 0.03
5 Harmonic Inc 37 -
2 Harsco Corp 39 -
28 Hartford Financial Services Group Inc 1,797 0.12
2 Harvard Bioscience Inc 16 -
10 Hasbro Inc 926 0.06
1 Haverty Furniture Cos Inc 64 -
2 Hawkins Inc 59 -
4 HB Fuller Co 274 0.02
1 HBT Financial Inc 19 -
- HCI Group Inc 32 -
1 Health Catalyst Inc 71 0.01
4 Healthcare Services Group Inc 108 0.01
4 HealthEquity Inc 352 0.02
2 HealthStream Inc 55 -
2 Heartland Express Inc 43 -
1 Heartland Financial USA Inc 58 -
32 Hecla Mining Co 290 0.02
2 HEICO Corp, Class A 255 0.02
1 HEICO Corp, Class B 185 0.01
2 Heidrick & Struggles International Inc 93 0.01
2 Helios Technologies Inc 108 0.01
14 Helix Energy Solutions Group Inc 73 0.01
4 Helmerich & Payne Inc 112 0.01
1 Hemisphere Media Group Inc 11 -
10 Henry Schein Inc 746 0.05
6 Herbalife Nutrition Ltd 292 0.02
3 Herc Holdings Inc 305 0.02
3 Heritage Commerce Corp 40 -
2 Heritage Financial Corp 64 -
2 Heritage Insurance Holdings Inc 15 -
Shares (000's)
Value(000's)
USD
% of NetAssetValue
Common Stock (continued)
United States - 64.10% (continued)
5 Herman Miller Inc 232 0.02
1 Heron Therapeutics Inc 17 -
- Heska Corp 84 0.01
60 Hewlett Packard Enterprise Co 956 0.07
5 Hexcel Corp 289 0.02
1 Hibbett Sports Inc 107 0.01
6 Hill International Inc 16 -
5 Hillenbrand Inc 214 0.01
2 Hill-Rom Holdings Inc 213 0.01
1 Hilltop Holdings Inc 54 -
- Hingham Institution for Savings 50 -
3 HNI Corp 133 0.01
6 HollyFrontier Corp 191 0.01
20 Hologic Inc 1,265 0.09
- Home Bancorp Inc 15 -
10 Home BancShares Inc 276 0.02
14 Home Depot Inc 4,386 0.30
2 Homology Medicines Inc 11 -
11 Honeywell International Inc 2,631 0.18
1 Hooker Furniture Corp 22 -
1 Hookipa Pharma Inc 18 -
8 Hope Bancorp Inc 115 0.01
3 Horace Mann Educators Corp 133 0.01
3 Horizon Bancorp Inc 53 -
2 Horizon Therapeutics PLC 155 0.01
4 Hostess Brands Inc 67 -
1 Houghton Mifflin Harcourt Co 8 -
3 Houlihan Lokey Inc 197 0.01
4 Howard Hughes Corp 419 0.03
11 Howmet Aerospace Inc 405 0.03
30 HP Inc 882 0.06
2 Hub Group Inc 131 0.01
4 Hubbell Inc 725 0.05
1 HubSpot Inc 278 0.02
5 Humana Inc 2,125 0.15
3 Huntington Ingalls Industries Inc 610 0.04
7 Huntsman Corp 210 0.01
1 Huron Consulting Group Inc 82 0.01
1 Hyster-Yale Materials Handling Inc 72 0.01
1 I3 Verticals Inc 28 -
7 IAA Inc 402 0.03
- IAC/InterActiveCorp 51 -
2 ICF International Inc 161 0.01
- Ichor Holdings Ltd 22 -
1 ICU Medical Inc 246 0.02
1 Ideaya Biosciences Inc 26 -
1 Identiv Inc 16 -
3 IDEX Corp 639 0.04
3 IDT Corp 98 0.01
1 IEC Electronics Corp 8 -
1 IES Holdings Inc 78 0.01
- IGM Biosciences Inc 12 -
7 iHeartMedia Inc 152 0.01
10 IHS Markit Ltd 1,002 0.07
10 Illinois Tool Works Inc 2,356 0.16
2 Illumina Inc 757 0.05
1 iMedia Brands Inc 14 -
3 Immersion Corp 22 -
3 ImmunityBio Inc 53 -
1 Incyte Corp 99 0.01
1 Independence Holding Co 46 -
1 Independent Bank Corp (Massachusetts) 105 0.01
Global Sustainability Core Equity FundPortfolio of Investments as at 31 May 2021 (continued)
Dimensional Fund Advisors Semi-Annual Report and Unaudited Financial Statements, 31 May 2021 248

Shares (000's)
Value(000's)
USD
% of NetAssetValue
Common Stock (continued)
United States - 64.10% (continued)
1 Independent Bank Corp (Michigan) 30 -
2 Independent Bank Group Inc 128 0.01
9 Infinera Corp 83 0.01
5 Information Services Group Inc 27 -
1 InfuSystem Holdings Inc 18 -
10 Ingersoll Rand Inc 474 0.03
2 Ingevity Corp 126 0.01
2 Innospec Inc 178 0.01
4 Innoviva Inc 53 -
1 Inogen Inc 74 0.01
4 Inovalon Holdings Inc 141 0.01
3 Inseego Corp 24 -
2 Insight Enterprises Inc 244 0.02
3 Insperity Inc 291 0.02
- Inspire Medical Systems Inc 74 0.01
2 Installed Building Products Inc 296 0.02
1 Insteel Industries Inc 43 -
2 Insulet Corp 416 0.03
2 Integer Holdings Corp 192 0.01
2 Integra LifeSciences Holdings Corp 139 0.01
60 Intel Corp 3,426 0.23
2 Intellia Therapeutics Inc 128 0.01
2 Inter Parfums Inc 133 0.01
2 Interactive Brokers Group Inc 167 0.01
10 Intercontinental Exchange Inc 1,074 0.07
1 InterDigital Inc 95 0.01
5 Interface Inc 83 0.01
4 International Bancshares Corp 176 0.01
38 International Business Machines Corp 5,492 0.37
9 International Flavors & Fragrances Inc (US listing) 1,231 0.08
11 International Game Technology PLC 271 0.02
5 International Paper Co 326 0.02
41 Interpublic Group of Cos Inc 1,377 0.09
1 inTEST Corp 13 -
- Intevac Inc 3 -
1 Intrepid Potash Inc 19 -
4 Intuit Inc 1,612 0.11
- Intuitive Surgical Inc 384 0.03
3 Invacare Corp 23 -
29 Invesco Ltd 828 0.06
15 Investors Bancorp Inc 223 0.02
- Investors Title Co 36 -
3 Ionis Pharmaceuticals Inc 118 0.01
2 Iovance Biotherapeutics Inc 29 -
5 IQVIA Holdings Inc 1,197 0.08
1 iRadimed Corp 19 -
1 iRhythm Technologies Inc 52 -
- Iridium Communications Inc 10 -
2 iRobot Corp 181 0.01
7 Ironwood Pharmaceuticals Inc 86 0.01
2 Iteris Inc 18 -
2 Itron Inc 210 0.01
5 ITT Inc 491 0.03
5 IVERIC bio Inc 32 -
1 J&J Snack Foods Corp 95 0.01
3 j2 Global Inc 426 0.03
2 Jack Henry & Associates Inc 291 0.02
- Jack in the Box Inc 51 -
8 Jacobs Engineering Group Inc 1,137 0.08
2 James River Group Holdings Ltd 63 -
11 Janus Henderson Group PLC 407 0.03
2 Jazz Pharmaceuticals PLC 346 0.02
Shares (000's)
Value(000's)
USD
% of NetAssetValue
Common Stock (continued)
United States - 64.10% (continued)
3 JB Hunt Transport Services Inc 544 0.04
4 JELD-WEN Holding Inc 119 0.01
6 JM Smucker Co 835 0.06
- John B Sanfilippo & Son Inc 41 -
3 John Bean Technologies Corp 502 0.03
3 John Wiley & Sons Inc, Class A 185 0.01
76 Johnson & Johnson 12,894 0.88
18 Johnson Controls International PLC 1,173 0.08
1 Johnson Outdoors Inc 67 -
1 Joint Corp 81 0.01
5 Jones Lang LaSalle Inc 976 0.07
1 Jounce Therapeutics Inc 11 -
55 JPMorgan Chase & Co 9,018 0.61
19 Juniper Networks Inc 501 0.03
1 Kadant Inc 90 0.01
- Kaiser Aluminum Corp 19 -
8 KAR Auction Services Inc 140 0.01
9 KB Home 420 0.03
10 KBR Inc 392 0.03
5 Kearny Financial Corp 67 -
8 Kellogg Co 543 0.04
4 Kelly Services Inc 95 0.01
6 Kemper Corp 461 0.03
5 Kennametal Inc 199 0.01
9 Kennedy-Wilson Holdings Inc 170 0.01
20 Keurig Dr Pepper Inc 740 0.05
29 KeyCorp 674 0.05
5 Keysight Technologies Inc 738 0.05
3 Kforce Inc 163 0.01
3 Kimball International Inc 34 -
26 Kinder Morgan Inc 477 0.03
1 Kingstone Cos Inc 11 -
1 Kiniksa Pharmaceuticals Ltd 20 -
1 Kinsale Capital Group Inc 101 0.01
10 KKR & Co Inc 578 0.04
7 KLA Corp 2,245 0.15
6 Knight-Swift Transportation Holdings Inc 285 0.02
2 Knoll Inc 47 -
6 Knowles Corp 118 0.01
9 Kohl's Corp 510 0.04
3 Kontoor Brands Inc 204 0.01
1 Koppers Holdings Inc 27 -
5 Korn Ferry 347 0.02
7 Kosmos Energy Ltd 22 -
24 Kraft Heinz Co 1,039 0.07
1 Kraton Corp 40 -
6 Kratos Defense & Security Solutions Inc 142 0.01
58 Kroger Co 2,135 0.15
4 Kronos Worldwide Inc 72 0.01
1 Krystal Biotech Inc 56 -
2 Kulicke & Soffa Industries Inc 119 0.01
2 Kura Oncology Inc 42 -
1 KVH Industries Inc 14 -
10 L Brands Inc 691 0.05
4 L3Harris Technologies Inc 949 0.07
4 Laboratory Corp of America Holdings 977 0.07
3 Lakeland Bancorp Inc 60 -
2 Lakeland Financial Corp 114 0.01
- Lakeland Industries Inc 10 -
6 Lam Research Corp 4,006 0.27
4 Lamb Weston Holdings Inc 329 0.02
1 Lancaster Colony Corp 147 0.01
Global Sustainability Core Equity FundPortfolio of Investments as at 31 May 2021 (continued)
Dimensional Fund Advisors Semi-Annual Report and Unaudited Financial Statements, 31 May 2021 249

Shares (000's)
Value(000's)
USD
% of NetAssetValue
Common Stock (continued)
United States - 64.10% (continued)
1 Landec Corp 11 -
2 Lands' End Inc 58 -
1 Landstar System Inc 155 0.01
4 Lantheus Holdings Inc 98 0.01
1 Larimar Therapeutics Inc 6 -
4 Las Vegas Sands Corp 223 0.02
2 Laureate Education Inc 33 -
1 Lawson Products Inc 42 -
9 Lazard Ltd 427 0.03
3 La-Z-Boy Inc 119 0.01
1 Lazydays Holdings Inc 20 -
1 LB Foster Co 13 -
2 LCI Industries 268 0.02
1 Leaf Group Ltd 13 -
4 Lear Corp 734 0.05
10 Leggett & Platt Inc 538 0.04
10 Leidos Holdings Inc 996 0.07
1 LeMaitre Vascular Inc 49 -
4 LendingClub Corp 67 -
- LendingTree Inc 61 -
19 Lennar Corp, Class A 1,898 0.13
1 Lennar Corp, Class B 107 0.01
1 Lennox International Inc 450 0.03
3 Levi Strauss & Co 78 0.01
6 Lexicon Pharmaceuticals Inc 24 -
3 LGI Homes Inc 530 0.04
1 LHC Group Inc 179 0.01
1 Liberty Broadband Corp, Class A 88 0.01
4 Liberty Broadband Corp, Class C 585 0.04
1 Liberty Latin America Ltd, Class A 18 -
4 Liberty Latin America Ltd, Class C 61 -
1 Liberty Media Corp-Liberty Braves, Class C 20 -
1 Liberty Media Corp-Liberty Formula One, Class A 29 -
7 Liberty Media Corp-Liberty Formula One, Class C 320 0.02
4 Liberty Media Corp-Liberty SiriusXM, Class A 189 0.01
9 Liberty Media Corp-Liberty SiriusXM, Class C 403 0.03
14 Liberty Oilfield Services Inc 214 0.01
2 Liberty TripAdvisor Holdings Inc 10 -
1 Lifetime Brands Inc 16 -
1 Lifevantage Corp 6 -
1 Ligand Pharmaceuticals Inc 66 -
2 Limelight Networks Inc 6 -
1 Lincoln Educational Services Corp 12 -
2 Lincoln Electric Holdings Inc 233 0.02
16 Lincoln National Corp 1,124 0.08
1 Lindsay Corp 92 0.01
2 Lions Gate Entertainment Corp, Class A 30 -
1 Liquidity Services Inc 36 -
2 Lithia Motors Inc 612 0.04
2 LivaNova PLC 136 0.01
4 Live Nation Entertainment Inc 332 0.02
2 Live Oak Bancshares Inc 119 0.01
5 Livent Corp 106 0.01
- LivePerson Ltd 11 -
2 LiveRamp Holdings Inc 108 0.01
21 LKQ Corp 1,066 0.07
1 Loral Space & Communications Inc 38 -
4 Louisiana-Pacific Corp 283 0.02
- LoveSac Co 33 -
15 Lowe's Cos Inc 2,884 0.20
6 LPL Financial Holdings Inc 830 0.06
2 LSI Industries Inc 20 -
Shares (000's)
Value(000's)
USD
% of NetAssetValue
Common Stock (continued)
United States - 64.10% (continued)
4 Lululemon Athletica Inc 1,448 0.10
1 Lumber Liquidators Holdings Inc 32 -
2 Lumentum Holdings Inc 149 0.01
2 Luminex Corp 75 0.01
1 Luna Innovations Inc 10 -
3 Luther Burbank Corp 33 -
1 Lydall Inc 38 -
11 Lyft Inc 623 0.04
3 M&T Bank Corp 483 0.03
2 Macquarie Infrastructure Corp 67 -
3 MacroGenics Inc 81 0.01
19 Macy's Inc 354 0.02
1 Madison Square Garden Entertainment Corp 104 0.01
- Madrigal Pharmaceuticals Inc 43 -
1 Magellan Health Inc 101 0.01
1 Magenta Therapeutics Inc 18 -
3 Magnite Inc 94 0.01
9 Maiden Holdings Ltd 33 -
- MainStreet Bancshares Inc 11 -
1 Malibu Boats Inc 117 0.01
- Mammoth Energy Services Inc 1 -
4 Manhattan Associates Inc 484 0.03
3 Manitex International Inc 20 -
2 Manitowoc Co Inc 54 -
5 ManpowerGroup Inc 616 0.04
2 ManTech International Corp 209 0.01
8 Marathon Petroleum Corp 524 0.04
4 Marchex Inc 9 -
3 Marcus & Millichap Inc 129 0.01
2 Marine Products Corp 32 -
2 MarineMax Inc 96 0.01
1 MarketAxess Holdings Inc 436 0.03
14 Marsh & McLennan Cos Inc 2,004 0.14
4 Marten Transport Ltd 63 -
1 Martin Marietta Materials Inc 406 0.03
12 Marvell Technology Inc 573 0.04
12 Masco Corp 698 0.05
2 Masimo Corp 326 0.02
1 Masonite International Corp 91 0.01
6 MasTec Inc 640 0.04
1 Mastech Digital Inc 13 -
22 Mastercard Inc 7,802 0.53
1 MasterCraft Boat Holdings Inc 35 -
2 Match Group Inc 253 0.02
1 Materion Corp 57 -
1 Matrix Service Co 12 -
11 Mattel Inc 240 0.02
2 Matthews International Corp 95 0.01
1 Maxar Technologies Inc (Canada listing) 20 -
5 Maxar Technologies Inc (US listing) 151 0.01
5 MAXIMUS Inc 501 0.03
3 MaxLinear Inc 126 0.01
1 Mayville Engineering Co Inc 14 -
1 MBIA Inc 13 -
8 McCormick & Co Inc (non-voting rights) 678 0.05
- McCormick & Co Inc (voting rights) 34 -
8 McDonald's Corp 1,776 0.12
2 McGrath RentCorp 191 0.01
6 McKesson Corp 1,199 0.08
7 MDC Holdings Inc 429 0.03
1 Medifast Inc 223 0.02
4 MEDNAX Inc 144 0.01
Global Sustainability Core Equity FundPortfolio of Investments as at 31 May 2021 (continued)
Dimensional Fund Advisors Semi-Annual Report and Unaudited Financial Statements, 31 May 2021 250

Shares (000's)
Value(000's)
USD
% of NetAssetValue
Common Stock (continued)
United States - 64.10% (continued)
1 Medpace Holdings Inc 207 0.01
25 Medtronic PLC 3,129 0.21
5 MEI Pharma Inc 16 -
2 MeiraGTx Holdings PLC 22 -
1 Mercantile Bank Corp 26 -
2 Mercer International Inc 26 -
2 Merchants Bancorp 106 0.01
35 Merck & Co Inc 2,665 0.18
5 Mercury General Corp 310 0.02
2 Mercury Systems Inc 151 0.01
3 Meredith Corp 106 0.01
4 Meridian Bancorp Inc 79 0.01
2 Meridian Bioscience Inc 46 -
1 Meridian Corp 14 -
2 Merit Medical Systems Inc 126 0.01
- Meritage Homes Corp 28 -
5 Meritor Inc 122 0.01
- Mesa Laboratories Inc 19 -
2 Meta Financial Group Inc 108 0.01
- Methode Electronics Inc 16 -
27 MetLife Inc 1,770 0.12
1 Metrocity Bankshares Inc 11 -
1 Metropolitan Bank Holding Corp 34 -
1 Mettler-Toledo International Inc 1,330 0.09
24 MGIC Investment Corp 356 0.02
10 MGM Resorts International 446 0.03
112 Microsoft Corp 27,841 1.90
- MicroStrategy Inc 102 0.01
3 Middleby Corp 535 0.04
1 Middlesex Water Co 86 0.01
2 Midland States Bancorp Inc 51 -
- MidWestOne Financial Group Inc 12 -
- Miller Industries Inc 15 -
1 Mimecast Ltd 61 -
1 Minerals Technologies Inc 108 0.01
1 Mirati Therapeutics Inc 198 0.01
3 Mistras Group Inc 28 -
2 Mitek Systems Inc 32 -
2 MKS Instruments Inc 297 0.02
1 Model N Inc 33 -
2 Moderna Inc 314 0.02
2 Modine Manufacturing Co 32 -
- ModivCare Inc 49 -
4 Moelis & Co 191 0.01
5 Molina Healthcare Inc 1,212 0.08
3 MoneyGram International Inc 27 -
2 MongoDB Inc 522 0.04
1 Monolithic Power Systems Inc 312 0.02
2 Monro Inc 125 0.01
15 Monster Beverage Corp 1,393 0.10
7 Moody's Corp 2,421 0.17
2 Moog Inc 168 0.01
23 Morgan Stanley 2,069 0.14
2 Morningstar Inc 422 0.03
9 Mosaic Co 310 0.02
3 Motorola Solutions Inc 708 0.05
2 Movado Group Inc 53 -
5 Mr Cooper Group Inc 185 0.01
6 MRC Global Inc 67 -
1 MSA Safety Inc 240 0.02
4 MSC Industrial Direct Co Inc 361 0.03
2 MSCI Inc 944 0.06
Shares (000's)
Value(000's)
USD
% of NetAssetValue
Common Stock (continued)
United States - 64.10% (continued)
2 MSG Networks Inc 24 -
1 Mueller Industries Inc 67 -
9 Mueller Water Products Inc 132 0.01
2 Murphy USA Inc 233 0.02
2 Mustang Bio Inc 7 -
1 MVB Financial Corp 21 -
2 Myers Industries Inc 55 -
2 MYR Group Inc 144 0.01
3 Myriad Genetics Inc 80 0.01
- Nabors Industries Ltd 21 -
1 Napco Security Technologies Inc 16 -
4 Nasdaq Inc 588 0.04
3 Natera Inc 253 0.02
2 National Bank Holdings Corp 83 0.01
4 National Beverage Corp 199 0.01
4 National CineMedia Inc 19 -
6 National Instruments Corp 255 0.02
1 National Research Corp 36 -
2 National Vision Holdings Inc 109 0.01
- National Western Life Group Inc 51 -
1 Natural Gas Services Group Inc 10 -
2 Natural Grocers by Vitamin Cottage Inc 19 -
1 Nature's Sunshine Products Inc 31 -
2 Natus Medical Inc 51 -
2 Nautilus Inc 29 -
17 Navient Corp 317 0.02
1 Navistar International Corp 23 -
2 NBT Bancorp Inc 70 0.01
10 NCR Corp 475 0.03
- Neenah Inc 19 -
6 Nektar Therapeutics 105 0.01
2 Nelnet Inc 139 0.01
1 Neogen Corp 127 0.01
3 NeoGenomics Inc 127 0.01
1 Neoleukin Therapeutics Inc 14 -
11 NetApp Inc 816 0.06
3 Netflix Inc 1,468 0.10
2 NETGEAR Inc 79 0.01
4 NetScout Systems Inc 131 0.01
1 Neurocrine Biosciences Inc 78 0.01
1 Nevro Corp 121 0.01
4 New Jersey Resources Corp 173 0.01
1 New Relic Inc 78 0.01
31 New York Community Bancorp Inc 368 0.03
8 New York Times Co 354 0.02
7 NewAge Inc 17 -
25 Newell Brands Inc 723 0.05
19 Newmark Group Inc 250 0.02
- NewMarket Corp 167 0.01
12 Newmont Goldcorp Corp 860 0.06
11 Newpark Resources Inc 38 -
18 News Corp, Class A 483 0.03
9 News Corp, Class B 241 0.02
3 Nexa Resources SA 29 -
4 Nexstar Media Group Inc 616 0.04
1 NextCure Inc 11 -
6 NextGen Healthcare Inc 91 0.01
20 NexTier Oilfield Solutions Inc 83 0.01
1 NGM Biopharmaceuticals Inc 19 -
2 NI Holdings Inc 44 -
1 Nicolet Bankshares Inc 46 -
43 Nielsen Holdings PLC 1,180 0.08
Global Sustainability Core Equity FundPortfolio of Investments as at 31 May 2021 (continued)
Dimensional Fund Advisors Semi-Annual Report and Unaudited Financial Statements, 31 May 2021 251

Shares (000's)
Value(000's)
USD
% of NetAssetValue
Common Stock (continued)
United States - 64.10% (continued)
28 NIKE Inc 3,855 0.26
7 NMI Holdings Inc 176 0.01
3 NN Inc 19 -
1 Nordson Corp 264 0.02
3 Nordstrom Inc 99 0.01
1 Northeast Bank 15 -
1 Northern Technologies International Corp 17 -
10 Northern Trust Corp 1,228 0.08
3 Northfield Bancorp Inc 59 -
10 Northwest Bancshares Inc 135 0.01
1 Northwest Natural Holding Co 35 -
- Northwest Pipe Co 13 -
21 NortonLifeLock Inc 576 0.04
33 NOV Inc 529 0.04
1 Novavax Inc 191 0.01
1 Novocure Ltd 302 0.02
8 NOW Inc 83 0.01
5 Nu Skin Enterprises Inc 286 0.02
7 Nuance Communications Inc 378 0.03
1 NuVasive Inc 90 0.01
1 NV5 Global Inc 83 0.01
9 nVent Electric PLC 290 0.02
10 NVIDIA Corp 6,235 0.42
- NVR Inc 1,393 0.10
15 Oceaneering International Inc 219 0.02
5 OceanFirst Financial Corp 109 0.01
1 Ocwen Financial Corp 35 -
1 Odonate Therapeutics Inc 4 -
3 ODP Corp 147 0.01
3 OFG Bancorp 75 0.01
6 Oil States International Inc 37 -
- Oil-Dri Corp of America 11 -
1 Okta Inc 147 0.01
2 Old Dominion Freight Line Inc 635 0.04
9 Old National Bancorp 172 0.01
28 Old Republic International Corp 739 0.05
2 Ollie's Bargain Outlet Holdings Inc 197 0.01
- Omega Flex Inc 49 -
2 Omnicell Inc 311 0.02
13 Omnicom Group Inc 1,048 0.07
1 ONE Gas Inc 98 0.01
11 OneMain Holdings Inc 631 0.04
2 ONEOK Inc 118 0.01
2 OneSpan Inc 41 -
3 OneSpaWorld Holdings Ltd 31 -
2 Onto Innovation Inc 122 0.01
30 OPKO Health Inc 115 0.01
1 Oppenheimer Holdings Inc 41 -
1 OptimizeRx Corp 27 -
6 Option Care Health Inc 105 0.01
39 Oracle Corp 3,032 0.21
1 OraSure Technologies Inc 12 -
2 O'Reilly Automotive Inc 1,315 0.09
1 Origin Bancorp Inc 53 -
3 Orion Energy Systems Inc 18 -
5 Ormat Technologies Inc (US listing) 321 0.02
- OrthoPediatrics Corp 23 -
5 Oshkosh Corp 638 0.04
1 OSI Systems Inc 122 0.01
9 Otis Worldwide Corp 737 0.05
6 Owens & Minor Inc 249 0.02
1 Oxford Industries Inc 91 0.01
Shares (000's)
Value(000's)
USD
% of NetAssetValue
Common Stock (continued)
United States - 64.10% (continued)
16 PACCAR Inc 1,448 0.10
3 Pacific Biosciences of California 94 0.01
3 Pacific Premier Bancorp Inc 155 0.01
1 Pacira BioSciences Inc 78 0.01
3 Packaging Corp of America 481 0.03
7 PacWest Bancorp 316 0.02
2 PagerDuty Inc 91 0.01
1 Palo Alto Networks Inc 206 0.01
1 Palomar Holdings Inc 80 0.01
- PAM Transportation Services Inc 18 -
1 Papa John's International Inc 68 0.01
1 Par Pacific Holdings Inc 13 -
1 Park Aerospace Corp 12 -
1 Park National Corp 131 0.01
1 Parke Bancorp Inc 24 -
5 Parker-Hannifin Corp 1,471 0.10
1 Park-Ohio Holdings Corp 22 -
7 Parsons Corp 269 0.02
2 Party City Holdco Inc 19 -
1 Patrick Industries Inc 96 0.01
12 Patterson-UTI Energy Inc 102 0.01
16 Paychex Inc 1,610 0.11
2 Paycom Software Inc 653 0.04
2 Paylocity Holding Corp 255 0.02
11 PayPal Holdings Inc 2,804 0.19
8 PBF Energy Inc 136 0.01
2 PC Connection Inc 78 0.01
1 PCSB Financial Corp 11 -
3 PC-Tel Inc 17 -
2 PDF Solutions Inc 31 -
1 Peapack Gladstone Financial Corp 35 -
1 Pegasystems Inc 142 0.01
1 Pennant Group Inc 21 -
6 Penske Automotive Group Inc 491 0.03
8 Pentair PLC 532 0.04
1 Penumbra Inc 232 0.02
- Peoples Bancorp Inc 13 -
13 People's United Financial Inc 248 0.02
15 PepsiCo Inc 2,183 0.15
1 Perdoceo Education Corp 7 -
2 Perficient Inc 120 0.01
10 Performance Food Group Co 485 0.03
5 Performant Financial Corp 15 -
7 PerkinElmer Inc 1,087 0.07
3 Perrigo Co PLC 138 0.01
2 Personalis Inc 34 -
1 PetMed Express Inc 17 -
48 Pfizer Inc 1,878 0.13
2 PGT Innovations Inc 55 -
6 Phillips 66 519 0.04
5 Ping Identity Holding Corp 120 0.01
5 Pinnacle Financial Partners Inc 414 0.03
3 Pinterest Inc 191 0.01
1 Piper Jaffray Cos 157 0.01
13 Pitney Bowes Inc 106 0.01
1 PJT Partners Inc 69 0.01
3 Planet Fitness Inc 251 0.02
1 PlayAGS Inc 11 -
1 Plexus Corp 104 0.01
6 Plug Power Inc 170 0.01
5 PNC Financial Services Group Inc 1,039 0.07
3 Polaris Inc 335 0.02
Global Sustainability Core Equity FundPortfolio of Investments as at 31 May 2021 (continued)
Dimensional Fund Advisors Semi-Annual Report and Unaudited Financial Statements, 31 May 2021 252

Shares (000's)
Value(000's)
USD
% of NetAssetValue
Common Stock (continued)
United States - 64.10% (continued)
2 Pool Corp 1,038 0.07
5 Popular Inc 382 0.03
3 Post Holdings Inc 335 0.02
1 Powell Industries Inc 32 -
3 Power Integrations Inc 255 0.02
2 Powerfleet Inc 11 -
10 PPG Industries Inc 1,820 0.12
2 PRA Group Inc 75 0.01
4 PRA Health Sciences Inc 721 0.05
1 Preferred Bank 64 -
- Preformed Line Products Co 18 -
2 Premier Financial Corp 66 -
5 Premier Inc 163 0.01
2 Prestige Consumer Healthcare Inc 86 0.01
2 PriceSmart Inc 174 0.01
3 Primerica Inc 547 0.04
2 Primoris Services Corp 66 -
13 Principal Financial Group Inc 821 0.06
4 ProAssurance Corp 108 0.01
33 Procter & Gamble Co 4,450 0.30
1 Professional Holding Corp 18 -
3 PROG Holdings Inc 147 0.01
4 Progress Software Corp 167 0.01
30 Progressive Corp 2,998 0.20
1 Progyny Inc 52 -
2 Proofpoint Inc 268 0.02
7 ProPetro Holding Corp 67 -
2 ProSight Global Inc 24 -
6 Prosperity Bancshares Inc 421 0.03
1 Protagonist Therapeutics Inc 35 -
2 Prothena Corp PLC 50 -
1 Proto Labs Inc 70 0.01
5 Provident Financial Services Inc 127 0.01
15 Prudential Financial Inc 1,618 0.11
3 PTC Inc 379 0.03
- PTC Therapeutics Inc 10 -
24 PulteGroup Inc 1,364 0.09
2 Pure Cycle Corp 28 -
7 Pure Storage Inc 140 0.01
3 Purple Innovation Inc 94 0.01
5 PVH Corp 564 0.04
1 Pzena Investment Management Inc 12 -
1 Q2 Holdings Inc 113 0.01
1 QAD Inc, Class A 39 -
1 QCR Holdings Inc 55 -
3 Quad/Graphics Inc 10 -
- Quaker Chemical Corp 109 0.01
22 QUALCOMM Inc 2,924 0.20
1 Qualys Inc 94 0.01
1 Quanex Building Products Corp 31 -
8 Quanta Services Inc 780 0.05
1 Quanterix Corp 26 -
5 Quest Diagnostics Inc 645 0.04
1 Quidel Corp 120 0.01
2 QuinStreet Inc 43 -
6 Quotient Technology Inc 68 0.01
36 Qurate Retail Inc 497 0.03
14 R1 RCM Inc 318 0.02
13 Radian Group Inc 305 0.02
7 Radiant Logistics Inc 52 -
3 RadNet Inc 69 0.01
1 Rafael Holdings Inc 36 -
Shares (000's)
Value(000's)
USD
% of NetAssetValue
Common Stock (continued)
United States - 64.10% (continued)
3 Ralph Lauren Corp 326 0.02
4 Rambus Inc 78 0.01
6 Ranpak Holdings Corp 137 0.01
- RAPT Therapeutics Inc 9 -
- Raven Industries Inc 14 -
6 Raymond James Financial Inc 841 0.06
3 Rayonier Advanced Materials Inc 25 -
28 Raytheon Technologies Corp 2,458 0.17
1 RBB Bancorp 25 -
1 RBC Bearings Inc 181 0.01
- RCI Hospitality Holdings Inc 24 -
2 RE/MAX Holdings Inc 59 -
11 Realogy Holdings Corp 194 0.01
- Red River Bancshares Inc 22 -
1 Red Robin Gourmet Burgers Inc 20 -
3 Redfin Corp 200 0.01
2 Regal Beloit Corp 276 0.02
3 Regeneron Pharmaceuticals Inc 1,486 0.10
2 REGENXBIO Inc 58 -
6 Regions Financial Corp 137 0.01
5 Reinsurance Group of America Inc 594 0.04
6 Reliance Steel & Aluminum Co 962 0.07
1 Reliant Bancorp Inc 21 -
3 RenaissanceRe Holdings Ltd 414 0.03
3 Renasant Corp 149 0.01
4 Renewable Energy Group Inc 262 0.02
5 Rent-A-Center Inc 289 0.02
2 Repligen Corp 301 0.02
1 Replimune Group Inc 40 -
1 Republic Bancorp Inc 53 -
10 Resideo Technologies Inc 285 0.02
5 ResMed Inc 957 0.07
1 Resolute Forest Products Inc 16 -
3 Resources Connection Inc 42 -
5 REV Group Inc 87 0.01
1 Revance Therapeutics Inc 34 -
2 Revolve Group Inc 115 0.01
9 Rexnord Corp 441 0.03
1 RH 698 0.05
1 Rhythm Pharmaceuticals Inc 18 -
7 Ribbon Communications Inc 54 -
1 Richmond Mutual BanCorp Inc 12 -
2 Rimini Street Inc 16 -
- RingCentral Inc 118 0.01
4 Rite Aid Corp 78 0.01
5 RLI Corp 482 0.03
1 RMR Group Inc 33 -
10 Robert Half International Inc 868 0.06
2 Rocket Pharmaceuticals Inc 89 0.01
5 Rockwell Automation Inc 1,294 0.09
1 Roku Inc 249 0.02
10 Rollins Inc 330 0.02
3 Roper Technologies Inc 1,127 0.08
7 Ross Stores Inc 861 0.06
4 Royal Gold Inc 526 0.04
15 RPC Inc 73 0.01
3 RPM International Inc 244 0.02
3 RR Donnelley & Sons Co 19 -
2 Rubius Therapeutics Inc 49 -
4 Rush Enterprises Inc 169 0.01
1 Ruth's Hospitality Group Inc 31 -
3 Ryder System Inc 230 0.02
Global Sustainability Core Equity FundPortfolio of Investments as at 31 May 2021 (continued)
Dimensional Fund Advisors Semi-Annual Report and Unaudited Financial Statements, 31 May 2021 253

Shares (000's)
Value(000's)
USD
% of NetAssetValue
Common Stock (continued)
United States - 64.10% (continued)
5 Ryerson Holding Corp 79 0.01
5 S&P Global Inc 1,888 0.13
2 S&T Bancorp Inc 70 0.01
12 Sabre Corp 168 0.01
3 Safeguard Scientifics Inc 22 -
2 Safety Insurance Group Inc 135 0.01
2 Sage Therapeutics Inc 124 0.01
1 Saia Inc 264 0.02
3 SailPoint Technologies Holding Inc 125 0.01
8 salesforce.com Inc 1,989 0.14
6 Sally Beauty Holdings Inc 137 0.01
3 Sandy Spring Bancorp Inc 145 0.01
7 Sangamo Therapeutics Inc 75 0.01
18 Santander Consumer USA Holdings Inc 676 0.05
2 Sapiens International Corp NV (US listing) 54 -
- Sarepta Therapeutics Inc 23 -
4 Satsuma Pharmaceuticals Inc 19 -
2 ScanSource Inc 55 -
77 Schlumberger Ltd 2,410 0.16
3 Schneider National Inc 83 0.01
2 Schnitzer Steel Industries Inc 117 0.01
2 Scholastic Corp 82 0.01
6 Science Applications International Corp 523 0.04
2 Scientific Games Corp 153 0.01
1 Sciplay Corp 26 -
1 Scorpio Tankers Inc 18 -
4 Scotts Miracle-Gro Co 971 0.07
3 Seacoast Banking Corp of Florida 122 0.01
2 Seagen Inc 310 0.02
4 Sealed Air Corp 227 0.02
1 SeaSpine Holdings Corp 16 -
1 SeaWorld Entertainment Inc 38 -
1 SecureWorks Corp 9 -
11 SEI Investments Co 682 0.05
6 Select Energy Services Inc 35 -
3 Select Interior Concepts Inc 33 -
5 Selective Insurance Group Inc 355 0.02
2 Semtech Corp 108 0.01
10 Sensata Technologies Holding PLC 590 0.04
2 Sensient Technologies Corp 184 0.01
1 ServiceNow Inc 367 0.03
3 ServisFirst Bancshares Inc 210 0.01
1 SFL Corp Ltd 10 -
1 Shake Shack Inc 48 -
1 SharpSpring Inc 10 -
13 Sherwin-Williams Co 3,737 0.25
1 Shockwave Medical Inc 115 0.01
1 Shoe Carnival Inc 59 -
- ShotSpotter Inc 16 -
2 Shutterstock Inc 153 0.01
3 Shyft Group Inc 111 0.01
1 SI-BONE Inc 37 -
1 Sierra Bancorp 14 -
1 Sierra Oncology Inc 18 -
1 SIGA Technologies Inc 11 -
2 Signature Bank 493 0.03
4 Signet Jewelers Ltd 261 0.02
8 Silgan Holdings Inc 343 0.02
2 Silicon Laboratories Inc 252 0.02
1 Silvercrest Asset Management Group Inc 13 -
1 Silvergate Capital Corp 82 0.01
6 Simmons First National Corp 187 0.01
Shares (000's)
Value(000's)
USD
% of NetAssetValue
Common Stock (continued)
United States - 64.10% (continued)
3 Simply Good Foods Co 114 0.01
44 Sirius XM Holdings Inc 273 0.02
4 SiriusPoint Ltd 45 -
2 SiteOne Landscape Supply Inc 279 0.02
1 SJW Group 68 0.01
8 Skechers U.S.A. Inc 399 0.03
4 Skyline Champion Corp 215 0.02
4 Slack Technologies Inc 165 0.01
1 Sleep Number Corp 99 0.01
30 SLM Corp 613 0.04
3 Smartsheet Inc 198 0.01
2 Smith Micro Software Inc 9 -
6 Snap Inc 376 0.03
3 Snap-on Inc 802 0.06
1 Solaris Oilfield Infrastructure Inc 9 -
6 SolarWinds Corp 96 0.01
2 Sonic Automotive Inc 97 0.01
6 Sonoco Products Co 393 0.03
3 Sonos Inc 124 0.01
7 South Jersey Industries Inc 193 0.01
1 South Plains Financial Inc 17 -
1 South State Corp 90 0.01
2 Southside Bancshares Inc 90 0.01
3 Southwest Gas Holdings Inc 173 0.01
1 SP Plus Corp 33 -
1 Spark Energy Inc 10 -
3 SpartanNash Co 59 -
2 Spectrum Pharmaceuticals Inc 8 -
1 Spero Therapeutics Inc 10 -
1 Spire Inc 92 0.01
5 Spirit AeroSystems Holdings Inc 233 0.02
1 Splunk Inc 85 0.01
2 Sportsman's Warehouse Holdings Inc 30 -
2 Spotify Technology SA 390 0.03
- SpringWorks Therapeutics Inc 18 -
9 Sprouts Farmers Market Inc 245 0.02
1 SPS Commerce Inc 100 0.01
3 SPX Corp 172 0.01
2 SPX FLOW Inc 149 0.01
1 Square Inc 279 0.02
12 SS&C Technologies Holdings Inc 870 0.06
2 St Joe Co 105 0.01
1 Stamps.com Inc 137 0.01
1 Standard Motor Products Inc 24 -
1 Standex International Corp 82 0.01
5 Stanley Black & Decker Inc 978 0.07
8 Starbucks Corp 904 0.06
3 State Auto Financial Corp 51 -
13 State Street Corp 1,096 0.08
6 Steel Dynamics Inc 397 0.03
6 Steelcase Inc 81 0.01
1 Stepan Co 198 0.01
3 Stereotaxis Inc 22 -
12 Sterling Bancorp 324 0.02
1 Sterling Bancorp Inc 5 -
2 Sterling Construction Co Inc 46 -
4 Steven Madden Ltd 157 0.01
2 Stewart Information Services Corp 149 0.01
7 Stifel Financial Corp 480 0.03
2 Stitch Fix Inc 120 0.01
1 Stock Yards Bancorp Inc 78 0.01
1 Stoke Therapeutics Inc 39 -
Global Sustainability Core Equity FundPortfolio of Investments as at 31 May 2021 (continued)
Dimensional Fund Advisors Semi-Annual Report and Unaudited Financial Statements, 31 May 2021 254

Shares (000's)
Value(000's)
USD
% of NetAssetValue
Common Stock (continued)
United States - 64.10% (continued)
1 Stoneridge Inc 35 -
2 StoneX Group Inc 103 0.01
1 Stratasys Ltd 32 -
- Strategic Education Inc 17 -
1 Stratus Properties Inc 23 -
4 Stryker Corp 1,142 0.08
7 Sunnova Energy International Inc 211 0.01
9 Sunrun Inc 399 0.03
3 Super Micro Computer Inc 103 0.01
1 Superior Group of Cos Inc 23 -
1 Supernus Pharmaceuticals Inc 44 -
5 Surface Oncology Inc 45 -
- Surmodics Inc 27 -
2 SVB Financial Group 1,164 0.08
1 SVMK Inc 28 -
5 Switch Inc 98 0.01
1 SWK Holdings Corp 10 -
3 Sykes Enterprises Inc 107 0.01
2 Synaptics Inc 220 0.02
28 Synchrony Financial 1,338 0.09
6 Syneos Health Inc 528 0.04
4 SYNNEX Corp 511 0.04
2 Synopsys Inc 599 0.04
9 Synovus Financial Corp 444 0.03
19 Sysco Corp 1,574 0.11
2 Systemax Inc 78 0.01
8 T Rowe Price Group Inc 1,599 0.11
1 Tabula Rasa HealthCare Inc 54 -
1 Tactile Systems Technology Inc 32 -
3 Take-Two Interactive Software Inc 577 0.04
- Talos Energy Inc 7 -
13 Tapestry Inc 580 0.04
3 Targa Resources Corp 113 0.01
14 Target Corp 3,229 0.22
1 Taro Pharmaceutical Industries Ltd 50 -
13 Taylor Morrison Home Corp 379 0.03
3 TCF Financial Corp 145 0.01
2 TCR2 Therapeutics Inc 31 -
3 Team Inc 22 -
38 TechnipFMC PLC 327 0.02
1 TechTarget Inc 53 -
4 Tecnoglass Inc 86 0.01
- Teekay Corp 1 -
1 Teekay Tankers Ltd 10 -
17 TEGNA Inc 333 0.02
1 Tejon Ranch Co 22 -
3 Teladoc Health Inc 490 0.03
2 Teledyne Technologies Inc 653 0.04
2 Teleflex Inc 770 0.05
1 Telephone & Data Systems Inc 22 -
10 Tempur Sealy International Inc 397 0.03
1 Tennant Co 74 0.01
3 Tenneco Inc 39 -
5 Teradata Corp 233 0.02
6 Teradyne Inc 832 0.06
4 Terex Corp 219 0.02
4 Terminix Global Holdings Inc 222 0.02
- Territorial Bancorp Inc 10 -
3 Tesla Inc 1,886 0.13
2 Tetra Tech Inc 296 0.02
7 TETRA Technologies Inc 25 -
3 Texas Capital Bancshares Inc 207 0.01
Shares (000's)
Value(000's)
USD
% of NetAssetValue
Common Stock (continued)
United States - 64.10% (continued)
2 Texas Roadhouse Inc 159 0.01
6 Textainer Group Holdings Ltd 185 0.01
10 TFS Financial Corp 231 0.02
6 Thermo Fisher Scientific Inc 2,587 0.18
2 Thermon Group Holdings Inc 32 -
3 Thor Industries Inc 430 0.03
1 Tidewater Inc 20 -
1 Tilly's Inc 18 -
5 Timken Co 440 0.03
1 Tiptree Inc 9 -
4 Titan International Inc 37 -
2 Titan Machinery Inc 64 -
3 Tivity Health Inc 79 0.01
40 TJX Cos Inc 2,734 0.19
11 T-Mobile US Inc 1,554 0.11
11 Toll Brothers Inc 749 0.05
1 Tompkins Financial Corp 67 -
1 Tootsie Roll Industries Inc 42 -
2 TopBuild Corp 306 0.02
4 Toro Co 481 0.03
2 Towne Bank 79 0.01
1 Townsquare Media Inc 21 -
1 TPI Composites Inc 51 -
3 Tractor Supply Co 625 0.04
- Trade Desk Inc 265 0.02
2 Tradeweb Markets Inc 150 0.01
6 Trane Technologies PLC 1,133 0.08
1 Transcat Inc 32 -
1 TransDigm Group Inc 770 0.05
21 Transocean Ltd 81 0.01
8 TransUnion 862 0.06
2 Travel + Leisure Co 109 0.01
1 TravelCenters of America Inc 17 -
13 Travelers Cos Inc 2,084 0.14
1 Travelzoo 12 -
1 Travere Therapeutics Inc 17 -
3 Trex Co Inc 247 0.02
12 TRI Pointe Group Inc 295 0.02
2 TriCo Bancshares 96 0.01
1 TriMas Corp 34 -
9 Trimble Inc 684 0.05
6 TriNet Group Inc 448 0.03
8 Trinity Industries Inc 231 0.02
2 Trinseo SA 153 0.01
5 TripAdvisor Inc 229 0.02
3 TriState Capital Holdings Inc 62 -
7 Triton International Ltd 357 0.02
2 Triumph Bancorp Inc 151 0.01
4 TrueBlue Inc 104 0.01
8 TrueCar Inc 45 -
20 Truist Financial Corp 1,242 0.08
1 Trupanion Inc 96 0.01
2 TrustCo Bank Corp NY 59 -
4 Trustmark Corp 131 0.01
3 TTEC Holdings Inc 283 0.02
2 Tupperware Brands Corp 40 -
1 Turtle Beach Corp 46 -
3 Tutor Perini Corp 51 -
2 Twilio Inc 687 0.05
1 Twin Disc Inc 11 -
15 Twitter Inc 866 0.06
1 Tyler Technologies Inc 273 0.02
Global Sustainability Core Equity FundPortfolio of Investments as at 31 May 2021 (continued)
Dimensional Fund Advisors Semi-Annual Report and Unaudited Financial Statements, 31 May 2021 255

Shares (000's)
Value(000's)
USD
% of NetAssetValue
Common Stock (continued)
United States - 64.10% (continued)
6 Uber Technologies Inc 280 0.02
- Ubiquiti Inc 115 0.01
2 UFP Industries Inc 175 0.01
- UFP Technologies Inc 22 -
12 UGI Corp 536 0.04
2 Ulta Salon Cosmetics & Fragrance Inc 773 0.05
2 Ultragenyx Pharmaceutical Inc 200 0.01
2 Ultralife Corp 20 -
3 UMB Financial Corp 297 0.02
13 Umpqua Holdings Corp 254 0.02
11 Under Armour Inc, Class A 237 0.02
12 Under Armour Inc, Class C 228 0.02
1 Unifi Inc 40 -
1 UniFirst Corp 187 0.01
- Union Pacific Corp 109 0.01
2 Unisys Corp 61 -
8 United Bankshares Inc 313 0.02
5 United Community Banks Inc 176 0.01
3 United Fire Group Inc 79 0.01
4 United Insurance Holdings Corp 23 -
6 United Natural Foods Inc 214 0.01
8 United Parcel Service Inc 1,800 0.12
5 United Rentals Inc 1,646 0.11
- United States Cellular Corp 12 -
1 United Therapeutics Corp 215 0.02
1 United-Guardian Inc 13 -
45 UnitedHealth Group Inc 18,501 1.26
- Unitil Corp 22 -
13 Univar Solutions Inc 363 0.03
1 Universal Display Corp 194 0.01
1 Universal Electronics Inc 35 -
2 Universal Insurance Holdings Inc 28 -
1 Universal Logistics Holdings Inc 22 -
2 Universal Technical Institute Inc 11 -
2 Univest Financial Corp 46 -
14 Unum Group 440 0.03
1 Upland Software Inc 54 -
3 Upwork Inc 163 0.01
6 Urban Outfitters Inc 232 0.02
10 US Bancorp 583 0.04
- US Concrete Inc 27 -
16 US Foods Holding Corp 625 0.04
1 US Physical Therapy Inc 68 0.01
2 US Silica Holdings Inc 22 -
2 US Xpress Enterprises Inc 25 -
1 USA Truck Inc 11 -
2 USANA Health Sciences Inc 170 0.01
- Utah Medical Products Inc 17 -
- Vail Resorts Inc 155 0.01
18 Valero Energy Corp 1,450 0.10
25 Valley National Bancorp 351 0.02
1 Valmont Industries Inc 215 0.02
10 Valvoline Inc 329 0.02
3 Vanda Pharmaceuticals Inc 44 -
1 Varex Imaging Corp 14 -
1 Vectrus Inc 36 -
1 Veeva Systems Inc 376 0.03
7 Venator Materials PLC 35 -
1 Veoneer Inc 16 -
3 Vera Bradley Inc 33 -
2 Veracyte Inc 63 -
5 Verastem Inc 19 -
Shares (000's)
Value(000's)
USD
% of NetAssetValue
Common Stock (continued)
United States - 64.10% (continued)
1 Vericel Corp 75 0.01
4 Verint Systems Inc 170 0.01
2 VeriSign Inc 473 0.03
7 Verisk Analytics Inc 1,217 0.08
3 Veritex Holdings Inc 104 0.01
67 Verizon Communications Inc 3,773 0.26
12 Verra Mobility Corp 169 0.01
- Verso Corp 6 -
9 Vertex Pharmaceuticals Inc 1,807 0.12
6 VF Corp 518 0.04
1 Viacom Inc, Class A 53 -
28 Viacom Inc, Class B 1,207 0.08
- Viad Corp 18 -
2 ViaSat Inc 126 0.01
12 Viavi Solutions Inc 205 0.01
1 Vicor Corp 62 -
1 Victory Capital Holdings Inc 42 -
7 ViewRay Inc 41 -
3 Viking Therapeutics Inc 16 -
- Village Super Market Inc 10 -
1 Vimeo Inc 22 -
9 Virtu Financial Inc 287 0.02
- Virtus Investment Partners Inc 139 0.01
36 Visa Inc 8,233 0.56
1 Visteon Corp 128 0.01
2 VMware Inc 374 0.03
1 Vocera Communications Inc 27 -
3 Volt Information Sciences Inc 10 -
9 Vontier Corp 332 0.02
2 VOXX International Corp 26 -
8 Voya Financial Inc 550 0.04
1 VSE Corp 69 0.01
5 Vulcan Materials Co 871 0.06
15 W R Berkley Corp 1,171 0.08
4 Wabash National Corp 57 -
43 Walgreens Boots Alliance Inc 2,268 0.15
3 Walker & Dunlop Inc 312 0.02
39 Walmart Inc 5,530 0.38
15 Walt Disney Co 2,623 0.18
5 Washington Federal Inc 157 0.01
1 Washington Trust Bancorp Inc 72 0.01
3 Waters Corp 907 0.06
2 Waterstone Financial Inc 34 -
1 Watsco Inc 366 0.03
2 Watts Water Technologies Inc 213 0.01
2 Wayfair Inc 654 0.04
5 Webster Financial Corp 312 0.02
2 Weis Markets Inc 104 0.01
6 Welbilt Inc 140 0.01
33 Wells Fargo & Co 1,533 0.10
4 Wendy's Co 88 0.01
3 Werner Enterprises Inc 153 0.01
3 WesBanco Inc 102 0.01
1 WESCO International Inc 108 0.01
1 West Bancorporation Inc 31 -
2 Westamerica Bancorporation 103 0.01
6 Western Alliance Bancorp 640 0.04
23 Western Union Co 570 0.04
9 Westinghouse Air Brake Technologies Corp 767 0.05
2 Westlake Chemical Corp 240 0.02
7 Westrock Co 395 0.03
2 WEX Inc 392 0.03
Global Sustainability Core Equity FundPortfolio of Investments as at 31 May 2021 (continued)
Dimensional Fund Advisors Semi-Annual Report and Unaudited Financial Statements, 31 May 2021 256

Shares (000's)
Value(000's)
USD
% of NetAssetValue
Common Stock (continued)
United States - 64.10% (continued)
1 Weyco Group Inc 17 -
4 Whirlpool Corp 993 0.07
- White Mountains Insurance Group Ltd 304 0.02
1 Willdan Group Inc 29 -
5 Williams-Sonoma Inc 853 0.06
5 Willis Towers Watson PLC 1,297 0.09
18 WillScot Mobile Mini Holdings Corp 509 0.04
1 Wingstop Inc 76 0.01
- Winmark Corp 42 -
2 Winnebago Industries Inc 176 0.01
3 Wintrust Financial Corp 244 0.02
10 WisdomTree Investments Inc 64 -
4 Wolverine World Wide Inc 132 0.01
3 Woodward Inc 341 0.02
1 Workday Inc 255 0.02
1 World Acceptance Corp 84 0.01
2 World Fuel Services Corp 56 -
2 World Wrestling Entertainment Inc 86 0.01
4 Worthington Industries Inc 250 0.02
1 WR Grace & Co 96 0.01
3 WSFS Financial Corp 155 0.01
4 WW Grainger Inc 1,638 0.11
1 WW International Inc 21 -
1 Wynn Resorts Ltd 170 0.01
2 X4 Pharmaceuticals Inc 18 -
2 Xencor Inc 81 0.01
11 Xerox Holdings Corp 262 0.02
4 Xilinx Inc 506 0.03
- Xperi Holding Corp 10 -
4 XPO Logistics Inc 640 0.04
8 Xylem Inc 951 0.07
1 Yellow Corp 10 -
4 Yelp Inc 162 0.01
1 York Water Co 38 -
6 Yum! Brands Inc 748 0.05
1 Zebra Technologies Corp 571 0.04
1 Zendesk Inc 177 0.01
1 Zillow Group Inc, Class A 162 0.01
4 Zillow Group Inc, Class C 442 0.03
5 Zimmer Biomet Holdings Inc 789 0.05
8 Zions Bancorp NA 476 0.03
3 ZIOPHARM Oncology Inc 9 -
2 Zix Corp 17 -
11 Zoetis Inc 2,029 0.14
1 Zogenix Inc 18 -
2 Zoom Video Communications Inc 518 0.04
1 Zscaler Inc 275 0.02
2 Zumiez Inc 77 0.01
25 Zynga Inc 272 0.02
941,569 64.10
Total Common Stock - 96.32% (30 November 2020: 96.23%) 1,414,759 96.32
Preferred Stock
Germany - 0.14%
3 Bayerische Motoren Werke AG 239 0.02
1 Draegerwerk AG & Co KGaA 73 0.01
2 Fuchs Petrolub SE 131 0.01
3 Henkel AG & Co KGaA 323 0.02
4 Jungheinrich AG 217 0.01
4 Porsche Automobil Holding SE 399 0.03
1 Sartorius AG 480 0.03
Shares (000's)
Value(000's)
USD
% of NetAssetValue
Preferred Stock (continued)
Germany - 0.14% (continued)
1 Sixt SE 101 0.01
- STO SE & Co KGaA 64 -
2,027 0.14
Italy - 0.00%
1 Danieli & C Officine Meccaniche SpA 14 -
94 Telecom Italia SpA 54 -
68 -
United States - 0.00%
- WESCO International Inc 13 -
13 -
Total Preferred Stock - 0.14% (30 November 2020: 0.15%) 2,108 0.14
Real Estate Investment Trust
Australia - 0.12%
10 Abacus Property Group 22 -
6 ALE Property Group 19 -
4 APN Convenience Retail REIT 11 -
7 APN Industria REIT 17 -
7 Arena REIT 17 -
10 Aventus Group 23 -
28 BWP Trust 92 0.01
13 Centuria Capital Group 28 -
20 Centuria Industrial REIT 57 0.01
9 Centuria Office REIT 15 -
21 Charter Hall Long Wale REIT 78 0.01
10 Charter Hall Social Infrastructure REIT 26 -
54 Cromwell Property Group 37 -
12 Dexus 99 0.01
18 GDI Property Group 15 -
24 Goodman Group 360 0.03
13 Growthpoint Properties Australia Ltd 39 -
4 Hotel Property Investments 11 -
6 Ingenia Communities Group 25 -
11 Investec Australia Property Fund 12 -
85 Mirvac Group 184 0.01
39 New South Resources Ltd 62 0.01
70 Scentre Group 149 0.01
24 Shopping Centres Australasia Property Group 45 -
53 Stockland 191 0.01
76 Vicinity Centres 92 0.01
25 Waypoint REIT 51 -
1,777 0.12
Belgium - 0.04%
1 Aedifica SA 152 0.01
- Ascencio 14 -
1 Befimmo SA 46 0.01
- Care Property Invest NV 11 -
1 Cofinimmo SA 102 0.01
1 Intervest Offices & Warehouses NV 11 -
- Montea CVA 30 -
1 Retail Estates NV 42 -
4 Warehouses De Pauw CVA 158 0.01
- Xior Student Housing NV 21 -
587 0.04
Canada - 0.05%
2 Allied Properties Real Estate Investment Trust 61 0.01
1 Artis Real Estate Investment Trust 12 -
2 Canadian Apartment Properties REIT 69 0.01
5 Choice Properties Real Estate Investment Trust 62 0.01
5 Cominar Real Estate Investment Trust 40 -
2 Crombie Real Estate Investment Trust 23 -
Global Sustainability Core Equity FundPortfolio of Investments as at 31 May 2021 (continued)
Dimensional Fund Advisors Semi-Annual Report and Unaudited Financial Statements, 31 May 2021 257

Shares (000's)
Value(000's)
USD
% of NetAssetValue
Real Estate Investment Trust (continued)
Canada - 0.05% (continued)
2 CT Real Estate Investment Trust 33 -
2 Dream Industrial Real Estate Investment Trust 26 -
1 Dream Office Real Estate Investment Trust 19 -
1 Granite Real Estate Investment Trust 75 0.01
3 H&R Real Estate Investment Trust 44 -
2 Inovalis Real Estate Investment Trust 12 -
1 InterRent Real Estate Investment Trust 17 -
2 Killam Apartment Real Estate Investment Trust 25 -
4 NorthWest Healthcare Properties Real EstateInvestment Trust 38 -
6 RioCan Real Estate Investment Trust 109 0.01
2 SmartCentres Real Estate Investment Trust 59 -
2 Summit Industrial Income REIT 30 -
1 WPT Industrial Real Estate Investment Trust 19 -
773 0.05
France - 0.07%
- Altarea SCA 41 -
- ARGAN SA 24 -
1 Carmila SA 19 -
3 Covivio 250 0.02
1 Covivio Hotels SACA 15 -
1 Gecina SA 207 0.02
2 ICADE 171 0.01
8 Klepierre SA 213 0.02
3 Mercialys SA 42 -
- Societe de la Tour Eiffel 10 -
992 0.07
Germany - 0.01%
7 alstria office REIT AG 133 0.01
1 Deutsche Konsum REIT AG 10 -
3 Hamborner REIT AG 38 -
181 0.01
Hong Kong - 0.02%
50 Champion REIT 29 -
55 Fortune Real Estate Investment Trust 60 -
23 Link REIT 221 0.02
36 Prosperity REIT 13 -
22 Sunlight Real Estate Investment Trust 13 -
336 0.02
Ireland - 0.00%
14 Hibernia REIT PLC 20 -
9 Irish Residential Properties REIT PLC 17 -
37 -
Israel - 0.01%
3 Summit Real Estate Holdings Ltd 43 0.01
43 0.01
Japan - 0.19%
- Advance Residence Investment Corp 130 0.01
- AEON REIT Investment Corp 75 0.01
- Comforia Residential REIT Inc 40 -
- CRE Logistics REIT Inc 24 -
- Daiwa House REIT Investment Corp 63 0.01
- Daiwa Office Investment Corp 42 -
- Frontier Real Estate Investment Corp 78 0.01
- Fukuoka REIT Corp 48 -
- Global One Real Estate Investment Corp 22 -
- GLP J-Reit 163 0.01
- Hankyu Hanshin REIT Inc 11 -
- Health Care & Medical Investment Corp 15 -
- Heiwa Real Estate REIT Inc 21 -
- Hoshino Resorts REIT Inc 35 -
Shares (000's)
Value(000's)
USD
% of NetAssetValue
Real Estate Investment Trust (continued)
Japan - 0.19% (continued)
- Hulic Reit Inc 35 -
- Ichigo Office REIT Investment 27 -
- Industrial & Infrastructure Fund Investment Corp 116 0.01
1 Invesco Office J-Reit Inc 45 -
1 Invincible Investment Corp 86 0.01
- Japan Prime Realty Investment Corp 55 -
- Japan Real Estate Investment Corp 139 0.01
- Japan Rental Housing Investments Inc 58 0.01
- Japan Retail Fund Investment Corp 37 -
- Kenedix Office Investment Corp 52 -
- Kenedix Residential Next Investment Corp 65 0.01
- Kenedix Retail REIT Corp 47 -
- LaSalle Logiport REIT 92 0.01
- Mirai Corp 19 -
- Mitsubishi Estate Logistics REIT Investment Corp 58 0.01
- Mitsui Fudosan Logistics Park Inc 113 0.01
- Mori Hills REIT Investment Corp 39 -
- Mori Trust Hotel Reit Inc 12 -
- Mori Trust Sogo Reit Inc 11 -
- Nippon Accommodations Fund Inc 57 -
- Nippon Prologis REIT Inc 214 0.02
- Nippon REIT Investment Corp 57 -
- Nomura Real Estate Master Fund Inc 76 0.01
- One REIT Inc 17 -
- Orix JREIT Inc 147 0.01
- Premier Investment Corp 45 -
- Samty Residential Investment Corp 23 -
- Sekisui House Reit Inc 97 0.01
- Star Asia Investment Corp 23 -
- Starts Proceed Investment Corp 13 -
- Takara Leben Real Estate Investment Corp 13 -
- Tokyu REIT Inc 27 -
- Tosei Reit Investment Corp 23 -
- United Urban Investment Corp 76 0.01
2,781 0.19
Netherlands - 0.04%
3 Eurocommercial Properties NV 74 0.01
- NSI NV 11 -
5 Unibail-Rodamco-Westfield 477 0.03
1 Vastned Retail NV 20 -
2 Wereldhave NV 38 -
620 0.04
New Zealand - 0.02%
28 Argosy Property Ltd 30 -
44 Goodman Property Trust 71 0.01
12 Investore Property Ltd 18 -
59 Kiwi Property Group Ltd 52 0.01
19 Precinct Properties New Zealand Ltd 21 -
14 Property for Industry Ltd 28 -
13 Stride Property Group 21 -
11 Vital Healthcare Property Trust 24 -
265 0.02
Singapore - 0.06%
21 AIMS APAC REIT 22 -
60 Ascendas Real Estate Investment Trust 133 0.01
29 Ascott Residence Trust 22 -
55 Cache Logistics Trust 33 -
47 CapitaLand Mall Trust 73 0.01
25 CapitaLand Retail China Trust 26 -
38 CDL Hospitality Trusts 34 -
67 ESR-REIT 20 -
50 Far East Hospitality Trust 22 -
Global Sustainability Core Equity FundPortfolio of Investments as at 31 May 2021 (continued)
Dimensional Fund Advisors Semi-Annual Report and Unaudited Financial Statements, 31 May 2021 258

Shares (000's)
Value(000's)
USD
% of NetAssetValue
Real Estate Investment Trust (continued)
Singapore - 0.06% (continued)
19 Frasers Centrepoint Trust 33 -
55 Frasers Logistics & Industrial Trust 59 0.01
37 Keppel REIT 32 -
21 Manulife US Real Estate Investment Trust 16 -
32 Mapletree Commercial Trust 51 0.01
31 Mapletree Industrial Trust 64 0.01
61 Mapletree Logistics Trust 91 0.01
42 Mapletree North Asia Commercial Trust 32 -
12 Parkway Life Real Estate Investment Trust 38 -
66 Sabana Shari'ah Compliant Industrial Real EstateInvestment Trust 21 -
33 Sasseur Real Estate Investment Trust 23 -
35 SPH REIT 23 -
29 Starhill Global REIT 12 -
17 Suntec Real Estate Investment Trust 19 -
899 0.06
Spain - 0.02%
12 Inmobiliaria Colonial Socimi SA 130 0.01
2 Lar Espana Real Estate Socimi SA 13 -
13 Merlin Properties Socimi SA 153 0.01
296 0.02
United Kingdom - 0.18%
80 Assura PLC 85 0.01
8 Big Yellow Group PLC 146 0.01
30 British Land Co PLC 218 0.01
37 Capital & Counties Properties PLC 91 0.01
7 Civitas Social Housing PLC 11 -
16 Custodian Reit PLC 22 -
4 Derwent London PLC 202 0.01
9 Ediston Property Investment Co PLC 9 -
11 Empiric Student Property PLC 13 -
18 GCP Student Living PLC 45 -
9 Great Portland Estates PLC 96 0.01
103 Hammerson PLC 58 -
8 Impact Healthcare Reit PLC 13 -
13 Intu Properties PLC - -
23 Land Securities Group PLC 233 0.02
38 LondonMetric Property PLC 127 0.01
30 LXI REIT plc 58 -
5 McKay Securities PLC 14 -
9 NewRiver REIT PLC 12 -
40 Primary Health Properties PLC 88 0.01
10 Regional REIT Ltd 13 -
7 Safestore Holdings PLC 98 0.01
22 Schroder Real Estate Investment Trust Ltd 14 -
33 Segro PLC 482 0.03
13 Shaftesbury PLC 114 0.01
14 Standard Life Investment Property Income Trust Ltd 13 -
7 Target Healthcare REIT PLC 12 -
82 Tritax Big Box REIT PLC 229 0.02
6 UNITE Group PLC 94 0.01
6 Workspace Group PLC 74 -
2,684 0.18
United States - 2.18%
3 Acadia Realty Trust 66 -
2 Agree Realty Corp 158 0.01
- Alexander & Baldwin Inc 9 -
- Alexander's Inc 48 -
2 Alexandria Real Estate Equities Inc 432 0.03
3 American Assets Trust Inc 93 0.01
5 American Campus Communities Inc 228 0.02
4 American Finance Trust Inc 36 -
Shares (000's)
Value(000's)
USD
% of NetAssetValue
Real Estate Investment Trust (continued)
United States - 2.18% (continued)
7 American Homes 4 Rent 257 0.02
- American Tower Corp 28 -
4 Apartment Income REIT Corp 187 0.01
2 Apartment Investment and Management Co 16 -
9 Apple Hospitality REIT Inc 146 0.01
5 AvalonBay Communities Inc 970 0.07
5 Boston Properties Inc 632 0.04
7 Brandywine Realty Trust 92 0.01
14 Brixmor Property Group Inc 315 0.02
1 Brookfield Property REIT Inc 14 -
2 Camden Property Trust 249 0.02
4 CareTrust REIT Inc 87 0.01
1 Cedar Realty Trust Inc 16 -
- Centerspace 24 -
2 Chatham Lodging Trust 33 -
1 City Office REIT Inc 17 -
3 Columbia Property Trust Inc 48 -
1 Community Healthcare Trust Inc 51 -
2 CorePoint Lodging Inc 25 -
2 Corporate Office Properties Trust 65 -
3 Cousins Properties Inc 123 0.01
8 Crown Castle International Corp 1,530 0.10
10 CubeSmart 416 0.03
6 CyrusOne Inc 421 0.03
8 DiamondRock Hospitality Co 77 0.01
7 Diversified Healthcare Trust 27 -
4 Douglas Emmett Inc 136 0.01
12 Duke Realty Corp 559 0.04
1 Easterly Government Properties Inc 30 -
2 EastGroup Properties Inc 287 0.02
7 Empire State Realty Trust Inc 79 0.01
3 EPR Properties 155 0.01
2 Equity Commonwealth 43 -
4 Equity LifeStyle Properties Inc 254 0.02
11 Equity Residential 840 0.06
5 Essential Properties Realty Trust Inc 132 0.01
2 Essex Property Trust Inc 653 0.04
5 Extra Space Storage Inc 687 0.05
4 Federal Realty Investment Trust 409 0.03
6 First Industrial Realty Trust Inc 311 0.02
3 Four Corners Property Trust Inc 93 0.01
1 Franklin Street Properties Corp 7 -
9 Gaming and Leisure Properties Inc 427 0.03
2 Getty Realty Corp 50 -
2 Gladstone Commercial Corp 42 -
3 Global Medical REIT Inc 40 -
3 Global Net Lease Inc 66 -
5 Healthcare Realty Trust Inc 164 0.01
8 Healthcare Trust of America Inc 229 0.02
9 Healthpeak Properties Inc 309 0.02
1 Hersha Hospitality Trust 12 -
2 Highwoods Properties Inc 102 0.01
25 Host Hotels & Resorts Inc 427 0.03
6 Hudson Pacific Properties Inc 171 0.01
3 Independence Realty Trust Inc 49 -
3 Industrial Logistics Properties Trust 78 0.01
9 Invitation Homes Inc 334 0.02
6 Iron Mountain Inc 254 0.02
3 JBG SMITH Properties 95 0.01
5 Kilroy Realty Corp 370 0.03
20 Kimco Realty Corp 435 0.03
3 Kite Realty Group Trust 64 -
Global Sustainability Core Equity FundPortfolio of Investments as at 31 May 2021 (continued)
Dimensional Fund Advisors Semi-Annual Report and Unaudited Financial Statements, 31 May 2021 259

Shares (000's)
Value(000's)
USD
% of NetAssetValue
Real Estate Investment Trust (continued)
United States - 2.18% (continued)
5 Lamar Advertising Co 565 0.04
13 Lexington Realty Trust 166 0.01
4 Life Storage Inc 364 0.03
2 LTC Properties Inc 71 0.01
8 Macerich Co 121 0.01
3 Mack-Cali Realty Corp 47 -
20 Medical Properties Trust Inc 422 0.03
5 MGM Growth Properties LLC 184 0.01
2 Mid-America Apartment Communities Inc 315 0.02
4 Monmouth Real Estate Investment Corp 78 0.01
2 National Health Investors Inc 120 0.01
7 National Retail Properties Inc 313 0.02
4 National Storage Affiliates Trust 168 0.01
1 New Senior Investment Group Inc 9 -
1 NexPoint Residential Trust Inc 45 -
2 Office Properties Income Trust 48 -
9 Omega Healthcare Investors Inc 326 0.02
1 One Liberty Properties Inc 15 -
9 Outfront Media Inc 213 0.01
8 Paramount Group Inc 86 0.01
4 Park Hotels & Resorts Inc 92 0.01
5 Pebblebrook Hotel Trust 110 0.01
6 Physicians Realty Trust 115 0.01
2 Piedmont Office Realty Trust Inc 45 -
1 Plymouth Industrial REIT Inc 23 -
1 Preferred Apartment Communities Inc 11 -
23 Prologis Inc 2,661 0.18
1 PS Business Parks Inc 159 0.01
3 Public Storage 957 0.07
3 QTS Realty Trust Inc 175 0.01
10 Realty Income Corp 689 0.05
8 Regency Centers Corp 519 0.04
5 Retail Opportunity Investments Corp 87 0.01
8 Retail Properties of America Inc 97 0.01
1 Retail Value Inc 10 -
6 Rexford Industrial Realty Inc 341 0.02
7 RLJ Lodging Trust 111 0.01
3 RPT Realty 34 -
2 Ryman Hospitality Properties Inc 163 0.01
9 Sabra Health Care REIT Inc 152 0.01
1 Saul Centers Inc 40 -
2 SBA Communications Corp 553 0.04
2 Seritage Growth Properties 32 -
6 Service Properties Trust 75 0.01
7 Simon Property Group Inc 864 0.06
8 SITE Centers Corp 114 0.01
3 SL Green Realty Corp 215 0.02
- Spirit MTA REIT - -
4 Spirit Realty Capital Inc 209 0.01
7 STAG Industrial Inc 257 0.02
10 STORE Capital Corp 355 0.02
Shares (000's)
Value(000's)
USD
% of NetAssetValue
Real Estate Investment Trust (continued)
United States - 2.18% (continued)
4 Summit Hotel Properties Inc 34 -
2 Sun Communities Inc 304 0.02
9 Sunstone Hotel Investors Inc 111 0.01
3 Tanger Factory Outlet Centers Inc 55 -
2 Terreno Realty Corp 143 0.01
10 UDR Inc 462 0.03
2 UMH Properties Inc 32 -
10 Uniti Group Inc 107 0.01
1 Universal Health Realty Income Trust 34 -
4 Urban Edge Properties 82 0.01
1 Urstadt Biddle Properties Inc, Class A 22 -
6 Ventas Inc 348 0.02
9 VEREIT Inc 417 0.03
4 Vornado Realty Trust 197 0.01
- Washington Prime Group Inc - -
2 Washington Real Estate Investment Trust 49 -
5 Weingarten Realty Investors 172 0.01
9 Welltower Inc 636 0.04
1 Whitestone REIT 7 -
6 WP Carey Inc 419 0.03
4 Xenia Hotels & Resorts Inc 82 0.01
31,983 2.18
Total Real Estate Investment Trust - 3.01% (30 November2020: 2.77%) 44,254 3.01
Rights
Australia - 0.00%
2 carsales.com Ltd - -
2 Charter Hall Long Wale REIT - -
- -
Austria - 0.00%
2 CA Immobilien Anlagen AG - -
- -
France - 0.00%
1 Covivio Hotels SACA - -
- -
Singapore - 0.00%
1 Mapletree Industrial Trust Rig - -
- -
Spain - 0.00%
5 Almirall SA 1 -
2 Ferrovial SA 1 -
2 -
United Kingdom - 0.00%
5 C&C Group PLC 4 -
4 -
Total Rights - 0.00% (30 November 2020: 0.00%) 6 -
Total Investments - 99.47% (30 November 2020: 99.15%) 1,461,127 99.47
Value (000's)USD
% of NetAssetValue
Cash and Cash Equivalents - 0.23% (30 November 2020: 0.02%) 3,400 0.23Other Assets in Excess of Other Liabilities - 0.30% (30 November 2020: 0.83%) 4,377 0.30
Total Net Assets 1,468,904 100.00
Amounts designated as “- “ are either $0, less than $500 or less than 500 shares.
Global Sustainability Core Equity FundPortfolio of Investments as at 31 May 2021 (continued)
Dimensional Fund Advisors Semi-Annual Report and Unaudited Financial Statements, 31 May 2021 260

Analysis of Total Assets % of Total Assets
Transferable securities admitted to an official exchange listing 98.66
Current Assets 1.34
Total Assets 100.00
Global Sustainability Core Equity FundPortfolio of Investments as at 31 May 2021 (continued)
Dimensional Fund Advisors Semi-Annual Report and Unaudited Financial Statements, 31 May 2021 261

Face Value(000's)
CouponRate %
MaturityDate
Value (000's)GBP
% of NetAssetValue
Corporate Bonds
Australia - 3.05%
2,714 Commonwealth Bank ofAustralia 3.150 19/09/2027 2,096 0.72
200 Westpac Banking Corp 2.850 13/05/2026 152 0.05
1,400 Westpac Banking Corp 3.350 08/03/2027 1,094 0.37
1,300 Westpac Banking Corp 0.875 17/04/2027 1,168 0.40
1,900 Westpac Banking Corp 1.125 05/09/2027 1,728 0.59
600 Westpac Banking Corp 3.400 25/01/2028 471 0.16
3,000 Westpac Banking Corp 2.650 16/01/2030 2,241 0.76
8,950 3.05
Belgium - 0.03%
100 Anheuser-Busch InBev SA/NV 2.250 24/05/2029 104 0.03
104 0.03
Canada - 1.29%
150 Alimentation Couche-Tard Inc 1.875 06/05/2026 137 0.05
500 Bank of Montreal 1.850 01/05/2025 366 0.12
1,000 Bank of Montreal 3.190 01/03/2028 635 0.22
300 Canadian Imperial Bank ofCommerce 2.550 16/06/2022 217 0.07
300 Fairfax Financial Holdings Ltd 2.750 29/03/2028 281 0.10
2,000 Magna International Inc 2.450 15/06/2030 1,431 0.49
300 Toronto-Dominion Bank 3.005 30/05/2023 183 0.06
750 Toronto-Dominion Bank 0.750 11/09/2025 525 0.18
3,775 1.29
Cayman Islands - 0.06%
200 CK Hutchison Finance 16 Ltd 2.000 06/04/2028 191 0.06
191 0.06
Denmark - 0.27%
1,000 Danske Bank AS 4.375 12/06/2028 783 0.27
783 0.27
Finland - 2.02%
1,250 Nordea Bank Abp 0.500 14/05/2027 1,100 0.38
1,500 Nordea Bank Abp 1.125 27/09/2027 1,370 0.47
4,033 OP Corporate Bank PLC 0.100 16/11/2027 3,443 1.17
5,913 2.02
France - 2.10%
200 Banque Federative du CreditMutuel SA 0.750 17/01/2030 172 0.06
150 BNP Paribas SA 1.125 11/06/2026 134 0.04
1,200 BNP Paribas SA 1.875 14/12/2027 1,222 0.42
600 BNP Paribas SA 4.400 14/08/2028 484 0.16
500 BPCE SA 0.000 14/01/2027 424 0.14
1,000 Credit Agricole SA 1.875 20/12/2026 932 0.32
550 Dexia Credit Local SA 1.125 09/04/2026 391 0.13
350 Dexia Credit Local SA 1.000 18/10/2027 321 0.11
200 Orange SA 0.500 04/09/2032 170 0.06
500 Sanofi 1.750 10/09/2026 471 0.16
100 Schlumberger Finance FranceSAS 1.000 18/02/2026 90 0.03
300 Societe Generale SA 4.750 14/09/2028 245 0.08
200 Societe Generale SA 0.875 24/09/2029 171 0.06
1,000 Societe Generale SA 3.000 22/01/2030 726 0.25
200 Vinci SA 2.750 15/09/2034 223 0.08
6,176 2.10
Germany - 0.65%
100 Amphenol TechnologiesHolding GmbH 2.000 08/10/2028 96 0.03
250 Daimler AG 1.125 08/08/2034 218 0.08
1,100 Deutsche Bahn Finance GmbH 3.125 24/07/2026 1,231 0.42
100 Deutsche Bank AG 1.750 17/01/2028 90 0.03
Face Value(000's)
CouponRate %
MaturityDate
Value (000's)GBP
% of NetAssetValue
Corporate Bonds (continued)
Germany - 0.65% (continued)
200 Fresenius Medical Care AG &Co KGaA 1.250 29/11/2029 179 0.06
100 Merck Financial ServicesGmbH 0.500 16/07/2028 88 0.03
1,902 0.65
Guernsey - 0.48%
2,000 Amdocs Ltd 2.538 15/06/2030 1,395 0.48
1,395 0.48
Ireland - 0.31%
200 Abbott Ireland Financing DAC 1.500 27/09/2026 184 0.06
700 AerCap Ireland Capital DAC 3.650 21/07/2027 525 0.18
250 Perrigo Finance Unlimited Co 3.900 15/12/2024 190 0.07
899 0.31
Italy - 0.36%
150 Intesa Sanpaolo SpA 1.750 04/07/2029 137 0.05
900 Intesa Sanpaolo SpA 2.500 15/01/2030 917 0.31
1,054 0.36
Japan - 2.05%
100 Mitsubishi UFJ Financial GroupInc 3.407 07/03/2024 76 0.03
100 Mitsubishi UFJ Financial GroupInc 3.677 22/02/2027 79 0.03
1,250 Mitsubishi UFJ Financial GroupInc 3.741 07/03/2029 982 0.34
700 Mitsubishi UFJ Financial GroupInc 3.195 18/07/2029 531 0.18
850 Mizuho Financial Group Inc 3.170 11/09/2027 653 0.22
500 Mizuho Financial Group Inc 4.018 05/03/2028 396 0.14
200 MUFG Bank Ltd 3.250 08/09/2024 152 0.05
900 Nomura Holdings Inc 3.103 16/01/2030 655 0.22
1,000 NTT Finance Corp 1.591 03/04/2028 696 0.24
200 Sumitomo Mitsui FinancialGroup Inc 3.784 09/03/2026 157 0.05
200 Sumitomo Mitsui FinancialGroup Inc 3.352 18/10/2027 155 0.05
300 Sumitomo Mitsui FinancialGroup Inc 3.944 19/07/2028 238 0.08
1,000 Sumitomo Mitsui FinancialGroup Inc 3.040 16/07/2029 747 0.25
200 Sumitomo Mitsui FinancialGroup Inc 2.750 15/01/2030 147 0.05
400 Takeda Pharmaceutical Co Ltd 1.375 09/07/2032 354 0.12
6,018 2.05
Luxembourg - 1.06%
250 CNH Industrial Finance EuropeSA 1.750 25/03/2027 230 0.08
300 CNH Industrial Finance EuropeSA 1.625 03/07/2029 273 0.09
200 DH Europe Finance Sarl 1.200 30/06/2027 181 0.06
1,000 Euroclear Investments SA 1.125 07/12/2026 911 0.31
1,000 Medtronic Global Holdings SCA 1.125 07/03/2027 904 0.31
700 Medtronic Global Holdings SCA 1.000 02/07/2031 620 0.21
3,119 1.06
Netherlands - 2.06%
1,400 Allianz Finance II BV 0.500 14/01/2031 1,216 0.41
200 BMW Finance NV 1.125 10/01/2028 183 0.06
200 BMW Finance NV 0.875 14/01/2032 179 0.06
210 Cooperatieve Rabobank UA 4.550 30/08/2029 264 0.09
500 Daimler International FinanceBV 0.625 06/05/2027 440 0.15
150 Deutsche Telekom InternationalFinance BV 2.500 10/10/2025 161 0.06
750 Digital Dutch Finco BV 1.250 01/02/2031 652 0.22
Global Sustainability Fixed Income FundPortfolio of Investments as at 31 May 2021
Dimensional Fund Advisors Semi-Annual Report and Unaudited Financial Statements, 31 May 2021 262

Face Value(000's)
CouponRate %
MaturityDate
Value (000's)GBP
% of NetAssetValue
Corporate Bonds (continued)
Netherlands - 2.06% (continued)
200 ING Groep NV 3.950 29/03/2027 159 0.05
200 ING Groep NV 2.000 20/09/2028 190 0.06
800 ING Groep NV 4.550 02/10/2028 657 0.22
350 ING Groep NV 4.050 09/04/2029 278 0.10
1,500 JAB Holdings 2.200 23/11/2030 1,012 0.35
120 Koninklijke KPN NV 5.000 18/11/2026 136 0.05
300 SiemensFinancieringsmaatschappij NV 0.500 05/09/2034 254 0.09
200 Telefonica Europe BV 5.875 14/02/2033 265 0.09
6,046 2.06
Singapore - 0.31%
100 Flex Ltd 5.000 15/02/2023 75 0.02
715 Flex Ltd 4.875 15/06/2029 575 0.20
350 Temasek Financial I Ltd 2.375 23/01/2023 255 0.09
905 0.31
Spain - 0.12%
400 CaixaBank SA 1.375 19/06/2026 358 0.12
358 0.12
Supranational - 5.33%
410,000 Asian Development Bank 2.350 21/06/2027 3,042 1.04
130,000 European Investment Bank 1.900 26/01/2026 914 0.31
467,000 European Investment Bank 2.150 18/01/2027 3,385 1.15
1,000 European Investment Bank 1.300 27/01/2031 513 0.18
600 European Investment Bank 5.625 07/06/2032 878 0.30
500 Inter-American DevelopmentBank 3.100 22/02/2028 301 0.10
3,525 Inter-American DevelopmentBank 3.125 18/09/2028 2,782 0.95
1,000 International Bank forReconstruction & Development 0.250 21/05/2029 880 0.30
6,000 International Finance Corp 1.500 15/04/2035 2,930 1.00
15,625 5.33
Sweden - 0.74%
500 Svenska Handelsbanken AB 1.000 15/04/2025 449 0.16
500 Swedbank AB 0.750 05/05/2025 443 0.15
1,500 Swedbank AB 0.200 12/01/2028 1,266 0.43
2,158 0.74
Switzerland - 0.09%
100 Credit Suisse Group AG 0.650 10/09/2029 84 0.03
200 UBS Group AG 1.250 01/09/2026 180 0.06
264 0.09
United Kingdom - 3.90%
1,800 AstraZeneca PLC 4.000 17/01/2029 1,450 0.49
400 Barclays PLC 3.250 17/01/2033 440 0.15
100 British TelecommunicationsPLC 2.125 26/09/2028 96 0.03
800 British TelecommunicationsPLC 3.250 08/11/2029 597 0.20
300 British TelecommunicationsPLC 3.125 21/11/2031 327 0.11
100 Coca-Cola European PartnersPLC 1.875 18/03/2030 95 0.03
400 Diageo Capital PLC 2.125 29/04/2032 277 0.10
2,000 Experian Finance PLC 2.750 08/03/2030 1,437 0.49
300 Experian Finance PLC 3.250 07/04/2032 340 0.12
400 GlaxoSmithKline Capital PLC 5.250 19/12/2033 559 0.19
300 GlaxoSmithKline Capital PLC 1.625 12/05/2035 288 0.10
200 HSBC Holdings PLC 6.500 20/05/2024 233 0.08
1,350 HSBC Holdings PLC 2.625 16/08/2028 1,432 0.49
600 Lloyds Banking Group PLC 4.375 22/03/2028 484 0.17
550 Lloyds Banking Group PLC 4.550 16/08/2028 449 0.15
100 NatWest Markets PLC 1.000 28/05/2024 89 0.03
Face Value(000's)
CouponRate %
MaturityDate
Value (000's)GBP
% of NetAssetValue
Corporate Bonds (continued)
United Kingdom - 3.90% (continued)
800 Prudential PLC 3.125 14/04/2030 601 0.21
1,200 Royalty Pharma 2.200 02/09/2030 814 0.28
600 Sky Ltd 4.000 26/11/2029 715 0.24
400 Transport for London 4.000 12/09/2033 501 0.17
150 Vodafone Group PLC 1.625 24/11/2030 140 0.05
50 Vodafone Group PLC 5.900 26/11/2032 71 0.02
11,435 3.90
United States - 44.80%
600 3M Co 2.250 19/09/2026 450 0.15
1,200 3M Co 2.375 26/08/2029 876 0.30
150 3M Co 1.500 02/06/2031 143 0.05
200 AbbVie Inc 1.250 18/11/2031 180 0.06
1,650 Activision Blizzard Inc 1.350 15/09/2030 1,069 0.36
2,400 Adobe Inc 2.300 01/02/2030 1,735 0.59
900 Advance Auto Parts Inc 3.900 15/04/2030 699 0.24
500 Affiliated Managers Group Inc 3.300 15/06/2030 375 0.13
1,150 Aflac Inc 3.600 01/04/2030 901 0.31
2,500 Alphabet Inc 1.100 15/08/2030 1,648 0.56
1,000 Amazon.com Inc 1.200 03/06/2027 703 0.24
2,550 Amazon.com Inc 3.150 22/08/2027 1,984 0.68
700 American Financial Group Inc 5.250 02/04/2030 600 0.20
300 American Honda Finance Corp 2.350 08/01/2027 223 0.08
350 American Honda Finance Corp 3.500 15/02/2028 274 0.09
100 American International GroupInc 5.000 26/04/2023 108 0.04
150 American International GroupInc 4.125 15/02/2024 116 0.04
500 American International GroupInc 1.875 21/06/2027 463 0.16
600 American Tower Corp 3.950 15/03/2029 470 0.16
150 American Water Capital Corp 3.450 01/06/2029 116 0.04
1,000 American Water Capital Corp 2.800 01/05/2030 739 0.25
200 Ameriprise Financial Inc 4.000 15/10/2023 153 0.05
200 AmerisourceBergen Corp 3.250 01/03/2025 152 0.05
200 AmerisourceBergen Corp 3.450 15/12/2027 155 0.05
1,000 AmerisourceBergen Corp 2.800 15/05/2030 731 0.25
150 Amgen Inc 5.500 07/12/2026 185 0.06
1,000 Amgen Inc 4.000 13/09/2029 1,188 0.41
200 Amgen Inc 2.300 25/02/2031 140 0.05
200 Anthem Inc 3.650 01/12/2027 157 0.05
300 Anthem Inc 4.101 01/03/2028 240 0.08
1,000 Anthem Inc 2.875 15/09/2029 741 0.25
450 Anthem Inc 2.250 15/05/2030 316 0.11
1,200 Aon Corp 4.500 15/12/2028 983 0.34
500 Apple Inc 2.050 11/09/2026 370 0.13
200 Apple Inc 3.350 09/02/2027 157 0.05
600 Apple Inc 3.200 11/05/2027 467 0.16
400 Apple Inc 3.000 13/11/2027 309 0.11
700 Apple Inc 1.375 24/05/2029 657 0.22
1,500 Apple Inc 3.050 31/07/2029 1,719 0.59
4,400 Apple Inc 2.200 11/09/2029 3,181 1.08
150 Arrow Electronics Inc 4.000 01/04/2025 115 0.04
500 Arrow Electronics Inc 3.875 12/01/2028 390 0.13
600 AT&T Inc 4.350 01/03/2029 484 0.16
150 AT&T Inc 0.800 04/03/2030 129 0.04
100 AT&T Inc 5.200 18/11/2033 131 0.04
200 Automatic Data Processing Inc 3.375 15/09/2025 156 0.05
250 AutoZone Inc 3.250 15/04/2025 190 0.06
900 AvalonBay Communities Inc 3.200 15/01/2028 683 0.23
1,000 AvalonBay Communities Inc 2.450 15/01/2031 712 0.24
400 Baxter International Inc 1.300 15/05/2029 367 0.13
395 Biogen Inc 2.250 01/05/2030 275 0.09
Global Sustainability Fixed Income FundPortfolio of Investments as at 31 May 2021 (continued)
Dimensional Fund Advisors Semi-Annual Report and Unaudited Financial Statements, 31 May 2021 263

Face Value(000's)
CouponRate %
MaturityDate
Value (000's)GBP
% of NetAssetValue
Corporate Bonds (continued)
United States - 44.80% (continued)
1,000 BlackRock Inc 3.200 15/03/2027 783 0.27
3,600 BlackRock Inc 3.250 30/04/2029 2,810 0.96
1,000 BlackRock Inc 2.400 30/04/2030 731 0.25
1,000 BlackRock Inc 1.900 28/01/2031 693 0.24
250 BMW US Capital LLC 3.300 06/04/2027 194 0.07
500 BMW US Capital LLC 3.950 14/08/2028 399 0.14
350 Booking Holdings Inc 1.800 03/03/2027 326 0.11
1,258 Booking Holdings Inc 4.625 13/04/2030 1,037 0.35
800 Boston Properties LP 3.400 21/06/2029 603 0.21
200 Boston Scientific Corp 0.625 01/12/2027 174 0.06
1,000 Bristol-Myers Squibb Co 3.450 15/11/2027 789 0.27
600 Broadcom Inc 5.000 15/04/2030 488 0.17
900 Broadcom Inc 3.419 15/04/2033 648 0.22
1,000 Brown & Brown Inc 2.375 15/03/2031 693 0.24
800 Camden Property Trust 3.150 01/07/2029 603 0.21
1,650 Camden Property Trust 2.800 15/05/2030 1,209 0.41
70 Campbell Soup Co 2.375 24/04/2030 49 0.02
300 Capital One Financial Corp 3.800 31/01/2028 237 0.08
200 Capital One Financial Corp 1.650 12/06/2029 181 0.06
100 Cardinal Health Inc 3.410 15/06/2027 77 0.03
1,000 Carrier Global Corp 2.722 15/02/2030 724 0.25
800 Caterpillar Inc 2.600 19/09/2029 596 0.20
900 Cboe Global Markets Inc 3.650 12/01/2027 711 0.24
200 Charles Schwab Corp 4.000 01/02/2029 161 0.05
250 Charles Schwab Corp 3.250 22/05/2029 192 0.07
150 Charles Schwab Corp 4.625 22/03/2030 127 0.04
200 Chubb INA Holdings Inc 1.550 15/03/2028 185 0.06
300 Chubb INA Holdings Inc 0.875 15/12/2029 264 0.09
72 Cigna Corp 3.750 15/07/2023 54 0.02
450 Cigna Corp 4.375 15/10/2028 366 0.12
1,333 Cigna Corp 2.400 15/03/2030 948 0.32
150 Cincinnati Financial Corp 6.920 15/05/2028 137 0.05
400 Citigroup Inc 3.400 01/05/2026 310 0.11
100 Citigroup Inc 1.500 26/10/2028 92 0.03
1,269 Citrix Systems Inc 3.300 01/03/2030 930 0.32
150 CME Group Inc 3.750 15/06/2028 120 0.04
500 CNA Financial Corp 3.900 01/05/2029 392 0.13
150 CNO Financial Group Inc 5.250 30/05/2025 120 0.04
200 CNO Financial Group Inc 5.250 30/05/2029 165 0.06
2,300 Coca-Cola Co 1.000 15/03/2028 1,564 0.53
800 Comcast Corp 3.400 01/04/2030 615 0.21
200 Comcast Corp 4.250 15/01/2033 165 0.06
300 Comerica Inc 4.000 01/02/2029 239 0.08
1,000 Constellation Brands Inc 3.150 01/08/2029 747 0.25
647 Costco Wholesale Corp 1.375 20/06/2027 459 0.16
3,800 Costco Wholesale Corp 1.600 20/04/2030 2,598 0.89
750 Crown Castle InternationalCorp 2.250 15/01/2031 511 0.17
226 CVS Health Corp 4.300 25/03/2028 183 0.06
100 CVS Health Corp 3.250 15/08/2029 76 0.03
550 Darden Restaurants Inc 3.850 01/05/2027 429 0.15
1,000 Dentsply Sirona Inc 3.250 01/06/2030 745 0.25
350 Discover Financial Services 4.500 30/01/2026 280 0.10
200 Discover Financial Services 4.100 09/02/2027 158 0.05
100 Discovery CommunicationsLLC 2.500 20/09/2024 104 0.04
200 Discovery CommunicationsLLC 1.900 19/03/2027 184 0.06
400 Discovery CommunicationsLLC 3.950 20/03/2028 310 0.11
100 Dollar Tree Inc 4.200 15/05/2028 80 0.03
150 DXC Technology Co 1.750 15/01/2026 136 0.05
Face Value(000's)
CouponRate %
MaturityDate
Value (000's)GBP
% of NetAssetValue
Corporate Bonds (continued)
United States - 44.80% (continued)
200 DXC Technology Co 4.750 15/04/2027 161 0.05
300 Eaton Corp 4.000 02/11/2032 244 0.08
600 eBay Inc 3.600 05/06/2027 469 0.16
1,000 Ecolab Inc 4.800 24/03/2030 850 0.29
200 Eli Lilly and Co 0.625 01/11/2031 173 0.06
200 Emerson Electric Co 0.375 22/05/2024 174 0.06
700 Equinix Inc 2.150 15/07/2030 479 0.16
1,500 Equitable Holdings Inc 4.350 20/04/2028 1,201 0.41
500 ERP Operating LP 2.500 15/02/2030 359 0.12
1,000 E-TRADE Financial 4.500 20/06/2028 811 0.28
150 FedEx Corp 1.300 05/08/2031 135 0.05
1,450 Fidelity National Financial Inc 3.400 15/06/2030 1,086 0.37
700 Fidelity National InformationServices Inc 3.360 21/05/2031 782 0.27
250 Fiserv Inc 1.625 01/07/2030 230 0.08
700 Fiserv Inc 3.000 01/07/2031 760 0.26
410 Fox Corp 4.709 25/01/2029 335 0.11
700 Fresenius Medical Care USFinance III 2.375 16/02/2031 475 0.16
400 General Motors Co 6.800 01/10/2027 356 0.12
500 General Motors Financial CoInc 5.200 20/03/2023 381 0.13
500 General Motors Financial CoInc 0.600 20/05/2027 427 0.15
200 Gilead Sciences Inc 3.500 01/02/2025 154 0.05
150 Goldman Sachs Group Inc 4.250 29/01/2026 171 0.06
500 Goldman Sachs Group Inc 2.000 22/03/2028 471 0.16
150 Goldman Sachs Group Inc 2.000 01/11/2028 142 0.05
200 Goldman Sachs Group Inc 3.125 25/07/2029 222 0.08
150 Goldman Sachs Group Inc 0.875 21/01/2030 131 0.04
1,000 Goldman Sachs Group Inc 3.800 15/03/2030 786 0.27
650 Hasbro Inc 3.500 15/09/2027 501 0.17
200 Hewlett Packard Enterprise Co 4.650 01/10/2024 158 0.05
400 HP Inc 3.400 17/06/2030 300 0.10
100 Illinois Tool Works Inc 1.000 05/06/2031 91 0.03
1,500 Intel Corp 3.900 25/03/2030 1,210 0.41
1,700 Intercontinental Exchange Inc 3.750 21/09/2028 1,340 0.46
600 International BusinessMachines Corp 3.500 15/05/2029 467 0.16
200 International BusinessMachines Corp 1.950 15/05/2030 139 0.05
300 International BusinessMachines Corp 1.750 31/01/2031 286 0.10
500 Interpublic Group of Cos Inc 4.650 01/10/2028 410 0.14
400 Jabil Inc 3.600 15/01/2030 303 0.10
500 Jabil Inc 3.000 15/01/2031 358 0.12
150 Janus Capital Group Inc 4.875 01/08/2025 120 0.04
1,000 John Deere Capital Corp 2.800 18/07/2029 754 0.26
1,000 Johnson & Johnson 0.950 01/09/2027 695 0.24
4,550 Johnson & Johnson 2.900 15/01/2028 3,507 1.20
150 JPMorgan Chase & Co 3.900 15/07/2025 118 0.04
700 Kimco Realty Corp 1.900 01/03/2028 491 0.17
300 Lam Research Corp 3.750 15/03/2026 237 0.08
500 Lear Corp 3.800 15/09/2027 388 0.13
300 Leggett & Platt Inc 4.400 15/03/2029 239 0.08
1,400 Lincoln National Corp 3.050 15/01/2030 1,037 0.35
500 Lincoln National Corp 3.400 15/01/2031 380 0.13
2,000 Loews Corp 3.200 15/05/2030 1,509 0.51
150 Markel Corp 3.500 01/11/2027 117 0.04
800 Mars Inc 3.600 01/04/2034 633 0.22
200 Marsh & McLennan Cos Inc 3.750 14/03/2026 157 0.05
250 Marsh & McLennan Cos Inc 2.250 15/11/2030 177 0.06
100 McDonald's Corp 1.500 28/11/2029 93 0.03
Global Sustainability Fixed Income FundPortfolio of Investments as at 31 May 2021 (continued)
Dimensional Fund Advisors Semi-Annual Report and Unaudited Financial Statements, 31 May 2021 264

Face Value(000's)
CouponRate %
MaturityDate
Value (000's)GBP
% of NetAssetValue
Corporate Bonds (continued)
United States - 44.80% (continued)
663 McKesson Corp 3.125 17/02/2029 722 0.25
150 Mead Johnson Nutrition Co 4.125 15/11/2025 120 0.04
6,110 Merck & Co Inc 3.400 07/03/2029 4,793 1.63
1,000 MetLife Inc 4.550 23/03/2030 836 0.29
400 Molson Coors Brewing Co 3.000 15/07/2026 302 0.10
200 Morgan Stanley 1.375 27/10/2026 182 0.06
200 Morgan Stanley 3.625 20/01/2027 157 0.05
200 Motorola Solutions Inc 4.600 23/02/2028 162 0.06
350 Motorola Solutions Inc 4.600 23/05/2029 283 0.10
100 Nasdaq Inc 1.750 28/03/2029 93 0.03
400 NetApp Inc 2.700 22/06/2030 288 0.10
500 NIKE Inc 2.375 01/11/2026 376 0.13
4,200 NIKE Inc 2.850 27/03/2030 3,171 1.08
500 Northern Trust Corp 1.950 01/05/2030 351 0.12
1,500 Novartis Capital Corp 2.200 14/08/2030 1,078 0.37
700 Omnicom Group Inc 4.200 01/06/2030 561 0.19
350 Oracle Corp 2.950 15/05/2025 264 0.09
650 Oracle Corp 3.250 15/11/2027 498 0.17
750 Oracle Corp 2.950 01/04/2030 551 0.19
200 Parker-Hannifin Corp 3.250 14/06/2029 152 0.05
200 Pfizer Inc 1.000 06/03/2027 181 0.06
800 Pfizer Inc 1.700 28/05/2030 552 0.19
400 PPG Industries Inc 2.550 15/06/2030 289 0.10
50 Principal Financial Group Inc 3.300 15/09/2022 37 0.01
200 Principal Financial Group Inc 3.400 15/05/2025 153 0.05
1,000 Principal Financial Group Inc 3.700 15/05/2029 782 0.27
1,000 Prologis Euro Finance 1.000 06/02/2035 846 0.29
500 Public Storage 0.875 24/01/2032 427 0.15
150 QUALCOMM Inc 3.250 20/05/2027 117 0.04
1,000 QUALCOMM Inc 1.300 20/05/2028 685 0.23
1,000 QUALCOMM Inc 2.150 20/05/2030 710 0.24
1,600 Ralph Lauren Corp 2.950 15/06/2030 1,180 0.40
2,500 Realty Income Corp 1.800 15/03/2033 1,634 0.56
700 Reinsurance Group of AmericaInc 3.900 15/05/2029 546 0.19
125 Reinsurance Group of AmericaInc 3.150 15/06/2030 93 0.03
200 Roche Holdings Inc 2.625 15/05/2026 151 0.05
300 Roche Holdings Inc 3.625 17/09/2028 239 0.08
100 Ryder System Inc 2.500 01/09/2024 74 0.03
500 salesforce.com Inc 3.700 11/04/2028 399 0.14
200 Santander Holdings USA Inc 3.400 18/01/2023 147 0.05
150 Santander Holdings USA Inc 4.500 17/07/2025 118 0.04
150 Sherwin-Williams Co 3.450 01/06/2027 117 0.04
1,000 Sherwin-Williams Co 2.950 15/08/2029 748 0.25
400 Simon Property Group LP 3.375 01/12/2027 307 0.10
450 Stanley Black & Decker Inc 2.300 15/03/2030 325 0.11
1,500 State Street Bank 2.400 24/01/2030 1,088 0.37
100 Stryker Corp 2.125 30/11/2027 95 0.03
500 Stryker Corp 2.625 30/11/2030 505 0.17
150 Sysco Corp 3.300 15/07/2026 115 0.04
300 Sysco Corp 3.250 15/07/2027 230 0.08
350 Target Corp 2.500 15/04/2026 265 0.09
150 TD Ameritrade Holding Corp 3.300 01/04/2027 116 0.04
1,000 TD Ameritrade Holding Corp 2.750 01/10/2029 746 0.25
300 Thermo Fisher Scientific Inc 0.875 01/10/2031 259 0.09
400 TJX Cos Inc 3.750 15/04/2027 317 0.11
1,300 Truist Financial Corp 1.950 05/06/2030 903 0.31
400 UnitedHealth Group Inc 3.850 15/06/2028 321 0.11
200 UnitedHealth Group Inc 3.875 15/12/2028 162 0.06
600 Unum Group 3.875 05/11/2025 466 0.16
150 Utah Acquisition Sub Inc 3.950 15/06/2026 117 0.04
Face Value(000's)
CouponRate %
MaturityDate
Value (000's)GBP
% of NetAssetValue
Corporate Bonds (continued)
United States - 44.80% (continued)
500 Utah Acquisition Sub Inc 3.125 22/11/2028 497 0.17
400 Ventas Realty LP 3.000 15/01/2030 292 0.10
400 Verizon Communications Inc 2.650 06/05/2030 214 0.07
100 Verizon Communications Inc 2.625 01/12/2031 102 0.03
500 VF Corp 2.800 23/04/2027 377 0.13
700 VF Corp 2.950 23/04/2030 517 0.18
300 VF Corp 0.625 25/02/2032 253 0.09
150 ViacomCBS Inc 4.200 01/06/2029 118 0.04
500 ViacomCBS Inc 4.950 15/01/2031 418 0.14
400 VMware Inc 4.650 15/05/2027 324 0.11
100 VMware Inc 3.900 21/08/2027 78 0.03
106 Walgreens Boots Alliance Inc 3.450 01/06/2026 82 0.03
250 Walgreens Boots Alliance Inc 2.125 20/11/2026 235 0.08
200 Walmart Inc 3.050 08/07/2026 155 0.05
1,000 Walmart Inc 3.700 26/06/2028 800 0.27
1,000 Walmart Inc 3.250 08/07/2029 782 0.27
2,000 Walmart Inc 4.875 21/09/2029 2,363 0.81
450 Walmart Inc 5.625 27/03/2034 664 0.23
1,000 Walmart Inc 5.250 28/09/2035 1,467 0.50
300 Walt Disney Co 2.200 13/01/2028 218 0.07
1,000 Walt Disney Co 3.800 22/03/2030 793 0.27
400 Walt Disney Co 2.650 13/01/2031 291 0.10
200 Wells Fargo & Co 3.000 23/10/2026 153 0.05
1,600 Wells Fargo & Co 4.150 24/01/2029 1,289 0.44
400 Wells Fargo & Co 2.500 02/05/2029 421 0.14
300 Whirlpool Corp 4.750 26/02/2029 249 0.08
200 Zimmer Biomet Holdings Inc 3.550 01/04/2025 154 0.05
131,394 44.80
Total Corporate Bonds - 71.08% (30 November 2020: 69.95%) 208,464 71.08
Government Bonds
Australia - 4.40%
800 New South Wales TreasuryCorp 3.000 20/03/2028 485 0.16
400 New South Wales TreasuryCorp 2.000 20/03/2031 222 0.08
1,100 New South Wales TreasuryCorp 2.000 08/03/2033 594 0.20
400 Queensland Treasury Corp 3.500 21/08/2030 252 0.09
4,800 Queensland Treasury Corp 1.500 20/08/2032 2,480 0.85
1,200 Queensland Treasury Corp 1.750 20/07/2034 614 0.21
700 South Australian GovernmentFinancing Authority 2.750 24/05/2030 414 0.14
3,200 Treasury Corp of Victoria 1.500 10/09/2031 1,680 0.57
500 Treasury Corp of Victoria 4.250 20/12/2032 336 0.11
10,050 Treasury Corp of Victoria 2.250 20/11/2034 5,451 1.86
200 Western Australian TreasuryCorp 2.750 24/07/2029 119 0.04
500 Western Australian TreasuryCorp 1.750 22/10/2031 269 0.09
12,916 4.40
Canada - 12.94%
4,000 CPPIB Capital Inc 1.125 14/12/2029 4,001 1.36
1,300 CPPIB Capital Inc 1.250 28/01/2031 870 0.30
800 Province of Alberta Canada 2.550 01/06/2027 495 0.17
1,200 Province of Alberta Canada 3.300 15/03/2028 944 0.32
1,100 Province of Alberta Canada 2.900 20/09/2029 688 0.23
7,650 Province of Alberta Canada 2.050 01/06/2030 4,457 1.52
500 Province of Alberta Canada 3.500 01/06/2031 326 0.11
900 Province of British ColumbiaCanada 2.950 18/12/2028 571 0.20
1,900 Province of British ColumbiaCanada 5.700 18/06/2029 1,429 0.49
Global Sustainability Fixed Income FundPortfolio of Investments as at 31 May 2021 (continued)
Dimensional Fund Advisors Semi-Annual Report and Unaudited Financial Statements, 31 May 2021 265

Face Value(000's)
CouponRate %
MaturityDate
Value (000's)GBP
% of NetAssetValue
Government Bonds (continued)
Canada - 12.94% (continued)
2,500 Province of British ColumbiaCanada 2.200 18/06/2030 1,488 0.51
2,700 Province of British ColumbiaCanada 1.550 18/06/2031 1,497 0.51
1,700 Province of British ColumbiaCanada 5.400 18/06/2035 1,354 0.46
2,100 Province of Manitoba Canada 2.750 02/06/2029 1,305 0.45
1,000 Province of Manitoba Canada 2.050 02/06/2030 585 0.20
500 Province of Manitoba Canada 6.300 05/03/2031 398 0.14
500 Province of Ontario Canada 1.050 21/05/2027 349 0.12
500 Province of Ontario Canada 6.500 08/03/2029 389 0.13
3,000 Province of Ontario Canada 2.700 02/06/2029 1,860 0.63
3,900 Province of Ontario Canada 1.350 02/12/2030 2,131 0.73
400 Province of Ontario Canada 6.200 02/06/2031 320 0.11
1,250 Province of Ontario Canada 5.850 08/03/2033 994 0.34
700 Province of Ontario Canada 5.600 02/06/2035 563 0.19
200 Province of Quebec Canada 0.875 05/07/2028 182 0.06
2,000 Province of Quebec Canada 2.300 01/09/2029 1,208 0.41
5,200 Province of Quebec Canada 1.900 01/09/2030 3,010 1.03
1,200 Province of Quebec Canada 6.250 01/06/2032 977 0.33
6,500 Province of SaskatchewanCanada 2.200 02/06/2030 3,851 1.31
2,100 Province of SaskatchewanCanada 6.400 05/09/2031 1,700 0.58
37,942 12.94
Denmark - 0.12%
600 Kommunekredit 2.900 27/11/2026 356 0.12
356 0.12
France - 3.48%
300 Action Logement Services 0.500 30/10/2034 253 0.09
200 Agence Francaise deDeveloppement EPIC 0.250 21/07/2026 176 0.06
200 Agence Francaise deDeveloppement EPIC 1.000 31/01/2028 184 0.06
200 Agence Francaise deDeveloppement EPIC 1.375 05/07/2032 191 0.06
400 Agence France Locale 1.125 20/06/2028 369 0.13
1,000 SNCF Reseau 5.250 07/12/2028 1,300 0.44
1,100 SNCF Reseau 0.875 22/01/2029 998 0.34
1,600 SNCF Reseau 5.250 31/01/2035 2,313 0.79
2,000 Societe Nationale SNCF SA 5.375 18/03/2027 2,479 0.85
1,700 Societe Nationale SNCF SA 1.500 02/02/2029 1,596 0.54
400 Societe Nationale SNCF SA 0.625 17/04/2030 354 0.12
10,213 3.48
Japan - 0.83%
20,000 Japan Government TwentyYear Bond 1.800 20/09/2031 151 0.05
20,000 Japan Government TwentyYear Bond 1.500 20/03/2034 149 0.05
Face Value(000's)
CouponRate %
MaturityDate
Value (000's)GBP
% of NetAssetValue
Government Bonds (continued)
Japan - 0.83% (continued)
162,000 Japan Government TwentyYear Bond 1.400 20/09/2034 1,201 0.41
130,000 Japan Government TwentyYear Bond 1.200 20/09/2035 945 0.32
2,446 0.83
Netherlands - 0.61%
2,500 BNG Bank NV 1.000 03/06/2030 1,665 0.57
200 Nederlandse WaterschapsbankNV 3.300 02/05/2029 121 0.04
1,786 0.61
New Zealand - 0.55%
1,000 New Zealand GovernmentBond 1.500 15/05/2031 494 0.17
1,900 New Zealand GovernmentBond 3.500 14/04/2033 1,115 0.38
1,609 0.55
Norway - 0.38%
5,000 Norway Government Bond 2.000 26/04/2028 441 0.15
8,000 Norway Government Bond 1.375 19/08/2030 670 0.23
1,111 0.38
Singapore - 0.65%
3,200 Singapore Government Bond 2.875 01/09/2030 1,908 0.65
1,908 0.65
United Kingdom - 0.87%
250 United Kingdom Gilt 1.625 22/10/2028 269 0.09
100 United Kingdom Gilt 4.500 07/09/2034 143 0.05
2,300 United Kingdom Gilt 0.625 31/07/2035 2,145 0.73
2,557 0.87
United States - 2.01%
250 Federal Home Loan Banks 3.250 09/06/2028 199 0.07
950 Federal Home Loan MortgageCorp 6.250 15/07/2032 975 0.33
200 Federal National MortgageAssociation 1.875 24/09/2026 149 0.05
1,090 Federal National MortgageAssociation 5.375 07/12/2028 1,423 0.49
1,500 Federal National MortgageAssociation 6.250 15/05/2029 1,442 0.49
600 Federal National MortgageAssociation 7.125 15/01/2030 612 0.21
800 Federal National MortgageAssociation 0.875 05/08/2030 528 0.18
550 Federal National MortgageAssociation 6.625 15/11/2030 557 0.19
5,885 2.01
Total Government Bonds - 26.84% (30 November2020: 27.77%) 78,729 26.84
Total Investments - 97.92% (30 November 2020: 97.72%) 287,193 97.92
Forward Currency Contracts
Buy Amount (000's) Sell Amount (000's) Counterparty Maturity Date
UnrealisedAppreciation/(Depreciation)
of Contracts (000's)GBP
% of NetAssetValue
Buy 62 AUD Sell 34 GBP State Street Bank 18/06/2021 - -
Buy 27,793 EUR Sell 24,014 GBP State Street Bank 04/06/2021 (133) (0.05)
Buy 19,818 EUR Sell 17,250 GBP State Street Bank 07/06/2021 (219) (0.07)
Buy 20,648 EUR Sell 17,949 GBP State Street Bank 10/06/2021 (205) (0.07)
Buy 6 EUR Sell 5 GBP State Street Bank 10/06/2021 - -
Buy 19,204 EUR Sell 16,705 GBP State Street Bank 11/06/2021 (199) (0.07)
Global Sustainability Fixed Income FundPortfolio of Investments as at 31 May 2021 (continued)
Dimensional Fund Advisors Semi-Annual Report and Unaudited Financial Statements, 31 May 2021 266

Forward Currency Contracts (continued)
Buy Amount (000's) Sell Amount (000's) Counterparty Maturity Date
UnrealisedAppreciation/(Depreciation)
of Contracts (000's)GBP
% of NetAssetValue
Buy 516 EUR Sell 443 GBP State Street Bank 11/06/2021 - -
Buy 17,837 GBP Sell 32,070 AUD State Street Bank 18/06/2021 416 0.14
Buy 32,614 GBP Sell 55,601 CAD State Street Bank 18/06/2021 183 0.05
Buy 219 GBP Sell 254 EUR State Street Bank 01/06/2021 1 -
Buy 49 GBP Sell 57 EUR State Street Bank 02/06/2021 - -
Buy 35 GBP Sell 41 EUR State Street Bank 04/06/2021 - -
Buy 186 GBP Sell 217 EUR State Street Bank 04/06/2021 - -
Buy 39,421 GBP Sell 45,491 EUR State Street Bank 18/06/2021 320 0.11
Buy 1,572 GBP Sell 1,830 EUR State Street Bank 18/06/2021 (1) -
Buy 407 GBP Sell 62,700 JPY State Street Bank 01/06/2021 4 -
Buy 715 GBP Sell 111,600 JPY State Street Bank 02/06/2021 - -
Buy 6,051 GBP Sell 919,527 JPY State Street Bank 22/06/2021 150 0.05
Buy 3,976 GBP Sell 611,570 JPY State Street Bank 23/06/2021 52 0.02
Buy 1,131 GBP Sell 13,259 NOK State Street Bank 25/06/2021 13 -
Buy 1,152 GBP Sell 2,262 NZD State Street Bank 23/06/2021 (2) -
Buy 496 GBP Sell 967 NZD State Street Bank 23/06/2021 3 -
Buy 1,936 GBP Sell 3,620 SGD State Street Bank 28/06/2021 7 -
Buy 8,593 GBP Sell 12,031 USD Bank of New York Mellon 11/06/2021 115 0.04
Buy 16 GBP Sell 22 USD State Street Bank 01/06/2021 - -
Buy 68,772 GBP Sell 95,579 USD State Street Bank 11/06/2021 1,426 0.48
Buy 75,662 GBP Sell 106,901 USD State Street Bank 29/06/2021 336 0.11
Buy 4,742,416 JPY Sell 31,280 GBP State Street Bank 11/06/2021 (852) (0.26)
Buy 111,600 JPY Sell 716 GBP State Street Bank 11/06/2021 - -
Buy 4,823,793 JPY Sell 31,856 GBP State Street Bank 16/06/2021 (906) (0.31)
Buy 43 NZD Sell 22 GBP State Street Bank 23/06/2021 - -
Buy 33 NZD Sell 17 GBP State Street Bank 23/06/2021 - -
Buy 17 SGD Sell 9 GBP State Street Bank 28/06/2021 - -
Buy 216 USD Sell 154 GBP State Street Bank 21/06/2021 (1) -
Buy 252 USD Sell 179 GBP State Street Bank 24/06/2021 (2) -
Unrealised Appreciation of Forward Currency Contracts 3,026 1.00
Unrealised Depreciation of Forward Currency Contracts (2,520) (0.83)
Net Unrealised Appreciation of Forward Currency Contracts - 0.17% (30 November 2020: 0.19%) 506 0.17
Value (000's)GBP
% of NetAssetValue
Cash and Cash Equivalents - 0.95% (30 November 2020: 1.07%) 2,785 0.95Other Assets in Excess of Other Liabilities - 0.96% (30 November 2020: 1.02%) 2,830 0.96
Total Net Assets 293,314 100.00
Amounts designated as “- “ are either £0 or less than £500.
Analysis of Total Assets % of Total Assets
Transferable securities admitted to an official exchange listing 80.37
Transferable securities dealt in on another regulated market 7.36
Other transferable securities of the type referred to in Regulations 68 (1)(a), (b) and (c) 8.82
OTC Financial derivative instruments 1.02
Current Assets 2.43
Total Assets 100.00
Global Sustainability Fixed Income FundPortfolio of Investments as at 31 May 2021 (continued)
Dimensional Fund Advisors Semi-Annual Report and Unaudited Financial Statements, 31 May 2021 267

Shares (000's)
Value(000's)
USD
% of NetAssetValue
Common Stock
Australia - 2.55%
77 A2B Australia Ltd 76 -
155 Accent Group Ltd 324 0.01
224 Adelaide Brighton Ltd 576 0.02
109 Ainsworth Game Technology Ltd 78 -
26 Alliance Aviation Services Ltd 87 -
1,195 AMP Ltd 1,084 0.03
107 Ampol Ltd 2,414 0.06
64 Ansell Ltd 2,017 0.05
75 AP Eagers Ltd 897 0.02
659 Arafura Resources Ltd 84 -
352 Ardent Leisure Group Ltd 274 0.01
533 Aurelia Metals Ltd 182 0.01
663 Aurizon Holdings Ltd 1,867 0.05
215 Austal Ltd 395 0.01
197 Australian Agricultural Co Ltd 189 0.01
264 Australian Pharmaceutical Industries Ltd 235 0.01
70 Australian Strategic Materials Ltd 251 0.01
110 Australian Vintage Ltd 66 -
6 Auswide Bank Ltd 30 -
379 Bank of Queensland Ltd 2,637 0.07
151 Bapcor Ltd 937 0.02
193 Base Resources Ltd 44 -
827 Beach Energy Ltd 813 0.02
708 Beacon Minerals Ltd 20 -
150 Bega Cheese Ltd 670 0.02
46 Bell Financial Group Ltd 61 -
282 Bendigo & Adelaide Bank Ltd 2,281 0.06
159 Bingo Industries Ltd 420 0.01
287 BlueScope Steel Ltd 4,733 0.12
687 Boral Ltd 3,639 0.09
62 Bravura Solutions Ltd 158 -
47 Brickworks Ltd 757 0.02
84 BWX Ltd 328 0.01
7 Capral Ltd 40 -
178 Cardno Ltd 95 -
350 Cash Converters International Ltd 59 -
43 Cedar Woods Properties Ltd 235 0.01
317 Challenger Ltd 1,272 0.03
979 Cleanaway Waste Management Ltd 2,091 0.05
103 Collection House Ltd 15 -
976 Cooper Energy Ltd 215 0.01
20 Corporate Travel Management Ltd 330 0.01
166 Costa Group Holdings Ltd 424 0.01
156 Crown Resorts Ltd 1,552 0.04
298 CSR Ltd 1,280 0.03
44 Decmil Group Ltd 18 -
118 Domain Holdings Australia Ltd 460 0.01
32 Dongfang Modern Agriculture Holding Group Ltd - -
410 Downer EDI Ltd 1,798 0.05
27 Earlypay Ltd 10 -
226 Eclipx Group Ltd 371 0.01
60 Elanor Investor Group 83 -
83 Elders Ltd 710 0.02
19 Electro Optic Systems Holdings Ltd 57 -
116 Emeco Holdings Ltd 81 -
347 Energy World Corp Ltd 24 -
5 Enero Group Ltd 10 -
151 Estia Health Ltd 292 0.01
55 EVENT Hospitality and Entertainment Ltd 545 0.01
342 Evolution Mining Ltd 1,389 0.04
63 Finbar Group Ltd 39 -
63 Fleetwood Corp Ltd 118 -
Shares (000's)
Value(000's)
USD
% of NetAssetValue
Common Stock (continued)
Australia - 2.55% (continued)
31 Flight Centre Travel Group Ltd 371 0.01
72 Freedom Foods Group Ltd 24 -
633 G8 Education Ltd 493 0.01
173 Galaxy Resources Ltd (voting rights) 511 0.01
227 Genworth Mortgage Insurance Australia Ltd 486 0.01
258 Gold Road Resources Ltd 298 0.01
118 GrainCorp Ltd 455 0.01
276 Grange Resources Ltd 108 -
238 Greenland Minerals Ltd 17 -
23 GWA Group Ltd 51 -
261 Harvey Norman Holdings Ltd 1,061 0.03
332 Healius Ltd 1,061 0.03
30 Helloworld Travel Ltd 42 -
111 HT&E Ltd 150 -
228 Humm Group Ltd 179 0.01
13 Huon Aquaculture Group Ltd 23 -
361 IGO Ltd 2,113 0.05
75 Iluka Resources Ltd 443 0.01
99 Imdex Ltd 159 -
1,032 Incitec Pivot Ltd 1,841 0.05
178 Intega Group Ltd 62 -
383 IOOF Holdings Ltd 1,160 0.03
33 IVE Group Ltd 38 -
137 Japara Healthcare Ltd 122 -
24 Juno Minerals Ltd 3 -
395 Jupiter Mines Ltd 88 -
342 Karoon Energy Ltd 322 0.01
259 Link Administration Holdings Ltd 1,089 0.03
285 Lynas Corp Ltd 1,218 0.03
126 MACA Ltd 78 -
626 Macmahon Holdings Ltd 94 -
955 Mayne Pharma Group Ltd 273 0.01
63 McPherson's Ltd 70 -
153 Medusa Mining Ltd 101 -
258 Mesoblast Ltd 402 0.01
303 Metals X Ltd 60 -
520 Metcash Ltd 1,413 0.04
27 Michael Hill International Ltd 16 -
77 Mineral Resources Ltd 2,729 0.07
161 MMA Offshore Ltd 41 -
21 Monadelphous Group Ltd 167 -
212 Monash IVF Group Ltd 138 -
58 Money3 Corp Ltd 143 -
34 Mortgage Choice Ltd 50 -
360 Mount Gibson Iron Ltd 231 0.01
537 Myer Holdings Ltd 131 -
5 Mystate Ltd 18 -
35 MyState Ltd 132 -
102 Navigator Global Investments Ltd 127 -
52 New Energy Solar Ltd 34 -
282 New Hope Corp Ltd 319 0.01
135 Nickel Mines Ltd 106 -
899 Nine Entertainment Co Holdings Ltd 2,056 0.05
180 NRW Holdings Ltd 236 0.01
142 Nufarm Ltd 532 0.01
694 Oil Search Ltd 1,992 0.05
33 OM Holdings Ltd 22 -
394 oOh!media Ltd 517 0.01
530 Origin Energy Ltd 1,669 0.04
35 Orocobre Ltd 180 0.01
297 Orora Ltd 722 0.02
209 OZ Minerals Ltd 4,082 0.10
Global Targeted Value FundPortfolio of Investments as at 31 May 2021
Dimensional Fund Advisors Semi-Annual Report and Unaudited Financial Statements, 31 May 2021 268

Shares (000's)
Value(000's)
USD
% of NetAssetValue
Common Stock (continued)
Australia - 2.55% (continued)
27 Pacific Current Group Ltd 114 -
111 Pact Group Holdings Ltd 312 0.01
471 Panoramic Resources Ltd 60 -
212 Peet Ltd 192 0.01
41 Pendal Group Ltd 253 0.01
450 Perenti Global Ltd 231 0.01
6 Perpetual Ltd 169 0.01
792 Perseus Mining Ltd 852 0.02
56 Premier Investments Ltd 1,142 0.03
31 Propel Funeral Partners Ltd 81 -
764 Qube Holdings Ltd 1,794 0.05
180 Ramelius Resources Ltd 271 0.01
12 Reject Shop Ltd 60 -
436 Reliance Worldwide Corp Ltd 1,740 0.05
666 Resolute Mining Ltd 300 0.01
193 Ridley Corp Ltd 179 0.01
16 Salmat Ltd - -
99 Sandfire Resources NL 547 0.01
67 Select Harvests Ltd 306 0.01
145 Senex Energy Ltd 351 0.01
28 Servcorp Ltd 76 -
74 Service Stream Ltd 56 -
56 SG Fleet Group Ltd 130 -
42 Shaver Shop Group Ltd 34 -
733 Sigma Healthcare Ltd 353 0.01
473 Silver Lake Resources Ltd 718 0.02
21 Silver Mines Ltd 5 -
96 Sims Metal Management Ltd 1,175 0.03
25 Southern Cross Electrical Engineering Ltd 10 -
145 Southern Cross Media Group Ltd 209 0.01
148 SpeedCast International Ltd - -
109 SRG Global Ltd 44 -
238 St Barbara Ltd 347 0.01
502 Star Entertainment Grp Ltd 1,578 0.04
40 Sunland Group Ltd 74 -
92 Super Retail Group Ltd 907 0.02
102 Superloop Ltd 79 -
300 Syrah Resources Ltd 239 0.01
721 Tabcorp Holdings Ltd 2,877 0.07
125 Tassal Group Ltd 361 0.01
1,005 Tiger Resources Ltd - -
3 Tribune Resources Ltd 12 -
107 Tuas Ltd 54 -
175 United Malt Group Ltd 594 0.02
365 Virgin Australia International Holdings - -
58 Virtus Health Ltd 279 0.01
97 Vita Group Ltd 70 -
381 Viva Energy Group Ltd 605 0.02
337 Vocus Group Ltd 1,422 0.04
144 Webjet Ltd 577 0.02
174 Western Areas Ltd 335 0.01
247 Westgold Resources Ltd 428 0.01
486 Whitehaven Coal Ltd 599 0.02
189 Worley Ltd 1,544 0.04
99,851 2.55
Austria - 0.32%
3 Addiko Bank AG 57 -
10 Agrana Beteiligungs AG 226 0.01
10 AT&S Austria Technologie & Systemtechnik AG 381 0.01
2 BAWAG Group AG 107 0.01
40 Erste Group Bank AG 1,656 0.04
31 EVN AG 761 0.02
Shares (000's)
Value(000's)
USD
% of NetAssetValue
Common Stock (continued)
Austria - 0.32% (continued)
19 OMV AG 1,115 0.03
5 POLYTEC Holding AG 69 -
5 Porr AG 94 -
94 Raiffeisen Bank International AG 2,235 0.06
7 Strabag SE 331 0.01
8 Telekom Austria AG 67 -
- UBM Development AG 14 -
97 UNIQA Insurance Group AG 883 0.02
30 Vienna Insurance Group AG Wiener VersicherungGruppe 839 0.02
80 Voestalpine AG 3,586 0.09
1 Zumtobel Group AG 11 -
12,432 0.32
Belgium - 0.59%
16 Ackermans & van Haaren NV 2,649 0.07
118 Ageas 7,636 0.20
78 AGFA-Gevaert NV 368 0.01
2 Atenor 168 -
- Banque Nationale de Belgique 107 -
28 Bekaert SA 1,344 0.03
5 Cie d'Entreprises CFE 568 0.02
53 Deceuninck NV 190 0.01
15 D'ieteren SA 1,809 0.05
50 Econocom Group SA 199 0.01
109 Euronav NV 1,039 0.03
6 EVS Broadcast Equipment SA 139 -
28 Exmar NV 128 -
10 Gimv NV 620 0.02
3 Greenyard NV 34 -
1 Immobel SA 123 -
2 Jensen-Group NV 61 -
69 Ontex Group NV 932 0.02
1 Picanol 85 -
81 Proximus SADP 1,652 0.04
29 Recticel SA 558 0.01
1 Resilux 108 -
2 Roularta Media Group NV 36 -
5 Sipef NV 287 0.01
12 Solvay SA 1,555 0.04
- TER Beke SA 47 -
14 Tessenderlo Group SA 594 0.02
31 Viohalco SA 170 -
23,206 0.59
Canada - 3.51%
31 5N Plus Inc 75 -
7 Acadian Timber Corp 110 -
159 Advantage Energy Ltd 472 0.01
37 Aecon Group Inc 564 0.01
165 Africa Oil Corp 167 -
4 Ag Growth International Inc 141 -
55 AGF Management Ltd 346 0.01
56 Aimia Inc 227 0.01
3 AirBoss of America Corp 84 -
251 Alamos Gold Inc 2,290 0.06
16 Alaris Equity Partners Income 220 0.01
10 Algoma Central Corp 133 -
181 AltaGas Ltd 3,586 0.09
30 Altius Minerals Corp 448 0.01
22 Amerigo Resources Ltd 26 -
18 Andrew Peller Ltd 156 -
409 ARC Resources Ltd 3,105 0.08
164 Argonaut Gold Inc 411 0.01
Global Targeted Value FundPortfolio of Investments as at 31 May 2021 (continued)
Dimensional Fund Advisors Semi-Annual Report and Unaudited Financial Statements, 31 May 2021 269

Shares (000's)
Value(000's)
USD
% of NetAssetValue
Common Stock (continued)
Canada - 3.51% (continued)
371 Athabasca Oil Corp 224 0.01
14 AutoCanada Inc 515 0.01
6 B2Gold Corp 29 -
206 Birchcliff Energy Ltd 588 0.02
39 Black Diamond Group Ltd 136 -
13 BlackBerry Ltd 126 -
21 Bonterra Energy Corp 78 -
251 Cameco Corp 5,004 0.13
74 Canaccord Genuity Group Inc 807 0.02
29 Canacol Energy Ltd 79 -
- Canadian Tire Corp Ltd 1 -
55 Canadian Western Bank 1,653 0.04
44 Canfor Corp 1,099 0.03
21 Canfor Pulp Products Inc 154 -
45 CanWel Building Materials Group Ltd 326 0.01
279 Capstone Mining Corp 1,282 0.03
90 Cardinal Energy Ltd 240 0.01
53 Cascades Inc 602 0.02
76 Celestica Inc 653 0.02
421 Cenovus Energy Inc 3,419 0.09
124 Centerra Gold Inc 1,008 0.03
4 Cervus Equipment Corp 51 -
194 CES Energy Solutions Corp 280 0.01
178 China Gold International Resources Corp Ltd 597 0.02
2 Cogeco Communications Inc 224 0.01
4 Cogeco Inc 297 0.01
108 Copper Mountain Mining Corp 389 0.01
124 Corus Entertainment Inc 630 0.02
391 Crescent Point Energy Corp 1,598 0.04
120 Crew Energy Inc 113 -
25 Dexterra Group Inc 133 -
13 DIRTT Environmental Solutions 43 -
23 Dorel Industries Inc 229 0.01
20 DREAM Unlimited Corp 403 0.01
101 Dundee Precious Metals Inc 736 0.02
108 ECN Capital Corp 754 0.02
1 E-L Financial Corp Ltd 704 0.02
115 Eldorado Gold Corp 1,362 0.03
171 Element Fleet Management Corp 1,929 0.05
46 Endeavour Mining Corp 1,112 0.03
70 Enerflex Ltd 460 0.01
166 Enerplus Corp 1,083 0.03
117 Ensign Energy Services Inc 126 -
29 Equinox Gold Corp 271 0.01
8 Equitable Group Inc 959 0.02
6 Exchange Income Corp 191 0.01
20 Exco Technologies Ltd 179 -
- EXFO Inc - -
9 Fairfax Financial Holdings Ltd 4,299 0.11
58 Finning International Inc 1,428 0.04
20 Firm Capital Mortgage Investment Corp 251 0.01
50 First Mining Gold Corp 16 -
282 First Quantum Minerals Ltd 7,015 0.18
301 Fission Uranium Corp 152 -
116 Fortuna Silver Mines Inc 806 0.02
71 Freehold Royalties Ltd 532 0.01
46 Frontera Energy Corp 243 0.01
110 Galiano Gold Inc 146 -
19 GoldMoney Inc 44 -
262 Gran Tierra Energy Inc 167 -
11 Guardian Capital Group Ltd 283 0.01
4 Hardwoods Distribution Inc 115 -
Shares (000's)
Value(000's)
USD
% of NetAssetValue
Common Stock (continued)
Canada - 3.51% (continued)
58 Headwater Exploration Inc 209 0.01
23 Heroux-Devtek Inc 337 0.01
11 HEXO Corp 79 -
14 High Liner Foods Inc 151 -
31 Home Capital Group Inc 889 0.02
158 Hudbay Minerals Inc 1,196 0.03
59 i-80 Gold Corp 126 -
40 iA Financial Corp Inc 2,295 0.06
280 IAMGOLD Corp 1,014 0.03
3 IGM Financial Inc 94 -
24 Imperial Metals Corp 97 -
43 Inter Pipeline Ltd 631 0.02
49 Interfor Corp 1,276 0.03
1 K-Bro Linen Inc 46 -
106 Kelt Exploration Ltd 271 0.01
95 Keyera Corp 2,367 0.06
462 Kinross Gold Corp 3,747 0.10
3 Kirkland Lake Gold Ltd 113 -
59 Knight Therapeutics Inc 258 0.01
8 KP Tissue Inc 72 -
1 Lassonde Industries Inc 127 -
25 Laurentian Bank of Canada 887 0.02
19 Leon's Furniture Ltd 361 0.01
78 Lightstream Resources Ltd - -
30 Linamar Corp 1,951 0.05
70 Lucara Diamond Corp 46 -
369 Lundin Mining Corp 3,957 0.10
12 Magellan Aerospace Corp 101 -
47 Major Drilling Group International Inc 411 0.01
- Manitok Energy Inc - -
28 Maple Leaf Foods Inc 622 0.02
56 Martinrea International Inc 626 0.02
3 Mav Beauty Brands Inc 16 -
6 MDF Commerce Inc 53 -
21 Medical Facilities Corp 130 -
169 MEG Energy Corp 1,125 0.03
2 Melcor Developments Ltd 25 -
32 Methanex Corp 1,121 0.03
34 Mountain Province Diamonds Inc 13 -
7 MTY Food Group Inc 336 0.01
71 Mullen Group Ltd 765 0.02
5 Neo Performance Materials Inc 70 -
24 Nevada Copper Corp 5 -
493 New Gold Inc 1,040 0.03
22 NFI Group Inc 460 0.01
7 Nighthawk Gold Corp 7 -
16 North American Construction Group Ltd 214 0.01
149 NuVista Energy Ltd 369 0.01
380 OceanaGold Corp 805 0.02
19 Onex Corp 1,382 0.04
24 Osisko Gold Royalties Ltd 343 0.01
49 Paramount Resources Ltd 582 0.02
82 Parex Resources Inc 1,396 0.04
16 Park Lawn Corp 433 0.01
40 Pason Systems Inc 290 0.01
93 Peyto Exploration & Development Corp 423 0.01
29 PHX Energy Services Corp 94 -
20 Pizza Pizza Royalty Corp 173 -
12 Polaris Infrastructure Inc 177 -
1 PolyMet Mining Corp 3 -
114 PrairieSky Royalty Ltd 1,265 0.03
13 Precision Drilling Corp 405 0.01
Global Targeted Value FundPortfolio of Investments as at 31 May 2021 (continued)
Dimensional Fund Advisors Semi-Annual Report and Unaudited Financial Statements, 31 May 2021 270

Shares (000's)
Value(000's)
USD
% of NetAssetValue
Common Stock (continued)
Canada - 3.51% (continued)
91 Pretium Resources Inc 1,039 0.03
79 Primo Water Corp 1,371 0.04
81 Quarterhill Inc 159 -
44 Questerre Energy Corp 6 -
5 Recipe Unlimited Corp 92 -
69 Rogers Sugar Inc 326 0.01
25 Roxgold Inc 49 -
41 Russel Metals Inc 1,120 0.03
127 Sabina Gold & Silver Corp 185 -
45 Sandstorm Gold Ltd 396 0.01
120 Secure Energy Services Inc 421 0.01
98 Shaw Communications Inc 2,931 0.08
56 ShawCor Ltd 275 0.01
31 Sienna Senior Living Inc 409 0.01
23 Sierra Wireless Inc (Canada listing) 354 0.01
33 SNC-Lavalin Group Inc 901 0.02
154 SSR Mining Inc 2,858 0.07
33 Stantec Inc 1,485 0.04
14 Stelco Holdings Inc 385 0.01
20 Stella-Jones Inc 769 0.02
13 Storm Resources Ltd 38 -
97 Superior Plus Corp 1,205 0.03
172 Tamarack Valley Energy Ltd 362 0.01
133 Taseko Mines Ltd 330 0.01
161 Teck Resources Ltd 3,976 0.10
191 Tidewater Midstream and Infrastructure Ltd 188 0.01
36 Timbercreek Financial Corp 283 0.01
49 Torex Gold Resources Inc 719 0.02
33 Total Energy Services Inc 104 -
163 Tourmaline Oil Corp 3,968 0.10
182 TransAlta Corp 1,648 0.04
47 Transcontinental Inc 873 0.02
17 TransGlobe Energy Corp 29 -
374 Trevali Mining Corp 78 -
189 Trican Well Service Ltd 359 0.01
22 Turquoise Hill Resources Ltd 391 0.01
37 Uni-Select Inc 475 0.01
94 Vermilion Energy Inc 721 0.02
14 Wajax Corp 276 0.01
29 West Fraser Timber Co Ltd 2,242 0.06
291 Western Forest Products Inc 533 0.01
16 Westshore Terminals Investment Corp 244 0.01
364 Whitecap Resources Inc 1,728 0.04
19 WildBrain Ltd 43 -
4 Winpak Ltd 121 -
477 Yamana Gold Inc 2,501 0.06
51 Yangarra Resources Ltd 49 -
137,826 3.51
China - 0.01%
2,221 FIH Mobile Ltd 337 0.01
337 0.01
Denmark - 0.95%
4 ALK-Abello AS 1,668 0.04
44 Alm Brand AS 455 0.01
83 Bang & Olufsen AS 422 0.01
3 BankNordik P/F 91 -
35 Bavarian Nordic AS 1,542 0.04
2 Brodrene Hartmann AS 179 0.01
46 Columbus AS 85 -
19 D/S Norden AS 547 0.01
5 Demant AS 281 0.01
26 Dfds AS 1,520 0.04
Shares (000's)
Value(000's)
USD
% of NetAssetValue
Common Stock (continued)
Denmark - 0.95% (continued)
29 FLSmidth & Co AS 1,194 0.03
- GronlandsBANKEN AS 4 -
40 H Lundbeck AS 1,273 0.03
14 H&H International AS 470 0.01
2 Harboes Bryggeri AS 21 -
58 ISS AS 1,231 0.03
42 Jyske Bank AS 2,175 0.06
13 Maersk Drilling AS 531 0.01
25 Matas AS 476 0.01
16 Nilfisk Holding AS 521 0.01
21 NKT AS 933 0.02
9 NNIT AS 188 0.01
3 North Media AS 58 -
43 Pandora AS 5,813 0.15
2 Parken Sport & Entertainment AS 26 -
16 Per Aarsleff Holding AS 779 0.02
20 Ringkjoebing Landbobank AS 2,080 0.05
2 Rockwool International AS, Class A 692 0.02
4 Rockwool International AS, Class B 1,928 0.05
23 Royal Unibrew AS 2,920 0.07
6 RTX AS 192 0.01
47 Scandinavian Tobacco Group AS 1,010 0.03
9 Schouw & Co AS 1,009 0.03
5 Solar AS 480 0.01
1 SP Group AS 65 -
72 Spar Nord Bank AS 814 0.02
45 Sydbank AS 1,437 0.04
1 Tivoli AS 111 -
21 Topdanmark AS 1,067 0.03
29 TORM PLC 273 0.01
1 United International Enterprises 362 0.01
462 Vestjysk Bank AS 260 0.01
37,183 0.95
Finland - 0.64%
24 Aktia Bank Oyj 322 0.01
1 Alandsbanken Abp 45 -
3 Alma Media Oyj 39 -
6 Altia Oyj 80 -
1 Apetit Oyj 19 -
2 Asiakastieto Group Oyj 91 -
11 Aspo Oyj 123 -
7 Atria Oyj 101 -
12 Bittium Oyj 92 -
27 Cargotec Oyj 1,551 0.04
6 Digia Oyj 59 -
462 Finnair Oyj 402 0.01
11 Fiskars Oyj Abp 231 0.01
16 Glaston Oyj Abp 20 -
20 HKScan Oyj 59 -
43 Huhtamaki Oyj 2,031 0.05
2 Ilkka-Yhtyma Oyj 9 -
67 Kemira Oyj 1,091 0.03
1 Kesko Oyj, Class A 34 -
42 Konecranes Oyj 1,906 0.05
16 Lassila & Tikanoja Oyj 282 0.01
113 Metsa Board Oyj 1,334 0.04
17 Neles Oyj 255 0.01
87 Nokian Renkaat Oyj 3,466 0.09
5 Olvi Oyj 310 0.01
63 Oriola Oyj, Class B 141 0.01
156 Outokumpu Oyj 870 0.02
71 Outotec Oyj 836 0.02
Global Targeted Value FundPortfolio of Investments as at 31 May 2021 (continued)
Dimensional Fund Advisors Semi-Annual Report and Unaudited Financial Statements, 31 May 2021 271

Shares (000's)
Value(000's)
USD
% of NetAssetValue
Common Stock (continued)
Finland - 0.64% (continued)
3 Pihlajalinna Oyj 43 -
65 Raisio Oyj 337 0.01
6 Rapala VMC Oyj 65 -
- Raute Oyj 10 -
13 Rovio Entertainment Oyj 104 -
42 Sanoma Oyj 717 0.02
4 Scanfil Oyj 35 -
16 SRV Group Oyj 12 -
17 Stockmann Oyj Abp 31 -
108 Stora Enso Oyj 1,930 0.05
2 Taaleri Oyj 36 -
8 Teleste Oyj 59 -
28 Terveystalo Oyj 401 0.01
52 Tieto Oyj 1,687 0.04
34 Uponor Oyj 1,015 0.03
9 Valmet Oyj 367 0.01
145 Wartsila Oyj Abp 1,955 0.05
77 YIT Oyj 479 0.01
25,082 0.64
France - 1.93%
1 Akka Technologies 33 -
6 AKWEL 217 0.01
11 Albioma SA 504 0.01
20 ALD SA 307 0.01
3 Amplitude Surgical SAS 7 -
17 Arkema SA 2,292 0.06
5 Assystem SA 169 -
53 Atos SE 3,569 0.09
4 Axway Software SA 149 -
31 Beneteau SA 533 0.01
11 Bigben Interactive 247 0.01
3 Boiron SA 169 -
180 Bollore SA 931 0.02
12 Bonduelle SCA 332 0.01
- Burelle SA 74 -
271 Carrefour SA 5,514 0.14
29 Casino Guichard Perrachon SA 940 0.02
1 Catering International Services 11 -
4 Cegedim SA 115 -
521 CGG SA 552 0.01
8 Chargeurs SA 224 0.01
7 Cie des Alpes 204 0.01
36 Cie Plastic Omnium SA 1,223 0.03
94 CNP Assurances 1,727 0.04
63 Coface SA 773 0.02
83 Derichebourg SA 852 0.02
39 Eiffage SA 4,268 0.11
2 Ekinops 13 -
72 Elior Group SA 575 0.02
128 Elis SA 2,448 0.06
5 Eramet 331 0.01
2 Esso SA Francaise 26 -
41 Etablissements Maurel et Prom SA 92 -
- Eurazeo SA 39 -
215 Europcar Mobility Group 103 -
110 Eutelsat Communications SA 1,388 0.04
1 Exel Industries 89 -
47 Faurecia SE 2,565 0.07
1 Fleury Michon SA 18 -
13 Fnac Darty SA 887 0.02
8 GL Events 141 -
2 Groupe Crit 127 -
Shares (000's)
Value(000's)
USD
% of NetAssetValue
Common Stock (continued)
France - 1.93% (continued)
5 Guerbet 176 0.01
8 Haulotte Group SA 58 -
3 Hexaom 139 -
10 Iliad SA 1,635 0.04
21 Imerys SA 1,105 0.03
28 IPSOS 1,137 0.03
11 Jacquet Metal Service SA 282 0.01
41 Korian SA 1,510 0.04
25 Lagardere SCA 637 0.02
2 Laurent-Perrier 197 0.01
- LDC SA 11 -
1 Linedata Services 35 -
15 LISI 525 0.01
33 Maisons du Monde SA 911 0.02
8 Manitou BF SA 250 0.01
1 Manutan International 89 -
14 Mersen SA 525 0.01
11 METabolic EXplorer SA 61 -
3 Metropole Television SA 63 -
437 Natixis SA 2,158 0.06
16 Nexans SA 1,388 0.04
27 Nexity SA 1,422 0.04
3 Nicox 15 -
9 NRJ Group 74 -
11 OL Groupe SA 28 -
36 Onxeo SA 29 -
6 Plastivaloire 54 -
44 Publicis Groupe SA 2,983 0.08
21 Quadient 618 0.02
17 Rallye SA 140 -
111 Renault SA 4,606 0.12
169 Rexel SA 3,439 0.09
16 Rothschild & Co 619 0.02
3 Savencia SA 274 0.01
90 SCOR SE 2,945 0.08
3 Seche Environnement SA 169 -
204 SES SA 1,701 0.04
4 SMCP SA 32 -
13 Societe BIC SA 1,019 0.03
- Societe Marseillaise du Tunnel Prado-Carenage SA 13 -
6 Sopra Steria Group 1,097 0.03
45 SPIE SA 1,076 0.03
10 SRP Groupe SA 43 -
3 Stef SA 286 0.01
2 Sword Group 91 -
4 Synergie SA 159 -
22 Tarkett SA 546 0.01
46 Technip Energies NV 702 0.02
30 Television Francaise 1 310 0.01
1 Total Gabon 95 -
1 Touax SCA-SGTR-CITE-SGT-CMTE-TAF-SLMTouage Investissments Reunies 9 -
4 Trigano SA 886 0.02
20 Valeo SA 670 0.02
6 Vallourec SA 209 0.01
1 Vetoquinol SA 192 0.01
14 Vicat SA 743 0.02
3 VIEL & Cie SA 22 -
5 Vilmorin & Cie SA 381 0.01
1 Vranken-Pommery Monopole SA 15 -
16 X-Fab Silicon Foundries SE 155 -
75,537 1.93
Global Targeted Value FundPortfolio of Investments as at 31 May 2021 (continued)
Dimensional Fund Advisors Semi-Annual Report and Unaudited Financial Statements, 31 May 2021 272

Shares (000's)
Value(000's)
USD
% of NetAssetValue
Common Stock (continued)
Germany - 2.43%
27 1&1 Drillisch AG 863 0.02
2 3U Holding AG 10 -
21 7C Solarparken AG 105 -
36 Aareal Bank AG 914 0.02
30 ADVA Optical Networking SE 390 0.01
1 Aixtron SE 14 -
4 Allgeier SE 135 -
3 Aumann AG 50 -
20 Aurubis AG 1,903 0.05
7 Bauer AG 108 -
10 BayWa AG 483 0.01
4 Bertrandt AG 278 0.01
3 Bijou Brigitte AG 86 -
19 Bilfinger SE 624 0.02
45 Borussia Dortmund GmbH & Co KGaA 319 0.01
10 CANCOM SE 569 0.01
103 Ceconomy AG 577 0.01
1 CENIT AG 25 -
3 Cewe Stiftung & Co KGaA 521 0.01
592 Commerzbank AG 4,776 0.12
12 Corestate Capital Holding SA 190 -
105 Covestro AG 7,306 0.19
20 CropEnergies AG 269 0.01
10 Deutsche Beteiligungs AG 424 0.01
48 Deutsche Lufthansa AG 624 0.02
91 Deutsche Pfandbriefbank AG 1,075 0.03
80 Deutz AG 676 0.02
37 Dialog Semiconductor PLC 2,904 0.07
4 DMG Mori AG 225 0.01
3 Draegerwerk AG & Co KGaA 228 0.01
28 Duerr AG 1,164 0.03
3 EDAG Engineering Group AG 36 -
5 Elmos Semiconductor AG 196 -
13 ElringKlinger AG 241 0.01
4 First Sensor AG 230 0.01
- FORTEC Elektronik AG 8 -
9 Francotyp-Postalia Holding AG 32 -
19 Fraport AG Frankfurt Airport Services Worldwide 1,322 0.03
75 Freenet AG 2,060 0.05
76 GEA Group AG 3,297 0.08
19 Gerresheimer AG 2,078 0.05
7 Gesco AG 173 -
14 GFT Technologies SE 344 0.01
1 Grammer AG 18 -
9 H&R GmbH & Co KGaA 74 -
8 Hamburger Hafen und Logistik AG 203 0.01
15 Hapag-Lloyd AG 2,970 0.08
50 HeidelbergCement AG 4,552 0.12
216 Heidelberger Druckmaschinen AG 492 0.01
22 Hella GmbH & Co KGaA 1,518 0.04
1 Highlight Communications AG 6 -
34 HolidayCheck Group AG 127 -
5 Hornbach Baumarkt AG 227 0.01
8 Hornbach Holding AG & Co KGaA 913 0.02
24 Hugo Boss AG 1,354 0.03
12 Indus Holding AG 515 0.01
18 Instone Real Estate Group AG 556 0.01
27 Jenoptik AG 806 0.02
4 JOST Werke AG 291 0.01
102 K&S AG 1,416 0.04
44 KION Group AG 4,698 0.12
48 Kloeckner & Co SE 657 0.02
Shares (000's)
Value(000's)
USD
% of NetAssetValue
Common Stock (continued)
Germany - 2.43% (continued)
10 Koenig & Bauer AG 365 0.01
4 KPS AG 24 -
9 Krones AG 896 0.02
- KSB SE & Co KGaA 36 -
6 KWS Saat SE & Co KGaA 590 0.02
52 Lanxess AG 3,874 0.10
5 Leifheit AG 288 0.01
22 Leoni AG 356 0.01
3 Manz AG 221 0.01
112 METRO AG 1,455 0.04
37 MLP SE 337 0.01
4 Nagarro SE 486 0.01
51 Nordex SE 1,177 0.03
19 Norma Group SE 1,117 0.03
24 Patrizia AG 700 0.02
56 PNE AG 498 0.01
2 Progress-Werk Oberkirch AG 61 -
65 ProSiebenSat.1 Media SE 1,465 0.04
82 QSC AG 184 -
25 Rheinmetall AG 2,658 0.07
22 RTL Group SA 1,284 0.03
38 SAF-Holland SE 611 0.02
21 Salzgitter AG 668 0.02
37 SGL Carbon SE 294 0.01
7 Sixt SE 1,105 0.03
2 Softing AG 18 -
30 Software AG 1,343 0.03
3 Stabilus SA 244 0.01
41 Suedzucker AG 682 0.02
14 SUESS MicroTec SE 392 0.01
6 Surteco Group SE 200 0.01
24 Takkt AG 409 0.01
30 Talanx AG 1,265 0.03
2 Technotrans SE 60 -
517 Telefonica Deutschland Holding AG 1,424 0.04
72 thyssenkrupp AG 846 0.02
1 Traffic Systems SE 31 -
47 Uniper SE 1,719 0.04
60 United Internet AG 2,481 0.06
16 VERBIO Vereinigte BioEnergie AG 880 0.02
5 Vossloh AG 256 0.01
9 Wacker Chemie AG 1,534 0.04
23 Wacker Neuson SE 699 0.02
14 Wuestenrot & Wuerttembergische AG 330 0.01
7 Zeal Network SE 334 0.01
95,142 2.43
Hong Kong - 0.81%
960 Aceso Life Science Group Ltd 27 -
110 AEON Credit Service Asia Co Ltd 74 -
240 Allied Group Ltd 98 -
60 APAC Resources Ltd 11 -
965 Applied Development Holdings Ltd 18 -
10 Arts Optical International Holdings Ltd 1 -
58 Asia Financial Holdings Ltd 28 -
384 Asia Standard International Group Ltd 64 -
28 Associated International Hotels Ltd 51 -
115 Automated Systems Holdings Ltd 19 -
276 Bank of East Asia Ltd 567 0.02
425 Blue River Holdings Ltd 22 -
104 BOC Aviation Ltd 940 0.03
395 BOCOM International Holdings Co Ltd 92 -
342 BOE Varitronix Ltd 185 0.01
Global Targeted Value FundPortfolio of Investments as at 31 May 2021 (continued)
Dimensional Fund Advisors Semi-Annual Report and Unaudited Financial Statements, 31 May 2021 273

Shares (000's)
Value(000's)
USD
% of NetAssetValue
Common Stock (continued)
Hong Kong - 0.81% (continued)
243 Brightoil Petroleum Holdings Ltd 9 -
1,860 Burwill Holdings Ltd 3 -
598 Cathay Pacific Airways Ltd 522 0.01
905 Century City International Holdings Ltd 52 -
84 Chen Hsong Holdings 29 -
124 Cheuk Nang Holdings Ltd 45 -
44 Chevalier International Holdings Ltd 55 -
130 China Best Group Holding Ltd 5 -
4,950 China Energy Development Holdings Ltd 59 -
432 China Star Entertainment Ltd 71 -
8,865 China Strategic Holdings Ltd 144 -
399 Chinese Estates Holdings Ltd 196 0.01
33 Chong Hing Bank Ltd 86 -
197 Chow Sang Sang Holdings International Ltd 344 0.01
650 Chuang's China Investments Ltd 38 -
451 Chuang's Consortium International Ltd 63 -
990 CITIC Telecom International Holdings Ltd 330 0.01
313 CNQC International Holdings Ltd 33 -
44 Crystal International Group Ltd 19 -
3,755 CSI Properties Ltd 123 -
303 CW Group Holdings Ltd 2 -
300 Dah Sing Banking Group Ltd 344 0.01
106 Dah Sing Financial Holdings Ltd 376 0.01
107 Dickson Concepts International Ltd 57 -
150 Eagle Nice International Holdings Ltd 93 -
228 EcoGreen International Group Ltd 57 -
2,538 Emperor Capital Group Ltd 44 -
345 Emperor Entertainment Hotel Ltd 51 -
842 Emperor International Holdings Ltd 125 -
1,830 Emperor Watch & Jewellery Ltd 39 -
2,193 Esprit Holdings Ltd 220 0.01
1,090 Eternity Investment Ltd 41 -
999 Far East Consortium International Ltd 359 0.01
1,590 First Pacific Co Ltd 555 0.02
608 First Shanghai Investments Ltd 25 -
73 FIT Hon Teng Ltd 21 -
8 Fosun Tourism Group 17 -
284 Fountain SET Holdings Ltd 52 -
242 GDH Guangnan Holdings Ltd 22 -
336 Genting Hong Kong Ltd 23 -
237 Get Nice Financial Group Ltd 29 -
812 Giordano International Ltd 180 0.01
334 Glorious Sun Enterprises Ltd 36 -
528 Golden Resources Development International Ltd 44 -
910 Good Resources Holdings Ltd 4 -
738 Goodbaby International Holdings Ltd 181 0.01
184 GR Properties Ltd 25 -
150 Great Eagle Holdings Ltd 511 0.01
14,236 G-Resources Group Ltd 86 -
23 Guoco Group Ltd 274 0.01
1,872 Guotai Junan International Holdings Ltd 340 0.01
1,550 Haitong International Securities Group Ltd 481 0.01
92 Hang Fung Gold Technology Ltd - -
546 Hang Lung Group Ltd 1,352 0.04
97 Hang Lung Properties Ltd 251 0.01
311 Hanison Construction Holdings Ltd 54 -
74 Harbour Centre Development Ltd 76 -
130 HKBN Ltd 176 0.01
580 HKR International Ltd 283 0.01
785 HKT Trust & HKT Ltd 1,072 0.03
58 Hon Kwok Land Investment Co Ltd 27 -
72 Hong Kong Ferry Holdings Co Ltd 56 -
Shares (000's)
Value(000's)
USD
% of NetAssetValue
Common Stock (continued)
Hong Kong - 0.81% (continued)
310 Hongkong & Shanghai Hotels Ltd 311 0.01
360 Hongkong Chinese Ltd 31 -
1,330 Hsin Chong Group Holdings Ltd 11 -
260 Hung Hing Printing Group Ltd 44 -
1,246 Hutchison Telecommunications Hong Kong HoldingsLtd 234 0.01
255 IPE Group Ltd 22 -
2,884 IRC Ltd 126 -
250 ITC Properties Group Ltd 33 -
356 Jacobson Pharma Corp Ltd 35 -
45 JBM Healthcare Ltd 11 -
228 Johnson Electric Holdings Ltd 608 0.02
251 K Wah International Holdings Ltd 124 -
192 Kader Holdings Co Ltd 10 -
50 Kam Hing International Holdings Ltd 2 -
46 Keck Seng Investments 24 -
327 Kerry Logistics Network Ltd 979 0.03
385 Kerry Properties Ltd 1,327 0.04
142 Kingmaker Footwear Holdings Ltd 17 -
261 Kowloon Development Co Ltd 325 0.01
46 Kwoon Chung Bus Holdings Ltd 15 -
115 Lai Sun Development Co Ltd 84 -
77 Lai Sun Garment International Ltd 60 -
1,136 Landing International Development Ltd 39 -
392 Landsea Green Group Co Ltd 26 -
651 Langham Hospitality Investments and LanghamHospitality Investments Ltd 81 -
820 Lerado Financial Group Co Ltd 3 -
916 Lippo China Resources Ltd 14 -
124 Lippo Ltd 38 -
130 Liu Chong Hing Investment Ltd 140 -
207 Luk Fook Holdings International Ltd 580 0.02
100 Lung Kee Bermuda Holdings 48 -
822 Magnificent Hotel Investment Ltd 12 -
17,041 Mason Group Holdings Ltd 70 -
402 Meilleure Health International Industry Group Ltd 22 -
321 Melco International Development Ltd 584 0.02
259 Midland Holdings Ltd 39 -
66 Ming Fai International Holdings Ltd 6 -
128 Miramar Hotel & Investment 246 0.01
288 Modern Dental Group Ltd 247 0.01
183 Mongolian Mining Corp 59 -
328 Nameson Holdings Ltd 25 -
66 National Electronics Holdings Ltd 10 -
126 Neo-Neon Holdings Ltd 8 -
560 NewOcean Energy Holdings Ltd 32 -
123 Nissin Foods Co Ltd 99 -
754 NWS Holdings Ltd 855 0.02
231 Oriental Watch Holdings 110 -
946 Pacific Andes International Holdings Ltd 3 -
2,642 Pacific Basin Shipping Ltd 997 0.03
125 Pacific Textiles Holdings Ltd 83 -
180 Paliburg Holdings Ltd 50 -
112 PC Partner Group Ltd 56 -
74 Pico Far East Holdings Ltd 13 -
626 Playmates Holdings Ltd 73 -
501 PT International Development Co Ltd 25 -
260 Public Financial Holdings Ltd 86 -
223 Regal Hotels International Holdings Ltd 117 -
72 Safety Godown Co Ltd 31 -
124 SAS Dragon Holdings Ltd 49 -
67 SEA Holdings Ltd 72 -
Global Targeted Value FundPortfolio of Investments as at 31 May 2021 (continued)
Dimensional Fund Advisors Semi-Annual Report and Unaudited Financial Statements, 31 May 2021 274

Shares (000's)
Value(000's)
USD
% of NetAssetValue
Common Stock (continued)
Hong Kong - 0.81% (continued)
597 Shangri-La Asia Ltd 558 0.02
295 Shenwan Hongyuan HK Ltd 38 -
14 Shun Ho Property Investments Ltd 2 -
737 Shun Tak Holdings Ltd 236 0.01
156 Sing Tao News Corp Ltd 17 -
722 Singamas Container Holdings Ltd 61 -
1,387 Sino Land Co Ltd 2,214 0.06
181 SmarTone Telecommunications Holdings Ltd 105 -
42 Soundwill Holdings Ltd 48 -
460 South China Holdings Co Ltd 7 -
270 Stella International Holdings Ltd 330 0.01
346 Sun Hung Kai & Co Ltd 192 0.01
271 Swire Pacific Ltd, Class A 2,110 0.06
471 Swire Pacific Ltd, Class B 579 0.02
218 TAI Cheung Holdings Ltd 135 -
42 Tan Chong International Ltd 11 -
163 Tao Heung Holdings Ltd 21 -
89 Television Broadcasts Ltd 89 -
31 Texhong Textile Group Ltd 47 -
574 Texwinca Holdings Ltd 149 -
948 Town Health International Medical Group Ltd 42 -
130 Transport International Holdings Ltd 263 0.01
463 United Laboratories International Holdings Ltd 422 0.01
3,030 Untrade Convoy 12 -
676 Up Energy Development Group Ltd 2 -
344 Vedan International Holdings Ltd 34 -
337 VPower Group International Holdings Ltd 79 -
438 VSTECS Holdings Ltd 428 0.01
68 Wai Kee Holdings Ltd 36 -
3,460 Wang On Group Ltd 32 -
60 Wealthking Investments Ltd 6 -
39 Wing On Co International Ltd 90 -
229 Wing Tai Properties Ltd 138 -
62 Wong's International Holdings Ltd 18 -
395 Yue Yuen Industrial Holdings Ltd 1,032 0.03
50 Yunfeng Financial Group Ltd 18 -
2,400 Zensun Enterprises Ltd 195 0.01
31,761 0.81
Ireland - 0.21%
250 AIB Group PLC 834 0.02
214 Bank of Ireland Group PLC 1,384 0.04
140 Cairn Homes PLC 182 -
5 FBD Holdings PLC 54 -
22 Flutter Entertainment PLC (UK listing) 4,188 0.11
24 Glanbia PLC 403 0.01
20 Glenveagh Properties PLC 25 -
9 Irish Continental Group PLC 47 -
23 Permanent TSB Group Holdings PLC 41 -
24 Smurfit Kappa Group PLC 1,255 0.03
8,413 0.21
Israel - 0.39%
1 Afcon Holdings Ltd 83 -
2 Africa Israel Residences Ltd 94 -
2 Albaad Massuot Yitzhak Ltd 33 -
3 Alrov Properties and Lodgings Ltd 125 -
2 Arad Ltd 24 -
26 Ashtrom Group Ltd 618 0.02
13 Aura Investments Ltd 13 -
31 Avgol Industries 1953 Ltd 29 -
46 Azorim-Investment Development & Construction CoLtd 190 0.01
2 Bet Shemesh Engines Holdings 1997 Ltd 37 -
Shares (000's)
Value(000's)
USD
% of NetAssetValue
Common Stock (continued)
Israel - 0.39% (continued)
23 Carasso Motors Ltd 125 -
73 Cellcom Israel Ltd 283 0.01
23 Ceragon Networks Ltd 76 -
35 Clal Insurance Enterprises Holdings Ltd 683 0.02
23 Delek Automotive Systems Ltd 278 0.01
5 Delek Group Ltd 243 0.01
6 Delta Galil Industries Ltd 218 0.01
3 Dor Alon Energy in Israel 1988 Ltd 79 -
1 Duniec Brothers Ltd 51 -
7 Electra Consumer Products 1970 Ltd 355 0.01
1 Ellomay Capital Ltd 35 -
14 Equital Ltd 391 0.01
27 First International Bank Of Israel Ltd 862 0.02
- FMS Enterprises Migun Ltd 12 -
5 Formula Systems 1985 Ltd 475 0.01
5 Fox Wizel Ltd 525 0.01
11 Gilat Satellite Networks Ltd 106 -
2 Hadera Paper Ltd 143 0.01
2 Hamat Group Ltd 12 -
69 Harel Insurance Investments & Financial ServicesLtd 730 0.02
1 IDI Insurance Co Ltd 25 -
- IES Holdings Ltd 12 -
- Ilex Medical Ltd 12 -
26 Isracard Ltd 105 -
49 Israel Canada T.R Ltd 203 0.01
8 Israel Land Development - Urban Renewal Ltd 105 -
1 Isras Investment Co Ltd 265 0.01
1 Issta Lines Ltd 24 -
22 Kamada Ltd 130 -
12 Kenon Holdings Ltd 421 0.01
3 Kerur Holdings Ltd 102 -
- Klil Industries Ltd 36 -
19 Magic Software Enterprises Ltd 317 0.01
1 Malam - Team Ltd 45 -
44 Mediterranean Towers Ltd 136 -
- Mehadrin Ltd 18 -
15 Meitav Dash Investments Ltd 91 -
18 Menora Mivtachim Holdings Ltd 371 0.01
266 Migdal Insurance & Financial Holdings Ltd 378 0.01
- Minrav Holdings Ltd 36 -
4 Mivtach Shamir Holdings Ltd 135 -
24 Naphtha Israel Petroleum Corp Ltd 109 -
18 Nawi Brothers Ltd 130 -
- Neto Malinda Trading Ltd 6 -
1 Neto ME Holdings Ltd 54 -
11 NR Spuntech Industries Ltd 32 -
1,209 Oil Refineries Ltd 327 0.01
2 Palram Industries 1990 Ltd 24 -
87 Partner Communications Co Ltd 416 0.01
4 Paz Oil Co Ltd 541 0.02
14 Perion Network Ltd 231 0.01
85 Phoenix Holdings Ltd 807 0.02
3 Plasson Industries Ltd 151 0.01
1 Prashkovsky Investments and Construction Ltd 49 -
2 Priortech Ltd 59 -
8 Raval Ics Ltd 26 -
5 Scope Metals Group Ltd 149 0.01
130 Shikun & Binui Ltd 881 0.02
28 Shufersal Ltd 233 0.01
34 Suny Cellular Communication 14 -
30 Tower Semiconductor Ltd 830 0.02
Global Targeted Value FundPortfolio of Investments as at 31 May 2021 (continued)
Dimensional Fund Advisors Semi-Annual Report and Unaudited Financial Statements, 31 May 2021 275

Shares (000's)
Value(000's)
USD
% of NetAssetValue
Common Stock (continued)
Israel - 0.39% (continued)
6 Vitania Ltd 42 -
5 YH Dimri Construction & Development Ltd 307 0.01
15,313 0.39
Italy - 1.30%
881 A2A SpA 1,840 0.05
30 ACEA SpA 723 0.02
29 Aeffe SpA 64 -
189 Anima Holding SpA 989 0.03
7 Aquafil SpA 51 -
60 Arnoldo Mondadori Editore SpA 124 -
54 Ascopiave SpA 244 0.01
50 Autogrill SpA 427 0.01
1 Autostrade Meridionali SpA 47 -
13 Avio SpA 211 0.01
16 Banca Carige SpA 6 -
13 Banca IFIS SpA 202 0.01
23 Banca Monte dei Paschi di Siena SpA 35 -
199 Banca Popolare di Sondrio SCpA 976 0.03
235 Banca Profilo SpA 62 -
44 Banca Sistema SpA 109 -
895 Banco BPM SpA 3,170 0.08
25 Banco di Desio e della Brianza SpA 96 -
10 Biesse SpA 356 0.01
641 BPER Banca 1,591 0.04
49 Buzzi Unicem SpA 1,403 0.04
37 Cairo Communication SpA 83 -
35 Cementir Holding NV 405 0.01
554 CIR SpA-Compagnie Industriali 341 0.01
313 CNH Industrial NV 5,381 0.14
68 Credito Emiliano SpA 448 0.01
320 d'Amico International Shipping SA 38 -
9 Danieli & C Officine Meccaniche SpA 233 0.01
21 De' Longhi SpA 912 0.02
40 DeA Capital SpA 66 -
11 Elica SpA 45 -
42 Emak SpA 97 -
6 Enav SpA 30 -
39 ERG SpA 1,185 0.03
25 Esprinet SpA 426 0.01
20 Eurotech SpA 111 -
25 Falck Renewables SpA 163 -
6 Fila SpA 80 -
326 Fincantieri SpA 287 0.01
98 FNM SpA 81 -
22 Freni Brembo SpA 283 0.01
4 Gefran SpA 42 -
67 Geox SpA 92 -
393 Hera SpA 1,671 0.04
24 Illimity Bank SpA 305 0.01
136 IMMSI SpA 79 -
194 Intek Group SpA 78 -
10 Italmobiliare SpA 357 0.01
8 IVS Group SA 59 -
7 La Doria SpA 148 -
249 Leonardo SpA 2,175 0.06
4 LU-VE SpA 79 -
69 Maire Tecnimont SpA 247 0.01
328 Mediaset SpA 1,173 0.03
356 Mediobanca Banca di Credito Finanziario SpA 4,235 0.11
16 Mondo TV SpA 31 -
7 Openjobmetis Spa agenzia per il lavoro 77 -
1 Orsero SpA 15 -
Shares (000's)
Value(000's)
USD
% of NetAssetValue
Common Stock (continued)
Italy - 1.30% (continued)
108 OVS SpA 238 0.01
111 Piaggio & C SpA 435 0.01
236 Pirelli & C SpA 1,394 0.04
3 Prima Industrie SpA 77 -
88 Prysmian SpA 3,045 0.08
149 Reno de Medici SpA 192 0.01
61 Rizzoli Corriere Della Sera Mediagroup SpA 53 -
4 Sabaf SpA 119 -
80 Safilo Group SpA 156 -
321 Saipem SpA 797 0.02
153 Salini Impregilo SpA 360 0.01
385 Saras SpA 330 0.01
8 Servizi Italia SpA 23 -
3 Sesa SpA 399 0.01
116 Societa Cattolica di Assicurazioni SC 857 0.02
8 Sogefi SpA 13 -
17 SOL SpA 335 0.01
5,420 Telecom Italia SpA 2,902 0.07
212 Tenaris SA 2,421 0.06
7 Tod's SpA 390 0.01
3 TXT e-solutions SpA 29 -
8 Unieuro SpA 234 0.01
272 Unipol Gruppo SpA 1,506 0.04
157 UnipolSai Assicurazioni SpA 469 0.01
51,058 1.30
Japan - 7.69%
39 77 Bank Ltd 479 0.01
3 A&A Material Corp 25 -
5 A&D Co Ltd 45 -
10 Achilles Corp 126 -
19 AD Works Co Ltd 28 -
52 ADEKA Corp 923 0.02
4 Advan Co Ltd 36 -
7 Advanced Media Inc 51 -
1 Advanex Inc 11 -
78 AEON Financial Service Co Ltd 922 0.02
8 AFC-HD AMS Life Science Co Ltd 69 -
4 Agro-Kanesho Co Ltd 50 -
2 AGS Corp 12 -
17 Ahresty Corp 65 -
6 Aichi Bank Ltd 160 0.01
27 Aichi Corp 212 0.01
8 Aichi Steel Corp 240 0.01
2 Aichi Tokei Denki Co Ltd 86 -
37 Aida Engineering Ltd 292 0.01
7 Aiphone Co Ltd 136 -
106 Air Water Inc 1,794 0.05
17 Airport Facilities Co Ltd 96 -
4 Airtech Japan Ltd 45 -
26 Aisan Industry Co Ltd 192 0.01
16 Aizawa Securities Co Ltd 160 0.01
21 Akatsuki Corp 69 -
63 Akebono Brake Industry Co Ltd 102 -
12 Akita Bank Ltd 158 0.01
5 Albis Co Ltd 101 -
16 Alconix Corp 221 0.01
13 Alfresa Holdings Corp 209 0.01
10 Alinco Inc 96 -
9 Alpen Co Ltd 212 0.01
5 Alpha Corp 51 -
32 Alps Alpine Co Ltd 348 0.01
12 Alps Logistics Co Ltd 98 -
Global Targeted Value FundPortfolio of Investments as at 31 May 2021 (continued)
Dimensional Fund Advisors Semi-Annual Report and Unaudited Financial Statements, 31 May 2021 276

Shares (000's)
Value(000's)
USD
% of NetAssetValue
Common Stock (continued)
Japan - 7.69% (continued)
8 Altech Co Ltd 28 -
36 Amada Holdings Co Ltd 387 0.01
3 Amiyaki Tei Co Ltd 75 -
5 Amuse Inc 97 -
3 Anabuki Kosan Inc 63 -
4 Anest Iwata Corp 40 -
3 AOI Electronics Co Ltd 72 -
16 AOI TYO Holdings Inc 128 -
28 AOKI Holdings Inc 165 0.01
15 Aomori Bank Ltd 293 0.01
34 Aoyama Trading Co Ltd 265 0.01
85 Aozora Bank Ltd 1,946 0.05
13 Arakawa Chemical Industries Ltd 138 -
9 Arata Corp 361 0.01
3 Araya Industrial Co Ltd 48 -
11 Arcland Sakamoto Co Ltd 147 -
27 Arcs Co Ltd 610 0.02
6 Arealink Co Ltd 72 -
25 Arisawa Manufacturing Co Ltd 214 0.01
13 Artnature Inc 77 -
9 Asahi Broadcasting Group Holdings Corp 59 -
11 Asahi Co Ltd 141 -
41 Asahi Diamond Industrial Co Ltd 195 0.01
3 Asahi Kogyosha Co Ltd 77 -
2 Asahi Printing Co Ltd 15 -
11 Asahi Yukizai Corp 135 -
5 Asanuma Corp 206 0.01
8 Asax Co Ltd 51 -
3 Ashimori Industry Co Ltd 30 -
24 Asia Pile Holdings Corp 110 -
14 ASKA Pharmaceutical Holdings 137 -
2 Asti Corp 59 -
11 Atsugi Co Ltd 65 -
41 Autobacs Seven Co Ltd 544 0.01
24 Avex Inc 337 0.01
23 Awa Bank Ltd 447 0.01
4 Axell Corp 36 -
27 Bando Chemical Industries Ltd 207 0.01
11 Bank of Iwate Ltd 179 0.01
7 Bank of Kochi Ltd 51 -
9 Bank of Nagoya Ltd 224 0.01
16 Bank of Okinawa Ltd 393 0.01
8 Bank of Saga Ltd 108 -
35 Bank of the Ryukyus Ltd 224 0.01
2 Bank of Toyama Ltd 38 -
32 Belluna Co Ltd 321 0.01
30 Benesse Holdings Inc 688 0.02
3 Biofermin Pharmaceutical Co Ltd 94 -
2 Broccoli Co Ltd 22 -
35 Bunka Shutter Co Ltd 346 0.01
4 C Uyemura & Co Ltd 285 0.01
8 CAC Holdings Corp 111 -
2 Canare Electric Co Ltd 31 -
15 Canon Electronics Inc 232 0.01
15 Carlit Holdings Co Ltd 94 -
10 Cawachi Ltd 209 0.01
25 Central Glass Co Ltd 476 0.01
4 Central Sports Co Ltd 83 -
81 Chiba Bank Ltd 525 0.01
41 Chiba Kogyo Bank Ltd 102 -
11 Chilled & Frozen Logistics Holdings Co Ltd 174 0.01
5 Chino Corp 62 -
Shares (000's)
Value(000's)
USD
% of NetAssetValue
Common Stock (continued)
Japan - 7.69% (continued)
12 Chiyoda Co Ltd 99 -
8 Chiyoda Integre Co Ltd 135 -
6 Chodai Co Ltd 101 -
14 Chofu Seisakusho Co Ltd 262 0.01
9 Chori Co Ltd 140 -
16 Chubu Shiryo Co Ltd 175 0.01
20 Chudenko Corp 439 0.01
6 Chuetsu Pulp & Paper Co Ltd 65 -
5 Chugai Ro Co Ltd 87 -
90 Chugoku Bank Ltd 730 0.02
28 Chugoku Marine Paints Ltd 227 0.01
8 Chukyo Bank Ltd 107 -
8 Chuo Spring Co Ltd 89 -
5 Chuo Warehouse Co Ltd 49 -
31 CI Takiron Corp 166 0.01
191 Citizen Watch Co Ltd 764 0.02
16 Cleanup Corp 78 -
6 CMIC Holdings Co Ltd 86 -
34 CMK Corp 148 -
85 Coca-Cola Bottlers Japan Holdings Inc 1,424 0.04
7 Computer Institute of Japan Ltd 51 -
307 Concordia Financial Group Ltd 1,165 0.03
8 CONEXIO Corp 105 -
8 Corona Corp 65 -
16 Cosel Co Ltd 156 0.01
39 Cosmo Energy Holdings Co Ltd 829 0.02
8 Cosmos Initia Co Ltd 34 -
4 Create Medic Co Ltd 36 -
94 Credit Saison Co Ltd 1,196 0.03
8 CTI Engineering Co Ltd 185 0.01
13 Dai Nippon Toryo Co Ltd 98 -
142 Daicel Corp 1,140 0.03
9 Dai-Dan Co Ltd 229 0.01
5 Daido Kogyo Co Ltd 54 -
31 Daido Metal Co Ltd 167 0.01
18 Daido Steel Co Ltd 907 0.02
19 Daidoh Ltd 31 -
14 Daihatsu Diesel Manufacturing Co Ltd 58 -
9 Daihen Corp 380 0.01
11 Daiho Corp 419 0.01
5 Dai-Ichi Cutter Kogyo KK 57 -
6 Daiichi Jitsugyo Co Ltd 248 0.01
3 Daiichi Kensetsu Corp 54 -
14 Daiichi Kigenso Kagaku-Kogyo Co Ltd 196 0.01
7 Dai-ichi Seiko Co Ltd 155 -
9 Daiken Corp 157 0.01
19 Daiki Aluminium Industry Co Ltd 209 0.01
6 Daikoku Denki Co Ltd 51 -
32 Daikyonishikawa Corp 225 0.01
9 Dainichi Co Ltd 63 -
9 Dainichiseika Color & Chemicals Manufacturing CoLtd 186 0.01
29 Daio Paper Corp 450 0.01
5 Daiseki Eco. Solution Co Ltd 48 -
25 Daishi Hokuetsu Financial Group Inc 547 0.01
2 Daishinku Corp 71 -
6 Daisue Construction Co Ltd 50 -
6 Daito Bank Ltd 36 -
2 Daito Chemix Corp 13 -
8 Daito Pharmaceutical Co Ltd 235 0.01
6 Daitron Co Ltd 102 -
22 Daiwa Industries Ltd 213 0.01
Global Targeted Value FundPortfolio of Investments as at 31 May 2021 (continued)
Dimensional Fund Advisors Semi-Annual Report and Unaudited Financial Statements, 31 May 2021 277

Shares (000's)
Value(000's)
USD
% of NetAssetValue
Common Stock (continued)
Japan - 7.69% (continued)
82 DCM Holdings Co Ltd 756 0.02
34 DeNA Co Ltd 680 0.02
45 Denka Co Ltd 1,700 0.04
7 Denki Kogyo Co Ltd 152 -
12 Denyo Co Ltd 220 0.01
55 DIC Corp 1,397 0.04
6 DKK-Toa Corp 42 -
6 DKS Co Ltd 195 0.01
13 Doshisha Co Ltd 205 0.01
21 Doutor Nichires Holdings Co Ltd 312 0.01
29 Dowa Holdings Co Ltd 1,183 0.03
23 Duskin Co Ltd 541 0.01
7 DyDo Group Holdings Inc 324 0.01
4 Dynic Corp 31 -
21 Eagle Industry Co Ltd 220 0.01
19 Ebara Corp 914 0.02
4 Ebara Foods Industry Inc 95 -
5 Eco's Co Ltd 77 -
56 EDION Corp 556 0.02
8 EF-ON Inc 75 -
24 Ehime Bank Ltd 182 0.01
15 Eidai Co Ltd 43 -
10 Eizo Corp 449 0.01
6 EJ Holdings Inc 56 -
13 Elematec Corp 145 -
8 Endo Lighting Corp 55 -
3 Enomoto Co Ltd 50 -
6 Enplas Corp 211 0.01
15 Ensuiko Sugar Refining Co Ltd 32 -
5 Envipro Holdings Inc 51 -
18 EPS Holdings Inc 264 0.01
6 Eslead Corp 94 -
13 ESPEC Corp 238 0.01
3 ESTELLE Holdings Co Ltd 15 -
20 Exedy Corp 297 0.01
6 Faith Inc 47 -
6 Falco Holdings Co Ltd 101 -
24 FCC Co Ltd 374 0.01
17 Feed One Co Ltd 116 -
4 Felissimo Corp 47 -
2 Fenwal Controls of Japan Ltd 27 -
27 Ferrotec Holdings Corp 622 0.02
150 FIDEA Holdings Co Ltd 168 0.01
14 Fields Corp 60 -
38 First Bank of Toyama Ltd 96 -
5 First Juken Co Ltd 59 -
14 FJ Next Co Ltd 131 -
17 Foster Electric Co Ltd 164 0.01
20 France Bed Holdings Co Ltd 168 0.01
5 Freund Corp 37 -
10 F-Tech Inc 64 -
12 Fudo Tetra Corp 195 0.01
14 Fuji Co Ltd 266 0.01
20 Fuji Corp Ltd 116 -
7 Fuji Die Co Ltd 40 -
1 Fuji Kosan Co Ltd 16 -
21 Fuji Media Holdings Inc 243 0.01
25 Fuji Oil Co Ltd 62 -
9 Fuji Pharma Co Ltd 98 -
6 Fujibo Holdings Inc 228 0.01
13 Fujicco Co Ltd 227 0.01
15 Fujikura Composites Inc 67 -
Shares (000's)
Value(000's)
USD
% of NetAssetValue
Common Stock (continued)
Japan - 7.69% (continued)
18 Fujikura Kasei Co Ltd 90 -
156 Fujikura Ltd 673 0.02
1 Fujimak Corp 10 -
13 Fujimori Kogyo Co Ltd 484 0.01
67 Fujisash Co Ltd 47 -
5 Fujishoji Co Ltd 41 -
8 Fujiya Co Ltd 150 -
7 FuKoKu Co Ltd 63 -
5 Fukuda Corp 217 0.01
3 Fukuda Denshi Co Ltd 257 0.01
14 Fukui Bank Ltd 205 0.01
95 Fukuoka Financial Group Inc 1,808 0.05
15 Fukushima Bank Ltd 31 -
16 Fukuyama Transporting Co Ltd 599 0.02
23 Furukawa Co Ltd 261 0.01
42 Furukawa Electric Co Ltd 1,132 0.03
18 Furuno Electric Co Ltd 171 0.01
8 Furusato Industries Ltd 124 -
6 Fuso Pharmaceutical Industries Ltd 111 -
27 Futaba Corp 208 0.01
43 Futaba Industrial Co Ltd 197 0.01
11 Fuyo General Lease Co Ltd 769 0.02
10 Gecoss Corp 82 -
27 Geo Holdings Corp 272 0.01
8 Geostr Corp 27 -
1 GL Sciences Inc 32 -
34 Glory Ltd 702 0.02
11 Glosel Co Ltd 42 -
8 Godo Steel Ltd 119 -
13 Goldcrest Co Ltd 211 0.01
10 Grandy House Corp 41 -
2 Gree Inc 8 -
25 GS Yuasa Corp 718 0.02
6 GSI Creos Corp 59 -
18 G-Tekt Corp 248 0.01
3 Gun-Ei Chemical Industry Co Ltd 75 -
250 Gunma Bank Ltd 828 0.02
11 Gunze Ltd 428 0.01
64 H2O Retailing Corp 519 0.01
253 Hachijuni Bank Ltd 876 0.02
8 Hagihara Industries Inc 112 -
6 Hagiwara Electric Holdings Co Ltd 127 -
4 Hakudo Co Ltd 71 -
10 Hakuto Co Ltd 147 -
11 Hamakyorex Co Ltd 303 0.01
24 Hanwa Co Ltd 713 0.02
12 Happinet Corp 159 0.01
7 Hard Off Corp Co Ltd 46 -
10 Harima Chemicals Group Inc 80 -
6 Haruyama Holdings Inc 35 -
156 Haseko Corp 2,222 0.06
1 Hashimoto Sogyo Holdings Co Ltd 21 -
2 Hayashikane Sangyo Co Ltd 11 -
119 Hazama Ando Corp 911 0.02
39 Heiwa Corp 658 0.02
23 Heiwa Real Estate Co Ltd 871 0.02
21 Heiwado Co Ltd 446 0.01
12 Helios Techno Holding Co Ltd 38 -
12 Hibiya Engineering Ltd 208 0.01
16 HI-LEX Corp 249 0.01
3 Himaraya Co Ltd 25 -
8 Hirakawa Hewtech Corp 95 -
Global Targeted Value FundPortfolio of Investments as at 31 May 2021 (continued)
Dimensional Fund Advisors Semi-Annual Report and Unaudited Financial Statements, 31 May 2021 278

Shares (000's)
Value(000's)
USD
% of NetAssetValue
Common Stock (continued)
Japan - 7.69% (continued)
3 Hirano Tecseed Co Ltd 58 -
153 Hirogin Holdings Inc 837 0.02
1 Hiroshima Electric Railway Co Ltd 4 -
17 Hisaka Works Ltd 127 -
101 Hitachi Zosen Corp 667 0.02
5 Hochiki Corp 52 -
5 Hodogaya Chemical Co Ltd 169 0.01
14 Hogy Medical Co Ltd 429 0.01
1 Hokkaido Coca-Cola Bottling Co Ltd 31 -
7 Hokkan Holdings Ltd 88 -
14 Hokko Chemical Industry Co Ltd 118 -
15 Hokkoku Bank Ltd 319 0.01
71 Hokuetsu Corp 385 0.01
6 Hokuetsu Industries Co Ltd 58 -
86 Hokuhoku Financial Group Inc 702 0.02
5 Hokuriku Electric Industry Co Ltd 50 -
8 Hokuriku Electrical Construction Co Ltd 84 -
12 Hokuto Corp 210 0.01
11 Honda Tsushin Kogyo Co Ltd 48 -
14 H-One Co Ltd 100 -
11 Honeys Holdings Co Ltd 101 -
3 Honshu Chemical Industry Co Ltd 57 -
19 Hoosiers Holdings 126 -
40 Hosiden Corp 375 0.01
5 Hosokawa Micron Corp 249 0.01
8 Howa Machinery Ltd 60 -
4 Hurxley Corp 31 -
159 Hyakugo Bank Ltd 455 0.01
17 Hyakujushi Bank Ltd 225 0.01
3 Ichiken Co Ltd 53 -
16 Ichinen Holdings Co Ltd 180 0.01
24 Ichiyoshi Securities Co Ltd 132 -
6 Icom Inc 131 -
3 IDEA Consultants Inc 53 -
5 Idec Corp 87 -
7 IDOM Inc 38 -
2 Ihara Science Corp 35 -
76 IHI Corp 1,875 0.05
65 Iino Kaiun Kaisha Ltd 260 0.01
16 IJTT Co Ltd 111 -
4 Ikegami Tsushinki Co Ltd 32 -
12 Imagica Group Inc 58 -
4 Imagineer Co Ltd 36 -
10 Imasen Electric Industrial 63 -
2 Imura Envelope Co Inc 15 -
30 Inaba Denki Sangyo Co Ltd 700 0.02
7 Inaba Seisakusho Co Ltd 94 -
30 Inabata & Co Ltd 482 0.01
13 Ines Corp 158 0.01
9 Innotech Corp 107 -
5 I-O Data Device Inc 47 -
2 Ise Chemicals Corp 49 -
14 Iseki & Co Ltd 180 0.01
38 Isetan Mitsukoshi Holdings Ltd 278 0.01
4 Ishihara Chemical Co Ltd 77 -
26 Ishihara Sangyo Kaisha Ltd 228 0.01
1 Ishii Iron Works Co Ltd 27 -
3 Ishizuka Glass Co Ltd 46 -
8 Isolite Insulating Products Co Ltd 47 -
27 Itochu Enex Co Ltd 248 0.01
4 Itochu-Shokuhin Co Ltd 181 0.01
99 Itoham Yonekyu Holdings Inc 641 0.02
Shares (000's)
Value(000's)
USD
% of NetAssetValue
Common Stock (continued)
Japan - 7.69% (continued)
29 Itoki Corp 96 -
15 IwaiCosmo Holdings Inc 239 0.01
20 Iwaki & Co Ltd 128 -
6 Iwaki Co Ltd 52 -
4 Iwasaki Electric Co Ltd 57 -
6 Iwatsu Electric Co Ltd 48 -
3 Iwatsuka Confectionery Co Ltd 113 -
163 Iyo Bank Ltd 870 0.02
21 Izumi Co Ltd 775 0.02
165 J Front Retailing Co Ltd 1,634 0.04
27 J Trust Co Ltd 91 -
17 Jaccs Co Ltd 384 0.01
16 Jafco Co Ltd 1,187 0.03
3 Jalux Inc 50 -
6 Jamco Corp 53 -
13 Janome Sewing Machine Co Ltd 97 -
18 Japan Asia Group Ltd 154 -
7 Japan Asia Investment Co Ltd 15 -
29 Japan Aviation Electronics Industry Ltd 508 0.01
16 Japan Cash Machine Co Ltd 83 -
386 Japan Display Inc 140 -
15 Japan Foundation Engineering Co Ltd 71 -
1 Japan Oil Transportation Co Ltd 28 -
8 Japan Pulp & Paper Co Ltd 278 0.01
2 Japan Pure Chemical Co Ltd 39 -
63 Japan Securities Finance Co Ltd 505 0.01
27 Japan Transcity Corp 133 -
32 Japan Wool Textile Co Ltd 278 0.01
8 Jastec Co Ltd 98 -
13 JDC Corp 66 -
2 JFE Systems Inc 32 -
140 JGC Holdings Corp 1,345 0.04
16 Jimoto Holdings Inc 98 -
10 JK Holdings Co Ltd 74 -
13 JMS Co Ltd 107 -
5 Joban Kosan Co Ltd 59 -
15 J-Oil Mills Inc 263 0.01
12 Joshin Denki Co Ltd 294 0.01
14 Joyful Honda Co Ltd 169 0.01
11 JSP Corp 167 0.01
139 JTEKT Corp 1,486 0.04
23 Juki Corp 163 0.01
20 Juroku Bank Ltd 366 0.01
142 JVCKenwood Corp 296 0.01
11 K&O Energy Group Inc 141 -
12 Kaga Electronics Co Ltd 318 0.01
17 Kamei Corp 182 0.01
35 Kamigumi Co Ltd 694 0.02
14 Kanaden Corp 140 -
4 Kanagawa Chuo Kotsu Co Ltd 130 -
19 Kanamoto Co Ltd 485 0.01
66 Kandenko Co Ltd 550 0.02
30 Kaneka Corp 1,256 0.03
8 Kaneko Seeds Co Ltd 106 -
48 Kanematsu Corp 648 0.02
1 Kanemi Co Ltd 16 -
11 Kansai Super Market Ltd 101 -
28 Kanto Denka Kogyo Co Ltd 244 0.01
21 Kasai Kogyo Co Ltd 75 -
3 Katakura & Co-op Agri Corp 38 -
18 Katakura Industries Co Ltd 249 0.01
14 Kato Sangyo Co Ltd 426 0.01
Global Targeted Value FundPortfolio of Investments as at 31 May 2021 (continued)
Dimensional Fund Advisors Semi-Annual Report and Unaudited Financial Statements, 31 May 2021 279

Shares (000's)
Value(000's)
USD
% of NetAssetValue
Common Stock (continued)
Japan - 7.69% (continued)
8 Kato Works Co Ltd 74 -
4 Kawada Technologies Inc 127 -
1 Kawagishi Bridge Works Co Ltd 27 -
4 Kawai Musical Instruments Manufacturing Co Ltd 135 -
85 Kawasaki Heavy Industries Ltd 2,053 0.05
27 Kawasaki Kisen Kaisha Ltd 712 0.02
1 Kawata Manufacturing Co Ltd 11 -
2 Keihin Co Ltdnato-Ku Tokyo Japan 26 -
71 Keiyo Bank Ltd 271 0.01
24 Keiyo Co Ltd 161 0.01
3 KEL Corp 23 -
9 Kenko Mayonnaise Co Ltd 133 -
1 KFC Ltd 10 -
23 Kimoto Co Ltd 54 -
12 Kimura Chemical Plants Co Ltd 95 -
5 Kimura Unity Co Ltd 57 -
84 Kinden Corp 1,409 0.04
5 King Co Ltd 25 -
4 King Jim Co Ltd 32 -
2 Kinki Sharyo Co Ltd 27 -
21 Kintetsu World Express Inc 487 0.01
18 Kissei Pharmaceutical Co Ltd 350 0.01
7 Kitagawa Corp 98 -
5 Kita-Nippon Bank Ltd 86 -
3 Kitano Construction Corp 60 -
7 Kito Corp 116 -
49 Kitz Corp 337 0.01
42 Kiyo Bank Ltd 570 0.02
18 Koa Corp 263 0.01
24 Koatsu Gas Kogyo Co Ltd 149 -
211 Kobe Steel Ltd 1,439 0.04
3 Kobelco Eco-Solutions Co Ltd 68 -
1 Koei Chemical Co Ltd 17 -
17 Kohnan Shoji Co Ltd 470 0.01
8 Kohsoku Corp 98 -
18 Kojima Co Ltd 133 -
3 Kokusai Co Ltd 21 -
5 Kokusai Pulp & Paper Co Ltd 11 -
52 Kokuyo Co Ltd 828 0.02
2 Komaihaltec Inc 34 -
22 Komatsu Matere Co Ltd 187 0.01
6 Komatsu Wall Industry Co Ltd 101 -
5 Komehyo Co Ltd 53 -
23 Komeri Co Ltd 558 0.02
34 Komori Corp 248 0.01
16 Konaka Co Ltd 50 -
13 Kondotec Inc 117 -
308 Konica Minolta Inc 1,707 0.04
21 Konishi Co Ltd 295 0.01
20 Konoike Transport Co Ltd 204 0.01
11 Kosaido Co Ltd 113 -
4 Krosaki Harima Corp 147 -
5 KRS Corp 66 -
104 K's Holdings Corp 1,251 0.03
9 KU Holdings Co Ltd 77 -
22 Kumagai Gumi Co Ltd 599 0.02
38 Kumiai Chemical Industry Co Ltd 294 0.01
5 Kunimine Industries Co Ltd 49 -
12 Kurabo Industries Ltd 204 0.01
185 Kuraray Co Ltd 1,960 0.05
10 Kureha Corp 563 0.02
6 Kurimoto Ltd 99 -
Shares (000's)
Value(000's)
USD
% of NetAssetValue
Common Stock (continued)
Japan - 7.69% (continued)
11 Kuriyama Holdings Corp 72 -
8 KYB Corp 265 0.01
6 Kyodo Printing Co Ltd 147 -
16 Kyoei Steel Ltd 211 0.01
4 Kyokuto Boeki Kaisha Ltd 86 -
24 Kyokuto Kaihatsu Kogyo Co Ltd 377 0.01
16 Kyokuto Securities Co Ltd 125 -
7 Kyokuyo Co Ltd 180 0.01
26 KYORIN Holdings Inc 404 0.01
20 Kyoritsu Printing Co Ltd 26 -
31 Kyosan Electric Manufacturing Co Ltd 123 -
15 Kyowa Electronic Instruments Co Ltd 56 -
9 Kyowa Leather Cloth Co Ltd 60 -
23 Kyudenko Corp 721 0.02
250 Kyushu Financial Group Inc 967 0.03
6 Kyushu Leasing Service Co Ltd 37 -
23 Laox Co Ltd 39 -
12 LEC Inc 121 -
26 Lintec Corp 567 0.02
2 Lonseal Corp 27 -
5 Look Holdings Inc 72 -
30 Macnica Fuji Electronics Holdings Inc 642 0.02
27 Macromill Inc 216 0.01
98 Maeda Corp 869 0.02
16 Maeda Road Construction Co Ltd 314 0.01
8 Maezawa Industries Inc 47 -
9 Maezawa Kasei Industries Co Ltd 101 -
14 Maezawa Kyuso Industries Co Ltd 137 -
16 Makino Milling Machine Co Ltd 647 0.02
3 Mamiya-Op Co Ltd 20 -
11 Mandom Corp 186 0.01
9 Mars Group Holdings Corp 133 -
11 Marubun Corp 58 -
13 Marudai Food Co Ltd 208 0.01
2 Marufuji Sheet Piling Co Ltd 30 -
27 Maruha Nichiro Corp 582 0.02
22 Maruichi Steel Tube Ltd 566 0.02
4 Maruka Corp 93 -
8 Marusan Securities Co Ltd 48 -
3 Maruyama Manufacturing Co Inc 44 -
11 Maruzen CHI Holdings Co Ltd 41 -
7 Maruzen Co Ltd 138 -
10 Maruzen Showa Unyu Co Ltd 306 0.01
11 Matsuda Sangyo Co Ltd 230 0.01
14 Matsui Construction Co Ltd 99 -
4 Matsuoka Corp 58 -
18 Max Co Ltd 273 0.01
35 Maxell Holdings Ltd 400 0.01
1 Maxvalu Nishinihon Co Ltd 15 -
5 Maxvalu Tokai Co Ltd 103 -
719 Mebuki Financial Group Inc 1,554 0.04
33 Megmilk Snow Brand Co Ltd 643 0.02
22 Meidensha Corp 456 0.01
6 Meiji Electric Industries Co Ltd 76 -
11 Meiji Shipping Co Ltd 42 -
28 Meisei Industrial Co Ltd 186 0.01
6 Meito Sangyo Co Ltd 89 -
15 Meiwa Corp 66 -
9 Meiwa Estate Co Ltd 51 -
4 Melco Holdings Inc 190 0.01
13 Michinoku Bank Ltd 120 -
29 Mie Kotsu Group Holdings Inc 130 -
Global Targeted Value FundPortfolio of Investments as at 31 May 2021 (continued)
Dimensional Fund Advisors Semi-Annual Report and Unaudited Financial Statements, 31 May 2021 280

Shares (000's)
Value(000's)
USD
% of NetAssetValue
Common Stock (continued)
Japan - 7.69% (continued)
16 Mikuni Corp 43 -
11 Mimaki Engineering Co Ltd 68 -
11 Mimasu Semiconductor Industry Co Ltd 260 0.01
11 Ministop Co Ltd 131 -
4 Mirai Industry Co Ltd 60 -
4 Miraial Co Ltd 55 -
51 Mirait Holdings Corp 906 0.02
4 Mitani Corp 267 0.01
21 Mitani Sangyo Co Ltd 76 -
32 Mito Securities Co Ltd 88 -
26 Mitsuba Corp 218 0.01
5 Mitsubishi Kakoki Kaisha Ltd 130 -
6 Mitsubishi Logistics Corp 183 0.01
76 Mitsubishi Materials Corp 1,625 0.04
96 Mitsubishi Motors Corp 267 0.01
22 Mitsubishi Paper Mills Ltd 71 -
10 Mitsubishi Pencil Co Ltd 134 -
5 Mitsubishi Research Institute Inc 176 0.01
11 Mitsubishi Shokuhin Co Ltd 298 0.01
10 Mitsubishi Steel Manufacturing Co Ltd 85 -
133 Mitsubishi UFJ Lease & Finance Co Ltd 751 0.02
17 Mitsuboshi Belting Ltd 267 0.01
55 Mitsui E&S Holdings Co Ltd 248 0.01
10 Mitsui Matsushima Holdings Co Ltd 86 -
36 Mitsui Mining & Smelting Co Ltd 1,043 0.03
58 Mitsui OSK Lines Ltd 2,303 0.06
6 Mitsui Sugar Co Ltd 104 -
13 Mitsui-Soko Holdings Co Ltd 275 0.01
20 Mitsuuroko Group Holdings Co Ltd 230 0.01
27 Mixi Inc 653 0.02
5 Miyaji Engineering Group Inc 90 -
12 Miyazaki Bank Ltd 218 0.01
5 Miyoshi Oil & Fat Co Ltd 58 -
18 Mizuho Leasing Co Ltd 584 0.02
14 Mizuno Corp 286 0.01
5 Mochida Pharmaceutical Co Ltd 172 0.01
14 Modec Inc 274 0.01
10 Molitec Steel Co Ltd 46 -
13 Money Partners Group Co Ltd 28 -
5 MORESCO Corp 46 -
15 Morinaga Milk Industry Co Ltd 792 0.02
4 Moriroku Holdings Co Ltd 81 -
11 Morita Holdings Corp 158 0.01
13 Morito Co Ltd 76 -
1 Morozoff Ltd 29 -
3 Mory Industries Inc 71 -
8 MRK Holdings Inc 10 -
16 MrMax Holdings Ltd 92 -
10 Mugen Estate Co Ltd 47 -
5 Murakami Corp 146 -
19 Musashino Bank Ltd 315 0.01
2 Mutoh Holdings Co Ltd 26 -
3 NAC Co Ltd 25 -
9 Nachi-Fujikoshi Corp 340 0.01
3 Nadex Co Ltd 19 -
10 Nafco Co Ltd 176 0.01
6 Nagano Bank Ltd 67 -
10 Nagano Keiki Co Ltd 111 -
71 Nagase & Co Ltd 1,040 0.03
1 Nagatanien Holdings Co Ltd 24 -
14 Nakabayashi Co Ltd 76 -
4 Nakamoto Packs Co Ltd 53 -
Shares (000's)
Value(000's)
USD
% of NetAssetValue
Common Stock (continued)
Japan - 7.69% (continued)
3 Nakamuraya Co Ltd 87 -
1 Nakanishi Manufacturing Co Ltd 10 -
13 Nakano Corp 49 -
17 Nakayama Steel Works Ltd 65 -
6 Nakayamafuku Co Ltd 24 -
2 Nakayo Inc 25 -
37 Namura Shipbuilding Co Ltd 58 -
20 Nanto Bank Ltd 345 0.01
3 Narasaki Sangyo Co Ltd 58 -
1 Nasu Denki Tekko Co Ltd 43 -
6 Natori Co Ltd 103 -
7 NEC Capital Solutions Ltd 125 -
26 Neturen Co Ltd 130 -
22 New Japan Chemical Co Ltd 59 -
96 NGK Spark Plug Co Ltd 1,521 0.04
146 NHK Spring Co Ltd 1,103 0.03
5 Nicca Chemical Co Ltd 55 -
4 Nice Holdings Inc 78 -
15 Nichia Steel Works Ltd 42 -
4 Nichias Corp 87 -
8 Nichiban Co Ltd 124 -
33 Nichicon Corp 347 0.01
11 Nichiden Corp 196 0.01
15 Nichiha Corp 413 0.01
39 Nichi-iko Pharmaceutical Co Ltd 309 0.01
20 Nichireki Co Ltd 249 0.01
7 Nichirin Co Ltd 110 -
8 Nihon Chouzai Co Ltd 112 -
1 Nihon Dengi Co Ltd 28 -
4 Nihon Denkei Co Ltd 56 -
1 Nihon Flush Co Ltd 15 -
31 Nihon House Holdings Co Ltd 97 -
8 Nihon Kagaku Sangyo Co Ltd 87 -
28 Nihon Nohyaku Co Ltd 136 -
50 Nihon Parkerizing Co Ltd 503 0.01
11 Nihon Plast Co Ltd 73 -
9 Nihon Tokushu Toryo Co Ltd 81 -
5 Nihon Yamamura Glass Co Ltd 40 -
5 Nikkato Corp 33 -
34 Nikkiso Co Ltd 372 0.01
19 Nikko Co Ltd 122 -
42 Nikkon Holdings Co Ltd 889 0.02
162 Nikon Corp 1,696 0.04
1 Nippi Inc 40 -
29 Nippo Corp 746 0.02
4 Nippon Air Conditioning Services Co Ltd 27 -
8 Nippon Beet Sugar Manufacturing Co Ltd 121 -
5 Nippon Carbide Industries Co Inc 55 -
7 Nippon Carbon Co Ltd 264 0.01
6 Nippon Chemical Industrial Co Ltd 150 -
13 Nippon Chemi-Con Corp 289 0.01
1 Nippon Chemiphar Co Ltd 29 -
117 Nippon Coke & Engineering Co Ltd 113 -
4 Nippon Commercial Development Co Ltd 60 -
29 Nippon Concrete Industries Co Ltd 91 -
85 Nippon Denko Co Ltd 250 0.01
24 Nippon Densetsu Kogyo Co Ltd 394 0.01
3 Nippon Dry-Chemical Co Ltd 48 -
57 Nippon Electric Glass Co Ltd 1,375 0.04
2 Nippon Felt Co Ltd 8 -
6 Nippon Filcon Co Ltd 28 -
9 Nippon Fine Chemical Co Ltd 119 -
Global Targeted Value FundPortfolio of Investments as at 31 May 2021 (continued)
Dimensional Fund Advisors Semi-Annual Report and Unaudited Financial Statements, 31 May 2021 281

Shares (000's)
Value(000's)
USD
% of NetAssetValue
Common Stock (continued)
Japan - 7.69% (continued)
33 Nippon Flour Mills Co Ltd 474 0.01
14 Nippon Hume Corp 93 -
58 Nippon Kayaku Co Ltd 548 0.02
9 Nippon Koei Co Ltd 250 0.01
39 Nippon Light Metal Holdings Co Ltd 676 0.02
70 Nippon Paper Industries Co Ltd 831 0.02
15 Nippon Pillar Packing Co Ltd 259 0.01
6 Nippon Piston Ring Co Ltd 68 -
4 Nippon Rietec Co Ltd 57 -
5 Nippon Road Co Ltd 310 0.01
32 Nippon Seiki Co Ltd 331 0.01
2 Nippon Seisen Co Ltd 93 -
4 Nippon Sharyo Ltd 87 -
11 Nippon Shokubai Co Ltd 558 0.02
31 Nippon Signal Company Ltd 268 0.01
16 Nippon Soda Co Ltd 500 0.01
11 Nippon Steel Trading Corp 432 0.01
192 Nippon Suisan Kaisha Ltd 897 0.02
1 Nippon Systemware Co Ltd 13 -
48 Nippon Thompson Co Ltd 275 0.01
6 Nippon Yakin Kogyo Co Ltd 125 -
21 Nippon Yusen KK 862 0.02
3 Nireco Corp 21 -
4 Nishikawa Rubber Co Ltd 57 -
37 Nishimatsu Construction Co Ltd 1,150 0.03
4 Nishimoto Co Ltd 108 -
86 Nishi-Nippon Financial Holdings Inc 551 0.02
13 Nishio Rent All Co Ltd 373 0.01
43 Nissan Shatai Co Ltd 281 0.01
21 Nissan Tokyo Sales Holdings Co Ltd 47 -
- Nissei Corp 4 -
10 Nissei Plastic Industrial Co Ltd 119 -
21 Nissha Co Ltd 294 0.01
24 Nisshin Fudosan Co 104 -
17 Nisshin Oillio Group Ltd 471 0.01
96 Nisshinbo Holdings Inc 810 0.02
11 Nissin Corp 147 -
30 Nissin Electric Co Ltd 355 0.01
10 Nissin Sugar Co Ltd 157 0.01
8 Nissui Pharmaceutical Co Ltd 68 -
15 Nitta Corp 365 0.01
9 Nitta Gelatin Inc 52 -
11 Nittan Valve Co Ltd 27 -
4 Nittetsu Mining Co Ltd 251 0.01
1 Nitto Fuji Flour Milling Co Ltd 72 -
19 Nitto Kogyo Corp 303 0.01
7 Nitto Kohki Co Ltd 127 -
19 Nitto Seiko Co Ltd 95 -
6 Nittoc Construction Co Ltd 43 -
4 NJS Co Ltd 84 -
6 Noda Corp 42 -
9 Nohmi Bosai Ltd 164 0.01
13 Nojima Corp 352 0.01
62 NOK Corp 778 0.02
68 Nomura Real Estate Holdings Inc 1,778 0.05
7 Noritake Co Ltd Japan 278 0.01
13 Noritsu Koki Co Ltd 279 0.01
21 Noritz Corp 374 0.01
181 North Pacific Bank Ltd 416 0.01
5 Nozawa Corp 29 -
7 NS United Kaiun Kaisha Ltd 134 -
256 NTN Corp 747 0.02
Shares (000's)
Value(000's)
USD
% of NetAssetValue
Common Stock (continued)
Japan - 7.69% (continued)
1 Ochi Holdings Co Ltd 16 -
28 Oenon Holdings Inc 96 -
24 Ogaki Kyoritsu Bank Ltd 416 0.01
4 Ohara Inc 56 -
7 Ohashi Technica Inc 100 -
1 Ohki Healthcare Holdings Co Ltd 12 -
1 Ohmoto Gumi Co Ltd 39 -
15 Oiles Corp 207 0.01
11 Oita Bank Ltd 177 0.01
26 Okabe Co Ltd 160 0.01
2 Okada Aiyon Corp 27 -
4 Okamoto Industries Inc 151 -
1 Okamoto Machine Tool Works Ltd 24 -
37 Okamura Corp 465 0.01
103 Okasan Securities Group Inc 419 0.01
50 Oki Electric Industry Co Ltd 454 0.01
15 OKUMA Corp 776 0.02
18 Okumura Corp 488 0.01
6 Okura Industrial Co Ltd 118 -
18 Okuwa Co Ltd 183 0.01
1 Oliver Corp 34 -
3 Olympic Group Corp 22 -
5 ONO Sokki Co Ltd 23 -
11 Onoken Co Ltd 137 -
77 Onward Holdings Co Ltd 210 0.01
5 Organo Corp 266 0.01
151 Orient Corp 216 0.01
97 Oriental Shiraishi Corp 250 0.01
3 Origin Co Ltd 41 -
9 Osaka Soda Co Ltd 216 0.01
10 Osaka Steel Co Ltd 103 -
9 Osaka Titanium Technologies Co Ltd 70 -
31 Osaki Electric Co Ltd 170 0.01
25 OSG Corp 414 0.01
2 OUG Holdings Inc 52 -
12 Oyo Corp 144 -
31 Pacific Industrial Co Ltd 334 0.01
13 Pacific Metals Co Ltd 218 0.01
6 Pack Corp 155 -
4 Paltek Corp 22 -
21 Paramount Bed Holdings Co Ltd 396 0.01
16 Paris Miki Holdings Inc 39 -
21 PC Depot Corp 84 -
16 Pegasus Sewing Machine Manufacturing Co Ltd 73 -
22 Piolax Inc 293 0.01
70 Press Kogyo Co Ltd 206 0.01
10 Pressance Corp 154 -
5 Pronexus Inc 51 -
183 Prospect Co Ltd 53 -
21 PS Mitsubishi Construction Co Ltd 129 -
12 Punch Industry Co Ltd 64 -
14 Qol Holdings Co Ltd 198 0.01
2 Raito Kogyo Co Ltd 35 -
23 Raiznext Corp 241 0.01
7 Rasa Corp 55 -
5 Rasa Industries Ltd 81 -
12 Raysum Co Ltd 87 -
1 Regal Corp 9 -
4 Renaissance Inc 40 -
121 Rengo Co Ltd 1,025 0.03
46 Resorttrust Inc 732 0.02
16 Restar Holdings Corp 260 0.01
Global Targeted Value FundPortfolio of Investments as at 31 May 2021 (continued)
Dimensional Fund Advisors Semi-Annual Report and Unaudited Financial Statements, 31 May 2021 282

Shares (000's)
Value(000's)
USD
% of NetAssetValue
Common Stock (continued)
Japan - 7.69% (continued)
15 Retail Partners Co Ltd 155 -
4 Rheon Automatic Machinery Co Ltd 49 -
4 Rhythm Watch Co Ltd 28 -
6 Riberesute Corp 42 -
11 Ricoh Leasing Co Ltd 331 0.01
10 Right On Co Ltd 62 -
7 Riken Corp 155 -
9 Riken Keiki Co Ltd 227 0.01
29 Riken Technos Corp 153 -
13 Riken Vitamin Co Ltd 181 0.01
3 Rion Co Ltd 79 -
9 Riso Kagaku Corp 143 -
1 Rix Corp 18 -
8 Rokko Butter Co Ltd 115 -
8 Roland DG Corp 157 0.01
18 Ryobi Ltd 269 0.01
10 Ryoden Corp 152 -
15 Ryosan Co Ltd 277 0.01
11 S Foods Inc 330 0.01
4 S LINE CO Ltd 32 -
15 Sac's Bar Holdings Inc 81 -
10 Sakai Chemical Industry Co Ltd 165 0.01
3 Sakai Heavy Industries Ltd 51 -
3 Sakai Ovex Co Ltd 90 -
32 Sakata INX Corp 297 0.01
44 Sala Corp 241 0.01
20 SAMTY Co Ltd 363 0.01
7 San Holdings Inc 77 -
16 San ju San Financial Group Inc 193 0.01
11 San-A Co Ltd 419 0.01
43 San-Ai Oil Co Ltd 466 0.01
17 Sanden Holdings Corp 55 -
6 Sanei Architecture Planning Co Ltd 117 -
28 Sangetsu Corp 393 0.01
107 San-In Godo Bank Ltd 524 0.01
27 Sanki Engineering Co Ltd 347 0.01
18 Sanko Gosei Ltd 68 -
2 Sanko Metal Industrial Co Ltd 46 -
32 Sankyo Co Ltd 792 0.02
- Sankyo Frontier Co Ltd 14 -
27 Sankyo Seiko Co Ltd 127 -
19 Sankyo Tateyama Inc 139 -
16 Sankyu Inc 722 0.02
15 Sanoh Industrial Co Ltd 151 -
16 Sanoyas Holdings Corp 22 -
4 Sansei Landic Co Ltd 30 -
7 Sansei Technologies Inc 48 -
7 Sansha Electric Manufacturing Co Ltd 60 -
7 Sanshin Electronics Co Ltd 128 -
1 Sanyei Corp 20 -
8 Sanyo Chemical Industries Ltd 382 0.01
5 Sanyo Denki Co Ltd 382 0.01
6 Sanyo Engineering & Construction Inc 37 -
8 Sanyo Housing Nagoya Co Ltd 64 -
9 Sanyo Shokai Ltd 70 -
16 Sanyo Special Steel Co Ltd 241 0.01
14 Sanyo Trading Co Ltd 161 0.01
43 Sapporo Holdings Ltd 853 0.02
9 Sata Construction Co Ltd 37 -
10 Sato Shoji Corp 104 -
9 Satori Electric Co Ltd 65 -
1 Satudora Holdings Co Ltd 17 -
Shares (000's)
Value(000's)
USD
% of NetAssetValue
Common Stock (continued)
Japan - 7.69% (continued)
18 Sawada Holdings Co Ltd 170 0.01
25 Sawai Group Holdings Co Ltd 1,080 0.03
3 Saxa Holdings Inc 44 -
4 SBI Insurance Group Co Ltd 50 -
11 Scroll Corp 95 -
1 SEC Carbon Ltd 55 -
1 Secom Joshinetsu Co Ltd 33 -
32 Seibu Holdings Inc 370 0.01
7 Seika Corp 118 -
18 Seikagaku Corp 189 0.01
23 Seikitokyu Kogyo Co Ltd 176 0.01
20 Seiko Holdings Corp 391 0.01
8 Seiko PMC Corp 59 -
92 Seino Holdings Co Ltd 1,300 0.03
16 Seiren Co Ltd 290 0.01
16 Sekisui Jushi Corp 308 0.01
17 Sekisui Plastics Co Ltd 94 -
1 SEMITEC Corp 22 -
67 Senko Group Holdings Co Ltd 624 0.02
5 Senshu Electric Co Ltd 157 0.01
165 Senshu Ikeda Holdings Inc 245 0.01
22 Senshukai Co Ltd 83 -
3 Shibaura Electronics Co Ltd 126 -
3 Shibaura Mechatronics Corp 147 -
7 Shibusawa Warehouse Co Ltd 137 -
1 Shibuya Corp 18 -
26 Shiga Bank Ltd 480 0.01
6 Shikibo Ltd 50 -
26 Shikoku Bank Ltd 166 0.01
22 Shikoku Chemicals Corp 253 0.01
18 Shima Seiki Manufacturing Ltd 355 0.01
8 Shimizu Bank Ltd 110 -
7 Shimojima Co Ltd 67 -
8 Shin Nippon Air Technologies Co Ltd 141 -
5 Shinagawa Refractories Co Ltd 158 0.01
6 Shindengen Electric Manufacturing Co Ltd 199 0.01
30 Shin-Etsu Polymer Co Ltd 286 0.01
17 Shinko Shoji Co Ltd 118 -
38 Shinmaywa Industries Ltd 338 0.01
19 Shinnihon Corp 154 -
15 Shin-Nihon Tatemono Co Ltd 54 -
12 Shinoken Group Co Ltd 133 -
106 Shinsei Bank Ltd 1,705 0.04
3 Shinsho Corp 63 -
3 Shinwa Co Ltd 56 -
7 Shinwa Co Ltd, Gifu 53 -
10 Shizuki Electric Co Inc 53 -
143 Shizuoka Bank Ltd 1,148 0.03
30 Shizuoka Gas Co Ltd 288 0.01
7 Shobunsha Publications Inc 30 -
9 Shofu Inc 147 -
79 Showa Denko KK 2,497 0.06
10 Showa Sangyo Co Ltd 274 0.01
2 Showa Shinku Co Ltd 26 -
4 Sigma Koki Co Ltd 59 -
19 Siix Corp 266 0.01
6 Sinanen Holdings Co Ltd 149 -
16 Sinfonia Technology Co Ltd 196 0.01
12 Sinko Industries Ltd 219 0.01
33 Sintokogio Ltd 224 0.01
6 SK-Electronics Co Ltd 58 -
95 SKY Perfect JSAT Holdings Inc 375 0.01
Global Targeted Value FundPortfolio of Investments as at 31 May 2021 (continued)
Dimensional Fund Advisors Semi-Annual Report and Unaudited Financial Statements, 31 May 2021 283
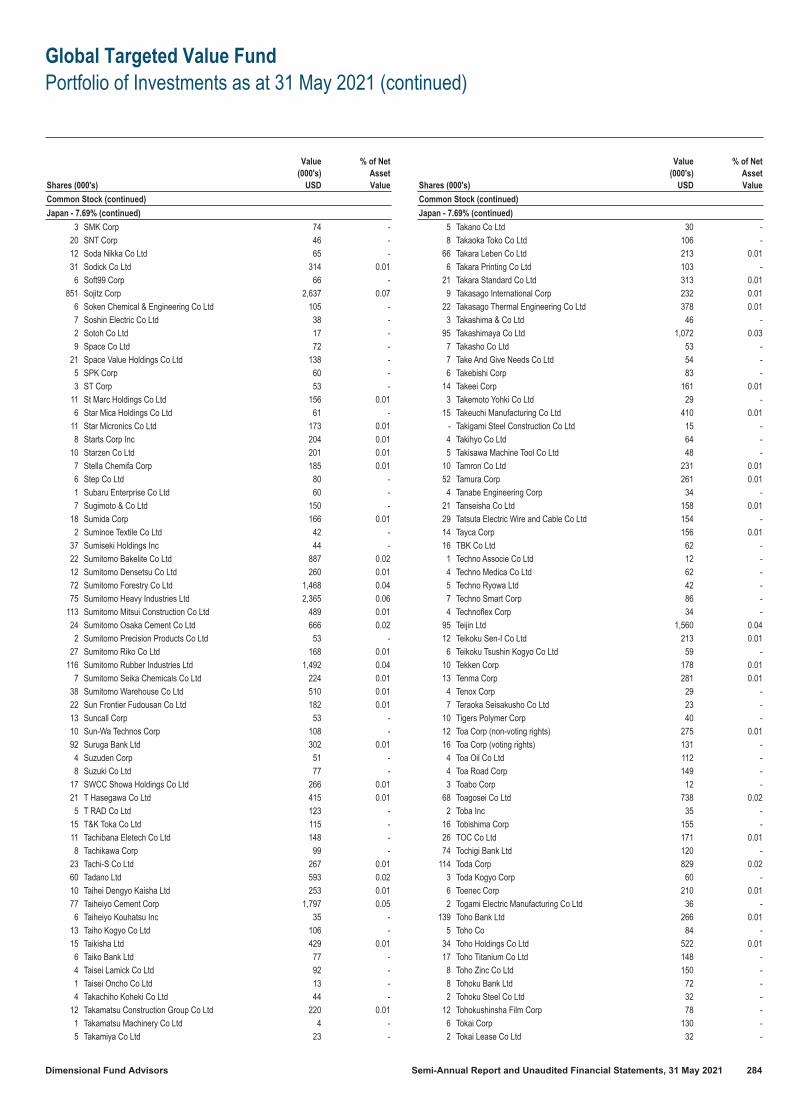
Shares (000's)
Value(000's)
USD
% of NetAssetValue
Common Stock (continued)
Japan - 7.69% (continued)
3 SMK Corp 74 -
20 SNT Corp 46 -
12 Soda Nikka Co Ltd 65 -
31 Sodick Co Ltd 314 0.01
6 Soft99 Corp 66 -
851 Sojitz Corp 2,637 0.07
6 Soken Chemical & Engineering Co Ltd 105 -
7 Soshin Electric Co Ltd 38 -
2 Sotoh Co Ltd 17 -
9 Space Co Ltd 72 -
21 Space Value Holdings Co Ltd 138 -
5 SPK Corp 60 -
3 ST Corp 53 -
11 St Marc Holdings Co Ltd 156 0.01
6 Star Mica Holdings Co Ltd 61 -
11 Star Micronics Co Ltd 173 0.01
8 Starts Corp Inc 204 0.01
10 Starzen Co Ltd 201 0.01
7 Stella Chemifa Corp 185 0.01
6 Step Co Ltd 80 -
1 Subaru Enterprise Co Ltd 60 -
7 Sugimoto & Co Ltd 150 -
18 Sumida Corp 166 0.01
2 Suminoe Textile Co Ltd 42 -
37 Sumiseki Holdings Inc 44 -
22 Sumitomo Bakelite Co Ltd 887 0.02
12 Sumitomo Densetsu Co Ltd 260 0.01
72 Sumitomo Forestry Co Ltd 1,468 0.04
75 Sumitomo Heavy Industries Ltd 2,365 0.06
113 Sumitomo Mitsui Construction Co Ltd 489 0.01
24 Sumitomo Osaka Cement Co Ltd 666 0.02
2 Sumitomo Precision Products Co Ltd 53 -
27 Sumitomo Riko Co Ltd 168 0.01
116 Sumitomo Rubber Industries Ltd 1,492 0.04
7 Sumitomo Seika Chemicals Co Ltd 224 0.01
38 Sumitomo Warehouse Co Ltd 510 0.01
22 Sun Frontier Fudousan Co Ltd 182 0.01
13 Suncall Corp 53 -
10 Sun-Wa Technos Corp 108 -
92 Suruga Bank Ltd 302 0.01
4 Suzuden Corp 51 -
8 Suzuki Co Ltd 77 -
17 SWCC Showa Holdings Co Ltd 266 0.01
21 T Hasegawa Co Ltd 415 0.01
5 T RAD Co Ltd 123 -
15 T&K Toka Co Ltd 115 -
11 Tachibana Eletech Co Ltd 148 -
8 Tachikawa Corp 99 -
23 Tachi-S Co Ltd 267 0.01
60 Tadano Ltd 593 0.02
10 Taihei Dengyo Kaisha Ltd 253 0.01
77 Taiheiyo Cement Corp 1,797 0.05
6 Taiheiyo Kouhatsu Inc 35 -
13 Taiho Kogyo Co Ltd 106 -
15 Taikisha Ltd 429 0.01
6 Taiko Bank Ltd 77 -
4 Taisei Lamick Co Ltd 92 -
1 Taisei Oncho Co Ltd 13 -
4 Takachiho Koheki Co Ltd 44 -
12 Takamatsu Construction Group Co Ltd 220 0.01
1 Takamatsu Machinery Co Ltd 4 -
5 Takamiya Co Ltd 23 -
Shares (000's)
Value(000's)
USD
% of NetAssetValue
Common Stock (continued)
Japan - 7.69% (continued)
5 Takano Co Ltd 30 -
8 Takaoka Toko Co Ltd 106 -
66 Takara Leben Co Ltd 213 0.01
6 Takara Printing Co Ltd 103 -
21 Takara Standard Co Ltd 313 0.01
9 Takasago International Corp 232 0.01
22 Takasago Thermal Engineering Co Ltd 378 0.01
3 Takashima & Co Ltd 46 -
95 Takashimaya Co Ltd 1,072 0.03
7 Takasho Co Ltd 53 -
7 Take And Give Needs Co Ltd 54 -
6 Takebishi Corp 83 -
14 Takeei Corp 161 0.01
3 Takemoto Yohki Co Ltd 29 -
15 Takeuchi Manufacturing Co Ltd 410 0.01
- Takigami Steel Construction Co Ltd 15 -
4 Takihyo Co Ltd 64 -
5 Takisawa Machine Tool Co Ltd 48 -
10 Tamron Co Ltd 231 0.01
52 Tamura Corp 261 0.01
4 Tanabe Engineering Corp 34 -
21 Tanseisha Co Ltd 158 0.01
29 Tatsuta Electric Wire and Cable Co Ltd 154 -
14 Tayca Corp 156 0.01
16 TBK Co Ltd 62 -
1 Techno Associe Co Ltd 12 -
4 Techno Medica Co Ltd 62 -
5 Techno Ryowa Ltd 42 -
7 Techno Smart Corp 86 -
4 Technoflex Corp 34 -
95 Teijin Ltd 1,560 0.04
12 Teikoku Sen-I Co Ltd 213 0.01
6 Teikoku Tsushin Kogyo Co Ltd 59 -
10 Tekken Corp 178 0.01
13 Tenma Corp 281 0.01
4 Tenox Corp 29 -
7 Teraoka Seisakusho Co Ltd 23 -
10 Tigers Polymer Corp 40 -
12 Toa Corp (non-voting rights) 275 0.01
16 Toa Corp (voting rights) 131 -
4 Toa Oil Co Ltd 112 -
4 Toa Road Corp 149 -
3 Toabo Corp 12 -
68 Toagosei Co Ltd 738 0.02
2 Toba Inc 35 -
16 Tobishima Corp 155 -
26 TOC Co Ltd 171 0.01
74 Tochigi Bank Ltd 120 -
114 Toda Corp 829 0.02
3 Toda Kogyo Corp 60 -
6 Toenec Corp 210 0.01
2 Togami Electric Manufacturing Co Ltd 36 -
139 Toho Bank Ltd 266 0.01
5 Toho Co 84 -
34 Toho Holdings Co Ltd 522 0.01
17 Toho Titanium Co Ltd 148 -
8 Toho Zinc Co Ltd 150 -
8 Tohoku Bank Ltd 72 -
2 Tohoku Steel Co Ltd 32 -
12 Tohokushinsha Film Corp 78 -
6 Tokai Corp 130 -
2 Tokai Lease Co Ltd 32 -
Global Targeted Value FundPortfolio of Investments as at 31 May 2021 (continued)
Dimensional Fund Advisors Semi-Annual Report and Unaudited Financial Statements, 31 May 2021 284

Shares (000's)
Value(000's)
USD
% of NetAssetValue
Common Stock (continued)
Japan - 7.69% (continued)
37 Tokai Rika Co Ltd 605 0.02
140 Tokai Tokyo Financial Holdings Inc 533 0.01
4 Token Corp 391 0.01
6 Tokushu Tokai Paper Co Ltd 228 0.01
38 Tokuyama Corp 805 0.02
16 Tokyo Energy & Systems Inc 147 -
9 Tokyo Keiki Inc 84 -
19 Tokyo Kiraboshi Financial Group Inc 240 0.01
1 Tokyo Printing Ink Manufacturing Co Ltd 12 -
5 Tokyo Radiator Manufacturing Co Ltd 26 -
2 Tokyo Rakutenchi Co Ltd 84 -
3 Tokyo Rope Manufacturing Co Ltd 30 -
14 Tokyo Sangyo Co Ltd 76 -
58 Tokyo Steel Manufacturing Co Ltd 616 0.02
105 Tokyo Tatemono Co Ltd 1,593 0.04
8 Tokyo Tekko Co Ltd 118 -
5 Tokyo Theatres Co Inc 56 -
65 Tokyu Construction Co Ltd 415 0.01
417 Tokyu Fudosan Holdings Corp 2,500 0.06
2 Tokyu Recreation Co Ltd 76 -
28 Toli Corp 63 -
5 Tomato Bank Ltd 50 -
2 Tomen Devices Corp 76 -
18 Tomoe Corp 65 -
5 Tomoe Engineering Co Ltd 92 -
3 Tomoegawa Co Ltd 20 -
8 Tomoku Co Ltd 143 -
103 TOMONY Holdings Inc 287 0.01
33 Tomy Co Ltd 290 0.01
4 Tonami Holdings Co Ltd 195 0.01
32 Toppan Forms Co Ltd 318 0.01
25 Topre Corp 372 0.01
11 Topy Industries Ltd 134 -
5 Torex Semiconductor Ltd 94 -
9 Torigoe Co Ltd 70 -
10 Torii Pharmaceutical Co Ltd 224 0.01
13 Torishima Pump Manufacturing Co Ltd 110 -
22 Tosei Corp 213 0.01
13 Toshiba Machine Co Ltd 308 0.01
3 Totech Corp 88 -
7 Totetsu Kogyo Co Ltd 143 -
2 Totoku Electric Co Ltd 37 -
6 Tottori Bank Ltd 65 -
25 Towa Bank Ltd 127 -
12 Towa Pharmaceutical Co Ltd 255 0.01
57 Toyo Construction Co Ltd 295 0.01
14 Toyo Corp 142 -
5 Toyo Denki Seizo KK 52 -
19 Toyo Engineering Corp 119 -
26 Toyo Ink SC Holdings Co Ltd 470 0.01
6 Toyo Kanetsu KK 125 -
5 Toyo Logistics Co Ltd 14 -
12 Toyo Machinery & Metal Co Ltd 57 -
47 Toyo Securities Co Ltd 71 -
82 Toyo Seikan Group Holdings Ltd 1,117 0.03
9 Toyo Tanso Co Ltd 204 0.01
56 Toyo Tire Corp 1,132 0.03
4 Toyo Wharf & Warehouse Co Ltd 57 -
58 Toyobo Co Ltd 717 0.02
35 Toyoda Gosei Co Ltd 901 0.02
38 Toyota Boshoku Corp 733 0.02
18 TPR Co Ltd 248 0.01
Shares (000's)
Value(000's)
USD
% of NetAssetValue
Common Stock (continued)
Japan - 7.69% (continued)
2 Trinity Industrial Corp 15 -
3 Trusco Nakayama Corp 67 -
58 TS Tech Co Ltd 822 0.02
41 TSI Holdings Co Ltd 114 -
29 Tsubaki Nakashima Co Ltd 478 0.01
18 Tsubakimoto Chain Co 526 0.01
3 Tsubakimoto Kogyo Co Ltd 91 -
3 Tsudakoma Corp 25 -
12 Tsukada Global Holdings Inc 44 -
16 Tsukishima Kikai Co Ltd 174 0.01
66 Tsukuba Bank Ltd 103 -
5 Tsumura & Co 159 0.01
12 Tsurumi Manufacturing Co Ltd 190 0.01
3 Tsutsumi Jewelry Co Ltd 72 -
1 Tsuzuki Denki Co Ltd 20 -
16 TV Asahi Holdings Corp 283 0.01
4 Tv Tokyo Holdings Corp 88 -
15 TYK Corp 44 -
24 UACJ Corp 519 0.01
72 Ube Industries Ltd 1,533 0.04
6 Uchida Yoko Co Ltd 243 0.01
3 Ueki Corp 41 -
9 Ulvac Inc 432 0.01
4 Uniden Holdings Corp 91 -
6 Union Tool Co 205 0.01
28 Unipres Corp 248 0.01
8 UNITED Inc 98 -
34 United Super Markets Holdings Inc 339 0.01
36 Unitika Ltd 121 -
18 Universal Entertainment Corp 394 0.01
41 Ushio Inc 588 0.02
11 Utoc Corp 51 -
22 Valor Holdings Co Ltd 455 0.01
5 Valqua Ltd 97 -
4 Vertex Corp 115 -
29 Vital KSK Holdings Inc 191 0.01
54 VT Holdings Co Ltd 230 0.01
28 Wacoal Holdings Corp 628 0.02
9 Wakachiku Construction Co Ltd 118 -
24 Wakita & Co Ltd 247 0.01
10 Warabeya Nichiyo Holdings Co Ltd 184 0.01
7 Watts Co Ltd 54 -
4 Wavelock Holdings Co Ltd 25 -
5 Wood One Co Ltd 62 -
17 World Co Ltd 222 0.01
3 Wowow Inc 63 -
20 Xebio Holdings Co Ltd 170 0.01
7 YAC Holdings Co Ltd 67 -
7 Yachiyo Industry Co Ltd 38 -
1 Yagi & Co Ltd 10 -
23 Yahagi Construction Co Ltd 154 -
5 Yaizu Suisankagaku Industry Co Ltd 44 -
26 Yamabiko Corp 288 0.01
4 Yamae Hisano Co Ltd 39 -
18 Yamagata Bank Ltd 149 -
139 Yamaguchi Financial Group Inc 828 0.02
22 Yamanashi Chuo Bank Ltd 167 0.01
40 Yamashina Corp 29 -
6 Yamatane Corp 83 -
12 Yamato Corp 89 -
11 Yamato International Inc 33 -
29 Yamato Kogyo Co Ltd 960 0.03
Global Targeted Value FundPortfolio of Investments as at 31 May 2021 (continued)
Dimensional Fund Advisors Semi-Annual Report and Unaudited Financial Statements, 31 May 2021 285

Shares (000's)
Value(000's)
USD
% of NetAssetValue
Common Stock (continued)
Japan - 7.69% (continued)
3 Yamaya Corp 56 -
2 Yamazawa Co Ltd 26 -
36 Yamazen Corp 320 0.01
12 Yashima Denki Co Ltd 107 -
11 Yasuda Logistics Corp 95 -
20 Yellow Hat Ltd 359 0.01
16 Yodogawa Steel Works Ltd 341 0.01
20 Yokogawa Bridge Holdings Corp 365 0.01
37 Yokohama Reito Co Ltd 294 0.01
80 Yokohama Rubber Co Ltd 1,639 0.04
5 Yomeishu Seizo Co Ltd 82 -
3 Yondenko Corp 89 -
9 Yondoshi Holdings Inc 154 -
2 Yonex Co Ltd 13 -
13 Yorozu Corp 145 -
15 Yotai Refractories Co Ltd 156 0.01
2 Yuasa Funashoku Co Ltd 57 -
13 Yuasa Trading Co Ltd 346 0.01
2 Yuken Kogyo Co Ltd 32 -
30 Yurtec Corp 203 0.01
9 Yushin Precision Equipment Co Ltd 69 -
8 Yushiro Chemical Industry Co Ltd 82 -
3 Yutaka Giken Co Ltd 56 -
3 Zaoh Co Ltd 45 -
2 Zenitaka Corp 73 -
4 Zuiko Corp 39 -
301,394 7.69
Netherlands - 0.90%
43 Aalberts NV 2,426 0.06
289 ABN AMRO Bank NV 3,870 0.10
8 Accell Group NV 451 0.01
655 Aegon NV 3,105 0.08
30 APERAM SA 1,632 0.04
42 Arcadis NV 1,837 0.05
- ASM International NV 182 -
87 ASR Nederland NV 3,730 0.09
57 Boskalis Westminster 1,932 0.05
18 Brunel International NV 240 0.01
26 ForFarmers NV 169 -
46 Fugro NV 506 0.01
18 Heijmans NV 299 0.01
3 Hunter Douglas NV 293 0.01
25 Intertrust NV 465 0.01
10 Kendrion NV 272 0.01
221 Koninklijke BAM Groep NV 653 0.02
34 Koninklijke Vopak NV 1,601 0.04
6 Lucas Bols BV 82 -
45 NN Group NV 2,300 0.06
64 Ordina NV 295 0.01
23 Randstad NV 1,772 0.04
95 SBM Offshore NV 1,636 0.04
68 Signify NV 4,200 0.11
16 Sligro Food Group NV 520 0.01
- SNS REAAL NV - -
5 TKH Group NV 280 0.01
25 TomTom NV 231 0.01
11 Van Lanschot Kempen NV 317 0.01
35,296 0.90
New Zealand - 0.18%
328 Air New Zealand Ltd 395 0.01
152 Arvida Group Ltd 201 0.01
142 Chorus Ltd 644 0.02
Shares (000's)
Value(000's)
USD
% of NetAssetValue
Common Stock (continued)
New Zealand - 0.18% (continued)
8 Comvita Ltd 18 -
295 Fletcher Building Ltd 1,585 0.04
301 Heartland Group Holdings Ltd 423 0.01
335 Kathmandu Holdings Ltd 384 0.01
20 Napier Port Holdings Ltd 48 -
5 New Zealand King Salmon Investments Ltd 6 -
117 New Zealand Refining Co Ltd 58 -
72 NZME Ltd 40 -
134 Oceania Healthcare Ltd 133 0.01
11 PGG Wrightson Ltd 26 -
26 Sanford Ltd 89 -
27 Scales Corp Ltd 89 -
16 Skellerup Holdings Ltd 52 -
884 SKY Network Television Ltd 110 -
346 SKYCITY Entertainment Group Ltd 897 0.02
65 Steel & Tube Holdings Ltd 53 -
115 Summerset Group Holdings Ltd 1,037 0.03
13 Synlait Milk Ltd 28 -
55 Tourism Holdings Ltd 99 -
155 Tower Ltd 84 -
26 Vista Group International Ltd 42 -
46 Warehouse Group Ltd 114 0.01
163 Z Energy Ltd 302 0.01
6,957 0.18
Norway - 0.39%
154 Akastor ASA 101 -
192 Aker Solutions ASA 350 0.01
44 American Shipping Co ASA 163 -
60 Austevoll Seafood ASA 791 0.02
44 Avance Gas Holding Ltd 226 0.01
118 Axactor SE 159 -
252 B2Holding ASA 313 0.01
16 Bonheur ASA 458 0.01
34 Borr Drilling Ltd 31 -
49 BW Energy Ltd 140 -
78 BW LPG Ltd 542 0.01
93 BW Offshore Ltd 380 0.01
425 DNO ASA 452 0.01
32 FLEX LNG Ltd 482 0.01
63 Frontline Ltd 533 0.01
9 Golden Ocean Group Ltd (Norway listing) 88 -
22 Grieg Seafood ASA 221 0.01
24 Komplett Bank ASA 28 -
165 Kongsberg Automotive ASA 57 -
44 Kongsberg Gruppen ASA 1,126 0.03
11 Norske Skog ASA 48 -
1 Norway Royal Salmon ASA 19 -
5 Norwegian Energy Co SA 76 -
49 Norwegian Finans Holding ASA 576 0.01
62 Ocean Yield ASA 217 0.01
108 Odfjell Drilling Ltd 280 0.01
4 Odfjell SE 16 -
74 Otello Corp ASA 289 0.01
6 Panoro Energy ASA 13 -
370 PGS ASA 231 0.01
62 Sbanken ASA 768 0.02
35 Selvaag Bolig ASA 256 0.01
3 Solon Eiendom ASA 12 -
110 SpareBank 1 SR-Bank ASA 1,513 0.04
22 Stolt-Nielsen Ltd 357 0.01
114 Storebrand ASA 1,140 0.03
91 Subsea 7 SA 907 0.02
Global Targeted Value FundPortfolio of Investments as at 31 May 2021 (continued)
Dimensional Fund Advisors Semi-Annual Report and Unaudited Financial Statements, 31 May 2021 286

Shares (000's)
Value(000's)
USD
% of NetAssetValue
Common Stock (continued)
Norway - 0.39% (continued)
84 TGS NOPEC Geophysical Co ASA 1,131 0.03
41 Treasure ASA 85 -
79 Wallenius Wilhelmsen ASA 316 0.01
10 Wilh Wilhelmsen Holding ASA (voting rights) 215 0.01
137 XXL ASA 346 0.01
15,452 0.39
Portugal - 0.13%
8,002 Banco Comercial Portugues SA 1,557 0.04
961 Banco Espirito Santo SA - -
13 EDP Renovaveis SA 302 0.01
59 Galp Energia SGPS SA 744 0.02
184 Navigator Co SA 677 0.02
212 NOS SGPS SA 766 0.02
18 Semapa-Sociedade de Investimento e Gestao 256 -
1,001 Sonae SGPS SA 969 0.02
5,271 0.13
Singapore - 0.28%
369 Accordia Golf Trust 6 -
48 Amara Holdings Ltd 13 -
174 Banyan Tree Holdings Ltd 38 -
154 Boustead Singapore Ltd 136 -
78 Bukit Sembawang Estates Ltd 292 0.01
148 China Aviation Oil Singapore Corp Ltd 118 -
186 China Sunsine Chemical Holdings Ltd 76 -
197 Chip Eng Seng Corp Ltd 66 -
96 Chuan Hup Holdings Ltd 15 -
106 City Developments Ltd 612 0.02
649 COSCO Shipping International Singapore Co Ltd 154 0.01
92 Del Monte Pacific Ltd 27 -
223 DMX Technologies Group Ltd - -
1,894 Ezion Holdings Ltd 12 -
1,374 Ezra Holdings Ltd 2 -
83 Far East Orchard Ltd 67 -
106 Food Empire Holdings Ltd 71 -
7 Fraser and Neave Ltd 7 -
297 Frasers Property Ltd 265 0.01
207 Fu Yu Corp Ltd 49 -
64 GK Goh Holdings Ltd 47 -
3,356 Golden Agri-Resources Ltd 596 0.02
189 GuocoLand Ltd 230 0.01
152 Hanwell Holdings Ltd 52 -
50 Haw Par Corp Ltd 513 0.01
23 Hiap Hoe Ltd 12 -
73 Ho Bee Land Ltd 147 0.01
203 Hong Fok Corp Ltd 131 -
113 Hong Leong Asia Ltd 85 -
133 Hong Leong Finance Ltd 243 0.01
36 Hotel Grand Central Ltd 29 -
47 Hour Glass Ltd 44 -
2,084 Hutchison Port Holdings Trust 500 0.01
359 Hyflux Ltd 45 -
189 Indofood Agri Resources Ltd 51 -
152 Japfa Ltd 101 -
89 KSH Holdings Ltd 24 -
176 Lian Beng Group Ltd 64 -
72 Low Keng Huat Singapore Ltd 27 -
19 Mandarin Oriental International Ltd 38 -
176 Metro Holdings Ltd 109 -
828 Midas Holdings Ltd 23 -
87 NetLink NBN Trust 63 -
75 Olam International Ltd 100 -
111 OUE Ltd 113 -
Shares (000's)
Value(000's)
USD
% of NetAssetValue
Common Stock (continued)
Singapore - 0.28% (continued)
502 Oxley Holdings Ltd 93 -
92 QAF Ltd 66 -
373 Raffles Education Corp Ltd 49 -
415 Sembcorp Industries Ltd 689 0.02
3,875 Sembcorp Marine Ltd 585 0.02
107 SHS Holdings Ltd 12 -
11 SIA Engineering Co Ltd 18 -
596 SIIC Environment Holdings Ltd 95 -
508 Sinarmas Land Ltd 107 -
76 Sing Holdings Ltd 22 -
32 Sing Investments & Finance Ltd 35 -
688 Singapore Post Ltd 374 0.01
714 Singapore Press Holdings Ltd 943 0.03
176 Stamford Land Corp Ltd 55 -
34 Straits Trading Co Ltd 71 -
137 Swiber Holdings Ltd 2 -
295 Tuan Sing Holdings Ltd 93 -
90 United Industrial Corp Ltd 182 0.01
127 UOB-Kay Hian Holdings Ltd 158 0.01
103 UOL Group Ltd 579 0.02
64 Valuetronics Holdings Ltd 31 -
194 Wing Tai Holdings Ltd 255 0.01
978 Yangzijiang Shipbuilding Holdings Ltd 1,100 0.03
11,027 0.28
Spain - 0.61%
11 Acciona SA 1,831 0.05
80 Acerinox SA 1,141 0.03
6 ACS Actividades de Construccion y Servicios SA 172 0.01
9 Adveo Group International SA 1 -
3 Aedas Homes SA 76 -
33 Almirall SA 562 0.01
65 Applus Services SA 680 0.02
51 Atresmedia Corp de Medios de Comunicacion SA 250 0.01
6 Azkoyen SA 44 -
3,377 Banco de Sabadell SA 2,598 0.07
366 Bankinter SA 2,091 0.05
455 CaixaBank SA 1,578 0.04
11 Construcciones y Auxiliar de Ferrocarriles SA 501 0.01
36 Ebro Foods SA 768 0.02
45 eDreams ODIGEO SA 292 0.01
14 Elecnor SA 179 0.01
88 Enagas SA 2,070 0.05
98 Ence Energia y Celulosa SA 414 0.01
44 Ercros SA 193 0.01
54 Euskaltel SA 724 0.02
13 Faes Farma SA 54 -
17 Fluidra SA 694 0.02
12 Fomento de Construcciones y Contratas SA 153 -
26 Gestamp Automocion SA 143 -
44 Global Dominion Access SA 236 0.01
20 Grupo Catalana Occidente SA 843 0.02
6 Iberpapel Gestion SA 135 -
64 Indra Sistemas SA 559 0.01
980 Liberbank SA 396 0.01
366 Linea Directa Aseguradora SA Cia de Seguros yReaseguros 714 0.02
579 Mapfre SA 1,326 0.03
53 Mediaset Espana Comunicacion SA 370 0.01
44 Melia Hotels International SA 368 0.01
7 Metrovacesa SA 62 -
10 Miquel y Costas & Miquel SA 188 0.01
8 Neinor Homes SA 109 -
Global Targeted Value FundPortfolio of Investments as at 31 May 2021 (continued)
Dimensional Fund Advisors Semi-Annual Report and Unaudited Financial Statements, 31 May 2021 287

Shares (000's)
Value(000's)
USD
% of NetAssetValue
Common Stock (continued)
Spain - 0.61% (continued)
88 Obrascon Huarte Lain SA 66 -
29 Prosegur Cia de Seguridad SA 89 -
7 Renta Corp Real Estate SA 20 -
236 Sacyr SA 633 0.02
14 Talgo SA 88 -
62 Tubacex SA 135 -
457 Unicaja Banco SA 514 0.01
39 Vocento SA 52 -
24,112 0.61
Sweden - 1.27%
51 AcadeMedia AB 489 0.01
30 Adapteo Oyj 585 0.02
1 AddNode Group AB 56 -
55 AF POYRY AB 1,895 0.05
19 Alimak Group AB 325 0.01
25 Ambea AB 208 0.01
22 Annehem Fastigheter 87 -
3 AQ Group AB 104 -
11 Arise AB 64 -
127 Arjo AB 1,271 0.03
57 Attendo AB 283 0.01
13 Beijer Alma AB 282 0.01
13 Beijer Electronics Group AB 84 -
21 Bergman & Beving AB 338 0.01
2 Besqab AB 42 -
71 Betsson AB 31 -
71 Betsson AB 631 0.02
19 BHG Group AB 364 0.01
53 Bilia AB 1,014 0.03
116 BillerudKorsnas AB 2,290 0.06
55 Bonava AB 701 0.02
4 Boule Diagnostics AB 25 -
72 Bravida Holding AB 1,099 0.03
16 Bufab AB 473 0.01
7 Bulten AB 86 -
31 Bure Equity AB 1,437 0.04
57 Byggmax Group AB 517 0.01
16 Catena Media PLC 118 -
21 Cavotec SA 66 -
11 Clas Ohlson AB 128 -
148 Cloetta AB 482 0.01
16 Collector AB 60 -
35 Coor Service Management Holding AB 306 0.01
153 Dometic Group AB 2,632 0.07
15 Doro AB 106 -
21 Duni AB 293 0.01
37 Dustin Group AB 469 0.01
8 Eastnine AB 119 -
10 Elanders AB 206 0.01
80 Electrolux Professional AB 550 0.01
23 Eltel AB 70 -
13 Enea AB 331 0.01
8 Eolus Vind AB 192 0.01
20 Fagerhult AB 160 -
4 Ferronordic AB 113 -
5 FormPipe Software AB 19 -
24 GHP Specialty Care AB 81 -
78 Granges AB 1,044 0.03
37 Haldex AB 261 0.01
96 Hexpol AB 1,197 0.03
55 Hoist Finance AB 240 0.01
24 Humana AB 211 0.01
Shares (000's)
Value(000's)
USD
% of NetAssetValue
Common Stock (continued)
Sweden - 1.27% (continued)
1 IAR Systems Group AB 25 -
44 International Petroleum Corp 189 -
44 Intrum AB 1,555 0.04
41 Inwido AB 733 0.02
35 JM AB 1,384 0.04
6 Karnov Group AB 34 -
9 KNOW IT AB 333 0.01
9 LeoVegas AB 48 -
45 Lindab International AB 1,083 0.03
45 Loomis AB 1,447 0.04
2 Medcap AB 38 -
36 Mekonomen AB 676 0.02
7 Midsona AB 61 -
53 Millicom International Cellular SA 2,380 0.06
42 Modern Times Group MTG AB 599 0.02
17 Momentum Group AB 318 0.01
36 Munters Group AB 374 0.01
18 NCC AB 352 0.01
4 Nederman Holding AB 76 -
144 Net Insight AB 43 -
26 New Wave Group AB 316 0.01
70 Nobia AB 645 0.02
38 Nobina AB 379 0.01
24 Nordic Entertainment Group AB 1,150 0.03
13 Nordic Waterproofing Holding AB 249 0.01
46 Pandox AB 815 0.02
107 Peab AB 1,468 0.04
82 Pricer AB 302 0.01
11 Proact IT Group AB 114 -
129 Ratos AB 827 0.02
9 RaySearch Laboratories AB 95 -
2 Rejlers AB 38 -
74 Resurs Holding AB 398 0.01
56 Rottneros AB 61 -
17 Saab AB 507 0.01
29 Scandi Standard AB 215 0.01
9 Scandic Hotels Group AB 39 -
5 Securitas AB 83 -
7 Semcon AB 98 -
127 Sensys Gatso Group AB 18 -
12 SkiStar AB 188 -
102 SSAB AB, Class A 536 0.01
275 SSAB AB, Class B 1,343 0.03
24 Swedish Orphan Biovitrum AB 415 0.01
11 Systemair AB 387 0.01
112 Trelleborg AB 2,880 0.07
6 VBG Group AB 141 -
49,690 1.27
Switzerland - 1.71%
22 Adecco Group AG 1,490 0.04
9 Allreal Holding AG 1,806 0.05
113 ams AG 2,212 0.06
35 Arbonia AG 652 0.02
615 Aryzta AG 826 0.02
2 Autoneum Holding AG 459 0.01
30 Baloise Holding AG 5,000 0.13
1 Banque Cantonale de Geneve 259 0.01
2 Bell Food Group AG 576 0.02
3 Bellevue Group AG 147 -
3 Berner Kantonalbank AG 716 0.02
6 Bobst Group SA 423 0.01
4 Bucher Industries AG 2,324 0.06
Global Targeted Value FundPortfolio of Investments as at 31 May 2021 (continued)
Dimensional Fund Advisors Semi-Annual Report and Unaudited Financial Statements, 31 May 2021 288

Shares (000's)
Value(000's)
USD
% of NetAssetValue
Common Stock (continued)
Switzerland - 1.71% (continued)
4 Calida Holding AG 141 -
- Carlo Gavazzi Holding AG 82 -
1 Cicor Technologies Ltd 76 -
1 Cie Financiere Tradition SA 141 -
109 Clariant AG 2,365 0.06
1 Conzzeta AG 1,124 0.03
25 DKSH Holding AG 2,000 0.05
40 Dufry AG 2,496 0.06
69 EFG International AG 545 0.01
4 Energiedienst Holding AG 151 -
179 Evolva Holding SA 37 -
2 Feintool International Holding AG 103 -
11 Flughafen Zurich AG 1,956 0.05
126 GAM Holding AG 322 0.01
2 Georg Fischer AG 2,346 0.06
25 Helvetia Holding AG 2,767 0.07
1 HOCHDORF Holding AG 41 -
9 Huber & Suhner AG 721 0.02
13 Implenia AG 386 0.01
3 Ina Invest Holding AG 58 -
2 Investis Holding SA 259 0.01
74 Julius Baer Group Ltd 5,029 0.13
4 Jungfraubahn Holding AG 561 0.01
20 Kudelski SA 87 -
19 Landis&Gyr Group AG 1,401 0.04
3 Lastminute.com NV 153 -
9 Liechtensteinische Landesbank AG 544 0.01
2 Luzerner Kantonalbank AG 1,007 0.03
4 Meier Tobler Group AG 77 -
- Metall Zug AG 328 0.01
273 Meyer Burger Technology AG 152 -
3 Mikron Holding AG 18 -
5 Mobimo Holding AG 1,793 0.05
6 Newron Pharmaceuticals SpA 18 -
141 OC Oerlikon Corp AG 1,613 0.04
8 Orascom Development Holding AG 101 -
- Orell Fuessli Holding AG 31 -
- Phoenix Mecano AG 252 0.01
- Plazza AG 174 0.01
3 Rieter Holding AG 498 0.01
345 Schmolz & Bickenbach AG 172 -
1 Schweiter Technologies AG 1,170 0.03
2 St Galler Kantonalbank AG 930 0.02
13 Sulzer AG 1,667 0.04
1 Swatch Group AG (Bearer) 473 0.01
2 Swatch Group AG (Registered) 129 -
1 Swiss Life Holding AG 711 0.02
56 Swiss Prime Site AG 5,712 0.15
1 Swissquote Group Holding SA 149 -
2 Tamedia AG 198 0.01
1 Thurgauer Kantonalbank 90 -
1 Tornos Holding AG 10 -
6 u-blox Holding AG 350 0.01
14 Valiant Holding AG 1,446 0.04
3 Valora Holding AG 754 0.02
1 Vaudoise Assurances Holding SA 360 0.01
10 Vetropack Holding AG 623 0.02
17 Vontobel Holding AG 1,325 0.03
3 VP Bank AG 340 0.01
1 V-ZUG Holding AG 227 0.01
1 Walliser Kantonalbank 113 -
7 Zehnder Group AG 660 0.02
Shares (000's)
Value(000's)
USD
% of NetAssetValue
Common Stock (continued)
Switzerland - 1.71% (continued)
- Zug Estates Holding AG 329 0.01
- Zuger Kantonalbank AG 455 0.01
67,237 1.71
United Kingdom - 5.34%
12 Accsys Technologies PLC 27 -
39 Advanced Medical Solutions Group PLC 153 -
31 AG Barr PLC 229 0.01
154 Aggreko PLC 1,876 0.05
54 Airtel Africa PLC 61 -
245 Alliance Pharma PLC 343 0.01
68 Allied Minds PLC 22 -
138 Anglo Pacific Group PLC 284 0.01
13 Anglo-Eastern Plantations PLC 122 -
51 Arrow Global Group PLC 219 0.01
329 Babcock International Group PLC 1,395 0.04
64 Bakkavor Group PLC 123 -
469 Balfour Beatty PLC 2,065 0.05
31 Bank of Georgia Group PLC 575 0.01
484 Barratt Developments PLC 5,180 0.13
22 Beazley PLC 92 -
53 Begbies Traynor Group PLC 101 -
86 Bellway PLC 4,367 0.11
56 Berkeley Group Holdings PLC 3,686 0.09
124 Biffa PLC 515 0.01
60 Bloomsbury Publishing PLC 272 0.01
120 Bodycote PLC 1,470 0.04
52 Boot Henry PLC 210 0.01
14 Braemar Shipping Services PLC 46 -
45 Breedon Group PLC 69 -
122 Burford Capital Ltd 1,468 0.04
212 C&C Group PLC 723 0.02
394 Cairn Energy PLC 908 0.02
42 CareTech Holdings PLC 337 0.01
31 Carr's Group PLC 69 -
6 Castings PLC 32 -
750 Centamin PLC 1,170 0.03
17 Centaur Media PLC 10 -
91 Central Asia Metals PLC 350 0.01
3,237 Centrica PLC 2,508 0.06
196 Chemring Group PLC 849 0.02
82 Chesnara PLC 320 0.01
629 Cineworld Group PLC 827 0.02
130 Circassia Pharmaceuticals PLC 63 -
17 Clarkson PLC 759 0.02
59 Clinigen Healthcare Ltd 713 0.02
96 Close Brothers Group PLC 2,235 0.06
5 CMC Markets PLC 35 -
184 Costain Group PLC 151 -
218 Countryside Properties PLC 1,579 0.04
14 Cranswick PLC 801 0.02
185 Crest Nicholson Holdings PLC 1,203 0.03
95 Daily Mail & General Trust PLC 1,197 0.03
43 Dart Group PLC 822 0.02
1 DCC PLC 88 -
648 Debenhams PLC - -
157 DFS Furniture PLC 633 0.02
3 Dialight PLC 13 -
329 Direct Line Insurance Group PLC 1,387 0.04
45 DiscoverIE Group PLC 478 0.01
224 Diversified Gas & Oil PLC 332 0.01
691 Dixons Carphone PLC 1,337 0.03
285 Drax Group PLC 1,761 0.05
Global Targeted Value FundPortfolio of Investments as at 31 May 2021 (continued)
Dimensional Fund Advisors Semi-Annual Report and Unaudited Financial Statements, 31 May 2021 289

Shares (000's)
Value(000's)
USD
% of NetAssetValue
Common Stock (continued)
United Kingdom - 5.34% (continued)
510 DS Smith PLC 3,021 0.08
21 easyJet PLC 305 0.01
467 Elementis PLC 1,044 0.03
1,118 EnQuest PLC 271 0.01
277 Equiniti Group PLC 710 0.02
35 Euromoney Institutional Investor PLC 522 0.01
216 Ferrexpo PLC 1,374 0.04
187 Filtrona PLC 825 0.02
914 Firstgroup PLC 1,060 0.03
58 Forterra PLC 240 0.01
195 Foxtons Group PLC 162 -
19 Fuller Smith & Turner PLC 222 0.01
82 Galliford Try Holdings PLC 146 -
47 Gamesys Group PLC 1,253 0.03
96 Gem Diamonds Ltd 97 -
77 Genel Energy PLC 150 -
27 Georgia Capital PLC 230 0.01
25 Go-Ahead Group PLC 447 0.01
1 Gooch & Housego PLC 25 -
142 Grafton Group PLC 2,356 0.06
398 Grainger PLC 1,611 0.04
134 Greencore Group PLC 267 0.01
167 Gulf Keystone Petroleum Ltd 392 0.01
323 GVC Holdings PLC 7,543 0.19
82 Gym Group PLC 321 0.01
15 H&T Group PLC 58 -
152 Halfords Group PLC 819 0.02
710 Harbour Energy PLC 207 0.01
14 Harworth Group PLC 30 -
314 Hays PLC 772 0.02
61 Headlam Group PLC 413 0.01
88 Helical PLC 544 0.01
187 Hochschild Mining PLC 522 0.01
39 Hostelworld Group PLC 53 -
104 Hunting PLC 386 0.01
261 Ibstock PLC 848 0.02
255 Inchcape PLC 2,828 0.07
264 Indivior PLC 584 0.02
31 Informa PLC 240 0.01
192 International Personal Finance PLC 359 0.01
468 Investec PLC 2,057 0.05
543 IP Group PLC 953 0.02
109 IQE PLC 84 -
1,194 J Sainsbury PLC 4,496 0.11
7 James Fisher & Sons PLC 99 -
224 John Laing Group PLC 1,278 0.03
435 John Wood Group PLC 1,509 0.04
159 Johnson Service Group PLC 383 0.01
150 Jupiter Fund Management PLC 592 0.02
722 Just Group PLC 1,129 0.03
47 Keller Group PLC 557 0.01
118 Kier Group PLC 192 0.01
103 Kier Group PLC 44 -
15 Kin & Carta PLC 42 -
1,142 Kingfisher PLC 5,797 0.15
216 Lamprell PLC 192 0.01
43 Lancashire Holdings Ltd 381 0.01
226 Lookers PLC 218 0.01
63 LSL Property Services PLC 415 0.01
1,491 M&G PLC 5,155 0.13
6 Macfarlane Group PLC 10 -
889 Man Group PLC 2,252 0.06
Shares (000's)
Value(000's)
USD
% of NetAssetValue
Common Stock (continued)
United Kingdom - 5.34% (continued)
1,260 Marks & Spencer Group PLC 2,945 0.08
502 Marston's PLC 648 0.02
78 McBride PLC 100 -
85 Mears Group PLC 225 0.01
280 Mediclinic International PLC 1,291 0.03
414 Meggitt PLC 2,980 0.08
1,154 Melrose Industries PLC 2,821 0.07
175 Micro Focus International PLC 1,284 0.03
221 Mitchells & Butlers PLC 957 0.02
416 Mitie Group PLC 402 0.01
28 MJ Gleeson PLC 343 0.01
5 Morgan Crucible Co PLC 26 -
24 Morgan Sindall Group PLC 770 0.02
22 Morses Club PLC 21 -
208 N Brown Group PLC 194 0.01
24 Naked Wines PLC 277 0.01
259 National Express Group PLC 1,106 0.03
158 NCC Group PLC 661 0.02
149 Ninety One PLC 504 0.01
35 Norcros PLC 153 -
127 Northgate PLC 694 0.02
165 OSB Group PLC 1,097 0.03
104 Pan African Resources PLC 34 -
174 Paragon Group of Cos PLC 1,199 0.03
22 Parkmead Group PLC 13 -
463 Pearson PLC 5,379 0.14
840 Pendragon PLC 220 0.01
128 Petrofac Ltd 241 0.01
1,679 Petropavlovsk PLC 595 0.02
350 Pets at Home Group PLC 2,225 0.06
191 Pharos Energy PLC 67 -
403 Phoenix Group Holdings PLC 4,211 0.11
180 Photo-Me International PLC 179 -
223 Playtech PLC 1,452 0.04
134 Polypipe Group PLC 1,225 0.03
5 Porvair PLC 38 -
10 PPHE Hotel Group Ltd 229 0.01
482 Premier Foods PLC 724 0.02
164 Provident Financial PLC 554 0.01
120 PZ Cussons PLC 434 0.01
339 QinetiQ Group PLC 1,707 0.04
650 Quilter PLC 1,414 0.04
132 Rank Group PLC 378 0.01
3 Rathbone Brothers PLC 86 -
272 Reach PLC 918 0.02
6 Redcentric PLC 12 -
160 Redrow PLC 1,539 0.04
385 Restaurant Group PLC 661 0.02
15 Rhi Magnesita NV (UK listing) 972 0.03
28 Ricardo PLC 181 -
1 Robert Walters PLC 12 -
43 Rockhopper Exploration PLC 6 -
619 Royal Mail PLC 5,078 0.13
195 RPS Group PLC 267 0.01
176 RSA Insurance Group PLC 1,708 0.04
75 RWS Holdings PLC 682 0.02
1 S&U PLC 50 -
57 Saga PLC 307 0.01
53 Savills PLC 886 0.02
11 ScS Group PLC 41 -
317 Senior PLC 714 0.02
239 Serco Group PLC 457 0.01
Global Targeted Value FundPortfolio of Investments as at 31 May 2021 (continued)
Dimensional Fund Advisors Semi-Annual Report and Unaudited Financial Statements, 31 May 2021 290

Shares (000's)
Value(000's)
USD
% of NetAssetValue
Common Stock (continued)
United Kingdom - 5.34% (continued)
67 Serica Energy PLC 111 -
212 Severfield PLC 238 0.01
666 Shanks Group PLC 513 0.01
618 SIG PLC 541 0.01
465 Signature Aviation PLC 2,609 0.07
41 Smart Metering Systems PLC 502 0.01
50 Spectris PLC 2,293 0.06
377 Speedy Hire PLC 400 0.01
204 Spire Healthcare Group PLC 709 0.02
40 Sportech PLC 17 -
141 Sports Direct International PLC 1,156 0.03
134 St Modwen Properties PLC 1,040 0.03
1,161 Standard Life Aberdeen PLC 4,516 0.12
112 Stobart Group Ltd 52 -
138 Stock Spirits Group PLC 525 0.01
47 SuperGroup PLC 260 0.01
272 Tate & Lyle PLC 2,956 0.08
84 Taylor Wimpey PLC 203 0.01
10 TBC Bank Group PLC 171 -
14 TClarke PLC 28 -
47 Ted Baker PLC 120 -
4 Telit Communications PLC 13 -
6 TEN Entertainment Group PLC 22 -
38 TI Fluid Systems PLC 167 -
540 TP ICAP Group PLC 1,639 0.04
141 Travis Perkins PLC 3,289 0.08
78 Trifast PLC 173 -
119 TT Electronics plc 433 0.01
31 TUI AG 192 0.01
1,086 Tullow Oil PLC 787 0.02
73 Tyman PLC 498 0.01
88 U & I Group PLC 120 -
88 UDG Healthcare PLC 1,324 0.03
7 Ultra Electronics Holdings PLC 204 0.01
412 Vectura Group PLC 929 0.02
310 Vertu Motors PLC 191 0.01
151 Vesuvius PLC 1,203 0.03
659 Virgin Money UK PLC 1,973 0.05
177 Vistry Group PLC 3,310 0.08
7 Vitec Group PLC 135 -
22 Vivo Energy PLC 31 -
6 Volex PLC 31 -
76 Volution Group PLC 472 0.01
3 Vp PLC 41 -
123 Weir Group PLC 3,353 0.09
158 Wickes Group PLC 575 0.01
971 WM Morrison Supermarkets PLC 2,437 0.06
78 Xaar PLC 229 0.01
7 Young & Co's Brewery PLC, Class A 153 -
12 Zotefoams PLC 81 -
209,311 5.34
United States - 65.27%
24 1-800-Flowers.com Inc 733 0.02
6 1st Constitution Bancorp 124 -
18 1st Source Corp 886 0.02
14 A H Belo Corp 26 -
19 AAR Corp 776 0.02
19 Aaron's Holdings Co Inc 691 0.02
47 Abercrombie & Fitch Co 2,022 0.05
44 ABM Industries Inc 2,219 0.06
41 Acacia Research Corp 220 0.01
67 Acadia Healthcare Co Inc 4,293 0.11
Shares (000's)
Value(000's)
USD
% of NetAssetValue
Common Stock (continued)
United States - 65.27% (continued)
57 ACCO Brands Corp 522 0.01
113 Achillion Pharmaceuticals Inc 162 -
37 ACI Worldwide Inc 1,410 0.04
4 Acme United Corp 148 -
6 ACNB Corp 169 -
25 Acuity Brands Inc 4,569 0.12
50 Acushnet Holdings Corp 2,674 0.07
3 Adams Resources & Energy Inc 69 -
9 Addus HomeCare Corp 860 0.02
70 Adient PLC 3,479 0.09
180 ADT Inc 1,862 0.05
35 Adtalem Global Education Inc 1,283 0.03
31 ADTRAN Inc 622 0.02
14 Advance Auto Parts Inc 2,581 0.07
13 Advanced Energy Industries Inc 1,325 0.03
22 AdvanSix Inc 691 0.02
80 AECOM 5,187 0.13
13 AeroVironment Inc 1,470 0.04
28 Affiliated Managers Group Inc 4,537 0.12
52 AGCO Corp 7,218 0.18
12 AgroFresh Solutions Inc 26 -
79 Air Lease Corp 3,718 0.10
1 Air T Inc 22 -
39 Air Transport Services Group Inc 980 0.03
44 Akamai Technologies Inc 5,048 0.13
9 Akebia Therapeutics Inc 30 -
8 Alamo Group Inc 1,206 0.03
60 Alaska Air Group Inc 4,145 0.11
38 Alaska Communications Systems Group Inc 125 -
2 Albany International Corp 185 0.01
35 Albemarle Corp 5,857 0.15
123 Alcoa Corp 4,890 0.13
5 Alerus Financial Corp 158 -
7 Alico Inc 224 0.01
11 Alithya Group Inc 23 -
9 Alleghany Corp 6,663 0.17
82 Allegheny Technologies Inc 2,001 0.05
13 Allegiance Bancshares Inc 509 0.01
6 Allegiant Travel Co 1,248 0.03
8 Alliance Data Systems Corp 942 0.02
8 Allied Motion Technologies Inc 277 0.01
126 Allscripts Healthcare Solutions Inc 2,184 0.06
279 Ally Financial Inc 15,256 0.39
11 Alpha & Omega Semiconductor Ltd 361 0.01
11 Alpha Pro Tech Ltd 87 -
13 Altabancorp 584 0.02
49 Altra Industrial Motion Corp 3,213 0.08
6 A-Mark Precious Metals Inc 345 0.01
22 Ambac Financial Group Inc 331 0.01
14 AMC Networks Inc 757 0.02
- AMCON Distributing Co 48 -
442 Amcor PLC 5,210 0.13
36 Amdocs Ltd 2,849 0.07
12 Amerco 7,062 0.18
21 Ameresco Inc 1,152 0.03
77 American Axle & Manufacturing Holdings Inc 858 0.02
109 American Eagle Outfitters Inc 3,852 0.10
43 American Equity Investment Life Holding Co 1,322 0.03
32 American Financial Group Inc 4,276 0.11
9 American National Bankshares Inc 303 0.01
17 American National Group Inc 2,492 0.06
9 American Outdoor Brands Inc 281 0.01
Global Targeted Value FundPortfolio of Investments as at 31 May 2021 (continued)
Dimensional Fund Advisors Semi-Annual Report and Unaudited Financial Statements, 31 May 2021 291

Shares (000's)
Value(000's)
USD
% of NetAssetValue
Common Stock (continued)
United States - 65.27% (continued)
11 American Public Education Inc 317 0.01
3 American River Bankshares 52 -
5 American Software Inc 92 -
6 American Superconductor Corp 92 -
19 American Vanguard Corp 347 0.01
12 American Woodmark Corp 1,002 0.03
47 Ameris Bancorp 2,598 0.07
7 Ames National Corp 180 -
161 Amkor Technology Inc 3,406 0.09
11 AMN Healthcare Services Inc 956 0.02
10 Ampco-Pittsburgh Corp 71 -
28 Amphastar Pharmaceuticals Inc 529 0.01
12 Amtech Systems Inc 121 -
3 AnaptysBio Inc 65 -
23 Andersons Inc 724 0.02
28 AngioDynamics Inc 656 0.02
10 Anika Therapeutics Inc 489 0.01
44 Antero Midstream Corp 419 0.01
214 Antero Resources Corp 2,768 0.07
214 APA Corp 4,460 0.11
21 Apogee Enterprises Inc 806 0.02
25 Applied Industrial Technologies Inc 2,416 0.06
38 Aptinyx Inc 97 -
130 Aramark 4,851 0.12
6 Aravive Inc 31 -
3 ARC Document Solutions Inc 6 -
12 ArcBest Corp 927 0.02
168 Arch Capital Group Ltd 6,689 0.17
11 Arch Resources Inc 645 0.02
98 Archrock Inc 900 0.02
89 Arconic Corp 3,221 0.08
34 Arcosa Inc 2,130 0.05
29 Ardmore Shipping Corp 129 -
24 Arena Pharmaceuticals Inc 1,464 0.04
8 Argan Inc 400 0.01
23 Argo Group International Holdings Ltd 1,260 0.03
1 Ark Restaurants Corp 25 -
63 Arlo Technologies Inc 423 0.01
18 Armstrong Flooring Inc 111 -
55 Arrow Electronics Inc 6,581 0.17
11 Arrow Financial Corp 423 0.01
13 Asbury Automotive Group Inc 2,619 0.07
33 ASGN Inc 3,392 0.09
41 Ashland Global Holdings Inc 3,885 0.10
11 Aspen Aerogels Inc 233 0.01
14 Assertio Holdings Inc 25 -
109 Associated Banc-Corp 2,513 0.06
3 Associated Capital Group Inc 121 -
39 Assurant Inc 6,236 0.16
53 Assured Guaranty Ltd 2,541 0.07
16 Astec Industries Inc 1,123 0.03
18 Astronics Corp, Class A 306 0.01
2 Astronics Corp, Class B 39 -
6 AstroNova Inc 92 -
44 At Home Group Inc 1,650 0.04
126 Athene Holding Ltd 7,922 0.20
17 Atlantic Capital Bancshares Inc 465 0.01
56 Atlantic Union Bankshares Corp 2,309 0.06
17 Atlas Air Worldwide Holdings Inc 1,260 0.03
11 ATN International Inc 507 0.01
- Auburn National BanCorp Inc 15 -
121 Audacy Inc 525 0.01
Shares (000's)
Value(000's)
USD
% of NetAssetValue
Common Stock (continued)
United States - 65.27% (continued)
51 Autoliv Inc 5,417 0.14
63 AutoNation Inc 6,421 0.16
31 Avanos Medical Inc 1,251 0.03
12 Aviat Networks Inc 440 0.01
54 Avient Corp 2,800 0.07
65 Avnet Inc 2,870 0.07
10 Aware Inc 38 -
266 AXA Equitable Holdings Inc 8,442 0.22
23 Axcelis Technologies Inc 973 0.03
58 Axis Capital Holdings Ltd 3,125 0.08
41 Axos Financial Inc 1,964 0.05
39 AXT Inc 395 0.01
19 AZZ Inc 1,004 0.03
26 B&G Foods Inc 800 0.02
306 Baker Hughes Co 7,470 0.19
14 Ballantyne Strong Inc 75 -
13 Bally's Corp 779 0.02
37 Banc of California Inc 642 0.02
22 BancFirst Corp 1,514 0.04
51 Bancorp Inc 1,235 0.03
73 BancorpSouth Bank 2,220 0.06
16 Bank of Commerce Holdings 241 0.01
10 Bank of Hawaii Corp 938 0.02
10 Bank of Marin Bancorp 324 0.01
35 Bank of NT Butterfield & Son Ltd 1,338 0.03
6 Bank of Princeton 168 -
90 Bank OZK 3,863 0.10
14 BankFinancial Corp 153 -
64 BankUnited Inc 3,060 0.08
7 Bankwell Financial Group Inc 204 0.01
26 Banner Corp 1,500 0.04
13 Bar Harbor Bankshares 382 0.01
45 Barnes & Noble Education Inc 371 0.01
32 Barnes Group Inc 1,712 0.04
2 Bassett Furniture Industries Inc 64 -
2 Battalion Oil Corp 29 -
6 BayCom Corp 111 -
7 BBX Capital Inc 50 -
15 BCB Bancorp Inc 220 0.01
49 Beacon Roofing Supply Inc 2,755 0.07
6 Beasley Broadcast Group Inc 16 -
30 Beazer Homes USA Inc 706 0.02
74 Bed Bath & Beyond Inc 2,071 0.05
10 Bel Fuse Inc 162 -
25 Belden Inc 1,241 0.03
16 Benchmark Electronics Inc 486 0.01
40 Berkshire Hills Bancorp Inc 1,121 0.03
48 Berry Corp 307 0.01
4 Berry Global Group Inc 300 0.01
12 Big 5 Sporting Goods Corp 378 0.01
27 Big Lots Inc 1,653 0.04
- Biglari Holdings Inc, Class A 125 -
2 Biglari Holdings Inc, Class B 244 0.01
12 Bio-Rad Laboratories Inc 7,280 0.19
12 BJ's Restaurants Inc 676 0.02
2 BK Technologies Corp 8 -
26 Blucora Inc 448 0.01
7 Bluegreen Vacations Holding Corp 140 -
4 BM Technologies Inc 55 -
25 Boise Cascade Co 1,639 0.04
48 BOK Financial Corp 4,330 0.11
15 Bonanza Creek Energy Inc 654 0.02
Global Targeted Value FundPortfolio of Investments as at 31 May 2021 (continued)
Dimensional Fund Advisors Semi-Annual Report and Unaudited Financial Statements, 31 May 2021 292

Shares (000's)
Value(000's)
USD
% of NetAssetValue
Common Stock (continued)
United States - 65.27% (continued)
20 Boot Barn Holdings Inc 1,555 0.04
146 BorgWarner Inc 7,498 0.19
8 Boston Omaha Corp 242 0.01
65 Boston Private Financial Holdings Inc 997 0.03
28 Brady Corp 1,618 0.04
7 Bridgewater Bancshares Inc 119 -
55 Brighthouse Financial Inc 2,692 0.07
40 BrightView Holdings Inc 686 0.02
2 Bristow Group Inc 41 -
8 Broadwind Energy Inc 36 -
152 Brookdale Senior Living Inc 1,022 0.03
91 Brookfield Renewable Corp 3,886 0.10
60 Brookline Bancorp Inc 1,011 0.03
41 Brooks Automation Inc 4,228 0.11
44 Brunswick Corp 4,450 0.11
13 Bryn Mawr Bank Corp 644 0.02
9 BSQUARE Corp 20 -
33 Buckle Inc 1,376 0.04
10 Build-A-Bear Workshop Inc 146 -
134 Builders FirstSource Inc 5,968 0.15
100 Bunge Ltd 8,669 0.22
2 Business First Bancshares Inc 39 -
20 Byline Bancorp Inc 454 0.01
3 C&F Financial Corp 152 -
37 Cabot Corp 2,384 0.06
111 Cabot Oil & Gas Corp 1,822 0.05
16 CACI International Inc 3,976 0.10
85 Cadence BanCorp 1,903 0.05
89 Caesars Entertainment Inc 9,529 0.24
12 CAI International Inc 498 0.01
23 CalAmp Corp 316 0.01
- Caledonia Mining Corp PLC 6 -
24 Caleres Inc 590 0.02
51 Callaway Golf Co 1,895 0.05
20 Callon Petroleum Co 787 0.02
26 Cal-Maine Foods Inc 911 0.02
2 Cambridge Bancorp 158 -
12 Camden National Corp 582 0.02
45 Cannae Holdings Inc 1,607 0.04
9 Cantel Medical Corp 734 0.02
3 Capital Bancorp Inc 73 -
14 Capital City Bank Group Inc 367 0.01
100 Capitol Federal Financial Inc 1,292 0.03
85 Capri Holdings Ltd 4,819 0.12
13 Capstar Financial Holdings Inc 278 0.01
13 Cardtronics PLC 487 0.01
31 Carlisle Cos Inc 5,941 0.15
28 CarMax Inc 3,221 0.08
282 Carnival Corp 8,348 0.21
26 Carpenter Technology Corp 1,247 0.03
14 Carriage Services Inc 531 0.01
41 Carrols Restaurant Group Inc 241 0.01
54 Cars.com Inc 793 0.02
6 Casey's General Stores Inc 1,267 0.03
11 Cass Information Systems Inc 491 0.01
14 Catalyst Biosciences Inc 58 -
3 Catalyst Pharmaceuticals Inc 17 -
55 Cathay General Bancorp 2,288 0.06
21 Cato Corp 323 0.01
6 Cavco Industries Inc 1,349 0.03
27 CBIZ Inc 908 0.02
11 Cboe Global Markets Inc 1,214 0.03
Shares (000's)
Value(000's)
USD
% of NetAssetValue
Common Stock (continued)
United States - 65.27% (continued)
21 CBTX Inc 630 0.02
- CCUR Holdings Inc 7 -
31 CECO Environmental Corp 236 0.01
4 Celldex Therapeutics Inc 117 -
189 Centennial Resource Development Inc 997 0.03
31 Central Garden & Pet Co (non-voting rights) 1,549 0.04
9 Central Garden & Pet Co (voting rights) 517 0.01
16 Central Pacific Financial Corp 455 0.01
10 Central Valley Community Bancorp 216 0.01
63 Century Aluminum Co 862 0.02
3 Century Bancorp Inc 363 0.01
22 Century Communities Inc 1,751 0.04
23 Cerence Inc 2,181 0.06
93 CF Industries Holdings Inc 4,945 0.13
56 ChampionX Corp 1,478 0.04
20 ChannelAdvisor Corp 481 0.01
7 Charles Schwab Corp 545 0.01
24 Chart Industries Inc 3,538 0.09
18 Cheesecake Factory Inc 1,075 0.03
20 Chefs' Warehouse Inc 626 0.02
79 Chemours Co 2,840 0.07
4 Chemung Financial Corp 203 0.01
101 Chico's FAS Inc 469 0.01
50 Chimerix Inc 390 0.01
13 Chuy's Holdings Inc 538 0.01
92 Ciena Corp 4,887 0.12
60 Cimarex Energy Co 4,095 0.10
20 Cincinnati Financial Corp 2,421 0.06
73 Cinemark Holdings Inc 1,655 0.04
17 CIRCOR International Inc 625 0.02
32 Cirrus Logic Inc 2,502 0.06
68 CIT Group Inc 3,616 0.09
9 Citi Trends Inc 781 0.02
9 Citizens & Northern Corp 212 0.01
7 Citizens Community Bancorp Inc 95 -
203 Citizens Financial Group Inc 10,150 0.26
11 City Holding Co 896 0.02
10 Civeo Corp 153 -
15 Civista Bancshares Inc 355 0.01
23 Clarus Corp 541 0.01
136 Clean Energy Fuels Corp 1,079 0.03
34 Clean Harbors Inc 3,204 0.08
9 Clearfield Inc 351 0.01
8 ClearOne Inc 20 -
9 Clearwater Paper Corp 267 0.01
17 CMC Materials Inc 2,653 0.07
31 CNA Financial Corp 1,476 0.04
12 CNB Financial Corp 297 0.01
57 CNO Financial Group Inc 1,514 0.04
157 CNX Resources Corp 2,142 0.05
3 Coastal Financial Corp 91 -
7 Codorus Valley Bancorp Inc 137 -
140 Coeur Mining Inc 1,452 0.04
41 Cognyte Software Ltd 1,054 0.03
14 Coherent Inc 3,735 0.10
23 Cohu Inc 842 0.02
82 Colfax Corp 3,620 0.09
7 Colony Bankcorp Inc 130 -
48 Columbia Banking System Inc 2,080 0.05
50 Columbia Financial Inc 882 0.02
15 Columbia Sportswear Co 1,575 0.04
15 Columbus McKinnon Corp 774 0.02
Global Targeted Value FundPortfolio of Investments as at 31 May 2021 (continued)
Dimensional Fund Advisors Semi-Annual Report and Unaudited Financial Statements, 31 May 2021 293

Shares (000's)
Value(000's)
USD
% of NetAssetValue
Common Stock (continued)
United States - 65.27% (continued)
97 Comerica Inc 7,605 0.19
24 Comfort Systems USA Inc 2,000 0.05
53 Commerce Bancshares Inc 4,102 0.10
51 Commercial Metals Co 1,601 0.04
22 Commercial Vehicle Group Inc 257 0.01
9 Communications Systems Inc 57 -
32 Community Bank System Inc 2,587 0.07
21 Community Bankers Trust Corp 183 -
5 Community Financial Corp 166 -
13 Community Trust Bancorp Inc 591 0.02
11 Computer Programs & Systems Inc 371 0.01
14 Computer Task Group Inc 141 -
50 comScore Inc 199 0.01
16 Comstock Resources Inc 89 -
9 Comtech Telecommunications Corp 225 0.01
188 Conagra Brands Inc 7,157 0.18
37 Concentrix Corp 5,704 0.15
5 Concert Pharmaceuticals Inc 21 -
158 Conduent Inc 1,199 0.03
28 ConnectOne Bancorp Inc 775 0.02
22 Conn's Inc 518 0.01
12 CONSOL Energy Inc 187 0.01
62 Consolidated Communications Holdings Inc 579 0.02
19 Construction Partners Inc 606 0.02
20 Consumer Portfolio Services Inc 94 -
13 Container Store Group Inc 177 -
60 Continental Resources Inc 1,963 0.05
24 Contra Zagg Inc 2 -
38 Cooper Tire & Rubber Co 2,230 0.06
13 Cooper-Standard Holdings Inc 374 0.01
19 Copa Holdings SA 1,582 0.04
3 Core Molding Technologies Inc 36 -
27 CoreLogic Inc 2,118 0.05
32 Core-Mark Holding Co Inc 1,445 0.04
93 Costamare Inc 999 0.03
394 Coty Inc 3,510 0.09
6 County Bancorp Inc 142 -
10 Covenant Transportation Group Inc 227 0.01
45 Covetrus Inc 1,244 0.03
22 Cowen Inc 860 0.02
5 CRA International Inc 390 0.01
28 Crane Co 2,701 0.07
9 Crawford & Co, Class A 88 -
9 Crawford & Co, Class B 84 -
32 Cross Country Healthcare Inc 504 0.01
5 Crown Crafts Inc 40 -
23 CryoLife Inc 674 0.02
9 CSW Industrials Inc 1,110 0.03
22 CTS Corp 852 0.02
39 Cullen/Frost Bankers Inc 4,730 0.12
11 Culp Inc 184 0.01
15 Cumberland Pharmaceuticals Inc 43 -
7 Cumulus Media Inc 76 -
26 Curtiss-Wright Corp 3,204 0.08
18 Cushman & Wakefield PLC 343 0.01
28 Customers Bancorp Inc 1,048 0.03
85 CVB Financial Corp 1,881 0.05
40 CVR Energy Inc 829 0.02
6 CyberOptics Corp 164 -
43 Daktronics Inc 289 0.01
105 Dana Inc 2,856 0.07
112 Darling Ingredients Inc 7,663 0.20
Shares (000's)
Value(000's)
USD
% of NetAssetValue
Common Stock (continued)
United States - 65.27% (continued)
20 Dawson Geophysical Co 48 -
33 Del Taco Restaurants Inc 338 0.01
51 Delek US Holdings Inc 1,128 0.03
2 Delta Apparel Inc 69 -
26 Deluxe Corp 1,174 0.03
7 Denbury Inc 447 0.01
77 Dentsply Sirona Inc 5,170 0.13
34 Designer Brands Inc 601 0.02
409 Devon Energy Corp 10,862 0.28
48 DHI Group Inc 154 -
116 DHT Holdings Inc 742 0.02
2 Diamond Hill Investment Group Inc 404 0.01
97 Diamondback Energy Inc 7,739 0.20
43 Dick's Sporting Goods Inc 4,166 0.11
16 Digi International Inc 295 0.01
16 Dillard's Inc 2,175 0.06
34 Dime Community Bancshares Inc 1,166 0.03
34 Diodes Inc 2,564 0.07
58 Discover Financial Services 6,842 0.17
69 Discovery Inc, Class A 2,200 0.06
136 Discovery Inc, Class C 4,085 0.10
83 DISH Network Corp 3,633 0.09
5 DLH Holdings Corp 60 -
8 DMC Global Inc 441 0.01
36 Dolby Laboratories Inc 3,555 0.09
110 Dollar Tree Inc 10,726 0.27
37 Domtar Corp 1,988 0.05
21 Donegal Group Inc 317 0.01
23 Donnelley Financial Solutions Inc 684 0.02
20 Dorian LPG Ltd 283 0.01
21 Dorman Products Inc 2,181 0.06
11 Douglas Dynamics Inc 494 0.01
26 Dril-Quip Inc 860 0.02
6 Ducommun Inc 327 0.01
168 DXC Technology Co 6,358 0.16
13 DXP Enterprises Inc 407 0.01
20 Dycom Industries Inc 1,506 0.04
5 DZS Inc 88 -
22 Eagle Bancorp Inc 1,268 0.03
5 Eagle Bancorp Montana Inc 119 -
7 Eagle Bulk Shipping Inc 342 0.01
19 Earthstone Energy Inc 184 0.01
86 East West Bancorp Inc 6,417 0.16
5 Eastern Co 148 -
83 Eastman Chemical Co 10,396 0.27
19 Ebix Inc 513 0.01
18 Echo Global Logistics Inc 612 0.02
34 EchoStar Corp 912 0.02
37 Edgewell Personal Care Co 1,692 0.04
26 El Pollo Loco Holdings Inc 442 0.01
3 Elanco Animal Health Inc (non-voting rights) - -
173 Elanco Animal Health Inc (voting rights) 6,208 0.16
3 Electromed Inc 34 -
177 Element Solutions Inc 4,129 0.11
13 Elevate Credit Inc 47 -
36 EMCOR Group Inc 4,477 0.11
26 EMCORE Corp 256 0.01
28 Emerald Holding Inc 157 -
31 Emergent BioSolutions Inc 1,903 0.05
20 Employers Holdings Inc 851 0.02
12 Enanta Pharmaceuticals Inc 599 0.02
23 Encore Capital Group Inc 1,077 0.03
Global Targeted Value FundPortfolio of Investments as at 31 May 2021 (continued)
Dimensional Fund Advisors Semi-Annual Report and Unaudited Financial Statements, 31 May 2021 294

Shares (000's)
Value(000's)
USD
% of NetAssetValue
Common Stock (continued)
United States - 65.27% (continued)
11 Encore Wire Corp 885 0.02
24 Enerpac Tool Group Corp 658 0.02
25 EnerSys 2,357 0.06
5 Eneti Inc 93 -
311 EnLink Midstream LLC 1,519 0.04
15 Ennis Inc 305 0.01
32 Enova International Inc 1,200 0.03
13 EnPro Industries Inc 1,230 0.03
12 Enstar Group Ltd 3,147 0.08
7 Enterprise Bancorp Inc 242 0.01
19 Enterprise Financial Services Corp 929 0.02
51 Entravision Communications Corp 237 0.01
11 Envestnet Inc 813 0.02
58 Envista Holdings Corp 2,552 0.07
38 Enzo Biochem Inc 116 -
9 ePlus Inc 846 0.02
6 Epsilon Energy Ltd 26 -
185 EQT Corp 3,869 0.10
124 Equitrans Midstream Corp 1,019 0.03
12 Equity Bancshares Inc 410 0.01
14 Escalade Inc 336 0.01
17 ESCO Technologies Inc 1,605 0.04
1 Espey Manufacturing & Electronics Corp 14 -
4 Esquire Financial Holdings Inc 90 -
7 ESSA Bancorp Inc 108 -
61 Essent Group Ltd 2,925 0.07
18 Ethan Allen Interiors Inc 520 0.01
4 Evans Bancorp Inc 134 -
25 Everest Re Group Ltd 6,510 0.17
66 Evolent Health Inc 1,280 0.03
23 Evolution Petroleum Corp 85 -
36 EW Scripps Co 772 0.02
76 Exelixis Inc 1,703 0.04
21 ExlService Holdings Inc 2,117 0.05
114 Extended Stay America Inc 2,247 0.06
26 Exterran Corp 123 -
42 EZCORP Inc 312 0.01
- F5 Networks Inc 34 -
24 Fabrinet 2,178 0.06
17 Farmer Brothers Co 199 0.01
4 Farmers & Merchants Bancorp Inc 97 -
18 Farmers National Banc Corp 314 0.01
3 FARO Technologies Inc 222 0.01
32 FB Financial Corp 1,344 0.03
7 Federal Agricultural Mortgage Corp 757 0.02
40 Federal Signal Corp 1,695 0.04
13 FedNat Holding Co 61 -
54 Ferro Corp 1,174 0.03
108 Ferroglobe PLC 559 0.01
29 Ferroglobe Representation & Warrants InsuranceTrust - -
118 Fidelity National Financial Inc 5,536 0.14
24 Fiesta Restaurant Group Inc 332 0.01
173 Fifth Third Bancorp 7,306 0.19
14 Financial Institutions Inc 447 0.01
78 First American Financial Corp 5,006 0.13
21 First Bancorp 911 0.02
154 First Bancorp (Puerto Rico listing) 1,975 0.05
7 First Bancorp Inc 231 0.01
13 First Bancshares Inc 502 0.01
8 First Bank 111 -
41 First Busey Corp 1,098 0.03
Shares (000's)
Value(000's)
USD
% of NetAssetValue
Common Stock (continued)
United States - 65.27% (continued)
7 First Business Financial Services Inc 189 0.01
8 First Choice Bancorp 258 0.01
7 First Citizens BancShares Inc 5,715 0.15
72 First Commonwealth Financial Corp 1,096 0.03
15 First Community Bankshares Inc 480 0.01
6 First Community Corp 124 -
71 First Financial Bancorp 1,797 0.05
10 First Financial Corp 467 0.01
8 First Financial Northwest Inc 113 -
35 First Foundation Inc 887 0.02
3 First Guaranty Bancshares Inc 52 -
89 First Hawaiian Inc 2,494 0.06
396 First Horizon National Corp 7,558 0.19
9 First Internet Bancorp 297 0.01
29 First Interstate BancSystem Inc 1,345 0.03
37 First Merchants Corp 1,703 0.04
12 First Mid Bancshares Inc 509 0.01
80 First Midwest Bancorp Inc 1,684 0.04
11 First Northwest Bancorp 189 0.01
19 First of Long Island Corp 433 0.01
1 First Savings Financial Group Inc 56 -
77 First Solar Inc 5,853 0.15
7 First United Corp 127 -
1 First US Bancshares Inc 12 -
2 First Western Financial Inc 46 -
10 FirstCash Inc 788 0.02
24 Five Star Senior Living Inc 142 -
36 Flagstar Bancorp Inc 1,666 0.04
300 Flex Ltd 5,482 0.14
8 Flexsteel Industries Inc 360 0.01
36 Flotek Industries Inc 78 -
23 Flowers Foods Inc 542 0.01
18 Flowserve Corp 783 0.02
14 Fluent Inc 40 -
7 Fluidigm Corp 41 -
77 Fluor Corp 1,416 0.04
23 Flushing Financial Corp 534 0.01
222 FNB Corp 2,973 0.08
6 FONAR Corp 106 -
75 Foot Locker Inc 4,754 0.12
36 Forestar Group Inc 840 0.02
55 FormFactor Inc 1,926 0.05
15 Fortitude Gold Corp 128 -
64 Fortune Brands Home & Security Inc 6,555 0.17
2 Forum Energy Technologies Inc 47 -
18 Forward Air Corp 1,791 0.05
44 Fossil Group Inc 616 0.02
164 Fox Corp, Class A 6,120 0.16
124 Fox Corp, Class B 4,491 0.11
17 Franklin Electric Co Inc 1,443 0.04
3 Franklin Financial Services Corp 83 -
331 Franklin Resources Inc 11,314 0.29
167 Frank's International NV 562 0.01
195 Freeport-McMoRan Inc 8,314 0.21
9 FreightCar America Inc 57 -
8 Frequency Electronics Inc 81 -
23 Fresh Del Monte Produce Inc 758 0.02
4 Friedman Industries Inc 54 -
9 FRP Holdings Inc 498 0.01
4 FS Bancorp Inc 286 0.01
23 FTI Consulting Inc 3,206 0.08
17 Full House Resorts Inc 193 0.01
Global Targeted Value FundPortfolio of Investments as at 31 May 2021 (continued)
Dimensional Fund Advisors Semi-Annual Report and Unaudited Financial Statements, 31 May 2021 295

Shares (000's)
Value(000's)
USD
% of NetAssetValue
Common Stock (continued)
United States - 65.27% (continued)
112 Fulton Financial Corp 1,941 0.05
35 FutureFuel Corp 355 0.01
3 FVCBankcorp Inc 58 -
96 Gannett Co Inc 495 0.01
62 GasLog Ltd 358 0.01
62 Gates Industrial Corp PLC 1,131 0.03
17 GATX Corp 1,707 0.04
47 GCP Applied Technologies Inc 1,155 0.03
9 Genasys Inc 47 -
34 Genco Shipping & Trading Ltd 544 0.01
12 Gencor Industries Inc 145 -
11 Genesco Inc 622 0.02
19 Genie Energy Ltd 115 -
3 Genpact Ltd 153 -
134 Gentex Corp 4,760 0.12
22 Gentherm Inc 1,581 0.04
177 Genworth Financial Inc 744 0.02
13 Geospace Technologies Corp 105 -
17 German American Bancorp Inc 691 0.02
21 Gibraltar Industries Inc 1,706 0.04
32 G-III Apparel Group Ltd 1,054 0.03
49 Glacier Bancorp Inc 2,830 0.07
23 Glatfelter Corp 343 0.01
8 Global Indemnity Group LLC 252 0.01
61 Globe Life Inc 6,450 0.16
13 Globus Medical Inc 925 0.02
32 GlycoMimetics Inc 82 -
33 GMS Inc 1,524 0.04
53 Gold Resource Corp 148 -
7 Goodrich Petroleum Corp 73 -
167 Goodyear Tire & Rubber Co 3,307 0.08
17 Gorman-Rupp Co 628 0.02
17 GP Strategies Corp 298 0.01
3 Graham Holdings Co 2,039 0.05
17 Grand Canyon Education Inc 1,556 0.04
28 Granite Construction Inc 1,143 0.03
178 Graphic Packaging Holding Co 3,151 0.08
63 Gray Television Inc 1,473 0.04
45 Great Lakes Dredge & Dock Corp 661 0.02
10 Great Southern Bancorp Inc 563 0.01
40 Great Western Bancorp Inc 1,333 0.03
36 Green Brick Partners Inc 851 0.02
29 Green Dot Corp 1,187 0.03
21 Green Plains Inc 685 0.02
23 Greenbrier Cos Inc 1,033 0.03
1 Greene County Bancorp Inc 40 -
27 Greenlight Capital Re Ltd 251 0.01
18 Greif Inc (non-voting rights) 1,104 0.03
10 Greif Inc (voting rights) 571 0.01
19 Griffon Corp 494 0.01
9 Group 1 Automotive Inc 1,478 0.04
34 Grubhub Inc 2,047 0.05
11 GSI Technology Inc 67 -
5 Guaranty Bancshares Inc 197 0.01
54 Guess? Inc 1,599 0.04
12 Gulf Island Fabrication Inc 61 -
9 H&E Equipment Services Inc 326 0.01
6 Hackett Group Inc 105 -
58 Hain Celestial Group Inc 2,381 0.06
462 Halliburton Co 10,380 0.26
14 Hallmark Financial Services Inc 62 -
58 Hancock Whitney Corp 2,847 0.07
Shares (000's)
Value(000's)
USD
% of NetAssetValue
Common Stock (continued)
United States - 65.27% (continued)
22 Hanmi Financial Corp 466 0.01
26 Hanover Insurance Group Inc 3,586 0.09
34 HarborOne Bancorp Inc 508 0.01
102 Harley-Davidson Inc 4,951 0.13
62 Harmonic Inc 434 0.01
26 Harsco Corp 581 0.02
171 Hartford Financial Services Group Inc 11,150 0.28
31 Harvard Bioscience Inc 214 0.01
- Hasbro Inc 15 -
10 Haverty Furniture Cos Inc 448 0.01
25 Hawaiian Holdings Inc 657 0.02
16 Hawkins Inc 537 0.01
5 Hawthorn Bancshares Inc 119 -
7 Haynes International Inc 261 0.01
34 HB Fuller Co 2,322 0.06
6 HCI Group Inc 496 0.01
24 HealthEquity Inc 2,032 0.05
22 HealthStream Inc 566 0.01
54 Heartland Express Inc 976 0.03
26 Heartland Financial USA Inc 1,308 0.03
410 Hecla Mining Co 3,692 0.09
15 Heidrick & Struggles International Inc 644 0.02
14 Helen of Troy Ltd 2,999 0.08
21 Helios Technologies Inc 1,506 0.04
101 Helix Energy Solutions Group Inc 527 0.01
70 Helmerich & Payne Inc 1,972 0.05
16 Hemisphere Media Group Inc 203 0.01
7 Hennessy Advisors Inc 61 -
51 Henry Schein Inc 3,890 0.10
18 Herc Holdings Inc 2,086 0.05
47 Heritage Commerce Corp 561 0.01
27 Heritage Financial Corp 794 0.02
25 Heritage Insurance Holdings Inc 210 0.01
17 Heritage-Crystal Clean Inc 539 0.01
38 Herman Miller Inc 1,818 0.05
637 Hewlett Packard Enterprise Co 10,163 0.26
8 Hibbett Sports Inc 691 0.02
40 Hill International Inc 102 -
5 Hill-Rom Holdings Inc 572 0.01
57 Hilltop Holdings Inc 2,108 0.05
2 Hingham Institution for Savings 457 0.01
28 HNI Corp 1,289 0.03
113 HollyFrontier Corp 3,680 0.09
5 Home Bancorp Inc 201 0.01
113 Home BancShares Inc 3,085 0.08
16 HomeStreet Inc 736 0.02
11 HomeTrust Bancshares Inc 317 0.01
11 Hooker Furniture Corp 404 0.01
88 Hope Bancorp Inc 1,352 0.03
23 Horace Mann Educators Corp 909 0.02
28 Horizon Bancorp Inc 515 0.01
13 Horizon Therapeutics PLC 1,158 0.03
82 Hostess Brands Inc 1,291 0.03
105 Houghton Mifflin Harcourt Co 1,039 0.03
17 Houston Wire & Cable Co 88 -
15 Howard Bancorp Inc 251 0.01
31 Howard Hughes Corp 3,278 0.08
283 Howmet Aerospace Inc 10,039 0.26
22 Hub Group Inc 1,542 0.04
1 Hubbell Inc 124 -
1 Hudson Global Inc 15 -
709 Huntington Bancshares Inc 11,246 0.29
Global Targeted Value FundPortfolio of Investments as at 31 May 2021 (continued)
Dimensional Fund Advisors Semi-Annual Report and Unaudited Financial Statements, 31 May 2021 296

Shares (000's)
Value(000's)
USD
% of NetAssetValue
Common Stock (continued)
United States - 65.27% (continued)
4 Huntington Ingalls Industries Inc 875 0.02
150 Huntsman Corp 4,248 0.11
5 Hurco Cos Inc 172 -
14 Huron Consulting Group Inc 778 0.02
19 Hyatt Hotels Corp 1,470 0.04
9 Hyster-Yale Materials Handling Inc 697 0.02
12 ICF International Inc 1,056 0.03
17 Ichor Holdings Ltd 944 0.02
8 ICU Medical Inc 1,697 0.04
2 Identiv Inc 26 -
7 IEC Electronics Corp 76 -
8 IES Holdings Inc 437 0.01
42 IMAX Corp 898 0.02
1 Independence Contract Drilling Inc 4 -
13 Independence Holding Co 558 0.01
21 Independent Bank Corp (Massachusetts) 1,731 0.04
20 Independent Bank Corp (Michigan) 464 0.01
33 Independent Bank Group Inc 2,614 0.07
34 Information Services Group Inc 200 0.01
190 Ingersoll Rand Inc 9,410 0.24
6 Ingles Markets Inc 363 0.01
42 Ingredion Inc 3,994 0.10
12 Innodata Inc 74 -
15 Innospec Inc 1,527 0.04
3 Innovative Solutions & Support Inc 17 -
3 Innoviva Inc 43 -
9 Inogen Inc 547 0.01
23 Insight Enterprises Inc 2,408 0.06
16 Insteel Industries Inc 572 0.01
20 Integer Holdings Corp 1,804 0.05
25 Integra LifeSciences Holdings Corp 1,718 0.04
8 Inter Parfums Inc 588 0.02
22 InterDigital Inc 1,797 0.05
39 Interface Inc 633 0.02
44 International Bancshares Corp 2,040 0.05
133 International Game Technology PLC 3,234 0.08
152 International Paper Co 9,602 0.25
24 International Seaways Inc 471 0.01
246 Interpublic Group of Cos Inc 8,283 0.21
6 inTEST Corp 90 -
21 Intevac Inc 145 -
10 Intrepid Potash Inc 300 0.01
6 IntriCon Corp 130 -
29 Invacare Corp 236 0.01
325 Invesco Ltd 9,261 0.24
8 Investar Holding Corp 187 0.01
168 Investors Bancorp Inc 2,497 0.06
1 Investors Title Co 259 0.01
20 IPG Photonics Corp 4,110 0.11
81 Iridium Communications Inc 3,104 0.08
1 Itron Inc 134 -
55 ITT Inc 5,186 0.13
13 J Alexander's Holdings Inc 160 -
7 J&J Snack Foods Corp 1,161 0.03
6 j2 Global Inc 728 0.02
97 Jabil Inc 5,488 0.14
75 Jacobs Engineering Group Inc 10,610 0.27
21 James River Group Holdings Ltd 724 0.02
134 Janus Henderson Group PLC 5,145 0.13
35 Jazz Pharmaceuticals PLC 6,211 0.16
171 Jefferies Financial Group Inc 5,505 0.14
67 JELD-WEN Holding Inc 1,868 0.05
Shares (000's)
Value(000's)
USD
% of NetAssetValue
Common Stock (continued)
United States - 65.27% (continued)
195 JetBlue Airways Corp 3,916 0.10
54 JM Smucker Co 7,147 0.18
2 John B Sanfilippo & Son Inc 208 0.01
28 John Wiley & Sons Inc, Class A 1,743 0.04
6 Johnson Outdoors Inc 731 0.02
34 Jones Lang LaSalle Inc 6,969 0.18
5 Jounce Therapeutics Inc 36 -
108 Juniper Networks Inc 2,846 0.07
8 Kadant Inc 1,273 0.03
6 Kaiser Aluminum Corp 751 0.02
11 Kansas City Southern 3,270 0.08
73 KAR Auction Services Inc 1,312 0.03
66 KB Home 3,089 0.08
99 KBR Inc 4,036 0.10
65 Kearny Financial Corp 847 0.02
17 Kelly Services Inc 439 0.01
40 Kemper Corp 3,012 0.08
52 Kennametal Inc 1,943 0.05
61 Kennedy-Wilson Holdings Inc 1,201 0.03
1 Kewaunee Scientific Corp 16 -
6 Key Tronic Corp 38 -
583 KeyCorp 13,440 0.34
17 Kimball Electronics Inc 373 0.01
26 Kimball International Inc 346 0.01
9 Kingstone Cos Inc 74 -
41 Kirby Corp 2,701 0.07
120 Knight-Swift Transportation Holdings Inc 5,725 0.15
36 Knoll Inc 929 0.02
65 Knowles Corp 1,343 0.03
110 Kohl's Corp 6,088 0.16
38 Korn Ferry 2,463 0.06
274 Kosmos Energy Ltd 871 0.02
26 Kraton Corp 891 0.02
32 Kratos Defense & Security Solutions Inc 808 0.02
244 Kroger Co 9,029 0.23
48 Kronos Worldwide Inc 786 0.02
32 Kulicke & Soffa Industries Inc 1,665 0.04
16 KVH Industries Inc 234 0.01
20 Laboratory Corp of America Holdings 5,518 0.14
41 Lakeland Bancorp Inc 772 0.02
17 Lakeland Financial Corp 1,070 0.03
8 Lakeland Industries Inc 191 0.01
18 Landec Corp 210 0.01
3 Landmark Bancorp Inc 71 -
20 Lands' End Inc 504 0.01
27 Lannett Co Inc 116 -
17 Lantheus Holdings Inc 400 0.01
10 Lantronix Inc 57 -
9 Laredo Petroleum Inc 498 0.01
62 Laureate Education Inc 908 0.02
7 Lawson Products Inc 401 0.01
32 La-Z-Boy Inc 1,304 0.03
10 LB Foster Co 183 -
17 LCI Industries 2,476 0.06
12 LCNB Corp 209 0.01
39 Lear Corp 7,594 0.19
45 Leidos Holdings Inc 4,573 0.12
56 LendingClub Corp 860 0.02
7 Lennar Corp, Class B 509 0.01
8 LENSAR Inc 65 -
5 Level One Bancorp Inc 127 -
15 LGI Homes Inc 2,793 0.07
Global Targeted Value FundPortfolio of Investments as at 31 May 2021 (continued)
Dimensional Fund Advisors Semi-Annual Report and Unaudited Financial Statements, 31 May 2021 297

Shares (000's)
Value(000's)
USD
% of NetAssetValue
Common Stock (continued)
United States - 65.27% (continued)
1 LGL Group Inc 15 -
17 LHC Group Inc 3,406 0.09
1 Liberty Broadband Corp, Class C 244 0.01
39 Liberty Latin America Ltd, Class A 559 0.01
129 Liberty Latin America Ltd, Class C 1,850 0.05
9 Liberty Media Corp-Liberty Braves, Class A 238 0.01
27 Liberty Media Corp-Liberty Braves, Class C 733 0.02
14 Liberty Media Corp-Liberty Formula One, Class A 559 0.01
46 Liberty Media Corp-Liberty Formula One, Class C 2,063 0.05
64 Liberty Media Corp-Liberty SiriusXM, Class A 2,812 0.07
149 Liberty Media Corp-Liberty SiriusXM, Class C 6,497 0.17
11 Liberty Oilfield Services Inc 158 -
52 Liberty TripAdvisor Holdings Inc 246 0.01
20 Lifetime Brands Inc 301 0.01
9 Ligand Pharmaceuticals Inc 1,088 0.03
7 Limbach Holdings Inc 62 -
2 Limoneira Co 45 -
3 Lincoln Educational Services Corp 21 -
126 Lincoln National Corp 8,763 0.22
60 Lions Gate Entertainment Corp, Class A 1,168 0.03
99 Lions Gate Entertainment Corp, Class B 1,714 0.04
27 Liquidity Services Inc 647 0.02
15 Lithia Motors Inc 5,239 0.13
14 Littelfuse Inc 3,634 0.09
5 LivaNova PLC 410 0.01
28 Live Oak Bancshares Inc 1,681 0.04
90 Livent Corp 1,751 0.04
5 LiveRamp Holdings Inc 263 0.01
154 LKQ Corp 7,822 0.20
193 Loews Corp 11,293 0.29
78 Louisiana-Pacific Corp 5,226 0.13
5 LS Starrett Co 48 -
25 LSB Industries Inc 158 -
26 LSI Industries Inc 241 0.01
20 Luby's Inc 73 -
7 Lumber Liquidators Holdings Inc 155 -
775 Lumen Technologies Inc 10,723 0.27
47 Lumentum Holdings Inc 3,793 0.10
23 Luminex Corp 849 0.02
5 Lumos Pharma Inc 56 -
24 Luna Innovations Inc 242 0.01
32 Luther Burbank Corp 390 0.01
15 Lydall Inc 554 0.01
58 M&T Bank Corp 9,387 0.24
14 M/I Homes Inc 979 0.03
26 Macatawa Bank Corp 247 0.01
10 Mackinac Financial Corp 223 0.01
61 Macquarie Infrastructure Corp 2,136 0.05
227 Macy's Inc 4,150 0.11
13 Magellan Health Inc 1,238 0.03
56 Maiden Holdings Ltd 199 0.01
2 MainStreet Bancshares Inc 49 -
3 Malibu Boats Inc 221 0.01
6 Malvern Bancorp Inc 120 -
8 Mammoth Energy Services Inc 30 -
10 Manitex International Inc 71 -
27 Manitowoc Co Inc 696 0.02
1 Mannatech Inc 20 -
3 Manning & Napier Inc 24 -
35 ManpowerGroup Inc 4,178 0.11
16 ManTech International Corp 1,361 0.04
531 Marathon Oil Corp 6,432 0.16
Shares (000's)
Value(000's)
USD
% of NetAssetValue
Common Stock (continued)
United States - 65.27% (continued)
35 Marchex Inc 89 -
21 Marcus & Millichap Inc 832 0.02
14 Marcus Corp 304 0.01
18 MarineMax Inc 924 0.02
5 Markel Corp 5,745 0.15
8 Marlin Business Services Corp 187 0.01
29 Marriott Vacations Worldwide Corp 4,980 0.13
36 Marten Transport Ltd 618 0.02
16 Masonite International Corp 1,902 0.05
49 MasTec Inc 5,646 0.14
8 Mastech Digital Inc 130 -
72 Matador Resources Co 2,192 0.06
12 Materion Corp 920 0.02
23 Matrix Service Co 254 0.01
28 Matson Inc 1,799 0.05
23 Matthews International Corp 898 0.02
20 Maxar Technologies Inc (Canada listing) 613 0.02
42 Maxar Technologies Inc (US listing) 1,314 0.03
53 MBIA Inc 525 0.01
16 McGrath RentCorp 1,370 0.04
32 MDC Holdings Inc 1,854 0.05
127 MDU Resources Group Inc 4,288 0.11
66 Media General Inc CVR 6 -
57 MEDNAX Inc 1,837 0.05
13 Mercantile Bank Corp 433 0.01
54 Mercer International Inc 802 0.02
5 Merchants Bancorp 218 0.01
35 Mercury General Corp 2,245 0.06
26 Mercury Systems Inc 1,714 0.04
29 Meredith Corp 978 0.03
41 Meridian Bancorp Inc 901 0.02
29 Meridian Bioscience Inc 595 0.02
35 Merit Medical Systems Inc 2,139 0.05
22 Meritage Homes Corp 2,392 0.06
8 Merrimack Pharmaceuticals Inc 48 -
21 Mesa Air Group Inc 205 0.01
28 Meta Financial Group Inc 1,500 0.04
26 Methode Electronics Inc 1,261 0.03
4 Metropolitan Bank Holding Corp 280 0.01
231 MGIC Investment Corp 3,397 0.09
11 MGP Ingredients Inc 784 0.02
4 MicroStrategy Inc 1,661 0.04
2 Mid Penn Bancorp Inc 48 -
17 Middleby Corp 2,723 0.07
5 Middlefield Banc Corp 114 -
20 Midland States Bancorp Inc 556 0.01
13 MidWestOne Financial Group Inc 415 0.01
6 Miller Industries Inc 233 0.01
3 MIND Technology Inc 6 -
25 Minerals Technologies Inc 2,174 0.06
23 Mistras Group Inc 238 0.01
33 MKS Instruments Inc 6,161 0.16
4 MMA Capital Holdings Inc 119 -
43 Modine Manufacturing Co 759 0.02
9 ModivCare Inc 1,312 0.03
48 Mohawk Industries Inc 10,184 0.26
135 Molson Coors Brewing Co 7,857 0.20
1 Monarch Casino & Resort Inc 60 -
1 Monitronics International Inc 7 -
22 Monro Inc 1,372 0.04
20 Moog Inc 1,824 0.05
257 Mosaic Co 9,295 0.24
Global Targeted Value FundPortfolio of Investments as at 31 May 2021 (continued)
Dimensional Fund Advisors Semi-Annual Report and Unaudited Financial Statements, 31 May 2021 298

Shares (000's)
Value(000's)
USD
% of NetAssetValue
Common Stock (continued)
United States - 65.27% (continued)
15 Motorcar Parts of America Inc 345 0.01
6 Movado Group Inc 170 -
63 Mr Cooper Group Inc 2,171 0.06
59 MRC Global Inc 635 0.02
26 MSC Industrial Direct Co Inc 2,490 0.06
38 Mueller Industries Inc 1,749 0.04
105 Mueller Water Products Inc 1,513 0.04
108 Murphy Oil Corp 2,342 0.06
5 Murphy USA Inc 645 0.02
7 MVB Financial Corp 282 0.01
24 Myers Industries Inc 531 0.01
11 MYR Group Inc 936 0.02
50 Myriad Genetics Inc 1,418 0.04
5 Nabors Industries Ltd 467 0.01
2 NACCO Industries Inc 59 -
20 National Bank Holdings Corp 809 0.02
2 National Bankshares Inc 81 -
10 National HealthCare Corp 764 0.02
49 National Vision Holdings Inc 2,438 0.06
3 National Western Life Group Inc 662 0.02
7 Natural Alternatives International Inc 93 -
13 Natural Gas Services Group Inc 139 -
18 Natural Grocers by Vitamin Cottage Inc 219 0.01
16 Nature's Sunshine Products Inc 332 0.01
3 Natus Medical Inc 91 -
21 Nautilus Inc 382 0.01
128 Navient Corp 2,343 0.06
30 NBT Bancorp Inc 1,158 0.03
48 NCR Corp 2,314 0.06
11 Neenah Inc 589 0.02
19 Nelnet Inc 1,471 0.04
28 NeoPhotonics Corp 281 0.01
20 NETGEAR Inc 759 0.02
56 NetScout Systems Inc 1,657 0.04
11 NetSol Technologies Inc 53 -
7 Network-1 Technologies Inc 22 -
16 New Home Co Inc 105 -
58 New Jersey Resources Corp 2,480 0.06
322 New York Community Bancorp Inc 3,851 0.10
238 Newell Brands Inc 6,831 0.17
62 Newmark Group Inc 797 0.02
5 Newpark Resources Inc 18 -
262 News Corp, Class A 7,077 0.18
136 News Corp, Class B 3,488 0.09
30 NewStar Financial Inc CVR 3 -
23 Nexa Resources SA 251 0.01
29 Nexstar Media Group Inc 4,461 0.11
49 NextGen Healthcare Inc 797 0.02
114 NexTier Oilfield Solutions Inc 487 0.01
10 NI Holdings Inc 198 0.01
6 Nicholas Financial Inc 67 -
6 Nicolet Bankshares Inc 459 0.01
217 Nielsen Holdings PLC 5,913 0.15
2 Nine Energy Service Inc 4 -
18 NL Industries Inc 131 -
45 NMI Holdings Inc 1,096 0.03
36 NN Inc 272 0.01
117 Nordic American Tankers Ltd 407 0.01
8 Northeast Bank 227 0.01
7 Northern Technologies International Corp 117 -
41 Northfield Bancorp Inc 693 0.02
5 Northrim BanCorp Inc 222 0.01
Shares (000's)
Value(000's)
USD
% of NetAssetValue
Common Stock (continued)
United States - 65.27% (continued)
93 Northwest Bancshares Inc 1,316 0.03
6 Northwest Pipe Co 195 0.01
125 Norwegian Cruise Line Holdings Ltd 3,978 0.10
3 Norwood Financial Corp 71 -
188 NOV Inc 3,031 0.08
70 NOW Inc 729 0.02
35 Nu Skin Enterprises Inc 2,128 0.05
139 Nucor Corp 14,275 0.36
16 NuVasive Inc 1,107 0.03
7 NV5 Global Inc 636 0.02
115 nVent Electric PLC 3,736 0.10
4 Oak Valley Bancorp 71 -
409 Occidental Petroleum Corp 10,617 0.27
72 Oceaneering International Inc 1,023 0.03
41 OceanFirst Financial Corp 913 0.02
1 Ocwen Financial Corp 41 -
36 ODP Corp 1,565 0.04
39 OFG Bancorp 942 0.02
1 Ohio Valley Banc Corp 17 -
47 Oil States International Inc 305 0.01
4 Oil-Dri Corp of America 138 -
115 Old National Bancorp 2,196 0.06
2 Old Point Financial Corp 44 -
208 Old Republic International Corp 5,462 0.14
25 Old Second Bancorp Inc 352 0.01
108 Olin Corp 5,256 0.13
- Ollie's Bargain Outlet Holdings Inc 23 -
10 Olympic Steel Inc 351 0.01
93 ON Semiconductor Corp 3,711 0.09
96 OneMain Holdings Inc 5,543 0.14
26 OneSpan Inc 686 0.02
14 Onto Innovation Inc 1,002 0.03
386 OPKO Health Inc 1,474 0.04
12 Oppenheimer Holdings Inc 591 0.02
7 Option Care Health Inc 125 -
46 OraSure Technologies Inc 442 0.01
57 ORBCOMM Inc 634 0.02
16 Origin Bancorp Inc 724 0.02
31 Orion Group Holdings Inc 188 0.01
5 Ormat Technologies Inc (Israel listing) 359 0.01
32 Ormat Technologies Inc (US listing) 2,237 0.06
9 Orrstown Financial Services Inc 217 0.01
13 Orthofix Medical Inc 515 0.01
44 Oshkosh Corp 5,819 0.15
12 OSI Systems Inc 1,148 0.03
24 Otonomy Inc 56 -
40 Overseas Shipholding Group Inc 92 -
161 Ovintiv Inc (Canada listing) 4,298 0.11
62 Owens & Minor Inc 2,786 0.07
78 Owens Corning 8,267 0.21
11 Oxford Industries Inc 1,095 0.03
20 Pacific Mercantile Bancorp 170 -
66 Pacific Premier Bancorp Inc 3,013 0.08
40 Packaging Corp of America 5,966 0.15
80 PacWest Bancorp 3,605 0.09
4 PAM Transportation Services Inc 255 0.01
36 Par Pacific Holdings Inc 505 0.01
17 Park Aerospace Corp 265 0.01
11 Park National Corp 1,409 0.04
9 Parke Bancorp Inc 194 0.01
12 Park-Ohio Holdings Corp 454 0.01
5 Parsons Corp 204 0.01
Global Targeted Value FundPortfolio of Investments as at 31 May 2021 (continued)
Dimensional Fund Advisors Semi-Annual Report and Unaudited Financial Statements, 31 May 2021 299

Shares (000's)
Value(000's)
USD
% of NetAssetValue
Common Stock (continued)
United States - 65.27% (continued)
15 Patrick Industries Inc 1,293 0.03
67 Patterson Cos Inc 2,190 0.06
143 Patterson-UTI Energy Inc 1,199 0.03
90 PBF Energy Inc 1,449 0.04
17 PC Connection Inc 846 0.02
12 PCB Bancorp 194 0.01
15 PCSB Financial Corp 272 0.01
13 PC-Tel Inc 83 -
76 PDC Energy Inc 3,204 0.08
26 PDF Solutions Inc 455 0.01
103 PDL BioPharma Inc 254 0.01
74 Peabody Energy Corp 489 0.01
17 Peapack Gladstone Financial Corp 552 0.01
43 Penn National Gaming Inc 3,522 0.09
4 Penn Virginia Corp 73 -
6 Penns Woods Bancorp Inc 151 -
57 Penske Automotive Group Inc 4,894 0.13
15 Peoples Bancorp Inc 498 0.01
3 Peoples Bancorp of North Carolina Inc 62 -
6 Peoples Financial Services Corp 262 0.01
298 People's United Financial Inc 5,632 0.14
46 Perdoceo Education Corp 565 0.01
21 Perficient Inc 1,505 0.04
52 Performance Food Group Co 2,631 0.07
4 Perma-Fix Environmental Services Inc 29 -
7 Perma-Pipe International Holdings Inc 49 -
86 Perrigo Co PLC 3,983 0.10
11 PetIQ Inc 464 0.01
3 PFSweb Inc 23 -
36 PGT Innovations Inc 882 0.02
39 Photronics Inc 523 0.01
15 PHX Minerals Inc 42 -
78 Pilgrim's Pride Corp 1,881 0.05
52 Pinnacle Financial Partners Inc 4,729 0.12
118 Pioneer Natural Resources Co 17,893 0.46
11 Piper Jaffray Cos 1,395 0.04
81 Playa Hotels & Resorts NV 591 0.02
19 Plexus Corp 1,892 0.05
4 Plumas Bancorp 118 -
3 Ponce de Leon Federal Bank 40 -
58 Popular Inc 4,738 0.12
43 Post Holdings Inc 5,006 0.13
18 Potbelly Corp 125 -
10 Powell Industries Inc 348 0.01
33 PQ Group Holdings Inc 536 0.01
29 PRA Group Inc 1,123 0.03
11 Preferred Bank 744 0.02
4 Preformed Line Products Co 319 0.01
11 Premier Financial Bancorp Inc 206 0.01
28 Premier Financial Corp 861 0.02
34 Premier Inc 1,116 0.03
37 Prestige Consumer Healthcare Inc 1,835 0.05
20 PriceSmart Inc 1,806 0.05
- PrimeEnergy Resources Corp 3 -
19 Primis Financial Corp 286 0.01
32 Primoris Services Corp 1,030 0.03
172 Principal Financial Group Inc 11,263 0.29
36 ProAssurance Corp 875 0.02
38 PROG Holdings Inc 2,026 0.05
67 ProPetro Holding Corp 663 0.02
62 Prosperity Bancshares Inc 4,642 0.12
8 Protective Insurance Corp 182 -
Shares (000's)
Value(000's)
USD
% of NetAssetValue
Common Stock (continued)
United States - 65.27% (continued)
26 Prothena Corp PLC 769 0.02
13 Provident Bancorp Inc 218 0.01
6 Provident Financial Holdings Inc 110 -
45 Provident Financial Services Inc 1,142 0.03
8 Prudential Bancorp Inc 106 -
2 Psychemedics Corp 12 -
82 PulteGroup Inc 4,753 0.12
53 PVH Corp 6,090 0.16
12 QCR Holdings Inc 574 0.01
29 Quad/Graphics Inc 97 -
18 Quanex Building Products Corp 477 0.01
95 Quanta Services Inc 9,033 0.23
54 Quest Diagnostics Inc 7,141 0.18
37 QuinStreet Inc 672 0.02
244 Qurate Retail Inc 3,324 0.09
131 Radian Group Inc 3,068 0.08
37 Radiant Logistics Inc 281 0.01
10 Rafael Holdings Inc 496 0.01
13 Ralph Lauren Corp 1,670 0.04
76 Rambus Inc 1,480 0.04
- Randolph Bancorp Inc 9 -
169 Range Resources Corp 2,286 0.06
10 Raven Industries Inc 446 0.01
61 Raymond James Financial Inc 8,067 0.21
67 Rayonier Advanced Materials Inc 517 0.01
13 RBB Bancorp 309 0.01
4 RCI Hospitality Holdings Inc 299 0.01
2 RCM Technologies Inc 9 -
15 RE/MAX Holdings Inc 519 0.01
14 Reading International Inc 92 -
25 RealNetworks Inc 60 -
74 Realogy Holdings Corp 1,308 0.03
8 Red Robin Gourmet Burgers Inc 299 0.01
28 Regal Beloit Corp 3,972 0.10
9 Regional Management Corp 439 0.01
594 Regions Financial Corp 13,895 0.35
22 Regis Corp 201 0.01
46 Reinsurance Group of America Inc 5,767 0.15
45 Reliance Steel & Aluminum Co 7,638 0.20
25 RenaissanceRe Holdings Ltd 3,782 0.10
38 Renasant Corp 1,663 0.04
29 Renewable Energy Group Inc 1,769 0.05
37 Rent-A-Center Inc 2,257 0.06
15 Republic Bancorp Inc 703 0.02
18 Republic First Bancorp Inc 73 -
59 Resideo Technologies Inc 1,779 0.05
77 Resolute Forest Products Inc 1,302 0.03
25 Resources Connection Inc 367 0.01
51 REV Group Inc 953 0.02
4 REX American Resources Corp 341 0.01
64 Rexnord Corp 3,214 0.08
6 RF Industries Ltd 43 -
92 Ribbon Communications Inc 683 0.02
10 Richardson Electronics Ltd 85 -
42 Rite Aid Corp 769 0.02
20 Riverview Bancorp Inc 140 -
1 RMR Group Inc 23 -
3 Rocky Brands Inc 192 0.01
12 Rogers Corp 2,277 0.06
7 Royal Gold Inc 853 0.02
51 RPC Inc 248 0.01
27 Rush Enterprises Inc 1,305 0.03
Global Targeted Value FundPortfolio of Investments as at 31 May 2021 (continued)
Dimensional Fund Advisors Semi-Annual Report and Unaudited Financial Statements, 31 May 2021 300

Shares (000's)
Value(000's)
USD
% of NetAssetValue
Common Stock (continued)
United States - 65.27% (continued)
1 Rush Enterprises Inc, Class B 32 -
31 Ryder System Inc 2,558 0.07
26 Ryerson Holding Corp 430 0.01
30 S&T Bancorp Inc 1,015 0.03
10 S&W Seed Co 36 -
10 Safety Insurance Group Inc 891 0.02
3 Saga Communications Inc 61 -
2 Sage Therapeutics Inc 119 -
17 Saia Inc 3,867 0.10
- Salisbury Bancorp Inc 13 -
14 Sanderson Farms Inc 2,219 0.06
41 SandRidge Energy Inc 216 0.01
29 Sandy Spring Bancorp Inc 1,348 0.03
36 Sanmina Corp 1,500 0.04
132 Santander Consumer USA Holdings Inc 5,008 0.13
19 Savara Inc 34 -
4 SB Financial Group Inc 84 -
14 ScanSource Inc 436 0.01
58 Schneider National Inc 1,412 0.04
22 Schnitzer Steel Industries Inc 1,186 0.03
15 Scholastic Corp 518 0.01
21 Schweitzer-Mauduit International Inc 845 0.02
20 Science Applications International Corp 1,782 0.05
44 Scorpio Tankers Inc 995 0.03
- Seaboard Corp 1,822 0.05
29 Seacoast Banking Corp of Florida 1,090 0.03
19 SEACOR Marine Holdings Inc 82 -
10 Security National Financial Corp 85 -
16 Select Bancorp Inc 218 0.01
44 Select Energy Services Inc 253 0.01
13 Select Interior Concepts Inc 145 -
83 Select Medical Holdings Corp 3,336 0.09
37 Selective Insurance Group Inc 2,757 0.07
5 Seneca Foods Corp 254 0.01
99 Sensata Technologies Holding PLC 5,872 0.15
28 Sensient Technologies Corp 2,427 0.06
28 ServiceSource International Inc 35 -
27 ServisFirst Bancshares Inc 1,879 0.05
8 Severn Bancorp Inc 94 -
83 SFL Corp Ltd 719 0.02
9 Shoe Carnival Inc 612 0.02
10 Shore Bancshares Inc 174 -
26 Shyft Group Inc 995 0.03
13 Sierra Bancorp 348 0.01
1 SIFCO Industries Inc 12 -
37 Signature Bank 9,327 0.24
43 Signet Jewelers Ltd 2,602 0.07
4 SilverBow Resources Inc 70 -
78 Simmons First National Corp 2,387 0.06
64 Simply Good Foods Co 2,207 0.06
25 Simpson Manufacturing Co Inc 2,837 0.07
69 SiriusPoint Ltd 728 0.02
84 Skechers U.S.A. Inc 3,996 0.10
9 Skyline Champion Corp 467 0.01
23 SkyWest Inc 1,104 0.03
252 SLM Corp 5,099 0.13
58 SM Energy Co 1,157 0.03
18 SMART Global Holdings Inc 836 0.02
12 SmartFinancial Inc 295 0.01
34 Smith & Wesson Brands Inc 717 0.02
36 Snap-on Inc 9,122 0.23
11 Solaris Oilfield Infrastructure Inc 113 -
Shares (000's)
Value(000's)
USD
% of NetAssetValue
Common Stock (continued)
United States - 65.27% (continued)
71 SolarWinds Corp 1,180 0.03
17 Sonic Automotive Inc 823 0.02
47 Sonoco Products Co 3,186 0.08
48 South State Corp 4,288 0.11
6 Southern First Bancshares Inc 307 0.01
7 Southern Missouri Bancorp Inc 295 0.01
24 Southside Bancshares Inc 1,008 0.03
447 Southwestern Energy Co 2,313 0.06
13 SP Plus Corp 422 0.01
25 SpartanNash Co 525 0.01
28 Spectrum Brands Holdings Inc 2,481 0.06
48 Spirit Airlines Inc 1,712 0.04
7 Spirit of Texas Bancshares Inc 151 -
13 Spok Holdings Inc 146 -
19 Sportsman's Warehouse Holdings Inc 339 0.01
41 Sprouts Farmers Market Inc 1,093 0.03
32 SPX FLOW Inc 2,203 0.06
71 SS&C Technologies Holdings Inc 5,211 0.13
39 St Joe Co 1,836 0.05
11 Stamps.com Inc 2,037 0.05
1 Standard AVB Financial Corp 41 -
15 Standard Motor Products Inc 696 0.02
9 Standex International Corp 912 0.02
1 Star Equity Holdings Inc 2 -
15 StarTek Inc 97 -
32 State Auto Financial Corp 599 0.02
95 State Street Corp 8,274 0.21
144 Steel Dynamics Inc 9,018 0.23
58 Steelcase Inc 834 0.02
15 Stepan Co 1,998 0.05
44 Stericycle Inc 3,479 0.09
138 Sterling Bancorp 3,682 0.09
8 Sterling Bancorp Inc 39 -
20 Sterling Construction Co Inc 458 0.01
51 Steven Madden Ltd 2,098 0.05
19 Stewart Information Services Corp 1,118 0.03
76 Stifel Financial Corp 5,280 0.13
15 Stock Yards Bancorp Inc 829 0.02
19 Stoneridge Inc 585 0.02
15 StoneX Group Inc 1,049 0.03
36 Stratasys Ltd 829 0.02
13 Strategic Education Inc 917 0.02
2 Strattec Security Corp 119 -
5 Stratus Properties Inc 137 -
20 Stride Inc 534 0.01
8 Summit Financial Group Inc 198 0.01
83 Summit Materials Inc 2,874 0.07
1 Summit State Bank 12 -
53 SunCoke Energy Inc 400 0.01
3 Sunrun Inc 141 -
36 Super Micro Computer Inc 1,263 0.03
11 Superior Group of Cos Inc 294 0.01
39 Supernus Pharmaceuticals Inc 1,157 0.03
63 Surgalign Holdings Inc 123 -
23 Surgery Partners Inc 1,368 0.04
17 SVB Financial Group 9,811 0.25
24 Sykes Enterprises Inc 1,017 0.03
7 Synalloy Corp 71 -
23 Synaptics Inc 2,843 0.07
286 Synchrony Financial 13,556 0.35
63 Syneos Health Inc 5,532 0.14
27 Synlogic Inc 102 -
Global Targeted Value FundPortfolio of Investments as at 31 May 2021 (continued)
Dimensional Fund Advisors Semi-Annual Report and Unaudited Financial Statements, 31 May 2021 301

Shares (000's)
Value(000's)
USD
% of NetAssetValue
Common Stock (continued)
United States - 65.27% (continued)
37 SYNNEX Corp 4,729 0.12
103 Synovus Financial Corp 5,068 0.13
41 Talos Energy Inc 576 0.02
4 Tandy Leather Factory Inc 15 -
166 Tapestry Inc 7,431 0.19
77 Targa Resources Corp 3,001 0.08
20 Taro Pharmaceutical Industries Ltd 1,387 0.04
89 Taylor Morrison Home Corp 2,627 0.07
101 TCF Financial Corp 4,815 0.12
28 Team Inc 241 0.01
231 TechnipFMC PLC 1,986 0.05
7 Tecnoglass Inc 146 -
14 Teekay Corp 49 -
25 Teekay Tankers Ltd 373 0.01
140 TEGNA Inc 2,715 0.07
22 Tejon Ranch Co 323 0.01
1 Teledyne Technologies Inc 456 0.01
77 Telephone & Data Systems Inc 1,989 0.05
46 Terex Corp 2,427 0.06
72 Terminix Global Holdings Inc 3,535 0.09
9 Territorial Bancorp Inc 223 0.01
7 TESSCO Technologies Inc 52 -
62 TETRA Technologies Inc 224 0.01
35 Texas Capital Bancshares Inc 2,397 0.06
48 Textainer Group Holdings Ltd 1,612 0.04
25 Thermon Group Holdings Inc 430 0.01
36 Thor Industries Inc 4,420 0.11
20 Tidewater Inc 268 0.01
17 Tilly's Inc 228 0.01
8 Timberland Bancorp Inc 235 0.01
47 Timken Co 4,193 0.11
35 TimkenSteel Corp 533 0.01
28 Tiptree Inc 305 0.01
49 Titan International Inc 458 0.01
16 Titan Machinery Inc 490 0.01
85 Toll Brothers Inc 5,577 0.14
10 Tompkins Financial Corp 837 0.02
21 Tootsie Roll Industries Inc 663 0.02
23 TopBuild Corp 4,481 0.11
53 Towne Bank 1,696 0.04
12 Townsquare Media Inc 163 -
4 TransAct Technologies Inc 59 -
5 Transcat Inc 275 0.01
375 Transocean Ltd 1,419 0.04
6 TravelCenters of America Inc 183 -
21 Trecora Resources 174 -
31 TreeHouse Foods Inc 1,527 0.04
93 TRI Pointe Group Inc 2,241 0.06
22 TriCo Bancshares 1,067 0.03
25 TriMas Corp 803 0.02
81 Trinity Industries Inc 2,240 0.06
24 Trinseo SA 1,566 0.04
17 TripAdvisor Inc 734 0.02
18 Triple-S Management Corp 460 0.01
23 TriState Capital Holdings Inc 526 0.01
50 Triton International Ltd 2,692 0.07
19 Triumph Bancorp Inc 1,599 0.04
90 Tronox Holdings PLC 2,121 0.05
29 TrueBlue Inc 787 0.02
97 TrueCar Inc 571 0.01
15 TrustCo Bank Corp NY 595 0.02
44 Trustmark Corp 1,467 0.04
Shares (000's)
Value(000's)
USD
% of NetAssetValue
Common Stock (continued)
United States - 65.27% (continued)
50 TTM Technologies Inc 752 0.02
38 Tutor Perini Corp 582 0.02
12 Twin Disc Inc 167 -
64 Tyson Foods Inc 5,067 0.13
41 UFP Industries Inc 3,233 0.08
6 UFP Technologies Inc 305 0.01
26 Ultra Clean Holdings Inc 1,463 0.04
14 Ultralife Corp 131 -
33 UMB Financial Corp 3,165 0.08
155 Umpqua Holdings Corp 2,951 0.08
77 Under Armour Inc, Class A 1,743 0.04
89 Under Armour Inc, Class C 1,688 0.04
6 Unifi Inc 155 -
9 UniFirst Corp 2,066 0.05
4 Unique Fabricating Inc 14 -
88 United Bankshares Inc 3,613 0.09
56 United Community Banks Inc 1,936 0.05
18 United Fire Group Inc 550 0.01
39 United Insurance Holdings Corp 221 0.01
41 United Natural Foods Inc 1,561 0.04
34 United Rentals Inc 11,341 0.29
12 United Security Bancshares 105 -
28 United States Cellular Corp 1,047 0.03
4 United States Lime & Minerals Inc 571 0.01
116 United States Steel Corp 3,006 0.08
31 United Therapeutics Corp 5,701 0.15
8 Unity Bancorp Inc 200 0.01
98 Univar Solutions Inc 2,656 0.07
10 Universal Corp 576 0.02
10 Universal Electronics Inc 512 0.01
43 Universal Health Services Inc 6,932 0.18
25 Universal Insurance Holdings Inc 350 0.01
9 Universal Logistics Holdings Inc 236 0.01
7 Universal Stainless & Alloy Products Inc 79 -
22 Universal Technical Institute Inc 131 -
23 Univest Financial Corp 657 0.02
135 Unum Group 4,181 0.11
61 Urban Outfitters Inc 2,378 0.06
12 US Concrete Inc 682 0.02
155 US Foods Holding Corp 6,020 0.15
60 US Silica Holdings Inc 614 0.02
4 US Xpress Enterprises Inc 46 -
5 USA Truck Inc 82 -
1 Utah Medical Products Inc 77 -
16 Vaalco Energy Inc 45 -
279 Valley National Bancorp 3,993 0.10
14 Valmont Industries Inc 3,376 0.09
40 Vanda Pharmaceuticals Inc 715 0.02
29 Varex Imaging Corp 718 0.02
9 Vectrus Inc 459 0.01
32 Veeco Instruments Inc 758 0.02
16 Venator Materials PLC 82 -
48 Veoneer Inc 1,126 0.03
25 Vera Bradley Inc 285 0.01
41 Verint Systems Inc 1,888 0.05
34 Veritex Holdings Inc 1,193 0.03
12 Veritiv Corp 747 0.02
29 Verso Corp 489 0.01
7 Viacom Inc, Class A 336 0.01
315 Viacom Inc, Class B 13,341 0.34
13 Viad Corp 591 0.02
39 ViaSat Inc 2,049 0.05
Global Targeted Value FundPortfolio of Investments as at 31 May 2021 (continued)
Dimensional Fund Advisors Semi-Annual Report and Unaudited Financial Statements, 31 May 2021 302

Shares (000's)
Value(000's)
USD
% of NetAssetValue
Common Stock (continued)
United States - 65.27% (continued)
349 Viatris Inc 5,313 0.14
15 Vidler Water Resouces Inc 153 -
9 Village Super Market Inc 212 0.01
2 Virco Manufacturing Corp 7 -
5 Virtus Investment Partners Inc 1,509 0.04
86 Vishay Intertechnology Inc 2,079 0.05
9 Vishay Precision Group Inc 301 0.01
45 Vista Outdoor Inc 1,971 0.05
354 Vistra Energy Corp 5,727 0.15
10 Volt Information Sciences Inc 35 -
19 VOXX International Corp 287 0.01
85 Voya Financial Inc 5,595 0.14
10 VSE Corp 459 0.01
35 W R Berkley Corp 2,742 0.07
37 Wabash National Corp 591 0.02
21 Walker & Dunlop Inc 2,092 0.05
33 Warrior Met Coal Inc 606 0.02
44 Washington Federal Inc 1,467 0.04
13 Washington Trust Bancorp Inc 720 0.02
24 Waterstone Financial Inc 466 0.01
16 Watts Water Technologies Inc 2,180 0.06
3 Wayside Technology Group Inc 93 -
57 Webster Financial Corp 3,253 0.08
21 Weis Markets Inc 1,053 0.03
47 Werner Enterprises Inc 2,233 0.06
45 WesBanco Inc 1,744 0.04
39 WESCO International Inc 4,134 0.11
12 West Bancorporation Inc 333 0.01
14 Westamerica Bancorporation 892 0.02
65 Western Alliance Bancorp 6,530 0.17
150 Western Digital Corp 11,282 0.29
25 Western New England Bancorp Inc 211 0.01
121 Westinghouse Air Brake Technologies Corp 10,034 0.26
63 Westlake Chemical Corp 6,370 0.16
188 Westrock Co 10,988 0.28
7 Westwood Holdings Group Inc 135 -
9 WEX Inc 1,795 0.05
8 Weyco Group Inc 173 -
39 Whirlpool Corp 9,350 0.24
2 White Mountains Insurance Group Ltd 2,650 0.07
2 Whiting Petroleum Corp 81 -
5 Willdan Group Inc 185 0.01
2 Willis Lease Finance Corp 68 -
136 WillScot Mobile Mini Holdings Corp 3,948 0.10
26 Winnebago Industries Inc 1,930 0.05
40 Wintrust Financial Corp 3,203 0.08
72 WisdomTree Investments Inc 485 0.01
37 Wolverine World Wide Inc 1,366 0.04
25 Woodward Inc 3,209 0.08
6 World Acceptance Corp 912 0.02
43 World Fuel Services Corp 1,333 0.03
34 Worthington Industries Inc 2,285 0.06
34 WSFS Financial Corp 1,812 0.05
146 Xerox Holdings Corp 3,429 0.09
66 Xperi Holding Corp 1,409 0.04
40 XPO Logistics Inc 5,863 0.15
47 Yelp Inc 1,898 0.05
116 Zions Bancorp NA 6,727 0.17
32 Zovio Inc 75 -
13 Zumiez Inc 589 0.02
2,559,793 65.27
Total Common Stock - 99.41% (30 November 2020: 99.67%) 3,898,681 99.41
Shares (000's)
Value(000's)
USD
% of NetAssetValue
Preferred Stock
Germany - 0.10%
7 Biotest AG 229 0.01
5 Draegerwerk AG & Co KGaA 494 0.01
29 Jungheinrich AG 1,481 0.04
66 Schaeffler AG 611 0.01
8 Sixt SE 754 0.02
2 STO SE & Co KGaA 383 0.01
6 Villeroy & Boch AG 133 -
4,085 0.10
Italy - 0.06%
28 Danieli & C Officine Meccaniche SpA 507 0.02
2,896 Telecom Italia SpA 1,655 0.04
2,162 0.06
United States - 0.02%
2 Qurate Retail Inc 255 0.01
18 WESCO International Inc 561 0.01
816 0.02
Total Preferred Stock - 0.18% (30 November 2020: 0.22%) 7,063 0.18
Real Estate Investment Trust
Israel - 0.01%
30 Summit Real Estate Holdings Ltd 479 0.01
479 0.01
Japan - 0.00%
10 Urbanet Corp Co Ltd 29 -
29 -
United States - 0.01%
3 CTO Realty Growth Inc 145 -
3 Indus Realty Trust Inc 211 0.01
356 0.01
Total Real Estate Investment Trust - 0.02% (30 November2020: 0.02%) 864 0.02
Rights
Australia - 0.00%
5 Mystate Ltd - -
- -
Austria - 0.00%
11 Intercell AG - -
- -
Canada - 0.01%
24 Imperial Metals Corp 1 -
204 Pan American Silver Corp 188 0.01
189 0.01
Italy - 0.00%
22 Freni Brembo SpA - -
- -
Spain - 0.00%
33 Almirall SA 8 -
8 -
United Kingdom - 0.00%
55 C&C Group PLC 44 -
44 -
Total Rights - 0.01% (30 November 2020: 0.01%) 241 0.01
Warrants
Canada - 0.00%
10 Cenovus Energy Inc 41 -
41 -
Global Targeted Value FundPortfolio of Investments as at 31 May 2021 (continued)
Dimensional Fund Advisors Semi-Annual Report and Unaudited Financial Statements, 31 May 2021 303

Shares (000's)
Value(000's)
USD
% of NetAssetValue
Warrants (continued)
Singapore - 0.00%
581 Ezion Holdings Ltd - -
- -
Total Warrants - 0.00% (30 November 2020: 0.00%) 41 -
Total Investments - 99.62% (30 November 2020: 99.92%) 3,906,890 99.62
Value (000's)USD
% of NetAssetValue
Cash and Cash Equivalents - 0.31% (30 November 2020: 0.24%) 12,030 0.31Other Assets in Excess of Other Liabilities - 0.07% (30 November 2020: (0.16)%) 2,920 0.07
Total Net Assets 3,921,840 100.00
Amounts designated as “- “ are either $0, less than $500 or less than 500 shares.
Analysis of Total Assets % of Total Assets
Transferable securities admitted to an official exchange listing 98.82
Current Assets 1.18
Total Assets 100.00
Global Targeted Value FundPortfolio of Investments as at 31 May 2021 (continued)
Dimensional Fund Advisors Semi-Annual Report and Unaudited Financial Statements, 31 May 2021 304

Face Value(000's)
CouponRate %
MaturityDate
Value (000's)GBP
% of NetAssetValue
Corporate Bonds
Australia - 1.88%
500 Macquarie Bank Ltd 1.125 20/01/2022 434 0.08
6,000 Macquarie Bank Ltd 0.781 21/06/2022 3,279 0.61
170 National Australia Bank Ltd 5.125 09/12/2021 174 0.03
5,700 Telstra Corp Ltd 3.500 21/09/2022 5,143 0.95
1,300 Wesfarmers Ltd 1.250 07/10/2021 1,123 0.21
10,153 1.88
Canada - 12.24%
5,000 Bank of Montreal 0.955 06/10/2022 2,743 0.51
15,000 Bank of Nova Scotia 1.900 02/12/2021 8,823 1.63
9,000 Bank of Nova Scotia 1.830 27/04/2022 5,321 0.99
4,000 Bank of Nova Scotia 0.957 08/09/2022 2,193 0.41
1,000 BMW Canada Inc 2.570 06/08/2021 586 0.11
8,500 Canadian Imperial Bank ofCommerce 2.300 11/07/2022 5,063 0.94
1,500 Daimler Canada Finance BV 3.300 16/08/2022 903 0.17
7,000 Enbridge Inc 3.190 05/12/2022 4,227 0.78
6,650 GE Capital Canada Funding 4.600 26/01/2022 3,981 0.74
1,000 Honda Canada Finance 2.488 19/12/2022 599 0.11
3,000 Honda Canada Finance Inc 1.823 07/12/2021 1,763 0.33
5,500 HSBC Bank Canada 2.253 15/09/2022 3,276 0.61
3,000 John Deere Canada Funding 2.630 21/09/2022 1,798 0.33
1,000 John Deere Canada Funding 2.700 17/01/2023 603 0.11
2,000 John Deere Financial 2.990 14/01/2022 1,186 0.22
6,000 National Bank of Canada 2.105 18/03/2022 3,550 0.66
3,000 National Bank of Canada 1.957 30/06/2022 1,780 0.33
250 National Bank of Canada 2.150 07/10/2022 181 0.03
15,000 Royal Bank of Canada 1.968 02/03/2022 8,859 1.64
1,500 Total Capital Canada Ltd 1.125 18/03/2022 1,305 0.24
7,000 Toyota Credit Canada Inc 2.350 18/07/2022 4,169 0.77
2,000 Toyota Credit Canada Inc 2.700 25/01/2023 1,205 0.22
3,250 VW Credit Canada Inc 2.650 27/06/2022 1,937 0.36
66,051 12.24
Cayman Islands - 0.67%
4,200 Hutchison Whampoa Finance14 Ltd 1.375 31/10/2021 3,634 0.67
3,634 0.67
Denmark - 0.65%
4,000 Danske Bank AS 0.875 22/05/2023 3,501 0.65
3,501 0.65
Finland - 0.76%
4,500 Fortum Oyj 2.250 06/09/2022 3,989 0.74
130 OP Corporate Bank PLC 0.750 03/03/2022 113 0.02
4,102 0.76
France - 3.98%
1,200 Air Liquide Finance SA 2.125 15/10/2021 1,041 0.19
970 BNP Paribas SA 2.950 23/05/2022 701 0.13
2,500 BPCE SA 0.513 09/03/2022 2,165 0.40
5,479 Credit Agricole SA 3.375 10/01/2022 3,933 0.74
4,800 Dexia Credit Local SA 0.875 07/09/2021 4,809 0.89
600 Electricite de France SA 3.875 18/01/2022 530 0.10
4,050 Holding d'Infrastructures deTransport SASU 4.875 27/10/2021 3,552 0.66
500 LVMH Moet Hennessy LouisVuitton SE 0.000 11/02/2022 431 0.08
2,700 Societe Generale SA 3.250 12/01/2022 1,937 0.36
2,000 Societe Generale SA 0.500 13/01/2023 1,738 0.32
700 Total Capital International SA 2.125 19/11/2021 609 0.11
21,446 3.98
Germany - 4.16%
1,458 BASF SE 2.500 18/01/2022 1,041 0.19
700 Deutsche Bank AG 1.250 08/09/2021 604 0.11
3,775 Deutsche Bank AG 4.250 14/10/2021 2,698 0.50
Face Value(000's)
CouponRate %
MaturityDate
Value (000's)GBP
% of NetAssetValue
Corporate Bonds (continued)
Germany - 4.16% (continued)
8,000 Kreditanstalt fuer Wiederaufbau 5.500 09/02/2022 4,508 0.84
150,000 Kreditanstalt fuer Wiederaufbau 1.125 12/05/2022 12,726 2.36
1,000 Volkswagen Leasing GmbH 2.375 06/09/2022 888 0.16
22,465 4.16
Guernsey - 0.64%
4,000 Credit Suisse Group FundingGuernsey Ltd 1.250 14/04/2022 3,478 0.64
3,478 0.64
Italy - 2.69%
1,148 Eni SpA 2.625 22/11/2021 1,001 0.19
4,070 Eni SpA 0.750 17/05/2022 3,535 0.65
4,259 FCA Bank SpA 1.625 29/09/2021 4,273 0.79
500 Intesa Sanpaolo SpA 0.875 27/06/2022 435 0.08
1,760 Intesa Sanpaolo SpA 3.125 14/07/2022 1,275 0.24
5,500 UniCredit SpA 3.750 12/04/2022 3,979 0.74
14,498 2.69
Japan - 3.13%
200 Daiwa Securities Group 3.129 19/04/2022 144 0.03
1,500 Mitsubishi UFJ Financial GroupInc 1.244 13/09/2021 1,060 0.20
2,500 Mitsubishi UFJ Financial GroupInc 3.218 07/03/2022 1,802 0.33
1,000 Mitsubishi UFJ Financial GroupInc 0.680 26/01/2023 873 0.16
5,500 Mizuho Financial Group Inc 1.324 13/09/2021 3,888 0.72
6,015 Sumitomo Mitsui Banking Corp 1.000 19/01/2022 5,217 0.97
4,500 Takeda Pharmaceutical Co Ltd 0.548 21/11/2022 3,918 0.72
16,902 3.13
Luxembourg - 1.84%
4,500 CNH Industrial Finance EuropeSA 2.875 27/09/2021 3,906 0.72
3,000 Intesa Sanpaolo BankLuxembourg SA 0.215 26/09/2021 2,582 0.48
2,000 John Deere Bank SA 1.000 03/10/2022 1,728 0.32
1,200 Medtronic Global Holdings SCA 0.000 15/03/2023 1,037 0.19
653 Nestle Finance InternationalLtd 2.125 10/09/2021 565 0.11
150 Nestle Finance InternationalLtd 0.750 08/11/2021 130 0.02
9,948 1.84
Netherlands - 7.72%
1,000 ABN AMRO Bank NV 4.125 28/03/2022 892 0.17
1,000 Allianz Finance II BV 3.500 14/02/2022 884 0.16
2,000 Bayer Capital Corp BV 0.015 26/06/2022 1,725 0.32
1,000 BMW Finance NV 0.250 14/01/2022 863 0.16
1,400 BMW Finance NV 0.018 18/02/2022 1,207 0.22
2,301 BMW Finance NV 0.875 16/08/2022 2,313 0.43
5,052 Daimler International FinanceBV 0.250 09/08/2021 4,347 0.81
4,500 Digital Dutch Finco BV 0.000 23/09/2022 3,878 0.72
6,000 Enel Finance International NV 2.875 25/05/2022 4,330 0.81
4,750 Fiat Chrysler Automobiles NV 5.250 15/04/2023 3,625 0.67
329 Heineken NV 2.750 01/04/2023 241 0.04
2,000 JAB Holdings BV 1.500 24/11/2021 1,734 0.32
1,000 LeasePlan Corp NV 1.000 25/02/2022 868 0.16
1,000 LeasePlan Corp NV 0.750 03/10/2022 870 0.16
1,810 LeasePlan Corp NV 1.000 02/05/2023 1,590 0.29
3,720 Linde Finance BV 0.250 18/01/2022 3,210 0.60
2,250 Shell International Finance BV 1.000 06/04/2022 1,957 0.36
1,500 SiemensFinancieringsmaatschappij NV 0.125 05/06/2022 1,296 0.24
1,366 Unilever NV 0.000 31/07/2021 1,175 0.22
Global Ultra Short Fixed Income FundPortfolio of Investments as at 31 May 2021
Dimensional Fund Advisors Semi-Annual Report and Unaudited Financial Statements, 31 May 2021 305

Face Value(000's)
CouponRate %
MaturityDate
Value (000's)GBP
% of NetAssetValue
Corporate Bonds (continued)
Netherlands - 7.72% (continued)
2,150 Unilever NV 0.500 03/02/2022 1,859 0.34
3,200 Upjohn Finance BV 0.816 23/06/2022 2,778 0.52
41,642 7.72
New Zealand - 0.15%
945 ANZ New Zealand Int'l Ltd 0.625 01/06/2021 812 0.15
812 0.15
Singapore - 0.20%
2,000 DBS Bank Ltd 0.761 23/08/2021 1,088 0.20
1,088 0.20
Spain - 1.91%
2,000 Banco Santander SA 3.848 12/04/2023 1,498 0.28
5,000 CaixaBank SA 1.125 12/01/2023 4,384 0.81
2,100 Telefonica Emisiones SA 1.477 14/09/2021 1,814 0.34
2,000 Telefonica Emisiones SA 0.750 13/04/2022 1,734 0.32
1,000 Telefonica Emisiones SA 2.242 27/05/2022 881 0.16
10,311 1.91
Supranational - 5.11%
10,000 African Development Bank 5.250 23/03/2022 5,658 1.05
5,000 Asian Development Bank 2.250 16/09/2021 2,935 0.54
9,000 Asian Development Bank 5.000 09/03/2022 5,073 0.94
110,000 European Investment Bank 1.500 12/05/2022 9,365 1.74
60 Inter-American DevelopmentBank 0.184 15/01/2022 42 0.01
53,000 Nordic Investment Bank 0.125 22/03/2022 4,503 0.83
27,576 5.11
Sweden - 1.33%
2,000 Lansforsakringar Bank 0.500 19/09/2022 1,738 0.32
400 Volvo Treasury AB 0.108 13/09/2021 344 0.06
400 Volvo Treasury AB 0.114 01/11/2021 345 0.07
600 Volvo Treasury AB 1.140 05/05/2022 523 0.10
4,900 Volvo Treasury AB 0.000 11/02/2023 4,228 0.78
7,178 1.33
United Kingdom - 10.60%
6,000 AstraZeneca PLC 0.875 24/11/2021 5,188 0.96
2,439 BAE Systems PLC 4.125 08/06/2022 2,528 0.47
500 Barclays PLC 1.500 01/04/2022 436 0.08
2,326 BAT International Finance PLC 3.625 09/11/2021 2,033 0.38
500 BAT International Finance PLC 2.375 19/01/2023 446 0.08
5,000 British TelecommunicationsPLC 1.125 10/03/2023 4,402 0.82
617 GlaxoSmithKline Capital PLC 0.061 23/09/2021 531 0.10
2,000 HSBC Bank PLC 0.059 07/06/2021 1,719 0.32
1,000 Lloyds Bank Corporate Markets 0.250 04/10/2022 866 0.16
5,071 Lloyds Banking Group PLC 0.750 09/11/2021 4,380 0.81
4,100 London Stock Exchange Group 4.750 02/11/2021 4,172 0.77
544 Nationwide Building Society 2.450 27/07/2021 385 0.07
2,500 Nationwide Building Society 1.000 24/01/2023 2,523 0.47
5,000 NatWest Markets PLC 0.362 27/09/2021 4,308 0.80
500 NatWest Markets PLC 0.625 02/03/2022 433 0.08
3,082 Next Group Plc 5.375 26/10/2021 3,140 0.58
3,900 Rolls-Royce PLC 2.125 18/06/2021 3,354 0.62
6,061 Sky Ltd 1.500 15/09/2021 5,238 0.97
900 SSE PLC 2.375 10/02/2022 788 0.15
5,700 Standard Chartered PLC 1.625 13/06/2021 4,902 0.91
5,286 Transport for London 2.250 09/08/2022 5,403 1.00
57,175 10.60
United States - 20.70%
6,148 3M Co 1.875 15/11/2021 5,340 0.99
3,840 AbbVie Inc 2.150 19/11/2021 2,731 0.51
1,500 AbbVie Inc 2.900 06/11/2022 1,095 0.20
2,524 Alleghany Corp 4.950 27/06/2022 1,864 0.35
Face Value(000's)
CouponRate %
MaturityDate
Value (000's)GBP
% of NetAssetValue
Corporate Bonds (continued)
United States - 20.70% (continued)
2,000 American Electric Power Co Inc 3.650 01/12/2021 1,433 0.27
1,500 American Honda Finance Corp 0.350 26/08/2022 1,300 0.24
3,000 American Tower Corp 3.500 31/01/2023 2,221 0.41
5,000 Aon Corp 2.200 15/11/2022 3,620 0.67
1,400 Bank of America Corp 6.125 15/09/2021 1,423 0.26
1,250 Bank of America Corp 3.228 22/06/2022 750 0.14
2,199 BAT Capital Corp 0.041 16/08/2021 1,891 0.35
3,000 Bayer US Finance LLC 3.000 08/10/2021 2,134 0.40
300 BMW US Capital LLC 0.625 20/04/2022 260 0.05
1,600 Boston Scientific Corp 3.375 15/05/2022 1,161 0.21
4,168 Cardinal Health Inc 3.200 15/06/2022 3,021 0.56
1,500 Cardinal Health Inc 3.200 15/03/2023 1,108 0.21
1,000 Cox Communications Inc 3.250 15/12/2022 736 0.14
1,000 Deutsche Bank NY 5.000 14/02/2022 727 0.13
1,000 Discover Financial Services 3.850 21/11/2022 740 0.14
1,889 Discovery CommunicationsLLC 2.375 07/03/2022 1,654 0.31
1,000 DTE Energy Co 2.600 15/06/2022 722 0.13
465 Eastman Chemical Co 3.500 01/12/2021 333 0.06
1,000 Eaton Corp 2.750 02/11/2022 729 0.13
1,000 ENI Finance USA Inc 0.460 23/06/2021 705 0.13
5,000 Enterprise Products OperatingLLC 3.500 01/02/2022 3,601 0.67
649 Enterprise Products OperatingLLC 4.050 15/02/2022 469 0.09
3,500 Equifax Inc 3.600 15/08/2021 2,483 0.46
2,000 Fidelity National InformationServices Inc 0.375 01/03/2023 1,408 0.26
3,847 General Motors Financial CoInc 3.550 08/07/2022 2,804 0.52
2,000 Goldman Sachs Group Inc 0.461 27/07/2021 1,721 0.32
1,300 Goldman Sachs Group Inc 1.375 26/07/2022 1,138 0.21
5,571 Honeywell International Inc 1.300 22/02/2023 4,921 0.91
1,000 HP Inc 4.050 15/09/2022 737 0.14
5,779 Illumina Inc 0.550 23/03/2023 4,077 0.76
4,000 International BusinessMachines Corp 0.500 07/09/2021 3,446 0.64
2,000 International BusinessMachines Corp 0.375 31/01/2023 1,738 0.32
1,000 JPMorgan Chase & Co 2.750 24/08/2022 893 0.17
621 Kinder Morgan Energy PartnersLP 4.150 01/03/2022 450 0.08
3,250 Kinder Morgan Inc 1.500 16/03/2022 2,832 0.52
1,000 Micron Technology Inc 2.497 24/04/2023 731 0.14
398 Morgan Stanley 2.625 17/11/2021 284 0.05
2,000 Mylan Inc 3.125 15/01/2023 1,465 0.27
4,500 National Grid North America Inc 0.750 11/02/2022 3,896 0.72
1,250 Nestle Holdings Inc 1.000 11/06/2021 1,250 0.23
5,750 NextEra Energy CapitalHoldings 0.650 01/03/2023 4,077 0.76
200 Nissan Motor Acceptance 2.800 13/01/2022 143 0.03
1,158 Nissan Motor Acceptance 2.650 13/07/2022 831 0.15
3,280 Nissan Motor Acceptance 2.600 28/09/2022 2,366 0.44
1,000 Nissan Motor Acceptance 3.450 15/03/2023 736 0.14
821 Parker-Hannifin Corp 3.500 15/09/2022 602 0.11
500 Procter & Gamble Co 2.000 05/11/2021 434 0.08
6,000 Ralph Lauren Corp 1.700 15/06/2022 4,293 0.80
4,500 Southern Power Co 1.000 20/06/2022 3,919 0.73
5,998 Sysco Corp 2.600 12/06/2022 4,323 0.80
4,143 TWDC Enterprises 18 Corp 2.125 13/09/2022 2,985 0.55
408 Union Pacific Corp 3.200 08/06/2021 288 0.05
1,000 Volkswagen Group of AmericaFinance LLC 2.700 26/09/2022 726 0.13
Global Ultra Short Fixed Income FundPortfolio of Investments as at 31 May 2021 (continued)
Dimensional Fund Advisors Semi-Annual Report and Unaudited Financial Statements, 31 May 2021 306

Face Value(000's)
CouponRate %
MaturityDate
Value (000's)GBP
% of NetAssetValue
Corporate Bonds (continued)
United States - 20.70% (continued)
1,000 Wells Fargo & Co 2.094 25/04/2022 592 0.11
4,700 Wells Fargo & Co 1.375 30/06/2022 4,740 0.88
95 WestRock RKT LLC 4.900 01/03/2022 69 0.01
3,489 Williams Cos Inc 7.875 01/09/2021 2,503 0.46
111,669 20.70
Total Corporate Bonds - 80.36% (30 November 2020: 82.00%) 433,629 80.36
Government Bonds
Canada - 8.58%
8,000 Canada Housing Trust No 1 0.598 15/03/2022 4,682 0.87
8,000 Canada Housing Trust No 1 0.538 15/09/2022 4,687 0.87
8,000 Export Development Canada 0.166 15/11/2021 8,000 1.48
16,330 Province of Alberta Canada 1.000 15/11/2021 16,388 3.04
6,640 Province of Manitoba Canada 0.750 15/12/2021 6,659 1.23
10,000 Province of Ontario Canada 0.585 27/06/2022 5,859 1.09
46,275 8.58
France - 0.19%
1,011 SNCF Reseau 5.500 01/12/2021 1,037 0.19
1,037 0.19
Germany - 3.06%
16,500 State of NorthRhine-Westphalia Germany 0.145 29/10/2021 16,501 3.06
16,501 3.06
Face Value(000's)
CouponRate %
MaturityDate
Value (000's)GBP
% of NetAssetValue
Government Bonds (continued)
Netherlands - 0.56%
3,000 BNG Bank NV 1.000 15/03/2022 3,021 0.56
3,021 0.56
Norway - 3.60%
50,000 Kommunalbanken AS 1.500 19/04/2022 4,250 0.79
175,000 Norway Government Bond 2.000 24/05/2023 15,177 2.81
19,427 3.60
Singapore - 0.79%
8,000 Mas Bill 0.000 28/05/2021 4,263 0.79
4,263 0.79
Sweden - 0.79%
50,000 Kommuninvest I Sverige 1.000 15/09/2021 4,259 0.79
4,259 0.79
United States - 0.35%
1,900 Tennessee Valley Authority 5.350 07/06/2021 1,901 0.35
1,901 0.35
Total Government Bonds - 17.92% (30 November2020: 13.82%) 96,684 17.92
Total Investments - 98.28% (30 November 2020: 95.82%) 530,313 98.28
Forward Currency Contracts
Buy Amount (000's) Sell Amount (000's) Counterparty Maturity Date
UnrealisedAppreciation/(Depreciation)
of Contracts (000's)GBP
% of NetAssetValue
Buy 10,084 CAD Sell 5,902 GBP State Street Bank 21/06/2021 (21) -
Buy 10,778 EUR Sell 9,281 GBP Bank of America Merrill Lynch 23/06/2021 (16) -
Buy 76,884 EUR Sell 66,232 GBP Citibank 25/06/2021 (140) (0.03)
Buy 68,853 EUR Sell 59,927 GBP State Street Bank 01/06/2021 (763) (0.14)
Buy 10 EUR Sell 9 GBP State Street Bank 01/06/2021 - -
Buy 7,792 EUR Sell 6,782 GBP State Street Bank 02/06/2021 (86) (0.02)
Buy 16 EUR Sell 14 GBP State Street Bank 02/06/2021 - -
Buy 7,851 EUR Sell 6,834 GBP State Street Bank 11/06/2021 (86) (0.02)
Buy 16,070 EUR Sell 13,873 GBP State Street Bank 22/06/2021 (58) (0.01)
Buy 2,049 EUR Sell 1,766 GBP State Street Bank 23/06/2021 (4) -
Buy 6,018 EUR Sell 5,188 GBP State Street Bank 24/06/2021 (16) -
Buy 2 EUR Sell 2 GBP State Street Bank 25/06/2021 - -
Buy 4,373 EUR Sell 3,789 GBP State Street Bank 30/06/2021 (30) (0.01)
Buy 68,854 EUR Sell 59,288 GBP State Street Bank 07/07/2021 (85) (0.02)
Buy 25,433 GBP Sell 45,715 AUD State Street Bank 21/06/2021 598 0.11
Buy 44,531 GBP Sell 76,118 CAD Citibank 21/06/2021 134 0.03
Buy 41,302 GBP Sell 70,391 CAD Citibank 02/07/2021 247 0.05
Buy 59,257 GBP Sell 68,863 EUR State Street Bank 01/06/2021 85 0.02
Buy 9 GBP Sell 11 EUR State Street Bank 01/06/2021 - -
Buy 23 GBP Sell 26 EUR State Street Bank 02/06/2021 - -
Buy 61 GBP Sell 70 EUR State Street Bank 11/06/2021 - -
Buy 14 GBP Sell 16 EUR State Street Bank 11/06/2021 - -
Buy 43,365 GBP Sell 50,044 EUR State Street Bank 18/06/2021 350 0.07
Buy 46,707 GBP Sell 53,768 EUR State Street Bank 22/06/2021 489 0.09
Buy 37,272 GBP Sell 43,260 EUR State Street Bank 23/06/2021 85 0.01
Buy 46,657 GBP Sell 54,087 EUR State Street Bank 24/06/2021 164 0.03
Buy 7,501 GBP Sell 8,701 EUR State Street Bank 25/06/2021 21 -
Buy 43,670 GBP Sell 50,800 EUR State Street Bank 30/06/2021 (4) -
Buy 15,327 GBP Sell 180,268 NOK Bank of New York Mellon 16/06/2021 138 0.03
Global Ultra Short Fixed Income FundPortfolio of Investments as at 31 May 2021 (continued)
Dimensional Fund Advisors Semi-Annual Report and Unaudited Financial Statements, 31 May 2021 307

Forward Currency Contracts (continued)
Buy Amount (000's) Sell Amount (000's) Counterparty Maturity Date
UnrealisedAppreciation/(Depreciation)
of Contracts (000's)GBP
% of NetAssetValue
Buy 26,792 GBP Sell 313,193 NOK Barclays Bank 16/06/2021 403 0.07
Buy 8,891 GBP Sell 103,656 SEK Citibank 22/06/2021 95 0.02
Buy 123 GBP Sell 1,439 SEK State Street Bank 03/06/2021 1 -
Buy 14 GBP Sell 160 SEK State Street Bank 09/06/2021 - -
Buy 6,936 GBP Sell 12,991 SGD Australia And New Zealand Banking Group 16/06/2021 15 -
Buy 4,816 GBP Sell 8,998 SGD Citibank 09/06/2021 21 -
Buy 32,811 GBP Sell 45,516 USD Citibank 21/06/2021 739 0.14
Buy 43,857 GBP Sell 61,254 USD State Street Bank 02/06/2021 694 0.13
Buy 32,728 GBP Sell 46,223 USD State Street Bank 29/06/2021 159 0.03
Buy 1,439 SEK Sell 123 GBP State Street Bank 01/06/2021 - -
Buy 3,088 SEK Sell 265 GBP State Street Bank 03/06/2021 (3) -
Buy 9,225 SEK Sell 779 GBP State Street Bank 03/06/2021 4 -
Buy 3,471 SEK Sell 297 GBP State Street Bank 09/06/2021 (3) -
Buy 1,002 SGD Sell 543 GBP State Street Bank 09/06/2021 (9) -
Buy 12,991 SGD Sell 7,053 GBP State Street Bank 16/06/2021 (132) (0.03)
Buy 9,714 USD Sell 6,906 GBP State Street Bank 02/06/2021 (63) (0.01)
Unrealised Appreciation of Forward Currency Contracts 4,442 0.83
Unrealised Depreciation of Forward Currency Contracts (1,519) (0.29)
Net Unrealised Appreciation of Forward Currency Contracts - 0.54% (30 November 2020: 0.53%) 2,923 0.54
Value (000's)GBP
% of NetAssetValue
Cash and Cash Equivalents - 0.56% (30 November 2020: 2.38%) 3,042 0.56Other Assets in Excess of Other Liabilities - 0.62% (30 November 2020: 1.27%) 3,299 0.62
Total Net Assets 539,577 100.00
Amounts designated as “- “ are either £0 or less than £500.
Analysis of Total Assets % of Total Assets
Transferable securities admitted to an official exchange listing 84.41
Transferable securities dealt in on another regulated market 8.28
Other transferable securities of the type referred to in Regulations 68 (1)(a), (b) and (c) 5.05
OTC Financial derivative instruments 0.82
Current Assets 1.44
Total Assets 100.00
Global Ultra Short Fixed Income FundPortfolio of Investments as at 31 May 2021 (continued)
Dimensional Fund Advisors Semi-Annual Report and Unaudited Financial Statements, 31 May 2021 308

Shares (000's)
Value(000's)
USD
% of NetAssetValue
Common Stock
Australia - 2.28%
122 Aurizon Holdings Ltd 342 0.05
112 Australia & New Zealand Banking Group Ltd 2,493 0.33
16 Bank of Queensland Ltd 114 0.01
12 Bendigo & Adelaide Bank Ltd 97 0.01
45 BlueScope Steel Ltd 739 0.10
112 Boral Ltd 592 0.08
141 Cleanaway Waste Management Ltd 302 0.04
13 Crown Resorts Ltd 125 0.02
2 Downer EDI Ltd 11 -
35 Harvey Norman Holdings Ltd 141 0.02
43 IGO Ltd 251 0.03
42 Incitec Pivot Ltd 74 0.01
31 Lendlease Group 292 0.04
153 National Australia Bank Ltd 3,193 0.42
60 Newcrest Mining Ltd 1,304 0.17
70 Oil Search Ltd 202 0.03
21 Orica Ltd 218 0.03
34 Origin Energy Ltd 108 0.01
16 OZ Minerals Ltd 303 0.04
39 QBE Insurance Group Ltd 333 0.04
34 Qube Holdings Ltd 80 0.01
144 Santos Ltd 767 0.10
144 South32 Ltd 333 0.04
37 Star Entertainment Grp Ltd 118 0.02
51 Suncorp Group Ltd 439 0.06
107 Tabcorp Holdings Ltd 429 0.06
40 TPG Telecom Ltd 165 0.02
26 Treasury Wine Estates Ltd 234 0.03
130 Westpac Banking Corp 2,670 0.35
45 Woodside Petroleum Ltd 766 0.10
5 Worley Ltd 42 0.01
17,277 2.28
Austria - 0.06%
8 Erste Group Bank AG 340 0.05
5 Raiffeisen Bank International AG 111 0.01
451 0.06
Belgium - 0.22%
9 Ageas 560 0.07
6 KBC Group NV 526 0.07
2 Solvay SA 266 0.04
3 UCB SA 291 0.04
1,643 0.22
Canada - 3.23%
36 Bank of Montreal 3,759 0.50
47 Bank of Nova Scotia 3,147 0.42
63 Barrick Gold Corp 1,508 0.20
1 BlackBerry Ltd 12 -
24 Canadian Imperial Bank of Commerce (Canadalisting) 2,861 0.38
94 Canadian Natural Resources Ltd 3,251 0.43
1 Canopy Growth Corp 21 -
45 Cenovus Energy Inc 363 0.05
- Element Fleet Management Corp 2 -
1 Fairfax Financial Holdings Ltd 479 0.06
25 First Quantum Minerals Ltd 626 0.08
10 Great-West Lifeco Inc 301 0.04
2 iA Financial Corp Inc 146 0.02
10 Imperial Oil Ltd 341 0.04
85 Kinross Gold Corp 689 0.09
18 Lundin Mining Corp 191 0.03
1 Magna International Inc 77 0.01
53 Manulife Financial Corp 1,114 0.15
Shares (000's)
Value(000's)
USD
% of NetAssetValue
Common Stock (continued)
Canada - 3.23% (continued)
27 Nutrien Ltd 1,653 0.22
2 Onex Corp 115 0.01
2 Pan American Silver Corp 68 0.01
30 Pembina Pipeline Corp 975 0.13
62 Suncor Energy Inc 1,441 0.19
18 Teck Resources Ltd 441 0.06
5 Toronto-Dominion Bank 369 0.05
9 Tourmaline Oil Corp 225 0.03
- West Fraser Timber Co Ltd 10 -
45 Yamana Gold Inc 235 0.03
24,420 3.23
Denmark - 0.61%
- AP Moller - Maersk AS, Class A 113 0.02
- AP Moller - Maersk AS, Class B 254 0.03
6 Carlsberg AS 1,087 0.14
13 Danske Bank AS 252 0.03
5 DSV Panalpina AS 1,199 0.16
3 H Lundbeck AS 97 0.01
5 Novozymes AS 322 0.04
- Rockwool International AS, Class A 114 0.02
- Rockwool International AS, Class B 130 0.02
7 Tryg AS 153 0.02
22 Vestas Wind Systems 873 0.12
4,594 0.61
Finland - 0.33%
23 Fortum Oyj 670 0.09
190 Nokia Oyj 990 0.13
45 Nordea Bank Abp 490 0.06
20 Stora Enso Oyj 347 0.05
2,497 0.33
France - 3.18%
2 Accor SA 75 0.01
- Aeroports de Paris 39 -
1 Amundi SA 131 0.02
4 Arkema SA 534 0.07
6 Atos SE 402 0.05
14 AXA SA 400 0.05
28 BNP Paribas SA 1,906 0.25
27 Bollore SA 141 0.02
15 Bouygues SA 598 0.08
48 Carrefour SA 985 0.13
36 Cie de Saint-Gobain 2,384 0.32
12 Cie Generale des Etablissements Michelin SCA 1,910 0.25
6 CNP Assurances 106 0.01
25 Credit Agricole SA 371 0.05
- Dassault Aviation SA 79 0.01
5 Eiffage SA 589 0.08
27 Electricite de France SA 382 0.05
85 Engie SA 1,263 0.17
4 EssilorLuxottica SA 632 0.08
1 Faurecia 75 0.01
2 Faurecia SE 133 0.02
- Iliad SA 10 -
19 Natixis SA 92 0.01
140 Orange SA 1,784 0.24
2 Orpea 188 0.02
15 Publicis Groupe SA 1,043 0.14
12 Renault SA 506 0.07
12 Sanofi 1,261 0.17
1 SCOR SE 47 0.01
27 Societe Generale SA 861 0.11
- Technip Energies NV 1 -
Global Value FundPortfolio of Investments as at 31 May 2021
Dimensional Fund Advisors Semi-Annual Report and Unaudited Financial Statements, 31 May 2021 309

Shares (000's)
Value(000's)
USD
% of NetAssetValue
Common Stock (continued)
France - 3.18% (continued)
98 TOTAL SA 4,558 0.60
11 Valeo SA 346 0.05
5 Vivendi SA 193 0.03
24,025 3.18
Germany - 2.70%
10 Allianz SE 2,723 0.36
14 BASF SE 1,151 0.15
31 Bayer AG 2,012 0.27
15 Bayerische Motoren Werke AG 1,645 0.22
21 Commerzbank AG 173 0.02
4 Continental AG 599 0.08
7 Covestro AG 484 0.06
41 Daimler AG 3,817 0.51
59 Deutsche Bank AG 883 0.12
2 Deutsche Lufthansa AG 28 -
12 Evonik Industries AG 432 0.06
10 Fresenius Medical Care AG & Co KGaA 816 0.11
29 Fresenius SE & Co KGaA 1,599 0.21
1 Hapag-Lloyd AG 172 0.02
11 HeidelbergCement AG 975 0.13
1 Muenchener Rueckversicherungs-Gesellschaft AGin Muenchen 237 0.03
29 RWE AG 1,088 0.14
6 Siemens Energy AG 179 0.02
2 Talanx AG 68 0.01
88 Telefonica Deutschland Holding AG 243 0.03
10 Uniper SE 353 0.05
2 Volkswagen AG 747 0.10
20,424 2.70
Hong Kong - 0.88%
21 Bank of East Asia Ltd 42 0.01
9 BOC Aviation Ltd 77 0.01
133 BOC Hong Kong Holdings Ltd 491 0.06
44 Cathay Pacific Airways Ltd 38 -
201 CK Asset Holdings Ltd 1,372 0.18
154 CK Hutchison Holdings Ltd 1,228 0.16
11 CK Infrastructure Holdings Ltd 70 0.01
3 Guoco Group Ltd 36 -
119 Hang Lung Properties Ltd 308 0.04
47 Henderson Land Development Co Ltd 225 0.03
253 HKT Trust & HKT Ltd 346 0.05
64 MTR Corp Ltd 364 0.05
79 New World Development Co Ltd 432 0.06
74 Sino Land Co Ltd 117 0.02
39 Sun Hung Kai Properties Ltd 601 0.08
20 Swire Pacific Ltd, Class A 156 0.02
47 Swire Pacific Ltd, Class B 58 0.01
781 WH Group Ltd 674 0.09
6,635 0.88
Ireland - 0.27%
30 CRH PLC 1,586 0.21
2 Flutter Entertainment PLC (Ireland listing) 302 0.04
1 Flutter Entertainment PLC (UK listing) 150 0.02
2,038 0.27
Israel - 0.18%
35 Bank Hapoalim BM 310 0.04
43 Bank Leumi Le-Israel BM 344 0.05
1 Harel Insurance Investments & Financial ServicesLtd 14 -
111 Israel Discount Bank Ltd 567 0.07
11 Teva Pharmaceutical Industries Ltd 114 0.02
1,349 0.18
Shares (000's)
Value(000's)
USD
% of NetAssetValue
Common Stock (continued)
Italy - 0.98%
123 Eni SpA 1,513 0.20
617 Intesa Sanpaolo SpA 1,810 0.24
155 Stellantis 3,043 0.40
504 Telecom Italia SpA 269 0.04
60 UniCredit SpA 772 0.10
7,407 0.98
Japan - 7.84%
11 AEON Financial Service Co Ltd 125 0.02
14 AGC Inc 603 0.08
10 Air Water Inc 172 0.02
11 Aisin Seiki Co Ltd 471 0.06
8 Alfresa Holdings Corp 127 0.02
13 Alps Alpine Co Ltd 142 0.02
13 Amada Holdings Co Ltd 138 0.02
3 Aozora Bank Ltd 78 0.01
58 Asahi Kasei Corp 647 0.09
1 Bank of Kyoto Ltd 51 0.01
18 Bridgestone Corp 793 0.10
14 Brother Industries Ltd 292 0.04
27 Canon Inc 635 0.08
2 Canon Marketing Japan Inc 52 0.01
11 Chiba Bank Ltd 71 0.01
6 Coca-Cola Bottlers Japan Holdings Inc 101 0.01
16 Concordia Financial Group Ltd 60 0.01
10 Credit Saison Co Ltd 130 0.02
14 Dai Nippon Printing Co Ltd 293 0.04
10 Daicel Corp 82 0.01
15 Dai-ichi Life Holdings Inc 324 0.04
2 Daio Paper Corp 30 -
19 Daiwa House Industry Co Ltd 553 0.07
65 Daiwa Securities Group Inc 374 0.05
6 DeNA Co Ltd 113 0.01
4 Denka Co Ltd 137 0.02
6 Dentsu Inc 212 0.03
4 DIC Corp 92 0.01
3 Dowa Holdings Co Ltd 119 0.02
7 Ebara Corp 324 0.04
3 Fuji Electric Co Ltd 160 0.02
4 FUJIFILM Holdings Corp 289 0.04
3 Fukuoka Financial Group Inc 65 0.01
1 Fukuyama Transporting Co Ltd 44 0.01
9 Hankyu Hanshin Holdings Inc 295 0.04
16 Haseko Corp 230 0.03
24 Hino Motors Ltd 229 0.03
5 Hitachi Construction Machinery Co Ltd 176 0.02
21 Hitachi Ltd 1,112 0.15
6 Hitachi Metals Ltd 116 0.02
45 Honda Motor Co Ltd 1,400 0.19
7 Idemitsu Kosan Co Ltd 176 0.02
10 IHI Corp 256 0.03
9 Iida Group Holdings Co Ltd 239 0.03
81 Inpex Corp 552 0.07
6 Isetan Mitsukoshi Holdings Ltd 45 0.01
42 Isuzu Motors Ltd 570 0.08
1 Izumi Co Ltd 38 -
10 J Front Retailing Co Ltd 95 0.01
12 Japan Airlines Co Ltd 263 0.03
18 Japan Post Holdings Co Ltd 156 0.02
11 Japan Post Insurance Co Ltd 223 0.03
21 JFE Holdings Inc 279 0.04
3 JGC Holdings Corp 32 -
5 JSR Corp 137 0.02
Global Value FundPortfolio of Investments as at 31 May 2021 (continued)
Dimensional Fund Advisors Semi-Annual Report and Unaudited Financial Statements, 31 May 2021 310

Shares (000's)
Value(000's)
USD
% of NetAssetValue
Common Stock (continued)
Japan - 7.84% (continued)
9 JTEKT Corp 98 0.01
58 JXTG Holdings Inc 239 0.03
29 Kajima Corp 398 0.05
4 Kamigumi Co Ltd 84 0.01
2 Kaneka Corp 79 0.01
11 Kawasaki Heavy Industries Ltd 260 0.03
8 Kinden Corp 138 0.02
11 Kobe Steel Ltd 74 0.01
20 Komatsu Ltd 612 0.08
19 Konica Minolta Inc 106 0.01
16 K's Holdings Corp 195 0.03
17 Kuraray Co Ltd 183 0.02
4 Kyocera Corp 252 0.03
5 Kyowa Exeo Corp 124 0.02
1 Kyudenko Corp 44 0.01
14 LIXIL Group Corp 366 0.05
1 Mabuchi Motor Co Ltd 32 -
90 Marubeni Corp 806 0.11
4 Marui Group Co Ltd 71 0.01
15 Mazda Motor Corp 135 0.02
10 Mebuki Financial Group Inc 21 -
7 Medipal Holdings Corp 133 0.02
89 Mitsubishi Chemical Holdings Corp 719 0.10
34 Mitsubishi Corp 924 0.12
38 Mitsubishi Electric Corp 589 0.08
26 Mitsubishi Estate Co Ltd 420 0.06
7 Mitsubishi Gas Chemical Co Inc 155 0.02
21 Mitsubishi Heavy Industries Ltd 650 0.09
1 Mitsubishi Logistics Corp 40 0.01
6 Mitsubishi Materials Corp 135 0.02
3 Mitsubishi Motors Corp 7 -
238 Mitsubishi UFJ Financial Group Inc 1,369 0.18
38 Mitsubishi UFJ Lease & Finance Co Ltd 211 0.03
40 Mitsui & Co Ltd 878 0.12
12 Mitsui Chemicals Inc 409 0.05
31 Mitsui Fudosan Co Ltd 744 0.10
5 Mitsui OSK Lines Ltd 198 0.03
27 Mizuho Financial Group Inc 417 0.06
2 Morinaga Milk Industry Co Ltd 104 0.01
7 MS&AD Insurance Group Holdings Inc 217 0.03
15 NGK Insulators Ltd 262 0.03
8 NGK Spark Plug Co Ltd 130 0.02
5 NH Foods Ltd 206 0.03
14 Nikon Corp 150 0.02
2 Nippo Corp 47 0.01
2 Nippon Electric Glass Co Ltd 41 0.01
5 Nippon Express Co Ltd 420 0.06
1 Nippon Shokubai Co Ltd 56 0.01
18 Nippon Steel Corp 337 0.04
9 Nippon Yusen KK 354 0.05
88 Nissan Motor Co Ltd 442 0.06
7 Nisshin Seifun Group Inc 109 0.01
2 Nitto Denko Corp 142 0.02
2 NOK Corp 29 -
103 Nomura Holdings Inc 567 0.07
6 Nomura Real Estate Holdings Inc 163 0.02
14 NSK Ltd 140 0.02
54 Obayashi Corp 457 0.06
65 Oji Holdings Corp 391 0.05
45 ORIX Corp 795 0.11
10 Otsuka Holdings Co Ltd 402 0.05
78 Panasonic Corp 890 0.12
Shares (000's)
Value(000's)
USD
% of NetAssetValue
Common Stock (continued)
Japan - 7.84% (continued)
9 Rengo Co Ltd 72 0.01
93 Resona Holdings Inc 400 0.05
46 Ricoh Co Ltd 546 0.07
1 Rohm Co Ltd 103 0.01
2 Sankyu Inc 101 0.01
2 Sawai Group Holdings Co Ltd 79 0.01
6 Sega Sammy Holdings Inc 79 0.01
7 Seibu Holdings Inc 75 0.01
17 Seiko Epson Corp 316 0.04
3 Seino Holdings Co Ltd 45 0.01
17 Sekisui Chemical Co Ltd 289 0.04
44 Sekisui House Ltd 926 0.12
28 Seven & i Holdings Co Ltd 1,254 0.17
1 Shimamura Co Ltd 106 0.01
44 Shimizu Corp 362 0.05
3 Shinsei Bank Ltd 48 0.01
6 Shizuoka Bank Ltd 50 0.01
6 Showa Denko KK 202 0.03
73 Sojitz Corp 226 0.03
12 Sompo Holdings Inc 463 0.06
3 Stanley Electric Co Ltd 99 0.01
22 Subaru Corp 429 0.06
100 Sumitomo Chemical Co Ltd 557 0.07
21 Sumitomo Corp 294 0.04
4 Sumitomo Dainippon Pharma Co Ltd 79 0.01
55 Sumitomo Electric Industries Ltd 847 0.11
11 Sumitomo Forestry Co Ltd 230 0.03
5 Sumitomo Heavy Industries Ltd 170 0.02
6 Sumitomo Metal Mining Co Ltd 286 0.04
20 Sumitomo Mitsui Financial Group Inc 735 0.10
17 Sumitomo Mitsui Trust Holdings Inc 608 0.08
11 Sumitomo Realty & Development Co Ltd 364 0.05
7 Sumitomo Rubber Industries Ltd 94 0.01
2 Suzuken Co Ltd Japan 50 0.01
10 Suzuki Motor Corp 419 0.06
27 T&D Holdings Inc 363 0.05
7 Taiheiyo Cement Corp 158 0.02
13 Taisei Corp 470 0.06
1 Taisho Pharmaceutical Holdings Co Ltd 46 0.01
2 Takashimaya Co Ltd 24 -
57 Takeda Pharmaceutical Co Ltd 1,937 0.26
10 Teijin Ltd 166 0.02
16 Toda Corp 118 0.02
10 Tokai Carbon Co Ltd 145 0.02
11 Tokio Marine Holdings Inc 492 0.06
12 Tokyo Tatemono Co Ltd 176 0.02
34 Tokyu Fudosan Holdings Corp 206 0.03
4 Toppan Printing Co Ltd 75 0.01
103 Toray Industries Inc 680 0.09
19 Tosoh Corp 334 0.04
3 Toyo Seikan Group Holdings Ltd 38 -
6 Toyo Tire Corp 126 0.02
4 Toyoda Gosei Co Ltd 89 0.01
4 Toyota Boshoku Corp 83 0.01
3 Toyota Industries Corp 277 0.04
83 Toyota Motor Corp 6,896 0.91
10 Toyota Tsusho Corp 470 0.06
1 Tsumura & Co 26 -
5 Ube Industries Ltd 96 0.01
37 Yamada Denki Co Ltd 183 0.02
20 Yamaha Motor Co Ltd 587 0.08
5 Yamazaki Baking Co Ltd 75 0.01
Global Value FundPortfolio of Investments as at 31 May 2021 (continued)
Dimensional Fund Advisors Semi-Annual Report and Unaudited Financial Statements, 31 May 2021 311

Shares (000's)
Value(000's)
USD
% of NetAssetValue
Common Stock (continued)
Japan - 7.84% (continued)
5 Yokohama Rubber Co Ltd 106 0.01
7 Zeon Corp 103 0.01
59,232 7.84
Netherlands - 1.34%
8 ABN AMRO Bank NV 111 0.01
41 Aegon NV 194 0.03
2 Akzo Nobel NV 212 0.03
18 ArcelorMittal SA 592 0.08
1 ASM International NV 340 0.05
11 Coca-Cola European Partners PLC 693 0.09
8 Heineken NV 901 0.12
88 ING Groep NV 1,226 0.16
50 Koninklijke Ahold Delhaize NV 1,447 0.19
9 Koninklijke DSM NV 1,590 0.21
103 Koninklijke KPN NV 345 0.05
23 Koninklijke Philips NV 1,308 0.17
8 NN Group NV 405 0.05
6 Randstad NV 450 0.06
5 Signify NV 312 0.04
10,126 1.34
New Zealand - 0.10%
33 Auckland International Airport Ltd 175 0.02
11 Chorus Ltd 48 0.01
5 Ebos Group Ltd 120 0.01
34 Fletcher Building Ltd 182 0.02
2 Mainfreight Ltd 134 0.02
15 Ryman Healthcare Ltd 140 0.02
799 0.10
Norway - 0.33%
24 DNB ASA 541 0.07
16 Equinor ASA 349 0.05
104 Norsk Hydro ASA 677 0.09
8 SpareBank 1 SR-Bank ASA 110 0.01
23 Storebrand ASA 227 0.03
7 Subsea 7 SA 65 0.01
9 Yara International ASA 500 0.07
2,469 0.33
Portugal - 0.04%
8 EDP Renovaveis SA 181 0.03
8 Galp Energia SGPS SA 104 0.01
285 0.04
Singapore - 0.30%
87 CapitaLand Ltd 241 0.03
36 City Developments Ltd 204 0.03
33 Hongkong Land Holdings Ltd 161 0.02
8 Jardine Cycle & Carriage Ltd 139 0.02
68 Keppel Corp Ltd 273 0.03
12 Olam International Ltd 16 -
71 Oversea-Chinese Banking Corp Ltd 674 0.09
77 Singapore Airlines Ltd 290 0.04
31 UOL Group Ltd 175 0.02
124 Yangzijiang Shipbuilding Holdings Ltd 139 0.02
2,312 0.30
Spain - 0.74%
228 Banco Bilbao Vizcaya Argentaria SA 1,424 0.19
759 Banco Santander SA 3,198 0.43
94 CaixaBank SA 325 0.04
11 Iberdrola SA 159 0.02
35 Repsol SA 463 0.06
5,569 0.74
Shares (000's)
Value(000's)
USD
% of NetAssetValue
Common Stock (continued)
Sweden - 1.07%
1 Annehem Fastigheter 4 -
8 BillerudKorsnas AB 152 0.02
17 Boliden 699 0.09
17 Boliden 13 -
3 Bure Equity AB 127 0.02
9 Dometic Group AB 149 0.02
12 Getinge AB 439 0.06
3 Holmen AB 138 0.02
19 Husqvarna AB, Class B 286 0.04
5 ICA Gruppen AB 238 0.03
3 Intrum AB 113 0.01
6 Millicom International Cellular SA 289 0.04
6 Peab AB 76 0.01
3 Saab AB 79 0.01
20 Securitas AB 324 0.04
40 Skandinaviska Enskilda Banken AB 515 0.07
17 Skanska AB 468 0.06
19 SKF AB 505 0.07
5 SSAB AB, Class B 25 -
13 Svenska Cellulosa AB SCA 209 0.03
34 Svenska Handelsbanken AB 388 0.05
14 Swedbank AB 254 0.03
7 Swedish Orphan Biovitrum AB 121 0.02
28 Tele2 AB 379 0.05
96 Telia Co AB 426 0.06
7 Trelleborg AB 184 0.02
11 Volvo AB, Class A 305 0.04
46 Volvo AB, Class B 1,225 0.16
8,130 1.07
Switzerland - 2.90%
41 ABB Ltd 1,402 0.19
7 Adecco Group AG 466 0.06
12 Alcon Inc 865 0.11
1 Baloise Holding AG 183 0.02
- Barry Callebaut AG 325 0.04
- Chocoladefabriken Lindt & Spruengli AG 300 0.04
18 Cie Financiere Richemont SA 2,136 0.28
121 Credit Suisse Group AG 1,319 0.18
14 Julius Baer Group Ltd 956 0.13
31 LafargeHolcim Ltd 1,860 0.25
2 Lonza Group AG 970 0.13
46 Novartis AG 4,101 0.54
6 SIG Combibloc Group AG 163 0.02
1 Swatch Group AG (Bearer) 302 0.04
1 Swatch Group AG (Registered) 86 0.01
1 Swiss Life Holding AG 756 0.10
1 Swiss Prime Site AG 100 0.01
7 Swiss Re AG 681 0.09
2 Swisscom AG 969 0.13
89 UBS Group AG 1,449 0.19
3 Vifor Pharma AG 375 0.05
5 Zurich Insurance Group AG 2,154 0.29
21,918 2.90
United Kingdom - 4.87%
49 Anglo American PLC 2,160 0.29
240 Aviva PLC 1,401 0.19
621 Barclays PLC 1,613 0.21
16 Barratt Developments PLC 168 0.02
5 Bellway PLC 234 0.03
825 BP PLC 3,596 0.48
83 British American Tobacco PLC 3,201 0.42
723 BT Group PLC 1,791 0.24
Global Value FundPortfolio of Investments as at 31 May 2021 (continued)
Dimensional Fund Advisors Semi-Annual Report and Unaudited Financial Statements, 31 May 2021 312

Shares (000's)
Value(000's)
USD
% of NetAssetValue
Common Stock (continued)
United Kingdom - 4.87% (continued)
4 Carnival PLC 108 0.01
99 DS Smith PLC 585 0.08
521 Glencore PLC 2,369 0.31
285 HSBC Holdings PLC 1,841 0.24
29 Informa PLC 225 0.03
138 J Sainsbury PLC 519 0.07
147 Kingfisher PLC 747 0.10
3,233 Lloyds Banking Group PLC 2,286 0.30
165 M&G PLC 571 0.08
137 Melrose Industries PLC 334 0.04
4 Micro Focus International PLC, ADR 31 -
11 Ninety One PLC 37 0.01
33 Pearson PLC 378 0.05
21 Phoenix Group Holdings PLC 216 0.03
236 Royal Bank of Scotland Group PLC 690 0.09
363 Royal Dutch Shell PLC 6,599 0.87
47 Royal Mail PLC 387 0.05
81 Standard Chartered PLC 583 0.08
81 Standard Life Aberdeen PLC 316 0.04
2 Takeaway.com NV 157 0.02
1 Takeaway.com NV (UK listing) 114 0.02
129 Taylor Wimpey PLC 312 0.04
1,160 Vodafone Group PLC 2,104 0.28
146 WM Morrison Supermarkets PLC 367 0.05
54 WPP PLC 746 0.10
36,786 4.87
United States - 64.57%
- AbbVie Inc 6 -
35 Activision Blizzard Inc 3,375 0.45
4 Advance Auto Parts Inc 737 0.10
32 Aflac Inc 1,821 0.24
12 Air Products and Chemicals Inc 3,724 0.49
10 Akamai Technologies Inc 1,137 0.15
- Alaska Air Group Inc 30 -
5 Albemarle Corp 909 0.12
10 Alexion Pharmaceuticals Inc 1,798 0.24
22 Allstate Corp 2,957 0.39
26 Ally Financial Inc 1,413 0.19
- Alphabet Inc, Class A 382 0.05
- Alphabet Inc, Class C 219 0.03
103 Amcor PLC 1,211 0.16
- Amdocs Ltd 10 -
- Amerco 60 0.01
40 American International Group Inc 2,125 0.28
- Ameriprise Financial Inc 78 0.01
10 AMETEK Inc 1,369 0.18
17 Analog Devices Inc 2,822 0.37
18 Anthem Inc 7,275 0.96
10 APA Corp 199 0.03
13 Aptiv PLC 1,944 0.26
3 Aramark 98 0.01
12 Arch Capital Group Ltd 458 0.06
28 Archer-Daniels-Midland Co 1,831 0.24
- Arconic Corp 14 -
251 AT&T Inc 7,384 0.98
1 Athene Holding Ltd 74 0.01
- Autoliv Inc 12 -
6 AXA Equitable Holdings Inc 201 0.03
33 Baker Hughes Co 812 0.11
- Ball Corp 9 -
117 Bank of America Corp 4,961 0.66
63 Bank of New York Mellon Corp 3,282 0.43
Shares (000's)
Value(000's)
USD
% of NetAssetValue
Common Stock (continued)
United States - 64.57% (continued)
30 Baxter International Inc 2,450 0.32
11 Becton Dickinson and Co 2,742 0.36
25 Berkshire Hathaway Inc 7,129 0.94
10 Biogen Inc 2,767 0.37
1 Bio-Rad Laboratories Inc 406 0.05
- BlackRock Inc 75 0.01
- BorgWarner Inc 9 -
31 Boston Scientific Corp 1,298 0.17
85 Bristol-Myers Squibb Co 5,604 0.74
4 Bunge Ltd 362 0.05
- CACI International Inc 51 0.01
22 Capital One Financial Corp 3,510 0.46
10 CarMax Inc 1,122 0.15
38 Carnival Corp 1,121 0.15
22 Carrier Global Corp 1,002 0.13
20 CBRE Group Inc 1,770 0.23
5 Celanese Corp 761 0.10
25 Centene Corp 1,857 0.25
- CF Industries Holdings Inc 20 -
28 Charles Schwab Corp 2,064 0.27
4 Charter Communications Inc 2,953 0.39
44 Chevron Corp 4,551 0.60
11 Chubb Ltd 1,926 0.25
- Ciena Corp 11 -
26 Cigna Corp 6,621 0.88
3 Cincinnati Financial Corp 393 0.05
137 Cisco Systems Inc 7,264 0.96
51 Citigroup Inc 4,048 0.54
19 Citizens Financial Group Inc 966 0.13
7 Clarivate PLC 200 0.03
11 CME Group Inc 2,463 0.33
1 CNA Financial Corp 29 -
35 Cognizant Technology Solutions Corp 2,497 0.33
182 Comcast Corp 10,444 1.38
31 Conagra Brands Inc 1,171 0.15
105 ConocoPhillips 5,865 0.78
13 Constellation Brands Inc 3,049 0.40
7 Continental Resources Inc 221 0.03
2 Cooper Cos Inc 658 0.09
42 Corning Inc 1,830 0.24
19 Corteva Inc 862 0.11
9 Coty Inc 76 0.01
39 CSX Corp 3,939 0.52
10 Cummins Inc 2,535 0.34
52 CVS Health Corp 4,476 0.59
9 Danaher Corp 2,189 0.29
1 Darden Restaurants Inc 77 0.01
1 DaVita Inc 76 0.01
- Deere & Co 77 0.01
2 Delta Air Lines Inc 77 0.01
4 Dentsply Sirona Inc 247 0.03
2 Devon Energy Corp 58 0.01
2 Diamondback Energy Inc 165 0.02
6 Discover Financial Services 663 0.09
12 Discovery Inc, Class A 399 0.05
24 Discovery Inc, Class C 719 0.10
19 DISH Network Corp 839 0.11
- Dolby Laboratories Inc 6 -
15 Dollar Tree Inc 1,440 0.19
51 Dow Inc 3,507 0.46
27 DR Horton Inc 2,569 0.34
8 DuPont de Nemours Inc 687 0.09
Global Value FundPortfolio of Investments as at 31 May 2021 (continued)
Dimensional Fund Advisors Semi-Annual Report and Unaudited Financial Statements, 31 May 2021 313

Shares (000's)
Value(000's)
USD
% of NetAssetValue
Common Stock (continued)
United States - 64.57% (continued)
9 Eastman Chemical Co 1,112 0.15
30 Eaton Corp PLC 4,338 0.57
11 Elanco Animal Health Inc (voting rights) 378 0.05
11 Electronic Arts Inc 1,590 0.21
29 Emerson Electric Co 2,795 0.37
38 EOG Resources Inc 3,025 0.40
- Expedia Group Inc 78 0.01
102 Exxon Mobil Corp 5,962 0.79
17 FedEx Corp 5,418 0.72
13 Fidelity National Financial Inc 610 0.08
8 Fidelity National Information Services Inc 1,247 0.17
32 Fifth Third Bancorp 1,330 0.18
1 First Republic Bank 158 0.02
24 Fiserv Inc 2,740 0.36
3 FMC Corp 373 0.05
226 Ford Motor Co 3,289 0.44
10 Fortive Corp 736 0.10
8 Fortune Brands Home & Security Inc 811 0.11
25 Fox Corp, Class A 915 0.12
18 Fox Corp, Class B 641 0.08
21 Franklin Resources Inc 728 0.10
58 Freeport-McMoRan Inc 2,474 0.33
1 Gap Inc 16 -
10 Garmin Ltd 1,461 0.19
143 General Electric Co 2,011 0.27
39 General Mills Inc 2,437 0.32
76 General Motors Co 4,523 0.60
5 Genuine Parts Co 619 0.08
68 Gilead Sciences Inc 4,523 0.60
7 Global Payments Inc 1,373 0.18
9 Goldman Sachs Group Inc 3,384 0.45
63 Halliburton Co 1,418 0.19
24 Hartford Financial Services Group Inc 1,596 0.21
8 Hasbro Inc 721 0.10
5 Henry Schein Inc 352 0.05
23 Hess Corp 1,912 0.25
64 Hewlett Packard Enterprise Co 1,014 0.13
6 Horizon Therapeutics PLC 510 0.07
22 Hormel Foods Corp 1,081 0.14
14 Howmet Aerospace Inc 504 0.07
- Hubbell Inc 37 -
9 Humana Inc 4,005 0.53
48 Huntington Bancshares Inc 755 0.10
- Hyatt Hotels Corp 12 -
14 IHS Markit Ltd 1,474 0.20
17 Ingersoll Rand Inc 847 0.11
- Ingredion Inc 15 -
153 Intel Corp 8,710 1.15
2 International Business Machines Corp 243 0.03
9 International Flavors & Fragrances Inc (US listing) 1,281 0.17
27 International Paper Co 1,726 0.23
8 Interpublic Group of Cos Inc 271 0.04
4 Invesco Ltd 112 0.01
- IQVIA Holdings Inc 77 0.01
6 Jacobs Engineering Group Inc 783 0.10
7 JM Smucker Co 893 0.12
18 Johnson Controls International PLC 1,182 0.16
112 JPMorgan Chase & Co 18,359 2.43
6 Kansas City Southern 1,880 0.25
34 Keurig Dr Pepper Inc 1,253 0.17
47 KeyCorp 1,073 0.14
66 Kinder Morgan Inc 1,203 0.16
Shares (000's)
Value(000's)
USD
% of NetAssetValue
Common Stock (continued)
United States - 64.57% (continued)
2 Kohl's Corp 95 0.01
26 Kraft Heinz Co 1,117 0.15
44 Kroger Co 1,641 0.22
8 L3Harris Technologies Inc 1,754 0.23
7 Laboratory Corp of America Holdings 1,914 0.25
- Lear Corp 62 0.01
7 Leidos Holdings Inc 713 0.09
20 Lennar Corp, Class A 1,931 0.26
2 Lennar Corp, Class B 192 0.03
1 Liberty Broadband Corp, Class A 91 0.01
4 Liberty Broadband Corp, Class C 722 0.10
3 Liberty Media Corp-Liberty Formula One, Class C 142 0.02
5 Liberty Media Corp-Liberty SiriusXM, Class A 230 0.03
10 Liberty Media Corp-Liberty SiriusXM, Class C 421 0.06
1 Lincoln National Corp 96 0.01
13 Linde PLC 3,950 0.52
17 LKQ Corp 854 0.11
5 Loews Corp 273 0.04
66 Lumen Technologies Inc 908 0.12
22 LyondellBasell Industries NV 2,445 0.32
7 M&T Bank Corp 1,045 0.14
2 Macy's Inc 29 -
26 Marathon Petroleum Corp 1,622 0.21
- Markel Corp 441 0.06
4 Martin Marietta Materials Inc 1,562 0.21
15 Marvell Technology Inc 711 0.09
9 McKesson Corp 1,813 0.24
35 Medtronic PLC 4,464 0.59
44 MetLife Inc 2,853 0.38
14 MGM Resorts International 607 0.08
67 Micron Technology Inc 5,645 0.75
3 Mohawk Industries Inc 534 0.07
92 Mondelez International Inc 5,821 0.77
45 Morgan Stanley 4,133 0.55
12 Mosaic Co 449 0.06
- Nasdaq Inc 78 0.01
23 Newell Brands Inc 666 0.09
52 Newmont Goldcorp Corp 3,812 0.50
8 News Corp, Class A 204 0.03
5 News Corp, Class B 125 0.02
- Nielsen Holdings PLC 11 -
18 Norfolk Southern Corp 5,031 0.67
12 Northern Trust Corp 1,492 0.20
5 NortonLifeLock Inc 147 0.02
- Norwegian Cruise Line Holdings Ltd 12 -
14 Nucor Corp 1,427 0.19
48 Occidental Petroleum Corp 1,255 0.17
1 Old Republic International Corp 13 -
- Omnicom Group Inc 25 -
20 ON Semiconductor Corp 794 0.11
32 ONEOK Inc 1,687 0.22
9 Otis Worldwide Corp 698 0.09
3 Ovintiv Inc (Canada listing) 90 0.01
23 PACCAR Inc 2,118 0.28
5 Packaging Corp of America 739 0.10
8 Parker-Hannifin Corp 2,488 0.33
6 PerkinElmer Inc 871 0.12
211 Pfizer Inc 8,176 1.08
12 Phillips 66 1,024 0.14
- Pilgrim's Pride Corp 10 -
9 Pioneer Natural Resources Co 1,405 0.19
20 PNC Financial Services Group Inc 3,922 0.52
Global Value FundPortfolio of Investments as at 31 May 2021 (continued)
Dimensional Fund Advisors Semi-Annual Report and Unaudited Financial Statements, 31 May 2021 314

Shares (000's)
Value(000's)
USD
% of NetAssetValue
Common Stock (continued)
United States - 64.57% (continued)
10 Principal Financial Group Inc 646 0.09
10 Prudential Financial Inc 1,039 0.14
15 PulteGroup Inc 894 0.12
- PVH Corp 26 -
8 Qorvo Inc 1,430 0.19
7 Quanta Services Inc 652 0.09
8 Quest Diagnostics Inc 1,113 0.15
1 Ralph Lauren Corp 104 0.01
3 Raymond James Financial Inc 335 0.04
26 Raytheon Technologies Corp 2,338 0.31
5 Regeneron Pharmaceuticals Inc 2,696 0.36
43 Regions Financial Corp 1,017 0.13
- Reliance Steel & Aluminum Co 34 -
21 Republic Services Inc 2,320 0.31
5 Roper Technologies Inc 2,104 0.28
8 Royal Caribbean Cruises Ltd 715 0.09
1 Santander Consumer USA Holdings Inc 19 -
99 Schlumberger Ltd 3,091 0.41
3 Skyworks Solutions Inc 466 0.06
2 Snap-on Inc 410 0.05
1 Southern Copper Corp 80 0.01
23 Southwest Airlines Co 1,428 0.19
17 SS&C Technologies Holdings Inc 1,227 0.16
10 Stanley Black & Decker Inc 2,142 0.28
17 State Street Corp 1,492 0.20
9 Steel Dynamics Inc 552 0.07
4 STERIS PLC 747 0.10
3 SVB Financial Group 1,648 0.22
36 Synchrony Financial 1,703 0.23
- Tapestry Inc 12 -
- Target Corp 76 0.01
13 TE Connectivity Ltd 1,711 0.23
- TechnipFMC PLC 4 -
2 Teladoc Health Inc 283 0.04
1 Teledyne Technologies Inc 573 0.08
21 T-Mobile US Inc 2,965 0.39
12 Trane Technologies PLC 2,168 0.29
18 Travelers Cos Inc 2,843 0.38
6 Trimble Inc 486 0.06
60 Truist Financial Corp 3,709 0.49
1 Twitter Inc 77 0.01
20 Tyson Foods Inc 1,566 0.21
10 United Airlines Holdings Inc 561 0.07
5 United Rentals Inc 1,579 0.21
31 UnitedHealth Group Inc 12,961 1.71
5 Universal Health Services Inc 718 0.10
- Unum Group 11 -
67 US Bancorp 4,072 0.54
- US Foods Holding Corp 12 -
Shares (000's)
Value(000's)
USD
% of NetAssetValue
Common Stock (continued)
United States - 64.57% (continued)
22 Valero Energy Corp 1,730 0.23
156 Verizon Communications Inc 8,813 1.17
- Viacom Inc, Class A 18 -
37 Viacom Inc, Class B 1,567 0.21
52 Viatris Inc 799 0.11
8 Vulcan Materials Co 1,505 0.20
67 Walgreens Boots Alliance Inc 3,506 0.46
29 Walmart Inc 4,123 0.55
38 Walt Disney Co 6,835 0.90
63 Wells Fargo & Co 2,945 0.39
20 Western Digital Corp 1,507 0.20
6 Westinghouse Air Brake Technologies Corp 464 0.06
4 Westlake Chemical Corp 412 0.05
4 Westrock Co 254 0.03
3 Whirlpool Corp 777 0.10
72 Williams Cos Inc 1,893 0.25
4 Willis Towers Watson PLC 1,065 0.14
1 XPO Logistics Inc 165 0.02
1 Xylem Inc 165 0.02
- Zillow Group Inc, Class C 49 0.01
5 Zimmer Biomet Holdings Inc 852 0.11
487,993 64.57
Total Common Stock - 99.02% (30 November 2020: 98.93%) 748,379 99.02
Preferred Stock
Germany - 0.40%
3 Bayerische Motoren Werke AG 303 0.04
3 Porsche Automobil Holding SE 361 0.05
9 Volkswagen AG 2,339 0.31
3,003 0.40
Italy - 0.03%
450 Telecom Italia SpA 257 0.03
257 0.03
Total Preferred Stock - 0.43% (30 November 2020: 0.36%) 3,260 0.43
Rights
Singapore - 0.00%
161 Singapore Airlines Ltd - -
- -
Total Rights - 0.00% (30 November 2020: 0.01%) - -
Warrants
Canada - 0.00%
1 Cenovus Energy Inc 5 -
5 -
Total Warrants - 0.00% (30 November 2020: 0.00%) 5 -
Total Investments - 99.45% (30 November 2020: 99.30%) 751,644 99.45
Value (000's)USD
% of NetAssetValue
Cash and Cash Equivalents - 0.60% (30 November 2020: 0.23%) 4,564 0.60Other Liabilities in Excess of Other Assets - (0.05)% (30 November 2020: 0.47%) (437) (0.05)
Total Net Assets 755,771 100.00
Amounts designated as “- “ are either $0, less than $500 or less than 500 shares.
Global Value FundPortfolio of Investments as at 31 May 2021 (continued)
Dimensional Fund Advisors Semi-Annual Report and Unaudited Financial Statements, 31 May 2021 315

Analysis of Total Assets % of Total Assets
Transferable securities admitted to an official exchange listing 98.68
Current Assets 1.32
Total Assets 100.00
Global Value FundPortfolio of Investments as at 31 May 2021 (continued)
Dimensional Fund Advisors Semi-Annual Report and Unaudited Financial Statements, 31 May 2021 316

Shares (000's)
Value(000's)
USD
% of NetAssetValue
Investment Funds
Australia - 0.02%
9 WAM Capital Ltd 16 0.02
16 0.02
Total Investment Funds - 0.02% (30 November 2020: 0.00%) 16 0.02
Common Stock
Australia - 18.70%
15 A2B Australia Ltd 15 0.01
24 Accent Group Ltd 50 0.05
14 Adairs Ltd 50 0.05
47 Adelaide Brighton Ltd 122 0.11
16 Ainsworth Game Technology Ltd 12 0.01
52 Alkane Resources Ltd 35 0.03
5 Alliance Aviation Services Ltd 18 0.02
18 ALS Ltd 169 0.16
8 Altium Ltd 177 0.16
193 Alumina Ltd 254 0.23
52 AMA Group Ltd 22 0.02
219 AMP Ltd 199 0.18
8 Ansell Ltd 262 0.24
15 AP Eagers Ltd 176 0.16
6 Appen Ltd 67 0.06
7 ARB Corp Ltd 241 0.22
57 Ardent Leisure Group Ltd 45 0.04
41 Asaleo Care Ltd 44 0.04
7 AUB Group Ltd 112 0.10
89 Aurelia Metals Ltd 30 0.03
47 Austal Ltd 87 0.08
43 Australian Agricultural Co Ltd 41 0.04
19 Australian Finance Group Ltd 41 0.04
56 Australian Pharmaceutical Industries Ltd 50 0.05
12 Australian Strategic Materials Ltd 41 0.04
28 Australian Vintage Ltd 17 0.02
4 Auswide Bank Ltd 18 0.02
19 AVJennings Ltd 8 0.01
12 Baby Bunting Group Ltd 57 0.05
64 Bank of Queensland Ltd 446 0.41
114 Bannerman Resources Ltd 18 0.02
30 Bapcor Ltd 190 0.18
146 Beach Energy Ltd 144 0.13
10 Beacon Lighting Group Ltd 15 0.01
30 Bega Cheese Ltd 136 0.13
10 Bell Financial Group Ltd 13 0.01
41 Bendigo & Adelaide Bank Ltd 335 0.31
30 Bingo Industries Ltd 78 0.07
151 Bionomics Ltd 23 0.02
2 Blackmores Ltd 96 0.09
4 Blue Sky Alternative Investments Ltd - -
22 Bravura Solutions Ltd 55 0.05
10 Breville Group Ltd 202 0.19
8 Brickworks Ltd 129 0.12
10 BWX Ltd 38 0.04
146 Capitol Health Ltd 40 0.04
16 Cardno Ltd 9 0.01
134 Carnarvon Petroleum Ltd 26 0.02
26 carsales.com Ltd 395 0.36
25 Cash Converters International Ltd 4 -
14 Catapult Group International Ltd 24 0.02
- CDS Technologies Ltd - -
11 Cedar Woods Properties Ltd 58 0.05
45 Challenger Ltd 180 0.17
30 Champion Iron Ltd 153 0.14
13 City Chic Collective Ltd 47 0.04
Shares (000's)
Value(000's)
USD
% of NetAssetValue
Common Stock (continued)
Australia - 18.70% (continued)
6 Class Ltd 8 0.01
172 Cleanaway Waste Management Ltd 368 0.34
4 Clinuvel Pharmaceuticals Ltd 100 0.09
17 Clover Corp Ltd 20 0.02
14 Codan Ltd 203 0.19
8 Collection House Ltd 1 -
13 Collins Foods Ltd 129 0.12
181 Cooper Energy Ltd 40 0.04
11 Corporate Travel Management Ltd 179 0.17
26 Costa Group Holdings Ltd 65 0.06
7 Credit Corp Group Ltd 147 0.14
55 CSR Ltd 235 0.22
23 Data#3 Ltd 105 0.10
9 Decmil Group Ltd 3 -
45 Deep Yellow Ltd 30 0.03
17 Deterra Royalties Ltd 56 0.05
5 Dicker Data Ltd 42 0.04
26 Domain Holdings Australia Ltd 101 0.09
44 Downer EDI Ltd 194 0.18
27 Eclipx Group Ltd 45 0.04
18 Elders Ltd 159 0.15
48 Emeco Holdings Ltd 34 0.03
19 EML Payments Ltd 51 0.05
100 Energy World Corp Ltd 7 0.01
2 EQT Holdings Ltd 43 0.04
17 Estia Health Ltd 32 0.03
17 Euroz Ltd 21 0.02
9 EVENT Hospitality and Entertainment Ltd 85 0.08
994 FAR Ltd 3 -
14 Finbar Group Ltd 9 0.01
6 Fleetwood Corp Ltd 12 0.01
11 Flight Centre Travel Group Ltd 127 0.12
10 Freedom Foods Group Ltd 3 -
75 G8 Education Ltd 58 0.05
43 Galaxy Resources Ltd (voting rights) 127 0.12
2 Gascoyne Resources Ltd 1 -
12 Genetic Signatures Ltd 11 0.01
78 Genex Power Ltd 14 0.01
35 Genworth Mortgage Insurance Australia Ltd 75 0.07
63 Gold Road Resources Ltd 73 0.07
20 GrainCorp Ltd 79 0.07
138 Greenland Minerals Ltd 10 0.01
9 GUD Holdings Ltd 83 0.08
24 GWA Group Ltd 53 0.05
18 Hansen Technologies Ltd 73 0.07
52 Healius Ltd 166 0.15
8 Helloworld Travel Ltd 11 0.01
35 HT&E Ltd 46 0.04
5 HUB24 Ltd 108 0.10
45 Humm Group Ltd 35 0.03
67 IGO Ltd 395 0.36
36 Iluka Resources Ltd 213 0.20
48 Imdex Ltd 77 0.07
38 Immutep Ltd 19 0.02
36 Infomedia Ltd 38 0.04
27 Inghams Group Ltd 70 0.06
16 Intega Group Ltd 6 0.01
12 Integral Diagnostics Ltd 45 0.04
11 Integrated Research Ltd 20 0.02
13 InvoCare Ltd 105 0.10
64 IOOF Holdings Ltd 193 0.18
21 IPH Ltd 107 0.10
Pacific Basin Small Companies FundPortfolio of Investments as at 31 May 2021
Dimensional Fund Advisors Semi-Annual Report and Unaudited Financial Statements, 31 May 2021 317

Shares (000's)
Value(000's)
USD
% of NetAssetValue
Common Stock (continued)
Australia - 18.70% (continued)
18 IRESS Ltd 149 0.14
9 IVE Group Ltd 10 0.01
27 Japara Healthcare Ltd 24 0.02
13 Johns Lyng Group Ltd 45 0.04
5 Jumbo Interactive Ltd 53 0.05
7 Juno Minerals Ltd 1 -
111 Jupiter Mines Ltd 25 0.02
50 Karoon Energy Ltd 47 0.04
25 Kingsgate Consolidated Ltd 17 0.02
8 Kogan.com Ltd 63 0.06
7 Lifestyle Communities Ltd 83 0.08
39 Link Administration Holdings Ltd 166 0.15
4 Lovisa Holdings Ltd 44 0.04
100 Lynas Corp Ltd 426 0.39
34 MACA Ltd 21 0.02
188 Macmahon Holdings Ltd 28 0.03
1 Macquarie Telecom Group Ltd 37 0.03
115 Mayne Pharma Group Ltd 33 0.03
7 McMillan Shakespeare Ltd 70 0.06
18 McPherson's Ltd 20 0.02
4 Medical Developments International 14 0.01
18 Medusa Mining Ltd 12 0.01
30 Mesoblast Ltd 47 0.04
66 Metals X Ltd 13 0.01
116 Metcash Ltd 315 0.29
11 Michael Hill International Ltd 7 0.01
35 Mincor Resources NL 26 0.02
7 MNF Group Ltd 27 0.03
5 Moelis Australia Ltd 20 0.02
8 Monadelphous Group Ltd 59 0.05
20 Monash IVF Group Ltd 13 0.01
16 Money3 Corp Ltd 40 0.04
42 Morning Star Gold NL - -
9 Mortgage Choice Ltd 13 0.01
56 Mount Gibson Iron Ltd 36 0.03
65 Myer Holdings Ltd 16 0.01
1 Mystate Ltd 4 -
5 MyState Ltd 18 0.02
25 Nanosonics Ltd 109 0.10
11 Navigator Global Investments Ltd 14 0.01
24 nearmap Ltd 34 0.03
59 Neometals Ltd 24 0.02
6 Netwealth Group Ltd 72 0.07
37 New Hope Corp Ltd 42 0.04
25 NEXTDC Ltd 216 0.20
46 nib holdings Ltd 222 0.20
8 Nick Scali Ltd 68 0.06
71 Nickel Mines Ltd 55 0.05
145 Nine Entertainment Co Holdings Ltd 331 0.31
48 NRW Holdings Ltd 63 0.06
32 Nufarm Ltd 118 0.11
1 Objective Corp Ltd 16 0.01
20 OFX Group Ltd 21 0.02
44 OM Holdings Ltd 29 0.03
32 Omni Bridgeway Ltd 99 0.09
45 oOh!media Ltd 59 0.05
22 Orocobre Ltd 110 0.10
74 Orora Ltd 179 0.17
30 OZ Minerals Ltd 586 0.54
3 Pacific Current Group Ltd 13 0.01
16 Pact Group Holdings Ltd 45 0.04
252 Panoramic Resources Ltd 32 0.03
Shares (000's)
Value(000's)
USD
% of NetAssetValue
Common Stock (continued)
Australia - 18.70% (continued)
127 Pantoro Ltd 23 0.02
24 Peet Ltd 22 0.02
31 Pendal Group Ltd 196 0.18
65 Perenti Global Ltd 34 0.03
5 Perpetual Ltd 150 0.14
127 Perseus Mining Ltd 136 0.13
30 Platinum Asset Management Ltd 108 0.10
5 PPK Group Ltd 57 0.05
46 Praemium Ltd 34 0.03
10 Premier Investments Ltd 208 0.19
- Prime AET&D Holdings No 1 Pty Ltd - -
5 Pro Medicus Ltd 183 0.17
5 Propel Funeral Partners Ltd 14 0.01
7 PSC Insurance Group Ltd 20 0.02
7 PWR Holdings Ltd 34 0.03
8 Qube Holdings Ltd 19 0.02
85 Ramelius Resources Ltd 127 0.12
9 ReadyTech Holdings Ltd 14 0.01
7 Reckon Ltd 5 -
12 Redbubble Ltd 33 0.03
33 Redcape Hotel Group 27 0.03
11 Regis Healthcare Ltd 16 0.01
84 Regis Resources Ltd 170 0.16
3 Reject Shop Ltd 13 0.01
71 Reliance Worldwide Corp Ltd 282 0.26
96 Resolute Mining Ltd 43 0.04
336 Retail Food Group Ltd 19 0.02
15 Rhipe Ltd 20 0.02
18 Ridley Corp Ltd 16 0.01
14 RPMGlobal Holdings Ltd 16 0.01
11 Salmat Ltd - -
18 Sandfire Resources NL 97 0.09
9 SeaLink Travel Group Ltd 68 0.06
14 Select Harvests Ltd 64 0.06
17 Senex Energy Ltd 41 0.04
6 Servcorp Ltd 16 0.01
43 Service Stream Ltd 32 0.03
104 Seven West Media Ltd 34 0.03
13 SG Fleet Group Ltd 30 0.03
96 Sigma Healthcare Ltd 46 0.04
74 Silver Lake Resources Ltd 113 0.10
21 Sims Metal Management Ltd 256 0.24
10 SmartGroup Corp Ltd 53 0.05
15 Southern Cross Media Group Ltd 22 0.02
160 Spark Infrastructure Group 268 0.25
21 SpeedCast International Ltd - -
27 Spirit Technology Solutions Ltd 6 0.01
66 St Barbara Ltd 96 0.09
75 Star Entertainment Grp Ltd 235 0.22
88 Steadfast Group Ltd 273 0.25
15 Sunland Group Ltd 27 0.03
3 Sunrise Energy Metals Ltd 5 -
17 Super Retail Group Ltd 168 0.16
32 Superloop Ltd 25 0.02
42 Syrah Resources Ltd 34 0.03
22 Tassal Group Ltd 62 0.06
26 Technology One Ltd 183 0.17
3 Temple & Webster Group Ltd 24 0.02
111 Tiger Resources Ltd - -
23 United Malt Group Ltd 79 0.07
211 Virgin Australia International Holdings - -
7 Virtus Health Ltd 31 0.03
Pacific Basin Small Companies FundPortfolio of Investments as at 31 May 2021 (continued)
Dimensional Fund Advisors Semi-Annual Report and Unaudited Financial Statements, 31 May 2021 318

Shares (000's)
Value(000's)
USD
% of NetAssetValue
Common Stock (continued)
Australia - 18.70% (continued)
20 Vita Group Ltd 15 0.01
74 Viva Energy Group Ltd 118 0.11
71 Vocus Group Ltd 299 0.28
14 Volpara Health Technologies 14 0.01
33 Webjet Ltd 131 0.12
40 Western Areas Ltd 77 0.07
26 Westgold Resources Ltd 44 0.04
75 Whitehaven Coal Ltd 93 0.09
31 Zip Co Ltd 173 0.16
20,272 18.70
China - 0.00%
54 Camsing International Holding Ltd 2 -
2 -
Hong Kong - 6.68%
208 Aceso Life Science Group Ltd 6 0.01
26 AEON Credit Service Asia Co Ltd 17 0.02
116 Allied Group Ltd 48 0.04
224 Apollo Future Mobility Group Ltd 14 0.01
250 Applied Development Holdings Ltd 5 -
28 Arts Optical International Holdings Ltd 3 -
85 Asia Standard International Group Ltd 14 0.01
33 Asiasec Properties Ltd 5 -
19 ASM Pacific Technology Ltd 251 0.23
12 Associated International Hotels Ltd 22 0.02
488 Ban Loong Holdings Ltd 29 0.03
53 Blue River Holdings Ltd 3 -
7 BOC Aviation Ltd 65 0.06
118 BOCOM International Holdings Co Ltd 28 0.03
78 BOE Varitronix Ltd 42 0.04
201 Brightoil Petroleum Holdings Ltd 7 0.01
291 Burwill Holdings Ltd 1 -
40 Cafe de Coral Holdings Ltd 87 0.08
101 Cathay Pacific Airways Ltd 88 0.08
195 Century City International Holdings Ltd 11 0.01
120 CGN Mining Co Ltd 11 0.01
35 Cheuk Nang Holdings Ltd 13 0.01
10 Chevalier International Holdings Ltd 13 0.01
117 China Baoli Technologies Holdings Ltd 1 -
672 China Energy Development Holdings Ltd 8 0.01
2 China Motor Bus Co Ltd 25 0.02
108 China Star Entertainment Ltd 18 0.02
1,027 China Strategic Holdings Ltd 17 0.02
100 China Tonghai International Financial Ltd 3 -
59 Chinese Estates Holdings Ltd 29 0.03
16 Chong Hing Bank Ltd 42 0.04
43 Chow Sang Sang Holdings International Ltd 75 0.07
193 Chuang's China Investments Ltd 11 0.01
48 Chuang's Consortium International Ltd 7 0.01
135 CITIC Telecom International Holdings Ltd 45 0.04
234 CK Life Sciences Int'l Holdings Inc 22 0.02
1,620 CMBC Capital Holdings Ltd 21 0.02
48 Convenience Retail Asia Ltd 4 -
396 CSI Properties Ltd 13 0.01
66 CW Group Holdings Ltd - -
50 Dah Sing Banking Group Ltd 58 0.05
18 Dah Sing Financial Holdings Ltd 63 0.06
8 Dynamic Holdings Ltd 14 0.01
24 Eagle Nice International Holdings Ltd 15 0.01
38 EC Healthcare 63 0.06
90 EcoGreen International Group Ltd 22 0.02
486 Emperor Capital Group Ltd 8 0.01
70 Emperor Entertainment Hotel Ltd 10 0.01
Shares (000's)
Value(000's)
USD
% of NetAssetValue
Common Stock (continued)
Hong Kong - 6.68% (continued)
97 Emperor International Holdings Ltd 14 0.01
360 Emperor Watch & Jewellery Ltd 8 0.01
253 Esprit Holdings Ltd 25 0.02
9 Fairwood Holdings Ltd 20 0.02
116 Far East Consortium International Ltd 42 0.04
264 First Pacific Co Ltd 92 0.08
80 First Shanghai Investments Ltd 3 -
74 Fountain SET Holdings Ltd 13 0.01
20 Four Seas Mercantile Holdings Ltd 7 0.01
42 GDH Guangnan Holdings Ltd 4 -
148 Giordano International Ltd 33 0.03
84 Glorious Sun Enterprises Ltd 9 0.01
98 Golden Resources Development International Ltd 8 0.01
166 Gold-Finance Holdings Ltd - -
109 Goodbaby International Holdings Ltd 27 0.02
19 Great Eagle Holdings Ltd 65 0.06
1,789 G-Resources Group Ltd 11 0.01
297 Guotai Junan International Holdings Ltd 54 0.05
266 Haitong International Securities Group Ltd 83 0.08
112 Hang Fung Gold Technology Ltd - -
64 Hang Lung Group Ltd 158 0.15
26 Hanison Construction Holdings Ltd 4 -
15 Harbour Centre Development Ltd 15 0.01
45 HKBN Ltd 61 0.06
102 HKR International Ltd 50 0.05
48 Hon Kwok Land Investment Co Ltd 22 0.02
14 Hong Kong Ferry Holdings Co Ltd 11 0.01
42 Hongkong & Shanghai Hotels Ltd 42 0.04
79 Hongkong Chinese Ltd 7 0.01
172 Hsin Chong Group Holdings Ltd 1 -
56 Hung Hing Printing Group Ltd 9 0.01
156 Hutchison Telecommunications Hong Kong HoldingsLtd 29 0.03
47 Hysan Development Co Ltd 186 0.17
82 IGG Inc 122 0.11
75 IPE Group Ltd 6 0.01
200 IRC Ltd 9 0.01
94 ITC Properties Group Ltd 12 0.01
62 Jacobson Pharma Corp Ltd 6 0.01
8 JBM Healthcare Ltd 2 -
38 Johnson Electric Holdings Ltd 100 0.09
54 K Wah International Holdings Ltd 27 0.02
66 Kam Hing International Holdings Ltd 3 -
72 Karrie International Holdings Ltd 17 0.02
72 Kerry Logistics Network Ltd 215 0.20
44 Kerry Properties Ltd 150 0.14
50 Kingmaker Footwear Holdings Ltd 6 0.01
42 Kowloon Development Co Ltd 52 0.05
20 Lai Sun Development Co Ltd 15 0.01
23 Lai Sun Garment International Ltd 17 0.02
3 Lam Soon Hong Kong Ltd 6 0.01
145 Landing International Development Ltd 5 -
28 Landsea Green Group Co Ltd 2 -
71 Langham Hospitality Investments and LanghamHospitality Investments Ltd 9 0.01
54 Lifestyle International Holdings Ltd 44 0.04
436 Lippo China Resources Ltd 7 0.01
30 Lippo Ltd 9 0.01
10 Liu Chong Hing Investment Ltd 11 0.01
40 L'Occitane International SA 134 0.12
36 Luk Fook Holdings International Ltd 101 0.09
306 Magnificent Hotel Investment Ltd 5 -
Pacific Basin Small Companies FundPortfolio of Investments as at 31 May 2021 (continued)
Dimensional Fund Advisors Semi-Annual Report and Unaudited Financial Statements, 31 May 2021 319

Shares (000's)
Value(000's)
USD
% of NetAssetValue
Common Stock (continued)
Hong Kong - 6.68% (continued)
2,599 Mason Group Holdings Ltd 11 0.01
71 Matrix Holdings Ltd 18 0.02
64 MECOM Power and Construction 41 0.04
60 Melco International Development Ltd 109 0.10
32 MGM China Holdings Ltd 52 0.05
26 Midland Holdings Ltd 4 -
55 Ming Fai International Holdings Ltd 5 -
24 Miramar Hotel & Investment 46 0.04
39 Modern Dental Group Ltd 34 0.03
98 NagaCorp Ltd 103 0.09
58 Nameson Holdings Ltd 4 -
158 NewOcean Energy Holdings Ltd 9 0.01
26 Nissin Foods Co Ltd 21 0.02
163 NWS Holdings Ltd 185 0.17
53 Oriental Watch Holdings 25 0.02
427 Oshidori International Holdings Ltd 32 0.03
381 Pacific Andes International Holdings Ltd 1 -
563 Pacific Basin Shipping Ltd 213 0.20
22 Pacific Century Premium Developments Ltd 2 -
82 Pacific Textiles Holdings Ltd 55 0.05
62 Paliburg Holdings Ltd 17 0.02
52 Paradise Entertainment Ltd 7 0.01
302 PCCW Ltd 167 0.15
178 Peace Mark Holdings Ltd - -
48 Pentamaster International Ltd 11 0.01
48 Perfect Shape Medical Ltd 50 0.05
112 Pico Far East Holdings Ltd 20 0.02
74 Playmates Holdings Ltd 9 0.01
36 Public Financial Holdings Ltd 12 0.01
28 Regal Hotels International Holdings Ltd 15 0.01
30 Regina Miracle International Holdings Ltd 9 0.01
78 Renco Holdings Group Ltd 2 -
160 Sa Sa International Holdings Ltd 39 0.04
12 Safety Godown Co Ltd 5 -
106 Samsonite International SA 202 0.19
21 SEA Holdings Ltd 23 0.02
72 Shangri-La Asia Ltd 67 0.06
45 Shenwan Hongyuan HK Ltd 6 0.01
6 Shun Ho Property Investments Ltd 1 -
152 Shun Tak Holdings Ltd 49 0.05
54 Sing Tao News Corp Ltd 6 0.01
138 Singamas Container Holdings Ltd 12 0.01
123 SITC International Holdings Co Ltd 434 0.40
49 SmarTone Telecommunications Holdings Ltd 28 0.03
214 Solomon Systech International Ltd 22 0.02
8 Soundwill Holdings Ltd 9 0.01
53 Stella International Holdings Ltd 65 0.06
84 Summit Ascent Holdings Ltd 8 0.01
57 Sun Hung Kai & Co Ltd 32 0.03
71 SUNeVision Holdings Ltd 74 0.07
22 TAI Cheung Holdings Ltd 14 0.01
78 Tan Chong International Ltd 21 0.02
32 Tao Heung Holdings Ltd 4 -
36 Television Broadcasts Ltd 36 0.03
108 Texwinca Holdings Ltd 28 0.03
585 Theme International Holdings Ltd 66 0.06
123 Town Health International Medical Group Ltd 5 -
78 Tradelink Electronic Commerce Ltd 12 0.01
19 Transport International Holdings Ltd 38 0.03
83 United Laboratories International Holdings Ltd 75 0.07
744 Untrade Convoy 3 -
150 Up Energy Development Group Ltd - -
Shares (000's)
Value(000's)
USD
% of NetAssetValue
Common Stock (continued)
Hong Kong - 6.68% (continued)
154 Upbest Group Ltd 17 0.02
93 Value Partners Group Ltd 63 0.06
24 Vedan International Holdings Ltd 2 -
56 Vitasoy International Holdings Ltd 218 0.20
35 VPower Group International Holdings Ltd 8 0.01
68 VSTECS Holdings Ltd 66 0.06
17 VTech Holdings Ltd 176 0.16
70 Wai Kee Holdings Ltd 37 0.03
1,440 Wang On Group Ltd 13 0.01
160 Wealthking Investments Ltd 15 0.01
11 Wing On Co International Ltd 25 0.02
63 Wing Tai Properties Ltd 38 0.04
81 YT Realty Group Ltd 18 0.02
53 Yue Yuen Industrial Holdings Ltd 138 0.13
142 Yunfeng Financial Group Ltd 52 0.05
1,020 Zensun Enterprises Ltd 83 0.08
200 Zhaobangji Properties Holdings Ltd 17 0.02
7,241 6.68
Japan - 49.63%
6 77 Bank Ltd 73 0.07
2 A&D Co Ltd 22 0.02
2 Access Co Ltd 13 0.01
2 Achilles Corp 21 0.02
3 Adastria Co Ltd 50 0.05
12 ADEKA Corp 208 0.19
1 Ad-Sol Nissin Corp 15 0.01
2 Advan Co Ltd 21 0.02
2 AEON Delight Co Ltd 67 0.06
1 AEON Fantasy Co Ltd 22 0.02
3 AEON Financial Service Co Ltd 33 0.03
2 AEON Hokkaido Corp 19 0.02
1 Aeria Inc 4 -
1 Agro-Kanesho Co Ltd 12 0.01
1 Ahresty Corp 3 -
4 Ai Holdings Corp 71 0.07
1 Aichi Bank Ltd 23 0.02
3 Aichi Corp 27 0.03
1 Aichi Steel Corp 43 0.04
1 Aichi Tokei Denki Co Ltd 20 0.02
6 Aida Engineering Ltd 49 0.05
43 Aiful Corp 149 0.14
2 Ain Holdings Inc 147 0.14
1 Aiphone Co Ltd 27 0.02
4 Airport Facilities Co Ltd 23 0.02
5 Aisan Industry Co Ltd 37 0.03
3 Aizawa Securities Co Ltd 35 0.03
- Ajis Co Ltd 13 0.01
1 Akatsuki Inc 23 0.02
15 Akebono Brake Industry Co Ltd 24 0.02
2 Akita Bank Ltd 23 0.02
1 Albis Co Ltd 27 0.03
2 Alconix Corp 28 0.03
2 Alinco Inc 16 0.01
1 Alpen Co Ltd 25 0.02
1 Alpha Corp 10 0.01
2 Alps Logistics Co Ltd 14 0.01
2 Altech Corp 39 0.04
6 Amano Corp 158 0.15
- Amiyaki Tei Co Ltd 8 0.01
2 Amuse Inc 35 0.03
- Amvis Holdings Inc 12 0.01
3 Anest Iwata Corp 25 0.02
Pacific Basin Small Companies FundPortfolio of Investments as at 31 May 2021 (continued)
Dimensional Fund Advisors Semi-Annual Report and Unaudited Financial Statements, 31 May 2021 320

Shares (000's)
Value(000's)
USD
% of NetAssetValue
Common Stock (continued)
Japan - 49.63% (continued)
8 Anicom Holdings Inc 69 0.06
- AOI Electronics Co Ltd 6 0.01
2 AOI TYO Holdings Inc 13 0.01
5 AOKI Holdings Inc 28 0.03
2 Aomori Bank Ltd 42 0.04
7 Aoyama Trading Co Ltd 54 0.05
1 Aoyama Zaisan Networks Co Ltd 18 0.02
5 Aozora Bank Ltd 110 0.10
2 Apaman Co Ltd 9 0.01
2 Arakawa Chemical Industries Ltd 17 0.02
1 Arata Corp 39 0.04
1 Arcland Sakamoto Co Ltd 18 0.02
2 Arcland Service Holdings Co Ltd 37 0.03
4 Arcs Co Ltd 86 0.08
44 Ardepro Co Ltd 23 0.02
2 Arealink Co Ltd 22 0.02
2 Argo Graphics Inc 61 0.06
4 Arisawa Manufacturing Co Ltd 37 0.03
2 ARTERIA Networks Corp 24 0.02
1 Artiza Networks Inc 21 0.02
3 Artnature Inc 17 0.02
1 ArtSpark Holdings Inc 27 0.02
3 Aruhi Corp 50 0.05
1 Asahi Co Ltd 12 0.01
8 Asahi Diamond Industrial Co Ltd 37 0.03
6 Asahi Holdings Inc 135 0.12
1 Asahi Kogyosha Co Ltd 16 0.01
2 Asahi Net Inc 14 0.01
1 Asahi Yukizai Corp 14 0.01
1 Asante Inc 11 0.01
1 Asanuma Corp 45 0.04
1 Ashimori Industry Co Ltd 6 0.01
2 Asia Pile Holdings Corp 10 0.01
2 ASKA Pharmaceutical Holdings 16 0.01
4 ASKUL Corp 61 0.06
1 Asukanet Co Ltd 12 0.01
1 Ateam Inc 23 0.02
13 Atom Corp 94 0.09
1 Atrae Inc 11 0.01
2 Atsugi Co Ltd 14 0.01
1 Aucnet Inc 14 0.01
10 Autobacs Seven Co Ltd 129 0.12
- Aval Data Corp 12 0.01
1 Avant Corp 17 0.02
5 Avex Inc 73 0.07
4 Awa Bank Ltd 75 0.07
1 Axial Retailing Inc 50 0.05
3 Bando Chemical Industries Ltd 23 0.02
2 Bank of Iwate Ltd 27 0.03
1 Bank of Kochi Ltd 6 0.01
1 Bank of Nagoya Ltd 25 0.02
2 Bank of Okinawa Ltd 42 0.04
3 Bank of Saga Ltd 33 0.03
5 Bank of the Ryukyus Ltd 31 0.03
1 Beauty Garage Inc 23 0.02
1 Beenos Inc 45 0.04
1 Belc Co Ltd 66 0.06
5 Bell System24 Holdings Inc 70 0.06
6 Belluna Co Ltd 60 0.06
7 Benesse Holdings Inc 155 0.14
- Bengo4.com Inc 32 0.03
8 Bic Camera Inc 79 0.07
Shares (000's)
Value(000's)
USD
% of NetAssetValue
Common Stock (continued)
Japan - 49.63% (continued)
1 Biofermin Pharmaceutical Co Ltd 17 0.02
2 BML Inc 85 0.08
1 BP Castrol KK 15 0.01
5 Br Holdings Corp 23 0.02
- BrainPad Inc 18 0.02
7 Broadleaf Co Ltd 35 0.03
6 Bunka Shutter Co Ltd 60 0.06
2 Business Brain Showa-Ota Inc 30 0.03
1 C Uyemura & Co Ltd 47 0.04
2 CAC Holdings Corp 21 0.02
1 Can Do Co Ltd 11 0.01
3 Canon Electronics Inc 49 0.05
2 Carlit Holdings Co Ltd 13 0.01
2 Cawachi Ltd 33 0.03
- CellSource Co Ltd 21 0.02
1 Central Automotive Products Ltd 27 0.03
4 Central Glass Co Ltd 72 0.07
1 Central Security Patrols Co Ltd 19 0.02
1 Central Sports Co Ltd 20 0.02
2 Change Inc 51 0.05
1 Charm Care Corp KK 15 0.01
3 Chiba Kogyo Bank Ltd 7 0.01
1 Chilled & Frozen Logistics Holdings Co Ltd 15 0.01
1 Chino Corp 8 0.01
2 Chiyoda Co Ltd 15 0.01
1 Chiyoda Integre Co Ltd 22 0.02
2 Chofu Seisakusho Co Ltd 39 0.04
2 Chori Co Ltd 25 0.02
3 Chubu Shiryo Co Ltd 29 0.03
3 Chudenko Corp 68 0.06
1 Chuetsu Pulp & Paper Co Ltd 7 0.01
1 Chugai Ro Co Ltd 15 0.01
14 Chugoku Bank Ltd 116 0.11
6 Chugoku Marine Paints Ltd 49 0.05
1 Chukyo Bank Ltd 12 0.01
5 CI Takiron Corp 27 0.03
27 Citizen Watch Co Ltd 109 0.10
- CK-San-Etsu Co Ltd 10 0.01
3 Cleanup Corp 13 0.01
1 CMIC Holdings Co Ltd 10 0.01
6 CMK Corp 25 0.02
2 Cocokara fine Inc 142 0.13
3 Computer Engineering & Consulting Ltd 43 0.04
3 Computer Institute of Japan Ltd 27 0.02
2 Comture Corp 38 0.04
1 CONEXIO Corp 15 0.01
8 COOKPAD Inc 18 0.02
1 Corona Corp 9 0.01
3 Cosel Co Ltd 32 0.03
6 Cosmo Energy Holdings Co Ltd 133 0.12
2 Cota Co Ltd 29 0.03
7 Create Restaurants Holdings Inc 54 0.05
1 Create SD Holdings Co Ltd 44 0.04
6 Credit Saison Co Ltd 81 0.07
1 Creek & River Co Ltd 21 0.02
2 Cresco Ltd 34 0.03
1 CTI Engineering Co Ltd 34 0.03
3 CTS Co Ltd 28 0.03
4 Curves Holdings Co Ltd 32 0.03
1 Cybernet Systems Co Ltd 4 -
3 Cybozu Inc 66 0.06
2 Dai Nippon Toryo Co Ltd 12 0.01
Pacific Basin Small Companies FundPortfolio of Investments as at 31 May 2021 (continued)
Dimensional Fund Advisors Semi-Annual Report and Unaudited Financial Statements, 31 May 2021 321

Shares (000's)
Value(000's)
USD
% of NetAssetValue
Common Stock (continued)
Japan - 49.63% (continued)
4 Daibiru Corp 52 0.05
10 Daicel Corp 82 0.08
2 Dai-Dan Co Ltd 39 0.04
1 Daido Kogyo Co Ltd 10 0.01
3 Daido Metal Co Ltd 17 0.02
2 Daido Steel Co Ltd 118 0.11
4 Daidoh Ltd 6 0.01
3 Daihatsu Diesel Manufacturing Co Ltd 12 0.01
3 Daihen Corp 115 0.11
2 Daiho Corp 64 0.06
1 Daiichi Jitsugyo Co Ltd 47 0.04
1 Daiichi Kigenso Kagaku-Kogyo Co Ltd 15 0.01
1 Dai-ichi Seiko Co Ltd 15 0.01
3 Daiichikosho Co Ltd 125 0.12
1 Daiken Corp 21 0.02
3 Daiki Aluminium Industry Co Ltd 33 0.03
1 Daikoku Denki Co Ltd 7 0.01
1 Daikokutenbussan Co Ltd 54 0.05
4 Daikyonishikawa Corp 25 0.02
2 Dainichi Co Ltd 12 0.01
1 Dainichiseika Color & Chemicals Manufacturing CoLtd 19 0.02
3 Daiseki Co Ltd 133 0.12
3 Daishi Hokuetsu Financial Group Inc 74 0.07
1 Daishinku Corp 21 0.02
1 Daito Bank Ltd 7 0.01
2 Daito Pharmaceutical Co Ltd 45 0.04
4 Daiwa Industries Ltd 39 0.04
9 Daiwabo Holdings Co Ltd 140 0.13
11 DCM Holdings Co Ltd 100 0.09
3 Dear Life Co Ltd 11 0.01
6 DeNA Co Ltd 129 0.12
1 Denki Kogyo Co Ltd 21 0.02
- Densan System Co Ltd 11 0.01
2 Denyo Co Ltd 34 0.03
4 Dexerials Corp 77 0.07
1 Digital Arts Inc 88 0.08
3 Digital Garage Inc 120 0.11
1 Digital Hearts Holdings Co Ltd 11 0.01
1 Digital Holdings Inc 27 0.02
1 Digital Information Technologies Corp 21 0.02
3 Dip Corp 92 0.08
1 DKS Co Ltd 33 0.03
11 DMG Mori Co Ltd 202 0.19
3 Doshisha Co Ltd 43 0.04
3 Doutor Nichires Holdings Co Ltd 42 0.04
2 Dowa Holdings Co Ltd 99 0.09
5 DTS Corp 109 0.10
4 Duskin Co Ltd 91 0.08
1 DyDo Group Holdings Inc 50 0.05
3 Eagle Industry Co Ltd 32 0.03
1 Earth Corp 65 0.06
1 Ebara Foods Industry Inc 14 0.01
- Ebara Jitsugyo Co Ltd 12 0.01
2 Ebase Co Ltd 15 0.01
1 Eco's Co Ltd 10 0.01
8 EDION Corp 79 0.07
- Edulab Inc 21 0.02
3 EF-ON Inc 25 0.02
2 eGuarantee Inc 49 0.05
1 E-Guardian Inc 25 0.02
4 Ehime Bank Ltd 33 0.03
Shares (000's)
Value(000's)
USD
% of NetAssetValue
Common Stock (continued)
Japan - 49.63% (continued)
2 Eidai Co Ltd 6 0.01
3 Eiken Chemical Co Ltd 61 0.06
1 Eizo Corp 65 0.06
2 Elan Corp 25 0.02
4 Elecom Co Ltd 69 0.06
1 Elematec Corp 14 0.01
3 EM Systems Co Ltd 25 0.02
2 Endo Lighting Corp 15 0.01
3 Enigmo Inc 39 0.04
3 en-japan Inc 89 0.08
1 Enplas Corp 30 0.03
3 EPS Holdings Inc 38 0.04
3 eRex Co Ltd 56 0.05
5 ES-Con Japan Ltd 39 0.04
1 Eslead Corp 7 0.01
2 ESPEC Corp 40 0.04
3 Exedy Corp 40 0.04
1 F&M Co Ltd 9 0.01
7 F@N Communications Inc 24 0.02
1 Faith Inc 6 0.01
1 Falco Holdings Co Ltd 22 0.02
4 FCC Co Ltd 58 0.05
2 FDK Corp 20 0.02
2 Feed One Co Ltd 16 0.01
4 Ferrotec Holdings Corp 85 0.08
- FFRI Inc 6 0.01
1 Fibergate Inc 6 0.01
12 FIDEA Holdings Co Ltd 13 0.01
1 Fields Corp 4 -
2 FINDEX Inc 23 0.02
3 First Bank of Toyama Ltd 7 0.01
1 Fixstars Corp 12 0.01
1 FJ Next Co Ltd 9 0.01
2 Focus Systems Corp 20 0.02
2 Foster Electric Co Ltd 16 0.01
1 France Bed Holdings Co Ltd 12 0.01
2 Freund Corp 12 0.01
2 F-Tech Inc 15 0.01
1 FTGroup Co Ltd 7 0.01
1 Fudo Tetra Corp 23 0.02
2 Fuji Co Ltd 40 0.04
1 Fuji Corp 11 0.01
5 Fuji Corp (Aichi) 136 0.13
2 Fuji Corp Ltd 11 0.01
2 Fuji Kyuko Co Ltd 84 0.08
4 Fuji Oil Co Ltd 10 0.01
4 Fuji Oil Holdings Inc 111 0.10
2 Fuji Pharma Co Ltd 17 0.02
3 Fuji Seal International Inc 72 0.07
2 Fuji Soft Inc 116 0.11
1 Fujibo Holdings Inc 29 0.03
2 Fujicco Co Ltd 30 0.03
4 Fujikura Composites Inc 17 0.02
3 Fujikura Kasei Co Ltd 16 0.01
26 Fujikura Ltd 111 0.10
1 Fujimori Kogyo Co Ltd 42 0.04
1 Fujiya Co Ltd 17 0.02
1 FuKoKu Co Ltd 12 0.01
1 Fukuda Corp 27 0.03
1 Fukuda Denshi Co Ltd 70 0.06
2 Fukui Bank Ltd 27 0.02
1 Fukui Computer Holdings Inc 28 0.03
Pacific Basin Small Companies FundPortfolio of Investments as at 31 May 2021 (continued)
Dimensional Fund Advisors Semi-Annual Report and Unaudited Financial Statements, 31 May 2021 322

Shares (000's)
Value(000's)
USD
% of NetAssetValue
Common Stock (continued)
Japan - 49.63% (continued)
3 Fukushima Bank Ltd 6 0.01
1 Fukushima Industries Corp 58 0.05
2 Fukuyama Transporting Co Ltd 66 0.06
1 FULLCAST Holdings Co Ltd 28 0.03
4 Funai Soken Holdings Inc 78 0.07
1 Furukawa Battery Co Ltd 16 0.01
3 Furukawa Co Ltd 39 0.04
5 Furukawa Electric Co Ltd 145 0.13
3 Furuno Electric Co Ltd 27 0.03
1 Furusato Industries Ltd 13 0.01
1 Furyu Corp 14 0.01
2 Fuso Chemical Co Ltd 68 0.06
1 Fuso Pharmaceutical Industries Ltd 14 0.01
3 Futaba Corp 25 0.02
7 Futaba Industrial Co Ltd 30 0.03
2 Future Corp 38 0.04
2 Fuyo General Lease Co Ltd 121 0.11
1 G-7 Holdings Inc 28 0.03
2 Gakken Holdings Co Ltd 22 0.02
1 Gakkyusha Co Ltd 17 0.02
2 Gakujo Co Ltd 25 0.02
4 GCA Corp 36 0.03
2 Gecoss Corp 18 0.02
1 Genki Sushi Co Ltd 16 0.01
1 Genky DrugStores Co Ltd 33 0.03
3 Geo Holdings Corp 31 0.03
2 Geostr Corp 7 0.01
1 giftee Inc 31 0.03
1 Giken Ltd 57 0.05
1 GL Sciences Inc 16 0.01
1 Globeride Inc 48 0.04
5 Glory Ltd 103 0.10
1 GMO Cloud KK 27 0.03
4 GMO Financial Holdings Inc 34 0.03
1 Godo Steel Ltd 20 0.02
2 Goldcrest Co Ltd 31 0.03
1 Golf Digest Online Inc 16 0.01
2 Grace Technology Inc 34 0.03
11 Gree Inc 56 0.05
7 GS Yuasa Corp 202 0.19
2 G-Tekt Corp 25 0.02
1 Gun-Ei Chemical Industry Co Ltd 16 0.01
4 GungHo Online Entertainment Inc 77 0.07
30 Gunma Bank Ltd 99 0.09
1 Gunze Ltd 55 0.05
10 H2O Retailing Corp 79 0.07
- HABA Laboratories Inc 11 0.01
29 Hachijuni Bank Ltd 100 0.09
1 Hagihara Industries Inc 15 0.01
1 Hagiwara Electric Holdings Co Ltd 25 0.02
1 Hakudo Co Ltd 16 0.01
2 Hakuto Co Ltd 27 0.03
1 Halows Co Ltd 23 0.02
1 Hamakyorex Co Ltd 39 0.04
1 Handsman Co Ltd 9 0.01
4 Hanwa Co Ltd 109 0.10
1 Happinet Corp 13 0.01
1 Harima Chemicals Group Inc 13 0.01
1 Haruyama Holdings Inc 9 0.01
18 Hazama Ando Corp 135 0.12
5 Heiwa Corp 79 0.07
4 Heiwa Real Estate Co Ltd 142 0.13
Shares (000's)
Value(000's)
USD
% of NetAssetValue
Common Stock (continued)
Japan - 49.63% (continued)
3 Heiwado Co Ltd 64 0.06
1 Helios Techno Holding Co Ltd 3 -
- Hennge KK 18 0.02
1 Hibiya Engineering Ltd 25 0.02
2 HI-LEX Corp 27 0.03
1 Hinokiya Group Co Ltd 16 0.01
1 Hioki EE Corp 33 0.03
1 Hirakawa Hewtech Corp 17 0.02
1 Hirano Tecseed Co Ltd 25 0.02
- Hirata Corp 24 0.02
21 Hirogin Holdings Inc 114 0.11
1 Hiroshima Electric Railway Co Ltd 10 0.01
9 Hiroshima Gas Co Ltd 30 0.03
4 HIS Co Ltd 89 0.08
3 Hisaka Works Ltd 26 0.02
14 Hitachi Zosen Corp 93 0.09
1 Hochiki Corp 12 0.01
1 Hodogaya Chemical Co Ltd 29 0.03
2 Hogy Medical Co Ltd 48 0.04
- Hokkaido Coca-Cola Bottling Co Ltd 8 0.01
19 Hokkaido Electric Power Co Inc 85 0.08
2 Hokkaido Gas Co Ltd 22 0.02
1 Hokkan Holdings Ltd 16 0.01
4 Hokko Chemical Industry Co Ltd 30 0.03
2 Hokkoku Bank Ltd 39 0.04
12 Hokuetsu Corp 65 0.06
3 Hokuetsu Industries Co Ltd 31 0.03
13 Hokuhoku Financial Group Inc 104 0.10
18 Hokuriku Electric Power Co 102 0.09
1 Hokuriku Electrical Construction Co Ltd 17 0.02
2 Hokuto Corp 39 0.04
1 Honda Tsushin Kogyo Co Ltd 5 -
2 H-One Co Ltd 15 0.01
3 Honeys Holdings Co Ltd 24 0.02
5 Hoosiers Holdings 33 0.03
7 Hosiden Corp 65 0.06
1 Hosokawa Micron Corp 33 0.03
- House Do Co Ltd 2 -
1 Howa Machinery Ltd 9 0.01
20 Hyakugo Bank Ltd 59 0.05
3 Hyakujushi Bank Ltd 41 0.04
1 IBJ Inc 14 0.01
1 Ichibanya Co Ltd 57 0.05
28 Ichigo Inc 88 0.08
1 Ichiken Co Ltd 8 0.01
4 Ichikoh Industries Ltd 27 0.02
2 Ichinen Holdings Co Ltd 18 0.02
6 Ichiyoshi Securities Co Ltd 32 0.03
1 Icom Inc 26 0.02
1 ID Holdings Corp 11 0.01
3 Idec Corp 62 0.06
9 IDOM Inc 49 0.05
1 Ihara Science Corp 9 0.01
7 Iino Kaiun Kaisha Ltd 29 0.03
3 IJTT Co Ltd 19 0.02
1 I'll Inc 17 0.02
2 Imagica Group Inc 9 0.01
- Imasen Electric Industrial 2 -
1 Imuraya Group Co Ltd 17 0.02
4 Inaba Denki Sangyo Co Ltd 103 0.10
2 Inaba Seisakusho Co Ltd 23 0.02
5 Inabata & Co Ltd 81 0.07
Pacific Basin Small Companies FundPortfolio of Investments as at 31 May 2021 (continued)
Dimensional Fund Advisors Semi-Annual Report and Unaudited Financial Statements, 31 May 2021 323

Shares (000's)
Value(000's)
USD
% of NetAssetValue
Common Stock (continued)
Japan - 49.63% (continued)
2 Inageya Co Ltd 26 0.02
2 Ines Corp 28 0.03
1 I-Net Corp 17 0.02
2 Infocom Corp 47 0.04
12 Infomart Corp 98 0.09
3 Information Services International-Dentsu Ltd 99 0.09
1 Insource Co Ltd 25 0.02
3 Intage Holdings Inc 39 0.04
2 Inter Action Corp 36 0.03
6 Internet Initiative Japan Inc 163 0.15
2 Iriso Electronics Co Ltd 92 0.08
1 I'rom Group Co Ltd 15 0.01
- Ise Chemicals Corp 6 0.01
1 Iseki & Co Ltd 18 0.02
3 Ishihara Sangyo Kaisha Ltd 27 0.03
2 Itfor Inc 12 0.01
1 ITmedia Inc 8 0.01
7 Itochu Enex Co Ltd 67 0.06
- Itochu-Shokuhin Co Ltd 14 0.01
13 Itoham Yonekyu Holdings Inc 84 0.08
3 Itoki Corp 11 0.01
- Itokuro Inc 4 -
1 IwaiCosmo Holdings Inc 18 0.02
6 Iwaki & Co Ltd 39 0.04
1 Iwasaki Electric Co Ltd 19 0.02
1 Iwatsu Electric Co Ltd 10 0.01
1 Iwatsuka Confectionery Co Ltd 18 0.02
22 Iyo Bank Ltd 116 0.11
11 J Front Retailing Co Ltd 109 0.10
11 J Trust Co Ltd 38 0.04
2 JAC Recruitment Co Ltd 39 0.04
2 Jaccs Co Ltd 53 0.05
3 Jafco Co Ltd 256 0.24
1 Jalux Inc 8 0.01
1 Jamco Corp 10 0.01
2 Janome Sewing Machine Co Ltd 16 0.01
5 Japan Aviation Electronics Industry Ltd 97 0.09
3 Japan Best Rescue System Co Ltd 16 0.01
1 Japan Cash Machine Co Ltd 8 0.01
26 Japan Display Inc 9 0.01
5 Japan Elevator Service Holdings Co Ltd 97 0.09
4 Japan Foundation Engineering Co Ltd 19 0.02
1 Japan Investment Adviser Co Ltd 13 0.01
8 Japan Lifeline Co Ltd 102 0.09
5 Japan Material Co Ltd 59 0.05
1 Japan Meat Co Ltd 15 0.01
2 Japan Medical Dynamic Marketing Inc 33 0.03
4 Japan Petroleum Exploration Co Ltd 67 0.06
2 Japan Property Management Center Co Ltd 25 0.02
1 Japan Pulp & Paper Co Ltd 36 0.03
1 Japan Pure Chemical Co Ltd 13 0.01
9 Japan Securities Finance Co Ltd 70 0.06
6 Japan Steel Works Ltd 170 0.16
4 Japan Transcity Corp 19 0.02
5 Japan Wool Textile Co Ltd 47 0.04
2 Jastec Co Ltd 19 0.02
2 JBCC Holdings Inc 21 0.02
2 JCU Corp 66 0.06
3 Jeol Ltd 153 0.14
- JIG-SAW Inc 8 0.01
1 Jimoto Holdings Inc 4 -
2 JINS Holdings Inc 118 0.11
Shares (000's)
Value(000's)
USD
% of NetAssetValue
Common Stock (continued)
Japan - 49.63% (continued)
1 JK Holdings Co Ltd 10 0.01
2 JMS Co Ltd 14 0.01
1 Joban Kosan Co Ltd 10 0.01
3 J-Oil Mills Inc 45 0.04
1 Joshin Denki Co Ltd 36 0.03
3 Joyful Honda Co Ltd 41 0.04
5 JP-Holdings Inc 12 0.01
- JSB Co Ltd 13 0.01
1 JSP Corp 14 0.01
1 J-Stream Inc 20 0.02
- JTOWER Inc 17 0.02
4 Juki Corp 28 0.03
3 Juroku Bank Ltd 61 0.06
12 JVCKenwood Corp 24 0.02
1 K&O Energy Group Inc 16 0.01
- Kadoya Sesame Mills Inc 15 0.01
2 Kaga Electronics Co Ltd 55 0.05
2 Kaken Pharmaceutical Co Ltd 91 0.08
1 Kakiyasu Honten Co Ltd 34 0.03
1 Kameda Seika Co Ltd 54 0.05
3 Kamei Corp 28 0.03
2 Kanaden Corp 18 0.02
1 Kanagawa Chuo Kotsu Co Ltd 27 0.02
2 Kanamic Network Co Ltd 14 0.01
3 Kanamoto Co Ltd 68 0.06
4 Kandenko Co Ltd 37 0.03
4 Kaneka Corp 178 0.16
1 Kaneko Seeds Co Ltd 11 0.01
8 Kanematsu Corp 105 0.10
2 Kanematsu Electronics Ltd 53 0.05
1 Kansai Super Market Ltd 9 0.01
4 Kanto Denka Kogyo Co Ltd 39 0.04
2 Kasai Kogyo Co Ltd 8 0.01
3 Katakura Industries Co Ltd 39 0.04
4 Katitas Co Ltd 116 0.11
2 Kato Sangyo Co Ltd 60 0.06
1 Kato Works Co Ltd 7 0.01
- Kawada Technologies Inc 11 0.01
1 Kawai Musical Instruments Manufacturing Co Ltd 27 0.03
- Kawasaki Kinkai Kisen Kaisha Ltd 5 -
6 Kawasaki Kisen Kaisha Ltd 174 0.16
1 KeePer Technical Laboratory Co Ltd 23 0.02
4 Keihanshin Building Co Ltd 54 0.05
1 Keihin Co Ltdnato-Ku Tokyo Japan 8 0.01
10 Keiyo Bank Ltd 38 0.04
4 Keiyo Co Ltd 24 0.02
1 Kenko Mayonnaise Co Ltd 11 0.01
2 KFC Holdings Japan Ltd 41 0.04
3 KH Neochem Co Ltd 67 0.06
7 Kimoto Co Ltd 16 0.01
1 Kintetsu Department Store Co Ltd 17 0.02
4 Kintetsu World Express Inc 100 0.09
3 Kissei Pharmaceutical Co Ltd 56 0.05
1 Ki-Star Real Estate Co Ltd 22 0.02
1 Kitagawa Corp 7 0.01
- Kita-Nippon Bank Ltd 6 0.01
- Kitano Construction Corp 9 0.01
3 Kitanotatsujin Corp 13 0.01
3 Kito Corp 49 0.05
7 Kitz Corp 47 0.04
6 Kiyo Bank Ltd 87 0.08
2 KLab Inc 15 0.01
Pacific Basin Small Companies FundPortfolio of Investments as at 31 May 2021 (continued)
Dimensional Fund Advisors Semi-Annual Report and Unaudited Financial Statements, 31 May 2021 324
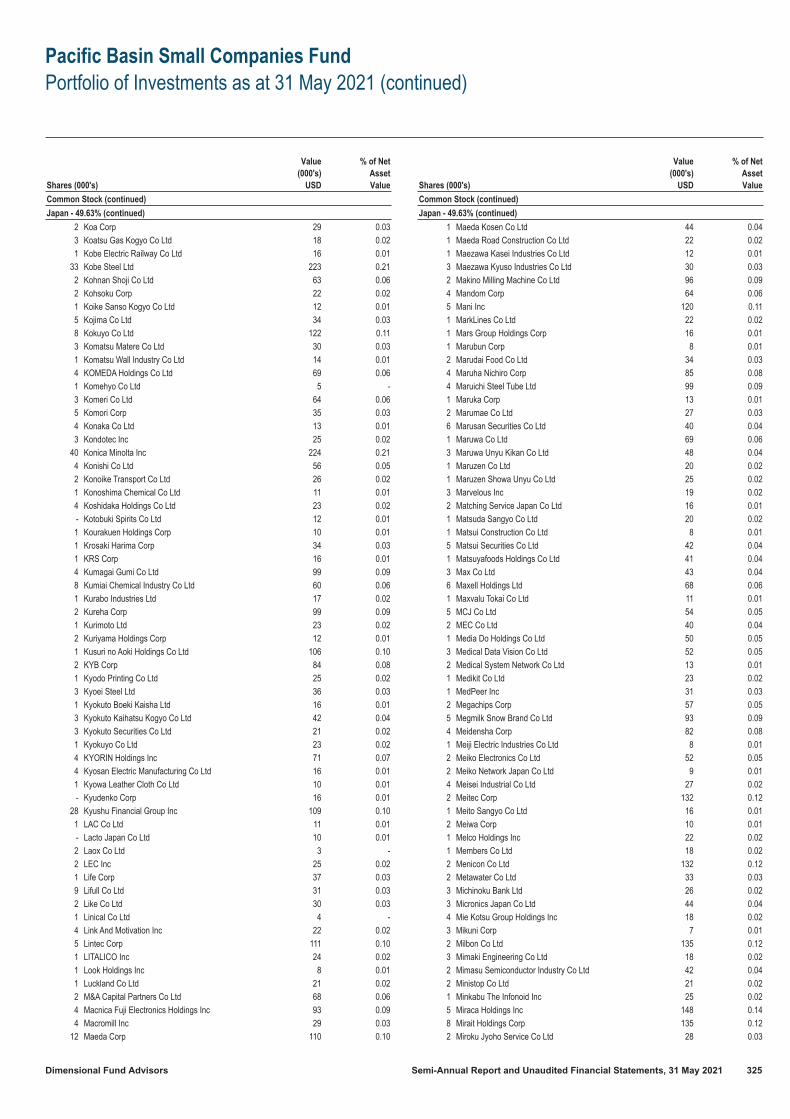
Shares (000's)
Value(000's)
USD
% of NetAssetValue
Common Stock (continued)
Japan - 49.63% (continued)
2 Koa Corp 29 0.03
3 Koatsu Gas Kogyo Co Ltd 18 0.02
1 Kobe Electric Railway Co Ltd 16 0.01
33 Kobe Steel Ltd 223 0.21
2 Kohnan Shoji Co Ltd 63 0.06
2 Kohsoku Corp 22 0.02
1 Koike Sanso Kogyo Co Ltd 12 0.01
5 Kojima Co Ltd 34 0.03
8 Kokuyo Co Ltd 122 0.11
3 Komatsu Matere Co Ltd 30 0.03
1 Komatsu Wall Industry Co Ltd 14 0.01
4 KOMEDA Holdings Co Ltd 69 0.06
1 Komehyo Co Ltd 5 -
3 Komeri Co Ltd 64 0.06
5 Komori Corp 35 0.03
4 Konaka Co Ltd 13 0.01
3 Kondotec Inc 25 0.02
40 Konica Minolta Inc 224 0.21
4 Konishi Co Ltd 56 0.05
2 Konoike Transport Co Ltd 26 0.02
1 Konoshima Chemical Co Ltd 11 0.01
4 Koshidaka Holdings Co Ltd 23 0.02
- Kotobuki Spirits Co Ltd 12 0.01
1 Kourakuen Holdings Corp 10 0.01
1 Krosaki Harima Corp 34 0.03
1 KRS Corp 16 0.01
4 Kumagai Gumi Co Ltd 99 0.09
8 Kumiai Chemical Industry Co Ltd 60 0.06
1 Kurabo Industries Ltd 17 0.02
2 Kureha Corp 99 0.09
1 Kurimoto Ltd 23 0.02
2 Kuriyama Holdings Corp 12 0.01
1 Kusuri no Aoki Holdings Co Ltd 106 0.10
2 KYB Corp 84 0.08
1 Kyodo Printing Co Ltd 25 0.02
3 Kyoei Steel Ltd 36 0.03
1 Kyokuto Boeki Kaisha Ltd 16 0.01
3 Kyokuto Kaihatsu Kogyo Co Ltd 42 0.04
3 Kyokuto Securities Co Ltd 21 0.02
1 Kyokuyo Co Ltd 23 0.02
4 KYORIN Holdings Inc 71 0.07
4 Kyosan Electric Manufacturing Co Ltd 16 0.01
1 Kyowa Leather Cloth Co Ltd 10 0.01
- Kyudenko Corp 16 0.01
28 Kyushu Financial Group Inc 109 0.10
1 LAC Co Ltd 11 0.01
- Lacto Japan Co Ltd 10 0.01
2 Laox Co Ltd 3 -
2 LEC Inc 25 0.02
1 Life Corp 37 0.03
9 Lifull Co Ltd 31 0.03
2 Like Co Ltd 30 0.03
1 Linical Co Ltd 4 -
4 Link And Motivation Inc 22 0.02
5 Lintec Corp 111 0.10
1 LITALICO Inc 24 0.02
1 Look Holdings Inc 8 0.01
1 Luckland Co Ltd 21 0.02
2 M&A Capital Partners Co Ltd 68 0.06
4 Macnica Fuji Electronics Holdings Inc 93 0.09
4 Macromill Inc 29 0.03
12 Maeda Corp 110 0.10
Shares (000's)
Value(000's)
USD
% of NetAssetValue
Common Stock (continued)
Japan - 49.63% (continued)
1 Maeda Kosen Co Ltd 44 0.04
1 Maeda Road Construction Co Ltd 22 0.02
1 Maezawa Kasei Industries Co Ltd 12 0.01
3 Maezawa Kyuso Industries Co Ltd 30 0.03
2 Makino Milling Machine Co Ltd 96 0.09
4 Mandom Corp 64 0.06
5 Mani Inc 120 0.11
1 MarkLines Co Ltd 22 0.02
1 Mars Group Holdings Corp 16 0.01
1 Marubun Corp 8 0.01
2 Marudai Food Co Ltd 34 0.03
4 Maruha Nichiro Corp 85 0.08
4 Maruichi Steel Tube Ltd 99 0.09
1 Maruka Corp 13 0.01
2 Marumae Co Ltd 27 0.03
6 Marusan Securities Co Ltd 40 0.04
1 Maruwa Co Ltd 69 0.06
3 Maruwa Unyu Kikan Co Ltd 48 0.04
1 Maruzen Co Ltd 20 0.02
1 Maruzen Showa Unyu Co Ltd 25 0.02
3 Marvelous Inc 19 0.02
2 Matching Service Japan Co Ltd 16 0.01
1 Matsuda Sangyo Co Ltd 20 0.02
1 Matsui Construction Co Ltd 8 0.01
5 Matsui Securities Co Ltd 42 0.04
1 Matsuyafoods Holdings Co Ltd 41 0.04
3 Max Co Ltd 43 0.04
6 Maxell Holdings Ltd 68 0.06
1 Maxvalu Tokai Co Ltd 11 0.01
5 MCJ Co Ltd 54 0.05
2 MEC Co Ltd 40 0.04
1 Media Do Holdings Co Ltd 50 0.05
3 Medical Data Vision Co Ltd 52 0.05
2 Medical System Network Co Ltd 13 0.01
1 Medikit Co Ltd 23 0.02
1 MedPeer Inc 31 0.03
2 Megachips Corp 57 0.05
5 Megmilk Snow Brand Co Ltd 93 0.09
4 Meidensha Corp 82 0.08
1 Meiji Electric Industries Co Ltd 8 0.01
2 Meiko Electronics Co Ltd 52 0.05
2 Meiko Network Japan Co Ltd 9 0.01
4 Meisei Industrial Co Ltd 27 0.02
2 Meitec Corp 132 0.12
1 Meito Sangyo Co Ltd 16 0.01
2 Meiwa Corp 10 0.01
1 Melco Holdings Inc 22 0.02
1 Members Co Ltd 18 0.02
2 Menicon Co Ltd 132 0.12
2 Metawater Co Ltd 33 0.03
3 Michinoku Bank Ltd 26 0.02
3 Micronics Japan Co Ltd 44 0.04
4 Mie Kotsu Group Holdings Inc 18 0.02
3 Mikuni Corp 7 0.01
2 Milbon Co Ltd 135 0.12
3 Mimaki Engineering Co Ltd 18 0.02
2 Mimasu Semiconductor Industry Co Ltd 42 0.04
2 Ministop Co Ltd 21 0.02
1 Minkabu The Infonoid Inc 25 0.02
5 Miraca Holdings Inc 148 0.14
8 Mirait Holdings Corp 135 0.12
2 Miroku Jyoho Service Co Ltd 28 0.03
Pacific Basin Small Companies FundPortfolio of Investments as at 31 May 2021 (continued)
Dimensional Fund Advisors Semi-Annual Report and Unaudited Financial Statements, 31 May 2021 325

Shares (000's)
Value(000's)
USD
% of NetAssetValue
Common Stock (continued)
Japan - 49.63% (continued)
1 Mitani Corp 76 0.07
1 Mitani Sekisan Co Ltd 45 0.04
6 Mito Securities Co Ltd 17 0.02
6 Mitsuba Corp 48 0.04
- Mitsubishi Kakoki Kaisha Ltd 7 0.01
4 Mitsubishi Logisnext Co Ltd 39 0.04
3 Mitsubishi Paper Mills Ltd 9 0.01
- Mitsubishi Pencil Co Ltd 5 -
1 Mitsubishi Research Institute Inc 38 0.04
2 Mitsubishi Shokuhin Co Ltd 42 0.04
1 Mitsubishi Steel Manufacturing Co Ltd 11 0.01
2 Mitsuboshi Belting Ltd 40 0.04
8 Mitsui E&S Holdings Co Ltd 38 0.04
2 Mitsui High-Tec Inc 80 0.07
2 Mitsui Matsushima Holdings Co Ltd 21 0.02
6 Mitsui Mining & Smelting Co Ltd 180 0.17
3 Mitsui Sugar Co Ltd 45 0.04
2 Mitsui-Soko Holdings Co Ltd 33 0.03
- Mitsumura Printing Co Ltd 6 0.01
3 Mitsuuroko Group Holdings Co Ltd 34 0.03
4 Mixi Inc 110 0.10
1 Miyaji Engineering Group Inc 10 0.01
1 Miyazaki Bank Ltd 24 0.02
3 Mizuho Leasing Co Ltd 92 0.08
2 Mizuno Corp 33 0.03
1 Mochida Pharmaceutical Co Ltd 43 0.04
3 Modec Inc 51 0.05
16 Monex Group Inc 127 0.12
6 Money Partners Group Co Ltd 12 0.01
1 Monogatari Corp 59 0.05
1 MORESCO Corp 6 0.01
3 Morinaga & Co Ltd 99 0.09
1 Moriroku Holdings Co Ltd 14 0.01
3 Morita Holdings Corp 40 0.04
2 Morito Co Ltd 14 0.01
- Morozoff Ltd 14 0.01
1 Mortgage Service Japan Ltd 9 0.01
- Mory Industries Inc 9 0.01
2 MrMax Holdings Ltd 13 0.01
4 MTI Ltd 26 0.02
1 Mugen Estate Co Ltd 5 -
1 M-up Holdings Inc 22 0.02
1 Murakami Corp 14 0.01
6 Musashi Seimitsu Industry Co Ltd 126 0.12
4 Musashino Bank Ltd 58 0.05
1 Nachi-Fujikoshi Corp 54 0.05
1 Nafco Co Ltd 14 0.01
1 Nagaileben Co Ltd 24 0.02
1 Nagano Bank Ltd 7 0.01
2 Nagano Keiki Co Ltd 21 0.02
11 Nagase & Co Ltd 159 0.15
1 Nagatanien Holdings Co Ltd 20 0.02
1 Nagawa Co Ltd 46 0.04
2 Nakabayashi Co Ltd 13 0.01
1 Nakamuraya Co Ltd 17 0.02
3 Nakanishi Inc 63 0.06
3 Nakayama Steel Works Ltd 10 0.01
10 Namura Shipbuilding Co Ltd 15 0.01
2 Nankai Electric Railway Co Ltd 54 0.05
3 Nanto Bank Ltd 44 0.04
1 Natori Co Ltd 21 0.02
1 NEC Capital Solutions Ltd 17 0.02
Shares (000's)
Value(000's)
USD
% of NetAssetValue
Common Stock (continued)
Japan - 49.63% (continued)
3 Neturen Co Ltd 14 0.01
3 New Japan Chemical Co Ltd 7 0.01
3 Nextage Co Ltd 48 0.04
21 NHK Spring Co Ltd 161 0.15
1 Nice Holdings Inc 13 0.01
5 Nichia Steel Works Ltd 14 0.01
6 Nichias Corp 154 0.14
1 Nichiban Co Ltd 16 0.01
5 Nichicon Corp 54 0.05
2 Nichiden Corp 29 0.03
2 Nichiha Corp 65 0.06
6 Nichi-iko Pharmaceutical Co Ltd 49 0.05
2 Nichireki Co Ltd 24 0.02
1 Nichirin Co Ltd 18 0.02
2 Nihon Chouzai Co Ltd 26 0.02
1 Nihon Dengi Co Ltd 34 0.03
1 Nihon Flush Co Ltd 7 0.01
7 Nihon House Holdings Co Ltd 22 0.02
3 Nihon Kagaku Sangyo Co Ltd 34 0.03
5 Nihon Nohyaku Co Ltd 24 0.02
9 Nihon Parkerizing Co Ltd 93 0.09
2 Nihon Plast Co Ltd 12 0.01
2 Nihon Tokushu Toryo Co Ltd 18 0.02
1 Nihon Yamamura Glass Co Ltd 11 0.01
1 Niitaka Co Ltd 15 0.01
4 Nikkiso Co Ltd 46 0.04
3 Nikko Co Ltd 19 0.02
6 Nikkon Holdings Co Ltd 135 0.12
3 Nippon Air Conditioning Services Co Ltd 19 0.02
1 Nippon Beet Sugar Manufacturing Co Ltd 22 0.02
1 Nippon Carbide Industries Co Inc 11 0.01
1 Nippon Carbon Co Ltd 55 0.05
1 Nippon Ceramic Co Ltd 15 0.01
1 Nippon Chemical Industrial Co Ltd 15 0.01
1 Nippon Chemi-Con Corp 25 0.02
18 Nippon Coke & Engineering Co Ltd 18 0.02
1 Nippon Commercial Development Co Ltd 24 0.02
3 Nippon Concrete Industries Co Ltd 9 0.01
11 Nippon Denko Co Ltd 34 0.03
3 Nippon Densetsu Kogyo Co Ltd 55 0.05
8 Nippon Electric Glass Co Ltd 193 0.18
1 Nippon Fine Chemical Co Ltd 19 0.02
5 Nippon Flour Mills Co Ltd 76 0.07
10 Nippon Gas Co Ltd 163 0.15
2 Nippon Hume Corp 11 0.01
1 Nippon Kanzai Co Ltd 13 0.01
11 Nippon Kayaku Co Ltd 103 0.10
- Nippon Kodoshi Corp 13 0.01
1 Nippon Koei Co Ltd 29 0.03
6 Nippon Light Metal Holdings Co Ltd 97 0.09
10 Nippon Paper Industries Co Ltd 114 0.11
30 Nippon Parking Development Co Ltd 42 0.04
2 Nippon Pillar Packing Co Ltd 33 0.03
1 Nippon Piston Ring Co Ltd 8 0.01
1 Nippon Rietec Co Ltd 11 0.01
- Nippon Road Co Ltd 34 0.03
4 Nippon Seiki Co Ltd 40 0.04
- Nippon Seisen Co Ltd 16 0.01
1 Nippon Sharyo Ltd 12 0.01
6 Nippon Signal Company Ltd 50 0.05
3 Nippon Soda Co Ltd 81 0.07
2 Nippon Steel Trading Corp 65 0.06
Pacific Basin Small Companies FundPortfolio of Investments as at 31 May 2021 (continued)
Dimensional Fund Advisors Semi-Annual Report and Unaudited Financial Statements, 31 May 2021 326

Shares (000's)
Value(000's)
USD
% of NetAssetValue
Common Stock (continued)
Japan - 49.63% (continued)
30 Nippon Suisan Kaisha Ltd 140 0.13
1 Nippon Systemware Co Ltd 17 0.02
8 Nippon Thompson Co Ltd 47 0.04
2 Nippon Yakin Kogyo Co Ltd 40 0.04
10 Nipro Corp 121 0.11
1 Nishikawa Rubber Co Ltd 16 0.01
6 Nishimatsu Construction Co Ltd 181 0.17
6 Nishimatsuya Chain Co Ltd 92 0.08
13 Nishi-Nippon Financial Holdings Inc 85 0.08
6 Nishi-Nippon Railroad Co Ltd 149 0.14
2 Nishio Rent All Co Ltd 62 0.06
7 Nissan Shatai Co Ltd 43 0.04
4 Nissan Tokyo Sales Holdings Co Ltd 9 0.01
1 Nissei ASB Machine Co Ltd 44 0.04
1 Nissei Corp 13 0.01
1 Nissei Plastic Industrial Co Ltd 8 0.01
3 Nissha Co Ltd 41 0.04
2 Nisshin Fudosan Co 10 0.01
3 Nisshin Oillio Group Ltd 83 0.08
18 Nisshinbo Holdings Inc 148 0.14
1 Nissin Corp 16 0.01
5 Nissin Electric Co Ltd 60 0.06
1 Nissin Sugar Co Ltd 16 0.01
3 Nisso Corp 18 0.02
2 Nissui Pharmaceutical Co Ltd 15 0.01
2 Nitta Corp 38 0.04
1 Nittetsu Mining Co Ltd 46 0.04
2 Nitto Boseki Co Ltd 65 0.06
3 Nitto Kogyo Corp 45 0.04
1 Nitto Kohki Co Ltd 17 0.02
1 Nitto Seiko Co Ltd 8 0.01
3 Nittoc Construction Co Ltd 19 0.02
1 NJS Co Ltd 23 0.02
1 Noevir Holdings Co Ltd 65 0.06
2 Nohmi Bosai Ltd 31 0.03
3 Nojima Corp 86 0.08
7 NOK Corp 94 0.09
8 Nomura Co Ltd 65 0.06
1 Nomura Micro Science Co Ltd 25 0.02
1 Noritake Co Ltd Japan 30 0.03
2 Noritsu Koki Co Ltd 47 0.04
3 Noritz Corp 51 0.05
31 North Pacific Bank Ltd 70 0.06
3 NPC Inc 16 0.01
1 NS Tool Co Ltd 8 0.01
1 NS United Kaiun Kaisha Ltd 14 0.01
6 NSD Co Ltd 100 0.09
45 NTN Corp 131 0.12
4 OAK Capital Corp 4 -
2 Obara Group Inc 56 0.05
8 Oenon Holdings Inc 28 0.03
4 Ogaki Kyoritsu Bank Ltd 66 0.06
1 Ohashi Technica Inc 11 0.01
1 Ohsho Food Service Corp 60 0.06
2 Oiles Corp 34 0.03
1 Oisix ra daichi Inc 23 0.02
2 Oita Bank Ltd 28 0.03
3 Okabe Co Ltd 18 0.02
1 Okamoto Industries Inc 38 0.04
- Okamoto Machine Tool Works Ltd 8 0.01
7 Okamura Corp 90 0.08
19 Okasan Securities Group Inc 75 0.07
Shares (000's)
Value(000's)
USD
% of NetAssetValue
Common Stock (continued)
Japan - 49.63% (continued)
9 Oki Electric Industry Co Ltd 78 0.07
1 Okinawa Cellular Telephone Co 63 0.06
5 Okinawa Electric Power Co Inc 62 0.06
2 OKUMA Corp 121 0.11
3 Okumura Corp 82 0.08
1 Okura Industrial Co Ltd 21 0.02
2 Okuwa Co Ltd 20 0.02
2 Olympic Group Corp 16 0.01
2 Onoken Co Ltd 24 0.02
12 Onward Holdings Co Ltd 33 0.03
3 Optex Group Co Ltd 48 0.04
2 Optim Corp 41 0.04
2 Optorun Co Ltd 54 0.05
1 Organo Corp 47 0.04
31 Orient Corp 45 0.04
11 Oriental Shiraishi Corp 27 0.02
1 Origin Co Ltd 7 0.01
1 Oro Co Ltd 22 0.02
1 Osaka Organic Chemical Industry Ltd 53 0.05
1 Osaka Soda Co Ltd 28 0.03
1 Osaka Steel Co Ltd 9 0.01
3 Osaka Titanium Technologies Co Ltd 21 0.02
4 Osaki Electric Co Ltd 22 0.02
9 OSG Corp 144 0.13
10 Outsourcing Inc 191 0.18
2 Oyo Corp 20 0.02
4 Pacific Industrial Co Ltd 43 0.04
2 Pacific Metals Co Ltd 36 0.03
1 Pack Corp 21 0.02
2 PAL Group Holdings Co Ltd 35 0.03
- Papyless Co Ltd 5 -
4 Paramount Bed Holdings Co Ltd 71 0.07
3 Paris Miki Holdings Inc 9 0.01
3 Pasona Group Inc 52 0.05
4 PC Depot Corp 18 0.02
1 PCA Corp 19 0.02
2 Pegasus Sewing Machine Manufacturing Co Ltd 7 0.01
27 Penta-Ocean Construction Co Ltd 196 0.18
1 Pickles Corp 14 0.01
2 Pilot Corp 74 0.07
3 Piolax Inc 36 0.03
3 Poletowin Pitcrew Holdings Inc 25 0.02
1 PR Times Inc 21 0.02
1 Premium Group Co Ltd 31 0.03
1 Premium Water Holdings Inc 17 0.02
9 Press Kogyo Co Ltd 27 0.03
1 Pressance Corp 19 0.02
10 Prestige International Inc 65 0.06
3 Prima Meat Packers Ltd 78 0.07
2 Pronexus Inc 24 0.02
1 Prored Partners Co Ltd 16 0.01
1 Pro-Ship Inc 12 0.01
24 Prospect Co Ltd 7 0.01
3 Proto Corp 32 0.03
3 PS Mitsubishi Construction Co Ltd 21 0.02
2 Punch Industry Co Ltd 12 0.01
1 QB Net Holdings Co Ltd 16 0.01
4 Qol Holdings Co Ltd 53 0.05
1 Quick Co Ltd 12 0.01
5 Raito Kogyo Co Ltd 87 0.08
3 Raiznext Corp 34 0.03
1 Rasa Industries Ltd 15 0.01
Pacific Basin Small Companies FundPortfolio of Investments as at 31 May 2021 (continued)
Dimensional Fund Advisors Semi-Annual Report and Unaudited Financial Statements, 31 May 2021 327

Shares (000's)
Value(000's)
USD
% of NetAssetValue
Common Stock (continued)
Japan - 49.63% (continued)
2 Raysum Co Ltd 12 0.01
5 Relia Inc 53 0.05
1 Renaissance Inc 7 0.01
2 RENOVA Inc 68 0.06
10 Resorttrust Inc 164 0.15
2 Restar Holdings Corp 30 0.03
3 Retail Partners Co Ltd 27 0.02
2 Rheon Automatic Machinery Co Ltd 22 0.02
1 Rhythm Watch Co Ltd 7 0.01
2 Ricoh Leasing Co Ltd 65 0.06
2 Right On Co Ltd 11 0.01
1 Riken Corp 16 0.01
1 Riken Keiki Co Ltd 31 0.03
4 Riken Technos Corp 21 0.02
2 Riken Vitamin Co Ltd 30 0.03
1 Rion Co Ltd 21 0.02
2 Riso Kagaku Corp 29 0.03
10 Riso Kyoiku Co Ltd 28 0.03
1 Rokko Butter Co Ltd 21 0.02
1 Roland Corp 68 0.06
2 Roland DG Corp 35 0.03
1 Rorze Corp 97 0.09
2 Round One Corp 25 0.02
- Rozetta Corp 7 0.01
- RS Technologies Co Ltd 20 0.02
2 Ryobi Ltd 36 0.03
2 Ryoden Corp 37 0.03
2 Ryosan Co Ltd 37 0.03
1 Ryoyo Electro Corp 29 0.03
2 S Foods Inc 51 0.05
1 S&B Foods Inc 34 0.03
2 Sac's Bar Holdings Inc 11 0.01
1 Sagami Rubber Industries Co Ltd 8 0.01
3 Saibu Gas Co Ltd 71 0.07
4 Saizeriya Co Ltd 78 0.07
1 Sakai Chemical Industry Co Ltd 13 0.01
1 Sakai Heavy Industries Ltd 9 0.01
1 Sakai Moving Service Co Ltd 56 0.05
4 Sakata INX Corp 35 0.03
1 Sakata Seed Corp 40 0.04
2 Sakura Internet Inc 13 0.01
5 Sala Corp 29 0.03
4 SAMTY Co Ltd 70 0.06
2 San ju San Financial Group Inc 22 0.02
2 San-A Co Ltd 66 0.06
5 San-Ai Oil Co Ltd 60 0.06
2 Sanden Holdings Corp 6 0.01
1 Sanei Architecture Planning Co Ltd 22 0.02
4 Sangetsu Corp 59 0.05
14 San-In Godo Bank Ltd 68 0.06
7 Sanix Inc 23 0.02
3 Sanken Electric Co Ltd 125 0.12
4 Sanki Engineering Co Ltd 48 0.04
3 Sankyo Co Ltd 64 0.06
- Sankyo Frontier Co Ltd 14 0.01
4 Sankyo Seiko Co Ltd 17 0.02
2 Sankyo Tateyama Inc 12 0.01
2 Sanoh Industrial Co Ltd 16 0.01
1 Sansei Technologies Inc 7 0.01
2 Sansha Electric Manufacturing Co Ltd 19 0.02
1 Sanshin Electronics Co Ltd 15 0.01
1 Sanyo Chemical Industries Ltd 61 0.06
Shares (000's)
Value(000's)
USD
% of NetAssetValue
Common Stock (continued)
Japan - 49.63% (continued)
1 Sanyo Denki Co Ltd 42 0.04
2 Sanyo Electric Railway Co Ltd 38 0.04
1 Sanyo Housing Nagoya Co Ltd 10 0.01
1 Sanyo Shokai Ltd 8 0.01
1 Sanyo Special Steel Co Ltd 21 0.02
3 Sanyo Trading Co Ltd 39 0.04
6 Sapporo Holdings Ltd 117 0.11
3 Sato Holdings Corp 79 0.07
1 Sato Shoji Corp 10 0.01
2 Satori Electric Co Ltd 15 0.01
3 Sawada Holdings Co Ltd 27 0.02
2 Sawai Group Holdings Co Ltd 92 0.08
1 SB Technology Corp 39 0.04
2 SBS Holdings Inc 68 0.06
2 Scala Inc 12 0.01
3 Scroll Corp 24 0.02
- SEC Carbon Ltd 12 0.01
1 Secom Joshinetsu Co Ltd 19 0.02
2 Seed Co Ltd 13 0.01
2 Seika Corp 26 0.02
3 Seikagaku Corp 36 0.03
2 Seikitokyu Kogyo Co Ltd 19 0.02
3 Seiko Holdings Corp 63 0.06
1 Seiko PMC Corp 9 0.01
4 Seiren Co Ltd 81 0.07
3 Sekisui Jushi Corp 68 0.06
2 Sekisui Plastics Co Ltd 13 0.01
12 Senko Group Holdings Co Ltd 109 0.10
1 Senshu Electric Co Ltd 27 0.03
24 Senshu Ikeda Holdings Inc 36 0.03
2 Senshukai Co Ltd 6 0.01
6 Septeni Holdings Co Ltd 24 0.02
1 Shibaura Electronics Co Ltd 30 0.03
1 Shibaura Mechatronics Corp 29 0.03
1 Shibusawa Warehouse Co Ltd 23 0.02
1 Shibuya Corp 34 0.03
4 Shiga Bank Ltd 72 0.07
3 Shikoku Bank Ltd 19 0.02
3 Shikoku Chemicals Corp 34 0.03
15 Shikoku Electric Power Co Inc 102 0.09
2 Shima Seiki Manufacturing Ltd 48 0.04
1 Shimizu Bank Ltd 19 0.02
1 Shimojima Co Ltd 13 0.01
1 Shin Nippon Air Technologies Co Ltd 9 0.01
1 Shinagawa Refractories Co Ltd 23 0.02
1 Shindengen Electric Manufacturing Co Ltd 20 0.02
5 Shin-Etsu Polymer Co Ltd 51 0.05
1 Shin-Keisei Electric Railway Co Ltd 24 0.02
5 Shinko Shoji Co Ltd 38 0.04
4 Shinmaywa Industries Ltd 40 0.04
4 Shinnihon Corp 30 0.03
1 Shinnihonseiyaku Co Ltd 17 0.02
3 Shinoken Group Co Ltd 35 0.03
1 Shinsho Corp 11 0.01
2 Shinwa Co Ltd 33 0.03
3 Shizuki Electric Co Inc 15 0.01
6 Shizuoka Gas Co Ltd 55 0.05
2 SHO-BOND Holdings Co Ltd 100 0.09
2 Shoei Co Ltd 73 0.07
1 Shoei Foods Corp 37 0.03
1 Shofu Inc 15 0.01
2 Showa Sangyo Co Ltd 43 0.04
Pacific Basin Small Companies FundPortfolio of Investments as at 31 May 2021 (continued)
Dimensional Fund Advisors Semi-Annual Report and Unaudited Financial Statements, 31 May 2021 328

Shares (000's)
Value(000's)
USD
% of NetAssetValue
Common Stock (continued)
Japan - 49.63% (continued)
1 SigmaXYZ Inc 15 0.01
3 Siix Corp 37 0.03
1 Sinanen Holdings Co Ltd 20 0.02
1 Sinfonia Technology Co Ltd 17 0.02
2 Sinko Industries Ltd 30 0.03
4 Sintokogio Ltd 26 0.02
1 SK-Electronics Co Ltd 9 0.01
17 SKY Perfect JSAT Holdings Inc 66 0.06
1 Smaregi Inc 23 0.02
1 SMK Corp 24 0.02
6 SMS Co Ltd 156 0.14
3 SNT Corp 7 0.01
3 Soda Nikka Co Ltd 16 0.01
4 Sodick Co Ltd 37 0.03
2 Soft99 Corp 26 0.02
1 Softcreate Holdings Corp 19 0.02
- Software Service Inc 21 0.02
1 Soken Chemical & Engineering Co Ltd 21 0.02
4 Solasto Corp 50 0.05
1 Soliton Systems KK 19 0.02
8 Sotetsu Holdings Inc 151 0.14
2 Sotoh Co Ltd 15 0.01
7 Sourcenext Corp 18 0.02
1 Space Co Ltd 12 0.01
4 Space Value Holdings Co Ltd 26 0.02
14 Sparx Group Co Ltd 37 0.03
4 S-Pool Inc 35 0.03
1 SRA Holdings 29 0.03
1 ST Corp 21 0.02
1 St Marc Holdings Co Ltd 14 0.01
1 Star Mica Holdings Co Ltd 10 0.01
3 Star Micronics Co Ltd 54 0.05
3 Starts Corp Inc 66 0.06
1 Starzen Co Ltd 27 0.02
2 St-Care Holding Corp 16 0.01
2 Stella Chemifa Corp 46 0.04
1 Step Co Ltd 12 0.01
1 Strike Co Ltd 31 0.03
1 Studio Alice Co Ltd 20 0.02
1 Sugimoto & Co Ltd 19 0.02
2 Sumida Corp 19 0.02
1 Suminoe Textile Co Ltd 12 0.01
3 Sumitomo Bakelite Co Ltd 138 0.13
2 Sumitomo Densetsu Co Ltd 38 0.04
15 Sumitomo Mitsui Construction Co Ltd 65 0.06
4 Sumitomo Osaka Cement Co Ltd 110 0.10
1 Sumitomo Precision Products Co Ltd 14 0.01
4 Sumitomo Riko Co Ltd 24 0.02
1 Sumitomo Seika Chemicals Co Ltd 33 0.03
5 Sumitomo Warehouse Co Ltd 74 0.07
3 Sun Frontier Fudousan Co Ltd 24 0.02
3 Suncall Corp 13 0.01
1 Sun-Wa Technos Corp 6 0.01
15 Suruga Bank Ltd 48 0.04
2 Suzuki Co Ltd 19 0.02
2 SWCC Showa Holdings Co Ltd 38 0.04
7 Systena Corp 119 0.11
2 Syuppin Co Ltd 17 0.02
3 T Hasegawa Co Ltd 59 0.05
1 T RAD Co Ltd 14 0.01
2 T&K Toka Co Ltd 14 0.01
1 Tachibana Eletech Co Ltd 15 0.01
Shares (000's)
Value(000's)
USD
% of NetAssetValue
Common Stock (continued)
Japan - 49.63% (continued)
1 Tachikawa Corp 13 0.01
3 Tachi-S Co Ltd 30 0.03
10 Tadano Ltd 101 0.09
1 Taihei Dengyo Kaisha Ltd 36 0.03
2 Taikisha Ltd 64 0.06
1 Taiko Bank Ltd 8 0.01
2 Taiko Pharmaceutical Co Ltd 22 0.02
1 Taisei Lamick Co Ltd 12 0.01
2 Taiyo Holdings Co Ltd 84 0.08
3 Takamatsu Construction Group Co Ltd 48 0.04
2 Takamiya Co Ltd 10 0.01
2 Takano Co Ltd 10 0.01
1 Takaoka Toko Co Ltd 13 0.01
2 Takara Holdings Inc 24 0.02
7 Takara Leben Co Ltd 22 0.02
- Takara Printing Co Ltd 3 -
3 Takara Standard Co Ltd 49 0.05
1 Takasago International Corp 30 0.03
4 Takasago Thermal Engineering Co Ltd 68 0.06
15 Takashimaya Co Ltd 171 0.16
1 Take And Give Needs Co Ltd 5 -
1 Takeei Corp 14 0.01
4 Takeuchi Manufacturing Co Ltd 105 0.10
1 Takihyo Co Ltd 17 0.02
1 Takisawa Machine Tool Co Ltd 5 -
1 Takuma Co Ltd 19 0.02
2 Tama Home Co Ltd 44 0.04
1 Tamagawa Holdings Co Ltd 12 0.01
1 Tamron Co Ltd 29 0.03
11 Tamura Corp 56 0.05
4 Tanseisha Co Ltd 32 0.03
- Taoka Chemical Co Ltd 32 0.03
3 Tatsuta Electric Wire and Cable Co Ltd 16 0.01
2 Tayca Corp 26 0.02
1 Tazmo Co Ltd 21 0.02
2 TBK Co Ltd 9 0.01
3 TDC Soft Inc 26 0.02
5 TechMatrix Corp 77 0.07
1 Techno Associe Co Ltd 9 0.01
2 Techno Ryowa Ltd 17 0.02
2 Teikoku Electric Manufacturing Co Ltd 18 0.02
1 Teikoku Sen-I Co Ltd 26 0.02
1 Teikoku Tsushin Kogyo Co Ltd 11 0.01
1 Tekken Corp 10 0.01
1 Tenma Corp 18 0.02
2 T-Gaia Corp 29 0.03
2 TKC Corp 69 0.06
1 Toa Corp (non-voting rights) 27 0.03
2 Toa Corp (voting rights) 16 0.01
1 Toa Oil Co Ltd 29 0.03
1 Toa Road Corp 33 0.03
10 Toagosei Co Ltd 115 0.11
1 Tobishima Corp 12 0.01
6 TOC Co Ltd 37 0.03
6 Tocalo Co Ltd 75 0.07
14 Tochigi Bank Ltd 23 0.02
7 Toda Corp 50 0.05
1 Toenec Corp 24 0.02
18 Toho Bank Ltd 35 0.03
1 Toho Co 16 0.01
5 Toho Holdings Co Ltd 71 0.07
5 Toho Titanium Co Ltd 47 0.04
Pacific Basin Small Companies FundPortfolio of Investments as at 31 May 2021 (continued)
Dimensional Fund Advisors Semi-Annual Report and Unaudited Financial Statements, 31 May 2021 329

Shares (000's)
Value(000's)
USD
% of NetAssetValue
Common Stock (continued)
Japan - 49.63% (continued)
1 Toho Zinc Co Ltd 20 0.02
1 Tohoku Bank Ltd 13 0.01
1 Tohokushinsha Film Corp 7 0.01
2 Tokai Corp 36 0.03
8 TOKAI Holdings Corp 65 0.06
5 Tokai Rika Co Ltd 77 0.07
27 Tokai Tokyo Financial Holdings Inc 101 0.09
1 Token Corp 80 0.07
1 Tokushu Tokai Paper Co Ltd 27 0.02
5 Tokuyama Corp 115 0.11
2 Tokyo Base Co Ltd 11 0.01
1 Tokyo Electron Device Ltd 38 0.04
2 Tokyo Energy & Systems Inc 18 0.02
2 Tokyo Individualized Educational Institute Inc 9 0.01
2 Tokyo Keiki Inc 23 0.02
2 Tokyo Kiraboshi Financial Group Inc 29 0.03
- Tokyo Rakutenchi Co Ltd 15 0.01
- Tokyo Rope Manufacturing Co Ltd 4 -
4 Tokyo Sangyo Co Ltd 25 0.02
4 Tokyo Seimitsu Co Ltd 194 0.18
10 Tokyo Steel Manufacturing Co Ltd 109 0.10
1 Tokyo Tekko Co Ltd 12 0.01
1 Tokyo Theatres Co Inc 11 0.01
1 Tokyotokeiba Co Ltd 74 0.07
8 Tokyu Construction Co Ltd 52 0.05
- Tokyu Recreation Co Ltd 3 -
7 Toli Corp 16 0.01
1 Tomato Bank Ltd 14 0.01
1 Tomen Devices Corp 18 0.02
1 Tomoe Engineering Co Ltd 12 0.01
1 Tomoegawa Co Ltd 9 0.01
2 Tomoku Co Ltd 28 0.03
13 TOMONY Holdings Inc 37 0.03
10 Tomy Co Ltd 88 0.08
1 Tonami Holdings Co Ltd 23 0.02
12 Topcon Corp 184 0.17
6 Toppan Forms Co Ltd 57 0.05
3 Topre Corp 43 0.04
1 Topy Industries Ltd 18 0.02
5 Toridoll Holdings Corp 76 0.07
1 Torigoe Co Ltd 10 0.01
2 Torii Pharmaceutical Co Ltd 38 0.04
1 Torikizoku Co Ltd 8 0.01
1 Torishima Pump Manufacturing Co Ltd 9 0.01
5 Tosei Corp 45 0.04
2 Toshiba Machine Co Ltd 46 0.04
2 Toshiba TEC Corp 70 0.06
2 Tosho Co Ltd 26 0.02
1 Totech Corp 16 0.01
2 Totetsu Kogyo Co Ltd 51 0.05
1 Tottori Bank Ltd 10 0.01
1 Toukei Computer Co Ltd 25 0.02
3 Tow Co Ltd 10 0.01
3 Towa Bank Ltd 13 0.01
2 Towa Corp 32 0.03
3 Towa Pharmaceutical Co Ltd 64 0.06
5 Toyo Construction Co Ltd 27 0.03
2 Toyo Corp 21 0.02
1 Toyo Denki Seizo KK 9 0.01
3 Toyo Engineering Corp 16 0.01
- Toyo Gosei Co Ltd 21 0.02
3 Toyo Ink SC Holdings Co Ltd 59 0.05
Shares (000's)
Value(000's)
USD
% of NetAssetValue
Common Stock (continued)
Japan - 49.63% (continued)
1 Toyo Kanetsu KK 32 0.03
2 Toyo Machinery & Metal Co Ltd 9 0.01
10 Toyo Securities Co Ltd 15 0.01
1 Toyo Seikan Group Holdings Ltd 20 0.02
1 Toyo Tanso Co Ltd 19 0.02
1 Toyo Wharf & Warehouse Co Ltd 14 0.01
8 Toyobo Co Ltd 105 0.10
2 TPR Co Ltd 30 0.03
1 Trancom Co Ltd 62 0.06
2 Transaction Co Ltd 22 0.02
1 Transcosmos Inc 16 0.01
3 Tri Chemical Laboratories Inc 102 0.09
5 Trusco Nakayama Corp 120 0.11
5 Trust Tech Inc 54 0.05
5 TS Tech Co Ltd 71 0.07
5 TSI Holdings Co Ltd 13 0.01
3 Tsubaki Nakashima Co Ltd 57 0.05
2 Tsubakimoto Chain Co 72 0.07
1 Tsubakimoto Kogyo Co Ltd 32 0.03
1 Tsudakoma Corp 8 0.01
5 Tsugami Corp 76 0.07
2 Tsukishima Kikai Co Ltd 22 0.02
10 Tsukuba Bank Ltd 16 0.01
3 Tsumura & Co 91 0.08
2 Tsurumi Manufacturing Co Ltd 26 0.02
1 Tsutsumi Jewelry Co Ltd 11 0.01
1 TV Asahi Holdings Corp 26 0.02
1 Tv Tokyo Holdings Corp 26 0.02
3 UACJ Corp 74 0.07
9 Ube Industries Ltd 193 0.18
- Ubicom Holdings Inc 11 0.01
1 Uchida Yoko Co Ltd 35 0.03
4 Ulvac Inc 180 0.17
1 Uniden Holdings Corp 23 0.02
1 Union Tool Co 20 0.02
4 Unipres Corp 32 0.03
3 United Arrows Ltd 52 0.05
1 UNITED Inc 19 0.02
6 United Super Markets Holdings Inc 63 0.06
4 Unitika Ltd 13 0.01
2 Universal Entertainment Corp 44 0.04
1 Usen-Next Holdings Co Ltd 23 0.02
11 Ushio Inc 161 0.15
3 UT Group Co Ltd 74 0.07
1 UUUM Inc 21 0.02
1 V Technology Co Ltd 47 0.04
3 Valor Holdings Co Ltd 72 0.07
2 Valqua Ltd 34 0.03
1 ValueCommerce Co Ltd 39 0.04
3 Vector Inc 28 0.03
2 Vision Inc 19 0.02
5 Vital KSK Holdings Inc 30 0.03
11 VT Holdings Co Ltd 48 0.04
4 Wacoal Holdings Corp 91 0.08
13 Wacom Co Ltd 82 0.08
1 Wakachiku Construction Co Ltd 14 0.01
1 Wakamoto Pharmaceutical Co Ltd 2 -
4 Wakita & Co Ltd 43 0.04
1 Warabeya Nichiyo Holdings Co Ltd 21 0.02
1 Watahan & Co Ltd 7 0.01
1 WDB Holdings Co Ltd 18 0.02
1 Weathernews Inc 30 0.03
Pacific Basin Small Companies FundPortfolio of Investments as at 31 May 2021 (continued)
Dimensional Fund Advisors Semi-Annual Report and Unaudited Financial Statements, 31 May 2021 330

Shares (000's)
Value(000's)
USD
% of NetAssetValue
Common Stock (continued)
Japan - 49.63% (continued)
1 Welbe Inc 15 0.01
3 Wellnet Corp 17 0.02
3 West Holdings Corp 85 0.08
1 Will Group Inc 9 0.01
1 WIN-Partners Co Ltd 8 0.01
1 Wood One Co Ltd 14 0.01
1 World Holdings Co Ltd 15 0.01
1 Wowow Inc 11 0.01
2 Xebio Holdings Co Ltd 15 0.01
1 Yahagi Construction Co Ltd 10 0.01
1 YAKUODO Holdings Co Ltd 13 0.01
2 Yamabiko Corp 21 0.02
1 Yamada Consulting Group Co Ltd 9 0.01
2 Yamagata Bank Ltd 18 0.02
21 Yamaguchi Financial Group Inc 125 0.12
2 Yamaichi Electronics Co Ltd 25 0.02
3 YA-MAN Ltd 41 0.04
2 Yamanashi Chuo Bank Ltd 18 0.02
1 Yamatane Corp 7 0.01
2 Yamato Corp 14 0.01
4 Yamato Kogyo Co Ltd 146 0.13
5 Yamazen Corp 48 0.04
1 Yaoko Co Ltd 76 0.07
1 Yashima Denki Co Ltd 13 0.01
2 Yasuda Logistics Corp 19 0.02
1 Yasunaga Corp 9 0.01
4 Yellow Hat Ltd 72 0.07
2 Yodogawa Steel Works Ltd 47 0.04
3 Yokogawa Bridge Holdings Corp 55 0.05
4 Yokohama Reito Co Ltd 36 0.03
2 Yokowo Co Ltd 40 0.04
1 Yomeishu Seizo Co Ltd 16 0.01
1 Yondoshi Holdings Inc 22 0.02
1 Yorozu Corp 16 0.01
2 Yuasa Trading Co Ltd 44 0.04
4 Yurtec Corp 27 0.03
2 Yushin Precision Equipment Co Ltd 17 0.02
3 Zenrin Co Ltd 33 0.03
1 ZERIA Pharmaceutical Co Ltd 23 0.02
2 Zuiko Corp 20 0.02
53,799 49.63
Korea, Republic of - 9.13%
1 Able C&C Co Ltd 5 -
1 Advanced Nano Products Co Ltd 16 0.01
1 Advanced Process Systems Corp 27 0.03
2 Aekyung Petrochemical Co Ltd 16 0.01
1 AfreecaTV Co Ltd 42 0.04
1 Agabang&Company 4 -
- Ahnlab Inc 14 0.01
- AK Holdings Inc 14 0.01
2 ALUKO Co Ltd 10 0.01
1 Amicogen Inc 21 0.02
3 Ananti Inc 25 0.02
- Anterogen Co Ltd 11 0.01
14 Aprogen KIC Inc 28 0.03
17 Aprogen pharmaceuticals Inc 18 0.02
- Asia Cement Co Ltd 11 0.01
- ASIA Holdings Co Ltd 4 -
- Asia Paper Manufacturing Co Ltd 11 0.01
1 BGF Co Ltd 9 0.01
2 BH Co Ltd 30 0.03
2 Binex Co Ltd 32 0.03
Shares (000's)
Value(000's)
USD
% of NetAssetValue
Common Stock (continued)
Korea, Republic of - 9.13% (continued)
- Binggrae Co Ltd 26 0.02
1 Biotoxtech Co Ltd 11 0.01
11 BNK Financial Group Inc 76 0.07
1 Boditech Med Inc 13 0.01
- Bookook Securities Co Ltd 4 -
2 Boryung Pharmaceutical Co Ltd 40 0.04
4 Bosung Power Technology Co Ltd 12 0.01
2 Bukwang Pharmaceutical Co Ltd 38 0.04
4 Byucksan Corp 16 0.01
1 Cafe24 Corp 22 0.02
2 Capro Corp 8 0.01
- Caregen Co Ltd 9 0.01
- Cell Biotech Co Ltd 4 -
1 Cellid Inc 38 0.04
2 Chabiotech Co Ltd 32 0.03
- Chong Kun Dang Pharmaceutical Corp 56 0.05
- Chongkundang Holdings Corp 12 0.01
11 Chorokbaem Media Co Ltd 24 0.02
- Chunbo Co Ltd 26 0.02
1 CJ CGV Co Ltd 36 0.03
- CJ Freshway Corp 6 0.01
6 CMG Pharmaceutical Co Ltd 24 0.02
- Com2uS Corp 24 0.02
3 Coreana Cosmetics Co Ltd 14 0.01
- Cosmax BTI Inc 4 -
- Cosmax Inc 42 0.04
1 COSMAX NBT Inc 4 -
1 CosmoAM&T Co Ltd 27 0.02
1 Cosmochemical Co Ltd 6 0.01
3 Creative & Innovative System 37 0.03
1 Crownhaitai Holdings Co Ltd 6 0.01
2 CrystalGenomics Inc 16 0.01
- Cuckoo Holdings Co Ltd 10 0.01
1 Cuckoo Homesys Co Ltd 23 0.02
- Dae Han Flour Mills Co Ltd 16 0.01
1 Dae Hwa Pharmaceutical Co Ltd 12 0.01
1 Dae Won Kang Up Co Ltd 4 -
7 Daea TI Co Ltd 40 0.04
- Daejoo Electronic Materials Co Ltd 13 0.01
1 Daekyo Co Ltd 6 0.01
1 Daelim Industrial Co Ltd 39 0.04
8 Daemyung Corp Co Ltd 11 0.01
1 Daesang Corp 32 0.03
- Daesang Holdings Co Ltd 4 -
1 Daewon Pharmaceutical Co Ltd 7 0.01
4 Daewoo Engineering & Construction Co Ltd 28 0.03
- Daewoong Pharmaceutical Co Ltd 30 0.03
- Daihan Pharmaceutical Co Ltd 8 0.01
1 Daishin Securities Co Ltd 19 0.02
3 Danal Co Ltd 18 0.02
1 Daou Data Corp 14 0.01
2 Daou Technology Inc 54 0.05
2 DASAN Networks Inc 17 0.02
1 Dawonsys Co Ltd 17 0.02
1 DB HiTek Co Ltd 28 0.03
- Dentium Co Ltd 12 0.01
10 DGB Financial Group Inc 85 0.08
1 DIO Corp 21 0.02
- Dong Ah Tire & Rubber Co Ltd 3 -
- Dong-A Socio Holdings Co Ltd 14 0.01
- Dong-A ST Co Ltd 33 0.03
2 Dongjin Semichem Co Ltd 60 0.06
Pacific Basin Small Companies FundPortfolio of Investments as at 31 May 2021 (continued)
Dimensional Fund Advisors Semi-Annual Report and Unaudited Financial Statements, 31 May 2021 331

Shares (000's)
Value(000's)
USD
% of NetAssetValue
Common Stock (continued)
Korea, Republic of - 9.13% (continued)
1 DongKook Pharmaceutical Co Ltd 28 0.03
4 Dongkuk Steel Mill Co Ltd 77 0.07
2 Dongkuk Structures & Construction Co Ltd 13 0.01
1 Dongsung Pharmaceutical Co Ltd 10 0.01
2 Dongwha Pharm Co Ltd 26 0.02
3 Dongwon Development Co Ltd 18 0.02
- Dongwon F&B Co Ltd 11 0.01
- Dongwon Industries Co Ltd 15 0.01
- Dongwon Systems Corp 18 0.02
1 Doosan Co Ltd 60 0.06
8 Doosan Infracore Co Ltd 86 0.08
1 DoubleUGames Co Ltd 36 0.03
2 Dreamtech Co Ltd 19 0.02
2 Dreamus Co 10 0.01
- DTR Automotive Corp 6 0.01
- Duk San Neolux Co Ltd 18 0.02
- e Tec E&C Ltd 4 -
- E1 Corp 15 0.01
2 Easy Bio Inc 15 0.01
4 Easy Holdings Co Ltd 18 0.02
1 Ecopro Co Ltd 58 0.05
- Ecopro HN Co Ltd 36 0.03
5 Ehwa Technologies Information Co Ltd 12 0.01
1 EM-Tech Co Ltd 22 0.02
1 ENF Technology Co Ltd 31 0.03
- Eo Technics Co Ltd 13 0.01
1 Eubiologics Co Ltd 49 0.05
5 Eugene Corp 27 0.03
1 Eugene Technology Co Ltd 34 0.03
1 Eusu Holdings Co Ltd 6 0.01
- F&F Co Ltd 5 -
- F&F Co Ltd 53 0.05
2 Farmsco 10 0.01
1 Fine Semitech Corp 19 0.02
2 Foosung Co Ltd 19 0.02
1 Gamevil Inc 19 0.02
1 GeneMatrix Inc 14 0.01
2 Genie Music Corp 13 0.01
- GOLFZON Co Ltd 12 0.01
1 Golfzon Newdin Holdings Co Ltd 5 -
2 Grand Korea Leisure Co Ltd 35 0.03
- Green Cross Cell Corp 17 0.02
2 Green Cross Holdings Corp 48 0.04
1 Green Cross LabCell Corp 46 0.04
- GS Home Shopping Inc 27 0.03
- Gwangju Shinsegae Co Ltd 6 0.01
1 HAESUNG DS Co Ltd 16 0.01
- Halla Holdings Corp 17 0.02
1 Han Kuk Carbon Co Ltd 10 0.01
1 Hana Tour Service Inc 37 0.03
1 Hanall Biopharma Co Ltd 15 0.01
1 Hancom Inc 25 0.02
- Handok Inc 11 0.01
1 Handsome Co Ltd 41 0.04
- Hanil Cement Co Ltd 9 0.01
- Hanil Holdings Co Ltd 3 -
- Hanil Hyundai Cement Co Ltd 11 0.01
3 Hanjin Heavy Industries & Construction Co Ltd 23 0.02
1 Hanjin Transportation Co Ltd 18 0.02
- Hankook Shell Oil Co Ltd 16 0.01
1 Hanmi Semiconductor Co Ltd 29 0.03
1 Hans Biomed Corp 9 0.01
Shares (000's)
Value(000's)
USD
% of NetAssetValue
Common Stock (continued)
Korea, Republic of - 9.13% (continued)
2 Hansae Co Ltd 48 0.04
- Hansae Yes24 Holdings Co Ltd 3 -
3 Hansol Holdings Co Ltd 12 0.01
1 Hansol Paper Co Ltd 13 0.01
1 Hansol Technics Co Ltd 8 0.01
3 Hanwha General Insurance Co Ltd 12 0.01
8 Hanwha Investment & Securities Co Ltd 35 0.03
9 Hanwha Life Insurance Co Ltd 31 0.03
1 Hanyang Eng Co Ltd 20 0.02
2 Harim Holdings Co Ltd 19 0.02
6 HB Technology Co Ltd 14 0.01
1 HDC Hyundai Development Co-Engineering &Construction 21 0.02
1 Helixmith Co Ltd 34 0.03
2 Heung-A Shipping Co Ltd - -
4 Heungkuk Fire & Marine Insurance Co Ltd 15 0.01
1 HFR Inc 15 0.01
2 HJ Magnolia Yongpyong Hotel & Resort Corp 9 0.01
3 HLB Life Science CO LTD 27 0.02
3 Homecast Co Ltd 7 0.01
4 HS Industries Co Ltd 28 0.03
3 HSD Engine Co Ltd 27 0.02
1 Huchems Fine Chemical Corp 14 0.01
- Hugel Inc 41 0.04
1 Humax Co Ltd 4 -
1 Humedix Co Ltd 21 0.02
- Huons Co Ltd 15 0.01
1 Huons Global Co Ltd 31 0.03
1 Hwa Shin Co Ltd 6 0.01
2 Hwaseung Enterprise Co Ltd 26 0.02
1 Hy-Lok Corp 19 0.02
- Hyosung Advanced Materials Corp 75 0.07
- Hyosung Chemical Corp 28 0.03
- Hyosung Corp 33 0.03
- Hyosung Heavy Industries Corp 18 0.02
- Hyosung TNC Co Ltd 25 0.02
1 Hyundai Bioscience Co Ltd 23 0.02
- Hyundai BNG Steel Co Ltd 9 0.01
1 Hyundai Construction Equipment Co Ltd 50 0.05
1 Hyundai Corp 11 0.01
- Hyundai Corp Holdings Inc 2 -
1 Hyundai Department Store Co Ltd 46 0.04
1 Hyundai Electric & Energy System Co Ltd 27 0.03
1 Hyundai Elevator Co Ltd 48 0.04
2 Hyundai Greenfood Co Ltd 24 0.02
1 Hyundai Home Shopping Network Corp 42 0.04
2 Hyundai Hy Communications & Network Co Ltd 10 0.01
1 Hyundai Livart Furniture Co Ltd 22 0.02
2 Hyundai Marine & Fire Insurance Co Ltd 53 0.05
- Hyundai Mipo Dockyard Co Ltd 36 0.03
2 Hyundai Motor Securities Co Ltd 23 0.02
3 Hyundai Rotem Co Ltd 61 0.06
1 Hyundai Wia Corp 58 0.05
1 HyVision System Inc 18 0.02
18 iA Inc 20 0.02
1 Icure Pharma Inc 20 0.02
- Il Dong Pharmaceutical Co Ltd 5 -
- Iljin Diamond Co Ltd 18 0.02
2 Iljin Holdings Co Ltd 8 0.01
- Ilshin Spinning Co Ltd 12 0.01
- Ilyang Pharmaceutical Co Ltd 16 0.01
1 iMarketKorea Inc 6 0.01
Pacific Basin Small Companies FundPortfolio of Investments as at 31 May 2021 (continued)
Dimensional Fund Advisors Semi-Annual Report and Unaudited Financial Statements, 31 May 2021 332

Shares (000's)
Value(000's)
USD
% of NetAssetValue
Common Stock (continued)
Korea, Republic of - 9.13% (continued)
1 InBody Co Ltd 32 0.03
1 Innocean Worldwide Inc 29 0.03
- InnoWireless Inc 14 0.01
- Innox Advanced Materials Co Ltd 22 0.02
2 Inscobee Inc 6 0.01
1 Insun ENT Co Ltd 17 0.02
1 Interflex Co Ltd 9 0.01
- Interojo Co Ltd 6 0.01
2 Interpark Holdings Corp 7 0.01
1 INTOPS Co Ltd 25 0.02
1 iNtRON Biotechnology Inc 29 0.03
1 IS Dongseo Co Ltd 56 0.05
- ISC Co Ltd 7 0.01
1 i-SENS Inc 22 0.02
1 ISU Chemical Co Ltd 9 0.01
4 IsuPetasys Co Ltd 11 0.01
1 Jahwa Electronics Co Ltd 10 0.01
1 JASTECH Ltd 7 0.01
1 Jayjun Cosmetic Co Ltd 2 -
8 JB Financial Group Co Ltd 59 0.05
- Jcontentree Corp 14 0.01
1 Jejuair Co Ltd 14 0.01
2 Jusung Engineering Co Ltd 26 0.02
1 JVM Co Ltd 8 0.01
4 JW Holdings Corp 15 0.01
1 JW Life Science Corp 16 0.01
1 JW Pharmaceutical Corp 22 0.02
2 JYP Entertainment Corp 58 0.05
1 KC Co Ltd 17 0.02
1 KC Tech Co Ltd 26 0.02
- KCC Corp 53 0.05
- KCC Glass Corp 10 0.01
1 KEPCO Engineering & Construction Co Inc 65 0.06
1 KEPCO Plant Service & Engineering Co Ltd 35 0.03
1 KEYEAST Co Ltd 12 0.01
1 Kginicis Co Ltd 13 0.01
7 KH FEELUX Co Ltd 21 0.02
1 KH Vatec Co Ltd 18 0.02
2 KISCO Corp 19 0.02
1 KISWIRE Ltd 20 0.02
1 KMW Co Ltd 48 0.04
3 Koentec Co Ltd 21 0.02
1 Koh Young Technology Inc 21 0.02
1 Kolmar BNH Co Ltd 35 0.03
- Kolmar Korea Co Ltd 19 0.02
1 Kolmar Korea Holdings Co Ltd 24 0.02
- Kolon Corp 7 0.01
1 Kolon Industries Inc 43 0.04
- KoMiCo Ltd 17 0.02
1 Komipharm International Co 6 0.01
1 Korea Circuit Co Ltd 6 0.01
- Korea District Heating Corp 9 0.01
- Korea Electric Terminal Co Ltd 30 0.03
10 Korea Line Corp 30 0.03
- Korea Petrochemical Ind Co Ltd 51 0.05
13 Korea Real Estate Investment & Trust Co Ltd 29 0.03
- Korea United Pharm Inc 20 0.02
4 Korean Reinsurance Co 31 0.03
5 KPM Tech Co Ltd 16 0.01
1 KT Skylife Co Ltd 10 0.01
2 KTB Investment & Securities Co Ltd 11 0.01
- Kukdo Chemical Co Ltd 6 0.01
Shares (000's)
Value(000's)
USD
% of NetAssetValue
Common Stock (continued)
Korea, Republic of - 9.13% (continued)
1 Kumho Industrial Co Ltd 14 0.01
5 Kumho Tire Co Inc 20 0.02
2 Kwang Dong Pharmaceutical Co Ltd 15 0.01
1 Kyeryong Construction Industrial Co Ltd 22 0.02
2 Kyobo Securities Co Ltd 16 0.01
- Kyung Dong Navien Co Ltd 20 0.02
1 Kyung-In Synthetic Corp 7 0.01
1 L&C Bio Co Ltd 20 0.02
- L&F Co Ltd 29 0.03
1 LabGenomics Co Ltd 14 0.01
3 LB Semicon Inc 37 0.03
1 Leaders Cosmetics Co Ltd 2 -
- LEENO Industrial Inc 17 0.02
- LegoChem Biosciences Inc 18 0.02
1 LF Corp 13 0.01
- LG Hausys Ltd 28 0.03
2 LG International Corp 62 0.06
1 Lock&Lock Co Ltd 18 0.02
- Lotte Chilsung Beverage Co Ltd 22 0.02
1 LOTTE Fine Chemical Co Ltd 41 0.04
- Lotte Food Co Ltd 16 0.01
1 LOTTE Himart Co Ltd 27 0.03
1 Lotte Tour Development Co Ltd 17 0.02
1 LS Industrial Systems Co Ltd 36 0.03
2 Lumens Co Ltd 3 -
1 Lutronic Corp 10 0.01
2 LVMC Holdings 6 0.01
- Maeil Dairies Co Ltd 11 0.01
- Maeil Holdings Co Ltd 1 -
1 Mcnex Co Ltd 46 0.04
3 ME2ON Co Ltd 15 0.01
1 Medipost Co Ltd 22 0.02
- Medy-Tox Inc 26 0.02
1 MegaStudy Co Ltd 6 0.01
- MegaStudyEdu Co Ltd 28 0.03
1 Meritz Financial Group Inc 22 0.02
2 Meritz Fire & Marine Insurance Co Ltd 33 0.03
2 MiCo Ltd 20 0.02
1 Minwise Co Ltd 15 0.01
2 Mirae Asset Life Insurance Co Ltd 8 0.01
1 Modetour Network Inc 23 0.02
- Motonic Corp 1 -
1 Muhak Co Ltd 5 -
2 Namhae Chemical Corp 18 0.02
8 Namsun Aluminum Co Ltd 25 0.02
- Namyang Dairy Products Co Ltd 12 0.01
1 Nasmedia Co Ltd 18 0.02
3 Naturecell Co Ltd 32 0.03
3 NDFOS Co. 13 0.01
- NeoPharm Co Ltd 4 -
2 Neowiz 34 0.03
1 NEPES Corp 48 0.04
2 Nexen Tire Corp 12 0.01
1 Nexturn Co Ltd 8 0.01
1 NHN Corp 33 0.03
- NHN KCP Corp 20 0.02
1 NICE Holdings Co Ltd 19 0.02
1 Nice Information & Telecommunication Inc 16 0.01
2 NICE Information Service Co Ltd 46 0.04
2 NICE Total Cash Management Co Ltd 13 0.01
- Nong Shim Holdings Co Ltd 9 0.01
- Nongshim Co Ltd 44 0.04
Pacific Basin Small Companies FundPortfolio of Investments as at 31 May 2021 (continued)
Dimensional Fund Advisors Semi-Annual Report and Unaudited Financial Statements, 31 May 2021 333

Shares (000's)
Value(000's)
USD
% of NetAssetValue
Common Stock (continued)
Korea, Republic of - 9.13% (continued)
1 NS Shopping Co Ltd 16 0.01
- OptoElectronics Solutions Co Ltd 13 0.01
1 OPTRON-TEC Inc 8 0.01
1 Orion Holdings Corp 15 0.01
1 Osstem Implant Co Ltd 54 0.05
- Ottogi Corp 31 0.03
2 Paradise Co Ltd 33 0.03
2 Partron Co Ltd 18 0.02
1 People & Technology Inc 22 0.02
- Pharma Research Products Co Ltd 30 0.03
3 Pharmicell Co Ltd 44 0.04
3 Posco ICT Co Ltd 19 0.02
2 POSCO International Corp 36 0.03
2 Posco M-Tech Co Ltd 13 0.01
4 Power Logics Co Ltd 26 0.02
1 PSK Inc 30 0.03
1 Pulmuone Co Ltd 16 0.01
1 Pyeong Hwa Automotive Co Ltd 7 0.01
1 RFHIC Corp 34 0.03
1 S&S Tech Corp 27 0.02
1 S&T Motiv Co Ltd 47 0.04
- Sajo Industries Co Ltd 15 0.01
1 Sam Chun Dang Pharm Co Ltd 44 0.04
- Sam Kwang Glass Co Ltd 16 0.01
1 Sam Yung Trading Co Ltd 9 0.01
5 Sambu Engineering & Construction 13 0.01
2 Samick Musical Instruments Co Ltd 4 -
1 Samick THK Co Ltd 11 0.01
1 Samjin Pharmaceutical Co Ltd 11 0.01
3 SAMT Co Ltd 10 0.01
1 Samwha Capacitor Co Ltd 30 0.03
- Samyang Corp 18 0.02
- Samyang Foods Co Ltd 22 0.02
- Samyang Holdings Corp 32 0.03
1 Sang-A Frontec Co Ltd 24 0.02
3 Sangsangin Co Ltd 24 0.02
23 SBW 14 0.01
1 Seah Besteel Corp 23 0.02
- SeAH Steel Corp 7 0.01
- SeAH Steel Holdings Corp 5 -
1 Sebang Co Ltd 9 0.01
1 Sebang Global Battery Co Ltd 42 0.04
36 Sejong Telecom Inc 22 0.02
1 Sekonix Co Ltd 3 -
1 Seobu T&D 8 0.01
1 Seojin System Co Ltd 37 0.03
2 Seoul Semiconductor Co Ltd 43 0.04
1 Seoyon Co Ltd 22 0.02
1 Seoyon E-Hwa Co Ltd 5 -
4 Sewon Cellontech Co Ltd 7 0.01
- Sewon Precision Industry Co Ltd - -
1 SFA Engineering Corp 30 0.03
5 SFA Semicon Co Ltd 30 0.03
- Shinsegae Food Co Ltd 11 0.01
- Shinsegae International Inc 36 0.03
6 Shinsung E&G Co Ltd 17 0.02
- Shinyoung Securities Co Ltd 14 0.01
1 Showbox Corp 4 -
1 Silicon Works Co Ltd 64 0.06
- Silla Co Ltd 3 -
1 SIMMTECH Co Ltd 13 0.01
- Sindoh Co Ltd 7 0.01
Shares (000's)
Value(000's)
USD
% of NetAssetValue
Common Stock (continued)
Korea, Republic of - 9.13% (continued)
- SK Bioland Co Ltd 9 0.01
1 SK D&D Co Ltd 18 0.02
1 SK Discovery Co Ltd 31 0.03
- SK Gas Ltd 29 0.03
11 SK Networks Co Ltd 56 0.05
22 SK Securities Co Ltd 20 0.02
1 SKCKOLONPI Inc 33 0.03
1 SL Corp 27 0.03
1 SM Entertainment Co Ltd 45 0.04
13 S-MAC Co Ltd 17 0.02
3 Solid Inc 17 0.02
1 Songwon Industrial Co Ltd 15 0.01
- Soulbrain Holdings Co Ltd 9 0.01
- SPC Samlip Co Ltd 11 0.01
- Spigen Korea Co Ltd 18 0.02
2 Ssangyong Motor Co 3 -
- ST Pharm Co Ltd 34 0.03
- Suheung Co Ltd 21 0.02
- SundayToz Corp 8 0.01
1 Sung Kwang Bend Co Ltd 8 0.01
2 Sungshin Cement Co Ltd 19 0.02
4 Sungwoo Hitech Co Ltd 22 0.02
1 Sunjin Co Ltd 11 0.01
- Suprema Inc 7 0.01
7 Synopex Inc 23 0.02
1 Systems Technology Inc 19 0.02
- Taekwang Industrial Co Ltd 6 0.01
1 Taewoong Co Ltd 8 0.01
1 Taeyoung Engineering & Construction Co Ltd 17 0.02
16 Taihan Electric Wire Co Ltd 24 0.02
5 Taihan Fiberoptics Co Ltd 14 0.01
1 TechWing Inc 20 0.02
6 Telcon RF Pharmaceutical Inc 24 0.02
1 TES Co Ltd 17 0.02
1 Theragen Etex Co Ltd 10 0.01
2 TK Corp 17 0.02
- Tokai Carbon Korea Co Ltd 49 0.05
5 Tong Yang Moolsan Co Ltd 7 0.01
16 Tongyang Inc 20 0.02
4 Tongyang Life Insurance Co Ltd 22 0.02
1 Toptec Co Ltd 9 0.01
1 Tovis Co Ltd 5 -
1 TY Holdings Co Ltd 36 0.03
2 UBCare Co Ltd 15 0.01
1 Ubiquoss Holdings Inc 16 0.01
- Unid Co Ltd 33 0.03
3 Union Semiconductor Equipment & Materials Co Ltd 34 0.03
5 Unison Co Ltd 20 0.02
1 UniTest Inc 12 0.01
- Value Added Technology Co Ltd 9 0.01
1 Viatron Technologies Inc 8 0.01
- Vieworks Co Ltd 12 0.01
1 Webcash Corp 27 0.02
1 Webzen Inc 20 0.02
- Wemade Co Ltd 16 0.01
1 Whanin Pharmaceutical Co Ltd 18 0.02
1 WiSoL Co Ltd 8 0.01
4 Wonik Holdings Co Ltd 23 0.02
- Wonik Materials Co Ltd 11 0.01
38 Woori Investment Bank Co Ltd 32 0.03
10 Woori Technology Inc 12 0.01
2 Woori Technology Investment Co Ltd 19 0.02
Pacific Basin Small Companies FundPortfolio of Investments as at 31 May 2021 (continued)
Dimensional Fund Advisors Semi-Annual Report and Unaudited Financial Statements, 31 May 2021 334

Shares (000's)
Value(000's)
USD
% of NetAssetValue
Common Stock (continued)
Korea, Republic of - 9.13% (continued)
1 Woory Industrial Co Ltd 15 0.01
3 Woosu AMS Co Ltd 14 0.01
2 Y G-1 Co Ltd 19 0.02
1 YG Entertainment Inc 31 0.03
- Young Poong Corp 16 0.01
1 Youngone Corp 27 0.03
- Youngone Holdings Co Ltd 16 0.01
6 Yuanta Securities Korea Co Ltd 24 0.02
6 Yungjin Pharmaceutical Co Ltd 33 0.03
- Zinus Inc 28 0.03
9,898 9.13
New Zealand - 1.53%
41 Air New Zealand Ltd 49 0.05
39 Arvida Group Ltd 52 0.05
3 Briscoe Group Ltd 14 0.01
7 CBL Corp Ltd - -
23 Chorus Ltd 106 0.10
- Delegat Group Ltd 1 -
7 Fletcher Building Ltd 37 0.03
14 Freightways Ltd 118 0.11
25 Genesis Energy Ltd 62 0.06
3 Gentrack Group Ltd 4 -
4 Hallenstein Glasson Holdings Ltd 22 0.02
52 Heartland Group Holdings Ltd 73 0.07
42 Kathmandu Holdings Ltd 48 0.04
4 Napier Port Holdings Ltd 10 0.01
21 New Zealand Refining Co Ltd 10 0.01
14 NZME Ltd 8 0.01
25 NZX Ltd 37 0.03
34 Oceania Healthcare Ltd 34 0.03
57 Pacific Edge Ltd 48 0.04
2 PGG Wrightson Ltd 5 -
69 Pushpay Holdings Ltd 84 0.08
3 Restaurant Brands New Zealand Ltd 30 0.03
6 Sanford Ltd 21 0.02
17 Scales Corp Ltd 56 0.05
6 Serko Ltd 29 0.03
19 Skellerup Holdings Ltd 63 0.06
152 SKY Network Television Ltd 19 0.02
64 SKYCITY Entertainment Group Ltd 166 0.15
15 Steel & Tube Holdings Ltd 12 0.01
23 Summerset Group Holdings Ltd 207 0.19
9 Synlait Milk Ltd 19 0.02
14 Tourism Holdings Ltd 25 0.02
16 Tower Ltd 8 0.01
3 Trustpower Ltd 19 0.02
5 Turners Automotive Group Ltd 14 0.01
24 Vista Group International Ltd 38 0.04
10 Warehouse Group Ltd 24 0.02
45 Z Energy Ltd 84 0.08
1,656 1.53
Singapore - 3.30%
79 Accordia Golf Trust 1 -
19 AEM Holdings Ltd 51 0.05
90 Ascendas India Trust 93 0.09
35 Banyan Tree Holdings Ltd 8 0.01
32 Best World International Ltd 6 0.01
19 Bonvests Holdings Ltd 13 0.01
4 Boustead Projects Ltd 3 -
50 Boustead Singapore Ltd 44 0.04
19 Bukit Sembawang Estates Ltd 72 0.07
30 Bund Center Investment Ltd 12 0.01
Shares (000's)
Value(000's)
USD
% of NetAssetValue
Common Stock (continued)
Singapore - 3.30% (continued)
25 China Aviation Oil Singapore Corp Ltd 20 0.02
39 China Sunsine Chemical Holdings Ltd 16 0.01
38 Chip Eng Seng Corp Ltd 13 0.01
74 Chuan Hup Holdings Ltd 12 0.01
206 ComfortDelGro Corp Ltd 261 0.24
152 COSCO Shipping International Singapore Co Ltd 36 0.03
5 Creative Technology Ltd 10 0.01
38 CSE Global Ltd 15 0.01
61 Del Monte Pacific Ltd 18 0.02
42 Delfi Ltd 27 0.03
25 DMX Technologies Group Ltd - -
240 Ezion Holdings Ltd 1 -
154 Ezra Holdings Ltd - -
20 Far East Orchard Ltd 16 0.02
52 First Resources Ltd 53 0.05
17 First Sponsor Group Ltd 18 0.02
1 Food Empire Holdings Ltd 1 -
140 Fragrance Group Ltd 12 0.01
20 Fraser and Neave Ltd 22 0.02
47 Frencken Group Ltd 63 0.06
221 Gallant Venture Ltd 22 0.02
17 GK Goh Holdings Ltd 12 0.01
678 Golden Agri-Resources Ltd 120 0.11
25 GuocoLand Ltd 31 0.03
29 Halcyon Agri Corp Ltd 6 0.01
35 Hanwell Holdings Ltd 12 0.01
12 Haw Par Corp Ltd 122 0.11
24 Ho Bee Land Ltd 48 0.04
52 Hong Fok Corp Ltd 34 0.03
17 Hong Leong Asia Ltd 13 0.01
30 Hong Leong Finance Ltd 55 0.05
13 Hotel Grand Central Ltd 11 0.01
24 Hour Glass Ltd 23 0.02
479 Hutchison Port Holdings Trust 115 0.11
35 Hyflux Ltd 4 -
10 iFAST Corp Ltd 64 0.06
27 Indofood Agri Resources Ltd 7 0.01
74 Japfa Ltd 49 0.05
90 Jurong Technologies Industrial Corp Ltd - -
16 k1 Ventures Ltd - -
325 Keppel Infrastructure Trust 134 0.12
41 Lian Beng Group Ltd 15 0.01
32 Low Keng Huat Singapore Ltd 12 0.01
19 Mandarin Oriental International Ltd 36 0.03
38 Metro Holdings Ltd 23 0.02
63 Mewah International Inc 22 0.02
77 Midas Holdings Ltd 2 -
165 mm2 Asia Ltd 8 0.01
195 NetLink NBN Trust 141 0.13
14 NSL Ltd 9 0.01
30 OUE Ltd 31 0.03
78 Oxley Holdings Ltd 14 0.01
16 Pan-United Corp Ltd 4 -
35 Q&M Dental Group Singapore Ltd 18 0.02
9 QAF Ltd 6 0.01
79 Raffles Education Corp Ltd 10 0.01
79 Raffles Medical Group Ltd 65 0.06
40 Riverstone Holdings Ltd 45 0.04
55 SATS Ltd 165 0.15
8 SBS Transit Ltd 19 0.02
92 Sembcorp Industries Ltd 153 0.14
714 Sembcorp Marine Ltd 108 0.10
Pacific Basin Small Companies FundPortfolio of Investments as at 31 May 2021 (continued)
Dimensional Fund Advisors Semi-Annual Report and Unaudited Financial Statements, 31 May 2021 335

Shares (000's)
Value(000's)
USD
% of NetAssetValue
Common Stock (continued)
Singapore - 3.30% (continued)
67 Sheng Siong Group Ltd 80 0.07
22 SIA Engineering Co Ltd 37 0.03
76 SIIC Environment Holdings Ltd 12 0.01
146 Sinarmas Land Ltd 31 0.03
52 Sing Holdings Ltd 15 0.01
148 Singapore Post Ltd 80 0.07
145 Singapore Press Holdings Ltd 191 0.18
68 StarHub Ltd 62 0.06
7 Straits Trading Co Ltd 16 0.02
284 Thomson Medical Group Ltd 19 0.02
27 Tuan Sing Holdings Ltd 9 0.01
39 UMS Holdings Ltd 41 0.04
13 United Industrial Corp Ltd 26 0.02
37 UOB-Kay Hian Holdings Ltd 47 0.04
39 Valuetronics Holdings Ltd 19 0.02
8 Vicom Ltd 13 0.01
39 Wing Tai Holdings Ltd 51 0.05
110 Yangzijiang Shipbuilding Holdings Ltd 124 0.11
3,578 3.30
Taiwan - 9.86%
29 AcBel Polytech Inc 27 0.03
4 ACES Electronic Co Ltd 6 0.01
2 Acter Group Corp Ltd 16 0.01
4 Actron Technology Corp 14 0.01
8 A-DATA Technology Co Ltd 29 0.03
5 ADLINK Technology Inc 11 0.01
2 Advanced Ceramic X Corp 35 0.03
6 Advanced International Multitech Co Ltd 16 0.01
46 Aerospace Industrial Development Corp 46 0.04
3 Alchip Technologies Ltd 57 0.05
10 ALI Corp 9 0.01
14 Alpha Networks Inc 14 0.01
23 Altek Corp 30 0.03
12 Ambassador Hotel 12 0.01
40 AmTRAN Technology Co Ltd 25 0.02
11 Apex International Co Ltd 22 0.02
12 Arcadyan Technology Corp 40 0.04
23 Ardentec Corp 35 0.03
3 Argosy Research Inc 11 0.01
13 Asia Optical Co Inc 38 0.04
151 Asia Pacific Telecom Co Ltd 48 0.04
22 Asia Polymer Corp 24 0.02
21 Asia Vital Components Co Ltd 53 0.05
1 ASPEED Technology Inc 79 0.07
2 ASROCK Inc 12 0.01
7 Aten International Co Ltd 21 0.02
1 Auden Techno Corp 7 0.01
9 Audix Corp 17 0.02
4 AURAS Technology Co Ltd 24 0.02
56 Bank of Kaohsiung Co Ltd 22 0.02
8 Basso Industry Corp 14 0.01
30 BES Engineering Corp 10 0.01
7 Bioteque Corp 28 0.03
9 Bizlink Holding Inc 75 0.07
3 Bright Led Electronics Corp 2 -
21 Brighton-Best International Taiwan Inc 25 0.02
126 Capital Securities Corp 80 0.07
19 Career Technology MFG. Co Ltd 21 0.02
49 Cathay Real Estate Development Co Ltd 35 0.03
18 Center Laboratories Inc 45 0.04
6 Century Iron & Steel Industrial 23 0.02
20 Chang Wah Electromaterials Inc 24 0.02
Shares (000's)
Value(000's)
USD
% of NetAssetValue
Common Stock (continued)
Taiwan - 9.86% (continued)
17 Channel Well Technology Co Ltd 32 0.03
14 Charoen Pokphand Enterprise 39 0.04
2 Chaun-Choung Technology Corp 14 0.01
4 CHC Resources Corp 7 0.01
8 Chenbro Micom Co Ltd 23 0.02
48 Cheng Loong Corp 71 0.07
51 Cheng Mei Materials Technology Corp 23 0.02
26 Cheng Uei Precision Industry Co Ltd 37 0.03
37 Chia Hsin Cement Corp 29 0.03
12 Chicony Power Technology Co Ltd 30 0.03
4 Chien Kuo Construction Co Ltd 2 -
9 Chilisin Electronics Corp 31 0.03
59 China Bills Finance Corp 34 0.03
2 China Ecotek Corp 3 -
25 China Electric Manufacturing Corp 10 0.01
28 China General Plastics Corp 35 0.03
111 China Man-Made Fiber Corp 41 0.04
19 China Metal Products 23 0.02
8 China Motor Corp 21 0.02
155 China Petrochemical Development Corp 72 0.07
11 China Steel Chemical Corp 43 0.04
30 Chin-Poon Industrial Co Ltd 31 0.03
27 Chipbond Technology Corp 66 0.06
21 ChipMOS Technologies Inc 34 0.03
3 Chlitina Holding Ltd 23 0.02
14 Chong Hong Construction Co Ltd 40 0.04
28 Chung Hung Steel Corp 48 0.04
18 Chung-Hsin Electric & Machinery ManufacturingCorp 34 0.03
1 Chunghwa Precision Test Tech Co Ltd 24 0.02
6 Cleanaway Co Ltd 37 0.03
26 Clevo Co 28 0.03
50 CMC Magnetics Corp 19 0.02
27 Compeq Manufacturing Co Ltd 37 0.03
31 Concord Securities Co Ltd 19 0.02
4 Concraft Holding Co Ltd 9 0.01
45 Continental Holdings Corp 40 0.04
5 Coremax Corp 12 0.01
18 Coretronic Corp 37 0.03
15 Co-Tech Development Corp 44 0.04
22 CSBC Corp Taiwan 18 0.02
33 CTCI Corp 45 0.04
3 Cub Elecparts Inc 23 0.02
5 Cyberlink Corp 15 0.01
20 CyberTAN Technology Inc 13 0.01
27 Da-Li Development Co Ltd 29 0.03
12 Darfon Electronics Corp 18 0.02
32 Darwin Precisions Corp 16 0.01
18 De Licacy Industrial Co Ltd 11 0.01
5 Depo Auto Parts Ind Co Ltd 10 0.01
30 D-Link Corp 21 0.02
12 Dynamic Electronics Co Ltd 8 0.01
6 Dynapack International Technology Corp 24 0.02
20 E Ink Holdings Inc 44 0.04
3 ECOVE Environment Corp 25 0.02
4 Egis Technology Inc 24 0.02
18 Elan Microelectronics Corp 134 0.12
6 E-Life Mall Corp 18 0.02
8 Elite Advanced Laser Corp 17 0.02
13 Elite Material Co Ltd 74 0.07
19 Elite Semiconductor Memory Technology Inc 90 0.08
18 Elitegroup Computer Systems Co Ltd 16 0.02
Pacific Basin Small Companies FundPortfolio of Investments as at 31 May 2021 (continued)
Dimensional Fund Advisors Semi-Annual Report and Unaudited Financial Statements, 31 May 2021 336

Shares (000's)
Value(000's)
USD
% of NetAssetValue
Common Stock (continued)
Taiwan - 9.86% (continued)
1 eMemory Technology Inc 34 0.03
4 Ennoconn Corp 28 0.03
30 ENNOSTAR Inc 82 0.08
35 EnTie Commercial Bank Co Ltd 19 0.02
44 Eternal Materials Co Ltd 63 0.06
13 Etron Technology Inc 12 0.01
28 Everest Textile Co Ltd 12 0.01
33 Evergreen International Storage & Transport Corp 27 0.03
24 Everlight Chemical Industrial Corp 17 0.02
26 Everlight Electronics Co Ltd 43 0.04
6 Excelsior Medical Co Ltd 12 0.01
53 Far Eastern Department Stores Ltd 43 0.04
117 Far Eastern International Bank 45 0.04
10 Faraday Technology Corp 24 0.02
17 Farglory Land Development Co Ltd 34 0.03
31 Federal Corp 32 0.03
26 Feng Hsin Steel Co Ltd 69 0.06
10 Firich Enterprises Co Ltd 10 0.01
16 First Insurance Co Ltd 8 0.01
35 First Steamship Co Ltd 16 0.01
14 FLEXium Interconnect Inc 57 0.05
5 Flytech Technology Co Ltd 10 0.01
7 Formosa Advanced Technologies Co Ltd 10 0.01
2 Formosa International Hotels Corp 11 0.01
41 Formosa Taffeta Co Ltd 46 0.04
16 Formosan Rubber Group Inc 14 0.01
9 Formosan Union Chemical 6 0.01
2 Foxsemicon Integrated Technology Inc 16 0.01
5 Fulgent Sun International Holding Co Ltd 23 0.02
23 Fulltech Fiber Glass Corp 13 0.01
3 Fusheng Precision Co Ltd 24 0.02
6 Gamania Digital Entertainment Co Ltd 14 0.01
16 Gemtek Technology Corp 18 0.02
12 General Interface Solution Holding Ltd 42 0.04
24 Getac Technology Corp 45 0.04
7 Gigabyte Technology Co Ltd 27 0.03
3 Ginko International Co Ltd 20 0.02
15 Global Brands Manufacture Ltd 17 0.02
4 Global Mixed Mode Technology Inc 32 0.03
2 Global PMX Co Ltd 12 0.01
2 Global Unichip Corp 26 0.02
37 Gloria Material Technology Corp 26 0.02
27 Gold Circuit Electronics Ltd 52 0.05
49 Goldsun Building Materials Co Ltd 45 0.04
5 Gourmet Master Co Ltd 30 0.03
47 Grand Pacific Petrochemical 44 0.04
6 Grape King Bio Ltd 36 0.03
12 Great China Metal Industry 11 0.01
29 Great Taipei Gas Co Ltd 35 0.03
35 Great Wall Enterprise Co Ltd 71 0.07
15 Greatek Electronics Inc 38 0.04
21 HannStar Board Corp 34 0.03
48 HannStar Display Corp 37 0.03
27 HannsTouch Solution Inc 12 0.01
6 Harvatek Corp 5 -
15 Hey Song Corp 19 0.02
5 Hiroca Holdings Ltd 11 0.01
71 Ho Tung Chemical Corp 29 0.03
2 Holiday Entertainment Co Ltd 4 -
9 Holtek Semiconductor Inc 31 0.03
6 Holy Stone Enterprise Co Ltd 28 0.03
14 Hong Pu Real Estate Development Co Ltd 11 0.01
Shares (000's)
Value(000's)
USD
% of NetAssetValue
Common Stock (continued)
Taiwan - 9.86% (continued)
18 Horizon Securities Co Ltd 16 0.01
6 Hota Industrial Manufacturing Co Ltd 20 0.02
15 Hsin Kuang Steel Co Ltd 36 0.03
22 HTC Corp 29 0.03
4 Hu Lane Associate Inc 14 0.01
12 HUA ENG Wire & Cable Co Ltd 12 0.01
14 Huaku Development Co Ltd 47 0.04
27 Hung Sheng Construction Ltd 19 0.02
1 Huxen Corp 2 -
6 Ibase Technology Inc 8 0.01
110 IBF Financial Holdings Co Ltd 68 0.06
13 Ichia Technologies Inc 8 0.01
15 I-Chiun Precision Industry Co Ltd 16 0.01
4 IEI Integration Corp 8 0.01
6 Innodisk Corp 40 0.04
8 Integrated Service Technology Inc 15 0.01
37 International CSRC Investment Holdings Co 33 0.03
3 International Games System Co Ltd 101 0.09
8 I-Sheng Electric Wire & Cable Co Ltd 13 0.01
7 ITE Technology Inc 31 0.03
5 ITEQ Corp 20 0.02
4 Jentech Precision Industrial Co Ltd 41 0.04
5 Jess-Link Products Co Ltd 7 0.01
7 Kaimei Electronic Corp 26 0.02
5 Kaori Heat Treatment Co Ltd 8 0.01
28 Kenda Rubber Industrial Co Ltd 42 0.04
6 Kerry TJ Logistics Co Ltd 13 0.01
2 Keystone Microtech Corp 21 0.02
14 Kindom Development Co Ltd 19 0.02
3 King Slide Works Co Ltd 41 0.04
47 King Yuan Electronics Co Ltd 73 0.07
33 King's Town Bank Co Ltd 49 0.05
6 Kinik Co 14 0.01
62 Kinpo Electronics 31 0.03
12 Kinsus Interconnect Technology Corp 45 0.04
5 KMC Kuei Meng International Inc 44 0.04
10 KS Terminals Inc 26 0.02
4 Kung Long Batteries Industrial Co Ltd 21 0.02
10 Kuo Toong International Co Ltd 9 0.01
14 Kuoyang Construction Co Ltd 15 0.01
9 KYE Systems Corp 4 -
12 L&K Engineering Co Ltd 12 0.01
4 LandMark Optoelectronics Corp 36 0.03
6 Lanner Electronics Inc 14 0.01
39 Lealea Enterprise Co Ltd 18 0.02
5 Li Cheng Enterprise Co Ltd 4 -
6 Li Peng Enterprise Co Ltd 3 -
14 Lien Hwa Industrial Holdings Corp 25 0.02
26 Lingsen Precision Industries Ltd 16 0.01
17 Long Bon International Co Ltd 12 0.01
44 Longchen Paper & Packaging Co Ltd 37 0.03
5 Longwell Co 11 0.01
2 Lotes Co Ltd 46 0.04
4 Lumax International Corp Ltd 10 0.01
11 Lung Yen Life Service Corp 24 0.02
2 Macauto Industrial Co Ltd 6 0.01
1 Machvision Inc 9 0.01
9 Makalot Industrial Co Ltd 92 0.09
7 Marketech International Corp 26 0.02
6 Mayer Steel Pipe Corp 8 0.01
14 Mercuries & Associates Holding Ltd 11 0.01
89 Mercuries Life Insurance Co Ltd 30 0.03
Pacific Basin Small Companies FundPortfolio of Investments as at 31 May 2021 (continued)
Dimensional Fund Advisors Semi-Annual Report and Unaudited Financial Statements, 31 May 2021 337

Shares (000's)
Value(000's)
USD
% of NetAssetValue
Common Stock (continued)
Taiwan - 9.86% (continued)
6 Merry Electronics Co Ltd 23 0.02
5 MIN AIK Technology Co Ltd 4 -
14 Mirle Automation Corp 23 0.02
30 Mitac Holdings Corp 31 0.03
3 MPI Corp 12 0.01
6 Namchow Holdings Co Ltd 12 0.01
18 Nantex Industry Co Ltd 84 0.08
5 National Petroleum Co Ltd 8 0.01
11 Nichidenbo Corp 21 0.02
9 Nien Hsing Textile Co Ltd 7 0.01
44 O-Bank Co Ltd 11 0.01
33 OptoTech Corp 32 0.03
27 Orient Semiconductor Electronics Ltd 17 0.02
25 Oriental Union Chemical Corp 20 0.02
17 Pan Jit International Inc 31 0.03
31 Pan-International Industrial Corp 44 0.04
7 PChome Online Inc 25 0.02
5 PCL Technologies Inc 17 0.02
7 Pharmally International Holding Co Ltd 5 -
7 Pixart Imaging Inc 46 0.04
6 Polytronics Technology Corp 24 0.02
56 President Securities Corp 58 0.05
23 Primax Electronics Ltd 44 0.04
50 Prince Housing & Development Corp 21 0.02
5 Promate Electronic Co Ltd 7 0.01
12 Qisda Corp 13 0.01
6 QST International Corp 14 0.01
4 Quang Viet Enterprise Co Ltd 19 0.02
17 Quanta Storage Inc 25 0.02
9 Radiant Opto-Electronics Corp 38 0.04
45 Radium Life Tech Co Ltd 18 0.02
20 Rechi Precision Co Ltd 14 0.01
8 Rexon Industrial Corp Ltd 22 0.02
31 Rich Development Co Ltd 11 0.01
19 Ritek Corp 7 0.01
41 Roo Hsing Co Ltd 14 0.01
11 Ruentex Development Co Ltd 20 0.02
8 Ruentex Industries Ltd 24 0.02
28 Sampo Corp 30 0.03
15 San Fang Chemical Industry Co Ltd 12 0.01
3 San Shing Fastech Corp 6 0.01
36 Sanyang Motor Co Ltd 36 0.03
9 SDI Corp 30 0.03
18 Sercomm Corp 43 0.04
12 Sesoda Corp 12 0.01
13 Shihlin Electric & Engineering Corp 24 0.02
5 Shin Zu Shing Co Ltd 21 0.02
34 Shining Building Business Co Ltd 15 0.01
10 Shinkong Insurance Co Ltd 14 0.01
67 Shinkong Synthetic Fibers Corp 52 0.05
23 Sigurd Microelectronics Corp 42 0.04
9 Sinbon Electronics Co Ltd 89 0.08
10 Sincere Navigation Corp 9 0.01
2 Sinmag Equipment Corp 8 0.01
25 Sinon Corp 19 0.02
22 Sinyi Realty Inc 24 0.02
6 Sirtec International Co Ltd 6 0.01
7 Sitronix Technology Corp 69 0.06
7 Soft-World International Corp 27 0.03
24 Solar Applied Materials Technology Co 40 0.04
8 Sonix Technology Co Ltd 27 0.03
8 Speed Tech Corp 20 0.02
Shares (000's)
Value(000's)
USD
% of NetAssetValue
Common Stock (continued)
Taiwan - 9.86% (continued)
3 Sporton International Inc 28 0.03
3 St Shine Optical Co Ltd 30 0.03
14 Standard Foods Corp 27 0.03
7 Stark Technology Inc 17 0.02
5 Sunny Friend Environmental Technology Co Ltd 38 0.04
18 Sunonwealth Electric Machine Industry Co Ltd 28 0.03
27 Sunplus Technology Co Ltd 29 0.03
4 Sunspring Metal Corp 4 -
19 Supreme Electronics Co Ltd 27 0.03
3 Sweeten Real Estate Development Co Ltd 3 -
9 Syncmold Enterprise Corp 26 0.02
11 Systex Corp 34 0.03
11 TA Chen Stainless Pipe 17 0.02
43 Ta Ya Electric Wire & Cable 43 0.04
6 Tah Hsin Industrial Corp 16 0.01
9 TA-I Technology Co Ltd 22 0.02
74 Taichung Commercial Bank Co Ltd 30 0.03
3 TaiDoc Technology Corp 23 0.02
8 Taiflex Scientific Co Ltd 14 0.01
8 Taimide Tech Inc 14 0.01
41 Tainan Spinning Co Ltd 42 0.04
22 Taisun Enterprise Co Ltd 23 0.02
15 Taita Chemical Co Ltd 22 0.02
5 Taiwan Chinsan Electronic Industrial Co Ltd 9 0.01
34 Taiwan Cogeneration Corp 47 0.04
6 Taiwan Fertilizer Co Ltd 12 0.01
11 Taiwan Fire & Marine Insurance Co Ltd 8 0.01
12 Taiwan FU Hsing Industrial Co Ltd 19 0.02
28 Taiwan Glass Industry Corp 33 0.03
10 Taiwan Hon Chuan Enterprise Co Ltd 25 0.02
65 Taiwan Kolin Co Ltd - -
23 Taiwan Land Development Corp 6 0.01
18 Taiwan Paiho Ltd 62 0.06
16 Taiwan PCB Techvest Co Ltd 28 0.03
11 Taiwan Sakura Corp 26 0.02
17 Taiwan Semiconductor Co Ltd 29 0.03
19 Taiwan Shin Kong Security Co Ltd 26 0.02
28 Taiwan Styrene Monomer 20 0.02
11 Taiwan Surface Mounting Technology Corp 47 0.04
35 Taiwan TEA Corp 24 0.02
12 Taiwan Union Technology Corp 42 0.04
49 Tatung Co Ltd 44 0.04
4 TCI Co Ltd 35 0.03
9 Test Research Inc 18 0.02
5 Thinking Electronic Industrial Co Ltd 29 0.03
10 Thye Ming Industrial Co Ltd 11 0.01
50 Ton Yi Industrial Corp 24 0.02
4 Tong Hsing Electronic Industries Ltd 26 0.02
20 Tong Yang Industry Co Ltd 24 0.02
10 Topco Scientific Co Ltd 46 0.04
3 Topkey Corp 18 0.02
6 Topoint Technology Co Ltd 8 0.01
4 Toung Loong Textile Manufacturing 6 0.01
13 TPK Holding Co Ltd 22 0.02
11 Transcend Information Inc 28 0.03
2 TSC Auto ID Technology Co Ltd 17 0.02
38 TSRC Corp 42 0.04
2 Ttet Union Corp 12 0.01
15 TTY Biopharm Co Ltd 47 0.04
40 Tung Ho Steel Enterprise Corp 69 0.06
16 TXC Corp 59 0.05
10 TYC Brother Industrial Co Ltd 8 0.01
Pacific Basin Small Companies FundPortfolio of Investments as at 31 May 2021 (continued)
Dimensional Fund Advisors Semi-Annual Report and Unaudited Financial Statements, 31 May 2021 338

Shares (000's)
Value(000's)
USD
% of NetAssetValue
Common Stock (continued)
Taiwan - 9.86% (continued)
14 Tyntek Corp 14 0.01
22 U-Ming Marine Transport Corp 48 0.04
65 Union Bank Of Taiwan 27 0.03
44 Unitech Printed Circuit Board Corp 33 0.03
8 United Integrated Services Co Ltd 69 0.06
107 United Renewable Energy Co Ltd 52 0.05
18 Unity Opto Technology Co Ltd - -
18 Universal Cement Corp 15 0.01
17 Unizyx Holding Corp 19 0.02
50 UPC Technology Corp 46 0.04
30 USI Corp 37 0.03
11 Visual Photonics Epitaxy Co Ltd 43 0.04
39 Wafer Works Corp 71 0.07
9 Wah Lee Industrial Corp 25 0.02
40 Walsin Lihwa Corp 36 0.03
14 Walton Advanced Engineering Inc 8 0.01
14 Wei Chuan Foods Corp 11 0.01
21 Weikeng Industrial Co Ltd 17 0.02
20 Wisdom Marine Lines Co Ltd 50 0.05
13 Wistron NeWeb Corp 30 0.03
3 Wowprime Corp 14 0.01
14 WT Microelectronics Co Ltd 27 0.03
12 XinTec Inc 66 0.06
13 Xxentria Technology Materials Corp 32 0.03
28 YC INOX Co Ltd 33 0.03
20 Yem Chio Co Ltd 14 0.01
3 Yeong Guan Energy Technology Group Co Ltd 8 0.01
12 YFC-Boneagle Electric Co Ltd 10 0.01
20 YFY Inc 28 0.03
70 Yieh Phui Enterprise Co Ltd 57 0.05
5 Youngtek Electronics Corp 14 0.01
11 Yulon Finance Corp 53 0.05
19 Yulon Motor Co Ltd 27 0.03
16 YungShin Global Holding Corp 25 0.02
3 Zeng Hsing Industrial Co Ltd 18 0.02
3 Zenitron Corp 3 -
27 Zig Sheng Industrial Co Ltd 26 0.02
3 ZillTek Technology Corp 37 0.03
26 Zinwell Corp 18 0.02
18 ZongTai Real Estate Development Co Ltd 25 0.02
10,694 9.86
Total Common Stock - 98.83% (30 November 2020: 99.32%) 107,140 98.83
Shares (000's)
Value(000's)
USD
% of NetAssetValue
Real Estate Investment Trust
Australia - 0.05%
26 Centuria Capital Group 55 0.05
55 0.05
Korea, Republic of - 0.02%
6 Korea Asset In Trust Co Ltd 26 0.02
26 0.02
New Zealand - 0.04%
28 Investore Property Ltd 41 0.04
41 0.04
Singapore - 0.01%
22 Dasin Retail Trust 12 0.01
12 0.01
Total Real Estate Investment Trust - 0.12% (30 November2020: 0.07%) 134 0.12
Rights
Australia - 0.00%
3 carsales.com Ltd - -
1 Mystate Ltd - -
- -
Korea, Republic of - 0.00%
- Cosmax Inc 1 -
- Humax Co Ltd - -
3 Korea Line Corp 2 -
- Solid Inc - -
3 -
Total Rights - 0.00% (30 November 2020: 0.00%) 3 -
Warrants
Singapore - 0.00%
67 Ezion Holdings Ltd - -
- -
Total Warrants - 0.00% (30 November 2020: 0.00%) - -
Total Investments - 98.97% (30 November 2020: 99.39%) 107,293 98.97
Value (000's)USD
% of NetAssetValue
Cash and Cash Equivalents - 0.70% (30 November 2020: 0.88%) 757 0.70Other Assets in Excess of Other Liabilities - 0.33% (30 November 2020: (0.27)%) 361 0.33
Total Net Assets 108,411 100.00
Amounts designated as “- “ are either $0, less than $500 or less than 500 shares.
Analysis of Total Assets % of Total Assets
Transferable securities admitted to an official exchange listing 96.93
Investment Funds 0.01
Current Assets 3.06
Total Assets 100.00
Pacific Basin Small Companies FundPortfolio of Investments as at 31 May 2021 (continued)
Dimensional Fund Advisors Semi-Annual Report and Unaudited Financial Statements, 31 May 2021 339

Face Value(000's)
CouponRate %
MaturityDate
Value (000's)GBP
% of NetAssetValue
Government Bonds
United Kingdom - 99.08%
1,509 United Kingdom Gilt InflationLinked 0.125 22/03/2024 2,040 0.22
41,345 United Kingdom Gilt InflationLinked 7.513 17/07/2024 147,979 16.11
9,551 United Kingdom Gilt InflationLinked 0.125 22/03/2026 12,839 1.40
10,012 United Kingdom Gilt InflationLinked 1.250 22/11/2027 19,997 2.18
3,679 United Kingdom Gilt InflationLinked 0.125 10/08/2028 4,862 0.53
60,533 United Kingdom Gilt InflationLinked 0.125 22/03/2029 95,081 10.35
47,908 United Kingdom Gilt InflationLinked 8.961 22/07/2030 177,939 19.37
732 United Kingdom Gilt InflationLinked 0.125 10/08/2031 983 0.11
36,847 United Kingdom Gilt InflationLinked 1.250 22/11/2032 76,703 8.35
Face Value(000's)
CouponRate %
MaturityDate
Value (000's)GBP
% of NetAssetValue
Government Bonds (continued)
United Kingdom - 99.08% (continued)
79,482 United Kingdom Gilt InflationLinked 0.750 22/03/2034 151,924 16.54
48,972 United Kingdom Gilt InflationLinked 3.381 26/01/2035 143,143 15.58
21,833 United Kingdom Gilt InflationLinked 0.125 22/11/2036 37,072 4.03
9,088 United Kingdom Gilt InflationLinked 1.125 22/11/2037 23,020 2.50
7,122 United Kingdom Gilt InflationLinked 0.625 22/03/2040 16,591 1.81
910,173 99.08
Total Government Bonds - 99.08% (30 November2020: 99.18%) 910,173 99.08
Total Investments - 99.08% (30 November 2020: 99.18%) 910,173 99.08
Value (000's)GBP
% of NetAssetValue
Cash and Cash Equivalents - 0.54% (30 November 2020: 0.60%) 4,946 0.54Other Assets in Excess of Other Liabilities - 0.38% (30 November 2020: 0.22%) 3,516 0.38
Total Net Assets 918,635 100.00
Analysis of Total Assets % of Total Assets
Transferable securities admitted to an official exchange listing 98.84
Current Assets 1.16
Total Assets 100.00
Sterling Inflation Linked Intermediate Duration Fixed Income FundPortfolio of Investments as at 31 May 2021
Dimensional Fund Advisors Semi-Annual Report and Unaudited Financial Statements, 31 May 2021 340

Shares (000's)
Value(000's)
USD
% of NetAssetValue
Common Stock
Basic Materials - 3.65%
- AdvanSix Inc 2 0.01
- Air Products and Chemicals Inc 27 0.13
- Albemarle Corp 10 0.05
1 Alcoa Corp 13 0.06
- Allegheny Technologies Inc 5 0.02
- American Vanguard Corp 2 0.01
- Ashland Global Holdings Inc 8 0.04
1 Axalta Coating Systems Ltd 13 0.06
- Balchem Corp 7 0.03
- Cabot Corp 6 0.03
- Carpenter Technology Corp 4 0.02
- Celanese Corp 26 0.12
- CF Industries Holdings Inc 15 0.07
- Chemours Co 10 0.05
1 Coeur Mining Inc 4 0.02
- Commercial Metals Co 3 0.01
- Compass Minerals International Inc 4 0.02
- Domtar Corp 5 0.02
1 Dow Inc 34 0.16
- DuPont de Nemours Inc 9 0.04
- Eastman Chemical Co 19 0.09
- Ecolab Inc 19 0.09
1 Element Solutions Inc 9 0.04
- Ferro Corp 2 0.01
1 Ferroglobe PLC 2 0.01
- FMC Corp 20 0.10
1 Freeport-McMoRan Inc 19 0.09
- GCP Applied Technologies Inc 3 0.01
- Glatfelter Corp 1 0.01
- Hawkins Inc 3 0.01
- HB Fuller Co 5 0.02
1 Hecla Mining Co 8 0.04
1 Huntsman Corp 11 0.05
- Ingevity Corp 6 0.03
- Innospec Inc 4 0.02
- International Flavors & Fragrances Inc (US listing) 14 0.07
- International Paper Co 18 0.09
- Intrepid Potash Inc 1 0.01
- Koppers Holdings Inc 1 0.01
- Kraton Corp 2 0.01
- Kronos Worldwide Inc 2 0.01
- Linde PLC 47 0.22
- Livent Corp 5 0.02
1 LyondellBasell Industries NV 37 0.18
- Mercer International Inc 2 0.01
- Minerals Technologies Inc 5 0.02
1 Mosaic Co 16 0.08
- Neenah Inc 2 0.01
- NewMarket Corp 6 0.03
1 Newmont Goldcorp Corp 39 0.19
- Nucor Corp 22 0.10
- Olin Corp 10 0.05
- PPG Industries Inc 39 0.19
- PQ Group Holdings Inc 3 0.01
- Quaker Chemical Corp 5 0.02
- Rayonier Advanced Materials Inc 1 0.01
- Reliance Steel & Aluminum Co 14 0.07
- Resolute Forest Products Inc 2 0.01
- Rogers Corp 4 0.02
- Royal Gold Inc 10 0.05
- RPM International Inc 15 0.07
- Schnitzer Steel Industries Inc 2 0.01
Shares (000's)
Value(000's)
USD
% of NetAssetValue
Common Stock (continued)
Basic Materials - 3.65% (continued)
- Schweitzer-Mauduit International Inc 3 0.01
- Sensient Technologies Corp 5 0.02
- Sherwin-Williams Co 33 0.16
- Southern Copper Corp 3 0.01
- Steel Dynamics Inc 18 0.09
- Stepan Co 4 0.02
- Tronox Holdings PLC 3 0.01
1 United States Steel Corp 9 0.04
- Valvoline Inc 7 0.03
- Verso Corp 1 0.01
- Westlake Chemical Corp 11 0.05
- WR Grace & Co 8 0.04
767 3.65
Communications - 11.10%
- 1-800-Flowers.com Inc 2 0.01
- ADTRAN Inc 2 0.01
- Alphabet Inc, Class A 177 0.84
- Alphabet Inc, Class C 176 0.84
- Altice USA Inc 8 0.04
- Amazon.com Inc 509 2.42
- AMC Networks Inc 4 0.02
- Anterix Inc 3 0.01
- Arista Networks Inc 11 0.05
3 AT&T Inc 93 0.44
- ATN International Inc 1 0.01
1 Audacy Inc 2 0.01
- Boingo Wireless Inc 2 0.01
- Booking Holdings Inc 19 0.09
- Boston Omaha Corp 1 0.01
- Cable One Inc 14 0.07
- Calix Inc 9 0.04
- Cars.com Inc 4 0.02
- CDW Corp 17 0.08
- Charter Communications Inc 42 0.20
- Ciena Corp 10 0.05
- Cincinnati Bell Inc 1 0.01
2 Cisco Systems Inc 86 0.41
- Cogent Communications Holdings Inc 4 0.02
2 Comcast Corp 116 0.55
1 CommScope Holding Co Inc 7 0.03
1 comScore Inc 1 0.01
- Consolidated Communications Holdings Inc 1 0.01
1 Corning Inc 19 0.09
- Discovery Inc, Class A 4 0.02
- Discovery Inc, Class C 7 0.03
- DISH Network Corp 9 0.04
1 eBay Inc 31 0.15
- EchoStar Corp 2 0.01
- Entravision Communications Corp 1 0.01
- ePlus Inc 2 0.01
- Etsy Inc 18 0.09
- EW Scripps Co 4 0.02
- Expedia Group Inc 5 0.02
- F5 Networks Inc 14 0.07
1 Facebook Inc 195 0.93
- FactSet Research Systems Inc 14 0.07
1 FireEye Inc 7 0.03
- Fox Corp, Class A 11 0.05
- Fox Corp, Class B 8 0.04
- GoDaddy Inc 9 0.04
- Gray Television Inc 4 0.02
- Grubhub Inc 2 0.01
U.S. Core Equity FundPortfolio of Investments as at 31 May 2021
Dimensional Fund Advisors Semi-Annual Report and Unaudited Financial Statements, 31 May 2021 341

Shares (000's)
Value(000's)
USD
% of NetAssetValue
Common Stock (continued)
Communications - 11.10% (continued)
1 GTT Communications Inc 1 0.01
- Harmonic Inc 2 0.01
- HealthStream Inc 1 0.01
- Houghton Mifflin Harcourt Co 2 0.01
- IDT Corp 2 0.01
- Infinera Corp 2 0.01
- InterDigital Inc 4 0.02
1 Interpublic Group of Cos Inc 17 0.08
- Iridium Communications Inc 9 0.04
1 Juniper Networks Inc 10 0.05
- Lands' End Inc 1 0.01
- Liberty Broadband Corp, Class A 3 0.01
- Liberty Broadband Corp, Class C 15 0.07
- Liberty Latin America Ltd, Class A 1 0.01
- Liberty Latin America Ltd, Class C 3 0.01
- Liberty Media Corp-Liberty Formula One, Class C 10 0.05
- Liberty Media Corp-Liberty SiriusXM, Class A 5 0.02
- Liberty Media Corp-Liberty SiriusXM, Class C 12 0.06
- Limelight Networks Inc 1 0.01
2 Lumen Technologies Inc 22 0.10
- Lyft Inc 3 0.01
- Madison Square Garden Entertainment Corp 3 0.01
- Meredith Corp 2 0.01
- Motorola Solutions Inc 15 0.07
- MSG Networks Inc 1 0.01
- National CineMedia Inc - -
- Netflix Inc 55 0.26
- NETGEAR Inc 3 0.01
- New York Times Co 6 0.03
1 News Corp, Class A 12 0.06
- News Corp, Class B 6 0.03
- Nexstar Media Group Inc 6 0.03
1 NortonLifeLock Inc 12 0.06
- Okta Inc 2 0.01
- Omnicom Group Inc 21 0.10
- ORBCOMM Inc 1 0.01
- Palo Alto Networks Inc 3 0.01
- Perficient Inc 5 0.02
- Q2 Holdings Inc 4 0.02
- Quotient Technology Inc 1 0.01
- Saga Communications Inc - -
- Scholastic Corp 2 0.01
- Shenandoah Telecommunications Co 4 0.02
- Shutterstock Inc 4 0.02
1 Sirius XM Holdings Inc 3 0.01
- Snap Inc 3 0.01
- Spok Holdings Inc 1 0.01
- Spotify Technology SA 9 0.04
- Stamps.com Inc 4 0.02
- TechTarget Inc 2 0.01
1 TEGNA Inc 7 0.03
- Telephone & Data Systems Inc 5 0.02
- T-Mobile US Inc 31 0.15
- Trade Desk Inc 3 0.01
- TripAdvisor Inc 4 0.02
- Twitter Inc 14 0.07
- Uber Technologies Inc 3 0.01
- Ubiquiti Inc 1 0.01
- United States Cellular Corp 3 0.01
- VeriSign Inc 11 0.05
2 Verizon Communications Inc 129 0.61
- Viacom Inc, Class A 1 -
Shares (000's)
Value(000's)
USD
% of NetAssetValue
Common Stock (continued)
Communications - 11.10% (continued)
1 Viacom Inc, Class B 18 0.09
- ViaSat Inc 5 0.02
- Viavi Solutions Inc 2 0.01
1 Vonage Holdings Corp 5 0.02
1 Walt Disney Co 57 0.27
- Wayfair Inc 9 0.04
- World Wrestling Entertainment Inc 5 0.02
- Yelp Inc 5 0.02
- Zillow Group Inc, Class A 3 0.01
- Zillow Group Inc, Class C 7 0.03
2,332 11.10
Consumer, Cyclical - 11.99%
- Abercrombie & Fitch Co 4 0.02
- Acushnet Holdings Corp 6 0.03
- Adient PLC 8 0.04
- Advance Auto Parts Inc 11 0.05
- Alaska Air Group Inc 9 0.04
- Allegiant Travel Co 4 0.02
- Allison Transmission Holdings Inc 8 0.04
1 American Airlines Group Inc 10 0.05
- American Axle & Manufacturing Holdings Inc 2 0.01
- American Eagle Outfitters Inc 8 0.04
- Aptiv PLC 20 0.10
- Aramark 8 0.04
- Asbury Automotive Group Inc 7 0.03
- At Home Group Inc 3 0.01
- Autoliv Inc 14 0.07
- AutoNation Inc 13 0.06
- AutoZone Inc 13 0.06
- Avient Corp 7 0.03
- Beacon Roofing Supply Inc 7 0.03
- Bed Bath & Beyond Inc 4 0.02
1 Best Buy Co Inc 31 0.15
- Big Lots Inc 3 0.01
- Biglari Holdings Inc, Class B - -
- BJ's Restaurants Inc 2 0.01
- BJ's Wholesale Club Holdings Inc 7 0.03
- Bloomin' Brands Inc 3 0.01
- Boot Barn Holdings Inc 4 0.02
1 BorgWarner Inc 13 0.06
- Boyd Gaming Corp 5 0.02
- Brinker International Inc 3 0.01
- Brunswick Corp 12 0.06
- Buckle Inc 2 0.01
- Burlington Stores Inc 2 0.01
- Caesars Entertainment Inc 8 0.04
- Caleres Inc 3 0.01
- Callaway Golf Co 5 0.02
- Cannae Holdings Inc 6 0.03
- Capri Holdings Ltd 7 0.03
- CarMax Inc 13 0.06
1 Carnival Corp 15 0.07
- Carrols Restaurant Group Inc - -
- Carter's Inc 8 0.04
- Casey's General Stores Inc 13 0.06
- Cato Corp - -
- Cavco Industries Inc 2 0.01
- Century Communities Inc 5 0.02
- Cheesecake Factory Inc 4 0.02
- Chico's FAS Inc 1 0.01
- Chipotle Mexican Grill Inc 14 0.07
- Choice Hotels International Inc 7 0.03
U.S. Core Equity FundPortfolio of Investments as at 31 May 2021 (continued)
Dimensional Fund Advisors Semi-Annual Report and Unaudited Financial Statements, 31 May 2021 342

Shares (000's)
Value(000's)
USD
% of NetAssetValue
Common Stock (continued)
Consumer, Cyclical - 11.99% (continued)
- Churchill Downs Inc 3 0.01
- Chuy's Holdings Inc 1 0.01
- Cinemark Holdings Inc 4 0.02
- Columbia Sportswear Co 8 0.04
- Conn's Inc 1 0.01
- Cooper Tire & Rubber Co 6 0.03
- Cooper-Standard Holdings Inc 1 0.01
- Copa Holdings SA 5 0.02
- Copart Inc 21 0.10
- Core-Mark Holding Co Inc 3 0.01
- Costco Wholesale Corp 75 0.36
- Cracker Barrel Old Country Store Inc 7 0.03
- Crocs Inc 7 0.03
- Cummins Inc 26 0.12
- Daktronics Inc - -
- Dana Inc 6 0.03
- Darden Restaurants Inc 13 0.06
- Dave & Buster's Entertainment Inc 1 0.01
- Deckers Outdoor Corp 14 0.07
- Del Taco Restaurants Inc 1 0.01
- Delta Air Lines Inc 3 0.01
- Denny's Corp 2 0.01
- Designer Brands Inc 4 0.02
- Dick's Sporting Goods Inc 9 0.04
- Dillard's Inc 5 0.02
- Dolby Laboratories Inc 6 0.03
1 Dollar General Corp 52 0.25
- Dollar Tree Inc 15 0.07
- Domino's Pizza Inc 7 0.03
- Dorman Products Inc 4 0.02
- Douglas Dynamics Inc 2 0.01
1 DR Horton Inc 29 0.14
- El Pollo Loco Holdings Inc 1 0.01
1 Fastenal Co 17 0.08
- Fiesta Restaurant Group Inc 1 0.01
- FirstCash Inc 7 0.03
- Five Below Inc 9 0.04
- Flexsteel Industries Inc 2 0.01
- Floor & Decor Holdings Inc 8 0.04
- Foot Locker Inc 11 0.05
2 Ford Motor Co 30 0.14
- Fossil Group Inc 1 0.01
1 Gap Inc 12 0.06
1 General Motors Co 41 0.20
- Genesco Inc 1 0.01
1 Gentex Corp 10 0.05
- Gentherm Inc 4 0.02
- Genuine Parts Co 18 0.09
- G-III Apparel Group Ltd 2 0.01
- GMS Inc 3 0.01
1 Goodyear Tire & Rubber Co 7 0.03
- Green Brick Partners Inc 4 0.02
- Guess? Inc 3 0.01
- H&E Equipment Services Inc 2 0.01
1 Hanesbrands Inc 11 0.05
1 Harley-Davidson Inc 13 0.06
- Hasbro Inc 12 0.06
- Haverty Furniture Cos Inc 4 0.02
- Hawaiian Holdings Inc 2 0.01
- Healthcare Services Group Inc 3 0.01
- Herman Miller Inc 4 0.02
- Hilton Grand Vacations Inc 3 0.01
Shares (000's)
Value(000's)
USD
% of NetAssetValue
Common Stock (continued)
Consumer, Cyclical - 11.99% (continued)
- Hilton Worldwide Holdings Inc 13 0.06
- HNI Corp 3 0.01
1 Home Depot Inc 131 0.62
- Hooker Furniture Corp 2 0.01
- Hyatt Hotels Corp 3 0.01
- IAA Inc 6 0.03
- IMAX Corp 2 0.01
- Installed Building Products Inc 5 0.02
- Interface Inc 1 0.01
1 International Game Technology PLC 8 0.04
- iRobot Corp 4 0.02
- Jack in the Box Inc 4 0.02
1 JetBlue Airways Corp 9 0.04
- Johnson Outdoors Inc 3 0.01
- KAR Auction Services Inc 2 0.01
- KB Home 6 0.03
- Kimball International Inc 1 0.01
- Knoll Inc 2 0.01
- Kohl's Corp 10 0.05
- Kontoor Brands Inc 3 0.01
- L Brands Inc 12 0.06
- Las Vegas Sands Corp 6 0.03
- La-Z-Boy Inc 3 0.01
- LCI Industries 5 0.02
- Lear Corp 15 0.07
- Leggett & Platt Inc 12 0.06
- Lennar Corp, Class A 20 0.10
- Lennar Corp, Class B 1 0.01
- LGI Homes Inc 6 0.03
1 Liberty TripAdvisor Holdings Inc 2 0.01
- Lindblad Expeditions Holdings Inc 3 0.01
- Lions Gate Entertainment Corp, Class A 3 0.01
- Lions Gate Entertainment Corp, Class B 4 0.02
- Lithia Motors Inc 14 0.07
- Live Nation Entertainment Inc 8 0.04
1 LKQ Corp 16 0.08
1 Lowe's Cos Inc 54 0.26
- Lululemon Athletica Inc 19 0.09
- Lumber Liquidators Holdings Inc 1 0.01
- M/I Homes Inc 6 0.03
1 Macy's Inc 10 0.05
- Malibu Boats Inc 3 0.01
- Marcus Corp 1 0.01
- MarineMax Inc 3 0.01
- Marriott International Inc 28 0.13
- Marriott Vacations Worldwide Corp 9 0.04
- Mattel Inc 4 0.02
- McDonald's Corp 22 0.11
- MDC Holdings Inc 7 0.03
- Meritor Inc 3 0.01
- Methode Electronics Inc 4 0.02
- MGM Resorts International 10 0.05
- Modine Manufacturing Co 2 0.01
- Mohawk Industries Inc 17 0.08
- MSC Industrial Direct Co Inc 8 0.04
- National Vision Holdings Inc 7 0.03
- Nautilus Inc 1 0.01
- Navistar International Corp 10 0.05
1 Newell Brands Inc 8 0.04
1 NIKE Inc 63 0.30
1 Norwegian Cruise Line Holdings Ltd 8 0.04
- Nu Skin Enterprises Inc 5 0.02
U.S. Core Equity FundPortfolio of Investments as at 31 May 2021 (continued)
Dimensional Fund Advisors Semi-Annual Report and Unaudited Financial Statements, 31 May 2021 343

Shares (000's)
Value(000's)
USD
% of NetAssetValue
Common Stock (continued)
Consumer, Cyclical - 11.99% (continued)
- NVR Inc 15 0.07
- ODP Corp 4 0.02
- Ollie's Bargain Outlet Holdings Inc 6 0.03
- O'Reilly Automotive Inc 22 0.11
- Oxford Industries Inc 2 0.01
- PACCAR Inc 21 0.10
- Papa John's International Inc 3 0.01
- PC Connection Inc 2 0.01
- Penn National Gaming Inc 4 0.02
- Penske Automotive Group Inc 11 0.05
- PetMed Express Inc 1 0.01
- Planet Fitness Inc 7 0.03
- Polaris Inc 8 0.04
- Pool Corp 11 0.05
- PriceSmart Inc 4 0.02
1 PulteGroup Inc 21 0.10
- PVH Corp 14 0.07
1 Qurate Retail Inc 6 0.03
- Ralph Lauren Corp 5 0.02
- Reading International Inc 1 0.01
- Red Robin Gourmet Burgers Inc 1 0.01
- Red Rock Resorts Inc 6 0.03
- Regis Corp 1 0.01
- Resideo Technologies Inc 3 0.01
- RH 15 0.07
- Rite Aid Corp - -
- Ross Stores Inc 15 0.07
- Royal Caribbean Cruises Ltd 11 0.05
- Rush Enterprises Inc 4 0.02
- Sally Beauty Holdings Inc 2 0.01
- ScanSource Inc 2 0.01
- Scientific Games Corp 7 0.03
- Scotts Miracle-Gro Co 14 0.07
- Shake Shack Inc 3 0.01
- Signet Jewelers Ltd 5 0.02
- SiteOne Landscape Supply Inc 11 0.05
- Skechers U.S.A. Inc 11 0.05
- Skyline Champion Corp 4 0.02
- SkyWest Inc 4 0.02
- Sleep Number Corp 3 0.01
1 Southwest Airlines Co 17 0.08
- Spirit Airlines Inc 6 0.03
- Standard Motor Products Inc 3 0.01
- Starbucks Corp 17 0.08
- Steelcase Inc 3 0.01
- Steven Madden Ltd 4 0.02
- Systemax Inc 2 0.01
1 Tapestry Inc 11 0.05
1 Target Corp 58 0.28
- Taylor Morrison Home Corp 3 0.01
1 Tempur Sealy International Inc 12 0.06
- Tenneco Inc 3 0.01
- Tesla Inc 31 0.15
- Texas Roadhouse Inc 7 0.03
- Thor Industries Inc 5 0.02
- TJX Cos Inc 13 0.06
- Toll Brothers Inc 10 0.05
- Tractor Supply Co 16 0.08
- Travel + Leisure Co 5 0.02
- TRI Pointe Group Inc 5 0.02
- Triton International Ltd 6 0.03
- Tupperware Brands Corp 1 0.01
Shares (000's)
Value(000's)
USD
% of NetAssetValue
Common Stock (continued)
Consumer, Cyclical - 11.99% (continued)
- Ulta Salon Cosmetics & Fragrance Inc 22 0.11
- Under Armour Inc, Class A 3 0.01
- Under Armour Inc, Class C 3 0.01
- Unifi Inc 2 0.01
- UniFirst Corp 4 0.02
1 United Airlines Holdings Inc 15 0.07
1 Univar Solutions Inc 9 0.04
- Universal Electronics Inc 1 0.01
- Urban Outfitters Inc 7 0.03
- Vail Resorts Inc 11 0.05
- Veoneer Inc 4 0.02
- Vera Bradley Inc 1 0.01
- Veritiv Corp 2 0.01
- VF Corp 13 0.06
- Vista Outdoor Inc 4 0.02
- Visteon Corp 4 0.02
- VSE Corp 2 0.01
- Wabash National Corp 1 0.01
1 Walgreens Boots Alliance Inc 32 0.15
1 Walmart Inc 103 0.49
- Watsco Inc 8 0.04
1 Wendy's Co 9 0.04
- Whirlpool Corp 22 0.11
- Williams-Sonoma Inc 20 0.10
- Wingstop Inc 4 0.02
- Winmark Corp 2 0.01
- Winnebago Industries Inc 4 0.02
- Wolverine World Wide Inc 4 0.02
- World Fuel Services Corp 3 0.01
- WW Grainger Inc 23 0.11
- Wyndham Hotels & Resorts Inc 5 0.02
- Wynn Resorts Ltd 5 0.02
- YETI Holdings Inc 9 0.04
- Yum! Brands Inc 15 0.07
- Zumiez Inc 4 0.02
2,520 11.99
Consumer, Non-cyclical - 20.57%
- 2U Inc 3 0.01
- Aaron's Holdings Co Inc 2 0.01
1 Abbott Laboratories 46 0.22
1 AbbVie Inc 91 0.43
- Abiomed Inc 7 0.03
- ABM Industries Inc 6 0.03
- Acadia Healthcare Co Inc 10 0.05
- Acadia Pharmaceuticals Inc 4 0.02
- Acceleron Pharma Inc 6 0.03
1 ACCO Brands Corp 3 0.01
- Addus HomeCare Corp 2 0.01
1 ADT Inc 9 0.04
- Adtalem Global Education Inc 3 0.01
- Alexion Pharmaceuticals Inc 19 0.09
- Align Technology Inc 14 0.07
1 Alkermes PLC 6 0.03
1 Altria Group Inc 34 0.16
- Amedisys Inc 8 0.04
- Amerco 15 0.07
- AmerisourceBergen Corp 9 0.04
1 Amgen Inc 63 0.30
- AMN Healthcare Services Inc 7 0.03
- Amphastar Pharmaceuticals Inc 1 0.01
- Andersons Inc 2 0.01
- AngioDynamics Inc 1 0.01
U.S. Core Equity FundPortfolio of Investments as at 31 May 2021 (continued)
Dimensional Fund Advisors Semi-Annual Report and Unaudited Financial Statements, 31 May 2021 344

Shares (000's)
Value(000's)
USD
% of NetAssetValue
Common Stock (continued)
Consumer, Non-cyclical - 20.57% (continued)
- ANI Pharmaceuticals Inc 1 0.01
- Anika Therapeutics Inc 1 0.01
- Anthem Inc 37 0.18
1 Archer-Daniels-Midland Co 22 0.10
- Arena Pharmaceuticals Inc 5 0.02
- Arlo Technologies Inc 1 -
- Arrowhead Pharmaceuticals Inc 10 0.05
- ASGN Inc 9 0.04
- Atrion Corp 2 0.01
- Automatic Data Processing Inc 40 0.19
- Avalara Inc 10 0.05
- Avanos Medical Inc 3 0.01
1 Avantor Inc 10 0.05
- Avery Dennison Corp 21 0.10
- Avis Budget Group Inc 7 0.03
- B&G Foods Inc 3 0.01
- Barrett Business Services Inc 1 0.01
1 Baxter International Inc 29 0.14
- Becton Dickinson and Co 22 0.10
- Biogen Inc 42 0.20
- BioMarin Pharmaceutical Inc 7 0.03
- Bio-Rad Laboratories Inc 9 0.04
- Bio-Techne Corp 14 0.07
- Bluebird Bio Inc 1 0.01
- Booz Allen Hamilton Holding Corp 15 0.07
- Boston Beer Co Inc 8 0.04
- Boston Scientific Corp 11 0.05
- Bright Horizons Family Solutions Inc 7 0.03
- Brink's Co 4 0.02
1 Bristol-Myers Squibb Co 64 0.30
1 Brookdale Senior Living Inc 2 0.01
- Brown-Forman Corp, Class A 3 0.01
- Brown-Forman Corp, Class B 15 0.07
- Bruker Corp 14 0.07
- Bunge Ltd 17 0.08
- Calavo Growers Inc 1 0.01
- Cal-Maine Foods Inc 2 0.01
1 Campbell Soup Co 21 0.10
- Cantel Medical Corp 5 0.02
1 Cardinal Health Inc 23 0.11
- Cardtronics PLC 3 0.01
- Carriage Services Inc 1 0.01
- Cass Information Systems Inc 1 0.01
- Catalent Inc 10 0.05
- CBIZ Inc 3 0.01
1 Centene Corp 26 0.12
- Central Garden & Pet Co (non-voting rights) 4 0.02
- Central Garden & Pet Co (voting rights) 3 0.01
- Charles River Laboratories International Inc 21 0.10
- Chefs' Warehouse Inc 3 0.01
- Chegg Inc 2 0.01
- Chemed Corp 10 0.05
- Church & Dwight Co Inc 17 0.08
- Cigna Corp 34 0.16
- Cimpress PLC 3 0.01
- Cintas Corp 34 0.16
- Civeo Corp 1 -
- Clorox Co 15 0.07
2 Coca-Cola Co 84 0.40
- Coca-Cola Consolidated Inc 5 0.02
- Colgate-Palmolive Co 20 0.10
- Community Health Systems Inc 2 0.01
Shares (000's)
Value(000's)
USD
% of NetAssetValue
Common Stock (continued)
Consumer, Non-cyclical - 20.57% (continued)
1 Conagra Brands Inc 16 0.08
- Concert Pharmaceuticals Inc 1 0.01
- CONMED Corp 6 0.03
- Constellation Brands Inc 20 0.10
- Cooper Cos Inc 10 0.05
- Corcept Therapeutics Inc 3 0.01
- CoreLogic Inc 17 0.08
1 Corteva Inc 18 0.09
- CorVel Corp 4 0.02
- CoStar Group Inc 13 0.06
1 Coty Inc 7 0.03
- Covetrus Inc 2 0.01
- Cross Country Healthcare Inc 1 0.01
- CryoLife Inc 3 0.01
1 CVS Health Corp 42 0.20
- Danaher Corp 52 0.25
- Darling Ingredients Inc 15 0.07
- DaVita Inc 20 0.10
- Deluxe Corp 3 0.01
- Dentsply Sirona Inc 11 0.05
- DexCom Inc 6 0.03
- Eagle Pharmaceuticals Inc 1 0.01
- Edgewell Personal Care Co 3 0.01
- Edwards Lifesciences Corp 6 0.03
1 Elanco Animal Health Inc (voting rights) 10 0.05
1 Eli Lilly & Co 64 0.30
- Emergent BioSolutions Inc 6 0.03
- Enanta Pharmaceuticals Inc 3 0.01
- Encompass Health Corp 13 0.06
- Endo International PLC 1 0.01
- Energizer Holdings Inc 3 0.01
- Ensign Group Inc 8 0.04
- Envista Holdings Corp 5 0.02
- Enzo Biochem Inc - -
- Equifax Inc 18 0.09
- Estee Lauder Cos Inc 26 0.12
- Euronet Worldwide Inc 6 0.03
- Evertec Inc 5 0.02
- Exact Sciences Corp 6 0.03
1 Exelixis Inc 8 0.04
- Farmer Brothers Co - -
- FleetCor Technologies Inc 22 0.10
1 Flowers Foods Inc 8 0.04
- Fresh Del Monte Produce Inc 3 0.01
- FTI Consulting Inc 6 0.03
- Gartner Inc 20 0.10
1 General Mills Inc 37 0.18
1 Gilead Sciences Inc 36 0.17
- Global Payments Inc 15 0.07
- Globus Medical Inc 8 0.04
- GP Strategies Corp 1 0.01
- Graham Holdings Co 5 0.02
- Grand Canyon Education Inc 6 0.03
- Green Dot Corp 5 0.02
- Guardant Health Inc 4 0.02
- H&R Block Inc 6 0.03
- Hackett Group Inc 1 0.01
- Haemonetics Corp 5 0.02
- Hain Celestial Group Inc 1 0.01
- Halozyme Therapeutics Inc 3 0.01
- HCA Healthcare Inc 9 0.04
- HealthEquity Inc 8 0.04
U.S. Core Equity FundPortfolio of Investments as at 31 May 2021 (continued)
Dimensional Fund Advisors Semi-Annual Report and Unaudited Financial Statements, 31 May 2021 345
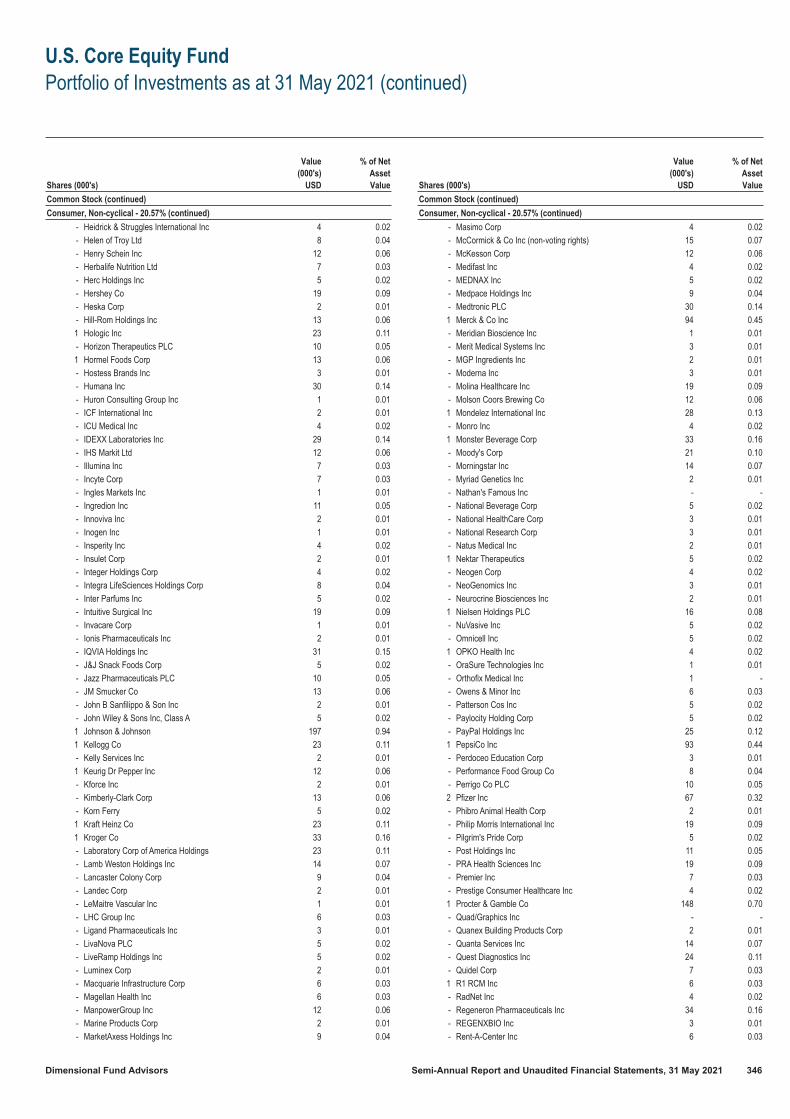
Shares (000's)
Value(000's)
USD
% of NetAssetValue
Common Stock (continued)
Consumer, Non-cyclical - 20.57% (continued)
- Heidrick & Struggles International Inc 4 0.02
- Helen of Troy Ltd 8 0.04
- Henry Schein Inc 12 0.06
- Herbalife Nutrition Ltd 7 0.03
- Herc Holdings Inc 5 0.02
- Hershey Co 19 0.09
- Heska Corp 2 0.01
- Hill-Rom Holdings Inc 13 0.06
1 Hologic Inc 23 0.11
- Horizon Therapeutics PLC 10 0.05
1 Hormel Foods Corp 13 0.06
- Hostess Brands Inc 3 0.01
- Humana Inc 30 0.14
- Huron Consulting Group Inc 1 0.01
- ICF International Inc 2 0.01
- ICU Medical Inc 4 0.02
- IDEXX Laboratories Inc 29 0.14
- IHS Markit Ltd 12 0.06
- Illumina Inc 7 0.03
- Incyte Corp 7 0.03
- Ingles Markets Inc 1 0.01
- Ingredion Inc 11 0.05
- Innoviva Inc 2 0.01
- Inogen Inc 1 0.01
- Insperity Inc 4 0.02
- Insulet Corp 2 0.01
- Integer Holdings Corp 4 0.02
- Integra LifeSciences Holdings Corp 8 0.04
- Inter Parfums Inc 5 0.02
- Intuitive Surgical Inc 19 0.09
- Invacare Corp 1 0.01
- Ionis Pharmaceuticals Inc 2 0.01
- IQVIA Holdings Inc 31 0.15
- J&J Snack Foods Corp 5 0.02
- Jazz Pharmaceuticals PLC 10 0.05
- JM Smucker Co 13 0.06
- John B Sanfilippo & Son Inc 2 0.01
- John Wiley & Sons Inc, Class A 5 0.02
1 Johnson & Johnson 197 0.94
1 Kellogg Co 23 0.11
- Kelly Services Inc 2 0.01
1 Keurig Dr Pepper Inc 12 0.06
- Kforce Inc 2 0.01
- Kimberly-Clark Corp 13 0.06
- Korn Ferry 5 0.02
1 Kraft Heinz Co 23 0.11
1 Kroger Co 33 0.16
- Laboratory Corp of America Holdings 23 0.11
- Lamb Weston Holdings Inc 14 0.07
- Lancaster Colony Corp 9 0.04
- Landec Corp 2 0.01
- LeMaitre Vascular Inc 1 0.01
- LHC Group Inc 6 0.03
- Ligand Pharmaceuticals Inc 3 0.01
- LivaNova PLC 5 0.02
- LiveRamp Holdings Inc 5 0.02
- Luminex Corp 2 0.01
- Macquarie Infrastructure Corp 6 0.03
- Magellan Health Inc 6 0.03
- ManpowerGroup Inc 12 0.06
- Marine Products Corp 2 0.01
- MarketAxess Holdings Inc 9 0.04
Shares (000's)
Value(000's)
USD
% of NetAssetValue
Common Stock (continued)
Consumer, Non-cyclical - 20.57% (continued)
- Masimo Corp 4 0.02
- McCormick & Co Inc (non-voting rights) 15 0.07
- McKesson Corp 12 0.06
- Medifast Inc 4 0.02
- MEDNAX Inc 5 0.02
- Medpace Holdings Inc 9 0.04
- Medtronic PLC 30 0.14
1 Merck & Co Inc 94 0.45
- Meridian Bioscience Inc 1 0.01
- Merit Medical Systems Inc 3 0.01
- MGP Ingredients Inc 2 0.01
- Moderna Inc 3 0.01
- Molina Healthcare Inc 19 0.09
- Molson Coors Brewing Co 12 0.06
1 Mondelez International Inc 28 0.13
- Monro Inc 4 0.02
1 Monster Beverage Corp 33 0.16
- Moody's Corp 21 0.10
- Morningstar Inc 14 0.07
- Myriad Genetics Inc 2 0.01
- Nathan's Famous Inc - -
- National Beverage Corp 5 0.02
- National HealthCare Corp 3 0.01
- National Research Corp 3 0.01
- Natus Medical Inc 2 0.01
1 Nektar Therapeutics 5 0.02
- Neogen Corp 4 0.02
- NeoGenomics Inc 3 0.01
- Neurocrine Biosciences Inc 2 0.01
1 Nielsen Holdings PLC 16 0.08
- NuVasive Inc 5 0.02
- Omnicell Inc 5 0.02
1 OPKO Health Inc 4 0.02
- OraSure Technologies Inc 1 0.01
- Orthofix Medical Inc 1 -
- Owens & Minor Inc 6 0.03
- Patterson Cos Inc 5 0.02
- Paylocity Holding Corp 5 0.02
- PayPal Holdings Inc 25 0.12
1 PepsiCo Inc 93 0.44
- Perdoceo Education Corp 3 0.01
- Performance Food Group Co 8 0.04
- Perrigo Co PLC 10 0.05
2 Pfizer Inc 67 0.32
- Phibro Animal Health Corp 2 0.01
- Philip Morris International Inc 19 0.09
- Pilgrim's Pride Corp 5 0.02
- Post Holdings Inc 11 0.05
- PRA Health Sciences Inc 19 0.09
- Premier Inc 7 0.03
- Prestige Consumer Healthcare Inc 4 0.02
1 Procter & Gamble Co 148 0.70
- Quad/Graphics Inc - -
- Quanex Building Products Corp 2 0.01
- Quanta Services Inc 14 0.07
- Quest Diagnostics Inc 24 0.11
- Quidel Corp 7 0.03
1 R1 RCM Inc 6 0.03
- RadNet Inc 4 0.02
- Regeneron Pharmaceuticals Inc 34 0.16
- REGENXBIO Inc 3 0.01
- Rent-A-Center Inc 6 0.03
U.S. Core Equity FundPortfolio of Investments as at 31 May 2021 (continued)
Dimensional Fund Advisors Semi-Annual Report and Unaudited Financial Statements, 31 May 2021 346

Shares (000's)
Value(000's)
USD
% of NetAssetValue
Common Stock (continued)
Consumer, Non-cyclical - 20.57% (continued)
- Repligen Corp 6 0.03
- ResMed Inc 14 0.07
- Robert Half International Inc 16 0.08
1 Rollins Inc 17 0.08
- S&P Global Inc 35 0.17
- Sanderson Farms Inc 6 0.03
- Sangamo Therapeutics Inc 2 0.01
- Sarepta Therapeutics Inc 2 0.01
- Seaboard Corp 4 0.02
- SEACOR Marine Holdings Inc - -
- Seagen Inc 8 0.04
- Select Medical Holdings Corp 9 0.04
- Seneca Foods Corp 2 0.01
1 Service Corp International 13 0.06
- Simply Good Foods Co 6 0.03
- SP Plus Corp 1 0.01
- SpartanNash Co 1 0.01
- Spectrum Brands Holdings Inc 7 0.03
- Sprouts Farmers Market Inc 4 0.02
- Square Inc 4 0.02
- STERIS PLC 16 0.08
- Strategic Education Inc 4 0.02
- Stride Inc 2 0.01
- Stryker Corp 14 0.07
- Supernus Pharmaceuticals Inc 3 0.01
- Surmodics Inc 1 0.01
- Syneos Health Inc 15 0.07
1 Sysco Corp 25 0.12
- Taro Pharmaceutical Industries Ltd 3 0.01
- Team Inc - -
- Teladoc Health Inc 9 0.04
- Teleflex Inc 9 0.04
- Tenet Healthcare Corp 4 0.02
- Terminix Global Holdings Inc 7 0.03
- Textainer Group Holdings Ltd 4 0.02
- Thermo Fisher Scientific Inc 79 0.38
- Tootsie Roll Industries Inc 2 0.01
- TransUnion 17 0.08
- TreeHouse Foods Inc 6 0.03
- TriNet Group Inc 8 0.04
- TrueBlue Inc 2 0.01
- Turning Point Brands Inc 1 0.01
- Tyson Foods Inc 20 0.10
- United Natural Foods Inc 4 0.02
- United Rentals Inc 27 0.13
- United Therapeutics Corp 13 0.06
1 UnitedHealth Group Inc 178 0.85
- Universal Corp 2 0.01
- Universal Health Services Inc 17 0.08
1 US Foods Holding Corp 10 0.05
- US Physical Therapy Inc 2 0.01
- USANA Health Sciences Inc 4 0.02
- Varex Imaging Corp 2 0.01
1 Vector Group Ltd 4 0.02
- Verisk Analytics Inc 15 0.07
- Vertex Pharmaceuticals Inc 10 0.05
- Viad Corp 1 0.01
1 Viatris Inc 12 0.06
- Village Super Market Inc 1 0.01
- WD-40 Co 3 0.01
- Weis Markets Inc 2 0.01
- West Pharmaceutical Services Inc 12 0.06
Shares (000's)
Value(000's)
USD
% of NetAssetValue
Common Stock (continued)
Consumer, Non-cyclical - 20.57% (continued)
- WEX Inc 7 0.03
- WW International Inc 3 0.01
- Xencor Inc 2 0.01
- Zimmer Biomet Holdings Inc 17 0.08
- Zoetis Inc 39 0.19
4,321 20.57
Energy - 3.50%
1 Antero Midstream Corp 8 0.04
1 Antero Resources Corp 6 0.03
- Arch Resources Inc 4 0.02
- Archrock Inc 2 0.01
- Atlantica Yield PLC 4 0.02
1 Baker Hughes Co 10 0.05
1 Cabot Oil & Gas Corp 10 0.05
- Callon Petroleum Co 3 0.01
1 Centennial Resource Development Inc 3 0.01
- ChampionX Corp 10 0.05
- Cheniere Energy Inc 8 0.04
1 Chevron Corp 53 0.25
- Cimarex Energy Co 11 0.05
- Clean Energy Fuels Corp 2 0.01
- CNX Resources Corp 4 0.02
1 ConocoPhillips 28 0.13
- CONSOL Energy Inc 1 0.01
1 Continental Resources Inc 13 0.06
- Core Laboratories NV 2 0.01
- CVR Energy Inc 3 0.01
- Devon Energy Corp 9 0.04
- Diamondback Energy Inc 16 0.08
- Dril-Quip Inc 3 0.01
1 EnLink Midstream LLC 4 0.02
- Enphase Energy Inc 6 0.03
1 EOG Resources Inc 34 0.16
- EQT Corp 5 0.02
- Equitrans Midstream Corp 2 0.01
- Exterran Corp - -
1 Exxon Mobil Corp 64 0.30
- First Solar Inc 9 0.04
1 Frank's International NV 2 0.01
- FutureFuel Corp 1 0.01
- Green Plains Inc 1 0.01
1 Halliburton Co 20 0.10
1 Helix Energy Solutions Group Inc 3 0.01
- Helmerich & Payne Inc 5 0.02
- Hess Corp 14 0.07
- HollyFrontier Corp 8 0.04
1 Kinder Morgan Inc 22 0.10
- KLX Energy Services Holdings Inc - -
1 Kosmos Energy Ltd 2 0.01
- Laredo Petroleum Inc 3 0.01
1 Marathon Oil Corp 11 0.05
- Marathon Petroleum Corp 22 0.10
- Matador Resources Co 6 0.03
- Matrix Service Co 1 0.01
- MRC Global Inc 2 0.01
- Murphy Oil Corp 6 0.03
- Murphy USA Inc 7 0.03
- Nabors Industries Ltd 1 -
- Newpark Resources Inc 1 0.01
1 NexTier Oilfield Solutions Inc 2 0.01
1 NOV Inc 7 0.03
- NOW Inc 2 0.01
U.S. Core Equity FundPortfolio of Investments as at 31 May 2021 (continued)
Dimensional Fund Advisors Semi-Annual Report and Unaudited Financial Statements, 31 May 2021 347

Shares (000's)
Value(000's)
USD
% of NetAssetValue
Common Stock (continued)
Energy - 3.50% (continued)
1 Occidental Petroleum Corp 27 0.13
- Oceaneering International Inc 2 0.01
- Oil States International Inc 2 0.01
- ONEOK Inc 12 0.06
1 Ovintiv Inc (US listing) 10 0.05
- Par Pacific Holdings Inc 1 0.01
- Patterson-UTI Energy Inc 2 0.01
- PBF Energy Inc 3 0.01
- PDC Energy Inc 7 0.03
1 Peabody Energy Corp 4 0.02
- Penn Virginia Corp 2 0.01
- Phillips 66 20 0.10
- Pioneer Natural Resources Co 13 0.06
- ProPetro Holding Corp 2 0.01
1 Range Resources Corp 6 0.03
- Renewable Energy Group Inc 4 0.02
- REX American Resources Corp 1 0.01
- RPC Inc 1 0.01
1 Schlumberger Ltd 31 0.15
- SM Energy Co 4 0.02
- SolarEdge Technologies Inc 6 0.03
1 Southwestern Energy Co 5 0.02
- SunCoke Energy Inc 1 0.01
- Sunnova Energy International Inc 2 0.01
- Sunrun Inc 3 0.01
- Talos Energy Inc 3 0.01
- Targa Resources Corp 13 0.06
1 TechnipFMC PLC 4 0.02
2 TETRA Technologies Inc 5 0.02
- TPI Composites Inc 2 0.01
1 Transocean Ltd 5 0.02
- US Silica Holdings Inc 3 0.01
- Valero Energy Corp 18 0.09
- Warrior Met Coal Inc 2 0.01
1 Williams Cos Inc 23 0.11
735 3.50
Financial - 16.17%
- 1st Source Corp 4 0.02
- Affiliated Managers Group Inc 11 0.05
1 Aflac Inc 22 0.10
- Air Lease Corp 9 0.04
- Alleghany Corp 12 0.06
- Allegiance Bancshares Inc 2 0.01
- Alliance Data Systems Corp 9 0.04
1 Allstate Corp 37 0.18
1 Ally Financial Inc 22 0.10
- Altabancorp 3 0.01
- American Equity Investment Life Holding Co 5 0.02
1 American Express Co 50 0.24
- American Financial Group Inc 13 0.06
1 American International Group Inc 24 0.11
- American National Group Inc 6 0.03
- Ameriprise Financial Inc 31 0.15
- Ameris Bancorp 7 0.03
- AMERISAFE Inc 1 0.01
- Aon PLC 37 0.18
1 Arch Capital Group Ltd 18 0.09
- Ares Management Corp 3 0.01
- Argo Group International Holdings Ltd 4 0.02
- Arthur J Gallagher & Co 16 0.08
- Artisan Partners Asset Management Inc 4 0.02
- Associated Banc-Corp 6 0.03
Shares (000's)
Value(000's)
USD
% of NetAssetValue
Common Stock (continued)
Financial - 16.17% (continued)
- Assurant Inc 11 0.05
- Assured Guaranty Ltd 6 0.03
- Athene Holding Ltd 14 0.07
- Atlantic Capital Bancshares Inc 3 0.01
- Atlantic Union Bankshares Corp 6 0.03
1 AXA Equitable Holdings Inc 9 0.04
- Axis Capital Holdings Ltd 8 0.04
- Axos Financial Inc 5 0.02
- B Riley Financial Inc 5 0.02
- Banc of California Inc 2 0.01
- BancFirst Corp 5 0.02
- BancorpSouth Bank 6 0.03
2 Bank of America Corp 87 0.41
- Bank of Hawaii Corp 6 0.03
- Bank of Marin Bancorp 2 0.01
1 Bank of New York Mellon Corp 33 0.16
- Bank of NT Butterfield & Son Ltd 3 0.01
- Bank OZK 10 0.05
- BankFinancial Corp 1 0.01
- BankUnited Inc 7 0.03
- Banner Corp 3 0.01
1 Berkshire Hathaway Inc 137 0.65
- Berkshire Hills Bancorp Inc 2 0.01
1 BGC Partners Inc 5 0.02
- BlackRock Inc 43 0.20
- Blackstone Group Inc 11 0.05
- Blucora Inc 1 0.01
- BOK Financial Corp 10 0.05
1 Boston Private Financial Holdings Inc 6 0.03
- Brighthouse Financial Inc 8 0.04
- Brightsphere Investment Group Inc 3 0.01
- Brookline Bancorp Inc 4 0.02
1 Brown & Brown Inc 17 0.08
- Bryn Mawr Bank Corp 1 0.01
- Cadence BanCorp 4 0.02
- Camden National Corp 1 0.01
- Capital One Financial Corp 27 0.13
- Capitol Federal Financial Inc 3 0.01
- Cathay General Bancorp 6 0.03
- Cboe Global Markets Inc 9 0.04
- CBRE Group Inc 16 0.08
- Central Pacific Financial Corp 1 0.01
1 Charles Schwab Corp 42 0.20
- Chemung Financial Corp - -
- Chubb Ltd 20 0.10
- Cincinnati Financial Corp 19 0.09
- CIT Group Inc 9 0.04
1 Citigroup Inc 44 0.21
- Citizens Financial Group Inc 9 0.04
- City Holding Co 2 0.01
- CME Group Inc 21 0.10
- CNB Financial Corp 1 0.01
- Cohen & Steers Inc 5 0.02
- Columbia Banking System Inc 5 0.02
- Comerica Inc 12 0.06
- Commerce Bancshares Inc 11 0.05
- Community Bank System Inc 8 0.04
- Community Trust Bancorp Inc 1 0.01
- ConnectOne Bancorp Inc 1 0.01
- Crawford & Co, Class B 1 0.01
- Credit Acceptance Corp 12 0.06
- Cullen/Frost Bankers Inc 13 0.06
U.S. Core Equity FundPortfolio of Investments as at 31 May 2021 (continued)
Dimensional Fund Advisors Semi-Annual Report and Unaudited Financial Statements, 31 May 2021 348

Shares (000's)
Value(000's)
USD
% of NetAssetValue
Common Stock (continued)
Financial - 16.17% (continued)
1 Cushman & Wakefield PLC 7 0.03
- Customers Bancorp Inc 2 0.01
- CVB Financial Corp 5 0.02
- Diamond Hill Investment Group Inc 1 0.01
- Dime Community Bancshares Inc 1 -
- Discover Financial Services 19 0.09
- Donegal Group Inc 2 0.01
- Eagle Bancorp Inc 3 0.01
- East West Bancorp Inc 13 0.06
- eHealth Inc 2 0.01
- Employers Holdings Inc 2 0.01
- Encore Capital Group Inc 3 0.01
- Enova International Inc 2 0.01
- Enstar Group Ltd 8 0.04
- Enterprise Bancorp Inc 2 0.01
- Enterprise Financial Services Corp 3 0.01
- Erie Indemnity Co 11 0.05
- Essent Group Ltd 9 0.04
- Evercore Inc 10 0.05
- Everest Re Group Ltd 11 0.05
- EZCORP Inc 1 0.01
- Farmers National Banc Corp 2 0.01
- FB Financial Corp 3 0.01
- Federal Agricultural Mortgage Corp 1 0.01
- Federated Investors Inc 7 0.03
1 Fidelity National Financial Inc 15 0.07
1 Fifth Third Bancorp 18 0.09
- Financial Institutions Inc 2 0.01
- First American Financial Corp 12 0.06
- First Bancorp 2 0.01
- First Bancorp (Puerto Rico listing) 3 0.01
- First Busey Corp 2 0.01
- First Citizens BancShares Inc 12 0.06
- First Commonwealth Financial Corp 3 0.01
- First Community Bankshares Inc 1 0.01
- First Financial Bancorp 4 0.02
- First Financial Bankshares Inc 10 0.05
- First Financial Corp 1 0.01
- First Foundation Inc 3 0.01
- First Hawaiian Inc 6 0.03
1 First Horizon National Corp 12 0.06
- First Interstate BancSystem Inc 5 0.02
- First Merchants Corp 4 0.02
- First Midwest Bancorp Inc 4 0.02
- First of Long Island Corp 2 0.01
- First Republic Bank 17 0.08
- Flagstar Bancorp Inc 4 0.02
- Flushing Financial Corp 1 0.01
1 FNB Corp 8 0.04
1 Franklin Resources Inc 15 0.07
1 Fulton Financial Corp 5 0.02
- German American Bancorp Inc 2 0.01
- Glacier Bancorp Inc 10 0.05
- Global Indemnity Group LLC 1 -
- Globe Life Inc 13 0.06
- Goldman Sachs Group Inc 46 0.22
- Great Southern Bancorp Inc 1 0.01
- Great Western Bancorp Inc 3 0.01
- Greenhill & Co Inc 1 0.01
- Greenlight Capital Re Ltd - -
- Hamilton Lane Inc 3 0.01
- Hancock Whitney Corp 7 0.03
Shares (000's)
Value(000's)
USD
% of NetAssetValue
Common Stock (continued)
Financial - 16.17% (continued)
- Hanmi Financial Corp 1 0.01
- Hanover Insurance Group Inc 8 0.04
1 Hartford Financial Services Group Inc 21 0.10
- HCI Group Inc 4 0.02
- Heartland Financial USA Inc 3 0.01
- Heritage Commerce Corp 1 0.01
- Heritage Financial Corp 3 0.01
- Heritage Insurance Holdings Inc 1 0.01
- Hilltop Holdings Inc 6 0.03
- Hingham Institution for Savings 3 0.01
1 Home BancShares Inc 8 0.04
- HomeStreet Inc 3 0.01
- Hope Bancorp Inc 3 0.01
- Horace Mann Educators Corp 3 0.01
- Horizon Bancorp Inc 1 0.01
- Houlihan Lokey Inc 4 0.02
- Howard Hughes Corp 9 0.04
1 Huntington Bancshares Inc 18 0.09
- Independent Bank Corp (Massachusetts) 4 0.02
- Independent Bank Group Inc 6 0.03
- Interactive Brokers Group Inc 2 0.01
- Intercontinental Exchange Inc 20 0.10
- International Bancshares Corp 6 0.03
1 Invesco Ltd 13 0.06
1 Investors Bancorp Inc 6 0.03
- James River Group Holdings Ltd 2 0.01
- Janus Henderson Group PLC 7 0.03
- Jefferies Financial Group Inc 8 0.04
- Jones Lang LaSalle Inc 12 0.06
1 JPMorgan Chase & Co 185 0.88
- Kearny Financial Corp 2 0.01
- Kemper Corp 8 0.04
- Kennedy-Wilson Holdings Inc 5 0.02
1 KeyCorp 13 0.06
- Kinsale Capital Group Inc 3 0.01
- KKR & Co Inc 12 0.06
- Lakeland Bancorp Inc 2 0.01
- Lakeland Financial Corp 3 0.01
- Lazard Ltd 9 0.04
- LendingClub Corp 1 -
- LendingTree Inc 2 0.01
- Lincoln National Corp 15 0.07
- Live Oak Bancshares Inc 3 0.01
1 Loews Corp 16 0.08
- LPL Financial Holdings Inc 16 0.08
- M&T Bank Corp 16 0.08
- Marcus & Millichap Inc 3 0.01
- Markel Corp 11 0.05
- Marsh & McLennan Cos Inc 18 0.09
1 Mastercard Inc 118 0.56
- McGrath RentCorp 3 0.01
- Mercantile Bank Corp 1 0.01
- Mercury General Corp 6 0.03
- Meridian Bancorp Inc 4 0.02
- Meta Financial Group Inc 2 0.01
- MetLife Inc 13 0.06
1 MGIC Investment Corp 7 0.03
- Midland States Bancorp Inc 1 0.01
- MidWestOne Financial Group Inc 2 0.01
- Moelis & Co 3 0.01
1 Morgan Stanley 47 0.22
- Nasdaq Inc 16 0.08
U.S. Core Equity FundPortfolio of Investments as at 31 May 2021 (continued)
Dimensional Fund Advisors Semi-Annual Report and Unaudited Financial Statements, 31 May 2021 349

Shares (000's)
Value(000's)
USD
% of NetAssetValue
Common Stock (continued)
Financial - 16.17% (continued)
- National Bank Holdings Corp 2 0.01
- National Western Life Group Inc 1 0.01
1 Navient Corp 6 0.03
- NBT Bancorp Inc 3 0.01
- Nelnet Inc 4 0.02
1 New York Community Bancorp Inc 9 0.04
- NMI Holdings Inc 4 0.02
- Northern Trust Corp 18 0.09
- Northfield Bancorp Inc 1 0.01
- Northwest Bancshares Inc 2 0.01
- OceanFirst Financial Corp 3 0.01
- Ocwen Financial Corp 1 -
- OFG Bancorp 2 0.01
1 Old National Bancorp 5 0.02
1 Old Republic International Corp 14 0.07
- OneMain Holdings Inc 13 0.06
- Pacific Premier Bancorp Inc 8 0.04
- PacWest Bancorp 10 0.05
- Palomar Holdings Inc 2 0.01
- Park National Corp 3 0.01
- Peoples Bancorp Inc 2 0.01
1 People's United Financial Inc 12 0.06
- Pinnacle Financial Partners Inc 12 0.06
- Piper Jaffray Cos 4 0.02
- PNC Financial Services Group Inc 22 0.10
- Popular Inc 11 0.05
- PRA Group Inc 3 0.01
- Preferred Bank 2 0.01
- Primerica Inc 11 0.05
1 Principal Financial Group Inc 18 0.09
- ProAssurance Corp 2 0.01
- PROG Holdings Inc 6 0.03
1 Progressive Corp 30 0.14
- Prosperity Bancshares Inc 11 0.05
- Protective Insurance Corp 1 0.01
- Provident Financial Services Inc 4 0.02
- Prudential Financial Inc 22 0.10
- QCR Holdings Inc 2 0.01
1 Radian Group Inc 7 0.03
- Rafael Holdings Inc 2 0.01
- Raymond James Financial Inc 21 0.10
- RE/MAX Holdings Inc 1 0.01
- Realogy Holdings Corp 4 0.02
- Redfin Corp 11 0.05
1 Regions Financial Corp 13 0.06
- Reinsurance Group of America Inc 8 0.04
- RenaissanceRe Holdings Ltd 9 0.04
- Renasant Corp 4 0.02
- Republic Bancorp Inc 3 0.01
- Republic First Bancorp Inc 1 0.01
- RLI Corp 6 0.03
- RMR Group Inc 1 0.01
- S&T Bancorp Inc 2 0.01
- Safety Insurance Group Inc 2 0.01
- Sandy Spring Bancorp Inc 4 0.02
1 Santander Consumer USA Holdings Inc 16 0.08
- Seacoast Banking Corp of Florida 3 0.01
- SEI Investments Co 14 0.07
- Selective Insurance Group Inc 8 0.04
- ServisFirst Bancshares Inc 7 0.03
- Signature Bank 17 0.08
- Simmons First National Corp 6 0.03
Shares (000's)
Value(000's)
USD
% of NetAssetValue
Common Stock (continued)
Financial - 16.17% (continued)
- SiriusPoint Ltd 2 0.01
1 SLM Corp 13 0.06
- Southside Bancshares Inc 3 0.01
- St Joe Co 4 0.02
- State Auto Financial Corp 1 0.01
- State Street Corp 21 0.10
1 Sterling Bancorp 9 0.04
- Stewart Information Services Corp 2 0.01
- Stifel Financial Corp 10 0.05
- Stock Yards Bancorp Inc 2 0.01
- SVB Financial Group 17 0.08
1 Synchrony Financial 21 0.10
- Synovus Financial Corp 12 0.06
- T Rowe Price Group Inc 29 0.14
- TCF Financial Corp 13 0.06
- Territorial Bancorp Inc 2 0.01
- Texas Capital Bancshares Inc 6 0.03
- TFS Financial Corp 5 0.02
- Tiptree Inc 1 0.01
- Tompkins Financial Corp 3 0.01
- Towne Bank 4 0.02
- Tradeweb Markets Inc 7 0.03
- Travelers Cos Inc 36 0.17
- TriCo Bancshares 3 0.01
- TriState Capital Holdings Inc 1 0.01
- Triumph Bancorp Inc 3 0.01
1 Truist Financial Corp 22 0.10
- TrustCo Bank Corp NY 1 -
- Trustmark Corp 3 0.01
- UMB Financial Corp 8 0.04
1 Umpqua Holdings Corp 7 0.03
- United Bankshares Inc 9 0.04
- United Community Banks Inc 5 0.02
- United Fire Group Inc 1 0.01
- Universal Insurance Holdings Inc 1 0.01
- Univest Financial Corp 1 0.01
1 Unum Group 9 0.04
1 US Bancorp 31 0.15
1 Valley National Bancorp 10 0.05
- Virtu Financial Inc 6 0.03
- Virtus Investment Partners Inc 3 0.01
1 Visa Inc 143 0.68
- Voya Financial Inc 10 0.05
- W R Berkley Corp 15 0.07
- Walker & Dunlop Inc 5 0.02
- Washington Federal Inc 4 0.02
- Washington Trust Bancorp Inc 1 0.01
- Waterstone Financial Inc 1 0.01
- Webster Financial Corp 9 0.04
1 Wells Fargo & Co 49 0.23
- WesBanco Inc 4 0.02
- Westamerica Bancorporation 3 0.01
- Western Alliance Bancorp 11 0.05
1 Western Union Co 7 0.03
- Westwood Holdings Group Inc 1 0.01
- White Mountains Insurance Group Ltd 7 0.03
- Willis Towers Watson PLC 19 0.09
- Wintrust Financial Corp 8 0.04
- WisdomTree Investments Inc 1 0.01
- World Acceptance Corp 2 0.01
U.S. Core Equity FundPortfolio of Investments as at 31 May 2021 (continued)
Dimensional Fund Advisors Semi-Annual Report and Unaudited Financial Statements, 31 May 2021 350

Shares (000's)
Value(000's)
USD
% of NetAssetValue
Common Stock (continued)
Financial - 16.17% (continued)
- WSFS Financial Corp 5 0.02
- Zions Bancorp NA 10 0.05
3,397 16.17
Industrial - 12.98%
1 3M Co 59 0.28
- AAON Inc 6 0.03
- AAR Corp 2 0.01
- Acuity Brands Inc 13 0.06
- Advanced Drainage Systems Inc 14 0.07
- Advanced Energy Industries Inc 6 0.03
- AECOM 10 0.05
- AeroVironment Inc 4 0.02
- AGCO Corp 12 0.06
- Agilent Technologies Inc 28 0.13
- Air Transport Services Group Inc 3 0.01
- Alamo Group Inc 4 0.02
- Alarm.com Holdings Inc 4 0.02
- Albany International Corp 4 0.02
- Allegion PLC 13 0.06
1 Amcor PLC 14 0.07
- American Outdoor Brands Inc 1 -
- American Woodmark Corp 3 0.01
- AMETEK Inc 16 0.08
1 Amphenol Corp 27 0.13
- AO Smith Corp 14 0.07
- Apogee Enterprises Inc 2 0.01
- Applied Industrial Technologies Inc 3 0.01
- AptarGroup Inc 15 0.07
- ArcBest Corp 4 0.02
- Arcosa Inc 5 0.02
- Argan Inc 1 0.01
- Armstrong Flooring Inc 1 0.01
- Armstrong World Industries Inc 9 0.04
- Arrow Electronics Inc 12 0.06
- Astec Industries Inc 1 0.01
- Astronics Corp, Class A 1 0.01
- Astronics Corp, Class B - -
- Atkore International Group Inc 6 0.03
- Atlas Air Worldwide Holdings Inc 4 0.02
- Avnet Inc 8 0.04
- Axon Enterprise Inc 3 0.01
- AZZ Inc 4 0.02
- Badger Meter Inc 5 0.02
1 Ball Corp 23 0.11
- Barnes Group Inc 4 0.02
- Belden Inc 6 0.03
- Benchmark Electronics Inc 4 0.02
1 Berry Global Group Inc 16 0.08
- Boise Cascade Co 6 0.03
- Brady Corp 4 0.02
1 Builders FirstSource Inc 11 0.05
- BWX Technologies Inc 9 0.04
- Cactus Inc 3 0.01
- Carlisle Cos Inc 16 0.08
1 Carrier Global Corp 37 0.18
- Casella Waste Systems Inc 5 0.02
1 Caterpillar Inc 59 0.28
- CECO Environmental Corp 1 0.01
- CH Robinson Worldwide Inc 14 0.07
- Chart Industries Inc 7 0.03
- Chase Corp 3 0.01
- CIRCOR International Inc 1 0.01
Shares (000's)
Value(000's)
USD
% of NetAssetValue
Common Stock (continued)
Industrial - 12.98% (continued)
- Clean Harbors Inc 9 0.04
- Cognex Corp 7 0.03
- Coherent Inc 9 0.04
1 Colfax Corp 10 0.05
- Columbus McKinnon Corp 2 0.01
- Comfort Systems USA Inc 4 0.02
- Comtech Telecommunications Corp 1 0.01
- Costamare Inc 2 0.01
1 Covanta Holding Corp 4 0.02
- Crane Co 7 0.03
- Crown Holdings Inc 19 0.09
- CSW Industrials Inc 2 0.01
1 CSX Corp 45 0.21
- Curtiss-Wright Corp 7 0.03
- Deere & Co 49 0.23
1 DHT Holdings Inc 3 0.01
- Donaldson Co Inc 12 0.06
- Dorian LPG Ltd 2 0.01
- Dover Corp 15 0.07
- Ducommun Inc 1 0.01
- Dycom Industries Inc 4 0.02
- Eagle Bulk Shipping Inc 1 -
- Eagle Materials Inc 9 0.04
- Eaton Corp PLC 18 0.09
- Echo Global Logistics Inc 2 0.01
- EMCOR Group Inc 12 0.06
1 Emerson Electric Co 26 0.12
- Encore Wire Corp 3 0.01
- EnerSys 7 0.03
- EnPro Industries Inc 2 0.01
- ESCO Technologies Inc 3 0.01
1 Expeditors International of Washington Inc 30 0.14
- Exponent Inc 7 0.03
- Fabrinet 5 0.02
- FARO Technologies Inc 2 0.01
- Federal Signal Corp 5 0.02
- FedEx Corp 36 0.17
1 Flex Ltd 13 0.06
- Flowserve Corp 8 0.04
1 Fluor Corp 4 0.02
- Fortive Corp 10 0.05
- Fortune Brands Home & Security Inc 19 0.09
- Forward Air Corp 4 0.02
- Franklin Electric Co Inc 5 0.02
- Frontdoor Inc 5 0.02
- Garmin Ltd 16 0.08
1 GasLog Ltd 4 0.02
- GATX Corp 6 0.03
- Generac Holdings Inc 9 0.04
2 General Electric Co 23 0.11
- Gibraltar Industries Inc 4 0.02
- GoPro Inc 1 0.01
- Gorman-Rupp Co 2 0.01
- Graco Inc 11 0.05
1 GrafTech International Ltd 3 0.01
- Granite Construction Inc 3 0.01
1 Graphic Packaging Holding Co 9 0.04
- Great Lakes Dredge & Dock Corp 2 0.01
- Greenbrier Cos Inc 2 0.01
- Greif Inc (non-voting rights) 3 0.01
- Greif Inc (voting rights) 1 -
- Griffon Corp 2 0.01
U.S. Core Equity FundPortfolio of Investments as at 31 May 2021 (continued)
Dimensional Fund Advisors Semi-Annual Report and Unaudited Financial Statements, 31 May 2021 351

Shares (000's)
Value(000's)
USD
% of NetAssetValue
Common Stock (continued)
Industrial - 12.98% (continued)
- Harsco Corp 3 0.01
- Haynes International Inc 1 0.01
1 Heartland Express Inc 4 0.02
- HEICO Corp, Class A 4 0.02
- HEICO Corp, Class B 6 0.03
- Helios Technologies Inc 4 0.02
- Heritage-Crystal Clean Inc 1 -
- Hexcel Corp 6 0.03
- Honeywell International Inc 41 0.20
1 Howmet Aerospace Inc 16 0.08
- Hub Group Inc 4 0.02
- Hubbell Inc 14 0.07
- Huntington Ingalls Industries Inc 15 0.07
- Hyster-Yale Materials Handling Inc 1 0.01
- IDEX Corp 21 0.10
- IES Holdings Inc 2 0.01
- II-VI Inc 7 0.03
- Illinois Tool Works Inc 28 0.13
1 Ingersoll Rand Inc 13 0.06
- Insteel Industries Inc 1 0.01
- International Seaways Inc 1 0.01
- Itron Inc 6 0.03
- ITT Inc 10 0.05
1 Jabil Inc 15 0.07
- Jacobs Engineering Group Inc 17 0.08
- JB Hunt Transport Services Inc 20 0.10
- JELD-WEN Holding Inc 4 0.02
- John Bean Technologies Corp 8 0.04
1 Johnson Controls International PLC 25 0.12
- Kadant Inc 3 0.01
- Kansas City Southern 18 0.09
- KBR Inc 6 0.03
- Kennametal Inc 5 0.02
- Keysight Technologies Inc 18 0.09
- Kimball Electronics Inc 1 0.01
- Knight-Swift Transportation Holdings Inc 10 0.05
- Knowles Corp 3 0.01
- Kratos Defense & Security Solutions Inc 4 0.02
- L3Harris Technologies Inc 32 0.15
- Landstar System Inc 12 0.06
- Lennox International Inc 8 0.04
- Lincoln Electric Holdings Inc 12 0.06
- Lindsay Corp 2 0.01
- Littelfuse Inc 9 0.04
- Louisiana-Pacific Corp 11 0.05
- Lydall Inc 1 0.01
- Manitowoc Co Inc 1 -
- Marten Transport Ltd 3 0.01
- Martin Marietta Materials Inc 13 0.06
- Masco Corp 7 0.03
- Masonite International Corp 5 0.02
- MasTec Inc 15 0.07
- Materion Corp 2 0.01
- Matson Inc 5 0.02
- Matthews International Corp 2 0.01
1 MDU Resources Group Inc 12 0.06
- Mercury Systems Inc 7 0.03
- Mettler-Toledo International Inc 20 0.10
- Middleby Corp 12 0.06
- Mistras Group Inc 1 0.01
- Moog Inc 5 0.02
- MSA Safety Inc 11 0.05
Shares (000's)
Value(000's)
USD
% of NetAssetValue
Common Stock (continued)
Industrial - 12.98% (continued)
- Mueller Industries Inc 4 0.02
1 Mueller Water Products Inc 5 0.02
- Myers Industries Inc 1 0.01
- National Instruments Corp 6 0.03
- NN Inc 1 0.01
- Nordson Corp 16 0.08
- Norfolk Southern Corp 33 0.16
- Novanta Inc 5 0.02
- NV5 Global Inc 2 0.01
- NVE Corp 1 0.01
1 nVent Electric PLC 10 0.05
- O-I Glass Inc 3 0.01
- Old Dominion Freight Line Inc 21 0.10
- Olympic Steel Inc 1 0.01
- Omega Flex Inc 2 0.01
- Oshkosh Corp 11 0.05
- OSI Systems Inc 3 0.01
- Otis Worldwide Corp 14 0.07
- Overseas Shipholding Group Inc - -
- Owens Corning 13 0.06
- Packaging Corp of America 19 0.09
- Parker-Hannifin Corp 27 0.13
- Park-Ohio Holdings Corp 1 0.01
- Patrick Industries Inc 4 0.02
- Pentair PLC 15 0.07
- PerkinElmer Inc 21 0.10
- PGT Innovations Inc 2 0.01
- Plexus Corp 4 0.02
- Primoris Services Corp 2 0.01
- Proto Labs Inc 3 0.01
- Raven Industries Inc 3 0.01
1 Raytheon Technologies Corp 35 0.17
- RBC Bearings Inc 6 0.03
- Regal Beloit Corp 10 0.05
- Republic Services Inc 23 0.11
- Rexnord Corp 10 0.05
- Rockwell Automation Inc 21 0.10
- Roper Technologies Inc 22 0.10
- Ryder System Inc 7 0.03
- Ryerson Holding Corp 1 -
- Saia Inc 11 0.05
- Sanmina Corp 5 0.02
- Schneider National Inc 4 0.02
- Scorpio Tankers Inc 2 0.01
- Sealed Air Corp 9 0.04
- Sensata Technologies Holding PLC 11 0.05
- SFL Corp Ltd 2 0.01
- Silgan Holdings Inc 7 0.03
- Simpson Manufacturing Co Inc 9 0.04
- Smith & Wesson Brands Inc 4 0.02
- Snap-on Inc 18 0.09
- Sonoco Products Co 10 0.05
- Spirit AeroSystems Holdings Inc 5 0.02
- SPX Corp 3 0.01
- SPX FLOW Inc 5 0.02
- Standex International Corp 1 0.01
- Stanley Black & Decker Inc 17 0.08
- Stericycle Inc 9 0.04
- Stoneridge Inc 2 0.01
- Summit Materials Inc 6 0.03
- SYNNEX Corp 10 0.05
- TE Connectivity Ltd 20 0.10
U.S. Core Equity FundPortfolio of Investments as at 31 May 2021 (continued)
Dimensional Fund Advisors Semi-Annual Report and Unaudited Financial Statements, 31 May 2021 352

Shares (000's)
Value(000's)
USD
% of NetAssetValue
Common Stock (continued)
Industrial - 12.98% (continued)
- Teekay Corp 1 0.01
- Teledyne Technologies Inc 22 0.10
- Tennant Co 1 0.01
- Terex Corp 5 0.02
- Tetra Tech Inc 7 0.03
- Timken Co 12 0.06
- TimkenSteel Corp 1 0.01
- TopBuild Corp 11 0.05
- Toro Co 17 0.08
- Trane Technologies PLC 30 0.14
- TransDigm Group Inc 8 0.04
- Trex Co Inc 14 0.07
- TriMas Corp 2 0.01
- Trimble Inc 8 0.04
- Trinity Industries Inc 6 0.03
- Trinseo SA 4 0.02
- TTM Technologies Inc 2 0.01
- UFP Industries Inc 7 0.03
1 Union Pacific Corp 69 0.33
1 United Parcel Service Inc 57 0.27
- Universal Display Corp 5 0.02
- Universal Logistics Holdings Inc 1 0.01
- US Concrete Inc 1 0.01
- US Ecology Inc 1 -
- Valmont Industries Inc 7 0.03
1 Vishay Intertechnology Inc 6 0.03
- Vontier Corp 3 0.01
- Vulcan Materials Co 14 0.07
1 Waste Management Inc 45 0.21
- Waters Corp 8 0.04
- Watts Water Technologies Inc 5 0.02
- Welbilt Inc 3 0.01
- Werner Enterprises Inc 6 0.03
- Westinghouse Air Brake Technologies Corp 15 0.07
1 Westrock Co 15 0.07
1 WillScot Mobile Mini Holdings Corp 9 0.04
- Woodward Inc 11 0.05
- Worthington Industries Inc 4 0.02
- XPO Logistics Inc 21 0.10
- Xylem Inc 10 0.05
- Yellow Corp 1 -
2,728 12.98
Technology - 17.57%
1 Accenture PLC 80 0.38
- ACI Worldwide Inc 6 0.03
- Activision Blizzard Inc 25 0.12
- Adobe Inc 85 0.41
- Advanced Micro Devices Inc 15 0.07
- Agilysys Inc 1 0.01
- Akamai Technologies Inc 22 0.11
- Allscripts Healthcare Solutions Inc 3 0.01
- Alpha & Omega Semiconductor Ltd 3 0.02
- Amdocs Ltd 11 0.05
1 Amkor Technology Inc 7 0.03
- Analog Devices Inc 19 0.09
- Ansys Inc 14 0.07
- Appfolio Inc 2 0.01
7 Apple Inc 806 3.84
1 Applied Materials Inc 47 0.22
- Aspen Technology Inc 11 0.05
- Atlassian Corp PLC 2 0.01
- Autodesk Inc 25 0.12
Shares (000's)
Value(000's)
USD
% of NetAssetValue
Common Stock (continued)
Technology - 17.57% (continued)
- Axcelis Technologies Inc 2 0.01
- Bill.com Holdings Inc 10 0.05
- Black Knight Inc 12 0.06
- Blackbaud Inc 3 0.01
- Blackline Inc 9 0.04
- BM Technologies Inc - -
- Box Inc 6 0.03
- Broadcom Inc 87 0.41
- Broadridge Financial Solutions Inc 16 0.08
- Brooks Automation Inc 11 0.05
- CACI International Inc 10 0.05
- Cadence Design Systems Inc 14 0.07
- CDK Global Inc 8 0.04
- Ceridian HCM Holding Inc 7 0.03
- Cerner Corp 16 0.08
- Cirrus Logic Inc 7 0.03
- Citrix Systems Inc 12 0.06
1 Cloudera Inc 5 0.02
- CMC Materials Inc 6 0.03
1 Cognizant Technology Solutions Corp 26 0.12
- Cognyte Software Ltd 2 0.01
- Cohu Inc 2 0.01
- CommVault Systems Inc 3 0.01
- Concentrix Corp 13 0.06
1 Conduent Inc 2 0.01
1 Contra Zagg Inc - -
- Cree Inc 11 0.05
- CSG Systems International Inc 3 0.02
- CTS Corp 3 0.01
- Dell Technologies Inc 10 0.05
- Digital Turbine Inc 5 0.02
- Diodes Inc 6 0.03
- Donnelley Financial Solutions Inc 3 0.01
1 Dropbox Inc 15 0.07
- DXC Technology Co 10 0.05
- Dynatrace Inc 6 0.03
- Ebix Inc 3 0.02
- Electronic Arts Inc 21 0.10
- Entegris Inc 12 0.06
- Envestnet Inc 7 0.03
- EPAM Systems Inc 10 0.05
- Evolent Health Inc 3 0.01
- ExlService Holdings Inc 5 0.02
- Fair Isaac Corp 15 0.07
- Fidelity National Information Services Inc 25 0.12
- Fiserv Inc 20 0.10
- FormFactor Inc 4 0.02
- Fortinet Inc 21 0.10
1 Genpact Ltd 13 0.06
- Globant SA 4 0.02
- Guidewire Software Inc 5 0.02
1 Hewlett Packard Enterprise Co 12 0.06
1 HP Inc 12 0.06
- HubSpot Inc 3 0.01
- Inovalon Holdings Inc 3 0.01
- Insight Enterprises Inc 6 0.03
2 Intel Corp 120 0.57
1 International Business Machines Corp 64 0.31
- Intuit Inc 32 0.15
- IPG Photonics Corp 11 0.05
- j2 Global Inc 9 0.04
- Jack Henry & Associates Inc 11 0.05
U.S. Core Equity FundPortfolio of Investments as at 31 May 2021 (continued)
Dimensional Fund Advisors Semi-Annual Report and Unaudited Financial Statements, 31 May 2021 353

Shares (000's)
Value(000's)
USD
% of NetAssetValue
Common Stock (continued)
Technology - 17.57% (continued)
- KLA Corp 36 0.17
- Kulicke & Soffa Industries Inc 4 0.02
- Lam Research Corp 43 0.21
- Lattice Semiconductor Corp 6 0.03
- Leidos Holdings Inc 19 0.09
- Lumentum Holdings Inc 9 0.04
- Manhattan Associates Inc 10 0.05
- ManTech International Corp 4 0.02
1 Marvell Technology Inc 15 0.07
- Maxim Integrated Products Inc 17 0.08
- MAXIMUS Inc 10 0.05
- MaxLinear Inc 4 0.02
- Microchip Technology Inc 28 0.13
1 Micron Technology Inc 36 0.17
3 Microsoft Corp 736 3.50
- MicroStrategy Inc - -
- MKS Instruments Inc 12 0.06
- MongoDB Inc 5 0.02
- Monolithic Power Systems Inc 5 0.02
- MSCI Inc 14 0.07
- NCR Corp 10 0.05
- NetApp Inc 17 0.08
- NetScout Systems Inc 4 0.02
- NextGen Healthcare Inc 2 0.01
- Nuance Communications Inc 5 0.02
- NVIDIA Corp 36 0.17
1 ON Semiconductor Corp 17 0.08
- OneSpan Inc 2 0.01
- Onto Innovation Inc 5 0.02
1 Oracle Corp 55 0.26
1 Paychex Inc 27 0.13
- Paycom Software Inc 10 0.05
- PDF Solutions Inc 2 0.01
- Pegasystems Inc 3 0.01
- Photronics Inc 2 0.01
- Pitney Bowes Inc 2 0.01
- Power Integrations Inc 5 0.02
- Progress Software Corp 4 0.02
- PTC Inc 7 0.03
- Pure Storage Inc 4 0.02
- Qorvo Inc 12 0.06
1 QUALCOMM Inc 58 0.28
- Qualys Inc 7 0.03
- Rambus Inc 4 0.02
- RingCentral Inc 3 0.01
- salesforce.com Inc 38 0.18
- Science Applications International Corp 8 0.04
- Seagate Technology Holdings 17 0.08
- Semtech Corp 3 0.01
- ServiceNow Inc 7 0.03
- Silicon Laboratories Inc 4 0.02
- Skyworks Solutions Inc 19 0.09
- Splunk Inc 3 0.01
- SS&C Technologies Holdings Inc 13 0.06
- Sykes Enterprises Inc 3 0.02
- Synaptics Inc 5 0.02
- Synchronoss Technologies Inc - -
- Synopsys Inc 16 0.08
- Take-Two Interactive Software Inc 17 0.08
- Teradata Corp 7 0.03
- Teradyne Inc 20 0.10
1 Texas Instruments Inc 82 0.39
Shares (000's)
Value(000's)
USD
% of NetAssetValue
Common Stock (continued)
Technology - 17.57% (continued)
- TTEC Holdings Inc 8 0.04
- Twilio Inc 3 0.01
- Tyler Technologies Inc 13 0.06
- Veeco Instruments Inc 2 0.01
- Veeva Systems Inc 14 0.07
- Verint Systems Inc 4 0.02
- VMware Inc 4 0.02
- W&T Offshore Inc 1 0.01
- Western Digital Corp 18 0.09
- Workday Inc 2 0.01
1 Xerox Holdings Corp 8 0.04
- Xilinx Inc 14 0.07
- Xperi Holding Corp 2 0.01
- Zebra Technologies Corp 12 0.06
- Zoom Video Communications Inc 5 0.02
- Zovio Inc - -
1 Zynga Inc 8 0.04
3,692 17.57
Utilities - 2.06%
1 AES Corp 7 0.03
- ALLETE Inc 3 0.01
- Alliant Energy Corp 6 0.03
- Ameren Corp 8 0.04
- American Electric Power Co Inc 15 0.07
- American States Water Co 3 0.02
- American Water Works Co Inc 12 0.06
- Artesian Resources Corp - -
- Atmos Energy Corp 9 0.04
- Avangrid Inc 2 0.01
- Avista Corp 3 0.01
- Black Hills Corp 5 0.02
- California Water Service Group 3 0.02
1 CenterPoint Energy Inc 9 0.04
- Chesapeake Utilities Corp 2 0.01
- Clearway Energy Inc, Class A 2 0.01
- Clearway Energy Inc, Class C 4 0.02
- CMS Energy Corp 8 0.04
- Consolidated Edison Inc 10 0.05
- Dominion Energy Inc 9 0.04
- DTE Energy Co 10 0.05
- Duke Energy Corp 11 0.05
- Edison International 9 0.04
- Entergy Corp 9 0.04
- Essential Utilities Inc 10 0.05
- Evergy Inc 10 0.05
- Eversource Energy 12 0.06
- Evoqua Water Technologies Corp 6 0.03
1 Exelon Corp 16 0.08
- FirstEnergy Corp 9 0.04
- Hawaiian Electric Industries Inc 6 0.03
- IDACORP Inc 6 0.03
- MGE Energy Inc 3 0.02
- National Fuel Gas Co 5 0.02
- New Jersey Resources Corp 7 0.03
1 NextEra Energy Inc 18 0.09
1 NiSource Inc 6 0.03
- Northwest Natural Holding Co 3 0.01
- NorthWestern Corp 3 0.01
1 NRG Energy Inc 14 0.07
- OGE Energy Corp 7 0.03
- ONE Gas Inc 5 0.02
- Ormat Technologies Inc (US listing) 6 0.03
U.S. Core Equity FundPortfolio of Investments as at 31 May 2021 (continued)
Dimensional Fund Advisors Semi-Annual Report and Unaudited Financial Statements, 31 May 2021 354

Shares (000's)
Value(000's)
USD
% of NetAssetValue
Common Stock (continued)
Utilities - 2.06% (continued)
- Otter Tail Corp 4 0.02
1 PG&E Corp 2 0.01
- Pinnacle West Capital Corp 7 0.03
- PNM Resources Inc 2 0.01
- Portland General Electric Co 5 0.02
1 PPL Corp 10 0.05
- Public Service Enterprise Group Inc 13 0.06
- Sempra Energy 9 0.04
- SJW Group 1 0.01
- South Jersey Industries Inc 3 0.01
- Southern Co 10 0.05
- Southwest Gas Holdings Inc 4 0.02
- Spire Inc 4 0.02
- UGI Corp 7 0.03
- Unitil Corp 2 0.01
Shares (000's)
Value(000's)
USD
% of NetAssetValue
Common Stock (continued)
Utilities - 2.06% (continued)
- Vidler Water Resouces Inc 2 0.01
1 Vistra Energy Corp 12 0.06
- WEC Energy Group Inc 12 0.06
- Xcel Energy Inc 12 0.06
432 2.06
Total Common Stock - 99.59% (30 November 2020: 99.93%) 20,924 99.59
Preferred Stock
Consumer, Cyclical - 0.02%
- WESCO International Inc 4 0.02
4 0.02
Total Preferred Stock - 0.02% (30 November 2020: 0.03%) 4 0.02
Total Investments - 99.61% (30 November 2020: 99.96%) 20,928 99.61
Value (000's)USD
% of NetAssetValue
Cash and Cash Equivalents - 0.38% (30 November 2020: 0.32%) 79 0.38Other Assets in Excess of Other Liabilities - 0.01% (30 November 2020: (0.28)%) 2 0.01
Total Net Assets 21,009 100.00
Amounts designated as “- “ are either $0, less than $500 or less than 500 shares.
Analysis of Total Assets % of Total Assets
Transferable securities admitted to an official exchange listing 99.51
Current Assets 0.49
Total Assets 100.00
U.S. Core Equity FundPortfolio of Investments as at 31 May 2021 (continued)
Dimensional Fund Advisors Semi-Annual Report and Unaudited Financial Statements, 31 May 2021 355

Shares (000's)
Value(000's)
USD
% of NetAssetValue
Common Stock
Basic Materials - 4.55%
3 AdvanSix Inc 100 0.06
9 AgroFresh Solutions Inc 19 0.01
9 Alcoa Corp 372 0.21
9 Allegheny Technologies Inc 218 0.13
2 American Vanguard Corp 35 0.02
- Arconic Corp 13 0.01
1 Ashland Global Holdings Inc 132 0.08
1 Axalta Coating Systems Ltd 43 0.02
2 Balchem Corp 232 0.13
4 Cabot Corp 225 0.13
1 Caledonia Mining Corp PLC 15 0.01
3 Carpenter Technology Corp 163 0.09
8 Century Aluminum Co 108 0.06
6 Chemours Co 230 0.13
2 Clearwater Paper Corp 49 0.03
4 Codexis Inc 88 0.05
12 Coeur Mining Inc 125 0.07
8 Commercial Metals Co 250 0.14
2 Compass Minerals International Inc 141 0.08
3 Domtar Corp 134 0.08
16 Element Solutions Inc 361 0.21
5 Ferro Corp 107 0.06
17 Ferroglobe PLC 87 0.05
2 Fortitude Gold Corp 20 0.01
2 Friedman Industries Inc 22 0.01
4 GCP Applied Technologies Inc 85 0.05
3 Glatfelter Corp 45 0.03
8 Gold Resource Corp 23 0.01
2 Hawkins Inc 64 0.04
3 HB Fuller Co 222 0.13
26 Hecla Mining Co 237 0.14
4 Huntsman Corp 99 0.06
2 Ingevity Corp 180 0.10
2 Innospec Inc 148 0.08
1 Intrepid Potash Inc 40 0.02
2 Kaiser Aluminum Corp 213 0.12
2 Koppers Holdings Inc 65 0.04
3 Kraton Corp 87 0.05
4 Kronos Worldwide Inc 68 0.04
2 Livent Corp 41 0.02
4 Mercer International Inc 64 0.04
2 Minerals Technologies Inc 175 0.10
1 Neenah Inc 57 0.03
- NewMarket Corp 83 0.05
1 Nexa Resources SA 12 0.01
1 Northern Technologies International Corp 20 0.01
- Oil-Dri Corp of America 10 0.01
7 Olin Corp 341 0.20
6 PQ Group Holdings Inc 103 0.06
1 Quaker Chemical Corp 224 0.13
5 Rayonier Advanced Materials Inc 40 0.02
4 Resolute Forest Products Inc 74 0.04
1 Rogers Corp 198 0.11
2 Schnitzer Steel Industries Inc 108 0.06
2 Schweitzer-Mauduit International Inc 78 0.04
2 Sensient Technologies Corp 188 0.11
1 Stepan Co 180 0.10
9 Tronox Holdings PLC 210 0.12
1 United States Lime & Minerals Inc 69 0.04
9 United States Steel Corp 223 0.13
1 Universal Stainless & Alloy Products Inc 14 0.01
6 Uranium Energy Corp 18 0.01
Shares (000's)
Value(000's)
USD
% of NetAssetValue
Common Stock (continued)
Basic Materials - 4.55% (continued)
8 Valvoline Inc 268 0.15
9 Venator Materials PLC 45 0.03
3 Verso Corp 50 0.03
3 WR Grace & Co 174 0.10
7,932 4.55
Communications - 4.99%
3 1-800-Flowers.com Inc 89 0.05
2 A H Belo Corp 3 -
6 A10 Networks Inc 62 0.04
4 ADTRAN Inc 77 0.04
1 Airgain Inc 28 0.02
2 AMC Networks Inc 133 0.08
2 Anterix Inc 73 0.04
2 ATN International Inc 71 0.04
11 Audacy Inc 47 0.03
1 Aviat Networks Inc 52 0.03
1 Beasley Broadcast Group Inc 4 -
1 BK Technologies Corp 3 -
4 Boingo Wireless Inc 50 0.03
2 Boston Omaha Corp 61 0.04
3 CalAmp Corp 35 0.02
4 Calix Inc 187 0.11
1 Cambium Networks Corp 83 0.05
5 Cargurus Inc 147 0.08
3 CarParts.com Inc 44 0.03
6 Cars.com Inc 92 0.05
6 Casa Systems Inc 49 0.03
2 ChannelAdvisor Corp 52 0.03
3 Cincinnati Bell Inc 50 0.03
1 Clearfield Inc 47 0.03
3 Cogent Communications Holdings Inc 224 0.13
11 CommScope Holding Co Inc 225 0.13
8 comScore Inc 31 0.02
7 Consolidated Communications Holdings Inc 70 0.04
2 Cumulus Media Inc 21 0.01
9 DHI Group Inc 29 0.02
1 DZS Inc 20 0.01
3 EchoStar Corp 68 0.04
9 Entravision Communications Corp 40 0.02
1 ePlus Inc 83 0.05
2 Eventbrite Inc 49 0.03
1 EverQuote Inc 18 0.01
4 EW Scripps Co 80 0.05
4 FireEye Inc 100 0.06
7 Fluent Inc 21 0.01
2 Frequency Electronics Inc 19 0.01
12 Gannett Co Inc 62 0.04
6 Gray Television Inc 136 0.08
1 Groupon Inc 65 0.04
2 Grubhub Inc 102 0.06
5 GTT Communications Inc 7 -
8 Harmonic Inc 58 0.03
- HC2 Holdings Inc 2 -
2 HealthStream Inc 64 0.04
2 Hemisphere Media Group Inc 24 0.01
11 Houghton Mifflin Harcourt Co 105 0.06
3 IDT Corp 78 0.04
2 iHeartMedia Inc 56 0.03
10 Infinera Corp 97 0.06
2 InterDigital Inc 130 0.07
8 Iridium Communications Inc 321 0.18
2 KVH Industries Inc 31 0.02
U.S. Small Companies FundPortfolio of Investments as at 31 May 2021
Dimensional Fund Advisors Semi-Annual Report and Unaudited Financial Statements, 31 May 2021 356

Shares (000's)
Value(000's)
USD
% of NetAssetValue
Common Stock (continued)
Communications - 4.99% (continued)
2 Lands' End Inc 57 0.03
- Leaf Group Ltd 1 -
3 Liberty Latin America Ltd, Class A 49 0.03
11 Liberty Latin America Ltd, Class C 155 0.09
9 Limelight Networks Inc 28 0.02
3 Liquidity Services Inc 73 0.04
2 Loral Space & Communications Inc 62 0.04
- Madison Square Garden Entertainment Corp 23 0.01
4 Magnite Inc 106 0.06
- Marchex Inc 1 -
2 Maxar Technologies Inc (US listing) 75 0.04
13 Media General Inc CVR 1 -
3 Meredith Corp 94 0.05
3 Mimecast Ltd 161 0.09
4 MSG Networks Inc 57 0.03
10 National CineMedia Inc 48 0.03
5 NeoPhotonics Corp 52 0.03
2 NETGEAR Inc 68 0.04
2 Nexstar Media Group Inc 350 0.20
2 Ooma Inc 29 0.02
1 Optical Cable Corp 3 -
8 ORBCOMM Inc 89 0.05
2 PC-Tel Inc 14 0.01
2 Perficient Inc 133 0.08
1 Preformed Line Products Co 41 0.02
1 Q2 Holdings Inc 59 0.03
2 QuinStreet Inc 44 0.03
6 Quotient Technology Inc 75 0.04
2 Revolve Group Inc 90 0.05
- RF Industries Ltd 2 -
10 Ribbon Communications Inc 74 0.04
1 Saga Communications Inc 14 0.01
2 Scholastic Corp 65 0.04
1 SharpSpring Inc 7 -
3 Shenandoah Telecommunications Co 127 0.07
2 Shutterstock Inc 166 0.10
2 Spok Holdings Inc 26 0.01
1 Stamps.com Inc 181 0.10
3 Stitch Fix Inc 154 0.09
5 Switch Inc 85 0.05
2 TechTarget Inc 131 0.08
9 TEGNA Inc 179 0.10
6 Telephone & Data Systems Inc 156 0.09
1 TESSCO Technologies Inc 8 -
1 Travelzoo 24 0.01
6 TripAdvisor Inc 263 0.15
7 TrueCar Inc 44 0.03
1 Tucows Inc 49 0.03
2 United States Cellular Corp 86 0.05
3 Upwork Inc 127 0.07
- Value Line Inc 3 -
1 ViaSat Inc 60 0.03
11 Viavi Solutions Inc 187 0.11
11 Vonage Holdings Corp 156 0.09
2 World Wrestling Entertainment Inc 122 0.07
4 Yelp Inc 164 0.09
6 Zix Corp 39 0.02
8,712 4.99
Consumer, Cyclical - 16.76%
6 Abercrombie & Fitch Co 237 0.14
6 Acushnet Holdings Corp 299 0.17
2 ADDvantage Technologies Group Inc 4 -
Shares (000's)
Value(000's)
USD
% of NetAssetValue
Common Stock (continued)
Consumer, Cyclical - 16.76% (continued)
4 Adient PLC 217 0.12
1 Allegiant Travel Co 257 0.15
5 Allison Transmission Holdings Inc 212 0.12
1 A-Mark Precious Metals Inc 49 0.03
10 American Axle & Manufacturing Holdings Inc 111 0.06
13 American Eagle Outfitters Inc 477 0.27
- America's Car-Mart Inc 83 0.05
1 AMREP Corp 15 0.01
- Ark Restaurants Corp 2 -
1 Asbury Automotive Group Inc 290 0.17
2 Aspen Aerogels Inc 42 0.02
5 At Home Group Inc 198 0.11
4 AutoNation Inc 399 0.23
4 Avid Bioservices Inc 81 0.05
3 Avient Corp 174 0.10
2 Bally's Corp 110 0.06
8 Barnes & Noble Education Inc 62 0.04
1 Bassett Furniture Industries Inc 41 0.02
1 BBQ Holdings Inc 20 0.01
4 Beacon Roofing Supply Inc 233 0.13
2 Beazer Homes USA Inc 42 0.02
6 Bed Bath & Beyond Inc 164 0.09
2 Big 5 Sporting Goods Corp 73 0.04
2 Big Lots Inc 143 0.08
- Biglari Holdings Inc, Class A 16 0.01
- Biglari Holdings Inc, Class B 32 0.02
2 BJ's Restaurants Inc 92 0.05
6 BJ's Wholesale Club Holdings Inc 269 0.15
6 Bloomin' Brands Inc 170 0.10
2 Blue Bird Corp 56 0.03
2 Bluegreen Vacations Holding Corp 33 0.02
1 BlueLinx Holdings Inc 61 0.03
2 Boot Barn Holdings Inc 170 0.10
4 Boyd Gaming Corp 249 0.14
3 Brinker International Inc 165 0.09
- Brunswick Corp 7 -
3 Buckle Inc 110 0.06
3 Caleres Inc 71 0.04
5 Callaway Golf Co 193 0.11
1 Camping World Holdings Inc 54 0.03
3 Cannae Holdings Inc 116 0.07
2 Capri Holdings Ltd 95 0.05
5 Carrols Restaurant Group Inc 27 0.02
2 Carter's Inc 199 0.11
2 Cato Corp 30 0.02
- Cavco Industries Inc 101 0.06
1 Century Casinos Inc 21 0.01
2 Century Communities Inc 186 0.11
2 Cheesecake Factory Inc 124 0.07
9 Chico's FAS Inc 41 0.02
1 Children's Place Inc 113 0.06
2 Choice Hotels International Inc 185 0.11
1 Chuy's Holdings Inc 51 0.03
7 Cinemark Holdings Inc 152 0.09
1 Citi Trends Inc 76 0.04
2 Clarus Corp 55 0.03
1 Columbia Sportswear Co 54 0.03
3 Commercial Vehicle Group Inc 34 0.02
3 Conn's Inc 59 0.03
5 Container Store Group Inc 64 0.04
4 Cooper Tire & Rubber Co 218 0.12
2 Cooper-Standard Holdings Inc 50 0.03
U.S. Small Companies FundPortfolio of Investments as at 31 May 2021 (continued)
Dimensional Fund Advisors Semi-Annual Report and Unaudited Financial Statements, 31 May 2021 357

Shares (000's)
Value(000's)
USD
% of NetAssetValue
Common Stock (continued)
Consumer, Cyclical - 16.76% (continued)
1 Copa Holdings SA 62 0.04
3 Core-Mark Holding Co Inc 121 0.07
1 Cracker Barrel Old Country Store Inc 168 0.10
3 Crocs Inc 339 0.19
2 Culp Inc 26 0.01
6 Daktronics Inc 43 0.02
8 Dana Inc 217 0.12
2 Dave & Buster's Entertainment Inc 100 0.06
3 Del Taco Restaurants Inc 36 0.02
- Delta Apparel Inc 12 0.01
4 Denny's Corp 70 0.04
5 Designer Brands Inc 94 0.05
3 Dick's Sporting Goods Inc 274 0.16
1 Dillard's Inc 89 0.05
2 Dorman Products Inc 158 0.09
1 Douglas Dynamics Inc 52 0.03
2 Dover Motorsports Inc 4 -
3 Duluth Holdings Inc 45 0.03
3 El Pollo Loco Holdings Inc 58 0.03
1 Escalade Inc 24 0.01
2 Ethan Allen Interiors Inc 60 0.03
6 Everi Holdings Inc 122 0.07
- EVI Industries Inc 9 0.01
4 Express Inc 16 0.01
11 Extended Stay America Inc 221 0.13
3 Fiesta Restaurant Group Inc 37 0.02
3 FirstCash Inc 209 0.12
1 Flexsteel Industries Inc 45 0.03
4 Foot Locker Inc 267 0.15
2 Forestar Group Inc 48 0.03
4 Fossil Group Inc 52 0.03
2 Fox Factory Holding Corp 359 0.21
3 Funko Inc 79 0.05
1 Gaia Inc 16 0.01
1 Genesco Inc 82 0.05
2 Gentherm Inc 142 0.08
3 G-III Apparel Group Ltd 113 0.06
2 GMS Inc 110 0.06
12 Goodyear Tire & Rubber Co 230 0.13
3 Green Brick Partners Inc 74 0.04
1 Group 1 Automotive Inc 203 0.12
2 GrowGeneration Corp 77 0.04
4 Guess? Inc 121 0.07
3 H&E Equipment Services Inc 96 0.06
1 Hamilton Beach Brands Holding Co 30 0.02
5 Hanesbrands Inc 90 0.05
3 Harley-Davidson Inc 128 0.07
2 Haverty Furniture Cos Inc 74 0.04
3 Hawaiian Holdings Inc 75 0.04
4 Healthcare Services Group Inc 128 0.07
4 Herman Miller Inc 172 0.10
1 Hibbett Sports Inc 115 0.07
4 Hilton Grand Vacations Inc 169 0.10
3 HNI Corp 115 0.07
1 Hooker Furniture Corp 37 0.02
3 IMAX Corp 61 0.04
1 Installed Building Products Inc 160 0.09
5 Interface Inc 87 0.05
4 International Game Technology PLC 88 0.05
2 iRobot Corp 154 0.09
2 J Alexander's Holdings Inc 28 0.02
1 Jack in the Box Inc 149 0.09
Shares (000's)
Value(000's)
USD
% of NetAssetValue
Common Stock (continued)
Consumer, Cyclical - 16.76% (continued)
1 Johnson Outdoors Inc 87 0.05
6 KAR Auction Services Inc 110 0.06
5 KB Home 219 0.13
3 Kimball International Inc 43 0.02
4 Knoll Inc 100 0.06
2 Kohl's Corp 132 0.08
3 Kontoor Brands Inc 196 0.11
1 Lakeland Industries Inc 27 0.02
3 La-Z-Boy Inc 119 0.07
1 LCI Industries 211 0.12
2 Leggett & Platt Inc 91 0.05
1 LGI Homes Inc 214 0.12
1 Liberty Media Corp-Liberty Braves, Class A 28 0.02
2 Liberty Media Corp-Liberty Braves, Class C 64 0.04
6 Liberty TripAdvisor Holdings Inc 28 0.02
2 Lifetime Brands Inc 30 0.02
3 Lindblad Expeditions Holdings Inc 52 0.03
5 Lions Gate Entertainment Corp, Class A 95 0.05
7 Lions Gate Entertainment Corp, Class B 127 0.07
1 LoveSac Co 77 0.04
2 Lumber Liquidators Holdings Inc 56 0.03
3 M/I Homes Inc 193 0.11
3 Macy's Inc 51 0.03
1 Malibu Boats Inc 114 0.07
3 Manitex International Inc 20 0.01
2 Marcus Corp 37 0.02
2 MarineMax Inc 100 0.06
2 Marriott Vacations Worldwide Corp 318 0.18
1 MasterCraft Boat Holdings Inc 33 0.02
4 Mattel Inc 87 0.05
4 MDC Holdings Inc 227 0.13
2 Meritage Homes Corp 265 0.15
5 Meritor Inc 120 0.07
2 Mesa Air Group Inc 17 0.01
3 Methode Electronics Inc 124 0.07
1 Miller Industries Inc 51 0.03
5 Modine Manufacturing Co 93 0.05
2 Motorcar Parts of America Inc 44 0.03
1 Movado Group Inc 33 0.02
2 MSC Industrial Direct Co Inc 178 0.10
3 National Vision Holdings Inc 137 0.08
3 Nautilus Inc 51 0.03
3 Navistar International Corp 116 0.07
3 Noodles & Co 45 0.03
3 Nu Skin Enterprises Inc 166 0.10
3 ODP Corp 141 0.08
2 Ollie's Bargain Outlet Holdings Inc 151 0.09
4 OneSpaWorld Holdings Ltd 42 0.02
1 OptimizeRx Corp 53 0.03
1 Oxford Industries Inc 100 0.06
2 Papa John's International Inc 197 0.11
1 PC Connection Inc 73 0.04
4 Penske Automotive Group Inc 354 0.20
2 PetMed Express Inc 51 0.03
- Planet Fitness Inc 3 -
6 Playa Hotels & Resorts NV 45 0.03
3 Potbelly Corp 23 0.01
2 PriceSmart Inc 152 0.09
3 Purple Innovation Inc 89 0.05
- PVH Corp 38 0.02
16 Qurate Retail Inc 215 0.12
1 RCI Hospitality Holdings Inc 66 0.04
U.S. Small Companies FundPortfolio of Investments as at 31 May 2021 (continued)
Dimensional Fund Advisors Semi-Annual Report and Unaudited Financial Statements, 31 May 2021 358

Shares (000's)
Value(000's)
USD
% of NetAssetValue
Common Stock (continued)
Consumer, Cyclical - 16.76% (continued)
4 Reading International Inc 23 0.01
1 Red Robin Gourmet Burgers Inc 44 0.03
4 Red Rock Resorts Inc 174 0.10
3 Regis Corp 25 0.01
6 Resideo Technologies Inc 186 0.11
4 REV Group Inc 77 0.04
3 Rite Aid Corp 59 0.03
1 Rocky Brands Inc 44 0.03
4 Rush Enterprises Inc 168 0.10
1 Rush Enterprises Inc, Class B 33 0.02
3 Ruth's Hospitality Group Inc 63 0.04
6 Sally Beauty Holdings Inc 131 0.08
2 ScanSource Inc 51 0.03
4 Scientific Games Corp 274 0.16
4 SeaWorld Entertainment Inc 221 0.13
2 Shake Shack Inc 143 0.08
1 Shoe Carnival Inc 80 0.05
3 Shyft Group Inc 116 0.07
3 Signet Jewelers Ltd 153 0.09
- SiteOne Landscape Supply Inc 68 0.04
- Skechers U.S.A. Inc 18 0.01
3 Skyline Champion Corp 141 0.08
3 SkyWest Inc 167 0.10
2 Sleep Number Corp 223 0.13
1 Sonic Automotive Inc 63 0.04
6 Sonos Inc 231 0.13
6 Spirit Airlines Inc 198 0.11
3 Sportsman's Warehouse Holdings Inc 60 0.03
1 Standard Motor Products Inc 63 0.04
6 Steelcase Inc 89 0.05
5 Steven Madden Ltd 208 0.12
2 Superior Group of Cos Inc 40 0.02
3 Systemax Inc 87 0.05
7 Taylor Morrison Home Corp 214 0.12
8 Tempur Sealy International Inc 314 0.18
5 Tenneco Inc 75 0.04
2 Texas Roadhouse Inc 251 0.14
- Thor Industries Inc 62 0.04
3 Tilly's Inc 35 0.02
6 Titan International Inc 57 0.03
1 Titan Machinery Inc 43 0.02
3 Travel + Leisure Co 186 0.11
1 TravelCenters of America Inc 23 0.01
8 TRI Pointe Group Inc 187 0.11
5 Triton International Ltd 281 0.16
3 Tupperware Brands Corp 82 0.05
2 Unifi Inc 43 0.02
1 UniFirst Corp 195 0.11
9 Univar Solutions Inc 237 0.14
1 Universal Electronics Inc 63 0.04
4 Urban Outfitters Inc 164 0.09
1 Veoneer Inc 15 0.01
2 Vera Bradley Inc 27 0.02
1 Veritiv Corp 75 0.04
- Vince Holding Corp 5 -
4 Vista Outdoor Inc 162 0.09
2 Visteon Corp 197 0.11
3 VOXX International Corp 51 0.03
1 VSE Corp 45 0.03
4 Wabash National Corp 59 0.03
9 Wendy's Co 214 0.12
3 WESCO International Inc 316 0.18
Shares (000's)
Value(000's)
USD
% of NetAssetValue
Common Stock (continued)
Consumer, Cyclical - 16.76% (continued)
1 Weyco Group Inc 17 0.01
2 Wingstop Inc 228 0.13
- Winmark Corp 66 0.04
2 Winnebago Industries Inc 143 0.08
3 Wolverine World Wide Inc 103 0.06
3 World Fuel Services Corp 96 0.06
2 YETI Holdings Inc 142 0.08
1 Zumiez Inc 66 0.04
29,253 16.76
Consumer, Non-cyclical - 19.35%
5 22nd Century Group Inc 22 0.01
2 2U Inc 66 0.04
2 Aaron's Holdings Co Inc 79 0.05
6 Abeona Therapeutics Inc 10 0.01
4 ABM Industries Inc 200 0.11
3 Acacia Research Corp 17 0.01
8 Acadia Healthcare Co Inc 513 0.29
9 ACCO Brands Corp 78 0.04
9 Accuray Inc 38 0.02
14 Achillion Pharmaceuticals Inc 20 0.01
1 Acme United Corp 26 0.01
1 Addus HomeCare Corp 100 0.06
10 ADMA Biologics Inc 17 0.01
5 Adtalem Global Education Inc 166 0.10
3 Aduro Biotech Inc - -
5 Adverum Biotechnologies Inc 18 0.01
4 Aeglea BioTherapeutics Inc 27 0.02
1 Agios Pharmaceuticals Inc 29 0.02
11 Akebia Therapeutics Inc 37 0.02
1 Albireo Pharma Inc 41 0.02
3 Aldeyra Therapeutics Inc 38 0.02
1 Alector Inc 26 0.01
1 Alico Inc 22 0.01
6 Alkermes PLC 140 0.08
2 Alpha Pro Tech Ltd 14 0.01
2 American Public Education Inc 49 0.03
3 AMN Healthcare Services Inc 275 0.16
10 Amneal Pharmaceuticals Inc 58 0.03
3 Amphastar Pharmaceuticals Inc 65 0.04
2 AnaptysBio Inc 53 0.03
3 Andersons Inc 92 0.05
4 AngioDynamics Inc 89 0.05
1 ANI Pharmaceuticals Inc 33 0.02
1 Anika Therapeutics Inc 45 0.03
11 Antares Pharma Inc 44 0.03
1 Apollo Medical Holdings Inc 37 0.02
2 Applied Genetic Technologies Corp 9 0.01
5 Aptinyx Inc 13 0.01
2 Apyx Medical Corp 17 0.01
2 Aravive Inc 12 0.01
8 Ardelyx Inc 59 0.03
3 Arena Pharmaceuticals Inc 207 0.12
10 Arlo Technologies Inc 67 0.04
1 Arvinas Inc 103 0.06
3 ASGN Inc 302 0.17
2 Aspen Group Inc 12 0.01
3 Assembly Biosciences Inc 14 0.01
4 Atara Biotherapeutics Inc 55 0.03
4 Athenex Inc 21 0.01
2 Atreca Inc 21 0.01
3 AtriCure Inc 248 0.14
- Atrion Corp 81 0.05
U.S. Small Companies FundPortfolio of Investments as at 31 May 2021 (continued)
Dimensional Fund Advisors Semi-Annual Report and Unaudited Financial Statements, 31 May 2021 359

Shares (000's)
Value(000's)
USD
% of NetAssetValue
Common Stock (continued)
Consumer, Non-cyclical - 19.35% (continued)
3 Avanos Medical Inc 124 0.07
5 Avis Budget Group Inc 480 0.28
1 Avrobio Inc 8 -
4 Axcella Health Inc 13 0.01
3 Axogen Inc 64 0.04
1 Axonics Inc 60 0.03
4 B&G Foods Inc 111 0.06
1 Barrett Business Services Inc 65 0.04
1 BGSF Inc 16 0.01
- Bioceres Crop Solutions Corp 1 -
10 BioDelivery Sciences International Inc 34 0.02
1 BioLife Solutions Inc 29 0.02
3 Bluebird Bio Inc 86 0.05
- Bridgford Foods Corp 7 -
4 BrightView Holdings Inc 68 0.04
2 Brink's Co 148 0.08
13 Brookdale Senior Living Inc 86 0.05
2 CAI International Inc 66 0.04
1 Calavo Growers Inc 76 0.04
7 Calithera Biosciences Inc 15 0.01
3 Cal-Maine Foods Inc 90 0.05
1 Calyxt Inc 6 -
3 Cantel Medical Corp 205 0.12
2 Cardiovascular Systems Inc 79 0.05
3 Cardtronics PLC 123 0.07
1 CareDx Inc 67 0.04
2 Carriage Services Inc 69 0.04
3 CASI Pharmaceuticals Inc 5 -
1 Cass Information Systems Inc 55 0.03
- Castle Biosciences Inc 17 0.01
4 Catabasis Pharmaceuticals Inc 8 -
2 Catalyst Biosciences Inc 8 -
8 Catalyst Pharmaceuticals Inc 46 0.03
4 CBIZ Inc 128 0.07
2 Celldex Therapeutics Inc 46 0.03
3 Celsius Holdings Inc 192 0.11
3 Central Garden & Pet Co (non-voting rights) 130 0.07
1 Central Garden & Pet Co (voting rights) 42 0.02
3 Chefs' Warehouse Inc 79 0.05
- ChemoCentryx Inc 3 -
3 Chiasma Inc 14 0.01
7 Chimerix Inc 55 0.03
2 Cimpress PLC 157 0.09
1 Civeo Corp 18 0.01
2 Clementia Pharmaceuticals Inc - -
- Coca-Cola Consolidated Inc 176 0.10
2 Collegium Pharmaceutical Inc 54 0.03
8 Community Health Systems Inc 111 0.06
2 Computer Task Group Inc 18 0.01
3 Concert Pharmaceuticals Inc 13 0.01
2 CONMED Corp 271 0.16
8 Corcept Therapeutics Inc 174 0.10
4 CoreLogic Inc 340 0.19
1 CorVel Corp 158 0.09
2 Corvus Pharmaceuticals Inc 5 -
4 Coty Inc 34 0.02
8 Covetrus Inc 232 0.13
1 CRA International Inc 64 0.04
1 Crinetics Pharmaceuticals Inc 23 0.01
3 Cross Country Healthcare Inc 50 0.03
3 CryoLife Inc 81 0.05
2 Cutera Inc 62 0.04
Shares (000's)
Value(000's)
USD
% of NetAssetValue
Common Stock (continued)
Consumer, Non-cyclical - 19.35% (continued)
4 Cyclerion Therapeutics Inc 11 0.01
5 Cymabay Therapeutics Inc 20 0.01
3 CytomX Therapeutics Inc 20 0.01
1 Darling Ingredients Inc 48 0.03
2 Deciphera Pharmaceuticals Inc 51 0.03
2 Deluxe Corp 104 0.06
15 Durect Corp 25 0.01
3 Dyadic International Inc 11 0.01
1 Eagle Pharmaceuticals Inc 41 0.02
3 Edgewell Personal Care Co 134 0.08
3 Editas Medicine Inc 113 0.06
2 Eiger BioPharmaceuticals Inc 14 0.01
7 Elanco Animal Health Inc (non-voting rights) - -
3 elf Beauty Inc 96 0.06
4 Emerald Holding Inc 24 0.01
3 Emergent BioSolutions Inc 177 0.10
1 Enanta Pharmaceuticals Inc 53 0.03
13 Endo International PLC 78 0.04
3 Energizer Holdings Inc 153 0.09
1 Eneti Inc 16 0.01
2 Ennis Inc 49 0.03
4 Ensign Group Inc 329 0.19
2 Envista Holdings Corp 76 0.04
6 Enzo Biochem Inc 20 0.01
3 Epizyme Inc 23 0.01
3 Evelo Biosciences Inc 36 0.02
4 Evertec Inc 172 0.10
3 Evo Payments Inc 75 0.04
2 Farmer Brothers Co 28 0.02
1 FibroGen Inc 22 0.01
4 Five Star Senior Living Inc 24 0.01
11 Flowers Foods Inc 276 0.16
1 FONAR Corp 13 0.01
2 Forrester Research Inc 71 0.04
1 Franklin Covey Co 30 0.02
1 Frequency Therapeutics Inc 6 -
2 Fresh Del Monte Produce Inc 80 0.05
2 FTI Consulting Inc 271 0.16
1 Fulcrum Therapeutics Inc 8 -
1 Fulgent Genetics Inc 84 0.05
3 G1 Therapeutics Inc 60 0.03
2 Genasys Inc 10 0.01
1 Glaukos Corp 83 0.05
1 Global Blood Therapeutics Inc 50 0.03
2 GlycoMimetics Inc 6 -
2 GP Strategies Corp 31 0.02
- Graham Holdings Co 136 0.08
2 Grand Canyon Education Inc 200 0.11
3 Green Dot Corp 112 0.06
4 GreenSky Inc 23 0.01
2 Gritstone Oncology Inc 15 0.01
4 Grocery Outlet Holding Corp 145 0.08
7 H&R Block Inc 173 0.10
2 Hackett Group Inc 40 0.02
1 Haemonetics Corp 73 0.04
5 Hain Celestial Group Inc 220 0.13
5 Halozyme Therapeutics Inc 197 0.11
3 Hanger Inc 66 0.04
1 Harrow Health Inc 6 -
6 Harvard Bioscience Inc 42 0.02
1 HealthEquity Inc 114 0.07
2 Heidrick & Struggles International Inc 65 0.04
U.S. Small Companies FundPortfolio of Investments as at 31 May 2021 (continued)
Dimensional Fund Advisors Semi-Annual Report and Unaudited Financial Statements, 31 May 2021 360

Shares (000's)
Value(000's)
USD
% of NetAssetValue
Common Stock (continued)
Consumer, Non-cyclical - 19.35% (continued)
1 Helen of Troy Ltd 299 0.17
1 Herbalife Nutrition Ltd 63 0.04
2 Herc Holdings Inc 187 0.11
4 Heron Therapeutics Inc 47 0.03
- Heska Corp 98 0.06
4 Hill International Inc 10 0.01
1 Homology Medicines Inc 6 -
7 Hostess Brands Inc 104 0.06
- Hudson Global Inc 9 0.01
1 Huron Consulting Group Inc 69 0.04
1 ICF International Inc 86 0.05
1 ICU Medical Inc 239 0.14
5 ImmunityBio Inc 80 0.05
1 InfuSystem Holdings Inc 26 0.01
1 Ingles Markets Inc 74 0.04
3 Ingredion Inc 285 0.16
6 Innoviva Inc 82 0.05
1 Inogen Inc 79 0.05
2 Insperity Inc 178 0.10
2 Integer Holdings Corp 177 0.10
5 Integra LifeSciences Holdings Corp 319 0.18
4 Intellia Therapeutics Inc 317 0.18
2 Inter Parfums Inc 147 0.08
- Intra-Cellular Therapies Inc 19 0.01
4 Invacare Corp 28 0.02
1 iRadimed Corp 31 0.02
- IRIDEX Corp 4 -
8 Ironwood Pharmaceuticals Inc 96 0.06
3 Iteris Inc 21 0.01
4 IVERIC bio Inc 29 0.02
1 J&J Snack Foods Corp 170 0.10
1 John B Sanfilippo & Son Inc 59 0.03
3 John Wiley & Sons Inc, Class A 180 0.10
1 Joint Corp 71 0.04
4 Jounce Therapeutics Inc 32 0.02
4 Kadmon Holdings Inc 16 0.01
4 Kala Pharmaceuticals Inc 24 0.01
1 KalVista Pharmaceuticals Inc 31 0.02
1 Karuna Therapeutics Inc 62 0.04
3 Kelly Services Inc 74 0.04
1 Kforce Inc 82 0.05
5 Kindred Biosciences Inc 24 0.01
2 Kiniksa Pharmaceuticals Ltd 21 0.01
3 Korn Ferry 228 0.13
1 Krystal Biotech Inc 57 0.03
3 Kura Oncology Inc 76 0.04
1 Lancaster Colony Corp 250 0.14
3 Landec Corp 33 0.02
3 Lannett Co Inc 14 0.01
3 Lantheus Holdings Inc 80 0.05
1 Larimar Therapeutics Inc 5 -
6 Laureate Education Inc 90 0.05
2 LeMaitre Vascular Inc 88 0.05
1 Lexicon Pharmaceuticals Inc 3 -
- LHC Group Inc 43 0.02
2 Lifevantage Corp 17 0.01
2 Lifeway Foods Inc 12 0.01
1 Ligand Pharmaceuticals Inc 105 0.06
2 Limoneira Co 31 0.02
3 Lincoln Educational Services Corp 26 0.01
8 Lineage Cell Therapeutics 19 0.01
3 LivaNova PLC 242 0.14
Shares (000's)
Value(000's)
USD
% of NetAssetValue
Common Stock (continued)
Consumer, Non-cyclical - 19.35% (continued)
3 LiveRamp Holdings Inc 155 0.09
3 Luminex Corp 104 0.06
- Lumos Pharma Inc 4 -
5 Macquarie Infrastructure Corp 168 0.10
2 MacroGenics Inc 65 0.04
- Madrigal Pharmaceuticals Inc 52 0.03
2 Magellan Health Inc 147 0.08
3 Magenta Therapeutics Inc 40 0.02
1 Mannatech Inc 16 0.01
- ManpowerGroup Inc 26 0.01
3 Marine Products Corp 45 0.03
3 MediciNova Inc 15 0.01
1 Medifast Inc 270 0.15
6 MEDNAX Inc 186 0.11
2 Medpace Holdings Inc 311 0.18
1 MEI Pharma Inc 3 -
3 MeiraGTx Holdings PLC 37 0.02
4 Meridian Bioscience Inc 77 0.04
3 Merit Medical Systems Inc 187 0.11
1 Merrimack Pharmaceuticals Inc 10 0.01
1 Mersana Therapeutics Inc 16 0.01
1 MGP Ingredients Inc 67 0.04
1 Milestone Pharmaceuticals Inc 9 0.01
6 Minerva Neurosciences Inc 17 0.01
1 ModivCare Inc 116 0.07
6 MoneyGram International Inc 63 0.04
2 Monro Inc 119 0.07
5 Mustang Bio Inc 15 0.01
4 Myriad Genetics Inc 123 0.07
1 Nabriva Therapeutics PLC 1 -
1 NanoString Technologies Inc 35 0.02
1 Nathan's Famous Inc 36 0.02
2 National Beverage Corp 110 0.06
1 National HealthCare Corp 56 0.03
2 National Research Corp 76 0.04
2 Natural Alternatives International Inc 25 0.01
2 Natural Grocers by Vitamin Cottage Inc 23 0.01
- Natural Health Trends Corp 2 -
2 Nature's Sunshine Products Inc 45 0.03
2 Natus Medical Inc 60 0.03
10 Nektar Therapeutics 172 0.10
3 Neogen Corp 270 0.15
5 NeoGenomics Inc 187 0.11
1 Nevro Corp 139 0.08
8 NewAge Inc 19 0.01
2 NextCure Inc 13 0.01
3 NGM Biopharmaceuticals Inc 48 0.03
3 NuVasive Inc 208 0.12
2 Omnicell Inc 330 0.19
21 OPKO Health Inc 81 0.05
6 Option Care Health Inc 109 0.06
5 OraSure Technologies Inc 46 0.03
1 Orthofix Medical Inc 58 0.03
1 OrthoPediatrics Corp 65 0.04
3 Osmotica Pharmaceuticals PLC 10 0.01
7 Otonomy Inc 17 0.01
5 Owens & Minor Inc 233 0.13
3 Pacira BioSciences Inc 157 0.09
7 Patterson Cos Inc 233 0.13
14 PDL BioPharma Inc 35 0.02
3 Pennant Group Inc 91 0.05
5 Perdoceo Education Corp 60 0.03
U.S. Small Companies FundPortfolio of Investments as at 31 May 2021 (continued)
Dimensional Fund Advisors Semi-Annual Report and Unaudited Financial Statements, 31 May 2021 361

Shares (000's)
Value(000's)
USD
% of NetAssetValue
Common Stock (continued)
Consumer, Non-cyclical - 19.35% (continued)
1 Performance Food Group Co 29 0.02
2 Perrigo Co PLC 74 0.04
3 Personalis Inc 66 0.04
1 PetIQ Inc 60 0.03
2 Pfenex Inc 2 -
2 PFSweb Inc 18 0.01
2 Phibro Animal Health Corp 67 0.04
7 Pilgrim's Pride Corp 179 0.10
6 Premier Inc 213 0.12
3 Prestige Consumer Healthcare Inc 153 0.09
3 Progenics Pharmaceuticals Inc - -
1 Progyny Inc 82 0.05
- ProPhase Labs Inc - -
2 Protagonist Therapeutics Inc 87 0.05
4 Prothena Corp PLC 118 0.07
1 Psychemedics Corp 5 -
- PTC Therapeutics Inc 13 0.01
2 Quad/Graphics Inc 7 -
3 Quanex Building Products Corp 76 0.04
2 Quanterix Corp 99 0.06
7 R1 RCM Inc 153 0.09
4 RadNet Inc 105 0.06
1 RAPT Therapeutics Inc 11 0.01
1 RCM Technologies Inc 2 -
2 REGENXBIO Inc 78 0.04
4 Rent-A-Center Inc 227 0.13
1 Replimune Group Inc 19 0.01
2 Resources Connection Inc 31 0.02
3 Retractable Technologies Inc 24 0.01
- Revance Therapeutics Inc 10 0.01
2 Rhythm Pharmaceuticals Inc 31 0.02
3 Rigel Pharmaceuticals Inc 12 0.01
2 Rocket Pharmaceuticals Inc 85 0.05
1 Rocky Mountain Chocolate Factory Inc 8 -
10 RR Donnelley & Sons Co 63 0.04
1 Sage Therapeutics Inc 102 0.06
1 Sanderson Farms Inc 188 0.11
7 Sangamo Therapeutics Inc 77 0.04
5 Savara Inc 10 0.01
1 Scpharmaceuticals Inc 8 -
- Seaboard Corp 147 0.08
3 SEACOR Marine Holdings Inc 14 0.01
2 SeaSpine Holdings Corp 43 0.02
9 Select Medical Holdings Corp 369 0.21
1 Seneca Foods Corp 37 0.02
- Seneca Foods Corp, Class B 9 0.01
4 ServiceSource International Inc 4 -
2 Shockwave Medical Inc 289 0.17
1 ShotSpotter Inc 46 0.03
1 SI-BONE Inc 27 0.02
6 SIGA Technologies Inc 44 0.03
4 Simply Good Foods Co 140 0.08
7 Sio Gene Therapies Inc 15 0.01
2 SP Plus Corp 67 0.04
3 SpartanNash Co 57 0.03
2 Spectrum Brands Holdings Inc 185 0.11
10 Spectrum Pharmaceuticals Inc 34 0.02
2 Spero Therapeutics Inc 34 0.02
6 Sprouts Farmers Market Inc 166 0.10
2 STAAR Surgical Co 276 0.16
- Star Equity Holdings Inc 1 -
3 Stereotaxis Inc 24 0.01
Shares (000's)
Value(000's)
USD
% of NetAssetValue
Common Stock (continued)
Consumer, Non-cyclical - 19.35% (continued)
1 Stoke Therapeutics Inc 30 0.02
1 Strategic Education Inc 55 0.03
3 Stride Inc 74 0.04
2 Strongbridge Biopharma PLC 6 -
4 Supernus Pharmaceuticals Inc 106 0.06
3 Surface Oncology Inc 30 0.02
9 Surgalign Holdings Inc 18 0.01
6 Surgery Partners Inc 338 0.19
1 Surmodics Inc 67 0.04
2 Sutro Biopharma Inc 30 0.02
3 Syndax Pharmaceuticals Inc 62 0.04
2 Synlogic Inc 8 -
1 Tactile Systems Technology Inc 49 0.03
1 Taro Pharmaceutical Industries Ltd 84 0.05
2 TCR2 Therapeutics Inc 29 0.02
3 Team Inc 21 0.01
2 Tejon Ranch Co 34 0.02
7 Tenet Healthcare Corp 439 0.25
1 Terminix Global Holdings Inc 33 0.02
4 Textainer Group Holdings Ltd 143 0.08
3 Tivity Health Inc 88 0.05
2 Tootsie Roll Industries Inc 64 0.04
2 Transmedics Group Inc 51 0.03
3 Travere Therapeutics Inc 50 0.03
3 TreeHouse Foods Inc 154 0.09
3 TriNet Group Inc 215 0.12
1 Triple-S Management Corp 37 0.02
3 TrueBlue Inc 80 0.05
1 Turning Point Brands Inc 51 0.03
3 United Natural Foods Inc 123 0.07
1 United-Guardian Inc 13 0.01
1 Universal Corp 74 0.04
2 Universal Technical Institute Inc 15 0.01
1 US Physical Therapy Inc 115 0.07
2 USANA Health Sciences Inc 162 0.09
1 Utah Medical Products Inc 46 0.03
4 Vanda Pharmaceuticals Inc 68 0.04
1 Vapotherm Inc 18 0.01
3 Varex Imaging Corp 65 0.04
9 Vector Group Ltd 121 0.07
1 Vectrus Inc 57 0.03
3 Veracyte Inc 127 0.07
7 Verastem Inc 25 0.01
3 Vericel Corp 142 0.08
6 Veru Inc 52 0.03
2 Viad Corp 73 0.04
13 ViewRay Inc 74 0.04
6 Viking Therapeutics Inc 31 0.02
1 Village Super Market Inc 25 0.01
1 Voyager Therapeutics Inc 4 -
2 WaVe Life Sciences Ltd 11 0.01
1 WD-40 Co 162 0.09
2 Weis Markets Inc 83 0.05
1 Willdan Group Inc 40 0.02
3 WW International Inc 130 0.07
1 X4 Pharmaceuticals Inc 7 -
3 Xencor Inc 123 0.07
1 Xenon Pharmaceuticals Inc 11 0.01
1 ZIOPHARM Oncology Inc 3 -
U.S. Small Companies FundPortfolio of Investments as at 31 May 2021 (continued)
Dimensional Fund Advisors Semi-Annual Report and Unaudited Financial Statements, 31 May 2021 362

Shares (000's)
Value(000's)
USD
% of NetAssetValue
Common Stock (continued)
Consumer, Non-cyclical - 19.35% (continued)
3 Zogenix Inc 55 0.03
2 Zynerba Pharmaceuticals Inc 9 0.01
33,756 19.35
Energy - 4.59%
- Adams Resources & Energy Inc 12 0.01
1 Alpha Metallurgical Resources 22 0.01
7 Alto Ingredients Inc 47 0.03
25 Antero Midstream Corp 237 0.14
21 Antero Resources Corp 276 0.16
- APA Corp 6 -
1 Arch Resources Inc 68 0.04
13 Archrock Inc 122 0.07
4 Atlantica Yield PLC 153 0.09
7 Berry Corp 46 0.03
2 Bonanza Creek Energy Inc 77 0.04
1 Broadwind Energy Inc 3 -
3 Callon Petroleum Co 111 0.06
13 Centennial Resource Development Inc 70 0.04
1 Centrus Energy Corp 16 0.01
6 ChampionX Corp 158 0.09
5 Cimarex Energy Co 355 0.20
19 Clean Energy Fuels Corp 153 0.09
12 CNX Resources Corp 160 0.09
12 Comstock Resources Inc 66 0.04
3 CONSOL Energy Inc 48 0.03
3 Core Laboratories NV 124 0.07
4 CVR Energy Inc 86 0.05
3 Dawson Geophysical Co 8 -
4 Delek US Holdings Inc 94 0.05
- Denbury Inc 14 0.01
1 DMC Global Inc 78 0.05
3 Dril-Quip Inc 84 0.05
3 Earthstone Energy Inc 32 0.02
28 EnLink Midstream LLC 137 0.08
14 EQT Corp 285 0.16
23 Equitrans Midstream Corp 187 0.11
5 Evolution Petroleum Corp 18 0.01
4 Exterran Corp 18 0.01
20 Frank's International NV 67 0.04
2 FuelCell Energy Inc 23 0.01
3 FutureFuel Corp 27 0.02
2 Green Plains Inc 75 0.04
13 Helix Energy Solutions Group Inc 70 0.04
5 Helmerich & Payne Inc 147 0.08
6 HollyFrontier Corp 194 0.11
- Independence Contract Drilling Inc 1 -
- KLX Energy Services Holdings Inc 5 -
28 Kosmos Energy Ltd 89 0.05
1 Laredo Petroleum Inc 55 0.03
5 Liberty Oilfield Services Inc 76 0.04
9 Magnolia Oil & Gas Corp 112 0.06
1 Mammoth Energy Services Inc 4 -
11 Marathon Oil Corp 131 0.08
8 Matador Resources Co 235 0.13
2 Matrix Service Co 25 0.01
8 MRC Global Inc 87 0.05
8 Murphy Oil Corp 170 0.10
2 Murphy USA Inc 220 0.13
1 Nabors Industries Ltd 57 0.03
1 NACCO Industries Inc 15 0.01
2 Natural Gas Services Group Inc 20 0.01
10 Newpark Resources Inc 33 0.02
Shares (000's)
Value(000's)
USD
% of NetAssetValue
Common Stock (continued)
Energy - 4.59% (continued)
3 NextDecade Corp 5 -
12 NexTier Oilfield Solutions Inc 50 0.03
6 NOV Inc 104 0.06
8 NOW Inc 86 0.05
- Oasis Petroleum Inc 14 0.01
8 Oceaneering International Inc 107 0.06
5 Oil States International Inc 33 0.02
4 Par Pacific Holdings Inc 60 0.03
17 Patterson-UTI Energy Inc 138 0.08
5 PBF Energy Inc 86 0.05
6 PDC Energy Inc 272 0.16
8 Peabody Energy Corp 56 0.03
1 Penn Virginia Corp 26 0.02
2 PHX Minerals Inc 7 -
9 ProPetro Holding Corp 89 0.05
14 Range Resources Corp 188 0.11
2 Renewable Energy Group Inc 136 0.08
1 REX American Resources Corp 49 0.03
12 RPC Inc 59 0.03
3 SandRidge Energy Inc 16 0.01
6 Select Energy Services Inc 31 0.02
1 SilverBow Resources Inc 12 0.01
9 SM Energy Co 175 0.10
2 Smart Sand Inc 4 -
3 Solaris Oilfield Infrastructure Inc 29 0.02
42 Southwestern Energy Co 216 0.12
6 SunCoke Energy Inc 48 0.03
5 Sunnova Energy International Inc 131 0.08
4 Talos Energy Inc 53 0.03
4 TechnipFMC PLC 33 0.02
3 Thermon Group Holdings Inc 54 0.03
2 TPI Composites Inc 106 0.06
25 Transocean Ltd 95 0.05
3 Trecora Resources 28 0.02
5 US Silica Holdings Inc 48 0.03
3 Warrior Met Coal Inc 55 0.03
8,008 4.59
Financial - 21.00%
2 1st Source Corp 83 0.05
1 ACNB Corp 14 0.01
2 Affiliated Managers Group Inc 392 0.22
5 Air Lease Corp 233 0.13
1 Alerus Financial Corp 18 0.01
1 Allegiance Bancshares Inc 57 0.03
1 Alliance Data Systems Corp 135 0.08
1 Altabancorp 61 0.04
3 Ambac Financial Group Inc 47 0.03
8 American Equity Investment Life Holding Co 251 0.14
1 American National Bankshares Inc 27 0.02
1 American National Group Inc 193 0.11
5 Ameris Bancorp 267 0.15
2 AMERISAFE Inc 111 0.06
5 AmeriServ Financial Inc 19 0.01
- Ames National Corp 4 -
2 Argo Group International Holdings Ltd 89 0.05
1 Arrow Financial Corp 51 0.03
2 Artisan Partners Asset Management Inc 127 0.07
3 Assetmark Financial Holdings Inc 69 0.04
8 Associated Banc-Corp 180 0.10
4 Assured Guaranty Ltd 201 0.12
2 Atlantic Capital Bancshares Inc 59 0.03
6 Atlantic Union Bankshares Corp 233 0.13
U.S. Small Companies FundPortfolio of Investments as at 31 May 2021 (continued)
Dimensional Fund Advisors Semi-Annual Report and Unaudited Financial Statements, 31 May 2021 363

Shares (000's)
Value(000's)
USD
% of NetAssetValue
Common Stock (continued)
Financial - 21.00% (continued)
3 Atlanticus Holdings Corp 103 0.06
4 Axis Capital Holdings Ltd 206 0.12
5 Axos Financial Inc 236 0.14
3 Banc of California Inc 59 0.03
3 BancFirst Corp 178 0.10
6 Bancorp Inc 141 0.08
7 BancorpSouth Bank 206 0.12
2 Bank of Hawaii Corp 217 0.12
1 Bank of Marin Bancorp 42 0.02
3 Bank of NT Butterfield & Son Ltd 129 0.07
6 Bank OZK 248 0.14
2 BankFinancial Corp 23 0.01
5 BankUnited Inc 240 0.14
- Bankwell Financial Group Inc 8 -
3 Banner Corp 147 0.08
1 Bar Harbor Bankshares 35 0.02
- BayCom Corp 8 -
2 BBX Capital Inc 12 0.01
1 BCB Bancorp Inc 9 0.01
3 Berkshire Hills Bancorp Inc 88 0.05
22 BGC Partners Inc 130 0.07
5 Blucora Inc 83 0.05
4 BOK Financial Corp 345 0.20
6 Boston Private Financial Holdings Inc 91 0.05
2 Bridgewater Bancshares Inc 35 0.02
4 Brighthouse Financial Inc 173 0.10
4 Brightsphere Investment Group Inc 99 0.06
5 Brookline Bancorp Inc 83 0.05
2 Bryn Mawr Bank Corp 88 0.05
1 Business First Bancshares Inc 17 0.01
3 Byline Bancorp Inc 64 0.04
- C&F Financial Corp 9 0.01
8 Cadence BanCorp 170 0.10
1 Cambridge Bancorp 51 0.03
1 Camden National Corp 58 0.03
1 Capital City Bank Group Inc 34 0.02
8 Capitol Federal Financial Inc 101 0.06
2 Capstar Financial Holdings Inc 34 0.02
5 Cathay General Bancorp 208 0.12
2 CBTX Inc 51 0.03
2 Central Pacific Financial Corp 47 0.03
1 Central Valley Community Bancorp 21 0.01
- Century Bancorp Inc 34 0.02
- Chemung Financial Corp 19 0.01
2 CIT Group Inc 110 0.06
1 Citizens & Northern Corp 26 0.01
1 Citizens Community Bancorp Inc 15 0.01
4 Citizens Inc 22 0.01
1 City Holding Co 109 0.06
1 Civista Bancshares Inc 19 0.01
1 CNB Financial Corp 29 0.02
3 Cohen & Steers Inc 192 0.11
4 Columbia Banking System Inc 171 0.10
4 Columbia Financial Inc 68 0.04
2 Community Bank System Inc 175 0.10
- Community Bankers Trust Corp 3 -
2 Community Trust Bancorp Inc 69 0.04
3 ConnectOne Bancorp Inc 89 0.05
2 Consumer Portfolio Services Inc 10 0.01
2 Cowen Inc 71 0.04
4 Crawford & Co, Class A 35 0.02
4 Crawford & Co, Class B 33 0.02
Shares (000's)
Value(000's)
USD
% of NetAssetValue
Common Stock (continued)
Financial - 21.00% (continued)
3 CrossFirst Bankshares Inc 41 0.02
- Cullen/Frost Bankers Inc 40 0.02
3 Curo Group Holdings Corp 44 0.03
8 Cushman & Wakefield PLC 156 0.09
2 Customers Bancorp Inc 75 0.04
8 CVB Financial Corp 181 0.10
- Diamond Hill Investment Group Inc 66 0.04
3 Dime Community Bancshares Inc 110 0.06
2 Donegal Group Inc 36 0.02
3 Eagle Bancorp Inc 189 0.11
1 Eagle Bancorp Montana Inc 12 0.01
2 East West Bancorp Inc 121 0.07
1 eHealth Inc 77 0.04
4 Elevate Credit Inc 13 0.01
3 Employers Holdings Inc 105 0.06
2 Encore Capital Group Inc 96 0.06
3 Enova International Inc 119 0.07
1 Enstar Group Ltd 272 0.16
- Enterprise Bancorp Inc 14 0.01
2 Enterprise Financial Services Corp 83 0.05
1 Equity Bancshares Inc 39 0.02
- Esquire Financial Holdings Inc 10 0.01
1 ESSA Bancorp Inc 16 0.01
4 Essent Group Ltd 210 0.12
2 Evercore Inc 303 0.17
2 eXp World Holdings Inc 80 0.05
5 EZCORP Inc 35 0.02
1 Farmers & Merchants Bancorp Inc 16 0.01
2 Farmers National Banc Corp 36 0.02
2 FB Financial Corp 96 0.06
1 Federal Agricultural Mortgage Corp 87 0.05
6 Federated Investors Inc 193 0.11
2 FedNat Holding Co 10 0.01
1 Financial Institutions Inc 48 0.03
- First American Financial Corp 31 0.02
2 First Bancorp 74 0.04
14 First Bancorp (Puerto Rico listing) 174 0.10
1 First Bancorp Inc 34 0.02
1 First Bancshares Inc 49 0.03
4 First Busey Corp 101 0.06
- First Business Financial Services Inc 13 0.01
- First Citizens BancShares Inc 179 0.10
5 First Commonwealth Financial Corp 74 0.04
2 First Community Bankshares Inc 52 0.03
6 First Financial Bancorp 158 0.09
5 First Financial Bankshares Inc 241 0.14
1 First Financial Corp 41 0.02
1 First Financial Northwest Inc 20 0.01
4 First Foundation Inc 93 0.05
5 First Hawaiian Inc 140 0.08
1 First Internet Bancorp 34 0.02
3 First Interstate BancSystem Inc 122 0.07
3 First Merchants Corp 137 0.08
1 First Mid Bancshares Inc 62 0.04
7 First Midwest Bancorp Inc 149 0.09
2 First of Long Island Corp 45 0.03
4 Five Point Holdings LLC 32 0.02
4 Flagstar Bancorp Inc 172 0.10
3 Flushing Financial Corp 59 0.03
11 FNB Corp 142 0.08
1 FRP Holdings Inc 47 0.03
1 FS Bancorp Inc 38 0.02
U.S. Small Companies FundPortfolio of Investments as at 31 May 2021 (continued)
Dimensional Fund Advisors Semi-Annual Report and Unaudited Financial Statements, 31 May 2021 364

Shares (000's)
Value(000's)
USD
% of NetAssetValue
Common Stock (continued)
Financial - 21.00% (continued)
9 Fulton Financial Corp 147 0.08
1 GAMCO Investors Inc 33 0.02
4 Genworth Financial Inc 16 0.01
2 German American Bancorp Inc 100 0.06
5 Glacier Bancorp Inc 286 0.16
1 Global Indemnity Group LLC 40 0.02
1 Great Southern Bancorp Inc 69 0.04
3 Great Western Bancorp Inc 108 0.06
2 Greenhill & Co Inc 34 0.02
3 Greenlight Capital Re Ltd 27 0.02
1 Guaranty Bancshares Inc 34 0.02
1 Hallmark Financial Services Inc 6 -
1 Hamilton Lane Inc 119 0.07
5 Hancock Whitney Corp 259 0.15
3 Hanmi Financial Corp 61 0.04
1 Hanover Insurance Group Inc 169 0.10
3 HarborOne Bancorp Inc 39 0.02
1 HBT Financial Inc 24 0.01
1 HCI Group Inc 68 0.04
2 Heartland Financial USA Inc 88 0.05
3 Heritage Commerce Corp 41 0.02
3 Heritage Financial Corp 81 0.05
3 Heritage Insurance Holdings Inc 24 0.01
5 Hilltop Holdings Inc 177 0.10
- Hingham Institution for Savings 66 0.04
1 Home Bancorp Inc 33 0.02
9 Home BancShares Inc 259 0.15
2 HomeStreet Inc 89 0.05
1 HomeTrust Bancshares Inc 29 0.02
8 Hope Bancorp Inc 119 0.07
2 Horace Mann Educators Corp 90 0.05
4 Horizon Bancorp Inc 65 0.04
2 Houlihan Lokey Inc 176 0.10
1 Howard Bancorp Inc 9 0.01
- Howard Hughes Corp 44 0.03
1 I3 Verticals Inc 29 0.02
2 Independence Holding Co 80 0.05
2 Independent Bank Corp (Massachusetts) 146 0.08
1 Independent Bank Corp (Michigan) 34 0.02
2 Independent Bank Group Inc 175 0.10
4 International Bancshares Corp 189 0.11
10 Invesco Ltd 275 0.16
1 Investar Holding Corp 11 0.01
12 Investors Bancorp Inc 183 0.10
- Investors Title Co 26 0.01
2 James River Group Holdings Ltd 55 0.03
6 Janus Henderson Group PLC 247 0.14
1 Jefferies Financial Group Inc 32 0.02
3 Kearny Financial Corp 42 0.02
4 Kemper Corp 272 0.16
7 Kennedy-Wilson Holdings Inc 137 0.08
1 Kingstone Cos Inc 10 0.01
1 Kinsale Capital Group Inc 173 0.10
4 Lakeland Bancorp Inc 82 0.05
2 Lakeland Financial Corp 102 0.06
5 Lazard Ltd 218 0.12
2 Legacy Housing Corp 28 0.02
4 LendingClub Corp 66 0.04
- LendingTree Inc 83 0.05
3 Live Oak Bancshares Inc 196 0.11
2 Luther Burbank Corp 28 0.02
5 Macatawa Bank Corp 47 0.03
Shares (000's)
Value(000's)
USD
% of NetAssetValue
Common Stock (continued)
Financial - 21.00% (continued)
17 Maiden Holdings Ltd 61 0.04
3 Manning & Napier Inc 26 0.01
2 Marcus & Millichap Inc 89 0.05
2 Marlin Business Services Corp 42 0.02
1 Maui Land & Pineapple Co Inc 11 0.01
5 MBIA Inc 53 0.03
1 McGrath RentCorp 120 0.07
1 Mercantile Bank Corp 47 0.03
1 Merchants Bancorp 62 0.04
3 Mercury General Corp 159 0.09
6 Meridian Bancorp Inc 129 0.07
3 Meta Financial Group Inc 137 0.08
1 Metropolitan Bank Holding Corp 41 0.02
13 MGIC Investment Corp 197 0.11
2 Midland States Bancorp Inc 52 0.03
1 MidWestOne Financial Group Inc 31 0.02
3 Moelis & Co 170 0.10
5 Mr Cooper Group Inc 172 0.10
- MVB Financial Corp 19 0.01
2 National Bank Holdings Corp 86 0.05
- National Western Life Group Inc 48 0.03
14 Navient Corp 263 0.15
3 NBT Bancorp Inc 105 0.06
2 Nelnet Inc 117 0.07
17 New York Community Bancorp Inc 206 0.12
8 Newmark Group Inc 100 0.06
8 NewStar Financial Inc CVR 1 -
1 Nicolet Bankshares Inc 60 0.03
4 NMI Holdings Inc 105 0.06
1 Northeast Bank 24 0.01
3 Northfield Bancorp Inc 59 0.03
1 Northrim BanCorp Inc 30 0.02
7 Northwest Bancshares Inc 93 0.05
3 OceanFirst Financial Corp 69 0.04
1 Ocwen Financial Corp 23 0.01
3 OFG Bancorp 77 0.04
8 Old National Bancorp 160 0.09
1 Old Republic International Corp 33 0.02
3 Old Second Bancorp Inc 36 0.02
3 OneMain Holdings Inc 201 0.12
1 Oppenheimer Holdings Inc 63 0.04
1 Origin Bancorp Inc 63 0.04
2 Pacific Mercantile Bancorp 20 0.01
6 Pacific Premier Bancorp Inc 267 0.15
5 PacWest Bancorp 232 0.13
1 Palomar Holdings Inc 98 0.06
1 Park National Corp 119 0.07
2 PCSB Financial Corp 32 0.02
2 Peapack Gladstone Financial Corp 59 0.03
1 Penns Woods Bancorp Inc 18 0.01
2 Peoples Bancorp Inc 66 0.04
1 Peoples Financial Services Corp 22 0.01
2 People's United Financial Inc 39 0.02
4 Pinnacle Financial Partners Inc 371 0.21
1 Piper Jaffray Cos 127 0.07
1 PJT Partners Inc 89 0.05
3 Popular Inc 232 0.13
3 PRA Group Inc 105 0.06
1 Preferred Bank 97 0.06
1 Premier Financial Bancorp Inc 25 0.01
2 Premier Financial Corp 55 0.03
2 Primerica Inc 304 0.17
U.S. Small Companies FundPortfolio of Investments as at 31 May 2021 (continued)
Dimensional Fund Advisors Semi-Annual Report and Unaudited Financial Statements, 31 May 2021 365

Shares (000's)
Value(000's)
USD
% of NetAssetValue
Common Stock (continued)
Financial - 21.00% (continued)
2 Primis Financial Corp 32 0.02
2 ProAssurance Corp 59 0.03
4 PROG Holdings Inc 198 0.11
3 Protective Insurance Corp 61 0.04
5 Provident Financial Services Inc 130 0.07
2 Pzena Investment Management Inc 26 0.01
1 QCR Holdings Inc 66 0.04
8 Radian Group Inc 175 0.10
1 Rafael Holdings Inc 75 0.04
1 RBB Bancorp 34 0.02
1 RE/MAX Holdings Inc 50 0.03
6 Realogy Holdings Corp 109 0.06
- Red River Bancshares Inc 16 0.01
1 Redfin Corp 83 0.05
1 Regional Management Corp 46 0.03
1 Reliant Bancorp Inc 21 0.01
3 Renasant Corp 116 0.07
2 Republic Bancorp Inc 77 0.04
4 Republic First Bancorp Inc 16 0.01
3 Riverview Bancorp Inc 18 0.01
3 RLI Corp 263 0.15
1 RMR Group Inc 37 0.02
2 S&T Bancorp Inc 57 0.03
- Safeguard Scientifics Inc 3 -
1 Safety Insurance Group Inc 75 0.04
3 Sandy Spring Bancorp Inc 130 0.07
3 Seacoast Banking Corp of Florida 114 0.07
3 Selective Insurance Group Inc 233 0.13
3 ServisFirst Bancshares Inc 230 0.13
1 Sierra Bancorp 36 0.02
6 Simmons First National Corp 186 0.11
4 SiriusPoint Ltd 46 0.03
14 SLM Corp 279 0.16
1 SmartFinancial Inc 31 0.02
3 South State Corp 225 0.13
1 Southern First Bancshares Inc 40 0.02
1 Southern Missouri Bancorp Inc 38 0.02
2 Southside Bancshares Inc 84 0.05
3 St Joe Co 157 0.09
4 State Auto Financial Corp 75 0.04
10 Sterling Bancorp 277 0.16
2 Sterling Bancorp Inc 11 0.01
2 Stewart Information Services Corp 116 0.07
6 Stifel Financial Corp 396 0.23
1 Stock Yards Bancorp Inc 71 0.04
2 StoneX Group Inc 105 0.06
1 Stratus Properties Inc 14 0.01
- Summit Financial Group Inc 11 0.01
8 Synovus Financial Corp 416 0.24
9 TCF Financial Corp 408 0.23
1 Territorial Bancorp Inc 37 0.02
3 Texas Capital Bancshares Inc 195 0.11
5 TFS Financial Corp 107 0.06
1 Timberland Bancorp Inc 29 0.02
3 Tiptree Inc 36 0.02
1 Tompkins Financial Corp 73 0.04
4 Towne Bank 123 0.07
1 TriCo Bancshares 69 0.04
3 TriState Capital Holdings Inc 79 0.05
2 Triumph Bancorp Inc 131 0.08
- Trupanion Inc 12 0.01
2 TrustCo Bank Corp NY 78 0.04
Shares (000's)
Value(000's)
USD
% of NetAssetValue
Common Stock (continued)
Financial - 21.00% (continued)
4 Trustmark Corp 141 0.08
2 UMB Financial Corp 235 0.13
13 Umpqua Holdings Corp 251 0.14
5 United Bankshares Inc 207 0.12
5 United Community Banks Inc 158 0.09
2 United Fire Group Inc 48 0.03
5 United Insurance Holdings Corp 25 0.01
3 United Security Bancshares 25 0.01
3 Universal Insurance Holdings Inc 38 0.02
3 Univest Financial Corp 79 0.05
4 Unum Group 128 0.07
20 Valley National Bancorp 284 0.16
2 Veritex Holdings Inc 59 0.03
5 Virtu Financial Inc 140 0.08
- Virtus Investment Partners Inc 134 0.08
2 Walker & Dunlop Inc 200 0.11
3 Washington Federal Inc 114 0.07
2 Washington Trust Bancorp Inc 90 0.05
3 Waterstone Financial Inc 52 0.03
3 Webster Financial Corp 190 0.11
3 WesBanco Inc 130 0.07
2 West Bancorporation Inc 60 0.03
2 Westamerica Bancorporation 104 0.06
3 Western Alliance Bancorp 265 0.15
5 Western New England Bancorp Inc 39 0.02
- Westwood Holdings Group Inc 8 -
- White Mountains Insurance Group Ltd 204 0.12
3 Wintrust Financial Corp 260 0.15
15 WisdomTree Investments Inc 97 0.06
1 World Acceptance Corp 93 0.05
3 WSFS Financial Corp 143 0.08
36,643 21.00
Industrial - 17.49%
2 AAON Inc 160 0.09
2 AAR Corp 91 0.05
2 Acuity Brands Inc 359 0.21
2 Advanced Drainage Systems Inc 275 0.16
1 Advanced Emissions Solutions Inc 6 -
2 Advanced Energy Industries Inc 203 0.12
1 AeroVironment Inc 138 0.08
- AGCO Corp 46 0.03
5 Air Transport Services Group Inc 134 0.08
1 Alamo Group Inc 158 0.09
2 Alarm.com Holdings Inc 199 0.11
3 Albany International Corp 236 0.14
1 Allied Motion Technologies Inc 43 0.02
1 Altra Industrial Motion Corp 86 0.05
1 American Outdoor Brands Inc 43 0.02
2 American Superconductor Corp 30 0.02
2 American Woodmark Corp 136 0.08
3 Ampco-Pittsburgh Corp 18 0.01
8 API Group Inc 164 0.09
2 Apogee Enterprises Inc 93 0.05
2 Applied Industrial Technologies Inc 211 0.12
1 Applied Optoelectronics Inc 9 0.01
2 ArcBest Corp 189 0.11
3 Arcosa Inc 196 0.11
4 Ardmore Shipping Corp 17 0.01
1 Argan Inc 54 0.03
2 Armstrong Flooring Inc 12 0.01
2 Armstrong World Industries Inc 238 0.14
1 Astec Industries Inc 87 0.05
U.S. Small Companies FundPortfolio of Investments as at 31 May 2021 (continued)
Dimensional Fund Advisors Semi-Annual Report and Unaudited Financial Statements, 31 May 2021 366

Shares (000's)
Value(000's)
USD
% of NetAssetValue
Common Stock (continued)
Industrial - 17.49% (continued)
2 Astronics Corp, Class A 34 0.02
1 Astronics Corp, Class B 9 0.01
4 Atkore International Group Inc 303 0.17
2 Atlas Air Worldwide Holdings Inc 172 0.10
2 Avnet Inc 90 0.05
5 Aware Inc 20 0.01
1 AZZ Inc 60 0.03
2 Badger Meter Inc 220 0.13
3 Ballantyne Strong Inc 15 0.01
3 Barnes Group Inc 180 0.10
2 Bel Fuse Inc 27 0.02
2 Belden Inc 123 0.07
2 Benchmark Electronics Inc 52 0.03
3 Boise Cascade Co 183 0.10
3 Brady Corp 182 0.10
- Bristow Group Inc 12 0.01
- Builders FirstSource Inc 15 0.01
5 BWX Technologies Inc 293 0.17
3 Cactus Inc 119 0.07
3 Casella Waste Systems Inc 184 0.11
4 CECO Environmental Corp 34 0.02
2 Chart Industries Inc 285 0.16
1 Chase Corp 74 0.04
2 CIRCOR International Inc 65 0.04
3 Clean Harbors Inc 264 0.15
1 Coherent Inc 350 0.20
3 Colfax Corp 146 0.08
2 Columbus McKinnon Corp 78 0.04
2 Comfort Systems USA Inc 190 0.11
2 Comtech Telecommunications Corp 53 0.03
2 Construction Partners Inc 72 0.04
1 Core Molding Technologies Inc 8 -
4 Cornerstone Building Brands Inc 63 0.04
5 Costamare Inc 49 0.03
8 Covanta Holding Corp 118 0.07
1 Covenant Transportation Group Inc 28 0.02
2 Crane Co 218 0.13
1 CSW Industrials Inc 111 0.06
2 Curtiss-Wright Corp 194 0.11
1 CyberOptics Corp 26 0.01
6 Daseke Inc 41 0.02
10 DHT Holdings Inc 66 0.04
3 Dorian LPG Ltd 40 0.02
1 Ducommun Inc 52 0.03
2 DXP Enterprises Inc 56 0.03
2 Dycom Industries Inc 149 0.09
1 Eagle Bulk Shipping Inc 58 0.03
2 Eagle Materials Inc 239 0.14
1 Eastern Co 17 0.01
2 Echo Global Logistics Inc 67 0.04
2 EMCOR Group Inc 191 0.11
1 Encore Wire Corp 111 0.06
4 Energy Recovery Inc 72 0.04
3 Enerpac Tool Group Corp 80 0.05
2 EnerSys 223 0.13
2 ENGlobal Corp 5 -
1 EnPro Industries Inc 108 0.06
1 ESCO Technologies Inc 132 0.08
- Espey Manufacturing & Electronics Corp 6 -
3 Exponent Inc 253 0.15
2 Fabrinet 203 0.12
1 FARO Technologies Inc 68 0.04
Shares (000's)
Value(000's)
USD
% of NetAssetValue
Common Stock (continued)
Industrial - 17.49% (continued)
4 Federal Signal Corp 165 0.09
17 Ferroglobe Representation & Warrants InsuranceTrust - -
2 Flowserve Corp 88 0.05
6 Fluidigm Corp 34 0.02
6 Fluor Corp 112 0.06
5 Forterra Inc 107 0.06
2 Forward Air Corp 166 0.10
2 Franklin Electric Co Inc 207 0.12
3 Frontdoor Inc 175 0.10
7 GasLog Ltd 41 0.02
6 Gates Industrial Corp PLC 105 0.06
2 GATX Corp 235 0.13
3 Genco Shipping & Trading Ltd 54 0.03
2 Gencor Industries Inc 26 0.02
2 Gibraltar Industries Inc 144 0.08
6 GoPro Inc 62 0.04
2 Gorman-Rupp Co 60 0.03
13 GrafTech International Ltd 171 0.10
1 Graham Corp 20 0.01
3 Granite Construction Inc 131 0.08
10 Graphic Packaging Holding Co 168 0.10
7 Great Lakes Dredge & Dock Corp 99 0.06
2 Greenbrier Cos Inc 100 0.06
2 Greif Inc (non-voting rights) 102 0.06
1 Greif Inc (voting rights) 55 0.03
3 Griffon Corp 91 0.05
5 Harsco Corp 107 0.06
1 Haynes International Inc 40 0.02
6 Heartland Express Inc 117 0.07
- HEICO Corp, Class A - -
2 Helios Technologies Inc 121 0.07
2 Heritage-Crystal Clean Inc 73 0.04
3 Hexcel Corp 148 0.08
3 Hillenbrand Inc 151 0.09
2 Hub Group Inc 148 0.08
1 Hurco Cos Inc 25 0.01
1 Hyster-Yale Materials Handling Inc 77 0.04
2 Ichor Holdings Ltd 86 0.05
1 Identiv Inc 17 0.01
1 IEC Electronics Corp 7 -
2 IES Holdings Inc 114 0.07
4 Innovative Solutions & Support Inc 21 0.01
2 Insteel Industries Inc 61 0.04
2 International Seaways Inc 49 0.03
5 Intevac Inc 33 0.02
1 IntriCon Corp 27 0.02
2 Itron Inc 200 0.11
- ITT Inc 32 0.02
2 Jabil Inc 103 0.06
5 JELD-WEN Holding Inc 148 0.08
2 John Bean Technologies Corp 265 0.15
1 Kadant Inc 107 0.06
7 KBR Inc 268 0.15
4 Kennametal Inc 161 0.09
3 Kimball Electronics Inc 59 0.03
1 Kirby Corp 83 0.05
4 Knowles Corp 91 0.05
6 Kratos Defense & Security Solutions Inc 139 0.08
1 Landstar System Inc 136 0.08
1 Lawson Products Inc 69 0.04
2 Lazare Kaplan International Inc - -
U.S. Small Companies FundPortfolio of Investments as at 31 May 2021 (continued)
Dimensional Fund Advisors Semi-Annual Report and Unaudited Financial Statements, 31 May 2021 367

Shares (000's)
Value(000's)
USD
% of NetAssetValue
Common Stock (continued)
Industrial - 17.49% (continued)
2 LB Foster Co 31 0.02
1 LENSAR Inc 9 0.01
- Lincoln Electric Holdings Inc 32 0.02
1 Lindsay Corp 90 0.05
1 Littelfuse Inc 163 0.09
5 Louisiana-Pacific Corp 320 0.18
- LS Starrett Co 4 -
4 LSB Industries Inc 27 0.02
3 LSI Industries Inc 28 0.02
3 Luna Innovations Inc 28 0.02
2 Lydall Inc 66 0.04
3 Manitowoc Co Inc 73 0.04
5 Marten Transport Ltd 83 0.05
1 Masonite International Corp 148 0.08
3 MasTec Inc 384 0.22
1 Materion Corp 80 0.05
3 Matson Inc 173 0.10
2 Matthews International Corp 69 0.04
4 MDU Resources Group Inc 139 0.08
2 Mercury Systems Inc 160 0.09
- Mesa Laboratories Inc 11 0.01
4 Mistras Group Inc 40 0.02
2 Moog Inc 160 0.09
1 MSA Safety Inc 236 0.14
4 Mueller Industries Inc 171 0.10
10 Mueller Water Products Inc 140 0.08
3 Myers Industries Inc 72 0.04
2 MYR Group Inc 137 0.08
2 Napco Security Technologies Inc 55 0.03
6 National Instruments Corp 251 0.14
5 NL Industries Inc 39 0.02
2 nLight Inc 67 0.04
4 NN Inc 27 0.02
10 Nordic American Tankers Ltd 36 0.02
1 Northwest Pipe Co 36 0.02
2 Novanta Inc 265 0.15
1 NV5 Global Inc 87 0.05
1 NVE Corp 35 0.02
6 nVent Electric PLC 183 0.10
8 O-I Glass Inc 144 0.08
1 Olympic Steel Inc 46 0.03
1 Omega Flex Inc 91 0.05
3 Orion Energy Systems Inc 17 0.01
5 Orion Group Holdings Inc 31 0.02
1 OSI Systems Inc 99 0.06
11 Overseas Shipholding Group Inc 26 0.02
1 PAM Transportation Services Inc 36 0.02
2 Park Aerospace Corp 28 0.02
1 Park-Ohio Holdings Corp 35 0.02
1 Patrick Industries Inc 107 0.06
- Patriot Transportation Holding Inc - -
4 PGT Innovations Inc 86 0.05
2 Plexus Corp 212 0.12
1 Powell Industries Inc 32 0.02
3 Primoris Services Corp 108 0.06
1 Proto Labs Inc 124 0.07
1 Pure Cycle Corp 11 0.01
5 Radiant Logistics Inc 41 0.02
3 Ranpak Holdings Corp 64 0.04
2 Raven Industries Inc 89 0.05
1 RBC Bearings Inc 184 0.11
2 Regal Beloit Corp 316 0.18
Shares (000's)
Value(000's)
USD
% of NetAssetValue
Common Stock (continued)
Industrial - 17.49% (continued)
7 Rexnord Corp 328 0.19
1 Ryder System Inc 58 0.03
5 Ryerson Holding Corp 77 0.04
2 Saia Inc 409 0.23
4 Sanmina Corp 181 0.10
2 Schneider National Inc 58 0.03
3 Scorpio Tankers Inc 74 0.04
2 Select Interior Concepts Inc 22 0.01
7 SFL Corp Ltd 58 0.03
1 Sharps Compliance Corp 14 0.01
1 SIFCO Industries Inc 10 0.01
6 Silgan Holdings Inc 239 0.14
3 Simpson Manufacturing Co Inc 321 0.18
2 SMART Global Holdings Inc 103 0.06
4 Smith & Wesson Brands Inc 79 0.05
- Sonoco Products Co 20 0.01
2 Spirit AeroSystems Holdings Inc 77 0.04
2 SPX Corp 150 0.09
2 SPX FLOW Inc 153 0.09
1 Standex International Corp 86 0.05
1 Stericycle Inc 55 0.03
3 Sterling Construction Co Inc 58 0.03
2 Stoneridge Inc 54 0.03
1 Strattec Security Corp 29 0.02
6 Summit Materials Inc 212 0.12
1 Synalloy Corp 9 0.01
1 SYNNEX Corp 72 0.04
10 Teekay Corp 35 0.02
2 Teekay Tankers Ltd 35 0.02
1 Tennant Co 84 0.05
4 Terex Corp 234 0.13
2 Tetra Tech Inc 264 0.15
2 Tidewater Inc 32 0.02
4 Timken Co 332 0.19
4 TimkenSteel Corp 62 0.04
1 TopBuild Corp 274 0.16
- Transcat Inc 24 0.01
3 Tredegar Corp 43 0.02
3 TriMas Corp 91 0.05
4 Trinity Industries Inc 117 0.07
2 Trinseo SA 154 0.09
5 TTM Technologies Inc 80 0.05
1 Turtle Beach Corp 41 0.02
5 Tutor Perini Corp 82 0.05
2 Twin Disc Inc 24 0.01
4 UFP Industries Inc 344 0.20
1 UFP Technologies Inc 26 0.02
1 Ultralife Corp 8 -
2 Universal Logistics Holdings Inc 50 0.03
1 US Concrete Inc 76 0.04
2 US Ecology Inc 72 0.04
3 US Xpress Enterprises Inc 30 0.02
2 USA Truck Inc 23 0.01
2 Valmont Industries Inc 374 0.21
1 Vicor Corp 100 0.06
8 Vishay Intertechnology Inc 188 0.11
1 Vishay Precision Group Inc 33 0.02
9 Vontier Corp 314 0.18
2 Watts Water Technologies Inc 213 0.12
8 Welbilt Inc 206 0.12
5 Werner Enterprises Inc 250 0.14
- Willis Lease Finance Corp 18 0.01
U.S. Small Companies FundPortfolio of Investments as at 31 May 2021 (continued)
Dimensional Fund Advisors Semi-Annual Report and Unaudited Financial Statements, 31 May 2021 368

Shares (000's)
Value(000's)
USD
% of NetAssetValue
Common Stock (continued)
Industrial - 17.49% (continued)
9 WillScot Mobile Mini Holdings Corp 269 0.15
- Woodward Inc 49 0.03
2 Worthington Industries Inc 153 0.09
5 Yellow Corp 31 0.02
30,511 17.49
Technology - 8.26%
3 3D Systems Corp 78 0.04
6 ACI Worldwide Inc 236 0.14
- ACM Research Inc 37 0.02
2 Agilysys Inc 86 0.05
4 Alithya Group Inc 7 -
12 Allscripts Healthcare Solutions Inc 217 0.12
2 Alpha & Omega Semiconductor Ltd 74 0.04
2 Altair Engineering Inc 120 0.07
2 Ambarella Inc 175 0.10
2 American Software Inc 40 0.02
15 Amkor Technology Inc 326 0.19
1 Appfolio Inc 104 0.06
1 AstroNova Inc 17 0.01
3 Asure Software Inc 22 0.01
6 Avaya Holdings Corp 165 0.09
5 Avid Technology Inc 152 0.09
3 Axcelis Technologies Inc 145 0.08
5 AXT Inc 50 0.03
3 Blackbaud Inc 182 0.10
- BM Technologies Inc 5 -
2 Bottomline Technologies DE Inc 83 0.05
8 Box Inc 187 0.11
3 Brightcove Inc 46 0.03
4 Brooks Automation Inc 375 0.22
2 BSQUARE Corp 4 -
1 CACI International Inc 347 0.20
4 Castlight Health Inc 7 -
1 CDK Global Inc 27 0.02
1 Cerence Inc 140 0.08
1 CEVA Inc 55 0.03
3 Cirrus Logic Inc 250 0.14
7 Cloudera Inc 92 0.05
2 CMC Materials Inc 250 0.14
3 Cognyte Software Ltd 67 0.04
2 Cohu Inc 80 0.05
2 CommVault Systems Inc 186 0.11
1 Computer Programs & Systems Inc 38 0.02
1 Concentrix Corp 87 0.05
16 Conduent Inc 118 0.07
6 Contra Zagg Inc 1 -
1 Cornerstone OnDemand Inc 53 0.03
3 CSG Systems International Inc 112 0.06
3 CTS Corp 106 0.06
2 Digi International Inc 46 0.03
4 Digital Turbine Inc 240 0.14
3 Diodes Inc 257 0.15
3 Donnelley Financial Solutions Inc 92 0.05
2 DSP Group Inc 34 0.02
2 Ebix Inc 61 0.04
2 eGain Corp 25 0.01
4 eMagin Corp 15 0.01
3 EMCORE Corp 25 0.01
3 Envestnet Inc 195 0.11
5 Evolent Health Inc 101 0.06
2 ExlService Holdings Inc 180 0.10
2 ExOne Co 35 0.02
Shares (000's)
Value(000's)
USD
% of NetAssetValue
Common Stock (continued)
Technology - 8.26% (continued)
5 FormFactor Inc 166 0.10
4 GSI Technology Inc 24 0.01
3 Health Catalyst Inc 135 0.08
3 Immersion Corp 25 0.01
1 Impinj Inc 76 0.04
4 Inovalon Holdings Inc 116 0.07
2 Insight Enterprises Inc 217 0.12
1 Intelligent Systems Corp 18 0.01
2 j2 Global Inc 239 0.14
1 Key Tronic Corp 9 0.01
4 Kulicke & Soffa Industries Inc 208 0.12
7 Lattice Semiconductor Corp 378 0.22
- Lumentum Holdings Inc 27 0.02
4 MACOM Technology Solutions Holdings Inc 218 0.13
3 MagnaChip Semiconductor Corp 69 0.04
1 ManTech International Corp 90 0.05
1 Mastech Digital Inc 21 0.01
3 MAXIMUS Inc 275 0.16
3 MaxLinear Inc 108 0.06
1 MicroStrategy Inc 243 0.14
4 Mitek Systems Inc 62 0.04
6 NCR Corp 302 0.17
3 NetScout Systems Inc 101 0.06
2 NetSol Technologies Inc 8 -
2 Network-1 Technologies Inc 7 -
1 New Relic Inc 88 0.05
4 NextGen Healthcare Inc 66 0.04
2 OneSpan Inc 58 0.03
2 Onto Innovation Inc 174 0.10
2 PagerDuty Inc 64 0.04
1 PAR Technology Corp 66 0.04
1 Paysign Inc 4 -
3 PDF Solutions Inc 46 0.03
4 Photronics Inc 56 0.03
3 Ping Identity Holding Corp 64 0.04
10 Pitney Bowes Inc 86 0.05
7 Pixelworks Inc 23 0.01
3 PlayAGS Inc 31 0.02
3 Power Integrations Inc 250 0.14
2 Progress Software Corp 111 0.06
11 Pure Storage Inc 211 0.12
1 QAD Inc, Class A 81 0.05
- QAD Inc, Class B 21 0.01
2 Qualys Inc 177 0.10
5 Rambus Inc 107 0.06
1 Red Violet Inc 22 0.01
5 Rimini Street Inc 32 0.02
2 SailPoint Technologies Holding Inc 114 0.07
3 Sapiens International Corp NV (US listing) 79 0.05
3 Science Applications International Corp 245 0.14
1 Sciplay Corp 26 0.02
3 Semtech Corp 181 0.10
- Silicon Laboratories Inc 34 0.02
4 Smith Micro Software Inc 22 0.01
2 SPS Commerce Inc 154 0.09
3 StarTek Inc 18 0.01
3 Stratasys Ltd 78 0.04
1 Super Micro Computer Inc 39 0.02
3 SVMK Inc 57 0.03
2 Sykes Enterprises Inc 90 0.05
2 Synaptics Inc 217 0.12
4 Synchronoss Technologies Inc 10 0.01
U.S. Small Companies FundPortfolio of Investments as at 31 May 2021 (continued)
Dimensional Fund Advisors Semi-Annual Report and Unaudited Financial Statements, 31 May 2021 369

Shares (000's)
Value(000's)
USD
% of NetAssetValue
Common Stock (continued)
Technology - 8.26% (continued)
1 Tabula Rasa HealthCare Inc 52 0.03
5 Teradata Corp 256 0.15
3 TTEC Holdings Inc 317 0.18
2 Ultra Clean Holdings Inc 123 0.07
4 Unisys Corp 101 0.06
2 Upland Software Inc 67 0.04
3 Veeco Instruments Inc 70 0.04
2 Verint Systems Inc 102 0.06
8 Verra Mobility Corp 121 0.07
2 Vocera Communications Inc 59 0.03
15 W&T Offshore Inc 57 0.03
1 Wayside Technology Group Inc 32 0.02
10 Xerox Holdings Corp 231 0.13
10 Xperi Holding Corp 205 0.12
1 Zedge Inc 10 0.01
5 Zovio Inc 11 0.01
14,413 8.26
Utilities - 2.59%
2 ALLETE Inc 157 0.09
2 Ameresco Inc 116 0.07
2 American States Water Co 190 0.11
1 Artesian Resources Corp 39 0.02
4 Avista Corp 188 0.11
2 Black Hills Corp 147 0.08
5 Brookfield Renewable Corp 194 0.11
3 California Water Service Group 177 0.10
1 Chesapeake Utilities Corp 119 0.07
2 Clearway Energy Inc, Class A 42 0.02
4 Clearway Energy Inc, Class C 98 0.06
2 Consolidated Water Co Ltd 19 0.01
5 Evoqua Water Technologies Corp 170 0.10
4 Genie Energy Ltd 26 0.02
4 Hawaiian Electric Industries Inc 183 0.10
3 IDACORP Inc 245 0.14
2 MGE Energy Inc 151 0.09
1 Middlesex Water Co 102 0.06
4 National Fuel Gas Co 201 0.12
Shares (000's)
Value(000's)
USD
% of NetAssetValue
Common Stock (continued)
Utilities - 2.59% (continued)
4 New Jersey Resources Corp 175 0.10
2 Northwest Natural Holding Co 79 0.05
3 NorthWestern Corp 188 0.11
2 ONE Gas Inc 184 0.11
3 Ormat Technologies Inc (US listing) 177 0.10
2 Otter Tail Corp 111 0.06
5 PNM Resources Inc 226 0.13
2 Portland General Electric Co 112 0.06
1 RGC Resources Inc 27 0.02
1 SJW Group 95 0.05
5 South Jersey Industries Inc 128 0.07
3 Southwest Gas Holdings Inc 179 0.10
2 Spire Inc 119 0.07
1 Unitil Corp 75 0.04
2 Vidler Water Resouces Inc 20 0.01
1 York Water Co 56 0.03
4,515 2.59
Total Common Stock - 99.58% (30 November2020: 100.22%) 173,743 99.58
Preferred Stock
Consumer, Cyclical - 0.10%
- Qurate Retail Inc 86 0.05
3 WESCO International Inc 91 0.05
177 0.10
Total Preferred Stock - 0.10% (30 November 2020: 0.10%) 177 0.10
Real Estate Investment Trust
Financial - 0.03%
- CTO Realty Growth Inc 11 0.01
1 Indus Realty Trust Inc 38 0.02
49 0.03
Total Real Estate Investment Trust - 0.03% (30 November2020: 0.00%) 49 0.03
Total Investments - 99.71% (30 November 2020: 100.32%) 173,969 99.71
Value (000's)USD
% of NetAssetValue
Cash and Cash Equivalents - 0.42% (30 November 2020: 0.23%) 728 0.42Other Liabilities in Excess of Other Assets - (0.13)% (30 November 2020: (0.55)%) (217) (0.13)
Total Net Assets 174,480 100.00
Amounts designated as “- “ are either $0, less than $500 or less than 500 shares.
Analysis of Total Assets % of Total Assets
Transferable securities admitted to an official exchange listing 99.14
Current Assets 0.86
Total Assets 100.00
U.S. Small Companies FundPortfolio of Investments as at 31 May 2021 (continued)
Dimensional Fund Advisors Semi-Annual Report and Unaudited Financial Statements, 31 May 2021 370

Shares (000's)
Value(000's)
GBP
% of NetAssetValue
Investment Funds
Ireland - 63.94%
69 Dimensional Funds plc - Global Core Equity Fund -GBP Distributing Class 2,012 2.00
1,759 Dimensional Funds plc - Global Short Fixed IncomeFund - GBP Distributing Class 18,027 17.95
1,590 Dimensional Funds plc - Global Short-TermInvestment Grade Fixed Income Fund - GBPDistributing Class 15,978 15.91
1,025 Dimensional Funds plc - Global Ultra Short FixedIncome Fund - GBP Distributing Class 10,019 9.98
690 Dimensional Funds plc - World Equity Fund - GBPDistributing Class 18,183 18.10
64,219 63.94
United Kingdom - 17.96%
1,696 Dimensional Funds ICVC - Global Short-Dated BondFund - GBP Income Class 18,044 17.96
18,044 17.96
Total Investment Funds - 81.90% (30 November2020: 81.76%) 82,263 81.90
Face Value(000's)
CouponRate %
MaturityDate
Value (000's)GBP
% of NetAssetValue
Corporate Bonds
Australia - 0.80%
450 National Australia Bank Ltd 5.125 09/12/2021 462 0.46
400 Westpac Banking Corp 0.250 17/01/2022 345 0.34
807 0.80
Austria - 0.45%
450 Oesterreichische KontrollbankAG 0.750 07/03/2022 452 0.45
452 0.45
Canada - 1.96%
425 Bank of Montreal 1.375 29/12/2021 428 0.43
350 Bank of Nova Scotia 1.900 02/12/2021 206 0.20
100 Bank of Nova Scotia 0.375 06/04/2022 86 0.09
400 Province of Quebec Canada 0.875 24/05/2022 403 0.40
700 Royal Bank of Canada 2.000 21/03/2022 414 0.41
500 Total Capital Canada Ltd 1.125 18/03/2022 435 0.43
1,972 1.96
Finland - 0.34%
200 Nordea Bank Abp 0.007 27/09/2021 172 0.17
200 Nordea Bank Abp 0.033 07/02/2022 173 0.17
345 0.34
France - 0.40%
400 Dexia Credit Local SA 0.875 07/09/2021 401 0.40
401 0.40
Germany - 1.83%
382 Deutsche Bahn Finance GMBH 2.750 20/06/2022 393 0.39
400 FMS Wertmanagement 0.329 14/01/2022 401 0.40
4,650 Kreditanstalt fuer Wiederaufbau 1.000 12/10/2021 393 0.39
100 Kreditanstalt fuer Wiederaufbau 0.875 15/03/2022 100 0.10
600 LandeskreditbankBaden-WuerttembergFoerderbank 0.313 27/09/2021 423 0.42
150 NRW Bank 0.000 01/02/2022 129 0.13
1,839 1.83
Luxembourg - 0.60%
200 Nestle Finance InternationalLtd 2.125 10/09/2021 173 0.17
500 Novartis Finance SA 0.750 09/11/2021 432 0.43
605 0.60
Face Value(000's)
CouponRate %
MaturityDate
Value (000's)GBP
% of NetAssetValue
Corporate Bonds (continued)
Netherlands - 1.23%
500 Allianz Finance II BV 3.500 14/02/2022 442 0.44
500 Cooperatieve Rabobank UA 4.000 11/01/2022 441 0.44
400 Shell International Finance BV 1.000 06/04/2022 348 0.35
1,231 1.23
New Zealand - 0.39%
450 ANZ New Zealand Int'l Ltd 0.625 01/06/2021 387 0.39
387 0.39
Norway - 0.44%
200 DNB Bank ASA 4.250 18/01/2022 177 0.18
300 DNB Bank ASA 0.211 25/07/2022 260 0.26
437 0.44
Singapore - 0.17%
200 Temasek Financial I Ltd 0.500 01/03/2022 173 0.17
173 0.17
Supranational - 3.04%
400 African Development Bank 0.875 20/12/2021 401 0.40
400 Asian Development Bank 0.310 01/02/2022 401 0.40
400 Council of EuropeDevelopment Bank 1.125 17/03/2022 403 0.40
450 European Bank forReconstruction & Development 0.309 18/01/2022 450 0.45
5,200 European Investment Bank 1.500 12/05/2022 443 0.44
500 International Finance Corp 0.299 18/01/2022 501 0.50
450 Nordic Investment Bank 0.625 02/11/2021 451 0.45
3,050 3.04
Sweden - 0.90%
400 Skandinaviska EnskildaBanken AB 0.300 17/02/2022 346 0.35
100 Skandinaviska EnskildaBanken AB 1.250 05/08/2022 101 0.10
450 Svenska Handelsbanken AB 2.375 18/01/2022 456 0.45
903 0.90
United States - 0.32%
235 Nestle Holdings Inc 1.000 11/06/2021 235 0.23
100 Procter & Gamble Co 2.000 05/11/2021 87 0.09
322 0.32
Total Corporate Bonds - 12.87% (30 November 2020: 12.90%) 12,924 12.87
Government Bonds
Canada - 1.64%
750 Canada Housing Trust No 1 0.538 15/09/2022 440 0.44
400 Export Development Canada 0.166 15/11/2021 400 0.40
400 Province of Alberta Canada 1.000 15/11/2021 401 0.40
400 Province of Manitoba Canada 0.750 15/12/2021 401 0.40
1,642 1.64
France - 1.07%
400 Bpifrance Financement SA 0.750 22/07/2022 402 0.40
400 SNCF Reseau 5.500 01/12/2021 410 0.41
300 Unedic Asseo 0.300 04/11/2021 259 0.26
1,071 1.07
Germany - 0.52%
140 Land Berlin 0.146 12/10/2022 121 0.12
400 State of NorthRhine-Westphalia Germany 0.145 29/10/2021 400 0.40
521 0.52
Netherlands - 0.60%
400 BNG Bank NV 1.000 15/03/2022 403 0.40
200 Nederlandse WaterschapsbankNV 0.875 20/12/2021 201 0.20
604 0.60
World Allocation 20/80 FundPortfolio of Investments as at 31 May 2021
Dimensional Fund Advisors Semi-Annual Report and Unaudited Financial Statements, 31 May 2021 371

Face Value(000's)
CouponRate %
MaturityDate
Value (000's)GBP
% of NetAssetValue
Government Bonds (continued)
Norway - 0.42%
5,000 Kommunalbanken AS 1.500 19/04/2022 425 0.42
425 0.42
Sweden - 0.42%
5,000 Kommuninvest I Sverige 1.000 15/09/2021 426 0.42
426 0.42
Face Value(000's)
CouponRate %
MaturityDate
Value (000's)GBP
% of NetAssetValue
Government Bonds (continued)
United States - 0.34%
340 Tennessee Valley Authority 5.350 07/06/2021 340 0.34
340 0.34
Total Government Bonds - 5.01% (30 November 2020: 4.86%) 5,029 5.01
Total Investments - 99.78% (30 November 2020: 99.52%) 100,216 99.78
Forward Currency Contracts
Buy Amount (000's) Sell Amount (000's) Counterparty Maturity Date
UnrealisedAppreciation/(Depreciation)
of Contracts (000's)GBP
% of NetAssetValue
Buy 128 EUR Sell 111 GBP State Street Bank 24/06/2021 (1) -
Buy 33,217 EUR Sell 28,775 GBP State Street Bank 24/06/2021 (221) (0.22)
Buy 40 EUR Sell 34 GBP State Street Bank 24/06/2021 - -
Buy 1,066 GBP Sell 1,821 CAD State Street Bank 16/06/2021 4 -
Buy 5,049 GBP Sell 5,842 EUR State Street Bank 29/06/2021 26 0.03
Buy 840 GBP Sell 9,758 NOK State Street Bank 18/06/2021 18 0.02
Buy 442 GBP Sell 5,257 NOK State Street Bank 18/06/2021 (1) -
Buy 431 GBP Sell 5,058 SEK State Street Bank 24/06/2021 2 -
Buy 425 GBP Sell 601 USD State Street Bank 18/06/2021 2 -
Buy 1,468 SGD Sell 781 GBP State Street Bank 24/06/2021 1 -
Buy 3,011 USD Sell 2,129 GBP State Street Bank 24/06/2021 (7) (0.01)
Unrealised Appreciation of Forward Currency Contracts 53 0.05
Unrealised Depreciation of Forward Currency Contracts (230) (0.23)
Net Unrealised Depreciation of Forward Currency Contracts - (0.18)% (30 November 2020: (0.11)%) (177) (0.18)
Value (000's)GBP
% of NetAssetValue
Cash and Cash Equivalents - 0.04% (30 November 2020: 0.21%) 37 0.04Other Assets in Excess of Other Liabilities - 0.36% (30 November 2020: 0.38%) 367 0.36
Total Net Assets 100,443 100.00
Amounts designated as “- “ are either £0 or less than £500.
Analysis of Total Assets % of Total Assets
Transferable securities admitted to an official exchange listing 17.40
Transferable securities dealt in on another regulated market 0.41
Investment Funds 81.60
OTC Financial derivative instruments 0.05
Current Assets 0.54
Total Assets 100.00
World Allocation 20/80 FundPortfolio of Investments as at 31 May 2021 (continued)
Dimensional Fund Advisors Semi-Annual Report and Unaudited Financial Statements, 31 May 2021 372

Shares (000's)
Value(000's)
GBP
% of NetAssetValue
Investment Funds
Ireland - 78.53%
4,538 Dimensional Funds plc - Global Core Equity Fund -GBP Distributing Class 132,284 16.04
1,602 Dimensional Funds plc - Global Core Fixed IncomeFund - GBP Distributing Class 16,289 1.97
14,444 Dimensional Funds plc - Global Short Fixed IncomeFund - GBP Distributing Class 148,049 17.95
9,801 Dimensional Funds plc - Global Short-TermInvestment Grade Fixed Income Fund - GBPDistributing Class 98,498 11.94
763 Dimensional Funds plc - Global Targeted ValueFund - GBP Distributing Class 21,253 2.58
8,426 Dimensional Funds plc - Global Ultra Short FixedIncome Fund - GBP Distributing Class 82,317 9.98
5,657 Dimensional Funds plc - World Equity Fund - GBPDistributing Class 149,013 18.07
647,703 78.53
Shares (000's)
Value(000's)
GBP
% of NetAssetValue
Investment Funds (continued)
United Kingdom - 21.22%
628 Dimensional Funds ICVC - Emerging Markets CoreEquity Fund - GBP Income Class 26,822 3.25
13,928 Dimensional Funds ICVC - Global Short-Dated BondFund - GBP Income Class 148,193 17.97
175,015 21.22
Total Investment Funds - 99.75% (30 November2020: 99.45%) 822,718 99.75
Total Investments - 99.75% (30 November 2020: 99.45%) 822,718 99.75
Forward Currency Contracts
Buy Amount (000's) Sell Amount (000's) Counterparty Maturity Date
UnrealisedDepreciation
of Contracts (000's)GBP
% of NetAssetValue
Buy 303 EUR Sell 263 GBP State Street Bank 24/06/2021 (2) -
Buy 46,318 EUR Sell 40,127 GBP State Street Bank 24/06/2021 (310) (0.04)
Buy 5,158 USD Sell 3,646 GBP State Street Bank 24/06/2021 (12) -
Unrealised Depreciation of Forward Currency Contracts (324) (0.04)
Net Unrealised Depreciation of Forward Currency Contracts - (0.04)% (30 November 2020: (0.02)%) (324) (0.04)
Value (000's)GBP
% of NetAssetValue
Cash and Cash Equivalents - 0.09% (30 November 2020: 0.18%) 724 0.09Other Assets in Excess of Other Liabilities - 0.20% (30 November 2020: 0.39%) 1,651 0.20
Total Net Assets 824,769 100.00
Amounts designated as “- “ are either £0 or less than £500.
Analysis of Total Assets % of Total Assets
Investment Funds 99.10
Current Assets 0.90
Total Assets 100.00
World Allocation 40/60 FundPortfolio of Investments as at 31 May 2021
Dimensional Fund Advisors Semi-Annual Report and Unaudited Financial Statements, 31 May 2021 373

Shares (000's)
Value(000's)
GBP
% of NetAssetValue
Investment Funds
Ireland - 34.78%
7,052 Dimensional Funds plc - Global Core Fixed IncomeFund - GBP Distributing Class 71,713 3.95
31,671 Dimensional Funds plc - Global Short Fixed IncomeFund - GBP Distributing Class 324,630 17.89
21,575 Dimensional Funds plc - Global Short-TermInvestment Grade Fixed Income Fund - GBPDistributing Class 216,829 11.95
1,835 Dimensional Funds plc - Global Ultra Short FixedIncome Fund - GBP Distributing Class 17,932 0.99
631,104 34.78
United Kingdom - 13.57%
3,651 Dimensional Funds ICVC - Emerging Markets CoreEquity Fund - GBP Income Class 155,807 8.59
8,488 Dimensional Funds ICVC - Global Short-Dated BondFund - GBP Income Class 90,314 4.98
246,121 13.57
Total Investment Funds - 48.35% (30 November2020: 99.50%) 877,225 48.35
Common Stock
Australia - 1.12%
14 Accent Group Ltd 21 -
4 Adairs Ltd 9 -
29 Adelaide Brighton Ltd 52 -
- Afterpay Touch Group Ltd 20 -
11 AGL Energy Ltd 48 -
23 ALS Ltd 154 0.01
3 Altium Ltd 43 -
59 Alumina Ltd 54 -
45 AMA Group Ltd 14 -
184 AMP Ltd 118 0.01
13 Ampol Ltd 202 0.01
6 Ansell Ltd 137 0.01
10 AP Eagers Ltd 86 0.01
21 APA Group 106 0.01
1 Appen Ltd 10 -
3 ARB Corp Ltd 61 -
4 Aristocrat Leisure Ltd 91 0.01
20 Asaleo Care Ltd 15 -
2 ASX Ltd 74 0.01
17 Atlas Arteria Ltd 57 -
2 AUB Group Ltd 19 -
65 Aurizon Holdings Ltd 128 0.01
40 AusNet Services 39 -
15 Austal Ltd 19 -
33 Australia & New Zealand Banking Group Ltd 515 0.03
14 Australian Agricultural Co Ltd 9 -
9 Australian Finance Group Ltd 13 -
22 Australian Pharmaceutical Industries Ltd 14 -
2 Auswide Bank Ltd 7 -
5 Baby Bunting Group Ltd 16 -
51 Bank of Queensland Ltd 252 0.01
18 Bapcor Ltd 77 0.01
147 Beach Energy Ltd 102 0.01
19 Bega Cheese Ltd 61 -
48 Bendigo & Adelaide Bank Ltd 276 0.02
51 BHP Group Ltd 1,343 0.07
12 Bingo Industries Ltd 22 -
- Blackmores Ltd 16 -
27 BlueScope Steel Ltd 316 0.02
61 Boral Ltd 229 0.01
28 Brambles Ltd 167 0.01
Shares (000's)
Value(000's)
GBP
% of NetAssetValue
Common Stock (continued)
Australia - 1.12% (continued)
11 Bravura Solutions Ltd 19 -
3 Breville Group Ltd 45 -
6 Brickworks Ltd 68 -
3 BWX Ltd 9 -
12 carsales.com Ltd 122 0.01
4 Cedar Woods Properties Ltd 15 -
50 Challenger Ltd 143 0.01
11 Champion Iron Ltd 39 -
2 CIMIC Group Ltd 26 -
3 City Chic Collective Ltd 8 -
111 Cleanaway Waste Management Ltd 167 0.01
1 Clinuvel Pharmaceuticals Ltd 18 -
1 Cochlear Ltd 133 0.01
4 Codan Ltd 44 -
19 Coles Group Ltd 173 0.01
6 Collins Foods Ltd 41 -
17 Commonwealth Bank of Australia 922 0.05
17 Computershare Ltd 150 0.01
39 Cooper Energy Ltd 6 -
3 Corporate Travel Management Ltd 29 -
19 Costa Group Holdings Ltd 34 -
2 Credit Corp Group Ltd 37 -
14 Crown Resorts Ltd 96 0.01
6 CSL Ltd 861 0.05
40 CSR Ltd 121 0.01
3 Data#3 Ltd 11 -
8 Deterra Royalties Ltd 19 -
2 Dicker Data Ltd 10 -
8 Domain Holdings Australia Ltd 23 -
2 Domino's Pizza Enterprises Ltd 108 0.01
52 Downer EDI Ltd 160 0.01
18 Eclipx Group Ltd 21 -
9 Elders Ltd 53 -
12 Emeco Holdings Ltd 6 -
16 Estia Health Ltd 22 -
4 EVENT Hospitality and Entertainment Ltd 27 -
39 Evolution Mining Ltd 110 0.01
6 Fleetwood Corp Ltd 9 -
3 Flight Centre Travel Group Ltd 26 -
33 Fortescue Metals Group Ltd 395 0.02
70 G8 Education Ltd 38 -
7 Galaxy Resources Ltd (voting rights) 14 -
27 Genworth Mortgage Insurance Australia Ltd 41 -
24 Gold Road Resources Ltd 19 -
21 GrainCorp Ltd 56 -
3 GUD Holdings Ltd 20 -
14 GWA Group Ltd 21 -
8 Hansen Technologies Ltd 24 -
37 Harvey Norman Holdings Ltd 106 0.01
42 Healius Ltd 96 0.01
15 HT&E Ltd 14 -
2 HUB24 Ltd 25 -
17 Humm Group Ltd 9 -
5 IDP Education Ltd 62 -
41 IGO Ltd 169 0.01
32 Iluka Resources Ltd 136 0.01
22 Imdex Ltd 25 -
168 Incitec Pivot Ltd 211 0.01
15 Infomedia Ltd 12 -
19 Inghams Group Ltd 35 -
27 Insurance Australia Group Ltd 74 0.01
5 Integral Diagnostics Ltd 13 -
World Allocation 60/40 FundPortfolio of Investments as at 31 May 2021
Dimensional Fund Advisors Semi-Annual Report and Unaudited Financial Statements, 31 May 2021 374

Shares (000's)
Value(000's)
GBP
% of NetAssetValue
Common Stock (continued)
Australia - 1.12% (continued)
5 InvoCare Ltd 31 -
41 IOOF Holdings Ltd 88 0.01
9 IPH Ltd 34 -
8 IRESS Ltd 44 -
14 IVE Group Ltd 12 -
8 James Hardie Industries PLC 193 0.01
5 JB Hi-Fi Ltd 130 0.01
4 Johns Lyng Group Ltd 10 -
4 Juno Minerals Ltd - -
66 Jupiter Mines Ltd 10 -
31 Karoon Energy Ltd 20 -
2 Kogan.com Ltd 10 -
12 Lendlease Group 79 0.01
3 Lifestyle Communities Ltd 25 -
36 Link Administration Holdings Ltd 107 0.01
2 Lovisa Holdings Ltd 13 -
25 Lynas Corp Ltd 76 0.01
29 MACA Ltd 13 -
3 Macquarie Group Ltd 275 0.02
- Macquarie Telecom Group Ltd 7 -
3 Magellan Financial Group Ltd 81 0.01
112 Mayne Pharma Group Ltd 23 -
3 McMillan Shakespeare Ltd 19 -
90 Medibank Pvt Ltd 154 0.01
10 Mesoblast Ltd 11 -
74 Metcash Ltd 142 0.01
12 Mineral Resources Ltd 297 0.02
3 MNF Group Ltd 7 -
3 Moelis Australia Ltd 10 -
3 Monadelphous Group Ltd 15 -
21 Monash IVF Group Ltd 10 -
8 Money3 Corp Ltd 14 -
30 Mount Gibson Iron Ltd 14 -
- Mystate Ltd 1 -
5 MyState Ltd 14 -
3 Nanosonics Ltd 7 -
40 National Australia Bank Ltd 582 0.03
8 Navigator Global Investments Ltd 7 -
4 Netwealth Group Ltd 32 -
22 New Hope Corp Ltd 17 -
14 Newcrest Mining Ltd 213 0.01
3 NEXTDC Ltd 21 -
18 nib holdings Ltd 61 -
5 Nick Scali Ltd 27 -
30 Nickel Mines Ltd 16 -
91 Nine Entertainment Co Holdings Ltd 146 0.01
31 Northern Star Resources Ltd 195 0.01
30 NRW Holdings Ltd 28 -
25 Nufarm Ltd 66 -
2 Objective Corp Ltd 13 -
11 OFX Group Ltd 9 -
55 Oil Search Ltd 112 0.01
8 Omni Bridgeway Ltd 18 -
36 oOh!media Ltd 33 -
9 Orica Ltd 65 -
36 Origin Energy Ltd 81 0.01
58 Orora Ltd 100 0.01
23 OZ Minerals Ltd 310 0.02
3 Pacific Current Group Ltd 8 -
9 Pact Group Holdings Ltd 17 -
11 Peet Ltd 7 -
11 Pendal Group Ltd 48 -
Shares (000's)
Value(000's)
GBP
% of NetAssetValue
Common Stock (continued)
Australia - 1.12% (continued)
44 Perenti Global Ltd 16 -
3 Perpetual Ltd 52 -
86 Perseus Mining Ltd 65 -
12 Platinum Asset Management Ltd 30 -
6 Premier Investments Ltd 89 0.01
2 Pro Medicus Ltd 52 -
2 PWR Holdings Ltd 8 -
6 Qantas Airways Ltd 15 -
27 QBE Insurance Group Ltd 160 0.01
57 Qube Holdings Ltd 95 0.01
32 Ramelius Resources Ltd 34 -
4 Ramsay Health Care Ltd 147 0.01
1 REA Group Ltd 87 0.01
2 Reece Ltd 23 -
35 Regis Resources Ltd 50 -
38 Reliance Worldwide Corp Ltd 107 0.01
27 Resolute Mining Ltd 8 -
236 Retail Food Group Ltd 9 -
14 Ridley Corp Ltd 9 -
6 Rio Tinto Ltd 384 0.02
13 Sandfire Resources NL 50 -
67 Santos Ltd 252 0.01
2 SeaLink Travel Group Ltd 8 -
4 SEEK Ltd 75 0.01
4 Select Harvests Ltd 11 -
6 Senex Energy Ltd 10 -
6 Seven Group Holdings Ltd 71 -
29 Seven West Media Ltd 7 -
6 SG Fleet Group Ltd 10 -
53 Sigma Healthcare Ltd 18 -
36 Silver Lake Resources Ltd 39 -
13 Sims Metal Management Ltd 112 0.01
4 SmartGroup Corp Ltd 15 -
9 Sonic Healthcare Ltd 173 0.01
75 South32 Ltd 122 0.01
6 Southern Cross Media Group Ltd 6 -
62 Spark Infrastructure Group 74 -
46 St Barbara Ltd 48 -
67 Star Entertainment Grp Ltd 148 0.01
36 Steadfast Group Ltd 78 0.01
21 Suncorp Group Ltd 126 0.01
6 Sunland Group Ltd 7 -
13 Super Retail Group Ltd 92 0.01
15 Superloop Ltd 8 -
18 Sydney Airport 59 -
74 Tabcorp Holdings Ltd 207 0.01
10 Tassal Group Ltd 21 -
12 Technology One Ltd 58 -
79 Telstra Corp Ltd 149 0.01
2 Temple & Webster Group Ltd 12 -
14 TPG Telecom Ltd 41 -
17 Transurban Group 126 0.01
14 Treasury Wine Estates Ltd 91 0.01
20 United Malt Group Ltd 48 -
5 Virtus Health Ltd 18 -
66 Viva Energy Group Ltd 74 -
42 Vocus Group Ltd 125 0.01
13 Webjet Ltd 35 -
10 Wesfarmers Ltd 297 0.02
21 Western Areas Ltd 28 -
25 Westgold Resources Ltd 31 -
30 Westpac Banking Corp 434 0.02
World Allocation 60/40 FundPortfolio of Investments as at 31 May 2021 (continued)
Dimensional Fund Advisors Semi-Annual Report and Unaudited Financial Statements, 31 May 2021 375

Shares (000's)
Value(000's)
GBP
% of NetAssetValue
Common Stock (continued)
Australia - 1.12% (continued)
64 Whitehaven Coal Ltd 56 -
10 Woodside Petroleum Ltd 124 0.01
15 Woolworths Group Ltd 351 0.02
17 Worley Ltd 97 0.01
1 Xero Ltd 93 0.01
20,361 1.12
Austria - 0.10%
3 Andritz AG 123 0.01
1 AT&S Austria Technologie & Systemtechnik AG 34 -
4 Atrium European Real Estate Ltd 10 -
3 BAWAG Group AG 126 0.01
6 Erste Group Bank AG 188 0.01
3 EVN AG 48 -
3 Immofinanz AG 44 -
- Lenzing AG 50 -
- Mayr Melnhof Karton AG 39 -
1 Oesterreichische Post AG 40 -
6 OMV AG 246 0.02
1 Palfinger AG 17 -
1 POLYTEC Holding AG 8 -
- Porr AG 7 -
13 Raiffeisen Bank International AG 213 0.01
- Rosenbauer International AG 7 -
1 S IMMO AG 21 -
1 Schoeller-Bleckmann Oilfield Equipment AG 17 -
- Semperit AG Holding 11 -
- Strabag SE 12 -
7 Telekom Austria AG 43 -
8 UNIQA Insurance Group AG 49 -
1 Verbund AG 39 -
3 Vienna Insurance Group AG Wiener VersicherungGruppe 62 0.01
9 Voestalpine AG 283 0.02
6 Wienerberger AG 154 0.01
1,891 0.10
Belgium - 0.21%
2 Ackermans & van Haaren NV 197 0.01
11 Ageas 485 0.03
11 AGFA-Gevaert NV 36 -
14 Anheuser-Busch InBev SA 742 0.04
- Argenx SE 54 -
1 Barco NV 27 -
3 Bekaert SA 98 0.01
5 bpost SA 51 -
1 Cie d'Entreprises CFE 46 -
2 Colruyt SA 99 0.01
2 D'ieteren SA 147 0.01
8 Econocom Group SA 22 -
1 Elia System Operator SA 69 0.01
15 Euronav NV 98 0.01
- EVS Broadcast Equipment SA 8 -
3 Fagron 44 -
1 Gimv NV 46 -
- Immobel SA 12 -
1 Ion Beam Applications 14 -
5 KBC Group NV 282 0.02
1 Kinepolis Group NV 27 -
- Lotus Bakeries NV 48 -
1 Melexis NV 63 -
5 Ontex Group NV 52 -
9 Proximus SADP 126 0.01
4 Recticel SA 52 -
Shares (000's)
Value(000's)
GBP
% of NetAssetValue
Common Stock (continued)
Belgium - 0.21% (continued)
1 Shurgard Self Storage SA 28 -
- Sipef NV 8 -
4 Solvay SA 341 0.02
2 Telenet Group Holding NV 46 -
2 Tessenderlo Group SA 66 -
1 UCB SA 86 0.01
6 Umicore SA 272 0.02
- Van de Velde NV 10 -
- VGP NV 42 -
3,844 0.21
Brazil - 0.00%
2 Natura & Co Holding SA, ADR 33 -
33 -
Canada - 1.78%
4 5N Plus Inc 7 -
3 Absolute Software Corp 26 -
2 AcuityAds Holdings Inc 17 -
11 Advantage Energy Ltd 23 -
5 Aecon Group Inc 59 -
2 AGF Management Ltd 11 -
4 Agnico Eagle Mines Ltd 228 0.01
3 Aimia Inc 9 -
2 Air Canada 37 -
1 AirBoss of America Corp 13 -
24 Alamos Gold Inc 156 0.01
1 Alaris Equity Partners Income 11 -
10 Algonquin Power & Utilities Corp 105 0.01
9 Alimentation Couche-Tard Inc 221 0.01
20 AltaGas Ltd 276 0.02
1 Altius Minerals Corp 13 -
1 Altus Group Ltd 44 -
1 Andrew Peller Ltd 8 -
55 ARC Resources Ltd 297 0.02
20 Argonaut Gold Inc 35 -
4 Aritzia Inc 66 -
3 Atco Ltd 74 -
2 ATS Automation Tooling Systems Inc 42 -
1 Aura Minerals Inc 11 -
1 AutoCanada Inc 14 -
50 B2Gold Corp 181 0.01
2 Badger Infrastructure Solution 43 -
10 Bank of Montreal 712 0.04
- Bank of Montreal 16 -
17 Bank of Nova Scotia 815 0.05
12 Barrick Gold Corp 208 0.01
10 Bausch Health Cos Inc 219 0.01
3 BCE Inc 90 0.01
17 Birchcliff Energy Ltd 34 -
2 Bird Construction Inc 12 -
11 BlackBerry Ltd 75 0.01
23 Bombardier Inc 13 -
2 Boralex Inc 40 -
2 Brookfield Asset Management Inc 76 0.01
1 BRP Inc 80 0.01
4 CAE Inc 88 0.01
1 Calian Group Ltd 16 -
26 Cameco Corp 370 0.02
9 Canaccord Genuity Group Inc 66 -
5 Canacol Energy Ltd 9 -
2 Canada Goose Holdings Inc 58 -
7 Canadian Imperial Bank of Commerce (Canadalisting) 569 0.03
World Allocation 60/40 FundPortfolio of Investments as at 31 May 2021 (continued)
Dimensional Fund Advisors Semi-Annual Report and Unaudited Financial Statements, 31 May 2021 376

Shares (000's)
Value(000's)
GBP
% of NetAssetValue
Common Stock (continued)
Canada - 1.78% (continued)
1 Canadian Imperial Bank of Commerce (US listing) 65 -
9 Canadian National Railway Co 745 0.04
22 Canadian Natural Resources Ltd 534 0.03
9 Canadian Pacific Railway Ltd 508 0.03
1 Canadian Tire Corp Ltd 147 0.01
3 Canadian Utilities Ltd, Class A 52 -
7 Canadian Western Bank 143 0.01
5 Canfor Corp 85 0.01
1 Canopy Growth Corp 24 -
4 CanWel Building Materials Group Ltd 18 -
4 Capital Power Corp 92 0.01
23 Capstone Mining Corp 74 -
9 Cardinal Energy Ltd 17 -
7 Cascades Inc 58 -
4 CCL Industries Inc 154 0.01
9 Celestica Inc 55 -
53 Cenovus Energy Inc 302 0.02
15 Centerra Gold Inc 87 0.01
1 Cervus Equipment Corp 9 -
9 CES Energy Solutions Corp 9 -
5 CGI Inc 344 0.02
3 Chartwell Retirement Residences 22 -
7 China Gold International Resources Corp Ltd 17 -
11 CI Financial Corp 142 0.01
1 Cogeco Communications Inc 58 -
- Cogeco Inc 17 -
1 Colliers International Group Inc 109 0.01
2 Computer Modelling Group Ltd 7 -
- Constellation Software Inc 247 0.01
1 Corby Spirit and Wine Ltd 8 -
18 Corus Entertainment Inc 64 -
47 Crescent Point Energy Corp 136 0.01
12 Cronos Group Inc 78 0.01
1 Descartes Systems Group Inc 50 -
2 Dexterra Group Inc 9 -
6 Dollarama Inc 182 0.01
2 Dorel Industries Inc 14 -
1 DREAM Unlimited Corp 22 -
12 Dundee Precious Metals Inc 61 -
16 ECN Capital Corp 79 0.01
- E-L Financial Corp Ltd 61 -
14 Eldorado Gold Corp 114 0.01
29 Element Fleet Management Corp 234 0.01
3 Emera Inc 102 0.01
6 Empire Co Ltd 155 0.01
13 Enbridge Inc (Canada listing) 343 0.02
10 Endeavour Mining Corp 177 0.01
7 Enerflex Ltd 34 -
17 Enerplus Corp 79 0.01
2 Enghouse Systems Ltd 56 -
12 Ensign Energy Services Inc 9 -
2 Equinox Gold Corp 14 -
1 Equitable Group Inc 73 -
3 ERO Copper Corp 54 -
1 Evertz Technologies Ltd 11 -
2 Exchange Income Corp 35 -
3 Extendicare Inc 13 -
1 Fairfax Financial Holdings Ltd 207 0.01
6 Fiera Capital Corp 36 -
11 Finning International Inc 187 0.01
2 Firm Capital Mortgage Investment Corp 20 -
5 First Capital Real Estate Investment Trust 48 -
Shares (000's)
Value(000's)
GBP
% of NetAssetValue
Common Stock (continued)
Canada - 1.78% (continued)
2 First Majestic Silver Corp 25 -
- First National Financial Corp 8 -
17 First Quantum Minerals Ltd 297 0.02
1 FirstService Corp 155 0.01
7 Fortis Inc (Canada listing) 211 0.01
1 Fortis Inc (US listing) 24 -
13 Fortuna Silver Mines Inc 63 -
- Franco-Nevada Corp 38 -
7 Freehold Royalties Ltd 36 -
1 GDI Integrated Facility Services Inc 17 -
3 George Weston Ltd 179 0.01
7 Gibson Energy Inc 97 0.01
3 Gildan Activewear Inc 70 -
- goeasy Ltd 19 -
3 Great Canadian Gaming Corp 65 -
5 Great-West Lifeco Inc 107 0.01
1 Guardian Capital Group Ltd 16 -
1 Hardwoods Distribution Inc 19 -
2 Heroux-Devtek Inc 19 -
4 Home Capital Group Inc 88 0.01
21 Hudbay Minerals Inc 112 0.01
5 Hydro One Ltd 98 0.01
4 i-80 Gold Corp 7 -
8 iA Financial Corp Inc 314 0.02
31 IAMGOLD Corp 79 0.01
2 IBI Group Inc 9 -
3 IGM Financial Inc 69 -
6 Imperial Oil Ltd 149 0.01
1 Information Services Corp 10 -
2 Innergex Renewable Energy Inc 28 -
2 Intact Financial Corp 172 0.01
19 Inter Pipeline Ltd 200 0.01
5 Interfor Corp 83 0.01
3 Intertape Polymer Group Inc 58 -
7 Ivanhoe Mines Ltd 38 -
1 Jamieson Wellness Inc 30 -
7 Karora Resources Inc 17 -
- K-Bro Linen Inc 10 -
13 Keyera Corp 228 0.01
- Kinaxis Inc 24 -
73 Kinross Gold Corp 416 0.02
7 Kirkland Lake Gold Ltd 227 0.01
4 Knight Therapeutics Inc 13 -
3 Labrador Iron Ore Royalty Corp 72 -
2 Largo Resources Ltd 17 -
- Lassonde Industries Inc 31 -
3 Laurentian Bank of Canada 83 0.01
2 Leon's Furniture Ltd 20 -
2 LifeWorks Inc 42 -
4 Linamar Corp 190 0.01
5 Loblaw Cos Ltd 203 0.01
47 Lundin Mining Corp 357 0.02
8 Magna International Inc 602 0.03
2 Major Drilling Group International Inc 12 -
18 Manulife Financial Corp 260 0.02
5 Maple Leaf Foods Inc 79 0.01
9 Martinrea International Inc 68 -
19 MEG Energy Corp 89 0.01
2 Methanex Corp 48 -
5 Metro Inc 172 0.01
1 MTY Food Group Inc 36 -
8 Mullen Group Ltd 63 -
World Allocation 60/40 FundPortfolio of Investments as at 31 May 2021 (continued)
Dimensional Fund Advisors Semi-Annual Report and Unaudited Financial Statements, 31 May 2021 377

Shares (000's)
Value(000's)
GBP
% of NetAssetValue
Common Stock (continued)
Canada - 1.78% (continued)
11 National Bank of Canada 601 0.03
1 Neo Performance Materials Inc 8 -
59 New Gold Inc 88 0.01
2 NFI Group Inc 30 -
2 North American Construction Group Ltd 14 -
3 North West Co Inc 55 -
6 Northland Power Inc 142 0.01
10 Nutrien Ltd 453 0.03
51 OceanaGold Corp 75 0.01
3 Onex Corp 180 0.01
6 Open Text Corp 203 0.01
9 Osisko Gold Royalties Ltd 86 0.01
6 Pan American Silver Corp 135 0.01
13 Parex Resources Inc 160 0.01
2 Park Lawn Corp 29 -
7 Parkland Corp 168 0.01
5 Pason Systems Inc 24 -
17 Pembina Pipeline Corp 376 0.02
7 Peyto Exploration & Development Corp 23 -
8 Photon Control Inc 17 -
1 Polaris Infrastructure Inc 13 -
1 Pollard Banknote Ltd 29 -
14 PrairieSky Royalty Ltd 108 0.01
1 Precision Drilling Corp 11 -
2 Premium Brands Holdings Corp 131 0.01
10 Pretium Resources Inc 83 0.01
8 Primo Water Corp 101 0.01
7 Quarterhill Inc 9 -
6 Quebecor Inc 115 0.01
2 Real Matters Inc 19 -
3 Restaurant Brands International Inc (Canada listing) 126 0.01
2 Restaurant Brands International Inc (US listing) 78 0.01
2 Richelieu Hardware Ltd 56 -
3 Ritchie Bros Auctioneers Inc 142 0.01
9 Rogers Communications Inc 323 0.02
7 Rogers Sugar Inc 24 -
6 Roxgold Inc 8 -
29 Royal Bank of Canada (Canada listing) 2,119 0.12
1 Royal Bank of Canada (US listing) 81 0.01
4 Russel Metals Inc 75 -
5 Sabina Gold & Silver Corp 5 -
4 Sandstorm Gold Ltd 22 -
5 Saputo Inc 121 0.01
2 Savaria Corp 19 -
14 Secure Energy Services Inc 35 -
22 Shaw Communications Inc 458 0.03
5 ShawCor Ltd 16 -
- Shopify Inc 136 0.01
2 Sienna Senior Living Inc 22 -
4 Sierra Metals Inc 11 -
2 Sierra Wireless Inc (Canada listing) 26 -
2 Sleep Country Canada Holdings Inc 38 -
8 SNC-Lavalin Group Inc 148 0.01
1 Spin Master Corp 28 -
1 Sprott Inc 16 -
16 SSR Mining Inc 203 0.01
6 Stantec Inc 176 0.01
1 Stelco Holdings Inc 17 -
4 Stella-Jones Inc 103 0.01
4 Storm Resources Ltd 9 -
6 Sun Life Financial Inc 239 0.01
15 Suncor Energy Inc 238 0.01
Shares (000's)
Value(000's)
GBP
% of NetAssetValue
Common Stock (continued)
Canada - 1.78% (continued)
1 SunOpta Inc 11 -
15 Superior Plus Corp 131 0.01
18 Tamarack Valley Energy Ltd 27 -
12 Taseko Mines Ltd 21 -
13 TC Energy Corp 479 0.03
23 Teck Resources Ltd 395 0.02
- TECSYS Inc 9 -
1 TELUS Corp 9 -
5 TFI International Inc 348 0.02
1 Thomson Reuters Corp 93 0.01
5 Timbercreek Financial Corp 28 -
1 TMX Group Ltd 115 0.01
- Topicus.com Inc 10 -
7 Torex Gold Resources Inc 69 -
3 Toromont Industries Ltd 169 0.01
19 Toronto-Dominion Bank 945 0.05
22 Tourmaline Oil Corp 383 0.02
25 TransAlta Corp 162 0.01
3 TransAlta Renewables Inc 31 -
6 Transcontinental Inc 84 0.01
- Trisura Group Ltd 28 -
7 Turquoise Hill Resources Ltd 85 0.01
1 Uni-Select Inc 9 -
13 Vermilion Energy Inc 70 -
2 Wajax Corp 21 -
- Waste Connections Inc (Canada listing) 24 -
1 Waste Connections Inc (US listing) 118 0.01
5 Wesdome Gold Mines Ltd 35 -
4 West Fraser Timber Co Ltd 214 0.01
12 Western Forest Products Inc 15 -
2 Westshore Terminals Investment Corp 25 -
2 Wheaton Precious Metals Corp 72 -
37 Whitecap Resources Inc 125 0.01
1 Winpak Ltd 19 -
3 WSP Global Inc 206 0.01
61 Yamana Gold Inc 224 0.01
32,300 1.78
China - 0.01%
197 FIH Mobile Ltd 21 -
43 Wharf Holdings Ltd 105 0.01
126 0.01
Denmark - 0.41%
- ALK-Abello AS 69 -
5 Alm Brand AS 39 -
1 Ambu AS 16 -
- AP Moller - Maersk AS, Class A 46 -
- AP Moller - Maersk AS, Class B 85 0.01
6 Bang & Olufsen AS 20 -
4 Bavarian Nordic AS 131 0.01
- Brodrene Hartmann AS 8 -
2 Carlsberg AS 294 0.02
- cBrain A/S 8 -
1 Chemometec AS 44 -
2 Chr Hansen Holding AS 151 0.01
1 Coloplast AS 149 0.01
4 Columbus AS 5 -
2 D/S Norden AS 43 -
24 Danske Bank AS 311 0.02
3 Demant AS 91 0.01
3 Dfds AS 116 0.01
2 DSV Panalpina AS 311 0.02
3 FLSmidth & Co AS 90 0.01
World Allocation 60/40 FundPortfolio of Investments as at 31 May 2021 (continued)
Dimensional Fund Advisors Semi-Annual Report and Unaudited Financial Statements, 31 May 2021 378

Shares (000's)
Value(000's)
GBP
% of NetAssetValue
Common Stock (continued)
Denmark - 0.41% (continued)
1 Genmab AS 336 0.02
4 GN Store Nord AS 264 0.01
5 H Lundbeck AS 108 0.01
2 H&H International AS 40 -
11 ISS AS 169 0.01
- Jeudan AS 8 -
4 Jyske Bank AS 154 0.01
1 Maersk Drilling AS 36 -
2 Matas AS 25 -
- MT Hoejgaard Holding 10 -
1 Netcompany Group AS 114 0.01
2 Nilfisk Holding AS 38 -
3 NKT AS 97 0.01
- Novo Nordisk A/S, ADR 22 -
24 Novo Nordisk AS 1,345 0.07
4 Novozymes AS 226 0.01
1 NTG Nordic Transport Group 32 -
1 Orsted AS 97 0.01
6 Pandora AS 561 0.03
2 Per Aarsleff Holding AS 59 -
2 Ringkjoebing Landbobank AS 157 0.01
- Rockwool International AS, Class A 85 -
- Rockwool International AS, Class B 113 0.01
3 Royal Unibrew AS 236 0.01
5 Scandinavian Tobacco Group AS 80 -
1 Schouw & Co AS 82 -
2 SimCorp AS 144 0.01
- Solar AS 24 -
- SP Group AS 16 -
7 Spar Nord Bank AS 52 -
5 Sydbank AS 113 0.01
1 TCM Group 8 -
- Tivoli AS 9 -
4 Topdanmark AS 125 0.01
12 Tryg AS 193 0.01
- United International Enterprises 18 -
10 Vestas Wind Systems 266 0.01
7,489 0.41
Finland - 0.29%
3 Aktia Bank Oyj 31 -
1 Alma Media Oyj 8 -
1 Aspo Oyj 8 -
1 Atria Oyj 14 -
3 Cargotec Oyj 116 0.01
5 Caverion Oyj 26 -
2 Digia Oyj 11 -
5 Elisa Oyj 196 0.01
42 Finnair Oyj 26 -
1 Fiskars Oyj Abp 17 -
11 Fortum Oyj 215 0.01
7 F-Secure Oyj 26 -
1 Harvia Oyj 29 -
6 Huhtamaki Oyj 185 0.01
1 Kamux Corp 12 -
8 Kemira Oyj 89 0.01
6 Kesko Oyj, Class A 137 0.01
12 Kesko Oyj, Class B 302 0.02
3 Kojamo Oyj 47 -
4 Kone Oyj 257 0.02
4 Konecranes Oyj 130 0.01
1 Lassila & Tikanoja Oyj 16 -
9 Metsa Board Oyj 74 0.01
Shares (000's)
Value(000's)
GBP
% of NetAssetValue
Common Stock (continued)
Finland - 0.29% (continued)
5 Neles Oyj 50 -
5 Neste Oyj 234 0.01
105 Nokia Oyj 386 0.02
7 Nokian Renkaat Oyj 193 0.01
29 Nordea Bank Abp 224 0.01
- Olvi Oyj 24 -
4 Oriola Oyj, Class B 7 -
1 Orion Oyj, Class A 33 -
4 Orion Oyj, Class B 128 0.01
23 Outokumpu Oyj 90 0.01
20 Outotec Oyj 170 0.01
- Ponsse Oyj 10 -
1 QT Group Oyj 66 -
5 Raisio Oyj 18 -
1 Revenio Group Oyj 40 -
5 Sampo Oyj 168 0.01
6 Sanoma Oyj 66 0.01
17 Stora Enso Oyj 219 0.01
1 Talenom Oyj 8 -
4 Terveystalo Oyj 42 -
5 Tieto Oyj 126 0.01
1 Tikkurila Oyj 33 -
3 Tokmanni Group Corp 57 -
11 UPM-Kymmene Oyj 292 0.02
4 Uponor Oyj 81 0.01
- Vaisala Oyj 16 -
7 Valmet Oyj 207 0.01
1 Verkkokauppa.com Oyj 7 -
19 Wartsila Oyj Abp 180 0.01
11 YIT Oyj 47 -
5,194 0.29
France - 1.35%
1 ABC arbitrage 7 -
6 Accor SA 174 0.01
1 Aeroports de Paris 54 -
5 Air Liquide SA 602 0.03
7 Airbus SE 687 0.04
1 AKWEL 17 -
2 Albioma SA 75 -
4 ALD SA 43 -
2 Alstom SA 96 0.01
2 Alten SA 145 0.01
1 Amundi SA 65 -
4 Arkema SA 390 0.02
6 Atos SE 295 0.02
1 Aubay 18 -
16 AXA SA 319 0.02
- Axway Software SA 9 -
2 Beneteau SA 25 -
1 Bigben Interactive 15 -
- BioMerieux 15 -
10 BNP Paribas SA 472 0.03
30 Bollore SA 109 0.01
1 Bonduelle SCA 17 -
7 Bouygues SA 209 0.01
9 Bureau Veritas SA 194 0.01
4 Capgemini SE 494 0.03
24 Carrefour SA 339 0.02
3 Casino Guichard Perrachon SA 66 -
63 CGG SA 47 -
- Chargeurs SA 9 -
13 Cie de Saint-Gobain 621 0.03
World Allocation 60/40 FundPortfolio of Investments as at 31 May 2021 (continued)
Dimensional Fund Advisors Semi-Annual Report and Unaudited Financial Statements, 31 May 2021 379

Shares (000's)
Value(000's)
GBP
% of NetAssetValue
Common Stock (continued)
France - 1.35% (continued)
1 Cie des Alpes 11 -
5 Cie Generale des Etablissements Michelin SCA 484 0.03
5 Cie Plastic Omnium SA 120 0.01
2 Claranova SADIR 15 -
6 CNP Assurances 81 0.01
7 Coface SA 63 -
13 Credit Agricole SA 135 0.01
11 Danone SA 547 0.03
- Dassault Aviation SA 27 -
- Dassault Systemes SE 63 -
- Delta Plus Group 8 -
8 Derichebourg SA 55 -
5 Edenred 207 0.01
6 Eiffage SA 452 0.03
13 Electricite de France SA 128 0.01
7 Elior Group SA 36 -
16 Elis SA 211 0.01
25 Engie SA 267 0.02
- ESI Group 11 -
2 EssilorLuxottica SA 207 0.01
2 Etablissements Maurel et Prom SA 3 -
3 Eurofins Scientific SE 228 0.01
3 Euronext NV 219 0.01
15 Eutelsat Communications SA 135 0.01
1 Faurecia 21 -
8 Faurecia SE 311 0.02
1 Fnac Darty SA 67 -
1 Gaztransport Et Technigaz SA 57 -
4 Getlink SE 40 -
- GL Events 5 -
- Groupe Crit 7 -
- Hermes International 262 0.01
- Hexaom 10 -
- ID Logistics Group 24 -
3 Iliad SA 295 0.02
3 Imerys SA 96 0.01
- Infotel SA 9 -
1 Ipsen SA 92 0.01
3 IPSOS 90 0.01
1 Jacquet Metal Service SA 13 -
5 JCDecaux SA 100 0.01
1 Kaufman & Broad SA 29 -
1 Kering SA 619 0.03
5 Korian SA 131 0.01
4 Lagardere SCA 63 -
- Laurent-Perrier 8 -
1 Lectra 21 -
6 Legrand SA 420 0.02
- Linedata Services 9 -
1 LISI 33 -
1 L'Oreal SA 362 0.02
4 LVMH Moet Hennessy Louis Vuitton SE 2,057 0.11
4 Maisons du Monde SA 75 -
1 Manitou BF SA 15 -
- Manutan International 7 -
2 Mersen SA 39 -
1 Metropole Television SA 17 -
40 Natixis SA 138 0.01
1 Neoen SA 22 -
2 Nexans SA 118 0.01
4 Nexity SA 127 0.01
70 Orange SA 630 0.04
Shares (000's)
Value(000's)
GBP
% of NetAssetValue
Common Stock (continued)
France - 1.35% (continued)
2 Orpea 191 0.01
1 Pernod Ricard SA 149 0.01
- Pharmagest Inter@ctive 7 -
13 Publicis Groupe SA 630 0.04
2 Quadient 47 -
- Remy Cointreau SA 32 -
10 Renault SA 281 0.02
19 Rexel SA 274 0.02
3 Rothschild & Co 77 -
4 Rubis SCA 120 0.01
2 Safran SA 203 0.01
- Samse SA 12 -
6 Sanofi 471 0.03
- Sartorius Stedim Biotech 134 0.01
- Savencia SA 26 -
3 Schneider Electric SE 337 0.02
12 SCOR SE 273 0.02
1 SEB SA 129 0.01
- Seche Environnement SA 12 -
20 SES SA 115 0.01
2 SMCP SA 13 -
1 Societe BIC SA 76 -
15 Societe Generale SA 343 0.02
- Societe pour l'Informatique Industrielle 9 -
3 Sodexo SA 207 0.01
1 SOITEC 103 0.01
- Somfy SA 39 -
1 Sopra Steria Group 149 0.01
8 SPIE SA 141 0.01
- Stef SA 15 -
9 STMicroelectronics NV 228 0.01
10 Suez 165 0.01
- Sword Group 10 -
1 Synergie SA 16 -
2 Tarkett SA 41 -
6 Technip Energies NV 59 -
1 Teleperformance 354 0.02
3 Television Francaise 1 21 -
3 Thales SA 216 0.01
- Thermador Groupe 8 -
- Total Gabon 9 -
36 TOTAL SA 1,180 0.07
1 Trigano SA 94 0.01
3 Ubisoft Entertainment SA 145 0.01
19 Valeo SA 438 0.02
9 Veolia Environnement SA 203 0.01
1 Verallia 39 -
- Vetoquinol SA 20 -
1 Vicat SA 53 -
- Vilmorin & Cie SA 20 -
5 Vinci SA 429 0.02
- Virbac SA 35 -
5 Vivendi SA 115 0.01
- Wavestone 9 -
3 Worldline SA 228 0.01
3 X-Fab Silicon Foundries SE 17 -
24,547 1.35
Germany - 1.20%
3 1&1 Drillisch AG 63 -
4 Aareal Bank AG 76 0.01
- Adesso SE 8 -
2 adidas AG 576 0.03
World Allocation 60/40 FundPortfolio of Investments as at 31 May 2021 (continued)
Dimensional Fund Advisors Semi-Annual Report and Unaudited Financial Statements, 31 May 2021 380

Shares (000's)
Value(000's)
GBP
% of NetAssetValue
Common Stock (continued)
Germany - 1.20% (continued)
2 ADO Properties SA 45 -
2 ADVA Optical Networking SE 18 -
2 Aixtron SE 31 -
- All for One Group AG 7 -
- Allgeier SE 4 -
3 Allianz SE 629 0.04
- Amadeus Fire AG 20 -
20 Aroundtown SA 121 0.01
- Atoss Software AG 38 -
3 Aurubis AG 174 0.01
5 BASF SE 274 0.02
- Basler AG 10 -
1 Bauer AG 8 -
14 Bayer AG 624 0.04
10 Bayerische Motoren Werke AG 759 0.04
1 BayWa AG 34 -
1 Bechtle AG 174 0.01
1 Befesa SA 69 -
- Beiersdorf AG 24 -
- Bertrandt AG 9 -
- bet-at-home.com AG 15 -
- Bijou Brigitte AG 9 -
2 Bilfinger SE 45 -
2 Borussia Dortmund GmbH & Co KGaA 9 -
6 Brenntag AG 423 0.02
2 CANCOM SE 75 0.01
- Carl Zeiss Meditec AG 14 -
12 Ceconomy AG 49 -
- Cewe Stiftung & Co KGaA 30 -
65 Commerzbank AG 367 0.02
1 CompuGroup Medical SE & Co KgaA 63 -
3 Continental AG 305 0.02
8 Covestro AG 391 0.02
2 CropEnergies AG 14 -
2 CTS Eventim AG & Co KGaA 108 0.01
19 Daimler AG 1,224 0.07
- Delivery Hero SE 19 -
1 Dermapharm Holding SE 53 -
32 Deutsche Bank AG 343 0.02
1 Deutsche Beteiligungs AG 20 -
3 Deutsche Boerse AG 302 0.02
2 Deutsche EuroShop AG 36 -
4 Deutsche Lufthansa AG 33 -
10 Deutsche Pfandbriefbank AG 85 0.01
16 Deutsche Post AG 787 0.04
74 Deutsche Telekom AG 1,088 0.06
5 Deutsche Wohnen SE 206 0.01
8 Deutz AG 46 -
4 Dialog Semiconductor PLC 235 0.01
2 DIC Asset AG 20 -
- Draegerwerk AG & Co KGaA 9 -
3 Duerr AG 94 0.01
31 E.ON SE 268 0.02
1 Eckert & Ziegler Strahlen- und Medizintechnik AG 49 -
- Elmos Semiconductor AG 8 -
1 ElringKlinger AG 8 -
2 Encavis AG 28 -
- Energiekontor AG 9 -
5 Evonik Industries AG 123 0.01
1 Evotec SE 38 -
- Fabasoft AG 7 -
1 Fielmann AG 62 -
Shares (000's)
Value(000's)
GBP
% of NetAssetValue
Common Stock (continued)
Germany - 1.20% (continued)
1 flatexDEGIRO AG 74 -
3 Fraport AG Frankfurt Airport Services Worldwide 124 0.01
10 Freenet AG 196 0.01
6 Fresenius Medical Care AG & Co KGaA 349 0.02
9 Fresenius SE & Co KGaA 359 0.02
1 Fuchs Petrolub SE 23 -
7 GEA Group AG 214 0.01
2 Gerresheimer AG 162 0.01
- Gesco AG 7 -
1 GFT Technologies SE 19 -
2 Global Fashion Group SA 17 -
4 Grand City Properties SA 79 0.01
1 Hamburger Hafen und Logistik AG 11 -
1 Hannover Rueck SE 100 0.01
1 Hapag-Lloyd AG 178 0.01
- Hawesko Holding AG 11 -
5 HeidelbergCement AG 346 0.02
3 Hella GmbH & Co KGaA 127 0.01
3 HelloFresh SE 207 0.01
1 Henkel AG & Co KGaA 53 -
- Hornbach Baumarkt AG 11 -
1 Hornbach Holding AG & Co KGaA 75 0.01
4 Hugo Boss AG 143 0.01
- Hypoport AG 37 -
2 Indus Holding AG 47 -
5 Infineon Technologies AG 143 0.01
2 Instone Real Estate Group AG 34 -
1 IVU Traffic Technologies AG 11 -
3 Jenoptik AG 63 -
- JOST Werke AG 13 -
15 K&S AG 148 0.01
6 KION Group AG 450 0.03
5 Kloeckner & Co SE 52 -
1 Knorr-Bremse AG 78 0.01
- Koenig & Bauer AG 10 -
1 Krones AG 39 -
1 KWS Saat SE & Co KGaA 39 -
6 Lanxess AG 303 0.02
1 LEG Immobilien AG 143 0.01
- Leifheit AG 16 -
1 Leoni AG 9 -
1 Merck KGaA 91 0.01
14 METRO AG 131 0.01
2 MLP SE 9 -
1 MTU Aero Engines AG 262 0.02
1 Muenchener Rueckversicherungs-Gesellschaft AGin Muenchen 168 0.01
- Nagarro SE 29 -
2 Nemetschek SE 112 0.01
- New Work SE 16 -
1 Nexus AG 35 -
2 Nordex SE 37 -
2 Norma Group SE 77 0.01
3 Patrizia AG 53 -
- Pfeiffer Vacuum Technology AG 20 -
5 PNE AG 31 -
13 ProSiebenSat.1 Media SE 210 0.01
1 PSI Software AG 15 -
1 Puma SE 40 -
- PVA TePla AG 6 -
3 QIAGEN NV 89 0.01
- Rational AG 65 -
World Allocation 60/40 FundPortfolio of Investments as at 31 May 2021 (continued)
Dimensional Fund Advisors Semi-Annual Report and Unaudited Financial Statements, 31 May 2021 381

Shares (000's)
Value(000's)
GBP
% of NetAssetValue
Common Stock (continued)
Germany - 1.20% (continued)
3 Rheinmetall AG 227 0.01
3 RTL Group SA 103 0.01
12 RWE AG 315 0.02
3 S&T AG 49 -
3 SAF-Holland SE 38 -
2 Salzgitter AG 52 -
9 SAP SE 876 0.05
- Schaltbau Holding AG 9 -
1 Scout24 AG 60 -
- Secunet Security Networks AG 9 -
3 SGL Carbon SE 14 -
3 Siemens AG 388 0.02
2 Siemens Energy AG 42 -
1 Siltronic AG 108 0.01
1 Sixt SE 113 0.01
3 Software AG 93 0.01
1 Stabilus SA 62 -
- Stratec SE 31 -
1 Stroeer SE & Co KGaA 73 -
5 Suedzucker AG 54 -
1 SUESS MicroTec SE 11 -
1 Surteco Group SE 15 -
3 Symrise AG 231 0.01
5 TAG Immobilien AG 113 0.01
1 Takkt AG 11 -
3 Talanx AG 74 0.01
80 Telefonica Deutschland Holding AG 155 0.01
33 thyssenkrupp AG 273 0.02
5 Uniper SE 123 0.01
7 United Internet AG 217 0.01
- va-Q-tec AG 7 -
2 VERBIO Vereinigte BioEnergie AG 83 0.01
1 Volkswagen AG 154 0.01
5 Vonovia SE 209 0.01
1 Wacker Chemie AG 148 0.01
2 Wacker Neuson SE 44 -
- Washtec AG 16 -
- Westwing Group AG 11 -
1 Wuestenrot & Wuerttembergische AG 17 -
1 Zalando SE 69 -
- Zeal Network SE 9 -
- zooplus AG 53 -
21,687 1.20
Hong Kong - 0.45%
154 AIA Group Ltd 1,446 0.08
26 Allied Group Ltd 7 -
9 ASM Pacific Technology Ltd 83 0.01
44 Bank of East Asia Ltd 63 -
17 BOC Aviation Ltd 107 0.01
50 BOC Hong Kong Holdings Ltd 130 0.01
92 BOCOM International Holdings Co Ltd 15 -
40 BOE Varitronix Ltd 15 -
21 Cafe de Coral Holdings Ltd 32 -
91 Cathay Pacific Airways Ltd 56 -
13 China Evergrande New Energy Vehicle Group 43 -
995 China Strategic Holdings Ltd 11 -
47 Chinese Estates Holdings Ltd 16 -
9 Chong Hing Bank Ltd 17 -
22 Chow Sang Sang Holdings International Ltd 27 -
35 Chow Tai Fook Jewellery Group Ltd 46 -
126 CITIC Telecom International Holdings Ltd 29 -
41 CK Asset Holdings Ltd 198 0.01
Shares (000's)
Value(000's)
GBP
% of NetAssetValue
Common Stock (continued)
Hong Kong - 0.45% (continued)
39 CK Hutchison Holdings Ltd 218 0.01
10 CK Infrastructure Holdings Ltd 46 -
14 CLP Holdings Ltd 103 0.01
29 Crystal International Group Ltd 9 -
340 CSI Properties Ltd 8 -
32 Dah Sing Banking Group Ltd 26 -
8 Dah Sing Financial Holdings Ltd 21 -
8 Dynamic Holdings Ltd 10 -
14 EC Healthcare 16 -
72 Emperor International Holdings Ltd 7 -
193 Esprit Holdings Ltd 14 -
5 Fairwood Holdings Ltd 7 -
69 Far East Consortium International Ltd 17 -
190 First Pacific Co Ltd 47 -
10 Fosun Tourism Group 14 -
3 Galaxy Entertainment Group Ltd 18 -
62 Giordano International Ltd 10 -
90 Goodbaby International Holdings Ltd 16 -
14 Great Eagle Holdings Ltd 35 -
4 Guoco Group Ltd 33 -
146 Guotai Junan International Holdings Ltd 19 -
182 Haitong International Securities Group Ltd 40 -
65 Hang Lung Group Ltd 114 0.01
33 Hang Lung Properties Ltd 60 -
8 Hang Seng Bank Ltd 120 0.01
23 Henderson Land Development Co Ltd 79 0.01
57 HK Electric Investments & HK Electric InvestmentsLtd 41 -
42 HKBN Ltd 40 -
71 HKR International Ltd 24 -
173 HKT Trust & HKT Ltd 166 0.01
60 Hong Kong & China Gas Co Ltd 74 0.01
14 Hong Kong Exchanges & Clearing Ltd 625 0.04
13 Hong Kong Ferry Holdings Co Ltd 7 -
20 Hong Kong Television Network Ltd 17 -
24 Hongkong & Shanghai Hotels Ltd 17 -
66 Hutchison Telecommunications Hong Kong HoldingsLtd 9 -
25 Hysan Development Co Ltd 69 0.01
38 IGG Inc 40 -
31 Johnson Electric Holdings Ltd 59 -
73 K Wah International Holdings Ltd 25 -
48 Karrie International Holdings Ltd 8 -
51 Kerry Logistics Network Ltd 108 0.01
48 Kerry Properties Ltd 116 0.01
13 Lai Sun Development Co Ltd 7 -
40 Langham Hospitality Investments and LanghamHospitality Investments Ltd 3 -
13 Lifestyle International Holdings Ltd 7 -
14 Liu Chong Hing Investment Ltd 11 -
20 L'Occitane International SA 47 -
25 Luk Fook Holdings International Ltd 49 -
64 Man Wah Holdings Ltd 102 0.01
43 Melco International Development Ltd 55 -
6 Miramar Hotel & Investment 8 -
44 Modern Dental Group Ltd 27 -
15 Mongolian Mining Corp 3 -
12 MTR Corp Ltd 48 -
63 NagaCorp Ltd 46 -
24 New World Development Co Ltd 92 0.01
31 Nissin Foods Co Ltd 17 -
104 NWS Holdings Ltd 83 0.01
World Allocation 60/40 FundPortfolio of Investments as at 31 May 2021 (continued)
Dimensional Fund Advisors Semi-Annual Report and Unaudited Financial Statements, 31 May 2021 382

Shares (000's)
Value(000's)
GBP
% of NetAssetValue
Common Stock (continued)
Hong Kong - 0.45% (continued)
377 Pacific Basin Shipping Ltd 100 0.01
60 Pacific Textiles Holdings Ltd 28 -
222 PCCW Ltd 87 0.01
24 Perfect Shape Medical Ltd 18 -
70 Pico Far East Holdings Ltd 9 -
19 Power Assets Holdings Ltd 86 0.01
17 PRADA SpA 81 0.01
4 Sands China Ltd 12 -
10 SEA Holdings Ltd 7 -
78 Shangri-La Asia Ltd 51 -
108 Shun Tak Holdings Ltd 24 -
138 Sino Land Co Ltd 156 0.01
72 SITC International Holdings Co Ltd 180 0.01
85 SJM Holdings Ltd 68 0.01
17 SmarTone Telecommunications Holdings Ltd 7 -
29 Stella International Holdings Ltd 25 -
30 Sun Hung Kai & Co Ltd 12 -
11 Sun Hung Kai Properties Ltd 119 0.01
38 SUNeVision Holdings Ltd 28 -
23 Swire Pacific Ltd, Class A 127 0.01
24 Swire Pacific Ltd, Class B 21 -
17 Swire Properties Ltd 36 -
23 TAI Cheung Holdings Ltd 10 -
18 Techtronic Industries Co Ltd 233 0.01
25 Television Broadcasts Ltd 18 -
64 Texwinca Holdings Ltd 12 -
370 Theme International Holdings Ltd 30 -
16 Transport International Holdings Ltd 22 -
47 United Laboratories International Holdings Ltd 30 -
70 Value Partners Group Ltd 34 -
30 Vitasoy International Holdings Ltd 83 0.01
4 Vobile Group Ltd 13 -
34 VPower Group International Holdings Ltd 6 -
44 VSTECS Holdings Ltd 30 -
8 VTech Holdings Ltd 62 -
459 WH Group Ltd 279 0.02
20 Wharf Real Estate Investment Co Ltd 87 0.01
37 Wynn Macau Ltd 45 -
58 Xinyi Glass Holdings Ltd 159 0.01
70 Yue Yuen Industrial Holdings Ltd 128 0.01
380 Zensun Enterprises Ltd 22 -
8,083 0.45
Ireland - 0.15%
47 AIB Group PLC 109 0.01
75 Bank of Ireland Group PLC 340 0.02
43 Cairn Homes PLC 40 -
22 CRH PLC 802 0.04
1 CRH PLC, ADR 40 -
- FBD Holdings PLC 2 -
1 Flutter Entertainment PLC (Ireland listing) 92 0.01
3 Flutter Entertainment PLC (UK listing) 368 0.02
6 Glanbia PLC 76 -
38 Glenveagh Properties PLC 33 -
7 Irish Continental Group PLC 28 -
1 Kerry Group PLC 115 0.01
4 Kingspan Group PLC 272 0.02
6 Permanent TSB Group Holdings PLC 7 -
10 Smurfit Kappa Group PLC 379 0.02
2,703 0.15
Israel - 0.08%
- AFI Properties Ltd 9 -
1 Airport City Ltd 8 -
Shares (000's)
Value(000's)
GBP
% of NetAssetValue
Common Stock (continued)
Israel - 0.08% (continued)
3 Alony Hetz Properties & Investments Ltd 34 -
2 Ashtrom Group Ltd 41 -
- Azrieli Group Ltd 12 -
8 Bank Hapoalim BM 52 -
12 Bank Leumi Le-Israel BM 69 0.01
1 Bayside Land Corp 9 -
46 Bezeq The Israeli Telecommunication Corp Ltd 36 -
3 Cellcom Israel Ltd 8 -
3 Clal Insurance Enterprises Holdings Ltd 41 -
- Danel Adir Yeoshua Ltd 10 -
- Electra Consumer Products 1970 Ltd 13 -
- Electra Ltd 22 -
1 Equital Ltd 11 -
3 First International Bank Of Israel Ltd 65 0.01
1 Formula Systems 1985 Ltd 32 -
1 Fox Wizel Ltd 49 -
6 Harel Insurance Investments & Financial ServicesLtd 47 -
1 Hilan Ltd 19 -
8 Industrial Buildings Corp Ltd 17 -
6 Isracard Ltd 16 -
6 Israel Chemicals Ltd 31 -
32 Israel Discount Bank Ltd 115 0.01
1 Magic Software Enterprises Ltd 9 -
1 Magic Software Enterprises Ltd (US listing) 9 -
1 Matrix IT Ltd 11 -
1 Maytronics Ltd 10 -
- Melisron Ltd 9 -
1 Menora Mivtachim Holdings Ltd 10 -
11 Migdal Insurance & Financial Holdings Ltd 11 -
4 Mizrahi Tefahot Bank Ltd 93 0.01
- Nice Ltd 73 0.01
- Nice Ltd, ADR 24 -
1 Nova Measuring Instruments Ltd 65 0.01
48 Oil Refineries Ltd 9 -
6 Partner Communications Co Ltd 19 -
- Paz Oil Co Ltd 44 -
8 Phoenix Holdings Ltd 53 -
1 Shapir Engineering and Industry Ltd 8 -
14 Shikun & Binui Ltd 67 0.01
5 Shufersal Ltd 28 -
2 Strauss Group Ltd 33 -
8 Teva Pharmaceutical Industries Ltd 59 -
4 Tower Semiconductor Ltd 77 0.01
1 Tower Semiconductor Ltd (US listing) 24 -
1,511 0.08
Italy - 0.53%
109 A2A SpA 161 0.01
4 ACEA SpA 62 -
6 Amplifon SpA 185 0.01
20 Anima Holding SpA 74 -
6 Arnoldo Mondadori Editore SpA 9 -
2 Ascopiave SpA 7 -
18 Assicurazioni Generali SpA 262 0.01
8 Atlantia SpA 103 0.01
4 Autogrill SpA 24 -
6 Azimut Holding SpA 102 0.01
4 Banca Farmafactoring SpA 26 -
4 Banca Generali SpA 107 0.01
9 Banca Mediolanum SpA 62 -
34 Banca Popolare di Sondrio SCpA 119 0.01
6 Banca Sistema SpA 11 -
World Allocation 60/40 FundPortfolio of Investments as at 31 May 2021 (continued)
Dimensional Fund Advisors Semi-Annual Report and Unaudited Financial Statements, 31 May 2021 383

Shares (000's)
Value(000's)
GBP
% of NetAssetValue
Common Stock (continued)
Italy - 0.53% (continued)
121 Banco BPM SpA 302 0.02
79 BPER Banca 138 0.01
1 Brunello Cucinelli SpA 62 -
5 Buzzi Unicem SpA 107 0.01
7 Cairo Communication SpA 12 -
2 Carel Industries SpA 35 -
1 Cementir Holding NV 11 -
11 Cerved Group SpA 90 0.01
22 CIR SpA-Compagnie Industriali 10 -
46 CNH Industrial NV 562 0.03
6 Credito Emiliano SpA 29 -
1 Danieli & C Officine Meccaniche SpA 19 -
3 De' Longhi SpA 81 -
1 DiaSorin SpA 90 0.01
- Digital Bros SpA 7 -
3 doValue SpA 23 -
90 Enel SpA 629 0.03
31 Eni SpA 272 0.02
4 ERG SpA 89 0.01
1 Esprinet SpA 12 -
1 Ferrari NV 219 0.01
17 FinecoBank Banca Fineco SpA 195 0.01
23 FNM SpA 14 -
7 Freni Brembo SpA 65 -
1 Gruppo MutuiOnline SpA 41 -
56 Hera SpA 169 0.01
1 Illimity Bank SpA 12 -
5 Infrastrutture Wireless Italiane SpA 41 -
3 Interpump Group SpA 103 0.01
145 Intesa Sanpaolo SpA 301 0.02
29 Iren SpA 64 -
16 Italgas SpA 74 -
1 Italmobiliare SpA 18 -
1 IVS Group SA 4 -
1 La Doria SpA 16 -
30 Leonardo SpA 186 0.01
6 Maire Tecnimont SpA 15 -
34 Mediaset SpA 86 0.01
45 Mediobanca Banca di Credito Finanziario SpA 375 0.02
6 Moncler SpA 293 0.02
1 Nexi SpA 14 -
17 OVS SpA 27 -
9 Piaggio & C SpA 24 -
24 Pirelli & C SpA 102 0.01
17 Poste Italiane SpA 167 0.01
9 Prysmian SpA 219 0.01
2 RAI Way SpA 8 -
3 Recordati SpA 125 0.01
1 Reply SpA 93 0.01
1 Sabaf SpA 12 -
35 Saipem SpA 61 -
42 Saras SpA 25 -
- Sesa SpA 27 -
69 Snam SpA 288 0.02
12 Societa Cattolica di Assicurazioni SC 60 -
2 SOL SpA 22 -
78 Stellantis 1,082 0.06
4 Tamburi Investment Partners SpA 24 -
6 Technogym SpA 53 -
585 Telecom Italia SpA 221 0.01
19 Tenaris SA 153 0.01
27 Terna Rete Elettrica Nazionale SpA 143 0.01
Shares (000's)
Value(000's)
GBP
% of NetAssetValue
Common Stock (continued)
Italy - 0.53% (continued)
1 Tinexta Spa 20 -
35 UniCredit SpA 312 0.02
1 Unieuro SpA 19 -
37 Unipol Gruppo SpA 146 0.01
24 UnipolSai Assicurazioni SpA 50 -
1 Zignago Vetro SpA 9 -
9,691 0.53
Japan - 3.67%
4 77 Bank Ltd 34 -
1 A&D Co Ltd 7 -
- ABC-Mart Inc 10 -
1 Achilles Corp 7 -
8 Acom Co Ltd 25 -
1 Adastria Co Ltd 11 -
7 ADEKA Corp 82 0.01
1 Advan Co Ltd 7 -
3 Advantest Corp 188 0.01
10 AEON Co Ltd 198 0.01
1 AEON Delight Co Ltd 26 -
7 AEON Financial Service Co Ltd 60 -
1 AEON Hokkaido Corp 7 -
2 AEON Mall Co Ltd 23 -
5 AGC Inc 148 0.01
1 Agro-Kanesho Co Ltd 7 -
1 Ai Holdings Corp 15 -
1 Aica Kogyo Co Ltd 36 -
1 Aichi Bank Ltd 9 -
4 Aichi Corp 23 -
1 Aichi Steel Corp 22 -
3 Aida Engineering Ltd 16 -
28 Aiful Corp 68 0.01
1 Ain Holdings Inc 55 -
1 Aiphone Co Ltd 11 -
10 Air Water Inc 121 0.01
3 Airport Facilities Co Ltd 12 -
4 Aisan Industry Co Ltd 20 -
4 Aisin Seiki Co Ltd 124 0.01
1 Aizawa Securities Co Ltd 11 -
11 Ajinomoto Co Inc 182 0.01
1 Akatsuki Inc 11 -
11 Akebono Brake Industry Co Ltd 12 -
1 Akita Bank Ltd 8 -
1 Albis Co Ltd 9 -
2 Alconix Corp 15 -
5 Alfresa Holdings Corp 53 -
2 Alinco Inc 16 -
1 Alpen Co Ltd 17 -
10 Alps Alpine Co Ltd 79 0.01
1 Altech Corp 8 -
11 Amada Holdings Co Ltd 81 0.01
2 Amano Corp 45 -
1 Amuse Inc 10 -
- Amvis Holdings Inc 17 -
1 ANA Holdings Inc 21 -
2 Anest Iwata Corp 12 -
2 Anicom Holdings Inc 13 -
6 Anritsu Corp 76 0.01
5 AOKI Holdings Inc 21 -
1 Aomori Bank Ltd 14 -
10 Aozora Bank Ltd 156 0.01
1 Arakawa Chemical Industries Ltd 7 -
1 Arata Corp 36 -
World Allocation 60/40 FundPortfolio of Investments as at 31 May 2021 (continued)
Dimensional Fund Advisors Semi-Annual Report and Unaudited Financial Statements, 31 May 2021 384

Shares (000's)
Value(000's)
GBP
% of NetAssetValue
Common Stock (continued)
Japan - 3.67% (continued)
1 Arcland Service Holdings Co Ltd 9 -
4 Arcs Co Ltd 55 -
1 Argo Graphics Inc 16 -
2 Arisawa Manufacturing Co Ltd 10 -
2 ARTERIA Networks Corp 24 -
2 Artnature Inc 7 -
1 ArtSpark Holdings Inc 17 -
2 Aruhi Corp 24 -
1 Asahi Co Ltd 10 -
4 Asahi Diamond Industrial Co Ltd 14 -
5 Asahi Group Holdings Ltd 185 0.01
4 Asahi Holdings Inc 61 0.01
4 Asahi Intecc Co Ltd 67 0.01
34 Asahi Kasei Corp 268 0.02
1 Asahi Yukizai Corp 7 -
- Asanuma Corp 9 -
2 Asia Pile Holdings Corp 7 -
1 Asics Corp 25 -
1 ASKA Pharmaceutical Holdings 5 -
1 ASKUL Corp 16 -
12 Astellas Pharma Inc 137 0.01
1 Aucnet Inc 9 -
4 Autobacs Seven Co Ltd 39 -
1 Avant Corp 9 -
2 Avex Inc 17 -
2 Awa Bank Ltd 30 -
1 Axial Retailing Inc 24 -
1 Azbil Corp 41 -
2 Bandai Namco Holdings Inc 125 0.01
2 Bando Chemical Industries Ltd 9 -
1 Bank of Iwate Ltd 8 -
2 Bank of Kyoto Ltd 70 0.01
1 Bank of Nagoya Ltd 9 -
2 Bank of Okinawa Ltd 26 -
1 Bank of Saga Ltd 7 -
3 Bank of the Ryukyus Ltd 14 -
- BayCurrent Consulting Inc 105 0.01
1 Beenos Inc 23 -
1 Belc Co Ltd 32 -
1 Bell System24 Holdings Inc 15 -
5 Belluna Co Ltd 32 -
2 Benefit One Inc 47 -
4 Benesse Holdings Inc 62 0.01
- Bengo4.com Inc 11 -
6 Bic Camera Inc 44 -
1 Biofermin Pharmaceutical Co Ltd 16 -
1 BML Inc 31 -
2 Br Holdings Corp 5 -
6 Bridgestone Corp 191 0.01
4 Broadleaf Co Ltd 13 -
8 Brother Industries Ltd 120 0.01
5 Bunka Shutter Co Ltd 34 -
- C Uyemura & Co Ltd 19 -
1 CAC Holdings Corp 14 -
4 Calbee Inc 64 0.01
1 Can Do Co Ltd 8 -
2 Canon Electronics Inc 24 -
6 Canon Inc 109 0.01
2 Canon Marketing Japan Inc 39 -
3 Capcom Co Ltd 69 0.01
2 Carlit Holdings Co Ltd 8 -
3 Casio Computer Co Ltd 33 -
Shares (000's)
Value(000's)
GBP
% of NetAssetValue
Common Stock (continued)
Japan - 3.67% (continued)
1 Cawachi Ltd 12 -
3 Central Glass Co Ltd 36 -
1 Central Japan Railway Co 108 0.01
1 Central Security Patrols Co Ltd 11 -
1 Ceres Inc 15 -
1 Change Inc 21 -
2 Charm Care Corp KK 13 -
14 Chiba Bank Ltd 63 0.01
4 Chiba Kogyo Bank Ltd 7 -
1 Chilled & Frozen Logistics Holdings Co Ltd 12 -
2 Chiyoda Co Ltd 13 -
1 Chiyoda Integre Co Ltd 8 -
1 Chodai Co Ltd 7 -
2 Chofu Seisakusho Co Ltd 27 -
1 Chori Co Ltd 9 -
8 Chubu Electric Power Co Inc 66 0.01
3 Chubu Shiryo Co Ltd 20 -
2 Chudenko Corp 31 -
6 Chugai Pharmaceutical Co Ltd 147 0.01
1 Chugai Ro Co Ltd 15 -
12 Chugoku Bank Ltd 69 0.01
5 Chugoku Electric Power Co Inc 34 -
3 Chugoku Marine Paints Ltd 15 -
1 Chukyo Bank Ltd 15 -
3 CI Takiron Corp 13 -
21 Citizen Watch Co Ltd 60 0.01
1 CKD Corp 16 -
2 CMIC Holdings Co Ltd 15 -
2 CMK Corp 8 -
5 Coca-Cola Bottlers Japan Holdings Inc 63 0.01
1 Cocokara fine Inc 42 -
3 COLOPL Inc 14 -
1 Computer Engineering & Consulting Ltd 13 -
3 COMSYS Holdings Corp 54 -
1 Comture Corp 19 -
39 Concordia Financial Group Ltd 104 0.01
1 CONEXIO Corp 7 -
9 COOKPAD Inc 15 -
1 Cosel Co Ltd 8 -
5 Cosmo Energy Holdings Co Ltd 71 0.01
1 Cosmos Pharmaceutical Corp 50 -
1 Cota Co Ltd 8 -
1 Create SD Holdings Co Ltd 28 -
11 Credit Saison Co Ltd 100 0.01
1 Cresco Ltd 10 -
1 CTI Engineering Co Ltd 10 -
2 Curves Holdings Co Ltd 9 -
9 CyberAgent Inc 129 0.01
1 Cybozu Inc 11 -
5 Dai Nippon Printing Co Ltd 76 0.01
1 Dai Nippon Toryo Co Ltd 8 -
2 Daibiru Corp 14 -
18 Daicel Corp 99 0.01
1 Dai-Dan Co Ltd 14 -
2 Daido Metal Co Ltd 8 -
2 Daido Steel Co Ltd 76 0.01
1 Daifuku Co Ltd 59 -
1 Daihen Corp 31 -
1 Daiho Corp 31 -
- Daiichi Jitsugyo Co Ltd 11 -
1 Daiichi Kigenso Kagaku-Kogyo Co Ltd 14 -
10 Dai-ichi Life Holdings Inc 152 0.01
World Allocation 60/40 FundPortfolio of Investments as at 31 May 2021 (continued)
Dimensional Fund Advisors Semi-Annual Report and Unaudited Financial Statements, 31 May 2021 385

Shares (000's)
Value(000's)
GBP
% of NetAssetValue
Common Stock (continued)
Japan - 3.67% (continued)
3 Daiichi Sankyo Co Ltd 49 -
2 Daiichikosho Co Ltd 60 -
1 Daiken Corp 9 -
3 Daiki Aluminium Industry Co Ltd 21 -
2 Daikin Industries Ltd 338 0.02
- Daikokutenbussan Co Ltd 10 -
2 Daikyonishikawa Corp 9 -
2 Dainichiseika Color & Chemicals Manufacturing CoLtd 24 -
4 Daio Paper Corp 49 -
1 Daiseki Co Ltd 39 -
3 Daishi Hokuetsu Financial Group Inc 43 -
1 Daishinku Corp 17 -
1 Daito Pharmaceutical Co Ltd 17 -
2 Daito Trust Construction Co Ltd 146 0.01
1 Daitron Co Ltd 16 -
14 Daiwa House Industry Co Ltd 287 0.02
2 Daiwa Industries Ltd 14 -
24 Daiwa Securities Group Inc 97 0.01
6 Daiwabo Holdings Co Ltd 61 0.01
9 DCM Holdings Co Ltd 61 0.01
5 DeNA Co Ltd 73 0.01
6 Denka Co Ltd 154 0.01
- Denki Kogyo Co Ltd 6 -
- Densan System Co Ltd 8 -
3 Denso Corp 129 0.01
3 Dentsu Inc 83 0.01
1 Denyo Co Ltd 8 -
5 Dexerials Corp 67 0.01
6 DIC Corp 109 0.01
- Digital Arts Inc 26 -
1 Digital Garage Inc 20 -
1 Digital Holdings Inc 18 -
1 Dip Corp 29 -
- Disco Corp 91 0.01
1 DKS Co Ltd 21 -
6 DMG Mori Co Ltd 77 0.01
1 Doshisha Co Ltd 13 -
2 Doutor Nichires Holdings Co Ltd 22 -
3 Dowa Holdings Co Ltd 97 0.01
2 DTS Corp 36 -
3 Duskin Co Ltd 50 -
1 DyDo Group Holdings Inc 23 -
1 Eagle Industry Co Ltd 7 -
1 Earth Corp 36 -
2 East Japan Railway Co 108 0.01
5 Ebara Corp 160 0.01
1 Ebara Foods Industry Inc 8 -
- Ebara Jitsugyo Co Ltd 12 -
2 Ebase Co Ltd 12 -
1 Eco's Co Ltd 7 -
6 EDION Corp 46 -
2 EF-ON Inc 15 -
1 eGuarantee Inc 11 -
- E-Guardian Inc 6 -
3 Ehime Bank Ltd 14 -
1 Eiken Chemical Co Ltd 14 -
2 Eisai Co Ltd 90 0.01
1 Eizo Corp 35 -
2 Elan Corp 16 -
2 Elecom Co Ltd 25 -
2 Electric Power Development Co Ltd 18 -
Shares (000's)
Value(000's)
GBP
% of NetAssetValue
Common Stock (continued)
Japan - 3.67% (continued)
1 Elematec Corp 10 -
1 Enigmo Inc 9 -
2 en-japan Inc 40 -
1 Enplas Corp 13 -
1 EPS Holdings Inc 11 -
1 eRex Co Ltd 16 -
1 ES-Con Japan Ltd 7 -
1 ESPEC Corp 13 -
3 Exedy Corp 30 -
1 Ezaki Glico Co Ltd 36 -
3 F@N Communications Inc 9 -
1 Falco Holdings Co Ltd 12 -
1 Fancl Corp 21 -
- FANUC Corp 45 -
1 Fast Retailing Co Ltd 421 0.02
2 FCC Co Ltd 25 -
1 Feed One Co Ltd 6 -
2 Ferrotec Holdings Corp 39 -
15 FIDEA Holdings Co Ltd 12 -
4 First Bank of Toyama Ltd 7 -
1 FJ Next Co Ltd 10 -
1 Foster Electric Co Ltd 9 -
2 FP Corp 48 -
1 France Bed Holdings Co Ltd 7 -
1 Fudo Tetra Corp 12 -
1 Fuji Co Ltd 19 -
4 Fuji Corp (Aichi) 72 0.01
2 Fuji Corp Ltd 7 -
3 Fuji Electric Co Ltd 96 0.01
- Fuji Kyuko Co Ltd 9 -
2 Fuji Media Holdings Inc 15 -
2 Fuji Oil Holdings Inc 44 -
1 Fuji Pharma Co Ltd 7 -
3 Fuji Seal International Inc 48 -
2 Fuji Soft Inc 54 -
1 Fujibo Holdings Inc 15 -
1 Fujicco Co Ltd 15 -
4 FUJIFILM Holdings Corp 197 0.01
3 Fujikura Kasei Co Ltd 10 -
21 Fujikura Ltd 65 0.01
1 Fujimi Inc 19 -
1 Fujimori Kogyo Co Ltd 28 -
2 Fujitec Co Ltd 38 -
2 Fujitsu General Ltd 31 -
3 Fujitsu Ltd 304 0.02
1 Fujiya Co Ltd 7 -
- Fukuda Corp 10 -
- Fukuda Denshi Co Ltd 20 -
1 Fukui Bank Ltd 13 -
1 Fukui Computer Holdings Inc 17 -
9 Fukuoka Financial Group Inc 125 0.01
1 Fukushima Industries Corp 18 -
2 Fukuyama Transporting Co Ltd 53 -
1 FULLCAST Holdings Co Ltd 11 -
2 Funai Soken Holdings Inc 27 -
2 Furukawa Co Ltd 15 -
5 Furukawa Electric Co Ltd 101 0.01
2 Furuno Electric Co Ltd 13 -
1 Furusato Industries Ltd 9 -
1 Furyu Corp 8 -
1 Fuso Chemical Co Ltd 25 -
1 Fuso Pharmaceutical Industries Ltd 7 -
World Allocation 60/40 FundPortfolio of Investments as at 31 May 2021 (continued)
Dimensional Fund Advisors Semi-Annual Report and Unaudited Financial Statements, 31 May 2021 386

Shares (000's)
Value(000's)
GBP
% of NetAssetValue
Common Stock (continued)
Japan - 3.67% (continued)
4 Futaba Corp 21 -
4 Futaba Industrial Co Ltd 14 -
1 Future Corp 17 -
2 Fuyo General Lease Co Ltd 78 0.01
1 G-7 Holdings Inc 14 -
1 Gakken Holdings Co Ltd 10 -
2 Gecoss Corp 11 -
1 Genky DrugStores Co Ltd 13 -
3 Geo Holdings Corp 21 -
1 giftee Inc 15 -
- Giken Ltd 8 -
3 Glory Ltd 50 -
3 GMO Financial Holdings Inc 15 -
3 GMO Internet Inc 49 -
1 GMO Payment Gateway Inc 77 0.01
1 Godo Steel Ltd 6 -
1 Goldcrest Co Ltd 13 -
1 Goldwin Inc 26 -
1 Grace Technology Inc 13 -
4 Gree Inc 16 -
6 GS Yuasa Corp 111 0.01
2 G-Tekt Corp 16 -
2 Gumi Inc 18 -
3 GungHo Online Entertainment Inc 38 -
27 Gunma Bank Ltd 64 0.01
1 Gunze Ltd 40 -
7 H2O Retailing Corp 42 -
27 Hachijuni Bank Ltd 67 0.01
1 Hagihara Industries Inc 7 -
1 Hagiwara Electric Holdings Co Ltd 8 -
2 Hakuhodo DY Holdings Inc 22 -
1 Hakuto Co Ltd 9 -
- Halows Co Ltd 7 -
1 Hamakyorex Co Ltd 16 -
1 Hamamatsu Photonics KK 54 -
4 Hankyu Hanshin Holdings Inc 83 0.01
2 Hanwa Co Ltd 52 -
1 Happinet Corp 11 -
18 Haseko Corp 180 0.01
14 Hazama Ando Corp 76 0.01
4 Heiwa Corp 45 -
2 Heiwa Real Estate Co Ltd 51 -
2 Heiwado Co Ltd 28 -
- Hennge KK 6 -
1 Hibiya Engineering Ltd 15 -
- Hikari Tsushin Inc 53 -
2 HI-LEX Corp 20 -
10 Hino Motors Ltd 69 0.01
- Hioki EE Corp 10 -
1 Hirakawa Hewtech Corp 8 -
- Hirata Corp 17 -
17 Hirogin Holdings Inc 66 0.01
- Hirose Electric Co Ltd 44 -
1 Hisaka Works Ltd 7 -
- Hisamitsu Pharmaceutical Co Inc 16 -
2 Hitachi Construction Machinery Co Ltd 55 -
16 Hitachi Ltd 602 0.03
3 Hitachi Metals Ltd 41 -
2 Hitachi Transport System Ltd 38 -
11 Hitachi Zosen Corp 51 -
1 Hochiki Corp 7 -
- Hodogaya Chemical Co Ltd 10 -
Shares (000's)
Value(000's)
GBP
% of NetAssetValue
Common Stock (continued)
Japan - 3.67% (continued)
1 Hogy Medical Co Ltd 31 -
5 Hokkaido Electric Power Co Inc 16 -
1 Hokko Chemical Industry Co Ltd 9 -
2 Hokkoku Bank Ltd 26 -
9 Hokuetsu Corp 34 -
1 Hokuetsu Industries Co Ltd 8 -
9 Hokuhoku Financial Group Inc 54 -
6 Hokuriku Electric Power Co 23 -
2 Hokuriku Electrical Construction Co Ltd 12 -
1 Hokuto Corp 11 -
13 Honda Motor Co Ltd 294 0.02
1 H-One Co Ltd 7 -
2 Honeys Holdings Co Ltd 10 -
4 Hoosiers Holdings 18 -
1 Horiba Ltd 53 -
3 Hosiden Corp 20 -
- Hosokawa Micron Corp 11 -
1 House Foods Group Inc 31 -
5 Hoya Corp 433 0.03
9 Hulic Co Ltd 70 0.01
13 Hyakugo Bank Ltd 27 -
2 Hyakujushi Bank Ltd 15 -
1 Ibiden Co Ltd 34 -
3 IBJ Inc 18 -
1 Ichibanya Co Ltd 15 -
16 Ichigo Inc 37 -
1 Ichikoh Industries Ltd 6 -
1 Ichinen Holdings Co Ltd 7 -
3 Ichiyoshi Securities Co Ltd 12 -
1 Icom Inc 8 -
1 Idec Corp 17 -
4 Idemitsu Kosan Co Ltd 59 -
2 IDOM Inc 9 -
12 IHI Corp 203 0.01
3 Iida Group Holdings Co Ltd 54 -
4 Iino Kaiun Kaisha Ltd 12 -
1 Imuraya Group Co Ltd 8 -
4 Inaba Denki Sangyo Co Ltd 58 -
1 Inaba Seisakusho Co Ltd 8 -
3 Inabata & Co Ltd 32 -
1 Inageya Co Ltd 7 -
1 Ines Corp 13 -
1 I-Net Corp 7 -
1 Infocom Corp 20 -
7 Infomart Corp 41 -
1 Information Services International-Dentsu Ltd 18 -
31 Inpex Corp 151 0.01
1 Insource Co Ltd 14 -
2 Intage Holdings Inc 19 -
1 Inter Action Corp 9 -
2 Internet Initiative Japan Inc 41 -
- IR Japan Holdings Ltd 29 -
- Iriso Electronics Co Ltd 8 -
1 Iseki & Co Ltd 8 -
11 Isetan Mitsukoshi Holdings Ltd 57 -
1 Ishihara Sangyo Kaisha Ltd 9 -
14 Isuzu Motors Ltd 132 0.01
1 Itfor Inc 7 -
1 ITmedia Inc 11 -
1 Ito En Ltd 54 -
16 ITOCHU Corp 330 0.02
4 Itochu Enex Co Ltd 24 -
World Allocation 60/40 FundPortfolio of Investments as at 31 May 2021 (continued)
Dimensional Fund Advisors Semi-Annual Report and Unaudited Financial Statements, 31 May 2021 387

Shares (000's)
Value(000's)
GBP
% of NetAssetValue
Common Stock (continued)
Japan - 3.67% (continued)
2 Itochu Techno-Solutions Corp 40 -
- Itochu-Shokuhin Co Ltd 10 -
11 Itoham Yonekyu Holdings Inc 51 -
3 Itoki Corp 7 -
1 IwaiCosmo Holdings Inc 11 -
3 Iwaki & Co Ltd 15 -
3 Iwatani Corp 108 0.01
- Iwatsuka Confectionery Co Ltd 8 -
18 Iyo Bank Ltd 68 0.01
2 Izumi Co Ltd 54 -
16 J Front Retailing Co Ltd 110 0.01
1 JAC Recruitment Co Ltd 8 -
1 Jaccs Co Ltd 21 -
2 Jafco Co Ltd 113 0.01
2 Janome Sewing Machine Co Ltd 11 -
5 Japan Airlines Co Ltd 85 0.01
- Japan Airport Terminal Co Ltd 6 -
3 Japan Aviation Electronics Industry Ltd 36 -
2 Japan Elevator Service Holdings Co Ltd 31 -
7 Japan Exchange Group Inc 119 0.01
1 Japan Investment Adviser Co Ltd 7 -
3 Japan Lifeline Co Ltd 25 -
3 Japan Material Co Ltd 21 -
1 Japan Meat Co Ltd 12 -
1 Japan Medical Dynamic Marketing Inc 8 -
1 Japan Petroleum Exploration Co Ltd 15 -
14 Japan Post Holdings Co Ltd 80 0.01
4 Japan Post Insurance Co Ltd 51 -
1 Japan Property Management Center Co Ltd 10 -
1 Japan Pulp & Paper Co Ltd 17 -
5 Japan Securities Finance Co Ltd 27 -
4 Japan Steel Works Ltd 69 0.01
24 Japan Tobacco Inc 332 0.02
2 Japan Transcity Corp 8 -
3 Japan Wool Textile Co Ltd 21 -
1 JBCC Holdings Inc 7 -
1 JCU Corp 18 -
2 JDC Corp 7 -
1 Jeol Ltd 37 -
10 JFE Holdings Inc 93 0.01
12 JGC Holdings Corp 83 0.01
1 Jimoto Holdings Inc 6 -
1 JINS Holdings Inc 32 -
2 JMS Co Ltd 13 -
1 J-Oil Mills Inc 17 -
1 Joshin Denki Co Ltd 23 -
2 Joyful Honda Co Ltd 17 -
1 JSP Corp 8 -
3 JSR Corp 61 0.01
13 JTEKT Corp 101 0.01
3 Juki Corp 14 -
2 Juroku Bank Ltd 26 -
1 Justsystems Corp 31 -
11 JVCKenwood Corp 16 -
28 JXTG Holdings Inc 82 0.01
1 K&O Energy Group Inc 7 -
1 Kadokawa Dwango 30 -
1 Kaga Electronics Co Ltd 24 -
1 Kagome Co Ltd 27 -
17 Kajima Corp 164 0.01
3 Kakaku.com Inc 59 -
2 Kaken Pharmaceutical Co Ltd 53 -
Shares (000's)
Value(000's)
GBP
% of NetAssetValue
Common Stock (continued)
Japan - 3.67% (continued)
1 Kameda Seika Co Ltd 26 -
1 Kamei Corp 8 -
4 Kamigumi Co Ltd 57 -
1 Kanaden Corp 6 -
- Kanagawa Chuo Kotsu Co Ltd 7 -
3 Kanamoto Co Ltd 51 -
8 Kandenko Co Ltd 46 -
4 Kaneka Corp 110 0.01
- Kaneko Seeds Co Ltd 1 -
6 Kanematsu Corp 60 -
1 Kanematsu Electronics Ltd 21 -
9 Kansai Electric Power Co Inc 60 -
1 Kansai Paint Co Ltd 24 -
1 Kansai Super Market Ltd 6 -
3 Kanto Denka Kogyo Co Ltd 16 -
6 Kao Corp 261 0.02
1 Katakura Industries Co Ltd 11 -
2 Katitas Co Ltd 36 -
2 Kato Sangyo Co Ltd 35 -
1 Kawada Technologies Inc 12 -
- Kawai Musical Instruments Manufacturing Co Ltd 10 -
10 Kawasaki Heavy Industries Ltd 179 0.01
2 Kawasaki Kisen Kaisha Ltd 47 -
42 KDDI Corp 999 0.06
1 KeePer Technical Laboratory Co Ltd 19 -
1 Keihan Holdings Co Ltd 14 -
1 Keihanshin Building Co Ltd 10 -
3 Keikyu Corp 32 -
1 Keio Corp 55 -
2 Keisei Electric Railway Co Ltd 42 -
6 Keiyo Bank Ltd 17 -
1 Keiyo Co Ltd 7 -
1 Kenko Mayonnaise Co Ltd 7 -
4 Kewpie Corp 61 0.01
1 Keyence Corp 192 0.01
1 KFC Holdings Japan Ltd 13 -
1 KH Neochem Co Ltd 20 -
2 Kikkoman Corp 75 0.01
6 Kinden Corp 72 0.01
2 Kintetsu Group Holdings Co Ltd 57 -
3 Kintetsu World Express Inc 48 -
9 Kirin Holdings Co Ltd 123 0.01
2 Kissei Pharmaceutical Co Ltd 25 -
1 Ki-Star Real Estate Co Ltd 18 -
1 Kitagawa Corp 12 -
1 Kita-Nippon Bank Ltd 10 -
1 Kito Corp 9 -
5 Kitz Corp 23 -
4 Kiyo Bank Ltd 42 -
2 KLab Inc 11 -
2 Koa Corp 21 -
2 Koatsu Gas Kogyo Co Ltd 7 -
- Kobayashi Pharmaceutical Co Ltd 26 -
3 Kobe Bussan Co Ltd 55 -
24 Kobe Steel Ltd 115 0.01
2 Kohnan Shoji Co Ltd 42 -
1 Kohsoku Corp 7 -
1 Koito Manufacturing Co Ltd 59 -
2 Kojima Co Ltd 9 -
6 Kokuyo Co Ltd 63 0.01
9 Komatsu Ltd 181 0.01
1 Komatsu Matere Co Ltd 7 -
World Allocation 60/40 FundPortfolio of Investments as at 31 May 2021 (continued)
Dimensional Fund Advisors Semi-Annual Report and Unaudited Financial Statements, 31 May 2021 388

Shares (000's)
Value(000's)
GBP
% of NetAssetValue
Common Stock (continued)
Japan - 3.67% (continued)
1 Komatsu Wall Industry Co Ltd 9 -
1 KOMEDA Holdings Co Ltd 19 -
3 Komeri Co Ltd 42 -
5 Komori Corp 25 -
2 Konami Holdings Corp 93 0.01
1 Kondotec Inc 7 -
37 Konica Minolta Inc 144 0.01
2 Konishi Co Ltd 16 -
1 Konoike Transport Co Ltd 10 -
- Kose Corp 12 -
- Krosaki Harima Corp 9 -
9 K's Holdings Corp 72 0.01
1 KU Holdings Co Ltd 7 -
6 Kubota Corp 96 0.01
3 Kumagai Gumi Co Ltd 58 -
2 Kumiai Chemical Industry Co Ltd 13 -
1 Kurabo Industries Ltd 11 -
19 Kuraray Co Ltd 139 0.01
1 Kureha Corp 58 -
1 Kurimoto Ltd 16 -
1 Kurita Water Industries Ltd 30 -
1 Kusuri no Aoki Holdings Co Ltd 28 -
1 KYB Corp 25 -
3 Kyocera Corp 120 0.01
- Kyodo Printing Co Ltd 7 -
1 Kyoei Steel Ltd 10 -
2 Kyokuto Kaihatsu Kogyo Co Ltd 20 -
2 Kyokuto Securities Co Ltd 8 -
- Kyokuyo Co Ltd 7 -
3 KYORIN Holdings Inc 32 -
3 Kyosan Electric Manufacturing Co Ltd 7 -
2 Kyowa Exeo Corp 38 -
2 Kyudenko Corp 52 -
8 Kyushu Electric Power Co Inc 45 -
30 Kyushu Financial Group Inc 81 0.01
3 Kyushu Railway Co 45 -
2 LAC Co Ltd 15 -
1 Lacto Japan Co Ltd 9 -
1 Lasertec Corp 109 0.01
2 Lawson Inc 73 0.01
1 LEC Inc 8 -
1 Life Corp 24 -
5 Lifull Co Ltd 12 -
4 Lintec Corp 64 0.01
4 Lion Corp 50 -
1 LITALICO Inc 17 -
7 LIXIL Group Corp 136 0.01
1 M&A Capital Partners Co Ltd 19 -
4 M3 Inc 207 0.01
1 Mabuchi Motor Co Ltd 20 -
4 Macnica Fuji Electronics Holdings Inc 61 0.01
3 Macromill Inc 15 -
9 Maeda Corp 58 -
1 Maeda Kosen Co Ltd 29 -
3 Maeda Road Construction Co Ltd 42 -
1 Maezawa Kasei Industries Co Ltd 8 -
1 Maezawa Kyuso Industries Co Ltd 7 -
2 Makino Milling Machine Co Ltd 48 -
- Makita Corp 8 -
2 Mandom Corp 24 -
1 Mani Inc 16 -
1 MarkLines Co Ltd 12 -
Shares (000's)
Value(000's)
GBP
% of NetAssetValue
Common Stock (continued)
Japan - 3.67% (continued)
1 Mars Group Holdings Corp 7 -
32 Marubeni Corp 202 0.01
1 Marudai Food Co Ltd 9 -
3 Maruha Nichiro Corp 52 -
5 Marui Group Co Ltd 71 0.01
4 Maruichi Steel Tube Ltd 68 0.01
1 Maruka Corp 12 -
3 Marusan Securities Co Ltd 16 -
- Maruwa Co Ltd 20 -
1 Maruwa Unyu Kikan Co Ltd 13 -
1 Maruzen Co Ltd 15 -
1 Maruzen Showa Unyu Co Ltd 17 -
3 Marvelous Inc 16 -
1 Matsuda Sangyo Co Ltd 13 -
1 Matsui Construction Co Ltd 7 -
5 Matsui Securities Co Ltd 27 -
1 Matsumotokiyoshi Holdings Co Ltd 22 -
2 Max Co Ltd 25 -
3 Maxell Holdings Ltd 24 -
1 Maxvalu Nishinihon Co Ltd 8 -
29 Mazda Motor Corp 177 0.01
1 McDonald's Holdings Co Japan Ltd 34 -
4 MCJ Co Ltd 27 -
56 Mebuki Financial Group Inc 85 0.01
1 MEC Co Ltd 14 -
- Media Do Holdings Co Ltd 6 -
1 Medical Data Vision Co Ltd 16 -
2 Medical System Network Co Ltd 8 -
- Medikit Co Ltd 8 -
5 Medipal Holdings Corp 64 0.01
1 MedPeer Inc 16 -
1 Megachips Corp 17 -
3 Megmilk Snow Brand Co Ltd 47 -
2 Meidensha Corp 34 -
4 MEIJI Holdings Co Ltd 155 0.01
1 Meiko Electronics Co Ltd 19 -
2 Meisei Industrial Co Ltd 7 -
1 Meitec Corp 51 -
1 Meito Sangyo Co Ltd 8 -
- Melco Holdings Inc 12 -
1 Menicon Co Ltd 38 -
2 Metawater Co Ltd 27 -
1 Michinoku Bank Ltd 7 -
1 Micronics Japan Co Ltd 13 -
2 Mie Kotsu Group Holdings Inc 7 -
1 Milbon Co Ltd 31 -
1 Mimasu Semiconductor Industry Co Ltd 19 -
10 Minebea Mitsumi Inc 188 0.01
1 Ministop Co Ltd 12 -
1 Minkabu The Infonoid Inc 17 -
3 Miraca Holdings Inc 66 0.01
7 Mirait Holdings Corp 89 0.01
1 Miroku Jyoho Service Co Ltd 7 -
3 MISUMI Group Inc 63 0.01
1 Mitani Corp 22 -
- Mitani Sekisan Co Ltd 8 -
4 Mito Securities Co Ltd 8 -
2 Mitsuba Corp 11 -
44 Mitsubishi Chemical Holdings Corp 253 0.02
12 Mitsubishi Corp 232 0.01
21 Mitsubishi Electric Corp 231 0.01
12 Mitsubishi Estate Co Ltd 142 0.01
World Allocation 60/40 FundPortfolio of Investments as at 31 May 2021 (continued)
Dimensional Fund Advisors Semi-Annual Report and Unaudited Financial Statements, 31 May 2021 389

Shares (000's)
Value(000's)
GBP
% of NetAssetValue
Common Stock (continued)
Japan - 3.67% (continued)
4 Mitsubishi Gas Chemical Co Inc 70 0.01
12 Mitsubishi Heavy Industries Ltd 254 0.02
1 Mitsubishi Kakoki Kaisha Ltd 14 -
1 Mitsubishi Logisnext Co Ltd 8 -
2 Mitsubishi Logistics Corp 52 -
6 Mitsubishi Materials Corp 94 0.01
23 Mitsubishi Motors Corp 46 -
2 Mitsubishi Pencil Co Ltd 19 -
- Mitsubishi Research Institute Inc 11 -
1 Mitsubishi Shokuhin Co Ltd 24 -
98 Mitsubishi UFJ Financial Group Inc 397 0.02
47 Mitsubishi UFJ Lease & Finance Co Ltd 188 0.01
1 Mitsuboshi Belting Ltd 16 -
14 Mitsui & Co Ltd 224 0.01
6 Mitsui Chemicals Inc 143 0.01
5 Mitsui E&S Holdings Co Ltd 16 -
8 Mitsui Fudosan Co Ltd 132 0.01
1 Mitsui High-Tec Inc 24 -
4 Mitsui Mining & Smelting Co Ltd 91 0.01
7 Mitsui OSK Lines Ltd 204 0.01
1 Mitsui Sugar Co Ltd 14 -
1 Mitsui-Soko Holdings Co Ltd 15 -
2 Mitsuuroko Group Holdings Co Ltd 14 -
1 Miura Co Ltd 27 -
3 Mixi Inc 57 -
1 Miyazaki Bank Ltd 15 -
21 Mizuho Financial Group Inc 227 0.01
2 Mizuho Leasing Co Ltd 52 -
1 Mizuno Corp 17 -
1 Mochida Pharmaceutical Co Ltd 19 -
1 Modec Inc 17 -
4 Monex Group Inc 24 -
- Monogatari Corp 17 -
4 MonotaRO Co Ltd 58 -
2 Morinaga & Co Ltd 47 -
2 Morinaga Milk Industry Co Ltd 85 0.01
1 Moriroku Holdings Co Ltd 11 -
2 Morita Holdings Corp 22 -
3 MrMax Holdings Ltd 12 -
4 MS&AD Insurance Group Holdings Inc 95 0.01
- Murakami Corp 8 -
8 Murata Manufacturing Co Ltd 403 0.02
4 Musashi Seimitsu Industry Co Ltd 63 0.01
1 Musashino Bank Ltd 17 -
2 Nabtesco Corp 70 0.01
1 Nachi-Fujikoshi Corp 25 -
1 Nafco Co Ltd 10 -
1 Nagaileben Co Ltd 8 -
1 Nagano Keiki Co Ltd 11 -
7 Nagase & Co Ltd 78 0.01
1 Nagatanien Holdings Co Ltd 7 -
- Nagawa Co Ltd 5 -
3 Nagoya Railroad Co Ltd 34 -
- Nakamuraya Co Ltd 10 -
3 Nankai Electric Railway Co Ltd 45 -
3 Nanto Bank Ltd 31 -
1 Natori Co Ltd 7 -
1 NEC Capital Solutions Ltd 8 -
6 NEC Corp 182 0.01
2 NEC Networks & System Integration Corp 24 -
3 NET One Systems Co Ltd 60 0.01
2 Neturen Co Ltd 7 -
Shares (000's)
Value(000's)
GBP
% of NetAssetValue
Common Stock (continued)
Japan - 3.67% (continued)
- Nexon Co Ltd 6 -
2 Nextage Co Ltd 17 -
6 NGK Insulators Ltd 74 0.01
8 NGK Spark Plug Co Ltd 84 0.01
4 NH Foods Ltd 121 0.01
17 NHK Spring Co Ltd 89 0.01
3 Nichias Corp 56 -
1 Nichiban Co Ltd 8 -
4 Nichicon Corp 33 -
2 Nichiden Corp 19 -
2 Nichiha Corp 35 -
4 Nichi-iko Pharmaceutical Co Ltd 23 -
5 Nichirei Corp 86 0.01
2 Nichireki Co Ltd 19 -
1 Nichirin Co Ltd 8 -
1 Nidec Corp 110 0.01
3 Nifco Inc 84 0.01
1 Nihon Chouzai Co Ltd 7 -
- Nihon Dengi Co Ltd 10 -
1 Nihon Flush Co Ltd 8 -
7 Nihon House Holdings Co Ltd 16 -
3 Nihon Kohden Corp 53 -
6 Nihon M&A Center Inc 110 0.01
3 Nihon Nohyaku Co Ltd 10 -
5 Nihon Parkerizing Co Ltd 37 -
1 Nihon Tokushu Toryo Co Ltd 7 -
3 Nihon Unisys Ltd 55 -
4 Nikkiso Co Ltd 30 -
2 Nikko Co Ltd 7 -
4 Nikkon Holdings Co Ltd 66 0.01
16 Nikon Corp 115 0.01
1 Nintendo Co Ltd 398 0.02
3 Nippo Corp 58 -
2 Nippon Air Conditioning Services Co Ltd 8 -
1 Nippon Beet Sugar Manufacturing Co Ltd 7 -
1 Nippon Carbon Co Ltd 17 -
- Nippon Chemical Industrial Co Ltd 7 -
1 Nippon Chemi-Con Corp 17 -
13 Nippon Coke & Engineering Co Ltd 9 -
1 Nippon Commercial Development Co Ltd 8 -
3 Nippon Concrete Industries Co Ltd 7 -
8 Nippon Denko Co Ltd 16 -
3 Nippon Densetsu Kogyo Co Ltd 30 -
7 Nippon Electric Glass Co Ltd 112 0.01
3 Nippon Express Co Ltd 145 0.01
1 Nippon Fine Chemical Co Ltd 7 -
4 Nippon Flour Mills Co Ltd 37 -
6 Nippon Gas Co Ltd 62 0.01
2 Nippon Hume Corp 7 -
1 Nippon Kanzai Co Ltd 11 -
9 Nippon Kayaku Co Ltd 59 -
1 Nippon Koei Co Ltd 12 -
5 Nippon Light Metal Holdings Co Ltd 61 0.01
2 Nippon Paint Holdings Co Ltd 21 -
9 Nippon Paper Industries Co Ltd 74 0.01
15 Nippon Parking Development Co Ltd 15 -
1 Nippon Pillar Packing Co Ltd 17 -
1 Nippon Rietec Co Ltd 5 -
- Nippon Road Co Ltd 24 -
3 Nippon Seiki Co Ltd 24 -
1 Nippon Seisen Co Ltd 17 -
1 Nippon Sharyo Ltd 7 -
World Allocation 60/40 FundPortfolio of Investments as at 31 May 2021 (continued)
Dimensional Fund Advisors Semi-Annual Report and Unaudited Financial Statements, 31 May 2021 390

Shares (000's)
Value(000's)
GBP
% of NetAssetValue
Common Stock (continued)
Japan - 3.67% (continued)
1 Nippon Shinyaku Co Ltd 59 -
2 Nippon Shokubai Co Ltd 55 -
3 Nippon Signal Company Ltd 19 -
2 Nippon Soda Co Ltd 34 -
5 Nippon Steel Corp 69 0.01
1 Nippon Steel Trading Corp 23 -
21 Nippon Suisan Kaisha Ltd 68 0.01
1 Nippon Systemware Co Ltd 7 -
12 Nippon Telegraph & Telephone Corp 228 0.01
5 Nippon Thompson Co Ltd 19 -
1 Nippon Yakin Kogyo Co Ltd 10 -
12 Nippon Yusen KK 332 0.02
8 Nipro Corp 72 0.01
1 Nishikawa Rubber Co Ltd 8 -
4 Nishimatsu Construction Co Ltd 84 0.01
3 Nishimatsuya Chain Co Ltd 32 -
9 Nishi-Nippon Financial Holdings Inc 40 -
3 Nishi-Nippon Railroad Co Ltd 45 -
1 Nishio Rent All Co Ltd 23 -
3 Nissan Chemical Corp 100 0.01
23 Nissan Motor Co Ltd 83 0.01
4 Nissan Shatai Co Ltd 19 -
- Nissei ASB Machine Co Ltd 16 -
1 Nissei Plastic Industrial Co Ltd 11 -
3 Nissha Co Ltd 32 -
3 Nisshin Fudosan Co 8 -
2 Nisshin Oillio Group Ltd 32 -
3 Nisshin Seifun Group Inc 30 -
10 Nisshinbo Holdings Inc 61 0.01
1 Nissin Corp 8 -
3 Nissin Electric Co Ltd 22 -
1 Nissin Foods Holdings Co Ltd 36 -
1 Nissin Sugar Co Ltd 8 -
3 Nisso Corp 13 -
1 Nitori Holdings Co Ltd 93 0.01
1 Nitta Corp 25 -
- Nittetsu Mining Co Ltd 12 -
1 Nitto Boseki Co Ltd 15 -
1 Nitto Denko Corp 45 -
2 Nitto Kogyo Corp 26 -
1 Nitto Kohki Co Ltd 7 -
2 Nitto Seiko Co Ltd 8 -
1 Noevir Holdings Co Ltd 26 -
1 NOF Corp 39 -
1 Nohmi Bosai Ltd 14 -
2 Nojima Corp 42 -
5 NOK Corp 40 -
32 Nomura Holdings Inc 122 0.01
8 Nomura Real Estate Holdings Inc 155 0.01
4 Nomura Research Institute Ltd 95 0.01
1 Noritake Co Ltd Japan 19 -
2 Noritsu Koki Co Ltd 23 -
2 Noritz Corp 20 -
18 North Pacific Bank Ltd 30 -
2 NS Solutions Corp 36 -
1 NS United Kaiun Kaisha Ltd 15 -
3 NSD Co Ltd 38 -
6 NSK Ltd 40 -
36 NTN Corp 75 0.01
14 NTT Data Corp 165 0.01
1 Obara Group Inc 15 -
21 Obayashi Corp 126 0.01
Shares (000's)
Value(000's)
GBP
% of NetAssetValue
Common Stock (continued)
Japan - 3.67% (continued)
- Obic Co Ltd 42 -
5 Odakyu Electric Railway Co Ltd 86 0.01
3 Ogaki Kyoritsu Bank Ltd 34 -
2 Ohashi Technica Inc 17 -
- Ohsho Food Service Corp 14 -
1 Oiles Corp 14 -
1 Oisix ra daichi Inc 29 -
1 Oita Bank Ltd 7 -
26 Oji Holdings Corp 112 0.01
2 Okabe Co Ltd 6 -
- Okamoto Industries Inc 11 -
4 Okamura Corp 40 -
9 Okasan Securities Group Inc 24 -
8 Oki Electric Industry Co Ltd 49 -
1 Okinawa Cellular Telephone Co 17 -
1 Okinawa Electric Power Co Inc 10 -
2 OKUMA Corp 77 0.01
2 Okumura Corp 33 -
1 Okura Industrial Co Ltd 9 -
2 Okuwa Co Ltd 16 -
15 Olympus Corp 231 0.01
1 Omron Corp 57 -
2 Ono Pharmaceutical Co Ltd 29 -
1 Onoken Co Ltd 8 -
8 Onward Holdings Co Ltd 16 -
2 Open House Co Ltd 69 0.01
1 Optim Corp 11 -
1 Optorun Co Ltd 16 -
1 Oracle Corp Japan 34 -
1 Organo Corp 25 -
41 Orient Corp 41 -
- Oriental Land Co Ltd 17 -
8 Oriental Shiraishi Corp 14 -
20 ORIX Corp 245 0.02
5 Osaka Gas Co Ltd 73 0.01
1 Osaka Organic Chemical Industry Ltd 16 -
1 Osaka Soda Co Ltd 19 -
1 Osaka Steel Co Ltd 7 -
3 Osaka Titanium Technologies Co Ltd 14 -
2 Osaki Electric Co Ltd 7 -
4 OSG Corp 45 -
3 Otsuka Corp 96 0.01
3 Otsuka Holdings Co Ltd 74 0.01
7 Outsourcing Inc 88 0.01
1 Oyo Corp 7 -
2 Pacific Industrial Co Ltd 18 -
1 Pacific Metals Co Ltd 11 -
1 Pack Corp 11 -
1 Paltac Corporation 44 -
6 Pan Pacific International Holdings Corp 79 0.01
58 Panasonic Corp 462 0.03
2 Paramount Bed Holdings Co Ltd 30 -
4 Park24 Co Ltd 66 0.01
1 Pasona Group Inc 12 -
4 PC Depot Corp 11 -
16 Penta-Ocean Construction Co Ltd 81 0.01
1 PeptiDream Inc 45 -
7 Persol Holdings Co Ltd 93 0.01
- Pickles Corp 8 -
2 Pigeon Corp 47 -
1 Pilot Corp 33 -
1 Piolax Inc 14 -
World Allocation 60/40 FundPortfolio of Investments as at 31 May 2021 (continued)
Dimensional Fund Advisors Semi-Annual Report and Unaudited Financial Statements, 31 May 2021 391

Shares (000's)
Value(000's)
GBP
% of NetAssetValue
Common Stock (continued)
Japan - 3.67% (continued)
1 Plenus Co Ltd 9 -
1 Pola Orbis Holdings Inc 17 -
1 Poletowin Pitcrew Holdings Inc 8 -
1 Premium Group Co Ltd 20 -
6 Press Kogyo Co Ltd 13 -
2 Pressance Corp 27 -
4 Prestige International Inc 17 -
2 Prima Meat Packers Ltd 31 -
1 Proto Corp 10 -
2 PS Mitsubishi Construction Co Ltd 10 -
1 QB Net Holdings Co Ltd 16 -
1 Qol Holdings Co Ltd 12 -
1 Raito Kogyo Co Ltd 16 -
2 Raiznext Corp 15 -
3 Rakus Co Ltd 40 -
1 Rasa Industries Ltd 10 -
12 Recruit Holdings Co Ltd 427 0.03
2 Relia Inc 17 -
4 Relo Group Inc 52 -
16 Renesas Electronics Corp 122 0.01
14 Rengo Co Ltd 85 0.01
2 RENOVA Inc 45 -
37 Resona Holdings Inc 111 0.01
6 Resorttrust Inc 62 0.01
2 Restar Holdings Corp 18 -
2 Retail Partners Co Ltd 12 -
15 Ricoh Co Ltd 127 0.01
1 Ricoh Leasing Co Ltd 25 -
1 Riken Corp 17 -
- Riken Keiki Co Ltd 7 -
2 Riken Technos Corp 8 -
1 Riken Vitamin Co Ltd 13 -
- Rinnai Corp 29 -
1 Rion Co Ltd 11 -
1 Riso Kagaku Corp 9 -
6 Riso Kyoiku Co Ltd 12 -
1 Rohm Co Ltd 61 0.01
3 Rohto Pharmaceutical Co Ltd 46 -
1 Rokko Butter Co Ltd 7 -
- Roland Corp 16 -
1 Roland DG Corp 8 -
1 Rorze Corp 39 -
- RS Technologies Co Ltd 14 -
1 Ryobi Ltd 12 -
1 Ryoden Corp 7 -
6 Ryohin Keikaku Co Ltd 78 0.01
1 Ryosan Co Ltd 13 -
1 Ryoyo Electro Corp 14 -
1 S Foods Inc 16 -
1 Saibu Gas Co Ltd 22 -
1 Saison Information Systems Co Ltd 8 -
- Sakai Moving Service Co Ltd 14 -
1 Sakai Ovex Co Ltd 11 -
3 Sakata INX Corp 22 -
4 Sala Corp 15 -
2 SAMTY Co Ltd 27 -
1 San ju San Financial Group Inc 10 -
1 San-A Co Ltd 33 -
4 San-Ai Oil Co Ltd 31 -
3 Sangetsu Corp 34 -
11 San-In Godo Bank Ltd 40 -
2 Sanki Engineering Co Ltd 21 -
Shares (000's)
Value(000's)
GBP
% of NetAssetValue
Common Stock (continued)
Japan - 3.67% (continued)
3 Sankyo Co Ltd 46 -
- Sankyo Frontier Co Ltd 7 -
3 Sankyo Seiko Co Ltd 9 -
1 Sankyo Tateyama Inc 8 -
3 Sankyu Inc 88 0.01
2 Sanoh Industrial Co Ltd 12 -
- Sansan Inc 15 -
1 Sanshin Electronics Co Ltd 8 -
6 Santen Pharmaceutical Co Ltd 55 -
10 Sanwa Holdings Corp 87 0.01
1 Sanyo Chemical Industries Ltd 26 -
1 Sanyo Denki Co Ltd 30 -
1 Sanyo Electric Railway Co Ltd 7 -
1 Sanyo Special Steel Co Ltd 12 -
1 Sanyo Trading Co Ltd 10 -
5 Sapporo Holdings Ltd 73 0.01
2 Sato Holdings Corp 31 -
1 Sato Shoji Corp 9 -
2 Sawai Group Holdings Co Ltd 69 0.01
4 SBI Holdings Inc 71 0.01
1 SBS Holdings Inc 18 -
- SCREEN Holdings Co Ltd 32 -
2 Scroll Corp 10 -
1 SCSK Corp 56 -
1 Secom Co Ltd 73 0.01
5 Sega Sammy Holdings Inc 45 -
11 Seibu Holdings Inc 86 0.01
1 Seika Corp 15 -
3 Seikagaku Corp 25 -
2 Seikitokyu Kogyo Co Ltd 9 -
11 Seiko Epson Corp 138 0.01
2 Seiko Holdings Corp 27 -
8 Seino Holdings Co Ltd 79 0.01
2 Seiren Co Ltd 20 -
10 Sekisui Chemical Co Ltd 123 0.01
5 Sekisui House Ltd 77 0.01
2 Sekisui Jushi Corp 25 -
4 Sekisui Plastics Co Ltd 14 -
8 Senko Group Holdings Co Ltd 55 -
- Senshu Electric Co Ltd 8 -
13 Senshu Ikeda Holdings Inc 14 -
5 Septeni Holdings Co Ltd 16 -
2 Seria Co Ltd 43 -
15 Seven & i Holdings Co Ltd 469 0.03
37 Seven Bank Ltd 55 -
3 SG Holdings Co Ltd 46 -
6 Sharp Corp 83 0.01
1 Shibaura Electronics Co Ltd 15 -
1 Shibaura Mechatronics Corp 21 -
1 Shibusawa Warehouse Co Ltd 11 -
- Shibuya Corp 9 -
- SHIFT Inc 20 -
3 Shiga Bank Ltd 40 -
2 Shikoku Bank Ltd 9 -
2 Shikoku Chemicals Corp 14 -
5 Shikoku Electric Power Co Inc 26 -
2 Shima Seiki Manufacturing Ltd 22 -
3 Shimadzu Corp 78 0.01
1 Shimamura Co Ltd 65 0.01
- Shimano Inc 35 -
1 Shimizu Bank Ltd 7 -
15 Shimizu Corp 86 0.01
World Allocation 60/40 FundPortfolio of Investments as at 31 May 2021 (continued)
Dimensional Fund Advisors Semi-Annual Report and Unaudited Financial Statements, 31 May 2021 392

Shares (000's)
Value(000's)
GBP
% of NetAssetValue
Common Stock (continued)
Japan - 3.67% (continued)
1 Shimojima Co Ltd 7 -
1 Shin Nippon Air Technologies Co Ltd 16 -
1 Shinagawa Refractories Co Ltd 19 -
1 Shindengen Electric Manufacturing Co Ltd 18 -
2 Shin-Etsu Chemical Co Ltd 252 0.02
3 Shin-Etsu Polymer Co Ltd 20 -
1 Shinko Electric Industries Co Ltd 33 -
2 Shinko Shoji Co Ltd 7 -
4 Shinmaywa Industries Ltd 27 -
1 Shinnihon Corp 7 -
1 Shinnihonseiyaku Co Ltd 9 -
9 Shinsei Bank Ltd 102 0.01
1 Shinwa Co Ltd 8 -
2 Shionogi & Co Ltd 62 0.01
3 Ship Healthcare Holdings Inc 47 -
2 Shiseido Co Ltd 83 0.01
15 Shizuoka Bank Ltd 87 0.01
4 Shizuoka Gas Co Ltd 27 -
1 SHO-BOND Holdings Co Ltd 30 -
1 Shoei Co Ltd 30 -
- Shoei Foods Corp 8 -
1 Shofu Inc 7 -
8 Showa Denko KK 186 0.01
1 Showa Sangyo Co Ltd 17 -
1 SigmaXYZ Inc 11 -
2 Siix Corp 23 -
- Sinanen Holdings Co Ltd 7 -
1 Sinfonia Technology Co Ltd 8 -
1 Sinko Industries Ltd 9 -
3 Sintokogio Ltd 15 -
9 SKY Perfect JSAT Holdings Inc 24 -
8 Skylark Holdings Co Ltd 78 0.01
- SMC Corp 48 -
3 SMS Co Ltd 53 -
3 Sodick Co Ltd 22 -
1 Soft99 Corp 8 -
18 Softbank Corp 162 0.01
12 SoftBank Group Corp 663 0.04
1 Softcreate Holdings Corp 13 -
1 Sohgo Security Services Co Ltd 31 -
64 Sojitz Corp 139 0.01
1 Soken Chemical & Engineering Co Ltd 6 -
2 Solasto Corp 15 -
4 Sompo Holdings Inc 109 0.01
20 Sony Corp 1,386 0.08
3 Sotetsu Holdings Inc 37 -
1 Space Co Ltd 8 -
2 Space Value Holdings Co Ltd 7 -
7 Sparx Group Co Ltd 13 -
2 S-Pool Inc 14 -
2 Square Enix Holdings Co Ltd 66 0.01
1 SRA Holdings 10 -
1 ST Corp 7 -
1 St Marc Holdings Co Ltd 11 -
1 Stanley Electric Co Ltd 30 -
1 Star Mica Holdings Co Ltd 9 -
2 Starts Corp Inc 35 -
1 Starzen Co Ltd 8 -
1 Stella Chemifa Corp 13 -
1 Strike Co Ltd 14 -
1 Studio Alice Co Ltd 9 -
8 Subaru Corp 114 0.01
Shares (000's)
Value(000's)
GBP
% of NetAssetValue
Common Stock (continued)
Japan - 3.67% (continued)
1 Sugi Holdings Co Ltd 48 -
1 Sugimoto & Co Ltd 7 -
8 SUMCO Corp 127 0.01
1 Sumida Corp 7 -
2 Sumitomo Bakelite Co Ltd 70 0.01
54 Sumitomo Chemical Co Ltd 212 0.01
11 Sumitomo Corp 107 0.01
3 Sumitomo Dainippon Pharma Co Ltd 44 -
1 Sumitomo Densetsu Co Ltd 20 -
18 Sumitomo Electric Industries Ltd 191 0.01
10 Sumitomo Forestry Co Ltd 144 0.01
7 Sumitomo Heavy Industries Ltd 156 0.01
3 Sumitomo Metal Mining Co Ltd 88 0.01
15 Sumitomo Mitsui Construction Co Ltd 45 -
11 Sumitomo Mitsui Financial Group Inc 294 0.02
6 Sumitomo Mitsui Trust Holdings Inc 144 0.01
3 Sumitomo Osaka Cement Co Ltd 55 -
3 Sumitomo Realty & Development Co Ltd 76 0.01
2 Sumitomo Riko Co Ltd 7 -
13 Sumitomo Rubber Industries Ltd 120 0.01
1 Sumitomo Seika Chemicals Co Ltd 16 -
4 Sumitomo Warehouse Co Ltd 35 -
2 Sun Frontier Fudousan Co Ltd 14 -
2 Sundrug Co Ltd 43 -
4 Suntory Beverage & Food Ltd 98 0.01
1 Sun-Wa Technos Corp 8 -
- SuRaLa Net Co Ltd 8 -
7 Suruga Bank Ltd 16 -
3 Sushiro Global Holdings Ltd 93 0.01
3 Suzuken Co Ltd Japan 66 0.01
4 Suzuki Motor Corp 137 0.01
1 SWCC Showa Holdings Co Ltd 14 -
1 Sysmex Corp 97 0.01
3 Systena Corp 36 -
2 Syuppin Co Ltd 14 -
2 T Hasegawa Co Ltd 33 -
1 T RAD Co Ltd 9 -
10 T&D Holdings Inc 95 0.01
2 T&K Toka Co Ltd 9 -
1 Tachibana Eletech Co Ltd 7 -
1 Tachikawa Corp 8 -
2 Tachi-S Co Ltd 16 -
8 Tadano Ltd 55 -
1 Taihei Dengyo Kaisha Ltd 19 -
9 Taiheiyo Cement Corp 148 0.01
2 Taiho Kogyo Co Ltd 15 -
2 Taikisha Ltd 38 -
1 Taiko Pharmaceutical Co Ltd 10 -
7 Taisei Corp 171 0.01
- Taisei Lamick Co Ltd 7 -
1 Taisho Pharmaceutical Holdings Co Ltd 29 -
1 Taiyo Holdings Co Ltd 32 -
5 Taiyo Nippon Sanso Corp 71 0.01
4 Taiyo Yuden Co Ltd 140 0.01
2 Takamatsu Construction Group Co Ltd 25 -
1 Takaoka Toko Co Ltd 13 -
5 Takara Holdings Inc 46 -
6 Takara Leben Co Ltd 14 -
1 Takara Printing Co Ltd 9 -
2 Takara Standard Co Ltd 16 -
1 Takasago International Corp 19 -
3 Takasago Thermal Engineering Co Ltd 40 -
World Allocation 60/40 FundPortfolio of Investments as at 31 May 2021 (continued)
Dimensional Fund Advisors Semi-Annual Report and Unaudited Financial Statements, 31 May 2021 393

Shares (000's)
Value(000's)
GBP
% of NetAssetValue
Common Stock (continued)
Japan - 3.67% (continued)
11 Takashimaya Co Ltd 84 0.01
10 Takeda Pharmaceutical Co Ltd 234 0.01
2 Takeei Corp 14 -
2 Takeuchi Manufacturing Co Ltd 45 -
3 Takuma Co Ltd 34 -
1 Tama Home Co Ltd 15 -
1 Tamron Co Ltd 13 -
6 Tamura Corp 20 -
3 Tanseisha Co Ltd 16 -
- Taoka Chemical Co Ltd 15 -
3 Tatsuta Electric Wire and Cable Co Ltd 12 -
1 Tayca Corp 6 -
2 Tazmo Co Ltd 16 -
3 TDK Corp 233 0.01
2 TechMatrix Corp 25 -
1 TechnoPro Holdings Inc 70 0.01
14 Teijin Ltd 163 0.01
1 Teikoku Electric Manufacturing Co Ltd 8 -
1 Teikoku Sen-I Co Ltd 12 -
1 Tekken Corp 17 -
1 Tenma Corp 17 -
6 Terumo Corp 164 0.01
1 T-Gaia Corp 16 -
2 THK Co Ltd 46 -
5 TIS Inc 91 0.01
1 TKC Corp 23 -
2 Toa Corp (non-voting rights) 26 -
1 Toa Corp (voting rights) 7 -
1 Toa Road Corp 18 -
8 Toagosei Co Ltd 62 0.01
2 Tobishima Corp 10 -
3 Tobu Railway Co Ltd 63 0.01
2 TOC Co Ltd 7 -
2 Tocalo Co Ltd 22 -
7 Tochigi Bank Ltd 8 -
13 Toda Corp 69 0.01
- Toei Animation Co Ltd 12 -
1 Toenec Corp 14 -
10 Toho Bank Ltd 14 -
1 Toho Co Ltd 25 -
1 Toho Gas Co Ltd 42 -
4 Toho Holdings Co Ltd 39 -
2 Toho Titanium Co Ltd 15 -
1 Toho Zinc Co Ltd 9 -
9 Tohoku Electric Power Co Inc 49 -
12 Tokai Carbon Co Ltd 123 0.01
1 Tokai Corp 18 -
6 TOKAI Holdings Corp 37 -
4 Tokai Rika Co Ltd 48 -
16 Tokai Tokyo Financial Holdings Inc 44 -
- Token Corp 30 -
5 Tokio Marine Holdings Inc 157 0.01
1 Tokushu Tokai Paper Co Ltd 15 -
5 Tokuyama Corp 77 0.01
2 Tokyo Broadcasting System Holdings Inc 22 -
2 Tokyo Century Corp 77 0.01
31 Tokyo Electric Power Co Holdings Inc 68 0.01
- Tokyo Electron Device Ltd 15 -
2 Tokyo Electron Ltd 600 0.03
1 Tokyo Energy & Systems Inc 8 -
5 Tokyo Gas Co Ltd 65 0.01
2 Tokyo Kiraboshi Financial Group Inc 19 -
Shares (000's)
Value(000's)
GBP
% of NetAssetValue
Common Stock (continued)
Japan - 3.67% (continued)
- Tokyo Ohka Kogyo Co Ltd 8 -
- Tokyo Rakutenchi Co Ltd 8 -
- Tokyo Rope Manufacturing Co Ltd 3 -
2 Tokyo Seimitsu Co Ltd 66 0.01
6 Tokyo Steel Manufacturing Co Ltd 46 -
12 Tokyo Tatemono Co Ltd 125 0.01
1 Tokyo Tekko Co Ltd 7 -
1 Tokyotokeiba Co Ltd 25 -
7 Tokyu Construction Co Ltd 31 -
6 Tokyu Corp 56 -
39 Tokyu Fudosan Holdings Corp 163 0.01
1 Tomoe Engineering Co Ltd 11 -
1 Tomoku Co Ltd 9 -
8 TOMONY Holdings Inc 16 -
5 Tomy Co Ltd 29 -
1 Tonami Holdings Co Ltd 22 -
3 Topcon Corp 39 -
3 Toppan Forms Co Ltd 24 -
4 Toppan Printing Co Ltd 51 -
2 Topre Corp 26 -
1 Topy Industries Ltd 8 -
45 Toray Industries Inc 208 0.01
1 Torex Semiconductor Ltd 13 -
2 Toridoll Holdings Corp 17 -
1 Torii Pharmaceutical Co Ltd 12 -
2 Torishima Pump Manufacturing Co Ltd 14 -
3 Tosei Corp 18 -
4 Toshiba Corp 105 0.01
1 Toshiba Machine Co Ltd 23 -
1 Toshiba TEC Corp 33 -
1 Tosho Co Ltd 10 -
6 Tosoh Corp 80 0.01
- Totech Corp 7 -
2 Totetsu Kogyo Co Ltd 28 -
1 TOTO Ltd 52 -
2 Towa Bank Ltd 6 -
1 Towa Corp 14 -
2 Towa Pharmaceutical Co Ltd 34 -
4 Toyo Construction Co Ltd 16 -
2 Toyo Corp 13 -
- Toyo Gosei Co Ltd 28 -
2 Toyo Ink SC Holdings Co Ltd 30 -
1 Toyo Kanetsu KK 14 -
9 Toyo Seikan Group Holdings Ltd 90 0.01
4 Toyo Suisan Kaisha Ltd 104 0.01
1 Toyo Tanso Co Ltd 17 -
8 Toyo Tire Corp 118 0.01
7 Toyobo Co Ltd 59 -
3 Toyoda Gosei Co Ltd 52 -
5 Toyota Boshoku Corp 69 0.01
1 Toyota Industries Corp 78 0.01
38 Toyota Motor Corp 2,243 0.13
- Toyota Motor Corp, ADR 25 -
3 Toyota Tsusho Corp 99 0.01
2 TPR Co Ltd 15 -
- Trancom Co Ltd 20 -
1 Transaction Co Ltd 10 -
2 Transcosmos Inc 31 -
3 Trend Micro Inc 111 0.01
1 Tri Chemical Laboratories Inc 16 -
2 Trusco Nakayama Corp 32 -
3 Trust Tech Inc 28 -
World Allocation 60/40 FundPortfolio of Investments as at 31 May 2021 (continued)
Dimensional Fund Advisors Semi-Annual Report and Unaudited Financial Statements, 31 May 2021 394

Shares (000's)
Value(000's)
GBP
% of NetAssetValue
Common Stock (continued)
Japan - 3.67% (continued)
7 TS Tech Co Ltd 66 0.01
4 TSI Holdings Co Ltd 8 -
2 Tsubaki Nakashima Co Ltd 25 -
2 Tsubakimoto Chain Co 43 -
1 Tsugami Corp 14 -
1 Tsukishima Kikai Co Ltd 10 -
9 Tsukuba Bank Ltd 10 -
1 Tsumura & Co 24 -
1 Tsuruha Holdings Inc 64 0.01
1 Tsurumi Manufacturing Co Ltd 15 -
1 TV Asahi Holdings Corp 18 -
1 Tv Tokyo Holdings Corp 7 -
2 UACJ Corp 35 -
8 Ube Industries Ltd 115 0.01
1 Uchida Yoko Co Ltd 18 -
2 Ulvac Inc 77 0.01
2 Unicharm Corp 50 -
1 Union Tool Co 16 -
3 Unipres Corp 17 -
1 UNITED Inc 10 -
4 United Super Markets Holdings Inc 30 -
5 Unitika Ltd 11 -
2 Universal Entertainment Corp 26 -
7 Ushio Inc 70 0.01
4 USS Co Ltd 55 -
1 UT Group Co Ltd 17 -
3 Valor Holdings Co Ltd 47 -
1 Valqua Ltd 12 -
1 ValueCommerce Co Ltd 14 -
1 Vector Inc 5 -
1 Vertex Corp 9 -
3 Vital KSK Holdings Inc 15 -
3 VT Holdings Co Ltd 10 -
3 Wacoal Holdings Corp 51 -
10 Wacom Co Ltd 43 -
1 Wakachiku Construction Co Ltd 11 -
2 Wakita & Co Ltd 14 -
1 Warabeya Nichiyo Holdings Co Ltd 11 -
1 Watahan & Co Ltd 7 -
- WDB Holdings Co Ltd 6 -
- Weathernews Inc 10 -
2 Welcia Holdings Co Ltd 39 -
1 West Holdings Corp 21 -
2 West Japan Railway Co 75 0.01
- Workman Co Ltd 8 -
2 World Co Ltd 14 -
1 World Holdings Co Ltd 12 -
- Wowow Inc 6 -
1 Xebio Holdings Co Ltd 8 -
1 Yahagi Construction Co Ltd 6 -
1 Yakult Honsha Co Ltd 46 -
1 YAKUODO Holdings Co Ltd 8 -
2 Yamabiko Corp 17 -
15 Yamada Denki Co Ltd 52 -
1 Yamagata Bank Ltd 6 -
14 Yamaguchi Financial Group Inc 61 0.01
1 Yamaha Corp 48 -
7 Yamaha Motor Co Ltd 144 0.01
1 Yamaichi Electronics Co Ltd 13 -
2 YA-MAN Ltd 16 -
1 Yamanashi Chuo Bank Ltd 7 -
4 Yamato Holdings Co Ltd 84 0.01
Shares (000's)
Value(000's)
GBP
% of NetAssetValue
Common Stock (continued)
Japan - 3.67% (continued)
3 Yamato Kogyo Co Ltd 73 0.01
5 Yamazaki Baking Co Ltd 50 -
4 Yamazen Corp 23 -
1 Yaoko Co Ltd 41 -
1 Yashima Denki Co Ltd 8 -
1 Yaskawa Electric Corp 35 -
2 Yasuda Logistics Corp 9 -
2 Yellow Hat Ltd 28 -
1 Yodogawa Steel Works Ltd 22 -
2 Yokogawa Bridge Holdings Corp 30 -
4 Yokogawa Electric Corp 46 -
3 Yokohama Reito Co Ltd 15 -
9 Yokohama Rubber Co Ltd 128 0.01
1 Yokowo Co Ltd 7 -
1 Yomeishu Seizo Co Ltd 7 -
1 Yondoshi Holdings Inc 10 -
1 Yorozu Corp 7 -
1 Yotai Refractories Co Ltd 10 -
1 Yuasa Trading Co Ltd 29 -
1 Yurtec Corp 7 -
2 Yushin Precision Equipment Co Ltd 9 -
31 Z Holdings Corp 103 0.01
2 Zenkoku Hosho Co Ltd 72 0.01
1 Zenrin Co Ltd 11 -
3 Zensho Holdings Co Ltd 52 -
5 Zeon Corp 53 -
1 ZERIA Pharmaceutical Co Ltd 18 -
1 ZOZO Inc 31 -
1 Zuiko Corp 10 -
66,600 3.67
Netherlands - 0.56%
7 Aalberts NV 266 0.02
8 ABN AMRO Bank NV 79 -
2 Accell Group NV 62 -
- Adyen NV 104 0.01
94 Aegon NV 315 0.02
4 Akzo Nobel NV 331 0.02
1 AMG Advanced Metallurgical Group NV 14 -
1 Amsterdam Commodities NV 23 -
4 APERAM SA 141 0.01
6 Arcadis NV 186 0.01
11 ArcelorMittal SA 251 0.01
1 ASM International NV 301 0.02
3 ASML Holding NV (Netherlands listing) 1,614 0.09
- ASML Holding NV (US listing) 21 -
11 ASR Nederland NV 339 0.02
2 B&S Group 17 -
2 Basic-Fit NV 53 -
4 BE Semiconductor Industries NV 200 0.01
6 Boskalis Westminster 146 0.01
2 Brunel International NV 17 -
5 Coca-Cola European Partners PLC 223 0.01
3 Coca-Cola European Partners PLC (US listing) 107 0.01
2 Corbion NV 82 0.01
2 Flow Traders 67 -
3 Fugro NV 25 -
2 GrandVision NV 53 -
2 Heineken NV 186 0.01
2 IMCD NV 216 0.01
34 ING Groep NV 330 0.02
4 Intertrust NV 53 -
- Kendrion NV 8 -
World Allocation 60/40 FundPortfolio of Investments as at 31 May 2021 (continued)
Dimensional Fund Advisors Semi-Annual Report and Unaudited Financial Statements, 31 May 2021 395

Shares (000's)
Value(000's)
GBP
% of NetAssetValue
Common Stock (continued)
Netherlands - 0.56% (continued)
41 Koninklijke Ahold Delhaize NV 838 0.05
20 Koninklijke BAM Groep NV 42 -
2 Koninklijke DSM NV 200 0.01
153 Koninklijke KPN NV 361 0.02
9 Koninklijke Philips NV 363 0.02
4 Koninklijke Vopak NV 147 0.01
- Nederland Apparatenfabriek 16 -
8 NN Group NV 277 0.02
1 NXP Semiconductors NV 117 0.01
8 OCI NV 145 0.01
8 Ordina NV 27 -
27 PostNL NV 112 0.01
2 Prosus NV 177 0.01
5 Randstad NV 254 0.01
11 SBM Offshore NV 132 0.01
10 Signify NV 429 0.02
2 Sligro Food Group NV 46 -
2 TKH Group NV 80 -
5 TomTom NV 32 -
8 Wolters Kluwer NV 532 0.03
10,157 0.56
New Zealand - 0.08%
12 a2 Milk Co Ltd 35 -
47 Air New Zealand Ltd 39 -
29 Arvida Group Ltd 27 -
10 Auckland International Airport Ltd 36 -
33 Chorus Ltd 104 0.01
11 Contact Energy Ltd 44 -
1 Delegat Group Ltd 7 -
4 Ebos Group Ltd 69 0.01
5 Fisher & Paykel Healthcare Corp Ltd 76 0.01
40 Fletcher Building Ltd 152 0.01
6 Freightways Ltd 38 -
5 Genesis Energy Ltd 9 -
2 Hallenstein Glasson Holdings Ltd 7 -
30 Heartland Group Holdings Ltd 30 -
21 Infratil Ltd 80 0.01
33 Kathmandu Holdings Ltd 27 -
2 Mainfreight Ltd 62 -
9 Mercury NZ Ltd 31 -
11 Meridian Energy Ltd 28 -
9 NZX Ltd 9 -
61 Oceania Healthcare Ltd 43 -
5 Port of Tauranga Ltd 19 -
- Restaurant Brands New Zealand Ltd 3 -
6 Ryman Healthcare Ltd 41 -
3 Scales Corp Ltd 8 -
4 Skellerup Holdings Ltd 9 -
107 SKY Network Television Ltd 9 -
53 SKYCITY Entertainment Group Ltd 97 0.01
55 Spark New Zealand Ltd 127 0.01
16 Summerset Group Holdings Ltd 103 0.01
7 Tourism Holdings Ltd 9 -
21 Tower Ltd 8 -
5 Turners Automotive Group Ltd 9 -
7 Vista Group International Ltd 8 -
31 Z Energy Ltd 40 -
1,443 0.08
Norway - 0.15%
35 ABG Sundal Collier Holding ASA 26 -
1 AF Gruppen ASA 19 -
- Aker ASA 9 -
Shares (000's)
Value(000's)
GBP
% of NetAssetValue
Common Stock (continued)
Norway - 0.15% (continued)
3 Aker BP ASA 68 0.01
20 Aker Solutions ASA 26 -
1 ArcticZymes Technologies ASA 10 -
1 Asetek AS 11 -
4 Atea ASA 54 -
1 Atlantic Sapphire ASA 7 -
5 Austevoll Seafood ASA 48 -
6 Avance Gas Holding Ltd 20 -
13 Axactor SE 12 -
25 B2Holding ASA 22 -
- Bakkafrost P/F 22 -
1 Bonheur ASA 23 -
5 Borregaard ASA 81 0.01
- Bouvet ASA 16 -
8 BW Energy Ltd 15 -
7 BW LPG Ltd 31 -
6 BW Offshore Ltd 17 -
2 Crayon Group Holding ASA 22 -
9 DNB ASA 148 0.01
29 DNO ASA 22 -
3 Elkem ASA 9 -
4 Entra ASA 61 -
9 Equinor ASA 140 0.01
10 Europris ASA 49 -
1 FLEX LNG Ltd 14 -
7 Frontline Ltd 40 -
7 Golden Ocean Group Ltd 46 -
1 Grieg Seafood ASA 8 -
2 Kid ASA 19 -
5 Kitron ASA 10 -
65 Kongsberg Automotive ASA 16 -
3 Kongsberg Gruppen ASA 52 -
4 Leroy Seafood Group ASA 25 -
- Medistim ASA 8 -
4 Mowi ASA 66 0.01
9 MPC Container Ships ASA 12 -
12 NEL ASA 18 -
3 Nordic Semiconductor ASA 64 -
19 Norsk Hydro ASA 87 0.01
5 Norske Skog ASA 15 -
1 Norwegian Energy Co SA 7 -
10 Norwegian Finans Holding ASA 83 0.01
3 Ocean Yield ASA 7 -
9 Odfjell Drilling Ltd 15 -
8 Orkla ASA 61 -
3 Pareto Bank ASA 15 -
25 PGS ASA 11 -
3 Protector Forsikring ASA 20 -
1 Salmar ASA 64 0.01
6 Sbanken ASA 48 -
2 Scatec Solar ASA 44 -
- Schibsted ASA, Class A 9 -
2 Selvaag Bolig ASA 9 -
1 Sparebank 1 Oestlandet 7 -
11 SpareBank 1 SR-Bank ASA 106 0.01
2 Stolt-Nielsen Ltd 16 -
19 Storebrand ASA 135 0.01
16 Subsea 7 SA 115 0.01
9 Telenor ASA 111 0.01
9 TGS NOPEC Geophysical Co ASA 83 0.01
2 Tomra Systems ASA 79 0.01
4 Veidekke ASA 47 -
World Allocation 60/40 FundPortfolio of Investments as at 31 May 2021 (continued)
Dimensional Fund Advisors Semi-Annual Report and Unaudited Financial Statements, 31 May 2021 396

Shares (000's)
Value(000's)
GBP
% of NetAssetValue
Common Stock (continued)
Norway - 0.15% (continued)
7 Wallenius Wilhelmsen ASA 20 -
1 Wilh Wilhelmsen Holding ASA (voting rights) 8 -
9 XXL ASA 17 -
3 Yara International ASA 126 0.01
2,751 0.15
Portugal - 0.04%
3 Altri SGPS SA 15 -
696 Banco Comercial Portugues SA 95 0.01
1 Corticeira Amorim SGPS SA 10 -
4 CTT-Correios de Portugal SA 13 -
3 EDP Renovaveis SA 50 -
34 EDP-Energias de Portugal SA 142 0.01
17 Galp Energia SGPS SA 147 0.01
7 Jeronimo Martins SGPS SA 92 0.01
15 Navigator Co SA 39 -
21 NOS SGPS SA 53 -
13 REN-Redes Energeticas Nacionais SGPS SA 26 -
60 Sonae SGPS SA 41 -
723 0.04
Singapore - 0.15%
10 AEM Holdings Ltd 18 -
31 Ascendas India Trust 22 -
14 Boustead Singapore Ltd 9 -
10 Bukit Sembawang Estates Ltd 26 -
28 CapitaLand Ltd 55 -
11 China Aviation Oil Singapore Corp Ltd 6 -
31 China Sunsine Chemical Holdings Ltd 9 -
14 City Developments Ltd 58 -
70 ComfortDelGro Corp Ltd 62 -
5 Dairy Farm International Holdings Ltd 16 -
18 DBS Group Holdings Ltd 291 0.02
34 Delfi Ltd 16 -
11 First Resources Ltd 8 -
13 Fraser and Neave Ltd 10 -
20 Frencken Group Ltd 19 -
445 Golden Agri-Resources Ltd 56 -
1 Great Eastern Holdings Ltd 9 -
20 GuocoLand Ltd 17 -
7 Haw Par Corp Ltd 51 -
10 Ho Bee Land Ltd 14 -
26 Hong Leong Asia Ltd 14 -
7 Hong Leong Finance Ltd 8 -
14 Hongkong Land Holdings Ltd 48 -
354 Hutchison Port Holdings Trust 60 -
6 iFAST Corp Ltd 25 -
6 Jardine Cycle & Carriage Ltd 65 0.01
30 Keppel Corp Ltd 85 0.01
113 Keppel Infrastructure Trust 33 -
6 Mandarin Oriental International Ltd 8 -
5 Metro Holdings Ltd 2 -
83 NetLink NBN Trust 42 -
631 Oceanus Group Ltd 13 -
36 Olam International Ltd 33 -
16 OUE Ltd 11 -
26 Oversea-Chinese Banking Corp Ltd 172 0.01
78 Oxley Holdings Ltd 10 -
19 QAF Ltd 10 -
38 Raffles Medical Group Ltd 22 -
69 Sembcorp Industries Ltd 81 0.01
458 Sembcorp Marine Ltd 49 -
26 Sheng Siong Group Ltd 22 -
76 SIIC Environment Holdings Ltd 9 -
Shares (000's)
Value(000's)
GBP
% of NetAssetValue
Common Stock (continued)
Singapore - 0.15% (continued)
24 Singapore Airlines Ltd 64 0.01
20 Singapore Exchange Ltd 111 0.01
78 Singapore Post Ltd 30 -
102 Singapore Press Holdings Ltd 95 0.01
34 Singapore Technologies Engineering Ltd 70 0.01
95 Singapore Telecommunications Ltd 122 0.01
21 StarHub Ltd 14 -
5 Straits Trading Co Ltd 7 -
12 UMS Holdings Ltd 9 -
6 United Industrial Corp Ltd 9 -
14 United Overseas Bank Ltd 197 0.01
12 UOB-Kay Hian Holdings Ltd 11 -
16 UOL Group Ltd 64 0.01
23 Valuetronics Holdings Ltd 8 -
8 Venture Corp Ltd 87 0.01
14 Wilmar International Ltd 34 -
23 Wing Tai Holdings Ltd 21 -
164 Yangzijiang Shipbuilding Holdings Ltd 130 0.01
2,677 0.15
Spain - 0.36%
2 Acciona SA 193 0.01
9 Acerinox SA 94 0.01
7 ACS Actividades de Construccion y Servicios SA 158 0.01
- Aena SME SA 34 -
4 Almirall SA 50 -
1 Amadeus IT Group SA 42 -
93 Amper SA 15 -
6 Applus Services SA 42 -
5 Atresmedia Corp de Medios de Comunicacion SA 17 -
71 Banco Bilbao Vizcaya Argentaria SA 311 0.02
390 Banco de Sabadell SA 211 0.01
205 Banco Santander SA 609 0.04
34 Bankinter SA 137 0.01
133 CaixaBank SA 325 0.02
1 Cellnex Telecom SA 47 -
4 Cia de Distribucion Integral Logista Holdings SA 60 -
3 CIE Automotive SA 73 0.01
1 Construcciones y Auxiliar de Ferrocarriles SA 48 -
4 Ebro Foods SA 60 0.01
2 eDreams ODIGEO SA 8 -
1 Elecnor SA 8 -
12 Enagas SA 193 0.01
7 Ence Energia y Celulosa SA 19 -
9 Endesa SA 174 0.01
5 Ercros SA 16 -
6 Euskaltel SA 54 -
15 Faes Farma SA 44 -
2 Ferrovial SA (voting rights) 39 -
4 Fluidra SA 100 0.01
3 Fomento de Construcciones y Contratas SA 24 -
8 Gestamp Automocion SA 32 -
6 Global Dominion Access SA 25 -
4 Grifols SA 72 0.01
2 Grupo Catalana Occidente SA 70 0.01
101 Iberdrola SA 978 0.06
1 Iberpapel Gestion SA 10 -
8 Indra Sistemas SA 51 -
13 Industria de Diseno Textil SA 364 0.02
1 Laboratorios Farmaceuticos Rovi SA 46 -
128 Liberbank SA 37 -
34 Linea Directa Aseguradora SA Cia de Seguros yReaseguros 47 -
World Allocation 60/40 FundPortfolio of Investments as at 31 May 2021 (continued)
Dimensional Fund Advisors Semi-Annual Report and Unaudited Financial Statements, 31 May 2021 397

Shares (000's)
Value(000's)
GBP
% of NetAssetValue
Common Stock (continued)
Spain - 0.36% (continued)
56 Mapfre SA 90 0.01
9 Mediaset Espana Comunicacion SA 45 -
4 Melia Hotels International SA 24 -
1 Metrovacesa SA 9 -
9 Naturgy Energy Group SA 175 0.01
- Pharma Mar SA 11 -
12 Prosegur Cash SA 8 -
9 Prosegur Cia de Seguridad SA 20 -
9 Red Electrica Corp SA 131 0.01
34 Repsol SA 326 0.02
29 Sacyr SA 54 -
2 Siemens Gamesa Renewable Energy SA 37 -
1 Solaria Energia y Medio Ambiente SA 11 -
1 Solarpack Corp Tecnologica 15 -
2 Talgo SA 9 -
120 Telefonica SA 416 0.02
60 Unicaja Banco SA 47 -
1 Vidrala SA (voting rights) 57 -
1 Viscofan SA 71 0.01
8 Zardoya Otis SA 39 -
6,532 0.36
Sweden - 0.63%
3 AAK AB 46 -
6 AcadeMedia AB 42 -
1 Adapteo Oyj 16 -
4 AddLife AB 77 0.01
1 AddNode Group AB 19 -
10 AddTech AB 115 0.01
6 AF POYRY AB 143 0.01
7 Alfa Laval AB 194 0.01
3 Alimak Group AB 32 -
5 Ambea AB 31 -
1 Annehem Fastigheter 2 -
- AQ Group AB 11 -
16 Arjo AB 114 0.01
6 Assa Abloy AB 130 0.01
9 Atlas Copco AB, Class A 381 0.02
5 Atlas Copco AB, Class B 184 0.01
1 Atrium Ljungberg AB 23 -
7 Attendo AB 23 -
4 Avanza Bank Holding AB 103 0.01
3 Axfood AB 59 -
2 Beijer Alma AB 24 -
5 Beijer Ref AB 57 -
2 Bergman & Beving AB 18 -
1 Besqab AB 9 -
9 Betsson AB 3 -
9 Betsson AB 59 -
- Better Collective A/S 8 -
2 BHG Group AB 30 -
7 Bilia AB 97 0.01
11 BillerudKorsnas AB 150 0.01
1 BioGaia AB 20 -
1 Biotage AB 9 -
8 Boliden 226 0.01
8 Boliden 4 -
7 Bonava AB 64 -
2 Boozt AB 34 -
8 Bravida Holding AB 82 0.01
2 Bufab AB 35 -
1 Bulten AB 12 -
4 Bure Equity AB 122 0.01
Shares (000's)
Value(000's)
GBP
% of NetAssetValue
Common Stock (continued)
Sweden - 0.63% (continued)
5 Byggmax Group AB 35 -
1 Calliditas Therapeutics AB 15 -
3 Castellum AB 60 -
4 Catella AB 9 -
1 Catena AB 34 -
5 Catena Media PLC 24 -
- Cellavision AB 15 -
2 Clas Ohlson AB 17 -
15 Cloetta AB 33 -
1 Concentric AB 18 -
5 Coor Service Management Holding AB 29 -
4 Dios Fastigheter AB 30 -
15 Dometic Group AB 184 0.01
2 Doro AB 8 -
2 Duni AB 17 -
3 Dustin Group AB 25 -
1 Eastnine AB 12 -
2 Elanders AB 23 -
8 Electrolux AB 164 0.01
11 Electrolux Professional AB 52 -
12 Elekta AB 114 0.01
1 Elos Medtech AB 10 -
8 Eltel AB 17 -
1 Enea AB 16 -
1 Eolus Vind AB 16 -
8 Epiroc AB, Class A 131 0.01
8 Epiroc AB, Class A 2 -
4 Epiroc AB, Class B 60 -
4 Epiroc AB, Class B 1 -
8 Essity AB 197 0.01
1 Evolution Gaming Group AB 104 0.01
5 Fabege AB 58 -
6 Fagerhult AB 32 -
2 Fastighets AB Balder 70 -
1 FastPartner AB 8 -
- Fenix Outdoor International AG 15 -
1 Ferronordic AB 21 -
- G5 Entertainment AB 15 -
7 Getinge AB 184 0.01
8 Granges AB 71 0.01
3 Haldex AB 15 -
1 Heba Fastighets AB 13 -
12 Hennes & Mauritz AB 218 0.01
4 Hexagon AB 44 -
1 Hexatronic Group AB 11 -
14 Hexpol AB 124 0.01
1 HMS Networks AB 24 -
5 Hoist Finance AB 15 -
2 Holmen AB 60 -
4 Hufvudstaden AB 45 -
2 Humana AB 12 -
1 Husqvarna AB, Class A 8 -
11 Husqvarna AB, Class B 116 0.01
2 ICA Gruppen AB 82 0.01
5 Indutrade AB 97 0.01
2 Instalco AB 50 -
4 Intrum AB 109 0.01
1 INVISIO AB 18 -
4 Inwido AB 48 -
4 JM AB 107 0.01
2 Karnov Group AB 7 -
8 Kindred Group PLC, SDR 100 0.01
World Allocation 60/40 FundPortfolio of Investments as at 31 May 2021 (continued)
Dimensional Fund Advisors Semi-Annual Report and Unaudited Financial Statements, 31 May 2021 398

Shares (000's)
Value(000's)
GBP
% of NetAssetValue
Common Stock (continued)
Sweden - 0.63% (continued)
20 Klovern AB 28 -
1 KNOW IT AB 37 -
8 Kungsleden AB 72 0.01
8 Lagercrantz Group AB 63 -
4 LeoVegas AB 13 -
4 Lifco AB 63 -
- Lime Technologies AB 7 -
6 Lindab International AB 104 0.01
6 Loomis AB 139 0.01
3 Lundin Petroleum AB 63 -
1 Medicover AB 23 -
3 Mekonomen AB 38 -
7 Millicom International Cellular SA 223 0.01
1 MIPS AB 74 0.01
5 Modern Times Group MTG AB 51 -
1 Momentum Group AB 8 -
5 Munters Group AB 36 -
3 Mycronic AB 77 0.01
4 NCC AB 57 -
1 Nederman Holding AB 10 -
2 New Wave Group AB 14 -
2 Nibe Industrier AB 14 -
9 Nobia AB 57 -
6 Nobina AB 42 -
11 Nolato AB 83 0.01
2 Nordic Entertainment Group AB 84 0.01
1 Nordic Waterproofing Holding AB 9 -
1 NP3 Fastigheter AB 10 -
5 Nyfosa AB 49 -
2 OEM International AB 22 -
6 Pandox AB 76 0.01
15 Peab AB 144 0.01
2 Platzer Fastigheter Holding AB 17 -
6 Pricer AB 16 -
2 Proact IT Group AB 17 -
19 Ratos AB 87 0.01
1 RaySearch Laboratories AB 8 -
1 Rejlers AB 10 -
7 Resurs Holding AB 29 -
3 Saab AB 64 -
23 Samhallsbyggnadsbolaget i Norden AB, Class B 71 -
5 Sandvik AB 101 0.01
1 Scandi Standard AB 7 -
6 Scandic Hotels Group AB 18 -
1 Sectra AB 45 -
12 Securitas AB 141 0.01
1 Semcon AB 11 -
- Sinch AB 11 -
14 Skandinaviska Enskilda Banken AB 131 0.01
11 Skanska AB 217 0.01
8 SKF AB 159 0.01
2 SkiStar AB 24 -
7 SSAB AB, Class A 27 -
23 SSAB AB, Class B 80 0.01
7 Svenska Cellulosa AB SCA 84 0.01
1 Svenska Cellulosa AB SCA, Class A 7 -
14 Svenska Handelsbanken AB 114 0.01
5 Sweco AB 60 -
8 Swedbank AB 101 0.01
19 Swedish Match AB 123 0.01
5 Swedish Orphan Biovitrum AB 55 -
1 Systemair AB 29 -
Shares (000's)
Value(000's)
GBP
% of NetAssetValue
Common Stock (continued)
Sweden - 0.63% (continued)
11 Tele2 AB 110 0.01
24 Telefonaktiebolaget LM Ericsson, Class B 230 0.01
37 Telia Co AB 114 0.01
3 Tethys Oil AB 14 -
3 Tethys Oil AB - -
2 Thule Group AB 79 0.01
5 Trelleborg AB 99 0.01
1 Troax Group AB 36 -
1 VBG Group AB 17 -
1 Vitec Software Group AB 37 -
7 Volvo AB, Class A 131 0.01
36 Volvo AB, Class B 670 0.04
3 Wallenstam AB 33 -
6 Wihlborgs Fastigheter AB 90 0.01
11,391 0.63
Switzerland - 1.25%
12 ABB Ltd 284 0.02
8 Adecco Group AG 364 0.02
1 AEVIS VICTORIA SA 10 -
9 Alcon Inc 417 0.02
1 Allreal Holding AG 174 0.01
- ALSO Holding AG 76 0.01
14 ams AG 197 0.01
- APG SGA SA 9 -
4 Arbonia AG 48 -
72 Aryzta AG 68 -
- Ascom Holding AG 4 -
- Autoneum Holding AG 21 -
- Bachem Holding AG 29 -
3 Baloise Holding AG 327 0.02
- Banque Cantonale de Geneve 7 -
1 Banque Cantonale Vaudoise 67 -
- Barry Callebaut AG 180 0.01
- Belimo Holding AG 66 -
- Bell Food Group AG 35 -
1 Bellevue Group AG 13 -
- Berner Kantonalbank AG 60 -
1 BKW AG 66 -
1 Bobst Group SA 30 -
- Bossard Holding AG 50 -
1 Bucher Industries AG 199 0.01
- Burckhardt Compression Holding AG 9 -
- Burkhalter Holding AG 8 -
- Calida Holding AG 7 -
2 Cembra Money Bank AG 160 0.01
- Chocoladefabriken Lindt & Spruengli AG 141 0.01
4 Cie Financiere Richemont SA 335 0.02
- Cie Financiere Tradition SA 9 -
13 Clariant AG 190 0.01
- Coltene Holding AG 28 -
- Comet Holding AG 29 -
- Conzzeta AG 95 0.01
41 Credit Suisse Group AG 313 0.02
- Daetwyler Holding AG 50 -
3 DKSH Holding AG 153 0.01
- dormakaba Holding AG 59 -
5 Dufry AG 222 0.01
6 EFG International AG 35 -
- Emmi AG 81 0.01
- EMS-Chemie Holding AG 37 -
1 Energiedienst Holding AG 13 -
2 Flughafen Zurich AG 213 0.01
World Allocation 60/40 FundPortfolio of Investments as at 31 May 2021 (continued)
Dimensional Fund Advisors Semi-Annual Report and Unaudited Financial Statements, 31 May 2021 399

Shares (000's)
Value(000's)
GBP
% of NetAssetValue
Common Stock (continued)
Switzerland - 1.25% (continued)
- Forbo Holding AG 79 0.01
1 Fundamenta Real Estate AG 10 -
2 Galenica AG 104 0.01
12 GAM Holding AG 22 -
1 Geberit AG 451 0.03
- Georg Fischer AG 273 0.02
- Givaudan SA 167 0.01
- Glarner Kantonalbank 8 -
- Gurit Holding AG 36 -
3 Helvetia Holding AG 248 0.01
- Hiag Immobilien Holding AG 14 -
1 Huber & Suhner AG 61 -
1 Implenia AG 18 -
- Inficon Holding AG 46 -
- Interroll Holding AG 67 -
- Intershop Holding AG 24 -
- Investis Holding SA 13 -
11 Julius Baer Group Ltd 509 0.03
- Jungfraubahn Holding AG 36 -
- Kardex AG 37 -
- Komax Holding AG 11 -
2 Kuehne & Nagel International AG 339 0.02
9 LafargeHolcim Ltd 367 0.02
2 Landis&Gyr Group AG 105 0.01
- LEM Holding SA 26 -
1 Liechtensteinische Landesbank AG 34 -
2 Logitech International SA 206 0.01
1 Lonza Group AG 218 0.01
- Luzerner Kantonalbank AG 82 0.01
- Medartis Holding AG 9 -
- Metall Zug AG 16 -
1 Mobilezone Holding AG 10 -
1 Mobimo Holding AG 131 0.01
42 Nestle SA 3,683 0.20
22 Novartis AG 1,358 0.08
17 OC Oerlikon Corp AG 135 0.01
- Orior AG 19 -
- Partners Group Holding AG 341 0.02
- Peach Property Group AG 10 -
- Phoenix Mecano AG 8 -
2 PSP Swiss Property AG 161 0.01
- Rieter Holding AG 28 -
9 Roche Holding AG (non-voting rights) 2,315 0.13
- Roche Holding AG (voting rights) 96 0.01
- Romande Energie Holding SA 11 -
- Schindler Holding AG 74 0.01
- Schweiter Technologies AG 91 0.01
1 Sensirion Holding AG 21 -
1 SFS Group AG 81 0.01
- SGS SA 293 0.02
- Siegfried Holding AG 119 0.01
11 SIG Combibloc Group AG 211 0.01
2 Sika AG 458 0.03
1 Softwareone Holding AG 18 -
1 Sonova Holding AG 180 0.01
- St Galler Kantonalbank AG 74 -
- Straumann Holding AG 66 -
2 Sulzer AG 143 0.01
1 Swatch Group AG (Bearer) 246 0.01
3 Swatch Group AG (Registered) 117 0.01
1 Swiss Life Holding AG 443 0.03
4 Swiss Prime Site AG 312 0.02
Shares (000's)
Value(000's)
GBP
% of NetAssetValue
Common Stock (continued)
Switzerland - 1.25% (continued)
6 Swiss Re AG 386 0.02
1 Swisscom AG 478 0.03
1 Swissquote Group Holding SA 63 -
- Tamedia AG 13 -
- Tecan Group AG 30 -
2 Temenos AG 216 0.01
1 u-blox Holding AG 25 -
32 UBS Group AG 369 0.02
1 Valiant Holding AG 82 0.01
- Valora Holding AG 37 -
1 VAT Group AG 165 0.01
- Vaudoise Assurances Holding SA 25 -
1 Vetropack Holding AG 36 -
2 Vifor Pharma AG 145 0.01
2 Vontobel Holding AG 128 0.01
- VP Bank AG 16 -
1 VZ Holding AG 41 -
- Warteck Invest AG 9 -
- Ypsomed Holding AG 17 -
1 Zehnder Group AG 58 -
- Zug Estates Holding AG 8 -
- Zuger Kantonalbank AG 27 -
1 Zurich Insurance Group AG 356 0.02
22,607 1.25
United Kingdom - 2.12%
12 3i Group PLC 151 0.01
1 4imprint Group PLC 32 -
24 888 Holdings PLC 96 0.01
1 Accsys Technologies PLC 1 -
4 Admiral Group PLC 109 0.01
3 Advanced Medical Solutions Group PLC 9 -
5 AG Barr PLC 26 -
17 Aggreko PLC 142 0.01
24 Airtel Africa PLC 19 -
6 AJ Bell PLC 24 -
14 Alliance Pharma PLC 14 -
9 Anglo American PLC 284 0.02
6 Anglo Pacific Group PLC 8 -
2 Anglo-Eastern Plantations PLC 11 -
6 Antofagasta PLC 100 0.01
10 AO World PLC 26 -
1 Aptitude Software Group PLC 8 -
7 Ascential PLC 27 -
11 Ashmore Group PLC 42 -
9 Ashtead Group PLC 461 0.03
2 ASOS PLC 104 0.01
6 Associated British Foods PLC 138 0.01
2 Aston Martin Lagonda Global Holdings 47 -
11 Astrazeneca PLC 849 0.05
23 Auto Trader Group PLC 130 0.01
6 Avast PLC 28 -
1 AVEVA Group PLC 19 -
84 Aviva PLC 344 0.02
1 Avon Rubber PLC 28 -
27 B&M European Value Retail SA 156 0.01
36 Babcock International Group PLC 108 0.01
40 BAE Systems PLC 211 0.01
10 Bakkavor Group PLC 13 -
37 Balfour Beatty PLC 116 0.01
3 Bank of Georgia Group PLC 39 -
165 Barclays PLC 302 0.02
28 Barratt Developments PLC 210 0.01
World Allocation 60/40 FundPortfolio of Investments as at 31 May 2021 (continued)
Dimensional Fund Advisors Semi-Annual Report and Unaudited Financial Statements, 31 May 2021 400

Shares (000's)
Value(000's)
GBP
% of NetAssetValue
Common Stock (continued)
United Kingdom - 2.12% (continued)
14 Beazley PLC 42 -
7 Bellway PLC 255 0.01
4 Berkeley Group Holdings PLC 193 0.01
32 BHP Group PLC 677 0.04
16 Biffa PLC 45 -
3 Bloomsbury Publishing PLC 8 -
12 Bodycote PLC 100 0.01
19 boohoo Group PLC 62 -
5 Boot Henry PLC 15 -
188 BP PLC 578 0.03
1 BP PLC, ADR 11 -
28 Breedon Group PLC 31 -
15 Brewin Dolphin Holdings PLC 51 -
17 British American Tobacco PLC 454 0.03
1 British American Tobacco PLC, ADR 23 -
16 Britvic PLC 145 0.01
397 BT Group PLC 693 0.04
7 Bunzl PLC 163 0.01
10 Burberry Group PLC 222 0.01
10 Burford Capital Ltd 85 0.01
17 C&C Group PLC 41 -
25 Cairn Energy PLC 41 -
25 Capita PLC 10 -
23 Card Factory PLC 16 -
4 CareTech Holdings PLC 25 -
2 Carnival PLC 37 -
69 Centamin PLC 76 0.01
7 Central Asia Metals PLC 18 -
377 Centrica PLC 206 0.01
17 Chemring Group PLC 51 -
6 Chesnara PLC 18 -
62 Cineworld Group PLC 57 -
1 Clarkson PLC 43 -
7 Clinigen Healthcare Ltd 56 -
4 Clipper Logistics PLC 32 -
8 Close Brothers Group PLC 125 0.01
8 CLS Holdings PLC 19 -
7 CMC Markets PLC 34 -
67 Coats Group PLC 45 -
3 Coca-Cola HBC AG 83 0.01
14 Compass Group PLC 222 0.01
4 Computacenter PLC 117 0.01
9 ContourGlobal PLC 17 -
26 ConvaTec Group PLC 63 -
24 Countryside Properties PLC 124 0.01
1 Cranswick PLC 30 -
22 Crest Nicholson Holdings PLC 103 0.01
2 Croda International PLC 125 0.01
4 CVS Group PLC 78 0.01
7 Daily Mail & General Trust PLC 66 -
6 Dart Group PLC 83 0.01
2 DCC PLC 141 0.01
9 De La Rue PLC 17 -
15 Devro PLC 31 -
9 DFS Furniture PLC 26 -
15 Diageo PLC 519 0.03
1 Dignity PLC 7 -
3 Diploma PLC 91 0.01
53 Direct Line Insurance Group PLC 159 0.01
3 DiscoverIE Group PLC 22 -
31 Diversified Gas & Oil PLC 32 -
80 Dixons Carphone PLC 109 0.01
Shares (000's)
Value(000's)
GBP
% of NetAssetValue
Common Stock (continued)
United Kingdom - 2.12% (continued)
17 Domino's Pizza Group PLC 60 -
8 dotdigital Group PLC 19 -
31 Drax Group PLC 137 0.01
54 DS Smith PLC 227 0.01
3 Dunelm Group PLC 50 -
2 DWF Group PLC 2 -
8 easyJet PLC 77 0.01
11 EKF Diagnostics Holdings PLC 9 -
15 Electrocomponents PLC 148 0.01
43 Elementis PLC 68 -
3 EMIS Group PLC 36 -
69 EnQuest PLC 12 -
29 Equiniti Group PLC 52 -
5 Euromoney Institutional Investor PLC 54 -
12 Evraz PLC 76 0.01
9 Experian PLC 243 0.01
2 FDM Group Holdings PLC 25 -
4 Ferguson PLC 392 0.02
23 Ferrexpo PLC 104 0.01
2 Fevertree Drinks PLC 57 -
15 Filtrona PLC 47 -
- First Derivatives PLC 6 -
100 Firstgroup PLC 81 0.01
10 Forterra PLC 29 -
15 Foxtons Group PLC 9 -
2 Fresnillo PLC 21 -
1 Frontier Developments PLC 21 -
1 Fuller Smith & Turner PLC 8 -
6 Funding Circle Holdings 11 -
7 Galliford Try Holdings PLC 9 -
1 Games Workshop Group PLC 135 0.01
4 Gamesys Group PLC 69 -
2 Gamma Communications PLC 41 -
2 GB Group PLC 17 -
13 Genel Energy PLC 17 -
2 Genus PLC 84 0.01
3 Georgia Capital PLC 18 -
31 GlaxoSmithKline PLC 420 0.02
95 Glencore PLC 304 0.02
3 Go-Ahead Group PLC 35 -
1 Gooch & Housego PLC 8 -
12 Grafton Group PLC 146 0.01
29 Grainger PLC 83 0.01
30 Greencore Group PLC 42 -
5 Greggs PLC 123 0.01
19 Gulf Keystone Petroleum Ltd 31 -
5 GVC Holdings PLC 86 0.01
7 Gym Group PLC 18 -
10 Halfords Group PLC 37 -
3 Halma PLC 84 0.01
5 Hargreaves Lansdown PLC 80 0.01
19 Hays PLC 32 -
3 Headlam Group PLC 14 -
6 Helical PLC 27 -
16 Helios Towers PLC 26 -
3 Hikma Pharmaceuticals PLC 80 0.01
3 Hill & Smith Holdings PLC 41 -
1 Hilton Food Group PLC 13 -
15 Hiscox Ltd 116 0.01
18 Hochschild Mining PLC 35 -
9 Hollywood Bowl Group PLC 23 -
7 HomeServe PLC 66 -
World Allocation 60/40 FundPortfolio of Investments as at 31 May 2021 (continued)
Dimensional Fund Advisors Semi-Annual Report and Unaudited Financial Statements, 31 May 2021 401

Shares (000's)
Value(000's)
GBP
% of NetAssetValue
Common Stock (continued)
United Kingdom - 2.12% (continued)
20 Howden Joinery Group PLC 162 0.01
125 HSBC Holdings PLC 571 0.03
10 Hunting PLC 26 -
22 Ibstock PLC 51 -
23 IG Group Holdings PLC 198 0.01
11 IMI PLC 191 0.01
3 Impax Asset Management Group PLC 31 -
32 Imperial Tobacco Group PLC 506 0.03
24 Inchcape PLC 190 0.01
36 Indivior PLC 56 -
25 Informa PLC 135 0.01
4 IntegraFin Holdings PLC 23 -
2 InterContinental Hotels Group PLC 104 0.01
3 Intermediate Capital Group PLC 70 -
18 International Consolidated Airlines Group SA 37 -
17 International Personal Finance PLC 22 -
3 Intertek Group PLC 144 0.01
52 Investec PLC 162 0.01
85 IP Group PLC 105 0.01
19 IQE PLC 10 -
133 ITV PLC 170 0.01
40 IWG PLC 145 0.01
108 J Sainsbury PLC 287 0.02
2 James Fisher & Sons PLC 17 -
- James Halstead PLC - -
12 JD Sports Fashion PLC 108 0.01
2 JD Wetherspoon PLC 26 -
33 John Laing Group PLC 133 0.01
5 John Menzies PLC 16 -
57 John Wood Group PLC 140 0.01
7 Johnson Matthey PLC 210 0.01
16 Johnson Service Group PLC 27 -
4 JTC PLC 25 -
27 Jupiter Fund Management PLC 76 0.01
83 Just Group PLC 91 0.01
4 Kainos Group PLC 57 -
5 Keller Group PLC 44 -
2 Keywords Studios PLC 40 -
123 Kingfisher PLC 439 0.03
15 Lamprell PLC 9 -
7 Lancashire Holdings Ltd 42 -
12 Learning Technologies Group PLC 20 -
75 Legal & General Group PLC 212 0.01
790 Lloyds Banking Group PLC 394 0.02
1 London Stock Exchange Group PLC 51 -
5 LSL Property Services PLC 25 -
3 Luceco PLC 10 -
135 M&G PLC 330 0.02
76 Man Group PLC 135 0.01
161 Marks & Spencer Group PLC 265 0.02
7 Marshalls PLC 53 -
33 Marston's PLC 30 -
12 McBride PLC 11 -
4 Mears Group PLC 8 -
27 Mediclinic International PLC 88 0.01
41 Meggitt PLC 208 0.01
129 Melrose Industries PLC 222 0.01
10 Metro Bank PLC 11 -
16 Michael Page International PLC 98 0.01
24 Micro Focus International PLC 125 0.01
2 Midwich Group PLC 9 -
19 Mitchells & Butlers PLC 58 -
Shares (000's)
Value(000's)
GBP
% of NetAssetValue
Common Stock (continued)
United Kingdom - 2.12% (continued)
63 Mitie Group PLC 43 -
1 MJ Gleeson PLC 10 -
12 Mondi PLC 233 0.01
18 Moneysupermarket.com Group PLC 48 -
16 Morgan Crucible Co PLC 52 -
3 Morgan Sindall Group PLC 56 -
3 Motorpoint group PLC 8 -
1 MP Evans Group PLC 11 -
29 National Express Group PLC 86 0.01
15 National Grid PLC 141 0.01
13 NCC Group PLC 39 -
3 Next Fifteen Communications Group PLC 25 -
2 Next PLC 170 0.01
19 Ninety One PLC 45 -
19 Northgate PLC 74 -
2 Numis Corp PLC 9 -
1 Ocado Group PLC 21 -
20 OSB Group PLC 95 0.01
1 Oxford Instruments PLC 28 -
31 Pan African Resources PLC 7 -
20 Paragon Group of Cos PLC 96 0.01
27 Pearson PLC 221 0.01
34 Pendragon PLC 6 -
8 Pennon Group PLC 82 0.01
4 Persimmon PLC 140 0.01
11 Petrofac Ltd 15 -
149 Petropavlovsk PLC 37 -
31 Pets at Home Group PLC 137 0.01
31 Phoenix Group Holdings PLC 228 0.01
20 Playtech PLC 93 0.01
4 Plus500 Ltd 64 -
5 Polar Capital Holdings PLC 43 -
12 Polypipe Group PLC 75 0.01
1 PPHE Hotel Group Ltd 10 -
55 Premier Foods PLC 58 -
17 Provident Financial PLC 41 -
10 Prudential PLC 146 0.01
13 PureTech Health PLC 52 -
9 PZ Cussons PLC 22 -
26 QinetiQ Group PLC 93 0.01
73 Quilter PLC 111 0.01
5 Rank Group PLC 11 -
2 Rathbone Brothers PLC 33 -
23 Reach PLC 54 -
5 Reckitt Benckiser Group PLC 319 0.02
15 Redrow PLC 98 0.01
6 RELX PLC (Netherlands listing) 103 0.01
10 RELX PLC (UK listing) 190 0.01
3 Renew Holdings PLC 18 -
- Renishaw PLC 27 -
25 Rentokil Initial PLC 120 0.01
31 Restaurant Group PLC 37 -
2 Rhi Magnesita NV (UK listing) 91 0.01
4 Ricardo PLC 19 -
22 Rightmove PLC 130 0.01
18 Rio Tinto PLC 1,110 0.06
2 Robert Walters PLC 12 -
103 Rolls-Royce Holdings PLC 109 0.01
29 Rotork PLC 96 0.01
65 Royal Bank of Scotland Group PLC 133 0.01
76 Royal Dutch Shell PLC 972 0.05
59 Royal Mail PLC 344 0.02
World Allocation 60/40 FundPortfolio of Investments as at 31 May 2021 (continued)
Dimensional Fund Advisors Semi-Annual Report and Unaudited Financial Statements, 31 May 2021 402

Shares (000's)
Value(000's)
GBP
% of NetAssetValue
Common Stock (continued)
United Kingdom - 2.12% (continued)
26 RPS Group PLC 26 -
25 RSA Insurance Group PLC 170 0.01
7 RWS Holdings PLC 43 -
4 Sabre Insurance Group PLC 10 -
7 Saga PLC 28 -
7 Sage Group PLC 46 -
1 Sanne Group PLC 9 -
10 Savills PLC 123 0.01
1 Schroders PLC (non-voting rights) 17 -
2 Schroders PLC (voting rights) 74 -
29 Senior PLC 46 -
14 Serco Group PLC 19 -
8 Serica Energy PLC 10 -
8 Severfield PLC 6 -
4 Severn Trent PLC 97 0.01
47 Shanks Group PLC 26 -
25 SIG PLC 15 -
39 Signature Aviation PLC 154 0.01
11 Sirius Real Estate Ltd 11 -
4 Smart Metering Systems PLC 36 -
4 Smith & Nephew PLC 69 -
9 Smiths Group PLC 136 0.01
5 Softcat PLC 96 0.01
5 Spectris PLC 163 0.01
27 Speedy Hire PLC 20 -
1 Spirax-Sarco Engineering PLC 132 0.01
23 Spire Healthcare Group PLC 57 -
17 Spirent Communications PLC 43 -
16 Sports Direct International PLC 90 0.01
19 SSE PLC 300 0.02
49 SSP Group PLC 143 0.01
8 St James's Place PLC 109 0.01
16 St Modwen Properties PLC 88 0.01
9 Stagecoach Group PLC 8 -
45 Standard Chartered PLC 229 0.01
83 Standard Life Aberdeen PLC 229 0.01
7 SThree PLC 28 -
22 Stobart Group Ltd 7 -
8 Stock Spirits Group PLC 22 -
6 Strix Group PLC 17 -
4 SuperGroup PLC 14 -
17 Synthomer PLC 89 0.01
1 Takeaway.com NV 63 -
1 Takeaway.com NV (UK listing) 75 -
27 Tate & Lyle PLC 209 0.01
2 Tatton Asset Management PLC 8 -
78 Taylor Wimpey PLC 133 0.01
4 TBC Bank Group PLC 43 -
12 Ted Baker PLC 22 -
2 Telecom Plus PLC 24 -
147 Tesco PLC 327 0.02
14 TI Fluid Systems PLC 41 -
45 TP ICAP Group PLC 97 0.01
12 Travis Perkins PLC 202 0.01
2 Tremor International Ltd 18 -
8 TT Electronics plc 20 -
16 TUI AG 68 -
95 Tullow Oil PLC 49 -
9 Tyman PLC 42 -
9 U & I Group PLC 8 -
16 UDG Healthcare PLC 169 0.01
2 Ultra Electronics Holdings PLC 38 -
Shares (000's)
Value(000's)
GBP
% of NetAssetValue
Common Stock (continued)
United Kingdom - 2.12% (continued)
21 Unilever PLC (Nitherland listing) 879 0.05
9 Unilever PLC (UK listing) 386 0.02
12 United Utilities Group PLC 117 0.01
26 Vectura Group PLC 41 -
24 Vertu Motors PLC 11 -
13 Vesuvius PLC 70 -
2 Victrex PLC 53 -
79 Virgin Money UK PLC 167 0.01
14 Vistry Group PLC 186 0.01
1 Vitec Group PLC 10 -
18 Vivo Energy PLC 18 -
405 Vodafone Group PLC 517 0.03
5 Volution Group PLC 22 -
8 Watches of Switzerland Group 66 -
15 Watkin Jones PLC 33 -
12 Weir Group PLC 239 0.01
4 WH Smith PLC 70 -
5 Whitbread PLC 165 0.01
14 Wickes Group PLC 35 -
7 Wincanton PLC 30 -
107 WM Morrison Supermarkets PLC 188 0.01
21 WPP PLC 203 0.01
5 Xaar PLC 11 -
1 XP Power Ltd 40 -
1 Young & Co's Brewery PLC NV 6 -
38,471 2.12
United States - 33.06%
- 10X Genomics Inc 13 -
2 1-800-Flowers.com Inc 43 -
2 1st Source Corp 75 -
4 2U Inc 104 0.01
6 3D Systems Corp 127 0.01
9 3M Co 1,329 0.07
2 A10 Networks Inc 16 -
2 AAON Inc 113 0.01
2 AAR Corp 62 -
2 Aaron's Holdings Co Inc 54 -
13 Abbott Laboratories 1,102 0.06
18 AbbVie Inc 1,435 0.08
5 Abercrombie & Fitch Co 154 0.01
1 Abiomed Inc 141 0.01
5 ABM Industries Inc 177 0.01
7 Acadia Healthcare Co Inc 336 0.02
2 Acadia Pharmaceuticals Inc 39 -
1 Acceleron Pharma Inc 91 0.01
8 Accenture PLC 1,642 0.09
6 ACCO Brands Corp 37 -
6 Accuray Inc 17 -
6 ACI Worldwide Inc 156 0.01
- ACM Research Inc 7 -
1 ACNB Corp 13 -
11 Activision Blizzard Inc 748 0.04
3 Acuity Brands Inc 387 0.02
6 Acushnet Holdings Corp 209 0.01
1 Adaptive Biotechnologies Corp 14 -
1 Addus HomeCare Corp 63 -
8 Adient PLC 266 0.02
4 Adobe Inc 1,413 0.08
30 ADT Inc 219 0.01
3 Adtalem Global Education Inc 81 -
4 ADTRAN Inc 53 -
4 Advance Auto Parts Inc 472 0.03
World Allocation 60/40 FundPortfolio of Investments as at 31 May 2021 (continued)
Dimensional Fund Advisors Semi-Annual Report and Unaudited Financial Statements, 31 May 2021 403

Shares (000's)
Value(000's)
GBP
% of NetAssetValue
Common Stock (continued)
United States - 33.06% (continued)
2 Advanced Drainage Systems Inc 165 0.01
2 Advanced Energy Industries Inc 138 0.01
4 Advanced Micro Devices Inc 214 0.01
2 AdvanSix Inc 48 -
2 Adverum Biotechnologies Inc 5 -
10 AECOM 469 0.03
1 AeroVironment Inc 110 0.01
17 AES Corp 307 0.02
4 Affiliated Managers Group Inc 422 0.02
12 Aflac Inc 489 0.03
6 AGCO Corp 591 0.03
3 Agilent Technologies Inc 308 0.02
- Agilysys Inc 16 -
2 Agios Pharmaceuticals Inc 76 -
9 Air Lease Corp 293 0.02
3 Air Products and Chemicals Inc 677 0.04
5 Air Transport Services Group Inc 95 0.01
5 Akamai Technologies Inc 400 0.02
7 Akebia Therapeutics Inc 16 -
1 Alamo Group Inc 97 0.01
1 Alarm.com Holdings Inc 80 -
8 Alaska Air Group Inc 382 0.02
2 Albany International Corp 118 0.01
7 Albemarle Corp 840 0.05
1 Albireo Pharma Inc 33 -
13 Alcoa Corp 362 0.02
5 Alexion Pharmaceuticals Inc 564 0.03
- Align Technology Inc 196 0.01
10 Alkermes PLC 158 0.01
1 Alleghany Corp 445 0.03
9 Allegheny Technologies Inc 158 0.01
2 Allegiance Bancshares Inc 48 -
1 Allegiant Travel Co 160 0.01
3 Allegion PLC 320 0.02
2 ALLETE Inc 97 0.01
3 Alliance Data Systems Corp 228 0.01
6 Alliant Energy Corp 224 0.01
- Allied Motion Technologies Inc 8 -
6 Allison Transmission Holdings Inc 185 0.01
14 Allscripts Healthcare Solutions Inc 169 0.01
9 Allstate Corp 903 0.05
29 Ally Financial Inc 1,123 0.06
1 Alnylam Pharmaceuticals Inc 117 0.01
2 Alpha & Omega Semiconductor Ltd 36 -
1 Alpha Metallurgical Resources 11 -
3 Alphabet Inc, Class A 5,045 0.28
3 Alphabet Inc, Class C 4,911 0.27
1 Alta Equipment Group Inc 9 -
1 Altabancorp 30 -
1 Altair Engineering Inc 43 -
- Alteryx Inc 25 -
11 Altice USA Inc 267 0.02
5 Alto Ingredients Inc 23 -
5 Altra Industrial Motion Corp 245 0.01
26 Altria Group Inc 900 0.05
- A-Mark Precious Metals Inc 16 -
5 Amazon.com Inc 10,520 0.58
1 Ambac Financial Group Inc 9 -
1 Ambarella Inc 86 0.01
3 AMC Networks Inc 103 0.01
17 Amcor Ltd 144 0.01
56 Amcor PLC 462 0.03
Shares (000's)
Value(000's)
GBP
% of NetAssetValue
Common Stock (continued)
United States - 33.06% (continued)
8 Amdocs Ltd 413 0.02
1 Amedisys Inc 151 0.01
2 Amerant Bancorp Inc 30 -
- Amerant Bancorp Inc 5 -
2 Amerco 609 0.03
5 Ameren Corp 277 0.02
2 Ameresco Inc 84 0.01
3 American Airlines Group Inc 51 -
9 American Axle & Manufacturing Holdings Inc 69 -
15 American Eagle Outfitters Inc 364 0.02
7 American Electric Power Co Inc 425 0.02
5 American Equity Investment Life Holding Co 108 0.01
8 American Express Co 906 0.05
5 American Financial Group Inc 471 0.03
15 American International Group Inc 566 0.03
1 American National Bankshares Inc 12 -
2 American National Group Inc 189 0.01
1 American Outdoor Brands Inc 16 -
- American Public Education Inc 9 -
1 American Software Inc 9 -
1 American States Water Co 66 -
1 American Superconductor Corp 6 -
1 American Vanguard Corp 10 -
3 American Water Works Co Inc 307 0.02
1 American Woodmark Corp 90 0.01
- America's Car-Mart Inc 27 -
7 Ameriprise Financial Inc 1,212 0.07
5 Ameris Bancorp 203 0.01
1 AMERISAFE Inc 56 -
8 AmerisourceBergen Corp 610 0.03
4 AMETEK Inc 411 0.02
9 Amgen Inc 1,547 0.09
21 Amkor Technology Inc 305 0.02
3 AMN Healthcare Services Inc 171 0.01
8 Amneal Pharmaceuticals Inc 33 -
4 Amphastar Pharmaceuticals Inc 50 -
11 Amphenol Corp 519 0.03
4 Analog Devices Inc 510 0.03
1 Anaplan Inc 47 -
2 AnaptysBio Inc 29 -
3 Andersons Inc 63 -
3 AngioDynamics Inc 41 -
1 ANI Pharmaceuticals Inc 24 -
1 Anika Therapeutics Inc 39 -
1 Ansys Inc 119 0.01
3 Antares Pharma Inc 7 -
- Anterix Inc 17 -
33 Antero Midstream Corp 226 0.01
21 Antero Resources Corp 188 0.01
4 Anthem Inc 1,036 0.06
5 AO Smith Corp 253 0.01
6 Aon PLC 1,067 0.06
22 APA Corp 328 0.02
11 API Group Inc 158 0.01
2 Apogee Enterprises Inc 50 -
1 Apollo Medical Holdings Inc 30 -
- Appfolio Inc 27 -
220 Apple Inc 19,286 1.06
2 Applied Industrial Technologies Inc 167 0.01
15 Applied Materials Inc 1,442 0.08
3 AptarGroup Inc 262 0.01
5 Aptiv PLC 486 0.03
World Allocation 60/40 FundPortfolio of Investments as at 31 May 2021 (continued)
Dimensional Fund Advisors Semi-Annual Report and Unaudited Financial Statements, 31 May 2021 404

Shares (000's)
Value(000's)
GBP
% of NetAssetValue
Common Stock (continued)
United States - 33.06% (continued)
16 Aramark 432 0.02
2 ArcBest Corp 90 0.01
19 Arch Capital Group Ltd 523 0.03
2 Arch Resources Inc 61 -
10 Archer-Daniels-Midland Co 460 0.03
12 Archrock Inc 77 -
8 Arconic Corp 216 0.01
4 Arcosa Inc 161 0.01
2 Ardelyx Inc 8 -
4 Arena Pharmaceuticals Inc 155 0.01
1 Ares Management Corp 52 -
1 Argan Inc 41 -
3 Argo Group International Holdings Ltd 101 0.01
2 Arista Networks Inc 488 0.03
6 Arlo Technologies Inc 31 -
2 Armstrong World Industries Inc 161 0.01
6 Arrow Electronics Inc 495 0.03
1 Arrow Financial Corp 21 -
2 Arrowhead Pharmaceuticals Inc 92 0.01
- Artesian Resources Corp 12 -
6 Arthur J Gallagher & Co 627 0.04
3 Artisan Partners Asset Management Inc 112 0.01
1 Arvinas Inc 35 -
2 Asbury Automotive Group Inc 227 0.01
4 ASGN Inc 305 0.02
4 Ashland Global Holdings Inc 277 0.02
1 Aspen Aerogels Inc 9 -
3 Aspen Technology Inc 257 0.01
12 Associated Banc-Corp 200 0.01
4 Assurant Inc 474 0.03
6 Assured Guaranty Ltd 205 0.01
2 Astec Industries Inc 100 0.01
1 Astronics Corp, Class A 17 -
1 Asure Software Inc 8 -
3 At Home Group Inc 88 0.01
103 AT&T Inc 2,137 0.12
3 Atara Biotherapeutics Inc 31 -
14 Athene Holding Ltd 611 0.03
1 Athenex Inc 5 -
3 Atkore International Group Inc 156 0.01
1 Atlantic Capital Bancshares Inc 20 -
6 Atlantic Union Bankshares Corp 170 0.01
4 Atlantica Yield PLC 100 0.01
- Atlanticus Holdings Corp 13 -
2 Atlas Air Worldwide Holdings Inc 100 0.01
- Atlassian Corp PLC 56 -
2 Atmos Energy Corp 171 0.01
1 ATN International Inc 22 -
1 Atreca Inc 5 -
1 AtriCure Inc 61 -
- Atrion Corp 37 -
9 Audacy Inc 27 -
3 Autodesk Inc 576 0.03
6 Autoliv Inc 430 0.02
7 Automatic Data Processing Inc 939 0.05
7 AutoNation Inc 536 0.03
- AutoZone Inc 375 0.02
1 Avalara Inc 68 -
2 Avangrid Inc 85 0.01
3 Avanos Medical Inc 96 0.01
5 Avaya Holdings Corp 94 0.01
3 Avery Dennison Corp 456 0.03
Shares (000's)
Value(000's)
GBP
% of NetAssetValue
Common Stock (continued)
United States - 33.06% (continued)
- Aviat Networks Inc 10 -
2 Avid Bioservices Inc 24 -
2 Avid Technology Inc 36 -
6 Avient Corp 229 0.01
3 Avis Budget Group Inc 164 0.01
3 Avista Corp 87 0.01
7 Avnet Inc 232 0.01
26 AXA Equitable Holdings Inc 584 0.03
13 Axalta Coating Systems Ltd 294 0.02
3 Axcelis Technologies Inc 83 0.01
6 Axis Capital Holdings Ltd 217 0.01
1 Axogen Inc 8 -
1 Axon Enterprise Inc 104 0.01
1 Axonics Inc 22 -
5 Axos Financial Inc 160 0.01
2 AXT Inc 11 -
2 AZZ Inc 76 -
1 B Riley Financial Inc 62 -
3 B&G Foods Inc 59 -
1 Badger Meter Inc 75 -
22 Baker Hughes Co 370 0.02
1 Balchem Corp 101 0.01
8 Ball Corp 458 0.03
2 Bally's Corp 81 -
3 Banc of California Inc 42 -
3 BancFirst Corp 128 0.01
5 Bancorp Inc 78 -
8 BancorpSouth Bank 165 0.01
65 Bank of America Corp 1,942 0.11
1 Bank of Commerce Holdings 7 -
2 Bank of Hawaii Corp 158 0.01
1 Bank of Marin Bancorp 16 -
14 Bank of New York Mellon Corp 530 0.03
4 Bank of NT Butterfield & Son Ltd 108 0.01
9 Bank OZK 285 0.02
7 BankUnited Inc 234 0.01
3 Banner Corp 119 0.01
1 Bar Harbor Bankshares 11 -
4 Barnes Group Inc 139 0.01
1 Barrett Business Services Inc 35 -
- Bassett Furniture Industries Inc 7 -
9 Baxter International Inc 534 0.03
1 BCB Bancorp Inc 8 -
6 Beacon Roofing Supply Inc 230 0.01
2 Beazer Homes USA Inc 34 -
3 Becton Dickinson and Co 471 0.03
8 Bed Bath & Beyond Inc 158 0.01
3 Belden Inc 110 0.01
2 Benchmark Electronics Inc 50 -
15 Berkshire Hathaway Inc 3,128 0.17
4 Berkshire Hills Bancorp Inc 75 -
3 Berry Corp 11 -
7 Berry Global Group Inc 314 0.02
8 Best Buy Co Inc 675 0.04
1 Beyond Meat Inc 58 -
15 BGC Partners Inc 62 -
4 Big Lots Inc 161 0.01
- Biglari Holdings Inc, Class B 11 -
1 Bioceres Crop Solutions Corp 13 -
6 Biogen Inc 1,159 0.06
3 BioMarin Pharmaceutical Inc 151 0.01
1 Bio-Rad Laboratories Inc 370 0.02
World Allocation 60/40 FundPortfolio of Investments as at 31 May 2021 (continued)
Dimensional Fund Advisors Semi-Annual Report and Unaudited Financial Statements, 31 May 2021 405

Shares (000's)
Value(000's)
GBP
% of NetAssetValue
Common Stock (continued)
United States - 33.06% (continued)
1 Bio-Techne Corp 204 0.01
2 BJ's Restaurants Inc 63 -
5 BJ's Wholesale Club Holdings Inc 148 0.01
2 Black Hills Corp 93 0.01
5 Black Knight Inc 253 0.01
1 Blackbaud Inc 62 -
1 Blackline Inc 53 -
1 BlackRock Inc 805 0.04
4 Blackstone Group Inc 272 0.02
4 Bloomin' Brands Inc 78 -
2 Blucora Inc 20 -
1 Blue Bird Corp 24 -
2 Bluebird Bio Inc 45 -
- BlueLinx Holdings Inc 15 -
- BM Technologies Inc 2 -
3 Boingo Wireless Inc 30 -
3 Boise Cascade Co 143 0.01
5 BOK Financial Corp 306 0.02
1 Bonanza Creek Energy Inc 18 -
- Booking Holdings Inc 65 -
2 Boot Barn Holdings Inc 133 0.01
5 Booz Allen Hamilton Holding Corp 307 0.02
19 BorgWarner Inc 672 0.04
- Boston Beer Co Inc 252 0.01
1 Boston Omaha Corp 27 -
6 Boston Private Financial Holdings Inc 65 -
12 Boston Scientific Corp 348 0.02
1 Bottomline Technologies DE Inc 38 -
2 Box Inc 31 -
3 Brady Corp 126 0.01
- Bridgebio Pharma Inc 13 -
1 Bridgewater Bancshares Inc 17 -
1 Bright Horizons Family Solutions Inc 124 0.01
1 Brightcove Inc 7 -
6 Brighthouse Financial Inc 210 0.01
5 Brightsphere Investment Group Inc 80 -
6 BrightView Holdings Inc 74 -
2 Brinker International Inc 67 -
2 Brink's Co 119 0.01
24 Bristol-Myers Squibb Co 1,122 0.06
6 Broadcom Inc 2,019 0.11
4 Broadridge Financial Solutions Inc 404 0.02
13 Brookdale Senior Living Inc 61 -
10 Brookfield Renewable Corp 308 0.02
7 Brookline Bancorp Inc 80 -
5 Brooks Automation Inc 353 0.02
9 Brown & Brown Inc 332 0.02
2 Brown-Forman Corp, Class A 85 0.01
8 Brown-Forman Corp, Class B 468 0.03
6 Bruker Corp 281 0.02
6 Brunswick Corp 445 0.03
1 Bryn Mawr Bank Corp 48 -
4 Buckle Inc 121 0.01
18 Builders FirstSource Inc 558 0.03
11 Bunge Ltd 663 0.04
- Burlington Stores Inc 92 0.01
1 Business First Bancshares Inc 9 -
4 BWX Technologies Inc 188 0.01
2 Byline Bancorp Inc 27 -
- Cable One Inc 285 0.02
5 Cabot Corp 202 0.01
25 Cabot Oil & Gas Corp 284 0.02
Shares (000's)
Value(000's)
GBP
% of NetAssetValue
Common Stock (continued)
United States - 33.06% (continued)
2 CACI International Inc 331 0.02
2 Cactus Inc 52 -
10 Cadence BanCorp 155 0.01
3 Cadence Design Systems Inc 292 0.02
9 Caesars Entertainment Inc 680 0.04
1 CAI International Inc 26 -
1 CalAmp Corp 9 -
1 Calavo Growers Inc 37 -
1 Caleres Inc 17 -
2 California Water Service Group 80 -
2 Calix Inc 62 -
7 Callaway Golf Co 175 0.01
2 Callon Petroleum Co 42 -
3 Cal-Maine Foods Inc 81 -
1 Cambium Networks Corp 25 -
1 Camden National Corp 29 -
11 Campbell Soup Co 372 0.02
2 Camping World Holdings Inc 66 -
6 Cannae Holdings Inc 153 0.01
- Capital Bancorp Inc 3 -
1 Capital City Bank Group Inc 19 -
8 Capital One Financial Corp 942 0.05
11 Capitol Federal Financial Inc 100 0.01
11 Capri Holdings Ltd 441 0.02
1 Capstar Financial Holdings Inc 15 -
- Cara Therapeutics Inc 4 -
10 Cardinal Health Inc 402 0.02
1 Cardiovascular Systems Inc 34 -
3 Cardtronics PLC 87 0.01
- CareDx Inc 9 -
3 Cargurus Inc 52 -
4 Carlisle Cos Inc 507 0.03
7 CarMax Inc 562 0.03
17 Carnival Corp 364 0.02
3 Carpenter Technology Corp 105 0.01
1 Carriage Services Inc 27 -
12 Carrier Global Corp 396 0.02
2 Carrols Restaurant Group Inc 7 -
4 Cars.com Inc 45 -
2 Carter's Inc 167 0.01
- Carvana Co 34 -
3 Casa Systems Inc 18 -
2 Casella Waste Systems Inc 100 0.01
2 Casey's General Stores Inc 303 0.02
1 Cass Information Systems Inc 26 -
7 Catalent Inc 498 0.03
3 Catalyst Pharmaceuticals Inc 13 -
9 Caterpillar Inc 1,537 0.09
6 Cathay General Bancorp 178 0.01
1 Cato Corp 9 -
1 Cavco Industries Inc 96 0.01
4 CBIZ Inc 91 0.01
5 Cboe Global Markets Inc 401 0.02
17 CBRE Group Inc 1,021 0.06
2 CBTX Inc 41 -
4 CDK Global Inc 136 0.01
4 CDW Corp 475 0.03
1 CECO Environmental Corp 4 -
4 Celanese Corp 519 0.03
1 Celsius Holdings Inc 26 -
9 Centene Corp 483 0.03
17 Centennial Resource Development Inc 62 -
World Allocation 60/40 FundPortfolio of Investments as at 31 May 2021 (continued)
Dimensional Fund Advisors Semi-Annual Report and Unaudited Financial Statements, 31 May 2021 406

Shares (000's)
Value(000's)
GBP
% of NetAssetValue
Common Stock (continued)
United States - 33.06% (continued)
13 CenterPoint Energy Inc 226 0.01
3 Central Garden & Pet Co (non-voting rights) 114 0.01
1 Central Garden & Pet Co (voting rights) 26 -
1 Central Pacific Financial Corp 13 -
1 Centrus Energy Corp 10 -
8 Century Aluminum Co 80 -
- Century Bancorp Inc 19 -
2 Century Communities Inc 123 0.01
2 Cerence Inc 163 0.01
3 Ceridian HCM Holding Inc 160 0.01
11 Cerner Corp 595 0.03
1 CEVA Inc 17 -
13 CF Industries Holdings Inc 489 0.03
4 CH Robinson Worldwide Inc 307 0.02
14 ChampionX Corp 267 0.02
1 ChannelAdvisor Corp 23 -
1 Charles River Laboratories International Inc 315 0.02
18 Charles Schwab Corp 945 0.05
3 Chart Industries Inc 292 0.02
3 Charter Communications Inc 1,307 0.07
1 Chase Corp 47 -
2 Cheesecake Factory Inc 78 -
2 Chefs' Warehouse Inc 46 -
2 Chegg Inc 84 0.01
1 Chemed Corp 197 0.01
1 ChemoCentryx Inc 4 -
13 Chemours Co 335 0.02
7 Cheniere Energy Inc 445 0.03
1 Chesapeake Utilities Corp 57 -
16 Chevron Corp 1,142 0.06
- Chewy Inc 22 -
1 Chimerix Inc 8 -
2 Chinook Therapeutics Inc 27 -
- Chipotle Mexican Grill Inc 204 0.01
2 Choice Hotels International Inc 142 0.01
4 Chubb Ltd 535 0.03
8 Church & Dwight Co Inc 483 0.03
1 Churchill Downs Inc 90 0.01
1 Chuy's Holdings Inc 27 -
10 Ciena Corp 359 0.02
6 Cigna Corp 1,053 0.06
7 Cimarex Energy Co 347 0.02
1 Cimpress PLC 69 -
9 Cincinnati Financial Corp 739 0.04
9 Cinemark Holdings Inc 143 0.01
2 Cintas Corp 464 0.03
1 CIRCOR International Inc 39 -
4 Cirrus Logic Inc 204 0.01
88 Cisco Systems Inc 3,263 0.18
7 CIT Group Inc 270 0.02
1 Citi Trends Inc 34 -
17 Citigroup Inc 959 0.05
- Citizens & Northern Corp 8 -
21 Citizens Financial Group Inc 732 0.04
3 Citrix Systems Inc 261 0.01
1 City Holding Co 69 -
1 Civeo Corp 14 -
- Civista Bancshares Inc 3 -
2 Clarus Corp 28 -
16 Clean Energy Fuels Corp 91 0.01
4 Clean Harbors Inc 290 0.02
- Clearfield Inc 10 -
Shares (000's)
Value(000's)
GBP
% of NetAssetValue
Common Stock (continued)
United States - 33.06% (continued)
- Clearwater Paper Corp 8 -
1 Clearway Energy Inc, Class A 15 -
3 Clearway Energy Inc, Class C 49 -
6 Cleveland-Cliffs Inc 92 0.01
3 Clorox Co 325 0.02
19 Cloudera Inc 171 0.01
- Cloudflare Inc 28 -
2 CMC Materials Inc 194 0.01
4 CME Group Inc 585 0.03
6 CMS Energy Corp 243 0.01
4 CNA Financial Corp 131 0.01
1 CNB Financial Corp 14 -
4 CNO Financial Group Inc 80 -
16 CNX Resources Corp 156 0.01
1 Coastal Financial Corp 11 -
50 Coca-Cola Co 1,956 0.11
- Coca-Cola Consolidated Inc 121 0.01
1 Codexis Inc 14 -
19 Coeur Mining Inc 137 0.01
2 Cogent Communications Holdings Inc 92 0.01
2 Cognex Corp 111 0.01
10 Cognizant Technology Solutions Corp 493 0.03
5 Cognyte Software Ltd 86 0.01
2 Cohen & Steers Inc 108 0.01
1 Coherent Inc 276 0.02
3 Cohu Inc 85 0.01
9 Colfax Corp 280 0.02
9 Colgate-Palmolive Co 505 0.03
1 Collegium Pharmaceutical Inc 18 -
5 Columbia Banking System Inc 160 0.01
8 Columbia Financial Inc 101 0.01
3 Columbia Sportswear Co 239 0.01
2 Columbus McKinnon Corp 71 -
79 Comcast Corp 3,206 0.18
10 Comerica Inc 534 0.03
3 Comfort Systems USA Inc 170 0.01
7 Commerce Bancshares Inc 391 0.02
8 Commercial Metals Co 174 0.01
2 Commercial Vehicle Group Inc 19 -
11 CommScope Holding Co Inc 151 0.01
4 Community Bank System Inc 217 0.01
5 Community Health Systems Inc 51 -
1 Community Trust Bancorp Inc 41 -
1 CommVault Systems Inc 40 -
2 Compass Minerals International Inc 98 0.01
1 Computer Programs & Systems Inc 18 -
3 comScore Inc 8 -
17 Comstock Resources Inc 66 -
2 Comtech Telecommunications Corp 30 -
18 Conagra Brands Inc 487 0.03
3 Concentrix Corp 373 0.02
1 Concrete Pumping Holdings Inc 8 -
17 Conduent Inc 89 0.01
2 CONMED Corp 147 0.01
3 ConnectOne Bancorp Inc 55 -
1 Conn's Inc 23 -
42 ConocoPhillips 1,667 0.09
2 CONSOL Energy Inc 25 -
5 Consolidated Communications Holdings Inc 31 -
4 Consolidated Edison Inc 232 0.01
3 Constellation Brands Inc 501 0.03
1 Constellation Pharmaceuticals Inc 17 -
World Allocation 60/40 FundPortfolio of Investments as at 31 May 2021 (continued)
Dimensional Fund Advisors Semi-Annual Report and Unaudited Financial Statements, 31 May 2021 407

Shares (000's)
Value(000's)
GBP
% of NetAssetValue
Common Stock (continued)
United States - 33.06% (continued)
2 Construction Partners Inc 48 -
1 Container Store Group Inc 10 -
9 Continental Resources Inc 208 0.01
2 Cooper Cos Inc 479 0.03
1 Cooper-Standard Holdings Inc 28 -
2 Copa Holdings SA 121 0.01
5 Copart Inc 473 0.03
5 Corcept Therapeutics Inc 82 0.01
2 Core Laboratories NV 64 -
5 CoreLogic Inc 284 0.02
4 Core-Mark Holding Co Inc 116 0.01
4 Cornerstone Building Brands Inc 43 -
1 Cornerstone OnDemand Inc 30 -
17 Corning Inc 512 0.03
16 Corteva Inc 522 0.03
1 CorVel Corp 72 -
9 Costamare Inc 65 -
- CoStar Group Inc 261 0.01
6 Costco Wholesale Corp 1,493 0.08
49 Coty Inc 310 0.02
- Coupa Software Inc 74 -
6 Covanta Holding Corp 66 -
7 Covetrus Inc 129 0.01
1 Cowen Inc 40 -
- CRA International Inc 11 -
1 Cracker Barrel Old Country Store Inc 117 0.01
4 Crane Co 272 0.02
2 Crawford & Co, Class A 16 -
1 Crawford & Co, Class B 8 -
1 Credit Acceptance Corp 293 0.02
5 Cree Inc 362 0.02
2 CRISPR Therapeutics AG 129 0.01
3 Crocs Inc 218 0.01
1 Cross Country Healthcare Inc 14 -
1 CrossFirst Bankshares Inc 13 -
7 Crown Holdings Inc 500 0.03
2 CryoLife Inc 45 -
2 CSG Systems International Inc 59 -
1 CSW Industrials Inc 84 0.01
16 CSX Corp 1,111 0.06
3 CTS Corp 68 -
4 Cullen/Frost Bankers Inc 370 0.02
4 Cummins Inc 669 0.04
3 Curtiss-Wright Corp 274 0.02
10 Cushman & Wakefield PLC 140 0.01
2 Customers Bancorp Inc 51 -
10 CVB Financial Corp 156 0.01
6 CVR Energy Inc 89 0.01
18 CVS Health Corp 1,124 0.06
- Daily Journal Corp 7 -
3 Daktronics Inc 15 -
12 Dana Inc 235 0.01
4 Danaher Corp 633 0.04
4 Darden Restaurants Inc 355 0.02
14 Darling Ingredients Inc 677 0.04
4 Daseke Inc 22 -
2 Dave & Buster's Entertainment Inc 46 -
6 DaVita Inc 549 0.03
2 Deckers Outdoor Corp 357 0.02
5 Deere & Co 1,323 0.07
1 Del Taco Restaurants Inc 10 -
6 Delek US Holdings Inc 99 0.01
Shares (000's)
Value(000's)
GBP
% of NetAssetValue
Common Stock (continued)
United States - 33.06% (continued)
3 Dell Technologies Inc 176 0.01
2 Delta Air Lines Inc 70 -
3 Deluxe Corp 98 0.01
3 Denali Therapeutics Inc 144 0.01
3 Denbury Inc 144 0.01
2 Denny's Corp 26 -
12 Dentsply Sirona Inc 575 0.03
1 Designer Brands Inc 17 -
49 Devon Energy Corp 914 0.05
1 DexCom Inc 136 0.01
3 DHI Group Inc 7 -
13 DHT Holdings Inc 59 -
- Diamond Hill Investment Group Inc 40 -
8 Diamondback Energy Inc 473 0.03
6 Dick's Sporting Goods Inc 399 0.02
1 Digi International Inc 17 -
3 Digital Turbine Inc 131 0.01
2 Dillard's Inc 146 0.01
2 Dime Community Bancshares Inc 44 -
4 Diodes Inc 216 0.01
15 Discover Financial Services 1,207 0.07
9 Discovery Inc, Class A 211 0.01
18 Discovery Inc, Class C 383 0.02
14 DISH Network Corp 422 0.02
- DMC Global Inc 12 -
- DocuSign Inc 56 -
4 Dolby Laboratories Inc 246 0.01
6 Dollar General Corp 830 0.05
12 Dollar Tree Inc 794 0.04
5 Dominion Energy Inc 293 0.02
1 Domino's Pizza Inc 275 0.02
4 Domtar Corp 144 0.01
5 Donaldson Co Inc 224 0.01
1 Donegal Group Inc 11 -
3 Donnelley Financial Solutions Inc 53 -
3 Dorian LPG Ltd 29 -
2 Dorman Products Inc 144 0.01
2 Douglas Dynamics Inc 48 -
5 Dover Corp 578 0.03
18 Dow Inc 860 0.05
10 DR Horton Inc 648 0.04
3 Dril-Quip Inc 70 -
6 Dropbox Inc 112 0.01
3 DTE Energy Co 330 0.02
1 Ducommun Inc 24 -
7 Duke Energy Corp 487 0.03
5 DuPont de Nemours Inc 323 0.02
17 DXC Technology Co 448 0.03
1 DXP Enterprises Inc 26 -
3 Dycom Industries Inc 147 0.01
3 Dynatrace Inc 126 0.01
1 DZS Inc 8 -
3 Eagle Bancorp Inc 107 0.01
2 Eagle Materials Inc 175 0.01
1 Eagle Pharmaceuticals Inc 14 -
2 Earthstone Energy Inc 13 -
11 East West Bancorp Inc 564 0.03
10 Eastman Chemical Co 852 0.05
8 Eaton Corp PLC 861 0.05
22 eBay Inc 953 0.05
2 Ebix Inc 32 -
2 Echo Global Logistics Inc 41 -
World Allocation 60/40 FundPortfolio of Investments as at 31 May 2021 (continued)
Dimensional Fund Advisors Semi-Annual Report and Unaudited Financial Statements, 31 May 2021 408

Shares (000's)
Value(000's)
GBP
% of NetAssetValue
Common Stock (continued)
United States - 33.06% (continued)
4 EchoStar Corp 77 -
3 Ecolab Inc 513 0.03
4 Edgewell Personal Care Co 140 0.01
7 Edison International 281 0.02
2 Editas Medicine Inc 57 -
5 Edwards Lifesciences Corp 369 0.02
1 eHealth Inc 38 -
3 El Pollo Loco Holdings Inc 32 -
20 Elanco Animal Health Inc (voting rights) 507 0.03
1 Elastic NV 66 -
5 Electronic Arts Inc 480 0.03
18 Element Solutions Inc 304 0.02
3 elf Beauty Inc 64 -
10 Eli Lilly & Co 1,410 0.08
4 EMCOR Group Inc 387 0.02
2 EMCORE Corp 16 -
3 Emergent BioSolutions Inc 132 0.01
18 Emerson Electric Co 1,213 0.07
2 Employers Holdings Inc 70 -
2 Enanta Pharmaceuticals Inc 56 -
5 Encompass Health Corp 294 0.02
3 Encore Capital Group Inc 85 0.01
1 Encore Wire Corp 78 -
5 Endo International PLC 23 -
3 Energizer Holdings Inc 104 0.01
1 Energy Recovery Inc 14 -
3 Enerpac Tool Group Corp 65 -
3 EnerSys 197 0.01
1 Eneti Inc 14 -
37 EnLink Midstream LLC 127 0.01
2 Ennis Inc 23 -
3 Enova International Inc 92 0.01
4 Enphase Energy Inc 419 0.02
2 EnPro Industries Inc 101 0.01
3 Ensign Group Inc 190 0.01
1 Enstar Group Ltd 232 0.01
5 Entegris Inc 382 0.02
4 Entergy Corp 284 0.02
1 Enterprise Bancorp Inc 18 -
2 Enterprise Financial Services Corp 78 -
2 Entravision Communications Corp 8 -
2 Envestnet Inc 84 0.01
10 Envista Holdings Corp 297 0.02
4 Enzo Biochem Inc 8 -
16 EOG Resources Inc 879 0.05
1 EPAM Systems Inc 345 0.02
2 Epizyme Inc 11 -
1 ePlus Inc 76 -
20 EQT Corp 290 0.02
3 Equifax Inc 496 0.03
30 Equitrans Midstream Corp 176 0.01
1 Equity Bancshares Inc 19 -
1 Erie Indemnity Co 149 0.01
2 ESCO Technologies Inc 127 0.01
8 Essent Group Ltd 256 0.01
6 Essential Utilities Inc 198 0.01
2 Estee Lauder Cos Inc 428 0.02
1 Ethan Allen Interiors Inc 30 -
2 Etsy Inc 287 0.02
2 Euronet Worldwide Inc 188 0.01
2 Eventbrite Inc 27 -
- Everbridge Inc 16 -
Shares (000's)
Value(000's)
GBP
% of NetAssetValue
Common Stock (continued)
United States - 33.06% (continued)
2 Evercore Inc 248 0.01
3 Everest Re Group Ltd 499 0.03
5 Evergy Inc 206 0.01
3 Everi Holdings Inc 38 -
4 Eversource Energy 249 0.01
4 Evertec Inc 122 0.01
2 Evo Payments Inc 34 -
8 Evolent Health Inc 110 0.01
5 Evoqua Water Technologies Corp 114 0.01
5 EW Scripps Co 75 -
2 Exact Sciences Corp 177 0.01
14 Exelixis Inc 222 0.01
13 Exelon Corp 414 0.02
2 ExlService Holdings Inc 143 0.01
2 eXp World Holdings Inc 38 -
1 Expedia Group Inc 120 0.01
5 Expeditors International of Washington Inc 433 0.02
1 Exponent Inc 87 0.01
15 Extended Stay America Inc 202 0.01
- Exterran Corp - -
36 Exxon Mobil Corp 1,473 0.08
2 EZCORP Inc 8 -
2 F5 Networks Inc 307 0.02
3 Fabrinet 170 0.01
36 Facebook Inc 8,443 0.47
1 FactSet Research Systems Inc 312 0.02
1 Fair Isaac Corp 333 0.02
1 Farmers National Banc Corp 15 -
1 FARO Technologies Inc 59 -
10 Fastenal Co 373 0.02
1 Fate Therapeutics Inc 74 -
3 FB Financial Corp 92 0.01
1 Federal Agricultural Mortgage Corp 46 -
4 Federal Signal Corp 127 0.01
6 Federated Investors Inc 131 0.01
4 FedEx Corp 935 0.05
6 Ferro Corp 95 0.01
7 Ferroglobe PLC 27 -
1 FibroGen Inc 22 -
19 Fidelity National Financial Inc 619 0.03
5 Fidelity National Information Services Inc 547 0.03
1 Fiesta Restaurant Group Inc 9 -
23 Fifth Third Bancorp 669 0.04
1 Financial Institutions Inc 13 -
8 FireEye Inc 119 0.01
9 First American Financial Corp 411 0.02
2 First Bancorp 76 -
14 First Bancorp (Puerto Rico listing) 130 0.01
- First Bancorp Inc 9 -
1 First Bancshares Inc 37 -
1 First Bank 9 -
5 First Busey Corp 86 0.01
1 First Business Financial Services Inc 10 -
1 First Choice Bancorp 14 -
1 First Citizens BancShares Inc 412 0.02
8 First Commonwealth Financial Corp 89 0.01
1 First Community Bankshares Inc 28 -
8 First Financial Bancorp 137 0.01
7 First Financial Bankshares Inc 265 0.02
1 First Financial Corp 23 -
4 First Foundation Inc 70 -
10 First Hawaiian Inc 190 0.01
World Allocation 60/40 FundPortfolio of Investments as at 31 May 2021 (continued)
Dimensional Fund Advisors Semi-Annual Report and Unaudited Financial Statements, 31 May 2021 409

Shares (000's)
Value(000's)
GBP
% of NetAssetValue
Common Stock (continued)
United States - 33.06% (continued)
41 First Horizon National Corp 545 0.03
- First Internet Bancorp 9 -
3 First Interstate BancSystem Inc 109 0.01
4 First Merchants Corp 127 0.01
1 First Mid Bancshares Inc 26 -
9 First Midwest Bancorp Inc 135 0.01
1 First of Long Island Corp 20 -
4 First Republic Bank 529 0.03
8 First Solar Inc 436 0.02
- First Western Financial Inc 5 -
2 FirstCash Inc 138 0.01
9 FirstEnergy Corp 236 0.01
5 Fiserv Inc 393 0.02
2 Five Below Inc 255 0.01
3 Five Point Holdings LLC 16 -
1 Five Star Senior Living Inc 4 -
1 Five9 Inc 64 -
4 Flagstar Bancorp Inc 122 0.01
2 FleetCor Technologies Inc 476 0.03
41 Flex Ltd 529 0.03
- Flexsteel Industries Inc 7 -
3 Floor & Decor Holdings Inc 204 0.01
12 Flowers Foods Inc 209 0.01
8 Flowserve Corp 253 0.01
2 Fluent Inc 4 -
2 Fluidigm Corp 7 -
9 Fluor Corp 124 0.01
1 Flushing Financial Corp 20 -
5 FMC Corp 382 0.02
24 FNB Corp 230 0.01
9 Foot Locker Inc 383 0.02
91 Ford Motor Co 930 0.05
4 Forestar Group Inc 65 -
5 FormFactor Inc 128 0.01
- Forrester Research Inc 10 -
3 Forterra Inc 48 -
3 Fortinet Inc 526 0.03
6 Fortive Corp 286 0.02
9 Fortune Brands Home & Security Inc 644 0.04
2 Forward Air Corp 135 0.01
3 Fossil Group Inc 27 -
21 Fox Corp, Class A 540 0.03
15 Fox Corp, Class B 390 0.02
1 Fox Factory Holding Corp 143 0.01
- Franklin Covey Co 11 -
2 Franklin Electric Co Inc 140 0.01
35 Franklin Resources Inc 832 0.05
15 Frank's International NV 36 -
37 Freeport-McMoRan Inc 1,124 0.06
- Frequency Therapeutics Inc 1 -
3 Fresh Del Monte Produce Inc 73 -
- Freshpet Inc 41 -
3 Frontdoor Inc 119 0.01
- FRP Holdings Inc 14 -
- FS Bancorp Inc 5 -
3 FTI Consulting Inc 247 0.01
5 FuelCell Energy Inc 32 -
12 Fulton Financial Corp 152 0.01
2 FutureFuel Corp 18 -
1 FVCBankcorp Inc 6 -
1 G1 Therapeutics Inc 20 -
1 GAMCO Investors Inc 14 -
Shares (000's)
Value(000's)
GBP
% of NetAssetValue
Common Stock (continued)
United States - 33.06% (continued)
4 Gannett Co Inc 14 -
28 Gap Inc 669 0.04
7 Garmin Ltd 735 0.04
3 Gartner Inc 506 0.03
11 Gates Industrial Corp PLC 137 0.01
2 GATX Corp 160 0.01
5 GCP Applied Technologies Inc 90 0.01
2 Genco Shipping & Trading Ltd 23 -
3 Generac Holdings Inc 599 0.03
65 General Electric Co 640 0.04
18 General Mills Inc 775 0.04
41 General Motors Co 1,709 0.09
1 Genesco Inc 33 -
8 Genpact Ltd 253 0.01
16 Gentex Corp 390 0.02
2 Gentherm Inc 123 0.01
4 Genuine Parts Co 330 0.02
10 Genworth Financial Inc 31 -
1 Geospace Technologies Corp 6 -
2 German American Bancorp Inc 65 -
2 Gibraltar Industries Inc 134 0.01
3 G-III Apparel Group Ltd 70 -
16 Gilead Sciences Inc 761 0.04
6 Glacier Bancorp Inc 263 0.01
1 Glatfelter Corp 10 -
2 Glaukos Corp 90 0.01
1 Global Blood Therapeutics Inc 17 -
4 Global Payments Inc 544 0.03
1 Global Water Resources Inc 16 -
1 Globant SA 97 0.01
8 Globe Life Inc 563 0.03
3 Globus Medical Inc 136 0.01
3 GMS Inc 111 0.01
4 GoDaddy Inc 202 0.01
3 Goldman Sachs Group Inc 865 0.05
18 Goodyear Tire & Rubber Co 252 0.01
2 GoPro Inc 16 -
2 Gorman-Rupp Co 43 -
1 GP Strategies Corp 10 -
6 Graco Inc 301 0.02
8 GrafTech International Ltd 74 -
1 Graham Corp 7 -
- Graham Holdings Co 153 0.01
3 Grand Canyon Education Inc 171 0.01
3 Granite Construction Inc 91 0.01
23 Graphic Packaging Holding Co 287 0.02
8 Gray Television Inc 125 0.01
6 Great Lakes Dredge & Dock Corp 60 -
1 Great Southern Bancorp Inc 41 -
5 Great Western Bancorp Inc 108 0.01
4 Green Brick Partners Inc 69 -
4 Green Dot Corp 115 0.01
3 Green Plains Inc 77 -
2 Greenbrier Cos Inc 73 -
2 Greenhill & Co Inc 21 -
1 Greenlight Capital Re Ltd 8 -
2 GreenSky Inc 7 -
3 Greif Inc (non-voting rights) 112 0.01
1 Greif Inc (voting rights) 57 -
3 Griffon Corp 54 -
2 Grocery Outlet Holding Corp 51 -
1 Group 1 Automotive Inc 113 0.01
World Allocation 60/40 FundPortfolio of Investments as at 31 May 2021 (continued)
Dimensional Fund Advisors Semi-Annual Report and Unaudited Financial Statements, 31 May 2021 410

Shares (000's)
Value(000's)
GBP
% of NetAssetValue
Common Stock (continued)
United States - 33.06% (continued)
4 Grubhub Inc 189 0.01
1 GSI Technology Inc 6 -
- GTY Technology Holdings Inc 1 -
- Guaranty Bancshares Inc 9 -
1 Guardant Health Inc 126 0.01
6 Guess? Inc 114 0.01
2 Guidewire Software Inc 127 0.01
3 H&E Equipment Services Inc 68 -
7 H&R Block Inc 131 0.01
1 Hackett Group Inc 9 -
2 Haemonetics Corp 70 -
7 Hain Celestial Group Inc 191 0.01
67 Halliburton Co 1,056 0.06
3 Halozyme Therapeutics Inc 85 0.01
1 Hamilton Lane Inc 74 -
7 Hancock Whitney Corp 233 0.01
21 Hanesbrands Inc 283 0.02
1 Hanger Inc 21 -
2 Hanmi Financial Corp 29 -
3 Hanover Insurance Group Inc 270 0.02
4 HarborOne Bancorp Inc 38 -
13 Harley-Davidson Inc 437 0.02
7 Harmonic Inc 34 -
5 Harsco Corp 81 -
20 Hartford Financial Services Group Inc 944 0.05
2 Harvard Bioscience Inc 8 -
5 Hasbro Inc 308 0.02
1 Haverty Furniture Cos Inc 46 -
4 Hawaiian Electric Industries Inc 121 0.01
3 Hawaiian Holdings Inc 48 -
1 Hawkins Inc 28 -
4 HB Fuller Co 190 0.01
1 HBT Financial Inc 10 -
4 HCA Healthcare Inc 613 0.03
- HCI Group Inc 14 -
1 Health Catalyst Inc 25 -
3 Healthcare Services Group Inc 56 -
1 HealthEquity Inc 44 -
2 HealthStream Inc 36 -
7 Heartland Express Inc 87 0.01
3 Heartland Financial USA Inc 104 0.01
42 Hecla Mining Co 268 0.02
2 HEICO Corp, Class A 181 0.01
1 HEICO Corp, Class B 130 0.01
1 Heidrick & Struggles International Inc 43 -
1 Helen of Troy Ltd 216 0.01
3 Helios Technologies Inc 132 0.01
10 Helix Energy Solutions Group Inc 35 -
8 Helmerich & Payne Inc 151 0.01
1 Hemisphere Media Group Inc 9 -
8 Henry Schein Inc 446 0.03
4 Herbalife Nutrition Ltd 164 0.01
3 Herc Holdings Inc 219 0.01
3 Heritage Commerce Corp 27 -
3 Heritage Financial Corp 63 -
2 Heritage-Crystal Clean Inc 43 -
5 Herman Miller Inc 164 0.01
3 Heron Therapeutics Inc 30 -
4 Hershey Co 460 0.03
- Heska Corp 36 -
13 Hess Corp 741 0.04
60 Hewlett Packard Enterprise Co 672 0.04
Shares (000's)
Value(000's)
GBP
% of NetAssetValue
Common Stock (continued)
United States - 33.06% (continued)
4 Hexcel Corp 184 0.01
1 Hibbett Sports Inc 39 -
5 Hillenbrand Inc 157 0.01
3 Hill-Rom Holdings Inc 201 0.01
5 Hilltop Holdings Inc 130 0.01
3 Hilton Grand Vacations Inc 112 0.01
5 Hilton Worldwide Holdings Inc 424 0.02
- Hingham Institution for Savings 22 -
4 HNI Corp 113 0.01
12 HollyFrontier Corp 271 0.02
12 Hologic Inc 554 0.03
- Home Bancorp Inc 11 -
12 Home BancShares Inc 231 0.01
10 Home Depot Inc 2,282 0.13
1 HomeStreet Inc 33 -
10 Honeywell International Inc 1,707 0.09
1 Hooker Furniture Corp 16 -
9 Hope Bancorp Inc 93 0.01
3 Horace Mann Educators Corp 90 0.01
3 Horizon Bancorp Inc 37 -
9 Horizon Therapeutics PLC 568 0.03
9 Hormel Foods Corp 292 0.02
10 Hostess Brands Inc 109 0.01
4 Houghton Mifflin Harcourt Co 29 -
2 Houlihan Lokey Inc 126 0.01
1 Howard Bancorp Inc 10 -
4 Howard Hughes Corp 261 0.01
32 Howmet Aerospace Inc 803 0.04
24 HP Inc 490 0.03
2 Hub Group Inc 108 0.01
3 Hubbell Inc 376 0.02
- HubSpot Inc 45 -
4 Humana Inc 1,087 0.06
64 Huntington Bancshares Inc 711 0.04
2 Huntington Ingalls Industries Inc 316 0.02
15 Huntsman Corp 310 0.02
2 Huron Consulting Group Inc 70 -
3 Hyatt Hotels Corp 140 0.01
1 Hyster-Yale Materials Handling Inc 47 -
1 I3 Verticals Inc 14 -
5 IAA Inc 186 0.01
- IAC/InterActiveCorp 53 -
1 ICF International Inc 92 0.01
2 Ichor Holdings Ltd 67 -
1 ICU Medical Inc 196 0.01
2 IDACORP Inc 126 0.01
2 IDEX Corp 382 0.02
2 IDEXX Laboratories Inc 689 0.04
1 IDT Corp 30 -
1 IES Holdings Inc 41 -
- IGM Biosciences Inc 10 -
7 iHeartMedia Inc 114 0.01
4 IHS Markit Ltd 327 0.02
2 II-VI Inc 117 0.01
5 Illinois Tool Works Inc 747 0.04
1 Illumina Inc 330 0.02
4 IMAX Corp 58 -
1 ImmunityBio Inc 12 -
- Impinj Inc 9 -
2 Incyte Corp 124 0.01
1 Independence Holding Co 27 -
2 Independent Bank Corp (Massachusetts) 140 0.01
World Allocation 60/40 FundPortfolio of Investments as at 31 May 2021 (continued)
Dimensional Fund Advisors Semi-Annual Report and Unaudited Financial Statements, 31 May 2021 411

Shares (000's)
Value(000's)
GBP
% of NetAssetValue
Common Stock (continued)
United States - 33.06% (continued)
1 Independent Bank Corp (Michigan) 24 -
4 Independent Bank Group Inc 198 0.01
9 Infinera Corp 60 -
3 Information Services Group Inc 11 -
1 InfuSystem Holdings Inc 8 -
21 Ingersoll Rand Inc 722 0.04
2 Ingevity Corp 95 0.01
5 Ingredion Inc 341 0.02
2 Innospec Inc 131 0.01
6 Innoviva Inc 56 -
1 Inogen Inc 63 -
3 Inovalon Holdings Inc 76 -
3 Insight Enterprises Inc 205 0.01
2 Insperity Inc 121 0.01
1 Installed Building Products Inc 120 0.01
1 Insteel Industries Inc 29 -
- Insulet Corp 77 -
2 Integer Holdings Corp 152 0.01
4 Integra LifeSciences Holdings Corp 173 0.01
103 Intel Corp 4,152 0.23
2 Intellia Therapeutics Inc 94 0.01
1 Inter Parfums Inc 76 -
- Interactive Brokers Group Inc 18 -
5 Intercontinental Exchange Inc 406 0.02
2 InterDigital Inc 133 0.01
4 Interface Inc 44 -
5 International Bancshares Corp 157 0.01
22 International Business Machines Corp 2,206 0.12
8 International Flavors & Fragrances Inc (US listing) 775 0.04
16 International Game Technology PLC 273 0.02
25 International Paper Co 1,112 0.06
2 International Seaways Inc 28 -
30 Interpublic Group of Cos Inc 719 0.04
2 Intra-Cellular Therapies Inc 53 -
- Intrepid Potash Inc 9 -
1 IntriCon Corp 8 -
1 Intuit Inc 445 0.03
- Intuitive Surgical Inc 131 0.01
3 Invacare Corp 15 -
33 Invesco Ltd 672 0.04
18 Investors Bancorp Inc 191 0.01
- Investors Title Co 17 -
3 Ionis Pharmaceuticals Inc 80 -
2 IPG Photonics Corp 344 0.02
3 IQVIA Holdings Inc 558 0.03
- iRhythm Technologies Inc 10 -
10 Iridium Communications Inc 274 0.02
1 iRobot Corp 62 -
7 Ironwood Pharmaceuticals Inc 57 -
2 Itron Inc 110 0.01
6 ITT Inc 419 0.02
3 IVERIC bio Inc 14 -
1 J&J Snack Foods Corp 89 0.01
3 j2 Global Inc 243 0.01
13 Jabil Inc 521 0.03
2 Jack Henry & Associates Inc 234 0.01
1 Jack in the Box Inc 63 -
7 Jacobs Engineering Group Inc 693 0.04
2 James River Group Holdings Ltd 56 -
14 Janus Henderson Group PLC 380 0.02
4 Jazz Pharmaceuticals PLC 498 0.03
4 JB Hunt Transport Services Inc 536 0.03
Shares (000's)
Value(000's)
GBP
% of NetAssetValue
Common Stock (continued)
United States - 33.06% (continued)
20 Jefferies Financial Group Inc 461 0.03
8 JELD-WEN Holding Inc 155 0.01
21 JetBlue Airways Corp 292 0.02
7 JM Smucker Co 618 0.03
1 John B Sanfilippo & Son Inc 41 -
2 John Bean Technologies Corp 166 0.01
4 John Wiley & Sons Inc, Class A 157 0.01
43 Johnson & Johnson 5,103 0.28
13 Johnson Controls International PLC 598 0.03
1 Johnson Outdoors Inc 53 -
1 Joint Corp 26 -
4 Jones Lang LaSalle Inc 513 0.03
2 Jounce Therapeutics Inc 12 -
41 JPMorgan Chase & Co 4,799 0.27
17 Juniper Networks Inc 318 0.02
1 Kadant Inc 106 0.01
1 Kaiser Aluminum Corp 60 -
3 Kansas City Southern 593 0.03
10 KAR Auction Services Inc 121 0.01
1 Karuna Therapeutics Inc 42 -
7 KB Home 222 0.01
11 KBR Inc 325 0.02
5 Kearny Financial Corp 51 -
8 Kellogg Co 390 0.02
2 Kelly Services Inc 28 -
5 Kemper Corp 252 0.01
6 Kennametal Inc 163 0.01
9 Kennedy-Wilson Holdings Inc 129 0.01
16 Keurig Dr Pepper Inc 406 0.02
34 KeyCorp 547 0.03
4 Keysight Technologies Inc 413 0.02
1 Kforce Inc 52 -
1 Kimball Electronics Inc 10 -
2 Kimball International Inc 18 -
5 Kimberly-Clark Corp 425 0.02
36 Kinder Morgan Inc 466 0.03
2 Kindred Biosciences Inc 7 -
1 Kiniksa Pharmaceuticals Ltd 5 -
- Kinsale Capital Group Inc 48 -
4 Kirby Corp 206 0.01
7 KKR & Co Inc 279 0.02
4 KLA Corp 908 0.05
12 Knight-Swift Transportation Holdings Inc 412 0.02
4 Knoll Inc 78 -
8 Knowles Corp 111 0.01
13 Kohl's Corp 509 0.03
2 Kontoor Brands Inc 107 0.01
1 Koppers Holdings Inc 30 -
4 Korn Ferry 179 0.01
26 Kosmos Energy Ltd 58 -
19 Kraft Heinz Co 568 0.03
2 Kraton Corp 52 -
8 Kratos Defense & Security Solutions Inc 142 0.01
34 Kroger Co 884 0.05
6 Kronos Worldwide Inc 68 -
1 Krystal Biotech Inc 31 -
4 Kulicke & Soffa Industries Inc 155 0.01
2 Kura Oncology Inc 31 -
1 KVH Industries Inc 8 -
4 L Brands Inc 205 0.01
4 L3Harris Technologies Inc 562 0.03
5 Laboratory Corp of America Holdings 930 0.05
World Allocation 60/40 FundPortfolio of Investments as at 31 May 2021 (continued)
Dimensional Fund Advisors Semi-Annual Report and Unaudited Financial Statements, 31 May 2021 412

Shares (000's)
Value(000's)
GBP
% of NetAssetValue
Common Stock (continued)
United States - 33.06% (continued)
4 Lakeland Bancorp Inc 50 -
2 Lakeland Financial Corp 83 0.01
3 Lam Research Corp 1,520 0.08
5 Lamb Weston Holdings Inc 299 0.02
1 Lancaster Colony Corp 170 0.01
2 Landec Corp 16 -
2 Lands' End Inc 28 -
2 Landstar System Inc 187 0.01
2 Lannett Co Inc 5 -
4 Lantheus Holdings Inc 68 -
1 Laredo Petroleum Inc 32 -
2 Las Vegas Sands Corp 79 -
4 Lattice Semiconductor Corp 135 0.01
9 Laureate Education Inc 89 0.01
- Lawson Products Inc 11 -
7 Lazard Ltd 228 0.01
3 La-Z-Boy Inc 101 0.01
1 LB Foster Co 15 -
2 LCI Industries 193 0.01
5 Lear Corp 647 0.04
1 Legacy Housing Corp 8 -
7 Leggett & Platt Inc 273 0.02
4 Leidos Holdings Inc 323 0.02
1 LeMaitre Vascular Inc 38 -
4 LendingClub Corp 38 -
- LendingTree Inc 45 -
9 Lennar Corp, Class A 630 0.04
1 Lennar Corp, Class B 35 -
1 Lennox International Inc 242 0.01
1 Levi Strauss & Co 22 -
2 LGI Homes Inc 227 0.01
2 LHC Group Inc 245 0.01
1 Liberty Broadband Corp, Class A 57 -
6 Liberty Broadband Corp, Class C 700 0.04
4 Liberty Latin America Ltd, Class A 43 -
13 Liberty Latin America Ltd, Class C 134 0.01
1 Liberty Media Corp-Liberty Braves, Class A 15 -
3 Liberty Media Corp-Liberty Braves, Class C 55 -
2 Liberty Media Corp-Liberty Formula One, Class A 50 -
11 Liberty Media Corp-Liberty Formula One, Class C 356 0.02
6 Liberty Media Corp-Liberty SiriusXM, Class A 186 0.01
14 Liberty Media Corp-Liberty SiriusXM, Class C 417 0.02
12 Liberty Oilfield Services Inc 132 0.01
1 Lifetime Brands Inc 8 -
1 Ligand Pharmaceuticals Inc 92 0.01
- Limoneira Co 5 -
3 Lincoln Electric Holdings Inc 227 0.01
14 Lincoln National Corp 667 0.04
5 Linde PLC 1,131 0.06
- Lindsay Corp 46 -
7 Lions Gate Entertainment Corp, Class A 98 0.01
11 Lions Gate Entertainment Corp, Class B 131 0.01
2 Liquidity Services Inc 34 -
2 Lithia Motors Inc 482 0.03
1 Littelfuse Inc 247 0.01
3 LivaNova PLC 187 0.01
2 Live Nation Entertainment Inc 114 0.01
3 Live Oak Bancshares Inc 136 0.01
10 Livent Corp 138 0.01
3 LiveRamp Holdings Inc 93 0.01
20 LKQ Corp 727 0.04
19 Loews Corp 790 0.04
Shares (000's)
Value(000's)
GBP
% of NetAssetValue
Common Stock (continued)
United States - 33.06% (continued)
1 Loral Space & Communications Inc 23 -
7 Louisiana-Pacific Corp 336 0.02
- LoveSac Co 21 -
9 Lowe's Cos Inc 1,196 0.07
5 LPL Financial Holdings Inc 471 0.03
2 LSI Industries Inc 10 -
2 Lululemon Athletica Inc 543 0.03
89 Lumen Technologies Inc 866 0.05
4 Lumentum Holdings Inc 252 0.01
3 Luminex Corp 85 0.01
1 Luther Burbank Corp 11 -
1 Lydall Inc 25 -
4 Lyft Inc 142 0.01
13 LyondellBasell Industries NV 1,031 0.06
5 M&T Bank Corp 588 0.03
1 M/I Homes Inc 43 -
1 Macatawa Bank Corp 9 -
- Mackinac Financial Corp 1 -
2 MACOM Technology Solutions Holdings Inc 71 -
6 Macquarie Infrastructure Corp 158 0.01
2 MacroGenics Inc 47 -
26 Macy's Inc 330 0.02
1 Madison Square Garden Entertainment Corp 74 -
- Madrigal Pharmaceuticals Inc 28 -
1 Magellan Health Inc 95 0.01
1 Magenta Therapeutics Inc 12 -
2 MagnaChip Semiconductor Corp 40 -
5 Magnolia Oil & Gas Corp 43 -
4 Maiden Holdings Ltd 10 -
2 Malibu Boats Inc 86 0.01
3 Manhattan Associates Inc 267 0.02
2 Manitowoc Co Inc 35 -
4 ManpowerGroup Inc 354 0.02
2 ManTech International Corp 118 0.01
54 Marathon Oil Corp 463 0.03
15 Marathon Petroleum Corp 632 0.04
3 Marcus & Millichap Inc 80 -
1 Marcus Corp 18 -
2 MarineMax Inc 66 -
1 Markel Corp 441 0.02
1 MarketAxess Holdings Inc 275 0.02
5 Marriott International Inc 496 0.03
3 Marriott Vacations Worldwide Corp 367 0.02
9 Marsh & McLennan Cos Inc 856 0.05
5 Marten Transport Ltd 55 -
3 Martin Marietta Materials Inc 645 0.04
10 Marvell Technology Inc 344 0.02
7 Masco Corp 291 0.02
1 Masimo Corp 160 0.01
2 Masonite International Corp 170 0.01
6 MasTec Inc 503 0.03
11 Mastercard Inc 2,686 0.15
8 Matador Resources Co 180 0.01
2 Match Group Inc 239 0.01
1 Materion Corp 81 -
1 Matrix Service Co 7 -
4 Matson Inc 164 0.01
14 Mattel Inc 211 0.01
3 Matthews International Corp 73 -
2 Maxar Technologies Inc (Canada listing) 41 -
5 Maxar Technologies Inc (US listing) 118 0.01
5 Maxim Integrated Products Inc 381 0.02
World Allocation 60/40 FundPortfolio of Investments as at 31 May 2021 (continued)
Dimensional Fund Advisors Semi-Annual Report and Unaudited Financial Statements, 31 May 2021 413

Shares (000's)
Value(000's)
GBP
% of NetAssetValue
Common Stock (continued)
United States - 33.06% (continued)
3 MAXIMUS Inc 182 0.01
3 MaxLinear Inc 82 0.01
5 MBIA Inc 36 -
6 McCormick & Co Inc (non-voting rights) 391 0.02
- McCormick & Co Inc (voting rights) 14 -
7 McDonald's Corp 1,113 0.06
2 McGrath RentCorp 133 0.01
3 McKesson Corp 432 0.02
4 MDC Holdings Inc 182 0.01
15 MDU Resources Group Inc 364 0.02
1 Medifast Inc 126 0.01
7 MEDNAX Inc 160 0.01
1 Medpace Holdings Inc 165 0.01
8 Medtronic PLC 741 0.04
1 MeiraGTx Holdings PLC 10 -
1 Mercantile Bank Corp 21 -
5 Mercer International Inc 50 -
2 Merchants Bancorp 46 -
41 Merck & Co Inc 2,185 0.12
4 Mercury General Corp 181 0.01
3 Mercury Systems Inc 129 0.01
4 Meredith Corp 86 0.01
4 Meridian Bancorp Inc 60 -
3 Meridian Bioscience Inc 44 -
4 Merit Medical Systems Inc 157 0.01
2 Meritage Homes Corp 156 0.01
5 Meritor Inc 86 0.01
1 Mersana Therapeutics Inc 7 -
1 Mesa Air Group Inc 6 -
- Mesa Laboratories Inc 23 -
3 Meta Financial Group Inc 114 0.01
3 Methode Electronics Inc 98 0.01
14 MetLife Inc 664 0.04
1 Metrocity Bankshares Inc 8 -
- Metropolitan Bank Holding Corp 22 -
1 Mettler-Toledo International Inc 487 0.03
1 MGE Energy Inc 58 -
27 MGIC Investment Corp 276 0.02
18 MGM Resorts International 537 0.03
1 MGP Ingredients Inc 54 -
4 Microchip Technology Inc 400 0.02
18 Micron Technology Inc 1,074 0.06
101 Microsoft Corp 17,710 0.98
- MicroStrategy Inc 89 0.01
1 Mid Penn Bancorp Inc 12 -
4 Middleby Corp 418 0.02
1 Middlesex Water Co 36 -
1 Midland States Bancorp Inc 22 -
1 MidWestOne Financial Group Inc 19 -
- Miller Industries Inc 6 -
2 Mimecast Ltd 62 -
3 Minerals Technologies Inc 163 0.01
1 Mirati Therapeutics Inc 76 -
1 Mistras Group Inc 8 -
1 Mitek Systems Inc 16 -
4 MKS Instruments Inc 482 0.03
1 Model N Inc 14 -
1 Moderna Inc 134 0.01
3 Modine Manufacturing Co 36 -
1 ModivCare Inc 101 0.01
3 Moelis & Co 117 0.01
5 Mohawk Industries Inc 685 0.04
Shares (000's)
Value(000's)
GBP
% of NetAssetValue
Common Stock (continued)
United States - 33.06% (continued)
3 Molina Healthcare Inc 566 0.03
14 Molson Coors Brewing Co 557 0.03
10 Mondelez International Inc 428 0.02
2 MoneyGram International Inc 12 -
- MongoDB Inc 60 -
1 Monolithic Power Systems Inc 128 0.01
3 Monro Inc 111 0.01
8 Monster Beverage Corp 545 0.03
4 Moody's Corp 861 0.05
2 Moog Inc 152 0.01
27 Morgan Stanley 1,725 0.10
1 Morningstar Inc 215 0.01
27 Mosaic Co 679 0.04
1 Motorcar Parts of America Inc 21 -
3 Motorola Solutions Inc 402 0.02
1 Movado Group Inc 18 -
7 Mr Cooper Group Inc 182 0.01
6 MRC Global Inc 42 -
1 MSA Safety Inc 129 0.01
3 MSC Industrial Direct Co Inc 214 0.01
1 MSCI Inc 484 0.03
1 MSG Networks Inc 13 -
4 Mueller Industries Inc 141 0.01
13 Mueller Water Products Inc 130 0.01
12 Murphy Oil Corp 188 0.01
2 Murphy USA Inc 174 0.01
1 MVB Financial Corp 24 -
2 Myers Industries Inc 33 -
1 MYR Group Inc 67 -
6 Myriad Genetics Inc 120 0.01
- Nabors Industries Ltd 26 -
1 Napco Security Technologies Inc 14 -
5 Nasdaq Inc 623 0.03
1 Natera Inc 43 -
- Nathan's Famous Inc 9 -
2 National Bank Holdings Corp 65 -
3 National Beverage Corp 117 0.01
3 National CineMedia Inc 9 -
3 National Energy Services Reunited 26 -
3 National Fuel Gas Co 109 0.01
1 National HealthCare Corp 65 -
5 National Instruments Corp 139 0.01
1 National Research Corp 26 -
5 National Vision Holdings Inc 159 0.01
- National Western Life Group Inc 40 -
1 Natural Gas Services Group Inc 8 -
1 Natural Grocers by Vitamin Cottage Inc 9 -
1 Nature's Sunshine Products Inc 17 -
2 Natus Medical Inc 46 -
1 Nautilus Inc 11 -
16 Navient Corp 211 0.01
1 Navistar International Corp 39 -
4 NBT Bancorp Inc 98 0.01
9 NCR Corp 303 0.02
1 Neenah Inc 55 -
10 Nektar Therapeutics 127 0.01
2 Nelnet Inc 97 0.01
2 Neogen Corp 129 0.01
2 NeoGenomics Inc 68 -
4 NeoPhotonics Corp 27 -
8 NetApp Inc 415 0.02
2 Netflix Inc 632 0.04
World Allocation 60/40 FundPortfolio of Investments as at 31 May 2021 (continued)
Dimensional Fund Advisors Semi-Annual Report and Unaudited Financial Statements, 31 May 2021 414

Shares (000's)
Value(000's)
GBP
% of NetAssetValue
Common Stock (continued)
United States - 33.06% (continued)
2 NETGEAR Inc 67 -
6 NetScout Systems Inc 120 0.01
2 Neurocrine Biosciences Inc 114 0.01
1 New Fortress Energy Inc 22 -
7 New Jersey Resources Corp 204 0.01
1 New Relic Inc 44 -
34 New York Community Bancorp Inc 289 0.02
5 New York Times Co 157 0.01
29 Newell Brands Inc 581 0.03
11 Newmark Group Inc 99 0.01
- NewMarket Corp 119 0.01
16 Newmont Goldcorp Corp 844 0.05
29 News Corp, Class A 550 0.03
15 News Corp, Class B 280 0.02
1 Nexa Resources SA 8 -
4 Nexstar Media Group Inc 423 0.02
1 NextCure Inc 4 -
12 NextEra Energy Inc 629 0.04
6 NextGen Healthcare Inc 64 -
13 NexTier Oilfield Solutions Inc 39 -
- NGM Biopharmaceuticals Inc 4 -
1 NI Holdings Inc 8 -
1 Nicolet Bankshares Inc 37 -
29 Nielsen Holdings PLC 555 0.03
7 NIKE Inc 697 0.04
9 NiSource Inc 166 0.01
6 NMI Holdings Inc 96 0.01
2 NN Inc 12 -
5 Nordic American Tankers Ltd 11 -
2 Nordson Corp 309 0.02
5 Norfolk Southern Corp 946 0.05
8 Northern Trust Corp 710 0.04
4 Northfield Bancorp Inc 43 -
10 Northwest Bancshares Inc 103 0.01
1 Northwest Natural Holding Co 36 -
- Northwest Pipe Co 10 -
2 NorthWestern Corp 71 -
17 NortonLifeLock Inc 339 0.02
14 Norwegian Cruise Line Holdings Ltd 324 0.02
20 NOV Inc 230 0.01
1 Novanta Inc 97 0.01
1 Novavax Inc 63 -
- Novocure Ltd 70 -
7 NOW Inc 51 -
14 NRG Energy Inc 313 0.02
5 Nu Skin Enterprises Inc 197 0.01
14 Nuance Communications Inc 528 0.03
9 Nucor Corp 686 0.04
2 NuVasive Inc 120 0.01
1 NV5 Global Inc 60 -
12 nVent Electric PLC 280 0.02
2 NVIDIA Corp 1,071 0.06
- NVR Inc 510 0.03
42 Occidental Petroleum Corp 759 0.04
8 Oceaneering International Inc 79 -
5 OceanFirst Financial Corp 77 -
- Ocwen Financial Corp 8 -
1 Odonate Therapeutics Inc 1 -
4 ODP Corp 131 0.01
3 OFG Bancorp 56 -
5 OGE Energy Corp 129 0.01
13 O-I Glass Inc 172 0.01
Shares (000's)
Value(000's)
GBP
% of NetAssetValue
Common Stock (continued)
United States - 33.06% (continued)
3 Oil States International Inc 13 -
- Okta Inc 60 -
3 Old Dominion Freight Line Inc 642 0.04
12 Old National Bancorp 163 0.01
21 Old Republic International Corp 383 0.02
1 Old Second Bancorp Inc 10 -
13 Olin Corp 446 0.03
2 Ollie's Bargain Outlet Holdings Inc 138 0.01
- Omega Flex Inc 27 -
2 Omnicell Inc 155 0.01
10 Omnicom Group Inc 594 0.03
29 ON Semiconductor Corp 828 0.05
2 ONE Gas Inc 79 -
11 OneMain Holdings Inc 448 0.03
17 ONEOK Inc 630 0.04
2 OneSpan Inc 41 -
2 OneSpaWorld Holdings Ltd 16 -
3 Onto Innovation Inc 144 0.01
48 OPKO Health Inc 130 0.01
1 Oppenheimer Holdings Inc 25 -
5 Option Care Health Inc 61 -
18 Oracle Corp 992 0.06
4 OraSure Technologies Inc 30 -
2 ORBCOMM Inc 18 -
2 O'Reilly Automotive Inc 565 0.03
1 Origin Bancorp Inc 38 -
2 Orion Group Holdings Inc 8 -
- Ormat Technologies Inc (Israel listing) 23 -
4 Ormat Technologies Inc (US listing) 183 0.01
1 Orrstown Financial Services Inc 9 -
1 Orthofix Medical Inc 38 -
1 OrthoPediatrics Corp 22 -
6 Oshkosh Corp 530 0.03
1 OSI Systems Inc 100 0.01
6 Otis Worldwide Corp 305 0.02
4 Otonomy Inc 7 -
2 Otter Tail Corp 53 -
17 Ovintiv Inc (Canada listing) 328 0.02
4 Ovintiv Inc (US listing) 81 -
6 Owens & Minor Inc 204 0.01
8 Owens Corning 632 0.04
1 Oxford Industries Inc 87 0.01
8 PACCAR Inc 531 0.03
7 Pacific Premier Bancorp Inc 223 0.01
2 Pacira BioSciences Inc 76 -
6 Packaging Corp of America 649 0.04
9 PacWest Bancorp 274 0.02
1 PagerDuty Inc 29 -
- Palo Alto Networks Inc 51 -
- PAM Transportation Services Inc 10 -
1 Papa John's International Inc 89 0.01
5 Par Pacific Holdings Inc 48 -
1 Park Aerospace Corp 13 -
1 Park National Corp 119 0.01
1 Parke Bancorp Inc 8 -
3 Parker-Hannifin Corp 745 0.04
1 Park-Ohio Holdings Corp 22 -
5 Parsons Corp 139 0.01
2 Patrick Industries Inc 124 0.01
7 Patterson Cos Inc 167 0.01
13 Patterson-UTI Energy Inc 76 -
9 Paychex Inc 612 0.03
World Allocation 60/40 FundPortfolio of Investments as at 31 May 2021 (continued)
Dimensional Fund Advisors Semi-Annual Report and Unaudited Financial Statements, 31 May 2021 415

Shares (000's)
Value(000's)
GBP
% of NetAssetValue
Common Stock (continued)
United States - 33.06% (continued)
1 Paycom Software Inc 329 0.02
1 Paylocity Holding Corp 129 0.01
5 PayPal Holdings Inc 986 0.05
9 PBF Energy Inc 102 0.01
2 PC Connection Inc 75 -
1 PCB Bancorp 11 -
- PCSB Financial Corp 4 -
1 PC-Tel Inc 6 -
9 PDC Energy Inc 258 0.01
2 PDF Solutions Inc 19 -
5 Peabody Energy Corp 25 -
1 Peapack Gladstone Financial Corp 24 -
1 Pegasystems Inc 86 0.01
5 Penn National Gaming Inc 268 0.02
1 Pennant Group Inc 24 -
6 Penske Automotive Group Inc 375 0.02
6 Pentair PLC 307 0.02
1 Penumbra Inc 99 0.01
1 Peoples Bancorp Inc 23 -
31 People's United Financial Inc 414 0.02
18 PepsiCo Inc 1,924 0.11
5 Perdoceo Education Corp 47 -
2 Perficient Inc 108 0.01
7 Performance Food Group Co 256 0.01
3 PerkinElmer Inc 332 0.02
10 Perrigo Co PLC 312 0.02
- Personalis Inc 4 -
1 PetIQ Inc 26 -
67 Pfizer Inc 1,832 0.10
23 PG&E Corp 167 0.01
5 PGT Innovations Inc 79 -
2 Phibro Animal Health Corp 30 -
14 Philip Morris International Inc 941 0.05
8 Phillips 66 470 0.03
2 Photronics Inc 15 -
11 Pilgrim's Pride Corp 181 0.01
3 Ping Identity Holding Corp 47 -
6 Pinnacle Financial Partners Inc 363 0.02
3 Pinnacle West Capital Corp 173 0.01
2 Pinterest Inc 71 -
13 Pioneer Natural Resources Co 1,359 0.08
1 Piper Jaffray Cos 126 0.01
11 Pitney Bowes Inc 62 -
1 PJT Partners Inc 46 -
2 Planet Fitness Inc 134 0.01
8 Playa Hotels & Resorts NV 42 -
2 Plexus Corp 144 0.01
1 Plug Power Inc 20 -
4 PNC Financial Services Group Inc 594 0.03
2 PNM Resources Inc 78 -
2 Polaris Inc 176 0.01
1 Pool Corp 451 0.03
6 Popular Inc 351 0.02
3 Portland General Electric Co 114 0.01
6 Post Holdings Inc 451 0.03
1 Powell Industries Inc 19 -
3 Power Integrations Inc 169 0.01
7 PPG Industries Inc 892 0.05
15 PPL Corp 301 0.02
8 PQ Group Holdings Inc 92 0.01
3 PRA Group Inc 92 0.01
3 PRA Health Sciences Inc 404 0.02
Shares (000's)
Value(000's)
GBP
% of NetAssetValue
Common Stock (continued)
United States - 33.06% (continued)
1 Preferred Bank 51 -
- Preformed Line Products Co 14 -
1 Premier Financial Bancorp Inc 11 -
2 Premier Financial Corp 51 -
6 Premier Inc 137 0.01
4 Prestige Consumer Healthcare Inc 138 0.01
2 PriceSmart Inc 151 0.01
2 Primerica Inc 252 0.01
1 Primis Financial Corp 11 -
4 Primoris Services Corp 92 0.01
16 Principal Financial Group Inc 749 0.04
4 ProAssurance Corp 76 -
32 Procter & Gamble Co 3,041 0.17
1 Professional Holding Corp 8 -
4 PROG Holdings Inc 159 0.01
2 Progress Software Corp 51 -
15 Progressive Corp 1,028 0.06
- Progyny Inc 19 -
1 Proofpoint Inc 102 0.01
7 ProPetro Holding Corp 46 -
7 Prosperity Bancshares Inc 346 0.02
2 Protagonist Therapeutics Inc 38 -
2 Prothena Corp PLC 41 -
1 Proto Labs Inc 57 -
4 Provident Financial Services Inc 77 -
7 Prudential Financial Inc 507 0.03
2 PTC Inc 174 0.01
1 PTC Therapeutics Inc 40 -
7 Public Service Enterprise Group Inc 294 0.02
14 PulteGroup Inc 580 0.03
1 Pure Cycle Corp 14 -
6 Pure Storage Inc 86 0.01
3 Purple Innovation Inc 53 -
5 PVH Corp 443 0.02
1 Q2 Holdings Inc 36 -
1 QAD Inc, Class A 36 -
1 QCR Holdings Inc 40 -
4 Qorvo Inc 496 0.03
2 Quad/Graphics Inc 5 -
15 QUALCOMM Inc 1,390 0.08
1 Qualys Inc 101 0.01
2 Quanex Building Products Corp 41 -
12 Quanta Services Inc 782 0.04
1 Quanterix Corp 20 -
6 Quest Diagnostics Inc 593 0.03
1 Quidel Corp 97 0.01
3 QuinStreet Inc 42 -
2 Quotient Technology Inc 14 -
31 Qurate Retail Inc 297 0.02
9 R1 RCM Inc 154 0.01
14 Radian Group Inc 227 0.01
2 Radiant Logistics Inc 8 -
3 RadNet Inc 52 -
1 Rafael Holdings Inc 25 -
3 Ralph Lauren Corp 301 0.02
9 Rambus Inc 124 0.01
21 Range Resources Corp 199 0.01
4 Ranpak Holdings Corp 65 -
2 Raven Industries Inc 58 -
9 Raymond James Financial Inc 839 0.05
5 Rayonier Advanced Materials Inc 25 -
13 Raytheon Technologies Corp 803 0.04
World Allocation 60/40 FundPortfolio of Investments as at 31 May 2021 (continued)
Dimensional Fund Advisors Semi-Annual Report and Unaudited Financial Statements, 31 May 2021 416

Shares (000's)
Value(000's)
GBP
% of NetAssetValue
Common Stock (continued)
United States - 33.06% (continued)
1 RBB Bancorp 18 -
1 RBC Bearings Inc 111 0.01
2 RE/MAX Holdings Inc 43 -
9 Realogy Holdings Corp 113 0.01
- Red River Bancshares Inc 16 -
3 Red Rock Resorts Inc 93 0.01
2 Redfin Corp 67 -
3 Regal Beloit Corp 303 0.02
1 Regeneron Pharmaceuticals Inc 504 0.03
2 REGENXBIO Inc 43 -
36 Regions Financial Corp 586 0.03
1 Regis Corp 7 -
4 Reinsurance Group of America Inc 355 0.02
5 Reliance Steel & Aluminum Co 608 0.03
- Reliant Bancorp Inc 10 -
3 RenaissanceRe Holdings Ltd 343 0.02
4 Renasant Corp 131 0.01
4 Renewable Energy Group Inc 161 0.01
5 Rent-A-Center Inc 217 0.01
1 Repligen Corp 133 0.01
1 Replimune Group Inc 17 -
1 Republic Bancorp Inc 46 -
6 Republic Services Inc 456 0.03
9 Resideo Technologies Inc 185 0.01
3 ResMed Inc 400 0.02
5 Resolute Forest Products Inc 61 -
2 Resources Connection Inc 19 -
4 REV Group Inc 58 -
1 Revance Therapeutics Inc 16 -
1 Revolve Group Inc 38 -
- REX American Resources Corp 10 -
9 Rexnord Corp 300 0.02
1 RH 317 0.02
1 Rhythm Pharmaceuticals Inc 20 -
8 Ribbon Communications Inc 43 -
2 Rimini Street Inc 11 -
- RingCentral Inc 45 -
3 Rite Aid Corp 37 -
3 RLI Corp 206 0.01
1 RMR Group Inc 14 -
6 Robert Half International Inc 396 0.02
2 Rocket Pharmaceuticals Inc 61 -
2 Rockwell Automation Inc 463 0.03
1 Rogers Corp 182 0.01
- Roku Inc 70 -
8 Rollins Inc 189 0.01
2 Roper Technologies Inc 489 0.03
2 Ross Stores Inc 209 0.01
9 Royal Caribbean Cruises Ltd 601 0.03
2 Royal Gold Inc 175 0.01
10 RPC Inc 36 -
4 RPM International Inc 283 0.02
3 RR Donnelley & Sons Co 15 -
3 Rush Enterprises Inc 114 0.01
1 Ruth's Hospitality Group Inc 12 -
4 Ryder System Inc 258 0.01
3 Ryerson Holding Corp 37 -
3 S&P Global Inc 728 0.04
3 S&T Bancorp Inc 77 -
5 Sabre Corp 50 -
1 Safety Insurance Group Inc 75 -
1 Sage Therapeutics Inc 54 -
Shares (000's)
Value(000's)
GBP
% of NetAssetValue
Common Stock (continued)
United States - 33.06% (continued)
2 Saia Inc 323 0.02
1 SailPoint Technologies Holding Inc 38 -
5 salesforce.com Inc 808 0.05
5 Sally Beauty Holdings Inc 80 -
2 Sanderson Farms Inc 183 0.01
3 Sandy Spring Bancorp Inc 111 0.01
6 Sangamo Therapeutics Inc 49 -
4 Sanmina Corp 124 0.01
19 Santander Consumer USA Holdings Inc 512 0.03
2 Sapiens International Corp NV (US listing) 32 -
1 Sarepta Therapeutics Inc 48 -
2 ScanSource Inc 34 -
81 Schlumberger Ltd 1,784 0.10
7 Schneider National Inc 125 0.01
2 Schnitzer Steel Industries Inc 66 -
2 Scholastic Corp 45 -
2 Schweitzer-Mauduit International Inc 66 -
3 Science Applications International Corp 191 0.01
3 Scientific Games Corp 157 0.01
1 Sciplay Corp 7 -
4 Scorpio Tankers Inc 63 -
2 Scotts Miracle-Gro Co 351 0.02
- Seaboard Corp 147 0.01
4 Seacoast Banking Corp of Florida 106 0.01
12 Seagate Technology Holdings 793 0.04
1 Seagen Inc 137 0.01
5 Sealed Air Corp 182 0.01
1 SeaSpine Holdings Corp 19 -
3 SeaWorld Entertainment Inc 128 0.01
5 SEI Investments Co 230 0.01
1 Select Bancorp Inc 8 -
3 Select Energy Services Inc 13 -
1 Select Interior Concepts Inc 8 -
9 Select Medical Holdings Corp 262 0.01
4 Selective Insurance Group Inc 235 0.01
4 Sempra Energy 334 0.02
2 Semtech Corp 82 0.01
11 Sensata Technologies Holding PLC 471 0.03
3 Sensient Technologies Corp 170 0.01
8 Service Corp International 305 0.02
- ServiceNow Inc 123 0.01
4 ServisFirst Bancshares Inc 187 0.01
9 SFL Corp Ltd 52 -
1 Shake Shack Inc 43 -
2 Shenandoah Telecommunications Co 87 0.01
4 Sherwin-Williams Co 776 0.04
- Shockwave Medical Inc 53 -
1 Shoe Carnival Inc 37 -
1 ShotSpotter Inc 16 -
1 Shutterstock Inc 92 0.01
2 Shyft Group Inc 64 -
1 SI-BONE Inc 15 -
1 Sierra Bancorp 14 -
2 SIGA Technologies Inc 7 -
4 Signature Bank 703 0.04
4 Signet Jewelers Ltd 187 0.01
6 Silgan Holdings Inc 184 0.01
1 Silicon Laboratories Inc 116 0.01
9 Simmons First National Corp 183 0.01
7 Simply Good Foods Co 178 0.01
3 Simpson Manufacturing Co Inc 221 0.01
- Simulations Plus Inc 7 -
World Allocation 60/40 FundPortfolio of Investments as at 31 May 2021 (continued)
Dimensional Fund Advisors Semi-Annual Report and Unaudited Financial Statements, 31 May 2021 417

Shares (000's)
Value(000's)
GBP
% of NetAssetValue
Common Stock (continued)
United States - 33.06% (continued)
27 Sirius XM Holdings Inc 118 0.01
8 SiriusPoint Ltd 60 -
2 SiteOne Landscape Supply Inc 183 0.01
1 SJW Group 40 -
10 Skechers U.S.A. Inc 338 0.02
3 Skyline Champion Corp 111 0.01
3 SkyWest Inc 113 0.01
5 Skyworks Solutions Inc 555 0.03
2 Slack Technologies Inc 70 -
1 Sleep Number Corp 71 -
34 SLM Corp 491 0.03
8 SM Energy Co 112 0.01
2 SMART Global Holdings Inc 65 -
2 Smartsheet Inc 70 -
3 Smith & Wesson Brands Inc 42 -
1 Snap Inc 34 -
4 Snap-on Inc 694 0.04
1 SolarEdge Technologies Inc 254 0.01
3 Solaris Oilfield Infrastructure Inc 18 -
9 SolarWinds Corp 104 0.01
2 Sonic Automotive Inc 55 -
7 Sonoco Products Co 349 0.02
3 Sonos Inc 71 -
3 South Jersey Industries Inc 63 -
1 South Plains Financial Inc 15 -
5 South State Corp 335 0.02
12 Southern Co 547 0.03
2 Southern Copper Corp 123 0.01
1 Southern First Bancshares Inc 20 -
- Southern Missouri Bancorp Inc 9 -
3 Southside Bancshares Inc 84 0.01
9 Southwest Airlines Co 373 0.02
2 Southwest Gas Holdings Inc 79 -
55 Southwestern Energy Co 200 0.01
1 SP Plus Corp 33 -
2 SpartanNash Co 23 -
3 Spectrum Brands Holdings Inc 202 0.01
2 Spire Inc 97 0.01
4 Spirit AeroSystems Holdings Inc 151 0.01
7 Spirit Airlines Inc 177 0.01
1 Spirit of Texas Bancshares Inc 9 -
- Splunk Inc 42 -
3 Sportsman's Warehouse Holdings Inc 39 -
- Spotify Technology SA 74 -
1 SpringWorks Therapeutics Inc 74 -
7 Sprouts Farmers Market Inc 128 0.01
1 SPS Commerce Inc 57 -
2 SPX Corp 79 -
3 SPX FLOW Inc 166 0.01
- Square Inc 46 -
10 SS&C Technologies Holdings Inc 513 0.03
4 St Joe Co 143 0.01
1 STAAR Surgical Co 77 -
1 Stamps.com Inc 177 0.01
2 Standard Motor Products Inc 61 -
1 Standex International Corp 78 -
3 Stanley Black & Decker Inc 427 0.02
11 Starbucks Corp 863 0.05
3 State Auto Financial Corp 41 -
9 State Street Corp 582 0.03
17 Steel Dynamics Inc 766 0.04
7 Steelcase Inc 75 -
Shares (000's)
Value(000's)
GBP
% of NetAssetValue
Common Stock (continued)
United States - 33.06% (continued)
2 Stepan Co 166 0.01
6 Stericycle Inc 329 0.02
3 STERIS PLC 454 0.03
15 Sterling Bancorp 274 0.02
2 Sterling Bancorp Inc 7 -
2 Sterling Construction Co Inc 32 -
5 Steven Madden Ltd 150 0.01
2 Stewart Information Services Corp 93 0.01
8 Stifel Financial Corp 406 0.02
1 Stitch Fix Inc 30 -
2 Stock Yards Bancorp Inc 73 -
- Stoke Therapeutics Inc 5 -
2 Stoneridge Inc 49 -
2 StoneX Group Inc 83 0.01
5 Stratasys Ltd 74 -
2 Strategic Education Inc 83 0.01
3 Stride Inc 49 -
2 Stryker Corp 334 0.02
9 Summit Materials Inc 218 0.01
2 SunCoke Energy Inc 11 -
3 Sunnova Energy International Inc 70 -
7 Sunrun Inc 217 0.01
4 Super Micro Computer Inc 102 0.01
- Superior Group of Cos Inc 8 -
5 Supernus Pharmaceuticals Inc 95 0.01
2 Surface Oncology Inc 15 -
2 Surgery Partners Inc 86 0.01
- Surmodics Inc 15 -
1 Sutro Biopharma Inc 14 -
3 SVB Financial Group 1,373 0.08
5 Switch Inc 66 -
2 Sykes Enterprises Inc 64 -
2 Synaptics Inc 190 0.01
36 Synchrony Financial 1,194 0.07
7 Syneos Health Inc 428 0.02
4 SYNNEX Corp 373 0.02
2 Synopsys Inc 276 0.02
11 Synovus Financial Corp 384 0.02
11 Sysco Corp 651 0.04
2 Systemax Inc 53 -
6 T Rowe Price Group Inc 874 0.05
- Tabula Rasa HealthCare Inc 8 -
- Tactile Systems Technology Inc 7 -
4 Take-Two Interactive Software Inc 494 0.03
6 Talos Energy Inc 64 -
1 Tandem Diabetes Care Inc 37 -
19 Tapestry Inc 609 0.03
13 Targa Resources Corp 358 0.02
9 Target Corp 1,490 0.08
2 Taro Pharmaceutical Industries Ltd 106 0.01
9 Taylor Morrison Home Corp 196 0.01
11 TCF Financial Corp 354 0.02
1 TCR2 Therapeutics Inc 14 -
4 TE Connectivity Ltd 394 0.02
1 Team Inc 7 -
28 TechnipFMC PLC 168 0.01
- TechTarget Inc 23 -
1 Tecnoglass Inc 22 -
3 Teekay Tankers Ltd 27 -
17 TEGNA Inc 230 0.01
1 Tejon Ranch Co 9 -
2 Teladoc Health Inc 234 0.01
World Allocation 60/40 FundPortfolio of Investments as at 31 May 2021 (continued)
Dimensional Fund Advisors Semi-Annual Report and Unaudited Financial Statements, 31 May 2021 418

Shares (000's)
Value(000's)
GBP
% of NetAssetValue
Common Stock (continued)
United States - 33.06% (continued)
2 Teledyne Technologies Inc 479 0.03
2 Teleflex Inc 525 0.03
8 Telephone & Data Systems Inc 148 0.01
10 Tempur Sealy International Inc 258 0.01
3 Tenet Healthcare Corp 148 0.01
1 Tennant Co 45 -
2 Tenneco Inc 25 -
5 Teradata Corp 159 0.01
6 Teradyne Inc 523 0.03
6 Terex Corp 228 0.01
9 Terminix Global Holdings Inc 327 0.02
1 Tesla Inc 432 0.02
2 Tetra Tech Inc 180 0.01
4 Texas Capital Bancshares Inc 183 0.01
13 Texas Instruments Inc 1,692 0.09
2 Texas Roadhouse Inc 106 0.01
5 Textainer Group Holdings Ltd 120 0.01
7 TFS Financial Corp 106 0.01
4 Thermo Fisher Scientific Inc 1,301 0.07
2 Thermon Group Holdings Inc 22 -
4 Thor Industries Inc 353 0.02
3 Tidewater Inc 25 -
6 Timken Co 398 0.02
3 TimkenSteel Corp 32 -
4 Titan International Inc 27 -
1 Titan Machinery Inc 31 -
2 Tivity Health Inc 35 -
19 TJX Cos Inc 911 0.05
8 T-Mobile US Inc 760 0.04
10 Toll Brothers Inc 442 0.02
1 Tompkins Financial Corp 70 -
2 Tootsie Roll Industries Inc 43 -
3 TopBuild Corp 393 0.02
4 Toro Co 319 0.02
6 Towne Bank 126 0.01
1 Townsquare Media Inc 10 -
1 TPI Composites Inc 37 -
5 Tractor Supply Co 591 0.03
- Trade Desk Inc 100 0.01
2 Tradeweb Markets Inc 89 0.01
5 Trane Technologies PLC 621 0.03
1 TransDigm Group Inc 399 0.02
- Transmedics Group Inc 7 -
42 Transocean Ltd 113 0.01
6 TransUnion 422 0.02
3 Travel + Leisure Co 122 0.01
8 Travelers Cos Inc 868 0.05
1 Travere Therapeutics Inc 11 -
4 TreeHouse Foods Inc 138 0.01
4 Trex Co Inc 247 0.01
9 TRI Pointe Group Inc 145 0.01
3 TriCo Bancshares 90 0.01
3 TriMas Corp 79 -
5 Trimble Inc 291 0.02
3 TriNet Group Inc 158 0.01
9 Trinity Industries Inc 182 0.01
3 Trinseo SA 143 0.01
5 TripAdvisor Inc 153 0.01
1 Triple-S Management Corp 13 -
2 TriState Capital Holdings Inc 32 -
6 Triton International Ltd 231 0.01
2 Triumph Bancorp Inc 124 0.01
Shares (000's)
Value(000's)
GBP
% of NetAssetValue
Common Stock (continued)
United States - 33.06% (continued)
14 Tronox Holdings PLC 229 0.01
2 TrueBlue Inc 46 -
6 TrueCar Inc 25 -
13 Truist Financial Corp 581 0.03
1 Trupanion Inc 41 -
1 TrustCo Bank Corp NY 41 -
5 Trustmark Corp 113 0.01
3 TTEC Holdings Inc 200 0.01
7 TTM Technologies Inc 74 -
2 Tupperware Brands Corp 36 -
1 Turning Point Brands Inc 42 -
3 Tutor Perini Corp 37 -
1 Twilio Inc 188 0.01
5 Twitter Inc 187 0.01
- Tyler Technologies Inc 111 0.01
12 Tyson Foods Inc 685 0.04
- Ubiquiti Inc 80 -
5 UFP Industries Inc 261 0.01
- UFP Technologies Inc 9 -
5 UGI Corp 170 0.01
2 Ulta Salon Cosmetics & Fragrance Inc 475 0.03
3 Ultra Clean Holdings Inc 127 0.01
1 Ultragenyx Pharmaceutical Inc 93 0.01
3 UMB Financial Corp 238 0.01
16 Umpqua Holdings Corp 222 0.01
9 Under Armour Inc, Class A 149 0.01
11 Under Armour Inc, Class C 148 0.01
- Unifi Inc 8 -
1 UniFirst Corp 167 0.01
11 Union Pacific Corp 1,760 0.10
2 Unisys Corp 43 -
14 United Airlines Holdings Inc 568 0.03
9 United Bankshares Inc 269 0.02
6 United Community Banks Inc 157 0.01
2 United Fire Group Inc 37 -
4 United Natural Foods Inc 113 0.01
9 United Parcel Service Inc 1,298 0.07
6 United Rentals Inc 1,507 0.08
3 United States Cellular Corp 77 -
- United States Lime & Minerals Inc 39 -
11 United States Steel Corp 206 0.01
3 United Therapeutics Corp 448 0.03
18 UnitedHealth Group Inc 5,275 0.29
- Unitil Corp 19 -
- Unity Bancorp Inc 5 -
12 Univar Solutions Inc 238 0.01
1 Universal Corp 58 -
1 Universal Display Corp 137 0.01
1 Universal Electronics Inc 35 -
5 Universal Health Services Inc 617 0.03
2 Universal Insurance Holdings Inc 17 -
1 Universal Logistics Holdings Inc 19 -
2 Univest Financial Corp 45 -
15 Unum Group 318 0.02
- Upland Software Inc 8 -
2 Upwork Inc 60 -
8 Urban Outfitters Inc 213 0.01
13 US Bancorp 556 0.03
1 US Concrete Inc 47 -
- US Ecology Inc 10 -
15 US Foods Holding Corp 415 0.02
- US Physical Therapy Inc 35 -
World Allocation 60/40 FundPortfolio of Investments as at 31 May 2021 (continued)
Dimensional Fund Advisors Semi-Annual Report and Unaudited Financial Statements, 31 May 2021 419

Shares (000's)
Value(000's)
GBP
% of NetAssetValue
Common Stock (continued)
United States - 33.06% (continued)
4 US Silica Holdings Inc 27 -
1 US Xpress Enterprises Inc 10 -
1 USANA Health Sciences Inc 92 0.01
- Utah Medical Products Inc 15 -
4 Vaalco Energy Inc 7 -
1 Vail Resorts Inc 169 0.01
9 Valero Energy Corp 491 0.03
29 Valley National Bancorp 296 0.02
2 Valmont Industries Inc 292 0.02
6 Valvoline Inc 136 0.01
4 Vanda Pharmaceuticals Inc 50 -
1 Vapotherm Inc 10 -
3 Varex Imaging Corp 48 -
6 Vector Group Ltd 60 -
1 Vectrus Inc 29 -
4 Veeco Instruments Inc 70 -
1 Veeva Systems Inc 166 0.01
2 Venator Materials PLC 8 -
5 Veoneer Inc 83 0.01
1 Vera Bradley Inc 8 -
1 Veracyte Inc 31 -
5 Verastem Inc 13 -
- Vericel Corp 18 -
5 Verint Systems Inc 154 0.01
2 VeriSign Inc 306 0.02
3 Verisk Analytics Inc 341 0.02
3 Veritex Holdings Inc 72 -
124 Verizon Communications Inc 4,947 0.27
7 Verra Mobility Corp 72 -
1 Verso Corp 14 -
1 Vertex Pharmaceuticals Inc 144 0.01
2 VF Corp 125 0.01
1 Viacom Inc, Class A 40 -
27 Viacom Inc, Class B 818 0.05
1 Viad Corp 26 -
4 ViaSat Inc 162 0.01
46 Viatris Inc 497 0.03
9 Viavi Solutions Inc 106 0.01
1 Vicor Corp 38 -
1 Victory Capital Holdings Inc 19 -
4 ViewRay Inc 17 -
2 Viking Therapeutics Inc 6 -
1 Vimeo Inc 23 -
1 Vir Biotechnology Inc 41 -
7 Virtu Financial Inc 145 0.01
1 Virtus Investment Partners Inc 130 0.01
22 Visa Inc 3,584 0.20
11 Vishay Intertechnology Inc 188 0.01
1 Vishay Precision Group Inc 24 -
5 Vista Outdoor Inc 155 0.01
1 Visteon Corp 56 -
42 Vistra Energy Corp 480 0.03
1 VMware Inc 81 -
1 Vocera Communications Inc 18 -
7 Vonage Holdings Corp 67 -
6 Vontier Corp 158 0.01
1 VOXX International Corp 15 -
9 Voya Financial Inc 433 0.02
1 VSE Corp 23 -
4 Vulcan Materials Co 467 0.03
7 W R Berkley Corp 362 0.02
7 W&T Offshore Inc 19 -
Shares (000's)
Value(000's)
GBP
% of NetAssetValue
Common Stock (continued)
United States - 33.06% (continued)
4 Wabash National Corp 39 -
20 Walgreens Boots Alliance Inc 750 0.04
3 Walker & Dunlop Inc 199 0.01
30 Walmart Inc 2,978 0.16
10 Walt Disney Co 1,216 0.07
5 Warrior Met Coal Inc 63 -
4 Washington Federal Inc 95 0.01
1 Washington Trust Bancorp Inc 48 -
10 Waste Management Inc 1,003 0.06
2 Waters Corp 361 0.02
2 Waterstone Financial Inc 21 -
1 Watsco Inc 264 0.02
2 Watts Water Technologies Inc 168 0.01
1 Wayfair Inc 139 0.01
1 WD-40 Co 93 0.01
6 Webster Financial Corp 257 0.01
4 WEC Energy Group Inc 270 0.02
2 Weis Markets Inc 82 0.01
5 Welbilt Inc 95 0.01
33 Wells Fargo & Co 1,086 0.06
9 Wendy's Co 152 0.01
6 Werner Enterprises Inc 200 0.01
5 WesBanco Inc 145 0.01
4 WESCO International Inc 290 0.02
- West Bancorporation Inc 9 -
1 West Pharmaceutical Services Inc 297 0.02
2 Westamerica Bancorporation 87 0.01
8 Western Alliance Bancorp 560 0.03
14 Western Digital Corp 761 0.04
14 Western Union Co 242 0.01
11 Westinghouse Air Brake Technologies Corp 625 0.03
7 Westlake Chemical Corp 462 0.03
19 Westrock Co 788 0.04
2 WEX Inc 244 0.01
- Weyco Group Inc 4 -
5 Whirlpool Corp 791 0.04
- White Mountains Insurance Group Ltd 197 0.01
2 Whiting Petroleum Corp 80 -
- Willdan Group Inc 7 -
21 Williams Cos Inc 396 0.02
5 Williams-Sonoma Inc 552 0.03
2 Willis Towers Watson PLC 404 0.02
16 WillScot Mobile Mini Holdings Corp 333 0.02
1 Wingstop Inc 86 0.01
- Winmark Corp 23 -
3 Winnebago Industries Inc 151 0.01
4 Wintrust Financial Corp 245 0.01
10 WisdomTree Investments Inc 45 -
5 Wolverine World Wide Inc 137 0.01
3 Woodward Inc 298 0.02
- Workday Inc 78 -
1 World Acceptance Corp 78 -
4 World Fuel Services Corp 89 0.01
2 World Wrestling Entertainment Inc 92 0.01
4 Worthington Industries Inc 190 0.01
3 WR Grace & Co 144 0.01
4 WSFS Financial Corp 150 0.01
2 WW Grainger Inc 493 0.03
2 WW International Inc 67 -
2 Wyndham Hotels & Resorts Inc 93 0.01
1 Wynn Resorts Ltd 51 -
8 Xcel Energy Inc 400 0.02
World Allocation 60/40 FundPortfolio of Investments as at 31 May 2021 (continued)
Dimensional Fund Advisors Semi-Annual Report and Unaudited Financial Statements, 31 May 2021 420

Shares (000's)
Value(000's)
GBP
% of NetAssetValue
Common Stock (continued)
United States - 33.06% (continued)
2 Xencor Inc 58 -
14 Xerox Holdings Corp 229 0.01
4 Xilinx Inc 387 0.02
6 Xperi Holding Corp 96 0.01
7 XPO Logistics Inc 769 0.04
4 Xylem Inc 365 0.02
4 Yellow Corp 19 -
5 Yelp Inc 137 0.01
4 YETI Holdings Inc 263 0.01
- York Water Co 13 -
5 Yum! Brands Inc 399 0.02
2 Zebra Technologies Corp 603 0.03
1 Zendesk Inc 66 -
1 Zillow Group Inc, Class A 66 -
2 Zillow Group Inc, Class C 185 0.01
4 Zimmer Biomet Holdings Inc 441 0.02
12 Zions Bancorp NA 473 0.03
3 Zix Corp 12 -
6 Zoetis Inc 774 0.04
2 Zogenix Inc 21 -
- Zoom Video Communications Inc 23 -
- Zscaler Inc 63 -
2 Zumiez Inc 46 -
28 Zynga Inc 217 0.01
599,747 33.06
Total Common Stock - 49.75% (30 November 2020: 0.00%) 902,559 49.75
Preferred Stock
Germany - 0.09%
2 Bayerische Motoren Werke AG 116 0.01
1 Draegerwerk AG & Co KGaA 36 -
2 Fuchs Petrolub SE 78 -
1 Henkel AG & Co KGaA 65 -
4 Jungheinrich AG 138 0.01
3 Porsche Automobil Holding SE 242 0.01
- Sartorius AG 155 0.01
8 Schaeffler AG 51 -
1 Sixt SE 86 0.01
- STO SE & Co KGaA 20 -
3 Volkswagen AG 655 0.04
1,642 0.09
Italy - 0.01%
3 Danieli & C Officine Meccaniche SpA 35 -
382 Telecom Italia SpA 154 0.01
189 0.01
United States - 0.01%
1 Qurate Retail Inc 69 0.01
2 WESCO International Inc 34 -
103 0.01
Total Preferred Stock - 0.11% (30 November 2020: 0.00%) 1,934 0.11
Real Estate Investment Trust
Australia - 0.08%
17 Abacus Property Group 28 -
3 ALE Property Group 7 -
7 APN Convenience Retail REIT 15 -
5 APN Industria REIT 8 -
14 Arena REIT 25 -
12 Aventus Group 19 -
16 BWP Trust 37 -
16 Centuria Industrial REIT 31 -
Shares (000's)
Value(000's)
GBP
% of NetAssetValue
Real Estate Investment Trust (continued)
Australia - 0.08% (continued)
14 Centuria Office REIT 17 -
13 Charter Hall Group 103 0.01
22 Charter Hall Long Wale REIT 57 -
17 Charter Hall Retail REIT 35 -
9 Charter Hall Social Infrastructure REIT 16 -
64 Cromwell Property Group 32 -
18 Dexus 104 0.01
25 GDI Property Group 15 -
15 Goodman Group 158 0.01
37 GPT Group 94 0.01
9 Growthpoint Properties Australia Ltd 18 -
4 Hotel Property Investments 8 -
10 Ingenia Communities Group 29 -
11 Investec Australia Property Fund 9 -
78 Mirvac Group 119 0.01
33 New South Resources Ltd 37 -
61 Scentre Group 91 0.01
34 Shopping Centres Australasia Property Group 47 -
38 Stockland 95 0.01
4 Unibail-Rodamco-Westfield 11 -
83 Vicinity Centres 71 0.01
27 Waypoint REIT 37 -
1,373 0.08
Belgium - 0.02%
1 Aedifica SA 108 0.01
- Ascencio 15 -
1 Befimmo SA 16 -
- Care Property Invest NV 8 -
1 Cofinimmo SA 85 -
1 Montea CVA 32 -
- Retail Estates NV 23 -
5 Warehouses De Pauw CVA 136 0.01
423 0.02
Canada - 0.03%
2 Allied Properties Real Estate Investment Trust 58 0.01
2 Artis Real Estate Investment Trust 11 -
1 Boardwalk Real Estate Investment Trust 18 -
2 Canadian Apartment Properties REIT 57 0.01
1 Choice Properties Real Estate Investment Trust 11 -
3 Cominar Real Estate Investment Trust 15 -
1 Crombie Real Estate Investment Trust 13 -
1 CT Real Estate Investment Trust 13 -
4 Dream Industrial Real Estate Investment Trust 31 -
2 Dream Office Real Estate Investment Trust 19 -
1 Granite Real Estate Investment Trust 47 -
5 H&R Real Estate Investment Trust 49 -
2 InterRent Real Estate Investment Trust 17 -
2 Killam Apartment Real Estate Investment Trust 26 -
2 NorthWest Healthcare Properties Real EstateInvestment Trust 18 -
6 RioCan Real Estate Investment Trust 76 0.01
3 SmartCentres Real Estate Investment Trust 43 -
4 Summit Industrial Income REIT 36 -
1 WPT Industrial Real Estate Investment Trust 11 -
569 0.03
France - 0.03%
- Altarea SCA 21 -
- ARGAN SA 28 -
2 Carmila SA 16 -
2 Covivio 102 0.01
1 Covivio Hotels SACA 15 -
1 Gecina SA 107 0.01
World Allocation 60/40 FundPortfolio of Investments as at 31 May 2021 (continued)
Dimensional Fund Advisors Semi-Annual Report and Unaudited Financial Statements, 31 May 2021 421

Shares (000's)
Value(000's)
GBP
% of NetAssetValue
Real Estate Investment Trust (continued)
France - 0.03% (continued)
1 ICADE 70 -
5 Klepierre SA 100 0.01
3 Mercialys SA 29 -
488 0.03
Germany - 0.00%
6 alstria office REIT AG 80 -
2 Hamborner REIT AG 16 -
96 -
Hong Kong - 0.02%
65 Champion REIT 27 -
44 Fortune Real Estate Investment Trust 34 -
36 Link REIT 241 0.02
32 Prosperity REIT 8 -
25 Sunlight Real Estate Investment Trust 10 -
320 0.02
Ireland - 0.00%
9 Hibernia REIT PLC 10 -
6 Irish Residential Properties REIT PLC 8 -
18 -
Israel - 0.00%
3 Summit Real Estate Holdings Ltd 32 -
32 -
Italy - 0.00%
3 Immobiliare Grande Distribuzione SIIQ SpA 9 -
9 -
Japan - 0.13%
- Activia Properties Inc 48 -
- Advance Residence Investment Corp 56 -
- AEON REIT Investment Corp 45 -
- Comforia Residential REIT Inc 50 -
- CRE Logistics REIT Inc 17 -
- Daiwa House REIT Investment Corp 60 0.01
- Daiwa Office Investment Corp 25 -
- Frontier Real Estate Investment Corp 58 -
- Fukuoka REIT Corp 24 -
- Global One Real Estate Investment Corp 24 -
- GLP J-Reit 79 0.01
- Hankyu Hanshin REIT Inc 20 -
- Health Care & Medical Investment Corp 9 -
- Heiwa Real Estate REIT Inc 28 -
- Hoshino Resorts REIT Inc 37 -
- Hulic Reit Inc 56 -
- Ichigo Hotel REIT Investment Corp 15 -
- Ichigo Office REIT Investment 26 -
- Industrial & Infrastructure Fund Investment Corp 52 -
1 Invesco Office J-Reit Inc 44 -
1 Invincible Investment Corp 72 0.01
- Itochu Advance Logistics Investment 13 -
- Japan Excellent Inc 50 -
- Japan Hotel REIT Investment Corp 69 0.01
- Japan Logistics Fund Inc 42 -
- Japan Prime Realty Investment Corp 36 -
- Japan Real Estate Investment Corp 64 0.01
- Japan Rental Housing Investments Inc 54 -
- Japan Retail Fund Investment Corp 114 0.01
- Kenedix Office Investment Corp 52 -
- Kenedix Residential Next Investment Corp 52 -
- Kenedix Retail REIT Corp 42 -
- LaSalle Logiport REIT 41 -
- Mirai Corp 16 -
- Mitsubishi Estate Logistics REIT Investment Corp 35 -
Shares (000's)
Value(000's)
GBP
% of NetAssetValue
Real Estate Investment Trust (continued)
Japan - 0.13% (continued)
- Mitsui Fudosan Logistics Park Inc 32 -
- Mori Hills REIT Investment Corp 42 -
- Mori Trust Hotel Reit Inc 9 -
- Mori Trust Sogo Reit Inc 45 -
- Nippon Accommodations Fund Inc 36 -
- Nippon Building Fund Inc 77 0.01
- Nippon Prologis REIT Inc 76 0.01
- Nippon REIT Investment Corp 58 0.01
- Nomura Real Estate Master Fund Inc 80 0.01
- One REIT Inc 16 -
- Orix JREIT Inc 66 0.01
- Premier Investment Corp 56 -
- Samty Residential Investment Corp 8 -
- Sekisui House Reit Inc 59 0.01
- Star Asia Investment Corp 17 -
- Starts Proceed Investment Corp 15 -
- Takara Leben Real Estate Investment Corp 13 -
- Tokyu REIT Inc 34 -
- Tosei Reit Investment Corp 9 -
- United Urban Investment Corp 65 0.01
- XYMAX REIT Investment Corp 8 -
2,346 0.13
Netherlands - 0.01%
1 Eurocommercial Properties NV 30 -
1 NSI NV 17 -
2 Unibail-Rodamco-Westfield 155 0.01
2 Wereldhave NV 25 -
227 0.01
New Zealand - 0.01%
27 Argosy Property Ltd 21 -
28 Goodman Property Trust 32 0.01
7 Investore Property Ltd 8 -
44 Kiwi Property Group Ltd 27 -
26 Precinct Properties New Zealand Ltd 20 -
11 Property for Industry Ltd 16 -
12 Stride Property Group 14 -
12 Vital Healthcare Property Trust 17 -
155 0.01
Singapore - 0.05%
11 AIMS APAC REIT 8 -
55 Ascendas Real Estate Investment Trust 85 0.01
61 Ascott Residence Trust 33 -
64 Cache Logistics Trust 27 -
87 CapitaLand Mall Trust 95 0.01
42 CapitaLand Retail China Trust 31 -
18 CDL Hospitality Trusts 11 -
65 ESR-REIT 14 -
19 Far East Hospitality Trust 6 -
113 First Real Estate Investment Trust 15 -
32 Frasers Centrepoint Trust 40 -
27 Frasers Hospitality Trust 8 -
51 Frasers Logistics & Industrial Trust 38 -
42 Keppel DC REIT 58 0.01
15 Keppel Pacific Oak US REIT 8 -
45 Keppel REIT 27 -
62 Manulife US Real Estate Investment Trust 33 -
51 Mapletree Commercial Trust 56 0.01
26 Mapletree Industrial Trust 38 -
31 Mapletree Logistics Trust 32 -
79 Mapletree North Asia Commercial Trust 43 -
12 Parkway Life Real Estate Investment Trust 28 -
26 Sasseur Real Estate Investment Trust 13 -
World Allocation 60/40 FundPortfolio of Investments as at 31 May 2021 (continued)
Dimensional Fund Advisors Semi-Annual Report and Unaudited Financial Statements, 31 May 2021 422

Shares (000's)
Value(000's)
GBP
% of NetAssetValue
Real Estate Investment Trust (continued)
Singapore - 0.05% (continued)
34 SPH REIT 15 -
54 Starhill Global REIT 16 -
59 Suntec Real Estate Investment Trust 46 0.01
824 0.05
Spain - 0.01%
11 Inmobiliaria Colonial Socimi SA 85 -
3 Lar Espana Real Estate Socimi SA 13 -
13 Merlin Properties Socimi SA 111 0.01
209 0.01
United Kingdom - 0.07%
57 Assura PLC 43 -
6 Big Yellow Group PLC 72 0.01
18 British Land Co PLC 91 0.01
24 Capital & Counties Properties PLC 41 -
17 Custodian Reit PLC 16 -
4 Derwent London PLC 142 0.01
12 Empiric Student Property PLC 11 -
21 GCP Student Living PLC 37 -
6 Great Portland Estates PLC 40 -
111 Hammerson PLC 44 -
1 Impact Healthcare Reit PLC 1 -
14 Land Securities Group PLC 100 0.01
21 LondonMetric Property PLC 49 -
20 LXI REIT plc 28 -
14 NewRiver REIT PLC 14 -
29 Primary Health Properties PLC 44 -
11 Regional REIT Ltd 10 -
8 Safestore Holdings PLC 73 0.01
21 Schroder Real Estate Investment Trust Ltd 10 -
7 Secure Income REIT PLC 28 -
14 Segro PLC 147 0.01
6 Shaftesbury PLC 39 -
14 Standard Life Investment Property Income Trust Ltd 9 -
7 Target Healthcare REIT PLC 8 -
62 Tritax Big Box REIT PLC 122 0.01
6 UNITE Group PLC 64 -
5 Workspace Group PLC 46 -
1,329 0.07
United States - 1.04%
3 Acadia Realty Trust 45 -
2 Agree Realty Corp 118 0.01
2 Alexander & Baldwin Inc 21 -
- Alexander's Inc 24 -
3 Alexandria Real Estate Equities Inc 328 0.02
2 American Assets Trust Inc 50 -
4 American Campus Communities Inc 148 0.01
5 American Finance Trust Inc 30 -
9 American Homes 4 Rent 229 0.01
4 American Tower Corp 725 0.04
4 Apartment Income REIT Corp 125 0.01
8 Apple Hospitality REIT Inc 93 0.01
3 AvalonBay Communities Inc 399 0.02
2 Bluerock Residential Growth REIT Inc 13 -
3 Boston Properties Inc 250 0.01
3 Braemar Hotels & Resorts Inc 13 -
6 Brandywine Realty Trust 59 -
9 Brixmor Property Group Inc 148 0.01
2 Brookfield Property REIT Inc 24 -
1 BRT Apartments Corp 9 -
3 Camden Property Trust 222 0.01
3 CareTrust REIT Inc 50 -
2 Chatham Lodging Trust 14 -
Shares (000's)
Value(000's)
GBP
% of NetAssetValue
Real Estate Investment Trust (continued)
United States - 1.04% (continued)
2 City Office REIT Inc 15 -
4 Columbia Property Trust Inc 49 -
1 Community Healthcare Trust Inc 35 -
3 CorePoint Lodging Inc 19 -
1 CoreSite Realty Corp 101 0.01
4 Corporate Office Properties Trust 69 -
5 Cousins Properties Inc 132 0.01
4 Crown Castle International Corp 522 0.03
- CTO Realty Growth Inc 15 -
6 CubeSmart 178 0.01
3 CyrusOne Inc 171 0.01
8 DiamondRock Hospitality Co 56 -
4 Digital Realty Trust Inc 416 0.02
10 Diversified Healthcare Trust 25 -
6 Douglas Emmett Inc 137 0.01
9 Duke Realty Corp 285 0.02
2 Easterly Government Properties Inc 36 -
1 EastGroup Properties Inc 146 0.01
6 Empire State Realty Trust Inc 46 -
3 EPR Properties 96 0.01
1 Equinix Inc 452 0.03
4 Equity Commonwealth 77 -
4 Equity LifeStyle Properties Inc 223 0.01
7 Equity Residential 398 0.02
4 Essential Properties Realty Trust Inc 78 -
1 Essex Property Trust Inc 266 0.02
3 Extra Space Storage Inc 293 0.02
2 Federal Realty Investment Trust 188 0.01
4 First Industrial Realty Trust Inc 134 0.01
2 Four Corners Property Trust Inc 45 -
2 Franklin Street Properties Corp 9 -
6 Gaming and Leisure Properties Inc 200 0.01
2 Getty Realty Corp 36 -
1 Gladstone Commercial Corp 17 -
2 Global Medical REIT Inc 18 -
3 Global Net Lease Inc 41 -
4 Healthcare Realty Trust Inc 91 0.01
6 Healthcare Trust of America Inc 119 0.01
11 Healthpeak Properties Inc 252 0.01
3 Hersha Hospitality Trust 20 -
4 Highwoods Properties Inc 120 0.01
16 Host Hotels & Resorts Inc 192 0.01
5 Hudson Pacific Properties Inc 105 0.01
4 Independence Realty Trust Inc 46 -
2 Industrial Logistics Properties Trust 42 -
12 Invitation Homes Inc 307 0.02
8 Iron Mountain Inc 241 0.01
4 JBG SMITH Properties 97 0.01
3 Kilroy Realty Corp 141 0.01
12 Kimco Realty Corp 178 0.01
3 Kite Realty Group Trust 47 -
3 Lamar Advertising Co 184 0.01
10 Lexington Realty Trust 91 0.01
2 Life Storage Inc 155 0.01
1 LTC Properties Inc 38 -
7 Macerich Co 79 0.01
4 Mack-Cali Realty Corp 44 -
12 Medical Properties Trust Inc 176 0.01
3 MGM Growth Properties LLC 66 -
2 Mid-America Apartment Communities Inc 281 0.02
3 Monmouth Real Estate Investment Corp 43 -
2 National Health Investors Inc 83 0.01
World Allocation 60/40 FundPortfolio of Investments as at 31 May 2021 (continued)
Dimensional Fund Advisors Semi-Annual Report and Unaudited Financial Statements, 31 May 2021 423

Shares (000's)
Value(000's)
GBP
% of NetAssetValue
Real Estate Investment Trust (continued)
United States - 1.04% (continued)
5 National Retail Properties Inc 172 0.01
3 National Storage Affiliates Trust 87 0.01
2 New Senior Investment Group Inc 9 -
1 NexPoint Residential Trust Inc 35 -
2 Office Properties Income Trust 42 -
6 Omega Healthcare Investors Inc 155 0.01
1 One Liberty Properties Inc 10 -
5 Outfront Media Inc 88 0.01
7 Paramount Group Inc 56 -
8 Park Hotels & Resorts Inc 118 0.01
4 Pebblebrook Hotel Trust 70 -
6 Physicians Realty Trust 78 0.01
4 Piedmont Office Realty Trust Inc 54 -
1 Plymouth Industrial REIT Inc 17 -
2 Preferred Apartment Communities Inc 15 -
8 Prologis Inc 667 0.04
1 PS Business Parks Inc 104 0.01
2 Public Storage 483 0.03
2 QTS Realty Trust Inc 85 0.01
7 Realty Income Corp 333 0.02
4 Regency Centers Corp 197 0.01
5 Retail Opportunity Investments Corp 60 -
8 Retail Properties of America Inc 72 -
1 Retail Value Inc 16 -
4 Rexford Industrial Realty Inc 145 0.01
7 RLJ Lodging Trust 72 -
2 RPT Realty 20 -
2 Ryman Hospitality Properties Inc 86 0.01
7 Sabra Health Care REIT Inc 89 0.01
1 Saul Centers Inc 26 -
2 SBA Communications Corp 403 0.02
1 Seritage Growth Properties 15 -
6 Service Properties Trust 57 -
5 Simon Property Group Inc 465 0.03
7 SITE Centers Corp 77 -
2 SL Green Realty Corp 137 0.01
4 Spirit Realty Capital Inc 137 0.01
5 STAG Industrial Inc 129 0.01
6 STORE Capital Corp 150 0.01
4 Summit Hotel Properties Inc 25 -
2 Sun Communities Inc 257 0.01
7 Sunstone Hotel Investors Inc 64 -
4 Tanger Factory Outlet Centers Inc 49 -
2 Terreno Realty Corp 106 0.01
7 UDR Inc 238 0.01
1 UMH Properties Inc 21 -
9 Uniti Group Inc 66 -
1 Universal Health Realty Income Trust 24 -
5 Urban Edge Properties 63 -
2 Urstadt Biddle Properties Inc, Class A 19 -
Shares (000's)
Value(000's)
GBP
% of NetAssetValue
Real Estate Investment Trust (continued)
United States - 1.04% (continued)
7 Ventas Inc 289 0.02
5 VEREIT Inc 184 0.01
5 Vornado Realty Trust 162 0.01
3 Washington Real Estate Investment Trust 42 -
5 Weingarten Realty Investors 108 0.01
7 Welltower Inc 342 0.02
1 Weyerhaeuser Co 21 -
2 Whitestone REIT 13 -
4 WP Carey Inc 217 0.01
5 Xenia Hotels & Resorts Inc 64 -
18,804 1.04
Total Real Estate Investment Trust - 1.50% (30 November2020: 0.00%) 27,222 1.50
Rights
Australia - 0.00%
2 carsales.com Ltd - -
1 Charter Hall Long Wale REIT - -
1 Mystate Ltd - -
- -
Austria - 0.00%
2 CA Immobilien Anlagen AG - -
- -
France - 0.00%
- Covivio Hotels SACA - -
- -
Italy - 0.00%
7 Freni Brembo SpA - -
- -
Singapore - 0.00%
2 Mapletree Industrial Trust Rig - -
50 Singapore Airlines Ltd - -
- -
Spain - 0.00%
4 Almirall SA 1 -
2 Ferrovial SA - -
1 -
United Kingdom - 0.00%
4 C&C Group PLC 3 -
3 -
Total Rights - 0.00% (30 November 2020: 0.00%) 4 -
Warrants
Canada - 0.00%
1 Cenovus Energy Inc 2 -
2 -
Total Warrants - 0.00% (30 November 2020: 0.00%) 2 -
Total Investments - 99.71% (30 November 2020: 99.50%) 1,808,946 99.71
Forward Currency Contracts
Buy Amount (000's) Sell Amount (000's) Counterparty Maturity Date
UnrealisedAppreciation/(Depreciation)
of Contracts (000's)GBP
% of NetAssetValue
Buy 13 AUD Sell 10 USD State Street Bank 01/06/2021 - -
Buy 89,829 EUR Sell 77,830 GBP State Street Bank 24/06/2021 (611) (0.04)
Buy 3,919 EUR Sell 3,395 GBP State Street Bank 24/06/2021 (26) -
World Allocation 60/40 FundPortfolio of Investments as at 31 May 2021 (continued)
Dimensional Fund Advisors Semi-Annual Report and Unaudited Financial Statements, 31 May 2021 424

Forward Currency Contracts (continued)
Buy Amount (000's) Sell Amount (000's) Counterparty Maturity Date
UnrealisedAppreciation/(Depreciation)
of Contracts (000's)GBP
% of NetAssetValue
Buy 3,546 SGD Sell 1,886 GBP State Street Bank 24/06/2021 3 -
Buy 20,707 USD Sell 14,641 GBP State Street Bank 24/06/2021 (50) -
Unrealised Appreciation of Forward Currency Contracts 3 -
Unrealised Depreciation of Forward Currency Contracts (687) (0.04)
Net Unrealised Depreciation of Forward Currency Contracts - (0.04)% (30 November 2020: (0.02)%) (684) (0.04)
Value (000's)GBP
% of NetAssetValue
Cash and Cash Equivalents - 0.14% (30 November 2020: 0.19%) 2,613 0.14Other Assets in Excess of Other Liabilities - 0.19% (30 November 2020: 0.33%) 3,464 0.19
Total Net Assets 1,814,339 100.00
Amounts designated as “- “ are either £0 or less than £500.
Analysis of Total Assets % of Total Assets
Transferable securities admitted to an official exchange listing 51.14
Investment Funds 48.14
Current Assets 0.72
Total Assets 100.00
World Allocation 60/40 FundPortfolio of Investments as at 31 May 2021 (continued)
Dimensional Fund Advisors Semi-Annual Report and Unaudited Financial Statements, 31 May 2021 425

Shares (000's)
Value(000's)
GBP
% of NetAssetValue
Investment Funds
Ireland - 71.28%
2,387 Dimensional Funds plc - Global Core Equity Fund -GBP Distributing Class 69,572 17.73
3,812 Dimensional Funds plc - Global Core Fixed IncomeFund - GBP Distributing Class 38,771 9.88
3,876 Dimensional Funds plc - Global Short-TermInvestment Grade Fixed Income Fund - GBPDistributing Class 38,959 9.92
1,675 Dimensional Funds plc - Global Small CompaniesFund - GBP Distributing Class 42,152 10.74
1,504 Dimensional Funds plc - Global Value Fund - GBPDistributing Class 20,599 5.25
2,646 Dimensional Funds plc - World Equity Fund - GBPDistributing Class 69,693 17.76
279,746 71.28
Shares (000's)
Value(000's)
GBP
% of NetAssetValue
Investment Funds (continued)
United Kingdom - 28.31%
859 Dimensional Funds ICVC - Emerging Markets CoreEquity Fund - GBP Income Class 36,648 9.34
2,525 Dimensional Funds ICVC - International Core EquityFund - GBP Income Class 70,489 17.96
253 Dimensional Funds ICVC - UK Core Equity - GBPIncome Class 3,946 1.01
111,083 28.31
Total Investment Funds - 99.59% (30 November2020: 99.43%) 390,829 99.59
Total Investments - 99.59% (30 November 2020: 99.43%) 390,829 99.59
Forward Currency Contracts
Buy Amount (000's) Sell Amount (000's) Counterparty Maturity Date
UnrealisedAppreciation/(Depreciation)
of Contracts (000's)GBP
% of NetAssetValue
Buy 288 EUR Sell 250 GBP State Street Bank 24/06/2021 (2) -
Buy 12,242 EUR Sell 10,606 GBP State Street Bank 24/06/2021 (82) (0.02)
Buy 928 SGD Sell 493 GBP State Street Bank 24/06/2021 1 -
Buy 3,264 USD Sell 2,308 GBP State Street Bank 24/06/2021 (8) -
Unrealised Appreciation of Forward Currency Contracts 1 -
Unrealised Depreciation of Forward Currency Contracts (92) (0.02)
Net Unrealised Depreciation of Forward Currency Contracts - (0.02)% (30 November 2020: (0.02)%) (91) (0.02)
Value (000's)GBP
% of NetAssetValue
Cash and Cash Equivalents - 0.07% (30 November 2020: 0.17%) 287 0.07Other Assets in Excess of Other Liabilities - 0.36% (30 November 2020: 0.42%) 1,401 0.36
Total Net Assets 392,426 100.00
Analysis of Total Assets % of Total Assets
Investment Funds 99.23
Current Assets 0.77
Total Assets 100.00
World Allocation 80/20 FundPortfolio of Investments as at 31 May 2021
Dimensional Fund Advisors Semi-Annual Report and Unaudited Financial Statements, 31 May 2021 426

Shares (000's)
Value(000's)
GBP
% of NetAssetValue
Investment Funds
Australia - 0.00%
3 WAM Capital Ltd 4 -
4 -
Total Investment Funds - 0.00% (30 November 2020: 0.00%) 4 -
Common Stock
Australia - 1.79%
11 3P Learning Ltd 8 -
13 A2B Australia Ltd 9 -
36 Accent Group Ltd 53 -
19 Adairs Ltd 49 -
36 Adelaide Brighton Ltd 65 -
1 Afterpay Touch Group Ltd 38 -
14 AGL Energy Ltd 62 -
14 Ainsworth Game Technology Ltd 7 -
36 Alkane Resources Ltd 17 -
6 Alliance Aviation Services Ltd 15 -
40 ALS Ltd 262 0.01
5 Altium Ltd 81 0.01
138 Alumina Ltd 128 0.01
30 AMA Group Ltd 9 -
309 AMP Ltd 198 0.01
11 Ampol Ltd 176 0.01
9 Ansell Ltd 210 0.01
14 AP Eagers Ltd 113 0.01
28 APA Group 143 0.01
3 Appen Ltd 21 -
6 ARB Corp Ltd 126 0.01
52 Ardent Leisure Group Ltd 29 -
9 Aristocrat Leisure Ltd 201 0.01
54 Asaleo Care Ltd 41 -
2 ASX Ltd 101 0.01
37 Atlas Arteria Ltd 124 0.01
2 AUB Group Ltd 23 -
188 Aurelia Metals Ltd 45 -
135 Aurizon Holdings Ltd 269 0.02
59 AusNet Services 57 -
35 Austal Ltd 45 -
90 Austin Engineering Ltd 6 -
66 Australia & New Zealand Banking Group Ltd 1,040 0.06
31 Australian Agricultural Co Ltd 21 -
6 Australian Ethical Investment Ltd 32 -
27 Australian Finance Group Ltd 41 -
56 Australian Pharmaceutical Industries Ltd 35 -
8 Australian Strategic Materials Ltd 20 -
4 Auswide Bank Ltd 12 -
10 Baby Bunting Group Ltd 33 -
73 Bank of Queensland Ltd 356 0.02
26 Bapcor Ltd 113 0.01
89 Base Resources Ltd 14 -
206 Beach Energy Ltd 143 0.01
31 Bega Cheese Ltd 98 0.01
24 Bell Financial Group Ltd 23 -
45 Bendigo & Adelaide Bank Ltd 255 0.01
88 BHP Group Ltd 2,290 0.12
29 Bingo Industries Ltd 55 -
1 Blackmores Ltd 35 -
22 BlueScope Steel Ltd 253 0.01
87 Boral Ltd 324 0.02
40 Brambles Ltd 237 0.01
20 Bravura Solutions Ltd 35 -
7 Breville Group Ltd 100 0.01
10 Brickworks Ltd 119 0.01
Shares (000's)
Value(000's)
GBP
% of NetAssetValue
Common Stock (continued)
Australia - 1.79% (continued)
13 BWX Ltd 37 -
31 Cardno Ltd 12 -
41 Carnarvon Petroleum Ltd 6 -
16 carsales.com Ltd 167 0.01
62 Cash Converters International Ltd 7 -
7 Cedar Woods Properties Ltd 26 -
60 Challenger Ltd 169 0.01
24 Champion Iron Ltd 87 0.01
3 CIMIC Group Ltd 37 -
12 City Chic Collective Ltd 30 -
5 Class Ltd 5 -
125 Cleanaway Waste Management Ltd 189 0.01
2 Clinuvel Pharmaceuticals Ltd 32 -
11 Clover Corp Ltd 9 -
2 Cochlear Ltd 246 0.01
15 Codan Ltd 153 0.01
27 Coles Group Ltd 241 0.01
15 Collection House Ltd 2 -
12 Collins Foods Ltd 85 0.01
26 Commonwealth Bank of Australia 1,402 0.07
32 Computershare Ltd 279 0.02
122 Cooper Energy Ltd 19 -
5 Corporate Travel Management Ltd 53 -
32 Costa Group Holdings Ltd 57 -
5 Credit Corp Group Ltd 76 0.01
25 Crown Resorts Ltd 173 0.01
7 CSL Ltd 1,055 0.06
55 CSR Ltd 166 0.01
19 Data#3 Ltd 61 -
18 Decmil Group Ltd 5 -
16 Deterra Royalties Ltd 36 -
5 Dicker Data Ltd 26 -
12 Domain Holdings Australia Ltd 34 -
3 Domino's Pizza Enterprises Ltd 196 0.01
63 Downer EDI Ltd 194 0.01
39 Eclipx Group Ltd 45 -
12 Elanor Investor Group 12 -
12 Elders Ltd 75 0.01
35 Emeco Holdings Ltd 17 -
133 Energy World Corp Ltd 6 -
4 Enero Group Ltd 6 -
1 EQT Holdings Ltd 10 -
33 Estia Health Ltd 45 -
8 Euroz Ltd 7 -
8 EVENT Hospitality and Entertainment Ltd 53 -
79 Evolution Mining Ltd 226 0.01
16 Finbar Group Ltd 7 -
15 Fleetwood Corp Ltd 21 -
8 Flight Centre Travel Group Ltd 71 0.01
46 Fortescue Metals Group Ltd 548 0.03
10 Freedom Foods Group Ltd 2 -
81 G8 Education Ltd 44 -
12 Galaxy Resources Ltd (voting rights) 25 -
43 Genworth Mortgage Insurance Australia Ltd 65 -
46 Gold Road Resources Ltd 38 -
23 GrainCorp Ltd 62 -
10 GTN Ltd 2 -
11 GUD Holdings Ltd 68 -
25 GWA Group Ltd 39 -
13 Hansen Technologies Ltd 38 -
57 Harvey Norman Holdings Ltd 164 0.01
60 Healius Ltd 134 0.01
World Equity FundPortfolio of Investments as at 31 May 2021
Dimensional Fund Advisors Semi-Annual Report and Unaudited Financial Statements, 31 May 2021 427

Shares (000's)
Value(000's)
GBP
% of NetAssetValue
Common Stock (continued)
Australia - 1.79% (continued)
4 Helloworld Travel Ltd 4 -
32 HT&E Ltd 31 -
1 HUB24 Ltd 22 -
51 Humm Group Ltd 28 -
4 Huon Aquaculture Group Ltd 5 -
8 IDP Education Ltd 98 0.01
57 IGO Ltd 235 0.01
36 Iluka Resources Ltd 149 0.01
48 Imdex Ltd 54 -
156 Incitec Pivot Ltd 196 0.01
30 Infomedia Ltd 23 -
34 Inghams Group Ltd 63 -
58 Insurance Australia Group Ltd 157 0.01
31 Intega Group Ltd 8 -
9 Integral Diagnostics Ltd 23 -
12 Integrated Research Ltd 15 -
10 InvoCare Ltd 55 -
66 IOOF Holdings Ltd 140 0.01
15 IPH Ltd 54 -
15 IRESS Ltd 85 0.01
9 IVE Group Ltd 7 -
12 James Hardie Industries PLC 276 0.02
29 Japara Healthcare Ltd 18 -
10 JB Hi-Fi Ltd 269 0.02
13 Johns Lyng Group Ltd 30 -
4 Jumbo Interactive Ltd 33 -
10 Juno Minerals Ltd 1 -
165 Jupiter Mines Ltd 26 -
55 Karoon Energy Ltd 37 -
7 Kogan.com Ltd 36 -
22 Lendlease Group 147 0.01
7 Lifestyle Communities Ltd 52 -
62 Link Administration Holdings Ltd 183 0.01
5 Lovisa Holdings Ltd 41 -
- Lycopodium Ltd 1 -
18 Lynas Corp Ltd 55 -
28 MACA Ltd 12 -
164 Macmahon Holdings Ltd 17 -
5 Macquarie Group Ltd 380 0.02
1 Macquarie Telecom Group Ltd 17 -
5 Magellan Financial Group Ltd 130 0.01
189 Mayne Pharma Group Ltd 38 -
8 McMillan Shakespeare Ltd 54 -
16 McPherson's Ltd 13 -
179 Medibank Pvt Ltd 305 0.02
28 Medusa Mining Ltd 13 -
27 Mesoblast Ltd 29 -
47 Metals X Ltd 7 -
108 Metcash Ltd 208 0.01
18 Mineral Resources Ltd 448 0.02
3 MNF Group Ltd 9 -
7 Monadelphous Group Ltd 37 -
50 Monash IVF Group Ltd 23 -
15 Money3 Corp Ltd 26 -
10 Mortgage Choice Ltd 11 -
70 Mount Gibson Iron Ltd 32 -
106 Myer Holdings Ltd 18 -
- Mystate Ltd 1 -
9 MyState Ltd 25 -
77 National Australia Bank Ltd 1,131 0.06
18 Navigator Global Investments Ltd 15 -
9 Netwealth Group Ltd 74 0.01
Shares (000's)
Value(000's)
GBP
% of NetAssetValue
Common Stock (continued)
Australia - 1.79% (continued)
55 New Energy Solar Ltd 25 -
51 New Hope Corp Ltd 40 -
34 Newcrest Mining Ltd 511 0.03
22 NEXTDC Ltd 134 0.01
43 nib holdings Ltd 146 0.01
5 Nick Scali Ltd 28 -
53 Nickel Mines Ltd 29 -
128 Nine Entertainment Co Holdings Ltd 206 0.01
61 Northern Star Resources Ltd 376 0.02
57 NRW Holdings Ltd 53 -
33 Nufarm Ltd 88 0.01
27 OFX Group Ltd 21 -
114 Oil Search Ltd 230 0.01
52 OM Holdings Ltd 24 -
9 Omni Bridgeway Ltd 18 -
64 oOh!media Ltd 59 -
23 Orica Ltd 173 0.01
87 Origin Energy Ltd 192 0.01
16 Orocobre Ltd 57 -
91 Orora Ltd 156 0.01
32 OZ Minerals Ltd 440 0.02
7 Pacific Current Group Ltd 19 -
31 Pact Group Holdings Ltd 61 -
52 Peet Ltd 33 -
17 Pendal Group Ltd 77 0.01
71 Perenti Global Ltd 26 -
6 Perpetual Ltd 120 0.01
114 Perseus Mining Ltd 87 0.01
30 Pilbara Minerals Ltd 20 -
28 Platinum Asset Management Ltd 71 0.01
36 Praemium Ltd 19 -
6 Premier Investments Ltd 82 0.01
5 Pro Medicus Ltd 126 0.01
7 Propel Funeral Partners Ltd 14 -
5 PSC Insurance Group Ltd 10 -
5 PWR Holdings Ltd 18 -
9 Qantas Airways Ltd 25 -
13 QANTM Intellectual Property Ltd 8 -
46 QBE Insurance Group Ltd 275 0.02
99 Qube Holdings Ltd 164 0.01
66 Ramelius Resources Ltd 70 -
7 Ramsay Health Care Ltd 225 0.01
2 REA Group Ltd 155 0.01
28 Redcape Hotel Group 16 -
6 Reece Ltd 63 -
20 Regis Healthcare Ltd 22 -
82 Regis Resources Ltd 118 0.01
4 Reject Shop Ltd 15 -
53 Reliance Worldwide Corp Ltd 150 0.01
103 Resolute Mining Ltd 33 -
197 Retail Food Group Ltd 8 -
26 Ridley Corp Ltd 17 -
8 Rio Tinto Ltd 554 0.03
13 Sandfire Resources NL 52 -
147 Santos Ltd 550 0.03
3 SeaLink Travel Group Ltd 16 -
7 SEEK Ltd 118 0.01
14 Select Harvests Ltd 44 -
13 Senex Energy Ltd 23 -
9 Servcorp Ltd 17 -
33 Service Stream Ltd 18 -
7 Seven Group Holdings Ltd 82 0.01
World Equity FundPortfolio of Investments as at 31 May 2021 (continued)
Dimensional Fund Advisors Semi-Annual Report and Unaudited Financial Statements, 31 May 2021 428

Shares (000's)
Value(000's)
GBP
% of NetAssetValue
Common Stock (continued)
Australia - 1.79% (continued)
66 Seven West Media Ltd 15 -
15 SG Fleet Group Ltd 24 -
129 Sigma Healthcare Ltd 44 -
61 Silver Lake Resources Ltd 65 -
22 Sims Metal Management Ltd 192 0.01
10 SmartGroup Corp Ltd 38 -
17 Sonic Healthcare Ltd 315 0.02
174 South32 Ltd 283 0.02
26 Southern Cross Media Group Ltd 26 -
108 Spark Infrastructure Group 128 0.01
28 SpeedCast International Ltd - -
80 St Barbara Ltd 82 0.01
75 Star Entertainment Grp Ltd 166 0.01
53 Steadfast Group Ltd 116 0.01
40 Suncorp Group Ltd 244 0.01
9 Sunland Group Ltd 12 -
19 Super Retail Group Ltd 132 0.01
32 Superloop Ltd 18 -
28 Sydney Airport 91 0.01
16 Syrah Resources Ltd 9 -
80 Tabcorp Holdings Ltd 225 0.01
29 Tassal Group Ltd 59 -
25 Technology One Ltd 126 0.01
162 Telstra Corp Ltd 308 0.02
25 TPG Telecom Ltd 71 0.01
26 Transurban Group 200 0.01
33 Treasury Wine Estates Ltd 208 0.01
19 Tuas Ltd 7 -
26 United Malt Group Ltd 62 -
9 Virtus Health Ltd 30 -
17 Vita Group Ltd 9 -
54 Viva Energy Group Ltd 60 -
64 Vocus Group Ltd 191 0.01
8 Wagners Holding Co Ltd 11 -
18 Webjet Ltd 50 -
18 Wesfarmers Ltd 536 0.03
39 Western Areas Ltd 53 -
51 Westgold Resources Ltd 63 -
54 Westpac Banking Corp 774 0.04
95 Whitehaven Coal Ltd 83 0.01
2 WiseTech Global Ltd 24 -
25 Woodside Petroleum Ltd 300 0.02
27 Woolworths Group Ltd 625 0.03
21 Worley Ltd 121 0.01
3 Xero Ltd 188 0.01
34,358 1.79
Austria - 0.18%
1 Agrana Beteiligungs AG 23 -
8 Andritz AG 308 0.02
2 AT&S Austria Technologie & Systemtechnik AG 60 -
14 Atrium European Real Estate Ltd 37 -
5 BAWAG Group AG 179 0.01
- DO & CO AG 14 -
14 Erste Group Bank AG 406 0.02
4 EVN AG 73 -
6 Immofinanz AG 96 0.01
1 Lenzing AG 84 -
1 Mayr Melnhof Karton AG 91 0.01
- Oberbank AG 13 -
3 Oesterreichische Post AG 124 0.01
11 OMV AG 435 0.02
1 Palfinger AG 44 -
Shares (000's)
Value(000's)
GBP
% of NetAssetValue
Common Stock (continued)
Austria - 0.18% (continued)
1 POLYTEC Holding AG 14 -
1 Porr AG 17 -
16 Raiffeisen Bank International AG 267 0.01
1 Rosenbauer International AG 28 -
3 S IMMO AG 59 -
1 Schoeller-Bleckmann Oilfield Equipment AG 23 -
1 Semperit AG Holding 37 -
1 Strabag SE 40 -
17 Telekom Austria AG 103 0.01
1 UBM Development AG 25 -
14 UNIQA Insurance Group AG 88 0.01
1 Verbund AG 61 -
4 Vienna Insurance Group AG Wiener VersicherungGruppe 89 0.01
10 Voestalpine AG 322 0.02
11 Wienerberger AG 291 0.02
2 Zumtobel Group AG 15 -
3,466 0.18
Belgium - 0.34%
3 Ackermans & van Haaren NV 292 0.02
12 Ageas 568 0.03
16 AGFA-Gevaert NV 53 -
23 Anheuser-Busch InBev SA 1,205 0.06
- Argenx SE 79 -
1 Atenor 25 -
- Banque Nationale de Belgique 8 -
2 Barco NV 44 -
4 Bekaert SA 129 0.01
10 bpost SA 92 0.01
1 Cie d'Entreprises CFE 82 -
4 Colruyt SA 164 0.01
4 Deceuninck NV 10 -
3 D'ieteren SA 268 0.01
12 Econocom Group SA 35 -
2 Elia System Operator SA 130 0.01
21 Euronav NV 144 0.01
1 EVS Broadcast Equipment SA 23 -
4 Exmar NV 13 -
7 Fagron 108 0.01
- Galapagos NV 7 -
3 Gimv NV 123 0.01
1 Immobel SA 40 -
1 Ion Beam Applications 20 -
1 Jensen-Group NV 13 -
9 KBC Group NV 516 0.03
1 Kinepolis Group NV 50 -
- Lotus Bakeries NV 153 0.01
2 Melexis NV 152 0.01
10 Ontex Group NV 92 -
- Picanol 14 -
16 Proximus SADP 231 0.01
4 Recticel SA 54 -
- Resilux 20 -
- Roularta Media Group NV 5 -
2 Shurgard Self Storage SA 61 -
1 Sipef NV 30 -
5 Solvay SA 478 0.03
3 Telenet Group Holding NV 83 -
- TER Beke SA 9 -
3 Tessenderlo Group SA 94 0.01
2 UCB SA 147 0.01
11 Umicore SA 477 0.03
World Equity FundPortfolio of Investments as at 31 May 2021 (continued)
Dimensional Fund Advisors Semi-Annual Report and Unaudited Financial Statements, 31 May 2021 429

Shares (000's)
Value(000's)
GBP
% of NetAssetValue
Common Stock (continued)
Belgium - 0.34% (continued)
1 Van de Velde NV 15 -
1 VGP NV 101 0.01
2 Viohalco SA 9 -
6,466 0.34
Brazil - 0.70%
26 Cia de Saneamento do Parana 72 -
20 AES Brasil Energia SA 38 -
3 Aliansce Sonae Shopping Centers sa 13 -
5 Alliar Medicos A Frente SA 8 -
15 Alupar Investimento SA 55 -
37 Ambev SA, ADR 91 0.01
18 Anima Holding SA 31 -
2 Arezzo Industria e Comercio SA 24 -
22 Atacadao SA 66 -
6 Azul SA, ADR 113 0.01
1 B2W Cia Digital 11 -
102 B3 SA - Brasil Bolsa Balcao 241 0.01
28 Banco Bradesco SA 88 0.01
12 Banco BTG Pactual SA 197 0.01
30 Banco do Brasil SA 138 0.01
9 Banco Santander Brasil SA 47 -
30 BB Seguridade Participacoes SA 95 0.01
22 BK Brasil Operacao e Assessoria a RestaurantesSA 32 -
57 BR Malls Participacoes SA 87 0.01
16 BR Properties SA 20 -
8 BrasilAgro - Co Brasileira de Propriedades Agricolas 34 -
61 BRF SA 212 0.01
10 C&A Modas Ltd 18 -
13 Camil Alimentos SA 17 -
121 CCR SA 227 0.01
9 Centrais Eletricas Brasileiras SA 52 -
15 Cia Brasileira de Distribuicao 81 0.01
35 Cia de Locacao das Americas 124 0.01
18 Cia de Saneamento Basico do Estado de Sao Paulo 97 0.01
20 Cia de Saneamento de Minas Gerais-COPASA 47 -
18 Cia de Saneamento do Parana 10 -
14 Cia Energetica de Minas Gerais 32 -
10 Cia Hering 45 -
17 Cia Paranaense de Energia 73 -
83 Cia Siderurgica Nacional SA 498 0.03
122 Cielo SA 69 -
175 Cogna Educacao 101 0.01
11 Construtora Tenda SA 34 -
42 Cosan SA 124 0.01
4 CPFL Energia SA 16 -
6 CSU Cardsystem SA 19 -
29 Cyrela Brazil Realty SA Empreendimentos eParticipacoes 93 0.01
5 Cyrela Commercial Properties SA Empreendimentose Participacoes 7 -
7 Dimed SA Distribuidora da Medicamentos 18 -
10 Direcional Engenharia SA 18 -
24 Duratex SA 66 -
14 EcoRodovias Infraestrutura e Logistica SA 23 -
22 EDP - Energias do Brasil SA 56 -
74 Embraer SA 175 0.01
4 Embraer SA, ADR 34 -
14 Enauta Participacoes SA 29 -
12 Energisa SA 79 0.01
50 Eneva SA 119 0.01
7 Engie Brasil Energia SA 35 -
Shares (000's)
Value(000's)
GBP
% of NetAssetValue
Common Stock (continued)
Brazil - 0.70% (continued)
52 Equatorial Energia SA 179 0.01
22 Even Construtora e Incorporadora SA 32 -
5 Ez Tec Empreendimentos e Participacoes SA 22 -
23 Fleury SA 81 0.01
59 Gafisa SA 35 -
4 Gol Linhas Aereas Inteligentes SA, ADR 27 -
10 Grendene SA 14 -
10 Guararapes Confeccoes SA 26 -
14 Hapvida Participacoes e Investimentos SA 30 -
12 Helbor Empreendimentos SA 14 -
30 Hypera SA 145 0.01
5 Iguatemi Empresa de Shopping Centers SA 31 -
6 Industrias Romi SA 24 -
5 Instituto Hermes Pardini SA 14 -
59 International Meal Co Alimentacao SA 31 -
13 Iochpe Maxion SA 31 -
47 IRB Brasil Resseguros SA 38 -
6 Itau Unibanco Holding SA 21 -
94 JBS SA 384 0.02
48 JHSF Participacoes SA 49 -
2 JSL SA 2 -
2 Kepler Weber SA 11 -
68 Klabin SA 239 0.01
19 Light SA 44 -
5 Linx SA, ADR 25 -
24 Localiza Rent a Car SA 204 0.01
7 LOG Commercial Properties e Participacoes SA 30 -
6 Log-in Logistica Intermodal SA 17 -
9 Lojas Americanas SA 22 -
55 Lojas Renner SA 353 0.02
7 M Dias Branco SA 25 -
55 Magazine Luiza SA 151 0.01
7 Mahle-Metal Leve SA 25 -
25 Marcopolo SA 9 -
35 Marfrig Global Foods SA 85 0.01
17 Marisa Lojas SA 17 -
13 Mills Estruturas e Servicos de Engenharia SA 14 -
46 Minerva SA 62 -
11 Movida Participacoes SA 25 -
36 MRV Engenharia e Participacoes SA 86 0.01
22 Multiplan Empreendimentos Imobiliarios SA 77 0.01
33 Natura & Co Holding SA 228 0.01
7 Natura & Co Holding SA, ADR 97 0.01
11 Notre Dame Intermedica Participacoes SA 127 0.01
28 Odontoprev SA 50 -
5 Omega Geracao SA 27 -
78 Petro Rio SA 207 0.01
51 Petrobras Distribuidora SA 178 0.01
174 Petroleo Brasileiro SA 628 0.03
13 Porto Seguro SA 94 0.01
13 Portobello SA 26 -
12 Positivo Tecnologia SA 23 -
6 Profarma Distribuidora de Produtos FarmaceuticosSA 6 -
26 Qualicorp Consultoria e Corretora de Seguros SA 101 0.01
53 Raia Drogasil SA 198 0.01
1 Restoque Comercio e Confeccoes de Roupas SA 1 -
90 Rumo SA 255 0.01
3 Sao Carlos Empreendimentos e Participacoes SA 16 -
22 Sao Martinho SA 103 0.01
15 Sendas Distribuidora SA 184 0.01
7 Ser Educacional SA 14 -
World Equity FundPortfolio of Investments as at 31 May 2021 (continued)
Dimensional Fund Advisors Semi-Annual Report and Unaudited Financial Statements, 31 May 2021 430
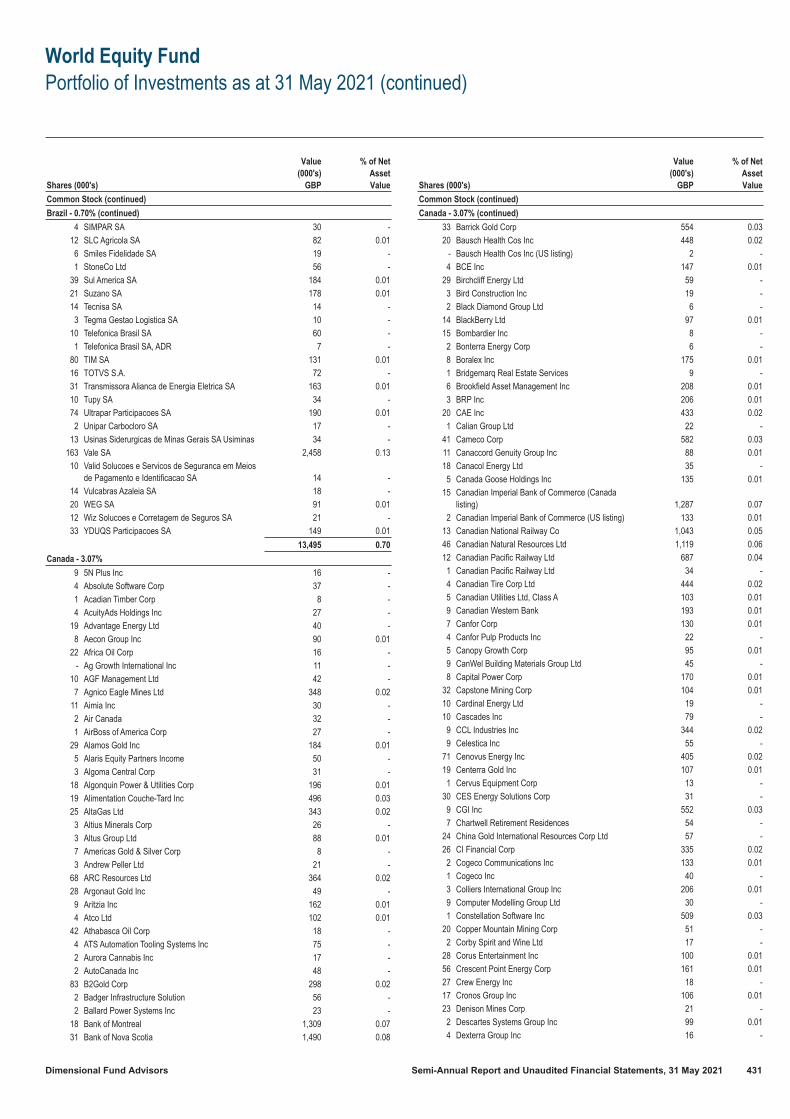
Shares (000's)
Value(000's)
GBP
% of NetAssetValue
Common Stock (continued)
Brazil - 0.70% (continued)
4 SIMPAR SA 30 -
12 SLC Agricola SA 82 0.01
6 Smiles Fidelidade SA 19 -
1 StoneCo Ltd 56 -
39 Sul America SA 184 0.01
21 Suzano SA 178 0.01
14 Tecnisa SA 14 -
3 Tegma Gestao Logistica SA 10 -
10 Telefonica Brasil SA 60 -
1 Telefonica Brasil SA, ADR 7 -
80 TIM SA 131 0.01
16 TOTVS S.A. 72 -
31 Transmissora Alianca de Energia Eletrica SA 163 0.01
10 Tupy SA 34 -
74 Ultrapar Participacoes SA 190 0.01
2 Unipar Carbocloro SA 17 -
13 Usinas Siderurgicas de Minas Gerais SA Usiminas 34 -
163 Vale SA 2,458 0.13
10 Valid Solucoes e Servicos de Seguranca em Meiosde Pagamento e Identificacao SA 14 -
14 Vulcabras Azaleia SA 18 -
20 WEG SA 91 0.01
12 Wiz Solucoes e Corretagem de Seguros SA 21 -
33 YDUQS Participacoes SA 149 0.01
13,495 0.70
Canada - 3.07%
9 5N Plus Inc 16 -
4 Absolute Software Corp 37 -
1 Acadian Timber Corp 8 -
4 AcuityAds Holdings Inc 27 -
19 Advantage Energy Ltd 40 -
8 Aecon Group Inc 90 0.01
22 Africa Oil Corp 16 -
- Ag Growth International Inc 11 -
10 AGF Management Ltd 42 -
7 Agnico Eagle Mines Ltd 348 0.02
11 Aimia Inc 30 -
2 Air Canada 32 -
1 AirBoss of America Corp 27 -
29 Alamos Gold Inc 184 0.01
5 Alaris Equity Partners Income 50 -
3 Algoma Central Corp 31 -
18 Algonquin Power & Utilities Corp 196 0.01
19 Alimentation Couche-Tard Inc 496 0.03
25 AltaGas Ltd 343 0.02
3 Altius Minerals Corp 26 -
3 Altus Group Ltd 88 0.01
7 Americas Gold & Silver Corp 8 -
3 Andrew Peller Ltd 21 -
68 ARC Resources Ltd 364 0.02
28 Argonaut Gold Inc 49 -
9 Aritzia Inc 162 0.01
4 Atco Ltd 102 0.01
42 Athabasca Oil Corp 18 -
4 ATS Automation Tooling Systems Inc 75 -
2 Aurora Cannabis Inc 17 -
2 AutoCanada Inc 48 -
83 B2Gold Corp 298 0.02
2 Badger Infrastructure Solution 56 -
2 Ballard Power Systems Inc 23 -
18 Bank of Montreal 1,309 0.07
31 Bank of Nova Scotia 1,490 0.08
Shares (000's)
Value(000's)
GBP
% of NetAssetValue
Common Stock (continued)
Canada - 3.07% (continued)
33 Barrick Gold Corp 554 0.03
20 Bausch Health Cos Inc 448 0.02
- Bausch Health Cos Inc (US listing) 2 -
4 BCE Inc 147 0.01
29 Birchcliff Energy Ltd 59 -
3 Bird Construction Inc 19 -
2 Black Diamond Group Ltd 6 -
14 BlackBerry Ltd 97 0.01
15 Bombardier Inc 8 -
2 Bonterra Energy Corp 6 -
8 Boralex Inc 175 0.01
1 Bridgemarq Real Estate Services 9 -
6 Brookfield Asset Management Inc 208 0.01
3 BRP Inc 206 0.01
20 CAE Inc 433 0.02
1 Calian Group Ltd 22 -
41 Cameco Corp 582 0.03
11 Canaccord Genuity Group Inc 88 0.01
18 Canacol Energy Ltd 35 -
5 Canada Goose Holdings Inc 135 0.01
15 Canadian Imperial Bank of Commerce (Canadalisting) 1,287 0.07
2 Canadian Imperial Bank of Commerce (US listing) 133 0.01
13 Canadian National Railway Co 1,043 0.05
46 Canadian Natural Resources Ltd 1,119 0.06
12 Canadian Pacific Railway Ltd 687 0.04
1 Canadian Pacific Railway Ltd 34 -
4 Canadian Tire Corp Ltd 444 0.02
5 Canadian Utilities Ltd, Class A 103 0.01
9 Canadian Western Bank 193 0.01
7 Canfor Corp 130 0.01
4 Canfor Pulp Products Inc 22 -
5 Canopy Growth Corp 95 0.01
9 CanWel Building Materials Group Ltd 45 -
8 Capital Power Corp 170 0.01
32 Capstone Mining Corp 104 0.01
10 Cardinal Energy Ltd 19 -
10 Cascades Inc 79 -
9 CCL Industries Inc 344 0.02
9 Celestica Inc 55 -
71 Cenovus Energy Inc 405 0.02
19 Centerra Gold Inc 107 0.01
1 Cervus Equipment Corp 13 -
30 CES Energy Solutions Corp 31 -
9 CGI Inc 552 0.03
7 Chartwell Retirement Residences 54 -
24 China Gold International Resources Corp Ltd 57 -
26 CI Financial Corp 335 0.02
2 Cogeco Communications Inc 133 0.01
1 Cogeco Inc 40 -
3 Colliers International Group Inc 206 0.01
9 Computer Modelling Group Ltd 30 -
1 Constellation Software Inc 509 0.03
20 Copper Mountain Mining Corp 51 -
2 Corby Spirit and Wine Ltd 17 -
28 Corus Entertainment Inc 100 0.01
56 Crescent Point Energy Corp 161 0.01
27 Crew Energy Inc 18 -
17 Cronos Group Inc 106 0.01
23 Denison Mines Corp 21 -
2 Descartes Systems Group Inc 99 0.01
4 Dexterra Group Inc 16 -
World Equity FundPortfolio of Investments as at 31 May 2021 (continued)
Dimensional Fund Advisors Semi-Annual Report and Unaudited Financial Statements, 31 May 2021 431

Shares (000's)
Value(000's)
GBP
% of NetAssetValue
Common Stock (continued)
Canada - 3.07% (continued)
4 DIRTT Environmental Solutions 9 -
9 Dollarama Inc 286 0.02
2 Dorel Industries Inc 15 -
3 DREAM Unlimited Corp 42 -
16 Dundee Precious Metals Inc 82 -
20 ECN Capital Corp 96 0.01
- E-L Financial Corp Ltd 114 0.01
22 Eldorado Gold Corp 181 0.01
47 Element Fleet Management Corp 371 0.02
9 Emera Inc 282 0.02
13 Empire Co Ltd 314 0.02
19 Enbridge Inc (Canada listing) 517 0.03
18 Endeavour Mining Corp 307 0.02
14 Enerflex Ltd 64 -
6 Energy Fuels Inc 29 -
14 Enerplus Corp 64 -
4 Enghouse Systems Ltd 133 0.01
16 Ensign Energy Services Inc 12 -
5 Equinox Gold Corp 35 -
1 Equitable Group Inc 97 0.01
6 ERO Copper Corp 94 0.01
3 Evertz Technologies Ltd 31 -
2 Exchange Income Corp 44 -
3 Exco Technologies Ltd 22 -
9 Extendicare Inc 44 -
2 Fairfax Financial Holdings Ltd 601 0.03
6 Fiera Capital Corp 39 -
20 Finning International Inc 347 0.02
3 Firm Capital Mortgage Investment Corp 23 -
8 First Capital Real Estate Investment Trust 78 -
7 First Majestic Silver Corp 82 -
2 First National Financial Corp 58 -
33 First Quantum Minerals Ltd 574 0.03
2 FirstService Corp 272 0.01
29 Fission Uranium Corp 10 -
10 Fortis Inc (Canada listing) 316 0.02
2 Fortis Inc (US listing) 48 -
8 Fortuna Silver Mines Inc 40 -
1 Franco-Nevada Corp 127 0.01
14 Freehold Royalties Ltd 72 -
8 Frontera Energy Corp 31 -
29 Galiano Gold Inc 27 -
3 Gamehost Inc 12 -
1 GDI Integrated Facility Services Inc 17 -
5 George Weston Ltd 376 0.02
17 Gibson Energy Inc 237 0.01
5 Gildan Activewear Inc 137 0.01
1 goeasy Ltd 108 0.01
5 Golden Star Resources Ltd 13 -
10 GoldMoney Inc 17 -
42 Gran Tierra Energy Inc 19 -
6 Great Canadian Gaming Corp 155 0.01
11 Great-West Lifeco Inc 242 0.01
3 Guardian Capital Group Ltd 46 -
1 Hardwoods Distribution Inc 19 -
9 Headwater Exploration Inc 24 -
2 Heroux-Devtek Inc 22 -
3 High Liner Foods Inc 21 -
1 HLS Therapeutics Inc 11 -
7 Home Capital Group Inc 136 0.01
38 Hudbay Minerals Inc 200 0.01
8 Hydro One Ltd 143 0.01
Shares (000's)
Value(000's)
GBP
% of NetAssetValue
Common Stock (continued)
Canada - 3.07% (continued)
11 i-80 Gold Corp 16 -
11 iA Financial Corp Inc 440 0.02
44 IAMGOLD Corp 112 0.01
3 IBI Group Inc 17 -
6 IGM Financial Inc 150 0.01
4 Imperial Metals Corp 11 -
10 Imperial Oil Ltd 237 0.01
2 Information Services Corp 29 -
6 Innergex Renewable Energy Inc 71 -
5 Intact Financial Corp 434 0.02
34 Inter Pipeline Ltd 354 0.02
8 Interfor Corp 140 0.01
7 Intertape Polymer Group Inc 125 0.01
4 Invesque Inc 8 -
28 Ivanhoe Mines Ltd 145 0.01
3 Jamieson Wellness Inc 61 -
- K-Bro Linen Inc 10 -
22 Kelt Exploration Ltd 39 -
16 Keyera Corp 281 0.02
1 Kinaxis Inc 90 0.01
105 Kinross Gold Corp 599 0.03
12 Kirkland Lake Gold Ltd 371 0.02
13 Knight Therapeutics Inc 41 -
1 KP Tissue Inc 4 -
7 Labrador Iron Ore Royalty Corp 171 0.01
1 Largo Resources Ltd 12 -
- Lassonde Industries Inc 48 -
6 Laurentian Bank of Canada 145 0.01
4 Leon's Furniture Ltd 53 -
5 LifeWorks Inc 104 0.01
1 Lightspeed POS Inc 46 -
5 Linamar Corp 214 0.01
10 Loblaw Cos Ltd 413 0.02
42 Lucara Diamond Corp 19 -
3 Lundin Gold Inc 24 -
69 Lundin Mining Corp 522 0.03
3 Magellan Aerospace Corp 16 -
18 Magna International Inc 1,267 0.07
- Mainstreet Equity Corp 21 -
6 Major Drilling Group International Inc 38 -
38 Manulife Financial Corp 565 0.03
7 Maple Leaf Foods Inc 113 0.01
11 Martinrea International Inc 88 0.01
5 Medical Facilities Corp 21 -
26 MEG Energy Corp 120 0.01
2 Melcor Developments Ltd 16 -
7 Methanex Corp 182 0.01
11 Metro Inc 367 0.02
- Morguard Corp 25 -
1 MTY Food Group Inc 22 -
10 Mullen Group Ltd 72 -
22 National Bank of Canada 1,235 0.07
1 Neo Performance Materials Inc 13 -
108 New Gold Inc 161 0.01
3 NFI Group Inc 44 -
5 Nighthawk Gold Corp 4 -
5 North American Construction Group Ltd 48 -
6 North West Co Inc 128 0.01
12 Northland Power Inc 293 0.02
22 Nutrien Ltd 965 0.05
28 NuVista Energy Ltd 50 -
82 OceanaGold Corp 122 0.01
World Equity FundPortfolio of Investments as at 31 May 2021 (continued)
Dimensional Fund Advisors Semi-Annual Report and Unaudited Financial Statements, 31 May 2021 432
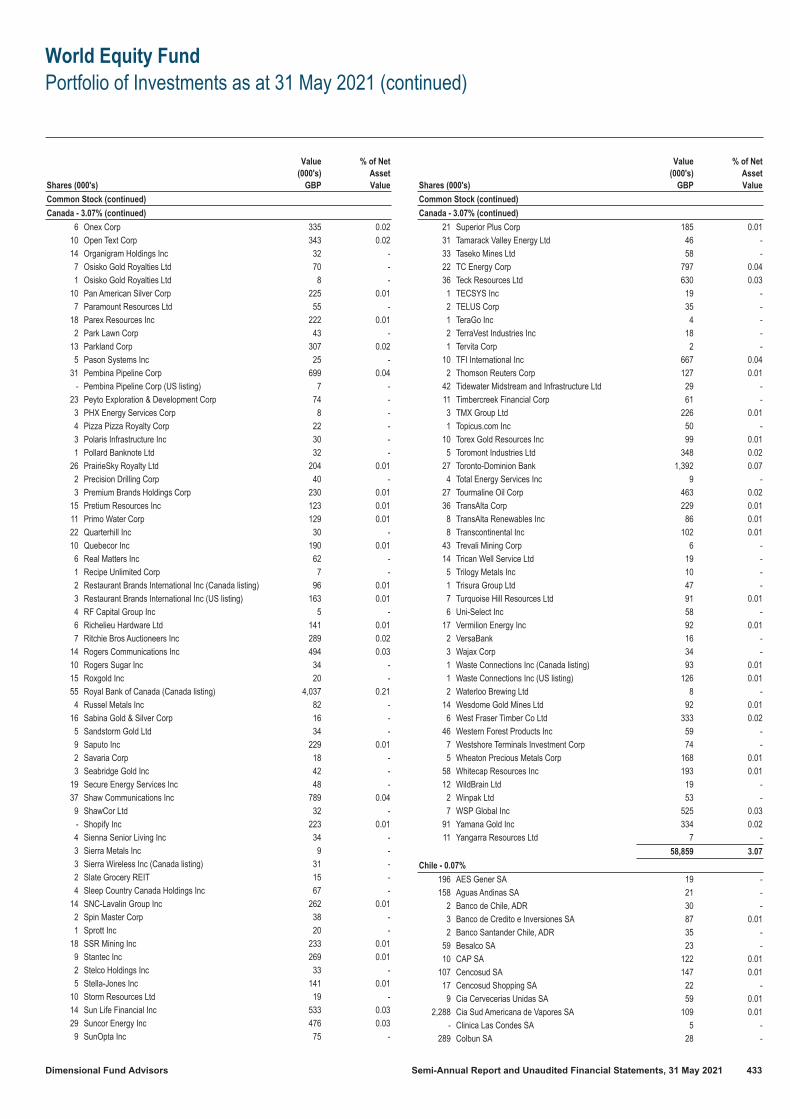
Shares (000's)
Value(000's)
GBP
% of NetAssetValue
Common Stock (continued)
Canada - 3.07% (continued)
6 Onex Corp 335 0.02
10 Open Text Corp 343 0.02
14 Organigram Holdings Inc 32 -
7 Osisko Gold Royalties Ltd 70 -
1 Osisko Gold Royalties Ltd 8 -
10 Pan American Silver Corp 225 0.01
7 Paramount Resources Ltd 55 -
18 Parex Resources Inc 222 0.01
2 Park Lawn Corp 43 -
13 Parkland Corp 307 0.02
5 Pason Systems Inc 25 -
31 Pembina Pipeline Corp 699 0.04
- Pembina Pipeline Corp (US listing) 7 -
23 Peyto Exploration & Development Corp 74 -
3 PHX Energy Services Corp 8 -
4 Pizza Pizza Royalty Corp 22 -
3 Polaris Infrastructure Inc 30 -
1 Pollard Banknote Ltd 32 -
26 PrairieSky Royalty Ltd 204 0.01
2 Precision Drilling Corp 40 -
3 Premium Brands Holdings Corp 230 0.01
15 Pretium Resources Inc 123 0.01
11 Primo Water Corp 129 0.01
22 Quarterhill Inc 30 -
10 Quebecor Inc 190 0.01
6 Real Matters Inc 62 -
1 Recipe Unlimited Corp 7 -
2 Restaurant Brands International Inc (Canada listing) 96 0.01
3 Restaurant Brands International Inc (US listing) 163 0.01
4 RF Capital Group Inc 5 -
6 Richelieu Hardware Ltd 141 0.01
7 Ritchie Bros Auctioneers Inc 289 0.02
14 Rogers Communications Inc 494 0.03
10 Rogers Sugar Inc 34 -
15 Roxgold Inc 20 -
55 Royal Bank of Canada (Canada listing) 4,037 0.21
4 Russel Metals Inc 82 -
16 Sabina Gold & Silver Corp 16 -
5 Sandstorm Gold Ltd 34 -
9 Saputo Inc 229 0.01
2 Savaria Corp 18 -
3 Seabridge Gold Inc 42 -
19 Secure Energy Services Inc 48 -
37 Shaw Communications Inc 789 0.04
9 ShawCor Ltd 32 -
- Shopify Inc 223 0.01
4 Sienna Senior Living Inc 34 -
3 Sierra Metals Inc 9 -
3 Sierra Wireless Inc (Canada listing) 31 -
2 Slate Grocery REIT 15 -
4 Sleep Country Canada Holdings Inc 67 -
14 SNC-Lavalin Group Inc 262 0.01
2 Spin Master Corp 38 -
1 Sprott Inc 20 -
18 SSR Mining Inc 233 0.01
9 Stantec Inc 269 0.01
2 Stelco Holdings Inc 33 -
5 Stella-Jones Inc 141 0.01
10 Storm Resources Ltd 19 -
14 Sun Life Financial Inc 533 0.03
29 Suncor Energy Inc 476 0.03
9 SunOpta Inc 75 -
Shares (000's)
Value(000's)
GBP
% of NetAssetValue
Common Stock (continued)
Canada - 3.07% (continued)
21 Superior Plus Corp 185 0.01
31 Tamarack Valley Energy Ltd 46 -
33 Taseko Mines Ltd 58 -
22 TC Energy Corp 797 0.04
36 Teck Resources Ltd 630 0.03
1 TECSYS Inc 19 -
2 TELUS Corp 35 -
1 TeraGo Inc 4 -
2 TerraVest Industries Inc 18 -
1 Tervita Corp 2 -
10 TFI International Inc 667 0.04
2 Thomson Reuters Corp 127 0.01
42 Tidewater Midstream and Infrastructure Ltd 29 -
11 Timbercreek Financial Corp 61 -
3 TMX Group Ltd 226 0.01
1 Topicus.com Inc 50 -
10 Torex Gold Resources Inc 99 0.01
5 Toromont Industries Ltd 348 0.02
27 Toronto-Dominion Bank 1,392 0.07
4 Total Energy Services Inc 9 -
27 Tourmaline Oil Corp 463 0.02
36 TransAlta Corp 229 0.01
8 TransAlta Renewables Inc 86 0.01
8 Transcontinental Inc 102 0.01
43 Trevali Mining Corp 6 -
14 Trican Well Service Ltd 19 -
5 Trilogy Metals Inc 10 -
1 Trisura Group Ltd 47 -
7 Turquoise Hill Resources Ltd 91 0.01
6 Uni-Select Inc 58 -
17 Vermilion Energy Inc 92 0.01
2 VersaBank 16 -
3 Wajax Corp 34 -
1 Waste Connections Inc (Canada listing) 93 0.01
1 Waste Connections Inc (US listing) 126 0.01
2 Waterloo Brewing Ltd 8 -
14 Wesdome Gold Mines Ltd 92 0.01
6 West Fraser Timber Co Ltd 333 0.02
46 Western Forest Products Inc 59 -
7 Westshore Terminals Investment Corp 74 -
5 Wheaton Precious Metals Corp 168 0.01
58 Whitecap Resources Inc 193 0.01
12 WildBrain Ltd 19 -
2 Winpak Ltd 53 -
7 WSP Global Inc 525 0.03
91 Yamana Gold Inc 334 0.02
11 Yangarra Resources Ltd 7 -
58,859 3.07
Chile - 0.07%
196 AES Gener SA 19 -
158 Aguas Andinas SA 21 -
2 Banco de Chile, ADR 30 -
3 Banco de Credito e Inversiones SA 87 0.01
2 Banco Santander Chile, ADR 35 -
59 Besalco SA 23 -
10 CAP SA 122 0.01
107 Cencosud SA 147 0.01
17 Cencosud Shopping SA 22 -
9 Cia Cervecerias Unidas SA 59 0.01
2,288 Cia Sud Americana de Vapores SA 109 0.01
- Clinica Las Condes SA 5 -
289 Colbun SA 28 -
World Equity FundPortfolio of Investments as at 31 May 2021 (continued)
Dimensional Fund Advisors Semi-Annual Report and Unaudited Financial Statements, 31 May 2021 433

Shares (000's)
Value(000's)
GBP
% of NetAssetValue
Common Stock (continued)
Chile - 0.07% (continued)
1 Embotelladora Andina SA, ADR 10 -
16 Empresa Nacional de Telecomunicaciones SA 60 0.01
32 Empresas CMPC SA 56 -
6 Empresas COPEC SA 40 -
4 Empresas Lipigas SA 16 -
685 Enel Americas SA 66 0.01
440 Enel Chile SA 18 -
6 Enel Chile SA, ADR 12 -
21 Engie Energia Chile SA 12 -
5 Forus SA 7 -
142 Grupo Security SA 19 -
23 Hortifrut SA 21 -
49 Inversiones Aguas Metropolitanas SA 19 -
3 Inversiones La Construccion SA 13 -
12,591 Itau CorpBanca 27 -
1 Itau CorpBanca, ADR 4 -
10 Latam Airlines Group SA 19 -
12 Latam Airlines Group SA, ADR 24 -
32 Parque Arauco SA 33 -
10 PAZ Corp SA 5 -
11 Plaza SA 13 -
43 Ripley Corp SA 9 -
33 Salfacorp SA 14 -
25 Sigdo Koppers SA 18 -
249 SMU SA 24 -
359 Sociedad Matriz SAAM SA 18 -
2 Sociedad Quimica y Minera de Chile SA, ADR 57 -
19 Socovesa SA 4 -
24 Vina Concha y Toro SA 31 -
1,376 0.07
China - 4.35%
3 21Vianet Group Inc, ADR 42 -
9 360 Security Technology Inc 12 -
107 361 Degrees International Ltd 34 -
145 3SBio Inc 118 0.01
1 51job Inc, ADR 68 0.01
33 5I5J Holding Group Co Ltd 19 -
69 AAC Technologies Holdings Inc 294 0.02
95 AAG Energy Holdings Ltd 11 -
6 Accelink Technologies Co 15 -
4 Addsino Co Ltd 8 -
6 AECC Aero-Engine Control Co Ltd 13 -
9 Aerospace Hi-Tech Holdings Grp Ltd 9 -
118 Agile Group Holdings Ltd 117 0.01
1,133 Agricultural Bank of China Ltd 324 0.02
4 Aier Eye Hospital Group Co Ltd 33 -
170 Air China Ltd 100 0.01
8 Aisino Corp 11 -
86 Ajisen China Holdings Ltd 11 -
30 AK Medical Holdings Ltd 38 -
55 Alibaba Group Holding Ltd 1,029 0.06
15 Alibaba Group Holding Ltd, ADR 2,211 0.12
26 Alibaba Health Information Technology Ltd 45 -
1,150 Alibaba Pictures Group Ltd 109 0.01
42 A-Living Smart City Services Co Ltd 144 0.01
410 Aluminum Corp of China Ltd 170 0.01
1 Amoy Diagnostics Co Ltd 9 -
104 Angang Steel Co Ltd 48 -
3 Angel Yeast Co Ltd 19 -
89 Anhui Conch Cement Co Ltd 388 0.02
20 Anhui Construction Engineering Group Co Ltd 9 -
56 Anhui Expressway Co Ltd 26 -
Shares (000's)
Value(000's)
GBP
% of NetAssetValue
Common Stock (continued)
China - 4.35% (continued)
5 Anhui Guangxin Agrochemical Co Ltd 16 -
1 Anhui Gujing Distillery Co Ltd 13 -
16 Anhui Jianghuai Automobile Group Corp Ltd 17 -
37 Anhui Jiangnan Chemical Industry Co Ltd 20 -
3 Anhui Jinhe Industrial Co Ltd 12 -
3 Anhui Kouzi Distillery Co Ltd 25 -
16 Anhui Tatfook Technology 16 -
16 Anhui Truchum Advanced Materials & TechnologyCo Ltd 14 -
7 Anhui Yingjia Distillery Co Ltd 32 -
13 Anhui Zhongding Sealing Parts Co Ltd 16 -
34 ANTA Sports Products Ltd 484 0.03
406 Anton Oilfield Services Group 19 -
2 Aoshikang Technology Co Ltd 17 -
6 Apeloa Pharmaceutical Co Ltd 15 -
34 APT Satellite Holdings Ltd 8 -
50 Ascletis Pharma Inc 17 -
56 Asia Cement China Holdings Corp 38 -
15 AsiaInfo Technologies Ltd 18 -
1 Asymchem Laboratories Tianjin Co Ltd 24 -
73 Ausnutria Dairy Corp Ltd 81 0.01
1 Autobio Diagnostics Co Ltd 12 -
3 Avary Holding Shenzhen Co Ltd 12 -
20 Avic Capital Co Ltd 9 -
496 AVIC International Holding HK Ltd 6 -
2 AVIC Shenyang Aircraft Co Ltd 13 -
4 AVIC Xi'an Aircraft Industry Group Co Ltd 11 -
204 AviChina Industry & Technology Co Ltd 96 0.01
54 Babytree Group 6 -
1 Bafang Electric Suzhou Co 16 -
15 BAIC BluePark New Energy Technology Co Ltd 26 -
182 BAIC Motor Corp Ltd 48 -
3 Baidu Inc, ADR 349 0.02
48 BAIOO Family Interactive Ltd 7 -
20 Bank of Beijing Co Ltd 11 -
20 Bank of Changsha Co Ltd 21 -
11 Bank of Chengdu Co Ltd 17 -
1,497 Bank of China Ltd 400 0.02
76 Bank of Chongqing Co Ltd 37 -
300 Bank of Communications Co Ltd 143 0.01
34 Bank of Guiyang Co Ltd 29 -
14 Bank of Hangzhou Co Ltd 25 -
55 Bank of Jiangsu Co Ltd 47 -
28 Bank of Nanjing Co Ltd 32 -
9 Bank of Ningbo Co Ltd 41 -
20 Bank of Shanghai Co Ltd 19 -
19 Bank of Suzhou Co Ltd 16 -
87 Bank of Zhengzhou Co Ltd 16 -
51 Baoshan Iron & Steel Co Ltd 45 -
24 Baoye Group Co Ltd 10 -
5 Baozun Inc, ADR 119 0.01
284 BBMG Corp 39 -
2 Bear Electric Appliance Co 12 -
10 Beibuwan Port Co Ltd 9 -
7 BeiGene Ltd 135 0.01
4 Beijing Aosaikang Pharmaceutical Co Ltd 6 -
66 Beijing Capital Co Ltd 22 -
12 Beijing Capital Development Co Ltd 7 -
198 Beijing Capital International Airport Co Ltd 95 0.01
237 Beijing Capital Land Ltd 23 -
3 Beijing Career International 19 -
6 Beijing Chunlizhengda Medical Instruments Co Ltd 15 -
World Equity FundPortfolio of Investments as at 31 May 2021 (continued)
Dimensional Fund Advisors Semi-Annual Report and Unaudited Financial Statements, 31 May 2021 434

Shares (000's)
Value(000's)
GBP
% of NetAssetValue
Common Stock (continued)
China - 4.35% (continued)
19 Beijing Dabeinong Technology Group Co Ltd 17 -
3 Beijing Easpring Material Technology 19 -
4 Beijing E-Hualu Information Technology Co Ltd 11 -
428 Beijing Energy International Holding Co Ltd 11 -
13 Beijing Enlight Media Co Ltd 17 -
1,731 Beijing Enterprises Clean Energy Group Ltd 15 -
39 Beijing Enterprises Holdings Ltd 97 0.01
670 Beijing Enterprises Water Group Ltd 189 0.01
1,312 Beijing Gas Blue Sky Holdings Ltd 10 -
14 Beijing GeoEnviron Engineering & Technology Inc 29 -
17 Beijing Jetsen Technology Co Ltd 7 -
92 Beijing Jingneng Clean Energy Co Ltd 14 -
3 Beijing Kunlun Tech Co Ltd 7 -
7 Beijing New Building Materials PLC 32 -
84 Beijing North Star Co Ltd 11 -
27 Beijing Orient Landscape & Environment Co Ltd 11 -
11 Beijing Orient National Communication Science &Technology Co Ltd 12 -
6 Beijing Oriental Yuhong Waterproof Technology CoLtd 40 -
29 Beijing Originwater Technology Co Ltd 23 -
10 Beijing Sanju Environmental Protection and NewMaterial Co Ltd 7 -
3 Beijing Shunxin Agriculture Co Ltd 17 -
17 Beijing Sinnet Technology Co Ltd 29 -
12 Beijing SL Pharmaceutical Co Ltd 15 -
26 Beijing SPC Environment Protection Tech Co Ltd 15 -
8 Beijing Thunisoft Corp Ltd 16 -
3 Beijing Tiantan Biological Products Corp Ltd 12 -
4 Beijing Tongrentang Co Ltd 17 -
2 Beijing Tongtech Co Ltd 8 -
27 Beijing Urban Construction Design & DevelopmentGroup Co Ltd 6 -
23 Beijing Yanjing Brewery Co Ltd 19 -
1 Beijing Yuanliu Hongyuan Electronic Technology 16 -
14 Beijing Zhong Ke San Huan High-Tech Co Ltd 14 -
5 Berry Genomics Co Ltd 20 -
10 BEST Inc 10 -
30 Best Pacific International Holdings Ltd 8 -
14 Bestsun Energy Co Ltd 8 -
6 Better Life Commercial Chain Share Co Ltd 5 -
1 BGI Genomics Co Ltd 14 -
8 Biem.L.Fdlkk Garment Co Ltd 18 -
6 Blue Sail Medical Co Ltd 13 -
20 Bluefocus Intelligent Communications Group Co Ltd 14 -
61 BOE Technology Group Co Ltd 43 -
82 Bohai Leasing Co Ltd 23 -
342 Bosideng International Holdings Ltd 131 0.01
46 Boyaa Interactive International Ltd 2 -
9 Bright Dairy & Food Co Ltd 17 -
294 Brilliance China Automotive Holdings Ltd 195 0.01
9 B-Soft Co Ltd 11 -
7 BTG Hotels Group Co Ltd 21 -
15 BYD Co Ltd 243 0.02
57 BYD Electronic International Co Ltd 256 0.02
111 C C Land Holdings Ltd 19 -
9 C&D International Investment Group Ltd 12 -
9 C&D Property Management Group 4 -
7 C&S Paper Co Ltd 27 -
46 CA Cultural Technology Group Ltd 14 -
51 Cabbeen Fashion Ltd 15 -
15 Caitong Securities Co Ltd 18 -
Shares (000's)
Value(000's)
GBP
% of NetAssetValue
Common Stock (continued)
China - 4.35% (continued)
6 Camel Group Co Ltd 8 -
26 Camsing International Holding Ltd 1 -
15 Canny Elevator Co Ltd 15 -
- CanSino Biologics Inc 11 -
55 Canvest Environmental Protection Group Co Ltd 20 -
688 Capital Environment Holdings Ltd 9 -
27 CECEP Solar Energy Co Ltd 20 -
36 CECEP Wind-Power Corp 16 -
110 Central China Management Co Ltd 15 -
110 Central China Real Estate Ltd 22 -
66 Central China Securities Co Ltd 10 -
164 CGN Meiya Power Holdings Co Ltd 35 -
367 CGN Power Co Ltd 57 0.01
- Changchun High & New Technology Industry GroupInc 18 -
24 Changjiang Securities Co Ltd 21 -
1 Changzhou Xingyu Automotive Lighting Systems CoLtd 21 -
70 Chaowei Power Holdings Ltd 18 -
4 Chaozhou Three-Circle Group Co Ltd 16 -
5 Cheetah Mobile Inc, ADR 8 -
14 Chengdu Hongqi Chain Co Ltd 10 -
7 Chengdu Kanghong Pharmaceutical Group 18 -
29 Chengdu Xingrong Environment Co Ltd 17 -
18 Chengtun Mining Group Co Ltd 16 -
5 Chifeng Jilong Gold Mining Co Ltd 9 -
176 China Aerospace International Holdings Ltd 11 -
16 China Aerospace Times Electronics Co Ltd 13 -
585 China Agri-Products Exchange Ltd 6 -
35 China Aircraft Leasing Group Holdings Ltd 20 -
122 China Aoyuan Group Ltd 101 0.01
16 China Baoan Group Co Ltd 17 -
274 China BlueChemical Ltd 61 0.01
34 China Boton Group Co Ltd 14 -
7 China Building Material Test & Certification GroupCo Ltd 18 -
11 China CAMC Engineering Co Ltd 8 -
332 China Chengtong Development Group Ltd 6 -
819 China Cinda Asset Management Co Ltd 123 0.01
269 China CITIC Bank Corp Ltd 104 0.01
267 China Coal Energy Co Ltd 114 0.01
234 China Communications Services Corp Ltd 69 0.01
107 China Conch Venture Holdings Ltd 347 0.02
3,453 China Construction Bank Corp 2,005 0.11
8 China CYTS Tours Holding Co Ltd 9 -
174 China Datang Corp Renewable Power Co Ltd 27 -
134 China Development Bank Financial Leasing Co Ltd 14 -
218 China Dili Group 41 -
374 China Dongxiang Group Co Ltd 33 -
670 China Dynamics Holdings Ltd 10 -
268 China Eastern Airlines Corp Ltd 89 0.01
43 China Education Group Holdings Ltd 77 0.01
408 China Electronics Optics Valley Union Holding CoLtd 16 -
222 China Energy Engineering Corp Ltd 15 -
44 China Enterprise Co Ltd 16 -
240 China Everbright Bank Co Ltd 72 0.01
184 China Everbright Environment Group Ltd 77 0.01
95 China Everbright Greentech Ltd 26 -
76 China Everbright Ltd 67 0.01
26 China Everbright Water Ltd 4 -
137 China Evergrande Group 150 0.01
World Equity FundPortfolio of Investments as at 31 May 2021 (continued)
Dimensional Fund Advisors Semi-Annual Report and Unaudited Financial Statements, 31 May 2021 435

Shares (000's)
Value(000's)
GBP
% of NetAssetValue
Common Stock (continued)
China - 4.35% (continued)
11 China Film Co Ltd 16 -
122 China Foods Ltd 35 -
36 China Fortune Land Development Co Ltd 22 -
304 China Galaxy Securities Co Ltd 135 0.01
225 China Gas Holdings Ltd 603 0.03
25 China Gezhouba Group Co Ltd 19 -
44 China Grand Automotive Services Group Co Ltd 14 -
92 China Grand Pharmaceutical and HealthcareHoldings Ltd 67 0.01
14 China Great Wall Securities Co Ltd 17 -
96 China Greenland Broad Greenstate Group Co Ltd 2 -
70 China Hanking Holdings Ltd 9 -
113 China Harmony New Energy Auto Holding Ltd 37 -
25 China High Speed Railway Technology Co Ltd 6 -
42 China High Speed Transmission Equipment GroupCo Ltd 19 -
156 China Hongqiao Group Ltd 178 0.01
1,302 China Huarong Asset Management Co Ltd 121 0.01
54 China Huirong Financial Holdings Ltd 6 -
74 China International Capital Corp Ltd 154 0.01
66 China International Marine Containers Group Co Ltd 89 0.01
428 China Jinmao Holdings Group Ltd 117 0.01
9 China Jushi Co Ltd 16 -
68 China Kepei Education Group Ltd 37 -
120 China Lesso Group Holdings Ltd 214 0.01
177 China Life Insurance Co Ltd 265 0.02
56 China Lilang Ltd 25 -
8 China Literature Ltd 57 0.01
70 China Logistics Property Holdings Co Ltd 27 -
128 China Longyuan Power Group Corp Ltd 130 0.01
138 China Machinery Engineering Corp 43 -
224 China Maple Leaf Educational Systems Ltd 33 -
950 China Medical & HealthCare Group Ltd 11 -
151 China Medical System Holdings Ltd 266 0.02
6 China Meheco Co Ltd 8 -
44 China Meidong Auto Holdings Ltd 165 0.01
117 China Mengniu Dairy Co Ltd 488 0.03
158 China Merchants Bank Co Ltd 1,033 0.06
57 China Merchants Energy Shipping Co Ltd 34 -
162 China Merchants Land Ltd 16 -
172 China Merchants Port Holdings Co Ltd 200 0.01
13 China Merchants Securities Co Ltd 14 -
9 China Merchants Shekou Industrial Zone HoldingsCo Ltd 12 -
257 China Minsheng Banking Corp Ltd 96 0.01
430 China Minsheng Financial Holding Corp Ltd 4 -
175 China Modern Dairy Holdings Ltd 32 -
207 China Molybdenum Co Ltd 98 0.01
3 China National Accord Medicines Corp Ltd 14 -
363 China National Building Material Co Ltd 339 0.02
7 China National Medicines Corp Ltd 29 -
39 China National Nuclear Power Co Ltd 23 -
17 China New Higher Education Group Ltd 9 -
220 China New Town Development Co Ltd 3 -
29 China Nonferrous Metal Industry's ForeignEngineering and Construction Co Ltd 16 -
248 China Oceanwide Holdings Ltd 4 -
704 China Oil & Gas Group Ltd 27 -
184 China Oilfield Services Ltd 121 0.01
176 China Oriental Group Co Ltd 41 -
166 China Overseas Grand Oceans Group Ltd 74 0.01
272 China Overseas Land & Investment Ltd 465 0.03
Shares (000's)
Value(000's)
GBP
% of NetAssetValue
Common Stock (continued)
China - 4.35% (continued)
45 China Overseas Property Holdings Ltd 33 -
205 China Pacific Insurance Group Co Ltd 549 0.03
866 China Petroleum & Chemical Corp 330 0.02
319 China Power International Development Ltd 56 0.01
16 China Publishing & Media Co Ltd 12 -
363 China Railway Group Ltd 135 0.01
10 China Railway Hi-tech Industry Co Ltd 9 -
168 China Railway Signal & Communication Corp Ltd 48 -
14 China Railway Tielong Container Logistics Co Ltd 8 -
292 China Rare Earth Holdings Ltd 25 -
557 China Reinsurance Group Corp 43 -
17 China Renaissance Holdings Ltd 33 -
46 China Resources Beer Holdings Co Ltd 285 0.02
218 China Resources Cement Holdings Ltd 163 0.01
9 China Resources Double Crane Pharmaceutical CoLtd 12 -
94 China Resources Gas Group Ltd 411 0.02
322 China Resources Land Ltd 1,072 0.06
111 China Resources Medical Holdings Co Ltd 79 0.01
215 China Resources Pharmaceutical Group Ltd 108 0.01
100 China Resources Power Holdings Co Ltd 91 0.01
6 China Resources Sanjiu Medical & PharmaceuticalCo Ltd 18 -
26 China Risun Group Ltd 14 -
79 China Sanjiang Fine Chemicals Co Ltd 23 -
275 China SCE Group Holdings Ltd 88 0.01
140 China Shanshui Cement Group Ltd 26 -
363 China Shengmu Organic Milk Ltd 20 -
256 China Shenhua Energy Co Ltd 399 0.02
39 China Shineway Pharmaceutical Group Ltd 29 -
102 China Shuifa Singyes Energy Holdings Ltd 10 -
108 China Silver Group Ltd 10 -
466 China South City Holdings Ltd 36 -
23 China South Publishing & Media Group Co Ltd 25 -
252 China Southern Airlines Co Ltd 126 0.01
82 China State Construction Development Holdings Ltd 9 -
96 China State Construction Engineering Corp Ltd 52 0.01
45 China Sunshine Paper Holdings Co Ltd 8 -
141 China Suntien Green Energy Corp Ltd 42 -
164 China Taiping Insurance Holdings Co Ltd 215 0.01
18 China Tian Lun Gas Holdings Ltd 13 -
58 China Tianrui Group Cement Co Ltd 34 -
26 China Tianying Inc 14 -
2 China Tourism Group Duty Free Corp Ltd 80 0.01
1,538 China Tower Corp Ltd 148 0.01
316 China Traditional Chinese Medicine Holdings Co Ltd 143 0.01
6 China TransInfo Technology Co Ltd 10 -
290 China Travel International Investment Hong KongLtd 34 -
17 China Tungsten And Hightech Materials 15 -
108 China Vanke Co Ltd 262 0.02
40 China Vast Industrial Urban Development Co Ltd 11 -
66 China Water Affairs Group Ltd 36 -
100 China Water Industry Group Ltd 3 -
9 China West Construction Group Co Ltd 8 -
36 China Wood Optimization Holding Ltd 3 -
30 China Xinhua Education Group Ltd 6 -
78 China XLX Fertiliser Ltd 24 -
21 China Yangtze Power Co Ltd 46 -
72 China Yongda Automobiles Services Holdings Ltd 90 0.01
88 China Yuhua Education Corp Ltd 62 0.01
141 China ZhengTong Auto Services Holdings Ltd 8 -
World Equity FundPortfolio of Investments as at 31 May 2021 (continued)
Dimensional Fund Advisors Semi-Annual Report and Unaudited Financial Statements, 31 May 2021 436

Shares (000's)
Value(000's)
GBP
% of NetAssetValue
Common Stock (continued)
China - 4.35% (continued)
4 China Zhenhua Group Science & Technology Co Ltd 21 -
22 China Zheshang Bank Co Ltd 7 -
108 China Zhongwang Holdings Ltd 19 -
246 Chinasoft International Ltd 223 0.01
19 Chinese Universe Publishing and Media Group CoLtd 22 -
1 Chongqing Brewery Co Ltd 23 -
8 Chongqing Changan Automobile Co Ltd 20 -
3 Chongqing Department Store Co Ltd 12 -
51 Chongqing Dima Industry Co Ltd 16 -
12 Chongqing Fuling Electric Power Industrial Co Ltd 20 -
4 Chongqing Fuling Zhacai Group Co Ltd 20 -
309 Chongqing Rural Commercial Bank Co Ltd 100 0.01
2 Chongqing Zhifei Biological Products Co Ltd 40 -
13 Chongqing Zongshen Power Machinery Co Ltd 10 -
6 Chow Tai Seng Jewellery Co Ltd 19 -
48 Chu Kong Shipping Enterprises Group Co Ltd 5 -
394 CIFI Holdings Group Co Ltd 242 0.01
88 CIMC Enric Holdings Ltd 57 0.01
30 Cinda Real Estate Co Ltd 13 -
64 CITIC Guoan Information Industry Co Ltd 16 -
201 CITIC Ltd 166 0.01
354 CITIC Resources Holdings Ltd 10 -
64 CITIC Securities Co Ltd 125 0.01
172 Citychamp Watch & Jewellery Group Ltd 26 -
17 CMST Development Co Ltd 10 -
4 CNHTC Jinan Truck Co Ltd 16 -
9 CNNC Hua Yuan Titanium Dioxide Co Ltd 13 -
17 COFCO Biotechnology Co Ltd 19 -
34 COFCO Joycome Foods Ltd 11 -
15 COFCO Sugar Holding Co Ltd 16 -
168 Cogobuy Group 33 -
45 Colour Life Services Group Co Ltd 14 -
86 Comba Telecom Systems Holdings Ltd 15 -
780 Concord New Energy Group Ltd 37 -
60 Consun Pharmaceutical Group Ltd 31 -
1 Contemporary Amperex Technology Co Ltd 59 0.01
176 Coolpad Group Ltd 6 -
375 COSCO SHIPPING Development Co Ltd 52 0.01
112 COSCO SHIPPING Energy Transportation Co Ltd 37 -
116 COSCO SHIPPING Holdings Co Ltd 171 0.01
78 COSCO SHIPPING International Hong Kong Co Ltd 19 -
216 COSCO SHIPPING Ports Ltd 124 0.01
648 Country Garden Holdings Co Ltd 582 0.03
44 Country Garden Services Holdings Co Ltd 316 0.02
892 CP Pokphand Co Ltd 80 0.01
92 CPMC Holdings Ltd 39 -
44 CSC Financial Co Ltd 40 -
22 CSG Holding Co Ltd 25 -
850 CSPC Pharmaceutical Group Ltd 900 0.05
10 CSSC Offshore and Marine Engineering Group CoLtd 7 -
322 CT Environmental Group Ltd 2 -
11 CTS International Logistics Ltd 18 -
660 CWT International Ltd 5 -
3 D&O Home Collection Co Ltd 6 -
8 Da An Gene Co Ltd of Sun Yat-Sen University 19 -
48 Da Ming International Holdings Ltd 12 -
24 DaFa Properties Group Ltd 14 -
249 Dali Foods Group Co Ltd 111 0.01
24 Daqin Railway Co Ltd 18 -
5 Dare Power Dekor Home Co Ltd 7 -
Shares (000's)
Value(000's)
GBP
% of NetAssetValue
Common Stock (continued)
China - 4.35% (continued)
1 Dashang Co Ltd 3 -
2 DaShenLin Pharmaceutical Group 15 -
222 Datang International Power Generation Co Ltd 25 -
96 Dawnrays Pharmaceutical Holdings Ltd 16 -
7 Dazzle Fashion Co Ltd 14 -
12 DBG Technology Co Ltd 13 -
12 Deppon Logistics Co Ltd 16 -
81 Dexin China Holdings Co Ltd 23 -
24 DHC Software Co Ltd 20 -
4 Dian Diagnostics Group Co 18 -
442 Differ Group Holding Co Ltd 85 0.01
3 Digital China Group Co Ltd 7 -
79 Digital China Holdings Ltd 38 -
10 Digital China Information Service 16 -
2 Dong-E-E-Jiao Co Ltd 10 -
54 Dongfang Electric Corp Ltd 35 -
282 Dongfeng Motor Group Co Ltd 189 0.01
20 Dongjiang Environmental Co Ltd 8 -
10 Dongxing Securities Co Ltd 13 -
148 Dongyue Group Ltd 79 0.01
19 Doushen Beijing Education & Technology Inc 13 -
2 DouYu International Holdings ADR 11 -
45 Dynagreen Environmental Protection Group Co Ltd 15 -
13 East Group Co Ltd 9 -
7 East Money Information Co Ltd 25 -
13 Easysight Supply Chain Management Co Ltd 9 -
168 E-Commodities Holdings Ltd 6 -
4 Edifier Technology Co Ltd 7 -
24 E-House China Enterprise Holdings Ltd 17 -
30 Elion Clean Energy Co Ltd 11 -
8 ENN Ecological Holdings Co Ltd 15 -
32 ENN Energy Holdings Ltd 415 0.02
34 Essex Bio-Technology Ltd 16 -
25 Eternal Asia Supply Chain Management Ltd 16 -
64 EVA Precision Industrial Holdings Ltd 4 -
27 Everbright Securities Co Ltd 17 -
- Fang Holdings Ltd, ADR 2 -
21 Fangda Carbon New Material Co Ltd 20 -
19 Fangda Special Steel Technology Co Ltd 19 -
5 Fanhua Inc, ADR 44 -
198 Fantasia Holdings Group Co Ltd 19 -
186 Far East Horizon Ltd 143 0.01
7 FAW Jiefang Group Co Ltd 9 -
19 FAWER Automotive Parts Co Ltd 14 -
9 FiberHome Telecommunication Technologies Co Ltd 18 -
4 Fibocom Wireless Inc 17 -
427 FIH Mobile Ltd 46 -
22 Financial Street Holdings Co Ltd 18 -
6 FinVolution Group, ADR 32 -
31 First Capital Securities Co Ltd 25 -
50 First Tractor Co Ltd 19 -
18 Flat Glass Group Co Ltd 36 -
30 Focus Media Information Technology Co Ltd 35 -
6 Foshan Haitian Flavouring & Food Co Ltd 85 0.01
195 Fosun International Ltd 222 0.01
160 Founder Holdings Co Ltd 11 -
35 Founder Securities Co Ltd 40 -
38 FriendTimes Inc 9 -
1 Fu Jian Anjoy Foods Co Ltd 22 -
93 Fu Shou Yuan International Group Ltd 70 0.01
203 Fufeng Group Ltd 47 -
13 Fujian Funeng Co Ltd 14 -
World Equity FundPortfolio of Investments as at 31 May 2021 (continued)
Dimensional Fund Advisors Semi-Annual Report and Unaudited Financial Statements, 31 May 2021 437

Shares (000's)
Value(000's)
GBP
% of NetAssetValue
Common Stock (continued)
China - 4.35% (continued)
13 Fujian Longking Co Ltd 12 -
8 Fujian Longma Environmental Sanitation EquipmentCo Ltd 14 -
2 Fujian Star-net Communication Co Ltd 5 -
11 Fujian Sunner Development Co Ltd 31 -
492 Fullshare Holdings Ltd 8 -
15 Fusen Pharmaceutical Co Ltd 5 -
- Futu Holdings Ltd ADR 16 -
26 Fuyao Glass Industry Group Co Ltd 117 0.01
1 Ganfeng Lithium 8 -
9 Gansu Qilianshan Cement Group Co Ltd 12 -
6 Gansu Shangfeng Cement Co Ltd 13 -
- G-bits Network Technology Xiamen Co Ltd 10 -
702 GCL New Energy Holdings Ltd 15 -
1,465 GCL-Poly Energy Holdings Ltd 263 0.02
1 GDS Holdings Ltd, ADR 62 0.01
326 Geely Automobile Holdings Ltd 582 0.03
19 Gemdale Corp 22 -
756 Gemdale Properties & Investment Corp Ltd 78 0.01
133 Genertec Universal Medical Group Co Ltd 85 0.01
20 Genimous Technology Co Ltd 15 -
109 GF Securities Co Ltd 110 0.01
7 Giant Network Group Co Ltd 10 -
1 Ginlong Technologies Co Ltd 25 -
177 Glorious Property Holdings Ltd 4 -
130 Glory Sun Land Group Ltd 3 -
7 GoerTek Inc 29 -
40 Golden Eagle Retail Group Ltd 25 -
2 GoldenHome Living Co Ltd 12 -
29 Goldlion Holdings Ltd 5 -
17 Goldpac Group Ltd 3 -
5 Gotion High-Tech Co Ltd 19 -
97 Grand Baoxin Auto Group Ltd 6 -
20 Grandjoy Holdings Group Co Ltd 9 -
169 Great Wall Motor Co Ltd 330 0.02
17 Greattown Holdings Ltd 7 -
95 Greatview Aseptic Packaging Co Ltd 32 -
5 Gree Electric Appliances Inc of Zhuhai 31 -
23 Gree Real Estate Co Ltd 21 -
79 Greenland Holdings Corp Ltd 50 -
114 Greenland Hong Kong Holdings Ltd 27 -
111 Greentown China Holdings Ltd 90 0.01
120 Greentown Service Group Co Ltd 131 0.01
11 GRG Banking Equipment Co Ltd 14 -
21 Guangdong Baolihua New Energy Stock Co Ltd 13 -
3 Guangdong Haid Group Co Ltd 28 -
38 Guangdong HEC Technology Holding Co Ltd 19 -
4 Guangdong Hongda Blasting Co Ltd 14 -
26 Guangdong Huatie Tongda High-speed RailwayEquipment Corp 16 -
128 Guangdong Investment Ltd 134 0.01
50 Guangdong Land Holdings Ltd 5 -
12 Guangdong Tapai Group Co Ltd 15 -
5 Guangdong Xinbao Electrical Appliances HoldingsCo Ltd 17 -
36 Guangdong Yueyun Transportation Co Ltd 5 -
14 Guangdong Zhongsheng Pharmaceutical Co Ltd 13 -
56 Guanghui Energy Co Ltd 20 -
186 Guangshen Railway Co Ltd 28 -
12 Guangxi Liugong Machinery Co Ltd 11 -
27 Guangxi Wuzhou Zhongheng Group Co Ltd 9 -
194 Guangzhou Automobile Group Co Ltd 118 0.01
Shares (000's)
Value(000's)
GBP
% of NetAssetValue
Common Stock (continued)
China - 4.35% (continued)
16 Guangzhou Baiyun International Airport Co Ltd 21 -
22 Guangzhou Baiyunshan Pharmaceutical HoldingsCo Ltd 45 -
25 Guangzhou Haige Communications Group Inc Co 28 -
2 Guangzhou Kingmed Diagnostics Group Co Ltd 29 -
163 Guangzhou R&F Properties Co Ltd 155 0.01
4 Guangzhou Restaurant Group 17 -
1 Guangzhou Shiyuan Electronic Technology Co Ltd 17 -
3 Guangzhou Tinci Materials Technology 30 -
2 Guangzhou Wondfo Biotech Co Ltd 19 -
8 Guangzhou Yuexiu Financial Holdings Group Co Ltd 12 -
19 Guizhou Panjiang Refined Coal Co Ltd 15 -
11 Guizhou Xinbang Pharmaceutical Co Ltd 14 -
59 Guolian Securities Co Ltd 21 -
23 Guomai Technologies Inc 16 -
164 Guorui Properties Ltd 4 -
11 Guosen Securities Co Ltd 14 -
13 Guosheng Financial Holding Inc 17 -
16 Guotai Junan Securities Co Ltd 17 -
32 Guoyuan Securities Co Ltd 29 -
143 Haichang Ocean Park Holdings Ltd 8 -
7 Haier Smart Home Co Ltd 25 -
237 Haier Smart Home Co Ltd 701 0.04
12 Hainan Meilan International Airport Co Ltd 36 -
26 Hainan Strait Shipping Co Ltd 17 -
75 Haitian International Holdings Ltd 191 0.01
137 Haitong Securities Co Ltd 92 0.01
8 Haitong UniTrust International Leasing 1 -
22 Hand Enterprise Solutions Co Ltd 17 -
8 Hang Zhou Great Star Industrial Co Ltd 31 -
5 Hangcha Group Co Ltd 10 -
6 Hangjin Technology Co Ltd 16 -
21 Hangxiao Steel Structure Co Ltd 8 -
25 Hangzhou Binjiang Real Estate Group Co Ltd 13 -
2 Hangzhou First Applied Material Co Ltd 18 -
8 Hangzhou Oxygen Plant Group Co Ltd 27 -
7 Hangzhou Robam Appliances Co Ltd 34 -
9 Han's Laser Technology Industry Group Co Ltd 38 -
77 Harbin Bank Co Ltd 7 -
11 Harbin Boshi Automation Co Ltd 15 -
88 Harbin Electric Co Ltd 17 -
91 HC Group Inc 8 -
24 Health & Happiness H&H International Holdings Ltd 65 0.01
5 Hebei Hengshui Laobaigan Liquor Co Ltd 16 -
3 Hefei Meiya Optoelectronic Technology Inc 16 -
10 Heilongjiang Agriculture Co Ltd 17 -
21 Henan Pinggao Electric Co Ltd 14 -
17 Henan Shenhuo Coal & Power Co Ltd 22 -
8 Henan Shuanghui Investment & Development CoLtd 33 -
39 Henan Zhongyuan Expressway Co Ltd 15 -
59 Hengan International Group Co Ltd 283 0.02
228 Hengdeli Holdings Ltd 6 -
10 Hengdian Group DMEGC Magnetics Co Ltd 15 -
22 Hengli Petrochemical Co Ltd 72 0.01
24 HengTen Networks Group Ltd 17 -
12 Hengtong Optic-Electric Co Ltd 16 -
15 Hengyi Petrochemical Co Ltd 20 -
74 Hesteel Co Ltd 21 -
5 Hexing Electrical Co Ltd 7 -
291 Hi Sun Technology China Ltd 39 -
33 Hisense Home Appliances Group Co Ltd 35 -
World Equity FundPortfolio of Investments as at 31 May 2021 (continued)
Dimensional Fund Advisors Semi-Annual Report and Unaudited Financial Statements, 31 May 2021 438

Shares (000's)
Value(000's)
GBP
% of NetAssetValue
Common Stock (continued)
China - 4.35% (continued)
2 Hithink RoyalFlush Information Network Co Ltd 28 -
18 HKC Holdings Ltd 13 -
47 Holitech Technology Co Ltd 18 -
34 Hongda Xingye Co Ltd 16 -
4 Hongfa Technology Co Ltd 27 -
223 Honghua Group Ltd 5 -
22 Honworld Group Ltd 6 -
190 Hope Education Group Co Ltd 40 -
68 Hopson Development Holdings 232 0.01
30 Hua Hong Semiconductor Ltd 115 0.01
26 Huaan Securities Co Ltd 19 -
118 Huadian Power International Corp Ltd 26 -
11 Huadong Medicine Co Ltd 65 0.01
15 Huafa Industrial Co Ltd Zhuhai 12 -
16 Huafon Microfibre Shanghai Technology Co Ltd 10 -
12 Huafu Fashion Co Ltd 7 -
7 Hualan Biological Engineering 29 -
240 Huaneng Power International Inc 60 0.01
110 Huanxi Media Group Ltd 19 -
20 Huapont Life Sciences Co Ltd 16 -
45 Huatai Securities Co Ltd 49 -
30 Huaxi Holdings Co Ltd 8 -
15 Huaxi Securities Co Ltd 16 -
28 Huaxia Bank Co Ltd 20 -
10 Huaxin Cement Co Ltd 24 -
10 Huayu Automotive Systems Co Ltd 27 -
60 Huazhong In-Vehicle Holdings Co Ltd 10 -
4 Huazhu Group Ltd, ADR 175 0.01
36 Hubei Biocause Pharmaceutical Co Ltd 16 -
7 Hubei Jumpcan Pharmaceutical Co Ltd 14 -
10 Hubei Kaile Science & Technology Co Ltd 9 -
9 Hubei Xingfa Chemicals Group Co Ltd 19 -
51 Huishang Bank Corp Ltd 12 -
5 Hunan Aihua Group Co Ltd 18 -
56 Hunan Dakang International Food & Agriculture CoLtd 15 -
16 Hunan Gold Corp Ltd 15 -
68 Hunan Valin Steel Co Ltd 52 0.01
2 Hundsun Technologies Inc 17 -
18 Huolinhe Opencut Coal Industry Corp Ltd of InnerMongolia 21 -
1 HUYA Inc ADR 13 -
21 Hytera Communications Corp Ltd 12 -
13 HyUnion Holding Co Ltd 8 -
34 iDreamSky Technology Holdings Ltd 13 -
5 Iflytek Co Ltd 31 -
16 IMAX China Holding Inc 19 -
2,468 Industrial & Commercial Bank of China Ltd 1,142 0.06
52 Industrial Bank Co Ltd 135 0.01
19 Industrial Securities Co Ltd 23 -
17 Infore Environment Technology Group Co Ltd 15 -
71 Inke Ltd 15 -
87 Inner Mongolia BaoTou Steel Union Co Ltd 15 -
7 Inner Mongolia Eerduosi Resources Co Ltd 15 -
8 Inner Mongolia First Machinery Group Co Ltd 9 -
24 Inner Mongolia Junzheng Energy & ChemicalIndustry Group Co Ltd 15 -
57 Inner Mongolia MengDian HuaNeng Thermal PowerCorp Ltd 15 -
12 Inner Mongolia Yili Industrial Group Co Ltd 53 0.01
8 Inner Mongolia Yitai Coal Co Ltd 4 -
42 Inner Mongolia Yuan Xing Energy Co Ltd 19 -
Shares (000's)
Value(000's)
GBP
% of NetAssetValue
Common Stock (continued)
China - 4.35% (continued)
9 Innovent Biologics Inc 73 0.01
4 Inspur Electronic Information Industry Co Ltd 13 -
42 Inspur International Ltd 8 -
4 IReader Technology Co Ltd 12 -
2 Jafron Biomedical Co Ltd 21 -
2 Jason Furniture Hangzhou Co Ltd 22 -
12 JCET Group Co Ltd 46 -
5 JD.com Inc 134 0.01
3 JD.com Inc, ADR 159 0.01
7 Jiajiayue Group Co Ltd 15 -
5 Jiangling Motors Corp Ltd 14 -
513 Jiangnan Group Ltd 18 -
58 Jiangsu Akcome Science & Technology Co Ltd 16 -
31 Jiangsu Changshu Rural Commercial Bank Co Ltd 24 -
66 Jiangsu Expressway Co Ltd 56 0.01
14 Jiangsu Guotai International Group Co Ltd 11 -
4 Jiangsu Hengli Hydraulic Co Ltd 32 -
4 Jiangsu Hengrui Medicine Co Ltd 38 -
7 Jiangsu Hengshun Vinegar Industry Co Ltd 16 -
36 Jiangsu Jiangyin Rural Commercial Bank Co Ltd 16 -
5 Jiangsu Kanion Pharmaceutical Co Ltd 6 -
4 Jiangsu King's Luck Brewery JSC Ltd 28 -
21 Jiangsu Leike Defense Technology Co Ltd 15 -
3 Jiangsu Lihua Animal Husbandry Stock 10 -
15 Jiangsu Linyang Energy Co Ltd 11 -
10 Jiangsu Nhwa Pharmaceutical Co Ltd 17 -
10 Jiangsu Provincial Agricultural Reclamation andDevelopment Corp 12 -
21 Jiangsu Shagang Co Ltd 23 -
9 Jiangsu Shuangxing Color Plastic New Materials 14 -
2 Jiangsu Yanghe Brewery Joint-Stock Co Ltd 48 -
2 Jiangsu Yangnong Chemical Co Ltd 22 -
5 Jiangsu Yuyue Medical Equipment & Supply Co Ltd 17 -
14 Jiangsu Zhangjiagang Rural Commercial Bank CoLtd 9 -
29 Jiangsu Zhongnan Construction Group Co Ltd 22 -
25 Jiangsu Zhongtian Technology Co Ltd 29 -
26 Jiangsu Zijin Rural Commercial Bank Co Ltd 11 -
83 Jiangxi Copper Co Ltd 137 0.01
6 Jiangxi Huangshanghuang Group Food 13 -
8 Jiangxi Wannianqing Cement Co Ltd 11 -
19 Jiangxi Zhengbang Technology Co Ltd 27 -
17 Jiaozuo Wanfang Aluminum Manufacturing Co Ltd 15 -
155 Jiayuan International Group Ltd 56 0.01
9 Jilin Aodong Pharmaceutical Group Co Ltd 16 -
108 Jinchuan Group International Resources Co Ltd 12 -
26 Jinduicheng Molybdenum Co Ltd 17 -
42 Jingrui Holdings Ltd 9 -
19 Jinke Properties Group Co Ltd 13 -
4 JinkoSolar Holding Co Ltd, ADR 93 0.01
8 Jinneng Science&Technology Co Ltd 17 -
1 JiuGui Liquor Co Ltd 19 -
15 Jiuzhitang Co Ltd 16 -
52 Jizhong Energy Resources Co Ltd 23 -
6 JL Mag Rare-Earth Co Ltd 17 -
30 JNBY Design Ltd 40 -
10 Joincare Pharmaceutical Group Industry Co Ltd 16 -
1 Joinn Laboratories China 16 -
10 Jointown Pharmaceutical Group Co Ltd 19 -
5 Jonjee Hi-Tech Industrial And Commercial HoldingCo Ltd 28 -
638 Joy City Property Ltd 29 -
World Equity FundPortfolio of Investments as at 31 May 2021 (continued)
Dimensional Fund Advisors Semi-Annual Report and Unaudited Financial Statements, 31 May 2021 439

Shares (000's)
Value(000's)
GBP
% of NetAssetValue
Common Stock (continued)
China - 4.35% (continued)
6 Joyoung Co Ltd 22 -
5 JOYY Inc, ADR 256 0.02
5 JSTI Group 3 -
122 Ju Teng International Holdings Ltd 20 -
9 Juneyao Airlines Co Ltd 17 -
243 Kaisa Group Holdings Ltd 79 0.01
5 Kaisa Prosperity Holdings Ltd 13 -
15 Kaiser China Cultural Co Ltd 15 -
51 Kangda International Environmental Co Ltd 3 -
99 Kasen International Holdings Ltd 7 -
80 Kingboard Holdings Ltd 312 0.02
120 Kingboard Laminates Holdings Ltd 183 0.01
29 Kingdee International Software Group Co Ltd 78 0.01
49 Kingsoft Corp Ltd 233 0.01
11 Konka Group Co Ltd 8 -
9 KPC Pharmaceuticals Inc 9 -
6 Kuang-Chi Technologies Co 13 -
318 Kunlun Energy Co Ltd 254 0.02
1 Kweichow Moutai Co Ltd 359 0.02
187 KWG Group Holdings Ltd 201 0.01
94 KWG Living Group Holdings Ltd 67 0.01
2 Lao Feng Xiang Co Ltd 12 -
3 Laobaixing Pharmacy Chain JSC 16 -
20 Launch Tech Co Ltd 7 -
28 Lee & Man Chemical Co Ltd 11 -
165 Lee & Man Paper Manufacturing Ltd 106 0.01
28 Lee's Pharmaceutical Holdings Ltd 12 -
51 Legend Holdings Corp 57 0.01
810 Lenovo Group Ltd 688 0.04
14 Lens Technology Co Ltd 45 -
36 Leo Group Co Ltd 9 -
7 Lepu Medical Technology Beijing Co Ltd 27 -
10 LexinFintech Holdings Ltd, ADR 63 0.01
13 Leyard Optoelectronic Co Ltd 10 -
117 Li Ning Co Ltd 761 0.04
13 LianChuang Electronic Technology Co Ltd 18 -
57 Lianhua Supermarket Holdings Co Ltd 5 -
6 Liaoning Cheng Da Co Ltd 14 -
6 Liaoning Wellhope Agri-Tech JSC Ltd 7 -
6 Lier Chemical Co Ltd 15 -
308 Lifetech Scientific Corp 134 0.01
25 Lingyi iTech Guangdong Co 24 -
15 Liuzhou Iron & Steel Co Ltd 11 -
16 Livzon Pharmaceutical Group Inc 56 0.01
25 LK Technology Holdings Ltd 27 -
132 Logan Property Holdings Co Ltd 149 0.01
9 Lomon Billions Group Co Ltd 33 -
41 Loncin Motor Co Ltd 16 -
18 Long Yuan Construction Group Co Ltd 10 -
117 Longfor Group Holdings Ltd 483 0.03
7 LONGi Green Energy Technology Co Ltd 79 0.01
5 Longshine Technology Group Co Ltd 10 -
263 Lonking Holdings Ltd 67 0.01
13 Luenmei Quantum Co Ltd 14 -
11 Luolai Lifestyle Technology Co Ltd 17 -
17 Luoniushan Co Ltd 16 -
36 Luoyang Glass Co Ltd 19 -
14 Luxi Chemical Group Co Ltd 26 -
14 Luxshare Precision Industry Co Ltd 60 0.01
163 Luye Pharma Group Ltd 78 0.01
2 Luzhou Laojiao Co Ltd 49 -
126 LVGEM China Real Estate Investment Co Ltd 24 -
Shares (000's)
Value(000's)
GBP
% of NetAssetValue
Common Stock (continued)
China - 4.35% (continued)
44 Maanshan Iron & Steel Co Ltd 15 -
4 Maccura Biotechnology Co Ltd 18 -
4 Mango Excellent Media Co Ltd 34 -
6 Maoyan Entertainment 8 -
115 Maoye International Holdings Ltd 4 -
13 Markor International Home Furnishings Co Ltd 7 -
199 Meitu Inc 35 -
15 Meituan 358 0.02
233 Metallurgical Corp of China Ltd 40 -
6 Microport Scientific Corp 33 -
20 Midea Group Co Ltd 188 0.01
1 Milkyway Chemical Supply Chain Service Co Ltd 15 -
16 Min Xin Holdings Ltd 6 -
16 Ming Yang Smart Energy Group Ltd 27 -
154 Mingfa Group International Co Ltd 10 -
166 Minmetals Land Ltd 13 -
60 Minsheng Education Group Co Ltd 7 -
80 Minth Group Ltd 238 0.01
11 MLS Co Ltd 18 -
236 MMG Ltd 101 0.01
39 Mobvista Inc 27 -
174 Modern Land China Co Ltd 12 -
11 Momo Inc, ADR 111 0.01
10 Montnets Cloud Technology Group 18 -
16 Mulsanne Group Holding Ltd 8 -
9 Muyuan Foodstuff Co Ltd 88 0.01
38 Myhome Real Estate Development Group Co Ltd 8 -
17 MYS Group Co Ltd 7 -
1,450 Nan Hai Corp Ltd 8 -
21 NanJi E-Commerce Co Ltd 23 -
2 Nanjing Hanrui Cobalt Co 16 -
54 Nanjing Iron & Steel Co Ltd 22 -
19 Nanjing Sample Technology Co Ltd 8 -
9 Nanjing Securities Co Ltd 10 -
8 Nanjing Xinjiekou Department Store Co Ltd 10 -
5 NARI Technology Co Ltd 15 -
8 NavInfo Co Ltd 12 -
26 NetDragon Websoft Holdings Ltd 54 0.01
15 NetEase Inc, ADR 1,210 0.07
30 New Century Healthcare Holding Co Ltd 4 -
58 New China Life Insurance Co Ltd 154 0.01
11 New Hope Liuhe Co Ltd 19 -
21 New Oriental Education & Technology Group Inc,ADR 153 0.01
5 Newland Digital Technology Co Ltd 8 -
60 Nexteer Automotive Group Ltd 53 0.01
196 Nine Dragons Paper Holdings Ltd 218 0.01
4 Ninestar Corp 10 -
9 Ningbo Huaxiang Electronic Co Ltd 17 -
15 Ningbo Joyson Electronic Corp 29 -
6 Ningbo Orient Wires & Cables Co Ltd 13 -
22 Ningbo Sanxing Medical Electric Co Ltd 43 -
2 Ningbo Tuopu Group Co Ltd 7 -
33 Ningbo Zhoushan Port Co Ltd 15 -
2 NIO Inc, ADR 43 -
4 Niu Technologies 102 0.01
- Noah Holdings Ltd, ADR 12 -
16 North Huajin Chemical Industries Co Ltd 14 -
8 Northeast Pharmaceutical Group Co Ltd 4 -
17 Northeast Securities Co Ltd 17 -
9 NSFOCUS Technologies Group Co Ltd 18 -
249 NVC Lighting Holding Ltd 5 -
World Equity FundPortfolio of Investments as at 31 May 2021 (continued)
Dimensional Fund Advisors Semi-Annual Report and Unaudited Financial Statements, 31 May 2021 440

Shares (000's)
Value(000's)
GBP
% of NetAssetValue
Common Stock (continued)
China - 4.35% (continued)
20 Oceanwide Holdings Co Ltd 6 -
4 Offcn Education Technology Co Ltd 12 -
31 Offshore Oil Engineering Co Ltd 15 -
22 OFILM Group Co Ltd 21 -
1 Oppein Home Group Inc 23 -
3 Opple Lighting Co Ltd 8 -
19 ORG Technology Co Ltd 11 -
39 Orient Group Inc 14 -
71 Orient Securities Co Ltd 35 -
27 Oriental Pearl Group Co Ltd 27 -
21 Ourpalm Co Ltd 10 -
4 Ovctek China Inc 38 -
30 Overseas Chinese Town Asia Holdings Ltd 5 -
72 Pacific Online Ltd 12 -
33 Pacific Securities Co Ltd 14 -
2 Pacific Shuanglin Bio-pharmacy 7 -
73 Pangang Group Vanadium Titanium & ResourcesCo Ltd 19 -
98 PAX Global Technology Ltd 86 0.01
16 PCI-Suntek Technology Co Ltd 12 -
272 People's Insurance Co Group of China Ltd 71 0.01
60 Perennial Energy Holdings Ltd 26 -
4 Perfect World Co Ltd 10 -
1,306 PetroChina Co Ltd 376 0.02
126 Phoenix Media Investment Holdings Ltd 8 -
3 Phoenix New Media Ltd, ADR 4 -
507 PICC Property & Casualty Co Ltd 349 0.02
1 Pinduoduo Inc, ADR 58 0.01
47 Ping An Bank Co Ltd 126 0.01
9 Ping An Healthcare and Technology Co Ltd 70 0.01
230 Ping An Insurance Group Co of China Ltd 1,770 0.09
28 Pingdingshan Tianan Coal Mining Co Ltd 22 -
9 Polaris Bay Group Co Ltd 11 -
11 Poly Developments and Holdings Group Co Ltd 17 -
268 Poly Property Group Co Ltd 54 0.01
420 Postal Savings Bank of China Co Ltd 213 0.01
302 Pou Sheng International Holdings Ltd 53 0.01
39 Power Construction Corp of China Ltd 17 -
154 Powerlong Real Estate Holdings Ltd 106 0.01
9 Prinx Chengshan Cayman Holding Ltd 7 -
1 Proya Cosmetics Co Ltd 19 -
50 PW Medtech Group Ltd 4 -
42 Q Technology Group Co Ltd 51 -
3 Qianhe Condiment and Food 11 -
11 Qingdao Eastsoft Communication Technology CoLtd 17 -
5 Qingdao Gon Technology Co 15 -
30 Qingdao Hanhe Cable Co Ltd 12 -
33 Qingdao Rural Commercial Bank 16 -
104 Qingling Motors Co Ltd 16 -
58 Qinhuangdao Port Co Ltd 7 -
2 Qinqin Foodstuffs Group Cayman Co Ltd - -
11 Qudian Inc, ADR 17 -
7 Rainbow Digital Commercial Co Ltd 5 -
1 Raytron Technology Co Ltd 15 -
32 Realcan Pharmaceutical Group Co Ltd 17 -
10 Realord Group Holdings Ltd 11 -
58 Red Star Macalline Group Corp Ltd 25 -
144 Redco Properties Group Ltd 35 -
75 Redsun Properties Group Ltd 18 -
13 Renhe Pharmacy Co Ltd 17 -
49 RiseSun Real Estate Development Co Ltd 34 -
Shares (000's)
Value(000's)
GBP
% of NetAssetValue
Common Stock (continued)
China - 4.35% (continued)
23 Road King Infrastructure Ltd 21 -
15 Rongsheng Petro Chemical Co Ltd 43 -
104 Ronshine China Holdings Ltd 51 0.01
3 RYB Education Inc, ADR 8 -
11 SAIC Motor Corp Ltd 25 -
22 Sailun Group Co Ltd 27 -
6 Sanan Optoelectronics Co Ltd 17 -
8 Sanquan Food Co Ltd 15 -
34 Sansteel Minguang Co Ltd Fujian 28 -
117 Sany Heavy Equipment International Holdings CoLtd 92 0.01
23 Sany Heavy Industry Co Ltd 78 0.01
35 Sealand Securities Co Ltd 17 -
260 Seazen Group Ltd 208 0.01
7 Seazen Holdings Co Ltd 39 -
1 Secoo Holding Ltd, ADR 2 -
17 S-Enjoy Service Group Co Ltd 37 -
12 SF Holding Co Ltd 93 0.01
1 SG Micro Corp 18 -
21 SGIS Songshan Co Ltd 12 -
18 Shaanxi Coal Industry Co Ltd 24 -
11 Shandong Buchang Pharmaceuticals Co Ltd 27 -
40 Shandong Chenming Paper Holdings Ltd 23 -
48 Shandong Gold Mining Co Ltd 73 0.01
4 Shandong Himile Mechanical Science & TechnologyCo Ltd 13 -
7 Shandong Hualu Hengsheng Chemical Co Ltd 20 -
9 Shandong Humon Smelting Co Ltd 12 -
6 Shandong Linglong Tyre Co Ltd 30 -
12 Shandong Longda Meat Foodstuff Co Ltd 15 -
57 Shandong Nanshan Aluminum Co Ltd 25 -
12 Shandong New Beiyang Information Technology CoLtd 12 -
13 Shandong Publishing & Media Co Ltd 9 -
9 Shandong Sun Paper Industry JSC Ltd 14 -
212 Shandong Weigao Group Medical Polymer Co Ltd 311 0.02
26 Shandong Xinhua Pharmaceutical Co Ltd 11 -
10 Shandong Yisheng Livestock & Poultry Breeding CoLtd 11 -
78 Shanghai 2345 Network Holding Group Co Ltd 18 -
17 Shanghai AJ Group Co Ltd 13 -
1 Shanghai Bairun Investment Holding Group Co Ltd 10 -
2 Shanghai Baosight Software Co Ltd 14 -
73 Shanghai Construction Group 24 -
6 Shanghai Daimay Automotive Interior Co Ltd 17 -
9 Shanghai Dazhong Public Utilities Group Co Ltd 2 -
176 Shanghai Electric Group Co Ltd 40 -
13 Shanghai Environment Group Co Ltd 17 -
5 Shanghai Fengyuzhu Culture and Technology CoLtd 15 -
33 Shanghai Fosun Pharmaceutical Group Co Ltd 192 0.01
14 Shanghai Fudan Microelectronics Group Co Ltd 16 -
50 Shanghai Fudan-Zhangjiang Bio-Pharmaceutical CoLtd 23 -
2 Shanghai Ganglian E-Commerce Holdings 15 -
6 Shanghai Hanbell Precise Machinery 17 -
31 Shanghai Industrial Development Co Ltd 17 -
73 Shanghai Industrial Holdings Ltd 82 0.01
344 Shanghai Industrial Urban Development Group Ltd 24 -
3 Shanghai International Airport Co Ltd 17 -
182 Shanghai Jin Jiang Capital Co Ltd 31 -
3 Shanghai Jinjiang International Hotels Co Ltd 19 -
7 Shanghai Lingang Holdings 16 -
World Equity FundPortfolio of Investments as at 31 May 2021 (continued)
Dimensional Fund Advisors Semi-Annual Report and Unaudited Financial Statements, 31 May 2021 441

Shares (000's)
Value(000's)
GBP
% of NetAssetValue
Common Stock (continued)
China - 4.35% (continued)
13 Shanghai Lujiazui Finance & Trade ZoneDevelopment Co Ltd 16 -
3 Shanghai M&G Stationery Inc 27 -
18 Shanghai Maling Aquarius Co Ltd 17 -
7 Shanghai Mechanical and Electrical Industry Co Ltd 14 -
84 Shanghai Pharmaceuticals Holding Co Ltd 129 0.01
35 Shanghai Pudong Development Bank Co Ltd 40 -
2 Shanghai Putailai New Energy Technology Co Ltd 24 -
11 Shanghai RAAS Blood Products Co Ltd 10 -
35 Shanghai Shimao Co Ltd 16 -
16 Shanghai Shyndec Pharmaceutical Co Ltd 19 -
3 Shanghai Sinyang Semiconductor Materials Co Ltd 15 -
27 Shanghai Tunnel Engineering Co Ltd 16 -
5 Shanghai Waigaoqiao Free Trade Zone Group CoLtd 8 -
10 Shanghai Wanye Enterprises Co Ltd 17 -
8 Shanghai Yuyuan Tourist Mart Group Co Ltd 13 -
575 Shanghai Zendai Property Ltd 4 -
7 Shanghai Zhangjiang High-Tech Park DevelopmentCo Ltd 14 -
39 Shanxi Coking Co Ltd 22 -
16 Shanxi Lu'an Environmental Energy DevelopmentCo Ltd 18 -
29 Shanxi Meijin Energy Co Ltd 24 -
28 Shanxi Securities Co Ltd 22 -
41 Shanxi Taigang Stainless Steel Co Ltd 30 -
1 Shanxi Xinghuacun Fen Wine Factory Co Ltd 65 0.01
42 Shanxi Xishan Coal & Electricity Power Co Ltd 31 -
25 Shanying International Holding Co Ltd 11 -
5 Shede Spirits Co Ltd 96 0.01
38 Sheng Ye Capital Ltd 25 -
9 Shenghe Resources Holding Co Ltd 16 -
57 Shengjing Bank Co Ltd 36 -
74 Shenguan Holdings Group Ltd 3 -
11 Shengyi Technology Co Ltd 29 -
1 Shennan Circuits Co Ltd 10 -
67 Shenwan Hongyuan Group Co Ltd 14 -
18 Shenzhen Agricultural Products Group Co Ltd 11 -
9 Shenzhen Airport Co Ltd 8 -
15 Shenzhen Aisidi Co Ltd 14 -
2 Shenzhen Capchem Technology 20 -
6 Shenzhen Changhong Technology Co Ltd 18 -
4 Shenzhen Desay Battery Technology Co 17 -
7 Shenzhen Everwin Precision Technology Co Ltd 18 -
42 Shenzhen Expressway Co Ltd 30 -
12 Shenzhen Fastprint Circuit Tech Co Ltd 13 -
3 Shenzhen FRD Science & Technology Co Ltd 5 -
11 Shenzhen Gas Corp Ltd 9 -
17 Shenzhen Gongjin Electronics Co Ltd 16 -
2 Shenzhen Goodix Technology Co Ltd 22 -
4 Shenzhen H&T Intelligent Control 9 -
7 Shenzhen Hepalink Pharmaceutical Group Co Ltd 12 -
2 Shenzhen Inovance Technology 18 -
117 Shenzhen International Holdings Ltd 126 0.01
27 Shenzhen Investment Holdings Bay AreaDevelopment 7 -
331 Shenzhen Investment Ltd 84 0.01
17 Shenzhen Jinjia Group Co Ltd 21 -
1 Shenzhen Kedali Industry Co Ltd 9 -
5 Shenzhen Kinwong Electronic 15 -
12 Shenzhen Laibao Hi-tech Co 15 -
6 Shenzhen Megmeet Electrical Co Ltd 22 -
1 Shenzhen Mindray Bio-Medical Electronics Co Ltd 77 0.01
Shares (000's)
Value(000's)
GBP
% of NetAssetValue
Common Stock (continued)
China - 4.35% (continued)
31 Shenzhen MTC Co Ltd 19 -
21 Shenzhen Neptunus Bioengineering Co Ltd 8 -
23 Shenzhen Overseas Chinese Town Co Ltd 21 -
1 Shenzhen SC New Energy Technology Corp 16 -
19 Shenzhen SDG Information Co Ltd 16 -
1 Shenzhen Sinovatio Technology Co Ltd 6 -
8 Shenzhen Sunline Tech Co 16 -
6 Shenzhen Sunlord Electronics Co Ltd 23 -
4 Shenzhen Suntak Circuit Technology Co Ltd 5 -
6 Shenzhen Sunway Communication Co Ltd 19 -
12 Shenzhen Tagen Group Co Ltd 9 -
26 Shenzhen World Union Group Inc 19 -
25 Shenzhen Yan Tian Port Holding Co Ltd 15 -
7 Shenzhen Yinghe Technology 15 -
4 Shenzhen YUTO Packaging Technology Co Ltd 11 -
8 Shenzhen Zhenye Group Co Ltd 4 -
27 Shenzhen Zhongjin Lingnan Nonfemet Co Ltd 15 -
26 Shenzhou International Group Holdings Ltd 490 0.03
25 Shijiazhuang Changshan BeiMing Technology CoLtd 27 -
5 Shijiazhuang Yiling Pharmaceutical Co Ltd 17 -
132 Shimao Property Holdings Ltd 268 0.02
7 Shinva Medical Instrument Co Ltd 16 -
203 Shoucheng Holdings Ltd 33 -
292 Shougang Fushan Resources Group Ltd 55 0.01
456 Shui On Land Ltd 54 0.01
12 Siasun Robot & Automation Co Ltd 13 -
9 Sichuan Development Lomon Co Ltd 8 -
68 Sichuan Expressway Co Ltd 12 -
118 Sichuan Hebang Biotechnology Co Ltd 26 -
7 Sichuan Kelun Pharmaceutical Co Ltd 17 -
29 Sichuan Languang Development Co Ltd 12 -
6 Sichuan Shuangma Cement Co Ltd 8 -
2 Sichuan Swellfun Co Ltd 31 -
6 Sieyuan Electric Co Ltd 17 -
470 Sihuan Pharmaceutical Holdings Group Ltd 146 0.01
148 Silver Grant International Holdings Group Ltd 9 -
891 Sino Biopharmaceutical Ltd 696 0.04
3 Sino Wealth Electronic Ltd 20 -
5 Sinocare Inc 16 -
20 Sinochem International Corp 15 -
256 Sinofert Holdings Ltd 25 -
14 Sinolink Securities Co Ltd 21 -
19 Sinoma International Engineering Co 20 -
10 Sinoma Science & Technology Co Ltd 24 -
368 Sino-Ocean Group Holding Ltd 55 0.01
144 Sinopec Engineering Group Co Ltd 64 0.01
164 Sinopec Kantons Holdings Ltd 46 -
296 Sinopec Oilfield Service Corp 20 -
430 Sinopec Shanghai Petrochemical Co Ltd 76 0.01
150 Sinopharm Group Co Ltd 352 0.02
70 Sinosoft Technology Group Ltd 12 -
304 Sinotrans Ltd 102 0.01
54 Sinotruk Hong Kong Ltd 92 0.01
1 Skshu Paint Co Ltd 20 -
370 Skyfame Realty Holdings Ltd 33 -
13 Skyworth Digital Co Ltd 12 -
128 Skyworth Group Ltd 26 -
6 Sogou Inc, ADR 34 -
274 SOHO China Ltd 59 0.01
- Sohu.com Ltd, ADR 4 -
165 Solargiga Energy Holdings Ltd 6 -
World Equity FundPortfolio of Investments as at 31 May 2021 (continued)
Dimensional Fund Advisors Semi-Annual Report and Unaudited Financial Statements, 31 May 2021 442

Shares (000's)
Value(000's)
GBP
% of NetAssetValue
Common Stock (continued)
China - 4.35% (continued)
17 SooChow Securities Co Ltd 17 -
34 Sou Yu Te Group Co Ltd 7 -
27 Southwest Securities Co Ltd 15 -
2 Spring Airlines Co Ltd 12 -
106 SPT Energy Group Inc 3 -
171 SSY Group Ltd 80 0.01
92 Sun King Power Electronics Group 22 -
225 Sunac China Holdings Ltd 583 0.03
8 Sunac Services Holdings Ltd 17 -
5 Sunflower Pharmaceutical Group Co Ltd 9 -
31 Suning Universal Co Ltd 37 -
29 Suning.com Co Ltd 22 -
21 Sunny Optical Technology Group Co Ltd 384 0.02
4 Sunresin New Materials Co 28 -
71 Sunshine 100 China Holdings Ltd 8 -
16 Sunward Intelligent Equipment Co Ltd 15 -
7 Sunwoda Electronic Co Ltd 23 -
6 Suofeiya Home Collection Co Ltd 20 -
9 Suzhou Anjie Technology Co Ltd 15 -
15 Suzhou Dongshan Precision Manufacturing Co Ltd 31 -
16 Suzhou Gold Mantis Construction Decoration Co Ltd 16 -
3 Suzhou TFC Optical Communication 17 -
170 Symphony Holdings Ltd 13 -
23 Tahoe Group Co Ltd 7 -
5 Taiji Computer Corp Ltd 11 -
75 Tang Palace China Holdings Ltd 6 -
20 Tangrenshen Group Co Ltd 15 -
15 Tangshan Jidong Cement Co Ltd 23 -
69 TangShan Port Group Co Ltd 19 -
18 Tangshan Sanyou Chemical Industries Co Ltd 21 -
6 Tasly Pharmaceutical Group Co Ltd 9 -
2,340 Taung Gold International Ltd 6 -
11 TBEA Co Ltd 14 -
107 TCL Electronics Holdings Ltd 50 -
8 TCL Technology Group Corp 7 -
20 Tech-Bank Food Co Ltd 16 -
36 Ten Pao Group Holdings Ltd 6 -
132 Tencent Holdings Ltd 7,255 0.38
8 Tencent Music Entertainment Group ADR 87 0.01
15 Tenfu Cayman Holdings Co Ltd 7 -
3 Three Squirrels Inc 16 -
78 Tian An China Investment Co Ltd 33 -
37 Tian Di Science & Technology Co Ltd 15 -
50 Tian Ge Interactive Holdings Ltd 6 -
40 Tian Shan Development Holding Ltd 7 -
116 Tiangong International Co Ltd 37 -
5 Tianjin 712 Communication & Broadcasting Co Ltd 17 -
32 Tianjin Capital Environmental Protection Group CoLtd 9 -
42 Tianjin Chase Sun Pharmaceutical Co Ltd 20 -
26 Tianjin Guangyu Development Co Ltd 16 -
288 Tianjin Port Development Holdings Ltd 18 -
8 Tianjin Zhonghuan Semiconductor Co Ltd 24 -
9 Tianjin ZhongXin Pharmaceutical Group Corp Ltd 23 -
104 Tianli Education International Holdings 38 -
34 Tianneng Power International Ltd 43 -
25 Tianshui Huatian Technology Co Ltd 35 -
52 Tianyun International Holdings Ltd 8 -
2 Tibet Rhodiola Pharmaceutical Holding 15 -
96 Tibet Water Resources Ltd 7 -
176 Tingyi Cayman Islands Holding Corp 236 0.01
13 Titan Wind Energy Suzhou Co Ltd 12 -
Shares (000's)
Value(000's)
GBP
% of NetAssetValue
Common Stock (continued)
China - 4.35% (continued)
40 TK Group Holdings Ltd 11 -
59 Tomson Group Ltd 11 -
59 Tong Ren Tang Technologies Co Ltd 44 -
52 Tongcheng-Elong Holdings Ltd 98 0.01
540 Tongda Group Holdings Ltd 30 -
5 TongFu Microelectronics Co Ltd 12 -
12 Tonghua Dongbao Pharmaceutical Co Ltd 17 -
5 Tongkun Group Co Ltd 12 -
94 Tongling Nonferrous Metals Group Co Ltd 31 -
4 Tongwei Co Ltd 17 -
44 Tongyu Heavy Industry Co 15 -
27 Top Spring International Holdings Ltd 3 -
1 Topchoice Medical Corp 19 -
6 Topsec Technologies Group Inc 12 -
71 Towngas China Co Ltd 34 -
26 Transfar Zhilian Co Ltd 19 -
78 TravelSky Technology Ltd 119 0.01
158 Trigiant Group Ltd 11 -
29 Trip.com Group Ltd, ADR 859 0.05
78 Truly International Holdings Ltd 11 -
20 Tsaker Chemical Group Ltd 2 -
28 Tsingtao Brewery Co Ltd 210 0.01
38 Tunghsu Optoelectronic Technology Co Ltd 8 -
1 Tuniu Corp, ADR 2 -
10 Tus Environmental Science And TechnologyDevelopment Co Ltd 6 -
2 Unigroup Guoxin Microelectronics Co Ltd 24 -
146 Uni-President China Holdings Ltd 112 0.01
5 Unisplendour Corp Ltd 11 -
1,040 United Energy Group Ltd 136 0.01
7 Universal Scientific Industrial Shanghai Co Ltd 13 -
436 V1 Group Ltd 27 -
5 Valiant Co Ltd 9 -
2 Vats Liquor Chain Store Management JSC Ltd 8 -
20 Vatti Corp Ltd 16 -
10 Victory Giant Technology Huizhou Co Ltd 25 -
47 Vinda International Holdings Ltd 104 0.01
23 Vipshop Holdings Ltd, ADR 369 0.02
52 Virscend Education Co Ltd 6 -
3 Walvax Biotechnology Co 23 -
5 Wangfujing Group Co Ltd 16 -
6 Wangneng Environment Co Ltd 11 -
35 Wangsu Science & Technology Co Ltd 22 -
4 Wanguo International Mining Group 1 -
6 Wanhua Chemical Group Co Ltd 75 0.01
460 Want Want China Holdings Ltd 241 0.01
38 Wanxiang Qianchao Co Ltd 21 -
60 Wasion Holdings Ltd 14 -
20 Wasu Media Holding Co Ltd 17 -
5 Weibo Corp, ADR 169 0.01
148 Weichai Power Co Ltd 242 0.01
4 Weifu High-Technology Group Co Ltd 11 -
3 Weihai Guangwei Composites Co Ltd 19 -
27 Weiqiao Textile Co 5 -
27 Wens Foodstuffs Group Co Ltd 42 -
158 West China Cement Ltd 19 -
27 Western Securities Co Ltd 26 -
6 Westone Information Industry Inc 11 -
127 Wharf Holdings Ltd 308 0.02
2 Will Semiconductor Co Ltd Shanghai 51 -
1 Wingtech Technology Co Ltd 14 -
86 Wisdom Education International Holdings Co Ltd 19 -
World Equity FundPortfolio of Investments as at 31 May 2021 (continued)
Dimensional Fund Advisors Semi-Annual Report and Unaudited Financial Statements, 31 May 2021 443

Shares (000's)
Value(000's)
GBP
% of NetAssetValue
Common Stock (continued)
China - 4.35% (continued)
10 Wolong Electric Group Co Ltd 13 -
51 Wuchan Zhongda Group Co Ltd 38 -
13 Wuhan Department Store Group Co Ltd 17 -
4 Wuhan Guide Infrared Co Ltd 15 -
2 Wuhan Jingce Electronic Group Co Ltd 14 -
11 Wuhan P&S Information Technology Co Ltd 5 -
8 Wuhu Sanqi Interactive Entertainment NetworkTechnology Group Co Ltd 21 -
15 Wuhu Token Science Co Ltd 13 -
6 Wuliangye Yibin Co Ltd 194 0.01
11 WUS Printed Circuit Kunshan Co Ltd 19 -
3 WuXi AppTec Co Ltd 37 -
20 Wuxi Biologics Cayman Inc 209 0.01
13 Wuxi Taiji Industry Co Ltd 12 -
25 XCMG Construction Machinery Co Ltd 19 -
8 XD Inc 45 -
36 Xiabuxiabu Catering Management China HoldingsCo Ltd 30 -
19 Xiamen C & D Inc 17 -
9 Xiamen Comfort Science & Technology Group CoLtd 17 -
1 Xiamen Faratronic Co Ltd 18 -
84 Xiamen International Port Co Ltd 9 -
4 Xiamen Intretech Inc 17 -
16 Xiamen ITG Group Corp Ltd 13 -
8 Xiamen Meiya Pico Information 15 -
9 Xiamen Tungsten Co Ltd 18 -
21 Xiamen Xiangyu Co Ltd 15 -
5 Xilinmen Furniture Co Ltd 16 -
7 Xinfengming Group Co Ltd 15 -
128 Xingda International Holdings Ltd 24 -
14 Xingfa Aluminium Holdings Ltd 15 -
54 Xinhu Zhongbao Co Ltd 19 -
68 Xinhua Winshare Publishing and Media Co Ltd 35 -
53 Xinjiang Goldwind Science & Technology Co Ltd 63 0.01
6 Xinjiang Tianshan Cement Co Ltd 11 -
11 Xinjiang Zhongtai Chemical Co Ltd 13 -
44 Xinxing Ductile Iron Pipes Co Ltd 19 -
8 Xinyangfeng Agricultural Technology Co Ltd 14 -
278 Xinyi Solar Holdings Ltd 347 0.02
31 Xinyu Iron & Steel Co Ltd 20 -
5 Xinyuan Real Estate Co Ltd, ADR 9 -
165 Xtep International Holdings Ltd 128 0.01
6 Xuji Electric Co Ltd 9 -
9 Xunlei Ltd, ADR 30 -
94 Yadea Group Holdings Ltd 145 0.01
14 YaGuang Technology Group Co Ltd 15 -
36 Yang Quan Coal Industry Group Co Ltd 23 -
27 Yango Group Co Ltd 17 -
3 Yangzhou Yangjie Electronic Technology 15 -
4 Yantai Changyu Pioneer Wine Co Ltd 16 -
8 Yantai Dongcheng Pharmaceutical Co Ltd 17 -
2 Yantai Eddie Precision Machinery 16 -
6 Yantai Jereh Oilfield Services Group Co Ltd 25 -
11 YanTai Shuangta Food Co Ltd 16 -
8 Yantai Tayho Advanced Materials 17 -
252 Yanzhou Coal Mining Co Ltd 226 0.01
63 Yashili International Holdings Ltd 4 -
2 Yealink Network Technology Corp Ltd 21 -
30 Yeebo International Holdings Ltd 6 -
30 YiChang HEC ChangJiang Pharmaceutical Co Ltd 20 -
32 Yida China Holdings Ltd 6 -
Shares (000's)
Value(000's)
GBP
% of NetAssetValue
Common Stock (continued)
China - 4.35% (continued)
8 Yifan Pharmaceutical Co Ltd 16 -
2 Yifeng Pharmacy Chain Co Ltd 15 -
25 Yihai International Holding Ltd 139 0.01
22 Yincheng International Holding 7 -
22 Yintai Gold Co Ltd 25 -
14 Yiren Digital Ltd, ADR 37 -
3 Yixintang Pharmaceutical Group Co Ltd 11 -
30 Yonghui Superstores Co Ltd 19 -
32 Yotrio Group Co Ltd 13 -
24 Youngor Group Co Ltd 19 -
7 Youzu Interactive Co Ltd 15 -
1,012 Yuexiu Property Co Ltd 176 0.01
74 Yuexiu Transport Infrastructure Ltd 32 -
23 Yum China Holdings Inc 1,101 0.06
18 Yunda Holding Co Ltd 29 -
22 Yunnan Aluminium Co Ltd 35 -
1 Yunnan Baiyao Group Co Ltd 19 -
8 Yunnan Copper Co Ltd 12 -
1 Yunnan Energy New Material Co Ltd 15 -
17 Yunnan Tin Co Ltd 30 -
5 Yusys Technologies Co Ltd 15 -
194 Yuzhou Properties Co Ltd 40 -
- Zai Lab Ltd 49 -
1 Zhangzhou Pientzehuang Pharmaceutical Co Ltd 21 -
98 Zhaojin Mining Industry Co Ltd 72 0.01
26 Zhefu Holding Group Co Ltd 15 -
34 Zhejiang Century Huatong Group Co Ltd 25 -
23 Zhejiang China Commodities City Group Co Ltd 13 -
5 Zhejiang Chint Electrics Co Ltd 17 -
9 Zhejiang Crystal-Optech Co Ltd 13 -
9 Zhejiang Dahua Technology Co Ltd 24 -
2 Zhejiang Dingli Machinery Co Ltd 15 -
86 Zhejiang Expressway Co Ltd 54 0.01
17 Zhejiang Hailiang Co Ltd 20 -
19 Zhejiang Hisoar Pharmaceutical Co Ltd 19 -
18 Zhejiang Huace Film & Television Co Ltd 12 -
19 Zhejiang Huafeng Spandex Co Ltd 26 -
12 Zhejiang Huahai Pharmaceutical Co Ltd 27 -
14 Zhejiang Jiahua Energy Chemical Industry Co Ltd 14 -
5 Zhejiang Jiemei Electronic & Technology 16 -
3 Zhejiang Jingsheng Mechanical & Electrical 16 -
10 Zhejiang Jingu Co Ltd 7 -
15 Zhejiang Jingxin Pharmaceutical Co Ltd 15 -
42 Zhejiang Jinke Culture Industry 15 -
6 Zhejiang JIULI Hi-tech Metals 7 -
10 Zhejiang Juhua Co Ltd 11 -
8 Zhejiang Kaishan Compressor Co Ltd 13 -
14 Zhejiang Longsheng Group Co Ltd 21 -
4 Zhejiang Medicine Co Ltd 8 -
4 Zhejiang Meida Industrial 9 -
14 Zhejiang Narada Power Source Co Ltd 16 -
13 Zhejiang NHU Co Ltd 46 -
24 Zhejiang Orient Financial Holdings Group Co Ltd 15 -
17 Zhejiang Runtu Co Ltd 18 -
7 Zhejiang Sanhua Intelligent Controls Co Ltd 17 -
4 Zhejiang Sanmei Chemical Industry Co Ltd 8 -
4 Zhejiang Satellite Petrochemical Co Ltd 20 -
19 Zhejiang Semir Garment Co Ltd 25 -
2 Zhejiang Supor Co Ltd 17 -
2 Zhejiang Tianyu Pharmaceutical 14 -
12 Zhejiang Wanfeng Auto Wheel Co Ltd 7 -
18 Zhejiang Wanliyang Co Ltd 16 -
World Equity FundPortfolio of Investments as at 31 May 2021 (continued)
Dimensional Fund Advisors Semi-Annual Report and Unaudited Financial Statements, 31 May 2021 444

Shares (000's)
Value(000's)
GBP
% of NetAssetValue
Common Stock (continued)
China - 4.35% (continued)
7 Zhejiang Weiming Environment Protection Co Ltd 18 -
10 Zhejiang Weixing New Building Materials Co Ltd 27 -
10 Zhejiang Xianju Pharmaceutical Co Ltd 15 -
12 Zhejiang Xinan Chemical Industrial Group Co Ltd 20 -
8 Zhejiang Yasha Decoration Co Ltd 6 -
14 Zhejiang Yinlun Machinery Co Ltd 17 -
22 Zhengzhou Coal Mining Machinery Group Co Ltd 18 -
15 Zhengzhou Yutong Bus Co Ltd 23 -
85 Zhenro Properties Group Ltd 39 -
23 Zheshang Securities Co Ltd 34 -
176 Zhong An Group Ltd 6 -
47 ZhongAn Online P&C Insurance Co Ltd 165 0.01
4 Zhongji Innolight Co Ltd 18 -
12 Zhongjin Gold Corp Ltd 13 -
27 Zhongshan Broad Ocean Motor Co Ltd 16 -
53 Zhongsheng Group Holdings Ltd 314 0.02
48 Zhongtian Financial Group Co Ltd 16 -
32 Zhongyu Gas Holdings Ltd 20 -
37 Zhou Hei Ya International Holdings Co Ltd 34 -
116 Zhuguang Holdings Group Co Ltd 27 -
14 Zhuhai Orbita Aerospace Science & Technology 13 -
59 Zhuzhou CRRC Times Electric Co Ltd 200 0.01
2 Zhuzhou Hongda Electronics 17 -
18 Zhuzhou Kibing Group Co Ltd 31 -
12 Zibo Qixiang Tengda Chemical Co Ltd 15 -
272 Zijin Mining Group Co Ltd 297 0.02
129 Zoomlion Heavy Industry Science and TechnologyCo Ltd 113 0.01
45 ZTE Corp 85 0.01
25 ZTO Express Cayman Inc, ADR 559 0.03
83,472 4.35
Colombia - 0.02%
1 Banco de Bogota SA 15 -
3 Bancolombia SA 17 -
2 Bancolombia SA, ADR 33 -
8 Bolsa de Valores de Colombia 17 -
42 Celsia SA ESP 33 -
42 Cementos Argos SA 40 0.01
21 CEMEX Latam Holdings SA 15 -
5 Corp Financiera Colombiana SA 28 -
60 Ecopetrol SA 25 -
23 Grupo Argos SA 45 0.01
10 Grupo de Inversiones Suramericana SA 40 -
32 Grupo Energia Bogota SA ESP 14 -
9 Grupo Nutresa SA 34 -
8 Interconexion Electrica SA ESP 32 -
11 Mineros SA 9 -
6 Promigas SA ESP 7 -
404 0.02
Czech Republic - 0.01%
6 CEZ AS 121 0.01
2 Komercni Banka AS 67 -
3 Moneta Money Bank AS 8 -
4 O2 Czech Republic AS 38 -
- Philip Morris CR AS 28 -
262 0.01
Denmark - 0.69%
1 ALK-Abello AS 184 0.01
9 Alm Brand AS 65 -
3 Ambu AS 78 -
- AP Moller - Maersk AS, Class A 108 0.01
- AP Moller - Maersk AS, Class B 154 0.01
Shares (000's)
Value(000's)
GBP
% of NetAssetValue
Common Stock (continued)
Denmark - 0.69% (continued)
10 Bang & Olufsen AS 36 -
1 BankNordik P/F 11 -
5 Bavarian Nordic AS 167 0.01
- Brodrene Hartmann AS 22 -
4 Carlsberg AS 520 0.03
1 cBrain A/S 17 -
1 Chemometec AS 63 -
6 Chr Hansen Holding AS 380 0.02
2 Coloplast AS 265 0.01
7 Columbus AS 9 -
3 D/S Norden AS 67 -
33 Danske Bank AS 444 0.02
5 Demant AS 191 0.01
4 Dfds AS 150 0.01
3 DSV Panalpina AS 504 0.03
4 FLSmidth & Co AS 124 0.01
- Fluegger Group A/S 9 -
2 Genmab AS 693 0.04
9 GN Store Nord AS 537 0.03
- GronlandsBANKEN AS 2 -
7 H Lundbeck AS 168 0.01
3 H&H International AS 66 -
14 ISS AS 204 0.01
1 Jeudan AS 22 -
6 Jyske Bank AS 218 0.01
2 Maersk Drilling AS 56 -
5 Matas AS 63 -
- MT Hoejgaard Holding 8 -
3 Netcompany Group AS 272 0.01
3 Nilfisk Holding AS 71 -
3 NKT AS 97 0.01
2 NNIT AS 25 -
1 North Media AS 11 -
2 Novo Nordisk A/S, ADR 121 0.01
32 Novo Nordisk AS 1,760 0.09
11 Novozymes AS 550 0.03
2 Orsted AS 237 0.01
13 Pandora AS 1,282 0.07
1 Parken Sport & Entertainment AS 6 -
2 Per Aarsleff Holding AS 81 0.01
3 Ringkjoebing Landbobank AS 204 0.01
- Rockwool International AS, Class A 164 0.01
1 Rockwool International AS, Class B 199 0.01
5 Royal Unibrew AS 448 0.02
1 RTX AS 15 -
8 Scandinavian Tobacco Group AS 125 0.01
2 Schouw & Co AS 126 0.01
3 SimCorp AS 274 0.02
1 Solar AS 46 -
- SP Group AS 18 -
12 Spar Nord Bank AS 95 0.01
8 Sydbank AS 176 0.01
- Tivoli AS 35 -
5 Topdanmark AS 180 0.01
5 TORM PLC 30 -
20 Tryg AS 342 0.02
- United International Enterprises 31 -
19 Vestas Wind Systems 519 0.03
84 Vestjysk Bank AS 33 -
2 Zealand Pharma AS 37 -
13,215 0.69
World Equity FundPortfolio of Investments as at 31 May 2021 (continued)
Dimensional Fund Advisors Semi-Annual Report and Unaudited Financial Statements, 31 May 2021 445

Shares (000's)
Value(000's)
GBP
% of NetAssetValue
Common Stock (continued)
Egypt - 0.00%
13 Commercial International Bank Egypt SAE, GDR 32 -
32 -
Finland - 0.47%
7 Aktia Bank Oyj 68 -
3 Alma Media Oyj 28 -
3 Altia Oyj 24 -
1 Asiakastieto Group Oyj 32 -
2 Aspo Oyj 19 -
2 Atria Oyj 15 -
- BasWare Oyj 15 -
5 Cargotec Oyj 197 0.01
10 Caverion Oyj 56 -
5 Citycon Oyj 34 -
4 Digia Oyj 22 -
8 Elisa Oyj 332 0.02
79 Finnair Oyj 48 -
3 Fiskars Oyj Abp 49 -
18 Fortum Oyj 361 0.02
7 F-Secure Oyj 26 -
1 Harvia Oyj 48 -
4 HKScan Oyj 8 -
9 Huhtamaki Oyj 294 0.02
2 Kamux Corp 25 -
11 Kemira Oyj 127 0.01
10 Kesko Oyj, Class A 222 0.01
23 Kesko Oyj, Class B 560 0.03
9 Kojamo Oyj 148 0.01
6 Kone Oyj 342 0.02
6 Konecranes Oyj 205 0.01
4 Lassila & Tikanoja Oyj 46 -
2 Lehto Group Oyj 2 -
11 Metsa Board Oyj 91 0.01
- Musti Group Oyj 8 -
10 Neles Oyj 102 0.01
9 Neste Oyj 403 0.02
178 Nokia Oyj 654 0.03
11 Nokian Renkaat Oyj 321 0.02
49 Nordea Bank Abp 374 0.02
1 Olvi Oyj 54 -
7 Oriola Oyj, Class A 12 -
16 Oriola Oyj, Class B 25 -
3 Orion Oyj, Class A 82 -
10 Orion Oyj, Class B 295 0.02
16 Outokumpu Oyj 63 -
35 Outotec Oyj 288 0.02
1 Pihlajalinna Oyj 5 -
1 Ponsse Oyj 53 -
1 QT Group Oyj 84 0.01
5 Raisio Oyj 20 -
2 Rapala VMC Oyj 16 -
1 Revenio Group Oyj 70 -
11 Sampo Oyj 352 0.02
9 Sanoma Oyj 106 0.01
3 Stockmann Oyj Abp 4 -
23 Stora Enso Oyj 291 0.02
2 Taaleri Oyj 17 -
2 Talenom Oyj 20 -
1 Teleste Oyj 7 -
7 Terveystalo Oyj 75 -
7 Tieto Oyj 161 0.01
4 Tikkurila Oyj 107 0.01
7 Tokmanni Group Corp 144 0.01
Shares (000's)
Value(000's)
GBP
% of NetAssetValue
Common Stock (continued)
Finland - 0.47% (continued)
18 UPM-Kymmene Oyj 490 0.03
6 Uponor Oyj 129 0.01
2 Vaisala Oyj 52 -
11 Valmet Oyj 335 0.02
2 Verkkokauppa.com Oyj 16 -
27 Wartsila Oyj Abp 261 0.01
18 YIT Oyj 80 -
9,020 0.47
France - 2.18%
2 ABC arbitrage 13 -
11 Accor SA 311 0.02
1 Aeroports de Paris 131 0.01
10 Air Liquide SA 1,209 0.06
9 Airbus SE 876 0.05
1 Akka Technologies 29 -
1 AKWEL 31 -
3 Albioma SA 101 0.01
6 ALD SA 61 -
3 Alstom SA 138 0.01
3 Alten SA 256 0.01
2 Amundi SA 151 0.01
6 Arkema SA 589 0.03
1 Assystem SA 19 -
9 Atos SE 401 0.02
1 Aubay 42 -
35 AXA SA 689 0.04
1 Axway Software SA 23 -
- Bastide le Confort Medical 10 -
5 Beneteau SA 59 -
1 Bigben Interactive 21 -
1 BioMerieux 55 -
15 BNP Paribas SA 713 0.04
1 Boiron SA 20 -
71 Bollore SA 260 0.01
2 Bonduelle SCA 43 -
15 Bouygues SA 422 0.02
18 Bureau Veritas SA 385 0.02
- Burelle SA 28 -
- Caisse Regionale de Credit Agricole Mutuel duLanguedoc SCCV 9 -
8 Capgemini SE 1,063 0.06
51 Carrefour SA 732 0.04
4 Casino Guichard Perrachon SA 90 0.01
1 Cegedim SA 12 -
82 CGG SA 61 -
24 Cie de Saint-Gobain 1,129 0.06
2 Cie des Alpes 33 -
9 Cie Generale des Etablissements Michelin SCA 982 0.05
7 Cie Plastic Omnium SA 176 0.01
10 CNP Assurances 126 0.01
11 Coface SA 98 0.01
20 Credit Agricole SA 208 0.01
21 Danone SA 1,073 0.06
- Dassault Aviation SA 62 -
1 Dassault Systemes SE 130 0.01
12 Derichebourg SA 88 0.01
10 Edenred 370 0.02
8 Eiffage SA 640 0.03
1 Ekinops 9 -
27 Electricite de France SA 271 0.02
- Electricite de Strasbourg SA 5 -
11 Elior Group SA 61 -
World Equity FundPortfolio of Investments as at 31 May 2021 (continued)
Dimensional Fund Advisors Semi-Annual Report and Unaudited Financial Statements, 31 May 2021 446

Shares (000's)
Value(000's)
GBP
% of NetAssetValue
Common Stock (continued)
France - 2.18% (continued)
22 Elis SA 293 0.02
46 Engie SA 483 0.03
1 Eramet 58 -
3 EssilorLuxottica SA 324 0.02
- Esso SA Francaise 3 -
3 Etablissements Maurel et Prom SA 4 -
- Eurazeo SA 17 -
5 Eurofins Scientific SE 388 0.02
5 Euronext NV 390 0.02
33 Europcar Mobility Group 11 -
21 Eutelsat Communications SA 187 0.01
- Exel Industries 11 -
1 Faurecia 45 -
13 Faurecia SE 506 0.03
2 Fnac Darty SA 91 0.01
2 Gaztransport Et Technigaz SA 136 0.01
16 Getlink SE 174 0.01
1 GL Events 17 -
- Groupe Crit 17 -
1 Guerbet 20 -
1 Haulotte Group SA 3 -
1 Hermes International 541 0.03
- Hexaom 17 -
- ID Logistics Group 58 -
2 Iliad SA 232 0.01
4 Imerys SA 164 0.01
2 Ipsen SA 171 0.01
5 IPSOS 139 0.01
2 Jacquet Metal Service SA 30 -
10 JCDecaux SA 209 0.01
2 Kaufman & Broad SA 67 -
1 Kering SA 921 0.05
8 Korian SA 209 0.01
10 Lagardere SCA 186 0.01
- Laurent-Perrier 18 -
2 Lectra 68 -
10 Legrand SA 721 0.04
1 Linedata Services 18 -
2 LISI 57 -
1 LNA Sante SA 33 -
2 L'Oreal SA 556 0.03
1 Lumibird 7 -
5 LVMH Moet Hennessy Louis Vuitton SE 2,850 0.15
6 Maisons du Monde SA 109 0.01
1 Manitou BF SA 33 -
- Manutan International 24 -
2 Mersen SA 54 -
4 Metropole Television SA 58 -
58 Natixis SA 202 0.01
2 Nexans SA 97 0.01
5 Nexity SA 200 0.01
3 NRJ Group 18 -
3 Oeneo SA 33 -
4 OL Groupe SA 7 -
155 Orange SA 1,391 0.07
4 Orpea 356 0.02
2 Pernod Ricard SA 240 0.01
- Pharmagest Inter@ctive 19 -
1 Plastivaloire 6 -
22 Publicis Groupe SA 1,050 0.06
5 Quadient 94 0.01
2 Rallye SA 13 -
Shares (000's)
Value(000's)
GBP
% of NetAssetValue
Common Stock (continued)
France - 2.18% (continued)
1 Recylex SA - -
1 Remy Cointreau SA 104 0.01
12 Renault SA 337 0.02
26 Rexel SA 377 0.02
- Robertet SA 17 -
4 Rothschild & Co 112 0.01
7 Rubis SCA 229 0.01
4 Safran SA 430 0.02
- Samse SA 12 -
9 Sanofi 663 0.04
1 Sartorius Stedim Biotech 195 0.01
1 Savencia SA 37 -
5 Schneider Electric SE 522 0.03
17 SCOR SE 383 0.02
2 SEB SA 246 0.01
1 Seche Environnement SA 21 -
26 SES SA 152 0.01
2 Societe BIC SA 111 0.01
- Societe des Bains de Mer et du Cercle desEtrangers a Monaco 8 -
29 Societe Generale SA 664 0.04
- Societe Marseillaise du Tunnel Prado-Carenage SA 6 -
1 Societe pour l'Informatique Industrielle 19 -
5 Sodexo SA 340 0.02
2 SOITEC 235 0.01
7 Solocal Group 15 -
1 Somfy SA 76 -
2 Sopra Steria Group 250 0.01
12 SPIE SA 198 0.01
- Stef SA 28 -
15 STMicroelectronics NV 382 0.02
15 Suez 263 0.01
1 Sword Group 19 -
1 Synergie SA 28 -
4 Tarkett SA 68 -
- Technicolor SA 1 -
6 Technip Energies NV 66 -
2 Teleperformance 492 0.03
4 Television Francaise 1 27 -
- TFF Group 8 -
5 Thales SA 375 0.02
1 Thermador Groupe 58 -
1 Tikehau Capital SCA 26 -
- Total Gabon 20 -
63 TOTAL SA 2,077 0.11
1 Trigano SA 143 0.01
5 Ubisoft Entertainment SA 268 0.01
- Union Financiere de France BQE SA 5 -
25 Valeo SA 574 0.03
1 Vallourec SA 20 -
2 Valneva SE 15 -
12 Veolia Environnement SA 267 0.01
3 Verallia 71 -
- Vetoquinol SA 36 -
3 Vicat SA 98 0.01
2 VIEL & Cie SA 9 -
1 Vilmorin & Cie SA 47 -
9 Vinci SA 720 0.04
- Virbac SA 70 -
8 Vivendi SA 207 0.01
1 Vranken-Pommery Monopole SA 8 -
7 Worldline SA 491 0.03
World Equity FundPortfolio of Investments as at 31 May 2021 (continued)
Dimensional Fund Advisors Semi-Annual Report and Unaudited Financial Statements, 31 May 2021 447

Shares (000's)
Value(000's)
GBP
% of NetAssetValue
Common Stock (continued)
France - 2.18% (continued)
4 X-Fab Silicon Foundries SE 27 -
- XPO Logistics Europe SADIR 1 -
41,742 2.18
Germany - 2.02%
4 1&1 Drillisch AG 90 0.01
4 7C Solarparken AG 14 -
7 Aareal Bank AG 119 0.01
3 adidas AG 799 0.04
4 ADO Properties SA 86 0.01
5 ADVA Optical Networking SE 48 -
4 Aixtron SE 54 -
- All for One Group AG 15 -
1 Allgeier SE 15 -
6 Allianz SE 1,206 0.06
- Amadeus Fire AG 61 -
51 Aroundtown SA 304 0.02
- Atoss Software AG 52 -
5 Aurubis AG 310 0.02
11 BASF SE 644 0.03
- Basler AG 41 -
1 Bauer AG 10 -
29 Bayer AG 1,285 0.07
15 Bayerische Motoren Werke AG 1,089 0.06
2 BayWa AG 62 -
- BayWa AG 4 -
3 Bechtle AG 393 0.02
2 Befesa SA 116 0.01
1 Beiersdorf AG 89 0.01
1 Bertrandt AG 36 -
- bet-at-home.com AG 12 -
1 Bijou Brigitte AG 13 -
3 Bilfinger SE 72 -
6 Borussia Dortmund GmbH & Co KGaA 31 -
15 Brenntag AG 998 0.05
3 CANCOM SE 109 0.01
- Carl Zeiss Meditec AG 62 -
16 Ceconomy AG 62 -
1 CENIT AG 11 -
1 Cewe Stiftung & Co KGaA 85 0.01
99 Commerzbank AG 561 0.03
2 CompuGroup Medical SE & Co KgaA 107 0.01
6 Continental AG 615 0.03
1 Corestate Capital Holding SA 16 -
17 Covestro AG 844 0.04
4 CropEnergies AG 39 -
3 CTS Eventim AG & Co KGaA 124 0.01
35 Daimler AG 2,307 0.12
1 Delivery Hero SE 81 -
1 Dermapharm Holding SE 79 -
61 Deutsche Bank AG 651 0.03
1 Deutsche Beteiligungs AG 44 -
5 Deutsche Boerse AG 525 0.03
3 Deutsche EuroShop AG 51 -
16 Deutsche Lufthansa AG 145 0.01
16 Deutsche Pfandbriefbank AG 132 0.01
25 Deutsche Post AG 1,210 0.06
142 Deutsche Telekom AG 2,082 0.11
8 Deutsche Wohnen SE 345 0.02
7 Deutz AG 42 -
5 Dialog Semiconductor PLC 256 0.01
4 DIC Asset AG 47 -
- Dr Hoenle AG 13 -
Shares (000's)
Value(000's)
GBP
% of NetAssetValue
Common Stock (continued)
Germany - 2.02% (continued)
- Draegerwerk AG & Co KGaA 30 -
3 Duerr AG 78 -
54 E.ON SE 464 0.02
2 Eckert & Ziegler Strahlen- und Medizintechnik AG 121 0.01
1 EDAG Engineering Group AG 10 -
1 Elmos Semiconductor AG 29 -
3 ElringKlinger AG 39 -
4 Encavis AG 52 -
1 Energiekontor AG 48 -
9 Evonik Industries AG 226 0.01
1 Evotec SE 43 -
1 Ferratum Oyj 3 -
3 Fielmann AG 149 0.01
- First Sensor AG 11 -
1 flatexDEGIRO AG 118 0.01
2 Francotyp-Postalia Holding AG 5 -
3 Fraport AG Frankfurt Airport Services Worldwide 156 0.01
15 Freenet AG 285 0.02
13 Fresenius Medical Care AG & Co KGaA 763 0.04
18 Fresenius SE & Co KGaA 696 0.04
2 Fuchs Petrolub SE 68 -
9 GEA Group AG 274 0.02
3 Gerresheimer AG 221 0.01
1 Gesco AG 18 -
2 GFT Technologies SE 32 -
- Grammer AG 8 -
7 Grand City Properties SA 149 0.01
1 H&R GmbH & Co KGaA 7 -
3 Hamburger Hafen und Logistik AG 63 -
2 Hannover Rueck SE 194 0.01
2 Hapag-Lloyd AG 252 0.01
- Hawesko Holding AG 12 -
6 HeidelbergCement AG 411 0.02
31 Heidelberger Druckmaschinen AG 50 -
2 Hella GmbH & Co KGaA 98 0.01
7 HelloFresh SE 464 0.02
2 Henkel AG & Co KGaA 106 0.01
2 Highlight Communications AG 7 -
2 HolidayCheck Group AG 6 -
1 Hornbach Baumarkt AG 50 -
2 Hornbach Holding AG & Co KGaA 132 0.01
6 Hugo Boss AG 226 0.01
- Hypoport AG 116 0.01
2 Indus Holding AG 58 -
11 Infineon Technologies AG 313 0.02
4 Instone Real Estate Group AG 87 0.01
- IVU Traffic Technologies AG 8 -
5 Jenoptik AG 97 0.01
1 JOST Werke AG 43 -
21 K&S AG 201 0.01
9 KION Group AG 642 0.03
8 Kloeckner & Co SE 82 0.01
2 Knorr-Bremse AG 158 0.01
2 Koenig & Bauer AG 38 -
1 Krones AG 35 -
- KSB SE & Co KGaA 6 -
1 KWS Saat SE & Co KGaA 72 -
7 Lanxess AG 357 0.02
3 LEG Immobilien AG 316 0.02
1 Leifheit AG 26 -
4 Leoni AG 41 -
1 LPKF Laser & Electronics AG 21 -
World Equity FundPortfolio of Investments as at 31 May 2021 (continued)
Dimensional Fund Advisors Semi-Annual Report and Unaudited Financial Statements, 31 May 2021 448

Shares (000's)
Value(000's)
GBP
% of NetAssetValue
Common Stock (continued)
Germany - 2.02% (continued)
- Manz AG 18 -
2 Merck KGaA 297 0.02
19 METRO AG 174 0.01
4 MLP SE 26 -
2 MTU Aero Engines AG 369 0.02
2 Muenchener Rueckversicherungs-Gesellschaft AGin Muenchen 390 0.02
1 Nagarro SE 46 -
4 Nemetschek SE 217 0.01
- New Work SE 41 -
2 Nexus AG 88 0.01
5 Nordex SE 81 0.01
2 Norma Group SE 63 -
1 OHB SE 22 -
3 Patrizia AG 63 -
- Pfeiffer Vacuum Technology AG 56 -
5 PNE AG 32 -
- Progress-Werk Oberkirch AG 2 -
22 ProSiebenSat.1 Media SE 349 0.02
1 PSI Software AG 16 -
3 Puma SE 238 0.01
1 PVA TePla AG 21 -
4 QIAGEN NV 142 0.01
9 QSC AG 15 -
- Rational AG 152 0.01
5 Rheinmetall AG 344 0.02
3 RTL Group SA 121 0.01
23 RWE AG 615 0.03
4 S&T AG 74 -
5 SAF-Holland SE 55 -
4 Salzgitter AG 101 0.01
13 SAP SE 1,276 0.07
- Schaltbau Holding AG 10 -
2 Scout24 AG 127 0.01
- Secunet Security Networks AG 29 -
5 SGL Carbon SE 26 -
5 Siemens AG 606 0.03
6 Siemens Energy AG 139 0.01
2 Siltronic AG 280 0.02
2 Sixt SE 172 0.01
- SMA Solar Technology AG 10 -
4 Software AG 135 0.01
3 Stabilus SA 152 0.01
- Stratec SE 43 -
3 Stroeer SE & Co KGaA 177 0.01
10 Suedzucker AG 113 0.01
2 SUESS MicroTec SE 38 -
1 Surteco Group SE 15 -
4 Symrise AG 337 0.02
10 TAG Immobilien AG 224 0.01
2 Takkt AG 27 -
5 Talanx AG 138 0.01
1 TeamViewer AG 38 -
1 Technotrans SE 23 -
110 Telefonica Deutschland Holding AG 214 0.01
44 thyssenkrupp AG 363 0.02
- Traffic Systems SE 15 -
6 Uniper SE 159 0.01
10 United Internet AG 298 0.02
1 Varta AG 84 0.01
4 VERBIO Vereinigte BioEnergie AG 138 0.01
1 Volkswagen AG 385 0.02
Shares (000's)
Value(000's)
GBP
% of NetAssetValue
Common Stock (continued)
Germany - 2.02% (continued)
6 Vonovia SE 279 0.02
1 Vossloh AG 33 -
2 Wacker Chemie AG 244 0.01
3 Wacker Neuson SE 72 -
1 Washtec AG 44 -
1 Westwing Group AG 41 -
3 Wuestenrot & Wuerttembergische AG 45 -
2 Zalando SE 114 0.01
1 Zeal Network SE 34 -
1 zooplus AG 108 0.01
38,637 2.02
Greece - 0.03%
79 Alpha Bank AE 74 0.01
3 Athens Water Supply & Sewage Co SA 23 -
1 Autohellas Tourist and Trading SA 9 -
2 Bank of Greece 20 -
158 Eurobank Ergasias SA 104 0.01
6 GEK Terna Holding Real Estate Construction SA 49 -
2 Hellenic Exchanges - Athens Stock Exchange SA 7 -
2 Hellenic Petroleum SA 10 -
5 Hellenic Telecommunications Organization SA 58 0.01
11 Holding Co ADMIE IPTO SA 24 -
4 LAMDA Development SA 24 -
2 Motor Oil Hellas Corinth Refineries SA 23 -
2 Mytilineos SA 25 -
10 National Bank of Greece SA 22 -
2 OPAP SA 24 -
1 Piraeus Financial Holdings 2 -
- Piraeus Port Authority SA 7 -
2 Sarantis SA 14 -
2 Terna Energy SA 23 -
4 Titan Cement International SA 52 -
594 0.03
Hong Kong - 0.75%
162 Aceso Life Science Group Ltd 3 -
16 AEON Credit Service Asia Co Ltd 7 -
262 AIA Group Ltd 2,465 0.13
40 Allied Group Ltd 12 -
100 APAC Resources Ltd 12 -
328 Apollo Future Mobility Group Ltd 14 -
205 Applied Development Holdings Ltd 3 -
22 Asia Financial Holdings Ltd 7 -
12 ASM Pacific Technology Ltd 111 0.01
2 Associated International Hotels Ltd 3 -
9 Atlas Corp 89 0.01
368 Ban Loong Holdings Ltd 16 -
68 Bank of East Asia Ltd 98 0.01
25 BOC Aviation Ltd 161 0.01
84 BOC Hong Kong Holdings Ltd 218 0.01
106 BOCOM International Holdings Co Ltd 17 -
88 BOE Varitronix Ltd 34 -
228 Brightoil Petroleum Holdings Ltd 6 -
9 Budweiser Brewing Co APAC 22 -
42 Cafe de Coral Holdings Ltd 65 0.01
132 Cathay Pacific Airways Ltd 81 0.01
136 Century City International Holdings Ltd 5 -
135 CGN Mining Co Ltd 8 -
6 Chevalier International Holdings Ltd 6 -
65 China Baoli Technologies Holdings Ltd - -
52 China Best Group Holding Ltd 1 -
456 China Energy Development Holdings Ltd 4 -
88 China Huishan Dairy Holdings Co Ltd - -
World Equity FundPortfolio of Investments as at 31 May 2021 (continued)
Dimensional Fund Advisors Semi-Annual Report and Unaudited Financial Statements, 31 May 2021 449

Shares (000's)
Value(000's)
GBP
% of NetAssetValue
Common Stock (continued)
Hong Kong - 0.75% (continued)
1 China Motor Bus Co Ltd 12 -
150 China Star Entertainment Ltd 17 -
2,210 China Strategic Holdings Ltd 25 -
140 China Tonghai International Financial Ltd 3 -
57 Chinese Estates Holdings Ltd 20 -
29 Chong Hing Bank Ltd 53 -
47 Chow Sang Sang Holdings International Ltd 58 -
43 Chow Tai Fook Jewellery Group Ltd 56 -
92 Chuang's Consortium International Ltd 9 -
210 CITIC Telecom International Holdings Ltd 49 -
74 CK Asset Holdings Ltd 357 0.02
44 CK Hutchison Holdings Ltd 247 0.01
23 CK Infrastructure Holdings Ltd 101 0.01
32 CLP Holdings Ltd 232 0.01
560 CMBC Capital Holdings Ltd 5 -
30 C-Mer Eye Care Holdings Ltd 16 -
56 Convenience Retail Asia Ltd 4 -
510 CSI Properties Ltd 12 -
55 Dah Sing Banking Group Ltd 44 -
14 Dah Sing Financial Holdings Ltd 36 -
44 Dickson Concepts International Ltd 16 -
10 Dynamic Holdings Ltd 13 -
34 Eagle Nice International Holdings Ltd 15 -
31 EC Healthcare 36 -
246 Emperor Capital Group Ltd 3 -
55 Emperor Entertainment Hotel Ltd 6 -
118 Emperor International Holdings Ltd 12 -
320 Emperor Watch & Jewellery Ltd 5 -
248 ENM Holdings Ltd 15 -
316 Esprit Holdings Ltd 22 -
13 Fairwood Holdings Ltd 20 -
162 Far East Consortium International Ltd 41 -
261 First Pacific Co Ltd 64 0.01
80 First Shanghai Investments Ltd 2 -
5 Fosun Tourism Group 7 -
25 FSE Lifestyle Services Ltd 17 -
31 Fuguiniao Co Ltd - -
7 Galaxy Entertainment Group Ltd 41 -
139 Genting Hong Kong Ltd 7 -
8 Get Nice Financial Group Ltd 1 -
166 Giordano International Ltd 26 -
118 Golden Resources Development International Ltd 7 -
36 Gold-Finance Holdings Ltd - -
90 Goodbaby International Holdings Ltd 16 -
90 GR Properties Ltd 8 -
25 Great Eagle Holdings Ltd 60 -
2,154 G-Resources Group Ltd 9 -
7 Guoco Group Ltd 57 -
393 Guotai Junan International Holdings Ltd 50 -
278 Haitong International Securities Group Ltd 61 -
81 Hang Lung Group Ltd 141 0.01
117 Hang Lung Properties Ltd 214 0.01
10 Hang Seng Bank Ltd 156 0.01
15 Hanison Construction Holdings Ltd 2 -
8 Harbour Centre Development Ltd 6 -
40 Harmonicare 3 -
42 Henderson Land Development Co Ltd 143 0.01
115 HK Electric Investments & HK Electric InvestmentsLtd 83 0.01
73 HKBN Ltd 70 0.01
82 HKR International Ltd 28 -
312 HKT Trust & HKT Ltd 300 0.02
Shares (000's)
Value(000's)
GBP
% of NetAssetValue
Common Stock (continued)
Hong Kong - 0.75% (continued)
36 Hon Kwok Land Investment Co Ltd 12 -
134 Hong Kong & China Gas Co Ltd 166 0.01
18 Hong Kong Exchanges & Clearing Ltd 800 0.04
16 Hong Kong Ferry Holdings Co Ltd 9 -
9 Hong Kong Television Network Ltd 8 -
55 Hongkong & Shanghai Hotels Ltd 39 -
56 Hongkong Chinese Ltd 3 -
21 Honma Golf Ltd 9 -
48 HOSA International Ltd - -
188 Hutchison Telecommunications Hong Kong HoldingsLtd 25 -
43 Hysan Development Co Ltd 120 0.01
79 IGG Inc 83 0.01
72 Imagi International Holdings 4 -
67 International Housewares Retail Co Ltd 18 -
212 IRC Ltd 7 -
36 ITC Properties Group Ltd 3 -
50 Jacobson Pharma Corp Ltd 3 -
6 JBM Healthcare Ltd 1 -
47 Johnson Electric Holdings Ltd 89 0.01
15 JS Global Lifestyle Co Ltd 31 -
122 K Wah International Holdings Ltd 42 -
78 Karrie International Holdings Ltd 13 -
74 Kerry Logistics Network Ltd 155 0.01
57 Kerry Properties Ltd 138 0.01
38 Kingmaker Footwear Holdings Ltd 3 -
284 Kingston Financial Group Ltd 15 -
50 Kowloon Development Co Ltd 44 -
28 Kwoon Chung Bus Holdings Ltd 6 -
26 Lai Sun Development Co Ltd 13 -
10 Lai Sun Garment International Ltd 6 -
140 Landing International Development Ltd 3 -
188 Langham Hospitality Investments and LanghamHospitality Investments Ltd 17 -
14 Lerthai Group Ltd 1 -
52 Lifestyle International Holdings Ltd 31 -
20 Lippo Ltd 4 -
30 Liu Chong Hing Investment Ltd 23 -
39 L'Occitane International SA 90 0.01
38 Luk Fook Holdings International Ltd 75 0.01
106 Man Wah Holdings Ltd 168 0.01
4,568 Mason Group Holdings Ltd 13 -
138 Meilleure Health International Industry Group Ltd 5 -
69 Melco International Development Ltd 89 0.01
86 Midland Holdings Ltd 9 -
26 Miramar Hotel & Investment 35 -
50 Modern Dental Group Ltd 30 -
31 MTR Corp Ltd 125 0.01
117 NagaCorp Ltd 86 0.01
76 Nameson Holdings Ltd 4 -
88 New World Development Co Ltd 336 0.02
104 NewOcean Energy Holdings Ltd 4 -
45 Nissin Foods Co Ltd 25 -
155 NWS Holdings Ltd 124 0.01
35 Oriental Watch Holdings 12 -
407 Oshidori International Holdings Ltd 21 -
580 Pacific Basin Shipping Ltd 154 0.01
59 Pacific Century Premium Developments Ltd 4 -
107 Pacific Textiles Holdings Ltd 50 -
54 Paliburg Holdings Ltd 10 -
18 PC Partner Group Ltd 6 -
416 PCCW Ltd 162 0.01
World Equity FundPortfolio of Investments as at 31 May 2021 (continued)
Dimensional Fund Advisors Semi-Annual Report and Unaudited Financial Statements, 31 May 2021 450

Shares (000's)
Value(000's)
GBP
% of NetAssetValue
Common Stock (continued)
Hong Kong - 0.75% (continued)
124 Pentamaster International Ltd 19 -
56 Perfect Shape Medical Ltd 41 -
86 Pico Far East Holdings Ltd 11 -
100 Playmates Holdings Ltd 8 -
50 Power Assets Holdings Ltd 219 0.01
28 PRADA SpA 135 0.01
100 PT International Development Co Ltd 4 -
26 Public Financial Holdings Ltd 6 -
24 Regal Hotels International Holdings Ltd 9 -
36 Regina Miracle International Holdings Ltd 7 -
18 Safety Godown Co Ltd 5 -
7 Sands China Ltd 23 -
36 SAS Dragon Holdings Ltd 10 -
16 SEA Holdings Ltd 12 -
120 Shangri-La Asia Ltd 79 0.01
35 Shenwan Hongyuan HK Ltd 3 -
190 Shun Tak Holdings Ltd 43 -
208 Sino Land Co Ltd 234 0.01
141 SITC International Holdings Co Ltd 351 0.02
127 SJM Holdings Ltd 103 0.01
46 SmarTone Telecommunications Holdings Ltd 19 -
9 Soundwill Holdings Ltd 7 -
50 Stella International Holdings Ltd 43 -
59 Sun Hung Kai & Co Ltd 23 -
19 Sun Hung Kai Properties Ltd 207 0.01
56 SUNeVision Holdings Ltd 41 -
34 Swire Pacific Ltd, Class A 186 0.01
68 Swire Pacific Ltd, Class B 59 -
29 Swire Properties Ltd 63 0.01
42 TAI Cheung Holdings Ltd 18 -
182 Taihan Fiberoptics Co Ltd 1 -
15 Tan Chong International Ltd 3 -
41 Tao Heung Holdings Ltd 4 -
33 Techtronic Industries Co Ltd 444 0.02
36 Television Broadcasts Ltd 25 -
57 Tenwow International Holdings Ltd 1 -
37 Texhong Textile Group Ltd 41 -
102 Texwinca Holdings Ltd 19 -
430 Theme International Holdings Ltd 34 -
106 Tradelink Electronic Commerce Ltd 11 -
23 Transport International Holdings Ltd 33 -
82 United Laboratories International Holdings Ltd 53 -
624 Untrade Convoy 2 -
366 Untrade Hua Han Health Ltd 10 -
32 Untrade Huiyuan Juice 1 -
73 Untrade Smi Holdings 1 -
61 Untrade.Youyuan Holdings - -
120 Value Partners Group Ltd 58 -
69 Vitasoy International Holdings Ltd 190 0.01
6 Vobile Group Ltd 19 -
45 VPower Group International Holdings Ltd 7 -
69 VSTECS Holdings Ltd 48 -
17 VTech Holdings Ltd 120 0.01
26 Wai Kee Holdings Ltd 10 -
1,200 Wang On Group Ltd 8 -
44 Wealthking Investments Ltd 3 -
655 WH Group Ltd 398 0.02
35 Wharf Real Estate Investment Co Ltd 151 0.01
6 Wing On Co International Ltd 10 -
32 Wing Tai Properties Ltd 14 -
60 Wynn Macau Ltd 73 0.01
80 Xinyi Glass Holdings Ltd 219 0.01
Shares (000's)
Value(000's)
GBP
% of NetAssetValue
Common Stock (continued)
Hong Kong - 0.75% (continued)
16 YTO Express Holdings Ltd 7 -
94 Yue Yuen Industrial Holdings Ltd 172 0.01
310 Zensun Enterprises Ltd 18 -
120 Zhaobangji Properties Holdings Ltd 7 -
14,391 0.75
Hungary - 0.03%
5 4iG Nyrt 8 -
37 Magyar Telekom Telecommunications PLC 38 -
48 MOL Hungarian Oil & Gas PLC 269 0.01
13 Opus Global Nyrt 7 -
4 OTP Bank Nyrt 153 0.01
5 Richter Gedeon Nyrt 100 0.01
575 0.03
India - 1.87%
- 3M India Ltd 38 -
6 Aarti Industries Ltd 91 0.01
- ABB Power Products & Systems India Ltd 4 -
- Abbott India Ltd 27 -
5 ACC Ltd 102 0.01
22 Adani Enterprises Ltd 283 0.02
22 Adani Gas Ltd 292 0.02
17 Adani Green Energy Ltd 205 0.01
40 Adani Ports & Special Economic Zone Ltd 298 0.02
91 Adani Power Ltd 81 0.01
34 Adani Transmission Ltd 482 0.03
57 Aditya Birla Capital Ltd 69 0.01
7 Advanced Enzyme Technologies Ltd 31 -
8 Aegis Logistics Ltd 26 -
1 Ahluwalia Contracts India Ltd 4 -
2 AIA Engineering Ltd 41 -
3 Ajanta Pharma Ltd 50 -
- Akzo Nobel India Ltd 10 -
6 Alembic Pharmaceuticals Ltd 54 -
1 Alkem Laboratories Ltd 29 -
1 Alkyl Amines Chemicals Ltd 27 -
4 Allcargo Logistics Ltd 6 -
5 Amara Raja Batteries Ltd 37 -
56 Ambuja Cements Ltd 176 0.01
1 Apar Industries Ltd 8 -
2 APL Apollo Tubes Ltd 30 -
5 Apollo Hospitals Enterprise Ltd 145 0.01
34 Apollo Tyres Ltd 74 0.01
1 Arvind Fashions - -
5 Arvind Fashions Ltd 7 -
14 Arvind Ltd 10 -
5 Asahi India Glass Ltd 14 -
99 Ashok Leyland Ltd 120 0.01
8 Ashoka Buildcon Ltd 7 -
6 Asian Paints Ltd 182 0.01
9 Aster DM Healthcare Ltd 13 -
7 Astra Microwave Products Ltd 9 -
6 Astral Poly Technik Ltd 104 0.01
- AstraZeneca Pharma India Ltd 12 -
1 Atul Ltd 115 0.01
4 AU Small Finance Bank Ltd 39 -
37 Aurobindo Pharma Ltd 364 0.02
1 Automotive Axles Ltd 10 -
5 Avanti Feeds Ltd 28 -
1 Avenue Supermarts Ltd 23 -
63 Axis Bank Ltd 451 0.03
1 Axis Bank Ltd, GDR 22 -
2 Bajaj Auto Ltd 87 0.01
World Equity FundPortfolio of Investments as at 31 May 2021 (continued)
Dimensional Fund Advisors Semi-Annual Report and Unaudited Financial Statements, 31 May 2021 451

Shares (000's)
Value(000's)
GBP
% of NetAssetValue
Common Stock (continued)
India - 1.87% (continued)
5 Bajaj Consumer Care Ltd 14 -
2 Bajaj Electricals Ltd 20 -
4 Bajaj Finance Ltd 196 0.01
2 Bajaj Finserv Ltd 175 0.01
131 Bajaj Hindusthan Sugar Ltd 14 -
2 Bajaj Holdings & Investment Ltd 82 0.01
1 Balaji Amines Ltd 24 -
7 Balkrishna Industries Ltd 155 0.01
10 Balmer Lawrie & Co Ltd 14 -
15 Balrampur Chini Mills Ltd 42 -
43 Bank of Baroda 35 -
58 Bank of Maharashtra 14 -
1 BASF India Ltd 19 -
2 Bata India Ltd 32 -
- Bayer CropScience Ltd 23 -
11 Berger Paints India Ltd 85 0.01
83 Bharat Electronics Ltd 118 0.01
31 Bharat Forge Ltd 202 0.01
18 Bharat Petroleum Corp Ltd 82 0.01
- Bharat Rasayan Ltd 19 -
56 Bharti Airtel Ltd 288 0.02
36 Bharti Infratel Ltd 85 0.01
22 Biocon Ltd 81 0.01
2 Birla Corp Ltd 29 -
14 Birlasoft India Ltd 42 -
3 Bliss Gvs Pharma Ltd 3 -
- Blue Dart Express Ltd 22 -
1 Blue Star Ltd 10 -
4 Bodal Chemicals Ltd 4 -
- Bosch Ltd 39 -
7 Brigade Enterprises Ltd 18 -
3 Britannia Industries Ltd 90 0.01
3 BSE Ltd 27 -
23 Cadila Healthcare Ltd 139 0.01
5 Camlin Fine Sciences Ltd 8 -
5 Can Fin Homes Ltd 28 -
36 Canara Bank 56 -
3 Capacit'e Infraprojects Ltd 5 -
1 Caplin Point Laboratories Ltd 7 -
6 Carborundum Universal Ltd 34 -
3 Care Ratings Ltd 17 -
36 Castrol India Ltd 47 -
6 CCL Products India Ltd 23 -
2 Ceat Ltd 28 -
2 Central Depository Services India 22 -
5 Century Plyboards India Ltd 21 -
3 Century Textiles & Industries Ltd 16 -
1 Cera Sanitaryware Ltd 22 -
5 CESC Ltd 30 -
16 Chambal Fertilizers and Chemicals Ltd 45 -
2 Chennai Petroleum Corp Ltd 2 -
18 Chennai Super Kings Cricket Ltd - -
9 Cholamandalam Financial Holdings Ltd 57 -
52 Cholamandalam Investment and Finance Co Ltd 272 0.02
35 Cipla Ltd 317 0.02
27 City Union Bank Ltd 46 -
36 Coal India Ltd 51 -
5 Cochin Shipyard Ltd 19 -
2 Coforge Ltd 60 -
3 Colgate-Palmolive India Ltd 54 -
11 Container Corp Of India Ltd 71 0.01
8 Coromandel International Ltd 60 -
Shares (000's)
Value(000's)
GBP
% of NetAssetValue
Common Stock (continued)
India - 1.87% (continued)
1 Cosmo Films Ltd 5 -
4 CreditAccess Grameen Ltd 25 -
2 CRISIL Ltd 32 -
45 Crompton Greaves Consumer Electricals Ltd 174 0.01
6 Cummins India Ltd 46 -
4 Cyient Ltd 32 -
12 Dabur India Ltd 60 -
7 Dalmia Bharat Ltd 125 0.01
2 DB Corp Ltd 2 -
20 DCB Bank Ltd 21 -
5 DCM Shriram Ltd 36 -
5 Deepak Fertilisers & Petrochemicals Corp Ltd 15 -
4 Deepak Nitrite Ltd 68 0.01
20 Delta Corp Ltd 33 -
3 Dhampur Sugar Mills Ltd 8 -
1 Dhanuka Agritech Ltd 11 -
3 Dilip Buildcon Ltd 15 -
12 Dish TV India Ltd 2 -
7 Dishman Carbogen Amcis Ltd 13 -
4 Divi's Laboratories Ltd 166 0.01
2 Dixon Technologies India Ltd 92 0.01
60 DLF Ltd 167 0.01
2 Dr Lal PathLabs Ltd 52 -
5 Dr Reddy's Laboratories Ltd 237 0.01
- DRC Systems India Ltd - -
1 eClerx Services Ltd 17 -
53 Edelweiss Financial Services Ltd 34 -
11 Eicher Motors Ltd 293 0.02
6 EID Parry India Ltd 24 -
10 EIH Ltd 10 -
6 Elgi Equipments Ltd 12 -
13 Emami Ltd 62 -
4 Endurance Technologies Ltd 52 -
16 Engineers India Ltd 13 -
5 EPL Ltd 11 -
3 Eris Lifesciences Ltd 23 -
- ESAB India Ltd 8 -
7 Escorts Ltd 78 0.01
2 Eveready Industries India 5 -
41 Exide Industries Ltd 77 0.01
3 FDC Ltd 9 -
200 Federal Bank Ltd 172 0.01
1 Fine Organic Industries Ltd 21 -
9 Finolex Cables Ltd 37 -
20 Finolex Industries Ltd 33 -
18 Firstsource Solutions Ltd 25 -
1 Force Motors Ltd 7 -
61 Fortis Healthcare Ltd 137 0.01
2 Future Lifestyle Fashions Ltd 1 -
5 Gabriel India Ltd 6 -
148 GAIL India Ltd 220 0.01
1 Galaxy Surfactants Ltd 30 -
1 Garware Technical Fibres Ltd 26 -
5 Gateway Distriparks Ltd 14 -
7 General Insurance Corp of India 13 -
3 GFL Ltd 3 -
8 GHCL Ltd 21 -
- Gillette India Ltd 21 -
1 GlaxoSmithKline Pharmaceuticals Ltd 22 -
19 Glenmark Pharmaceuticals Ltd 111 0.01
- GMM Pfaudler Ltd 12 -
1 Godfrey Phillips India Ltd 9 -
World Equity FundPortfolio of Investments as at 31 May 2021 (continued)
Dimensional Fund Advisors Semi-Annual Report and Unaudited Financial Statements, 31 May 2021 452

Shares (000's)
Value(000's)
GBP
% of NetAssetValue
Common Stock (continued)
India - 1.87% (continued)
21 Godrej Consumer Products Ltd 175 0.01
8 Godrej Industries Ltd 41 -
2 Godrej Properties Ltd 23 -
22 Granules India Ltd 69 0.01
6 Graphite India Ltd 43 -
29 Grasim Industries Ltd 418 0.02
5 Great Eastern Shipping Co Ltd 22 -
5 Greaves Cotton Ltd 6 -
3 Greenply Industries Ltd 6 -
4 Grindwell Norton Ltd 43 -
4 Gujarat Alkalies & Chemicals Ltd 17 -
7 Gujarat Ambuja Exports Ltd 11 -
3 Gujarat Fluorochemicals Ltd 28 -
14 Gujarat Gas Ltd 68 0.01
8 Gujarat Narmada Valley Fertilizers & Chemicals Ltd 28 -
28 Gujarat Pipavav Port Ltd 29 -
8 Gujarat State Fertilizers & Chemicals Ltd 9 -
26 Gujarat State Petronet Ltd 69 0.01
1 Gulf Oil Lubricants India Ltd 7 -
13 Hathway Cable & Datacom Ltd 3 -
5 Hatsun Agro Product Ltd 45 -
10 Havells India Ltd 96 0.01
37 HCL Technologies Ltd 338 0.02
3 HDFC Asset Management Co Ltd 84 0.01
66 HDFC Bank Ltd 964 0.05
6 HDFC Life Insurance Co Ltd 37 -
3 HealthCare Global Enterprises Ltd 5 -
1 HEG Ltd 15 -
6 HeidelbergCement India Ltd 14 -
5 Hemisphere Properties India Ltd 7 -
1 Heritage Foods Ltd 2 -
12 Hero MotoCorp Ltd 351 0.02
90 HFCL Ltd 40 -
4 Hikal Ltd 17 -
6 Himadri Speciality Chemical Ltd 3 -
5 Himatsingka Seide Ltd 8 -
141 Hindalco Industries Ltd 532 0.03
1 Hinduja Global Solutions Ltd 15 -
2 Hindustan Aeronautics Ltd 16 -
40 Hindustan Petroleum Corp Ltd 110 0.01
14 Hindustan Unilever Ltd 306 0.02
- Honeywell Automation India Ltd 26 -
17 Housing Development Finance Corp Ltd 416 0.02
3 Huhtamaki India Ltd 7 -
2 I G Petrochemicals Ltd 9 -
41 ICICI Bank Ltd 259 0.02
21 ICICI Bank Ltd, ADR 267 0.02
8 ICICI Lombard General Insurance Co Ltd 110 0.01
10 ICICI Prudential Life Insurance Co Ltd 51 -
7 ICICI Securities Ltd 39 -
324 IDFC First Bank Ltd 186 0.01
100 IDFC Ltd 55 -
59 IFCI Ltd 7 -
1 Igarashi Motors India Ltd 4 -
14 IIFL Finance Ltd 34 -
9 IIFL Securities Ltd 7 -
2 IIFL Wealth Management Ltd 24 -
11 India Cements Ltd 20 -
30 Indiabulls Housing Finance Ltd 65 -
25 Indiabulls Real Estate Ltd 24 -
24 Indiabulls Ventures Ltd 40 -
1 Indiabulls Ventures Ltd (voting rights) 1 -
Shares (000's)
Value(000's)
GBP
% of NetAssetValue
Common Stock (continued)
India - 1.87% (continued)
1 IndiaMart InterMesh Ltd 61 -
24 Indian Bank 34 -
12 Indian Energy Exchange Ltd 42 -
46 Indian Hotels Co Ltd 59 -
2 Indian Hume Pipe Co Ltd 4 -
51 Indian Oil Corp Ltd 55 -
193 Indian Overseas Bank 32 -
2 Indo Count Industries Ltd 3 -
2 Indoco Remedies Ltd 9 -
13 Indraprastha Gas Ltd 63 -
15 IndusInd Bank Ltd 147 0.01
30 Infibeam Avenues Ltd 13 -
1 Info Edge India Ltd 29 -
86 Infosys Ltd 1,169 0.06
1 Ingersoll Rand India Ltd 11 -
7 Inox Leisure Ltd 22 -
- Inox Wind Energy Ltd - -
3 Intellect Design Arena Ltd 21 -
1 InterGlobe Aviation Ltd 20 -
4 IOL Chemicals and Pharmaceuticals Ltd 27 -
3 Ipca Laboratories Ltd 67 0.01
13 IRB Infrastructure Developers Ltd 13 -
8 Ircon International Ltd 4 -
8 IRCON International Ltd 4 -
97 ITC Ltd 202 0.01
4 ITD Cementation India Ltd 4 -
4 J Kumar Infraprojects Ltd 8 -
5 Jagran Prakashan Ltd 3 -
109 Jaiprakash Associates Ltd 9 -
15 Jammu & Kashmir Bank Ltd 4 -
11 Jamna Auto Industries Ltd 9 -
2 JB Chemicals & Pharmaceuticals Ltd 34 -
1 Jindal Poly Films Ltd 8 -
17 Jindal Saw Ltd 16 -
8 Jindal Stainless Hisar Ltd 13 -
41 Jindal Stainless Ltd 37 -
54 Jindal Steel & Power Ltd 207 0.01
2 JK Cement Ltd 52 -
7 JK Lakshmi Cement Ltd 38 -
4 JK Paper Ltd 6 -
8 JK Tyre & Industries Ltd 10 -
35 JM Financial Ltd 30 -
1 Johnson Controls-Hitachi Air Conditioning India Ltd 11 -
41 JSW Energy Ltd 46 -
100 JSW Steel Ltd 669 0.04
6 JTEKT India Ltd 6 -
7 Jubilant Foodworks Ltd 203 0.01
9 Jubilant Ingrevia Ltd 43 -
9 Jubilant Life Sciences Ltd 78 0.01
3 Just Dial Ltd 25 -
11 Jyothy Labs Ltd 17 -
5 Kajaria Ceramics Ltd 50 -
4 Kalpataru Power Transmission Ltd 15 -
2 Kalyani Steels Ltd 6 -
4 Kansai Nerolac Paints Ltd 24 -
18 Karnataka Bank Ltd 11 -
48 Karur Vysya Bank Ltd 27 -
2 Kaveri Seed Co Ltd 16 -
10 KCP Ltd 10 -
11 KEC International Ltd 44 -
4 KEI Industries Ltd 24 -
2 Kiri Industries Ltd 9 -
World Equity FundPortfolio of Investments as at 31 May 2021 (continued)
Dimensional Fund Advisors Semi-Annual Report and Unaudited Financial Statements, 31 May 2021 453

Shares (000's)
Value(000's)
GBP
% of NetAssetValue
Common Stock (continued)
India - 1.87% (continued)
6 Kirloskar Ferrous Industries Ltd 15 -
8 Kirloskar Oil Engines Ltd 18 -
7 KNR Constructions Ltd 15 -
12 Kotak Mahindra Bank Ltd 216 0.01
14 KPIT Technologies Ltd 32 -
1 KPR Mill Ltd 22 -
5 KRBL Ltd 10 -
1 KSB Ltd 12 -
6 LA Opala RG Ltd 15 -
- Lakshmi Machine Works Ltd 13 -
22 Laurus Labs Ltd 111 0.01
22 Lemon Tree Hotels Ltd 9 -
48 LIC Housing Finance Ltd 212 0.01
1 Linde India Ltd 14 -
10 LT Foods Ltd 7 -
25 Lupin Ltd 296 0.02
1 LUX Industries Ltd 34 -
12 Magma Fincorp Ltd 15 -
4 Mahanagar Gas Ltd 51 -
- Maharashtra Scooters Ltd 12 -
2 Maharashtra Seamless Ltd 7 -
80 Mahindra & Mahindra Financial Services Ltd 124 0.01
38 Mahindra & Mahindra Ltd 311 0.02
10 Mahindra CIE Automotive Ltd 19 -
3 Mahindra Holidays & Resorts India Ltd 7 -
2 Mahindra Lifespace Developers Ltd 10 -
1 Mahindra Logistics Ltd 5 -
43 Manappuram Finance Ltd 65 -
16 Mangalore Refinery & Petrochemicals Ltd 8 -
26 Marico Ltd 121 0.01
2 Maruti Suzuki India Ltd 154 0.01
1 MAS Financial Services Ltd 12 -
11 Max Financial Services Ltd 96 0.01
3 Max Healthcare Institute Ltd 7 -
2 Mayur Uniquoters Ltd 7 -
13 Meghmani Organics Ltd 18 -
1 Metropolis Healthcare Ltd 16 -
8 Minda Corp Ltd 8 -
6 Minda Industries Ltd 31 -
4 Mindtree Ltd 98 0.01
5 Mishra Dhatu Nigam Ltd 9 -
9 MOIL Ltd 15 -
27 Morepen Laboratories Ltd 15 -
137 Motherson Sumi Systems Ltd 313 0.02
3 Motilal Oswal Financial Services Ltd 24 -
11 Mphasis Ltd 214 0.01
- MRF Ltd 105 0.01
12 Muthoot Finance Ltd 146 0.01
5 Natco Pharma Ltd 48 -
84 National Aluminium Co Ltd 59 -
9 Nava Bharat Ventures Ltd 8 -
2 Navin Fluorine International Ltd 47 -
8 Navneet Education Ltd 7 -
22 NBCC India Ltd 10 -
51 NCC Ltd 41 -
2 NESCO Ltd 10 -
1 Nestle India Ltd 112 0.01
- Neuland Laboratories Ltd 6 -
186 NHPC Ltd 47 -
8 NIIT Ltd 16 -
1 Nilkamal Ltd 13 -
7 NLC India Ltd 4 -
Shares (000's)
Value(000's)
GBP
% of NetAssetValue
Common Stock (continued)
India - 1.87% (continued)
58 NMDC Ltd 101 0.01
6 NOCIL Ltd 12 -
4 NRB Bearings Ltd 5 -
75 NTPC Ltd 80 0.01
9 Oberoi Realty Ltd 48 -
71 Oil & Natural Gas Corp Ltd 77 0.01
34 Oil India Ltd 44 -
7 Omaxe Ltd 6 -
2 Oracle Financial Services Software Ltd 53 -
5 Orient Cement Ltd 7 -
7 Orient Electric Ltd 22 -
4 Orient Refractories Ltd 12 -
- Page Industries Ltd 144 0.01
2 Paisalo Digital Ltd 12 -
3 Parag Milk Foods Ltd 4 -
20 PC Jeweller Ltd 5 -
5 Persistent Systems Ltd 124 0.01
69 Petronet LNG Ltd 161 0.01
- Pfizer Ltd 12 -
6 Phillips Carbon Black Ltd 14 -
5 Phoenix Mills Ltd 37 -
3 PI Industries Ltd 77 0.01
4 Pidilite Industries Ltd 89 0.01
9 Piramal Enterprises Ltd 151 0.01
8 PNB Housing Finance Ltd 33 -
6 PNC Infratech Ltd 15 -
2 Poly Medicure Ltd 15 -
1 Polyplex Corp Ltd 15 -
81 Power Finance Corp Ltd 95 0.01
46 Power Grid Corp of India Ltd 101 0.01
10 Praj Industries Ltd 33 -
7 Prakash Industries Ltd 6 -
18 Prestige Estates Projects Ltd 48 -
9 Prism Johnson Ltd 11 -
- Procter & Gamble Health Ltd 19 -
- Procter & Gamble Hygiene & Health Care Ltd 49 -
30 PTC India Financial Services Ltd 5 -
30 PTC India Ltd 26 -
207 Punjab National Bank 85 0.01
2 PVR Ltd 27 -
9 Quess Corp Ltd 60 -
6 Radico Khaitan Ltd 36 -
14 Rain Industries Ltd 24 -
8 Rajesh Exports Ltd 40 -
5 Rallis India Ltd 14 -
7 Ramco Cements Ltd 66 -
4 Ramco Industries Ltd 10 -
16 Rashtriya Chemicals & Fertilizers Ltd 13 -
2 Ratnamani Metals & Tubes Ltd 37 -
4 Raymond Ltd 13 -
54 RBL Bank Ltd 113 0.01
95 REC Ltd 135 0.01
35 Redington India Ltd 75 0.01
6 Relaxo Footwears Ltd 64 -
45 Reliance Industries Ltd, GDR 1,825 0.10
3 Repco Home Finance Ltd 10 -
1 Sanofi India Ltd 44 -
9 SBI Life Insurance Co Ltd 89 0.01
1 Schaeffler India Ltd 29 -
2 Security & Intelligence Services India Ltd 8 -
13 Sequent Scientific Ltd 33 -
10 SH Kelkar & Co Ltd 15 -
World Equity FundPortfolio of Investments as at 31 May 2021 (continued)
Dimensional Fund Advisors Semi-Annual Report and Unaudited Financial Statements, 31 May 2021 454

Shares (000's)
Value(000's)
GBP
% of NetAssetValue
Common Stock (continued)
India - 1.87% (continued)
2 Sharda Cropchem Ltd 6 -
3 Shilpa Medicare Ltd 13 -
18 Shipping Corp of India Ltd 21 -
- Shree Cement Ltd 63 -
56 Shree Renuka Sugars Ltd 9 -
3 Shriram City Union Finance Ltd 42 -
21 Shriram Transport Finance Co Ltd 298 0.02
1 Siemens Ltd 30 -
1 SKF India Ltd 29 -
4 Sobha Ltd 20 -
2 Solar Industries India Ltd 23 -
1 Solara Active Pharma Sciences Ltd 25 -
1 Somany Ceramics Ltd 5 -
3 Somany Home Innovation Ltd 10 -
4 Sonata Software Ltd 29 -
91 South Indian Bank Ltd 9 -
11 SpiceJet Ltd 8 -
2 SRF Ltd 110 0.01
8 Star Cement Ltd 8 -
2 State Bank of India, GDR 92 0.01
66 Steel Authority of India Ltd 78 0.01
19 Sterlite Technologies Ltd 45 -
5 Strides Pharma Science Ltd 39 -
2 Subros Ltd 7 -
1 Sudarshan Chemical Industries 9 -
27 Sun Pharmaceutical Industries Ltd 179 0.01
11 Sun TV Network Ltd 58 -
1 Sundaram Finance Holdings Ltd 1 -
3 Sundaram Finance Ltd 70 0.01
- Sundaram-Clayton Ltd 16 -
5 Sundram Fasteners Ltd 40 -
5 Sunteck Realty Ltd 15 -
4 Suprajit Engineering Ltd 11 -
4 Supreme Industries Ltd 88 0.01
3 Supreme Petrochem Ltd 21 -
1 Surya Roshni Ltd 6 -
14 Suven Pharmaceuticals Ltd 71 0.01
2 Suvidhaa Infoserve PVT Ltd - -
1 Swaraj Engines Ltd 9 -
1 Symphony Ltd 6 -
6 Syngene International Ltd 34 -
8 TAKE Solutions Ltd 5 -
4 Tanla Platforms Ltd 34 -
13 Tata Chemicals Ltd 91 0.01
5 Tata Communications Ltd 53 -
18 Tata Consultancy Services Ltd 546 0.03
2 Tata Elxsi Ltd 82 0.01
31 Tata Global Beverages Ltd 196 0.01
1 Tata Metaliks Ltd 12 -
171 Tata Motors Ltd 531 0.03
5 Tata Motors Ltd, ADR 80 0.01
70 Tata Power Co Ltd 72 0.01
27 Tata Steel Bsl Ltd 26 -
36 Tata Steel Ltd 390 0.02
1 TCI Express Ltd 14 -
35 Tech Mahindra Ltd 352 0.02
4 Techno Electric & Engineering Co Ltd 11 -
6 Tejas Networks Ltd 10 -
2 Thermax Ltd 32 -
8 Thomas Cook India Ltd 5 -
2 Thyrocare Technologies Ltd 18 -
- Tide Water Oil Co India Ltd 16 -
Shares (000's)
Value(000's)
GBP
% of NetAssetValue
Common Stock (continued)
India - 1.87% (continued)
9 Time Technoplast Ltd 7 -
2 Timken India Ltd 24 -
12 Titan Co Ltd 186 0.01
4 Torrent Pharmaceuticals Ltd 105 0.01
8 Torrent Power Ltd 32 -
4 Transport Corp of India Ltd 15 -
123 Trident Ltd 20 -
15 Triveni Engineering & Industries Ltd 20 -
8 Triveni Turbine Ltd 8 -
- TTK Prestige Ltd 26 -
7 Tube Investments of India Ltd 76 0.01
3 TV Today Network Ltd 9 -
52 TV18 Broadcast Ltd 21 -
7 TVS Motor Co Ltd 44 -
- TVS Srichakra Ltd 4 -
105 UCO Bank 14 -
3 Uflex Ltd 14 -
3 UltraTech Cement Ltd 203 0.01
3 Unichem Laboratories Ltd 9 -
17 United Spirits Ltd 100 0.01
73 UPL Ltd 577 0.03
31 Usha Martin Ltd 15 -
2 VA Tech Wabag Ltd 5 -
6 Vaibhav Global Ltd 48 -
75 Vakrangee Ltd 29 -
3 Vardhman Textiles Ltd 34 -
3 Varroc Engineering Ltd 14 -
7 Varun Beverages Ltd 65 -
11 Vedanta Ltd, ADR 114 0.01
1 Venky's India Ltd 14 -
1 Vesuvius India Ltd 7 -
4 V-Guard Industries Ltd 12 -
3 Vinati Organics Ltd 52 -
1 Vindhya Telelinks Ltd 7 -
- V-Mart Retail Ltd 7 -
637 Vodafone Idea Ltd 54 -
2 VRL Logistics Ltd 6 -
1 VST Industries Ltd 17 -
11 Welspun Corp Ltd 16 -
7 Welspun Enterprises Ltd 8 -
44 Welspun India Ltd 39 -
3 West Coast Paper Mills Ltd 6 -
1 Wheels India Ltd 3 -
1 Whirlpool of India Ltd 26 -
49 Wipro Ltd 257 0.01
2 Wockhardt Ltd 14 -
174 Yes Bank Ltd 23 -
72 Zee Entertainment Enterprises Ltd 149 0.01
8 Zensar Technologies Ltd 24 -
- Zydus Wellness Ltd 8 -
35,778 1.87
Indonesia - 0.18%
602 Ace Hardware Indonesia Tbk PT 44 -
1,103 Adaro Energy Tbk PT 64 0.01
149 Adhi Karya Persero Tbk PT 7 -
198 AKR Corporindo Tbk PT 32 -
1,315 Alam Sutera Realty Tbk PT 12 -
120 Aneka Tambang Tbk 15 -
206 Arwana Citramulia tkb PT 7 -
51 Astra Agro Lestari Tbk PT 22 -
741 Astra International Tbk PT 188 0.01
328 Asuransi Kresna Mitra Tbk PT 11 -
World Equity FundPortfolio of Investments as at 31 May 2021 (continued)
Dimensional Fund Advisors Semi-Annual Report and Unaudited Financial Statements, 31 May 2021 455

Shares (000's)
Value(000's)
GBP
% of NetAssetValue
Common Stock (continued)
Indonesia - 0.18% (continued)
132 Bank BTPN Syariah Tbk PT 17 -
402 Bank Bukopin Tbk 8 -
551 Bank Capital Indonesia Tbk PT 11 -
173 Bank Central Asia Tbk PT 270 0.02
177 Bank Danamon Indonesia Tbk PT 20 -
208 Bank Mandiri Persero Tbk PT 59 -
71 Bank Mayapada International Tkb 7 -
1,069 Bank Maybank Indonesia Tbk PT 20 -
290 Bank Negara Indonesia Persero Tbk PT 74 0.01
284 Bank Pan Indonesia Tbk PT 12 -
310 Bank Pembangunan Daerah Jawa Barat DanBanten Tbk PT 21 -
199 Bank Pembangunan Daerah Jawa Timur Tbk PT 7 -
650 Bank Rakyat Indonesia Persero Tbk PT 131 0.01
483 Bank Tabungan Negara Persero Tbk PT 38 -
562 Bekasi Fajar Industrial Estate Tbk PT 4 -
234 BFI Finance Indonesia Tbk PT 9 -
151 BISI International Tbk PT 9 -
64 Blue Bird Tbk PT 4 -
778 Buana Lintas Lautan Tbk PT 11 -
336 Bukit Asam Tbk PT 36 -
847 Bumi Serpong Damai Tbk PT 47 -
285 Bumi Teknokultura Unggul Tbk PT 1 -
397 Capital Financial Indonesia Tbk PT 7 -
222 Charoen Pokphand Indonesia Tbk PT 73 0.01
1,213 Ciputra Development Tbk PT 64 0.01
864 Delta Dunia Makmur Tbk PT 15 -
534 Dharma Satya Nusantara Tbk PT 14 -
460 Eagle High Plantations Tbk PT 2 -
867 Erajaya Swasembada Tbk PT 25 -
58 Gajah Tunggal Tbk PT 2 -
47 Gudang Garam Tbk PT 76 0.01
8,647 Hanson International Tbk PT 4 -
224 Indah Kiat Pulp & Paper Corp Tbk PT 93 0.01
213 Indika Energy Tbk PT 13 -
48 Indo Tambangraya Megah Tbk PT 31 -
42 Indocement Tunggal Prakarsa Tbk PT 25 -
88 Indofood CBP Sukses Makmur Tbk PT 35 -
419 Indofood Sukses Makmur Tbk PT 129 0.01
104 Indosat Tbk PT 32 -
657 Industri Jamu Dan Farmasi Sido Muncul Tbk PT 25 -
675 Intiland Development Tbk PT 6 -
551 Japfa Comfeed Indonesia Tbk PT 55 -
99 Jasa Marga Persero Tbk PT 19 -
176 Jaya Real Property Tbk PT 5 -
1,382 Kalbe Farma Tbk PT 98 0.01
1,312 Kawasan Industri Jababeka Tbk PT 12 -
140 Krakatau Steel Persero Tbk PT 4 -
911 Kresna Graha Investama Tbk PT 6 -
127 Link Net Tbk PT 26 -
2,965 Lippo Karawaci Tbk PT 22 -
101 Matahari Department Store Tbk PT 9 -
189 Mayora Indah Tbk PT 24 -
464 Medco Energi Internasional Tbk PT 16 -
508 Media Nusantara Citra Tbk PT 24 -
37 Medikaloka Hermina 8 -
350 Mega Manunggal Property Tbk 7 -
488 Merdeka Copper Gold Tbk PT 63 0.01
193 Metrodata Electronics Tbk PT 16 -
825 Mitra Adiperkasa Tbk PT 28 -
175 Mitra Keluarga Karyasehat Tbk PT 22 -
409 Mitra Pinasthika Mustika Tbk PT 17 -
Shares (000's)
Value(000's)
GBP
% of NetAssetValue
Common Stock (continued)
Indonesia - 0.18% (continued)
5,728 MNC Land Tbk PT 31 -
1,112 MNC Vision Networks Tbk PT 13 -
49 Pabrik Kertas Tjiwi Kimia Tbk PT 21 -
601 Pakuwon Jati Tbk PT 15 -
409 Pan Brothers Tbk PT 3 -
1,281 Panin Financial Tbk PT 12 -
137 Paninvest Tbk PT 5 -
396 Perusahaan Gas Negara Tbk PT 22 -
240 Perusahaan Perkebunan London Sumatra IndonesiaTbk PT 14 -
63 Pool Advista Indonesia Tbk PT - -
375 PP Persero Tbk PT 20 -
1,329 Puradelta Lestari Tbk PT 14 -
331 Ramayana Lestari Sentosa Tbk PT 11 -
5,171 Rimo International Lestari Tbk PT 2 -
407 Salim Ivomas Pratama Tbk PT 10 -
1,280 Sarana Menara Nusantara Tbk PT 74 0.01
156 Sawit Sumbermas Sarana Tbk PT 7 -
118 Selamat Sempurna Tbk PT 7 -
199 Semen Indonesia Persero Tbk PT 94 0.01
12 Siloam International Hospitals Tbk PT 5 -
903 Sri Rejeki Isman Tbk PT 7 -
104 Sumber Alfaria Trijaya Tbk PT 5 -
842 Summarecon Agung Tbk PT 37 -
525 Surya Citra Media Tbk PT 41 -
751 Surya Esa Perkasa Tbk PT 13 -
749 Surya Semesta Internusa Tbk PT 16 -
517 Telekomunikasi Indonesia Persero Tbk PT 83 0.01
3 Telekomunikasi Indonesia Persero Tbk PT, ADR 45 -
176 Tiga Pilar Sejahtera Food Tbk 2 -
190 Timah Tbk PT 15 -
573 Tower Bersama Infrastructure Tbk PT 68 0.01
1,853 Trada Alam Minera Tbk PT 1 -
45 Transcoal Pacific Tbk PT 18 -
226 Tunas Baru Lampung Tbk PT 10 -
434 Ultrajaya Milk Industry & Trading Co Tbk PT 33 -
167 Unilever Indonesia Tbk PT 48 -
162 United Tractors Tbk PT 174 0.01
146 Vale Indonesia Tbk PT 34 -
759 Waskita Beton Precast Tbk PT 7 -
201 Waskita Karya Persero Tbk PT 10 -
322 Wijaya Karya Persero Tbk PT 19 -
392 XL Axiata Tbk PT 46 -
3,482 0.18
Ireland - 0.24%
40 AIB Group PLC 95 0.01
103 Bank of Ireland Group PLC 469 0.03
91 Cairn Homes PLC 83 -
34 CRH PLC 1,239 0.07
6 CRH PLC, ADR 218 0.01
2 Dalata Hotel Group PLC 9 -
2 Datalex PLC 1 -
4 FBD Holdings PLC 32 -
2 Flutter Entertainment PLC (Ireland listing) 219 0.01
4 Flutter Entertainment PLC (UK listing) 496 0.03
16 Glanbia PLC 186 0.01
15 Irish Continental Group PLC 56 -
- Kenmare Resources PLC 1 -
2 Kerry Group PLC 179 0.01
8 Kingspan Group PLC 571 0.03
World Equity FundPortfolio of Investments as at 31 May 2021 (continued)
Dimensional Fund Advisors Semi-Annual Report and Unaudited Financial Statements, 31 May 2021 456

Shares (000's)
Value(000's)
GBP
% of NetAssetValue
Common Stock (continued)
Ireland - 0.24% (continued)
14 Permanent TSB Group Holdings PLC 17 -
17 Smurfit Kappa Group PLC 646 0.03
4,517 0.24
Israel - 0.24%
- Afcon Holdings Ltd 7 -
2 AFI Properties Ltd 50 -
3 Airport City Ltd 43 -
2 Allot Ltd 22 -
7 Alony Hetz Properties & Investments Ltd 66 0.01
1 Alrov Properties and Lodgings Ltd 31 -
10 Amot Investments Ltd 51 -
1 Arad Ltd 11 -
4 Ashtrom Group Ltd 69 0.01
1 AudioCodes Ltd 10 -
8 Avgol Industries 1953 Ltd 5 -
10 Azorim-Investment Development & Construction CoLtd 28 -
1 Azrieli Group Ltd 47 -
15 Bank Hapoalim BM 93 0.01
33 Bank Leumi Le-Israel BM 184 0.01
8 Bayside Land Corp 49 -
- Bet Shemesh Engines Holdings 1997 Ltd 6 -
91 Bezeq The Israeli Telecommunication Corp Ltd 71 0.01
1 Big Shopping Centers Ltd 44 -
- Blue Square Real Estate Ltd 18 -
- Brack Capital Properties NV 17 -
2 Camtek Ltd 55 -
4 Carasso Motors Ltd 15 -
10 Cellcom Israel Ltd 27 -
5 Ceragon Networks Ltd 11 -
5 Clal Insurance Enterprises Holdings Ltd 68 0.01
2 Compugen Ltd 12 -
- Danel Adir Yeoshua Ltd 48 -
5 Delek Automotive Systems Ltd 43 -
- Delek Group Ltd 16 -
1 Delta Galil Industries Ltd 30 -
1 Dor Alon Energy in Israel 1988 Ltd 14 -
1 Electra Consumer Products 1970 Ltd 48 -
- Electra Ltd 73 0.01
2 Electra Real Estate Ltd 15 -
10 Energix-Renewable Energies Ltd 28 -
24 Enlight Renewable Energy Ltd 36 -
2 Equital Ltd 40 -
5 First International Bank Of Israel Ltd 122 0.01
- FMS Enterprises Migun Ltd 6 -
1 Formula Systems 1985 Ltd 61 0.01
1 Fox Wizel Ltd 107 0.01
2 Gilat Satellite Networks Ltd 17 -
- Hadera Paper Ltd 16 -
10 Harel Insurance Investments & Financial ServicesLtd 75 0.01
2 Hilan Ltd 63 0.01
- IDI Insurance Co Ltd 11 -
25 Industrial Buildings Corp Ltd 52 -
10 Inrom Construction Industries Ltd 35 -
10 Isracard Ltd 27 -
7 Israel Canada T.R Ltd 21 -
25 Israel Chemicals Ltd 124 0.01
56 Israel Discount Bank Ltd 204 0.01
1 Israel Land Development - Urban Renewal Ltd 12 -
- Isras Investment Co Ltd 27 -
2 Kamada Ltd 10 -
Shares (000's)
Value(000's)
GBP
% of NetAssetValue
Common Stock (continued)
Israel - 0.24% (continued)
2 Kenon Holdings Ltd 38 -
- Kerur Holdings Ltd 8 -
- Klil Industries Ltd 8 -
- Levinstein Properties Ltd 8 -
2 Magic Software Enterprises Ltd 20 -
5 Magic Software Enterprises Ltd (US listing) 53 -
1 Malam - Team Ltd 23 -
3 Matrix IT Ltd 58 -
4 Maytronics Ltd 57 -
7 Mediterranean Towers Ltd 15 -
1 Mega Or Holdings Ltd 30 -
- Mehadrin Ltd 3 -
4 Meitav Dash Investments Ltd 16 -
1 Melisron Ltd 48 -
3 Menora Mivtachim Holdings Ltd 44 -
47 Migdal Insurance & Financial Holdings Ltd 47 -
1 Mivtach Shamir Holdings Ltd 16 -
10 Mizrahi Tefahot Bank Ltd 221 0.01
6 Naphtha Israel Petroleum Corp Ltd 20 -
2 Nawi Brothers Ltd 8 -
- Neto Malinda Trading Ltd 5 -
- Neto ME Holdings Ltd 5 -
1 Nice Ltd, ADR 136 0.01
2 Nova Measuring Instruments Ltd 156 0.01
24 Novolog Ltd 16 -
233 Oil Refineries Ltd 44 -
- One Software Technologies Ltd 25 -
4 OPC Energy Ltd 28 -
12 Partner Communications Co Ltd 40 -
1 Paz Oil Co Ltd 83 0.01
2 Perion Network Ltd 18 -
13 Phoenix Holdings Ltd 90 0.01
- Plasson Industries Ltd 12 -
1 Rami Levy Chain Stores Hashikma Marketing2006 Ltd 23 -
1 Scope Metals Group Ltd 12 -
8 Shapir Engineering and Industry Ltd 43 -
18 Shikun & Binui Ltd 85 0.01
10 Shufersal Ltd 60 0.01
3 Strauss Group Ltd 66 0.01
- Tadiran Holdings Ltd 38 -
17 Teva Pharmaceutical Industries Ltd 122 0.01
1 Tower Semiconductor Ltd 18 -
7 Tower Semiconductor Ltd (US listing) 135 0.01
1 Victory Supermarket Chain Ltd 13 -
1 YH Dimri Construction & Development Ltd 21 -
4,526 0.24
Italy - 0.84%
150 A2A SpA 221 0.01
6 ACEA SpA 101 0.01
13 Amplifon SpA 431 0.02
26 Anima Holding SpA 97 0.01
3 Aquafil SpA 14 -
17 Arnoldo Mondadori Editore SpA 25 -
8 Ascopiave SpA 25 -
33 Assicurazioni Generali SpA 482 0.03
16 Atlantia SpA 210 0.01
13 Autogrill SpA 77 -
1 Avio SpA 16 -
12 Azimut Holding SpA 211 0.01
4 Banca Carige SpA 1 -
12 Banca Farmafactoring SpA 77 -
World Equity FundPortfolio of Investments as at 31 May 2021 (continued)
Dimensional Fund Advisors Semi-Annual Report and Unaudited Financial Statements, 31 May 2021 457

Shares (000's)
Value(000's)
GBP
% of NetAssetValue
Common Stock (continued)
Italy - 0.84% (continued)
5 Banca Generali SpA 152 0.01
3 Banca IFIS SpA 33 -
13 Banca Mediolanum SpA 85 0.01
1 Banca Monte dei Paschi di Siena SpA 1 -
64 Banca Popolare di Sondrio SCpA 220 0.01
8 Banca Sistema SpA 15 -
153 Banco BPM SpA 383 0.02
4 Banco di Desio e della Brianza SpA 12 -
12 BE SpA 16 -
1 Biesse SpA 38 -
119 BPER Banca 208 0.01
4 Brunello Cucinelli SpA 165 0.01
9 Buzzi Unicem SpA 188 0.01
8 Cairo Communication SpA 13 -
3 Carel Industries SpA 64 -
4 Cementir Holding NV 33 -
18 Cerved Group SpA 155 0.01
99 CIR SpA-Compagnie Industriali 43 -
54 CNH Industrial NV 653 0.03
11 Credito Emiliano SpA 52 -
53 d'Amico International Shipping SA 4 -
2 Danieli & C Officine Meccaniche SpA 36 -
6 Davide Campari-Milano NV 57 -
4 De' Longhi SpA 111 0.01
- DeA Capital SpA 1 -
1 DiaSorin SpA 132 0.01
1 doValue SpA 7 -
9 Emak SpA 15 -
2 Enav SpA 7 -
158 Enel SpA 1,105 0.06
53 Eni SpA 455 0.02
6 ERG SpA 126 0.01
3 Esprinet SpA 34 -
2 Ferrari NV 319 0.02
5 Fiera Milano SpA 14 -
1 Fila SpA 7 -
50 Fincantieri SpA 31 -
41 FinecoBank Banca Fineco SpA 478 0.03
17 FNM SpA 10 -
4 Freni Brembo SpA 37 -
5 Geox SpA 5 -
2 Gruppo MutuiOnline SpA 84 0.01
91 Hera SpA 273 0.02
5 Illimity Bank SpA 42 -
34 IMMSI SpA 14 -
13 Infrastrutture Wireless Italiane SpA 105 0.01
15 Intek Group SpA 4 -
4 Interpump Group SpA 155 0.01
247 Intesa Sanpaolo SpA 511 0.03
41 Iren SpA 92 0.01
32 Italgas SpA 149 0.01
1 Italmobiliare SpA 37 -
1 IVS Group SA 5 -
40 Juventus Football Club SpA 26 -
1 La Doria SpA 22 -
44 Leonardo SpA 270 0.01
1 LU-VE SpA 8 -
15 Maire Tecnimont SpA 37 -
40 Mediaset SpA 99 0.01
44 Mediobanca Banca di Credito Finanziario SpA 367 0.02
10 Moncler SpA 511 0.03
5 Nexi SpA 76 -
Shares (000's)
Value(000's)
GBP
% of NetAssetValue
Common Stock (continued)
Italy - 0.84% (continued)
23 OVS SpA 36 -
23 Piaggio & C SpA 64 -
37 Pirelli & C SpA 154 0.01
35 Poste Italiane SpA 342 0.02
1 Prima Industrie SpA 16 -
12 Prysmian SpA 280 0.02
11 RAI Way SpA 47 -
5 Recordati SpA 202 0.01
18 Reno de Medici SpA 16 -
1 Reply SpA 163 0.01
14 Rizzoli Corriere Della Sera Mediagroup SpA 9 -
13 Safilo Group SpA 18 -
44 Saipem SpA 76 -
26 Salini Impregilo SpA 42 -
42 Saras SpA 25 -
1 Sesa SpA 91 0.01
43 Snam SpA 177 0.01
19 Societa Cattolica di Assicurazioni SC 99 0.01
4 Sogefi SpA 5 -
3 SOL SpA 47 -
153 Stellantis 2,118 0.11
7 Tamburi Investment Partners SpA 49 -
9 Technogym SpA 78 -
689 Telecom Italia SpA 260 0.01
29 Tenaris SA 235 0.01
35 Terna Rete Elettrica Nazionale SpA 189 0.01
2 Tinexta Spa 41 -
1 Tod's SpA 40 -
66 UniCredit SpA 594 0.03
1 Unieuro SpA 30 -
29 Unipol Gruppo SpA 113 0.01
40 UnipolSai Assicurazioni SpA 85 0.01
3 Zignago Vetro SpA 39 -
16,175 0.84
Japan - 6.10%
6 77 Bank Ltd 48 -
2 A&D Co Ltd 13 -
1 ABC-Mart Inc 50 -
1 Achilles Corp 11 -
11 Acom Co Ltd 34 -
3 AD Works Co Ltd 3 -
2 Adastria Co Ltd 20 -
10 ADEKA Corp 130 0.01
1 Ad-Sol Nissin Corp 20 -
4 Advan Co Ltd 24 -
4 Advantest Corp 262 0.02
- Adventure Inc 15 -
16 AEON Co Ltd 309 0.02
2 AEON Delight Co Ltd 47 -
1 AEON Fantasy Co Ltd 15 -
12 AEON Financial Service Co Ltd 96 0.01
2 AEON Hokkaido Corp 15 -
6 AEON Mall Co Ltd 68 0.01
1 Aeria Inc 5 -
2 AFC-HD AMS Life Science Co Ltd 14 -
8 AGC Inc 254 0.01
1 Agro-Kanesho Co Ltd 8 -
2 Ahresty Corp 7 -
1 Ai Holdings Corp 18 -
3 Aica Kogyo Co Ltd 66 -
1 Aichi Bank Ltd 15 -
3 Aichi Corp 17 -
World Equity FundPortfolio of Investments as at 31 May 2021 (continued)
Dimensional Fund Advisors Semi-Annual Report and Unaudited Financial Statements, 31 May 2021 458

Shares (000's)
Value(000's)
GBP
% of NetAssetValue
Common Stock (continued)
Japan - 6.10% (continued)
2 Aichi Steel Corp 34 -
- Aichi Tokei Denki Co Ltd 11 -
7 Aida Engineering Ltd 38 -
23 Aiful Corp 56 -
2 Ain Holdings Inc 87 0.01
1 Aiphone Co Ltd 13 -
17 Air Water Inc 205 0.01
2 Airport Facilities Co Ltd 8 -
1 Airtech Japan Ltd 8 -
4 Aisan Industry Co Ltd 22 -
8 Aisin Seiki Co Ltd 246 0.01
3 Aizawa Securities Co Ltd 25 -
22 Ajinomoto Co Inc 360 0.02
1 Ajis Co Ltd 19 -
1 Akatsuki Inc 25 -
14 Akebono Brake Industry Co Ltd 16 -
3 Akita Bank Ltd 25 -
1 Albis Co Ltd 10 -
3 Alconix Corp 32 -
12 Alfresa Holdings Corp 131 0.01
1 Alinco Inc 10 -
2 Alleanza Holdings Co Ltd 16 -
1 Alpen Co Ltd 21 -
1 Alpha Systems Inc 16 -
17 Alps Alpine Co Ltd 130 0.01
2 Alps Logistics Co Ltd 11 -
2 Altech Corp 20 -
19 Amada Holdings Co Ltd 143 0.01
5 Amano Corp 91 0.01
1 Amiyaki Tei Co Ltd 9 -
1 Amuse Inc 12 -
- Amvis Holdings Inc 17 -
3 ANA Holdings Inc 51 -
1 Anabuki Kosan Inc 12 -
3 Anest Iwata Corp 21 -
2 Anicom Holdings Inc 16 -
10 Anritsu Corp 129 0.01
- AOI Electronics Co Ltd 4 -
2 AOI TYO Holdings Inc 11 -
5 AOKI Holdings Inc 23 -
2 Aomori Bank Ltd 36 -
3 Aoyama Trading Co Ltd 17 -
1 Aoyama Zaisan Networks Co Ltd 11 -
8 Aozora Bank Ltd 129 0.01
1 Apaman Co Ltd 3 -
2 Arakawa Chemical Industries Ltd 13 -
1 Arata Corp 35 -
4 Arcland Sakamoto Co Ltd 33 -
2 Arcland Service Holdings Co Ltd 23 -
4 Arcs Co Ltd 65 -
1 Arealink Co Ltd 9 -
2 Argo Graphics Inc 35 -
3 Arisawa Manufacturing Co Ltd 19 -
2 ARTERIA Networks Corp 18 -
1 Artnature Inc 6 -
2 ArtSpark Holdings Inc 45 -
2 Aruhi Corp 25 -
- As One Corp 24 -
2 Asahi Co Ltd 16 -
6 Asahi Diamond Industrial Co Ltd 21 -
9 Asahi Group Holdings Ltd 308 0.02
8 Asahi Holdings Inc 127 0.01
Shares (000's)
Value(000's)
GBP
% of NetAssetValue
Common Stock (continued)
Japan - 6.10% (continued)
5 Asahi Intecc Co Ltd 89 0.01
67 Asahi Kasei Corp 529 0.03
1 Asahi Kogyosha Co Ltd 12 -
2 Asahi Net Inc 8 -
2 Asahi Yukizai Corp 19 -
1 Asanuma Corp 17 -
1 Ascentech KK 11 -
1 Ashimori Industry Co Ltd 4 -
2 Asia Pile Holdings Corp 8 -
4 Asics Corp 70 0.01
3 ASKA Pharmaceutical Holdings 18 -
2 ASKUL Corp 27 -
16 Astellas Pharma Inc 177 0.01
1 Ateam Inc 12 -
4 Atom Corp 20 -
2 Atsugi Co Ltd 9 -
2 Aucnet Inc 13 -
8 Autobacs Seven Co Ltd 76 0.01
- Aval Data Corp 9 -
3 Avant Corp 29 -
3 Avex Inc 28 -
4 Awa Bank Ltd 57 -
2 Axial Retailing Inc 41 -
1 Azbil Corp 29 -
3 Bandai Namco Holdings Inc 168 0.01
4 Bando Chemical Industries Ltd 23 -
2 Bank of Iwate Ltd 29 -
1 Bank of Kochi Ltd 7 -
5 Bank of Kyoto Ltd 163 0.01
3 Bank of Okinawa Ltd 43 -
1 Bank of Saga Ltd 13 -
6 Bank of the Ryukyus Ltd 28 -
1 Bank of Toyama Ltd 8 -
1 Baroque Japan Ltd 6 -
1 BayCurrent Consulting Inc 197 0.01
1 Beenos Inc 25 -
1 Belc Co Ltd 39 -
4 Bell System24 Holdings Inc 46 -
7 Belluna Co Ltd 48 -
4 Benefit One Inc 89 0.01
6 Benesse Holdings Inc 105 0.01
1 Bengo4.com Inc 28 -
8 Bic Camera Inc 58 -
- Biofermin Pharmaceutical Co Ltd 8 -
3 BML Inc 63 -
1 Bourbon Corp 10 -
1 BP Castrol KK 7 -
11 Bridgestone Corp 345 0.02
9 Broadband Tower Inc 14 -
9 Broadleaf Co Ltd 32 -
16 Brother Industries Ltd 233 0.01
6 Bunka Shutter Co Ltd 43 -
1 Business Brain Showa-Ota Inc 12 -
1 C Uyemura & Co Ltd 33 -
1 CAC Holdings Corp 7 -
7 Calbee Inc 112 0.01
1 Can Do Co Ltd 12 -
3 Canon Electronics Inc 31 -
11 Canon Inc 182 0.01
4 Canon Marketing Japan Inc 60 -
6 Capcom Co Ltd 146 0.01
3 Carlit Holdings Co Ltd 13 -
World Equity FundPortfolio of Investments as at 31 May 2021 (continued)
Dimensional Fund Advisors Semi-Annual Report and Unaudited Financial Statements, 31 May 2021 459

Shares (000's)
Value(000's)
GBP
% of NetAssetValue
Common Stock (continued)
Japan - 6.10% (continued)
2 Carta Holdings Inc 16 -
5 Casio Computer Co Ltd 63 -
2 Cawachi Ltd 29 -
1 Central Automotive Products Ltd 26 -
4 Central Glass Co Ltd 53 -
2 Central Japan Railway Co 183 0.01
1 Central Security Patrols Co Ltd 15 -
1 Central Sports Co Ltd 10 -
3 Change Inc 58 -
1 Charm Care Corp KK 7 -
26 Chiba Bank Ltd 118 0.01
4 Chiba Kogyo Bank Ltd 8 -
3 Chilled & Frozen Logistics Holdings Co Ltd 29 -
1 Chino Corp 10 -
2 Chiyoda Co Ltd 13 -
1 Chiyoda Integre Co Ltd 17 -
1 Chodai Co Ltd 16 -
2 Chofu Seisakusho Co Ltd 25 -
1 Chori Co Ltd 15 -
13 Chubu Electric Power Co Inc 107 0.01
3 Chubu Shiryo Co Ltd 23 -
4 Chudenko Corp 56 -
1 Chuetsu Pulp & Paper Co Ltd 5 -
10 Chugai Pharmaceutical Co Ltd 279 0.02
1 Chugai Ro Co Ltd 8 -
19 Chugoku Bank Ltd 108 0.01
12 Chugoku Electric Power Co Inc 79 0.01
5 Chugoku Marine Paints Ltd 27 -
2 Chukyo Bank Ltd 16 -
2 Chuo Spring Co Ltd 15 -
1 Chuo Warehouse Co Ltd 9 -
5 CI Takiron Corp 19 -
35 Citizen Watch Co Ltd 99 0.01
1 CK-San-Etsu Co Ltd 12 -
2 Cleanup Corp 6 -
1 CMIC Holdings Co Ltd 11 -
6 CMK Corp 20 -
9 Coca-Cola Bottlers Japan Holdings Inc 106 0.01
1 Cocokara fine Inc 70 0.01
2 Computer Engineering & Consulting Ltd 19 -
1 Computer Institute of Japan Ltd 8 -
7 COMSYS Holdings Corp 152 0.01
2 Comture Corp 30 -
70 Concordia Financial Group Ltd 186 0.01
2 CONEXIO Corp 20 -
9 COOKPAD Inc 15 -
2 Corona Corp 13 -
2 Cosel Co Ltd 15 -
5 Cosmo Energy Holdings Co Ltd 77 0.01
1 Cosmos Pharmaceutical Corp 67 -
1 Cota Co Ltd 14 -
1 CRE Inc 9 -
9 Create Restaurants Holdings Inc 44 -
3 Create SD Holdings Co Ltd 54 -
13 Credit Saison Co Ltd 112 0.01
1 Creek & River Co Ltd 11 -
1 Cresco Ltd 15 -
1 CTI Engineering Co Ltd 19 -
3 CTS Co Ltd 17 -
14 CyberAgent Inc 190 0.01
1 Cyberlinks Co Ltd 9 -
1 Cybernet Systems Co Ltd 7 -
Shares (000's)
Value(000's)
GBP
% of NetAssetValue
Common Stock (continued)
Japan - 6.10% (continued)
2 Cybozu Inc 37 -
8 Dai Nippon Printing Co Ltd 121 0.01
1 Dai Nippon Toryo Co Ltd 4 -
4 Daibiru Corp 33 -
25 Daicel Corp 141 0.01
2 Dai-Dan Co Ltd 26 -
1 Daido Kogyo Co Ltd 6 -
4 Daido Metal Co Ltd 16 -
4 Daido Steel Co Ltd 123 0.01
2 Daidoh Ltd 3 -
2 Daifuku Co Ltd 128 0.01
2 Daihatsu Diesel Manufacturing Co Ltd 6 -
2 Daihen Corp 56 -
2 Daiho Corp 52 -
1 Daiichi Jitsugyo Co Ltd 28 -
2 Daiichi Kensetsu Corp 20 -
3 Daiichi Kigenso Kagaku-Kogyo Co Ltd 30 -
16 Dai-ichi Life Holdings Inc 237 0.01
3 Daiichi Sankyo Co Ltd 50 -
1 Dai-ichi Seiko Co Ltd 18 -
2 Daiichikosho Co Ltd 44 -
1 Daiken Corp 15 -
2 Daiken Medical Co Ltd 7 -
4 Daiki Aluminium Industry Co Ltd 31 -
1 Daiki Axis Co Ltd 7 -
3 Daikin Industries Ltd 476 0.03
1 Daikoku Denki Co Ltd 5 -
1 Daikokutenbussan Co Ltd 38 -
6 Daikyonishikawa Corp 29 -
2 Dainichiseika Color & Chemicals Manufacturing CoLtd 27 -
7 Daio Paper Corp 78 0.01
3 Daiseki Co Ltd 94 0.01
4 Daishi Hokuetsu Financial Group Inc 68 -
1 Daishinku Corp 10 -
1 Daisue Construction Co Ltd 8 -
1 Daito Pharmaceutical Co Ltd 32 -
5 Daito Trust Construction Co Ltd 353 0.02
1 Daitron Co Ltd 11 -
22 Daiwa House Industry Co Ltd 444 0.02
5 Daiwa Industries Ltd 36 -
45 Daiwa Securities Group Inc 184 0.01
10 Daiwabo Holdings Co Ltd 111 0.01
10 DCM Holdings Co Ltd 67 -
2 Dear Life Co Ltd 6 -
7 DeNA Co Ltd 98 0.01
8 Denka Co Ltd 214 0.01
1 Denki Kogyo Co Ltd 18 -
1 Densan System Co Ltd 19 -
3 Denso Corp 149 0.01
7 Dentsu Inc 172 0.01
2 Denyo Co Ltd 26 -
6 Dexerials Corp 83 0.01
1 Diamond Electric Holdings Co 18 -
9 DIC Corp 159 0.01
1 Digital Arts Inc 57 -
2 Digital Garage Inc 57 -
2 Digital Hearts Holdings Co Ltd 14 -
1 Digital Information Technologies Corp 15 -
3 Dip Corp 63 -
1 Disco Corp 127 0.01
1 DKS Co Ltd 16 -
World Equity FundPortfolio of Investments as at 31 May 2021 (continued)
Dimensional Fund Advisors Semi-Annual Report and Unaudited Financial Statements, 31 May 2021 460

Shares (000's)
Value(000's)
GBP
% of NetAssetValue
Common Stock (continued)
Japan - 6.10% (continued)
10 DMG Mori Co Ltd 127 0.01
3 Doshisha Co Ltd 29 -
4 Doutor Nichires Holdings Co Ltd 40 -
4 Dowa Holdings Co Ltd 108 0.01
3 DTS Corp 55 -
3 Duskin Co Ltd 57 -
1 DyDo Group Holdings Inc 32 -
3 Eagle Industry Co Ltd 26 -
1 Earth Corp 60 -
3 East Japan Railway Co 174 0.01
6 Ebara Corp 205 0.01
1 Ebara Foods Industry Inc 10 -
1 Ebase Co Ltd 8 -
1 Eco's Co Ltd 12 -
10 EDION Corp 67 -
3 EF-ON Inc 19 -
2 eGuarantee Inc 32 -
1 E-Guardian Inc 11 -
4 Ehime Bank Ltd 22 -
4 Eidai Co Ltd 8 -
2 Eiken Chemical Co Ltd 28 -
5 Eisai Co Ltd 235 0.01
2 Eizo Corp 62 -
1 EJ Holdings Inc 9 -
3 Elan Corp 27 -
4 Elecom Co Ltd 50 -
5 Electric Power Development Co Ltd 54 -
2 Elematec Corp 13 -
1 Endo Lighting Corp 6 -
3 Enigmo Inc 22 -
4 en-japan Inc 102 0.01
- Enplas Corp 11 -
3 EPS Holdings Inc 27 -
2 eRex Co Ltd 25 -
1 ES-Con Japan Ltd 7 -
1 Eslead Corp 10 -
2 ESPEC Corp 30 -
4 Exedy Corp 39 -
3 Ezaki Glico Co Ltd 86 0.01
7 F@N Communications Inc 18 -
1 Faith Inc 7 -
1 Falco Holdings Co Ltd 8 -
3 Fancl Corp 61 -
- FANUC Corp 41 -
1 Fast Retailing Co Ltd 518 0.03
4 FCC Co Ltd 49 -
1 FDK Corp 11 -
5 Feed One Co Ltd 22 -
3 Ferrotec Holdings Corp 48 -
24 FIDEA Holdings Co Ltd 19 -
1 Fields Corp 3 -
1 FINDEX Inc 9 -
8 First Bank of Toyama Ltd 15 -
1 First Juken Co Ltd 7 -
2 Fixstars Corp 10 -
3 FJ Next Co Ltd 17 -
- Forval Corp 2 -
3 Foster Electric Co Ltd 20 -
4 FP Corp 111 0.01
3 France Bed Holdings Co Ltd 17 -
2 Freebit Co Ltd 10 -
1 Freund Corp 3 -
Shares (000's)
Value(000's)
GBP
% of NetAssetValue
Common Stock (continued)
Japan - 6.10% (continued)
2 F-Tech Inc 7 -
2 Fudo Tetra Corp 25 -
2 Fuji Co Ltd 33 -
1 Fuji Corp 11 -
7 Fuji Corp (Aichi) 127 0.01
4 Fuji Corp Ltd 15 -
6 Fuji Electric Co Ltd 200 0.01
- Fuji Kyuko Co Ltd 10 -
4 Fuji Media Holdings Inc 32 -
5 Fuji Oil Co Ltd 9 -
5 Fuji Oil Holdings Inc 91 0.01
2 Fuji Pharma Co Ltd 15 -
6 Fuji Seal International Inc 84 0.01
2 Fuji Soft Inc 87 0.01
1 Fujibo Holdings Inc 23 -
2 Fujicco Co Ltd 22 -
5 FUJIFILM Holdings Corp 259 0.01
2 Fujikura Composites Inc 7 -
2 Fujikura Kasei Co Ltd 8 -
34 Fujikura Ltd 104 0.01
2 Fujimori Kogyo Co Ltd 55 -
13 Fujisash Co Ltd 6 -
4 Fujitec Co Ltd 66 -
4 Fujitsu General Ltd 73 0.01
5 Fujitsu Ltd 519 0.03
1 Fujiya Co Ltd 15 -
1 FuKoKu Co Ltd 8 -
1 Fukuda Corp 32 -
1 Fukuda Denshi Co Ltd 51 -
3 Fukui Bank Ltd 26 -
1 Fukui Computer Holdings Inc 31 -
12 Fukuoka Financial Group Inc 162 0.01
2 Fukushima Bank Ltd 2 -
1 Fukushima Industries Corp 37 -
3 Fukuyama Transporting Co Ltd 88 0.01
2 FULLCAST Holdings Co Ltd 29 -
4 Funai Soken Holdings Inc 54 -
2 Furukawa Battery Co Ltd 20 -
4 Furukawa Co Ltd 34 -
6 Furukawa Electric Co Ltd 120 0.01
2 Furuno Electric Co Ltd 16 -
1 Furusato Industries Ltd 9 -
1 Furuya Metal Co Ltd 24 -
1 Furyu Corp 9 -
2 Fuso Chemical Co Ltd 53 -
1 Fuso Pharmaceutical Industries Ltd 19 -
5 Futaba Corp 27 -
6 Futaba Industrial Co Ltd 19 -
2 Future Corp 23 -
2 Fuyo General Lease Co Ltd 92 0.01
1 G-7 Holdings Inc 22 -
2 Gakken Holdings Co Ltd 21 -
1 Gakkyusha Co Ltd 8 -
2 GCA Corp 9 -
1 Genki Sushi Co Ltd 13 -
1 Genky DrugStores Co Ltd 30 -
4 Geo Holdings Corp 30 -
1 Geostr Corp 3 -
1 giftee Inc 17 -
- Giken Ltd 4 -
1 GL Sciences Inc 18 -
1 Globeride Inc 26 -
World Equity FundPortfolio of Investments as at 31 May 2021 (continued)
Dimensional Fund Advisors Semi-Annual Report and Unaudited Financial Statements, 31 May 2021 461

Shares (000's)
Value(000's)
GBP
% of NetAssetValue
Common Stock (continued)
Japan - 6.10% (continued)
5 Glory Ltd 76 0.01
- GMO Cloud KK 10 -
7 GMO Financial Holdings Inc 37 -
5 GMO Internet Inc 99 0.01
1 GMO Payment Gateway Inc 114 0.01
1 GNI Group Ltd 8 -
1 Godo Steel Ltd 12 -
3 Goldcrest Co Ltd 31 -
1 Goldwin Inc 53 -
3 Grace Technology Inc 33 -
10 Gree Inc 36 -
9 GS Yuasa Corp 175 0.01
4 G-Tekt Corp 35 -
3 Gumi Inc 19 -
1 Gun-Ei Chemical Industry Co Ltd 10 -
4 GungHo Online Entertainment Inc 50 -
41 Gunma Bank Ltd 95 0.01
2 Gunze Ltd 52 -
12 H2O Retailing Corp 68 0.01
- HABA Laboratories Inc 8 -
38 Hachijuni Bank Ltd 93 0.01
2 Hagihara Industries Inc 17 -
1 Hagiwara Electric Holdings Co Ltd 13 -
- Hagoromo Foods Corp 2 -
1 Hakudo Co Ltd 9 -
4 Hakuhodo DY Holdings Inc 52 -
2 Hakuto Co Ltd 18 -
1 Halows Co Ltd 13 -
2 Hamakyorex Co Ltd 44 -
1 Hamamatsu Photonics KK 62 -
1 Hamee Corp 13 -
7 Hankyu Hanshin Holdings Inc 159 0.01
4 Hanwa Co Ltd 86 0.01
2 Happinet Corp 18 -
2 Harima Chemicals Group Inc 15 -
1 Haruyama Holdings Inc 3 -
27 Haseko Corp 270 0.02
- Hashimoto Sogyo Holdings Co Ltd 3 -
21 Hazama Ando Corp 113 0.01
7 Heiwa Corp 80 0.01
3 Heiwa Real Estate Co Ltd 73 0.01
4 Heiwado Co Ltd 58 -
2 Helios Techno Holding Co Ltd 4 -
1 Hennge KK 16 -
2 Hibiya Engineering Ltd 29 -
1 Hikari Tsushin Inc 95 0.01
2 HI-LEX Corp 21 -
20 Hino Motors Ltd 132 0.01
1 Hinokiya Group Co Ltd 8 -
1 Hioki EE Corp 17 -
1 Hirakawa Hewtech Corp 7 -
4 Hiramatsu Inc 4 -
1 Hirano Tecseed Co Ltd 18 -
- Hirata Corp 8 -
29 Hirogin Holdings Inc 110 0.01
1 Hirose Electric Co Ltd 95 0.01
3 Hiroshima Gas Co Ltd 9 -
3 Hisaka Works Ltd 18 -
1 Hisamitsu Pharmaceutical Co Inc 24 -
4 Hitachi Construction Machinery Co Ltd 93 0.01
41 Hitachi Ltd 1,505 0.08
5 Hitachi Metals Ltd 67 -
Shares (000's)
Value(000's)
GBP
% of NetAssetValue
Common Stock (continued)
Japan - 6.10% (continued)
3 Hitachi Transport System Ltd 60 -
19 Hitachi Zosen Corp 90 0.01
1 Hito Communications Holdings Inc 9 -
2 Hochiki Corp 12 -
1 Hodogaya Chemical Co Ltd 18 -
2 Hogy Medical Co Ltd 41 -
- Hokkaido Coca-Cola Bottling Co Ltd 11 -
14 Hokkaido Electric Power Co Inc 45 -
2 Hokkaido Gas Co Ltd 18 -
1 Hokkan Holdings Ltd 7 -
2 Hokko Chemical Industry Co Ltd 10 -
2 Hokkoku Bank Ltd 37 -
11 Hokuetsu Corp 41 -
3 Hokuetsu Industries Co Ltd 20 -
14 Hokuhoku Financial Group Inc 81 0.01
1 Hokuriku Electric Industry Co Ltd 7 -
13 Hokuriku Electric Power Co 51 -
1 Hokuriku Electrical Construction Co Ltd 10 -
3 Hokuto Corp 32 -
25 Honda Motor Co Ltd 557 0.03
1 H-One Co Ltd 7 -
2 Honeys Holdings Co Ltd 14 -
6 Hoosiers Holdings 30 -
3 Horiba Ltd 150 0.01
- Hoshizaki Corp 26 -
7 Hosiden Corp 45 -
1 Hosokawa Micron Corp 31 -
2 Hotland Co Ltd 14 -
4 House Foods Group Inc 77 0.01
1 Howa Machinery Ltd 7 -
6 Hoya Corp 566 0.03
19 Hulic Co Ltd 153 0.01
27 Hyakugo Bank Ltd 54 -
3 Hyakujushi Bank Ltd 33 -
2 Ibiden Co Ltd 55 -
3 IBJ Inc 19 -
1 Ichibanya Co Ltd 21 -
25 Ichigo Inc 56 -
1 Ichiken Co Ltd 7 -
5 Ichikoh Industries Ltd 23 -
2 Ichimasa Kamaboko Co Ltd 10 -
2 Ichinen Holdings Co Ltd 18 -
5 Ichiyoshi Securities Co Ltd 18 -
1 Icom Inc 9 -
1 ID Holdings Corp 9 -
1 IDEA Consultants Inc 8 -
3 Idec Corp 45 -
8 Idemitsu Kosan Co Ltd 128 0.01
6 IDOM Inc 23 -
1 Ihara Science Corp 9 -
16 IHI Corp 281 0.02
7 Iida Group Holdings Co Ltd 124 0.01
11 Iino Kaiun Kaisha Ltd 32 -
1 Ikegami Tsushinki Co Ltd 5 -
2 Imagica Group Inc 8 -
- Imasen Electric Industrial 2 -
1 Imuraya Group Co Ltd 9 -
4 Inaba Denki Sangyo Co Ltd 67 -
1 Inaba Seisakusho Co Ltd 10 -
5 Inabata & Co Ltd 56 -
2 Inageya Co Ltd 18 -
1 Ines Corp 10 -
World Equity FundPortfolio of Investments as at 31 May 2021 (continued)
Dimensional Fund Advisors Semi-Annual Report and Unaudited Financial Statements, 31 May 2021 462

Shares (000's)
Value(000's)
GBP
% of NetAssetValue
Common Stock (continued)
Japan - 6.10% (continued)
1 I-Net Corp 10 -
2 Infocom Corp 33 -
11 Infomart Corp 67 -
2 Information Services International-Dentsu Ltd 47 -
2 Innotech Corp 19 -
63 Inpex Corp 302 0.02
2 Insource Co Ltd 34 -
5 Intage Holdings Inc 52 -
1 Inter Action Corp 18 -
5 Internet Initiative Japan Inc 104 0.01
1 I-O Data Device Inc 8 -
1 IR Japan Holdings Ltd 46 -
1 Iriso Electronics Co Ltd 21 -
2 ISB Corp 15 -
2 Iseki & Co Ltd 20 -
24 Isetan Mitsukoshi Holdings Ltd 121 0.01
1 Ishihara Chemical Co Ltd 11 -
5 Ishihara Sangyo Kaisha Ltd 32 -
2 Isolite Insulating Products Co Ltd 7 -
21 Isuzu Motors Ltd 197 0.01
2 Itfor Inc 12 -
2 ITmedia Inc 17 -
2 Ito En Ltd 75 0.01
33 ITOCHU Corp 697 0.04
7 Itochu Enex Co Ltd 44 -
3 Itochu Techno-Solutions Corp 68 0.01
1 Itochu-Shokuhin Co Ltd 22 -
15 Itoham Yonekyu Holdings Inc 69 0.01
5 Itoki Corp 11 -
2 IwaiCosmo Holdings Inc 26 -
4 Iwaki & Co Ltd 18 -
1 Iwasaki Electric Co Ltd 8 -
4 Iwatani Corp 175 0.01
2 Iwatsu Electric Co Ltd 10 -
1 Iwatsuka Confectionery Co Ltd 13 -
8 Iyo Bank Ltd 31 -
4 Izumi Co Ltd 108 0.01
21 J Front Retailing Co Ltd 149 0.01
1 JAC Recruitment Co Ltd 18 -
3 Jaccs Co Ltd 52 -
3 Jafco Co Ltd 179 0.01
1 Jalux Inc 8 -
1 Jamco Corp 4 -
2 Janome Sewing Machine Co Ltd 11 -
11 Japan Airlines Co Ltd 178 0.01
1 Japan Airport Terminal Co Ltd 32 -
2 Japan Asia Group Ltd 13 -
6 Japan Aviation Electronics Industry Ltd 73 0.01
2 Japan Best Rescue System Co Ltd 9 -
2 Japan Cash Machine Co Ltd 9 -
61 Japan Display Inc 16 -
4 Japan Elevator Service Holdings Co Ltd 58 -
16 Japan Exchange Group Inc 261 0.02
2 Japan Investment Adviser Co Ltd 14 -
5 Japan Lifeline Co Ltd 44 -
5 Japan Material Co Ltd 43 -
1 Japan Meat Co Ltd 17 -
2 Japan Medical Dynamic Marketing Inc 30 -
3 Japan Petroleum Exploration Co Ltd 37 -
24 Japan Post Holdings Co Ltd 140 0.01
7 Japan Post Insurance Co Ltd 91 0.01
1 Japan Property Management Center Co Ltd 8 -
Shares (000's)
Value(000's)
GBP
% of NetAssetValue
Common Stock (continued)
Japan - 6.10% (continued)
2 Japan Pulp & Paper Co Ltd 39 -
11 Japan Securities Finance Co Ltd 62 -
5 Japan Steel Works Ltd 97 0.01
45 Japan Tobacco Inc 624 0.03
5 Japan Transcity Corp 19 -
6 Japan Wool Textile Co Ltd 35 -
1 Jastec Co Ltd 9 -
2 JBCC Holdings Inc 14 -
2 JCR Pharmaceuticals Co Ltd 49 -
3 JCU Corp 63 -
3 Jeol Ltd 86 0.01
21 JFE Holdings Inc 202 0.01
18 JGC Holdings Corp 120 0.01
- JIG-SAW Inc 22 -
3 Jimoto Holdings Inc 13 -
1 JINS Holdings Inc 71 0.01
1 JK Holdings Co Ltd 7 -
1 JMDC Inc 16 -
2 JMS Co Ltd 12 -
1 Joban Kosan Co Ltd 7 -
3 J-Oil Mills Inc 34 -
2 Joshin Denki Co Ltd 36 -
4 Joyful Honda Co Ltd 32 -
7 JP-Holdings Inc 13 -
1 JSP Corp 10 -
6 JSR Corp 133 0.01
15 JTEKT Corp 111 0.01
- JTOWER Inc 16 -
3 Juki Corp 17 -
3 Juroku Bank Ltd 44 -
1 Justsystems Corp 53 -
19 JVCKenwood Corp 28 -
64 JXTG Holdings Inc 187 0.01
1 K&O Energy Group Inc 12 -
2 Kadokawa Dwango 46 -
- Kadoya Sesame Mills Inc 10 -
2 Kaga Electronics Co Ltd 44 -
2 Kagome Co Ltd 43 -
26 Kajima Corp 250 0.01
4 Kakaku.com Inc 88 0.01
3 Kaken Pharmaceutical Co Ltd 82 0.01
1 Kameda Seika Co Ltd 29 -
3 Kamei Corp 25 -
8 Kamigumi Co Ltd 114 0.01
2 Kanaden Corp 17 -
1 Kanagawa Chuo Kotsu Co Ltd 21 -
3 Kanamic Network Co Ltd 14 -
4 Kanamoto Co Ltd 69 0.01
13 Kandenko Co Ltd 74 0.01
6 Kaneka Corp 173 0.01
1 Kaneko Seeds Co Ltd 11 -
9 Kanematsu Corp 90 0.01
1 Kanematsu Electronics Ltd 33 -
15 Kansai Electric Power Co Inc 100 0.01
1 Kansai Paint Co Ltd 22 -
1 Kansai Super Market Ltd 8 -
6 Kanto Denka Kogyo Co Ltd 37 -
11 Kao Corp 463 0.03
3 Kasai Kogyo Co Ltd 8 -
3 Katakura Industries Co Ltd 30 -
4 Katitas Co Ltd 86 0.01
2 Kato Sangyo Co Ltd 38 -
World Equity FundPortfolio of Investments as at 31 May 2021 (continued)
Dimensional Fund Advisors Semi-Annual Report and Unaudited Financial Statements, 31 May 2021 463

Shares (000's)
Value(000's)
GBP
% of NetAssetValue
Common Stock (continued)
Japan - 6.10% (continued)
1 Kato Works Co Ltd 8 -
1 Kawada Technologies Inc 12 -
1 Kawai Musical Instruments Manufacturing Co Ltd 17 -
12 Kawasaki Heavy Industries Ltd 199 0.01
4 Kawasaki Kisen Kaisha Ltd 67 -
67 KDDI Corp 1,614 0.09
2 KeePer Technical Laboratory Co Ltd 26 -
5 Keihan Holdings Co Ltd 109 0.01
3 Keihanshin Building Co Ltd 24 -
7 Keikyu Corp 66 -
3 Keio Corp 122 0.01
3 Keisei Electric Railway Co Ltd 72 0.01
11 Keiyo Bank Ltd 29 -
5 Keiyo Co Ltd 23 -
1 Kenko Mayonnaise Co Ltd 16 -
10 Kewpie Corp 155 0.01
1 Keyence Corp 295 0.02
2 KFC Holdings Japan Ltd 39 -
1 KFC Ltd 8 -
2 KH Neochem Co Ltd 31 -
3 Kikkoman Corp 149 0.01
8 Kinden Corp 100 0.01
1 Kintetsu Department Store Co Ltd 16 -
4 Kintetsu Group Holdings Co Ltd 104 0.01
4 Kintetsu World Express Inc 61 -
18 Kirin Holdings Co Ltd 260 0.02
3 Kissei Pharmaceutical Co Ltd 45 -
1 Ki-Star Real Estate Co Ltd 27 -
1 Kitagawa Corp 11 -
1 Kita-Nippon Bank Ltd 16 -
- Kitano Construction Corp 6 -
2 Kitanotatsujin Corp 7 -
2 Kito Corp 27 -
9 Kitz Corp 45 -
6 Kiyo Bank Ltd 60 -
4 KLab Inc 18 -
4 Koa Corp 36 -
3 Koatsu Gas Kogyo Co Ltd 13 -
1 Kobayashi Pharmaceutical Co Ltd 32 -
3 Kobe Bussan Co Ltd 59 -
- Kobe Electric Railway Co Ltd 9 -
40 Kobe Steel Ltd 191 0.01
1 Koei Tecmo Holdings Co Ltd 26 -
4 Kohnan Shoji Co Ltd 69 0.01
1 Kohsoku Corp 8 -
2 Koito Manufacturing Co Ltd 73 0.01
5 Kojima Co Ltd 24 -
- Kokusai Co Ltd - -
5 Kokusai Pulp & Paper Co Ltd 7 -
9 Kokuyo Co Ltd 98 0.01
13 Komatsu Ltd 286 0.02
2 Komatsu Matere Co Ltd 9 -
1 Komatsu Wall Industry Co Ltd 9 -
5 KOMEDA Holdings Co Ltd 60 -
1 Komehyo Co Ltd 5 -
4 Komeri Co Ltd 74 0.01
7 Komori Corp 36 -
3 Konaka Co Ltd 7 -
4 Konami Holdings Corp 166 0.01
1 Kondotec Inc 10 -
47 Konica Minolta Inc 184 0.01
4 Konishi Co Ltd 36 -
Shares (000's)
Value(000's)
GBP
% of NetAssetValue
Common Stock (continued)
Japan - 6.10% (continued)
3 Konoike Transport Co Ltd 25 -
1 Konoshima Chemical Co Ltd 8 -
- Kose Corp 34 -
5 Koshidaka Holdings Co Ltd 19 -
1 Kozo Keikaku Engineering Inc 9 -
1 Krosaki Harima Corp 18 -
1 KRS Corp 10 -
18 K's Holdings Corp 155 0.01
2 KU Holdings Co Ltd 10 -
12 Kubota Corp 198 0.01
4 Kumagai Gumi Co Ltd 87 0.01
7 Kumiai Chemical Industry Co Ltd 38 -
2 Kurabo Industries Ltd 21 -
31 Kuraray Co Ltd 228 0.01
2 Kureha Corp 94 0.01
1 Kurimoto Ltd 14 -
5 Kurita Water Industries Ltd 159 0.01
1 Kuriyama Holdings Corp 7 -
1 Kusuri no Aoki Holdings Co Ltd 55 -
3 KYB Corp 64 -
5 Kyocera Corp 218 0.01
1 Kyodo Printing Co Ltd 21 -
3 Kyoei Steel Ltd 24 -
1 Kyokuto Boeki Kaisha Ltd 11 -
4 Kyokuto Kaihatsu Kogyo Co Ltd 44 -
3 Kyokuto Securities Co Ltd 14 -
1 Kyokuyo Co Ltd 20 -
3 KYORIN Holdings Inc 35 -
5 Kyoritsu Printing Co Ltd 5 -
4 Kyosan Electric Manufacturing Co Ltd 11 -
3 Kyowa Electronic Instruments Co Ltd 7 -
6 Kyowa Exeo Corp 108 0.01
1 Kyowa Kirin Co Ltd 19 -
4 Kyudenko Corp 86 0.01
11 Kyushu Electric Power Co Inc 62 -
28 Kyushu Financial Group Inc 75 0.01
5 Kyushu Railway Co 78 0.01
2 LAC Co Ltd 11 -
- Lacto Japan Co Ltd 7 -
1 Laox Co Ltd 1 -
2 Lasertec Corp 260 0.02
5 Lawson Inc 155 0.01
3 LEC Inc 18 -
2 Life Corp 34 -
5 Lifull Co Ltd 11 -
1 Like Co Ltd 17 -
1 Linical Co Ltd 5 -
4 Link And Motivation Inc 13 -
4 Lintec Corp 69 0.01
7 Lion Corp 84 0.01
1 LITALICO Inc 24 -
15 LIXIL Group Corp 284 0.02
1 Look Holdings Inc 11 -
1 M&A Capital Partners Co Ltd 43 -
6 M3 Inc 272 0.02
3 Mabuchi Motor Co Ltd 71 0.01
6 Macnica Fuji Electronics Holdings Inc 92 0.01
4 Macromill Inc 21 -
18 Maeda Corp 111 0.01
1 Maeda Kosen Co Ltd 20 -
3 Maeda Road Construction Co Ltd 40 -
2 Maezawa Kyuso Industries Co Ltd 13 -
World Equity FundPortfolio of Investments as at 31 May 2021 (continued)
Dimensional Fund Advisors Semi-Annual Report and Unaudited Financial Statements, 31 May 2021 464

Shares (000's)
Value(000's)
GBP
% of NetAssetValue
Common Stock (continued)
Japan - 6.10% (continued)
2 Makino Milling Machine Co Ltd 65 -
2 Makita Corp 53 -
1 Mani Inc 19 -
2 MarkLines Co Ltd 35 -
2 Mars Group Holdings Corp 23 -
63 Marubeni Corp 398 0.02
2 Marubun Corp 7 -
3 Marudai Food Co Ltd 31 -
5 Maruha Nichiro Corp 76 0.01
13 Marui Group Co Ltd 173 0.01
3 Maruichi Steel Tube Ltd 52 -
1 Maruka Corp 12 -
8 Marusan Securities Co Ltd 35 -
1 Maruwa Co Ltd 47 -
4 Maruwa Unyu Kikan Co Ltd 42 -
3 Maruzen CHI Holdings Co Ltd 8 -
1 Maruzen Co Ltd 14 -
1 Maruzen Showa Unyu Co Ltd 30 -
3 Marvelous Inc 18 -
1 Matsuda Sangyo Co Ltd 20 -
2 Matsui Construction Co Ltd 9 -
10 Matsui Securities Co Ltd 56 -
5 Matsumotokiyoshi Holdings Co Ltd 168 0.01
1 Matsuoka Corp 7 -
1 Matsuyafoods Holdings Co Ltd 18 -
2 Max Co Ltd 21 -
5 Maxell Holdings Ltd 40 -
1 Maxvalu Tokai Co Ltd 14 -
17 Mazda Motor Corp 107 0.01
2 McDonald's Holdings Co Japan Ltd 68 0.01
7 MCJ Co Ltd 51 -
71 Mebuki Financial Group Inc 108 0.01
2 MEC Co Ltd 26 -
1 Media Do Holdings Co Ltd 33 -
2 Medical Data Vision Co Ltd 29 -
3 Medical System Network Co Ltd 15 -
6 Medipal Holdings Corp 85 0.01
1 MedPeer Inc 31 -
1 Megachips Corp 19 -
5 Megmilk Snow Brand Co Ltd 64 -
4 Meidensha Corp 59 -
1 Meiji Electric Industries Co Ltd 7 -
7 MEIJI Holdings Co Ltd 300 0.02
3 Meiko Electronics Co Ltd 50 -
2 Meiko Network Japan Co Ltd 6 -
3 Meisei Industrial Co Ltd 15 -
2 Meitec Corp 89 0.01
1 Meito Sangyo Co Ltd 12 -
1 Melco Holdings Inc 16 -
1 Members Co Ltd 24 -
2 Menicon Co Ltd 89 0.01
1 Mercari Inc 20 -
2 Metawater Co Ltd 29 -
2 Michinoku Bank Ltd 12 -
1 Micronics Japan Co Ltd 7 -
8 Mie Kotsu Group Holdings Inc 24 -
4 Mikuni Corp 7 -
2 Milbon Co Ltd 73 0.01
2 Mimasu Semiconductor Industry Co Ltd 38 -
16 Minebea Mitsumi Inc 313 0.02
2 Ministop Co Ltd 16 -
1 Minkabu The Infonoid Inc 17 -
Shares (000's)
Value(000's)
GBP
% of NetAssetValue
Common Stock (continued)
Japan - 6.10% (continued)
6 Miraca Holdings Inc 117 0.01
1 Miraial Co Ltd 9 -
10 Mirait Holdings Corp 128 0.01
2 Miroku Jyoho Service Co Ltd 23 -
5 MISUMI Group Inc 108 0.01
1 Mitani Corp 41 -
3 Mitani Sangyo Co Ltd 8 -
1 Mitani Sekisan Co Ltd 18 -
6 Mito Securities Co Ltd 12 -
3 Mitsuba Corp 19 -
70 Mitsubishi Chemical Holdings Corp 398 0.02
20 Mitsubishi Corp 391 0.02
28 Mitsubishi Electric Corp 303 0.02
14 Mitsubishi Estate Co Ltd 166 0.01
5 Mitsubishi Gas Chemical Co Inc 90 0.01
15 Mitsubishi Heavy Industries Ltd 318 0.02
1 Mitsubishi Kakoki Kaisha Ltd 9 -
4 Mitsubishi Logisnext Co Ltd 26 -
4 Mitsubishi Logistics Corp 79 0.01
9 Mitsubishi Materials Corp 134 0.01
48 Mitsubishi Motors Corp 94 0.01
3 Mitsubishi Paper Mills Ltd 8 -
3 Mitsubishi Pencil Co Ltd 32 -
1 Mitsubishi Research Institute Inc 24 -
2 Mitsubishi Shokuhin Co Ltd 42 -
2 Mitsubishi Steel Manufacturing Co Ltd 11 -
184 Mitsubishi UFJ Financial Group Inc 747 0.04
78 Mitsubishi UFJ Lease & Finance Co Ltd 312 0.02
3 Mitsuboshi Belting Ltd 36 -
22 Mitsui & Co Ltd 344 0.02
11 Mitsui Chemicals Inc 266 0.02
10 Mitsui E&S Holdings Co Ltd 33 -
12 Mitsui Fudosan Co Ltd 193 0.01
1 Mitsui High-Tec Inc 35 -
2 Mitsui Matsushima Holdings Co Ltd 11 -
4 Mitsui Mining & Smelting Co Ltd 88 0.01
8 Mitsui OSK Lines Ltd 236 0.01
2 Mitsui Sugar Co Ltd 27 -
3 Mitsui-Soko Holdings Co Ltd 38 -
4 Mitsuuroko Group Holdings Co Ltd 34 -
1 Miura Co Ltd 33 -
5 Mixi Inc 87 0.01
1 Miyaji Engineering Group Inc 11 -
2 Miyazaki Bank Ltd 23 -
1 Miyoshi Oil & Fat Co Ltd 6 -
35 Mizuho Financial Group Inc 383 0.02
3 Mizuho Leasing Co Ltd 72 0.01
2 Mizuno Corp 37 -
2 Mochida Pharmaceutical Co Ltd 37 -
2 Modec Inc 21 -
12 Monex Group Inc 64 -
1 Monogatari Corp 50 -
5 MonotaRO Co Ltd 81 0.01
3 Morinaga & Co Ltd 68 0.01
3 Morinaga Milk Industry Co Ltd 123 0.01
3 Morita Holdings Corp 34 -
2 Morito Co Ltd 9 -
- Morozoff Ltd 7 -
2 Mortgage Service Japan Ltd 15 -
1 Mory Industries Inc 9 -
3 MrMax Holdings Ltd 13 -
7 MS&AD Insurance Group Holdings Inc 146 0.01
World Equity FundPortfolio of Investments as at 31 May 2021 (continued)
Dimensional Fund Advisors Semi-Annual Report and Unaudited Financial Statements, 31 May 2021 465

Shares (000's)
Value(000's)
GBP
% of NetAssetValue
Common Stock (continued)
Japan - 6.10% (continued)
3 MTI Ltd 16 -
2 Mugen Estate Co Ltd 6 -
1 Murakami Corp 12 -
12 Murata Manufacturing Co Ltd 649 0.04
5 Musashi Seimitsu Industry Co Ltd 72 0.01
4 Musashino Bank Ltd 44 -
4 Nabtesco Corp 116 0.01
1 Nachi-Fujikoshi Corp 33 -
1 Nafco Co Ltd 14 -
1 Nagaileben Co Ltd 15 -
1 Nagano Bank Ltd 5 -
1 Nagano Keiki Co Ltd 10 -
12 Nagase & Co Ltd 126 0.01
1 Nagatanien Holdings Co Ltd 14 -
- Nagawa Co Ltd 16 -
5 Nagoya Railroad Co Ltd 73 0.01
1 Naigai Trans Line Ltd 8 -
2 Nakabayashi Co Ltd 8 -
- Nakamuraya Co Ltd 10 -
3 Nakanishi Inc 40 -
2 Nakano Corp 6 -
2 Nakayama Steel Works Ltd 6 -
2 Nakayamafuku Co Ltd 6 -
5 Namura Shipbuilding Co Ltd 6 -
4 Nankai Electric Railway Co Ltd 67 -
3 Nanto Bank Ltd 42 -
- Narasaki Sangyo Co Ltd 5 -
1 Natori Co Ltd 10 -
2 NEC Capital Solutions Ltd 23 -
10 NEC Corp 319 0.02
4 NEC Networks & System Integration Corp 46 -
6 NET One Systems Co Ltd 119 0.01
3 Neturen Co Ltd 12 -
2 Nexon Co Ltd 35 -
2 Nextage Co Ltd 26 -
11 NGK Insulators Ltd 136 0.01
15 NGK Spark Plug Co Ltd 173 0.01
7 NH Foods Ltd 191 0.01
24 NHK Spring Co Ltd 125 0.01
2 Nicca Chemical Co Ltd 11 -
3 Nichia Steel Works Ltd 7 -
6 Nichias Corp 110 0.01
2 Nichiban Co Ltd 17 -
5 Nichicon Corp 35 -
2 Nichiden Corp 28 -
3 Nichiha Corp 57 -
6 Nichi-iko Pharmaceutical Co Ltd 34 -
9 Nichirei Corp 166 0.01
2 Nichireki Co Ltd 15 -
2 Nichirin Co Ltd 19 -
2 Nidec Corp 165 0.01
6 Nifco Inc 140 0.01
1 Nihon Chouzai Co Ltd 12 -
- Nihon Dengi Co Ltd 10 -
1 Nihon Flush Co Ltd 8 -
4 Nihon House Holdings Co Ltd 9 -
2 Nihon Kagaku Sangyo Co Ltd 16 -
5 Nihon Kohden Corp 99 0.01
10 Nihon M&A Center Inc 174 0.01
6 Nihon Nohyaku Co Ltd 22 -
6 Nihon Parkerizing Co Ltd 41 -
1 Nihon Plast Co Ltd 5 -
Shares (000's)
Value(000's)
GBP
% of NetAssetValue
Common Stock (continued)
Japan - 6.10% (continued)
2 Nihon Tokushu Toryo Co Ltd 10 -
5 Nihon Unisys Ltd 109 0.01
6 Nikkiso Co Ltd 49 -
4 Nikko Co Ltd 18 -
7 Nikkon Holdings Co Ltd 107 0.01
21 Nikon Corp 154 0.01
2 Nintendo Co Ltd 732 0.04
4 Nippo Corp 82 0.01
2 Nippon Air Conditioning Services Co Ltd 8 -
2 Nippon Aqua Co Ltd 6 -
1 Nippon Beet Sugar Manufacturing Co Ltd 13 -
1 Nippon Carbide Industries Co Inc 4 -
1 Nippon Carbon Co Ltd 22 -
1 Nippon Ceramic Co Ltd 25 -
1 Nippon Chemi-Con Corp 22 -
21 Nippon Coke & Engineering Co Ltd 15 -
1 Nippon Commercial Development Co Ltd 13 -
1 Nippon Concept Corp 13 -
5 Nippon Concrete Industries Co Ltd 10 -
11 Nippon Denko Co Ltd 22 -
4 Nippon Densetsu Kogyo Co Ltd 52 -
1 Nippon Dry-Chemical Co Ltd 9 -
7 Nippon Electric Glass Co Ltd 122 0.01
5 Nippon Express Co Ltd 277 0.02
1 Nippon Fine Chemical Co Ltd 12 -
6 Nippon Flour Mills Co Ltd 56 -
13 Nippon Gas Co Ltd 144 0.01
2 Nippon Hume Corp 12 -
1 Nippon Kanzai Co Ltd 8 -
17 Nippon Kayaku Co Ltd 114 0.01
1 Nippon Kodoshi Corp 13 -
2 Nippon Koei Co Ltd 38 -
7 Nippon Light Metal Holdings Co Ltd 83 0.01
6 Nippon Paint Holdings Co Ltd 65 -
13 Nippon Paper Industries Co Ltd 111 0.01
24 Nippon Parking Development Co Ltd 23 -
2 Nippon Pillar Packing Co Ltd 20 -
2 Nippon Piston Ring Co Ltd 12 -
1 Nippon Rietec Co Ltd 5 -
1 Nippon Road Co Ltd 37 -
6 Nippon Seiki Co Ltd 41 -
- Nippon Seisen Co Ltd 11 -
1 Nippon Sharyo Ltd 10 -
1 Nippon Shinyaku Co Ltd 71 0.01
2 Nippon Shokubai Co Ltd 79 0.01
5 Nippon Signal Company Ltd 30 -
3 Nippon Soda Co Ltd 61 -
14 Nippon Steel Corp 182 0.01
2 Nippon Steel Trading Corp 48 -
32 Nippon Suisan Kaisha Ltd 106 0.01
1 Nippon Systemware Co Ltd 10 -
17 Nippon Telegraph & Telephone Corp 321 0.02
4 Nippon Thompson Co Ltd 16 -
2 Nippon Yakin Kogyo Co Ltd 29 -
14 Nippon Yusen KK 409 0.02
15 Nipro Corp 133 0.01
2 Nishikawa Rubber Co Ltd 18 -
6 Nishimatsu Construction Co Ltd 138 0.01
3 Nishimatsuya Chain Co Ltd 30 -
- Nishimoto Co Ltd 7 -
14 Nishi-Nippon Financial Holdings Inc 62 -
3 Nishi-Nippon Railroad Co Ltd 48 -
World Equity FundPortfolio of Investments as at 31 May 2021 (continued)
Dimensional Fund Advisors Semi-Annual Report and Unaudited Financial Statements, 31 May 2021 466

Shares (000's)
Value(000's)
GBP
% of NetAssetValue
Common Stock (continued)
Japan - 6.10% (continued)
2 Nishio Rent All Co Ltd 50 -
4 Nissan Chemical Corp 144 0.01
35 Nissan Motor Co Ltd 123 0.01
8 Nissan Shatai Co Ltd 36 -
4 Nissan Tokyo Sales Holdings Co Ltd 6 -
1 Nissei ASB Machine Co Ltd 32 -
1 Nissei Plastic Industrial Co Ltd 9 -
4 Nissha Co Ltd 43 -
3 Nisshin Oillio Group Ltd 66 -
6 Nisshin Seifun Group Inc 64 -
12 Nisshinbo Holdings Inc 71 0.01
4 Nissin Electric Co Ltd 36 -
2 Nissin Foods Holdings Co Ltd 91 0.01
1 Nissin Sugar Co Ltd 17 -
2 Nisso Corp 9 -
1 Nissui Pharmaceutical Co Ltd 7 -
2 Nitori Holdings Co Ltd 225 0.01
1 Nitta Corp 19 -
1 Nitta Gelatin Inc 4 -
1 Nittetsu Mining Co Ltd 24 -
1 Nitto Boseki Co Ltd 28 -
7 Nitto Denko Corp 378 0.02
- Nitto Fuji Flour Milling Co Ltd 18 -
3 Nitto Kogyo Corp 36 -
1 Nitto Kohki Co Ltd 13 -
3 Nitto Seiko Co Ltd 11 -
4 Nittoc Construction Co Ltd 19 -
2 Noda Corp 9 -
1 Noevir Holdings Co Ltd 27 -
3 NOF Corp 113 0.01
2 Nohmi Bosai Ltd 22 -
4 Nojima Corp 70 0.01
7 NOK Corp 61 -
68 Nomura Holdings Inc 264 0.02
13 Nomura Real Estate Holdings Inc 236 0.01
5 Nomura Research Institute Ltd 105 0.01
1 Noritake Co Ltd Japan 38 -
2 Noritsu Koki Co Ltd 38 -
4 Noritz Corp 46 -
32 North Pacific Bank Ltd 52 -
1 Nozawa Corp 4 -
3 NS Solutions Corp 55 -
2 NS Tool Co Ltd 15 -
1 NS United Kaiun Kaisha Ltd 15 -
6 NSD Co Ltd 74 0.01
12 NSK Ltd 85 0.01
44 NTN Corp 91 0.01
22 NTT Data Corp 253 0.01
1 Oat Agrio Co Ltd 6 -
1 Obara Group Inc 32 -
40 Obayashi Corp 240 0.01
- OBIC Business Consultants Co Ltd 15 -
1 Obic Co Ltd 67 -
7 Odakyu Electric Railway Co Ltd 139 0.01
6 Oenon Holdings Inc 15 -
4 Ogaki Kyoritsu Bank Ltd 47 -
1 Ohashi Technica Inc 14 -
1 Ohsho Food Service Corp 39 -
3 Oiles Corp 32 -
2 Oisix ra daichi Inc 31 -
1 Oita Bank Ltd 17 -
42 Oji Holdings Corp 176 0.01
Shares (000's)
Value(000's)
GBP
% of NetAssetValue
Common Stock (continued)
Japan - 6.10% (continued)
6 Okabe Co Ltd 26 -
1 Okada Aiyon Corp 8 -
1 Okamoto Industries Inc 37 -
1 Okamoto Machine Tool Works Ltd 17 -
6 Okamura Corp 58 -
16 Okasan Securities Group Inc 46 -
11 Oki Electric Industry Co Ltd 67 -
1 Okinawa Cellular Telephone Co 43 -
3 Okinawa Electric Power Co Inc 31 -
2 OKUMA Corp 56 -
4 Okumura Corp 68 0.01
1 Okura Industrial Co Ltd 15 -
3 Okuwa Co Ltd 22 -
18 Olympus Corp 273 0.02
1 Omron Corp 73 0.01
5 Ono Pharmaceutical Co Ltd 72 0.01
3 Onoken Co Ltd 22 -
13 Onward Holdings Co Ltd 25 -
3 Open House Co Ltd 86 0.01
2 Optim Corp 24 -
2 Optorun Co Ltd 40 -
1 Oracle Corp Japan 81 0.01
1 Organo Corp 38 -
51 Orient Corp 51 -
1 Oriental Land Co Ltd 52 -
20 Oriental Shiraishi Corp 36 -
1 Origin Co Ltd 7 -
35 ORIX Corp 434 0.02
8 Osaka Gas Co Ltd 110 0.01
1 Osaka Organic Chemical Industry Ltd 29 -
1 Osaka Soda Co Ltd 19 -
2 Osaka Steel Co Ltd 14 -
2 Osaka Titanium Technologies Co Ltd 9 -
5 Osaki Electric Co Ltd 19 -
8 OSG Corp 88 0.01
4 Otsuka Corp 139 0.01
4 Otsuka Holdings Co Ltd 123 0.01
1 OUG Holdings Inc 9 -
14 Outsourcing Inc 179 0.01
5 Pacific Industrial Co Ltd 38 -
2 Pacific Metals Co Ltd 24 -
2 Pack Corp 29 -
2 PAL Group Holdings Co Ltd 16 -
2 Paltac Corporation 86 0.01
8 Pan Pacific International Holdings Corp 107 0.01
103 Panasonic Corp 824 0.04
1 Paraca Inc 8 -
4 Paramount Bed Holdings Co Ltd 49 -
3 Paris Miki Holdings Inc 5 -
9 Park24 Co Ltd 131 0.01
2 Parker Corp 8 -
2 Pasona Group Inc 27 -
3 PC Depot Corp 9 -
2 Pegasus Sewing Machine Manufacturing Co Ltd 5 -
30 Penta-Ocean Construction Co Ltd 150 0.01
3 PeptiDream Inc 91 0.01
15 Persol Holdings Co Ltd 199 0.01
- Pickles Corp 8 -
6 Pigeon Corp 131 0.01
3 Pilot Corp 63 -
4 Piolax Inc 37 -
1 Plenus Co Ltd 11 -
World Equity FundPortfolio of Investments as at 31 May 2021 (continued)
Dimensional Fund Advisors Semi-Annual Report and Unaudited Financial Statements, 31 May 2021 467

Shares (000's)
Value(000's)
GBP
% of NetAssetValue
Common Stock (continued)
Japan - 6.10% (continued)
1 Pola Orbis Holdings Inc 20 -
3 Poletowin Pitcrew Holdings Inc 19 -
1 Premium Group Co Ltd 26 -
12 Press Kogyo Co Ltd 25 -
1 Pressance Corp 15 -
8 Prestige International Inc 37 -
3 Prima Meat Packers Ltd 67 -
2 Pronexus Inc 14 -
1 Prored Partners Co Ltd 11 -
35 Prospect Co Ltd 7 -
3 Proto Corp 22 -
4 PS Mitsubishi Construction Co Ltd 18 -
1 Punch Industry Co Ltd 5 -
1 QB Net Holdings Co Ltd 11 -
3 Qol Holdings Co Ltd 28 -
2 Quick Co Ltd 13 -
1 Raccoon Holdings Inc 19 -
4 Raito Kogyo Co Ltd 41 -
3 Raiznext Corp 22 -
6 Rakus Co Ltd 77 0.01
3 Rakuten Inc 28 -
1 Rasa Corp 3 -
1 Rasa Industries Ltd 7 -
1 Raysum Co Ltd 7 -
18 Recruit Holdings Co Ltd 639 0.03
5 Relia Inc 40 -
7 Relo Group Inc 95 0.01
1 Renaissance Inc 9 -
25 Renesas Electronics Corp 181 0.01
22 Rengo Co Ltd 129 0.01
4 RENOVA Inc 83 0.01
80 Resona Holdings Inc 241 0.01
7 Resorttrust Inc 81 0.01
2 Restar Holdings Corp 28 -
3 Retail Partners Co Ltd 20 -
18 Ricoh Co Ltd 154 0.01
2 Ricoh Leasing Co Ltd 44 -
1 Ride On Express Holdings Co Ltd 9 -
1 Right On Co Ltd 6 -
1 Riken Corp 17 -
1 Riken Keiki Co Ltd 24 -
5 Riken Technos Corp 20 -
2 Riken Vitamin Co Ltd 15 -
1 Rinnai Corp 59 -
1 Rion Co Ltd 10 -
10 Riso Kyoiku Co Ltd 20 -
1 Rix Corp 5 -
2 Rohm Co Ltd 146 0.01
6 Rohto Pharmaceutical Co Ltd 105 0.01
2 Rokko Butter Co Ltd 18 -
1 Roland Corp 32 -
1 Roland DG Corp 19 -
1 Rorze Corp 79 0.01
1 RS Technologies Co Ltd 21 -
4 Ryobi Ltd 37 -
2 Ryoden Corp 15 -
7 Ryohin Keikaku Co Ltd 94 0.01
3 Ryosan Co Ltd 38 -
2 Ryoyo Electro Corp 25 -
2 S Foods Inc 34 -
1 S&B Foods Inc 24 -
2 Saibu Gas Co Ltd 35 -
Shares (000's)
Value(000's)
GBP
% of NetAssetValue
Common Stock (continued)
Japan - 6.10% (continued)
1 Saison Information Systems Co Ltd 7 -
1 Saizeriya Co Ltd 20 -
1 Sakai Chemical Industry Co Ltd 16 -
1 Sakai Moving Service Co Ltd 39 -
- Sakai Ovex Co Ltd 8 -
5 Sakata INX Corp 36 -
1 Sakata Seed Corp 16 -
3 Sakura Internet Inc 11 -
7 Sala Corp 27 -
4 SAMTY Co Ltd 49 -
3 San ju San Financial Group Inc 24 -
1 San-A Co Ltd 38 -
7 San-Ai Oil Co Ltd 55 -
3 Sanden Holdings Corp 6 -
1 Sanei Architecture Planning Co Ltd 13 -
3 Sangetsu Corp 34 -
15 San-In Godo Bank Ltd 53 -
5 Sanki Engineering Co Ltd 45 -
3 Sankyo Co Ltd 59 -
- Sankyo Frontier Co Ltd 10 -
6 Sankyo Seiko Co Ltd 21 -
4 Sankyo Tateyama Inc 20 -
6 Sankyu Inc 180 0.01
2 Sanoh Industrial Co Ltd 17 -
- Sansan Inc 15 -
1 Sansei Technologies Inc 4 -
1 Sanshin Electronics Co Ltd 15 -
12 Santen Pharmaceutical Co Ltd 117 0.01
20 Sanwa Holdings Corp 177 0.01
1 Sanyo Chemical Industries Ltd 46 -
- Sanyo Denki Co Ltd 20 -
1 Sanyo Electric Railway Co Ltd 12 -
1 Sanyo Housing Nagoya Co Ltd 6 -
2 Sanyo Special Steel Co Ltd 23 -
3 Sanyo Trading Co Ltd 23 -
8 Sapporo Holdings Ltd 113 0.01
3 Sato Holdings Corp 49 -
1 Sato Shoji Corp 10 -
3 Satori Electric Co Ltd 15 -
2 Sawada Holdings Co Ltd 15 -
3 Sawai Group Holdings Co Ltd 107 0.01
1 SB Technology Corp 26 -
6 SBI Holdings Inc 109 0.01
1 SBI Insurance Group Co Ltd 8 -
2 SBS Holdings Inc 42 -
3 Scala Inc 14 -
1 SCREEN Holdings Co Ltd 60 -
5 Scroll Corp 27 -
3 SCSK Corp 107 0.01
- SEC Carbon Ltd 13 -
2 Secom Co Ltd 137 0.01
2 Seed Co Ltd 10 -
9 Sega Sammy Holdings Inc 82 0.01
1 Seibu Electric & Machinery Co Ltd 10 -
16 Seibu Holdings Inc 127 0.01
4 Seikagaku Corp 33 -
4 Seikitokyu Kogyo Co Ltd 21 -
22 Seiko Epson Corp 276 0.02
3 Seiko Holdings Corp 46 -
2 Seiko PMC Corp 9 -
10 Seino Holdings Co Ltd 102 0.01
3 Seiren Co Ltd 46 -
World Equity FundPortfolio of Investments as at 31 May 2021 (continued)
Dimensional Fund Advisors Semi-Annual Report and Unaudited Financial Statements, 31 May 2021 468

Shares (000's)
Value(000's)
GBP
% of NetAssetValue
Common Stock (continued)
Japan - 6.10% (continued)
18 Sekisui Chemical Co Ltd 224 0.01
11 Sekisui House Ltd 161 0.01
2 Sekisui Jushi Corp 31 -
2 Sekisui Plastics Co Ltd 9 -
12 Senko Group Holdings Co Ltd 81 0.01
1 Senshu Electric Co Ltd 23 -
31 Senshu Ikeda Holdings Inc 33 -
3 Senshukai Co Ltd 8 -
5 Septeni Holdings Co Ltd 16 -
3 Seria Co Ltd 87 0.01
26 Seven & i Holdings Co Ltd 803 0.04
67 Seven Bank Ltd 98 0.01
6 SG Holdings Co Ltd 90 0.01
10 Sharp Corp 129 0.01
1 Shibaura Electronics Co Ltd 25 -
- Shibaura Mechatronics Corp 17 -
1 Shibusawa Warehouse Co Ltd 17 -
1 Shibuya Corp 30 -
1 SHIFT Inc 49 -
5 Shiga Bank Ltd 65 -
1 Shikibo Ltd 5 -
4 Shikoku Bank Ltd 18 -
3 Shikoku Chemicals Corp 25 -
11 Shikoku Electric Power Co Inc 53 -
2 Shima Seiki Manufacturing Ltd 21 -
5 Shimadzu Corp 123 0.01
2 Shimamura Co Ltd 107 0.01
1 Shimano Inc 89 0.01
1 Shimizu Bank Ltd 12 -
25 Shimizu Corp 141 0.01
1 Shimojima Co Ltd 8 -
1 Shin Nippon Air Technologies Co Ltd 14 -
4 Shin Nippon Biomedical Laboratories Ltd 19 -
1 Shinagawa Refractories Co Ltd 19 -
1 Shindengen Electric Manufacturing Co Ltd 18 -
3 Shin-Etsu Chemical Co Ltd 401 0.02
6 Shin-Etsu Polymer Co Ltd 41 -
1 Shinki Bus Co Ltd 10 -
2 Shinko Electric Industries Co Ltd 54 -
5 Shinko Shoji Co Ltd 24 -
7 Shinmaywa Industries Ltd 44 -
4 Shinnihon Corp 21 -
1 Shinnihonseiyaku Co Ltd 14 -
3 Shinoken Group Co Ltd 23 -
13 Shinsei Bank Ltd 150 0.01
1 Shinsho Corp 11 -
1 Shinwa Co Ltd 12 -
2 Shinwa Co Ltd, Gifu 9 -
2 Shionogi & Co Ltd 88 0.01
6 Ship Healthcare Holdings Inc 97 0.01
2 Shiseido Co Ltd 125 0.01
2 Shizuki Electric Co Inc 6 -
20 Shizuoka Bank Ltd 115 0.01
6 Shizuoka Gas Co Ltd 42 -
1 SHO-BOND Holdings Co Ltd 42 -
2 Shoei Co Ltd 52 -
1 Shoei Foods Corp 36 -
1 Shofu Inc 11 -
7 Showa Denko KK 152 0.01
2 Showa Sangyo Co Ltd 36 -
2 SigmaXYZ Inc 24 -
3 Siix Corp 32 -
Shares (000's)
Value(000's)
GBP
% of NetAssetValue
Common Stock (continued)
Japan - 6.10% (continued)
1 Silver Life Co Ltd 11 -
1 Sinanen Holdings Co Ltd 16 -
2 Sinfonia Technology Co Ltd 15 -
2 Sinko Industries Ltd 28 -
6 Sintokogio Ltd 29 -
1 SK-Electronics Co Ltd 7 -
15 SKY Perfect JSAT Holdings Inc 42 -
17 Skylark Holdings Co Ltd 167 0.01
- SMC Corp 108 0.01
1 SMK Corp 8 -
5 SMS Co Ltd 101 0.01
1 Snow Peak Inc 14 -
5 Sodick Co Ltd 37 -
1 Soft99 Corp 9 -
34 Softbank Corp 305 0.02
31 SoftBank Group Corp 1,679 0.09
1 Softcreate Holdings Corp 10 -
5 Sohgo Security Services Co Ltd 160 0.01
85 Sojitz Corp 186 0.01
1 Soken Chemical & Engineering Co Ltd 12 -
5 Solasto Corp 40 -
1 Soliton Systems KK 16 -
7 Sompo Holdings Inc 204 0.01
31 Sony Corp 2,186 0.12
5 Sotetsu Holdings Inc 64 -
6 Sourcenext Corp 12 -
1 Space Co Ltd 6 -
3 Space Value Holdings Co Ltd 14 -
10 Sparx Group Co Ltd 19 -
4 S-Pool Inc 25 -
3 Square Enix Holdings Co Ltd 112 0.01
2 SRA Holdings 25 -
1 ST Corp 16 -
2 St Marc Holdings Co Ltd 18 -
5 Stanley Electric Co Ltd 96 0.01
2 Star Mica Holdings Co Ltd 12 -
3 Star Micronics Co Ltd 36 -
4 Starts Corp Inc 67 -
2 Starzen Co Ltd 24 -
1 Stella Chemifa Corp 23 -
1 Strike Co Ltd 22 -
1 Studio Alice Co Ltd 16 -
20 Subaru Corp 268 0.02
1 Sugi Holdings Co Ltd 71 0.01
2 Sugimoto & Co Ltd 23 -
15 SUMCO Corp 247 0.01
3 Sumida Corp 22 -
2 Sumitomo Bakelite Co Ltd 60 -
107 Sumitomo Chemical Co Ltd 419 0.02
19 Sumitomo Corp 188 0.01
7 Sumitomo Dainippon Pharma Co Ltd 95 0.01
1 Sumitomo Densetsu Co Ltd 22 -
31 Sumitomo Electric Industries Ltd 331 0.02
15 Sumitomo Forestry Co Ltd 216 0.01
9 Sumitomo Heavy Industries Ltd 202 0.01
5 Sumitomo Metal Mining Co Ltd 162 0.01
19 Sumitomo Mitsui Construction Co Ltd 57 -
19 Sumitomo Mitsui Financial Group Inc 491 0.03
8 Sumitomo Mitsui Trust Holdings Inc 203 0.01
5 Sumitomo Osaka Cement Co Ltd 98 0.01
1 Sumitomo Precision Products Co Ltd 8 -
4 Sumitomo Realty & Development Co Ltd 92 0.01
World Equity FundPortfolio of Investments as at 31 May 2021 (continued)
Dimensional Fund Advisors Semi-Annual Report and Unaudited Financial Statements, 31 May 2021 469

Shares (000's)
Value(000's)
GBP
% of NetAssetValue
Common Stock (continued)
Japan - 6.10% (continued)
5 Sumitomo Riko Co Ltd 20 -
17 Sumitomo Rubber Industries Ltd 154 0.01
1 Sumitomo Seika Chemicals Co Ltd 23 -
7 Sumitomo Warehouse Co Ltd 69 0.01
4 Sun Frontier Fudousan Co Ltd 27 -
2 Suncall Corp 6 -
4 Sundrug Co Ltd 103 0.01
8 Suntory Beverage & Food Ltd 214 0.01
2 Sun-Wa Technos Corp 13 -
1 SuRaLa Net Co Ltd 15 -
13 Suruga Bank Ltd 30 -
5 Sushiro Global Holdings Ltd 159 0.01
1 Suzuden Corp 8 -
4 Suzuken Co Ltd Japan 98 0.01
2 Suzuki Co Ltd 13 -
6 Suzuki Motor Corp 170 0.01
3 SWCC Showa Holdings Co Ltd 36 -
3 Sysmex Corp 205 0.01
6 Systena Corp 71 0.01
2 Syuppin Co Ltd 11 -
3 T Hasegawa Co Ltd 41 -
1 T RAD Co Ltd 10 -
17 T&D Holdings Inc 164 0.01
2 T&K Toka Co Ltd 14 -
2 Tachibana Eletech Co Ltd 16 -
1 Tachikawa Corp 12 -
4 Tachi-S Co Ltd 35 -
9 Tadano Ltd 64 -
2 Taihei Dengyo Kaisha Ltd 34 -
10 Taiheiyo Cement Corp 165 0.01
2 Taiho Kogyo Co Ltd 12 -
2 Taikisha Ltd 43 -
1 Taiko Bank Ltd 9 -
2 Taiko Pharmaceutical Co Ltd 12 -
14 Taisei Corp 358 0.02
1 Taisei Lamick Co Ltd 12 -
1 Taisho Pharmaceutical Holdings Co Ltd 58 -
1 Taiyo Holdings Co Ltd 44 -
9 Taiyo Nippon Sanso Corp 126 0.01
4 Taiyo Yuden Co Ltd 142 0.01
3 Takamatsu Construction Group Co Ltd 34 -
2 Takamiya Co Ltd 8 -
1 Takaoka Toko Co Ltd 9 -
2 Takara Bio Inc 40 -
9 Takara Holdings Inc 87 0.01
13 Takara Leben Co Ltd 29 -
1 Takara Printing Co Ltd 11 -
4 Takara Standard Co Ltd 42 -
2 Takasago International Corp 35 -
4 Takasago Thermal Engineering Co Ltd 50 -
18 Takashimaya Co Ltd 141 0.01
1 Take And Give Needs Co Ltd 6 -
1 Takebishi Corp 13 -
17 Takeda Pharmaceutical Co Ltd 412 0.02
4 Takeei Corp 32 -
1 Takemoto Yohki Co Ltd 5 -
4 Takeuchi Manufacturing Co Ltd 69 0.01
1 Takihyo Co Ltd 7 -
1 Takisawa Machine Tool Co Ltd 7 -
4 Takuma Co Ltd 52 -
2 Tama Home Co Ltd 29 -
1 Tamron Co Ltd 19 -
Shares (000's)
Value(000's)
GBP
% of NetAssetValue
Common Stock (continued)
Japan - 6.10% (continued)
6 Tamura Corp 20 -
4 Tanseisha Co Ltd 24 -
- Taoka Chemical Co Ltd 15 -
5 Tatsuta Electric Wire and Cable Co Ltd 20 -
2 Tayca Corp 15 -
2 Tazmo Co Ltd 17 -
2 TBK Co Ltd 7 -
3 TDC Soft Inc 17 -
6 TDK Corp 512 0.03
4 TechMatrix Corp 50 -
1 Techno Associe Co Ltd 8 -
1 Techno Medica Co Ltd 7 -
2 Techno Smart Corp 16 -
3 TechnoPro Holdings Inc 133 0.01
20 Teijin Ltd 236 0.01
1 Teikoku Electric Manufacturing Co Ltd 11 -
1 Teikoku Sen-I Co Ltd 16 -
1 Teikoku Tsushin Kogyo Co Ltd 7 -
2 Tekken Corp 20 -
2 Tenma Corp 28 -
9 Terumo Corp 242 0.01
3 T-Gaia Corp 35 -
5 THK Co Ltd 115 0.01
1 Tigers Polymer Corp 4 -
7 TIS Inc 133 0.01
2 TKC Corp 41 -
2 Toa Corp (non-voting rights) 30 -
1 Toa Oil Co Ltd 24 -
- Toa Road Corp 12 -
14 Toagosei Co Ltd 105 0.01
- Toba Inc 3 -
2 Tobishima Corp 16 -
5 Tobu Railway Co Ltd 89 0.01
6 TOC Co Ltd 29 -
7 Tocalo Co Ltd 67 -
10 Tochigi Bank Ltd 12 -
17 Toda Corp 85 0.01
1 Toei Animation Co Ltd 51 -
- Toei Co Ltd 44 -
1 Toenec Corp 24 -
27 Toho Bank Ltd 36 -
1 Toho Co 5 -
2 Toho Co Ltd 50 -
2 Toho Gas Co Ltd 60 -
6 Toho Holdings Co Ltd 68 0.01
2 Toho Titanium Co Ltd 14 -
1 Toho Zinc Co Ltd 18 -
1 Tohoku Bank Ltd 6 -
16 Tohoku Electric Power Co Inc 90 0.01
2 Tohokushinsha Film Corp 8 -
12 Tokai Carbon Co Ltd 131 0.01
2 Tokai Corp 29 -
9 TOKAI Holdings Corp 52 -
6 Tokai Rika Co Ltd 73 0.01
27 Tokai Tokyo Financial Holdings Inc 73 0.01
1 Token Corp 53 -
13 Tokio Marine Holdings Inc 413 0.02
1 Tokushu Tokai Paper Co Ltd 31 -
7 Tokuyama Corp 105 0.01
2 Tokyo Base Co Ltd 7 -
3 Tokyo Broadcasting System Holdings Inc 40 -
4 Tokyo Century Corp 168 0.01
World Equity FundPortfolio of Investments as at 31 May 2021 (continued)
Dimensional Fund Advisors Semi-Annual Report and Unaudited Financial Statements, 31 May 2021 470

Shares (000's)
Value(000's)
GBP
% of NetAssetValue
Common Stock (continued)
Japan - 6.10% (continued)
51 Tokyo Electric Power Co Holdings Inc 113 0.01
1 Tokyo Electron Device Ltd 31 -
3 Tokyo Electron Ltd 837 0.05
3 Tokyo Energy & Systems Inc 19 -
8 Tokyo Gas Co Ltd 115 0.01
2 Tokyo Individualized Educational Institute Inc 8 -
1 Tokyo Keiki Inc 9 -
3 Tokyo Kiraboshi Financial Group Inc 30 -
1 Tokyo Ohka Kogyo Co Ltd 62 -
- Tokyo Rakutenchi Co Ltd 8 -
- Tokyo Rope Manufacturing Co Ltd 2 -
2 Tokyo Sangyo Co Ltd 7 -
3 Tokyo Seimitsu Co Ltd 122 0.01
13 Tokyo Steel Manufacturing Co Ltd 98 0.01
14 Tokyo Tatemono Co Ltd 150 0.01
1 Tokyo Tekko Co Ltd 10 -
2 Tokyotokeiba Co Ltd 62 -
12 Tokyu Construction Co Ltd 56 -
12 Tokyu Corp 109 0.01
59 Tokyu Fudosan Holdings Corp 250 0.01
- Tokyu Recreation Co Ltd 12 -
5 Toli Corp 8 -
1 Tomato Bank Ltd 5 -
1 Tomen Devices Corp 13 -
3 Tomoe Corp 8 -
1 Tomoe Engineering Co Ltd 10 -
1 Tomoku Co Ltd 12 -
21 TOMONY Holdings Inc 41 -
10 Tomy Co Ltd 59 -
1 Tonami Holdings Co Ltd 26 -
8 Topcon Corp 90 0.01
6 Toppan Forms Co Ltd 40 -
9 Toppan Printing Co Ltd 108 0.01
4 Topre Corp 43 -
2 Topy Industries Ltd 15 -
102 Toray Industries Inc 476 0.03
1 Torex Semiconductor Ltd 9 -
4 Toridoll Holdings Corp 48 -
2 Torigoe Co Ltd 11 -
2 Torii Pharmaceutical Co Ltd 29 -
3 Torishima Pump Manufacturing Co Ltd 19 -
4 Tosei Corp 30 -
8 Toshiba Corp 225 0.01
1 Toshiba Machine Co Ltd 20 -
3 Toshiba TEC Corp 79 0.01
2 Tosho Co Ltd 22 -
11 Tosoh Corp 139 0.01
1 Totech Corp 11 -
2 Totetsu Kogyo Co Ltd 39 -
1 TOTO Ltd 46 -
1 Totoku Electric Co Ltd 8 -
1 Tottori Bank Ltd 4 -
- Toukei Computer Co Ltd 9 -
5 Tow Co Ltd 12 -
2 Towa Bank Ltd 8 -
2 Towa Corp 20 -
3 Towa Pharmaceutical Co Ltd 51 -
12 Toyo Construction Co Ltd 44 -
2 Toyo Corp 17 -
1 Toyo Denki Seizo KK 8 -
2 Toyo Engineering Corp 9 -
1 Toyo Gosei Co Ltd 37 -
Shares (000's)
Value(000's)
GBP
% of NetAssetValue
Common Stock (continued)
Japan - 6.10% (continued)
4 Toyo Ink SC Holdings Co Ltd 55 -
1 Toyo Kanetsu KK 15 -
4 Toyo Logistics Co Ltd 8 -
12 Toyo Seikan Group Holdings Ltd 117 0.01
6 Toyo Suisan Kaisha Ltd 182 0.01
1 Toyo Tanso Co Ltd 14 -
11 Toyo Tire Corp 161 0.01
1 Toyo Wharf & Warehouse Co Ltd 11 -
8 Toyobo Co Ltd 73 0.01
5 Toyoda Gosei Co Ltd 88 0.01
6 Toyota Boshoku Corp 76 0.01
2 Toyota Industries Corp 139 0.01
70 Toyota Motor Corp 4,077 0.21
1 Toyota Motor Corp, ADR 136 0.01
6 Toyota Tsusho Corp 191 0.01
3 TPR Co Ltd 29 -
1 Trancom Co Ltd 51 -
2 Transaction Co Ltd 19 -
2 Transcosmos Inc 41 -
5 Trend Micro Inc 167 0.01
2 Tri Chemical Laboratories Inc 46 -
4 Trusco Nakayama Corp 73 0.01
6 Trust Tech Inc 48 -
10 TS Tech Co Ltd 103 0.01
10 TSI Holdings Co Ltd 20 -
3 Tsubaki Nakashima Co Ltd 31 -
3 Tsubakimoto Chain Co 58 -
1 Tsubakimoto Kogyo Co Ltd 16 -
2 Tsugami Corp 25 -
2 Tsukada Global Holdings Inc 5 -
4 Tsukishima Kikai Co Ltd 27 -
15 Tsukuba Bank Ltd 17 -
3 Tsumura & Co 79 0.01
1 Tsuruha Holdings Inc 102 0.01
3 Tsurumi Manufacturing Co Ltd 32 -
1 Tsutsumi Jewelry Co Ltd 13 -
1 Tsuzuki Denki Co Ltd 13 -
3 TV Asahi Holdings Corp 34 -
1 Tv Tokyo Holdings Corp 15 -
3 TYK Corp 5 -
5 UACJ Corp 70 0.01
8 Ube Industries Ltd 123 0.01
1 Uchida Yoko Co Ltd 34 -
3 Ulvac Inc 108 0.01
5 Unicharm Corp 133 0.01
1 Uniden Holdings Corp 16 -
1 Union Tool Co 19 -
5 Unipres Corp 32 -
2 United Arrows Ltd 25 -
2 UNITED Inc 14 -
5 United Super Markets Holdings Inc 37 -
8 Unitika Ltd 18 -
3 Universal Entertainment Corp 43 -
- UPR Corp 7 -
2 Usen-Next Holdings Co Ltd 23 -
13 Ushio Inc 132 0.01
9 USS Co Ltd 109 0.01
3 UT Group Co Ltd 49 -
3 Utoc Corp 8 -
1 UUUM Inc 7 -
5 Valor Holdings Co Ltd 67 -
2 Valqua Ltd 21 -
World Equity FundPortfolio of Investments as at 31 May 2021 (continued)
Dimensional Fund Advisors Semi-Annual Report and Unaudited Financial Statements, 31 May 2021 471

Shares (000's)
Value(000's)
GBP
% of NetAssetValue
Common Stock (continued)
Japan - 6.10% (continued)
2 Value HR Co Ltd 17 -
2 ValueCommerce Co Ltd 35 -
2 V-Cube Inc 28 -
2 Vector Inc 12 -
1 Vertex Corp 26 -
2 Vision Inc 12 -
6 Vital KSK Holdings Inc 29 -
10 VT Holdings Co Ltd 29 -
5 Wacoal Holdings Corp 80 0.01
16 Wacom Co Ltd 73 0.01
2 Wakachiku Construction Co Ltd 17 -
5 Wakita & Co Ltd 35 -
2 Warabeya Nichiyo Holdings Co Ltd 25 -
2 Watahan & Co Ltd 13 -
1 WDB Holdings Co Ltd 21 -
1 Weathernews Inc 21 -
1 Welbe Inc 8 -
3 Welcia Holdings Co Ltd 70 0.01
3 West Holdings Corp 63 -
3 West Japan Railway Co 111 0.01
2 Will Group Inc 13 -
2 WIN-Partners Co Ltd 11 -
1 Wood One Co Ltd 9 -
1 Workman Co Ltd 39 -
4 World Co Ltd 33 -
1 World Holdings Co Ltd 19 -
1 Wowow Inc 10 -
2 Xebio Holdings Co Ltd 11 -
1 Yachiyo Industry Co Ltd 3 -
4 Yahagi Construction Co Ltd 18 -
1 Yaizu Suisankagaku Industry Co Ltd 8 -
2 Yakult Honsha Co Ltd 61 -
1 YAKUODO Holdings Co Ltd 21 -
4 Yamabiko Corp 29 -
1 Yamada Consulting Group Co Ltd 6 -
27 Yamada Denki Co Ltd 94 0.01
4 Yamagata Bank Ltd 25 -
25 Yamaguchi Financial Group Inc 104 0.01
1 Yamaha Corp 55 -
14 Yamaha Motor Co Ltd 283 0.02
3 Yamaichi Electronics Co Ltd 32 -
3 YA-MAN Ltd 31 -
4 Yamanashi Chuo Bank Ltd 24 -
1 Yamatane Corp 8 -
9 Yamato Holdings Co Ltd 166 0.01
5 Yamato Kogyo Co Ltd 124 0.01
11 Yamazaki Baking Co Ltd 114 0.01
1 Yamazawa Co Ltd 9 -
5 Yamazen Corp 32 -
2 Yaoko Co Ltd 87 0.01
2 Yashima Denki Co Ltd 14 -
2 Yaskawa Electric Corp 62 -
2 Yasuda Logistics Corp 10 -
4 Yellow Hat Ltd 47 -
3 Yodogawa Steel Works Ltd 45 -
3 Yokogawa Bridge Holdings Corp 36 -
13 Yokogawa Electric Corp 154 0.01
6 Yokohama Reito Co Ltd 33 -
10 Yokohama Rubber Co Ltd 146 0.01
2 Yokowo Co Ltd 27 -
1 Yomeishu Seizo Co Ltd 8 -
2 Yonex Co Ltd 9 -
Shares (000's)
Value(000's)
GBP
% of NetAssetValue
Common Stock (continued)
Japan - 6.10% (continued)
2 Yorozu Corp 15 -
2 Yotai Refractories Co Ltd 12 -
1 Yuasa Funashoku Co Ltd 9 -
2 Yuasa Trading Co Ltd 39 -
- Yuken Kogyo Co Ltd 4 -
5 Yurtec Corp 22 -
1 Yushin Precision Equipment Co Ltd 7 -
1 Yushiro Chemical Industry Co Ltd 7 -
48 Z Holdings Corp 162 0.01
1 Zaoh Co Ltd 7 -
1 Zenitaka Corp 14 -
5 Zenkoku Hosho Co Ltd 146 0.01
4 Zenrin Co Ltd 27 -
5 Zensho Holdings Co Ltd 88 0.01
9 Zeon Corp 97 0.01
3 ZOZO Inc 77 0.01
2 Zuiko Corp 11 -
116,958 6.10
Korea, Republic of - 2.04%
1 ABOV Semiconductor Co Ltd 14 -
1 Advanced Process Systems Corp 19 -
1 Aekyung Industrial Co Ltd 17 -
2 Aekyung Petrochemical Co Ltd 13 -
2 AeroSpace Technology of Korea Inc 9 -
1 AfreecaTV Co Ltd 51 -
3 Agabang&Company 11 -
- Ahnlab Inc 16 -
2 AJ Networks Co Ltd 8 -
7 Ajin Industrial Co Ltd 16 -
1 Aju Capital Co Ltd 5 -
1 AK Holdings Inc 12 -
1 Alteogen Inc 28 -
5 ALUKO Co Ltd 15 -
1 Amorepacific Corp 86 0.01
1 Amorepacific Group 32 -
3 Ananti Inc 19 -
11 Aprogen KIC Inc 15 -
20 Aprogen pharmaceuticals Inc 15 -
1 APS Holdings Corp 13 -
- Asia Cement Co Ltd 12 -
- ASIA Holdings Co Ltd 12 -
1 Asia Paper Manufacturing Co Ltd 30 -
4 BGF Co Ltd 17 -
1 BGF retail Co Ltd 83 0.01
2 BH Co Ltd 26 -
1 Binex Co Ltd 13 -
1 Binggrae Co Ltd 30 -
25 BNK Financial Group Inc 126 0.01
1 Boditech Med Inc 17 -
1 Boryung Pharmaceutical Co Ltd 14 -
1 Bukwang Pharmaceutical Co Ltd 9 -
- Busan City Gas Co Ltd 15 -
- BYC Co Ltd 8 -
5 Byucksan Corp 11 -
4 Capro Corp 10 -
- Caregen Co Ltd 9 -
1 Celltrion Healthcare Co Ltd 51 -
2 Celltrion Inc 260 0.02
- Celltrion Pharm Inc 14 -
1 Chabiotech Co Ltd 15 -
1 Changhae Ethanol Co Ltd 6 -
6 Cheil Worldwide Inc 88 0.01
World Equity FundPortfolio of Investments as at 31 May 2021 (continued)
Dimensional Fund Advisors Semi-Annual Report and Unaudited Financial Statements, 31 May 2021 472

Shares (000's)
Value(000's)
GBP
% of NetAssetValue
Common Stock (continued)
Korea, Republic of - 2.04% (continued)
1 Chemtronics Co Ltd 13 -
1 Chong Kun Dang Pharmaceutical Corp 58 0.01
- Chongkundang Holdings Corp 10 -
- Chosun Refractories Co Ltd 12 -
- Chunbo Co Ltd 17 -
1 CJ CheilJedang Corp 220 0.01
1 CJ Corp 71 0.01
1 CJ ENM Co Ltd 86 0.01
- CJ Freshway Corp 7 -
2 CJ Hello Co Ltd 7 -
1 CJ Logistics Corp 102 0.01
2 Classys Inc 17 -
- Com2uS Corp 39 -
17 Comtec Systems Co Ltd 13 -
1 Cosmax Inc 59 0.01
1 CosmoAM&T Co Ltd 15 -
3 Coway Co Ltd 170 0.01
4 Cowell Fashion Co Ltd 17 -
3 Creative & Innovative System 19 -
- Crownhaitai Holdings Co Ltd 2 -
1 CS Wind Corp 31 -
- Cuckoo Holdings Co Ltd 7 -
1 Cuckoo Homesys Co Ltd 27 -
2 Dae Dong Industrial Co Ltd 18 -
- Dae Han Flour Mills Co Ltd 13 -
4 Dae Won Kang Up Co Ltd 10 -
10 Daechang Co Ltd 16 -
3 Daeduck Co Ltd 16 -
2 Daeduck Electronics Co Ltd 23 -
1 Daehan Steel Co Ltd 12 -
1 Daejoo Electronic Materials Co Ltd 17 -
2 Daekyo Co Ltd 6 -
1 Daelim Industrial Co Ltd 69 0.01
2 Daesang Corp 30 -
1 Daesang Holdings Co Ltd 8 -
- Daesung Holdings Co Ltd 8 -
1 Daewon Pharmaceutical Co Ltd 10 -
1 Daewon San Up Co Ltd 2 -
19 Daewoo Engineering & Construction Co Ltd 94 0.01
4 Daewoo Shipbuilding & Marine Engineering Co Ltd 78 0.01
1 Daewoong Co Ltd 28 -
- Daewoong Pharmaceutical Co Ltd 12 -
1 Daihan Pharmaceutical Co Ltd 15 -
4 Daishin Securities Co Ltd 51 -
1 Danawa Co Ltd 20 -
2 Daou Data Corp 13 -
2 Daou Technology Inc 31 -
1 Dawonsys Co Ltd 15 -
4 DB Financial Investment Co Ltd 18 -
3 DB HiTek Co Ltd 83 0.01
13 DB Inc 8 -
5 DB Insurance Co Ltd 158 0.01
- Dentium Co Ltd 7 -
3 Deutsch Motors Inc 18 -
1 Device ENG Co Ltd 15 -
12 DGB Financial Group Inc 73 0.01
- DI Dong Il Corp 24 -
2 Digital Power Communications Co Ltd 20 -
1 DIO Corp 19 -
2 DL E&C Co Ltd 138 0.01
3 DMS Co Ltd 15 -
- Dong Ah Tire & Rubber Co Ltd 3 -
Shares (000's)
Value(000's)
GBP
% of NetAssetValue
Common Stock (continued)
Korea, Republic of - 2.04% (continued)
- Dong-A Socio Holdings Co Ltd 12 -
1 Dong-A ST Co Ltd 31 -
4 Dongbang Transport Logistics Co Ltd 14 -
2 Dongbu Corp 14 -
3 Dongjin Semichem Co Ltd 53 0.01
2 DongKook Pharmaceutical Co Ltd 40 -
4 Dongkuk Industries Co Ltd 10 -
7 Dongkuk Steel Mill Co Ltd 99 0.01
1 Dongsuh Cos Inc 18 -
2 DONGSUNG Corp 9 -
1 Dongsung Finetec Co Ltd 10 -
- Dongwha Enterprise Co Ltd 19 -
1 Dongwha Pharm Co Ltd 8 -
6 Dongwon Development Co Ltd 23 -
- Dongwon F&B Co Ltd 22 -
- Dongwon Industries Co Ltd 18 -
- Dongwon Systems Corp 13 -
2 Doosan Bobcat Inc 76 0.01
1 Doosan Co Ltd 29 -
2 Doosan Fuel Cell Co Ltd 54 0.01
9 Doosan Heavy Industries & Construction Co Ltd 104 0.01
10 Doosan Infracore Co Ltd 81 0.01
1 Doosan Solus Co Ltd 32 -
1 DoubleUGames Co Ltd 37 -
1 Douzone Bizon Co Ltd 77 0.01
- DTR Automotive Corp 6 -
1 Duk San Neolux Co Ltd 23 -
1 DY POWER Corp 13 -
- e Tec E&C Ltd 5 -
- E1 Corp 15 -
2 Eagon Industrial Ltd 18 -
3 Easy Bio Inc 11 -
4 Easy Holdings Co Ltd 13 -
3 EBEST Investment & Securities Co Ltd 15 -
1 Echo Marketing Inc 21 -
- Ecopro BM Co Ltd 21 -
1 Ecopro Co Ltd 34 -
- Ecopro HN Co Ltd 21 -
6 Ehwa Technologies Information Co Ltd 10 -
1 e-LITECOM Co Ltd 7 -
1 E-MART Inc 139 0.01
2 EM-Tech Co Ltd 16 -
1 ENF Technology Co Ltd 14 -
- Eo Technics Co Ltd 33 -
5 Eugene Corp 17 -
8 Eugene Investment & Securities Co Ltd 25 -
- Eugene Technology Co Ltd 13 -
1 Eusu Holdings Co Ltd 8 -
6 E-World Ltd 14 -
- F&F Co Ltd 7 -
- F&F Co Ltd 82 0.01
1 Farmsco 5 -
2 Fila Korea Ltd 73 0.01
1 Fine Semitech Corp 22 -
4 Fine Technix Co Ltd 16 -
2 Foosung Co Ltd 14 -
- Fursys Inc 7 -
1 Gamevil Inc 12 -
- Genexine Co Ltd 11 -
1 Geumhwa PSC Co Ltd 13 -
- GOLFZON Co Ltd 18 -
3 Golfzon Newdin Holdings Co Ltd 20 -
World Equity FundPortfolio of Investments as at 31 May 2021 (continued)
Dimensional Fund Advisors Semi-Annual Report and Unaudited Financial Statements, 31 May 2021 473

Shares (000's)
Value(000's)
GBP
% of NetAssetValue
Common Stock (continued)
Korea, Republic of - 2.04% (continued)
2 Grand Korea Leisure Co Ltd 25 -
- Green Cross Corp 22 -
1 Green Cross Holdings Corp 25 -
- Green Cross LabCell Corp 14 -
4 GS Engineering & Construction Corp 116 0.01
9 GS Global Corp 16 -
4 GS Holdings Corp 130 0.01
1 GS Home Shopping Inc 50 -
3 GS Retail Co Ltd 70 0.01
- Gwangju Shinsegae Co Ltd 11 -
1 HAESUNG DS Co Ltd 25 -
3 Halla Corp 10 -
1 Halla Holdings Corp 22 -
3 Han Kuk Carbon Co Ltd 22 -
11 Hana Financial Group Inc 308 0.02
3 Hana Micron Inc 24 -
1 Hana Pharm Co Ltd 7 -
1 Hanall Biopharma Co Ltd 10 -
2 Hancom Inc 22 -
1 Handok Inc 14 -
2 Handsome Co Ltd 43 -
1 Hanil Holdings Co Ltd 7 -
1 Hanjin Heavy Industries & Construction Co Ltd 7 -
- Hanjin Kal Corp 17 -
1 Hanjin Transportation Co Ltd 32 -
- Hankook Shell Oil Co Ltd 10 -
6 Hankook Tire & Technology Co Ltd 179 0.01
- Hanmi Pharm Co Ltd 36 -
- Hanmi Science Co ltd 10 -
1 Hanmi Semiconductor Co Ltd 30 -
7 Hanon Systems 75 0.01
1 Hansae Co Ltd 11 -
2 Hansae Yes24 Holdings Co Ltd 11 -
1 Hanshin Construction 8 -
- Hansol Chemical Co Ltd 69 0.01
3 Hansol Holdings Co Ltd 8 -
9 Hansol HomeDeco Co Ltd 12 -
7 Hansol Logistics Co Ltd 16 -
2 Hansol Paper Co Ltd 18 -
2 Hansol Technics Co Ltd 10 -
1 Hanssem Co Ltd 34 -
4 Hanwha Chemical Corp 119 0.01
5 Hanwha General Insurance Co Ltd 15 -
14 Hanwha Investment & Securities Co Ltd 44 -
47 Hanwha Life Insurance Co Ltd 116 0.01
1 Hanyang Eng Co Ltd 17 -
5 Harim Co Ltd 9 -
5 Harim Holdings Co Ltd 31 -
4 HDC Hyundai Development Co-Engineering &Construction 73 0.01
1 Helixmith Co Ltd 15 -
6 Heungkuk Fire & Marine Insurance Co Ltd 16 -
3 Hite Jinro Co Ltd 70 0.01
1 Hitejinro Holdings Co Ltd 10 -
4 HJ Magnolia Yongpyong Hotel & Resort Corp 12 -
1 HLB Inc 12 -
3 HLB Life Science CO LTD 18 -
4 HS Industries Co Ltd 23 -
3 HSD Engine Co Ltd 19 -
2 Huchems Fine Chemical Corp 30 -
- Hugel Inc 17 -
2 Humasis Co Ltd 18 -
Shares (000's)
Value(000's)
GBP
% of NetAssetValue
Common Stock (continued)
Korea, Republic of - 2.04% (continued)
2 Humax Co Ltd 5 -
1 Huons Co Ltd 31 -
1 Huons Global Co Ltd 49 -
2 Huvis Corp 15 -
4 Hwa Shin Co Ltd 18 -
1 Hwaseung Enterprise Co Ltd 17 -
1 HwaSung Industrial Co Ltd 7 -
1 Hy-Lok Corp 9 -
- Hyosung Advanced Materials Corp 70 0.01
- Hyosung Chemical Corp 47 -
1 Hyosung Corp 57 0.01
- Hyosung Heavy Industries Corp 17 -
- Hyosung TNC Co Ltd 125 0.01
1 Hyundai BNG Steel Co Ltd 14 -
1 Hyundai Construction Equipment Co Ltd 45 -
1 Hyundai Corp 7 -
- Hyundai Corp Holdings Inc 3 -
1 Hyundai Department Store Co Ltd 67 0.01
2 Hyundai Electric & Energy System Co Ltd 22 -
1 Hyundai Elevator Co Ltd 46 -
4 Hyundai Engineering & Construction Co Ltd 137 0.01
3 Hyundai Ezwel Co Ltd 18 -
1 Hyundai Glovis Co Ltd 148 0.01
6 Hyundai Greenfood Co Ltd 40 -
3 Hyundai Heavy Industries Holdings Co Ltd 143 0.01
1 Hyundai Home Shopping Network Corp 50 -
5 Hyundai Hy Communications & Network Co Ltd 15 -
1 Hyundai Livart Furniture Co Ltd 10 -
10 Hyundai Marine & Fire Insurance Co Ltd 151 0.01
10 Hyundai Merchant Marine Co Ltd 306 0.02
3 Hyundai Mipo Dockyard Co Ltd 150 0.01
2 Hyundai Mobis Co Ltd 347 0.02
3 Hyundai Motor Co 402 0.02
2 Hyundai Motor Securities Co Ltd 16 -
3 Hyundai Rotem Co Ltd 45 -
5 Hyundai Steel Co 175 0.01
2 Hyundai Wia Corp 94 0.01
1 ICD Co Ltd 10 -
1 IDIS Holdings Co Ltd 6 -
9 IHQ Inc 13 -
1 Iljin Diamond Co Ltd 15 -
2 Iljin Holdings Co Ltd 8 -
- Ilshin Spinning Co Ltd 8 -
- Ilyang Pharmaceutical Co Ltd 9 -
2 iMarketKorea Inc 12 -
1 InBody Co Ltd 11 -
- Incross Co Ld 9 -
21 Industrial Bank of Korea 146 0.01
1 Innocean Worldwide Inc 23 -
- InnoWireless Inc 12 -
3 Insun ENT Co Ltd 27 -
1 Intekplus Co Ltd 13 -
- Intelligent Digital Integrated Security Co Ltd 8 -
2 Interflex Co Ltd 15 -
1 Interojo Co Ltd 11 -
3 Interpark Holdings Corp 10 -
1 INTOPS Co Ltd 20 -
1 iNtRON Biotechnology Inc 12 -
5 INZI Display Co Ltd 10 -
1 IS Dongseo Co Ltd 42 -
1 i-SENS Inc 17 -
2 ISU Chemical Co Ltd 16 -
World Equity FundPortfolio of Investments as at 31 May 2021 (continued)
Dimensional Fund Advisors Semi-Annual Report and Unaudited Financial Statements, 31 May 2021 474

Shares (000's)
Value(000's)
GBP
% of NetAssetValue
Common Stock (continued)
Korea, Republic of - 2.04% (continued)
1 Jahwa Electronics Co Ltd 13 -
1 Jayjun Cosmetic Co Ltd 2 -
8 JB Financial Group Co Ltd 39 -
3 JNTC Co Ltd 15 -
3 JoyCity Corp 16 -
3 Jusung Engineering Co Ltd 26 -
1 JW Life Science Corp 12 -
2 JYP Entertainment Corp 44 -
1 Kakao Corp 44 -
- Kangnam Jevisco Co Ltd 8 -
5 Kangwon Land Inc 95 0.01
3 KAON Media Co Ltd 24 -
8 KB Financial Group Inc 271 0.02
6 KB Financial Group Inc, ADR 210 0.01
1 KC Co Ltd 16 -
1 KC Tech Co Ltd 25 -
- KCC Corp 78 0.01
1 KCC Glass Corp 44 -
3 KCTC 15 -
11 KEC Corp 16 -
2 KEPCO Engineering & Construction Co Inc 66 0.01
2 KEPCO Plant Service & Engineering Co Ltd 49 -
2 KEYEAST Co Ltd 18 -
1 KG Chemical Corp 18 -
2 Kginicis Co Ltd 29 -
3 KGMobilians Co Ltd 17 -
6 KH FEELUX Co Ltd 13 -
1 KH Vatec Co Ltd 13 -
8 Kia Motors Corp 440 0.03
1 KineMaster Corp 6 -
- KINX Inc 10 -
2 KISCO Corp 15 -
1 KISCO Holdings Co Ltd 12 -
1 KISWIRE Ltd 22 -
2 KIWOOM Securities Co Ltd 155 0.01
1 KMW Co Ltd 18 -
2 Koentec Co Ltd 13 -
1 Koh Young Technology Inc 19 -
1 Kolmar BNH Co Ltd 21 -
1 Kolmar Korea Co Ltd 28 -
2 Kolmar Korea Holdings Co Ltd 32 -
- Kolon Corp 8 -
1 Kolon Global Corp 13 -
2 Kolon Industries Inc 65 0.01
1 KoMiCo Ltd 37 -
2 Korea Alcohol Industrial Co Ltd 22 -
2 Korea Cast Iron Pipe Industries Co Ltd 15 -
1 Korea Circuit Co Ltd 10 -
7 Korea Electric Power Corp 111 0.01
1 Korea Electric Terminal Co Ltd 31 -
1 Korea Gas Corp 25 -
3 Korea Investment Holdings Co Ltd 216 0.01
14 Korea Line Corp 29 -
- Korea Petrochemical Ind Co Ltd 66 0.01
14 Korea Real Estate Investment & Trust Co Ltd 21 -
2 Korea Shipbuilding & Offshore Engineering Co Ltd 172 0.01
1 Korea United Pharm Inc 19 -
1 Korea Zinc Co Ltd 173 0.01
21 Korean Air Lines Co Ltd 412 0.02
11 Korean Reinsurance Co 65 0.01
1 Kortek Corp 9 -
8 KPM Tech Co Ltd 17 -
Shares (000's)
Value(000's)
GBP
% of NetAssetValue
Common Stock (continued)
Korea, Republic of - 2.04% (continued)
- KPX Chemical Co Ltd 6 -
3 KSS LINE Ltd 20 -
1 KT Corp 17 -
3 KT Skylife Co Ltd 18 -
4 KT&G Corp 228 0.01
4 KTB Investment & Securities Co Ltd 15 -
- Kukdo Chemical Co Ltd 15 -
2 Kumho Industrial Co Ltd 15 -
2 Kumho Petrochemical Co Ltd 226 0.01
7 Kumho Tire Co Inc 21 -
2 Kumkang Kind Co Ltd 8 -
3 Kwang Dong Pharmaceutical Co Ltd 16 -
1 Kyeryong Construction Industrial Co Ltd 17 -
2 Kyobo Securities Co Ltd 14 -
1 Kyung Dong Navien Co Ltd 22 -
1 Kyungbang Co Ltd 10 -
- KyungDong City Gas Co Ltd 2 -
2 Kyungdong Pharm Co Ltd 11 -
3 Kyung-In Synthetic Corp 15 -
- L&F Co Ltd 20 -
1 LabGenomics Co Ltd 11 -
5 LB Semicon Inc 38 -
2 LEADCORP Inc 10 -
- Leaders Cosmetics Co Ltd 1 -
1 LEENO Industrial Inc 87 0.01
2 LF Corp 23 -
- LG Chem Ltd 200 0.01
3 LG Corp 183 0.01
16 LG Display Co Ltd 244 0.02
11 LG Display Co Ltd, ADR 81 0.01
8 LG Electronics Inc 725 0.04
1 LG Hausys Ltd 32 -
- LG Household & Health Care Ltd 232 0.01
1 LG Innotek Co Ltd 140 0.01
3 LG International Corp 55 0.01
20 LG Uplus Corp 188 0.01
2 Lock&Lock Co Ltd 17 -
1 Lotte Chemical Corp 149 0.01
- Lotte Chilsung Beverage Co Ltd 33 -
- Lotte Confectionery Co Ltd 28 -
1 Lotte Corp 28 -
- Lotte Data Communication Co 11 -
2 LOTTE Fine Chemical Co Ltd 75 0.01
- Lotte Food Co Ltd 10 -
1 LOTTE Himart Co Ltd 30 -
1 Lotte Shopping Co Ltd 55 0.01
1 LS Corp 50 -
1 LS Industrial Systems Co Ltd 45 -
4 Lumens Co Ltd 4 -
7 LVMC Holdings 16 -
1 LX Holdings Corp 10 -
18 Macquarie Korea Infrastructure Fund 137 0.01
- Maeil Dairies Co Ltd 16 -
- Maeil Holdings Co Ltd 2 -
2 Mando Corp 85 0.01
1 Mcnex Co Ltd 45 -
- Medy-Tox Inc 15 -
2 MegaStudy Co Ltd 15 -
1 MegaStudyEdu Co Ltd 49 -
4 Meritz Financial Group Inc 51 -
5 Meritz Fire & Marine Insurance Co Ltd 55 0.01
15 Meritz Securities Co Ltd 43 -
World Equity FundPortfolio of Investments as at 31 May 2021 (continued)
Dimensional Fund Advisors Semi-Annual Report and Unaudited Financial Statements, 31 May 2021 475

Shares (000's)
Value(000's)
GBP
% of NetAssetValue
Common Stock (continued)
Korea, Republic of - 2.04% (continued)
3 MiCo Ltd 24 -
19 Mirae Asset Daewoo Co Ltd 117 0.01
9 Mirae Asset Life Insurance Co Ltd 23 -
- Miwon Commercial Co Ltd 35 -
- Miwon Specialty Chemical Co Ltd 21 -
2 MK Electron Co Ltd 17 -
3 Moorim P&P Co Ltd 11 -
1 Motonic Corp 10 -
4 MS Autotech Co Ltd 19 -
1 Muhak Co Ltd 7 -
2 Namhae Chemical Corp 13 -
- Namyang Dairy Products Co Ltd 14 -
- Nasmedia Co Ltd 8 -
1 NAVER Corp 173 0.01
1 NCSoft Corp 290 0.02
1 Neowiz 15 -
1 Neowiz Holdings Corp 13 -
2 NEPES Corp 41 -
- Netmarble Corp 13 -
3 Nexen Corp 10 -
4 Nexen Tire Corp 20 -
9 NH Investment & Securities Co Ltd 80 0.01
1 NHN Corp 40 -
2 NHN KCP Corp 64 0.01
2 NICE Holdings Co Ltd 21 -
1 Nice Information & Telecommunication Inc 11 -
3 NICE Information Service Co Ltd 47 -
2 NICE Total Cash Management Co Ltd 9 -
- Nong Shim Holdings Co Ltd 10 -
- Nongshim Co Ltd 61 0.01
1 NOVAREX Co Ltd 17 -
2 NS Shopping Co Ltd 15 -
1 OCI Co Ltd 51 -
- Orion Corp 17 -
3 Orion Holdings Corp 37 -
1 Osstem Implant Co Ltd 70 0.01
6 Osung Advanced Materials Co Ltd 14 -
- Ottogi Corp 39 -
4 Paik Kwang Industrial Co Ltd 15 -
25 Pan Ocean Co Ltd 108 0.01
3 Paradise Co Ltd 42 -
- Park Systems Corp 34 -
2 Partron Co Ltd 15 -
1 Pearl Abyss Corp 20 -
- Pharma Research Products Co Ltd 19 -
2 Pharmicell Co Ltd 16 -
2 PNE Solution Co Ltd 23 -
2 POSCO 461 0.03
- POSCO Chemical Co Ltd 18 -
3 Posco ICT Co Ltd 17 -
6 POSCO International Corp 87 0.01
1 POSCO, ADR 79 0.01
2 Power Logics Co Ltd 12 -
1 PSK Inc 18 -
1 Pulmuone Co Ltd 13 -
2 Pyeong Hwa Automotive Co Ltd 18 -
- S&S Tech Corp 8 -
1 S&T Motiv Co Ltd 45 -
1 S-1 Corp 66 0.01
- Sajo Industries Co Ltd 8 -
- Sajodaerim Corp 3 -
- Sam Chun Dang Pharm Co Ltd 10 -
Shares (000's)
Value(000's)
GBP
% of NetAssetValue
Common Stock (continued)
Korea, Republic of - 2.04% (continued)
2 Sam Young Electronics Co Ltd 19 -
1 Sam Yung Trading Co Ltd 14 -
1 Sambo Corrugated Board Co Ltd 15 -
9 Sambu Engineering & Construction 14 -
2 Samho Development Co Ltd 9 -
1 Samho International Co Ltd 25 -
2 SAMHWA Paints Industrial Co Ltd 13 -
1 Samji Electronics Co Ltd 11 -
1 Samjin Pharmaceutical Co Ltd 14 -
6 SAMPYO Cement Co Ltd 22 -
2 Samsung C&T Corp 203 0.01
2 Samsung Card Co Ltd 50 -
2 Samsung Electro-Mechanics Co Ltd 225 0.01
159 Samsung Electronics Co Ltd 8,065 0.42
2 Samsung Electronics Co Ltd, GDR 2,357 0.13
16 Samsung Engineering Co Ltd 200 0.01
2 Samsung Fire & Marine Insurance Co Ltd 293 0.02
33 Samsung Heavy Industries Co Ltd 123 0.01
2 Samsung Life Insurance Co Ltd 113 0.01
- Samsung SDI Co Ltd 66 0.01
- Samsung SDS Co Ltd 50 -
6 Samsung Securities Co Ltd 175 0.01
8 SAMT Co Ltd 18 -
1 Samwha Capacitor Co Ltd 17 -
- Samyang Corp 11 -
- Samyang Foods Co Ltd 17 -
- Samyang Holdings Corp 25 -
- Samyang Tongsang Co Ltd 7 -
5 Sangsangin Co Ltd 23 -
1 SaraminHR Co Ltd 23 -
1 Seah Besteel Corp 28 -
- SeAH Holdings Corp 7 -
- SeAH Steel Corp 14 -
- SeAH Steel Holdings Corp 9 -
1 Sebang Co Ltd 7 -
1 Sebang Global Battery Co Ltd 43 -
2 Seegene Inc 97 0.01
36 Sejong Telecom Inc 16 -
2 Seobu T&D 13 -
10 Seohan Co Ltd 12 -
- Seojin System Co Ltd 9 -
4 Seoul Semiconductor Co Ltd 45 -
1 Seoul Viosys Co Ltd 14 -
1 Seoyon Co Ltd 15 -
1 Seoyon E-Hwa Co Ltd 8 -
6 Sewon Cellontech Co Ltd 7 -
2 SFA Engineering Corp 55 0.01
5 SFA Semicon Co Ltd 21 -
1 Shin Heung Energy & Electronics 16 -
- Shin Poong Pharmaceutical Co Ltd 8 -
- Shindaeyang Paper Co Ltd 9 -
15 Shinhan Financial Group Co Ltd 398 0.02
1 Shinsegae Engineering & Construction Co Ltd 13 -
- Shinsegae Food Co Ltd 12 -
1 Shinsegae Inc 110 0.01
- Shinsegae International Inc 17 -
1 Shinyoung Securities Co Ltd 22 -
4 Showbox Corp 11 -
1 Silicon Works Co Ltd 52 -
2 SIMMTECH Co Ltd 21 -
1 Sindoh Co Ltd 13 -
1 Sinil Pharm Co Ltd 13 -
World Equity FundPortfolio of Investments as at 31 May 2021 (continued)
Dimensional Fund Advisors Semi-Annual Report and Unaudited Financial Statements, 31 May 2021 476

Shares (000's)
Value(000's)
GBP
% of NetAssetValue
Common Stock (continued)
Korea, Republic of - 2.04% (continued)
- SK Chemicals Co Ltd 44 -
1 SK D&D Co Ltd 25 -
1 SK Discovery Co Ltd 44 -
- SK Gas Ltd 18 -
2 SK Holdings Co Ltd 262 0.02
22 SK Hynix Inc 1,763 0.09
1 SK Innovation Co Ltd 229 0.01
- SK Materials Co Ltd 50 -
19 SK Networks Co Ltd 73 0.01
43 SK Securities Co Ltd 27 -
1 SK Telecom Co Ltd 160 0.01
1 SKC Co Ltd 48 -
1 SKCKOLONPI Inc 38 -
1 SL Corp 29 -
1 SM Entertainment Co Ltd 32 -
17 S-MAC Co Ltd 15 -
- S-Oil Corp 20 -
1 Songwon Industrial Co Ltd 18 -
- Soulbrain Co Ltd 55 0.01
1 Soulbrain Holdings Co Ltd 14 -
- SPC Samlip Co Ltd 13 -
2 Speco Co Ltd 9 -
- Spigen Korea Co Ltd 15 -
6 Ssangyong Cement Industrial Co Ltd 27 -
- ST Pharm Co Ltd 16 -
- Studio Dragon Corp 23 -
- Suheung Co Ltd 14 -
- Sun Kwang Co Ltd 7 -
2 Sung Kwang Bend Co Ltd 13 -
8 Sungchang Enterprise Holdings Ltd 14 -
2 Sungshin Cement Co Ltd 18 -
4 Sungwoo Hitech Co Ltd 17 -
2 Sunjin Co Ltd 17 -
- Suprema Inc 8 -
7 Synopex Inc 16 -
1 Systems Technology Inc 15 -
4 Tae Kyung Industrial Co Ltd 15 -
- Taekwang Industrial Co Ltd 31 -
5 Taekyung BK Co Ltd 14 -
3 Taeyoung Engineering & Construction Co Ltd 22 -
7 Taihan Fiberoptics Co Ltd 14 -
1 TES Co Ltd 14 -
1 Tesna Co Ltd 23 -
3 Theragen Etex Co Ltd 15 -
1 TK Corp 7 -
- Tokai Carbon Korea Co Ltd 38 -
18 Tongyang Inc 15 -
4 Tongyang Life Insurance Co Ltd 14 -
2 Top Engineering Co Ltd 13 -
2 Toptec Co Ltd 14 -
3 Tovis Co Ltd 14 -
- TSE Co Ltd 15 -
3 Tuksu Construction Co Ltd 27 -
3 TY Holdings Co Ltd 48 -
- Uju Electronics Co Ltd 4 -
1 Unid Co Ltd 31 -
4 Union Semiconductor Equipment & Materials Co Ltd 31 -
1 UniTest Inc 14 -
1 Value Added Technology Co Ltd 13 -
1 Viatron Technologies Inc 9 -
2 Vidente Co Ltd 12 -
1 Vieworks Co Ltd 11 -
Shares (000's)
Value(000's)
GBP
% of NetAssetValue
Common Stock (continued)
Korea, Republic of - 2.04% (continued)
2 Vitzro Tech Co Ltd 17 -
1 Webcash Corp 14 -
2 Webzen Inc 31 -
1 Whanin Pharmaceutical Co Ltd 11 -
1 Winix Inc 16 -
2 WiSoL Co Ltd 19 -
6 Wonik Holdings Co Ltd 23 -
2 Wonik IPS Co Ltd 56 0.01
1 Wonik Materials Co Ltd 17 -
1 Wonik QnC Corp 18 -
9 Woongjin Coway Co Ltd 16 -
6 Woongjin Thinkbig Co Ltd 16 -
4 Wooree Bio Co Ltd 13 -
40 Woori Financial Group Inc 278 0.02
47 Woori Investment Bank Co Ltd 28 -
6 Woori Technology Investment Co Ltd 33 -
1 Worldex Industry & Trading Co Ltd 15 -
1 Y G-1 Co Ltd 7 -
2 Y-entec Co Ltd 15 -
- YG Entertainment Inc 9 -
1 Youlchon Chemical Co Ltd 8 -
- Young Poong Corp 23 -
3 Young Poong Precision Corp 16 -
2 Youngone Corp 67 0.01
1 Youngone Holdings Co Ltd 20 -
9 Yuanta Securities Korea Co Ltd 27 -
1 Yuhan Corp 42 -
- Zinus Inc 23 -
39,078 2.04
Malaysia - 0.22%
64 7-Eleven Malaysia Holdings Bhd 16 -
35 AEON Co M Bhd 8 -
9 AEON Credit Service M Bhd 18 -
54 AFFIN Bank Bhd 16 -
177 AirAsia Group Bhd 25 -
3 Ajinomoto Malaysia Bhd 9 -
113 Alliance Bank Malaysia Bhd 51 -
145 AMMB Holdings Bhd 71 0.01
77 Astro Malaysia Holdings Bhd 14 -
103 Axiata Group Bhd 65 0.01
11 Batu Kawan Bhd 37 -
268 Berjaya Corp Bhd 13 -
74 Berjaya Sports Toto Bhd 25 -
44 BIMB Holdings Bhd 29 -
57 Boustead Holdings Bhd 6 -
47 Boustead Plantations Bhd 5 -
13 British American Tobacco Malaysia Bhd 34 -
322 Bumi Armada Bhd 24 -
54 Bursa Malaysia Bhd 75 0.01
75 Cahya Mata Sarawak Bhd 21 -
12 Carlsberg Brewery Malaysia Bhd 45 -
110 CIMB Group Holdings Bhd 81 0.01
57 D&O Green Technologies Bhd 42 -
90 Datasonic Group Bhd 8 -
35 Dayang Enterprise Holdings Bhd 8 -
118 Dialog Group Bhd 59 0.01
95 DiGi.Com Bhd 70 0.01
81 DRB-Hicom Bhd 26 -
23 Dufu Technology Corp Bhd 17 -
2 Dutch Lady Milk Industries Bhd 9 -
65 Eco World Development Group Bhd 7 -
116 Ekovest Bhd 8 -
World Equity FundPortfolio of Investments as at 31 May 2021 (continued)
Dimensional Fund Advisors Semi-Annual Report and Unaudited Financial Statements, 31 May 2021 477

Shares (000's)
Value(000's)
GBP
% of NetAssetValue
Common Stock (continued)
Malaysia - 0.22% (continued)
8 Fraser & Neave Holdings Bhd 38 -
73 Frontken Corp Bhd 37 -
26 Gabungan AQRS Bhd 3 -
57 Gadang Holdings Bhd 4 -
139 Gamuda Bhd 77 0.01
108 Genting Bhd 90 0.01
133 Genting Malaysia Bhd 63 0.01
18 Genting Plantations Bhd 24 -
13 George Kent Malaysia Bhd 2 -
57 Globetronics Technology Bhd 20 -
17 Greatech Technology Bhd 16 -
27 Guan Chong Bhd 12 -
12 HAP Seng Consolidated Bhd 16 -
23 Hartalega Holdings Bhd 35 -
12 Heineken Malaysia Bhd 50 -
11 Hengyuan Refining Co Bhd 10 -
10 Hong Leong Bank Bhd 30 -
9 Hong Leong Financial Group Bhd 27 -
5 Hong Leong Industries Bhd 7 -
18 IGB Bhd 9 -
283 IJM Corp Bhd 87 0.01
66 Inari Amertron Bhd 35 -
26 IOI Corp Bhd 18 -
112 IOI Properties Group Bhd 25 -
154 JAKS Resources Bhd 15 -
11 Keck Seng Malaysia Bhd 7 -
26 Kenanga Investment Bank Bhd 7 -
206 KNM Group Bhd 6 -
75 Kossan Rubber Industries 53 -
196 KPJ Healthcare Bhd 33 -
5 Kuala Lumpur Kepong Bhd 21 -
57 LBS Bina Group Bhd 4 -
60 Leong Hup International 7 -
18 Lii Hen Industries Bhd 10 -
39 Lotte Chemical Titan Holding Bhd 20 -
19 LPI Capital Bhd 43 -
23 Magni-Tech Industries Bhd 9 -
20 Magnum Bhd 7 -
101 Mah Sing Group Bhd 16 -
71 Malakoff Corp Bhd 10 -
64 Malayan Banking Bhd 90 0.01
85 Malayan Flour Mills Bhd 13 -
99 Malaysia Airports Holdings Bhd 93 0.01
186 Malaysia Building Society Bhd 20 -
6 Malaysian Pacific Industries Bhd 39 -
227 Malaysian Resources Corp Bhd 17 -
58 Matrix Concepts Holdings Bhd 20 -
51 Maxis Bhd 41 -
13 MBM Resources Bhd 7 -
25 Mega First Corp Bhd 31 -
58 MISC Bhd 68 0.01
37 MKH Bhd 8 -
79 MMC Corp Bhd 16 -
- MNRB Holdings Bhd - -
21 MPHB Capital Bhd 4 -
22 Muhibbah Engineering M Bhd 4 -
168 My EG Services Bhd 56 0.01
2 Nestle Malaysia Bhd 51 -
33 Oriental Holdings Bhd 29 -
127 OSK Holdings Bhd 19 -
36 Padini Holdings Bhd 18 -
42 Pentamaster Corp Bhd 34 -
Shares (000's)
Value(000's)
GBP
% of NetAssetValue
Common Stock (continued)
Malaysia - 0.22% (continued)
5 Petron Malaysia Refining & Marketing Bhd 4 -
23 Petronas Chemicals Group Bhd 32 -
12 Petronas Dagangan Bhd 39 -
14 Petronas Gas Bhd 38 -
24 Pos Malaysia Bhd 3 -
20 PPB Group Bhd 64 0.01
32 Press Metal Aluminium Holdings Bhd 28 -
285 Public Bank Bhd 208 0.01
59 QL Resources Bhd 60 0.01
40 Ranhill Utilities Bhd 5 -
63 RHB Bank Bhd 58 0.01
896 Sapura Energy Bhd 20 -
12 Sarawak Oil Palms Bhd 8 -
49 Scientex Bhd 35 -
141 Serba Dinamik Holdings Bhd 39 -
249 Sime Darby Bhd 97 0.01
37 Sime Darby Plantation Bhd 29 -
278 Sime Darby Property Bhd 29 -
49 SKP Resources Bhd 12 -
218 SP Setia Bhd Group 39 -
137 Sunway Bhd 37 -
51 Supermax Corp Bhd 36 -
32 Syarikat Takaful Malaysia Keluarga Bhd 25 -
17 Ta Ann Holdings Bhd 9 -
22 Telekom Malaysia Bhd 23 -
31 Tenaga Nasional Bhd 53 0.01
25 Thong Guan Industries Bhd 12 -
26 TIME dotCom Bhd 63 0.01
65 Top Glove Corp Bhd 56 0.01
63 Tropicana Corp Bhd 10 -
41 Tune Protect Group Bhd 3 -
16 Uchi Technologies Bhd 8 -
24 UEM Edgenta Bhd 7 -
174 UEM Sunrise Bhd 12 -
25 UMW Holdings Bhd 13 -
10 United Malacca Bhd 8 -
11 United Plantations Bhd 25 -
60 UOA Development Bhd 19 -
19 UWC BHD 17 -
384 Velesto Energy Bhd 9 -
9 ViTrox Corp Bhd 23 -
171 VS Industry Bhd 35 -
60 WCT Holdings Bhd 5 -
54 Westports Holdings Bhd 40 -
59 Yinson Holdings Bhd 50 -
57 YNH Property Bhd 27 -
302 YTL Corp Bhd 35 -
59 YTL Power International Bhd 7 -
4,137 0.22
Mexico - 0.29%
16 ALEATICA SAB de CV 11 -
387 Alfa SAB de CV 191 0.01
39 Alpek SAB de CV 31 -
49 Alsea SAB de CV 57 -
390 America Movil SAB de CV 211 0.01
4 America Movil SAB de CV, ADR 45 -
17 Arca Continental SAB de CV 67 -
145 Axtel SAB de CV 28 -
75 Banco del Bajio SA 90 0.01
12 Becle SAB de CV 21 -
34 Bolsa Mexicana de Valores SAB de CV 53 -
1,222 Cemex SAB de CV 712 0.04
World Equity FundPortfolio of Investments as at 31 May 2021 (continued)
Dimensional Fund Advisors Semi-Annual Report and Unaudited Financial Statements, 31 May 2021 478

Shares (000's)
Value(000's)
GBP
% of NetAssetValue
Common Stock (continued)
Mexico - 0.29% (continued)
18 Coca-Cola Femsa SAB de CV 63 -
56 Consorcio ARA SAB de CV 10 -
387 Controladora Nemak SAB de CV 43 -
45 Controladora Vuela Cia de Aviacion SAB de CV 55 -
1 Controladora Vuela Cia de Aviacion SAB de CV,ADR 14 -
17 Corp Actinver SAB de CV 6 -
35 Corp Inmobiliaria Vesta SAB de CV 51 -
1 Corporativo Fragua SAB de CV 10 -
13 Credito Real SAB de CV SOFOM ER 3 -
9 Cydsa SAB de CV 5 -
13 El Puerto de Liverpool SAB de CV 38 -
8 Elementia SAB de CV 4 -
11 Fomento Economico Mexicano SAB de CV 64 -
176 Genomma Lab Internacional SAB de CV 130 0.01
85 Gentera SAB de CV 34 -
16 Gruma SAB de CV 119 0.01
26 Grupo Aeroportuario del Centro Norte SAB de CV 117 0.01
17 Grupo Aeroportuario del Pacifico SAB de CV 124 0.01
4 Grupo Aeroportuario del Sureste SAB de CV 49 -
82 Grupo Bimbo SAB de CV 126 0.01
22 Grupo Carso SAB de CV 47 -
15 Grupo Cementos de Chihuahua SAB de CV 76 0.01
44 Grupo Comercial Chedraui SA de CV 50 -
1 Grupo Elektra SAB de CV 35 -
72 Grupo Financiero Banorte SAB de CV 344 0.02
145 Grupo Financiero Inbursa SAB de CV 101 0.01
17 Grupo GICSA SAB de CV 2 -
19 Grupo Herdez SAB de CV 29 -
12 Grupo Hotelero Santa Fe SAB de CV 2 -
39 Grupo Industrial Saltillo SAB de CV 41 -
6 Grupo KUO SAB De CV 9 -
47 Grupo Lala SAB de CV 27 -
48 Grupo Mexico SAB de CV 162 0.01
31 Grupo Rotoplas SAB de CV 37 -
19 Grupo Sanborns SAB de CV 13 -
14 Grupo Simec SAB de CV 73 -
261 Grupo Televisa SAB 478 0.03
3 Grupo Traxion SAB de CV 4 -
36 Hoteles City Express SAB de CV 8 -
19 Industrias Bachoco SAB de CV 52 -
18 Industrias CH SAB de CV 93 0.01
9 Industrias Penoles SAB de CV 93 0.01
16 Infraestructura Energetica Nova SAB de CV 47 -
72 Kimberly-Clark de Mexico SAB de CV 92 0.01
65 La Comer SAB de CV 87 0.01
88 Megacable Holdings SAB de CV 233 0.01
34 Minera Frisco SAB de CV, Class A1 5 -
36 Minera Frisco SAB de CV, Class A2 5 -
89 Nemak SAB de CV 21 -
120 Orbia Advance Corp SAB de CV 239 0.01
9 Organizacion Cultiba SAB de CV 4 -
20 Organizacion Soriana SAB de CV 13 -
20 Promotora y Operadora de Infraestructura SAB deCV 112 0.01
3 Promotora y Operadora de Infraestructura SAB deCV, Class L 10 -
16 Qualitas Controladora SAB de CV 61 -
25 Regional SAB de CV 96 0.01
75 Telesites SAB de CV 51 -
35 Unifin Financiera SAB de CV 29 -
Shares (000's)
Value(000's)
GBP
% of NetAssetValue
Common Stock (continued)
Mexico - 0.29% (continued)
12 Vitro SAB de CV 11 -
66 Wal-Mart de Mexico SAB de CV 149 0.01
5,623 0.29
Netherlands - 0.93%
13 Aalberts NV 515 0.03
12 ABN AMRO Bank NV 109 0.01
2 Accell Group NV 96 -
- Adyen NV 179 0.01
144 Aegon NV 480 0.03
6 Akzo Nobel NV 541 0.03
2 AMG Advanced Metallurgical Group NV 48 -
2 Amsterdam Commodities NV 42 -
5 APERAM SA 200 0.01
9 Arcadis NV 289 0.02
21 ArcelorMittal SA 487 0.03
2 ASM International NV 493 0.03
7 ASML Holding NV (Netherlands listing) 3,308 0.17
14 ASR Nederland NV 427 0.02
3 Basic-Fit NV 105 0.01
8 BE Semiconductor Industries NV 447 0.02
2 Beter Bed Holding NV 9 -
8 Boskalis Westminster 202 0.01
2 Brunel International NV 21 -
11 Coca-Cola European Partners PLC 474 0.02
2 Coca-Cola European Partners PLC (US listing) 86 -
5 Corbion NV 184 0.01
4 Flow Traders 125 0.01
5 ForFarmers NV 24 -
10 Fugro NV 77 -
5 GrandVision NV 125 0.01
3 Heijmans NV 37 -
4 Heineken NV 315 0.02
1 Hunter Douglas NV 58 -
4 IMCD NV 432 0.02
55 ING Groep NV 541 0.03
10 Intertrust NV 135 0.01
2 Kendrion NV 31 -
60 Koninklijke Ahold Delhaize NV 1,233 0.06
38 Koninklijke BAM Groep NV 78 -
4 Koninklijke DSM NV 541 0.03
303 Koninklijke KPN NV 713 0.04
14 Koninklijke Philips NV 543 0.03
6 Koninklijke Vopak NV 203 0.01
1 Lucas Bols BV 9 -
1 Nederland Apparatenfabriek 29 -
16 NN Group NV 565 0.03
1 NXP Semiconductors NV 140 0.01
7 OCI NV 128 0.01
10 Ordina NV 34 -
45 PostNL NV 188 0.01
4 Prosus NV 321 0.02
10 Randstad NV 555 0.03
13 SBM Offshore NV 160 0.01
1 SIF Holding NV 20 -
15 Signify NV 641 0.03
3 Sligro Food Group NV 59 -
5 TKH Group NV 170 0.01
9 TomTom NV 59 -
2 Van Lanschot Kempen NV 33 -
12 Wolters Kluwer NV 805 0.04
17,869 0.93
World Equity FundPortfolio of Investments as at 31 May 2021 (continued)
Dimensional Fund Advisors Semi-Annual Report and Unaudited Financial Statements, 31 May 2021 479

Shares (000's)
Value(000's)
GBP
% of NetAssetValue
Common Stock (continued)
New Zealand - 0.13%
20 a2 Milk Co Ltd 60 -
65 Air New Zealand Ltd 55 -
49 Arvida Group Ltd 45 -
18 Auckland International Airport Ltd 69 0.01
48 Chorus Ltd 152 0.01
2 Comvita Ltd 4 -
20 Contact Energy Ltd 79 0.01
2 Delegat Group Ltd 16 -
10 Ebos Group Ltd 169 0.01
6 Fisher & Paykel Healthcare Corp Ltd 82 0.01
47 Fletcher Building Ltd 179 0.01
5 Fonterra Co-operative Group Ltd 10 -
15 Freightways Ltd 91 0.01
28 Genesis Energy Ltd 49 -
5 Gentrack Group Ltd 5 -
7 Hallenstein Glasson Holdings Ltd 26 -
57 Heartland Group Holdings Ltd 56 -
39 Infratil Ltd 150 0.01
63 Kathmandu Holdings Ltd 51 -
2 Mainfreight Ltd 65 -
13 Mercury NZ Ltd 44 -
15 Meridian Energy Ltd 40 -
18 New Zealand Refining Co Ltd 6 -
15 NZME Ltd 6 -
19 NZX Ltd 20 -
41 Oceania Healthcare Ltd 29 -
15 Port of Tauranga Ltd 53 -
3 Restaurant Brands New Zealand Ltd 23 -
12 Ryman Healthcare Ltd 79 0.01
9 Sanford Ltd 22 -
12 Scales Corp Ltd 29 -
18 Skellerup Holdings Ltd 42 -
135 SKY Network Television Ltd 12 -
77 SKYCITY Entertainment Group Ltd 140 0.01
82 Spark New Zealand Ltd 189 0.01
15 Steel & Tube Holdings Ltd 9 -
26 Summerset Group Holdings Ltd 162 0.01
11 Synlait Milk Ltd 17 -
15 Tourism Holdings Ltd 19 -
35 Tower Ltd 13 -
5 Trustpower Ltd 22 -
7 Turners Automotive Group Ltd 15 -
9 Vector Ltd 19 -
7 Vista Group International Ltd 8 -
15 Warehouse Group Ltd 26 -
56 Z Energy Ltd 73 0.01
2,530 0.13
Norway - 0.28%
42 ABG Sundal Collier Holding ASA 31 -
3 AF Gruppen ASA 53 -
18 Akastor ASA 8 -
2 Aker ASA 80 -
5 Aker BP ASA 113 0.01
16 Aker Solutions ASA 21 -
8 American Shipping Co ASA 21 -
3 ArcticZymes Technologies ASA 21 -
8 Atea ASA 112 0.01
9 Austevoll Seafood ASA 85 0.01
8 Avance Gas Holding Ltd 27 -
16 Axactor SE 15 -
34 B2Holding ASA 30 -
1 Bakkafrost P/F 89 0.01
Shares (000's)
Value(000's)
GBP
% of NetAssetValue
Common Stock (continued)
Norway - 0.28% (continued)
2 Bonheur ASA 46 -
9 Borregaard ASA 141 0.01
- Bouvet ASA 11 -
3 BW Energy Ltd 6 -
8 BW LPG Ltd 41 -
12 BW Offshore Ltd 34 -
4 Crayon Group Holding ASA 39 -
18 DNB ASA 287 0.02
65 DNO ASA 49 -
7 Entra ASA 114 0.01
31 Equinor ASA 480 0.03
18 Europris ASA 84 0.01
6 Fjordkraft Holding ASA 28 -
5 FLEX LNG Ltd 48 -
12 Frontline Ltd 72 -
4 Gjensidige Forsikring ASA 55 -
11 Golden Ocean Group Ltd 78 -
1 Golden Ocean Group Ltd (Norway listing) 6 -
4 Grieg Seafood ASA 24 -
6 Hexagon Composites ASA 18 -
2 Kid ASA 17 -
10 Komplett Bank ASA 8 -
37 Kongsberg Automotive ASA 9 -
6 Kongsberg Gruppen ASA 111 0.01
11 Leroy Seafood Group ASA 72 -
- Medistim ASA 6 -
8 Mowi ASA 137 0.01
34 NEL ASA 52 -
6 Nordic Semiconductor ASA 122 0.01
32 Norsk Hydro ASA 147 0.01
5 Norske Skog ASA 14 -
2 Norway Royal Salmon ASA 26 -
19 Norwegian Finans Holding ASA 155 0.01
9 Norwegian Property ASA 11 -
7 Ocean Yield ASA 18 -
15 Odfjell Drilling Ltd 27 -
4 Odfjell SE 9 -
1 Olav Thon Eiendomsselskap ASA 21 -
20 Orkla ASA 150 0.01
12 Otello Corp ASA 33 -
43 PGS ASA 19 -
9 Protector Forsikring ASA 64 -
- REC Silicon ASA - -
2 Salmar ASA 104 0.01
1 Sandnes Sparebank 8 -
5 SATS Ltd 9 -
10 Sbanken ASA 82 0.01
4 Scatec Solar ASA 80 -
1 Schibsted ASA, Class A 27 -
1 Schibsted ASA, Class B 27 -
4 Selvaag Bolig ASA 22 -
16 SpareBank 1 SR-Bank ASA 158 0.01
- Sparebanken More 11 -
3 Stolt-Nielsen Ltd 38 -
34 Storebrand ASA 238 0.01
16 Subsea 7 SA 109 0.01
13 Telenor ASA 158 0.01
10 TGS NOPEC Geophysical Co ASA 97 0.01
3 Tomra Systems ASA 125 0.01
3 Treasure ASA 5 -
11 Veidekke ASA 117 0.01
10 Wallenius Wilhelmsen ASA 28 -
World Equity FundPortfolio of Investments as at 31 May 2021 (continued)
Dimensional Fund Advisors Semi-Annual Report and Unaudited Financial Statements, 31 May 2021 480

Shares (000's)
Value(000's)
GBP
% of NetAssetValue
Common Stock (continued)
Norway - 0.28% (continued)
1 Wilh Wilhelmsen Holding ASA (voting rights) 19 -
11 XXL ASA 19 -
6 Yara International ASA 240 0.01
5,316 0.28
Peru - 0.01%
1 Aenza SAA, ADR 1 -
1 Cementos Pacasmayo SAA, ADR 3 -
1 Cia de Minas Buenaventura SAA, ADR 10 -
1 Credicorp Ltd 76 0.01
90 0.01
Philippines - 0.10%
76 8990 Holdings Inc 8 -
40 Aboitiz Equity Ventures Inc 24 -
56 Aboitiz Power Corp 19 -
222 AC Energy Corp 24 -
506 Alliance Global Group Inc 76 0.01
66 Atlas Consolidated Mining & Development Corp 7 -
3 Ayala Corp 38 -
77 Ayala Land Inc 39 -
2 AyalaLand Logistics Holdings Corp - -
59 Bank of the Philippine Islands 73 0.01
125 BDO Unibank Inc 187 0.01
385 Belle Corp 8 -
285 Bloomberry Resorts Corp 29 -
19 Cebu Air Inc 13 -
344 CEMEX Holdings Philippines Inc 6 -
123 Century Pacific Food Inc 43 -
66 Chelsea Logistics and Infrastructure Holdings Corp 3 -
122 China Banking Corp 44 -
153 Cosco Capital Inc 11 -
222 D&L Industries Inc 24 -
413 DMCI Holdings Inc 34 -
50 DoubleDragon Properties Corp 9 -
53 Eagle Cement Corp 10 -
50 EEI Corp 5 -
130 Emperador Inc 19 -
44 Filinvest Development Corp 5 -
1,330 Filinvest Land Inc 21 -
55 First Gen Corp 23 -
24 First Philippine Holdings Corp 24 -
2 Globe Telecom Inc 40 -
8 GT Capital Holdings Inc 67 0.01
57 Holcim Philippines Inc 5 -
49 Integrated Micro-Electronics Inc 6 -
41 International Container Terminal Services Inc 88 0.01
69 JG Summit Holdings Inc 59 0.01
16 Jollibee Foods Corp 45 -
158 LT Group Inc 33 -
4 Manila Electric Co 15 -
61 Manila Water Co Inc 13 -
83 Megawide Construction Corp 8 -
729 Megaworld Corp 34 -
355 Metro Pacific Investments Corp 21 -
86 Metropolitan Bank & Trust Co 62 0.01
529 Nickel Asia Corp 41 -
282 Petron Corp 13 -
92 Philex Mining Corp 10 -
50 Philippine National Bank 16 -
7 Philippine Seven Corp 11 -
46 Phoenix Petroleum Philippines Inc 9 -
42 Pilipinas Shell Petroleum Corp 13 -
5 PLDT Inc, ADR 97 0.01
Shares (000's)
Value(000's)
GBP
% of NetAssetValue
Common Stock (continued)
Philippines - 0.10% (continued)
8 Pnb Holdings Corporation - -
88 Puregold Price Club Inc 51 0.01
31 Rizal Commercial Banking Corp 8 -
199 Robinsons Land Corp 50 -
41 Robinsons Retail Holdings Inc 32 -
17 San Miguel Corp 30 -
20 San Miguel Food and Beverage Inc 21 -
20 Security Bank Corp 36 -
119 Semirara Mining & Power Corp 23 -
25 Shakey's Pizza Asia Ventures Inc 3 -
1 SM Investments Corp 17 -
80 SM Prime Holdings Inc 43 -
3 Top Frontier Investment Holdings Inc 5 -
15 Union Bank of the Philippines 16 -
25 Universal Robina Corp 52 0.01
341 Vista Land & Lifescapes Inc 19 -
115 Wilcon Depot Inc 31 -
1,969 0.10
Poland - 0.13%
- 11 bit studios SA 15 -
1 AB SA 13 -
3 Agora SA 6 -
9 Alior Bank SA 62 0.01
1 Alumetal SA 14 -
- Amica SA 14 -
4 AmRest Holdings SE 21 -
4 Asseco Poland SA 61 0.01
1 Asseco South Eastern Europe SA 8 -
3 Bank Handlowy w Warszawie SA 26 -
62 Bank Millennium SA 60 -
5 Bank Polska Kasa Opieki SA 99 0.01
- Benefit Systems SA 27 -
1 Budimex SA 63 0.01
2 CCC SA 36 -
2 CD Projekt SA 51 -
2 Ciech SA 21 -
1 ComArch SA 25 -
10 Cyfrowy Polsat SA 60 -
39 Develia SA 23 -
1 Dino Polska SA 37 -
1 Dom Development SA 32 -
15 Echo Investment SA 14 -
19 Enea SA 31 -
9 Eurocash SA 27 -
1 Fabryki Mebli Forte SA 11 -
21 Famur SA 9 -
10 Globe Trade Centre SA 13 -
4 Grupa Azoty SA 29 -
1 Grupa Kety SA 107 0.01
6 Grupa Lotos SA 63 0.01
1 ING Bank Slaski SA 43 -
1 Inter Cars SA 44 -
6 Jastrzebska Spolka Weglowa SA 40 -
7 Kernel Holding SA 80 0.01
3 KGHM Polska Miedz SA 105 0.01
1 KRUK SA 47 -
1 LiveChat Software SA 27 -
- LPP SA 147 0.01
1 Lubelski Wegiel Bogdanka SA 6 -
1 mBank SA 45 -
12 Netia SA 13 -
- Neuca SA 27 -
World Equity FundPortfolio of Investments as at 31 May 2021 (continued)
Dimensional Fund Advisors Semi-Annual Report and Unaudited Financial Statements, 31 May 2021 481

Shares (000's)
Value(000's)
GBP
% of NetAssetValue
Common Stock (continued)
Poland - 0.13% (continued)
2 NEWAG SA 8 -
24 Orange Polska SA 31 -
63 PGE Polska Grupa Energetyczna SA 123 0.01
3 PKP Cargo SA 11 -
12 Polski Koncern Naftowy ORLEN SA 187 0.01
14 Powszechna Kasa Oszczednosci Bank Polski SA 107 0.01
5 Powszechny Zaklad Ubezpieczen SA 36 -
1 Santander Bank Polska SA 50 -
16 Stalexport Autostrady SA 11 -
142 Tauron Polska Energia SA 92 0.01
1 Tim SA 9 -
2 Warsaw Stock Exchange 22 -
1 Wirtualna Polska Holding SA 12 -
2,401 0.13
Portugal - 0.07%
9 Altri SGPS SA 46 -
899 Banco Comercial Portugues SA 123 0.01
45 Banco Espirito Santo SA - -
13 CTT-Correios de Portugal SA 46 -
6 EDP Renovaveis SA 109 0.01
58 EDP-Energias de Portugal SA 238 0.01
34 Galp Energia SGPS SA 298 0.02
12 Jeronimo Martins SGPS SA 159 0.01
15 Mota-Engil SGPS SA 19 -
31 Navigator Co SA 81 0.01
28 NOS SGPS SA 71 -
30 REN-Redes Energeticas Nacionais SGPS SA 61 -
4 Semapa-Sociedade de Investimento e Gestao 39 -
113 Sonae SGPS SA 77 -
1,367 0.07
Qatar - 0.08%
165 Aamal co 32 -
13 Al Khaleej Takaful Group Co 11 -
66 Al Khalij Commercial Bank PQSC 28 -
6 Al Meera Consumer Goods Co QSC 22 -
150 Barwa Real Estate Company QPSC 95 0.01
50 Commercial Bank of Qatar PSQC 52 -
42 Doha Bank QPSC 23 -
16 Doha Insurance Co QPSC 6 -
112 Gulf International Services QPSC 32 -
31 Gulf Warehousing Co QPSC 31 -
6 Industries of Qatar 16 -
46 Investment Holding Group 10 -
27 Masraf Al Rayan QSC 24 -
58 Mazaya Real Estate Development QPSC 13 -
7 Medicare Group 12 -
150 Mesaieed Petrochemical Holding Co 55 -
29 Ooredoo 39 -
24 Qatar Electricity & Water Co QSC 78 0.01
34 Qatar Fuel Co 120 0.01
135 Qatar Gas Transport Co Ltd 82 0.01
11 Qatar Industrial Manufacturing Co QSC 6 -
112 Qatar Insurance Co 54 -
33 Qatar International Islamic Bank QSC 60 0.01
14 Qatar Islamic Bank SAQ 48 -
6 Qatar Islamic Insurance Group 9 -
117 Qatar National Bank QPSC 397 0.02
12 Qatar National Cement Co 11 -
148 Salam International Investment Ltd 29 -
187 United Development Co QPSC 57 0.01
Shares (000's)
Value(000's)
GBP
% of NetAssetValue
Common Stock (continued)
Qatar - 0.08% (continued)
109 Vodafone Qatar Group PLC 37 -
4 Widam Food Co 3 -
1,492 0.08
Russia - 0.10%
10 Etalon Group PLC, GDR 12 -
38 Gazprom PJSC, ADR 188 0.01
10 LSR Group PJSC, GDR 15 -
4 LUKOIL PJSC, ADR 226 0.01
8 Magnitogorsk Iron & Steel Works PJSC, GDR 59 -
7 MMC Norilsk Nickel PJSC, ADR 186 0.01
11 Mobile TeleSystems PJSC, ADR 72 0.01
- Novatek PJSC, GDR 8 -
1 Novolipetskiy Metallurgicheskiy Kombinat PAO,GDR 24 -
- Novolipetskiy Metallurgicheskiy Kombinat PAO,GDR 1 -
6 PhosAgro PJSC, GDR 91 0.01
- Polyus PJSC, GDR 38 -
- QIWI PLC, ADR 3 -
2 Ros Agro PLC, GDR 21 -
11 Rosneft Oil Co PJSC, GDR 54 -
6 Rostelecom PJSC, ADR 37 -
46 RusHydro PJSC, ADR 35 -
31 Sberbank of Russia PJSC, ADR 362 0.02
4 Severstal PJSC, GDR 58 -
4 Tatneft PJSC, ADR 114 0.01
40 VEON Ltd, ADR 51 -
79 VTB Bank PJSC, GDR 74 0.01
1 X5 Retail Group NV, GDR (Germany listing) 13 -
4 X5 Retail Group NV, GDR (UK listing) 75 0.01
1,817 0.10
Saudi Arabia - 0.32%
3 Abdullah Al Othaim Markets Co 76 0.01
3 Advanced Petrochemical Co 45 -
4 Al Hammadi Co for Development and Investment 23 -
1 Al Jouf Agricultural Development Co 22 -
4 Al Jouf Cement Co 10 -
1 Al Moammar Information Systems Co 22 -
24 Al Rajhi Bank 459 0.03
1 Al Rajhi Co for Co-operative Insurance 24 -
2 Al Yamamah Steel Industries Co 18 -
3 Alandalus Property Co 17 -
4 Al-Babtain Power and Telecommunication Co 32 -
3 Aldrees Petroleum and Transport Services Co 40 -
2 Al-Etihad Co-operative Insurance Co 8 -
4 Al-Hassan Ghazi Ibrahim Shaker Co 17 -
41 Alinma Bank 156 0.01
9 Almarai Co JSC 92 0.01
2 Alujain Holding Corp 20 -
15 Arab National Bank 63 0.01
4 Arabian Cement Co Ltd 38 -
7 Arabian Centres Co Ltd 37 -
1 Arabian Shield Cooperative Insurance Co 8 -
8 Arriyadh Development Co 34 -
5 Aseer Trading Tourism and Manufacturing Co 24 -
3 Astra Industrial Group Co 24 -
2 AXA Cooperative Insurance 16 -
20 Bank AlBilad 145 0.01
37 Bank AlJazira 128 0.01
2 Banque Saudi Fransi 15 -
2 Batic Investments and Logistic Co 12 -
3 Bawan Co 20 -
World Equity FundPortfolio of Investments as at 31 May 2021 (continued)
Dimensional Fund Advisors Semi-Annual Report and Unaudited Financial Statements, 31 May 2021 482

Shares (000's)
Value(000's)
GBP
% of NetAssetValue
Common Stock (continued)
Saudi Arabia - 0.32% (continued)
3 Bupa Arabia for Cooperative Insurance Co 59 -
5 City Cement Co 29 -
6 Co for Cooperative Insurance 92 0.01
2 Dallah Healthcare Co 26 -
48 Dar Al Arkan Real Estate Development Co 94 0.01
4 Dur Hospitality Co 23 -
3 Eastern Province Cement Co 27 -
3 Electrical Industries Co 16 -
41 Emaar Economic City 85 0.01
34 Etihad Etisalat Co 210 0.01
2 Hail Cement Co 9 -
1 Halwani Brothers Co 15 -
2 Herfy Food Services Co 24 -
3 Jarir Marketing Co 106 0.01
2 Jazan Energy and Development Co 8 -
1 Leejam Sports Co JSC 17 -
2 Maharah Human Resources Co 32 -
2 Mediterranean & Gulf Insurance & Reinsurance 8 -
6 Methanol Chemicals Co 18 -
2 Middle East Healthcare Co 18 -
2 Middle East Paper Co 11 -
42 Mobile Telecommunications Co Saudi Arabia 113 0.01
2 Mouwasat Medical Services Co 67 0.01
6 Najran Cement Co 29 -
5 National Agriculture Development Co 37 -
59 National Commercial Bank 597 0.03
3 National Gas & Industrialization Co 19 -
2 National Gypsum Co 15 -
23 National Industrialization Co 80 0.01
2 National Medical Care Co 22 -
3 National Petrochemical Co 25 -
9 Northern Region Cement Co 29 -
4 Qassim Cement Co 66 0.01
12 Rabigh Refining & Petrochemical Co 51 -
30 Riyad Bank 150 0.01
27 Sahara International Petrochemical Co 151 0.01
4 Saudi Arabian Fertilizer Co 70 0.01
5 Saudi Arabian Mining Co 58 -
1 Saudi Automotive Services Co 7 -
9 Saudi Basic Industries Corp 217 0.01
25 Saudi British Bank 149 0.01
6 Saudi Cement Co 80 0.01
4 Saudi Ceramic Co 46 -
2 Saudi Chemical Holding Co 16 -
1 Saudi Co For Hardware CJSC 12 -
11 Saudi Electricity Co 50 -
7 Saudi Ground Services Co 47 -
7 Saudi Industrial Investment Group 47 -
4 Saudi Industrial Services Co 38 -
8 Saudi Investment Bank 27 -
47 Saudi Kayan Petrochemical Co 155 0.01
3 Saudi Marketing Co 19 -
4 Saudi Pharmaceutical Industries & MedicalAppliances Corp 31 -
2 Saudi Printing & Packaging Co 10 -
5 Saudi Public Transport Co 22 -
6 Saudi Re for Cooperative Reinsurance Co 16 -
4 Saudi Real Estate Co 16 -
3 Saudi Research & Marketing Group 59 -
13 Saudi Telecom Co 312 0.02
2 Saudia Dairy & Foodstuff Co 56 -
21 Savola Group 158 0.01
Shares (000's)
Value(000's)
GBP
% of NetAssetValue
Common Stock (continued)
Saudi Arabia - 0.32% (continued)
13 Seera Group Holding 52 -
5 Southern Province Cement Co 77 0.01
4 Tabuk Cement Co 17 -
4 Takween Advanced Industries Co 14 -
3 Umm Al-Qura Cement Co 16 -
3 United Electronics Co 60 -
4 United International Transportation Co 33 -
1 United Wire Factories Co 8 -
9 Yamama Cement Co 59 -
7 Yanbu Cement Co 54 -
3 Yanbu National Petrochemical Co 39 -
1 Zahrat Al Waha For Trading 15 -
2 Zamil Industrial Investment Co 13 -
6,198 0.32
Singapore - 0.26%
113 Accordia Golf Trust 1 -
19 AEM Holdings Ltd 37 -
46 Ascendas India Trust 33 -
91 Avarga Ltd 15 -
26 Banyan Tree Holdings Ltd 4 -
25 Best World International Ltd 3 -
2 Boustead Projects Ltd 1 -
25 Boustead Singapore Ltd 16 -
18 Bukit Sembawang Estates Ltd 48 -
48 CapitaLand Ltd 93 0.01
10 Centurion Corp Ltd 2 -
21 China Aviation Oil Singapore Corp Ltd 12 -
40 China Sunsine Chemical Holdings Ltd 11 -
33 Chip Eng Seng Corp Ltd 8 -
77 Chuan Hup Holdings Ltd 9 -
11 City Developments Ltd 45 -
30 Civmec Ltd 9 -
147 ComfortDelGro Corp Ltd 132 0.01
48 COSCO Shipping International Singapore Co Ltd 8 -
36 CSE Global Ltd 10 -
13 Dairy Farm International Holdings Ltd 41 -
28 DBS Group Holdings Ltd 454 0.03
61 Del Monte Pacific Ltd 13 -
32 Delfi Ltd 14 -
359 Ezion Holdings Ltd 2 -
230 Ezra Holdings Ltd - -
24 Far East Orchard Ltd 13 -
59 First Resources Ltd 43 -
32 Fraser and Neave Ltd 25 -
56 Frasers Property Ltd 35 -
26 Frencken Group Ltd 24 -
97 Fu Yu Corp Ltd 16 -
139 Gallant Venture Ltd 10 -
47 Genting Singapore Ltd 21 -
721 Golden Agri-Resources Ltd 90 0.01
3 Great Eastern Holdings Ltd 33 -
37 GuocoLand Ltd 32 -
11 Haw Par Corp Ltd 78 0.01
20 Ho Bee Land Ltd 29 -
29 Hong Fok Corp Ltd 13 -
22 Hong Leong Asia Ltd 12 -
36 Hong Leong Finance Ltd 46 -
42 Hongkong Land Holdings Ltd 144 0.01
13 Hotel Grand Central Ltd 7 -
44 Hour Glass Ltd 29 -
696 Hutchison Port Holdings Trust 118 0.01
66 Hyflux Ltd 6 -
World Equity FundPortfolio of Investments as at 31 May 2021 (continued)
Dimensional Fund Advisors Semi-Annual Report and Unaudited Financial Statements, 31 May 2021 483

Shares (000's)
Value(000's)
GBP
% of NetAssetValue
Common Stock (continued)
Singapore - 0.26% (continued)
16 iFAST Corp Ltd 70 -
17 Indofood Agri Resources Ltd 3 -
50 Japfa Ltd 23 -
8 Jardine Cycle & Carriage Ltd 97 0.01
19 k1 Ventures Ltd - -
46 Keppel Corp Ltd 131 0.01
267 Keppel Infrastructure Trust 78 0.01
30 Lian Beng Group Ltd 8 -
29 Low Keng Huat Singapore Ltd 8 -
15 Mandarin Oriental International Ltd 20 -
45 Metro Holdings Ltd 20 -
69 Midas Holdings Ltd 1 -
124 mm2 Asia Ltd 4 -
91 NetLink NBN Trust 46 -
66 Olam International Ltd 62 -
39 OUE Ltd 28 -
43 Oversea-Chinese Banking Corp Ltd 283 0.02
103 Oxley Holdings Ltd 13 -
33 Pan-United Corp Ltd 6 -
24 Q&M Dental Group Singapore Ltd 9 -
26 QAF Ltd 13 -
52 Raffles Medical Group Ltd 30 -
26 Riverstone Holdings Ltd 20 -
10 Roxy-Pacific Holdings Ltd 2 -
8 SATS Ltd 17 -
6 SBS Transit Ltd 10 -
132 Sembcorp Industries Ltd 155 0.01
642 Sembcorp Marine Ltd 68 -
68 Sheng Siong Group Ltd 57 -
7 SIA Engineering Co Ltd 8 -
121 SIIC Environment Holdings Ltd 14 -
119 Sinarmas Land Ltd 18 -
11 Sing Investments & Finance Ltd 9 -
65 Singapore Airlines Ltd 173 0.01
27 Singapore Exchange Ltd 150 0.01
154 Singapore Post Ltd 59 -
166 Singapore Press Holdings Ltd 155 0.01
56 Singapore Technologies Engineering Ltd 116 0.01
133 Singapore Telecommunications Ltd 171 0.01
46 Stamford Land Corp Ltd 10 -
59 StarHub Ltd 39 -
21 Straits Trading Co Ltd 31 -
53 Tuan Sing Holdings Ltd 12 -
56 UMS Holdings Ltd 42 -
26 United Industrial Corp Ltd 36 -
20 United Overseas Bank Ltd 281 0.02
35 UOB-Kay Hian Holdings Ltd 31 -
26 UOL Group Ltd 105 0.01
74 Valuetronics Holdings Ltd 25 -
14 Venture Corp Ltd 143 0.01
10 Vicom Ltd 11 -
29 Wilmar International Ltd 75 0.01
45 Wing Tai Holdings Ltd 42 -
167 Yangzijiang Shipbuilding Holdings Ltd 133 0.01
5,016 0.26
South Africa - 0.73%
54 Absa Group Ltd 392 0.02
6 Adcock Ingram Holdings Ltd 15 -
71 Advtech Ltd 50 -
13 AECI Ltd 69 -
17 African Rainbow Minerals Ltd 234 0.01
6 Afrimat Ltd 15 -
Shares (000's)
Value(000's)
GBP
% of NetAssetValue
Common Stock (continued)
South Africa - 0.73% (continued)
142 Alexander Forbes Group Holdings Ltd 29 -
28 Allied Electronics Corp Ltd 17 -
14 Alviva Holdings Ltd 9 -
1 Anglo American Platinum Ltd 78 -
5 AngloGold Ashanti Ltd 83 0.01
12 AngloGold Ashanti Ltd, ADR 204 0.01
41 Aspen Pharmacare Holdings Ltd 345 0.02
6 Astral Foods Ltd 46 -
29 AVI Ltd 109 0.01
32 Barloworld Ltd 194 0.01
21 Bid Corp Ltd 308 0.02
31 Bidvest Group Ltd 307 0.02
47 Blue Label Telecoms Ltd 11 -
69 Brait SE 10 -
2 Capitec Bank Holdings Ltd 207 0.01
3 Cashbuild Ltd 44 -
8 Caxton and CTP Publishers and Printers Ltd 3 -
45 City Lodge Hotels Ltd 10 -
16 Clicks Group Ltd 216 0.01
19 Coronation Fund Managers Ltd 54 -
10 Curro Holdings Ltd 6 -
30 DataTec Ltd 48 -
33 Dis-Chem Pharmacies Ltd 50 -
43 Discovery Ltd 311 0.02
7 Distell Group Holdings Ltd 63 -
27 Exxaro Resources Ltd 206 0.01
157 FirstRand Ltd 453 0.02
44 Foschini Group Ltd 298 0.02
27 Gold Fields Ltd 232 0.01
42 Gold Fields Ltd, ADR 358 0.02
64 Grindrod Ltd 15 -
1 Grindrod Shipping Holdings Ltd 5 -
38 Harmony Gold Mining Co Ltd 138 0.01
6 Harmony Gold Mining Co Ltd, ADR 23 -
2 Hudaco Industries Ltd 13 -
55 Impala Platinum Holdings Ltd 664 0.04
21 Imperial Logistics Ltd 53 -
27 Investec Ltd 80 0.01
37 Italtile Ltd 31 -
8 JSE Ltd 44 -
303 KAP Industrial Holdings Ltd 69 -
3 Kumba Iron Ore Ltd 97 0.01
7 Lewis Group Ltd 12 -
13 Liberty Holdings Ltd 47 -
193 Life Healthcare Group Holdings Ltd 217 0.01
33 Long4Life Ltd 8 -
13 Massmart Holdings Ltd 44 -
19 Metair Investments Ltd 22 -
1 MiX Telematics Ltd, ADR 10 -
140 Momentum Metropolitan Holdings 141 0.01
21 Motus Holdings Ltd 104 0.01
26 Mpact Ltd 29 -
14 Mr Price Group Ltd 170 0.01
156 MTN Group Ltd 811 0.04
42 MultiChoice Group 294 0.02
31 Murray & Roberts Holdings Ltd 16 -
62 Nampak Ltd 9 -
2 Naspers Ltd 249 0.01
28 Nedbank Group Ltd 228 0.01
19 NEPI Rockcastle PLC 93 0.01
135 Netcare Ltd 106 0.01
12 Ninety One Ltd 28 -
World Equity FundPortfolio of Investments as at 31 May 2021 (continued)
Dimensional Fund Advisors Semi-Annual Report and Unaudited Financial Statements, 31 May 2021 484

Shares (000's)
Value(000's)
GBP
% of NetAssetValue
Common Stock (continued)
South Africa - 0.73% (continued)
25 Northam Platinum Ltd 288 0.02
10 Oceana Group Ltd 36 -
355 Old Mutual Ltd 259 0.01
21 Omnia Holdings Ltd 55 -
111 Pepkor Holdings Ltd 114 0.01
37 Pick n Pay Stores Ltd 110 0.01
149 PPC Ltd 26 -
21 PSG Group Ltd 87 0.01
64 PSG Konsult Ltd 38 -
8 Raubex Group Ltd 14 -
12 RCL Foods Ltd 6 -
25 Reunert Ltd 67 -
15 Rhodes Food Group Pty Ltd 11 -
14 Royal Bafokeng Platinum Ltd 70 -
105 Sanlam Ltd 318 0.02
5 Santam Ltd 61 -
74 Sappi Ltd 162 0.01
29 Sasol Ltd 328 0.02
13 Sasol Ltd, ADR 155 0.01
33 Shoprite Holdings Ltd 255 0.01
174 Sibanye Stillwater Ltd 558 0.03
16 SPAR Group Ltd 157 0.01
6 Spur Corp Ltd 6 -
89 Standard Bank Group Ltd 605 0.03
59 Steinhoff International Holdings NV 6 -
36 Sun International Ltd 36 -
44 Super Group Ltd 70 -
35 Telkom SA SOC Ltd 88 0.01
22 Tiger Brands Ltd 249 0.01
12 Tongaat Hulett Ltd 5 -
63 Transaction Capital Ltd 117 0.01
39 Truworths International Ltd 111 0.01
53 Tsogo Sun Hotels Ltd 7 -
27 Vodacom Group Ltd 183 0.01
6 Wilson Bayly Holmes-Ovcon Ltd 35 -
95 Woolworths Holdings Ltd 271 0.02
13,918 0.73
Spain - 0.61%
2 Acciona SA 286 0.02
12 Acerinox SA 122 0.01
11 ACS Actividades de Construccion y Servicios SA 230 0.01
4 Adveo Group International SA - -
1 Aena SME SA 84 0.01
1 Alantra Partners SA 17 -
8 Almirall SA 93 0.01
3 Amadeus IT Group SA 179 0.01
86 Amper SA 14 -
7 Applus Services SA 49 -
13 Atresmedia Corp de Medios de Comunicacion SA 44 -
2 Azkoyen SA 8 -
131 Banco Bilbao Vizcaya Argentaria SA 575 0.03
628 Banco de Sabadell SA 340 0.02
364 Banco Santander SA 1,079 0.06
38 Bankinter SA 154 0.01
235 CaixaBank SA 575 0.03
3 Cellnex Telecom SA 113 0.01
6 Cia de Distribucion Integral Logista Holdings SA 89 0.01
6 CIE Automotive SA 129 0.01
2 Construcciones y Auxiliar de Ferrocarriles SA 76 -
155 Distribuidora Internacional de Alimentacion SA 11 -
5 Ebro Foods SA 74 -
5 eDreams ODIGEO SA 25 -
Shares (000's)
Value(000's)
GBP
% of NetAssetValue
Common Stock (continued)
Spain - 0.61% (continued)
5 Elecnor SA 43 -
24 Enagas SA 392 0.02
15 Ence Energia y Celulosa SA 43 -
13 Endesa SA 271 0.01
11 Ercros SA 35 -
10 Euskaltel SA 92 0.01
32 Faes Farma SA 92 0.01
6 Ferrovial SA (voting rights) 118 0.01
4 Fluidra SA 101 0.01
8 Fomento de Construcciones y Contratas SA 76 -
20 Gestamp Automocion SA 78 -
12 Global Dominion Access SA 45 -
5 Grifols SA 105 0.01
3 Grupo Catalana Occidente SA 102 0.01
10 Grupo Ezentis SA 3 -
183 Iberdrola SA 1,780 0.09
1 Iberpapel Gestion SA 15 -
14 Indra Sistemas SA 86 0.01
18 Industria de Diseno Textil SA 505 0.03
2 Laboratorios Farmaceuticos Rovi SA 79 -
261 Liberbank SA 74 -
38 Linea Directa Aseguradora SA Cia de Seguros yReaseguros 53 -
66 Mapfre SA 106 0.01
20 Mediaset Espana Comunicacion SA 97 0.01
12 Melia Hotels International SA 73 -
4 Metrovacesa SA 25 -
3 Miquel y Costas & Miquel SA 38 -
20 Naturgy Energy Group SA 370 0.02
4 Neinor Homes SA 38 -
11 Obrascon Huarte Lain SA 6 -
1 Pharma Mar SA 64 -
17 Promotora de Informaciones SA 13 -
41 Prosegur Cash SA 27 -
28 Prosegur Cia de Seguridad SA 61 -
24 Realia Business SA 14 -
18 Red Electrica Corp SA 254 0.01
59 Repsol SA 554 0.03
35 Sacyr SA 67 -
2 Siemens Gamesa Renewable Energy SA 54 -
2 Solaria Energia y Medio Ambiente SA 30 -
1 Solarpack Corp Tecnologica 22 -
5 Talgo SA 21 -
3 Tecnicas Reunidas SA 35 -
176 Telefonica SA 611 0.03
13 Tubacex SA 20 -
99 Unicaja Banco SA 79 -
2 Vidrala SA (voting rights) 151 0.01
4 Viscofan SA 179 0.01
9 Vocento SA 8 -
18 Zardoya Otis SA 91 0.01
11,662 0.61
Sweden - 1.06%
6 AAK AB 89 0.01
12 AcadeMedia AB 81 0.01
5 Adapteo Oyj 74 -
8 AddLife AB 151 0.01
2 AddNode Group AB 53 -
23 AddTech AB 267 0.02
7 AF POYRY AB 158 0.01
10 Alfa Laval AB 253 0.01
4 Alimak Group AB 43 -
World Equity FundPortfolio of Investments as at 31 May 2021 (continued)
Dimensional Fund Advisors Semi-Annual Report and Unaudited Financial Statements, 31 May 2021 485

Shares (000's)
Value(000's)
GBP
% of NetAssetValue
Common Stock (continued)
Sweden - 1.06% (continued)
4 Ambea AB 23 -
5 Annehem Fastigheter 13 -
4 Arise AB 17 -
26 Arjo AB 184 0.01
9 Assa Abloy AB 195 0.01
13 Atlas Copco AB, Class A 543 0.03
7 Atlas Copco AB, Class B 256 0.01
3 Atrium Ljungberg AB 49 -
13 Attendo AB 46 -
9 Avanza Bank Holding AB 215 0.01
5 Axfood AB 102 0.01
5 Beijer Alma AB 68 -
2 Beijer Electronics Group AB 9 -
10 Beijer Ref AB 122 0.01
4 Bergman & Beving AB 42 -
1 Besqab AB 7 -
15 Betsson AB 5 -
15 Betsson AB 97 0.01
6 BHG Group AB 87 0.01
11 Bilia AB 152 0.01
13 BillerudKorsnas AB 179 0.01
2 BioGaia AB 66 -
3 Biotage AB 48 -
15 Boliden 436 0.02
15 Boliden 8 -
10 Bonava AB 92 0.01
2 Boozt AB 33 -
14 Bravida Holding AB 151 0.01
3 Bufab AB 64 -
2 Bulten AB 16 -
7 Bure Equity AB 215 0.01
9 Byggmax Group AB 58 -
5 Castellum AB 94 0.01
5 Catella AB 13 -
1 Catena AB 50 -
5 Catena Media PLC 25 -
6 Cavotec SA 13 -
- CDON AB 15 -
1 Cellavision AB 26 -
3 Clas Ohlson AB 26 -
27 Cloetta AB 61 -
4 Collector AB 10 -
3 Concentric AB 51 -
7 Coor Service Management Holding AB 41 -
7 Dios Fastigheter AB 51 -
20 Dometic Group AB 240 0.01
2 Doro AB 10 -
5 Duni AB 47 -
7 Dustin Group AB 63 -
3 Eastnine AB 32 -
1 Elanders AB 21 -
16 Electrolux AB 321 0.02
21 Electrolux Professional AB 99 0.01
19 Elekta AB 189 0.01
1 Elos Medtech AB 18 -
15 Eltel AB 32 -
2 Enea AB 30 -
12 Epiroc AB, Class A 199 0.01
12 Epiroc AB, Class A 3 -
4 Epiroc AB, Class B 58 -
4 Epiroc AB, Class B 1 -
1 Essity A 27 -
Shares (000's)
Value(000's)
GBP
% of NetAssetValue
Common Stock (continued)
Sweden - 1.06% (continued)
15 Essity AB 364 0.02
1 Evolution Gaming Group AB 146 0.01
4 Fabege AB 51 -
6 Fagerhult AB 32 -
3 Fastighets AB Balder 140 0.01
2 FastPartner AB 21 -
- Fenix Outdoor International AG 24 -
11 Fingerprint Cards AB 33 -
1 G5 Entertainment AB 22 -
1 GARO AB 12 -
16 Getinge AB 410 0.02
11 Granges AB 105 0.01
4 Haldex AB 22 -
3 Heba Fastighets AB 35 -
21 Hennes & Mauritz AB 380 0.02
7 Hexagon AB 74 -
23 Hexpol AB 199 0.01
2 HMS Networks AB 52 -
10 Hoist Finance AB 30 -
4 Holmen AB 133 0.01
4 Hufvudstaden AB 44 -
3 Humana AB 21 -
3 Husqvarna AB, Class A 26 -
23 Husqvarna AB, Class B 239 0.01
4 ICA Gruppen AB 139 0.01
9 Indutrade AB 172 0.01
3 Instalco AB 80 0.01
5 International Petroleum Corp 16 -
6 Intrum AB 144 0.01
2 INVISIO AB 31 -
7 Inwido AB 83 0.01
2 ITAB Shop Concept AB 3 -
5 JM AB 145 0.01
4 Karnov Group AB 16 -
20 Kindred Group PLC, SDR 244 0.01
37 Klovern AB 53 -
2 KNOW IT AB 56 -
13 Kungsleden AB 113 0.01
16 Lagercrantz Group AB 129 0.01
6 LeoVegas AB 20 -
4 Lifco AB 64 -
1 Lime Technologies AB 17 -
11 Lindab International AB 178 0.01
9 Loomis AB 207 0.01
4 Lundin Petroleum AB 92 0.01
11 Maha Energy AB 11 -
2 Medicover AB 48 -
2 Medivir AB 2 -
5 Mekonomen AB 70 -
11 Millicom International Cellular SA 347 0.02
2 MIPS AB 123 0.01
10 Modern Times Group MTG AB 95 0.01
3 Momentum Group AB 47 -
6 Munters Group AB 42 -
5 Mycronic AB 115 0.01
9 NCC AB 121 0.01
2 Nederman Holding AB 35 -
1 Nelly Group AB 4 -
41 Net Insight AB 9 -
6 New Wave Group AB 50 -
7 Nibe Industrier AB 50 -
10 Nobia AB 64 -
World Equity FundPortfolio of Investments as at 31 May 2021 (continued)
Dimensional Fund Advisors Semi-Annual Report and Unaudited Financial Statements, 31 May 2021 486

Shares (000's)
Value(000's)
GBP
% of NetAssetValue
Common Stock (continued)
Sweden - 1.06% (continued)
12 Nobina AB 87 0.01
21 Nolato AB 154 0.01
6 Nordic Entertainment Group AB 197 0.01
3 Nordic Waterproofing Holding AB 48 -
2 NP3 Fastigheter AB 34 -
12 Nyfosa AB 114 0.01
4 OEM International AB 41 -
2 Orexo AB 6 -
7 Pandox AB 82 0.01
20 Peab AB 196 0.01
5 Platzer Fastigheter Holding AB 48 -
4 Pricer AB 11 -
4 Proact IT Group AB 31 -
1 Qliro AB 4 -
31 Ratos AB 139 0.01
3 RaySearch Laboratories AB 22 -
1 Rejlers AB 11 -
14 Resurs Holding AB 51 -
5 Saab AB 110 0.01
1 Sagax AB 27 -
41 Samhallsbyggnadsbolaget i Norden AB, Class B 127 0.01
9 Sandvik AB 158 0.01
266 SAS AB 43 -
7 Scandi Standard AB 37 -
2 Sectra AB 101 0.01
23 Securitas AB 259 0.01
2 Semcon AB 20 -
- Sinch AB 36 -
24 Skandinaviska Enskilda Banken AB 220 0.01
25 Skanska AB 503 0.03
15 SKF AB 276 0.02
1 SKF AB, Class A 25 -
5 SkiStar AB 57 -
13 SSAB AB, Class A 47 -
36 SSAB AB, Class B 124 0.01
24 Svenska Cellulosa AB SCA 285 0.02
1 Svenska Cellulosa AB SCA, Class A 17 -
24 Svenska Handelsbanken AB 189 0.01
1 Svenska Handelsbanken AB, Class B 6 -
9 Sweco AB 114 0.01
12 Swedbank AB 149 0.01
30 Swedish Match AB 198 0.01
8 Swedish Orphan Biovitrum AB 91 0.01
2 Systemair AB 49 -
23 Tele2 AB 225 0.01
2 Telefonaktiebolaget LM Ericsson, Class A 14 -
81 Telefonaktiebolaget LM Ericsson, Class B 766 0.04
70 Telia Co AB 219 0.01
5 Thule Group AB 177 0.01
18 Trelleborg AB 322 0.02
4 Troax Group AB 114 0.01
3 VBG Group AB 43 -
2 Vitec Software Group AB 59 -
12 Volvo AB, Class A 230 0.01
56 Volvo AB, Class B 1,039 0.06
4 Wallenstam AB 46 -
8 Wihlborgs Fastigheter AB 127 0.01
20,408 1.06
Switzerland - 2.01%
22 ABB Ltd 532 0.03
11 Adecco Group AG 545 0.03
16 Alcon Inc 797 0.04
Shares (000's)
Value(000's)
GBP
% of NetAssetValue
Common Stock (continued)
Switzerland - 2.01% (continued)
1 Allreal Holding AG 190 0.01
1 ALSO Holding AG 120 0.01
22 ams AG 305 0.02
- APG SGA SA 21 -
5 Arbonia AG 64 -
89 Aryzta AG 84 0.01
3 Ascom Holding AG 31 -
- Autoneum Holding AG 46 -
- Bachem Holding AG 112 0.01
3 Baloise Holding AG 392 0.02
- Banque Cantonale de Geneve 37 -
2 Banque Cantonale Vaudoise 161 0.01
- Barry Callebaut AG 332 0.02
- Belimo Holding AG 102 0.01
- Bell Food Group AG 70 -
1 Bellevue Group AG 39 -
1 Berner Kantonalbank AG 98 0.01
2 BKW AG 117 0.01
1 Bobst Group SA 53 -
1 Bossard Holding AG 124 0.01
1 Bucher Industries AG 307 0.02
- Burckhardt Compression Holding AG 54 -
1 Burkhalter Holding AG 32 -
1 Calida Holding AG 12 -
- Carlo Gavazzi Holding AG 17 -
2 Cembra Money Bank AG 132 0.01
- Chocoladefabriken Lindt & Spruengli AG 282 0.02
- Cicor Technologies Ltd 11 -
7 Cie Financiere Richemont SA 617 0.03
- Cie Financiere Tradition SA 20 -
27 Clariant AG 403 0.02
1 Coltene Holding AG 67 -
- Conzzeta AG 167 0.01
85 Credit Suisse Group AG 656 0.03
1 Daetwyler Holding AG 139 0.01
4 DKSH Holding AG 228 0.01
- dormakaba Holding AG 126 0.01
- Dottikon Es Holding AG 23 -
7 Dufry AG 327 0.02
12 EFG International AG 64 -
- Emmi AG 173 0.01
- EMS-Chemie Holding AG 83 -
2 Energiedienst Holding AG 69 -
87 Evolva Holding SA 13 -
- Feintool International Holding AG 6 -
2 Flughafen Zurich AG 257 0.01
- Forbo Holding AG 165 0.01
1 Fundamenta Real Estate AG 22 -
5 Galenica AG 236 0.01
15 GAM Holding AG 28 -
1 Geberit AG 645 0.03
- Georg Fischer AG 422 0.02
- Givaudan SA 312 0.02
- Gurit Holding AG 66 -
4 Helvetia Holding AG 311 0.02
1 Hiag Immobilien Holding AG 40 -
- HOCHDORF Holding AG 6 -
2 Huber & Suhner AG 114 0.01
- Hypothekarbank Lenzburg AG 37 -
2 Implenia AG 40 -
1 Ina Invest Holding AG 7 -
- Inficon Holding AG 108 0.01
World Equity FundPortfolio of Investments as at 31 May 2021 (continued)
Dimensional Fund Advisors Semi-Annual Report and Unaudited Financial Statements, 31 May 2021 487

Shares (000's)
Value(000's)
GBP
% of NetAssetValue
Common Stock (continued)
Switzerland - 2.01% (continued)
- Interroll Holding AG 165 0.01
- Intershop Holding AG 41 -
1 Investis Holding SA 33 -
19 Julius Baer Group Ltd 919 0.05
1 Jungfraubahn Holding AG 53 -
- Kardex AG 61 -
- Komax Holding AG 62 -
3 Kudelski SA 9 -
3 Kuehne & Nagel International AG 599 0.03
18 LafargeHolcim Ltd 757 0.04
3 Landis&Gyr Group AG 140 0.01
1 Lastminute.com NV 34 -
- LEM Holding SA 100 0.01
2 Liechtensteinische Landesbank AG 71 -
5 Logitech International SA 433 0.02
1 Lonza Group AG 348 0.02
- Luzerner Kantonalbank AG 143 0.01
- Medartis Holding AG 18 -
1 Meier Tobler Group AG 12 -
- Metall Zug AG 44 -
1 Mikron Holding AG 6 -
4 Mobilezone Holding AG 32 -
1 Mobimo Holding AG 165 0.01
70 Nestle SA 6,081 0.32
32 Novartis AG 1,971 0.10
- Novartis AG, ADR 17 -
22 OC Oerlikon Corp AG 175 0.01
2 Orascom Development Holding AG 14 -
- Orell Fuessli Holding AG 6 -
1 Orior AG 57 -
1 Partners Group Holding AG 621 0.03
- Peach Property Group AG 17 -
- Phoenix Mecano AG 33 -
- Plazza AG 47 -
3 PSP Swiss Property AG 256 0.01
- Rieter Holding AG 54 -
13 Roche Holding AG (non-voting rights) 3,183 0.17
1 Roche Holding AG (voting rights) 136 0.01
- Romande Energie Holding SA 38 -
- Schaffner Holding AG 3 -
1 Schindler Holding AG 166 0.01
61 Schmolz & Bickenbach AG 21 -
- Schweiter Technologies AG 167 0.01
2 SFS Group AG 173 0.01
- SGS SA 473 0.03
- Siegfried Holding AG 237 0.01
26 SIG Combibloc Group AG 477 0.03
4 Sika AG 800 0.04
4 Softwareone Holding AG 73 -
2 Sonova Holding AG 479 0.03
- St Galler Kantonalbank AG 134 0.01
- Straumann Holding AG 100 0.01
2 Sulzer AG 192 0.01
2 Swatch Group AG (Bearer) 473 0.03
4 Swatch Group AG (Registered) 191 0.01
2 Swiss Life Holding AG 553 0.03
7 Swiss Prime Site AG 516 0.03
9 Swiss Re AG 641 0.03
2 Swisscom AG 884 0.05
1 Swissquote Group Holding SA 134 0.01
- Tamedia AG 23 -
1 Tecan Group AG 168 0.01
Shares (000's)
Value(000's)
GBP
% of NetAssetValue
Common Stock (continued)
Switzerland - 2.01% (continued)
4 Temenos AG 404 0.02
- Thurgauer Kantonalbank 11 -
1 u-blox Holding AG 37 -
49 UBS Group AG 565 0.03
2 Valiant Holding AG 122 0.01
- Valora Holding AG 65 -
- Varia US Properties AG 8 -
1 VAT Group AG 307 0.02
- Vaudoise Assurances Holding SA 46 -
2 Vetropack Holding AG 66 -
3 Vifor Pharma AG 341 0.02
4 Vontobel Holding AG 208 0.01
1 VP Bank AG 41 -
1 VZ Holding AG 82 -
- V-ZUG Holding AG 31 -
- Walliser Kantonalbank 27 -
- Warteck Invest AG 26 -
- Ypsomed Holding AG 24 -
1 Zehnder Group AG 72 -
- Zug Estates Holding AG 51 -
- Zuger Kantonalbank AG 96 0.01
3 Zurich Insurance Group AG 739 0.04
38,614 2.01
Taiwan - 2.16%
22 Ability Enterprise Co Ltd 9 -
36 AcBel Polytech Inc 24 -
22 Accton Technology Corp 164 0.01
200 Acer Inc 161 0.01
7 ACES Electronic Co Ltd 8 -
5 Acter Group Corp Ltd 23 -
52 Action Electronics Co Ltd 18 -
15 A-DATA Technology Co Ltd 38 -
3 Addcn Technology Co Ltd 17 -
4 Advanced Ceramic X Corp 49 -
16 Advanced International Multitech Co Ltd 30 -
21 Advancetek Enterprise Co Ltd 9 -
8 Advantech Co Ltd 63 0.01
47 Aerospace Industrial Development Corp 33 -
53 AGV Products Corp 16 -
1 Airtac International Group 31 -
7 Alchip Technologies Ltd 94 0.01
5 All Ring Tech Co Ltd 16 -
4 Allied Circuit Co Ltd 10 -
21 Alltek Technology Corp 15 -
5 Alltop Technology Co Ltd 17 -
32 Alpha Networks Inc 22 -
23 Altek Corp 21 -
6 Amazing Microelectronic Corp 18 -
38 Ambassador Hotel 27 -
68 AmTRAN Technology Co Ltd 30 -
10 Anpec Electronics Corp 35 -
2 AP Memory Technology Corp 35 -
16 Apacer Technology Inc 18 -
25 Apex Biotechnology Corp 15 -
13 Apex International Co Ltd 18 -
41 Apex Science & Engineering 12 -
15 Arcadyan Technology Corp 36 -
52 Ardentec Corp 57 0.01
5 Argosy Research Inc 12 -
182 ASE Technology Holding Co Ltd 510 0.03
162 Asia Cement Corp 208 0.01
20 Asia Optical Co Inc 41 -
World Equity FundPortfolio of Investments as at 31 May 2021 (continued)
Dimensional Fund Advisors Semi-Annual Report and Unaudited Financial Statements, 31 May 2021 488

Shares (000's)
Value(000's)
GBP
% of NetAssetValue
Common Stock (continued)
Taiwan - 2.16% (continued)
151 Asia Pacific Telecom Co Ltd 34 -
53 Asia Polymer Corp 41 -
11 Asia Tech Image Inc 15 -
37 Asia Vital Components Co Ltd 67 0.01
1 ASMedia Technology Inc 37 -
2 ASPEED Technology Inc 112 0.01
3 ASROCK Inc 12 -
23 Asustek Computer Inc 228 0.01
9 Aten International Co Ltd 19 -
325 AU Optronics Corp 192 0.01
2 Auden Techno Corp 10 -
9 Audix Corp 12 -
7 AURAS Technology Co Ltd 30 -
10 Aurora Corp 23 -
13 Avermedia Technologies 14 -
15 AVY Precision Technology Inc 11 -
7 Axiomtek Co Ltd 10 -
52 Bank of Kaohsiung Co Ltd 14 -
13 Basso Industry Corp 16 -
19 BenQ Materials Corp 13 -
174 BES Engineering Corp 40 -
7 Bin Chuan Enterprise Co Ltd 5 -
4 Bioteque Corp 12 -
8 Bizlink Holding Inc 50 -
3 Brighten Optix Corp 16 -
33 Brighton-Best International Taiwan Inc 28 -
13 Browave Corp 15 -
20 C Sun Manufacturing Ltd 27 -
12 Capital Futures Corp 13 -
104 Capital Securities Corp 46 -
58 Career Technology MFG. Co Ltd 44 -
59 Catcher Technology Co Ltd 274 0.02
239 Cathay Financial Holding Co Ltd 337 0.02
70 Cathay Real Estate Development Co Ltd 35 -
4 Cayman Engley Industrial Co Ltd 10 -
12 Celxpert Energy Corp 14 -
27 Center Laboratories Inc 47 -
43 Chailease Holding Co Ltd 229 0.01
42 Champion Building Materials Co Ltd 12 -
345 Chang Hwa Commercial Bank Ltd 148 0.01
30 Chang Wah Electromaterials Inc 26 -
9 Chang Wah Technology Co Ltd 14 -
22 Channel Well Technology Co Ltd 29 -
19 Charoen Pokphand Enterprise 38 -
3 Chaun-Choung Technology Corp 15 -
13 CHC Healthcare Group 12 -
8 CHC Resources Corp 9 -
13 Chen Full International Co Ltd 14 -
11 Chenbro Micom Co Ltd 22 -
93 Cheng Loong Corp 97 0.01
41 Cheng Mei Materials Technology Corp 13 -
143 Cheng Shin Rubber Industry Co Ltd 172 0.01
28 Cheng Uei Precision Industry Co Ltd 28 -
6 Chia Chang Co Ltd 6 -
49 Chia Hsin Cement Corp 27 -
49 Chicony Electronics Co Ltd 97 0.01
18 Chicony Power Technology Co Ltd 32 -
1 Chief Telecom Inc 8 -
8 Chieftek Precision Co Ltd 22 -
41 Chien Kuo Construction Co Ltd 14 -
17 Chilisin Electronics Corp 42 -
174 China Airlines Ltd 80 0.01
Shares (000's)
Value(000's)
GBP
% of NetAssetValue
Common Stock (continued)
Taiwan - 2.16% (continued)
102 China Bills Finance Corp 41 -
34 China Chemical & Pharmaceutical Co Ltd 20 -
668 China Development Financial Holding Corp 208 0.01
28 China Electric Manufacturing Corp 8 -
32 China General Plastics Corp 29 -
56 China Life Insurance Co Ltd 35 -
132 China Man-Made Fiber Corp 34 -
34 China Metal Products 28 -
30 China Motor Corp 52 -
496 China Petrochemical Development Corp 162 0.01
12 China Steel Chemical Corp 33 -
255 China Steel Corp 237 0.01
13 China Steel Structure Co Ltd 14 -
15 China Wire & Cable Co Ltd 11 -
18 Chinese Maritime Transport Ltd 21 -
17 Ching Feng Home Fashions Co Ltd 10 -
42 Chin-Poon Industrial Co Ltd 31 -
64 Chipbond Technology Corp 111 0.01
62 ChipMOS Technologies Inc 70 0.01
6 Chlitina Holding Ltd 33 -
20 Chong Hong Construction Co Ltd 39 -
20 Chroma ATE Inc 97 0.01
14 Chun YU Works & Co Ltd 10 -
58 Chun Yuan Steel Industry Co Ltd 30 -
53 Chung Hung Steel Corp 66 0.01
4 Chung Hwa Food Industrial Co Ltd 11 -
51 Chung Hwa Pulp Corp 31 -
37 Chung-Hsin Electric & Machinery ManufacturingCorp 48 -
2 Chunghwa Precision Test Tech Co Ltd 34 -
56 Chunghwa Telecom Co Ltd 161 0.01
12 Chyang Sheng Dyeing & Finishing Co Ltd 4 -
8 Cleanaway Co Ltd 35 -
59 Clevo Co 45 -
131 CMC Magnetics Corp 34 -
29 Collins Co Ltd 12 -
354 Compal Electronics Inc 209 0.01
134 Compeq Manufacturing Co Ltd 130 0.01
56 Concord Securities Co Ltd 25 -
4 Concraft Holding Co Ltd 6 -
33 Continental Holdings Corp 21 -
1 Coremax Corp 1 -
49 Coretronic Corp 71 0.01
21 Co-Tech Development Corp 43 -
15 Crowell Development Corp 8 -
11 CSBC Corp Taiwan 6 -
601 CTBC Financial Holding Co Ltd 351 0.02
52 CTCI Corp 50 -
3 Cyberlink Corp 6 -
6 CyberPower Systems Inc 12 -
27 CyberTAN Technology Inc 12 -
6 Cypress Technology Co Ltd 7 -
28 DA CIN Construction Co Ltd 24 -
8 Dafeng TV Ltd 9 -
17 Da-Li Development Co Ltd 13 -
25 Darfon Electronics Corp 27 -
57 Darwin Precisions Corp 20 -
9 Daxin Materials Corp 20 -
35 De Licacy Industrial Co Ltd 15 -
22 Delpha Construction Co Ltd 8 -
17 Delta Electronics Inc 122 0.01
13 Depo Auto Parts Ind Co Ltd 19 -
World Equity FundPortfolio of Investments as at 31 May 2021 (continued)
Dimensional Fund Advisors Semi-Annual Report and Unaudited Financial Statements, 31 May 2021 489

Shares (000's)
Value(000's)
GBP
% of NetAssetValue
Common Stock (continued)
Taiwan - 2.16% (continued)
5 Dimerco Express Corp 10 -
45 D-Link Corp 22 -
6 Dyaco International Inc 14 -
36 Dynamic Electronics Co Ltd 17 -
13 Dynapack International Technology Corp 36 -
57 E Ink Holdings Inc 89 0.01
427 E.Sun Financial Holding Co Ltd 275 0.02
40 Eastern Media International Corp 18 -
9 Eclat Textile Co Ltd 151 0.01
3 ECOVE Environment Corp 17 -
14 Edom Technology Co Ltd 12 -
9 Egis Technology Inc 38 -
29 Elan Microelectronics Corp 153 0.01
9 E-Life Mall Corp 19 -
10 Elite Advanced Laser Corp 14 -
26 Elite Material Co Ltd 105 0.01
30 Elite Semiconductor Memory Technology Inc 103 0.01
20 Elitegroup Computer Systems Co Ltd 12 -
4 eMemory Technology Inc 95 0.01
25 Emerging Display Technologies Corp 14 -
5 Ennoconn Corp 27 -
60 ENNOSTAR Inc 116 0.01
84 EnTie Commercial Bank Co Ltd 31 -
7 Eson Precision Ind Co Ltd 11 -
60 Eternal Materials Co Ltd 62 0.01
275 Eva Airways Corp 122 0.01
34 Everest Textile Co Ltd 10 -
53 Evergreen International Storage & Transport Corp 30 -
222 Evergreen Marine Corp Taiwan Ltd 542 0.03
6 EVERGREEN Steel Corp 8 -
46 Everlight Chemical Industrial Corp 22 -
30 Everlight Electronics Co Ltd 35 -
14 Excelsior Medical Co Ltd 21 -
117 Far Eastern Department Stores Ltd 66 0.01
256 Far Eastern International Bank 69 0.01
187 Far Eastern New Century Corp 148 0.01
92 Far EasTone Telecommunications Co Ltd 151 0.01
12 Faraday Technology Corp 20 -
14 Farglory F T Z Investment Holding Co Ltd 12 -
13 Farglory Land Development Co Ltd 18 -
42 Federal Corp 30 -
26 Feng Hsin Steel Co Ltd 49 -
15 Feng TAY Enterprise Co Ltd 91 0.01
447 First Financial Holding Co Ltd 248 0.01
23 First Hotel 8 -
26 First Insurance Co Ltd 9 -
78 First Steamship Co Ltd 26 -
13 FIT Holding Co Ltd 9 -
6 Fitipower Integrated Technology 50 -
4 Fittech Co Ltd 16 -
35 FLEXium Interconnect Inc 102 0.01
12 Flytech Technology Co Ltd 19 -
6 Forcecon Tech Co Ltd 14 -
21 Formosa Advanced Technologies Co Ltd 21 -
57 Formosa Chemicals & Fibre Corp 124 0.01
9 Formosa International Hotels Corp 32 -
10 Formosa Laboratories Inc 24 -
5 Formosa Optical Technology Co Ltd 8 -
14 Formosa Petrochemical Corp 35 -
83 Formosa Plastics Corp 214 0.01
6 Formosa Sumco Technology Corp 25 -
82 Formosa Taffeta Co Ltd 64 0.01
Shares (000's)
Value(000's)
GBP
% of NetAssetValue
Common Stock (continued)
Taiwan - 2.16% (continued)
24 Formosan Rubber Group Inc 15 -
45 Formosan Union Chemical 20 -
7 Fortune Electric Co Ltd 8 -
15 Founding Construction & Development Co Ltd 6 -
91 Foxconn Technology Co Ltd 150 0.01
5 Foxsemicon Integrated Technology Inc 32 -
33 Froch Enterprise Co Ltd 17 -
24 FSP Technology Inc 27 -
166 Fubon Financial Holding Co Ltd 303 0.02
17 Fulgent Sun International Holding Co Ltd 53 -
34 Fulltech Fiber Glass Corp 14 -
7 Fusheng Precision Co Ltd 39 -
20 Fwusow Industry Co Ltd 12 -
16 G Shank Enterprise Co Ltd 14 -
12 Gamania Digital Entertainment Co Ltd 20 -
6 GCS Holdings Inc 7 -
5 GEM Services Inc 9 -
46 Gemtek Technology Corp 35 -
24 General Interface Solution Holding Ltd 59 0.01
12 Genesys Logic Inc 18 -
6 Genius Electronic Optical Co Ltd 75 0.01
36 Getac Technology Corp 48 -
24 Giant Manufacturing Co Ltd 203 0.01
29 Giantplus Technology Co Ltd 10 -
48 Gigabyte Technology Co Ltd 131 0.01
7 Ginko International Co Ltd 33 -
18 Global Brands Manufacture Ltd 14 -
7 Global Mixed Mode Technology Inc 39 -
3 Global PMX Co Ltd 13 -
5 Global Unichip Corp 45 -
11 Globalwafers Co Ltd 223 0.01
37 Globe Union Industrial Corp 16 -
53 Gloria Material Technology Corp 26 -
53 Gold Circuit Electronics Ltd 71 0.01
6 Golden Friends Corp 9 -
71 Goldsun Building Materials Co Ltd 45 -
7 Gourmet Master Co Ltd 30 -
12 Grand Ocean Retail Group Ltd 6 -
90 Grand Pacific Petrochemical 60 0.01
2 Grand Plastic Technology Corp 17 -
14 Grape King Bio Ltd 59 0.01
20 Great China Metal Industry 13 -
14 Great Taipei Gas Co Ltd 12 -
58 Great Wall Enterprise Co Ltd 84 0.01
24 Greatek Electronics Inc 43 -
40 HannStar Board Corp 45 -
165 HannStar Display Corp 89 0.01
54 HannsTouch Solution Inc 17 -
18 Hanpin Electron Co Ltd 14 -
32 Harvatek Corp 17 -
3 Heran Co Ltd 9 -
35 Hey Song Corp 31 -
52 Highwealth Construction Corp 56 -
7 Hiroca Holdings Ltd 11 -
14 Hitron Technology Inc 8 -
17 Hiwin Technologies Corp 154 0.01
71 Ho Tung Chemical Corp 20 -
31 Hocheng Corp 9 -
5 Holiday Entertainment Co Ltd 8 -
16 Holtek Semiconductor Inc 38 -
7 Holy Stone Enterprise Co Ltd 23 -
194 Hon Hai Precision Industry Co Ltd 547 0.03
World Equity FundPortfolio of Investments as at 31 May 2021 (continued)
Dimensional Fund Advisors Semi-Annual Report and Unaudited Financial Statements, 31 May 2021 490

Shares (000's)
Value(000's)
GBP
% of NetAssetValue
Common Stock (continued)
Taiwan - 2.16% (continued)
23 Hong Pu Real Estate Development Co Ltd 13 -
31 Hong TAI Electric Industrial 20 -
23 Hong YI Fiber Industry Co 15 -
56 Horizon Securities Co Ltd 35 -
17 Hota Industrial Manufacturing Co Ltd 39 -
14 Hotai Finance Co Ltd 29 -
10 Hotai Motor Co Ltd 143 0.01
14 Hsin Kuang Steel Co Ltd 23 -
5 Hsin Yung Chien Co Ltd 15 -
22 Hsing TA Cement Co 15 -
59 HTC Corp 55 -
6 Hu Lane Associate Inc 16 -
42 HUA ENG Wire & Cable Co Ltd 29 -
282 Hua Nan Financial Holdings Co Ltd 130 0.01
27 Huaku Development Co Ltd 64 0.01
12 Huang Hsiang Construction Corp 12 -
13 Hung Ching Development & Construction Co Ltd 7 -
45 Hung Sheng Construction Ltd 22 -
15 Ibase Technology Inc 15 -
164 IBF Financial Holdings Co Ltd 71 0.01
33 Ichia Technologies Inc 14 -
12 IEI Integration Corp 15 -
23 Infortrend Technology Inc 12 -
7 Innodisk Corp 31 -
553 Innolux Corp 312 0.02
12 Inpaq Technology Co Ltd 18 -
6 Integrated Service Technology Inc 8 -
59 International CSRC Investment Holdings Co 37 -
6 International Games System Co Ltd 142 0.01
188 Inventec Corp 123 0.01
4 Iron Force Industrial Co Ltd 7 -
15 I-Sheng Electric Wire & Cable Co Ltd 17 -
17 ITE Technology Inc 53 -
14 ITEQ Corp 45 -
6 Jarllytec Co Ltd 11 -
4 Jentech Precision Industrial Co Ltd 29 -
12 Jess-Link Products Co Ltd 12 -
4 Jia Wei Lifestyle Inc 8 -
5 Jih Lin Technology Co Ltd 10 -
7 Johnson Health Tech Co Ltd 14 -
16 K Laser Technology Inc 9 -
9 Kaimei Electronic Corp 24 -
7 Kaori Heat Treatment Co Ltd 8 -
6 Kedge Construction Co Ltd 7 -
34 KEE TAI Properties Co Ltd 9 -
52 Kenda Rubber Industrial Co Ltd 55 -
14 Kenmec Mechanical Engineering Co Ltd 8 -
15 Kerry TJ Logistics Co Ltd 24 -
37 Kindom Development Co Ltd 35 -
3 King Slide Works Co Ltd 29 -
97 King Yuan Electronics Co Ltd 105 0.01
75 King's Town Bank Co Ltd 79 0.01
4 King's Town Construction Co Ltd 4 -
8 Kinik Co 13 -
11 Kinko Optical Co Ltd 9 -
127 Kinpo Electronics 44 -
35 Kinsus Interconnect Technology Corp 93 0.01
6 KMC Kuei Meng International Inc 38 -
5 Ko Ja Cayman Co Ltd 14 -
15 KS Terminals Inc 28 -
7 Kung Long Batteries Industrial Co Ltd 26 -
47 Kung Sing Engineering Corp 12 -
Shares (000's)
Value(000's)
GBP
% of NetAssetValue
Common Stock (continued)
Taiwan - 2.16% (continued)
26 Kuo Toong International Co Ltd 18 -
16 Kwong Lung Enterprise Co Ltd 18 -
43 KYE Systems Corp 14 -
14 L&K Engineering Co Ltd 10 -
2 LandMark Optoelectronics Corp 13 -
9 Lanner Electronics Inc 13 -
4 Largan Precision Co Ltd 295 0.02
75 Lealea Enterprise Co Ltd 24 -
13 LEE CHI Enterprises Co Ltd 8 -
9 Lelon Electronics Corp 15 -
8 Li Cheng Enterprise Co Ltd 5 -
33 Li Peng Enterprise Co Ltd 11 -
8 Lida Holdings Ltd 6 -
57 Lien Hwa Industrial Holdings Corp 71 0.01
38 Lingsen Precision Industries Ltd 17 -
152 Lite-On Technology Corp 253 0.02
25 Long Da Construction & Development Corp 14 -
82 Longchen Paper & Packaging Co Ltd 48 -
12 Longwell Co 19 -
5 Lotes Co Ltd 80 0.01
8 Lotus Pharmaceutical Co Ltd 19 -
12 Lumax International Corp Ltd 21 -
14 Lung Yen Life Service Corp 21 -
2 M31 Technology Corp 17 -
4 Macauto Industrial Co Ltd 9 -
3 Machvision Inc 19 -
139 Macronix International 150 0.01
13 Makalot Industrial Co Ltd 95 0.01
4 Marketech International Corp 10 -
6 Materials Analysis Technology Inc 18 -
19 MediaTek Inc 463 0.03
334 Mega Financial Holding Co Ltd 281 0.02
56 Mercuries & Associates Holding Ltd 31 -
182 Mercuries Life Insurance Co Ltd 43 -
9 Merida Industry Co Ltd 73 0.01
12 Merry Electronics Co Ltd 33 -
46 Micro-Star International Co Ltd 194 0.01
14 MIN AIK Technology Co Ltd 9 -
24 Mirle Automation Corp 28 -
89 Mitac Holdings Corp 64 0.01
1 Momo.com Inc 32 -
8 MOSA Industrial Corp 9 -
8 MPI Corp 22 -
4 Nak Sealing Technologies Corp 9 -
22 Namchow Holdings Co Ltd 32 -
23 Nan Kang Rubber Tire Co Ltd 22 -
3 Nan Liu Enterprise Co Ltd 13 -
3 Nan Pao Resins Chemical Co 11 -
112 Nan Ya Plastics Corp 238 0.01
5 Nan Ya Printed Circuit Board Corp 40 -
22 Nantex Industry Co Ltd 73 0.01
41 Nanya Technology Corp 84 0.01
6 National Petroleum Co Ltd 7 -
11 Newmax Technology Co Ltd 13 -
12 Nexcom International Co Ltd 7 -
12 Nichidenbo Corp 16 -
10 Nien Hsing Textile Co Ltd 6 -
12 Nien Made Enterprise Co Ltd 124 0.01
6 Nishoku Technology Inc 21 -
16 Novatek Microelectronics Corp 205 0.01
169 O-Bank Co Ltd 30 -
24 Ocean Plastics Co Ltd 21 -
World Equity FundPortfolio of Investments as at 31 May 2021 (continued)
Dimensional Fund Advisors Semi-Annual Report and Unaudited Financial Statements, 31 May 2021 491

Shares (000's)
Value(000's)
GBP
% of NetAssetValue
Common Stock (continued)
Taiwan - 2.16% (continued)
3 Oneness Biotech Co Ltd 16 -
50 OptoTech Corp 34 -
42 Orient Semiconductor Electronics Ltd 19 -
81 Oriental Union Chemical Corp 44 -
33 Pacific Construction Co 9 -
10 Pacific Hospital Supply Co Ltd 20 -
12 Paiho Shih Holdings Corp 14 -
3 Pan German Universal Motors 17 -
18 Pan Jit International Inc 23 -
27 Pan-International Industrial Corp 27 -
2 Parade Technologies Ltd 76 0.01
7 PChome Online Inc 18 -
4 PCL Technologies Inc 11 -
5 P-Duke Technology Co Ltd 9 -
83 Pegatron Corp 154 0.01
3 Pegavision Corp 39 -
5 PharmaEngine inc 8 -
8 Pharmally International Holding Co Ltd 4 -
27 Phihong Technology Co Ltd 23 -
11 Phison Electronics Corp 130 0.01
12 Phoenix Silicon International Corp 14 -
7 Pixart Imaging Inc 32 -
5 Polytronics Technology Corp 14 -
163 Pou Chen Corp 158 0.01
5 Power Wind Health Industry Inc 17 -
58 Powertech Technology Inc 156 0.01
4 Poya International Co Ltd 56 -
21 President Chain Store Corp 140 0.01
111 President Securities Corp 81 0.01
53 Primax Electronics Ltd 72 0.01
142 Prince Housing & Development Corp 43 -
21 Promate Electronic Co Ltd 21 -
12 Prosperity Dielectrics Co Ltd 19 -
178 Qisda Corp 136 0.01
5 QST International Corp 8 -
17 Qualipoly Chemical Corp 15 -
4 Quang Viet Enterprise Co Ltd 13 -
94 Quanta Computer Inc 210 0.01
15 Quanta Storage Inc 16 -
34 Radiant Opto-Electronics Corp 102 0.01
79 Radium Life Tech Co Ltd 22 -
16 Realtek Semiconductor Corp 202 0.01
30 Rechi Precision Co Ltd 15 -
9 Rexon Industrial Corp Ltd 18 -
69 Rich Development Co Ltd 17 -
4 RichWave Technology Corp 49 -
105 Ritek Corp 26 -
35 Roo Hsing Co Ltd 9 -
124 Ruentex Development Co Ltd 164 0.01
34 Ruentex Industries Ltd 71 0.01
11 Sakura Development Co Ltd 9 -
38 Sampo Corp 29 -
17 San Fang Chemical Industry Co Ltd 9 -
42 San Far Property Ltd 16 -
11 San Shing Fastech Corp 17 -
39 Sanyang Motor Co Ltd 28 -
11 ScinoPharm Taiwan Ltd 8 -
13 SDI Corp 31 -
6 Sea Sonic Electronics Co Ltd 16 -
12 Senao International Co Ltd 10 -
4 Senao Networks Inc 9 -
21 Sercomm Corp 35 -
Shares (000's)
Value(000's)
GBP
% of NetAssetValue
Common Stock (continued)
Taiwan - 2.16% (continued)
23 Sesoda Corp 16 -
106 Shanghai Commercial & Savings Bank Ltd 122 0.01
10 Shan-Loong Transportation Co Ltd 9 -
12 Sharehope Medicine Co Ltd 9 -
22 Sheng Yu Steel Co Ltd 19 -
22 Shih Wei Navigation Co Ltd 20 -
39 Shihlin Electric & Engineering Corp 51 -
3 Shin Foong Specialty & Applied Materials co Ltd 21 -
707 Shin Kong Financial Holding Co Ltd 178 0.01
17 Shin Zu Shing Co Ltd 47 -
45 Shining Building Business Co Ltd 14 -
19 Shinkong Insurance Co Ltd 19 -
121 Shinkong Synthetic Fibers Corp 66 0.01
8 Shinkong Textile Co Ltd 8 -
9 Shiny Chemical Industrial Co Ltd 26 -
5 ShunSin Technology Holding Ltd 14 -
44 Shuttle Inc 15 -
31 Sigurd Microelectronics Corp 40 -
1 Silergy Corp 88 0.01
7 Silicon Optronics Inc 21 -
14 Simplo Technology Co Ltd 130 0.01
12 Sinbon Electronics Co Ltd 77 0.01
31 Sincere Navigation Corp 21 -
12 Sinher Technology Inc 15 -
3 Sinmag Equipment Corp 8 -
39 Sino-American Silicon Products Inc 163 0.01
58 Sinon Corp 32 -
655 SinoPac Financial Holdings Co Ltd 224 0.01
10 Sinphar Pharmaceutical Co Ltd 8 -
20 Sinyi Realty Inc 16 -
14 Sirtec International Co Ltd 10 -
7 Sitronix Technology Corp 47 -
20 Siward Crystal Technology Co Ltd 14 -
5 Soft-World International Corp 13 -
23 Solar Applied Materials Technology Co 27 -
16 Solomon Technology Corp 7 -
8 Solteam Inc 14 -
11 Sonix Technology Co Ltd 26 -
9 Speed Tech Corp 16 -
7 Sporton International Inc 44 -
3 St Shine Optical Co Ltd 21 -
16 Standard Chemical & Pharmaceutical Co Ltd 16 -
34 Standard Foods Corp 45 -
7 Stark Technology Inc 12 -
2 Sunjuice Holdings Co Ltd 24 -
8 Sunny Friend Environmental Technology Co Ltd 43 -
12 Sunonwealth Electric Machine Industry Co Ltd 13 -
21 Sunplus Technology Co Ltd 16 -
11 Sunrex Technology Corp 16 -
36 Supreme Electronics Co Ltd 37 -
31 Sweeten Real Estate Development Co Ltd 19 -
6 Symtek Automation Asia Co Ltd 14 -
7 Syncmold Enterprise Corp 15 -
22 Synmosa Biopharma Corp 14 -
92 Synnex Technology International Corp 137 0.01
15 Sysage Technology Co Ltd 16 -
14 Systex Corp 31 -
12 T3EX Global Holdings Corp 29 -
132 TA Chen Stainless Pipe 151 0.01
14 Ta Ching Securities Co Ltd 8 -
35 Ta Ya Electric Wire & Cable 25 -
8 Tah Hsin Industrial Corp 15 -
World Equity FundPortfolio of Investments as at 31 May 2021 (continued)
Dimensional Fund Advisors Semi-Annual Report and Unaudited Financial Statements, 31 May 2021 492

Shares (000's)
Value(000's)
GBP
% of NetAssetValue
Common Stock (continued)
Taiwan - 2.16% (continued)
11 TA-I Technology Co Ltd 20 -
364 Taichung Commercial Bank Co Ltd 105 0.01
4 TaiDoc Technology Corp 22 -
23 Taiflex Scientific Co Ltd 28 -
10 Taimide Tech Inc 12 -
135 Tainan Spinning Co Ltd 97 0.01
662 Taishin Financial Holding Co Ltd 247 0.01
17 Taisun Enterprise Co Ltd 12 -
17 Taita Chemical Co Ltd 18 -
422 Taiwan Business Bank 102 0.01
201 Taiwan Cement Corp 259 0.02
7 Taiwan Chinsan Electronic Industrial Co Ltd 8 -
32 Taiwan Cogeneration Corp 31 -
299 Taiwan Cooperative Financial Holding Co Ltd 158 0.01
92 Taiwan Fertilizer Co Ltd 130 0.01
23 Taiwan Fire & Marine Insurance Co Ltd 12 -
19 Taiwan FU Hsing Industrial Co Ltd 22 -
53 Taiwan Glass Industry Corp 43 -
88 Taiwan High Speed Rail Corp 65 0.01
29 Taiwan Hon Chuan Enterprise Co Ltd 51 -
21 Taiwan Hopax Chemicals Manufacturing Co Ltd 17 -
84 Taiwan Land Development Corp 15 -
8 Taiwan Mask Corp 17 -
91 Taiwan Mobile Co Ltd 230 0.01
27 Taiwan Navigation Co Ltd 26 -
33 Taiwan Paiho Ltd 79 0.01
27 Taiwan PCB Techvest Co Ltd 33 -
14 Taiwan Sakura Corp 23 -
4 Taiwan Sanyo Electric Co Ltd 3 -
22 Taiwan Secom Co Ltd 51 -
11 Taiwan Semiconductor Co Ltd 13 -
270 Taiwan Semiconductor Manufacturing Co Ltd 4,040 0.21
24 Taiwan Semiconductor Manufacturing Co Ltd, ADR 2,010 0.11
26 Taiwan Shin Kong Security Co Ltd 25 -
49 Taiwan Styrene Monomer 24 -
19 Taiwan Surface Mounting Technology Corp 57 0.01
69 Taiwan TEA Corp 33 -
24 Taiwan Union Technology Corp 59 0.01
11 Taiyen Biotech Co Ltd 9 -
146 Tatung Co Ltd 92 0.01
9 TBI Motion Technology Co Ltd 12 -
9 TCI Co Ltd 56 -
4 Te Chang Construction Co Ltd 3 -
105 Teco Electric and Machinery Co Ltd 88 0.01
2 Tehmag Foods Corp 16 -
13 Test Research Inc 19 -
29 Test Rite International Co Ltd 20 -
5 Thinking Electronic Industrial Co Ltd 20 -
16 Thye Ming Industrial Co Ltd 13 -
78 Ton Yi Industrial Corp 27 -
14 Tong Hsing Electronic Industries Ltd 66 0.01
37 Tong Yang Industry Co Ltd 31 -
26 Tong-Tai Machine & Tool Co Ltd 10 -
9 TOPBI International Holdings Ltd 3 -
16 Topco Scientific Co Ltd 53 -
8 Topco Technologies Corp 15 -
6 Topkey Corp 25 -
12 Topoint Technology Co Ltd 12 -
9 Toung Loong Textile Manufacturing 9 -
46 TPK Holding Co Ltd 54 -
15 Transcend Information Inc 27 -
31 Tripod Technology Corp 100 0.01
Shares (000's)
Value(000's)
GBP
% of NetAssetValue
Common Stock (continued)
Taiwan - 2.16% (continued)
3 TSC Auto ID Technology Co Ltd 16 -
70 TSRC Corp 55 -
3 TST Group Holding Ltd 11 -
3 Ttet Union Corp 12 -
2 TTFB Co Ltd 12 -
19 TTY Biopharm Co Ltd 42 -
51 Tung Ho Steel Enterprise Corp 62 0.01
4 TURVO International Co Ltd 11 -
28 TXC Corp 73 0.01
33 TYC Brother Industrial Co Ltd 18 -
50 Tycoons Group Enterprise 17 -
28 Tyntek Corp 20 -
29 U-Ming Marine Transport Corp 44 -
92 Unimicron Technology Corp 243 0.01
196 Union Bank Of Taiwan 58 0.01
272 Uni-President Enterprises Corp 503 0.03
13 Unitech Computer Co Ltd 10 -
74 Unitech Printed Circuit Board Corp 39 -
13 United Integrated Services Co Ltd 77 0.01
313 United Microelectronics Corp 415 0.02
10 United Orthopedic Corp 8 -
103 United Renewable Energy Co Ltd 36 -
35 Unity Opto Technology Co Ltd 1 -
50 Universal Cement Corp 29 -
3 Universal Vision Biotechnology Co Ltd 23 -
19 Unizyx Holding Corp 15 -
88 UPC Technology Corp 57 0.01
57 USI Corp 49 -
7 Utechzone Co Ltd 10 -
32 Vanguard International Semiconductor Corp 95 0.01
14 Ve Wong Corp 13 -
7 Ventec International Group 19 -
17 Victory New Materials Ltd Co 5 -
8 Visual Photonics Epitaxy Co Ltd 24 -
5 Voltronic Power Technology Corp 145 0.01
33 Wafer Works Corp 42 -
21 Wah Lee Industrial Corp 41 -
102 Walsin Lihwa Corp 65 0.01
23 Walsin Technology Corp 119 0.01
31 Walton Advanced Engineering Inc 12 -
73 Wan Hai Lines Ltd 287 0.02
27 Wei Chuan Foods Corp 15 -
40 Weikeng Industrial Co Ltd 23 -
13 Well Shin Technology Co Ltd 17 -
27 Win Semiconductors Corp 220 0.01
235 Winbond Electronics Corp 201 0.01
3 WinWay Technology Co Ltd 20 -
54 Wisdom Marine Lines Co Ltd 95 0.01
229 Wistron Corp 178 0.01
6 Wistron Information Technology & Services 15 -
28 Wistron NeWeb Corp 47 -
6 Wiwynn Corp 138 0.01
8 Wowprime Corp 27 -
113 WPG Holdings Ltd 148 0.01
46 WT Microelectronics Co Ltd 64 0.01
27 WUS Printed Circuit Co Ltd 19 -
16 XinTec Inc 62 0.01
11 Xxentria Technology Materials Corp 19 -
12 Yageo Corp 154 0.01
136 Yang Ming Marine Transport Corp 373 0.02
38 YC INOX Co Ltd 31 -
15 Yea Shin International Development Co Ltd 9 -
World Equity FundPortfolio of Investments as at 31 May 2021 (continued)
Dimensional Fund Advisors Semi-Annual Report and Unaudited Financial Statements, 31 May 2021 493

Shares (000's)
Value(000's)
GBP
% of NetAssetValue
Common Stock (continued)
Taiwan - 2.16% (continued)
43 Yem Chio Co Ltd 20 -
7 Yeong Guan Energy Technology Group Co Ltd 14 -
8 YFC-Boneagle Electric Co Ltd 5 -
100 YFY Inc 96 0.01
32 Yi Jinn Industrial Co Ltd 15 -
75 Yieh Phui Enterprise Co Ltd 43 -
9 Yonyu Plastics Co Ltd 8 -
15 Young Fast Optoelectronics Co Ltd 13 -
11 Youngtek Electronics Corp 22 -
3 Yuan High-Tech Development Co Ltd 13 -
594 Yuanta Financial Holding Co Ltd 386 0.02
9 Yuanta Futures Co Ltd 12 -
19 Yulon Finance Corp 67 0.01
47 Yulon Motor Co Ltd 47 -
6 Yung Chi Paint & Varnish Manufacturing Co Ltd 11 -
9 Yungshin Construction & Development Co Ltd 11 -
14 YungShin Global Holding Corp 15 -
8 Yungtay Engineering Co Ltd 12 -
6 Zeng Hsing Industrial Co Ltd 25 -
20 Zenitron Corp 14 -
13 Zero One Technology Co Ltd 15 -
50 Zhen Ding Technology Holding Ltd 123 0.01
35 Zig Sheng Industrial Co Ltd 24 -
3 ZillTek Technology Corp 26 -
35 Zinwell Corp 17 -
11 Zippy Technology Corp 10 -
9 ZongTai Real Estate Development Co Ltd 9 -
41,363 2.16
Thailand - 0.32%
33 AAPICO Hitech PCL 18 -
22 Advanced Info Service PCL 84 0.01
18 Advanced Information Technology PCL 9 -
9 AEON Thana Sinsap Thailand PCL 39 -
44 Airports of Thailand PCL 62 0.01
1 Alucon PCL 2 -
41 Amata Corp PCL 17 -
299 AP Thailand PCL 58 0.01
251 Asia Plus Group Holdings PCL 20 -
50 Asia Sermkij Leasing PCL, NVDR 39 -
298 Asian Insulators PLC 16 -
27 B Grimm Power PCL 27 -
125 Bangchak Corp PCL 71 0.01
69 Bangkok Airways PCL 11 -
13 Bangkok Aviation Fuel Services PCL 7 -
22 Bangkok Bank PCL, NVDR 57 0.01
3 Bangkok Bank PCL, NVDR (voting rights) 7 -
102 Bangkok Chain Hospital PCL 47 -
109 Bangkok Commercial Asset Management 46 -
210 Bangkok Dusit Medical Services PCL 102 0.01
404 Bangkok Expressway & Metro PCL 73 0.01
12 Bangkok Insurance PCL 73 0.01
1,112 Bangkok Land PCL 28 -
64 Bangkok Life Assurance PCL, NVDR 44 -
603 Banpu PCL 175 0.01
44 Banpu Power PCL 19 -
31 BCPG PCL 10 -
99 BEC World PCL 28 -
95 Berli Jucker PCL 74 0.01
238 BTS Group Holdings PCL 48 -
12 Bumrungrad Hospital PCL 35 -
446 Cal-Comp Electronics Thailand PCL 32 -
13 Carabao Group PCL 39 -
Shares (000's)
Value(000's)
GBP
% of NetAssetValue
Common Stock (continued)
Thailand - 0.32% (continued)
49 Central Pattana PCL 56 0.01
22 Central Plaza Hotel PCL 16 -
34 Central Retail Corp PCL 26 -
97 CH Karnchang PCL 44 -
273 Charoen Pokphand Foods PCL 168 0.01
616 Chularat Hospital PCL 49 -
130 CK Power PCL 16 -
22 Com7 PCL 36 -
309 Country Group Development PCL 5 -
103 CP ALL PCL 141 0.01
53 Demco PCL 6 -
68 Dhipaya Insurance PCL 53 -
53 Diamond Building Products PCL 9 -
24 Dohome PCL 14 -
213 Dynasty Ceramic PCL 15 -
65 Eastern Polymer Group PCL 17 -
84 Eastern Water Resources Development andManagement PCL 19 -
12 Electricity Generating PCL 46 -
34 Energy Absolute PCL 46 -
80 Esso Thailand PCL 15 -
47 Frasers Property Thailand PCL 14 -
53 GFPT PCL 13 -
34 Global Green Chemicals PCL 8 -
8 Global Power Synergy PCL 13 -
122 Group Lease PCL, NVDR 2 -
451 Gunkul Engineering PCL 36 -
48 Hana Microelectronics PCL 64 0.01
226 Home Product Center PCL 70 0.01
45 Ichitan Group PCL 12 -
104 Indorama Ventures PCL 106 0.01
24 Intouch Holdings PCL 34 -
865 IRPC PCL 80 0.01
463 Italian-Thai Development PCL 29 -
408 Jasmine International PCL 26 -
64 JKN Global Media PCL 15 -
21 JMT Network Services PCL 21 -
11 Kasikornbank PCL 30 -
52 KCE Electronics PCL 82 0.01
126 KGI Securities Thailand PCL 21 -
189 Khon Kaen Sugar Industry PCL 18 -
22 Kiatnakin Bank PCL 27 -
134 Krung Thai Bank PCL 33 -
35 Krungthai Card PCL 58 0.01
44 Lalin Property PCL 10 -
373 Land & Houses PCL 67 0.01
29 Lanna Resources PCL 7 -
696 LH Financial Group PCL 16 -
156 LPN Development PCL 18 -
158 MBK PCL 49 -
50 MCS Steel PCL 16 -
34 Mega Lifesciences PCL 28 -
30 Minor International PCL 21 -
18 MK Restaurants Group PCL 22 -
29 Muangthai Capital PCL 40 -
12 Netbay PCL 7 -
110 Noble Development PCL 18 -
127 Northeast Rubber 18 -
645 Nusasiri PCL 6 -
97 Origin Property PCL 20 -
32 Osotspa PCL 26 -
162 Plan B Media Pcl 22 -
World Equity FundPortfolio of Investments as at 31 May 2021 (continued)
Dimensional Fund Advisors Semi-Annual Report and Unaudited Financial Statements, 31 May 2021 494

Shares (000's)
Value(000's)
GBP
% of NetAssetValue
Common Stock (continued)
Thailand - 0.32% (continued)
29 Polyplex Thailand PCL 18 -
389 Power Solution Technologies PCL 19 -
74 Precious Shipping PCL 30 -
31 Premier Marketing PCL 7 -
122 Prima Marine PCL 20 -
835 Property Perfect PCL 9 -
120 Pruksa Holding PCL 37 -
127 PTG Energy PCL 55 0.01
54 PTT Exploration & Production PCL 144 0.01
44 PTT Global Chemical PCL 63 0.01
219 PTT PCL 198 0.01
1,006 Quality Houses PCL 52 -
282 Raimon Land PCL 6 -
36 Rajthanee Hospital PCL 23 -
38 Ratch Group PCL 44 -
204 Ratchthani Leasing PCL 19 -
28 Regional Container Lines PCL 31 -
122 Rojana Industrial Park PCL 20 -
27 RS PCL 15 -
39 S 11 Group PCL 6 -
25 Sabina PCL 12 -
14 Saha Pathana Inter-Holding PCL 19 -
25 Saha-Union PCL 20 -
31 Samart Corp PCL 7 -
34 Samart Telcoms PCL 5 -
1,641 Sansiri PCL 49 -
145 SC Asset Corp PCL 10 -
42 SEAFCO PCL 5 -
65 Sermsang Power Corp Co Ltd 19 -
13 Siam Cement PCL 127 0.01
10 Siam City Cement PCL 40 -
9 Siam Commercial Bank PCL 22 -
146 Siam Future Development PCL 24 -
70 Siam Global House PCL 33 -
102 Siamgas & Petrochemicals PCL 26 -
18 Singer Thailand PLC 16 -
434 Singha Estate PCL 21 -
135 Sino-Thai Engineering & Construction PCL 47 -
57 Somboon Advance Technology PCL 27 -
44 SPCG PCL 20 -
72 Sri Trang Agro-Industry PCL 71 0.01
59 Srisawad Corp PCL 99 0.01
152 Star Petroleum Refining PCL 33 -
133 STP & I PCL 14 -
200 Supalai PCL 95 0.01
1,864 Super Energy Corp PCL 40 -
119 Syntec Construction PCL 6 -
27 Taokaenoi Food & Marketing PCL 4 -
95 Thai Agro Energy PCL 6 -
4 Thai Nakarin Hospital PCL 3 -
61 Thai Oil PCL 82 0.01
3 Thai President Foods PCL 13 -
68 Thai Reinsurance Public Co Ltd 2 -
4 Thai Stanley Electric PCL, NVDR 15 -
263 Thai Union Group PCL 105 0.01
40 Thai Vegetable Oil PCL 30 -
49 Thai Wah PCL 6 -
68 Thaicom PCL 17 -
122 Thaifoods Group PCL 14 -
24 Thanachart Capital PCL 19 -
32 Thitikorn PCL 7 -
154 Thoresen Thai Agencies PCL 61 0.01
Shares (000's)
Value(000's)
GBP
% of NetAssetValue
Common Stock (continued)
Thailand - 0.32% (continued)
59 Tipco Asphalt PCL 26 -
16 Tisco Financial Group PCL 33 -
2,014 TMB Bank PCL 51 -
36 TOA Paint Thailand PCL 31 -
54 Total Access Communication PCL 38 -
25 TPC Power Holdings Co Ltd 8 -
733 TPI Polene PCL 33 -
354 TPI Polene Power PCL 36 -
11 TQM Corp PCL 28 -
1,500 True Corp PCL 114 0.01
85 TTW PCL 22 -
331 U City PCL 6 -
49 Unique Engineering & Construction PCL 9 -
37 United Paper PCL 19 -
82 Univentures PCL 7 -
74 Vanachai Group PCL 12 -
30 Vinythai PCL 25 -
429 WHA Corp PCL 30 -
57 WHA Utilities and Power PCL 6 -
18 Workpoint Entertainment PCL 10 -
6,088 0.32
Turkey - 0.07%
122 Akbank TAS 52 0.01
20 Aksa Akrilik Kimya Sanayii AS 27 -
16 Aksa Enerji Uretim AS 17 -
4 Alarko Holding AS 3 -
5 Alkim Alkali Kimya AS 6 -
13 Anadolu Anonim Turk Sigorta Sirketi 7 -
17 Anadolu Efes Biracilik Ve Malt Sanayii AS 32 -
13 Arcelik AS 34 -
12 Aselsan Elektronik Sanayi Ve Ticaret AS 14 -
35 Bera Holding AS 77 0.01
8 Besiktas Futbol Yatirimlari Sanayi ve Ticaret AS 4 -
5 BIM Birlesik Magazalar AS 29 -
3 Cimsa Cimento Sanayi VE Ticaret AS 6 -
7 Coca-Cola Icecek AS 45 -
6 Deva Holding AS 13 -
73 Dogan Sirketler Grubu Holding AS 18 -
- EGE Endustri VE Ticaret AS 15 -
33 Enka Insaat ve Sanayi AS 23 -
11 Eregli Demir ve Celik Fabrikalari TAS 18 -
1 Ford Otomotiv Sanayi AS 15 -
23 Hektas Ticaret TAS 18 -
14 Is Yatirim Menkul Degerler AS 20 -
14 Kardemir Karabuk Demir Celik Sanayi ve Ticaret AS,Class A 8 -
78 Kardemir Karabuk Demir Celik Sanayi ve Ticaret AS,Class D 50 0.01
12 KOC Holding AS 18 -
4 Koza Altin Isletmeleri AS 42 -
22 Koza Anadolu Metal Madencilik Isletmeleri AS 29 -
1 Logo Yazilim Sanayi Ve Ticaret AS 16 -
3 Mavi Giyim Sanayi Ve Ticaret AS 12 -
7 Migros Ticaret AS 20 -
11 NET Holding AS 5 -
4 Nuh Cimento Sanayi AS 18 -
1 Otokar Otomotiv Ve Savunma Sanayi AS 16 -
85 Petkim Petrokimya Holding AS 44 -
49 Sekerbank Turk AS 4 -
12 Sok Marketler Ticaret AS 11 -
17 TAV Havalimanlari Holding AS 33 -
14 Tekfen Holding AS 17 -
World Equity FundPortfolio of Investments as at 31 May 2021 (continued)
Dimensional Fund Advisors Semi-Annual Report and Unaudited Financial Statements, 31 May 2021 495

Shares (000's)
Value(000's)
GBP
% of NetAssetValue
Common Stock (continued)
Turkey - 0.07% (continued)
14 Tofas Turk Otomobil Fabrikasi AS 32 -
48 Turk Hava Yollari AO 52 0.01
19 Turk Telekomunikasyon AS 11 -
1 Turk Traktor ve Ziraat Makineleri 9 -
88 Turkcell Iletisim Hizmetleri AS 114 0.01
132 Turkiye Garanti Bankasi AS 87 0.01
71 Turkiye Halk Bankasi AS 27 -
80 Turkiye Is Bankasi AS 34 -
2 Turkiye Petrol Rafinerileri AS 12 -
110 Turkiye Sinai Kalkinma Bankasi AS 12 -
88 Turkiye Sise ve Cam Fabrikalari AS 58 0.01
60 Turkiye Vakiflar Bankasi TAO 18 -
20 Ulker Biskuvi Sanayi AS 37 -
10 Vestel Elektronik Sanayi ve Ticaret AS 27 -
241 Yapi ve Kredi Bankasi AS 43 -
7 Yatas Yatak ve Yorgan Sanayi ve Ticaret AS 9 -
77 Zorlu Enerji Elektrik Uretim AS 13 -
1,431 0.07
United Arab Emirates - 0.07%
90 Abu Dhabi Commercial Bank PJSC 118 0.01
144 Abu Dhabi Islamic Bank PJSC 156 0.01
9 Agthia Group PJSC 12 -
76 Air Arabia PJSC Holdings 20 -
128 Aldar Properties PJSC 91 0.01
76 Amanat Holdings PJSC 14 -
55 Amlak Finance PJSC 3 -
60 Aramex PJSC 49 -
137 DAMAC Properties Dubai Co PJSC 37 -
271 Dana Gas PJSC 43 -
138 Deyaar Development PJSC 8 -
95 Dubai Financial Market PJSC 21 -
162 Dubai Investments PJSC 53 -
62 Dubai Islamic Bank PJSC 57 -
67 Emaar Development PJSC 46 -
66 Emaar Malls PJSC 25 -
199 Emaar Properties PJSC 155 0.01
95 Emirates NBD Bank PJSC 245 0.01
28 Emirates Telecommunications Group Co PJSC 117 0.01
128 Eshraq Investments PJSC 8 -
27 First Abu Dhabi Bank PJSC 86 0.01
166 Manazel Real Estate PJSC 11 -
111 RAK Properties PJSC 12 -
28 Ras Al Khaimah Ceramics 12 -
1,399 0.07
United Kingdom - 3.99%
25 3i Group PLC 304 0.02
3 4imprint Group PLC 78 0.01
31 888 Holdings PLC 125 0.01
5 Accsys Technologies PLC 8 -
8 Admiral Group PLC 232 0.01
8 Advanced Medical Solutions Group PLC 21 -
11 AG Barr PLC 58 -
29 Aggreko PLC 246 0.01
4 Air Partner PLC 3 -
10 Airtel Africa PLC 8 -
15 AJ Bell PLC 63 -
34 Alliance Pharma PLC 33 -
28 Allied Minds PLC 6 -
15 Anglo American PLC 481 0.03
11 Anglo Pacific Group PLC 15 -
4 Anglo-Eastern Plantations PLC 23 -
17 Antofagasta PLC 262 0.01
Shares (000's)
Value(000's)
GBP
% of NetAssetValue
Common Stock (continued)
United Kingdom - 3.99% (continued)
9 AO World PLC 23 -
22 Appreciate Group PLC 9 -
10 Arrow Global Group PLC 30 -
12 Ascential PLC 44 -
32 Ashmore Group PLC 127 0.01
19 Ashtead Group PLC 993 0.05
4 ASOS PLC 213 0.01
12 Associated British Foods PLC 266 0.01
- Aston Martin Lagonda Global Holdings 9 -
21 Astrazeneca PLC 1,656 0.09
62 Auto Trader Group PLC 349 0.02
23 Avast PLC 107 0.01
2 AVEVA Group PLC 62 -
140 Aviva PLC 573 0.03
3 Avon Rubber PLC 82 0.01
89 B&M European Value Retail SA 511 0.03
55 Babcock International Group PLC 163 0.01
102 BAE Systems PLC 536 0.03
11 Bakkavor Group PLC 15 -
35 Balfour Beatty PLC 107 0.01
6 Bank of Georgia Group PLC 72 -
301 Barclays PLC 551 0.03
47 Barratt Developments PLC 355 0.02
43 Beazley PLC 129 0.01
9 Bellway PLC 314 0.02
6 Berkeley Group Holdings PLC 287 0.02
68 BHP Group PLC 1,454 0.08
24 Biffa PLC 69 -
10 Bloomsbury Publishing PLC 33 -
20 Bodycote PLC 171 0.01
59 boohoo Group PLC 187 0.01
11 Boot Henry PLC 31 -
418 BP PLC 1,285 0.07
3 BP PLC, ADR 63 -
4 Braemar Shipping Services PLC 10 -
39 Breedon Group PLC 42 -
33 Brewin Dolphin Holdings PLC 112 0.01
44 British American Tobacco PLC 1,202 0.06
2 British American Tobacco PLC, ADR 44 -
27 Britvic PLC 248 0.01
710 BT Group PLC 1,238 0.07
14 Bunzl PLC 318 0.02
23 Burberry Group PLC 490 0.03
13 Burford Capital Ltd 107 0.01
11 Bytes Technology Group PLC 53 -
7 Bytes Technology Group PLC 34 -
27 C&C Group PLC 66 -
80 Cairn Energy PLC 130 0.01
140 Capita PLC 56 -
51 Card Factory PLC 35 -
7 CareTech Holdings PLC 40 -
5 Carnival PLC 88 0.01
5 Carr's Group PLC 7 -
1 Castings PLC 3 -
116 Centamin PLC 128 0.01
20 Central Asia Metals PLC 53 -
622 Centrica PLC 339 0.02
21 Chemring Group PLC 63 -
15 Chesnara PLC 43 -
105 Cineworld Group PLC 98 0.01
17 Circassia Pharmaceuticals PLC 6 -
2 Clarkson PLC 62 -
World Equity FundPortfolio of Investments as at 31 May 2021 (continued)
Dimensional Fund Advisors Semi-Annual Report and Unaudited Financial Statements, 31 May 2021 496

Shares (000's)
Value(000's)
GBP
% of NetAssetValue
Common Stock (continued)
United Kingdom - 3.99% (continued)
9 Clinigen Healthcare Ltd 73 -
7 Clipper Logistics PLC 50 -
12 Close Brothers Group PLC 194 0.01
16 CLS Holdings PLC 39 -
10 CMC Markets PLC 50 -
142 Coats Group PLC 94 0.01
8 Coca-Cola HBC AG 206 0.01
40 Compass Group PLC 649 0.03
9 Computacenter PLC 237 0.01
64 ConvaTec Group PLC 153 0.01
18 Costain Group PLC 11 -
40 Countryside Properties PLC 204 0.01
3 Cranswick PLC 121 0.01
33 Crest Nicholson Holdings PLC 149 0.01
4 Croda International PLC 281 0.02
5 CVS Group PLC 106 0.01
10 Daily Mail & General Trust PLC 91 0.01
12 Dart Group PLC 168 0.01
6 DCC PLC 347 0.02
9 De La Rue PLC 16 -
82 Debenhams PLC - -
20 Devro PLC 41 -
11 DFS Furniture PLC 32 -
33 Diageo PLC 1,121 0.06
- Diageo PLC, ADR 19 -
4 Dignity PLC 29 -
8 Diploma PLC 228 0.01
84 Direct Line Insurance Group PLC 251 0.01
5 DiscoverIE Group PLC 38 -
35 Diversified Gas & Oil PLC 37 -
121 Dixons Carphone PLC 165 0.01
36 Domino's Pizza Group PLC 131 0.01
4 dotdigital Group PLC 10 -
51 Drax Group PLC 223 0.01
96 DS Smith PLC 400 0.02
11 Dunelm Group PLC 163 0.01
16 easyJet PLC 157 0.01
13 EKF Diagnostics Holdings PLC 10 -
39 Electrocomponents PLC 388 0.02
38 Elementis PLC 60 -
5 EMIS Group PLC 62 -
155 EnQuest PLC 27 -
14 Epwin Group PLC 15 -
36 Equiniti Group PLC 65 -
9 Euromoney Institutional Investor PLC 94 0.01
41 Evraz PLC 261 0.01
16 Experian PLC 439 0.02
9 FDM Group Holdings PLC 84 0.01
8 Ferguson PLC 772 0.04
38 Ferrexpo PLC 168 0.01
3 Fevertree Drinks PLC 82 0.01
24 Filtrona PLC 75 -
1 First Derivatives PLC 17 -
137 Firstgroup PLC 111 0.01
9 Forterra PLC 25 -
26 Foxtons Group PLC 15 -
5 Fresnillo PLC 41 -
1 Frontier Developments PLC 18 -
2 Fuller Smith & Turner PLC 17 -
11 Funding Circle Holdings 19 -
1 Future PLC 34 -
15 Galliford Try Holdings PLC 19 -
Shares (000's)
Value(000's)
GBP
% of NetAssetValue
Common Stock (continued)
United Kingdom - 3.99% (continued)
3 Games Workshop Group PLC 376 0.02
4 Gamesys Group PLC 70 -
4 Gamma Communications PLC 83 0.01
11 Gem Diamonds Ltd 8 -
15 Genel Energy PLC 20 -
2 Genus PLC 114 0.01
5 Georgia Capital PLC 33 -
69 GlaxoSmithKline PLC 928 0.05
190 Glencore PLC 610 0.03
6 Go-Ahead Group PLC 74 -
- Goodwin PLC 12 -
14 Grafton Group PLC 166 0.01
31 Grainger PLC 87 0.01
49 Greencore Group PLC 68 -
11 Greggs PLC 268 0.02
30 Gulf Keystone Petroleum Ltd 50 -
29 GVC Holdings PLC 470 0.03
11 Gym Group PLC 31 -
21 Halfords Group PLC 79 0.01
8 Halma PLC 212 0.01
120 Harbour Energy PLC 25 -
12 Hargreaves Lansdown PLC 204 0.01
152 Hays PLC 264 0.01
9 Headlam Group PLC 42 -
15 Helical PLC 65 -
6 Helios Towers PLC 10 -
10 Hikma Pharmaceuticals PLC 247 0.01
3 Hill & Smith Holdings PLC 52 -
6 Hilton Food Group PLC 73 -
18 Hiscox Ltd 141 0.01
33 Hochschild Mining PLC 64 -
17 Hollywood Bowl Group PLC 44 -
23 HomeServe PLC 211 0.01
4 Hostelworld Group PLC 4 -
47 Howden Joinery Group PLC 372 0.02
282 HSBC Holdings PLC 1,284 0.07
17 Hunting PLC 46 -
18 Hyve Group PLC 24 -
21 Ibstock PLC 49 -
36 IDOX PLC 22 -
36 IG Group Holdings PLC 306 0.02
31 IMI PLC 510 0.03
2 Impax Asset Management Group PLC 17 -
65 Imperial Tobacco Group PLC 1,044 0.06
33 Inchcape PLC 257 0.01
71 Indivior PLC 112 0.01
50 Informa PLC 274 0.02
9 IntegraFin Holdings PLC 48 -
4 InterContinental Hotels Group PLC 213 0.01
7 Intermediate Capital Group PLC 151 0.01
11 International Consolidated Airlines Group SA 21 -
32 International Personal Finance PLC 42 -
6 Intertek Group PLC 334 0.02
60 Investec PLC 187 0.01
12 iomart Group PLC 32 -
105 IP Group PLC 129 0.01
303 ITV PLC 388 0.02
77 IWG PLC 277 0.02
153 J Sainsbury PLC 406 0.02
6 James Fisher & Sons PLC 55 -
6 James Halstead PLC 32 -
30 JD Sports Fashion PLC 282 0.02
World Equity FundPortfolio of Investments as at 31 May 2021 (continued)
Dimensional Fund Advisors Semi-Annual Report and Unaudited Financial Statements, 31 May 2021 497

Shares (000's)
Value(000's)
GBP
% of NetAssetValue
Common Stock (continued)
United Kingdom - 3.99% (continued)
10 JD Wetherspoon PLC 136 0.01
42 John Laing Group PLC 170 0.01
11 John Menzies PLC 33 -
78 John Wood Group PLC 191 0.01
15 Johnson Matthey PLC 444 0.02
26 Johnson Service Group PLC 44 -
3 Joules Group PLC 9 -
2 JTC PLC 11 -
56 Jupiter Fund Management PLC 155 0.01
148 Just Group PLC 163 0.01
6 Kainos Group PLC 90 0.01
10 Keller Group PLC 85 0.01
- Keywords Studios PLC 8 -
9 Kier Group PLC 11 -
8 Kier Group PLC 2 -
13 Kin & Carta PLC 26 -
173 Kingfisher PLC 617 0.03
16 Lamprell PLC 10 -
15 Lancashire Holdings Ltd 97 0.01
10 Learning Technologies Group PLC 16 -
176 Legal & General Group PLC 500 0.03
3 Liontrust Asset Management PLC 50 -
1,588 Lloyds Banking Group PLC 791 0.04
2 London Stock Exchange Group PLC 126 0.01
35 Lookers PLC 24 -
10 LSL Property Services PLC 45 -
201 M&G PLC 490 0.03
119 Man Group PLC 213 0.01
208 Marks & Spencer Group PLC 342 0.02
16 Marshalls PLC 115 0.01
70 Marston's PLC 64 -
21 McBride PLC 19 -
16 Mears Group PLC 31 -
35 Mediclinic International PLC 113 0.01
50 Meggitt PLC 255 0.01
266 Melrose Industries PLC 459 0.03
35 Michael Page International PLC 206 0.01
32 Micro Focus International PLC 163 0.01
5 Micro Focus International PLC, ADR 23 -
4 Midwich Group PLC 19 -
31 Mitchells & Butlers PLC 95 0.01
108 Mitie Group PLC 74 -
1 MJ Gleeson PLC 10 -
31 Mondi PLC 585 0.03
6 Mondi PLC (South Africa listing) 114 0.01
55 Moneysupermarket.com Group PLC 150 0.01
36 Morgan Crucible Co PLC 120 0.01
4 Morgan Sindall Group PLC 96 0.01
13 Morses Club PLC 8 -
4 Mortgage Advice Bureau Holdings Ltd 47 -
6 Motorpoint group PLC 16 -
2 MP Evans Group PLC 16 -
31 N Brown Group PLC 21 -
5 Naked Wines PLC 41 -
49 National Express Group PLC 149 0.01
44 National Grid PLC 415 0.02
19 NCC Group PLC 57 -
2 Network International Holdings 7 -
5 Next Fifteen Communications Group PLC 40 -
5 Next PLC 393 0.02
26 Ninety One PLC 63 -
6 NMC Health PLC 1 -
Shares (000's)
Value(000's)
GBP
% of NetAssetValue
Common Stock (continued)
United Kingdom - 3.99% (continued)
9 Norcros PLC 29 -
26 Northgate PLC 98 0.01
4 Numis Corp PLC 15 -
3 Ocado Group PLC 47 -
6 On the Beach Group PLC 25 -
32 OSB Group PLC 148 0.01
4 Oxford Instruments PLC 89 0.01
175 Pan African Resources PLC 41 -
29 Paragon Group of Cos PLC 143 0.01
7 PayPoint PLC 39 -
46 Pearson PLC 376 0.02
129 Pendragon PLC 24 -
18 Pennon Group PLC 190 0.01
11 Persimmon PLC 347 0.02
33 Petrofac Ltd 44 -
249 Petropavlovsk PLC 62 -
50 Pets at Home Group PLC 223 0.01
33 Pharos Energy PLC 8 -
44 Phoenix Group Holdings PLC 325 0.02
34 Photo-Me International PLC 24 -
38 Playtech PLC 173 0.01
15 Plus500 Ltd 220 0.01
7 Polar Capital Holdings PLC 54 -
20 Polypipe Group PLC 128 0.01
2 Porvair PLC 13 -
1 PPHE Hotel Group Ltd 20 -
64 Premier Foods PLC 68 -
18 Provident Financial PLC 43 -
24 Prudential PLC 367 0.02
9 PureTech Health PLC 37 -
9 Purplebricks Group PLC 8 -
7 PZ Cussons PLC 18 -
45 QinetiQ Group PLC 159 0.01
109 Quilter PLC 166 0.01
17 Rank Group PLC 35 -
3 Rathbone Brothers PLC 56 -
9 Raven Property Group Ltd 3 -
44 Reach PLC 106 0.01
12 Reckitt Benckiser Group PLC 775 0.04
11 Redcentric PLC 16 -
26 Redrow PLC 175 0.01
10 RELX PLC (Netherlands listing) 187 0.01
22 RELX PLC (UK listing) 408 0.02
1 Relx PLC, ADR 9 -
1 Renishaw PLC 43 -
55 Rentokil Initial PLC 258 0.01
55 Restaurant Group PLC 67 -
1 Rhi Magnesita NV (Austria listing) 54 -
3 Rhi Magnesita NV (UK listing) 134 0.01
3 Ricardo PLC 15 -
56 Rightmove PLC 339 0.02
37 Rio Tinto PLC 2,243 0.12
3 River & Mercantile Group PLC 6 -
7 RM PLC 15 -
9 Robert Walters PLC 60 -
43 Rockhopper Exploration PLC 4 -
240 Rolls-Royce Holdings PLC 256 0.01
56 Rotork PLC 187 0.01
183 Royal Bank of Scotland Group PLC 378 0.02
164 Royal Dutch Shell PLC 2,105 0.11
1 Royal Dutch Shell PLC, ADR 33 -
110 Royal Mail PLC 633 0.03
World Equity FundPortfolio of Investments as at 31 May 2021 (continued)
Dimensional Fund Advisors Semi-Annual Report and Unaudited Financial Statements, 31 May 2021 498

Shares (000's)
Value(000's)
GBP
% of NetAssetValue
Common Stock (continued)
United Kingdom - 3.99% (continued)
39 RPS Group PLC 37 -
55 RSA Insurance Group PLC 375 0.02
9 RWS Holdings PLC 59 -
7 Sabre Insurance Group PLC 19 -
12 Saga PLC 46 -
14 Sage Group PLC 91 0.01
1 Sanne Group PLC 10 -
15 Savills PLC 179 0.01
2 Schroders PLC (non-voting rights) 48 -
4 Schroders PLC (voting rights) 147 0.01
47 Senior PLC 74 -
72 Serco Group PLC 98 0.01
9 Serica Energy PLC 10 -
24 Severfield PLC 19 -
10 Severn Trent PLC 244 0.01
114 Shanks Group PLC 62 -
74 SIG PLC 46 -
52 Signature Aviation PLC 205 0.01
5 Smart Metering Systems PLC 44 -
21 Smith & Nephew PLC 317 0.02
15 Smiths Group PLC 231 0.01
12 Softcat PLC 217 0.01
54 SolGold PLC 19 -
8 Spectris PLC 246 0.01
60 Speedy Hire PLC 45 -
2 Spirax-Sarco Engineering PLC 312 0.02
32 Spire Healthcare Group PLC 77 0.01
39 Spirent Communications PLC 96 0.01
11 Sportech PLC 3 -
31 Sports Direct International PLC 180 0.01
39 SSE PLC 606 0.03
59 SSP Group PLC 174 0.01
21 St James's Place PLC 289 0.02
29 St Modwen Properties PLC 160 0.01
50 Stagecoach Group PLC 44 -
98 Standard Chartered PLC 498 0.03
157 Standard Life Aberdeen PLC 431 0.02
13 SThree PLC 53 -
38 Stobart Group Ltd 12 -
17 Stock Spirits Group PLC 45 -
15 Strix Group PLC 46 -
4 Studio Retail Group PLC 10 -
2 STV Group PLC 8 -
6 SuperGroup PLC 25 -
37 Synthomer PLC 193 0.01
1 Takeaway.com NV 72 -
3 Takeaway.com NV (UK listing) 216 0.01
47 Tate & Lyle PLC 359 0.02
6 Tatton Asset Management PLC 26 -
185 Taylor Wimpey PLC 316 0.02
6 TBC Bank Group PLC 68 -
10 TClarke PLC 14 -
7 Ted Baker PLC 13 -
7 Telecom Plus PLC 87 0.01
401 Tesco PLC 895 0.05
7 TI Fluid Systems PLC 21 -
18 Topps Tiles PLC 14 -
69 TP ICAP Group PLC 148 0.01
20 Travis Perkins PLC 325 0.02
5 Trifast PLC 7 -
18 TT Electronics plc 45 -
17 TUI AG 72 -
Shares (000's)
Value(000's)
GBP
% of NetAssetValue
Common Stock (continued)
United Kingdom - 3.99% (continued)
130 Tullow Oil PLC 67 -
25 Tyman PLC 119 0.01
21 U & I Group PLC 20 -
18 UDG Healthcare PLC 188 0.01
5 Ultra Electronics Holdings PLC 110 0.01
27 Unilever PLC (Nitherland listing) 1,156 0.06
19 Unilever PLC (UK listing) 806 0.04
- Unilever PLC, ADR 19 -
27 United Utilities Group PLC 268 0.02
40 Vectura Group PLC 63 -
43 Vertu Motors PLC 19 -
19 Vesuvius PLC 108 0.01
3 Victrex PLC 83 0.01
135 Virgin Money UK PLC 284 0.02
19 Vistry Group PLC 256 0.01
2 Vitec Group PLC 30 -
10 Vivo Energy PLC 10 -
1,106 Vodafone Group PLC 1,412 0.07
1 Vodafone Group PLC, ADR 13 -
7 Volex PLC 26 -
16 Volution Group PLC 70 -
3 Vp PLC 26 -
16 Watches of Switzerland Group 128 0.01
14 Watkin Jones PLC 31 -
21 Weir Group PLC 406 0.02
9 WH Smith PLC 159 0.01
8 Whitbread PLC 262 0.01
22 Wickes Group PLC 57 -
1 Wilmington PLC 2 -
10 Wincanton PLC 43 -
- Wizz Air Holdings PLC 20 -
213 WM Morrison Supermarkets PLC 377 0.02
42 WPP PLC 405 0.02
3 Xaar PLC 6 -
2 XP Power Ltd 75 0.01
1 Young & Co's Brewery PLC NV 4 -
76,509 3.99
United States - 54.48%
1 10X Genomics Inc 97 0.01
3 1-800-Flowers.com Inc 69 -
2 1st Constitution Bancorp 27 -
3 1st Source Corp 121 0.01
8 2U Inc 199 0.01
8 3D Systems Corp 163 0.01
14 3M Co 2,059 0.11
2 A H Belo Corp 2 -
6 A10 Networks Inc 44 -
5 AAON Inc 214 0.01
3 AAR Corp 96 0.01
4 Aaron's Holdings Co Inc 108 0.01
22 Abbott Laboratories 1,822 0.10
36 AbbVie Inc 2,872 0.15
7 Abeona Therapeutics Inc 9 -
6 Abercrombie & Fitch Co 183 0.01
2 Abiomed Inc 315 0.02
7 ABM Industries Inc 251 0.01
6 Acacia Research Corp 23 -
10 Acadia Healthcare Co Inc 440 0.02
3 Acadia Pharmaceuticals Inc 52 -
2 Acceleron Pharma Inc 147 0.01
13 Accenture PLC 2,662 0.14
8 ACCO Brands Corp 54 -
World Equity FundPortfolio of Investments as at 31 May 2021 (continued)
Dimensional Fund Advisors Semi-Annual Report and Unaudited Financial Statements, 31 May 2021 499

Shares (000's)
Value(000's)
GBP
% of NetAssetValue
Common Stock (continued)
United States - 54.48% (continued)
8 Accuray Inc 23 -
16 Achillion Pharmaceuticals Inc 17 -
9 ACI Worldwide Inc 254 0.01
1 Aclaris Therapeutics Inc 8 -
1 ACM Research Inc 31 -
- Acme United Corp 12 -
1 ACNB Corp 25 -
23 Activision Blizzard Inc 1,569 0.08
4 Acuity Brands Inc 504 0.03
8 Acushnet Holdings Corp 296 0.02
- Adams Resources & Energy Inc 8 -
3 Adaptive Biotechnologies Corp 80 -
1 Addus HomeCare Corp 87 0.01
11 Adient PLC 399 0.02
5 Adobe Inc 1,656 0.09
37 ADT Inc 270 0.01
4 Adtalem Global Education Inc 103 0.01
5 ADTRAN Inc 72 -
2 Aduro Biotech Inc - -
7 Advance Auto Parts Inc 936 0.05
3 Advanced Drainage Systems Inc 216 0.01
1 Advanced Emissions Solutions Inc 8 -
3 Advanced Energy Industries Inc 221 0.01
8 Advanced Micro Devices Inc 468 0.02
3 AdvanSix Inc 74 -
16 AECOM 743 0.04
2 Aeglea BioTherapeutics Inc 11 -
2 AeroVironment Inc 151 0.01
31 AES Corp 553 0.03
5 Affiliated Managers Group Inc 608 0.03
25 Aflac Inc 1,014 0.05
9 AGCO Corp 853 0.05
8 Agilent Technologies Inc 747 0.04
1 Agilysys Inc 40 -
6 Agios Pharmaceuticals Inc 224 0.01
3 AgroFresh Solutions Inc 5 -
12 Air Lease Corp 381 0.02
5 Air Products and Chemicals Inc 1,136 0.06
6 Air Transport Services Group Inc 105 0.01
1 Airgain Inc 20 -
12 Akamai Technologies Inc 956 0.05
18 Akebia Therapeutics Inc 45 -
1 Alamo Group Inc 143 0.01
2 Alarm.com Holdings Inc 119 0.01
13 Alaska Air Group Inc 647 0.03
6 Alaska Communications Systems Group Inc 14 -
3 Albany International Corp 204 0.01
12 Albemarle Corp 1,367 0.07
1 Albireo Pharma Inc 24 -
19 Alcoa Corp 543 0.03
2 Aldeyra Therapeutics Inc 19 -
2 Alerus Financial Corp 41 -
8 Alexion Pharmaceuticals Inc 966 0.05
1 Alico Inc 23 -
1 Align Technology Inc 338 0.02
- Alithya Group Inc 1 -
17 Alkermes PLC 278 0.02
1 Allakos Inc 40 -
1 Alleghany Corp 570 0.03
14 Allegheny Technologies Inc 239 0.01
3 Allegiance Bancshares Inc 83 -
1 Allegiant Travel Co 185 0.01
Shares (000's)
Value(000's)
GBP
% of NetAssetValue
Common Stock (continued)
United States - 54.48% (continued)
6 Allegion PLC 628 0.03
2 ALLETE Inc 117 0.01
5 Alliance Data Systems Corp 423 0.02
11 Alliant Energy Corp 461 0.02
2 Allied Motion Technologies Inc 42 -
13 Allison Transmission Holdings Inc 384 0.02
23 Allscripts Healthcare Solutions Inc 277 0.01
21 Allstate Corp 2,017 0.11
41 Ally Financial Inc 1,573 0.08
2 Alnylam Pharmaceuticals Inc 180 0.01
3 Alpha & Omega Semiconductor Ltd 58 -
1 Alpha Metallurgical Resources 19 -
4 Alphabet Inc, Class A 7,194 0.38
4 Alphabet Inc, Class C 7,528 0.39
3 Alta Equipment Group Inc 31 -
2 Altabancorp 54 -
1 Altair Engineering Inc 62 -
1 Alteryx Inc 43 -
25 Altice USA Inc 633 0.03
8 Altra Industrial Motion Corp 380 0.02
45 Altria Group Inc 1,558 0.08
1 A-Mark Precious Metals Inc 38 -
5 Amazon.com Inc 11,789 0.62
4 Ambac Financial Group Inc 39 -
2 Ambarella Inc 137 0.01
4 AMC Networks Inc 132 0.01
17 Amcor Ltd 143 0.01
124 Amcor PLC 1,028 0.05
13 Amdocs Ltd 730 0.04
2 Amedisys Inc 312 0.02
2 Amerant Bancorp Inc 27 -
2 Amerco 871 0.05
8 Ameren Corp 498 0.03
3 Ameresco Inc 98 0.01
35 American Airlines Group Inc 600 0.03
12 American Axle & Manufacturing Holdings Inc 92 0.01
16 American Eagle Outfitters Inc 403 0.02
11 American Electric Power Co Inc 692 0.04
5 American Equity Investment Life Holding Co 99 0.01
21 American Express Co 2,413 0.13
9 American Financial Group Inc 864 0.05
30 American International Group Inc 1,129 0.06
2 American National Bankshares Inc 37 -
2 American National Group Inc 262 0.01
1 American Outdoor Brands Inc 32 -
2 American Public Education Inc 37 -
1 American River Bankshares 9 -
3 American Software Inc 44 -
3 American States Water Co 155 0.01
1 American Superconductor Corp 12 -
2 American Vanguard Corp 31 -
4 American Water Works Co Inc 437 0.02
2 American Woodmark Corp 142 0.01
1 America's Car-Mart Inc 66 -
12 Ameriprise Financial Inc 2,253 0.12
7 Ameris Bancorp 271 0.01
3 AMERISAFE Inc 118 0.01
13 AmerisourceBergen Corp 1,089 0.06
1 Ames National Corp 15 -
9 AMETEK Inc 840 0.04
15 Amgen Inc 2,528 0.13
26 Amkor Technology Inc 389 0.02
World Equity FundPortfolio of Investments as at 31 May 2021 (continued)
Dimensional Fund Advisors Semi-Annual Report and Unaudited Financial Statements, 31 May 2021 500

Shares (000's)
Value(000's)
GBP
% of NetAssetValue
Common Stock (continued)
United States - 54.48% (continued)
5 AMN Healthcare Services Inc 285 0.02
11 Amneal Pharmaceuticals Inc 43 -
1 Ampco-Pittsburgh Corp 5 -
7 Amphastar Pharmaceuticals Inc 91 0.01
18 Amphenol Corp 838 0.04
2 Amtech Systems Inc 14 -
11 Analog Devices Inc 1,332 0.07
2 Anaplan Inc 78 -
4 AnaptysBio Inc 60 -
4 Andersons Inc 93 0.01
3 ANGI Homeservices Inc 33 -
3 AngioDynamics Inc 56 -
1 ANI Pharmaceuticals Inc 31 -
2 Anika Therapeutics Inc 50 -
1 Ansys Inc 249 0.01
5 Antares Pharma Inc 15 -
1 Anterix Inc 44 -
54 Antero Midstream Corp 368 0.02
30 Antero Resources Corp 276 0.01
8 Anthem Inc 2,369 0.12
11 AO Smith Corp 541 0.03
8 Aon PLC 1,434 0.08
27 APA Corp 390 0.02
15 API Group Inc 222 0.01
3 Apogee Enterprises Inc 83 -
2 Apollo Medical Holdings Inc 45 -
- Appfolio Inc 38 -
1 Appian Corp 36 -
383 Apple Inc 33,651 1.76
4 Applied Genetic Technologies Corp 10 -
2 Applied Industrial Technologies Inc 146 0.01
27 Applied Materials Inc 2,620 0.14
1 Applied Optoelectronics Inc 8 -
5 AptarGroup Inc 553 0.03
8 Aptinyx Inc 15 -
9 Aptiv PLC 965 0.05
2 Apyx Medical Corp 15 -
22 Aramark 572 0.03
2 Aravive Inc 7 -
2 ArcBest Corp 107 0.01
23 Arch Capital Group Ltd 658 0.03
2 Arch Resources Inc 92 0.01
20 Archer-Daniels-Midland Co 943 0.05
17 Archrock Inc 112 0.01
12 Arconic Corp 307 0.02
5 Arcosa Inc 224 0.01
9 Ardelyx Inc 45 -
5 Ardmore Shipping Corp 15 -
4 Arena Pharmaceuticals Inc 193 0.01
3 Ares Management Corp 114 0.01
2 Argan Inc 69 -
4 Argo Group International Holdings Ltd 152 0.01
3 Arista Networks Inc 801 0.04
2 Arko Corp 14 -
5 Arlo Technologies Inc 25 -
3 Armstrong Flooring Inc 11 -
5 Armstrong World Industries Inc 375 0.02
8 Arrow Electronics Inc 679 0.04
2 Arrow Financial Corp 52 -
3 Arrowhead Pharmaceuticals Inc 140 0.01
1 Artesian Resources Corp 20 -
14 Arthur J Gallagher & Co 1,419 0.07
Shares (000's)
Value(000's)
GBP
% of NetAssetValue
Common Stock (continued)
United States - 54.48% (continued)
7 Artisan Partners Asset Management Inc 252 0.01
2 Arvinas Inc 101 0.01
2 Asbury Automotive Group Inc 258 0.01
7 ASGN Inc 473 0.03
6 Ashland Global Holdings Inc 379 0.02
2 Aspen Aerogels Inc 25 -
2 Aspen Group Inc 7 -
6 Aspen Technology Inc 552 0.03
5 Assembly Biosciences Inc 14 -
2 Assetmark Financial Holdings Inc 43 -
18 Associated Banc-Corp 291 0.02
1 Associated Capital Group Inc 17 -
6 Assurant Inc 691 0.04
9 Assured Guaranty Ltd 288 0.02
3 Astec Industries Inc 122 0.01
3 Astronics Corp, Class A 39 -
1 Astronics Corp, Class B 10 -
1 AstroNova Inc 9 -
4 At Home Group Inc 94 0.01
180 AT&T Inc 3,741 0.20
7 Atara Biotherapeutics Inc 68 -
22 Athene Holding Ltd 952 0.05
7 Atkore International Group Inc 371 0.02
3 Atlantic Capital Bancshares Inc 66 -
7 Atlantic Union Bankshares Corp 204 0.01
7 Atlantica Yield PLC 189 0.01
3 Atlanticus Holdings Corp 71 -
3 Atlas Air Worldwide Holdings Inc 142 0.01
- Atlassian Corp PLC 76 -
5 Atmos Energy Corp 344 0.02
1 ATN International Inc 45 -
2 AtriCure Inc 85 -
- Atrion Corp 74 -
1 Auburn National BanCorp Inc 17 -
19 Audacy Inc 58 -
5 Autodesk Inc 1,049 0.06
7 Autoliv Inc 550 0.03
11 Automatic Data Processing Inc 1,575 0.08
11 AutoNation Inc 817 0.04
- AutoZone Inc 471 0.03
2 Avalara Inc 175 0.01
5 Avangrid Inc 170 0.01
5 Avanos Medical Inc 136 0.01
34 Avantor Inc 764 0.04
7 Avaya Holdings Corp 133 0.01
6 Avery Dennison Corp 931 0.05
1 Aviat Networks Inc 36 -
1 Avid Bioservices Inc 9 -
4 Avid Technology Inc 87 0.01
10 Avient Corp 360 0.02
4 Avis Budget Group Inc 251 0.01
5 Avista Corp 165 0.01
11 Avnet Inc 351 0.02
3 Aware Inc 8 -
45 AXA Equitable Holdings Inc 1,008 0.05
24 Axalta Coating Systems Ltd 552 0.03
5 Axcelis Technologies Inc 140 0.01
2 Axcella Health Inc 5 -
9 Axis Capital Holdings Ltd 350 0.02
2 Axogen Inc 31 -
1 Axon Enterprise Inc 146 0.01
- Axonics Inc 9 -
World Equity FundPortfolio of Investments as at 31 May 2021 (continued)
Dimensional Fund Advisors Semi-Annual Report and Unaudited Financial Statements, 31 May 2021 501

Shares (000's)
Value(000's)
GBP
% of NetAssetValue
Common Stock (continued)
United States - 54.48% (continued)
6 Axos Financial Inc 200 0.01
6 AXT Inc 40 -
3 AZZ Inc 97 0.01
2 B Riley Financial Inc 113 0.01
4 B&G Foods Inc 85 -
2 Badger Meter Inc 155 0.01
45 Baker Hughes Co 772 0.04
3 Balchem Corp 249 0.01
12 Ball Corp 668 0.04
2 Ballantyne Strong Inc 9 -
3 Bally's Corp 102 0.01
6 Banc of California Inc 74 -
4 BancFirst Corp 204 0.01
8 Bancorp Inc 145 0.01
11 BancorpSouth Bank 247 0.01
127 Bank of America Corp 3,792 0.20
1 Bank of Commerce Holdings 13 -
4 Bank of Hawaii Corp 278 0.02
2 Bank of Marin Bancorp 40 -
32 Bank of New York Mellon Corp 1,192 0.06
5 Bank of NT Butterfield & Son Ltd 122 0.01
1 Bank of Princeton 28 -
1 Bank of South Carolina Corp 12 -
13 Bank OZK 396 0.02
2 BankFinancial Corp 17 -
9 BankUnited Inc 317 0.02
1 Bankwell Financial Group Inc 23 -
4 Banner Corp 183 0.01
2 Bar Harbor Bankshares 47 -
3 Barnes & Noble Education Inc 19 -
5 Barnes Group Inc 183 0.01
1 Barrett Business Services Inc 53 -
1 Bassett Furniture Industries Inc 17 -
1 Battalion Oil Corp 10 -
19 Baxter International Inc 1,085 0.06
2 BayCom Corp 23 -
2 BBX Capital Inc 13 -
3 BCB Bancorp Inc 26 -
9 Beacon Roofing Supply Inc 354 0.02
5 Beazer Homes USA Inc 77 -
7 Becton Dickinson and Co 1,271 0.07
12 Bed Bath & Beyond Inc 230 0.01
1 Bel Fuse Inc 15 -
5 Belden Inc 176 0.01
4 Benchmark Electronics Inc 86 -
31 Berkshire Hathaway Inc 6,244 0.33
5 Berkshire Hills Bancorp Inc 99 0.01
9 Berry Corp 42 -
13 Berry Global Group Inc 644 0.03
16 Best Buy Co Inc 1,342 0.07
1 Beyond Meat Inc 87 0.01
28 BGC Partners Inc 116 0.01
1 BGSF Inc 12 -
2 Big 5 Sporting Goods Corp 43 -
5 Big Lots Inc 208 0.01
- Biglari Holdings Inc, Class A 12 -
- Biglari Holdings Inc, Class B 41 -
1 Bill.com Holdings Inc 144 0.01
11 Biogen Inc 2,104 0.11
7 BioMarin Pharmaceutical Inc 377 0.02
2 Bio-Rad Laboratories Inc 742 0.04
2 Bio-Techne Corp 467 0.02
Shares (000's)
Value(000's)
GBP
% of NetAssetValue
Common Stock (continued)
United States - 54.48% (continued)
2 BJ's Restaurants Inc 90 0.01
10 BJ's Wholesale Club Holdings Inc 324 0.02
5 Black Hills Corp 215 0.01
12 Black Knight Inc 596 0.03
2 Blackbaud Inc 123 0.01
1 Blackline Inc 98 0.01
2 BlackRock Inc 1,446 0.08
12 Blackstone Group Inc 814 0.04
9 Bloomin' Brands Inc 187 0.01
4 Blucora Inc 43 -
2 Blue Bird Corp 32 -
3 Bluebird Bio Inc 75 -
2 Bluegreen Vacations Holding Corp 35 -
1 BM Technologies Inc 4 -
7 Boingo Wireless Inc 64 -
5 Boise Cascade Co 240 0.01
7 BOK Financial Corp 465 0.02
2 Bonanza Creek Energy Inc 71 -
- Booking Holdings Inc 559 0.03
4 Boot Barn Holdings Inc 196 0.01
10 Booz Allen Hamilton Holding Corp 622 0.03
25 BorgWarner Inc 901 0.05
1 Boston Beer Co Inc 661 0.03
2 Boston Omaha Corp 45 -
11 Boston Private Financial Holdings Inc 116 0.01
34 Boston Scientific Corp 1,030 0.05
3 Bottomline Technologies DE Inc 82 -
4 Box Inc 70 -
5 Brady Corp 182 0.01
2 Bridgebio Pharma Inc 73 -
2 Bridgewater Bancshares Inc 21 -
3 Bright Horizons Family Solutions Inc 303 0.02
2 Brightcove Inc 19 -
8 Brighthouse Financial Inc 282 0.02
8 Brightsphere Investment Group Inc 119 0.01
8 BrightView Holdings Inc 93 0.01
3 Brinker International Inc 117 0.01
6 Brink's Co 293 0.02
49 Bristol-Myers Squibb Co 2,247 0.12
10 Broadcom Inc 3,289 0.17
8 Broadridge Financial Solutions Inc 855 0.05
3 Broadwind Energy Inc 9 -
21 Brookdale Senior Living Inc 97 0.01
15 Brookfield Renewable Corp 447 0.02
11 Brookline Bancorp Inc 128 0.01
5 Brooks Automation Inc 371 0.02
22 Brown & Brown Inc 806 0.04
2 Brown-Forman Corp, Class A 124 0.01
11 Brown-Forman Corp, Class B 646 0.03
14 Bruker Corp 695 0.04
8 Brunswick Corp 592 0.03
3 Bryn Mawr Bank Corp 98 0.01
6 Buckle Inc 171 0.01
2 Build-A-Bear Workshop Inc 18 -
29 Builders FirstSource Inc 899 0.05
15 Bunge Ltd 943 0.05
1 Burlington Stores Inc 178 0.01
2 Business First Bancshares Inc 31 -
10 BWX Technologies Inc 445 0.02
5 Byline Bancorp Inc 79 -
1 C&F Financial Corp 25 -
1 Cable One Inc 642 0.03
World Equity FundPortfolio of Investments as at 31 May 2021 (continued)
Dimensional Fund Advisors Semi-Annual Report and Unaudited Financial Statements, 31 May 2021 502

Shares (000's)
Value(000's)
GBP
% of NetAssetValue
Common Stock (continued)
United States - 54.48% (continued)
5 Cabot Corp 232 0.01
43 Cabot Oil & Gas Corp 495 0.03
3 CACI International Inc 487 0.03
5 Cactus Inc 114 0.01
15 Cadence BanCorp 234 0.01
8 Cadence Design Systems Inc 742 0.04
8 Caesars Entertainment Inc 628 0.03
2 CAI International Inc 69 -
5 CalAmp Corp 47 -
2 Calavo Growers Inc 88 0.01
2 Caledonia Mining Corp PLC 19 -
3 Caleres Inc 61 -
4 California Water Service Group 149 0.01
11 Calithera Biosciences Inc 17 -
4 Calix Inc 125 0.01
5 Callaway Golf Co 142 0.01
4 Callon Petroleum Co 112 0.01
6 Cal-Maine Foods Inc 137 0.01
2 Calyxt Inc 6 -
1 Cambium Networks Corp 26 -
1 Cambridge Bancorp 51 -
2 Camden National Corp 68 -
23 Campbell Soup Co 798 0.04
2 Camping World Holdings Inc 60 -
10 Cannae Holdings Inc 244 0.01
1 Capital Bancorp Inc 20 -
2 Capital City Bank Group Inc 46 -
16 Capital One Financial Corp 1,821 0.10
14 Capitol Federal Financial Inc 130 0.01
15 Capri Holdings Ltd 605 0.03
3 Capstar Financial Holdings Inc 47 -
- Cara Therapeutics Inc 3 -
20 Cardinal Health Inc 801 0.04
1 Cardiovascular Systems Inc 17 -
6 Cardtronics PLC 165 0.01
4 Cargurus Inc 76 -
6 Carlisle Cos Inc 775 0.04
14 CarMax Inc 1,112 0.06
62 Carnival Corp 1,287 0.07
4 Carpenter Technology Corp 150 0.01
2 Carriage Services Inc 65 -
42 Carrier Global Corp 1,361 0.07
8 Carrols Restaurant Group Inc 31 -
8 Cars.com Inc 81 -
5 Carter's Inc 333 0.02
- Carvana Co 80 -
4 Casella Waste Systems Inc 210 0.01
4 Casey's General Stores Inc 628 0.03
2 Cass Information Systems Inc 68 -
7 Castlight Health Inc 9 -
2 Catabasis Pharmaceuticals Inc 3 -
12 Catalent Inc 918 0.05
3 Catalyst Biosciences Inc 10 -
7 Catalyst Pharmaceuticals Inc 26 -
18 Caterpillar Inc 3,053 0.16
8 Cathay General Bancorp 235 0.01
2 Cato Corp 23 -
1 Cavco Industries Inc 116 0.01
7 CBIZ Inc 164 0.01
10 Cboe Global Markets Inc 751 0.04
26 CBRE Group Inc 1,582 0.08
4 CBTX Inc 74 -
Shares (000's)
Value(000's)
GBP
% of NetAssetValue
Common Stock (continued)
United States - 54.48% (continued)
10 CDK Global Inc 368 0.02
9 CDW Corp 1,059 0.06
6 CECO Environmental Corp 30 -
9 Celanese Corp 1,079 0.06
1 Celsius Holdings Inc 37 -
20 Centene Corp 1,045 0.06
25 Centennial Resource Development Inc 94 0.01
26 CenterPoint Energy Inc 455 0.02
4 Central Garden & Pet Co (non-voting rights) 131 0.01
2 Central Garden & Pet Co (voting rights) 64 -
3 Central Pacific Financial Corp 49 -
2 Central Valley Community Bancorp 26 -
14 Century Aluminum Co 133 0.01
1 Century Bancorp Inc 50 -
4 Century Casinos Inc 37 -
3 Century Communities Inc 152 0.01
4 Cerence Inc 268 0.01
5 Ceridian HCM Holding Inc 337 0.02
21 Cerner Corp 1,181 0.06
2 CEVA Inc 54 -
21 CF Industries Holdings Inc 768 0.04
9 CH Robinson Worldwide Inc 602 0.03
22 ChampionX Corp 414 0.02
3 ChannelAdvisor Corp 55 -
3 Charles River Laboratories International Inc 758 0.04
27 Charles Schwab Corp 1,408 0.07
5 Chart Industries Inc 466 0.02
5 Charter Communications Inc 2,375 0.12
1 Chase Corp 80 -
3 Cheesecake Factory Inc 110 0.01
2 Chefs' Warehouse Inc 50 -
3 Chegg Inc 184 0.01
1 Chembio Diagnostics Inc 3 -
1 Chemed Corp 496 0.03
22 Chemours Co 561 0.03
1 Chemung Financial Corp 20 -
13 Cheniere Energy Inc 751 0.04
1 Chesapeake Utilities Corp 92 0.01
30 Chevron Corp 2,179 0.11
1 Chewy Inc 74 -
3 Chiasma Inc 10 -
14 Chico's FAS Inc 46 -
1 Children's Place Inc 39 -
5 Chimerix Inc 29 -
- Chipotle Mexican Grill Inc 311 0.02
4 Choice Hotels International Inc 305 0.02
8 Chubb Ltd 1,010 0.05
16 Church & Dwight Co Inc 993 0.05
1 Churchill Downs Inc 191 0.01
2 Chuy's Holdings Inc 66 -
13 Ciena Corp 484 0.03
11 Cigna Corp 2,076 0.11
12 Cimarex Energy Co 556 0.03
2 Cimpress PLC 111 0.01
4 Cincinnati Bell Inc 47 -
11 Cincinnati Financial Corp 981 0.05
12 Cinemark Holdings Inc 187 0.01
3 Cintas Corp 721 0.04
2 CIRCOR International Inc 66 -
5 Cirrus Logic Inc 297 0.02
161 Cisco Systems Inc 5,983 0.31
11 CIT Group Inc 397 0.02
World Equity FundPortfolio of Investments as at 31 May 2021 (continued)
Dimensional Fund Advisors Semi-Annual Report and Unaudited Financial Statements, 31 May 2021 503

Shares (000's)
Value(000's)
GBP
% of NetAssetValue
Common Stock (continued)
United States - 54.48% (continued)
1 Citi Trends Inc 65 -
34 Citigroup Inc 1,883 0.10
2 Citizens & Northern Corp 32 -
2 Citizens Community Bancorp Inc 18 -
31 Citizens Financial Group Inc 1,078 0.06
- Citizens Holding Co 6 -
1 Citizens Inc 5 -
6 Citrix Systems Inc 448 0.02
2 City Holding Co 86 -
1 Civeo Corp 15 -
2 Civista Bancshares Inc 41 -
4 Clarus Corp 72 -
22 Clean Energy Fuels Corp 124 0.01
6 Clean Harbors Inc 386 0.02
2 Clearfield Inc 42 -
1 ClearOne Inc 2 -
1 Clearwater Paper Corp 28 -
2 Clearway Energy Inc, Class A 43 -
6 Clearway Energy Inc, Class C 111 0.01
4 Clorox Co 531 0.03
32 Cloudera Inc 288 0.02
1 Cloudflare Inc 55 -
2 CMC Materials Inc 256 0.01
10 CME Group Inc 1,577 0.08
10 CMS Energy Corp 438 0.02
6 CNA Financial Corp 191 0.01
2 CNB Financial Corp 37 -
3 CNO Financial Group Inc 51 -
24 CNX Resources Corp 228 0.01
2 Coastal Financial Corp 37 -
92 Coca-Cola Co 3,577 0.19
1 Coca-Cola Consolidated Inc 265 0.01
3 Codexis Inc 38 -
1 Codorus Valley Bancorp Inc 16 -
20 Coeur Mining Inc 148 0.01
3 Cogent Communications Holdings Inc 174 0.01
8 Cognex Corp 435 0.02
18 Cognizant Technology Solutions Corp 912 0.05
7 Cognyte Software Ltd 132 0.01
5 Cohen & Steers Inc 251 0.01
2 Coherent Inc 347 0.02
6 Cohu Inc 147 0.01
13 Colfax Corp 395 0.02
17 Colgate-Palmolive Co 1,020 0.05
3 Collegium Pharmaceutical Inc 51 -
2 Colony Bankcorp Inc 26 -
7 Columbia Banking System Inc 224 0.01
14 Columbia Financial Inc 181 0.01
6 Columbia Sportswear Co 421 0.02
3 Columbus McKinnon Corp 120 0.01
159 Comcast Corp 6,440 0.34
13 Comerica Inc 693 0.04
3 Comfort Systems USA Inc 189 0.01
11 Commerce Bancshares Inc 630 0.03
11 Commercial Metals Co 248 0.01
4 Commercial Vehicle Group Inc 35 -
16 CommScope Holding Co Inc 235 0.01
2 Communications Systems Inc 8 -
6 Community Bank System Inc 344 0.02
3 Community Bankers Trust Corp 20 -
1 Community Financial Corp 21 -
8 Community Health Systems Inc 78 -
Shares (000's)
Value(000's)
GBP
% of NetAssetValue
Common Stock (continued)
United States - 54.48% (continued)
3 Community Trust Bancorp Inc 80 -
1 Community West Bancshares 4 -
2 CommVault Systems Inc 130 0.01
4 Compass Minerals International Inc 200 0.01
2 Computer Programs & Systems Inc 44 -
2 Computer Task Group Inc 16 -
9 comScore Inc 26 -
22 Comstock Resources Inc 86 -
3 Comtech Telecommunications Corp 49 -
35 Conagra Brands Inc 943 0.05
6 Concentrix Corp 613 0.03
4 Concert Pharmaceuticals Inc 10 -
1 Concrete Pumping Holdings Inc 5 -
18 Conduent Inc 99 0.01
2 CONMED Corp 188 0.01
5 ConnectOne Bancorp Inc 105 0.01
4 Conn's Inc 63 -
71 ConocoPhillips 2,782 0.15
4 CONSOL Energy Inc 43 -
11 Consolidated Communications Holdings Inc 73 -
7 Consolidated Edison Inc 379 0.02
2 Consolidated Water Co Ltd 15 -
5 Constellation Brands Inc 905 0.05
5 Construction Partners Inc 105 0.01
3 Consumer Portfolio Services Inc 10 -
6 Container Store Group Inc 53 -
21 Continental Resources Inc 477 0.03
4 Contra Zagg Inc - -
3 Cooper Cos Inc 881 0.05
7 Cooper Tire & Rubber Co 287 0.02
2 Cooper-Standard Holdings Inc 43 -
3 Copa Holdings SA 198 0.01
14 Copart Inc 1,290 0.07
11 Corcept Therapeutics Inc 164 0.01
4 Core Laboratories NV 131 0.01
1 Core Molding Technologies Inc 7 -
9 CoreLogic Inc 485 0.03
5 Core-Mark Holding Co Inc 157 0.01
2 Cornerstone OnDemand Inc 48 -
29 Corning Inc 903 0.05
27 Corteva Inc 875 0.05
1 CorVel Corp 125 0.01
2 Corvus Pharmaceuticals Inc 5 -
15 Costamare Inc 110 0.01
1 CoStar Group Inc 404 0.02
10 Costco Wholesale Corp 2,639 0.14
85 Coty Inc 531 0.03
1 County Bancorp Inc 22 -
1 Coupa Software Inc 100 0.01
16 Covanta Holding Corp 168 0.01
2 Covenant Transportation Group Inc 29 -
15 Covetrus Inc 291 0.02
3 Cowen Inc 88 0.01
1 CRA International Inc 35 -
2 Cracker Barrel Old Country Store Inc 241 0.01
6 Crane Co 418 0.02
6 Crawford & Co, Class A 40 -
3 Crawford & Co, Class B 21 -
2 Credit Acceptance Corp 572 0.03
8 Cree Inc 537 0.03
2 Crinetics Pharmaceuticals Inc 23 -
3 CRISPR Therapeutics AG 257 0.01
World Equity FundPortfolio of Investments as at 31 May 2021 (continued)
Dimensional Fund Advisors Semi-Annual Report and Unaudited Financial Statements, 31 May 2021 504

Shares (000's)
Value(000's)
GBP
% of NetAssetValue
Common Stock (continued)
United States - 54.48% (continued)
8 Crocs Inc 554 0.03
3 Cross Country Healthcare Inc 31 -
- Crowdstrike Holdings Inc 16 -
1 Crown Crafts Inc 7 -
14 Crown Holdings Inc 993 0.05
4 CryoLife Inc 88 0.01
4 CSG Systems International Inc 124 0.01
2 CSW Industrials Inc 132 0.01
30 CSX Corp 2,138 0.11
3 CTS Corp 90 0.01
6 Cullen/Frost Bankers Inc 543 0.03
2 Culp Inc 23 -
7 Cummins Inc 1,295 0.07
2 Cumulus Media Inc 19 -
1 Curo Group Holdings Corp 12 -
4 Curtiss-Wright Corp 397 0.02
23 Cushman & Wakefield PLC 310 0.02
3 Customers Bancorp Inc 73 -
- Cutera Inc 11 -
15 CVB Financial Corp 230 0.01
10 CVR Energy Inc 143 0.01
34 CVS Health Corp 2,090 0.11
1 CyberOptics Corp 17 -
1 Cyclerion Therapeutics Inc 2 -
7 Cymabay Therapeutics Inc 21 -
2 CytomX Therapeutics Inc 8 -
- Daily Journal Corp 23 -
8 Daktronics Inc 37 -
19 Dana Inc 357 0.02
7 Danaher Corp 1,229 0.06
8 Darden Restaurants Inc 777 0.04
21 Darling Ingredients Inc 1,029 0.05
10 Daseke Inc 52 -
- Datadog Inc 29 -
3 Dave & Buster's Entertainment Inc 95 0.01
13 DaVita Inc 1,078 0.06
4 Dawson Geophysical Co 7 -
3 Deckers Outdoor Corp 809 0.04
10 Deere & Co 2,546 0.13
5 Del Taco Restaurants Inc 36 -
9 Delek US Holdings Inc 134 0.01
5 Dell Technologies Inc 343 0.02
2 Delta Air Lines Inc 63 -
1 Delta Apparel Inc 14 -
5 Deluxe Corp 161 0.01
8 Denali Therapeutics Inc 352 0.02
5 Denbury Inc 245 0.01
4 Denny's Corp 54 -
22 Dentsply Sirona Inc 1,028 0.05
8 Designer Brands Inc 96 0.01
63 Devon Energy Corp 1,176 0.06
1 DexCom Inc 193 0.01
10 DHI Group Inc 22 -
20 DHT Holdings Inc 91 0.01
- Diamond Hill Investment Group Inc 52 -
14 Diamondback Energy Inc 772 0.04
8 Dick's Sporting Goods Inc 561 0.03
3 Digi International Inc 44 -
7 Digital Turbine Inc 306 0.02
2 Dillard's Inc 215 0.01
5 Dime Community Bancshares Inc 114 0.01
6 Diodes Inc 298 0.02
Shares (000's)
Value(000's)
GBP
% of NetAssetValue
Common Stock (continued)
United States - 54.48% (continued)
21 Discover Financial Services 1,718 0.09
14 Discovery Inc, Class A 309 0.02
25 Discovery Inc, Class C 537 0.03
22 DISH Network Corp 672 0.04
1 DLH Holdings Corp 10 -
1 DMC Global Inc 36 -
1 DocuSign Inc 179 0.01
4 Dolby Laboratories Inc 282 0.02
9 Dollar General Corp 1,342 0.07
19 Dollar Tree Inc 1,271 0.07
9 Dominion Energy Inc 458 0.02
2 Domino's Pizza Inc 456 0.02
6 Domtar Corp 211 0.01
13 Donaldson Co Inc 559 0.03
4 Donegal Group Inc 43 -
5 Donnelley Financial Solutions Inc 95 0.01
4 Dorian LPG Ltd 38 -
2 Dorman Products Inc 150 0.01
2 Douglas Dynamics Inc 47 -
13 Dover Corp 1,342 0.07
30 Dow Inc 1,428 0.08
26 DR Horton Inc 1,775 0.09
5 Dril-Quip Inc 118 0.01
26 Dropbox Inc 503 0.03
3 DSP Group Inc 32 -
8 DTE Energy Co 737 0.04
1 Ducommun Inc 42 -
13 Duke Energy Corp 889 0.05
12 DuPont de Nemours Inc 711 0.04
26 DXC Technology Co 699 0.04
2 DXP Enterprises Inc 50 -
2 Dyadic International Inc 6 -
4 Dycom Industries Inc 226 0.01
5 Dynatrace Inc 189 0.01
3 DZS Inc 29 -
4 Eagle Bancorp Inc 172 0.01
1 Eagle Bancorp Montana Inc 19 -
2 Eagle Bulk Shipping Inc 54 -
3 Eagle Materials Inc 283 0.02
1 Eagle Pharmaceuticals Inc 30 -
3 Earthstone Energy Inc 23 -
15 East West Bancorp Inc 796 0.04
1 Eastern Co 27 -
14 Eastman Chemical Co 1,249 0.07
14 Eaton Corp PLC 1,478 0.08
32 eBay Inc 1,365 0.07
2 Ebix Inc 44 -
2 Echo Global Logistics Inc 55 -
7 EchoStar Corp 125 0.01
6 Ecolab Inc 930 0.05
7 Edgewell Personal Care Co 212 0.01
14 Edison International 551 0.03
3 Editas Medicine Inc 71 -
10 Edwards Lifesciences Corp 670 0.04
3 eGain Corp 23 -
2 eHealth Inc 86 -
1 Eiger BioPharmaceuticals Inc 5 -
5 El Pollo Loco Holdings Inc 64 -
6 Elanco Animal Health Inc (non-voting rights) - -
35 Elanco Animal Health Inc (voting rights) 891 0.05
2 Elastic NV 132 0.01
1 Electromed Inc 9 -
World Equity FundPortfolio of Investments as at 31 May 2021 (continued)
Dimensional Fund Advisors Semi-Annual Report and Unaudited Financial Statements, 31 May 2021 505

Shares (000's)
Value(000's)
GBP
% of NetAssetValue
Common Stock (continued)
United States - 54.48% (continued)
8 Electronic Arts Inc 812 0.04
27 Element Solutions Inc 446 0.02
5 Elevate Credit Inc 13 -
4 elf Beauty Inc 76 -
14 Eli Lilly & Co 1,912 0.10
- Elmira Savings Bank 1 -
6 EMCOR Group Inc 569 0.03
5 EMCORE Corp 33 -
5 Emerald Holding Inc 19 -
4 Emergent BioSolutions Inc 170 0.01
38 Emerson Electric Co 2,580 0.14
4 Employers Holdings Inc 106 0.01
3 Enanta Pharmaceuticals Inc 97 0.01
10 Encompass Health Corp 591 0.03
4 Encore Capital Group Inc 127 0.01
2 Encore Wire Corp 111 0.01
16 Endo International PLC 67 -
6 Energizer Holdings Inc 198 0.01
6 Energy Recovery Inc 76 -
5 Enerpac Tool Group Corp 104 0.01
5 EnerSys 311 0.02
1 Eneti Inc 13 -
56 EnLink Midstream LLC 193 0.01
2 Ennis Inc 35 -
4 Enova International Inc 116 0.01
9 Enphase Energy Inc 934 0.05
2 EnPro Industries Inc 153 0.01
5 Ensign Group Inc 317 0.02
2 Enstar Group Ltd 349 0.02
11 Entegris Inc 910 0.05
7 Entergy Corp 513 0.03
2 Enterprise Bancorp Inc 39 -
4 Enterprise Financial Services Corp 124 0.01
6 Entravision Communications Corp 20 -
3 Envestnet Inc 144 0.01
15 Envista Holdings Corp 464 0.02
7 Enzo Biochem Inc 15 -
27 EOG Resources Inc 1,529 0.08
2 EPAM Systems Inc 743 0.04
5 Epizyme Inc 31 -
2 ePlus Inc 124 0.01
6 Epsilon Energy Ltd 17 -
28 EQT Corp 413 0.02
6 Equifax Inc 1,027 0.05
44 Equitrans Midstream Corp 257 0.01
2 Equity Bancshares Inc 54 -
2 Erie Indemnity Co 309 0.02
2 Escalade Inc 34 -
3 ESCO Technologies Inc 178 0.01
1 Esquire Financial Holdings Inc 19 -
1 ESSA Bancorp Inc 17 -
12 Essent Group Ltd 408 0.02
12 Essential Utilities Inc 421 0.02
4 Estee Lauder Cos Inc 822 0.04
3 Ethan Allen Interiors Inc 59 -
7 Etsy Inc 786 0.04
3 Euronet Worldwide Inc 344 0.02
1 Evans Bancorp Inc 17 -
3 Eventbrite Inc 42 -
4 Evercore Inc 401 0.02
4 Everest Re Group Ltd 767 0.04
10 Evergy Inc 419 0.02
Shares (000's)
Value(000's)
GBP
% of NetAssetValue
Common Stock (continued)
United States - 54.48% (continued)
6 Everi Holdings Inc 85 -
7 Eversource Energy 400 0.02
9 Evertec Inc 262 0.01
2 Evo Payments Inc 42 -
13 Evolent Health Inc 174 0.01
6 Evolution Petroleum Corp 14 -
10 Evoqua Water Technologies Corp 227 0.01
8 EW Scripps Co 124 0.01
4 Exact Sciences Corp 292 0.02
20 Exelixis Inc 314 0.02
22 Exelon Corp 706 0.04
3 ExlService Holdings Inc 203 0.01
1 ExOne Co 18 -
2 eXp World Holdings Inc 36 -
1 Expedia Group Inc 135 0.01
10 Expeditors International of Washington Inc 863 0.05
3 Exponent Inc 185 0.01
17 Extended Stay America Inc 234 0.01
3 Exterran Corp 10 -
66 Exxon Mobil Corp 2,726 0.14
5 EZCORP Inc 26 -
5 F5 Networks Inc 668 0.04
4 Fabrinet 258 0.01
79 Facebook Inc 18,379 0.96
3 FactSet Research Systems Inc 590 0.03
2 Fair Isaac Corp 663 0.04
2 Farmer Brothers Co 17 -
1 Farmers & Merchants Bancorp Inc 17 -
4 Farmers National Banc Corp 50 -
2 FARO Technologies Inc 85 -
16 Fastenal Co 607 0.03
2 Fate Therapeutics Inc 103 0.01
4 FB Financial Corp 127 0.01
1 Federal Agricultural Mortgage Corp 69 -
6 Federal Signal Corp 186 0.01
10 Federated Investors Inc 234 0.01
17 FedEx Corp 3,663 0.19
3 FedNat Holding Co 9 -
8 Ferro Corp 121 0.01
5 Ferroglobe PLC 16 -
12 Ferroglobe Representation & Warrants InsuranceTrust - -
2 FibroGen Inc 32 -
30 Fidelity National Financial Inc 1,002 0.05
10 Fidelity National Information Services Inc 1,030 0.05
3 Fiesta Restaurant Group Inc 27 -
50 Fifth Third Bancorp 1,472 0.08
2 Financial Institutions Inc 43 -
18 FireEye Inc 279 0.02
13 First American Financial Corp 573 0.03
4 First Bancorp 119 0.01
20 First Bancorp (Puerto Rico listing) 178 0.01
1 First Bancorp Inc 20 -
2 First Bancshares Inc 67 -
3 First Bank 28 -
7 First Busey Corp 140 0.01
1 First Business Financial Services Inc 25 -
- First Capital Inc 13 -
1 First Choice Bancorp 32 -
1 First Citizens BancShares Inc 499 0.03
14 First Commonwealth Financial Corp 148 0.01
3 First Community Bankshares Inc 55 -
World Equity FundPortfolio of Investments as at 31 May 2021 (continued)
Dimensional Fund Advisors Semi-Annual Report and Unaudited Financial Statements, 31 May 2021 506

Shares (000's)
Value(000's)
GBP
% of NetAssetValue
Common Stock (continued)
United States - 54.48% (continued)
1 First Community Corp 16 -
11 First Financial Bancorp 190 0.01
9 First Financial Bankshares Inc 335 0.02
2 First Financial Corp 56 -
1 First Financial Northwest Inc 11 -
6 First Foundation Inc 110 0.01
1 First Guaranty Bancshares Inc 15 -
14 First Hawaiian Inc 277 0.01
59 First Horizon National Corp 787 0.04
1 First Internet Bancorp 31 -
4 First Interstate BancSystem Inc 141 0.01
5 First Merchants Corp 147 0.01
2 First Mid Bancshares Inc 67 -
14 First Midwest Bancorp Inc 208 0.01
2 First Northwest Bancorp 21 -
3 First of Long Island Corp 55 -
9 First Republic Bank 1,251 0.07
- First Savings Financial Group Inc 21 -
12 First Solar Inc 639 0.03
2 First United Corp 21 -
1 First US Bancshares Inc 8 -
1 First Western Financial Inc 14 -
4 FirstCash Inc 237 0.01
22 FirstEnergy Corp 575 0.03
17 Fiserv Inc 1,392 0.07
5 Five Below Inc 611 0.03
4 Five Point Holdings LLC 20 -
5 Five Star Senior Living Inc 21 -
1 Five9 Inc 119 0.01
6 Flagstar Bancorp Inc 178 0.01
5 FleetCor Technologies Inc 1,032 0.05
54 Flex Ltd 699 0.04
2 Flexsteel Industries Inc 50 -
6 Floor & Decor Holdings Inc 401 0.02
9 Flotek Industries Inc 14 -
19 Flowers Foods Inc 329 0.02
14 Flowserve Corp 424 0.02
11 Fluent Inc 22 -
10 Fluidigm Corp 40 -
15 Fluor Corp 195 0.01
3 Flushing Financial Corp 43 -
11 FMC Corp 893 0.05
34 FNB Corp 326 0.02
1 FONAR Corp 19 -
11 Foot Locker Inc 504 0.03
176 Ford Motor Co 1,801 0.09
6 Forestar Group Inc 102 0.01
5 FormFactor Inc 130 0.01
2 Forrester Research Inc 57 -
5 Forterra Inc 80 -
5 Fortinet Inc 694 0.04
4 Fortitude Gold Corp 24 -
19 Fortive Corp 995 0.05
13 Fortune Brands Home & Security Inc 910 0.05
1 Forum Energy Technologies Inc 10 -
2 Forward Air Corp 161 0.01
6 Fossil Group Inc 55 -
30 Fox Corp, Class A 785 0.04
22 Fox Corp, Class B 559 0.03
3 Fox Factory Holding Corp 353 0.02
1 Franklin Covey Co 22 -
3 Franklin Electric Co Inc 196 0.01
Shares (000's)
Value(000's)
GBP
% of NetAssetValue
Common Stock (continued)
United States - 54.48% (continued)
1 Franklin Financial Services Corp 13 -
52 Franklin Resources Inc 1,263 0.07
23 Frank's International NV 54 -
53 Freeport-McMoRan Inc 1,584 0.08
1 FreightCar America Inc 6 -
1 Frequency Electronics Inc 10 -
4 Fresh Del Monte Produce Inc 97 0.01
1 Freshpet Inc 63 -
4 Frontdoor Inc 168 0.01
1 FRP Holdings Inc 42 -
1 FS Bancorp Inc 30 -
4 FTI Consulting Inc 367 0.02
- FTS International Inc 3 -
3 Full House Resorts Inc 27 -
16 Fulton Financial Corp 199 0.01
5 FutureFuel Corp 36 -
1 FVCBankcorp Inc 17 -
4 G1 Therapeutics Inc 56 -
1 Gaia Inc 9 -
1 GAMCO Investors Inc 14 -
12 Gannett Co Inc 43 -
41 Gap Inc 970 0.05
14 Garmin Ltd 1,371 0.07
7 Gartner Inc 1,100 0.06
9 GasLog Ltd 37 -
21 Gates Industrial Corp PLC 266 0.01
3 GATX Corp 228 0.01
8 GCP Applied Technologies Inc 137 0.01
3 Genasys Inc 11 -
4 Genco Shipping & Trading Ltd 46 -
2 Gencor Industries Inc 14 -
7 Generac Holdings Inc 1,557 0.08
129 General Electric Co 1,277 0.07
37 General Mills Inc 1,628 0.09
89 General Motors Co 3,725 0.19
1 Genesco Inc 56 -
4 Genie Energy Ltd 17 -
15 Genpact Ltd 489 0.03
21 Gentex Corp 515 0.03
3 Gentherm Inc 175 0.01
10 Genuine Parts Co 952 0.05
15 Genworth Financial Inc 43 -
2 Geospace Technologies Corp 14 -
4 German American Bancorp Inc 115 0.01
3 Gibraltar Industries Inc 166 0.01
4 G-III Apparel Group Ltd 97 0.01
45 Gilead Sciences Inc 2,084 0.11
10 Glacier Bancorp Inc 413 0.02
3 Glatfelter Corp 30 -
3 Glaukos Corp 133 0.01
1 Global Blood Therapeutics Inc 37 -
1 Global Indemnity Group LLC 23 -
10 Global Payments Inc 1,420 0.07
2 Global Water Resources Inc 20 -
2 Globant SA 293 0.02
12 Globe Life Inc 865 0.05
6 Globus Medical Inc 282 0.02
4 GlycoMimetics Inc 7 -
5 GMS Inc 160 0.01
9 GoDaddy Inc 500 0.03
14 Gold Resource Corp 28 -
8 Goldman Sachs Group Inc 2,173 0.11
World Equity FundPortfolio of Investments as at 31 May 2021 (continued)
Dimensional Fund Advisors Semi-Annual Report and Unaudited Financial Statements, 31 May 2021 507

Shares (000's)
Value(000's)
GBP
% of NetAssetValue
Common Stock (continued)
United States - 54.48% (continued)
2 Goodrich Petroleum Corp 12 -
26 Goodyear Tire & Rubber Co 366 0.02
7 GoPro Inc 52 -
3 Gorman-Rupp Co 82 -
2 GP Strategies Corp 26 -
14 Graco Inc 731 0.04
13 GrafTech International Ltd 126 0.01
2 Graham Corp 18 -
- Graham Holdings Co 221 0.01
5 Grand Canyon Education Inc 310 0.02
5 Granite Construction Inc 139 0.01
28 Graphic Packaging Holding Co 344 0.02
12 Gray Television Inc 203 0.01
3 Great Elm Group Inc 6 -
8 Great Lakes Dredge & Dock Corp 87 0.01
2 Great Southern Bancorp Inc 82 -
7 Great Western Bancorp Inc 172 0.01
6 Green Brick Partners Inc 90 0.01
6 Green Dot Corp 174 0.01
4 Green Plains Inc 92 0.01
3 Greenbrier Cos Inc 104 0.01
1 Greene County Bancorp Inc 17 -
1 Greenhill & Co Inc 13 -
5 Greenlight Capital Re Ltd 33 -
4 Greif Inc (non-voting rights) 156 0.01
2 Greif Inc (voting rights) 78 -
4 Griffon Corp 79 -
3 Gritstone Oncology Inc 17 -
3 Grocery Outlet Holding Corp 74 -
1 Group 1 Automotive Inc 156 0.01
1 Groupon Inc 35 -
7 Grubhub Inc 306 0.02
3 GSI Technology Inc 15 -
6 GTT Communications Inc 7 -
1 Guaranty Bancshares Inc 23 -
1 Guaranty Federal Bancshares Inc 10 -
3 Guardant Health Inc 218 0.01
8 Guess? Inc 155 0.01
4 Guidewire Software Inc 255 0.01
1 Gulf Island Fabrication Inc 4 -
5 H&E Equipment Services Inc 132 0.01
15 H&R Block Inc 255 0.01
3 Hackett Group Inc 38 -
4 Haemonetics Corp 168 0.01
11 Hain Celestial Group Inc 327 0.02
96 Halliburton Co 1,523 0.08
1 Hallmark Financial Services Inc 3 -
11 Halozyme Therapeutics Inc 310 0.02
2 Hamilton Beach Brands Holding Co 27 -
2 Hamilton Lane Inc 151 0.01
10 Hancock Whitney Corp 351 0.02
39 Hanesbrands Inc 533 0.03
3 Hanger Inc 63 -
3 Hanmi Financial Corp 47 -
4 Hanover Insurance Group Inc 394 0.02
7 HarborOne Bancorp Inc 74 -
16 Harley-Davidson Inc 560 0.03
11 Harmonic Inc 54 -
1 Harpoon Therapeutics Inc 15 -
11 Harsco Corp 177 0.01
26 Hartford Financial Services Group Inc 1,218 0.06
5 Harvard Bioscience Inc 27 -
Shares (000's)
Value(000's)
GBP
% of NetAssetValue
Common Stock (continued)
United States - 54.48% (continued)
11 Hasbro Inc 751 0.04
2 Haverty Furniture Cos Inc 69 -
8 Hawaiian Electric Industries Inc 243 0.01
6 Hawaiian Holdings Inc 101 0.01
3 Hawkins Inc 74 -
1 Hawthorn Bancshares Inc 25 -
1 Haynes International Inc 22 -
6 HB Fuller Co 268 0.01
8 HC2 Holdings Inc 22 -
6 HCA Healthcare Inc 913 0.05
1 HCI Group Inc 59 -
6 Healthcare Services Group Inc 135 0.01
4 HealthEquity Inc 225 0.01
3 HealthStream Inc 55 -
11 Heartland Express Inc 137 0.01
5 Heartland Financial USA Inc 172 0.01
59 Hecla Mining Co 376 0.02
5 HEICO Corp, Class A 434 0.02
3 HEICO Corp, Class B 270 0.01
3 Heidrick & Struggles International Inc 76 -
2 Helen of Troy Ltd 260 0.01
4 Helios Technologies Inc 207 0.01
15 Helix Energy Solutions Group Inc 56 -
12 Helmerich & Payne Inc 233 0.01
3 Hemisphere Media Group Inc 26 -
1 Hennessy Advisors Inc 7 -
12 Henry Schein Inc 669 0.04
9 Herbalife Nutrition Ltd 340 0.02
4 Herc Holdings Inc 290 0.02
7 Heritage Commerce Corp 60 -
5 Heritage Financial Corp 94 0.01
4 Heritage Insurance Holdings Inc 23 -
3 Heritage-Crystal Clean Inc 73 -
7 Herman Miller Inc 229 0.01
9 Heron Therapeutics Inc 80 -
5 Hershey Co 617 0.03
1 Heska Corp 75 -
23 Hess Corp 1,367 0.07
91 Hewlett Packard Enterprise Co 1,018 0.05
9 Hexcel Corp 357 0.02
2 Hibbett Sports Inc 106 0.01
9 Hill International Inc 16 -
7 Hillenbrand Inc 219 0.01
6 Hill-Rom Holdings Inc 433 0.02
6 Hilltop Holdings Inc 166 0.01
5 Hilton Grand Vacations Inc 153 0.01
7 Hilton Worldwide Holdings Inc 604 0.03
- Hingham Institution for Savings 54 -
1 HMN Financial Inc 8 -
4 HNI Corp 132 0.01
18 HollyFrontier Corp 416 0.02
23 Hologic Inc 1,033 0.05
1 Home Bancorp Inc 30 -
18 Home BancShares Inc 353 0.02
13 Home Depot Inc 2,905 0.15
2 HomeStreet Inc 67 -
2 HomeTrust Bancshares Inc 41 -
20 Honeywell International Inc 3,331 0.17
1 Hooker Furniture Corp 20 -
12 Hope Bancorp Inc 132 0.01
5 Horace Mann Educators Corp 152 0.01
5 Horizon Bancorp Inc 67 -
World Equity FundPortfolio of Investments as at 31 May 2021 (continued)
Dimensional Fund Advisors Semi-Annual Report and Unaudited Financial Statements, 31 May 2021 508

Shares (000's)
Value(000's)
GBP
% of NetAssetValue
Common Stock (continued)
United States - 54.48% (continued)
14 Horizon Therapeutics PLC 911 0.05
15 Hormel Foods Corp 518 0.03
16 Hostess Brands Inc 177 0.01
16 Houghton Mifflin Harcourt Co 113 0.01
4 Houlihan Lokey Inc 231 0.01
2 Houston Wire & Cable Co 8 -
2 Howard Bancorp Inc 28 -
5 Howard Hughes Corp 367 0.02
46 Howmet Aerospace Inc 1,154 0.06
34 HP Inc 697 0.04
3 Hub Group Inc 149 0.01
5 Hubbell Inc 727 0.04
- HubSpot Inc 121 0.01
6 Humana Inc 1,762 0.09
89 Huntington Bancshares Inc 994 0.05
4 Huntington Ingalls Industries Inc 621 0.03
23 Huntsman Corp 452 0.02
- Hurco Cos Inc 12 -
3 Huron Consulting Group Inc 114 0.01
2 Huttig Building Products Inc 7 -
4 Hyatt Hotels Corp 246 0.01
2 Hyster-Yale Materials Handling Inc 91 0.01
1 I3 Verticals Inc 28 -
10 IAA Inc 390 0.02
1 IAC/InterActiveCorp 102 0.01
3 ICF International Inc 155 0.01
2 Ichor Holdings Ltd 72 -
2 ICU Medical Inc 249 0.01
3 IDACORP Inc 192 0.01
2 Ideaya Biosciences Inc 23 -
2 Identiv Inc 24 -
6 IDEX Corp 958 0.05
3 IDEXX Laboratories Inc 1,115 0.06
5 IDT Corp 100 0.01
2 IEC Electronics Corp 14 -
3 IES Holdings Inc 112 0.01
- IF Bancorp Inc 3 -
12 iHeartMedia Inc 196 0.01
7 IHS Markit Ltd 502 0.03
9 II-VI Inc 422 0.02
8 Illinois Tool Works Inc 1,312 0.07
1 Illumina Inc 423 0.02
6 IMAX Corp 97 0.01
2 Immersion Corp 10 -
1 ImmunityBio Inc 15 -
3 Incyte Corp 195 0.01
- Independence Contract Drilling Inc - -
2 Independence Holding Co 61 -
4 Independent Bank Corp (Massachusetts) 222 0.01
3 Independent Bank Corp (Michigan) 50 -
5 Independent Bank Group Inc 297 0.02
16 Infinera Corp 110 0.01
8 Information Services Group Inc 35 -
3 InfuSystem Holdings Inc 33 -
28 Ingersoll Rand Inc 985 0.05
3 Ingevity Corp 148 0.01
1 Ingles Markets Inc 43 -
7 Ingredion Inc 462 0.02
3 Innospec Inc 187 0.01
2 Innovative Solutions & Support Inc 8 -
12 Innoviva Inc 118 0.01
2 Inogen Inc 75 -
Shares (000's)
Value(000's)
GBP
% of NetAssetValue
Common Stock (continued)
United States - 54.48% (continued)
6 Inovalon Holdings Inc 138 0.01
4 Insight Enterprises Inc 285 0.02
3 Insperity Inc 226 0.01
4 Installed Building Products Inc 308 0.02
3 Insteel Industries Inc 70 -
1 Insulet Corp 111 0.01
4 Integer Holdings Corp 228 0.01
6 Integra LifeSciences Holdings Corp 299 0.02
178 Intel Corp 7,152 0.37
4 Intellia Therapeutics Inc 207 0.01
3 Inter Parfums Inc 140 0.01
2 Interactive Brokers Group Inc 78 -
9 Intercontinental Exchange Inc 701 0.04
3 InterDigital Inc 196 0.01
7 Interface Inc 76 -
6 International Bancshares Corp 206 0.01
27 International Business Machines Corp 2,720 0.14
18 International Flavors & Fragrances Inc (US listing) 1,753 0.09
22 International Game Technology PLC 371 0.02
33 International Paper Co 1,473 0.08
4 International Seaways Inc 49 -
40 Interpublic Group of Cos Inc 949 0.05
2 Intersect ENT Inc 24 -
2 inTEST Corp 15 -
4 Intevac Inc 18 -
4 Intra-Cellular Therapies Inc 100 0.01
2 Intrepid Potash Inc 41 -
1 IntriCon Corp 18 -
3 Intuit Inc 920 0.05
- Intuitive Surgical Inc 182 0.01
4 Invacare Corp 25 -
52 Invesco Ltd 1,036 0.05
2 Investar Holding Corp 30 -
22 Investors Bancorp Inc 233 0.01
- Investors Title Co 42 -
4 Ionis Pharmaceuticals Inc 102 0.01
1 Iovance Biotherapeutics Inc 12 -
3 IPG Photonics Corp 449 0.02
7 IQVIA Holdings Inc 1,222 0.06
1 iRadimed Corp 12 -
- iRhythm Technologies Inc 21 -
15 Iridium Communications Inc 406 0.02
1 iRobot Corp 102 0.01
12 Ironwood Pharmaceuticals Inc 101 0.01
3 Iteris Inc 14 -
4 Itron Inc 242 0.01
8 ITT Inc 532 0.03
6 IVERIC bio Inc 31 -
2 J Alexander's Holdings Inc 19 -
1 J&J Snack Foods Corp 162 0.01
5 j2 Global Inc 413 0.02
16 Jabil Inc 654 0.03
4 Jack Henry & Associates Inc 427 0.02
2 Jack in the Box Inc 134 0.01
9 Jacobs Engineering Group Inc 867 0.05
3 James River Group Holdings Ltd 65 -
20 Janus Henderson Group PLC 544 0.03
6 Jazz Pharmaceuticals PLC 767 0.04
10 JB Hunt Transport Services Inc 1,165 0.06
26 Jefferies Financial Group Inc 593 0.03
11 JELD-WEN Holding Inc 218 0.01
30 JetBlue Airways Corp 428 0.02
World Equity FundPortfolio of Investments as at 31 May 2021 (continued)
Dimensional Fund Advisors Semi-Annual Report and Unaudited Financial Statements, 31 May 2021 509

Shares (000's)
Value(000's)
GBP
% of NetAssetValue
Common Stock (continued)
United States - 54.48% (continued)
9 JM Smucker Co 842 0.04
1 John B Sanfilippo & Son Inc 74 -
3 John Bean Technologies Corp 339 0.02
5 John Wiley & Sons Inc, Class A 245 0.01
1 John Wiley & Sons Inc, Class B 25 -
84 Johnson & Johnson 10,024 0.52
27 Johnson Controls International PLC 1,253 0.07
1 Johnson Outdoors Inc 107 0.01
1 Joint Corp 62 -
5 Jones Lang LaSalle Inc 766 0.04
6 Jounce Therapeutics Inc 32 -
77 JPMorgan Chase & Co 8,925 0.47
34 Juniper Networks Inc 625 0.03
1 Kadant Inc 150 0.01
9 Kadmon Holdings Inc 23 -
1 Kaiser Aluminum Corp 77 -
6 Kala Pharmaceuticals Inc 23 -
7 Kansas City Southern 1,493 0.08
17 KAR Auction Services Inc 210 0.01
- Karuna Therapeutics Inc 23 -
10 KB Home 327 0.02
16 KBR Inc 449 0.02
9 Kearny Financial Corp 85 -
12 Kellogg Co 536 0.03
3 Kelly Services Inc 58 -
7 Kemper Corp 368 0.02
9 Kennametal Inc 239 0.01
15 Kennedy-Wilson Holdings Inc 204 0.01
26 Keurig Dr Pepper Inc 688 0.04
- Kewaunee Scientific Corp 3 -
68 KeyCorp 1,104 0.06
9 Keysight Technologies Inc 936 0.05
2 Kforce Inc 94 0.01
2 Kimball Electronics Inc 36 -
5 Kimball International Inc 42 -
7 Kimberly-Clark Corp 686 0.04
74 Kinder Morgan Inc 958 0.05
4 Kindred Biosciences Inc 13 -
1 Kingstone Cos Inc 8 -
2 Kiniksa Pharmaceuticals Ltd 14 -
1 Kinsale Capital Group Inc 72 -
6 Kirby Corp 278 0.02
14 KKR & Co Inc 539 0.03
6 KLA Corp 1,258 0.07
19 Knight-Swift Transportation Holdings Inc 631 0.03
5 Knoll Inc 99 0.01
12 Knowles Corp 176 0.01
15 Kohl's Corp 586 0.03
4 Kontoor Brands Inc 166 0.01
2 Koppers Holdings Inc 43 -
6 Korn Ferry 271 0.01
38 Kosmos Energy Ltd 85 -
34 Kraft Heinz Co 1,038 0.05
3 Kraton Corp 73 -
12 Kratos Defense & Security Solutions Inc 207 0.01
72 Kroger Co 1,886 0.10
10 Kronos Worldwide Inc 117 0.01
1 Krystal Biotech Inc 58 -
6 Kulicke & Soffa Industries Inc 227 0.01
2 Kura Oncology Inc 36 -
2 KVH Industries Inc 24 -
12 L Brands Inc 576 0.03
Shares (000's)
Value(000's)
GBP
% of NetAssetValue
Common Stock (continued)
United States - 54.48% (continued)
7 L3Harris Technologies Inc 1,142 0.06
9 Laboratory Corp of America Holdings 1,690 0.09
7 Lakeland Bancorp Inc 92 0.01
3 Lakeland Financial Corp 108 0.01
1 Lakeland Industries Inc 20 -
6 Lam Research Corp 2,710 0.14
11 Lamb Weston Holdings Inc 667 0.04
3 Lancaster Colony Corp 334 0.02
3 Landec Corp 23 -
1 Landmark Bancorp Inc 17 -
4 Lands' End Inc 77 -
3 Landstar System Inc 373 0.02
4 Lannett Co Inc 11 -
9 Lantheus Holdings Inc 152 0.01
4 Lantronix Inc 17 -
2 Laredo Petroleum Inc 63 -
5 Las Vegas Sands Corp 203 0.01
7 Lattice Semiconductor Corp 279 0.02
15 Laureate Education Inc 156 0.01
1 Lawson Products Inc 41 -
11 Lazard Ltd 369 0.02
5 La-Z-Boy Inc 139 0.01
1 Lazydays Holdings Inc 13 -
1 LB Foster Co 18 -
2 LCI Industries 244 0.01
2 LCNB Corp 26 -
- Leaf Group Ltd 2 -
7 Lear Corp 893 0.05
1 Legacy Housing Corp 19 -
14 Leggett & Platt Inc 541 0.03
10 Leidos Holdings Inc 716 0.04
2 LeMaitre Vascular Inc 70 -
7 LendingClub Corp 74 -
- LendingTree Inc 42 -
18 Lennar Corp, Class A 1,247 0.07
1 Lennar Corp, Class B 69 -
2 Lennox International Inc 514 0.03
1 LENSAR Inc 8 -
1 Level One Bancorp Inc 18 -
2 LGI Homes Inc 289 0.02
2 LHC Group Inc 332 0.02
1 Liberty Broadband Corp, Class A 105 0.01
10 Liberty Broadband Corp, Class C 1,129 0.06
7 Liberty Latin America Ltd, Class A 72 -
18 Liberty Latin America Ltd, Class C 180 0.01
1 Liberty Media Corp-Liberty Braves, Class A 18 -
4 Liberty Media Corp-Liberty Braves, Class C 73 -
3 Liberty Media Corp-Liberty Formula One, Class A 84 -
21 Liberty Media Corp-Liberty Formula One, Class C 664 0.04
7 Liberty Media Corp-Liberty SiriusXM, Class A 222 0.01
16 Liberty Media Corp-Liberty SiriusXM, Class C 488 0.03
19 Liberty Oilfield Services Inc 197 0.01
5 Liberty TripAdvisor Holdings Inc 17 -
3 Lifetime Brands Inc 33 -
1 Lifevantage Corp 7 -
1 Lifeway Foods Inc 4 -
2 Ligand Pharmaceuticals Inc 129 0.01
3 LightPath Technologies Inc 6 -
12 Limelight Networks Inc 27 -
2 Limoneira Co 33 -
3 Lincoln Educational Services Corp 14 -
5 Lincoln Electric Holdings Inc 487 0.03
World Equity FundPortfolio of Investments as at 31 May 2021 (continued)
Dimensional Fund Advisors Semi-Annual Report and Unaudited Financial Statements, 31 May 2021 510

Shares (000's)
Value(000's)
GBP
% of NetAssetValue
Common Stock (continued)
United States - 54.48% (continued)
20 Lincoln National Corp 1,005 0.05
1 Lindblad Expeditions Holdings Inc 12 -
12 Linde PLC 2,458 0.13
1 Lindsay Corp 110 0.01
11 Lions Gate Entertainment Corp, Class A 147 0.01
14 Lions Gate Entertainment Corp, Class B 169 0.01
5 Liquidity Services Inc 85 -
3 Lithia Motors Inc 807 0.04
2 Littelfuse Inc 286 0.02
5 LivaNova PLC 292 0.02
7 Live Nation Entertainment Inc 460 0.02
5 Live Oak Bancshares Inc 199 0.01
12 Livent Corp 166 0.01
5 LiveRamp Holdings Inc 183 0.01
32 LKQ Corp 1,131 0.06
29 Loews Corp 1,178 0.06
1 Loral Space & Communications Inc 33 -
8 Louisiana-Pacific Corp 392 0.02
13 Lowe's Cos Inc 1,794 0.09
8 LPL Financial Holdings Inc 876 0.05
5 LSB Industries Inc 24 -
3 LSI Industries Inc 17 -
2 Luby's Inc 6 -
4 Lululemon Athletica Inc 908 0.05
112 Lumen Technologies Inc 1,092 0.06
6 Lumentum Holdings Inc 327 0.02
6 Luminex Corp 145 0.01
1 Lumos Pharma Inc 9 -
3 Luna Innovations Inc 22 -
5 Luther Burbank Corp 47 -
2 Lydall Inc 52 -
5 Lyft Inc 217 0.01
21 LyondellBasell Industries NV 1,679 0.09
8 M&T Bank Corp 901 0.05
2 M/I Homes Inc 83 -
6 Macatawa Bank Corp 40 -
1 Mackinac Financial Corp 20 -
3 MACOM Technology Solutions Holdings Inc 105 0.01
8 Macquarie Infrastructure Corp 200 0.01
5 MacroGenics Inc 111 0.01
35 Macy's Inc 447 0.02
2 Madison Square Garden Entertainment Corp 120 0.01
1 Madrigal Pharmaceuticals Inc 62 -
1 Magellan Health Inc 93 0.01
2 Magenta Therapeutics Inc 20 -
3 MagnaChip Semiconductor Corp 43 -
11 Magnolia Oil & Gas Corp 102 0.01
7 Maiden Holdings Ltd 17 -
1 MainStreet Bancshares Inc 21 -
3 Malibu Boats Inc 156 0.01
1 Malvern Bancorp Inc 12 -
2 Mammoth Energy Services Inc 5 -
7 Manhattan Associates Inc 627 0.03
4 Manitex International Inc 22 -
5 Manitowoc Co Inc 84 -
2 Manning & Napier Inc 10 -
6 ManpowerGroup Inc 470 0.03
3 ManTech International Corp 170 0.01
69 Marathon Oil Corp 589 0.03
31 Marathon Petroleum Corp 1,340 0.07
9 Marchex Inc 16 -
5 Marcus & Millichap Inc 135 0.01
Shares (000's)
Value(000's)
GBP
% of NetAssetValue
Common Stock (continued)
United States - 54.48% (continued)
3 Marcus Corp 41 -
1 Marine Products Corp 12 -
3 MarineMax Inc 119 0.01
2 Marinus Pharmaceuticals Inc 20 -
1 Markel Corp 790 0.04
2 MarketAxess Holdings Inc 506 0.03
1 Marlin Business Services Corp 21 -
10 Marriott International Inc 1,003 0.05
5 Marriott Vacations Worldwide Corp 547 0.03
19 Marsh & McLennan Cos Inc 1,856 0.10
7 Marten Transport Ltd 89 0.01
5 Martin Marietta Materials Inc 1,275 0.07
21 Marvell Technology Inc 729 0.04
14 Masco Corp 589 0.03
2 Masimo Corp 321 0.02
3 Masonite International Corp 265 0.01
8 MasTec Inc 668 0.04
15 Mastercard Inc 3,686 0.19
1 MasterCraft Boat Holdings Inc 10 -
13 Matador Resources Co 286 0.02
5 Match Group Inc 471 0.03
3 Materion Corp 146 0.01
3 Matrix Service Co 27 -
5 Matson Inc 247 0.01
22 Mattel Inc 327 0.02
4 Matthews International Corp 110 0.01
3 Maxar Technologies Inc (Canada listing) 73 -
8 Maxar Technologies Inc (US listing) 177 0.01
7 Maxim Integrated Products Inc 498 0.03
6 MAXIMUS Inc 401 0.02
4 MaxLinear Inc 117 0.01
1 Mayville Engineering Co Inc 19 -
8 MBIA Inc 53 -
12 McCormick & Co Inc (non-voting rights) 752 0.04
1 McCormick & Co Inc (voting rights) 58 -
9 McDonald's Corp 1,502 0.08
10 McEwen Mining Inc 10 -
3 McGrath RentCorp 195 0.01
9 McKesson Corp 1,265 0.07
8 MDC Holdings Inc 321 0.02
21 MDU Resources Group Inc 507 0.03
5 Media General Inc CVR - -
1 Medifast Inc 309 0.02
11 MEDNAX Inc 257 0.01
2 Medpace Holdings Inc 259 0.01
20 Medtronic PLC 1,760 0.09
1 MeiraGTx Holdings PLC 11 -
2 Mercantile Bank Corp 51 -
8 Mercer International Inc 86 -
3 Merchants Bancorp 90 0.01
65 Merck & Co Inc 3,495 0.18
6 Mercury General Corp 267 0.01
3 Mercury Systems Inc 160 0.01
4 Meredith Corp 106 0.01
7 Meridian Bancorp Inc 115 0.01
6 Meridian Bioscience Inc 86 -
1 Meridian Corp 13 -
4 Merit Medical Systems Inc 181 0.01
3 Meritage Homes Corp 194 0.01
8 Meritor Inc 154 0.01
2 Merrimack Pharmaceuticals Inc 9 -
4 Mersana Therapeutics Inc 37 -
World Equity FundPortfolio of Investments as at 31 May 2021 (continued)
Dimensional Fund Advisors Semi-Annual Report and Unaudited Financial Statements, 31 May 2021 511

Shares (000's)
Value(000's)
GBP
% of NetAssetValue
Common Stock (continued)
United States - 54.48% (continued)
5 Mesa Air Group Inc 37 -
5 Meta Financial Group Inc 171 0.01
4 Methode Electronics Inc 126 0.01
30 MetLife Inc 1,384 0.07
2 Metropolitan Bank Holding Corp 68 -
1 Mettler-Toledo International Inc 806 0.04
3 MGE Energy Inc 135 0.01
35 MGIC Investment Corp 366 0.02
32 MGM Resorts International 980 0.05
2 MGP Ingredients Inc 102 0.01
9 Microchip Technology Inc 946 0.05
32 Micron Technology Inc 1,902 0.10
172 Microsoft Corp 30,344 1.58
- MicroStrategy Inc 138 0.01
1 Mid Penn Bancorp Inc 18 -
6 Middleby Corp 739 0.04
1 Middlefield Banc Corp 14 -
1 Middlesex Water Co 86 0.01
2 Midland States Bancorp Inc 44 -
2 MidWestOne Financial Group Inc 34 -
1 Miller Industries Inc 27 -
3 Mimecast Ltd 98 0.01
4 Minerals Technologies Inc 219 0.01
1 Mirati Therapeutics Inc 91 0.01
3 Mistras Group Inc 25 -
4 Mitek Systems Inc 42 -
5 MKS Instruments Inc 630 0.03
1 MMA Capital Holdings Inc 15 -
- Model N Inc 8 -
2 Moderna Inc 274 0.01
4 Modine Manufacturing Co 54 -
1 ModivCare Inc 126 0.01
4 Moelis & Co 164 0.01
5 Mohawk Industries Inc 790 0.04
6 Molina Healthcare Inc 1,024 0.05
17 Molson Coors Brewing Co 717 0.04
1 Monarch Casino & Resort Inc 45 -
21 Mondelez International Inc 930 0.05
4 MoneyGram International Inc 29 -
2 MongoDB Inc 381 0.02
1 Monolithic Power Systems Inc 333 0.02
4 Monro Inc 186 0.01
16 Monster Beverage Corp 1,031 0.05
6 Moody's Corp 1,335 0.07
3 Moog Inc 207 0.01
47 Morgan Stanley 3,000 0.16
2 Morningstar Inc 402 0.02
35 Mosaic Co 894 0.05
2 Motorcar Parts of America Inc 33 -
4 Motorola Solutions Inc 593 0.03
1 Movado Group Inc 25 -
11 Mr Cooper Group Inc 279 0.02
9 MRC Global Inc 70 -
2 MSA Safety Inc 273 0.01
4 MSC Industrial Direct Co Inc 287 0.02
2 MSCI Inc 631 0.03
5 MSG Networks Inc 50 -
6 Mueller Industries Inc 203 0.01
20 Mueller Water Products Inc 207 0.01
18 Murphy Oil Corp 272 0.01
3 Murphy USA Inc 276 0.01
2 MVB Financial Corp 46 -
Shares (000's)
Value(000's)
GBP
% of NetAssetValue
Common Stock (continued)
United States - 54.48% (continued)
3 Myers Industries Inc 41 -
1 MYR Group Inc 90 0.01
9 Myriad Genetics Inc 177 0.01
1 Nabors Industries Ltd 61 -
1 Nabriva Therapeutics PLC 1 -
- NACCO Industries Inc 5 -
- NanoString Technologies Inc 15 -
2 Napco Security Technologies Inc 35 -
13 Nasdaq Inc 1,506 0.08
2 Natera Inc 129 0.01
- Nathan's Famous Inc 20 -
3 National Bank Holdings Corp 80 -
1 National Bankshares Inc 23 -
5 National Beverage Corp 182 0.01
5 National CineMedia Inc 18 -
6 National Fuel Gas Co 227 0.01
2 National HealthCare Corp 114 0.01
10 National Instruments Corp 300 0.02
2 National Research Corp 82 -
6 National Vision Holdings Inc 208 0.01
- National Western Life Group Inc 66 -
1 Natural Alternatives International Inc 13 -
1 Natural Gas Services Group Inc 6 -
3 Natural Grocers by Vitamin Cottage Inc 27 -
- Natural Health Trends Corp 2 -
3 Nature's Sunshine Products Inc 40 -
3 Natus Medical Inc 65 -
3 Nautilus Inc 39 -
25 Navient Corp 324 0.02
5 Navistar International Corp 149 0.01
6 NBT Bancorp Inc 164 0.01
14 NCR Corp 482 0.03
2 Neenah Inc 88 0.01
19 Nektar Therapeutics 243 0.01
2 Nelnet Inc 119 0.01
3 Neogen Corp 226 0.01
5 NeoGenomics Inc 137 0.01
5 NeoPhotonics Corp 33 -
17 NetApp Inc 948 0.05
3 Netflix Inc 1,079 0.06
4 NETGEAR Inc 107 0.01
8 NetScout Systems Inc 163 0.01
2 NetSol Technologies Inc 6 -
3 Neurocrine Biosciences Inc 214 0.01
2 New Fortress Energy Inc 71 -
2 New Home Co Inc 8 -
11 New Jersey Resources Corp 317 0.02
1 New Relic Inc 60 -
52 New York Community Bancorp Inc 440 0.02
12 New York Times Co 366 0.02
10 NewAge Inc 16 -
45 Newell Brands Inc 917 0.05
18 Newmark Group Inc 164 0.01
1 NewMarket Corp 287 0.02
35 Newmont Goldcorp Corp 1,836 0.10
8 Newpark Resources Inc 19 -
36 News Corp, Class A 676 0.04
24 News Corp, Class B 435 0.02
4 NewStar Financial Inc CVR - -
6 Nexa Resources SA 46 -
5 Nexstar Media Group Inc 519 0.03
22 NextEra Energy Inc 1,121 0.06
World Equity FundPortfolio of Investments as at 31 May 2021 (continued)
Dimensional Fund Advisors Semi-Annual Report and Unaudited Financial Statements, 31 May 2021 512

Shares (000's)
Value(000's)
GBP
% of NetAssetValue
Common Stock (continued)
United States - 54.48% (continued)
9 NextGen Healthcare Inc 100 0.01
22 NexTier Oilfield Solutions Inc 65 -
2 NGM Biopharmaceuticals Inc 18 -
3 NI Holdings Inc 37 -
1 Nicholas Financial Inc 8 -
1 Nicolet Bankshares Inc 81 -
35 Nielsen Holdings PLC 679 0.04
14 NIKE Inc 1,377 0.07
20 NiSource Inc 357 0.02
2 NL Industries Inc 12 -
9 NMI Holdings Inc 150 0.01
6 NN Inc 33 -
3 Noodles & Co 27 -
9 Nordic American Tankers Ltd 23 -
5 Nordson Corp 713 0.04
1 Nordstrom Inc 13 -
9 Norfolk Southern Corp 1,802 0.09
1 Northeast Bank 20 -
2 Northern Technologies International Corp 21 -
17 Northern Trust Corp 1,477 0.08
6 Northfield Bancorp Inc 72 -
1 Northrim BanCorp Inc 19 -
16 Northwest Bancshares Inc 161 0.01
2 Northwest Natural Holding Co 84 -
1 Northwest Pipe Co 31 -
4 NorthWestern Corp 169 0.01
26 NortonLifeLock Inc 504 0.03
28 Norwegian Cruise Line Holdings Ltd 637 0.03
2 Norwood Financial Corp 29 -
39 NOV Inc 446 0.02
2 Novanta Inc 223 0.01
2 Novavax Inc 158 0.01
1 Novocure Ltd 185 0.01
10 NOW Inc 75 -
26 NRG Energy Inc 598 0.03
7 Nu Skin Enterprises Inc 287 0.02
16 Nuance Communications Inc 592 0.03
17 Nucor Corp 1,254 0.07
4 NuVasive Inc 169 0.01
2 NV5 Global Inc 107 0.01
- NVE Corp 15 -
18 nVent Electric PLC 419 0.02
4 NVIDIA Corp 1,955 0.10
- NVR Inc 1,102 0.06
1 Oak Valley Bancorp 16 -
78 Occidental Petroleum Corp 1,434 0.08
10 Oceaneering International Inc 104 0.01
8 OceanFirst Financial Corp 128 0.01
1 Ocwen Financial Corp 14 -
2 Odonate Therapeutics Inc 4 -
7 ODP Corp 209 0.01
5 OFG Bancorp 93 0.01
10 OGE Energy Corp 235 0.01
1 Ohio Valley Banc Corp 15 -
18 O-I Glass Inc 237 0.01
6 Oil States International Inc 26 -
1 Oil-Dri Corp of America 26 -
- Okta Inc 57 -
7 Old Dominion Freight Line Inc 1,319 0.07
17 Old National Bancorp 222 0.01
- Old Point Financial Corp 6 -
31 Old Republic International Corp 573 0.03
Shares (000's)
Value(000's)
GBP
% of NetAssetValue
Common Stock (continued)
United States - 54.48% (continued)
4 Old Second Bancorp Inc 40 -
16 Olin Corp 548 0.03
5 Ollie's Bargain Outlet Holdings Inc 334 0.02
1 Olympic Steel Inc 23 -
1 Omega Flex Inc 88 0.01
3 Omnicell Inc 311 0.02
19 Omnicom Group Inc 1,088 0.06
43 ON Semiconductor Corp 1,210 0.06
3 ONE Gas Inc 166 0.01
14 OneMain Holdings Inc 577 0.03
32 ONEOK Inc 1,186 0.06
3 OneSpan Inc 52 -
4 OneSpaWorld Holdings Ltd 33 -
5 Onto Innovation Inc 274 0.01
61 OPKO Health Inc 165 0.01
2 Oppenheimer Holdings Inc 59 -
4 Option Care Health Inc 47 -
47 Oracle Corp 2,584 0.14
8 OraSure Technologies Inc 52 -
6 ORBCOMM Inc 49 -
2 O'Reilly Automotive Inc 833 0.04
2 Orgenesis Inc 6 -
3 Origin Bancorp Inc 98 0.01
- Orion Energy Systems Inc 1 -
2 Orion Group Holdings Inc 10 -
1 Ormat Technologies Inc (Israel listing) 37 -
6 Ormat Technologies Inc (US listing) 273 0.01
1 Orrstown Financial Services Inc 25 -
3 Orthofix Medical Inc 74 -
1 OrthoPediatrics Corp 46 -
7 Oshkosh Corp 668 0.04
2 OSI Systems Inc 163 0.01
2 Osmotica Pharmaceuticals PLC 3 -
9 Otis Worldwide Corp 523 0.03
3 Otonomy Inc 5 -
3 Otter Tail Corp 96 0.01
11 Overseas Shipholding Group Inc 17 -
15 Ovintiv Inc (Canada listing) 274 0.01
12 Ovintiv Inc (US listing) 219 0.01
9 Owens & Minor Inc 271 0.01
11 Owens Corning 855 0.05
2 Oxford Industries Inc 109 0.01
13 PACCAR Inc 824 0.04
1 Pacific Biosciences of California 19 -
3 Pacific Mercantile Bancorp 18 -
9 Pacific Premier Bancorp Inc 306 0.02
3 Pacira BioSciences Inc 107 0.01
10 Packaging Corp of America 1,044 0.05
12 PacWest Bancorp 384 0.02
1 PagerDuty Inc 17 -
1 Palo Alto Networks Inc 135 0.01
1 PAM Transportation Services Inc 27 -
2 Papa John's International Inc 157 0.01
7 Par Pacific Holdings Inc 70 -
1 PAR Technology Corp 28 -
3 Park Aerospace Corp 33 -
2 Park National Corp 187 0.01
1 Parke Bancorp Inc 22 -
8 Parker-Hannifin Corp 1,652 0.09
2 Park-Ohio Holdings Corp 50 -
2 Parsons Corp 56 -
3 Patrick Industries Inc 168 0.01
World Equity FundPortfolio of Investments as at 31 May 2021 (continued)
Dimensional Fund Advisors Semi-Annual Report and Unaudited Financial Statements, 31 May 2021 513

Shares (000's)
Value(000's)
GBP
% of NetAssetValue
Common Stock (continued)
United States - 54.48% (continued)
9 Patterson Cos Inc 218 0.01
22 Patterson-UTI Energy Inc 132 0.01
13 Paychex Inc 939 0.05
2 Paycom Software Inc 570 0.03
2 Paylocity Holding Corp 226 0.01
9 PayPal Holdings Inc 1,668 0.09
13 PBF Energy Inc 151 0.01
4 PC Connection Inc 122 0.01
2 PCB Bancorp 25 -
2 PCSB Financial Corp 26 -
3 PC-Tel Inc 12 -
12 PDC Energy Inc 344 0.02
3 PDF Solutions Inc 32 -
19 PDL BioPharma Inc 32 -
13 Peabody Energy Corp 60 -
2 Peapack Gladstone Financial Corp 55 -
2 Pegasystems Inc 165 0.01
9 Penn National Gaming Inc 503 0.03
2 Penn Virginia Corp 32 -
2 Pennant Group Inc 51 -
1 Penns Woods Bancorp Inc 22 -
9 Penske Automotive Group Inc 562 0.03
14 Pentair PLC 666 0.04
1 Penumbra Inc 155 0.01
2 Peoples Bancorp Inc 51 -
1 Peoples Bancorp of North Carolina Inc 16 -
1 Peoples Financial Services Corp 27 -
44 People's United Financial Inc 587 0.03
22 PepsiCo Inc 2,287 0.12
7 Perdoceo Education Corp 59 -
3 Perficient Inc 154 0.01
14 Performance Food Group Co 478 0.03
10 Performant Financial Corp 22 -
8 PerkinElmer Inc 849 0.04
2 Perma-Fix Environmental Services Inc 9 -
1 Perma-Pipe International Holdings Inc 6 -
14 Perrigo Co PLC 471 0.03
1 PetIQ Inc 42 -
2 PetMed Express Inc 38 -
3 Pfenex Inc 2 -
82 Pfizer Inc 2,235 0.12
3 PFSweb Inc 14 -
77 PG&E Corp 548 0.03
7 PGT Innovations Inc 126 0.01
3 Phibro Animal Health Corp 59 -
18 Philip Morris International Inc 1,245 0.07
15 Phillips 66 917 0.05
5 Photronics Inc 47 -
2 PHX Minerals Inc 3 -
5 Pieris Pharmaceuticals Inc 12 -
18 Pilgrim's Pride Corp 297 0.02
2 Ping Identity Holding Corp 33 -
8 Pinnacle Financial Partners Inc 522 0.03
6 Pinnacle West Capital Corp 347 0.02
1 Pinterest Inc 50 -
20 Pioneer Natural Resources Co 2,123 0.11
2 Piper Jaffray Cos 202 0.01
27 Pitney Bowes Inc 157 0.01
3 Pixelworks Inc 8 -
1 PJT Partners Inc 57 -
5 Planet Fitness Inc 273 0.01
14 Playa Hotels & Resorts NV 70 -
Shares (000's)
Value(000's)
GBP
% of NetAssetValue
Common Stock (continued)
United States - 54.48% (continued)
3 Plexus Corp 220 0.01
3 Plug Power Inc 56 -
1 Plumas Bancorp 12 -
10 PNC Financial Services Group Inc 1,370 0.07
4 PNM Resources Inc 144 0.01
4 Polaris Inc 350 0.02
3 Ponce de Leon Federal Bank 30 -
3 Pool Corp 885 0.05
9 Popular Inc 507 0.03
7 Portland General Electric Co 221 0.01
7 Post Holdings Inc 574 0.03
2 Potbelly Corp 11 -
1 Powell Industries Inc 29 -
6 Power Integrations Inc 345 0.02
15 PPG Industries Inc 1,910 0.10
28 PPL Corp 568 0.03
11 PQ Group Holdings Inc 127 0.01
5 PRA Group Inc 125 0.01
7 PRA Health Sciences Inc 849 0.04
2 Preferred Bank 88 0.01
1 Preformed Line Products Co 34 -
2 Premier Financial Bancorp Inc 28 -
3 Premier Financial Corp 74 -
9 Premier Inc 209 0.01
5 Prestige Consumer Healthcare Inc 177 0.01
3 PriceSmart Inc 206 0.01
- PrimeEnergy Resources Corp 5 -
4 Primerica Inc 462 0.02
2 Primis Financial Corp 18 -
6 Primoris Services Corp 137 0.01
19 Principal Financial Group Inc 884 0.05
8 ProAssurance Corp 129 0.01
55 Procter & Gamble Co 5,266 0.28
9 PROG Holdings Inc 317 0.02
8 Progenics Pharmaceuticals Inc - -
4 Progress Software Corp 111 0.01
35 Progressive Corp 2,462 0.13
1 Proofpoint Inc 171 0.01
11 ProPetro Holding Corp 74 -
10 Prosperity Bancshares Inc 544 0.03
2 Protagonist Therapeutics Inc 49 -
1 Protective Insurance Corp 23 -
2 Prothena Corp PLC 50 -
1 Proto Labs Inc 64 -
3 Provident Bancorp Inc 31 -
2 Provident Financial Holdings Inc 20 -
5 Provident Financial Services Inc 91 0.01
1 Prudential Bancorp Inc 8 -
14 Prudential Financial Inc 1,040 0.05
1 Psychemedics Corp 5 -
3 PTC Inc 328 0.02
3 PTC Therapeutics Inc 84 -
11 Public Service Enterprise Group Inc 491 0.03
25 PulteGroup Inc 1,032 0.05
2 Pure Cycle Corp 15 -
11 Pure Storage Inc 152 0.01
4 Purple Innovation Inc 70 -
8 PVH Corp 618 0.03
2 Pzena Investment Management Inc 16 -
1 Q2 Holdings Inc 37 -
1 QAD Inc, Class A 52 -
2 QCR Holdings Inc 78 -
World Equity FundPortfolio of Investments as at 31 May 2021 (continued)
Dimensional Fund Advisors Semi-Annual Report and Unaudited Financial Statements, 31 May 2021 514

Shares (000's)
Value(000's)
GBP
% of NetAssetValue
Common Stock (continued)
United States - 54.48% (continued)
8 Qorvo Inc 1,024 0.05
5 Quad/Graphics Inc 12 -
- Quaker Chemical Corp 27 -
22 QUALCOMM Inc 2,064 0.11
2 Qualys Inc 135 0.01
2 Quanex Building Products Corp 46 -
19 Quanta Services Inc 1,246 0.07
12 Quest Diagnostics Inc 1,080 0.06
3 Quidel Corp 231 0.01
5 QuinStreet Inc 68 -
4 Quotient Technology Inc 30 -
50 Qurate Retail Inc 484 0.03
19 R1 RCM Inc 312 0.02
18 Radian Group Inc 302 0.02
9 Radiant Logistics Inc 49 -
6 RadNet Inc 107 0.01
2 Rafael Holdings Inc 81 -
6 Ralph Lauren Corp 483 0.03
2 Ramaco Resources Inc 7 -
13 Rambus Inc 185 0.01
1 Randolph Bancorp Inc 14 -
24 Range Resources Corp 229 0.01
4 Ranpak Holdings Corp 59 -
3 Raven Industries Inc 87 0.01
14 Raymond James Financial Inc 1,339 0.07
10 Rayonier Advanced Materials Inc 55 -
25 Raytheon Technologies Corp 1,547 0.08
2 RBB Bancorp 31 -
2 RBC Bearings Inc 264 0.01
1 RCI Hospitality Holdings Inc 44 -
3 RE/MAX Holdings Inc 63 -
2 Reading International Inc 10 -
3 RealNetworks Inc 5 -
15 Realogy Holdings Corp 190 0.01
- Red River Bancshares Inc 15 -
1 Red Robin Gourmet Burgers Inc 24 -
7 Red Rock Resorts Inc 229 0.01
2 Redfin Corp 79 -
4 Regal Beloit Corp 397 0.02
4 Regeneron Pharmaceuticals Inc 1,520 0.08
3 REGENXBIO Inc 64 -
1 Regional Management Corp 43 -
68 Regions Financial Corp 1,126 0.06
4 Regis Corp 25 -
4 Reinsurance Group of America Inc 395 0.02
7 Reliance Steel & Aluminum Co 802 0.04
1 Reliant Bancorp Inc 14 -
5 RenaissanceRe Holdings Ltd 546 0.03
6 Renasant Corp 178 0.01
6 Renewable Energy Group Inc 238 0.01
7 Rent-A-Center Inc 321 0.02
2 Repligen Corp 263 0.01
1 Replimune Group Inc 25 -
2 Republic Bancorp Inc 81 -
5 Republic First Bancorp Inc 14 -
12 Republic Services Inc 934 0.05
16 Resideo Technologies Inc 334 0.02
5 ResMed Inc 753 0.04
8 Resolute Forest Products Inc 97 0.01
5 Resources Connection Inc 49 -
7 REV Group Inc 92 0.01
1 Revolve Group Inc 48 -
Shares (000's)
Value(000's)
GBP
% of NetAssetValue
Common Stock (continued)
United States - 54.48% (continued)
1 REX American Resources Corp 35 -
14 Rexnord Corp 490 0.03
- RGC Resources Inc 7 -
1 RH 666 0.04
2 Rhythm Pharmaceuticals Inc 23 -
12 Ribbon Communications Inc 62 -
1 Richardson Electronics Ltd 3 -
2 Richmond Mutual BanCorp Inc 20 -
3 Rimini Street Inc 13 -
- RingCentral Inc 72 -
3 Rite Aid Corp 45 -
3 Riverview Bancorp Inc 16 -
3 RLI Corp 250 0.01
1 RMR Group Inc 26 -
13 Robert Half International Inc 800 0.04
4 Rocket Pharmaceuticals Inc 107 0.01
4 Rockwell Automation Inc 746 0.04
- Rocky Mountain Chocolate Factory Inc 1 -
2 Rogers Corp 273 0.01
1 Roku Inc 167 0.01
21 Rollins Inc 503 0.03
3 Roper Technologies Inc 886 0.05
6 Ross Stores Inc 501 0.03
17 Royal Caribbean Cruises Ltd 1,092 0.06
4 Royal Gold Inc 353 0.02
22 RPC Inc 76 -
11 RPM International Inc 707 0.04
2 RR Donnelley & Sons Co 10 -
5 Rush Enterprises Inc 157 0.01
3 Ruth's Hospitality Group Inc 45 -
5 Ryder System Inc 293 0.02
4 Ryerson Holding Corp 52 -
4 S&P Global Inc 1,149 0.06
5 S&T Bancorp Inc 119 0.01
1 Safeguard Scientifics Inc 7 -
2 Safety Insurance Group Inc 124 0.01
- Saga Communications Inc 3 -
2 Sage Therapeutics Inc 76 -
2 Saia Inc 363 0.02
5 SailPoint Technologies Holding Inc 168 0.01
9 salesforce.com Inc 1,445 0.08
- Salisbury Bancorp Inc 7 -
6 Sally Beauty Holdings Inc 99 0.01
2 Sanderson Farms Inc 273 0.01
4 Sandy Spring Bancorp Inc 146 0.01
7 Sangamo Therapeutics Inc 53 -
7 Sanmina Corp 198 0.01
27 Santander Consumer USA Holdings Inc 726 0.04
1 Sapiens International Corp NV (Israel listing) 19 -
2 Sapiens International Corp NV (US listing) 49 -
2 Sarepta Therapeutics Inc 91 0.01
4 Savara Inc 5 -
1 SB Financial Group Inc 10 -
2 ScanSource Inc 52 -
110 Schlumberger Ltd 2,417 0.13
10 Schneider National Inc 175 0.01
3 Schnitzer Steel Industries Inc 97 0.01
3 Scholastic Corp 80 -
2 Schweitzer-Mauduit International Inc 69 -
5 Science Applications International Corp 316 0.02
6 Scientific Games Corp 285 0.02
2 Sciplay Corp 19 -
World Equity FundPortfolio of Investments as at 31 May 2021 (continued)
Dimensional Fund Advisors Semi-Annual Report and Unaudited Financial Statements, 31 May 2021 515

Shares (000's)
Value(000's)
GBP
% of NetAssetValue
Common Stock (continued)
United States - 54.48% (continued)
6 Scorpio Tankers Inc 101 0.01
5 Scotts Miracle-Gro Co 741 0.04
1 Scpharmaceuticals Inc 4 -
- Seaboard Corp 253 0.01
7 Seacoast Banking Corp of Florida 180 0.01
2 SEACOR Marine Holdings Inc 7 -
20 Seagate Technology Holdings 1,361 0.07
1 Seagen Inc 145 0.01
9 Sealed Air Corp 377 0.02
4 SeaSpine Holdings Corp 53 -
7 SeaWorld Entertainment Inc 285 0.02
1 SecureWorks Corp 11 -
2 Security National Financial Corp 10 -
12 SEI Investments Co 526 0.03
3 Select Bancorp Inc 27 -
9 Select Energy Services Inc 37 -
3 Select Interior Concepts Inc 24 -
15 Select Medical Holdings Corp 424 0.02
7 Selective Insurance Group Inc 362 0.02
6 Sempra Energy 581 0.03
2 Semtech Corp 73 -
1 Seneca Foods Corp 23 -
14 Sensata Technologies Holding PLC 569 0.03
2 Sensient Technologies Corp 142 0.01
19 Service Corp International 722 0.04
- ServiceNow Inc 163 0.01
3 ServiceSource International Inc 3 -
6 ServisFirst Bancshares Inc 275 0.01
2 Severn Bancorp Inc 13 -
17 SFL Corp Ltd 101 0.01
1 Shake Shack Inc 56 -
5 Shenandoah Telecommunications Co 159 0.01
6 Sherwin-Williams Co 1,245 0.07
- Shockwave Medical Inc 13 -
1 Shoe Carnival Inc 58 -
2 Shore Bancshares Inc 24 -
1 ShotSpotter Inc 26 -
3 Shutterstock Inc 218 0.01
4 Shyft Group Inc 113 0.01
2 SI-BONE Inc 33 -
2 Sierra Bancorp 41 -
2 Sierra Oncology Inc 25 -
6 SIGA Technologies Inc 30 -
6 Signature Bank 1,071 0.06
6 Signet Jewelers Ltd 254 0.01
12 Silgan Holdings Inc 358 0.02
3 Silicon Laboratories Inc 284 0.02
1 SilverBow Resources Inc 6 -
1 Silvercrest Asset Management Group Inc 10 -
11 Simmons First National Corp 239 0.01
11 Simply Good Foods Co 279 0.02
4 Simpson Manufacturing Co Inc 316 0.02
1 Simulations Plus Inc 38 -
4 Sio Gene Therapies Inc 6 -
49 Sirius XM Holdings Inc 215 0.01
13 SiriusPoint Ltd 97 0.01
4 SiteOne Landscape Supply Inc 434 0.02
2 SJW Group 85 -
14 Skechers U.S.A. Inc 483 0.03
5 Skyline Champion Corp 191 0.01
5 SkyWest Inc 161 0.01
12 Skyworks Solutions Inc 1,400 0.07
Shares (000's)
Value(000's)
GBP
% of NetAssetValue
Common Stock (continued)
United States - 54.48% (continued)
2 Sleep Number Corp 135 0.01
36 SLM Corp 509 0.03
17 SM Energy Co 234 0.01
3 SMART Global Holdings Inc 84 -
2 SmartFinancial Inc 37 -
3 Smartsheet Inc 138 0.01
5 Smith & Wesson Brands Inc 71 -
5 Snap Inc 198 0.01
5 Snap-on Inc 984 0.05
3 SolarEdge Technologies Inc 513 0.03
4 Solaris Oilfield Infrastructure Inc 30 -
14 SolarWinds Corp 158 0.01
4 Solid Biosciences Inc 9 -
3 Sonic Automotive Inc 102 0.01
11 Sonoco Products Co 509 0.03
7 Sonos Inc 174 0.01
- Sound Financial Bancorp Inc 6 -
7 South Jersey Industries Inc 127 0.01
7 South State Corp 459 0.02
20 Southern Co 909 0.05
4 Southern Copper Corp 218 0.01
1 Southern First Bancshares Inc 36 -
1 Southern Missouri Bancorp Inc 32 -
5 Southside Bancshares Inc 140 0.01
22 Southwest Airlines Co 962 0.05
4 Southwest Gas Holdings Inc 187 0.01
76 Southwestern Energy Co 277 0.01
2 SP Plus Corp 46 -
1 Spark Energy Inc 10 -
3 SpartanNash Co 46 -
5 Spectrum Brands Holdings Inc 296 0.02
15 Spectrum Pharmaceuticals Inc 37 -
1 Spero Therapeutics Inc 12 -
4 Spire Inc 193 0.01
8 Spirit AeroSystems Holdings Inc 287 0.02
9 Spirit Airlines Inc 228 0.01
3 Spirit of Texas Bancshares Inc 46 -
1 Splunk Inc 80 -
1 Spok Holdings Inc 10 -
4 Sportsman's Warehouse Holdings Inc 55 -
1 Spotify Technology SA 180 0.01
2 SpringWorks Therapeutics Inc 86 -
14 Sprouts Farmers Market Inc 257 0.01
1 SPS Commerce Inc 93 0.01
4 SPX Corp 178 0.01
5 SPX FLOW Inc 235 0.01
1 Square Inc 173 0.01
21 SS&C Technologies Holdings Inc 1,067 0.06
6 St Joe Co 192 0.01
1 STAAR Surgical Co 52 -
2 Stamps.com Inc 261 0.01
- Standard AVB Financial Corp 9 -
3 Standard Motor Products Inc 100 0.01
2 Standex International Corp 123 0.01
6 Stanley Black & Decker Inc 887 0.05
- Star Equity Holdings Inc - -
14 Starbucks Corp 1,104 0.06
1 StarTek Inc 6 -
6 State Auto Financial Corp 76 -
22 State Street Corp 1,326 0.07
23 Steel Dynamics Inc 1,010 0.05
12 Steelcase Inc 122 0.01
World Equity FundPortfolio of Investments as at 31 May 2021 (continued)
Dimensional Fund Advisors Semi-Annual Report and Unaudited Financial Statements, 31 May 2021 516

Shares (000's)
Value(000's)
GBP
% of NetAssetValue
Common Stock (continued)
United States - 54.48% (continued)
2 Stepan Co 221 0.01
9 Stericycle Inc 515 0.03
7 STERIS PLC 927 0.05
21 Sterling Bancorp 385 0.02
7 Sterling Bancorp Inc 24 -
3 Sterling Construction Co Inc 53 -
6 Steven Madden Ltd 176 0.01
3 Stewart Information Services Corp 148 0.01
12 Stifel Financial Corp 571 0.03
1 Stitch Fix Inc 29 -
3 Stock Yards Bancorp Inc 128 0.01
2 Stoneridge Inc 44 -
3 StoneX Group Inc 132 0.01
3 Stratasys Ltd 48 -
3 Strategic Education Inc 146 0.01
- Strattec Security Corp 7 -
1 Stratus Properties Inc 17 -
4 Stride Inc 71 -
4 Strongbridge Biopharma PLC 8 -
3 Stryker Corp 600 0.03
1 Summit Financial Group Inc 22 -
13 Summit Materials Inc 311 0.02
1 Summit State Bank 13 -
8 SunCoke Energy Inc 44 -
7 Sunnova Energy International Inc 150 0.01
14 Sunrun Inc 426 0.02
7 Super Micro Computer Inc 160 0.01
2 Superior Group of Cos Inc 34 -
8 Supernus Pharmaceuticals Inc 158 0.01
2 Surface Oncology Inc 13 -
11 Surgalign Holdings Inc 15 -
4 Surgery Partners Inc 165 0.01
1 Surmodics Inc 52 -
4 SVB Financial Group 1,797 0.09
7 Switch Inc 99 0.01
4 Sykes Enterprises Inc 121 0.01
1 Synalloy Corp 6 -
3 Synaptics Inc 250 0.01
6 Synchronoss Technologies Inc 12 -
47 Synchrony Financial 1,570 0.08
11 Syneos Health Inc 707 0.04
3 Synlogic Inc 8 -
6 SYNNEX Corp 508 0.03
2 Synopsys Inc 383 0.02
15 Synovus Financial Corp 522 0.03
16 Sysco Corp 890 0.05
5 Systemax Inc 116 0.01
14 T Rowe Price Group Inc 1,850 0.10
1 Tabula Rasa HealthCare Inc 22 -
1 Tactile Systems Technology Inc 19 -
7 Take-Two Interactive Software Inc 892 0.05
8 Talos Energy Inc 82 -
1 Tandem Diabetes Care Inc 49 -
26 Tapestry Inc 834 0.04
22 Targa Resources Corp 612 0.03
17 Target Corp 2,683 0.14
3 Taro Pharmaceutical Industries Ltd 131 0.01
12 Taylor Morrison Home Corp 250 0.01
15 TCF Financial Corp 506 0.03
3 TCR2 Therapeutics Inc 44 -
8 TE Connectivity Ltd 781 0.04
4 Team Inc 21 -
Shares (000's)
Value(000's)
GBP
% of NetAssetValue
Common Stock (continued)
United States - 54.48% (continued)
31 TechnipFMC PLC 186 0.01
3 TechTarget Inc 135 0.01
6 Tecnoglass Inc 97 0.01
3 Teekay Corp 8 -
5 Teekay Tankers Ltd 49 -
23 TEGNA Inc 310 0.02
4 Tejon Ranch Co 41 -
5 Teladoc Health Inc 486 0.03
3 Teledyne Technologies Inc 897 0.05
3 Teleflex Inc 960 0.05
11 Telephone & Data Systems Inc 200 0.01
22 Tempur Sealy International Inc 584 0.03
7 Tenet Healthcare Corp 319 0.02
2 Tennant Co 107 0.01
3 Tenneco Inc 33 -
9 Teradata Corp 312 0.02
12 Teradyne Inc 1,132 0.06
9 Terex Corp 320 0.02
13 Terminix Global Holdings Inc 456 0.02
2 Territorial Bancorp Inc 29 -
2 Tesla Inc 898 0.05
1 TESSCO Technologies Inc 6 -
5 Tetra Tech Inc 396 0.02
6 Texas Capital Bancshares Inc 270 0.01
22 Texas Instruments Inc 2,928 0.15
4 Texas Roadhouse Inc 271 0.01
9 Textainer Group Holdings Ltd 210 0.01
13 TFS Financial Corp 198 0.01
5 Thermo Fisher Scientific Inc 1,816 0.10
4 Thermon Group Holdings Inc 55 -
6 Thor Industries Inc 549 0.03
4 Tidewater Inc 43 -
3 Tilly's Inc 26 -
1 Timberland Bancorp Inc 27 -
10 Timken Co 603 0.03
5 TimkenSteel Corp 49 -
4 Tiptree Inc 31 -
6 Titan International Inc 40 -
3 Titan Machinery Inc 61 -
3 Tivity Health Inc 52 -
33 TJX Cos Inc 1,565 0.08
15 T-Mobile US Inc 1,451 0.08
12 Toll Brothers Inc 565 0.03
2 Tompkins Financial Corp 119 0.01
4 Tootsie Roll Industries Inc 81 -
5 TopBuild Corp 634 0.03
10 Toro Co 745 0.04
7 Towne Bank 161 0.01
2 Townsquare Media Inc 19 -
3 TPI Composites Inc 109 0.01
9 Tractor Supply Co 1,183 0.06
- Trade Desk Inc 166 0.01
3 Tradeweb Markets Inc 175 0.01
9 Trane Technologies PLC 1,180 0.06
1 TransAct Technologies Inc 8 -
1 Transcat Inc 34 -
1 TransDigm Group Inc 595 0.03
- Transmedics Group Inc 9 -
66 Transocean Ltd 176 0.01
11 TransUnion 843 0.04
5 Travel + Leisure Co 238 0.01
1 TravelCenters of America Inc 19 -
World Equity FundPortfolio of Investments as at 31 May 2021 (continued)
Dimensional Fund Advisors Semi-Annual Report and Unaudited Financial Statements, 31 May 2021 517

Shares (000's)
Value(000's)
GBP
% of NetAssetValue
Common Stock (continued)
United States - 54.48% (continued)
17 Travelers Cos Inc 1,858 0.10
2 Travelzoo 19 -
3 Travere Therapeutics Inc 32 -
3 Trecora Resources 15 -
6 TreeHouse Foods Inc 209 0.01
8 Trex Co Inc 533 0.03
10 TRI Pointe Group Inc 166 0.01
2 TriCo Bancshares 74 -
6 TriMas Corp 133 0.01
18 Trimble Inc 986 0.05
7 TriNet Group Inc 379 0.02
12 Trinity Industries Inc 235 0.01
2 Trinity Place Holdings Inc 2 -
5 Trinseo SA 221 0.01
8 TripAdvisor Inc 247 0.01
1 Triple-S Management Corp 18 -
3 TriState Capital Holdings Inc 54 -
7 Triton International Ltd 250 0.01
3 Triumph Bancorp Inc 180 0.01
21 Tronox Holdings PLC 344 0.02
3 TrueBlue Inc 66 -
12 TrueCar Inc 49 -
41 Truist Financial Corp 1,791 0.09
1 Trupanion Inc 35 -
1 TrustCo Bank Corp NY 27 -
6 Trustmark Corp 148 0.01
6 TTEC Holdings Inc 421 0.02
11 TTM Technologies Inc 118 0.01
3 Tupperware Brands Corp 46 -
1 Turning Point Brands Inc 22 -
6 Tutor Perini Corp 62 -
1 Twilio Inc 340 0.02
1 Twin Disc Inc 12 -
16 Twitter Inc 659 0.03
1 Tyler Technologies Inc 223 0.01
22 Tyson Foods Inc 1,260 0.07
1 Ubiquiti Inc 135 0.01
6 UFP Industries Inc 333 0.02
1 UFP Technologies Inc 34 -
11 UGI Corp 348 0.02
4 Ulta Salon Cosmetics & Fragrance Inc 887 0.05
5 Ultra Clean Holdings Inc 212 0.01
3 Ultragenyx Pharmaceutical Inc 201 0.01
2 Ultralife Corp 15 -
5 UMB Financial Corp 342 0.02
23 Umpqua Holdings Corp 303 0.02
13 Under Armour Inc, Class A 204 0.01
15 Under Armour Inc, Class C 204 0.01
2 Unifi Inc 30 -
2 UniFirst Corp 267 0.01
17 Union Pacific Corp 2,692 0.14
1 Unique Fabricating Inc 2 -
5 Unisys Corp 82 -
19 United Airlines Holdings Inc 784 0.04
- United Bancorp Inc 2 -
14 United Bankshares Inc 410 0.02
11 United Community Banks Inc 258 0.01
3 United Fire Group Inc 71 -
8 United Insurance Holdings Corp 32 -
5 United Natural Foods Inc 140 0.01
13 United Parcel Service Inc 1,993 0.10
9 United Rentals Inc 2,174 0.11
Shares (000's)
Value(000's)
GBP
% of NetAssetValue
Common Stock (continued)
United States - 54.48% (continued)
4 United Security Bancshares 21 -
4 United States Cellular Corp 109 0.01
1 United States Lime & Minerals Inc 69 -
25 United States Steel Corp 457 0.02
5 United Therapeutics Corp 618 0.03
- United-Guardian Inc 5 -
34 UnitedHealth Group Inc 9,958 0.52
1 Unitil Corp 57 -
1 Unity Bancorp Inc 25 -
18 Univar Solutions Inc 352 0.02
2 Universal Corp 84 -
2 Universal Display Corp 315 0.02
2 Universal Electronics Inc 67 -
8 Universal Health Services Inc 944 0.05
4 Universal Insurance Holdings Inc 42 -
2 Universal Logistics Holdings Inc 32 -
1 Universal Stainless & Alloy Products Inc 10 -
3 Universal Technical Institute Inc 15 -
4 Univest Financial Corp 89 0.01
22 Unum Group 481 0.03
1 Upland Software Inc 34 -
3 Urban One Inc 11 -
12 Urban Outfitters Inc 322 0.02
28 US Bancorp 1,216 0.06
2 US Concrete Inc 80 -
2 US Ecology Inc 56 -
18 US Foods Holding Corp 489 0.03
1 US Physical Therapy Inc 82 -
7 US Silica Holdings Inc 52 -
4 US Xpress Enterprises Inc 28 -
- USA Truck Inc 4 -
3 USANA Health Sciences Inc 189 0.01
1 Utah Medical Products Inc 32 -
1 Vail Resorts Inc 264 0.01
17 Valero Energy Corp 943 0.05
44 Valley National Bancorp 444 0.02
2 Valmont Industries Inc 410 0.02
13 Valvoline Inc 296 0.02
8 Vanda Pharmaceuticals Inc 101 0.01
5 Varex Imaging Corp 91 0.01
11 Vector Group Ltd 104 0.01
1 Vectrus Inc 44 -
7 Veeco Instruments Inc 121 0.01
1 Veeva Systems Inc 278 0.02
12 Venator Materials PLC 41 -
8 Veoneer Inc 130 0.01
3 Vera Bradley Inc 23 -
1 Veracyte Inc 34 -
2 Verastem Inc 4 -
1 Vericel Corp 58 -
7 Verint Systems Inc 234 0.01
3 VeriSign Inc 469 0.02
4 Verisk Analytics Inc 522 0.03
2 Veritiv Corp 70 -
193 Verizon Communications Inc 7,682 0.40
3 Verra Mobility Corp 27 -
1 Verrica Pharmaceuticals Inc 11 -
3 Verso Corp 40 -
3 Vertex Pharmaceuticals Inc 411 0.02
6 VF Corp 333 0.02
2 Viacom Inc, Class A 63 -
48 Viacom Inc, Class B 1,442 0.08
World Equity FundPortfolio of Investments as at 31 May 2021 (continued)
Dimensional Fund Advisors Semi-Annual Report and Unaudited Financial Statements, 31 May 2021 518

Shares (000's)
Value(000's)
GBP
% of NetAssetValue
Common Stock (continued)
United States - 54.48% (continued)
2 Viad Corp 50 -
6 ViaSat Inc 214 0.01
63 Viatris Inc 679 0.04
19 Viavi Solutions Inc 230 0.01
1 Vicor Corp 88 0.01
- Victory Capital Holdings Inc 8 -
2 Vidler Water Resouces Inc 14 -
7 ViewRay Inc 29 -
9 Viking Therapeutics Inc 33 -
1 Village Super Market Inc 23 -
1 Vimeo Inc 44 -
1 Vince Holding Corp 10 -
1 Vir Biotechnology Inc 38 -
3 Virgin Galactic Holdings Inc 62 -
12 Virtu Financial Inc 253 0.01
1 Virtus Investment Partners Inc 220 0.01
38 Visa Inc 6,026 0.31
14 Vishay Intertechnology Inc 236 0.01
2 Vishay Precision Group Inc 34 -
8 Vista Outdoor Inc 258 0.01
2 Visteon Corp 131 0.01
53 Vistra Energy Corp 604 0.03
2 VMware Inc 198 0.01
1 Vocera Communications Inc 27 -
3 Volt Information Sciences Inc 7 -
11 Vonage Holdings Corp 108 0.01
13 Vontier Corp 333 0.02
2 VOXX International Corp 25 -
13 Voya Financial Inc 615 0.03
1 VSE Corp 44 -
8 Vulcan Materials Co 1,065 0.06
1 VYNE Therapeutics Inc 2 -
13 W R Berkley Corp 729 0.04
9 W&T Offshore Inc 24 -
4 Wabash National Corp 44 -
38 Walgreens Boots Alliance Inc 1,410 0.07
4 Walker & Dunlop Inc 284 0.02
53 Walmart Inc 5,338 0.28
21 Walt Disney Co 2,584 0.14
7 Warrior Met Coal Inc 92 0.01
5 Washington Federal Inc 116 0.01
2 Washington Trust Bancorp Inc 89 0.01
14 Waste Management Inc 1,411 0.07
3 Waters Corp 714 0.04
3 Waterstone Financial Inc 44 -
3 Watsco Inc 602 0.03
2 Watts Water Technologies Inc 238 0.01
2 Wayfair Inc 478 0.03
1 Wayside Technology Group Inc 15 -
1 WD-40 Co 210 0.01
10 Webster Financial Corp 379 0.02
7 WEC Energy Group Inc 435 0.02
3 Weis Markets Inc 124 0.01
11 Welbilt Inc 199 0.01
64 Wells Fargo & Co 2,113 0.11
21 Wendy's Co 342 0.02
8 Werner Enterprises Inc 255 0.01
8 WesBanco Inc 232 0.01
5 WESCO International Inc 382 0.02
2 West Bancorporation Inc 45 -
2 West Pharmaceutical Services Inc 552 0.03
3 Westamerica Bancorporation 147 0.01
Shares (000's)
Value(000's)
GBP
% of NetAssetValue
Common Stock (continued)
United States - 54.48% (continued)
11 Western Alliance Bancorp 806 0.04
24 Western Digital Corp 1,292 0.07
3 Western New England Bancorp Inc 21 -
32 Western Union Co 559 0.03
14 Westinghouse Air Brake Technologies Corp 802 0.04
9 Westlake Chemical Corp 640 0.03
25 Westrock Co 1,021 0.05
1 Westwood Holdings Group Inc 16 -
4 WEX Inc 502 0.03
1 Weyco Group Inc 21 -
6 Whirlpool Corp 1,071 0.06
- White Mountains Insurance Group Ltd 284 0.02
4 Whiting Petroleum Corp 127 0.01
1 Willdan Group Inc 18 -
47 Williams Cos Inc 867 0.05
9 Williams-Sonoma Inc 1,116 0.06
4 Willis Towers Watson PLC 807 0.04
23 WillScot Mobile Mini Holdings Corp 476 0.03
2 Wingstop Inc 179 0.01
- Winmark Corp 48 -
4 Winnebago Industries Inc 223 0.01
6 Wintrust Financial Corp 356 0.02
22 WisdomTree Investments Inc 106 0.01
6 Wolverine World Wide Inc 144 0.01
5 Woodward Inc 446 0.02
1 Workday Inc 144 0.01
1 World Acceptance Corp 119 0.01
6 World Fuel Services Corp 137 0.01
3 World Wrestling Entertainment Inc 117 0.01
6 Worthington Industries Inc 272 0.01
6 WR Grace & Co 268 0.01
6 WSFS Financial Corp 225 0.01
3 WW Grainger Inc 1,051 0.06
4 WW International Inc 103 0.01
5 Wyndham Hotels & Resorts Inc 238 0.01
1 Wynn Resorts Ltd 115 0.01
12 Xcel Energy Inc 600 0.03
4 Xencor Inc 113 0.01
1 Xenon Pharmaceuticals Inc 14 -
20 Xerox Holdings Corp 330 0.02
7 Xilinx Inc 610 0.03
9 Xperi Holding Corp 128 0.01
10 XPO Logistics Inc 996 0.05
11 Xylem Inc 934 0.05
2 Yellow Corp 9 -
7 Yelp Inc 193 0.01
12 YETI Holdings Inc 746 0.04
1 York Water Co 35 -
6 Yum! Brands Inc 510 0.03
3 Zebra Technologies Corp 1,218 0.06
- Zedge Inc 3 -
1 Zendesk Inc 119 0.01
2 Zillow Group Inc, Class A 166 0.01
5 Zillow Group Inc, Class C 426 0.02
7 Zimmer Biomet Holdings Inc 880 0.05
16 Zions Bancorp NA 667 0.04
5 Zix Corp 26 -
10 Zoetis Inc 1,245 0.07
3 Zogenix Inc 38 -
1 Zoom Video Communications Inc 184 0.01
5 Zovio Inc 8 -
1 Zscaler Inc 118 0.01
World Equity FundPortfolio of Investments as at 31 May 2021 (continued)
Dimensional Fund Advisors Semi-Annual Report and Unaudited Financial Statements, 31 May 2021 519

Shares (000's)
Value(000's)
GBP
% of NetAssetValue
Common Stock (continued)
United States - 54.48% (continued)
2 Zumiez Inc 58 -
55 Zynga Inc 421 0.02
1,044,340 54.48
Total Common Stock - 96.63% (30 November 2020: 97.15%) 1,852,435 96.63
Preferred Stock
Brazil - 0.16%
5 Alpargatas SA 34 -
11 Banco ABC Brasil SA (non-voting rights) 25 -
98 Banco Bradesco SA 353 0.02
26 Banco do Estado do Rio Grande do Sul SA 47 -
13 Banco Inter SA 39 -
28 Banco Pan SA 87 0.01
7 Braskem SA 53 -
8 Centrais Eletricas Brasileiras SA 46 -
1 Centrais Eletricas Santa Catarina 9 -
79 Cia de Saneamento do Parana 44 -
9 Cia de Transmissao de Energia Eletrica Paulista 31 -
57 Cia Energetica de Minas Gerais 106 0.01
14 Cia Energetica de Sao Paulo 47 -
1 Cia Energetica do Ceara 6 -
5 Cia Ferro Ligas da Bahia - Ferbasa 25 -
59 Cia Paranaense de Energia 51 -
10 Eucatex SA Industria e Comercio 14 -
72 Gerdau SA 316 0.02
2 Grazziotin SA 7 -
62 Itau Unibanco Holding SA 247 0.02
34 Lojas Americanas SA 93 0.01
65 Marcopolo SA 24 -
242 Petroleo Brasileiro SA 884 0.05
27 Randon SA Implementos e Participacoes 54 -
5 Schulz SA 7 -
10 Unipar Carbocloro SA 129 0.01
78 Usinas Siderurgicas de Minas Gerais SA Usiminas 205 0.01
2,983 0.16
Chile - 0.00%
19 Coca-Cola Embonor SA 18 -
21 Embotelladora Andina SA 34 -
52 -
Colombia - 0.00%
5 Banco Davivienda SA 30 -
3 Grupo Argos SA 5 -
166 Grupo Aval Acciones y Valores SA 33 -
7 Grupo de Inversiones Suramericana SA 22 -
90 -
Germany - 0.19%
3 Bayerische Motoren Werke AG 203 0.01
1 Biotest AG 27 -
1 Draegerwerk AG & Co KGaA 69 -
4 Fuchs Petrolub SE 137 0.01
3 Henkel AG & Co KGaA 214 0.01
6 Jungheinrich AG 206 0.01
5 Porsche Automobil Holding SE 427 0.02
1 Sartorius AG 353 0.02
11 Schaeffler AG 71 0.01
2 Sixt SE 145 0.01
- STO SE & Co KGaA 43 -
2 Villeroy & Boch AG 27 -
9 Volkswagen AG 1,661 0.09
3,583 0.19
Shares (000's)
Value(000's)
GBP
% of NetAssetValue
Preferred Stock (continued)
Italy - 0.02%
5 Danieli & C Officine Meccaniche SpA 64 0.01
610 Telecom Italia SpA 246 0.01
310 0.02
Korea, Republic of - 0.00%
- Amorepacific Group 1 -
1 -
Philippines - 0.00%
10 Cebu Air Inc 7 -
7 -
Thailand - 0.00%
994 U City PCL 22 -
22 -
United States - 0.00%
1 Liberty Broadband Corp 11 -
2 WESCO International Inc 53 -
64 -
Total Preferred Stock - 0.37% (30 November 2020: 0.31%) 7,112 0.37
Real Estate Investment Trust
Australia - 0.12%
32 Abacus Property Group 53 -
8 ALE Property Group 18 -
10 APN Convenience Retail REIT 19 -
15 APN Industria REIT 26 -
23 Arena REIT 42 -
10 Australian Unity Office Fund 15 -
20 Aventus Group 32 -
34 BWP Trust 78 0.01
1 Carindale Property Trust 3 -
35 Centuria Industrial REIT 68 -
32 Centuria Office REIT 39 -
24 Charter Hall Group 184 0.01
35 Charter Hall Long Wale REIT 91 0.01
38 Charter Hall Retail REIT 78 0.01
26 Charter Hall Social Infrastructure REIT 48 -
92 Cromwell Property Group 45 -
24 Dexus 136 0.01
13 Garda Diversified Property Fund 9 -
35 GDI Property Group 20 -
22 Goodman Group 237 0.01
53 GPT Group 135 0.01
11 Growthpoint Properties Australia Ltd 23 -
9 Hotel Property Investments 16 -
16 Ingenia Communities Group 50 -
27 Investec Australia Property Fund 21 -
120 Mirvac Group 183 0.01
52 New South Resources Ltd 59 -
104 Scentre Group 156 0.01
72 Shopping Centres Australasia Property Group 97 0.01
48 Stockland 122 0.01
159 Vicinity Centres 136 0.01
46 Waypoint REIT 64 -
2,303 0.12
Belgium - 0.05%
2 Aedifica SA 180 0.01
- Ascencio 25 -
2 Befimmo SA 50 -
2 Care Property Invest NV 43 -
2 Cofinimmo SA 204 0.01
- Home Invest Belgium SA 13 -
2 Intervest Offices & Warehouses NV 37 -
World Equity FundPortfolio of Investments as at 31 May 2021 (continued)
Dimensional Fund Advisors Semi-Annual Report and Unaudited Financial Statements, 31 May 2021 520

Shares (000's)
Value(000's)
GBP
% of NetAssetValue
Real Estate Investment Trust (continued)
Belgium - 0.05% (continued)
- Leasinvest Real Estate SCA 17 -
1 Montea CVA 68 0.01
1 Retail Estates NV 37 -
10 Warehouses De Pauw CVA 268 0.02
- Wereldhave Belgium Comm VA 10 -
952 0.05
Canada - 0.06%
3 Allied Properties Real Estate Investment Trust 64 0.01
7 Artis Real Estate Investment Trust 44 -
2 Automotive Properties Real Estate Investment Trust 16 -
2 Boardwalk Real Estate Investment Trust 45 -
1 BSR Real Estate Investment Trust 11 -
3 Canadian Apartment Properties REIT 104 0.01
5 Choice Properties Real Estate Investment Trust 46 -
8 Cominar Real Estate Investment Trust 48 -
4 Crombie Real Estate Investment Trust 39 -
4 CT Real Estate Investment Trust 35 -
6 Dream Industrial Real Estate Investment Trust 44 -
3 Dream Office Real Estate Investment Trust 32 -
2 Granite Real Estate Investment Trust 95 0.01
5 H&R Real Estate Investment Trust 50 0.01
1 Inovalis Real Estate Investment Trust 8 -
4 InterRent Real Estate Investment Trust 38 -
4 Killam Apartment Real Estate Investment Trust 48 -
1 Morguard North American Residential Real EstateInvestment Trust 10 -
3 Morguard Real Estate Investment Trust 9 -
6 NorthWest Healthcare Properties Real EstateInvestment Trust 47 -
3 Plaza Retail REIT 8 -
2 PRO Real Estate Investment Trust 8 -
6 RioCan Real Estate Investment Trust 79 0.01
4 Slate Office REIT 10 -
4 SmartCentres Real Estate Investment Trust 61 0.01
5 Summit Industrial Income REIT 45 -
4 True North Commercial Real Estate InvestmentTrust 18 -
3 WPT Industrial Real Estate Investment Trust 30 -
1,092 0.06
China - 0.00%
57 Spring Real Estate Investment Trust 14 -
140 Yuexiu Real Estate Investment Trust 53 -
67 -
France - 0.04%
- Altarea SCA 34 -
1 ARGAN SA 69 -
4 Carmila SA 47 -
2 Covivio 156 0.01
2 Gecina SA 199 0.01
2 ICADE 105 0.01
9 Klepierre SA 186 0.01
5 Mercialys SA 41 -
- Societe de la Tour Eiffel 12 -
849 0.04
Germany - 0.01%
11 alstria office REIT AG 143 0.01
6 Hamborner REIT AG 44 -
187 0.01
Hong Kong - 0.03%
131 Champion REIT 54 -
97 Fortune Real Estate Investment Trust 74 0.01
50 Link REIT 340 0.02
Shares (000's)
Value(000's)
GBP
% of NetAssetValue
Real Estate Investment Trust (continued)
Hong Kong - 0.03% (continued)
81 Prosperity REIT 21 -
42 Regal Real Estate Investment Trust 6 -
105 Sunlight Real Estate Investment Trust 43 -
538 0.03
Ireland - 0.00%
51 Hibernia REIT PLC 53 -
33 Irish Residential Properties REIT PLC 45 -
98 -
Israel - 0.00%
5 Summit Real Estate Holdings Ltd 50 -
50 -
Italy - 0.00%
1 COIMA RES SpA 7 -
6 Immobiliare Grande Distribuzione SIIQ SpA 22 -
29 -
Japan - 0.23%
- Activia Properties Inc 114 0.01
- Advance Residence Investment Corp 105 0.01
- AEON REIT Investment Corp 107 0.01
- Comforia Residential REIT Inc 78 -
- CRE Logistics REIT Inc 28 -
- Daiwa House REIT Investment Corp 88 -
- Daiwa Office Investment Corp 79 -
- Frontier Real Estate Investment Corp 114 0.01
- Fukuoka REIT Corp 66 -
- Global One Real Estate Investment Corp 56 -
- GLP J-Reit 109 0.01
- Hankyu Hanshin REIT Inc 51 -
- Health Care & Medical Investment Corp 27 -
- Heiwa Real Estate REIT Inc 66 -
- Hoshino Resorts REIT Inc 75 -
- Hulic Reit Inc 87 -
- Ichigo Hotel REIT Investment Corp 7 -
- Ichigo Office REIT Investment 65 -
- Industrial & Infrastructure Fund Investment Corp 111 0.01
1 Invesco Office J-Reit Inc 100 0.01
1 Invincible Investment Corp 127 0.01
- Japan Excellent Inc 82 -
1 Japan Hotel REIT Investment Corp 84 -
- Japan Logistics Fund Inc 81 -
- Japan Prime Realty Investment Corp 113 0.01
- Japan Real Estate Investment Corp 107 0.01
- Japan Rental Housing Investments Inc 84 -
1 Japan Retail Fund Investment Corp 174 0.01
- Kenedix Office Investment Corp 110 0.01
- Kenedix Residential Next Investment Corp 90 0.01
- Kenedix Retail REIT Corp 62 -
- LaSalle Logiport REIT 92 0.01
- Marimo Regional Revitalization REIT Inc 10 -
- Mirai Corp 23 -
- Mitsubishi Estate Logistics REIT Investment Corp 61 -
- Mitsui Fudosan Logistics Park Inc 69 -
- Mori Hills REIT Investment Corp 80 -
- Mori Trust Hotel Reit Inc 15 -
- Mori Trust Sogo Reit Inc 67 -
- Nippon Accommodations Fund Inc 97 0.01
- Nippon Building Fund Inc 131 0.01
- Nippon Prologis REIT Inc 113 0.01
- Nippon REIT Investment Corp 101 0.01
- Nomura Real Estate Master Fund Inc 130 0.01
- One REIT Inc 39 -
World Equity FundPortfolio of Investments as at 31 May 2021 (continued)
Dimensional Fund Advisors Semi-Annual Report and Unaudited Financial Statements, 31 May 2021 521

Shares (000's)
Value(000's)
GBP
% of NetAssetValue
Real Estate Investment Trust (continued)
Japan - 0.23% (continued)
- Ooedo Onsen Reit Investment Corp 10 -
- Orix JREIT Inc 140 0.01
- Premier Investment Corp 93 0.01
- Samty Residential Investment Corp 13 -
- Sekisui House Reit Inc 112 0.01
- Star Asia Investment Corp 19 -
- Starts Proceed Investment Corp 22 -
- Takara Leben Real Estate Investment Corp 26 -
- Tokyu REIT Inc 85 -
- Tosei Reit Investment Corp 23 -
- United Urban Investment Corp 150 0.01
- XYMAX REIT Investment Corp 8 -
4,376 0.23
Korea, Republic of - 0.00%
7 Korea Asset In Trust Co Ltd 23 -
23 -
Malaysia - 0.01%
56 Axis Real Estate Investment Trust 18 -
54 Capitaland Malaysia Mall Trust 6 -
96 IGB Real Estate Investment Trust 27 -
12 KLCCP Stapled Group 14 -
45 Pavilion Real Estate Investment Trust 10 -
118 Sunway Real Estate Investment Trust 28 0.01
41 YTL Hospitality REIT 6 -
109 0.01
Mexico - 0.01%
39 Asesor de Activos Prisma SAPI de CV 4 -
26 Concentradora Fibra Danhos SA de CV 22 -
41 Concentradora Fibra Hotelera Mexicana SA de CV 8 -
18 Fibra Shop Portafolios Inmobiliarios SAPI de CV 5 -
134 Fibra Uno Administracion SA de CV 111 0.01
51 Macquarie Mexico Real Estate Management SA deCV 39 -
39 PLA Administradora Industrial S de RL de CV 42 -
21 Prologis Property Mexico SA de CV 34 -
265 0.01
Netherlands - 0.03%
3 Eurocommercial Properties NV 63 0.01
2 NSI NV 43 -
5 Unibail-Rodamco-Westfield 324 0.02
1 Vastned Retail NV 20 -
3 Wereldhave NV 39 -
489 0.03
New Zealand - 0.02%
65 Argosy Property Ltd 49 -
58 Goodman Property Trust 66 0.01
14 Investore Property Ltd 14 -
81 Kiwi Property Group Ltd 50 -
77 Precinct Properties New Zealand Ltd 61 0.01
31 Property for Industry Ltd 44 -
25 Stride Property Group 30 -
26 Vital Healthcare Property Trust 40 -
354 0.02
Singapore - 0.08%
47 AIMS APAC REIT 35 -
80 Ascendas Real Estate Investment Trust 124 0.01
121 Ascott Residence Trust 64 -
64 Cache Logistics Trust 27 -
128 CapitaLand Mall Trust 139 0.01
66 CapitaLand Retail China Trust 47 -
56 CDL Hospitality Trusts 34 -
Shares (000's)
Value(000's)
GBP
% of NetAssetValue
Real Estate Investment Trust (continued)
Singapore - 0.08% (continued)
25 Dasin Retail Trust 10 -
37 EC World Real Estate Investment Trust 16 -
165 ESR-REIT 35 -
59 Far East Hospitality Trust 19 -
101 First Real Estate Investment Trust 14 -
59 Frasers Centrepoint Trust 73 0.01
40 Frasers Hospitality Trust 11 -
75 Frasers Logistics & Industrial Trust 57 -
64 Keppel DC REIT 88 0.01
44 Keppel Pacific Oak US REIT 23 -
74 Keppel REIT 46 -
345 Lippo Malls Indonesia Retail Trust 12 -
91 Manulife US Real Estate Investment Trust 49 -
94 Mapletree Commercial Trust 104 0.01
59 Mapletree Industrial Trust 86 0.01
64 Mapletree Logistics Trust 68 0.01
181 Mapletree North Asia Commercial Trust 99 0.01
104 OUE Commercial Real Estate Investment Trust 21 -
24 Parkway Life Real Estate Investment Trust 55 -
63 Sabana Shari'ah Compliant Industrial Real EstateInvestment Trust 14 -
64 SPH REIT 29 -
104 Starhill Global REIT 30 -
54 Suntec Real Estate Investment Trust 42 -
1,471 0.08
South Africa - 0.02%
72 Arrowhead Properties Ltd 12 -
32 Attacq Ltd 11 -
42 Equites Property Fund Ltd 40 -
156 Growthpoint Properties Ltd 117 0.01
12 Hyprop Investments Ltd 17 -
38 Investec Property Fund Ltd 21 -
11 Octodec Investments Ltd 5 -
314 Redefine Properties Ltd 67 0.01
22 Resilient REIT Ltd 56 -
112 SA Corporate Real Estate Ltd 12 -
20 Tower Property Fund Ltd 4 -
52 Vukile Property Fund Ltd 26 -
388 0.02
Spain - 0.02%
17 Inmobiliaria Colonial Socimi SA 136 0.01
6 Lar Espana Real Estate Socimi SA 25 -
20 Merlin Properties Socimi SA 164 0.01
325 0.02
Taiwan - 0.01%
100 Cathay No 1 REIT 46 0.01
63 Cathay No 2 REIT 32 -
32 Fubon No 1 REIT 15 -
73 Fubon No 2 REIT 31 -
77 Shin Kong No.1 REIT 37 -
161 0.01
Turkey - 0.00%
24 AKIS Gayrimenkul Yatirimi AS 4 -
123 Emlak Konut Gayrimenkul Yatirim Ortakligi AS 19 -
31 Is Gayrimenkul Yatirim Ortakligi AS 5 -
15 Yeni Gimat Gayrimenkul Ortakligi AS 17 -
45 -
United Kingdom - 0.15%
174 Assura PLC 130 0.01
12 Big Yellow Group PLC 154 0.01
33 British Land Co PLC 170 0.01
World Equity FundPortfolio of Investments as at 31 May 2021 (continued)
Dimensional Fund Advisors Semi-Annual Report and Unaudited Financial Statements, 31 May 2021 522

Shares (000's)
Value(000's)
GBP
% of NetAssetValue
Real Estate Investment Trust (continued)
United Kingdom - 0.15% (continued)
45 Capital & Counties Properties PLC 78 -
37 Custodian Reit PLC 36 -
6 Derwent London PLC 204 0.01
9 Ediston Property Investment Co PLC 6 -
44 Empiric Student Property PLC 39 -
31 GCP Student Living PLC 52 -
16 Great Portland Estates PLC 114 0.01
223 Hammerson PLC 89 0.01
47 Intu Properties PLC - -
28 Land Securities Group PLC 193 0.01
64 LondonMetric Property PLC 149 0.01
9 McKay Securities PLC 19 -
24 NewRiver REIT PLC 23 -
4 Palace Capital PLC 9 -
88 Primary Health Properties PLC 136 0.01
37 Regional REIT Ltd 33 -
15 Safestore Holdings PLC 145 0.01
48 Schroder Real Estate Investment Trust Ltd 22 -
9 Secure Income REIT PLC 34 -
28 Segro PLC 295 0.02
14 Shaftesbury PLC 86 0.01
28 Standard Life Investment Property Income Trust Ltd 18 -
49 Target Healthcare REIT PLC 56 -
123 Tritax Big Box REIT PLC 243 0.01
16 UNITE Group PLC 182 0.01
8 Workspace Group PLC 76 -
2,791 0.15
United States - 1.80%
5 Acadia Realty Trust 80 -
3 Agree Realty Corp 166 0.01
5 Alexander & Baldwin Inc 66 -
- Alexander's Inc 75 -
5 Alexandria Real Estate Equities Inc 653 0.03
5 American Assets Trust Inc 126 0.01
8 American Campus Communities Inc 259 0.01
7 American Finance Trust Inc 46 -
18 American Homes 4 Rent 474 0.02
4 American Tower Corp 802 0.04
9 Apartment Income REIT Corp 286 0.02
10 Apartment Investment and Management Co 51 -
16 Apple Hospitality REIT Inc 174 0.01
1 Ashford Hospitality Trust Inc 2 -
5 AvalonBay Communities Inc 774 0.04
3 Bluerock Residential Growth REIT Inc 18 -
6 Boston Properties Inc 490 0.03
4 Braemar Hotels & Resorts Inc 17 -
14 Brandywine Realty Trust 137 0.01
21 Brixmor Property Group Inc 332 0.02
4 Brookfield Property REIT Inc 48 -
2 BRT Apartments Corp 23 -
5 Camden Property Trust 409 0.02
7 CareTrust REIT Inc 123 0.01
1 Cedar Realty Trust Inc 12 -
1 Centerspace 47 -
3 Chatham Lodging Trust 33 -
1 CIM Commercial Trust Corp 9 -
3 City Office REIT Inc 24 -
2 Clipper Realty Inc 9 -
10 Columbia Property Trust Inc 120 0.01
2 Community Healthcare Trust Inc 61 -
2 Condor Hospitality Trust Inc 6 -
4 CorePoint Lodging Inc 33 -
Shares (000's)
Value(000's)
GBP
% of NetAssetValue
Real Estate Investment Trust (continued)
United States - 1.80% (continued)
3 CoreSite Realty Corp 237 0.01
8 Corporate Office Properties Trust 160 0.01
10 Cousins Properties Inc 258 0.01
5 Crown Castle International Corp 637 0.03
1 CTO Realty Growth Inc 25 -
12 CubeSmart 371 0.02
7 CyrusOne Inc 350 0.02
14 DiamondRock Hospitality Co 94 0.01
6 Digital Realty Trust Inc 653 0.03
15 Diversified Healthcare Trust 38 -
10 Douglas Emmett Inc 243 0.01
14 Duke Realty Corp 465 0.02
6 Easterly Government Properties Inc 83 -
2 EastGroup Properties Inc 268 0.01
13 Empire State Realty Trust Inc 107 0.01
5 EPR Properties 166 0.01
1 Equinix Inc 547 0.03
9 Equity Commonwealth 177 0.01
8 Equity LifeStyle Properties Inc 408 0.02
14 Equity Residential 774 0.04
6 Essential Properties Realty Trust Inc 105 0.01
2 Essex Property Trust Inc 503 0.03
5 Extra Space Storage Inc 532 0.03
3 Federal Realty Investment Trust 265 0.01
8 First Industrial Realty Trust Inc 281 0.01
6 Four Corners Property Trust Inc 113 0.01
8 Franklin Street Properties Corp 30 -
12 Gaming and Leisure Properties Inc 391 0.02
3 Getty Realty Corp 61 -
3 Gladstone Commercial Corp 49 -
4 Global Medical REIT Inc 37 -
4 Global Net Lease Inc 53 -
10 Healthcare Realty Trust Inc 212 0.01
12 Healthcare Trust of America Inc 241 0.01
21 Healthpeak Properties Inc 484 0.03
3 Hersha Hospitality Trust 25 -
7 Highwoods Properties Inc 234 0.01
36 Host Hotels & Resorts Inc 439 0.02
8 Hudson Pacific Properties Inc 173 0.01
7 Independence Realty Trust Inc 88 -
- Indus Realty Trust Inc 16 -
4 Industrial Logistics Properties Trust 63 -
24 Invitation Homes Inc 602 0.03
15 Iron Mountain Inc 465 0.02
10 JBG SMITH Properties 226 0.01
6 Kilroy Realty Corp 292 0.02
23 Kimco Realty Corp 340 0.02
6 Kite Realty Group Trust 87 -
5 Lamar Advertising Co 385 0.02
20 Lexington Realty Trust 175 0.01
4 Life Storage Inc 288 0.02
3 LTC Properties Inc 93 0.01
6 Macerich Co 68 -
6 Mack-Cali Realty Corp 78 -
27 Medical Properties Trust Inc 402 0.02
6 MGM Growth Properties LLC 144 0.01
4 Mid-America Apartment Communities Inc 493 0.03
8 Monmouth Real Estate Investment Corp 102 0.01
3 National Health Investors Inc 158 0.01
9 National Retail Properties Inc 294 0.02
5 National Storage Affiliates Trust 158 0.01
6 New Senior Investment Group Inc 26 -
World Equity FundPortfolio of Investments as at 31 May 2021 (continued)
Dimensional Fund Advisors Semi-Annual Report and Unaudited Financial Statements, 31 May 2021 523

Shares (000's)
Value(000's)
GBP
% of NetAssetValue
Real Estate Investment Trust (continued)
United States - 1.80% (continued)
1 NexPoint Residential Trust Inc 53 -
4 Office Properties Income Trust 74 -
11 Omega Healthcare Investors Inc 292 0.02
2 One Liberty Properties Inc 35 -
9 Outfront Media Inc 157 0.01
16 Paramount Group Inc 126 0.01
14 Park Hotels & Resorts Inc 211 0.01
9 Pebblebrook Hotel Trust 149 0.01
14 Physicians Realty Trust 174 0.01
10 Piedmont Office Realty Trust Inc 129 0.01
1 Plymouth Industrial REIT Inc 12 -
1 Preferred Apartment Communities Inc 10 -
14 Prologis Inc 1,175 0.06
2 PS Business Parks Inc 212 0.01
4 Public Storage 738 0.04
4 QTS Realty Trust Inc 190 0.01
14 Realty Income Corp 663 0.03
9 Regency Centers Corp 396 0.02
8 Retail Opportunity Investments Corp 95 0.01
13 Retail Properties of America Inc 114 0.01
2 Retail Value Inc 26 -
8 Rexford Industrial Realty Inc 322 0.02
10 RLJ Lodging Trust 107 0.01
6 RPT Realty 51 -
3 Ryman Hospitality Properties Inc 174 0.01
12 Sabra Health Care REIT Inc 149 0.01
2 Saul Centers Inc 58 -
3 SBA Communications Corp 555 0.03
3 Seritage Growth Properties 34 -
10 Service Properties Trust 92 0.01
10 Simon Property Group Inc 873 0.05
12 SITE Centers Corp 126 0.01
5 SL Green Realty Corp 299 0.02
3 Spirit MTA REIT 1 -
7 Spirit Realty Capital Inc 230 0.01
9 STAG Industrial Inc 228 0.01
12 STORE Capital Corp 287 0.02
8 Summit Hotel Properties Inc 51 -
4 Sun Communities Inc 495 0.03
16 Sunstone Hotel Investors Inc 145 0.01
6 Tanger Factory Outlet Centers Inc 75 -
4 Terreno Realty Corp 185 0.01
15 UDR Inc 504 0.03
4 UMH Properties Inc 56 -
11 Uniti Group Inc 82 -
1 Universal Health Realty Income Trust 51 -
7 Urban Edge Properties 99 0.01
3 Urstadt Biddle Properties Inc, Class A 33 -
14 Ventas Inc 557 0.03
11 VEREIT Inc 357 0.02
10 Vornado Realty Trust 327 0.02
2 Washington Prime Group Inc 3 -
6 Washington Real Estate Investment Trust 96 0.01
8 Weingarten Realty Investors 194 0.01
15 Welltower Inc 794 0.04
3 Whitestone REIT 18 -
8 WP Carey Inc 416 0.02
7 Xenia Hotels & Resorts Inc 102 0.01
34,574 1.80
Total Real Estate Investment Trust - 2.69% (30 November2020: 2.73%) 51,536 2.69
Shares (000's)
Value(000's)
GBP
% of NetAssetValue
Rights
Australia - 0.00%
2 carsales.com Ltd - -
3 Charter Hall Long Wale REIT - -
1 Mystate Ltd - -
- -
Austria - 0.00%
5 CA Immobilien Anlagen AG - -
- -
Canada - 0.00%
4 Imperial Metals Corp - -
21 Pan American Silver Corp 14 -
14 -
Hong Kong - 0.00%
88 Coolpad Group Ltd 1 -
1 -
India - 0.00%
1 Sundaram Finance Holdings Ltd - -
- -
Italy - 0.00%
4 Freni Brembo SpA - -
- -
Korea, Republic of - 0.00%
- Cosmax Inc 1 -
1 Humax Co Ltd - -
3 Korea Line Corp 2 -
3 -
Singapore - 0.00%
3 Mapletree Industrial Trust Rig - -
137 Singapore Airlines Ltd - -
- -
Spain - 0.00%
8 Almirall SA 1 -
9 Ferrovial SA 2 -
3 -
United Kingdom - 0.00%
7 C&C Group PLC 4 -
4 -
United States - 0.00%
- Contra Gol Linhas - -
- -
Total Rights - 0.00% (30 November 2020: 0.01%) 25 -
Warrants
Canada - 0.00%
1 Cenovus Energy Inc 5 -
5 -
Malaysia - 0.00%
24 Frontken Corp 2 -
8 SKP Resources Bhd - -
2 -
Singapore - 0.00%
96 Ezion Holdings Ltd - -
- -
Thailand - 0.00%
62 Country Group Development PCL - -
7 Mbk W2 Wrts 2 -
1 Minor International PCL - -
1 Minor International PCL - -
9 Noble W2 - -
161 Nusa W4 - -
World Equity FundPortfolio of Investments as at 31 May 2021 (continued)
Dimensional Fund Advisors Semi-Annual Report and Unaudited Financial Statements, 31 May 2021 524

Shares (000's)
Value(000's)
GBP
% of NetAssetValue
Warrants (continued)
Thailand - 0.00% (continued)
5 Rs Pcl Foreign - -
5 Samart W3 - -
6 Samtel W1 - -
12 Thaifoods Group Group PLC - -
2 -
Total Warrants - 0.00% (30 November 2020: 0.00%) 9 -
Total Investments - 99.69% (30 November 2020: 100.20%) 1,911,121 99.69
Value (000's)GBP
% of NetAssetValue
Cash and Cash Equivalents - 0.33% (30 November 2020: 0.28%) 6,263 0.33Other Liabilities in Excess of Other Assets - (0.02)% (30 November 2020: (0.48)%) (358) (0.02)
Total Net Assets 1,917,026 100.00
Amounts designated as “- “ are either £0, less than £500 or less than 500 shares.
Analysis of Total Assets % of Total Assets
Transferable securities admitted to an official exchange listing 99.06
Current Assets 0.94
Total Assets 100.00
World Equity FundPortfolio of Investments as at 31 May 2021 (continued)
Dimensional Fund Advisors Semi-Annual Report and Unaudited Financial Statements, 31 May 2021 525

1. OrganisationDimensional Funds plc (the “Company”) was incorporated on
14 January 2002. The Company is established as an umbrella
investment company with segregated liability between funds (each a
“Fund”, together the “Funds”) and variable capital incorporated in
Ireland as a public limited company pursuant to the Companies Act,
2014 and the European Communities (Undertakings for Collective
Investment in Transferable Securities) Regulations 2011 (as
amended), and under the Central Bank (Supervision and
Enforcement) Act 2013 (Section 48(1)) (Undertakings for Collective
Investment in Transferable Securities) Regulations 2019 (together the
�UCITS Regulations�).
A number of the Company shares are or have applied to be listed on
Euronext Dublin.
2. Basis of Preparation and PresentationThese condensed unaudited Financial Statements are prepared in
accordance with the Financial Reporting Standard 104 ‘Interim
Financial Reporting’ (“FRS 104”), and comply with financial reporting
standards of the Financial Reporting Council and the UCITS
Regulations. The Company has continued to avail of the exemption
available to open-ended investment funds under Financial Reporting
Standard applicable in the UK and Republic of Ireland (�FRS 102�) and
is not presenting a cash flow statement.
The condensed unaudited Financial Statements should be read in
conjunction with the Company’s annual audited Financial Statements
for the financial year ended 30 November 2020 which were prepared in
accordance with FRS 102 and the applicable regulations as issued by
the Central Bank of Ireland (the “Central Bank”).
The condensed Financial Statements are unaudited. We note that the
statutory auditor’s report in the Company’s annual audited Financial
Statements for the financial year ended 30 November 2020 was
unqualified.
The Financial Statements have been prepared on a going concern
basis.
3. Significant Accounting PoliciesThe Company makes estimates and assumptions that affect the
reported amounts of assets and liabilities. Estimates and judgements
are continually evaluated and are based on historical experience and
other factors. Estimates and assumptions used may include the use of
valuation techniques for the purposes of determining the fair value of
financial instruments that are not quoted in active markets, such as
unlisted equities and investment in other investment funds.
4. Lending of SecuritiesEach security loan is collateralised with collateral assets in an amount
greater than the current market value of the loaned securities. There is
a risk of delay in receiving collateral or in recovering the securities
loaned or even loss of rights in collateral should the borrower fail
financially.
However, in the event of default or bankruptcy by the other party to the
agreement, realisation and/or retention of the collateral may be subject
to legal proceedings. In the event that the borrower fails to return
loaned securities, and collateral being maintained by the Fund in
question is insufficient to cover the value of loaned securities and
provided such collateral insufficiency is not the result of investment
losses, the securities lending agent has agreed to pay the amount of
the shortfall to the respective Fund or, at the option of the securities
lending agent, to replace the securities.
Subject to each Fund’s investment policy, any cash collateral received
by a Fund from securities on loan may be invested in securities of the
U.S. government or its agencies, repurchase agreements
collateralised by securities of the U.S. government or its agencies, time
deposits and registered and unregistered money market funds.
Agencies include both agency debentures and agency mortgage
backed securities.
As at 31 May 2021, EUR75,036,903 (30 November
2020: EUR52,812,474) of the total cash collateral received by the
Funds (as disclosed on the Statement of Financial Position and in the
tables below) was re-invested in repurchase agreements with
approved counterparties: Citigroup, JP Morgan and Merrill Lynch
(30 November 2020: Calyon, Citigroup and Merrill Lynch). The fair
value of these repurchase agreements as at 31 May 2021 was
EUR75,036,903 (30 November 2020: EUR52,812,474). These
agreements were entered into on 28 May 2021 and matured on 1 June
2021 (30 November 2020: entered into on 30 November 2020 and
matured on 1 December 2020).
In addition, each Fund will be able to terminate the loan at any time and
will receive reasonable interest on the loan, as well as amounts equal
to any dividends, interest or other distributions on the loaned securities.
As at 31 May 2021 and 30 November 2020 each of the Funds
disclosed in the following tables had outstanding loans of securities to
certain brokers, dealers or other financial institutions for which each
Fund has a security interest and lien upon segregated cash and/or
securities equivalent to at least 100% of the current market value of
the loaned securities with respect to any type of securities loaned
through the securities lending agent.
As at 31 May 2021 and 30 November 2020 the collateral received for
securities lending purposes comprised cash and government bonds as
disclosed in the Market Value of U.S. Loaned Securities and Market
Value of non-U.S. Loaned Securities on the following tables.
Notes to the Financial Statementsfor the financial period ended 31 May 2021
Dimensional Fund Advisors Semi-Annual Report and Unaudited Financial Statements, 31 May 2021 526

4. Lending of Securities (continued)As at 31 May 2021 and 30 November 2020, each of the following
Funds had loaned securities with respect to U.S. securities through the
securities lending agent:
Market Value of U.S. Loaned Securities
As at31 May 2021
USD '000
As at30 November
2020USD '000
Emerging Markets Large Cap Core Equity Fund 10,965 9,026
Emerging Markets Value Fund 5,764 7,592
Global Core Equity Fund 46,094 57,090
Global Core Fixed Income Fund 12,336 3,398
Global Short Fixed Income Fund 355 -
Global Short-Term Investment Grade Fixed Income Fund 5,545 10,720
Global Small Companies Fund 49,247 42,959
Global Sustainability Core Equity Fund 20,205 12,849
Global Targeted Value Fund 100,182 91,673
Global Value Fund 1,836 3,277
U.S. Core Equity Fund 636 740
U.S. Small Companies Fund 20,730 20,142
World Allocation 60/40 Fund 18,386 -
World Equity Fund 28,782 38,456
Total 321,063 297,922
Fair value of securities received as collateral 310,129 280,788
Cash collateral received 30,634 26,073
Total 340,763 306,861
As at 31 May 2021 and 30 November 2020, each of the followingFunds had loaned securities with respect to non-U.S. securitiesthrough the securities lending agent:
Market Value of non-U.S. Loaned Securities
As at31 May
2021USD '000
As at30 November
2020USD '000
Emerging Markets Large Cap Core Equity Fund 66,145 28,888
Emerging Markets Value Fund 184,795 83,962
Euro Inflation Linked Intermediate Duration Fixed Income Fund 8,500 -
European Small Companies Fund 29,167 33,911
European Value Fund 5,684 2,951
Global Core Equity Fund 149,333 177,768
Global Core Fixed Income Fund 259 -
Global Short Fixed Income Fund 7,584 -
Global Short-Term Investment Grade Fixed Income Fund 2,136 -
Global Small Companies Fund 76,431 66,848
Global Sustainability Core Equity Fund 50,384 30,453
Global Sustainability Fixed Income Fund 382 563
Global Targeted Value Fund 222,424 191,715
Global Ultra Short Fixed Income Fund 640 312
Global Value Fund 17,774 17,535
Pacific Basin Small Companies Fund 18,814 16,529
World Allocation 20/80 Fund - 101
World Allocation 60/40 Fund 52,707 -
World Equity Fund 108,569 115,037
Total 1,001,728 766,573
Fair value of securities received as collateral 1,005,306 808,036
Cash collateral received 61,444 39,358
Total 1,066,750 847,394
Securities lending income, as disclosed in the Statement of Comprehensive Income is received net of the securities lending agent’s fee. The securities
lending agent’s fees incurred for the financial period ended 31 May 2021 and financial year 30 November 2020 are disclosed in the table below. Alloperational costs are borne out of the securities lending agent’s share.
Fund Currency
Period ended31 May 2021
'000
Period ended31 May 2020
'000
Emerging Markets Large Cap Core Equity Fund USD 23 21
Emerging Markets Value Fund USD 71 54
Euro Inflation Linked Intermediate Duration Fixed Income Fund* EUR - -
European Small Companies Fund EUR 15 18
European Value Fund EUR 2 2
Global Core Equity Fund USD 71 88
Global Core Fixed Income Fund * GBP - -
Global Short Fixed Income Fund* EUR - -
Global Short-Term Investment Grade Fixed Income Fund* USD - 2
Global Small Companies Fund USD 36 36
Global Sustainability Core Equity Fund USD 16 9
Global Sustainability Fixed Income Fund* GBP - -
Global Targeted Value Fund USD 105 145
Global Ultra Short Fixed Income Fund* GBP - -
Global Value Fund USD 11 6
Pacific Basin Small Companies Fund USD 5 5
U.S. Core Equity Fund* USD - -
U.S. Small Companies Fund USD 4 6
World Allocation 60/40 Fund GBP 7 -
World Equity Fund GBP 36 46
Notes to the Financial Statementsfor the financial period ended 31 May 2021 (continued)
Dimensional Fund Advisors Semi-Annual Report and Unaudited Financial Statements, 31 May 2021 527

4. Lending of Securities (continued)
* The securities lending agent's fees incurred for the financial period ended 31 May 2021 for Global Short-Term Investment Grade Fixed Income Fund are displaying a nil value in the above table whenrounded to the nearest thousand. Similarly, the securities lending agent's fees incurred for the financial periods ended 31 May 2021 and 31 May 2020 for Global Core Fixed Income Fund, Global Short FixedIncome Fund, Global Ultra Short Fixed Income Fund and U.S. Core Equity Fund amount to a nil value when rounded to the nearest thousand, and are therefore not included in the above table.
One of the above securities and cash collateral received from a single issuer, Barclays Bank Plc, has exceeded 20% of the Fund’s NAV at the financial
period end date (30 November 2020: none).
5. TaxationUnder current law and practice, the Company qualifies as an
investment undertaking as defined in Section 739B of the Taxes
Consolidation Act, 1997, as amended. On that basis, it is not
chargeable to Irish tax on its income or chargeable gains. However,
Irish tax may arise on the happening of a “chargeable event”. A
chargeable event includes any distribution payments to shareholders,
any encashment, redemption, cancellation or transfer of shares and
the holding of shares at the end of each eight year anniversary
beginning with the acquisition of such shares.
No Irish tax will arise on the Company in respect of chargeable events
in respect of:
a) a shareholder who is neither Irish resident nor ordinarily
resident in Ireland for tax purposes, at the time of the
chargeable event, provided appropriate valid declarations in
accordance with the provisions of the Taxes Consolidation Act,
1997, as amended, are held by the Company at that time or the
Company has been authorised by the Irish Revenue to make
gross payments in the absence of appropriate declarations; and
b) certain exempted Irish tax resident shareholders who have
provided the Company with the appropriate signed declarations
in the prescribed Revenue format.
Dividends, interest and capital gains (if any) received on investments
made by the Company may be subject to taxes imposed by the country
from which the investment income/gains are received and such taxes
may not be recoverable by the Company or its shareholders.
For the financial period ended 31 May 2021 the Company incurred
capital gains taxes of EUR6,522,113 (31 May 2020: refund of capital
gains taxes EUR4,527,807).
6. Cash and Cash EquivalentsThe cash balances as disclosed in the Statement of Financial Position
were held at State Street Custodial Services (Ireland) Limited as at
31 May 2021 and 30 November 2020.
In March 2015, the Central Bank introduced Investor Money
Regulations (“IMR”). These regulations, which were effective from
1 July 2016, detail material changes to the current rules in relation to
investor money, and were designed to increase transparency and
enhance investor protection.
In response to these regulations, cash accounts held with a third party
banking entity for collection of subscriptions and payment of
redemptions are now deemed to be assets of the Company.
Cash collateral received relates to collateral received for securities on
loan and is held by the securities lending agent as at 31 May 2021 and
30 November 2020.
See Note 4 for reference to cash collateral received by the Funds that
was re-invested in repurchase agreements.
7. Share CapitalThe authorised share capital of the Company is
500,000,030,000 shares of no par value divided
into 30,000 Subscriber Shares of no par value and
500,000,000,000 shares (the “Shares”) of no par value.
The Subscriber Shares entitle the holders to attend and vote at general
meetings of the Company but do not entitle the holders to participate in
the profits or assets of the Company except for a return of capital on a
winding-up. The Subscriber Shares are not included in the calculation
of the NAV per redeemable share.
As at 31 May 2021, Peter Blessing, Dermot Butler, Victoria Parry,
Nathan Lacaze and John Romiza held subscriber shares (fully
paid-up) in the Company (30 November 2020: Peter Blessing, Dermot
Butler, Victoria Parry, Nathan Lacaze and John Romiza).
Shares entitle the holders to attend and vote at general meetings of the
Company and to participate equally (subject to any differences
between fees, charges and expenses applicable to different classes) in
the profits and assets of the Company on the terms and conditions set
out in the Prospectus. The Funds have the ability to issue multiple
classes of redeemable shares. Each redeemable share within a class
represents an identical legal interest in the Funds and has identical
rights.
8. Related Party TransactionsThe related parties to the Fund are the Directors, the Investment Manager, the Investment Sub-Advisors and the shareholders with significant holdings
of at least 20% of the Fund.
Notes to the Financial Statementsfor the financial period ended 31 May 2021 (continued)
Dimensional Fund Advisors Semi-Annual Report and Unaudited Financial Statements, 31 May 2021 528

8. Related Party Transactions (continued)As 31 May 2021 and 30 November 2020, the Investment Manager, Dimensional Fund Advisors Ltd., held shares in each of the following Funds:
Fund 31 May 2021 30 November 2020
Global Core Equity Fund 1,150 SEK Accumulation Class 1,150 SEK Accumulation Class
Global Short Fixed Income Fund 1,150 SEK Accumulation Class 1,150 SEK Accumulation Class
Global Ultra Short Fixed Income Fund 710,307 GBP Accumulation Class 710,307 GBP Accumulation Class
Global Ultra Short Fixed Income Fund 1,150 SEK Accumulation Class 1,150 SEK Accumulation Class
U.S. Core Equity Fund 17,414 USD Accumulation Class 17,414 USD Accumulation Class
As at 31 May 2021 and 30 November 2020, World Allocation 20/80 Fund, World Allocation 40/60 Fund, World Allocation 60/40 Fund and World
Allocation 80/20 Fund invested in other Funds of the Company and also other related funds which have appointed the same Investment Manager,
Investment Sub-Advisor or other related party entities to provide investment management services to the Company, as disclosed in the Portfolio of
Investments. The management fees in relation to the underlying Funds have been waived by the Investment Manager, and these waivers are disclosed
in the Statement of Comprehensive Income.
The Investment Manager, of which Catherine L. Newell, Victoria Parry, Gerard O’Reilly, John Romiza and Nathan Lacaze are also directors, acts as the
authorised corporate director to another fund range in which certain Funds have made investments.
In the opinion of the Directors, the Investment Manager and the Investment Sub-Advisors are related parties under FRS 102. Fees earned by these
parties and the amounts due at 31 May 2021 and 30 November 2020 are disclosed in the Statement of Comprehensive Income and Statement of
Financial Position respectively. The Investment Manager shall pay the fees of any Investment Sub-Advisors out of the Management fees.
Management fees waived and reimbursed during the financial period are disclosed in the Statement of Comprehensive Income.
The following tables detail the number of shareholders with significant holdings of at least 20% of the relevant Fund and the aggregate value and
percentage of that holding as at 31 May 2021 and 30 November 2020. One or more of the shareholders may be omnibus accounts, which typically hold
shares for the benefit of several other underlying investors.
31 May 2021
FundNumber of Significant
Shareholders of the FundValue of Holding
'000Aggregate Shareholding
as a % Fund NAV
Emerging Markets Large Cap Core Equity Fund 1 USD 500,212 61.35
Euro Inflation Linked Intermediate Duration Fixed Income Fund 1 EUR 12,642 22.37
European Small Companies Fund 1 EUR 46,213 27.51
Global Short-Term Investment Grade Fixed Income Fund 1 USD 307,713 21.34
Global Small Companies Fund 1 USD 221,407 21.65
Global Sustainability Core Equity Fund 1 USD 379,802 25.86
Global Sustainability Fixed Income Fund 1 GBP 88,229 30.08
Global Targeted Value Fund 1 USD 915,148 23.33
Global Value Fund 1 USD 236,300 31.27
Sterling Inflation Linked Intermediate Duration Fixed Income Fund 1 GBP 419,388 45.65
U.S. Core Equity Fund 2 USD 9,358 44.54
World Allocation 40/60 Fund 1 GBP 191,324 23.20
World Allocation 60/40 Fund 1 GBP 448,010 24.69
World Allocation 80/20 Fund 1 GBP 116,221 29.62
Notes to the Financial Statementsfor the financial period ended 31 May 2021 (continued)
Dimensional Fund Advisors Semi-Annual Report and Unaudited Financial Statements, 31 May 2021 529

8. Related Party Transactions (continued)
30 November 2020
FundNumber of Significant
Shareholders of the FundValue of Holding
'000Aggregate Shareholding
as a % Fund NAV
Emerging Markets Large Cap Core Equity Fund 1 USD 414,828 68.91
Euro Inflation Linked Intermediate Duration Fixed Income Fund 1 EUR 10,694 21.84
European Small Companies Fund 1 EUR 37,196 21.76
Global Small Companies Fund 1 USD 179,203 22.42
Global Sustainability Core Equity Fund 1 USD 214,096 27.94
Global Sustainability Fixed Income Fund 1 GBP 51,370 46.88
Global Targeted Value Fund 1 USD 687,381 22.23
Global Value Fund 1 USD 178,662 31.20
Pacific Basin Small Companies Fund 1 USD 19,171 20.03
Sterling Inflation Linked Intermediate Duration Fixed Income Fund 1 GBP 391,879 44.46
U.S. Core Equity Fund 2 USD 9,527 50.91
World Allocation 40/60 Fund 1 GBP 182,542 23.77
World Allocation 60/40 Fund 1 GBP 407,530 25.95
World Allocation 80/20 Fund 1 GBP 101,908 31.71
Cross Holdings
As at the Statement of Financial Position date a number of Funds invested in other Funds of the Company. Details of these cross investments are
outlined below. The impact of these cross-investment transactions have been eliminated from the total column of the Statement of Financial Position,
Statement of Comprehensive Income and the Statement of Changes in Net Assets Attributable to Holders of Redeemable Shares.
World Allocation 20/80 Fund held the following investments as at 31 May 2021 and related gains and losses on Funds within the Company during the
financial period ended 31 May 2021:
Fund
Global CoreEquity Fund
GBP '000
Global Short FixedIncome Fund
GBP '000
GlobalShort-TermInvestment
Grade FixedIncome Fund
GBP '000
Global Ultra ShortFixed Income Fund
GBP '000
World EquityFund
GBP '000
Issue of shares 303 2,827 2,396 2,064 2,619
Redemption of shares (548) (2,455) (2,042) (2,007) (4,290)
Fair value of investment funds 2,012 18,027 15,978 10,019 18,183
Net realised gain/(loss) on financial assets at fairvalue through profit or loss 103 (8) (17) (20) 754
Dividend Income 7 7 50 - 62
Movement in Net unrealised gain on financialassets at fair value through profit or loss 142 25 16 20 1,628
World Allocation 40/60 Fund held the following investments as at 31 May 2021 and related gains and losses on Funds within the Company during the
financial period ended 31 May 2021:
Fund
Global CoreEquity Fund
GBP '000
Global Core FixedIncome Fund
GBP '000
Global Short FixedIncome Fund
GBP '000
GlobalShort-TermInvestment
Grade FixedIncome Fund
GBP '000
Global TargetedValue Fund
GBP '000
Global Ultra ShortFixed Income Fund
GBP '000
World EquityFund
GBP '000
Issue of shares 1,358 2,222 13,648 9,187 847 7,917 1,341
Redemption of shares (11,938) (312) (3,165) (1,875) (3,284) (1,562) (8,290)
Fair value of investment funds 132,284 16,289 148,049 98,498 21,253 82,317 149,013
Net realised gain/(loss) on financial assets at fairvalue through profit or loss 4,390 8 70 (5) 577 (44) 3,286
Dividend Income 467 111 58 310 57 - 500
Movement in Net unrealised gain/(loss) onfinancial assets at fair value through profit or loss 11,750 (475) 79 1 4,232 45 15,785
Notes to the Financial Statementsfor the financial period ended 31 May 2021 (continued)
Dimensional Fund Advisors Semi-Annual Report and Unaudited Financial Statements, 31 May 2021 530

8. Related Party Transactions (continued)Cross Holdings (continued)
World Allocation 60/40 Fund held the following investments as at 31 May 2021 and related gains and losses on Funds within the Company during the
financial period ended 31 May 2021:
Fund
Global CoreEquity Fund
GBP '000
Global Core FixedIncome Fund
GBP '000
Global Short FixedIncome Fund
GBP '000
GlobalShort-TermInvestment
Grade FixedIncome Fund
GBP '000
Global TargetedValue Fund
GBP '000
Global Ultra ShortFixed Income Fund
GBP '000
World EquityFund
GBP '000
Issue of shares 1,925 44,117 47,567 32,408 - 5,620 1,952
Redemption of shares (291,786) (588) (4,700) (2,060) (86,568) (33,542) (302,401)
Fair value of investment funds - 71,713 324,630 216,829 - 17,932 -
Net realised gain/(loss) on financial assets at fairvalue through profit or loss 54,215 14 66 (6) 4,982 (927) 55,222
Dividend Income - 488 128 683 - - -
Movement in Net unrealised (loss)/gain onfinancial assets at fair value through profit or loss (45,811) (1,892) 272 (8) (463) 928 (36,240)
World Allocation 80/20 Fund held the following investments as at 31 May 2021 and related gains and losses on Funds within the Company during the
financial period ended 31 May 2021:
Fund
Global CoreEquity Fund
GBP '000
Global Core FixedIncome Fund
GBP '000
GlobalShort-TermInvestment
Grade FixedIncome Fund
GBP '000
Global SmallCompanies Fund
GBP '000
Global ValueFund
GBP '000
World EquityFund
GBP '000
Issue of shares 6,933 10,524 9,765 5,796 3,288 6,419
Redemption of shares (2,170) (2,011) (2,265) (2,401) (6,015) (2,170)
Fair value of investment funds 69,572 38,771 38,959 42,152 20,599 69,693
Net realised gain/(loss) on financial assets at fairvalue through profit or loss 682 74 (31) 384 1,057 643
Dividend Income 246 264 123 110 90 233
Movement in Net unrealised gain/(loss) onfinancial assets at fair value through profit or loss 6,920 (1,100) 29 5,626 2,265 7,593
World Allocation 20/80 Fund held the following investments as at 30 November 2020 and related gains and losses on Funds within the Company during
the financial year ended 30 November 2020:
Fund
Global CoreEquity Fund
GBP '000
Global Short FixedIncome Fund
GBP '000
GlobalShort-TermInvestment
Grade FixedIncome Fund
GBP '000
Global Ultra ShortFixed Income Fund
GBP '000
World EquityFund
GBP '000
Issue of shares 1,235 4,574 3,630 2,720 7,521
Redemption of shares (1,037) (1,839) (1,236) (1,141) (5,831)
Fair value of investment funds 2,012 17,637 15,625 9,961 17,474
Net realised gain/(loss) on financial assets at fairvalue through profit or loss 12 29 6 (6) 424
Dividend Income 26 19 74 23 232
Movement in Net unrealised (loss)/gain onfinancial assets at fair value through profit or loss (18,336) (404) 439 1,471 (17,147)
Notes to the Financial Statementsfor the financial period ended 31 May 2021 (continued)
Dimensional Fund Advisors Semi-Annual Report and Unaudited Financial Statements, 31 May 2021 531

8. Related Party Transactions (continued)Cross Holdings (continued)
World Allocation 40/60 Fund held the following investments as at 30 November 2020 and related gains and losses on Funds within the Company during
the financial year ended 30 November 2020:
Fund
Global CoreEquity Fund
GBP '000
Global Core FixedIncome Fund
GBP '000
Global Short FixedIncome Fund
GBP '000
GlobalShort-TermInvestment
Grade FixedIncome Fund
GBP '000
Global TargetedValue Fund
GBP '000
Global Ultra ShortFixed Income Fund
GBP '000
World EquityFund
GBP'000
Issue of shares 25,825 14,327 32,394 18,482 6,240 14,706 33,367
Redemption of shares (18,299) (123) (16,776) (8,215) (5,484) (18,965) (23,810)
Fair value of investment funds 126,723 14,846 137,418 91,189 18,882 75,962 136,891
Net realised gain/(loss) on financial assets at fairvalue through profit or loss 6,024 4 412 123 173 (33) 6,616
Dividend Income 1,584 225 151 434 215 181 1,820
Movement in Net unrealised gain/(loss) onfinancial assets at fair value through profit or loss 2,583 637 637 761 (94) 254 886
World Allocation 60/40 Fund held the following investments as at 30 November 2020 and related gains and losses on Funds within the Company during
the financial year ended 30 November 2020:
Fund
Global CoreEquity Fund
GBP '000
Global Core FixedIncome Fund
GBP '000
Global Short FixedIncome Fund
GBP '000
GlobalShort-TermInvestment
Grade FixedIncome Fund
GBP '000
Global TargetedValue Fund
GBP '000
Global Ultra ShortFixed Income Fund
GBP'000
World EquityFund
GBP'000
Issue of shares 56,418 29,014 92,251 55,394 22,975 9,071 58,577
Redemption of shares (47,694) (148) (78,054) (46,327) (20,844) (36,320) (45,582)
Fair value of investment funds 281,456 30,062 281,424 186,495 82,049 45,854 281,468
Net realised gain/(loss) on financial assets at fairvalue through profit or loss 12,676 5 1,822 124 (47) (207) 9,660
Dividend Income 3,484 442 301 870 889 114 3,688
Movement in Net unrealised gain on financialassets at fair value through profit or loss 27,178 1,193 2,850 1,002 217 513 17,691
World Allocation 80/20 Fund held the following investments as at 30 November 2020 and related gains and losses on Funds within the Company during
the financial year ended 30 November 2020:
Fund
Global CoreEquity Fund
GBP '000
Global Core FixedIncome Fund
GBP '000
Global Short FixedIncome Fund
GBP '000
GlobalShort-TermInvestment
Grade FixedIncome Fund
GBP '000
Global SmallCompanies Fund
GBP '000
Global TargetedValue Fund
GBP '000
Global ValueFund
GBP '000
World EquityFund
GBP '000
Issue of shares 11,802 31,194 5,279 12,614 31,689 12,768 18,949 12,454
Redemption of shares (1,376) (1,169) (29,569) (5,642) (901) (49,751) (136) (1,354)
Fair value of investment funds 57,206 31,285 - 31,461 32,746 - 20,006 57,208
Net realised gain/(loss) on financial assets at fairvalue through profit or loss 425 44 448 59 62 (2,867) 7 409
Dividend Income 696 470 - 144 266 156 265 737
Movement in Net unrealised (loss)/gain onfinancial assets at fair value through profit or loss (10,362) 1,216 (403) 580 1,896 (373) 1,186 (12,314)
Notes to the Financial Statementsfor the financial period ended 31 May 2021 (continued)
Dimensional Fund Advisors Semi-Annual Report and Unaudited Financial Statements, 31 May 2021 532

8. Related Party Transactions (continued)Cross Holdings (continued)
World Allocation 20/80 Fund held the following investments as at 31 May 2020 and related gains and losses on Funds within the Company during the
financial period ended 31 May 2020:
Fund
Global CoreEquity Fund
GBP'000
Global Short FixedIncome Fund
GBP'000
GlobalShort-TermInvestment
Grade FixedIncome Fund
GBP'000
Global Ultra ShortFixed Income Fund
GBP'000
World EquityFund
GBP'000
Issue of shares 1,158 2,192 1,725 1,220 5,991
Redemption of shares (777) (1,157) (695) (803) (3,374)
Fair value of investment funds 1,981 15,840 13,969 8,743 16,267
Net realised gain/(loss) on financial assets at fairvalue through profit or loss (36) 24 5 (3) 173
Dividend Income 8 11 28 19 61
Movement in Net unrealised (loss)/gain onfinancial assets at fair value through profit or loss (10) 7 (158) (24) (1,189)
World Allocation 40/60 Fund held the following investments as at 31 May 2020 and related gains and losses on Funds within the Company during the
financial period ended 31 May 2020:
Fund
Global CoreEquity Fund
GBP'000
Global Core FixedIncome Fund
GBP'000
Global Short FixedIncome Fund
GBP'000
GlobalShort-TermInvestment
Grade FixedIncome Fund
GBP'000
Global TargetedValue Fund
GBP'000
Global Ultra ShortFixed Income Fund
GBP'000
World EquityFund
GBP'000
Issue of shares 22,908 12,322 18,612 10,781 5,568 8,811 29,821
Redemption of shares (12,967) (8) (14,658) (7,386) (151) (18,393) (13,839)
Fair value of investment funds 115,413 12,425 124,853 82,604 20,149 70,145 126,975
Net realised gain/(loss) on financial assets at fairvalue through profit or loss 4,130 - 362 110 27 (29) 3,324
Dividend Income 452 76 86 168 74 153 475
Movement in Net unrealised (loss)/gain onfinancial assets at fair value through profit or loss (9,247) 110 (69) (938) (3,341) (190) (12,163)
World Allocation 60/40 Fund held the following investments as at 31 May 2020 and related gains and losses on Funds within the Company during the
financial period ended 31 May 2020:
Fund
Global CoreEquity Fund
GBP'000
Global Core FixedIncome Fund
GBP'000
Global Short FixedIncome Fund
GBP'000
GlobalShort-TermInvestment
Grade FixedIncome Fund
GBP'000
Global TargetedValue Fund
GBP'000
Global Ultra ShortFixed Income Fund
GBP'000
World EquityFund
GBP'000
Issue of shares 47,924 22,578 52,251 31,425 18,921 7,722 51,114
Redemption of shares (42,969) (32) (73,642) (45,430) (10,545) (35,878) (39,865)
Fair value of investment funds 247,654 22,740 243,627 159,781 74,779 44,532 247,336
Net realised gain/(loss) on financial assets at fairvalue through profit or loss 10,960 - 1,770 125 (641) (201) 7,772
Dividend Income 969 140 168 325 275 97 926
Movement in Net unrealised (loss)/gain onfinancial assets at fair value through profit or loss (29,694) 194 (1,200) (1,984) (16,867) (7) (32,238)
Notes to the Financial Statementsfor the financial period ended 31 May 2021 (continued)
Dimensional Fund Advisors Semi-Annual Report and Unaudited Financial Statements, 31 May 2021 533

8. Related Party Transactions (continued)Cross Holdings (continued)
World Allocation 80/20 Fund held the following investments as at 31 May 2020 and related gains and losses on Funds within the Company during thefinancial period ended 31 May 2020:
Fund
Global CoreEquity Fund
USD '000
Global Core FixedIncome Fund
GBP
Global Short FixedIncome Fund
EUR '000
GlobalShort-TermInvestment
Grade FixedIncome Fund
USD'000
Global TargetedValue Fund
USD '000
World EquityFund
GBP '000
Issue of shares 7,390 25,250 5,525 6,521 10,248 8,076
Redemption of shares (908) (78) (29,568) (4,825) (956) (772)
Fair value of investment funds 47,179 25,379 - 25,403 42,593 46,848
Net realised gain/(loss) on financial assets at fairvalue through profit or loss 281 - 448 56 201 230
Dividend Income 185 156 - 52 156 175
Movement in Net unrealised (loss)/gain onfinancial assets at fair value through profit or loss (2,321) 206 (403) (273) (7,121) (3,334)
There have been no other related party transactions for the financial period under review.
9. Fair Value EstimationThe fair value of the financial instruments traded in active markets
such as publicly traded derivatives and trading securities is based on
quoted market prices at the Statement of Financial Position date. The
quoted market price at the valuation point used for bonds traded on a
regulated market held by the Company can be last traded price or
quoted mid price depending on the bond type. Securities other than
bonds which are traded on a regulated market will be issued at the last
traded prices at the relevant valuation point. When a “readily available
market quotation” for a security is not available, the Company employs
“fair value” methodologies to price securities. As a general principle,
fair value is the price that the Fund might reasonably expect to receive
upon a current sale. The fair valuation process requires the Investment
Manager or the Investment Sub-Advisors to make a determination in
good faith as to the value of a particular security or group of securities
depending on the particular facts and circumstances involved.
Circumstances in which a market quotation is not readily available may
include, trading suspensions prior to the close of the relevant market;
events that unexpectedly close entire markets such as natural
disasters, power blackouts, or similar major events; market holidays; or
volume of trading in a security.
When a market quotation for a security is not available and a fair
valuation is being determined, the Investment Manager or the
Investment Sub-Advisors may consider all relevant methods, including
but not limited to any one or all of the following pricing methods:
1. A multiple of earnings;
2. A discount from market of a similar freely traded security;
3. A discounted cash-flow analysis;
4. The book value or a multiple thereof;
5. A risk premium/yield analysis;
6. Yield to maturity; or
7. Fundamental investment analysis.
Investments measured and reported at fair value are classified and
disclosed in one of the following fair value hierarchy levels based on
the significance of the inputs used in measuring its fair value. These
levels are the fair value hierarchy levels per FRS 102.
Level 1 inputs are unadjusted quoted prices in active markets for
identical assets or liabilities that the reporting entity has the ability to
access at the valuation date. An active market for the asset or liability is
a market in which transactions for the asset or liability occur with
sufficient frequency and volume to provide pricing information on an
ongoing basis.
Level 2 inputs are inputs other than quoted prices in active markets
included within Level 1 that are observable for the asset or liability,
either directly or indirectly. Fair value is determined through the use of
models or other valuation methodologies.
Level 2 inputs include the following:
a) Quoted prices for similar assets or liabilities in active markets;
b) Quoted prices for identical or similar assets or liabilities in markets
that are not active, that is, markets in which there are few transactions
for the asset or liability, the prices are not current, or price quotations
vary substantially either over time or among market makers, or in which
little information is released publicly;
c) Inputs other than quoted prices that are observable for the asset or
liability (e.g. interest rate and yield curves observable at commonly
quoted intervals, volatilities, prepayment speeds, loss severities, credit
risks and default rates); and
d) Inputs that are derived principally from or corroborated by
observable market data by correlation or other means.
Level 3 inputs are unobservable inputs for the asset or liability.
Unobservable inputs reflect the Company’s own assumptions about
how market participants would be expected to value the asset or
Notes to the Financial Statementsfor the financial period ended 31 May 2021 (continued)
Dimensional Fund Advisors Semi-Annual Report and Unaudited Financial Statements, 31 May 2021 534

9. Fair Value Estimation (continued)liability. Unobservable inputs are developed based on the best
information available in the circumstances, other than market data
obtained from sources independent of the Company and might include
the Company’s own data.
An investment is always categorised as Level 1, 2 or 3 in its entirety. In
certain cases, the fair value measurement for an investment may use a
number of different inputs that fall into different levels of the fair value
hierarchy. In such cases, an investment’s level within the fair value
hierarchy is based on the lowest level of input that is significant to the
fair value measurement. The assessment of the significance of a
particular input to the fair value measurement requires judgment and is
specific to the investment.
The inputs or methodology used for valuing securities are not
necessarily an indication of the risk associated with investing in these
securities.
The following tables analyse under the fair value hierarchy the Funds’ financial assets and financial liabilities measured at fair value at 31 May 2021 and
30 November 2020. All amounts represent the valuation of securities as presented in the Portfolio of Investments.
Emerging MarketsLarge Cap Core
Equity FundEmerging Markets
Value Fund
Euro Inflation LinkedIntermediate Duration Fixed
Income FundEuropean SmallCompanies Fund
31 May 2021 30 Nov 2020 31 May 2021 30 Nov 2020 31 May 2021 30 Nov 2020 31 May 2021 30 Nov 2020USD '000 USD '000 USD '000 USD '000 EUR '000 EUR '000 EUR '000 EUR '000
Level 1Equity Instruments 775,365 575,752 1,387,615 1,156,191 - - 167,084 170,993
Investment Funds 37,320 25,378 - - - - - -
812,685 601,130 1,387,615 1,156,191 - - 167,084 170,993
Level 2Equity Instruments - 86 5,243 505 - - 2 19
Bonds and Notes - - - - 55,833 48,497 - -
- 86 5,243 505 55,833 48,497 2 19
Total 812,685 601,216 1,392,858 1,156,696 55,833 48,497 167,086 171,012
EuropeanValue Fund
Global CoreEquity Fund
Global Core FixedIncome Fund
Global Short FixedIncome Fund
31 May 2021 30 Nov 2020 31 May 2021 30 Nov 2020 31 May 2021 30 Nov 2020 31 May 2021 30 Nov 2020EUR '000 EUR '000 USD '000 USD '000 GBP '000 GBP '000 EUR '000 EUR '000
Level 1Equity Instruments 91,202 59,125 4,453,447 4,339,453 - - - -
Investment Funds - - 17 - - - - -
91,202 59,125 4,453,464 4,339,453 - - - -
Level 2Equity Instruments - - 149 90 - - - -
Bonds and Notes - - - - 387,101 233,907 2,662,013 2,483,207
Derivative assets held for trading - - - - 5,145 2,459 22,254 8,401
Derivative liabilities held for trading - - - - (2,371) (1,668) (28,441) (16,280)
- - 149 90 389,875 234,698 2,655,826 2,475,328
Total 91,202 59,125 4,453,613 4,339,543 389,875 234,698 2,655,826 2,475,328
Notes to the Financial Statementsfor the financial period ended 31 May 2021 (continued)
Dimensional Fund Advisors Semi-Annual Report and Unaudited Financial Statements, 31 May 2021 535

9. Fair Value Estimation (continued)
Global Short-TermInvestment
Grade Fixed Income FundGlobal Small
Companies FundGlobal Sustainability
Core Equity FundGlobal SustainabilityFixed Income Fund
31 May 2021 30 Nov 2020 31 May 2021 30 Nov 2020 31 May 2021 30 Nov 2020 31 May 2021 30 Nov 2020USD '000 USD '000 USD '000 USD '000 USD '000 USD '000 GBP '000 GBP '000
Level 1Equity Instruments - - 1,018,056 798,438 1,461,120 759,897 - -
- - 1,018,056 798,438 1,461,120 759,897 - -
Level 2Equity Instruments - - 104 87 7 - - -
Bonds and Notes 1,411,361 1,270,903 - - - - 287,193 107,075
Derivative assets held for trading 17,059 13,543 - - - - 3,026 586
Derivative liabilities held for trading (8,812) (12,464) - - - - (2,520) (375)
1,419,608 1,271,982 104 87 7 - 287,699 107,286
Total 1,419,608 1,271,982 1,018,160 798,525 1,461,127 759,897 287,699 107,286
Global TargetedValue Fund
Global Ultra ShortFixed Income Fund
Global ValueFund
Pacific Basin SmallCompanies Fund
31 May 2021 30 Nov 2020 31 May 2021 30 Nov 2020 31 May 2021 30 Nov 2020 31 May 2021 30 Nov 2020USD '000 USD '000 GBP '000 GBP '000 USD '000 USD '000 USD '000 USD '000
Level 1Equity Instruments 3,906,317 3,088,967 - - 751,644 568,668 107,226 95,041
Investment Funds - - - - - - 16 -
3,906,317 3,088,967 - - 751,644 568,668 107,242 95,041
Level 2Equity Instruments 573 339 - - - - 51 80
Bonds and Notes - - 530,313 599,089 - - - -
Derivative assets held for trading - - 4,442 4,987 - - - -
Derivative liabilities held for trading - - (1,519) (1,687) - - - -
573 339 533,236 602,389 - - 51 80
Total 3,906,890 3,089,306 533,236 602,389 751,644 568,668 107,293 95,121
Sterling InflationLinked Intermediate
DurationFixed Income Fund
U.S. Core EquityFund
U.S. Small CompaniesFund
World Allocation20/80 Fund
31 May 2021 30 Nov 2020 31 May 2021 30 Nov 2020 31 May 2021 30 Nov 2020 31 May 2021 30 Nov 2020GBP '000 GBP '000 USD '000 USD '000 USD '000 USD '000 GBP '000 GBP '000
Level 1Equity Instruments - - 20,928 18,707 173,909 166,559 - -
- - 20,928 18,707 173,909 166,559 - -
Level 2Equity Instruments - - - - 60 4 - -
Investment Funds - - - - - - 82,263 80,346
Bonds and Notes 910,173 874,150 - - - - 17,953 17,450
Derivative assets held for trading - - - - - - 53 29
Derivative liabilities held for trading - - - - - - (230) (135)
910,173 874,150 - - 60 4 100,039 97,690
Total 910,173 874,150 20,928 18,707 173,969 166,563 100,039 97,690
Notes to the Financial Statementsfor the financial period ended 31 May 2021 (continued)
Dimensional Fund Advisors Semi-Annual Report and Unaudited Financial Statements, 31 May 2021 536

9. Fair Value Estimation (continued)
World Allocation40/60 Fund
World Allocation60/40 Fund
World Allocation80/20 Fund
World EquityFund
31 May 2021 30 Nov 2020 31 May 2021 30 Nov 2020 31 May 2021 30 Nov 2020 31 May 2021 30 Nov 2020GBP '000 GBP '000 GBP '000 GBP '000 GBP '000 GBP '000 GBP '000 GBP '000
Level 1Equity Instruments - - 931,721 - - - 1,910,383 1,915,052
Investment Funds - - - - - - 4 -
- - 931,721 - - - 1,910,387 1,915,052
Level 2Equity Instruments - - - - - - 734 189
Investment Funds 822,718 763,843 877,225 1,562,889 390,829 319,533 - -
Derivative assets held for trading - 7 3 8 1 - - -
Derivative liabilities held for trading (324) (157) (687) (381) (92) (49) - -
822,394 763,693 876,541 1,562,516 390,738 319,484 734 189
Total 822,394 763,693 1,808,262 1,562,516 390,738 319,484 1,911,121 1,915,241
There were no Level 3 securities held during the financial period ended 31 May 2021 and the financial year ended 30 November 2020.
Notes to the Financial Statementsfor the financial period ended 31 May 2021 (continued)
Dimensional Fund Advisors Semi-Annual Report and Unaudited Financial Statements, 31 May 2021 537

9. Fair Value Estimation (continued)Securities of the aggregated market value of EUR5,122,688 were transferred from Level 1 to Level 2 during the financial period ended 31 May
2021 (30 November 2020: EUR323,024). During the same time securities of the aggregated market value of EUR706,348 were transferred from
Level 2 to Level 1 (30 November 2020: EUR812,358).
10. Foreign Exchange Rates
The following exchange rates were used to convert the investments
and other assets and liabilities denominated in currencies other than
the respective Fund’s base currency at 31 May 2021 and 30 November
2020:
Exchange Rates against Euro 31 May 2021 30 November 2020
Australian Dollar 1.5819 1.6250
Canadian Dollar 1.4732 1.5492
Danish Krone 7.4364 7.4436
Israeli Shekel 3.962 3.9458
Japanese Yen 133.9383 124.5336
New Zealand Dollar 1.6834 1.7012
Norwegian Krone 10.1983 10.6115
Pound Sterling 0.8593 0.8948
Singapore Dollar 1.6127 1.5998
South African Rand 16.8055 18.4728
Swedish Krona 10.1265 10.2310
Swiss Franc 1.0969 1.0840
United States Dollar 1.2194 1.1929
Exchange Rates against Pound Sterling 31 May 2021 30 November 2020
Australian Dollar 1.8409 1.8162
Brazilian Real 7.3962 7.1422
Canadian Dollar 1.7144 1.7314
Chilean Peso 1,028.1744 1,015.7272
Chinese Yuan 9.0339 8.7751
Colombian Peso 5,262.2093 4,794.3416
Czech Koruna 29.6311 29.3430
Danish Krone 8.6543 8.3191
Euro 1.1638 1.1176
Hong Kong Dollar 11.0139 10.3333
Hungarian Forint 405.2513 400.9119
Indian Rupee 102.8068 98.7281
Indonesian Rupiah 20,272.5620 18,824.0815
Israeli Shekel 4.6108 4.4099
Japanese Yen 155.8724 139.1809
Malaysian Ringgit 5.8661 5.4313
Mexican Peso 28.2666 26.9433
New Zealand Dollar 1.9591 1.9012
Norwegian Krone 11.8684 11.8596
Philippine Peso 67.8318 64.0979
Polish Zloty 5.2175 5.0038
Quatari Riyal 5.1680 4.8550
Saudi Riyal 5.3222 5.0001
Singapore Dollar 1.8768 1.7880
South African Rand 19.5577 20.6455
South Korean Won 1,582.7783 1,475.1974
Swedish Krona 11.7848 11.4343
Swiss Franc 1.2765 1.2115
Taiwan Dollar 39.3679 37.9981
Exchange Rates against Pound Sterling(continued) 31 May 2021 30 November 2020
Thai Baht 44.3484 40.3278
Turkish Lira 12.1561 10.4252
United Arab Emirates Girham 5.2128 4.8969
United States Dollar 1.4192 1.3332
Yuan Renminbi Offshore 9.0256 -
Exchange Rates against U.S. Dollar 31 May 2021 30 November 2020
Australian Dollar 1.2972 1.3623
Brazilian Real 5.2117 5.3574
Canadian Dollar 1.2081 1.2987
Chilean Peso 724.5000 761.9000
Chinese Yuan 6.3657 6.5822
Colombian Peso 3,708.0000 3,596.2500
Czech Koruna 20.8795 22.0103
Danish Krone 6.0982 6.2402
Euro 0.8200 0.8383
Hong Kong Dollar 7.7609 7.7511
Hungarian Forint 285.5591 300.7252
Indian Rupee 72.4425 74.0563
Indonesian Rupiah 14,285.0000 14,120.0000
Israeli Shekel 3.2490 3.3079
Japanese Yen 109.8350 104.4000
Malaysian Ringgit 4.1335 4.0740
Mexican Peso 19.918 20.2103
New Zealand Dollar 1.3805 1.4261
Norwegian Krone 8.3630 8.8959
Philippine Peso 47.7975 48.0800
Polish Zloty 3.6765 3.7534
Pound Sterling 0.7046 0.7501
Quatari Riyal 3.6417 3.6418
Saudi Riyal 3.7503 3.7506
Singapore Dollar 1.3225 1.3412
South African Rand 13.7813 15.4863
South Korean Won 1,115.3000 1,106.5500
Swedish Krona 8.3042 8.5769
Swiss Franc 0.8995 0.9088
Taiwan Dollar 27.7405 28.5025
Thai Baht 31.2500 30.2500
Turkish Lira 8.5658 7.8200
United Arab Emirates Girham 3.6732 3.6732
Yuan Renminbi Offshore 6.3599 -
At 31 May 2021 an exchange rate of 1.2041 (31 May 2020: 1.1065)
was used to translate the Statement of Comprehensive Income of
Emerging Markets Large Cap Core Equity Fund, Emerging Markets
Value Fund, Global Core Equity Fund, Global Short-Term Investment
Grade Fixed Income Fund, Global Small Companies Fund, Global
Sustainability Core Equity Fund, Global Targeted Value Fund, Global
Value Fund, Pacific Basin Small Companies Fund, U.S. Core Equity
Fund and U.S. Small Companies Fund from USD to EUR.
Notes to the Financial Statementsfor the financial period ended 31 May 2021 (continued)
Dimensional Fund Advisors Semi-Annual Report and Unaudited Financial Statements, 31 May 2021 538

10. Foreign Exchange Rates (continued)At 31 May 2021 an exchange rate of 0.8743 (31 May 2020: 0.8652)
was used to translate the Statement of Comprehensive Income of
Global Core Fixed Income Fund, Global Sustainability Fixed Income
Fund, Global Ultra Short Fixed Income Fund, Sterling Inflation Linked
Intermediate Duration Fixed Income Fund, World Allocation
20/80 Fund, World Allocation 40/60 Fund, World Allocation
60/40 Fund, World Allocation 80/20 Fund and World Equity Fund from
GBP to EUR.
11. Derivative Financial InstrumentsA Fund may employ investment techniques and instruments for
efficient portfolio management of its assets including hedging against
market movements, currency exchange or interest rate risks, under the
conditions and within the limits stipulated by the Central Bank under
the UCITS Regulations. A Fund may use such investment techniques
and instruments only where their use is, in the opinion of the
Investment Manager, consistent with the investment policies of that
Fund. In particular, a Fund may lend its securities, enter repurchase
and reverse repurchase agreements, call options, spot and forward
contracts and financial futures. The total exposure of a Fund including
but not limited to its exposure from the use of any derivative
instruments, may not exceed the total net assets of the Fund.
As at 31 May 2021, Global Core Fixed Income Fund, Global Short
Fixed Income Fund, Global Short-Term Investment Grade Fixed
Income Fund, Global Sustainability Fixed Income Fund, Global Ultra
Short Fixed Income Fund, World Allocation 20/80 Fund, World
Allocation 40/60 Fund, World Allocation 60/40 Fund and World
Allocation 80/20 Fund had investments in forward currency contracts
which were utilised for efficient portfolio management purposes
(30 November 2020: Global Core Equity Fund, Global Core Fixed
Income Fund, Global Short Fixed Income Fund, Global Short-Term
Investment Grade Fixed Income Fund, Global Small Companies Fund,
Global Sustainability Fixed Income Fund, Global Ultra Short Fixed
Income Fund, World Allocation 20/80 Fund, World Allocation
40/60 Fund, World Allocation 60/40 Fund and World Allocation
80/20 Fund had investments in forward currency contracts which were
utilised for efficient portfolio management purposes). Any gains or
losses from these forward currency contracts are assigned solely to
the relevant non-base currency class.
The direct and indirect operational costs arising from these forward
currency contracts cannot practically be split from the total return of
the instrument. The realised and unrealised gains and losses on
forward currency contracts are included within net gain/(loss) on
financial assets at fair value through profit or loss in the Statement of
Comprehensive Income. Details of the exposure obtained and
counterparties to the settlement of these forward currency contracts
are disclosed in the Portfolio of Investments.
As at 31 May 2021, a number of Funds have also entered into
securities lending agreements for the purposes of efficient portfolio
management. Please refer to Note 4 for further details.
12. DistributionsThe Directors may declare dividends in respect of any shares out of
net income (including dividend and interest income) and the excess of
realised and unrealised capital gains over realised and unrealised
losses in respect of investments of the Company. Paid and proposed
distributions to redeemable participating shares are classified as
finance costs in the Statement of Comprehensive Income.
The Directors anticipate that there will be no dividend distributions in
respect of the accumulation classes of the Funds. Accordingly, income
and capital gains arising in respect of the accumulation classes of the
Funds will be re-invested in the relevant Fund and reflected in the NAV
per share of the relevant Fund.
The Directors anticipate making dividend distributions in respect of the
distributing classes of the Funds. Accordingly, any income arising in
respect of the distributing classes of the Funds will be distributed to
investors in the relevant Fund in accordance with their respective
shareholdings.
Dividends of the GBP distributing classes, if any are declared by the
Directors, will normally be paid for the financial periods ending 31 May
and 30 November. Dividends of the JPY distributing classes and SGD
distributing classes, if any are declared by the Directors, will normally
be paid for the financial periods ending 28 February, 31 May, 31 August
and 30 November. Dividends of the other distributing classes will
normally be declared by the Directors for the period ending
30 November.
The Directors do not expect to declare a dividend in respect of any
class where it would be uneconomical to pay such dividend to
shareholders.
Notes to the Financial Statementsfor the financial period ended 31 May 2021 (continued)
Dimensional Fund Advisors Semi-Annual Report and Unaudited Financial Statements, 31 May 2021 539

12. Distributions (continued)Distributions for the financial periods ended 31 May 2021 and 31 May 2020 were as follows:
Emerging MarketsLarge Cap Core
Equity FundEmerging Markets
Value Fund
Euro Inflation LinkedIntermediate Duration Fixed
Income Fund
31 May 21 31 May 20 31 May 21 31 May 20 31 May 21 31 May 20USD '000 USD '000 USD '000 USD '000 EUR '000 EUR '000
Gross distribution for the financial period - - 491 631 - -
Add: Income deducted on cancellation of shares - - 151 164 - -
Deduct: Income received on issue of shares - - (99) (192) - -
Net distribution for the financial period - - 543 603 - -
European SmallCompanies Fund
EuropeanValue Fund
Global CoreEquity Fund
31 May 21 31 May 20 31 May 21 31 May 20 31 May 21 31 May 20EUR '000 EUR '000 EUR '000 EUR '000 USD '000 USD '000
Gross distribution for the financial period 119 75 22 15 5,372 6,014
Add: Income deducted on cancellation of shares 115 14 13 11 1,720 787
Deduct: Income received on issue of shares (10) (16) (11) (13) (701) (1,142)
Net distribution for the financial period 224 73 24 13 6,391 5,659
Global Core FixedIncome Fund
Global Short FixedIncome Fund
Global Short-Term InvestmentGrade Fixed Income Fund
31 May 21 31 May 20 31 May 21 31 May 20 31 May 21 31 May 20GBP '000 GBP '000 EUR '000 EUR '000 USD '000 USD '000
Gross distribution for the financial period 1,230 418 523 665 2,173 1,055
Add: Income deducted on cancellation of shares 23 1 83 212 98 128
Deduct: Income received on issue of shares (257) (363) (131) (109) (193) (116)
Net distribution for the financial period 996 56 475 768 2,078 1,067
Global SmallCompanies Fund
Global SustainabilityCore Equity Fund
Global SustainabilityFixed Income Fund
31 May 21 31 May 20 31 May 21 31 May 20 31 May 21 31 May 20USD '000 USD '000 USD '000 USD '000 GBP '000 GBP '000
Gross distribution for the financial period 788 567 1,194 365 728 161
Add: Income deducted on cancellation of shares 106 70 68 21 17 1
Deduct: Income received on issue of shares (88) (114) (669) (139) (303) (19)
Net distribution for the financial period 806 523 593 247 442 143
Global TargetedValue Fund
Global Ultra ShortFixed Income Fund
Global ValueFund
31 May 21 31 May 20 31 May 21 31 May 20 31 May 21 31 May 20USD '000 USD '000 GBP '000 GBP '000 USD '000 USD '000
Gross distribution for the financial period 2,772 2,921 - 1,035 1,045 598
Add: Income deducted on cancellation of shares 550 436 - 247 105 48
Deduct: Income received on issue of shares (253) (998) - (74) (137) (137)
Net distribution for the financial period 3,069 2,359 - 1,208 1,013 509
Notes to the Financial Statementsfor the financial period ended 31 May 2021 (continued)
Dimensional Fund Advisors Semi-Annual Report and Unaudited Financial Statements, 31 May 2021 540

12. Distributions (continued)
Pacific Basin SmallCompanies Fund
Sterling InflationLinked Intermediate Duration
Fixed Income FundU.S. Core Equity
Fund
31 May 21 31 May 20 31 May 21 31 May 20 31 May 21 31 May 20USD '000 USD '000 GBP '000 GBP '000 USD '000 USD '000
Gross distribution for the financial period 108 94 - 703 - -
Add: Income deducted on cancellation of shares 10 6 - 172 - -
Deduct: Income received on issue of shares (6) (7) - (70) - -
Net distribution for the financial period 112 93 - 805 - -
U.S. Small CompaniesFund
World Allocation20/80 Fund
World Allocation40/60 Fund
31 May 21 31 May 20 31 May 21 31 May 20 31 May 21 31 May 20USD '000 USD '000 GBP '000 GBP '000 GBP '000 GBP '000
Gross distribution for the financial period 55 62 17 18 278 280
Add: Income deducted on cancellation of shares 10 5 - - 6 3
Deduct: Income received on issue of shares (4) (7) - (1) (9) (10)
Net distribution for the financial period 61 60 17 17 275 273
World Allocation60/40 Fund
World Allocation80/20 Fund
World EquityFund
31 May 21 31 May 20 31 May 21 31 May 20 31 May 21 31 May 20GBP '000 GBP '000 GBP '000 GBP '000 GBP '000 GBP '000
Gross distribution for the financial period 686 670 269 192 1,639 2,346
Add: Income deducted on cancellation of shares 45 31 7 1 465 423
Deduct: Income received on issue of shares (82) (61) (38) (24) (127) (465)
Net distribution for the financial period 649 640 238 169 1,977 2,304
13. Comparative Net Asset Values
Emerging Markets Large Cap Core Equity Fund31 May 2021
'00030 November 2020
'00031 May 2020
'000
Net Asset Value USD815,303 USD601,979 USD555,098
Outstanding shares
EUR Accumulation Class 8,082 5,298 10,825
EUR Distributing Class 1,262 681 616
GBP Accumulation Class 2,470 2,213 2,027
NOK Accumulation Class 5,376 5,154 4,909
SEK Accumulation Class* 1,871 318 -
SGD Accumulation Class 3,109 1,977 1,342
USD Accumulation Class 2,177 2,090 4,448
USD Z Institutional Accumulation Class 34,689 34,714 34,739
Net Asset Value per share
EUR Accumulation Class EUR14.69 EUR12.47 EUR10.56
EUR Distributing Class EUR13.15 EUR11.16 EUR9.65
GBP Accumulation Class GBP11.61 GBP10.26 GBP8.74
NOK Accumulation Class NOK11.76 NOK10.39 NOK8.95
SEK Accumulation Class* SEK11.62 SEK9.96 -
SGD Accumulation Class SGD25.94 SGD21.84 SGD18.14
USD Accumulation Class USD17.63 USD14.63 USD11.54
USD Z Institutional Accumulation Class USD14.42 USD11.95 USD9.40
* Class launched during the financial year ended 30 November 2020.
Notes to the Financial Statementsfor the financial period ended 31 May 2021 (continued)
Dimensional Fund Advisors Semi-Annual Report and Unaudited Financial Statements, 31 May 2021 541

13. Comparative Net Asset Values (continued)
Emerging Markets Value Fund31 May 2021
'00030 November 2020
'00031 May 2020
'000
Net Asset Value USD1,389,830 USD1,192,555 USD1,116,522
Outstanding shares
EUR Accumulation Class 21,839 20,439 27,147
EUR Distributing Class 8,509 9,837 12,040
GBP Accumulation Class 3,102 4,582 4,496
GBP Distributing Class 5,623 6,043 6,159
JPY Accumulation Class 739 946 904
JPY Distributing Class 2,539 6,363 6,019
SEK Accumulation Class 1,206 4,028 3,700
USD Accumulation Class 11,131 10,896 11,330
USD Distributing Class 1,150 1,205 1,294
Net Asset Value per share
EUR Accumulation Class EUR25.15 EUR20.75 EUR17.85
EUR Distributing Class EUR10.83 EUR8.93 EUR7.86
GBP Accumulation Class GBP26.39 GBP22.68 GBP19.60
GBP Distributing Class GBP20.03 GBP17.26 GBP15.21
JPY Accumulation Class JPY1,622.69 JPY1,245.23 JPY1,029.60
JPY Distributing Class JPY1,196.99 JPY921.27 JPY777.28
SEK Accumulation Class SEK15.38 SEK12.82 SEK11.28
USD Accumulation Class USD24.96 USD20.15 USD16.13
USD Distributing Class USD11.42 USD9.22 USD7.55
Euro Inflation Linked Intermediate Duration Fixed Income Fund31 May 2021
'00030 November 2020
'00031 May 2020
'000
Net Asset Value EUR56,503 EUR48,956 EUR54,580
Outstanding shares
EUR Accumulation Class 2,238 2,252 3,064
EUR Distributing Class 2,035 1,497 1,283
Net Asset Value per share
EUR Accumulation Class EUR13.61 EUR13.37 EUR12.78
EUR Distributing Class EUR12.81 EUR12.59 EUR12.03
European Small Companies Fund31 May 2021
'00030 November 2020
'00031 May 2020
'000
Net Asset Value EUR167,970 EUR170,934 EUR155,537
Outstanding shares
EUR Accumulation Class 1,821 2,084 2,207
EUR Distributing Class 1,318 2,189 2,130
GBP Accumulation Class 390 510 693
GBP Distributing Class 527 564 581
USD Accumulation Class 64 71 63
USD Distributing Class 1 1 9
Net Asset Value per share
EUR Accumulation Class EUR47.61 EUR38.32 EUR32.52
EUR Distributing Class EUR27.28 EUR21.96 EUR18.91
GBP Accumulation Class GBP43.93 GBP36.82 GBP31.39
GBP Distributing Class GBP37.38 GBP31.49 GBP27.13
USD Accumulation Class USD46.03 USD36.24 USD28.62
USD Distributing Class USD25.98 USD20.45 USD16.44
Notes to the Financial Statementsfor the financial period ended 31 May 2021 (continued)
Dimensional Fund Advisors Semi-Annual Report and Unaudited Financial Statements, 31 May 2021 542

13. Comparative Net Asset Values (continued)
European Value Fund31 May 2021
'00030 November 2020
'00031 May 2020
'000
Net Asset Value EUR92,231 EUR59,014 EUR50,478
Outstanding shares
EUR Accumulation Class 4,067 2,583 2,520
EUR Distributing Class 1,362 1,323 1,313
GBP Accumulation Class 249 293 352
GBP Distributing Class 102 128 143
USD Accumulation Class 520 554 532
USD Distributing Class 97 70 39
Net Asset Value per share
EUR Accumulation Class EUR13.86 EUR11.27 EUR9.59
EUR Distributing Class EUR16.47 EUR13.39 EUR11.61
GBP Accumulation Class GBP16.07 GBP13.60 GBP11.63
GBP Distributing Class GBP21.67 GBP18.49 GBP16.02
USD Accumulation Class USD12.19 USD9.69 USD7.68
USD Distributing Class USD12.63 USD10.04 USD8.10
Global Core Equity Fund31 May 2021
'00030 November 2020
'00031 May 2020
'000
Net Asset Value USD4,465,519 USD4,329,291 USD3,659,835
Outstanding shares
EUR Accumulation Class 18,932 19,006 19,983
EUR Accumulation Hedged Class* - - 1
EUR Distributing Class 18,416 19,526 20,381
GBP Accumulation Class 22,462 23,545 25,451
GBP Distributing Class 34,240 45,357 45,136
JPY Accumulation Class 1,224 1,056 1,026
JPY Distributing Class 4,212 19,529 20,063
SEK Accumulation Class 4,237 4,625 5,087
SGD Accumulation Class 12,640 9,054 7,122
USD Accumulation Class 4,767 5,890 6,255
USD Distributing Class 1,135 1,220 1,316
Net Asset Value per share
EUR Accumulation Class EUR34.08 EUR28.87 EUR25.45
EUR Accumulation Hedged Class* - - EUR10.83
EUR Distributing Class EUR26.87 EUR22.76 EUR20.31
GBP Accumulation Class GBP34.66 GBP30.58 GBP27.08
GBP Distributing Class GBP29.15 GBP25.80 GBP23.06
JPY Accumulation Class JPY1,985.92 JPY1,564.14 JPY1,325.72
JPY Distributing Class JPY1,789.86 JPY1,415.83 JPY1,210.23
SEK Accumulation Class SEK20.88 SEK17.87 SEK16.11
SGD Accumulation Class SGD30.59 SGD25.71 SGD22.22
USD Accumulation Class USD28.70 USD23.78 USD19.51
USD Distributing Class USD20.51 USD16.99 USD14.11
* Class terminated during the financial year ended 30 November 2020.
Notes to the Financial Statementsfor the financial period ended 31 May 2021 (continued)
Dimensional Fund Advisors Semi-Annual Report and Unaudited Financial Statements, 31 May 2021 543

13. Comparative Net Asset Values (continued)
Global Core Fixed Income Fund31 May 2021
'00030 November 2020
'00031 May 2020
'000
Net Asset Value GBP397,744 GBP239,692 GBP142,337
Outstanding shares
EUR Accumulation Class 3,905 2,266 1,399
EUR Distributing Class* 8 - -
GBP Accumulation Class 5,392 2,448 1,548
GBP Distributing Class 17,522 9,926 6,436
JPY Accumulation Class 3,343 1,000 1,000
SGD Accumulation Class 4,539 2,627 306
SGD Distributing Class 232 198 204
USD Accumulation Class 5,049 4,483 3,585
Net Asset Value per share
EUR Accumulation Class EUR11.03 EUR11.33 EUR10.83
EUR Distributing Class* EUR10.07 - -
GBP Accumulation Class GBP11.28 GBP11.55 GBP11.01
GBP Distributing Class GBP10.17 GBP10.48 GBP10.09
JPY Accumulation Class JPY1,043.84 JPY1,070.45 JPY1,021.60
SGD Accumulation Class SGD22.96 SGD23.47 SGD22.35
SGD Distributing Class SGD20.54 SGD21.15 SGD20.30
USD Accumulation Class USD11.60 USD11.86 USD11.29
* Class launched during the financial period ended 31 May 2021.
Notes to the Financial Statementsfor the financial period ended 31 May 2021 (continued)
Dimensional Fund Advisors Semi-Annual Report and Unaudited Financial Statements, 31 May 2021 544

13. Comparative Net Asset Values (continued)
Global Short Fixed Income Fund31 May 2021
'00030 November 2020
'00031 May 2020
'000
Net Asset Value EUR2,723,675 EUR2,516,366 EUR2,594,859
Outstanding shares
CHF Distributing Class 3,573 3,177 3,863
EUR Accumulation Class 35,549 35,441 31,276
EUR Distributing Class 42,632 46,034 58,571
GBP Accumulation Class 1,318 1,451 1,510
GBP Distributing Class 49,698 44,240 39,345
JPY Accumulation Class 35,946 36,899 36,570
JPY Distributing Class 84,707 62,320 66,350
NOK Accumulation Class 60,698 3,202 3,262
NOK Distributing Class 18,459 17,245 16,373
SEK Accumulation Class 28,320 24,239 22,997
SEK Distributing Class 5,258 5,317 5,802
SGD Accumulation Class 2,653 2,490 2,468
USD Accumulation Class 9,926 11,177 11,428
USD Distributing Class 2,366 2,196 2,123
Net Asset Value per share
CHF Distributing Class CHF10.06 CHF10.08 CHF10.07
EUR Accumulation Class EUR13.48 EUR13.50 EUR13.45
EUR Distributing Class EUR9.82 EUR9.83 EUR9.81
GBP Accumulation Class GBP11.09 GBP11.07 GBP11.00
GBP Distributing Class GBP10.25 GBP10.24 GBP10.18
JPY Accumulation Class JPY1,052.91 JPY1,051.96 JPY1,046.84
JPY Distributing Class JPY967.49 JPY967.16 JPY962.75
NOK Accumulation Class NOK10.46 NOK10.42 NOK10.36
NOK Distributing Class NOK13.12 NOK13.07 NOK13.00
SEK Accumulation Class SEK10.22 SEK10.21 SEK10.16
SEK Distributing Class SEK10.59 SEK10.58 SEK10.54
SGD Accumulation Class SGD21.27 SGD21.18 SGD21.04
USD Accumulation Class USD13.84 USD13.79 USD13.69
USD Distributing Class USD10.84 USD10.80 USD10.73
Notes to the Financial Statementsfor the financial period ended 31 May 2021 (continued)
Dimensional Fund Advisors Semi-Annual Report and Unaudited Financial Statements, 31 May 2021 545

13. Comparative Net Asset Values (continued)
Global Short-Term Investment Grade Fixed Income Fund31 May 2021
'00030 November 2020
'00031 May 2020
'000
Net Asset Value USD1,442,183 USD1,302,993 USD1,213,386
Outstanding shares
CHF Distributing Class 1,367 1,365 1,962
EUR Accumulation Class 17,729 16,422 16,401
EUR Distributing Class 18,845 19,144 20,077
GBP Accumulation Class 13,301 13,922 15,112
GBP Distributing Class 48,248 44,120 42,350
JPY Distributing Class 475 517 573
SEK Accumulation Class 35,657 25,174 23,057
SGD Accumulation Class 977 909 2,070
USD Accumulation Class 1,517 1,667 1,805
USD Distributing Class 876 629 554
Net Asset Value per share
CHF Distributing Class CHF9.32 CHF9.34 CHF9.21
EUR Accumulation Class EUR10.32 EUR10.32 EUR10.12
EUR Distributing Class EUR9.48 EUR9.48 EUR9.34
GBP Accumulation Class GBP11.02 GBP10.99 GBP10.75
GBP Distributing Class GBP10.05 GBP10.05 GBP9.85
JPY Distributing Class JPY959.21 JPY960.30 JPY942.68
SEK Accumulation Class SEK10.27 SEK10.25 SEK10.03
SGD Accumulation Class SGD21.46 SGD21.36 SGD20.88
USD Accumulation Class USD11.62 USD11.56 USD11.29
USD Distributing Class USD10.71 USD10.66 USD10.47
Global Small Companies Fund31 May 2021
'00030 November 2020
'00031 May 2020
'000
Net Asset Value USD1,022,447 USD799,327 USD598,094
Outstanding shares
EUR Accumulation Class 3,799 3,590 3,377
EUR Distributing Class 1,365 1,621 1,747
GBP Accumulation Class 7,084 6,533 5,899
GBP Distributing Class 8,505 8,643 6,942
USD Accumulation Class 10,169 10,181 11,286
USD Distributing Class 338 354 327
Net Asset Value per share
EUR Accumulation Class EUR29.50 EUR23.94 EUR20.48
EUR Distributing Class EUR24.80 EUR20.12 EUR17.39
GBP Accumulation Class GBP28.09 GBP23.74 GBP20.39
GBP Distributing Class GBP25.16 GBP21.32 GBP18.46
USD Accumulation Class USD24.86 USD19.74 USD15.71
USD Distributing Class USD16.50 USD13.10 USD10.53
Notes to the Financial Statementsfor the financial period ended 31 May 2021 (continued)
Dimensional Fund Advisors Semi-Annual Report and Unaudited Financial Statements, 31 May 2021 546

13. Comparative Net Asset Values (continued)
Global Sustainability Core Equity Fund31 May 2021
'00030 November 2020
'00031 May 2020
'000
Net Asset Value USD1,468,904 USD766,400 USD449,623
Outstanding shares
EUR Accumulation Class 8,040 5,207 4,124
EUR Distributing Class 4,331 3,110 2,240
GBP Accumulation Class 16,905 10,936 6,874
GBP Distributing Class 10,447 5,914 4,740
JPY Distributing Class 3,962 873 12
NOK Accumulation Class 15,093 14,490 14,331
SEK Accumulation Class* 7,706 956 -
USD Accumulation Class 1,396 1,043 1,261
USD Distributing Class 119 103 112
Net Asset Value per share
EUR Accumulation Class EUR25.69 EUR22.01 EUR19.20
EUR Distributing Class EUR23.35 EUR20.01 EUR17.62
GBP Accumulation Class GBP25.98 GBP23.18 GBP20.31
GBP Distributing Class GBP23.40 GBP20.94 GBP18.49
JPY Distributing Class JPY1,488.44 JPY1,189.95 JPY1,002.93
NOK Accumulation Class NOK12.66 NOK11.29 NOK10.01
SEK Accumulation Class* SEK11.60 SEK10.04 -
USD Accumulation Class USD24.07 USD20.17 USD16.37
USD Distributing Class USD21.85 USD18.31 USD15.02
* Class launched during the financial year ended 30 November 2020.
Global Sustainability Fixed Income Fund31 May 2021
'00030 November 2020
'00031 May 2020
'000
Net Asset Value GBP293,314 GBP109,574 GBP50,112
Outstanding shares
EUR Accumulation Class 3,882 1,313 420
EUR Distributing Class 4,474 147 28
GBP Accumulation Class 7,188 2,353 1,448
GBP Distributing Class 7,958 5,161 3,057
JPY Distributing Class 9,683 2,226 47
USD Accumulation Class* 48 19 -
SEK Accumulation Class 10 - -
Net Asset Value per share
EUR Accumulation Class EUR10.26 EUR10.57 EUR10.16
EUR Distributing Class EUR10.79 EUR11.12 EUR10.78
GBP Accumulation Class GBP10.34 GBP10.61 GBP10.17
GBP Distributing Class GBP10.14 GBP10.47 GBP10.12
JPY Distributing Class JPY1,001.28 JPY1,034.93 JPY1,002.08
USD Accumulation Class* USD9.85 USD10.09 -
SEK Accumulation Class SEK10.02 - -
* Class launched during the financial year ended 30 November 2020.
Notes to the Financial Statementsfor the financial period ended 31 May 2021 (continued)
Dimensional Fund Advisors Semi-Annual Report and Unaudited Financial Statements, 31 May 2021 547

13. Comparative Net Asset Values (continued)
Global Targeted Value Fund31 May 2021
'00030 November 2020
'00031 May 2020
'000
Net Asset Value USD3,921,840 USD3,091,867 USD2,700,509
Outstanding shares
EUR Accumulation Class 16,851 15,597 14,888
EUR Distributing Class 11,121 11,591 27,039
GBP Accumulation Class 29,490 30,514 30,255
GBP Distributing Class 26,466 31,675 34,241
JPY Accumulation Class 523 783 839
NOK Accumulation Class 2,877 2,780 2,518
SEK Accumulation Class 9,209 6,897 6,305
SGD Accumulation Class 1,529 1,434 1,123
USD Accumulation Class 22,788 22,917 22,135
USD Distributing Class 634 654 607
Net Asset Value per share
EUR Accumulation Class EUR28.26 EUR21.53 EUR18.10
EUR Distributing Class EUR22.72 EUR17.32 EUR14.71
GBP Accumulation Class GBP32.82 GBP26.05 GBP21.99
GBP Distributing Class GBP27.84 GBP22.15 GBP18.84
JPY Accumulation Class JPY1,221.35 JPY865.40 JPY699.12
NOK Accumulation Class NOK12.31 NOK9.76 NOK8.34
SEK Accumulation Class SEK18.61 SEK14.33 SEK12.31
SGD Accumulation Class SGD26.43 SGD19.98 SGD16.46
USD Accumulation Class USD23.60 USD17.59 USD13.76
USD Distributing Class USD23.08 USD17.21 USD13.60
Global Ultra Short Fixed Income Fund31 May 2021
'00030 November 2020
'00031 May 2020
'000
Net Asset Value GBP539,577 GBP625,180 GBP733,812
Outstanding shares
EUR Accumulation Class 14,036 10,530 4,107
EUR Distributing Class 1,686 2,053 2,242
GBP Accumulation Class 10,877 10,772 19,366
GBP Distributing Class 29,818 41,051 48,737
SEK Accumulation Class 1,445 604 928
Net Asset Value per share
EUR Accumulation Class EUR9.75 EUR9.77 EUR9.74
EUR Distributing Class EUR9.21 EUR9.23 EUR9.23
GBP Accumulation Class GBP10.67 GBP10.66 GBP10.59
GBP Distributing Class GBP9.77 GBP9.77 GBP9.71
SEK Accumulation Class SEK9.82 SEK9.82 SEK9.78
Global Value Fund31 May 2021
'00030 November 2020
'00031 May 2020
'000
Net Asset Value USD755,771 USD572,705 USD339,732
Outstanding shares
EUR Accumulation Class 2,241 1,890 1,492
GBP Accumulation Class 22,433 21,497 14,887
GBP Distributing Class 12,286 11,564 8,316
Net Asset Value per share
EUR Accumulation Class EUR14.82 EUR12.11 EUR10.89
GBP Accumulation Class GBP14.96 GBP12.73 GBP11.51
GBP Distributing Class GBP13.70 GBP11.71 GBP10.72
Notes to the Financial Statementsfor the financial period ended 31 May 2021 (continued)
Dimensional Fund Advisors Semi-Annual Report and Unaudited Financial Statements, 31 May 2021 548

13. Comparative Net Asset Values (continued)
Pacific Basin Small Companies Fund31 May 2021
'00030 November 2020
'00031 May 2020
'000
Net Asset Value USD108,411 USD95,700 USD80,424
Outstanding shares
EUR Accumulation Class 413 428 428
EUR Distributing Class 384 373 391
GBP Accumulation Class 705 920 1,028
GBP Distributing Class 593 618 638
SGD Accumulation Class 1,100 389 8
USD Accumulation Class 130 128 127
USD Distributing Class 132 150 151
Net Asset Value per share
EUR Accumulation Class EUR28.21 EUR25.65 EUR23.20
EUR Distributing Class EUR12.85 EUR11.68 EUR10.73
GBP Accumulation Class GBP34.93 GBP33.08 GBP30.05
GBP Distributing Class GBP30.50 GBP29.00 GBP26.66
SGD Accumulation Class SGD24.65 SGD22.24 SGD19.71
USD Accumulation Class USD36.98 USD32.90 USD27.69
USD Distributing Class USD17.10 USD15.21 USD13.01
Sterling Inflation Linked Intermediate Duration Fixed Income Fund31 May 2021
'00030 November 2020
'00031 May 2020
'000
Net Asset Value GBP918,635 GBP881,353 GBP871,703
Outstanding shares
GBP Accumulation Class 38,565 35,589 34,424
GBP Distributing Class 25,428 24,984 25,004
Net Asset Value per share
GBP Accumulation Class GBP15.54 GBP15.80 GBP15.94
GBP Distributing Class GBP12.55 GBP12.76 GBP12.92
U.S. Core Equity Fund31 May 2021
'00030 November 2020
'00031 May 2020
'000
Net Asset Value USD21,009 USD18,715 USD26,408
Outstanding shares
USD Accumulation Class 947 1,037 1,800
Net Asset Value per share
USD Accumulation Class USD22.18 USD18.04 USD14.67
U.S. Small Companies Fund31 May 2021
'00030 November 2020
'00031 May 2020
'000
Net Asset Value USD174,480 USD166,037 USD160,882
Outstanding shares
EUR Accumulation Class 860 1,453 1,968
GBP Accumulation Class 415 588 771
GBP Distributing Class 571 615 643
USD Accumulation Class 1,023 1,028 1,222
USD Distributing Class 112 131 170
Net Asset Value per share
EUR Accumulation Class EUR43.85 EUR33.23 EUR27.83
GBP Accumulation Class GBP54.67 GBP43.14 GBP36.29
GBP Distributing Class GBP56.14 GBP44.35 GBP37.48
USD Accumulation Class USD46.12 USD34.18 USD26.64
USD Distributing Class USD32.33 USD23.97 USD18.79
Notes to the Financial Statementsfor the financial period ended 31 May 2021 (continued)
Dimensional Fund Advisors Semi-Annual Report and Unaudited Financial Statements, 31 May 2021 549

13. Comparative Net Asset Values (continued)
World Allocation 20/80 Fund31 May 2021
'00030 November 2020
'00031 May 2020
'000
Net Asset Value GBP100,443 GBP98,268 GBP88,848
Outstanding shares
EUR Accumulation Class 3,747 3,515 3,392
EUR Distributing Class* 20 - -
GBP Accumulation Class 3,877 4,059 3,884
GBP Distributing Class 1,254 1,146 920
SGD Accumulation Class 81 73 15
USD Accumulation Class 335 433 383
Net Asset Value per share
EUR Accumulation Class EUR11.14 EUR10.77 EUR10.43
EUR Distributing Class* EUR10.60 EUR10.25 -
GBP Accumulation Class GBP11.99 GBP11.66 GBP11.27
GBP Distributing Class GBP11.37 GBP11.06 GBP10.74
SGD Accumulation Class SGD22.66 SGD21.78 SGD20.95
USD Accumulation Class USD11.28 USD10.82 USD10.29
* Class launched during the financial year ended 30 November 2020.
World Allocation 40/60 Fund31 May 2021
'00030 November 2020
'00031 May 2020
'000
Net Asset Value GBP824,769 GBP768,074 GBP700,046
Outstanding shares
EUR Accumulation Class 6,191 6,027 6,108
EUR Distributing Hedged Class* 45 17 -
GBP Accumulation Class 34,615 34,456 33,287
GBP Distributing Class 8,795 8,303 7,941
USD Accumulation Class 719 469 385
Net Asset Value per share
EUR Accumulation Class EUR12.53 EUR11.68 EUR10.99
EUR Distributing Hedged Class* EUR11.21 EUR10.44 -
GBP Accumulation Class GBP17.70 GBP16.74 GBP15.75
GBP Distributing Class GBP15.78 GBP14.95 GBP14.13
USD Accumulation Class USD12.00 USD11.05 USD10.07
* Class launched during the financial year ended 30 November 2020.
Notes to the Financial Statementsfor the financial period ended 31 May 2021 (continued)
Dimensional Fund Advisors Semi-Annual Report and Unaudited Financial Statements, 31 May 2021 550

13. Comparative Net Asset Values (continued)
World Allocation 60/40 Fund31 May 2021
'00030 November 2020
'00031 May 2020
'000
Net Asset Value GBP1,814,339 GBP1,570,743 GBP1,367,254
Outstanding shares
EUR Accumulation Class 16,291 14,668 14,013
EUR Distributing Class 779 556 432
GBP Accumulation Class 60,013 56,980 54,628
GBP Distributing Class 14,263 13,253 12,387
SGD Accumulation Class 368 180 79
USD Accumulation Class 4,159 3,442 2,480
Net Asset Value per share
EUR Accumulation Class EUR13.89 EUR12.52 EUR11.44
EUR Distributing Class EUR12.69 EUR11.43 EUR10.54
GBP Accumulation Class GBP21.62 GBP19.94 GBP18.26
GBP Distributing Class GBP19.06 GBP17.62 GBP16.24
SGD Accumulation Class SGD24.19 SGD21.64 SGD19.51
USD Accumulation Class USD12.65 USD11.22 USD9.80
World Allocation 80/20 Fund31 May 2021
'00030 November 2020
'00031 May 2020
'000
Net Asset Value GBP392,426 GBP321,380 GBP262,730
Outstanding shares
EUR Accumulation Class 4,116 3,527 3,275
EUR Distributing Class* 116 38 -
GBP Accumulation Class 14,754 14,168 13,110
GBP Distributing Class 4,242 3,517 3,242
SGD Accumulation Class* 182 45 24
USD Accumulation Class 1,255 853 590
Net Asset Value per share
EUR Accumulation Class EUR15.01 EUR13.08 EUR11.58
EUR Distributing Class* EUR12.58 EUR10.96 -
GBP Accumulation Class GBP17.38 GBP15.63 GBP13.89
GBP Distributing Class GBP15.94 GBP14.39 GBP12.91
SGD Accumulation Class* SGD25.62 SGD22.16 SGD19.30
USD Accumulation Class USD13.11 USD11.21 USD9.36
* Class launched during the financial year ended 30 November 2020.
Notes to the Financial Statementsfor the financial period ended 31 May 2021 (continued)
Dimensional Fund Advisors Semi-Annual Report and Unaudited Financial Statements, 31 May 2021 551

13. Comparative Net Asset Values (continued)
World Equity Fund31 May 2021
'00030 November 2020
'00031 May 2020
'000
Net Asset Value GBP1,917,026 GBP1,911,476 GBP1,877,830
Outstanding shares
EUR Accumulation Class 18,126 17,612 17,194
EUR Distributing Class 8,680 8,801 9,075
GBP Accumulation Class 21,002 20,203 19,070
GBP Distributing Class 18,552 30,753 30,677
SEK Accumulation Class 37,863 35,355 33,225
SEK Distributing Class 3,244 1,518 1,528
SGD Accumulation Class 2,381 2,157 2,578
USD Accumulation Class 2,218 1,912 31,965
USD Distributing Class 5,217 4,698 4,978
Net Asset Value per share
EUR Accumulation Class EUR27.67 EUR23.20 EUR20.24
EUR Distributing Class EUR24.33 EUR20.40 EUR18.04
GBP Accumulation Class GBP30.32 GBP26.47 GBP23.21
GBP Distributing Class GBP26.34 GBP23.07 GBP20.43
SEK Accumulation Class SEK18.85 SEK15.97 SEK14.25
SEK Distributing Class SEK11.60 SEK9.83 SEK8.89
SGD Accumulation Class SGD27.41 SGD22.80 SGD19.51
USD Accumulation Class USD13.58 USD11.13 USD9.05
USD Distributing Class USD16.14 USD13.24 USD10.89
14. Use of Soft Commission and Brokerage ServicesThe Company pays no brokerage services and soft commission
through commission sharing arrangements.
15. Commitments and Contingent LiabilitiesAs at 31 May 2021 and 30 November 2020, the Company did not have
commitments or contingent liabilities to be presented in the Statement
of Financial Position.
16. Connected party transactionsCentral Bank UCITS Regulations ’Restrictions on transactions with
connected persons’ states that ’A responsible person shall ensure that
any transaction between a UCITS and a connected person is a)
conducted at arm’s length; and b) in the best interest of the unitholders
of the UCITS’.
As required under Central Bank UCITS Regulations, the Directors, as
responsible persons are satisfied that there are in place arrangements,
evidenced by written procedures, to ensure that the obligations that are
prescribed by Regulation 43(1) are applied to all transactions with a
connected party; and all transactions with connected parties that were
entered into during the financial period to which the report relates
complied with the obligations that are prescribed by Regulation 43(1).
17. Significant Events during the Financial PeriodOn 31 January 2020, the United Kingdom (UK) formerly exited the
European Union (EU) (Brexit). The Brexit withdrawal agreement
allowed for a transitional period which subsequently ended on
31 December 2020. Ireland remains to be a member of the EU. The
Company remains an EU regulated UCITS that can avail of
passporting rights under the UCITS Regulations to market and sell
shares in the Funds in the EU, subject to complying with the terms of
the UCITS Regulations. The Company has appointed Dimensional
Fund Advisors Ltd. (DFAL) a UK company, as its investment manager.
UCITS funds are entitled to have non-EU investment managers.
Accordingly, DFAL is in a position to continue to act as investment
manager to the Company post-Brexit, now that the necessary
regulator-to-regulator cooperation arrangements have been agreed.
Due to the ongoing regulatory uncertainty as regards the terms of the
UK’s future relationship with the EU, the precise impact on the
Company and its Funds is difficult to determine. As such, no assurance
can be given that such matters will not adversely affect the Company
and/or DFAL’s ability to achieve the Funds’ respective investment
objectives.
COVID-19 continues to have an adverse effect globally and is
expected to have a significant impact for the foreseeable future.
Notes to the Financial Statementsfor the financial period ended 31 May 2021 (continued)
Dimensional Fund Advisors Semi-Annual Report and Unaudited Financial Statements, 31 May 2021 552

17. Significant Events during the Financial Period(continued)The prospectus was updated by way of a Second Addendum, this was
issued on 9 March 2021. The prospectus was updated to include
sustainability-related disclosures required by regulation, including:
• A description of the manner in which sustainability risks are
integrated into investment decisions and the results of the
assessment of the likely impacts of sustainability risks on the
returns of the sub-funds.
• A “Sustainability Risks” risk factor was added.
• Sustainability disclosure for the Global Sustainability Core
Equity Fund and the Global Sustainability Fixed Income Fund
was enhanced.
The prospectus was updated by way of a Third Addendum, this was
issued on 5 May 2021. The prospectus was updated to add the
following share classes:
• SEK Accumulation Class to the Global Core Fixed Income
Fund;
• SEK Accumulation Class, SGD Accumulation Class and SGD
Distributing Class to the Global Sustainability Fixed Income
Fund;
• SGD Accumulation Class and SGD Distributing Class to the
Global Sustainability Core Equity Fund;
• SGD Accumulation Class and SGD Distributing Class to the
U.S. Core Equity Fund.
There were no other significant events after the financial period end
which required adjustment to, or disclosure in, these financial
statements.
18. Significant Events after the Financial Period EndThere are no significant events after the financial period end which
require adjustment to, or disclosure in, these financial statements.
19. Seasonal or Cyclical ActivitiesThe Company is not subject to seasonal or cyclical activities.
20. Approval of Financial StatementsThe financial statements were approved by the Directors on 22 July
2021.
Notes to the Financial Statementsfor the financial period ended 31 May 2021 (continued)
Dimensional Fund Advisors Semi-Annual Report and Unaudited Financial Statements, 31 May 2021 553

In accordance with the Central Bank (Supervision and Enforcement) Act, 2013 (Section 48(1)) (Undertakings for Collective Investment in Transferable
Securities) Regulations, 2019, a statement of the largest changes in the composition of the Portfolio of Investments during the financial period is
provided to ensure that shareholders can identify changes in the investments held by the Fund. These statements present the aggregate purchases and
sales of an investment exceeding 1.00% of the total value of purchases and sales for the financial period or at least the top 20 purchases and sales.
Emerging Markets Large Cap Core Equity Fund
Largest PurchasesCost
USD ’000
Alibaba Group Holding Ltd 11,370
iShares MSCI India UCITS ETF 5,322
Tencent Holdings Ltd 3,670
NetEase Inc, ADR 3,561
Ping An Insurance Group Co of China Ltd 3,321
China Construction Bank Corp 3,306
SK Hynix Inc 3,292
Sino Biopharmaceutical Ltd 3,210
LG Display Co Ltd 2,538
KB Financial Group Inc 2,428
PICC Property & Casualty Co Ltd 2,178
Bank of China Ltd 2,038
CSPC Pharmaceutical Group Ltd 2,024
President Chain Store Corp 1,990
ICICI Bank Ltd, ADR 1,971
Mobile Telecommunications Co Saudi Arabia 1,750
Yum China Holdings Inc 1,720
China Gas Holdings Ltd 1,650
Lenovo Group Ltd 1,533
China Tower Corp Ltd 1,423
Largest SalesProceedsUSD ’000
CNOOC Ltd 8,353
China Mobile Ltd 6,217
BYD Co Ltd 4,422
Vipshop Holdings Ltd, ADR 3,122
Xiaomi Corp 2,642
Tata Motors Ltd, ADR 2,052
China Unicom Hong Kong Ltd 1,912
Shenzhou International Group Holdings Ltd 1,823
CITIC Ltd 1,806
AAC Technologies Holdings Inc 1,548
Agile Group Holdings Ltd 1,253
Shinhan Financial Group Co Ltd 1,201
Seazen Group Ltd 1,184
Xinyi Solar Holdings Ltd 1,148
President Chain Store Corp 1,115
Standard Bank Group Ltd 1,109
E.Sun Financial Holding Co Ltd 852
Nine Dragons Paper Holdings Ltd 754
NetEase Inc, ADR 745
Bid Corp Ltd 729
China Mobile Ltd, ADR 683
Statement of Portfolio Changesfor the financial period ended 31 May 2021
Dimensional Fund Advisors Semi-Annual Report and Unaudited Financial Statements, 31 May 2021 554

Emerging Markets Value Fund
Largest PurchasesCost
USD ’000
Ping An Insurance Group Co of China Ltd 25,982
SK Hynix Inc 7,897
Yum China Holdings Inc 6,371
ICICI Bank Ltd 3,929
China Gas Holdings Ltd 3,500
KT&G Corp 3,399
CSPC Pharmaceutical Group Ltd 2,744
China Construction Bank Corp 2,570
China Merchants Bank Co Ltd 2,536
Geely Automobile Holdings Ltd 2,501
China Life Insurance Co Ltd 2,470
ASE Technology Holding Co Ltd 2,351
Astra International Tbk PT 2,342
JD.com Inc 2,311
Sino Biopharmaceutical Ltd 2,274
Formosa Plastics Corp 1,968
Nan Ya Plastics Corp 1,950
Quanta Computer Inc 1,929
ZTO Express Cayman Inc, ADR 1,863
Shandong Weigao Group Medical Polymer Co Ltd 1,854
Largest SalesProceedsUSD ’000
China Mobile Ltd 24,213
CNOOC Ltd 13,966
China Construction Bank Corp 11,500
Baidu Inc, ADR 10,857
LG Electronics Inc 4,188
Vale SA 4,082
SK Hynix Inc 3,897
United Microelectronics Corp 3,563
Great Wall Motor Co Ltd 3,394
Semiconductor Manufacturing International Corp 3,096
Petroleo Brasileiro SA, ADR (non-voting rights) 3,029
China Unicom Hong Kong Ltd 2,987
Bank of China Ltd 2,971
China Merchants Bank Co Ltd 2,683
Bharti Airtel Ltd 2,471
China Steel Corp 2,341
Sibanye Stillwater Ltd 2,333
KGHM Polska Miedz SA 2,182
Petroleo Brasileiro SA 2,140
Hon Hai Precision Industry Co Ltd 2,135
Statement of Portfolio Changesfor the financial period ended 31 May 2021 (continued)
Dimensional Fund Advisors Semi-Annual Report and Unaudited Financial Statements, 31 May 2021 555

Euro Inflation Linked Intermediate Duration Fixed Income Fund
Largest PurchasesCost
EUR ’000
French Republic Government Bond OAT 1.800% due 25/07/2040 4,001
French Republic Government Bond OAT 0.100% due 01/03/2026 3,148
Deutsche Bundesrepublik Inflation Linked Bond 0.500% due 15/04/2030 1,483
French Republic Government Bond OAT 3.150% due 25/07/2032 1,477
French Republic Government Bond OAT 0.100% due 25/07/2031 1,076
French Republic Government Bond OAT Zero Coupon% due 25/07/2036 1,003
Deutsche Bundesrepublik Inflation Linked Bond 0.100% due 15/04/2026 521
Deutsche Bundesrepublik Inflation Linked Bond 0.101% due 15/04/2033 399
French Republic Government Bond OAT 1.850% due 25/07/2027 397
French Republic Government Bond OAT 0.100% due 01/03/2029 100
Largest SalesProceedsEUR ’000
French Republic Government Bond OAT 0.100% due 01/03/2026 4,002
French Republic Government Bond OAT 0.250% due 25/07/2024 1,498
French Republic Government Bond OAT Zero Coupon% due 25/07/2036 815
French Republic Government Bond OAT 3.150% due 25/07/2032 448
Deutsche Bundesrepublik Inflation Linked Bond 0.500% due 15/04/2030 163
Deutsche Bundesrepublik Inflation Linked Bond 0.100% due 15/04/2026 100
Statement of Portfolio Changesfor the financial period ended 31 May 2021 (continued)
Dimensional Fund Advisors Semi-Annual Report and Unaudited Financial Statements, 31 May 2021 556

European Small Companies Fund
Largest PurchasesCost
EUR ’000
Scout24 AG 390
Klepierre SA 381
Eurazeo SA 310
Genus PLC 306
Future PLC 246
flatexDEGIRO AG 243
Softwareone Holding AG 145
Netcompany Group AS 129
zooplus AG 111
Comet Holding AG 109
Chemometec AS 103
Ninety One PLC 97
Dermapharm Holding SE 97
Encavis AG 95
VGP NV 95
Tecan Group AG 93
Keywords Studios PLC 93
Intrum AB 85
Boozt AB 77
Covivio 75
thyssenkrupp AG 75
TUI AG 60
Learning Technologies Group PLC 56
Enav SpA 52
H Lundbeck AS 50
Largest SalesProceedsEUR ’000
Worldline SA 1,050
ASM International NV 792
Amplifon SpA 691
Royal Mail PLC 612
Aegon NV 501
Adecco Group AG 395
ITV PLC 380
Interpump Group SpA 376
Renishaw PLC 350
Banque Cantonale Vaudoise 341
Voestalpine AG 324
Acciona SA 317
CaixaBank SA 294
Travis Perkins PLC 291
AddTech AB 281
Spectris PLC 253
Euronext NV 227
Wienerberger AG 219
ADO Properties SA 217
Quilter PLC 213
Statement of Portfolio Changesfor the financial period ended 31 May 2021 (continued)
Dimensional Fund Advisors Semi-Annual Report and Unaudited Financial Statements, 31 May 2021 557

European Value Fund
Largest PurchasesCost
EUR ’000
Novartis AG 1,620
TOTAL SA 1,375
Royal Dutch Shell PLC 1,303
Banco Santander SA 988
BP PLC 901
UBS Group AG 880
RWE AG 703
Orange SA 560
BT Group PLC 558
British American Tobacco PLC 546
Vodafone Group PLC 545
Allianz SE 510
Intesa Sanpaolo SpA 470
Carlsberg AS 456
BNP Paribas SA 445
HSBC Holdings PLC 444
Credit Suisse Group AG 436
LafargeHolcim Ltd 410
Eni SpA 396
Cie Financiere Richemont SA 378
Repsol SA 376
Bayer AG 365
Skanska AB 355
ArcelorMittal SA 354
CRH PLC 353
Publicis Groupe SA 321
Kingfisher PLC 289
Alcon Inc 283
Muenchener Rueckversicherungs-Gesellschaft AG in Muenchen 265
Swisscom AG 260
Standard Life Aberdeen PLC 259
Fresenius Medical Care AG & Co KGaA 254
Siemens Energy AG 254
Largest SalesProceedsEUR ’000
Capgemini SE 711
BASF SE 690
Novartis AG 660
Genmab AS 514
Anglo American PLC 469
Banco Bilbao Vizcaya Argentaria SA 338
Lloyds Banking Group PLC 276
ABB Ltd 225
UPM-Kymmene Oyj 224
Volvo AB, Class B 183
M&G PLC 159
Whitbread PLC 153
Vestas Wind Systems AS 142
Heineken NV 142
Deutsche Lufthansa AG 138
Novozymes AS 134
Naturgy Energy Group SA 122
Koninklijke Vopak NV 117
Demant AS 110
Barratt Developments PLC 106
Koninklijke Philips NV 99
WPP PLC 98
SKF AB 82
Stora Enso Oyj 79
Barclays PLC 71
Volkswagen AG 69
Statement of Portfolio Changesfor the financial period ended 31 May 2021 (continued)
Dimensional Fund Advisors Semi-Annual Report and Unaudited Financial Statements, 31 May 2021 558

Global Core Equity Fund
Largest PurchasesCost
USD ’000
Facebook Inc 12,746
Mondelez International Inc 3,376
ASML Holding NV (Netherlands listing) 3,080
Microsoft Corp 3,058
T-Mobile US Inc 2,846
Volkswagen AG 2,721
Daimler AG 2,716
FedEx Corp 2,705
Hitachi Ltd 2,205
Laboratory Corp of America Holdings 1,998
Vodafone Group PLC 1,918
Exxon Mobil Corp 1,844
Kroger Co 1,823
Progressive Corp 1,804
Fiserv Inc 1,636
Berkshire Hathaway Inc 1,554
Becton Dickinson and Co 1,501
CME Group Inc 1,483
Deutsche Telekom AG 1,447
Fortive Corp 1,420
Largest SalesProceedsUSD ’000
Apple Inc 16,595
Comcast Corp 12,704
Caterpillar Inc 6,729
Booking Holdings Inc 5,310
Abbott Laboratories 5,101
Lam Research Corp 4,743
Infineon Technologies AG 4,497
Deere & Co 4,400
Alphabet Inc, Class C 4,146
Schlumberger Ltd 4,077
Alphabet Inc, Class A 3,620
Ross Stores Inc 3,525
Anthem Inc 3,495
Amazon.com Inc 3,448
ConocoPhillips 3,297
Micron Technology Inc 2,936
Intuit Inc 2,908
Rio Tinto PLC 2,714
Tesla Inc 2,706
Valero Energy Corp 2,568
Statement of Portfolio Changesfor the financial period ended 31 May 2021 (continued)
Dimensional Fund Advisors Semi-Annual Report and Unaudited Financial Statements, 31 May 2021 559

Global Core Fixed Income Fund
Largest PurchasesCost
GBP ’000
NIKE Inc 2.850% due 27/03/2030 9,293
Province of Quebec Canada 1.900% due 01/09/2030 5,767
Chevron USA Inc 1.018% due 12/08/2027 4,423
Treasury Corp of Victoria 2.250% due 20/11/2034 4,337
International Finance Corp 1.500% due 15/04/2035 4,230
Province of Saskatchewan Canada 2.200% due 02/06/2030 4,197
Westpac Banking Corp 3.350% due 03/08/2027 4,059
OP Corporate Bank PLC 0.100% due 16/11/2027 4,014
Walmart Inc 4.875% due 21/09/2029 3,862
Oracle Corp 2.950% due 04/01/2030 3,418
Federal National Mortgage Association 5.375% due 07/12/2028 3,374
BlackRock Inc 3.250% due 30/04/2029 3,327
Treasury Corp of Victoria 1.500% due 09/10/2031 3,147
Westpac Banking Corp 2.650% due 16/01/2030 3,026
Province of Alberta Canada 2.050% due 01/06/2030 2,978
United States Treasury Note 1.250% due 31/03/2028 2,884
Ralph Lauren Corp 2.950% due 15/06/2030 2,766
National Australia Bank Ltd 1.250% due 18/05/2026 2,737
Dexia Credit Local SA Zero Coupon% due 22/01/2027 2,604
Lam Research Corp 4.000% due 15/03/2029 2,591
Province of Ontario Canada 1.350% due 02/12/2030 2,461
Equinor ASA 3.125% due 04/06/2030 2,403
Societe Nationale SNCF SA 0.625% due 17/04/2030 2,401
Chevron USA Inc 3.250% due 15/10/2029 2,346
Shell International Finance BV 1.000% due 12/10/2030 2,337
Apple Inc 3.050% due 31/07/2029 2,309
European Investment Bank 2.150% due 18/01/2027 2,224
New Zealand Government Bond 3.500% due 14/04/2033 2,168
Australian Government Bond 1.000% due 21/12/2030 2,098
Total Capital Canada Ltd 2.125% due 18/09/2029 2,043
Largest SalesProceedsGBP ’000
Treasury Corp of Victoria 2.250% due 20/11/2034 2,176
Australian Government Bond 1.000% due 21/12/2030 2,066
Citigroup Inc 3.300% due 27/04/2025 850
LeasePlan Corp NV 1.000% due 02/05/2023 784
AmerisourceBergen Corp 3.400% due 15/05/2024 626
Volkswagen International Finance NV 3.300% due 22/03/2033 534
Japan Government Twenty Year Bond 1.800% due 20/09/2031 499
Cisco Systems Inc 2.950% due 28/02/2026 493
CPPIB Capital Inc 1.500% due 03/04/2033 485
Fiat Chrysler Automobiles NV 5.250% due 15/04/2023 459
Southwest Airlines Co 4.750% due 05/04/2023 457
Yara International ASA 3.148% due 06/04/2030 456
Santander Holdings USA Inc 3.500% due 06/07/2024 455
Province of Quebec Canada Zero Coupon% due 15/10/2029 447
Marsh & McLennan Cos Inc 3.500% due 03/10/2025 424
Japan Government Ten Year Bond 0.500% due 20/12/2024 407
Bank of America Corp 4.125% due 22/01/2024 404
Apple Inc 3.250% due 23/02/2026 387
Japan Government Twenty Year Bond 2.100% due 20/09/2028 384
Chevron Corp 2.954% due 16/05/2026 382
Ares Capital Corp 4.200% due 06/10/2024 381
Anheuser-Busch InBev SA/NV 2.000% due 17/03/2028 359
Ryder System Inc 4.625% due 06/01/2025 321
Thomson Reuters Corp 3.850% due 29/09/2024 307
Agence Francaise de Developpement EPIC 1.375% due 05/07/2032 286
SNCF Reseau 1.000% due 11/09/2031 273
Deutsche Telekom AG 1.375% due 07/05/2034 273
Ingersoll-Rand Luxembourg Finance SA 3.550% due 11/01/2024 230
Abbott Ireland Financing DAC 1.500% due 27/09/2026 230
ITC Holdings Corp 3.650% due 15/06/2024 229
Statement of Portfolio Changesfor the financial period ended 31 May 2021 (continued)
Dimensional Fund Advisors Semi-Annual Report and Unaudited Financial Statements, 31 May 2021 560

Global Core Fixed Income Fund (continued)
Largest Sales (continued)ProceedsGBP ’000
Aon PLC 3.500% due 14/06/2024 229
Statement of Portfolio Changesfor the financial period ended 31 May 2021 (continued)
Dimensional Fund Advisors Semi-Annual Report and Unaudited Financial Statements, 31 May 2021 561

Global Short Fixed Income Fund
Largest PurchasesCost
EUR ’000
United States Treasury Note 0.750% due 31/03/2026 84,126
Canadian Government Bond 0.250% due 01/03/2026 75,747
United States Treasury Note 0.750% due 30/04/2026 73,296
Inter-American Development Bank 0.875% due 20/04/2026 70,903
State of North Rhine-Westphalia Germany 1.000% due 21/04/2026 67,240
Norway Government Bond 1.500% due 19/02/2026 66,903
European Bank for Reconstruction & Development 0.500% due 28/01/2026 60,435
Asian Development Bank 1.000% due 14/04/2026 54,395
Caisse d'Amortissement de la Dette Sociale 0.625% due 18/02/2026 52,251
United States Treasury Note 0.375% due 31/01/2026 50,603
Kreditanstalt fuer Wiederaufbau 0.625% due 22/01/2026 49,523
Dexia Credit Local SA 1.125% due 09/04/2026 45,873
Australia Government Bond 0.250% due 21/11/2025 40,770
Province of Ontario Canada 0.625% due 21/01/2026 37,203
International Bank for Reconstruction & Development 0.625% due 14/01/2026 36,621
Province of Alberta Canada 2.350% due 01/06/2025 35,586
Treasury Corp of Victoria 0.500% due 20/11/2025 35,151
Province of Quebec Canada 2.750% due 01/09/2025 34,988
Agence Francaise de Developpement EPIC 0.625% due 22/01/2026 33,228
African Development Bank 0.875% due 23/03/2026 33,045
Inter-American Investment Corp 0.625% due 10/02/2026 32,818
United States Treasury Note 0.500% due 28/02/2026 32,207
Federal National Mortgage Association 0.375% due 25/08/2025 32,207
European Investment Bank 0.375% due 26/03/2026 31,293
Kommunekredit 0.500% due 28/01/2026 30,964
Kuntarahoitus Oyj 0.625% due 20/03/2026 30,088
Federal National Mortgage Association 0.500% due 11/07/2025 27,402
Landwirtschaftliche Rentenbank 0.875% due 30/03/2026 27,070
BNG Bank NV 0.875% due 18/05/2026 26,760
BNG Bank NV 2.375% due 16/03/2026 26,739
Federal Home Loan Mortgage Corp 0.375% due 23/09/2025 26,177
Monetary Authority of Singapore Bill Zero Coupon% due 04/09/2021 24,757
Australia Government Bond 4.250% due 21/04/2026 24,537
Province of Alberta Canada 1.000% due 15/11/2021 23,800
SFIL SA 0.625% due 02/09/2026 23,411
Apple Inc 0.700% due 08/02/2026 22,812
Asian Development Bank 0.500% due 04/02/2026 22,741
Caisse d'Amortissement de la Dette Sociale 3.375% due 25/04/2021 22,223
New Zealand Government Bond 0.500% due 15/05/2026 22,200
Largest SalesProceedsEUR ’000
Landeskreditbank Baden-Wuerttemberg Foerderbank 0.360% due 15/03/2022 53,309
Canada Housing Trust No 1 0.398% due 15/03/2025 52,231
Oesterreichische Kontrollbank AG 0.160% due 22/11/2021 41,631
Eurofima 0.277% due 03/11/2022 37,295
BNG Bank NV 0.050% due 07/11/2023 35,984
Bank of Montreal 0.007% due 28/09/2021 31,258
Bank of Montreal 0.250% due 17/11/2021 30,832
Bank of Nova Scotia 0.375% due 04/06/2022 28,725
Agence Francaise de Developpement EPIC 0.392% due 17/12/2021 28,523
Province of Quebec Canada 0.980% due 19/10/2023 28,081
Kommunekredit 0.125% due 28/08/2023 27,591
International Bank for Reconstruction & Development 0.289% due 10/04/2023 27,336
Province of Alberta Canada 1.000% due 15/11/2021 25,987
Export Development Canada 0.359% due 29/05/2024 24,081
State of North Rhine-Westphalia Germany 0.145% due 29/10/2021 22,902
Caisse d'Amortissement de la Dette Sociale 0.125% due 25/10/2023 22,782
European Bank for Reconstruction & Development 0.290% due 15/10/2024 22,552
Unedic Asseo 2.250% due 04/05/2023 21,778
Unedic Asseo 0.875% due 25/10/2022 21,359
Toronto-Dominion Bank 1.994% due 23/03/2022 21,228
Canadian Imperial Bank of Commerce 2.900% due 14/09/2021 20,440
Statement of Portfolio Changesfor the financial period ended 31 May 2021 (continued)
Dimensional Fund Advisors Semi-Annual Report and Unaudited Financial Statements, 31 May 2021 562

Global Short Fixed Income Fund (continued)
Largest Sales (continued)ProceedsEUR ’000
Province of Ontario Canada 0.695% due 27/10/2021 19,876
Dexia Credit Local SA 0.250% due 06/01/2023 18,805
Kommuninvest I Sverige AB 0.750% due 22/02/2023 18,546
Export Development Canada 0.166% due 15/11/2021 18,530
Asian Development Bank 0.200% due 25/05/2023 18,452
Kommunalbanken AS 0.125% due 21/03/2022 17,783
Pfizer Inc 0.250% due 06/03/2022 17,597
Kommuninvest I Sverige AB 1.000% due 15/09/2021 17,386
European Bank for Reconstruction & Development 0.299% due 27/02/2023 17,341
Commonwealth Bank of Australia 0.500% due 11/07/2022 17,257
Sanofi SA 0.500% due 21/03/2023 16,755
International Bank for Reconstruction & Development 0.319% due 15/05/2024 16,380
Agence Francaise de Developpement EPIC 0.125% due 30/04/2022 16,208
Statement of Portfolio Changesfor the financial period ended 31 May 2021 (continued)
Dimensional Fund Advisors Semi-Annual Report and Unaudited Financial Statements, 31 May 2021 563

Global Short-Term Investment Grade Fixed Income Fund
Largest PurchasesCost
USD ’000
Norway Government Bond 3.000% due 14/03/2024 34,135
Kreditanstalt fuer Wiederaufbau 1.625% due 03/04/2024 27,887
International Bank for Reconstruction & Development 0.320% due 18/09/2025 17,095
European Bank for Reconstruction & Development 1.048% due 20/11/2025 16,727
Australia Government Bond 0.250% due 21/11/2025 15,965
Oracle Corp 1.650% due 25/03/2026 11,756
Royal Bank of Canada 0.875% due 20/01/2026 10,962
Cargill Inc 0.750% due 02/02/2026 10,757
Landwirtschaftliche Rentenbank 0.875% due 30/03/2026 9,966
Inter-American Development Bank 2.750% due 30/10/2025 9,837
Nucor Corp 2.000% due 06/01/2025 9,356
Treasury Corp of Victoria 0.500% due 20/11/2025 9,144
Perrigo Finance Unlimited Co 4.375% due 15/03/2026 8,805
New Zealand Government Bond Zero Coupon% due 21/04/2021 8,545
Kommuninvest I Sverige AB 1.000% due 15/09/2021 8,369
Cigna Corp 1.250% due 15/03/2026 8,155
Province of Alberta Canada 1.000% due 15/11/2021 8,139
Bank of Nova Scotia 1.050% due 02/03/2026 8,112
Asian Development Bank 0.310% due 28/05/2024 8,013
Canada Housing Trust No 1 0.398% due 15/03/2025 7,893
Fidelity National Information Services Inc 1.150% due 01/03/2026 7,838
McDonald's Corp 3.700% due 30/01/2026 7,776
Anthem Inc 1.500% due 15/03/2026 7,586
Norway Government Bond 1.500% due 19/02/2026 7,257
Southwestern Electric Power Co 1.650% due 15/03/2026 7,130
Waste Management Inc 0.750% due 15/11/2025 6,869
Caisse d'Amortissement de la Dette Sociale 0.625% due 18/02/2026 6,868
Verizon Communications Inc 1.450% due 20/03/2026 6,430
Inter-American Development Bank 0.875% due 20/04/2026 6,000
Public Storage 0.875% due 15/02/2026 5,893
Comcast Corp 3.950% due 15/10/2025 5,627
Gilead Sciences Inc 3.650% due 01/03/2026 5,555
New Zealand Government Bond 6.000% due 15/05/2021 5,480
Aker Solutions ASA 2.875% due 15/01/2026 5,198
Expedia Group Inc 5.000% due 15/02/2026 5,111
International Bank for Reconstruction & Development 0.310% due 08/06/2024 5,025
Largest SalesProceedsUSD ’000
International Bank for Reconstruction & Development 0.320% due 18/09/2025 29,212
Toronto-Dominion Bank 0.625% due 20/07/2023 10,744
Agence Francaise de Developpement EPIC 0.392% due 17/12/2021 10,014
Intesa Sanpaolo SpA 1.000% due 04/07/2024 9,959
Province of Ontario Canada 0.695% due 27/10/2021 9,706
Sanofi SA 0.500% due 21/03/2023 8,547
European Investment Bank 0.399% due 29/06/2023 8,402
Kommuninvest I Sverige AB 1.000% due 15/09/2021 8,214
BNG Bank NV 0.750% due 13/11/2023 7,834
Eni SpA 1.750% due 18/01/2024 7,832
Berkshire Hathaway Inc 1.300% due 15/03/2024 7,086
Toyota Motor Finance Netherlands BV 0.625% due 26/09/2023 6,155
Johnson Controls International PLC 1.000% due 15/09/2023 6,004
New Zealand Government Bond 6.000% due 15/05/2021 5,435
International Bank for Reconstruction & Development 0.310% due 08/06/2024 5,029
Apple Inc 1.000% due 10/11/2022 5,001
UBS Group AG 1.750% due 16/11/2022 4,956
Westpac Banking Corp 0.375% due 03/05/2023 4,950
BG Energy Capital PLC 1.250% due 21/11/2022 4,928
ASB Finance Ltd 0.750% due 13/03/2024 4,864
Enel Finance International NV Zero Coupon% due 17/06/2024 4,710
Rolls-Royce PLC 0.875% due 05/09/2024 4,461
Svenska Handelsbanken AB 1.125% due 14/12/2022 4,361
Stryker Corp 1.125% due 30/11/2023 4,329
Statement of Portfolio Changesfor the financial period ended 31 May 2021 (continued)
Dimensional Fund Advisors Semi-Annual Report and Unaudited Financial Statements, 31 May 2021 564

Global Short-Term Investment Grade Fixed Income Fund (continued)
Largest Sales (continued)ProceedsUSD ’000
Medtronic Global Holdings SCA Zero Coupon% due 02/12/2022 4,267
BNG Bank NV 5.375% due 06/07/2021 4,177
Honeywell International Inc 1.300% due 22/02/2023 3,743
American Honda Finance Corp 1.375% due 10/11/2022 3,733
BNG Bank NV 1.125% due 24/05/2021 3,723
Nationwide Building Society 0.625% due 19/04/2023 3,703
BP Capital Markets PLC 1.060% due 16/09/2021 3,689
Booking Holdings Inc 2.150% due 25/11/2022 3,582
BPCE SA 4.250% due 02/06/2023 3,287
Phillips 66 3.700% due 04/06/2023 3,211
Landeskreditbank Baden-Wuerttemberg Foerderbank 1.125% due 17/05/2021 2,779
CNH Industrial Finance Europe SA 2.875% due 17/05/2023 2,579
Sky Ltd 1.875% due 24/11/2023 2,539
Statement of Portfolio Changesfor the financial period ended 31 May 2021 (continued)
Dimensional Fund Advisors Semi-Annual Report and Unaudited Financial Statements, 31 May 2021 565

Global Small Companies Fund
Largest PurchasesCost
USD ’000
JM Smucker Co 1,138
Packaging Corp of America 1,017
Bill.com Holdings Inc 965
Erie Indemnity Co 963
WP Carey Inc 948
Black Knight Inc 939
Elanco Animal Health Inc (voting rights) 917
Essential Utilities Inc 915
Whirlpool Corp 908
Atmos Energy Corp 907
Plug Power Inc 884
PulteGroup Inc 874
Evergy Inc 840
Hasbro Inc 837
Lennox International Inc 830
Fate Therapeutics Inc 798
CenterPoint Energy Inc 762
Brown & Brown Inc 761
GoDaddy Inc 756
Cleveland-Cliffs Inc 718
Largest SalesProceedsUSD ’000
GameStop Corp 2,204
Generac Holdings Inc 1,914
Enphase Energy Inc 1,687
Plug Power Inc 1,666
United Airlines Holdings Inc 1,372
PTC Inc 1,181
ASM International NV 1,122
Sunrun Inc 1,100
Regions Financial Corp 922
Pandora AS 921
Worldline SA 893
Lumen Technologies Inc 851
Avery Dennison Corp 850
Huntington Bancshares Inc 750
PulteGroup Inc 733
Liberty Broadband Corp, Class C 718
OZ Minerals Ltd 712
BlackBerry Ltd 688
West Fraser Timber Co Ltd 677
International Flavors & Fragrances Inc (US listing) 676
Morgan Stanley 674
Zendesk Inc 644
Fortune Brands Home & Security Inc 633
Westrock Co 633
Statement of Portfolio Changesfor the financial period ended 31 May 2021 (continued)
Dimensional Fund Advisors Semi-Annual Report and Unaudited Financial Statements, 31 May 2021 566

Global Sustainability Core Equity Fund
Largest PurchasesCost
USD ’000
Apple Inc 23,544
Facebook Inc 17,478
Microsoft Corp 11,427
UnitedHealth Group Inc 6,928
Johnson & Johnson 6,740
Alphabet Inc, Class A 4,636
NVIDIA Corp 4,288
Mastercard Inc 3,627
JPMorgan Chase & Co 3,180
Alphabet Inc, Class C 3,124
Cisco Systems Inc 3,116
ASML Holding NV (Netherlands listing) 2,858
Visa Inc 2,785
LVMH Moet Hennessy Louis Vuitton SE 2,689
International Business Machines Corp 2,549
Adobe Inc 2,217
AbbVie Inc 2,200
Amgen Inc 2,060
Novartis AG 1,935
AIA Group Ltd 1,889
Largest SalesProceedsUSD ’000
Toyota Motor Corp 3,177
Comcast Corp 1,207
Compass Group PLC 765
Automatic Data Processing Inc 542
Uber Technologies Inc 445
Intuit Inc 374
Union Pacific Corp 332
Catalent Inc 293
FLIR Systems Inc 281
Illumina Inc 276
Safran SA 268
YETI Holdings Inc 262
Infineon Technologies AG 244
Keysight Technologies Inc 239
Walt Disney Co 238
Ross Stores Inc 219
PennyMac Financial Services Inc 218
Jabil Inc 209
GameStop Corp 203
Brookfield Asset Management Inc 203
Statement of Portfolio Changesfor the financial period ended 31 May 2021 (continued)
Dimensional Fund Advisors Semi-Annual Report and Unaudited Financial Statements, 31 May 2021 567

Global Sustainability Fixed Income Fund
Largest PurchasesCost
GBP ’000
Merck & Co Inc 3.400% due 07/03/2029 5,072
Treasury Corp of Victoria 2.250% due 20/11/2034 4,859
Province of Alberta Canada 2.050% due 01/06/2030 3,889
OP Corporate Bank PLC 0.100% due 16/11/2027 3,466
NIKE Inc 2.850% due 27/03/2030 3,311
Province of Saskatchewan Canada 2.200% due 02/06/2030 2,956
International Finance Corp 1.500% due 15/04/2035 2,951
Inter-American Development Bank 3.125% due 18/09/2028 2,899
Costco Wholesale Corp 1.600% due 20/04/2030 2,676
Johnson & Johnson 2.900% due 15/01/2028 2,355
Westpac Banking Corp 2.650% due 16/01/2030 2,277
Walmart Inc 4.875% due 21/09/2029 2,267
United Kingdom Gilt 0.625% due 31/07/2035 2,252
Province of Ontario Canada 1.350% due 02/12/2030 2,201
Asian Development Bank 2.350% due 21/06/2027 2,168
Commonwealth Bank of Australia 3.150% due 19/09/2027 2,159
Singapore Government Bond 2.875% due 09/01/2030 1,912
Queensland Treasury Corp 1.500% due 20/08/2032 1,847
Province of Ontario Canada 2.700% due 02/06/2029 1,842
BNG Bank NV 1.000% due 03/06/2030 1,816
Largest SalesProceedsGBP ’000
Australian Government Bond 1.000% due 21/12/2030 1,498
Australian Government Bond 1.500% due 21/06/2031 807
Australian Government Bond 2.750% due 21/06/2035 714
Toyota Motor Credit Corp 3.650% due 01/08/2029 486
Toyota Credit Canada Inc 2.350% due 18/07/2022 295
Fairfax Financial Holdings Ltd 4.850% due 17/04/2028 243
Toyota Motor Credit Corp 3.400% due 14/04/2025 158
Novartis Capital Corp 3.400% due 05/06/2024 155
Statement of Portfolio Changesfor the financial period ended 31 May 2021 (continued)
Dimensional Fund Advisors Semi-Annual Report and Unaudited Financial Statements, 31 May 2021 568

Global Targeted Value Fund
Largest PurchasesCost
USD ’000
Kroger Co 12,168
State Street Corp 8,657
Occidental Petroleum Corp 7,168
Conagra Brands Inc 6,984
Covestro AG 6,442
Laboratory Corp of America Holdings 5,329
Amcor PLC 5,000
SS&C Technologies Holdings Inc 4,967
Carrefour SA 4,804
Akamai Technologies Inc 4,602
Tyson Foods Inc 4,523
Leidos Holdings Inc 4,440
Quest Diagnostics Inc 4,111
Dollar Tree Inc 3,496
Pandora AS 3,481
Barratt Developments PLC 3,325
Julius Baer Group Ltd 3,325
Standard Life Aberdeen PLC 3,150
Lennar Corp, Class A 3,129
ABN AMRO Bank NV 2,974
M&T Bank Corp 2,943
Bio-Rad Laboratories Inc 2,830
Largest SalesProceedsUSD ’000
GameStop Corp 18,195
Morgan Stanley 12,843
Valero Energy Corp 10,877
Fifth Third Bancorp 9,651
ConocoPhillips 8,014
Nuance Communications Inc 7,646
Gap Inc 7,188
SVB Financial Group 6,988
Cree Inc 6,571
Cincinnati Financial Corp 6,373
United Airlines Holdings Inc 6,078
ON Semiconductor Corp 6,024
Horizon Therapeutics PLC 5,538
Marathon Petroleum Corp 5,461
Danske Bank AS 5,291
Liberty Broadband Corp, Class C 4,991
Southwest Airlines Co 4,521
Kroger Co 4,339
Nucor Corp 4,338
Valeo SA 3,804
United Rentals Inc 3,645
Iliad SA 3,426
PennyMac Financial Services Inc 3,349
Caesars Entertainment Inc 3,159
XPO Logistics Inc 3,149
BlackBerry Ltd 3,137
Statement of Portfolio Changesfor the financial period ended 31 May 2021 (continued)
Dimensional Fund Advisors Semi-Annual Report and Unaudited Financial Statements, 31 May 2021 569

Global Ultra Short Fixed Income Fund
Largest PurchasesCost
GBP ’000
Province of Alberta Canada 1.000% due 15/11/2021 18,472
Norway Government Bond 2.000% due 24/05/2023 15,248
Kreditanstalt fuer Wiederaufbau 1.125% due 12/05/2022 12,789
Sweden Government Bond Zero Coupon% due 17/03/2021 9,879
European Investment Bank 1.500% due 12/05/2022 9,503
Royal Bank of Canada 1.968% due 03/02/2022 8,850
Province of Ontario Canada 0.585% due 27/06/2022 7,582
Province of Manitoba Canada 0.750% due 15/12/2021 6,670
Telstra Corp Ltd 3.500% due 21/09/2022 5,662
Bank of Nova Scotia 1.830% due 27/04/2022 5,297
BP Capital Markets PLC 1.526% due 26/09/2022 5,047
Honeywell International Inc 1.300% due 22/02/2023 4,944
Monetary Authority of Singapore Bill Zero Coupon% due 04/09/2021 4,820
Nordic Investment Bank 0.125% due 22/03/2022 4,795
Kommunalbanken AS 6.500% due 04/12/2021 4,582
Kommuninvest I Sverige AB 1.000% due 15/09/2021 4,528
CaixaBank SA 1.125% due 12/01/2023 4,474
British Telecommunications PLC 1.125% due 10/03/2023 4,395
Kommunalbanken AS 1.500% due 19/04/2022 4,363
Monetary Authority of Singapore Bill Zero Coupon% due 28/05/2021 4,312
FCA Bank SpA 1.625% due 29/09/2021 4,287
Wells Fargo & Co 1.375% due 30/06/2022 4,243
Volvo Treasury AB Zero Coupon% due 02/11/2023 4,241
New Zealand Government Bond Zero Coupon% due 21/04/2021 4,222
London Stock Exchange Group 4.750% due 02/11/2021 4,211
Illumina Inc 0.550% due 23/03/2023 4,207
Transport for London 2.250% due 08/09/2022 4,197
APT Pipelines Ltd 1.375% due 22/03/2022 4,197
NextEra Energy Capital Holdings Inc 0.650% due 01/03/2023 4,188
Fortum Oyj 2.250% due 06/09/2022 4,149
Enbridge Inc 3.190% due 05/12/2022 4,128
Toyota Credit Canada Inc 2.350% due 18/07/2022 4,088
Takeda Pharmaceutical Co Ltd 0.548% due 21/11/2022 4,055
GE Capital Canada Funding Co 4.600% due 26/01/2022 3,957
Aon Corp 2.200% due 15/11/2022 3,738
Fiat Chrysler Automobiles NV 5.250% due 15/04/2023 3,683
Holding d'Infrastructures de Transport SAS 4.875% due 27/10/2021 3,588
National Bank of Canada 2.105% due 18/03/2022 3,526
Danske Bank AS 0.875% due 22/05/2023 3,518
Largest SalesProceedsGBP ’000
Nederlandse Waterschapsbank NV 0.254% due 15/12/2021 11,966
Eurofima 0.277% due 03/11/2022 11,090
Agence Francaise de Developpement EPIC 0.392% due 17/12/2021 9,220
Citigroup Inc 1.375% due 27/10/2021 6,248
European Investment Bank 0.246% due 21/05/2021 6,003
Canada Housing Trust No 1 0.598% due 15/03/2022 5,890
Province of Ontario Canada 0.585% due 27/06/2022 4,700
Intesa Sanpaolo SpA 2.000% due 18/06/2021 3,543
State of North Rhine-Westphalia Germany 0.145% due 29/10/2021 3,500
National Rural Utilities Cooperative Finance Corp 0.574% due 30/06/2021 3,257
Bank of America Corp 1.375% due 09/10/2021 3,065
Bank of Montreal 0.007% due 28/09/2021 3,013
Goldman Sachs Group Inc 2.500% due 18/10/2021 2,964
National Australia Bank Ltd 0.767% due 20/09/2021 2,775
Land Baden-Wuerttemberg 0.168% due 19/07/2021 2,716
FMS Wertmanagement 0.329% due 14/01/2022 2,705
Barclays PLC 3.200% due 08/10/2021 2,653
Eastern Energy Gas Holdings LLC 0.784% due 15/06/2021 2,526
American Honda Finance Corp 0.526% due 11/05/2021 2,222
American Honda Finance Corp 1.600% due 20/04/2022 2,088
BNG Bank NV 1.000% due 15/03/2022 2,014
Statement of Portfolio Changesfor the financial period ended 31 May 2021 (continued)
Dimensional Fund Advisors Semi-Annual Report and Unaudited Financial Statements, 31 May 2021 570

Global Ultra Short Fixed Income Fund (continued)
Largest Sales (continued)ProceedsGBP ’000
Province of Alberta Canada 1.000% due 15/11/2021 2,008
European Investment Bank 0.330% due 10/01/2022 2,004
Mitsubishi UFJ Financial Group Inc 0.826% due 26/07/2021 1,854
New Zealand Government Bond 6.000% due 15/05/2021 1,826
Canadian Natural Resources Ltd 3.310% due 02/11/2022 1,803
Banco Santander SA 1.375% due 02/09/2022 1,789
BPCE SA 0.513% due 09/03/2022 1,736
Canada Housing Trust No 1 0.680% due 15/03/2021 1,717
Shell International Finance BV 1.875% due 05/10/2021 1,712
BPCE SA 3.000% due 22/05/2022 1,684
Penske Truck Leasing Co Lp / PTL Finance Corp 4.875% due 07/11/2022 1,569
Statement of Portfolio Changesfor the financial period ended 31 May 2021 (continued)
Dimensional Fund Advisors Semi-Annual Report and Unaudited Financial Statements, 31 May 2021 571

Global Value Fund
Largest PurchasesCost
USD ’000
Walmart Inc 4,100
Walt Disney Co 3,537
Mondelez International Inc 3,106
UnitedHealth Group Inc 2,738
Air Products and Chemicals Inc 2,353
Regeneron Pharmaceuticals Inc 2,312
Baxter International Inc 1,986
Gilead Sciences Inc 1,374
Takeda Pharmaceutical Co Ltd 1,322
Royal Dutch Shell PLC 1,255
Barrick Gold Corp 1,242
Bank of Nova Scotia 1,103
Walgreens Boots Alliance Inc 811
Ally Financial Inc 798
Truist Financial Corp 775
Banco Santander SA 766
Western Digital Corp 719
Bank of Montreal 701
Keurig Dr Pepper Inc 667
Newell Brands Inc 656
Largest SalesProceedsUSD ’000
Deere & Co 4,040
Magna International Inc 2,072
Charles Schwab Corp 1,745
Discover Financial Services 1,443
Bank of Nova Scotia 1,415
Delta Air Lines Inc 1,124
Target Corp 1,048
JPMorgan Chase & Co 1,042
Lloyds Banking Group PLC 1,040
Genmab AS 992
First Republic Bank 965
Banco Bilbao Vizcaya Argentaria SA 943
Micron Technology Inc 856
Chevron Corp 837
Skyworks Solutions Inc 789
Toronto-Dominion Bank 705
ABB Ltd 670
Ford Motor Co 615
IQVIA Holdings Inc 609
Ameriprise Financial Inc 567
Southwest Airlines Co 561
Suncor Energy Inc 538
Raytheon Technologies Corp 535
Cie Financiere Richemont SA 505
Naturgy Energy Group SA 479
Whitbread PLC 467
TE Connectivity Ltd 466
Barclays PLC 444
UPM-Kymmene Oyj 442
Walt Disney Co 436
Capgemini SE 427
Statement of Portfolio Changesfor the financial period ended 31 May 2021 (continued)
Dimensional Fund Advisors Semi-Annual Report and Unaudited Financial Statements, 31 May 2021 572

Pacific Basin Small Companies Fund
Largest PurchasesCost
USD ’000
Zip Co Ltd 220
NEXTDC Ltd 215
AMP Ltd 208
Sotetsu Holdings Inc 169
ASM Pacific Technology Ltd 152
SMS Co Ltd 151
NetLink NBN Trust 141
Benesse Holdings Inc 133
Nanosonics Ltd 130
Ain Holdings Inc 129
Incitec Pivot Ltd 128
Menicon Co Ltd 126
Mani Inc 121
Morinaga & Co Ltd 119
Champion Iron Ltd 111
Kusuri no Aoki Holdings Co Ltd 109
NagaCorp Ltd 109
Yangzijiang Shipbuilding Holdings Ltd 109
Bank of Queensland Ltd 107
Alumina Ltd 106
Iluka Resources Ltd 104
SHO-BOND Holdings Co Ltd 103
Largest SalesProceedsUSD ’000
Man Wah Holdings Ltd 468
Mineral Resources Ltd 401
Incitec Pivot Ltd 230
Northern Star Resources Ltd 226
Ansell Ltd 213
Iwatani Corp 211
BayCurrent Consulting Inc 199
ALS Ltd 194
Yang Ming Marine Transport Corp 159
Hyosung TNC Co Ltd 133
IR Japan Holdings Ltd 122
eMemory Technology Inc 121
OCI Co Ltd 98
Colowide Co Ltd 96
CS Wind Corp 94
Kotobuki Spirits Co Ltd 91
OZ Minerals Ltd 88
L&F Co Ltd 88
Yoshinoya Holdings Co Ltd 80
HannStar Display Corp 78
Statement of Portfolio Changesfor the financial period ended 31 May 2021 (continued)
Dimensional Fund Advisors Semi-Annual Report and Unaudited Financial Statements, 31 May 2021 573

Sterling Inflation Linked Intermediate Duration Fixed Income Fund
Largest PurchasesCost
GBP ’000
United Kingdom Gilt Inflation Linked 1.125% due 22/11/2037 19,978
United Kingdom Gilt Inflation Linked 0.625% due 22/03/2040 15,524
United Kingdom Gilt Inflation Linked 8.961% due 22/07/2030 13,988
United Kingdom Gilt Inflation Linked 3.381% due 26/01/2035 8,510
United Kingdom Gilt Inflation Linked 0.125% due 22/03/2026 4,999
United Kingdom Gilt Inflation Linked 0.125% due 22/11/2036 3,996
United Kingdom Gilt Inflation Linked 0.750% due 22/03/2034 3,984
United Kingdom Gilt Inflation Linked 7.513% due 17/07/2024 1,988
United Kingdom Gilt Inflation Linked 0.125% due 22/03/2029 1,001
United Kingdom Gilt Inflation Linked 1.250% due 22/11/2032 999
United Kingdom Gilt Inflation Linked 0.125% due 08/10/2031 990
Largest SalesProceedsGBP ’000
United Kingdom Gilt Inflation Linked 7.513% due 17/07/2024 19,874
United Kingdom Gilt Inflation Linked 0.125% due 22/03/2024 1,000
Statement of Portfolio Changesfor the financial period ended 31 May 2021 (continued)
Dimensional Fund Advisors Semi-Annual Report and Unaudited Financial Statements, 31 May 2021 574

U.S. Core Equity Fund
Largest PurchasesCost
USD ’000
Apple Inc 85
Home Depot Inc 75
NIKE Inc 67
Adobe Inc 63
Walt Disney Co 61
Procter & Gamble Co 52
Walmart Inc 50
Thermo Fisher Scientific Inc 45
Microsoft Corp 43
Amazon.com Inc 42
Monster Beverage Corp 40
Netflix Inc 35
Pfizer Inc 35
Broadcom Inc 31
Costco Wholesale Corp 30
Alphabet Inc, Class C 29
Dollar General Corp 29
Alphabet Inc, Class A 27
NVIDIA Corp 24
Gilead Sciences Inc 24
Honeywell International Inc 24
Waste Management Inc 23
Largest SalesProceedsUSD ’000
Apple Inc 143
Walt Disney Co 71
Alphabet Inc, Class C 65
Alphabet Inc, Class A 58
Pfizer Inc 52
Microsoft Corp 46
Booking Holdings Inc 41
NIKE Inc 40
GameStop Corp 37
Emerson Electric Co 37
ConocoPhillips 36
Eaton Corp PLC 33
NVIDIA Corp 31
Honeywell International Inc 31
Adobe Inc 29
Viacom Inc, Class B 28
MetLife Inc 27
Cisco Systems Inc 25
JPMorgan Chase & Co 24
Twitter Inc 24
Statement of Portfolio Changesfor the financial period ended 31 May 2021 (continued)
Dimensional Fund Advisors Semi-Annual Report and Unaudited Financial Statements, 31 May 2021 575

U.S. Small Companies Fund
Largest PurchasesCost
USD ’000
Halozyme Therapeutics Inc 378
Redfin Corp 195
Pure Storage Inc 193
Box Inc 174
Radian Group Inc 164
Nevro Corp 163
MGIC Investment Corp 163
Quanterix Corp 147
Health Catalyst Inc 145
Celsius Holdings Inc 136
Turning Point Therapeutics Inc 126
Ping Identity Holding Corp 110
HealthEquity Inc 100
Owl Rock Capital Corp 99
Vontier Corp 93
Glaukos Corp 93
Castle Biosciences Inc 92
Magnolia Oil & Gas Corp 91
Magnite Inc 90
Fluor Corp 88
Largest SalesProceedsUSD ’000
GameStop Corp 2,041
Darling Ingredients Inc 655
Lithia Motors Inc 580
Builders FirstSource Inc 517
Trex Co Inc 480
Penn National Gaming Inc 465
DXC Technology Co 455
ManpowerGroup Inc 426
Middleby Corp 418
Oshkosh Corp 415
Deckers Outdoor Corp 412
Brunswick Corp 408
Devon Energy Corp 382
Toll Brothers Inc 379
Zions Bancorp NA 377
Thor Industries Inc 373
US Foods Holding Corp 356
Skechers U.S.A. Inc 348
Cullen/Frost Bankers Inc 344
Jabil Inc 343
Statement of Portfolio Changesfor the financial period ended 31 May 2021 (continued)
Dimensional Fund Advisors Semi-Annual Report and Unaudited Financial Statements, 31 May 2021 576

World Allocation 20/80 Fund
Largest PurchasesCost
GBP ’000
Dimensional Funds plc - Global Short Fixed Income Fund - GBP Distributing Class 2,827
Dimensional Funds plc - World Equity Fund - GBP Distributing Class 2,619
Dimensional Funds plc - Global Short-Term Investment Grade Fixed Income Fund - GBP Distributing Class 2,396
Dimensional Funds plc - Global Ultra Short Fixed Income Fund - GBP Distributing Class 2,064
Dimensional Funds ICVC - Global Short-Dated Bond Fund - GBP Income Class 1,705
Allianz Finance II BV 3.500% due 14/02/2022 471
Kommuninvest I Sverige AB 1.000% due 15/09/2021 447
Total Capital Canada Ltd 1.125% due 18/03/2022 445
European Investment Bank 1.500% due 12/05/2022 443
Novartis Finance SA 0.750% due 09/11/2021 434
Kommunalbanken AS 1.500% due 19/04/2022 434
Landeskreditbank Baden-Wuerttemberg Foerderbank 0.313% due 27/09/2021 426
Royal Bank of Canada 2.000% due 21/03/2022 413
Kreditanstalt fuer Wiederaufbau 1.000% due 12/10/2021 395
Agence Francaise de Developpement EPIC 0.125% due 31/03/2021 362
Tennessee Valley Authority 5.350% due 06/07/2021 343
Dimensional Funds plc - Global Core Equity Fund - GBP Distributing Class 303
DNB Bank ASA 0.211% due 25/07/2022 273
Euroclear Bank SA Zero Coupon% due 03/08/2021 270
Unedic Asseo 0.300% due 11/04/2021 257
Nestle Holdings Inc 1.000% due 11/06/2021 236
Roche Holdings Inc 6.500% due 03/04/2021 229
Nederlandse Waterschapsbank NV 0.875% due 20/12/2021 201
Largest SalesProceedsGBP ’000
Dimensional Funds plc - World Equity Fund - GBP Distributing Class 4,291
Dimensional Funds plc - Global Short Fixed Income Fund - GBP Distributing Class 2,455
Dimensional Funds plc - Global Short-Term Investment Grade Fixed Income Fund - GBP Distributing Class 2,042
Dimensional Funds plc - Global Ultra Short Fixed Income Fund - GBP Distributing Class 2,007
Dimensional Funds ICVC - Global Short-Dated Bond Fund - GBP Income Class 1,314
Dimensional Funds plc - Global Core Equity Fund - GBP Distributing Class 548
International Bank for Reconstruction & Development 0.375% due 15/06/2021 400
NRW Bank 1.250% due 15/12/2021 303
Landwirtschaftliche Rentenbank 1.125% due 05/12/2021 150
Kreditanstalt fuer Wiederaufbau 0.875% due 15/03/2022 101
Statement of Portfolio Changesfor the financial period ended 31 May 2021 (continued)
Dimensional Fund Advisors Semi-Annual Report and Unaudited Financial Statements, 31 May 2021 577

World Allocation 40/60 Fund
Largest PurchasesCost
GBP ’000
Dimensional Funds plc - Global Short Fixed Income Fund - GBP Distributing Class 13,647
Dimensional Funds ICVC - Global Short-Dated Bond Fund - GBP Income Class 11,572
Dimensional Funds plc - Global Short-Term Investment Grade Fixed Income Fund - GBP Distributing Class 9,187
Dimensional Funds plc - Global Ultra Short Fixed Income Fund - GBP Distributing Class 7,917
Dimensional Funds plc - Global Core Fixed Income Fund - GBP Distributing Class 2,222
Dimensional Funds ICVC - Emerging Markets Core Equity Fund - GBP Income Class 1,394
Dimensional Funds plc - Global Core Equity Fund - GBP Distributing Class 1,358
Dimensional Funds plc - World Equity Fund - GBP Distributing Class 1,341
Dimensional Funds plc - Global Targeted Value Fund - GBP Distributing Class 847
Largest SalesProceedsGBP ’000
Dimensional Funds plc - Global Core Equity Fund - GBP Distributing Class 11,937
Dimensional Funds plc - World Equity Fund - GBP Distributing Class 8,290
Dimensional Funds plc - Global Targeted Value Fund - GBP Distributing Class 3,284
Dimensional Funds plc - Global Short Fixed Income Fund - GBP Distributing Class 3,165
Dimensional Funds plc - Global Short-Term Investment Grade Fixed Income Fund - GBP Distributing Class 1,875
Dimensional Funds ICVC - Emerging Markets Core Equity Fund - GBP Income Class 1,817
Dimensional Funds plc - Global Ultra Short Fixed Income Fund - GBP Distributing Class 1,562
Dimensional Funds ICVC - Global Short-Dated Bond Fund - GBP Income Class 943
Dimensional Funds plc - Global Core Fixed Income Fund - GBP Distributing Class 312
Statement of Portfolio Changesfor the financial period ended 31 May 2021 (continued)
Dimensional Fund Advisors Semi-Annual Report and Unaudited Financial Statements, 31 May 2021 578

World Allocation 60/40 Fund
Largest PurchasesCost
GBP ’000
Dimensional Funds ICVC - Emerging Markets Core Equity Fund - GBP Income Class 49,255
Dimensional Funds plc - Global Short Fixed Income Fund - GBP Distributing Class 47,567
Dimensional Funds plc - Global Core Fixed Income Fund - GBP Distributing Class 44,117
Dimensional Funds plc - Global Short-Term Investment Grade Fixed Income Fund - GBP Distributing Class 32,408
Dimensional Funds ICVC - Global Short-Dated Bond Fund - GBP Income Class 14,364
Dimensional Funds plc - Global Ultra Short Fixed Income Fund - GBP Distributing Class 5,620
Facebook Inc 4,183
Dimensional Funds plc - World Equity Fund - GBP Distributing Class 1,952
Dimensional Funds plc - Global Core Equity Fund - GBP Distributing Class 1,925
Rio Tinto PLC 1,093
Royal Dutch Shell PLC 1,057
Astrazeneca PLC 783
CRH PLC 693
BHP Group PLC 672
BT Group PLC 568
BP PLC 540
Vodafone Group PLC 527
Imperial Tobacco Group PLC 499
HSBC Holdings PLC 492
British American Tobacco PLC 463
Largest SalesProceedsGBP ’000
Dimensional Funds plc - World Equity Fund - GBP Distributing Class 302,401
Dimensional Funds plc - Global Core Equity Fund - GBP Distributing Class 291,786
Dimensional Funds ICVC - International Core Equity Fund - GBP Income Class 200,273
Dimensional Funds plc - Global Targeted Value Fund - GBP Distributing Class 86,568
Dimensional Funds plc - Global Ultra Short Fixed Income Fund - GBP Distributing Class 33,542
Dimensional Funds plc - Global Short Fixed Income Fund - GBP Distributing Class 4,700
Apple Inc 4,461
Dimensional Funds ICVC - Emerging Markets Core Equity Fund - GBP Income Class 3,656
Dimensional Funds plc - Global Short-Term Investment Grade Fixed Income Fund - GBP Distributing Class 2,060
Comcast Corp 1,723
GameStop Corp 1,147
Booking Holdings Inc 941
Caterpillar Inc 908
Alphabet Inc, Class C 842
Deere & Co 832
Walt Disney Co 671
Oracle Corp 646
Viacom Inc, Class B 645
Tesla Inc 641
NIKE Inc 632
Statement of Portfolio Changesfor the financial period ended 31 May 2021 (continued)
Dimensional Fund Advisors Semi-Annual Report and Unaudited Financial Statements, 31 May 2021 579

World Allocation 80/20 Fund
Largest PurchasesCost
GBP ’000
Dimensional Funds plc - Global Core Fixed Income Fund - GBP Distributing Class 10,523
Dimensional Funds plc - Global Short-Term Investment Grade Fixed Income Fund - GBP Distributing Class 9,765
Dimensional Funds plc - Global Core Equity Fund - GBP Distributing Class 6,933
Dimensional Funds plc - World Equity Fund - GBP Distributing Class 6,419
Dimensional Funds ICVC - Emerging Markets Core Equity Fund - GBP Income Class 6,109
Dimensional Funds plc - Global Small Companies Fund - GBP Distributing Class 5,796
Dimensional Funds ICVC - International Core Equity Fund - GBP Income Class 5,684
Dimensional Funds plc - Global Value Fund - GBP Distributing Class 3,288
Largest SalesProceedsGBP ’000
Dimensional Funds plc - Global Value Fund - GBP Distributing Class 6,016
Dimensional Funds plc - Global Small Companies Fund - GBP Distributing Class 2,401
Dimensional Funds plc - Global Short-Term Investment Grade Fixed Income Fund - GBP Distributing Class 2,265
Dimensional Funds plc - World Equity Fund - GBP Distributing Class 2,170
Dimensional Funds plc - Global Core Equity Fund - GBP Distributing Class 2,170
Dimensional Funds plc - Global Core Fixed Income Fund - GBP Distributing Class 2,011
Dimensional Funds ICVC - Emerging Markets Core Equity Fund - GBP Income Class 1,010
Dimensional Funds ICVC - International Core Equity Fund - GBP Income Class 220
Dimensional Funds ICVC - UK Core Equity - GBP Income Class 100
Statement of Portfolio Changesfor the financial period ended 31 May 2021 (continued)
Dimensional Fund Advisors Semi-Annual Report and Unaudited Financial Statements, 31 May 2021 580

World Equity Fund
Largest PurchasesCost
GBP ’000
Facebook Inc 9,336
Johnson & Johnson 2,509
FedEx Corp 1,982
AbbVie Inc 1,113
American Express Co 1,038
General Motors Co 1,016
SK Hynix Inc 959
ASML Holding NV (Netherlands listing) 864
Alibaba Group Holding Ltd 834
Fiserv Inc 803
China Construction Bank Corp 769
Avantor Inc 744
Linde PLC 736
Activision Blizzard Inc 723
Volkswagen AG 705
Amazon.com Inc 676
Becton Dickinson and Co 669
Automatic Data Processing Inc 661
Occidental Petroleum Corp 659
DR Horton Inc 628
Largest SalesProceedsGBP ’000
Taiwan Semiconductor Manufacturing Co Ltd, ADR 2,666
Comcast Corp 1,793
China Mobile Ltd 1,611
Delta Air Lines Inc 1,553
GameStop Corp 1,471
Deere & Co 1,460
CNOOC Ltd 1,353
SK Hynix Inc 1,338
Applied Materials Inc 1,125
Johnson & Johnson 1,123
Micron Technology Inc 1,094
Tesla Inc 1,056
China Construction Bank Corp 1,025
Caterpillar Inc 1,025
Royal Dutch Shell PLC 969
Booking Holdings Inc 901
Baidu Inc, ADR 897
Suncor Energy Inc 889
Infineon Technologies AG 847
Vinci SA 817
Statement of Portfolio Changesfor the financial period ended 31 May 2021 (continued)
Dimensional Fund Advisors Semi-Annual Report and Unaudited Financial Statements, 31 May 2021 581

Emerging Markets Large Cap Core Equity Fund
Data displayed in '000's
1. Global Data
Proportion of securities and commodities on loan USD %
Total lendable assets excluding cash and cash equivalents: 591,938
Securities and commodities on loan 77,110 13.03%
Assets engaged in SFTs and total return swaps USD %
Fund assets under management (AUM) 815,303
Absolute value of assets engaged in:
Securities lending 77,110 9.46%
2. Concentration Data
Top 10 Collateral Issuers
Name and value of collateral and commodities received USD
United States 50,313
French Republic 10,742
Republic of Germany 8,235
Kingdom of Belgium 3,846
United Kingdom 3,355
Kingdom of the Netherlands 3,173
Australia 483
Republic of Finland 229
Republic of Austria 212
Denmark 59
Top 10 Counterparties
Name and value of outstanding transactions USD
Securities lending
Merrill Lynch International 16,563
JP Morgan Securities Plc 16,225
Credit Suisse AG (Dublin Branch) 10,804
Barclays Capital Securities Limited 9,302
Citigroup Global Markets Limited 7,571
UBS Europe SE 6,046
Barclays Bank Plc 4,515
Morgan Stanley & Co. International Plc 4,466
Credit Suisse International 546
Macquarie Bank Limited 521
3. Aggregate transaction data
Type, Quality and Currency of Collateral Type
Type Quality Currencies USD
Bond Investment Grade United States Dollar 50,314
Bond Investment Grade Euro 26,495
Bond Investment Grade Pound Sterling 3,355
Bond Investment Grade Australian Dollar 483
Bond Investment Grade Canadian Dollar 21
Cash Collateral Investment Grade United States Dollar 1,511
Securities Financing Transactions
Dimensional Fund Advisors Semi-Annual Report and Unaudited Financial Statements, 31 May 2021 582

Emerging Markets Large Cap Core Equity Fund (continued)
Data displayed in '000's
3. Aggregate transaction data (continued)
Maturity Tenor of Collateral (remaining period to maturity)
Type Less than one dayOne day to oneweek
One week to onemonth
One to threemonths
Three months to oneyear Above one year Open maturity
Securities lending 1,511 - 551 728 9,624 69,765 -
1,511 - 551 728 9,624 69,765 -
Counterparty details
TypeCountries of counterpartyestablishment
Settlement andclearing USD
Securities lending United Kingdom Bi-lateral 47,673
Securities lending Germany Bi-lateral 6,539
Securities lending Ireland Bi-lateral 5,034
Securities lending Australia Bi-lateral 554
Securities lending Switzerland Bi-lateral 317
Securities lending Canada Bi-lateral 38
Securities lending France Bi-lateral 19
Securities lending United Kingdom Tri-party 15,031
Securities lending Ireland Tri-party 6,770
Securities lending Switzerland Tri-party 204
4. Safekeeping of Collateral Received
Names and value of custodians safekeeping collateral USD
JP Morgan 15,009
Bank of New York 6,996
Number of custodians safekeeping collateral 2
5. Return and Cost
Please refer to the Statement of Comprehensive Income and Note 4 for details of income and associated costs.
Securities Financing Transactions (continued)
Dimensional Fund Advisors Semi-Annual Report and Unaudited Financial Statements, 31 May 2021 583

Emerging Markets Value Fund
Data displayed in '000's
1. Global Data
Proportion of securities and commodities on loan USD %
Total lendable assets excluding cash and cash equivalents: 936,612
Securities and commodities on loan 190,559 20.35%
Assets engaged in SFTs and total return swaps USD %
Fund assets under management (AUM) 1,389,830
Absolute value of assets engaged in:
Securities lending 190,559 13.71%
2. Concentration Data
Top 10 Collateral Issuers
Name and value of collateral and commodities received USD
United States 131,540
French Republic 28,665
Republic of Germany 19,661
Kingdom of Belgium 7,651
United Kingdom 7,174
Kingdom of the Netherlands 4,463
Canada 1,499
Australia 1,356
Republic of Austria 89
Republic of Finland 87
Top 10 Counterparties
Name and value of outstanding transactions USD
Securities lending
Barclays Capital Securities Limited 73,340
JP Morgan Securities Plc 29,084
Merrill Lynch International 20,995
Citigroup Global Markets Limited 18,321
Goldman Sachs International 15,572
UBS Europe SE 7,852
Morgan Stanley & Co. International Plc 7,691
UBS AG 6,648
Credit Suisse AG (Dublin Branch) 4,860
Macquarie Bank Limited 2,007
3. Aggregate transaction data
Type, Quality and Currency of Collateral Type
Type Quality Currencies USD
Bond Investment Grade United States Dollar 131,540
Bond Investment Grade Euro 60,696
Bond Investment Grade Pound Sterling 7,174
Bond Investment Grade Canadian Dollar 1,499
Bond Investment Grade Australian Dollar 1,356
Cash Collateral Investment Grade United States Dollar 3,373
Securities Financing Transactions (continued)
Dimensional Fund Advisors Semi-Annual Report and Unaudited Financial Statements, 31 May 2021 584

Emerging Markets Value Fund (continued)
Data displayed in '000's
3. Aggregate transaction data (continued)
Maturity Tenor of Collateral (remaining period to maturity)
Type Less than one dayOne day to oneweek
One week to onemonth
One to threemonths
Three months to oneyear Above one year Open maturity
Securities lending 3,373 - 183 873 12,621 188,588 -
3,373 - 183 873 12,621 188,588 -
Counterparty details
TypeCountries of counterpartyestablishment
Settlement andclearing USD
Securities lending United Kingdom Bi-lateral 144,579
Securities lending Germany Bi-lateral 11,479
Securities lending Switzerland Bi-lateral 4,552
Securities lending Ireland Bi-lateral 3,918
Securities lending Australia Bi-lateral 2,164
Securities lending Canada Bi-lateral 491
Securities lending France Bi-lateral 292
Securities lending United Kingdom Tri-party 34,088
Securities lending Switzerland Tri-party 2,454
Securities lending Ireland Tri-party 1,481
Securities lending France Tri-party 140
4. Safekeeping of Collateral Received
Names and value of custodians safekeeping collateral USD
Bank of New York 23,297
JP Morgan 14,866
Number of custodians safekeeping collateral 2
5. Return and Cost
Please refer to the Statement of Comprehensive Income and Note 4 for details of income and associated costs.
Securities Financing Transactions (continued)
Dimensional Fund Advisors Semi-Annual Report and Unaudited Financial Statements, 31 May 2021 585

Euro Inflation Linked Intermediate Duration Fixed Income Fund
Data displayed in '000's
1. Global Data
Proportion of securities and commodities on loan EUR %
Total lendable assets excluding cash and cash equivalents: 53,108
Securities and commodities on loan 6,970 13.12%
Assets engaged in SFTs and total return swaps EUR %
Fund assets under management (AUM) 56,503
Absolute value of assets engaged in:
Securities lending 6,970 12.34%
2. Concentration Data
Top 10 Collateral Issuers*
Name and value of collateral and commodities received EUR
United Kingdom 7,400
Top 10 Counterparties*
Name and value of outstanding transactions EUR
Securities lending
Barclays Bank Plc 6,970
* The Top 10 Collateral Issuers and Top 10 Counterparties are disclosed where appropriate. In some instances there may be less than 10 Collateral Issuers Counterparties present.
3. Aggregate transaction data
Type, Quality and Currency of Collateral Type
Type Quality Currencies EUR
Bond Investment Grade Pound Sterling 7,400
Maturity Tenor of Collateral (remaining period to maturity)
Type Less than one dayOne day to oneweek
One week to onemonth
One to threemonths
Three months to oneyear Above one year Open maturity
Securities lending - - - - - 7,400 -
- - - - - 7,400 -
Counterparty details
TypeCountries of counterpartyestablishment
Settlement andclearing EUR
Secirities lending United Kingdom Bi-lateral 7,400
4. Return and Cost
Please refer to the Statement of Comprehensive Income and Note 4 for details of income and associated costs.
Securities Financing Transactions (continued)
Dimensional Fund Advisors Semi-Annual Report and Unaudited Financial Statements, 31 May 2021 586

European Small Companies Fund
Data displayed in '000's
1. Global Data
Proportion of securities and commodities on loan EUR %
Total lendable assets excluding cash and cash equivalents: 165,407
Securities and commodities on loan 23,918 14.46%
Assets engaged in SFTs and total return swaps EUR %
Fund assets under management (AUM) 167,970
Absolute value of assets engaged in:
Securities lending 23,918 14.24%
2. Concentration Data
Top 10 Collateral Issuers
Name and value of collateral and commodities received EUR
French Republic 6,305
Republic of Germany 4,716
Kingdom of the Netherlands 3,349
Kingdom of Belgium 2,299
United Kingdom 2,145
United States 2,062
Republic of Austria 686
Republic of Finland 495
Canada 359
Australia 257
Top 10 Counterparties
Name and value of outstanding transactions EUR
Securities lending
Barclays Capital Securities Limited 5,603
UBS AG 3,378
Merrill Lynch International 3,263
HSBC Bank Plc 2,828
Credit Suisse AG (Dublin Branch) 1,797
Societe Generale SA 1,250
Morgan Stanley & Co. International Plc 1,164
JP Morgan Securities Plc 1,040
Credit Suisse International 858
Citigroup Global Markets Limited 823
3. Aggregate transaction data
Type, Quality and Currency of Collateral Type
Type Quality Currencies EUR
Bond Investment Grade Euro 17,870
Bond Investment Grade Pound Sterling 2,145
Bond Investment Grade United States Dollar 2,062
Bond Investment Grade Canadian Dollar 359
Bond Investment Grade Australian Dollar 257
Bond Investment Grade Swedish Krona 12
Bond Investment Grade Danish Krone 6
Cash Collateral Investment Grade United States Dollar 2,638
Securities Financing Transactions (continued)
Dimensional Fund Advisors Semi-Annual Report and Unaudited Financial Statements, 31 May 2021 587

European Small Companies Fund (continued)
Data displayed in '000's
3. Aggregate transaction data (continued)
Maturity Tenor of Collateral (remaining period to maturity)
Type Less than one dayOne day to oneweek
One week to onemonth
One to threemonths
Three months to oneyear Above one year Open maturity
Securities lending 2,638 - 8 163 857 21,683 -
2,638 - 8 163 857 21,683 -
Counterparty details
TypeCountries of counterpartyestablishment
Settlement andclearing EUR
Securities lending United Kingdom Bi-lateral 9,351
Securities lending Switzerland Bi-lateral 910
Securities lending Ireland Bi-lateral 521
Securities lending France Bi-lateral 233
Securities lending Canada Bi-lateral 120
Securities lending Germany Bi-lateral 23
Securities lending United Kingdom Tri-party 7,836
Securities lending Switzerland Tri-party 2,663
Securities lending Ireland Tri-party 1,416
Securities lending France Tri-party 1,313
Securities lending Canada Tri-party 476
Securities lending Germany Tri-party 429
Securities lending Netherlands Tri-party 58
4. Safekeeping of Collateral Received
Names and value of custodians safekeeping collateral EUR
Bank of New York 10,521
JP Morgan 3,671
Number of custodians safekeeping collateral 2
5. Return and Cost
Please refer to the Statement of Comprehensive Income and Note 4 for details of income and associated costs.
Securities Financing Transactions (continued)
Dimensional Fund Advisors Semi-Annual Report and Unaudited Financial Statements, 31 May 2021 588

European Value Fund
Data displayed in '000's
1. Global Data
Proportion of securities and commodities on loan EUR %
Total lendable assets excluding cash and cash equivalents: 90,821
Securities and commodities on loan 4,661 5.13%
Assets engaged in SFTs and total return swaps EUR %
Fund assets under management (AUM) 92,231
Absolute value of assets engaged in:
Securities lending 4,661 5.05%
2. Concentration Data
Top 10 Collateral Issuers*
Name and value of collateral and commodities received EUR
French Republic 940
Kingdom of Belgium 774
Republic of Austria 564
Republic of Germany 462
Kingdom of the Netherlands 435
Republic of Finland 432
United Kingdom 330
United States 238
Australia 150
Top 10 Counterparties*
Name and value of outstanding transactions EUR
Securities lending
UBS AG 1,757
JP Morgan Securities Plc 1,064
Citigroup Global Markets Limited 541
Merrill Lynch International 444
Morgan Stanley & Co. International Plc 323
Credit Suisse AG (Dublin Branch) 260
HSBC Bank Plc 138
Barclays Capital Securities Limited 134
* The Top 10 Collateral Issuers and Top 10 Counterparties are disclosed where appropriate. In some instances there may be less than 10 Collateral Issuers Counterparties present.
3. Aggregate transaction data
Type, Quality and Currency of Collateral Type
Type Quality Currencies EUR
Bond Investment Grade Euro 3,607
Bond Investment Grade Pound Sterling 330
Bond Investment Grade United States Dollar 238
Bond Investment Grade Australian Dollar 150
Cash Collateral Investment Grade 603
Maturity Tenor of Collateral (remaining period to maturity)
Type Less than one dayOne day to oneweek
One week to onemonth
One to threemonths
Three months to oneyear Above one year Open maturity
Securities lending 603 - - 14 250 4,061 -
603 - - 14 250 4,061 -
Securities Financing Transactions (continued)
Dimensional Fund Advisors Semi-Annual Report and Unaudited Financial Statements, 31 May 2021 589

European Value Fund (continued)
Data displayed in '000's
3. Aggregate transaction data (continued)
Counterparty details
TypeCountries of counterpartyestablishment
Settlement andclearing EUR
Securities lending United Kingdom Bi-lateral 776
Securities lending Ireland Bi-lateral 80
Securities lending United Kingdom Tri-party 2,014
Securities lending Switzerland Tri-party 1,857
Securities lending Ireland Tri-party 201
4. Safekeeping of Collateral Received
Names and value of custodians safekeeping collateral EUR
Bank of New York 2,214
JP Morgan 1,859
Number of custodians safekeeping collateral 2
5. Return and Cost
Please refer to the Statement of Comprehensive Income and Note 4 for details of income and associated costs.
Securities Financing Transactions (continued)
Dimensional Fund Advisors Semi-Annual Report and Unaudited Financial Statements, 31 May 2021 590

Global Core Equity Fund
Data displayed in '000's
1. Global Data
Proportion of securities and commodities on loan USD %
Total lendable assets excluding cash and cash equivalents: 4,412,235
Securities and commodities on loan 195,425 4.43%
Assets engaged in SFTs and total return swaps USD %
Fund assets under management (AUM) 4,465,519
Absolute value of assets engaged in:
Securities lending 195,425 4.38%
2. Concentration Data
Top 10 Collateral Issuers
Name and value of collateral and commodities received USD
French Republic 41,144
United States 37,741
Republic of Germany 35,325
Kingdom of Belgium 33,462
United Kingdom 21,802
Kingdom of the Netherlands 16,616
Canada 3,261
Republic of Austria 2,824
Republic of Finland 2,522
Australia 1,569
Top 10 Counterparties
Name and value of outstanding transactions USD
Securities lending
Credit Suisse AG (Dublin Branch) 45,138
UBS AG 40,949
Goldman Sachs International 25,920
JP Morgan Securities Plc 19,470
Barclays Capital Securities Limited 11,724
Merrill Lynch International 9,938
Citigroup Global Markets Limited 8,907
Morgan Stanley & Co. International Plc 8,135
Barclays Bank Plc 7,810
HSBC Bank Plc 7,128
3. Aggregate transaction data
Type, Quality and Currency of Collateral Type
Type Quality Currencies USD
Bond Investment Grade Euro 132,619
Bond Investment Grade United States Dollar 37,741
Bond Investment Grade Pound Sterling 21,802
Bond Investment Grade Canadian Dollar 3,261
Bond Investment Grade Australian Dollar 1,569
Bond Investment Grade Swedish Krona 4
Cash Collateral Investment Grade United States Dollar 10,325
Securities Financing Transactions (continued)
Dimensional Fund Advisors Semi-Annual Report and Unaudited Financial Statements, 31 May 2021 591

Global Core Equity Fund (continued)
Data displayed in '000's
3. Aggregate transaction data (continued)
Maturity Tenor of Collateral (remaining period to maturity)
Type Less than one dayOne day to oneweek
One week to onemonth
One to threemonths
Three months to oneyear Above one year Open maturity
Securities lending 10,325 - 2,107 4,520 10,797 179,572 -
10,325 - 2,107 4,520 10,797 179,572 -
Counterparty details
TypeCountries of counterpartyestablishment
Settlement andclearing USD
Securities lending United Kingdom Bi-lateral 43,261
Securities lending Switzerland Bi-lateral 33,089
Securities lending Ireland Bi-lateral 2,397
Securities lending France Bi-lateral 2,335
Securities lending Germany Bi-lateral 1,837
Securities lending Australia Bi-lateral 953
Securities lending Canada Bi-lateral 420
Securities lending United Kingdom Tri-party 63,455
Securities lending Ireland Tri-party 45,811
Securities lending Switzerland Tri-party 10,473
Securities lending France Tri-party 2,724
Securities lending Germany Tri-party 335
Securities lending Australia Tri-party 123
Securities lending Canada 108
4. Safekeeping of Collateral Received
Names and value of custodians safekeeping collateral USD
JP Morgan 69,538
Bank of New York 53,489
Number of custodians safekeeping collateral 2
5. Return and Cost
Please refer to the Statement of Comprehensive Income and Note 4 for details of income and associated costs.
Securities Financing Transactions (continued)
Dimensional Fund Advisors Semi-Annual Report and Unaudited Financial Statements, 31 May 2021 592

Global Core Fixed Income Fund
Data displayed in '000's
1. Global Data
Proportion of securities and commodities on loan GBP %
Total lendable assets excluding cash and cash equivalents: 382,608
Securities and commodities on loan 8,875 2.32%
Assets engaged in SFTs and total return swaps GBP %
Fund assets under management (AUM) 397,744
Absolute value of assets engaged in:
Securities lending 8,875 2.23%
2. Concentration Data
Top 10 Counterparties*
Name and value of outstanding transactions GBP
Securities lending
Barclays Bank Plc 8,693
HSBC Bank Plc 182
* The Top 10 Counterparties are disclosed where appropriate. In some instances there may be less than 10 Counterparties present.
3. Aggregate transaction data
Type, Quality and Currency of Collateral Type
Type Quality Currencies GBP
Cash Collateral Investment Grade United States Dollar 9,048
Maturity Tenor of Collateral (remaining period to maturity)
Type Less than one dayOne day to oneweek
One week to onemonth
One to threemonths
Three months to oneyear Above one year Open maturity
Securities lending 9,048 - - - - - -
9,048 - - - - - -
Counterparty details
TypeCountries of counterpartyestablishment
Settlement andclearing GBP
Securities lending United Kingdom Bi-lateral 9,048
4. Return and Cost
Please refer to the Statement of Comprehensive Income and Note 4 for details of income and associated costs.
Securities Financing Transactions (continued)
Dimensional Fund Advisors Semi-Annual Report and Unaudited Financial Statements, 31 May 2021 593

Global Short Fixed Income Fund
Data displayed in '000's
1. Global Data
Proportion of securities and commodities on loan EUR %
Total lendable assets excluding cash and cash equivalents: 2,282,731
Securities and commodities on loan 6,510 0.29%
Assets engaged in SFTs and total return swaps EUR %
Fund assets under management (AUM) 2,723,675
Absolute value of assets engaged in:
Securities lending 6,510 0.24%
2. Concentration Data
Top 10 Collateral Issuers*
Name and value of collateral and commodities received EUR
United States 297
Top 10 Counterparties*
Name and value of outstanding transactions EUR
Securities lending
Barclays Bank Plc 6,510
* The Top 10 Collateral Issuers and Top 10 Counterparties are disclosed where appropriate. In some instances there may be less than 10 Collateral Issuers Counterparties present.
3. Aggregate transaction data
Type, Quality and Currency of Collateral Type
Type Quality Currencies EUR
Bond Investment Grade United States Dollar 6,356
Cash Collateral Investment Grade United States Dollar 297
Maturity Tenor of Collateral (remaining period to maturity)
Type Less than one dayOne day to oneweek
One week to onemonth
One to threemonths
Three months to oneyear Above one year Open maturity
Securities lending 6,356 - 14 - 67 216 -
6,356 - 14 - 67 216 -
Counterparty details
TypeCountries of counterpartyestablishment
Settlement andclearing EUR
Secirities lending United Kingdom Bi-lateral 6,653
4. Safekeeping of Collateral Received
5. Return and Cost
Please refer to the Statement of Comprehensive Income and Note 4 for details of income and associated costs.
Securities Financing Transactions (continued)
Dimensional Fund Advisors Semi-Annual Report and Unaudited Financial Statements, 31 May 2021 594

Global Short-Term Investment Grade Fixed Income Fund
Data displayed in '000's
1. Global Data
Proportion of securities and commodities on loan USD %
Total lendable assets excluding cash and cash equivalents: 1,335,962
Securities and commodities on loan 7,682 0.58%
Assets engaged in SFTs and total return swaps USD %
Fund assets under management (AUM) 1,442,183
Absolute value of assets engaged in:
Securities lending 7,682 0.53%
2. Concentration Data
Top 10 Counterparties*
Name and value of outstanding transactions USD
Securities lending
Barclays Bank Plc 2,813
Societe Generale SA 2,733
Merrill Lynch International 1,139
Credit Suisse Securities (Europe) Limited 997
* The Top 10 Counterparties are disclosed where appropriate. In some instances there may be less than 10 Counterparties present.
3. Aggregate transaction data
Type, Quality and Currency of Collateral Type
Type Quality Currencies USD
Cash Collateral Investment Grade United States Dollar 7,839
Maturity Tenor of Collateral (remaining period to maturity)
Type Less than one dayOne day to oneweek
One week to onemonth
One to threemonths
Three months to oneyear Above one year Open maturity
Securities lending 7,839 - - - - - -
7,839 - - - - - -
Counterparty details
TypeCountries of counterpartyestablishment
Settlement andclearing USD
Securities lending United Kingdom Bi-lateral 5,046
Securities lending France Bi-lateral 2,793
4. Return and Cost
Please refer to the Statement of Comprehensive Income and Note 4 for details of income and associated costs.
Securities Financing Transactions (continued)
Dimensional Fund Advisors Semi-Annual Report and Unaudited Financial Statements, 31 May 2021 595

Global Small Companies Fund
Data displayed in '000's
1. Global Data
Proportion of securities and commodities on loan USD %
Total lendable assets excluding cash and cash equivalents: 998,628
Securities and commodities on loan 125,677 12.58%
Assets engaged in SFTs and total return swaps USD %
Fund assets under management (AUM) 1,022,447
Absolute value of assets engaged in:
Securities lending 125,677 12.29%
2. Concentration Data
Top 10 Collateral Issuers
Name and value of collateral and commodities received USD
French Republic 26,078
Republic of Germany 23,973
United States 23,648
Kingdom of Belgium 21,782
United Kingdom 14,718
Kingdom of the Netherlands 11,443
Republic of Austria 1,500
Australia 1,241
Republic of Finland 1,237
Canada 1,126
Top 10 Counterparties
Name and value of outstanding transactions USD
Securities lending
Credit Suisse AG (Dublin Branch) 48,221
UBS AG 27,987
Goldman Sachs International 6,991
Barclays Capital Securities Limited 6,930
Morgan Stanley & Co. International Plc 6,865
Merrill Lynch International 6,625
Barclays Bank Plc 4,987
HSBC Bank Plc 3,526
JP Morgan Securities Plc 2,863
Citigroup Global Markets Limited 2,770
3. Aggregate transaction data
Type, Quality and Currency of Collateral Type
Type Quality Currencies USD
Bond Investment Grade Euro 86,679
Bond Investment Grade United States Dollar 23,648
Bond Investment Grade Pound Sterling 14,718
Bond Investment Grade Australian Dollar 1,241
Bond Investment Grade Canadian Dollar 1,126
Bond Investment Grade Swedish Krona 17
Bond Investment Grade Danish Krone 11
Cash Collateral Investment Grade United States Dollar 6,356
Securities Financing Transactions (continued)
Dimensional Fund Advisors Semi-Annual Report and Unaudited Financial Statements, 31 May 2021 596

Global Small Companies Fund (continued)
Data displayed in '000's
3. Aggregate transaction data (continued)
Maturity Tenor of Collateral (remaining period to maturity)
Type Less than one dayOne day to oneweek
One week to onemonth
One to threemonths
Three months to oneyear Above one year Open maturity
Securities lending 6,356 - 1,987 4,420 7,293 113,740 -
6,356 - 1,987 4,420 7,293 113,740 -
Counterparty details
TypeCountries of counterpartyestablishment
Settlement andclearing USD
Securities lending United Kingdom Bi-lateral 25,467
Securities lending Switzerland Bi-lateral 21,574
Securities lending France Bi-lateral 1,665
Securities lending Germany Bi-lateral 1,398
Securities lending Ireland Bi-lateral 790
Securities lending Canada Bi-lateral 302
Securities lending Australia Bi-lateral 40
Securities lending Ireland Tri-party 50,628
Securities lending United Kingdom Tri-party 19,906
Securities lending Switzerland Tri-party 8,389
Securities lending France Tri-party 1,801
Securities lending Germany Tri-party 1,061
Securities lending Canada Tri-party 653
Securities lending Netherlands Tri-party 84
Securities lending Australia Tri-party 38
4. Safekeeping of Collateral Received
Names and value of custodians safekeeping collateral USD
JP Morgan 55,179
Bank of New York 27,381
Number of custodians safekeeping collateral 2
5. Return and Cost
Please refer to the Statement of Comprehensive Income and Note 4 for details of income and associated costs.
Securities Financing Transactions (continued)
Dimensional Fund Advisors Semi-Annual Report and Unaudited Financial Statements, 31 May 2021 597

Global Sustainability Core Equity Fund
Data displayed in '000's
1. Global Data
Proportion of securities and commodities on loan USD %
Total lendable assets excluding cash and cash equivalents: 1,440,102
Securities and commodities on loan 70,590 4.90%
Assets engaged in SFTs and total return swaps USD %
Fund assets under management (AUM) 1,468,904
Absolute value of assets engaged in:
Securities lending 70,590 4.81%
2. Concentration Data
Top 10 Collateral Issuers
Name and value of collateral and commodities received USD
French Republic 14,786
Kingdom of Belgium 13,569
Republic of Germany 13,180
United States 9,580
Kingdom of the Netherlands 7,424
United Kingdom 7,150
Republic of Austria 1,103
Republic of Finland 792
Australia 767
Canada 485
Top 10 Counterparties
Name and value of outstanding transactions USD
Securities lending
Credit Suisse AG (Dublin Branch) 21,899
UBS AG 19,654
Barclays Capital Securities Limited 6,057
Merrill Lynch International 4,831
Morgan Stanley & Co. International Plc 4,370
Citigroup Global Markets Limited 3,888
HSBC Bank Plc 3,313
Societe Generale SA 2,043
Barclays Bank Plc 1,759
Deutsche Bank AG 1,102
3. Aggregate transaction data
Type, Quality and Currency of Collateral Type
Type Quality Currencies USD
Bond Investment Grade Euro 51,269
Bond Investment Grade United States Dollar 9,580
Bond Investment Grade Pound Sterling 7,150
Bond Investment Grade Australian Dollar 767
Bond Investment Grade Canadian Dollar 485
Bond Investment Grade Danish Krone 1
Bond Investment Grade Swedish Krona 1
Cash Collateral Investment Grade United States Dollar 5,557
Securities Financing Transactions (continued)
Dimensional Fund Advisors Semi-Annual Report and Unaudited Financial Statements, 31 May 2021 598

Global Sustainability Core Equity Fund (continued)
Data displayed in '000's
3. Aggregate transaction data (continued)
Maturity Tenor of Collateral (remaining period to maturity)
Type Less than one dayOne day to oneweek
One week to onemonth
One to threemonths
Three months to oneyear Above one year Open maturity
Securities lending 5,557 - 814 1,814 4,284 62,341 -
5,557 - 814 1,814 4,284 62,341 -
Counterparty details
TypeCountries of counterpartyestablishment
Settlement andclearing USD
Securities lending Switzerland Bi-lateral 13,940
Securities lending United Kingdom Bi-lateral 13,009
Securities lending Germany Bi-lateral 924
Securities lending France Bi-lateral 897
Securities lending Ireland Bi-lateral 668
Securities lending Australia Bi-lateral 607
Securities lending Canada Bi-lateral 158
Securities lending Ireland Tri-party 22,677
Securities lending United Kingdom Tri-party 12,951
Securities lending Switzerland Tri-party 6,934
Securities lending France Tri-party 1,497
Securities lending Canada Tri-party 291
Securities lending Germany Tri-party 239
Securities lending Australia Tri-party 18
4. Safekeeping of Collateral Received
Names and value of custodians safekeeping collateral USD
JP Morgan 26,146
Bank of New York 18,461
Number of custodians safekeeping collateral 2
5. Return and Cost
Please refer to the Statement of Comprehensive Income and Note 4 for details of income and associated costs.
Securities Financing Transactions (continued)
Dimensional Fund Advisors Semi-Annual Report and Unaudited Financial Statements, 31 May 2021 599

Global Sustainability Fixed Income Fund
Data displayed in '000's
1. Global Data
Proportion of securities and commodities on loan GBP %
Total lendable assets excluding cash and cash equivalents: 281,633
Securities and commodities on loan 269 0.10%
Assets engaged in SFTs and total return swaps GBP %
Fund assets under management (AUM) 293,314
Absolute value of assets engaged in:
Securities lending 269 0.09%
2. Concentration Data
Top 10 Collateral Issuers*
Name and value of collateral and commodities received GBP
United Kingdom 266
French Republic 9
Top 10 Counterparties*
Name and value of outstanding transactions GBP
Securities lending
Merrill Lynch International 269
* The Top 10 Collateral Issuers and Top 10 Counterparties are disclosed where appropriate. In some instances there may be less than 10 Collateral Issuers Counterparties present.
3. Aggregate transaction data
Type, Quality and Currency of Collateral Type
Type Quality Currencies GBP
Bond Investment Grade Pound Sterling 266
Bond Investment Grade Euro 9
Maturity Tenor of Collateral (remaining period to maturity)
Type Less than one dayOne day to oneweek
One week to onemonth
One to threemonths
Three months to oneyear Above one year Open maturity
Securities lending - - - 4 - 271 -
- - - 4 - 271 -
Counterparty details
TypeCountries of counterpartyestablishment
Settlement andclearing GBP
Securities lending United Kingdom Bi-lateral 275
4. Return and Cost
Please refer to the Statement of Comprehensive Income and Note 4 for details of income and associated costs.
Securities Financing Transactions (continued)
Dimensional Fund Advisors Semi-Annual Report and Unaudited Financial Statements, 31 May 2021 600

Global Targeted Value Fund
Data displayed in '000's
1. Global Data
Proportion of securities and commodities on loan USD %
Total lendable assets excluding cash and cash equivalents: 3,862,264
Securities and commodities on loan 322,604 8.35%
Assets engaged in SFTs and total return swaps USD %
Fund assets under management (AUM) 3,921,840
Absolute value of assets engaged in:
Securities lending 322,604 8.23%
2. Concentration Data
Top 10 Collateral Issuers
Name and value of collateral and commodities received USD
Kingdom of Belgium 69,079
Republic of Germany 68,062
French Republic 66,632
United States 44,297
United Kingdom 38,832
Kingdom of the Netherlands 25,366
Australia 3,845
Republic of Austria 3,128
Republic of Finland 2,862
Canada 2,764
Top 10 Counterparties
Name and value of outstanding transactions USD
Securities lending
Credit Suisse AG (Dublin Branch) 109,646
UBS AG 80,603
Barclays Capital Securities Limited 26,285
Morgan Stanley & Co. International Plc 23,479
Goldman Sachs International 17,185
Merrill Lynch International 16,801
JP Morgan Securities Plc 11,477
Societe Generale SA 9,381
Citigroup Global Markets Limited 8,800
Barclays Bank Plc 5,230
3. Aggregate transaction data
Type, Quality and Currency of Collateral Type
Type Quality Currencies USD
Bond Investment Grade Euro 236,657
Bond Investment Grade United States Dollar 44,297
Bond Investment Grade Pound Sterling 38,832
Bond Investment Grade Australian Dollar 3,845
Bond Investment Grade Canadian Dollar 2,764
Bond Investment Grade Danish Krone 7
Bond Investment Grade Swedish Krona 2
Cash Collateral Investment Grade United States Dollar 16,295
Securities Financing Transactions (continued)
Dimensional Fund Advisors Semi-Annual Report and Unaudited Financial Statements, 31 May 2021 601

Global Targeted Value Fund (continued)
Data displayed in '000's
3. Aggregate transaction data (continued)
Maturity Tenor of Collateral (remaining period to maturity)
Type Less than one dayOne day to oneweek
One week to onemonth
One to threemonths
Three months to oneyear Above one year Open maturity
Securities lending 16,295 - 4,266 9,610 17,323 295,205 -
16,295 - 4,266 9,610 17,323 295,205 -
Counterparty details
TypeCountries of counterpartyestablishment
Settlement andclearing USD
Securities lending Switzerland Bi-lateral 74,604
Securities lending United Kingdom Bi-lateral 52,695
Securities lending France Bi-lateral 5,701
Securities lending Ireland Bi-lateral 1,854
Securities lending Germany Bi-lateral 1,481
Securities lending Canada Bi-lateral 1,277
Securities lending Australia Bi-lateral 36
Securities lending Ireland Tri-party 115,058
Securities lending United Kingdom Tri-party 70,031
Securities lending Switzerland Tri-party 11,207
Securities lending France Tri-party 6,887
Securities lending Germany Tri-party 1,143
Securities lending Canada Tri-party 673
Securities lending Australia Tri-party 52
4. Safekeeping of Collateral Received
Names and value of custodians safekeeping collateral USD
JP Morgan 127,705
Bank of New York 77,345
Number of custodians safekeeping collateral 2
5. Return and Cost
Please refer to the Statement of Comprehensive Income and Note 4 for details of income and associated costs.
Securities Financing Transactions (continued)
Dimensional Fund Advisors Semi-Annual Report and Unaudited Financial Statements, 31 May 2021 602

Global Ultra Short Fixed Income Fund
Data displayed in '000's
1. Global Data
Proportion of securities and commodities on loan GBP %
Total lendable assets excluding cash and cash equivalents: 501,708
Securities and commodities on loan 451 0.09%
Assets engaged in SFTs and total return swaps GBP %
Fund assets under management (AUM) 539,577
Absolute value of assets engaged in:
Securities lending 451 0.08%
2. Concentration Data
Top 10 Counterparties*
Name and value of outstanding transactions GBP
Securities lending
Barclays Bank Plc 451
* The Top 10 Counterparties are disclosed where appropriate. In some instances there may be less than 10 Counterparties present.
3. Aggregate transaction data
Type, Quality and Currency of Collateral Type
Type Quality Currencies GBP
Cash Collateral Investment Grade United States Dollar 459
Maturity Tenor of Collateral (remaining period to maturity)
Type Less than one dayOne day to oneweek
One week to onemonth
One to threemonths
Three months to oneyear Above one year Open maturity
Securities lending 459 - - - - - -
459 - - - - - -
Counterparty details
TypeCountries of counterpartyestablishment
Settlement andclearing GBP
Securities lending United Kingdom Bi-lateral 459
4. Return and Cost
Please refer to the Statement of Comprehensive Income and Note 4 for details of income and associated costs.
Securities Financing Transactions (continued)
Dimensional Fund Advisors Semi-Annual Report and Unaudited Financial Statements, 31 May 2021 603

Global Value Fund
Data displayed in '000's
1. Global Data
Proportion of securities and commodities on loan USD %
Total lendable assets excluding cash and cash equivalents: 741,218
Securities and commodities on loan 19,610 2.65%
Assets engaged in SFTs and total return swaps USD %
Fund assets under management (AUM) 755,771
Absolute value of assets engaged in:
Securities lending 19,610 2.59%
2. Concentration Data
Top 10 Collateral Issuers
Name and value of collateral and commodities received USD
Kingdom of Belgium 5,293
Republic of Germany 3,865
French Republic 3,232
Kingdom of the Netherlands 1,969
United Kingdom 1,920
United States 1,724
Republic of Austria 895
Republic of Finland 696
Australia 225
Canada 153
Top 10 Counterparties*
Name and value of outstanding transactions USD
Securities lending
UBS AG 9,562
JP Morgan Securities Plc 3,435
Barclays Capital Securities Limited 1,919
Credit Suisse AG (Dublin Branch) 1,711
Citigroup Global Markets Limited 990
Morgan Stanley & Co. International Plc 943
Deutsche Bank AG 845
HSBC Bank Plc 205
* The Top 10 Counterparties are disclosed where appropriate. In some instances there may be less than 10 Counterparties present.
3. Aggregate transaction data
Type, Quality and Currency of Collateral Type
Type Quality Currencies USD
Bond Investment Grade Euro 16,066
Bond Investment Grade Pound Sterling 1,920
Bond Investment Grade United States Dollar 1,724
Bond Investment Grade Australian Dollar 225
Bond Investment Grade Canadian Dollar 153
Cash Collateral Investment Grade United States Dollar 605
Securities Financing Transactions (continued)
Dimensional Fund Advisors Semi-Annual Report and Unaudited Financial Statements, 31 May 2021 604

Global Value Fund (continued)
Data displayed in '000's
3. Aggregate transaction data (continued)
Maturity Tenor of Collateral (remaining period to maturity)
Type Less than one dayOne day to oneweek
One week to onemonth
One to threemonths
Three months to oneyear Above one year Open maturity
Securities lending 605 - 67 70 566 19,385 -
605 - 67 70 566 19,385 -
Counterparty details
TypeCountries of counterpartyestablishment
Settlement andclearing USD
Securities lending Switzerland Bi-lateral 6,158
Securities lending United Kingdom Bi-lateral 1,120
Securities lending Germany Bi-lateral 139
Securities lending United Kingdom Tri-party 6,777
Securities lending Switzerland Tri-party 3,945
Securities lending Ireland Tri-party 1,806
Securities lending Germany Tri-party 748
4. Safekeeping of Collateral Received
Names and value of custodians safekeeping collateral USD
Bank of New York 6,650
JP Morgan 6,625
Number of custodians safekeeping collateral 2
5. Return and Cost
Please refer to the Statement of Comprehensive Income and Note 4 for details of income and associated costs.
Securities Financing Transactions (continued)
Dimensional Fund Advisors Semi-Annual Report and Unaudited Financial Statements, 31 May 2021 605

Pacific Basin Small Companies Fund
Data displayed in '000's
1. Global Data
Proportion of securities and commodities on loan USD %
Total lendable assets excluding cash and cash equivalents: 86,518
Securities and commodities on loan 18,814 21.75%
Assets engaged in SFTs and total return swaps USD %
Fund assets under management (AUM) 108,411
Absolute value of assets engaged in:
Securities lending 18,814 17.35%
2. Concentration Data
Top 10 Collateral Issuers
Name and value of collateral and commodities received USD
Kingdom of Belgium 5,021
French Republic 3,473
Republic of Germany 3,417
United States 3,168
United Kingdom 1,423
Kingdom of the Netherlands 712
Australia 700
Denmark 145
Canada 83
Republic of Austria 62
Top 10 Counterparties
Name and value of outstanding transactions USD
Securities lending
UBS AG 6,933
Morgan Stanley & Co. International Plc 3,348
Goldman Sachs International 2,081
Credit Suisse AG (Dublin Branch) 1,886
Merrill Lynch International 1,514
JP Morgan Securities Plc 955
Deutsche Bank AG 734
Barclays Capital Securities Limited 673
Bank of Nova Scotia 276
Citigroup Global Markets Limited 207
3. Aggregate transaction data
Type, Quality and Currency of Collateral Type
Type Quality Currencies USD
Bond Investment Grade Euro 12,864
Bond Investment Grade United States Dollar 3,168
Bond Investment Grade Pound Sterling 1,423
Bond Investment Grade Australian Dollar 700
Bond Investment Grade Canadian Dollar 83
Cash Collateral Investment Grade United States Dollar 1,796
Securities Financing Transactions (continued)
Dimensional Fund Advisors Semi-Annual Report and Unaudited Financial Statements, 31 May 2021 606

Pacific Basin Small Companies Fund (continued)
Data displayed in '000's
3. Aggregate transaction data (continued)
Maturity Tenor of Collateral (remaining period to maturity)
Type Less than one dayOne day to oneweek
One week to onemonth
One to threemonths
Three months to oneyear Above one year Open maturity
Securities lending 1,796 - 33 194 1,171 16,840 -
1,796 - 33 194 1,171 16,840 -
Counterparty details
TypeCountries of counterpartyestablishment
Settlement andclearing USD
Securities lending Switzerland Bi-lateral 6,350
Securities lending United Kingdom Bi-lateral 4,531
Securities lending Germany Bi-lateral 773
Securities lending Ireland Bi-lateral 243
Securities lending France Bi-lateral 68
Securities lending Canada Bi-lateral 61
Securities lending United Kingdom Tri-party 4,958
Securities lending Ireland Tri-party 1,761
Securities lending Switzerland Tri-party 1,019
Securities lending Canada Tri-party 232
Securities lending Australia Tri-party 22
Securities lending France Tri-party 16
4. Safekeeping of Collateral Received
Names and value of custodians safekeeping collateral USD
Bank of New York 5,682
JP Morgan 2,325
Number of custodians safekeeping collateral 2
5. Return and Cost
Please refer to the Statement of Comprehensive Income and Note 4 for details of income and associated costs.
Securities Financing Transactions (continued)
Dimensional Fund Advisors Semi-Annual Report and Unaudited Financial Statements, 31 May 2021 607

Sterling Inflation Linked Intermediate Duration Fixed Income Fund
Data displayed in '000's
1. Global Data
Proportion of securities and commodities on loan GBP %
Total lendable assets excluding cash and cash equivalents: 913,824
Securities and commodities on loan - -
Assets engaged in SFTs and total return swaps GBP %
Fund assets under management (AUM) 918,635
Absolute value of assets engaged in:
Securities lending - -
2. Return and Cost
Please refer to the Statement of Comprehensive Income and Note 4 for details of income and associated costs.
Securities Financing Transactions (continued)
Dimensional Fund Advisors Semi-Annual Report and Unaudited Financial Statements, 31 May 2021 608

U.S. Core Equity Fund
Data displayed in '000's
1. Global Data
Proportion of securities and commodities on loan USD %
Total lendable assets excluding cash and cash equivalents: 20,737
Securities and commodities on loan 636 3.07%
Assets engaged in SFTs and total return swaps USD %
Fund assets under management (AUM) 21,009
Absolute value of assets engaged in:
Securities lending 636 3.03%
2. Concentration Data
Top 10 Collateral Issuers*
Name and value of collateral and commodities received USD
United States 146
Republic of Germany 140
United Kingdom 115
French Republic 105
Kingdom of the Netherlands 84
Kingdom of Belgium 75
Canada 11
Denmark 2
Top 10 Counterparties*
Name and value of outstanding transactions USD
Securities lending
Credit Suisse AG (Dublin Branch) 488
UBS AG 135
Merrill Lynch International 9
Deutsche Bank AG 4
* The Top 10 Collateral Issuers and Top 10 Counterparties are disclosed where appropriate. In some instances there may be less than 10 Collateral Issuers Counterparties present.
3. Aggregate transaction data
Type, Quality and Currency of Collateral Type
Type Quality Currencies USD
Securities lending Investment Grade Euro 407
Securities lending Investment Grade United States Dollar 145
Securities lending Investment Grade Pound Sterling 115
Securities lending Investment Grade Canadian Dollar 11
Maturity Tenor of Collateral (remaining period to maturity)
Type Less than one dayOne day to oneweek
One week to onemonth
One to threemonths
Three months to oneyear Above one year Open maturity
Securities lending - - 22 43 36 577 -
- - 22 43 36 577 -
Counterparty details
TypeCountries of counterpartyestablishment
Settlement andclearing USD
Securities lending Switzerland Bi-lateral 34
Securities lending United Kingdom Bi-lateral 10
Securities Financing Transactions (continued)
Dimensional Fund Advisors Semi-Annual Report and Unaudited Financial Statements, 31 May 2021 609

U.S. Core Equity Fund (continued)
Data displayed in '000's
3. Aggregate transaction data (continued)
TypeCountries of counterpartyestablishment
Settlement andclearing USD
Securities lending Ireland Tri-party 521
Securities lending Switzerland Tri-party 109
Securities lending Germany Tri-party 4
4. Safekeeping of Collateral Received
Names and value of custodians safekeeping collateral USD
JP Morgan 525
Bank of New York 109
Number of custodians safekeeping collateral 2
5. Return and Cost
Please refer to the Statement of Comprehensive Income and Note 4 for details of income and associated costs.
Securities Financing Transactions (continued)
Dimensional Fund Advisors Semi-Annual Report and Unaudited Financial Statements, 31 May 2021 610

U.S. Small Companies Fund
Data displayed in '000's
1. Global Data
Proportion of securities and commodities on loan USD %
Total lendable assets excluding cash and cash equivalents: 173,412
Securities and commodities on loan 20,730 11.95%
Assets engaged in SFTs and total return swaps USD %
Fund assets under management (AUM) 174,480
Absolute value of assets engaged in:
Securities lending 20,730 11.88%
2. Concentration Data
Top 10 Collateral Issuers*
Name and value of collateral and commodities received USD
United States 5,970
Republic of Germany 4,026
United Kingdom 3,550
French Republic 3,391
Kingdom of Belgium 2,421
Kingdom of the Netherlands 2,367
Canada 199
Denmark 71
Top 10 Counterparties*
Name and value of outstanding transactions USD
Securities lending
Credit Suisse AG (Dublin Branch) 15,941
UBS AG 3,076
Barclays Bank Plc 1,487
Societe Generale SA 163
Goldman Sachs International 23
Deutsche Bank AG 13
HSBC Bank Plc 12
Merrill Lynch International 8
Morgan Stanley & Co. International Plc 7
* The Top 10 Collateral Issuers and Top 10 Counterparties are disclosed where appropriate. In some instances there may be less than 10 Collateral Issuers Counterparties present.
3. Aggregate transaction data
Type, Quality and Currency of Collateral Type
Type Quality Currencies USD
Bond Investment Grade Euro 12,275
Bond Investment Grade United States Dollar 5,971
Bond Investment Grade Pound Sterling 3,550
Bond Investment Grade Canadian Dollar 199
Cash Collateral Investment Grade United States Dollar 232
Maturity Tenor of Collateral (remaining period to maturity)
Type Less than one dayOne day to oneweek
One week to onemonth
One to threemonths
Three months to oneyear Above one year Open maturity
Securities lending 232 - 774 1,566 1,304 18,351 -
232 - 774 1,566 1,304 18,351 -
Securities Financing Transactions (continued)
Dimensional Fund Advisors Semi-Annual Report and Unaudited Financial Statements, 31 May 2021 611

U.S. Small Companies Fund (continued)
Data displayed in '000's
3. Aggregate transaction data (continued)
Counterparty details
TypeCountries of counterpartyestablishment
Settlement andclearing USD
Securities lending United Kingdom Bi-lateral 1,595
Securities lending Switzerland Bi-lateral 1,495
Securities lending France Bi-lateral 168
Securities lending Ireland Tri-party 17,020
Securities lending Switzerland Tri-party 1,928
Securities lending Germany Tri-party 14
Securities lending United Kingdom Tri-party 7
4. Safekeeping of Collateral Received
Names and value of custodians safekeeping collateral USD
JP Morgan 17,033
Bank of New York 1,935
Number of custodians safekeeping collateral 2
5. Return and Cost
Please refer to the Statement of Comprehensive Income and Note 4 for details of income and associated costs.
Securities Financing Transactions (continued)
Dimensional Fund Advisors Semi-Annual Report and Unaudited Financial Statements, 31 May 2021 612

World Allocation 20/80 Fund
Data displayed in '000's
1. Global Data
Proportion of securities and commodities on loan GBP %
Total lendable assets excluding cash and cash equivalents: 15,714
Securities and commodities on loan - -
Assets engaged in SFTs and total return swaps GBP %
Fund assets under management (AUM) 100,443
Absolute value of assets engaged in:
Securities lending - -
2. Return and Cost
Please refer to the Statement of Comprehensive Income and Note 4 for details of income and associated costs.
Securities Financing Transactions (continued)
Dimensional Fund Advisors Semi-Annual Report and Unaudited Financial Statements, 31 May 2021 613

World Allocation 40/60 Fund
Data displayed in '000's
1. Global Data
Assets engaged in SFTs and total return swaps GBP %
Fund assets under management (AUM) 824,769
2. Return and Cost
Please refer to the Statement of Comprehensive Income and Note 4 for details of income and associated costs.
Securities Financing Transactions (continued)
Dimensional Fund Advisors Semi-Annual Report and Unaudited Financial Statements, 31 May 2021 614

World Allocation 60/40 Fund
Data displayed in '000's
1. Global Data
Proportion of securities and commodities on loan GBP %
Total lendable assets excluding cash and cash equivalents: 917,680
Securities and commodities on loan 50,096 5.46%
Assets engaged in SFTs and total return swaps GBP %
Fund assets under management (AUM) 1,814,339
Absolute value of assets engaged in:
Securities lending 50,096 2.76%
2. Concentration Data
Top 10 Collateral Issuers
Name and value of collateral and commodities received GBP
Kingdom of Belgium 11,120
French Republic 10,323
Republic of Germany 9,238
United States 5,830
Kingdom of the Netherlands 5,792
United Kingdom 4,449
Republic of Austria 1,122
Republic of Finland 763
Australia 668
Canada 524
Top 10 Counterparties
Name and value of outstanding transactions GBP
Securities lending
UBS AG 22,580
Credit Suisse AG (Dublin Branch) 10,410
JP Morgan Securities Plc 5,072
Citigroup Global Markets Limited 4,305
HSBC Bank Plc 3,952
Morgan Stanley & Co. International Plc 2,913
Credit Suisse International 645
Bank of Nova Scotia 166
BMO Capital Markets Limited 37
Credit Suisse Securities (Europe) Limited 16
3. Aggregate transaction data
Type, Quality and Currency of Collateral Type
Type Quality Currencies GBP
Bond Investment Grade Euro 38,626
Bond Investment Grade United States Dollar 5,830
Bond Investment Grade Pound Sterling 4,449
Bond Investment Grade Australian Dollar 668
Bond Investment Grade Canadian Dollar 524
Bond Investment Grade Swedish Krona 1
Cash Collateral Investment Grade United States Dollar 3,203
Securities Financing Transactions (continued)
Dimensional Fund Advisors Semi-Annual Report and Unaudited Financial Statements, 31 May 2021 615

World Allocation 60/40 Fund (continued)
Data displayed in '000's
3. Aggregate transaction data (continued)
Maturity Tenor of Collateral (remaining period to maturity)
Type Less than one dayOne day to oneweek
One week to onemonth
One to threemonths
Three months to oneyear Above one year Open maturity
Securities lending 3,203 - 416 808 2,822 46,052 -
3,203 - 416 808 2,822 46,052 -
Counterparty details
TypeCountries of counterpartyestablishment
Settlement andclearing GBP
Securities lending Switzerland Bi-lateral 13,156
Securities lending United Kingdom Bi-lateral 9,171
Securities lending Ireland Bi-lateral 241
Securities lending Canada Bi-lateral 88
Securities lending Switzerland Tri-party 10,983
Securities lending Ireland Tri-party 10,840
Securities lending United Kingdom Tri-party 8,732
Securities lending Canada Tri-party 90
4. Safekeeping of Collateral Received
Names and value of custodians safekeeping collateral GBP
JP Morgan 17,383
Bank of New York 13,262
Number of custodians safekeeping collateral 2
5. Return and Cost
Please refer to the Statement of Comprehensive Income and Note 4 for details of income and associated costs.
Securities Financing Transactions (continued)
Dimensional Fund Advisors Semi-Annual Report and Unaudited Financial Statements, 31 May 2021 616

World Allocation 80/20 Fund
Data displayed in '000's
1. Global Data
Assets engaged in SFTs and total return swaps GBP %
Fund assets under management (AUM) 392,426
2. Return and Cost
Please refer to the Statement of Comprehensive Income and Note 4 for details of income and associated costs.
Securities Financing Transactions (continued)
Dimensional Fund Advisors Semi-Annual Report and Unaudited Financial Statements, 31 May 2021 617

World Equity Fund
Data displayed in '000's
1. Global Data
Proportion of securities and commodities on loan GBP %
Total lendable assets excluding cash and cash equivalents: 1,791,725
Securities and commodities on loan 96,784 5.40%
Assets engaged in SFTs and total return swaps GBP %
Fund assets under management (AUM) 1,917,026
Absolute value of assets engaged in:
Securities lending 96,784 5.05%
2. Concentration Data
Top 10 Collateral Issuers
Name and value of collateral and commodities received GBP
United States 19,536
Republic of Germany 18,731
French Republic 18,549
Kingdom of Belgium 18,102
United Kingdom 9,736
Kingdom of the Netherlands 7,288
Republic of Austria 1,350
Australia 1,350
Republic of Finland 1,124
Denmark 637
Top 10 Counterparties
Name and value of outstanding transactions GBP
Securities lending
Credit Suisse AG (Dublin Branch) 24,430
UBS AG 22,304
Merrill Lynch International 10,033
Barclays Capital Securities Limited 9,787
JP Morgan Securities Plc 7,597
Morgan Stanley & Co. International Plc 7,472
Citigroup Global Markets Limited 4,357
Barclays Bank Plc 3,632
Societe Generale SA 1,920
Credit Suisse International 1,257
3. Aggregate transaction data
Type, Quality and Currency of Collateral Type
Type Quality Currencies GBP
Bond Investment Grade Euro 65,780
Bond Investment Grade United States Dollar 19,536
Bond Investment Grade Pound Sterling 9,736
Bond Investment Grade Australian Dollar 1,350
Bond Investment Grade Canadian Dollar 438
Bond Investment Grade Danish Krone 1
Cash Collateral Investment Grade United States Dollar 5,954
Securities Financing Transactions (continued)
Dimensional Fund Advisors Semi-Annual Report and Unaudited Financial Statements, 31 May 2021 618

World Equity Fund (continued)
Data displayed in '000's
3. Aggregate transaction data (continued)
Maturity Tenor of Collateral (remaining period to maturity)
Type Less than one dayOne day to oneweek
One week to onemonth
One to threemonths
Three months to oneyear Above one year Open maturity
Securities lending 5,954 - 970 1,782 6,801 87,288 -
5,954 - 970 1,782 6,801 87,288 -
Counterparty details
TypeCountries of counterpartyestablishment
Settlement andclearing GBP
Securities lending United Kingdom Bi-lateral 22,397
Securities lending Switzerland Bi-lateral 17,794
Securities lending France Bi-lateral 2,159
Securities lending Germany Bi-lateral 1,421
Securities lending Ireland Bi-lateral 1,303
Securities lending Australia Bi-lateral 1,113
Securities lending Canada Bi-lateral 369
Securities lending Ireland Tri-party 24,737
Securities lending United Kingdom Tri-party 24,311
Securities lending Switzerland Tri-party 6,031
Securities lending France Tri-party 938
Securities lending Canada Tri-party 107
Securities lending Germany Tri-party 97
Securities lending Australia Tri-party 18
4. Safekeeping of Collateral Received
Names and value of custodians safekeeping collateral GBP
JP Morgan 32,984
Bank of New York 23,256
Number of custodians safekeeping collateral 2
5. Return and Cost
Please refer to the Statement of Comprehensive Income and Note 4 for details of income and associated costs.
Securities Financing Transactions (continued)
Dimensional Fund Advisors Semi-Annual Report and Unaudited Financial Statements, 31 May 2021 619

Dimensional Funds plc is structured as an umbrella fund with segregated liability between sub-funds, established as anopen-ended investment company with variable capital and limited liability under the laws of Ireland with registration number352043. Dimensional Funds plc qualifies and is authorised by the Central Bank of Ireland as an undertaking for collectiveinvestments in transferable securities (UCITS).
The value of investments and any income from them may fall as well as rise and past performance is not a guarantee of futureresults. This is not a prospectus. Prospective investors should receive a prospectus, which should be read carefully beforeinvesting in the Company. Prospectuses are available to download from http://www.dimensional.com.
AMERICAS EUROPE ASIA PACIFIC
Austin, Charlotte, Santa Monica, Toronto, Vancouver London, Amsterdam, Berlin Sydney, Melbourne, Singapore, Tokyo
www.dimensional.com