Interim report and unaudited financial statements
446
Interim report and unaudited financial statements BlackRock Collective Investment Funds • BlackRock Balanced Managed Fund • BlackRock Corporate Bond 1-10 Year Fund • iShares 100 UK Equity Index Fund (UK) • iShares 350 UK Equity Index Fund (UK) • iShares Continental European Equity Index Fund (UK) • iShares Corporate Bond Index Fund (UK) • iShares Emerging Markets Equity Index Fund (UK) • iShares Global Property Securities Equity Index Fund (UK) • iShares Index Linked Gilt Index Fund (UK) • iShares Japan Equity Index Fund (UK) • iShares Mid Cap UK Equity Index Fund (UK) • iShares North American Equity Index Fund (UK) • iShares Over 15 Years Corporate Bond Index Fund (UK) • iShares Over 15 Years Gilts Index Fund (UK) • iShares Overseas Corporate Bond Index Fund (UK) • iShares Overseas Government Bond Index Fund (UK) • iShares Pacific Ex Japan Equity Index Fund (UK) • iShares UK Equity Index Fund (UK) • iShares UK Gilts All Stocks Index Fund (UK) • iShares US Equity Index Fund (UK) For the financial period ended 31 August 2020
-
Upload
khangminh22 -
Category
Documents
-
view
1 -
download
0
Transcript of Interim report and unaudited financial statements

Interim report and unaudited
financial statements
BlackRock Collective Investment Funds
• BlackRock Balanced Managed Fund
• BlackRock Corporate Bond 1-10 Year Fund
• iShares 100 UK Equity Index Fund (UK)
• iShares 350 UK Equity Index Fund (UK)
• iShares Continental European Equity Index Fund (UK)
• iShares Corporate Bond Index Fund (UK)
• iShares Emerging Markets Equity Index Fund (UK)
• iShares Global Property Securities Equity Index Fund (UK)
• iShares Index Linked Gilt Index Fund (UK)
• iShares Japan Equity Index Fund (UK)
• iShares Mid Cap UK Equity Index Fund (UK)
• iShares North American Equity Index Fund (UK)
• iShares Over 15 Years Corporate Bond Index Fund (UK)
• iShares Over 15 Years Gilts Index Fund (UK)
• iShares Overseas Corporate Bond Index Fund (UK)
• iShares Overseas Government Bond Index Fund (UK)
• iShares Pacific Ex Japan Equity Index Fund (UK)
• iShares UK Equity Index Fund (UK)
• iShares UK Gilts All Stocks Index Fund (UK)
• iShares US Equity Index Fund (UK)
For the financial period ended 31 August 2020

General Information 2
About the Trust 3
Fund Managers 3
Significant Events 3
Investment Report 4
Notes to Financial Statements 10
BlackRock Balanced Managed Fund 12
BlackRock Corporate Bond 1-10 Year Fund 20
iShares 100 UK Equity Index Fund (UK) 34
iShares 350 UK Equity Index Fund (UK) 42
iShares Continental European Equity Index Fund (UK) 54
iShares Corporate Bond Index Fund (UK) 65
iShares Emerging Markets Equity Index Fund (UK) 93
iShares Global Property Securities Equity Index Fund (UK) 117
iShares Index Linked Gilt Index Fund (UK) 128
iShares Japan Equity Index Fund (UK) 133
iShares Mid Cap UK Equity Index Fund (UK) 145
iShares North American Equity Index Fund (UK) 155
iShares Over 15 Years Corporate Bond Index Fund (UK) 170
iShares Over 15 Years Gilts Index Fund (UK) 179
iShares Overseas Corporate Bond Index Fund (UK) 184
iShares Overseas Government Bond Index Fund (UK) 329
iShares Pacific Ex Japan Equity Index Fund (UK) 353
iShares UK Equity Index Fund (UK) 365
iShares UK Gilts All Stocks Index Fund (UK) 381
iShares US Equity Index Fund (UK) 388
Supplementary Information 402
Contents
BlackRock Collective Investment Funds1

General Information
Manager & RegistrarBlackRock Fund Managers Limited12 Throgmorton Avenue, London EC2N 2DL
Member of The Investment Association and authorised and regulated by the Financial Conduct Authority (“FCA”).
Directors of the ManagerG D Bamping* M B Cook W I Cullen* R A R Hayes A M Lawrence L E Watkins M T Zemek* H NMepham
Trustee & CustodianThe Bank of New York Mellon (International) LimitedOne Canada Square, London E14 5AL
Authorised by the Prudential Regulation Authority and regulated by the FCA and the Prudential RegulationAuthority.
Investment ManagerBlackRock Investment Management (UK) Limited12 Throgmorton Avenue, London EC2N 2DL
Authorised and regulated by the FCA.
Stock Lending AgentBlackRock Advisors (UK) Limited12 Throgmorton Avenue, London EC2N 2DL
Authorised and regulated by the FCA
AuditorErnst & Young LLP25 Churchill Place, Canary Wharf, London E14 5EY
BlackRock’s proxy voting agent is ISS (Institutional Shareholder Services).
This Report relates to the packaged products of and is issued by:BlackRock Fund Managers Limited12 Throgmorton Avenue, London EC2N 2DLTelephone: 020 7743 3000Dealing and Investor Services: 0800 44 55 22blackrock.co.uk
For your protection, telephone calls are usually recorded.
* Non-executive Director.
BlackRock Collective Investment Funds 2

About the Trust
BlackRock Collective Investment Funds (the “Trust”) is organised as an umbrella unit trust scheme comprisingseparate funds with segregated liability (each referred to as a “Fund” and collectively the “Funds”).
The Trust is an authorised unit trust scheme and each Fund qualifies as a UCITS scheme under the FCA’sCollective Investment Schemes Sourcebook (the “COLL Sourcebook”).
Cross sub-fund holdings within the Trust
As at 31 August 2020 and 29 February 2020 there were no cross sub-fund holdings within the Trust.
Assessment of value
The FCA has introduced new requirements for UK authorised fund managers to consider whether the chargestaken from a fund they manage are justified in the context of the overall service and value offered by that fund,and to report on those findings. BlackRock is preparing for the reporting requirement, including assessingrelevant charges, and will be publishing the assessment of value statements no later than 31 October 2020 in acomposite report for all funds managed by BlackRock Fund Managers Limited subject to these requirements.
Funds not yet launched
Funds approved by the FCA but not yet launched are as follows:
iShares Developed Asia Pacific Ex Japan Equity Index Fund (UK)
iShares World Ex UK Equity Index Fund (UK)
Fund Managers
As at 31 August 2020, the Fund Managers of the Trust are Duncan Fergusson, Francis Rayner, Darren Wills,Kieran Doyle, David Curtin, Adam Ryan, Jason Byro and Conan McKenzie and Matthew Jackson.
Significant Events
Outbreak of COVID-19
An outbreak of an infectious respiratory illness caused by a novel coronavirus known as COVID-19 was firstdetected in China in December 2019 and has now developed into a global pandemic. The impact of thissignificant event on the Funds’ financial risk exposure is disclosed in Note 2.
The Manager has assessed the impact of market conditions arising from the COVID-19 outbreak on the Funds’ability to meet their investment objectives. Based on the latest available information, the Funds continue to bemanaged in line with their investment objectives, with no disruption to the operations of the Funds and thepublication of net asset values.
BlackRock Collective Investment Funds3

Investment ObjectiveThe investment objective of the Funds is to provide investors with a total return, taking into account the capital andincome returns, which reflect the total returns of the respective target/comparator benchmark listed below.
Fund nameTarget/comparatorbenchmark
Investment managementapproach
BlackRock Balanced Managed Fund Investment Association Mixed Investment40%-85% Shares#
Active
BlackRock Corporate Bond 1-10 YearFund
Composite Index^ Non-replicating
iShares 100 UK Equity Index Fund (UK) FTSE 100 Index^ Replicating
iShares 350 UK Equity Index Fund (UK) FTSE 350 Index^ Replicating
iShares Continental European Equity IndexFund (UK)
FTSE World Europe ex UK Index^ Replicating
iShares Corporate Bond Index Fund (UK) Markit iBoxx GBP Non-Gilts Overall TRIndex^
Non-replicating
iShares Emerging Markets Equity IndexFund (UK)
FTSE Emerging Index^ Non-replicating
iShares Global Property Securities EquityIndex Fund (UK)
FTSE EPRA/NAREIT Developed Index^ Non-replicating
iShares Index Linked Gilt Index Fund (UK) FTSE Actuaries UK Index Linked Gilts Over5 Years Index^
Non-replicating
iShares Japan Equity Index Fund (UK) FTSE Japan Index^ Replicating
iShares Mid Cap UK Equity Index Fund(UK)
FTSE 250 Index^ Replicating
iShares North American Equity Index Fund(UK)
FTSE North America Index^ Replicating
iShares Over 15 Years Corporate BondIndex Fund (UK)
Markit iBoxx GBP Non-Gilts Over 15 YearsIndex^
Non-replicating
iShares Over 15 Years Gilts Index Fund(UK)
FTSE Actuaries UK Conventional Gilts Over15 Years Index^
Non-replicating
iShares Overseas Corporate Bond IndexFund (UK)
Bloomberg Barclays Global AggregateCorporate ex GBP Index^
Non-replicating
iShares Overseas Government Bond IndexFund (UK)
JP Morgan Global Government Bond Indexex UK^
Non-replicating
iShares Pacific Ex Japan Equity IndexFund (UK)
FTSE World Asia-Pacific ex-Japan Index^ Replicating
iShares UK Equity Index Fund (UK) FTSE All-Share Index^ Replicating
iShares UK Gilts All Stocks Index Fund(UK)
FTSE Actuaries UK Conventional Gilts AllStocks Index^
Non-replicating
iShares US Equity Index Fund (UK) FTSE USA Index^ Replicating# Comparator benchmark^ Target benchmark
Performance Summary, Tracking Difference and Tracking ErrorThe returns disclosed are the performance returns for the primary unit class for each Fund, net of ongoingcharges, which has been selected as a representative unit class. The primary unit class represents the class ofunit which is the highest charging unit class, free of any commissions or rebates, and is freely available.Performance returns for any other unit class can be made available on request.
Tracking difference is defined as the difference in returns between a Fund and its target benchmark.
Investment Reportfor the six months ended 31 August 2020
BlackRock Collective Investment Funds 4
Realised tracking error is the annualised standard deviation of the difference in monthly returns between a Fundand its target benchmark. Tracking error shows the consistency of the returns relative to the target benchmarkover a defined period of time.
Anticipated tracking error is based on the expected volatility of differences between the returns of a Fund andthe returns of its target benchmark.
For physically replicating Funds, the investment management approach is to buy a portfolio of securities that asfar as practicable consist of the securities that make up the target benchmark, in similar proportion to the weightsrepresented in the target benchmark over a defined period of time.
For non-replicating Funds, the investment management approach aims to match the main risk characteristics ofthe target benchmark by investing in a portfolio that is primarily made up of securities that represent the targetbenchmark. The objective is to generate a return which is as close as practicable to the total return of the indexnet of transaction costs and gross of fees and other costs.
Cash management, efficient portfolio management techniques including securities lending, transaction costsfrom rebalancing and currency hedging can have an impact on tracking difference. Importantly, these impactscan be either positive or negative depending on the underlying circumstances.
In addition to the above, the Funds may also have a tracking difference or tracking error due to withholding taxsuffered by the Funds on any income received from their investments. The level and quantum of trackingdifference or tracking error arising due to withholding taxes depends on various factors such as any reclaims filedon behalf of the Funds with various tax authorities, any benefits obtained by the Funds under a tax treaty or anysecurities lending activities carried out by the Funds.
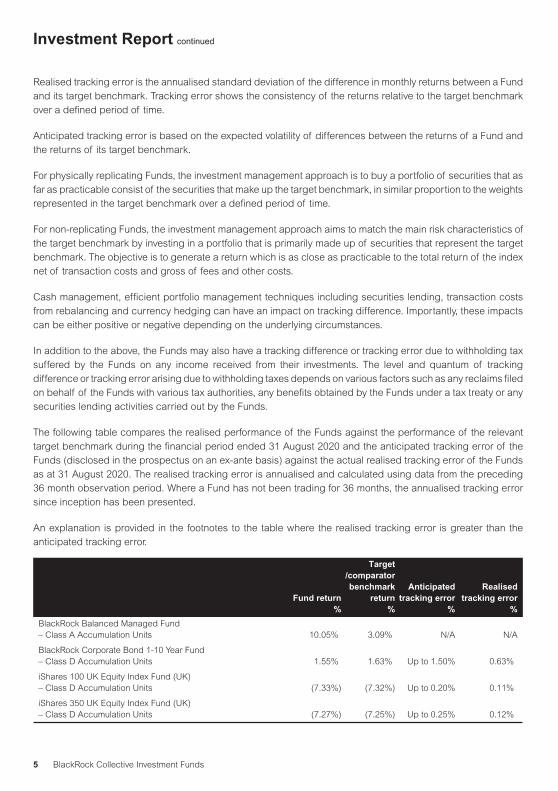
The following table compares the realised performance of the Funds against the performance of the relevanttarget benchmark during the financial period ended 31 August 2020 and the anticipated tracking error of theFunds (disclosed in the prospectus on an ex-ante basis) against the actual realised tracking error of the Fundsas at 31 August 2020. The realised tracking error is annualised and calculated using data from the preceding36 month observation period. Where a Fund has not been trading for 36 months, the annualised tracking errorsince inception has been presented.
An explanation is provided in the footnotes to the table where the realised tracking error is greater than theanticipated tracking error.
Fund return%
Target/comparatorbenchmark
return%
Anticipatedtracking error
%
Realisedtracking error
%
BlackRock Balanced Managed Fund– Class A Accumulation Units 10.05% 3.09% N/A N/A
BlackRock Corporate Bond 1-10 Year Fund– Class D Accumulation Units 1.55% 1.63% Up to 1.50% 0.63%
iShares 100 UK Equity Index Fund (UK)– Class D Accumulation Units (7.33%) (7.32%) Up to 0.20% 0.11%
iShares 350 UK Equity Index Fund (UK)– Class D Accumulation Units (7.27%) (7.25%) Up to 0.25% 0.12%
Investment Report continued
BlackRock Collective Investment Funds5

Fund return%
Target/comparatorbenchmark
return%
Anticipatedtracking error
%
Realisedtracking error
%
iShares Continental European Equity Index Fund (UK)– Class D Accumulation Units 7.94% 7.88% Up to 0.30% 0.16%
iShares Corporate Bond Index Fund (UK)– Class D Accumulation Units 1.00% 1.15% Up to 0.40% 0.47%1
iShares Emerging Markets Equity Index Fund (UK)– Class D Accumulation Units 8.37% 7.38% Up to 1.30% 0.83%
iShares Global Property Securities Equity Index Fund (UK)– Class D Accumulation Units (13.62%) (13.79%) Up to 1.50% 0.50%
iShares Index Linked Gilt Index Fund (UK)– Class D Accumulation Units (0.60%) (0.51%) Up to 1.00% 0.41%
iShares Japan Equity Index Fund (UK)– Class D Accumulation Units 8.83% 7.76% Up to 3.50% 1.20%
iShares Mid Cap UK Equity Index Fund (UK)– Class D Accumulation Units (7.09%) (6.95%) Up to 0.25% 0.26%2
iShares North American Equity Index Fund (UK)– Class D Accumulation Units 17.59% 15.21% Up to 2.50% 1.99%
iShares Over 15 Years Corporate Bond Index Fund (UK)– Class D Accumulation Units 1.23% 1.19% Up to 0.30% 1.36%1
iShares Over 15 Years Gilts Index Fund (UK)– Class D Accumulation Units (0.08%) (0.06%) Up to 0.60% 0.25%
iShares Overseas Corporate Bond Index Fund (UK)– Class D Accumulation Units 0.97% (0.26%) Up to 4.00% 2.07%
iShares Overseas Government Bond Index Fund (UK)– Class D Accumulation Units 0.81% (0.68%) Up to 4.00% 1.91%
iShares Pacific Ex Japan Equity Index Fund (UK)– Class D Accumulation Units 6.99% 6.03% Up to 0.75% 0.74%
iShares UK Equity Index Fund (UK)– Class D Accumulation Units (7.03%) (7.12%) Up to 0.20% 0.24%2
iShares UK Gilts All Stocks Index Fund (UK)– Class D Accumulation Units 0.53% 0.56% Up to 0.60% 0.16%
iShares US Equity Index Fund (UK)– Class D Accumulation Units 18.22% 15.96% Up to 2.50% 1.98%1 Negative market sentiment relating to fund performance drove up pricing point differences i.e. both index and fund are noon priced, but the exact timing of the price of the
underlying securities may vary which causes pricing point differences. These pricing point difference resulted in the tracking error.2 Operational time delays in receiving details of cash flows in and out of the fund may occur. In a period of high market volatility with higher levels of cash flows, this delay has
an effect on fund performance and has led to a tracking difference and thus a tracking error. Other factors attributing to the tracking error were securities lending return, cash dragdue to use of futures, and transaction costs.
Investment Report continued
BlackRock Collective Investment Funds 6

Global Economic OverviewGlobal equities, as represented by the MSCI All Country World Index (“ACWI”) (in sterling terms), posted a returnof 9.92% for the six months ended 31 August 2020. The period began as many nations moved into lockdowns toarrest the advance of the COVID-19 pandemic and as financial markets weighed the consequences ofdraconian social restrictions. These provoked a severe global economic downturn and a rise in unemploymentdespite many governments’ best efforts to subsidise workers and help employers. From late March to Mayhowever, equities regained a significant portion of their losses as aggressive policy responses from governmentsand central banks, the phased reopening of economies around the world, and new COVID-19 treatments raisedhopes for an economic recovery. By the end of the reporting period, some indices touched all-time highs, evenas economic data continued to indicate substantial weakness.
Looking at currencies, the US dollar declined against most global currencies, particularly late in the reportingperiod, reflecting unprecedented monetary stimulus, record low interest rates and the rapid spread of theCOVID-19 infections early in the period. The euro, the sterling, and the Japanese yen all advanced against the USdollar.
Economic conditions during the reporting period were substantially weakened by the travel and businessrestrictions put in place to counteract the spread of the COVID-19 virus. This disruption led to a significanteconomic contraction, and the US economy shrank by an annualised 5% in the first quarter of 2020 and a record33% in the second quarter of 2020. The economies of the eurozone and Japan fell into recession, while theChinese economy returned to growth in the second quarter of 2020, raising hopes for recovery in the region.
Bond performance was volatile following the COVID-19 outbreak and initially diverged based on credit quality, asUS treasuries posted the strongest performance while corporate and emerging market bonds underperformedthe broader bond market. The demand for less risky assets drove the yield (which moves inversely to the price)on the 10-year US Treasury which is a benchmark lending rate for the bond market, to an all-time low in March2020.
However, after yields rose sharply in the corporate bond market, the Federal Reserve (�the Fed�) announced inlate March 2020 that it would implement an unprecedented corporate bond purchasing facility, which providedsignificant support to US corporate bond prices. Yields on corporate bonds fell throughout the rest of thereporting period, and both investment-grade and high-yield bonds posted positive returns overall.
Equities in emerging markets advanced significantly during the reporting period. These equities were initiallyamong the most affected by the COVID-19 pandemic, as lockdowns and factory closures in China weighed onChinese markets. Many of the emerging Asian economies that have significant trade with China also sufferedsignificant supply and demand shocks. However, emerging market equities rebounded as infection rates slowedand economies reopened, and China reported economic data indicating a strong recovery. Emerging marketbond prices, which fell sharply in March 2020, posted a positive return for the 6-month period, recovering due tooptimism about the pace of the economic recovery.
In the commodities market, gold prices rose to an all-time high amid geopolitical tensions and a move towardsless risky assets due to the outbreak of COVID-19. Oil prices fell to a 21-year low in April 2020 amid deterioratingdemand and a supply dispute between major oil producing nations, although prices recovered somewhatthroughout May and June 2020.
Investment Report continued
BlackRock Collective Investment Funds7

Governments responded to the economic slowdown with both fiscal and monetary stimulus. The US authorisedmore than $2 trillion in stimulus payments to businesses and individuals, and many other countries around theworld also passed stimulus measures. The Fed instituted two emergency interest rate cuts and, along with otherinfluential central banks, implemented a major bond buying program to stabilise debt markets. The synchronisedeconomic stimulus ultimately jumpstarted economic growth and supported risk taking in global markets.
Fund Performance Review and Activity
BlackRock Balanced Managed Fund
Over the six-month period to 31 August 2020, the Fund’s return was 10.05%, outperforming its comparatorbenchmark, which returned 3.09%.
The performance of markets during the review period was driven predominantly by the COVID-19 outbreak andthe unprecedented government and central bank response to mitigate its impact on public health as well as theeconomy. Markets endured a rollercoaster ride, initially falling significantly before support from governments andaccommodative central bank policy helped to restore confidence.
The Fund performed strongly over the period, initially utilising hedging strategies to minimise losses beforestepping back into markets through increased global equity exposure and precious metals in order to drivereturns as markets rebounded.
During the six-month period the following were the largest contributors to and detractors from the Fund’s absolutereturn:
Largest Contributors Largest Detractors
StrategyEffect on
Fund returnStrategy
Effect onFund return
iShares MSCI USA SRI UCITS ETF 4.40% US Policy Equity Basket -1.25%
S&P 500 Futures 2.04% BlackRock Segregated UK Equity Portfolio -0.75%
US Enterprise Tech Equity Basket 1.49% MSCI Emerging Market Equity Futures -0.67%
Equity Variance Strategies 1.06% BlackRock UK Smaller Companies Fund -0.63%
BlackRock Continental European Fund 1.06% iShares Corp Bond ETF USD -0.44%
The Fund’s strong performance has been driven by its exposure to US equities through the iShares MSCI USA SRIUCITS ETF, US equity futures, and the bespoke US Enterprise Tech Equity Basket as markets rebounded. In orderto fund some of these exposures we sold out of the US Policy Basket as our long-term conviction over the strategywaned. Also detracting was exposure to UK equities which haven’t fully recovered from the sell-off due toincreased political uncertainty around Brexit.
The following table details the significant portfolio weightings at 31 August 2020 and 29 February 2020:
31 August 2020 29 February 2020
Asset Class Gross exposure Asset Class Gross exposure
UK equities 27.5% UK equities 27.5%
Global (ex-UK) equities 49.7% Global (ex-UK) equities 45.1%
Corporate bonds 13.6% Corporate bonds 18.8%
Government bonds 5.3% Government bonds 6.6%
Volatility & Carry Strategies 4.1% Volatility & Carry Strategies 4.8%
Investment Report continued
BlackRock Collective Investment Funds 8

Over the course of the period we increased our allocation to global equities, increasing exposure to cyclicalelements of the market as government and central bank intervention helped prop up the economies.
Investment Report continued
BlackRock Collective Investment Funds9

1. Accounting PoliciesThe financial statements have been prepared in accordance with United Kingdom Generally AcceptedAccounting Practice (�UK GAAP�) and the Statement of Recommended Practice for Authorised Funds (the“SORP”) issued by the Investment Management Association (now known as the Investment Association) in May2014 and amended in June 2017.
The accounting policies applied are consistent with those of the financial statements for the year ended29 February 2020 and are described in those annual financial statements.
2. Financial risksThe Funds’ investment activities expose them to the various types of risk which are associated with the financialinstruments and markets in which they invest. The risks are substantially consistent with those disclosed in theprevious annual financial statements with the exception of those outlined below.
Market risk arising from price riskPrice risk is the risk that the fair value of future cash flows of a financial instrument will fluctuate because ofchanges in market prices (other than those arising from interest rate risk or currency risk), whether those changesare caused by factors specific to the individual financial instrument or its issuer, or factors affecting similarfinancial instruments traded in the market. Local, regional or global events such as war, acts of terrorism, thespread of infectious illness or other public health issue, recessions, or other events could have a significantimpact on the Funds and the market price of their investments.
An outbreak of an infectious respiratory illness caused by a novel coronavirus known as COVID-19 was firstdetected in China in December 2019 and has now developed into a global pandemic. This coronavirus hasresulted in travel restrictions, closed international borders, enhanced health screenings at ports of entry andelsewhere, disruption of and delays in healthcare service preparation and delivery, prolonged quarantines,cancellations, supply chain disruptions, and lower consumer demand, as well as general concern anduncertainty. The impact of COVID-19 has adversely affected the economies of many nations across the entireglobal economy, individual issuers and capital markets, and could continue to extents that cannot necessarily beforeseen. In addition, the impact of infectious illnesses in emerging market countries may be greater due togenerally less established healthcare systems. Public health crises caused by the COVID-19 outbreak mayexacerbate other pre-existing political, social and economic risks in certain countries or globally. The duration ofthe COVID-19 outbreak and its effects cannot be determined with certainty.
A key metric used by the BlackRock Risk and Quantitative Analysis Group to measure market risk is Value-at-Risk(“VaR”) which encompasses currency, interest rate and price risk. VaR is a statistical risk measure that estimatesthe potential portfolio loss from adverse market movements in an ordinary market environment. VaR analysisreflects the interdependencies between risk variables, unlike a traditional sensitivity analysis.
Notes to Financial Statements (unaudited)for the six months ended 31 August 2020
BlackRock Collective Investment Funds 10

The one-day VaR based on a 99% confidence level is outlined in the table below:
Fund name31.8.2020
%29.2.2020
%
BlackRock Balanced Managed Fund 3.26 1.91
BlackRock Corporate Bond 1-10 Year Fund 0.54 0.37
iShares 100 UK Equity Index Fund (UK) 5.37 3.28
iShares 350 UK Equity Index Fund (UK) 5.16 3.27
iShares Continental European Equity Index Fund (UK) 4.46 2.95
iShares Corporate Bond Index Fund (UK) 0.86 0.66
iShares Emerging Markets Equity Index Fund (UK) 3.36 2.92
iShares Global Property Securities Equity Index Fund (UK) 4.75 2.47
iShares Index Linked Gilt Index Fund (UK) 2.70 2.29
iShares Japan Equity Index Fund (UK) 3.95 2.81
iShares Mid Cap UK Equity Index Fund (UK) 5.63 3.41
iShares North American Equity Index Fund (UK) 5.00 3.50
iShares Over 15 Years Corporate Bond Index Fund (UK) 2.02 1.45
iShares Over 15 Years Gilts Index Fund (UK) 2.38 1.93
iShares Overseas Corporate Bond Index Fund (UK) 1.55 1.66
iShares Overseas Government Bond Index Fund (UK) 1.53 1.60
iShares Pacific Ex Japan Equity Index Fund (UK) 3.58 2.78
iShares UK Equity Index Fund (UK) 5.17 3.29
iShares UK Gilts All Stocks Index Fund (UK) 1.31 1.12
iShares US Equity Index Fund (UK) 5.01 3.51
Notes to Financial Statements (unaudited) continued
BlackRock Collective Investment Funds11

The Fund is a sub-fund of BlackRock Collective Investment Funds (previously known as BlackRock QualifiedInvestor Schemes (1)), a UCITS scheme under the COLL Sourcebook. The Fund was established on 21 June2005 and was authorised by the FCA on 21 June 2005. The Fund was previously known as Merrill Lynch BalancedManaged Fund. It adopted its present name with effect from 28 April 2008. The Fund’s FCA product referencenumber is 645667.
Risk and Reward ProfileLower riskTypically lower rewards
Higher riskTypically higher rewards
Unit Class
A Accumulation 1 2 3 4 5 6 7
• The risk indicator was calculated incorporating historical data and may not be a reliable indication of the futurerisk profile of the Fund.
• The risk category shown is not guaranteed and may change over time.
• The lowest category does not mean risk free.
• The use of derivatives will impact the value of the Fund and may expose the Fund to a higher degree of risk.Derivatives are highly sensitive to changes in the value of the asset on which they are based and can increasethe size of losses and gains, resulting in greater fluctuations in the value of the Fund. The impact to the Fundcan be greater where derivatives are used in an extensive or complex way.
For more information on this, please see the Fund’s Key Investor Information Document (“KIID”), which is availableat www.blackrock.com.
BlackRock Balanced Managed Fund
About the Fund
BlackRock Collective Investment Funds 12

Net Asset Value
At 31 August 2020 Units in IssueNet Asset Value
£000’s
Net Asset Valueper Unit
p
A Accumulation 255,341,986 557,639 218.4
Distributions Payable for the period to 31 August 2020
Unit Class Distribution payable on 31.10.2020
Pence per Unit
A Accumulation 0.2173
Operating Charges
Unit Class1.3.2020
to 31.8.20201.3.2019
to 29.2.2020
A Accumulation 1.55% 1.56%
Operating charges are annualised and exclude portfolio trade-related costs, except costs paid to the custodian/depositary and entry/exit charges paid to an underlyingcollective investment scheme (if any).
BlackRock Balanced Managed Fund
Performance Record
BlackRock Collective Investment Funds13

Holding orNominalValue Investment
MarketValue
£000’s
% ofTotal
NetAssets
EUROPE − 23.23%; 29.2.2020 25.30%
EQUITIES − 15.96%; 29.2.2020 17.85%
Ireland − 0.20%; 29.2.2020 0.20%
40,000 CRH 1,132 0.20
Netherlands − 0.59%; 29.2.2020 1.00%
5,159 Just Eat Takeaway.com 434 0.08
266,500 Royal Dutch Shell 2,833 0.51
3,267 0.59
United Kingdom − 15.17%; 29.2.2020 16.65%
324,900 3i 3,048 0.55
365,000 Ascential 1,139 0.20
70,500 Ashtead 1,836 0.33
89,800 Associated British Foods 1,836 0.33
97,450 AstraZeneca 8,125 1.46
496,931 Auto Trader 2,798 0.50
640,000 Barclays 715 0.13
381,400 BP 1,008 0.18
163,500 British AmericanTobacco
4,140 0.74
540,000 Cairn Energy 761 0.14
466,000 Capital & CountiesProperties
603 0.11
293,120 Compass 3,578 0.64
121,100 easyJet 767 0.14
70,300 Ferguson 5,185 0.93
24,673 Fevertree Drinks 507 0.09
92,200 Hargreaves Lansdown 1,490 0.27
250,000 HSBC 825 0.15
56,500 Johnson Matthey 1,342 0.24
2,365,000 Lloyds Banking 671 0.12
36,400 London Stock Exchange 3,203 0.57
504,000 Melrose Industries 513 0.09
61,800 Next 3,732 0.67
125,477 Patisserie Valerie1 – 0.00
144,600 Prudential 1,766 0.32
57,200 Reckitt Benckiser 4,295 0.77
346,900 RELX 5,906 1.06
406,000 Rentokil InitialØ 2,162 0.39
475,400 Rightmove 3,013 0.54
157,000 Rio Tinto 7,276 1.30
987,000 Serco 1,382 0.25
131,400 Smith & Nephew 1,999 0.36
531,023 SSPØ 1,302 0.23
517,000 Standard Chartered 2,028 0.36
1,324,900 Tesco 2,896 0.52
Holding orNominalValue Investment
MarketValue
£000’s
% ofTotal
NetAssets
127,100 Trainline 504 0.09
31,800 Unilever 1,418 0.25
87,034 Unite 841 0.15
84,610 15.17
BONDS − 7.27%; 29.2.2020 7.45%
UK Sterling Denominated GovernmentBonds − 5.83%; 29.2.2020 6.29%
£6,646,298 United Kingdom Gilt 0.5%22/7/2022Ø
6,713 1.20
£3,591,516 United Kingdom Gilt 0.75%22/7/2023Ø
3,676 0.66
£8,135,694 United Kingdom Gilt 1.5%22/1/2021Ø
8,179 1.47
£3,584,650 United Kingdom Gilt 1.5%22/7/2026Ø
3,895 0.70
£2,635,692 United Kingdom Gilt 2%7/9/2025Ø
2,903 0.52
£3,687,163 United Kingdom Gilt 2.75%7/9/2024Ø
4,102 0.74
£876,823 United Kingdom Gilt 4.25%7/6/2032
1,259 0.23
£1,212,020 United Kingdom Gilt 4.75%7/12/2030Ø
1,754 0.31
32,481 5.83
US Dollar Denominated CorporateBonds − 1.44%; 29.2.2020 1.16%
$7,000,000 Goldman Sachs International 0%21/12/2021
8,055 1.44
NORTH AMERICA − 5.34%; 29.2.2020 12.18%
EQUITIES − 5.34%; 29.2.2020 12.18%
Bermuda − 0.14%; 29.2.2020 0.00%
100,100 HiscoxØ 794 0.14
United States of America − 5.20%; 29.2.2020 12.18%
2,842 Adobe 1,089 0.20
907 Alphabet 1,102 0.20
353 Amazon.com 907 0.16
7,147 Analog Devices 624 0.11
3,348 ANSYS 847 0.15
19,188 Apple 1,846 0.33
2,338 Arista Networks 390 0.07
5,136 Aspen Technology 486 0.09
11,593 Booz Allen Hamilton 762 0.14
3,055 Broadcom 791 0.14
13,627 Cadence Design Systems 1,128 0.20
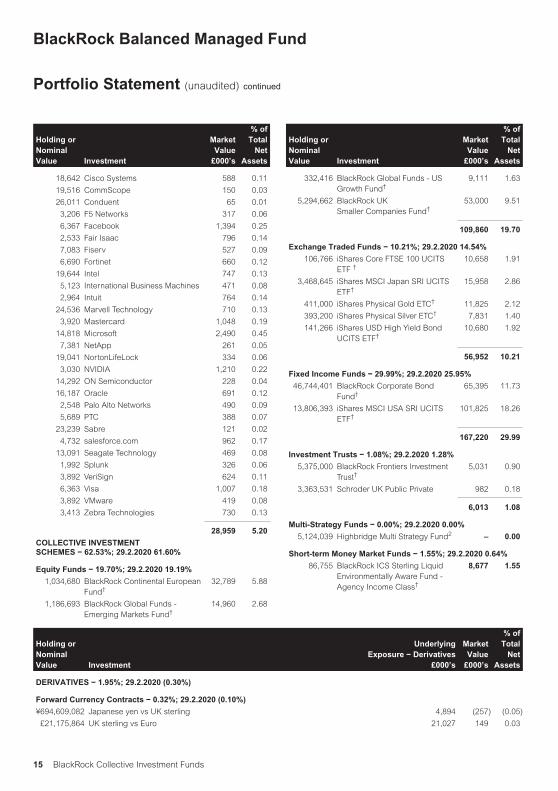
BlackRock Balanced Managed Fund
Portfolio Statement (unaudited)
at 31 August 2020
BlackRock Collective Investment Funds 14
Holding orNominalValue Investment
MarketValue
£000’s
% ofTotal
NetAssets
18,642 Cisco Systems 588 0.11
19,516 CommScope 150 0.03
26,011 Conduent 65 0.01
3,206 F5 Networks 317 0.06
6,367 Facebook 1,394 0.25
2,533 Fair Isaac 796 0.14
7,083 Fiserv 527 0.09
6,690 Fortinet 660 0.12
19,644 Intel 747 0.13
5,123 International Business Machines 471 0.08
2,964 Intuit 764 0.14
24,536 Marvell Technology 710 0.13
3,920 Mastercard 1,048 0.19
14,818 Microsoft 2,490 0.45
7,381 NetApp 261 0.05
19,041 NortonLifeLock 334 0.06
3,030 NVIDIA 1,210 0.22
14,292 ON Semiconductor 228 0.04
16,187 Oracle 691 0.12
2,548 Palo Alto Networks 490 0.09
5,689 PTC 388 0.07
23,239 Sabre 121 0.02
4,732 salesforce.com 962 0.17
13,091 Seagate Technology 469 0.08
1,992 Splunk 326 0.06
3,892 VeriSign 624 0.11
6,363 Visa 1,007 0.18
3,892 VMware 419 0.08
3,413 Zebra Technologies 730 0.13
28,959 5.20
COLLECTIVE INVESTMENTSCHEMES − 62.53%; 29.2.2020 61.60%
Equity Funds − 19.70%; 29.2.2020 19.19%
1,034,680 BlackRock Continental EuropeanFund†
32,789 5.88
1,186,693 BlackRock Global Funds -Emerging Markets Fund†
14,960 2.68
Holding orNominalValue Investment
MarketValue
£000’s
% ofTotal
NetAssets
332,416 BlackRock Global Funds - USGrowth Fund†
9,111 1.63
5,294,662 BlackRock UKSmaller Companies Fund†
53,000 9.51
109,860 19.70
Exchange Traded Funds − 10.21%; 29.2.2020 14.54%
106,766 iShares Core FTSE 100 UCITSETF †
10,658 1.91
3,468,645 iShares MSCI Japan SRI UCITSETF†
15,958 2.86
411,000 iShares Physical Gold ETC† 11,825 2.12
393,200 iShares Physical Silver ETC† 7,831 1.40
141,266 iShares USD High Yield BondUCITS ETF†
10,680 1.92
56,952 10.21
Fixed Income Funds − 29.99%; 29.2.2020 25.95%
46,744,401 BlackRock Corporate BondFund†
65,395 11.73
13,806,393 iShares MSCI USA SRI UCITSETF†
101,825 18.26
167,220 29.99
Investment Trusts − 1.08%; 29.2.2020 1.28%
5,375,000 BlackRock Frontiers InvestmentTrust†
5,031 0.90
3,363,531 Schroder UK Public Private 982 0.18
6,013 1.08
Multi-Strategy Funds − 0.00%; 29.2.2020 0.00%
5,124,039 Highbridge Multi Strategy Fund2 – 0.00
Short-term Money Market Funds − 1.55%; 29.2.2020 0.64%
86,755 BlackRock ICS Sterling LiquidEnvironmentally Aware Fund -Agency Income Class†
8,677 1.55
Holding orNominalValue Investment
UnderlyingExposure − Derivatives
£000’s
MarketValue
£000’s
% ofTotal
NetAssets
DERIVATIVES − 1.95%; 29.2.2020 (0.30%)
Forward Currency Contracts − 0.32%; 29.2.2020 (0.10%)
¥694,609,082 Japanese yen vs UK sterling 4,894 (257) (0.05)
£21,175,864 UK sterling vs Euro 21,027 149 0.03
BlackRock Balanced Managed Fund
Portfolio Statement (unaudited) continued
BlackRock Collective Investment Funds15

Holding orNominalValue Investment
UnderlyingExposure − Derivatives
£000’s
MarketValue
£000’s
% ofTotal
NetAssets
£38,700,000 UK sterling vs US dollar 36,802 1,898 0.34
62,723 1,790 0.32
Futures − (0.15%); 29.2.2020 0.19%
45 Euro Stoxx 50 September 2020 1,312 6 0.00
956 Euro Stoxx Bank September 2020 2,643 (159) (0.03)
(84) MSCI Emerging Markets September 2020 3,452 (293) (0.05)
(32) S&P 500 E-Mini September 2020 4,181 (218) (0.04)
(27) US 10 Year Note (CBT) December 2020 2,808 – 0.00
(142) US 10 Year Ultra September 2020 2,956 (176) (0.03)
17,352 (840) (0.15)
Options − 0.06%; 29.2.2020 0.07%
452 DAX Call Option 18/12/2020 13750 8,466 626 0.11
(308) DAX Put Option 18/12/2020 2150 5,721 (652) (0.12)
796 Euro Stoxx 50 Call Option 18/12/2020 3450 7,711 551 0.10
858 Euro Stoxx 50 Call Option 18/12/2020 4000 489 17 0.00
(1,225) S&P 500 Put Option 21/20/2020 28 607 (192) (0.03)
22,994 350 0.06
Total Return Swaps − 1.24%; 29.2.2020 (0.27%)
2,285,118 (Barclays WVMM Index) 0.6% 15/9/2020 1,751 40 0.01
2,445,709 (Volatility Carry Strategy) 0.6% 9/3/2021 1,868 39 0.01
7,257,232 Bank of America Merrill Lynch (Dow Jones US Select Home) 0.392%22/7/2021
5,609 266 0.05
2,204,728 Barclays (Barclays WVMW Index) 0.6% 10/9/2020 1,706 56 0.01
9,742,952 Barclays Bank (SPX Trend Strategy) 0.9% 30/4/2021 7,304 (19) (0.01)
815,000 BNP Paribas (BNP S&P 500 Stocks vs Index Volatility) 0% 14/12/2020 628 22 0.00
20,283,855 BNP Paribas (Cyber Security Basket) 0.614% 23/4/2021 18,838 3,666 0.66
10,957 Citibank (Global Brands Basket Index) 0% 4/9/2020 20,657 2,726 0.49
2,288,000 Société Générale (Index Dispersion Strategy Index) 0% 21/12/2020 1,348 (349) (0.06)
3,297,398 Société Générale (Small Caps Strong Balance) 0.726% 14/12/2020 2,774 290 0.05
3,461,521 Société Générale (Small Caps Strong Balance) 0.738% 14/12/2020 2,774 167 0.03
65,257 6,904 1.24
Volatility Swaps − 0.48%; 29.2.2020 (0.19%)
7,180 (Russell 2000) 0% 19/12/2020 12,236 10,128 1.82
BlackRock Balanced Managed Fund
Portfolio Statement (unaudited) continued
BlackRock Collective Investment Funds 16

Holding orNominalValue Investment
UnderlyingExposure − Derivatives
£000’s
MarketValue
£000’s
% ofTotal
NetAssets
8,303 (SPX) 0% 19/12/2020 9,226 (7,445) (1.34)
21,462 2,683 0.48
Portfolio of investments 518,907 93.05
Net other assets 38,732 6.95
Total net assets 557,639 100.00
Unless otherwise stated, all securities are either listed on a recognised exchange or traded on an eligible securities market.
Underlying exposure has been calculated according to the guidelines issued by the European Securities and Markets Authority (“ESMA”) and represents the market value of an equivalent positionin the assets underlying each financial derivative instrument.
The counterparties for the forward currency contracts are Barclays Bank Plc and Deutsche Bank AG.
The total return swaps (“TRS”) shown in the portfolio statement starting on page 0 are expressed at both their mark-to-market and original notional value, which when added together represent thecurrent notional value of the TRS. The current notional value of a TRS represents the reference amount used to calculate payments between the counterparties to the TRS. The full notional valuerepresents the economic interest in the security underlying the TRS, but does not change hands in full between the counterparties.1 Security fair valued by Manager at zero.2 Illiquid Security Fair Valued by the Manager.Ø All or a portion of this investment represents a security on loan.† Managed by a related party.
BlackRock Balanced Managed Fund
Portfolio Statement (unaudited) continued
BlackRock Collective Investment Funds17
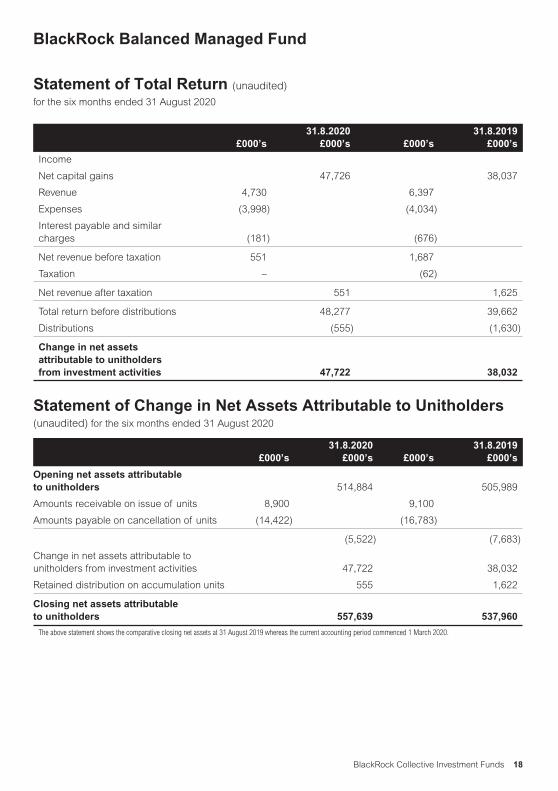
£000’s31.8.2020
£000’s £000’s31.8.2019
£000’s
Income
Net capital gains 47,726 38,037
Revenue 4,730 6,397
Expenses (3,998) (4,034)
Interest payable and similarcharges (181) (676)
Net revenue before taxation 551 1,687
Taxation – (62)
Net revenue after taxation 551 1,625
Total return before distributions 48,277 39,662
Distributions (555) (1,630)
Change in net assetsattributable to unitholdersfrom investment activities 47,722 38,032
Statement of Change in Net Assets Attributable to Unitholders(unaudited) for the six months ended 31 August 2020
£000’s31.8.2020
£000’s £000’s31.8.2019
£000’s
Opening net assets attributableto unitholders 514,884 505,989
Amounts receivable on issue of units 8,900 9,100
Amounts payable on cancellation of units (14,422) (16,783)
(5,522) (7,683)
Change in net assets attributable tounitholders from investment activities 47,722 38,032
Retained distribution on accumulation units 555 1,622
Closing net assets attributableto unitholders 557,639 537,960
The above statement shows the comparative closing net assets at 31 August 2019 whereas the current accounting period commenced 1 March 2020.
BlackRock Balanced Managed Fund
Statement of Total Return (unaudited)
for the six months ended 31 August 2020
BlackRock Collective Investment Funds 18

31.8.2020£000’s
29.2.2020£000’s
Assets:
Fixed assets
− Investment assets 528,667 516,314
Current assets
− Debtors 1,193 12,960
− Cash and bank balances 50,094 5,747
− Pledged investments – 883
Total assets 579,954 535,904
Liabilities:
Investment liabilities (9,760) (8,569)
Creditors
− Amounts held at futures clearing houses and brokers – (1,489)
− Cash collateral payable (9,202) (2,040)
− Other creditors (3,353) (8,922)
Total liabilities (22,315) (21,020)
Net assets attributable to unitholders 557,639 514,884
G D Bamping (Director)M T Zemek (Director)BlackRock Fund Managers Limited29 October 2020
BlackRock Balanced Managed Fund
Balance Sheet (unaudited)
at 31 August 2020
BlackRock Collective Investment Funds19

The Fund is a sub-fund of BlackRock Collective Investment Funds (previously known as BlackRock QualifiedInvestor Schemes (1)), a UCITS scheme under the COLL Sourcebook. The Fund was authorised by the FCA on28 April 2010 and launched on 21 June 2010. The Fund’s FCA product reference number is 645675.
Risk and Reward ProfileLower riskTypically lower rewards
Higher riskTypically higher rewards
Unit Class
A Accumulation 1 2 3 4 5 6 7
L Accumulation 1 2 3 4 5 6 7
X Accumulation 1 2 3 4 5 6 7
D Accumulation 1 2 3 4 5 6 7
• The risk indicator was calculated incorporating simulated historical data and may not be a reliable indicationof the future risk profile of the Fund.
• The risk category shown is not guaranteed and may change over time.
• The lowest category does not mean risk free.
For more information on this, please see the Fund’s Key Investor Information Documents (“KIIDs”), which areavailable at www.blackrock.com.
BlackRock Corporate Bond 1-10 Year Fund
About the Fund
BlackRock Collective Investment Funds 20

Net Asset Value
At 31 August 2020 Units in IssueNet Asset Value
£000’s
Net Asset Valueper Unit
p
A Accumulation 957,421 1,505 157.2
L Accumulation 99,877,567 162,088 162.3
X Accumulation 563,020,702 858,915 152.6
D Accumulation 127,137,036 203,850 160.3
Distributions Payable for the period to 31 August 2020
Unit Class Distribution payable on 31.10.2020
Pence per Unit
A Accumulation 1.5817
L Accumulation 1.8684
X Accumulation 1.9049
D Accumulation 1.8851
Operating Charges
Unit Class1.3.2020
to 31.8.20201.3.2019
to 29.2.2020
A Accumulation 0.52% 0.52%
L Accumulation 0.22% 0.22%
X Accumulation 0.02% 0.02%
D Accumulation 0.17% 0.17%
Operating charges are annualised and exclude portfolio trade-related costs, except costs paid to the custodian/depositary and entry/exit charges paid to an underlyingcollective investment scheme (if any).
BlackRock Corporate Bond 1-10 Year Fund
Performance Record
BlackRock Collective Investment Funds21

Holding orNominalValue Investment
MarketValue
£000’s
% ofTotal
NetAssets
BONDS − 98.03%; 29.2.2020 98.55%
UK Sterling Denominated CorporateBonds − 97.62%; 29.2.2020 98.55%
£650,000 3i 6.875% 9/3/2023 734 0.06
£623,000 A2D Funding 4.75%18/10/2022
663 0.05
£750,000 A2D Funding II 4.5%30/9/2026
859 0.07
£1,500,000 A2Dominion Housing3.5% 15/11/2028
1,653 0.13
£2,400,000 Abertis Infraestructuras3.375% 27/11/2026
2,536 0.21
£2,900,000 ABN AMRO Bank1.375% 7/6/2022
2,948 0.24
£1,600,000 ABN AMRO Bank1.375% 16/1/2025
1,639 0.13
£1,000,000 ABN AMRO Bank2.375% 7/12/2021
1,026 0.08
£850,000 Admiral 5.5%25/7/2024Ø
974 0.08
£1,750,000 Affinity Water Finance5.875% 13/7/2026
2,215 0.18
£2,050,000 Akelius ResidentialProperty 2.375%15/8/2025
2,118 0.17
£2,850,000 America Movil 5%27/10/2026
3,464 0.28
£3,650,000 America Movil 5.75%28/6/2030
4,910 0.40
£1,000,000 American HondaFinance 1.3% 21/3/2022
1,004 0.08
£750,000 American HondaFinance 2.625%14/10/2022
775 0.06
£1,900,000 American International5% 26/4/2023
2,087 0.17
£4,000,000 Amgen 4% 13/9/2029Ø 4,913 0.40
£2,450,000 Amgen 5.5% 7/12/2026 3,134 0.26
£1,600,000 Anglo American Capital3.375% 11/3/2029
1,719 0.14
£3,350,000 Anheuser-Busch InBev1.75% 7/3/2025
3,474 0.28
£4,000,000 Anheuser-Busch InBev2.25% 24/5/2029
4,200 0.34
£2,400,000 Anheuser-Busch InBev4% 24/9/2025
2,752 0.22
£2,050,000 Anheuser-Busch InBev9.75% 30/7/2024
2,749 0.22
£2,600,000 Annington Funding2.646% 12/7/2025
2,771 0.23
Holding orNominalValue Investment
MarketValue
£000’s
% ofTotal
NetAssets
£3,700,000 Annington Funding 3.184%12/7/2029
4,074 0.33
£1,550,000 AP Moller - Maersk 4% 4/4/2025 1,653 0.13
£4,600,000 Apple 3.05% 31/7/2029Ø 5,511 0.45
£500,000 APT Pipelines 3.5% 22/3/2030 562 0.05
£1,025,000 APT Pipelines 4.25% 26/11/2024 1,155 0.09
£2,900,000 Aroundtown 3% 16/10/2029 2,942 0.24
£2,235,000 Aroundtown 3.25% 18/7/2027 2,355 0.19
£1,800,000 Aroundtown 4.75% Perpetual25/6/2169
1,823 0.15
£2,175,000 Assura Financing 3% 19/7/2028 2,402 0.20
£3,775,000 AT&T 2.9% 4/12/2026 4,128 0.34
£4,700,000 AT&T 4.375% 14/9/2029 5,698 0.46
£3,550,000 AT&T 5.5% 15/3/2027 4,433 0.36
£2,000,000 Aviva 4.375% 12/9/2049Ø 2,214 0.18
£2,000,000 Aviva 5.125% 4/6/2050 2,333 0.19
£4,900,000 Aviva 6.125% 14/11/2036 5,954 0.49
£3,650,000 Aviva 6.125% Perpetual29/9/2168
3,998 0.33
£4,300,000 AXA 5.453% Perpetual 4/3/2169 4,927 0.40
£2,000,000 AXA 6.6862% Perpetual6/7/2169
2,443 0.20
£1,800,000 Babcock International 1.875%5/10/2026Ø
1,719 0.14
£1,900,000 BAE Systems 4.125% 8/6/2022 2,005 0.16
£3,600,000 Banco Santander 1.375%31/7/2024
3,646 0.30
£2,600,000 Banco Santander 1.75%17/2/2027
2,574 0.21
£1,900,000 Banco Santander 2.75%12/9/2023
1,990 0.16
£2,675,000 Bank of America 2.3%25/7/2025
2,855 0.23
£1,400,000 Bank of America 4.25%10/12/2026
1,665 0.14
£1,300,000 Bank of America 5.5%22/11/2021
1,375 0.11
£2,500,000 Bank of America 6.125%15/9/2021
2,646 0.22
£7,650,000 Bank of America 7% 31/7/2028 10,871 0.89
£500,000 Bank of America 8.125%2/6/2028Ø
715 0.06
£975,000 Bank of Montreal 1.375%29/12/2021
987 0.08
£1,875,000 Bank of Montreal 1.5%18/12/2024
1,944 0.16
£1,800,000 Bank of Montreal 1.625%21/6/2022
1,839 0.15
£1,700,000 Bank of Nova Scotia/The 1.25%8/6/2022
1,722 0.14
BlackRock Corporate Bond 1-10 Year Fund
Portfolio Statement (unaudited)
at 31 August 2020
BlackRock Collective Investment Funds 22

Holding orNominalValue Investment
MarketValue
£000’s
% ofTotal
NetAssets
£1,250,000 Bank of Nova Scotia/The1.375% 5/12/2023
1,278 0.10
£700,000 Bank of Nova Scotia/The 1.75%23/12/2022
720 0.06
£1,100,000 Bank of Scotland 7.281%Perpetual 30/11/2168
1,266 0.10
£3,200,000 Banque Federative du CreditMutuel 1.25% 5/12/2025
3,273 0.27
£1,300,000 Banque Federative du CreditMutuel 1.375% 20/12/2021
1,316 0.11
£1,500,000 Banque Federative du CreditMutuel 1.5% 7/10/2026
1,557 0.13
£2,900,000 Banque Federative du CreditMutuel 1.75% 19/12/2024
3,046 0.25
£800,000 Banque Federative du CreditMutuel 1.875% 13/12/2022
826 0.07
£1,400,000 Banque Federative du CreditMutuel 2.25% 18/12/2023
1,477 0.12
£4,300,000 Barclays 2.375% 6/10/2023 4,408 0.36
£3,575,000 Barclays 3% 8/5/2026 3,823 0.31
£4,870,000 Barclays 3.125% 17/1/2024 5,148 0.42
£7,550,000 Barclays 3.25% 12/2/2027 8,202 0.67
£2,200,000 Barclays 3.75% 22/11/2030 2,318 0.19
£1,650,000 Barclays Bank 5.75% 14/9/2026 1,984 0.16
£750,000 Barclays Bank 9.5% 7/8/2021 807 0.07
£500,000 BASF 0.875% 6/10/2023 506 0.04
£500,000 BASF 1.375% 21/6/2022 508 0.04
£2,550,000 BASF 1.75% 11/3/2025 2,675 0.22
£2,650,000 BAT Capital 2.125% 15/8/2025 2,736 0.22
£2,975,000 BAT International Finance 2.25%26/6/2028
2,977 0.24
£3,305,000 BAT International Finance 4%4/9/2026
3,709 0.30
£900,000 BAT International Finance 6%29/6/2022
983 0.08
£2,400,000 BAT International Finance 7.25%12/3/2024
2,903 0.24
£1,500,000 Bazalgette Finance 2.375%29/11/2027
1,614 0.13
£1,275,000 Becton Dickinson and 3.02%24/5/2025
1,364 0.11
£4,325,000 BG Energy Capital 5.125%1/12/2025
5,331 0.43
£1,850,000 BHP Billiton Finance 3.25%25/9/2024
2,059 0.17
£2,494,000 BHP Billiton Finance 6.5%22/10/2077
2,728 0.22
£2,700,000 BMW Finance 0.875% 16/8/2022 2,715 0.22
£775,000 BMW Finance 2.375% 1/12/2021 793 0.06
Holding orNominalValue Investment
MarketValue
£000’s
% ofTotal
NetAssets
£1,300,000 BMW International Investment1% 17/11/2021
1,308 0.11
£330,000 BMW International Investment1.25% 11/7/2022
335 0.03
£1,550,000 BMW International Investment1.375% 1/10/2024
1,583 0.13
£1,300,000 BMW International Investment1.75% 19/4/2022
1,323 0.11
£1,300,000 BMW International Investment1.875% 11/9/2023
1,344 0.11
£1,900,000 BNP Paribas 1.125% 16/8/2022 1,926 0.16
£5,200,000 BNP Paribas 1.875% 14/12/2027 5,338 0.44
£5,200,000 BNP Paribas 3.375% 23/1/2026Ø 5,755 0.47
£990,000 BNP Paribas 5.75% 24/1/2022 1,056 0.09
£2,350,000 Bouygues 5.5% 6/10/2026 2,945 0.24
£2,500,000 BP Capital Markets 1.177%12/8/2023
2,546 0.21
£2,450,000 BP Capital Markets 1.827%8/9/2025Ø
2,570 0.21
£1,700,000 BP Capital Markets 2.03%14/2/2025
1,789 0.15
£2,900,000 BP Capital Markets 2.274%3/7/2026
3,128 0.26
£6,875,000 BP Capital Markets 4.25%Perpetual 22/6/2169
7,287 0.59
£2,000,000 BPCE 1.375% 23/12/2026 2,044 0.17
£1,000,000 BPCE 2.125% 16/12/2022 1,037 0.08
£4,500,000 BPCE 5.25% 16/4/2029 5,662 0.46
£1,192,000 British Land 2.375% 14/9/2029 1,202 0.10
£3,500,000 British Telecommunications5.75% 7/12/2028
4,593 0.37
£1,650,000 Brown-Forman 2.6% 7/7/2028 1,822 0.15
£1,525,000 Bunzl Finance 2.25% 11/6/2025 1,596 0.13
£2,400,000 BUPA Finance 1.75% 14/6/2027 2,417 0.20
£1,125,000 BUPA Finance 2% 5/4/2024 1,165 0.09
£2,100,000 BUPA Finance 5% 25/4/2023 2,259 0.18
£2,545,000 BUPA Finance 5% 8/12/2026 2,879 0.23
£4,950,000 Cadent Finance 2.125%22/9/2028
5,228 0.43
£2,000,000 Canadian Imperial Bank ofCommerce 1.625% 25/9/2025Ø
2,058 0.17
£3,450,000 Centrica 4.375% 13/3/2029 4,127 0.34
£750,000 Centrica 6.375% 10/3/2022Ø 811 0.07
£1,500,000 Cie de Saint-Gobain 4.625%9/10/2029
1,875 0.15
£1,200,000 Cie de Saint-Gobain 5.625%15/11/2024
1,422 0.12
£4,450,000 Citigroup 1.75% 23/10/2026 4,582 0.37
£3,200,000 Citigroup 2.75% 24/1/2024 3,387 0.28
£3,150,000 Citigroup 5.15% 21/5/2026 3,828 0.31
BlackRock Corporate Bond 1-10 Year Fund
Portfolio Statement (unaudited) continued
BlackRock Collective Investment Funds23

Holding orNominalValue Investment
MarketValue
£000’s
% ofTotal
NetAssets
£425,000 Citigroup 5.875% 1/7/2024 493 0.04
£2,500,000 CK Hutchison Telecom Finance2% 17/10/2027
2,563 0.21
£1,425,000 Clarion Funding 2.625%18/1/2029Ø
1,560 0.13
£875,000 Close Brothers 2.75% 26/4/2023 909 0.07
£1,000,000 Close Brothers 4.25% 24/1/2027 1,023 0.08
£1,725,000 Close Brothers Finance 2.75%19/10/2026Ø
1,838 0.15
£1,000,000 CNP Assurances 7.375%30/9/2041
1,065 0.09
£3,825,000 Comcast 1.5% 20/2/2029 3,907 0.32
£3,500,000 Comcast 5.5% 23/11/2029 4,791 0.39
£1,400,000 Commerzbank 1.75% 22/1/2025 1,384 0.11
£1,225,000 Compass 2% 5/9/2025 1,279 0.10
£1,000,000 Compass 2% 3/7/2029 1,052 0.09
£2,300,000 Compass 3.85% 26/6/2026 2,654 0.22
£1,300,000 Cooperatieve Rabobank UA1.25% 14/1/2025
1,327 0.11
£3,225,000 Cooperatieve Rabobank UA2.25% 23/3/2022Ø
3,321 0.27
£1,800,000 Cooperatieve Rabobank UA 4%19/9/2022
1,930 0.16
£1,000,000 Cooperatieve Rabobank UA4.55% 30/8/2029
1,300 0.11
£6,200,000 Cooperatieve Rabobank UA4.625% 23/5/2029
7,634 0.62
£1,250,000 Cooperatieve Rabobank UA4.875% 10/1/2023
1,377 0.11
£3,250,000 Cooperatieve Rabobank UA5.25% 14/9/2027Ø
4,059 0.33
£1,550,000 Coventry Building Society 1.5%23/1/2023
1,579 0.13
£1,600,000 Coventry Building Society1.875% 24/10/2023
1,656 0.14
£1,938,000 Coventry Building Society5.875% 28/9/2022
2,149 0.18
£2,075,000 CPI Property 2.75% 22/1/2028 2,001 0.16
£800,000 Credit Agricole 1.25% 2/10/2024 820 0.07
£1,700,000 Credit Agricole 7.375%18/12/2023
2,022 0.16
£3,550,000 Credit Suisse 2.125% 12/9/2025 3,667 0.30
£3,625,000 Credit Suisse 2.25% 9/6/2028 3,737 0.30
£3,220,000 Credit Suisse Funding Guernsey2.75% 8/8/2025
3,443 0.28
£1,775,000 Credit Suisse Funding Guernsey3% 27/5/2022
1,843 0.15
£2,700,000 Crh Finance UK 4.125%2/12/2029
3,250 0.26
Holding orNominalValue Investment
MarketValue
£000’s
% ofTotal
NetAssets
£1,100,000 Daimler International Finance1.25% 5/9/2022
1,101 0.09
£1,575,000 Daimler International Finance1.5% 13/1/2022
1,586 0.13
£1,100,000 Daimler International Finance1.625% 11/11/2024
1,110 0.09
£2,000,000 Daimler International Finance2% 4/9/2023
2,048 0.17
£1,350,000 Daimler International Finance2.125% 7/6/2022
1,375 0.11
£1,500,000 Daimler International Finance2.375% 16/12/2021
1,528 0.12
£4,700,000 Danske Bank 2.25% 14/1/2028 4,786 0.39
£2,100,000 Deutsche Bahn Finance 1.375%7/7/2025Ø
2,179 0.18
£1,650,000 Deutsche Bahn Finance 1.875%13/2/2026Ø
1,758 0.14
£1,066,000 Deutsche Bahn Finance 2.75%20/6/2022
1,110 0.09
£2,400,000 Deutsche Bahn Finance 3.125%24/7/2026
2,739 0.22
£1,000,000 Deutsche Bank 1.75%16/12/2021
1,002 0.08
£3,700,000 Deutsche Bank 2.625%16/12/2024
3,776 0.31
£1,900,000 Deutsche Bank 3.875%12/2/2024
2,015 0.16
£1,000,000 Deutsche Pfandbriefbank 1.75%21/11/2022
1,004 0.08
£1,400,000 Deutsche Telekom InternationalFinance 1.25% 6/10/2023
1,428 0.12
£1,600,000 Deutsche Telekom InternationalFinance 2.25% 13/4/2029Ø
1,706 0.14
£1,775,000 Deutsche Telekom InternationalFinance 2.5% 10/10/2025
1,912 0.16
£2,420,000 Deutsche Telekom InternationalFinance 6.5% 8/4/2022
2,648 0.22
£410,000 Deutsche Telekom InternationalFinance 7.625% 15/6/2030
634 0.05
£2,850,000 Deutsche Telekom InternationalFinance 8.875% 27/11/2028
4,516 0.37
£3,275,000 Diageo Finance 1.75%12/10/2026
3,467 0.28
£950,000 Diageo Finance 2.875%27/3/2029
1,088 0.09
£900,000 Digital Stout 2.75% 19/7/2024 963 0.08
£2,200,000 Digital Stout 3.3% 19/7/2029 2,503 0.20
£1,450,000 Digital Stout 4.25% 17/1/2025 1,650 0.13
£1,000,000 Digital Stout 4.75% 13/10/2023 1,112 0.09
£1,321,000 Direct Line Insurance 9.25%27/4/2042
1,498 0.12
BlackRock Corporate Bond 1-10 Year Fund
Portfolio Statement (unaudited) continued
BlackRock Collective Investment Funds 24
Holding orNominalValue Investment
MarketValue
£000’s
% ofTotal
NetAssets
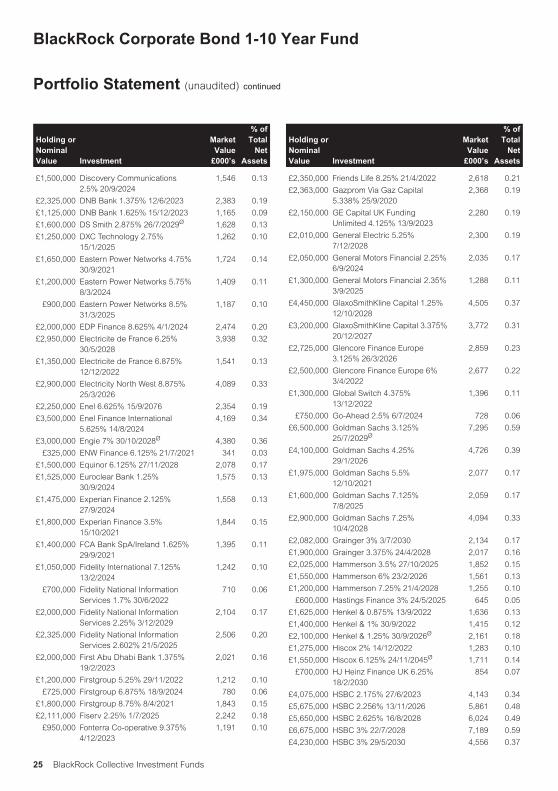
£1,500,000 Discovery Communications2.5% 20/9/2024
1,546 0.13
£2,325,000 DNB Bank 1.375% 12/6/2023 2,383 0.19
£1,125,000 DNB Bank 1.625% 15/12/2023 1,165 0.09
£1,600,000 DS Smith 2.875% 26/7/2029Ø 1,628 0.13
£1,250,000 DXC Technology 2.75%15/1/2025
1,262 0.10
£1,650,000 Eastern Power Networks 4.75%30/9/2021
1,724 0.14
£1,200,000 Eastern Power Networks 5.75%8/3/2024
1,409 0.11
£900,000 Eastern Power Networks 8.5%31/3/2025
1,187 0.10
£2,000,000 EDP Finance 8.625% 4/1/2024 2,474 0.20
£2,950,000 Electricite de France 6.25%30/5/2028
3,938 0.32
£1,350,000 Electricite de France 6.875%12/12/2022
1,541 0.13
£2,900,000 Electricity North West 8.875%25/3/2026
4,089 0.33
£2,250,000 Enel 6.625% 15/9/2076 2,354 0.19
£3,500,000 Enel Finance International5.625% 14/8/2024
4,169 0.34
£3,000,000 Engie 7% 30/10/2028Ø 4,380 0.36
£325,000 ENW Finance 6.125% 21/7/2021 341 0.03
£1,500,000 Equinor 6.125% 27/11/2028 2,078 0.17
£1,525,000 Euroclear Bank 1.25%30/9/2024
1,575 0.13
£1,475,000 Experian Finance 2.125%27/9/2024
1,558 0.13
£1,800,000 Experian Finance 3.5%15/10/2021
1,844 0.15
£1,400,000 FCA Bank SpA/Ireland 1.625%29/9/2021
1,395 0.11
£1,050,000 Fidelity International 7.125%13/2/2024
1,242 0.10
£700,000 Fidelity National InformationServices 1.7% 30/6/2022
710 0.06
£2,000,000 Fidelity National InformationServices 2.25% 3/12/2029
2,104 0.17
£2,325,000 Fidelity National InformationServices 2.602% 21/5/2025
2,506 0.20
£2,000,000 First Abu Dhabi Bank 1.375%19/2/2023
2,021 0.16
£1,200,000 Firstgroup 5.25% 29/11/2022 1,212 0.10
£725,000 Firstgroup 6.875% 18/9/2024 780 0.06
£1,800,000 Firstgroup 8.75% 8/4/2021 1,843 0.15
£2,111,000 Fiserv 2.25% 1/7/2025 2,242 0.18
£950,000 Fonterra Co-operative 9.375%4/12/2023
1,191 0.10
Holding orNominalValue Investment
MarketValue
£000’s
% ofTotal
NetAssets
£2,350,000 Friends Life 8.25% 21/4/2022 2,618 0.21
£2,363,000 Gazprom Via Gaz Capital5.338% 25/9/2020
2,368 0.19
£2,150,000 GE Capital UK FundingUnlimited 4.125% 13/9/2023
2,280 0.19
£2,010,000 General Electric 5.25%7/12/2028
2,300 0.19
£2,050,000 General Motors Financial 2.25%6/9/2024
2,035 0.17
£1,300,000 General Motors Financial 2.35%3/9/2025
1,288 0.11
£4,450,000 GlaxoSmithKline Capital 1.25%12/10/2028
4,505 0.37
£3,200,000 GlaxoSmithKline Capital 3.375%20/12/2027
3,772 0.31
£2,725,000 Glencore Finance Europe3.125% 26/3/2026
2,859 0.23
£2,500,000 Glencore Finance Europe 6%3/4/2022
2,677 0.22
£1,300,000 Global Switch 4.375%13/12/2022
1,396 0.11
£750,000 Go-Ahead 2.5% 6/7/2024 728 0.06
£6,500,000 Goldman Sachs 3.125%25/7/2029Ø
7,295 0.59
£4,100,000 Goldman Sachs 4.25%29/1/2026
4,726 0.39
£1,975,000 Goldman Sachs 5.5%12/10/2021
2,077 0.17
£1,600,000 Goldman Sachs 7.125%7/8/2025
2,059 0.17
£2,900,000 Goldman Sachs 7.25%10/4/2028
4,094 0.33
£2,082,000 Grainger 3% 3/7/2030 2,134 0.17
£1,900,000 Grainger 3.375% 24/4/2028 2,017 0.16
£2,025,000 Hammerson 3.5% 27/10/2025 1,852 0.15
£1,550,000 Hammerson 6% 23/2/2026 1,561 0.13
£1,200,000 Hammerson 7.25% 21/4/2028 1,255 0.10
£600,000 Hastings Finance 3% 24/5/2025 645 0.05
£1,625,000 Henkel & 0.875% 13/9/2022 1,636 0.13
£1,400,000 Henkel & 1% 30/9/2022 1,415 0.12
£2,100,000 Henkel & 1.25% 30/9/2026Ø 2,161 0.18
£1,275,000 Hiscox 2% 14/12/2022 1,283 0.10
£1,550,000 Hiscox 6.125% 24/11/2045Ø 1,711 0.14
£700,000 HJ Heinz Finance UK 6.25%18/2/2030
854 0.07
£4,075,000 HSBC 2.175% 27/6/2023 4,143 0.34
£5,675,000 HSBC 2.256% 13/11/2026 5,861 0.48
£5,650,000 HSBC 2.625% 16/8/2028 6,024 0.49
£6,675,000 HSBC 3% 22/7/2028 7,189 0.59
£4,230,000 HSBC 3% 29/5/2030 4,556 0.37
BlackRock Corporate Bond 1-10 Year Fund
Portfolio Statement (unaudited) continued
BlackRock Collective Investment Funds25

Holding orNominalValue Investment
MarketValue
£000’s
% ofTotal
NetAssets
£3,600,000 HSBC 5.75% 20/12/2027 4,412 0.36
£2,850,000 HSBC 6.5% 20/5/2024 3,381 0.28
£4,100,000 HSBC 6.75% 11/9/2028 5,356 0.44
£1,750,000 HSBC Bank 5.375% 4/11/2030 2,054 0.17
£1,400,000 HSBC Bank 6.5% 7/7/2023 1,594 0.13
£1,900,000 Hutchison Whampoa FinanceUK 5.625% 24/11/2026
2,409 0.20
£1,000,000 Iberdrola Finanzas 6%1/7/2022Ø
1,097 0.09
£2,100,000 Iberdrola Finanzas 7.375%29/1/2024
2,562 0.21
£3,292,000 Imperial Brands Finance 5.5%28/9/2026
3,964 0.32
£1,950,000 Imperial Brands Finance 8.125%15/3/2024
2,388 0.19
£4,150,000 Imperial Brands Finance 9%17/2/2022
4,637 0.38
£2,300,000 Industrial & Commercial Bank ofChina Ltd/London 1.5%31/7/2022
2,322 0.19
£1,725,000 Informa 3.125% 5/7/2026 1,750 0.14
£5,900,000 ING Groep 3% 18/2/2026 6,436 0.52
£2,050,000 innogy Finance 5.5% 6/7/2022 2,230 0.18
£2,150,000 innogy Finance 5.625%6/12/2023
2,484 0.20
£4,300,000 innogy Finance 6.25% 3/6/2030 6,050 0.49
£2,100,000 InterContinental Hotels 2.125%24/8/2026
1,975 0.16
£1,925,000 InterContinental Hotels 3.75%14/8/2025
1,975 0.16
£1,550,000 InterContinental Hotels 3.875%28/11/2022
1,581 0.13
£506,000 Intermediate Capital 5%24/3/2023
527 0.04
£1,400,000 International Business Machines2.625% 5/8/2022
1,459 0.12
£2,000,000 Intesa Sanpaolo 2.5% 15/1/2030 1,998 0.16
£550,000 Intesa Sanpaolo 5.25%28/1/2022
579 0.05
£1,764,000 Investec 4.5% 5/5/2022 1,837 0.15
£1,750,000 Investec Bank 4.25% 24/7/2028 1,746 0.14
£1,400,000 Investec Bank 9.625%17/2/2022
1,531 0.12
£1,850,000 Johnson & Johnson 5.5%6/11/2024
2,238 0.18
£2,350,000 JPMorgan Chase & 3.5%18/12/2026Ø
2,735 0.22
£1,050,000 Just 3.5% 7/2/2025 961 0.08
£1,000,000 Just 8.125% 26/10/2029 1,035 0.08
Holding orNominalValue Investment
MarketValue
£000’s
% ofTotal
NetAssets
£2,300,000 Kennedy Wilson Europe RealEstate 3.95% 30/6/2022
2,246 0.18
£2,300,000 Koninklijke KPN 5% 18/11/2026 2,706 0.22
£4,900,000 Koninklijke KPN 5.75%17/9/2029
6,176 0.50
£2,100,000 Landesbank Baden-Wuerttemberg 1.5% 3/2/2025
2,150 0.18
£825,000 Leeds Building Society 3.75%25/4/2029
853 0.07
£3,275,000 Legal & General 3.75%26/11/2049
3,399 0.28
£2,607,000 Legal & General 5.125%14/11/2048
2,983 0.24
£3,450,000 Legal & General 5.375%27/10/2045
3,954 0.32
£1,050,000 Lendlease Europe Finance6.125% 12/10/2021
1,091 0.09
£1,150,000 Liberty Living Finance 2.625%28/11/2024
1,170 0.10
£2,000,000 Liberty Living Finance 3.375%28/11/2029
2,023 0.16
£1,100,000 Linde Finance 5.875%24/4/2023
1,254 0.10
£1,500,000 Liverpool Victoria FriendlySociety 6.5% 22/5/2043
1,655 0.13
£2,200,000 Lloyds Bank 7.5% 15/4/2024 2,715 0.22
£4,900,000 Lloyds Bank 7.625% 22/4/2025 6,249 0.51
£1,200,000 Lloyds Bank 9.625% 6/4/2023 1,443 0.12
£3,400,000 Lloyds Bank 13% Perpetual21/7/2169Ø
5,831 0.48
£575,000 Lloyds Bank Corporate Markets1.5% 23/6/2023
584 0.05
£1,725,000 Lloyds Bank Corporate Markets1.75% 11/7/2024
1,769 0.14
£3,475,000 Lloyds Banking 1.875%15/1/2026
3,537 0.29
£4,175,000 Lloyds Banking 2.25%16/10/2024
4,352 0.35
£2,350,000 Logicor Financing Sarl 2.75%15/1/2030
2,346 0.19
£1,600,000 London & Quadrant HousingTrust 2.25% 20/7/2029
1,673 0.14
£1,625,000 London & Quadrant HousingTrust 2.625% 5/5/2026
1,724 0.14
£1,675,000 London & Quadrant HousingTrust 2.625% 28/2/2028
1,790 0.15
£1,325,000 London Power Networks 2.625%1/3/2029
1,456 0.12
£1,200,000 London Power Networks 5.125%31/3/2023
1,335 0.11
BlackRock Corporate Bond 1-10 Year Fund
Portfolio Statement (unaudited) continued
BlackRock Collective Investment Funds 26

Holding orNominalValue Investment
MarketValue
£000’s
% ofTotal
NetAssets
£1,750,000 London Power Networks 6.125%7/6/2027Ø
2,297 0.19
£1,475,000 LVMH Moet Hennessy LouisVuitton 1% 14/6/2022
1,487 0.12
£2,900,000 LVMH Moet Hennessy LouisVuitton 1% 11/2/2023
2,929 0.24
£4,800,000 LVMH Moet Hennessy LouisVuitton 1.125% 11/2/2027
4,830 0.39
£1,375,000 M&G 3.875% 20/7/2049 1,444 0.12
£1,515,000 Manchester Airport Funding4.125% 2/4/2024Ø
1,620 0.13
£2,000,000 MassMutual Global Funding II1.375% 15/12/2026
2,071 0.17
£2,600,000 McKesson 3.125% 17/2/2029 2,781 0.23
£1,900,000 MetLife 5.375% 9/12/2024 2,240 0.18
£1,650,000 Metropolitan Life Global FundingI 1.125% 15/12/2021
1,664 0.14
£1,245,000 Metropolitan Life Global FundingI 1.625% 9/6/2022
1,266 0.10
£2,750,000 Metropolitan Life Global FundingI 1.625% 21/9/2029
2,847 0.23
£2,100,000 Metropolitan Life Global FundingI 2.625% 5/12/2022
2,189 0.18
£950,000 Metropolitan Life Global FundingI 2.875% 11/1/2023
998 0.08
£3,100,000 Metropolitan Life Global FundingI 3.5% 30/9/2026
3,570 0.29
£5,900,000 Morgan Stanley 2.625%9/3/2027
6,413 0.52
£2,075,000 Motability Operations 1.75%3/7/2029
2,186 0.18
£2,000,000 Motability Operations 3.75%16/7/2026
2,327 0.19
£1,750,000 Motability Operations 4.375%8/2/2027
2,122 0.17
£1,200,000 Motability Operations 5.375%28/6/2022
1,302 0.11
£1,900,000 MuenchenerRueckversicherungs-Gesellschaft in Muenchen6.625% 26/5/2042
2,076 0.17
£1,000,000 National Australia Bank 1.375%27/6/2022
1,015 0.08
£2,900,000 National Australia Bank 5.125%9/12/2021
3,074 0.25
£1,500,000 National Express 2.375%20/11/2028
1,450 0.12
£1,425,000 National Express 2.5%11/11/2023
1,441 0.12
£1,570,000 National Grid ElectricityTransmission 1.125% 7/7/2028
1,580 0.13
Holding orNominalValue Investment
MarketValue
£000’s
% ofTotal
NetAssets
£2,050,000 National Grid ElectricityTransmission 1.375% 16/9/2026
2,122 0.17
£1,900,000 National Grid ElectricityTransmission 4% 8/6/2027
2,268 0.18
£550,000 National Grid ElectricityTransmission 5.875% 2/2/2024
640 0.05
£1,150,000 National Westminster Bank 6.5%7/9/2021
1,210 0.10
£2,375,000 Nationwide Building Society 1%24/1/2023
2,396 0.20
£100,000 Nationwide Building Society2.25% 29/4/2022
103 0.01
£2,250,000 Nationwide Building Society 3%6/5/2026
2,520 0.21
£2,450,000 Nationwide Building Society3.25% 20/1/2028
2,849 0.23
£4,650,000 Natwest 2.875% 19/9/2026 4,940 0.40
£2,650,000 Natwest 3.125% 28/3/2027 2,853 0.23
£3,975,000 Natwest 3.622% 14/8/2030 4,199 0.34
£700,000 Nestle Finance International2.25% 30/11/2023
745 0.06
£525,000 New York Life Global Funding1% 15/12/2021
529 0.04
£2,675,000 New York Life Global Funding1.25% 17/12/2026
2,755 0.22
£2,725,000 New York Life Global Funding1.625% 15/12/2023
2,817 0.23
£2,950,000 New York Life Global Funding1.75% 15/12/2022
3,034 0.25
£2,025,000 NewRiver REIT 3.5% 7/3/2028 1,779 0.15
£1,275,000 Next 3% 26/8/2025 1,303 0.11
£1,500,000 Next 3.625% 18/5/2028 1,531 0.12
£1,650,000 Next 4.375% 2/10/2026 1,790 0.15
£1,125,000 Next 5.375% 26/10/2021 1,168 0.10
£3,425,000 NGG Finance 5.625% 18/6/2073 3,942 0.32
£1,000,000 NIBC Bank 3.125% 15/11/2023 1,034 0.08
£1,900,000 NIE Finance 2.5% 27/10/2025 2,042 0.17
£2,050,000 NIE Finance 6.375% 2/6/2026 2,657 0.22
£2,005,000 Nordea Bank 2.375% 2/6/2022 2,074 0.17
£1,550,000 Northern Gas Networks Finance4.875% 30/6/2027
1,912 0.16
£1,000,000 Northern Powergrid 7.25%15/12/2022
1,148 0.09
£850,000 Northern Powergrid Yorkshire2.5% 1/4/2025
902 0.07
£1,900,000 Northumbrian Water Finance1.625% 11/10/2026
1,964 0.16
£1,575,000 Northumbrian Water Finance2.375% 5/10/2027
1,699 0.14
BlackRock Corporate Bond 1-10 Year Fund
Portfolio Statement (unaudited) continued
BlackRock Collective Investment Funds27

Holding orNominalValue Investment
MarketValue
£000’s
% ofTotal
NetAssets
£1,450,000 Northumbrian Water Finance6.875% 6/2/2023
1,662 0.14
£1,425,000 Notting Hill Genesis 2.875%31/1/2029
1,539 0.13
£1,375,000 OP Corporate Bank 2.5%20/5/2022
1,425 0.12
£1,550,000 Orange 5.25% 5/12/2025 1,893 0.15
£2,550,000 Orange 5.75% Perpetual1/4/2169
2,792 0.23
£2,200,000 Orange 5.875% Perpetual7/2/2169
2,335 0.19
£2,950,000 Orange 8.125% 20/11/2028 4,503 0.37
£2,375,000 Orsted 2.125% 17/5/2027 2,551 0.21
£1,200,000 Pacific National Finance Pty 5%19/9/2023
1,307 0.11
£1,950,000 Pearson Funding 3.75%4/6/2030
2,089 0.17
£1,525,000 Pension Insurance 6.5%3/7/2024
1,793 0.15
£1,400,000 Pension Insurance 8%23/11/2026
1,826 0.15
£1,750,000 PepsiCo 2.5% 1/11/2022 1,837 0.15
£1,975,000 Phoenix 4.125% 20/7/2022 2,057 0.17
£2,350,000 Phoenix 6.625% 18/12/2025 2,785 0.23
£1,600,000 Places for People Homes3.625% 22/11/2028
1,788 0.15
£2,300,000 Places For People Treasury2.875% 17/8/2026
2,441 0.20
£1,350,000 Principality Building Society2.375% 23/11/2023
1,387 0.11
£1,450,000 Procter & Gamble 1.375%3/5/2025Ø
1,515 0.12
£2,900,000 Procter & Gamble 1.8%3/5/2029
3,144 0.26
£500,000 Procter & Gamble 6.25%31/1/2030
722 0.06
£3,000,000 Prologis LP 2.25% 30/6/2029Ø 3,219 0.26
£1,300,000 Prudential 5.875% 11/5/2029 1,710 0.14
£1,300,000 Prudential 6.875% 20/1/2023 1,483 0.12
£1,461,000 QBE Insurance 6.115%24/5/2042
1,547 0.13
£2,200,000 Quadgas Finance 3.375%17/9/2029
2,312 0.19
£1,000,000 Quilter 4.478% 28/2/2028 1,011 0.08
£1,200,000 RCI Banque 1.875% 8/11/2022 1,193 0.10
£3,000,000 Rio Tinto Finance 4%11/12/2029
3,744 0.31
£2,100,000 Rl Finance Bonds No 3 6.125%13/11/2028
2,564 0.21
Holding orNominalValue Investment
MarketValue
£000’s
% ofTotal
NetAssets
£1,650,000 RL Finance Bonds No. 2 6.125%30/11/2043
1,841 0.15
£4,000,000 Rothesay Life 3.375% 12/7/2026 4,132 0.34
£1,500,000 Rothesay Life 5.5% 17/9/2029 1,639 0.13
£600,000 Rothesay Life 8% 30/10/2025 734 0.06
£2,150,000 Royal Bank of Canada 1.125%15/12/2025
2,170 0.18
£1,350,000 Royal Bank of Canada 1.375%9/12/2024
1,389 0.11
£950,000 RSA Insurance 1.625%28/8/2024
971 0.08
£2,200,000 RSA Insurance 5.125%10/10/2045Ø
2,490 0.20
£2,800,000 Santander UK 2.92% 8/5/2026 2,964 0.24
£1,925,000 Santander UK 3.625%14/1/2026
2,120 0.17
£2,450,000 Santander UK 3.875%15/10/2029
2,950 0.24
£1,150,000 Santander UK 7.037% Perpetual14/2/2169
1,300 0.11
£950,000 Scania 1.875% 28/6/2022 954 0.08
£2,290,000 Scentre Trust 1 3.875%16/7/2026Ø
2,469 0.20
£1,700,000 Scentre Trust 1 / Scentre Trust2 2.375% 8/4/2022
1,713 0.14
£1,750,000 Scotland Gas Networks 3.25%8/3/2027
1,966 0.16
£1,130,000 Scottish Power UK 6.75%29/5/2023
1,317 0.11
£3,650,000 Scottish Widows 5.5% 16/6/2023 4,008 0.33
£2,250,000 Segro 2.375% 11/10/2029Ø 2,432 0.20
£850,000 Severn Trent Utilities Finance1.125% 7/9/2021
855 0.07
£1,350,000 Severn Trent Utilities Finance1.625% 4/12/2022
1,380 0.11
£2,550,000 Severn Trent Utilities Finance3.625% 16/1/2026
2,911 0.24
£800,000 Severn Trent Utilities Finance6.125% 26/2/2024
947 0.08
£2,500,000 Severn Trent Utilities Finance6.25% 7/6/2029
3,547 0.29
£300,000 SiemensFinancieringsmaatschappij0.875% 5/6/2023
303 0.02
£3,100,000 SiemensFinancieringsmaatschappij 1%20/2/2025
3,171 0.26
£2,400,000 SiemensFinancieringsmaatschappij2.75% 10/9/2025
2,668 0.22
BlackRock Corporate Bond 1-10 Year Fund
Portfolio Statement (unaudited) continued
BlackRock Collective Investment Funds 28

Holding orNominalValue Investment
MarketValue
£000’s
% ofTotal
NetAssets
£2,325,000 Skandinaviska Enskilda Banken1.25% 5/8/2022
2,356 0.19
£1,400,000 Sky 4% 26/11/2029 1,736 0.14
£2,200,000 Sky 6% 21/5/2027 2,918 0.24
£1,400,000 Societe Generale 1.875%3/10/2024
1,428 0.12
£1,800,000 Society of Lloyd’s 4.75%30/10/2024
1,930 0.16
£1,650,000 Society of Lloyd’s 4.875%7/2/2047Ø
1,766 0.14
£1,650,000 Sodexo 1.75% 26/6/2028 1,667 0.14
£1,500,000 South Eastern Power Networks5.5% 5/6/2026
1,855 0.15
£3,150,000 Southern Gas Networks 2.5%3/2/2025
3,376 0.28
£700,000 Southern Gas Networks 4.875%5/10/2023
787 0.06
£1,500,000 Southern Gas Networks 4.875%21/3/2029
1,937 0.16
£1,450,000 SP Distribution 5.875%17/7/2026
1,834 0.15
£1,850,000 SP Manweb 4.875% 20/9/2027 2,299 0.19
£1,525,000 SSE 3.625% 16/9/2077 1,559 0.13
£2,775,000 SSE 3.74% Perpetual 14/4/2169 2,886 0.24
£750,000 SSE 4.25% 14/9/2021 778 0.06
£1,500,000 SSE 5.875% 22/9/2022 1,661 0.14
£2,600,000 SSE 8.375% 20/11/2028 3,976 0.32
£2,300,000 Stagecoach 4% 29/9/2025 2,299 0.19
£1,075,000 Svenska Handelsbanken1.625% 18/6/2022
1,098 0.09
£1,400,000 Svenska Handelsbanken1.625% 15/12/2023
1,453 0.12
£2,200,000 Svenska Handelsbanken2.375% 18/1/2022
2,259 0.18
£1,050,000 Svenska Handelsbanken 2.75%5/12/2022
1,105 0.09
£2,000,000 Swedbank 1.25% 29/12/2021 2,022 0.16
£1,650,000 Swedbank 1.625% 28/12/2022 1,695 0.14
£2,700,000 Telefonica Emisiones 5.289%9/12/2022
2,972 0.24
£2,900,000 Telefonica Emisiones 5.375%2/2/2026
3,523 0.29
£2,400,000 Telefonica Emisiones 5.445%8/10/2029
3,156 0.26
£1,674,000 Tesco 6.125% 24/2/2022 1,797 0.15
£1,500,000 Tesco Corporate TreasuryServices 2.5% 2/5/2025
1,587 0.13
£2,650,000 Tesco Corporate TreasuryServices 2.75% 27/4/2030
2,803 0.23
Holding orNominalValue Investment
MarketValue
£000’s
% ofTotal
NetAssets
£1,400,000 Tesco Personal Finance 3.5%25/7/2025
1,464 0.12
£950,000 Total Capital International 1.25%16/12/2024
982 0.08
£2,900,000 Total Capital International 1.66%22/7/2026
3,055 0.25
£1,525,000 Total Capital International 1.75%7/7/2025
1,607 0.13
£1,550,000 Total Capital International 2.25%9/6/2022
1,597 0.13
£900,000 Toyota Finance Australia 1.625%11/7/2022
916 0.07
£2,150,000 Toyota Motor Credit 1%27/9/2022
2,167 0.18
£1,400,000 Toyota Motor FinanceNetherlands 1.375% 23/5/2023
1,427 0.12
£1,675,000 TP ICAP 5.25% 26/1/2024Ø 1,813 0.15
£1,700,000 TP ICAP 5.25% 29/5/2026Ø 1,891 0.15
£2,375,000 Transport for London 2.125%24/4/2025
2,526 0.21
£2,300,000 Transport for London 2.25%9/8/2022
2,370 0.19
£1,300,000 Tritax Big Box REIT 2.625%14/12/2026
1,395 0.11
£1,050,000 Unilever 1.125% 3/2/2022Ø 1,063 0.09
£700,000 Unilever 1.375% 15/9/2024 730 0.06
£3,325,000 Unilever 1.5% 22/7/2026 3,517 0.29
£1,700,000 Unilever 1.875% 15/9/2029Ø 1,858 0.15
£1,525,000 UNITE 3.5% 15/10/2028 1,581 0.13
£1,250,000 United Utilities Water 5.625%20/12/2027
1,659 0.14
£1,575,000 United Utilities Water 5.75%25/3/2022
1,704 0.14
£2,200,000 United Utilities Water Finance2% 14/2/2025
2,327 0.19
£1,682,000 Verizon Communications4.073% 18/6/2024
1,901 0.15
£1,800,000 Vicinity Centres Trust 3.375%7/4/2026
1,885 0.15
£2,400,000 Vinci 2.25% 15/3/2027 2,558 0.21
£950,000 Virgin Money UK 3.125%22/6/2025
947 0.08
£2,150,000 Virgin Money UK 3.375%24/4/2026
2,153 0.18
£2,450,000 Virgin Money UK 4% 25/9/2026 2,524 0.21
£2,100,000 Virgin Money UK 4% 3/9/2027 2,155 0.18
£1,600,000 Vodafone 5.625% 4/12/2025 1,988 0.16
£400,000 Volkswagen Financial Services1.625% 9/6/2022
403 0.03
BlackRock Corporate Bond 1-10 Year Fund
Portfolio Statement (unaudited) continued
BlackRock Collective Investment Funds29

Holding orNominalValue Investment
MarketValue
£000’s
% ofTotal
NetAssets
£1,000,000 Volkswagen Financial Services1.625% 30/11/2022
1,010 0.08
£1,500,000 Volkswagen Financial Services1.625% 10/2/2024
1,516 0.12
£1,250,000 Volkswagen Financial Services1.75% 12/9/2022Ø
1,266 0.10
£1,400,000 Volkswagen Financial Services1.875% 7/9/2021
1,411 0.12
£1,000,000 Volkswagen Financial Services1.875% 3/12/2024
1,016 0.08
£1,600,000 Volkswagen Financial Services2.125% 27/6/2024
1,643 0.13
£2,500,000 Volkswagen Financial Services2.25% 12/4/2025
2,583 0.21
£1,500,000 Volkswagen Financial Services2.75% 10/7/2023
1,566 0.13
£1,800,000 Volkswagen Financial Services4.25% 9/10/2025
2,031 0.17
£2,500,000 Volkswagen InternationalFinance 3.375% 16/11/2026
2,741 0.22
£975,000 Wales & West Utilities Finance4.625% 13/12/2023
1,099 0.09
£850,000 Wales & West Utilities Finance5% 7/3/2028
1,082 0.09
£1,800,000 Wales & West Utilities Finance5.75% 29/3/2030
2,512 0.20
£1,500,000 Walgreens Boots Alliance 3.6%20/11/2025
1,590 0.13
£2,800,000 Wells Fargo 1.375% 30/6/2022 2,827 0.23
£4,300,000 Wells Fargo & 2% 28/7/2025 4,479 0.37
£3,250,000 Wells Fargo & 2.125% 22/4/2022 3,321 0.27
£1,575,000 Wells Fargo & 2.125%20/12/2023
1,634 0.13
£3,225,000 Wells Fargo & 2.5% 2/5/2029 3,438 0.28
£3,300,000 Wells Fargo & 3.5% 12/9/2029 3,785 0.31
£2,700,000 Wells Fargo Bank NA 5.25%1/8/2023
3,033 0.25
£2,900,000 Welltower 4.8% 20/11/2028 3,352 0.27
£1,750,000 Wessex Water Services Finance1.5% 17/9/2029
1,769 0.14
£1,000,000 Wessex Water Services Finance4% 24/9/2021
1,036 0.08
£850,000 Wessex Water Services Finance5.375% 10/3/2028
1,098 0.09
£2,725,000 Western Power Distribution 3.5%16/10/2026
2,998 0.24
£1,800,000 Western Power Distribution3.625% 6/11/2023
1,913 0.16
£2,600,000 Western Power Distribution EastMidlands 5.25% 17/1/2023
2,886 0.24
Holding orNominalValue Investment
MarketValue
£000’s
% ofTotal
NetAssets
£2,250,000 Western Power DistributionSouth West 5.875% 25/3/2027
2,905 0.24
£2,300,000 Western Power Distribution WestMidlands 3.875% 17/10/2024
2,567 0.21
£400,000 Western Power Distribution WestMidlands 6% 9/5/2025
492 0.04
£1,400,000 Westfield America Management2.125% 30/3/2025
1,390 0.11
£2,600,000 Westfield America Management2.625% 30/3/2029
2,574 0.21
£1,500,000 Westpac Banking 2.125%2/5/2025Ø
1,593 0.13
£1,050,000 Westpac Banking 2.625%14/12/2022
1,096 0.09
£2,650,000 Whitbread 3.375% 16/10/2025 2,654 0.22
£1,740,000 Wm Morrison Supermarkets3.5% 27/7/2026
1,962 0.16
£1,250,000 Wm Morrison Supermarkets4.625% 8/12/2023
1,402 0.11
£1,000,000 Wm Morrison Supermarkets4.75% 4/7/2029
1,245 0.10
£1,250,000 Yorkshire Building Society 3%18/4/2025
1,323 0.11
£1,825,000 Yorkshire Building Society3.375% 13/9/2028
1,908 0.16
£2,200,000 Yorkshire Building Society 3.5%21/4/2026
2,467 0.20
£1,250,000 Yorkshire Power Finance 7.25%4/8/2028
1,771 0.14
£1,970,000 Zurich Finance UK 6.625%Perpetual 2/10/2168
2,181 0.18
1,197,164 97.62
UK Sterling Denominated GovernmentBonds − 0.41%; 29.2.2020 0.00%
£1,000,000 Development Bank of Japan1.125% 28/4/2023
1,015 0.08
£3,150,000 Societe Nationale SNCF 5.375%18/3/2027
4,021 0.33
5,036 0.41
COLLECTIVE INVESTMENTSCHEMES − 0.20%; 29.2.2020 0.17%
Short-term Money Market Funds − 0.20%; 29.2.2020 0.17%
23,905 BlackRock ICS Sterling LiquidEnvironmentally Aware Fund -Agency Income Class†
2,391 0.20
BlackRock Corporate Bond 1-10 Year Fund
Portfolio Statement (unaudited) continued
BlackRock Collective Investment Funds 30

Holding orNominalValue Investment
UnderlyingExposure − Derivatives
£000’s
MarketValue
£000’s
% ofTotal
NetAssets
DERIVATIVES − 0.00%; 29.2.2020 0.00%
Futures − 0.00%; 29.2.2020 0.00%
Portfolio of investments 1,204,591 98.23
Net other assets 21,767 1.77
Total net assets 1,226,358 100.00
Unless otherwise stated, all securities are either listed on a recognised exchange or traded on an eligible securities market.Ø All or a portion of this investment represents a security on loan.† Managed by a related party.
BlackRock Corporate Bond 1-10 Year Fund
Portfolio Statement (unaudited) continued
BlackRock Collective Investment Funds31

£000’s31.8.2020
£000’s £000’s31.8.2019
£000’s
Income
Net capital gains 6,041 50,392
Revenue 15,653 16,947
Expenses (443) (459)
Net revenue before taxation 15,210 16,488
Taxation – –
Net revenue after taxation 15,210 16,488
Total return before distributions 21,251 66,880
Distributions (15,210) (16,488)
Change in net assetsattributable to unitholdersfrom investment activities 6,041 50,392
Statement of Change in Net Assets Attributable to Unitholders(unaudited) for the six months ended 31 August 2020
£000’s31.8.2020
£000’s £000’s31.8.2019
£000’s
Opening net assets attributableto unitholders 1,211,364 1,188,243
Amounts receivable on issue of units 160,991 78,014
Amounts payable on cancellation of units (167,041) (85,123)
(6,050) (7,109)
Change in net assets attributable tounitholders from investment activities 6,041 50,392
Retained distribution on accumulation units 15,003 16,309
Closing net assets attributableto unitholders 1,226,358 1,247,835
The above statement shows the comparative closing net assets at 31 August 2019 whereas the current accounting period commenced 1 March 2020.
BlackRock Corporate Bond 1-10 Year Fund
Statement of Total Return (unaudited)
for the six months ended 31 August 2020
BlackRock Collective Investment Funds 32

31.8.2020£000’s
29.2.2020£000’s
Assets:
Fixed assets
− Investment assets 1,204,591 1,195,960
Current assets
− Debtors 24,480 40,372
− Cash and bank balances 658 580
− Cash collateral posted – 91
Total assets 1,229,729 1,237,003
Liabilities:
Investment liabilities – (50)
Creditors
− Other creditors (3,371) (25,589)
Total liabilities (3,371) (25,639)
Net assets attributable to unitholders 1,226,358 1,211,364
G D Bamping (Director)M T Zemek (Director)BlackRock Fund Managers Limited29 October 2020
BlackRock Corporate Bond 1-10 Year Fund
Balance Sheet (unaudited)
at 31 August 2020
BlackRock Collective Investment Funds33

The Fund is a sub-fund of BlackRock Collective Investment Funds, a UCITS scheme under the COLLSourcebook. The Fund was established on 29 June 2012 and was authorised by the FCA on 25 May 2012. TheFund’s FCA product reference number is 645683.
Risk and Reward ProfileLower riskTypically lower rewards
Higher riskTypically higher rewards
Unit Class
A Accumulation 1 2 3 4 5 6 7
L Income 1 2 3 4 5 6 7
L Accumulation 1 2 3 4 5 6 7
X Income 1 2 3 4 5 6 7
X Accumulation 1 2 3 4 5 6 7
D Accumulation 1 2 3 4 5 6 7
• The risk indicator was calculated incorporating simulated historical data and may not be a reliable indicationof the future risk profile of the Fund.
• The risk category shown is not guaranteed and may change over time.
• The lowest category does not mean risk free.
• The use of derivatives will impact the value of the Fund and may expose the Fund to a higher degree of risk.Derivatives are highly sensitive to changes in the value of the asset on which they are based and can increasethe size of losses and gains, resulting in greater fluctuations in the value of the Fund. The impact to the Fundcan be greater where derivatives are used in an extensive or complex way.
For more information on this, please see the Fund’s Key Investor Information Documents (“KIIDs”), which areavailable at www.blackrock.com.
iShares 100 UK Equity Index Fund (UK)
About the Fund
BlackRock Collective Investment Funds 34

Net Asset Value
At 31 August 2020 Units in IssueNet Asset Value
£000’s
Net Asset Valueper Unit
p
A Accumulation 614,815 865 140.7
L Income 804,460 662 82.34
L Accumulation 58,420,893 83,589 143.1
X Income 2,568,642 2,768 107.8
X Accumulation 494,735,138 719,247 145.4
D Accumulation 316,571,964 461,610 145.8
Distributions Payable for the period to 31 August 2020
Unit Class Distribution payable on 31.10.2020
Pence per Unit
A Accumulation 2.4471
L Income 2.0846
L Accumulation 2.6987
X Income 2.1760
X Accumulation 2.8794
D Accumulation 2.8522
Operating Charges
Unit Class1.3.2020
to 31.8.20201.3.2019
to 29.2.2020
A Accumulation 0.51% 0.51%
L Income 0.21% 0.21%
L Accumulation 0.21% 0.21%
X Income 0.01% 0.01%
X Accumulation 0.01% 0.01%
D Accumulation 0.07% 0.07%
Operating charges are annualised and exclude portfolio trade-related costs, except costs paid to the custodian/depositary and entry/exit charges paid to an underlyingcollective investment scheme (if any).
iShares 100 UK Equity Index Fund (UK)
Performance Record
BlackRock Collective Investment Funds35

Holding orNominalValue Investment
MarketValue
£000’s
% ofTotal
NetAssets
EQUITIES − 96.82%; 29.2.2020 97.62%
AUSTRALIA − 2.29%; 29.2.2020 1.75%
Mining − 2.29%; 29.2.2020 1.75%
1,697,563 BHP 29,069 2.29
CHILE − 0.25%; 29.2.2020 0.16%
Mining − 0.25%; 29.2.2020 0.16%
289,835 Antofagasta 3,110 0.25
CYPRUS − 0.44%; 29.2.2020 0.22%
Mining − 0.44%; 29.2.2020 0.22%
275,450 Polymetal International 5,583 0.44
CZECH REPUBLIC − 0.19%; 29.2.2020 0.00%
Computers − 0.19%; 29.2.2020 0.00%
450,446 Avast 2,412 0.19
GERMANY − 0.00%; 29.2.2020 0.16%
Leisure Time − 0.00%; 29.2.2020 0.16%
IRELAND − 4.84%; 29.2.2020 3.70%
Building Materials − 1.43%; 29.2.2020 1.24%
643,389 CRH 18,201 1.43
Commercial Services − 1.63%; 29.2.2020 1.39%
739,710 Experian 20,638 1.63
Entertainment − 0.95%; 29.2.2020 0.38%
97,423 Flutter Entertainment 12,056 0.95
Forest Products & Paper − 0.41%; 29.2.2020 0.37%
194,307 Smurfit Kappa 5,196 0.41
Oil & Gas Producers − 0.42%; 29.2.2020 0.32%
80,107 DCC 5,308 0.42
ISLE OF MAN − 0.30%; 29.2.2020 0.00%
Entertainment − 0.30%; 29.2.2020 0.00%
475,317 GVC 3,821 0.30
JORDAN − 0.26%; 29.2.2020 0.15%
Pharmaceuticals − 0.26%; 29.2.2020 0.15%
137,675 Hikma Pharmaceuticals 3,263 0.26
MEXICO − 0.14%; 29.2.2020 0.00%
Mining − 0.14%; 29.2.2020 0.00%
145,480 Fresnillo 1,837 0.14
Holding orNominalValue Investment
MarketValue
£000’s
% ofTotal
NetAssets
NETHERLANDS − 6.10%; 29.2.2020 8.30%
Food Producers − 0.64%; 29.2.2020 0.44%
96,729 Just Eat Takeaway.com 8,137 0.64
Oil & Gas Producers − 5.46%; 29.2.2020 7.86%
3,352,042 Royal Dutch Shell 37,100 2.92
3,031,200 Royal Dutch Shell 32,222 2.54
69,322 5.46
RUSSIA − 0.00%; 29.2.2020 0.11%
Iron & Steel − 0.00%; 29.2.2020 0.11%
SWITZERLAND − 1.43%; 29.2.2020 1.53%
Beverages − 0.25%; 29.2.2020 0.29%
159,406 Coca-Cola HBC 3,179 0.25
Mining − 1.18%; 29.2.2020 1.24%
8,824,028 Glencore 14,928 1.18
UNITED ARAB EMIRATES − 0.00%; 29.2.2020 0.06%
Healthcare Services − 0.00%; 29.2.2020 0.06%
UNITED KINGDOM − 80.58%; 29.2.2020 81.26%
Advertising − 0.49%; 29.2.2020 0.55%
965,422 WPP 6,233 0.49
Aerospace & Defence − 1.35%; 29.2.2020 2.03%
2,634,606 BAE Systems 13,689 1.08
1,414,386 Rolls-RoyceØ 3,410 0.27
17,099 1.35
Agriculture − 4.48%; 29.2.2020 5.03%
1,865,754 British American Tobacco 47,241 3.72
768,378 Imperial Brands 9,628 0.76
56,869 4.48
Airlines − 0.21%; 29.2.2020 0.58%
1,220,399 International ConsolidatedAirlinesØ
2,637 0.21
Apparel − 0.38%; 29.2.2020 0.40%
330,604 BurberryØ 4,776 0.38
Banks − 7.85%; 29.2.2020 11.27%
14,169,175 Barclays 15,833 1.25
16,654,354 HSBC 54,976 4.33
57,660,937 Lloyds Banking 16,347 1.29
3,699,969 Natwest 4,172 0.33
2,112,139 Standard Chartered 8,286 0.65
99,614 7.85
iShares 100 UK Equity Index Fund (UK)
Portfolio Statement (unaudited)
at 31 August 2020
BlackRock Collective Investment Funds 36

Holding orNominalValue Investment
MarketValue
£000’s
% ofTotal
NetAssets
Beverages − 3.71%; 29.2.2020 3.78%
1,874,949 Diageo 47,052 3.71
Chemicals − 0.76%; 29.2.2020 0.62%
101,150 Croda International 5,966 0.47
155,921 Johnson Matthey 3,703 0.29
9,669 0.76
Commercial Services − 4.03%; 29.2.2020 3.77%
366,025 Ashtead 9,531 0.75
132,162 Intertek 7,763 0.61
1,517,322 RELX 25,832 2.04
1,511,028 Rentokil Initial 8,048 0.63
51,174 4.03
Cosmetics & Personal Care − 3.13%; 29.2.2020 2.69%
891,012 UnileverØ 39,739 3.13
Distribution & Wholesale − 1.58%; 29.2.2020 1.27%
273,937 Bunzl 6,635 0.52
182,964 Ferguson 13,495 1.06
20,130 1.58
Diversified Financial Services − 3.03%; 29.2.2020 2.58%
293,968 Hargreaves LansdownØ 4,750 0.37
256,750 London Stock Exchange 22,594 1.78
90,594 Schroders 2,625 0.21
427,022 St James’s Place 4,181 0.33
1,843,542 Standard Life AberdeenØ 4,371 0.34
38,521 3.03
Electricity − 0.85%; 29.2.2020 0.93%
853,496 SSE 10,745 0.85
Electronics − 0.54%; 29.2.2020 0.44%
310,034 Halma 6,873 0.54
Engineering & Construction − 0.23%; 29.2.2020 0.00%
225,375 HomeServe 2,928 0.23
Food Producers − 3.01%; 29.2.2020 2.48%
287,031 Associated British Foods 5,870 0.46
1,309,940 J SainsburyØ 2,407 0.19
371,583 OcadoØ 9,275 0.73
7,887,269 Tesco 17,242 1.36
1,812,607 Wm Morrison Supermarkets 3,486 0.27
38,280 3.01
Food Services − 1.41%; 29.2.2020 1.60%
1,460,795 Compass 17,829 1.41
Holding orNominalValue Investment
MarketValue
£000’s
% ofTotal
NetAssets
Forest Products & Paper − 0.46%; 29.2.2020 0.45%
398,949 Mondi 5,827 0.46
Gas − 1.90%; 29.2.2020 2.27%
2,863,717 National Grid 24,141 1.90
Healthcare Products − 0.86%; 29.2.2020 0.91%
712,887 Smith & Nephew 10,847 0.86
Home Builders − 1.50%; 29.2.2020 1.71%
821,161 Barratt Developments 4,311 0.34
95,325 Berkeley 4,346 0.34
258,152 Persimmon 6,764 0.53
2,963,927 Taylor Wimpey 3,629 0.29
19,050 1.50
Household Products − 3.05%; 29.2.2020 2.14%
515,522 Reckitt Benckiser 38,705 3.05
Insurance − 4.78%; 29.2.2020 4.79%
167,842 AdmiralØ 4,426 0.35
3,183,618 Aviva 9,000 0.71
4,824,858 Legal & General 10,484 0.83
2,142,297 M&G 3,705 0.29
441,322 Phoenix 3,054 0.24
2,138,257 Prudential 26,119 2.06
845,879 RSA Insurance 3,801 0.30
60,589 4.78
Internet − 0.69%; 29.2.2020 0.61%
773,404 Auto Trader 4,354 0.34
700,422 Rightmove 4,439 0.35
8,793 0.69
Investment Companies − 0.31%; 29.2.2020 0.60%
3,919,020 Melrose Industries 3,990 0.31
Iron & Steel − 0.12%; 29.2.2020 0.00%
480,949 Evraz 1,559 0.12
Lodging − 0.85%; 29.2.2020 0.78%
148,292 InterContinental HotelsØ 6,532 0.52
164,180 WhitbreadØ 4,150 0.33
10,682 0.85
Machinery Diversified − 0.49%; 29.2.2020 0.37%
60,560 Spirax-Sarco EngineeringØ 6,201 0.49
Media − 0.82%; 29.2.2020 1.02%
1,218,008 Informa 5,034 0.40
3,054,890 ITV 1,855 0.15
iShares 100 UK Equity Index Fund (UK)
Portfolio Statement (unaudited) continued
BlackRock Collective Investment Funds37

Holding orNominalValue Investment
MarketValue
£000’s
% ofTotal
NetAssets
615,006 Pearson 3,439 0.27
10,328 0.82
Mining − 4.69%; 29.2.2020 3.69%
1,004,687 Anglo American 18,410 1.45
887,387 Rio Tinto 41,126 3.24
59,536 4.69
Miscellaneous Manufacturing − 0.36%; 29.2.2020 0.36%
322,657 Smiths 4,524 0.36
Oil & Gas Producers − 3.38%; 29.2.2020 4.68%
16,211,193 BP 42,830 3.38
Packaging & Containers − 0.21%; 29.2.2020 0.24%
1,045,823 DS Smith 2,706 0.21
Pharmaceuticals − 11.72%; 29.2.2020 9.84%
1,073,126 AstraZeneca 89,477 7.05
4,029,177 GlaxoSmithKline 59,309 4.67
148,786 11.72
Private Equity − 0.83%; 29.2.2020 0.57%
782,922 3i 7,344 0.58
229,955 Intermediate Capital 3,143 0.25
10,487 0.83
Real Estate Investment Trusts − 1.21%; 29.2.2020 1.15%
746,647 British Land 2,730 0.22
580,486 Land 3,356 0.26
974,881 Segro 9,287 0.73
15,373 1.21
Holding orNominalValue Investment
MarketValue
£000’s
% ofTotal
NetAssets
Retail − 1.07%; 29.2.2020 0.85%
359,454 JD Sports Fashion 2,601 0.21
1,730,641 Kingfisher 4,676 0.37
103,878 Next 6,272 0.49
13,549 1.07
Software − 0.73%; 29.2.2020 0.60%
51,407 Aveva 2,607 0.21
887,405 Sage 6,572 0.52
9,179 0.73
Telecommunications − 2.51%; 29.2.2020 2.88%
7,114,625 BT 7,445 0.59
21,876,308 VodafoneØ 24,379 1.92
31,824 2.51
Water − 1.00%; 29.2.2020 0.73%
342,072 Pennon 3,440 0.27
193,510 Severn Trent 4,509 0.36
564,992 United Utilities 4,696 0.37
12,645 1.00
UNITED STATES OF AMERICA − 0.00%; 29.2.2020 0.22%
Leisure Time − 0.00%; 29.2.2020 0.22%
COLLECTIVE INVESTMENTSCHEMES − 0.90%; 29.2.2020 0.48%
Investment Trusts − 0.90%; 29.2.2020 0.48%
1,191,088 Scottish Mortgage InvestmentTrust
11,446 0.90
iShares 100 UK Equity Index Fund (UK)
Portfolio Statement (unaudited) continued
BlackRock Collective Investment Funds 38

Holding orNominalValue Investment
UnderlyingExposure − Derivatives
£000’s
MarketValue
£000’s
% ofTotal
NetAssets
DERIVATIVES − (0.06%); 29.2.2020 (0.22%)
Forward Currency Contracts − 0.00%; 29.2.2020 0.00%
£1,309,685 UK sterling vs US dollar 1,277 33 0.00
Futures − (0.06%); 29.2.2020 (0.22%)
474 FTSE 100 Index September 2020 28,257 (853) (0.06)
Portfolio of investments 1,239,005 97.66
CASH EQUIVALENTS
Short-term Money Market Funds − 1.17%; 29.2.2020 0.89%
14,885,995 BlackRock ICS Sterling Liquidity Fund - Agency Income Class† 14,886 1.17
Net other assets 14,850 1.17
Total net assets 1,268,741 100.00
Unless otherwise stated, all securities are either listed on a recognised exchange or traded on an eligible securities market.
Underlying exposure has been calculated according to the guidelines issued by the European Securities and Markets Authority (“ESMA”) and represents the market value of an equivalent positionin the assets underlying each financial derivative instrument.
The counterparty for the forward currency contracts is State Street Global Advisors Limited.Ø All or a portion of this investment represents a security on loan.† Managed by a related party.
iShares 100 UK Equity Index Fund (UK)
Portfolio Statement (unaudited) continued
BlackRock Collective Investment Funds39

£000’s31.8.2020
£000’s £000’s31.8.2019
£000’s
Income
Net capital (losses)/gains (128,486) 21,389
Revenue 25,114 39,932
Expenses (283) (325)
Net revenue before taxation 24,831 39,607
Taxation (77) (286)
Net revenue after taxation 24,754 39,321
Total return before distributions (103,732) 60,710
Distributions (24,677) (39,321)
Change in net assetsattributable to unitholdersfrom investment activities (128,409) 21,389
Statement of Change in Net Assets Attributable to Unitholders(unaudited) for the six months ended 31 August 2020
£000’s31.8.2020
£000’s £000’s31.8.2019
£000’s
Opening net assets attributableto unitholders 1,323,949 1,323,187
Amounts receivable on issue of units 126,599 171,274
Amounts payable on cancellation of units (78,264) (96,273)
48,335 75,001
Change in net assets attributable tounitholders from investment activities (128,409) 21,389
Retained distribution on accumulation units 24,866 39,021
Closing net assets attributableto unitholders 1,268,741 1,458,598
The above statement shows the comparative closing net assets at 31 August 2019 whereas the current accounting period commenced 1 March 2020.
iShares 100 UK Equity Index Fund (UK)
Statement of Total Return (unaudited)
for the six months ended 31 August 2020
BlackRock Collective Investment Funds 40

31.8.2020£000’s
29.2.2020£000’s
Assets:
Fixed assets
− Investment assets 1,239,858 1,298,827
Current assets
− Debtors 10,796 14,363
− Cash and bank balances 1,584 5,126
− Cash collateral posted 3,112 1,005
− Cash equivalents 14,886 11,840
Total assets 1,270,236 1,331,161
Liabilities:
Investment liabilities (853) (3,004)
Creditors
− Distributions payable (73) (62)
− Other creditors (569) (4,146)
Total liabilities (1,495) (7,212)
Net assets attributable to unitholders 1,268,741 1,323,949
G D Bamping (Director)M T Zemek (Director)BlackRock Fund Managers Limited29 October 2020
iShares 100 UK Equity Index Fund (UK)
Balance Sheet (unaudited)
at 31 August 2020
BlackRock Collective Investment Funds41

The Fund is a sub-fund of BlackRock Collective Investment Funds, a UCITS scheme under the COLLSourcebook. The Fund was established on 30 September 2013 and was authorised by the FCA on 6 September2013. The Fund’s FCA product reference number is 645684.
Risk and Reward ProfileLower riskTypically lower rewards
Higher riskTypically higher rewards
Unit Class
A Accumulation 1 2 3 4 5 6 7
L Income 1 2 3 4 5 6 7
L Accumulation 1 2 3 4 5 6 7
X Income 1 2 3 4 5 6 7
X Accumulation 1 2 3 4 5 6 7
D Accumulation 1 2 3 4 5 6 7
• The risk indicator was calculated incorporating simulated historical data and may not be a reliable indicationof the future risk profile of the Fund.
• The risk category shown is not guaranteed and may change over time.
• The lowest category does not mean risk free.
• The use of derivatives will impact the value of the Fund and may expose the Fund to a higher degree of risk.Derivatives are highly sensitive to changes in the value of the asset on which they are based and can increasethe size of losses and gains, resulting in greater fluctuations in the value of the Fund. The impact to the Fundcan be greater where derivatives are used in an extensive or complex way.
For more information on this, please see the Fund’s Key Investor Information Documents (“KIIDs”), which areavailable at www.blackrock.com.
iShares 350 UK Equity Index Fund (UK)
About the Fund
BlackRock Collective Investment Funds 42

Net Asset Value
At 31 August 2020 Units in IssueNet Asset Value
£000’s
Net Asset Valueper Unit
p
A Accumulation 183,193 223 121.8
L Income 917,741,846 884,023 96.33
L Accumulation 100 – 126.0
X Income 2,960,696 2,855 96.43
X Accumulation 100 – 123.9
D Accumulation 4,615,789 5,689 123.3
Distributions Payable for the period to 31 August 2020
Unit Class Distribution payable on 31.10.2020
Pence per Unit
A Accumulation 1.9395
L Income 1.7053
L Accumulation 2.4000
X Income 1.8016
X Accumulation 2.3000
D Accumulation 2.1752
Operating Charges
Unit Class1.3.2020
to 31.8.20201.3.2019
to 29.2.2020
A Accumulation 0.51% 0.51%
L Income 0.21% 0.21%
L Accumulation 0.20% 0.20%
X Income 0.01% 0.01%
X Accumulation 0.01% 0.01%
D Accumulation 0.16% 0.16%
Operating charges are annualised and exclude portfolio trade-related costs, except costs paid to the custodian/depositary and entry/exit charges paid to an underlyingcollective investment scheme (if any).
iShares 350 UK Equity Index Fund (UK)
Performance Record
BlackRock Collective Investment Funds43
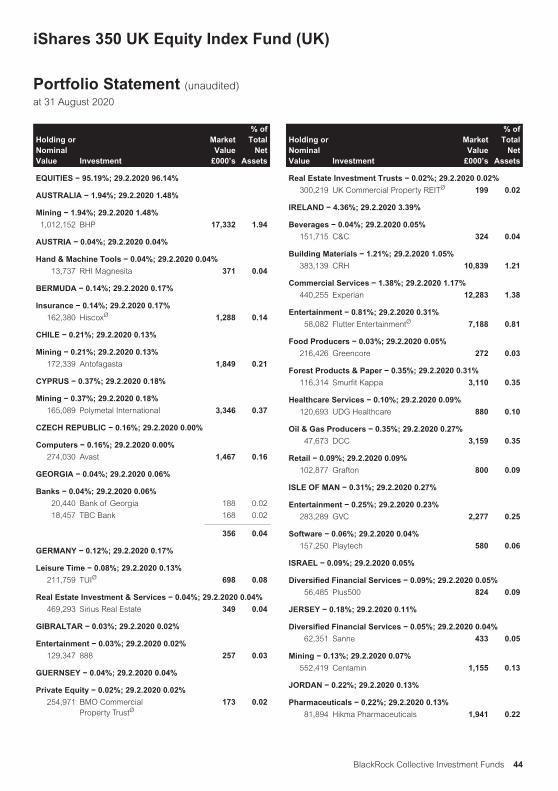
Holding orNominalValue Investment
MarketValue
£000’s
% ofTotal
NetAssets
EQUITIES − 95.19%; 29.2.2020 96.14%
AUSTRALIA − 1.94%; 29.2.2020 1.48%
Mining − 1.94%; 29.2.2020 1.48%
1,012,152 BHP 17,332 1.94
AUSTRIA − 0.04%; 29.2.2020 0.04%
Hand & Machine Tools − 0.04%; 29.2.2020 0.04%
13,737 RHI Magnesita 371 0.04
BERMUDA − 0.14%; 29.2.2020 0.17%
Insurance − 0.14%; 29.2.2020 0.17%
162,380 HiscoxØ 1,288 0.14
CHILE − 0.21%; 29.2.2020 0.13%
Mining − 0.21%; 29.2.2020 0.13%
172,339 Antofagasta 1,849 0.21
CYPRUS − 0.37%; 29.2.2020 0.18%
Mining − 0.37%; 29.2.2020 0.18%
165,089 Polymetal International 3,346 0.37
CZECH REPUBLIC − 0.16%; 29.2.2020 0.00%
Computers − 0.16%; 29.2.2020 0.00%
274,030 Avast 1,467 0.16
GEORGIA − 0.04%; 29.2.2020 0.06%
Banks − 0.04%; 29.2.2020 0.06%
20,440 Bank of Georgia 188 0.02
18,457 TBC Bank 168 0.02
356 0.04
GERMANY − 0.12%; 29.2.2020 0.17%
Leisure Time − 0.08%; 29.2.2020 0.13%
211,759 TUIØ 698 0.08
Real Estate Investment & Services − 0.04%; 29.2.2020 0.04%
469,293 Sirius Real Estate 349 0.04
GIBRALTAR − 0.03%; 29.2.2020 0.02%
Entertainment − 0.03%; 29.2.2020 0.02%
129,347 888 257 0.03
GUERNSEY − 0.04%; 29.2.2020 0.04%
Private Equity − 0.02%; 29.2.2020 0.02%
254,971 BMO CommercialProperty TrustØ
173 0.02
Holding orNominalValue Investment
MarketValue
£000’s
% ofTotal
NetAssets
Real Estate Investment Trusts − 0.02%; 29.2.2020 0.02%
300,219 UK Commercial Property REITØ 199 0.02
IRELAND − 4.36%; 29.2.2020 3.39%
Beverages − 0.04%; 29.2.2020 0.05%
151,715 C&C 324 0.04
Building Materials − 1.21%; 29.2.2020 1.05%
383,139 CRH 10,839 1.21
Commercial Services − 1.38%; 29.2.2020 1.17%
440,255 Experian 12,283 1.38
Entertainment − 0.81%; 29.2.2020 0.31%
58,082 Flutter EntertainmentØ 7,188 0.81
Food Producers − 0.03%; 29.2.2020 0.05%
216,426 Greencore 272 0.03
Forest Products & Paper − 0.35%; 29.2.2020 0.31%
116,314 Smurfit Kappa 3,110 0.35
Healthcare Services − 0.10%; 29.2.2020 0.09%
120,693 UDG Healthcare 880 0.10
Oil & Gas Producers − 0.35%; 29.2.2020 0.27%
47,673 DCC 3,159 0.35
Retail − 0.09%; 29.2.2020 0.09%
102,877 Grafton 800 0.09
ISLE OF MAN − 0.31%; 29.2.2020 0.27%
Entertainment − 0.25%; 29.2.2020 0.23%
283,289 GVC 2,277 0.25
Software − 0.06%; 29.2.2020 0.04%
157,250 Playtech 580 0.06
ISRAEL − 0.09%; 29.2.2020 0.05%
Diversified Financial Services − 0.09%; 29.2.2020 0.05%
56,485 Plus500 824 0.09
JERSEY − 0.18%; 29.2.2020 0.11%
Diversified Financial Services − 0.05%; 29.2.2020 0.04%
62,351 Sanne 433 0.05
Mining − 0.13%; 29.2.2020 0.07%
552,419 Centamin 1,155 0.13
JORDAN − 0.22%; 29.2.2020 0.13%
Pharmaceuticals − 0.22%; 29.2.2020 0.13%
81,894 Hikma Pharmaceuticals 1,941 0.22
iShares 350 UK Equity Index Fund (UK)
Portfolio Statement (unaudited)
at 31 August 2020
BlackRock Collective Investment Funds 44

Holding orNominalValue Investment
MarketValue
£000’s
% ofTotal
NetAssets
MEXICO − 0.13%; 29.2.2020 0.06%
Mining − 0.13%; 29.2.2020 0.06%
93,729 Fresnillo 1,183 0.13
NETHERLANDS − 5.18%; 29.2.2020 7.00%
Food Producers − 0.54%; 29.2.2020 0.37%
57,290 Just Eat Takeaway.com 4,819 0.54
Lodging − 0.01%; 29.2.2020 0.02%
11,206 PPHE HotelØ 126 0.01
Oil & Gas Producers − 4.63%; 29.2.2020 6.61%
2,001,764 Royal Dutch Shell 22,156 2.48
1,808,721 Royal Dutch Shell 19,227 2.15
41,383 4.63
PERU − 0.03%; 29.2.2020 0.02%
Mining − 0.03%; 29.2.2020 0.02%
103,262 Hochschild Mining 248 0.03
RUSSIA − 0.05%; 29.2.2020 0.09%
Iron & Steel − 0.00%; 29.2.2020 0.09%
Mining − 0.05%; 29.2.2020 0.00%
1,197,554 Petropavlovsk 438 0.05
SINGAPORE − 0.04%; 29.2.2020 0.00%
Electricity − 0.04%; 29.2.2020 0.00%
7,171 XP PowerØ 322 0.04
SOUTH AFRICA − 0.10%; 29.2.2020 0.19%
Banks − 0.05%; 29.2.2020 0.13%
319,562 InvestecØ 471 0.05
Healthcare Services − 0.05%; 29.2.2020 0.06%
184,635 Mediclinic International 480 0.05
SWITZERLAND − 1.50%; 29.2.2020 1.54%
Airlines − 0.15%; 29.2.2020 0.12%
33,342 Wizz Air 1,296 0.15
Beverages − 0.21%; 29.2.2020 0.24%
94,038 Coca-Cola HBC 1,875 0.21
Commercial Services − 0.12%; 29.2.2020 0.12%
368,869 IWGØ 1,039 0.12
Iron & Steel − 0.03%; 29.2.2020 0.02%
146,249 Ferrexpo 270 0.03
Mining − 0.99%; 29.2.2020 1.04%
5,251,272 Glencore 8,884 0.99
Holding orNominalValue Investment
MarketValue
£000’s
% ofTotal
NetAssets
UNITED ARAB EMIRATES − 0.09%; 29.2.2020 0.18%
Diversified Financial Services − 0.09%; 29.2.2020 0.12%
217,607 Network InternationalØ 815 0.09
Healthcare Services − 0.00%; 29.2.2020 0.06%
UNITED KINGDOM − 79.72%; 29.2.2020 80.61%
Advertising − 0.49%; 29.2.2020 0.53%
196,971 AscentialØ 615 0.07
582,066 WPP 3,758 0.42
4,373 0.49
Aerospace & Defence − 1.37%; 29.2.2020 1.77%
1,567,272 BAE Systems 8,144 0.91
135,048 Chemring 327 0.04
373,953 Meggitt 1,088 0.12
830,783 Rolls-RoyceØ 2,003 0.22
32,515 Ultra Electronics 757 0.08
12,319 1.37
Agriculture − 3.92%; 29.2.2020 4.34%
1,112,376 British American Tobacco 28,165 3.15
30,549 Genus 1,030 0.12
460,561 Imperial Brands 5,771 0.65
34,966 3.92
Airlines − 0.25%; 29.2.2020 0.50%
119,246 easyJet 755 0.08
720,963 International Consolidated Airlines 1,558 0.17
2,313 0.25
Alternative Energy Sources − 0.08%; 29.2.2020 0.08%
247,903 John LaingØ 707 0.08
Apparel − 0.31%; 29.2.2020 0.34%
193,543 Burberry 2,796 0.31
Automobile Manufacturers − 0.02%; 29.2.2020 0.01%
293,177 Aston Martin Lagonda GlobalØ 164 0.02
Automobile Parts & Equipment − 0.02%; 29.2.2020 0.02%
113,224 TI Fluid Systems 178 0.02
Banks − 6.77%; 29.2.2020 9.63%
8,421,766 Barclays 9,410 1.05
9,929,449 HSBC 32,777 3.67
34,289,850 Lloyds Banking 9,721 1.09
2,222,510 Natwest 2,506 0.28
115,330 Paragon Banking 410 0.05
1,270,420 Standard Chartered 4,984 0.56
iShares 350 UK Equity Index Fund (UK)
Portfolio Statement (unaudited) continued
BlackRock Collective Investment Funds45

Holding orNominalValue Investment
MarketValue
£000’s
% ofTotal
NetAssets
625,432 Virgin Money UKØ 583 0.07
60,391 6.77
Beverages − 3.29%; 29.2.2020 3.36%
48,114 Barr 204 0.02
131,736 Britvic 1,116 0.12
1,119,974 Diageo 28,106 3.15
29,426 3.29
Biotechnology − 0.03%; 29.2.2020 0.00%
27,849 Oxford BiomedicaØ 235 0.03
Building Materials − 0.15%; 29.2.2020 0.17%
192,966 Ibstock 298 0.03
93,113 Marshalls 590 0.07
96,732 PolypipeØ 421 0.05
1,309 0.15
Chemicals − 0.79%; 29.2.2020 0.68%
60,977 Croda International 3,596 0.40
93,328 Johnson Matthey 2,217 0.25
144,842 Synthomer 454 0.05
39,527 Victrex 763 0.09
7,030 0.79
Commercial Services − 4.09%; 29.2.2020 4.03%
13,884 4imprint 301 0.03
121,929 Aggreko 582 0.07
216,402 Ashtead 5,635 0.63
249,503 Babcock International 679 0.08
66,572 Calisen 117 0.01
830,837 CapitaØ 257 0.03
149,537 Equiniti 170 0.02
87,487 Finablr1 1 0.00
751,333 G4S 1,078 0.12
752,918 Hays 908 0.10
78,948 IntertekØ 4,637 0.52
154,937 PagegroupØ 597 0.07
259,251 QinetiQ 756 0.08
905,493 RELX 15,416 1.73
905,517 Rentokil InitialØ 4,823 0.54
62,411 Savills 509 0.06
36,466 4.09
Computers − 0.35%; 29.2.2020 0.47%
36,780 Computacenter 743 0.08
43,635 FDM 455 0.05
29,105 KainosØ 325 0.04
605,370 Serco 848 0.09
Holding orNominalValue Investment
MarketValue
£000’s
% ofTotal
NetAssets
60,087 SoftcatØ 831 0.09
3,202 0.35
Cosmetics & Personal Care − 2.68%; 29.2.2020 2.29%
94,085 PZ CussonsØ 194 0.02
531,994 Unilever 23,727 2.66
23,921 2.68
Distribution & Wholesale − 1.75%; 29.2.2020 1.50%
164,549 BunzlØ 3,985 0.45
53,376 Diploma 1,030 0.12
109,500 Ferguson 8,077 0.90
194,101 Inchcape 981 0.11
125,029 Travis Perkins 1,537 0.17
15,610 1.75
Diversified Financial Services − 3.76%; 29.2.2020 3.24%
128,337 AJ BellØ 576 0.06
227,657 AshmoreØ 959 0.11
154,798 Brewin Dolphin 385 0.04
74,103 Close Brothers 831 0.09
174,110 Hargreaves LansdownØ 2,814 0.32
180,592 IG 1,426 0.16
126,470 IntegraFin 679 0.08
202,253 Jupiter Fund Management 424 0.05
25,865 Liontrust Asset Management 328 0.04
153,686 London Stock Exchange 13,524 1.51
750,029 Man 919 0.10
159,781 Ninety One 352 0.04
177,178 OneSavings Bank 537 0.06
32,717 PayPoint 206 0.02
131,318 Provident FinancialØ 323 0.04
877,248 QuilterØ 1,255 0.14
27,503 Rathbone Brothers 464 0.05
55,137 Schroders 1,598 0.18
257,829 St James’s Place 2,524 0.28
1,126,508 Standard Life Aberdeen 2,671 0.30
270,585 TP ICAP 823 0.09
33,618 3.76
Electricity − 0.80%; 29.2.2020 0.85%
65,534 ContourGlobal 137 0.02
181,501 Drax 508 0.06
508,576 SSE 6,403 0.72
7,048 0.80
Electronics − 1.06%; 29.2.2020 0.87%
212,595 Electrocomponents 1,444 0.16
iShares 350 UK Equity Index Fund (UK)
Portfolio Statement (unaudited) continued
BlackRock Collective Investment Funds 46

Holding orNominalValue Investment
MarketValue
£000’s
% ofTotal
NetAssets
184,611 Halma 4,093 0.46
27,149 Oxford Instruments 429 0.05
16,241 Renishaw 777 0.09
422,108 RotorkØ 1,264 0.14
57,886 Spectris 1,467 0.16
9,474 1.06
Engineering & Construction − 0.48%; 29.2.2020 0.41%
341,053 Balfour Beatty 761 0.09
248,470 Helios Towers 380 0.04
135,171 HomeServe 1,756 0.20
19,461 Morgan Sindall 244 0.03
404,935 Signature AviationØ 1,068 0.12
4,209 0.48
Entertainment − 0.19%; 29.2.2020 0.16%
498,037 CineworldØ 314 0.04
32,718 Gamesys 380 0.04
75,043 Rank 101 0.01
510,084 William Hill 883 0.10
1,678 0.19
Environmental Control − 0.02%; 29.2.2020 0.00%
87,859 Biffa 180 0.02
Food Producers − 3.02%; 29.2.2020 2.60%
170,096 Associated British Foods 3,478 0.39
24,262 Cranswick 905 0.10
48,130 Greggs 682 0.08
33,967 Hilton Food 402 0.04
793,174 J Sainsbury 1,457 0.16
221,575 OcadoØ 5,531 0.62
254,569 SSP 624 0.07
229,464 Tate & Lyle 1,564 0.18
4,708,653 Tesco 10,293 1.15
1,067,202 Wm Morrison Supermarkets 2,052 0.23
26,988 3.02
Food Services − 1.19%; 29.2.2020 1.35%
870,414 CompassØ 10,623 1.19
Forest Products & Paper − 0.39%; 29.2.2020 0.38%
235,955 Mondi 3,446 0.39
Gas − 1.77%; 29.2.2020 1.92%
2,860,924 CentricaØ 1,317 0.15
1,712,075 National GridØ 14,433 1.62
15,750 1.77
Holding orNominalValue Investment
MarketValue
£000’s
% ofTotal
NetAssets
Healthcare Products − 0.90%; 29.2.2020 0.91%
774,075 ConvaTec 1,482 0.17
427,158 Smith & Nephew 6,499 0.73
7,981 0.90
Home Builders − 1.68%; 29.2.2020 2.05%
491,048 Barratt Developments 2,578 0.29
59,373 Bellway 1,417 0.16
56,880 Berkeley 2,593 0.29
251,664 Countryside Properties 809 0.09
112,453 Crest Nicholson 223 0.02
155,068 Persimmon 4,063 0.46
109,977 Redrow 501 0.06
1,763,057 Taylor Wimpey 2,159 0.24
104,713 Vistry 665 0.07
15,008 1.68
Home Furnishings − 0.18%; 29.2.2020 0.18%
280,202 Howden Joinery 1,575 0.18
Household Products − 2.58%; 29.2.2020 1.80%
307,358 Reckitt Benckiser 23,076 2.58
Insurance − 4.60%; 29.2.2020 4.54%
101,990 Admiral 2,689 0.30
1,910,780 Aviva 5,402 0.60
290,569 Beazley 1,250 0.14
665,195 Direct Line Insurance 1,962 0.22
150,435 HastingsØ 379 0.04
504,839 Just 257 0.03
116,850 Lancashire 897 0.10
2,889,495 Legal & General 6,279 0.70
1,262,802 M&G 2,184 0.24
258,519 Phoenix 1,789 0.20
1,274,626 Prudential 15,570 1.74
508,249 RSA Insurance 2,284 0.26
117,656 Sabre Insurance 311 0.03
41,253 4.60
Internet − 0.78%; 29.2.2020 0.70%
458,068 Auto Trader 2,579 0.29
255,928 Moneysupermarket.com 779 0.09
423,449 Rightmove 2,684 0.30
225,245 TrainlineØ 892 0.10
6,934 0.78
Investment Companies − 0.27%; 29.2.2020 0.50%
2,354,091 Melrose Industries 2,396 0.27
iShares 350 UK Equity Index Fund (UK)
Portfolio Statement (unaudited) continued
BlackRock Collective Investment Funds47

Holding orNominalValue Investment
MarketValue
£000’s
% ofTotal
NetAssets
Iron & Steel − 0.10%; 29.2.2020 0.00%
264,261 Evraz 856 0.10
Lodging − 0.72%; 29.2.2020 0.65%
88,389 InterContinental HotelsØ 3,894 0.44
98,712 Whitbread 2,495 0.28
6,389 0.72
Machinery Construction & Mining − 0.17%; 29.2.2020 0.17%
122,284 Weir 1,551 0.17
Machinery Diversified − 0.41%; 29.2.2020 0.31%
35,656 Spirax-Sarco EngineeringØ 3,651 0.41
Media − 0.82%; 29.2.2020 0.97%
51,209 Euromoney Institutional Investor 428 0.05
46,166 FutureØ 684 0.08
725,982 Informa 3,000 0.34
1,815,323 ITV 1,102 0.12
366,288 Pearson 2,048 0.23
7,262 0.82
Metal & Hardware − 0.06%; 29.2.2020 0.08%
97,034 BodycoteØ 544 0.06
Mining − 4.04%; 29.2.2020 3.15%
598,424 Anglo American 10,966 1.23
100,172 KAZ Minerals 581 0.06
529,067 Rio Tinto 24,520 2.75
36,067 4.04
Miscellaneous Manufacturing − 0.65%; 29.2.2020 0.68%
13,882 Avon Rubber 530 0.06
39,209 Hill & Smith 477 0.05
132,832 IMI 1,401 0.16
122,602 Morgan Advanced Materials 283 0.03
189,523 SmithsØ 2,657 0.30
99,779 Vesuvius 408 0.05
5,756 0.65
Oil & Gas Producers − 2.97%; 29.2.2020 4.12%
9,679,944 BP 25,574 2.86
278,910 Cairn Energy 393 0.04
49,054 EnergeanØ 281 0.03
137,791 PetrofacØ 222 0.02
187,856 Vivo EnergyØ 141 0.02
26,611 2.97
Oil & Gas Services − 0.09%; 29.2.2020 0.14%
332,985 John Wood 825 0.09
Holding orNominalValue Investment
MarketValue
£000’s
% ofTotal
NetAssets
Packaging & Containers − 0.22%; 29.2.2020 0.20%
626,862 DS Smith 1,622 0.18
120,005 EssentraØ 368 0.04
1,990 0.22
Pharmaceuticals − 10.11%; 29.2.2020 8.42%
639,806 AstraZeneca 53,347 5.98
48,755 Dechra Pharmaceuticals 1,532 0.17
2,402,225 GlaxoSmithKline 35,361 3.96
90,240 10.11
Private Equity − 0.74%; 29.2.2020 0.73%
465,963 3i 4,371 0.49
134,609 Intermediate Capital 1,840 0.21
480,535 IP 352 0.04
6,563 0.74
Real Estate Investment & Services − 0.15%; 29.2.2020 0.30%
56,563 CLS 111 0.01
321,297 Grainger 1,006 0.11
74,816 St Modwen Properties 242 0.03
1,359 0.15
Real Estate Investment Trusts − 2.29%; 29.2.2020 2.24%
1,268,975 Assura 1,027 0.11
74,557 Big Yellow 796 0.09
460,845 British Land 1,685 0.19
365,316 Capital & Counties Properties 472 0.05
302,033 Civitas Social Housing 333 0.04
49,551 Derwent London 1,401 0.16
205,704 GCP Student Living 283 0.03
128,149 Great Portland Estates 773 0.09
372,720 Hammerson 181 0.02
346,629 Land 2,004 0.22
446,158 LondonMetric PropertyØ 1,056 0.12
254,618 LXI REIT 288 0.03
607,440 Primary Health PropertiesØ 923 0.10
579,817 Segro 5,523 0.62
105,588 Shaftesbury 558 0.06
852,246 Tritax Big Box REIT 1,327 0.15
155,096 Unite 1,498 0.17
61,272 Workspace 345 0.04
20,473 2.29
Retail − 1.78%; 29.2.2020 1.59%
413,960 B&M European Value Retail 1,970 0.22
465,383 Dixons Carphone 430 0.05
237,256 Domino’s PizzaØ 796 0.09
iShares 350 UK Equity Index Fund (UK)
Portfolio Statement (unaudited) continued
BlackRock Collective Investment Funds 48

Holding orNominalValue Investment
MarketValue
£000’s
% ofTotal
NetAssets
47,998 Dunelm 685 0.08
92,358 Frasers 323 0.04
41,090 J D Wetherspoon 420 0.05
214,066 JD Sports Fashion 1,549 0.17
1,037,154 Kingfisher 2,802 0.31
942,259 Marks & Spencer 1,047 0.12
114,332 Mitchells & Butlers 197 0.02
62,192 NextØ 3,755 0.42
240,261 Pets at HomeØ 707 0.08
39,975 Watches of Switzerland 137 0.02
61,075 WH Smith 719 0.08
138,678 World 279 0.03
15,816 1.78
Software − 0.67%; 29.2.2020 0.63%
30,896 Aveva 1,567 0.18
151,489 Micro Focus InternationalØ 453 0.05
531,786 Sage 3,938 0.44
5,958 0.67
Storage & Warehousing − 0.09%; 29.2.2020 0.08%
99,121 Safestore 775 0.09
Telecommunications − 2.33%; 29.2.2020 2.61%
550,404 Airtel AfricaØ 314 0.04
4,273,637 BT 4,472 0.50
311,136 Spirent Communications 905 0.10
300,513 TalkTalk Telecom 221 0.02
24,651 Telecom Plus 338 0.04
13,066,583 Vodafone 14,561 1.63
20,811 2.33
Textiles − 0.04%; 29.2.2020 0.04%
698,953 Coats 385 0.04
Toys, Games & Hobbies − 0.17%; 29.2.2020 0.10%
16,421 Games Workshop 1,513 0.17
Transportation − 0.23%; 29.2.2020 0.38%
13,199 Clarkson 324 0.04
545,343 Firstgroup 238 0.03
22,524 Go-Ahead 148 0.02
17,623 James Fisher & Sons 216 0.02
202,832 National Express 256 0.03
457,197 Royal Mail 820 0.09
2,002 0.23
Water − 0.84%; 29.2.2020 0.84%
205,303 Pennon 2,064 0.23
115,945 Severn Trent 2,702 0.30
Holding orNominalValue Investment
MarketValue
£000’s
% ofTotal
NetAssets
335,681 United Utilities 2,790 0.31
7,556 0.84
UNITED STATES OF AMERICA − 0.10%; 29.2.2020 0.21%
Biotechnology − 0.02%; 29.2.2020 0.02%
78,409 PureTech Health 218 0.02
Leisure Time − 0.08%; 29.2.2020 0.19%
63,919 Carnival 674 0.08
COLLECTIVE INVESTMENTSCHEMES − 5.33%; 29.2.2020 4.15%
Equities − 0.13%; 29.2.2020 0.11%
816,883 Renewables Infrastructure 1,116 0.13
Equity Funds − 1.01%; 29.2.2020 0.77%
131,951 Apax Global AlphaØ 219 0.03
319,226 BBGI 547 0.06
274,428 Foresight Solar FundØ 295 0.03
451,212 GCP Infrastructure Investments 542 0.06
59,376 Genesis Emerging Markets FundØ 449 0.05
39,517 HarbourVest Global PrivateEquityØ
675 0.08
324,894 Hipgnosis Songs Fund 392 0.04
787,574 International Public PartnershipsØ 1,307 0.15
261,531 JLEN Environmental AssetsØ 314 0.04
99,099 Pershing Square FundØ 1,997 0.22
130,198 Schroder Oriental Income FundØ 303 0.03
769,136 Sequoia Economic InfrastructureIncome Fund
832 0.09
233,122 Syncona 550 0.06
82,858 Vietnam Enterprise InvestmentsØ 355 0.04
72,163 VinaCapital Vietnam OpportunityFund
230 0.03
9,007 1.01
Investment Trusts − 4.19%; 29.2.2020 3.27%
301,596 3i Infrastructure 881 0.10
39,641 Aberforth Smaller CompaniesTrust
342 0.04
161,555 Alliance TrustØ 1,325 0.15
16,942 Allianz Technology Trust 423 0.05
58,757 Avi Global Trust 421 0.05
48,098 Baillie Gifford Japan Trust 391 0.04
57,586 Bankers Investment Trust 588 0.07
216,167 BB Healthcare TrustØ 339 0.04
25,268 BlackRock Smaller Cos Trust† 309 0.03
86,312 BlackRock World Mining Trust† 349 0.04
334,320 BMO Global Smaller Companies 405 0.05
iShares 350 UK Equity Index Fund (UK)
Portfolio Statement (unaudited) continued
BlackRock Collective Investment Funds49

Holding orNominalValue Investment
MarketValue
£000’s
% ofTotal
NetAssets
15,121 Caledonia Investments 384 0.04
204,768 City of London Investment Trust 660 0.07
89,633 Edinburgh Investment Trust 415 0.05
147,847 Edinburgh Worldwide InvestmentTrustØ
407 0.05
52,386 European Opportunities Trust 357 0.04
267,281 F&C Investment Trust 1,868 0.21
165,469 Fidelity China Special Situations 531 0.06
193,121 Fidelity European TrustØ 510 0.06
96,945 Fidelity Special Values 175 0.02
102,739 Finsbury Growth & Income Trust 853 0.10
740,444 Greencoat UK Wind 1,060 0.12
37,395 Henderson Smaller CompaniesInvestment Trust
289 0.03
32,398 Herald Investment Trust 535 0.06
175,910 HgCapital Trust 480 0.05
892,593 Hicl Infrastructure 1,496 0.17
34,536 ICG Enterprise Trust 289 0.03
119,905 Impax Environmental Markets 417 0.05
103,312 JP Morgan American InvestmentTrust
534 0.06
55,197 JPMorgan Emerging MarketsInvestment Trust
591 0.07
87,395 JPMorgan Japanese InvestmentTrust
477 0.05
59,174 Law Debenture 314 0.03
Holding orNominalValue Investment
MarketValue
£000’s
% ofTotal
NetAssets
367,461 Mercantile Investment Trust 713 0.08
105,197 Monks Investment TrustØ 1,206 0.13
60,086 Murray International Trust 568 0.06
291,395 NextEnergy Solar FundØ 308 0.03
25,542 Pantheon International Fund 575 0.06
103,487 Perpetual Income and GrowthInvestment Trust
239 0.03
1,174 Personal Assets Trust 531 0.06
64,352 Polar Capital Technology Trust 1,400 0.16
37,587 Pollen Street Secured Lending 317 0.03
62,823 RIT Capital Partners 1,142 0.13
73,025 Schroder AsiaPacific Fund 354 0.04
72,659 Scottish American Investment 310 0.03
33,147 Scottish Investment Trust 240 0.03
706,100 Scottish Mortgage InvestmentTrust
6,786 0.76
57,323 Smithson Investment Trust 856 0.10
27,638 Temple Bar Investment Trust 203 0.02
122,067 Templeton Emerging MarketsInvestment Trust
1,011 0.11
149,901 TR Property Investment Trust -Ordinary Shares
528 0.06
420,940 Witan Investment Trust 786 0.09
27,026 Worldwide Healthcare Trust 926 0.10
37,414 4.19
iShares 350 UK Equity Index Fund (UK)
Portfolio Statement (unaudited) continued
BlackRock Collective Investment Funds 50

Holding orNominalValue Investment
UnderlyingExposure − Derivatives
£000’s
MarketValue
£000’s
% ofTotal
NetAssets
DERIVATIVES − (0.03%); 29.2.2020 (0.21%)
Forward Currency Contracts − 0.00%; 29.2.2020 (0.01%)
£773,555 UK sterling vs US dollar 754 19 0.00
Futures − (0.03%); 29.2.2020 (0.20%)
191 FTSE 100 Index September 2020 11,387 (271) (0.03)
Portfolio of investments 897,172 100.49
CASH EQUIVALENTS
Short-term Money Market Funds − 0.30%; 29.2.2020 0.65%
2,693,709 BlackRock ICS Sterling Liquidity Fund - Agency Income Class† 2,694 0.30
Net other liabilities (7,076) (0.79)
Total net assets 892,790 100.00
Unless otherwise stated, all securities are either listed on a recognised exchange or traded on an eligible securities market.
Underlying exposure has been calculated according to the guidelines issued by the European Securities and Markets Authority (“ESMA”) and represents the market value of an equivalent positionin the assets underlying each financial derivative instrument.
The counterparty for the forward currency contracts is Morgan Stanley & Co. International Plc.1 Delisted security fair valued by the Manager.Ø All or a portion of this investment represents a security on loan.† Managed by a related party.
iShares 350 UK Equity Index Fund (UK)
Portfolio Statement (unaudited) continued
BlackRock Collective Investment Funds51

£000’s31.8.2020
£000’s £000’s31.8.2019
£000’s
Income
Net capital (losses)/gains (90,399) 19,996
Revenue 16,816 30,505
Expenses (961) (1,201)
Interest payable and similarcharges (1) –
Net revenue before taxation 15,854 29,304
Taxation (50) (216)
Net revenue after taxation 15,804 29,088
Total return before distributions (74,595) 49,084
Distributions (15,804) (29,088)
Change in net assetsattributable to unitholdersfrom investment activities (90,399) 19,996
Statement of Change in Net Assets Attributable to Unitholders(unaudited) for the six months ended 31 August 2020
£000’s31.8.2020
£000’s £000’s31.8.2019
£000’s
Opening net assets attributableto unitholders 982,218 1,085,223
Amounts receivable on issue of units 5,145 1,774
Amounts payable on cancellation of units (4,278) (6,999)
867 (5,225)
Change in net assets attributable tounitholders from investment activities (90,399) 19,996
Retained distribution on accumulation units 104 116
Closing net assets attributableto unitholders 892,790 1,100,110
The above statement shows the comparative closing net assets at 31 August 2019 whereas the current accounting period commenced 1 March 2020.
iShares 350 UK Equity Index Fund (UK)
Statement of Total Return (unaudited)
for the six months ended 31 August 2020
BlackRock Collective Investment Funds 52

31.8.2020£000’s
29.2.2020£000’s
Assets:
Fixed assets
− Investment assets 897,443 985,105
Current assets
− Debtors 6,236 8,349
− Cash and bank balances 1,848 2,093
− Cash collateral posted 1,254 604
− Cash equivalents 2,694 6,430
Total assets 909,475 1,002,581
Liabilities:
Investment liabilities (271) (2,062)
Creditors
− Distributions payable (15,703) (17,509)
− Other creditors (711) (792)
Total liabilities (16,685) (20,363)
Net assets attributable to unitholders 892,790 982,218
G D Bamping (Director)M T Zemek (Director)BlackRock Fund Managers Limited29 October 2020
iShares 350 UK Equity Index Fund (UK)
Balance Sheet (unaudited)
at 31 August 2020
BlackRock Collective Investment Funds53

The Fund is a sub-fund of BlackRock Collective Investment Funds (previously known as BlackRock QualifiedInvestor Schemes (1)), a UCITS scheme under the COLL Sourcebook. The Fund was established on 21 June2005 and was authorised by the FCA on 21 June 2005. The Fund’s FCA product reference number is 645668.
Risk and Reward ProfileLower riskTypically lower rewards
Higher riskTypically higher rewards
Unit Class
A Accumulation 1 2 3 4 5 6 7
L Income 1 2 3 4 5 6 7
L Accumulation 1 2 3 4 5 6 7
X Income 1 2 3 4 5 6 7
X Accumulation 1 2 3 4 5 6 7
D Accumulation 1 2 3 4 5 6 7
H Income 1 2 3 4 5 6 7
H Accumulation 1 2 3 4 5 6 7
• The risk indicator was calculated incorporating historical or simulated historical data and may not be a reliableindication of the future risk profile of the Fund.
• The risk category shown is not guaranteed and may change over time.
• The lowest category does not mean risk free.
• The use of derivatives will impact the value of the Fund and may expose the Fund to a higher degree of risk.Derivatives are highly sensitive to changes in the value of the asset on which they are based and can increasethe size of losses and gains, resulting in greater fluctuations in the value of the Fund. The impact to the Fundcan be greater where derivatives are used in an extensive or complex way.
For more information on this, please see the Fund’s Key Investor Information Documents (“KIIDs”), which areavailable at www.blackrock.com.
iShares Continental European Equity Index Fund (UK)
About the Fund
BlackRock Collective Investment Funds 54

Net Asset Value
At 31 August 2020 Units in IssueNet Asset Value
£000’s
Net Asset Valueper Unit
p
A Accumulation 1,384,433 3,545 256.1
L Income 5,659,188 7,248 128.1
L Accumulation 791,264,716 2,090,450 264.2
X Income 28,685,994 51,098 178.1
X Accumulation 543,740,419 1,194,908 219.8
D Accumulation 72,663,772 188,349 259.2
H Income 13,948,491 19,147 137.3
H Accumulation 71,304,205 110,703 155.3
Distributions Payable for the period to 31 August 2020
Unit Class Distribution payable on 31.10.2020
Pence per Unit
A Accumulation 3.4821
L Income 1.9457
L Accumulation 3.9507
X Income 2.8664
X Accumulation 3.4800
D Accumulation 4.0653
H Income 2.1871
H Accumulation 2.4348
Operating Charges
Unit Class1.3.2020
to 31.8.20201.3.2019
to 29.2.2020
A Accumulation 0.52% 0.52%
L Income 0.22% 0.22%
L Accumulation 0.22% 0.22%
X Income 0.02% 0.02%
X Accumulation 0.02% 0.02%
D Accumulation 0.06% 0.06%
H Income 0.06% 0.05%
H Accumulation 0.06% 0.06%
Operating charges are annualised and exclude portfolio trade-related costs, except costs paid to the custodian/depositary and entry/exit charges paid to an underlyingcollective investment scheme (if any).
iShares Continental European Equity Index Fund (UK)
Performance Record
BlackRock Collective Investment Funds55

Holding orNominalValue Investment1
MarketValue
£000’s
% ofTotal
NetAssets
EQUITIES − 99.22%; 29.2.2020 99.73%
Austria − 0.34%; 29.2.2020 0.42%
47,932 ANDRITZ 1,205 0.03
191,492 Erste Bank 3,482 0.10
100,129 OMVØ 2,434 0.07
89,402 Raiffeisen BankInternational
1,195 0.03
57,981 Telekom AustriaØ 320 0.01
48,147 VerbundØ 1,939 0.05
27,486 Vienna Insurance WienerVersicherung GruppeØ
503 0.01
87,541 voestalpine 1,624 0.04
12,702 0.34
Belgium − 1.94%; 29.2.2020 1.96%
14,855 Ackermans & vanHaaren
1,579 0.04
122,701 Ageas 3,858 0.11
577,610 Anheuser-Busch InBevØ 25,175 0.69
33,529 Colruyt 1,587 0.04
24,734 EliaØ 1,988 0.05
33,208 GalapagosØ 3,379 0.09
76,540 Groupe BruxellesLambertØ
5,298 0.14
188,898 KBC 8,116 0.22
96,291 Proximus 1,426 0.04
10,823 Sofina 2,431 0.07
49,895 SolvayØ 3,237 0.09
31,861 Telenet 925 0.03
82,113 UCB 7,293 0.20
137,422 Umicore 4,723 0.13
71,015 1.94
Czech Republic − 0.08%; 29.2.2020 0.09%
106,115 CEZ 1,645 0.04
48,900 Komercni banka 884 0.02
343,261 Moneta Money Bank 650 0.02
3,179 0.08
Denmark − 4.76%; 29.2.2020 4.20%
115,564 AmbuØ 2,545 0.07
2,876 AP Moller - Maersk 3,073 0.08
4,266 AP Moller - MaerskØ 4,910 0.13
68,642 Carlsberg 7,223 0.20
71,557 Chr HansenØ 6,135 0.17
92,416 Coloplast 11,737 0.32
448,348 Danske Bank 5,197 0.14
65,669 DemantØ 1,464 0.04
Holding orNominalValue Investment1
MarketValue
£000’s
% ofTotal
NetAssets
134,615 DSV Panalpina 15,748 0.43
41,112 Genmab 11,671 0.32
87,151 GN Store Nord 4,735 0.13
40,133 H LundbeckØ 985 0.03
138,154 ISSØ 1,586 0.04
1,115,141 Novo Nordisk 55,292 1.51
144,440 NovozymesØ 6,386 0.17
130,733 Orsted 13,847 0.38
62,789 PandoraØ 3,445 0.09
4,532 Rockwool InternationalØ 1,287 0.04
84,678 TrygØ 1,953 0.05
135,144 Vestas Wind Systems 15,372 0.42
174,591 4.76
Finland − 2.83%; 29.2.2020 2.60%
100,993 ElisaØ 4,449 0.12
307,245 FortumØ 4,867 0.13
61,296 Huhtamaki 2,216 0.06
183,244 Kesko 3,035 0.08
272,620 Kone 17,567 0.48
422,340 Metso Outotec 2,346 0.06
73,740 Neles 749 0.02
286,366 Neste 11,472 0.31
3,914,824 Nokia 14,193 0.39
97,496 Nokian RenkaatØ 2,029 0.06
135,976 Nordea Bank 822 0.02
2,073,373 Nordea Bank 12,528 0.34
73,583 Orion 2,578 0.07
343,504 Sampo 10,355 0.28
410,731 Stora Enso 4,527 0.12
371,046 UPM-Kymmene 8,402 0.23
346,053 WartsilaØ 2,209 0.06
104,344 2.83
France − 20.49%; 29.2.2020 22.40%
132,982 Accor 3,057 0.08
21,482 Aeroports de ParisØ 1,685 0.05
127,348 Air France-KLMØ 430 0.01
320,006 Air Liquide 39,745 1.08
385,462 Airbus 23,702 0.65
69,418 ALDØ 533 0.01
127,987 AlstomØ 5,332 0.15
37,103 Amundi 2,157 0.06
45,945 Arkema 3,813 0.10
65,337 Atos 4,231 0.12
1,336,334 AXAØ 20,380 0.56
28,718 BioMerieuxØ 3,258 0.09
755,175 BNP Paribas 24,664 0.67
iShares Continental European Equity Index Fund (UK)
Portfolio Statement (unaudited)
at 31 August 2020
BlackRock Collective Investment Funds 56

Holding orNominalValue Investment1
MarketValue
£000’s
% ofTotal
NetAssets
755,120 Bollore 2,122 0.06
152,838 BouyguesØ 4,539 0.12
188,719 Bureau Veritas 3,202 0.09
109,653 CapgeminiØ 11,361 0.31
385,390 CarrefourØ 4,632 0.13
37,909 Casino Guichard PerrachonØ 736 0.02
340,138 Cie de Saint-GobainØ 10,324 0.28
121,684 Cie Generale desEtablissements Michelin
10,282 0.28
34,557 Cie Plastic OmniumØ 583 0.02
102,347 CNP AssurancesØ 1,025 0.03
33,466 CovivioØ 1,856 0.05
813,579 Credit AgricoleØ 6,241 0.17
411,387 Danone 20,240 0.55
1,540 Dassault AviationØ 1,048 0.03
92,160 Dassault Systemes 12,994 0.35
162,130 EdenredØ 6,265 0.17
49,901 Eiffage 3,441 0.09
345,034 Electricite de France 2,712 0.07
153,377 Elis 1,484 0.04
1,125,827 Engie 11,720 0.32
204,820 EssilorLuxottica 20,509 0.56
32,188 Eurazeo 1,271 0.03
131,967 Eutelsat CommunicationsØ 991 0.03
49,296 Faurecia 1,608 0.04
34,679 Gecina 3,565 0.10
302,681 Getlink 3,471 0.09
21,298 Hermes International 13,682 0.37
23,923 ICADE 1,159 0.03
10,795 Iliad 1,726 0.05
24,800 ImerysØ 753 0.02
41,775 IngenicoØ 5,306 0.14
23,407 IpsenØ 1,814 0.05
51,750 JCDecauxØ 736 0.02
50,993 Kering 23,434 0.64
132,233 Klepierre 1,628 0.04
61,416 La Francaise des Jeux SAEM 1,704 0.05
185,099 Legrand 11,554 0.32
165,357 L’Oreal 40,898 1.12
172,153 LVMH Moet Hennessy LouisVuittonØ
60,401 1.65
633,736 NatixisØ 1,305 0.04
1,328,440 Orange 11,068 0.30
33,409 OrpeaØ 3,001 0.08
143,948 Pernod RicardØ 18,451 0.50
366,356 PeugeotØ 4,702 0.13
153,010 Publicis Groupe 4,013 0.11
16,612 Remy Cointreau 2,045 0.06
Holding orNominalValue Investment1
MarketValue
£000’s
% ofTotal
NetAssets
130,606 Renault 2,781 0.08
205,745 Rexel 2,060 0.06
66,514 Rubis 2,348 0.06
221,542 Safran 19,199 0.52
752,509 Sanofi 57,039 1.56
17,131 Sartorius Stedim Biotech 4,587 0.13
364,751 Schneider Electric 33,786 0.92
105,067 SCOR 2,104 0.06
18,316 SEBØ 2,405 0.07
532,435 Societe Generale 6,459 0.18
56,192 SodexoØ 3,008 0.08
240,021 Suez 3,110 0.08
39,888 Teleperformance 9,206 0.25
68,188 Thales 3,989 0.11
1,635,923 TotalØ 48,367 1.32
65,184 Ubisoft Entertainment 4,015 0.11
88,744 Unibail-Rodamco-WestfieldØ 3,104 0.08
171,547 ValeoØ 3,923 0.11
344,779 Veolia Environnement 6,218 0.17
320,240 Vinci 22,472 0.61
552,222 VivendiØ 11,739 0.32
19,698 Wendel 1,511 0.04
100,999 Worldline Ø 6,946 0.19
750,965 20.49
Germany − 19.31%; 29.2.2020 17.87%
33,097 1&1 DrillischØ 706 0.02
133,721 adidas 30,159 0.82
286,278 AllianzØ 46,452 1.27
635,891 BASFØ 28,967 0.79
681,341 Bayer 33,813 0.92
40,449 Bayerische Motoren Werke 1,708 0.05
224,956 Bayerische Motoren WerkeØ 12,120 0.33
19,230 BechtleØ 2,903 0.08
70,158 BeiersdorfØ 6,074 0.17
102,804 Brenntag 4,814 0.13
26,236 Carl Zeiss MeditecØ 2,208 0.06
688,349 CommerzbankØ 2,984 0.08
71,955 ContinentalØ 5,842 0.16
114,759 CovestroØ 4,077 0.11
41,374 CTS Eventim &Ø 1,543 0.04
559,390 DaimlerØ 21,265 0.58
95,592 Delivery Hero 7,662 0.21
1,424,110 Deutsche BankØ 10,242 0.28
127,582 Deutsche Boerse 18,011 0.49
181,339 Deutsche LufthansaØ 1,418 0.04
679,059 Deutsche Post 23,049 0.63
2,217,061 Deutsche Telekom 29,210 0.80
iShares Continental European Equity Index Fund (UK)
Portfolio Statement (unaudited) continued
BlackRock Collective Investment Funds57

Holding orNominalValue Investment1
MarketValue
£000’s
% ofTotal
NetAssets
251,304 Deutsche WohnenØ 9,984 0.27
22,992 DWS 675 0.02
1,499,222 E.onØ 13,231 0.36
137,135 Evonik IndustriesØ 2,973 0.08
16,543 Fielmann 899 0.02
24,045 Fraport Frankfurt AirportServices WorldwideØ
822 0.02
281,174 Fresenius & 9,707 0.26
144,076 Fresenius Medical Care & 9,137 0.25
25,103 FUCHS PETROLUB 674 0.02
47,154 FUCHS PETROLUBØ 1,672 0.04
112,414 GEAØ 3,059 0.08
17,279 GRENKEØ 955 0.03
40,994 Hannover Rueck 5,240 0.14
102,441 HeidelbergCement 4,864 0.13
29,547 Hella &Ø 1,083 0.03
68,025 Henkel & 4,578 0.13
120,753 Henkel &Ø 9,230 0.25
12,862 Hochtief 853 0.02
42,980 HUGO BOSSØ 854 0.02
902,804 Infineon Technologies 18,672 0.51
46,868 KIONØ 2,964 0.08
39,337 Knorr-Bremse 3,728 0.10
53,727 LANXESS 2,358 0.06
49,084 LEG Immobilien 5,393 0.15
88,680 Merck 8,979 0.25
121,868 METROØ 905 0.02
37,678 MTU Aero Engines 5,211 0.14
95,433 MuenchenerRueckversicherungs-Gesellschaft in Muenchen
20,637 0.56
37,366 Nemetschek 2,216 0.06
26,320 OSRAM LichtØ 1,019 0.03
101,510 Porsche Automobil 4,677 0.13
110,088 ProSiebenSat.1 Media 933 0.03
55,471 Puma 3,429 0.09
2,341 RationalØ 1,121 0.03
31,758 Rheinmetall 2,208 0.06
45,169 Rocket InternetØ 764 0.02
435,259 RWEØ 12,873 0.35
774,091 SAP 95,141 2.60
22,943 Sartorius 7,300 0.20
72,682 Scout24 5,083 0.14
527,848 Siemens 54,494 1.49
89,744 Siemens HealthineersØ 3,048 0.08
61,070 SuedzuckerØ 931 0.03
86,380 Symrise 8,919 0.24
23,925 Talanx 665 0.02
Holding orNominalValue Investment1
MarketValue
£000’s
% ofTotal
NetAssets
81,959 TeamViewerØ 3,321 0.09
456,209 Telefonica Deutschland 942 0.03
337,100 thyssenkruppØ 1,820 0.05
35,120 TratonØ 539 0.01
78,630 Uniper 1,923 0.05
65,101 United Internet 2,398 0.07
9,947 VartaØ 1,159 0.03
20,824 VolkswagenØ 2,799 0.08
127,229 Volkswagen 15,790 0.43
377,267 Vonovia 20,192 0.55
9,250 Wacker ChemieØ 677 0.02
113,093 Zalando 7,362 0.20
708,307 19.31
Greece − 0.18%; 29.2.2020 0.21%
927,466 Alpha Bank AE 459 0.01
1,701,988 Eurobank Ergasias Services and 611 0.02
27,572 FF2Ø – 0.00
166,449 Hellenic TelecommunicationsOrganization
2,037 0.06
80,798 JUMBO 1,050 0.03
34,030 Motor Oil Hellas CorinthRefineriesØ
356 0.01
75,864 Mytilineos 534 0.01
407,633 National Bank of Greece 415 0.01
163,128 OPAP 1,119 0.03
6,581 0.18
Hungary − 0.20%; 29.2.2020 0.25%
324,446 Magyar TelekomTelecommunications
294 0.01
271,295 MOL Hungarian Oil & Gas 1,142 0.03
156,906 OTP Bank Nyrt 3,973 0.11
90,736 Richter Gedeon Nyrt 1,669 0.05
7,078 0.20
Ireland − 0.55%; 29.2.2020 0.55%
632,051 AIB 582 0.02
680,186 Bank of Ireland 1,146 0.03
155,680 Glanbia 1,342 0.04
105,622 Kerry 10,378 0.28
104,876 Kingspan 6,735 0.18
20,183 0.55
Italy − 4.41%; 29.2.2020 5.09%
1,081,704 A2AØ 1,181 0.03
80,497 AmplifonØ 2,004 0.05
884,467 Assicurazioni Generali 10,274 0.28
iShares Continental European Equity Index Fund (UK)
Portfolio Statement (unaudited) continued
BlackRock Collective Investment Funds 58

Holding orNominalValue Investment1
MarketValue
£000’s
% ofTotal
NetAssets
350,474 AtlantiaØ 4,173 0.11
148,967 Banca Mediolanum 827 0.02
886,920 Banco BPMØ 1,118 0.03
31,925 Buzzi Unicem 331 0.01
41,516 Buzzi UnicemØ 761 0.02
378,399 Davide Campari-MilanoØ 2,901 0.08
15,415 DiaSorinØ 2,086 0.06
5,404,089 Enel 36,627 1.00
1,670,840 EniØ 11,641 0.32
82,792 FerrariØ 12,065 0.33
410,420 FinecoBank Banca Fineco 4,656 0.13
565,433 Hera 1,614 0.04
205,049 Infrastrutture Wireless Italiane 1,495 0.04
10,727,417 Intesa Sanpaolo 17,295 0.47
339,239 Italgas 1,633 0.04
256,991 LeonardoØ 1,301 0.04
246,436 MediasetØ 341 0.01
500,779 Mediobanca Banca di CreditoFinanziarioØ
3,257 0.09
130,192 Moncler 3,772 0.10
251,275 NexiØ 3,337 0.09
252,461 Pirelli & CØ 817 0.02
336,618 Poste Italiane 2,312 0.06
164,772 Prysmian 3,450 0.09
67,747 Recordati Industria Chimica eFarmaceuticaØ
2,763 0.08
371,368 SaipemØ 595 0.02
54,651 Salvatore FerragamoØ 589 0.02
1,539,833 Snam 5,900 0.16
7,195,205 Telecom ItaliaØ 2,563 0.07
4,167,606 Telecom Italia SpA/MilanoØ 1,473 0.04
983,431 Terna Rete Elettrica Nazionale 5,321 0.15
1,457,623 UniCreditØ 10,739 0.29
299,312 UnipolSai AssicurazioniØ 643 0.02
161,855 4.41
Luxembourg − 0.43%; 29.2.2020 0.53%
437,807 ArcelorMittal 4,146 0.11
824,346 Aroundtown 3,391 0.09
8,574 Eurofins ScientificØ 5,137 0.14
24,418 RTLØ 609 0.02
235,301 SES 1,251 0.03
351,378 TenarisØ 1,542 0.04
16,076 0.43
Netherlands − 7.74%; 29.2.2020 6.78%
72,510 Aalberts 2,047 0.06
302,050 ABN AMRO Bank 2,154 0.06
Holding orNominalValue Investment1
MarketValue
£000’s
% ofTotal
NetAssets
18,483 Adyen 23,328 0.64
1,242,121 AegonØ 2,588 0.07
133,254 Akzo Nobel 9,870 0.27
385,504 Altice Europe 1,277 0.03
30,227 ArgenxØ 5,227 0.14
34,169 ASM International 3,847 0.11
275,714 ASML 77,403 2.11
98,139 ASR Nederland 2,546 0.07
53,513 Boskalis WestminsterØ 838 0.02
42,502 Euronext 3,853 0.11
69,856 EXOR 3,082 0.08
39,355 GrandVision 844 0.02
73,251 HeinekenØ 4,488 0.12
165,713 HeinekenØ 11,480 0.31
2,697,171 ING Groep 16,392 0.45
43,948 JDE Peet’sØ 1,447 0.04
754,947 Koninklijke Ahold Delhaize 17,000 0.46
119,384 Koninklijke DSM 14,337 0.39
2,249,399 Koninklijke KPN 4,412 0.12
619,521 Koninklijke Philips 21,933 0.60
45,324 Koninklijke VopakØ 1,863 0.05
219,840 NN 6,189 0.17
69,899 OCIØ 709 0.02
296,881 Prosus 22,222 0.61
151,415 QiagenØ 5,740 0.16
74,680 RandstadØ 2,911 0.08
89,288 SignifyØ 2,231 0.06
186,145 Wolters Kluwer 11,439 0.31
283,697 7.74
Norway − 1.33%; 29.2.2020 1.33%
162,585 Adevinta 2,279 0.06
17,403 AkerØ 608 0.02
73,230 Aker BP 1,095 0.03
720,096 DNBØ 8,689 0.24
694,584 Equinor 8,462 0.23
111,949 Gjensidige Forsikring 1,793 0.05
167,273 Leroy Seafood 795 0.02
305,923 Mowi 4,498 0.12
856,311 Norsk HydroØ 2,055 0.06
508,854 Orkla 3,894 0.11
36,558 Salmar 1,489 0.04
53,115 SchibstedØ 1,738 0.05
63,361 Schibsted 1,888 0.05
457,499 TelenorØ 5,595 0.15
121,511 Yara InternationalØ 3,827 0.10
48,705 1.33
iShares Continental European Equity Index Fund (UK)
Portfolio Statement (unaudited) continued
BlackRock Collective Investment Funds59

Holding orNominalValue Investment1
MarketValue
£000’s
% ofTotal
NetAssets
Poland − 0.57%; 29.2.2020 0.57%
112,835 Bank Polska Kasa Opieki 1,201 0.03
42,020 CD Projekt 3,746 0.10
177,904 Cyfrowy Polsat 1,032 0.03
33,745 Dino PolskaØ 1,536 0.04
64,909 Grupa Lotos 534 0.01
89,038 KGHM Polska MiedzØ 2,481 0.07
589 LPPØ 862 0.02
8,508 mBankØ 326 0.01
508,134 PGE Polska GrupaEnergetyczna
625 0.02
223,313 Polski Koncern Naftowy ORLEN 2,302 0.06
1,177,787 Polskie Gornictwo Naftowe iGazownictwo
1,230 0.03
622,570 Powszechna KasaOszczednosci Bank Polski
2,734 0.07
420,920 Powszechny ZakladUbezpieczen
2,328 0.06
21,462 Santander Bank Polska 662 0.02
21,599 0.57
Portugal − 0.34%; 29.2.2020 0.37%
1,916,080 EDP - Energias de Portugal 7,257 0.20
359,675 Galp Energia SGPS 2,882 0.08
167,428 Jeronimo Martins SGPSØ 2,056 0.06
12,195 0.34
Spain − 4.80%; 29.2.2020 6.05%
15,238 AccionaØ 1,364 0.04
172,352 ACS Actividades deConstruccion y Servicios
3,159 0.09
48,854 Aena SME 5,459 0.15
293,169 Amadeus IT 12,284 0.34
4,651,105 Banco Bilbao VizcayaArgentaria
10,187 0.28
4,182,134 Banco de Sabadell 1,263 0.03
11,263,404 Banco Santander 18,741 0.51
825,700 BankiaØ 778 0.02
517,545 Bankinter 2,084 0.06
2,446,108 CaixaBank 4,025 0.11
236,828 Cellnex TelecomØ 11,347 0.31
122,830 EDP Renovaveis 1,569 0.04
153,704 EnagasØ 2,813 0.08
209,651 Endesa 4,350 0.12
324,666 Ferrovial 6,490 0.18
231,131 Grifols 4,688 0.13
4,172,505 Iberdrola 39,319 1.07
729,089 Industria de Diseno Textil 15,324 0.42
229,116 Inmobiliaria Colonial SocimiØ 1,505 0.04
Holding orNominalValue Investment1
MarketValue
£000’s
% ofTotal
NetAssets
665,380 Mapfre 944 0.03
231,878 Merlin Properties Socimi 1,555 0.04
198,420 Naturgy EnergyØ 2,864 0.08
291,207 Red ElectricaØ 4,162 0.11
960,583 Repsol 5,682 0.16
153,754 Siemens Gamesa RenewableEnergy
3,075 0.08
3,205,958 TelefonicaØ 9,481 0.26
125,796 Zardoya Otis 654 0.02
175,166 4.80
Sweden − 6.46%; 29.2.2020 5.82%
211,968 Alfa Laval 3,882 0.11
634,278 Assa Abloy 10,990 0.30
255,216 Atlas Copco 7,735 0.21
434,222 Atlas Copco 15,078 0.41
192,823 Boliden 4,311 0.12
187,838 Castellum 2,870 0.08
168,473 ElectroluxØ 2,736 0.07
168,473 Electrolux ProfessionalØ 557 0.02
231,077 Elekta 2,166 0.06
252,689 Epiroc 2,721 0.07
421,624 Epiroc 4,699 0.13
141,686 EQTØ 1,958 0.05
418,346 Essity 10,806 0.29
71,901 Fastighets BalderØ 2,148 0.06
609,989 Hennes & MauritzØ 7,316 0.20
176,192 Hexagon 9,551 0.26
77,051 Hufvudstaden 715 0.02
288,514 Husqvarna 2,350 0.06
54,845 ICA GruppenØ 2,015 0.06
124,658 IndustrivardenØ 2,472 0.07
147,912 Industrivarden 2,946 0.08
74,482 Investment LatourØ 1,246 0.03
89,238 Investor 4,223 0.12
313,245 Investor 14,929 0.41
166,652 Kinnevik 4,823 0.13
166,652 Kinnevik 100 0.00
48,400 L E Lundbergforetagen 1,668 0.05
139,366 Lundin Energy 2,551 0.07
207,066 Nibe IndustrierØ 4,357 0.12
62,368 SaabØ 1,404 0.04
745,017 Sandvik 10,967 0.30
216,175 Securitas 2,316 0.06
981,401 Skandinaviska Enskilda Banken 7,310 0.20
236,042 Skanska 3,624 0.10
274,147 SKFØ 4,118 0.11
396,505 Svenska CellulosaØ 3,823 0.10
iShares Continental European Equity Index Fund (UK)
Portfolio Statement (unaudited) continued
BlackRock Collective Investment Funds 60

Holding orNominalValue Investment1
MarketValue
£000’s
% ofTotal
NetAssets
26,599 Svenska HandelsbankenØ 221 0.01
1,042,134 Svenska HandelsbankenØ 7,851 0.21
680,909 Swedbank 8,659 0.24
109,743 Swedish Match 6,240 0.17
120,231 Swedish Orphan BiovitrumØ 2,013 0.06
385,122 Tele2 4,090 0.11
2,060,559 Telefonaktiebolaget LM Ericsson 17,905 0.49
1,779,391 TeliaØ 5,136 0.14
167,145 Trelleborg 2,183 0.06
1,029,789 Volvo 14,807 0.40
236,586 6.46
Switzerland − 20.56%; 29.2.2020 20.49%
1,243,813 ABBØ 23,696 0.65
107,324 Adecco 4,206 0.11
318,454 Alcon 13,565 0.37
32,526 BaloiseØ 3,788 0.10
20,180 Banque Cantonale VaudoiseØ 1,612 0.04
2,113 Barry CallebautØ 3,505 0.10
73 Chocoladefabriken Lindt &Spruengli
4,832 0.13
702 Chocoladefabriken Lindt &Spruengli
4,477 0.12
354,554 Cie Financiere RichemontØ 17,567 0.48
147,875 ClariantØ 2,306 0.06
1,669,514 Credit Suisse 13,750 0.38
25,510 DKSH 1,279 0.03
18,705 DufryØ 422 0.01
4,882 EMS-ChemieØ 3,296 0.09
13,470 Flughafen ZurichØ 1,518 0.04
24,570 Geberit 10,605 0.29
2,708 Georg FischerØ 2,016 0.06
6,408 GivaudanØ 20,143 0.55
24,307 Helvetia 1,714 0.05
149,187 Julius Baer 5,356 0.15
34,632 Kuehne + Nagel InternationalØ 5,028 0.14
352,405 LafargeHolcim 12,536 0.34
101,982 Logitech InternationalØ 5,650 0.15
50,920 Lonza 23,659 0.65
1,991,905 NestleØ 179,349 4.89
1,483,434 Novartis 96,004 2.62
113,353 OC Oerlikon 774 0.02
11,376 PartnersØ 8,658 0.24
27,090 PSP Swiss PropertyØ 2,422 0.07
17,793 Roche 4,666 0.13
481,200 Roche 125,957 3.44
12,584 SchindlerØ 2,482 0.07
28,722 Schindler 5,743 0.16
Holding orNominalValue Investment1
MarketValue
£000’s
% ofTotal
NetAssets
4,023 SGS 7,801 0.21
96,058 SikaØ 17,249 0.47
37,513 SonovaØ 6,568 0.18
435,376 STMicroelectronics 9,800 0.27
6,730 StraumannØ 4,959 0.14
13,476 Sulzer 899 0.02
19,436 Swatch AG/TheØ 3,079 0.08
32,676 Swatch AG/The 966 0.03
23,039 Swiss LifeØ 6,971 0.19
53,822 Swiss Prime SiteØ 3,629 0.10
200,103 Swiss ReØ 12,056 0.33
17,772 SwisscomØ 7,370 0.20
42,538 TemenosØ 5,142 0.14
2,324,150 UBSØ 21,175 0.58
36,435 Vifor PharmaØ 4,031 0.11
102,622 Zurich InsuranceØ 28,428 0.78
752,704 20.56
Turkey − 0.36%; 29.2.2020 0.48%
1,743,871 Akbank T.A.S. 865 0.02
135,909 Anadolu Efes Biracilik Ve MaltSanayii
265 0.01
131,685 ArcelikØ 281 0.01
397,998 Aselsan Elektronik Sanayi VeTicaret
656 0.02
333,558 BIM Birlesik Magazalar 2,297 0.06
48,519 Coca-Cola Icecek 213 0.01
508,446 Enka Insaat ve Sanayi 330 0.01
887,796 Eregli Demir ve Celik Fabrikalari 786 0.02
51,909 Ford Otomotiv Sanayi 444 0.01
437,722 Haci Omer Sabanci 343 0.01
597,457 KOC 903 0.02
47,423 Koza Altin Isletmeleri 374 0.01
574,056 Petkim Petrokimya 228 0.01
1 Soda Sanayii – 0.00
108,148 TAV Havalimanlari 165 0.00
74,802 TekfenØ 113 0.00
93,521 Tofas Turk Otomobil Fabrikasi 213 0.01
81,052 Tupras Turkiye Petrol Rafinerileri 658 0.02
398,306 Turk Hava YollariØ 427 0.01
365,327 Turk TelekomunikasyonØ 253 0.01
656,723 Turkcell Iletisim Hizmetleri 954 0.03
1,384,815 Turkiye Garanti Bankasi 950 0.03
902,273 Turkiye Is BankasiØ 450 0.01
1 Turkiye Sinai Kalkinma Bankasi – 0.00
444,133 Turkiye Sise ve Cam FabrikalariØ 272 0.01
795,811 Turkiye Vakiflar BankasiØ 328 0.01
iShares Continental European Equity Index Fund (UK)
Portfolio Statement (unaudited) continued
BlackRock Collective Investment Funds61

Holding orNominalValue Investment1
MarketValue
£000’s
% ofTotal
NetAssets
643,099 Yapi ve Kredi BankasiØ 132 0.00
12,900 0.36
United Kingdom − 1.54%; 29.2.2020 1.67%
663,324 CNH Industrial 3,929 0.11
773,294 Fiat Chrysler Automobiles 6,375 0.17
169,234 Subsea 7Ø 1,030 0.03
308,178 TechnipFMCØ 1,790 0.05
1,001,330 Unilever 43,388 1.18
56,512 1.54
Holding orNominalValue Investment1
MarketValue
£000’s
% ofTotal
NetAssets
COLLECTIVE INVESTMENTSCHEMES − 0.32; 29.2.2020 0.00%
Short-term Money Market Funds − 0.32%; 29.2.2020 0.00%
130,074 BlackRock ICS Euro LiquidityFund - Agency Income Class‡
11,538 0.32
Holding orNominalValue Investment
UnderlyingExposure − Derivatives
£000’s
MarketValue
£000’s
% ofTotal
NetAssets
DERIVATIVES − (0.01%); 29.2.2020 (0.04%)
Futures − (0.01%); 29.2.2020 (0.04%)
758 Euro Stoxx 50 September 2020 22,106 (241) (0.01)
103 Swiss Market Index September 2020 8,683 (27) 0.00
30,789 (268) (0.01)
Portfolio of investments 3,648,210 99.53
Net other assets 17,238 0.47
Total net assets 3,665,448 100.00
Unless otherwise stated, all securities are either listed on a recognised exchange or traded on an eligible securities market.
Underlying exposure has been calculated according to the guidelines issued by the European Securities and Markets Authority (“ESMA”) and represents the market value of an equivalent positionin the assets underlying each financial derivative instrument.1 All securities that have a value of less than £500 have been rounded to zero.2 Security fair valued by Manager at zero.Ø All or a portion of this investment represents a security on loan.‡ Related party to the Fund.
iShares Continental European Equity Index Fund (UK)
Portfolio Statement (unaudited) continued
BlackRock Collective Investment Funds 62

£000’s31.8.2020
£000’s £000’s31.8.2019
£000’s
Income
Net capital gains 148,900 295,306
Revenue 71,588 93,866
Expenses (2,397) (2,310)
Interest payable and similarcharges (99) (169)
Net revenue before taxation 69,092 91,387
Taxation (7,808) (9,414)
Net revenue after taxation 61,284 81,973
Total return before distributions 210,184 377,279
Distributions (58,137) (81,973)
Change in net assetsattributable to unitholdersfrom investment activities 152,047 295,306
Statement of Change in Net Assets Attributable to Unitholders(unaudited) for the six months ended 31 August 2020
£000’s31.8.2020
£000’s £000’s31.8.2019
£000’s
Opening net assets attributableto unitholders 3,596,915 3,204,880
Amounts receivable on issue of units 373,129 360,633
Amounts payable on cancellation of units (511,564) (359,948)
(138,435) 685
Stamp duty reserve tax – 4
Change in net assets attributable tounitholders from investment activities 152,047 295,306
Retained distribution on accumulation units 54,921 81,533
Closing net assets attributableto unitholders 3,665,448 3,582,408
The above statement shows the comparative closing net assets at 31 August 2019 whereas the current accounting period commenced 1 March 2020.
iShares Continental European Equity Index Fund (UK)
Statement of Total Return (unaudited)
BlackRock Collective Investment Funds63

31.8.2020£000’s
29.2.2020£000’s
Assets:
Fixed assets
− Investment assets 3,648,478 3,587,165
Current assets
− Debtors 44,873 30,227
− Cash and bank balances 21,651 17,974
− Cash collateral posted 6,422 800
Total assets 3,721,424 3,636,166
Liabilities:
Investment liabilities (268) (1,549)
Creditors
− Amounts held at futures clearing houses and brokers (289) –
− Distributions payable (1,238) (339)
− Other creditors (54,181) (37,363)
Total liabilities (55,976) (39,251)
Net assets attributable to unitholders 3,665,448 3,596,915
G D Bamping (Director)M T Zemek (Director)BlackRock Fund Managers Limited29 October 2020
iShares Continental European Equity Index Fund (UK)
Balance Sheet (unaudited)
BlackRock Collective Investment Funds 64

The Fund is a sub-fund of BlackRock Collective Investment Funds (previously known as BlackRock QualifiedInvestor Schemes (1)), a UCITS scheme under the COLL Sourcebook. This Fund launched on 30 June 2010. ThisFund was approved by the FCA on 28 April 2010. The Fund’s FCA product reference number is 645676.
Risk and Reward ProfileLower riskTypically lower rewards
Higher riskTypically higher rewards
Unit Class
A Accumulation 1 2 3 4 5 6 7
L Income 1 2 3 4 5 6 7
L Accumulation 1 2 3 4 5 6 7
X Income 1 2 3 4 5 6 7
X Accumulation 1 2 3 4 5 6 7
D Income 1 2 3 4 5 6 7
D Accumulation 1 2 3 4 5 6 7
H Income 1 2 3 4 5 6 7
H Accumulation 1 2 3 4 5 6 7
• The risk indicator was calculated incorporating simulated historical data and may not be a reliable indicationof the future risk profile of the Fund.
• The risk category shown is not guaranteed and may change over time.
• The lowest category does not mean risk free.
For more information on this, please see the Fund’s Key Investor Information Documents (“KIIDs”), which areavailable at www.blackrock.com.
iShares Corporate Bond Index Fund (UK)
About the Fund
BlackRock Collective Investment Funds65

Net Asset Value
At 31 August 2020 Units in IssueNet Asset Value
£000’s
Net Asset Valueper Unit
p
A Accumulation 3,171,399 5,353 168.8
L Income 8,161,049 11,545 141.5
L Accumulation 767,867,008 1,333,005 173.6
X Income 61,076,774 77,264 126.5
X Accumulation 2,283,027,536 3,618,414 158.5
D Income 98,126,670 136,617 139.2
D Accumulation 158,903,489 273,273 172.0
H Income 49,487,470 58,778 118.8
H Accumulation 161,749,199 224,449 138.8
Distributions Payable for the period to 31 August 2020
Unit Class Distribution payable on 30.10.2020
Pence per Unit
A Accumulation 1.5159
L Income 0.2445
L Accumulation 1.8160
X Income 1.4702
X Accumulation 1.8143
D Income 0.2526
D Accumulation 1.8841
H Income 1.3162
H Accumulation 1.5202
iShares Corporate Bond Index Fund (UK)
Performance Record
BlackRock Collective Investment Funds 66
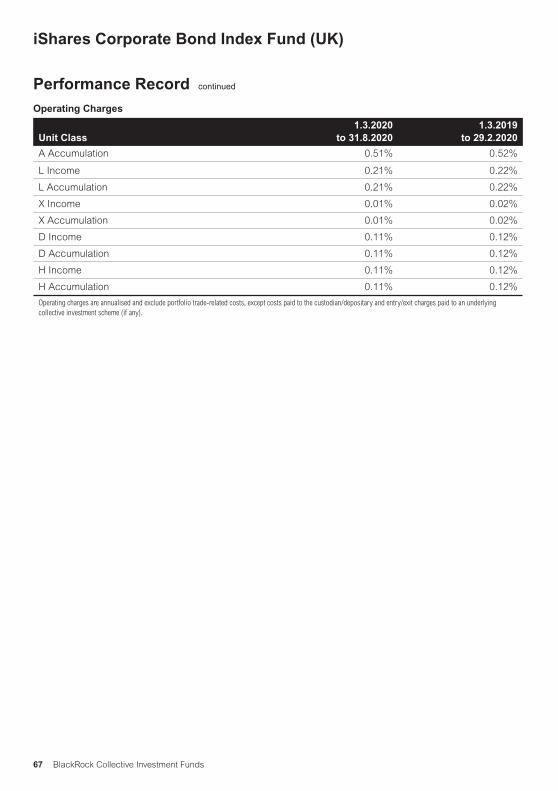
Operating Charges
Unit Class1.3.2020
to 31.8.20201.3.2019
to 29.2.2020
A Accumulation 0.51% 0.52%
L Income 0.21% 0.22%
L Accumulation 0.21% 0.22%
X Income 0.01% 0.02%
X Accumulation 0.01% 0.02%
D Income 0.11% 0.12%
D Accumulation 0.11% 0.12%
H Income 0.11% 0.12%
H Accumulation 0.11% 0.12%
Operating charges are annualised and exclude portfolio trade-related costs, except costs paid to the custodian/depositary and entry/exit charges paid to an underlyingcollective investment scheme (if any).
iShares Corporate Bond Index Fund (UK)
Performance Record continued
BlackRock Collective Investment Funds67

Holding orNominalValue Investment
MarketValue
£000’s
% ofTotal
NetAssets
BONDS − 98.25%; 29.2.2020 98.54%
UK Sterling Denominated CorporateBonds − 94.36%; 29.2.2020 95.36%
£4,300,000 3i 3.75% 5/6/2040 4,528 0.08
£3,238,000 3i 5.75% 3/12/2032 4,236 0.07
£1,175,000 3i 6.875% 9/3/2023 1,328 0.02
£2,050,000 A2Dominion Housing3.5% 15/11/2028
2,258 0.04
£2,150,000 AA Bond 2.75%31/7/2043Ø
2,101 0.04
£4,536,000 AA Bond 2.875%31/7/2043
4,511 0.08
£5,860,000 AA Bond 4.875%31/7/2043
6,007 0.10
£1,323,000 AA Bond 5.5%31/7/2050
1,401 0.02
£3,405,000 AA Bond 6.269%2/7/2043Ø
3,662 0.06
£3,136,000 Aareal Bank 1.5%16/6/2022
3,192 0.06
£3,500,000 Abertis Infraestructuras3.375% 27/11/2026
3,698 0.06
£3,500,000 ABN AMRO Bank1.375% 7/6/2022
3,558 0.06
£5,100,000 ABN AMRO Bank1.375% 16/1/2025
5,226 0.09
£2,900,000 ABN AMRO Bank2.375% 7/12/2021
2,975 0.05
£3,310,000 Accent Capital 2.625%18/7/2049
3,843 0.07
£2,202,000 Aegon 6.125%15/12/2031
3,214 0.06
£3,208,000 Aegon 6.625%16/12/2039
5,528 0.10
£3,175,000 Affinity Sutton CapitalMarkets 4.25%8/10/2042
4,416 0.08
£1,455,000 Affinity Sutton CapitalMarkets 5.981%17/9/2038
2,364 0.04
£1,850,000 Affinity Water Finance4.5% 31/3/2036
2,515 0.04
£2,364,000 Affinity Water Finance5.875% 13/7/2026
2,992 0.05
£10,102,000 Affordable HousingFinance 2.893%11/8/2045
12,967 0.23
£4,116,000 Affordable HousingFinance 3.8%20/5/2044Ø
5,922 0.10
Holding orNominalValue Investment
MarketValue
£000’s
% ofTotal
NetAssets
£7,038,000 African Development Bank0.875% 20/12/2021
7,097 0.12
£3,225,000 Akelius Residential Property2.375% 15/8/2025
3,332 0.06
£6,600,000 Allianz Finance II 4.5%13/3/2043
10,344 0.18
£6,582,000 America Movil 4.375%7/8/2041
8,708 0.15
£3,140,000 America Movil 4.948%22/7/2033
4,185 0.07
£4,268,000 America Movil 5% 27/10/2026 5,187 0.09
£4,506,000 America Movil 5.75%28/6/2030
6,062 0.11
£3,500,000 American Honda Finance 1.3%21/3/2022
3,514 0.06
£915,000 American Honda Finance2.625% 14/10/2022
946 0.02
£4,600,000 American International 5%26/4/2023
5,052 0.09
£6,337,000 Amgen 4% 13/9/2029 7,783 0.14
£4,325,000 Amgen 5.5% 7/12/2026 5,533 0.10
£2,350,000 Anglian Water ServicesFinancing 1.625% 10/8/2025
2,426 0.04
£2,000,000 Anglian Water ServicesFinancing 2.75% 26/10/2029
2,234 0.04
£1,600,000 Anglian Water ServicesFinancing 4.5% 5/10/2027
1,922 0.03
£2,196,000 Anglian Water ServicesFinancing 5.837% 30/7/2022
2,412 0.04
£2,912,000 Anglian Water ServicesFinancing 6.293% 30/7/2030
4,182 0.07
£1,754,000 Anglian Water ServicesFinancing 6.625% 15/1/2029
2,454 0.04
£974,000 Anglian Water ServicesFinancing 6.875% 21/8/2023
1,151 0.02
£2,875,000 Anglo American Capital3.375% 11/3/2029
3,090 0.05
£4,838,000 Anheuser-Busch InBev 1.75%7/3/2025
5,017 0.09
£5,579,000 Anheuser-Busch InBev 2.25%24/5/2029
5,857 0.10
£8,309,000 Anheuser-Busch InBev 2.85%25/5/2037
8,925 0.16
£4,510,000 Anheuser-Busch InBev 4%24/9/2025
5,171 0.09
£5,078,000 Anheuser-Busch InBev 9.75%30/7/2024
6,811 0.12
£5,276,000 Annington Funding 2.646%12/7/2025
5,622 0.10
£6,260,000 Annington Funding 3.184%12/7/2029
6,892 0.12
iShares Corporate Bond Index Fund (UK)
Portfolio Statement (unaudited)
at 31 August 2020
BlackRock Collective Investment Funds 68

Holding orNominalValue Investment
MarketValue
£000’s
% ofTotal
NetAssets
£4,435,000 Annington Funding 3.685%12/7/2034
5,142 0.09
£5,770,000 Annington Funding 3.935%12/7/2047
7,086 0.12
£2,615,000 AP Moller - Maersk 4%4/4/2025
2,790 0.05
£6,308,000 Apple 3.05% 31/7/2029 7,558 0.13
£4,270,000 Apple 3.6% 31/7/2042 6,070 0.11
£4,325,000 APT Pipelines 3.125%18/7/2031
4,755 0.08
£4,020,000 APT Pipelines 3.5% 22/3/2030 4,515 0.08
£3,100,000 APT Pipelines 4.25%26/11/2024
3,493 0.06
£4,980,000 Aroundtown 3% 16/10/2029 5,052 0.09
£2,423,000 Aroundtown 3.25% 18/7/2027 2,554 0.04
£3,450,000 Aroundtown 3.625% 10/4/2031 3,643 0.06
£3,300,000 Aroundtown 4.75% Perpetual25/6/2169
3,341 0.06
£2,345,833 Arqiva Financing 4.882%31/12/2032
2,669 0.05
£3,195,000 Artesian Finance II 6%30/9/2033
4,916 0.09
£2,000,000 Asian Development Bank0.625% 15/9/2026Ø
2,033 0.04
£1,847,000 Asian Development Bank0.75% 24/3/2022
1,864 0.03
£3,518,000 Asian Development Bank 1%15/12/2022Ø
3,584 0.06
£5,800,000 Asian Development Bank1.125% 15/12/2025Ø
6,040 0.11
£7,209,000 Asian Development Bank1.375% 15/12/2023
7,490 0.13
£2,887,000 Asian Development Bank1.375% 7/3/2025Ø
3,030 0.05
£600,000 ASIF II 6.375% 5/10/2020 603 0.01
£4,123,290 Aspire Defence Finance4.674% 31/3/2040
5,561 0.10
£5,840,666 Aspire Defence Finance4.674% 31/3/2040
7,878 0.14
£2,140,000 Assura Financing 3%19/7/2028Ø
2,363 0.04
£3,813,000 Aster Treasury 4.5%18/12/2043
5,622 0.10
£2,768,000 AstraZeneca 5.75%13/11/2031Ø
4,065 0.07
£6,285,000 AT&T 2.9% 4/12/2026 6,873 0.12
£9,301,000 AT&T 4.25% 1/6/2043 11,511 0.20
£6,084,000 AT&T 4.375% 14/9/2029 7,376 0.13
£11,273,000 AT&T 4.875% 1/6/2044 15,210 0.27
£2,750,000 AT&T 5.2% 18/11/2033 3,729 0.07
Holding orNominalValue Investment
MarketValue
£000’s
% ofTotal
NetAssets
£4,900,000 AT&T 5.5% 15/3/2027 6,119 0.11
£9,450,000 AT&T 7% 30/4/2040 15,494 0.27
£5,200,000 Aviva 4% 3/6/2055 5,552 0.10
£3,225,000 Aviva 4.375% 12/9/2049Ø 3,570 0.06
£3,307,000 Aviva 5.125% 4/6/2050 3,858 0.07
£5,590,000 Aviva 6.125% 14/11/2036 6,792 0.12
£6,380,000 Aviva 6.125% Perpetual29/9/2168
6,987 0.12
£4,738,000 Aviva 6.875% 20/5/2058 6,980 0.12
£5,323,000 AXA 5.453% Perpetual4/3/2169
6,100 0.11
£7,142,000 AXA 5.625% 16/1/2054 8,884 0.15
£2,418,000 AXA 6.6862% Perpetual6/7/2169
2,954 0.05
£2,450,000 Babcock International 1.875%5/10/2026
2,339 0.04
£3,891,000 BAE Systems 4.125% 8/6/2022 4,106 0.07
£4,100,000 Banco Bilbao VizcayaArgentaria 3.104% 15/7/2031
4,080 0.07
£6,400,000 Banco Santander 1.375%31/7/2024
6,481 0.11
£5,000,000 Banco Santander 1.75%17/2/2027
4,950 0.09
£3,700,000 Banco Santander 2.75%12/9/2023
3,876 0.07
£5,850,000 Bank of America 2.3%25/7/2025
6,243 0.11
£2,025,000 Bank of America 4.25%10/12/2026
2,408 0.04
£2,530,000 Bank of America 5.5%22/11/2021
2,675 0.05
£5,700,000 Bank of America 6.125%15/9/2021
6,032 0.11
£10,900,000 Bank of America 7% 31/7/2028 15,489 0.27
£1,200,000 Bank of America 8.125%2/6/2028
1,716 0.03
£1,450,000 Bank of Montreal 1.375%29/12/2021Ø
1,468 0.03
£4,525,000 Bank of Montreal 1.5%18/12/2024
4,692 0.08
£3,615,000 Bank of Montreal 1.625%21/6/2022
3,693 0.06
£3,865,000 Bank of Nova Scotia/The0.75% 14/9/2021
3,876 0.07
£3,480,000 Bank of Nova Scotia/The1.25% 8/6/2022
3,526 0.06
£1,700,000 Bank of Nova Scotia/The1.375% 5/12/2023
1,738 0.03
£2,760,000 Bank of Nova Scotia/The1.75% 23/12/2022
2,838 0.05
iShares Corporate Bond Index Fund (UK)
Portfolio Statement (unaudited) continued
BlackRock Collective Investment Funds69
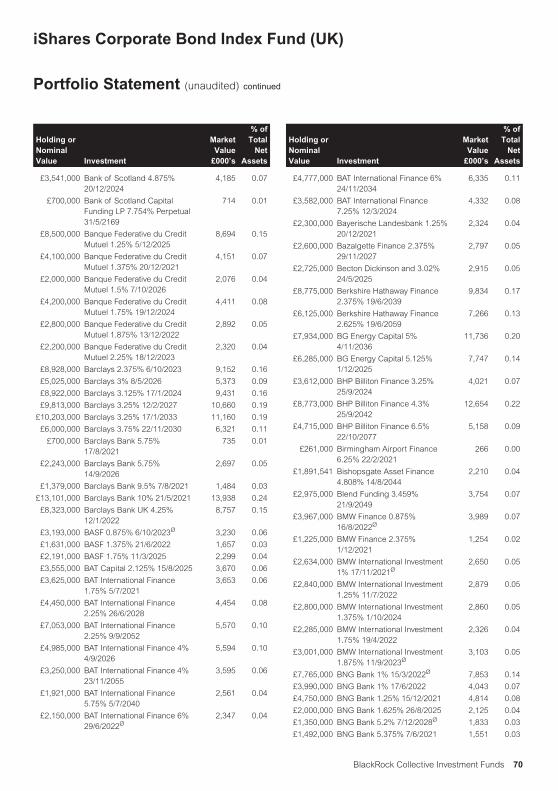
Holding orNominalValue Investment
MarketValue
£000’s
% ofTotal
NetAssets
£3,541,000 Bank of Scotland 4.875%20/12/2024
4,185 0.07
£700,000 Bank of Scotland CapitalFunding LP 7.754% Perpetual31/5/2169
714 0.01
£8,500,000 Banque Federative du CreditMutuel 1.25% 5/12/2025
8,694 0.15
£4,100,000 Banque Federative du CreditMutuel 1.375% 20/12/2021
4,151 0.07
£2,000,000 Banque Federative du CreditMutuel 1.5% 7/10/2026
2,076 0.04
£4,200,000 Banque Federative du CreditMutuel 1.75% 19/12/2024
4,411 0.08
£2,800,000 Banque Federative du CreditMutuel 1.875% 13/12/2022
2,892 0.05
£2,200,000 Banque Federative du CreditMutuel 2.25% 18/12/2023
2,320 0.04
£8,928,000 Barclays 2.375% 6/10/2023 9,152 0.16
£5,025,000 Barclays 3% 8/5/2026 5,373 0.09
£8,922,000 Barclays 3.125% 17/1/2024 9,431 0.16
£9,813,000 Barclays 3.25% 12/2/2027 10,660 0.19
£10,203,000 Barclays 3.25% 17/1/2033 11,160 0.19
£6,000,000 Barclays 3.75% 22/11/2030 6,321 0.11
£700,000 Barclays Bank 5.75%17/8/2021
735 0.01
£2,243,000 Barclays Bank 5.75%14/9/2026
2,697 0.05
£1,379,000 Barclays Bank 9.5% 7/8/2021 1,484 0.03
£13,101,000 Barclays Bank 10% 21/5/2021 13,938 0.24
£8,323,000 Barclays Bank UK 4.25%12/1/2022
8,757 0.15
£3,193,000 BASF 0.875% 6/10/2023Ø 3,230 0.06
£1,631,000 BASF 1.375% 21/6/2022 1,657 0.03
£2,191,000 BASF 1.75% 11/3/2025 2,299 0.04
£3,555,000 BAT Capital 2.125% 15/8/2025 3,670 0.06
£3,625,000 BAT International Finance1.75% 5/7/2021
3,653 0.06
£4,450,000 BAT International Finance2.25% 26/6/2028
4,454 0.08
£7,053,000 BAT International Finance2.25% 9/9/2052
5,570 0.10
£4,985,000 BAT International Finance 4%4/9/2026
5,594 0.10
£3,250,000 BAT International Finance 4%23/11/2055
3,595 0.06
£1,921,000 BAT International Finance5.75% 5/7/2040
2,561 0.04
£2,150,000 BAT International Finance 6%29/6/2022Ø
2,347 0.04
Holding orNominalValue Investment
MarketValue
£000’s
% ofTotal
NetAssets
£4,777,000 BAT International Finance 6%24/11/2034
6,335 0.11
£3,582,000 BAT International Finance7.25% 12/3/2024
4,332 0.08
£2,300,000 Bayerische Landesbank 1.25%20/12/2021
2,324 0.04
£2,600,000 Bazalgette Finance 2.375%29/11/2027
2,797 0.05
£2,725,000 Becton Dickinson and 3.02%24/5/2025
2,915 0.05
£8,775,000 Berkshire Hathaway Finance2.375% 19/6/2039
9,834 0.17
£6,125,000 Berkshire Hathaway Finance2.625% 19/6/2059
7,266 0.13
£7,934,000 BG Energy Capital 5%4/11/2036
11,736 0.20
£6,285,000 BG Energy Capital 5.125%1/12/2025
7,747 0.14
£3,612,000 BHP Billiton Finance 3.25%25/9/2024
4,021 0.07
£8,773,000 BHP Billiton Finance 4.3%25/9/2042
12,654 0.22
£4,715,000 BHP Billiton Finance 6.5%22/10/2077
5,158 0.09
£261,000 Birmingham Airport Finance6.25% 22/2/2021
266 0.00
£1,891,541 Bishopsgate Asset Finance4.808% 14/8/2044
2,210 0.04
£2,975,000 Blend Funding 3.459%21/9/2049
3,754 0.07
£3,967,000 BMW Finance 0.875%16/8/2022Ø
3,989 0.07
£1,225,000 BMW Finance 2.375%1/12/2021
1,254 0.02
£2,634,000 BMW International Investment1% 17/11/2021Ø
2,650 0.05
£2,840,000 BMW International Investment1.25% 11/7/2022
2,879 0.05
£2,800,000 BMW International Investment1.375% 1/10/2024
2,860 0.05
£2,285,000 BMW International Investment1.75% 19/4/2022
2,326 0.04
£3,001,000 BMW International Investment1.875% 11/9/2023Ø
3,103 0.05
£7,765,000 BNG Bank 1% 15/3/2022Ø 7,853 0.14
£3,990,000 BNG Bank 1% 17/6/2022 4,043 0.07
£4,750,000 BNG Bank 1.25% 15/12/2021 4,814 0.08
£2,000,000 BNG Bank 1.625% 26/8/2025 2,125 0.04
£1,350,000 BNG Bank 5.2% 7/12/2028Ø 1,833 0.03
£1,492,000 BNG Bank 5.375% 7/6/2021 1,551 0.03
iShares Corporate Bond Index Fund (UK)
Portfolio Statement (unaudited) continued
BlackRock Collective Investment Funds 70

Holding orNominalValue Investment
MarketValue
£000’s
% ofTotal
NetAssets
£4,025,000 BNP Paribas 1.125% 16/8/2022 4,079 0.07
£6,600,000 BNP Paribas 1.875%14/12/2027
6,775 0.12
£9,175,000 BNP Paribas 3.375% 23/1/2026 10,154 0.18
£2,454,000 BNP Paribas 5.75% 24/1/2022 2,617 0.05
£2,800,000 Bouygues 5.5% 6/10/2026 3,509 0.06
£4,670,000 BP Capital Markets 1.177%12/8/2023
4,756 0.08
£2,975,000 BP Capital Markets 1.827%8/9/2025
3,121 0.05
£3,925,000 BP Capital Markets 2.03%14/2/2025
4,131 0.07
£4,650,000 BP Capital Markets 2.274%3/7/2026
5,015 0.09
£10,375,000 BP Capital Markets 4.25%Perpetual 22/6/2169
10,998 0.19
£4,000,000 BPCE 1.375% 23/12/2026 4,087 0.07
£2,300,000 BPCE 2.125% 16/12/2022 2,384 0.04
£6,900,000 BPCE 5.25% 16/4/2029 8,682 0.15
£2,950,000 BPHA Finance 4.816%11/4/2044
4,475 0.08
£3,000,000 British Land 2.375% 14/9/2029 3,025 0.05
£3,990,000 British Telecommunications3.125% 21/11/2031
4,456 0.08
£1,950,000 British Telecommunications3.625% 21/11/2047Ø
2,287 0.04
£6,426,000 British Telecommunications5.75% 7/12/2028
8,432 0.15
£3,933,000 British Telecommunications6.375% 23/6/2037
6,040 0.11
£2,710,000 Broadgate Financing 4.821%5/7/2036
3,631 0.06
£925,000 Broadgate Financing 4.851%5/4/2033
1,190 0.02
£1,025,085 Broadgate Financing 4.949%5/4/2031
1,187 0.02
£3,350,000 Broadgate Financing 4.999%5/10/2033
4,032 0.07
£2,149,582 Broadgate Financing 5.098%5/4/2035
2,578 0.05
£2,300,000 Bromford Housing 3.125%3/5/2048
2,894 0.05
£2,840,000 Brown-Forman 2.6% 7/7/2028Ø 3,136 0.05
£2,050,000 Bunzl Finance 2.25%11/6/2025
2,146 0.04
£2,900,000 BUPA Finance 1.75%14/6/2027
2,921 0.05
£2,020,000 BUPA Finance 2% 5/4/2024 2,092 0.04
£882,000 BUPA Finance 3.375%17/6/2021
900 0.02
Holding orNominalValue Investment
MarketValue
£000’s
% ofTotal
NetAssets
£3,025,000 BUPA Finance 4.125%14/6/2035
3,219 0.06
£3,020,000 BUPA Finance 5% 25/4/2023 3,249 0.06
£3,395,000 BUPA Finance 5% 8/12/2026 3,840 0.07
£1,287,000 Cadent Finance 1.125%22/9/2021
1,293 0.02
£8,311,000 Cadent Finance 2.125%22/9/2028
8,778 0.15
£2,015,000 Cadent Finance 2.25%10/10/2035
2,126 0.04
£5,824,000 Cadent Finance 2.625%22/9/2038
6,379 0.11
£6,582,000 Cadent Finance 2.75%22/9/2046
7,335 0.13
£3,600,000 Cadent Finance 3.125%21/3/2040
4,195 0.07
£3,420,000 Canadian Imperial Bank ofCommerce 1.125% 30/6/2022
3,459 0.06
£2,500,000 Canadian Imperial Bank ofCommerce 1.625% 25/9/2025Ø
2,572 0.04
£2,245,000 Canary Wharf Finance II5.952% 22/10/2037
3,206 0.06
£1,601,731 Canary Wharf Finance II6.455% 22/10/2033
1,985 0.03
£2,586,858 Canary Wharf Finance II 6.8%22/10/2033
3,308 0.06
£2,565,000 Cardiff University 3%7/12/2055
3,440 0.06
£950,000 Cargill 5.375% 2/3/2037 1,394 0.02
£3,100,000 Catalyst Housing 3.125%31/10/2047
3,718 0.06
£4,940,000 Centrica 4.25% 12/9/2044 6,422 0.11
£4,106,000 Centrica 4.375% 13/3/2029 4,912 0.09
£2,000,000 Centrica 6.375% 10/3/2022 2,163 0.04
£7,248,000 Centrica 7% 19/9/2033 11,264 0.20
£2,900,000 Chancellor Masters & Scholarsof The University ofCambridge/The 2.35%27/6/2078
4,295 0.07
£2,290,000 Chancellor Masters & Scholarsof The University ofCambridge/The 3.75%17/10/2052
3,781 0.07
£2,867,000 Channel Link EnterprisesFinance 3.848% 30/6/2050
3,272 0.06
£2,220,000 Cie de Financement Foncier5.5% 26/1/2027
2,864 0.05
£2,175,000 Cie de Saint-Gobain 4.625%9/10/2029
2,719 0.05
£2,350,000 Cie de Saint-Gobain 5.625%15/11/2024
2,784 0.05
iShares Corporate Bond Index Fund (UK)
Portfolio Statement (unaudited) continued
BlackRock Collective Investment Funds71

Holding orNominalValue Investment
MarketValue
£000’s
% ofTotal
NetAssets
£1,925,000 Circle Anglia Social Housing5.2% 2/3/2044
3,037 0.05
£3,260,000 Circle Anglia Social Housing7.25% 12/11/2038
5,937 0.10
£6,575,000 Citigroup 1.75% 23/10/2026 6,770 0.12
£5,175,000 Citigroup 2.75% 24/1/2024 5,477 0.10
£1,365,000 Citigroup 4.5% 3/3/2031 1,651 0.03
£90,000 Citigroup 4.5% 3/3/2031 109 0.00
£5,277,000 Citigroup 5.15% 21/5/2026 6,413 0.11
£1,706,000 Citigroup 5.875% 1/7/2024 1,978 0.03
£4,585,000 Citigroup 6.8% 25/6/2038 7,957 0.14
£4,081,000 Citigroup 7.375% 1/9/2039 7,504 0.13
£2,900,000 Citizen Treasury 3.25%20/10/2048
3,661 0.06
£3,775,000 CK Hutchison Telecom Finance2% 17/10/2027
3,870 0.07
£2,500,000 CK Hutchison Telecom Finance2.625% 17/10/2034
2,570 0.04
£1,000,000 Clarion Funding 1.875%22/1/2035
1,020 0.02
£2,750,000 Clarion Funding 2.625%18/1/2029Ø
3,011 0.05
£3,050,000 Clarion Funding 3.125%19/4/2048
3,697 0.06
£2,540,000 Close Brothers 2.75%26/4/2023
2,639 0.05
£2,050,000 Close Brothers Finance 2.75%19/10/2026
2,184 0.04
£2,150,000 Close Brothers Finance3.875% 27/6/2021
2,205 0.04
£5,547,000 Clydesdale Bank 4.625%8/6/2026
6,753 0.12
£3,600,000 CNP Assurances 7.375%30/9/2041
3,833 0.07
£6,100,000 Comcast 1.5% 20/2/2029 6,230 0.11
£6,625,000 Comcast 1.875% 20/2/2036 6,820 0.12
£4,423,000 Comcast 5.5% 23/11/2029 6,055 0.11
£3,000,000 Commerzbank 1.75%22/1/2025
2,966 0.05
£2,300,000 Commonwealth Bank ofAustralia 1.125% 22/12/2021
2,322 0.04
£6,164,000 Commonwealth Bank ofAustralia 3% 4/9/2026
6,993 0.12
£5,738,000 Community Finance 1 5.017%31/7/2034
7,854 0.14
£2,275,000 Compass 2% 5/9/2025 2,376 0.04
£2,800,000 Compass 2% 3/7/2029Ø 2,946 0.05
£1,570,000 Compass 3.85% 26/6/2026 1,812 0.03
£6,576,750 Connect Plus M25 Issuer2.607% 31/3/2039
7,400 0.13
Holding orNominalValue Investment
MarketValue
£000’s
% ofTotal
NetAssets
£1,900,000 Cooperatieve Rabobank UA1.25% 14/1/2025
1,940 0.03
£6,682,000 Cooperatieve Rabobank UA2.25% 23/3/2022
6,881 0.12
£4,394,000 Cooperatieve Rabobank UA4% 19/9/2022
4,712 0.08
£2,256,000 Cooperatieve Rabobank UA4.55% 30/8/2029
2,933 0.05
£8,685,000 Cooperatieve Rabobank UA4.625% 23/5/2029
10,694 0.19
£1,465,000 Cooperatieve Rabobank UA4.875% 10/1/2023
1,614 0.03
£3,925,000 Cooperatieve Rabobank UA5.25% 14/9/2027
4,902 0.09
£2,583,000 Cooperatieve Rabobank UA5.25% 23/5/2041
4,298 0.07
£3,550,000 Cooperatieve Rabobank UA5.375% 3/8/2060
7,281 0.13
£1,425,000 Cooperatieve Rabobank UA6.91% Perpetual 10/12/2168
2,371 0.04
£3,355,000 Co-Operative Bank 4.75%11/11/2021
3,494 0.06
£2,892,000 Council Of EuropeDevelopment Bank 0.625%15/6/2022Ø
2,912 0.05
£4,000,000 Council Of EuropeDevelopment Bank 0.75%22/7/2027
4,075 0.07
£4,646,000 Council Of EuropeDevelopment Bank 1.125%15/12/2021
4,699 0.08
£5,000,000 Council Of EuropeDevelopment Bank 1.125%17/3/2022Ø
5,069 0.09
£3,400,000 Coventry Building Society 1.5%23/1/2023
3,465 0.06
£4,220,000 Coventry Building Society1.875% 24/10/2023
4,369 0.08
£3,371,000 Coventry Building Society5.875% 28/9/2022
3,738 0.07
£3,124,000 CPI Property 2.75% 22/1/2028 3,013 0.05
£3,982,000 CPUK Finance 3.588%28/2/2042
4,047 0.07
£2,150,000 CPUK Finance 3.69%28/2/2047
2,177 0.04
£2,880,000 CPUK Finance 7.239%28/2/2042
3,261 0.06
£1,900,000 Credit Agricole 1.25%2/10/2024
1,947 0.03
£3,600,000 Credit Agricole 7.375%18/12/2023
4,281 0.07
iShares Corporate Bond Index Fund (UK)
Portfolio Statement (unaudited) continued
BlackRock Collective Investment Funds 72

Holding orNominalValue Investment
MarketValue
£000’s
% ofTotal
NetAssets
£5,913,000 Credit Suisse 2.125%12/9/2025
6,108 0.11
£6,199,000 Credit Suisse 2.25% 9/6/2028 6,390 0.11
£649,000 Credit Suisse Finance US 7%5/10/2020
653 0.01
£4,880,000 Credit Suisse FundingGuernsey 2.75% 8/8/2025
5,217 0.09
£5,150,000 Credit Suisse FundingGuernsey 3% 27/5/2022
5,346 0.09
£3,365,000 Crh Finance UK 4.125%2/12/2029
4,051 0.07
£2,579,285 CTRL Section 1 Finance5.234% 2/5/2035
3,541 0.06
£1,600,000 Daimler International Finance1.25% 5/9/2022
1,602 0.03
£3,300,000 Daimler International Finance1.5% 18/8/2021
3,319 0.06
£4,026,000 Daimler International Finance1.5% 13/1/2022
4,053 0.07
£1,800,000 Daimler International Finance1.625% 11/11/2024
1,817 0.03
£4,100,000 Daimler International Finance2% 4/9/2023
4,198 0.07
£2,536,000 Daimler International Finance2.125% 7/6/2022
2,582 0.05
£1,468,000 Daimler International Finance2.375% 16/12/2021
1,495 0.03
£1,500,000 Dali Capital 4.79924%21/12/2037
2,015 0.04
£7,025,000 Danske Bank 2.25% 14/1/2028 7,154 0.12
£1,571,272 Delamare Finance 5.5457%19/2/2029
1,806 0.03
£4,012,292 Derby Healthcare 5.564%30/6/2041
5,688 0.10
£1,693,000 Deutsche Bahn Finance1.375% 7/7/2025Ø
1,757 0.03
£1,575,000 Deutsche Bahn Finance1.875% 13/2/2026
1,678 0.03
£3,372,000 Deutsche Bahn Finance 2.75%20/6/2022
3,511 0.06
£4,533,000 Deutsche Bahn Finance3.125% 24/7/2026
5,174 0.09
£2,900,000 Deutsche Bank 1.75%16/12/2021Ø
2,906 0.05
£7,800,000 Deutsche Bank 2.625%16/12/2024
7,961 0.14
£3,500,000 Deutsche Bank 3.875%12/2/2024
3,711 0.06
£2,500,000 Deutsche Pfandbriefbank 1.5%16/12/2021
2,531 0.04
Holding orNominalValue Investment
MarketValue
£000’s
% ofTotal
NetAssets
£2,400,000 Deutsche Pfandbriefbank1.75% 21/11/2022
2,409 0.04
£4,630,000 Deutsche Telekom 3.125%6/2/2034
5,365 0.09
£1,930,000 Deutsche Telekom InternationalFinance 1.25% 6/10/2023
1,968 0.03
£3,024,000 Deutsche Telekom InternationalFinance 2.25% 13/4/2029Ø
3,224 0.06
£3,111,000 Deutsche Telekom InternationalFinance 2.5% 10/10/2025
3,352 0.06
£5,488,000 Deutsche Telekom InternationalFinance 6.5% 8/4/2022
6,005 0.10
£1,963,000 Deutsche Telekom InternationalFinance 7.625% 15/6/2030
3,034 0.05
£1,530,000 Deutsche Telekom InternationalFinance 8.875% 27/11/2028
2,424 0.04
£8,300,000 Dexia Credit Local 0.5%22/7/2023
8,334 0.15
£3,900,000 Dexia Credit Local 0.875%7/9/2021
3,924 0.07
£9,400,000 Dexia Credit Local 1.125%15/6/2022
9,534 0.17
£7,000,000 Dexia Credit Local 1.375%7/12/2022
7,166 0.12
£7,700,000 Dexia Credit Local 1.625%8/12/2023
8,010 0.14
£6,500,000 Dexia Credit Local 2.125%12/2/2025
6,941 0.12
£4,325,000 Diageo Finance 1.75%12/10/2026
4,579 0.08
£3,900,000 Diageo Finance 2.875%27/3/2029
4,465 0.08
£1,800,000 Digital Stout 2.75% 19/7/2024 1,926 0.03
£3,085,000 Digital Stout 3.3% 19/7/2029Ø 3,510 0.06
£5,296,000 Digital Stout 3.75% 17/10/2030 6,244 0.11
£3,405,000 Digital Stout 4.25% 17/1/2025 3,875 0.07
£2,925,000 Digital Stout 4.75% 13/10/2023 3,252 0.06
£2,150,000 Direct Line Insurance 4%5/6/2032
2,346 0.04
£1,870,000 Direct Line Insurance 9.25%27/4/2042
2,120 0.04
£3,890,000 Discovery Communications2.5% 20/9/2024
4,008 0.07
£3,425,000 DNB Bank 1.375% 12/6/2023 3,510 0.06
£2,800,000 DNB Bank 1.625% 15/12/2023 2,900 0.05
£2,900,000 DP World 4.25% 25/9/2030 3,162 0.06
£2,300,000 DS Smith 2.875% 26/7/2029Ø 2,340 0.04
£2,475,000 DWR Cymru Financing UK1.375% 31/3/2033
2,470 0.04
iShares Corporate Bond Index Fund (UK)
Portfolio Statement (unaudited) continued
BlackRock Collective Investment Funds73

Holding orNominalValue Investment
MarketValue
£000’s
% ofTotal
NetAssets
£2,350,000 DWR Cymru Financing UK2.5% 31/3/2036
2,657 0.05
£450,000 DWR Cymru Financing UK4.473% 31/3/2057
762 0.01
£2,663,000 DWR Cymru Financing UK6.015% 31/3/2028
3,599 0.06
£2,472,000 DWR Cymru Financing UK6.907% 31/3/2021
2,558 0.04
£1,930,000 DXC Technology 2.75%15/1/2025
1,949 0.03
£7,200,000 E.ON International Finance5.875% 30/10/2037
11,171 0.19
£8,974,000 E.ON International Finance6.375% 7/6/2032
13,368 0.23
£5,850,000 E.ON International Finance6.75% 27/1/2039
10,004 0.17
£1,950,000 East Japan Railway 4.5%25/1/2036
2,762 0.05
£2,900,000 East Japan Railway 4.75%8/12/2031
4,009 0.07
£2,400,000 East Japan Railway 4.875%14/6/2034
3,447 0.06
£2,200,000 East Japan Railway 5.25%22/4/2033
3,222 0.06
£2,550,000 Eastern Power Networks1.875% 1/6/2035
2,625 0.05
£1,650,000 Eastern Power Networks2.125% 25/11/2033
1,769 0.03
£2,965,000 Eastern Power Networks 4.75%30/9/2021
3,099 0.05
£3,685,000 Eastern Power Networks 5.75%8/3/2024
4,325 0.08
£2,529,000 Eastern Power Networks 6.25%12/11/2036
4,131 0.07
£791,000 Eastern Power Networks 8.5%31/3/2025
1,043 0.02
£2,295,000 EDP Finance 8.625% 4/1/2024 2,839 0.05
£8,450,000 Electricite de France 5.125%22/9/2050
12,662 0.22
£4,900,000 Electricite de France 5.5%27/3/2037
7,024 0.12
£12,000,000 Electricite de France 5.5%17/10/2041
17,692 0.31
£6,454,000 Electricite de France 5.875%18/7/2031
9,051 0.16
£12,100,000 Electricite de France 6%23/1/2114
20,298 0.35
£12,250,000 Electricite de France 6.125%2/6/2034
18,085 0.32
£4,600,000 Electricite de France 6.25%30/5/2028
6,140 0.11
Holding orNominalValue Investment
MarketValue
£000’s
% ofTotal
NetAssets
£3,400,000 Electricite de France 6.875%12/12/2022
3,882 0.07
£3,583,000 Electricity North West 8.875%25/3/2026
5,052 0.09
£4,778,000 Enel 5.75% 22/6/2037 7,153 0.12
£4,420,000 Enel 6.625% 15/9/2076 4,624 0.08
£7,185,000 Enel Finance International5.625% 14/8/2024
8,558 0.15
£12,268,000 Enel Finance International5.75% 14/9/2040
18,763 0.33
£10,050,000 Engie 5% 1/10/2060 18,582 0.32
£4,100,000 Engie 7% 30/10/2028 5,986 0.10
£775,000 ENW Finance 1.415%30/7/2030
778 0.01
£2,240,000 ENW Finance 6.125%21/7/2021
2,347 0.04
£3,575,000 Equinor 4.25% 10/4/2041 5,053 0.09
£1,895,000 Equinor 6.125% 27/11/2028 2,625 0.05
£6,498,000 Equinor 6.875% 11/3/2031 10,016 0.17
£1,230,644 Equity Release Funding No1 5.7% 26/2/2031
1,440 0.03
£1,321,153 Equity Release Funding No2 5.88% 26/5/2032
1,608 0.03
£2,221,356 Equity Release Funding No3 5.05% 26/4/2033
2,788 0.05
£1,500,000 ESB Finance DAC 1.875%21/7/2035
1,575 0.03
£3,025,000 Euroclear Bank 1.25%30/9/2024
3,124 0.05
£813,000 EUROFIMA 5.5% 7/6/2032 1,214 0.02
£400,000 European Bank forReconstruction & Development1.25% 15/12/2022
410 0.01
£2,390,000 European Bank forReconstruction & Development5.125% 7/6/2032
3,535 0.06
£5,524,000 European Bank forReconstruction & Development5.625% 7/12/2028
7,765 0.14
£5,464,000 European Investment Bank 0%7/12/2028
5,162 0.09
£14,500,000 European Investment Bank0.75% 14/7/2023Ø
14,769 0.26
£14,900,000 European Investment Bank0.75% 15/11/2024Ø
15,257 0.27
£5,000,000 European Investment Bank0.75% 22/7/2027Ø
5,114 0.09
£20,441,000 European Investment Bank0.875% 15/12/2023
20,949 0.37
£18,684,000 European Investment Bank 1%21/9/2026
19,489 0.34
iShares Corporate Bond Index Fund (UK)
Portfolio Statement (unaudited) continued
BlackRock Collective Investment Funds 74

Holding orNominalValue Investment
MarketValue
£000’s
% ofTotal
NetAssets
£10,454,000 European Investment Bank1.125% 7/9/2021Ø
10,565 0.18
£11,342,000 European Investment Bank1.375% 7/3/2025Ø
11,929 0.21
£19,756,000 European Investment Bank2.5% 31/10/2022
20,759 0.36
£4,674,000 European Investment Bank3.75% 7/12/2027
5,773 0.10
£10,286,000 European Investment Bank3.875% 8/6/2037
14,864 0.26
£3,967,800 European Investment Bank4.25% 7/12/2021
4,175 0.07
£9,529,000 European Investment Bank4.5% 7/6/2029
12,685 0.22
£7,025,000 European Investment Bank4.5% 7/3/2044Ø
11,939 0.21
£5,991,000 European Investment Bank4.625% 12/10/2054
11,842 0.21
£12,401,000 European Investment Bank 5%15/4/2039
20,771 0.36
£13,500,000 European Investment Bank5.5% 15/4/2025
16,766 0.29
£19,253,000 European Investment Bank5.625% 7/6/2032
29,649 0.52
£23,335,000 European Investment Bank 6%7/12/2028
33,524 0.58
£2,875,000 Eversholt Funding 2.742%30/6/2040
2,958 0.05
£2,905,000 Eversholt Funding 3.529%7/8/2042
3,193 0.06
£3,975,000 Eversholt Funding 6.359%2/12/2025Ø
4,879 0.09
£4,850,000 Eversholt Funding 6.697%22/2/2035
6,322 0.11
£805,777 Exchequer Partnership No2 5.396% 13/7/2036
1,109 0.02
£4,850,000 Experian Finance 2.125%27/9/2024
5,122 0.09
£3,575,000 Experian Finance 3.25%7/4/2032
4,178 0.07
£2,700,000 Experian Finance 3.5%15/10/2021
2,766 0.05
£2,640,000 FCA Bank SpA/Ireland 1.625%29/9/2021
2,630 0.05
£1,134,000 Fidelity International 6.75%19/10/2020
1,142 0.02
£2,300,000 Fidelity International 7.125%13/2/2024
2,721 0.05
£2,700,000 Fidelity National InformationServices 1.7% 30/6/2022
2,739 0.05
Holding orNominalValue Investment
MarketValue
£000’s
% ofTotal
NetAssets
£1,900,000 Fidelity National InformationServices 2.25% 3/12/2029
1,999 0.03
£6,775,000 Fidelity National InformationServices 2.602% 21/5/2025
7,302 0.13
£5,075,000 Fidelity National InformationServices 3.36% 21/5/2031
5,862 0.10
£200,000 Fidelity National InformationServices 3.36% 21/5/2031
231 0.00
£4,025,000 Finance 6.25% 14/12/2026 4,784 0.08
£1,350,000 First Abu Dhabi Bank 1.375%19/2/2023
1,364 0.02
£1,815,000 Firstgroup 5.25% 29/11/2022Ø 1,833 0.03
£2,255,000 Firstgroup 6.875% 18/9/2024 2,426 0.04
£2,317,000 Firstgroup 8.75% 8/4/2021 2,373 0.04
£4,329,000 Fiserv 2.25% 1/7/2025 4,598 0.08
£4,200,000 Fiserv 3% 1/7/2031 4,713 0.08
£500,000 FMS Wertmanagement 0.625%15/6/2022
504 0.01
£10,800,000 FMS Wertmanagement 0.875%14/2/2022Ø
10,908 0.19
£10,200,000 FMS Wertmanagement 1%7/9/2022Ø
10,367 0.18
£8,000,000 FMS Wertmanagement 1.125%15/9/2021
8,079 0.14
£4,500,000 FMS Wertmanagement 1.125%20/3/2023Ø
4,603 0.08
£10,700,000 FMS Wertmanagement 1.125%7/9/2023
10,987 0.19
£2,900,000 FMS Wertmanagement 1.375%7/3/2025Ø
3,040 0.05
£1,165,000 Fonterra Co-operative 9.375%4/12/2023
1,461 0.03
£2,140,000 Freshwater Finance 4.556%3/4/2036
2,766 0.05
£1,560,000 Freshwater Finance 4.607%17/10/2036
2,043 0.04
£3,556,000 Freshwater Finance 5.182%20/4/2035
4,865 0.08
£4,920,000 Friends Life 8.25% 21/4/2022 5,481 0.10
£1,890,000 Gatwick Funding 2.625%7/10/2048
1,636 0.03
£2,625,000 Gatwick Funding 2.875%5/7/2051
2,362 0.04
£2,755,000 Gatwick Funding 3.125%28/9/2041
2,681 0.05
£2,425,000 Gatwick Funding 3.25%26/2/2048
2,335 0.04
£2,850,000 Gatwick Funding 4.625%27/3/2036
3,285 0.06
iShares Corporate Bond Index Fund (UK)
Portfolio Statement (unaudited) continued
BlackRock Collective Investment Funds75

Holding orNominalValue Investment
MarketValue
£000’s
% ofTotal
NetAssets
£2,565,000 Gatwick Funding 5.25%23/1/2026
2,793 0.05
£2,061,000 Gatwick Funding 5.75%23/1/2039
2,647 0.05
£2,925,000 Gatwick Funding 6.125%2/3/2028
3,435 0.06
£3,450,000 Gatwick Funding 6.5%2/3/2043
4,896 0.09
£5,336,000 Gazprom Via Gaz Capital5.338% 25/9/2020
5,346 0.09
£1,800,000 GB Social Housing 5.193%12/2/2040
2,513 0.04
£4,505,000 GE Capital UK FundingUnlimited 4.125% 13/9/2023
4,776 0.08
£4,792,000 GE Capital UK FundingUnlimited 5.875% 18/1/2033
5,710 0.10
£3,778,000 GE Capital UK FundingUnlimited 6.25% 5/5/2038
4,734 0.08
£4,194,000 GE Capital UK FundingUnlimited 8% 14/1/2039
5,970 0.10
£4,228,000 General Electric 4.875%18/9/2037
4,175 0.07
£2,070,000 General Electric 5.25%7/12/2028Ø
2,369 0.04
£4,140,000 General Electric 5.375%18/12/2040
4,717 0.08
£3,570,000 General Electric 5.5% 7/6/2021 3,669 0.06
£1,638,000 General Electric 5.625%16/9/2031
1,877 0.03
£2,315,000 General Motors Financial2.25% 6/9/2024
2,298 0.04
£2,800,000 General Motors Financial2.35% 3/9/2025
2,774 0.05
£2,900,000 Genfinance II 6.064%21/12/2039
4,537 0.08
£6,100,000 GlaxoSmithKline Capital 1.25%12/10/2028
6,175 0.11
£5,400,000 GlaxoSmithKline Capital1.625% 12/5/2035
5,469 0.10
£4,350,000 GlaxoSmithKline Capital3.375% 20/12/2027
5,127 0.09
£6,579,000 GlaxoSmithKline Capital 4.25%18/12/2045
9,853 0.17
£7,910,000 GlaxoSmithKline Capital 5.25%19/12/2033
11,672 0.20
£9,045,000 GlaxoSmithKline Capital 5.25%10/4/2042
14,735 0.26
£8,477,000 GlaxoSmithKline Capital6.375% 9/3/2039
14,780 0.26
£4,050,000 Glencore Finance Europe3.125% 26/3/2026
4,249 0.07
Holding orNominalValue Investment
MarketValue
£000’s
% ofTotal
NetAssets
£3,845,000 Glencore Finance Europe 6%3/4/2022
4,117 0.07
£2,600,000 Global Switch 4.375%13/12/2022
2,791 0.05
£2,708,000 Go-Ahead 2.5% 6/7/2024Ø 2,628 0.05
£8,765,000 Goldman Sachs 3.125%25/7/2029
9,837 0.17
£6,115,000 Goldman Sachs 4.25%29/1/2026Ø
7,049 0.12
£2,360,000 Goldman Sachs 5.5%12/10/2021
2,482 0.04
£3,495,000 Goldman Sachs 6.875%18/1/2038
5,533 0.10
£3,161,000 Goldman Sachs 7.125%7/8/2025
4,068 0.07
£4,671,000 Goldman Sachs 7.25%10/4/2028
6,595 0.11
£3,100,000 Grainger 3% 3/7/2030 3,177 0.06
£3,215,000 Grainger 3.375% 24/4/2028 3,413 0.06
£1,450,000 Great Places Housing 4.75%22/10/2042
2,075 0.04
£3,494,475 Great Rolling Stock 6.5%5/4/2031
4,362 0.08
£2,633,433 Great Rolling Stock 6.875%27/7/2035
3,342 0.06
£2,100,000 Greene King Finance 3.593%15/3/2035
2,065 0.04
£1,135,740 Greene King Finance 4.0643%15/3/2035
1,164 0.02
£3,040,000 Greene King Finance 5.106%15/3/2034
3,300 0.06
£1,375,091 Greene King Finance 5.318%15/9/2031
1,509 0.03
£4,000,000 Guinness Partnership 2%22/4/2055
4,135 0.07
£2,582,000 Guinness Partnership 4%24/10/2044
3,719 0.06
£172,512 Guinness Partnership 9.125%31/1/2025
231 0.00
£3,527,016 Gwynt y Mor OFTO 2.778%17/2/2034
3,859 0.07
£3,250,000 Hammerson 3.5% 27/10/2025 2,973 0.05
£2,172,000 Hammerson 6% 23/2/2026 2,188 0.04
£1,654,000 Hammerson 7.25% 21/4/2028 1,730 0.03
£2,177,456 Harbour Funding 5.28%31/3/2044
3,026 0.05
£3,325,000 Hastings Finance 3%24/5/2025
3,572 0.06
£2,173,561 Haven Funding 8.125%30/9/2037
3,484 0.06
iShares Corporate Bond Index Fund (UK)
Portfolio Statement (unaudited) continued
BlackRock Collective Investment Funds 76

Holding orNominalValue Investment
MarketValue
£000’s
% ofTotal
NetAssets
£4,025,000 Heathrow Funding 2.75%9/8/2051
3,919 0.07
£6,193,000 Heathrow Funding 4.625%31/10/2046
8,052 0.14
£5,820,000 Heathrow Funding 5.225%15/2/2023
6,257 0.11
£6,827,000 Heathrow Funding 5.875%13/5/2043
9,878 0.17
£7,959,000 Heathrow Funding 6.45%10/12/2031
11,063 0.19
£5,854,000 Heathrow Funding 6.75%3/12/2028
7,325 0.13
£1,550,000 Heathrow Funding 7.075%4/8/2028
2,027 0.04
£5,723,000 Heathrow Funding 7.125%14/2/2024
6,447 0.11
£1,275,000 Heathrow Funding 9.2%29/3/2023
1,326 0.02
£1,423,000 Henkel & 0.875% 13/9/2022 1,433 0.03
£3,200,000 Henkel & 1% 30/9/2022 3,234 0.06
£3,500,000 Henkel & 1.25% 30/9/2026 3,602 0.06
£5,091,000 High Speed Rail Finance1 4.375% 1/11/2038
6,743 0.12
£1,161,221 Highbury Finance 7.017%20/3/2023
1,271 0.02
£2,000,000 Hiscox 2% 14/12/2022 2,013 0.04
£1,925,000 Hiscox 6.125% 24/11/2045Ø 2,124 0.04
£3,775,000 Home 3.125% 27/3/2043 4,372 0.08
£1,775,000 Housing & Care 21 3.288%8/11/2049
2,085 0.04
£650,000 Housing & Care 21 3.288%8/11/2049
764 0.01
£7,316,000 HSBC 2.175% 27/6/2023 7,438 0.13
£9,205,000 HSBC 2.256% 13/11/2026 9,507 0.17
£7,889,000 HSBC 2.625% 16/8/2028 8,411 0.15
£7,300,000 HSBC 3% 22/7/2028 7,862 0.14
£6,125,000 HSBC 3% 29/5/2030 6,598 0.12
£6,296,000 HSBC 5.75% 20/12/2027 7,716 0.13
£9,289,000 HSBC 6% 29/3/2040 12,327 0.21
£5,323,000 HSBC 6.5% 20/5/2024 6,316 0.11
£5,400,000 HSBC 6.75% 11/9/2028 7,054 0.12
£5,900,000 HSBC 7% 7/4/2038 8,551 0.15
£5,148,000 HSBC Bank 4.75% 24/3/2046 6,173 0.11
£2,788,000 HSBC Bank 5.375% 4/11/2030 3,273 0.06
£5,214,000 HSBC Bank 5.375% 22/8/2033 6,832 0.12
£1,454,000 HSBC Bank 6.25% 30/1/2041 2,019 0.04
£100,000 HSBC Bank 6.25% 30/1/2041 139 0.00
£2,572,000 HSBC Bank 6.5% 7/7/2023 2,928 0.05
Holding orNominalValue Investment
MarketValue
£000’s
% ofTotal
NetAssets
£5,836,000 HSBC Bank Capital FundingSterling 1 LP 5.844% Perpetual5/11/2168
8,097 0.14
£2,550,000 Hutchison Whampoa FinanceUK 5.625% 24/11/2026
3,233 0.06
£5,275,000 Hyde Housing Association1.75% 18/8/2055
4,736 0.08
£1,495,000 Hyde Housing Association5.125% 23/7/2040
2,240 0.04
£4,600,000 Iberdrola Finanzas 7.375%29/1/2024
5,613 0.10
£4,085,000 Imperial Brands Finance4.875% 7/6/2032
4,890 0.09
£4,260,000 Imperial Brands Finance 5.5%28/9/2026
5,129 0.09
£5,485,000 Imperial Brands Finance8.125% 15/3/2024
6,717 0.12
£8,425,000 Imperial Brands Finance 9%17/2/2022
9,414 0.16
£2,251,000 Incommunities Treasury 3.25%21/3/2049
2,906 0.05
£5,275,000 Industrial & Commercial Bankof China Ltd/London 1.5%31/7/2022
5,325 0.09
£3,375,000 Informa 3.125% 5/7/2026 3,424 0.06
£8,400,000 ING Groep 3% 18/2/2026 9,164 0.16
£5,000,000 innogy Finance 4.75%31/1/2034
6,654 0.12
£3,250,000 innogy Finance 5.5% 6/7/2022 3,535 0.06
£3,637,000 innogy Finance 5.625%6/12/2023
4,202 0.07
£8,750,000 innogy Finance 6.125%6/7/2039
14,128 0.25
£5,728,000 innogy Finance 6.25%3/6/2030
8,060 0.14
£4,369,000 innogy Finance 6.5%20/4/2021
4,525 0.08
£1,880,582 Integrated AccommodationServices 6.48% 31/3/2029
2,320 0.04
£3,800,000 Inter-American DevelopmentBank 0.5% 15/9/2026Ø
3,830 0.07
£2,765,000 Inter-American DevelopmentBank 0.625% 15/12/2021
2,781 0.05
£3,500,000 Inter-American DevelopmentBank 1.25% 15/12/2022
3,584 0.06
£15,751,000 Inter-American DevelopmentBank 1.25% 15/12/2023
16,289 0.28
£10,000,000 Inter-American DevelopmentBank 1.25% 15/12/2025
10,471 0.18
£15,200,000 Inter-American DevelopmentBank 1.375% 15/12/2024
15,912 0.28
iShares Corporate Bond Index Fund (UK)
Portfolio Statement (unaudited) continued
BlackRock Collective Investment Funds77

Holding orNominalValue Investment
MarketValue
£000’s
% ofTotal
NetAssets
£495,000 Inter-American DevelopmentBank 5.25% 7/6/2021
514 0.01
£2,525,000 InterContinental Hotels 2.125%24/8/2026
2,374 0.04
£3,962,000 InterContinental Hotels 3.75%14/8/2025
4,064 0.07
£2,860,000 InterContinental Hotels 3.875%28/11/2022
2,917 0.05
£1,522,000 International Bank forReconstruction & Development0.375% 15/6/2021
1,525 0.03
£10,500,000 International Bank forReconstruction & Development0.5% 24/7/2023
10,602 0.18
£2,324,000 International Bank forReconstruction & Development0.625% 15/12/2023
2,357 0.04
£8,800,000 International Bank forReconstruction & Development0.75% 7/12/2021
8,866 0.15
£16,400,000 International Bank forReconstruction & Development0.75% 15/12/2026
16,765 0.29
£5,700,000 International Bank forReconstruction & Development0.875% 13/12/2024
5,885 0.10
£14,034,000 International Bank forReconstruction & Development1% 19/12/2022
14,301 0.25
£14,900,000 International Bank forReconstruction & Development1% 21/12/2029
15,395 0.27
£8,000,000 International Bank forReconstruction & Development1.25% 7/9/2023Ø
8,253 0.14
£939,000 International Bank forReconstruction & Development4.875% 7/12/2028
1,263 0.02
£2,667,000 International Bank forReconstruction & Development5.75% 7/6/2032
4,152 0.07
£1,725,000 International BusinessMachines 2.625% 5/8/2022
1,798 0.03
£10,905,000 International DevelopmentAssociation 0.75% 12/12/2024
11,120 0.19
£4,000,000 International Finance 0.75%22/7/2027
4,074 0.07
£2,957,000 International Finance 1.25%15/12/2023Ø
3,057 0.05
£8,696,000 International Finance 1.375%7/3/2025
9,124 0.16
Holding orNominalValue Investment
MarketValue
£000’s
% ofTotal
NetAssets
£2,625,000 Intesa Sanpaolo 2.5%15/1/2030
2,622 0.05
£1,700,000 Intesa Sanpaolo 5.25%28/1/2022
1,789 0.03
£3,256,000 Investec 4.5% 5/5/2022 3,391 0.06
£4,090,000 Investec Bank 4.25%24/7/2028
4,080 0.07
£1,687,000 Investec Bank 9.625%17/2/2022
1,845 0.03
£2,105,000 Investor 5.5% 5/5/2037 3,149 0.05
£4,350,000 Johnson & Johnson 5.5%6/11/2024
5,262 0.09
£5,885,000 JPMorgan Chase & 3.5%18/12/2026
6,849 0.12
£3,450,000 JT International FinancialServices 2.75% 28/9/2033
3,832 0.07
£5,408,522 Juturna European LoanConduit No 16 5.0636%10/8/2033
6,808 0.12
£2,979,000 Karbon Homes 3.375%15/11/2047
3,913 0.07
£3,670,000 Kennedy Wilson Europe RealEstate 3.95% 30/6/2022
3,584 0.06
£4,580,000 Koninklijke KPN 5% 18/11/2026 5,389 0.09
£6,220,000 Koninklijke KPN 5.75%17/9/2029
7,840 0.14
£22,382,000 Kreditanstalt fuerWiederaufbau 0.875%15/3/2022
22,628 0.39
£15,000,000 Kreditanstalt fuerWiederaufbau 0.875%18/7/2024
15,395 0.27
£5,000,000 Kreditanstalt fuerWiederaufbau 0.875%15/9/2026
5,158 0.09
£12,835,000 Kreditanstalt fuerWiederaufbau 1% 15/12/2022
13,080 0.23
£12,000,000 Kreditanstalt fuerWiederaufbau 1.125%7/12/2021
12,158 0.21
£13,820,000 Kreditanstalt fuerWiederaufbau 1.25%29/12/2023
14,313 0.25
£19,000,000 Kreditanstalt fuerWiederaufbau 1.375%9/12/2024Ø
19,905 0.35
£12,700,000 Kreditanstalt fuerWiederaufbau 1.375%15/12/2025Ø
13,415 0.23
iShares Corporate Bond Index Fund (UK)
Portfolio Statement (unaudited) continued
BlackRock Collective Investment Funds 78

Holding orNominalValue Investment
MarketValue
£000’s
% ofTotal
NetAssets
£2,511,000 Kreditanstalt fuerWiederaufbau 4.875%15/3/2037
4,006 0.07
£1,504,000 Kreditanstalt fuerWiederaufbau 5% 10/9/2024
1,792 0.03
£5,032,000 Kreditanstalt fuerWiederaufbau 5% 9/6/2036
8,071 0.14
£5,367,000 Kreditanstalt fuerWiederaufbau 5.5%18/6/2025Ø
6,703 0.12
£17,600,000 Kreditanstalt fuerWiederaufbau 5.55% 7/6/2021
18,332 0.32
£13,272,000 Kreditanstalt fuerWiederaufbau 5.75%7/6/2032Ø
20,690 0.36
£26,923,000 Kreditanstalt fuerWiederaufbau 6% 7/12/2028
38,661 0.67
£2,540,000 LafargeHolcim Sterling FinanceNetherlands 3% 12/5/2032Ø
2,780 0.05
£4,375,000 Land Capital Markets 1.974%8/2/2026Ø
4,488 0.08
£3,075,000 Land Capital Markets 2.375%29/3/2029
3,246 0.06
£3,950,000 Land Capital Markets 2.399%8/2/2031
4,191 0.07
£2,610,000 Land Capital Markets 2.625%22/9/2039Ø
2,805 0.05
£4,136,000 Land Capital Markets 2.75%22/9/2059
4,552 0.08
£3,300,000 Landesbank Baden-Wuerttemberg 1.5% 3/2/2025
3,379 0.06
£6,200,000 Landeskreditbank Baden-Wuerttemberg Foerderbank0.375% 9/12/2024
6,216 0.11
£3,022,000 Landeskreditbank Baden-Wuerttemberg Foerderbank0.875% 7/3/2022
3,047 0.05
£2,798,000 Landeskreditbank Baden-Wuerttemberg Foerderbank1.375% 15/12/2023
2,896 0.05
£2,000,000 LandwirtschaftlicheRentenbank 0.625%15/12/2022
2,020 0.04
£4,000,000 LandwirtschaftlicheRentenbank 0.875%15/12/2026
4,114 0.07
£5,488,000 LandwirtschaftlicheRentenbank 1.125%12/5/2021Ø
5,524 0.10
Holding orNominalValue Investment
MarketValue
£000’s
% ofTotal
NetAssets
£6,470,000 LandwirtschaftlicheRentenbank 1.125%15/12/2023Ø
6,665 0.12
£5,000,000 LandwirtschaftlicheRentenbank 1.375%16/12/2024
5,233 0.09
£3,791,000 LandwirtschaftlicheRentenbank 1.375% 8/9/2025
3,988 0.07
£3,500,000 LandwirtschaftlicheRentenbank 1.375% 8/9/2025Ø
3,680 0.06
£9,292,000 LCR Finance 4.5% 7/12/2028 12,150 0.21
£3,829,000 LCR Finance 4.5% 7/12/2038 6,018 0.10
£8,985,000 LCR Finance 5.1% 7/3/2051 17,876 0.31
£4,900,000 Legal & General 3.75%26/11/2049
5,086 0.09
£4,100,000 Legal & General 4.5%1/11/2050
4,492 0.08
£3,163,000 Legal & General 5.125%14/11/2048
3,619 0.06
£4,827,000 Legal & General 5.375%27/10/2045
5,532 0.10
£5,228,000 Legal & General 5.5%27/6/2064
6,251 0.11
£2,600,000 Legal & General 10%23/7/2041
2,807 0.05
£3,148,000 Legal & General Finance5.875% 11/12/2031
4,580 0.08
£1,230,000 Legal & General Finance5.875% 5/4/2033
1,816 0.03
£2,395,000 Lendlease Europe Finance6.125% 12/10/2021
2,489 0.04
£1,950,000 Liberty Living Finance 2.625%28/11/2024
1,983 0.03
£3,075,000 Liberty Living Finance 3.375%28/11/2029
3,110 0.05
£1,200,000 Libra Longhurst Treasury5.125% 2/8/2038
1,719 0.03
£2,775,000 Libra Longhurst Treasury NO2 3.25% 15/5/2043
3,243 0.06
£2,183,000 Linde Finance 5.875%24/4/2023
2,489 0.04
£2,625,000 Liverpool Victoria FriendlySociety 6.5% 22/5/2043
2,897 0.05
£1,875,000 LiveWest Treasury 2.25%10/10/2043
1,996 0.03
£3,815,000 Lloyds Bank 1.75% 31/3/2022 3,896 0.07
£13,184,000 Lloyds Bank 4.875% 30/3/2027 16,616 0.29
£10,067,000 Lloyds Bank 5.125% 7/3/2025 12,074 0.21
£9,850,000 Lloyds Bank 6% 8/2/2029 13,790 0.24
£6,961,000 Lloyds Bank 6.5% 17/9/2040 12,122 0.21
iShares Corporate Bond Index Fund (UK)
Portfolio Statement (unaudited) continued
BlackRock Collective Investment Funds79

Holding orNominalValue Investment
MarketValue
£000’s
% ofTotal
NetAssets
£4,675,000 Lloyds Bank 7.5% 15/4/2024 5,769 0.10
£6,215,000 Lloyds Bank 7.625% 22/4/2025 7,926 0.14
£2,501,000 Lloyds Bank 9.625% 6/4/2023 3,007 0.05
£4,800,000 Lloyds Bank 13% Perpetual21/7/2169
8,232 0.14
£4,125,000 Lloyds Bank CorporateMarkets 1.5% 23/6/2023
4,191 0.07
£4,375,000 Lloyds Bank CorporateMarkets 1.75% 11/7/2024
4,487 0.08
£4,000,000 Lloyds Banking 1.875%15/1/2026
4,071 0.07
£11,160,000 Lloyds Banking 2.25%16/10/2024
11,633 0.20
£7,450,000 Logicor 2019-1 UK 1.875%17/11/2026
7,710 0.13
£850,000 Logicor Financing Sarl 2.75%15/1/2030Ø
849 0.01
£2,990,000 London & Quadrant HousingTrust 2.25% 20/7/2029
3,126 0.05
£2,525,000 London & Quadrant HousingTrust 2.625% 5/5/2026
2,678 0.05
£1,890,000 London & Quadrant HousingTrust 2.625% 28/2/2028
2,020 0.04
£2,060,000 London & Quadrant HousingTrust 2.75% 20/7/2057
2,267 0.04
£2,690,000 London & Quadrant HousingTrust 3.125% 28/2/2053
3,207 0.06
£1,375,000 London & Quadrant HousingTrust 3.75% 27/10/2049
1,796 0.03
£2,650,000 London & Quadrant HousingTrust 4.625% 5/12/2033
3,503 0.06
£2,250,000 London & Quadrant HousingTrust 5.486% 15/6/2042
3,491 0.06
£2,525,000 London & Quadrant HousingTrust 5.5% 27/1/2040
3,815 0.07
£565,000 London Merchant 6.5%16/3/2026
716 0.01
£2,750,000 London Power Networks2.625% 1/3/2029
3,022 0.05
£1,650,000 London Power Networks5.125% 31/3/2023
1,836 0.03
£2,082,000 London Power Networks6.125% 7/6/2027
2,733 0.05
£2,078,297 Longstone Finance 4.791%19/4/2036
2,430 0.04
£2,585,000 Longstone Finance 4.896%19/4/2036
3,063 0.05
£2,138,000 Lunar Funding I 5.75%18/10/2033
3,108 0.05
£3,365,000 LVMH Moet Hennessy LouisVuitton 1% 14/6/2022
3,391 0.06
Holding orNominalValue Investment
MarketValue
£000’s
% ofTotal
NetAssets
£5,800,000 LVMH Moet Hennessy LouisVuitton 1% 11/2/2023
5,859 0.10
£7,000,000 LVMH Moet Hennessy LouisVuitton 1.125% 11/2/2027
7,044 0.12
£2,600,000 M&G 3.875% 20/7/2049 2,731 0.05
£5,378,000 M&G 5.56% 20/7/2055 6,033 0.11
£6,175,000 M&G 5.625% 20/10/2051 7,090 0.12
£4,650,000 M&G 6.25% 20/10/2068 5,566 0.10
£5,498,000 M&G 6.34% 19/12/2063 6,717 0.12
£2,090,000 Manchester Airport Funding2.875% 31/3/2039
2,019 0.04
£2,800,000 Manchester Airport Funding2.875% 30/9/2044
2,598 0.05
£3,818,000 Manchester Airport Funding4.125% 2/4/2024
4,084 0.07
£3,805,000 Manchester Airport Funding4.75% 31/3/2034
4,570 0.08
£1,365,000 Marston’s Issuer 5.1774%15/7/2032
1,374 0.02
£3,610,000 Martlet Homes 3% 9/5/2052 4,329 0.08
£3,000,000 MassMutual Global Funding II1.375% 15/12/2026Ø
3,106 0.05
£2,400,000 McDonald’s 2.95% 15/3/2034 2,753 0.05
£2,900,000 McDonald’s 4.125% 11/6/2054 4,235 0.07
£1,276,000 McDonald’s 5.875%23/4/2032Ø
1,852 0.03
£3,695,000 McKesson 3.125% 17/2/2029 3,953 0.07
£4,084,000 MDGH - GMTN 6.875%14/3/2026
5,210 0.09
£2,990,347 Meadowhall Finance 4.986%12/7/2037
3,613 0.06
£1,472,490 Meadowhall Finance 4.988%12/7/2037
1,809 0.03
£603,000 Mercantile Investment Trust6.125% 25/2/2030
825 0.01
£1,925,000 Merseylink Issuer 3.842%31/3/2043
2,722 0.05
£3,795,000 MetLife 5.375% 9/12/2024 4,474 0.08
£2,150,000 Metropolitan Funding 4.125%5/4/2048
2,716 0.05
£5,320,000 Metropolitan Life GlobalFunding I 1.125% 15/12/2021
5,366 0.09
£615,000 Metropolitan Life GlobalFunding I 1.625% 9/6/2022
625 0.01
£4,150,000 Metropolitan Life GlobalFunding I 1.625% 21/9/2029
4,296 0.07
£3,735,000 Metropolitan Life GlobalFunding I 2.625% 5/12/2022
3,894 0.07
£2,290,000 Metropolitan Life GlobalFunding I 2.875% 11/1/2023
2,405 0.04
iShares Corporate Bond Index Fund (UK)
Portfolio Statement (unaudited) continued
BlackRock Collective Investment Funds 80

Holding orNominalValue Investment
MarketValue
£000’s
% ofTotal
NetAssets
£5,060,000 Metropolitan Life GlobalFunding I 3.5% 30/9/2026
5,826 0.10
£815,647 Mitchells & Butlers Finance5.574% 15/12/2030
881 0.02
£359,539 Mitchells & Butlers Finance5.965% 15/12/2025
368 0.01
£2,549,508 Mitchells & Butlers Finance6.013% 15/12/2030
2,700 0.05
£8,124,000 Morgan Stanley 2.625%9/3/2027
8,830 0.15
£2,850,000 Morhomes 3.4% 19/2/2038 3,239 0.06
£2,900,000 Motability Operations 1.75%3/7/2029
3,055 0.05
£3,455,000 Motability Operations 2.375%14/3/2032
3,836 0.07
£4,425,000 Motability Operations 2.375%3/7/2039
4,926 0.09
£5,101,000 Motability Operations 3.625%10/3/2036
6,580 0.11
£2,625,000 Motability Operations 3.75%16/7/2026
3,054 0.05
£3,190,000 Motability Operations 4.375%8/2/2027Ø
3,869 0.07
£2,308,000 Motability Operations 5.375%28/6/2022
2,505 0.04
£1,540,000 Motability Operations 5.625%29/11/2030Ø
2,189 0.04
£3,500,000 MuenchenerRueckversicherungs-Gesellschaft in Muenchen6.625% 26/5/2042
3,823 0.07
£3,915,000 National Australia Bank 1.125%10/11/2021
3,951 0.07
£2,215,000 National Australia Bank 1.375%27/6/2022Ø
2,247 0.04
£2,325,000 National Australia Bank 3%4/9/2026
2,632 0.05
£3,745,000 National Australia Bank 5.125%9/12/2021
3,970 0.07
£2,150,000 National Express 2.375%20/11/2028Ø
2,078 0.04
£3,365,000 National Express 2.5%11/11/2023
3,402 0.06
£2,400,000 National Grid ElectricityTransmission 1.125% 7/7/2028
2,415 0.04
£1,525,000 National Grid ElectricityTransmission 1.375%16/9/2026
1,578 0.03
£3,375,000 National Grid ElectricityTransmission 2% 16/9/2038
3,565 0.06
Holding orNominalValue Investment
MarketValue
£000’s
% ofTotal
NetAssets
£4,275,000 National Grid ElectricityTransmission 2% 17/4/2040
4,471 0.08
£3,475,000 National Grid ElectricityTransmission 2.75% 6/2/2035
4,031 0.07
£3,870,000 National Grid ElectricityTransmission 4% 8/6/2027
4,620 0.08
£1,237,000 National Grid ElectricityTransmission 5.875% 2/2/2024
1,439 0.03
£1,925,000 National Grid Gas 1.375%7/2/2031Ø
1,954 0.03
£6,458,000 National Westminster Bank5.125% 13/1/2024
7,441 0.13
£3,620,000 National Westminster Bank6.5% 7/9/2021
3,809 0.07
£2,550,000 Nationwide Building Society1% 24/1/2023
2,573 0.04
£2,915,000 Nationwide Building Society3% 6/5/2026
3,265 0.06
£5,490,000 Nationwide Building Society3.25% 20/1/2028
6,385 0.11
£5,442,000 Nationwide Building Society5.625% 28/1/2026
6,877 0.12
£2,389,888 Nats En Route 5.25%31/3/2026
2,712 0.05
£6,118,000 Natwest 2.875% 19/9/2026 6,499 0.11
£4,750,000 Natwest 3.125% 28/3/2027 5,114 0.09
£10,375,000 Natwest 3.622% 14/8/2030 10,960 0.19
£4,602,000 Nestle 1% 11/6/2021 4,626 0.08
£3,186,000 Nestle Finance International2.25% 30/11/2023
3,390 0.06
£2,950,000 Network Rail InfrastructureFinance 3% 7/9/2023
3,196 0.06
£6,775,000 Network Rail InfrastructureFinance 4.375% 9/12/2030
9,266 0.16
£6,390,000 Network Rail InfrastructureFinance 4.75% 22/1/2024
7,361 0.13
£10,606,000 Network Rail InfrastructureFinance 4.75% 29/11/2035
16,306 0.28
£2,950,000 New York Life Global Funding1% 15/12/2021
2,971 0.05
£4,550,000 New York Life Global Funding1.25% 17/12/2026
4,686 0.08
£4,225,000 New York Life Global Funding1.625% 15/12/2023
4,368 0.08
£4,460,000 New York Life Global Funding1.75% 15/12/2022
4,587 0.08
£2,465,000 NewRiver REIT 3.5% 7/3/2028 2,166 0.04
£3,025,000 Next 3% 26/8/2025 3,091 0.05
£2,300,000 Next 3.625% 18/5/2028 2,348 0.04
£2,550,000 Next 4.375% 2/10/2026Ø 2,767 0.05
iShares Corporate Bond Index Fund (UK)
Portfolio Statement (unaudited) continued
BlackRock Collective Investment Funds81

Holding orNominalValue Investment
MarketValue
£000’s
% ofTotal
NetAssets
£1,450,000 Next 5.375% 26/10/2021 1,506 0.03
£8,033,000 NGG Finance 5.625%18/6/2073
9,245 0.16
£3,000,000 NIBC Bank 3.125% 15/11/2023 3,103 0.05
£3,165,000 NIE Finance 2.5% 27/10/2025 3,402 0.06
£3,805,000 NIE Finance 6.375% 2/6/2026 4,932 0.09
£3,510,000 Nordea Bank 2.375% 2/6/2022 3,630 0.06
£4,863,000 Nordic Investment Bank0.625% 2/11/2021Ø
4,889 0.09
£4,300,000 Nordic Investment Bank1.125% 16/3/2022
4,358 0.08
£3,380,000 Nordic Investment Bank1.125% 15/12/2022Ø
3,450 0.06
£4,686,000 Nordic Investment Bank1.125% 15/12/2023
4,822 0.08
£990,000 Nordic Investment Bank 5.2%7/6/2032
1,471 0.03
£1,410,000 Northern Electric Finance5.125% 4/5/2035Ø
2,005 0.04
£1,695,000 Northern Gas NetworksFinance 4.875% 30/6/2027
2,090 0.04
£2,655,000 Northern Gas NetworksFinance 4.875% 15/11/2035
3,740 0.07
£1,565,000 Northern Gas NetworksFinance 5.625% 23/3/2040
2,467 0.04
£820,000 Northern Powergrid 7.25%15/12/2022
942 0.02
£1,700,000 Northern Powergrid Northeast1.875% 16/6/2062
1,713 0.03
£3,475,000 Northern Powergrid Yorkshire2.25% 9/10/2059
3,846 0.07
£1,690,000 Northern Powergrid Yorkshire5.125% 4/5/2035Ø
2,403 0.04
£3,125,000 Northumbrian Water Finance1.625% 11/10/2026
3,230 0.06
£2,600,000 Northumbrian Water Finance2.375% 5/10/2027
2,805 0.05
£2,810,000 Northumbrian Water Finance5.125% 23/1/2042
4,367 0.08
£3,521,000 Northumbrian Water Finance5.625% 29/4/2033
5,172 0.09
£2,980,000 Northumbrian Water Finance6.875% 6/2/2023
3,416 0.06
£2,450,000 Notting Hill Genesis 2.875%31/1/2029Ø
2,646 0.05
£3,275,000 Notting Hill Genesis 3.25%12/10/2048
3,743 0.07
£2,000,000 Notting Hill Genesis 3.75%20/12/2032
2,355 0.04
£1,700,000 Notting Hill Genesis 4.375%20/2/2054
2,392 0.04
Holding orNominalValue Investment
MarketValue
£000’s
% ofTotal
NetAssets
£2,325,000 Notting Hill Genesis 5.25%7/7/2042
3,392 0.06
£7,200,000 NRW Bank 1% 15/6/2022 7,295 0.13
£2,000,000 NRW Bank 1.25% 15/12/2021 2,026 0.04
£3,000,000 NRW Bank 1.375% 15/12/2023 3,104 0.05
£2,067,670 Octagon Healthcare Funding5.333% 30/6/2036
2,686 0.05
£4,460,000 Oesterreichische Kontrollbank0.75% 7/3/2022
4,493 0.08
£8,000,000 Oesterreichische Kontrollbank1.125% 15/12/2022
8,165 0.14
£7,000,000 Oesterreichische Kontrollbank1.25% 15/12/2023
7,225 0.13
£909,000 Oesterreichische Kontrollbank5.75% 7/12/2028
1,273 0.02
£4,100,000 OP Corporate Bank 2.5%20/5/2022
4,250 0.07
£1,757,000 Optivo Finance 2.857%7/10/2035
2,013 0.04
£1,713,000 Optivo Finance 3.283%22/3/2048
2,105 0.04
£6,200,000 Orange 3.25% 15/1/2032 7,220 0.13
£2,120,000 Orange 5.25% 5/12/2025 2,589 0.05
£5,000,000 Orange 5.375% 22/11/2050 8,380 0.15
£3,156,000 Orange 5.625% 23/1/2034 4,607 0.08
£4,780,000 Orange 5.75% Perpetual1/4/2169
5,234 0.09
£5,175,000 Orange 5.875% Perpetual7/2/2169
5,493 0.10
£1,809,000 Orange 7.25% 10/11/2020 1,831 0.03
£4,235,000 Orange 8.125% 20/11/2028 6,465 0.11
£3,075,000 Orbit Capital 3.375% 14/6/2048 3,709 0.06
£2,975,000 Orbit Capital 3.5% 24/3/2045 3,606 0.06
£1,825,000 Orsted 2.125% 17/5/2027 1,960 0.03
£2,400,000 Orsted 2.5% 16/5/2033 2,714 0.05
£5,265,000 Orsted 4.875% 12/1/2032 7,240 0.13
£5,662,000 Orsted 5.75% 9/4/2040 9,424 0.16
£2,625,000 Pacific National Finance Pty5% 19/9/2023
2,860 0.05
£557,424 Pacific Quay Finance 5.5653%25/7/2034
710 0.01
£1,850,000 Paragon Treasury 3.625%21/1/2047
2,280 0.04
£4,350,000 Peabody Capital No 2 3.25%14/9/2048
5,317 0.09
£2,850,000 Peabody Capital No 2 4.625%12/12/2053
4,493 0.08
£2,875,000 Pearson Funding 3.75%4/6/2030
3,080 0.05
iShares Corporate Bond Index Fund (UK)
Portfolio Statement (unaudited) continued
BlackRock Collective Investment Funds 82
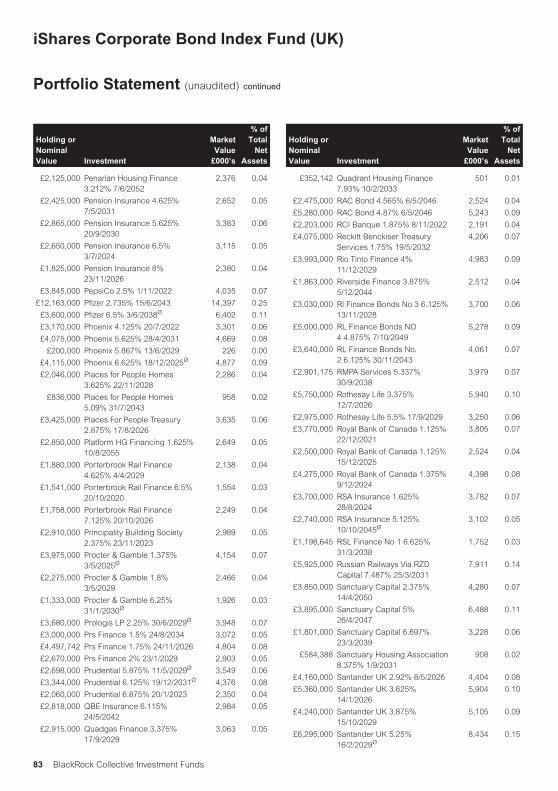
Holding orNominalValue Investment
MarketValue
£000’s
% ofTotal
NetAssets
£2,125,000 Penarian Housing Finance3.212% 7/6/2052
2,376 0.04
£2,425,000 Pension Insurance 4.625%7/5/2031
2,652 0.05
£2,865,000 Pension Insurance 5.625%20/9/2030
3,383 0.06
£2,650,000 Pension Insurance 6.5%3/7/2024
3,115 0.05
£1,825,000 Pension Insurance 8%23/11/2026
2,380 0.04
£3,845,000 PepsiCo 2.5% 1/11/2022 4,035 0.07
£12,163,000 Pfizer 2.735% 15/6/2043 14,397 0.25
£3,600,000 Pfizer 6.5% 3/6/2038Ø 6,402 0.11
£3,170,000 Phoenix 4.125% 20/7/2022 3,301 0.06
£4,075,000 Phoenix 5.625% 28/4/2031 4,669 0.08
£200,000 Phoenix 5.867% 13/6/2029 226 0.00
£4,115,000 Phoenix 6.625% 18/12/2025Ø 4,877 0.09
£2,046,000 Places for People Homes3.625% 22/11/2028
2,286 0.04
£836,000 Places for People Homes5.09% 31/7/2043
958 0.02
£3,425,000 Places For People Treasury2.875% 17/8/2026
3,635 0.06
£2,850,000 Platform HG Financing 1.625%10/8/2055
2,649 0.05
£1,880,000 Porterbrook Rail Finance4.625% 4/4/2029
2,138 0.04
£1,541,000 Porterbrook Rail Finance 6.5%20/10/2020
1,554 0.03
£1,758,000 Porterbrook Rail Finance7.125% 20/10/2026
2,249 0.04
£2,910,000 Principality Building Society2.375% 23/11/2023
2,989 0.05
£3,975,000 Procter & Gamble 1.375%3/5/2025Ø
4,154 0.07
£2,275,000 Procter & Gamble 1.8%3/5/2029
2,466 0.04
£1,333,000 Procter & Gamble 6.25%31/1/2030Ø
1,926 0.03
£3,680,000 Prologis LP 2.25% 30/6/2029Ø 3,948 0.07
£3,000,000 Prs Finance 1.5% 24/8/2034 3,072 0.05
£4,497,742 Prs Finance 1.75% 24/11/2026 4,804 0.08
£2,670,000 Prs Finance 2% 23/1/2029 2,903 0.05
£2,698,000 Prudential 5.875% 11/5/2029Ø 3,549 0.06
£3,344,000 Prudential 6.125% 19/12/2031Ø 4,376 0.08
£2,060,000 Prudential 6.875% 20/1/2023 2,350 0.04
£2,818,000 QBE Insurance 6.115%24/5/2042
2,984 0.05
£2,915,000 Quadgas Finance 3.375%17/9/2029
3,063 0.05
Holding orNominalValue Investment
MarketValue
£000’s
% ofTotal
NetAssets
£352,142 Quadrant Housing Finance7.93% 10/2/2033
501 0.01
£2,475,000 RAC Bond 4.565% 6/5/2046 2,524 0.04
£5,280,000 RAC Bond 4.87% 6/5/2046 5,243 0.09
£2,203,000 RCI Banque 1.875% 8/11/2022 2,191 0.04
£4,075,000 Reckitt Benckiser TreasuryServices 1.75% 19/5/2032
4,206 0.07
£3,993,000 Rio Tinto Finance 4%11/12/2029
4,983 0.09
£1,863,000 Riverside Finance 3.875%5/12/2044
2,512 0.04
£3,030,000 Rl Finance Bonds No 3 6.125%13/11/2028
3,700 0.06
£5,000,000 RL Finance Bonds NO4 4.875% 7/10/2049
5,278 0.09
£3,640,000 RL Finance Bonds No.2 6.125% 30/11/2043
4,061 0.07
£2,901,175 RMPA Services 5.337%30/9/2038
3,979 0.07
£5,750,000 Rothesay Life 3.375%12/7/2026
5,940 0.10
£2,975,000 Rothesay Life 5.5% 17/9/2029 3,250 0.06
£3,770,000 Royal Bank of Canada 1.125%22/12/2021
3,805 0.07
£2,500,000 Royal Bank of Canada 1.125%15/12/2025
2,524 0.04
£4,275,000 Royal Bank of Canada 1.375%9/12/2024
4,398 0.08
£3,700,000 RSA Insurance 1.625%28/8/2024
3,782 0.07
£2,740,000 RSA Insurance 5.125%10/10/2045Ø
3,102 0.05
£1,198,645 RSL Finance No 1 6.625%31/3/2038
1,752 0.03
£5,925,000 Russian Railways Via RZDCapital 7.487% 25/3/2031
7,911 0.14
£3,850,000 Sanctuary Capital 2.375%14/4/2050
4,280 0.07
£3,895,000 Sanctuary Capital 5%26/4/2047
6,488 0.11
£1,801,000 Sanctuary Capital 6.697%23/3/2039
3,228 0.06
£584,388 Sanctuary Housing Association8.375% 1/9/2031
908 0.02
£4,160,000 Santander UK 2.92% 8/5/2026 4,404 0.08
£5,360,000 Santander UK 3.625%14/1/2026
5,904 0.10
£4,240,000 Santander UK 3.875%15/10/2029
5,105 0.09
£6,295,000 Santander UK 5.25%16/2/2029Ø
8,434 0.15
iShares Corporate Bond Index Fund (UK)
Portfolio Statement (unaudited) continued
BlackRock Collective Investment Funds83

Holding orNominalValue Investment
MarketValue
£000’s
% ofTotal
NetAssets
£8,060,000 Santander UK 5.75% 2/3/2026 10,259 0.18
£2,680,000 Scania 1.875% 28/6/2022 2,692 0.05
£3,535,000 Scentre Trust 1 3.875%16/7/2026
3,811 0.07
£2,540,000 Scentre Trust 1 / Scentre Trust2 2.375% 8/4/2022
2,559 0.04
£4,275,000 Scotland Gas Networks 3.25%8/3/2027
4,804 0.08
£3,550,000 Scotland Gas Networks4.875% 21/12/2034
4,956 0.09
£3,750,000 Scottish Hydro ElectricTransmission 2.25% 27/9/2035
4,040 0.07
£1,753,000 Scottish Power UK 6.75%29/5/2023
2,042 0.04
£7,278,000 Scottish Widows 5.5%16/6/2023
7,992 0.14
£5,410,000 Scottish Widows 7% 16/6/2043 7,607 0.13
£3,140,000 Segro 2.375% 11/10/2029Ø 3,394 0.06
£3,915,000 Segro 2.875% 11/10/2037 4,482 0.08
£1,891,000 Segro 5.75% 20/6/2035Ø 2,854 0.05
£6,000 Segro 7% 14/3/2022 6 0.00
£1,800,000 Severn Trent Utilities Finance1.625% 4/12/2022
1,840 0.03
£2,475,000 Severn Trent Utilities Finance2% 2/6/2040
2,573 0.04
£4,615,000 Severn Trent Utilities Finance2.75% 5/12/2031
5,331 0.09
£5,335,000 Severn Trent Utilities Finance3.625% 16/1/2026
6,090 0.11
£2,525,000 Severn Trent Utilities Finance4.875% 24/1/2042
3,885 0.07
£1,648,000 Severn Trent Utilities Finance6.125% 26/2/2024
1,951 0.03
£3,206,000 Severn Trent Utilities Finance6.25% 7/6/2029
4,549 0.08
£1,280,000 SGSP Australia Assets Pty5.125% 11/2/2021
1,303 0.02
£3,400,000 SiemensFinancieringsmaatschappij0.875% 5/6/2023
3,437 0.06
£4,500,000 SiemensFinancieringsmaatschappij 1%20/2/2025
4,603 0.08
£2,800,000 SiemensFinancieringsmaatschappij2.75% 10/9/2025
3,113 0.05
£5,800,000 SiemensFinancieringsmaatschappij3.75% 10/9/2042
8,385 0.15
£6,995,000 Skandinaviska EnskildaBanken 1.25% 5/8/2022
7,089 0.12
Holding orNominalValue Investment
MarketValue
£000’s
% ofTotal
NetAssets
£2,475,000 Sky 4% 26/11/2029 3,069 0.05
£3,200,000 Sky 6% 21/5/2027 4,244 0.07
£2,500,000 Societe Generale 1.875%3/10/2024
2,550 0.04
£4,995,000 Society of Lloyd’s 4.75%30/10/2024
5,356 0.09
£2,090,000 Society of Lloyd’s 4.875%7/2/2047Ø
2,238 0.04
£1,075,000 Sodexo 1.75% 26/6/2028 1,086 0.02
£775,000 South East Water Finance5.5834% 29/3/2029
991 0.02
£2,860,000 South Eastern Power Networks5.5% 5/6/2026
3,537 0.06
£2,175,000 South Eastern Power Networks5.625% 30/9/2030
3,008 0.05
£3,601,000 South Eastern Power Networks6.375% 12/11/2031
5,426 0.09
£2,706,000 Southern Electric PowerDistribution 4.625% 20/2/2037Ø
3,761 0.07
£3,066,000 Southern Electric PowerDistribution 5.5% 7/6/2032
4,362 0.08
£3,365,000 Southern Gas Networks 2.5%3/2/2025
3,607 0.06
£1,255,000 Southern Gas Networks 3.1%15/9/2036
1,480 0.03
£1,875,000 Southern Gas Networks4.875% 5/10/2023
2,108 0.04
£1,540,000 Southern Gas Networks4.875% 21/3/2029Ø
1,988 0.03
£2,775,000 Southern Gas Networks6.375% 15/5/2040
4,778 0.08
£2,775,000 Southern Housing 3.5%19/10/2047
3,427 0.06
£2,200,000 Southern Water ServicesFinance 2.375% 28/5/2028
2,245 0.04
£2,375,000 Southern Water ServicesFinance 3% 28/5/2037
2,447 0.04
£2,565,000 Southern Water ServicesFinance 4.5% 31/3/2052
3,977 0.07
£2,587,000 Southern Water ServicesFinance 5% 31/3/2021
2,647 0.05
£950,000 Southern Water ServicesFinance 5% 31/3/2041
1,404 0.02
£520,000 Southern Water ServicesFinance 5.125% 30/9/2056
908 0.02
£3,348,000 Southern Water ServicesFinance 6.192% 31/3/2029
4,575 0.08
£4,527,000 Southern Water ServicesFinance 6.64% 31/3/2026
5,640 0.10
£2,580,000 Sovereign Housing Capital2.375% 4/11/2048
2,876 0.05
iShares Corporate Bond Index Fund (UK)
Portfolio Statement (unaudited) continued
BlackRock Collective Investment Funds 84

Holding orNominalValue Investment
MarketValue
£000’s
% ofTotal
NetAssets
£2,858,000 Sovereign Housing Capital4.768% 1/6/2043
4,432 0.08
£830,000 Sovereign Housing Capital5.705% 10/9/2039Ø
1,362 0.02
£3,780,000 SP Distribution 5.875%17/7/2026
4,781 0.08
£3,225,000 SP Manweb 4.875% 20/9/2027 4,008 0.07
£2,575,000 SP Transmission 2%13/11/2031
2,727 0.05
£1,730,000 SpareBank 1 Boligkreditt1.75% 18/12/2023
1,793 0.03
£2,350,000 SSE 3.625% 16/9/2077 2,403 0.04
£4,350,000 SSE 3.74% Perpetual14/4/2169
4,524 0.08
£2,550,000 SSE 4.25% 14/9/2021 2,646 0.05
£2,006,000 SSE 5.875% 22/9/2022 2,221 0.04
£2,910,000 SSE 6.25% 27/8/2038 4,777 0.08
£4,868,000 SSE 8.375% 20/11/2028 7,444 0.13
£3,115,000 Stagecoach 4% 29/9/2025 3,114 0.05
£4,771,000 Standard Chartered 4.375%18/1/2038
6,418 0.11
£4,601,000 Standard Chartered 5.125%6/6/2034
5,288 0.09
£1,900,000 Suez 5.375% 2/12/2030 2,606 0.05
£1,823,000 Sunderland SHG Finance6.38% 31/3/2042
2,630 0.05
£2,100,000 Svensk Exportkredit 1.375%15/12/2022
2,152 0.04
£3,000,000 Svensk Exportkredit 1.375%15/12/2023
3,099 0.05
£2,855,000 Svenska Handelsbanken1.625% 18/6/2022
2,915 0.05
£2,500,000 Svenska Handelsbanken1.625% 15/12/2023Ø
2,595 0.05
£2,990,000 Svenska Handelsbanken2.375% 18/1/2022
3,070 0.05
£1,840,000 Svenska Handelsbanken2.75% 5/12/2022
1,936 0.03
£2,575,000 Swan Housing Capital 3.625%5/3/2048
2,875 0.05
£2,565,000 Swedbank 1.25% 29/12/2021 2,594 0.05
£4,590,000 Swedbank 1.625% 28/12/2022 4,716 0.08
£3,510,000 Swedbank Hypotek 1.125%7/12/2021
3,535 0.06
£724,909 TC Dudgeon Ofto 3.158%12/11/2038
839 0.01
£5,650,000 Telefonica Emisiones 5.289%9/12/2022
6,220 0.11
£4,863,000 Telefonica Emisiones 5.375%2/2/2026
5,908 0.10
Holding orNominalValue Investment
MarketValue
£000’s
% ofTotal
NetAssets
£2,600,000 Telefonica Emisiones 5.445%8/10/2029
3,419 0.06
£2,795,585 Telereal Secured Finance4.01% 10/12/2033
3,046 0.05
£1,161,660 Telereal Securitisation 4.9741%10/12/2033
1,315 0.02
£1,855,774 Telereal Securitisation 5.3887%10/12/2033
2,241 0.04
£1,471,822 Telereal Securitisation 5.4252%10/12/2033
1,764 0.03
£1,156,403 Telereal Securitisation 5.5534%10/12/2033
1,390 0.02
£769,521 Telereal Securitisation 5.9478%10/12/2033
937 0.02
£2,640,120 Telereal Securitisation 6.1645%10/12/2033
3,301 0.06
£1,200,000 Temasek Financial I 4.625%26/7/2022
1,294 0.02
£4,165,000 Temasek Financial I 5.125%26/7/2040
6,906 0.12
£1,372,000 Tesco 6.125% 24/2/2022 1,473 0.03
£4,750,000 Tesco Corporate TreasuryServices 2.5% 2/5/2025
5,027 0.09
£4,324,000 Tesco Corporate TreasuryServices 2.75% 27/4/2030
4,573 0.08
£2,525,000 Tesco Personal Finance 3.5%25/7/2025
2,640 0.05
£2,896,538 Tesco Property Finance1 7.6227% 13/7/2039
4,309 0.08
£4,081,410 Tesco Property Finance2 6.0517% 13/10/2039
5,437 0.09
£6,996,676 Tesco Property Finance3 5.744% 13/4/2040
9,310 0.16
£5,227,596 Tesco Property Finance4 5.8006% 13/10/2040
7,009 0.12
£1,958,665 Tesco Property Finance5 5.6611% 13/10/2041
2,611 0.05
£7,663,812 Tesco Property Finance6 5.4111% 13/7/2044
10,078 0.18
£1,275,000 Thames Water Utilities Finance1.875% 24/1/2024
1,311 0.02
£3,025,000 Thames Water Utilities Finance2.375% 22/4/2040
3,096 0.05
£1,775,000 Thames Water Utilities Finance2.625% 24/1/2032
1,917 0.03
£2,500,000 Thames Water Utilities Finance3.5% 25/2/2028
2,833 0.05
£4,290,000 Thames Water Utilities Finance4% 19/6/2025
4,864 0.08
£2,000,000 Thames Water Utilities Finance4.375% 3/7/2034
2,571 0.04
iShares Corporate Bond Index Fund (UK)
Portfolio Statement (unaudited) continued
BlackRock Collective Investment Funds85

Holding orNominalValue Investment
MarketValue
£000’s
% ofTotal
NetAssets
£4,400,000 Thames Water Utilities Finance4.625% 4/6/2046
6,325 0.11
£4,999,000 Thames Water Utilities Finance5.125% 28/9/2037
7,087 0.12
£4,483,000 Thames Water Utilities Finance5.5% 11/2/2041
6,800 0.12
£1,500,000 Thames Water Utilities Finance6.5% 9/2/2032
2,212 0.04
£3,270,000 Thames Water Utilities Finance6.75% 16/11/2028
4,560 0.08
£2,760,000 Thames Water Utilities Finance7.738% 9/4/2058
5,734 0.10
£904,000 THFC Funding No 1 5.125%21/12/2037
1,297 0.02
£2,389,000 THFC Funding No 2 6.35%8/7/2041
3,993 0.07
£11,081,000 THFC Funding No 3 5.2%11/10/2043
17,298 0.30
£5,151,000 Time Warner Cable 5.25%15/7/2042
6,548 0.11
£5,043,000 Time Warner Cable 5.75%2/6/2031
6,401 0.11
£2,202,000 Together Housing Finance4.5% 17/12/2042
3,215 0.06
£1,800,000 Toronto-Dominion Bank/The 1%13/12/2021
1,812 0.03
£2,561,000 Total Capital International1.25% 16/12/2024
2,648 0.05
£3,900,000 Total Capital International1.405% 3/9/2031
4,020 0.07
£4,300,000 Total Capital International1.66% 22/7/2026
4,529 0.08
£2,611,000 Total Capital International1.75% 7/7/2025Ø
2,751 0.05
£2,191,000 Total Capital International2.25% 9/6/2022
2,258 0.04
£2,740,000 Toyota Finance Australia1.625% 11/7/2022
2,789 0.05
£2,995,000 Toyota Motor Credit 1%27/9/2022
3,019 0.05
£2,675,000 Toyota Motor Credit 1.125%7/9/2021
2,692 0.05
£2,750,000 Toyota Motor FinanceNetherlands 1.375% 23/5/2023
2,804 0.05
£4,335,000 TP ICAP 5.25% 26/1/2024Ø 4,691 0.08
£2,025,000 TP ICAP 5.25% 29/5/2026Ø 2,252 0.04
£1,819,203 Trafford Centre Finance 6.5%28/7/2033
2,362 0.04
£4,990,000 Transport for London 2.125%24/4/2025
5,308 0.09
Holding orNominalValue Investment
MarketValue
£000’s
% ofTotal
NetAssets
£3,040,000 Transport for London 2.25%9/8/2022
3,133 0.05
£2,799,000 Transport for London 3.625%15/5/2045
3,810 0.07
£3,825,000 Transport for London 3.875%23/7/2042
5,291 0.09
£2,725,000 Transport for London 4%12/9/2033
3,589 0.06
£4,990,000 Transport for London 4%7/4/2064
8,249 0.14
£1,175,000 Transport for London 4.5%31/3/2031
1,435 0.03
£1,765,000 Transport for London 5%31/3/2035
2,394 0.04
£2,110,000 Tritax Big Box REIT 2.625%14/12/2026
2,264 0.04
£2,000,000 Tritax Big Box REIT 3.125%14/12/2031Ø
2,227 0.04
£2,795,000 TSB Banking 5.75% 6/5/2026 2,819 0.05
£2,265,000 Unilever 1.125% 3/2/2022 2,294 0.04
£4,350,000 Unilever 1.375% 15/9/2024Ø 4,534 0.08
£3,500,000 Unilever 1.5% 22/7/2026 3,702 0.06
£1,400,000 Unilever 1.875% 15/9/2029Ø 1,530 0.03
£2,200,000 UNITE 3.5% 15/10/2028 2,280 0.04
£3,000,000 UNITE USAF II 3.374%30/6/2028
3,113 0.05
£3,010,000 UNITE USAF II 3.921%30/6/2030
3,275 0.06
£3,850,000 United Parcel Service 5.125%12/2/2050
6,369 0.11
£855,000 United Utilities Water 5%28/2/2035Ø
1,247 0.02
£3,030,000 United Utilities Water 5.625%20/12/2027Ø
4,021 0.07
£2,400,000 United Utilities Water 5.75%25/3/2022
2,596 0.05
£2,500,000 United Utilities Water Finance1.75% 10/2/2038
2,535 0.04
£2,450,000 United Utilities Water Finance1.875% 3/6/2042
2,499 0.04
£5,050,000 United Utilities Water Finance2% 14/2/2025
5,342 0.09
£2,625,000 United Utilities Water Finance2% 3/7/2033
2,832 0.05
£5,025,000 United Utilities Water Finance2.625% 12/2/2031
5,717 0.10
£2,285,000 University of Leeds 3.125%19/12/2050
3,030 0.05
£1,000,000 University of Leeds 3.125%19/12/2050
1,328 0.02
iShares Corporate Bond Index Fund (UK)
Portfolio Statement (unaudited) continued
BlackRock Collective Investment Funds 86

Holding orNominalValue Investment
MarketValue
£000’s
% ofTotal
NetAssets
£1,955,000 University of Liverpool 3.375%25/6/2055
2,953 0.05
£2,288,000 University of Manchester4.25% 4/7/2053Ø
3,911 0.07
£8,756,000 University of Oxford 2.544%8/12/2117
12,123 0.21
£2,860,000 University of Southampton2.25% 11/4/2057
3,306 0.06
£2,776,003 UPP Bond 1 Issuer 4.9023%28/2/2040
3,330 0.06
£6,773,000 Vattenfall 6.875% 15/4/2039 12,239 0.21
£5,650,000 Veolia Environnement 6.125%29/10/2037
9,300 0.16
£4,625,000 Verizon Communications1.875% 19/9/2030
4,814 0.08
£4,300,000 Verizon Communications 2.5%8/4/2031
4,749 0.08
£4,250,000 Verizon Communications3.125% 2/11/2035
5,076 0.09
£9,197,000 Verizon Communications3.375% 27/10/2036
11,281 0.20
£3,611,000 Verizon Communications4.073% 18/6/2024
4,081 0.07
£2,660,000 Verizon Communications4.75% 17/2/2034
3,644 0.06
£2,425,000 Vicinity Centres Trust 3.375%7/4/2026
2,539 0.04
£2,600,000 Vinci 2.25% 15/3/2027 2,771 0.05
£3,600,000 Vinci 2.75% 15/9/2034Ø 4,068 0.07
£2,550,000 Virgin Money UK 3.125%22/6/2025
2,541 0.04
£3,220,000 Virgin Money UK 3.375%24/4/2026
3,225 0.06
£4,575,000 Virgin Money UK 4% 25/9/2026 4,713 0.08
£2,175,000 Virgin Money UK 4% 3/9/2027 2,232 0.04
£8,485,000 Vodafone 3% 12/8/2056 9,116 0.16
£7,246,000 Vodafone 3.375% 8/8/2049 8,305 0.14
£1,423,000 Vodafone 5.625% 4/12/2025Ø 1,768 0.03
£3,803,000 Vodafone 5.9% 26/11/2032 5,577 0.10
£3,770,000 Volkswagen Financial Services1.5% 12/4/2021
3,775 0.07
£2,600,000 Volkswagen Financial Services1.625% 9/6/2022Ø
2,620 0.05
£2,900,000 Volkswagen Financial Services1.625% 30/11/2022
2,929 0.05
£1,200,000 Volkswagen Financial Services1.625% 10/2/2024
1,213 0.02
£1,890,000 Volkswagen Financial Services1.75% 12/9/2022Ø
1,915 0.03
Holding orNominalValue Investment
MarketValue
£000’s
% ofTotal
NetAssets
£3,900,000 Volkswagen Financial Services1.875% 7/9/2021
3,929 0.07
£4,700,000 Volkswagen Financial Services1.875% 3/12/2024
4,775 0.08
£2,100,000 Volkswagen Financial Services2.125% 27/6/2024
2,156 0.04
£2,252,000 Volkswagen Financial Services2.25% 12/4/2025
2,327 0.04
£3,300,000 Volkswagen Financial Services2.75% 10/7/2023
3,446 0.06
£3,100,000 Volkswagen Financial Services4.25% 9/10/2025
3,498 0.06
£3,400,000 Volkswagen InternationalFinance 3.375% 16/11/2026
3,727 0.07
£3,800,000 Volkswagen InternationalFinance 4.125% 17/11/2031
4,450 0.08
£2,900,000 Wales & West Utilities Finance1.875% 28/5/2041
2,916 0.05
£3,565,000 Wales & West Utilities Finance3% 3/8/2038
4,279 0.07
£2,050,000 Wales & West Utilities Finance4.625% 13/12/2023
2,312 0.04
£1,824,000 Wales & West Utilities Finance5.75% 29/3/2030
2,546 0.04
£2,450,000 Walgreens Boots Alliance 3.6%20/11/2025
2,597 0.05
£1,893,000 Walmart 4.875% 19/1/2039Ø 2,975 0.05
£8,955,000 Walmart 5.25% 28/9/2035 13,940 0.24
£8,753,000 Walmart 5.625% 27/3/2034 13,567 0.24
£3,170,000 Walmart 5.75% 19/12/2030 4,659 0.08
£6,429,000 Wellcome Trust 2.517%7/2/2118
9,023 0.16
£3,790,000 Wellcome Trust 4% 9/5/2059 6,862 0.12
£3,688,000 Wellcome Trust Finance4.625% 25/7/2036
5,712 0.10
£2,380,000 Wellcome Trust Finance 4.75%28/5/2021
2,457 0.04
£4,604,000 Wells Fargo 1.375% 30/6/2022 4,649 0.08
£7,064,000 Wells Fargo & 2% 28/7/2025 7,357 0.13
£5,520,000 Wells Fargo & 2.125%22/4/2022
5,640 0.10
£5,925,000 Wells Fargo & 2.125%20/12/2023
6,146 0.11
£3,900,000 Wells Fargo & 2.125%24/9/2031
4,028 0.07
£5,350,000 Wells Fargo & 2.5% 2/5/2029 5,703 0.10
£4,560,000 Wells Fargo & 3.5% 12/9/2029 5,230 0.09
£7,697,000 Wells Fargo & 4.625%2/11/2035
10,430 0.18
iShares Corporate Bond Index Fund (UK)
Portfolio Statement (unaudited) continued
BlackRock Collective Investment Funds87
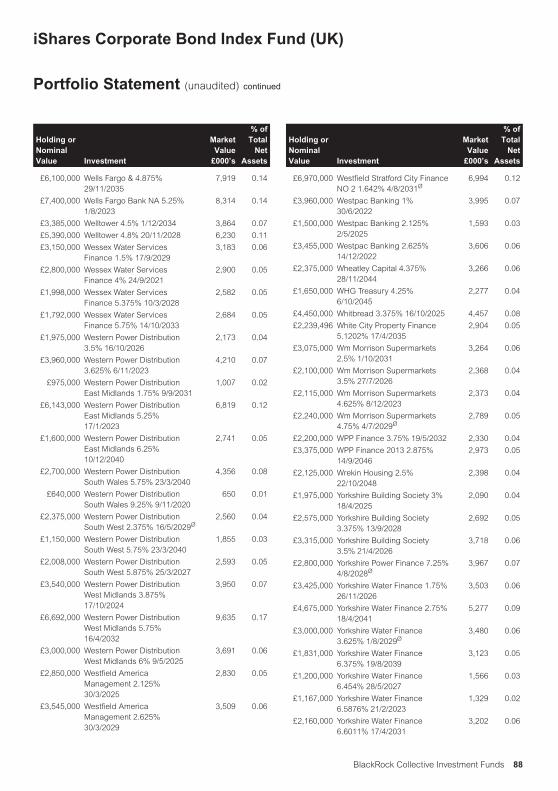
Holding orNominalValue Investment
MarketValue
£000’s
% ofTotal
NetAssets
£6,100,000 Wells Fargo & 4.875%29/11/2035
7,919 0.14
£7,400,000 Wells Fargo Bank NA 5.25%1/8/2023
8,314 0.14
£3,385,000 Welltower 4.5% 1/12/2034 3,864 0.07
£5,390,000 Welltower 4.8% 20/11/2028 6,230 0.11
£3,150,000 Wessex Water ServicesFinance 1.5% 17/9/2029
3,183 0.06
£2,800,000 Wessex Water ServicesFinance 4% 24/9/2021
2,900 0.05
£1,998,000 Wessex Water ServicesFinance 5.375% 10/3/2028
2,582 0.05
£1,792,000 Wessex Water ServicesFinance 5.75% 14/10/2033
2,684 0.05
£1,975,000 Western Power Distribution3.5% 16/10/2026
2,173 0.04
£3,960,000 Western Power Distribution3.625% 6/11/2023
4,210 0.07
£975,000 Western Power DistributionEast Midlands 1.75% 9/9/2031
1,007 0.02
£6,143,000 Western Power DistributionEast Midlands 5.25%17/1/2023
6,819 0.12
£1,600,000 Western Power DistributionEast Midlands 6.25%10/12/2040
2,741 0.05
£2,700,000 Western Power DistributionSouth Wales 5.75% 23/3/2040
4,356 0.08
£640,000 Western Power DistributionSouth Wales 9.25% 9/11/2020
650 0.01
£2,375,000 Western Power DistributionSouth West 2.375% 16/5/2029Ø
2,560 0.04
£1,150,000 Western Power DistributionSouth West 5.75% 23/3/2040
1,855 0.03
£2,008,000 Western Power DistributionSouth West 5.875% 25/3/2027
2,593 0.05
£3,540,000 Western Power DistributionWest Midlands 3.875%17/10/2024
3,950 0.07
£6,692,000 Western Power DistributionWest Midlands 5.75%16/4/2032
9,635 0.17
£3,000,000 Western Power DistributionWest Midlands 6% 9/5/2025
3,691 0.06
£2,850,000 Westfield AmericaManagement 2.125%30/3/2025
2,830 0.05
£3,545,000 Westfield AmericaManagement 2.625%30/3/2029
3,509 0.06
Holding orNominalValue Investment
MarketValue
£000’s
% ofTotal
NetAssets
£6,970,000 Westfield Stratford City FinanceNO 2 1.642% 4/8/2031Ø
6,994 0.12
£3,960,000 Westpac Banking 1%30/6/2022
3,995 0.07
£1,500,000 Westpac Banking 2.125%2/5/2025
1,593 0.03
£3,455,000 Westpac Banking 2.625%14/12/2022
3,606 0.06
£2,375,000 Wheatley Capital 4.375%28/11/2044
3,266 0.06
£1,650,000 WHG Treasury 4.25%6/10/2045
2,277 0.04
£4,450,000 Whitbread 3.375% 16/10/2025 4,457 0.08
£2,239,496 White City Property Finance5.1202% 17/4/2035
2,904 0.05
£3,075,000 Wm Morrison Supermarkets2.5% 1/10/2031
3,264 0.06
£2,100,000 Wm Morrison Supermarkets3.5% 27/7/2026
2,368 0.04
£2,115,000 Wm Morrison Supermarkets4.625% 8/12/2023
2,373 0.04
£2,240,000 Wm Morrison Supermarkets4.75% 4/7/2029Ø
2,789 0.05
£2,200,000 WPP Finance 3.75% 19/5/2032 2,330 0.04
£3,375,000 WPP Finance 2013 2.875%14/9/2046
2,973 0.05
£2,125,000 Wrekin Housing 2.5%22/10/2048
2,398 0.04
£1,975,000 Yorkshire Building Society 3%18/4/2025
2,090 0.04
£2,575,000 Yorkshire Building Society3.375% 13/9/2028
2,692 0.05
£3,315,000 Yorkshire Building Society3.5% 21/4/2026
3,718 0.06
£2,800,000 Yorkshire Power Finance 7.25%4/8/2028Ø
3,967 0.07
£3,425,000 Yorkshire Water Finance 1.75%26/11/2026
3,503 0.06
£4,675,000 Yorkshire Water Finance 2.75%18/4/2041
5,277 0.09
£3,000,000 Yorkshire Water Finance3.625% 1/8/2029Ø
3,480 0.06
£1,831,000 Yorkshire Water Finance6.375% 19/8/2039
3,123 0.05
£1,200,000 Yorkshire Water Finance6.454% 28/5/2027
1,566 0.03
£1,167,000 Yorkshire Water Finance6.5876% 21/2/2023
1,329 0.02
£2,160,000 Yorkshire Water Finance6.6011% 17/4/2031
3,202 0.06
iShares Corporate Bond Index Fund (UK)
Portfolio Statement (unaudited) continued
BlackRock Collective Investment Funds 88

Holding orNominalValue Investment
MarketValue
£000’s
% ofTotal
NetAssets
£1,350,000 Yorkshire Water ServicesFinance 5.5% 28/5/2037
2,113 0.04
£3,035,000 Zurich Finance UK 6.625%Perpetual 2/10/2168
3,360 0.06
5,415,230 94.36
UK Sterling Denominated GovernmentBonds − 3.89%; 29.2.2020 3.18%
£4,200,000 BNG Bank 0.375%15/12/2025Ø
4,203 0.07
£2,000,000 Bpifrance Financement 0.75%22/7/2022
2,014 0.04
£800,000 Caisse des Depots etConsignations 0.5% 21/7/2023
805 0.01
£3,000,000 Caisse des Depots etConsignations 0.875%15/12/2021
3,022 0.05
£395,000 Caisse Francaise deFinancement Local 5.5%16/7/2026
507 0.01
£8,175,000 China Development Bank1.25% 21/1/2023
8,222 0.14
£8,300,000 CPPIB Capital 0.375%25/7/2023
8,308 0.15
£5,000,000 CPPIB Capital 0.875%17/12/2024
5,101 0.09
£7,000,000 CPPIB Capital 1.125%14/12/2029
7,111 0.12
£1,195,000 Development Bank of Japan1.125% 28/4/2023
1,213 0.02
£4,000,000 Export Development Canada0.875% 7/12/2021Ø
4,035 0.07
£2,900,000 Export Development Canada1.375% 8/12/2023
3,001 0.05
£140,000 Federal National MortgageAssociation 5.375% 7/6/2021
145 0.00
£3,174,000 Federal National MortgageAssociation 5.375% 7/12/2028
4,315 0.08
£1,532,000 Isle of Man GovernmentInternational Bond 5.375%14/8/2034
2,303 0.04
£2,100,000 Jersey International Bond3.75% 9/6/2054
3,205 0.06
£300,000 Kingdom of BelgiumGovernment International Bond5.7% 28/5/2032
452 0.01
£2,300,000 Kommunalbanken 1%12/12/2024
2,364 0.04
£4,500,000 Kommunalbanken 1.125%15/12/2021
4,550 0.08
Holding orNominalValue Investment
MarketValue
£000’s
% ofTotal
NetAssets
£4,960,000 Kommunalbanken 1.125%30/11/2022
5,057 0.09
£3,000,000 Kommunalbanken 1.5%15/12/2023
3,123 0.06
£2,890,000 Kommunekredit 1.375%12/10/2022Ø
2,955 0.05
£2,000,000 Korea Development Bank/The1.75% 15/12/2022
2,043 0.04
£3,000,000 Kuntarahoitus 1.25% 7/12/2022 3,068 0.05
£8,290,000 Mexico GovernmentInternational Bond 5.625%19/3/2114
8,704 0.15
£3,651,000 Mexico GovernmentInternational Bond 6.75%6/2/2024Ø
4,193 0.07
£3,550,000 NederlandseWaterschapsbank 0.25%15/12/2025
3,525 0.06
£1,700,000 NederlandseWaterschapsbank 0.875%20/12/2021Ø
1,715 0.03
£4,298,000 NederlandseWaterschapsbank 5.375%7/6/2032Ø
6,442 0.11
£5,307,000 Province of Alberta Canada1% 15/11/2021
5,352 0.09
£3,000,000 Province of Alberta Canada1.5% 15/12/2022
3,077 0.05
£3,090,000 Province of Manitoba Canada0.75% 15/12/2021
3,104 0.05
£1,900,000 Province of Manitoba Canada1.5% 15/12/2022
1,947 0.03
£8,300,000 Province of Ontario Canada0.5% 15/12/2023
8,316 0.15
£2,100,000 Province of Quebec Canada0.75% 13/12/2024
2,126 0.04
£2,700,000 Province of Quebec Canada0.875% 24/5/2022Ø
2,722 0.05
£4,090,000 Province of Quebec Canada1.5% 15/12/2023
4,235 0.07
£1,538,000 Republic of Italy GovernmentInternational Bond 5.25%7/12/2034
1,937 0.03
£12,350,000 Republic of Italy GovernmentInternational Bond 6%4/8/2028
15,473 0.27
£4,782,000 SNCF Reseau 4.83%25/3/2060
8,878 0.16
£4,717,000 SNCF Reseau 5% 11/3/2052 8,421 0.15
£6,436,000 SNCF Reseau 5.25%7/12/2028
8,607 0.15
iShares Corporate Bond Index Fund (UK)
Portfolio Statement (unaudited) continued
BlackRock Collective Investment Funds89

Holding orNominalValue Investment
MarketValue
£000’s
% ofTotal
NetAssets
£5,345,000 SNCF Reseau 5.25%31/1/2035
8,050 0.14
£5,846,000 SNCF Reseau 5.5% 1/12/2021 6,218 0.11
£4,164,000 Societe Nationale SNCF5.375% 18/3/2027
5,316 0.09
£1,598,000 Spain GovernmentInternational Bond 5.25%6/4/2029
2,027 0.04
£2,138,000 States of Guernsey Bond3.375% 12/12/2046
2,889 0.05
£1,621,000 Tennessee Valley Authority4.625% 7/6/2043
2,544 0.05
£591,000 Tennessee Valley Authority5.35% 7/6/2021
613 0.01
£2,349,000 Tennessee Valley Authority5.625% 7/6/2032
3,504 0.06
£7,500,000 United Kingdom Gilt 4.25%7/9/2039
12,127 0.21
223,184 3.89
Holding orNominalValue Investment
MarketValue
£000’s
% ofTotal
NetAssets
COLLECTIVE INVESTMENTSCHEMES − 0.53%; 29.2.2020 0.06%
Short-term Money Market Funds − 0.53%; 29.2.2020 0.06%
304,367 BlackRock ICS Sterling LiquidEnvironmentally Aware Fund -Agency Income Class†
30,440 0.53
Portfolio of investments 5,668,854 98.78
Net other assets 69,844 1.22
Total net assets 5,738,698 100.00
Unless otherwise stated, all securities are either listed on a recognised exchange or traded on aneligible securities market.Ø All or a portion of this investment represents a security on loan.† Managed by a related party.
iShares Corporate Bond Index Fund (UK)
Portfolio Statement (unaudited) continued
BlackRock Collective Investment Funds 90

£000’s31.8.2020
£000’s £000’s31.8.2019
£000’s
Income
Net capital gains 11,576 319,659
Revenue 63,601 61,056
Expenses (2,050) (2,100)
Net revenue before taxation 61,551 58,956
Taxation – –
Net revenue after taxation 61,551 58,956
Total return before distributions 73,127 378,615
Distributions (61,551) (58,956)
Change in net assetsattributable to unitholdersfrom investment activities 11,576 319,659
Statement of Change in Net Assets Attributable to Unitholders(unaudited) for the six months ended 31 August 2020
£000’s31.8.2020
£000’s £000’s31.8.2019
£000’s
Opening net assets attributableto unitholders 5,524,088 4,410,257
Amounts receivable on issue of units 680,596 788,705
Amounts payable on cancellation of units (538,427) (336,980)
142,169 451,725
Change in net assets attributable tounitholders from investment activities 11,576 319,659
Retained distribution on accumulation units 60,865 59,220
Closing net assets attributableto unitholders 5,738,698 5,240,861
The above statement shows the comparative closing net assets at 31 August 2019 whereas the current accounting period commenced 1 March 2020.
iShares Corporate Bond Index Fund (UK)
Statement of Total Return (unaudited)
for the six months ended 31 August 2020
BlackRock Collective Investment Funds91

31.8.2020£000’s
29.2.2020£000’s
Assets:
Fixed assets
− Investment assets 5,668,854 5,446,927
Current assets
− Debtors 133,906 144,382
− Cash and bank balances 2,768 2,546
Total assets 5,805,528 5,593,855
Liabilities:
Creditors
− Distributions payable (1,818) (1,521)
− Other creditors (65,012) (68,246)
Total liabilities (66,830) (69,767)
Net assets attributable to unitholders 5,738,698 5,524,088
G D Bamping (Director)M T Zemek (Director)BlackRock Fund Managers Limited29 October 2020
iShares Corporate Bond Index Fund (UK)
Balance Sheet (unaudited)
at 31 August 2020
BlackRock Collective Investment Funds 92

The Fund is a sub-fund of BlackRock Collective Investment Funds (previously known as BlackRock QualifiedInvestor Schemes (1)), a UCITS scheme under the COLL Sourcebook. The Fund was authorised by the FCA on27 October 2009 and the Fund was launched on 20 November 2009. The Fund’s FCA product reference numberis 645674.
Risk and Reward ProfileLower riskTypically lower rewards
Higher riskTypically higher rewards
Unit Class
A Accumulation 1 2 3 4 5 6 7
L Income 1 2 3 4 5 6 7
L Accumulation 1 2 3 4 5 6 7
X Income 1 2 3 4 5 6 7
X Accumulation 1 2 3 4 5 6 7
D Income 1 2 3 4 5 6 7
D Accumulation 1 2 3 4 5 6 7
H Income 1 2 3 4 5 6 7
H Accumulation 1 2 3 4 5 6 7
• The risk indicator was calculated incorporating historical or simulated historical data and may not be a reliableindication of the future risk profile of the Fund.
• The risk category shown is not guaranteed and may change over time.
• The lowest category does not mean risk free.
• The use of derivatives will impact the value of the Fund and may expose the Fund to a higher degree of risk.Derivatives are highly sensitive to changes in the value of the asset on which they are based and can increasethe size of losses and gains, resulting in greater fluctuations in the value of the Fund. The impact to the Fundcan be greater where derivatives are used in an extensive or complex way.
For more information on this, please see the Fund’s Key Investor Information Documents (“KIIDs”), which areavailable at www.blackrock.com.
iShares Emerging Markets Equity Index Fund (UK)
About the Fund
BlackRock Collective Investment Funds93
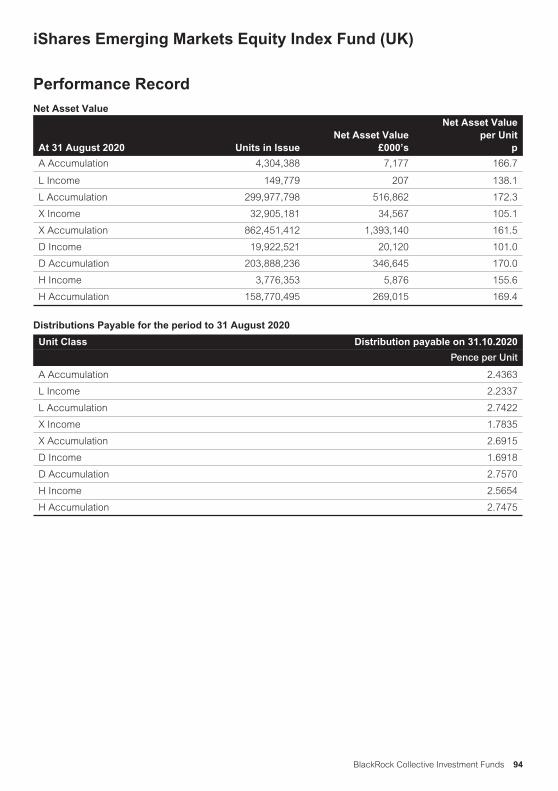
Net Asset Value
At 31 August 2020 Units in IssueNet Asset Value
£000’s
Net Asset Valueper Unit
p
A Accumulation 4,304,388 7,177 166.7
L Income 149,779 207 138.1
L Accumulation 299,977,798 516,862 172.3
X Income 32,905,181 34,567 105.1
X Accumulation 862,451,412 1,393,140 161.5
D Income 19,922,521 20,120 101.0
D Accumulation 203,888,236 346,645 170.0
H Income 3,776,353 5,876 155.6
H Accumulation 158,770,495 269,015 169.4
Distributions Payable for the period to 31 August 2020
Unit Class Distribution payable on 31.10.2020
Pence per Unit
A Accumulation 2.4363
L Income 2.2337
L Accumulation 2.7422
X Income 1.7835
X Accumulation 2.6915
D Income 1.6918
D Accumulation 2.7570
H Income 2.5654
H Accumulation 2.7475
iShares Emerging Markets Equity Index Fund (UK)
Performance Record
BlackRock Collective Investment Funds 94

Operating Charges
Unit Class1.3.2020
to 31.8.20201.3.2019
to 29.2.2020
A Accumulation 0.60% 0.62%
L Income 0.25% 0.27%
L Accumulation 0.25% 0.27%
X Income 0.05% 0.08%
X Accumulation 0.05% 0.08%
D Income 0.18% 0.17%
D Accumulation 0.17% 0.20%
H Income 0.17% 0.20%
H Accumulation 0.17% 0.20%
Operating charges are annualised and exclude portfolio trade-related costs, except costs paid to the custodian/depositary and entry/exit charges paid to an underlyingcollective investment scheme (if any).
iShares Emerging Markets Equity Index Fund (UK)
Performance Record continued
BlackRock Collective Investment Funds95

Holding orNominalValue Investment
MarketValue
£000’s
% ofTotal
NetAssets
AFRICA − 4.08%; 29.2.2020 4.89%
EQUITIES − 4.08%; 29.2.2020 4.89%
Egypt − 0.10%; 29.2.2020 0.14%
700,868 CommercialInternational Bank Egypt
2,213 0.09
151,701 Egypt Kuwait 127 0.00
351,917 ElSewedy Electric 122 0.00
625,414 Talaat Moustafa 197 0.01
159,840 Telecom Egypt 101 0.00
2,760 0.10
South Africa − 3.98%; 29.2.2020 4.75%
420,114 Absa 1,431 0.06
52,871 African RainbowMineralsØ
496 0.02
37,823 Anglo AmericanPlatinumØ
2,108 0.08
246,791 AngloGold Ashanti 5,382 0.21
219,600 Aspen Pharmacare 1,315 0.05
193,820 AVIØ 590 0.02
127,342 BarloworldØ 336 0.01
190,501 Bid 2,347 0.09
211,672 BidvestØ 1,269 0.05
43,324 Capitec Bank 1,595 0.06
149,309 Clicks 1,514 0.06
154,352 Coronation FundManagers
290 0.01
196,306 Dis-Chem PharmaciesØ 158 0.01
237,049 Discovery 1,265 0.05
36,728 DistellØ 116 0.00
161,808 Exxaro Resources 979 0.04
2,694,880 FirstRand 4,497 0.17
735,245 Fortress REIT 408 0.02
393,253 Fortress REIT 31 0.00
162,548 Foschini 540 0.02
510,595 Gold Fields 4,931 0.19
1,745,128 Growthpoint Properties 939 0.04
239,773 Harmony Gold Mining 1,169 0.05
221,583 Hyprop Investments 182 0.01
432,893 Impala Platinum 2,984 0.11
234,141 Investec 324 0.01
27,872 Kumba Iron OreØ 652 0.03
60,669 Liberty 161 0.01
842,926 Life Healthcare 615 0.02
558,363 Momentum Metropolitan 373 0.01
101,630 Motus 124 0.00
149,295 Mr PriceØ 763 0.03
Holding orNominalValue Investment
MarketValue
£000’s
% ofTotal
NetAssets
1,088,418 MTNØ 2,928 0.11
249,489 MultiChoice 1,066 0.04
249,181 Naspers 33,974 1.31
230,820 Nedbank 975 0.04
884,700 Netcare 487 0.02
117,070 Ninety One 238 0.01
209,815 Northam Platinum 1,480 0.06
2,650,862 Old Mutual 1,308 0.05
439,275 Pepkor 188 0.01
212,599 Pick n Pay Stores 391 0.02
94,417 PSG 187 0.01
436,089 Rand Merchant Investment 578 0.02
4,017,397 Redefine PropertiesØ 436 0.02
297,896 Remgro 1,155 0.04
219,385 Resilient REITØ 377 0.01
91,744 Reunert 126 0.00
637,685 RMB 35 0.00
1,057,063 Sanlam 2,562 0.10
21,225 Santam 229 0.01
282,260 Sappi 277 0.01
317,524 Sasol 1,940 0.07
281,315 Shoprite 1,370 0.05
1,313,019 Sibanye StillwaterØ 2,969 0.11
115,214 SPAR 821 0.03
748,074 Standard Bank 3,482 0.13
169,057 Telkom SOC 168 0.01
93,928 Tiger Brands 714 0.03
226,410 Truworths International 303 0.01
271,783 Tsogo Sun Gaming 44 0.00
347,053 VodacomØ 1,953 0.08
553,108 Vukile Property FundØ 120 0.00
499,700 Woolworths 699 0.03
103,464 3.98
ASIA AND PACIFIC − 78.53%; 29.2.2020 71.81%
EQUITIES − 78.53%; 29.2.2020 71.81%
China − 42.65%; 29.2.2020 34.73%
126,100 360 Security Technology 257 0.01
757,500 3SBioØ 664 0.03
16,916 51jobØ 828 0.03
59,057 58.comØ 2,442 0.09
91,900 AECC Aviation Power 447 0.02
789,500 AgileØ 814 0.03
18,478,000 Agricultural Bank of China 4,612 0.18
5,652,000 Agricultural Bank of China 1,978 0.08
166,360 Aier Eye Hospital 943 0.04
1,148,000 Air ChinaØ 591 0.02
iShares Emerging Markets Equity Index Fund (UK)
Portfolio Statement (unaudited)
at 31 August 2020
BlackRock Collective Investment Funds 96

Holding orNominalValue Investment
MarketValue
£000’s
% ofTotal
NetAssets
258,900 Air China 204 0.01
91,300 Aisino 179 0.01
1,040,612 Alibaba 223,075 8.60
190,500 A-Living Services 734 0.03
1,914,000 Aluminum of ChinaØ 350 0.01
590,400 Aluminum of China 203 0.01
730,600 Angang SteelØ 157 0.01
40,900 Angel Yeast 310 0.01
688,000 Anhui Conch CementØ 3,726 0.14
165,200 Anhui Conch Cement 1,097 0.04
156,000 Anhui ExpresswayØ 57 0.00
80,300 Anhui Gujing Distillery 761 0.03
17,800 Anhui Gujing Distillery 501 0.02
703,000 ANTA Sports ProductsØ 5,186 0.20
7,900 Asymchem Laboratories Tianjin 236 0.01
14,100 Autobio Diagnostics 248 0.01
33,871 AutohomeØ 2,030 0.08
39,500 Avary Shenzhen 211 0.01
129,200 AVIC Aircraft 341 0.01
445,299 Avic Capital 244 0.01
313,400 AVIC ElectromechanicalSystems
353 0.01
54,400 AVIC Jonhon OptronicTechnology
285 0.01
63,100 Avic Shenyang Aircraft 406 0.02
1,441,000 AviChina Industry &TechnologyØ
672 0.03
56,200 Avicopter 351 0.01
1,603,500 BAIC Motor 573 0.02
160,271 Baidu 14,903 0.57
965,100 Bank of Beijing 511 0.02
208,600 Bank of Changsha 208 0.01
45,226,936 Bank of China 11,027 0.43
3,109,600 Bank of China 1,109 0.04
4,411,655 Bank of Communications 1,722 0.07
1,621,500 Bank of Communications 836 0.03
245,000 Bank of Hangzhou 346 0.01
274,800 Bank of Jiangsu 192 0.01
391,988 Bank of Nanjing 367 0.01
232,500 Bank of Ningbo 900 0.03
679,506 Bank of Shanghai 622 0.02
947,283 Baoshan Iron & Steel 510 0.02
1,494,000 BBMG 233 0.01
760,300 BBMG 273 0.01
978,000 Beijing Capital InternationalAirportØ
516 0.02
249,200 Beijing Dabeinong Technology 309 0.01
136,400 Beijing Enlight Media 241 0.01
Holding orNominalValue Investment
MarketValue
£000’s
% ofTotal
NetAssets
828,000 Beijing Jingneng Clean Energy 164 0.01
107,000 Beijing Kunlun Tech 325 0.01
65,000 Beijing New Building Materials 232 0.01
202,000 Beijing North Star 33 0.00
100,200 Beijing Oriental YuhongWaterproof Technology
655 0.03
163,400 Beijing Originwater Technology 173 0.01
50,900 Beijing Shiji InformationTechnology
183 0.01
30,700 Beijing Shunxin Agriculture 252 0.01
59,760 Beijing Tiantan BiologicalProducts
276 0.01
67,100 Beijing Tongrentang 217 0.01
690,409 Bengang Steel Plates 104 0.00
89,822 BilibiliØ 3,168 0.12
489,320 BOE Technology 149 0.01
1,555,400 BOE Technology 933 0.04
429,500 BYDØ 3,187 0.12
83,400 BYD 773 0.03
503,500 BYD Electronic International 1,594 0.06
375,000 CAR 89 0.00
6,199,098 CGN PowerØ 1,004 0.04
18,500 Changchun High & NewTechnology Industry
943 0.04
279,700 Changjiang 260 0.01
21,200 Changzhou Xingyu AutomotiveLighting Systems
383 0.01
70,600 Chaozhou Three-Circle 215 0.01
711,000 China AoyuanØ 613 0.02
14,331 China Biologic Products 1,129 0.04
1,052,000 China BlueChemical 116 0.00
5,657,000 China Cinda Asset Management 801 0.03
5,512,754 China CITIC Bank 1,721 0.07
447,200 China CITIC Bank 254 0.01
911,801 China Coal EnergyØ 170 0.01
2,651,606 China CommunicationsConstruction
1,112 0.04
208,300 China CommunicationsConstruction
181 0.01
1,556,800 China Communications Services 762 0.03
983,000 China Conch VentureØ 3,178 0.12
55,089,930 China Construction Bank 29,092 1.12
458,100 China Construction Bank 309 0.01
148,200 China CSSC 338 0.01
233,500 China East Education 385 0.01
664,000 China Eastern AirlinesØ 205 0.01
407,500 China Eastern Airlines 224 0.01
349,500 China Enterprise 161 0.01
2,143,000 China Everbright BankØ 574 0.02
iShares Emerging Markets Equity Index Fund (UK)
Portfolio Statement (unaudited) continued
BlackRock Collective Investment Funds97

Holding orNominalValue Investment
MarketValue
£000’s
% ofTotal
NetAssets
2,034,200 China Everbright Bank 852 0.03
1,292,000 China Evergrande 2,251 0.09
700,000 China Feihe 1,058 0.04
245,050 China Fortune LandDevelopment
449 0.02
1,963,500 China GalaxyØ 882 0.03
119,200 China Galaxy 176 0.01
253,200 China Gezhouba 175 0.01
121,400 China Great Wall 184 0.01
135,900 China Greatwall Technology 262 0.01
1,352,500 China Hongqiao 652 0.03
6,287,000 China Huarong AssetManagement
539 0.02
49,180 China Huishan Dairy1 – 0.00
598,000 China International Capital 1,058 0.04
333,360 China International MarineContainersØ
254 0.01
224,100 China Jushi 363 0.01
533,000 China LessoØ 742 0.03
4,436,000 China Life InsuranceØ 8,062 0.31
215,100 China Life Insurance 1,025 0.04
138,800 China LiteratureØ 643 0.02
2,204,000 China Longyuan PowerØ 1,039 0.04
406,000 China Machinery Engineering 71 0.00
695,000 China Medical System 585 0.02
603,460 China MerchantsØ 582 0.02
329,200 China Merchants 774 0.03
98,760 China Merchants 232 0.01
2,248,996 China Merchants Bank 8,019 0.31
852,190 China Merchants Bank 3,502 0.13
250,500 China Merchants EnergyShipping
176 0.01
88,376 China Merchants ShekouIndustrial Zone
159 0.01
220,177 China Merchants ShekouIndustrial Zone
396 0.02
3,870,824 China Minsheng BankingØ 1,757 0.07
1,464,900 China Minsheng Banking 887 0.03
2,532,000 China Molybdenum 769 0.03
324,700 China Molybdenum 152 0.01
2,380,486 China National Building Material 2,500 0.10
266,000 China National ChemicalEngineering
169 0.01
70,000 China National Medicines 342 0.01
962,716 China National Nuclear Power 488 0.02
25,700 China National Software &Service
276 0.01
191,500 China Northern Rare EarthHigh-Tech
258 0.01
Holding orNominalValue Investment
MarketValue
£000’s
% ofTotal
NetAssets
1,094,000 China Oilfield Services 641 0.02
169,600 China Oilfield Services 244 0.01
1,560,400 China Pacific Insurance 3,233 0.12
259,700 China Pacific Insurance 873 0.03
14,983,600 China Petroleum & Chemical 5,169 0.20
1,409,800 China Petroleum & Chemical 620 0.02
2,450,000 China Railway 940 0.04
1,177,500 China Railway ConstructionØ 676 0.03
612,200 China Railway Construction 595 0.02
667,000 China Railway Signal &Communication
201 0.01
3,217,000 China Reinsurance 257 0.01
987,500 China ResourcesPharmaceutical
417 0.02
85,600 China Resources Sanjiu Medical& Pharmaceutical
266 0.01
126,600 China Satellite Communications 317 0.01
1,986,000 China Shenhua Energy 2,473 0.10
314,600 China Shenhua Energy 554 0.02
937,600 China Shipbuilding Industry 496 0.02
944,000 China Southern AirlinesØ 371 0.01
373,600 China Southern Airlines 238 0.01
53,500 China Spacesat 230 0.01
1,733,980 China State ConstructionEngineering
972 0.04
8,176,000 China Telecom 2,001 0.08
80,679 China Tourism Duty Free 1,830 0.07
27,826,000 China TowerØ 3,942 0.15
1,235,000 China United NetworkCommunications
698 0.03
1,137,400 China Vanke 2,642 0.10
401,710 China Vanke 1,194 0.05
584,224 China Yangtze Power 1,230 0.05
632,200 China Zheshang Bank 287 0.01
969,200 China ZhongwangØ 153 0.01
41,300 Chongqing Brewery 410 0.02
366,800 Chongqing ChanganAutomobile
146 0.01
163,900 Chongqing ChanganAutomobile
209 0.01
70,500 Chongqing Fuling Zhacai 393 0.02
1,309,000 Chongqing Rural CommercialBank
399 0.02
460,400 Chongqing Rural CommercialBank
262 0.01
50,600 Chongqing Zhifei BiologicalProducts
746 0.03
2,042,000 CIFI 1,295 0.05
2,884,000 CITIC 1,962 0.08
iShares Emerging Markets Equity Index Fund (UK)
Portfolio Statement (unaudited) continued
BlackRock Collective Investment Funds 98

Holding orNominalValue Investment
MarketValue
£000’s
% ofTotal
NetAssets
1,314,500 CITICØ 2,359 0.09
252,800 CITIC 876 0.03
187,100 CITIC 649 0.02
240,120 Citic Pacific Special Steel 473 0.02
9,438,000 CNOOC 8,013 0.31
33,500 Contemporary AmperexTechnology
753 0.03
1,119,500 Cosco Shipping 420 0.02
454,100 Cosco Shipping 269 0.01
1,127,000 Cosco Shipping DevelopmentØ 86 0.00
830,000 Cosco Shipping EnergyTransportationØ
286 0.01
4,449,333 Country GardenØ 4,120 0.16
752,635 Country Garden ServicesØ 3,920 0.15
2,595,200 CRRC 875 0.03
1,264,900 CRRC 807 0.03
566,000 CSC FinancialØ 627 0.02
49,400 CSC Financial 282 0.01
307,534 CSG 69 0.00
3,610,800 CSPC Pharmaceutical 5,992 0.23
1,288,000 Dali Foods 590 0.02
600,900 Daqin Railway 433 0.02
1,646,000 Datang International PowerGenerationØ
165 0.01
48,300 Dawning Information Industry 238 0.01
460,100 Dazhong Transportation 117 0.00
112,400 DHC Software 143 0.01
88,400 Dongfang ElectricØ 37 0.00
254,900 Dongfang Electric 278 0.01
1,588,000 Dongfeng Motor 823 0.03
150,100 Dongxing 219 0.01
368,240 East Money Information 1,050 0.04
456,100 ENN Energy 3,776 0.15
109,870 Eve Energy 587 0.02
181,400 Everbright 434 0.02
354,400 Fangda Carbon New Material 259 0.01
205,000 FAW Jiefang 315 0.01
46,100 Fiberhome TelecommunicationTechnologies
132 0.01
988,673 Focus Media InformationTechnology
813 0.03
63,600 Foshan Haitian Flavouring &Food
1,271 0.05
1,311,336 Fosun InternationalØ 1,088 0.04
362,700 Founder 347 0.01
170,600 Foxconn Industrial Internet 274 0.01
60,300 Fujian Sunner Development 177 0.01
286,400 Fuyao Glass IndustryØ 689 0.03
91,200 Fuyao Glass Industry 288 0.01
Holding orNominalValue Investment
MarketValue
£000’s
% ofTotal
NetAssets
73,500 Ganfeng Lithium 405 0.02
82,200 Ganfeng Lithium 310 0.01
5,500 G-bits Network TechnologyXiamen
371 0.01
899,800 GD Power Development 200 0.01
51,802 GDSØ 3,130 0.12
213,200 Gemdale 333 0.01
546,000 Genscript BiotechØ 787 0.03
944,800 GFØ 835 0.03
244,500 GF 431 0.02
20,860 Gigadevice SemiconductorBeijing
454 0.02
55,900 Glodon 425 0.02
154,900 GoerTek 694 0.03
7,403,000 GOME RetailØ 792 0.03
55,400 Gotion High-tech 153 0.01
1,882,250 Great Wall MotorØ 1,524 0.06
290,800 Great Wall Motor 442 0.02
248,495 Gree Electric Appliances ofZhuhai
1,476 0.06
312,000 Greenland 260 0.01
456,000 Greentown ChinaØ 448 0.02
207,000 GRG Banking Equipment 316 0.01
16,717 GSX Techedu 1,066 0.04
226,200 Guangdong Electric PowerDevelopment
47 0.00
66,600 Guangdong Haid 514 0.02
522,000 Guangshen RailwayØ 75 0.00
1,750,907 Guangzhou AutomobileØ 1,122 0.04
141,500 Guangzhou Automobile 160 0.01
104,100 Guangzhou Baiyun InternationalAirport
173 0.01
134,000 Guangzhou BaiyunshanPharmaceuticalØ
261 0.01
60,200 Guangzhou BaiyunshanPharmaceutical
213 0.01
190,300 Guangzhou HaigeCommunications
274 0.01
730,000 Guangzhou R&F PropertiesØ 694 0.03
192,900 Guosen 295 0.01
427,600 Guotai Junan 499 0.02
327,500 Guotai Junan 691 0.03
190,200 Guoyuan 229 0.01
228,000 Haidilao International 1,099 0.04
285,200 Haier Smart Home 694 0.03
302,000 Haitian InternationalØ 545 0.02
2,160,800 HaitongØ 1,466 0.06
381,800 Haitong 630 0.02
iShares Emerging Markets Equity Index Fund (UK)
Portfolio Statement (unaudited) continued
BlackRock Collective Investment Funds99

Holding orNominalValue Investment
MarketValue
£000’s
% ofTotal
NetAssets
386,077 Hangzhou Hikvision DigitalTechnology
1,575 0.06
47,800 Hangzhou Robam Appliances 203 0.01
34,300 Hangzhou Tigermed Consulting 419 0.02
77,000 Han’s Laser TechnologyIndustry
312 0.01
584,000 Hansoh Pharmaceutical 2,065 0.08
51,200 Hefei Meiya OptoelectronicTechnology
325 0.01
159,900 Heilongjiang Agriculture 352 0.01
181,054 Henan Shuanghui Investment &Development
1,253 0.05
419,500 Hengan International 2,468 0.10
135,600 Hengli Petrochemical 311 0.01
13,096,000 HengTen NetworksØ 314 0.01
82,400 Hengtong Optic-electric 147 0.01
21,600 Hithink RoyalFlush InformationNetwork
395 0.02
66,500 Hongfa Technology 338 0.01
115,300 Hongta 262 0.01
1,266,000 Huadian Fuxin EnergyØ 301 0.01
1,332,000 Huadian Power InternationalØ 277 0.01
78,500 Huadong Medicine 239 0.01
88,400 Hualan Biological Engineering 555 0.02
2,592,000 Huaneng Power InternationalØ 804 0.03
355,900 Huaneng Power International 214 0.01
1,020,000 HuataiØ 1,337 0.05
329,800 Huatai 770 0.03
729,200 Huaxia Bank 510 0.02
166,600 Huaxin Cement 288 0.01
75,700 Huaxin Cement 231 0.01
207,000 Huayu Automotive Systems 562 0.02
89,254 Huazhu 2,982 0.11
61,040 Hundsun Technologies 742 0.03
135,900 Iflytek 559 0.02
330,800 Industrial 297 0.01
46,432,655 Industrial & Commercial Bank ofChina
19,420 0.75
3,182,200 Industrial & Commercial Bank ofChina
1,721 0.07
858,194 Industrial Bank 1,512 0.06
2,357,300 Inner Mongolia BaoTou SteelUnion
298 0.01
300,700 Inner Mongolia Yili Industrial 1,375 0.05
722,733 Inner Mongolia Yitai Coal 376 0.01
679,500 Innovent Biologics 3,382 0.13
100,068 Inspur Electronic InformationIndustry
394 0.02
125,519 iQIYIØ 2,030 0.08
Holding orNominalValue Investment
MarketValue
£000’s
% ofTotal
NetAssets
38,000 Jafron Biomedical 316 0.01
511,920 JD.com 30,066 1.16
786,000 Jiangsu Expressway 588 0.02
47,656 Jiangsu Hengli Hydraulic 340 0.01
219,235 Jiangsu Hengrui Medicine 2,268 0.09
57,000 Jiangsu King’s Luck BreweryJSC
339 0.01
77,845 Jiangsu Yanghe Brewery Joint-Stock
1,198 0.05
51,600 Jiangsu Yuyue MedicalEquipment & Supply
207 0.01
307,300 Jiangsu Zhongnan Construction 326 0.01
151,300 Jiangsu Zhongtian Technology 186 0.01
497,000 Jiangxi BankØ 158 0.01
812,000 Jiangxi CopperØ 715 0.03
127,000 Jiangxi Copper 216 0.01
117,700 Jiangxi Zhengbang Technology 319 0.01
226,900 Jinke Properties 253 0.01
544,000 Jinxin Fertility 574 0.02
97,000 Jinyu Bio-Technology 305 0.01
160,200 Joincare PharmaceuticalIndustry
340 0.01
100,900 Jointown Pharmaceutical 195 0.01
40,000 Jonjee Hi-Tech Industrial AndCommercial
356 0.01
70,600 Joyoung 339 0.01
31,816 JoyyØ 2,030 0.08
60,783 KE 2,345 0.09
1,364,000 Kingdee International Software 2,597 0.10
508,000 KingsoftØ 2,029 0.08
51,900 Kweichow Moutai 10,110 0.39
767,141 KWG 1,088 0.04
128,000 Lao Feng Xiang 287 0.01
25,620 Laobaixing Pharmacy ChainJSC
248 0.01
364,400 Legend 399 0.02
123,800 Lens Technology 466 0.02
360,700 Leo 120 0.00
81,300 Lepu Medical TechnologyBeijing
344 0.01
1,061,999 Li Ning 3,352 0.13
129,800 Liaoning Cheng Da 371 0.01
273,800 Lingyi iTech Guangdong 357 0.01
111,330 Livzon Pharmaceutical 397 0.02
52,800 Livzon Pharmaceutical 308 0.01
671,000 LoganØ 932 0.04
119,000 Lomon Billions 305 0.01
1,045,500 LongforØ 4,131 0.16
iShares Emerging Markets Equity Index Fund (UK)
Portfolio Statement (unaudited) continued
BlackRock Collective Investment Funds 100

Holding orNominalValue Investment
MarketValue
£000’s
% ofTotal
NetAssets
213,200 LONGi Green EnergyTechnology
1,471 0.06
340,209 Luxshare Precision Industry 2,040 0.08
901,500 Luye PharmaØ 365 0.01
62,900 Luzhou Laojiao 1,025 0.04
672,000 Maanshan Iron & Steel 135 0.01
39,000 Maccura Biotechnology 217 0.01
79,050 Mango Excellent Media 611 0.02
175,100 Meinian Onehealth Healthcare 335 0.01
1,192,000 Meitu 194 0.01
2,124,000 Meituan DianpingØ 52,317 2.02
1,226,500 Metallurgical of China 156 0.01
697,400 Metallurgical of China 214 0.01
91,514 Momo 1,394 0.05
147,300 Muyuan Foodstuff 1,410 0.05
87,900 NanJi E-Commerce 178 0.01
50,570 Nanjing King-FriendBiochemical Pharmaceutical
271 0.01
190,900 NARI Technology 466 0.02
24,300 NAURA Technology 488 0.02
93,100 NavInfo 167 0.01
44,432 NetEase 16,142 0.62
488,800 New China Life InsuranceØ 1,458 0.06
119,300 New China Life Insurance 778 0.03
246,100 New Hope Liuhe 1,020 0.04
81,379 New Oriental Education &Technology
8,901 0.34
105,800 Ningbo Joyson Electronic 265 0.01
684,600 Ningbo Zhoushan Port 277 0.01
482,376 NIO 6,859 0.26
93,400 OFILM 192 0.01
18,413 OneConnect FinancialTechnology
296 0.01
318,800 Orient Ltd/China 150 0.01
232,400 Orient Ltd/China 299 0.01
174,200 Oriental Pearl 202 0.01
4,672,000 People’s Insurance of China 1,139 0.04
51,900 Perfect World Ltd/China 207 0.01
12,462,000 PetroChina 3,218 0.12
50,100 Pharmaron Beijing 497 0.02
3,953,449 PICC Property & Casualty 2,278 0.09
162,412 Pinduoduo 10,783 0.42
801,676 Ping An Bank 1,317 0.05
205,900 Ping An Healthcare andTechnologyØ
2,242 0.09
3,251,500 Ping An Insurance of ChinaØ 25,850 1.00
447,500 Ping An Insurance of China 3,739 0.14
608,000 Poly Developments and 1,067 0.04
78,600 Poly Property Services 514 0.02
Holding orNominalValue Investment
MarketValue
£000’s
% ofTotal
NetAssets
5,507,000 Postal Savings Bank of ChinaØ 1,948 0.08
455,400 Power Construction of China 202 0.01
823,000 Qingdao Port InternationalØ 374 0.01
204,639 Red Star Macalline 101 0.00
212,500 RiseSun Real EstateDevelopment
190 0.01
399,800 SAIC Motor 813 0.03
192,900 Sanan Optoelectronics 571 0.02
13,200 Sangfor Technologies 316 0.01
348,500 Sany Heavy Industry 841 0.03
156,300 SDIC Capital 259 0.01
282,000 SDIC Power 279 0.01
531,100 Sealand 323 0.01
143,700 Seazen 562 0.02
1,140,000 Seazen 771 0.03
105,200 SF 976 0.04
7,300 SG Micro 227 0.01
285,400 Shaanxi Coal Industry 252 0.01
214,950 Shandong Chenming Paper 57 0.00
258,750 Shandong Chenming PaperØ 88 0.00
162,148 Shandong Gold Mining 513 0.02
302,400 Shandong Gold Mining 634 0.02
106,800 Shandong Hualu HengshengChemical
313 0.01
790,700 Shandong Nanshan Aluminum 229 0.01
1,356,000 Shandong Weigao MedicalPolymerØ
2,363 0.09
92,400 Shanghai Bailian 64 0.00
35,000 Shanghai Bairun Investment 234 0.01
161,850 Shanghai Baosight Software 413 0.02
44,900 Shanghai Baosight Software 340 0.01
231,980 Shanghai Chlor-Alkali Chemical 81 0.00
1,334,000 Shanghai Electric 293 0.01
422,100 Shanghai Electric 256 0.01
304,500 Shanghai FosunPharmaceuticalØ
960 0.04
95,100 Shanghai Fosun Pharmaceutical 568 0.02
224,800 Shanghai Haixin 63 0.00
68,800 Shanghai Huayi 25 0.00
95,400 Shanghai International Airport 795 0.03
821,300 Shanghai International Port 397 0.02
57,800 Shanghai Jahwa United 262 0.01
47,200 Shanghai Jinjiang InternationalHotels
59 0.00
137,000 Shanghai Jinqiao ExportProcessing Zone Development
106 0.00
515,358 Shanghai Lujiazui Finance &Trade Zone Development
328 0.01
43,600 Shanghai M&G Stationery 330 0.01
iShares Emerging Markets Equity Index Fund (UK)
Portfolio Statement (unaudited) continued
BlackRock Collective Investment Funds101

Holding orNominalValue Investment
MarketValue
£000’s
% ofTotal
NetAssets
95,700 Shanghai Mechanical andElectrical Industry
92 0.00
546,700 Shanghai PharmaceuticalsØ 728 0.03
94,300 Shanghai Pharmaceuticals 228 0.01
1,212,500 Shanghai Pudong DevelopmentBank
1,368 0.05
19,100 Shanghai Putailai New EnergyTechnology
206 0.01
429,200 Shanghai RAAS Blood Products 421 0.02
85,300 Shanghai Waigaoqiao FreeTrade Zone#
66 0.00
191,400 Shanghai Yuyuan Tourist Mart 207 0.01
126,500 Shanghai Zhangjiang High-TechPark Development
305 0.01
646,920 Shanghai Zhenhua HeavyIndustries
121 0.00
34,800 Shanxi Xinghuacun Fen WineFactory
748 0.03
446,100 Shenergy 278 0.01
102,700 Shengyi Technology 278 0.01
15,100 Shennan Circuits 228 0.01
1,282,515 Shenwan Hongyuan 789 0.03
506,000 Shenzhen ExpresswayØ 342 0.01
14,700 Shenzhen Goodix Technology 287 0.01
83,600 Shenzhen Inovance Technology 509 0.02
68,400 Shenzhen Kaifa Technology 190 0.01
28,900 Shenzhen Kangtai BiologicalProducts
624 0.02
43,000 Shenzhen Mindray Bio-MedicalElectronics
1,605 0.06
359,300 Shenzhen Overseas ChineseTown
280 0.01
45,100 Shenzhen SunwayCommunication
305 0.01
426,400 Shenzhou International 5,136 0.20
52,800 Shijiazhuang YilingPharmaceutical
165 0.01
234,000 Sichuan Chuantou Energy 256 0.01
216,000 Sichuan Expressway 37 0.00
73,000 Sichuan Kelun Pharmaceutical 197 0.01
43,400 Sichuan Swellfun 360 0.01
2,943,000 Sihuan Pharmaceutical 267 0.01
38,785 SINA Corp/China 1,178 0.05
178,100 Sinolink 302 0.01
157,900 Sinoma Science & Technology 343 0.01
2,092,500 Sino-Ocean 361 0.01
748,000 Sinopec Engineering 247 0.01
1,990,000 Sinopec Oilfield ServiceØ 107 0.00
Holding orNominalValue Investment
MarketValue
£000’s
% ofTotal
NetAssets
2,628,000 Sinopec ShanghaiPetrochemicalØ
405 0.02
785,600 SinopharmØ 1,443 0.06
998,000 Sinotrans 177 0.01
453,500 Sinotruk Hong KongØ 881 0.03
1,438,500 SOHO China 331 0.01
108,540 Songcheng PerformanceDevelopment
212 0.01
328,900 SooChow 386 0.01
523,400 Southwest 320 0.01
64,200 Spring Airlines 309 0.01
132,500 STO Express 238 0.01
1,468,000 Sunac China 4,605 0.18
628,371 Suning.com 675 0.03
387,100 Sunny Optical TechnologyØ 4,282 0.17
75,000 Sunwoda Electronic 196 0.01
216,945 TAL Education 11,961 0.46
131,500 Tangshan Jidong Cement 257 0.01
202,900 TBEA 181 0.01
604,700 TCL Technology 466 0.02
3,381,700 Tencent 172,881 6.67
273,016 Tencent Music EntertainmentØ 3,185 0.12
33,900 Thunder Software Technology 340 0.01
297,180 Tianfeng 224 0.01
108,000 Tianjin Capital EnvironmentalProtection
27 0.00
102,900 Tianjin ZhonghuanSemiconductor
243 0.01
172,700 Tianma Microelectronics 309 0.01
89,700 Tianqi Lithium 222 0.01
304,000 Times Neighborhood 322 0.01
503,200 Tongcheng-Elong 735 0.03
105,000 Tonghua DongbaoPharmaceutical
163 0.01
179,200 Tongkun 315 0.01
281,900 Tongwei 750 0.03
11,800 Topchoice Medical 291 0.01
738,000 Topsports International 681 0.03
527,000 TravelSky TechnologyØ 818 0.03
277,086 Trip.com 6,250 0.24
238,000 Tsingtao BreweryØ 1,619 0.06
26,700 Tsingtao Brewery 254 0.01
31,800 Unigroup GuoxinMicroelectronics
434 0.02
58,940 Unisplendour 211 0.01
45,400 Venustech 189 0.01
250,583 VipshopØ 3,084 0.12
75,100 Walvax Biotechnology 520 0.02
102,700 Wanda Film 208 0.01
iShares Emerging Markets Equity Index Fund (UK)
Portfolio Statement (unaudited) continued
BlackRock Collective Investment Funds 102

Holding orNominalValue Investment
MarketValue
£000’s
% ofTotal
NetAssets
62,200 Wangfujing 348 0.01
129,700 Wanhua Chemical 1,036 0.04
33,893 WeiboØ 944 0.04
1,136,400 Weichai PowerØ 1,715 0.07
247,500 Weichai Power 400 0.02
50,700 Weifu High-Technology 68 0.00
81,720 Wens Foodstuffs 220 0.01
191,200 Western 203 0.01
25,000 Will Semiconductor 458 0.02
46,400 Wingtech Technology 699 0.03
94,510 Winning Health Technology 218 0.01
111,600 Wonders Information 323 0.01
77,350 Wuhan Guide Infrared 324 0.01
92,900 Wuhu Sanqi InteractiveEntertainment NetworkTechnology
462 0.02
160,300 Wuliangye Yibin 4,195 0.16
86,800 WUS Printed Circuit Kunshan 199 0.01
136,640 WuXi AppTecØ 1,512 0.06
35,700 WuXi AppTec 428 0.02
505,000 Wuxi Biologics CaymanØ 9,791 0.38
38,500 Wuxi Lead Intelligent Equipment 189 0.01
326,400 XCMG Construction Machinery 221 0.01
262,900 Xiamen C & D 274 0.01
7,001,800 XiaomiØ 15,823 0.61
784,900 Xinhu Zhongbao 300 0.01
349,000 Xinhua Winshare Publishing andMediaØ
171 0.01
405,125 Xinjiang Goldwind Science &Technology
260 0.01
164,000 Xinjiang Goldwind Science &Technology
195 0.01
255,250 Yango 196 0.01
117,500 Yangtze Optical Fibre and CableJoint StockØ
162 0.01
1,254,800 Yangzijiang Shipbuilding 631 0.02
86,910 Yantai Changyu Pioneer Wine 129 0.00
42,200 Yantai Jereh Oilfield Services 158 0.01
1,260,000 Yanzhou Coal MiningØ 724 0.03
56,650 Yealink Network Technology 348 0.01
84,100 Yifan Pharmaceutical 275 0.01
286,000 Yihai InternationalØ 3,357 0.13
102,100 Yintai Gold 180 0.01
611,000 Yonghui Superstores 592 0.02
134,270 Yonyou Network Technology 614 0.02
260,700 Youngor 219 0.01
109,000 YTO Express 190 0.01
77,090 Yunda 175 0.01
65,400 Yunnan Baiyao 825 0.03
Holding orNominalValue Investment
MarketValue
£000’s
% ofTotal
NetAssets
28,300 Yunnan Energy New Material 241 0.01
26,100 Zhangzhou PientzehuangPharmaceutical
716 0.03
578,500 Zhaojin Mining IndustryØ 484 0.02
65,153 Zhejiang Chint Electrics 244 0.01
125,500 Zhejiang Dahua Technology 313 0.01
734,000 Zhejiang Expressway 370 0.01
62,040 Zhejiang Huahai Pharmaceutical 297 0.01
86,500 Zhejiang Huayou Cobalt 379 0.01
142,800 Zhejiang Longsheng 223 0.01
100,300 Zhejiang NHU 358 0.01
176,540 Zhejiang Sanhua IntelligentControls
435 0.02
24,900 Zhejiang Supor 229 0.01
127,900 Zhengzhou Yutong Bus 198 0.01
195,600 ZhongAn Online P&C Insurance 961 0.04
29,900 Zhongji Innolight 193 0.01
223,500 Zhongjin Gold 265 0.01
346,000 ZhongshengØ 1,614 0.06
316,100 Zhuzhou CRRC Times Electric 758 0.03
3,219,000 Zijin Mining 1,638 0.06
735,700 Zijin Mining 577 0.02
809,811 Zoomlion Heavy IndustryScience and TechnologyØ
606 0.02
260,100 Zoomlion Heavy IndustryScience and Technology
242 0.01
451,904 ZTE 980 0.04
201,000 ZTE 855 0.03
224,051 ZTO Express Cayman 5,611 0.22
1,104,776 42.65
Hong Kong − 3.06%; 29.2.2020 3.65%
2,430,000 Alibaba Health InformationTechnologyØ
4,379 0.17
8,330,000 Alibaba PicturesØ 883 0.03
318,000 Beijing Enterprises 755 0.03
3,104,000 Beijing Enterprises WaterØ 912 0.04
1,260,000 Bosideng International 270 0.01
1,704,000 Brilliance China AutomotiveØ 1,138 0.04
500,000 China EverbrightØ 574 0.02
2,011,666 China Everbright InternationalØ 905 0.03
240,000 China Foods2 63 0.00
1,516,000 China GasØ 3,097 0.12
3,602,000 China JinmaoØ 1,677 0.06
800,377 China Merchants Port 684 0.03
3,142,000 China MobileØ 16,381 0.63
2,248,000 China Overseas Land &Investment
4,863 0.19
iShares Emerging Markets Equity Index Fund (UK)
Portfolio Statement (unaudited) continued
BlackRock Collective Investment Funds103

Holding orNominalValue Investment
MarketValue
£000’s
% ofTotal
NetAssets
2,617,333 China Power InternationalDevelopmentØ
376 0.01
940,085 China Resources Beer 4,566 0.18
1,286,000 China Resources Cement 1,400 0.05
530,000 China Resources GasØ 1,859 0.07
1,632,888 China Resources LandØ 5,633 0.22
1,157,272 China Resources Power 1,026 0.04
978,000 China South City 74 0.00
948,750 China State ConstructionInternationalØ
549 0.02
873,286 China Taiping InsuranceØ 1,037 0.04
1,344,000 China Traditional ChineseMedicineØ
427 0.02
3,648,000 China Unicom Hong Kong 1,930 0.07
424,000 CIMC EnricØ 127 0.00
986,276 Cosco Shipping Ports 417 0.02
1,251,000 Far East HorizonØ 826 0.03
3,069,000 Geely Automobile 4,838 0.19
1,754,000 Guangdong Investment 2,045 0.08
745,000 Haier ElectronicsØ 1,906 0.07
72,000 Health & Happiness H&HInternational
235 0.01
404,000 Hopson Development 602 0.02
924,000 Jiayuan InternationalØ 325 0.01
428,800 KingboardØ 1,027 0.04
547,500 Kingboard LaminatesØ 515 0.02
1,596,961 Kunlun Energy 885 0.03
786,000 Lee & Man Paper Manufacturing 351 0.01
921,000 Nine Dragons PaperØ 763 0.03
836,000 Poly Property 197 0.01
250,000 Shanghai Industrial 280 0.01
534,000 Shenzhen International 639 0.02
2,196,660 Shenzhen InvestmentØ 555 0.02
817,500 ShimaoØ 2,749 0.11
5,680,500 Sino BiopharmaceuticalØ 4,899 0.19
3,379,690 Yuexiu Property 482 0.02
80,121 3.06
India − 9.52%; 29.2.2020 10.14%
1,272 3M India 260 0.01
28,085 ABB India 271 0.01
22,005 ACC 294 0.01
156,161 Adani Enterprises 439 0.02
449,147 Adani Ports & Special EconomicZone
1,611 0.06
412,990 Adani Power 155 0.01
284,893 Aditya Birla Capital 176 0.01
14,509 Alkem Laboratories 401 0.02
458,002 Ambuja Cements 972 0.04
Holding orNominalValue Investment
MarketValue
£000’s
% ofTotal
NetAssets
711,371 Ashok Leyland 490 0.02
165,919 Asian Paints 3,190 0.12
81,070 AU Small Finance Bank 548 0.02
146,544 Aurobindo Pharma 1,194 0.05
87,829 Avenue Supermarts 2,002 0.08
14,556 Axis Bank 383 0.01
1,336,786 Axis Bank 6,672 0.26
16,999 Bajaj & Investment 461 0.02
54,200 Bajaj Auto 1,627 0.06
108,399 Bajaj Finance 3,826 0.15
21,627 Bajaj Finserv 1,360 0.05
360,905 Bandhan Bank 1,119 0.04
539,768 Bank of Baroda 267 0.01
241,093 Bank of India 132 0.01
17,718 Bata India 233 0.01
128,247 Berger Paints India 701 0.03
466,679 Bharat Electronics 505 0.02
109,880 Bharat Forge 547 0.02
526,027 Bharat Heavy Electricals 206 0.01
583,975 Bharat Petroleum 2,397 0.09
1,338,845 Bharti Airtel 6,961 0.27
495,149 Bharti Infratel 994 0.04
188,785 Biocon 718 0.03
4,067 Bosch 530 0.02
34,097 Britannia Industries 1,286 0.05
162,947 Cadila Healthcare 614 0.02
79,330 Canara Bank 86 0.00
287,638 Castrol India 349 0.01
130,672 Cholamandalam Investment andFinance
309 0.01
187,264 Cipla 1,346 0.05
855,089 Coal India 1,164 0.04
48,045 Colgate-Palmolive India 664 0.03
129,710 Container Of India 517 0.02
47,549 Cummins India 222 0.01
301,627 Dabur India 1,445 0.06
28,871 Dalmia Bharat 219 0.01
45,046 Divi’s Laboratories 1,421 0.05
467,527 DLF 747 0.03
626 Dr Reddy’s Laboratories 27 0.00
49,842 Dr Reddy’s Laboratories 2,141 0.08
76,200 Eicher Motors 1,625 0.06
70,114 Emami 248 0.01
90,800 Embassy Office Parks REIT 334 0.01
107,653 Exide Industries 179 0.01
1,198,679 Federal Bank 674 0.03
91,270 Future Retail 150 0.01
839,768 Gail India 811 0.03
iShares Emerging Markets Equity Index Fund (UK)
Portfolio Statement (unaudited) continued
BlackRock Collective Investment Funds 104

Holding orNominalValue Investment
MarketValue
£000’s
% ofTotal
NetAssets
1,800 Gillette India 99 0.00
64,629 Glenmark Pharmaceuticals 307 0.01
551,914 GMR Infrastructure 131 0.00
210,776 Godrej Consumer Products 1,387 0.05
61,262 Godrej Industries 272 0.01
29,773 Godrej Properties 272 0.01
184,079 Grasim Industries 1,253 0.05
151,525 Havells India 942 0.04
651,697 HCL Technologies 4,543 0.18
26,130 HDFC Asset Management 639 0.02
383,817 HDFC Life Insurance 2,237 0.09
46,905 Hemisphere Properties India3 72 0.00
58,967 Hero MotoCorp 1,791 0.07
592,602 Hindalco Industries 1,109 0.04
345,924 Hindustan Petroleum 704 0.03
526,753 Hindustan Unilever 11,261 0.43
121,305 Hindustan Zinc 278 0.01
1,020,974 Housing Development Finance 18,906 0.73
360,002 ICICI Bank 1,432 0.06
103,253 ICICI Lombard GeneralInsurance
1,312 0.05
175,344 ICICI Prudential Life Insurance 751 0.03
1,353,020 IDFC First Bank 438 0.02
165,686 Indiabulls Housing Finance 346 0.01
1,291,700 Indian Oil 1,121 0.04
35,432 Info Edge India 1,166 0.04
106,533 Infosys 1,003 0.04
2,013,314 Infosys 18,765 0.72
52,745 InterGlobe Aviation 640 0.02
1,806,485 ITC 3,498 0.13
211,812 Jindal Steel & Power 437 0.02
96,461 JSW Energy 53 0.00
588,787 JSW Steel 1,607 0.06
41,575 Jubilant Foodworks 883 0.03
73,909 Kansai Nerolac Paints 351 0.01
216,167 L&T Finance 147 0.01
194,035 Larsen & Toubro 1,860 0.07
13,941 Larsen & Toubro Infotech 347 0.01
118,157 LIC Housing Finance 359 0.01
128,794 Lupin 1,210 0.05
331,482 Mahindra & Mahindra 2,031 0.08
371,028 Mahindra & Mahindra FinancialServices
507 0.02
76,321 Mangalore Refinery &Petrochemicals
25 0.00
266,716 Marico 995 0.04
72,191 Maruti Suzuki India 4,988 0.19
710,044 Motherson Sumi Systems 790 0.03
Holding orNominalValue Investment
MarketValue
£000’s
% ofTotal
NetAssets
37,093 Mphasis 414 0.02
742 MRF 437 0.02
63,762 Muthoot Finance 743 0.03
13,295 Nestle India 2,156 0.08
1,847,097 NHPC 405 0.02
84,368 Nippon Life India AssetManagement
232 0.01
449,155 NMDC 442 0.02
1,457,761 NTPC 1,432 0.06
49,933 Oberoi Realty 199 0.01
1,840,520 Oil & Natural Gas 1,524 0.06
116,914 Oil India 112 0.00
10,452 Oracle Financial ServicesSoftware
320 0.01
2,691 Page Industries 517 0.02
310,600 Petronet LNG 755 0.03
70,045 Pidilite Industries 994 0.04
62,927 Piramal Enterprises 874 0.03
334,087 Power Finance 320 0.01
1,051,763 Power Grid of India 1,921 0.07
477,132 Punjab National Bank 168 0.01
85,075 Rajesh Exports 386 0.01
257,997 RBL Bank 512 0.02
431,801 REC 467 0.02
1,520,967 Reliance Industries 31,914 1.23
136,658 Reliance Industries 5,909 0.23
100,780 Reliance Industries 1,215 0.05
211,136 SBI Life Insurance 1,772 0.07
5,160 Shree Cement 1,056 0.04
96,847 Shriram Transport Finance 689 0.03
51,108 Siemens 600 0.02
1,011,202 State Bank of India 2,173 0.08
567,545 Steel Authority of India 222 0.01
672,458 Sun Pharmaceutical Industries 3,508 0.14
43,241 Sun TV Network 196 0.01
46,905 Tata Communications 412 0.02
535,191 Tata Consultancy Services 12,191 0.47
30,335 Tata Motors 220 0.01
111,693 Tata Motors 57 0.00
468,914 Tata Motors 676 0.03
393,542 Tata Power 235 0.01
152,887 Tata Steel 638 0.02
289,271 Tech Mahindra 2,169 0.08
177,483 Titan 1,969 0.08
21,833 Torrent Pharmaceuticals 587 0.02
92,352 Torrent Power 311 0.01
67,273 TVS Motor 295 0.01
65,758 UltraTech Cement 2,606 0.10
iShares Emerging Markets Equity Index Fund (UK)
Portfolio Statement (unaudited) continued
BlackRock Collective Investment Funds105

Holding orNominalValue Investment
MarketValue
£000’s
% ofTotal
NetAssets
81,415 Union Bank of India 25 0.00
35,470 United Breweries 365 0.01
170,881 United Spirits 945 0.04
331,975 UPL 1,697 0.07
671,013 Vedanta 871 0.03
69,882 Vedanta 365 0.01
4,162,351 Vodafone Idea 429 0.02
45,332 Voltas 293 0.01
17,256 Whirlpool of India 370 0.01
132,880 Wipro 426 0.02
635,112 Wipro 1,727 0.07
585,754 YES BANK 3 YEAR LOCK UP 64 0.00
546,792 Zee Entertainment Enterprises 1,118 0.04
247,130 9.52
Indonesia − 1.51%; 29.2.2020 1.88%
6,494,300 Adaro Energy 361 0.01
192,088 Astra Agro Lestari 99 0.00
11,900,100 Astra International 3,113 0.12
5,724,100 Bank Central Asia 9,211 0.36
10,899,960 Bank Mandiri Persero 3,326 0.13
4,361,793 Bank Negara Indonesia Persero 1,135 0.04
31,448,900 Bank Rakyat Indonesia Persero 5,661 0.22
10,927,800 Barito Pacific 471 0.02
3,566,700 Bukit Asam 373 0.01
5,651,100 Bumi Serpong Damai 223 0.01
4,131,200 Charoen Pokphand Indonesia 1,329 0.05
263,800 Gudang Garam 643 0.02
5,113,200 Hanjaya Mandala Sampoerna 433 0.02
1,358,000 Indah Kiat Pulp & Paper 646 0.02
789,000 Indocement Tunggal Prakarsa 481 0.02
1,217,500 Indofood CBP Sukses Makmur 638 0.02
2,450,400 Indofood Sukses Makmur 958 0.04
2,010,422 Jasa Marga Persero 403 0.02
11,573,200 Kalbe Farma 938 0.04
1,119,400 Matahari Department Store 72 0.00
3,459,000 Media Nusantara Citra 157 0.01
5,661,200 Perusahaan Gas Negara 364 0.01
1,660,800 Semen Indonesia Persero 899 0.03
4,965,900 Surya Citra Media 315 0.01
27,104,800 Telekomunikasi IndonesiaPersero
3,976 0.15
5,346,000 Tower Bersama Infrastructure 356 0.01
3,427,500 Unilever Indonesia 1,441 0.06
908,072 United Tractors 1,070 0.04
877,300 Vale Indonesia 171 0.01
1,885,775 XL Axiata 236 0.01
39,499 1.51
Holding orNominalValue Investment
MarketValue
£000’s
% ofTotal
NetAssets
Malaysia − 2.13%; 29.2.2020 2.35%
1,117,900 AirAsia 132 0.01
519,200 Alliance Bank Malaysia 203 0.01
1,132,400 AMMB 593 0.02
674,300 Astro Malaysia 93 0.00
2,665,679 Axiata 1,439 0.06
95,100 British American TobaccoMalaysia
174 0.01
4,228,798 CIMB 2,502 0.10
2,591,300 Dialog 1,668 0.06
2,149,551 DiGi.Com 1,522 0.06
1,414,300 FGV 309 0.01
47,600 Fraser & Neave 261 0.01
1,355,500 Gamuda 826 0.03
1,303,218 Genting 820 0.03
1,726,900 Genting Malaysia 706 0.03
326,700 HAP Seng Consolidated 422 0.02
902,400 Hartalega 2,673 0.10
366,900 Hong Leong Bank 921 0.04
143,700 Hong Leong Financial 318 0.01
1,752,220 IHH Healthcare 1,684 0.06
1,935,100 IJM 416 0.02
1,861,432 IOI 1,488 0.06
804,440 IOI Properties 130 0.00
270,239 Kuala Lumpur Kepong 1,098 0.04
3,560,484 Malayan Banking 4,679 0.18
574,860 Malaysia Airports 526 0.02
1,586,200 Maxis 1,422 0.05
861,600 MISC 1,176 0.05
35,400 Nestle Malaysia 884 0.03
1,695,885 Petronas Chemicals 1,660 0.06
187,700 Petronas Dagangan 693 0.03
337,600 Petronas Gas 999 0.04
403,520 PPB 1,302 0.05
1,035,400 Press Metal Aluminium 967 0.04
1,858,955 Public Bank 5,473 0.21
438,900 QL Resources 755 0.03
1,000,990 RHB Bank 822 0.03
1,880,700 Sime Darby 738 0.03
2,070,600 Sime Darby Plantation 1,890 0.07
1,970,000 Sime Darby Property 231 0.01
664,835 Telekom Malaysia 495 0.02
2,345,286 Tenaga Nasional 4,567 0.18
973,000 Top Glove 4,567 0.18
533,500 UEM Sunrise 38 0.00
649,400 Westports 425 0.02
2,513,757 YTL 302 0.01
55,009 2.13
iShares Emerging Markets Equity Index Fund (UK)
Portfolio Statement (unaudited) continued
BlackRock Collective Investment Funds 106

Holding orNominalValue Investment
MarketValue
£000’s
% ofTotal
NetAssets
Philippines − 0.90%; 29.2.2020 1.09%
1,038,500 Aboitiz Power 424 0.02
2,230,300 Alliance Global 212 0.01
190,928 Ayala 2,153 0.08
4,577,260 Ayala Land 2,031 0.08
1,096,374 Bank of the Philippine Islands 1,121 0.04
1,150,580 BDO Unibank 1,523 0.06
1,386,454 Bloomberry Resorts 129 0.00
3,497,550 DMCI 208 0.01
16,755 Globe Telecom 539 0.02
55,777 GT Capital 343 0.01
675,860 International Container TerminalServices
1,093 0.04
1,754,200 JG Summit 1,716 0.07
212,968 Jollibee Foods 443 0.02
1,088,000 LT 139 0.01
147,270 Manila Electric 610 0.02
6,457,900 Megaworld 289 0.01
8,343,200 Metro Pacific Investments 431 0.02
952,823 Metropolitan Bank & Trust 492 0.02
66,260 PLDT 1,506 0.06
166,750 San Miguel 257 0.01
303,150 San Miguel Food and Beverage 311 0.01
441,560 Semirara Mining & Power 64 0.00
285,750 SM Investments 3,735 0.14
5,570,875 SM Prime 2,501 0.10
542,750 Universal Robina 1,152 0.04
23,422 0.90
Saudi Arabia − 2.91%; 29.2.2020 2.21%
26,025 Abdullah Al Othaim Markets 643 0.02
56,583 Advanced Petrochemical 621 0.02
722,928 Al Rajhi Bank 9,343 0.36
578,343 Alinma Bank 1,785 0.07
148,681 Almarai JSC 1,590 0.06
379,139 Arab National Bank 1,567 0.06
80,402 Arabian Centres 408 0.02
216,899 Bank AlBilad 1,037 0.04
204,114 Bank Al-Jazira 531 0.02
346,803 Banque Saudi Fransi 2,206 0.08
36,648 Bupa Arabia for CooperativeInsurance
895 0.03
19,024 Dallah Healthcare 215 0.01
285,811 Dar Al Arkan Real EstateDevelopment
462 0.02
327,359 Emaar Economic City 526 0.02
223,486 Etihad Etisalat 1,193 0.05
48,139 Fawaz Abdulaziz Al Hokair & 214 0.01
Holding orNominalValue Investment
MarketValue
£000’s
% ofTotal
NetAssets
33,408 for Cooperative Insurance/The 526 0.02
34,701 Jarir Marketing 1,129 0.04
166,934 Mobile TelecommunicationsSaudi Arabia
388 0.01
28,812 Mouwasat Medical Services 685 0.03
797,353 National Commercial Bank 5,907 0.23
172,127 National Industrialization 405 0.02
89,235 National Petrochemical 476 0.02
18,413 Qassim Cement 249 0.01
104,694 Rabigh Refining &Petrochemical
297 0.01
867,514 Riyad Bank 3,313 0.13
231,156 Sahara InternationalPetrochemical
733 0.03
578,343 Samba Financial 3,173 0.12
23,492 Saudi Airlines Catering 375 0.01
118,423 Saudi Arabian Fertilizer 1,955 0.08
238,348 Saudi Arabian Mining 1,870 0.07
912,336 Saudi Arabian Oil 6,450 0.25
531,131 Saudi Basic Industries 9,308 0.36
50,055 Saudi Cement 561 0.02
461,781 Saudi Electricity 1,462 0.06
71,665 Saudi Ground Services 434 0.02
112,406 Saudi Industrial Investment 490 0.02
446,963 Saudi Kayan Petrochemical 808 0.03
21,760 Saudi Research & Marketing 308 0.01
354,087 Saudi Telecom 6,769 0.26
154,412 Savola Group/The 1,494 0.06
113,375 Seera 390 0.01
44,716 Southern Province Cement 571 0.02
32,777 Yanbu Cement 214 0.01
137,297 Yanbu National Petrochemical 1,463 0.06
75,439 2.91
Singapore − 0.01%; 29.2.2020 0.01%
348,100 Yanlord Land 229 0.01
Taiwan − 13.58%; 29.2.2020 13.03%
304,000 Accton Technology 1,811 0.07
1,840,346 Acer 1,094 0.04
242,672 Advantech 1,875 0.07
2,032,911 ASE Technology 3,162 0.12
1,441,181 Asia Cement 1,559 0.06
420,388 Asustek Computer 2,600 0.10
5,245,000 AU Optronics 1,388 0.05
1,396,080 Capital 391 0.02
435,000 Catcher Technology 2,214 0.09
4,971,281 Cathay Financial 5,036 0.19
742,102 Chailease 2,446 0.09
iShares Emerging Markets Equity Index Fund (UK)
Portfolio Statement (unaudited) continued
BlackRock Collective Investment Funds107

Holding orNominalValue Investment
MarketValue
£000’s
% ofTotal
NetAssets
3,840,324 Chang Hwa Commercial Bank 1,784 0.07
1,072,101 Cheng Shin Rubber Industry 982 0.04
373,850 Chicony Electronics 841 0.03
1,449,609 China Airlines 315 0.01
7,888,856 China Development Financial 1,715 0.07
1,812,613 China Life Insurance Ltd/Taiwan 948 0.04
188,000 China Motor 203 0.01
7,232,249 China Steel 3,663 0.14
2,277,981 Chunghwa Telecom 6,291 0.24
2,387,439 Compal Electronics 1,124 0.04
10,620,103 CTBC Financial 5,123 0.20
1,282,660 Delta Electronics 6,154 0.24
7,069,669 E.Sun Financial 4,886 0.19
117,612 Eclat Textile 1,159 0.04
578,000 Epistar 586 0.02
522,874 Eternal Materials 460 0.02
1,493,790 Eva Airways 435 0.02
1,419,444 Evergreen Marine Taiwan 629 0.02
1,213,474 Far Eastern International Bank 346 0.01
2,289,305 Far Eastern New Century 1,538 0.06
970,000 Far EasToneTelecommunications
1,514 0.06
255,816 Feng TAY Enterprise 1,110 0.04
6,119,390 First Financial 3,310 0.13
2,033,180 Formosa Chemicals & Fibre 3,509 0.14
790,000 Formosa Petrochemical 1,649 0.06
2,924,320 Formosa Plastics 5,813 0.22
510,000 Formosa Taffeta 411 0.02
620,287 Foxconn Technology 823 0.03
4,323,561 Fubon Financial 4,705 0.18
183,000 Giant Manufacturing 1,421 0.05
131,000 Globalwafers 1,312 0.05
7,087,549 Hon Hai Precision Industry 13,873 0.53
185,000 Hotai Motor 2,811 0.11
472,737 HTC 362 0.01
5,559,585 Hua Nan Financial 2,554 0.10
4,603,746 Innolux 1,069 0.04
1,817,070 Inventec 1,052 0.04
61,000 Largan Precision 5,248 0.20
1,234,040 Lite-On Technology 1,457 0.06
877,614 MediaTek 12,420 0.48
6,389,739 Mega Financial 4,757 0.18
3,308,000 Nan Ya Plastics 5,162 0.20
435,000 Nanya Technology 575 0.02
353,000 Novatek Microelectronics 2,156 0.08
78,184 OBI Pharma 235 0.01
552,500 Oriental Union Chemical 240 0.01
1,162,534 Pegatron 1,849 0.07
Holding orNominalValue Investment
MarketValue
£000’s
% ofTotal
NetAssets
1,458,000 Pou Chen 1,026 0.04
330,000 President Chain Store 2,268 0.09
1,613,000 Quanta Computer 3,157 0.12
269,933 Realtek Semiconductor 2,611 0.10
1,883,000 Shanghai Commercial &Savings Bank
2,001 0.08
6,829,544 Shin Kong Financial 1,443 0.06
6,288,646 SinoPac Financial 1,729 0.07
858,613 Synnex Technology International 955 0.04
5,859,364 Taishin Financial 1,969 0.08
3,195,251 Taiwan Business Bank 813 0.03
2,950,440 Taiwan Cement 3,222 0.12
5,524,414 Taiwan Cooperative Financial 2,819 0.11
475,000 Taiwan Fertilizer 657 0.03
671,705 Taiwan Glass Industry 196 0.01
1,266,000 Taiwan High Speed Rail 1,046 0.04
927,300 Taiwan Mobile 2,396 0.09
190,000 Taiwan Secom 411 0.02
14,202,000 Taiwan SemiconductorManufacturing
154,178 5.94
1,146,000 Teco Electric and Machinery 855 0.03
292,692 TPK 367 0.01
205,000 Transcend Information 342 0.01
275,000 U-Ming Marine Transport 210 0.01
688,000 Unimicron Technology 1,289 0.05
2,879,186 Uni-President Enterprises 4,874 0.19
6,568,000 United Microelectronics 3,544 0.14
524,000 Vanguard InternationalSemiconductor
1,247 0.05
1,926,000 Walsin Lihwa 824 0.03
276,000 Walsin Technology 1,124 0.04
406,700 Wan Hai Lines 219 0.01
231,000 Win Semiconductors 1,682 0.06
1,610,863 Wistron 1,308 0.05
48,000 Wiwynn 955 0.04
269,000 Yageo 2,280 0.09
6,854,687 Yuanta Financial 3,202 0.12
478,000 Yulon Motor 308 0.01
7,000 Yulon Nissan Motor 44 0.00
336,000 Zhen Ding Technology 1,052 0.04
352,778 13.58
Thailand − 2.26%; 29.2.2020 2.72%
180,600 Advanced Info Service 791 0.03
486,300 Advanced Info Service 2,130 0.08
1,706,300 Airports of Thailand 2,293 0.09
725,000 Airports of Thailand 974 0.04
3,625,300 Asset World 339 0.01
iShares Emerging Markets Equity Index Fund (UK)
Portfolio Statement (unaudited) continued
BlackRock Collective Investment Funds 108

Holding orNominalValue Investment
MarketValue
£000’s
% ofTotal
NetAssets
420,100 B Grimm PowerØ 466 0.02
286,000 Bangkok Bank 731 0.03
3,711,900 Bangkok Dusit Medical Services 1,844 0.07
1,533,900 Bangkok Dusit MedicalServicesØ
762 0.03
4,806,600 Bangkok Expressway & Metro 1,044 0.04
2,829,000 BanpuØ 387 0.01
205,900 Berli Jucker 183 0.01
416,650 Berli Jucker 370 0.01
5,253,232 BTSØ 1,298 0.05
211,800 Bumrungrad Hospital 562 0.02
629,900 Central PattanaØ 710 0.03
839,800 Central Pattana 947 0.04
219,600 Charoen Pokphand Foods 170 0.01
1,854,400 Charoen Pokphand FoodsØ 1,435 0.06
656,300 CP ALL 996 0.04
2,440,000 CP ALL 3,703 0.14
3,023,931 Digital TelecommunicationsInfrastructure Fund
1,074 0.04
165,100 Electricity GeneratingØ 880 0.03
1,042,400 Energy AbsoluteØ 1,044 0.04
410,900 Global Power Synergy 631 0.02
2,251,400 Gulf Energy DevelopmentØ 1,702 0.07
225,140 Gulf Energy DevelopmentRights 21/9/2020
8 0.00
3,317,200 Home Product CenterØ 1,186 0.05
601,700 Indorama Ventures 342 0.01
538,200 Indorama VenturesØ 306 0.01
1,298,600 IntouchØ 1,698 0.07
8,400,900 IRPCØ 472 0.02
356,100 KasikornbankØ 720 0.03
686,000 Kasikornbank 1,387 0.05
3,520,100 Krung Thai Bank 802 0.03
877,500 Krungthai CardØ 642 0.02
3,102,320 Land & HousesØ 551 0.02
2,332,086 Minor InternationalØ 1,254 0.05
92,401 Minor International Warrants30/9/2021
2 0.00
106,004 Minor International Warrants31/7/2023
25 0.00
453,900 Muangthai Capital 542 0.02
803,300 Osotspa 747 0.03
7,905,200 PTT 6,829 0.26
582,000 PTT 503 0.02
815,000 PTT Exploration & ProductionØ 1,741 0.07
81,153 PTT Global Chemical 90 0.00
1,177,100 PTT Global ChemicalØ 1,306 0.05
101,500 Ratch 136 0.01
316,800 RatchØ 424 0.02
Holding orNominalValue Investment
MarketValue
£000’s
% ofTotal
NetAssets
89,300 Siam Cement 759 0.03
416,300 Siam CementØ 3,536 0.14
27,208 Siam City CementØ 92 0.00
1,183,200 Siam Commercial BankØ 2,051 0.08
223,600 Siam Commercial Bank 388 0.01
13,104 Srisawad Warrants 31/12/20491 – 0.00
327,600 SrisawadØ 360 0.01
634,300 Thai OilØ 632 0.02
772,100 Thai Union 261 0.01
755,120 Thai Union 255 0.01
25,105,877 TMB BankØ 566 0.02
5,625,427 TMB Bank 127 0.00
269,900 Total Access CommunicationØ 230 0.01
119,300 Total Access Communication 102 0.00
5,664,045 TrueØ 451 0.02
58,989 2.26
EUROPE − 4.10%; 29.2.2020 5.30%
EQUITIES − 4.10%; 29.2.2020 5.30%
Czech Republic − 0.11%; 29.2.2020 0.15%
91,095 CEZ 1,412 0.05
43,252 Komercni bankaØ 782 0.03
329,639 Moneta Money Bank 624 0.02
24,542 O2 Czech Republic 184 0.01
3,002 0.11
Greece − 0.20%; 29.2.2020 0.29%
788,206 Alpha Bank AEØ 390 0.01
1,482,896 Eurobank Ergasias Services and 533 0.02
8,200 FF1 – 0.00
23,718 Hellenic Petroleum 108 0.00
145,457 Hellenic TelecommunicationsOrganizationØ
1,780 0.07
63,289 JUMBO 823 0.03
30,121 Motor Oil Hellas CorinthRefineriesØ
315 0.01
61,255 MytilineosØ 431 0.02
268,712 National Bank of Greece 274 0.01
127,780 OPAP 877 0.03
5,531 0.20
Hungary − 0.24%; 29.2.2020 0.32%
250,293 Magyar TelekomTelecommunications
227 0.01
263,643 MOL Hungarian Oil & Gas 1,109 0.04
136,112 OTP Bank Nyrt 3,446 0.13
iShares Emerging Markets Equity Index Fund (UK)
Portfolio Statement (unaudited) continued
BlackRock Collective Investment Funds109

Holding orNominalValue Investment
MarketValue
£000’s
% ofTotal
NetAssets
86,020 Richter Gedeon Nyrt 1,583 0.06
6,365 0.24
Romania − 0.03%; 29.2.2020 0.05%
235,004 NEPI Rockcastle 821 0.03
Russia − 3.09%; 29.2.2020 3.90%
393,030 Aeroflot 318 0.01
1,496,639 Alrosa 997 0.04
210,346,070 Federal Grid Unified EnergySystem
417 0.02
2,581,475 Gazprom 9,382 0.36
1,158,348 Gazprom 2,113 0.08
20,587,860 Inter RAO UES 1,074 0.04
141,011 Lukoil 7,199 0.28
104,554 LUKOIL 5,247 0.20
163,525 Magnit 1,792 0.07
1,034,822 Magnitogorsk Iron & Steel Works 393 0.02
18,540 MMC Norilsk Nickel 3,603 0.14
114,172 MMC Norilsk Nickel 2,221 0.09
9,278 MMC Norilsk Nickel 181 0.01
139,444 Mobile TeleSystems 970 0.04
254,296 Mobile TeleSystems 870 0.03
846,089 Moscow Exchange MICEX-RTS 1,167 0.04
49,648 Novatek 5,488 0.21
127,427 Novatek 1,422 0.05
592,020 Novolipetsk Steel 927 0.04
37,548 PhosAgro 334 0.01
10,103 PhosAgro 285 0.01
15,981 Polyus 1,469 0.06
8,317 Polyus 1,513 0.06
708,063 Rosneft Oil 2,685 0.10
16,265,660 Rosseti 238 0.01
47,827 Rostelecom 281 0.01
425,876 Rostelecom 412 0.02
397,162 RusHydro 284 0.01
102,607 Sberbank of Russia 926 0.04
5,675,528 Sberbank of Russia 12,936 0.50
114,435 Severstal PAO 1,079 0.04
2,009,940 Sistema PJSFC 433 0.02
285,846 Surgutneftegas 1,057 0.04
4,868,402 Surgutneftegas 1,823 0.07
1,440,106 Surgutneftegas 533 0.02
87,009 Tatneft 466 0.02
103,042 Tatneft 3,438 0.13
256,431 Tatneft 1,414 0.05
866 Transneft 1,205 0.05
9,619,699 Unipro 261 0.01
Holding orNominalValue Investment
MarketValue
£000’s
% ofTotal
NetAssets
1,622,197 VTB Bank 1,107 0.04
79,960 3.09
Turkey − 0.43%; 29.2.2020 0.59%
1,506,438 Akbank T.A.S. 748 0.03
121,616 Anadolu Efes Biracilik Ve MaltSanayii
237 0.01
124,967 ArcelikØ 267 0.01
379,422 Aselsan Elektronik Sanayi VeTicaret
625 0.02
264,093 BIM Birlesik Magazalar 1,819 0.07
23,266 Coca-Cola Icecek 102 0.00
346,904 Enka Insaat ve Sanayi 225 0.01
858,727 Eregli Demir ve CelikFabrikalariØ
760 0.03
41,299 Ford Otomotiv Sanayi 353 0.01
521,988 Haci Omer Sabanci 409 0.02
519,262 KOC 785 0.03
40,520 Koza Altin IsletmeleriØ 320 0.01
548,395 Petkim PetrokimyaØ 218 0.01
1 Soda Sanayii – 0.00
81,967 TAV HavalimanlariØ 125 0.00
125,237 TekfenØ 188 0.01
99,570 Tofas Turk Otomobil Fabrikasi 227 0.01
71,428 Tupras Turkiye Petrol Rafinerileri 580 0.02
358,852 Turk Hava YollariØ 385 0.01
359,535 Turk TelekomunikasyonØ 249 0.01
38,050 Turkcell Iletisim Hizmetleri 139 0.01
565,376 Turkcell Iletisim Hizmetleri 821 0.03
1,206,401 Turkiye Garanti BankasiØ 828 0.03
742,277 Turkiye Is Bankasi 370 0.01
1 Turkiye Sinai Kalkinma Bankasi – 0.00
231,524 Turkiye Sise ve Cam FabrikalariØ 142 0.01
452,858 Turkiye Vakiflar Bankasi 187 0.01
939,612 Yapi ve Kredi BankasiØ 193 0.01
11,302 0.43
MIDDLE EAST − 2.27%; 29.2.2020 2.78%
EQUITIES − 2.27%; 29.2.2020 2.78%
Kuwait − 0.65%; 29.2.2020 0.79%
662,930 Agility Public Warehousing KSC 1,011 0.04
560,524 Boubyan Bank KSCP 793 0.03
212,943 Boubyan Petrochemicals KSCP 279 0.01
393,589 Burgan Bank SAK 190 0.01
1,079,719 Gulf Bank KSCP 560 0.02
59,762 Humansoft KSC 369 0.01
2,278,457 Kuwait Finance House KSCP 3,485 0.13
iShares Emerging Markets Equity Index Fund (UK)
Portfolio Statement (unaudited) continued
BlackRock Collective Investment Funds 110

Holding orNominalValue Investment
MarketValue
£000’s
% ofTotal
NetAssets
302,436 Mabanee SAK 471 0.02
1,287,497 Mobile TelecommunicationsKSC
1,859 0.07
3,793,218 National Bank of Kuwait SAKP 7,974 0.31
16,991 0.65
Qatar − 0.98%; 29.2.2020 1.11%
962,710 Barwa Real Estate 662 0.03
1,351,953 Commercial Bank PSQC/The 1,126 0.04
1,057,570 Doha Bank 504 0.02
1,041,780 Ezdan 294 0.01
1,199,568 Industries Qatar 2,385 0.09
2,085,384 Masraf Al Rayan 1,752 0.07
2,737,770 Mesaieed Petrochemical 1,170 0.05
476,270 Ooredoo 634 0.02
942,950 Qatar Aluminum Manufacturing 187 0.01
315,027 Qatar Electricity & Water 1,091 0.04
275,629 Qatar Fuel 1,020 0.04
1,496,952 Qatar Gas Transport 822 0.03
794,550 Qatar Insurance 339 0.01
385,321 Qatar International Islamic Bank 665 0.03
733,274 Qatar Islamic Bank 2,365 0.09
2,638,571 Qatar National Bank 9,570 0.37
1,706,970 United Development 426 0.02
1,089,030 Vodafone Qatar 285 0.01
25,297 0.98
United Arab Emirates − 0.64%; 29.2.2020 0.88%
1,598,031 Abu Dhabi Commercial Bank 1,797 0.07
467,904 Abu Dhabi Islamic Bank 381 0.01
967,822 Air Arabia 226 0.01
2,235,958 Aldar Properties 923 0.04
553,812 DAMAC Properties Dubai 98 0.00
1,969,702 Dana Gas 290 0.01
1,542,628 Dubai Financial Market 267 0.01
1,050,709 Dubai Investments 258 0.01
1,159,486 Dubai Islamic Bank 967 0.04
402,681 Emaar Development 184 0.01
1,356,296 Emaar Malls 383 0.01
2,151,918 Emaar Properties 1,260 0.05
1,021,006 Emirates Telecommunications 3,438 0.13
2,628,944 First Abu Dhabi Bank 6,126 0.24
16,598 0.64
Holding orNominalValue Investment
MarketValue
£000’s
% ofTotal
NetAssets
NORTH AMERICA − 2.00%; 29.2.2020 2.75%
EQUITIES − 2.00%; 29.2.2020 2.75%
Bahamas − 0.07%; 29.2.2020 0.09%
3,297,144 Ahli United Bank BSC 1,872 0.07
Mexico − 1.93%; 29.2.2020 2.66%
1,876,594 Alfa 902 0.03
203,328 Alpek 112 0.00
222,222 Alsea 171 0.01
17,575,727 America Movil 7,977 0.31
230,830 Arca Continental 784 0.03
401,046 Banco del Bajio 239 0.01
355,888 Banco Santander MexicoInstitucion de Banca MultipleGrupo Financiero Santand
169 0.01
297,093 Becle 425 0.02
9,692,512 Cemex 2,319 0.09
280,898 Coca-Cola Femsa 873 0.03
161,380 Concentradora Fibra Danhos de 114 0.00
142,628 El Puerto de Liverpool 279 0.01
1,642,147 Fibra Uno Administracion de 957 0.04
1,078,123 Fomento Economico Mexicano 4,682 0.18
727,291 GMexico Transportes 692 0.03
118,855 Gruma 1,048 0.04
196,161 Grupo Aeroportuario del CentroNorte
666 0.03
250,300 Grupo Aeroportuario delPacifico
1,448 0.06
119,164 Grupo Aeroportuario delSureste
1,008 0.04
1,364,461 Grupo Bimbo 1,881 0.07
237,814 Grupo Carso 354 0.01
38,286 Grupo Elektra 1,557 0.06
1,668,381 Grupo Financiero Banorte 4,281 0.17
1,233,936 Grupo Financiero Inbursa 673 0.03
312,419 Grupo Lala 147 0.01
1,897,112 Grupo Mexico 3,781 0.15
1,382,670 Grupo Televisa SAB 1,260 0.05
93,055 Industrias Bachoco 217 0.01
67,227 Industrias Penoles 830 0.03
303,523 Infraestructura Energetica Nova 657 0.03
510,661 Kimberly-Clark de Mexico 608 0.02
207,040 Megacable 446 0.02
655,306 Orbia Advance 786 0.03
134,129 Promotora y Operadora deInfraestructura
742 0.03
121,526 Regional 227 0.01
733,030 Telesites 413 0.02
iShares Emerging Markets Equity Index Fund (UK)
Portfolio Statement (unaudited) continued
BlackRock Collective Investment Funds111

Holding orNominalValue Investment
MarketValue
£000’s
% ofTotal
NetAssets
3,026,005 Wal-Mart de Mexico 5,411 0.21
49,136 1.93
SOUTH AMERICA − 6.62%; 29.2.2020 9.01%
EQUITIES − 6.62%; 29.2.2020 9.01%
Brazil − 5.67%; 29.2.2020 7.79%
73,521 Aliansce Sonae ShoppingCenters
264 0.01
123,588 Alpargatas 626 0.02
2,584,943 Ambev 4,332 0.17
231,117 Atacadao 614 0.02
163,438 Azul 494 0.02
130,683 B2W Cia Digital 1,994 0.08
1,204,863 B3 - Brasil Bolsa Balcao 9,645 0.37
2,286,776 Banco Bradesco 6,457 0.25
740,799 Banco Bradesco 1,919 0.07
144,223 Banco BTG Pactual 1,577 0.06
517,094 Banco do Brasil 2,298 0.09
111,936 Banco do Estado do Rio Grandedo Sul
200 0.01
214,155 Banco Santander Brasil 825 0.03
391,585 BB Seguridade Participacoes 1,406 0.05
413,776 BR Malls Participacoes 523 0.02
129,631 Bradespar 776 0.03
100,451 Braskem 291 0.01
373,733 BRF 997 0.04
660,435 CCR 1,199 0.05
176,246 Centrais Eletricas Brasileiras 861 0.03
267,616 Centrais Eletricas Brasileiras 1,294 0.05
90,158 Cia Brasileira de Distribuicao 780 0.03
199,884 Cia de Locacao das Americas 555 0.02
196,090 Cia de Saneamento Basico doEstado de Sao Paulo
1,275 0.05
115,449 Cia de Saneamento do Parana 420 0.02
112,819 Cia de Transmissao de EnergiaEletrica Paulista
329 0.01
557,115 Cia Energetica de Minas Gerais 799 0.03
123,198 Cia Energetica de Minas Gerais 177 0.01
103,112 Cia Energetica de Sao Paulo 422 0.02
54,468 Cia Paranaense de Energia 458 0.02
14,371 Cia Paranaense de Energia 119 0.00
414,890 Cia Siderurgica Nacional 859 0.03
648,624 Cielo 403 0.02
1,008,622 Cogna Educacao 783 0.03
97,559 Cosan 1,106 0.04
76,194 Cosan Logistica 222 0.01
132,395 CPFL Energia 517 0.02
Holding orNominalValue Investment
MarketValue
£000’s
% ofTotal
NetAssets
71,725 CVC Brasil Operadora eAgencia de Viagens
179 0.01
9,755 CVC Brasil Operadora eAgencia de Viagens Warrants29/1/20211
– 0.00
146,574 Cyrela Brazil RealtyEmpreendimentos eParticipacoes
481 0.02
156,382 Duratex 339 0.01
175,602 EDP - Energias do Brasil 447 0.02
434,015 Embraer 433 0.02
150,168 Energisa 888 0.03
100,716 Eneva 678 0.03
103,314 Engie Brasil Energia 600 0.02
503,021 Equatorial Energia 1,589 0.06
144,273 Fleury 512 0.02
610,128 Gerdau 1,586 0.06
79,953 Gol Linhas Aereas Inteligentes 195 0.01
152,026 Grendene 158 0.01
82,407 Guararapes Confeccoes 196 0.01
124,577 Hapvida Participacoes eInvestimentos
1,098 0.04
230,546 Hypera 993 0.04
168,735 IRB Brasil Resseguros 159 0.01
469,508 IRB Brasil Resseguros S/A 456 0.02
2,807,817 Itau Unibanco 9,002 0.35
294,489 Itau Unibanco 904 0.03
2,552,398 Itausa 3,277 0.13
1 Itausa – 0.00
563,225 JBS 1,719 0.07
219,731 Klabin 768 0.03
330,387 Localiza Rent a Car 2,169 0.08
433,140 Lojas Americanas 1,903 0.07
144,827 Lojas Americanas 540 0.02
477,518 Lojas Renner 2,826 0.11
38,400 M Dias Branco 185 0.01
383,892 Magazine Luiza 4,872 0.19
212,637 Multiplan EmpreendimentosImobiliarios
603 0.02
450,316 Natura & 3,025 0.12
117,161 Neoenergia 297 0.01
260,566 Notre Dame IntermedicaParticipacoes
2,629 0.10
146,435 Odontoprev 255 0.01
449,825 Petrobras Distribuidora 1,307 0.05
2,207,791 Petroleo Brasileiro 6,709 0.26
2,694,882 Petroleo Brasileiro 8,031 0.31
60,778 Porto Seguro 437 0.02
iShares Emerging Markets Equity Index Fund (UK)
Portfolio Statement (unaudited) continued
BlackRock Collective Investment Funds 112

Holding orNominalValue Investment
MarketValue
£000’s
% ofTotal
NetAssets
136,535 Qualicorp Consultoria eCorretora de Seguros
580 0.02
138,214 Raia Drogasil 2,028 0.08
650,379 Rumo 2,001 0.08
101,741 Sao Martinho 334 0.01
164,610 Sul America 968 0.04
353,958 Suzano 2,419 0.09
248,987 Telefonica Brasil 1,621 0.06
22,358 Telefonica Brasil 148 0.01
476,697 TIM Participacoes 929 0.04
266,934 TOTVS 1,047 0.04
161,063 Transmissora Alianca deEnergia Eletrica
618 0.02
486,951 Ultrapar Participacoes 1,289 0.05
185,576 Usinas Siderurgicas de MinasGerais Usiminas
256 0.01
1,944,153 Vale 15,796 0.61
546,418 Via Varejo S/A 1,523 0.06
429,214 WEG 3,776 0.15
177,190 YDUQS Participacoes 650 0.03
146,244 5.67
Chile − 0.62%; 29.2.2020 0.76%
1,607,173 AES Gener 189 0.01
1,261,075 Aguas Andinas 283 0.01
66,231 Banco de ChileØ 828 0.03
14,948,233 Banco de Chile 938 0.04
24,514 Banco de Credito e Inversiones 575 0.02
57,458 Banco Santander ChileØ 660 0.03
14,233,293 Banco Santander Chile 412 0.02
722,227 Cencosud 831 0.03
330,875 Cencosud Shopping 382 0.01
97,734 Cia Cervecerias Unidas 488 0.02
3,645,125 Colbun 428 0.02
130,095 Embotelladora Andina 208 0.01
72,710 Empresa Nacional deTelecomunicaciones
331 0.01
706,038 Empresas CMPC 1,103 0.04
300,892 Empresas COPEC 1,696 0.07
Holding orNominalValue Investment
MarketValue
£000’s
% ofTotal
NetAssets
17,484,257 Enel Americas 1,886 0.07
15,457,212 Enel Chile 874 0.03
323,192 Engie Energia Chile 311 0.01
467,254 Falabella 1,127 0.04
87,946,623 Itau CorpBanca Chile 194 0.01
174,219 Latam Airlines 220 0.01
309,059 Parque Arauco 354 0.01
134,118 Plaza 147 0.01
17,610 Sociedad Quimica y Minera deChile
412 0.02
49,426 Sociedad Quimica y Minera deChile
1,162 0.04
16,039 0.62
Colombia − 0.28%; 29.2.2020 0.42%
167,359 Bancolombia 867 0.03
257,771 Bancolombia 1,366 0.05
319,181 Cementos Argos 310 0.01
2,646,205 Ecopetrol 1,146 0.04
40,530 Financiera Colombiana 216 0.01
199,265 Grupo Argos SA/Colombia 473 0.02
2,897,162 Grupo Aval Acciones y Valores 537 0.02
80,981 Grupo de InversionesSuramericana
287 0.01
163,158 Grupo de InversionesSuramericana
682 0.03
1,074,250 Grupo Energia Bogota 523 0.02
223,855 Interconexion Electrica 934 0.04
7,341 0.28
Peru − 0.05%; 29.2.2020 0.04%
118,426 Cia de Minas Buenaventura 1,244 0.05
COLLECTIVE INVESTMENTSCHEMES − 2.03%; 29.2.2020 3.38%
Short-term Money Market Funds − 2.03%; 29.2.2020 3.38%
70,457,222 BlackRock ICS US DollarLiquidity Fund - Agency IncomeClass†
52,621 2.03
iShares Emerging Markets Equity Index Fund (UK)
Portfolio Statement (unaudited) continued
BlackRock Collective Investment Funds113

Holding orNominalValue Investment
UnderlyingExposure − Derivatives
£000’s
MarketValue
£000’s
% ofTotal
NetAssets
DERIVATIVES − 0.07%; 29.2.2020 (0.30%)
Futures − 0.07%; 29.2.2020 (0.30%)
1,575 MSCI Emerging Markets September 2020 64,720 1,918 0.07
Portfolio of investments 2,585,898 99.70
Net other assets 7,711 0.30
Total net assets 2,593,609 100.00
Unless otherwise stated, all securities are either listed on a recognised exchange or traded on an eligible securities market.
Underlying exposure has been calculated according to the guidelines issued by the European Securities and Markets Authority (“ESMA”) and represents the market value of an equivalent positionin the assets underlying each financial derivative instrument.1 Security fair valued by Manager at zero.2 Fair valued by the Manager3 Illiquid Security Fair Valued by the Manager.Ø All or a portion of this investment represents a security on loan.# Investments valued using significant unobservable inputs. Refer to note 2(d) for further information.† Managed by a related party.
iShares Emerging Markets Equity Index Fund (UK)
Portfolio Statement (unaudited) continued
BlackRock Collective Investment Funds 114

£000’s31.8.2020
£000’s £000’s31.8.2019
£000’s
Income
Net capital gains 88,598 54,893
Revenue 45,526 45,583
Expenses (1,250) (1,193)
Interest payable and similarcharges (3) (3)
Net revenue before taxation 44,273 44,387
Taxation (2,480) (4,598)
Net revenue after taxation 41,793 39,789
Total return before distributions 130,391 94,682
Distributions (41,601) (37,454)
Change in net assetsattributable to unitholdersfrom investment activities 88,790 57,228
Statement of Change in Net Assets Attributable to Unitholders(unaudited) for the six months ended 31 August 2020
£000’s31.8.2020
£000’s £000’s31.8.2019
£000’s
Opening net assets attributableto unitholders 2,321,572 1,587,451
Amounts receivable on issue of units 476,526 552,939
Amounts payable on cancellation of units (334,806) (139,567)
141,720 413,372
Change in net assets attributable tounitholders from investment activities 88,790 57,228
Retained distribution on accumulation units 41,527 40,207
Closing net assets attributableto unitholders 2,593,609 2,098,258
The above statement shows the comparative closing net assets at 31 August 2019 whereas the current accounting period commenced 1 March 2020.
iShares Emerging Markets Equity Index Fund (UK)
Statement of Total Return (unaudited)
for the six months ended 31 August 2020
BlackRock Collective Investment Funds115
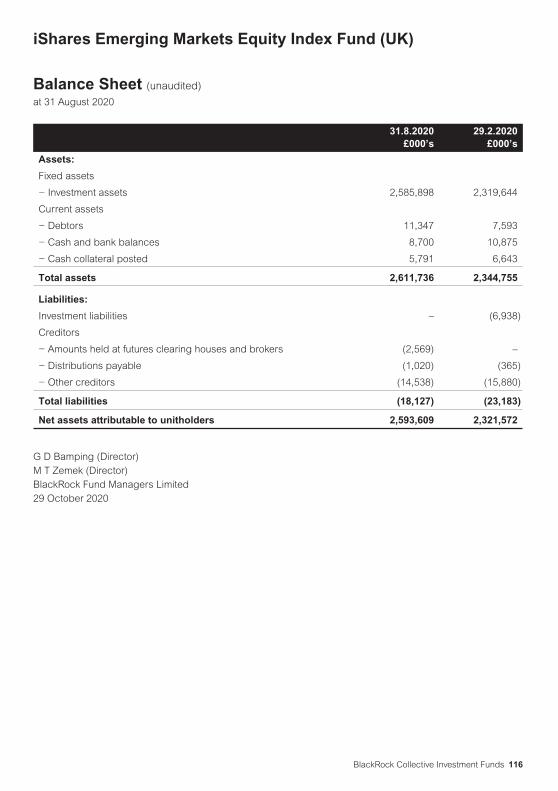
31.8.2020£000’s
29.2.2020£000’s
Assets:
Fixed assets
− Investment assets 2,585,898 2,319,644
Current assets
− Debtors 11,347 7,593
− Cash and bank balances 8,700 10,875
− Cash collateral posted 5,791 6,643
Total assets 2,611,736 2,344,755
Liabilities:
Investment liabilities – (6,938)
Creditors
− Amounts held at futures clearing houses and brokers (2,569) –
− Distributions payable (1,020) (365)
− Other creditors (14,538) (15,880)
Total liabilities (18,127) (23,183)
Net assets attributable to unitholders 2,593,609 2,321,572
G D Bamping (Director)M T Zemek (Director)BlackRock Fund Managers Limited29 October 2020
iShares Emerging Markets Equity Index Fund (UK)
Balance Sheet (unaudited)
at 31 August 2020
BlackRock Collective Investment Funds 116

The Fund is a sub-fund of BlackRock Collective Investment Funds (previously known as BlackRock QualifiedInvestor Schemes (1)), a UCITS scheme under the COLL Sourcebook. The Fund was established on15 November 2010 and was authorised by the FCA on 3 June 2010. The Fund’s FCA product reference numberis 645677.
Risk and Reward ProfileLower riskTypically lower rewards
Higher riskTypically higher rewards
Unit Class
A Income 1 2 3 4 5 6 7
A Accumulation 1 2 3 4 5 6 7
L Accumulation 1 2 3 4 5 6 7
X Income 1 2 3 4 5 6 7
X Accumulation 1 2 3 4 5 6 7
D Income 1 2 3 4 5 6 7
D Accumulation 1 2 3 4 5 6 7
H Income 1 2 3 4 5 6 7
H Accumulation 1 2 3 4 5 6 7
• The risk indicator was calculated incorporating simulated historical data and may not be a reliable indicationof the future risk profile of the Fund.
• The risk category shown is not guaranteed and may change over time.
• The lowest category does not mean risk free.
• The use of derivatives will impact the value of the Fund and may expose the Fund to a higher degree of risk.Derivatives are highly sensitive to changes in the value of the asset on which they are based and can increasethe size of losses and gains, resulting in greater fluctuations in the value of the Fund. The impact to the Fundcan be greater where derivatives are used in an extensive or complex way.
For more information on this, please see the Fund’s Key Investor Information Documents (“KIIDs”), which areavailable at www.blackrock.com.
iShares Global Property Securities Equity Index Fund (UK)
About the Fund
BlackRock Collective Investment Funds117

Net Asset Value
At 31 August 2020 Units in IssueNet Asset Value
£000’s
Net Asset Valueper Unit
p
A Income 51,778 80 154.4
A Accumulation 3,556,784 6,666 187.4
L Accumulation 214,031,965 413,533 193.2
X Income 665,095 588 88.42
X Accumulation 577,099,937 1,026,572 177.9
D Income 391,042,157 607,681 155.4
D Accumulation 346,926,972 661,843 190.8
H Income 52,261,578 61,496 117.7
H Accumulation 209,692,704 287,570 137.1
Distributions Payable for the period to 31 August 2020
Unit Class Distribution payable on 31.10.2020
Pence per Unit
A Income 2.2407
A Accumulation 2.6831
L Accumulation 3.0221
X Income 1.4875
X Accumulation 2.9342
D Income 2.5078
D Accumulation 3.0265
H Income 1.8966
H Accumulation 2.1804
iShares Global Property Securities Equity Index Fund (UK)
Performance Record
BlackRock Collective Investment Funds 118

Operating Charges
Unit Class1.3.2020
to 31.8.20201.3.2019
to 29.2.2020
A Income 0.56% 0.56%
A Accumulation 0.56% 0.56%
L Accumulation 0.22% 0.21%
X Income 0.01% 0.01%
X Accumulation 0.01% 0.01%
D Income 0.18% 0.17%
D Accumulation 0.18% 0.17%
H Income 0.18% 0.17%
H Accumulation 0.18% 0.17%
Operating charges are annualised and exclude portfolio trade-related costs, except costs paid to the custodian/depositary and entry/exit charges paid to an underlyingcollective investment scheme (if any).
iShares Global Property Securities Equity Index Fund (UK)
Performance Record continued
BlackRock Collective Investment Funds119

Holding orNominalValue Investment
MarketValue
£000’s
% ofTotal
NetAssets
EQUITIES − 99.35%; 29.2.2020 100.01%
Australia − 3.34%; 29.2.2020 3.51%
1,470,493 BWP Trust 3,298 0.11
1,249,089 Charter Hall Long WaleREITØ
3,415 0.11
1,378,510 Charter Hall Retail REIT 2,612 0.09
6,964,805 Cromwell PropertyØ 3,443 0.11
3,175,718 Dexus 15,471 0.50
5,669,045 GPT 11,992 0.39
11,436,335 Mirvac 13,265 0.43
2,719,776 National Storage REIT 2,854 0.09
15,091,207 Scentre 18,755 0.61
3,192,383 Shopping CentresAustralasia Property
3,950 0.13
6,932,917 Stockland 15,164 0.49
10,908,594 Vicinity Centres 8,646 0.28
102,865 3.34
Austria − 0.15%; 29.2.2020 0.19%
203,313 CA Immobilien Anlagen 4,722 0.15
Belgium − 1.13%; 29.2.2020 0.97%
80,997 AedificaØ 7,126 0.23
70,688 BefimmoØ 2,538 0.08
76,900 Cofinimmo 8,407 0.27
74,276 Intervest Offices &Warehouses
1,466 0.05
9,515 Leasinvest Real EstateØ 685 0.02
33,983 Retail Estates 1,736 0.06
391,390 Warehouses De PauwCVAØ
10,345 0.34
10,547 Wereldhave BelgiumComm VA
443 0.01
47,738 Xior Student Housing 2,183 0.07
34,929 1.13
Canada − 2.74%; 29.2.2020 2.97%
361,744 Allied Properties RealEstate Investment Trust
7,612 0.25
381,824 Artis Real EstateInvestment TrustØ
1,913 0.06
122,499 Boardwalk Real EstateInvestment TrustØ
2,088 0.07
498,728 Canadian ApartmentProperties REIT
12,864 0.42
622,920 Chartwell RetirementResidencesØ
3,720 0.12
761,603 Choice Properties RealEstate Investment TrustØ
5,527 0.18
Holding orNominalValue Investment
MarketValue
£000’s
% ofTotal
NetAssets
543,638 Cominar Real Estate InvestmentTrustØ
2,191 0.07
279,021 Crombie Real Estate InvestmentTrustØ
2,102 0.07
474,202 Dream Industrial Real EstateInvestment Trust
3,014 0.10
132,240 Dream Office Real EstateInvestment TrustØ
1,440 0.05
157,005 Granite Real Estate InvestmentTrust
6,962 0.23
847,686 H&R Real Estate InvestmentTrustØ
4,873 0.16
351,291 InterRent Real Estate InvestmentTrust
2,501 0.08
302,118 Killam Apartment Real EstateInvestment Trust
2,996 0.10
178,076 Northview Apartment RealEstate Investment Trust
3,490 0.11
458,614 NorthWest HealthcareProperties Real EstateInvestment TrustØ
3,094 0.10
940,317 RioCan Real Estate InvestmentTrustØ
8,166 0.27
387,784 SmartCentres Real EstateInvestment TrustØ
4,561 0.15
386,684 Summit Industrial Income REIT 2,613 0.09
178,772 WPT Industrial Real EstateInvestment Trust
1,788 0.06
83,515 2.74
Finland − 0.36%; 29.2.2020 0.16%
241,089 CityconØ 1,443 0.05
523,336 Kojamo 9,443 0.31
10,886 0.36
France − 1.63%; 29.2.2020 2.61%
120,105 CarmilaØ 991 0.03
134,665 CovivioØ 7,470 0.24
150,760 Gecina 15,499 0.51
94,488 ICADE 4,579 0.15
550,773 KlepierreØ 6,782 0.22
179,456 MercialysØ 859 0.03
391,916 Unibail-Rodamco-WestfieldØ 13,709 0.45
49,889 1.63
Germany − 5.63%; 29.2.2020 3.96%
186,735 ADO Properties 4,297 0.14
519,897 alstria office REIT-AGØ 5,819 0.19
152,422 Deutsche EuroShopØ 1,696 0.06
1,047,050 Deutsche Wohnen 41,600 1.36
iShares Global Property Securities Equity Index Fund (UK)
Portfolio Statement (unaudited)
at 31 August 2020
BlackRock Collective Investment Funds 120

Holding orNominalValue Investment
MarketValue
£000’s
% ofTotal
NetAssets
210,285 Hamborner REITØ 1,614 0.05
200,839 LEG Immobilien 22,065 0.72
2,659,622 Sirius Real Estate 1,979 0.06
367,112 TAG Immobilien 8,191 0.27
44,719 TLG Immobilien 674 0.02
1,578,175 Vonovia 84,466 2.76
172,401 5.63
Guernsey − 0.07%; 29.2.2020 0.14%
1,478,511 BMO Commercial Property Trust 1,003 0.03
1,971,869 UK Commercial Property REITØ 1,307 0.04
2,310 0.07
Hong Kong − 6.01%; 29.2.2020 5.95%
5,674,427 Champion REITØ 2,236 0.07
7,818,253 CK Asset 31,644 1.03
3,905,000 Fortune Real Estate InvestmentTrustØ
2,517 0.08
5,889,881 Hang Lung Properties 12,373 0.40
3,369,681 Hongkong LandØ 9,639 0.31
1,828,758 Hysan Development 4,318 0.14
5,979,500 Link REIT 35,467 1.16
4,143,745 New World Development 16,033 0.52
9,607,108 Sino Land 8,360 0.27
4,132,487 Sun Hung Kai Properties 41,297 1.35
3,099,281 Swire PropertiesØ 6,272 0.20
4,770,341 Wharf Real Estate Investment 14,802 0.48
184,958 6.01
Ireland − 0.12%; 29.2.2020 0.11%
2,004,313 Hibernia REIT 2,109 0.07
1,342,655 Irish Residential Properties REIT 1,667 0.05
3,776 0.12
Israel − 0.19%; 29.2.2020 0.17%
408,088 Amot InvestmentsØ 1,559 0.05
105,737 Azrieli 4,265 0.14
5,824 0.19
Italy − 0.02%; 29.2.2020 0.02%
178,569 Immobiliare GrandeDistribuzione SIIQØ
488 0.02
Japan − 11.57%; 29.2.2020 11.91%
2,008 Activia PropertiesØ 5,636 0.18
3,749 Advance Residence Investment 8,238 0.27
351,700 Aeon MallØ 3,475 0.11
4,574 AEON REIT Investment 3,708 0.12
1,734 Comforia Residential REITØ 3,957 0.13
Holding orNominalValue Investment
MarketValue
£000’s
% ofTotal
NetAssets
5,416 Daiwa Living InvestmentsØ 4,036 0.13
5,846 Daiwa House REIT InvestmentØ 11,364 0.37
818 Daiwa Office InvestmentØ 3,474 0.11
1,353 Frontier Real Estate Investment 3,349 0.11
2,036 Fukuoka REITØ 1,952 0.06
2,704 Global One Real EstateInvestmentØ
1,998 0.07
10,523 GLP J-ReitØ 12,117 0.40
1,055,000 Hulic 7,170 0.23
3,264 Hulic ReitØ 3,156 0.10
3,476 Ichigo Office REIT InvestmentØ 1,841 0.06
5,490 Industrial & Infrastructure FundInvestment
7,161 0.23
26,284 Invesco Office J-Reit 2,736 0.09
13,820 Invincible InvestmentØ 3,081 0.10
3,726 Japan Excellent 3,283 0.11
13,033 Japan Hotel REIT InvestmentØ 4,479 0.15
2,536 Japan Logistics FundØ 5,088 0.17
2,581 Japan Prime Realty Investment 5,789 0.19
3,776 Japan Real Estate Investment 15,610 0.51
7,599 Japan Retail Fund InvestmentØ 8,504 0.28
1,122 Kenedix Office Investment 4,931 0.16
2,745 Kenedix Residential NextInvestmentØ
3,648 0.12
1,519 Kenedix Retail REIT 2,329 0.08
3,910 LaSalle Logiport REITØ 4,899 0.16
4,672 MCUBS MidCity Investment 2,649 0.09
3,311,100 Mitsubishi EstateØ 38,687 1.26
825 Mitsubishi Estate Logistics REITInvestmentØ
2,519 0.08
2,689,900 Mitsui Fudosan 36,354 1.19
1,170 Mitsui Fudosan Logistics ParkØ 4,359 0.14
4,443 Mori Hills REIT InvestmentØ 4,130 0.13
2,829 Mori Trust Sogo Reit 2,757 0.09
1,295 Nippon Accommodations FundØ 5,910 0.19
3,681 Nippon Building Fund 16,462 0.54
6,201 Nippon Prologis REIT 15,132 0.49
1,280 NIPPON REIT Investment 3,331 0.11
334,900 Nomura Real EstateØ 4,781 0.16
13,036 Nomura Real Estate MasterFundØ
12,403 0.40
7,645 Orix JREITØ 8,351 0.27
3,760 Premier Investment 3,297 0.11
11,775 Sekisui House Reit 6,178 0.20
1,147,600 Sumitomo Realty &DevelopmentØ
25,306 0.83
577,800 Tokyo TatemonoØ 5,249 0.17
2,658 Tokyu REIT 2,649 0.09
iShares Global Property Securities Equity Index Fund (UK)
Portfolio Statement (unaudited) continued
BlackRock Collective Investment Funds121

Holding orNominalValue Investment
MarketValue
£000’s
% ofTotal
NetAssets
8,622 United Urban Investment 7,129 0.23
354,642 11.57
Luxembourg − 0.67%; 29.2.2020 0.84%
3,497,949 Aroundtown 14,391 0.47
325,269 Grand City Properties 6,235 0.20
20,626 0.67
Netherlands − 0.17%; 29.2.2020 0.20%
157,647 Eurocommercial PropertiesØ 1,411 0.05
52,359 NSIØ 1,391 0.05
49,250 Vastned RetailØ 1,078 0.04
132,295 WereldhaveØ 828 0.03
4,708 0.17
New Zealand − 0.28%; 29.2.2020 0.09%
3,103,717 Goodman Property Trust 3,643 0.12
4,563,122 Kiwi Property 2,350 0.08
3,078,467 Precinct Properties NewZealandØ
2,580 0.08
8,573 0.28
Norway − 0.17%; 29.2.2020 0.16%
499,842 Entra 5,123 0.17
Singapore − 3.38%; 29.2.2020 3.02%
8,546,160 Ascendas Real EstateInvestment TrustØ
15,539 0.51
5,485,000 Ascott Residence TrustØ 2,697 0.09
7,277,402 CapitaLandØ 11,073 0.36
7,924,825 CapitaLand Commercial Trust 7,270 0.24
6,973,400 CapitaLand Mall TrustØ 7,470 0.24
2,458,560 CDL Hospitality TrustsØ 1,418 0.05
1,362,100 City DevelopmentsØ 5,971 0.20
2,130,400 Frasers Centrepoint TrustØ 2,926 0.10
7,292,300 Frasers Logistics & CommercialTrustØ
5,368 0.18
3,549,233 Keppel DC REITØ 5,654 0.18
5,814,942 Keppel REITØ 3,354 0.11
3,952,200 Manulife US Real EstateInvestment TrustØ
2,184 0.07
6,363,115 Mapletree Commercial Trust 6,676 0.22
4,457,600 Mapletree Industrial TrustØ 7,468 0.24
7,403,503 Mapletree Logistics Trust 8,378 0.27
6,121,600 Suntec Real Estate InvestmentTrustØ
4,708 0.15
1,432,695 UOLØ 5,163 0.17
103,317 3.38
Holding orNominalValue Investment
MarketValue
£000’s
% ofTotal
NetAssets
Spain − 0.43%; 29.2.2020 0.59%
949,544 Inmobiliaria Colonial Socimi 6,238 0.20
182,166 Lar Espana Real Estate Socimi 694 0.02
964,290 Merlin Properties Socimi 6,468 0.21
13,400 0.43
Sweden − 1.96%; 29.2.2020 2.14%
126,151 Atrium Ljungberg 1,350 0.04
783,458 Castellum 11,971 0.39
70,273 CatenaØ 2,111 0.07
255,970 Dios Fastigheter 1,239 0.04
766,868 FabegeØ 6,986 0.23
281,795 Fastighets Balder 8,418 0.27
328,444 Hufvudstaden 3,049 0.10
1,531,379 KlovernØ 1,762 0.06
572,728 Kungsleden 3,402 0.11
494,243 Nyfosa 2,664 0.09
253,054 PandoxØ 2,150 0.07
2,738,116 Samhallsbyggnadsbolaget iNordenØ
5,714 0.19
475,343 WallenstamØ 4,643 0.15
391,782 Wihlborgs Fastigheter 4,668 0.15
60,127 1.96
Switzerland − 1.26%; 29.2.2020 1.31%
40,806 Allreal 6,329 0.21
8,149 Hiag Immobilien 635 0.02
3,332 Intershop 1,583 0.05
19,483 Mobimo 4,282 0.14
125,079 PSP Swiss PropertyØ 11,183 0.36
218,346 Swiss Prime SiteØ 14,723 0.48
38,735 1.26
United Kingdom − 4.75%; 29.2.2020 4.51%
691,616 Aberdeen Standard EuropeanLogistics Income
730 0.02
7,599,776 Assura 6,148 0.20
475,117 Big Yellow 5,074 0.17
795,295 BMO Real Estate Investments 541 0.02
2,688,643 British Land 9,830 0.32
2,232,554 Capital & Counties Properties 2,887 0.09
1,792,578 Civitas Social Housing 1,979 0.06
1,135,609 Custodian Reit 978 0.03
292,402 Derwent London 8,269 0.27
1,719,810 Empiric Student PropertyØ 1,200 0.04
1,341,333 GCP Student Living 1,848 0.06
1,932,498 Grainger 6,049 0.20
755,752 Great Portland Estates 4,560 0.15
iShares Global Property Securities Equity Index Fund (UK)
Portfolio Statement (unaudited) continued
BlackRock Collective Investment Funds 122

Holding orNominalValue Investment
MarketValue
£000’s
% ofTotal
NetAssets
2,415,501 Hammerson 1,170 0.04
286,825 Helical 816 0.03
658,450 Impact Healthcare Reit 654 0.02
2,071,977 Land 11,978 0.39
2,564,351 LondonMetric PropertyØ 6,067 0.20
1,410,608 LXI REIT 1,594 0.05
971,635 NewRiver REIT 578 0.02
247,862 Phoenix Spree Deutschland 756 0.02
1,555,187 Picton Property Income 1,093 0.04
3,494,794 Primary Health Properties 5,312 0.17
738,586 RDI REITØ 629 0.02
1,096,788 Regional REIT 838 0.03
600,215 Safestore 4,691 0.15
1,333,229 Schroder Real Estate InvestmentTrust
398 0.01
3,457,982 Segro 32,941 1.07
641,704 Shaftesbury 3,391 0.11
1,191,515 Standard Life InvestmentProperty Income Trust
626 0.02
1,281,003 Target Healthcare REIT 1,391 0.05
917,446 Triple Point Social Housing Reit 982 0.03
4,961,702 Tritax Big Box REITØ 7,725 0.25
1,215,960 Tritax EuroBox 1,109 0.04
925,106 Unite 8,936 0.29
402,534 Workspace 2,266 0.07
146,034 4.75
United States of America − 53.32%; 29.2.2020 54.48%
242,358 Acadia Realty Trust 2,051 0.07
153,440 Agree RealtyØ 7,669 0.25
6,448 Alexander’s 1,236 0.04
363,278 Alexandria Real Estate EquitiesØ 45,665 1.49
144,603 American Assets Trust 2,758 0.09
396,939 American Campus Communities 10,050 0.33
326,692 American Finance Trust 1,666 0.05
752,754 American Homes 4 RentØ 16,101 0.53
580,694 Americold Realty TrustØ 16,619 0.54
429,306 Apartment Investment andManagement
11,543 0.38
605,066 Apple Hospitality REIT 4,596 0.15
167,745 Armada Hoffler Properties 1,264 0.04
408,299 AvalonBay Communities 48,180 1.57
451,211 Boston Properties 29,261 0.95
504,441 Brandywine Realty TrustØ 4,193 0.14
859,003 Brixmor Property 7,557 0.25
168,102 Brookfield Property REITØ 1,448 0.05
273,551 Camden Property Trust 18,565 0.61
263,999 CareTrust REIT 3,819 0.12
Holding orNominalValue Investment
MarketValue
£000’s
% ofTotal
NetAssets
1,475,399 Colony Capital 2,997 0.10
329,749 Columbia Property Trust 2,906 0.10
61,033 Community Healthcare Trust 2,127 0.07
325,489 Corporate Office PropertiesTrust
5,987 0.20
429,193 Cousins PropertiesØ 9,568 0.31
560,181 CubeSmartØ 13,225 0.43
333,434 CyrusOneØ 20,784 0.68
570,669 DiamondRock Hospitality 2,259 0.07
775,843 Digital Realty TrustØ 90,126 2.94
686,286 Diversified Healthcare Trust 1,943 0.06
482,402 Douglas Emmett 10,059 0.33
1,068,577 Duke Realty 30,750 1.00
225,003 Easterly GovernmentPropertiesØ
4,065 0.13
111,421 EastGroup PropertiesØ 11,093 0.36
444,419 Empire State Realty TrustØ 2,094 0.07
227,084 EPR Properties 5,480 0.18
338,420 Equity Commonwealth 7,934 0.26
504,290 Equity LifeStyle PropertiesØ 24,956 0.81
1,066,434 Equity Residential 44,921 1.47
270,209 Essential Properties Realty Trust 3,421 0.11
189,173 Essex Property Trust 30,574 1.00
365,753 Extra Space StorageØ 29,100 0.95
218,211 Federal Realty Investment TrustØ 12,901 0.42
366,012 First Industrial Realty Trust 11,656 0.38
204,569 Four Corners Property Trust 3,858 0.13
346,363 Franklin Street PropertiesØ 1,146 0.04
582,711 Gaming and Leisure Properties 15,806 0.52
96,688 Getty Realty 2,115 0.07
389,575 Healthcare Realty TrustØ 8,382 0.27
630,297 Healthcare Trust of America 12,409 0.40
1,564,351 Healthpeak PropertiesØ 32,270 1.05
298,240 Highwoods Properties 8,299 0.27
2,027,511 Host Hotels & ResortsØ 17,005 0.55
435,499 Hudson Pacific PropertiesØ 7,624 0.25
289,875 Independence Realty Trust 2,535 0.08
194,761 Industrial Logistics PropertiesTrust
3,138 0.10
49,589 Innovative Industrial PropertiesØ 4,550 0.15
35,809 Investors Real Estate TrustØ 1,901 0.06
1,578,864 Invitation HomesØ 33,748 1.10
353,174 JBG SMITH PropertiesØ 7,291 0.24
356,546 Kennedy-Wilson 3,803 0.12
333,150 Kilroy RealtyØ 14,551 0.47
1,197,757 Kimco Realty 10,717 0.35
244,776 Kite Realty Trust 2,053 0.07
737,927 Lexington Realty TrustØ 6,266 0.20
iShares Global Property Securities Equity Index Fund (UK)
Portfolio Statement (unaudited) continued
BlackRock Collective Investment Funds123

Holding orNominalValue Investment
MarketValue
£000’s
% ofTotal
NetAssets
135,232 Life Storage 10,644 0.35
115,471 LTC PropertiesØ 3,142 0.10
413,551 MacerichØ 2,446 0.08
263,200 Mack-Cali RealtyØ 2,485 0.08
1,508,162 Medical Properties TrustØ 20,906 0.68
330,380 Mid-America ApartmentCommunities
28,874 0.94
282,586 Monmouth Real EstateInvestment
3,060 0.10
125,610 National Health InvestorsØ 5,829 0.19
496,603 National Retail PropertiesØ 13,137 0.43
178,829 National Storage Affiliates Trust 4,580 0.15
145,444 Office Properties Income Trust 2,589 0.08
652,436 Omega Healthcare Investors 15,081 0.49
545,016 Paramount 3,012 0.10
708,677 Park Hotels & ResortsØ 5,018 0.16
385,086 Pebblebrook Hotel TrustØ 3,627 0.12
585,608 Physicians Realty TrustØ 7,934 0.26
373,630 Piedmont Office Realty Trust 4,269 0.14
2,138,448 PrologisØ 162,618 5.30
58,519 PS Business Parks 5,516 0.18
437,572 Public Storage 69,364 2.26
173,196 QTS Realty TrustØ 8,771 0.29
997,899 Realty IncomeØ 46,185 1.51
488,637 Regency Centers 14,484 0.47
346,391 Retail Opportunity InvestmentsØ 2,879 0.09
637,817 Retail Properties of AmericaØ 3,006 0.10
336,557 Rexford Industrial RealtyØ 12,043 0.39
485,716 RLJ Lodging TrustØ 3,421 0.11
268,127 RPT Realty 1,173 0.04
150,610 Ryman Hospitality Properties 4,291 0.14
592,287 Sabra Health Care REIT 6,560 0.21
37,342 Saul Centers 781 0.03
494,852 Service Properties TrustØ 3,034 0.10
882,830 Simon Property 44,690 1.46
Holding orNominalValue Investment
MarketValue
£000’s
% ofTotal
NetAssets
439,743 SITE CentersØ 2,463 0.08
224,191 SL Green RealtyØ 7,824 0.26
298,240 Spirit Realty CapitalØ 7,907 0.26
432,152 STAG IndustrialØ 10,418 0.34
651,766 STORE CapitalØ 13,153 0.43
313,089 Summit Hotel PropertiesØ 1,380 0.05
280,347 Sun CommunitiesØ 31,204 1.02
644,780 Sunstone Hotel Investors 4,011 0.13
271,232 Tanger Factory Outlet CentersØ 1,153 0.04
179,909 Taubman Centers 5,148 0.17
192,253 Terreno RealtyØ 8,563 0.28
849,573 UDRØ 22,081 0.72
37,601 Universal Health Realty IncomeTrust
1,873 0.06
334,264 Urban Edge Properties 2,634 0.09
86,556 Urstadt Biddle Properties 602 0.02
1,082,808 VentasØ 33,294 1.09
3,131,376 VEREITØ 15,716 0.51
1,361,619 VICI PropertiesØ 22,708 0.74
508,810 Vornado Realty TrustØ 13,616 0.44
245,361 Washington Real EstateInvestment TrustØ
4,019 0.13
352,222 Weingarten Realty Investors 4,590 0.15
1,213,266 Welltower 52,084 1.70
496,241 WP Carey 25,702 0.84
324,254 Xenia Hotels & Resorts 2,172 0.07
1,634,398 53.32
COLLECTIVE INVESTMENTSCHEMES − 0.24; 29.2.2020 0.07%
Short-term Money Market Funds − 0.24%; 29.2.2020 0.07%
9,787,884 BlackRock ICS US DollarLiquidity Fund - Agency IncomeClass†
7,310 0.24
Holding orNominalValue Investment
UnderlyingExposure − Derivatives
£000’s
MarketValue
£000’s
% ofTotal
NetAssets
DERIVATIVES − 0.02%; 29.2.2020 (0.05%)
Futures − 0.02%; 29.2.2020 (0.05%)
39 Dow Jones US Real Estate September 2020 940 56 0.00
40 FTSE 100 Index September 2020 2,385 (14) 0.00
24 Hang Seng Index September 2020 2,900 (40) 0.00
138 S&P 500 E-Mini September 2020 18,031 574 0.02
28 SPI 200 September 2020 2,331 7 0.00
iShares Global Property Securities Equity Index Fund (UK)
Portfolio Statement (unaudited) continued
BlackRock Collective Investment Funds 124

Holding orNominalValue Investment
UnderlyingExposure − Derivatives
£000’s
MarketValue
£000’s
% ofTotal
NetAssets
37 TOPIX Index September 2020 4,211 78 0.00
30,798 661 0.02
Portfolio of investments 3,054,217 99.61
Net other assets 11,812 0.39
Total net assets 3,066,029 100.00
Unless otherwise stated, all securities are either listed on a recognised exchange or traded on an eligible securities market.
Underlying exposure has been calculated according to the guidelines issued by the European Securities and Markets Authority (“ESMA”) and represents the market value of an equivalent positionin the assets underlying each financial derivative instrument.Ø All or a portion of this investment represents a security on loan.† Managed by a related party.
iShares Global Property Securities Equity Index Fund (UK)
Portfolio Statement (unaudited) continued
BlackRock Collective Investment Funds125

£000’s31.8.2020
£000’s £000’s31.8.2019
£000’s
Income
Net capital (losses)/gains (426,459) 338,377
Revenue 52,297 53,622
Expenses (1,810) (1,978)
Interest payable and similarcharges (12) (6)
Net revenue before taxation 50,475 51,638
Taxation (8,246) (8,413)
Net revenue after taxation 42,229 43,225
Total return before distributions (384,230) 381,602
Distributions (41,413) (43,225)
Change in net assetsattributable to unitholdersfrom investment activities (425,643) 338,377
Statement of Change in Net Assets Attributable to Unitholders(unaudited) for the six months ended 31 August 2020
£000’s31.8.2020
£000’s £000’s31.8.2019
£000’s
Opening net assets attributableto unitholders 2,796,223 2,425,900
Amounts receivable on issue of units 1,166,142 505,840
Amounts payable on cancellation of units (509,262) (581,201)
656,880 (75,361)
Change in net assets attributable tounitholders from investment activities (425,643) 338,377
Retained distribution on accumulation units 38,569 29,090
Closing net assets attributableto unitholders 3,066,029 2,718,006
The above statement shows the comparative closing net assets at 31 August 2019 whereas the current accounting period commenced 1 March 2020.
iShares Global Property Securities Equity Index Fund (UK)
Statement of Total Return (unaudited)
for the six months ended 31 August 2020
BlackRock Collective Investment Funds 126

31.8.2020£000’s
29.2.2020£000’s
Assets:
Fixed assets
− Investment assets 3,054,271 2,798,292
Current assets
− Debtors 123,685 16,991
− Cash and bank balances 8,364 13,245
− Cash collateral posted 1,777 –
Total assets 3,188,097 2,828,528
Liabilities:
Investment liabilities (54) (1,227)
Creditors
− Amounts held at futures clearing houses and brokers (678) –
− Distributions payable (10,809) (9,129)
− Other creditors (110,527) (21,949)
Total liabilities (122,068) (32,305)
Net assets attributable to unitholders 3,066,029 2,796,223
G D Bamping (Director)M T Zemek (Director)BlackRock Fund Managers Limited29 October 2020
iShares Global Property Securities Equity Index Fund (UK)
Balance Sheet (unaudited)
at 31 August 2020
BlackRock Collective Investment Funds127

The Fund is a sub-fund of BlackRock Collective Investment Funds, a UCITS scheme under the COLLSourcebook. The Fund was established on 29 June 2012 and was authorised by the FCA on 25 May 2012. TheFund’s FCA product reference number is 645680.
Risk and Reward ProfileLower riskTypically lower rewards
Higher riskTypically higher rewards
Unit Class
A Accumulation 1 2 3 4 5 6 7
L Accumulation 1 2 3 4 5 6 7
X Income 1 2 3 4 5 6 7
X Accumulation 1 2 3 4 5 6 7
D Accumulation 1 2 3 4 5 6 7
H Accumulation 1 2 3 4 5 6 7
• The risk indicator was calculated incorporating historical data and may not be a reliable indication of the futurerisk profile of the Fund.
• The risk category shown is not guaranteed and may change over time.
• The lowest category does not mean risk free.
For more information on this, please see the Fund’s Key Investor Information Documents (“KIIDs”), which areavailable at www.blackrock.com.
iShares Index Linked Gilt Index Fund (UK)
About the Fund
BlackRock Collective Investment Funds 128

Net Asset Value
At 31 August 2020 Units in IssueNet Asset Value
£000’s
Net Asset Valueper Unit
p
A Accumulation 322,435 575 178.4
L Accumulation 36,259,463 66,070 182.2
X Income 6,688,358 11,798 176.4
X Accumulation 1,037,555,896 1,916,946 184.8
D Accumulation 134,942,759 247,723 183.6
H Accumulation 41,321,830 66,752 161.5
Distributions Payable for the period to 31 August 2020
Unit Class Distribution payable on 31.10.2020
Pence per Unit
A Accumulation 0.0000
L Accumulation 0.1358
X Income 0.3107
X Accumulation 0.3249
D Accumulation 0.2299
H Accumulation 0.2024
Operating Charges
Unit Class1.3.2020
to 31.8.20201.3.2019
to 29.2.2020
A Accumulation 0.51% 0.51%
L Accumulation 0.21% 0.21%
X Income 0.01% 0.01%
X Accumulation 0.01% 0.01%
D Accumulation 0.11% 0.11%
H Accumulation 0.11% 0.11%
Operating charges are annualised and exclude portfolio trade-related costs, except costs paid to the custodian/depositary and entry/exit charges paid to an underlyingcollective investment scheme (if any).
iShares Index Linked Gilt Index Fund (UK)
Performance Record
BlackRock Collective Investment Funds129

Holding orNominalValue Investment
MarketValue
£000’s
% ofTotal
NetAssets
BONDS − 99.79%; 29.2.2020 99.77%
UK Sterling Denominated GovernmentBonds − 99.79%; 29.2.2020 99.77%
£42,456,602 United Kingdom GiltInflation Linked 0.125%22/3/2026
57,251 2.48
£50,131,000 United Kingdom GiltInflation Linked 0.125%10/8/2028
67,177 2.91
£50,389,169 United Kingdom GiltInflation Linked 0.125%22/3/2029
80,707 3.49
£42,510,515 United Kingdom GiltInflation Linked 0.125%22/11/2036
74,407 3.22
£38,197,000 United Kingdom GiltInflation Linked 0.125%10/8/2041
66,964 2.90
£51,065,488 United Kingdom GiltInflation Linked 0.125%22/3/2044
106,861 4.63
£44,332,801 United Kingdom GiltInflation Linked 0.125%22/3/2046
90,076 3.90
£37,997,738 United Kingdom GiltInflation Linked 0.125%10/8/2048
75,669 3.27
£19,057,000 United Kingdom GiltInflation Linked 0.125%22/11/2056
45,438 1.97
£35,650,830 United Kingdom GiltInflation Linked 0.125%22/3/2058
90,309 3.91
£23,709,000 United Kingdom GiltInflation Linked 0.125%22/11/2065
68,541 2.97
£41,453,249 United Kingdom GiltInflation Linked 0.125%22/3/2068
133,152 5.76
Holding orNominalValue Investment
MarketValue
£000’s
% ofTotal
NetAssets
£39,836,913 United Kingdom Gilt InflationLinked 0.25% 22/3/2052
98,652 4.27
£40,203,682 United Kingdom Gilt InflationLinked 0.375% 22/3/2062
126,106 5.46
£40,216,186 United Kingdom Gilt InflationLinked 0.5% 22/3/2050
114,600 4.96
£46,249,780 United Kingdom Gilt InflationLinked 0.625% 22/3/2040
110,187 4.77
£40,671,050 United Kingdom Gilt InflationLinked 0.625% 22/11/2042
104,204 4.51
£48,826,207 United Kingdom Gilt InflationLinked 0.75% 22/3/2034
97,029 4.20
£37,448,453 United Kingdom Gilt InflationLinked 0.75% 22/11/2047
110,323 4.78
£41,200,641 United Kingdom Gilt InflationLinked 1.125% 22/11/2037
108,540 4.70
£909,000 United Kingdom Gilt InflationLinked 1.125% 22/11/2037
2,395 0.10
£44,531,566 United Kingdom Gilt InflationLinked 1.25% 22/11/2027
90,458 3.92
£45,942,000 United Kingdom Gilt InflationLinked 1.25% 22/11/2032
99,510 4.31
£33,214,917 United Kingdom Gilt InflationLinked 1.25% 22/11/2055
137,404 5.95
£29,431,000 United Kingdom Gilt InflationLinked 2% 26/1/2035
89,213 3.86
£15,473,385 United Kingdom Gilt InflationLinked 4.125% 22/7/2030
59,882 2.59
2,305,055 99.79
Portfolio of investments 2,305,055 99.79
Net other assets 4,809 0.21
Total net assets 2,309,864 100.00
Unless otherwise stated, all securities are either listed on a recognised exchange or traded on aneligible securities market.
All securities in the portfolio at 31 August 2020 are investment grade.
iShares Index Linked Gilt Index Fund (UK)
Portfolio Statement (unaudited)
at 31 August 2020
BlackRock Collective Investment Funds 130

£000’s31.8.2020
£000’s £000’s31.8.2019
£000’s
Income
Net capital gains 32,555 337,698
Revenue 3,938 4,227
Expenses (305) (269)
Net revenue before taxation 3,633 3,958
Taxation – –
Net revenue after taxation 3,633 3,958
Total return before distributions 36,188 341,656
Distributions (3,633) (3,958)
Change in net assetsattributable to unitholdersfrom investment activities 32,555 337,698
Statement of Change in Net Assets Attributable to Unitholders(unaudited) for the six months ended 31 August 2020
£000’s31.8.2020
£000’s £000’s31.8.2019
£000’s
Opening net assets attributableto unitholders 2,225,828 1,737,847
Amounts receivable on issue of units 362,370 448,365
Amounts payable on cancellation of units (314,703) (204,650)
47,667 243,715
Change in net assets attributable tounitholders from investment activities 32,555 337,698
Retained distribution on accumulation units 3,814 4,272
Closing net assets attributableto unitholders 2,309,864 2,323,532
The above statement shows the comparative closing net assets at 31 August 2019 whereas the current accounting period commenced 1 March 2020.
iShares Index Linked Gilt Index Fund (UK)
Statement of Total Return (unaudited)
for the six months ended 31 August 2020
BlackRock Collective Investment Funds131
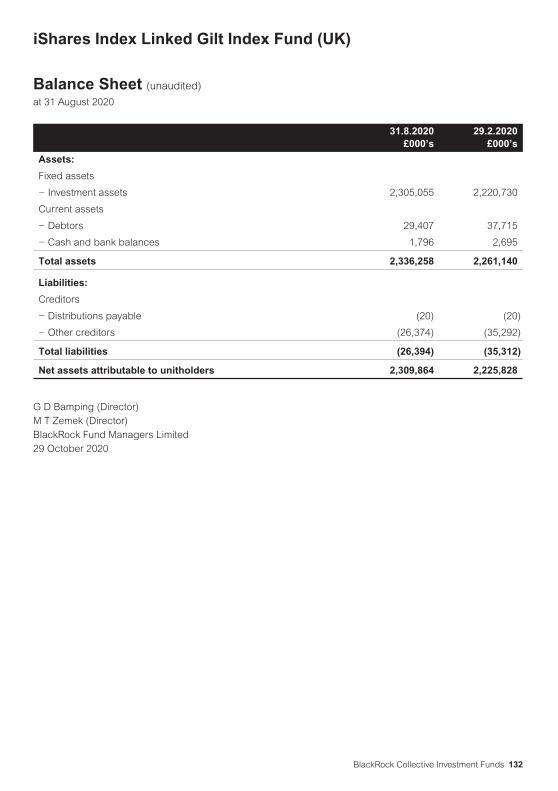
31.8.2020£000’s
29.2.2020£000’s
Assets:
Fixed assets
− Investment assets 2,305,055 2,220,730
Current assets
− Debtors 29,407 37,715
− Cash and bank balances 1,796 2,695
Total assets 2,336,258 2,261,140
Liabilities:
Creditors
− Distributions payable (20) (20)
− Other creditors (26,374) (35,292)
Total liabilities (26,394) (35,312)
Net assets attributable to unitholders 2,309,864 2,225,828
G D Bamping (Director)M T Zemek (Director)BlackRock Fund Managers Limited29 October 2020
iShares Index Linked Gilt Index Fund (UK)
Balance Sheet (unaudited)
at 31 August 2020
BlackRock Collective Investment Funds 132

The Fund is a sub-fund of BlackRock Collective Investment Funds (previously known as BlackRock QualifiedInvestor Schemes (1)), a UCITS scheme under the COLL Sourcebook. The Fund was established on 21 June2005 and was authorised by the FCA on 21 June 2005. The Fund’s FCA product reference number is 645670.
Risk and Reward ProfileLower riskTypically lower rewards
Higher riskTypically higher rewards
Unit Class
A Accumulation 1 2 3 4 5 6 7
L Income 1 2 3 4 5 6 7
L Accumulation 1 2 3 4 5 6 7
X Income 1 2 3 4 5 6 7
X Accumulation 1 2 3 4 5 6 7
D Accumulation 1 2 3 4 5 6 7
H Accumulation 1 2 3 4 5 6 7
• The risk indicator was calculated incorporating historical or simulated historical data and may not be a reliableindication of the future risk profile of the Fund.
• The risk category shown is not guaranteed and may change over time.
• The lowest category does not mean risk free.
• The use of derivatives will impact the value of the Fund and may expose the Fund to a higher degree of risk.Derivatives are highly sensitive to changes in the value of the asset on which they are based and can increasethe size of losses and gains, resulting in greater fluctuations in the value of the Fund. The impact to the Fundcan be greater where derivatives are used in an extensive or complex way.
For more information on this, please see the Fund’s Key Investor Information Documents (“KIIDs”), which areavailable at www.blackrock.com.
iShares Japan Equity Index Fund (UK)
About the Fund
BlackRock Collective Investment Funds133

Net Asset Value
At 31 August 2020 Units in IssueNet Asset Value
£000’s
Net Asset Valueper Unit
p
A Accumulation 1,723,761 3,853 223.5
L Income 4,425,742 7,478 169.0
L Accumulation 507,378,888 1,163,164 229.3
X Income 20,442,732 37,986 185.8
X Accumulation 157,919,687 340,712 215.8
D Accumulation 71,095,996 161,962 227.8
H Accumulation 74,411,914 134,560 180.8
Distributions Payable for the period to 31 August 2020
Unit Class Distribution payable on 31.10.2020
Pence per Unit
A Accumulation 2.0491
L Income 1.8141
L Accumulation 2.4362
X Income 2.1767
X Accumulation 2.4969
D Accumulation 2.5641
H Accumulation 2.0353
Operating Charges
Unit Class1.3.2020
to 31.8.20201.3.2019
to 29.2.2020
A Accumulation 0.52% 0.51%
L Income 0.22% 0.22%
L Accumulation 0.22% 0.21%
X Income 0.02% 0.01%
X Accumulation 0.02% 0.01%
D Accumulation 0.09% 0.08%
H Accumulation 0.09% 0.08%
Operating charges are annualised and exclude portfolio trade-related costs, except costs paid to the custodian/depositary and entry/exit charges paid to an underlyingcollective investment scheme (if any).
iShares Japan Equity Index Fund (UK)
Performance Record
BlackRock Collective Investment Funds 134

Holding orNominalValue Investment
MarketValue
£000’s
% ofTotal
NetAssets
EQUITIES − 97.89%; 29.2.2020 98.34%
JAPAN − 97.89%; 29.2.2020 98.34%
Advertising − 0.21%; 29.2.2020 0.23%
134,624 Dentsu 2,639 0.14
147,700 Hakuhodo DYØ 1,372 0.07
4,011 0.21
Aerospace & Defence − 0.10%; 29.2.2020 0.15%
83,500 IHIØ 926 0.05
90,000 Kawasaki HeavyIndustriesØ
952 0.05
1,878 0.10
Agriculture − 0.57%; 29.2.2020 0.66%
754,900 Japan TobaccoØ 10,535 0.57
Airlines − 0.13%; 29.2.2020 0.16%
68,600 ANA 1,279 0.07
71,900 Japan Airlines 1,070 0.06
2,349 0.13
Apparel − 0.09%; 29.2.2020 0.09%
106,000 AsicsØ 1,092 0.06
35,700 WacoalØ 474 0.03
1,566 0.09
Automobile Manufacturers − 6.62%; 29.2.2020 7.32%
181,800 Hino Motors 913 0.05
1,084,420 Honda MotorØ 20,812 1.12
327,200 Isuzu Motors 2,409 0.13
374,500 Mazda MotorØ 1,794 0.10
367,200 Mitsubishi MotorsØ 657 0.04
1,222,821 Nissan MotorØ 3,716 0.20
33,600 Nissan ShataiØ 224 0.01
387,500 SubaruØ 6,005 0.32
286,831 Suzuki MotorØ 8,783 0.47
1,565,760 Toyota MotorØ 77,258 4.18
122,571 6.62
Automobile Parts & Equipment − 2.45%; 29.2.2020 2.59%
112,000 Aisin SeikiØ 2,871 0.16
369,356 BridgestoneØ 8,738 0.47
288,516 DensoØ 9,048 0.49
146,709 JtektØ 845 0.05
73,800 Koito ManufacturingØ 2,666 0.14
163,077 NGK InsulatorsØ 1,724 0.09
128,100 NGK Spark PlugØ 1,638 0.09
90,500 NHK Spring 424 0.02
Holding orNominalValue Investment
MarketValue
£000’s
% ofTotal
NetAssets
55,500 Nifco Inc/JapanØ 1,062 0.06
90,400 Nisshinbo 467 0.03
67,300 NOKØ 547 0.03
94,600 Stanley ElectricØ 2,022 0.11
470,975 Sumitomo Electric Industries 4,135 0.22
108,930 Sumitomo Rubber Industries 783 0.04
35,400 Tokai Rika 397 0.02
66,900 Toyo TireØ 832 0.04
50,755 Toyoda Gosei 827 0.04
44,300 Toyota Boshoku 468 0.03
101,900 Toyota Industries 4,428 0.24
32,700 TS TechØ 714 0.04
61,500 Yokohama Rubber 718 0.04
45,354 2.45
Banks − 4.80%; 29.2.2020 5.61%
47,100 77 BankØ 517 0.03
79,526 AEON Financial ServiceØ 528 0.03
77,900 Aozora BankØ 1,045 0.06
44,600 Bank of KyotoØ 1,418 0.08
403,600 Chiba BankØ 1,561 0.08
105,017 Chugoku BankØ 723 0.04
717,700 Concordia FinancialØ 1,774 0.10
24,800 Daishi Hokuetsu FinancialØ 356 0.02
102,980 Fukuoka Financial 1,273 0.07
252,512 Gunma Bank 619 0.03
295,600 Hachijuni BankØ 851 0.05
162,200 Hiroshima BankØ 611 0.03
70,800 Hokuhoku FinancialØ 490 0.03
180,800 Iyo BankØ 858 0.05
257,800 Japan Post BankØ 1,547 0.08
119,900 Kansai Mirai FinancialØ 374 0.02
260,550 Kyushu FinancialØ 890 0.05
7,921,576 Mitsubishi UFJ FinancialØ 24,648 1.33
16,115,300 Mizuho FinancialØ 16,298 0.88
100,600 Nishi-Nippon FinancialØ 497 0.03
1,388,747 ResonaØ 3,814 0.21
384,800 Seven BankØ 721 0.04
33,400 Shiga BankØ 583 0.03
116,500 Shinsei Bank 1,017 0.05
309,772 Shizuoka BankØ 1,601 0.09
823,308 Sumitomo Mitsui FinancialØ 18,074 0.98
232,600 Sumitomo Mitsui TrustØ 5,024 0.27
142,700 Yamaguchi FinancialØ 705 0.04
88,417 4.80
Beverages − 1.07%; 29.2.2020 1.20%
241,624 Asahi 6,317 0.34
iShares Japan Equity Index Fund (UK)
Portfolio Statement (unaudited)
at 31 August 2020
BlackRock Collective Investment Funds135

Holding orNominalValue Investment
MarketValue
£000’s
% ofTotal
NetAssets
84,800 Coca-Cola Bottlers Japan 1,054 0.06
34,658 Ito EnØ 1,562 0.08
487,461 Kirin 7,153 0.39
45,300 SapporoØ 603 0.03
81,600 Suntory Beverage & Food 2,348 0.13
102,100 TakaraØ 714 0.04
19,751 1.07
Biotechnology − 0.08%; 29.2.2020 0.02%
9,000 JCR Pharmaceuticals 721 0.04
32,700 Takara BioØ 659 0.04
1,380 0.08
Building Materials − 1.96%; 29.2.2020 1.65%
118,100 Agc Inc 2,495 0.13
169,300 Daikin Industries 23,799 1.29
171,800 LIXIL 2,358 0.13
24,298 Rinnai 1,672 0.09
118,700 Sanwa 892 0.05
22,100 Sumitomo Osaka CementØ 535 0.03
79,000 Taiheiyo Cement 1,498 0.08
92,800 TotoØ 3,039 0.16
36,288 1.96
Chemicals − 4.07%; 29.2.2020 4.26%
31,400 Aica KogyoØ 804 0.04
110,741 Air WaterØ 1,162 0.06
781,300 Asahi Kasei 4,891 0.26
163,600 DaicelØ 885 0.05
59,000 DenkaØ 1,239 0.07
48,900 DIC 869 0.05
33,300 Kaneka 630 0.03
124,400 Kansai Paint 2,212 0.12
215,051 Kuraray 1,640 0.09
30,400 Lintec 537 0.03
814,221 Mitsubishi Chemical 3,550 0.19
112,300 Mitsubishi Gas ChemicalØ 1,497 0.08
109,200 Mitsui ChemicalsØ 1,917 0.10
101,800 Nippon KayakuØ 748 0.04
99,200 Nippon PaintØ 6,351 0.34
20,900 Nippon ShokubaiØ 821 0.04
87,283 Nissan ChemicalØ 3,449 0.19
96,562 Nitto DenkoØ 4,373 0.24
45,800 NOF 1,385 0.07
252,215 Shin-Etsu ChemicalØ 22,870 1.24
89,300 Showa DenkoØ 1,300 0.07
21,100 Sumitomo Bakelite 417 0.02
979,186 Sumitomo ChemicalØ 2,372 0.13
Holding orNominalValue Investment
MarketValue
£000’s
% ofTotal
NetAssets
94,000 Taiyo Nippon SansoØ 1,233 0.07
127,300 Tokai CarbonØ 890 0.05
41,000 Tokuyama 717 0.04
943,600 Toray Industries 3,344 0.18
175,000 TosohØ 1,940 0.10
60,600 Ube IndustriesØ 809 0.04
90,642 ZeonØ 712 0.04
75,564 4.07
Commercial Services − 2.59%; 29.2.2020 2.52%
39,400 Benefit OneØ 710 0.04
47,978 Benesse 912 0.05
177,800 Dai Nippon Printing 2,815 0.15
26,100 GMO Payment GatewayØ 2,053 0.11
82,500 Nihon M&A Center 3,056 0.17
68,738 Park24Ø 928 0.05
112,600 PersolØ 1,312 0.07
807,200 RecruitØ 22,853 1.24
123,799 Secom 8,736 0.47
40,800 Sohgo Security Services 1,422 0.08
21,900 TechnoProØ 871 0.05
176,300 Toppan Printing 2,045 0.11
47,713 2.59
Computers − 2.07%; 29.2.2020 1.81%
120,015 Fujitsu 11,681 0.63
63,100 Itochu Techno-Solutions 1,704 0.09
158,600 NEC 6,233 0.34
56,200 NET One SystemsØ 1,611 0.09
38,700 Nihon UnisysØ 829 0.04
166,000 Nomura Research InstituteØ 3,288 0.18
22,300 NS SolutionsØ 482 0.03
401,000 NTT Data 3,420 0.18
42,500 Obic 5,624 0.30
63,300 OtsukaØ 2,318 0.13
27,200 SCSKØ 1,100 0.06
38,290 2.07
Cosmetics & Personal Care − 2.39%; 29.2.2020 2.38%
43,200 FanclØ 1,051 0.06
300,554 Kao 17,074 0.92
18,100 KoseØ 1,585 0.09
162,937 Lion 2,575 0.14
10,500 Noevir 358 0.02
67,600 PigeonØ 2,304 0.12
44,400 Pola OrbisØ 600 0.03
246,891 ShiseidoØ 10,723 0.58
iShares Japan Equity Index Fund (UK)
Portfolio Statement (unaudited) continued
BlackRock Collective Investment Funds 136

Holding orNominalValue Investment
MarketValue
£000’s
% ofTotal
NetAssets
247,700 Unicharm 8,040 0.43
44,310 2.39
Distribution & Wholesale − 3.29%; 29.2.2020 3.61%
861,723 ItochuØ 16,517 0.89
983,800 MarubeniØ 4,425 0.24
760,969 Mitsubishi 13,401 0.72
1,048,336 Mitsui &Ø 14,043 0.76
64,355 Nagase & 625 0.03
19,200 PALTAC 791 0.04
778,780 SojitzØ 1,327 0.07
711,221 Sumitomo 6,867 0.37
143,300 Toyota TsushoØ 3,113 0.17
61,109 3.29
Diversified Financial Services − 1.85%; 29.2.2020 1.97%
226,801 AcomØ 660 0.04
94,800 Credit Saison 807 0.04
961,116 Daiwa 3,233 0.17
12,800 Fuyo General Lease 576 0.03
28,900 Hitachi CapitalØ 527 0.03
339,500 Japan ExchangeØ 6,559 0.35
61,100 MatsuiØ 406 0.02
603,000 Mebuki FinancialØ 1,079 0.06
274,300 Mitsubishi UFJ Lease &FinanceØ
968 0.05
1,914,820 NomuraØ 7,342 0.40
306,200 OrientØ 250 0.01
797,200 ORIX 7,403 0.40
147,200 SBI Inc/Japan 2,498 0.13
38,700 Tokyo CenturyØ 1,483 0.08
30,500 Zenkoku Hosho 807 0.04
34,598 1.85
Electrical Components &Equipment − 0.37%; 29.2.2020 0.42%
143,800 Brother Industries 1,777 0.10
134,000 Casio Computer 1,612 0.09
181,800 Fujikura 399 0.02
38,000 Furukawa ElectricØ 676 0.04
52,892 GS YuasaØ 654 0.04
30,422 Mabuchi MotorØ 800 0.04
72,700 UshioØ 672 0.04
6,590 0.37
Electricity − 0.96%; 29.2.2020 1.15%
445,603 Chubu Electric PowerØ 4,108 0.22
193,200 Chugoku Electric PowerØ 1,755 0.09
Holding orNominalValue Investment
MarketValue
£000’s
% ofTotal
NetAssets
104,800 Electric Power DevelopmentØ 1,179 0.06
99,316 Hokuriku Electric PowerØ 547 0.03
470,159 Kansai Electric Power 3,457 0.19
291,700 Kyushu Electric Power 1,927 0.10
90,768 Shikoku Electric PowerØ 515 0.03
293,048 Tohoku Electric Power 2,217 0.12
976,785 Tokyo Electric Power 2,139 0.12
17,844 0.96
Electronics − 4.93%; 29.2.2020 4.83%
129,894 Alps AlpineØ 1,541 0.08
90,900 AnritsuØ 1,481 0.08
81,500 AzbilØ 1,909 0.10
38,900 Fujitsu General 760 0.04
21,002 Hirose Electric 1,772 0.10
22,800 HoribaØ 930 0.05
231,246 Hoya 16,938 0.92
71,000 IbidenØ 1,660 0.09
22,600 Japan Aviation ElectronicsIndustry
220 0.01
197,000 KyoceraØ 8,444 0.46
265,143 Minebea MitsumiØ 3,432 0.19
361,601 Murata Manufacturing 15,991 0.86
294,100 NidecØ 18,432 1.00
47,400 Nippon Electric Glass 660 0.04
116,900 OmronØ 6,389 0.35
23,800 ScreenØ 867 0.05
81,700 Taiyo YudenØ 1,643 0.09
77,120 TDKØ 5,975 0.32
158,800 Yokogawa ElectricØ 1,937 0.10
90,981 4.93
Engineering & Construction − 1.19%; 29.2.2020 1.27%
68,167 ComsysØ 1,422 0.08
29,800 Japan Airport TerminalØ 1,000 0.05
134,300 JGCØ 1,106 0.06
293,161 KajimaØ 2,721 0.15
72,500 KandenkoØ 425 0.02
84,900 Kinden 1,042 0.06
61,200 Kyowa ExeoØ 1,150 0.06
25,900 Kyudenko 553 0.03
86,900 Maeda 481 0.03
21,600 Maeda Road ConstructionØ 297 0.02
35,700 Nippo 689 0.04
432,900 ObayashiØ 3,159 0.17
180,400 Penta-Ocean ConstructionØ 863 0.05
341,400 ShimizuØ 1,962 0.11
27,400 Sho-BondØ 965 0.05
iShares Japan Equity Index Fund (UK)
Portfolio Statement (unaudited) continued
BlackRock Collective Investment Funds137

Holding orNominalValue Investment
MarketValue
£000’s
% ofTotal
NetAssets
129,300 TaiseiØ 3,337 0.18
131,300 Toda 638 0.03
21,810 1.19
Entertainment − 0.88%; 29.2.2020 0.84%
118,900 Oriental LandØ 12,046 0.65
30,000 Sankyo 619 0.03
121,896 Sega Sammy 1,054 0.06
6,500 Shochiku 650 0.03
68,900 Toho 1,951 0.11
16,320 0.88
Environmental Control − 0.08%; 29.2.2020 0.08%
66,600 Kurita Water Industries 1,557 0.08
Food Producers − 2.87%; 29.2.2020 2.75%
316,300 AjinomotoØ 4,397 0.24
11,700 Ariake JapanØ 600 0.03
45,400 Calbee 1,055 0.06
30,700 Ezaki GlicoØ 971 0.05
27,500 Fuji OilØ 600 0.03
44,800 House Foods 1,128 0.06
83,400 Itoham YonekyuØ 414 0.02
47,446 Kagome 1,099 0.06
65,839 KewpieØ 931 0.05
114,100 KikkomanØ 4,629 0.25
15,400 Kobe BussanØ 677 0.04
12,100 Kotobuki SpiritsØ 415 0.02
25,800 Maruha Nichiro 436 0.02
29,300 Megmilk Snow Brand 495 0.03
85,308 MeijiØ 5,137 0.28
5,800 Mitsubishi ShokuhinØ 111 0.01
25,000 Morinaga &Ø 683 0.04
25,600 Morinaga Milk IndustryØ 927 0.05
65,200 NH FoodsØ 2,200 0.12
65,500 Nichirei 1,276 0.07
169,990 Nisshin SeifunØ 2,095 0.11
44,900 Nissin Foods 3,349 0.18
490,122 Seven & iØ 11,819 0.64
55,853 Toyo Suisan Kaisha 2,368 0.13
77,300 Yakult Honsha 3,288 0.18
77,034 Yamazaki Baking 935 0.05
14,600 Yaoko 851 0.05
52,886 2.87
Forest Products & Paper − 0.18%; 29.2.2020 0.22%
54,100 Nippon Paper IndustriesØ 514 0.03
545,980 OjiØ 1,842 0.10
Holding orNominalValue Investment
MarketValue
£000’s
% ofTotal
NetAssets
79,100 Sumitomo Forestry 945 0.05
3,301 0.18
Gas − 0.54%; 29.2.2020 0.50%
255,400 Osaka GasØ 3,725 0.20
55,400 Toho Gas 1,820 0.10
269,800 Tokyo Gas 4,477 0.24
10,022 0.54
Hand & Machine Tools − 0.68%; 29.2.2020 0.63%
200,100 AmadaØ 1,328 0.07
17,400 DiscoØ 3,029 0.16
60,900 DMG Mori 577 0.03
79,191 Fuji ElectricØ 1,849 0.10
157,000 MakitaØ 5,418 0.29
44,000 OSGØ 485 0.03
12,686 0.68
Healthcare Products − 2.13%; 29.2.2020 1.92%
121,200 Asahi InteccØ 2,672 0.14
43,600 ManiØ 825 0.04
46,400 Nihon Kohden 1,181 0.06
67,500 NiproØ 568 0.03
669,848 OlympusØ 9,893 0.53
172,517 ShimadzuØ 3,839 0.21
120,200 SysmexØ 7,831 0.42
416,500 TerumoØ 12,640 0.68
66,900 Topcon 402 0.02
39,851 2.13
Healthcare Services − 0.16%; 29.2.2020 0.17%
16,400 Ain 789 0.04
30,626 H.U.Ø 563 0.03
53,400 PeptiDreamØ 1,619 0.09
2,971 0.16
Home Builders − 1.11%; 29.2.2020 1.17%
412,260 Daiwa House Industry 8,246 0.45
171,700 HasekoØ 1,750 0.09
85,300 IidaØ 1,243 0.07
39,000 Open HouseØ 1,033 0.06
227,051 Sekisui ChemicalØ 2,706 0.15
363,440 Sekisui House 5,355 0.29
20,333 1.11
Home Furnishings − 3.15%; 29.2.2020 2.91%
34,200 HoshizakiØ 1,949 0.11
56,300 Kokuyo 468 0.03
iShares Japan Equity Index Fund (UK)
Portfolio Statement (unaudited) continued
BlackRock Collective Investment Funds 138

Holding orNominalValue Investment
MarketValue
£000’s
% ofTotal
NetAssets
1,364,178 Panasonic 9,392 0.51
100,102 SharpØ 928 0.05
776,826 Sony 45,371 2.45
58,108 3.15
Household Products − 0.02%; 29.2.2020 0.03%
20,100 Pilot 441 0.02
Insurance − 2.34%; 29.2.2020 2.85%
683,200 Dai-ichi LifeØ 7,725 0.42
846,000 Japan PostØ 4,667 0.25
121,300 Japan Post InsuranceØ 1,446 0.08
306,712 MS&AD InsuranceØ 6,345 0.34
215,100 SompoØ 6,020 0.33
356,330 T&D 2,783 0.15
412,424 Tokio Marine 14,180 0.77
43,166 2.34
Internet − 1.99%; 29.2.2020 1.32%
11,300 Askul 260 0.01
61,800 CyberAgentØ 2,450 0.13
40,300 GMO internet 809 0.04
85,800 Kakaku.com 1,706 0.09
34,900 LINEØ 1,327 0.07
267,300 M3Ø 11,521 0.62
72,400 MonotaROØ 2,126 0.11
498,700 RakutenØ 3,273 0.18
32,100 SMS 663 0.04
74,100 Trend Micro Inc/Japan 3,418 0.18
1,665,400 ZØ 8,269 0.45
59,900 Zozo 1,258 0.07
37,080 1.99
Iron & Steel − 0.48%; 29.2.2020 0.58%
22,300 Daido SteelØ 554 0.03
130,347 Hitachi MetalsØ 1,460 0.08
41,400 Japan Steel WorksØ 446 0.02
327,385 JFE 1,849 0.10
177,300 Kobe SteelØ 508 0.03
514,220 Nippon Steel 3,775 0.20
21,463 Yamato Kogyo 384 0.02
8,976 0.48
Leisure Time − 0.80%; 29.2.2020 0.75%
24,100 Daiichikosho 561 0.03
29,700 Heiwa 374 0.02
19,500 HIS 260 0.01
49,600 Shimano 7,828 0.42
100,700 YamahaØ 3,660 0.20
Holding orNominalValue Investment
MarketValue
£000’s
% ofTotal
NetAssets
182,583 Yamaha MotorØ 2,147 0.12
14,830 0.80
Lodging − 0.05%; 29.2.2020 0.05%
16,600 Kyoritsu MaintenanceØ 455 0.02
44,200 Resorttrust 470 0.03
925 0.05
Machinery Construction & Mining − 2.31%; 29.2.2020 2.45%
587,070 Hitachi 14,583 0.79
69,400 Hitachi Construction MachineryØ 1,818 0.10
580,705 KomatsuØ 9,417 0.51
1,253,365 Mitsubishi Electric 12,905 0.70
180,200 Mitsubishi Heavy Industries 3,342 0.18
78,900 TadanoØ 482 0.03
42,547 2.31
Machinery Diversified − 4.98%; 29.2.2020 4.35%
61,400 Daifuku 4,035 0.22
58,300 Ebara 1,121 0.06
121,876 Fanuc 15,948 0.86
114,700 KeyenceØ 35,253 1.91
697,699 KubotaØ 9,410 0.51
64,300 MiuraØ 1,963 0.11
72,500 NabtescoØ 1,713 0.09
16,700 OkumaØ 569 0.03
36,400 SMC 14,930 0.81
75,000 Sumitomo Heavy IndustriesØ 1,274 0.07
75,600 THK 1,323 0.07
165,255 Yaskawa ElectricØ 4,434 0.24
91,973 4.98
Media − 0.06%; 29.2.2020 0.07%
31,000 Fuji Media 230 0.01
14,600 Nippon Television 129 0.01
63,900 SKY Perfect JSAT 182 0.01
27,626 Tokyo Broadcasting System 356 0.02
8,500 TV Asahi 101 0.01
998 0.06
Metal & Hardware − 0.34%; 29.2.2020 0.32%
36,679 Maruichi Steel Tube 734 0.04
180,400 MisumiØ 3,532 0.19
275,600 NSKØ 1,578 0.09
278,081 NTNØ 400 0.02
6,244 0.34
iShares Japan Equity Index Fund (UK)
Portfolio Statement (unaudited) continued
BlackRock Collective Investment Funds139

Holding orNominalValue Investment
MarketValue
£000’s
% ofTotal
NetAssets
Mining − 0.31%; 29.2.2020 0.33%
26,500 DowaØ 614 0.03
76,300 Mitsubishi Materials 1,196 0.06
35,500 Mitsui Mining & SmeltingØ 637 0.03
152,700 Sumitomo Metal Mining 3,480 0.19
5,927 0.31
Miscellaneous Manufacturing − 0.58%; 29.2.2020 0.64%
38,500 Amano 598 0.03
31,480 Glory 491 0.03
118,585 JSRØ 1,887 0.10
210,800 NikonØ 1,235 0.07
279,260 ToshibaØ 5,999 0.32
50,700 ToyoboØ 545 0.03
10,755 0.58
Office & Business Equipment − 1.17%; 29.2.2020 1.58%
636,609 CanonØ 8,198 0.44
32,100 Canon Marketing Japan 428 0.02
223,687 FujifilmØ 7,942 0.43
291,642 Konica MinoltaØ 702 0.04
420,394 RicohØ 2,345 0.13
171,700 Seiko EpsonØ 1,530 0.08
15,600 Toshiba TECØ 486 0.03
21,631 1.17
Oil & Gas Producers − 0.62%; 29.2.2020 0.76%
41,114 Cosmo EnergyØ 486 0.03
1,903,000 Eneos 5,562 0.30
145,815 Idemitsu Kosan 2,393 0.13
566,400 Inpex 2,687 0.15
16,200 Japan Petroleum Exploration 210 0.01
11,338 0.62
Packaging & Containers − 0.14%; 29.2.2020 0.16%
13,400 FP 762 0.04
24,400 Fuji Seal International 330 0.02
123,850 RengoØ 683 0.04
88,200 Toyo SeikanØ 737 0.04
2,512 0.14
Pharmaceuticals − 7.55%; 29.2.2020 7.03%
108,300 AlfresaØ 1,622 0.09
1,180,900 Astellas Pharma 13,839 0.75
412,400 Chugai PharmaceuticalØ 13,709 0.74
405,500 Daiichi Sankyo 26,945 1.46
168,800 Eisai 11,013 0.60
46,500 Hisamitsu PharmaceuticalØ 1,598 0.09
Holding orNominalValue Investment
MarketValue
£000’s
% ofTotal
NetAssets
19,800 Kaken Pharmaceutical 683 0.04
15,649 Kissei Pharmaceutical 254 0.01
38,600 Kobayashi PharmaceuticalØ 2,561 0.14
161,400 Kyowa KirinØ 3,108 0.17
89,700 MedipalØ 1,279 0.07
18,100 Mochida Pharmaceutical 498 0.03
31,900 Nippon Shinyaku 1,964 0.11
271,403 Ono Pharmaceutical 6,103 0.33
268,896 Otsuka 8,817 0.48
64,880 Rohto Pharmaceutical 1,538 0.08
224,500 Santen Pharmaceutical 3,184 0.17
23,300 Sawai Pharmaceutical 888 0.05
173,800 Shionogi &Ø 7,180 0.39
25,400 Ship HealthcareØ 877 0.05
104,800 Sumitomo Dainippon PharmaØ 990 0.05
46,955 Suzuken Ltd/Aichi Japan 1,301 0.07
26,600 Taisho PharmaceuticalØ 1,220 0.07
973,168 Takeda Pharmaceutical 27,121 1.47
38,438 Tsumura & 815 0.04
139,107 7.55
Real Estate Investment & Services − 1.73%; 29.2.2020 2.18%
82,700 Aeon MallØ 817 0.04
42,000 Daito Trust Construction 2,780 0.15
233,600 Hulic 1,588 0.09
153,300 Ichigo 307 0.02
723,527 Mitsubishi Estate 8,454 0.46
586,916 Mitsui Fudosan 7,932 0.43
75,668 Nomura Real Estate 1,080 0.06
62,000 ReloØ 1,050 0.06
250,415 Sumitomo Realty & Development 5,522 0.30
121,700 Tokyo Tatemono 1,106 0.06
364,600 Tokyu FudosanØ 1,171 0.06
31,807 1.73
Retail − 3.59%; 29.2.2020 3.29%
16,000 ABC-MartØ 628 0.03
443,200 AeonØ 8,205 0.44
41,600 Autobacs Seven 402 0.02
90,600 Bic CameraØ 749 0.04
155,900 Citizen WatchØ 370 0.02
11,000 Cosmos PharmaceuticalØ 1,443 0.08
32,832 Fast RetailingØ 14,628 0.79
22,800 GoldwinØ 1,224 0.07
59,500 H2O RetailingØ 310 0.02
227,778 Isetan Mitsukoshi 934 0.05
23,800 IzumiØ 692 0.04
151,000 J Front RetailingØ 784 0.04
iShares Japan Equity Index Fund (UK)
Portfolio Statement (unaudited) continued
BlackRock Collective Investment Funds 140

Holding orNominalValue Investment
MarketValue
£000’s
% ofTotal
NetAssets
114,900 K’s 1,215 0.07
9,400 Kusuri no AokiØ 597 0.03
29,100 LawsonØ 1,070 0.06
128,000 MaruiØ 1,745 0.09
46,592 Matsumotokiyoshi 1,216 0.07
47,200 Nitori 7,368 0.40
322,292 Pan Pacific InternationalØ 5,636 0.30
155,600 Ryohin Keikaku 1,819 0.10
13,500 ShimamuraØ 831 0.04
123,500 SkylarkØ 1,464 0.08
21,800 SugiØ 1,173 0.06
40,200 Sundrug 1,117 0.06
65,600 Sushiro Global 1,138 0.06
91,700 TakashimayaØ 539 0.03
22,800 TsuruhaØ 2,274 0.12
140,400 USS 1,770 0.10
62,200 Welcia 1,984 0.11
491,804 Yamada Denki 1,967 0.11
63,000 ZenshoØ 1,059 0.06
66,351 3.59
Semiconductors − 1.88%; 29.2.2020 1.68%
126,100 AdvantestØ 4,503 0.24
81,589 Hamamatsu Photonics 2,773 0.15
48,800 LasertecØ 2,746 0.15
468,800 Renesas Electronics 2,202 0.12
51,417 Rohm 2,466 0.13
145,400 SUMCOØ 1,473 0.08
93,751 Tokyo Electron 17,926 0.97
29,800 UlvacØ 790 0.04
34,879 1.88
Software − 1.00%; 29.2.2020 0.79%
55,596 CapcomØ 2,005 0.11
66,500 DeNAØ 791 0.04
18,660 GungHo Online Entertainment 287 0.02
23,000 JustsystemsØ 1,314 0.07
38,780 Koei TecmoØ 1,147 0.06
60,800 KonamiØ 1,747 0.09
259,600 NexonØ 4,538 0.25
8,000 OBIC Business Consultants 355 0.02
21,200 Oracle Japan 1,854 0.10
47,100 Square Enix 2,312 0.12
153,500 TIS 2,291 0.12
18,641 1.00
Telecommunications − 6.12%; 29.2.2020 5.88%
14,500 Hikari Tsushin 2,614 0.14
Holding orNominalValue Investment
MarketValue
£000’s
% ofTotal
NetAssets
1,083,900 KDDIØ 23,428 1.27
787,132 Nippon Telegraph & Telephone 13,366 0.72
718,100 NTT DocomoØ 14,876 0.80
1,160,300 SoftBankØ 11,351 0.61
1,029,034 SoftBankØ 47,818 2.58
113,453 6.12
Textiles − 0.08%; 29.2.2020 0.09%
124,100 Teijin 1,453 0.08
Toys, Games & Hobbies − 1.79%; 29.2.2020 1.29%
123,605 Bandai NamcoØ 5,729 0.31
67,689 Nintendo 26,959 1.46
35,800 Sanrio 447 0.02
33,135 1.79
Transportation − 4.39%; 29.2.2020 4.78%
114,800 Central Japan RailwayØ 12,843 0.69
229,614 East Japan RailwayØ 11,152 0.60
22,000 Fukuyama Transporting 807 0.04
140,700 Hankyu Hanshin 3,414 0.18
30,300 Hitachi Transport System 786 0.04
61,400 Kamigumi 947 0.05
54,700 Kawasaki Kisen KaishaØ 455 0.02
61,100 KeihanØ 1,964 0.11
155,200 KeikyuØ 1,726 0.09
71,500 KeioØ 3,223 0.17
91,500 Keisei Electric RailwayØ 2,007 0.11
112,200 KintetsuØ 3,674 0.20
97,800 Kyushu Railway 1,609 0.09
45,000 Mitsubishi LogisticsØ 1,017 0.05
75,000 Mitsui OSK Lines 1,034 0.06
121,600 Nagoya RailroadØ 2,533 0.14
67,200 Nankai Electric RailwayØ 1,102 0.06
43,800 Nippon ExpressØ 1,919 0.10
108,600 Nippon Yusen 1,267 0.07
45,100 Nishi-Nippon RailroadØ 978 0.05
194,000 Odakyu Electric RailwayØ 3,576 0.19
29,400 SankyuØ 915 0.05
126,800 SeibuØ 1,036 0.06
97,527 SeinoØ 1,111 0.06
136,600 SGØ 4,671 0.25
47,300 SotetsuØ 961 0.05
131,300 Tobu RailwayØ 3,047 0.16
307,900 Tokyu 3,071 0.17
116,687 West Japan RailwayØ 4,567 0.25
219,200 Yamato 4,270 0.23
81,682 4.39
iShares Japan Equity Index Fund (UK)
Portfolio Statement (unaudited) continued
BlackRock Collective Investment Funds141

Holding orNominalValue Investment
UnderlyingExposure − Derivatives
£000’s
MarketValue
£000’s
% ofTotal
NetAssets
DERIVATIVES − 0.06%; 29.2.2020 (0.18%)
Futures − 0.06%; 29.2.2020 (0.18%)
338 TOPIX Index September 2020 38,468 1,077 0.06
Portfolio of investments 1,811,872 97.95
Net other assets 37,843 2.05
Total net assets 1,849,715 100.00
Unless otherwise stated, all securities are either listed on a recognised exchange or traded on an eligible securities market.
Underlying exposure has been calculated according to the guidelines issued by the European Securities and Markets Authority (“ESMA”) and represents the market value of an equivalent positionin the assets underlying each financial derivative instrument.Ø All or a portion of this investment represents a security on loan.
iShares Japan Equity Index Fund (UK)
Portfolio Statement (unaudited) continued
BlackRock Collective Investment Funds 142

£000’s31.8.2020
£000’s £000’s31.8.2019
£000’s
Income
Net capital gains 65,782 117,893
Revenue 23,905 21,543
Expenses (1,406) (1,288)
Interest payable and similarcharges (53) (45)
Net revenue before taxation 22,446 20,210
Taxation (1,939) (2,135)
Net revenue after taxation 20,507 18,075
Total return before distributions 86,289 135,968
Distributions (20,507) (18,075)
Change in net assetsattributable to unitholdersfrom investment activities 65,782 117,893
Statement of Change in Net Assets Attributable to Unitholders(unaudited) for the six months ended 31 August 2020
£000’s31.8.2020
£000’s £000’s31.8.2019
£000’s
Opening net assets attributableto unitholders 1,802,270 1,445,543
Amounts receivable on issue of units 262,792 343,496
Amounts payable on cancellation of units (300,805) (233,483)
(38,013) 110,013
Change in net assets attributable tounitholders from investment activities 65,782 117,893
Retained distribution on accumulation units 19,676 18,112
Closing net assets attributableto unitholders 1,849,715 1,691,561
The above statement shows the comparative closing net assets at 31 August 2019 whereas the current accounting period commenced 1 March 2020.
iShares Japan Equity Index Fund (UK)
Statement of Total Return (unaudited)
for the six months ended 31 August 2020
BlackRock Collective Investment Funds143

31.8.2020£000’s
29.2.2020£000’s
Assets:
Fixed assets
− Investment assets 1,811,872 1,772,329
Current assets
− Debtors 17,439 20,099
− Cash and bank balances 49,347 25,388
Total assets 1,878,658 1,817,816
Liabilities:
Investment liabilities – (3,307)
Creditors
− Amounts held at futures clearing houses and brokers (781) –
− Distributions payable (526) (507)
− Other creditors (27,636) (11,732)
Total liabilities (28,943) (15,546)
Net assets attributable to unitholders 1,849,715 1,802,270
G D Bamping (Director)M T Zemek (Director)BlackRock Fund Managers Limited29 October 2020
iShares Japan Equity Index Fund (UK)
Balance Sheet (unaudited)
at 31 August 2020
BlackRock Collective Investment Funds 144

The Fund is a sub-fund of BlackRock Collective Investment Funds (previously known as BlackRock QualifiedInvestor Schemes (1)), a UCITS scheme under the COLL Sourcebook. The Fund was established on 29 June2012 and was authorised by the FCA on 25 May 2012. The Fund’s FCA product reference number is 645681.
Risk and Reward ProfileLower riskTypically lower rewards
Higher riskTypically higher rewards
Unit Class
A Accumulation 1 2 3 4 5 6 7
L Income 1 2 3 4 5 6 7
L Accumulation 1 2 3 4 5 6 7
X Income 1 2 3 4 5 6 7
X Accumulation 1 2 3 4 5 6 7
D Income 1 2 3 4 5 6 7
D Accumulation 1 2 3 4 5 6 7
• The risk indicator was calculated incorporating simulated historical data and may not be a reliable indicationof the future risk profile of the Fund.
• The risk category shown is not guaranteed and may change over time.
• The lowest category does not mean risk free.
• The use of derivatives will impact the value of the Fund and may expose the Fund to a higher degree of risk.Derivatives are highly sensitive to changes in the value of the asset on which they are based and can increasethe size of losses and gains, resulting in greater fluctuations in the value of the Fund. The impact to the Fundcan be greater where derivatives are used in an extensive or complex way.
For more information on this, please see the Fund’s Key Investor Information Documents (“KIIDs”), which areavailable at www.blackrock.com.
iShares Mid Cap UK Equity Index Fund (UK)
About the Fund
BlackRock Collective Investment Funds145

Net Asset Value
At 31 August 2020 Units in IssueNet Asset Value
£000’s
Net Asset Valueper Unit
p
A Accumulation 2,988,637 5,725 191.6
L Income 100 – 96.28
L Accumulation 7,040,202 13,705 194.7
X Income 100 – 95.73
X Accumulation 117,471,373 232,736 198.1
D Income 34,126,183 56,493 165.5
D Accumulation 145,368,836 286,872 197.3
Distributions Payable for the period to 31 August 2020
Unit Class Distribution payable on 31.10.2020
Pence per Unit
A Accumulation 1.5567
L Income 0.0000
L Accumulation 1.8033
X Income 0.9600
X Accumulation 1.9844
D Income 1.5793
D Accumulation 1.8651
Operating Charges
Unit Class1.3.2020
to 31.8.20201.3.2019
to 29.2.2020
A Accumulation 0.52% 0.52%
L Income 0.22% 0.22%
L Accumulation 0.22% 0.22%
X Income 0.02% 0.02%
X Accumulation 0.02% 0.02%
D Income 0.17% 0.17%
D Accumulation 0.17% 0.17%
Operating charges are annualised and exclude portfolio trade-related costs, except costs paid to the custodian/depositary and entry/exit charges paid to an underlyingcollective investment scheme (if any).
iShares Mid Cap UK Equity Index Fund (UK)
Performance Record
BlackRock Collective Investment Funds 146

Holding orNominalValue Investment
MarketValue
£000’s
% ofTotal
NetAssets
EQUITIES − 71.57%; 29.2.2020 75.22%
AUSTRIA − 0.24%; 29.2.2020 0.22%
Hand & Machine Tools − 0.24%; 29.2.2020 0.22%
52,346 RHI Magnesita 1,415 0.24
BERMUDA − 0.79%; 29.2.2020 0.92%
Insurance − 0.79%; 29.2.2020 0.92%
594,073 HiscoxØ 4,713 0.79
GEORGIA − 0.20%; 29.2.2020 0.29%
Banks − 0.20%; 29.2.2020 0.29%
70,248 Bank of Georgia 645 0.11
61,701 TBC Bank 560 0.09
1,205 0.20
GERMANY − 0.64%; 29.2.2020 0.21%
Leisure Time − 0.43%; 29.2.2020 0.00%
780,007 TUIØ 2,572 0.43
Real Estate Investment & Services − 0.21%; 29.2.2020 0.21%
1,667,915 Sirius Real Estate 1,241 0.21
GIBRALTAR − 0.16%; 29.2.2020 0.08%
Entertainment − 0.16%; 29.2.2020 0.08%
486,204 888 968 0.16
GUERNSEY − 0.23%; 29.2.2020 0.27%
Private Equity − 0.11%; 29.2.2020 0.13%
969,714 BMO CommercialProperty TrustØ
658 0.11
Real Estate Investment Trusts − 0.12%; 29.2.2020 0.14%
1,119,561 UK CommercialProperty REITØ
742 0.12
IRELAND − 1.43%; 29.2.2020 1.51%
Beverages − 0.20%; 29.2.2020 0.28%
561,106 C&C 1,198 0.20
Food Producers − 0.17%; 29.2.2020 0.25%
785,333 Greencore 987 0.17
Healthcare Services − 0.55%; 29.2.2020 0.47%
450,163 UDG Healthcare 3,282 0.55
Retail − 0.51%; 29.2.2020 0.51%
390,382 Grafton 3,035 0.51
Holding orNominalValue Investment
MarketValue
£000’s
% ofTotal
NetAssets
ISLE OF MAN − 0.33%; 29.2.2020 1.43%
Entertainment − 0.00%; 29.2.2020 1.23%
Software − 0.33%; 29.2.2020 0.20%
528,436 Playtech 1,949 0.33
ISRAEL − 0.45%; 29.2.2020 0.27%
Diversified Financial Services − 0.45%; 29.2.2020 0.27%
185,316 Plus500Ø 2,702 0.45
JERSEY − 0.96%; 29.2.2020 0.58%
Diversified Financial Services − 0.29%; 29.2.2020 0.21%
250,735 SanneØ 1,740 0.29
Mining − 0.67%; 29.2.2020 0.37%
1,913,392 Centamin 3,999 0.67
MEXICO − 0.00%; 29.2.2020 0.30%
Mining − 0.00%; 29.2.2020 0.30%
NETHERLANDS − 0.07%; 29.2.2020 0.10%
Lodging − 0.07%; 29.2.2020 0.10%
37,337 PPHE HotelØ 420 0.07
PERU − 0.18%; 29.2.2020 0.11%
Mining − 0.18%; 29.2.2020 0.11%
451,948 Hochschild MiningØ 1,086 0.18
RUSSIA − 0.28%; 29.2.2020 0.00%
Mining − 0.28%; 29.2.2020 0.00%
4,623,393 Petropavlovsk 1,692 0.28
SINGAPORE − 0.20%; 29.2.2020 0.00%
Electricity − 0.20%; 29.2.2020 0.00%
26,272 XP Power 1,180 0.20
SOUTH AFRICA − 0.59%; 29.2.2020 1.06%
Banks − 0.29%; 29.2.2020 0.70%
1,185,561 Investec 1,746 0.29
Healthcare Services − 0.30%; 29.2.2020 0.36%
684,007 Mediclinic InternationalØ 1,778 0.30
SWITZERLAND − 1.55%; 29.2.2020 1.36%
Airlines − 0.79%; 29.2.2020 0.63%
121,035 Wizz Air 4,703 0.79
Commercial Services − 0.60%; 29.2.2020 0.63%
1,269,555 IWG 3,575 0.60
iShares Mid Cap UK Equity Index Fund (UK)
Portfolio Statement (unaudited)
at 31 August 2020
BlackRock Collective Investment Funds147

Holding orNominalValue Investment
MarketValue
£000’s
% ofTotal
NetAssets
Iron & Steel − 0.16%; 29.2.2020 0.10%
505,553 Ferrexpo 932 0.16
UNITED ARAB EMIRATES − 0.47%; 29.2.2020 0.64%
Diversified Financial Services − 0.47%; 29.2.2020 0.64%
754,274 Network InternationalØ 2,824 0.47
UNITED KINGDOM − 62.24%; 29.2.2020 65.75%
Advertising − 0.37%; 29.2.2020 0.37%
706,715 AscentialØ 2,205 0.37
Aerospace & Defence − 1.37%; 29.2.2020 0.37%
518,767 Chemring 1,255 0.21
1,377,276 Meggitt 4,006 0.67
124,812 Ultra Electronics 2,906 0.49
8,167 1.37
Agriculture − 0.65%; 29.2.2020 0.55%
115,094 Genus 3,879 0.65
Airlines − 0.47%; 29.2.2020 0.00%
441,536 easyJet 2,796 0.47
Alternative Energy Sources − 0.42%; 29.2.2020 0.45%
886,155 John LaingØ 2,527 0.42
Automobile Manufacturers − 0.10%; 29.2.2020 0.05%
1,102,022 Aston Martin Lagonda GlobalØ 618 0.10
Automobile Parts & Equipment − 0.11%; 29.2.2020 0.12%
405,532 TI Fluid Systems 638 0.11
Banks − 0.62%; 29.2.2020 0.82%
457,241 Paragon Banking 1,627 0.27
2,218,304 Virgin Money UKØ 2,067 0.35
3,694 0.62
Beverages − 0.77%; 29.2.2020 0.88%
146,120 BarrØ 620 0.10
470,674 Britvic 3,987 0.67
4,607 0.77
Biotechnology − 0.15%; 29.2.2020 0.00%
104,682 Oxford Biomedica 882 0.15
Building Materials − 0.79%; 29.2.2020 0.95%
681,499 Ibstock 1,054 0.18
349,268 Marshalls 2,214 0.37
332,132 Polypipe 1,445 0.24
4,713 0.79
Holding orNominalValue Investment
MarketValue
£000’s
% ofTotal
NetAssets
Chemicals − 0.79%; 29.2.2020 0.87%
599,217 Synthomer 1,878 0.32
144,266 Victrex 2,784 0.47
4,662 0.79
Commercial Services − 3.63%; 29.2.2020 4.64%
50,274 4imprint 1,091 0.18
422,655 AggrekoØ 2,016 0.34
902,830 Babcock International 2,457 0.41
250,239 Calisen 440 0.07
2,857,602 CapitaØ 884 0.15
585,896 Equiniti 664 0.11
321,570 Finablr1 3 0.00
2,756,744 G4SØ 3,955 0.66
2,732,627 Hays 3,296 0.55
548,423 PagegroupØ 2,113 0.35
996,481 QinetiQ 2,908 0.49
231,856 Savills 1,891 0.32
21,718 3.63
Computers − 1.91%; 29.2.2020 2.67%
125,718 Computacenter 2,539 0.43
153,152 FDM 1,596 0.27
97,827 Kainos 1,094 0.18
2,184,505 Serco 3,058 0.51
222,150 SoftcatØ 3,072 0.52
11,359 1.91
Cosmetics & Personal Care − 0.12%; 29.2.2020 0.09%
347,341 PZ CussonsØ 716 0.12
Distribution & Wholesale − 2.15%; 29.2.2020 2.28%
195,271 Diploma 3,769 0.63
691,144 Inchcape 3,494 0.59
448,401 Travis Perkins 5,513 0.93
12,776 2.15
Diversified Financial Services − 6.36%; 29.2.2020 5.68%
517,824 AJ BellØ 2,325 0.39
804,279 Ashmore 3,389 0.57
509,661 Brewin Dolphin 1,267 0.21
266,951 Close Brothers 2,995 0.50
644,991 IG 5,092 0.85
461,119 IntegraFinØ 2,476 0.42
734,525 Jupiter Fund Management 1,538 0.26
92,754 Liontrust Asset Management 1,178 0.20
2,552,494 Man 3,128 0.53
586,266 Ninety OneØ 1,293 0.22
663,381 OneSavings Bank 2,010 0.34
iShares Mid Cap UK Equity Index Fund (UK)
Portfolio Statement (unaudited) continued
BlackRock Collective Investment Funds 148

Holding orNominalValue Investment
MarketValue
£000’s
% ofTotal
NetAssets
113,788 PayPointØ 717 0.12
438,544 Provident Financial 1,080 0.18
3,249,141 QuilterØ 4,648 0.78
99,619 Rathbone Brothers 1,682 0.28
993,136 TP ICAP 3,019 0.51
37,837 6.36
Electricity − 0.44%; 29.2.2020 0.36%
316,047 ContourGlobal 659 0.11
712,505 Drax 1,995 0.33
2,654 0.44
Electronics − 3.31%; 29.2.2020 2.75%
792,853 Electrocomponents 5,383 0.90
96,295 Oxford Instruments 1,521 0.26
60,555 Renishaw 2,896 0.49
1,542,788 RotorkØ 4,619 0.78
205,733 Spectris 5,215 0.88
19,634 3.31
Engineering & Construction − 1.48%; 29.2.2020 2.19%
1,230,383 Balfour Beatty 2,744 0.46
892,953 Helios Towers 1,364 0.23
69,663 Morgan Sindall 872 0.15
1,451,488 Signature AviationØ 3,829 0.64
8,809 1.48
Entertainment − 1.07%; 29.2.2020 0.89%
1,764,408 CineworldØ 1,112 0.19
137,630 Gamesys 1,597 0.27
304,806 Rank 411 0.07
1,870,890 William HillØ 3,238 0.54
6,358 1.07
Environmental Control − 0.11%; 29.2.2020 0.00%
321,436 Biffa 657 0.11
Food Producers − 2.56%; 29.2.2020 2.73%
91,622 Cranswick 3,417 0.57
178,432 Greggs 2,527 0.42
115,623 Hilton Food 1,369 0.23
941,612 SSP 2,309 0.39
831,617 Tate & Lyle 5,670 0.95
15,292 2.56
Gas − 0.80%; 29.2.2020 0.00%
10,344,934 Centrica 4,763 0.80
Holding orNominalValue Investment
MarketValue
£000’s
% ofTotal
NetAssets
Healthcare Products − 0.90%; 29.2.2020 0.81%
2,812,336 ConvaTec 5,386 0.90
Home Builders − 2.26%; 29.2.2020 3.31%
219,150 Bellway 5,231 0.88
922,193 Countryside Properties 2,966 0.50
445,464 Crest Nicholson 883 0.15
407,074 Redrow 1,855 0.31
394,440 Vistry 2,507 0.42
13,442 2.26
Home Furnishings − 0.96%; 29.2.2020 0.99%
1,012,617 Howden Joinery 5,691 0.96
Insurance − 3.10%; 29.2.2020 2.80%
1,062,054 BeazleyØ 4,569 0.77
2,426,654 Direct Line Insurance 7,156 1.20
556,874 Hastings 1,404 0.24
1,863,299 Just 948 0.16
425,863 Lancashire 3,268 0.55
415,279 Sabre InsuranceØ 1,098 0.18
18,443 3.10
Internet − 1.01%; 29.2.2020 1.02%
912,444 Moneysupermarket.com 2,777 0.47
812,916 Trainline 3,221 0.54
5,998 1.01
Machinery Construction & Mining − 0.98%; 29.2.2020 0.92%
460,243 Weir 5,838 0.98
Media − 0.70%; 29.2.2020 0.60%
189,700 Euromoney Institutional Investor 1,586 0.27
171,824 FutureØ 2,546 0.43
4,132 0.70
Metal & Hardware − 0.31%; 29.2.2020 0.39%
328,521 Bodycote 1,843 0.31
Mining − 0.39%; 29.2.2020 0.24%
398,599 KAZ MineralsØ 2,311 0.39
Miscellaneous Manufacturing − 1.91%; 29.2.2020 2.08%
50,057 Avon Rubber 1,912 0.32
142,263 Hill & Smith 1,730 0.29
476,173 IMI 5,024 0.84
510,592 Morgan Advanced Materials 1,177 0.20
384,400 Vesuvius 1,571 0.26
11,414 1.91
iShares Mid Cap UK Equity Index Fund (UK)
Portfolio Statement (unaudited) continued
BlackRock Collective Investment Funds149

Holding orNominalValue Investment
MarketValue
£000’s
% ofTotal
NetAssets
Oil & Gas Producers − 0.62%; 29.2.2020 1.01%
1,031,009 Cairn EnergyØ 1,454 0.24
178,160 EnergeanØ 1,020 0.17
460,454 PetrofacØ 741 0.12
683,363 Vivo EnergyØ 514 0.09
3,729 0.62
Oil & Gas Services − 0.50%; 29.2.2020 0.77%
1,193,226 John WoodØ 2,957 0.50
Packaging & Containers − 0.24%; 29.2.2020 0.00%
456,917 EssentraØ 1,401 0.24
Pharmaceuticals − 0.94%; 29.2.2020 0.71%
177,233 Dechra Pharmaceuticals 5,569 0.94
Private Equity − 0.22%; 29.2.2020 1.37%
1,812,444 IP 1,327 0.22
Real Estate Investment & Services − 0.87%; 29.2.2020 1.50%
279,830 CLS 549 0.09
1,169,971 Grainger 3,662 0.61
321,434 St Modwen Properties 1,040 0.17
5,251 0.87
Real Estate Investment Trusts − 6.85%; 29.2.2020 6.79%
4,620,527 Assura 3,738 0.63
288,818 Big Yellow 3,085 0.52
1,281,705 Capital & Counties Properties 1,657 0.28
1,083,377 Civitas Social Housing 1,196 0.20
178,494 Derwent London 5,048 0.85
803,444 GCP Student Living 1,107 0.19
448,344 Great Portland Estates 2,705 0.45
1,398,492 Hammerson 677 0.11
1,553,915 LondonMetric PropertyØ 3,677 0.62
948,525 LXI REIT 1,072 0.18
2,119,888 Primary Health PropertiesØ 3,222 0.54
390,793 Shaftesbury 2,065 0.35
3,026,173 Tritax Big Box REITØ 4,712 0.79
565,170 Unite 5,460 0.92
233,772 Workspace 1,316 0.22
40,737 6.85
Retail − 4.70%; 29.2.2020 4.68%
1,512,624 B&M European Value Retail 7,200 1.21
1,808,408 Dixons CarphoneØ 1,669 0.28
818,764 Domino’s PizzaØ 2,746 0.46
172,472 DunelmØ 2,463 0.41
334,259 FrasersØ 1,167 0.20
139,341 J D Wetherspoon 1,423 0.24
Holding orNominalValue Investment
MarketValue
£000’s
% ofTotal
NetAssets
3,450,658 Marks & Spencer 3,834 0.64
373,915 Mitchells & Butlers 644 0.11
851,366 Pets at HomeØ 2,505 0.42
214,211 Watches of SwitzerlandØ 733 0.12
222,852 WH SmithØ 2,623 0.44
493,190 WorldØ 991 0.17
27,998 4.70
Software − 0.29%; 29.2.2020 0.65%
584,547 Micro Focus InternationalØ 1,747 0.29
Storage & Warehousing − 0.48%; 29.2.2020 0.44%
367,262 SafestoreØ 2,870 0.48
Telecommunications − 1.09%; 29.2.2020 0.96%
1,871,891 Airtel AfricaØ 1,067 0.18
1,070,119 Spirent Communications 3,114 0.52
1,210,307 TalkTalk TelecomØ 890 0.15
102,617 Telecom Plus 1,408 0.24
6,479 1.09
Textiles − 0.24%; 29.2.2020 0.23%
2,581,519 Coats 1,422 0.24
Toys, Games & Hobbies − 0.90%; 29.2.2020 0.55%
57,861 Games Workshop 5,332 0.90
Transportation − 1.23%; 29.2.2020 2.00%
44,351 Clarkson 1,089 0.18
2,189,975 Firstgroup 956 0.16
77,500 Go-Ahead 510 0.09
73,402 James Fisher & Sons 901 0.15
760,954 National Express 959 0.16
1,624,361 Royal MailØ 2,914 0.49
7,329 1.23
Water − 0.00%; 29.2.2020 1.22%
UNITED STATES OF AMERICA − 0.56%; 29.2.2020 0.12%
Biotechnology − 0.14%; 29.2.2020 0.12%
292,046 PureTech Health 810 0.14
Leisure Time − 0.42%; 29.2.2020 0.00%
235,010 Carnival 2,477 0.42
COLLECTIVE INVESTMENTSCHEMES − 28.02%; 29.2.2020 23.09%
Equities − 0.00%; 29.2.2020 0.59%
Equity Funds − 6.00%; 29.2.2020 4.16%
472,657 Apax Global Alpha 786 0.13
1,103,772 BBGI 1,892 0.32
iShares Mid Cap UK Equity Index Fund (UK)
Portfolio Statement (unaudited) continued
BlackRock Collective Investment Funds 150

Holding orNominalValue Investment
MarketValue
£000’s
% ofTotal
NetAssets
1,087,818 Foresight Solar FundØ 1,169 0.20
1,563,751 GCP Infrastructure Investments 1,880 0.32
219,590 Genesis Emerging Markets Fund 1,660 0.28
140,717 HarbourVest Global Private Equity 2,403 0.40
2,854,284 International Public PartnershipsØ 4,738 0.80
931,385 JLEN Environmental AssetsØ 1,118 0.19
363,587 Pershing Square FundØ 7,326 1.23
2,899,488 Renewables Infrastructure 3,961 0.66
490,739 Schroder Oriental Income Fund 1,143 0.19
2,967,710 Sequoia Economic InfrastructureIncome Fund
3,211 0.54
831,157 SynconaØ 1,962 0.33
349,862 Vietnam Enterprise InvestmentsØ 1,497 0.25
309,722 VinaCapital Vietnam OpportunityFund
985 0.16
35,731 6.00
Exchange Traded Funds − 2.96%; 29.2.2020 2.97%
1,042,695 iShares FTSE 250 UCITS ETF†Ø 17,599 2.96
Investment Trusts − 19.06%; 29.2.2020 15.37%
1,058,454 3i Infrastructure 3,091 0.52
161,755 Aberforth Smaller CompaniesTrust
1,396 0.23
582,907 Alliance TrustØ 4,780 0.80
65,821 Allianz Technology Trust 1,642 0.28
188,944 Avi Global Trust 1,355 0.23
160,037 Baillie Gifford Japan Trust 1,300 0.22
227,734 Bankers Investment Trust 2,327 0.39
776,079 BB Healthcare Trust 1,219 0.20
87,909 BlackRock Smaller Cos Trust† 1,074 0.18
302,822 BlackRock World Mining Trust† 1,223 0.21
1,056,386 BMO Global Smaller Companies 1,278 0.21
58,713 Caledonia Investments 1,491 0.25
740,829 City of London Investment Trust 2,389 0.40
312,680 Edinburgh Investment Trust 1,449 0.24
543,315 Edinburgh Worldwide InvestmentTrustØ
1,497 0.25
193,165 European Opportunities Trust 1,316 0.22
963,851 F&C Investment Trust 6,737 1.13
643,283 Fidelity China Special Situations 2,065 0.35
732,018 Fidelity European TrustØ 1,933 0.32
348,979 Fidelity Special ValuesØ 630 0.11
Holding orNominalValue Investment
MarketValue
£000’s
% ofTotal
NetAssets
384,976 Finsbury Growth & Income Trust 3,195 0.54
2,685,642 Greencoat UK Wind 3,846 0.65
133,567 Henderson Smaller CompaniesInvestment Trust
1,034 0.17
117,902 Herald Investment Trust 1,945 0.33
659,231 HgCapital Trust Ø 1,800 0.30
3,311,614 Hicl Infrastructure 5,550 0.93
1,093,055 Hipgnosis Songs Fund Ø 1,317 0.22
125,777 ICG Enterprise Trust 1,052 0.18
409,803 Impax Environmental Markets 1,426 0.24
363,159 JP Morgan American InvestmentTrust
1,877 0.31
213,019 JPMorgan Emerging MarketsInvestment Trust
2,279 0.38
289,268 JPMorgan Japanese InvestmentTrust
1,579 0.27
212,652 Law Debenture 1,129 0.19
1,402,444 Mercantile Investment Trust 2,721 0.46
393,806 Monks Investment TrustØ 4,513 0.76
224,430 Murray International Trust 2,123 0.36
1,059,461 NextEnergy Solar Fund 1,121 0.19
96,582 Pantheon International Fund 2,173 0.37
385,978 Perpetual Income and GrowthInvestment Trust
890 0.15
4,535 Personal Assets Trust 2,052 0.34
239,112 Polar Capital Technology Trust 5,201 0.87
136,791 Pollen Street Secured LendingØ 1,155 0.19
226,471 RIT Capital Partners 4,117 0.69
302,135 Schroder AsiaPacific Fund 1,467 0.25
259,792 Scottish American Investment 1,109 0.19
135,016 Scottish Investment Trust 979 0.16
208,389 Smithson Investment Trust 3,113 0.52
119,842 Temple Bar Investment Trust 878 0.15
427,476 Templeton Emerging MarketsInvestment Trust
3,540 0.59
568,435 TR Property Investment Trust -Ordinary Shares
2,001 0.34
1,526,100 Witan Investment Trust 2,851 0.48
95,778 Worldwide Healthcare Trust 3,280 0.55
113,505 19.06
iShares Mid Cap UK Equity Index Fund (UK)
Portfolio Statement (unaudited) continued
BlackRock Collective Investment Funds151

Holding orNominalValue Investment
UnderlyingExposure − Derivatives
£000’s
MarketValue
£000’s
% ofTotal
NetAssets
DERIVATIVES − 0.00%; 29.2.2020 (0.29%)
Forward Currency Contracts − 0.00%; 29.2.2020 (0.01%)
Futures − 0.00%; 29.2.2020 (0.28%)
86 FTSE 250 Index September 2020 3,059 7 0.00
Portfolio of investments 593,078 99.59
CASH EQUIVALENTS
Short-term Money Market Funds − 0.36%; 29.2.2020 1.59%
2,171,473 BlackRock ICS Sterling Liquidity Fund - Agency Income Class† 2,171 0.36
Net other assets 282 0.05
Total net assets 595,531 100.00
Unless otherwise stated, all securities are either listed on a recognised exchange or traded on an eligible securities market.
Underlying exposure has been calculated according to the guidelines issued by the European Securities and Markets Authority (“ESMA”) and represents the market value of an equivalent positionin the assets underlying each financial derivative instrument.1 Delisted security fair valued by the Manager.Ø All or a portion of this investment represents a security on loan.† Managed by a related party.
iShares Mid Cap UK Equity Index Fund (UK)
Portfolio Statement (unaudited) continued
BlackRock Collective Investment Funds 152
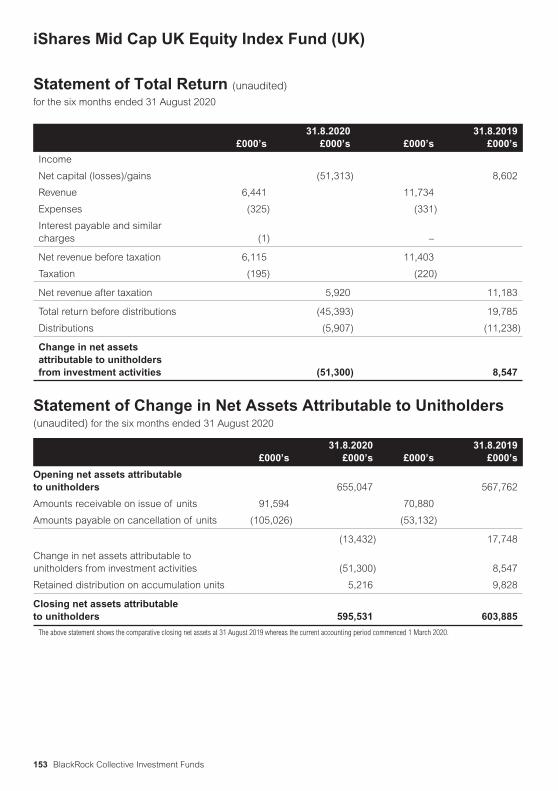
£000’s31.8.2020
£000’s £000’s31.8.2019
£000’s
Income
Net capital (losses)/gains (51,313) 8,602
Revenue 6,441 11,734
Expenses (325) (331)
Interest payable and similarcharges (1) –
Net revenue before taxation 6,115 11,403
Taxation (195) (220)
Net revenue after taxation 5,920 11,183
Total return before distributions (45,393) 19,785
Distributions (5,907) (11,238)
Change in net assetsattributable to unitholdersfrom investment activities (51,300) 8,547
Statement of Change in Net Assets Attributable to Unitholders(unaudited) for the six months ended 31 August 2020
£000’s31.8.2020
£000’s £000’s31.8.2019
£000’s
Opening net assets attributableto unitholders 655,047 567,762
Amounts receivable on issue of units 91,594 70,880
Amounts payable on cancellation of units (105,026) (53,132)
(13,432) 17,748
Change in net assets attributable tounitholders from investment activities (51,300) 8,547
Retained distribution on accumulation units 5,216 9,828
Closing net assets attributableto unitholders 595,531 603,885
The above statement shows the comparative closing net assets at 31 August 2019 whereas the current accounting period commenced 1 March 2020.
iShares Mid Cap UK Equity Index Fund (UK)
Statement of Total Return (unaudited)
for the six months ended 31 August 2020
BlackRock Collective Investment Funds153

31.8.2020£000’s
29.2.2020£000’s
Assets:
Fixed assets
− Investment assets 593,078 644,034
Current assets
− Debtors 8,755 3,289
− Cash and bank balances 790 2,375
− Cash collateral posted 371 981
− Cash equivalents 2,171 10,436
Total assets 605,165 661,115
Liabilities:
Investment liabilities – (1,917)
Creditors
− Distributions payable (539) (929)
− Other creditors (9,095) (3,222)
Total liabilities (9,634) (6,068)
Net assets attributable to unitholders 595,531 655,047
G D Bamping (Director)M T Zemek (Director)BlackRock Fund Managers Limited29 October 2020
iShares Mid Cap UK Equity Index Fund (UK)
Balance Sheet (unaudited)
at 31 August 2020
BlackRock Collective Investment Funds 154

The Fund is a sub-fund of BlackRock Collective Investment Funds (previously known as BlackRock QualifiedInvestor Schemes (1)), a UCITS scheme under the COLL Sourcebook. The Fund was established on 21 June2005 and was authorised by the FCA on 21 June 2005. The Fund was previously known as Merrill Lynch NorthAmerican Equity Tracker Fund. It adopted its present name with effect from 28 April 2008. The Fund’s FCAproduct reference number is 645671.
Risk and Reward ProfileLower riskTypically lower rewards
Higher riskTypically higher rewards
Unit Class
A Accumulation 1 2 3 4 5 6 7
L Accumulation 1 2 3 4 5 6 7
X Income 1 2 3 4 5 6 7
X Accumulation 1 2 3 4 5 6 7
D Accumulation 1 2 3 4 5 6 7
H Accumulation 1 2 3 4 5 6 7
• The risk indicator was calculated incorporating historical or simulated historical data and may not be a reliableindication of the future risk profile of the Fund.
• The risk category shown is not guaranteed and may change over time.
• The lowest category does not mean risk free.
• The use of derivatives will impact the value of the Fund and may expose the Fund to a higher degree of risk.Derivatives are highly sensitive to changes in the value of the asset on which they are based and can increasethe size of losses and gains, resulting in greater fluctuations in the value of the Fund. The impact to the Fundcan be greater where derivatives are used in an extensive or complex way.
For more information on this, please see the Fund’s Key Investor Information Documents (“KIIDs”), which areavailable at www.blackrock.com.
iShares North American Equity Index Fund (UK)
About the Fund
BlackRock Collective Investment Funds155

Net Asset Value
At 31 August 2020 Units in IssueNet Asset Value
£000’s
Net Asset Valueper Unit
p
A Accumulation 2,276,865 10,166 446.5
L Accumulation 647,806,099 2,987,561 461.2
X Income 67,469,072 90,752 134.5
X Accumulation 545,849,339 1,911,408 350.2
D Accumulation 117,728,474 543,430 461.6
H Accumulation 277,414,671 644,474 232.3
Distributions Payable for the period to 31 August 2020
Unit Class Distribution payable on 31.10.2020
Pence per Unit
A Accumulation 2.3892
L Accumulation 3.0428
X Income 1.0101
X Accumulation 2.6103
D Accumulation 3.3191
H Accumulation 1.6703
Operating Charges
Unit Class1.3.2020
to 31.8.20201.3.2019
to 29.2.2020
A Accumulation 0.51% 0.51%
L Accumulation 0.21% 0.21%
X Income 0.01% 0.01%
X Accumulation 0.01% 0.01%
D Accumulation 0.08% 0.07%
H Accumulation 0.08% 0.07%
Operating charges are annualised and exclude portfolio trade-related costs, except costs paid to the custodian/depositary and entry/exit charges paid to an underlyingcollective investment scheme (if any).
iShares North American Equity Index Fund (UK)
Performance Record
BlackRock Collective Investment Funds 156

Holding orNominalValue Investment
MarketValue
£000’s
% ofTotal
NetAssets
EQUITIES − 97.46%; 29.2.2020 98.55%
ARGENTINA − 0.16%; 29.2.2020 0.10%
Internet − 0.16%; 29.2.2020 0.10%
11,547 MercadoLibre 10,056 0.16
AUSTRALIA − 0.07%; 29.2.2020 0.07%
Software − 0.07%; 29.2.2020 0.07%
31,308 AtlassianØ 4,484 0.07
BERMUDA − 0.10%; 29.2.2020 0.14%
Insurance − 0.10%; 29.2.2020 0.14%
105,205 Arch Capital 2,477 0.04
9,788 Everest Re 1,608 0.03
11,691 RenaissanceRe 1,604 0.03
5,689 0.10
CANADA − 4.08%; 29.2.2020 4.63%
Automobile Parts & Equipment − 0.04%; 29.2.2020 0.05%
71,454 Magna International 2,595 0.04
Banks − 1.06%; 29.2.2020 1.31%
166,934 Bank of Montreal 7,914 0.13
109,305 Canadian Imperial Bankof Commerce
6,479 0.10
86,090 National Bank ofCanada
3,530 0.06
360,006 Royal Bank of Canada 20,466 0.33
307,789 The Bank of Nova Scotia 9,945 0.16
460,490 Toronto-Dominion BankØ 17,175 0.28
65,509 1.06
Chemicals − 0.07%; 29.2.2020 0.08%
154,486 NutrienØ 4,253 0.07
Computers − 0.05%; 29.2.2020 0.06%
60,449 CGI 3,163 0.05
Diversified Financial Services − 0.01%; 29.2.2020 0.01%
17,575 IGM FinancialØ 319 0.01
Electricity − 0.09%; 29.2.2020 0.09%
27,534 Canadian UtilitiesØ 516 0.01
118,818 Fortis Inc/CanadaØ 3,553 0.06
93,268 Hydro One 1,438 0.02
5,507 0.09
Food Producers − 0.10%; 29.2.2020 0.11%
18,839 George Weston 1,016 0.02
46,732 Loblaw Cos 1,801 0.03
Holding orNominalValue Investment
MarketValue
£000’s
% ofTotal
NetAssets
58,951 Metro Inc/CNØ 1,986 0.03
53,074 Saputo 989 0.02
5,792 0.10
Insurance − 0.28%; 29.2.2020 0.39%
6,395 Fairfax Financial 1,472 0.02
61,050 Great-West LifecoØ 931 0.02
33,835 Intact FinancialØ 2,697 0.04
475,915 Manulife Financial 5,243 0.08
149,902 Power of CanadaØ 2,230 0.04
156,397 Sun Life Financial 4,879 0.08
17,452 0.28
Internet − 0.34%; 29.2.2020 0.17%
20,480 Shopify 16,311 0.26
6,446 ShopifyØ 5,126 0.08
21,437 0.34
Media − 0.07%; 29.2.2020 0.09%
111,878 Shaw CommunicationsØ 1,562 0.03
46,544 Thomson ReutersØ 2,651 0.04
4,213 0.07
Mining − 0.40%; 29.2.2020 0.31%
59,869 Agnico Eagle MinesØ 3,683 0.06
439,942 Barrick Gold 9,734 0.16
46,340 Franco-Nevada 5,207 0.08
114,035 Teck Resources 980 0.02
117,290 Wheaton Precious Metals 4,671 0.08
24,275 0.40
Oil & Gas Producers − 0.17%; 29.2.2020 0.31%
312,384 Canadian Natural Resources 4,586 0.07
277,743 Cenovus EnergyØ 976 0.02
61,499 Imperial OilØ 756 0.01
376,321 Suncor EnergyØ 4,515 0.07
10,833 0.17
Pharmaceuticals − 0.01%; 29.2.2020 0.01%
43,506 Canopy GrowthØ 536 0.01
Pipelines − 0.39%; 29.2.2020 0.55%
511,804 Enbridge 12,242 0.20
113,489 Inter PipelineØ 887 0.01
148,729 Pembina Pipeline 2,749 0.04
242,501 TC EnergyØ 8,444 0.14
24,322 0.39
iShares North American Equity Index Fund (UK)
Portfolio Statement (unaudited)
at 31 August 2020
BlackRock Collective Investment Funds157
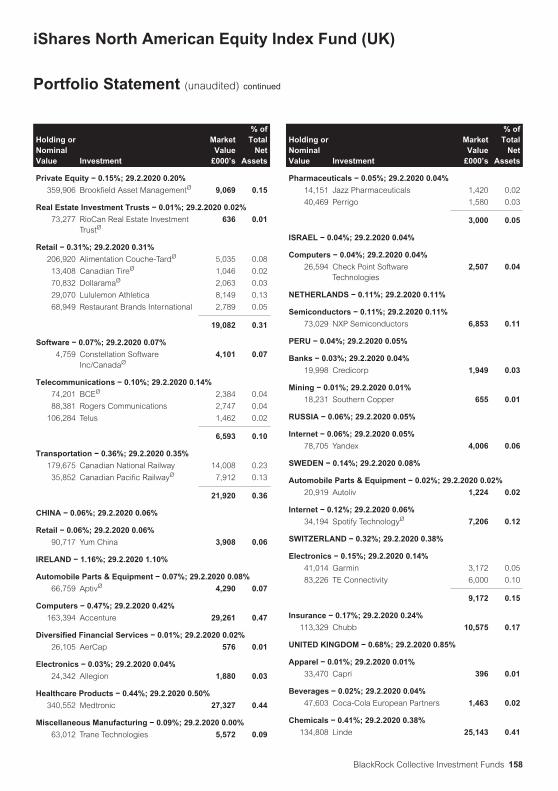
Holding orNominalValue Investment
MarketValue
£000’s
% ofTotal
NetAssets
Private Equity − 0.15%; 29.2.2020 0.20%
359,906 Brookfield Asset ManagementØ 9,069 0.15
Real Estate Investment Trusts − 0.01%; 29.2.2020 0.02%
73,277 RioCan Real Estate InvestmentTrustØ
636 0.01
Retail − 0.31%; 29.2.2020 0.31%
206,920 Alimentation Couche-TardØ 5,035 0.08
13,408 Canadian TireØ 1,046 0.02
70,832 DollaramaØ 2,063 0.03
29,070 Lululemon Athletica 8,149 0.13
68,949 Restaurant Brands International 2,789 0.05
19,082 0.31
Software − 0.07%; 29.2.2020 0.07%
4,759 Constellation SoftwareInc/CanadaØ
4,101 0.07
Telecommunications − 0.10%; 29.2.2020 0.14%
74,201 BCEØ 2,384 0.04
88,381 Rogers Communications 2,747 0.04
106,284 Telus 1,462 0.02
6,593 0.10
Transportation − 0.36%; 29.2.2020 0.35%
179,675 Canadian National Railway 14,008 0.23
35,852 Canadian Pacific RailwayØ 7,912 0.13
21,920 0.36
CHINA − 0.06%; 29.2.2020 0.06%
Retail − 0.06%; 29.2.2020 0.06%
90,717 Yum China 3,908 0.06
IRELAND − 1.16%; 29.2.2020 1.10%
Automobile Parts & Equipment − 0.07%; 29.2.2020 0.08%
66,759 AptivØ 4,290 0.07
Computers − 0.47%; 29.2.2020 0.42%
163,394 Accenture 29,261 0.47
Diversified Financial Services − 0.01%; 29.2.2020 0.02%
26,105 AerCap 576 0.01
Electronics − 0.03%; 29.2.2020 0.04%
24,342 Allegion 1,880 0.03
Healthcare Products − 0.44%; 29.2.2020 0.50%
340,552 Medtronic 27,327 0.44
Miscellaneous Manufacturing − 0.09%; 29.2.2020 0.00%
63,012 Trane Technologies 5,572 0.09
Holding orNominalValue Investment
MarketValue
£000’s
% ofTotal
NetAssets
Pharmaceuticals − 0.05%; 29.2.2020 0.04%
14,151 Jazz Pharmaceuticals 1,420 0.02
40,469 Perrigo 1,580 0.03
3,000 0.05
ISRAEL − 0.04%; 29.2.2020 0.04%
Computers − 0.04%; 29.2.2020 0.04%
26,594 Check Point SoftwareTechnologies
2,507 0.04
NETHERLANDS − 0.11%; 29.2.2020 0.11%
Semiconductors − 0.11%; 29.2.2020 0.11%
73,029 NXP Semiconductors 6,853 0.11
PERU − 0.04%; 29.2.2020 0.05%
Banks − 0.03%; 29.2.2020 0.04%
19,998 Credicorp 1,949 0.03
Mining − 0.01%; 29.2.2020 0.01%
18,231 Southern Copper 655 0.01
RUSSIA − 0.06%; 29.2.2020 0.05%
Internet − 0.06%; 29.2.2020 0.05%
78,705 Yandex 4,006 0.06
SWEDEN − 0.14%; 29.2.2020 0.08%
Automobile Parts & Equipment − 0.02%; 29.2.2020 0.02%
20,919 Autoliv 1,224 0.02
Internet − 0.12%; 29.2.2020 0.06%
34,194 Spotify TechnologyØ 7,206 0.12
SWITZERLAND − 0.32%; 29.2.2020 0.38%
Electronics − 0.15%; 29.2.2020 0.14%
41,014 Garmin 3,172 0.05
83,226 TE Connectivity 6,000 0.10
9,172 0.15
Insurance − 0.17%; 29.2.2020 0.24%
113,329 Chubb 10,575 0.17
UNITED KINGDOM − 0.68%; 29.2.2020 0.85%
Apparel − 0.01%; 29.2.2020 0.01%
33,470 Capri 396 0.01
Beverages − 0.02%; 29.2.2020 0.04%
47,603 Coca-Cola European Partners 1,463 0.02
Chemicals − 0.41%; 29.2.2020 0.38%
134,808 Linde 25,143 0.41
iShares North American Equity Index Fund (UK)
Portfolio Statement (unaudited) continued
BlackRock Collective Investment Funds 158

Holding orNominalValue Investment
MarketValue
£000’s
% ofTotal
NetAssets
Commercial Services − 0.10%; 29.2.2020 0.10%
102,829 IHS Markit 6,132 0.10
Environmental Control − 0.02%; 29.2.2020 0.02%
38,754 Pentair 1,306 0.02
Insurance − 0.08%; 29.2.2020 0.26%
33,802 Willis Towers Watson 5,183 0.08
Media − 0.04%; 29.2.2020 0.04%
116,679 Liberty Global 2,004 0.03
51,547 Liberty GlobalØ 900 0.01
2,904 0.04
UNITED STATES OF AMERICA − 90.44%; 29.2.2020 90.89%
Advertising − 0.05%; 29.2.2020 0.08%
101,835 Interpublic 1,349 0.02
51,755 Omnicom 2,090 0.03
3,439 0.05
Aerospace & Defence − 1.40%; 29.2.2020 2.13%
136,945 Boeing 17,573 0.28
63,014 General Dynamics 7,027 0.11
18,295 Heico 1,221 0.02
9,347 Heico 767 0.01
91,760 Howmet Aerospace 1,201 0.02
53,765 L3Harris Technologies 7,257 0.12
62,856 Lockheed Martin 18,318 0.30
39,187 Northrop Grumman 10,027 0.16
365,031 Raytheon Technologies 16,608 0.27
9,062 Teledyne Technologies 2,121 0.03
13,537 TransDigm 5,052 0.08
87,172 1.40
Agriculture − 0.72%; 29.2.2020 0.85%
476,133 Altria 15,550 0.25
135,102 Archer-Daniels-MidlandØ 4,514 0.07
33,100 Bunge 1,128 0.02
396,492 Philip Morris International 23,613 0.38
44,805 0.72
Airlines − 0.05%; 29.2.2020 0.08%
6,583 Alaska AirØ 191 0.00
30,771 American AirlinesØ 300 0.01
39,898 Delta Air Lines 919 0.02
31,949 Southwest Airlines 897 0.01
16,770 United AirlinesØ 451 0.01
2,758 0.05
Holding orNominalValue Investment
MarketValue
£000’s
% ofTotal
NetAssets
Apparel − 0.53%; 29.2.2020 0.56%
77,420 HanesbrandsØ 884 0.01
308,837 Nike 25,799 0.42
17,647 PVHØ 735 0.01
11,753 Ralph Lauren 604 0.01
67,757 Tapestry 745 0.01
37,182 Under ArmourØ 246 0.00
36,921 Under ArmourØ 271 0.00
86,381 VF 4,237 0.07
33,521 0.53
Automobile Manufacturers − 1.50%; 29.2.2020 0.75%
36,869 Cummins 5,707 0.09
991,969 Ford Motor 5,053 0.08
314,784 General Motors 6,964 0.11
87,086 Paccar 5,580 0.09
188,505 TeslaØ 70,151 1.13
93,455 1.50
Automobile Parts & Equipment − 0.05%; 29.2.2020 0.04%
51,066 BorgWarner 1,548 0.03
14,499 Lear 1,234 0.02
2,782 0.05
Banks − 3.58%; 29.2.2020 5.16%
1,972,269 Bank of America 37,885 0.61
210,792 Bank of New York Mellon 5,817 0.09
525,766 Citigroup 20,065 0.32
105,758 Citizens Financial 2,043 0.03
37,920 Comerica 1,119 0.02
21,583 Commerce BancsharesØ 960 0.02
175,432 Fifth Third Bancorp 2,706 0.04
41,085 First Republic Bank/CA 3,463 0.06
83,195 Goldman Sachs 12,718 0.21
267,267 Huntington Bancshares 1,876 0.03
772,626 JPMorgan Chase 57,779 0.93
267,719 KeyCorp 2,461 0.04
32,862 M&T Bank 2,533 0.04
286,393 Morgan StanleyØ 11,176 0.18
49,944 Northern Trust 3,053 0.05
110,469 PNC Financial Services‡ 9,170 0.15
250,392 Regions Financial 2,160 0.04
88,103 State StreetØ 4,479 0.07
13,351 SVB Financial 2,547 0.04
345,577 Truist Financial 10,012 0.16
349,251 US Bancorp 9,492 0.15
955,288 Wells Fargo 17,216 0.28
iShares North American Equity Index Fund (UK)
Portfolio Statement (unaudited) continued
BlackRock Collective Investment Funds159

Holding orNominalValue Investment
MarketValue
£000’s
% ofTotal
NetAssets
46,317 Zions Bancorp NA 1,112 0.02
221,842 3.58
Beverages − 1.48%; 29.2.2020 1.76%
44,842 Brown-Forman 2,450 0.04
983,504 Coca-Cola 36,374 0.59
41,746 Constellation Brands 5,749 0.09
106,741 Keurig Dr PepperØ 2,378 0.04
50,148 Molson Coors Beverage 1,409 0.02
94,345 Monster Beverage 5,905 0.10
354,195 PepsiCo 37,034 0.60
91,299 1.48
Biotechnology − 1.79%; 29.2.2020 1.84%
52,056 Alexion Pharmaceuticals 4,439 0.07
29,430 Alnylam Pharmaceuticals 2,915 0.05
149,966 Amgen 28,347 0.46
40,430 BiogenØ 8,685 0.14
42,844 BioMarin Pharmaceutical 2,493 0.04
183,569 CortevaØ 3,911 0.06
38,432 Exact SciencesØ 2,159 0.04
317,617 Gilead Sciences 15,829 0.26
38,001 Illumina 10,128 0.16
45,985 Incyte 3,309 0.05
24,237 Regeneron Pharmaceuticals 11,202 0.18
29,513 Seattle Genetics 3,485 0.06
66,341 Vertex Pharmaceuticals 13,814 0.22
110,716 1.79
Building Materials − 0.36%; 29.2.2020 0.32%
226,910 Carrier Global 5,057 0.08
40,573 Fortune Brands Home &Security
2,548 0.04
188,666 Johnson Controls International 5,735 0.09
15,546 Martin Marietta Materials 2,355 0.04
72,249 Masco 3,145 0.05
38,940 MDU Resources 686 0.01
32,119 Vulcan Materials 2,879 0.05
22,405 0.36
Chemicals − 1.13%; 29.2.2020 1.15%
57,154 Air Products and Chemicals 12,473 0.20
24,675 AlbemarleØ 1,675 0.03
29,524 Celanese 2,228 0.04
50,540 CF Industries 1,231 0.02
183,529 Dow 6,182 0.10
187,827 DuPont de Nemours 7,821 0.13
31,657 Eastman Chemical 1,728 0.03
Holding orNominalValue Investment
MarketValue
£000’s
% ofTotal
NetAssets
64,823 Ecolab 9,536 0.15
35,505 FMC 2,833 0.05
25,495 International Flavors &FragrancesØ
2,356 0.04
65,393 LyondellBasell Industries 3,196 0.05
88,678 Mosaic 1,207 0.02
60,009 PPG Industries 5,395 0.09
21,114 Sherwin-Williams 10,577 0.17
10,259 Westlake Chemical 455 0.01
68,893 1.13
Commercial Services − 2.32%; 29.2.2020 2.10%
108,373 Automatic Data Processing 11,248 0.18
23,128 Cintas 5,757 0.09
9,511 CoStar 6,018 0.10
30,811 Equifax 3,870 0.06
22,444 FleetCor Technologies 4,214 0.07
21,951 Gartner 2,127 0.03
77,237 Global Payments 10,188 0.16
14,399 ManpowerGroup 788 0.01
8,833 MarketAxess 3,204 0.05
41,707 Moody’s 9,178 0.15
83,827 Nielsen 957 0.02
297,122 PayPal 45,256 0.73
27,351 Robert Half International 1,087 0.02
43,621 Rollins 1,796 0.03
61,526 S&P Global 16,834 0.27
90,338 Square 10,761 0.17
48,208 TransUnion 3,122 0.05
18,287 United Rentals 2,417 0.04
41,557 Verisk Analytics 5,789 0.09
144,611 2.32
Computers − 7.29%; 29.2.2020 5.53%
30,233 Amdocs 1,381 0.02
4,159,392 Apple 400,081 6.47
134,537 Cognizant Technology Solutions 6,713 0.11
43,727 Dell Technologies 2,157 0.04
60,671 DXC Technology 905 0.01
34,226 Fortinet 3,374 0.05
343,438 Hewlett Packard EnterpriseØ 2,480 0.04
356,419 HP 5,204 0.08
224,900 International Business Machines 20,694 0.33
32,655 Leidos 2,205 0.04
57,285 NetApp 2,025 0.03
66,821 Seagate Technology 2,394 0.04
75,039 Western Digital 2,153 0.03
451,766 7.29
iShares North American Equity Index Fund (UK)
Portfolio Statement (unaudited) continued
BlackRock Collective Investment Funds 160

Holding orNominalValue Investment
MarketValue
£000’s
% ofTotal
NetAssets
Cosmetics & Personal Care − 1.40%; 29.2.2020 1.40%
214,538 Colgate-Palmolive 12,695 0.21
103,839 CotyØ 278 0.00
57,736 Estee Lauder Cos 9,561 0.15
621,209 Procter & Gamble 64,146 1.04
86,680 1.40
Distribution & Wholesale − 0.24%; 29.2.2020 0.21%
52,445 Copart 4,046 0.07
148,955 Fastenal 5,433 0.09
79,895 LKQ 1,892 0.03
11,998 WW Grainger 3,275 0.05
14,646 0.24
Diversified Financial Services − 3.64%; 29.2.2020 4.02%
10,379 Alliance Data Systems 350 0.01
96,825 Ally Financial 1,655 0.03
164,629 American Express 12,482 0.20
30,792 Ameriprise Financial 3,605 0.06
36,651 BlackRock‡ 16,262 0.26
119,214 Capital One Financial 6,146 0.10
29,218 Cboe Global Markets 1,996 0.03
292,158 Charles Schwab 7,748 0.13
92,038 CME 12,079 0.20
73,242 Discover Financial Services 2,904 0.05
69,930 Franklin Resources 1,099 0.02
139,627 Intercontinental Exchange 11,068 0.18
88,034 Invesco 671 0.01
63,636 Jefferies Financial 833 0.01
225,008 Mastercard 60,161 0.97
31,172 Nasdaq 3,126 0.05
30,184 Raymond James Financial 1,706 0.03
24,440 Santander Consumer USAØ 314 0.01
36,552 SEI Investments 1,429 0.02
162,177 Synchrony Financial 3,004 0.05
55,204 T Rowe Price 5,732 0.09
430,226 VisaØ 68,116 1.10
111,181 Western Union 1,959 0.03
224,445 3.64
Electrical Components &Equipment − 0.22%; 29.2.2020 0.23%
8,592 Acuity Brands 701 0.01
61,590 AMETEK 4,631 0.08
150,382 Emerson Electric 7,799 0.13
13,131 0.22
Holding orNominalValue Investment
MarketValue
£000’s
% ofTotal
NetAssets
Electricity − 2.42%; 29.2.2020 3.00%
161,833 AES 2,144 0.03
60,637 Alliant Energy 2,452 0.04
60,401 Ameren 3,567 0.06
125,215 American Electric Power 7,369 0.12
12,597 Avangrid 452 0.01
140,978 CenterPoint EnergyØ 2,112 0.03
69,161 CMS Energy 3,124 0.05
83,104 Consolidated Edison 4,427 0.07
211,661 Dominion Energy 12,392 0.20
50,906 DTE Energy 4,511 0.07
183,346 Duke Energy 10,994 0.18
97,420 Edison International 3,818 0.06
49,217 Entergy 3,644 0.06
59,551 Evergy 2,367 0.04
89,546 Eversource Energy 5,727 0.09
243,345 Exelon 6,705 0.11
129,254 FirstEnergy 2,757 0.04
124,324 NextEra Energy 25,909 0.42
66,372 NRG Energy 1,705 0.03
210,992 PG&E 1,461 0.02
29,963 Pinnacle West Capital 1,641 0.03
200,826 PPL 4,143 0.07
122,670 Public Service Enterprise 4,782 0.08
74,070 Sempra Energy 6,837 0.11
265,789 Southern 10,356 0.17
115,039 Vistra 1,651 0.03
78,894 WEC Energy 5,540 0.09
132,838 Xcel Energy 6,892 0.11
149,479 2.42
Electronics − 1.03%; 29.2.2020 1.13%
76,523 Agilent Technologies 5,735 0.09
71,190 Amphenol 5,835 0.09
19,645 Arrow Electronics 1,152 0.02
111,677 Flex 904 0.01
73,230 Fortive 3,943 0.06
58,872 Gentex 1,189 0.02
178,439 Honeywell International 22,039 0.36
33,172 Jabil 846 0.01
47,536 Keysight Technologies 3,497 0.06
5,784 Mettler-Toledo International 4,193 0.07
26,189 Roper Technologies 8,353 0.14
36,691 Sensata Technologies 1,141 0.02
59,151 Trimble 2,314 0.04
15,755 Waters 2,544 0.04
63,685 1.03
iShares North American Equity Index Fund (UK)
Portfolio Statement (unaudited) continued
BlackRock Collective Investment Funds161

Holding orNominalValue Investment
MarketValue
£000’s
% ofTotal
NetAssets
Engineering & Construction − 0.03%; 29.2.2020 0.04%
31,279 Jacobs Engineering 2,109 0.03
Entertainment − 0.06%; 29.2.2020 0.05%
40,270 Live Nation EntertainmentØ 1,708 0.03
11,661 Vail ResortsØ 1,896 0.03
3,604 0.06
Environmental Control − 0.29%; 29.2.2020 0.34%
56,601 Republic Services 3,920 0.06
69,019 Waste Connections 5,153 0.08
106,875 Waste Management 9,092 0.15
18,165 0.29
Food Producers − 1.08%; 29.2.2020 1.11%
50,954 Campbell Soup 2,002 0.03
120,811 Conagra Brands 3,460 0.06
150,425 General Mills 7,183 0.12
35,699 Hershey 3,962 0.06
71,883 Hormel Foods 2,735 0.04
17,274 Ingredion 1,038 0.02
27,838 J M Smucker 2,497 0.04
59,958 Kellogg 3,174 0.05
167,882 Kraft Heinz 4,392 0.07
201,576 Kroger 5,370 0.09
35,529 Lamb Weston 1,668 0.03
30,414 McCormick Ø 4,683 0.08
361,427 Mondelez International 15,764 0.25
124,366 Sysco 5,585 0.09
70,029 Tyson Foods 3,284 0.05
66,797 1.08
Food Services − 0.02%; 29.2.2020 0.03%
64,760 Aramark 1,334 0.02
Forest Products & Paper − 0.04%; 29.2.2020 0.05%
94,408 International Paper 2,557 0.04
Gas − 0.06%; 29.2.2020 0.09%
32,456 Atmos Energy 2,419 0.04
90,823 NiSource 1,502 0.02
3,921 0.06
Hand & Machine Tools − 0.09%; 29.2.2020 0.11%
12,628 Snap-on 1,398 0.02
37,931 Stanley Black & Decker 4,565 0.07
5,963 0.09
Healthcare Products − 3.13%; 29.2.2020 2.88%
439,363 Abbott Laboratories 35,912 0.58
Holding orNominalValue Investment
MarketValue
£000’s
% ofTotal
NetAssets
11,382 AbiomedØ 2,615 0.04
18,979 Align Technology 4,205 0.07
129,711 Baxter International 8,434 0.14
360,228 Boston Scientific 11,033 0.18
12,116 Cooper Cos 2,845 0.05
160,987 Danaher 24,809 0.40
58,313 Dentsply Sirona 1,954 0.03
154,998 Edwards Lifesciences 9,936 0.16
35,303 Henry Schein 1,750 0.03
61,101 Hologic 2,724 0.04
22,254 IDEXX Laboratories 6,497 0.11
29,301 Intuitive Surgical 15,986 0.26
35,248 ResMed 4,755 0.08
20,106 Steris 2,396 0.04
88,977 Stryker 13,158 0.21
11,458 Teleflex 3,361 0.05
99,807 Thermo Fisher Scientific 31,969 0.52
22,191 Varian Medical Systems 2,878 0.05
52,842 Zimmer Biomet 5,560 0.09
192,777 3.13
Healthcare Services − 1.76%; 29.2.2020 1.77%
63,416 Anthem 13,330 0.22
151,371 Centene 6,929 0.11
24,332 DaVita 1,576 0.03
65,907 HCA Healthcare 6,677 0.11
33,387 Humana 10,347 0.17
49,273 IQVIA 6,025 0.10
23,940 Laboratory of America 3,144 0.05
36,382 Quest Diagnostics 3,023 0.05
239,546 UnitedHealth 55,917 0.90
18,099 Universal Health Services 1,490 0.02
108,458 1.76
Home Builders − 0.25%; 29.2.2020 0.23%
80,604 DR Horton 4,296 0.07
73,079 Lennar 4,083 0.07
895 NVR 2,779 0.05
70,202 PulteGroup 2,336 0.04
31,170 Toll BrothersØ 983 0.02
14,477 0.25
Home Furnishings − 0.05%; 29.2.2020 0.05%
37,801 Leggett & PlattØ 1,156 0.02
15,479 WhirlpoolØ 2,055 0.03
3,211 0.05
iShares North American Equity Index Fund (UK)
Portfolio Statement (unaudited) continued
BlackRock Collective Investment Funds 162

Holding orNominalValue Investment
MarketValue
£000’s
% ofTotal
NetAssets
Household Products − 0.34%; 29.2.2020 0.34%
19,663 Avery Dennison 1,694 0.03
60,499 Church & Dwight 4,330 0.07
31,365 Clorox 5,234 0.08
84,600 Kimberly-Clark 9,962 0.16
21,220 0.34
Housewares − 0.02%; 29.2.2020 0.02%
102,230 Newell Brands 1,219 0.02
Insurance − 2.81%; 29.2.2020 3.24%
177,758 Aflac 4,818 0.08
3,187 Alleghany 1,325 0.02
78,967 Allstate 5,483 0.09
223,899 American International 4,871 0.08
57,624 Aon 8,607 0.14
48,917 Arthur J Gallagher 3,844 0.06
13,469 Assurant 1,222 0.02
341,677 Berkshire Hathaway 55,630 0.90
104 Berkshire Hathaway 25,415 0.41
54,838 Brown & BrownØ 1,900 0.03
39,470 Cincinnati Financial 2,339 0.04
6,244 CNA Financial 150 0.00
115,885 Equitable 1,834 0.03
74,867 Fidelity National Financial 1,835 0.03
23,869 Globe Life 1,471 0.02
87,904 Hartford Financial Services 2,656 0.04
49,029 Lincoln NationalØ 1,319 0.02
58,005 Loews 1,553 0.03
3,418 Markel 2,771 0.04
127,880 Marsh & McLennan Cos 10,974 0.18
196,627 MetLife 5,642 0.09
60,946 Old Republic International 733 0.01
69,838 Principal Financial 2,194 0.04
147,222 Progressive 10,440 0.17
105,427 Prudential Financial 5,335 0.09
62,296 Travelers Cos 5,395 0.09
51,196 Unum 706 0.01
34,727 Voya FinancialØ 1,346 0.02
38,003 W R Berkley 1,761 0.03
173,569 2.81
Internet − 11.57%; 29.2.2020 9.23%
76,344 Alphabet 92,768 1.50
75,363 Alphabet 91,859 1.48
107,805 Amazon.com 277,060 4.48
10,363 Booking 14,778 0.24
34,241 CDW 2,903 0.05
59,181 E*TRADE Financial 2,390 0.04
Holding orNominalValue Investment
MarketValue
£000’s
% ofTotal
NetAssets
165,863 eBayØ 6,778 0.11
35,077 Expedia 2,569 0.04
17,132 F5 Networks 1,692 0.03
610,505 Facebook 133,637 2.16
41,588 GoDaddy 2,600 0.04
18,570 IAC 1,840 0.03
62,101 LyftØ 1,375 0.02
54,676 Match 4,560 0.07
107,594 Netflix 42,513 0.69
138,740 NortonLifeLock 2,435 0.04
28,730 Okta 4,614 0.07
25,057 Palo Alto Networks 4,816 0.08
62,717 TD Ameritrade 1,798 0.03
201,216 Twitter 6,097 0.10
339,075 Uber TechnologiesØ 8,516 0.14
25,614 VeriSign 4,108 0.07
36,011 Zillow 2,305 0.04
15,146 Zillow 965 0.02
714,976 11.57
Iron & Steel − 0.06%; 29.2.2020 0.06%
71,072 Nucor 2,413 0.04
49,899 Steel Dynamics 1,100 0.02
3,513 0.06
Leisure Time − 0.09%; 29.2.2020 0.17%
124,791 Carnival 1,536 0.02
38,879 Harley-DavidsonØ 805 0.01
55,450 Norwegian Cruise Line 708 0.01
15,247 Polaris 1,150 0.02
40,992 Royal Caribbean CruisesØ 2,111 0.03
6,310 0.09
Lodging − 0.27%; 29.2.2020 0.40%
66,937 Hilton Worldwide 4,516 0.07
81,419 Las Vegas Sands 3,084 0.05
68,192 Marriott International 5,237 0.08
130,111 MGM Resorts International 2,186 0.04
22,870 Wyndham Hotels & Resorts 894 0.01
23,096 Wynn ResortsØ 1,508 0.02
17,425 0.27
Machinery Construction & Mining − 0.24%; 29.2.2020 0.24%
138,565 Caterpillar 14,723 0.24
Machinery Diversified − 0.57%; 29.2.2020 0.48%
81,468 Deere 12,776 0.21
38,700 Dover 3,172 0.05
36,444 FlowserveØ 808 0.01
iShares North American Equity Index Fund (UK)
Portfolio Statement (unaudited) continued
BlackRock Collective Investment Funds163
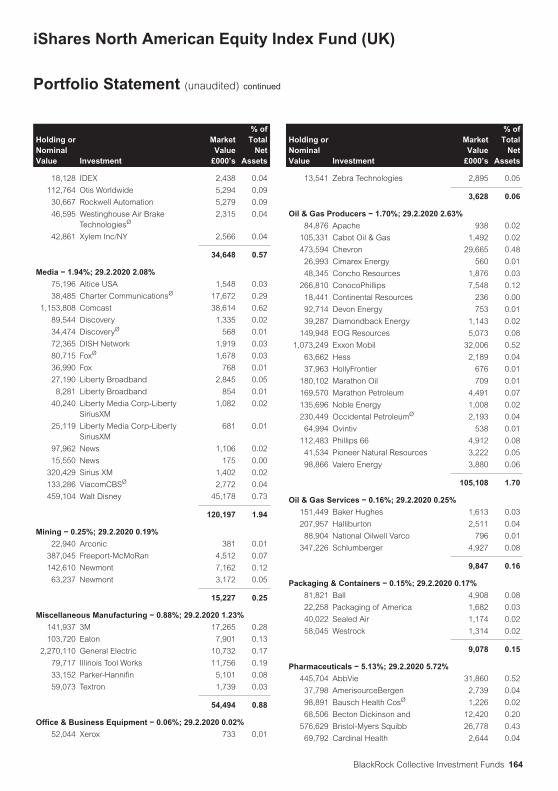
Holding orNominalValue Investment
MarketValue
£000’s
% ofTotal
NetAssets
18,128 IDEX 2,438 0.04
112,764 Otis Worldwide 5,294 0.09
30,667 Rockwell Automation 5,279 0.09
46,595 Westinghouse Air BrakeTechnologiesØ
2,315 0.04
42,861 Xylem Inc/NY 2,566 0.04
34,648 0.57
Media − 1.94%; 29.2.2020 2.08%
75,196 Altice USA 1,548 0.03
38,485 Charter CommunicationsØ 17,672 0.29
1,153,808 Comcast 38,614 0.62
89,544 Discovery 1,335 0.02
34,474 DiscoveryØ 568 0.01
72,365 DISH Network 1,919 0.03
80,715 FoxØ 1,678 0.03
36,990 Fox 768 0.01
27,190 Liberty Broadband 2,845 0.05
8,281 Liberty Broadband 854 0.01
40,240 Liberty Media Corp-LibertySiriusXM
1,082 0.02
25,119 Liberty Media Corp-LibertySiriusXM
681 0.01
97,962 News 1,106 0.02
15,550 News 175 0.00
320,429 Sirius XM 1,402 0.02
133,286 ViacomCBSØ 2,772 0.04
459,104 Walt Disney 45,178 0.73
120,197 1.94
Mining − 0.25%; 29.2.2020 0.19%
22,940 Arconic 381 0.01
387,045 Freeport-McMoRan 4,512 0.07
142,610 Newmont 7,162 0.12
63,237 Newmont 3,172 0.05
15,227 0.25
Miscellaneous Manufacturing − 0.88%; 29.2.2020 1.23%
141,937 3M 17,265 0.28
103,720 Eaton 7,901 0.13
2,270,110 General Electric 10,732 0.17
79,717 Illinois Tool Works 11,756 0.19
33,152 Parker-Hannifin 5,101 0.08
59,073 Textron 1,739 0.03
54,494 0.88
Office & Business Equipment − 0.06%; 29.2.2020 0.02%
52,044 Xerox 733 0.01
Holding orNominalValue Investment
MarketValue
£000’s
% ofTotal
NetAssets
13,541 Zebra Technologies 2,895 0.05
3,628 0.06
Oil & Gas Producers − 1.70%; 29.2.2020 2.63%
84,876 Apache 938 0.02
105,331 Cabot Oil & Gas 1,492 0.02
473,594 Chevron 29,665 0.48
26,993 Cimarex Energy 560 0.01
48,345 Concho Resources 1,876 0.03
266,810 ConocoPhillips 7,548 0.12
18,441 Continental Resources 236 0.00
92,714 Devon Energy 753 0.01
39,287 Diamondback Energy 1,143 0.02
149,948 EOG Resources 5,073 0.08
1,073,249 Exxon Mobil 32,006 0.52
63,662 Hess 2,189 0.04
37,963 HollyFrontier 676 0.01
180,102 Marathon Oil 709 0.01
169,570 Marathon Petroleum 4,491 0.07
135,696 Noble Energy 1,008 0.02
230,449 Occidental PetroleumØ 2,193 0.04
64,994 Ovintiv 538 0.01
112,483 Phillips 66 4,912 0.08
41,534 Pioneer Natural Resources 3,222 0.05
98,866 Valero Energy 3,880 0.06
105,108 1.70
Oil & Gas Services − 0.16%; 29.2.2020 0.25%
151,449 Baker Hughes 1,613 0.03
207,957 Halliburton 2,511 0.04
88,904 National Oilwell Varco 796 0.01
347,226 Schlumberger 4,927 0.08
9,847 0.16
Packaging & Containers − 0.15%; 29.2.2020 0.17%
81,821 Ball 4,908 0.08
22,258 Packaging of America 1,682 0.03
40,022 Sealed Air 1,174 0.02
58,045 Westrock 1,314 0.02
9,078 0.15
Pharmaceuticals − 5.13%; 29.2.2020 5.72%
445,704 AbbVie 31,860 0.52
37,798 AmerisourceBergen 2,739 0.04
98,891 Bausch Health CosØ 1,226 0.02
68,506 Becton Dickinson and 12,420 0.20
576,629 Bristol-Myers Squibb 26,778 0.43
69,792 Cardinal Health 2,644 0.04
iShares North American Equity Index Fund (UK)
Portfolio Statement (unaudited) continued
BlackRock Collective Investment Funds 164

Holding orNominalValue Investment
MarketValue
£000’s
% ofTotal
NetAssets
92,666 Cigna 12,284 0.20
327,687 CVS Health 15,200 0.25
23,329 DexCom 7,400 0.12
113,365 Elanco Animal Health 2,460 0.04
213,275 Eli Lilly and 23,628 0.38
27,080 Herbalife Nutrition 995 0.02
671,357 Johnson & Johnson 76,865 1.24
42,150 McKesson 4,830 0.08
640,554 Merck 40,769 0.66
115,211 Mylan 1,409 0.02
1,414,248 Pfizer 39,884 0.64
119,532 Zoetis 14,287 0.23
317,678 5.13
Pipelines − 0.24%; 29.2.2020 0.40%
55,853 Cheniere Energy 2,173 0.04
483,264 Kinder Morgan 4,984 0.08
116,855 Oneok 2,397 0.04
57,093 Targa Resources 725 0.01
296,416 Williams Cos 4,594 0.07
14,873 0.24
Real Estate Investment & Services − 0.05%; 29.2.2020 0.06%
89,627 CBRE 3,146 0.05
Real Estate Investment Trusts − 2.49%; 29.2.2020 2.95%
157,388 AGNC Investment 1,657 0.03
30,279 Alexandria Real Estate Equities 3,806 0.06
111,665 American Tower 20,768 0.34
361,358 Annaly Capital Management 1,981 0.03
36,289 AvalonBay Communities 4,282 0.07
37,556 Boston Properties 2,436 0.04
104,932 Crown Castle International 12,787 0.21
67,966 Digital Realty Trust 7,895 0.13
92,107 Duke Realty 2,651 0.04
22,376 Equinix 13,186 0.21
43,891 Equity LifeStyle Properties 2,172 0.04
89,388 Equity Residential 3,765 0.06
16,385 Essex Property Trust 2,648 0.04
30,043 Extra Space StorageØ 2,390 0.04
18,614 Federal Realty Investment Trust 1,100 0.02
149,263 Healthpeak Properties 3,079 0.05
183,150 Host Hotels & Resorts 1,536 0.02
128,842 Invitation Homes 2,754 0.04
75,243 Iron MountainØ 1,691 0.03
88,034 Kimco Realty 788 0.01
27,654 Mid-America ApartmentCommunities
2,417 0.04
65,942 Park Hotels & Resorts 467 0.01
Holding orNominalValue Investment
MarketValue
£000’s
% ofTotal
NetAssets
185,897 Prologis 14,136 0.23
39,682 Public Storage 6,290 0.10
85,263 Realty Income 3,946 0.06
47,248 Regency Centers 1,401 0.02
27,735 SBA Communications 6,335 0.10
80,485 Simon Property 4,074 0.07
20,448 SL Green Realty 714 0.01
22,921 Sun Communities 2,551 0.04
84,893 UDR 2,206 0.04
91,341 Ventas 2,809 0.05
278,773 VEREIT 1,399 0.02
42,449 Vornado Realty Trust 1,136 0.02
105,522 Welltower 4,530 0.07
185,660 Weyerhaeuser 4,201 0.07
39,386 WP Carey 2,040 0.03
154,024 2.49
Retail − 4.91%; 29.2.2020 4.97%
16,345 Advance Auto Parts 1,907 0.03
6,112 AutoZone 5,456 0.09
57,435 Best Buy 4,757 0.08
17,833 Burlington Stores 2,623 0.04
38,663 CarMax 3,088 0.05
6,959 Chipotle Mexican Grill 6,810 0.11
112,436 Costco Wholesale 29,172 0.47
34,315 Darden Restaurants 2,221 0.04
64,774 Dollar General 9,765 0.16
62,262 Dollar Tree 4,472 0.07
10,568 Domino’s Pizza 3,227 0.05
46,418 Gap 603 0.01
36,064 Genuine Parts 2,542 0.04
272,037 Home Depot 57,837 0.93
41,087 Kohl’s 655 0.01
190,519 Lowe’s Cos 23,431 0.38
71,424 Macy’sØ 372 0.01
188,674 McDonald’s 30,075 0.49
27,427 Nordstrom 328 0.01
18,069 O’Reilly Automotive 6,275 0.10
90,623 Ross Stores 6,161 0.10
297,273 Starbucks 18,752 0.30
129,315 Target 14,600 0.24
30,231 Tiffany 2,764 0.04
301,811 TJX Cos 12,346 0.20
29,990 Tractor Supply 3,332 0.05
14,012 Ulta Beauty 2,428 0.04
187,863 Walgreens Boots Alliance 5,334 0.09
354,062 Walmart 36,716 0.59
iShares North American Equity Index Fund (UK)
Portfolio Statement (unaudited) continued
BlackRock Collective Investment Funds165

Holding orNominalValue Investment
MarketValue
£000’s
% ofTotal
NetAssets
78,387 Yum! Brands 5,608 0.09
303,657 4.91
Savings & Loans − 0.01%; 29.2.2020 0.02%
104,127 People’s United FinancialØ 821 0.01
Semiconductors − 4.33%; 29.2.2020 3.96%
297,403 Advanced Micro Devices 20,166 0.33
95,693 Analog Devices 8,349 0.14
234,231 Applied Materials 10,769 0.17
99,066 Broadcom 25,650 0.41
1,077,683 Intel 40,984 0.66
7,778 IPG Photonics 938 0.02
38,492 KLA 5,892 0.10
36,216 Lam Research 9,095 0.15
159,614 Marvell Technology 4,622 0.07
64,438 Maxim Integrated Products 3,290 0.05
61,939 Microchip TechnologyØ 5,071 0.08
288,072 Micron Technology 9,787 0.16
150,247 NVIDIA 60,019 0.97
31,936 Qorvo 3,059 0.05
283,877 QUALCOMM 25,247 0.41
45,195 Skyworks Solutions 4,886 0.08
235,592 Texas Instruments 24,991 0.40
63,886 Xilinx 4,965 0.08
267,780 4.33
Shipbuilding − 0.02%; 29.2.2020 0.03%
9,668 Huntington Ingalls Industries 1,094 0.02
Software − 10.06%; 29.2.2020 8.62%
190,528 Activision Blizzard 11,885 0.19
121,841 Adobe 46,683 0.75
39,846 Akamai TechnologiesØ 3,463 0.06
22,488 ANSYS 5,686 0.09
56,061 Autodesk 10,284 0.17
29,078 Broadridge Financial Solutions 2,983 0.05
67,615 Cadence Design Systems 5,599 0.09
30,636 CDK Global 1,067 0.02
78,610 Cerner 4,303 0.07
31,426 Citrix Systems 3,405 0.06
44,049 DocuSign 7,329 0.12
72,948 Electronic Arts 7,594 0.12
157,613 Fidelity National InformationServices
17,756 0.29
141,932 Fiserv 10,552 0.17
63,458 Intuit 16,361 0.26
1,903,890 Microsoft 319,934 5.17
21,817 MSCI 6,082 0.10
Holding orNominalValue Investment
MarketValue
£000’s
% ofTotal
NetAssets
499,441 Oracle 21,325 0.34
78,919 Paychex 4,505 0.07
11,810 Paycom Software 2,641 0.04
25,756 PTC 1,758 0.03
18,848 RingCentral 4,093 0.07
219,114 salesforce.com 44,559 0.72
48,471 ServiceNow 17,448 0.28
93,089 Slack Technologies 2,280 0.04
40,615 SplunkØ 6,647 0.11
53,125 SS&C Technologies 2,526 0.04
39,021 Synopsys 6,449 0.10
28,680 Take-Two Interactive Software 3,667 0.06
34,584 TwilioØ 6,972 0.11
34,649 Veeva Systems 7,305 0.12
19,394 VMwareØ 2,089 0.03
42,214 WorkdayØ 7,557 0.12
622,787 10.06
Telecommunications − 2.39%; 29.2.2020 2.82%
13,981 Arista Networks 2,333 0.04
1,813,036 AT&T 40,351 0.65
260,563 CenturyLinkØ 2,090 0.03
1,082,955 Cisco Systems 34,132 0.55
183,438 CorningØ 4,446 0.07
82,708 Juniper Networks 1,544 0.03
44,009 Motorola Solutions 5,085 0.08
138,124 T-Mobile US 12,032 0.19
1,055,363 Verizon Communications 46,685 0.75
148,698 2.39
Textiles − 0.02%; 29.2.2020 0.02%
13,372 Mohawk Industries 922 0.02
Toys, Games & Hobbies − 0.03%; 29.2.2020 0.03%
29,295 Hasbro 1,726 0.03
Transportation − 1.51%; 29.2.2020 1.36%
31,510 CH Robinson Worldwide 2,311 0.04
193,204 CSX 11,029 0.18
44,599 Expeditors International ofWashington
2,942 0.05
61,548 FedEx 10,104 0.16
21,992 JB Hunt Transport Services 2,308 0.04
23,627 Kansas City Southern 3,212 0.05
64,057 Norfolk SouthernØ 10,167 0.16
23,824 Old Dominion Freight Line 3,594 0.06
171,910 Union Pacific 24,687 0.40
177,743 United Parcel Service 21,708 0.35
iShares North American Equity Index Fund (UK)
Portfolio Statement (unaudited) continued
BlackRock Collective Investment Funds 166

Holding orNominalValue Investment
MarketValue
£000’s
% ofTotal
NetAssets
22,001 XPO Logistics 1,450 0.02
93,512 1.51
Water − 0.08%; 29.2.2020 0.09%
47,867 American Water Works 5,051 0.08
COLLECTIVE INVESTMENTSCHEMES − 1.43%; 29.2.2020 0.78%
Short-term Money Market Funds − 1.43%; 29.2.2020 0.78%
118,651,325 BlackRock ICS US DollarLiquidity Fund - Agency IncomeClass†
88,615 1.43
Holding orNominalValue Investment
UnderlyingExposure − Derivatives
£000’s
MarketValue
£000’s
% ofTotal
NetAssets
DERIVATIVES − 0.18%; 29.2.2020 (0.15%)
Futures − 0.18%; 29.2.2020 (0.15%)
1,150 S&P 500 E-Mini September 2020 150,261 11,011 0.18
57 S&P/TSX 60 Index September 2020 6,463 182 0.00
156,724 11,193 0.18
Portfolio of investments 6,129,986 99.07
Net other assets 57,805 0.93
Total net assets 6,187,791 100.00
Unless otherwise stated, all securities are either listed on a recognised exchange or traded on an eligible securities market.
Underlying exposure has been calculated according to the guidelines issued by the European Securities and Markets Authority (“ESMA”) and represents the market value of an equivalent positionin the assets underlying each financial derivative instrument.Ø All or a portion of this investment represents a security on loan.‡ Related party to the Fund.† Managed by a related party.
iShares North American Equity Index Fund (UK)
Portfolio Statement (unaudited) continued
BlackRock Collective Investment Funds167

£000’s31.8.2020
£000’s £000’s31.8.2019
£000’s
Income
Net capital gains 689,857 642,429
Revenue 52,291 51,543
Expenses (3,331) (2,940)
Interest payable and similarcharges (7) –
Net revenue before taxation 48,953 48,603
Taxation (6,742) (7,194)
Net revenue after taxation 42,211 41,409
Total return before distributions 732,068 683,838
Distributions (42,211) (41,409)
Change in net assetsattributable to unitholdersfrom investment activities 689,857 642,429
Statement of Change in Net Assets Attributable to Unitholders(unaudited) for the six months ended 31 August 2020
£000’s31.8.2020
£000’s £000’s31.8.2019
£000’s
Opening net assets attributableto unitholders 5,375,718 4,450,267
Amounts receivable on issue of units 809,255 590,171
Amounts payable on cancellation of units (729,594) (497,605)
79,661 92,566
Change in net assets attributable tounitholders from investment activities 689,857 642,429
Retained distribution on accumulation units 42,555 40,680
Closing net assets attributableto unitholders 6,187,791 5,225,942
The above statement shows the comparative closing net assets at 31 August 2019 whereas the current accounting period commenced 1 March 2020.
iShares North American Equity Index Fund (UK)
Statement of Total Return (unaudited)
for the six months ended 31 August 2020
BlackRock Collective Investment Funds 168

31.8.2020£000’s
29.2.2020£000’s
Assets:
Fixed assets
− Investment assets 6,129,986 5,339,736
Current assets
− Debtors 130,933 39,714
− Cash and bank balances 7,475 18,848
− Cash collateral posted 11,063 4,193
Total assets 6,279,457 5,402,491
Liabilities:
Investment liabilities – (8,064)
Creditors
− Amounts held at futures clearing houses and brokers (10,701) –
− Distributions payable (682) (741)
− Other creditors (80,283) (17,968)
Total liabilities (91,666) (26,773)
Net assets attributable to unitholders 6,187,791 5,375,718
G D Bamping (Director)M T Zemek (Director)BlackRock Fund Managers Limited29 October 2020
iShares North American Equity Index Fund (UK)
Balance Sheet (unaudited)
at 31 August 2020
BlackRock Collective Investment Funds169

The Fund is a sub-fund of BlackRock Collective Investment Funds (previously known as BlackRock QualifiedInvestor Schemes (1)), a UCITS scheme under the COLL Sourcebook. This Fund was authorised on 30 July2018 and launched on 24 September 2018.
Risk and Reward ProfileLower riskTypically lower rewards
Higher riskTypically higher rewards
Unit Class
A Income 1 2 3 4 5 6 7
A Accumulation 1 2 3 4 5 6 7
L Income 1 2 3 4 5 6 7
L Accumulation 1 2 3 4 5 6 7
X Accumulation 1 2 3 4 5 6 7
D Income 1 2 3 4 5 6 7
D Accumulation 1 2 3 4 5 6 7
• The risk indicator was calculated incorporating historical or simulated historical data and may not be a reliableindication of the future risk profile of the Fund.
• The risk category shown is not guaranteed and may change over time.
• The lowest category does not mean risk free.
For more information on this, please see the Fund’s Key Investor Information Documents (“KIIDs”), which areavailable at www.blackrock.com.
iShares Over 15 Years Corporate Bond Index Fund (UK)
About the Fund
BlackRock Collective Investment Funds 170

Net Asset Value
At 31 August 2020 Units in IssueNet Asset Value
£000’s
Net Asset Valueper Unit
p
A Income 100 – 117.7
A Accumulation 100 – 123.9
L Income 100 – 117.5
L Accumulation 100 – 124.0
X Accumulation 220,435,383 273,579 124.1
D Income 100 – 117.5
D Accumulation 2,850,298 3,536 124.0
Distributions Payable for the period to 31 August 2020
Unit Class Distribution payable on 31.10.2020
Pence per Unit
A Income 1.4800
A Accumulation 1.5500
L Income 1.6100
L Accumulation 1.5800
X Accumulation 1.6307
D Income 1.6100
D Accumulation 1.5386
Operating Charges
Unit Class1.3.2020
to 31.8.20201.3.2019
to 29.2.2020
A Income 0.52% 0.53%
A Accumulation 0.52% 0.52%
L Income 0.22% 0.20%
L Accumulation 0.22% 0.20%
X Accumulation 0.02% 0.02%
D Income 0.17% 0.15%
D Accumulation 0.17% 0.17%
Operating charges are annualised and exclude portfolio trade-related costs, except costs paid to the custodian/depositary and entry/exit charges paid to an underlyingcollective investment scheme (if any).
iShares Over 15 Years Corporate Bond Index Fund (UK)
Performance Record
BlackRock Collective Investment Funds171

Holding orNominalValue Investment
MarketValue
£000’s
% ofTotal
NetAssets
BONDS − 98.68%; 29.2.2020 98.45%
UK STERLING − 98.68%; 29.2.2020 98.45%
UK Sterling Denominated CorporateBonds − 96.05%; 29.2.2020 95.83%
£675,000 3i 3.75% 5/6/2040 711 0.26
£710,000 Accent Capital 2.625%18/7/2049
824 0.30
£680,000 Aegon 6.625%16/12/2039
1,172 0.42
£410,000 Affinity Sutton CapitalMarkets 4.25%8/10/2042
570 0.21
£310,000 Affinity Sutton CapitalMarkets 5.981%17/9/2038
504 0.18
£540,000 Affinity Water Finance4.5% 31/3/2036
734 0.26
£1,950,000 Affordable HousingFinance 2.893%11/8/2045
2,503 0.90
£1,005,000 Affordable HousingFinance 3.8% 20/5/2044
1,446 0.52
£1,300,000 Allianz Finance II 4.5%13/3/2043
2,037 0.74
£1,250,000 America Movil 4.375%7/8/2041
1,651 0.60
£1,510,000 Anheuser-Busch InBev2.85% 25/5/2037
1,622 0.59
£1,105,000 Annington Funding3.935% 12/7/2047
1,357 0.49
£900,000 Apple 3.6% 31/7/2042 1,279 0.46
£740,000 Aster Treasury 4.5%18/12/2043
1,091 0.39
£1,760,000 AT&T 4.25% 1/6/2043 2,178 0.79
£2,100,000 AT&T 4.875% 1/6/2044 2,834 1.02
£1,900,000 AT&T 7% 30/4/2040 3,115 1.12
£1,060,000 Aviva 6.875% 20/5/2058 1,562 0.56
£1,040,000 BAT InternationalFinance 2.25% 9/9/2052
821 0.30
£640,000 BAT InternationalFinance 4% 23/11/2055
708 0.26
£540,000 BAT InternationalFinance 5.75% 5/7/2040
720 0.26
£1,670,000 Berkshire HathawayFinance 2.375%19/6/2039
1,872 0.68
£1,300,000 Berkshire HathawayFinance 2.625%19/6/2059
1,542 0.56
Holding orNominalValue Investment
MarketValue
£000’s
% ofTotal
NetAssets
£1,305,000 BG Energy Capital 5% 4/11/2036 1,930 0.70
£1,805,000 BHP Billiton Finance 4.3%25/9/2042
2,604 0.94
£284,038 Bishopsgate Asset Finance4.808% 14/8/2044
332 0.12
£600,000 Blend Funding 3.459% 21/9/2049 757 0.27
£600,000 BPHA Finance 4.816% 11/4/2044 910 0.33
£460,000 British Telecommunications3.625% 21/11/2047
540 0.19
£790,000 British Telecommunications6.375% 23/6/2037
1,213 0.44
£525,000 Bromford Housing 3.125%3/5/2048
661 0.24
£300,000 Cadent Finance 2.25%10/10/2035
317 0.11
£1,540,000 Cadent Finance 2.625%22/9/2038
1,687 0.61
£1,330,000 Cadent Finance 2.75% 22/9/2046 1,482 0.53
£500,000 Cadent Finance 3.125%21/3/2040
583 0.21
£580,000 Cardiff University 3% 7/12/2055 778 0.28
£250,000 Cargill 5.375% 2/3/2037 367 0.13
£610,000 Catalyst Housing 3.125%31/10/2047
732 0.26
£900,000 Centrica 4.25% 12/9/2044 1,170 0.42
£510,000 Chancellor Masters & Scholars ofThe University of Cambridge/The2.35% 27/6/2078
755 0.27
£630,000 Chancellor Masters & Scholars ofThe University of Cambridge/The3.75% 17/10/2052
1,040 0.38
£570,000 Channel Link Enterprises Finance3.848% 30/6/2050
651 0.24
£520,000 Circle Anglia Social Housing 5.2%2/3/2044
820 0.30
£710,000 Circle Anglia Social Housing7.25% 12/11/2038
1,293 0.47
£815,000 Citigroup 6.8% 25/6/2038 1,414 0.51
£790,000 Citigroup 7.375% 1/9/2039 1,453 0.52
£610,000 Citizen Treasury 3.25%20/10/2048
770 0.28
£550,000 Clarion Funding 3.125%19/4/2048
667 0.24
£1,350,000 Comcast 1.875% 20/2/2036 1,390 0.50
£680,000 Cooperatieve Rabobank UA5.25% 23/5/2041
1,131 0.41
£500,000 Cooperatieve Rabobank UA5.375% 3/8/2060
1,025 0.37
£450,000 Cooperatieve Rabobank UA6.91% Perpetual 10/12/2168
749 0.27
iShares Over 15 Years Corporate Bond Index Fund (UK)
Portfolio Statement (unaudited)
at 31 August 2020
BlackRock Collective Investment Funds 172

Holding orNominalValue Investment
MarketValue
£000’s
% ofTotal
NetAssets
£400,000 Dali Capital 4.79924% 21/12/2037 537 0.19
£550,000 DWR Cymru Financing UK 2.5%31/3/2036
622 0.22
£200,000 DWR Cymru Financing UK4.473% 31/3/2057
339 0.12
£1,500,000 E.ON International Finance5.875% 30/10/2037Ø
2,327 0.84
£1,200,000 E.ON International Finance 6.75%27/1/2039
2,052 0.74
£350,000 East Japan Railway 4.5%25/1/2036
496 0.18
£580,000 Eastern Power Networks 6.25%12/11/2036
947 0.34
£1,700,000 Electricite de France 5.125%22/9/2050
2,547 0.92
£700,000 Electricite de France 5.5%27/3/2037
1,004 0.36
£2,600,000 Electricite de France 5.5%17/10/2041
3,833 1.38
£2,400,000 Electricite de France 6%23/1/2114
4,026 1.45
£1,045,000 Enel 5.75% 22/6/2037 1,564 0.56
£2,420,000 Enel Finance International 5.75%14/9/2040
3,701 1.34
£1,900,000 Engie 5% 1/10/2060 3,513 1.27
£570,000 Equinor 4.25% 10/4/2041 806 0.29
£1,905,000 European Investment Bank3.875% 8/6/2037
2,753 0.99
£1,295,000 European Investment Bank 4.5%7/3/2044Ø
2,201 0.79
£1,375,000 European Investment Bank4.625% 12/10/2054
2,718 0.98
£2,550,000 European Investment Bank 5%15/4/2039
4,271 1.54
£650,000 Eversholt Funding 3.529%7/8/2042
715 0.26
£370,000 Freshwater Finance 4.556%3/4/2036
478 0.17
£380,000 Freshwater Finance 4.607%17/10/2036
498 0.18
£470,000 Gatwick Funding 2.625%7/10/2048
407 0.15
£500,000 Gatwick Funding 2.875% 5/7/2051 450 0.16
£480,000 Gatwick Funding 3.125%28/9/2041
467 0.17
£630,000 Gatwick Funding 3.25% 26/2/2048 607 0.22
£565,000 Gatwick Funding 5.75% 23/1/2039 726 0.26
£570,000 Gatwick Funding 6.5% 2/3/2043 809 0.29
£600,000 GB Social Housing 5.193%12/2/2040
838 0.30
Holding orNominalValue Investment
MarketValue
£000’s
% ofTotal
NetAssets
£385,000 GE Capital UK Funding Unlimited6.25% 5/5/2038
482 0.17
£1,174,000 GE Capital UK Funding Unlimited8% 14/1/2039
1,671 0.60
£830,000 General Electric 4.875%18/9/2037
820 0.30
£650,000 General Electric 5.375%18/12/2040
741 0.27
£390,000 Genfinance II 6.064% 21/12/2039 610 0.22
£1,350,000 GlaxoSmithKline Capital 4.25%18/12/2045
2,022 0.73
£1,680,000 GlaxoSmithKline Capital 5.25%10/4/2042
2,737 0.99
£1,235,000 GlaxoSmithKline Capital 6.375%9/3/2039
2,153 0.78
£590,000 Goldman Sachs 6.875%18/1/2038
934 0.34
£560,000 Great Places Housing 4.75%22/10/2042
801 0.29
£675,000 Guinness Partnership 2%22/4/2055
698 0.25
£450,000 Guinness Partnership 4%24/10/2044
648 0.23
£670,000 Heathrow Funding 2.75%9/8/2051
652 0.24
£1,205,000 Heathrow Funding 4.625%31/10/2046
1,567 0.57
£1,390,000 Heathrow Funding 5.875%13/5/2043
2,011 0.73
£579,000 Home 3.125% 27/3/2043Ø 671 0.24
£545,000 Housing & Care 21 3.288%8/11/2049
640 0.23
£100,000 Housing & Care 21 3.288%8/11/2049
118 0.04
£1,530,000 HSBC 6% 29/3/2040 2,030 0.73
£1,250,000 HSBC 7% 7/4/2038 1,812 0.65
£1,050,000 HSBC Bank 4.75% 24/3/2046 1,259 0.45
£470,000 HSBC Bank 6.25% 30/1/2041 653 0.24
£800,000 Hyde Housing Association 1.75%18/8/2055
718 0.26
£420,000 Hyde Housing Association5.125% 23/7/2040
629 0.23
£475,000 Incommunities Treasury 3.25%21/3/2049
613 0.22
£1,800,000 innogy Finance 6.125% 6/7/2039 2,906 1.05
£440,000 Investor 5.5% 5/5/2037 658 0.24
£500,000 Karbon Homes 3.375%15/11/2047Ø
657 0.24
£420,000 Kreditanstalt fuer Wiederaufbau4.875% 15/3/2037
670 0.24
iShares Over 15 Years Corporate Bond Index Fund (UK)
Portfolio Statement (unaudited) continued
BlackRock Collective Investment Funds173

Holding orNominalValue Investment
MarketValue
£000’s
% ofTotal
NetAssets
£1,330,000 Kreditanstalt fuer Wiederaufbau5% 9/6/2036Ø
2,133 0.77
£730,000 Land Capital Markets 2.625%22/9/2039Ø
784 0.28
£1,030,000 Land Capital Markets 2.75%22/9/2059
1,134 0.41
£745,000 LCR Finance 4.5% 7/12/2038 1,171 0.42
£1,830,000 LCR Finance 5.1% 7/3/2051 3,641 1.31
£1,080,000 Legal & General 5.5% 27/6/2064 1,291 0.47
£450,000 Libra Longhurst Treasury 5.125%2/8/2038
645 0.23
£440,000 Libra Longhurst Treasury NO2 3.25% 15/5/2043
514 0.19
£450,000 LiveWest Treasury 2.25%10/10/2043
479 0.17
£1,430,000 Lloyds Bank 6.5% 17/9/2040 2,490 0.90
£450,000 London & Quadrant Housing Trust2.75% 20/7/2057
495 0.18
£600,000 London & Quadrant Housing Trust3.125% 28/2/2053
715 0.26
£440,000 London & Quadrant Housing Trust3.75% 27/10/2049
575 0.21
£480,000 London & Quadrant Housing Trust5.486% 15/6/2042
745 0.27
£450,000 London & Quadrant Housing Trust5.5% 27/1/2040
680 0.25
£875,000 M&G 6.25% 20/10/2068 1,047 0.38
£1,230,000 M&G 6.34% 19/12/2063 1,503 0.54
£570,000 Manchester Airport Funding2.875% 31/3/2039
551 0.20
£575,000 Manchester Airport Funding2.875% 30/9/2044
534 0.19
£650,000 Martlet Homes 3% 9/5/2052 779 0.28
£500,000 McDonald’s 4.125% 11/6/2054 730 0.26
£485,000 Merseylink Issuer 3.842%31/3/2043
686 0.25
£520,000 Metropolitan Funding 4.125%5/4/2048
657 0.24
£550,000 Morhomes 3.4% 19/2/2038 625 0.23
£900,000 Motability Operations 2.375%3/7/2039
1,002 0.36
£970,000 Motability Operations 3.625%10/3/2036
1,251 0.45
£875,000 National Grid ElectricityTransmission 2% 16/9/2038
924 0.33
£675,000 National Grid ElectricityTransmission 2% 17/4/2040
706 0.25
£2,250,000 Network Rail InfrastructureFinance 4.75% 29/11/2035
3,459 1.25
Holding orNominalValue Investment
MarketValue
£000’s
% ofTotal
NetAssets
£390,000 Northern Gas Networks Finance4.875% 15/11/2035
549 0.20
£330,000 Northern Gas Networks Finance5.625% 23/3/2040
520 0.19
£175,000 Northern Powergrid Northeast1.875% 16/6/2062
176 0.06
£700,000 Northern Powergrid Yorkshire2.25% 9/10/2059
775 0.28
£600,000 Northumbrian Water Finance5.125% 23/1/2042
932 0.34
£675,000 Notting Hill Genesis 3.25%12/10/2048
772 0.28
£500,000 Notting Hill Genesis 4.375%20/2/2054
704 0.25
£520,000 Notting Hill Genesis 5.25%7/7/2042
759 0.27
£125,000 Optivo Finance 2.857% 7/10/2035 143 0.05
£630,000 Optivo Finance 3.283% 22/3/2048 774 0.28
£900,000 Orange 5.375% 22/11/2050 1,508 0.54
£820,000 Orbit Capital 3.375% 14/6/2048 989 0.36
£430,000 Orbit Capital 3.5% 24/3/2045 521 0.19
£900,000 Orsted 5.75% 9/4/2040 1,498 0.54
£490,000 Paragon Treasury 3.625%21/1/2047
604 0.22
£715,000 Peabody Capital No 2 3.25%14/9/2048
874 0.32
£580,000 Peabody Capital No 2 4.625%12/12/2053
914 0.33
£510,000 Penarian Housing Finance 3.212%7/6/2052
570 0.21
£2,390,000 Pfizer 2.735% 15/6/2043 2,829 1.02
£850,000 Pfizer 6.5% 3/6/2038Ø 1,512 0.55
£200,000 Platform HG Financing 1.625%10/8/2055
186 0.07
£460,000 Riverside Finance 3.875%5/12/2044
620 0.22
£975,000 RL Finance Bonds NO 4 4.875%7/10/2049
1,029 0.37
£425,000 Sanctuary Capital 2.375%14/4/2050
473 0.17
£945,000 Sanctuary Capital 5% 26/4/2047 1,574 0.57
£610,000 Sanctuary Capital 6.697%23/3/2039
1,093 0.39
£500,000 Scottish Hydro ElectricTransmission 2.25% 27/9/2035
539 0.19
£1,145,000 Scottish Widows 7% 16/6/2043 1,610 0.58
£775,000 Segro 2.875% 11/10/2037Ø 887 0.32
£600,000 Severn Trent Utilities Finance 2%2/6/2040
624 0.23
iShares Over 15 Years Corporate Bond Index Fund (UK)
Portfolio Statement (unaudited) continued
BlackRock Collective Investment Funds 174

Holding orNominalValue Investment
MarketValue
£000’s
% ofTotal
NetAssets
£580,000 Severn Trent Utilities Finance4.875% 24/1/2042Ø
892 0.32
£1,100,000 SiemensFinancieringsmaatschappij 3.75%10/9/2042
1,590 0.57
£550,000 Southern Electric PowerDistribution 4.625% 20/2/2037
764 0.28
£700,000 Southern Gas Networks 3.1%15/9/2036
826 0.30
£370,000 Southern Gas Networks 6.375%15/5/2040
637 0.23
£525,000 Southern Housing 3.5%19/10/2047
648 0.23
£450,000 Southern Water Services Finance3% 28/5/2037
464 0.17
£580,000 Southern Water Services Finance4.5% 31/3/2052
899 0.32
£220,000 Southern Water Services Finance5% 31/3/2041
325 0.12
£330,000 Southern Water Services Finance5.125% 30/9/2056
577 0.21
£640,000 Sovereign Housing Capital2.375% 4/11/2048Ø
713 0.26
£420,000 Sovereign Housing Capital4.768% 1/6/2043
651 0.24
£230,000 Sovereign Housing Capital5.705% 10/9/2039
377 0.14
£600,000 SSE 6.25% 27/8/2038 985 0.36
£840,000 Standard Chartered 4.375%18/1/2038Ø
1,130 0.41
£510,000 Swan Housing Capital 3.625%5/3/2048
569 0.21
£795,000 Temasek Financial I 5.125%26/7/2040
1,322 0.48
£200,000 Thames Water Utilities Finance2.375% 22/4/2040
205 0.07
£600,000 Thames Water Utilities Finance4.625% 4/6/2046
862 0.31
£1,060,000 Thames Water Utilities Finance5.125% 28/9/2037
1,503 0.54
£1,050,000 Thames Water Utilities Finance5.5% 11/2/2041
1,593 0.57
£720,000 Thames Water Utilities Finance7.738% 9/4/2058
1,496 0.54
£420,000 THFC Funding No 1 5.125%21/12/2037
603 0.22
£555,000 THFC Funding No 2 6.35%8/7/2041
928 0.33
£1,740,000 THFC Funding No 3 5.2%11/10/2043
2,716 0.98
Holding orNominalValue Investment
MarketValue
£000’s
% ofTotal
NetAssets
£1,170,000 Time Warner Cable 5.25%15/7/2042
1,487 0.54
£610,000 Together Housing Finance 4.5%17/12/2042
891 0.32
£740,000 Transport for London 3.625%15/5/2045
1,007 0.36
£900,000 Transport for London 3.875%23/7/2042
1,245 0.45
£840,000 Transport for London 4% 7/4/2064 1,389 0.50
£800,000 United Parcel Service 5.125%12/2/2050
1,324 0.48
£550,000 United Utilities Water Finance1.75% 10/2/2038
558 0.20
£475,000 United Utilities Water Finance1.875% 3/6/2042
485 0.18
£420,000 University of Leeds 3.125%19/12/2050
557 0.20
£100,000 University of Leeds 3.125%19/12/2050
133 0.05
£440,000 University of Liverpool 3.375%25/6/2055
665 0.24
£500,000 University of Manchester 4.25%4/7/2053
855 0.31
£1,790,000 University of Oxford 2.544%8/12/2117
2,478 0.89
£565,000 University of Southampton 2.25%11/4/2057
653 0.24
£1,250,000 Vattenfall 6.875% 15/4/2039 2,259 0.82
£1,050,000 Veolia Environnement 6.125%29/10/2037
1,728 0.62
£860,000 Verizon Communications 3.125%2/11/2035
1,027 0.37
£1,685,000 Verizon Communications 3.375%27/10/2036
2,067 0.75
£1,760,000 Vodafone 3% 12/8/2056 1,891 0.68
£1,390,000 Vodafone 3.375% 8/8/2049 1,593 0.57
£475,000 Wales & West Utilities Finance1.875% 28/5/2041
478 0.17
£760,000 Wales & West Utilities Finance 3%3/8/2038
912 0.33
£580,000 Walmart 4.875% 19/1/2039Ø 912 0.33
£1,410,000 Walmart 5.25% 28/9/2035 2,195 0.79
£1,270,000 Wellcome Trust 2.517% 7/2/2118 1,782 0.64
£760,000 Wellcome Trust 4% 9/5/2059 1,376 0.50
£950,000 Wellcome Trust Finance 4.625%25/7/2036Ø
1,471 0.53
£1,205,000 Wells Fargo & 4.625% 2/11/2035 1,633 0.59
£1,250,000 Wells Fargo & 4.875% 29/11/2035 1,623 0.59
£500,000 Western Power Distribution EastMidlands 6.25% 10/12/2040
856 0.31
iShares Over 15 Years Corporate Bond Index Fund (UK)
Portfolio Statement (unaudited) continued
BlackRock Collective Investment Funds175

Holding orNominalValue Investment
MarketValue
£000’s
% ofTotal
NetAssets
£300,000 Western Power Distribution SouthWales 5.75% 23/3/2040
484 0.17
£350,000 Western Power Distribution SouthWest 5.75% 23/3/2040
565 0.20
£500,000 Wheatley Capital 4.375%28/11/2044Ø
688 0.25
£490,000 WHG Treasury 4.25% 6/10/2045 676 0.24
£770,000 WPP Finance 2013 2.875%14/9/2046
678 0.24
£475,000 Wrekin Housing 2.5% 22/10/2048 536 0.19
£775,000 Yorkshire Water Finance 2.75%18/4/2041
875 0.32
£620,000 Yorkshire Water Finance 6.375%19/8/2039
1,057 0.38
£250,000 Yorkshire Water Services Finance5.5% 28/5/2037
391 0.14
266,166 96.05
UK Sterling Denominated GovernmentBonds − 2.63%; 29.2.2020 2.62%
£450,000 Jersey International Bond 3.75%9/6/2054
687 0.25
£1,810,000 Mexico Government InternationalBond 5.625% 19/3/2114
1,919 0.69
Holding orNominalValue Investment
MarketValue
£000’s
% ofTotal
NetAssets
£985,000 SNCF Reseau 4.83% 25/3/2060 1,829 0.66
£940,000 SNCF Reseau 5% 11/3/2052 1,678 0.60
£630,000 States of Guernsey Bond 3.375%12/12/2046
851 0.31
£220,000 Tennessee Valley Authority4.625% 7/6/2043
345 0.12
7,309 2.63
COLLECTIVE INVESTMENTSCHEMES − 0.10%; 29.2.2020 0.00%
Short-term Money Market Funds − 0.10%; 29.2.2020 0.00%
2,722 BlackRock ICS Sterling LiquidEnvironmentally Aware Fund -Agency Income Class†
272 0.10
Portfolio of investments 273,747 98.78
Net other assets 3,368 1.22
Total net assets 277,115 100.00
Unless otherwise stated, all securities are either listed on a recognised exchange or traded on aneligible securities market.Ø All or a portion of this investment represents a security on loan.† Managed by a related party.
iShares Over 15 Years Corporate Bond Index Fund (UK)
Portfolio Statement (unaudited) continued
BlackRock Collective Investment Funds 176

£000’s31.8.2020
£000’s £000’s31.8.2019
£000’s
Income
Net capital gains 2,662 36,905
Revenue 3,827 4,081
Expenses (30) (26)
Net revenue before taxation 3,797 4,055
Taxation – (15)
Net revenue after taxation 3,797 4,040
Total return before distributions 6,459 40,945
Distributions (3,797) (4,040)
Change in net assetsattributable to unitholdersfrom investment activities 2,662 36,905
Statement of Change in Net Assets Attributable to Unitholders(unaudited) for the six months ended 31 August 2020
£000’s31.8.2020
£000’s £000’s31.8.2019
£000’s
Opening net assets attributableto unitholders 315,684 234,228
Amounts receivable on issue of units 35,781 56,955
Amounts payable on cancellation of units (80,650) (26,497)
(44,869) 30,458
Change in net assets attributable tounitholders from investment activities 2,662 36,905
Retained distribution on accumulation units 3,638 4,179
Closing net assets attributableto unitholders 277,115 305,770
The above statement shows the comparative closing net assets at 31 August 2019 whereas the current accounting period commenced 1 March 2020.
iShares Over 15 Years Corporate Bond Index Fund (UK)
Statement of Total Return (unaudited)
for the six months ended 31 August 2020
BlackRock Collective Investment Funds177

31.8.2020£000’s
29.2.2020£000’s
Assets:
Fixed assets
− Investment assets 273,747 310,802
Current assets
− Debtors 3,823 6,054
− Cash and bank balances 141 89
Total assets 277,711 316,945
Liabilities:
Creditors
− Other creditors (596) (1,261)
Total liabilities (596) (1,261)
Net assets attributable to unitholders 277,115 315,684
G D Bamping (Director)M T Zemek (Director)BlackRock Fund Managers Limited29 October 2020
iShares Over 15 Years Corporate Bond Index Fund (UK)
Balance Sheet (unaudited)
at 31 August 2020
BlackRock Collective Investment Funds 178

The Fund is a sub-fund of BlackRock Collective Investment Funds (previously known as BlackRock QualifiedInvestor Schemes (1)), a UCITS scheme under the COLL Sourcebook. This Fund was authorised on 28 April2010 and launched on 23 March 2017.
Risk and Reward ProfileLower riskTypically lower rewards
Higher riskTypically higher rewards
Unit Class
X Income 1 2 3 4 5 6 7
X Accumulation 1 2 3 4 5 6 7
D Accumulation 1 2 3 4 5 6 7
• The risk indicator was calculated incorporating simulated historical data and may not be a reliable indicationof the future risk profile of the Fund.
• The risk category shown is not guaranteed and may change over time.
• The lowest category does not mean risk free.
For more information on this, please see the Fund’s Key Investor Information Documents (“KIIDs”), which areavailable at www.blackrock.com.
iShares Over 15 Years Gilts Index Fund (UK)
About the Fund
BlackRock Collective Investment Funds179

Net Asset Value
At 31 August 2020 Units in IssueNet Asset Value
£000’s
Net Asset Valueper Unit
p
X Income 100 – 123.4
X Accumulation 1,374,473,906 1,722,090 125.3
D Accumulation 4,625,513 5,879 127.1
Distributions Payable for the period to 31 August 2020
Unit Class Distribution payable on 31.10.2020
Pence per Unit
X Income 0.6900
X Accumulation 0.8280
D Accumulation 0.7378
Operating Charges
Unit Class1.3.2020
to 31.8.20201.3.2019
to 29.2.2020
X Income 0.01% 0.01%
X Accumulation 0.01% 0.01%
D Accumulation 0.16% 0.16%
Operating charges are annualised and exclude portfolio trade-related costs, except costs paid to the custodian/depositary and entry/exit charges paid to an underlyingcollective investment scheme (if any).
iShares Over 15 Years Gilts Index Fund (UK)
Performance Record
BlackRock Collective Investment Funds 180

Holding orNominalValue Investment
MarketValue
£000’s
% ofTotal
NetAssets
BONDS − 99.66%; 29.2.2020 99.68%
UK Sterling Denominated GovernmentBonds − 99.66%; 29.2.2020 99.68%
£15,489,000 United Kingdom Gilt0.5% 22/10/2061
13,691 0.79
£36,464,000 United Kingdom Gilt0.625% 22/10/2050Ø
33,817 1.96
£33,680,000 United Kingdom Gilt1.25% 22/10/2041Ø
36,246 2.10
£52,982,000 United Kingdom Gilt1.5% 22/7/2047
60,721 3.51
£40,410,000 United Kingdom Gilt1.625% 22/10/2054
49,263 2.85
£29,951,000 United Kingdom Gilt1.625% 22/10/2071Ø
41,173 2.38
£60,898,000 United Kingdom Gilt1.75% 7/9/2037Ø
70,689 4.09
£53,312,183 United Kingdom Gilt1.75% 22/1/2049Ø
64,848 3.75
£52,535,000 United Kingdom Gilt1.75% 22/7/2057
67,338 3.90
£42,420,000 United Kingdom Gilt2.5% 22/7/2065
68,838 3.98
£59,765,000 United Kingdom Gilt3.25% 22/1/2044
89,718 5.19
£59,570,000 United Kingdom Gilt3.5% 22/1/2045
93,768 5.43
£42,374,000 United Kingdom Gilt3.5% 22/7/2068
87,391 5.06
£51,415,130 United Kingdom Gilt3.75% 22/7/2052
92,582 5.36
£51,344,000 United Kingdom Gilt 4%22/1/2060
105,649 6.11
Holding orNominalValue Investment
MarketValue
£000’s
% ofTotal
NetAssets
£63,665,000 United Kingdom Gilt 4.25%7/3/2036
97,425 5.64
£1,522,061 United Kingdom Gilt 4.25%7/9/2039
2,461 0.14
£47,917,939 United Kingdom Gilt 4.25%7/9/2039
77,491 4.48
£53,965,000 United Kingdom Gilt 4.25%7/12/2040
88,652 5.13
£51,598,000 United Kingdom Gilt 4.25%7/12/2046
92,277 5.34
£42,465,000 United Kingdom Gilt 4.25%7/12/2049
79,281 4.59
£1,069,200 United Kingdom Gilt 4.25%7/12/2055
2,167 0.13
£55,464,800 United Kingdom Gilt 4.25%7/12/2055
112,415 6.51
£57,976,000 United Kingdom Gilt 4.5%7/12/2042
101,045 5.85
£55,103,831 United Kingdom Gilt 4.75%7/12/2038
93,074 5.39
1,722,020 99.66
Portfolio of investments 1,722,020 99.66
Net other assets 5,949 0.34
Total net assets 1,727,969 100.00
Unless otherwise stated, all securities are either listed on a recognised exchange or traded on aneligible securities market.
All securities in the portfolio at 31 August 2020 are investment grade.Ø All or a portion of this investment represents a security on loan.
iShares Over 15 Years Gilts Index Fund (UK)
Portfolio Statement (unaudited)
at 31 August 2020
BlackRock Collective Investment Funds181

£000’s31.8.2020
£000’s £000’s31.8.2019
£000’s
Income
Net capital gains 12,125 281,379
Revenue 11,436 14,232
Expenses (86) (98)
Net revenue before taxation 11,350 14,134
Taxation – –
Net revenue after taxation 11,350 14,134
Total return before distributions 23,475 295,513
Distributions (11,350) (14,134)
Change in net assetsattributable to unitholdersfrom investment activities 12,125 281,379
Statement of Change in Net Assets Attributable to Unitholders(unaudited) for the six months ended 31 August 2020
£000’s31.8.2020
£000’s £000’s31.8.2019
£000’s
Opening net assets attributableto unitholders 1,820,173 1,632,247
Amounts receivable on issue of units 159,708 169,340
Amounts payable on cancellation of units (275,452) (173,516)
(115,744) (4,176)
Change in net assets attributable tounitholders from investment activities 12,125 281,379
Retained distribution on accumulation units 11,415 13,966
Closing net assets attributableto unitholders 1,727,969 1,923,416
The above statement shows the comparative closing net assets at 31 August 2019 whereas the current accounting period commenced 1 March 2020.
iShares Over 15 Years Gilts Index Fund (UK)
Statement of Total Return (unaudited)
for the six months ended 31 August 2020
BlackRock Collective Investment Funds 182

31.8.2020£000’s
29.2.2020£000’s
Assets:
Fixed assets
− Investment assets 1,722,020 1,814,262
Current assets
− Debtors 12,809 53,357
− Cash and bank balances 528 244
Total assets 1,735,357 1,867,863
Liabilities:
Creditors
− Other creditors (7,388) (47,690)
Total liabilities (7,388) (47,690)
Net assets attributable to unitholders 1,727,969 1,820,173
G D Bamping (Director)M T Zemek (Director)BlackRock Fund Managers Limited29 October 2020
iShares Over 15 Years Gilts Index Fund (UK)
Balance Sheet (unaudited)
at 31 August 2020
BlackRock Collective Investment Funds183

The Fund is a sub-fund of BlackRock Collective Investment Funds (previously known as BlackRock QualifiedInvestor Schemes (1)), a UCITS scheme under the COLL Sourcebook. The Fund was established on 28 January2011 and was authorised by the FCA on 28 April 2010. The Fund’s FCA product reference number is 645678.
Risk and Reward ProfileLower riskTypically lower rewards
Higher riskTypically higher rewards
Unit Class
A Accumulation 1 2 3 4 5 6 7
L Accumulation 1 2 3 4 5 6 7
X Income 1 2 3 4 5 6 7
X Accumulation 1 2 3 4 5 6 7
D Income 1 2 3 4 5 6 7
D Accumulation 1 2 3 4 5 6 7
H Income 1 2 3 4 5 6 7
H Accumulation 1 2 3 4 5 6 7
• The risk indicator was calculated incorporating simulated historical data and may not be a reliable indicationof the future risk profile of the Fund.
• The risk category shown is not guaranteed and may change over time.
• The lowest category does not mean risk free.
For more information on this, please see the Fund’s Key Investor Information Documents (“KIIDs”), which areavailable at www.blackrock.com.
iShares Overseas Corporate Bond Index Fund (UK)
About the Fund
BlackRock Collective Investment Funds 184

Net Asset Value
At 31 August 2020 Units in IssueNet Asset Value
£000’s
Net Asset Valueper Unit
p
A Accumulation 335,886 552 164.5
L Accumulation 532,096,355 896,860 168.6
X Income 15,927,845 21,043 132.1
X Accumulation 782,083,780 1,273,855 162.9
D Income 26,407,923 37,532 142.1
D Accumulation 282,969,392 474,094 167.5
H Income 7,546,053 9,719 128.8
H Accumulation 121,947,930 183,544 150.5
Distributions Payable for the period to 31 August 2020
Unit Class Distribution payable on 31.10.2020
Pence per Unit
A Accumulation 1.7836
L Accumulation 2.0856
X Income 1.7933
X Accumulation 2.1805
D Income 1.8552
D Accumulation 2.1582
H Income 1.6811
H Accumulation 1.9388
Operating Charges
Unit Class1.3.2020
to 31.8.20201.3.2019
to 29.2.2020
A Accumulation 0.51% 0.51%
L Accumulation 0.21% 0.21%
X Income 0.01% 0.01%
X Accumulation 0.01% 0.01%
D Income 0.11% 0.12%
D Accumulation 0.11% 0.11%
H Income 0.11% 0.12%
H Accumulation 0.11% 0.11%
Operating charges are annualised and exclude portfolio trade-related costs, except costs paid to the custodian/depositary and entry/exit charges paid to an underlyingcollective investment scheme (if any).
iShares Overseas Corporate Bond Index Fund (UK)
Performance Record
BlackRock Collective Investment Funds185

Holding orNominalValue Investment
MarketValue
£000’s
% ofTotal
NetAssets
BONDS − 97.98%; 29.2.2020 98.34%
AUSTRALIAN DOLLAR − 0.28%; 29.2.2020 0.33%
Australian Dollar Denominated CorporateBonds − 0.28%; 29.2.2020 0.33%
AU$500,000 Anheuser-Busch InBevWorldwide 3.75%6/9/2024
302 0.01
AU$500,000 Apple 3.35% 10/1/2024 300 0.01
AU$570,000 Apple 3.7% 28/8/2022 335 0.01
AU$300,000 AT&T 4.6% 19/9/2028 194 0.01
AU$700,000 AusNet Services Pty4.2% 21/8/2028
455 0.02
AU$500,000 AusNet Services Pty4.4% 16/8/2027
326 0.01
AU$500,000 Australia & New ZealandBanking 1.55%29/8/2024
285 0.01
AU$500,000 Bank of Montreal 2.1%17/7/2024
286 0.01
AU$250,000 Barclays 3.25%26/6/2024
144 0.00
AU$300,000 Commonwealth Bank ofAustralia 3.2%16/8/2023
178 0.01
AU$300,000 Commonwealth Bank ofAustralia 3.25%31/3/2022
173 0.01
AU$500,000 DEXUS Finance Pty 3%3/2/2032
275 0.01
AU$500,000 General PropertyTrust/The 2.849%20/2/2032
269 0.01
AU$750,000 Goldman Sachs 4.7%8/9/2021
431 0.01
AU$500,000 Hyundai CapitalServices 3.5% 3/6/2021
278 0.01
AU$300,000 Intel 4% 1/12/2022 178 0.01
AU$700,000 Lloyds Banking 3.65%20/3/2023
407 0.01
AU$500,000 Lonsdale Finance Pty2.45% 20/11/2026
282 0.01
AU$600,000 Macquarie 3.25%15/12/2022
339 0.01
AU$300,000 Macquarie Bank 1.7%12/2/2025
171 0.01
AU$300,000 McDonald’s 3.8%8/3/2029
189 0.01
AU$300,000 National Australia Bank2.9% 26/2/2024
179 0.01
Holding orNominalValue Investment
MarketValue
£000’s
% ofTotal
NetAssets
AU$500,000 Qantas Airways 7.75%19/5/2022
299 0.01
AU$500,000 Telstra 4% 16/9/2022 294 0.01
AU$400,000 Total Capital International4.25% 26/11/2021
230 0.01
AU$500,000 Verizon Communications3.5% 4/11/2039
279 0.01
AU$500,000 Verizon Communications4.05% 17/2/2025
309 0.01
AU$300,000 Vodafone 4.2% 13/12/2027 188 0.01
AU$200,000 Wells Fargo & 3.25%27/4/2022
115 0.00
AU$200,000 Westpac Banking 3.1%3/6/2021
113 0.00
AU$200,000 Westpac Banking 3.125%27/10/2022
117 0.00
AU$200,000 Westpac Banking 4.5%11/3/2027
114 0.00
AU$200,000 WSO Finance Pty 4.5%31/3/2027
127 0.00
8,161 0.28
CANADIAN DOLLAR − 3.39%; 29.2.2020 3.48%
Canadian Dollar Denominated CorporateBonds − 3.39%; 29.2.2020 3.48%
CA$500,000 407 International 1.8%22/5/2025
297 0.01
CA$500,000 407 International 2.59%25/5/2032
306 0.01
CA$250,000 407 International 2.84%7/3/2050
148 0.00
CA$300,000 407 International 3.6%21/5/2047
202 0.01
CA$300,000 407 International 3.65%8/9/2044
202 0.01
CA$200,000 407 International 3.72%11/5/2048
137 0.00
CA$300,000 407 International 3.83%11/5/2046
208 0.01
CA$150,000 407 International 3.98%11/9/2052
109 0.00
CA$300,000 407 International 4.19%25/4/2042
215 0.01
CA$100,000 407 International 5.75%14/2/2036
75 0.00
CA$200,000 Aeroports de Montreal3.03% 21/4/2050
118 0.00
CA$250,000 Aeroports de Montreal5.17% 17/9/2035
185 0.01
CA$200,000 Air Lease 2.625% 5/12/2024 108 0.00
iShares Overseas Corporate Bond Index Fund (UK)
Portfolio Statement (unaudited)
at 31 August 2020
BlackRock Collective Investment Funds 186

Holding orNominalValue Investment
MarketValue
£000’s
% ofTotal
NetAssets
CA$495,000 Alberta Powerline LP4.065% 1/12/2053
338 0.01
CA$400,000 Alectra 2.488% 17/5/2027 248 0.01
CA$150,000 Alectra 3.458% 12/4/2049 101 0.00
CA$800,000 Alimentation Couche-Tard3.056% 26/7/2024
489 0.02
CA$300,000 Alimentation Couche-Tard3.6% 2/6/2025
189 0.01
CA$300,000 Allied Properties Real EstateInvestment Trust 3.113%8/4/2027
182 0.01
CA$500,000 Allied Properties Real EstateInvestment Trust 3.131%15/5/2028
302 0.01
CA$400,000 Allied Properties Real EstateInvestment Trust 3.394%15/8/2029
244 0.01
CA$400,000 AltaGas 3.72% 28/9/2021 236 0.01
CA$700,000 AltaGas 3.98% 4/10/2027 453 0.02
CA$500,000 AltaLink Investments LP2.244% 7/3/2022
292 0.01
CA$500,000 AltaLink LP 3.668%6/11/2023
312 0.01
CA$300,000 AltaLink LP 3.717%3/12/2046
211 0.01
CA$500,000 AltaLink LP 4.462%8/11/2041
378 0.01
CA$150,000 AltaLink LP 4.922%17/9/2043
122 0.00
CA$700,000 Anheuser-Busch InBevFinance 2.6% 15/5/2024
420 0.01
CA$200,000 Anheuser-Busch InBevFinance 4.32% 15/5/2047
124 0.00
CA$750,000 Apple 2.513% 19/8/2024 456 0.02
CA$600,000 Aroundtown 4.625%18/9/2025
366 0.01
CA$500,000 AT&T 4% 25/11/2025 322 0.01
CA$300,000 AT&T 4.85% 25/5/2047 199 0.01
CA$250,000 AT&T 5.1% 25/11/2048 172 0.01
CA$400,000 Bank of America 2.604%15/3/2023
235 0.01
CA$400,000 Bank of America 3.407%20/9/2025
248 0.01
CA$200,000 Bank of America 3.515%24/3/2026
125 0.00
CA$200,000 Bank of Montreal 1.88%31/3/2021
116 0.00
CA$500,000 Bank of Montreal 2.077%17/6/2030
291 0.01
CA$500,000 Bank of Montreal 2.12%16/3/2022
293 0.01
Holding orNominalValue Investment
MarketValue
£000’s
% ofTotal
NetAssets
CA$800,000 Bank of Montreal 2.37%3/2/2025
482 0.02
CA$500,000 Bank of Montreal 2.57%1/6/2027
294 0.01
CA$600,000 Bank of Montreal 2.7%11/9/2024
368 0.01
CA$500,000 Bank of Montreal 2.7%9/12/2026
314 0.01
CA$500,000 Bank of Montreal 2.85%6/3/2024
304 0.01
CA$300,000 Bank of Montreal 2.88%17/9/2029
180 0.01
CA$700,000 Bank of Montreal 2.89%20/6/2023
425 0.01
CA$1,000,000 Bank of Montreal 3.19%1/3/2028
651 0.02
CA$750,000 Bank of Nova Scotia/The1.83% 27/4/2022
439 0.01
CA$500,000 Bank of Nova Scotia/The1.9% 2/12/2021
292 0.01
CA$800,000 Bank of Nova Scotia/The2.16% 3/2/2025
478 0.02
CA$800,000 Bank of Nova Scotia/The2.29% 28/6/2024
483 0.02
CA$600,000 Bank of Nova Scotia/The2.36% 8/11/2022
357 0.01
CA$2,000,000 Bank of Nova Scotia/The2.38% 1/5/2023
1,190 0.04
CA$800,000 Bank of Nova Scotia/The2.49% 23/9/2024
483 0.02
CA$300,000 Bank of Nova Scotia/The2.62% 2/12/2026
188 0.01
CA$400,000 Bank of Nova Scotia/The2.836% 3/7/2029
240 0.01
CA$500,000 Bank of Nova Scotia/The2.873% 4/6/2021
292 0.01
CA$400,000 Bank of Nova Scotia/The3.89% 18/1/2029
247 0.01
CA$500,000 Bell Canada 1.65%16/8/2027
286 0.01
CA$500,000 Bell Canada 2% 1/10/2021 291 0.01
CA$800,000 Bell Canada 2.5%14/5/2030
480 0.02
CA$500,000 Bell Canada 2.75%29/1/2025
305 0.01
CA$300,000 Bell Canada 2.9%12/8/2026
186 0.01
CA$1,000,000 Bell Canada 2.9%10/9/2029
620 0.02
CA$500,000 Bell Canada 3% 3/10/2022 299 0.01
iShares Overseas Corporate Bond Index Fund (UK)
Portfolio Statement (unaudited) continued
BlackRock Collective Investment Funds187

Holding orNominalValue Investment
MarketValue
£000’s
% ofTotal
NetAssets
CA$500,000 Bell Canada 3.35%12/3/2025
313 0.01
CA$200,000 Bell Canada 3.5%30/9/2050
121 0.00
CA$250,000 Bell Canada 3.55%2/3/2026
159 0.01
CA$500,000 Bell Canada 4.45%27/2/2047
345 0.01
CA$500,000 Bell Canada 4.7%11/9/2023
317 0.01
CA$250,000 Bell Canada 6.1%16/3/2035
193 0.01
CA$250,000 Bell Canada 6.17%26/2/2037
201 0.01
CA$300,000 Bell Canada 7.3%23/2/2032
246 0.01
CA$200,000 BP Capital Markets 3.497%9/11/2020
115 0.00
CA$500,000 British Columbia FerryServices 5.021% 20/3/2037
376 0.01
CA$300,000 Brookfield AssetManagement 5.04%8/3/2024
192 0.01
CA$200,000 Brookfield AssetManagement 5.95%14/6/2035
150 0.00
CA$200,000 Brookfield InfrastructureFinance ULC 2.855%1/9/2032
116 0.00
CA$400,000 Brookfield InfrastructureFinance ULC 3.315%22/2/2024
243 0.01
CA$400,000 Brookfield InfrastructureFinance ULC 3.41%9/10/2029
248 0.01
CA$500,000 Brookfield Property FinanceULC 3.926% 24/8/2025
290 0.01
CA$900,000 Brookfield Property FinanceULC 4.3% 1/3/2024
530 0.02
CA$200,000 Brookfield RenewablePartners ULC 3.38%15/1/2030
126 0.00
CA$300,000 Brookfield RenewablePartners ULC 3.63%15/1/2027
191 0.01
CA$300,000 Brookfield RenewablePartners ULC 4.29%5/11/2049
203 0.01
CA$200,000 Brookfield RenewablePartners ULC 4.79%7/2/2022
121 0.00
Holding orNominalValue Investment
MarketValue
£000’s
% ofTotal
NetAssets
CA$300,000 Bruce Power LP 3%21/6/2024
182 0.01
CA$1,000,000 Bruce Power LP 3.969%23/6/2026
645 0.02
CA$400,000 Bruce Power LP 4%21/6/2030
263 0.01
CA$300,000 Bruce Power LP 4.746%21/6/2049
222 0.01
CA$300,000 Cameco 4.19% 24/6/2024 183 0.01
CA$1,000,000 Canadian Imperial Bank ofCommerce 2% 17/4/2025
593 0.02
CA$500,000 Canadian Imperial Bank ofCommerce 2.01%21/7/2030
290 0.01
CA$500,000 Canadian Imperial Bank ofCommerce 2.04%21/3/2022
293 0.01
CA$500,000 Canadian Imperial Bank ofCommerce 2.35%28/8/2024
300 0.01
CA$600,000 Canadian Imperial Bank ofCommerce 2.95%19/6/2029
361 0.01
CA$1,000,000 Canadian Imperial Bank ofCommerce 2.97%11/7/2023
610 0.02
CA$400,000 Canadian Imperial Bank ofCommerce 3.29%15/1/2024
246 0.01
CA$1,000,000 Canadian Imperial Bank ofCommerce 3.3% 26/5/2025
636 0.02
CA$500,000 Canadian Imperial Bank ofCommerce 3.45% 4/4/2028
302 0.01
CA$500,000 Canadian National Railway3% 8/2/2029
319 0.01
CA$300,000 Canadian National Railway3.2% 31/7/2028
193 0.01
CA$300,000 Canadian National Railway3.6% 31/7/2048
202 0.01
CA$250,000 Canadian National Railway3.95% 22/9/2045
175 0.01
CA$200,000 Canadian NaturalResources 3.31% 11/2/2022
118 0.00
CA$300,000 Canadian NaturalResources 3.42% 1/12/2026
184 0.01
CA$500,000 Canadian NaturalResources 3.55% 3/6/2024
304 0.01
CA$100,000 Canadian NaturalResources 4.85% 30/5/2047
63 0.00
CA$700,000 Canadian Pacific Railway3.15% 13/3/2029
446 0.02
iShares Overseas Corporate Bond Index Fund (UK)
Portfolio Statement (unaudited) continued
BlackRock Collective Investment Funds 188
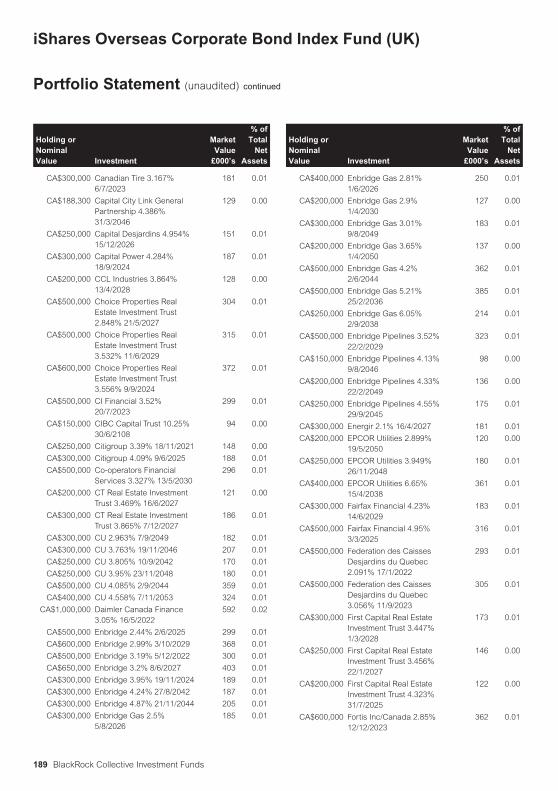
Holding orNominalValue Investment
MarketValue
£000’s
% ofTotal
NetAssets
CA$300,000 Canadian Tire 3.167%6/7/2023
181 0.01
CA$188,300 Capital City Link GeneralPartnership 4.386%31/3/2046
129 0.00
CA$250,000 Capital Desjardins 4.954%15/12/2026
151 0.01
CA$300,000 Capital Power 4.284%18/9/2024
187 0.01
CA$200,000 CCL Industries 3.864%13/4/2028
128 0.00
CA$500,000 Choice Properties RealEstate Investment Trust2.848% 21/5/2027
304 0.01
CA$500,000 Choice Properties RealEstate Investment Trust3.532% 11/6/2029
315 0.01
CA$600,000 Choice Properties RealEstate Investment Trust3.556% 9/9/2024
372 0.01
CA$500,000 CI Financial 3.52%20/7/2023
299 0.01
CA$150,000 CIBC Capital Trust 10.25%30/6/2108
94 0.00
CA$250,000 Citigroup 3.39% 18/11/2021 148 0.00
CA$300,000 Citigroup 4.09% 9/6/2025 188 0.01
CA$500,000 Co-operators FinancialServices 3.327% 13/5/2030
296 0.01
CA$200,000 CT Real Estate InvestmentTrust 3.469% 16/6/2027
121 0.00
CA$300,000 CT Real Estate InvestmentTrust 3.865% 7/12/2027
186 0.01
CA$300,000 CU 2.963% 7/9/2049 182 0.01
CA$300,000 CU 3.763% 19/11/2046 207 0.01
CA$250,000 CU 3.805% 10/9/2042 170 0.01
CA$250,000 CU 3.95% 23/11/2048 180 0.01
CA$500,000 CU 4.085% 2/9/2044 359 0.01
CA$400,000 CU 4.558% 7/11/2053 324 0.01
CA$1,000,000 Daimler Canada Finance3.05% 16/5/2022
592 0.02
CA$500,000 Enbridge 2.44% 2/6/2025 299 0.01
CA$600,000 Enbridge 2.99% 3/10/2029 368 0.01
CA$500,000 Enbridge 3.19% 5/12/2022 300 0.01
CA$650,000 Enbridge 3.2% 8/6/2027 403 0.01
CA$300,000 Enbridge 3.95% 19/11/2024 189 0.01
CA$300,000 Enbridge 4.24% 27/8/2042 187 0.01
CA$300,000 Enbridge 4.87% 21/11/2044 205 0.01
CA$300,000 Enbridge Gas 2.5%5/8/2026
185 0.01
Holding orNominalValue Investment
MarketValue
£000’s
% ofTotal
NetAssets
CA$400,000 Enbridge Gas 2.81%1/6/2026
250 0.01
CA$200,000 Enbridge Gas 2.9%1/4/2030
127 0.00
CA$300,000 Enbridge Gas 3.01%9/8/2049
183 0.01
CA$200,000 Enbridge Gas 3.65%1/4/2050
137 0.00
CA$500,000 Enbridge Gas 4.2%2/6/2044
362 0.01
CA$500,000 Enbridge Gas 5.21%25/2/2036
385 0.01
CA$250,000 Enbridge Gas 6.05%2/9/2038
214 0.01
CA$500,000 Enbridge Pipelines 3.52%22/2/2029
323 0.01
CA$150,000 Enbridge Pipelines 4.13%9/8/2046
98 0.00
CA$200,000 Enbridge Pipelines 4.33%22/2/2049
136 0.00
CA$250,000 Enbridge Pipelines 4.55%29/9/2045
175 0.01
CA$300,000 Energir 2.1% 16/4/2027 181 0.01
CA$200,000 EPCOR Utilities 2.899%19/5/2050
120 0.00
CA$250,000 EPCOR Utilities 3.949%26/11/2048
180 0.01
CA$400,000 EPCOR Utilities 6.65%15/4/2038
361 0.01
CA$300,000 Fairfax Financial 4.23%14/6/2029
183 0.01
CA$500,000 Fairfax Financial 4.95%3/3/2025
316 0.01
CA$500,000 Federation des CaissesDesjardins du Quebec2.091% 17/1/2022
293 0.01
CA$500,000 Federation des CaissesDesjardins du Quebec3.056% 11/9/2023
305 0.01
CA$300,000 First Capital Real EstateInvestment Trust 3.447%1/3/2028
173 0.01
CA$250,000 First Capital Real EstateInvestment Trust 3.456%22/1/2027
146 0.00
CA$200,000 First Capital Real EstateInvestment Trust 4.323%31/7/2025
122 0.00
CA$600,000 Fortis Inc/Canada 2.85%12/12/2023
362 0.01
iShares Overseas Corporate Bond Index Fund (UK)
Portfolio Statement (unaudited) continued
BlackRock Collective Investment Funds189

Holding orNominalValue Investment
MarketValue
£000’s
% ofTotal
NetAssets
CA$300,000 FortisAlberta 6.22%31/10/2034
249 0.01
CA$400,000 FortisBC Energy 2.54%13/7/2050
226 0.01
CA$500,000 FortisBC Energy 3.67%9/4/2046
345 0.01
CA$100,000 FortisBC Energy 3.85%7/12/2048
72 0.00
CA$800,000 GE Capital Canada Funding4.6% 26/1/2022
477 0.02
CA$300,000 General Motors Financial ofCanada 3.25% 7/11/2023
177 0.01
CA$500,000 General Motors Financial ofCanada 5.95% 14/5/2024
319 0.01
CA$500,000 Goldman Sachs 2.433%26/4/2023
293 0.01
CA$300,000 Greater Toronto AirportsAuthority 2.73% 3/4/2029
184 0.01
CA$400,000 Greater Toronto AirportsAuthority 2.75% 17/10/2039
230 0.01
CA$300,000 Greater Toronto AirportsAuthority 3.26% 1/6/2037
183 0.01
CA$214,287 Greater Toronto AirportsAuthority 6.45% 30/7/2029
154 0.01
CA$200,000 Greater Toronto AirportsAuthority 6.98% 15/10/2032
167 0.01
CA$250,000 Greater Toronto AirportsAuthority 7.05% 12/6/2030
201 0.01
CA$500,000 Great-West Lifeco 2.379%14/5/2030
304 0.01
CA$450,000 Great-West Lifeco 2.981%8/7/2050
271 0.01
CA$200,000 Great-West Lifeco 3.337%28/2/2028
130 0.00
CA$200,000 Great-West Lifeco 6.67%21/3/2033
164 0.01
CA$500,000 HCN Canadian Holdings-1 LP 2.95% 15/1/2027
291 0.01
CA$600,000 Heathrow Funding 3.25%21/5/2027
358 0.01
CA$200,000 Heathrow Funding 3.4%8/3/2030
118 0.00
CA$300,000 Honda Canada Finance2.5% 4/6/2024
180 0.01
CA$300,000 Honda Canada Finance2.537% 1/3/2023
179 0.01
CA$200,000 Honda Canada Finance3.176% 28/8/2023
122 0.00
CA$500,000 HSBC 3.196% 5/12/2023 304 0.01
CA$1,000,000 HSBC Bank Canada 2.17%29/6/2022
589 0.02
Holding orNominalValue Investment
MarketValue
£000’s
% ofTotal
NetAssets
CA$1,000,000 HSBC Bank Canada2.542% 31/1/2023
596 0.02
CA$800,000 Husky Energy 3.5%7/2/2028
459 0.02
CA$300,000 Husky Energy 3.6%10/3/2027
176 0.01
CA$200,000 Hydro One 1.76% 28/2/2025 118 0.00
CA$400,000 Hydro One 2.77% 24/2/2026 248 0.01
CA$500,000 Hydro One 2.97% 26/6/2025 313 0.01
CA$300,000 Hydro One 3.02% 5/4/2029 193 0.01
CA$500,000 Hydro One 3.63% 25/6/2049 345 0.01
CA$300,000 Hydro One 3.64% 5/4/2050 208 0.01
CA$300,000 Hydro One 4.89% 13/3/2037 227 0.01
CA$600,000 Hydro One 5% 19/10/2046 499 0.02
CA$300,000 IGM Financial 3.44%26/1/2027
188 0.01
CA$200,000 IGM Financial 4.206%21/3/2050
134 0.00
CA$500,000 IGM Financial 4.56%25/1/2047
351 0.01
CA$1,000,000 Intact Financial 2.85%7/6/2027
619 0.02
CA$500,000 Inter Pipeline 3.173%24/3/2025
299 0.01
CA$400,000 Inter Pipeline 3.484%16/12/2026
243 0.01
CA$500,000 John Deere CanadaFunding 2.7% 17/1/2023
299 0.01
CA$400,000 John Deere Financial 2.46%4/4/2024
241 0.01
CA$100,000 John Deere Financial 2.58%16/10/2026
62 0.00
CA$400,000 Laurentian Bank of Canada2.55% 20/6/2022
233 0.01
CA$500,000 Loblaw Cos 2.284%7/5/2030
294 0.01
CA$500,000 Loblaw Cos 4.86%12/9/2023
317 0.01
CA$150,000 Loblaw Cos 5.9% 18/1/2036 115 0.00
CA$700,000 Manulife Bank of Canada2.844% 12/1/2023
420 0.01
CA$300,000 Manulife Finance DelawareLP 5.059% 15/12/2041
215 0.01
CA$500,000 Manulife Financial 2.237%12/5/2030
297 0.01
CA$1,000,000 Manulife Financial 2.818%13/5/2035
611 0.02
CA$200,000 Manulife Financial 3.317%9/5/2028
121 0.00
iShares Overseas Corporate Bond Index Fund (UK)
Portfolio Statement (unaudited) continued
BlackRock Collective Investment Funds 190

Holding orNominalValue Investment
MarketValue
£000’s
% ofTotal
NetAssets
CA$500,000 McDonald’s 3.125%4/3/2025
309 0.01
CA$400,000 Metro Inc/CN 3.39%6/12/2027
256 0.01
CA$150,000 Metro Inc/CN 3.413%28/2/2050
89 0.00
CA$250,000 Metro Inc/CN 5.97%15/10/2035
192 0.01
CA$300,000 Metropolitan Life GlobalFunding I 3.394% 9/4/2030
194 0.01
CA$500,000 Molson Coors InternationalLP 2.84% 15/7/2023
295 0.01
CA$500,000 Mondelez International3.25% 7/3/2025
309 0.01
CA$500,000 Morgan Stanley 3%7/2/2024
304 0.01
CA$1,000,000 National Australia Bank3.515% 12/6/2030
595 0.02
CA$500,000 National Bank of Canada1.573% 18/8/2026
289 0.01
CA$500,000 National Bank of Canada1.957% 30/6/2022
294 0.01
CA$400,000 National Bank of Canada2.105% 18/3/2022
235 0.01
CA$300,000 National Bank of Canada2.58% 3/2/2025
182 0.01
CA$1,000,000 National Bank of Canada2.983% 4/3/2024
611 0.02
CA$250,000 National Bank of Canada3.183% 1/2/2028
149 0.00
CA$150,000 NAV Canada 2.063%29/5/2030
89 0.00
CA$200,000 NAV Canada 2.924%29/9/2051
124 0.00
CA$500,000 NAV Canada 3.209%29/9/2050
324 0.01
CA$500,000 Nissan Canada 2.606%5/3/2021
288 0.01
CA$400,000 North West RedwaterPartnership / NWRFinancing 2.8% 1/6/2027
245 0.01
CA$200,000 North West RedwaterPartnership / NWRFinancing 3.2% 22/7/2024
123 0.00
CA$300,000 North West RedwaterPartnership / NWRFinancing 3.65% 1/6/2035
191 0.01
CA$250,000 North West RedwaterPartnership / NWRFinancing 4.05% 22/7/2044
165 0.01
Holding orNominalValue Investment
MarketValue
£000’s
% ofTotal
NetAssets
CA$300,000 North West RedwaterPartnership / NWRFinancing 4.35% 10/1/2039
201 0.01
CA$500,000 North West RedwaterPartnership / NWRFinancing 4.75% 1/6/2037
348 0.01
CA$499,684 Nouvelle Autoroute30 Financement 4.114%31/3/2042
339 0.01
CA$200,000 Nova Scotia Power 3.307%25/4/2050
126 0.00
CA$300,000 Nova Scotia Power 3.571%5/4/2049
197 0.01
CA$250,000 Nova Scotia Power 4.5%20/7/2043
183 0.01
CA$500,000 OMERS Realty 3.628%5/6/2030
337 0.01
CA$300,000 Pembina Pipeline 3.62%3/4/2029
189 0.01
CA$300,000 Pembina Pipeline 3.71%11/8/2026
189 0.01
CA$300,000 Pembina Pipeline 4.02%27/3/2028
193 0.01
CA$500,000 Pembina Pipeline 4.24%15/6/2027
325 0.01
CA$400,000 Pembina Pipeline 4.54%3/4/2049
253 0.01
CA$300,000 Pembina Pipeline 4.67%28/5/2050
194 0.01
CA$300,000 Pembina Pipeline 4.74%21/1/2047
192 0.01
CA$300,000 Pembina Pipeline 4.75%30/4/2043
192 0.01
CA$300,000 PepsiCo 2.15% 6/5/2024 179 0.01
CA$182,160 Plenary Properties LTAP LP6.288% 31/1/2044
150 0.00
CA$300,000 Power of Canada 4.81%31/1/2047
222 0.01
CA$500,000 Reliance LP 2.68%1/12/2027
292 0.01
CA$500,000 Reliance LP 3.75%15/3/2026
312 0.01
CA$500,000 RioCan Real EstateInvestment Trust 2.194%9/4/2021
288 0.01
CA$200,000 RioCan Real EstateInvestment Trust 2.361%10/3/2027
112 0.00
CA$300,000 RioCan Real EstateInvestment Trust 2.576%12/2/2025
174 0.01
iShares Overseas Corporate Bond Index Fund (UK)
Portfolio Statement (unaudited) continued
BlackRock Collective Investment Funds191

Holding orNominalValue Investment
MarketValue
£000’s
% ofTotal
NetAssets
CA$400,000 Rogers Communications3.25% 1/5/2029
255 0.01
CA$500,000 Rogers Communications3.65% 31/3/2027
323 0.01
CA$800,000 Rogers Communications 4%13/3/2024
503 0.02
CA$300,000 Rogers Communications6.11% 25/8/2040
243 0.01
CA$750,000 Royal Bank of Canada1.583% 13/9/2021
435 0.01
CA$500,000 Royal Bank of Canada1.936% 1/5/2025
296 0.01
CA$500,000 Royal Bank of Canada1.968% 2/3/2022
293 0.01
CA$1,000,000 Royal Bank of Canada 2%21/3/2022
586 0.02
CA$900,000 Royal Bank of Canada2.328% 28/1/2027
546 0.02
CA$500,000 Royal Bank of Canada2.333% 5/12/2023
301 0.01
CA$700,000 Royal Bank of Canada2.352% 2/7/2024
424 0.01
CA$400,000 Royal Bank of Canada2.36% 5/12/2022
238 0.01
CA$500,000 Royal Bank of Canada2.609% 1/11/2024
303 0.01
CA$500,000 Royal Bank of Canada2.74% 25/7/2029
300 0.01
CA$1,500,000 Royal Bank of Canada2.88% 23/12/2029
905 0.03
CA$1,000,000 Royal Bank of Canada2.949% 1/5/2023
608 0.02
CA$1,000,000 Royal Bank of Canada3.296% 26/9/2023
617 0.02
CA$500,000 Royal Bank of Canada3.45% 29/9/2026
294 0.01
CA$300,000 Saputo 2.876% 19/11/2024 183 0.01
CA$300,000 Scotiabank Capital Trust5.65% 31/12/2056
202 0.01
CA$200,000 Shaw Communications2.9% 9/12/2030
120 0.00
CA$200,000 Shaw Communications3.3% 10/12/2029
125 0.00
CA$500,000 Shaw Communications3.8% 1/3/2027
321 0.01
CA$200,000 Shaw Communications4.25% 9/12/2049
127 0.00
CA$300,000 Shaw Communications6.75% 9/11/2039
245 0.01
CA$200,000 Sun Life Financial 2.38%13/8/2029
120 0.00
Holding orNominalValue Investment
MarketValue
£000’s
% ofTotal
NetAssets
CA$1,000,000 Sun Life Financial 2.58%10/5/2032
605 0.02
CA$200,000 Sun Life Financial 5.4%29/5/2042
149 0.00
CA$550,000 Suncor Energy 3.1%26/11/2021
323 0.01
CA$500,000 Suncor Energy 3.1%24/5/2029
303 0.01
CA$500,000 Suncor Energy 5% 9/4/2030 344 0.01
CA$200,000 Sysco Canada 3.65%25/4/2025
121 0.00
CA$500,000 TELUS 2.35% 27/1/2028 299 0.01
CA$300,000 TELUS 2.75% 8/7/2026 184 0.01
CA$400,000 TELUS 3.15% 19/2/2030 252 0.01
CA$400,000 TELUS 3.3% 2/5/2029 255 0.01
CA$500,000 TELUS 3.35% 15/3/2023 302 0.01
CA$600,000 TELUS 3.75% 17/1/2025 379 0.01
CA$500,000 TELUS 3.75% 10/3/2026 321 0.01
CA$400,000 TELUS 3.95% 16/2/2050 256 0.01
CA$400,000 TELUS 4.4% 29/1/2046 269 0.01
CA$500,000 TELUS 5.15% 26/11/2043 370 0.01
CA$200,000 Teranet LP 3.544%11/6/2025
120 0.00
CA$700,000 Teranet LP 3.646%18/11/2022
416 0.01
CA$107,000 Teranet LP 4.807%16/12/2020
62 0.00
CA$500,000 Thomson Reuters 2.239%14/5/2025
299 0.01
CA$400,000 Toronto-Dominion Bank/The1.909% 18/7/2023
237 0.01
CA$500,000 Toronto-Dominion Bank/The1.943% 13/3/2025
297 0.01
CA$1,200,000 Toronto-Dominion Bank/The1.994% 23/3/2022
703 0.02
CA$500,000 Toronto-Dominion Bank/The2.496% 2/12/2024
303 0.01
CA$400,000 Toronto-Dominion Bank/The2.621% 22/12/2021
236 0.01
CA$500,000 Toronto-Dominion Bank/The2.85% 8/3/2024
305 0.01
CA$1,100,000 Toronto-Dominion Bank/The3.06% 26/1/2032
679 0.02
CA$1,300,000 Toronto-Dominion Bank/The3.105% 22/4/2030
796 0.03
CA$700,000 Toronto-Dominion Bank/The3.226% 24/7/2024
438 0.01
CA$1,200,000 Toronto-Dominion Bank/The3.589% 14/9/2028
734 0.03
iShares Overseas Corporate Bond Index Fund (UK)
Portfolio Statement (unaudited) continued
BlackRock Collective Investment Funds 192

Holding orNominalValue Investment
MarketValue
£000’s
% ofTotal
NetAssets
CA$250,000 Toronto-Dominion Bank/The4.859% 4/3/2031
167 0.01
CA$500,000 Toyota Credit Canada2.02% 28/2/2022
292 0.01
CA$500,000 Toyota Credit Canada2.31% 23/10/2024
301 0.01
CA$300,000 Toyota Credit Canada2.64% 27/3/2024
182 0.01
CA$500,000 Toyota Credit Canada 2.7%25/1/2023
299 0.01
CA$500,000 TransCanada PipeLines 3%18/9/2029
303 0.01
CA$700,000 TransCanada PipeLines3.39% 15/3/2028
439 0.01
CA$100,000 TransCanada PipeLines3.65% 15/11/2021
59 0.00
CA$500,000 TransCanada PipeLines3.69% 19/7/2023
305 0.01
CA$1,000,000 TransCanada PipeLines3.8% 5/4/2027
640 0.02
CA$350,000 TransCanada PipeLines4.18% 3/7/2048
220 0.01
CA$400,000 TransCanada PipeLines4.34% 15/10/2049
259 0.01
CA$300,000 TransCanada PipeLines4.55% 15/11/2041
195 0.01
CA$350,000 TransCanada PipeLines8.05% 17/2/2039
319 0.01
CA$500,000 TWDC Enterprises18 2.758% 7/10/2024
304 0.01
CA$500,000 United Parcel Service2.125% 21/5/2024
298 0.01
CA$300,000 Vancouver Airport Authority2.874% 18/10/2049
173 0.01
CA$200,000 Ventas Canada Finance2.8% 12/4/2024
116 0.00
CA$200,000 Ventas Canada Finance4.125% 30/9/2024
121 0.00
CA$800,000 Verizon Communications2.5% 16/5/2030
478 0.02
CA$100,000 Verizon Communications3.625% 16/5/2050
60 0.00
CA$500,000 VW Credit Canada 2.85%26/9/2024
302 0.01
CA$500,000 VW Credit Canada 3.7%14/11/2022
302 0.01
CA$400,000 Walt Disney 3.057%30/3/2027
247 0.01
CA$500,000 Waste Management ofCanada 2.6% 23/9/2026
305 0.01
Holding orNominalValue Investment
MarketValue
£000’s
% ofTotal
NetAssets
CA$800,000 Wells Fargo & 2.094%25/4/2022
467 0.02
CA$400,000 Wells Fargo & 2.493%18/2/2027
236 0.01
CA$500,000 Wells Fargo & 2.568%1/5/2026
297 0.01
CA$500,000 Wells Fargo & 2.975%19/5/2026
304 0.01
CA$500,000 Wells Fargo & 3.184%8/2/2024
304 0.01
CA$400,000 Wells Fargo & 3.874%21/5/2025
249 0.01
CA$400,000 Westcoast Energy 4.791%28/10/2041
281 0.01
98,116 3.39
Canadian Dollar Denominated GovernmentBonds − 0.00%; 29.2.2020 0.00%
CA$130,123 Royal Office Finance LP5.209% 12/11/2037
96 0.00
EURO − 24.54%; 29.2.2020 24.23%
Euro Denominated Bonds − 0.00%; 29.2.2020 0.02%
Euro Denominated CorporateBonds − 24.54%; 29.2.2020 24.21%
€400,000 2i Rete Gas 1.608%31/10/2027
382 0.01
€100,000 2i Rete Gas 2.195%11/9/2025
97 0.00
€150,000 2i Rete Gas 3% 16/7/2024 149 0.00
€175,000 3M 1.5% 9/11/2026 171 0.01
€350,000 3M 1.5% 2/6/2031 354 0.01
€100,000 3M 1.875% 15/11/2021 92 0.00
€500,000 ABB Finance 0.75%16/5/2024
460 0.02
€175,000 Abbott Ireland FinancingDAC 0.1% 19/11/2024
156 0.00
€125,000 Abbott Ireland FinancingDAC 0.375% 19/11/2027
113 0.00
€250,000 Abbott Ireland FinancingDAC 0.875% 27/9/2023
230 0.01
€700,000 Abbott Ireland FinancingDAC 1.5% 27/9/2026
673 0.02
€500,000 AbbVie 0.75% 18/11/2027 454 0.02
€175,000 AbbVie 1.25% 1/6/2024 162 0.01
€300,000 AbbVie 1.375% 17/5/2024 279 0.01
€200,000 AbbVie 1.5% 15/11/2023 186 0.01
€175,000 AbbVie 2.125% 1/6/2029 174 0.01
€800,000 AbbVie 2.625% 15/11/2028 827 0.03
iShares Overseas Corporate Bond Index Fund (UK)
Portfolio Statement (unaudited) continued
BlackRock Collective Investment Funds193

Holding orNominalValue Investment
MarketValue
£000’s
% ofTotal
NetAssets
€600,000 Abertis Infraestructuras0.625% 15/7/2025
523 0.02
€500,000 Abertis Infraestructuras1.125% 26/3/2028
425 0.01
€400,000 Abertis Infraestructuras1.25% 7/2/2028
345 0.01
€400,000 Abertis Infraestructuras1.375% 20/5/2026
357 0.01
€200,000 Abertis Infraestructuras1.5% 27/6/2024
182 0.01
€100,000 Abertis Infraestructuras1.625% 15/7/2029
86 0.00
€600,000 Abertis Infraestructuras2.375% 27/9/2027
557 0.02
€100,000 Abertis Infraestructuras2.5% 27/2/2025
95 0.00
€300,000 Abertis Infraestructuras 3%27/3/2031
285 0.01
€500,000 ABN AMRO Bank 0.5%17/7/2023
454 0.02
€125,000 ABN AMRO Bank 0.5%15/4/2026
114 0.00
€500,000 ABN AMRO Bank 0.6%15/1/2027
449 0.02
€575,000 ABN AMRO Bank 0.625%31/5/2022
521 0.02
€400,000 ABN AMRO Bank 0.875%15/1/2024
368 0.01
€500,000 ABN AMRO Bank 0.875%22/4/2025
465 0.02
€350,000 ABN AMRO Bank 1%16/4/2025
328 0.01
€200,000 ABN AMRO Bank 1.25%28/5/2025
186 0.01
€500,000 ABN AMRO Bank 2.5%29/11/2023
484 0.02
€300,000 ABN AMRO Bank 2.875%18/1/2028
281 0.01
€150,000 ABN AMRO Bank 4.125%28/3/2022
143 0.00
€124,000 ABN AMRO Bank 7.125%6/7/2022
125 0.00
€225,000 Achmea 1.5% 26/5/2027 211 0.01
€100,000 Achmea 2.5% 19/11/2020 90 0.00
€250,000 Achmea 4.25% Perpetual4/2/2169
240 0.01
€300,000 Achmea Bank 1.125%25/4/2022
272 0.01
€300,000 ACS ServiciosComunicaciones y EnergiaSL 1.875% 20/4/2026
281 0.01
Holding orNominalValue Investment
MarketValue
£000’s
% ofTotal
NetAssets
€375,000 Adecco InternationalFinancial Services 1.25%20/11/2029
343 0.01
€300,000 Aegon 1% 8/12/2023 276 0.01
€250,000 Aegon 4% 25/4/2044 241 0.01
€200,000 Aeroporti di Roma 1.625%8/6/2027
174 0.01
€100,000 Aeroporti di Roma 3.25%20/2/2021
90 0.00
€100,000 Ageas 3.25% 2/7/2049 97 0.00
€500,000 AIB 1.25% 28/5/2024 456 0.02
€200,000 AIB 1.5% 29/3/2023 183 0.01
€100,000 Air Liquide Finance 0.5%13/6/2022
90 0.00
€400,000 Air Liquide Finance 0.625%20/6/2030
370 0.01
€400,000 Air Liquide Finance 0.75%13/6/2024
368 0.01
€500,000 Air Liquide Finance 1%2/4/2025
466 0.02
€200,000 Air Liquide Finance 1.25%3/6/2025
189 0.01
€200,000 Air Liquide Finance 1.25%13/6/2028
195 0.01
€500,000 Air Liquide Finance 1.375%2/4/2030
492 0.02
€100,000 Air Products and Chemicals0.5% 5/5/2028
90 0.00
€100,000 Air Products and Chemicals0.8% 5/5/2032
90 0.00
€175,000 Air Products and Chemicals1% 12/2/2025
163 0.01
€500,000 Airbus 1.375% 9/6/2026 463 0.02
€500,000 Airbus 1.625% 7/4/2025 470 0.02
€350,000 Airbus 1.625% 9/6/2030 320 0.01
€300,000 Airbus 2% 7/4/2028 288 0.01
€400,000 Airbus 2.375% 7/4/2032 387 0.01
€300,000 Airbus 2.375% 9/6/2040 273 0.01
€200,000 Airbus Finance 1.375%13/5/2031
179 0.01
€300,000 Airbus Finance 2.125%29/10/2029Ø
295 0.01
€225,000 Akelius Residential Property1.125% 14/3/2024
203 0.01
€200,000 Akelius Residential Property1.5% 23/1/2022
182 0.01
€100,000 Akelius Residential Property1.75% 7/2/2025
92 0.00
€500,000 Akzo Nobel 1.625%14/4/2030
481 0.02
iShares Overseas Corporate Bond Index Fund (UK)
Portfolio Statement (unaudited) continued
BlackRock Collective Investment Funds 194

Holding orNominalValue Investment
MarketValue
£000’s
% ofTotal
NetAssets
€500,000 Akzo Nobel 2.625%27/7/2022
469 0.02
€200,000 Albemarle 1.875%8/12/2021
181 0.01
€150,000 Albemarle New 1.125%25/11/2025
134 0.00
€200,000 Albemarle New 1.625%25/11/2028
179 0.01
€500,000 ALD 0.875% 18/7/2022Ø 451 0.02
€100,000 Alfa Laval TreasuryInternational 0.25%25/6/2024
88 0.00
€100,000 Alfa Laval TreasuryInternational 1.375%12/9/2022
91 0.00
€175,000 Alimentation Couche-Tard1.875% 6/5/2026
167 0.01
€600,000 Allianz 1.301% 25/9/2049 533 0.02
€400,000 Allianz 2.121% 8/7/2050 377 0.01
€700,000 Allianz 2.241% 7/7/2045 661 0.02
€300,000 Allianz 3.099% 6/7/2047Ø 303 0.01
€300,000 Allianz 3.375% Perpetual18/9/2168
293 0.01
€400,000 Allianz 4.75% Perpetual24/10/2168
400 0.01
€800,000 Allianz 5.625% 17/10/2042 789 0.03
€500,000 Allianz Finance II 0%14/1/2025
449 0.02
€300,000 Allianz Finance II 0.5%14/1/2031
273 0.01
€300,000 Allianz Finance II 0.875%15/1/2026
281 0.01
€300,000 Allianz Finance II 0.875%6/12/2027
285 0.01
€100,000 Allianz Finance II 1.375%21/4/2031
99 0.00
€200,000 Allianz Finance II 1.5%15/1/2030
201 0.01
€100,000 Allianz Finance II 3%13/3/2028
110 0.00
€300,000 Allianz Finance II 3.5%14/2/2022
283 0.01
€200,000 Alpha Trains Finance2.064% 30/6/2030
187 0.01
€500,000 alstria office REIT-AG 0.5%26/9/2025
436 0.01
€100,000 alstria office REIT-AG2.125% 12/4/2023
92 0.00
€200,000 Altarea 1.875% 17/1/2028 166 0.01
€100,000 Altarea 2.25% 5/7/2024 91 0.00
Holding orNominalValue Investment
MarketValue
£000’s
% ofTotal
NetAssets
€300,000 Altareit 2.875% 2/7/2025 271 0.01
€125,000 Altria 1% 15/2/2023 114 0.00
€350,000 Altria 1.7% 15/6/2025 328 0.01
€825,000 Altria 2.2% 15/6/2027 792 0.03
€125,000 Altria 3.125% 15/6/2031 126 0.00
€100,000 Amadeus Capital MarketsSAU 1.625% 17/11/2021
90 0.00
€200,000 Amadeus IT 0.875%18/9/2023
178 0.01
€200,000 Amadeus IT 1.5% 18/9/2026 181 0.01
€200,000 Amadeus IT 2.5% 20/5/2024 186 0.01
€200,000 Amadeus IT 2.875%20/5/2027
190 0.01
€738,000 America Movil 1.5%10/3/2024
687 0.02
€100,000 America Movil 2.125%10/3/2028
100 0.00
€700,000 America Movil 3%12/7/2021
640 0.02
€400,000 America Movil 4.75%28/6/2022
386 0.01
€100,000 America Movil 6.375%6/9/2073
102 0.00
€300,000 American Honda Finance0.35% 26/8/2022
270 0.01
€400,000 American Honda Finance1.375% 10/11/2022
368 0.01
€500,000 American Honda Finance1.6% 20/4/2022
458 0.02
€625,000 American Honda Finance1.95% 18/10/2024
597 0.02
€525,000 American International 1.5%8/6/2023
484 0.02
€300,000 American International1.875% 21/6/2027
286 0.01
€225,000 American Tower 1.95%22/5/2026
217 0.01
€225,000 Amgen 1.25% 25/2/2022 204 0.01
€300,000 Amgen 2% 25/2/2026 293 0.01
€125,000 Amphenol Technologies 2%8/10/2028
123 0.00
€350,000 Anglo American Capital1.625% 18/9/2025
328 0.01
€300,000 Anglo American Capital1.625% 11/3/2026
278 0.01
€700,000 Anheuser-Busch InBev1.125% 1/7/2027
653 0.02
€275,000 Anheuser-Busch InBev1.15% 22/1/2027
257 0.01
iShares Overseas Corporate Bond Index Fund (UK)
Portfolio Statement (unaudited) continued
BlackRock Collective Investment Funds195

Holding orNominalValue Investment
MarketValue
£000’s
% ofTotal
NetAssets
€1,000,000 Anheuser-Busch InBev1.5% 17/3/2025
951 0.03
€475,000 Anheuser-Busch InBev1.65% 28/3/2031
456 0.02
€575,000 Anheuser-Busch InBev 2%17/3/2028
567 0.02
€300,000 Anheuser-Busch InBev 2%23/1/2035
288 0.01
€500,000 Anheuser-Busch InBev2.125% 2/12/2027
496 0.02
€500,000 Anheuser-Busch InBev2.7% 31/3/2026
510 0.02
€875,000 Anheuser-Busch InBev2.75% 17/3/2036
902 0.03
€750,000 Anheuser-Busch InBev2.875% 2/4/2032
795 0.03
€700,000 Anheuser-Busch InBev3.7% 2/4/2040
785 0.03
€200,000 Annington Funding 1.65%12/7/2024
186 0.01
€125,000 Aon 2.875% 14/5/2026 126 0.00
€400,000 AP Moller - Maersk 1.75%16/3/2026
368 0.01
€300,000 Apple 0.5% 15/11/2031 277 0.01
€1,000,000 Apple 0.875% 24/5/2025 934 0.03
€250,000 Apple 1% 10/11/2022 229 0.01
€250,000 Apple 1.375% 17/1/2024 235 0.01
€400,000 Apple 1.375% 24/5/2029 395 0.01
€200,000 Apple 1.625% 10/11/2026 197 0.01
€300,000 Apple 2% 17/9/2027 306 0.01
€300,000 APRR 0% 20/1/2023 268 0.01
€500,000 APRR 1.125% 9/1/2026Ø 470 0.02
€200,000 APRR 1.25% 6/1/2027 191 0.01
€300,000 APRR 1.5% 25/1/2030 296 0.01
€200,000 APRR 1.625% 13/1/2032 200 0.01
€300,000 APRR 1.875% 6/1/2031 305 0.01
€200,000 APT Pipelines 1.375%22/3/2022
181 0.01
€225,000 APT Pipelines 2% 22/3/2027 215 0.01
€175,000 APT Pipelines 2% 15/7/2030 167 0.01
€200,000 Aptiv 1.5% 10/3/2025 184 0.01
€125,000 Aptiv 1.6% 15/9/2028 114 0.00
€200,000 Aquarius & Investments forZurich Insurance 4.25%2/10/2043
197 0.01
€375,000 Archer-Daniels-Midland 1%12/9/2025
348 0.01
€200,000 Argenta Spaarbank 1%29/1/2027
179 0.01
Holding orNominalValue Investment
MarketValue
£000’s
% ofTotal
NetAssets
€300,000 Argentum Netherlands forGivaudan 1.125% 17/9/2025
281 0.01
€500,000 Argentum Netherlands forSwiss Life 4.375% Perpetual16/6/2169
500 0.02
€100,000 Argentum Netherlands forZurich Insurance 2.75%19/2/2049
100 0.00
€475,000 Argentum Netherlands forZurich Insurance 3.5%1/10/2046
484 0.02
€100,000 Arion Banki HF 1.625%1/12/2021
91 0.00
€200,000 Arkema 0.75% 3/12/2029 177 0.01
€600,000 Arkema 1.5% 20/1/2025 565 0.02
€100,000 Arkema 1.5% Perpetual21/1/2169
85 0.00
€500,000 Aroundtown 0.625%9/7/2025
441 0.01
€200,000 Aroundtown 1.5% 28/5/2026 183 0.01
€400,000 Aroundtown 2% 2/11/2026 378 0.01
€200,000 Aroundtown 2.875%Perpetual 12/1/2169
173 0.01
€150,000 Asahi 0.321% 19/9/2021 134 0.00
€300,000 Asahi 1.151% 19/9/2025Ø 276 0.01
€500,000 ASB Finance 0.5%10/6/2022
451 0.02
€300,000 ASB Finance 0.75%13/3/2024
275 0.01
€825,000 ASML 0.25% 25/2/2030 725 0.02
€500,000 ASML 0.625% 7/7/2022 452 0.02
€125,000 ASML 0.625% 7/5/2029 114 0.00
€300,000 ASML 1.375% 7/7/2026 289 0.01
€225,000 ASML 1.625% 28/5/2027 221 0.01
€150,000 ASML 3.375% 19/9/2023 148 0.00
€200,000 ASR Nederland 3.375%2/5/2049
192 0.01
€200,000 ASR Nederland 5%Perpetual 30/9/2168
201 0.01
€300,000 Assicurazioni Generali2.124% 1/10/2030
271 0.01
€200,000 Assicurazioni Generali2.429% 14/7/2031
181 0.01
€200,000 Assicurazioni Generali3.875% 29/1/2029
203 0.01
€100,000 Assicurazioni Generali4.125% 4/5/2026
102 0.00
€200,000 Assicurazioni Generali 5%8/6/2048
208 0.01
iShares Overseas Corporate Bond Index Fund (UK)
Portfolio Statement (unaudited) continued
BlackRock Collective Investment Funds 196

Holding orNominalValue Investment
MarketValue
£000’s
% ofTotal
NetAssets
€450,000 Assicurazioni Generali5.125% 16/9/2024
484 0.02
€375,000 Assicurazioni Generali 5.5%27/10/2047
398 0.01
€200,000 Assicurazioni Generali7.75% 12/12/2042
206 0.01
€100,000 Assicurazioni Generali10.125% 10/7/2042
105 0.00
€200,000 ASTM 1.625% 8/2/2028 175 0.01
€100,000 ASTM 3.375% 13/2/2024 95 0.00
€325,000 AstraZeneca 0.75%12/5/2024
298 0.01
€125,000 AstraZeneca 0.875%24/11/2021
113 0.00
€250,000 AstraZeneca 1.25%12/5/2028
241 0.01
€500,000 AT&T 0.25% 4/3/2026 442 0.01
€300,000 AT&T 0.8% 4/3/2030 264 0.01
€225,000 AT&T 1.05% 5/9/2023 206 0.01
€475,000 AT&T 1.3% 5/9/2023 438 0.01
€450,000 AT&T 1.45% 1/6/2022 411 0.01
€600,000 AT&T 1.6% 19/5/2028 567 0.02
€300,000 AT&T 1.8% 5/9/2026 287 0.01
€325,000 AT&T 1.8% 14/9/2039 285 0.01
€600,000 AT&T 1.95% 15/9/2023 563 0.02
€300,000 AT&T 2.05% 19/5/2032 290 0.01
€525,000 AT&T 2.35% 5/9/2029 526 0.02
€450,000 AT&T 2.4% 15/3/2024 430 0.01
€200,000 AT&T 2.45% 15/3/2035 197 0.01
€400,000 AT&T 2.6% 17/12/2029 410 0.01
€525,000 AT&T 2.6% 19/5/2038 518 0.02
€100,000 AT&T 2.75% 19/5/2023 96 0.00
€650,000 AT&T 3.15% 4/9/2036 682 0.02
€250,000 AT&T 3.375% 15/3/2034 273 0.01
€100,000 AT&T 3.5% 17/12/2025 103 0.00
€200,000 AT&T 3.55% 17/12/2032 222 0.01
€500,000 ATF Netherlands 3.75%Perpetual 20/1/2169
452 0.02
€450,000 Athene Global Funding1.125% 2/9/2025
403 0.01
€500,000 Athene Global Funding1.875% 23/6/2023
461 0.02
€150,000 Atlas Copco 0.625%30/8/2026
138 0.00
€500,000 Atos 0.75% 7/5/2022 452 0.02
€200,000 Atos 1.75% 7/5/2025 190 0.01
€100,000 Auchan 2.25% 6/4/2023 92 0.00
€100,000 Auchan 2.375% 12/12/2022 92 0.00
€400,000 Auchan 2.375% 25/4/2025 364 0.01
Holding orNominalValue Investment
MarketValue
£000’s
% ofTotal
NetAssets
€400,000 Auchan 2.625% 30/1/2024 370 0.01
€500,000 Auchan 2.875% 29/1/2026 459 0.02
€200,000 Auchan 3.25% 23/7/2027 184 0.01
€300,000 Aurizon Network Pty 2%18/9/2024
283 0.01
€150,000 Aurizon Network Pty 3.125%1/6/2026
149 0.00
€400,000 Ausgrid Finance Pty 1.25%30/7/2025
373 0.01
€100,000 AusNet Services Pty 1.5%26/2/2027
97 0.00
€500,000 Australia & New ZealandBanking 0.625% 21/2/2023
455 0.02
€225,000 Australia & New ZealandBanking 1.125% 21/11/2029
201 0.01
€200,000 Australia Pacific AirportsMelbourne Pty 1.75%15/10/2024
182 0.01
€125,000 Autoliv 0.75% 26/6/2023 111 0.00
€600,000 Autoroutes du Sud de laFrance 1.25% 18/1/2027
573 0.02
€200,000 Autoroutes du Sud de laFrance 1.375% 27/6/2028
195 0.01
€300,000 Autoroutes du Sud de laFrance 1.375% 21/2/2031
295 0.01
€500,000 Autoroutes du Sud de laFrance 2.875% 18/1/2023
477 0.02
€300,000 Autoroutes du Sud de laFrance 2.95% 17/1/2024
293 0.01
€250,000 Autoroutes du Sud de laFrance 5.625% 4/7/2022
246 0.01
€175,000 Aviva 0.625% 27/10/2023 159 0.01
€200,000 Aviva 1.875% 13/11/2027 197 0.01
€200,000 Aviva 3.375% 4/12/2045 193 0.01
€300,000 Aviva 6.125% 5/7/2043 306 0.01
€200,000 AXA 1.125% 15/5/2028 194 0.01
€600,000 AXA 3.25% 28/5/2049 607 0.02
€550,000 AXA 3.375% 6/7/2047 558 0.02
€125,000 AXA 3.875% Perpetual8/10/2168
125 0.00
€300,000 AXA 3.941% Perpetual7/11/2168
296 0.01
€600,000 AXA 5.125% 4/7/2043 600 0.02
€300,000 Azimut 1.625% 12/12/2024 263 0.01
€200,000 Azimut 2% 28/3/2022 180 0.01
€500,000 Azzurra Aeroporti 2.125%30/5/2024
445 0.01
€225,000 Babcock International1.375% 13/9/2027
198 0.01
iShares Overseas Corporate Bond Index Fund (UK)
Portfolio Statement (unaudited) continued
BlackRock Collective Investment Funds197

Holding orNominalValue Investment
MarketValue
£000’s
% ofTotal
NetAssets
€200,000 Babcock International1.75% 6/10/2022
182 0.01
€100,000 Bacardi 2.75% 3/7/2023 93 0.00
€500,000 Banco Bilbao VizcayaArgentaria 0.5% 14/1/2027
433 0.01
€700,000 Banco Bilbao VizcayaArgentaria 0.75% 11/9/2022
633 0.02
€200,000 Banco Bilbao VizcayaArgentaria 0.75% 4/6/2025
182 0.01
€600,000 Banco Bilbao VizcayaArgentaria 1% 21/6/2026
544 0.02
€500,000 Banco Bilbao VizcayaArgentaria 1% 16/1/2030
424 0.01
€900,000 Banco Bilbao VizcayaArgentaria 1.125%28/2/2024
814 0.03
€300,000 Banco Bilbao VizcayaArgentaria 1.375%14/5/2025
277 0.01
€300,000 Banco Bilbao VizcayaArgentaria 2.575%22/2/2029
275 0.01
€200,000 Banco Bilbao VizcayaArgentaria 3.5% 10/2/2027
199 0.01
€800,000 Banco de Sabadell 0.625%7/11/2025
697 0.02
€600,000 Banco de Sabadell 1.625%7/3/2024
546 0.02
€500,000 Banco de Sabadell 1.75%29/6/2023
454 0.02
€200,000 Banco de Sabadell 1.75%10/5/2024
175 0.01
€500,000 Banco Santander 0.25%19/6/2024
448 0.01
€200,000 Banco Santander 0.3%4/10/2026
179 0.01
€400,000 Banco Santander 0.5%4/2/2027
350 0.01
€100,000 Banco Santander 1.125%23/6/2027
91 0.00
€600,000 Banco Santander 1.375%9/2/2022
546 0.02
€500,000 Banco Santander 1.375%14/12/2022
461 0.02
€1,000,000 Banco Santander 1.375%5/1/2026
920 0.03
€500,000 Banco Santander 2.5%18/3/2025
475 0.02
€900,000 Banco Santander 3.125%19/1/2027
888 0.03
Holding orNominalValue Investment
MarketValue
£000’s
% ofTotal
NetAssets
€500,000 Banco Santander 3.25%4/4/2026
492 0.02
€600,000 Bank of America 0.58%8/8/2029
531 0.02
€500,000 Bank of America 0.75%26/7/2023
455 0.02
€975,000 Bank of America 0.808%9/5/2026
888 0.03
€500,000 Bank of America 1.379%7/2/2025
465 0.02
€200,000 Bank of America 1.381%9/5/2030
189 0.01
€500,000 Bank of America 1.625%14/9/2022
462 0.02
€300,000 Bank of America 1.662%25/4/2028
286 0.01
€175,000 Bank of America 1.776%4/5/2027
168 0.01
€400,000 Bank of America 2.375%19/6/2024
387 0.01
€500,000 Bank of America 3.648%31/3/2029
543 0.02
€150,000 Bank of Ireland 1%25/11/2025
135 0.00
€600,000 Bank of Ireland 1.375%29/8/2023
547 0.02
€500,000 Bank of Nova Scotia/The0.375% 6/4/2022
450 0.02
€425,000 Bank of Nova Scotia/The0.5% 30/4/2024
385 0.01
€100,000 Bankia 0.75% 9/7/2026 88 0.00
€600,000 Bankia 0.875% 25/3/2024 540 0.02
€100,000 Bankia 1% 25/6/2024 88 0.00
€300,000 Bankia 1.125% 12/11/2026 260 0.01
€100,000 Bankinter 0.625% 6/10/2027 86 0.00
€100,000 Bankinter 0.875% 5/3/2024 91 0.00
€400,000 Bankinter 0.875% 8/7/2026 353 0.01
€500,000 Banque Federative duCredit Mutuel 0.125%30/8/2021
449 0.02
€700,000 Banque Federative duCredit Mutuel 0.125%5/2/2024
628 0.02
€500,000 Banque Federative duCredit Mutuel 0.375%13/1/2022
450 0.02
€300,000 Banque Federative duCredit Mutuel 0.5%16/11/2022
271 0.01
iShares Overseas Corporate Bond Index Fund (UK)
Portfolio Statement (unaudited) continued
BlackRock Collective Investment Funds 198

Holding orNominalValue Investment
MarketValue
£000’s
% ofTotal
NetAssets
€1,400,000 Banque Federative duCredit Mutuel 0.75%15/6/2023
1,278 0.04
€500,000 Banque Federative duCredit Mutuel 0.75%17/7/2025
461 0.02
€400,000 Banque Federative duCredit Mutuel 0.75%8/6/2026
369 0.01
€500,000 Banque Federative duCredit Mutuel 0.75%8/6/2026
461 0.02
€700,000 Banque Federative duCredit Mutuel 0.75%17/1/2030
629 0.02
€500,000 Banque Federative duCredit Mutuel 1.25%14/1/2025
470 0.02
€300,000 Banque Federative duCredit Mutuel 1.25%26/5/2027
288 0.01
€300,000 Banque Federative duCredit Mutuel 1.25%3/6/2030
280 0.01
€300,000 Banque Federative duCredit Mutuel 1.625%19/1/2026
290 0.01
€300,000 Banque Federative duCredit Mutuel 1.875%4/11/2026
282 0.01
€300,000 Banque Federative duCredit Mutuel 1.875%18/6/2029
285 0.01
€300,000 Banque Federative duCredit Mutuel 2.375%24/3/2026
288 0.01
€300,000 Banque Federative duCredit Mutuel 2.5%25/5/2028
297 0.01
€200,000 Banque Federative duCredit Mutuel 2.625%18/3/2024
195 0.01
€500,000 Banque Federative duCredit Mutuel 2.625%31/3/2027
493 0.02
€500,000 Banque Federative duCredit Mutuel 3%28/11/2023
491 0.02
€125,000 Banque Federative duCredit Mutuel 3% 21/5/2024
121 0.00
€500,000 Barclays 0.75% 9/6/2025 445 0.01
€400,000 Barclays 1.375% 24/1/2026 366 0.01
Holding orNominalValue Investment
MarketValue
£000’s
% ofTotal
NetAssets
€300,000 Barclays 1.5% 1/4/2022 273 0.01
€475,000 Barclays 1.875% 8/12/2023 444 0.01
€550,000 Barclays 2% 7/2/2028 494 0.02
€800,000 Barclays 3.375% 2/4/2025 778 0.03
€500,000 Barclays Bank 6.625%30/3/2022
489 0.02
€500,000 BASF 0.101% 5/6/2023 448 0.02
€800,000 BASF 0.875% 22/5/2025 744 0.03
€625,000 BASF 0.875% 15/11/2027 588 0.02
€200,000 BASF 1.5% 22/5/2030 199 0.01
€225,000 BASF 1.625% 15/11/2037 226 0.01
€400,000 BASF 2% 5/12/2022 374 0.01
€200,000 BASF 2.5% 22/1/2024 193 0.01
€275,000 BAT Capital 1.125%16/11/2023
251 0.01
€500,000 BAT International Finance0.875% 13/10/2023
454 0.02
€500,000 BAT International Finance1.25% 13/3/2027
453 0.02
€550,000 BAT International Finance2.25% 16/1/2030
520 0.02
€200,000 BAT International Finance2.75% 25/3/2025
198 0.01
€350,000 BAT International Finance3.625% 9/11/2021
325 0.01
€775,000 BAT Netherlands Finance2.375% 7/10/2024
743 0.03
€475,000 BAT Netherlands Finance3.125% 7/4/2028
483 0.02
€100,000 BAWAG 2.375% 26/3/2029 90 0.00
€300,000 BAWAG PSK Bank fuerArbeit und Wirtschaft undOesterreichischePostsparkasse 0.375%3/9/2027
252 0.01
€225,000 Baxter International 0.4%15/5/2024
204 0.01
€275,000 Baxter International 1.3%30/5/2025
259 0.01
€150,000 Baxter International 1.3%15/5/2029
142 0.00
€500,000 Bayer 0.375% 6/7/2024 450 0.02
€500,000 Bayer 1.125% 6/1/2030 454 0.02
€500,000 Bayer 1.375% 6/7/2032 455 0.02
€100,000 Bayer 1.875% 25/1/2021 90 0.00
€300,000 Bayer 2.375% 2/4/2075 269 0.01
€300,000 Bayer 2.375% 12/11/2079 264 0.01
€400,000 Bayer 3.125% 12/11/2079 360 0.01
€600,000 Bayer 3.75% 1/7/2074 558 0.02
iShares Overseas Corporate Bond Index Fund (UK)
Portfolio Statement (unaudited) continued
BlackRock Collective Investment Funds199

Holding orNominalValue Investment
MarketValue
£000’s
% ofTotal
NetAssets
€200,000 Bayer Capital 0.625%15/12/2022
181 0.01
€100,000 Bayer Capital 1.25%13/11/2023
93 0.00
€600,000 Bayer Capital 1.5%26/6/2026
565 0.02
€400,000 Bayer Capital 2.125%15/12/2029
396 0.01
€150,000 Becton Dickinson and 1.9%15/12/2026
141 0.00
€500,000 Becton Dickinson EuroFinance Sarl 0.632%4/6/2023
448 0.01
€200,000 Becton Dickinson EuroFinance Sarl 1.208%4/6/2026
182 0.01
€300,000 Belfius Bank 0% 28/8/2026 263 0.01
€100,000 Belfius Bank 0.375%2/9/2025
89 0.00
€100,000 Belfius Bank 0.375%13/2/2026
89 0.00
€500,000 Belfius Bank 0.75%12/9/2022
452 0.02
€200,000 Belfius Bank 1% 26/10/2024 184 0.01
€100,000 Belfius Bank 3.125%11/5/2026
100 0.00
€600,000 Berkshire Hathaway 0%12/3/2025
534 0.02
€150,000 Berkshire Hathaway 0.625%17/1/2023
136 0.00
€375,000 Berkshire Hathaway 0.75%16/3/2023
341 0.01
€400,000 Berkshire Hathaway 1.125%16/3/2027
379 0.01
€300,000 Berkshire Hathaway 1.3%15/3/2024
280 0.01
€200,000 Berkshire Hathaway 1.625%16/3/2035
202 0.01
€625,000 Berkshire Hathaway 2.15%15/3/2028
636 0.02
€400,000 Berlin Hyp 0.375%28/8/2023
363 0.01
€300,000 Berlin Hyp 0.5% 26/9/2023 270 0.01
€200,000 Berlin Hyp 0.5% 5/11/2029 182 0.01
€300,000 Berlin Hyp 1% 5/2/2026 282 0.01
€100,000 Bertelsmann & 1.125%27/4/2026
94 0.00
€100,000 Bertelsmann & 1.25%29/9/2025
94 0.00
€100,000 Bertelsmann & 1.5%15/5/2030
94 0.00
Holding orNominalValue Investment
MarketValue
£000’s
% ofTotal
NetAssets
€400,000 Bertelsmann & 1.75%14/10/2024
382 0.01
€500,000 Bertelsmann & 2% 1/4/2028 490 0.02
€200,000 BG Energy Capital 1.25%21/11/2022
182 0.01
€200,000 BG Energy Capital 2.25%21/11/2029
204 0.01
€300,000 BHP Billiton Finance 0.75%28/10/2022
272 0.01
€200,000 BHP Billiton Finance 1.5%29/4/2030
195 0.01
€200,000 BHP Billiton Finance 3%29/5/2024
199 0.01
€100,000 BHP Billiton Finance 3.125%29/4/2033
114 0.00
€250,000 BHP Billiton Finance 3.25%24/9/2027
270 0.01
€200,000 BHP Billiton Finance 5.625%22/10/2079
210 0.01
€150,000 Blackstone Finance 1.5%10/4/2029
144 0.00
€250,000 Blackstone Finance 2%19/5/2025Ø
239 0.01
€125,000 Blackstone PropertyPartners Europe Sarl 1.4%6/7/2022
113 0.00
€700,000 Blackstone PropertyPartners Europe Sarl 2%15/2/2024
646 0.02
€300,000 Blackstone PropertyPartners Europe Sarl 2.2%24/7/2025
280 0.01
€500,000 BMW Finance 0% 24/3/2023 446 0.01
€500,000 BMW Finance 0.125%13/7/2022
448 0.01
€200,000 BMW Finance 0.25%14/1/2022
179 0.01
€700,000 BMW Finance 0.375%10/7/2023
631 0.02
€500,000 BMW Finance 0.375%14/1/2027
448 0.02
€200,000 BMW Finance 0.375%24/9/2027
179 0.01
€1,000,000 BMW Finance 0.5%22/11/2022
904 0.03
€1,000,000 BMW Finance 0.625%6/10/2023
910 0.03
€250,000 BMW Finance 0.75%15/4/2024
229 0.01
€275,000 BMW Finance 0.75%13/7/2026
253 0.01
iShares Overseas Corporate Bond Index Fund (UK)
Portfolio Statement (unaudited) continued
BlackRock Collective Investment Funds 200

Holding orNominalValue Investment
MarketValue
£000’s
% ofTotal
NetAssets
€250,000 BMW Finance 0.875%3/4/2025
232 0.01
€300,000 BMW Finance 1%14/11/2024
278 0.01
€225,000 BMW Finance 1.125%10/1/2028
213 0.01
€600,000 BMW Finance 1.5%6/2/2029
581 0.02
€100,000 BMW Finance 2.375%24/1/2023
94 0.00
€400,000 BMW US Capital 0.625%20/4/2022
361 0.01
€400,000 BMW US Capital 1%20/4/2027
375 0.01
€400,000 BMW US Capital 1.125%18/9/2021
362 0.01
€300,000 BNP Paribas 0.125%4/9/2026
261 0.01
€500,000 BNP Paribas 0.5%15/7/2025
448 0.01
€300,000 BNP Paribas 0.5% 4/6/2026 269 0.01
€400,000 BNP Paribas 0.5%19/2/2028
354 0.01
€200,000 BNP Paribas 0.75%11/11/2022
182 0.01
€625,000 BNP Paribas 1.125%15/1/2023
573 0.02
€500,000 BNP Paribas 1.125%10/10/2023
460 0.02
€500,000 BNP Paribas 1.125%22/11/2023
460 0.02
€200,000 BNP Paribas 1.125%28/8/2024
185 0.01
€500,000 BNP Paribas 1.125%11/6/2026
462 0.02
€600,000 BNP Paribas 1.125%17/4/2029
554 0.02
€300,000 BNP Paribas 1.125%15/1/2032
265 0.01
€800,000 BNP Paribas 1.25%19/3/2025
743 0.03
€300,000 BNP Paribas 1.375%28/5/2029
284 0.01
€500,000 BNP Paribas 1.5%17/11/2025
472 0.02
€200,000 BNP Paribas 1.5%23/5/2028
191 0.01
€300,000 BNP Paribas 1.5%25/5/2028
298 0.01
€300,000 BNP Paribas 1.625%23/2/2026
294 0.01
Holding orNominalValue Investment
MarketValue
£000’s
% ofTotal
NetAssets
€300,000 BNP Paribas 1.625%2/7/2031
271 0.01
€700,000 BNP Paribas 2.125%23/1/2027
678 0.02
€275,000 BNP Paribas 2.25%11/1/2027
264 0.01
€300,000 BNP Paribas 2.375%20/5/2024
293 0.01
€800,000 BNP Paribas 2.375%17/2/2025
764 0.03
€200,000 BNP Paribas 2.375%20/11/2030
191 0.01
€250,000 BNP Paribas 2.75%27/1/2026
245 0.01
€100,000 BNP Paribas 2.875%24/10/2022
95 0.00
€800,000 BNP Paribas 2.875%26/9/2023
780 0.03
€400,000 BNP Paribas 2.875%1/10/2026
398 0.01
€400,000 BNP Paribas Cardif 1%29/11/2024
359 0.01
€200,000 BNP Paribas Cardif 4.032%Perpetual 25/11/2168
197 0.01
€200,000 BNZ International FundingLtd/London 0.5% 13/5/2023
181 0.01
€675,000 BNZ International FundingLtd/London 0.625%23/4/2022
609 0.02
€225,000 Booking 1.8% 3/3/2027 210 0.01
€400,000 Booking 2.15% 25/11/2022 370 0.01
€300,000 Booking 2.375% 23/9/2024 285 0.01
€125,000 Boston Scientific 0.625%1/12/2027
110 0.00
€300,000 Bouygues 1.125%24/7/2028
281 0.01
€200,000 Bouygues 1.375% 7/6/2027 193 0.01
€200,000 Bouygues 3.625%16/1/2023
194 0.01
€500,000 Bouygues 4.5% 9/2/2022 476 0.02
€300,000 BP Capital Markets 0.83%19/9/2024
275 0.01
€300,000 BP Capital Markets 0.831%8/11/2027
273 0.01
€500,000 BP Capital Markets 0.9%3/7/2024
459 0.02
€400,000 BP Capital Markets 1.077%26/6/2025
372 0.01
€300,000 BP Capital Markets 1.104%15/11/2034
268 0.01
iShares Overseas Corporate Bond Index Fund (UK)
Portfolio Statement (unaudited) continued
BlackRock Collective Investment Funds201

Holding orNominalValue Investment
MarketValue
£000’s
% ofTotal
NetAssets
€300,000 BP Capital Markets 1.109%16/2/2023
276 0.01
€125,000 BP Capital Markets 1.117%25/1/2024
115 0.00
€375,000 BP Capital Markets 1.231%8/5/2031
346 0.01
€500,000 BP Capital Markets 1.526%26/9/2022
462 0.02
€300,000 BP Capital Markets 1.573%16/2/2027
287 0.01
€300,000 BP Capital Markets 1.594%3/7/2028
286 0.01
€300,000 BP Capital Markets 1.876%7/4/2024
284 0.01
€100,000 BP Capital Markets 1.953%3/3/2025
96 0.00
€500,000 BP Capital Markets 2.177%28/9/2021
457 0.02
€400,000 BP Capital Markets 2.213%25/9/2026
399 0.01
€650,000 BP Capital Markets 2.519%7/4/2028
657 0.02
€500,000 BP Capital Markets 2.822%7/4/2032
534 0.02
€775,000 BP Capital Markets 3.25%Perpetual 22/6/2169
715 0.02
€775,000 BP Capital Markets 3.625%Perpetual 22/6/2169
726 0.02
€400,000 BPCE 0.125% 4/12/2024 358 0.01
€400,000 BPCE 0.25% 15/1/2026 358 0.01
€500,000 BPCE 0.375% 5/10/2023 452 0.02
€300,000 BPCE 0.5% 24/2/2027 267 0.01
€800,000 BPCE 0.625% 26/9/2023 729 0.02
€500,000 BPCE 0.625% 26/9/2024 452 0.02
€300,000 BPCE 0.625% 15/1/2030 274 0.01
€800,000 BPCE 0.875% 31/1/2024 729 0.02
€400,000 BPCE 1% 15/7/2024 371 0.01
€300,000 BPCE 1% 1/4/2025 275 0.01
€300,000 BPCE 1.125% 18/1/2023 274 0.01
€300,000 BPCE 1.375% 23/3/2026 281 0.01
€600,000 BPCE 1.625% 31/1/2028 578 0.02
€300,000 BPCE 2.75% 30/11/2027 281 0.01
€100,000 BPCE 2.875% 22/4/2026 101 0.00
€400,000 BPCE 3% 19/7/2024 399 0.01
€300,000 BPCE 4.25% 6/2/2023 296 0.01
€100,000 BPCE 4.625% 18/7/2023 100 0.00
€250,000 Brambles Finance 1.5%4/10/2027Ø
230 0.01
€125,000 Brambles Finance 2.375%12/6/2024
119 0.00
Holding orNominalValue Investment
MarketValue
£000’s
% ofTotal
NetAssets
€150,000 Brenntag Finance 1.125%27/9/2025
138 0.00
€200,000 Brisa-Concessao Rodoviaria1.875% 30/4/2025Ø
185 0.01
€100,000 Brisa-Concessao Rodoviaria2% 22/3/2023
93 0.00
€125,000 Bristol-Myers Squibb 1%15/5/2025
118 0.00
€200,000 Bristol-Myers Squibb 1.75%15/5/2035
206 0.01
€375,000 British Telecommunications0.5% 23/6/2022
338 0.01
€325,000 British Telecommunications0.5% 12/9/2025
292 0.01
€400,000 British Telecommunications1% 23/6/2024
367 0.01
€425,000 British Telecommunications1.125% 10/3/2023
390 0.01
€400,000 British Telecommunications1.125% 12/9/2029
365 0.01
€425,000 British Telecommunications1.5% 23/6/2027
401 0.01
€225,000 British Telecommunications1.75% 10/3/2026
215 0.01
€125,000 Brown-Forman 1.2%7/7/2026
115 0.00
€100,000 Brussels Airport NV/SA 1%3/5/2024
89 0.00
€375,000 Bunge Finance Europe1.85% 16/6/2023
341 0.01
€100,000 CA Immobilien Anlagen0.875% 5/2/2027
86 0.00
€500,000 Cadent Finance 0.625%22/9/2024
454 0.02
€300,000 Caisse Nationale deReassuranceMutuelle AgricoleGroupama 3.375%24/9/2028
290 0.01
€200,000 Caisse Nationale deReassuranceMutuelle AgricoleGroupama 6% 23/1/2027
219 0.01
€300,000 Caisse Nationale deReassuranceMutuelle AgricoleGroupama 6.375%Perpetual 28/5/2169
305 0.01
€200,000 CaixaBank 0.375% 3/2/2025 178 0.01
€700,000 CaixaBank 0.75% 18/4/2023 635 0.02
iShares Overseas Corporate Bond Index Fund (UK)
Portfolio Statement (unaudited) continued
BlackRock Collective Investment Funds 202

Holding orNominalValue Investment
MarketValue
£000’s
% ofTotal
NetAssets
€200,000 CaixaBank 1.125%17/5/2024
183 0.01
€300,000 CaixaBank 1.125%27/3/2026
276 0.01
€700,000 CaixaBank 1.375%19/6/2026
634 0.02
€500,000 CaixaBank 1.75%24/10/2023
462 0.02
€200,000 CaixaBank 2.25% 17/4/2030 181 0.01
€300,000 CaixaBank 2.375% 1/2/2024 282 0.01
€1,100,000 CaixaBank 2.75% 14/7/2028 1,011 0.03
€500,000 Canadian Imperial Bank ofCommerce 0.375%3/5/2024
447 0.01
€400,000 Canadian Imperial Bank ofCommerce 0.75%22/3/2023
365 0.01
€100,000 Capgemini 0.625%23/6/2025
91 0.00
€100,000 Capgemini 1% 18/10/2024 92 0.00
€100,000 Capgemini 1.125%23/6/2030
92 0.00
€100,000 Capgemini 1.25% 15/4/2022 91 0.00
€300,000 Capgemini 1.625%15/4/2026
286 0.01
€100,000 Capgemini 1.75% 18/4/2028 97 0.00
€300,000 Capgemini 2% 15/4/2029 297 0.01
€500,000 Capgemini 2.375%15/4/2032
513 0.02
€400,000 Capgemini 2.5% 1/7/2023 380 0.01
€400,000 Capital One Financial 0.8%12/6/2024
357 0.01
€200,000 Capital One Financial 1.65%12/6/2029
181 0.01
€100,000 Cargill 2.5% 15/2/2023 95 0.00
€400,000 Carlsberg Breweries 0.5%6/9/2023
362 0.01
€200,000 Carlsberg Breweries0.875% 1/7/2029
183 0.01
€500,000 Carlsberg Breweries 2.5%28/5/2024
484 0.02
€100,000 Carmila 2.375% 18/9/2023 92 0.00
€300,000 Carmila 2.375% 16/9/2024Ø 274 0.01
€450,000 Carrefour 0.75% 26/4/2024 412 0.01
€100,000 Carrefour 0.875% 12/6/2023 91 0.00
€200,000 Carrefour 1% 17/5/2027 186 0.01
€100,000 Carrefour 1.25% 3/6/2025 94 0.00
€100,000 Carrefour 1.75% 15/7/2022 92 0.00
€200,000 Carrefour 1.75% 4/5/2026 193 0.01
Holding orNominalValue Investment
MarketValue
£000’s
% ofTotal
NetAssets
€500,000 Carrefour 2.625%15/12/2027
509 0.02
€200,000 Castellum 2.125%20/11/2023
187 0.01
€100,000 Ceetrus 2.75% 26/11/2026 88 0.00
€400,000 Celanese US 1.125%26/9/2023
358 0.01
€275,000 Celanese US 2.125%1/3/2027
250 0.01
€125,000 Cetin Finance 1.423%6/12/2021
113 0.00
€100,000 Cheung Kong InfrastructureFinance BVI 1% 12/12/2024
89 0.00
€100,000 Chorus 1.125% 18/10/2023 92 0.00
€400,000 Chubb INA 0.875%15/6/2027
366 0.01
€500,000 Chubb INA 0.875%15/12/2029
455 0.02
€150,000 Chubb INA 1.4% 15/6/2031 143 0.00
€200,000 Chubb INA 1.55%15/3/2028
191 0.01
€225,000 Chubb INA 2.5% 15/3/2038 241 0.01
€400,000 Cie de Saint-Gobain 0.875%21/9/2023
366 0.01
€400,000 Cie de Saint-Gobain 1%17/3/2025
373 0.01
€400,000 Cie de Saint-Gobain 1.125%23/3/2026
374 0.01
€200,000 Cie de Saint-Gobain 1.875%21/9/2028
196 0.01
€200,000 Cie de Saint-Gobain 1.875%15/3/2031
197 0.01
€900,000 Cie de Saint-Gobain 2.375%4/10/2027
903 0.03
€250,000 Cie de Saint-Gobain 3.625%28/3/2022
236 0.01
€200,000 Cie Financiere et Industrielledes Autoroutes 0.375%7/2/2025
182 0.01
€400,000 Cie Financiere et Industrielledes Autoroutes 1%19/5/2031
377 0.01
€300,000 Cie Financiere et Industrielledes Autoroutes 1.125%13/10/2027
286 0.01
€300,000 Cie Generale desEtablissements Michelin1.75% 3/9/2030
309 0.01
€200,000 Cie Generale desEtablissements Michelin2.5% 3/9/2038Ø
237 0.01
iShares Overseas Corporate Bond Index Fund (UK)
Portfolio Statement (unaudited) continued
BlackRock Collective Investment Funds203

Holding orNominalValue Investment
MarketValue
£000’s
% ofTotal
NetAssets
€500,000 Citigroup 0.5% 8/10/2027 442 0.01
€175,000 Citigroup 0.75% 26/10/2023 159 0.01
€1,000,000 Citigroup 1.25% 6/7/2026 922 0.03
€525,000 Citigroup 1.25% 10/4/2029 496 0.02
€1,000,000 Citigroup 1.375%27/10/2021
910 0.03
€125,000 Citigroup 1.5% 24/7/2026 117 0.00
€225,000 Citigroup 1.5% 26/10/2028 217 0.01
€425,000 Citigroup 1.625% 21/3/2028 413 0.01
€500,000 Citigroup 1.75% 28/1/2025 476 0.02
€300,000 Citigroup 2.125% 10/9/2026 295 0.01
€300,000 Citigroup 2.375% 22/5/2024 290 0.01
€175,000 Citycon Treasury 1.25%8/9/2026
132 0.00
€150,000 Citycon Treasury 2.375%15/1/2027
119 0.00
€200,000 Citycon Treasury 2.5%1/10/2024
169 0.01
€1,100,000 CK Hutchison TelecomFinance 1.125% 17/10/2028
1,002 0.03
€300,000 CK Hutchison EuropeFinance 18 1.25%13/4/2025
276 0.01
€250,000 CK Hutchison EuropeFinance 18 2% 13/4/2030Ø
245 0.01
€554,000 CK Hutchison Finance16 1.25% 6/4/2023
504 0.02
€243,000 CK Hutchison Finance16 2% 6/4/2028
235 0.01
€300,000 CK Hutchison Finance 16 II0.875% 3/10/2024
271 0.01
€275,000 CNH Industrial FinanceEurope 1.625% 3/7/2029
240 0.01
€475,000 CNH Industrial FinanceEurope 1.875% 19/1/2026
435 0.01
€500,000 CNP Assurances 1.875%20/10/2022
459 0.02
€200,000 CNP Assurances 2%27/7/2050
178 0.01
€200,000 CNP Assurances 2.75%5/2/2029
199 0.01
€100,000 CNP Assurances 4%Perpetual 18/11/2168
98 0.00
€700,000 CNP Assurances 4.25%5/6/2045
712 0.02
€450,000 Coca-Cola 0.125%22/9/2022
404 0.01
€275,000 Coca-Cola 0.5% 8/3/2024 251 0.01
€250,000 Coca-Cola 0.75% 9/3/2023 228 0.01
€250,000 Coca-Cola 0.75% 22/9/2026 233 0.01
Holding orNominalValue Investment
MarketValue
£000’s
% ofTotal
NetAssets
€175,000 Coca-Cola 1.1% 2/9/2036 165 0.01
€400,000 Coca-Cola 1.125% 9/3/2027 380 0.01
€600,000 Coca-Cola 1.25% 8/3/2031 587 0.02
€300,000 Coca-Cola 1.625% 9/3/2035 305 0.01
€425,000 Coca-Cola 1.875%22/9/2026
423 0.01
€500,000 Coca-Cola EuropeanPartners 0.75% 24/2/2022
452 0.02
€300,000 Coca-Cola EuropeanPartners 1.125% 12/4/2029
283 0.01
€500,000 Coca-Cola EuropeanPartners 1.75% 27/3/2026
484 0.02
€400,000 Coca-Cola EuropeanPartners 2.375% 7/5/2025
396 0.01
€100,000 Coca-Cola EuropeanPartners 2.625% 6/11/2023
97 0.00
€325,000 Coca-Cola HBC Finance 1%14/5/2027
304 0.01
€275,000 Coca-Cola HBC Finance1.625% 14/5/2031
270 0.01
€100,000 Coca-Cola HBC Finance1.875% 11/11/2024
97 0.00
€100,000 Coface 4.125% 27/3/2024 98 0.00
€200,000 Colgate-Palmolive 0.5%6/3/2026
184 0.01
€150,000 Colgate-Palmolive 0.875%12/11/2039
140 0.00
€150,000 Comcast 0.25% 20/5/2027 134 0.00
€500,000 Comcast 0.75% 20/2/2032 449 0.02
€300,000 Comcast 1.25% 20/2/2040 266 0.01
€275,000 Commerzbank 0.375%1/9/2027
242 0.01
€1,000,000 Commerzbank 0.5%28/8/2023
903 0.03
€175,000 Commerzbank 0.5%4/12/2026
156 0.00
€600,000 Commerzbank 0.625%28/8/2024
545 0.02
€100,000 Commerzbank 0.875%22/1/2027
87 0.00
€450,000 Commerzbank 1% 4/3/2026 413 0.01
€500,000 Commerzbank 1.125%19/9/2025
452 0.02
€300,000 Commerzbank 1.25%23/10/2023
273 0.01
€500,000 Commerzbank 1.875%28/2/2028
465 0.02
€300,000 Commonwealth Bank ofAustralia 1.125% 18/1/2028
289 0.01
iShares Overseas Corporate Bond Index Fund (UK)
Portfolio Statement (unaudited) continued
BlackRock Collective Investment Funds 204

Holding orNominalValue Investment
MarketValue
£000’s
% ofTotal
NetAssets
€300,000 Commonwealth Bank ofAustralia 1.936% 3/10/2029
278 0.01
€250,000 Commonwealth Bank ofAustralia 2% 22/4/2027
228 0.01
€175,000 Compass 1.875% 27/1/2023 163 0.01
€200,000 Compass FinanceNetherlands 1.5% 5/9/2028
194 0.01
€325,000 Compass International0.625% 3/7/2024
296 0.01
€500,000 Conti-Gummi Finance1.125% 25/9/2024
454 0.02
€500,000 Conti-Gummi Finance2.125% 27/11/2023
468 0.02
€75,000 Continental 0% 12/9/2023 66 0.00
€375,000 Continental 2.5% 27/8/2026 362 0.01
€400,000 Cooperatieve Rabobank UA0.125% 11/10/2021
359 0.01
€500,000 Cooperatieve Rabobank UA0.25% 30/10/2026
447 0.01
€500,000 Cooperatieve Rabobank UA0.5% 6/12/2022
454 0.02
€400,000 Cooperatieve Rabobank UA0.625% 27/2/2024
364 0.01
€800,000 Cooperatieve Rabobank UA0.75% 29/8/2023
729 0.02
€400,000 Cooperatieve Rabobank UA0.875% 5/5/2028
368 0.01
€400,000 Cooperatieve Rabobank UA1.125% 7/5/2031
381 0.01
€525,000 Cooperatieve Rabobank UA1.25% 23/3/2026
501 0.02
€500,000 Cooperatieve Rabobank UA1.375% 3/2/2027
488 0.02
€500,000 Cooperatieve Rabobank UA3.875% 25/7/2023
493 0.02
€600,000 Cooperatieve Rabobank UA4% 11/1/2022
567 0.02
€300,000 Cooperatieve Rabobank UA4.125% 14/9/2022
290 0.01
€500,000 Cooperatieve Rabobank UA4.125% 14/7/2025
538 0.02
€600,000 Cooperatieve Rabobank UA4.75% 6/6/2022
583 0.02
€175,000 Covestro 1% 7/10/2021 158 0.00
€125,000 Covestro 1.75% 25/9/2024 118 0.00
€500,000 Covivio 1.125% 17/9/2031 425 0.01
€300,000 Covivio 1.625% 17/10/2024 273 0.01
€100,000 Covivio 1.625% 23/6/2030 90 0.00
€100,000 Covivio 1.875% 20/5/2026 93 0.00
Holding orNominalValue Investment
MarketValue
£000’s
% ofTotal
NetAssets
€200,000 Covivio Hotels SACA1.875% 24/9/2025
170 0.01
€125,000 CPI Property 1.45%14/4/2022
111 0.00
€200,000 CPI Property 1.625%23/4/2027
172 0.01
€150,000 CPI Property 2.125%4/10/2024
136 0.00
€500,000 CPI Property 2.75%12/5/2026
459 0.02
€400,000 Credit Agricole 0.375%21/10/2025
358 0.01
€500,000 Credit Agricole 0.875%14/1/2032
452 0.02
€900,000 Credit Agricole 1%22/4/2026
824 0.03
€300,000 Credit Agricole 1.625%5/6/2030
276 0.01
€500,000 Credit Agricole 2%25/3/2029
481 0.02
€625,000 Credit Agricole 2.625%17/3/2027
621 0.02
€300,000 Credit Agricole Assurances2% 17/7/2030
273 0.01
€600,000 Credit Agricole Assurances2.625% 29/1/2048
562 0.02
€700,000 Credit Agricole Assurances4.25% Perpetual 13/1/2169
688 0.02
€300,000 Credit Agricole Assurances4.75% 27/9/2048
325 0.01
€300,000 Credit Agricole SA/London0.5% 24/6/2024
270 0.01
€700,000 Credit Agricole SA/London0.75% 1/12/2022
639 0.02
€200,000 Credit Agricole SA/London0.875% 19/1/2022
181 0.01
€400,000 Credit Agricole SA/London1% 16/9/2024
373 0.01
€200,000 Credit Agricole SA/London1% 3/7/2029
191 0.01
€200,000 Credit Agricole SA/London1.25% 14/4/2026
191 0.01
€400,000 Credit Agricole SA/London1.375% 13/3/2025
374 0.01
€500,000 Credit Agricole SA/London1.375% 3/5/2027
483 0.02
€400,000 Credit Agricole SA/London1.75% 5/3/2029
391 0.01
€300,000 Credit Agricole SA/London1.875% 20/12/2026
291 0.01
iShares Overseas Corporate Bond Index Fund (UK)
Portfolio Statement (unaudited) continued
BlackRock Collective Investment Funds205

Holding orNominalValue Investment
MarketValue
£000’s
% ofTotal
NetAssets
€1,000,000 Credit Agricole SA/London2.375% 20/5/2024
974 0.03
€200,000 Credit Agricole SA/London3.125% 17/7/2023
196 0.01
€100,000 Credit Logement 1.35%28/11/2029
90 0.00
€200,000 Credit Mutuel Arkea 0.375%3/10/2028
178 0.01
€500,000 Credit Mutuel Arkea 1%26/1/2023Ø
457 0.02
€500,000 Credit Mutuel Arkea 1.25%31/5/2024
461 0.02
€300,000 Credit Mutuel Arkea 1.625%15/4/2026
284 0.01
€500,000 Credit Mutuel Arkea 3.25%1/6/2026
501 0.02
€300,000 Credit Mutuel Arkea 3.375%11/3/2031
305 0.01
€200,000 Credit Mutuel Arkea 3.5%9/2/2029
207 0.01
€400,000 Credit Suisse 0.65%14/1/2028
356 0.01
€300,000 Credit Suisse 0.65%10/9/2029
267 0.01
€850,000 Credit Suisse 1% 24/6/2027 774 0.03
€400,000 Credit Suisse 1.25%17/7/2025
368 0.01
€500,000 Credit Suisse 3.25%2/4/2026
500 0.02
€1,000,000 Credit Suisse FundingGuernsey 1.25% 14/4/2022
911 0.03
€125,000 Credit Suisse AG/London0.45% 19/5/2025
114 0.00
€1,000,000 Credit Suisse AG/London1% 7/6/2023
921 0.03
€100,000 Credit Suisse AG/London1.375% 31/1/2022
91 0.00
€400,000 CRH Finance DAC 3.125%3/4/2023
385 0.01
€350,000 CRH Finance Germany1.75% 16/7/2021
316 0.01
€325,000 CRH Funding 1.625%5/5/2030
312 0.01
€100,000 CRH Funding 1.875%9/1/2024
94 0.00
€200,000 Criteria Caixa 1.5%10/5/2023
184 0.01
€200,000 Criteria Caixa 1.625%21/4/2022
183 0.01
€200,000 CyrusOne LP / CyrusOneFinance 1.45% 22/1/2027
176 0.01
Holding orNominalValue Investment
MarketValue
£000’s
% ofTotal
NetAssets
€300,000 Daimler 0.375% 8/11/2026 262 0.01
€300,000 Daimler 0.75% 11/5/2023 272 0.01
€250,000 Daimler 0.75% 8/2/2030 216 0.01
€175,000 Daimler 1% 15/11/2027 158 0.00
€500,000 Daimler 1.125% 6/11/2031 444 0.01
€300,000 Daimler 1.125% 8/8/2034 263 0.01
€500,000 Daimler 1.4% 12/1/2024 461 0.02
€300,000 Daimler 1.5% 9/3/2026 280 0.01
€725,000 Daimler 1.5% 3/7/2029 686 0.02
€925,000 Daimler 1.625% 22/8/2023Ø 857 0.03
€775,000 Daimler 2% 22/8/2026 743 0.03
€300,000 Daimler 2% 27/2/2031 291 0.01
€500,000 Daimler 2.25% 24/1/2022 461 0.02
€100,000 Daimler 2.375% 22/5/2030 99 0.00
€1,000,000 Daimler 2.625% 7/4/2025 973 0.03
€300,000 Daimler InternationalFinance 0.2% 13/9/2021
269 0.01
€500,000 Daimler InternationalFinance 0.25% 6/11/2023
444 0.01
€600,000 Daimler InternationalFinance 0.625% 27/2/2023
542 0.02
€500,000 Daimler InternationalFinance 0.625% 6/5/2027
438 0.01
€1,100,000 Daimler InternationalFinance 0.875% 9/4/2024
993 0.03
€400,000 Daimler InternationalFinance 1% 11/11/2025
363 0.01
€300,000 Daimler InternationalFinance 1.375% 26/6/2026
277 0.01
€100,000 Daimler InternationalFinance 1.5% 9/2/2027
93 0.00
€500,000 Danaher 1.7% 30/3/2024 471 0.02
€300,000 Danaher 2.1% 30/9/2026 295 0.01
€300,000 Danaher 2.5% 30/3/2030 312 0.01
€300,000 Danfoss 1.375% 23/2/2022 272 0.01
€100,000 Danica PensionLivsforsikrings 4.375%29/9/2045
99 0.00
€100,000 Danone 0.395% 10/6/2029 91 0.00
€500,000 Danone 0.424% 3/11/2022 451 0.02
€100,000 Danone 0.571% 17/3/2027 92 0.00
€500,000 Danone 0.709% 3/11/2024 461 0.02
€100,000 Danone 1.125% 14/1/2025 94 0.00
€500,000 Danone 1.208% 3/11/2028 488 0.02
€500,000 Danone 1.25% 30/5/2024 469 0.02
€200,000 Danone 1.75% Perpetual23/6/2169
180 0.01
€300,000 Danone 2.25% 15/11/2021 274 0.01
€100,000 Danone 2.6% 28/6/2023 96 0.00
iShares Overseas Corporate Bond Index Fund (UK)
Portfolio Statement (unaudited) continued
BlackRock Collective Investment Funds 206

Holding orNominalValue Investment
MarketValue
£000’s
% ofTotal
NetAssets
€100,000 Danske Bank 0.5% 6/5/2021 90 0.00
€375,000 Danske Bank 0.5%27/8/2025
333 0.01
€500,000 Danske Bank 0.625%26/5/2025
454 0.02
€600,000 Danske Bank 0.875%22/5/2023
541 0.02
€100,000 Danske Bank 1.375%24/5/2023
90 0.00
€275,000 Danske Bank 1.375%12/2/2030
244 0.01
€275,000 Danske Bank 1.5% 2/9/2030 245 0.01
€400,000 Danske Bank 1.625%15/3/2024
370 0.01
€200,000 Danske Bank 2.5%21/6/2029
187 0.01
€400,000 Dassault Systemes 0%16/9/2022
357 0.01
€200,000 Dassault Systemes 0%16/9/2024
178 0.01
€200,000 Dassault Systemes 0.125%16/9/2026
178 0.01
€400,000 Dassault Systemes 0.375%16/9/2029
357 0.01
€300,000 DBS 1.5% 11/4/2028 273 0.01
€200,000 de Volksbank 0.75%25/6/2023
182 0.01
€200,000 de Volksbank 1.75%22/10/2030
183 0.01
€350,000 Dell Bank International DAC0.625% 17/10/2022
311 0.01
€600,000 Dell Bank International DAC1.625% 24/6/2024
544 0.02
€800,000 Deutsche Bank 1.125%30/8/2023
737 0.02
€300,000 Deutsche Bank 1.125%17/3/2025Ø
269 0.01
€1,100,000 Deutsche Bank 1.375%3/9/2026
978 0.03
€400,000 Deutsche Bank 1.5%20/1/2022
361 0.01
€500,000 Deutsche Bank 1.625%20/1/2027
448 0.02
€400,000 Deutsche Bank 1.75%17/1/2028
359 0.01
€400,000 Deutsche Bank 1.875%14/2/2022
363 0.01
€300,000 Deutsche Bank 2.625%12/2/2026
284 0.01
€450,000 Deutsche Boerse 1.125%26/3/2028
432 0.01
Holding orNominalValue Investment
MarketValue
£000’s
% ofTotal
NetAssets
€100,000 Deutsche Boerse 1.25%16/6/2047
89 0.00
€500,000 Deutsche Pfandbriefbank0.625% 23/2/2022
445 0.01
€150,000 Deutsche Post 0.375%20/5/2026
135 0.00
€200,000 Deutsche Post 0.75%20/5/2029
184 0.01
€200,000 Deutsche Post 1%13/12/2027
187 0.01
€250,000 Deutsche Post 1%20/5/2032
232 0.01
€200,000 Deutsche Post 1.25%1/4/2026
189 0.01
€250,000 Deutsche Post 1.625%5/12/2028
245 0.01
€250,000 Deutsche Post 2.875%11/12/2024
251 0.01
€300,000 Deutsche Post Finance2.95% 27/6/2022
284 0.01
€1,000,000 Deutsche Telekom 0.5%5/7/2027
909 0.03
€150,000 Deutsche Telekom 0.875%25/3/2026
139 0.00
€300,000 Deutsche Telekom 1.375%5/7/2034
283 0.01
€175,000 Deutsche Telekom 1.75%9/12/2049
162 0.01
€300,000 Deutsche Telekom 2.25%29/3/2039
313 0.01
€500,000 Deutsche TelekomInternational Finance0.375% 30/10/2021
449 0.02
€775,000 Deutsche TelekomInternational Finance0.625% 1/12/2022
703 0.02
€1,000,000 Deutsche TelekomInternational Finance0.625% 13/12/2024
916 0.03
€400,000 Deutsche TelekomInternational Finance0.875% 30/1/2024
368 0.01
€500,000 Deutsche TelekomInternational Finance1.125% 22/5/2026
471 0.02
€600,000 Deutsche TelekomInternational Finance1.375% 1/12/2025
572 0.02
€175,000 Deutsche TelekomInternational Finance 1.5%3/4/2028
169 0.01
iShares Overseas Corporate Bond Index Fund (UK)
Portfolio Statement (unaudited) continued
BlackRock Collective Investment Funds207

Holding orNominalValue Investment
MarketValue
£000’s
% ofTotal
NetAssets
€175,000 Deutsche TelekomInternational Finance 2%1/12/2029
177 0.01
€200,000 Deutsche TelekomInternational Finance 3.25%17/1/2028
216 0.01
€150,000 Deutsche TelekomInternational Finance 4.5%28/10/2030
184 0.01
€100,000 Deutsche Wohnen 1%30/4/2025
92 0.00
€400,000 Deutsche Wohnen 1.5%30/4/2030
382 0.01
€275,000 DH Europe Finance II Sarl0.2% 18/3/2026
244 0.01
€525,000 DH Europe Finance II Sarl0.45% 18/3/2028
464 0.02
€500,000 DH Europe Finance II Sarl0.75% 18/9/2031
442 0.01
€375,000 DH Europe Finance II Sarl1.35% 18/9/2039
331 0.01
€275,000 DH Europe Finance II Sarl1.8% 18/9/2049
248 0.01
€225,000 DH Europe Finance Sarl1.2% 30/6/2027
211 0.01
€175,000 DH Europe Finance Sarl1.7% 4/1/2022
160 0.01
€200,000 DH Europe Finance Sarl2.5% 8/7/2025
198 0.01
€400,000 Diageo Finance 0.125%12/10/2023
360 0.01
€500,000 Diageo Finance 0.5%19/6/2024
457 0.02
€300,000 Diageo Finance 1.5%22/10/2027
293 0.01
€400,000 Diageo Finance 1.75%23/9/2024
383 0.01
€500,000 Diageo Finance 2.5%27/3/2032
541 0.02
€300,000 Digital Dutch Finco 1.5%15/3/2030
278 0.01
€775,000 Digital Euro Finco 1.125%9/4/2028
705 0.02
€400,000 Digital Euro Finco 2.625%15/4/2024
387 0.01
€100,000 d’Infrastructures deTransport SASU 0.625%27/3/2023
88 0.00
€200,000 d’Infrastructures deTransport SASU 1.625%27/11/2027
177 0.01
Holding orNominalValue Investment
MarketValue
£000’s
% ofTotal
NetAssets
€200,000 d’Infrastructures deTransport SASU 2.25%24/3/2025Ø
186 0.01
€200,000 d’Infrastructures deTransport SASU 2.5%4/5/2027
188 0.01
€350,000 d’Infrastructures deTransport SASU 4.875%27/10/2021
328 0.01
€100,000 Discovery Communications1.9% 19/3/2027
93 0.00
€125,000 Discovery Communications2.375% 7/3/2022Ø
115 0.00
€600,000 DNB Bank 0.05%14/11/2023
538 0.02
€700,000 DNB Bank 0.25% 9/4/2024 632 0.02
€400,000 DNB Bank 1.125% 1/3/2023 369 0.01
€225,000 DNB Bank 1.25% 1/3/2027 204 0.01
€100,000 DNB Bank 4.25% 18/1/2022 95 0.00
€100,000 Dover 0.75% 4/11/2027 89 0.00
€100,000 Dover 1.25% 9/11/2026 93 0.00
€425,000 Dow Chemical 0.5%15/3/2027
363 0.01
€400,000 Dow Chemical 1.125%15/3/2032
334 0.01
€100,000 Dow Chemical 1.875%15/3/2040
84 0.00
€150,000 DS Smith 0.875% 12/9/2026 132 0.00
€500,000 DS Smith 2.25% 16/9/2022 460 0.02
€200,000 DSV Panalpina 0.375%26/2/2027
176 0.01
€300,000 DVB Bank 0.875%9/4/2021Ø
269 0.01
€300,000 DVB Bank 1% 25/4/2022 269 0.01
€275,000 DXC Technology 1.75%15/1/2026
246 0.01
€875,000 E.ON 0% 24/10/2022 782 0.03
€150,000 E.ON 0% 18/12/2023 134 0.00
€400,000 E.ON 0% 28/8/2024 357 0.01
€275,000 E.ON 0.25% 24/10/2026 247 0.01
€175,000 E.ON 0.375% 29/9/2027 158 0.00
€300,000 E.ON 0.625% 7/11/2031 268 0.01
€300,000 E.ON 0.75% 18/12/2030 274 0.01
€250,000 E.ON 0.875% 20/8/2031 230 0.01
€600,000 E.ON 1% 7/10/2025 559 0.02
€300,000 E.ON 1.625% 22/5/2029 295 0.01
€100,000 Eastman Chemical 1.5%26/5/2023
91 0.00
€350,000 Eastman Chemical 1.875%23/11/2026
322 0.01
iShares Overseas Corporate Bond Index Fund (UK)
Portfolio Statement (unaudited) continued
BlackRock Collective Investment Funds 208

Holding orNominalValue Investment
MarketValue
£000’s
% ofTotal
NetAssets
€300,000 easyJet 0.875% 11/6/2025 224 0.01
€100,000 easyJet 1.75% 9/2/2023 79 0.00
€300,000 Eaton Capital Unlimited0.697% 14/5/2025
272 0.01
€150,000 Eaton Capital Unlimited0.75% 20/9/2024
136 0.00
€125,000 Ecolab 1% 15/1/2024 115 0.00
€100,000 Ecolab 2.625% 8/7/2025 100 0.00
€200,000 Edenred 1.875% 6/3/2026 191 0.01
€300,000 Edenred 1.875% 30/3/2027 289 0.01
€300,000 EDP - Energias de Portugal1.625% 15/4/2027
288 0.01
€250,000 EDP Finance 1.5%22/11/2027
238 0.01
€375,000 EDP Finance 1.625%26/1/2026
358 0.01
€175,000 EDP Finance 2% 22/4/2025 169 0.01
€300,000 EDP Finance 2.375%23/3/2023
284 0.01
€500,000 EDP Finance 2.625%18/1/2022
463 0.02
€100,000 Elenia Finance 0.375%6/2/2027
89 0.00
€175,000 Eli Lilly and 0.625%1/11/2031
161 0.01
€375,000 Eli Lilly and 1.7% 1/11/2049 361 0.01
€250,000 Eli Lilly and 2.125%3/6/2030
263 0.01
€200,000 Elia 1.5% 5/9/2028 193 0.01
€200,000 Elia 2.75% Perpetual5/12/2168
186 0.01
€500,000 Elia Transmission Belgium0.875% 28/4/2030
461 0.02
€300,000 Elia Transmission Belgium1.375% 27/5/2024
280 0.01
€100,000 Elia Transmission Belgium3.25% 4/4/2028
109 0.00
€175,000 Elisa 1.125% 26/2/2026 163 0.01
€300,000 ELM for HelvetiaSchweizerischeVersicherungsgesellschaft3.375% 29/9/2047
294 0.01
€300,000 ELM for Swiss Reinsurance2.6% Perpetual 1/9/2169
285 0.01
€250,000 Emerson Electric 2%15/10/2029
251 0.01
€300,000 Enagas Financiaciones0.75% 27/10/2026
278 0.01
€500,000 Enagas Financiaciones1.25% 6/2/2025
472 0.02
Holding orNominalValue Investment
MarketValue
£000’s
% ofTotal
NetAssets
€200,000 Enagas Financiaciones2.5% 11/4/2022
186 0.01
€500,000 Enel 2.5% 24/11/2078 456 0.02
€250,000 Enel 3.375% 24/11/2081 237 0.01
€575,000 Enel 3.5% 24/5/2080 546 0.02
€150,000 Enel 5.25% 20/5/2024 160 0.01
€300,000 Enel 5.625% 21/6/2027 363 0.01
€400,000 Enel Finance International0% 17/6/2024
356 0.01
€325,000 Enel Finance International0.375% 17/6/2027
289 0.01
€425,000 Enel Finance International1% 16/9/2024
394 0.01
€350,000 Enel Finance International1.125% 16/9/2026
331 0.01
€300,000 Enel Finance International1.125% 17/10/2034
274 0.01
€303,000 Enel Finance International1.375% 1/6/2026
289 0.01
€300,000 Enel Finance International1.5% 21/7/2025
285 0.01
€376,000 Enel Finance International1.966% 27/1/2025
364 0.01
€400,000 Enel Finance International4.875% 17/4/2023
405 0.01
€150,000 Enel Finance International5% 14/9/2022
148 0.00
€500,000 Engie 0% 4/3/2027 442 0.01
€500,000 Engie 0.375% 21/6/2027 452 0.02
€200,000 Engie 0.5% 13/3/2022 180 0.01
€200,000 Engie 0.875% 27/3/2024 184 0.01
€100,000 Engie 1% 13/3/2026 94 0.00
€300,000 Engie 1.25% 24/10/2041 271 0.01
€500,000 Engie 1.375% 27/3/2025 473 0.02
€400,000 Engie 1.375% 22/6/2028 385 0.01
€400,000 Engie 1.375% 28/2/2029 386 0.01
€300,000 Engie 1.375% 21/6/2039 281 0.01
€300,000 Engie 1.375% Perpetual16/4/2169
267 0.01
€200,000 Engie 1.5% 13/3/2035 193 0.01
€400,000 Engie 1.625% Perpetual8/7/2169
357 0.01
€500,000 Engie 1.75% 27/3/2028 494 0.02
€400,000 Engie 1.875% 19/9/2033 409 0.01
€200,000 Engie 2% 28/9/2037 204 0.01
€500,000 Engie 2.125% 30/3/2032 520 0.02
€200,000 Engie 2.375% 19/5/2026 202 0.01
€400,000 Engie 2.625% 20/7/2022 375 0.01
€200,000 Engie 3.25% Perpetual28/2/2169
192 0.01
iShares Overseas Corporate Bond Index Fund (UK)
Portfolio Statement (unaudited) continued
BlackRock Collective Investment Funds209

Holding orNominalValue Investment
MarketValue
£000’s
% ofTotal
NetAssets
€250,000 Engie 3.5% 18/10/2022 239 0.01
€300,000 Engie 3.875% Perpetual2/6/2169
291 0.01
€40,000 Engie 5.95% 16/3/2111 74 0.00
€150,000 Engie Alliance GIE 5.75%24/6/2023
156 0.00
€500,000 Eni 0.625% 23/1/2030Ø 444 0.01
€800,000 Eni 1% 14/3/2025 739 0.03
€275,000 Eni 1% 11/10/2034 249 0.01
€400,000 Eni 1.125% 19/9/2028 375 0.01
€275,000 Eni 1.25% 18/5/2026 258 0.01
€300,000 Eni 1.5% 2/2/2026 284 0.01
€350,000 Eni 1.5% 17/1/2027 334 0.01
€175,000 Eni 1.625% 17/5/2028 169 0.01
€500,000 Eni 1.75% 18/1/2024 472 0.02
€350,000 Eni 2% 18/5/2031 351 0.01
€400,000 Eni 3.75% 12/9/2025 420 0.01
€200,000 EP Infrastructure 1.698%30/7/2026
179 0.01
€300,000 EP Infrastructure 2.045%9/10/2028Ø
267 0.01
€500,000 Equinix 2.875% 1/10/2025 454 0.02
€400,000 Erste Bank 0.375%16/4/2024
361 0.01
€200,000 Erste Bank 0.875%22/5/2026
184 0.01
€500,000 Erste Bank 1% 10/6/2030 431 0.01
€700,000 EssilorLuxottica 0%27/5/2023
626 0.02
€900,000 EssilorLuxottica 0.125%27/5/2025
808 0.03
€600,000 EssilorLuxottica 0.25%5/1/2024
540 0.02
€300,000 EssilorLuxottica 0.375%27/11/2027
271 0.01
€400,000 EssilorLuxottica 0.5%5/6/2028
363 0.01
€300,000 EssilorLuxottica 0.75%27/11/2031
275 0.01
€200,000 EssilorLuxottica 2.625%10/2/2024
195 0.01
€350,000 Essity 0.5% 3/2/2030 310 0.01
€175,000 Essity 0.625% 28/3/2022 158 0.00
€150,000 Essity 1.125% 5/3/2025 140 0.00
€125,000 Essity 1.625% 30/3/2027 120 0.00
€250,000 Euroclear Bank 0.5%10/7/2023
228 0.01
€100,000 Euroclear Investments1.125% 7/12/2026
95 0.00
Holding orNominalValue Investment
MarketValue
£000’s
% ofTotal
NetAssets
€200,000 Euroclear Investments2.625% 11/4/2048
193 0.01
€500,000 Eurogrid 1.113% 15/5/2032 473 0.02
€200,000 Eurogrid 1.625% 3/11/2023 187 0.01
€300,000 Eurogrid 1.875% 10/6/2025 290 0.01
€375,000 Euronet Worldwide 1.375%22/5/2026
327 0.01
€150,000 Euronext 1% 18/4/2025 138 0.00
€100,000 Euronext 1.125% 12/6/2029 95 0.00
€400,000 Eutelsat 2% 2/10/2025 374 0.01
€200,000 Eutelsat 2.25% 13/7/2027 186 0.01
€150,000 Evonik Finance 0% 8/3/2021 134 0.00
€150,000 Evonik Finance 0.375%7/9/2024
136 0.00
€175,000 Evonik Finance 0.75%7/9/2028
161 0.01
€500,000 Evonik Industries 0.625%18/9/2025
455 0.02
€175,000 Evonik Industries 1%23/1/2023
160 0.01
€100,000 Evonik Industries 2.125%7/7/2077
91 0.00
€200,000 EXOR 1.75% 14/10/2034 168 0.01
€500,000 EXOR 2.25% 29/4/2030 459 0.02
€125,000 EXOR 2.5% 8/10/2024 119 0.00
€225,000 Expedia 2.5% 3/6/2022 203 0.01
€825,000 Exxon Mobil 0.142%26/6/2024
739 0.03
€300,000 Exxon Mobil 0.524%26/6/2028
269 0.01
€350,000 Exxon Mobil 0.835%26/6/2032
310 0.01
€350,000 Exxon Mobil 1.408%26/6/2039
309 0.01
€500,000 Fairfax Financial 2.75%29/3/2028
461 0.02
€225,000 Fastighets Balder 1.125%14/3/2022
203 0.01
€225,000 Fastighets Balder 1.125%29/1/2027
191 0.01
€100,000 Fastighets Balder 1.25%28/1/2028
84 0.00
€325,000 Fastighets Balder 1.875%14/3/2025
295 0.01
€250,000 FCA Bank SpA/Ireland0.25% 28/2/2023
221 0.01
€500,000 FCA Bank SpA/Ireland 0.5%13/9/2024
440 0.01
€125,000 FCA Bank SpA/Ireland0.625% 24/11/2022
112 0.00
iShares Overseas Corporate Bond Index Fund (UK)
Portfolio Statement (unaudited) continued
BlackRock Collective Investment Funds 210

Holding orNominalValue Investment
MarketValue
£000’s
% ofTotal
NetAssets
€700,000 FCA Bank SpA/Ireland1.25% 21/6/2022
634 0.02
€425,000 FCC Aqualia 2.629%8/6/2027
412 0.01
€600,000 FCC Servicios MedioAmbiente SAU 0.815%4/12/2023
538 0.02
€100,000 FCC Servicios MedioAmbiente SAU 1.661%4/12/2026
91 0.00
€500,000 FedEx 0.7% 13/5/2022 451 0.02
€100,000 FedEx 1% 11/1/2023 91 0.00
€225,000 FedEx 1.3% 5/8/2031 201 0.01
€425,000 FedEx 1.625% 11/1/2027 402 0.01
€300,000 Ferrovial Emisiones 0.375%14/9/2022
269 0.01
€500,000 Ferrovial Emisiones 1.382%14/5/2026
461 0.02
€500,000 Fidelity National InformationServices 0.125% 3/12/2022
448 0.02
€350,000 Fidelity National InformationServices 0.625% 3/12/2025
317 0.01
€100,000 Fidelity National InformationServices 0.75% 21/5/2023
91 0.00
€250,000 Fidelity National InformationServices 1% 3/12/2028
227 0.01
€500,000 Fidelity National InformationServices 1.1% 15/7/2024
463 0.02
€275,000 Fidelity National InformationServices 1.5% 21/5/2027
261 0.01
€300,000 Fidelity National InformationServices 2% 21/5/2030
296 0.01
€150,000 Fidelity National InformationServices 2.95% 21/5/2039
159 0.01
€500,000 Firmenich ProductionsParticipations SAS 1.375%30/10/2026
465 0.02
€250,000 Firmenich ProductionsParticipations SAS 1.75%30/4/2030
237 0.01
€100,000 Fiserv 0.375% 1/7/2023 90 0.00
€100,000 Fiserv 1.125% 1/7/2027 92 0.00
€150,000 Fiserv 1.625% 1/7/2030 141 0.00
€300,000 Flowserve 1.25% 17/3/2022 262 0.01
€300,000 Fomento EconomicoMexicano 1.75% 20/3/2023
278 0.01
€225,000 Fonterra Co-operative0.75% 8/11/2024
201 0.01
€250,000 Fresenius & 0.75%15/1/2028
222 0.01
Holding orNominalValue Investment
MarketValue
£000’s
% ofTotal
NetAssets
€500,000 Fresenius & 1.625%8/10/2027
471 0.02
€100,000 Fresenius & 1.875%15/2/2025
94 0.00
€175,000 Fresenius & 2.875%15/2/2029
180 0.01
€300,000 Fresenius & 4% 1/2/2024 301 0.01
€225,000 Fresenius Finance Ireland0.875% 31/1/2022
202 0.01
€300,000 Fresenius Finance Ireland3% 30/1/2032Ø
322 0.01
€200,000 Fresenius Medical Care &0.25% 29/11/2023
179 0.01
€150,000 Fresenius Medical Care &0.625% 30/11/2026
134 0.00
€400,000 Fresenius Medical Care &1% 29/5/2026
366 0.01
€200,000 Fresenius Medical Care &1.25% 29/11/2029
185 0.01
€125,000 Fresenius Medical Care &1.5% 11/7/2025
118 0.00
€100,000 Fresenius Medical Care &1.5% 29/5/2030
93 0.00
€225,000 G4S International Finance1.5% 9/1/2023
204 0.01
€175,000 G4S International Finance1.5% 2/6/2024
159 0.01
€250,000 G4S International Finance1.875% 24/5/2025Ø
229 0.01
€300,000 Galp Gas NaturalDistribuicao 1.375%19/9/2023
273 0.01
€500,000 GE Capital EuropeanFunding Unlimited 2.625%15/3/2023
472 0.02
€200,000 GE Capital EuropeanFunding Unlimited 6.025%1/3/2038
237 0.01
€500,000 Gecina 1.375% 26/1/2028 473 0.02
€100,000 Gecina 1.5% 20/1/2025 94 0.00
€100,000 Gecina 1.625% 29/5/2034 94 0.00
€200,000 Gecina 2% 30/6/2032 199 0.01
€225,000 GELF Bond Issuer I 1.625%20/10/2026
209 0.01
€275,000 General Electric 0.375%17/5/2022
246 0.01
€300,000 General Electric 0.875%17/5/2025
265 0.01
€150,000 General Electric 1.25%26/5/2023
137 0.00
iShares Overseas Corporate Bond Index Fund (UK)
Portfolio Statement (unaudited) continued
BlackRock Collective Investment Funds211

Holding orNominalValue Investment
MarketValue
£000’s
% ofTotal
NetAssets
€1,000,000 General Electric 1.5%17/5/2029
861 0.03
€300,000 General Electric 1.875%28/5/2027
270 0.01
€275,000 General Electric 2.125%17/5/2037
232 0.01
€250,000 General Electric 4.125%19/9/2035
259 0.01
€176,000 General Mills 0.45%15/1/2026
158 0.00
€150,000 General Mills 1% 27/4/2023 137 0.00
€200,000 General Mills 1.5%27/4/2027Ø
188 0.01
€500,000 General Motors Financial0.2% 2/9/2022
441 0.01
€600,000 General Motors Financial0.85% 26/2/2026
510 0.02
€250,000 General Motors Financial0.955% 7/9/2023
222 0.01
€275,000 General Motors Financial2.2% 1/4/2024
252 0.01
€500,000 Givaudan Finance Europe1% 22/4/2027
466 0.02
€100,000 Givaudan Finance Europe1.625% 22/4/2032
97 0.00
€300,000 GlaxoSmithKline Capital 0%23/9/2023
269 0.01
€500,000 GlaxoSmithKline Capital 1%12/9/2026
471 0.02
€400,000 GlaxoSmithKline Capital1.25% 21/5/2026
381 0.01
€500,000 GlaxoSmithKline Capital1.375% 2/12/2024
474 0.02
€500,000 GlaxoSmithKline Capital1.375% 12/9/2029
493 0.02
€400,000 Glencore Finance Europe1.5% 15/10/2026
367 0.01
€100,000 Glencore Finance Europe1.625% 18/1/2022
90 0.00
€300,000 Glencore Finance Europe1.75% 17/3/2025
280 0.01
€575,000 Glencore Finance Europe1.875% 13/9/2023
532 0.02
€375,000 Global Switch 1.5%31/1/2024
342 0.01
€200,000 Globalworth Real EstateInvestments 2.95%29/7/2026
178 0.01
€250,000 Globalworth Real EstateInvestments 3% 29/3/2025
224 0.01
Holding orNominalValue Investment
MarketValue
£000’s
% ofTotal
NetAssets
€550,000 Goldman Sachs 0.875%21/1/2030
494 0.02
€825,000 Goldman Sachs 1.25%1/5/2025Ø
758 0.03
€500,000 Goldman Sachs 1.375%26/7/2022
458 0.02
€700,000 Goldman Sachs 1.375%15/5/2024
642 0.02
€500,000 Goldman Sachs 1.625%27/7/2026
474 0.02
€100,000 Goldman Sachs 2%27/7/2023
94 0.00
€400,000 Goldman Sachs 2%22/3/2028
392 0.01
€150,000 Goldman Sachs 2%1/11/2028
148 0.00
€500,000 Goldman Sachs 2.5%18/10/2021
460 0.02
€500,000 Goldman Sachs 2.875%3/6/2026
505 0.02
€150,000 Goldman Sachs 3%12/2/2031
163 0.01
€250,000 Goldman Sachs 3.25%1/2/2023
240 0.01
€1,300,000 Goldman Sachs 3.375%27/3/2025
1,311 0.04
€300,000 Grand City Properties1.375% 3/8/2026
279 0.01
€200,000 Grand City Properties 1.5%17/4/2025
187 0.01
€200,000 Grand City Properties 1.5%22/2/2027
187 0.01
€200,000 Grand City Properties 1.7%9/4/2024
187 0.01
€500,000 Great-West Lifeco 2.5%18/4/2023
474 0.02
€50,000 Grenke Finance 0.625%9/1/2025
44 0.00
€175,000 Grenke Finance 1.625%5/4/2024
159 0.01
€100,000 Hamburg Commercial Bank0.5% 23/5/2022
89 0.00
€200,000 Hammerson 1.75%15/3/2023Ø
163 0.01
€100,000 Hammerson 2% 1/7/2022 84 0.00
€200,000 Hannover FinanceLuxembourg 5% 30/6/2043
200 0.01
€400,000 Hannover Rueck 1.125%9/10/2039
348 0.01
€200,000 Hannover Rueck 1.75%8/10/2040
180 0.01
iShares Overseas Corporate Bond Index Fund (UK)
Portfolio Statement (unaudited) continued
BlackRock Collective Investment Funds 212

Holding orNominalValue Investment
MarketValue
£000’s
% ofTotal
NetAssets
€100,000 Hannover Rueck 3.375%Perpetual 26/6/2169
100 0.00
€400,000 Harley-Davidson FinancialServices 0.9% 19/11/2024
349 0.01
€375,000 Harman FinanceInternational 2% 27/5/2022
340 0.01
€300,000 Heathrow Funding 1.5%11/2/2030
266 0.01
€100,000 Heathrow Funding 1.875%23/5/2024
91 0.00
€300,000 Heathrow Funding 1.875%12/7/2032
270 0.01
€150,000 Heathrow Funding 1.875%14/3/2036
134 0.00
€175,000 HeidelbergCement 1.5%7/2/2025
162 0.01
€250,000 HeidelbergCement 2.25%3/6/2024
237 0.01
€500,000 HeidelbergCement FinanceLuxembourg 0.5% 9/8/2022
446 0.01
€100,000 HeidelbergCement FinanceLuxembourg 1.125%1/12/2027
90 0.00
€300,000 HeidelbergCement FinanceLuxembourg 1.5%14/6/2027
277 0.01
€275,000 HeidelbergCement FinanceLuxembourg 1.625%7/4/2026
255 0.01
€275,000 HeidelbergCement FinanceLuxembourg 1.75%24/4/2028
256 0.01
€200,000 HeidelbergCement FinanceLuxembourg 2.5%9/10/2024
191 0.01
€100,000 Heimstaden Bostad 1.125%21/1/2026
88 0.00
€600,000 Heimstaden Bostad 2.125%5/9/2023
554 0.02
€100,000 Heimstaden BostadTreasury 1.375% 3/3/2027
89 0.00
€125,000 Heineken 1% 4/5/2026 117 0.00
€300,000 Heineken 1.25% 17/3/2027 284 0.01
€300,000 Heineken 1.25% 7/5/2033 275 0.01
€300,000 Heineken 1.5% 7/12/2024 284 0.01
€250,000 Heineken 1.5% 3/10/2029 245 0.01
€300,000 Heineken 1.75% 17/3/2031 298 0.01
€300,000 Heineken 1.75% 7/5/2040 272 0.01
€250,000 Heineken 2.25% 30/3/2030 257 0.01
€500,000 Heineken 2.875% 4/8/2025 506 0.02
€150,000 Heineken 3.5% 19/3/2024 151 0.00
Holding orNominalValue Investment
MarketValue
£000’s
% ofTotal
NetAssets
€225,000 Hella & 0.5% 26/1/2027 194 0.01
€100,000 Hella & 1% 17/5/2024 91 0.00
€100,000 Hemso Fastighets 1%9/9/2026
90 0.00
€200,000 Hemso Fastighets 1.75%19/6/2029
187 0.01
€250,000 Henkel & 0% 13/9/2021 224 0.01
€100,000 Hitachi Capital UK 0.125%29/11/2022
88 0.00
€200,000 HOCHTIEF 0.5% 3/9/2027 177 0.01
€175,000 HOCHTIEF 1.75% 3/7/2025 165 0.01
€125,000 Holcim FinanceLuxembourg 0.5%29/11/2026
111 0.00
€400,000 Holcim FinanceLuxembourg 1.375%26/5/2023
369 0.01
€100,000 Holcim FinanceLuxembourg 1.75%29/8/2029
97 0.00
€300,000 Holcim FinanceLuxembourg 2.25%26/5/2028
298 0.01
€500,000 Holcim FinanceLuxembourg 2.375%9/4/2025
484 0.02
€200,000 Holcim FinanceLuxembourg 3% 22/1/2024
195 0.01
€750,000 Honeywell International 0%10/3/2024
668 0.02
€300,000 Honeywell International0.75% 10/3/2032
267 0.01
€300,000 Honeywell International1.3% 22/2/2023
276 0.01
€400,000 Honeywell International2.25% 22/2/2028
407 0.01
€625,000 HSBC 0.875% 6/9/2024 571 0.02
€400,000 HSBC 1.5% 15/3/2022 365 0.01
€900,000 HSBC 1.5% 4/12/2024 835 0.03
€600,000 HSBC 2.5% 15/3/2027 614 0.02
€600,000 HSBC 3.125% 7/6/2028 625 0.02
€400,000 HSBC France 0.1%3/9/2027
352 0.01
€500,000 HSBC France 0.25%17/5/2024
450 0.02
€600,000 HSBC France 0.6%20/3/2023
545 0.02
€200,000 Hutchison WhampoaEurope Finance 12 3.625%6/6/2022
189 0.01
iShares Overseas Corporate Bond Index Fund (UK)
Portfolio Statement (unaudited) continued
BlackRock Collective Investment Funds213

Holding orNominalValue Investment
MarketValue
£000’s
% ofTotal
NetAssets
€550,000 Hutchison WhampoaFinance 14 1.375%31/10/2021
498 0.02
€500,000 Iberdrola Finanzas 0.875%16/6/2025
462 0.02
€200,000 Iberdrola Finanzas 1%7/3/2024
184 0.01
€500,000 Iberdrola Finanzas 1%7/3/2025
465 0.02
€500,000 Iberdrola Finanzas 1.25%28/10/2026
475 0.02
€300,000 Iberdrola Finanzas 1.621%29/11/2029
300 0.01
€500,000 Iberdrola International0.375% 15/9/2025
453 0.02
€100,000 Iberdrola International1.125% 21/4/2026
94 0.00
€100,000 Iberdrola International1.75% 17/9/2023
94 0.00
€200,000 Iberdrola International1.875% 8/10/2024
192 0.01
€300,000 Iberdrola International1.875% Perpetual 22/5/2169
271 0.01
€400,000 Iberdrola International 2.5%24/10/2022
377 0.01
€200,000 Iberdrola International2.625% Perpetual 26/3/2169
187 0.01
€300,000 Iberdrola International3.25% Perpetual 12/2/2169
289 0.01
€600,000 ICADE 1.125% 17/11/2025 534 0.02
€200,000 ICADE 1.5% 13/9/2027 182 0.01
€200,000 ICADE 1.625% 28/2/2028 181 0.01
€100,000 ICADE 1.875% 14/9/2022 92 0.00
€100,000 Icade Sante SAS 0.875%4/11/2029
84 0.00
€200,000 IE2 Holdco SAU 2.375%27/11/2023
190 0.01
€300,000 Illinois Tool Works 0.25%5/12/2024
271 0.01
€200,000 Illinois Tool Works 0.625%5/12/2027
182 0.01
€250,000 Illinois Tool Works 1%5/6/2031
236 0.01
€250,000 Illinois Tool Works 1.75%20/5/2022
230 0.01
€300,000 Illinois Tool Works 2.125%22/5/2030
311 0.01
€200,000 Imerys 0.875% 31/3/2022 178 0.01
€300,000 Imerys 1.5% 15/1/2027 262 0.01
€100,000 Imerys 1.875% 31/3/2028 89 0.00
Holding orNominalValue Investment
MarketValue
£000’s
% ofTotal
NetAssets
€500,000 IMMOFINANZ 2.625%27/1/2023
449 0.02
€275,000 Imperial Brands Finance1.125% 14/8/2023
251 0.01
€600,000 Imperial Brands Finance2.125% 12/2/2027
564 0.02
€400,000 Indigo SAS 1.625%19/4/2028
340 0.01
€500,000 Infineon Technologies0.75% 24/6/2023
455 0.02
€500,000 Infineon Technologies 2%24/6/2032
472 0.02
€300,000 Informa 1.25% 22/4/2028 246 0.01
€225,000 Informa 1.5% 5/7/2023 199 0.01
€250,000 ING Bank 4.5% 21/2/2022 239 0.01
€300,000 ING Groep 0.1% 3/9/2025 266 0.01
€500,000 ING Groep 0.75% 9/3/2022 452 0.02
€600,000 ING Groep 1% 13/11/2030 530 0.02
€1,200,000 ING Groep 1.125%14/2/2025
1,115 0.04
€500,000 ING Groep 1.625%26/9/2029
458 0.02
€1,000,000 ING Groep 2% 20/9/2028 1,013 0.03
€300,000 ING Groep 2% 22/3/2030 278 0.01
€700,000 ING Groep 2.125%10/1/2026
688 0.02
€400,000 ING Groep 2.125%26/5/2031
374 0.01
€300,000 ING Groep 3% 11/4/2028 283 0.01
€100,000 In’li 1.125% 2/7/2029 89 0.00
€200,000 Inmobiliaria Colonial Socimi1.45% 28/10/2024
183 0.01
€100,000 Inmobiliaria Colonial Socimi1.625% 28/11/2025
92 0.00
€300,000 Inmobiliaria Colonial Socimi2.5% 28/11/2029
280 0.01
€200,000 Inmobiliaria Colonial Socimi2.728% 5/6/2023
191 0.01
€500,000 innogy Finance 0.75%30/11/2022
453 0.02
€750,000 innogy Finance 1%13/4/2025
697 0.02
€700,000 innogy Finance 1.5%31/7/2029
677 0.02
€200,000 Insurance 3.5% 30/6/2047 197 0.01
€200,000 InterContinental Hotels2.125% 15/5/2027
177 0.01
€500,000 International BusinessMachines 0.3% 11/2/2028
445 0.01
iShares Overseas Corporate Bond Index Fund (UK)
Portfolio Statement (unaudited) continued
BlackRock Collective Investment Funds 214

Holding orNominalValue Investment
MarketValue
£000’s
% ofTotal
NetAssets
€700,000 International BusinessMachines 0.65% 11/2/2032
620 0.02
€200,000 International BusinessMachines 0.875% 31/1/2025
186 0.01
€500,000 International BusinessMachines 0.95% 23/5/2025
466 0.02
€350,000 International BusinessMachines 1.2% 11/2/2040
312 0.01
€500,000 International BusinessMachines 1.25% 26/5/2023
463 0.02
€500,000 International BusinessMachines 1.25% 29/1/2027
475 0.02
€225,000 International BusinessMachines 1.5% 23/5/2029
220 0.01
€400,000 International BusinessMachines 1.75% 31/1/2031
399 0.01
€100,000 International BusinessMachines 2.875% 7/11/2025
102 0.00
€450,000 International Flavors &Fragrances 1.75%14/3/2024
415 0.01
€225,000 International Flavors &Fragrances 1.8% 25/9/2026
205 0.01
€100,000 Intesa Sanpaolo 0.75%4/12/2024
90 0.00
€500,000 Intesa Sanpaolo 0.875%27/6/2022
450 0.02
€200,000 Intesa Sanpaolo 1%4/7/2024
181 0.01
€400,000 Intesa Sanpaolo 1%19/11/2026
356 0.01
€600,000 Intesa Sanpaolo 1.375%18/1/2024
548 0.02
€250,000 Intesa Sanpaolo 1.75%20/3/2028
232 0.01
€425,000 Intesa Sanpaolo 1.75%4/7/2029
394 0.01
€1,000,000 Intesa Sanpaolo 2.125%30/8/2023
937 0.03
€525,000 Intesa Sanpaolo 2.125%26/5/2025
496 0.02
€100,000 Intesa Sanpaolo 4%30/10/2023
99 0.00
€250,000 Investor 1.5% 12/9/2030 246 0.01
€225,000 Investor 1.5% 20/6/2039 220 0.01
€175,000 Investor 4.875% 18/11/2021 166 0.01
€300,000 Iren 0.875% 4/11/2024 274 0.01
€200,000 Iren 1.5% 24/10/2027 191 0.01
€600,000 Iren 1.95% 19/9/2025 578 0.02
€100,000 ISS Finance 1.25% 7/7/2025 91 0.00
Holding orNominalValue Investment
MarketValue
£000’s
% ofTotal
NetAssets
€350,000 ISS Global 0.875%18/6/2026
310 0.01
€325,000 ISS Global 1.5% 31/8/2027 296 0.01
€300,000 Italgas 0.875% 24/4/2030 278 0.01
€200,000 Italgas 1% 11/12/2031 186 0.01
€200,000 Italgas 1.625% 18/1/2029 196 0.01
€250,000 ITV 1.375% 26/9/2026 219 0.01
€150,000 ITV 2.125% 21/9/2022 137 0.00
€100,000 JAB 1% 20/12/2027 88 0.00
€200,000 JAB 1.25% 22/5/2024 184 0.01
€200,000 JAB 1.625% 30/4/2025 187 0.01
€300,000 JAB 1.75% 25/5/2023 279 0.01
€700,000 JAB 1.75% 25/6/2026 656 0.02
€200,000 JAB 2% 18/5/2028 189 0.01
€100,000 JAB 2.125% 16/9/2022 93 0.00
€200,000 JAB 2.25% 19/12/2039 179 0.01
€100,000 JAB 2.5% 17/4/2027 97 0.00
€300,000 JAB 2.5% 25/6/2029 295 0.01
€200,000 JAB 3.375% 17/4/2035 209 0.01
€500,000 JCDecaux 1% 1/6/2023 450 0.02
€200,000 JCDecaux 2.625%24/4/2028
189 0.01
€500,000 Jefferies 1% 19/7/2024 441 0.01
€100,000 John Deere CashManagement 0.5%15/9/2023
91 0.00
€500,000 John Deere CashManagement 1.375%2/4/2024
470 0.02
€150,000 John Deere CashManagement 1.65%13/6/2039
149 0.00
€300,000 John Deere CashManagement 1.85%2/4/2028
297 0.01
€500,000 John Deere CashManagement 2.2% 2/4/2032
525 0.02
€500,000 Johnson & Johnson 0.65%20/5/2024
461 0.02
€400,000 Johnson & Johnson 1.65%20/5/2035
424 0.01
€100,000 Johnson ControlsInternational 0% 4/12/2020
89 0.00
€125,000 Johnson ControlsInternational 1% 15/9/2023
115 0.00
€125,000 Johnson ControlsInternational 1.375%25/2/2025
116 0.00
€775,000 JPMorgan Chase & 0.389%24/2/2028
682 0.02
iShares Overseas Corporate Bond Index Fund (UK)
Portfolio Statement (unaudited) continued
BlackRock Collective Investment Funds215

Holding orNominalValue Investment
MarketValue
£000’s
% ofTotal
NetAssets
€500,000 JPMorgan Chase & 0.625%25/1/2024
454 0.02
€250,000 JPMorgan Chase & 1.001%25/7/2031
229 0.01
€575,000 JPMorgan Chase & 1.047%4/11/2032
526 0.02
€775,000 JPMorgan Chase & 1.09%11/3/2027
714 0.02
€200,000 JPMorgan Chase & 1.375%16/9/2021
182 0.01
€1,250,000 JPMorgan Chase & 1.5%26/10/2022
1,154 0.04
€300,000 JPMorgan Chase & 1.5%27/1/2025
284 0.01
€400,000 JPMorgan Chase & 1.5%29/10/2026
385 0.01
€500,000 JPMorgan Chase & 1.638%18/5/2028
478 0.02
€500,000 JPMorgan Chase & 1.812%12/6/2029
494 0.02
€350,000 JPMorgan Chase & 2.75%24/8/2022
330 0.01
€150,000 JPMorgan Chase & 2.75%1/2/2023
143 0.00
€400,000 JPMorgan Chase & 2.875%24/5/2028
427 0.01
€325,000 JPMorgan Chase & 3%19/2/2026
334 0.01
€125,000 JT International FinancialServices 1% 26/11/2029
113 0.00
€300,000 KBC 0.5% 3/12/2029 263 0.01
€500,000 KBC 0.625% 10/4/2025 457 0.02
€400,000 KBC 0.75% 1/3/2022 362 0.01
€300,000 KBC 0.75% 18/10/2023 274 0.01
€100,000 KBC 1% 26/4/2021 90 0.00
€500,000 KBC 1.125% 25/1/2024 462 0.02
€300,000 KBC 1.625% 18/9/2029 276 0.01
€350,000 Kellogg 0.8% 17/11/2022 318 0.01
€125,000 Kellogg 1.75% 24/5/2021 113 0.00
€200,000 Kennedy Wilson EuropeReal Estate 3.25%12/11/2025
172 0.01
€100,000 Kering 0.75% 13/5/2028 92 0.00
€300,000 Kering 1.25% 10/5/2026 284 0.01
€100,000 Kering 1.5% 5/4/2027 96 0.00
€275,000 Kerry Financial ServicesUnltd 0.625% 20/9/2029
245 0.01
€150,000 Kerry Financial ServicesUnltd 2.375% 10/9/2025
149 0.00
Holding orNominalValue Investment
MarketValue
£000’s
% ofTotal
NetAssets
€200,000 Kinder Morgan 1.5%16/3/2022
181 0.01
€300,000 KKR Finance V 1.625%22/5/2029
281 0.01
€300,000 Klepierre 0.625% 1/7/2030 257 0.01
€100,000 Klepierre 1% 17/4/2023 91 0.00
€400,000 Klepierre 1.25% 29/9/2031 359 0.01
€400,000 Klepierre 1.375% 16/2/2027 367 0.01
€200,000 Klepierre 2% 12/5/2029 191 0.01
€125,000 Knorr-Bremse 0.5%8/12/2021
112 0.00
€200,000 Knorr-Bremse 1.125%13/6/2025
187 0.01
€200,000 Kojamo 1.625% 7/3/2025 186 0.01
€275,000 Kojamo 1.875% 27/5/2027 258 0.01
€100,000 Koninklijke Ahold Delhaize0.25% 26/6/2025
90 0.00
€250,000 Koninklijke Ahold Delhaize0.875% 19/9/2024
231 0.01
€100,000 Koninklijke Ahold Delhaize1.125% 19/3/2026
94 0.00
€700,000 Koninklijke Ahold Delhaize1.75% 2/4/2027
684 0.02
€300,000 Koninklijke DSM 0.75%28/9/2026
280 0.01
€350,000 Koninklijke DSM 2.375%3/4/2024Ø
338 0.01
€200,000 Koninklijke KPN 0.625%9/4/2025
180 0.01
€500,000 Koninklijke KPN 1.125%11/9/2028
457 0.02
€150,000 Koninklijke KPN 4.25%1/3/2022
142 0.00
€300,000 Koninklijke KPN 5.625%30/9/2024
324 0.01
€100,000 Koninklijke Philips 0.5%6/9/2023
91 0.00
€400,000 Koninklijke Philips 1.375%30/3/2025
375 0.01
€300,000 Koninklijke Philips 1.375%2/5/2028
290 0.01
€300,000 Koninklijke Philips 2%30/3/2030
301 0.01
€150,000 La Mondiale SAM 5.05%Perpetual 17/12/2168
150 0.00
€300,000 Lansforsakringar Bank0.875% 25/9/2023
274 0.01
€125,000 LANXESS 1% 7/10/2026Ø 116 0.00
€150,000 LANXESS 2.625%21/11/2022
142 0.00
iShares Overseas Corporate Bond Index Fund (UK)
Portfolio Statement (unaudited) continued
BlackRock Collective Investment Funds 216

Holding orNominalValue Investment
MarketValue
£000’s
% ofTotal
NetAssets
€500,000 LeasePlan 1% 25/2/2022 450 0.02
€300,000 LeasePlan 1% 2/5/2023 272 0.01
€700,000 LeasePlan 3.5% 9/4/2025 698 0.02
€150,000 Leeds Building Society1.375% 5/5/2022
137 0.00
€100,000 Leeds Building Society2.625% 1/4/2021
91 0.00
€200,000 LEG Immobilien 0.875%28/11/2027
183 0.01
€200,000 LEG Immobilien 1.25%23/1/2024
184 0.01
€500,000 Legrand 0.5% 9/10/2023Ø 453 0.02
€500,000 Legrand 0.625% 24/6/2028 453 0.02
€100,000 Legrand 0.75% 20/5/2030 91 0.00
€100,000 Legrand 1.875% 6/7/2032 102 0.00
€175,000 LG Chem 0.5% 15/4/2023 155 0.00
€350,000 Liberty Mutual 2.75%4/5/2026
349 0.01
€500,000 Linde Finance 0.25%18/1/2022
449 0.02
€200,000 Linde Finance 0.25%19/5/2027
180 0.01
€100,000 Linde Finance 0.55%19/5/2032
90 0.00
€175,000 Linde Finance 1%20/4/2028
168 0.01
€100,000 Linde Finance 1.75%17/9/2020
89 0.00
€200,000 Linde Finance 1.875%22/5/2024
192 0.01
€125,000 Lloyds Bank 1% 19/11/2021 113 0.00
€300,000 Lloyds Bank 1.25%13/1/2025
285 0.01
€700,000 Lloyds Bank 1.375%8/9/2022Ø
645 0.02
€300,000 Lloyds Bank CorporateMarkets 0.25% 4/10/2022
268 0.01
€250,000 Lloyds Bank CorporateMarkets 0.375% 28/1/2025
223 0.01
€500,000 Lloyds Bank CorporateMarkets 2.375% 9/4/2026
489 0.02
€400,000 Lloyds Banking 0.5%12/11/2025
356 0.01
€512,000 Lloyds Banking 0.75%9/11/2021
461 0.02
€369,000 Lloyds Banking 1%9/11/2023
338 0.01
€500,000 Lloyds Banking 1.75%7/9/2028
453 0.02
Holding orNominalValue Investment
MarketValue
£000’s
% ofTotal
NetAssets
€500,000 Lloyds Banking 3.5%1/4/2026
503 0.02
€200,000 Lloyds Banking 4.5%18/3/2030
199 0.01
€250,000 Logicor Financing Sarl0.75% 15/7/2024
223 0.01
€450,000 Logicor Financing Sarl 1.5%14/11/2022
410 0.01
€200,000 Logicor Financing Sarl 1.5%13/7/2026
179 0.01
€500,000 Logicor Financing Sarl3.25% 13/11/2028
496 0.02
€100,000 London Stock Exchange0.875% 19/9/2024
92 0.00
€275,000 London Stock Exchange1.75% 19/9/2029
267 0.01
€275,000 Luminor Bank AS/Estonia1.375% 21/10/2022
246 0.01
€500,000 LVMH Moet Hennessy LouisVuitton 0% 11/2/2024
447 0.01
€800,000 LVMH Moet Hennessy LouisVuitton 0% 11/2/2026
711 0.02
€300,000 LVMH Moet Hennessy LouisVuitton 0.125% 28/2/2023
270 0.01
€600,000 LVMH Moet Hennessy LouisVuitton 0.125% 11/2/2028
532 0.02
€400,000 LVMH Moet Hennessy LouisVuitton 0.375% 11/2/2031
355 0.01
€325,000 LVMH Moet Hennessy LouisVuitton 0.75% 26/5/2024
299 0.01
€500,000 LVMH Moet Hennessy LouisVuitton 0.75% 7/4/2025
461 0.02
€500,000 LVMH Moet Hennessy LouisVuitton 1% 24/9/2021
451 0.02
€200,000 LYB International Finance II1.625% 17/9/2031
180 0.01
€300,000 Macquarie 0.625% 3/2/2027 267 0.01
€50,000 Macquarie Bank 6%21/9/2020
45 0.00
€200,000 Madrilena Red de GasFinance 2.25% 11/4/2029
190 0.01
€125,000 Magna International 1.5%25/9/2027
118 0.00
€100,000 Magna International 1.9%24/11/2023
94 0.00
€100,000 ManpowerGroup 1.75%22/6/2026
92 0.00
€200,000 Mapfre 1.625% 19/5/2026 193 0.01
€400,000 Mapfre 4.125% 7/9/2048 400 0.01
€150,000 Marsh & McLennan Cos1.349% 21/9/2026
142 0.00
iShares Overseas Corporate Bond Index Fund (UK)
Portfolio Statement (unaudited) continued
BlackRock Collective Investment Funds217

Holding orNominalValue Investment
MarketValue
£000’s
% ofTotal
NetAssets
€150,000 Marsh & McLennan Cos1.979% 21/3/2030
150 0.00
€300,000 Mastercard 1.1% 1/12/2022 275 0.01
€125,000 Mastercard 2.1% 1/12/2027 126 0.00
€275,000 mBank 1.058% 5/9/2022Ø 246 0.01
€500,000 McDonald’s 0.625%29/1/2024
456 0.02
€800,000 McDonald’s 0.9% 15/6/2026 742 0.03
€300,000 McDonald’s 1% 15/11/2023 277 0.01
€200,000 McDonald’s 1.5%28/11/2029
195 0.01
€200,000 McDonald’s 1.75% 3/5/2028 197 0.01
€200,000 McDonald’s 2% 1/6/2023 189 0.01
€400,000 McKesson 1.5% 17/11/2025 372 0.01
€200,000 Mediobanca Banca diCredito Finanziario 0.75%15/7/2027
173 0.01
€250,000 Mediobanca Banca diCredito Finanziario 1.125%23/4/2025
221 0.01
€200,000 Mediobanca Banca diCredito Finanziario 1.125%15/7/2025
181 0.01
€200,000 Mediobanca Banca diCredito Finanziario 1.625%7/1/2025
184 0.01
€400,000 Medtronic Global 0%2/12/2022
357 0.01
€400,000 Medtronic Global 0.25%2/7/2025
360 0.01
€875,000 Medtronic Global 0.375%7/3/2023
789 0.03
€425,000 Medtronic Global 1%2/7/2031
400 0.01
€450,000 Medtronic Global 1.125%7/3/2027
425 0.01
€400,000 Medtronic Global 1.5%2/7/2039
373 0.01
€150,000 Medtronic Global 1.625%7/3/2031
149 0.00
€300,000 Medtronic Global 1.75%2/7/2049
280 0.01
€325,000 Medtronic Global 2.25%7/3/2039
340 0.01
€100,000 Mercialys 1.787% 31/3/2023 88 0.00
€100,000 Mercialys 1.8% 27/2/2026 80 0.00
€200,000 Mercialys 4.625% 7/7/2027 181 0.01
€100,000 Merck 1.625% 25/6/2079 90 0.00
€300,000 Merck 2.875% 25/6/2079 286 0.01
€200,000 Merck 3.375% 12/12/2074Ø 193 0.01
Holding orNominalValue Investment
MarketValue
£000’s
% ofTotal
NetAssets
€1,000,000 Merck & 0.5% 2/11/2024 916 0.03
€300,000 Merck & 1.875% 15/10/2026 297 0.01
€100,000 Merck & 2.5% 15/10/2034 113 0.00
€200,000 Merck Financial Services0.005% 15/12/2023
179 0.01
€600,000 Merck Financial Services0.125% 16/7/2025
537 0.02
€100,000 Merck Financial Services0.375% 5/7/2027
90 0.00
€200,000 Merck Financial Services0.5% 16/7/2028
181 0.01
€200,000 Merck Financial Services0.875% 5/7/2031
184 0.01
€300,000 Merck Financial Services1.375% 1/9/2022
274 0.01
€300,000 Merlin Properties Socimi1.75% 26/5/2025
270 0.01
€450,000 Merlin Properties Socimi1.875% 2/11/2026
403 0.01
€200,000 Merlin Properties Socimi1.875% 4/12/2034
166 0.01
€200,000 Merlin Properties Socimi2.375% 13/7/2027
181 0.01
€400,000 METRO 1.125% 6/3/2023 359 0.01
€800,000 Metropolitan Life GlobalFunding I 0% 23/9/2022
715 0.02
€250,000 Metropolitan Life GlobalFunding I 0.375% 9/4/2024
226 0.01
€150,000 Metropolitan Life GlobalFunding I 2.375% 11/1/2023
142 0.00
€175,000 mFinance France 1.398%26/9/2020
156 0.00
€250,000 Michelin Luxembourg SCS1.75% 28/5/2027
249 0.01
€200,000 Microsoft 2.625% 2/5/2033Ø 233 0.01
€650,000 Microsoft 3.125% 6/12/2028 732 0.02
€400,000 Mitsubishi UFJ Financial0.339% 19/7/2024
359 0.01
€400,000 Mitsubishi UFJ Financial0.872% 7/9/2024
367 0.01
€500,000 Mitsubishi UFJ Financial0.978% 9/6/2024
460 0.02
€200,000 Mitsubishi UFJ Financial0.98% 9/10/2023
184 0.01
€200,000 Mizuho Financial 0.118%6/9/2024
178 0.01
€325,000 Mizuho Financial 0.402%6/9/2029
287 0.01
€500,000 Mizuho Financial 0.523%10/6/2024
453 0.02
iShares Overseas Corporate Bond Index Fund (UK)
Portfolio Statement (unaudited) continued
BlackRock Collective Investment Funds 218

Holding orNominalValue Investment
MarketValue
£000’s
% ofTotal
NetAssets
€225,000 Mizuho Financial 0.797%15/4/2030
204 0.01
€150,000 Mizuho Financial 0.956%16/10/2024
138 0.00
€600,000 Mizuho Financial 1.02%11/10/2023
550 0.02
€400,000 MMS USA Investments1.25% 13/6/2028
360 0.01
€300,000 MMS USA Investments1.75% 13/6/2031
275 0.01
€400,000 Mohawk Capital Finance1.75% 12/6/2027
332 0.01
€275,000 Mohawk Industries 2%14/1/2022
239 0.01
€175,000 Molnlycke 0.875% 5/9/2029 152 0.00
€125,000 Molnlycke 1.5% 28/2/2022 114 0.00
€150,000 Molnlycke 1.75% 28/2/2024 140 0.00
€125,000 Molnlycke 1.875%28/2/2025
117 0.00
€300,000 Molson Coors Beverage1.25% 15/7/2024
269 0.01
€100,000 Mondelez International 1%7/3/2022
91 0.00
€175,000 Mondelez International1.625% 20/1/2023
162 0.01
€200,000 Mondelez International1.625% 8/3/2027
193 0.01
€200,000 Mondelez International2.375% 6/3/2035
204 0.01
€175,000 Mondelez InternationalNetherlands 0.875%1/10/2031
161 0.01
€700,000 Mondi Finance 1.625%27/4/2026
664 0.02
€200,000 Moody’s 0.95% 25/2/2030 187 0.01
€300,000 Moody’s 1.75% 9/3/2027 293 0.01
€600,000 Morgan Stanley 0.637%26/7/2024
542 0.02
€300,000 Morgan Stanley 1%2/12/2022
274 0.01
€500,000 Morgan Stanley 1.342%23/10/2026
468 0.02
€500,000 Morgan Stanley 1.375%27/10/2026
473 0.02
€900,000 Morgan Stanley 1.75%11/3/2024
849 0.03
€225,000 Morgan Stanley 1.75%30/1/2025
214 0.01
€400,000 Morgan Stanley 1.875%30/3/2023
374 0.01
Holding orNominalValue Investment
MarketValue
£000’s
% ofTotal
NetAssets
€600,000 Morgan Stanley 1.875%27/4/2027
589 0.02
€325,000 Motability Operations0.875% 14/3/2025
303 0.01
€125,000 Motability Operations1.625% 9/6/2023
117 0.00
€300,000 MuenchenerRueckversicherungs-Gesellschaft in Muenchen3.25% 26/5/2049
309 0.01
€300,000 MuenchenerRueckversicherungs-Gesellschaft in Muenchen6.25% 26/5/2042
294 0.01
€500,000 MUFG Bank 0.875%11/3/2022
454 0.02
€275,000 Mylan 2.25% 22/11/2024 261 0.01
€200,000 Mylan 3.125% 22/11/2028 204 0.01
€350,000 Nasdaq 0.875% 13/2/2030 315 0.01
€125,000 Nasdaq 1.75% 19/5/2023 116 0.00
€300,000 National Australia Bank0.25% 20/5/2024
271 0.01
€500,000 National Australia Bank0.35% 7/9/2022
451 0.02
€875,000 National Australia Bank0.625% 30/8/2023
798 0.03
€400,000 National Australia Bank0.625% 10/11/2023
365 0.01
€100,000 National Australia Bank1.125% 20/5/2031
97 0.00
€500,000 National Australia Bank1.375% 30/8/2028
489 0.02
€250,000 National Australia Bank2.75% 8/8/2022
236 0.01
€175,000 National Grid ElectricityTransmission 0.19%20/1/2025
157 0.00
€250,000 National Grid ElectricityTransmission 0.823%7/7/2032
227 0.01
€200,000 National Grid North America0.75% 11/2/2022
180 0.01
€100,000 National Grid North America1% 12/7/2024
92 0.00
€400,000 Nationale-NederlandenBank NV/The Netherlands0.375% 26/2/2025
358 0.01
€100,000 Nationale-NederlandenLevensverzekeringMaatschappij 9% 29/8/2042
104 0.00
iShares Overseas Corporate Bond Index Fund (UK)
Portfolio Statement (unaudited) continued
BlackRock Collective Investment Funds219

Holding orNominalValue Investment
MarketValue
£000’s
% ofTotal
NetAssets
€275,000 Nationwide Building Society0.25% 22/7/2025
246 0.01
€375,000 Nationwide Building Society0.625% 19/4/2023
341 0.01
€275,000 Nationwide Building Society1.125% 3/6/2022
251 0.01
€125,000 Nationwide Building Society1.25% 3/3/2025
118 0.00
€500,000 Nationwide Building Society1.5% 8/3/2026
470 0.02
€125,000 Nationwide Building Society2% 25/7/2029
115 0.00
€400,000 Naturgy Capital Markets1.125% 11/4/2024
369 0.01
€300,000 Naturgy Finance 0.75%28/11/2029
272 0.01
€800,000 Naturgy Finance 0.875%15/5/2025
738 0.03
€300,000 Naturgy Finance 1.25%15/1/2026
281 0.01
€200,000 Naturgy Finance 1.25%19/4/2026
188 0.01
€400,000 Naturgy Finance 1.375%19/1/2027
379 0.01
€300,000 Naturgy Finance 1.875%5/10/2029
299 0.01
€200,000 Naturgy Finance 2.875%11/3/2024
196 0.01
€700,000 Natwest 1.75% 2/3/2026 653 0.02
€850,000 Natwest 2% 8/3/2023 779 0.03
€200,000 Natwest 2.5% 22/3/2023 188 0.01
€600,000 NatWest Markets 0.625%2/3/2022
539 0.02
€250,000 NatWest Markets 1.125%14/6/2023
228 0.01
€1,000,000 NatWest Markets 2.75%2/4/2025
976 0.03
€500,000 NE Property 2.625%22/5/2023Ø
454 0.02
€300,000 NE Property 3.375%14/7/2027
270 0.01
€425,000 Nestle 0.875% 18/7/2025 398 0.01
€750,000 Nestle Finance International0.125% 12/11/2027
673 0.02
€275,000 Nestle Finance International0.375% 12/5/2032
248 0.01
€300,000 Nestle Finance International0.75% 16/5/2023
275 0.01
€500,000 Nestle Finance International1.125% 1/4/2026
475 0.02
Holding orNominalValue Investment
MarketValue
£000’s
% ofTotal
NetAssets
€500,000 Nestle Finance International1.5% 1/4/2030
500 0.02
€600,000 Nestle Finance International1.75% 12/9/2022
557 0.02
€200,000 Nestle Finance International1.75% 2/11/2037
216 0.01
€325,000 New York Life GlobalFunding 0.25% 23/1/2027
288 0.01
€125,000 NGG Finance 1.625%5/12/2079
111 0.00
€475,000 NGG Finance 2.125%5/9/2082
427 0.01
€500,000 NIBC Bank 0.875%8/7/2025
442 0.01
€100,000 NN 1% 18/3/2022 91 0.00
€300,000 NN 1.625% 1/6/2027 289 0.01
€400,000 NN 4.375% Perpetual13/6/2169
391 0.01
€150,000 NN 4.5% Perpetual15/7/2169
150 0.00
€250,000 NN 4.625% 8/4/2044 251 0.01
€425,000 NN 4.625% 13/1/2048 447 0.01
€150,000 Nordea Bank 0.375%28/5/2026
137 0.00
€800,000 Nordea Bank 0.5%14/5/2027
732 0.02
€300,000 Nordea Bank 0.875%26/6/2023
275 0.01
€700,000 Nordea Bank 1% 22/2/2023 641 0.02
€200,000 Nordea Bank 1% 7/9/2026 179 0.01
€400,000 Nordea Bank 1% 27/6/2029 355 0.01
€350,000 Nordea Bank 1.125%12/2/2025
330 0.01
€200,000 Nordea Bank 3.25%5/7/2022
190 0.01
€100,000 Norsk Hydro 1.125%11/4/2025
87 0.00
€125,000 Norsk Hydro 2% 11/4/2029 103 0.00
€350,000 NorteGas EnergiaDistribucion 2.065%28/9/2027
337 0.01
€500,000 Novartis Finance 0.125%20/9/2023
451 0.02
€500,000 Novartis Finance 0.75%9/11/2021
452 0.02
€900,000 Novartis Finance 1.125%30/9/2027
867 0.03
€325,000 Novartis Finance 1.375%14/8/2030
322 0.01
iShares Overseas Corporate Bond Index Fund (UK)
Portfolio Statement (unaudited) continued
BlackRock Collective Investment Funds 220

Holding orNominalValue Investment
MarketValue
£000’s
% ofTotal
NetAssets
€500,000 Novartis Finance 1.625%9/11/2026
493 0.02
€350,000 Nykredit Realkredit 0.125%10/7/2024
307 0.01
€775,000 Nykredit Realkredit 0.25%20/1/2023
691 0.02
€175,000 Nykredit Realkredit 0.75%14/7/2021
157 0.00
€325,000 Nykredit Realkredit 0.75%20/1/2027
290 0.01
€200,000 Nykredit Realkredit 2.75%17/11/2027
186 0.01
€100,000 O2 Telefonica DeutschlandFinanzierungs 1.75%5/7/2025
94 0.00
€100,000 Omnicom Finance 0.8%8/7/2027
89 0.00
€200,000 Omnicom Finance 1.4%8/7/2031
185 0.01
€500,000 OMV 0% 16/6/2023 446 0.01
€100,000 OMV 0% 3/7/2025 89 0.00
€250,000 OMV 0.75% 4/12/2023 228 0.01
€175,000 OMV 0.75% 16/6/2030 157 0.00
€125,000 OMV 1% 14/12/2026 117 0.00
€375,000 OMV 1% 3/7/2034 333 0.01
€1,025,000 OMV 2% 9/4/2028 1,019 0.03
€100,000 OMV 2.5% Perpetual1/9/2169
89 0.00
€300,000 OMV 2.625% 27/9/2022 282 0.01
€300,000 OMV 2.875% Perpetual19/6/2169
273 0.01
€100,000 OMV 2.875% Perpetual1/9/2169
89 0.00
€200,000 OMV 5.25% Perpetual9/12/2168
187 0.01
€150,000 OMV 6.25% Perpetual9/12/2168
159 0.01
€800,000 OP Corporate Bank 0.125%1/7/2024
718 0.02
€600,000 OP Corporate Bank 0.375%26/2/2024
545 0.02
€350,000 OP Corporate Bank 0.5%12/8/2025
319 0.01
€500,000 OP Corporate Bank 0.625%12/11/2029
448 0.01
€500,000 OP Corporate Bank 0.75%3/3/2022
453 0.02
€100,000 Oracle 3.125% 10/7/2025 102 0.00
€200,000 Orange 0% 4/9/2026 177 0.01
€300,000 Orange 0.5% 4/9/2032 262 0.01
Holding orNominalValue Investment
MarketValue
£000’s
% ofTotal
NetAssets
€500,000 Orange 0.875% 3/2/2027 465 0.02
€400,000 Orange 1.125% 15/7/2024 371 0.01
€500,000 Orange 1.25% 7/7/2027 476 0.02
€500,000 Orange 1.375% 20/3/2028 482 0.02
€200,000 Orange 1.375% 16/1/2030 196 0.01
€300,000 Orange 1.375% 4/9/2049 267 0.01
€400,000 Orange 1.5% 9/9/2027 387 0.01
€400,000 Orange 1.625% 7/4/2032 396 0.01
€100,000 Orange 1.75% Perpetual19/3/2169
90 0.00
€300,000 Orange 1.875% 12/9/2030 306 0.01
€300,000 Orange 2% 15/1/2029 305 0.01
€500,000 Orange 2.375% Perpetual15/4/2169
461 0.02
€700,000 Orange 2.5% 1/3/2023 665 0.02
€200,000 Orange 3% 15/6/2022 189 0.01
€100,000 Orange 3.125% 9/1/2024 99 0.00
€400,000 Orange 3.375% 16/9/2022 382 0.01
€125,000 Orange 5% Perpetual1/10/2168
132 0.00
€500,000 Orange 5.25% Perpetual7/2/2169
504 0.02
€400,000 Orange 8.125% 28/1/2033 659 0.02
€150,000 Origin Energy Finance 1%17/9/2029
132 0.00
€100,000 Origin Energy Finance 2.5%23/10/2020
90 0.00
€200,000 Origin Energy Finance 3.5%4/10/2021
184 0.01
€150,000 ORLEN Capital 2.5%30/6/2021
136 0.00
€300,000 OTE 0.875% 24/9/2026 268 0.01
€175,000 PACCAR Financial Europe0.125% 7/3/2022
156 0.00
€125,000 Parker-Hannifin 1.125%1/3/2025
113 0.00
€325,000 PartnerRe Ireland FinanceDAC 1.25% 15/9/2026
300 0.01
€400,000 PepsiCo 0.5% 6/5/2028 366 0.01
€125,000 PepsiCo 0.75% 18/3/2027 117 0.00
€200,000 PepsiCo 0.875% 18/7/2028 189 0.01
€200,000 PepsiCo 0.875% 16/10/2039 183 0.01
€150,000 PepsiCo 1.125% 18/3/2031 145 0.00
€150,000 PepsiCo 1.75% 28/4/2021 135 0.00
€100,000 PepsiCo 2.625% 28/4/2026 103 0.00
€175,000 PerkinElmer 0.6% 9/4/2021 156 0.00
€200,000 PerkinElmer 1.875%19/7/2026
187 0.01
iShares Overseas Corporate Bond Index Fund (UK)
Portfolio Statement (unaudited) continued
BlackRock Collective Investment Funds221

Holding orNominalValue Investment
MarketValue
£000’s
% ofTotal
NetAssets
€600,000 Pernod Ricard 0%24/10/2023
535 0.02
€200,000 Pernod Ricard 0.5%24/10/2027
181 0.01
€200,000 Pernod Ricard 0.875%24/10/2031
182 0.01
€200,000 Pernod Ricard 1.125%7/4/2025
186 0.01
€100,000 Pernod Ricard 1.5%18/5/2026
95 0.00
€500,000 Pernod Ricard 1.75%8/4/2030
493 0.02
€500,000 Pernod Ricard 2.125%27/9/2024
481 0.02
€150,000 Peugeot 2% 23/3/2024 138 0.00
€600,000 Peugeot 2% 20/3/2025 548 0.02
€150,000 Peugeot 2.375% 14/4/2023 138 0.00
€700,000 Peugeot 2.75% 15/5/2026 660 0.02
€225,000 Pfizer 0.25% 6/3/2022 202 0.01
€175,000 Pfizer 1% 6/3/2027 165 0.01
€275,000 Philip Morris International0.8% 1/8/2031
239 0.01
€200,000 Philip Morris International1.45% 1/8/2039
172 0.01
€300,000 Philip Morris International1.875% 6/11/2037
279 0.01
€250,000 Philip Morris International2% 9/5/2036
238 0.01
€100,000 Philip Morris International2.75% 19/3/2025
99 0.00
€100,000 Philip Morris International2.875% 30/5/2024
99 0.00
€200,000 Philip Morris International2.875% 3/3/2026
203 0.01
€100,000 Philip Morris International3.125% 3/6/2033
108 0.00
€300,000 Phoenix 4.375% 24/1/2029 296 0.01
€500,000 POSCO 0.5% 17/1/2024 439 0.01
€100,000 PostNL 0.625% 23/9/2026 89 0.00
€175,000 PostNL 1% 21/11/2024 159 0.01
€100,000 PPG Industries 0.875%3/11/2025
92 0.00
€200,000 PPG Industries 1.4%13/3/2027
186 0.01
€400,000 Praxair 1.2% 12/2/2024 373 0.01
€100,000 Procter & Gamble 0.5%25/10/2024
92 0.00
€125,000 Procter & Gamble 0.625%30/10/2024
115 0.00
Holding orNominalValue Investment
MarketValue
£000’s
% ofTotal
NetAssets
€250,000 Procter & Gamble 1.125%2/11/2023
233 0.01
€375,000 Procter & Gamble 1.2%30/10/2028
366 0.01
€150,000 Procter & Gamble 1.25%25/10/2029Ø
148 0.00
€125,000 Procter & Gamble 1.875%30/10/2038
136 0.00
€1,100,000 Procter & Gamble 2%16/8/2022
1,026 0.03
€100,000 Procter & Gamble 4.875%11/5/2027
119 0.00
€100,000 Prologis Euro Finance0.25% 10/9/2027
88 0.00
€175,000 Prologis Euro Finance0.375% 6/2/2028
156 0.00
€500,000 Prologis Euro Finance0.625% 10/9/2031
438 0.01
€275,000 Prologis Euro Finance 1%6/2/2035
246 0.01
€100,000 Prologis Euro Finance 1.5%10/9/2049
87 0.00
€125,000 Prologis InternationalFunding II 0.875% 9/7/2029
114 0.00
€275,000 Prologis InternationalFunding II 2.375%14/11/2030
284 0.01
€200,000 Prologis InternationalFunding II 2.875% 4/4/2022
186 0.01
€300,000 Prologis LP 3% 2/6/2026 310 0.01
€100,000 Prologis LP 3.375%20/2/2024
99 0.00
€400,000 Prosegur Cash 1.375%4/2/2026
364 0.01
€100,000 Prosegur Cia de Seguridad1% 8/2/2023
90 0.00
€250,000 Prosus 1.539% 3/8/2028 225 0.01
€175,000 Prosus 2.031% 3/8/2032 158 0.00
€125,000 PSA Banque France 0.5%12/4/2022
112 0.00
€200,000 PSA Banque France 0.625%21/6/2024
179 0.01
€100,000 PSA Tresorerie GIE 6%19/9/2033
123 0.00
€300,000 Public Storage 0.875%24/1/2032
264 0.01
€200,000 Publicis Groupe 1.125%16/12/2021
181 0.01
€200,000 Publicis Groupe 1.625%16/12/2024
189 0.01
€200,000 PVH 3.125% 15/12/2027 171 0.01
iShares Overseas Corporate Bond Index Fund (UK)
Portfolio Statement (unaudited) continued
BlackRock Collective Investment Funds 222
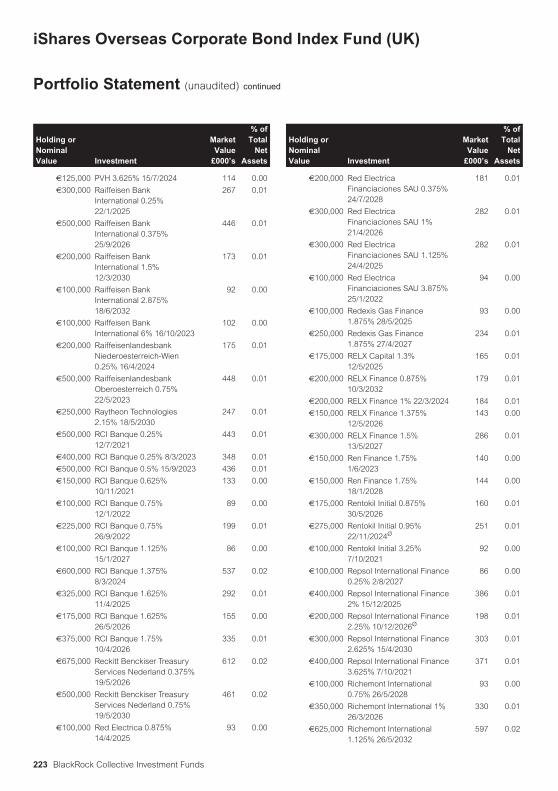
Holding orNominalValue Investment
MarketValue
£000’s
% ofTotal
NetAssets
€125,000 PVH 3.625% 15/7/2024 114 0.00
€300,000 Raiffeisen BankInternational 0.25%22/1/2025
267 0.01
€500,000 Raiffeisen BankInternational 0.375%25/9/2026
446 0.01
€200,000 Raiffeisen BankInternational 1.5%12/3/2030
173 0.01
€100,000 Raiffeisen BankInternational 2.875%18/6/2032
92 0.00
€100,000 Raiffeisen BankInternational 6% 16/10/2023
102 0.00
€200,000 RaiffeisenlandesbankNiederoesterreich-Wien0.25% 16/4/2024
175 0.01
€500,000 RaiffeisenlandesbankOberoesterreich 0.75%22/5/2023
448 0.01
€250,000 Raytheon Technologies2.15% 18/5/2030
247 0.01
€500,000 RCI Banque 0.25%12/7/2021
443 0.01
€400,000 RCI Banque 0.25% 8/3/2023 348 0.01
€500,000 RCI Banque 0.5% 15/9/2023 436 0.01
€150,000 RCI Banque 0.625%10/11/2021
133 0.00
€100,000 RCI Banque 0.75%12/1/2022
89 0.00
€225,000 RCI Banque 0.75%26/9/2022
199 0.01
€100,000 RCI Banque 1.125%15/1/2027
86 0.00
€600,000 RCI Banque 1.375%8/3/2024
537 0.02
€325,000 RCI Banque 1.625%11/4/2025
292 0.01
€175,000 RCI Banque 1.625%26/5/2026
155 0.00
€375,000 RCI Banque 1.75%10/4/2026
335 0.01
€675,000 Reckitt Benckiser TreasuryServices Nederland 0.375%19/5/2026
612 0.02
€500,000 Reckitt Benckiser TreasuryServices Nederland 0.75%19/5/2030
461 0.02
€100,000 Red Electrica 0.875%14/4/2025
93 0.00
Holding orNominalValue Investment
MarketValue
£000’s
% ofTotal
NetAssets
€200,000 Red ElectricaFinanciaciones SAU 0.375%24/7/2028
181 0.01
€300,000 Red ElectricaFinanciaciones SAU 1%21/4/2026
282 0.01
€300,000 Red ElectricaFinanciaciones SAU 1.125%24/4/2025
282 0.01
€100,000 Red ElectricaFinanciaciones SAU 3.875%25/1/2022
94 0.00
€100,000 Redexis Gas Finance1.875% 28/5/2025
93 0.00
€250,000 Redexis Gas Finance1.875% 27/4/2027
234 0.01
€175,000 RELX Capital 1.3%12/5/2025
165 0.01
€200,000 RELX Finance 0.875%10/3/2032
179 0.01
€200,000 RELX Finance 1% 22/3/2024 184 0.01
€150,000 RELX Finance 1.375%12/5/2026
143 0.00
€300,000 RELX Finance 1.5%13/5/2027
286 0.01
€150,000 Ren Finance 1.75%1/6/2023
140 0.00
€150,000 Ren Finance 1.75%18/1/2028
144 0.00
€175,000 Rentokil Initial 0.875%30/5/2026
160 0.01
€275,000 Rentokil Initial 0.95%22/11/2024Ø
251 0.01
€100,000 Rentokil Initial 3.25%7/10/2021
92 0.00
€100,000 Repsol International Finance0.25% 2/8/2027
86 0.00
€400,000 Repsol International Finance2% 15/12/2025
386 0.01
€200,000 Repsol International Finance2.25% 10/12/2026Ø
198 0.01
€300,000 Repsol International Finance2.625% 15/4/2030
303 0.01
€400,000 Repsol International Finance3.625% 7/10/2021
371 0.01
€100,000 Richemont International0.75% 26/5/2028
93 0.00
€350,000 Richemont International 1%26/3/2026
330 0.01
€625,000 Richemont International1.125% 26/5/2032
597 0.02
iShares Overseas Corporate Bond Index Fund (UK)
Portfolio Statement (unaudited) continued
BlackRock Collective Investment Funds223

Holding orNominalValue Investment
MarketValue
£000’s
% ofTotal
NetAssets
€325,000 Richemont International1.5% 26/3/2030
321 0.01
€175,000 Richemont International1.625% 26/5/2040
169 0.01
€350,000 Richemont International 2%26/3/2038
362 0.01
€200,000 Rio Tinto Finance 2.875%11/12/2024
200 0.01
€275,000 Roadster Finance DAC2.375% 8/12/2032
240 0.01
€200,000 Robert Bosch InvestmentNederland 1.625%24/5/2021
181 0.01
€100,000 Robert Bosch InvestmentNederland 2.625%24/5/2028
106 0.00
€300,000 Roche Finance Europe0.5% 27/2/2023
272 0.01
€400,000 Roche Finance Europe0.875% 25/2/2025
374 0.01
€600,000 Royal Bank of Canada0.125% 23/7/2024
537 0.02
€200,000 Royal Bank of Canada0.25% 2/5/2024
180 0.01
€200,000 Royal Mail 1.25% 8/10/2026 174 0.01
€200,000 Royal Mail 2.375%29/7/2024
189 0.01
€650,000 Ryanair DAC 1.125%10/3/2023
557 0.02
€350,000 Sagax 2% 17/1/2024 319 0.01
€150,000 Sagax 2.25% 13/3/2025 137 0.00
€175,000 Samhallsbyggnadsbolaget iNorden 1% 12/8/2027
147 0.00
€350,000 Samhallsbyggnadsbolaget iNorden 1.75% 14/1/2025
316 0.01
€500,000 Sampo 1% 18/9/2023 460 0.02
€125,000 Sampo 1.5% 16/9/2021 113 0.00
€250,000 Sampo 2.25% 27/9/2030 258 0.01
€350,000 Sampo 3.375% 23/5/2049 345 0.01
€300,000 SANEF 1.875% 16/3/2026 277 0.01
€300,000 Sanofi 0% 13/9/2022 269 0.01
€500,000 Sanofi 0.5% 21/3/2023 454 0.02
€300,000 Sanofi 0.5% 13/1/2027 276 0.01
€200,000 Sanofi 0.625% 5/4/2024 184 0.01
€500,000 Sanofi 0.875% 22/9/2021 450 0.02
€300,000 Sanofi 0.875% 21/3/2029 284 0.01
€800,000 Sanofi 1% 21/3/2026 756 0.03
€400,000 Sanofi 1.125% 5/4/2028 387 0.01
€200,000 Sanofi 1.25% 21/3/2034 200 0.01
€400,000 Sanofi 1.375% 21/3/2030 398 0.01
Holding orNominalValue Investment
MarketValue
£000’s
% ofTotal
NetAssets
€400,000 Sanofi 1.5% 22/9/2025 385 0.01
€500,000 Sanofi 1.5% 1/4/2030 500 0.02
€500,000 Sanofi 1.75% 10/9/2026 494 0.02
€300,000 Sanofi 1.875% 21/3/2038Ø 324 0.01
€600,000 Santander Consumer Bank0.125% 25/2/2025
526 0.02
€400,000 Santander Consumer Bank0.75% 17/10/2022Ø
361 0.01
€400,000 Santander ConsumerFinance 0.375% 27/6/2024
357 0.01
€200,000 Santander ConsumerFinance 0.375% 17/1/2025
178 0.01
€200,000 Santander ConsumerFinance 0.5% 14/11/2026
178 0.01
€400,000 Santander ConsumerFinance 0.875% 24/1/2022
361 0.01
€400,000 Santander ConsumerFinance 1% 27/2/2024
365 0.01
€300,000 Santander UK 0.391%28/2/2025
266 0.01
€125,000 Santander UK 0.875%25/11/2020
112 0.00
€300,000 Santander UK 1.125%14/1/2022
272 0.01
€300,000 Santander UK 1.125%8/9/2023
274 0.01
€500,000 SAP 0.25% 10/3/2022 449 0.02
€700,000 SAP 0.375% 18/5/2029 632 0.02
€400,000 SAP 0.75% 10/12/2024 369 0.01
€200,000 SAP 1% 13/3/2026 188 0.01
€150,000 SAP 1.125% 20/2/2023 138 0.00
€500,000 SAP 1.25% 10/3/2028 483 0.02
€200,000 SAP 1.375% 13/3/2030 197 0.01
€500,000 SAP 1.75% 22/2/2027 494 0.02
€175,000 SATO 1.375% 31/5/2024 154 0.00
€100,000 Scania 2.25% 3/6/2025 93 0.00
€175,000 Scentre Trust 1 / ScentreTrust 2 1.375% 22/3/2023
158 0.00
€300,000 Scentre Trust 2 3.25%11/9/2023
286 0.01
€300,000 Schlumberger Finance0.25% 15/10/2027
258 0.01
€150,000 Schlumberger Finance 0.5%15/10/2031
126 0.00
€425,000 Schlumberger Finance1.375% 28/10/2026
395 0.01
€400,000 Schlumberger Finance 2%6/5/2032
384 0.01
€300,000 Schlumberger FinanceFrance SAS 1% 18/2/2026
274 0.01
iShares Overseas Corporate Bond Index Fund (UK)
Portfolio Statement (unaudited) continued
BlackRock Collective Investment Funds 224

Holding orNominalValue Investment
MarketValue
£000’s
% ofTotal
NetAssets
€800,000 Schneider Electric 0%12/6/2023
716 0.02
€100,000 Schneider Electric 0.25%11/3/2029
89 0.00
€700,000 Schneider Electric 0.875%11/3/2025Ø
649 0.02
€100,000 Schneider Electric 1%9/4/2027
94 0.00
€100,000 Schneider Electric 1.375%21/6/2027
97 0.00
€400,000 Schneider Electric 1.5%8/9/2023
373 0.01
€300,000 Schneider Electric 1.5%15/1/2028
293 0.01
€200,000 Schneider Electric 2.5%6/9/2021
183 0.01
€200,000 SCOR 3% 8/6/2046 200 0.01
€100,000 SCOR 3.625% 27/5/2048 105 0.00
€100,000 Securitas 1.25% 6/3/2025 92 0.00
€100,000 SELP Finance Sarl 1.25%25/10/2023
91 0.00
€275,000 SELP Finance Sarl 1.5%20/11/2025
252 0.01
€375,000 SES 1.625% 22/3/2026 340 0.01
€150,000 Shell International Finance0.125% 8/11/2027
133 0.00
€700,000 Shell International Finance0.375% 15/2/2025
638 0.02
€225,000 Shell International Finance0.5% 8/11/2031
197 0.01
€400,000 Shell International Finance0.75% 15/8/2028
370 0.01
€300,000 Shell International Finance0.875% 8/11/2039
254 0.01
€600,000 Shell International Finance1% 6/4/2022
546 0.02
€800,000 Shell International Finance1.125% 7/4/2024
745 0.03
€250,000 Shell International Finance1.25% 12/5/2028
239 0.01
€500,000 Shell International Finance1.25% 11/11/2032
470 0.02
€700,000 Shell International Finance1.5% 7/4/2028
681 0.02
€500,000 Shell International Finance1.875% 15/9/2025
490 0.02
€500,000 Shell International Finance1.875% 7/4/2032
501 0.02
€250,000 Shell International Finance2.5% 24/3/2026
255 0.01
Holding orNominalValue Investment
MarketValue
£000’s
% ofTotal
NetAssets
€500,000 Shinhan Bank 0.25%16/10/2024
435 0.01
€300,000 SiemensFinancieringsmaatschappij0% 5/9/2021
268 0.01
€1,000,000 SiemensFinancieringsmaatschappij0% 20/2/2023
895 0.03
€225,000 SiemensFinancieringsmaatschappij0% 5/9/2024
201 0.01
€600,000 SiemensFinancieringsmaatschappij0% 20/2/2026
534 0.02
€500,000 SiemensFinancieringsmaatschappij0.125% 5/9/2029
441 0.01
€700,000 SiemensFinancieringsmaatschappij0.25% 5/6/2024
631 0.02
€500,000 SiemensFinancieringsmaatschappij0.25% 20/2/2029
445 0.01
€300,000 SiemensFinancieringsmaatschappij0.3% 28/2/2024
272 0.01
€300,000 SiemensFinancieringsmaatschappij0.375% 6/9/2023
271 0.01
€200,000 SiemensFinancieringsmaatschappij0.375% 5/6/2026
181 0.01
€400,000 SiemensFinancieringsmaatschappij0.5% 20/2/2032
361 0.01
€200,000 SiemensFinancieringsmaatschappij0.5% 5/9/2034
174 0.01
€400,000 SiemensFinancieringsmaatschappij0.9% 28/2/2028
376 0.01
€300,000 SiemensFinancieringsmaatschappij1% 6/9/2027
285 0.01
€375,000 SiemensFinancieringsmaatschappij1.375% 6/9/2030
368 0.01
€200,000 SiemensFinancieringsmaatschappij1.75% 28/2/2039
204 0.01
€125,000 Sigma Alimentos de 2.625%7/2/2024
115 0.00
iShares Overseas Corporate Bond Index Fund (UK)
Portfolio Statement (unaudited) continued
BlackRock Collective Investment Funds225
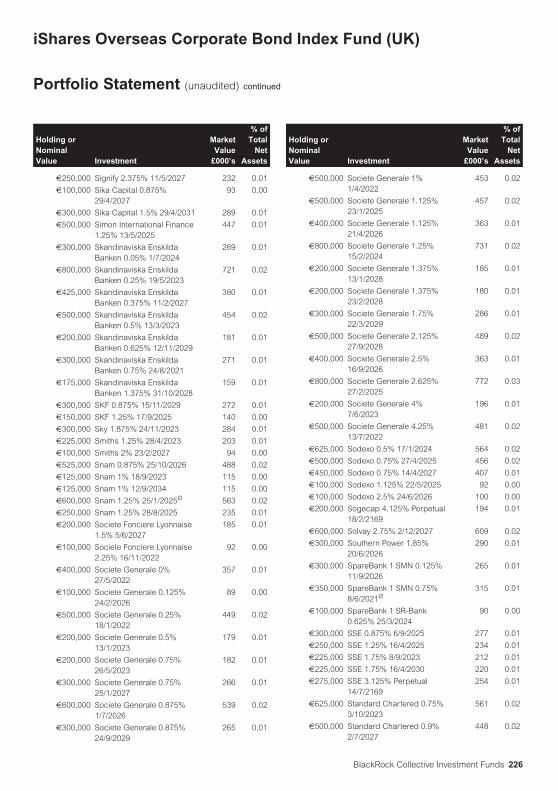
Holding orNominalValue Investment
MarketValue
£000’s
% ofTotal
NetAssets
€250,000 Signify 2.375% 11/5/2027 232 0.01
€100,000 Sika Capital 0.875%29/4/2027
93 0.00
€300,000 Sika Capital 1.5% 29/4/2031 289 0.01
€500,000 Simon International Finance1.25% 13/5/2025
447 0.01
€300,000 Skandinaviska EnskildaBanken 0.05% 1/7/2024
269 0.01
€800,000 Skandinaviska EnskildaBanken 0.25% 19/5/2023
721 0.02
€425,000 Skandinaviska EnskildaBanken 0.375% 11/2/2027
380 0.01
€500,000 Skandinaviska EnskildaBanken 0.5% 13/3/2023
454 0.02
€200,000 Skandinaviska EnskildaBanken 0.625% 12/11/2029
181 0.01
€300,000 Skandinaviska EnskildaBanken 0.75% 24/8/2021
271 0.01
€175,000 Skandinaviska EnskildaBanken 1.375% 31/10/2028
159 0.01
€300,000 SKF 0.875% 15/11/2029 272 0.01
€150,000 SKF 1.25% 17/9/2025 140 0.00
€300,000 Sky 1.875% 24/11/2023 284 0.01
€225,000 Smiths 1.25% 28/4/2023 203 0.01
€100,000 Smiths 2% 23/2/2027 94 0.00
€525,000 Snam 0.875% 25/10/2026 488 0.02
€125,000 Snam 1% 18/9/2023 115 0.00
€125,000 Snam 1% 12/9/2034 115 0.00
€600,000 Snam 1.25% 25/1/2025Ø 563 0.02
€250,000 Snam 1.25% 28/8/2025 235 0.01
€200,000 Societe Fonciere Lyonnaise1.5% 5/6/2027
185 0.01
€100,000 Societe Fonciere Lyonnaise2.25% 16/11/2022
92 0.00
€400,000 Societe Generale 0%27/5/2022
357 0.01
€100,000 Societe Generale 0.125%24/2/2026
89 0.00
€500,000 Societe Generale 0.25%18/1/2022
449 0.02
€200,000 Societe Generale 0.5%13/1/2023
179 0.01
€200,000 Societe Generale 0.75%26/5/2023
182 0.01
€300,000 Societe Generale 0.75%25/1/2027
266 0.01
€600,000 Societe Generale 0.875%1/7/2026
539 0.02
€300,000 Societe Generale 0.875%24/9/2029
265 0.01
Holding orNominalValue Investment
MarketValue
£000’s
% ofTotal
NetAssets
€500,000 Societe Generale 1%1/4/2022
453 0.02
€500,000 Societe Generale 1.125%23/1/2025
457 0.02
€400,000 Societe Generale 1.125%21/4/2026
363 0.01
€800,000 Societe Generale 1.25%15/2/2024
731 0.02
€200,000 Societe Generale 1.375%13/1/2028
185 0.01
€200,000 Societe Generale 1.375%23/2/2028
180 0.01
€300,000 Societe Generale 1.75%22/3/2029
286 0.01
€500,000 Societe Generale 2.125%27/9/2028
489 0.02
€400,000 Societe Generale 2.5%16/9/2026
363 0.01
€800,000 Societe Generale 2.625%27/2/2025
772 0.03
€200,000 Societe Generale 4%7/6/2023
196 0.01
€500,000 Societe Generale 4.25%13/7/2022
481 0.02
€625,000 Sodexo 0.5% 17/1/2024 564 0.02
€500,000 Sodexo 0.75% 27/4/2025 456 0.02
€450,000 Sodexo 0.75% 14/4/2027 407 0.01
€100,000 Sodexo 1.125% 22/5/2025 92 0.00
€100,000 Sodexo 2.5% 24/6/2026 100 0.00
€200,000 Sogecap 4.125% Perpetual18/2/2169
194 0.01
€600,000 Solvay 2.75% 2/12/2027 609 0.02
€300,000 Southern Power 1.85%20/6/2026
290 0.01
€300,000 SpareBank 1 SMN 0.125%11/9/2026
265 0.01
€350,000 SpareBank 1 SMN 0.75%8/6/2021Ø
315 0.01
€100,000 SpareBank 1 SR-Bank0.625% 25/3/2024
90 0.00
€300,000 SSE 0.875% 6/9/2025 277 0.01
€250,000 SSE 1.25% 16/4/2025 234 0.01
€225,000 SSE 1.75% 8/9/2023 212 0.01
€225,000 SSE 1.75% 16/4/2030 220 0.01
€275,000 SSE 3.125% Perpetual14/7/2169
254 0.01
€625,000 Standard Chartered 0.75%3/10/2023
561 0.02
€500,000 Standard Chartered 0.9%2/7/2027
448 0.02
iShares Overseas Corporate Bond Index Fund (UK)
Portfolio Statement (unaudited) continued
BlackRock Collective Investment Funds 226

Holding orNominalValue Investment
MarketValue
£000’s
% ofTotal
NetAssets
€125,000 Standard Chartered 1.625%3/10/2027
117 0.00
€250,000 Standard Chartered 2.5%9/9/2030
231 0.01
€500,000 Standard Chartered 3.625%23/11/2022
478 0.02
€125,000 Stockland Trust 1.625%27/4/2026
111 0.00
€300,000 Stora Enso 2.5% 21/3/2028Ø 290 0.01
€125,000 Stryker 0.25% 3/12/2024 112 0.00
€225,000 Stryker 0.75% 1/3/2029 202 0.01
€150,000 Stryker 1% 3/12/2031 135 0.00
€325,000 Stryker 1.125% 30/11/2023 300 0.01
€300,000 Stryker 2.125% 30/11/2027 299 0.01
€250,000 Stryker 2.625% 30/11/2030 262 0.01
€500,000 Sudzucker InternationalFinance 1.25% 29/11/2023
450 0.02
€400,000 Suez 0.5% 14/10/2031 352 0.01
€200,000 Suez 1% 3/4/2025 185 0.01
€500,000 Suez 1.25% 2/4/2027 471 0.02
€200,000 Suez 1.25% 14/5/2035 185 0.01
€100,000 Suez 1.5% 3/4/2029 97 0.00
€200,000 Suez 1.625% 17/9/2030 197 0.01
€200,000 Suez 1.625% 21/9/2032 198 0.01
€300,000 Suez 1.625% Perpetual12/9/2168
263 0.01
€100,000 Suez 1.75% 10/9/2025 96 0.00
€100,000 Suez 2.5% Perpetual30/3/2169
91 0.00
€100,000 Suez 2.75% 9/10/2023 97 0.00
€100,000 Suez 2.875% Perpetual19/4/2169
93 0.00
€500,000 Suez 4.125% 24/6/2022 482 0.02
€400,000 Sumitomo Mitsui Financial0.632% 23/10/2029
357 0.01
€875,000 Sumitomo Mitsui Financial0.819% 23/7/2023
799 0.03
€800,000 Sumitomo Mitsui Financial0.934% 11/10/2024
736 0.02
€200,000 Sumitomo Mitsui Financial1.413% 14/6/2027
192 0.01
€100,000 Sumitomo Mitsui Financial1.546% 15/6/2026
96 0.00
€250,000 Svenska Handelsbanken0.05% 3/9/2026
221 0.01
€500,000 Svenska Handelsbanken0.125% 18/6/2024
450 0.02
€500,000 Svenska Handelsbanken0.25% 28/2/2022
450 0.02
Holding orNominalValue Investment
MarketValue
£000’s
% ofTotal
NetAssets
€150,000 Svenska Handelsbanken0.375% 3/7/2023
136 0.00
€300,000 Svenska Handelsbanken0.5% 18/2/2030
268 0.01
€400,000 Svenska Handelsbanken1% 15/4/2025
374 0.01
€325,000 Svenska Handelsbanken1.25% 2/3/2028
295 0.01
€500,000 Svenska Handelsbanken2.625% 23/8/2022
471 0.02
€250,000 Svenska Handelsbanken4.375% 20/10/2021
235 0.01
€600,000 Swedbank 0.25% 7/11/2022 539 0.02
€600,000 Swedbank 0.3% 6/9/2022 540 0.02
€600,000 Swedbank 0.75% 5/5/2025 552 0.02
€500,000 Swedbank 1% 22/11/2027 447 0.01
€175,000 Swedish Match 0.875%23/9/2024
158 0.00
€200,000 Swiss Re FinanceLuxembourg 2.534%30/4/2050
191 0.01
€200,000 Swiss Re Finance UK1.375% 27/5/2023
185 0.01
€200,000 Sydbank 1.375% 18/9/2023 182 0.01
€200,000 Sydney Airport Finance Pty1.75% 26/4/2028
184 0.01
€300,000 Sydney Airport Finance Pty2.75% 23/4/2024
284 0.01
€725,000 Takeda Pharmaceutical0.75% 9/7/2027
659 0.02
€550,000 Takeda Pharmaceutical 2%9/7/2040
517 0.02
€300,000 Takeda Pharmaceutical2.25% 21/11/2026
297 0.01
€600,000 Takeda Pharmaceutical 3%21/11/2030
644 0.02
€300,000 Talanx 2.25% 5/12/2047 279 0.01
€100,000 Talanx 2.5% 23/7/2026 102 0.00
€100,000 Talanx Finanz Luxembourg8.3673% 15/6/2042
102 0.00
€500,000 Talent Yield Euro 1.3%21/4/2022
450 0.02
€300,000 Tauron Polska Energia2.375% 5/7/2027
269 0.01
€200,000 TDF Infrastructure SASU2.5% 7/4/2026
186 0.01
€125,000 Tele2 1.125% 15/5/2024 115 0.00
€200,000 Tele2 2.125% 15/5/2028 196 0.01
€500,000 TelefonicaEmisiones 0.664% 3/2/2030
443 0.01
iShares Overseas Corporate Bond Index Fund (UK)
Portfolio Statement (unaudited) continued
BlackRock Collective Investment Funds227

Holding orNominalValue Investment
MarketValue
£000’s
% ofTotal
NetAssets
€100,000 Telefonica Emisiones 0.75%13/4/2022
91 0.00
€500,000 TelefonicaEmisiones 1.069% 5/2/2024
462 0.02
€400,000 TelefonicaEmisiones 1.201%21/8/2027
375 0.01
€200,000 TelefonicaEmisiones 1.447%22/1/2027
190 0.01
€1,500,000 Telefonica Emisiones 1.46%13/4/2026
1,427 0.05
€1,000,000 TelefonicaEmisiones 1.807%21/5/2032Ø
967 0.03
€100,000 TelefonicaEmisiones 1.864%13/7/2040
92 0.00
€200,000 Telefonica Emisiones 1.93%17/10/2031
199 0.01
€250,000 TelefonicaEmisiones 1.957% 1/7/2039
241 0.01
€300,000 TelefonicaEmisiones 2.242%27/5/2022
279 0.01
€300,000 TelefonicaEmisiones 2.318%17/10/2028
308 0.01
€300,000 TelefonicaEmisiones 2.932%17/10/2029
324 0.01
€500,000 TelefonicaEmisiones 3.987%23/1/2023
490 0.02
€400,000 TelekomFinanzmanagement 1.5%7/12/2026
386 0.01
€100,000 TelekomFinanzmanagement 3.125%3/12/2021
93 0.00
€500,000 TelekomFinanzmanagement 4%4/4/2022
475 0.02
€300,000 Teleperformance 1.5%3/4/2024
276 0.01
€100,000 Teleperformance 1.875%2/7/2025
95 0.00
€300,000 Telia 1.375% 11/5/2081 264 0.01
€175,000 Telia 1.625% 23/2/2035 166 0.01
€125,000 Telia 2.125% 20/2/2034 126 0.00
€175,000 Telia 3% 4/4/2078 162 0.01
Holding orNominalValue Investment
MarketValue
£000’s
% ofTotal
NetAssets
€300,000 Telia 3.625% 14/2/2024 301 0.01
€150,000 Telia 3.875% 1/10/2025 158 0.00
€200,000 Telia 4% 22/3/2022 189 0.01
€500,000 Telstra 1% 23/4/2030 467 0.02
€300,000 Telstra 1.125% 14/4/2026 282 0.01
€125,000 Telstra 1.375% 26/3/2029 121 0.00
€100,000 Telstra 2.5% 15/9/2023 96 0.00
€300,000 Telstra 3.5% 21/9/2022 287 0.01
€500,000 Terega 4.339% 7/7/2021 462 0.02
€100,000 Terega SASU 0.625%27/2/2028
85 0.00
€500,000 Terna Rete ElettricaNazionale 0.875% 2/2/2022
452 0.02
€100,000 Terna Rete ElettricaNazionale 1% 10/4/2026
93 0.00
€200,000 Terna Rete ElettricaNazionale 1% 11/10/2028Ø
189 0.01
€500,000 Terna Rete ElettricaNazionale 1.375%26/7/2027
482 0.02
€250,000 Terna Rete ElettricaNazionale 4.75% 15/3/2021
229 0.01
€100,000 Terna Rete ElettricaNazionale 4.9% 28/10/2024
107 0.00
€150,000 Tesco 5.125% 10/4/2047 189 0.01
€275,000 Tesco Corporate TreasuryServices 0.875% 29/5/2026
249 0.01
€100,000 Tesco Corporate TreasuryServices 1.375%24/10/2023
92 0.00
€200,000 Tesco Corporate TreasuryServices 2.5% 1/7/2024
193 0.01
€600,000 Thales 0% 31/5/2022 536 0.02
€300,000 Thales 0.75% 23/1/2025 274 0.01
€100,000 Thales 1% 15/5/2028 92 0.00
€300,000 Thermo Fisher Scientific0.125% 1/3/2025
267 0.01
€275,000 Thermo Fisher Scientific0.5% 1/3/2028
246 0.01
€200,000 Thermo Fisher Scientific0.75% 12/9/2024
183 0.01
€250,000 Thermo Fisher Scientific0.875% 1/10/2031
225 0.01
€500,000 Thermo Fisher Scientific1.375% 12/9/2028
482 0.02
€150,000 Thermo Fisher Scientific1.45% 16/3/2027
144 0.00
€300,000 Thermo Fisher Scientific1.5% 1/10/2039
274 0.01
iShares Overseas Corporate Bond Index Fund (UK)
Portfolio Statement (unaudited) continued
BlackRock Collective Investment Funds 228
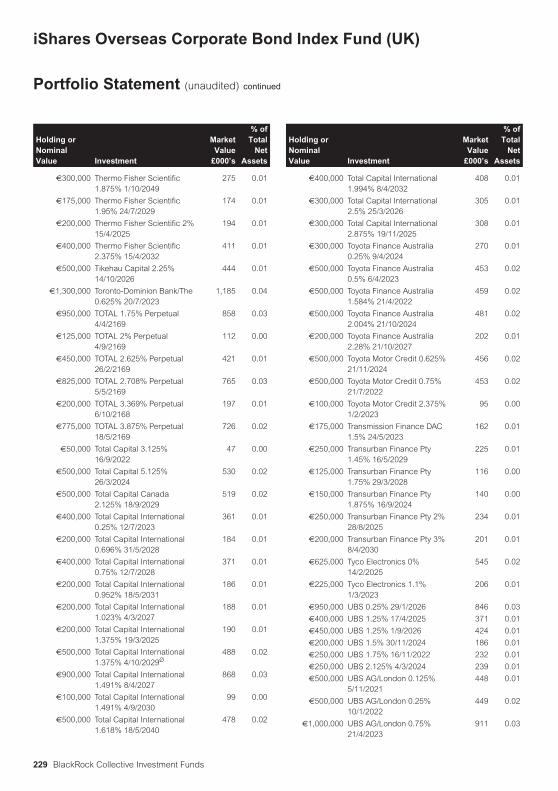
Holding orNominalValue Investment
MarketValue
£000’s
% ofTotal
NetAssets
€300,000 Thermo Fisher Scientific1.875% 1/10/2049
275 0.01
€175,000 Thermo Fisher Scientific1.95% 24/7/2029
174 0.01
€200,000 Thermo Fisher Scientific 2%15/4/2025
194 0.01
€400,000 Thermo Fisher Scientific2.375% 15/4/2032
411 0.01
€500,000 Tikehau Capital 2.25%14/10/2026
444 0.01
€1,300,000 Toronto-Dominion Bank/The0.625% 20/7/2023
1,185 0.04
€950,000 TOTAL 1.75% Perpetual4/4/2169
858 0.03
€125,000 TOTAL 2% Perpetual4/9/2169
112 0.00
€450,000 TOTAL 2.625% Perpetual26/2/2169
421 0.01
€825,000 TOTAL 2.708% Perpetual5/5/2169
765 0.03
€200,000 TOTAL 3.369% Perpetual6/10/2168
197 0.01
€775,000 TOTAL 3.875% Perpetual18/5/2169
726 0.02
€50,000 Total Capital 3.125%16/9/2022
47 0.00
€500,000 Total Capital 5.125%26/3/2024
530 0.02
€500,000 Total Capital Canada2.125% 18/9/2029
519 0.02
€400,000 Total Capital International0.25% 12/7/2023
361 0.01
€200,000 Total Capital International0.696% 31/5/2028
184 0.01
€400,000 Total Capital International0.75% 12/7/2028
371 0.01
€200,000 Total Capital International0.952% 18/5/2031
186 0.01
€200,000 Total Capital International1.023% 4/3/2027
188 0.01
€200,000 Total Capital International1.375% 19/3/2025
190 0.01
€500,000 Total Capital International1.375% 4/10/2029Ø
488 0.02
€900,000 Total Capital International1.491% 8/4/2027
868 0.03
€100,000 Total Capital International1.491% 4/9/2030
99 0.00
€500,000 Total Capital International1.618% 18/5/2040
478 0.02
Holding orNominalValue Investment
MarketValue
£000’s
% ofTotal
NetAssets
€400,000 Total Capital International1.994% 8/4/2032
408 0.01
€300,000 Total Capital International2.5% 25/3/2026
305 0.01
€300,000 Total Capital International2.875% 19/11/2025
308 0.01
€300,000 Toyota Finance Australia0.25% 9/4/2024
270 0.01
€500,000 Toyota Finance Australia0.5% 6/4/2023
453 0.02
€500,000 Toyota Finance Australia1.584% 21/4/2022
459 0.02
€500,000 Toyota Finance Australia2.004% 21/10/2024
481 0.02
€200,000 Toyota Finance Australia2.28% 21/10/2027
202 0.01
€500,000 Toyota Motor Credit 0.625%21/11/2024
456 0.02
€500,000 Toyota Motor Credit 0.75%21/7/2022
453 0.02
€100,000 Toyota Motor Credit 2.375%1/2/2023
95 0.00
€175,000 Transmission Finance DAC1.5% 24/5/2023
162 0.01
€250,000 Transurban Finance Pty1.45% 16/5/2029
225 0.01
€125,000 Transurban Finance Pty1.75% 29/3/2028
116 0.00
€150,000 Transurban Finance Pty1.875% 16/9/2024
140 0.00
€250,000 Transurban Finance Pty 2%28/8/2025
234 0.01
€200,000 Transurban Finance Pty 3%8/4/2030
201 0.01
€625,000 Tyco Electronics 0%14/2/2025
545 0.02
€225,000 Tyco Electronics 1.1%1/3/2023
206 0.01
€950,000 UBS 0.25% 29/1/2026 846 0.03
€400,000 UBS 1.25% 17/4/2025 371 0.01
€450,000 UBS 1.25% 1/9/2026 424 0.01
€200,000 UBS 1.5% 30/11/2024 186 0.01
€250,000 UBS 1.75% 16/11/2022 232 0.01
€250,000 UBS 2.125% 4/3/2024 239 0.01
€500,000 UBS AG/London 0.125%5/11/2021
448 0.01
€500,000 UBS AG/London 0.25%10/1/2022
449 0.02
€1,000,000 UBS AG/London 0.75%21/4/2023
911 0.03
iShares Overseas Corporate Bond Index Fund (UK)
Portfolio Statement (unaudited) continued
BlackRock Collective Investment Funds229

Holding orNominalValue Investment
MarketValue
£000’s
% ofTotal
NetAssets
€400,000 UBS AG/London 1.25%3/9/2021
363 0.01
€150,000 Unibail-Rodamco-Westfield0.875% 21/2/2025
135 0.00
€200,000 Unibail-Rodamco-Westfield0.875% 29/3/2032
164 0.01
€100,000 Unibail-Rodamco-Westfield1% 14/3/2025
91 0.00
€500,000 Unibail-Rodamco-Westfield1% 27/2/2027
445 0.01
€500,000 Unibail-Rodamco-Westfield1.375% 9/3/2026
459 0.02
€200,000 Unibail-Rodamco-Westfield1.375% 15/4/2030
179 0.01
€275,000 Unibail-Rodamco-Westfield1.5% 29/5/2029
248 0.01
€300,000 Unibail-Rodamco-Westfield1.75% 27/2/2034
266 0.01
€200,000 Unibail-Rodamco-Westfield1.75% 1/7/2049
160 0.01
€200,000 Unibail-Rodamco-Westfield1.875% 15/1/2031
184 0.01
€175,000 Unibail-Rodamco-Westfield2% 29/5/2037Ø
157 0.00
€300,000 Unibail-Rodamco-Westfield2.125% 9/4/2025
283 0.01
€300,000 Unibail-Rodamco-Westfield2.125% Perpetual25/10/2168Ø
239 0.01
€125,000 Unibail-Rodamco-Westfield2.5% 26/2/2024
118 0.00
€400,000 Unibail-Rodamco-Westfield2.5% 4/6/2026
388 0.01
€500,000 Unibail-Rodamco-Westfield2.625% 9/4/2030
492 0.02
€300,000 Unibail-Rodamco-Westfield2.875% Perpetual 25/4/2169
235 0.01
€500,000 UniCredit 0.5% 9/4/2025 440 0.01
€250,000 UniCredit 1% 18/1/2023 224 0.01
€500,000 UniCredit 1.25% 25/6/2025 451 0.02
€300,000 UniCredit 1.625% 3/7/2025 267 0.01
€250,000 UniCredit 1.8% 20/1/2030 219 0.01
€250,000 UniCredit 2% 4/3/2023Ø 233 0.01
€700,000 UniCredit 2.125%24/10/2026Ø
669 0.02
€600,000 UniCredit 2.2% 22/7/2027 533 0.02
€200,000 UniCredit Leasing IFN0.502% 18/10/2022
178 0.01
€150,000 Unilever 0.5% 3/2/2022 135 0.00
€800,000 Unilever 0.5% 12/8/2023 729 0.02
Holding orNominalValue Investment
MarketValue
£000’s
% ofTotal
NetAssets
€275,000 Unilever 0.875% 31/7/2025 257 0.01
€250,000 Unilever 1.125% 29/4/2028 242 0.01
€600,000 Unilever 1.25% 25/3/2025 567 0.02
€400,000 Unilever 1.375% 4/9/2030Ø 402 0.01
€200,000 Unilever 1.5% 11/6/2039 203 0.01
€250,000 Unilever 1.625% 12/2/2033 258 0.01
€900,000 Unilever 1.75% 25/3/2030 916 0.03
€300,000 Unione di Banche Italiane0.75% 17/10/2022
270 0.01
€300,000 Unione di Banche Italiane1.5% 10/4/2024
275 0.01
€200,000 UNIQA Insurance 6.875%31/7/2043
206 0.01
€250,000 United Parcel Service0.375% 15/11/2023
226 0.01
€200,000 United Parcel Service 1.5%15/11/2032
199 0.01
€300,000 United Parcel Service1.625% 15/11/2025
290 0.01
€300,000 Upjohn Finance 0.816%23/6/2022
271 0.01
€500,000 Upjohn Finance 1.023%23/6/2024
456 0.02
€100,000 Upjohn Finance 1.362%23/6/2027
92 0.00
€100,000 Upjohn Finance 1.908%23/6/2032
95 0.00
€200,000 US Bancorp 0.85%7/6/2024
183 0.01
€400,000 Veolia Environnement0.314% 4/10/2023
360 0.01
€600,000 Veolia Environnement0.664% 15/1/2031
536 0.02
€200,000 Veolia Environnement0.672% 30/3/2022
180 0.01
€100,000 Veolia Environnement 0.8%15/1/2032
90 0.00
€200,000 Veolia Environnement0.892% 14/1/2024
183 0.01
€300,000 Veolia Environnement0.927% 4/1/2029
277 0.01
€100,000 Veolia Environnement 1.25%15/4/2028
95 0.00
€300,000 Veolia Environnement1.496% 30/11/2026
288 0.01
€100,000 Veolia Environnement4.625% 30/3/2027
115 0.00
€200,000 Veolia Environnement5.125% 24/5/2022
195 0.01
iShares Overseas Corporate Bond Index Fund (UK)
Portfolio Statement (unaudited) continued
BlackRock Collective Investment Funds 230

Holding orNominalValue Investment
MarketValue
£000’s
% ofTotal
NetAssets
€250,000 Veolia Environnement6.125% 25/11/2033
372 0.01
€500,000 Verizon Communications0.875% 8/4/2027
462 0.02
€500,000 Verizon Communications0.875% 19/3/2032
450 0.02
€400,000 Verizon Communications1.25% 8/4/2030
377 0.01
€700,000 Verizon Communications1.3% 18/5/2033
652 0.02
€500,000 Verizon Communications1.375% 27/10/2026
477 0.02
€350,000 Verizon Communications1.375% 2/11/2028
336 0.01
€400,000 Verizon Communications1.625% 1/3/2024
379 0.01
€275,000 Verizon Communications1.875% 26/10/2029
274 0.01
€200,000 Verizon Communications2.625% 1/12/2031
215 0.01
€800,000 Verizon Communications2.875% 15/1/2038
884 0.03
€425,000 Verizon Communications3.25% 17/2/2026
443 0.01
€500,000 Vesteda Finance 2%10/7/2026
478 0.02
€225,000 VF 0.25% 25/2/2028 195 0.01
€250,000 VF 0.625% 20/9/2023 226 0.01
€200,000 VF 0.625% 25/2/2032 169 0.01
€275,000 Vicinity Centres Trust1.125% 7/11/2029
234 0.01
€125,000 Vienna Insurance WienerVersicherung Gruppe3.75% 2/3/2046
123 0.00
€100,000 Vier Gas Transport 0.125%10/9/2029
88 0.00
€300,000 Vier Gas Transport 0.5%10/9/2034
258 0.01
€100,000 Vier Gas Transport 1.5%25/9/2028
98 0.00
€150,000 Vier Gas Transport 2.875%12/6/2025
153 0.00
€200,000 Vinci 1% 26/9/2025 188 0.01
€300,000 Vinci 1.625% 18/1/2029 297 0.01
€700,000 Vinci 1.75% 26/9/2030 708 0.02
€275,000 Virgin Money UK 2.875%24/6/2025
247 0.01
€300,000 Vivendi 0.625% 11/6/2025 273 0.01
€100,000 Vivendi 0.875% 18/9/2024 92 0.00
€400,000 Vivendi 1.125% 24/11/2023 369 0.01
Holding orNominalValue Investment
MarketValue
£000’s
% ofTotal
NetAssets
€300,000 Vivendi 1.125% 11/12/2028 278 0.01
€500,000 Vodafone 0.375%22/11/2021
449 0.02
€400,000 Vodafone 0.9% 24/11/2026 372 0.01
€500,000 Vodafone 1.125%20/11/2025
469 0.02
€300,000 Vodafone 1.6% 29/7/2031 291 0.01
€300,000 Vodafone 1.625%24/11/2030
293 0.01
€350,000 Vodafone 1.75% 25/8/2023 329 0.01
€500,000 Vodafone 1.875% 11/9/2025 484 0.02
€300,000 Vodafone 1.875%20/11/2029
302 0.01
€225,000 Vodafone 2.2% 25/8/2026 225 0.01
€300,000 Vodafone 2.5% 24/5/2039 304 0.01
€400,000 Vodafone 2.875%20/11/2037
429 0.01
€400,000 Vodafone 4.65% 20/1/2022 381 0.01
€600,000 Volkswagen Bank 0.625%8/9/2021
538 0.02
€300,000 Volkswagen Bank 1.875%31/1/2024
278 0.01
€300,000 Volkswagen Bank 2.5%31/7/2026
290 0.01
€800,000 Volkswagen FinancialServices 0.625% 1/4/2022
718 0.02
€300,000 Volkswagen FinancialServices 0.875% 12/4/2023
270 0.01
€400,000 Volkswagen FinancialServices 1.375%16/10/2023
365 0.01
€100,000 Volkswagen FinancialServices 1.5% 1/10/2024
91 0.00
€300,000 Volkswagen FinancialServices 2.25% 1/10/2027
287 0.01
€1,000,000 Volkswagen FinancialServices 2.5% 6/4/2023Ø
936 0.03
€500,000 Volkswagen FinancialServices 3.375% 6/4/2028
514 0.02
€500,000 Volkswagen InternationalFinance 0.875% 16/1/2023
451 0.02
€500,000 Volkswagen InternationalFinance 1.125% 2/10/2023
455 0.02
€250,000 Volkswagen InternationalFinance 1.625% 16/1/2030
230 0.01
€400,000 Volkswagen InternationalFinance 1.875% 30/3/2027
374 0.01
€400,000 Volkswagen InternationalFinance 2.5% Perpetual20/3/2169
357 0.01
iShares Overseas Corporate Bond Index Fund (UK)
Portfolio Statement (unaudited) continued
BlackRock Collective Investment Funds231

Holding orNominalValue Investment
MarketValue
£000’s
% ofTotal
NetAssets
€300,000 Volkswagen InternationalFinance 2.625% 16/11/2027
296 0.01
€200,000 Volkswagen InternationalFinance 2.7% Perpetual14/12/2168
179 0.01
€400,000 Volkswagen InternationalFinance 3.25% 18/11/2030
417 0.01
€300,000 Volkswagen InternationalFinance 3.3% 22/3/2033
317 0.01
€800,000 Volkswagen InternationalFinance 3.375% Perpetual27/6/2169
720 0.02
€900,000 Volkswagen InternationalFinance 3.5% Perpetual20/3/2169
791 0.03
€500,000 Volkswagen InternationalFinance 3.5% Perpetual17/6/2169
452 0.02
€500,000 Volkswagen InternationalFinance 3.875% Perpetual14/6/2169
455 0.02
€500,000 Volkswagen InternationalFinance 3.875% Perpetual17/6/2169
451 0.02
€400,000 Volkswagen InternationalFinance 4.125% 16/11/2038
464 0.02
€645,000 Volkswagen InternationalFinance 4.625% Perpetual24/3/2169
616 0.02
€400,000 Volkswagen InternationalFinance 4.625% Perpetual27/6/2169
379 0.01
€200,000 Volkswagen InternationalFinance 5.125% Perpetual4/9/2168
190 0.01
€175,000 Volkswagen Leasing 0.5%20/6/2022
157 0.00
€225,000 Volkswagen Leasing 1%16/2/2023
203 0.01
€300,000 Volkswagen Leasing1.375% 20/1/2025
273 0.01
€250,000 Volkswagen Leasing 1.5%19/6/2026
229 0.01
€175,000 Volkswagen Leasing1.625% 15/8/2025
161 0.01
€700,000 Volkswagen Leasing2.125% 4/4/2022
643 0.02
€80,000 Volkswagen Leasing2.625% 15/1/2024
76 0.00
€425,000 Volvo Treasury 1.625%26/5/2025
400 0.01
Holding orNominalValue Investment
MarketValue
£000’s
% ofTotal
NetAssets
€100,000 Volvo Treasury 4.85%10/3/2078
93 0.00
€100,000 Vonovia Finance 0.125%6/4/2023
89 0.00
€300,000 Vonovia Finance 0.5%14/9/2029
263 0.01
€100,000 Vonovia Finance 0.625%7/10/2027
90 0.00
€200,000 Vonovia Finance 0.75%15/1/2024
183 0.01
€100,000 Vonovia Finance 0.875%10/6/2022
91 0.00
€300,000 Vonovia Finance 1.25%6/12/2024
281 0.01
€600,000 Vonovia Finance 1.5%22/3/2026
570 0.02
€300,000 Vonovia Finance 1.5%10/6/2026Ø
285 0.01
€100,000 Vonovia Finance 1.5%14/1/2028
96 0.00
€400,000 Vonovia Finance 1.625%7/4/2024
375 0.01
€200,000 Vonovia Finance 1.625%7/10/2039
182 0.01
€200,000 Vonovia Finance 1.8%29/6/2025
191 0.01
€275,000 Vonovia Finance 2.125%9/7/2022
255 0.01
€500,000 Vonovia Finance 2.125%22/3/2030Ø
501 0.02
€400,000 Vonovia Finance 2.25%15/12/2023
383 0.01
€500,000 Vonovia Finance 2.25%7/4/2030
503 0.02
€200,000 Vonovia Finance 4%Perpetual 17/12/2168
185 0.01
€275,000 Walgreens Boots Alliance2.125% 20/11/2026
257 0.01
€500,000 Walmart 2.55% 8/4/2026 512 0.02
€300,000 Walmart 4.875% 21/9/2029 380 0.01
€300,000 Wellcome Trust 1.125%21/1/2027
282 0.01
€400,000 Wells Fargo & 0.5%26/4/2024
358 0.01
€400,000 Wells Fargo & 0.625%14/8/2030
342 0.01
€450,000 Wells Fargo & 1% 2/2/2027 409 0.01
€500,000 Wells Fargo & 1.125%29/10/2021
453 0.02
€975,000 Wells Fargo & 1.338%4/5/2025
893 0.03
iShares Overseas Corporate Bond Index Fund (UK)
Portfolio Statement (unaudited) continued
BlackRock Collective Investment Funds 232

Holding orNominalValue Investment
MarketValue
£000’s
% ofTotal
NetAssets
€1,000,000 Wells Fargo & 1.375%26/10/2026
930 0.03
€500,000 Wells Fargo & 1.5%12/9/2022
459 0.02
€800,000 Wells Fargo & 1.5%24/5/2027
748 0.03
€150,000 Wells Fargo & 1.625%2/6/2025
141 0.00
€475,000 Wells Fargo & 1.741%4/5/2030
446 0.01
€500,000 Wells Fargo & 2% 27/4/2026 481 0.02
€700,000 Wells Fargo & 2.25%2/5/2023
659 0.02
€300,000 Wendel 1.375% 26/4/2026 276 0.01
€200,000 Wendel 2.5% 9/2/2027 193 0.01
€300,000 Wendel 2.75% 2/10/2024 291 0.01
€500,000 Wesfarmers 2.75% 2/8/2022 468 0.02
€700,000 Westlake Chemical 1.625%17/7/2029
607 0.02
€100,000 Westpac NZ Ltd/London0.3% 25/6/2024
90 0.00
€200,000 Westpac Banking 0.75%17/10/2023
183 0.01
€400,000 Westpac Banking 0.875%17/4/2027
376 0.01
€500,000 Westpac Banking 1.125%5/9/2027
477 0.02
€225,000 Westpac Banking 1.45%17/7/2028
222 0.01
€100,000 Whirlpool EMEA FinanceSarl 0.5% 20/2/2028
85 0.00
€200,000 Whirlpool FinanceLuxembourg Sarl 1.1%9/11/2027
179 0.01
€500,000 Whirlpool FinanceLuxembourg Sarl 1.25%2/11/2026
453 0.02
€250,000 Willow No 2 Ireland forZurich Insurance 3.375%27/6/2022
237 0.01
€300,000 Wintershall Dea Finance0.452% 25/9/2023
265 0.01
€400,000 Wintershall Dea Finance0.84% 25/9/2025
348 0.01
€200,000 Wintershall Dea Finance1.332% 25/9/2028
170 0.01
€300,000 Wintershall Dea Finance1.823% 25/9/2031
255 0.01
€150,000 Wolters Kluwer 1.5%22/3/2027
144 0.00
Holding orNominalValue Investment
MarketValue
£000’s
% ofTotal
NetAssets
€100,000 Wolters Kluwer 2.5%13/5/2024
97 0.00
€100,000 Wolters Kluwer 2.875%21/3/2023
96 0.00
€500,000 Worldline SA/France 0.5%30/6/2023
451 0.02
€125,000 WP Carey 2% 20/1/2023 115 0.00
€200,000 WPC Eurobond 2.125%15/4/2027
188 0.01
€500,000 WPC Eurobond 2.25%19/7/2024
473 0.02
€150,000 WPP Finance 2.25%22/9/2026
144 0.00
€300,000 WPP Finance 2.375%19/5/2027
286 0.01
€100,000 WPP Finance 2013 3%20/11/2023
97 0.00
€300,000 WPP Finance 2016 1.375%20/3/2025
276 0.01
€150,000 WPP Finance Deutschland1.625% 23/3/2030
137 0.00
€425,000 Wurth Finance International0.75% 22/11/2027
393 0.01
€300,000 Wurth Finance International1% 26/5/2025
279 0.01
€100,000 XLIT 3.25% 29/6/2047 99 0.00
€400,000 Xylem Inc/NY 2.25%11/3/2023
375 0.01
€350,000 Yorkshire Building Society0.875% 20/3/2023
316 0.01
€300,000 Yorkshire Building Society1.25% 17/3/2022
272 0.01
€250,000 Zimmer Biomet 1.164%15/11/2027Ø
224 0.01
€500,000 Zimmer Biomet 1.414%13/12/2022
452 0.02
€150,000 Zimmer Biomet 2.425%13/12/2026
145 0.00
€350,000 Zurich Finance IrelandDesignated Activity 1.625%17/6/2039
349 0.01
€350,000 Zurich Finance IrelandDesignated Activity 1.875%17/9/2050
321 0.01
711,078 24.54
iShares Overseas Corporate Bond Index Fund (UK)
Portfolio Statement (unaudited) continued
BlackRock Collective Investment Funds233

Holding orNominalValue Investment
MarketValue
£000’s
% ofTotal
NetAssets
JAPANESE YEN − 0.86%; 29.2.2020 0.94%
Japanese Yen Denominated CorporateBonds − 0.20%; 29.2.2020 0.25%
¥100,000,000 Australia & New ZealandBanking 0.293% 23/1/2024
705 0.03
¥100,000,000 Credit Agricole 0.443%9/6/2022
702 0.02
¥250,000,000 International BusinessMachines 0.3% 2/11/2026
1,746 0.06
¥105,000,000 Kreditanstalt fuerWiederaufbau 2.6%20/6/2037
1,047 0.04
¥200,000,000 Panasonic 0.47% 18/9/2026 1,418 0.05
5,618 0.20
Japanese Yen Denominated GovernmentBonds − 0.66%; 29.2.2020 0.69%
¥33,000,000 Japan Government Ten YearBond 0.1% 20/3/2027
235 0.01
¥500,100,000 Japan Government Ten YearBond 0.1% 20/3/2029
3,549 0.12
¥1,338,250,000 Japan Government Ten YearBond 0.6% 20/3/2024
9,659 0.33
¥616,300,000 Japan Government Ten YearBond 1% 20/9/2020
4,343 0.15
¥195,000,000 Japan Government Ten YearBond 1.1% 20/9/2021
1,391 0.05
19,177 0.66
NEW ZEALAND DOLLAR − 0.01%; 29.2.2020 0.01%
New Zealand Dollar Denominated CorporateBonds − 0.01%; 29.2.2020 0.01%
NZD 300,000 Westpac New Zealand2.22% 29/7/2024
161 0.01
SWISS FRANC − 0.34%; 29.2.2020 0.35%
Swiss Franc Denominated CorporateBonds − 0.34%; 29.2.2020 0.35%
CHF 300,000 ABB 2.25% 11/10/2021 255 0.01
CHF 800,000 Apple 0.375% 25/11/2024 683 0.02
CHF 200,000 Apple 0.75% 25/2/2030 177 0.01
CHF 200,000 AT&T 1.375% 4/12/2024 174 0.01
CHF 1,050,000 Banco Santander 0.75%12/6/2023
877 0.03
CHF 100,000 Bank of America 0.2525%12/6/2026
83 0.00
CHF 500,000 Bank of Montreal 0.05%30/12/2022
416 0.01
Holding orNominalValue Investment
MarketValue
£000’s
% ofTotal
NetAssets
CHF 200,000 BAT International Finance0.625% 8/9/2021
167 0.01
CHF 300,000 BNZ International FundingLtd/London 0.111%24/7/2028
248 0.01
CHF 200,000 Citigroup 0.5% 1/11/2028 167 0.01
CHF 100,000 Citigroup 0.75% 2/4/2026 85 0.00
CHF 200,000 Commonwealth Bank ofAustralia 0.4% 25/9/2026
170 0.01
CHF 500,000 Credit Suisse FundingGuernsey 1% 14/4/2023
423 0.02
CHF 150,000 Deutsche Bank 0.625%19/12/2023
122 0.00
CHF 300,000 Deutsche Telekom 0.435%6/2/2032
248 0.01
CHF 830,000 Eli Lilly and 0.15%24/5/2024
694 0.02
CHF 350,000 Glencore Finance Europe1.25% 1/12/2020
291 0.01
CHF 500,000 Goldman Sachs 0.5%4/12/2024
418 0.01
CHF 100,000 Goldman Sachs 1%24/11/2025
86 0.00
CHF 500,000 Henkel & 0.2725%28/4/2023
418 0.01
CHF 300,000 Jackson National Life GlobalFunding 0.125% 14/7/2028
243 0.01
CHF 1,000,000 JPMorgan Chase & 0.5%4/12/2023
846 0.03
CHF 400,000 LafargeHolcim 3%22/11/2022
351 0.01
CHF 200,000 New York Life GlobalFunding 0.25% 18/10/2027
166 0.01
CHF 400,000 Novartis 0.625% 13/11/2029 348 0.01
CHF 200,000 Philip Morris International2% 6/12/2021
169 0.01
CHF 200,000 Shell International Finance0.875% 21/8/2028
175 0.01
CHF 500,000 Verizon Communications0.375% 31/5/2023
419 0.01
CHF 150,000 Verizon Communications 1%30/11/2027
129 0.00
CHF 1,000,000 Vodafone 0.375% 3/12/2024 839 0.03
9,887 0.34
US DOLLAR − 68.56%; 29.2.2020 69.00%
US Dollar Denominated CorporateBonds − 68.56%; 29.2.2020 69.00%
$500,000 3M 1.75% 14/2/2023 386 0.01
$500,000 3M 2% 26/6/2022 385 0.01
iShares Overseas Corporate Bond Index Fund (UK)
Portfolio Statement (unaudited) continued
BlackRock Collective Investment Funds 234

Holding orNominalValue Investment
MarketValue
£000’s
% ofTotal
NetAssets
$900,000 3M 3% 7/8/2025 749 0.03
$900,000 3M 3.05% 15/4/2030 766 0.03
$200,000 3M 3.125% 19/9/2046 164 0.01
$500,000 3M 3.375% 1/3/2029 430 0.01
$400,000 3M 3.625% 14/9/2028 349 0.01
$250,000 3M 3.625% 15/10/2047 218 0.01
$400,000 3M 3.7% 15/4/2050 363 0.01
$150,000 3M 3.875% 15/6/2044 137 0.00
$300,000 3M 4% 14/9/2048 284 0.01
$900,000 ABB Finance USA 3.8%3/4/2028
796 0.03
$200,000 ABB Finance USA 4.375%8/5/2042
192 0.01
$1,000,000 Abbott Laboratories 1.4%30/6/2030
759 0.03
$300,000 Abbott Laboratories 2.55%15/3/2022
232 0.01
$500,000 Abbott Laboratories 2.95%15/3/2025
410 0.01
$350,000 Abbott Laboratories 3.4%30/11/2023
286 0.01
$284,000 Abbott Laboratories 3.75%30/11/2026
248 0.01
$100,000 Abbott Laboratories 3.875%15/9/2025
85 0.00
$400,000 Abbott Laboratories 4.75%30/11/2036
405 0.01
$500,000 Abbott Laboratories 4.75%30/11/2036
506 0.02
$300,000 Abbott Laboratories 4.75%15/4/2043
310 0.01
$1,000,000 Abbott Laboratories 4.9%30/11/2046
1,071 0.04
$300,000 Abbott Laboratories 5.3%27/5/2040
329 0.01
$500,000 AbbVie 2.15% 19/11/2021 381 0.01
$1,500,000 AbbVie 2.3% 21/11/2022 1,164 0.04
$950,000 AbbVie 2.6% 21/11/2024 760 0.03
$250,000 AbbVie 2.85% 14/5/2023 197 0.01
$700,000 AbbVie 2.9% 6/11/2022 550 0.02
$1,500,000 AbbVie 2.95% 21/11/2026 1,232 0.04
$450,000 AbbVie 3.2% 14/5/2026 374 0.01
$1,950,000 AbbVie 3.2% 21/11/2029 1,613 0.06
$1,000,000 AbbVie 3.25% 1/10/2022 783 0.03
$500,000 AbbVie 3.375% 15/9/2020 374 0.01
$750,000 AbbVie 3.45% 15/3/2022 583 0.02
$1,200,000 AbbVie 3.6% 14/5/2025 1,000 0.03
$500,000 AbbVie 3.75% 14/11/2023 410 0.01
$500,000 AbbVie 3.8% 15/3/2025 418 0.01
Holding orNominalValue Investment
MarketValue
£000’s
% ofTotal
NetAssets
$500,000 AbbVie 3.85% 15/6/2024 412 0.01
$1,000,000 AbbVie 4.05% 21/11/2039 874 0.03
$500,000 AbbVie 4.25% 14/11/2028 445 0.02
$500,000 AbbVie 4.25% 14/11/2028 445 0.02
$1,875,000 AbbVie 4.25% 21/11/2049 1,690 0.06
$300,000 AbbVie 4.3% 14/5/2036 268 0.01
$1,000,000 AbbVie 4.4% 6/11/2042 903 0.03
$400,000 AbbVie 4.45% 14/5/2046 362 0.01
$700,000 AbbVie 4.5% 14/5/2035 646 0.02
$500,000 AbbVie 4.55% 15/3/2035 467 0.02
$300,000 AbbVie 4.625% 1/10/2042 276 0.01
$750,000 AbbVie 4.7% 14/5/2045 700 0.02
$500,000 AbbVie 4.85% 15/6/2044 470 0.02
$550,000 AbbVie 4.85% 15/6/2044 517 0.02
$326,000 AbbVie 4.875% 15/2/2021 246 0.01
$700,000 AbbVie 4.875% 14/11/2048 676 0.02
$500,000 AbbVie 5% 15/12/2021 390 0.01
$500,000 ABN AMRO Bank 3.4%27/8/2021
384 0.01
$600,000 ABN AMRO Bank 4.4%27/3/2028Ø
474 0.02
$300,000 ABN AMRO Bank 4.75%28/7/2025
253 0.01
$200,000 ABN AMRO Bank 4.8%18/4/2026
171 0.01
$600,000 ABN AMRO Bank 4.8%18/4/2026
513 0.02
$400,000 ABN AMRO Bank 6.25%27/4/2022
322 0.01
$450,000 ABQ Finance 3.5%22/2/2022
340 0.01
$194,960 ABY Transmision Sur6.875% 30/4/2043
190 0.01
$500,000 Activision Blizzard 1.35%15/9/2030
366 0.01
$500,000 Activision Blizzard 2.5%15/9/2050
349 0.01
$275,000 Activision Blizzard 3.4%15/6/2027
234 0.01
$125,000 Activision Blizzard 4.5%15/6/2047
121 0.00
$300,000 Acwa Power ManagementAnd Investments One 5.95%15/12/2039
249 0.01
$300,000 Adani Electricity Mumbai3.949% 12/2/2030
223 0.01
$400,000 Adani Ports & SpecialEconomic Zone 4.2%4/8/2027
306 0.01
iShares Overseas Corporate Bond Index Fund (UK)
Portfolio Statement (unaudited) continued
BlackRock Collective Investment Funds235

Holding orNominalValue Investment
MarketValue
£000’s
% ofTotal
NetAssets
$500,000 Adani Ports & SpecialEconomic Zone 4.375%3/7/2029
381 0.01
$298,500 Adani Transmission 4.25%21/5/2036
223 0.01
$300,000 Adobe 1.7% 1/2/2023 232 0.01
$500,000 Adobe 1.9% 1/2/2025 395 0.01
$500,000 Adobe 2.15% 1/2/2027 402 0.01
$500,000 Adobe 2.3% 1/2/2030 403 0.01
$300,000 Advance Auto Parts 3.9%15/4/2030
247 0.01
$115,000 Advocate Health &Hospitals 3.008% 15/6/2050
91 0.00
$250,000 Advocate Health &Hospitals 3.387%15/10/2049
209 0.01
$400,000 Aegon 5.5% 11/4/2048Ø 333 0.01
$200,000 AEP Texas 3.45% 15/1/2050 165 0.01
$500,000 AEP Texas 3.95% 1/6/2028 434 0.02
$500,000 AEP Transmission 3.75%1/12/2047
444 0.02
$200,000 AEP Transmission 4%1/12/2046
184 0.01
$500,000 AerCap Ireland Capital DAC/ AerCap Global AviationTrust 3.3% 23/1/2023
372 0.01
$1,000,000 AerCap Ireland Capital DAC/ AerCap Global AviationTrust 3.5% 26/5/2022
751 0.03
$400,000 AerCap Ireland Capital DAC/ AerCap Global AviationTrust 3.65% 21/7/2027Ø
279 0.01
$500,000 AerCap Ireland Capital DAC/ AerCap Global AviationTrust 3.95% 1/2/2022
378 0.01
$400,000 AerCap Ireland Capital DAC/ AerCap Global AviationTrust 4.45% 3/4/2026
301 0.01
$500,000 AerCap Ireland Capital DAC/ AerCap Global AviationTrust 4.875% 16/1/2024
384 0.01
$500,000 AerCap Ireland Capital DAC/ AerCap Global AviationTrust 6.5% 15/7/2025
406 0.01
$500,000 AES 3.3% 15/7/2025 401 0.01
$400,000 Aetna 2.75% 15/11/2022 312 0.01
$700,000 Aetna 2.8% 15/6/2023 551 0.02
$500,000 Aetna 3.875% 15/8/2047 436 0.02
$200,000 Aetna 4.5% 15/5/2042 179 0.01
$300,000 Aetna 4.75% 15/3/2044 279 0.01
$150,000 Aetna 6.625% 15/6/2036 162 0.01
Holding orNominalValue Investment
MarketValue
£000’s
% ofTotal
NetAssets
$150,000 Aetna 6.75% 15/12/2037 162 0.01
$1,000,000 Aflac 3.25% 17/3/2025 835 0.03
$500,000 Aflac 3.6% 1/4/2030 438 0.02
$200,000 Aflac 4% 15/10/2046 175 0.01
$175,000 Agilent Technologies 3.05%22/9/2026
144 0.01
$500,000 AIA 3.375% 7/4/2030 419 0.01
$500,000 AIA 3.6% 9/4/2029 421 0.01
$300,000 AIA 4.875% 11/3/2044Ø 294 0.01
$500,000 AIB 4.263% 10/4/2025 405 0.01
$150,000 AIG SunAmerica GlobalFinancing X 6.9% 15/3/2032
170 0.01
$395,686 Air Canada 2015-1 Class APass Through Trust 3.6%15/9/2028
272 0.01
$600,000 Air Lease 2.25% 15/1/2023 450 0.02
$800,000 Air Lease 2.875% 15/1/2026 592 0.02
$500,000 Air Lease 3.5% 15/1/2022 382 0.01
$1,300,000 Air Lease 3.625% 1/4/2027 973 0.03
$500,000 Air Lease 3.75% 1/2/2022 382 0.01
$500,000 Air Lease 4.25% 15/9/2024 390 0.01
$250,000 Air Liquide Finance 1.75%27/9/2021
189 0.01
$200,000 Air Liquide Finance 2.25%27/9/2023
156 0.01
$300,000 Air Liquide Finance 2.25%10/9/2029
238 0.01
$450,000 Air Liquide Finance 2.5%27/9/2026
367 0.01
$200,000 Air Liquide Finance 3.5%27/9/2046
178 0.01
$500,000 Air Products and Chemicals1.85% 15/5/2027
394 0.01
$500,000 Air Products and Chemicals2.7% 15/5/2040
400 0.01
$300,000 Air Products and Chemicals2.8% 15/5/2050
238 0.01
$250,000 Air Products and Chemicals3% 3/11/2021
192 0.01
$300,000 Airbus 3.95% 10/4/2047 255 0.01
$300,000 Airbus Finance 2.7%17/4/2023
234 0.01
$1,000,000 Aircastle 4.4% 25/9/2023 742 0.03
$300,000 Aker BP 3% 15/1/2025 226 0.01
$300,000 Aker BP 3.75% 15/1/2030 223 0.01
$400,000 Alabama Power 3.45%1/10/2049
343 0.01
$300,000 Alabama Power 3.7%1/12/2047
267 0.01
iShares Overseas Corporate Bond Index Fund (UK)
Portfolio Statement (unaudited) continued
BlackRock Collective Investment Funds 236

Holding orNominalValue Investment
MarketValue
£000’s
% ofTotal
NetAssets
$200,000 Alabama Power 3.75%1/3/2045
176 0.01
$150,000 Alabama Power 3.85%1/12/2042
133 0.00
$300,000 Alabama Power 4.15%15/8/2044
277 0.01
$300,000 Alabama Power 4.3%2/1/2046
279 0.01
$300,000 Alabama Power 6.125%15/5/2038
327 0.01
$550,000 Alaska Airlines 2020-1 ClassA Pass Through Trust 4.8%15/2/2029
429 0.01
$300,000 Albemarle 4.15% 1/12/2024 244 0.01
$500,000 Alcon Finance 2.6%27/5/2030
396 0.01
$200,000 Alcon Finance 2.75%23/9/2026
162 0.01
$200,000 Alcon Finance 3%23/9/2029
162 0.01
$250,000 Alcon Finance 3.8%23/9/2049
215 0.01
$500,000 Alexandria Real EstateEquities 3.375% 15/8/2031
425 0.01
$500,000 Alexandria Real EstateEquities 4% 15/1/2024
413 0.01
$300,000 Alexandria Real EstateEquities 4.3% 15/1/2026
260 0.01
$400,000 Alexandria Real EstateEquities 4.5% 30/7/2029
366 0.01
$250,000 Alexandria Real EstateEquities 4.85% 15/4/2049
254 0.01
$500,000 Alexandria Real EstateEquities 4.9% 15/12/2030
474 0.02
$400,000 Alfa 5.25% 25/3/2024 323 0.01
$200,000 Alfa 6.875% 25/3/2044 174 0.01
$400,000 Alibaba 2.8% 6/6/2023 316 0.01
$800,000 Alibaba 3.4% 6/12/2027 677 0.02
$600,000 Alibaba 3.6% 28/11/2024 496 0.02
$500,000 Alibaba 4% 6/12/2037 449 0.02
$725,000 Alibaba 4.2% 6/12/2047Ø 699 0.02
$200,000 Alibaba 4.4% 6/12/2057 205 0.01
$300,000 Alibaba 4.5% 28/11/2034 283 0.01
$100,000 Alimentation Couche-Tard2.7% 26/7/2022
77 0.00
$250,000 Alimentation Couche-Tard2.95% 25/1/2030
201 0.01
$150,000 Alimentation Couche-Tard3.55% 26/7/2027
124 0.00
Holding orNominalValue Investment
MarketValue
£000’s
% ofTotal
NetAssets
$250,000 Alimentation Couche-Tard3.8% 25/1/2050
202 0.01
$100,000 Alimentation Couche-Tard4.5% 26/7/2047
90 0.00
$200,000 Alleghany 4.95% 27/6/2022 159 0.01
$500,000 Allegion 3.5% 1/10/2029 407 0.01
$400,000 Allstate 3.28% 15/12/2026 345 0.01
$100,000 Allstate 3.85% 10/8/2049 89 0.00
$300,000 Allstate 4.2% 15/12/2046 280 0.01
$250,000 Allstate 4.5% 15/6/2043 239 0.01
$300,000 Allstate 5.55% 9/5/2035 332 0.01
$200,000 Allstate 5.75% 15/8/2053 160 0.01
$100,000 Allstate 6.5% 15/5/2067 97 0.00
$900,000 Ally Financial 3.875%21/5/2024
716 0.02
$800,000 Ally Financial 5.8% 1/5/2025 690 0.02
$700,000 Ally Financial 8% 1/11/2031 711 0.02
$300,000 Alpek 4.25% 18/9/2029 227 0.01
$300,000 Alpek 4.5% 20/11/2022 234 0.01
$1,000,000 Alphabet 0.45% 15/8/2025 747 0.03
$1,000,000 Alphabet 1.1% 15/8/2030 745 0.03
$600,000 Alphabet 1.9% 15/8/2040 437 0.02
$600,000 Alphabet 1.998% 15/8/2026 482 0.02
$500,000 Alphabet 2.05% 15/8/2050 356 0.01
$1,000,000 Alphabet 2.25% 15/8/2060 715 0.02
$250,000 Alphabet 3.625% 19/5/2021 191 0.01
$300,000 Altria 2.35% 6/5/2025 238 0.01
$600,000 Altria 2.95% 2/5/2023 474 0.02
$500,000 Altria 3.49% 14/2/2022 390 0.01
$500,000 Altria 3.8% 14/2/2024 410 0.01
$250,000 Altria 3.875% 16/9/2046 195 0.01
$500,000 Altria 4% 31/1/2024 413 0.01
$250,000 Altria 4.25% 9/8/2042 198 0.01
$500,000 Altria 4.4% 14/2/2026 433 0.02
$200,000 Altria 4.45% 6/5/2050 171 0.01
$300,000 Altria 4.5% 2/5/2043 246 0.01
$500,000 Altria 4.8% 14/2/2029 446 0.02
$600,000 Altria 5.375% 31/1/2044 556 0.02
$300,000 Altria 5.8% 14/2/2039 286 0.01
$500,000 Altria 5.8% 14/2/2039 476 0.02
$600,000 Altria 5.95% 14/2/2049 609 0.02
$400,000 Altria 5.95% 14/2/2049 406 0.01
$300,000 Altria 6.2% 14/2/2059 306 0.01
$500,000 Amazon.com 0.4% 3/6/2023 375 0.01
$500,000 Amazon.com 0.8% 3/6/2025 378 0.01
$500,000 Amazon.com 1.2% 3/6/2027 381 0.01
$800,000 Amazon.com 1.5% 3/6/2030 610 0.02
iShares Overseas Corporate Bond Index Fund (UK)
Portfolio Statement (unaudited) continued
BlackRock Collective Investment Funds237

Holding orNominalValue Investment
MarketValue
£000’s
% ofTotal
NetAssets
$500,000 Amazon.com 2.4%22/2/2023
392 0.01
$800,000 Amazon.com 2.5% 3/6/2050 607 0.02
$700,000 Amazon.com 2.7% 3/6/2060 540 0.02
$675,000 Amazon.com 2.8%22/8/2024
549 0.02
$1,050,000 Amazon.com 3.15%22/8/2027
898 0.03
$350,000 Amazon.com 3.3%5/12/2021
270 0.01
$500,000 Amazon.com 3.8%5/12/2024
423 0.01
$775,000 Amazon.com 3.875%22/8/2037
724 0.03
$300,000 Amazon.com 3.875%22/8/2037
280 0.01
$1,200,000 Amazon.com 4.05%22/8/2047
1,165 0.04
$700,000 Amazon.com 4.25%22/8/2057
712 0.02
$400,000 Amazon.com 4.8%5/12/2034
413 0.01
$350,000 Amazon.com 4.95%5/12/2044
375 0.01
$300,000 Amazon.com 5.2%3/12/2025
275 0.01
$200,000 Amcor Finance USA 3.625%28/4/2026
167 0.01
$500,000 Amdocs 2.538% 15/6/2030 389 0.01
$500,000 Ameren 2.5% 15/9/2024 399 0.01
$500,000 Ameren 3.5% 15/1/2031 429 0.01
$500,000 Ameren Illinois 3.25%1/3/2025
411 0.01
$300,000 Ameren Illinois 3.25%15/3/2050
258 0.01
$300,000 Ameren Illinois 3.7%1/12/2047
268 0.01
$800,000 America Movil 2.875%7/5/2030
645 0.02
$300,000 America Movil 3.125%16/7/2022
233 0.01
$600,000 America Movil 3.625%22/4/2029
510 0.02
$500,000 America Movil 4.375%16/7/2042
457 0.02
$300,000 America Movil 4.375%22/4/2049
279 0.01
$750,000 America Movil 6.125%30/3/2040
813 0.03
Holding orNominalValue Investment
MarketValue
£000’s
% ofTotal
NetAssets
$225,713 American Airlines 2015-1 Class A Pass ThroughTrust 3.375% 1/11/2028
141 0.00
$405,273 American Airlines 2015-2 Class AA Pass ThroughTrust 3.6% 22/3/2029
286 0.01
$323,748 American Airlines 2016-1 Class AA Pass ThroughTrust 3.575% 15/7/2029
233 0.01
$300,000 American CampusCommunities OperatingPartnership LP 2.85%1/2/2030
224 0.01
$400,000 American CampusCommunities OperatingPartnership LP 4.125%1/7/2024
323 0.01
$300,000 American Electric Power3.2% 13/11/2027
247 0.01
$700,000 American Express 2.5%1/8/2022
543 0.02
$1,000,000 American Express 2.5%30/7/2024
799 0.03
$400,000 American Express 2.65%2/12/2022
314 0.01
$200,000 American Express 3%30/10/2024
163 0.01
$700,000 American Express 3.125%20/5/2026
587 0.02
$500,000 American Express 3.4%27/2/2023
399 0.01
$400,000 American Express 3.4%22/2/2024
327 0.01
$100,000 American Express 3.625%5/12/2024
83 0.00
$500,000 American Express 3.7%5/11/2021
388 0.01
$500,000 American Express 3.7%3/8/2023
407 0.01
$502,000 American Express 4.05%3/12/2042
474 0.02
$700,000 American Express Credit2.7% 3/3/2022
540 0.02
$300,000 American Financial Inc/OH3.5% 15/8/2026
242 0.01
$300,000 American Financial Inc/OH5.25% 2/4/2030
273 0.01
$200,000 American Homes 4 Rent LP4.25% 15/2/2028
170 0.01
$1,500,000 American Honda Finance1.95% 10/5/2023
1,162 0.04
iShares Overseas Corporate Bond Index Fund (UK)
Portfolio Statement (unaudited) continued
BlackRock Collective Investment Funds 238

Holding orNominalValue Investment
MarketValue
£000’s
% ofTotal
NetAssets
$400,000 American Honda Finance2.05% 10/1/2023
310 0.01
$500,000 American Honda Finance2.2% 27/6/2022
385 0.01
$500,000 American Honda Finance2.3% 9/9/2026
399 0.01
$500,000 American Honda Finance2.35% 8/1/2027
399 0.01
$500,000 American Honda Finance2.4% 27/6/2024
395 0.01
$500,000 American Honda Finance3.45% 14/7/2023
403 0.01
$300,000 American Honda Finance3.55% 12/1/2024
245 0.01
$1,000,000 American International 2.5%30/6/2025
799 0.03
$500,000 American International 3.4%30/6/2030
414 0.01
$200,000 American International3.875% 15/1/2035
174 0.01
$500,000 American International 3.9%1/4/2026
427 0.01
$750,000 American International4.125% 15/2/2024
624 0.02
$200,000 American International4.25% 15/3/2029
175 0.01
$500,000 American International4.25% 15/3/2029
439 0.02
$450,000 American International4.375% 30/6/2050
400 0.01
$200,000 American International4.375% 15/1/2055
175 0.01
$800,000 American International 4.5%16/7/2044
703 0.02
$300,000 American International4.75% 1/4/2048
274 0.01
$400,000 American International 4.8%10/7/2045
362 0.01
$700,000 American International4.875% 1/6/2022
563 0.02
$400,000 American International5.75% 1/4/2048
330 0.01
$100,000 American International8.175% 15/5/2068
107 0.00
$500,000 American Tower 2.25%15/1/2022
383 0.01
$500,000 American Tower 2.9%15/1/2030
406 0.01
$400,000 American Tower 2.95%15/1/2025
324 0.01
Holding orNominalValue Investment
MarketValue
£000’s
% ofTotal
NetAssets
$500,000 American Tower 3%15/6/2023
398 0.01
$250,000 American Tower 3.1%15/6/2050
192 0.01
$250,000 American Tower 3.125%15/1/2027
206 0.01
$500,000 American Tower 3.375%15/5/2024
407 0.01
$500,000 American Tower 3.375%15/10/2026
420 0.01
$500,000 American Tower 3.55%15/7/2027
421 0.01
$200,000 American Tower 3.7%15/10/2049
168 0.01
$500,000 American Tower 3.8%15/8/2029
432 0.02
$400,000 American Tower 3.95%15/3/2029
347 0.01
$100,000 American Tower 4%1/6/2025
85 0.00
$250,000 American Tower 4.7%15/3/2022
199 0.01
$200,000 American TransmissionSystems 5% 1/9/2044
190 0.01
$200,000 American Water Capital2.8% 1/5/2030
165 0.01
$700,000 American Water Capital2.95% 1/9/2027
580 0.02
$200,000 American Water Capital3.4% 1/3/2025
165 0.01
$200,000 American Water Capital3.45% 1/6/2029
172 0.01
$200,000 American Water Capital3.45% 1/5/2050
171 0.01
$300,000 American Water Capital3.75% 1/9/2028
262 0.01
$100,000 American Water Capital3.75% 1/9/2047
89 0.00
$300,000 American Water Capital 4%1/12/2046
272 0.01
$200,000 American Water Capital4.15% 1/6/2049
188 0.01
$200,000 American Water Capital4.2% 1/9/2048
186 0.01
$350,000 American Water Capital4.3% 1/12/2042
328 0.01
$800,000 Ameriprise Financial 3%2/4/2025
654 0.02
$500,000 Ameriprise Financial 4%15/10/2023
415 0.01
iShares Overseas Corporate Bond Index Fund (UK)
Portfolio Statement (unaudited) continued
BlackRock Collective Investment Funds239

Holding orNominalValue Investment
MarketValue
£000’s
% ofTotal
NetAssets
$300,000 AmerisourceBergen 2.8%15/5/2030
241 0.01
$500,000 AmerisourceBergen 3.25%1/3/2025
410 0.01
$700,000 AmerisourceBergen 3.45%15/12/2027
599 0.02
$150,000 AmerisourceBergen 4.3%15/12/2047
132 0.00
$600,000 Amgen 1.9% 21/2/2025 472 0.02
$1,000,000 Amgen 2.2% 21/2/2027 793 0.03
$500,000 Amgen 2.25% 19/8/2023 391 0.01
$500,000 Amgen 2.3% 25/2/2031 395 0.01
$500,000 Amgen 2.45% 21/2/2030 399 0.01
$300,000 Amgen 2.6% 19/8/2026 246 0.01
$400,000 Amgen 2.65% 11/5/2022 310 0.01
$500,000 Amgen 2.7% 1/5/2022 386 0.01
$345,000 Amgen 2.77% 1/9/2053 254 0.01
$250,000 Amgen 3.125% 1/5/2025 206 0.01
$600,000 Amgen 3.15% 21/2/2040 477 0.02
$300,000 Amgen 3.2% 2/11/2027 253 0.01
$900,000 Amgen 3.375% 21/2/2050 734 0.03
$331,429 Amgen 3.875% 15/11/2021 256 0.01
$750,000 Amgen 4.4% 1/5/2045 704 0.02
$522,000 Amgen 4.563% 15/6/2048 502 0.02
$1,024,000 Amgen 4.663% 15/6/2051 1,011 0.04
$250,000 Amgen 4.95% 1/10/2041 248 0.01
$400,000 Amgen 5.15% 15/11/2041 401 0.01
$800,000 Amphenol 2.8% 15/2/2030 655 0.02
$500,000 Analog Devices 3.125%5/12/2023
403 0.01
$500,000 Analog Devices 3.5%5/12/2026
425 0.01
$1,000,000 Anglo American Capital3.75% 10/4/2022
774 0.03
$525,000 Anglo American Capital 4%11/9/2027
432 0.02
$500,000 Anglo American Capital5.625% 1/4/2030Ø
465 0.02
$1,100,000 Anheuser-Busch Cos /Anheuser-Busch InBevWorldwide 3.65% 1/2/2026
930 0.03
$1,625,000 Anheuser-Busch Cos /Anheuser-Busch InBevWorldwide 4.7% 1/2/2036
1,458 0.05
$3,700,000 Anheuser-Busch Cos /Anheuser-Busch InBevWorldwide 4.9% 1/2/2046
3,412 0.12
$500,000 Anheuser-Busch InBevFinance 3.65% 1/2/2026
421 0.01
Holding orNominalValue Investment
MarketValue
£000’s
% ofTotal
NetAssets
$600,000 Anheuser-Busch InBevFinance 3.7% 1/2/2024
492 0.02
$400,000 Anheuser-Busch InBevFinance 4% 17/1/2043
326 0.01
$350,000 Anheuser-Busch InBevFinance 4.625% 1/2/2044
308 0.01
$400,000 Anheuser-Busch InBevFinance 4.7% 1/2/2036
356 0.01
$300,000 Anheuser-Busch InBevFinance 4.9% 1/2/2046
273 0.01
$875,000 Anheuser-Busch InBevWorldwide 3.5% 12/1/2024
711 0.02
$700,000 Anheuser-Busch InBevWorldwide 3.5% 1/6/2030
598 0.02
$300,000 Anheuser-Busch InBevWorldwide 3.75% 15/7/2042
240 0.01
$400,000 Anheuser-Busch InBevWorldwide 4% 13/4/2028
346 0.01
$400,000 Anheuser-Busch InBevWorldwide 4% 13/4/2028
346 0.01
$275,000 Anheuser-Busch InBevWorldwide 4.15% 23/1/2025
233 0.01
$500,000 Anheuser-Busch InBevWorldwide 4.15% 23/1/2025
424 0.01
$300,000 Anheuser-Busch InBevWorldwide 4.35% 1/6/2040
261 0.01
$400,000 Anheuser-Busch InBevWorldwide 4.375%15/4/2038
345 0.01
$697,000 Anheuser-Busch InBevWorldwide 4.439%6/10/2048
607 0.02
$700,000 Anheuser-Busch InBevWorldwide 4.5% 1/6/2050
632 0.02
$600,000 Anheuser-Busch InBevWorldwide 4.6% 15/4/2048
534 0.02
$350,000 Anheuser-Busch InBevWorldwide 4.6% 1/6/2060
321 0.01
$300,000 Anheuser-Busch InBevWorldwide 4.75% 23/1/2029
273 0.01
$1,500,000 Anheuser-Busch InBevWorldwide 4.75% 23/1/2029
1,366 0.05
$500,000 Anheuser-Busch InBevWorldwide 4.75% 15/4/2058
465 0.02
$200,000 Anheuser-Busch InBevWorldwide 4.9% 23/1/2031
190 0.01
$300,000 Anheuser-Busch InBevWorldwide 4.95% 15/1/2042
272 0.01
$700,000 Anheuser-Busch InBevWorldwide 5.45% 23/1/2039
667 0.02
iShares Overseas Corporate Bond Index Fund (UK)
Portfolio Statement (unaudited) continued
BlackRock Collective Investment Funds 240

Holding orNominalValue Investment
MarketValue
£000’s
% ofTotal
NetAssets
$1,100,000 Anheuser-Busch InBevWorldwide 5.55% 23/1/2049
1,105 0.04
$250,000 Anheuser-Busch InBevWorldwide 5.55% 23/1/2049
251 0.01
$550,000 Anheuser-Busch InBevWorldwide 5.8% 23/1/2059
587 0.02
$200,000 Anheuser-Busch InBevWorldwide 5.875%15/6/2035
207 0.01
$200,000 Anheuser-Busch InBevWorldwide 8% 15/11/2039
235 0.01
$200,000 Anheuser-Busch InBevWorldwide 8.2% 15/1/2039
240 0.01
$500,000 Anthem 2.25% 15/5/2030 387 0.01
$1,000,000 Anthem 2.875% 15/9/2029 815 0.03
$250,000 Anthem 2.95% 1/12/2022 197 0.01
$250,000 Anthem 3.125% 15/5/2022 195 0.01
$350,000 Anthem 3.125% 15/5/2050 276 0.01
$300,000 Anthem 3.3% 15/1/2023 239 0.01
$300,000 Anthem 3.5% 15/8/2024 247 0.01
$500,000 Anthem 3.65% 1/12/2027 429 0.01
$400,000 Anthem 3.7% 15/8/2021 306 0.01
$350,000 Anthem 3.7% 15/9/2049 299 0.01
$400,000 Anthem 4.375% 1/12/2047 377 0.01
$300,000 Anthem 4.55% 1/3/2048 289 0.01
$150,000 Anthem 4.625% 15/5/2042 142 0.01
$200,000 Anthem 4.65% 15/1/2043 190 0.01
$300,000 Anthem 4.65% 15/8/2044 286 0.01
$200,000 Anthem 5.1% 15/1/2044 200 0.01
$300,000 Anthem 5.95% 15/12/2034 317 0.01
$500,000 ANZ New Zealand Int’lLtd/London 2.55%13/2/2030
408 0.01
$500,000 ANZ New Zealand Int’lLtd/London 2.875%25/1/2022
386 0.01
$1,000,000 ANZ New Zealand Int’lLtd/London 3.4% 19/3/2024
813 0.03
$500,000 Aon 2.2% 15/11/2022 388 0.01
$500,000 Aon 2.8% 15/5/2030 405 0.01
$200,000 Aon 3.75% 2/5/2029 173 0.01
$400,000 Aon 3.875% 15/12/2025 343 0.01
$250,000 Aon 4.6% 14/6/2044 239 0.01
$200,000 Aon 4.75% 15/5/2045 197 0.01
$150,000 Aon 6.25% 30/9/2040 166 0.01
$400,000 AP Moller - Maersk 3.875%28/9/2025
325 0.01
$300,000 AP Moller - Maersk 4.5%20/6/2029
248 0.01
Holding orNominalValue Investment
MarketValue
£000’s
% ofTotal
NetAssets
$300,000 Apollo Management LP 4%30/5/2024
247 0.01
$400,000 Apollo Management LP4.872% 15/2/2029
350 0.01
$200,000 Apollo Management LP 5%15/3/2048
180 0.01
$700,000 Appalachian Power 3.3%1/6/2027
571 0.02
$400,000 Appalachian Power 3.4%1/6/2025
328 0.01
$500,000 Appalachian Power 3.7%1/5/2050
423 0.01
$500,000 Appalachian Power 4.45%1/6/2045
453 0.02
$300,000 Appalachian Power 4.5%1/3/2049
278 0.01
$250,000 Appalachian Power 4.6%30/3/2021
189 0.01
$300,000 Appalachian Power 7%1/4/2038
336 0.01
$1,200,000 Apple 0.55% 20/8/2025 899 0.03
$700,000 Apple 0.75% 11/5/2023 529 0.02
$800,000 Apple 1.125% 11/5/2025 613 0.02
$400,000 Apple 1.25% 20/8/2030 300 0.01
$500,000 Apple 1.55% 4/8/2021 378 0.01
$600,000 Apple 1.65% 11/5/2030 465 0.02
$1,000,000 Apple 1.7% 11/9/2022 769 0.03
$300,000 Apple 1.8% 11/9/2024 235 0.01
$1,000,000 Apple 2.05% 11/9/2026 803 0.03
$200,000 Apple 2.1% 12/9/2022 155 0.01
$200,000 Apple 2.15% 9/2/2022 153 0.01
$500,000 Apple 2.2% 11/9/2029 403 0.01
$500,000 Apple 2.3% 11/5/2022 386 0.01
$1,000,000 Apple 2.4% 3/5/2023 788 0.03
$500,000 Apple 2.4% 20/8/2050 372 0.01
$900,000 Apple 2.45% 4/8/2026 735 0.03
$500,000 Apple 2.5% 9/2/2022 385 0.01
$700,000 Apple 2.5% 9/2/2025 567 0.02
$600,000 Apple 2.55% 20/8/2060 445 0.02
$800,000 Apple 2.65% 11/5/2050 617 0.02
$300,000 Apple 2.7% 13/5/2022 233 0.01
$500,000 Apple 2.75% 13/1/2025 408 0.01
$800,000 Apple 2.85% 23/2/2023 632 0.02
$500,000 Apple 2.85% 11/5/2024 404 0.01
$500,000 Apple 2.9% 12/9/2027 420 0.01
$500,000 Apple 2.95% 11/9/2049 403 0.01
$400,000 Apple 3% 9/2/2024 323 0.01
$550,000 Apple 3% 20/6/2027 463 0.02
$400,000 Apple 3% 13/11/2027 339 0.01
iShares Overseas Corporate Bond Index Fund (UK)
Portfolio Statement (unaudited) continued
BlackRock Collective Investment Funds241

Holding orNominalValue Investment
MarketValue
£000’s
% ofTotal
NetAssets
$450,000 Apple 3.2% 13/5/2025 376 0.01
$500,000 Apple 3.2% 11/5/2027 425 0.01
$700,000 Apple 3.25% 23/2/2026 591 0.02
$250,000 Apple 3.35% 9/2/2027 214 0.01
$500,000 Apple 3.35% 9/2/2027 428 0.01
$700,000 Apple 3.45% 6/5/2024 579 0.02
$900,000 Apple 3.45% 9/2/2045 786 0.03
$400,000 Apple 3.75% 12/9/2047 362 0.01
$450,000 Apple 3.75% 13/11/2047 408 0.01
$900,000 Apple 3.85% 4/5/2043 829 0.03
$500,000 Apple 3.85% 4/8/2046 461 0.02
$300,000 Apple 4.25% 9/2/2047 296 0.01
$900,000 Apple 4.375% 13/5/2045 888 0.03
$300,000 Apple 4.45% 6/5/2044 302 0.01
$400,000 Apple 4.5% 23/2/2036 397 0.01
$1,300,000 Apple 4.65% 23/2/2046 1,335 0.05
$500,000 Applied Materials 1.75%1/6/2030
388 0.01
$300,000 Applied Materials 2.75%1/6/2050
239 0.01
$500,000 Applied Materials 3.9%1/10/2025
430 0.01
$300,000 Applied Materials 4.35%1/4/2047
304 0.01
$100,000 Applied Materials 5.1%1/10/2035
105 0.00
$150,000 Applied Materials 5.85%15/6/2041
172 0.01
$500,000 APT Pipelines 4.2%23/3/2025
414 0.01
$400,000 APT Pipelines 4.25%15/7/2027
337 0.01
$300,000 Aptiv 5.4% 15/3/2049 250 0.01
$300,000 Arch Capital 3.635%30/6/2050
240 0.01
$250,000 Arch Capital US 5.144%1/11/2043
243 0.01
$200,000 Arch Capital Finance4.011% 15/12/2026
173 0.01
$200,000 Arch Capital Finance5.031% 15/12/2046
191 0.01
$350,000 Archer-Daniels-Midland2.5% 11/8/2026
285 0.01
$500,000 Archer-Daniels-Midland3.25% 27/3/2030
429 0.01
$300,000 Archer-Daniels-Midland3.75% 15/9/2047
280 0.01
$200,000 Archer-Daniels-Midland4.016% 16/4/2043
187 0.01
Holding orNominalValue Investment
MarketValue
£000’s
% ofTotal
NetAssets
$200,000 Archer-Daniels-Midland4.5% 15/3/2049
209 0.01
$100,000 Archer-Daniels-Midland4.535% 26/3/2042
100 0.00
$250,000 Archer-Daniels-Midland5.935% 1/10/2032
273 0.01
$300,000 Ares Capital 3.25%15/7/2025
224 0.01
$500,000 Ares Capital 3.625%19/1/2022
383 0.01
$500,000 Ares Capital 3.875%15/1/2026
377 0.01
$400,000 Ares Capital 4.2%10/6/2024
309 0.01
$600,000 Argentum Netherlands forSwiss Re 4.625% Perpetual15/8/2169Ø
449 0.02
$500,000 Argentum Netherlands forSwiss Re 5.625%15/8/2052Ø
420 0.01
$200,000 Argentum Netherlands forSwiss Re 5.75% 15/8/2050
166 0.01
$500,000 Argentum Netherlands forZurich Insurance 5.125%1/6/2048
427 0.01
$400,000 Arizona Public Service3.35% 15/5/2050
334 0.01
$400,000 Arizona Public Service3.75% 15/5/2046
347 0.01
$200,000 Arizona Public Service 4.5%1/4/2042
187 0.01
$300,000 Arizona Public Service5.05% 1/9/2041
296 0.01
$300,000 Aroundtown 5.375%21/3/2029
259 0.01
$375,000 Arrow Electronics 3.25%8/9/2024
301 0.01
$300,000 Arrow Electronics 3.875%12/1/2028
245 0.01
$150,000 Arrow Electronics 4%1/4/2025
122 0.00
$400,000 ASB Finance 2.125%1/9/2021
303 0.01
$600,000 Ascension Health 3.106%15/11/2039
487 0.02
$250,000 Ascension Health 3.945%15/11/2046
237 0.01
$40,000 Ascension Health 4.847%15/11/2053
45 0.00
$300,000 Ashtead Capital 4%1/5/2028
232 0.01
iShares Overseas Corporate Bond Index Fund (UK)
Portfolio Statement (unaudited) continued
BlackRock Collective Investment Funds 242
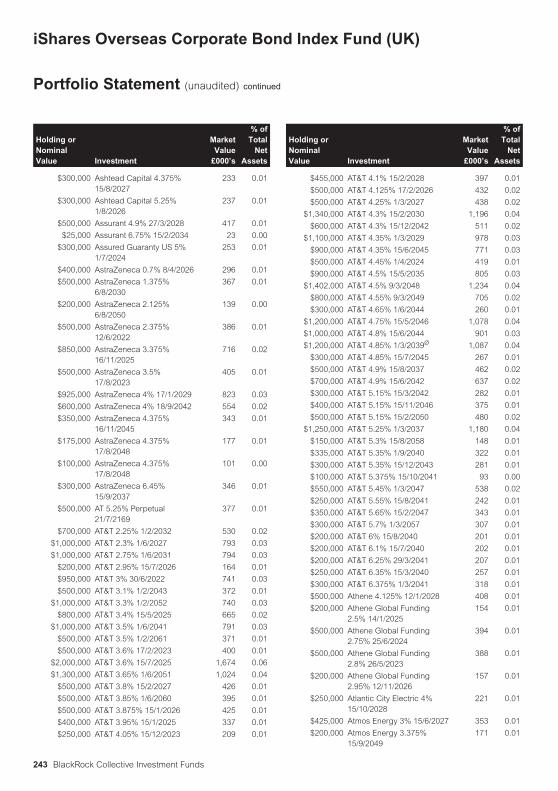
Holding orNominalValue Investment
MarketValue
£000’s
% ofTotal
NetAssets
$300,000 Ashtead Capital 4.375%15/8/2027
233 0.01
$300,000 Ashtead Capital 5.25%1/8/2026
237 0.01
$500,000 Assurant 4.9% 27/3/2028 417 0.01
$25,000 Assurant 6.75% 15/2/2034 23 0.00
$300,000 Assured Guaranty US 5%1/7/2024
253 0.01
$400,000 AstraZeneca 0.7% 8/4/2026 296 0.01
$500,000 AstraZeneca 1.375%6/8/2030
367 0.01
$200,000 AstraZeneca 2.125%6/8/2050
139 0.00
$500,000 AstraZeneca 2.375%12/6/2022
386 0.01
$850,000 AstraZeneca 3.375%16/11/2025
716 0.02
$500,000 AstraZeneca 3.5%17/8/2023
405 0.01
$925,000 AstraZeneca 4% 17/1/2029 823 0.03
$600,000 AstraZeneca 4% 18/9/2042 554 0.02
$350,000 AstraZeneca 4.375%16/11/2045
343 0.01
$175,000 AstraZeneca 4.375%17/8/2048
177 0.01
$100,000 AstraZeneca 4.375%17/8/2048
101 0.00
$300,000 AstraZeneca 6.45%15/9/2037
346 0.01
$500,000 AT 5.25% Perpetual21/7/2169
377 0.01
$700,000 AT&T 2.25% 1/2/2032 530 0.02
$1,000,000 AT&T 2.3% 1/6/2027 793 0.03
$1,000,000 AT&T 2.75% 1/6/2031 794 0.03
$200,000 AT&T 2.95% 15/7/2026 164 0.01
$950,000 AT&T 3% 30/6/2022 741 0.03
$500,000 AT&T 3.1% 1/2/2043 372 0.01
$1,000,000 AT&T 3.3% 1/2/2052 740 0.03
$800,000 AT&T 3.4% 15/5/2025 665 0.02
$1,000,000 AT&T 3.5% 1/6/2041 791 0.03
$500,000 AT&T 3.5% 1/2/2061 371 0.01
$500,000 AT&T 3.6% 17/2/2023 400 0.01
$2,000,000 AT&T 3.6% 15/7/2025 1,674 0.06
$1,300,000 AT&T 3.65% 1/6/2051 1,024 0.04
$500,000 AT&T 3.8% 15/2/2027 426 0.01
$500,000 AT&T 3.85% 1/6/2060 395 0.01
$500,000 AT&T 3.875% 15/1/2026 425 0.01
$400,000 AT&T 3.95% 15/1/2025 337 0.01
$250,000 AT&T 4.05% 15/12/2023 209 0.01
Holding orNominalValue Investment
MarketValue
£000’s
% ofTotal
NetAssets
$455,000 AT&T 4.1% 15/2/2028 397 0.01
$500,000 AT&T 4.125% 17/2/2026 432 0.02
$500,000 AT&T 4.25% 1/3/2027 438 0.02
$1,340,000 AT&T 4.3% 15/2/2030 1,196 0.04
$600,000 AT&T 4.3% 15/12/2042 511 0.02
$1,100,000 AT&T 4.35% 1/3/2029 978 0.03
$900,000 AT&T 4.35% 15/6/2045 771 0.03
$500,000 AT&T 4.45% 1/4/2024 419 0.01
$900,000 AT&T 4.5% 15/5/2035 805 0.03
$1,402,000 AT&T 4.5% 9/3/2048 1,234 0.04
$800,000 AT&T 4.55% 9/3/2049 705 0.02
$300,000 AT&T 4.65% 1/6/2044 260 0.01
$1,200,000 AT&T 4.75% 15/5/2046 1,078 0.04
$1,000,000 AT&T 4.8% 15/6/2044 901 0.03
$1,200,000 AT&T 4.85% 1/3/2039Ø 1,087 0.04
$300,000 AT&T 4.85% 15/7/2045 267 0.01
$500,000 AT&T 4.9% 15/8/2037 462 0.02
$700,000 AT&T 4.9% 15/6/2042 637 0.02
$300,000 AT&T 5.15% 15/3/2042 282 0.01
$400,000 AT&T 5.15% 15/11/2046 375 0.01
$500,000 AT&T 5.15% 15/2/2050 480 0.02
$1,250,000 AT&T 5.25% 1/3/2037 1,180 0.04
$150,000 AT&T 5.3% 15/8/2058 148 0.01
$335,000 AT&T 5.35% 1/9/2040 322 0.01
$300,000 AT&T 5.35% 15/12/2043 281 0.01
$100,000 AT&T 5.375% 15/10/2041 93 0.00
$550,000 AT&T 5.45% 1/3/2047 538 0.02
$250,000 AT&T 5.55% 15/8/2041 242 0.01
$350,000 AT&T 5.65% 15/2/2047 343 0.01
$300,000 AT&T 5.7% 1/3/2057 307 0.01
$200,000 AT&T 6% 15/8/2040 201 0.01
$200,000 AT&T 6.1% 15/7/2040 202 0.01
$200,000 AT&T 6.25% 29/3/2041 207 0.01
$250,000 AT&T 6.35% 15/3/2040 257 0.01
$300,000 AT&T 6.375% 1/3/2041 318 0.01
$500,000 Athene 4.125% 12/1/2028 408 0.01
$200,000 Athene Global Funding2.5% 14/1/2025
154 0.01
$500,000 Athene Global Funding2.75% 25/6/2024
394 0.01
$500,000 Athene Global Funding2.8% 26/5/2023
388 0.01
$200,000 Athene Global Funding2.95% 12/11/2026
157 0.01
$250,000 Atlantic City Electric 4%15/10/2028
221 0.01
$425,000 Atmos Energy 3% 15/6/2027 353 0.01
$200,000 Atmos Energy 3.375%15/9/2049
171 0.01
iShares Overseas Corporate Bond Index Fund (UK)
Portfolio Statement (unaudited) continued
BlackRock Collective Investment Funds243

Holding orNominalValue Investment
MarketValue
£000’s
% ofTotal
NetAssets
$200,000 Atmos Energy 4.125%15/10/2044
186 0.01
$300,000 Atmos Energy 4.125%15/3/2049
279 0.01
$100,000 Atmos Energy 5.5%15/6/2041
106 0.00
$500,000 Australia & New ZealandBanking 2.95% 22/7/2030
389 0.01
$300,000 Australia & New ZealandBanking 4.4% 19/5/2026
253 0.01
$500,000 Australia & New ZealandBanking 4.5% 19/3/2024
411 0.01
$100,000 Australia & New ZealandBanking 4.875% 12/1/2021
76 0.00
$600,000 Australia & New ZealandBanking Ltd/New York NY2.05% 21/11/2022
465 0.02
$500,000 Australia & New ZealandBanking Ltd/New York NY2.55% 23/11/2021
384 0.01
$600,000 Australia & New ZealandBanking Ltd/New York NY2.625% 9/11/2022
471 0.02
$350,000 Autodesk 3.5% 15/6/2027 297 0.01
$500,000 Autodesk 3.6% 15/12/2022 397 0.01
$500,000 Automatic Data Processing3.375% 15/9/2025
422 0.01
$400,000 AutoNation 3.8% 15/11/2027 322 0.01
$500,000 AutoZone 3.125% 18/4/2024 403 0.01
$200,000 AutoZone 3.125% 21/4/2026 165 0.01
$100,000 AutoZone 3.7% 15/4/2022 78 0.00
$500,000 AutoZone 3.75% 1/6/2027 427 0.01
$500,000 AutoZone 3.75% 18/4/2029 433 0.02
$500,000 AvalonBay Communities2.45% 15/1/2031
398 0.01
$500,000 AvalonBay Communities2.9% 15/10/2026
408 0.01
$500,000 AvalonBay Communities3.3% 1/6/2029
425 0.01
$100,000 AvalonBay Communities3.45% 1/6/2025
84 0.00
$300,000 AvalonBay Communities4.15% 1/7/2047
284 0.01
$500,000 AvalonBay Communities4.2% 15/12/2023
413 0.01
$500,000 Avangrid 3.15% 1/12/2024 409 0.01
$300,000 Avangrid 3.2% 15/4/2025 247 0.01
$250,000 Avangrid 3.8% 1/6/2029 218 0.01
$300,000 Avery Dennison 2.65%30/4/2030
238 0.01
Holding orNominalValue Investment
MarketValue
£000’s
% ofTotal
NetAssets
$500,000 Aviation Capital 2.875%20/1/2022
371 0.01
$700,000 Aviation Capital 3.5%1/11/2027
465 0.02
$250,000 Avnet 4.625% 15/4/2026 208 0.01
$500,000 Avolon Funding 2.875%15/2/2025
332 0.01
$400,000 Avolon Funding 3.625%1/5/2022
289 0.01
$300,000 Avolon Funding 3.95%1/7/2024
207 0.01
$500,000 Avolon Funding 4.375%1/5/2026
344 0.01
$300,000 AXA 5.125% 17/1/2047 256 0.01
$300,000 AXA 6.379% Perpetual14/6/2169
297 0.01
$300,000 AXA 8.6% 15/12/2030 339 0.01
$300,000 AXIS Specialty Finance3.9% 15/7/2029
246 0.01
$1,000,000 Azure Nova InternationalFinance 3.5% 21/3/2022
767 0.03
$500,000 Azure Orbit IV InternationalFinance 3.75% 25/1/2023
390 0.01
$150,000 Bacardi 2.75% 15/7/2026 116 0.00
$600,000 Bacardi 5.15% 15/5/2038 545 0.02
$750,000 BAE Systems 3.4%15/4/2030
629 0.02
$800,000 BAE Systems 3.85%15/12/2025
675 0.02
$300,000 BAE Systems 4.75%7/10/2044
283 0.01
$500,000 Baidu 2.875% 6/7/2022Ø 385 0.01
$300,000 Baidu 3.625% 6/7/2027 246 0.01
$200,000 Baidu 4.125% 30/6/2025 166 0.01
$400,000 Baidu 4.375% 14/5/2024 329 0.01
$200,000 Baidu 4.375% 29/3/2028 172 0.01
$500,000 Baidu 4.375% 29/3/2028 431 0.01
$350,000 Baker Hughes 5.125%15/9/2040
318 0.01
$400,000 Baker Hughes a GE / BakerHughes Co-Obligor 2.773%15/12/2022
313 0.01
$500,000 Baker Hughes a GE / BakerHughes Co-Obligor 3.138%7/11/2029
400 0.01
$500,000 Baker Hughes a GE / BakerHughes Co-Obligor 3.337%15/12/2027
407 0.01
iShares Overseas Corporate Bond Index Fund (UK)
Portfolio Statement (unaudited) continued
BlackRock Collective Investment Funds 244

Holding orNominalValue Investment
MarketValue
£000’s
% ofTotal
NetAssets
$450,000 Baker Hughes a GE / BakerHughes Co-Obligor 4.08%15/12/2047
356 0.01
$200,000 Baker Hughes a GE / BakerHughes Co-Obligor 4.486%1/5/2030
175 0.01
$500,000 Baltimore Gas and Electric2.4% 15/8/2026
404 0.01
$200,000 Baltimore Gas and Electric3.2% 15/9/2049
163 0.01
$250,000 Baltimore Gas and Electric3.5% 15/8/2046
217 0.01
$200,000 Banco de Bogota 4.375%3/8/2027
156 0.01
$800,000 Banco de Credito del Peru3.125% 1/7/2030
601 0.02
$328,000 Banco de Credito del Peru4.25% 1/4/2023
262 0.01
$200,000 Banco General 4.125%7/8/2027
165 0.01
$400,000 Banco Inbursa InstitucionDe Banca Multiple GrupoFinanciero Inbursa 4.125%6/6/2024
313 0.01
$1,000,000 Banco Santander 2.706%27/6/2024
797 0.03
$600,000 Banco Santander 2.746%28/5/2025
476 0.02
$400,000 Banco Santander 3.125%23/2/2023
315 0.01
$400,000 Banco Santander 3.306%27/6/2029
327 0.01
$600,000 Banco Santander 3.49%28/5/2030
492 0.02
$200,000 Banco Santander 3.5%11/4/2022
156 0.01
$400,000 Banco Santander 3.8%23/2/2028
328 0.01
$200,000 Banco Santander 3.848%12/4/2023
161 0.01
$400,000 Banco Santander 4.25%11/4/2027
338 0.01
$400,000 Banco Santander 5.179%19/11/2025
341 0.01
$600,000 Banco Santander Chile2.7% 10/1/2025
472 0.02
$250,000 Banco Santander MexicoInstitucion de BancaMultiple Grupo FinancieroSantand 4.125% 9/11/2022Ø
196 0.01
Holding orNominalValue Investment
MarketValue
£000’s
% ofTotal
NetAssets
$1,000,000 Banco Santander MexicoInstitucion de BancaMultiple Grupo FinancieroSantand 5.375% 17/4/2025
842 0.03
$300,000 Bancolombia 3% 29/1/2025 228 0.01
$400,000 Bangkok Bank PCL/HongKong 3.875% 27/9/2022
314 0.01
$500,000 Bangkok Bank PCL/HongKong 4.45% 19/9/2028Ø
431 0.01
$200,000 Bangkok Bank PCL/HongKong 4.8% 18/10/2020
150 0.01
$1,000,000 Bank of America 1.319%19/6/2026
756 0.03
$1,500,000 Bank of America 1.486%19/5/2024
1,148 0.04
$1,000,000 Bank of America 1.898%23/7/2031
751 0.03
$800,000 Bank of America 2.015%13/2/2026
623 0.02
$600,000 Bank of America 2.456%22/10/2025
474 0.02
$1,000,000 Bank of America 2.496%13/2/2031
787 0.03
$700,000 Bank of America 2.503%21/10/2022
535 0.02
$1,000,000 Bank of America 2.592%29/4/2031
796 0.03
$2,000,000 Bank of America 2.676%19/6/2041
1,525 0.05
$500,000 Bank of America 2.816%21/7/2023
389 0.01
$600,000 Bank of America 2.881%24/4/2023
465 0.02
$700,000 Bank of America 2.884%22/10/2030
569 0.02
$2,690,000 Bank of America 3.004%20/12/2023
2,117 0.07
$500,000 Bank of America 3.093%1/10/2025
406 0.01
$900,000 Bank of America 3.194%23/7/2030
747 0.03
$700,000 Bank of America 3.248%21/10/2027
582 0.02
$500,000 Bank of America 3.3%11/1/2023
398 0.01
$1,000,000 Bank of America 3.366%23/1/2026
821 0.03
$1,907,000 Bank of America 3.419%20/12/2028
1,593 0.06
$600,000 Bank of America 3.458%15/3/2025
490 0.02
iShares Overseas Corporate Bond Index Fund (UK)
Portfolio Statement (unaudited) continued
BlackRock Collective Investment Funds245

Holding orNominalValue Investment
MarketValue
£000’s
% ofTotal
NetAssets
$1,500,000 Bank of America 3.55%5/3/2024
1,199 0.04
$900,000 Bank of America 3.559%23/4/2027
756 0.03
$700,000 Bank of America 3.593%21/7/2028
590 0.02
$900,000 Bank of America 3.705%24/4/2028
762 0.03
$500,000 Bank of America 3.824%20/1/2028
425 0.01
$1,000,000 Bank of America 3.875%1/8/2025
852 0.03
$600,000 Bank of America 3.946%23/1/2049
550 0.02
$800,000 Bank of America 3.95%21/4/2025
671 0.02
$800,000 Bank of America 3.97%5/3/2029
688 0.02
$800,000 Bank of America 3.974%7/2/2030
698 0.02
$600,000 Bank of America 4%1/4/2024
500 0.02
$1,200,000 Bank of America 4%22/1/2025
1,004 0.03
$500,000 Bank of America 4.078%23/4/2040
452 0.02
$2,300,000 Bank of America 4.083%20/3/2051
2,151 0.07
$1,200,000 Bank of America 4.1%24/7/2023
988 0.03
$500,000 Bank of America 4.125%22/1/2024
418 0.01
$500,000 Bank of America 4.183%25/11/2027
431 0.01
$900,000 Bank of America 4.2%26/8/2024
753 0.03
$900,000 Bank of America 4.244%24/4/2038
820 0.03
$750,000 Bank of America 4.25%22/10/2026
649 0.02
$1,000,000 Bank of America 4.271%23/7/2029
883 0.03
$650,000 Bank of America 4.33%15/3/2050
628 0.02
$100,000 Bank of America 4.33%15/3/2050
97 0.00
$500,000 Bank of America 4.443%20/1/2048
480 0.02
$750,000 Bank of America 4.45%3/3/2026
649 0.02
Holding orNominalValue Investment
MarketValue
£000’s
% ofTotal
NetAssets
$250,000 Bank of America 4.75%21/4/2045
250 0.01
$350,000 Bank of America 5%21/1/2044
363 0.01
$600,000 Bank of America 5.875%7/2/2042
670 0.02
$1,400,000 Bank of America 6.11%29/1/2037
1,497 0.05
$350,000 Bank of America 6.22%15/9/2026
322 0.01
$700,000 Bank of America NA3.335% 25/1/2023
544 0.02
$400,000 Bank of America NA 6%15/10/2036
434 0.02
$1,000,000 Bank of East Asia 4%29/5/2030
783 0.03
$300,000 Bank of Ireland 4.5%25/11/2023
243 0.01
$800,000 Bank of Montreal 1.85%1/5/2025
628 0.02
$500,000 Bank of Montreal 1.9%27/8/2021
380 0.01
$750,000 Bank of Montreal 2.35%11/9/2022
584 0.02
$550,000 Bank of Montreal 2.5%28/6/2024
440 0.02
$400,000 Bank of Montreal 2.55%6/11/2022
312 0.01
$500,000 Bank of Montreal 2.9%26/3/2022
388 0.01
$500,000 Bank of Montreal 3.3%5/2/2024
408 0.01
$400,000 Bank of Montreal 3.803%15/12/2032
331 0.01
$1,000,000 Bank of New York Mellon1.6% 24/4/2025
779 0.03
$500,000 Bank of New York Mellon2.1% 24/10/2024
398 0.01
$1,000,000 Bank of New York Mellon2.661% 16/5/2023
774 0.03
$500,000 Bank of New York Mellon2.8% 4/5/2026
417 0.01
$500,000 Bank of New York Mellon2.95% 29/1/2023
396 0.01
$400,000 Bank of New York Mellon3% 24/2/2025
329 0.01
$200,000 Bank of New York Mellon3% 30/10/2028
167 0.01
$300,000 Bank of New York Mellon3.3% 23/8/2029
259 0.01
iShares Overseas Corporate Bond Index Fund (UK)
Portfolio Statement (unaudited) continued
BlackRock Collective Investment Funds 246

Holding orNominalValue Investment
MarketValue
£000’s
% ofTotal
NetAssets
$500,000 Bank of New York Mellon3.4% 15/5/2024
413 0.01
$500,000 Bank of New York Mellon3.4% 29/1/2028
434 0.02
$300,000 Bank of New York Mellon3.442% 7/2/2028
259 0.01
$300,000 Bank of New York Mellon3.45% 11/8/2023
244 0.01
$200,000 Bank of New York Mellon3.55% 23/9/2021
154 0.01
$500,000 Bank of New Zealand 3.5%20/2/2024
407 0.01
$800,000 Bank of Nova Scotia/The1.3% 11/6/2025
611 0.02
$800,000 Bank of Nova Scotia/The1.625% 1/5/2023
615 0.02
$500,000 Bank of Nova Scotia/The2.2% 3/2/2025
396 0.01
$1,300,000 Bank of Nova Scotia/The2.45% 19/9/2022
1,014 0.04
$500,000 Bank of Nova Scotia/The3.4% 11/2/2024
408 0.01
$200,000 Bank of Nova Scotia/The4.375% 13/1/2021
152 0.01
$450,000 Bank of Nova Scotia/The4.5% 16/12/2025
391 0.01
$500,000 Bank of the PhilippineIslands 4.25% 4/9/2023
399 0.01
$500,000 Banque Federative duCredit Mutuel 2.125%21/11/2022
386 0.01
$500,000 Banque Federative duCredit Mutuel 2.375%21/11/2024
398 0.01
$300,000 Banque Federative duCredit Mutuel 2.7%20/7/2022
233 0.01
$500,000 Banque Federative duCredit Mutuel 3.75%20/7/2023
406 0.01
$500,000 Barclays 2.852% 7/5/2026 394 0.01
$400,000 Barclays 3.2% 10/8/2021 306 0.01
$300,000 Barclays 3.65% 16/3/2025 245 0.01
$400,000 Barclays 3.684% 10/1/2023 310 0.01
$500,000 Barclays 3.932% 7/5/2025 406 0.01
$400,000 Barclays 4.337% 10/1/2028 337 0.01
$1,100,000 Barclays 4.338% 16/5/2024 889 0.03
$800,000 Barclays 4.375% 12/1/2026 679 0.02
$400,000 Barclays 4.836% 9/5/2028 333 0.01
$500,000 Barclays 4.95% 10/1/2047Ø 504 0.02
Holding orNominalValue Investment
MarketValue
£000’s
% ofTotal
NetAssets
$1,300,000 Barclays 4.972% 16/5/2029 1,156 0.04
$400,000 Barclays 5.088% 20/6/2030 347 0.01
$1,400,000 Barclays 5.2% 12/5/2026 1,189 0.04
$300,000 Barclays 5.25% 17/8/2045 307 0.01
$1,000,000 Barclays Bank 1.7%12/5/2022
760 0.03
$400,000 Barclays Bank 5.14%14/10/2020
300 0.01
$200,000 Barclays Bank 10.179%12/6/2021
160 0.01
$350,000 Barrick Gold 5.25%1/4/2042
359 0.01
$400,000 Barrick InternationalBarbados 6.35%15/10/2036
413 0.01
$250,000 Barrick North AmericaFinance 5.75% 1/5/2043
273 0.01
$150,000 Barrick PD AustraliaFinance Pty 5.95%15/10/2039
160 0.01
$400,000 BASF 2.5% 18/1/2022Ø 307 0.01
$200,000 Basin Electric PowerCooperative 4.75%26/4/2047
176 0.01
$600,000 BAT Capital 2.764%15/8/2022
466 0.02
$600,000 BAT Capital 2.789%6/9/2024
477 0.02
$850,000 BAT Capital 3.222%15/8/2024
685 0.02
$400,000 BAT Capital 3.462%6/9/2029
325 0.01
$600,000 BAT Capital 3.557%15/8/2027
491 0.02
$775,000 BAT Capital 4.39%15/8/2037
631 0.02
$850,000 BAT Capital 4.54%15/8/2047
691 0.02
$600,000 BAT Capital 4.7% 2/4/2027 520 0.02
$300,000 BAT Capital 4.758%6/9/2049
251 0.01
$500,000 BAT Capital 4.906%2/4/2030
445 0.02
$250,000 BAT Capital 5.282%2/4/2050
224 0.01
$500,000 BAT International Finance3.25% 7/6/2022
391 0.01
$400,000 BAT International Finance3.95% 15/6/2025
333 0.01
$149,000 Baxalta 4% 23/6/2025 127 0.00
$67,000 Baxalta 5.25% 23/6/2045 70 0.00
iShares Overseas Corporate Bond Index Fund (UK)
Portfolio Statement (unaudited) continued
BlackRock Collective Investment Funds247

Holding orNominalValue Investment
MarketValue
£000’s
% ofTotal
NetAssets
$75,000 Baxter International 1.7%15/8/2021
57 0.00
$325,000 Baxter International 2.6%15/8/2026
266 0.01
$100,000 Baxter International 3.5%15/8/2046
86 0.00
$400,000 Baxter International 3.95%1/4/2030
359 0.01
$650,000 Bayer US Finance 3%8/10/2021
497 0.02
$500,000 Bayer US Finance 3.375%8/10/2024
409 0.01
$250,000 Bayer US Finance II 2.85%15/4/2025
195 0.01
$175,000 Bayer US Finance II 3.375%15/7/2024
142 0.01
$550,000 Bayer US Finance II 3.875%15/12/2023
450 0.02
$300,000 Bayer US Finance II 3.95%15/4/2045
246 0.01
$700,000 Bayer US Finance II 4.25%15/12/2025
601 0.02
$600,000 Bayer US Finance II 4.375%15/12/2028
526 0.02
$1,000,000 Bayer US Finance II 4.375%15/12/2028
876 0.03
$300,000 Bayer US Finance II 4.4%15/7/2044
254 0.01
$300,000 Bayer US Finance II 4.625%25/6/2038
268 0.01
$230,000 Bayer US Finance II 4.7%15/7/2064
191 0.01
$700,000 Bayer US Finance II 4.875%25/6/2048
648 0.02
$200,000 Baylor Scott & White3.967% 15/11/2046
179 0.01
$500,000 BBVA Bancomer SA/Texas4.375% 10/4/2024Ø
403 0.01
$500,000 BBVA USA 2.5% 27/8/2024 385 0.01
$500,000 BBVA USA 3.875%10/4/2025
402 0.01
$400,000 Becton Dickinson and2.894% 6/6/2022
310 0.01
$300,000 Becton Dickinson and3.125% 8/11/2021
231 0.01
$500,000 Becton Dickinson and3.363% 6/6/2024
406 0.01
$489,000 Becton Dickinson and 3.7%6/6/2027
414 0.01
$600,000 Becton Dickinson and3.734% 15/12/2024
498 0.02
Holding orNominalValue Investment
MarketValue
£000’s
% ofTotal
NetAssets
$500,000 Becton Dickinson and3.794% 20/5/2050
422 0.01
$500,000 Becton Dickinson and4.669% 6/6/2047Ø
471 0.02
$235,000 Becton Dickinson and4.685% 15/12/2044
222 0.01
$200,000 Bell Canada 4.3%29/7/2049
188 0.01
$250,000 Bell Canada 4.3%29/7/2049
235 0.01
$200,000 Bell Canada 4.464%1/4/2048
191 0.01
$500,000 Bemis 2.63% 19/6/2030 401 0.01
$750,000 Berkshire Hathaway 2.75%15/3/2023
592 0.02
$500,000 Berkshire Hathaway 3.125%15/3/2026
418 0.01
$500,000 Berkshire Hathaway 3.4%31/1/2022
390 0.01
$400,000 Berkshire Hathaway 4.5%11/2/2043
405 0.01
$100,000 Berkshire Hathaway Energy3.8% 15/7/2048
89 0.00
$500,000 Berkshire Hathaway Energy4.05% 15/4/2025
427 0.01
$300,000 Berkshire Hathaway Energy4.25% 15/10/2050
284 0.01
$200,000 Berkshire Hathaway Energy4.45% 15/1/2049
194 0.01
$200,000 Berkshire Hathaway Energy4.5% 1/2/2045
192 0.01
$200,000 Berkshire Hathaway Energy5.15% 15/11/2043
205 0.01
$300,000 Berkshire Hathaway Energy5.95% 15/5/2037
325 0.01
$300,000 Berkshire HathawayFinance 1.85% 12/3/2030
233 0.01
$500,000 Berkshire HathawayFinance 3% 15/5/2022
391 0.01
$700,000 Berkshire HathawayFinance 4.2% 15/8/2048
674 0.02
$250,000 Berkshire HathawayFinance 4.25% 15/1/2021
189 0.01
$700,000 Berkshire HathawayFinance 4.25% 15/1/2049
680 0.02
$250,000 Berkshire HathawayFinance 4.3% 15/5/2043
242 0.01
$200,000 Berkshire HathawayFinance 4.4% 15/5/2042
195 0.01
$200,000 Berkshire HathawayFinance 5.75% 15/1/2040
229 0.01
iShares Overseas Corporate Bond Index Fund (UK)
Portfolio Statement (unaudited) continued
BlackRock Collective Investment Funds 248

Holding orNominalValue Investment
MarketValue
£000’s
% ofTotal
NetAssets
$400,000 Best Buy 4.45% 1/10/2028 354 0.01
$400,000 BG Energy Capital 4%15/10/2021
310 0.01
$200,000 BG Energy Capital 5.125%15/10/2041
194 0.01
$500,000 BGC Partners 5.375%24/7/2023
396 0.01
$500,000 Bharti Airtel 4.375%10/6/2025Ø
397 0.01
$500,000 Bharti Airtel InternationalNetherlands 5.35%20/5/2024
406 0.01
$500,000 BHP Billiton Finance USA2.875% 24/2/2022
387 0.01
$250,000 BHP Billiton Finance USA3.85% 30/9/2023
206 0.01
$200,000 BHP Billiton Finance USA4.125% 24/2/2042
189 0.01
$900,000 BHP Billiton Finance USA5% 30/9/2043
956 0.03
$700,000 BHP Billiton Finance USA6.75% 19/10/2075
625 0.02
$500,000 Bi Hai 6.25% 5/3/2022 384 0.01
$900,000 Biogen 2.25% 1/5/2030 691 0.02
$500,000 Biogen 3.15% 1/5/2050 380 0.01
$750,000 Biogen 3.625% 15/9/2022 596 0.02
$250,000 Biogen 4.05% 15/9/2025 215 0.01
$500,000 Biogen 5.2% 15/9/2045 511 0.02
$500,000 Black Hills 3.05%15/10/2029
407 0.01
$200,000 Black Hills 3.95% 15/1/2026 164 0.01
$100,000 Black Hills 4.2% 15/9/2046 91 0.00
$300,000 Black Hills 4.35% 1/5/2033 261 0.01
$300,000 BlackRock 2.4% 30/4/2030‡ 245 0.01
$500,000 BlackRock 3.25%30/4/2029‡
438 0.02
$500,000 BlackRock 3.375%1/6/2022‡
393 0.01
$150,000 Blackstone Finance 2.5%10/1/2030
120 0.00
$300,000 Blackstone Finance 3.5%10/9/2049
246 0.01
$350,000 Blackstone Finance 4.75%15/2/2023
287 0.01
$150,000 Blackstone Finance 5%15/6/2044
144 0.01
$500,000 Block Financial 3.875%15/8/2030
380 0.01
$300,000 Block Financial 5.25%1/10/2025
252 0.01
Holding orNominalValue Investment
MarketValue
£000’s
% ofTotal
NetAssets
$500,000 BMW Finance 2.25%12/8/2022
385 0.01
$200,000 BMW Finance 2.4%14/8/2024
158 0.01
$400,000 BMW Finance 2.85%14/8/2029
322 0.01
$750,000 BMW US Capital 1.85%15/9/2021
568 0.02
$350,000 BMW US Capital 2.25%15/9/2023
272 0.01
$500,000 BMW US Capital 3.45%12/4/2023
399 0.01
$500,000 BMW US Capital 3.75%12/4/2028
424 0.01
$500,000 BMW US Capital 3.8%6/4/2023
404 0.01
$800,000 BMW US Capital 3.9%9/4/2025
672 0.02
$250,000 BMW US Capital 3.95%14/8/2028
215 0.01
$500,000 BMW US Capital 4.15%9/4/2030
443 0.02
$700,000 BNP Paribas 2.219%9/6/2026
545 0.02
$900,000 BNP Paribas 2.588%12/8/2035
667 0.02
$600,000 BNP Paribas 2.819%19/11/2025
477 0.02
$600,000 BNP Paribas 3.052%13/1/2031
484 0.02
$900,000 BNP Paribas 3.25%3/3/2023
720 0.02
$500,000 BNP Paribas 3.375%9/1/2025
408 0.01
$700,000 BNP Paribas 3.5% 1/3/2023 557 0.02
$400,000 BNP Paribas 3.5%16/11/2027
333 0.01
$500,000 BNP Paribas 3.8%10/1/2024
407 0.01
$400,000 BNP Paribas 4.375%28/9/2025
335 0.01
$400,000 BNP Paribas 4.375%12/5/2026
339 0.01
$300,000 BNP Paribas 4.375%1/3/2033
253 0.01
$300,000 BNP Paribas 4.4%14/8/2028
265 0.01
$500,000 BNP Paribas 4.625%13/3/2027
427 0.01
$800,000 BNP Paribas 4.705%10/1/2025
668 0.02
iShares Overseas Corporate Bond Index Fund (UK)
Portfolio Statement (unaudited) continued
BlackRock Collective Investment Funds249

Holding orNominalValue Investment
MarketValue
£000’s
% ofTotal
NetAssets
$500,000 BNP Paribas 5.198%10/1/2030
464 0.02
$300,000 BNP Paribas 7.195%Perpetual 25/12/2168
244 0.01
$400,000 BNZ International FundingLtd/London 3.375%1/3/2023
319 0.01
$400,000 Boardwalk Pipelines LP3.375% 1/2/2023
306 0.01
$500,000 Boardwalk Pipelines LP3.4% 15/2/2031
377 0.01
$200,000 Boardwalk Pipelines LP4.8% 3/5/2029
165 0.01
$175,000 Boardwalk Pipelines LP5.95% 1/6/2026
152 0.01
$500,000 Bocom LeasingManagement Hong Kong1.75% 14/7/2023
373 0.01
$400,000 Bocom LeasingManagement Hong Kong4% 22/1/2022
308 0.01
$200,000 Bocom LeasingManagement Hong Kong4.375% 22/1/2024
161 0.01
$1,000,000 Boeing 1.875% 15/6/2023 742 0.03
$75,000 Boeing 2.6% 30/10/2025 56 0.00
$1,000,000 Boeing 2.7% 1/2/2027 725 0.03
$300,000 Boeing 2.95% 1/2/2030 219 0.01
$300,000 Boeing 3.1% 1/5/2026 224 0.01
$500,000 Boeing 3.2% 1/3/2029 371 0.01
$300,000 Boeing 3.25% 1/2/2035 210 0.01
$500,000 Boeing 3.45% 1/11/2028 374 0.01
$200,000 Boeing 3.6% 1/5/2034 147 0.01
$150,000 Boeing 3.65% 1/3/2047 97 0.00
$400,000 Boeing 3.75% 1/2/2050 269 0.01
$200,000 Boeing 3.825% 1/3/2059 132 0.00
$300,000 Boeing 3.85% 1/11/2048 200 0.01
$200,000 Boeing 3.9% 1/5/2049 137 0.00
$1,400,000 Boeing 4.508% 1/5/2023 1,104 0.04
$1,100,000 Boeing 4.875% 1/5/2025 894 0.03
$800,000 Boeing 5.04% 1/5/2027 658 0.02
$1,450,000 Boeing 5.15% 1/5/2030 1,214 0.04
$1,000,000 Boeing 5.705% 1/5/2040 867 0.03
$1,650,000 Boeing 5.805% 1/5/2050 1,478 0.05
$150,000 Boeing 5.875% 15/2/2040 128 0.00
$1,400,000 Boeing 5.93% 1/5/2060 1,280 0.04
$600,000 Boeing 6.875% 15/3/2039 557 0.02
$300,000 Booking 2.75% 15/3/2023 236 0.01
$200,000 Booking 3.55% 15/3/2028 167 0.01
$500,000 Booking 3.6% 1/6/2026 419 0.01
Holding orNominalValue Investment
MarketValue
£000’s
% ofTotal
NetAssets
$500,000 Booking 3.65% 15/3/2025 415 0.01
$400,000 Booking 4.625% 13/4/2030 361 0.01
$500,000 BorgWarner 2.65% 1/7/2027 396 0.01
$500,000 BorgWarner 3.375%15/3/2025
407 0.01
$500,000 BOS Funding 4.23%7/3/2022
380 0.01
$300,000 Boston Gas 3.15% 1/8/2027 249 0.01
$200,000 Boston Gas 4.487%15/2/2042
187 0.01
$400,000 Boston Properties LP 2.75%1/10/2026
323 0.01
$500,000 Boston Properties LP 2.9%15/3/2030
395 0.01
$1,000,000 Boston Properties LP 3.65%1/2/2026
834 0.03
$400,000 Boston Properties LP 3.85%1/2/2023
319 0.01
$300,000 Boston Properties LP 4.5%1/12/2028
265 0.01
$600,000 Boston Scientific 2.65%1/6/2030
478 0.02
$600,000 Boston Scientific 3.375%15/5/2022
469 0.02
$800,000 Boston Scientific 3.75%1/3/2026
684 0.02
$400,000 Boston Scientific 4%1/3/2029
349 0.01
$250,000 Boston Scientific 4.55%1/3/2039
234 0.01
$300,000 Boston Scientific 4.7%1/3/2049
298 0.01
$150,000 Boston Scientific 7.375%15/1/2040
180 0.01
$350,000 BP Capital Markets 2.5%6/11/2022
273 0.01
$500,000 BP Capital Markets 3.062%17/3/2022
389 0.01
$500,000 BP Capital Markets 3.279%19/9/2027
417 0.01
$500,000 BP Capital Markets 3.535%4/11/2024
414 0.01
$400,000 BP Capital Markets 3.561%1/11/2021
310 0.01
$250,000 BP Capital Markets 3.723%28/11/2028
215 0.01
$500,000 BP Capital Markets 3.814%10/2/2024
412 0.01
$500,000 BP Capital Markets 3.994%26/9/2023
412 0.01
iShares Overseas Corporate Bond Index Fund (UK)
Portfolio Statement (unaudited) continued
BlackRock Collective Investment Funds 250

Holding orNominalValue Investment
MarketValue
£000’s
% ofTotal
NetAssets
$350,000 BP Capital Markets America1.749% 10/8/2030
260 0.01
$800,000 BP Capital Markets America2.52% 19/9/2022
621 0.02
$500,000 BP Capital Markets America2.772% 10/11/2050
353 0.01
$300,000 BP Capital Markets America2.937% 6/4/2023
238 0.01
$400,000 BP Capital Markets America3% 24/2/2050
294 0.01
$200,000 BP Capital Markets America3% 24/2/2050
147 0.01
$500,000 BP Capital Markets America3.017% 16/1/2027
410 0.01
$500,000 BP Capital Markets America3.119% 4/5/2026
414 0.01
$500,000 BP Capital Markets America3.194% 6/4/2025
411 0.01
$500,000 BP Capital Markets America3.245% 6/5/2022
392 0.01
$600,000 BP Capital Markets America3.41% 11/2/2026
502 0.02
$500,000 BP Capital Markets America3.543% 6/4/2027
421 0.01
$500,000 BP Capital Markets America3.588% 14/4/2027
420 0.01
$400,000 BP Capital Markets America3.633% 6/4/2030
344 0.01
$300,000 BP Capital Markets America3.937% 21/9/2028
262 0.01
$500,000 BP Capital Markets America4.234% 6/11/2028
445 0.02
$300,000 BP Capital Markets America4.742% 11/3/2021
229 0.01
$1,000,000 BPCE 2.375% 14/1/2025 783 0.03
$250,000 BPCE 2.7% 1/10/2029 201 0.01
$300,000 BPCE 2.75% 2/12/2021 231 0.01
$750,000 BPCE 3% 22/5/2022 582 0.02
$500,000 BPCE 3.25% 11/1/2028 412 0.01
$500,000 BPCE 3.5% 23/10/2027 412 0.01
$500,000 BPCE 4% 15/4/2024 415 0.01
$300,000 BPCE 4.5% 15/3/2025 250 0.01
$400,000 BPCE 4.625% 11/7/2024 330 0.01
$300,000 BPCE 4.625% 12/9/2028 266 0.01
$400,000 BPCE 5.15% 21/7/2024 336 0.01
$300,000 BPCE 5.7% 22/10/2023 252 0.01
$500,000 Brandywine OperatingPartnership LP 3.95%15/11/2027
386 0.01
Holding orNominalValue Investment
MarketValue
£000’s
% ofTotal
NetAssets
$500,000 Bright Galaxy International3.375% 3/11/2021
376 0.01
$500,000 Brighthouse Financial 3.7%22/6/2027
393 0.01
$450,000 Brighthouse Financial 4.7%22/6/2047
324 0.01
$500,000 Brighthouse Financial5.625% 15/5/2030
434 0.02
$250,000 Bristol-Myers Squibb 2%1/8/2022
192 0.01
$300,000 Bristol-Myers Squibb 2.55%14/5/2021
228 0.01
$500,000 Bristol-Myers Squibb 2.6%16/5/2022
388 0.01
$100,000 Bristol-Myers Squibb 2.75%15/2/2023
79 0.00
$1,000,000 Bristol-Myers Squibb 2.9%26/7/2024
814 0.03
$500,000 Bristol-Myers Squibb 3.2%15/6/2026
425 0.01
$400,000 Bristol-Myers Squibb 3.25%15/8/2022
316 0.01
$300,000 Bristol-Myers Squibb 3.25%20/2/2023
239 0.01
$1,200,000 Bristol-Myers Squibb 3.4%26/7/2029
1,047 0.04
$800,000 Bristol-Myers Squibb 3.45%15/11/2027
689 0.02
$500,000 Bristol-Myers Squibb 3.55%15/8/2022
397 0.01
$500,000 Bristol-Myers Squibb3.625% 15/5/2024
414 0.01
$900,000 Bristol-Myers Squibb3.875% 15/8/2025
773 0.03
$500,000 Bristol-Myers Squibb 3.9%20/2/2028
436 0.02
$900,000 Bristol-Myers Squibb4.125% 15/6/2039
862 0.03
$1,150,000 Bristol-Myers Squibb 4.25%26/10/2049
1,143 0.04
$700,000 Bristol-Myers Squibb 4.35%15/11/2047
697 0.02
$200,000 Bristol-Myers Squibb 4.5%1/3/2044
203 0.01
$500,000 Bristol-Myers Squibb 4.55%20/2/2048
516 0.02
$200,000 Bristol-Myers Squibb4.625% 15/5/2044
202 0.01
$200,000 Bristol-Myers Squibb4.625% 15/5/2044
202 0.01
iShares Overseas Corporate Bond Index Fund (UK)
Portfolio Statement (unaudited) continued
BlackRock Collective Investment Funds251

Holding orNominalValue Investment
MarketValue
£000’s
% ofTotal
NetAssets
$700,000 Bristol-Myers Squibb 5%15/8/2045
746 0.03
$399,423 British Airways 2019-1 ClassAA Pass Through Trust 3.3%15/6/2034
275 0.01
$500,000 British Telecommunications3.25% 8/11/2029
408 0.01
$300,000 British Telecommunications4.25% 8/11/2049
261 0.01
$800,000 British Telecommunications9.625% 15/12/2030
974 0.03
$400,000 Brixmor OperatingPartnership LP 3.25%15/9/2023
308 0.01
$500,000 Brixmor OperatingPartnership LP 3.85%1/2/2025
396 0.01
$500,000 Brixmor OperatingPartnership LP 4.125%15/5/2029
405 0.01
$500,000 Broadcom 3.125%15/10/2022
392 0.01
$1,200,000 Broadcom 3.15%15/11/2025
971 0.03
$509,000 Broadcom 3.459%15/9/2026
417 0.01
$521,000 Broadcom 3.459%15/9/2026
426 0.01
$526,000 Broadcom 4.11% 15/9/2028 440 0.02
$318,000 Broadcom 4.11% 15/9/2028 266 0.01
$1,200,000 Broadcom 4.15%15/11/2030
1,010 0.03
$800,000 Broadcom 4.25% 15/4/2026 678 0.02
$650,000 Broadcom 4.3% 15/11/2032 559 0.02
$500,000 Broadcom 4.7% 15/4/2025 427 0.01
$1,200,000 Broadcom 4.75% 15/4/2029 1,052 0.04
$500,000 Broadcom 5% 15/4/2030 445 0.02
$1,000,000 Broadcom / BroadcomCayman Finance 2.65%15/1/2023
777 0.03
$250,000 Broadcom / BroadcomCayman Finance 3.125%15/1/2025
200 0.01
$500,000 Broadcom / BroadcomCayman Finance 3.5%15/1/2028
404 0.01
$1,300,000 Broadcom / BroadcomCayman Finance 3.875%15/1/2027
1,077 0.04
$500,000 Broadridge FinancialSolutions 2.9% 1/12/2029
407 0.01
Holding orNominalValue Investment
MarketValue
£000’s
% ofTotal
NetAssets
$500,000 Brookfield Finance 4%1/4/2024
410 0.01
$500,000 Brookfield Finance 4.35%15/4/2030
433 0.02
$375,000 Brookfield Finance 4.7%20/9/2047
331 0.01
$500,000 Brookfield Finance 4.85%29/3/2029
446 0.02
$400,000 Brooklyn Union Gas 3.865%4/3/2029
349 0.01
$200,000 Brooklyn Union Gas 4.487%4/3/2049
194 0.01
$400,000 Brooklyn Union Gas 4.504%10/3/2046
383 0.01
$300,000 Brown & Brown 4.5%15/3/2029
249 0.01
$300,000 Brown-Forman 4.5%15/7/2045
298 0.01
$500,000 Bunge Finance 3.25%15/8/2026
401 0.01
$300,000 Bunge Finance 3.5%24/11/2020
225 0.01
$500,000 Bunge Finance 4.35%15/3/2024
410 0.01
$500,000 Burlington Northern SantaFe 3% 15/3/2023
397 0.01
$300,000 Burlington Northern SantaFe 3.05% 15/2/2051
248 0.01
$300,000 Burlington Northern SantaFe 3.25% 15/6/2027
255 0.01
$500,000 Burlington Northern SantaFe 3.4% 1/9/2024
414 0.01
$200,000 Burlington Northern SantaFe 3.45% 15/9/2021
153 0.01
$400,000 Burlington Northern SantaFe 3.55% 15/2/2050
356 0.01
$500,000 Burlington Northern SantaFe 3.85% 1/9/2023
408 0.01
$250,000 Burlington Northern SantaFe 3.9% 1/8/2046
232 0.01
$400,000 Burlington Northern SantaFe 4.05% 15/6/2048
378 0.01
$300,000 Burlington Northern SantaFe 4.125% 15/6/2047
283 0.01
$300,000 Burlington Northern SantaFe 4.15% 1/4/2045
284 0.01
$300,000 Burlington Northern SantaFe 4.15% 15/12/2048
290 0.01
$250,000 Burlington Northern SantaFe 4.375% 1/9/2042
240 0.01
iShares Overseas Corporate Bond Index Fund (UK)
Portfolio Statement (unaudited) continued
BlackRock Collective Investment Funds 252

Holding orNominalValue Investment
MarketValue
£000’s
% ofTotal
NetAssets
$500,000 Burlington Northern SantaFe 4.4% 15/3/2042
476 0.02
$250,000 Burlington Northern SantaFe 4.7% 1/9/2045
253 0.01
$300,000 Burlington Northern SantaFe 4.9% 1/4/2044
310 0.01
$200,000 Burlington Northern SantaFe 4.95% 15/9/2041
202 0.01
$400,000 Burlington Northern SantaFe 5.4% 1/6/2041
423 0.01
$200,000 Burlington Northern SantaFe 5.75% 1/5/2040
217 0.01
$200,000 Burlington Resources 7.2%15/8/2031
217 0.01
$400,000 Cabot 4% 1/7/2029 317 0.01
$300,000 California Institute ofTechnology 3.65% 1/9/2119
249 0.01
$500,000 Camden Property Trust2.8% 15/5/2030
410 0.01
$300,000 Camden Property Trust3.15% 1/7/2029
251 0.01
$200,000 Camden Property Trust3.35% 1/11/2049
166 0.01
$500,000 Cameron LNG 2.902%15/7/2031
409 0.01
$500,000 Cameron LNG 3.402%15/1/2038
402 0.01
$450,000 Campbell Soup 2.375%24/4/2030
350 0.01
$150,000 Campbell Soup 3.125%24/4/2050
113 0.00
$286,000 Campbell Soup 3.65%15/3/2023
229 0.01
$400,000 Campbell Soup 4.15%15/3/2028
349 0.01
$200,000 Campbell Soup 4.8%15/3/2048
194 0.01
$300,000 Canadian Imperial Bank ofCommerce 2.25%28/1/2025
238 0.01
$400,000 Canadian Imperial Bank ofCommerce 2.606%22/7/2023
310 0.01
$800,000 Canadian Imperial Bank ofCommerce 3.1% 2/4/2024
647 0.02
$400,000 Canadian Imperial Bank ofCommerce 3.5% 13/9/2023
327 0.01
$500,000 Canadian National Railway2.75% 1/3/2026
410 0.01
$200,000 Canadian National Railway2.85% 15/12/2021
153 0.01
Holding orNominalValue Investment
MarketValue
£000’s
% ofTotal
NetAssets
$550,000 Canadian National Railway3.2% 2/8/2046
472 0.02
$500,000 Canadian National Railway3.65% 3/2/2048
459 0.02
$250,000 Canadian National Railway6.2% 1/6/2036
285 0.01
$425,000 Canadian NaturalResources 2.95% 15/1/2023
331 0.01
$800,000 Canadian NaturalResources 2.95% 15/7/2030
611 0.02
$150,000 Canadian NaturalResources 3.45%15/11/2021
115 0.00
$300,000 Canadian NaturalResources 3.8% 15/4/2024
242 0.01
$600,000 Canadian NaturalResources 4.95% 1/6/2047
522 0.02
$400,000 Canadian NaturalResources 6.25% 15/3/2038
375 0.01
$100,000 Canadian NaturalResources 6.5% 15/2/2037
95 0.00
$200,000 Canadian NaturalResources 7.2% 15/1/2032
198 0.01
$500,000 Canadian Pacific Railway2.05% 5/3/2030
391 0.01
$400,000 Canadian Pacific Railway2.9% 1/2/2025
325 0.01
$100,000 Canadian Pacific Railway4.8% 15/9/2035
99 0.00
$400,000 Canadian Pacific Railway6.125% 15/9/2115
458 0.02
$100,000 Canadian Pacific Railway7.125% 15/10/2031
108 0.00
$400,000 Cantor Fitzgerald LP4.875% 1/5/2024
328 0.01
$800,000 Capital One Bank USA NA3.375% 15/2/2023
633 0.02
$800,000 Capital One Financial 2.6%11/5/2023
626 0.02
$750,000 Capital One Financial 3.05%9/3/2022
581 0.02
$600,000 Capital One Financial 3.2%5/2/2025
488 0.02
$500,000 Capital One Financial 3.3%30/10/2024
406 0.01
$500,000 Capital One Financial 3.65%11/5/2027
416 0.01
$400,000 Capital One Financial 3.75%28/7/2026
328 0.01
$300,000 Capital One Financial 3.75%9/3/2027
249 0.01
iShares Overseas Corporate Bond Index Fund (UK)
Portfolio Statement (unaudited) continued
BlackRock Collective Investment Funds253

Holding orNominalValue Investment
MarketValue
£000’s
% ofTotal
NetAssets
$300,000 Capital One Financial 3.8%31/1/2028
250 0.01
$400,000 Capital One Financial 3.9%29/1/2024
326 0.01
$500,000 Capital One Financial 4.2%29/10/2025
418 0.01
$800,000 Capital One Financial 4.25%30/4/2025
682 0.02
$500,000 Cardinal Health 2.616%15/6/2022
386 0.01
$300,000 Cardinal Health 3.2%15/3/2023
238 0.01
$500,000 Cardinal Health 3.41%15/6/2027
419 0.01
$300,000 Cardinal Health 4.368%15/6/2047
250 0.01
$250,000 Cardinal Health 4.9%15/9/2045
221 0.01
$250,000 Cargill 2.125% 23/4/2030 195 0.01
$250,000 Cargill 3.25% 15/11/2021 193 0.01
$500,000 Cargill 3.25% 23/5/2029 422 0.01
$196,000 Cargill 4.76% 23/11/2045 185 0.01
$500,000 Carlisle Cos 3.75%1/12/2027
420 0.01
$150,000 Carlyle II Finance 5.625%30/3/2043
141 0.00
$100,000 Carlyle Finance 5.65%15/9/2048
96 0.00
$200,000 Carlyle Finance Subsidiary3.5% 19/9/2029
159 0.01
$300,000 Carrier Global 1.923%15/2/2023
231 0.01
$600,000 Carrier Global 2.242%15/2/2025
470 0.02
$500,000 Carrier Global 2.493%15/2/2027
392 0.01
$300,000 Carrier Global 2.7%15/2/2031
235 0.01
$600,000 Carrier Global 2.722%15/2/2030
470 0.02
$700,000 Carrier Global 3.377%5/4/2040
543 0.02
$700,000 Carrier Global 3.577%5/4/2050
554 0.02
$500,000 Caterpillar 2.6% 26/6/2022 387 0.01
$400,000 Caterpillar 2.6% 19/9/2029 328 0.01
$300,000 Caterpillar 2.6% 9/4/2030 246 0.01
$500,000 Caterpillar 2.6% 9/4/2030 410 0.01
$400,000 Caterpillar 3.25% 19/9/2049 336 0.01
$350,000 Caterpillar 3.25% 9/4/2050 296 0.01
Holding orNominalValue Investment
MarketValue
£000’s
% ofTotal
NetAssets
$459,000 Caterpillar 3.803%15/8/2042
422 0.01
$200,000 Caterpillar 4.75% 15/5/2064 213 0.01
$300,000 Caterpillar 5.2% 27/5/2041 311 0.01
$500,000 Caterpillar FinancialServices 1.9% 6/9/2022
385 0.01
$500,000 Caterpillar FinancialServices 1.931% 1/10/2021
380 0.01
$500,000 Caterpillar FinancialServices 1.95% 18/11/2022
386 0.01
$1,500,000 Caterpillar FinancialServices 2.15% 8/11/2024
1,192 0.04
$500,000 Caterpillar FinancialServices 2.4% 6/6/2022
387 0.01
$200,000 Caterpillar FinancialServices 2.4% 9/8/2026
162 0.01
$500,000 Caterpillar FinancialServices 2.85% 17/5/2024
403 0.01
$500,000 Caterpillar FinancialServices 2.95% 26/2/2022
388 0.01
$500,000 Catholic Health Services ofLong Island Obligated3.368% 1/7/2050
373 0.01
$250,000 CBQ Finance 5% 24/5/2023 199 0.01
$300,000 CBRE Services 4.875%1/3/2026
260 0.01
$200,000 CBRE Services 5.25%15/3/2025
172 0.01
$500,000 CCL Industries 3.05%1/6/2030
388 0.01
$200,000 CCL Industries 3.25%1/10/2026
155 0.01
$500,000 Celanese US 3.5% 8/5/2024 399 0.01
$300,000 Celulosa Arauco yConstitucion 4.2%29/1/2030
238 0.01
$300,000 Celulosa Arauco yConstitucion 4.25%30/4/2029
239 0.01
$300,000 Celulosa Arauco yConstitucion 5.15%29/1/2050
236 0.01
$200,000 Celulosa Arauco yConstitucion 5.5%30/4/2049Ø
164 0.01
$250,000 Cencosud 6.625%12/2/2045Ø
219 0.01
$300,000 CenterPoint Energy 2.95%1/3/2030
247 0.01
$500,000 CenterPoint Energy 3.6%1/11/2021
387 0.01
iShares Overseas Corporate Bond Index Fund (UK)
Portfolio Statement (unaudited) continued
BlackRock Collective Investment Funds 254

Holding orNominalValue Investment
MarketValue
£000’s
% ofTotal
NetAssets
$300,000 CenterPoint Energy 3.85%1/2/2024
246 0.01
$200,000 CenterPoint Energy 4.25%1/11/2028
177 0.01
$200,000 CenterPoint Energy HoustonElectric 3.55% 1/8/2042
172 0.01
$200,000 CenterPoint Energy HoustonElectric 3.95% 1/3/2048
188 0.01
$400,000 CenterPoint Energy HoustonElectric 4.25% 1/2/2049
387 0.01
$700,000 CenterPoint EnergyResources 4% 1/4/2028
604 0.02
$100,000 CenterPoint EnergyResources 5.85% 15/1/2041
102 0.00
$550,000 Central Japan Railway 2.8%23/2/2022
423 0.01
$300,000 Central Plaza Development3.875% 30/1/2021
225 0.01
$400,000 CF Industries 4.5%1/12/2026
339 0.01
$400,000 CH Robinson Worldwide4.2% 15/4/2028
353 0.01
$750,000 Charles Schwab 2.65%25/1/2023
590 0.02
$500,000 Charles Schwab 3.2%2/3/2027
419 0.01
$150,000 Charles Schwab 3.225%1/9/2022
118 0.00
$500,000 Charles Schwab 3.85%21/5/2025
428 0.01
$1,000,000 Charles Schwab 4.625%22/3/2030
952 0.03
$500,000 Charter CommunicationsOperating / CharterCommunications OperatingCapital 2.8% 1/4/2031
393 0.01
$650,000 Charter CommunicationsOperating / CharterCommunications OperatingCapital 3.7% 1/4/2051
484 0.02
$500,000 Charter CommunicationsOperating / CharterCommunications OperatingCapital 3.75% 15/2/2028
416 0.01
$500,000 Charter CommunicationsOperating / CharterCommunications OperatingCapital 4.2% 15/3/2028
428 0.01
Holding orNominalValue Investment
MarketValue
£000’s
% ofTotal
NetAssets
$900,000 Charter CommunicationsOperating / CharterCommunications OperatingCapital 4.464% 23/7/2022
716 0.02
$500,000 Charter CommunicationsOperating / CharterCommunications OperatingCapital 4.5% 1/2/2024
416 0.01
$850,000 Charter CommunicationsOperating / CharterCommunications OperatingCapital 4.8% 1/3/2050
725 0.03
$1,150,000 Charter CommunicationsOperating / CharterCommunications OperatingCapital 4.908% 23/7/2025
999 0.03
$400,000 Charter CommunicationsOperating / CharterCommunications OperatingCapital 5.05% 30/3/2029
361 0.01
$500,000 Charter CommunicationsOperating / CharterCommunications OperatingCapital 5.125% 1/7/2049
439 0.02
$400,000 Charter CommunicationsOperating / CharterCommunications OperatingCapital 5.375% 1/4/2038Ø
365 0.01
$500,000 Charter CommunicationsOperating / CharterCommunications OperatingCapital 5.375% 1/5/2047
447 0.02
$500,000 Charter CommunicationsOperating / CharterCommunications OperatingCapital 5.375% 1/5/2047
447 0.02
$850,000 Charter CommunicationsOperating / CharterCommunications OperatingCapital 5.75% 1/4/2048
797 0.03
$400,000 Charter CommunicationsOperating / CharterCommunications OperatingCapital 6.384% 23/10/2035
414 0.01
$950,000 Charter CommunicationsOperating / CharterCommunications OperatingCapital 6.484% 23/10/2045
969 0.03
$200,000 Charter CommunicationsOperating / CharterCommunications OperatingCapital 6.834% 23/10/2055
206 0.01
iShares Overseas Corporate Bond Index Fund (UK)
Portfolio Statement (unaudited) continued
BlackRock Collective Investment Funds255

Holding orNominalValue Investment
MarketValue
£000’s
% ofTotal
NetAssets
$200,000 Chengdu Tianfu New AreaInvestment 4.65% 7/5/2024
155 0.01
$600,000 Cheniere Corpus Christi3.7% 15/11/2029
473 0.02
$500,000 Cheniere Corpus Christi5.125% 30/6/2027
420 0.01
$600,000 Cheniere Corpus Christi 7%30/6/2024
522 0.02
$400,000 Chevron 1.141% 11/5/2023 305 0.01
$1,300,000 Chevron 1.554% 11/5/2025 1,011 0.04
$500,000 Chevron 2.236% 11/5/2030 399 0.01
$400,000 Chevron 2.411% 3/3/2022 307 0.01
$300,000 Chevron 2.419% 17/11/2020 225 0.01
$500,000 Chevron 2.566% 16/5/2023 395 0.01
$500,000 Chevron 2.895% 3/3/2024 402 0.01
$700,000 Chevron 2.954% 16/5/2026 582 0.02
$200,000 Chevron 2.978% 11/5/2040 162 0.01
$350,000 Chevron 3.078% 11/5/2050 284 0.01
$550,000 Chevron 3.191% 24/6/2023 440 0.02
$25,000 Chevron 3.326% 17/11/2025 21 0.00
$500,000 Chevron Phillips Chemical /Chevron Phillips ChemicalLP 3.4% 1/12/2026
410 0.01
$500,000 Chevron Phillips Chemical /Chevron Phillips ChemicalLP 5.125% 1/4/2025
442 0.02
$500,000 Chevron USA 0.333%12/8/2022
374 0.01
$300,000 Chevron USA 0.687%12/8/2025
225 0.01
$300,000 Chevron USA 1.018%12/8/2027
224 0.01
$300,000 Chevron USA 2.343%12/8/2050
214 0.01
$500,000 Children’s Hospital 2.585%1/2/2050
368 0.01
$500,000 China Huadian OverseasDevelopment 2018 3.375%Perpetual 23/12/2168
383 0.01
$700,000 China Huaneng Hong KongTreasury Management 2.6%10/12/2024
544 0.02
$600,000 China Mengniu Dairy 3%18/7/2024
469 0.02
$500,000 China Merchants Finance4.75% 3/8/2025
422 0.01
$200,000 China Railway Xunjie 3.25%28/7/2026
162 0.01
Holding orNominalValue Investment
MarketValue
£000’s
% ofTotal
NetAssets
$250,000 China Southern Power GridInternational Finance BVI2.75% 8/5/2022Ø
192 0.01
$250,000 China Southern Power GridInternational Finance BVI3.5% 8/5/2027
205 0.01
$350,000 China Southern Power GridInternational Finance BVI2018 4.25% 18/9/2028
306 0.01
$800,000 Choice Hotels International3.7% 15/1/2031
626 0.02
$400,000 Chongqing InternationalLogistics Hub ParkConstruction 3.25%6/9/2021
296 0.01
$500,000 Chongqing Nan’an UrbanConstruction &Development 4.66%4/6/2024
380 0.01
$200,000 Chubb 6% 11/5/2037 222 0.01
$200,000 Chubb 6.5% 15/5/2038 233 0.01
$150,000 Chubb INA 2.3% 3/11/2020 112 0.00
$600,000 Chubb INA 3.35%15/5/2024
493 0.02
$500,000 Chubb INA 3.35% 3/5/2026 427 0.01
$200,000 Chubb INA 4.15%13/3/2043
190 0.01
$350,000 Chubb INA 4.35%3/11/2045
349 0.01
$200,000 Chubb INA 6.7% 15/5/2036 230 0.01
$300,000 Church & Dwight 2.45%1/8/2022
232 0.01
$300,000 Church & Dwight 3.95%1/8/2047
266 0.01
$500,000 CICC Hong Kong Finance2016 MTN 1.75% 10/8/2023
375 0.01
$500,000 Cigna 2.4% 15/3/2030 392 0.01
$500,000 Cigna 3% 15/7/2023 399 0.01
$500,000 Cigna 3.05% 15/10/2027 414 0.01
$200,000 Cigna 3.2% 15/3/2040 159 0.01
$600,000 Cigna 3.4% 1/3/2027 502 0.02
$300,000 Cigna 3.4% 15/3/2050 241 0.01
$200,000 Cigna 3.5% 15/6/2024 164 0.01
$831,000 Cigna 3.75% 15/7/2023 676 0.02
$300,000 Cigna 3.875% 15/10/2047 256 0.01
$200,000 Cigna 3.9% 15/2/2022 157 0.01
$750,000 Cigna 4.125% 15/11/2025 648 0.02
$1,000,000 Cigna 4.375% 15/10/2028 895 0.03
$500,000 Cigna 4.5% 25/2/2026 439 0.02
$900,000 Cigna 4.8% 15/8/2038 849 0.03
iShares Overseas Corporate Bond Index Fund (UK)
Portfolio Statement (unaudited) continued
BlackRock Collective Investment Funds 256

Holding orNominalValue Investment
MarketValue
£000’s
% ofTotal
NetAssets
$600,000 Cigna 4.8% 15/7/2046 581 0.02
$750,000 Cigna 4.9% 15/12/2048 750 0.03
$300,000 Cigna 4.9% 15/12/2048 300 0.01
$21,000 Cigna 6.125% 15/11/2041 23 0.00
$300,000 Cimarex Energy 4.375%1/6/2024
241 0.01
$500,000 Cimarex Energy 4.375%15/3/2029
399 0.01
$200,000 Cincinnati Financial 6.92%15/5/2028
198 0.01
$500,000 Cintas No 2 2.9% 1/4/2022 387 0.01
$300,000 Cintas No 2 3.7% 1/4/2027 256 0.01
$500,000 Cisco Systems 1.85%20/9/2021
379 0.01
$500,000 Cisco Systems 2.2%20/9/2023
394 0.01
$650,000 Cisco Systems 2.5%20/9/2026
537 0.02
$750,000 Cisco Systems 2.6%28/2/2023
592 0.02
$200,000 Cisco Systems 3%15/6/2022
157 0.01
$300,000 Cisco Systems 3.5%15/6/2025
256 0.01
$550,000 Cisco Systems 5.5%15/1/2040
604 0.02
$600,000 Cisco Systems 5.9%15/2/2039
680 0.02
$400,000 Citadel LP 4.875%15/1/2027
319 0.01
$800,000 Citibank NA 3.65%23/1/2024
658 0.02
$500,000 Citigroup 1.678% 15/5/2024 383 0.01
$400,000 Citigroup 2.312% 4/11/2022 305 0.01
$700,000 Citigroup 2.35% 2/8/2021 532 0.02
$1,200,000 Citigroup 2.572% 3/6/2031 949 0.03
$800,000 Citigroup 2.666% 29/1/2031 636 0.02
$500,000 Citigroup 2.7% 27/10/2022 391 0.01
$1,500,000 Citigroup 2.75% 25/4/2022 1,160 0.04
$500,000 Citigroup 2.876% 24/7/2023 389 0.01
$500,000 Citigroup 2.9% 8/12/2021 385 0.01
$1,100,000 Citigroup 2.976% 5/11/2030 893 0.03
$1,000,000 Citigroup 3.106% 8/4/2026 812 0.03
$1,000,000 Citigroup 3.142% 24/1/2023 772 0.03
$400,000 Citigroup 3.2% 21/10/2026 333 0.01
$600,000 Citigroup 3.3% 27/4/2025 498 0.02
$700,000 Citigroup 3.352% 24/4/2025 569 0.02
$550,000 Citigroup 3.5% 15/5/2023 440 0.02
$700,000 Citigroup 3.52% 27/10/2028 585 0.02
Holding orNominalValue Investment
MarketValue
£000’s
% ofTotal
NetAssets
$850,000 Citigroup 3.668% 24/7/2028 717 0.02
$300,000 Citigroup 3.7% 12/1/2026 254 0.01
$400,000 Citigroup 3.875%25/10/2023
329 0.01
$300,000 Citigroup 3.875% 26/3/2025 249 0.01
$300,000 Citigroup 3.878% 24/1/2039 267 0.01
$800,000 Citigroup 3.887% 10/1/2028 682 0.02
$900,000 Citigroup 3.98% 20/3/2030 780 0.03
$300,000 Citigroup 4% 5/8/2024 247 0.01
$1,100,000 Citigroup 4.044% 1/6/2024 893 0.03
$700,000 Citigroup 4.075% 23/4/2029 609 0.02
$1,000,000 Citigroup 4.125% 25/7/2028 858 0.03
$300,000 Citigroup 4.281% 24/4/2048 290 0.01
$600,000 Citigroup 4.3% 20/11/2026 517 0.02
$700,000 Citigroup 4.4% 10/6/2025 596 0.02
$2,000,000 Citigroup 4.412% 31/3/2031 1,818 0.06
$1,050,000 Citigroup 4.45% 29/9/2027 912 0.03
$850,000 Citigroup 4.5% 14/1/2022 671 0.02
$750,000 Citigroup 4.6% 9/3/2026 651 0.02
$200,000 Citigroup 4.65% 30/7/2045 193 0.01
$800,000 Citigroup 4.65% 23/7/2048 804 0.03
$600,000 Citigroup 4.75% 18/5/2046 574 0.02
$600,000 Citigroup 5.3% 6/5/2044 603 0.02
$1,000,000 Citigroup 5.316% 26/3/2041 1,046 0.04
$500,000 Citigroup 5.5% 13/9/2025 445 0.02
$200,000 Citigroup 5.875% 30/1/2042 221 0.01
$300,000 Citigroup 6.125% 25/8/2036 304 0.01
$300,000 Citigroup 6.625% 15/6/2032 316 0.01
$450,000 Citigroup 8.125% 15/7/2039 593 0.02
$800,000 Citizens BankNA/Providence RI 2.25%28/4/2025
636 0.02
$500,000 Citizens BankNA/Providence RI 3.25%14/2/2022
388 0.01
$500,000 Citizens BankNA/Providence RI 3.75%18/2/2026
429 0.01
$300,000 Citizens Financial 2.5%6/2/2030
237 0.01
$400,000 Citizens Financial 4.3%3/12/2025
344 0.01
$500,000 Citrix Systems 4.5%1/12/2027
427 0.01
$300,000 CK Hutchison International16 1.875% 3/10/2021
226 0.01
$500,000 CK Hutchison International17 II 2.75% 29/3/2023
389 0.01
iShares Overseas Corporate Bond Index Fund (UK)
Portfolio Statement (unaudited) continued
BlackRock Collective Investment Funds257

Holding orNominalValue Investment
MarketValue
£000’s
% ofTotal
NetAssets
$300,000 CK Hutchison International17 II 3.25% 29/9/2027
247 0.01
$300,000 CK Hutchison International19 3.25% 11/4/2024
239 0.01
$400,000 CK Hutchison International19 3.625% 11/4/2029
339 0.01
$300,000 CK Hutchison International19 II 2.75% 6/9/2029
239 0.01
$300,000 CK Hutchison International19 II 3.375% 6/9/2049
251 0.01
$300,000 CK Hutchison International20 2.5% 8/5/2030
236 0.01
$500,000 CK Hutchison International20 3.375% 8/5/2050Ø
421 0.01
$250,000 Cleco Corporate 4.973%1/5/2046
210 0.01
$400,000 Clorox 3.8% 15/11/2021 311 0.01
$500,000 Clorox 3.9% 15/5/2028 444 0.02
$300,000 Cloverie for ZurichInsurance 5.625%24/6/2046Ø
262 0.01
$300,000 CLP Power Hong KongFinancing 2.125%30/6/2030
228 0.01
$200,000 CLP Power Hong KongFinancing 2.875%26/4/2023
155 0.01
$500,000 CMB International LeasingManagement 2.75%12/8/2030
377 0.01
$500,000 CMB International LeasingManagement 3% 3/7/2024
388 0.01
$500,000 CME 3% 15/9/2022 394 0.01
$250,000 CME 4.15% 15/6/2048 246 0.01
$200,000 CME 5.3% 15/9/2043 219 0.01
$300,000 CMHI Finance BVI 5%6/8/2028
266 0.01
$200,000 CMS Energy 3.45%15/8/2027
168 0.01
$200,000 CMS Energy 4.875%1/3/2044
200 0.01
$250,000 CMS Energy 5.05%15/3/2022
197 0.01
$475,000 CNA Financial 3.45%15/8/2027
392 0.01
$400,000 CNA Financial 3.95%15/5/2024
330 0.01
$100,000 CNA Financial 5.75%15/8/2021
78 0.00
$500,000 CNH Industrial 3.85%15/11/2027
405 0.01
Holding orNominalValue Investment
MarketValue
£000’s
% ofTotal
NetAssets
$600,000 CNH Industrial Capital3.875% 15/10/2021
461 0.02
$300,000 CNO Financial 5.25%30/5/2029
261 0.01
$400,000 Coastal Emerald 4.3%Perpetual 1/2/2169
308 0.01
$100,000 Coca-Cola 1.55% 1/9/2021 76 0.00
$500,000 Coca-Cola 1.65% 1/6/2030 387 0.01
$500,000 Coca-Cola 1.75% 6/9/2024 392 0.01
$500,000 Coca-Cola 2.125% 6/9/2029 401 0.01
$400,000 Coca-Cola 2.2% 25/5/2022 309 0.01
$400,000 Coca-Cola 2.5% 1/6/2040 309 0.01
$400,000 Coca-Cola 2.55% 1/6/2026 329 0.01
$500,000 Coca-Cola 2.6% 1/6/2050 380 0.01
$300,000 Coca-Cola 2.75% 1/6/2060 228 0.01
$700,000 Coca-Cola 2.875%27/10/2025
579 0.02
$500,000 Coca-Cola 2.9% 25/5/2027 420 0.01
$500,000 Coca-Cola 2.95% 25/3/2025 412 0.01
$500,000 Coca-Cola 3.2% 1/11/2023 407 0.01
$500,000 Coca-Cola 3.3% 1/9/2021 385 0.01
$300,000 Coca-Cola 3.375%25/3/2027
259 0.01
$700,000 Coca-Cola 3.45% 25/3/2030 625 0.02
$150,000 Coca-Cola 4.125%25/3/2040
144 0.01
$400,000 Coca-Cola 4.2% 25/3/2050 395 0.01
$700,000 Coca-Cola Femsa 1.85%1/9/2032
523 0.02
$600,000 Coca-Cola Femsa 2.75%22/1/2030
482 0.02
$600,000 Colbun 3.15% 6/3/2030 484 0.02
$400,000 Colgate-Palmolive 1.95%1/2/2023
311 0.01
$300,000 Colgate-Palmolive 3.25%15/3/2024
246 0.01
$250,000 Colgate-Palmolive 3.7%1/8/2047
245 0.01
$300,000 Colgate-Palmolive 4%15/8/2045
303 0.01
$500,000 Colonial Enterprises 3.25%15/5/2030
415 0.01
$150,000 Colonial Pipeline 4.2%15/4/2043
123 0.00
$200,000 Colonial Pipeline 4.25%15/4/2048
170 0.01
$600,000 Columbia Pipeline 4.5%1/6/2025
522 0.02
$600,000 Comcast 1.5% 15/2/2031 446 0.02
$500,000 Comcast 1.95% 15/1/2031 385 0.01
iShares Overseas Corporate Bond Index Fund (UK)
Portfolio Statement (unaudited) continued
BlackRock Collective Investment Funds 258

Holding orNominalValue Investment
MarketValue
£000’s
% ofTotal
NetAssets
$600,000 Comcast 2.35% 15/1/2027 482 0.02
$500,000 Comcast 2.45% 15/8/2052 358 0.01
$400,000 Comcast 2.65% 1/2/2030 326 0.01
$500,000 Comcast 2.65% 15/8/2062 361 0.01
$600,000 Comcast 2.8% 15/1/2051 454 0.02
$700,000 Comcast 3% 1/2/2024 565 0.02
$800,000 Comcast 3.1% 1/4/2025 661 0.02
$500,000 Comcast 3.125% 15/7/2022 392 0.01
$600,000 Comcast 3.15% 1/3/2026 503 0.02
$500,000 Comcast 3.15% 15/2/2028 423 0.01
$325,000 Comcast 3.2% 15/7/2036 273 0.01
$500,000 Comcast 3.25% 1/11/2039 414 0.01
$400,000 Comcast 3.3% 1/2/2027 337 0.01
$500,000 Comcast 3.3% 1/4/2027 425 0.01
$500,000 Comcast 3.375% 15/8/2025 418 0.01
$500,000 Comcast 3.4% 1/4/2030 431 0.01
$300,000 Comcast 3.4% 15/7/2046 249 0.01
$750,000 Comcast 3.45% 1/2/2050 631 0.02
$500,000 Comcast 3.55% 1/5/2028 434 0.02
$500,000 Comcast 3.6% 1/3/2024 414 0.01
$400,000 Comcast 3.7% 15/4/2024 332 0.01
$700,000 Comcast 3.75% 1/4/2040 619 0.02
$500,000 Comcast 3.9% 1/3/2038 447 0.02
$300,000 Comcast 3.95% 15/10/2025 258 0.01
$1,000,000 Comcast 3.95% 15/10/2025 861 0.03
$500,000 Comcast 3.969% 1/11/2047 449 0.02
$400,000 Comcast 3.999% 1/11/2049 363 0.01
$400,000 Comcast 4% 15/8/2047 362 0.01
$300,000 Comcast 4% 1/3/2048 272 0.01
$500,000 Comcast 4.049% 1/11/2052 456 0.02
$1,500,000 Comcast 4.15% 15/10/2028 1,359 0.05
$350,000 Comcast 4.25% 15/10/2030 323 0.01
$300,000 Comcast 4.25% 15/10/2030 277 0.01
$500,000 Comcast 4.25% 15/1/2033 467 0.02
$250,000 Comcast 4.4% 15/8/2035 238 0.01
$300,000 Comcast 4.5% 15/1/2043 284 0.01
$700,000 Comcast 4.6% 15/10/2038 673 0.02
$200,000 Comcast 4.6% 15/10/2038 192 0.01
$250,000 Comcast 4.6% 15/8/2045 242 0.01
$600,000 Comcast 4.65% 15/7/2042 580 0.02
$1,100,000 Comcast 4.7% 15/10/2048 1,105 0.04
$1,000,000 Comcast 4.7% 15/10/2048 1,004 0.03
$850,000 Comcast 4.95% 15/10/2058 915 0.03
$600,000 Comcast 5.65% 15/6/2035 639 0.02
$250,000 Comcast 6.45% 15/3/2037 282 0.01
$450,000 Comcast 6.5% 15/11/2035 515 0.02
$500,000 Comcast 6.95% 15/8/2037 590 0.02
$300,000 Comcast 7.05% 15/3/2033 343 0.01
Holding orNominalValue Investment
MarketValue
£000’s
% ofTotal
NetAssets
$300,000 Comcast CableCommunications 9.455%15/11/2022
270 0.01
$500,000 Comerica Bank 2.5%23/7/2024
398 0.01
$380,000 Cometa Energia de 6.375%24/4/2035
306 0.01
$500,000 CommonSpirit Health 2.95%1/11/2022
389 0.01
$500,000 CommonSpirit Health3.347% 1/10/2029
398 0.01
$300,000 CommonSpirit Health3.817% 1/10/2049
252 0.01
$300,000 CommonSpirit Health4.187% 1/10/2049
240 0.01
$250,000 Commonwealth Bank ofAustralia 2% 6/9/2021
190 0.01
$400,000 Commonwealth Bank ofAustralia 2.625% 6/9/2026
328 0.01
$800,000 Commonwealth Bank ofAustralia 3.15% 19/9/2027
675 0.02
$500,000 Commonwealth Bank ofAustralia 3.375%20/10/2026
380 0.01
$500,000 Commonwealth Bank ofAustralia 3.45% 16/3/2023Ø
401 0.01
$400,000 Commonwealth Bank ofAustralia 3.61% 12/9/2034
328 0.01
$500,000 Commonwealth Bank ofAustralia 3.743% 12/9/2039
420 0.01
$500,000 Commonwealth Bank ofAustralia 3.9% 12/7/2047
461 0.02
$400,000 Commonwealth Bank ofAustralia 4.316% 10/1/2048
363 0.01
$250,000 Commonwealth Bank ofAustralia/New York NY2.55% 15/3/2021
189 0.01
$500,000 Commonwealth Edison2.2% 1/3/2030
398 0.01
$200,000 Commonwealth Edison 3%1/3/2050
161 0.01
$200,000 Commonwealth Edison3.2% 15/11/2049
165 0.01
$200,000 Commonwealth Edison3.65% 15/6/2046
177 0.01
$500,000 Commonwealth Edison3.7% 15/8/2028
436 0.02
$300,000 Commonwealth Edison 4%1/3/2048
283 0.01
$200,000 Commonwealth Edison4.6% 15/8/2043
195 0.01
iShares Overseas Corporate Bond Index Fund (UK)
Portfolio Statement (unaudited) continued
BlackRock Collective Investment Funds259

Holding orNominalValue Investment
MarketValue
£000’s
% ofTotal
NetAssets
$350,000 Commonwealth Edison4.7% 15/1/2044
349 0.01
$150,000 Commonwealth Edison5.9% 15/3/2036
162 0.01
$500,000 Community Health Network3.099% 1/5/2050
367 0.01
$500,000 Conagra Brands 3.2%25/1/2023
394 0.01
$900,000 Conagra Brands 4.6%1/11/2025
781 0.03
$500,000 Conagra Brands 4.85%1/11/2028
456 0.02
$300,000 Conagra Brands 5.3%1/11/2038
289 0.01
$400,000 Conagra Brands 5.4%1/11/2048
412 0.01
$500,000 Concho Resources 3.75%1/10/2027
410 0.01
$500,000 Concho Resources 4.3%15/8/2028
422 0.01
$350,000 Concho Resources 4.85%15/8/2048
303 0.01
$300,000 Connecticut Light andPower 4% 1/4/2048
287 0.01
$300,000 Connecticut Light andPower 4.3% 15/4/2044
290 0.01
$500,000 ConocoPhillips 4.15%15/11/2034
432 0.02
$300,000 ConocoPhillips 4.3%15/11/2044
285 0.01
$1,500,000 ConocoPhillips 4.95%15/3/2026
1,350 0.05
$400,000 ConocoPhillips 5.9%15/5/2038
424 0.01
$400,000 ConocoPhillips 5.95%15/3/2046
453 0.02
$700,000 ConocoPhillips 6.5%1/2/2039
792 0.03
$1,400,000 Consolidated Edison ofNew York 3.35% 1/4/2030
1,211 0.04
$500,000 Consolidated Edison ofNew York 3.7% 15/11/2059
428 0.01
$500,000 Consolidated Edison ofNew York 3.8% 15/5/2028
435 0.02
$200,000 Consolidated Edison ofNew York 3.85% 15/6/2046
174 0.01
$400,000 Consolidated Edison ofNew York 3.95% 1/4/2050
358 0.01
$500,000 Consolidated Edison ofNew York 4% 1/12/2028
445 0.02
Holding orNominalValue Investment
MarketValue
£000’s
% ofTotal
NetAssets
$300,000 Consolidated Edison ofNew York 4% 15/11/2057
265 0.01
$300,000 Consolidated Edison ofNew York 4.125% 15/5/2049
277 0.01
$300,000 Consolidated Edison ofNew York 4.3% 1/12/2056
278 0.01
$300,000 Consolidated Edison ofNew York 4.5% 1/12/2045
284 0.01
$300,000 Consolidated Edison ofNew York 4.625% 1/12/2054
295 0.01
$300,000 Consolidated Edison ofNew York 4.65% 1/12/2048
294 0.01
$300,000 Consolidated Edison ofNew York 5.5% 1/12/2039
309 0.01
$500,000 Constellation Brands 2.7%9/5/2022
386 0.01
$200,000 Constellation Brands2.875% 1/5/2030
160 0.01
$300,000 Constellation Brands 3.15%1/8/2029
244 0.01
$600,000 Constellation Brands 3.6%15/2/2028
505 0.02
$800,000 Constellation Brands 3.7%6/12/2026
687 0.02
$200,000 Constellation Brands 3.75%1/5/2050
165 0.01
$700,000 Constellation Brands 4.65%15/11/2028
628 0.02
$250,000 Constellation Brands 5.25%15/11/2048
250 0.01
$400,000 Consumers Energy 2.5%1/5/2060
290 0.01
$400,000 Consumers Energy 2.85%15/5/2022
310 0.01
$300,000 Consumers Energy 3.1%15/8/2050
247 0.01
$300,000 Consumers Energy 3.75%15/2/2050
276 0.01
$200,000 Consumers Energy 3.95%15/7/2047
186 0.01
$200,000 Consumers Energy 4.35%15/4/2049
201 0.01
$131,094 Continental Airlines 2012-1 Class A Pass ThroughTrust 4.15% 11/10/2025
92 0.00
$200,000 Controladora Mabe de 5.6%23/10/2028
164 0.01
$400,000 Cooperatieve Rabobank UA1.339% 24/6/2026
303 0.01
$300,000 Cooperatieve Rabobank UA2.625% 22/7/2024
240 0.01
iShares Overseas Corporate Bond Index Fund (UK)
Portfolio Statement (unaudited) continued
BlackRock Collective Investment Funds 260

Holding orNominalValue Investment
MarketValue
£000’s
% ofTotal
NetAssets
$500,000 Cooperatieve Rabobank UA3.75% 21/7/2026
421 0.01
$1,000,000 Cooperatieve Rabobank UA3.875% 8/2/2022
785 0.03
$750,000 Cooperatieve Rabobank UA3.875% 26/9/2023
616 0.02
$400,000 Cooperatieve Rabobank UA4% 10/4/2029
320 0.01
$900,000 Cooperatieve Rabobank UA4.375% 4/8/2025
767 0.03
$600,000 Cooperatieve Rabobank UA5.25% 24/5/2041
663 0.02
$300,000 Cooperatieve Rabobank UA5.25% 4/8/2045
315 0.01
$500,000 Cooperatieve Rabobank UA5.75% 1/12/2043
548 0.02
$300,000 Cooperatieve RabobankUA/NY 2.75% 10/1/2022
232 0.01
$400,000 Cooperatieve RabobankUA/NY 2.75% 10/1/2023
315 0.01
$500,000 Corning 2.9% 15/5/2022 386 0.01
$600,000 Corning 3.9% 15/11/2049 517 0.02
$200,000 Corning 4.375% 15/11/2057 183 0.01
$100,000 Corning 4.75% 15/3/2042 94 0.00
$200,000 Corning 5.45% 15/11/2079 187 0.01
$250,000 Corning 5.85% 15/11/2068 251 0.01
$300,000 Corporate Office PropertiesLP 3.6% 15/5/2023
232 0.01
$500,000 Costco Wholesale 1.375%20/6/2027
382 0.01
$500,000 Costco Wholesale 1.6%20/4/2030
380 0.01
$500,000 Costco Wholesale 1.75%20/4/2032
384 0.01
$400,000 Costco Wholesale 2.3%18/5/2022
309 0.01
$300,000 Costco Wholesale 2.75%18/5/2024
242 0.01
$500,000 Country Garden 4.8%6/8/2030
376 0.01
$800,000 Country Garden 5.125%17/1/2025Ø
622 0.02
$300,000 Country Garden 5.625%14/1/2030
237 0.01
$500,000 Country Garden 6.5%8/4/2024
403 0.01
$400,000 Country Garden 7.25%8/4/2026
332 0.01
$800,000 Country Garden 8%27/1/2024
653 0.02
Holding orNominalValue Investment
MarketValue
£000’s
% ofTotal
NetAssets
$150,000 Covidien InternationalFinance 3.2% 15/6/2022
117 0.00
$600,000 Cox Communications 3.15%15/8/2024
486 0.02
$200,000 Cox Communications 3.25%15/12/2022
158 0.01
$500,000 Cox Communications 3.35%15/9/2026
416 0.01
$300,000 Cox Communications 3.5%15/8/2027
252 0.01
$250,000 Cox Communications 4.5%30/6/2043
227 0.01
$300,000 Cox Communications 4.6%15/8/2047
281 0.01
$500,000 Cox Communications 4.8%1/2/2035
469 0.02
$400,000 Credit Agricole 3.25%14/1/2030
324 0.01
$400,000 Credit Agricole 4%10/1/2033
332 0.01
$350,000 Credit Agricole 4.375%17/3/2025
290 0.01
$500,000 Credit Agricole SA/London1.907% 16/6/2026
385 0.01
$300,000 Credit Agricole SA/London2.375% 22/1/2025
238 0.01
$600,000 Credit Agricole SA/London3.25% 4/10/2024
489 0.02
$500,000 Credit Agricole SA/London3.375% 10/1/2022
387 0.01
$300,000 Credit Agricole SA/London4.125% 10/1/2027
258 0.01
$500,000 Credit Suisse 2.193%5/6/2026
386 0.01
$1,300,000 Credit Suisse 2.593%11/9/2025
1,017 0.04
$750,000 Credit Suisse 3.574%9/1/2023
582 0.02
$400,000 Credit Suisse 3.869%12/1/2029
336 0.01
$1,400,000 Credit Suisse 4.194%1/4/2031
1,219 0.04
$1,000,000 Credit Suisse 4.207%12/6/2024
812 0.03
$750,000 Credit Suisse 4.282%9/1/2028
638 0.02
$900,000 Credit Suisse FundingGuernsey 3.75% 26/3/2025
745 0.03
$1,200,000 Credit Suisse FundingGuernsey 3.8% 15/9/2022
953 0.03
iShares Overseas Corporate Bond Index Fund (UK)
Portfolio Statement (unaudited) continued
BlackRock Collective Investment Funds261

Holding orNominalValue Investment
MarketValue
£000’s
% ofTotal
NetAssets
$500,000 Credit Suisse FundingGuernsey 3.8% 9/6/2023
404 0.01
$900,000 Credit Suisse FundingGuernsey 4.55% 17/4/2026
789 0.03
$500,000 Credit Suisse FundingGuernsey 4.875%15/5/2045
508 0.02
$1,000,000 Credit Suisse AG/New YorkNY 1% 5/5/2023
759 0.03
$500,000 Credit Suisse AG/New YorkNY 2.8% 8/4/2022
388 0.01
$500,000 Credit Suisse AG/New YorkNY 2.95% 9/4/2025
410 0.01
$500,000 Credit Suisse AG/New YorkNY 3% 29/10/2021
385 0.01
$400,000 Credit Suisse AG/New YorkNY 3.625% 9/9/2024
333 0.01
$200,000 Credit Suisse USA 7.125%15/7/2032
231 0.01
$500,000 CRH America 3.875%18/5/2025
423 0.01
$200,000 CRH America 5.125%18/5/2045
179 0.01
$400,000 CRH America Finance3.95% 4/4/2028
338 0.01
$300,000 CRH America Finance 4.4%9/5/2047
252 0.01
$800,000 Crown Castle International3.15% 15/7/2023
638 0.02
$500,000 Crown Castle International3.2% 1/9/2024
405 0.01
$300,000 Crown Castle International3.25% 15/1/2051
233 0.01
$500,000 Crown Castle International3.3% 1/7/2030
416 0.01
$500,000 Crown Castle International3.7% 15/6/2026
422 0.01
$500,000 Crown Castle International3.8% 15/2/2028
427 0.01
$300,000 Crown Castle International4% 1/3/2027
258 0.01
$200,000 Crown Castle International4.15% 1/7/2050
176 0.01
$300,000 Crown Castle International4.45% 15/2/2026
260 0.01
$400,000 Crown Castle International4.75% 15/5/2047
382 0.01
$500,000 CSX 2.4% 15/2/2030 394 0.01
$500,000 CSX 2.6% 1/11/2026 408 0.01
$400,000 CSX 3.35% 1/11/2025 338 0.01
$300,000 CSX 3.35% 15/9/2049 252 0.01
Holding orNominalValue Investment
MarketValue
£000’s
% ofTotal
NetAssets
$400,000 CSX 3.4% 1/8/2024 331 0.01
$200,000 CSX 3.8% 1/3/2028 174 0.01
$300,000 CSX 3.8% 1/11/2046 261 0.01
$300,000 CSX 3.8% 15/4/2050 270 0.01
$200,000 CSX 3.95% 1/5/2050 183 0.01
$350,000 CSX 4.1% 15/3/2044 321 0.01
$100,000 CSX 4.25% 1/6/2021 76 0.00
$500,000 CSX 4.25% 15/3/2029 449 0.02
$300,000 CSX 4.25% 1/11/2066 279 0.01
$200,000 CSX 4.3% 1/3/2048 190 0.01
$100,000 CSX 4.4% 1/3/2043 92 0.00
$300,000 CSX 4.75% 30/5/2042 290 0.01
$300,000 CSX 4.75% 15/11/2048 302 0.01
$100,000 CSX 5.5% 15/4/2041 102 0.00
$400,000 CSX 6% 1/10/2036 417 0.01
$300,000 CubeSmart LP 4.375%15/2/2029
262 0.01
$500,000 Cummins 1.5% 1/9/2030 372 0.01
$500,000 Cummins 2.6% 1/9/2050 367 0.01
$500,000 Cummins 3.65% 1/10/2023 408 0.01
$500,000 CVS Health 1.3% 21/8/2027 372 0.01
$400,000 CVS Health 1.75%21/8/2030
295 0.01
$300,000 CVS Health 2.625%15/8/2024
240 0.01
$1,000,000 CVS Health 2.7% 21/8/2040 731 0.03
$750,000 CVS Health 2.75%1/12/2022
587 0.02
$750,000 CVS Health 2.875%1/6/2026
610 0.02
$700,000 CVS Health 3% 15/8/2026 574 0.02
$500,000 CVS Health 3.25%15/8/2029
415 0.01
$500,000 CVS Health 3.5% 20/7/2022 394 0.01
$800,000 CVS Health 3.625%1/4/2027
676 0.02
$1,432,000 CVS Health 3.7% 9/3/2023 1,151 0.04
$500,000 CVS Health 3.75% 1/4/2030 432 0.02
$500,000 CVS Health 3.875%20/7/2025
423 0.01
$641,000 CVS Health 4.1% 25/3/2025 546 0.02
$600,000 CVS Health 4.125%1/4/2040
521 0.02
$400,000 CVS Health 4.25% 1/4/2050 357 0.01
$3,100,000 CVS Health 4.3% 25/3/2028 2,726 0.09
$1,300,000 CVS Health 4.78%25/3/2038
1,193 0.04
$300,000 CVS Health 4.875%20/7/2035
286 0.01
iShares Overseas Corporate Bond Index Fund (UK)
Portfolio Statement (unaudited) continued
BlackRock Collective Investment Funds 262

Holding orNominalValue Investment
MarketValue
£000’s
% ofTotal
NetAssets
$2,700,000 CVS Health 5.05%25/3/2048
2,630 0.09
$900,000 CVS Health 5.125%20/7/2045
870 0.03
$100,000 CVS Health 5.3% 5/12/2043 98 0.00
$300,000 CyrusOne LP / CyrusOneFinance 3.45% 15/11/2029
245 0.01
$600,000 Dai-ichi Life Insurance 4%Perpetual 24/1/2169
488 0.02
$200,000 Dai-ichi Life Insurance 5.1%Perpetual 28/4/2169
167 0.01
$500,000 Daimler Finance NorthAmerica 1.75% 10/3/2023
382 0.01
$350,000 Daimler Finance NorthAmerica 2.625% 10/3/2030
266 0.01
$500,000 Daimler Finance NorthAmerica 2.85% 6/1/2022
384 0.01
$300,000 Daimler Finance NorthAmerica 3.1% 15/8/2029
238 0.01
$500,000 Daimler Finance NorthAmerica 3.25% 1/8/2024
403 0.01
$500,000 Daimler Finance NorthAmerica 3.65% 22/2/2024
405 0.01
$1,000,000 Daimler Finance NorthAmerica 3.7% 4/5/2023
801 0.03
$600,000 Daimler Finance NorthAmerica 3.75% 5/11/2021
464 0.02
$750,000 Daimler Finance NorthAmerica 3.75% 22/2/2028
619 0.02
$450,000 Daimler Finance NorthAmerica 8.5% 18/1/2031
517 0.02
$300,000 Daiwa 3.129% 19/4/2022 232 0.01
$150,000 Danaher 4.375% 15/9/2045 146 0.01
$400,000 Danone 2.077% 2/11/2021 304 0.01
$500,000 Danone 2.589% 2/11/2023 394 0.01
$600,000 Danone 2.947% 2/11/2026 499 0.02
$450,000 Danone 3% 15/6/2022 350 0.01
$450,000 Danske Bank 1.226%22/6/2024
340 0.01
$600,000 Danske Bank 3.001%20/9/2022
458 0.02
$350,000 Danske Bank 3.244%20/12/2025
281 0.01
$500,000 Danske Bank 3.875%12/9/2023
403 0.01
$400,000 Danske Bank 5% 12/1/2023 314 0.01
$300,000 Danske Bank 5.375%12/1/2024
254 0.01
$500,000 Darden Restaurants 3.85%1/5/2027
385 0.01
Holding orNominalValue Investment
MarketValue
£000’s
% ofTotal
NetAssets
$250,000 Dayton Power & Light 3.95%15/6/2049
203 0.01
$300,000 DBS 2.85% 16/4/2022 231 0.01
$500,000 DBS 3.6% Perpetual7/3/2169
379 0.01
$250,000 DBS 4.52% 11/12/2028 203 0.01
$500,000 Deere & 2.75% 15/4/2025 409 0.01
$200,000 Deere & 2.875% 7/9/2049 163 0.01
$600,000 Deere & 3.1% 15/4/2030 513 0.02
$300,000 Deere & 3.75% 15/4/2050 275 0.01
$250,000 Deere & 3.9% 9/6/2042Ø 239 0.01
$400,000 Delek & Avner Tamar Bond5.082% 30/12/2023Ø
300 0.01
$500,000 Dell International / EMC 4%15/7/2024
403 0.01
$600,000 Dell International / EMC4.9% 1/10/2026
507 0.02
$600,000 Dell International / EMC4.9% 1/10/2026
507 0.02
$500,000 Dell International / EMC5.3% 1/10/2029
426 0.01
$1,200,000 Dell International / EMC5.45% 15/6/2023
990 0.03
$500,000 Dell International / EMC5.85% 15/7/2025
437 0.02
$695,000 Dell International / EMC6.02% 15/6/2026
613 0.02
$200,000 Dell International / EMC6.1% 15/7/2027
176 0.01
$300,000 Dell International / EMC6.2% 15/7/2030
271 0.01
$500,000 Dell International / EMC8.1% 15/7/2036
497 0.02
$650,000 Dell International / EMC8.35% 15/7/2046
656 0.02
$300,000 Delmarva Power & Light4.15% 15/5/2045
273 0.01
$1,300,000 Delta Air Lines 7% 1/5/2025 1,063 0.04
$36,652 Delta Air Lines 2007-1 ClassA Pass Through Trust6.821% 10/2/2024
27 0.00
$700,000 Deutsche Bank 4.1%13/1/2026
563 0.02
$300,000 Deutsche Bank AG/London3.7% 30/5/2024
239 0.01
$300,000 Deutsche Bank AG/NewYork NY 3.3% 16/11/2022
232 0.01
$500,000 Deutsche Bank AG/NewYork NY 3.7% 30/5/2024
399 0.01
iShares Overseas Corporate Bond Index Fund (UK)
Portfolio Statement (unaudited) continued
BlackRock Collective Investment Funds263

Holding orNominalValue Investment
MarketValue
£000’s
% ofTotal
NetAssets
$400,000 Deutsche Bank AG/NewYork NY 3.95% 27/2/2023
316 0.01
$500,000 Deutsche Bank AG/NewYork NY 3.961% 26/11/2025
401 0.01
$500,000 Deutsche Bank AG/NewYork NY 4.1% 13/1/2026
398 0.01
$700,000 Deutsche Bank AG/NewYork NY 5% 14/2/2022
550 0.02
$500,000 Deutsche Telekom 3.625%21/1/2050
415 0.01
$300,000 Deutsche TelekomInternational Finance 3.6%19/1/2027
251 0.01
$1,000,000 Deutsche TelekomInternational Finance4.375% 21/6/2028
892 0.03
$200,000 Deutsche TelekomInternational Finance 4.75%21/6/2038
190 0.01
$250,000 Deutsche TelekomInternational Finance4.875% 6/3/2042
245 0.01
$1,050,000 Deutsche TelekomInternational Finance 8.75%15/6/2030
1,236 0.04
$250,000 Deutsche TelekomInternational Finance 9.25%1/6/2032
314 0.01
$300,000 Devon Energy 4.75%15/5/2042
217 0.01
$300,000 Devon Energy 5% 15/6/2045 224 0.01
$500,000 Devon Energy 5.6%15/7/2041
395 0.01
$350,000 Devon Energy 5.85%15/12/2025
300 0.01
$400,000 DH Europe Finance II Sarl2.2% 15/11/2024
316 0.01
$300,000 DH Europe Finance II Sarl2.6% 15/11/2029
244 0.01
$300,000 DH Europe Finance II Sarl3.25% 15/11/2039
252 0.01
$300,000 DH Europe Finance II Sarl3.4% 15/11/2049
260 0.01
$300,000 Diageo Capital 2%29/4/2030
233 0.01
$800,000 Diageo Capital 2.125%29/4/2032
622 0.02
$300,000 Diageo Capital 2.375%24/10/2029
240 0.01
$200,000 Diageo Capital 3.875%29/4/2043
179 0.01
Holding orNominalValue Investment
MarketValue
£000’s
% ofTotal
NetAssets
$300,000 Diageo Capital 5.875%30/9/2036
323 0.01
$300,000 Diageo Investment 2.875%11/5/2022
233 0.01
$200,000 Diageo Investment 4.25%11/5/2042
188 0.01
$500,000 Diageo Investment 8%15/9/2022
428 0.01
$300,000 Diamondback Energy2.875% 1/12/2024
231 0.01
$700,000 Diamondback Energy 3.5%1/12/2029
532 0.02
$500,000 Diamondback Energy4.75% 31/5/2025
410 0.01
$500,000 DIB Sukuk 2.95% 16/1/2026 386 0.01
$500,000 DIB Sukuk 3.625% 6/2/2023 389 0.01
$300,000 DIB Sukuk 3.664%14/2/2022
231 0.01
$700,000 Digital Realty Trust LP4.45% 15/7/2028
626 0.02
$800,000 Digital Realty Trust LP4.75% 1/10/2025
702 0.02
$500,000 Discover Bank 2.7%6/2/2030
390 0.01
$250,000 Discover Bank 4.2%8/8/2023
206 0.01
$275,000 Discover Bank 4.65%13/9/2028
241 0.01
$500,000 Discover Bank 4.682%9/8/2028
391 0.01
$750,000 Discover Financial Services3.85% 21/11/2022
598 0.02
$300,000 Discover Financial Services4.1% 9/2/2027
250 0.01
$500,000 Discover Financial Services4.5% 30/1/2026
428 0.01
$263,000 Discovery Communications2.95% 20/3/2023
208 0.01
$400,000 Discovery Communications3.625% 15/5/2030
331 0.01
$500,000 Discovery Communications3.95% 15/6/2025
422 0.01
$600,000 Discovery Communications3.95% 20/3/2028
507 0.02
$300,000 Discovery Communications4.125% 15/5/2029
256 0.01
$400,000 Discovery Communications4.65% 15/5/2050
343 0.01
$200,000 Discovery Communications4.875% 1/4/2043
170 0.01
iShares Overseas Corporate Bond Index Fund (UK)
Portfolio Statement (unaudited) continued
BlackRock Collective Investment Funds 264

Holding orNominalValue Investment
MarketValue
£000’s
% ofTotal
NetAssets
$150,000 Discovery Communications4.95% 15/5/2042
131 0.00
$500,000 Discovery Communications5% 20/9/2037
442 0.02
$500,000 Discovery Communications5.2% 20/9/2047
448 0.02
$300,000 Discovery Communications5.3% 15/5/2049
275 0.01
$400,000 DNB Bank 2.125%2/10/2020
299 0.01
$250,000 Dollar General 3.25%15/4/2023
198 0.01
$200,000 Dollar General 3.5%3/4/2030
171 0.01
$300,000 Dollar General 3.875%15/4/2027
259 0.01
$200,000 Dollar General 4.125%3/4/2050
180 0.01
$750,000 Dollar Tree 4.2% 15/5/2028 661 0.02
$1,000,000 Dominion Energy 2.45%15/1/2023
778 0.03
$550,000 Dominion Energy 2.85%15/8/2026
454 0.02
$500,000 Dominion Energy 3.071%15/8/2024
405 0.01
$500,000 Dominion Energy 3.375%1/4/2030
425 0.01
$500,000 Dominion Energy 3.375%1/4/2030
425 0.01
$100,000 Dominion Energy 3.6%15/3/2027
85 0.00
$400,000 Dominion Energy 4.104%1/4/2021
305 0.01
$500,000 Dominion Energy 4.25%1/6/2028
441 0.02
$350,000 Dominion Energy 4.9%1/8/2041
339 0.01
$300,000 Dominion Energy 5.95%15/6/2035
308 0.01
$500,000 Dominion Energy Gas 3%15/11/2029
413 0.01
$300,000 Dominion Energy Gas 4.8%1/11/2043
284 0.01
$300,000 Dominion Energy SouthCarolina 4.25% 15/8/2028
260 0.01
$200,000 Dominion Energy SouthCarolina 5.1% 1/6/2065
229 0.01
$300,000 Dominion Energy SouthCarolina 5.3% 15/5/2033
304 0.01
$500,000 Doosan Infracore 1%21/7/2023
375 0.01
Holding orNominalValue Investment
MarketValue
£000’s
% ofTotal
NetAssets
$300,000 Dover 2.95% 4/11/2029 241 0.01
$500,000 Dover 3.15% 15/11/2025 412 0.01
$900,000 Dow Chemical 2.1%15/11/2030
663 0.02
$200,000 Dow Chemical 3.15%15/5/2024
161 0.01
$300,000 Dow Chemical 3.5%1/10/2024
245 0.01
$500,000 Dow Chemical 3.6%15/11/2050
381 0.01
$400,000 Dow Chemical 3.625%15/5/2026
334 0.01
$500,000 Dow Chemical 4.25%1/10/2034
441 0.02
$250,000 Dow Chemical 4.375%15/11/2042
211 0.01
$300,000 Dow Chemical 4.55%30/11/2025
260 0.01
$300,000 Dow Chemical 4.625%1/10/2044
258 0.01
$250,000 Dow Chemical 4.8%15/5/2049
224 0.01
$300,000 Dow Chemical 5.25%15/11/2041
273 0.01
$250,000 Dow Chemical 5.55%30/11/2048
246 0.01
$300,000 Dow Chemical 9.4%15/5/2039
381 0.01
$500,000 DR Horton 2.5% 15/10/2024 398 0.01
$500,000 DTE Electric 2.25%1/3/2030
400 0.01
$200,000 DTE Electric 2.625%1/3/2031
165 0.01
$200,000 DTE Electric 2.95%1/3/2050
159 0.01
$500,000 DTE Electric 3.375%1/3/2025
415 0.01
$100,000 DTE Electric 3.7%15/3/2045
89 0.00
$200,000 DTE Electric 3.7% 1/6/2046 177 0.01
$300,000 DTE Electric 3.75%15/8/2047
268 0.01
$400,000 DTE Electric 3.95%1/3/2049
376 0.01
$500,000 DTE Energy 3.4% 15/6/2029 415 0.01
$250,000 DTE Energy 3.5% 1/6/2024 204 0.01
$500,000 DTE Energy 3.8% 15/3/2027 421 0.01
$500,000 Duke Energy 1.8% 1/9/2021 378 0.01
$300,000 Duke Energy 2.45%1/6/2030
237 0.01
iShares Overseas Corporate Bond Index Fund (UK)
Portfolio Statement (unaudited) continued
BlackRock Collective Investment Funds265

Holding orNominalValue Investment
MarketValue
£000’s
% ofTotal
NetAssets
$500,000 Duke Energy 2.65%1/9/2026
407 0.01
$400,000 Duke Energy 3.4%15/6/2029
338 0.01
$500,000 Duke Energy 3.75%15/4/2024
412 0.01
$100,000 Duke Energy 3.75%1/9/2046
86 0.00
$300,000 Duke Energy 3.95%15/10/2023
246 0.01
$100,000 Duke Energy 3.95%15/8/2047
88 0.00
$600,000 Duke Energy 4.2%15/6/2049
551 0.02
$500,000 Duke Energy Carolinas2.45% 15/8/2029
407 0.01
$500,000 Duke Energy Carolinas2.45% 1/2/2030
406 0.01
$500,000 Duke Energy Carolinas2.5% 15/3/2023
392 0.01
$400,000 Duke Energy Carolinas3.2% 15/8/2049
338 0.01
$200,000 Duke Energy Carolinas3.7% 1/12/2047
180 0.01
$700,000 Duke Energy Carolinas3.875% 15/3/2046
644 0.02
$50,000 Duke Energy Carolinas3.9% 15/6/2021
38 0.00
$500,000 Duke Energy Carolinas3.95% 15/11/2028
452 0.02
$200,000 Duke Energy Carolinas3.95% 15/3/2048
185 0.01
$200,000 Duke Energy Carolinas5.3% 15/2/2040
211 0.01
$150,000 Duke Energy Carolinas 6%15/1/2038
169 0.01
$300,000 Duke Energy Carolinas6.05% 15/4/2038
339 0.01
$300,000 Duke Energy Florida 2.5%1/12/2029
245 0.01
$400,000 Duke Energy Florida 3.2%15/1/2027
337 0.01
$400,000 Duke Energy Florida 3.4%1/10/2046
338 0.01
$150,000 Duke Energy Florida 5.65%1/4/2040
162 0.01
$250,000 Duke Energy Florida 6.35%15/9/2037
284 0.01
$250,000 Duke Energy Florida 6.4%15/6/2038
288 0.01
Holding orNominalValue Investment
MarketValue
£000’s
% ofTotal
NetAssets
$200,000 Duke Energy Indiana 2.75%1/4/2050
155 0.01
$200,000 Duke Energy Indiana 3.25%1/10/2049
168 0.01
$100,000 Duke Energy Indiana 3.75%15/5/2046
88 0.00
$500,000 Duke Energy Ohio 2.125%1/6/2030
395 0.01
$500,000 Duke Energy Ohio 3.7%15/6/2046
438 0.02
$300,000 Duke Energy Progress 2.5%15/8/2050
222 0.01
$500,000 Duke Energy Progress 2.8%15/5/2022
388 0.01
$150,000 Duke Energy Progress 3%15/9/2021
114 0.00
$300,000 Duke Energy Progress3.45% 15/3/2029
261 0.01
$300,000 Duke Energy Progress 3.6%15/9/2047
264 0.01
$400,000 Duke Energy Progress 3.7%1/9/2028
350 0.01
$200,000 Duke Energy Progress 3.7%15/10/2046
178 0.01
$250,000 Duke Energy Progress4.15% 1/12/2044
234 0.01
$300,000 Duke Energy Progress 4.2%15/8/2045
281 0.01
$500,000 Duke Energy Progress 6.3%1/4/2038
569 0.02
$500,000 Duke Realty LP 2.875%15/11/2029
410 0.01
$300,000 Duke University 2.682%1/10/2044
240 0.01
$200,000 Duke University HealthSystem 3.92% 1/6/2047
192 0.01
$800,000 DuPont de Nemours 4.205%15/11/2023
660 0.02
$750,000 DuPont de Nemours 4.493%15/11/2025
652 0.02
$500,000 DuPont de Nemours 4.725%15/11/2028
454 0.02
$400,000 DuPont de Nemours 5.319%15/11/2038
386 0.01
$500,000 DuPont de Nemours 5.319%15/11/2038
482 0.02
$300,000 DuPont de Nemours 5.419%15/11/2048
307 0.01
$400,000 DuPont de Nemours 5.419%15/11/2048
409 0.01
iShares Overseas Corporate Bond Index Fund (UK)
Portfolio Statement (unaudited) continued
BlackRock Collective Investment Funds 266

Holding orNominalValue Investment
MarketValue
£000’s
% ofTotal
NetAssets
$600,000 Duquesne Light 3.616%1/8/2027
481 0.02
$200,000 DXC Technology 4%15/4/2023
158 0.01
$500,000 DXC Technology 4.125%15/4/2025
404 0.01
$500,000 E*TRADE Financial 3.8%24/8/2027
417 0.01
$350,000 E.ON International Finance6.65% 30/4/2038
379 0.01
$300,000 East Ohio Gas 2%15/6/2030
233 0.01
$300,000 East Ohio Gas 3%15/6/2050
235 0.01
$500,000 Eastman Chemical 3.8%15/3/2025
413 0.01
$300,000 Eastman Chemical 4.65%15/10/2044
265 0.01
$150,000 Eastman Chemical 4.8%1/9/2042
133 0.00
$1,000,000 Eaton 2.75% 2/11/2022 784 0.03
$200,000 Eaton 3.915% 15/9/2047 179 0.01
$450,000 Eaton 4% 2/11/2032 405 0.01
$300,000 eBay 1.9% 11/3/2025 235 0.01
$200,000 eBay 2.6% 15/7/2022 154 0.01
$300,000 eBay 2.7% 11/3/2030 238 0.01
$400,000 eBay 3.45% 1/8/2024 328 0.01
$500,000 eBay 3.6% 5/6/2027 422 0.01
$150,000 eBay 4% 15/7/2042 125 0.00
$500,000 Ecolab 3.25% 14/1/2023 396 0.01
$332,000 Ecolab 3.95% 1/12/2047 316 0.01
$246,000 Ecolab 4.35% 8/12/2021 193 0.01
$500,000 Ecolab 4.8% 24/3/2030 474 0.02
$41,000 Ecolab 5.5% 8/12/2041 44 0.00
$400,000 Edison International 2.4%15/9/2022
305 0.01
$200,000 Edison International 3.55%15/11/2024
159 0.01
$300,000 Edison International 4.125%15/3/2028
234 0.01
$400,000 EDP Finance 3.625%15/7/2024
324 0.01
$150,000 Edwards Lifesciences 4.3%15/6/2028
135 0.00
$200,000 EFG International Guernsey5% 5/4/2027
151 0.01
$150,000 El Paso Electric 5%1/12/2044
139 0.00
$400,000 El Puerto de Liverpool3.875% 6/10/2026
307 0.01
Holding orNominalValue Investment
MarketValue
£000’s
% ofTotal
NetAssets
$500,000 Elect Global Investments4.1% Perpetual 3/9/2168
364 0.01
$400,000 Eli Lilly and 2.25%15/5/2050
286 0.01
$400,000 Eli Lilly and 2.5% 15/9/2060 285 0.01
$500,000 Eli Lilly and 2.75% 1/6/2025 411 0.01
$250,000 Eli Lilly and 3.1% 15/5/2027 211 0.01
$200,000 Eli Lilly and 3.375%15/3/2029
174 0.01
$800,000 Eli Lilly and 3.375%15/3/2029
696 0.02
$150,000 Eli Lilly and 3.7% 1/3/2045 137 0.00
$170,000 Eli Lilly and 3.875%15/3/2039
155 0.01
$150,000 Eli Lilly and 3.95%15/5/2047
142 0.01
$350,000 Eli Lilly and 3.95%15/3/2049
337 0.01
$200,000 Eli Lilly and 3.95%15/3/2049
192 0.01
$300,000 Eli Lilly and 4.15%15/3/2059
296 0.01
$150,000 Embotelladora Andina3.95% 21/1/2050
118 0.00
$350,000 EMD Finance 2.95%19/3/2022
270 0.01
$500,000 EMD Finance 3.25%19/3/2025
414 0.01
$300,000 Emera US Finance LP3.55% 15/6/2026
251 0.01
$400,000 Emera US Finance LP4.75% 15/6/2046
372 0.01
$200,000 Emerson Electric 1.8%15/10/2027
157 0.01
$300,000 Emerson Electric 1.95%15/10/2030
234 0.01
$700,000 Emerson Electric 2.625%1/12/2021
537 0.02
$200,000 Emerson Electric 2.75%15/10/2050
155 0.01
$391,250 Empresa Electrica Angamos4.875% 25/5/2029
308 0.01
$500,000 Empresa Nacional deTelecomunicaciones 4.75%1/8/2026
413 0.01
$500,000 Enable Midstream PartnersLP 4.4% 15/3/2027
367 0.01
$300,000 Enable Midstream PartnersLP 4.95% 15/5/2028
221 0.01
$300,000 Enable Midstream PartnersLP 5% 15/5/2044
193 0.01
iShares Overseas Corporate Bond Index Fund (UK)
Portfolio Statement (unaudited) continued
BlackRock Collective Investment Funds267

Holding orNominalValue Investment
MarketValue
£000’s
% ofTotal
NetAssets
$600,000 Enbridge 3.125%15/11/2029
484 0.02
$800,000 Enbridge 3.5% 10/6/2024 648 0.02
$400,000 Enbridge 4% 1/10/2023 325 0.01
$150,000 Enbridge 4% 15/11/2049 123 0.00
$100,000 Enbridge 4.5% 10/6/2044 86 0.00
$300,000 Enbridge 5.5% 1/12/2046 298 0.01
$150,000 Enbridge Energy PartnersLP 4.2% 15/9/2021
115 0.00
$200,000 Enbridge Energy PartnersLP 7.375% 15/10/2045
225 0.01
$150,000 Enbridge Energy PartnersLP 7.5% 15/4/2038
157 0.01
$500,000 Enel 8.75% 24/9/2073 438 0.02
$200,000 Enel Americas 4%25/10/2026
163 0.01
$250,000 Enel Chile 4.875%12/6/2028
224 0.01
$500,000 Enel Finance International2.65% 10/9/2024
395 0.01
$400,000 Enel Finance International2.75% 6/4/2023
312 0.01
$500,000 Enel Finance International2.875% 25/5/2022
386 0.01
$500,000 Enel Finance International3.5% 6/4/2028
416 0.01
$500,000 Enel Finance International3.625% 25/5/2027
416 0.01
$500,000 Enel Finance International4.25% 14/9/2023
409 0.01
$650,000 Enel Finance International4.625% 14/9/2025
562 0.02
$500,000 Enel Finance International4.75% 25/5/2047
472 0.02
$600,000 Enel Finance International4.875% 14/6/2029
552 0.02
$450,000 Enel Finance International6% 7/10/2039
450 0.02
$200,000 Enel Finance International6.8% 15/9/2037
208 0.01
$400,000 Energy Transfer OperatingLP 2.9% 15/5/2025
307 0.01
$500,000 Energy Transfer OperatingLP 3.6% 1/2/2023
387 0.01
$500,000 Energy Transfer OperatingLP 3.75% 15/5/2030
371 0.01
$200,000 Energy Transfer OperatingLP 3.75% 15/5/2030
148 0.01
$125,000 Energy Transfer OperatingLP 4.05% 15/3/2025
100 0.00
Holding orNominalValue Investment
MarketValue
£000’s
% ofTotal
NetAssets
$300,000 Energy Transfer OperatingLP 4.2% 15/4/2027
234 0.01
$500,000 Energy Transfer OperatingLP 4.5% 15/4/2024
402 0.01
$150,000 Energy Transfer OperatingLP 4.65% 1/6/2021
114 0.00
$250,000 Energy Transfer OperatingLP 4.75% 15/1/2026
204 0.01
$400,000 Energy Transfer OperatingLP 4.9% 1/2/2024
322 0.01
$150,000 Energy Transfer OperatingLP 4.9% 15/3/2035
111 0.00
$500,000 Energy Transfer OperatingLP 4.95% 15/6/2028
400 0.01
$1,500,000 Energy Transfer OperatingLP 5% 15/5/2050
1,070 0.04
$300,000 Energy Transfer OperatingLP 5.15% 15/3/2045
209 0.01
$300,000 Energy Transfer OperatingLP 5.2% 1/2/2022
233 0.01
$500,000 Energy Transfer OperatingLP 5.25% 15/4/2029
409 0.01
$300,000 Energy Transfer OperatingLP 5.3% 15/4/2047
218 0.01
$500,000 Energy Transfer OperatingLP 5.5% 1/6/2027
417 0.01
$400,000 Energy Transfer OperatingLP 5.8% 15/6/2038
303 0.01
$500,000 Energy Transfer OperatingLP 5.875% 15/1/2024
415 0.01
$250,000 Energy Transfer OperatingLP 5.95% 1/10/2043
184 0.01
$400,000 Energy Transfer OperatingLP 6% 15/6/2048
311 0.01
$300,000 Energy Transfer OperatingLP 6.05% 1/6/2041
227 0.01
$450,000 Energy Transfer OperatingLP 6.125% 15/12/2045
343 0.01
$150,000 Energy Transfer OperatingLP 6.5% 1/2/2042
121 0.00
$150,000 Energy Transfer OperatingLP 7.5% 1/7/2038
132 0.00
$300,000 Energy Transfer Partners LP/ Regency Energy Finance5.875% 1/3/2022
236 0.01
$300,000 Engie 2.875% 10/10/2022 232 0.01
$250,000 Engie Energia Chile 4.5%29/1/2025
207 0.01
$500,000 Eni 4.25% 9/5/2029 420 0.01
$250,000 Eni USA 7.3% 15/11/2027 240 0.01
$500,000 Entergy 2.8% 15/6/2030 408 0.01
iShares Overseas Corporate Bond Index Fund (UK)
Portfolio Statement (unaudited) continued
BlackRock Collective Investment Funds 268

Holding orNominalValue Investment
MarketValue
£000’s
% ofTotal
NetAssets
$400,000 Entergy 2.95% 1/9/2026 332 0.01
$300,000 Entergy 3.75% 15/6/2050 259 0.01
$400,000 Entergy 4% 15/7/2022 317 0.01
$250,000 Entergy Gulf StatesLouisiana 5.59% 1/10/2024
222 0.01
$400,000 Entergy Louisiana 2.9%15/3/2051
317 0.01
$100,000 Entergy Louisiana 4%15/3/2033
94 0.00
$150,000 Entergy Louisiana 4.05%1/9/2023
123 0.00
$500,000 Entergy Louisiana 4.2%1/9/2048
483 0.02
$150,000 Entergy Louisiana 4.2%1/4/2050
146 0.01
$400,000 Entergy Mississippi 2.85%1/6/2028
327 0.01
$200,000 Entergy Mississippi 3.85%1/6/2049
183 0.01
$200,000 Entergy Texas 4% 30/3/2029 175 0.01
$300,000 Enterprise ProductsOperating 2.8% 31/1/2030
239 0.01
$900,000 Enterprise ProductsOperating 3.125%31/7/2029
734 0.03
$700,000 Enterprise ProductsOperating 3.2% 15/2/2052
492 0.02
$400,000 Enterprise ProductsOperating 3.35% 15/3/2023
318 0.01
$700,000 Enterprise ProductsOperating 3.5% 1/2/2022
544 0.02
$100,000 Enterprise ProductsOperating 3.7% 31/1/2051
76 0.00
$200,000 Enterprise ProductsOperating 3.7% 31/1/2051
152 0.01
$300,000 Enterprise ProductsOperating 3.75% 15/2/2025
250 0.01
$500,000 Enterprise ProductsOperating 3.9% 15/2/2024
411 0.01
$200,000 Enterprise ProductsOperating 3.95% 15/2/2027
170 0.01
$300,000 Enterprise ProductsOperating 3.95% 31/1/2060
228 0.01
$400,000 Enterprise ProductsOperating 4.15%16/10/2028
351 0.01
$300,000 Enterprise ProductsOperating 4.2% 31/1/2050
244 0.01
$700,000 Enterprise ProductsOperating 4.25% 15/2/2048
569 0.02
Holding orNominalValue Investment
MarketValue
£000’s
% ofTotal
NetAssets
$550,000 Enterprise ProductsOperating 4.45% 15/2/2043
452 0.02
$150,000 Enterprise ProductsOperating 4.8% 1/2/2049
132 0.00
$250,000 Enterprise ProductsOperating 4.85% 15/8/2042
217 0.01
$400,000 Enterprise ProductsOperating 4.85% 15/3/2044
346 0.01
$200,000 Enterprise ProductsOperating 4.875%16/8/2077
133 0.00
$200,000 Enterprise ProductsOperating 4.9% 15/5/2046
175 0.01
$300,000 Enterprise ProductsOperating 4.95%15/10/2054
258 0.01
$200,000 Enterprise ProductsOperating 5.1% 15/2/2045
179 0.01
$300,000 Enterprise ProductsOperating 5.25% 16/8/2077
215 0.01
$200,000 Enterprise ProductsOperating 5.375%15/2/2078
136 0.00
$250,000 Enterprise ProductsOperating 5.7% 15/2/2042
237 0.01
$500,000 Enterprise ProductsOperating 5.95% 1/2/2041
477 0.02
$200,000 Enterprise ProductsOperating 6.125%15/10/2039
194 0.01
$100,000 Enterprise ProductsOperating 6.45% 1/9/2040
100 0.00
$400,000 EOG Resources 3.15%1/4/2025
329 0.01
$500,000 EOG Resources 4.15%15/1/2026
433 0.02
$500,000 EOG Resources 4.375%15/4/2030
448 0.02
$300,000 EOG Resources 4.95%15/4/2050
287 0.01
$300,000 EPR Properties 4.5%1/6/2027
210 0.01
$450,000 EPR Properties 4.95%15/4/2028
326 0.01
$400,000 Equifax 2.6% 1/12/2024 319 0.01
$300,000 Equifax 3.1% 15/5/2030 245 0.01
$400,000 Equinix 2.15% 15/7/2030 306 0.01
$500,000 Equinix 2.625% 18/11/2024 400 0.01
$500,000 Equinix 3.2% 18/11/2029 412 0.01
$800,000 Equinix 5.375% 15/5/2027 653 0.02
$500,000 Equitable 3.9% 20/4/2023 402 0.01
iShares Overseas Corporate Bond Index Fund (UK)
Portfolio Statement (unaudited) continued
BlackRock Collective Investment Funds269

Holding orNominalValue Investment
MarketValue
£000’s
% ofTotal
NetAssets
$400,000 Equitable 4.35% 20/4/2028 342 0.01
$400,000 Equitable 5% 20/4/2048 354 0.01
$300,000 Equitable 5% 20/4/2048 266 0.01
$600,000 ERAC USA Finance 3.3%15/10/2022
468 0.02
$500,000 ERAC USA Finance 3.3%1/12/2026
407 0.01
$500,000 ERAC USA Finance 3.8%1/11/2025
417 0.01
$250,000 ERAC USA Finance 3.85%15/11/2024
206 0.01
$200,000 ERAC USA Finance 4.2%1/11/2046
163 0.01
$150,000 ERAC USA Finance 4.5%15/2/2045
126 0.00
$200,000 ERAC USA Finance 5.625%15/3/2042
184 0.01
$350,000 ERAC USA Finance 7%15/10/2037
372 0.01
$300,000 ERP Operating LP 3.5%1/3/2028
255 0.01
$200,000 ERP Operating LP 4%1/8/2047
184 0.01
$500,000 ERP Operating LP 4.15%1/12/2028
445 0.02
$300,000 ERP Operating LP 4.5%1/7/2044
289 0.01
$300,000 ERP Operating LP 4.625%15/12/2021
234 0.01
$500,000 Essential Utilities 2.704%15/4/2030
404 0.01
$300,000 Essential Utilities 3.351%15/4/2050
244 0.01
$200,000 Essential Utilities 4.276%1/5/2049
188 0.01
$100,000 Essex Portfolio LP 1.65%15/1/2031
72 0.00
$200,000 Essex Portfolio LP 2.65%15/3/2032
159 0.01
$100,000 Essex Portfolio LP 2.65%1/9/2050
69 0.00
$200,000 Essex Portfolio LP 3%15/1/2030
162 0.01
$500,000 Essex Portfolio LP 3.625%15/8/2022
393 0.01
$400,000 Essex Portfolio LP 4%1/3/2029
348 0.01
$200,000 Estee Lauder Cos 2%1/12/2024
158 0.01
$500,000 Estee Lauder Cos 2.375%1/12/2029
401 0.01
Holding orNominalValue Investment
MarketValue
£000’s
% ofTotal
NetAssets
$500,000 Estee Lauder Cos 2.6%15/4/2030
410 0.01
$200,000 Estee Lauder Cos 4.15%15/3/2047
189 0.01
$200,000 Estee Lauder Cos 4.375%15/6/2045
194 0.01
$500,000 Evergy 2.9% 15/9/2029 404 0.01
$500,000 Evergy 4.85% 1/6/2021 381 0.01
$100,000 Evergy Kansas Central3.25% 1/9/2049
84 0.00
$300,000 Evergy Kansas Central4.125% 1/3/2042
273 0.01
$400,000 Evergy Kansas Central4.25% 1/12/2045
378 0.01
$250,000 Evergy Metro 4.2%15/6/2047
235 0.01
$50,000 Evergy Metro 5.3%1/10/2041
51 0.00
$250,000 Eversource Energy 2.75%15/3/2022
193 0.01
$400,000 Eversource Energy 3.15%15/1/2025
327 0.01
$700,000 Eversource Energy 3.3%15/1/2028
585 0.02
$200,000 Eversource Energy 3.45%15/1/2050
166 0.01
$200,000 Exelon 2.45% 15/4/2021 151 0.01
$300,000 Exelon 3.4% 15/4/2026 253 0.01
$500,000 Exelon 3.497% 1/6/2022 391 0.01
$200,000 Exelon 3.95% 15/6/2025 171 0.01
$750,000 Exelon 4.05% 15/4/2030 664 0.02
$300,000 Exelon 4.45% 15/4/2046 276 0.01
$400,000 Exelon 4.7% 15/4/2050 386 0.01
$300,000 Exelon 5.1% 15/6/2045 292 0.01
$150,000 Exelon 5.625% 15/6/2035 150 0.01
$500,000 Exelon Generation 3.25%1/6/2025
411 0.01
$121,000 Exelon Generation 4.25%15/6/2022
96 0.00
$400,000 Exelon Generation 5.6%15/6/2042
348 0.01
$500,000 Exelon Generation 6.25%1/10/2039
461 0.02
$400,000 Expedia 3.25% 15/2/2030 283 0.01
$300,000 Expedia 3.8% 15/2/2028 224 0.01
$300,000 Expedia 4.625% 1/8/2027 234 0.01
$300,000 Expedia 5% 15/2/2026 236 0.01
$800,000 Expedia 6.25% 1/5/2025 657 0.02
$475,000 Experian Finance 4.25%1/2/2029
420 0.01
iShares Overseas Corporate Bond Index Fund (UK)
Portfolio Statement (unaudited) continued
BlackRock Collective Investment Funds 270

Holding orNominalValue Investment
MarketValue
£000’s
% ofTotal
NetAssets
$800,000 Exxon Mobil 1.571%15/4/2023
616 0.02
$400,000 Exxon Mobil 2.019%16/8/2024
317 0.01
$200,000 Exxon Mobil 2.222%1/3/2021
151 0.01
$700,000 Exxon Mobil 2.275%16/8/2026
568 0.02
$900,000 Exxon Mobil 2.397%6/3/2022
692 0.02
$300,000 Exxon Mobil 2.44%16/8/2029
243 0.01
$700,000 Exxon Mobil 2.61%15/10/2030
569 0.02
$400,000 Exxon Mobil 2.709%6/3/2025
324 0.01
$300,000 Exxon Mobil 2.726%1/3/2023
236 0.01
$1,000,000 Exxon Mobil 2.992%19/3/2025
823 0.03
$200,000 Exxon Mobil 2.995%16/8/2039
160 0.01
$500,000 Exxon Mobil 3.043%1/3/2026
416 0.01
$500,000 Exxon Mobil 3.095%16/8/2049
392 0.01
$300,000 Exxon Mobil 3.176%15/3/2024
243 0.01
$500,000 Exxon Mobil 3.294%19/3/2027
425 0.01
$900,000 Exxon Mobil 3.452%15/4/2051
754 0.03
$800,000 Exxon Mobil 3.482%19/3/2030
695 0.02
$250,000 Exxon Mobil 3.567%6/3/2045
209 0.01
$800,000 Exxon Mobil 4.114%1/3/2046
723 0.03
$900,000 Exxon Mobil 4.227%19/3/2040
831 0.03
$900,000 Exxon Mobil 4.327%19/3/2050
862 0.03
$500,000 Fairfax Financial 4.85%17/4/2028
414 0.01
$200,000 Falabella 4.375%27/1/2025Ø
160 0.01
$300,000 Farmers Exchange Capital II6.151% 1/11/2053
283 0.01
$400,000 Farmers InsuranceExchange 4.747%1/11/2057
307 0.01
Holding orNominalValue Investment
MarketValue
£000’s
% ofTotal
NetAssets
$500,000 Federal Realty InvestmentTrust 3.5% 1/6/2030
405 0.01
$200,000 Federal Realty InvestmentTrust 4.5% 1/12/2044
173 0.01
$800,000 Federation des CaissesDesjardins du Quebec2.05% 10/2/2025
624 0.02
$500,000 FedEx 3.1% 5/8/2029 414 0.01
$300,000 FedEx 3.2% 1/2/2025 246 0.01
$400,000 FedEx 3.25% 1/4/2026 333 0.01
$500,000 FedEx 3.3% 15/3/2027 412 0.01
$300,000 FedEx 3.8% 15/5/2025 253 0.01
$200,000 FedEx 3.875% 1/8/2042 161 0.01
$300,000 FedEx 4% 15/1/2024 249 0.01
$300,000 FedEx 4.05% 15/2/2048 251 0.01
$300,000 FedEx 4.2% 17/10/2028 265 0.01
$200,000 FedEx 4.25% 15/5/2030 179 0.01
$300,000 FedEx 4.4% 15/1/2047 259 0.01
$300,000 FedEx 4.55% 1/4/2046 267 0.01
$275,000 FedEx 4.75% 15/11/2045 249 0.01
$500,000 FedEx 4.9% 15/1/2034 478 0.02
$400,000 FedEx 4.95% 17/10/2048 373 0.01
$200,000 FedEx 5.1% 15/1/2044 188 0.01
$800,000 FedEx 5.25% 15/5/2050 800 0.03
$200,000 Ferguson Finance 4.5%24/10/2028
170 0.01
$258,531 Fermaca Enterprises S deRL de 6.375% 30/3/2038
207 0.01
$300,000 Fibria Overseas Finance 4%14/1/2025
236 0.01
$300,000 Fibria Overseas Finance5.25% 12/5/2024
245 0.01
$100,000 Fibria Overseas Finance5.5% 17/1/2027
83 0.00
$300,000 Fidelity National InformationServices 3% 15/8/2026
251 0.01
$300,000 Fidelity National InformationServices 3.5% 15/4/2023
239 0.01
$500,000 Fidelity National InformationServices 3.75% 21/5/2029
439 0.02
$125,000 Fidelity National InformationServices 4.25% 15/5/2028
112 0.00
$100,000 Fidelity National InformationServices 4.5% 15/8/2046
93 0.00
$500,000 Fifth Third Bancorp 1.625%5/5/2023
383 0.01
$500,000 Fifth Third Bancorp 3.65%25/1/2024
409 0.01
$300,000 Fifth Third Bancorp 8.25%1/3/2038
373 0.01
iShares Overseas Corporate Bond Index Fund (UK)
Portfolio Statement (unaudited) continued
BlackRock Collective Investment Funds271

Holding orNominalValue Investment
MarketValue
£000’s
% ofTotal
NetAssets
$1,000,000 Fifth Third Bank NA 1.8%30/1/2023
770 0.03
$300,000 Fifth Third Bank NA 2.25%1/2/2027
240 0.01
$500,000 Fifth Third Bank NA 2.875%1/10/2021
382 0.01
$250,000 Fifth Third Bank NA 3.85%15/3/2026
214 0.01
$350,000 Fifth Third Bank NA 3.95%28/7/2025
301 0.01
$500,000 First American Financial 4%15/5/2030
399 0.01
$800,000 First Horizon National 3.55%26/5/2023
629 0.02
$250,000 First Republic Bank/CA4.375% 1/8/2046
227 0.01
$300,000 FirstEnergy 2.65% 1/3/2030 231 0.01
$300,000 FirstEnergy 3.4% 1/3/2050 225 0.01
$300,000 FirstEnergy 4.25%15/3/2023
238 0.01
$300,000 FirstEnergy 4.85%15/7/2047
274 0.01
$500,000 FirstEnergy 7.375%15/11/2031
529 0.02
$300,000 FirstEnergy Transmission4.55% 1/4/2049
260 0.01
$300,000 FirstEnergy Transmission5.45% 15/7/2044
283 0.01
$1,300,000 Fiserv 2.25% 1/6/2027 1,030 0.04
$400,000 Fiserv 2.75% 1/7/2024 321 0.01
$750,000 Fiserv 3.2% 1/7/2026 628 0.02
$500,000 Fiserv 3.2% 1/7/2026 419 0.01
$500,000 Fiserv 3.5% 1/10/2022 393 0.01
$900,000 Fiserv 3.5% 1/7/2029 765 0.03
$500,000 Fiserv 3.8% 1/10/2023 409 0.01
$575,000 Fiserv 4.4% 1/7/2049 540 0.02
$250,000 Flex 4.75% 15/6/2025 209 0.01
$300,000 Flex 4.875% 15/6/2029 257 0.01
$500,000 Flex 4.875% 12/5/2030 426 0.01
$300,000 Florida Power & Light 2.75%1/6/2023
236 0.01
$500,000 Florida Power & Light 2.85%1/4/2025
410 0.01
$500,000 Florida Power & Light3.125% 1/12/2025
417 0.01
$200,000 Florida Power & Light 3.15%1/10/2049
170 0.01
$500,000 Florida Power & Light 3.7%1/12/2047
462 0.02
Holding orNominalValue Investment
MarketValue
£000’s
% ofTotal
NetAssets
$300,000 Florida Power & Light 3.8%15/12/2042
275 0.01
$300,000 Florida Power & Light 3.95%1/3/2048
288 0.01
$400,000 Florida Power & Light 3.99%1/3/2049
385 0.01
$300,000 Florida Power & Light 4.05%1/6/2042
281 0.01
$400,000 Florida Power & Light4.125% 1/6/2048
398 0.01
$200,000 Florida Power & Light 5.25%1/2/2041
212 0.01
$200,000 Florida Power & Light 5.96%1/4/2039
225 0.01
$150,000 FMC 3.2% 1/10/2026 125 0.00
$150,000 FMC 3.45% 1/10/2029 126 0.00
$150,000 FMC 4.5% 1/10/2049 142 0.01
$250,000 FMR 4.95% 1/2/2033 254 0.01
$250,000 FMR 6.5% 14/12/2040 285 0.01
$400,000 FMR 7.57% 15/6/2029 440 0.02
$600,000 Fomento EconomicoMexicano 3.5% 16/1/2050
481 0.02
$300,000 Fomento EconomicoMexicano 3.5% 16/1/2050
240 0.01
$300,000 Fomento EconomicoMexicano 4.375% 10/5/2043
275 0.01
$250,000 Ford Foundation/The2.815% 1/6/2070
198 0.01
$300,000 Formosa Cayman 3.375%22/4/2025
241 0.01
$400,000 Fortis Inc/Canada 3.055%4/10/2026
327 0.01
$500,000 Fortive 3.15% 15/6/2026 413 0.01
$300,000 Fortive 4.3% 15/6/2046 271 0.01
$400,000 Fortune Brands Home &Security 3.25% 15/9/2029
333 0.01
$600,000 Fox 3.05% 7/4/2025 491 0.02
$500,000 Fox 3.5% 8/4/2030 422 0.01
$600,000 Fox 4.03% 25/1/2024 495 0.02
$400,000 Fox 4.709% 25/1/2029 359 0.01
$500,000 Fox 5.476% 25/1/2039 495 0.02
$400,000 Fox 5.576% 25/1/2049 410 0.01
$500,000 Foxconn Far East 2.25%23/9/2021
376 0.01
$200,000 Franklin Resources 2.85%30/3/2025
164 0.01
$600,000 FS KKR Capital 4.125%1/2/2025
444 0.02
iShares Overseas Corporate Bond Index Fund (UK)
Portfolio Statement (unaudited) continued
BlackRock Collective Investment Funds 272

Holding orNominalValue Investment
MarketValue
£000’s
% ofTotal
NetAssets
$200,000 Fuqing InvestmentManagement 3.25%23/6/2025
150 0.01
$200,000 Gansu Provincial HighwayAviation Tourism Investment3.875% 5/7/2022
151 0.01
$300,000 GATX 4.7% 1/4/2029 262 0.01
$250,000 GATX 5.2% 15/3/2044 230 0.01
$1,000,000 GE Capital Funding 4.05%15/5/2027
792 0.03
$500,000 GE Capital Funding 4.4%15/5/2030
394 0.01
$500,000 GE Capital Funding 4.55%15/5/2032
397 0.01
$783,000 GE Capital InternationalFunding Unlimited 3.373%15/11/2025Ø
621 0.02
$3,489,000 GE Capital InternationalFunding Unlimited 4.418%15/11/2035
2,692 0.09
$200,000 Geely Automobile 3.625%25/1/2023
152 0.01
$250,000 General Dynamics 2.125%15/8/2026
201 0.01
$400,000 General Dynamics 2.25%15/11/2022
310 0.01
$1,000,000 General Dynamics 3.375%15/5/2023
805 0.03
$600,000 General Dynamics 3.625%1/4/2030
532 0.02
$600,000 General Dynamics 4.25%1/4/2040
566 0.02
$300,000 General Dynamics 4.25%1/4/2050
292 0.01
$300,000 General Electric 2.7%9/10/2022
234 0.01
$750,000 General Electric 3.1%9/1/2023
591 0.02
$372,000 General Electric 3.15%7/9/2022
292 0.01
$400,000 General Electric 3.375%11/3/2024
322 0.01
$100,000 General Electric 3.45%15/5/2024
80 0.00
$800,000 General Electric 3.45%1/5/2027
631 0.02
$600,000 General Electric 3.625%1/5/2030
462 0.02
$216,000 General Electric 4.125%9/10/2042
162 0.01
Holding orNominalValue Investment
MarketValue
£000’s
% ofTotal
NetAssets
$600,000 General Electric 4.25%1/5/2040
452 0.02
$1,200,000 General Electric 4.35%1/5/2050
910 0.03
$375,000 General Electric 4.5%11/3/2044
290 0.01
$765,000 General Electric 5.875%14/1/2038
660 0.02
$300,000 General Electric 6.15%7/8/2037
266 0.01
$722,000 General Electric 6.75%15/3/2032
676 0.02
$994,000 General Electric 6.875%10/1/2039
946 0.03
$400,000 General Mills 2.6%12/10/2022
312 0.01
$500,000 General Mills 2.875%15/4/2030
411 0.01
$100,000 General Mills 3.15%15/12/2021
77 0.00
$200,000 General Mills 3.2%10/2/2027
168 0.01
$300,000 General Mills 3.65%15/2/2024
245 0.01
$100,000 General Mills 4.15%15/2/2043
93 0.00
$500,000 General Mills 4.2%17/4/2028
443 0.02
$400,000 General Mills 4.55%17/4/2038
387 0.01
$200,000 General Mills 5.4%15/6/2040
206 0.01
$300,000 General Motors 5%1/10/2028
249 0.01
$300,000 General Motors 5%1/4/2035
244 0.01
$500,000 General Motors 5.15%1/4/2038
398 0.01
$200,000 General Motors 5.2%1/4/2045
162 0.01
$1,500,000 General Motors 5.4%2/10/2023
1,242 0.04
$300,000 General Motors 5.4%1/4/2048
246 0.01
$300,000 General Motors 5.95%1/4/2049
264 0.01
$1,300,000 General Motors 6.125%1/10/2025
1,140 0.04
$500,000 General Motors 6.25%2/10/2043
436 0.02
iShares Overseas Corporate Bond Index Fund (UK)
Portfolio Statement (unaudited) continued
BlackRock Collective Investment Funds273

Holding orNominalValue Investment
MarketValue
£000’s
% ofTotal
NetAssets
$300,000 General Motors 6.6%1/4/2036
269 0.01
$350,000 General Motors 6.75%1/4/2046
318 0.01
$600,000 General Motors 6.8%1/10/2027
548 0.02
$1,000,000 General Motors Financial1.7% 18/8/2023
751 0.03
$400,000 General Motors Financial2.9% 26/2/2025
309 0.01
$1,000,000 General Motors Financial3.15% 30/6/2022
770 0.03
$300,000 General Motors Financial3.25% 5/1/2023
233 0.01
$500,000 General Motors Financial3.45% 14/1/2022
383 0.01
$400,000 General Motors Financial3.45% 10/4/2022
308 0.01
$400,000 General Motors Financial3.55% 8/7/2022
311 0.01
$300,000 General Motors Financial3.6% 21/6/2030
234 0.01
$800,000 General Motors Financial3.85% 5/1/2028
629 0.02
$700,000 General Motors Financial4.15% 19/6/2023
557 0.02
$250,000 General Motors Financial4.2% 6/11/2021
193 0.01
$500,000 General Motors Financial4.35% 9/4/2025
408 0.01
$300,000 General Motors Financial4.35% 17/1/2027
243 0.01
$600,000 General Motors Financial4.375% 25/9/2021
463 0.02
$500,000 General Motors Financial5.1% 17/1/2024
410 0.01
$250,000 General Motors Financial5.25% 1/3/2026
212 0.01
$200,000 General Motors Financial5.65% 17/1/2029
175 0.01
$400,000 George WashingtonUniversity/The 4.126%15/9/2048
390 0.01
$200,000 Georgetown University/The4.315% 1/4/2049
192 0.01
$300,000 Georgia Power 2.1%30/7/2023
235 0.01
$500,000 Georgia Power 2.65%15/9/2029
400 0.01
$500,000 Georgia Power 2.85%15/5/2022
389 0.01
Holding orNominalValue Investment
MarketValue
£000’s
% ofTotal
NetAssets
$200,000 Georgia Power 3.25%30/3/2027
164 0.01
$300,000 Georgia Power 3.7%30/1/2050
255 0.01
$200,000 Georgia Power 4.3%15/3/2042
177 0.01
$300,000 Georgia Power 4.3%15/3/2043
268 0.01
$800,000 Georgia-Pacific 1.75%30/9/2025
625 0.02
$500,000 Georgia-Pacific 2.3%30/4/2030
397 0.01
$700,000 Georgia-Pacific 8%15/1/2024
653 0.02
$150,000 Georgia-Pacific 8.875%15/5/2031
183 0.01
$250,000 Gerdau Trade 4.75%15/4/2023
197 0.01
$300,000 Gilead Sciences 1.95%1/3/2022
229 0.01
$1,000,000 Gilead Sciences 2.5%1/9/2023
789 0.03
$400,000 Gilead Sciences 2.95%1/3/2027
335 0.01
$500,000 Gilead Sciences 3.65%1/3/2026
428 0.01
$1,000,000 Gilead Sciences 3.7%1/4/2024
826 0.03
$400,000 Gilead Sciences 4%1/9/2036
374 0.01
$600,000 Gilead Sciences 4.15%1/3/2047
576 0.02
$150,000 Gilead Sciences 4.4%1/12/2021
116 0.00
$500,000 Gilead Sciences 4.5%1/2/2045
485 0.02
$500,000 Gilead Sciences 4.6%1/9/2035
497 0.02
$800,000 Gilead Sciences 4.75%1/3/2046
800 0.03
$700,000 Gilead Sciences 4.8%1/4/2044
696 0.02
$150,000 Gilead Sciences 5.65%1/12/2041
164 0.01
$550,000 GlaxoSmithKline Capital2.85% 8/5/2022
428 0.01
$400,000 GlaxoSmithKline Capital2.875% 1/6/2022
311 0.01
$700,000 GlaxoSmithKline Capital 3%1/6/2024
568 0.02
iShares Overseas Corporate Bond Index Fund (UK)
Portfolio Statement (unaudited) continued
BlackRock Collective Investment Funds 274

Holding orNominalValue Investment
MarketValue
£000’s
% ofTotal
NetAssets
$600,000 GlaxoSmithKline Capital3.375% 15/5/2023
484 0.02
$250,000 GlaxoSmithKline Capital3.375% 1/6/2029
216 0.01
$600,000 GlaxoSmithKline Capital3.625% 15/5/2025
510 0.02
$650,000 GlaxoSmithKline Capital3.875% 15/5/2028
576 0.02
$250,000 GlaxoSmithKline Capital4.2% 18/3/2043
241 0.01
$200,000 GlaxoSmithKline Capital5.375% 15/4/2034
211 0.01
$700,000 GlaxoSmithKline Capital6.375% 15/5/2038
813 0.03
$500,000 Glencore Finance Canada4.25% 25/10/2022
397 0.01
$400,000 Glencore Finance Canada4.95% 15/11/2021
312 0.01
$250,000 Glencore Finance Canada5.55% 25/10/2042
218 0.01
$150,000 Glencore Finance Canada6% 15/11/2041
133 0.00
$800,000 Glencore Funding 1.625%1/9/2025
596 0.02
$700,000 Glencore Funding 2.5%1/9/2030
514 0.02
$300,000 Glencore Funding 3.875%27/10/2027
244 0.01
$400,000 Glencore Funding 4.125%30/5/2023
321 0.01
$500,000 Glencore Funding 4.125%12/3/2024
406 0.01
$500,000 Glencore Funding 4.625%29/4/2024
414 0.01
$300,000 Glencore Funding 4.875%12/3/2029
265 0.01
$500,000 Global Atlantic Fin 4.4%15/10/2029
388 0.01
$300,000 Global Bank 5.25%16/4/2029
235 0.01
$300,000 Global Payments 2.65%15/2/2025
239 0.01
$300,000 Global Payments 2.9%15/5/2030
241 0.01
$400,000 Global Payments 3.2%15/8/2029
328 0.01
$500,000 Global Payments 3.75%1/6/2023
401 0.01
$300,000 Global Payments 4.15%15/8/2049
265 0.01
Holding orNominalValue Investment
MarketValue
£000’s
% ofTotal
NetAssets
$400,000 GLP Capital LP / GLPFinancing II 3.35% 1/9/2024
302 0.01
$200,000 GLP Capital LP / GLPFinancing II 4% 15/1/2030
155 0.01
$400,000 GLP Capital LP / GLPFinancing II 5.25% 1/6/2025
323 0.01
$500,000 GLP Capital LP / GLPFinancing II 5.75% 1/6/2028
425 0.01
$250,000 GLP Pte 3.875% 4/6/2025 192 0.01
$300,000 GNL Quintero 4.634%31/7/2029
243 0.01
$500,000 Gohl Capital 4.25%24/1/2027
374 0.01
$975,000 Goldman Sachs 2.35%15/11/2021
731 0.03
$300,000 Goldman Sachs 2.6%7/2/2030
239 0.01
$500,000 Goldman Sachs 2.6%7/2/2030
398 0.01
$1,000,000 Goldman Sachs 2.876%31/10/2022
766 0.03
$1,000,000 Goldman Sachs 2.905%24/7/2023
779 0.03
$700,000 Goldman Sachs 2.908%5/6/2023
543 0.02
$800,000 Goldman Sachs 3%26/4/2022
607 0.02
$300,000 Goldman Sachs 3%31/5/2024
244 0.01
$1,000,000 Goldman Sachs 3.2%23/2/2023
795 0.03
$1,000,000 Goldman Sachs 3.272%29/9/2025
815 0.03
$750,000 Goldman Sachs 3.5%23/1/2025
615 0.02
$1,500,000 Goldman Sachs 3.5%1/4/2025
1,241 0.04
$1,000,000 Goldman Sachs 3.5%16/11/2026
833 0.03
$500,000 Goldman Sachs 3.625%22/1/2023
401 0.01
$500,000 Goldman Sachs 3.625%20/2/2024
407 0.01
$500,000 Goldman Sachs 3.691%5/6/2028
424 0.01
$500,000 Goldman Sachs 3.75%22/5/2025
418 0.01
$600,000 Goldman Sachs 3.75%25/2/2026
508 0.02
$1,000,000 Goldman Sachs 3.8%15/3/2030
870 0.03
iShares Overseas Corporate Bond Index Fund (UK)
Portfolio Statement (unaudited) continued
BlackRock Collective Investment Funds275

Holding orNominalValue Investment
MarketValue
£000’s
% ofTotal
NetAssets
$500,000 Goldman Sachs 3.814%23/4/2029
428 0.01
$1,300,000 Goldman Sachs 3.814%23/4/2029
1,113 0.04
$500,000 Goldman Sachs 3.85%8/7/2024
413 0.01
$500,000 Goldman Sachs 3.85%26/1/2027
426 0.01
$1,150,000 Goldman Sachs 4%3/3/2024
952 0.03
$1,100,000 Goldman Sachs 4.017%31/10/2038
969 0.03
$900,000 Goldman Sachs 4.223%1/5/2029
790 0.03
$700,000 Goldman Sachs 4.25%21/10/2025
596 0.02
$750,000 Goldman Sachs 4.411%23/4/2039
691 0.02
$500,000 Goldman Sachs 4.75%21/10/2045
498 0.02
$400,000 Goldman Sachs 4.8%8/7/2044
393 0.01
$700,000 Goldman Sachs 5.15%22/5/2045
696 0.02
$800,000 Goldman Sachs 5.75%24/1/2022
641 0.02
$477,000 Goldman Sachs 5.95%15/1/2027
441 0.02
$250,000 Goldman Sachs 6.125%15/2/2033
264 0.01
$550,000 Goldman Sachs 6.25%1/2/2041
621 0.02
$300,000 Goldman Sachs 6.45%1/5/2036
311 0.01
$1,850,000 Goldman Sachs 6.75%1/10/2037
2,016 0.07
$500,000 Goldman Sachs BDC 3.75%10/2/2025
392 0.01
$250,000 Goldman Sachs Capital I6.345% 15/2/2034
264 0.01
$250,000 Goodman US Finance Two6% 22/3/2022
199 0.01
$300,000 Great-West Lifeco Finance2018 LP 4.047% 17/5/2028
260 0.01
$300,000 Great-West Lifeco FinanceDelaware LP 4.15%3/6/2047
266 0.01
$150,000 Great-West Lifeco USFinance 2020 LP 0.904%12/8/2025
112 0.00
Holding orNominalValue Investment
MarketValue
£000’s
% ofTotal
NetAssets
$600,000 Grupo Bimbo 3.875%27/6/2024Ø
484 0.02
$200,000 Grupo Bimbo 4% 6/9/2049 160 0.01
$200,000 Grupo Bimbo 4.7%10/11/2047
177 0.01
$500,000 Grupo de InversionesSuramericana 5.5%29/4/2026Ø
420 0.01
$400,000 Grupo Televisa SAB 5%13/5/2045Ø
337 0.01
$200,000 Grupo Televisa SAB 5.25%24/5/2049
177 0.01
$400,000 Grupo Televisa SAB 6.125%31/1/2046Ø
389 0.01
$400,000 Grupo Televisa SAB 6.625%18/3/2025
359 0.01
$500,000 GS Caltex 3.875%27/6/2023
400 0.01
$250,000 GTL Trade Finance 7.25%16/4/2044Ø
249 0.01
$541,000 GTL Trade Finance / Gerdau5.893% 29/4/2024Ø
445 0.02
$150,000 Guardian Life GlobalFunding 1.1% 23/6/2025
113 0.00
$500,000 Guardian Life GlobalFunding 2.5% 8/5/2022
387 0.01
$200,000 Guardian Life Insurance ofAmerica/The 4.85%24/1/2077
199 0.01
$150,000 Guardian Life Insurance ofAmerica/The 4.875%19/6/2064
152 0.01
$500,000 GUSAP III LP 4.25%21/1/2030
392 0.01
$500,000 Hackensack MeridianHealth 2.875% 1/9/2050
372 0.01
$200,000 Hackensack MeridianHealth 4.211% 1/7/2048
187 0.01
$200,000 Haitong International3.125% 18/5/2025
156 0.01
$500,000 Haitong InternationalFinance 2015 2.107%12/3/2025
379 0.01
$600,000 Halliburton 2.92% 1/3/2030 455 0.02
$500,000 Halliburton 2.92% 1/3/2030 379 0.01
$264,000 Halliburton 3.5% 1/8/2023Ø 210 0.01
$213,000 Halliburton 3.8% 15/11/2025 175 0.01
$150,000 Halliburton 4.5% 15/11/2041 113 0.00
$400,000 Halliburton 4.75% 1/8/2043 312 0.01
$400,000 Halliburton 4.85%15/11/2035
333 0.01
iShares Overseas Corporate Bond Index Fund (UK)
Portfolio Statement (unaudited) continued
BlackRock Collective Investment Funds 276
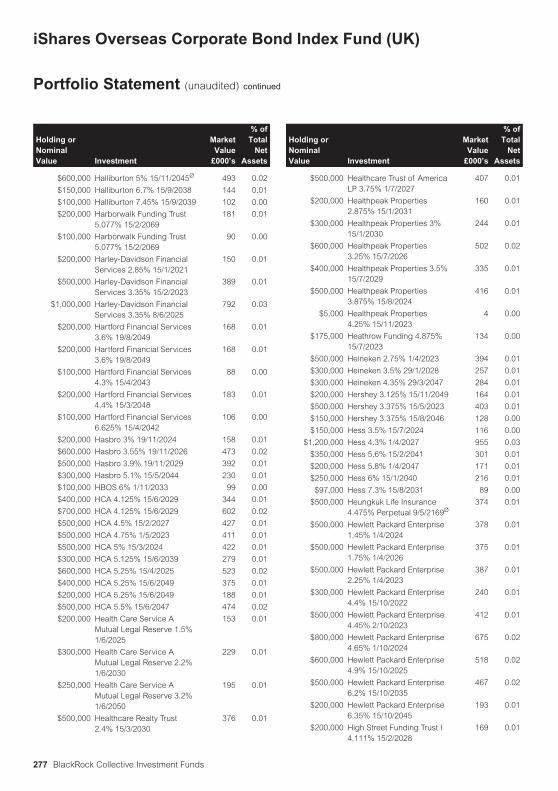
Holding orNominalValue Investment
MarketValue
£000’s
% ofTotal
NetAssets
$600,000 Halliburton 5% 15/11/2045Ø 493 0.02
$150,000 Halliburton 6.7% 15/9/2038 144 0.01
$100,000 Halliburton 7.45% 15/9/2039 102 0.00
$200,000 Harborwalk Funding Trust5.077% 15/2/2069
181 0.01
$100,000 Harborwalk Funding Trust5.077% 15/2/2069
90 0.00
$200,000 Harley-Davidson FinancialServices 2.85% 15/1/2021
150 0.01
$500,000 Harley-Davidson FinancialServices 3.35% 15/2/2023
389 0.01
$1,000,000 Harley-Davidson FinancialServices 3.35% 8/6/2025
792 0.03
$200,000 Hartford Financial Services3.6% 19/8/2049
168 0.01
$200,000 Hartford Financial Services3.6% 19/8/2049
168 0.01
$100,000 Hartford Financial Services4.3% 15/4/2043
88 0.00
$200,000 Hartford Financial Services4.4% 15/3/2048
183 0.01
$100,000 Hartford Financial Services6.625% 15/4/2042
106 0.00
$200,000 Hasbro 3% 19/11/2024 158 0.01
$600,000 Hasbro 3.55% 19/11/2026 473 0.02
$500,000 Hasbro 3.9% 19/11/2029 392 0.01
$300,000 Hasbro 5.1% 15/5/2044 230 0.01
$100,000 HBOS 6% 1/11/2033 99 0.00
$400,000 HCA 4.125% 15/6/2029 344 0.01
$700,000 HCA 4.125% 15/6/2029 602 0.02
$500,000 HCA 4.5% 15/2/2027 427 0.01
$500,000 HCA 4.75% 1/5/2023 411 0.01
$500,000 HCA 5% 15/3/2024 422 0.01
$300,000 HCA 5.125% 15/6/2039 279 0.01
$600,000 HCA 5.25% 15/4/2025 523 0.02
$400,000 HCA 5.25% 15/6/2049 375 0.01
$200,000 HCA 5.25% 15/6/2049 188 0.01
$500,000 HCA 5.5% 15/6/2047 474 0.02
$200,000 Health Care Service AMutual Legal Reserve 1.5%1/6/2025
153 0.01
$300,000 Health Care Service AMutual Legal Reserve 2.2%1/6/2030
229 0.01
$250,000 Health Care Service AMutual Legal Reserve 3.2%1/6/2050
195 0.01
$500,000 Healthcare Realty Trust2.4% 15/3/2030
376 0.01
Holding orNominalValue Investment
MarketValue
£000’s
% ofTotal
NetAssets
$500,000 Healthcare Trust of AmericaLP 3.75% 1/7/2027
407 0.01
$200,000 Healthpeak Properties2.875% 15/1/2031
160 0.01
$300,000 Healthpeak Properties 3%15/1/2030
244 0.01
$600,000 Healthpeak Properties3.25% 15/7/2026
502 0.02
$400,000 Healthpeak Properties 3.5%15/7/2029
335 0.01
$500,000 Healthpeak Properties3.875% 15/8/2024
416 0.01
$5,000 Healthpeak Properties4.25% 15/11/2023
4 0.00
$175,000 Heathrow Funding 4.875%15/7/2023
134 0.00
$500,000 Heineken 2.75% 1/4/2023 394 0.01
$300,000 Heineken 3.5% 29/1/2028 257 0.01
$300,000 Heineken 4.35% 29/3/2047 284 0.01
$200,000 Hershey 3.125% 15/11/2049 164 0.01
$500,000 Hershey 3.375% 15/5/2023 403 0.01
$150,000 Hershey 3.375% 15/8/2046 128 0.00
$150,000 Hess 3.5% 15/7/2024 116 0.00
$1,200,000 Hess 4.3% 1/4/2027 955 0.03
$350,000 Hess 5.6% 15/2/2041 301 0.01
$200,000 Hess 5.8% 1/4/2047 171 0.01
$250,000 Hess 6% 15/1/2040 216 0.01
$97,000 Hess 7.3% 15/8/2031 89 0.00
$500,000 Heungkuk Life Insurance4.475% Perpetual 9/5/2169Ø
374 0.01
$500,000 Hewlett Packard Enterprise1.45% 1/4/2024
378 0.01
$500,000 Hewlett Packard Enterprise1.75% 1/4/2026
375 0.01
$500,000 Hewlett Packard Enterprise2.25% 1/4/2023
387 0.01
$300,000 Hewlett Packard Enterprise4.4% 15/10/2022
240 0.01
$500,000 Hewlett Packard Enterprise4.45% 2/10/2023
412 0.01
$800,000 Hewlett Packard Enterprise4.65% 1/10/2024
675 0.02
$600,000 Hewlett Packard Enterprise4.9% 15/10/2025
518 0.02
$500,000 Hewlett Packard Enterprise6.2% 15/10/2035
467 0.02
$200,000 Hewlett Packard Enterprise6.35% 15/10/2045
193 0.01
$200,000 High Street Funding Trust I4.111% 15/2/2028
169 0.01
iShares Overseas Corporate Bond Index Fund (UK)
Portfolio Statement (unaudited) continued
BlackRock Collective Investment Funds277

Holding orNominalValue Investment
MarketValue
£000’s
% ofTotal
NetAssets
$500,000 Highwoods Realty LP3.875% 1/3/2027
404 0.01
$350,000 HKT Capital No 2 3.625%2/4/2025Ø
282 0.01
$500,000 HKT Capital No 5 3.25%30/9/2029Ø
397 0.01
$400,000 HollyFrontier 5.875%1/4/2026
328 0.01
$600,000 Home Depot 2.125%15/9/2026
484 0.02
$500,000 Home Depot 2.5%15/4/2027
409 0.01
$500,000 Home Depot 2.625%1/6/2022
388 0.01
$1,000,000 Home Depot 2.7%15/4/2030
830 0.03
$300,000 Home Depot 2.8%14/9/2027
249 0.01
$500,000 Home Depot 2.95%15/6/2029
421 0.01
$700,000 Home Depot 3% 1/4/2026 588 0.02
$400,000 Home Depot 3.125%15/12/2049
329 0.01
$300,000 Home Depot 3.25%1/3/2022
234 0.01
$800,000 Home Depot 3.3%15/4/2040
683 0.02
$200,000 Home Depot 3.35%15/9/2025
168 0.01
$500,000 Home Depot 3.35%15/4/2050
427 0.01
$400,000 Home Depot 3.5%15/9/2056
356 0.01
$400,000 Home Depot 3.9%6/12/2028
357 0.01
$400,000 Home Depot 3.9%15/6/2047
365 0.01
$300,000 Home Depot 4.2% 1/4/2043 282 0.01
$600,000 Home Depot 4.25%1/4/2046
575 0.02
$400,000 Home Depot 4.4%15/3/2045
385 0.01
$200,000 Home Depot 4.5%6/12/2048
200 0.01
$250,000 Home Depot 4.5%6/12/2048
250 0.01
$300,000 Home Depot 4.875%15/2/2044
304 0.01
$550,000 Home Depot 5.875%16/12/2036
615 0.02
Holding orNominalValue Investment
MarketValue
£000’s
% ofTotal
NetAssets
$200,000 Home Depot 5.95%1/4/2041
227 0.01
$500,000 Honeywell International1.35% 1/6/2025
385 0.01
$750,000 Honeywell International1.85% 1/11/2021
569 0.02
$500,000 Honeywell International1.95% 1/6/2030
393 0.01
$600,000 Honeywell International2.3% 15/8/2024
479 0.02
$300,000 Honeywell International2.7% 15/8/2029
251 0.01
$300,000 Honeywell International2.8% 1/6/2050
243 0.01
$250,000 Honeywell International3.812% 21/11/2047
238 0.01
$500,000 Hongkong Electric Finance2.875% 3/5/2026
402 0.01
$300,000 Hongkong Land FinanceCayman Islands 4.5%1/6/2022
236 0.01
$500,000 Horse Gallop Finance 1.7%28/7/2025
375 0.01
$600,000 Horse Gallop Finance3.25% 30/5/2022Ø
462 0.02
$300,000 Host Hotels & Resorts LP3.375% 15/12/2029
218 0.01
$375,000 Host Hotels & Resorts LP4% 15/6/2025
293 0.01
$500,000 Howmet Aerospace 5.125%1/10/2024
401 0.01
$250,000 Howmet Aerospace 5.95%1/2/2037
211 0.01
$500,000 Howmet Aerospace 6.875%1/5/2025
424 0.01
$300,000 HP 2.2% 17/6/2025 236 0.01
$300,000 HP 3% 17/6/2027 243 0.01
$300,000 HP 3.4% 17/6/2030 242 0.01
$250,000 HP 4.05% 15/9/2022 199 0.01
$400,000 HP 6% 15/9/2041 367 0.01
$405,000 HPHT Finance 17 2.75%11/9/2022
309 0.01
$1,600,000 HSBC 1.645% 18/4/2026 1,205 0.04
$500,000 HSBC 2.357% 18/8/2031 378 0.01
$900,000 HSBC 2.633% 7/11/2025 705 0.02
$600,000 HSBC 3.033% 22/11/2023 470 0.02
$500,000 HSBC 3.262% 13/3/2023 388 0.01
$500,000 HSBC 3.262% 13/3/2023 388 0.01
$1,000,000 HSBC 3.6% 25/5/2023 803 0.03
$700,000 HSBC 3.803% 11/3/2025 567 0.02
iShares Overseas Corporate Bond Index Fund (UK)
Portfolio Statement (unaudited) continued
BlackRock Collective Investment Funds 278

Holding orNominalValue Investment
MarketValue
£000’s
% ofTotal
NetAssets
$500,000 HSBC 3.9% 25/5/2026 422 0.01
$500,000 HSBC 3.95% 18/5/2024 403 0.01
$800,000 HSBC 3.973% 22/5/2030 678 0.02
$500,000 HSBC 3.973% 22/5/2030Ø 424 0.01
$300,000 HSBC 4% 30/3/2022 236 0.01
$700,000 HSBC 4.041% 13/3/2028 588 0.02
$500,000 HSBC 4.25% 14/3/2024 409 0.01
$700,000 HSBC 4.25% 18/8/2025 580 0.02
$700,000 HSBC 4.292% 12/9/2026 589 0.02
$850,000 HSBC 4.3% 8/3/2026 729 0.03
$1,000,000 HSBC 4.375% 23/11/2026 845 0.03
$800,000 HSBC 4.583% 19/6/2029 698 0.02
$1,200,000 HSBC 4.95% 31/3/2030 1,104 0.04
$200,000 HSBC 5.25% 14/3/2044 195 0.01
$300,000 HSBC 6.1% 14/1/2042 330 0.01
$1,550,000 HSBC 6.5% 2/5/2036 1,597 0.06
$1,200,000 HSBC 6.5% 15/9/2037 1,256 0.04
$250,000 HSBC Bank USA NA 7%15/1/2039
285 0.01
$150,000 HSBC Capital FundingDollar 1 LP 10.176%Perpetual 31/12/2168
179 0.01
$500,000 HSBC USA 3.5% 23/6/2024 411 0.01
$600,000 Hubbell 3.5% 15/2/2028 482 0.02
$300,000 Hudson Pacific PropertiesLP 4.65% 1/4/2029
253 0.01
$600,000 Humana 3.125% 15/8/2029 495 0.02
$300,000 Humana 3.15% 1/12/2022 236 0.01
$1,000,000 Humana 3.85% 1/10/2024 826 0.03
$200,000 Humana 3.95% 15/8/2049 181 0.01
$350,000 Humana 4.625% 1/12/2042 333 0.01
$400,000 Huntington BancsharesInc/OH 2.3% 14/1/2022
306 0.01
$500,000 Huntington BancsharesInc/OH 2.625% 6/8/2024
400 0.01
$400,000 Huntington IngallsIndustries 3.483%1/12/2027
326 0.01
$500,000 Huntington NationalBank/The 3.125% 1/4/2022
388 0.01
$500,000 Huntington NationalBank/The 3.55% 6/10/2023
408 0.01
$400,000 Huntsman International4.5% 1/5/2029
331 0.01
$350,000 Husky Energy 3.95%15/4/2022
270 0.01
$300,000 Husky Energy 4.4%15/4/2029
239 0.01
$500,000 Husky Energy 4.4%15/4/2029
398 0.01
Holding orNominalValue Investment
MarketValue
£000’s
% ofTotal
NetAssets
$100,000 Hutchison WhampoaInternational 03/33 7.45%24/11/2033
119 0.00
$600,000 Hutchison WhampoaInternational 11 4.625%13/1/2022Ø
469 0.02
$200,000 Hutchison WhampoaInternational 12 II 3.25%8/11/2022Ø
156 0.01
$500,000 Hutchison WhampoaInternational 14 3.625%31/10/2024Ø
407 0.01
$400,000 Hyatt Hotels 4.375%15/9/2028
307 0.01
$200,000 Hyatt Hotels 5.375%23/4/2025
163 0.01
$400,000 Hysan MTN 2.82% 4/9/2029 306 0.01
$500,000 Hyundai Capital America2.65% 10/2/2025
388 0.01
$300,000 Hyundai Capital America2.85% 1/11/2022
232 0.01
$300,000 Hyundai Capital America3% 20/6/2022
231 0.01
$500,000 Hyundai Capital America3% 10/2/2027
391 0.01
$300,000 Hyundai Capital America3.5% 2/11/2026
242 0.01
$500,000 Hyundai Capital America5.75% 6/4/2023
416 0.01
$250,000 Hyundai Capital America6.375% 8/4/2030
241 0.01
$750,000 Hyundai Capital Services3% 29/8/2022Ø
580 0.02
$800,000 IBM Credit 3% 6/2/2023 637 0.02
$500,000 IBM Credit 3.6% 30/11/2021 389 0.01
$500,000 ICICI Bank Ltd/Dubai 3.8%14/12/2027
382 0.01
$275,000 ICL 6.375% 31/5/2038Ø 256 0.01
$300,000 IFC Development CorporateTreasury 3.625% 17/4/2029
246 0.01
$400,000 IHS Markit 3.625% 1/5/2024 323 0.01
$400,000 IHS Markit 3.625% 1/5/2024 323 0.01
$400,000 IHS Markit 4.75% 1/8/2028 358 0.01
$400,000 IHS Markit 5% 1/11/2022 321 0.01
$500,000 Illinois Tool Works 2.65%15/11/2026
415 0.01
$150,000 Illinois Tool Works 3.375%15/9/2021
115 0.00
$200,000 Illinois Tool Works 3.5%1/3/2024
164 0.01
iShares Overseas Corporate Bond Index Fund (UK)
Portfolio Statement (unaudited) continued
BlackRock Collective Investment Funds279

Holding orNominalValue Investment
MarketValue
£000’s
% ofTotal
NetAssets
$350,000 Illinois Tool Works 3.9%1/9/2042
328 0.01
$700,000 Imperial Brands Finance3.125% 26/7/2024
552 0.02
$300,000 Imperial Brands Finance3.75% 21/7/2022
234 0.01
$800,000 Imperial Brands Finance4.25% 21/7/2025
664 0.02
$100,000 Indiana Michigan Power6.05% 15/3/2037
105 0.00
$400,000 Industrial Bank Ltd/HongKong 3.5% 5/3/2021
302 0.01
$300,000 Industrias Penoles 5.65%12/9/2049
264 0.01
$250,000 Infraestructura EnergeticaNova 4.875% 14/1/2048
187 0.01
$500,000 ING Groep 3.15% 29/3/2022 388 0.01
$400,000 ING Groep 3.55% 9/4/2024 328 0.01
$500,000 ING Groep 3.95% 29/3/2027 432 0.02
$300,000 ING Groep 4.05% 9/4/2029 266 0.01
$500,000 ING Groep 4.1% 2/10/2023 412 0.01
$400,000 ING Groep 4.55% 2/10/2028 364 0.01
$400,000 ING Groep 4.625% 6/1/2026 354 0.01
$500,000 ING Groep 4.7%22/3/2028Ø
397 0.01
$200,000 Ingredion 2.9% 1/6/2030 162 0.01
$150,000 Ingredion 3.9% 1/6/2050 129 0.00
$500,000 Intel 2.35% 11/5/2022 386 0.01
$500,000 Intel 2.45% 15/11/2029 406 0.01
$500,000 Intel 2.6% 19/5/2026 411 0.01
$750,000 Intel 2.7% 15/12/2022 592 0.02
$400,000 Intel 2.875% 11/5/2024 323 0.01
$450,000 Intel 3.1% 15/2/2060 360 0.01
$300,000 Intel 3.15% 11/5/2027 252 0.01
$300,000 Intel 3.3% 1/10/2021 231 0.01
$500,000 Intel 3.4% 25/3/2025 419 0.01
$600,000 Intel 3.7% 29/7/2025 511 0.02
$1,006,000 Intel 3.734% 8/12/2047 896 0.03
$500,000 Intel 3.75% 25/3/2027 437 0.02
$500,000 Intel 3.9% 25/3/2030 454 0.02
$300,000 Intel 4.1% 19/5/2046 279 0.01
$300,000 Intel 4.1% 11/5/2047 283 0.01
$500,000 Intel 4.6% 25/3/2040 497 0.02
$1,300,000 Intel 4.75% 25/3/2050 1,345 0.05
$400,000 Intel 4.8% 1/10/2041 402 0.01
$400,000 Intel 4.9% 29/7/2045 410 0.01
$1,000,000 Intercontinental Exchange0.7% 15/6/2023
752 0.03
Holding orNominalValue Investment
MarketValue
£000’s
% ofTotal
NetAssets
$500,000 Intercontinental Exchange1.85% 15/9/2032
378 0.01
$500,000 Intercontinental Exchange2.1% 15/6/2030
387 0.01
$300,000 Intercontinental Exchange2.65% 15/9/2040
227 0.01
$300,000 Intercontinental Exchange3% 15/6/2050
234 0.01
$600,000 Intercontinental Exchange3% 15/9/2060
463 0.02
$600,000 Intercontinental Exchange3.1% 15/9/2027
498 0.02
$100,000 Intercontinental Exchange3.75% 21/9/2028
86 0.00
$700,000 Intercontinental Exchange4% 15/10/2023
583 0.02
$400,000 Intercontinental Exchange4.25% 21/9/2048
374 0.01
$1,000,000 International BusinessMachines 1.7% 15/5/2027
774 0.03
$350,000 International BusinessMachines 1.875% 1/8/2022
269 0.01
$500,000 International BusinessMachines 1.95% 15/5/2030
386 0.01
$800,000 International BusinessMachines 2.85% 13/5/2022
623 0.02
$300,000 International BusinessMachines 2.85% 15/5/2040
238 0.01
$500,000 International BusinessMachines 2.875% 9/11/2022
394 0.01
$350,000 International BusinessMachines 2.95% 15/5/2050
270 0.01
$800,000 International BusinessMachines 3% 15/5/2024
650 0.02
$1,000,000 International BusinessMachines 3.3% 15/5/2026
848 0.03
$300,000 International BusinessMachines 3.3% 27/1/2027
254 0.01
$500,000 International BusinessMachines 3.45% 19/2/2026
425 0.01
$200,000 International BusinessMachines 3.5% 15/5/2029
173 0.01
$1,000,000 International BusinessMachines 3.5% 15/5/2029
867 0.03
$1,000,000 International BusinessMachines 3.625% 12/2/2024
824 0.03
$750,000 International BusinessMachines 4.15% 15/5/2039
689 0.02
$850,000 International BusinessMachines 4.25% 15/5/2049
807 0.03
iShares Overseas Corporate Bond Index Fund (UK)
Portfolio Statement (unaudited) continued
BlackRock Collective Investment Funds 280

Holding orNominalValue Investment
MarketValue
£000’s
% ofTotal
NetAssets
$200,000 International BusinessMachines 4.25% 15/5/2049
190 0.01
$400,000 International BusinessMachines 4.7% 19/2/2046
399 0.01
$211,000 International BusinessMachines 5.6% 30/11/2039
226 0.01
$200,000 International Flavors &Fragrances 4.375%1/6/2047
170 0.01
$200,000 International Flavors &Fragrances 5% 26/9/2048
186 0.01
$500,000 International Lease Finance5.875% 15/8/2022
404 0.01
$400,000 International Paper 3%15/2/2027
329 0.01
$300,000 International Paper 3.65%15/6/2024
248 0.01
$300,000 International Paper 3.8%15/1/2026
256 0.01
$300,000 International Paper 4.35%15/8/2048
269 0.01
$400,000 International Paper 4.4%15/8/2047
361 0.01
$150,000 International Paper 4.8%15/6/2044
137 0.00
$300,000 International Paper 5%15/9/2035
289 0.01
$200,000 International Paper 5.15%15/5/2046
191 0.01
$500,000 International Paper 6%15/11/2041
504 0.02
$150,000 International Paper 7.3%15/11/2039
161 0.01
$300,000 Interpublic of Cos 3.75%15/2/2023
239 0.01
$800,000 Interpublic of Cos 4.75%30/3/2030
719 0.02
$300,000 Interpublic of Cos 5.4%1/10/2048
266 0.01
$600,000 Interstate Power and Light3.25% 1/12/2024
494 0.02
$100,000 Interstate Power and Light3.5% 30/9/2049
84 0.00
$250,000 Interstate Power and Light4.1% 26/9/2028
222 0.01
$600,000 Intesa Sanpaolo 3.125%14/7/2022
460 0.02
$300,000 Intesa Sanpaolo 3.25%23/9/2024
237 0.01
$500,000 Intesa Sanpaolo 3.875%12/1/2028
395 0.01
Holding orNominalValue Investment
MarketValue
£000’s
% ofTotal
NetAssets
$200,000 Intesa Sanpaolo 4.7%23/9/2049
172 0.01
$250,000 Intesa Sanpaolo 6.5%24/2/2021
191 0.01
$500,000 Intuit 0.95% 15/7/2025 378 0.01
$300,000 Inversiones CMPC 4.375%4/4/2027Ø
250 0.01
$200,000 Inversiones CMPC 4.75%15/9/2024
164 0.01
$400,000 Inversiones CMPCSA/Cayman Islands Branch4.375% 15/5/2023
317 0.01
$600,000 Invesco Finance 4%30/1/2024
491 0.02
$200,000 Invesco Finance 5.375%30/11/2043
183 0.01
$600,000 IPALCO Enterprises 4.25%1/5/2030
501 0.02
$500,000 ITC 2.95% 14/5/2030 406 0.01
$500,000 ITC 3.65% 15/6/2024 410 0.01
$500,000 J M Smucker 2.375%15/3/2030
389 0.01
$500,000 J M Smucker 3.5%15/3/2025Ø
419 0.01
$250,000 J M Smucker 4.25%15/3/2035
224 0.01
$200,000 J M Smucker 4.375%15/3/2045
180 0.01
$500,000 Jabil 3.95% 12/1/2028 411 0.01
$250,000 Jackson National Life GlobalFunding 3.05% 29/4/2026
205 0.01
$1,000,000 Jackson National Life GlobalFunding 3.25% 30/1/2024
805 0.03
$400,000 JB Hunt Transport Services3.875% 1/3/2026
345 0.01
$200,000 JD.com 3.875% 29/4/2026 167 0.01
$200,000 JD.com 4.125% 14/1/2050 171 0.01
$100,000 Jefferies 5.125% 20/1/2023 82 0.00
$250,000 Jefferies 6.25% 15/1/2036 226 0.01
$150,000 Jefferies 6.5% 20/1/2043 142 0.01
$250,000 Jefferies 6.875% 15/4/2021 194 0.01
$300,000 Jefferies / Jefferies CapitalFinance 4.15% 23/1/2030
253 0.01
$300,000 Jefferies Financial 5.5%18/10/2023
247 0.01
$300,000 Jersey Central Power &Light 4.7% 1/4/2024
251 0.01
$493,904 JetBlue 2019-1 Class AAPass Through Trust 2.75%15/11/2033
354 0.01
iShares Overseas Corporate Bond Index Fund (UK)
Portfolio Statement (unaudited) continued
BlackRock Collective Investment Funds281

Holding orNominalValue Investment
MarketValue
£000’s
% ofTotal
NetAssets
$700,000 John Deere Capital 2.65%24/6/2024
563 0.02
$300,000 John Deere Capital 2.65%10/6/2026
248 0.01
$400,000 John Deere Capital 2.75%15/3/2022
310 0.01
$200,000 John Deere Capital 2.8%27/1/2023
158 0.01
$500,000 John Deere Capital 2.8%6/3/2023
397 0.01
$500,000 John Deere Capital 2.8%18/7/2029
419 0.01
$300,000 John Deere Capital 3.05%6/1/2028
252 0.01
$500,000 John Deere Capital 3.2%10/1/2022
388 0.01
$600,000 John Deere Capital 3.4%11/9/2025
506 0.02
$900,000 John Deere Capital 3.45%10/1/2024
736 0.03
$300,000 John Deere Capital 3.9%12/7/2021
231 0.01
$1,000,000 Johnson & Johnson 0.95%1/9/2027
754 0.03
$500,000 Johnson & Johnson 2.1%1/9/2040
374 0.01
$500,000 Johnson & Johnson 2.25%3/3/2022
384 0.01
$300,000 Johnson & Johnson 2.45%5/12/2021
230 0.01
$500,000 Johnson & Johnson 2.45%1/3/2026
410 0.01
$900,000 Johnson & Johnson 2.45%1/9/2060
661 0.02
$400,000 Johnson & Johnson 2.625%15/1/2025
325 0.01
$500,000 Johnson & Johnson 2.9%15/1/2028
423 0.01
$575,000 Johnson & Johnson 2.95%3/3/2027
482 0.02
$400,000 Johnson & Johnson 3.375%5/12/2023
330 0.01
$500,000 Johnson & Johnson 3.4%15/1/2038
443 0.02
$200,000 Johnson & Johnson 3.5%15/1/2048
182 0.01
$500,000 Johnson & Johnson 3.55%1/3/2036
449 0.02
$800,000 Johnson & Johnson 3.7%1/3/2046
743 0.03
Holding orNominalValue Investment
MarketValue
£000’s
% ofTotal
NetAssets
$450,000 Johnson & Johnson 3.75%3/3/2047
419 0.01
$250,000 Johnson & Johnson 4.375%5/12/2033
246 0.01
$300,000 Johnson & Johnson 4.5%1/9/2040
300 0.01
$100,000 Johnson & Johnson 4.85%15/5/2041
106 0.00
$250,000 Johnson & Johnson 4.95%15/5/2033
259 0.01
$100,000 Johnson & Johnson 5.85%15/7/2038
115 0.00
$300,000 Johnson & Johnson 5.95%15/8/2037
348 0.01
$300,000 Johnson & Son 4%15/5/2043
267 0.01
$300,000 Johnson & Son 4.75%15/10/2046
301 0.01
$373,000 Johnson ControlsInternational 3.9%14/2/2026
314 0.01
$200,000 Johnson ControlsInternational 4.625%2/7/2044
182 0.01
$200,000 Johnson ControlsInternational 4.95%2/7/2064
187 0.01
$105,000 Johnson ControlsInternational 5.125%14/9/2045
103 0.00
$1,500,000 JPMorgan Chase & 1.514%1/6/2024
1,146 0.04
$2,000,000 JPMorgan Chase & 2.005%13/3/2026
1,559 0.05
$1,000,000 JPMorgan Chase & 2.083%22/4/2026
784 0.03
$1,000,000 JPMorgan Chase & 2.182%1/6/2028
782 0.03
$700,000 JPMorgan Chase & 2.301%15/10/2025
552 0.02
$1,000,000 JPMorgan Chase & 2.522%22/4/2031
801 0.03
$500,000 JPMorgan Chase & 2.7%18/5/2023
395 0.01
$1,100,000 JPMorgan Chase & 2.739%15/10/2030
892 0.03
$800,000 JPMorgan Chase & 2.95%1/10/2026
662 0.02
$1,000,000 JPMorgan Chase & 2.956%13/5/2031
803 0.03
iShares Overseas Corporate Bond Index Fund (UK)
Portfolio Statement (unaudited) continued
BlackRock Collective Investment Funds 282
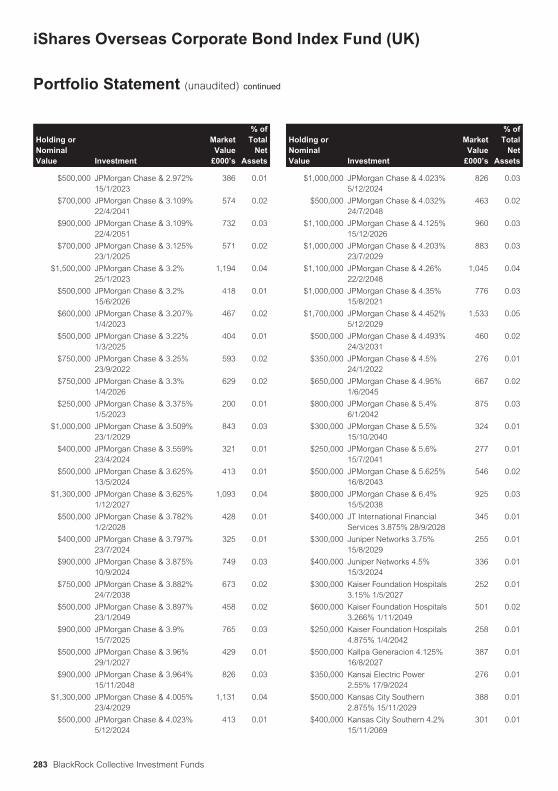
Holding orNominalValue Investment
MarketValue
£000’s
% ofTotal
NetAssets
$500,000 JPMorgan Chase & 2.972%15/1/2023
386 0.01
$700,000 JPMorgan Chase & 3.109%22/4/2041
574 0.02
$900,000 JPMorgan Chase & 3.109%22/4/2051
732 0.03
$700,000 JPMorgan Chase & 3.125%23/1/2025
571 0.02
$1,500,000 JPMorgan Chase & 3.2%25/1/2023
1,194 0.04
$500,000 JPMorgan Chase & 3.2%15/6/2026
418 0.01
$600,000 JPMorgan Chase & 3.207%1/4/2023
467 0.02
$500,000 JPMorgan Chase & 3.22%1/3/2025
404 0.01
$750,000 JPMorgan Chase & 3.25%23/9/2022
593 0.02
$750,000 JPMorgan Chase & 3.3%1/4/2026
629 0.02
$250,000 JPMorgan Chase & 3.375%1/5/2023
200 0.01
$1,000,000 JPMorgan Chase & 3.509%23/1/2029
843 0.03
$400,000 JPMorgan Chase & 3.559%23/4/2024
321 0.01
$500,000 JPMorgan Chase & 3.625%13/5/2024
413 0.01
$1,300,000 JPMorgan Chase & 3.625%1/12/2027
1,093 0.04
$500,000 JPMorgan Chase & 3.782%1/2/2028
428 0.01
$400,000 JPMorgan Chase & 3.797%23/7/2024
325 0.01
$900,000 JPMorgan Chase & 3.875%10/9/2024
749 0.03
$750,000 JPMorgan Chase & 3.882%24/7/2038
673 0.02
$500,000 JPMorgan Chase & 3.897%23/1/2049
458 0.02
$900,000 JPMorgan Chase & 3.9%15/7/2025
765 0.03
$500,000 JPMorgan Chase & 3.96%29/1/2027
429 0.01
$900,000 JPMorgan Chase & 3.964%15/11/2048
826 0.03
$1,300,000 JPMorgan Chase & 4.005%23/4/2029
1,131 0.04
$500,000 JPMorgan Chase & 4.023%5/12/2024
413 0.01
Holding orNominalValue Investment
MarketValue
£000’s
% ofTotal
NetAssets
$1,000,000 JPMorgan Chase & 4.023%5/12/2024
826 0.03
$500,000 JPMorgan Chase & 4.032%24/7/2048
463 0.02
$1,100,000 JPMorgan Chase & 4.125%15/12/2026
960 0.03
$1,000,000 JPMorgan Chase & 4.203%23/7/2029
883 0.03
$1,100,000 JPMorgan Chase & 4.26%22/2/2048
1,045 0.04
$1,000,000 JPMorgan Chase & 4.35%15/8/2021
776 0.03
$1,700,000 JPMorgan Chase & 4.452%5/12/2029
1,533 0.05
$500,000 JPMorgan Chase & 4.493%24/3/2031
460 0.02
$350,000 JPMorgan Chase & 4.5%24/1/2022
276 0.01
$650,000 JPMorgan Chase & 4.95%1/6/2045
667 0.02
$800,000 JPMorgan Chase & 5.4%6/1/2042
875 0.03
$300,000 JPMorgan Chase & 5.5%15/10/2040
324 0.01
$250,000 JPMorgan Chase & 5.6%15/7/2041
277 0.01
$500,000 JPMorgan Chase & 5.625%16/8/2043
546 0.02
$800,000 JPMorgan Chase & 6.4%15/5/2038
925 0.03
$400,000 JT International FinancialServices 3.875% 28/9/2028
345 0.01
$300,000 Juniper Networks 3.75%15/8/2029
255 0.01
$400,000 Juniper Networks 4.5%15/3/2024
336 0.01
$300,000 Kaiser Foundation Hospitals3.15% 1/5/2027
252 0.01
$600,000 Kaiser Foundation Hospitals3.266% 1/11/2049
501 0.02
$250,000 Kaiser Foundation Hospitals4.875% 1/4/2042
258 0.01
$500,000 Kallpa Generacion 4.125%16/8/2027
387 0.01
$350,000 Kansai Electric Power2.55% 17/9/2024
276 0.01
$500,000 Kansas City Southern2.875% 15/11/2029
388 0.01
$400,000 Kansas City Southern 4.2%15/11/2069
301 0.01
iShares Overseas Corporate Bond Index Fund (UK)
Portfolio Statement (unaudited) continued
BlackRock Collective Investment Funds283

Holding orNominalValue Investment
MarketValue
£000’s
% ofTotal
NetAssets
$250,000 Kansas City Southern4.95% 15/8/2045
200 0.01
$200,000 KEB Hana Bank 2.5%27/1/2021
150 0.01
$500,000 KEB Hana Bank 4.375%30/9/2024
412 0.01
$500,000 Kellogg 2.1% 1/6/2030 383 0.01
$300,000 Kellogg 2.65% 1/12/2023 238 0.01
$600,000 Kellogg 3.25% 1/4/2026 504 0.02
$200,000 Kellogg 3.4% 15/11/2027 168 0.01
$25,000 Kellogg 4% 15/12/2020 19 0.00
$300,000 Kellogg 4.5% 1/4/2046 284 0.01
$100,000 Kentucky Utilities 4.375%1/10/2045
94 0.00
$250,000 Kerry Financial ServicesUnltd 3.2% 9/4/2023
196 0.01
$500,000 Keurig Dr Pepper 3.2%1/5/2030
419 0.01
$250,000 Keurig Dr Pepper 3.4%15/11/2025
209 0.01
$250,000 Keurig Dr Pepper 3.8%1/5/2050
217 0.01
$700,000 Keurig Dr Pepper 4.057%25/5/2023
571 0.02
$400,000 Keurig Dr Pepper 4.417%25/5/2025
346 0.01
$300,000 Keurig Dr Pepper 4.42%15/12/2046
281 0.01
$700,000 Keurig Dr Pepper 4.597%25/5/2028
632 0.02
$225,000 Keurig Dr Pepper 4.985%25/5/2038
220 0.01
$200,000 Keurig Dr Pepper 5.085%25/5/2048
204 0.01
$1,000,000 KeyBank NA/Cleveland OH1.25% 10/3/2023
762 0.03
$300,000 KeyBank NA/Cleveland OH2.4% 9/6/2022
232 0.01
$300,000 KeyBank NA/Cleveland OH3.18% 15/10/2027
234 0.01
$300,000 KeyBank NA/Cleveland OH3.3% 1/6/2025
251 0.01
$250,000 KeyBank NA/Cleveland OH3.9% 13/4/2029
214 0.01
$200,000 KeyCorp 2.55% 1/10/2029 160 0.01
$250,000 KeyCorp 2.9% 15/9/2020 187 0.01
$300,000 KeyCorp 4.1% 30/4/2028 263 0.01
$200,000 KeyCorp 4.15% 29/10/2025 173 0.01
$400,000 Keysight Technologies 3%30/10/2029
329 0.01
Holding orNominalValue Investment
MarketValue
£000’s
% ofTotal
NetAssets
$300,000 KeySpan Gas East 5.819%1/4/2041
311 0.01
$306,000 Kia Motors 3.25% 21/4/2026 247 0.01
$200,000 Kilroy Realty LP 3.05%15/2/2030
155 0.01
$200,000 Kilroy Realty LP 4.25%15/8/2029
168 0.01
$200,000 Kilroy Realty LP 4.375%1/10/2025
165 0.01
$350,000 Kimberly-Clark 2.4%1/3/2022
269 0.01
$600,000 Kimberly-Clark 2.4%1/6/2023
472 0.02
$200,000 Kimberly-Clark 2.875%7/2/2050
163 0.01
$500,000 Kimberly-Clark 3.1%26/3/2030
426 0.01
$200,000 Kimberly-Clark 3.2%30/7/2046
173 0.01
$200,000 Kimberly-Clark 3.9%4/5/2047
190 0.01
$300,000 Kimberly-Clark 3.95%1/11/2028
270 0.01
$150,000 Kimberly-Clark 6.625%1/8/2037
180 0.01
$800,000 Kimco Realty 2.7% 1/3/2024 621 0.02
$500,000 Kimco Realty 2.8%1/10/2026
392 0.01
$150,000 Kimco Realty 4.25%1/4/2045
119 0.00
$300,000 Kimco Realty 4.45%1/9/2047
244 0.01
$300,000 Kinder Morgan 2%15/2/2031
220 0.01
$200,000 Kinder Morgan 3.25%1/8/2050
140 0.00
$500,000 Kinder Morgan 4.3%1/6/2025
424 0.01
$400,000 Kinder Morgan 4.3%1/3/2028
346 0.01
$400,000 Kinder Morgan 5.05%15/2/2046
354 0.01
$300,000 Kinder Morgan 5.2%1/3/2048
275 0.01
$300,000 Kinder Morgan 5.3%1/12/2034
269 0.01
$850,000 Kinder Morgan 5.55%1/6/2045
786 0.03
$400,000 Kinder Morgan 7.75%15/1/2032
429 0.01
iShares Overseas Corporate Bond Index Fund (UK)
Portfolio Statement (unaudited) continued
BlackRock Collective Investment Funds 284

Holding orNominalValue Investment
MarketValue
£000’s
% ofTotal
NetAssets
$1,000,000 Kinder Morgan EnergyPartners LP 3.45%15/2/2023
785 0.03
$350,000 Kinder Morgan EnergyPartners LP 3.5% 1/9/2023
280 0.01
$500,000 Kinder Morgan EnergyPartners LP 3.95% 1/9/2022
395 0.01
$500,000 Kinder Morgan EnergyPartners LP 4.3% 1/5/2024
414 0.01
$400,000 Kinder Morgan EnergyPartners LP 4.7% 1/11/2042
326 0.01
$100,000 Kinder Morgan EnergyPartners LP 5% 1/10/2021
77 0.00
$250,000 Kinder Morgan EnergyPartners LP 5% 1/3/2043
212 0.01
$100,000 Kinder Morgan EnergyPartners LP 5.4% 1/9/2044
89 0.00
$200,000 Kinder Morgan EnergyPartners LP 5.5% 1/3/2044
179 0.01
$250,000 Kinder Morgan EnergyPartners LP 6.375%1/3/2041
235 0.01
$300,000 Kinder Morgan EnergyPartners LP 6.55%15/9/2040
279 0.01
$250,000 Kinder Morgan EnergyPartners LP 6.95%15/1/2038
248 0.01
$150,000 Kinder Morgan EnergyPartners LP 7.4% 15/3/2031
149 0.01
$150,000 Kinder Morgan EnergyPartners LP 7.5%15/11/2040
152 0.01
$500,000 Kinross Gold 5.95%15/3/2024
428 0.01
$200,000 Kirby 4.2% 1/3/2028 157 0.01
$200,000 KKR Finance II 5.5%1/2/2043
191 0.01
$200,000 KKR Finance III 5.125%1/6/2044
185 0.01
$500,000 KKR Finance VI 3.75%1/7/2029
428 0.01
$200,000 KKR Finance VII 3.625%25/2/2050
153 0.01
$500,000 KKR Finance VIII 3.5%25/8/2050
381 0.01
$200,000 KLA 3.3% 1/3/2050 159 0.01
$500,000 KLA 4.1% 15/3/2029 449 0.02
$500,000 KLA 4.65% 1/11/2024 429 0.01
$200,000 KLA 5% 15/3/2049 199 0.01
$200,000 Kohl’s 4.25% 17/7/2025 147 0.01
Holding orNominalValue Investment
MarketValue
£000’s
% ofTotal
NetAssets
$200,000 Kohl’s 5.55% 17/7/2045 136 0.00
$200,000 Kohl’s 9.5% 15/5/2025 180 0.01
$102,000 Koninklijke Ahold Delhaize5.7% 1/10/2040
107 0.00
$200,000 Koninklijke Philips 5%15/3/2042
196 0.01
$100,000 Koninklijke Philips 6.875%11/3/2038
114 0.00
$1,000,000 Kookmin Bank 2.875%25/3/2023Ø
787 0.03
$150,000 Kroger 2.2% 1/5/2030 117 0.00
$250,000 Kroger 3.5% 1/2/2026 210 0.01
$800,000 Kroger 3.7% 1/8/2027 692 0.02
$200,000 Kroger 3.875% 15/10/2046 171 0.01
$200,000 Kroger 3.95% 15/1/2050 174 0.01
$400,000 Kroger 4% 1/2/2024 329 0.01
$300,000 Kroger 4.45% 1/2/2047 276 0.01
$300,000 Kroger 4.5% 15/1/2029 275 0.01
$300,000 Kroger 5% 15/4/2042 283 0.01
$300,000 Kroger 5.4% 15/1/2049 308 0.01
$200,000 Kroger 5.4% 15/1/2049 205 0.01
$400,000 KT 2.625% 7/8/2022 309 0.01
$350,000 L3Harris Technologies3.832% 27/4/2025
294 0.01
$257,000 L3Harris Technologies3.95% 28/5/2024
210 0.01
$700,000 L3Harris Technologies 4.4%15/6/2028
624 0.02
$300,000 L3Harris Technologies5.054% 27/4/2045
300 0.01
$400,000 La Mondiale SAM 4.8%18/1/2048Ø
312 0.01
$300,000 La Mondiale SAM 5.875%26/1/2047
253 0.01
$750,000 Laboratory of America3.25% 1/9/2024
614 0.02
$250,000 Laboratory of America 3.6%1/2/2025
208 0.01
$500,000 Laboratory of America 3.6%1/9/2027
426 0.01
$300,000 Laboratory of America 4.7%1/2/2045
287 0.01
$200,000 LafargeHolcim Finance US4.75% 22/9/2046
169 0.01
$225,000 Lam Research 2.8%15/6/2021
171 0.01
$400,000 Lam Research 2.875%15/6/2050
316 0.01
$400,000 Lam Research 3.75%15/3/2026
344 0.01
iShares Overseas Corporate Bond Index Fund (UK)
Portfolio Statement (unaudited) continued
BlackRock Collective Investment Funds285

Holding orNominalValue Investment
MarketValue
£000’s
% ofTotal
NetAssets
$400,000 Lam Research 4%15/3/2029
358 0.01
$200,000 Lam Research 4%15/3/2029
179 0.01
$200,000 Lam Research 4.875%15/3/2049
214 0.01
$500,000 Las Vegas Sands 2.9%25/6/2025
371 0.01
$500,000 Las Vegas Sands 3.2%8/8/2024
378 0.01
$500,000 Las Vegas Sands 3.5%18/8/2026
381 0.01
$500,000 Lazard 3.625% 1/3/2027 402 0.01
$300,000 Leading Affluence 4.5%24/1/2023
233 0.01
$200,000 Lear 3.5% 30/5/2030 153 0.01
$200,000 Lear 4.25% 15/5/2029 160 0.01
$200,000 Lear 5.25% 15/5/2049 161 0.01
$500,000 LeasePlan 2.875%24/10/2024
390 0.01
$700,000 Legal & General 5.25%21/3/2047
575 0.02
$200,000 Legg Mason 5.625%15/1/2044
203 0.01
$400,000 Leggett & Platt 4.4%15/3/2029
329 0.01
$200,000 Legrand France 8.5%15/2/2025
198 0.01
$700,000 Leidos 4.375% 15/5/2030 612 0.02
$100,000 Leland Stanford JuniorUniversity/The 1.289%1/6/2027
76 0.00
$300,000 Leland Stanford JuniorUniversity/The 2.413%1/6/2050
233 0.01
$111,000 Leland Stanford JuniorUniversity/The 3.647%1/5/2048
106 0.00
$300,000 Level 3 Financing 3.875%15/11/2029
243 0.01
$400,000 LG Chem 3.25%15/10/2024Ø
322 0.01
$500,000 Liberty Mutual 3.95%15/5/2060
408 0.01
$450,000 Liberty Mutual 3.951%15/10/2050
377 0.01
$500,000 Liberty Mutual 4.25%15/6/2023
410 0.01
$200,000 Liberty Mutual 4.569%1/2/2029
181 0.01
Holding orNominalValue Investment
MarketValue
£000’s
% ofTotal
NetAssets
$300,000 LifeStorage LP/CA 3.5%1/7/2026
245 0.01
$266,106 Lima Metro Line 2 Finance5.875% 5/7/2034
247 0.01
$150,000 Lincoln National 3.35%9/3/2025
123 0.00
$500,000 Lincoln National 3.4%15/1/2031
417 0.01
$700,000 Lincoln National 3.8%1/3/2028
593 0.02
$250,000 Lincoln National 4.2%15/3/2022
197 0.01
$200,000 Lincoln National 4.35%1/3/2048
175 0.01
$100,000 Lincoln National 6.3%9/10/2037
97 0.00
$100,000 Lincoln National 7%15/6/2040
108 0.00
$400,000 Link Finance Cayman2009 3.6% 3/9/2024
321 0.01
$500,000 Lloyds Banking 2.858%17/3/2023
386 0.01
$1,000,000 Lloyds Banking 2.907%7/11/2023
781 0.03
$300,000 Lloyds Banking 3%11/1/2022
232 0.01
$500,000 Lloyds Banking 3.574%7/11/2028
416 0.01
$1,000,000 Lloyds Banking 3.75%11/1/2027
841 0.03
$1,000,000 Lloyds Banking 3.87%9/7/2025
821 0.03
$250,000 Lloyds Banking 3.9%12/3/2024
205 0.01
$1,000,000 Lloyds Banking 4.05%16/8/2023
818 0.03
$500,000 Lloyds Banking 4.344%9/1/2048
467 0.02
$500,000 Lloyds Banking 4.375%22/3/2028
442 0.02
$300,000 Lloyds Banking 4.5%4/11/2024
248 0.01
$500,000 Lloyds Banking 4.55%16/8/2028
447 0.02
$719,000 Lloyds Banking 4.582%10/12/2025
604 0.02
$800,000 Lloyds Banking 4.65%24/3/2026
678 0.02
$200,000 Lloyds Banking 5.3%1/12/2045
208 0.01
iShares Overseas Corporate Bond Index Fund (UK)
Portfolio Statement (unaudited) continued
BlackRock Collective Investment Funds 286

Holding orNominalValue Investment
MarketValue
£000’s
% ofTotal
NetAssets
$375,600 LLPL Capital Pte 6.875%4/2/2039
323 0.01
$500,000 Lockheed Martin 1.85%15/6/2030
387 0.01
$300,000 Lockheed Martin 2.8%15/6/2050
237 0.01
$300,000 Lockheed Martin 2.9%1/3/2025
245 0.01
$50,000 Lockheed Martin 3.1%15/1/2023
40 0.00
$306,000 Lockheed Martin 3.35%15/9/2021
236 0.01
$300,000 Lockheed Martin 3.55%15/1/2026
256 0.01
$800,000 Lockheed Martin 3.8%1/3/2045
730 0.03
$400,000 Lockheed Martin 4.07%15/12/2042
377 0.01
$564,000 Lockheed Martin 4.09%15/9/2052
547 0.02
$475,000 Lockheed Martin 4.5%15/5/2036
459 0.02
$400,000 Lockheed Martin 4.7%15/5/2046
409 0.01
$350,000 Loews 2.625% 15/5/2023 275 0.01
$300,000 Loews 3.75% 1/4/2026 254 0.01
$200,000 Loews 4.125% 15/5/2043 169 0.01
$400,000 Longfor 3.95% 16/9/2029Ø 317 0.01
$250,000 Lowe’s Cos 2.5% 15/4/2026 203 0.01
$800,000 Lowe’s Cos 3.1% 3/5/2027 667 0.02
$150,000 Lowe’s Cos 3.12%15/4/2022
116 0.00
$500,000 Lowe’s Cos 3.375%15/9/2025
418 0.01
$600,000 Lowe’s Cos 3.65% 5/4/2029 519 0.02
$100,000 Lowe’s Cos 3.7% 15/4/2046 85 0.00
$600,000 Lowe’s Cos 4% 15/4/2025 512 0.02
$300,000 Lowe’s Cos 4.05% 3/5/2047 268 0.01
$300,000 Lowe’s Cos 4.25%15/9/2044
266 0.01
$400,000 Lowe’s Cos 4.375%15/9/2045
363 0.01
$500,000 Lowe’s Cos 4.55% 5/4/2049 480 0.02
$200,000 Lowe’s Cos 4.65%15/4/2042
190 0.01
$500,000 Lowe’s Cos 5% 15/4/2040 494 0.02
$650,000 Lowe’s Cos 5.125%15/4/2050
673 0.02
$150,000 Lubrizol 6.5% 1/10/2034 175 0.01
$500,000 Lukoil 3.875% 6/5/2030 398 0.01
Holding orNominalValue Investment
MarketValue
£000’s
% ofTotal
NetAssets
$500,000 Lukoil International Finance4.563% 24/4/2023
398 0.01
$500,000 Lukoil International Finance4.75% 2/11/2026
419 0.01
$200,000 LYB International Finance4.875% 15/3/2044
179 0.01
$200,000 LYB International Finance5.25% 15/7/2043
183 0.01
$500,000 LYB International Finance II3.5% 2/3/2027Ø
415 0.01
$500,000 LYB International Finance III2.875% 1/5/2025
401 0.01
$150,000 LYB International Finance III3.375% 1/5/2030
122 0.00
$300,000 LYB International Finance III4.2% 15/10/2049
249 0.01
$400,000 LYB International Finance III4.2% 1/5/2050
327 0.01
$400,000 LyondellBasell Industries4.625% 26/2/2055
342 0.01
$500,000 LyondellBasell Industries5.75% 15/4/2024
431 0.02
$500,000 LyondellBasell Industries6% 15/11/2021
393 0.01
$300,000 M&G 6.5% 20/10/2048 278 0.01
$500,000 Macquarie 4.15% 27/3/2024 402 0.01
$1,200,000 Macquarie 5.033%15/1/2030
1,073 0.04
$500,000 Macquarie Bank 2.1%17/10/2022
386 0.01
$200,000 Macquarie Bank 6.625%7/4/2021
155 0.01
$200,000 MAF Sukuk 3.9325%28/2/2030
154 0.01
$250,000 MAF Sukuk 4.5% 3/11/2025 201 0.01
$200,000 MAF Sukuk 4.638%14/5/2029
162 0.01
$500,000 Magellan MidstreamPartners LP 3.25% 1/6/2030
403 0.01
$200,000 Magellan MidstreamPartners LP 3.95% 1/3/2050
158 0.01
$300,000 Magellan MidstreamPartners LP 4.2% 3/10/2047
242 0.01
$200,000 Magellan MidstreamPartners LP 4.25%15/9/2046
161 0.01
$200,000 Magellan MidstreamPartners LP 5% 1/3/2026
174 0.01
$500,000 Magna International 4.15%1/10/2025
426 0.01
iShares Overseas Corporate Bond Index Fund (UK)
Portfolio Statement (unaudited) continued
BlackRock Collective Investment Funds287

Holding orNominalValue Investment
MarketValue
£000’s
% ofTotal
NetAssets
$400,000 Manufacturers & TradersTrust 2.5% 18/5/2022
309 0.01
$500,000 Manufacturers & TradersTrust 3.4% 17/8/2027
416 0.01
$500,000 Manulife Financial 2.484%19/5/2027
403 0.01
$300,000 Manulife Financial 4.061%24/2/2032
239 0.01
$200,000 Manulife Financial 4.15%4/3/2026
177 0.01
$300,000 Manulife Financial 5.375%4/3/2046
309 0.01
$500,000 MAR Sukuk 3.025%13/11/2024
383 0.01
$500,000 Marathon Oil 3.85%1/6/2025
388 0.01
$150,000 Marathon Oil 5.2% 1/6/2045 112 0.00
$500,000 Marathon Oil 6.6%1/10/2037
403 0.01
$500,000 Marathon Petroleum 3.8%1/4/2028
410 0.01
$300,000 Marathon Petroleum 4.5%1/4/2048
240 0.01
$700,000 Marathon Petroleum 4.75%15/12/2023
579 0.02
$300,000 Marathon Petroleum 5%15/9/2054
249 0.01
$300,000 Marathon Petroleum 5.125%1/3/2021
229 0.01
$300,000 Marathon Petroleum 5.125%15/12/2026
266 0.01
$300,000 Marathon Petroleum 6.5%1/3/2041
287 0.01
$200,000 Markel 5% 5/4/2046 196 0.01
$400,000 Markel 5% 20/5/2049 393 0.01
$150,000 Marriott InternationalInc/MD 3.125% 15/6/2026
112 0.00
$400,000 Marriott InternationalInc/MD 3.5% 15/10/2032
301 0.01
$500,000 Marriott InternationalInc/MD 4% 15/4/2028
382 0.01
$200,000 Marriott InternationalInc/MD 4.5% 1/10/2034
153 0.01
$750,000 Marriott InternationalInc/MD 5.75% 1/5/2025
629 0.02
$500,000 Mars 2.375% 16/7/2040 367 0.01
$250,000 Mars 3.2% 1/4/2030 214 0.01
$300,000 Mars 3.6% 1/4/2034 272 0.01
$250,000 Mars 3.875% 1/4/2039 222 0.01
$300,000 Mars 3.95% 1/4/2049 281 0.01
Holding orNominalValue Investment
MarketValue
£000’s
% ofTotal
NetAssets
$300,000 Mars 4.125% 1/4/2054 287 0.01
$300,000 Mars 4.2% 1/4/2059 288 0.01
$500,000 Marsh & McLennan Cos2.25% 15/11/2030
392 0.01
$300,000 Marsh & McLennan Cos3.5% 3/6/2024
246 0.01
$500,000 Marsh & McLennan Cos3.75% 14/3/2026
429 0.01
$1,100,000 Marsh & McLennan Cos3.875% 15/3/2024
911 0.03
$250,000 Marsh & McLennan Cos4.35% 30/1/2047
244 0.01
$500,000 Marsh & McLennan Cos4.375% 15/3/2029
455 0.02
$500,000 Marsh & McLennan Cos4.9% 15/3/2049
527 0.02
$300,000 Martin Marietta Materials3.45% 1/6/2027
250 0.01
$300,000 Martin Marietta Materials4.25% 15/12/2047
253 0.01
$350,000 Masco 3.5% 15/11/2027 283 0.01
$500,000 Masco 4.375% 1/4/2026 438 0.02
$200,000 Massachusetts Electric4.004% 15/8/2046
180 0.01
$200,000 Massachusetts Electric5.9% 15/11/2039
214 0.01
$600,000 Massachusetts Institute ofTechnology 2.294%1/7/2051
448 0.02
$300,000 Massachusetts Institute ofTechnology 2.989%1/7/2050
263 0.01
$100,000 Massachusetts Institute ofTechnology 3.885%1/7/2116
94 0.00
$400,000 Massachusetts Institute ofTechnology 4.678%1/7/2114
448 0.02
$300,000 Massachusetts Mutual LifeInsurance 3.375%15/4/2050
232 0.01
$332,000 Massachusetts Mutual LifeInsurance 3.729%15/10/2070
271 0.01
$500,000 MassMutual Global FundingII 2.25% 1/7/2022
387 0.01
$500,000 MassMutual Global FundingII 2.35% 14/1/2027
403 0.01
$750,000 MassMutual Global FundingII 2.5% 13/4/2022
580 0.02
iShares Overseas Corporate Bond Index Fund (UK)
Portfolio Statement (unaudited) continued
BlackRock Collective Investment Funds 288
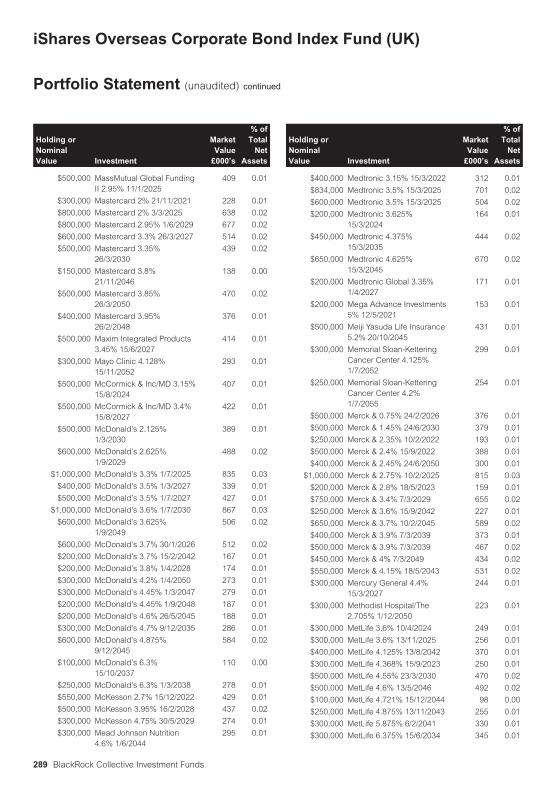
Holding orNominalValue Investment
MarketValue
£000’s
% ofTotal
NetAssets
$500,000 MassMutual Global FundingII 2.95% 11/1/2025
409 0.01
$300,000 Mastercard 2% 21/11/2021 228 0.01
$800,000 Mastercard 2% 3/3/2025 638 0.02
$800,000 Mastercard 2.95% 1/6/2029 677 0.02
$600,000 Mastercard 3.3% 26/3/2027 514 0.02
$500,000 Mastercard 3.35%26/3/2030
439 0.02
$150,000 Mastercard 3.8%21/11/2046
138 0.00
$500,000 Mastercard 3.85%26/3/2050
470 0.02
$400,000 Mastercard 3.95%26/2/2048
376 0.01
$500,000 Maxim Integrated Products3.45% 15/6/2027
414 0.01
$300,000 Mayo Clinic 4.128%15/11/2052
293 0.01
$500,000 McCormick & Inc/MD 3.15%15/8/2024
407 0.01
$500,000 McCormick & Inc/MD 3.4%15/8/2027
422 0.01
$500,000 McDonald’s 2.125%1/3/2030
389 0.01
$600,000 McDonald’s 2.625%1/9/2029
488 0.02
$1,000,000 McDonald’s 3.3% 1/7/2025 835 0.03
$400,000 McDonald’s 3.5% 1/3/2027 339 0.01
$500,000 McDonald’s 3.5% 1/7/2027 427 0.01
$1,000,000 McDonald’s 3.6% 1/7/2030 867 0.03
$600,000 McDonald’s 3.625%1/9/2049
506 0.02
$600,000 McDonald’s 3.7% 30/1/2026 512 0.02
$200,000 McDonald’s 3.7% 15/2/2042 167 0.01
$200,000 McDonald’s 3.8% 1/4/2028 174 0.01
$300,000 McDonald’s 4.2% 1/4/2050 273 0.01
$300,000 McDonald’s 4.45% 1/3/2047 279 0.01
$200,000 McDonald’s 4.45% 1/9/2048 187 0.01
$200,000 McDonald’s 4.6% 26/5/2045 188 0.01
$300,000 McDonald’s 4.7% 9/12/2035 286 0.01
$600,000 McDonald’s 4.875%9/12/2045
584 0.02
$100,000 McDonald’s 6.3%15/10/2037
110 0.00
$250,000 McDonald’s 6.3% 1/3/2038 278 0.01
$550,000 McKesson 2.7% 15/12/2022 429 0.01
$500,000 McKesson 3.95% 16/2/2028 437 0.02
$300,000 McKesson 4.75% 30/5/2029 274 0.01
$300,000 Mead Johnson Nutrition4.6% 1/6/2044
295 0.01
Holding orNominalValue Investment
MarketValue
£000’s
% ofTotal
NetAssets
$400,000 Medtronic 3.15% 15/3/2022 312 0.01
$834,000 Medtronic 3.5% 15/3/2025 701 0.02
$600,000 Medtronic 3.5% 15/3/2025 504 0.02
$200,000 Medtronic 3.625%15/3/2024
164 0.01
$450,000 Medtronic 4.375%15/3/2035
444 0.02
$650,000 Medtronic 4.625%15/3/2045
670 0.02
$200,000 Medtronic Global 3.35%1/4/2027
171 0.01
$200,000 Mega Advance Investments5% 12/5/2021
153 0.01
$500,000 Meiji Yasuda Life Insurance5.2% 20/10/2045
431 0.01
$300,000 Memorial Sloan-KetteringCancer Center 4.125%1/7/2052
299 0.01
$250,000 Memorial Sloan-KetteringCancer Center 4.2%1/7/2055
254 0.01
$500,000 Merck & 0.75% 24/2/2026 376 0.01
$500,000 Merck & 1.45% 24/6/2030 379 0.01
$250,000 Merck & 2.35% 10/2/2022 193 0.01
$500,000 Merck & 2.4% 15/9/2022 388 0.01
$400,000 Merck & 2.45% 24/6/2050 300 0.01
$1,000,000 Merck & 2.75% 10/2/2025 815 0.03
$200,000 Merck & 2.8% 18/5/2023 159 0.01
$750,000 Merck & 3.4% 7/3/2029 655 0.02
$250,000 Merck & 3.6% 15/9/2042 227 0.01
$650,000 Merck & 3.7% 10/2/2045 589 0.02
$400,000 Merck & 3.9% 7/3/2039 373 0.01
$500,000 Merck & 3.9% 7/3/2039 467 0.02
$450,000 Merck & 4% 7/3/2049 434 0.02
$550,000 Merck & 4.15% 18/5/2043 531 0.02
$300,000 Mercury General 4.4%15/3/2027
244 0.01
$300,000 Methodist Hospital/The2.705% 1/12/2050
223 0.01
$300,000 MetLife 3.6% 10/4/2024 249 0.01
$300,000 MetLife 3.6% 13/11/2025 256 0.01
$400,000 MetLife 4.125% 13/8/2042 370 0.01
$300,000 MetLife 4.368% 15/9/2023 250 0.01
$500,000 MetLife 4.55% 23/3/2030 470 0.02
$500,000 MetLife 4.6% 13/5/2046 492 0.02
$100,000 MetLife 4.721% 15/12/2044 98 0.00
$250,000 MetLife 4.875% 13/11/2043 255 0.01
$300,000 MetLife 5.875% 6/2/2041 330 0.01
$300,000 MetLife 6.375% 15/6/2034 345 0.01
iShares Overseas Corporate Bond Index Fund (UK)
Portfolio Statement (unaudited) continued
BlackRock Collective Investment Funds289

Holding orNominalValue Investment
MarketValue
£000’s
% ofTotal
NetAssets
$300,000 MetLife 6.4% 15/12/2066 282 0.01
$300,000 MetLife 6.5% 15/12/2032 339 0.01
$300,000 MetLife 9.25% 8/4/2068 337 0.01
$150,000 MetLife 10.75% 1/8/2069 182 0.01
$700,000 Metropolitan Edison 4.3%15/1/2029
616 0.02
$400,000 Metropolitan Life GlobalFunding I 1.95% 15/9/2021
304 0.01
$600,000 Metropolitan Life GlobalFunding I 1.95% 13/1/2023
464 0.02
$600,000 Metropolitan Life GlobalFunding I 2.4% 17/6/2022
465 0.02
$600,000 Metropolitan Life GlobalFunding I 2.4% 17/6/2022
465 0.02
$600,000 Metropolitan Life GlobalFunding I 2.95% 9/4/2030
504 0.02
$200,000 Metropolitan Life GlobalFunding I 3% 19/9/2027
167 0.01
$500,000 Metropolitan Life GlobalFunding I 3.05% 17/6/2029
425 0.01
$500,000 Metropolitan Life GlobalFunding I 3.45% 18/12/2026
429 0.01
$800,000 Metropolitan Life GlobalFunding I 3.6% 11/1/2024
658 0.02
$500,000 Microchip Technology4.333% 1/6/2023
402 0.01
$500,000 Micron Technology 4.64%6/2/2024
415 0.01
$400,000 Micron Technology 4.975%6/2/2026
348 0.01
$400,000 Micron Technology 5.327%6/2/2029
357 0.01
$500,000 Microsoft 1.55% 8/8/2021 378 0.01
$450,000 Microsoft 2% 8/8/2023 352 0.01
$350,000 Microsoft 2.375% 12/2/2022 269 0.01
$600,000 Microsoft 2.375% 1/5/2023 472 0.02
$750,000 Microsoft 2.4% 6/2/2022 576 0.02
$2,000,000 Microsoft 2.4% 8/8/2026 1,633 0.06
$1,980,000 Microsoft 2.525% 1/6/2050 1,553 0.05
$500,000 Microsoft 2.65% 3/11/2022 392 0.01
$1,469,000 Microsoft 2.675% 1/6/2060 1,154 0.04
$500,000 Microsoft 2.7% 12/2/2025 408 0.01
$1,000,000 Microsoft 2.875% 6/2/2024 806 0.03
$700,000 Microsoft 3.125% 3/11/2025 586 0.02
$1,400,000 Microsoft 3.3% 6/2/2027 1,198 0.04
$1,150,000 Microsoft 3.45% 8/8/2036 1,035 0.04
$500,000 Microsoft 3.5% 12/2/2035 461 0.02
$700,000 Microsoft 3.625%15/12/2023
575 0.02
$1,600,000 Microsoft 3.7% 8/8/2046 1,497 0.05
Holding orNominalValue Investment
MarketValue
£000’s
% ofTotal
NetAssets
$225,000 Microsoft 3.75% 12/2/2045 209 0.01
$502,000 Microsoft 3.95% 8/8/2056 496 0.02
$375,000 Microsoft 4% 12/2/2055 375 0.01
$570,000 Microsoft 4.1% 6/2/2037 548 0.02
$200,000 Microsoft 4.2% 3/11/2035 196 0.01
$450,000 Microsoft 4.25% 6/2/2047 453 0.02
$450,000 Microsoft 4.45% 3/11/2045 469 0.02
$300,000 Microsoft 4.5% 1/10/2040 303 0.01
$250,000 Microsoft 4.5% 6/2/2057 268 0.01
$150,000 Microsoft 4.75% 3/11/2055 168 0.01
$125,000 Microsoft 5.3% 8/2/2041 141 0.00
$300,000 Mid-America Apartments LP2.75% 15/3/2030
241 0.01
$500,000 Mid-America Apartments LP4% 15/11/2025
424 0.01
$900,000 MidAmerican Energy 3.1%1/5/2027
756 0.03
$200,000 MidAmerican Energy 3.15%15/4/2050
168 0.01
$300,000 MidAmerican Energy 3.95%1/8/2047
281 0.01
$300,000 MidAmerican Energy 4.25%1/5/2046
287 0.01
$300,000 MidAmerican Energy 4.25%15/7/2049
297 0.01
$500,000 Mid-Atlantic InterstateTransmission 4.1%15/5/2028
423 0.01
$600,000 Midwest Connector Capital3.9% 1/4/2024
451 0.02
$1,300,000 Mileage Plus / Mileage PlusIntellectual Property Assets6.5% 20/6/2027
1,010 0.03
$500,000 Minejesa Capital 4.625%10/8/2030
387 0.01
$250,000 Minejesa Capital 5.625%10/8/2037
197 0.01
$300,000 Minera Mexico de 4.5%26/1/2050
244 0.01
$500,000 Mirae Asset Daewoo3.375% 7/5/2024
389 0.01
$500,000 Mississippi Power 3.95%30/3/2028
427 0.01
$100,000 Mississippi Power 4.25%15/3/2042
89 0.00
$500,000 Mitsubishi 2.5% 9/7/2024 394 0.01
$500,000 Mitsubishi 3.375%23/7/2024
406 0.01
$400,000 Mitsubishi UFJ Financial2.048% 17/7/2030
304 0.01
iShares Overseas Corporate Bond Index Fund (UK)
Portfolio Statement (unaudited) continued
BlackRock Collective Investment Funds 290

Holding orNominalValue Investment
MarketValue
£000’s
% ofTotal
NetAssets
$571,000 Mitsubishi UFJ Financial2.19% 13/9/2021
434 0.02
$800,000 Mitsubishi UFJ Financial2.193% 25/2/2025
629 0.02
$500,000 Mitsubishi UFJ Financial2.193% 25/2/2025
393 0.01
$500,000 Mitsubishi UFJ Financial2.527% 13/9/2023
394 0.01
$350,000 Mitsubishi UFJ Financial2.559% 25/2/2030
278 0.01
$800,000 Mitsubishi UFJ Financial2.559% 25/2/2030
636 0.02
$800,000 Mitsubishi UFJ Financial2.623% 18/7/2022
622 0.02
$700,000 Mitsubishi UFJ Financial2.665% 25/7/2022
544 0.02
$288,000 Mitsubishi UFJ Financial2.95% 1/3/2021
218 0.01
$500,000 Mitsubishi UFJ Financial3.195% 18/7/2029
414 0.01
$400,000 Mitsubishi UFJ Financial3.218% 7/3/2022
311 0.01
$350,000 Mitsubishi UFJ Financial3.218% 7/3/2022
272 0.01
$300,000 Mitsubishi UFJ Financial3.287% 25/7/2027
251 0.01
$1,000,000 Mitsubishi UFJ Financial3.407% 7/3/2024
813 0.03
$600,000 Mitsubishi UFJ Financial3.455% 2/3/2023
479 0.02
$300,000 Mitsubishi UFJ Financial3.677% 22/2/2027
255 0.01
$350,000 Mitsubishi UFJ Financial3.741% 7/3/2029
302 0.01
$500,000 Mitsubishi UFJ Financial3.751% 18/7/2039
437 0.02
$300,000 Mitsubishi UFJ Financial3.761% 26/7/2023
244 0.01
$450,000 Mitsubishi UFJ Financial3.777% 2/3/2025
377 0.01
$750,000 Mitsubishi UFJ Financial3.85% 1/3/2026
647 0.02
$500,000 Mitsubishi UFJ Financial3.961% 2/3/2028
435 0.02
$700,000 Mitsubishi UFJ Financial4.05% 11/9/2028
617 0.02
$200,000 Mitsubishi UFJ Financial4.153% 7/3/2039
183 0.01
$500,000 Mitsubishi UFJ Lease &Finance 2.75% 21/10/2020
374 0.01
Holding orNominalValue Investment
MarketValue
£000’s
% ofTotal
NetAssets
$300,000 Mitsubishi UFJ Lease &Finance 3.96% 19/9/2023
242 0.01
$500,000 Mitsui Sumitomo Insurance4.95% Perpetual 6/9/2168Ø
452 0.02
$100,000 Mitsui Sumitomo Insurance7% 15/3/2072
81 0.00
$500,000 Mizuho Bank 3.2%26/3/2025
410 0.01
$1,400,000 Mizuho Financial 1.241%10/7/2024
1,058 0.04
$300,000 Mizuho Financial 2.201%10/7/2031
229 0.01
$800,000 Mizuho Financial 2.226%25/5/2026
624 0.02
$200,000 Mizuho Financial 2.273%13/9/2021
152 0.01
$500,000 Mizuho Financial 2.591%25/5/2031
395 0.01
$1,000,000 Mizuho Financial 2.601%11/9/2022
778 0.03
$500,000 Mizuho Financial 2.721%16/7/2023
387 0.01
$325,000 Mizuho Financial 2.839%13/9/2026
266 0.01
$400,000 Mizuho Financial 2.953%28/2/2022
310 0.01
$500,000 Mizuho Financial 3.153%16/7/2030
411 0.01
$600,000 Mizuho Financial 3.17%11/9/2027
498 0.02
$250,000 Mizuho Financial 3.477%12/4/2026
209 0.01
$500,000 Mizuho Financial 3.663%28/2/2027Ø
421 0.01
$550,000 Mizuho Financial Cayman2 4.2% 18/7/2022
434 0.02
$500,000 Mizuho Financial Cayman3 4.6% 27/3/2024
411 0.01
$300,000 MMC Norilsk Nickel OJSCVia MMC Finance DAC 4.1%11/4/2023
235 0.01
$250,000 MMC Norilsk Nickel OJSCVia MMC Finance DAC5.55% 28/10/2020
188 0.01
$200,000 MMC Norilsk Nickel OJSCVia MMC Finance DAC6.625% 14/10/2022
163 0.01
$500,000 Molex ElectronicTechnologies 3.9%15/4/2025
388 0.01
iShares Overseas Corporate Bond Index Fund (UK)
Portfolio Statement (unaudited) continued
BlackRock Collective Investment Funds291

Holding orNominalValue Investment
MarketValue
£000’s
% ofTotal
NetAssets
$600,000 Molson Coors Beverage 3%15/7/2026
479 0.02
$150,000 Molson Coors Beverage3.5% 1/5/2022
117 0.00
$400,000 Molson Coors Beverage4.2% 15/7/2046
310 0.01
$550,000 Molson Coors Beverage 5%1/5/2042
465 0.02
$300,000 Mondelez International2.125% 13/4/2023
233 0.01
$500,000 Mondelez International2.75% 13/4/2030
409 0.01
$500,000 Mondelez International3.625% 7/5/2023
402 0.01
$200,000 Mondelez International3.625% 13/2/2026
171 0.01
$200,000 Mondelez International4.125% 7/5/2028
179 0.01
$100,000 Mondelez International6.5% 9/2/2040
105 0.00
$600,000 Mondelez InternationalNetherlands 2.125%19/9/2022
463 0.02
$200,000 Monongahela Power 5.4%15/12/2043
208 0.01
$300,000 Montefiore Obligated5.246% 1/11/2048
259 0.01
$400,000 Moody’s 2.55% 18/8/2060 279 0.01
$250,000 Moody’s 2.75% 15/12/2021 192 0.01
$500,000 Moody’s 3.75% 24/3/2025 422 0.01
$400,000 Moody’s 4.875% 15/2/2024 338 0.01
$300,000 Moody’s 4.875% 17/12/2048 300 0.01
$1,500,000 Morgan Stanley 2.188%28/4/2026
1,180 0.04
$1,400,000 Morgan Stanley 2.699%22/1/2031
1,128 0.04
$600,000 Morgan Stanley 2.72%22/7/2025
480 0.02
$750,000 Morgan Stanley 2.75%19/5/2022
582 0.02
$800,000 Morgan Stanley 3.125%23/1/2023
634 0.02
$425,000 Morgan Stanley 3.125%27/7/2026
354 0.01
$1,550,000 Morgan Stanley 3.591%22/7/2028
1,311 0.05
$1,000,000 Morgan Stanley 3.622%1/4/2031
868 0.03
$1,050,000 Morgan Stanley 3.625%20/1/2027
896 0.03
Holding orNominalValue Investment
MarketValue
£000’s
% ofTotal
NetAssets
$1,000,000 Morgan Stanley 3.7%23/10/2024
834 0.03
$1,500,000 Morgan Stanley 3.737%24/4/2024
1,211 0.04
$750,000 Morgan Stanley 3.75%25/2/2023
605 0.02
$900,000 Morgan Stanley 3.772%24/1/2029
773 0.03
$900,000 Morgan Stanley 3.875%29/4/2024
748 0.03
$1,800,000 Morgan Stanley 3.875%27/1/2026
1,542 0.05
$500,000 Morgan Stanley 3.95%23/4/2027
424 0.01
$400,000 Morgan Stanley 3.971%22/7/2038
361 0.01
$600,000 Morgan Stanley 4%23/7/2025
513 0.02
$400,000 Morgan Stanley 4.1%22/5/2023
325 0.01
$500,000 Morgan Stanley 4.3%27/1/2045
487 0.02
$500,000 Morgan Stanley 4.35%8/9/2026
436 0.02
$700,000 Morgan Stanley 4.375%22/1/2047
697 0.02
$750,000 Morgan Stanley 4.431%23/1/2030
677 0.02
$750,000 Morgan Stanley 4.457%22/4/2039
710 0.02
$750,000 Morgan Stanley 4.875%1/11/2022
610 0.02
$1,000,000 Morgan Stanley 5%24/11/2025
879 0.03
$700,000 Morgan Stanley 5.597%24/3/2051
806 0.03
$800,000 Morgan Stanley 6.25%9/8/2026
770 0.03
$750,000 Morgan Stanley 6.375%24/7/2042
888 0.03
$300,000 Morgan Stanley 7.25%1/4/2032
343 0.01
$600,000 Mosaic 4.25% 15/11/2023 486 0.02
$400,000 Mosaic 5.45% 15/11/2033 344 0.01
$300,000 Mosaic 5.625% 15/11/2043 258 0.01
$500,000 Motorola Solutions 3.75%15/5/2022
394 0.01
$500,000 Motorola Solutions 4.6%23/5/2029
438 0.02
$200,000 Motorola Solutions 5.5%1/9/2044
174 0.01
iShares Overseas Corporate Bond Index Fund (UK)
Portfolio Statement (unaudited) continued
BlackRock Collective Investment Funds 292

Holding orNominalValue Investment
MarketValue
£000’s
% ofTotal
NetAssets
$300,000 Mount Sinai Hospitals3.737% 1/7/2049
250 0.01
$500,000 MPLX LP 1.75% 1/3/2026 374 0.01
$500,000 MPLX LP 2.65% 15/8/2030 371 0.01
$700,000 MPLX LP 3.375% 15/3/2023 551 0.02
$400,000 MPLX LP 4% 15/3/2028 329 0.01
$700,000 MPLX LP 4.125% 1/3/2027 579 0.02
$300,000 MPLX LP 4.25% 1/12/2027 250 0.01
$500,000 MPLX LP 4.5% 15/7/2023 404 0.01
$500,000 MPLX LP 4.5% 15/4/2038 397 0.01
$500,000 MPLX LP 4.7% 15/4/2048 402 0.01
$400,000 MPLX LP 4.8% 15/2/2029 346 0.01
$500,000 MPLX LP 4.875% 1/6/2025 427 0.01
$500,000 MPLX LP 5.2% 1/3/2047 424 0.01
$300,000 MPLX LP 5.25% 15/1/2025 234 0.01
$600,000 MPLX LP 5.5% 15/2/2049 532 0.02
$240,000 MUFG Americas 3%10/2/2025
193 0.01
$500,000 MUFG Bank 3.25% 8/9/2024 408 0.01
$500,000 MUFG Bank 3.75%10/3/2024
411 0.01
$500,000 MUFG Union Bank NA 2.1%9/12/2022
386 0.01
$100,000 Mylan 3.125% 15/1/2023 79 0.00
$1,000,000 Mylan 3.95% 15/6/2026 846 0.03
$200,000 Mylan 4.55% 15/4/2028 175 0.01
$250,000 Mylan 5.2% 15/4/2048 236 0.01
$350,000 Mylan 5.25% 15/6/2046 328 0.01
$300,000 Mylan 5.4% 29/11/2043 287 0.01
$500,000 Nan Fung Treasury 3.625%27/8/2030
375 0.01
$400,000 Nan Fung Treasury 3.875%3/10/2027
308 0.01
$600,000 Narragansett Electric3.395% 9/4/2030
514 0.02
$200,000 Nasdaq 3.25% 28/4/2050 160 0.01
$500,000 Nasdaq 3.85% 30/6/2026 430 0.01
$1,000,000 National Clearing 1.2%23/4/2023
761 0.03
$800,000 National Australia Bank2.332% 21/8/2030
596 0.02
$500,000 National Australia Bank3.5% 10/1/2027
427 0.01
$500,000 National Australia Bank3.933% 2/8/2034
416 0.01
$1,500,000 National Australia BankLtd/New York 2.5%22/5/2022
1,163 0.04
Holding orNominalValue Investment
MarketValue
£000’s
% ofTotal
NetAssets
$500,000 National Australia BankLtd/New York 2.5%12/7/2026
408 0.01
$600,000 National Bank of Canada2.1% 1/2/2023
464 0.02
$250,000 National Fuel Gas 5.2%15/7/2025
206 0.01
$500,000 National Fuel Gas 5.5%15/1/2026
409 0.01
$200,000 National Oilwell Varco 3.6%1/12/2029
147 0.01
$250,000 National Oilwell Varco3.95% 1/12/2042
168 0.01
$200,000 National Retail Properties3.1% 15/4/2050
132 0.00
$350,000 National Retail Properties3.3% 15/4/2023
275 0.01
$300,000 National Retail Properties3.5% 15/10/2027
238 0.01
$200,000 National Retail Properties4.8% 15/10/2048
173 0.01
$400,000 National Rural UtilitiesCooperative Finance 2.3%15/9/2022
310 0.01
$500,000 National Rural UtilitiesCooperative Finance 2.4%25/4/2022
385 0.01
$150,000 National Rural UtilitiesCooperative Finance 2.4%15/3/2030
122 0.00
$300,000 National Rural UtilitiesCooperative Finance 2.85%27/1/2025
245 0.01
$300,000 National Rural UtilitiesCooperative Finance 2.95%7/2/2024
241 0.01
$300,000 National Rural UtilitiesCooperative Finance 3.4%7/2/2028
261 0.01
$400,000 National Rural UtilitiesCooperative Finance 4.3%15/3/2049
388 0.01
$150,000 National Rural UtilitiesCooperative Finance 8%1/3/2032
179 0.01
$400,000 Nationwide Building Society1% 28/8/2025
299 0.01
$800,000 Nationwide Building Society2% 27/1/2023
618 0.02
$500,000 Nationwide Building Society3.766% 8/3/2024
398 0.01
iShares Overseas Corporate Bond Index Fund (UK)
Portfolio Statement (unaudited) continued
BlackRock Collective Investment Funds293

Holding orNominalValue Investment
MarketValue
£000’s
% ofTotal
NetAssets
$400,000 Nationwide Building Society3.766% 8/3/2024
318 0.01
$400,000 Nationwide Building Society3.9% 21/7/2025
339 0.01
$200,000 Nationwide Building Society3.96% 18/7/2030
172 0.01
$400,000 Nationwide Building Society4% 14/9/2026
329 0.01
$300,000 Nationwide Building Society4.125% 18/10/2032
245 0.01
$250,000 Nationwide Building Society4.363% 1/8/2024
204 0.01
$200,000 Nationwide FinancialServices 3.9% 30/11/2049
154 0.01
$300,000 Nationwide FinancialServices 5.3% 18/11/2044
254 0.01
$650,000 Nationwide MutualInsurance 4.35% 30/4/2050
535 0.02
$200,000 Nationwide MutualInsurance 4.95% 22/4/2044
159 0.01
$150,000 Nationwide MutualInsurance 8.25% 1/12/2031
159 0.01
$250,000 Nationwide MutualInsurance 9.375%15/8/2039
306 0.01
$1,000,000 Natwest 2.359% 22/5/2024 772 0.03
$400,000 Natwest 3.032% 28/11/2035 297 0.01
$1,000,000 Natwest 3.073% 22/5/2028 800 0.03
$500,000 Natwest 3.498% 15/5/2023 390 0.01
$500,000 Natwest 3.754% 1/11/2029 394 0.01
$500,000 Natwest 3.875% 12/9/2023 405 0.01
$500,000 Natwest 4.269% 22/3/2025 411 0.01
$1,000,000 Natwest 4.519% 25/6/2024 815 0.03
$500,000 Natwest 4.8% 5/4/2026 440 0.02
$500,000 Natwest 4.892% 18/5/2029 445 0.02
$500,000 Natwest 5.076% 27/1/2030 455 0.02
$1,000,000 Natwest 5.125% 28/5/2024Ø 827 0.03
$800,000 Natwest 6% 19/12/2023 674 0.02
$500,000 NatWest Markets 3.625%29/9/2022
394 0.01
$250,000 NBCUniversal Media2.875% 15/1/2023Ø
198 0.01
$250,000 NBCUniversal Media 4.45%15/1/2043
236 0.01
$250,000 NBCUniversal Media 5.95%1/4/2041
278 0.01
$200,000 NBCUniversal Media 6.4%30/4/2040
229 0.01
$300,000 Nestle 2.25% 10/5/2022Ø 231 0.01
$250,000 Nestle 3.1% 24/9/2021 192 0.01
Holding orNominalValue Investment
MarketValue
£000’s
% ofTotal
NetAssets
$400,000 Nestle 3.125% 22/3/2023 319 0.01
$750,000 Nestle 3.35% 24/9/2023 609 0.02
$300,000 Nestle 3.625% 24/9/2028 262 0.01
$200,000 Nestle 3.9% 24/9/2038 189 0.01
$900,000 Nestle 4% 24/9/2048 887 0.03
$300,000 NetApp 1.875% 22/6/2025 233 0.01
$300,000 NetApp 2.7% 22/6/2030 235 0.01
$150,000 Neuberger Berman /Neuberger Berman Finance4.875% 15/4/2045
122 0.00
$500,000 Nevada Power 2.4%1/5/2030
402 0.01
$100,000 Nevada Power 3.125%1/8/2050
82 0.00
$700,000 Nevada Power 3.7%1/5/2029
615 0.02
$200,000 Nevada Power 6.75%1/7/2037
228 0.01
$150,000 New England Power 3.8%5/12/2047
132 0.00
$500,000 New York and PresbyterianHospital/The 2.256%1/8/2040
366 0.01
$200,000 New York and PresbyterianHospital/The 3.954%1/8/2119
173 0.01
$250,000 New York and PresbyterianHospital/The 4.063%1/8/2056
245 0.01
$1,000,000 New York Life GlobalFunding 1.1% 5/5/2023
761 0.03
$100,000 New York Life GlobalFunding 2.35% 14/7/2026
81 0.00
$200,000 New York Life GlobalFunding 2.875% 10/4/2024
161 0.01
$500,000 New York Life GlobalFunding 2.9% 17/1/2024
402 0.01
$300,000 New York Life GlobalFunding 3% 10/1/2028
251 0.01
$500,000 New York Life Insurance3.75% 15/5/2050
425 0.01
$450,000 New York Life Insurance4.45% 15/5/2069
420 0.01
$100,000 New York Life Insurance5.875% 15/5/2033
103 0.00
$200,000 New York Life Insurance6.75% 15/11/2039
230 0.01
$300,000 Newcrest Finance Pty 4.2%13/5/2050
266 0.01
$200,000 Newcrest Finance Pty5.75% 15/11/2041
204 0.01
iShares Overseas Corporate Bond Index Fund (UK)
Portfolio Statement (unaudited) continued
BlackRock Collective Investment Funds 294

Holding orNominalValue Investment
MarketValue
£000’s
% ofTotal
NetAssets
$500,000 Newfield Exploration5.625% 1/7/2024
380 0.01
$450,000 Newmont 2.25% 1/10/2030 351 0.01
$500,000 Newmont 2.8% 1/10/2029 406 0.01
$92,000 Newmont 3.7% 15/3/2023 72 0.00
$400,000 Newmont 4.875% 15/3/2042 404 0.01
$100,000 Newmont 5.45% 9/6/2044 105 0.00
$250,000 Newmont 6.25% 1/10/2039 274 0.01
$700,000 NextEra Energy Capital2.25% 1/6/2030
548 0.02
$600,000 NextEra Energy Capital2.403% 1/9/2021
458 0.02
$400,000 NextEra Energy Capital2.75% 1/5/2025
324 0.01
$400,000 NextEra Energy Capital2.75% 1/11/2029
327 0.01
$300,000 NextEra Energy Capital2.8% 15/1/2023
236 0.01
$600,000 NextEra Energy Capital2.9% 1/4/2022
466 0.02
$500,000 NextEra Energy Capital3.15% 1/4/2024
405 0.01
$500,000 NextEra Energy Capital3.25% 1/4/2026
420 0.01
$400,000 NextEra Energy Capital3.5% 1/4/2029
343 0.01
$250,000 NextEra Energy Capital4.8% 1/12/2077
201 0.01
$600,000 NGPL PipeCo 4.875%15/8/2027
491 0.02
$300,000 Niagara Mohawk Power2.721% 28/11/2022
234 0.01
$500,000 Niagara Mohawk Power3.025% 27/6/2050
399 0.01
$100,000 Niagara Mohawk Power4.119% 28/11/2042
91 0.00
$200,000 Niagara Mohawk Power4.278% 15/12/2028
178 0.01
$200,000 Niagara Mohawk Power4.278% 1/10/2034
185 0.01
$400,000 Nike 3.375% 27/3/2050 344 0.01
$250,000 NIKE 2.25% 1/5/2023 196 0.01
$500,000 NIKE 2.4% 27/3/2025 403 0.01
$1,000,000 NIKE 2.85% 27/3/2030 835 0.03
$300,000 NIKE 3.25% 27/3/2040 252 0.01
$250,000 NIKE 3.375% 1/11/2046 215 0.01
$400,000 NIKE 3.875% 1/11/2045 363 0.01
$500,000 Nippon Life Insurance 3.4%23/1/2050
401 0.01
Holding orNominalValue Investment
MarketValue
£000’s
% ofTotal
NetAssets
$300,000 Nippon Life Insurance 4%19/9/2047
248 0.01
$400,000 Nippon Life Insurance 4.7%20/1/2046
338 0.01
$200,000 Nippon Life Insurance 5%18/10/2042
159 0.01
$500,000 Nippon Life Insurance 5.1%16/10/2044
419 0.01
$500,000 NiSource 2.95% 1/9/2029 410 0.01
$200,000 NiSource 3.49% 15/5/2027 169 0.01
$1,000,000 NiSource 3.6% 1/5/2030 862 0.03
$300,000 NiSource 4.375% 15/5/2047 279 0.01
$200,000 NiSource 5.25% 15/2/2043 200 0.01
$600,000 NiSource 5.65% 1/2/2045 619 0.02
$750,000 Nissan Motor Acceptance2.6% 28/9/2022
564 0.02
$500,000 Noble Energy 3.9%15/11/2024
414 0.01
$350,000 Noble Energy 4.2%15/10/2049
318 0.01
$350,000 Noble Energy 5.05%15/11/2044
341 0.01
$250,000 Noble Energy 5.25%15/11/2043
249 0.01
$300,000 Noble Energy 6% 1/3/2041 310 0.01
$500,000 Nomura 1.851% 16/7/2025 381 0.01
$500,000 Nomura 2.648% 16/1/2025 394 0.01
$500,000 Nomura 2.679% 16/7/2030 388 0.01
$400,000 Nomura 3.103% 16/1/2030 320 0.01
$1,000,000 Nordea Bank 0.75%28/8/2025
745 0.03
$400,000 Nordea Bank 4.625%13/9/2033
341 0.01
$200,000 Nordea Bank 4.875%14/1/2021
152 0.01
$250,000 Nordea Bank 4.875%13/5/2021
192 0.01
$500,000 Nordstrom 4.375% 1/4/2030 302 0.01
$250,000 Nordstrom 5% 15/1/2044 131 0.00
$300,000 Norfolk Southern 2.903%15/2/2023
236 0.01
$300,000 Norfolk Southern 3.05%15/5/2050
238 0.01
$206,000 Norfolk Southern 3.155%15/5/2055
162 0.01
$250,000 Norfolk Southern 3.4%1/11/2049
208 0.01
$1,400,000 Norfolk Southern 3.8%1/8/2028
1,239 0.04
iShares Overseas Corporate Bond Index Fund (UK)
Portfolio Statement (unaudited) continued
BlackRock Collective Investment Funds295
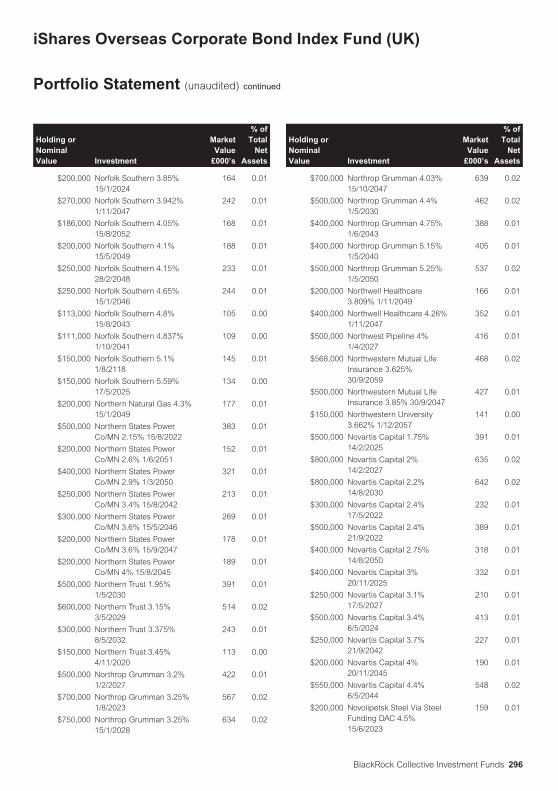
Holding orNominalValue Investment
MarketValue
£000’s
% ofTotal
NetAssets
$200,000 Norfolk Southern 3.85%15/1/2024
164 0.01
$270,000 Norfolk Southern 3.942%1/11/2047
242 0.01
$186,000 Norfolk Southern 4.05%15/8/2052
168 0.01
$200,000 Norfolk Southern 4.1%15/5/2049
188 0.01
$250,000 Norfolk Southern 4.15%28/2/2048
233 0.01
$250,000 Norfolk Southern 4.65%15/1/2046
244 0.01
$113,000 Norfolk Southern 4.8%15/8/2043
105 0.00
$111,000 Norfolk Southern 4.837%1/10/2041
109 0.00
$150,000 Norfolk Southern 5.1%1/8/2118
145 0.01
$150,000 Norfolk Southern 5.59%17/5/2025
134 0.00
$200,000 Northern Natural Gas 4.3%15/1/2049
177 0.01
$500,000 Northern States PowerCo/MN 2.15% 15/8/2022
383 0.01
$200,000 Northern States PowerCo/MN 2.6% 1/6/2051
152 0.01
$400,000 Northern States PowerCo/MN 2.9% 1/3/2050
321 0.01
$250,000 Northern States PowerCo/MN 3.4% 15/8/2042
213 0.01
$300,000 Northern States PowerCo/MN 3.6% 15/5/2046
269 0.01
$200,000 Northern States PowerCo/MN 3.6% 15/9/2047
178 0.01
$200,000 Northern States PowerCo/MN 4% 15/8/2045
189 0.01
$500,000 Northern Trust 1.95%1/5/2030
391 0.01
$600,000 Northern Trust 3.15%3/5/2029
514 0.02
$300,000 Northern Trust 3.375%8/5/2032
243 0.01
$150,000 Northern Trust 3.45%4/11/2020
113 0.00
$500,000 Northrop Grumman 3.2%1/2/2027
422 0.01
$700,000 Northrop Grumman 3.25%1/8/2023
567 0.02
$750,000 Northrop Grumman 3.25%15/1/2028
634 0.02
Holding orNominalValue Investment
MarketValue
£000’s
% ofTotal
NetAssets
$700,000 Northrop Grumman 4.03%15/10/2047
639 0.02
$500,000 Northrop Grumman 4.4%1/5/2030
462 0.02
$400,000 Northrop Grumman 4.75%1/6/2043
388 0.01
$400,000 Northrop Grumman 5.15%1/5/2040
405 0.01
$500,000 Northrop Grumman 5.25%1/5/2050
537 0.02
$200,000 Northwell Healthcare3.809% 1/11/2049
166 0.01
$400,000 Northwell Healthcare 4.26%1/11/2047
352 0.01
$500,000 Northwest Pipeline 4%1/4/2027
416 0.01
$568,000 Northwestern Mutual LifeInsurance 3.625%30/9/2059
468 0.02
$500,000 Northwestern Mutual LifeInsurance 3.85% 30/9/2047
427 0.01
$150,000 Northwestern University3.662% 1/12/2057
141 0.00
$500,000 Novartis Capital 1.75%14/2/2025
391 0.01
$800,000 Novartis Capital 2%14/2/2027
635 0.02
$800,000 Novartis Capital 2.2%14/8/2030
642 0.02
$300,000 Novartis Capital 2.4%17/5/2022
232 0.01
$500,000 Novartis Capital 2.4%21/9/2022
389 0.01
$400,000 Novartis Capital 2.75%14/8/2050
318 0.01
$400,000 Novartis Capital 3%20/11/2025
332 0.01
$250,000 Novartis Capital 3.1%17/5/2027
210 0.01
$500,000 Novartis Capital 3.4%6/5/2024
413 0.01
$250,000 Novartis Capital 3.7%21/9/2042
227 0.01
$200,000 Novartis Capital 4%20/11/2045
190 0.01
$550,000 Novartis Capital 4.4%6/5/2044
548 0.02
$200,000 Novolipetsk Steel Via SteelFunding DAC 4.5%15/6/2023
159 0.01
iShares Overseas Corporate Bond Index Fund (UK)
Portfolio Statement (unaudited) continued
BlackRock Collective Investment Funds 296

Holding orNominalValue Investment
MarketValue
£000’s
% ofTotal
NetAssets
$500,000 NRG Energy 3.75%15/6/2024
401 0.01
$250,000 NSTAR Electric 2.375%15/10/2022
194 0.01
$350,000 NSTAR Electric 3.2%15/5/2027
295 0.01
$500,000 NSTAR Electric 3.95%1/4/2030
453 0.02
$500,000 Nucor 3.95% 1/5/2028 436 0.02
$150,000 Nucor 4.125% 15/9/2022 120 0.00
$300,000 Nucor 4.4% 1/5/2048 286 0.01
$300,000 Nucor 5.2% 1/8/2043 294 0.01
$500,000 Nutrien 3.15% 1/10/2022 391 0.01
$500,000 Nutrien 3.625% 15/3/2024 408 0.01
$300,000 Nutrien 3.95% 13/5/2050 260 0.01
$100,000 Nutrien 4% 15/12/2026 86 0.00
$200,000 Nutrien 4.125% 15/3/2035 173 0.01
$250,000 Nutrien 4.9% 1/6/2043 232 0.01
$300,000 Nutrien 5% 1/4/2049 293 0.01
$200,000 Nutrien 5.25% 15/1/2045 188 0.01
$200,000 Nutrien 5.625% 1/12/2040 191 0.01
$100,000 Nutrien 5.875% 1/12/2036 92 0.00
$100,000 Nutrien 6.125% 15/1/2041 99 0.00
$700,000 Nuveen Finance 4.125%1/11/2024
593 0.02
$400,000 nVent Finance Sarl 3.95%15/4/2023
315 0.01
$475,000 NVIDIA 2.2% 16/9/2021 361 0.01
$800,000 NVIDIA 2.85% 1/4/2030 666 0.02
$150,000 NVIDIA 3.2% 16/9/2026 127 0.00
$300,000 NVIDIA 3.5% 1/4/2040 258 0.01
$600,000 NVIDIA 3.5% 1/4/2050 507 0.02
$250,000 NVIDIA 3.7% 1/4/2060 219 0.01
$600,000 NVR 3% 15/5/2030 486 0.02
$500,000 NXP / NXP Funding 4.625%1/6/2023
410 0.01
$600,000 NXP / NXP Funding 4.875%1/3/2024
504 0.02
$400,000 NXP / NXP Funding 5.55%1/12/2028
375 0.01
$500,000 NXP / NXP Funding / NXPUSA 2.7% 1/5/2025
398 0.01
$600,000 NXP / NXP Funding / NXPUSA 3.4% 1/5/2030
497 0.02
$200,000 NXP / NXP Funding / NXPUSA 3.875% 18/6/2026
168 0.01
$500,000 NY Society for Relief ofRuptured & CrippledMaintaining Hosp SpecialSurgery 2.667% 1/10/2050
352 0.01
Holding orNominalValue Investment
MarketValue
£000’s
% ofTotal
NetAssets
$500,000 Oaktree Specialty Lending3.5% 25/2/2025
376 0.01
$250,000 Office Properties IncomeTrust 4.5% 1/2/2025
189 0.01
$200,000 Oglethorpe Power 5.05%1/10/2048
178 0.01
$150,000 Oglethorpe Power 5.375%1/11/2040
135 0.00
$300,000 Oglethorpe Power 5.95%1/11/2039
293 0.01
$200,000 Ohio National FinancialServices 5.55% 24/1/2030
144 0.01
$300,000 Ohio Power 4% 1/6/2049 274 0.01
$500,000 Oklahoma Gas and Electric3.25% 1/4/2030
419 0.01
$100,000 Oklahoma Gas and Electric3.8% 15/8/2028
86 0.00
$300,000 Oklahoma Gas and Electric4.15% 1/4/2047
266 0.01
$200,000 Old Republic International3.875% 26/8/2026
166 0.01
$500,000 Omega HealthcareInvestors 3.625% 1/10/2029
376 0.01
$400,000 Omega HealthcareInvestors 4.95% 1/4/2024
319 0.01
$300,000 Omega HealthcareInvestors 5.25% 15/1/2026
246 0.01
$500,000 Omnicom 2.45% 30/4/2030 386 0.01
$450,000 Omnicom / OmnicomCapital 3.6% 15/4/2026
379 0.01
$200,000 Omnicom / OmnicomCapital 3.625% 1/5/2022
157 0.01
$300,000 Oncor Electric Delivery3.1% 15/9/2049
247 0.01
$400,000 Oncor Electric Delivery3.7% 15/11/2028
352 0.01
$500,000 Oncor Electric Delivery3.7% 15/11/2028
440 0.02
$300,000 Oncor Electric Delivery3.7% 15/5/2050
273 0.01
$300,000 Oncor Electric Delivery3.8% 30/9/2047
272 0.01
$300,000 Oncor Electric Delivery3.8% 1/6/2049
277 0.01
$250,000 Oncor Electric Delivery5.25% 30/9/2040
261 0.01
$250,000 Oncor Electric Delivery 7%1/9/2022
211 0.01
$150,000 Oncor Electric Delivery7.5% 1/9/2038
191 0.01
$300,000 ONE Gas 3.61% 1/2/2024 245 0.01
iShares Overseas Corporate Bond Index Fund (UK)
Portfolio Statement (unaudited) continued
BlackRock Collective Investment Funds297

Holding orNominalValue Investment
MarketValue
£000’s
% ofTotal
NetAssets
$200,000 ONE Gas 4.5% 1/11/2048 195 0.01
$500,000 ONEOK 3.1% 15/3/2030 357 0.01
$200,000 ONEOK 3.4% 1/9/2029 147 0.01
$200,000 ONEOK 3.4% 1/9/2029 147 0.01
$500,000 ONEOK 4% 13/7/2027 390 0.01
$450,000 ONEOK 4.35% 15/3/2029 352 0.01
$400,000 ONEOK 4.45% 1/9/2049 270 0.01
$400,000 ONEOK 4.95% 13/7/2047 290 0.01
$150,000 ONEOK 5.2% 15/7/2048 110 0.00
$500,000 ONEOK 6.35% 15/1/2031 441 0.02
$200,000 ONEOK 7.15% 15/1/2051 181 0.01
$300,000 ONEOK Partners LP 3.375%1/10/2022
233 0.01
$500,000 ONEOK Partners LP 5%15/9/2023
406 0.01
$100,000 ONEOK Partners LP 6.2%15/9/2043
82 0.00
$150,000 ONEOK Partners LP 6.65%1/10/2036
129 0.00
$150,000 ONEOK Partners LP 6.85%15/10/2037
128 0.00
$1,300,000 Oracle 1.9% 15/9/2021 986 0.03
$1,050,000 Oracle 2.4% 15/9/2023 829 0.03
$800,000 Oracle 2.5% 15/5/2022 618 0.02
$1,150,000 Oracle 2.5% 15/10/2022 898 0.03
$1,000,000 Oracle 2.5% 1/4/2025 804 0.03
$500,000 Oracle 2.625% 15/2/2023 393 0.01
$750,000 Oracle 2.65% 15/7/2026 614 0.02
$1,100,000 Oracle 2.8% 1/4/2027 904 0.03
$700,000 Oracle 2.95% 15/11/2024 569 0.02
$500,000 Oracle 2.95% 15/11/2024 406 0.01
$600,000 Oracle 2.95% 15/5/2025 492 0.02
$1,800,000 Oracle 2.95% 1/4/2030 1,504 0.05
$700,000 Oracle 3.25% 15/11/2027 592 0.02
$500,000 Oracle 3.4% 8/7/2024 411 0.01
$2,300,000 Oracle 3.6% 1/4/2040 1,944 0.07
$1,500,000 Oracle 3.6% 1/4/2050 1,246 0.04
$500,000 Oracle 3.8% 15/11/2037 433 0.02
$400,000 Oracle 3.85% 15/7/2036 352 0.01
$1,300,000 Oracle 3.85% 1/4/2060 1,122 0.04
$300,000 Oracle 3.9% 15/5/2035 271 0.01
$600,000 Oracle 4% 15/7/2046 528 0.02
$600,000 Oracle 4% 15/11/2047 531 0.02
$900,000 Oracle 4.125% 15/5/2045 801 0.03
$400,000 Oracle 4.3% 8/7/2034 373 0.01
$300,000 Oracle 4.375% 15/5/2055 282 0.01
$300,000 Oracle 4.5% 8/7/2044 278 0.01
$400,000 Oracle 5.375% 15/7/2040 411 0.01
$400,000 Oracle 6.5% 15/4/2038 459 0.02
Holding orNominalValue Investment
MarketValue
£000’s
% ofTotal
NetAssets
$450,000 Orange 5.375% 13/1/2042 477 0.02
$100,000 Orange 5.5% 6/2/2044Ø 110 0.00
$750,000 Orange 9% 1/3/2031 919 0.03
$300,000 Orbia Advance 4%4/10/2027
240 0.01
$250,000 Orbia Advance 4.875%19/9/2022
197 0.01
$200,000 Orbia Advance 5.5%15/1/2048
168 0.01
$250,000 Orbia Advance 5.875%17/9/2044Ø
218 0.01
$500,000 O’Reilly Automotive 3.6%1/9/2027
429 0.01
$300,000 O’Reilly Automotive 3.85%15/6/2023
241 0.01
$250,000 O’Reilly Automotive 4.2%1/4/2030
225 0.01
$225,000 ORIX 2.9% 18/7/2022 175 0.01
$500,000 ORIX 3.2% 19/1/2022 385 0.01
$500,000 Oshkosh 3.1% 1/3/2030 394 0.01
$800,000 Otis Worldwide 2.056%5/4/2025
631 0.02
$500,000 Otis Worldwide 2.565%15/2/2030
399 0.01
$300,000 Otis Worldwide 3.112%15/2/2040
240 0.01
$300,000 Otis Worldwide 3.362%15/2/2050
246 0.01
$500,000 Oversea-Chinese Banking4.25% 19/6/2024Ø
410 0.01
$600,000 Ovintiv 3.9% 15/11/2021 453 0.02
$300,000 Ovintiv 6.5% 15/8/2034 218 0.01
$250,000 Ovintiv 6.625% 15/8/2037 181 0.01
$500,000 Ovintiv 7.2% 1/11/2031 383 0.01
$500,000 Owens Corning 3.95%15/8/2029
422 0.01
$400,000 Owens Corning 4.4%30/1/2048
328 0.01
$29,000 Owens Corning 7%1/12/2036
29 0.00
$200,000 Owl Rock Capital 3.75%22/7/2025
149 0.01
$400,000 Owl Rock Capital 4%30/3/2025
301 0.01
$300,000 PACCAR Financial 2.65%10/5/2022
233 0.01
$400,000 Pacific Gas and Electric2.1% 1/8/2027
290 0.01
$700,000 Pacific Gas and Electric2.5% 1/2/2031
502 0.02
iShares Overseas Corporate Bond Index Fund (UK)
Portfolio Statement (unaudited) continued
BlackRock Collective Investment Funds 298

Holding orNominalValue Investment
MarketValue
£000’s
% ofTotal
NetAssets
$1,100,000 Pacific Gas and Electric3.15% 1/1/2026
850 0.03
$400,000 Pacific Gas and Electric3.3% 1/12/2027
309 0.01
$600,000 Pacific Gas and Electric3.3% 1/8/2040
419 0.01
$300,000 Pacific Gas and Electric3.3% 1/8/2040
209 0.01
$1,000,000 Pacific Gas and Electric3.45% 1/7/2025
783 0.03
$600,000 Pacific Gas and Electric3.5% 1/8/2050
417 0.01
$1,000,000 Pacific Gas and Electric4.25% 1/8/2023
797 0.03
$600,000 Pacific Gas and Electric4.5% 1/7/2040
467 0.02
$1,000,000 Pacific Gas and Electric4.55% 1/7/2030
826 0.03
$800,000 Pacific Gas and Electric4.75% 15/2/2044
630 0.02
$1,400,000 Pacific Gas and Electric4.95% 1/7/2050
1,152 0.04
$400,000 Pacific Life Insurance 4.3%24/10/2067
314 0.01
$200,000 Pacific LifeCorp 5.125%30/1/2043
173 0.01
$300,000 Pacific National Finance Pty4.75% 22/3/2028
235 0.01
$500,000 PacifiCorp 2.7% 15/9/2030 415 0.01
$500,000 PacifiCorp 2.95% 1/6/2023 397 0.01
$400,000 PacifiCorp 3.3% 15/3/2051 339 0.01
$400,000 PacifiCorp 4.1% 1/2/2042 368 0.01
$350,000 PacifiCorp 4.125%15/1/2049
327 0.01
$400,000 PacifiCorp 4.15% 15/2/2050 378 0.01
$250,000 PacifiCorp 5.75% 1/4/2037 265 0.01
$50,000 PacifiCorp 6% 15/1/2039 55 0.00
$600,000 PacifiCorp 6.25%15/10/2037
662 0.02
$150,000 PacifiCorp 7.7% 15/11/2031 175 0.01
$500,000 Packaging of America 3%15/12/2029
409 0.01
$200,000 Packaging of America4.05% 15/12/2049
180 0.01
$400,000 Packaging of America 4.5%1/11/2023
330 0.01
$500,000 Panasonic 2.536%19/7/2022
385 0.01
$900,000 Park Aerospace 4.5%15/3/2023
642 0.02
Holding orNominalValue Investment
MarketValue
£000’s
% ofTotal
NetAssets
$900,000 Park Aerospace 5.5%15/2/2024
663 0.02
$300,000 Parker-Hannifin 2.7%14/6/2024
240 0.01
$400,000 Parker-Hannifin 3.25%14/6/2029
338 0.01
$400,000 Parker-Hannifin 3.3%21/11/2024
328 0.01
$200,000 Parker-Hannifin 4%14/6/2049
182 0.01
$100,000 Parker-Hannifin 4%14/6/2049
91 0.00
$200,000 Parker-Hannifin 4.1%1/3/2047
181 0.01
$400,000 Parker-Hannifin 4.2%21/11/2034
367 0.01
$150,000 Partners Healthcare System3.192% 1/7/2049
121 0.00
$200,000 Partners Healthcare System3.342% 1/7/2060
163 0.01
$205,000 Partners Healthcare System3.765% 1/7/2048
182 0.01
$800,000 PayPal 1.65% 1/6/2025 622 0.02
$500,000 PayPal 2.2% 26/9/2022 387 0.01
$350,000 PayPal 2.3% 1/6/2030 278 0.01
$500,000 PayPal 2.65% 1/10/2026 409 0.01
$500,000 PayPal 2.85% 1/10/2029 414 0.01
$350,000 PayPal 3.25% 1/6/2050 295 0.01
$300,000 PECO Energy 2.8%15/6/2050
237 0.01
$300,000 PECO Energy 3% 15/9/2049 244 0.01
$300,000 PECO Energy 3.9%1/3/2048
280 0.01
$400,000 Penske Truck Leasing Lp /PTL Finance 3.4%15/11/2026
328 0.01
$400,000 Penske Truck Leasing Lp /PTL Finance 3.45%1/7/2024
324 0.01
$400,000 Penske Truck Leasing Lp /PTL Finance 3.95%10/3/2025
332 0.01
$500,000 Penske Truck Leasing Lp /PTL Finance 4% 15/7/2025
420 0.01
$500,000 Penske Truck Leasing Lp /PTL Finance 4.25%17/1/2023
403 0.01
$550,000 Penske Truck Leasing Lp /PTL Finance 4.875%11/7/2022
442 0.02
$500,000 PepsiCo 0.75% 1/5/2023 378 0.01
iShares Overseas Corporate Bond Index Fund (UK)
Portfolio Statement (unaudited) continued
BlackRock Collective Investment Funds299

Holding orNominalValue Investment
MarketValue
£000’s
% ofTotal
NetAssets
$600,000 PepsiCo 1.625% 1/5/2030 463 0.02
$300,000 PepsiCo 1.7% 6/10/2021 227 0.01
$500,000 PepsiCo 2.25% 2/5/2022 385 0.01
$400,000 PepsiCo 2.375% 6/10/2026 327 0.01
$500,000 PepsiCo 2.625% 19/3/2027 413 0.01
$500,000 PepsiCo 2.625% 29/7/2029 415 0.01
$250,000 PepsiCo 2.75% 5/3/2022 194 0.01
$500,000 PepsiCo 2.75% 1/3/2023 396 0.01
$350,000 PepsiCo 2.75% 30/4/2025 286 0.01
$1,000,000 PepsiCo 2.75% 19/3/2030 838 0.03
$400,000 PepsiCo 2.85% 24/2/2026 331 0.01
$400,000 PepsiCo 2.875% 15/10/2049 320 0.01
$600,000 PepsiCo 3% 15/10/2027 508 0.02
$150,000 PepsiCo 3.125% 1/11/2020 113 0.00
$300,000 PepsiCo 3.375% 29/7/2049 258 0.01
$650,000 PepsiCo 3.45% 6/10/2046 571 0.02
$300,000 PepsiCo 3.6% 1/3/2024 246 0.01
$200,000 PepsiCo 3.6% 13/8/2042 184 0.01
$500,000 PepsiCo 3.625% 19/3/2050 454 0.02
$200,000 PepsiCo 3.875% 19/3/2060 191 0.01
$150,000 PepsiCo 4% 5/3/2042 142 0.01
$250,000 PepsiCo 4% 2/5/2047 236 0.01
$450,000 PepsiCo 4.25% 22/10/2044 434 0.02
$300,000 PepsiCo 4.45% 14/4/2046 299 0.01
$250,000 PepsiCo 4.6% 17/7/2045 258 0.01
$400,000 PerkinElmer 3.3% 15/9/2029 332 0.01
$250,000 Pernod Ricard 4.45%15/1/2022
197 0.01
$150,000 Pernod Ricard 5.5%15/1/2042
154 0.01
$350,000 Perrigo Finance Unlimited3.15% 15/6/2030
275 0.01
$500,000 Perrigo Finance Unlimited3.9% 15/12/2024
404 0.01
$250,000 Perrigo Finance Unlimited4.375% 15/3/2026
210 0.01
$200,000 Perrigo Finance Unlimited4.9% 15/12/2044
162 0.01
$600,000 Pfizer 1.7% 28/5/2030 464 0.02
$600,000 Pfizer 2.55% 28/5/2040 470 0.02
$800,000 Pfizer 2.625% 1/4/2030 667 0.02
$300,000 Pfizer 2.7% 28/5/2050 234 0.01
$400,000 Pfizer 2.75% 3/6/2026 333 0.01
$400,000 Pfizer 2.8% 11/3/2022 310 0.01
$700,000 Pfizer 2.95% 15/3/2024 567 0.02
$500,000 Pfizer 3% 15/6/2023 400 0.01
$700,000 Pfizer 3.45% 15/3/2029 613 0.02
$1,000,000 Pfizer 3.6% 15/9/2028 882 0.03
$200,000 Pfizer 3.9% 15/3/2039 185 0.01
Holding orNominalValue Investment
MarketValue
£000’s
% ofTotal
NetAssets
$400,000 Pfizer 3.9% 15/3/2039 371 0.01
$450,000 Pfizer 4% 15/12/2036 414 0.01
$200,000 Pfizer 4% 15/3/2049 190 0.01
$300,000 Pfizer 4% 15/3/2049 285 0.01
$500,000 Pfizer 4.1% 15/9/2038 470 0.02
$300,000 Pfizer 4.125% 15/12/2046 288 0.01
$300,000 Pfizer 4.2% 15/9/2048 295 0.01
$350,000 Pfizer 4.3% 15/6/2043 338 0.01
$300,000 Pfizer 4.4% 15/5/2044 299 0.01
$550,000 Pfizer 7.2% 15/3/2039 689 0.02
$500,000 Pharmacia 6.6% 1/12/2028 520 0.02
$500,000 Philip Morris International2.1% 1/5/2030
388 0.01
$500,000 Philip Morris International2.625% 18/2/2022
385 0.01
$500,000 Philip Morris International2.75% 25/2/2026
411 0.01
$250,000 Philip Morris International2.9% 15/11/2021
192 0.01
$1,000,000 Philip Morris International3.125% 2/3/2028
837 0.03
$800,000 Philip Morris International3.25% 10/11/2024
662 0.02
$500,000 Philip Morris International3.375% 15/8/2029
426 0.01
$600,000 Philip Morris International3.6% 15/11/2023
490 0.02
$150,000 Philip Morris International3.875% 21/8/2042
129 0.00
$250,000 Philip Morris International4.125% 4/3/2043
221 0.01
$400,000 Philip Morris International4.25% 10/11/2044
365 0.01
$200,000 Philip Morris International4.375% 15/11/2041
184 0.01
$300,000 Philip Morris International4.5% 20/3/2042
275 0.01
$300,000 Philip Morris International4.875% 15/11/2043
291 0.01
$250,000 Philip Morris International6.375% 16/5/2038
281 0.01
$300,000 Phillips 66 2.15%15/12/2030
221 0.01
$500,000 Phillips 66 3.7% 6/4/2023 402 0.01
$500,000 Phillips 66 3.85% 9/4/2025 418 0.01
$250,000 Phillips 66 3.9% 15/3/2028 211 0.01
$1,000,000 Phillips 66 4.3% 1/4/2022 791 0.03
$250,000 Phillips 66 4.65%15/11/2034
227 0.01
iShares Overseas Corporate Bond Index Fund (UK)
Portfolio Statement (unaudited) continued
BlackRock Collective Investment Funds 300

Holding orNominalValue Investment
MarketValue
£000’s
% ofTotal
NetAssets
$500,000 Phillips 66 4.875%15/11/2044
455 0.02
$400,000 Phillips 66 5.875% 1/5/2042 404 0.01
$300,000 Phillips 66 Partners LP3.15% 15/12/2029
226 0.01
$400,000 Phillips 66 Partners LP3.75% 1/3/2028
314 0.01
$50,000 Phillips 66 Partners LP4.68% 15/2/2045
39 0.00
$200,000 Phillips 66 Partners LP 4.9%1/10/2046
161 0.01
$300,000 Phoenix 5.375% 6/7/2027 246 0.01
$250,000 Physicians Realty LP 4.3%15/3/2027
198 0.01
$200,000 Piedmont Natural Gas3.35% 1/6/2050
167 0.01
$200,000 Piedmont Natural Gas3.64% 1/11/2046
171 0.01
$500,000 Pine Street Trust I 4.572%15/2/2029
430 0.01
$1,000,000 Pioneer Natural Resources1.9% 15/8/2030
726 0.03
$400,000 Plains All American PipelineLP / PAA Finance 2.85%31/1/2023
306 0.01
$300,000 Plains All American PipelineLP / PAA Finance 3.55%15/12/2029
223 0.01
$250,000 Plains All American PipelineLP / PAA Finance 3.65%1/6/2022
192 0.01
$400,000 Plains All American PipelineLP / PAA Finance 3.8%15/9/2030
301 0.01
$800,000 Plains All American PipelineLP / PAA Finance 4.5%15/12/2026
650 0.02
$250,000 Plains All American PipelineLP / PAA Finance 4.65%15/10/2025
203 0.01
$450,000 Plains All American PipelineLP / PAA Finance 4.9%15/2/2045
322 0.01
$200,000 Plains All American PipelineLP / PAA Finance 5%1/2/2021
150 0.01
$250,000 Plains All American PipelineLP / PAA Finance 5.15%1/6/2042
183 0.01
$1,000,000 PNC Bank NA 2.45%28/7/2022‡
775 0.03
Holding orNominalValue Investment
MarketValue
£000’s
% ofTotal
NetAssets
$500,000 PNC Bank NA 2.55%9/12/2021‡
384 0.01
$500,000 PNC Bank NA 2.625%17/2/2022‡
385 0.01
$500,000 PNC Bank NA 2.7%1/11/2022‡
391 0.01
$300,000 PNC Bank NA 2.7%22/10/2029‡
243 0.01
$500,000 PNC Bank NA 3.1%25/10/2027‡
425 0.01
$800,000 PNC Bank NA 3.5%8/6/2023
645 0.02
$400,000 PNC Bank NA 4.05%26/7/2028‡
353 0.01
$300,000 PNC Bank NA 4.2%1/11/2025‡
261 0.01
$500,000 PNC Financial Services2.55% 22/1/2030‡
406 0.01
$300,000 PNC Financial Services2.6% 23/7/2026‡
246 0.01
$500,000 PNC Financial Services2.854% 9/11/2022‡
393 0.01
$500,000 PNC Financial Services3.15% 19/5/2027‡
421 0.01
$370,000 PNC Financial Services3.45% 23/4/2029‡
321 0.01
$600,000 PNC Financial Services3.5% 23/1/2024‡
491 0.02
$750,000 Poly Real Estate Finance4.75% 17/9/2023
605 0.02
$500,000 POSCO 2.375% 12/11/2022 383 0.01
$400,000 POSCO 2.75% 15/7/2024 313 0.01
$400,000 Potomac Electric Power3.6% 15/3/2024
326 0.01
$300,000 Powszechna KasaOszczednosci Bank PolskiVia PKO Finance 4.63%26/9/2022
238 0.01
$100,000 PPG Industries 2.8%15/8/2029
81 0.00
$500,000 PPG Industries 3.2%15/3/2023
397 0.01
$300,000 PPL Capital Funding 3.1%15/5/2026
249 0.01
$600,000 PPL Capital Funding 3.4%1/6/2023
478 0.02
$500,000 PPL Capital Funding 4%15/9/2047
438 0.02
$500,000 PPL Capital Funding4.125% 15/4/2030
442 0.02
iShares Overseas Corporate Bond Index Fund (UK)
Portfolio Statement (unaudited) continued
BlackRock Collective Investment Funds301

Holding orNominalValue Investment
MarketValue
£000’s
% ofTotal
NetAssets
$300,000 PPL Capital Funding 4.7%1/6/2043
277 0.01
$300,000 PPL Capital Funding 5%15/3/2044
287 0.01
$250,000 PPL Electric Utilities 3%15/9/2021
190 0.01
$300,000 PPL Electric Utilities 3.95%1/6/2047
276 0.01
$200,000 PPL Electric Utilities 4.15%15/6/2048
193 0.01
$350,000 PPL Electric Utilities 6.25%15/5/2039
388 0.01
$250,000 Praxair 1.1% 10/8/2030 183 0.01
$100,000 Praxair 2% 10/8/2050 69 0.00
$500,000 Praxair 2.2% 15/8/2022 385 0.01
$250,000 Praxair 3% 1/9/2021 192 0.01
$200,000 Praxair 3.2% 30/1/2026 168 0.01
$250,000 Praxair 3.55% 7/11/2042 223 0.01
$250,000 Praxair 4.05% 15/3/2021 191 0.01
$500,000 Precision Castparts 2.5%15/1/2023
391 0.01
$200,000 Precision Castparts 3.25%15/6/2025
167 0.01
$200,000 Precision Castparts 4.375%15/6/2045
187 0.01
$150,000 President and Fellows ofHarvard College 2.517%15/10/2050
115 0.00
$300,000 President and Fellows ofHarvard College 3.15%15/7/2046
255 0.01
$300,000 President and Fellows ofHarvard College 3.3%15/7/2056
276 0.01
$100,000 President and Fellows ofHarvard College 4.875%15/10/2040
105 0.00
$500,000 Pricoa Global Funding I2.45% 21/9/2022
389 0.01
$125,000 Principal Financial 3.1%15/11/2026
104 0.00
$300,000 Principal Financial 3.3%15/9/2022
236 0.01
$500,000 Principal Financial 3.7%15/5/2029
435 0.02
$300,000 Principal Financial 4.3%15/11/2046
271 0.01
$250,000 Principal Financial 4.625%15/9/2042
234 0.01
$800,000 Principal Life GlobalFunding II 1.25% 23/6/2025
610 0.02
Holding orNominalValue Investment
MarketValue
£000’s
% ofTotal
NetAssets
$500,000 Procter & Gamble 2.15%11/8/2022
387 0.01
$500,000 Procter & Gamble 2.45%25/3/2025
405 0.01
$100,000 Procter & Gamble 2.7%2/2/2026
84 0.00
$1,000,000 Procter & Gamble 3%25/3/2030
863 0.03
$500,000 Procter & Gamble 3.1%15/8/2023
404 0.01
$200,000 Procter & Gamble 3.5%25/10/2047
189 0.01
$350,000 Procter & Gamble 3.55%25/3/2040
320 0.01
$500,000 Procter & Gamble 3.6%25/3/2050
474 0.02
$400,000 Procter & Gamble 5.5%1/2/2034
424 0.01
$200,000 Procter & Gamble 5.55%5/3/2037
227 0.01
$200,000 Progress Energy 6%1/12/2039
210 0.01
$500,000 Progressive 3.2% 26/3/2030 430 0.01
$300,000 Progressive 3.75%23/8/2021
232 0.01
$400,000 Progressive 3.95%26/3/2050
384 0.01
$400,000 Progressive 4% 1/3/2029 358 0.01
$200,000 Progressive 4.2% 15/3/2048 198 0.01
$300,000 Progressive 4.35%25/4/2044
293 0.01
$350,000 Prologis LP 1.25%15/10/2030
256 0.01
$200,000 Prologis LP 2.125%15/10/2050
138 0.00
$500,000 Prologis LP 2.25%15/4/2030
398 0.01
$250,000 Prologis LP 3% 15/4/2050 203 0.01
$500,000 Prologis LP 3.75%1/11/2025
428 0.01
$200,000 Prologis LP 4.375%1/2/2029
183 0.01
$400,000 Prosus 3.68% 21/1/2030 325 0.01
$500,000 Prosus 4.027% 3/8/2050Ø 397 0.01
$500,000 Prosus 4.85% 6/7/2027 431 0.01
$300,000 Prosus 5.5% 21/7/2025 258 0.01
$150,000 Protective Life 8.45%15/10/2039
171 0.01
$500,000 Protective Life GlobalFunding 2.615% 22/8/2022
389 0.01
iShares Overseas Corporate Bond Index Fund (UK)
Portfolio Statement (unaudited) continued
BlackRock Collective Investment Funds 302

Holding orNominalValue Investment
MarketValue
£000’s
% ofTotal
NetAssets
$300,000 Providence St JosephHealth Obligated 3.93%1/10/2048
269 0.01
$500,000 Prudential 3.125%14/4/2030
413 0.01
$500,000 Prudential Financial 1.5%10/3/2026
390 0.01
$650,000 Prudential Financial 2.1%10/3/2030
513 0.02
$450,000 Prudential Financial 3%10/3/2040
358 0.01
$1,000,000 Prudential Financial 3.5%15/5/2024
831 0.03
$300,000 Prudential Financial 3.7%1/10/2050
231 0.01
$500,000 Prudential Financial 3.7%13/3/2051
421 0.01
$493,000 Prudential Financial 3.905%7/12/2047
419 0.01
$602,000 Prudential Financial 3.935%7/12/2049
514 0.02
$300,000 Prudential Financial 4.35%25/2/2050
273 0.01
$350,000 Prudential Financial 4.5%16/11/2021
274 0.01
$500,000 Prudential Financial 4.5%15/9/2047
404 0.01
$200,000 Prudential Financial 4.6%15/5/2044
185 0.01
$200,000 Prudential Financial 5.375%15/5/2045
164 0.01
$250,000 Prudential Financial 5.625%15/6/2043
200 0.01
$300,000 Prudential Financial 5.7%14/12/2036
320 0.01
$500,000 Prudential Financial 5.7%15/9/2048
431 0.01
$250,000 Prudential Financial 5.875%15/9/2042
199 0.01
$250,000 PSEG Power 3.85%1/6/2023
201 0.01
$400,000 PTT Global Chemical 4.25%19/9/2022
313 0.01
$800,000 PTTEP Treasury Center2.993% 15/1/2030
634 0.02
$300,000 PTTEP Treasury Center3.903% 6/12/2059
253 0.01
$500,000 Public Service of Colorado1.9% 15/1/2031
392 0.01
$250,000 Public Service of Colorado3.6% 15/9/2042
220 0.01
Holding orNominalValue Investment
MarketValue
£000’s
% ofTotal
NetAssets
$300,000 Public Service of Colorado4.05% 15/9/2049
287 0.01
$100,000 Public Service Electric andGas 2.45% 15/1/2030
82 0.00
$500,000 Public Service Electric andGas 3% 15/5/2027
414 0.01
$100,000 Public Service Electric andGas 3.15% 1/1/2050
85 0.00
$300,000 Public Service Electric andGas 3.2% 1/8/2049
252 0.01
$500,000 Public Service Electric andGas 3.25% 1/9/2023
403 0.01
$200,000 Public Service Electric andGas 3.6% 1/12/2047
181 0.01
$200,000 Public Service Electric andGas 3.65% 1/9/2028
175 0.01
$250,000 Public Service Electric andGas 3.65% 1/9/2042
222 0.01
$250,000 Public Service Electric andGas 3.8% 1/1/2043
225 0.01
$150,000 Public Service Electric andGas 3.8% 1/3/2046
137 0.00
$200,000 Public Service Electric andGas 3.85% 1/5/2049
188 0.01
$250,000 Public Service Electric andGas 4.05% 1/5/2048
240 0.01
$500,000 Public Service Enterprise2.875% 15/6/2024
403 0.01
$200,000 Public Storage 3.094%15/9/2027
169 0.01
$100,000 Puget Energy 3.65%15/5/2025
80 0.00
$500,000 Puget Energy 4.1%15/6/2030
412 0.01
$300,000 Puget Energy 5.625%15/7/2022
239 0.01
$500,000 Puget Energy 6% 1/9/2021 393 0.01
$200,000 Puget Sound Energy 3.25%15/9/2049
168 0.01
$200,000 Puget Sound Energy4.223% 15/6/2048
190 0.01
$250,000 Puget Sound Energy5.638% 15/4/2041
268 0.01
$800,000 PVH 4.625% 10/7/2025 613 0.02
$500,000 Qatar Reinsurance 4.95%Perpetual 13/9/2168
367 0.01
$250,000 QBE Insurance 6.75%2/12/2044
211 0.01
$300,000 QBE Insurance 7.5%24/11/2043
251 0.01
iShares Overseas Corporate Bond Index Fund (UK)
Portfolio Statement (unaudited) continued
BlackRock Collective Investment Funds303

Holding orNominalValue Investment
MarketValue
£000’s
% ofTotal
NetAssets
$400,000 QIB Sukuk 3.251%23/5/2022
300 0.01
$1,052,000 QUALCOMM 1.3%20/5/2028
788 0.03
$1,325,000 QUALCOMM 1.65%20/5/2032
987 0.03
$600,000 QUALCOMM 2.15%20/5/2030
473 0.02
$1,000,000 QUALCOMM 3.25%20/5/2027
844 0.03
$1,000,000 QUALCOMM 4.3%20/5/2047
954 0.03
$200,000 QUALCOMM 4.65%20/5/2035
201 0.01
$200,000 QUALCOMM 4.8%20/5/2045
203 0.01
$800,000 Quest Diagnostics 2.95%30/6/2030
653 0.02
$500,000 Quest Diagnostics 3.5%30/3/2025
414 0.01
$400,000 Rakuten 3.546%27/11/2024Ø
321 0.01
$400,000 Ralph Lauren 2.95%15/6/2030
309 0.01
$500,000 Raymond James Financial4.65% 1/4/2030
455 0.02
$300,000 Raymond James Financial4.95% 15/7/2046
286 0.01
$500,000 Raytheon Technologies2.25% 1/7/2030
395 0.01
$300,000 Raytheon Technologies2.5% 15/12/2022
233 0.01
$250,000 Raytheon Technologies2.65% 1/11/2026
207 0.01
$500,000 Raytheon Technologies2.8% 15/3/2022
386 0.01
$500,000 Raytheon Technologies3.125% 4/5/2027
414 0.01
$500,000 Raytheon Technologies3.125% 1/7/2050
401 0.01
$500,000 Raytheon Technologies3.2% 15/3/2024
404 0.01
$500,000 Raytheon Technologies3.5% 15/3/2027
424 0.01
$300,000 Raytheon Technologies3.75% 1/11/2046
259 0.01
$400,000 Raytheon Technologies3.95% 16/8/2025
342 0.01
$300,000 Raytheon Technologies4.05% 4/5/2047
271 0.01
Holding orNominalValue Investment
MarketValue
£000’s
% ofTotal
NetAssets
$1,000,000 Raytheon Technologies4.125% 16/11/2028
890 0.03
$400,000 Raytheon Technologies4.15% 15/5/2045
362 0.01
$200,000 Raytheon Technologies4.2% 15/12/2044
173 0.01
$200,000 Raytheon Technologies4.35% 15/4/2047
186 0.01
$500,000 Raytheon Technologies4.45% 16/11/2038
462 0.02
$700,000 Raytheon Technologies4.5% 1/6/2042
665 0.02
$300,000 Raytheon Technologies4.625% 16/11/2048
295 0.01
$150,000 Raytheon Technologies4.8% 15/12/2043
144 0.01
$500,000 Raytheon Technologies5.7% 15/4/2040
521 0.02
$600,000 Raytheon Technologies6.05% 1/6/2036
638 0.02
$200,000 Raytheon Technologies6.125% 15/7/2038
219 0.01
$200,000 Raytheon Technologies7.5% 15/9/2029
219 0.01
$300,000 Realty Income 3%15/1/2027
242 0.01
$500,000 Realty Income 3.25%15/1/2031
415 0.01
$300,000 Realty Income 3.875%15/7/2024
248 0.01
$300,000 Realty Income 3.875%15/4/2025
254 0.01
$250,000 Realty Income 4.65%1/8/2023
208 0.01
$300,000 Realty Income 4.65%15/3/2047
292 0.01
$500,000 Reckitt Benckiser TreasuryServices 2.375% 24/6/2022
386 0.01
$400,000 Reckitt Benckiser TreasuryServices 2.75% 26/6/2024
321 0.01
$1,000,000 Reckitt Benckiser TreasuryServices 3% 26/6/2027
826 0.03
$400,000 Reckitt Benckiser TreasuryServices 3.625% 21/9/2023
324 0.01
$500,000 Regency Centers LP 3.6%1/2/2027
400 0.01
$500,000 Regency Centers LP 3.7%15/6/2030
411 0.01
$250,000 Regency Centers LP 4.65%15/3/2049
219 0.01
iShares Overseas Corporate Bond Index Fund (UK)
Portfolio Statement (unaudited) continued
BlackRock Collective Investment Funds 304

Holding orNominalValue Investment
MarketValue
£000’s
% ofTotal
NetAssets
$500,000 Regeneron Pharmaceuticals1.75% 15/9/2030
366 0.01
$500,000 Regeneron Pharmaceuticals2.8% 15/9/2050
357 0.01
$800,000 Regions Financial 2.25%18/5/2025
635 0.02
$500,000 Regions Financial 2.75%14/8/2022
389 0.01
$250,000 Regions Financial 7.375%10/12/2037
280 0.01
$300,000 Reinsurance of America4.7% 15/9/2023
248 0.01
$100,000 Reinsurance of America 5%1/6/2021
77 0.00
$700,000 Reliance Industries 3.667%30/11/2027
578 0.02
$750,000 Reliance Industries 4.125%28/1/2025Ø
617 0.02
$250,000 Reliance Industries 5.4%14/2/2022
197 0.01
$500,000 Reliance Standard LifeGlobal Funding II 2.15%21/1/2023
383 0.01
$800,000 Reliance Standard LifeGlobal Funding II 2.75%7/5/2025
625 0.02
$400,000 RELX Capital 3.5%16/3/2023
320 0.01
$250,000 RELX Capital 4% 18/3/2029 221 0.01
$300,000 RenaissanceRe Finance3.7% 1/4/2025
244 0.01
$800,000 Republic Services 1.45%15/2/2031
590 0.02
$500,000 Republic Services 2.5%15/8/2024
399 0.01
$200,000 Republic Services 3.05%1/3/2050
160 0.01
$500,000 Republic Services 3.2%15/3/2025
410 0.01
$500,000 Republic Services 3.375%15/11/2027
424 0.01
$500,000 Republic Services 3.95%15/5/2028
442 0.02
$200,000 Republic Services 5.25%15/11/2021
158 0.01
$500,000 Resorts World Las Vegas /RWLV Capital 4.625%16/4/2029
353 0.01
$400,000 Reynolds American 4%12/6/2022
317 0.01
Holding orNominalValue Investment
MarketValue
£000’s
% ofTotal
NetAssets
$500,000 Reynolds American 4.45%12/6/2025
425 0.01
$200,000 Reynolds American 4.85%15/9/2023
167 0.01
$300,000 Reynolds American 5.7%15/8/2035
278 0.01
$700,000 Reynolds American 5.85%15/8/2045
649 0.02
$300,000 Reynolds American 6.15%15/9/2043
282 0.01
$300,000 Rio Tinto Alcan 6.125%15/12/2033
329 0.01
$500,000 Rio Tinto Finance USA3.75% 15/6/2025
423 0.01
$200,000 Rio Tinto Finance USA4.125% 21/8/2042
190 0.01
$300,000 Rio Tinto Finance USA4.75% 22/3/2042
305 0.01
$150,000 Rio Tinto Finance USA 5.2%2/11/2040
161 0.01
$300,000 Rio Tinto Finance USA7.125% 15/7/2028
317 0.01
$1,000,000 Riyad Bank 3.174%25/2/2030
748 0.03
$500,000 Rizal Commercial Banking3% 11/9/2024
378 0.01
$400,000 Roche 1.75% 28/1/2022 305 0.01
$200,000 Roche 2.375% 28/1/2027 162 0.01
$350,000 Roche 2.625% 15/5/2026 289 0.01
$400,000 Roche 2.875% 29/9/2021 306 0.01
$200,000 Roche 3% 10/11/2025 165 0.01
$250,000 Roche 3.25% 17/9/2023 202 0.01
$200,000 Roche 3.35% 30/9/2024 166 0.01
$500,000 Roche 3.625% 17/9/2028 436 0.02
$200,000 Roche 4% 28/11/2044 196 0.01
$200,000 Roche 7% 1/3/2039 247 0.01
$250,000 Rochester Gas and Electric3.1% 1/6/2027
206 0.01
$500,000 Rockwell Automation 3.5%1/3/2029
433 0.02
$200,000 Rockwell Automation 4.2%1/3/2049
199 0.01
$600,000 Rogers Communications3.625% 15/12/2025
510 0.02
$350,000 Rogers Communications3.7% 15/11/2049
298 0.01
$300,000 Rogers Communications4.1% 1/10/2023
247 0.01
$300,000 Rogers Communications4.3% 15/2/2048
278 0.01
iShares Overseas Corporate Bond Index Fund (UK)
Portfolio Statement (unaudited) continued
BlackRock Collective Investment Funds305

Holding orNominalValue Investment
MarketValue
£000’s
% ofTotal
NetAssets
$400,000 Rogers Communications4.35% 1/5/2049
371 0.01
$100,000 Rogers Communications4.35% 1/5/2049
93 0.00
$150,000 Rogers Communications4.5% 15/3/2043
137 0.00
$300,000 Rogers Communications 5%15/3/2044
293 0.01
$100,000 Rogers Communications5.45% 1/10/2043
103 0.00
$150,000 Rogers Communications7.5% 15/8/2038
174 0.01
$500,000 Roper Technologies 1%15/9/2025
376 0.01
$500,000 Roper Technologies 1.75%15/2/2031
375 0.01
$400,000 Roper Technologies 2.35%15/9/2024
317 0.01
$400,000 Roper Technologies 2.8%15/12/2021
307 0.01
$400,000 Roper Technologies 2.95%15/9/2029
328 0.01
$500,000 Roper Technologies 3.8%15/12/2026
432 0.02
$400,000 Roper Technologies 4.2%15/9/2028
358 0.01
$300,000 Ross Stores 4.8% 15/4/2030 270 0.01
$250,000 Ross Stores 5.45%15/4/2050
240 0.01
$1,000,000 Royal Bank of Canada 1.6%17/4/2023
772 0.03
$500,000 Royal Bank of Canada2.25% 1/11/2024
398 0.01
$500,000 Royal Bank of Canada2.55% 16/7/2024
402 0.01
$500,000 Royal Bank of Canada2.75% 1/2/2022
387 0.01
$500,000 Royal Bank of Canada 3.7%5/10/2023
410 0.01
$500,000 Royal Bank of Canada4.65% 27/1/2026
442 0.02
$600,000 Royalty Pharma 1.75%2/9/2027
447 0.02
$600,000 Royalty Pharma 2.2%2/9/2030
444 0.02
$700,000 Royalty Pharma 3.55%2/9/2050
503 0.02
$400,000 RPM International 3.75%15/3/2027
324 0.01
$300,000 RPM International 4.55%1/3/2029
261 0.01
Holding orNominalValue Investment
MarketValue
£000’s
% ofTotal
NetAssets
$300,000 RWJ Barnabas Health3.477% 1/7/2049
237 0.01
$500,000 Ryder System 2.5%1/9/2024
395 0.01
$100,000 Ryder System 2.9%1/12/2026
80 0.00
$500,000 Ryder System 3.45%15/11/2021
386 0.01
$500,000 Ryder System 3.65%18/3/2024
408 0.01
$500,000 Ryder System 3.75%9/6/2023
403 0.01
$400,000 S&P Global 1.25%15/8/2030
295 0.01
$400,000 S&P Global 2.3% 15/8/2060 277 0.01
$52,000 S&P Global 2.95%22/1/2027
43 0.00
$200,000 S&P Global 3.25%1/12/2049
174 0.01
$550,000 S&P Global 4% 15/6/2025 470 0.02
$400,000 Sabal Trail Transmission4.832% 1/5/2048
350 0.01
$175,000 Sabine Pass Liquefaction4.2% 15/3/2028
144 0.01
$700,000 Sabine Pass Liquefaction4.2% 15/3/2028
575 0.02
$600,000 Sabine Pass Liquefaction4.5% 15/5/2030
513 0.02
$400,000 Sabine Pass Liquefaction5% 15/3/2027
340 0.01
$600,000 Sabine Pass Liquefaction5.625% 15/4/2023
495 0.02
$700,000 Sabine Pass Liquefaction5.625% 1/3/2025
609 0.02
$500,000 Sabine Pass Liquefaction5.75% 15/5/2024
427 0.01
$400,000 Sabine Pass Liquefaction5.875% 30/6/2026
359 0.01
$500,000 Sabine Pass Liquefaction6.25% 15/3/2022
399 0.01
$200,000 Sabra Health Care LP5.125% 15/8/2026
163 0.01
$275,000 salesforce.com 3.25%11/4/2023
220 0.01
$600,000 salesforce.com 3.25%11/4/2023
481 0.02
$200,000 salesforce.com 3.7%11/4/2028
175 0.01
$500,000 Samba Funding 2.75%2/10/2024
389 0.01
iShares Overseas Corporate Bond Index Fund (UK)
Portfolio Statement (unaudited) continued
BlackRock Collective Investment Funds 306

Holding orNominalValue Investment
MarketValue
£000’s
% ofTotal
NetAssets
$500,000 Samba Funding 2.9%29/1/2027
389 0.01
$400,000 San Diego Gas & Electric2.5% 15/5/2026
323 0.01
$150,000 San Diego Gas & Electric3% 15/8/2021
115 0.00
$300,000 San Diego Gas & Electric3.32% 15/4/2050
250 0.01
$400,000 San Diego Gas & Electric3.6% 1/9/2023
324 0.01
$300,000 San Diego Gas & Electric4.1% 15/6/2049
275 0.01
$200,000 San Diego Gas & Electric4.5% 15/8/2040
187 0.01
$650,000 Sands China 4.6%8/8/2023Ø
519 0.02
$600,000 Sands China 5.125%8/8/2025
496 0.02
$900,000 Sands China 5.4% 8/8/2028 762 0.03
$600,000 Sanofi 3.375% 19/6/2023 485 0.02
$500,000 Sanofi 3.625% 19/6/2028 439 0.02
$400,000 Santander USA 3.244%5/10/2026
318 0.01
$500,000 Santander USA 3.4%18/1/2023
392 0.01
$800,000 Santander USA 3.5%7/6/2024
641 0.02
$400,000 Santander USA 4.5%17/7/2025
330 0.01
$500,000 Santander UK 2.1%13/1/2023
387 0.01
$500,000 Santander UK 2.875%5/8/2021
382 0.01
$400,000 Santander UK 2.875%18/6/2024
323 0.01
$500,000 Santander UK 3.373%5/1/2024
393 0.01
$300,000 Santander UK 3.571%10/1/2023
232 0.01
$500,000 Santander UK 3.823%3/11/2028
417 0.01
$250,000 Santander UK 4.75%15/9/2025
207 0.01
$500,000 Santander UK 4.796%15/11/2024
416 0.01
$200,000 Santander UK 5.625%15/9/2045
187 0.01
$400,000 Santos Finance 5.25%13/3/2029
332 0.01
$300,000 Scentre Trust 1 / ScentreTrust 2 3.5% 12/2/2025
237 0.01
Holding orNominalValue Investment
MarketValue
£000’s
% ofTotal
NetAssets
$500,000 Scentre Trust 1 / ScentreTrust 2 3.625% 28/1/2026
399 0.01
$500,000 Scentre Trust 1 / ScentreTrust 2 3.75% 23/3/2027
395 0.01
$500,000 Scentre Trust 1 / ScentreTrust 2 4.375% 28/5/2030
420 0.01
$500,000 Schlumberger 3.75%1/5/2024
407 0.01
$353,000 Schlumberger 3.9%17/5/2028
288 0.01
$20,000 Schlumberger 4%21/12/2025
17 0.00
$500,000 Schlumberger 4.3%1/5/2029
422 0.01
$200,000 Schlumberger FinanceCanada 2.65% 20/11/2022
155 0.01
$300,000 Schlumberger Investment2.4% 1/8/2022
230 0.01
$400,000 Schlumberger Investment3.65% 1/12/2023
324 0.01
$350,000 Schneider Electric 2.95%27/9/2022
274 0.01
$214,000 Seagate HDD Cayman4.091% 1/6/2029
171 0.01
$100,000 Seagate HDD Cayman4.75% 1/1/2025
81 0.00
$250,000 Seagate HDD Cayman4.875% 1/3/2024
204 0.01
$376,000 Seagate HDD Cayman4.875% 1/6/2027
314 0.01
$100,000 Seagate HDD Cayman5.75% 1/12/2034
85 0.00
$200,000 Securian Financial 4.8%15/4/2048
180 0.01
$200,000 Selective Insurance 5.375%1/3/2049
184 0.01
$300,000 Sempra Energy 2.875%1/10/2022
233 0.01
$800,000 Sempra Energy 3.25%15/6/2027
663 0.02
$500,000 Sempra Energy 3.4%1/2/2028
417 0.01
$400,000 Sempra Energy 3.55%15/6/2024
326 0.01
$400,000 Sempra Energy 3.8%1/2/2038
343 0.01
$100,000 Sempra Energy 4%1/2/2048
87 0.00
$100,000 Sempra Energy 6%15/10/2039
105 0.00
$1,000,000 ServiceNow 1.4% 1/9/2030 735 0.03
iShares Overseas Corporate Bond Index Fund (UK)
Portfolio Statement (unaudited) continued
BlackRock Collective Investment Funds307

Holding orNominalValue Investment
MarketValue
£000’s
% ofTotal
NetAssets
$300,000 SES GLOBAL Americas GP5.3% 25/3/2044
234 0.01
$500,000 Seven & i 3.35% 17/9/2021 383 0.01
$650,000 Severstal Via Steel Capital3.85% 27/8/2021
496 0.02
$340,000 SF Investment 4.125%26/7/2023
272 0.01
$300,000 Shanghai Port BVIDevelopment 2.875%18/6/2024Ø
236 0.01
$300,000 Shanghai Port BVIDevelopment 3.375%18/6/2029Ø
246 0.01
$500,000 Shanghai Port BVIDevelopment 2 2.375%13/7/2030
380 0.01
$500,000 Shell International Finance2% 7/11/2024
395 0.01
$600,000 Shell International Finance2.25% 6/1/2023
469 0.02
$500,000 Shell International Finance2.375% 21/8/2022
388 0.01
$500,000 Shell International Finance2.375% 6/4/2025
401 0.01
$500,000 Shell International Finance2.375% 7/11/2029
398 0.01
$500,000 Shell International Finance2.5% 12/9/2026
410 0.01
$900,000 Shell International Finance2.75% 6/4/2030
740 0.03
$700,000 Shell International Finance2.875% 10/5/2026
582 0.02
$400,000 Shell International Finance3.125% 7/11/2049
314 0.01
$500,000 Shell International Finance3.25% 11/5/2025
417 0.01
$700,000 Shell International Finance3.25% 6/4/2050
564 0.02
$500,000 Shell International Finance3.4% 12/8/2023
405 0.01
$250,000 Shell International Finance3.5% 13/11/2023
204 0.01
$250,000 Shell International Finance3.75% 12/9/2046
214 0.01
$300,000 Shell International Finance3.875% 13/11/2028
264 0.01
$900,000 Shell International Finance4% 10/5/2046
803 0.03
$900,000 Shell International Finance4.375% 11/5/2045
835 0.03
Holding orNominalValue Investment
MarketValue
£000’s
% ofTotal
NetAssets
$600,000 Shell International Finance4.55% 12/8/2043
562 0.02
$400,000 Shell International Finance5.5% 25/3/2040
419 0.01
$850,000 Shell International Finance6.375% 15/12/2038
951 0.03
$500,000 Sherwin-Williams 2.3%15/5/2030
388 0.01
$25,000 Sherwin-Williams 2.75%1/6/2022
19 0.00
$200,000 Sherwin-Williams 3.3%15/5/2050
160 0.01
$500,000 Sherwin-Williams 3.45%1/8/2025
415 0.01
$400,000 Sherwin-Williams 3.8%15/8/2049
344 0.01
$700,000 Sherwin-Williams 3.95%15/1/2026
596 0.02
$300,000 Sherwin-Williams 4.5%1/6/2047Ø
283 0.01
$500,000 Shimao 5.6% 15/7/2026 404 0.01
$600,000 Shimao 6.125% 21/2/2024Ø 478 0.02
$200,000 Shinhan Bank 3.875%5/11/2023
164 0.01
$200,000 Shinhan Bank 3.875%24/3/2026
164 0.01
$500,000 Shinhan Bank 4.5%26/3/2028
426 0.01
$500,000 Shinhan Financial 3.34%5/2/2030
391 0.01
$272,000 ShireAcquisitions InvestmentsIreland DAC 2.4% 23/9/2021
207 0.01
$850,000 ShireAcquisitions InvestmentsIreland DAC 2.875%23/9/2023
676 0.02
$1,300,000 ShireAcquisitions InvestmentsIreland DAC 3.2% 23/9/2026
1,088 0.04
$300,000 Siam Commercial BankPCL/Cayman Islands 4.4%11/2/2029
257 0.01
$800,000 SIB Sukuk III 2.85%23/6/2025
614 0.02
$700,000 SiemensFinancieringsmaatschappij2.35% 15/10/2026
565 0.02
$600,000 SiemensFinancieringsmaatschappij2.7% 16/3/2022
464 0.02
iShares Overseas Corporate Bond Index Fund (UK)
Portfolio Statement (unaudited) continued
BlackRock Collective Investment Funds 308
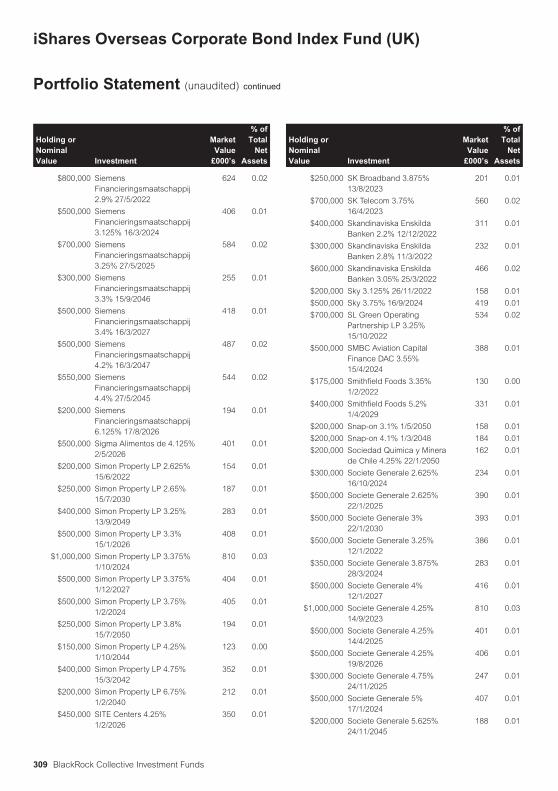
Holding orNominalValue Investment
MarketValue
£000’s
% ofTotal
NetAssets
$800,000 SiemensFinancieringsmaatschappij2.9% 27/5/2022
624 0.02
$500,000 SiemensFinancieringsmaatschappij3.125% 16/3/2024
406 0.01
$700,000 SiemensFinancieringsmaatschappij3.25% 27/5/2025
584 0.02
$300,000 SiemensFinancieringsmaatschappij3.3% 15/9/2046
255 0.01
$500,000 SiemensFinancieringsmaatschappij3.4% 16/3/2027
418 0.01
$500,000 SiemensFinancieringsmaatschappij4.2% 16/3/2047
487 0.02
$550,000 SiemensFinancieringsmaatschappij4.4% 27/5/2045
544 0.02
$200,000 SiemensFinancieringsmaatschappij6.125% 17/8/2026
194 0.01
$500,000 Sigma Alimentos de 4.125%2/5/2026
401 0.01
$200,000 Simon Property LP 2.625%15/6/2022
154 0.01
$250,000 Simon Property LP 2.65%15/7/2030
187 0.01
$400,000 Simon Property LP 3.25%13/9/2049
283 0.01
$500,000 Simon Property LP 3.3%15/1/2026
408 0.01
$1,000,000 Simon Property LP 3.375%1/10/2024
810 0.03
$500,000 Simon Property LP 3.375%1/12/2027
404 0.01
$500,000 Simon Property LP 3.75%1/2/2024
405 0.01
$250,000 Simon Property LP 3.8%15/7/2050
194 0.01
$150,000 Simon Property LP 4.25%1/10/2044
123 0.00
$400,000 Simon Property LP 4.75%15/3/2042
352 0.01
$200,000 Simon Property LP 6.75%1/2/2040
212 0.01
$450,000 SITE Centers 4.25%1/2/2026
350 0.01
Holding orNominalValue Investment
MarketValue
£000’s
% ofTotal
NetAssets
$250,000 SK Broadband 3.875%13/8/2023
201 0.01
$700,000 SK Telecom 3.75%16/4/2023
560 0.02
$400,000 Skandinaviska EnskildaBanken 2.2% 12/12/2022
311 0.01
$300,000 Skandinaviska EnskildaBanken 2.8% 11/3/2022
232 0.01
$600,000 Skandinaviska EnskildaBanken 3.05% 25/3/2022
466 0.02
$200,000 Sky 3.125% 26/11/2022 158 0.01
$500,000 Sky 3.75% 16/9/2024 419 0.01
$700,000 SL Green OperatingPartnership LP 3.25%15/10/2022
534 0.02
$500,000 SMBC Aviation CapitalFinance DAC 3.55%15/4/2024
388 0.01
$175,000 Smithfield Foods 3.35%1/2/2022
130 0.00
$400,000 Smithfield Foods 5.2%1/4/2029
331 0.01
$200,000 Snap-on 3.1% 1/5/2050 158 0.01
$200,000 Snap-on 4.1% 1/3/2048 184 0.01
$200,000 Sociedad Quimica y Minerade Chile 4.25% 22/1/2050
162 0.01
$300,000 Societe Generale 2.625%16/10/2024
234 0.01
$500,000 Societe Generale 2.625%22/1/2025
390 0.01
$500,000 Societe Generale 3%22/1/2030
393 0.01
$500,000 Societe Generale 3.25%12/1/2022
386 0.01
$350,000 Societe Generale 3.875%28/3/2024
283 0.01
$500,000 Societe Generale 4%12/1/2027
416 0.01
$1,000,000 Societe Generale 4.25%14/9/2023
810 0.03
$500,000 Societe Generale 4.25%14/4/2025
401 0.01
$500,000 Societe Generale 4.25%19/8/2026
406 0.01
$300,000 Societe Generale 4.75%24/11/2025
247 0.01
$500,000 Societe Generale 5%17/1/2024
407 0.01
$200,000 Societe Generale 5.625%24/11/2045
188 0.01
iShares Overseas Corporate Bond Index Fund (UK)
Portfolio Statement (unaudited) continued
BlackRock Collective Investment Funds309

Holding orNominalValue Investment
MarketValue
£000’s
% ofTotal
NetAssets
$300,000 Solvay Finance America4.45% 3/12/2025
253 0.01
$200,000 Sompo Japan Insurance5.325% 28/3/2073
162 0.01
$200,000 Sonoco Products 5.75%1/11/2040
196 0.01
$400,000 Southern 2.35% 1/7/2021 303 0.01
$1,000,000 Southern 2.95% 1/7/2023 794 0.03
$500,000 Southern 3.7% 30/4/2030 428 0.01
$600,000 Southern 4.4% 1/7/2046 539 0.02
$300,000 Southern 5.5% 15/3/2057 231 0.01
$1,000,000 Southern Gas Capital 1.75%15/1/2031
741 0.03
$500,000 Southern Gas Capital 2.45%1/10/2023
393 0.01
$250,000 Southern Gas Capital 3.95%1/10/2046
210 0.01
$150,000 Southern Gas Capital 4.4%30/5/2047
137 0.00
$200,000 Southern Gas Capital5.875% 15/3/2041
207 0.01
$500,000 Southern California Edison2.25% 1/6/2030
379 0.01
$400,000 Southern California Edison3.6% 1/2/2045
309 0.01
$700,000 Southern California Edison3.65% 1/3/2028
587 0.02
$300,000 Southern California Edison3.65% 1/2/2050
238 0.01
$500,000 Southern California Edison3.875% 1/6/2021
380 0.01
$600,000 Southern California Edison4% 1/4/2047
490 0.02
$250,000 Southern California Edison4.05% 15/3/2042
206 0.01
$500,000 Southern California Edison4.125% 1/3/2048
417 0.01
$200,000 Southern California Edison4.65% 1/10/2043
174 0.01
$300,000 Southern California Edison4.875% 1/3/2049
272 0.01
$200,000 Southern California Edison5.5% 15/3/2040
190 0.01
$200,000 Southern California Edison5.95% 1/2/2038
196 0.01
$550,000 Southern California Edison6.05% 15/3/2039
543 0.02
$400,000 Southern California Gas2.55% 1/2/2030
326 0.01
$300,000 Southern California Gas3.75% 15/9/2042
265 0.01
Holding orNominalValue Investment
MarketValue
£000’s
% ofTotal
NetAssets
$300,000 Southern California Gas3.95% 15/2/2050
284 0.01
$200,000 Southern California Gas4.3% 15/1/2049
196 0.01
$75,000 Southern Copper 3.875%23/4/2025
62 0.00
$400,000 Southern Copper 5.25%8/11/2042
382 0.01
$550,000 Southern Copper 5.875%23/4/2045
570 0.02
$600,000 Southern Copper 6.75%16/4/2040
647 0.02
$150,000 Southern Copper 7.5%27/7/2035
167 0.01
$150,000 Southern Natural Gas 4.8%15/3/2047
123 0.00
$100,000 Southern Union 7.6%1/2/2024
84 0.00
$200,000 Southwest Airlines 2.625%10/2/2030
140 0.00
$250,000 Southwest Airlines 3%15/11/2026
188 0.01
$200,000 Southwest Airlines 4.75%4/5/2023
159 0.01
$500,000 Southwest Airlines 5.125%15/6/2027
408 0.01
$900,000 Southwest Airlines 5.25%4/5/2025
734 0.03
$150,000 Southwest Gas 2.2%15/6/2030
118 0.00
$200,000 Southwest Gas 3.7%1/4/2028
170 0.01
$300,000 Southwestern Electric Power3.85% 1/2/2048
253 0.01
$200,000 Southwestern Electric Power4.1% 15/9/2028
175 0.01
$500,000 Southwestern PublicService 3.15% 1/5/2050
407 0.01
$250,000 Southwestern PublicService 3.4% 15/8/2046
210 0.01
$200,000 Southwestern PublicService 3.7% 15/8/2047
175 0.01
$300,000 Spectra Energy Partners LP3.375% 15/10/2026
247 0.01
$200,000 Spectra Energy Partners LP4.5% 15/3/2045
175 0.01
$300,000 Spectra Energy Partners LP5.95% 25/9/2043
291 0.01
$200,000 Spirit Realty LP 3.2%15/1/2027
151 0.01
iShares Overseas Corporate Bond Index Fund (UK)
Portfolio Statement (unaudited) continued
BlackRock Collective Investment Funds 310

Holding orNominalValue Investment
MarketValue
£000’s
% ofTotal
NetAssets
$200,000 Spirit Realty LP 3.2%15/2/2031
146 0.01
$200,000 Spirit Realty LP 3.4%15/1/2030
149 0.01
$1,000,000 Sprint Spectrum / SprintSpectrum II / SprintSpectrum III 4.738%20/9/2029
810 0.03
$500,000 Sprint Spectrum / SprintSpectrum II / SprintSpectrum III 5.152%20/9/2029
439 0.02
$300,000 SSE 4.75% 16/9/2077 229 0.01
$500,000 SSM Health Care 3.823%1/6/2027
411 0.01
$800,000 Standard Chartered 2.819%30/1/2026
620 0.02
$400,000 Standard Chartered 3.516%12/2/2030Ø
308 0.01
$500,000 Standard Chartered 3.785%21/5/2025
399 0.01
$600,000 Standard Chartered 3.885%15/3/2024
474 0.02
$500,000 Standard Chartered 3.95%11/1/2023
390 0.01
$500,000 Standard Chartered 4.05%12/4/2026
413 0.01
$800,000 Standard Chartered 4.3%19/2/2027
644 0.02
$200,000 Standard Chartered 4.305%21/5/2030
169 0.01
$900,000 Standard Chartered 4.644%1/4/2031
788 0.03
$300,000 Standard Chartered 4.866%15/3/2033
246 0.01
$300,000 Standard Chartered 5.2%26/1/2024
246 0.01
$200,000 Standard Chartered 5.3%9/1/2043
182 0.01
$300,000 Standard Chartered 5.7%25/1/2022
236 0.01
$600,000 Standard Chartered 5.7%26/3/2044
583 0.02
$400,000 Standard Life Aberdeen4.25% 30/6/2028
315 0.01
$200,000 Stanford Health Care3.795% 15/11/2048
188 0.01
$200,000 Stanley Black & Decker2.3% 15/3/2030
158 0.01
$400,000 Stanley Black & Decker2.9% 1/11/2022
315 0.01
Holding orNominalValue Investment
MarketValue
£000’s
% ofTotal
NetAssets
$400,000 Stanley Black & Decker 4%15/3/2060
314 0.01
$400,000 Stanley Black & Decker4.25% 15/11/2028
361 0.01
$600,000 Starbucks 2% 12/3/2027 470 0.02
$500,000 Starbucks 2.25% 12/3/2030 386 0.01
$500,000 Starbucks 2.45% 15/6/2026 405 0.01
$500,000 Starbucks 3.1% 1/3/2023 397 0.01
$150,000 Starbucks 3.35% 12/3/2050 115 0.00
$400,000 Starbucks 3.5% 15/11/2050 317 0.01
$1,000,000 Starbucks 3.55% 15/8/2029 860 0.03
$250,000 Starbucks 3.75% 1/12/2047 204 0.01
$500,000 Starbucks 3.8% 15/8/2025 425 0.01
$300,000 Starbucks 4.45% 15/8/2049 272 0.01
$300,000 Starbucks 4.5% 15/11/2048 276 0.01
$350,000 State Street 2.354%1/11/2025
279 0.01
$400,000 State Street 2.65%19/5/2026
331 0.01
$400,000 State Street 2.653%15/5/2023
310 0.01
$300,000 State Street 3.031%1/11/2034
246 0.01
$300,000 State Street 3.1% 15/5/2023 240 0.01
$600,000 State Street 3.152%30/3/2031
512 0.02
$1,000,000 State Street 3.55%18/8/2025
852 0.03
$700,000 State Street 3.7%20/11/2023
578 0.02
$250,000 State Street 4.375%7/3/2021
191 0.01
$500,000 Steel Dynamics 2.8%15/12/2024
396 0.01
$300,000 Steel Dynamics 3.45%15/4/2030
246 0.01
$400,000 Steelcase 5.125%18/1/2029
324 0.01
$300,000 Steelcase 5.125%18/1/2029
243 0.01
$500,000 Stifel Financial 4%15/5/2030
402 0.01
$400,000 STORE Capital 4.5%15/3/2028
316 0.01
$400,000 Stryker 1.95% 15/6/2030 307 0.01
$300,000 Stryker 2.9% 15/6/2050 234 0.01
$700,000 Stryker 3.375% 1/11/2025 587 0.02
$200,000 Stryker 4.1% 1/4/2043 178 0.01
$400,000 Stryker 4.625% 15/3/2046 393 0.01
$500,000 Sumitomo 2.6% 9/7/2024Ø 395 0.01
iShares Overseas Corporate Bond Index Fund (UK)
Portfolio Statement (unaudited) continued
BlackRock Collective Investment Funds311

Holding orNominalValue Investment
MarketValue
£000’s
% ofTotal
NetAssets
$500,000 Sumitomo Life Insurance4% 14/9/2077
422 0.01
$250,000 Sumitomo Life Insurance6.5% 20/9/2073
213 0.01
$250,000 Sumitomo Mitsui Banking3.65% 23/7/2025
210 0.01
$300,000 Sumitomo Mitsui Banking3.95% 12/1/2022
235 0.01
$250,000 Sumitomo Mitsui Banking3.95% 19/7/2023
204 0.01
$400,000 Sumitomo Mitsui Banking3.95% 10/1/2024
328 0.01
$300,000 Sumitomo Mitsui Banking4.85% 1/3/2022
236 0.01
$800,000 Sumitomo Mitsui Financial1.474% 8/7/2025
610 0.02
$500,000 Sumitomo Mitsui Financial2.13% 8/7/2030
383 0.01
$500,000 Sumitomo Mitsui Financial2.348% 15/1/2025
397 0.01
$300,000 Sumitomo Mitsui Financial2.448% 27/9/2024
238 0.01
$500,000 Sumitomo Mitsui Financial2.632% 14/7/2026
406 0.01
$400,000 Sumitomo Mitsui Financial2.696% 16/7/2024
320 0.01
$300,000 Sumitomo Mitsui Financial2.724% 27/9/2029
240 0.01
$800,000 Sumitomo Mitsui Financial2.75% 15/1/2030
645 0.02
$1,000,000 Sumitomo Mitsui Financial2.778% 18/10/2022
782 0.03
$750,000 Sumitomo Mitsui Financial2.784% 12/7/2022
584 0.02
$300,000 Sumitomo Mitsui Financial2.846% 11/1/2022
231 0.01
$500,000 Sumitomo Mitsui Financial3.01% 19/10/2026
414 0.01
$700,000 Sumitomo Mitsui Financial3.04% 16/7/2029
573 0.02
$500,000 Sumitomo Mitsui Financial3.102% 17/1/2023
396 0.01
$300,000 Sumitomo Mitsui Financial3.202% 17/9/2029
243 0.01
$400,000 Sumitomo Mitsui Financial3.364% 12/7/2027
334 0.01
$500,000 Sumitomo Mitsui Financial3.446% 11/1/2027
419 0.01
$700,000 Sumitomo Mitsui Financial3.544% 17/1/2028
592 0.02
Holding orNominalValue Investment
MarketValue
£000’s
% ofTotal
NetAssets
$300,000 Sumitomo Mitsui Financial3.748% 19/7/2023
244 0.01
$400,000 Sumitomo Mitsui Financial3.936% 16/10/2023
330 0.01
$400,000 Sumitomo Mitsui Financial4.306% 16/10/2028
356 0.01
$400,000 Sumitomo Mitsui Financial4.436% 2/4/2024
329 0.01
$400,000 Sun Hung Kai PropertiesCapital Market 2.75%13/5/2030
316 0.01
$600,000 Sun Hung Kai PropertiesCapital Market 2.875%21/1/2030
477 0.02
$600,000 Sun Hung Kai PropertiesCapital Market 4.5%14/2/2022Ø
468 0.02
$500,000 Suncor Energy 3.1%15/5/2025
410 0.01
$300,000 Suncor Energy 3.6%1/12/2024
247 0.01
$400,000 Suncor Energy 4%15/11/2047
324 0.01
$400,000 Suncor Energy 5.35%15/7/2033
349 0.01
$600,000 Suncor Energy 6.5%15/6/2038
590 0.02
$200,000 Suncor Energy 6.8%15/5/2038
203 0.01
$200,000 Suncor Energy 6.85%1/6/2039
203 0.01
$500,000 Suncorp-Metway 2.8%4/5/2022
387 0.01
$240,000 Sunny Optical Technology3.75% 23/1/2023Ø
187 0.01
$600,000 Sunoco Logistics PartnersOperations LP 3.9%15/7/2026
470 0.02
$250,000 Sunoco Logistics PartnersOperations LP 4.25%1/4/2024
199 0.01
$300,000 Sunoco Logistics PartnersOperations LP 5.3%1/4/2044
213 0.01
$500,000 Sunoco Logistics PartnersOperations LP 5.4%1/10/2047
371 0.01
$200,000 Sunrise Cayman 5.25%11/3/2024
156 0.01
$600,000 Suntory 2.25% 16/10/2024 469 0.02
iShares Overseas Corporate Bond Index Fund (UK)
Portfolio Statement (unaudited) continued
BlackRock Collective Investment Funds 312

Holding orNominalValue Investment
MarketValue
£000’s
% ofTotal
NetAssets
$500,000 SURA Asset Management4.375% 11/4/2027
410 0.01
$300,000 Sutter Health 3.695%15/8/2028
253 0.01
$400,000 Suzano Austria 5%15/1/2030
318 0.01
$1,300,000 Suzano Austria 6%15/1/2029Ø
1,101 0.04
$400,000 Suzano Austria 7%16/3/2047
348 0.01
$800,000 Svenska Handelsbanken0.625% 30/6/2023
600 0.02
$400,000 Svenska Handelsbanken3.9% 20/11/2023
332 0.01
$800,000 Swedbank 2.8% 14/3/2022 618 0.02
$400,000 Swire Pacific MTNFinancing 4.5% 28/2/2022
311 0.01
$200,000 Swire Pacific Mtn FinancingHK 2.875% 30/1/2030
157 0.01
$200,000 Swire Properties MTNFinancing 3.5% 10/1/2028
161 0.01
$300,000 Swire Properties MTNFinancing 3.625%13/1/2026
244 0.01
$600,000 Swiss Re FinanceLuxembourg 4.25%Perpetual 4/9/2168Ø
458 0.02
$400,000 Swiss Re FinanceLuxembourg 5% 2/4/2049
341 0.01
$250,000 Swiss Re Treasury US4.25% 6/12/2042
231 0.01
$400,000 Sydney Airport Finance Pty3.625% 28/4/2026Ø
323 0.01
$100,000 Sydney Airport Finance Pty3.9% 22/3/2023
79 0.00
$600,000 Synchrony Bank 3%15/6/2022
463 0.02
$800,000 Synchrony Financial 3.75%15/8/2021
611 0.02
$500,000 Synchrony Financial 4.375%19/3/2024
402 0.01
$500,000 Synchrony Financial 4.5%23/7/2025
406 0.01
$400,000 Synchrony Financial 5.15%19/3/2029
342 0.01
$600,000 Synovus Bank/ColumbusGA 2.289% 10/2/2023
455 0.02
$300,000 Sysco 2.4% 15/2/2030 224 0.01
$100,000 Sysco 2.5% 15/7/2021 76 0.00
$200,000 Sysco 2.6% 12/6/2022 155 0.01
$400,000 Sysco 3.25% 15/7/2027 322 0.01
Holding orNominalValue Investment
MarketValue
£000’s
% ofTotal
NetAssets
$300,000 Sysco 3.3% 15/7/2026 243 0.01
$200,000 Sysco 3.3% 15/2/2050 140 0.00
$250,000 Sysco 3.75% 1/10/2025 206 0.01
$450,000 Sysco 4.5% 1/4/2046 363 0.01
$500,000 Sysco 5.95% 1/4/2030 471 0.02
$500,000 Sysco 6.6% 1/4/2040 499 0.02
$300,000 Sysco 6.6% 1/4/2050 310 0.01
$800,000 Takeda Pharmaceutical2.05% 31/3/2030
607 0.02
$500,000 Takeda Pharmaceutical3.025% 9/7/2040
387 0.01
$600,000 Takeda Pharmaceutical3.175% 9/7/2050
460 0.02
$400,000 Takeda Pharmaceutical3.375% 9/7/2060
307 0.01
$1,000,000 Takeda Pharmaceutical 4%26/11/2021
777 0.03
$500,000 Takeda Pharmaceutical4.4% 26/11/2023
417 0.01
$900,000 Takeda Pharmaceutical 5%26/11/2028
832 0.03
$400,000 Talent Yield Investments4.5% 25/4/2022
312 0.01
$400,000 Tampa Electric 3.625%15/6/2050
347 0.01
$200,000 Tampa Electric 4.35%15/5/2044
186 0.01
$300,000 Tanger Properties LP3.875% 15/7/2027
214 0.01
$400,000 Tapestry 4.125% 15/7/2027 292 0.01
$200,000 Tapestry 4.25% 1/4/2025 152 0.01
$600,000 Target 2.25% 15/4/2025 481 0.02
$750,000 Target 2.35% 15/2/2030 608 0.02
$500,000 Target 2.65% 15/9/2030 415 0.01
$650,000 Target 2.9% 15/1/2022 503 0.02
$300,000 Target 3.375% 15/4/2029 262 0.01
$500,000 Target 3.5% 1/7/2024 415 0.01
$500,000 Target 3.625% 15/4/2046 462 0.02
$200,000 Target 3.9% 15/11/2047 195 0.01
$200,000 Target 4% 1/7/2042 192 0.01
$400,000 Target 7% 15/1/2038 486 0.02
$200,000 TC PipeLines LP 3.9%25/5/2027
161 0.01
$200,000 TCI Communications7.875% 15/2/2026
203 0.01
$400,000 TD Ameritrade 3.3%1/4/2027
338 0.01
$300,000 TD Ameritrade 3.625%1/4/2025
252 0.01
iShares Overseas Corporate Bond Index Fund (UK)
Portfolio Statement (unaudited) continued
BlackRock Collective Investment Funds313

Holding orNominalValue Investment
MarketValue
£000’s
% ofTotal
NetAssets
$800,000 Teachers Insurance &Annuity Association ofAmerica 3.3% 15/5/2050
620 0.02
$600,000 Teachers Insurance &Annuity Association ofAmerica 4.27% 15/5/2047
532 0.02
$100,000 Teachers Insurance &Annuity Association ofAmerica 4.375% 15/9/2054
80 0.00
$400,000 Teachers Insurance &Annuity Association ofAmerica 4.9% 15/9/2044
377 0.01
$334,000 Teachers Insurance &Annuity Association ofAmerica 6.85% 16/12/2039
376 0.01
$400,000 Teck Resources 5.4%1/2/2043
309 0.01
$400,000 Teck Resources 6.25%15/7/2041
335 0.01
$800,000 TelefonicaEmisiones 4.103%8/3/2027Ø
684 0.02
$300,000 Telefonica Emisiones 4.57%27/4/2023
246 0.01
$300,000 TelefonicaEmisiones 4.665% 6/3/2038
264 0.01
$300,000 TelefonicaEmisiones 4.895% 6/3/2048
266 0.01
$750,000 TelefonicaEmisiones 5.213% 8/3/2047
679 0.02
$250,000 Telefonica Emisiones 5.52%1/3/2049
236 0.01
$200,000 Telefonica Emisiones 5.52%1/3/2049Ø
189 0.01
$700,000 TelefonicaEmisiones 7.045%20/6/2036
761 0.03
$250,000 Telefonica Europe 8.25%15/9/2030
284 0.01
$300,000 Telstra 3.125% 7/4/2025 246 0.01
$200,000 Telstra 4.8% 12/10/2021 156 0.01
$300,000 TELUS 2.8% 16/2/2027 240 0.01
$200,000 TELUS 4.3% 15/6/2049 181 0.01
$200,000 TELUS 4.6% 16/11/2048 188 0.01
$500,000 Tencent 1.81% 26/1/2026 382 0.01
$800,000 Tencent 2.39% 3/6/2030 620 0.02
$800,000 Tencent 3.24% 3/6/2050 634 0.02
$200,000 Tencent 3.28% 11/4/2024 160 0.01
$250,000 Tencent 3.29% 3/6/2060 200 0.01
$1,075,000 Tencent 3.595% 19/1/2028 893 0.03
$300,000 Tencent 3.8% 11/2/2025 248 0.01
Holding orNominalValue Investment
MarketValue
£000’s
% ofTotal
NetAssets
$200,000 Tencent 3.925% 19/1/2038 171 0.01
$800,000 Tencent 3.975% 11/4/2029 689 0.02
$200,000 Tencent 3.975% 11/4/2029 172 0.01
$200,000 Tencent 4.525% 11/4/2049 195 0.01
$300,000 Tengizchevroil FinanceInternational 3.25%15/8/2030
231 0.01
$200,000 Tengizchevroil FinanceInternational 4% 15/8/2026
160 0.01
$1,300,000 Tennessee Gas Pipeline2.9% 1/3/2030
1,015 0.04
$300,000 Tennessee Gas Pipeline 7%15/10/2028
289 0.01
$200,000 Tesco 6.15% 15/11/2037 193 0.01
$350,000 Texas Eastern TransmissionLP 2.8% 15/10/2022
268 0.01
$300,000 Texas Eastern TransmissionLP 4.15% 15/1/2048
239 0.01
$400,000 Texas Health Resources2.328% 15/11/2050
280 0.01
$300,000 Texas Instruments 1.75%4/5/2030
232 0.01
$600,000 Texas Instruments 1.85%15/5/2022
460 0.02
$500,000 Texas Instruments 2.9%3/11/2027
420 0.01
$300,000 Texas Instruments 3.875%15/3/2039
281 0.01
$350,000 Texas Instruments 4.15%15/5/2048
343 0.01
$600,000 Textron 2.45% 15/3/2031 443 0.02
$200,000 Textron 3% 1/6/2030 157 0.01
$500,000 Textron 4% 15/3/2026 412 0.01
$300,000 Thaioil Treasury Center2.5% 18/6/2030
226 0.01
$250,000 Thaioil Treasury Center3.5% 17/10/2049
178 0.01
$205,000 Thaioil Treasury Center3.75% 18/6/2050
152 0.01
$300,000 Thaioil Treasury Center5.375% 20/11/2048
281 0.01
$300,000 Thermo Fisher Scientific2.6% 1/10/2029
243 0.01
$500,000 Thermo Fisher Scientific2.95% 19/9/2026
418 0.01
$400,000 Thermo Fisher Scientific 3%15/4/2023
317 0.01
$300,000 Thermo Fisher Scientific3.2% 15/8/2027
253 0.01
iShares Overseas Corporate Bond Index Fund (UK)
Portfolio Statement (unaudited) continued
BlackRock Collective Investment Funds 314

Holding orNominalValue Investment
MarketValue
£000’s
% ofTotal
NetAssets
$200,000 Thermo Fisher Scientific4.1% 15/8/2047
191 0.01
$500,000 Thermo Fisher Scientific4.133% 25/3/2025
429 0.01
$500,000 Thermo Fisher Scientific4.15% 1/2/2024
414 0.01
$500,000 Thermo Fisher Scientific4.497% 25/3/2030
465 0.02
$150,000 Thermo Fisher Scientific5.3% 1/2/2044
157 0.01
$250,000 Thomson Reuters 3.35%15/5/2026
208 0.01
$200,000 Thomson Reuters 5.65%23/11/2043
199 0.01
$150,000 Thomson Reuters 5.85%15/4/2040
150 0.01
$500,000 Time Warner Cable 4%1/9/2021
382 0.01
$250,000 Time Warner Cable 4.125%15/2/2021
188 0.01
$400,000 Time Warner Cable 4.5%15/9/2042
335 0.01
$500,000 Time Warner Cable 5.5%1/9/2041
459 0.02
$700,000 Time Warner Cable 5.875%15/11/2040
665 0.02
$500,000 Time Warner Cable 6.55%1/5/2037
503 0.02
$300,000 Time Warner Cable 6.75%15/6/2039
312 0.01
$500,000 Time Warner Cable 7.3%1/7/2038
534 0.02
$300,000 TJX Cos 2.25% 15/9/2026 239 0.01
$100,000 TJX Cos 2.5% 15/5/2023 79 0.00
$500,000 TJX Cos 3.5% 15/4/2025 417 0.01
$300,000 TJX Cos 3.75% 15/4/2027 258 0.01
$500,000 TJX Cos 3.875% 15/4/2030 444 0.02
$200,000 TJX Cos 4.5% 15/4/2050 190 0.01
$400,000 T-Mobile USA 1.5%15/2/2026
303 0.01
$400,000 T-Mobile USA 2.05%15/2/2028
306 0.01
$500,000 T-Mobile USA 2.55%15/2/2031
390 0.01
$900,000 T-Mobile USA 3.5%15/4/2025
743 0.03
$1,350,000 T-Mobile USA 3.75%15/4/2027
1,141 0.04
$2,450,000 T-Mobile USA 3.875%15/4/2030
2,097 0.07
Holding orNominalValue Investment
MarketValue
£000’s
% ofTotal
NetAssets
$600,000 T-Mobile USA 4.375%15/4/2040
536 0.02
$1,000,000 T-Mobile USA 4.5%15/4/2050
912 0.03
$500,000 Toledo Hospital/The 5.75%15/11/2038
441 0.02
$500,000 Toronto-Dominion Bank/The1.15% 12/6/2025
382 0.01
$500,000 Toronto-Dominion Bank/The1.9% 1/12/2022
386 0.01
$600,000 Toronto-Dominion Bank/The2.65% 12/6/2024
482 0.02
$500,000 Toronto-Dominion Bank/The3.25% 11/3/2024
407 0.01
$500,000 Toronto-Dominion Bank/The3.5% 19/7/2023
408 0.01
$500,000 Toronto-Dominion Bank/The3.625% 15/9/2031
425 0.01
$250,000 Total Capital 3.883%11/10/2028
222 0.01
$800,000 Total Capital 4.25%15/12/2021
628 0.02
$500,000 Total Capital International2.434% 10/1/2025
401 0.01
$500,000 Total Capital International2.434% 10/1/2025
401 0.01
$300,000 Total Capital International2.829% 10/1/2030
249 0.01
$250,000 Total Capital International2.875% 17/2/2022
194 0.01
$400,000 Total Capital International2.986% 29/6/2041
313 0.01
$600,000 Total Capital International3.127% 29/5/2050
472 0.02
$250,000 Total Capital International3.386% 29/6/2060
204 0.01
$700,000 Total Capital International3.455% 19/2/2029
603 0.02
$400,000 Total Capital International3.461% 12/7/2049
333 0.01
$250,000 Total Capital International3.75% 10/4/2024
208 0.01
$500,000 Toyota Industries 3.235%16/3/2023
394 0.01
$700,000 Toyota Motor 2.358%2/7/2024
558 0.02
$1,000,000 Toyota Motor Credit 0.5%14/8/2023
748 0.03
$600,000 Toyota Motor Credit 2%7/10/2024
473 0.02
iShares Overseas Corporate Bond Index Fund (UK)
Portfolio Statement (unaudited) continued
BlackRock Collective Investment Funds315

Holding orNominalValue Investment
MarketValue
£000’s
% ofTotal
NetAssets
$500,000 Toyota Motor Credit 2.15%13/2/2030
396 0.01
$500,000 Toyota Motor Credit 2.25%18/10/2023
393 0.01
$800,000 Toyota Motor Credit 2.6%11/1/2022
616 0.02
$500,000 Toyota Motor Credit 2.7%11/1/2023
393 0.01
$500,000 Toyota Motor Credit 2.8%13/7/2022
391 0.01
$500,000 Toyota Motor Credit 2.9%30/3/2023
397 0.01
$400,000 Toyota Motor Credit 3%1/4/2025
329 0.01
$200,000 Toyota Motor Credit 3.2%11/1/2027
168 0.01
$250,000 Toyota Motor Credit 3.3%12/1/2022
194 0.01
$800,000 Toyota Motor Credit 3.375%1/4/2030
698 0.02
$500,000 Toyota Motor Credit 3.4%15/9/2021
385 0.01
$1,000,000 Toyota Motor Credit 3.45%20/9/2023
814 0.03
$300,000 Toyota Motor Credit 3.65%8/1/2029
265 0.01
$450,000 Trane Technologies Global4.25% 15/6/2023
372 0.01
$300,000 Trane TechnologiesLuxembourg Finance 3.55%1/11/2024
248 0.01
$300,000 Trane TechnologiesLuxembourg Finance 3.8%21/3/2029
263 0.01
$300,000 Trane TechnologiesLuxembourg Finance 3.8%21/3/2029
263 0.01
$200,000 Trane TechnologiesLuxembourg Finance 4.5%21/3/2049
188 0.01
$300,000 Trane TechnologiesLuxembourg Finance 4.65%1/11/2044
276 0.01
$750,000 Trans-Allegheny InterstateLine 3.85% 1/6/2025
616 0.02
$200,000 Transatlantic 8% 30/11/2039 233 0.01
$500,000 TransCanada PipeLines2.5% 1/8/2022
387 0.01
$200,000 TransCanada PipeLines3.75% 16/10/2023
163 0.01
Holding orNominalValue Investment
MarketValue
£000’s
% ofTotal
NetAssets
$500,000 TransCanada PipeLines4.1% 15/4/2030
434 0.02
$400,000 TransCanada PipeLines4.25% 15/5/2028
348 0.01
$200,000 TransCanada PipeLines4.625% 1/3/2034
180 0.01
$600,000 TransCanada PipeLines4.875% 15/5/2048
578 0.02
$100,000 TransCanada PipeLines4.875% 15/5/2048
96 0.00
$250,000 TransCanada PipeLines 5%16/10/2043
229 0.01
$500,000 TransCanada PipeLines5.1% 15/3/2049Ø
498 0.02
$450,000 TransCanada PipeLines6.1% 1/6/2040
456 0.02
$400,000 TransCanada PipeLines6.2% 15/10/2037
408 0.01
$150,000 TransCanada PipeLines7.625% 15/1/2039
173 0.01
$400,000 Transcanada Trust 5.5%15/9/2079
318 0.01
$500,000 Transcontinental Gas PipeLine 3.25% 15/5/2030
406 0.01
$200,000 Transcontinental Gas PipeLine 3.95% 15/5/2050
163 0.01
$300,000 Transcontinental Gas PipeLine 4% 15/3/2028
254 0.01
$200,000 Transcontinental Gas PipeLine 4.6% 15/3/2048
177 0.01
$300,000 Transelec 3.875% 12/1/2029 240 0.01
$400,000 Transportadora de Gas delPeru 4.25% 30/4/2028
333 0.01
$400,000 Transurban Finance Pty3.375% 22/3/2027
320 0.01
$300,000 Travelers Cos 4% 30/5/2047 280 0.01
$300,000 Travelers Cos 4.05%7/3/2048
278 0.01
$300,000 Travelers Cos 4.1% 4/3/2049 281 0.01
$200,000 Travelers Cos 4.3%25/8/2045
189 0.01
$150,000 Travelers Cos 4.6% 1/8/2043 147 0.01
$300,000 Travelers Cos 5.35%1/11/2040
315 0.01
$200,000 Travelers Cos 6.75%20/6/2036
231 0.01
$400,000 Trimble 4.9% 15/6/2028 357 0.01
$300,000 Trinity Acquisition 4.4%15/3/2026
258 0.01
$300,000 Trinity Health 3.434%1/12/2048
238 0.01
iShares Overseas Corporate Bond Index Fund (UK)
Portfolio Statement (unaudited) continued
BlackRock Collective Investment Funds 316

Holding orNominalValue Investment
MarketValue
£000’s
% ofTotal
NetAssets
$500,000 Truist Bank 2.15%6/12/2024
397 0.01
$600,000 Truist Bank 2.25%11/3/2030
466 0.02
$400,000 Truist Bank 2.45% 1/8/2022 310 0.01
$300,000 Truist Bank 2.625%15/1/2022
231 0.01
$250,000 Truist Bank 2.636%17/9/2029
193 0.01
$500,000 Truist Bank 3.2% 1/4/2024 408 0.01
$200,000 Truist Bank 3.3% 15/5/2026 168 0.01
$800,000 Truist Bank 3.689%2/8/2024
651 0.02
$500,000 Truist Bank 3.8%30/10/2026
435 0.02
$500,000 Truist Bank 4.05%3/11/2025
435 0.02
$500,000 Truist Financial 1.125%3/8/2027
373 0.01
$1,000,000 Truist Financial 2.2%16/3/2023
779 0.03
$300,000 Truist Financial 2.7%27/1/2022
231 0.01
$350,000 Truist Financial 2.75%1/4/2022
271 0.01
$500,000 Truist Financial 3.05%20/6/2022
390 0.01
$700,000 Truist Financial 3.7%5/6/2025
596 0.02
$250,000 Truist Financial 3.75%6/12/2023
206 0.01
$300,000 Truist Financial 3.875%19/3/2029
260 0.01
$500,000 Truist Financial 4% 1/5/2025 426 0.01
$300,000 Trust Fibra Uno 6.39%15/1/2050
231 0.01
$250,000 Trust Fibra Uno 6.95%30/1/2044Ø
204 0.01
$200,000 Trustees of BostonUniversity 4.061%1/10/2048
197 0.01
$600,000 Trustees of the University ofPennsylvania/The 2.396%1/10/2050
450 0.02
$250,000 TTX 4.2% 1/7/2046 224 0.01
$300,000 Tucson Electric Power 4%15/6/2050
272 0.01
$500,000 TWDC Enterprises18 1.85% 30/7/2026
393 0.01
$800,000 TWDC Enterprises18 2.45% 4/3/2022
617 0.02
Holding orNominalValue Investment
MarketValue
£000’s
% ofTotal
NetAssets
$300,000 TWDC Enterprises18 2.55% 15/2/2022
231 0.01
$300,000 TWDC Enterprises 18 3%30/7/2046
232 0.01
$200,000 TWDC Enterprises 18 3.7%1/12/2042
170 0.01
$200,000 TWDC Enterprises18 4.125% 1/6/2044
181 0.01
$300,000 TWDC Enterprises18 4.375% 16/8/2041
274 0.01
$250,000 Tyco Electronics 3.5%3/2/2022
193 0.01
$300,000 Tyco Electronics 3.7%15/2/2026
251 0.01
$500,000 Tyson Foods 3.55%2/6/2027
423 0.01
$500,000 Tyson Foods 3.95%15/8/2024
416 0.01
$500,000 Tyson Foods 4% 1/3/2026 430 0.01
$400,000 Tyson Foods 4.35%1/3/2029
361 0.01
$300,000 Tyson Foods 4.5%15/6/2022
238 0.01
$250,000 Tyson Foods 4.55%2/6/2047
235 0.01
$125,000 Tyson Foods 4.875%15/8/2034
123 0.00
$300,000 Tyson Foods 5.1%28/9/2048
308 0.01
$300,000 Tyson Foods 5.1%28/9/2048
308 0.01
$150,000 Tyson Foods 5.15%15/8/2044
147 0.01
$1,000,000 UBS 1.364% 30/1/2027 754 0.03
$500,000 UBS 2.65% 1/2/2022 385 0.01
$1,300,000 UBS 2.859% 15/8/2023 1,010 0.03
$400,000 UBS 3.126% 13/8/2030 332 0.01
$500,000 UBS 3.491% 23/5/2023 392 0.01
$750,000 UBS 4.125% 24/9/2025 643 0.02
$300,000 UBS 4.125% 15/4/2026 260 0.01
$500,000 UBS 4.253% 23/3/2028 434 0.02
$1,000,000 UBS AG/London 1.75%21/4/2022
762 0.03
$500,000 UBS AG/London 4.5%26/6/2048
533 0.02
$500,000 UDR 3.2% 15/1/2030 415 0.01
$400,000 UDR 4% 1/10/2025 336 0.01
$500,000 UniCredit 3.75% 12/4/2022 386 0.01
$400,000 UniCredit 6.572% 14/1/2022 318 0.01
iShares Overseas Corporate Bond Index Fund (UK)
Portfolio Statement (unaudited) continued
BlackRock Collective Investment Funds317

Holding orNominalValue Investment
MarketValue
£000’s
% ofTotal
NetAssets
$200,000 Unilever Capital 2%28/7/2026
160 0.01
$500,000 Unilever Capital 2.125%6/9/2029
398 0.01
$400,000 Unilever Capital 2.2%5/5/2022
308 0.01
$700,000 Unilever Capital 2.6%5/5/2024
562 0.02
$500,000 Unilever Capital 2.9%5/5/2027
420 0.01
$300,000 Unilever Capital 3.125%22/3/2023
239 0.01
$300,000 Unilever Capital 3.5%22/3/2028
264 0.01
$250,000 Unilever Capital 5.9%15/11/2032
276 0.01
$200,000 Union Electric 3.25%1/10/2049
169 0.01
$200,000 Union Electric 3.65%15/4/2045
176 0.01
$200,000 Union Electric 3.9%15/9/2042
177 0.01
$150,000 Union Electric 5.3%1/8/2037
151 0.01
$500,000 Union Pacific 2.15%5/2/2027
399 0.01
$500,000 Union Pacific 2.4% 5/2/2030 404 0.01
$200,000 Union Pacific 2.75%1/3/2026
163 0.01
$500,000 Union Pacific 2.75%1/3/2026
408 0.01
$400,000 Union Pacific 2.95%1/3/2022
311 0.01
$500,000 Union Pacific 3% 15/4/2027 418 0.01
$200,000 Union Pacific 3.25%15/1/2025
163 0.01
$550,000 Union Pacific 3.25%5/2/2050
455 0.02
$300,000 Union Pacific 3.35%15/8/2046
245 0.01
$500,000 Union Pacific 3.55%15/8/2039
440 0.02
$200,000 Union Pacific 3.646%15/2/2024
163 0.01
$500,000 Union Pacific 3.7% 1/3/2029 437 0.02
$200,000 Union Pacific 3.7% 1/3/2029 175 0.01
$200,000 Union Pacific 3.75%5/2/2070
170 0.01
$250,000 Union Pacific 3.799%1/10/2051
226 0.01
Holding orNominalValue Investment
MarketValue
£000’s
% ofTotal
NetAssets
$400,000 Union Pacific 3.839%20/3/2060
349 0.01
$600,000 Union Pacific 3.839%20/3/2060
523 0.02
$150,000 Union Pacific 3.875%1/2/2055
135 0.00
$500,000 Union Pacific 3.95%10/9/2028
442 0.02
$150,000 Union Pacific 3.95%15/8/2059
131 0.00
$50,000 Union Pacific 4% 1/2/2021 38 0.00
$200,000 Union Pacific 4% 15/4/2047 181 0.01
$200,000 Union Pacific 4.3%15/6/2042
183 0.01
$300,000 Union Pacific 4.3% 1/3/2049 290 0.01
$500,000 Union Pacific 4.375%10/9/2038
465 0.02
$400,000 Union Pacific 4.5%10/9/2048
397 0.01
$210,425 United Airlines 2016-1 ClassAA Pass Through Trust 3.1%7/1/2030
153 0.01
$216,961 United Airlines 2016-2 ClassAA Pass Through Trust2.875% 7/4/2030
152 0.01
$746,421 United Airlines 2018-1 ClassAA Pass Through Trust 3.5%1/9/2031
519 0.02
$200,000 United Overseas Bank2.88% 8/3/2027
152 0.01
$250,000 United Overseas Bank 3.5%16/9/2026
190 0.01
$300,000 United Overseas Bank3.75% 15/4/2029
240 0.01
$500,000 United Parcel Service2.35% 16/5/2022
385 0.01
$300,000 United Parcel Service2.45% 1/10/2022
234 0.01
$200,000 United Parcel Service 2.5%1/9/2029
164 0.01
$500,000 United Parcel Service3.05% 15/11/2027
423 0.01
$500,000 United Parcel Service 3.4%15/3/2029
434 0.02
$200,000 United Parcel Service 3.4%15/11/2046
170 0.01
$200,000 United Parcel Service 3.4%1/9/2049
172 0.01
$300,000 United Parcel Service3.625% 1/10/2042
260 0.01
iShares Overseas Corporate Bond Index Fund (UK)
Portfolio Statement (unaudited) continued
BlackRock Collective Investment Funds 318

Holding orNominalValue Investment
MarketValue
£000’s
% ofTotal
NetAssets
$300,000 United Parcel Service3.75% 15/11/2047
270 0.01
$500,000 United Parcel Service 3.9%1/4/2025
426 0.01
$300,000 United Parcel Service4.25% 15/3/2049
292 0.01
$500,000 United Parcel Service4.45% 1/4/2030
471 0.02
$200,000 United Parcel Service 5.2%1/4/2040
207 0.01
$400,000 United Parcel Service 5.3%1/4/2050
440 0.02
$400,000 United Parcel Service 6.2%15/1/2038
455 0.02
$500,000 UnitedHealth 1.25%15/1/2026
383 0.01
$500,000 UnitedHealth 2% 15/5/2030 391 0.01
$750,000 UnitedHealth 2.375%15/10/2022
585 0.02
$500,000 UnitedHealth 2.75%15/5/2040
396 0.01
$200,000 UnitedHealth 2.875%15/3/2022
154 0.01
$700,000 UnitedHealth 2.875%15/8/2029
587 0.02
$900,000 UnitedHealth 2.9%15/5/2050
715 0.02
$500,000 UnitedHealth 3.1%15/3/2026
420 0.01
$300,000 UnitedHealth 3.125%15/5/2060
246 0.01
$750,000 UnitedHealth 3.35%15/7/2022
592 0.02
$150,000 UnitedHealth 3.375%15/11/2021
115 0.00
$500,000 UnitedHealth 3.375%15/4/2027
426 0.01
$750,000 UnitedHealth 3.5%15/2/2024
617 0.02
$500,000 UnitedHealth 3.5%15/8/2039
434 0.02
$500,000 UnitedHealth 3.75%15/7/2025
428 0.01
$200,000 UnitedHealth 3.75%15/10/2047
179 0.01
$500,000 UnitedHealth 3.85%15/6/2028
442 0.02
$250,000 UnitedHealth 3.875%15/12/2028
223 0.01
$400,000 UnitedHealth 3.875%15/8/2059
374 0.01
Holding orNominalValue Investment
MarketValue
£000’s
% ofTotal
NetAssets
$200,000 UnitedHealth 3.95%15/10/2042
180 0.01
$300,000 UnitedHealth 4.2%15/1/2047
284 0.01
$200,000 UnitedHealth 4.25%15/3/2043
191 0.01
$300,000 UnitedHealth 4.25%15/4/2047
289 0.01
$1,000,000 UnitedHealth 4.25%15/6/2048
963 0.03
$300,000 UnitedHealth 4.45%15/12/2048
298 0.01
$850,000 UnitedHealth 4.625%15/7/2035
839 0.03
$150,000 UnitedHealth 4.625%15/11/2041
149 0.01
$500,000 UnitedHealth 4.75%15/7/2045
509 0.02
$250,000 UnitedHealth 5.95%15/2/2041
280 0.01
$200,000 UnitedHealth 6.5%15/6/2037
231 0.01
$250,000 UnitedHealth 6.875%15/2/2038
301 0.01
$500,000 Unity 1 Sukuk 3.86%30/11/2021
378 0.01
$400,000 Universal Health Services4.75% 1/8/2022
299 0.01
$100,000 University of Chicago/The2.761% 1/4/2045
79 0.00
$150,000 University of Chicago/The4.003% 1/10/2053
142 0.01
$200,000 University of Notre Dame duLac 3.394% 15/2/2048
177 0.01
$200,000 University of SouthernCalifornia 2.805% 1/10/2050
160 0.01
$600,000 University of SouthernCalifornia 3.028% 1/10/2039
495 0.02
$250,000 Unum 4% 15/3/2024 202 0.01
$400,000 Unum 4% 15/6/2029 327 0.01
$100,000 Unum 4.5% 15/12/2049 77 0.00
$100,000 Unum 5.75% 15/8/2042 85 0.00
$500,000 Upjohn 1.125% 22/6/2022 377 0.01
$300,000 Upjohn 1.65% 22/6/2025 230 0.01
$300,000 Upjohn 2.3% 22/6/2027 233 0.01
$500,000 Upjohn 2.7% 22/6/2030 389 0.01
$500,000 Upjohn 3.85% 22/6/2040 406 0.01
$700,000 Upjohn 4% 22/6/2050 569 0.02
$500,000 UPL 4.625% 16/6/2030 385 0.01
iShares Overseas Corporate Bond Index Fund (UK)
Portfolio Statement (unaudited) continued
BlackRock Collective Investment Funds319

Holding orNominalValue Investment
MarketValue
£000’s
% ofTotal
NetAssets
$400,000 US Bancorp 1.375%22/7/2030
296 0.01
$1,000,000 US Bancorp 1.45%12/5/2025
774 0.03
$750,000 US Bancorp 2.625%24/1/2022
578 0.02
$400,000 US Bancorp 2.95%15/7/2022
313 0.01
$250,000 US Bancorp 3% 15/3/2022 194 0.01
$500,000 US Bancorp 3.1%27/4/2026
418 0.01
$800,000 US Bancorp 3.15%27/4/2027
677 0.02
$500,000 US Bancorp 3.375%5/2/2024
408 0.01
$500,000 US Bancorp 3.6%11/9/2024
416 0.01
$350,000 US Bancorp 3.7%30/1/2024
289 0.01
$500,000 US Bank NA/Cincinnati OH2.05% 21/1/2025
396 0.01
$500,000 US Bank NA/Cincinnati OH2.65% 23/5/2022
388 0.01
$600,000 US Bank NA/Cincinnati OH2.8% 27/1/2025
489 0.02
$750,000 US Bank NA/Cincinnati OH2.85% 23/1/2023
593 0.02
$300,000 Vale 5.625% 11/9/2042 270 0.01
$750,000 Vale Overseas 6.25%10/8/2026Ø
666 0.02
$550,000 Vale Overseas 6.875%21/11/2036
546 0.02
$275,000 Vale Overseas 6.875%10/11/2039Ø
277 0.01
$300,000 Vale Overseas 8.25%17/1/2034
322 0.01
$300,000 Valero Energy 2.85%15/4/2025
240 0.01
$375,000 Valero Energy 3.4%15/9/2026
309 0.01
$250,000 Valero Energy 3.65%15/3/2025
205 0.01
$400,000 Valero Energy 4% 1/4/2029 336 0.01
$300,000 Valero Energy 4% 1/4/2029 252 0.01
$200,000 Valero Energy 4.35%1/6/2028
170 0.01
$500,000 Valero Energy 4.9%15/3/2045
444 0.02
$500,000 Valero Energy Partners LP4.375% 15/12/2026
430 0.01
Holding orNominalValue Investment
MarketValue
£000’s
% ofTotal
NetAssets
$700,000 Valero Energy Partners LP4.5% 15/3/2028
602 0.02
$300,000 Valmont Industries 5.25%1/10/2054
239 0.01
$200,000 Vanke Real Estate HongKong 3.5% 12/11/2029
159 0.01
$500,000 Vanke Real Estate HongKong 3.975% 9/11/2027Ø
409 0.01
$300,000 Ventas Realty LP 2.65%15/1/2025
234 0.01
$500,000 Ventas Realty LP 3.1%15/1/2023
388 0.01
$400,000 Ventas Realty LP 3.5%15/4/2024
319 0.01
$800,000 Ventas Realty LP 4%1/3/2028
647 0.02
$500,000 Ventas Realty LP 4.125%15/1/2026
419 0.01
$500,000 Ventas Realty LP 4.75%15/11/2030
427 0.01
$200,000 Ventas Realty LP 4.875%15/4/2049
165 0.01
$200,000 VEREIT OperatingPartnership LP 3.1%15/12/2029
150 0.01
$300,000 VEREIT OperatingPartnership LP 4.625%1/11/2025
248 0.01
$500,000 VEREIT OperatingPartnership LP 4.875%1/6/2026
417 0.01
$300,000 Verisk Analytics 4%15/6/2025
257 0.01
$300,000 Verisk Analytics 4.125%15/3/2029
268 0.01
$300,000 Verisk Analytics 5.5%15/6/2045
316 0.01
$500,000 Verizon Communications2.45% 1/11/2022
387 0.01
$1,225,000 Verizon Communications2.625% 15/8/2026
1,008 0.03
$500,000 Verizon Communications2.946% 15/3/2022
388 0.01
$500,000 Verizon Communications 3%22/3/2027
417 0.01
$500,000 Verizon Communications3.15% 22/3/2030
423 0.01
$715,000 Verizon Communications3.376% 15/2/2025
598 0.02
$400,000 Verizon Communications3.5% 1/11/2024
333 0.01
iShares Overseas Corporate Bond Index Fund (UK)
Portfolio Statement (unaudited) continued
BlackRock Collective Investment Funds 320

Holding orNominalValue Investment
MarketValue
£000’s
% ofTotal
NetAssets
$150,000 Verizon Communications3.85% 1/11/2042
134 0.00
$400,000 Verizon Communications3.875% 8/2/2029
354 0.01
$1,100,000 Verizon Communications 4%22/3/2050
1,030 0.04
$300,000 Verizon Communications4.016% 3/12/2029
269 0.01
$1,000,000 Verizon Communications4.016% 3/12/2029
898 0.03
$1,000,000 Verizon Communications4.125% 16/3/2027
884 0.03
$300,000 Verizon Communications4.125% 15/8/2046
278 0.01
$977,000 Verizon Communications4.272% 15/1/2036
895 0.03
$1,736,000 Verizon Communications4.329% 21/9/2028
1,570 0.05
$750,000 Verizon Communications4.4% 1/11/2034
698 0.02
$1,200,000 Verizon Communications4.5% 10/8/2033
1,137 0.04
$1,709,000 Verizon Communications4.522% 15/9/2048
1,678 0.06
$700,000 Verizon Communications4.672% 15/3/2055
719 0.02
$50,000 Verizon Communications4.75% 1/11/2041
49 0.00
$250,000 Verizon Communications4.812% 15/3/2039
247 0.01
$1,230,000 Verizon Communications4.862% 21/8/2046
1,240 0.04
$100,000 Verizon Communications5.012% 15/4/2049
104 0.00
$400,000 Verizon Communications5.012% 21/8/2054
432 0.02
$1,000,000 Verizon Communications5.15% 15/9/2023
850 0.03
$1,200,000 Verizon Communications5.25% 16/3/2037
1,217 0.04
$350,000 Verizon Communications5.5% 16/3/2047
383 0.01
$600,000 Verizon Communications6.55% 15/9/2043Ø
720 0.02
$500,000 VF 2.95% 23/4/2030 406 0.01
$200,000 ViacomCBS 2.9% 15/1/2027 161 0.01
$500,000 ViacomCBS 3.375%1/3/2022
386 0.01
$400,000 ViacomCBS 3.7% 15/8/2024 328 0.01
$500,000 ViacomCBS 4.2% 1/6/2029 429 0.01
$500,000 ViacomCBS 4.2% 19/5/2032 425 0.01
Holding orNominalValue Investment
MarketValue
£000’s
% ofTotal
NetAssets
$800,000 ViacomCBS 4.25% 1/9/2023 655 0.02
$500,000 ViacomCBS 4.375%15/3/2043Ø
398 0.01
$400,000 ViacomCBS 4.6% 15/1/2045 326 0.01
$500,000 ViacomCBS 4.75%15/5/2025
431 0.01
$400,000 ViacomCBS 4.85% 1/7/2042 335 0.01
$500,000 ViacomCBS 4.95%15/1/2031
446 0.02
$300,000 ViacomCBS 4.95%19/5/2050
261 0.01
$200,000 ViacomCBS 5.25% 1/4/2044 174 0.01
$500,000 ViacomCBS 5.85% 1/9/2043 467 0.02
$150,000 ViacomCBS 6.875%30/4/2036
153 0.01
$500,000 Vigorous ChampionInternational 3.625%28/5/2024
395 0.01
$200,000 Vigorous ChampionInternational 4.375%10/9/2023
160 0.01
$300,000 Vinci 3.75% 10/4/2029 266 0.01
$200,000 Virginia Electric and Power2.75% 15/3/2023
157 0.01
$700,000 Virginia Electric and Power2.875% 15/7/2029
587 0.02
$100,000 Virginia Electric and Power2.95% 15/1/2022
77 0.00
$400,000 Virginia Electric and Power3.3% 1/12/2049
349 0.01
$400,000 Virginia Electric and Power3.8% 1/4/2028
353 0.01
$400,000 Virginia Electric and Power4.45% 15/2/2044
391 0.01
$300,000 Virginia Electric and Power4.6% 1/12/2048
310 0.01
$300,000 Virginia Electric and Power4.65% 15/8/2043
299 0.01
$250,000 Virginia Electric and Power6% 15/1/2036
262 0.01
$200,000 Virginia Electric and Power6.35% 30/11/2037
224 0.01
$300,000 Virginia Electric and Power8.875% 15/11/2038
407 0.01
$200,000 Visa 0.75% 15/8/2027 149 0.01
$400,000 Visa 1.1% 15/2/2031 292 0.01
$1,000,000 Visa 1.9% 15/4/2027 791 0.03
$500,000 Visa 2% 15/8/2050 351 0.01
$900,000 Visa 2.05% 15/4/2030 715 0.02
$500,000 Visa 2.15% 15/9/2022 387 0.01
iShares Overseas Corporate Bond Index Fund (UK)
Portfolio Statement (unaudited) continued
BlackRock Collective Investment Funds321

Holding orNominalValue Investment
MarketValue
£000’s
% ofTotal
NetAssets
$500,000 Visa 2.7% 15/4/2040 403 0.01
$600,000 Visa 2.8% 14/12/2022 473 0.02
$875,000 Visa 3.15% 14/12/2025 735 0.03
$300,000 Visa 3.65% 15/9/2047 276 0.01
$700,000 Visa 4.15% 14/12/2035 681 0.02
$950,000 Visa 4.3% 14/12/2045 944 0.03
$400,000 Vistra Operations 3.55%15/7/2024
317 0.01
$500,000 Vistra Operations 4.3%15/7/2029
406 0.01
$750,000 VMware 2.95% 21/8/2022 584 0.02
$300,000 VMware 3.9% 21/8/2027 249 0.01
$500,000 VMware 4.65% 15/5/2027 436 0.02
$300,000 VMware 4.7% 15/5/2030 264 0.01
$400,000 Vodafone 2.5% 26/9/2022 311 0.01
$300,000 Vodafone 3.75% 16/1/2024 246 0.01
$575,000 Vodafone 4.125% 30/5/2025 493 0.02
$500,000 Vodafone 4.25% 17/9/2050 436 0.02
$1,000,000 Vodafone 4.375% 30/5/2028 894 0.03
$500,000 Vodafone 4.375% 19/2/2043 439 0.02
$300,000 Vodafone 4.875% 19/6/2049 281 0.01
$400,000 Vodafone 4.875% 19/6/2049 374 0.01
$300,000 Vodafone 5% 30/5/2038 282 0.01
$200,000 Vodafone 5.125% 19/6/2059 188 0.01
$900,000 Vodafone 5.25% 30/5/2048 882 0.03
$500,000 Vodafone 6.15% 27/2/2037 527 0.02
$400,000 Vodafone 7.875% 15/2/2030 437 0.02
$500,000 Volkswagen of AmericaFinance 2.7% 26/9/2022
388 0.01
$500,000 Volkswagen of AmericaFinance 2.9% 13/5/2022
387 0.01
$500,000 Volkswagen of AmericaFinance 3.125% 12/5/2023
396 0.01
$800,000 Volkswagen of AmericaFinance 3.35% 13/5/2025
657 0.02
$600,000 Volkswagen of AmericaFinance 4.25% 13/11/2023
496 0.02
$1,000,000 Volkswagen of AmericaFinance 4.625% 13/11/2025
874 0.03
$300,000 Volkswagen of AmericaFinance 4.75% 13/11/2028
271 0.01
$500,000 Vornado Realty LP 3.5%15/1/2025
388 0.01
$200,000 Votorantim CimentosInternational 7.25%5/4/2041Ø
190 0.01
$350,000 Voya Financial 4.7%23/1/2048
263 0.01
$200,000 Voya Financial 4.8%15/6/2046
183 0.01
Holding orNominalValue Investment
MarketValue
£000’s
% ofTotal
NetAssets
$400,000 Voya Financial 5.65%15/5/2053
312 0.01
$300,000 Voyage Bonds 3.375%28/9/2022
232 0.01
$125,000 Vulcan Materials 3.9%1/4/2027
105 0.00
$500,000 Vulcan Materials 4.5%15/6/2047
435 0.02
$200,000 W R Berkley 4.75% 1/8/2044 185 0.01
$100,000 Wachovia 5.5% 1/8/2035 100 0.00
$250,000 Walgreen 3.1% 15/9/2022 196 0.01
$200,000 Walgreen 4.4% 15/9/2042 158 0.01
$500,000 Walgreens Boots Alliance3.2% 15/4/2030
396 0.01
$400,000 Walgreens Boots Alliance3.3% 18/11/2021
308 0.01
$500,000 Walgreens Boots Alliance3.45% 1/6/2026
411 0.01
$1,000,000 Walgreens Boots Alliance3.8% 18/11/2024
825 0.03
$300,000 Walgreens Boots Alliance4.1% 15/4/2050
225 0.01
$100,000 Walgreens Boots Alliance4.5% 18/11/2034
86 0.00
$450,000 Walgreens Boots Alliance4.65% 1/6/2046
361 0.01
$300,000 Walgreens Boots Alliance4.8% 18/11/2044
247 0.01
$500,000 Walmart 2.35% 15/12/2022 391 0.01
$300,000 Walmart 2.375% 24/9/2029 246 0.01
$600,000 Walmart 2.55% 11/4/2023 473 0.02
$300,000 Walmart 2.65% 15/12/2024 243 0.01
$500,000 Walmart 2.85% 8/7/2024 406 0.01
$300,000 Walmart 2.95% 24/9/2049 249 0.01
$500,000 Walmart 3.05% 8/7/2026 421 0.01
$300,000 Walmart 3.25% 8/7/2029 262 0.01
$100,000 Walmart 3.25% 8/7/2029 87 0.00
$600,000 Walmart 3.3% 22/4/2024 490 0.02
$950,000 Walmart 3.4% 26/6/2023 769 0.03
$500,000 Walmart 3.55% 26/6/2025 426 0.01
$300,000 Walmart 3.625% 15/12/2047 276 0.01
$900,000 Walmart 3.7% 26/6/2028 796 0.03
$1,400,000 Walmart 3.95% 28/6/2038 1,307 0.05
$400,000 Walmart 4% 11/4/2043 375 0.01
$1,000,000 Walmart 4.05% 29/6/2048 970 0.03
$250,000 Walmart 4.875% 8/7/2040 255 0.01
$300,000 Walmart 5% 25/10/2040 316 0.01
$900,000 Walmart 5.25% 1/9/2035 971 0.03
$400,000 Walmart 5.875% 5/4/2027 390 0.01
iShares Overseas Corporate Bond Index Fund (UK)
Portfolio Statement (unaudited) continued
BlackRock Collective Investment Funds 322

Holding orNominalValue Investment
MarketValue
£000’s
% ofTotal
NetAssets
$500,000 Walt Disney 1.65% 1/9/2022 383 0.01
$700,000 Walt Disney 1.75%30/8/2024
544 0.02
$500,000 Walt Disney 1.75%13/1/2026
389 0.01
$500,000 Walt Disney 2% 1/9/2029 389 0.01
$1,000,000 Walt Disney 2.65%13/1/2031
809 0.03
$250,000 Walt Disney 2.75% 1/9/2049 184 0.01
$500,000 Walt Disney 3% 15/9/2022 393 0.01
$500,000 Walt Disney 3.35%24/3/2025
416 0.01
$800,000 Walt Disney 3.5% 13/5/2040 670 0.02
$1,000,000 Walt Disney 3.6% 13/1/2051 852 0.03
$600,000 Walt Disney 3.8% 22/3/2030 534 0.02
$500,000 Walt Disney 3.8% 13/5/2060 439 0.02
$300,000 Walt Disney 4.625%23/3/2040
285 0.01
$800,000 Walt Disney 4.7% 23/3/2050 794 0.03
$300,000 Walt Disney 4.75%15/9/2044
285 0.01
$100,000 Walt Disney 4.95%15/10/2045
99 0.00
$300,000 Walt Disney 5.4% 1/10/2043 310 0.01
$500,000 Walt Disney 6.15% 1/3/2037 533 0.02
$450,000 Walt Disney 6.2%15/12/2034
494 0.02
$400,000 Walt Disney 6.55%15/3/2033
440 0.02
$500,000 Walt Disney 6.65%15/11/2037
567 0.02
$150,000 Walt Disney 6.9% 15/8/2039 174 0.01
$200,000 Washington Gas Light3.796% 15/9/2046
166 0.01
$200,000 Waste Connections 2.6%1/2/2030
160 0.01
$150,000 Waste Connections 3.05%1/4/2050
116 0.00
$400,000 Waste Connections 3.5%1/5/2029
341 0.01
$400,000 Waste Management 2.9%15/9/2022
312 0.01
$250,000 Waste Management 3.5%15/5/2024
204 0.01
$75,000 Waste Management 3.9%1/3/2035
67 0.00
$250,000 Waste Management 4.1%1/3/2045
228 0.01
$350,000 Waste Management 4.15%15/7/2049
329 0.01
Holding orNominalValue Investment
MarketValue
£000’s
% ofTotal
NetAssets
$250,000 Waste Management 4.6%1/3/2021
189 0.01
$900,000 WEA Finance 2.875%15/1/2027
669 0.02
$400,000 WEA Finance 3.5%15/6/2029
300 0.01
$600,000 WEA Finance / Westfield UK& Europe Finance 3.75%17/9/2024
469 0.02
$200,000 WEA Finance / Westfield UK& Europe Finance 4.75%17/9/2044
152 0.01
$300,000 WEC Energy 3.55%15/6/2025
252 0.01
$300,000 Weibo 3.375% 8/7/2030 234 0.01
$500,000 Weibo 3.5% 5/7/2024 396 0.01
$500,000 Weichai International HongKong Energy 3.75%Perpetual 14/3/2169
378 0.01
$1,000,000 Wells Fargo 3.069%24/1/2023
773 0.03
$1,500,000 Wells Fargo 3.75%24/1/2024
1,224 0.04
$750,000 Wells Fargo 2.625%22/7/2022
583 0.02
$1,800,000 Wells Fargo & 1.654%2/6/2024
1,375 0.05
$1,000,000 Wells Fargo & 2.164%11/2/2026
779 0.03
$1,000,000 Wells Fargo & 2.164%11/2/2026
779 0.03
$1,000,000 Wells Fargo & 2.188%30/4/2026
780 0.03
$1,500,000 Wells Fargo & 2.393%2/6/2028
1,170 0.04
$900,000 Wells Fargo & 2.406%30/10/2025
708 0.02
$1,500,000 Wells Fargo & 2.572%11/2/2031
1,183 0.04
$1,200,000 Wells Fargo & 2.879%30/10/2030
965 0.03
$500,000 Wells Fargo & 3% 19/2/2025 405 0.01
$700,000 Wells Fargo & 3% 22/4/2026 573 0.02
$1,000,000 Wells Fargo & 3%23/10/2026
823 0.03
$1,300,000 Wells Fargo & 3.068%30/4/2041
1,028 0.04
$1,000,000 Wells Fargo & 3.196%17/6/2027
817 0.03
$800,000 Wells Fargo & 3.3%9/9/2024
655 0.02
iShares Overseas Corporate Bond Index Fund (UK)
Portfolio Statement (unaudited) continued
BlackRock Collective Investment Funds323

Holding orNominalValue Investment
MarketValue
£000’s
% ofTotal
NetAssets
$500,000 Wells Fargo & 3.45%13/2/2023
397 0.01
$750,000 Wells Fargo & 3.55%29/9/2025
627 0.02
$1,000,000 Wells Fargo & 3.584%22/5/2028
838 0.03
$550,000 Wells Fargo & 3.9%1/5/2045
484 0.02
$600,000 Wells Fargo & 4.1%3/6/2026
507 0.02
$500,000 Wells Fargo & 4.125%15/8/2023
409 0.01
$200,000 Wells Fargo & 4.15%24/1/2029
176 0.01
$300,000 Wells Fargo & 4.15%24/1/2029
264 0.01
$1,000,000 Wells Fargo & 4.3%22/7/2027
861 0.03
$450,000 Wells Fargo & 4.4%14/6/2046
402 0.01
$1,200,000 Wells Fargo & 4.478%4/4/2031
1,093 0.04
$258,000 Wells Fargo & 4.48%16/1/2024
215 0.01
$500,000 Wells Fargo & 4.65%4/11/2044
455 0.02
$900,000 Wells Fargo & 4.75%7/12/2046Ø
851 0.03
$800,000 Wells Fargo & 4.9%17/11/2045
759 0.03
$1,900,000 Wells Fargo & 5.013%4/4/2051
1,937 0.07
$450,000 Wells Fargo & 5.375%2/11/2043
450 0.02
$1,100,000 Wells Fargo & 5.606%15/1/2044
1,119 0.04
$600,000 Wells Fargo Bank NA2.082% 9/9/2022
455 0.02
$1,000,000 Wells Fargo Bank NA 3.55%14/8/2023
812 0.03
$500,000 Wells Fargo Bank NA3.625% 22/10/2021
387 0.01
$250,000 Wells Fargo Bank NA 5.85%1/2/2037
255 0.01
$400,000 Wells Fargo Bank NA 6.6%15/1/2038
443 0.02
$500,000 Welltower 2.7% 15/2/2027 397 0.01
$900,000 Welltower 4% 1/6/2025 757 0.03
$400,000 Welltower 4.125% 15/3/2029 336 0.01
$300,000 Welltower 4.95% 1/9/2048 271 0.01
Holding orNominalValue Investment
MarketValue
£000’s
% ofTotal
NetAssets
$300,000 Western & Southern LifeInsurance 5.15% 15/1/2049
286 0.01
$600,000 Western Union 2.85%10/1/2025
475 0.02
$400,000 Western Union 3.6%15/3/2022
311 0.01
$1,000,000 Westinghouse Air BrakeTechnologies 4.4%15/3/2024
812 0.03
$400,000 Westinghouse Air BrakeTechnologies 4.95%15/9/2028
344 0.01
$200,000 Westlake Chemical 3.6%15/8/2026
163 0.01
$300,000 Westlake Chemical 3.6%15/8/2026
245 0.01
$250,000 Westlake Chemical 5%15/8/2046
214 0.01
$300,000 Westpac Banking 2%13/1/2023
232 0.01
$900,000 Westpac Banking 2.35%19/2/2025
721 0.03
$1,000,000 Westpac Banking 2.5%28/6/2022
777 0.03
$300,000 Westpac Banking 2.65%16/1/2030
249 0.01
$500,000 Westpac Banking 2.7%19/8/2026
413 0.01
$600,000 Westpac Banking 2.85%13/5/2026
498 0.02
$500,000 Westpac Banking 2.894%4/2/2030
387 0.01
$650,000 Westpac Banking 3.3%26/2/2024
529 0.02
$500,000 Westpac Banking 3.35%8/3/2027
429 0.01
$500,000 Westpac Banking 3.65%15/5/2023
405 0.01
$500,000 Westpac Banking 4.11%24/7/2034
422 0.01
$250,000 Westpac Banking 4.322%23/11/2031
213 0.01
$500,000 Westpac Banking 4.322%23/11/2031Ø
426 0.01
$300,000 Westpac Banking 4.421%24/7/2039
277 0.01
$200,000 WestRock MWV 8.2%15/1/2030
213 0.01
$700,000 Weyerhaeuser 4%15/11/2029
601 0.02
iShares Overseas Corporate Bond Index Fund (UK)
Portfolio Statement (unaudited) continued
BlackRock Collective Investment Funds 324

Holding orNominalValue Investment
MarketValue
£000’s
% ofTotal
NetAssets
$500,000 Weyerhaeuser 4%15/4/2030
435 0.02
$375,000 Weyerhaeuser 7.375%15/3/2032
407 0.01
$300,000 Wharf REIC Finance BVI2.875% 7/5/2030
235 0.01
$300,000 Wharf REIC Finance BVI3.5% 17/1/2028
245 0.01
$250,000 Whirlpool 4% 1/3/2024 204 0.01
$100,000 Whirlpool 4.5% 1/6/2046 88 0.00
$200,000 Whirlpool 4.6% 15/5/2050 185 0.01
$300,000 Whirlpool 4.75% 26/2/2029 274 0.01
$600,000 Williams Cos 3.5%15/11/2030
495 0.02
$500,000 Williams Cos 3.6%15/3/2022
388 0.01
$500,000 Williams Cos 3.7%15/1/2023
396 0.01
$500,000 Williams Cos 3.75%15/6/2027
413 0.01
$1,300,000 Williams Cos 4% 15/9/2025 1,086 0.04
$600,000 Williams Cos 4.85%1/3/2048
521 0.02
$350,000 Williams Cos 4.9%15/1/2045
295 0.01
$300,000 Williams Cos 5.8%15/11/2043
267 0.01
$150,000 Williams Cos 6.3%15/4/2040
141 0.00
$400,000 Williams Cos 8.75%15/3/2032
431 0.01
$500,000 Willis North America 2.95%15/9/2029
405 0.01
$300,000 Willis North America 3.875%15/9/2049
259 0.01
$500,000 Willis North America 4.5%15/9/2028
445 0.02
$300,000 Willis Towers Watson 5.75%15/3/2021
230 0.01
$300,000 Wisconsin Electric Power2.95% 15/9/2021
229 0.01
$150,000 Wisconsin Electric Power4.3% 15/10/2048
142 0.01
$200,000 Wisconsin Electric Power5.7% 1/12/2036
212 0.01
$300,000 Wisconsin Power and Light3% 1/7/2029
254 0.01
$200,000 Wisconsin Power and Light3.65% 1/4/2050
177 0.01
$150,000 Wisconsin Power and Light6.375% 15/8/2037
168 0.01
Holding orNominalValue Investment
MarketValue
£000’s
% ofTotal
NetAssets
$150,000 Wisconsin Public Service3.3% 1/9/2049
125 0.00
$250,000 Woodside Finance 3.7%15/9/2026
201 0.01
$200,000 Woodside Finance 3.7%15/3/2028
158 0.01
$700,000 Woodside Finance 4.5%4/3/2029
593 0.02
$100,000 Woodside Finance 4.6%10/5/2021
76 0.00
$250,000 Woori Bank 5.125%6/8/2028
220 0.01
$325,000 WP Carey 3.85% 15/7/2029 261 0.01
$200,000 WP Carey 4.6% 1/4/2024 164 0.01
$500,000 WPP Finance 2010 3.625%7/9/2022
392 0.01
$300,000 WRKCo 3% 15/9/2024 242 0.01
$500,000 WRKCo 3.375% 15/9/2027 412 0.01
$400,000 WRKCo 3.75% 15/3/2025 336 0.01
$300,000 WRKCo 3.9% 1/6/2028 256 0.01
$500,000 WRKCo 4.9% 15/3/2029 460 0.02
$500,000 Wuhan Metro 2.96%24/9/2024
388 0.01
$300,000 WW Grainger 4.2%15/5/2047
273 0.01
$250,000 WW Grainger 4.6%15/6/2045
241 0.01
$400,000 Wyeth 5.95% 1/4/2037 443 0.02
$200,000 Wyeth 6% 15/2/2036 217 0.01
$300,000 Wyeth 6.45% 1/2/2024 268 0.01
$1,000,000 Xcel Energy 2.6% 1/12/2029 808 0.03
$200,000 Xcel Energy 3.35%1/12/2026
170 0.01
$500,000 Xcel Energy 3.4% 1/6/2030 431 0.01
$150,000 Xcel Energy 6.5% 1/7/2036 165 0.01
$500,000 Xiaomi Best TimeInternational 3.375%29/4/2030
396 0.01
$500,000 Xilinx 2.375% 1/6/2030 399 0.01
$500,000 Xingsheng BVI 4.5%20/9/2021
384 0.01
$250,000 XLIT 5.5% 31/3/2045 256 0.01
$600,000 Xylem Inc/NY 1.95%30/1/2028
468 0.02
$75,000 Xylem Inc/NY 3.25%1/11/2026
63 0.00
$200,000 Xylem Inc/NY 4.375%1/11/2046
174 0.01
$300,000 Yale University 0.873%15/4/2025
227 0.01
iShares Overseas Corporate Bond Index Fund (UK)
Portfolio Statement (unaudited) continued
BlackRock Collective Investment Funds325

Holding orNominalValue Investment
MarketValue
£000’s
% ofTotal
NetAssets
$500,000 Yale-New Haven HealthServices 2.496% 1/7/2050
367 0.01
$200,000 Yara International 3.8%6/6/2026
166 0.01
$400,000 Yara International 4.75%1/6/2028
349 0.01
$500,000 Zimmer Biomet 3.05%15/1/2026
411 0.01
$300,000 Zimmer Biomet 3.55%1/4/2025
249 0.01
$500,000 Zimmer Biomet 3.55%20/3/2030
417 0.01
$300,000 Zimmer Biomet 4.45%15/8/2045
250 0.01
$300,000 Zions Bancorp NA 3.25%29/10/2029
223 0.01
$500,000 Zoetis 2% 15/5/2030 389 0.01
$500,000 Zoetis 3% 12/9/2027 417 0.01
Holding orNominalValue Investment
MarketValue
£000’s
% ofTotal
NetAssets
$100,000 Zoetis 3.25% 1/2/2023 79 0.00
$300,000 Zoetis 3.95% 12/9/2047 278 0.01
$275,000 Zoetis 4.5% 13/11/2025 242 0.01
$350,000 Zoetis 4.7% 1/2/2043 347 0.01
1,986,274 68.56
CERTIFICATE OF DEPOSITS − 0.00%; 29.2.2020 0.01%
Portfolio of investments 2,838,568 97.98
Net other assets 58,631 2.02
Total net assets 2,897,199 100.00
Unless otherwise stated, all securities are either listed on a recognised exchange or traded on aneligible securities market.Ø All or a portion of this investment represents a security on loan.‡ Related party to the Fund.
iShares Overseas Corporate Bond Index Fund (UK)
Portfolio Statement (unaudited) continued
BlackRock Collective Investment Funds 326

£000’s31.8.2020
£000’s £000’s31.8.2019
£000’s
Income
Net capital (losses)/gains (48,587) 285,086
Revenue 35,259 28,874
Expenses (1,462) (1,168)
Interest payable and similarcharges (46) (11)
Net revenue before taxation 33,751 27,695
Taxation 13 (1)
Net revenue after taxation 33,764 27,694
Total return before distributions (14,823) 312,780
Distributions (33,764) (27,694)
Change in net assetsattributable to unitholdersfrom investment activities (48,587) 285,086
Statement of Change in Net Assets Attributable to Unitholders(unaudited) for the six months ended 31 August 2020
£000’s31.8.2020
£000’s £000’s31.8.2019
£000’s
Opening net assets attributableto unitholders 2,416,037 1,573,661
Amounts receivable on issue of units 1,024,712 538,834
Amounts payable on cancellation of units (531,591) (188,881)
493,121 349,953
Change in net assets attributable tounitholders from investment activities (48,587) 285,086
Retained distribution on accumulation units 36,628 29,834
Closing net assets attributableto unitholders 2,897,199 2,238,534
The above statement shows the comparative closing net assets at 31 August 2019 whereas the current accounting period commenced 1 March 2020.
iShares Overseas Corporate Bond Index Fund (UK)
Statement of Total Return (unaudited)
for the six months ended 31 August 2020
BlackRock Collective Investment Funds327
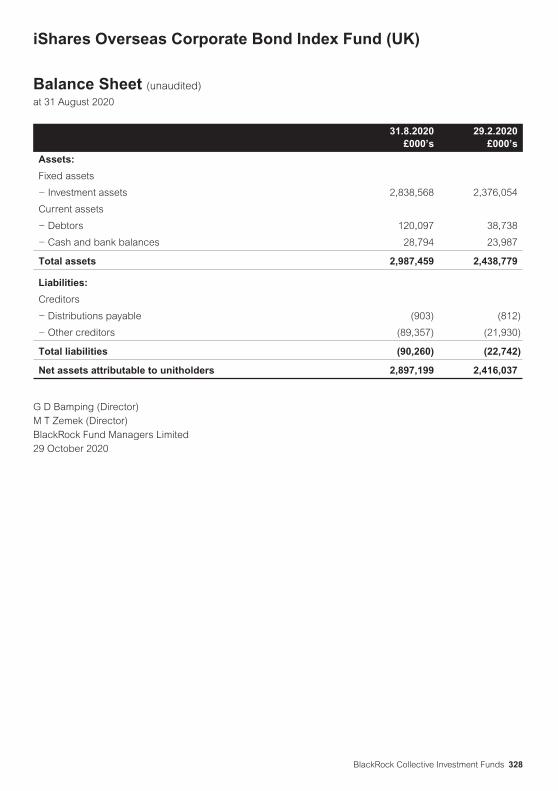
31.8.2020£000’s
29.2.2020£000’s
Assets:
Fixed assets
− Investment assets 2,838,568 2,376,054
Current assets
− Debtors 120,097 38,738
− Cash and bank balances 28,794 23,987
Total assets 2,987,459 2,438,779
Liabilities:
Creditors
− Distributions payable (903) (812)
− Other creditors (89,357) (21,930)
Total liabilities (90,260) (22,742)
Net assets attributable to unitholders 2,897,199 2,416,037
G D Bamping (Director)M T Zemek (Director)BlackRock Fund Managers Limited29 October 2020
iShares Overseas Corporate Bond Index Fund (UK)
Balance Sheet (unaudited)
at 31 August 2020
BlackRock Collective Investment Funds 328

The Fund is a sub-fund of BlackRock Collective Investment Funds (previously known as BlackRock QualifiedInvestor Schemes (1)), a UCITS scheme under the COLL Sourcebook. The Fund was established on 28 January2011 and was authorised by the FCA on 28 April 2010. The Fund’s FCA product reference number is 645679.
Risk and Reward ProfileLower riskTypically lower rewards
Higher riskTypically higher rewards
Unit Class
A Accumulation 1 2 3 4 5 6 7
L Accumulation 1 2 3 4 5 6 7
X Income 1 2 3 4 5 6 7
X Accumulation 1 2 3 4 5 6 7
D Accumulation 1 2 3 4 5 6 7
H Accumulation 1 2 3 4 5 6 7
• The risk indicator was calculated incorporating simulated historical data and may not be a reliable indicationof the future risk profile of the Fund.
• The risk category shown is not guaranteed and may change over time.
• The lowest category does not mean risk free.
For more information on this, please see the Fund’s Key Investor Information Documents (“KIIDs”), which areavailable at www.blackrock.com.
iShares Overseas Government Bond Index Fund (UK)
About the Fund
BlackRock Collective Investment Funds329

Net Asset Value
At 31 August 2020 Units in IssueNet Asset Value
£000’s
Net Asset Valueper Unit
p
A Accumulation 116,663 161 138.3
L Accumulation 291,798,346 413,809 141.8
X Income 27,361,159 29,687 108.5
X Accumulation 811,966,785 1,119,901 137.9
D Accumulation 95,737,671 135,728 141.8
H Accumulation 42,923,433 60,722 141.5
Distributions Payable for the period to 31 August 2020
Unit Class Distribution payable on 31.10.2020
Pence per Unit
A Accumulation 0.4945
L Accumulation 0.7318
X Income 0.6778
X Accumulation 0.8560
D Accumulation 0.8059
H Accumulation 0.8043
Operating Charges
Unit Class1.3.2020
to 31.8.20201.3.2019
to 29.2.2020
A Accumulation 0.52% 0.51%
L Accumulation 0.22% 0.21%
X Income 0.02% 0.01%
X Accumulation 0.02% 0.01%
D Accumulation 0.10% 0.12%
H Accumulation 0.10% 0.12%
Operating charges are annualised and exclude portfolio trade-related costs, except costs paid to the custodian/depositary and entry/exit charges paid to an underlyingcollective investment scheme (if any).
iShares Overseas Government Bond Index Fund (UK)
Performance Record
BlackRock Collective Investment Funds 330

Holding orNominalValue Investment
MarketValue
£000’s
% ofTotal
NetAssets
BONDS − 99.26%; 29.2.2020 99.11%
Australian Dollar Denominated GovernmentBonds − 1.90%; 29.2.2020 1.49%
AU$2,510,000 Australia GovernmentBond 0.25% 21/11/2024
1,379 0.08
AU$1,530,000 Australia GovernmentBond 0.25% 21/11/2025
833 0.05
AU$2,230,000 Australia GovernmentBond 1% 21/12/2030
1,228 0.07
AU$1,460,000 Australia GovernmentBond 1.25% 21/5/2032
817 0.05
AU$1,910,000 Australia GovernmentBond 1.5% 21/6/2031
1,100 0.06
AU$1,450,000 Australia GovernmentBond 1.75% 21/6/2051
768 0.04
AU$1,635,000 Australia GovernmentBond 2% 21/12/2021
924 0.05
AU$1,900,000 Australia GovernmentBond 2.25% 21/11/2022
1,095 0.06
AU$3,955,000 Australia GovernmentBond 2.25% 21/5/2028
2,417 0.14
AU$3,010,000 Australia GovernmentBond 2.5% 21/5/2030
1,892 0.11
AU$2,015,000 Australia GovernmentBond 2.75% 21/4/2024
1,211 0.07
AU$965,000 Australia GovernmentBond 2.75% 21/4/2024
580 0.03
AU$2,430,000 Australia GovernmentBond 2.75% 21/11/2027
1,530 0.09
AU$2,480,000 Australia GovernmentBond 2.75% 21/11/2028
1,572 0.09
AU$2,550,000 Australia GovernmentBond 2.75% 21/11/2029
1,628 0.09
AU$665,000 Australia GovernmentBond 2.75% 21/6/2035
437 0.02
AU$600,000 Australia GovernmentBond 2.75% 21/5/2041
391 0.02
AU$1,220,000 Australia GovernmentBond 3% 21/3/2047
841 0.05
AU$3,270,000 Australia GovernmentBond 3.25% 21/4/2025
2,039 0.12
AU$2,900,000 Australia GovernmentBond 3.25% 21/4/2029
1,909 0.11
AU$820,000 Australia GovernmentBond 3.25% 21/6/2039
572 0.03
AU$1,210,000 Australia GovernmentBond 3.75% 21/4/2037
892 0.05
AU$2,910,000 Australia GovernmentBond 4.25% 21/4/2026
1,937 0.11
Holding orNominalValue Investment
MarketValue
£000’s
% ofTotal
NetAssets
AU$1,305,000 Australia Government Bond4.5% 21/4/2033
1,003 0.06
AU$1,835,000 Australia Government Bond4.75% 21/4/2027
1,281 0.07
AU$2,700,000 Australia Government Bond5.5% 21/4/2023
1,696 0.10
AU$2,335,000 Australia Government Bond5.75% 15/7/2022
1,421 0.08
33,393 1.90
Canadian Dollar Denominated GovernmentBonds − 1.66%; 29.2.2020 1.34%
CA$750,000 Canadian Government Bond0.25% 1/8/2022
430 0.02
CA$1,480,000 Canadian Government Bond0.5% 1/3/2022
852 0.05
CA$2,580,000 Canadian Government Bond0.5% 1/9/2025
1,488 0.08
CA$2,645,000 Canadian Government Bond0.75% 1/9/2021
1,523 0.09
CA$1,540,000 Canadian Government Bond1% 1/9/2022
896 0.05
CA$290,000 Canadian Government Bond1% 1/6/2027
172 0.01
CA$500,000 Canadian Government Bond1.25% 1/11/2021
290 0.02
CA$2,290,000 Canadian Government Bond1.25% 1/3/2025
1,364 0.08
CA$3,090,000 Canadian Government Bond1.25% 1/6/2030
1,874 0.11
CA$10,000 Canadian Government Bond1.5% 1/8/2021
6 0.00
CA$1,540,000 Canadian Government Bond1.5% 1/2/2022
898 0.05
CA$1,730,000 Canadian Government Bond1.5% 1/5/2022
1,012 0.06
CA$480,000 Canadian Government Bond1.5% 1/6/2023
285 0.02
CA$1,660,000 Canadian Government Bond1.5% 1/9/2024
996 0.06
CA$860,000 Canadian Government Bond1.5% 1/6/2026
524 0.03
CA$2,000,000 Canadian Government Bond1.75% 1/3/2023
1,189 0.07
CA$1,570,000 Canadian Government Bond2% 1/6/2028
1,002 0.06
CA$1,920,000 Canadian Government Bond2% 1/12/2051
1,339 0.08
CA$430,000 Canadian Government Bond2.25% 1/3/2024
263 0.01
iShares Overseas Government Bond Index Fund (UK)
Portfolio Statement (unaudited)
at 31 August 2020
BlackRock Collective Investment Funds331

Holding orNominalValue Investment
MarketValue
£000’s
% ofTotal
NetAssets
CA$730,000 Canadian Government Bond2.25% 1/6/2025
456 0.03
CA$1,400,000 Canadian Government Bond2.25% 1/6/2029
918 0.05
CA$4,640,000 Canadian Government Bond2.5% 1/6/2024
2,879 0.16
CA$1,910,000 Canadian Government Bond2.75% 1/6/2022
1,143 0.06
CA$1,075,000 Canadian Government Bond2.75% 1/12/2048
852 0.05
CA$430,000 Canadian Government Bond2.75% 1/12/2064
380 0.02
CA$1,300,000 Canadian Government Bond3.5% 1/12/2045
1,132 0.06
CA$1,080,000 Canadian Government Bond4% 1/6/2041
958 0.05
CA$1,218,000 Canadian Government Bond5% 1/6/2037
1,140 0.06
CA$1,440,000 Canadian Government Bond5.75% 1/6/2029
1,189 0.07
CA$670,000 Canadian Government Bond5.75% 1/6/2033
617 0.03
CA$650,000 Canadian Government Bond8% 1/6/2023
451 0.03
CA$180,000 Canadian Government Bond8% 1/6/2027
155 0.01
CA$610,000 Canadian Government Bond9% 1/6/2025
492 0.03
29,165 1.66
Danish Krone Denominated GovernmentBonds − 0.41%; 29.2.2020 0.39%
kr 3,960,000 Denmark Government Bond0.25% 15/11/2022
484 0.03
kr 1,660,000 Denmark Government Bond0.25% 15/11/2052
202 0.01
kr 10,272,000 Denmark Government Bond0.5% 15/11/2027
1,312 0.07
kr 7,880,000 Denmark Government Bond0.5% 15/11/2029
1,016 0.06
kr 5,620,000 Denmark Government Bond1.5% 15/11/2023
719 0.04
kr 2,400,000 Denmark Government Bond1.75% 15/11/2025
322 0.02
kr 3,800,000 Denmark Government Bond3% 15/11/2021
476 0.03
kr 11,900,000 Denmark Government Bond4.5% 15/11/2039
2,655 0.15
Holding orNominalValue Investment
MarketValue
£000’s
% ofTotal
NetAssets
kr 251,000 Denmark Government Bond7% 10/11/2024
40 0.00
7,226 0.41
Euro Denominated GovernmentBonds − 28.66%; 29.2.2020 27.82%
€430,000 Bundesobligation 0%8/10/2021
387 0.02
€2,561,000 Bundesobligation 0%8/4/2022
2,311 0.13
€725,000 Bundesobligation 0%7/10/2022
657 0.04
€1,484,000 Bundesobligation 0%14/4/2023
1,349 0.08
€1,150,000 Bundesobligation 0%13/10/2023
1,049 0.06
€950,000 Bundesobligation 0%18/10/2024
872 0.05
€440,000 Bundesobligation 0%11/4/2025
405 0.02
€500,000 Bundesobligation 0%10/10/2025
461 0.03
€2,610,000 Bundesrepublik DeutschlandBundesanleihe 0%15/8/2026Ø
2,420 0.14
€290,000 Bundesrepublik DeutschlandBundesanleihe 0%15/11/2027
269 0.02
€1,670,000 Bundesrepublik DeutschlandBundesanleihe 0%15/8/2029
1,556 0.09
€2,230,000 Bundesrepublik DeutschlandBundesanleihe 0%15/2/2030Ø
2,076 0.12
€900,000 Bundesrepublik DeutschlandBundesanleihe 0%15/8/2030Ø
837 0.05
€1,350,000 Bundesrepublik DeutschlandBundesanleihe 0%15/5/2035
1,237 0.07
€1,400,000 Bundesrepublik DeutschlandBundesanleihe 0%15/8/2050Ø
1,226 0.07
€2,060,000 Bundesrepublik DeutschlandBundesanleihe 0.25%15/2/2027
1,944 0.11
€1,900,000 Bundesrepublik DeutschlandBundesanleihe 0.25%15/8/2028Ø
1,805 0.10
iShares Overseas Government Bond Index Fund (UK)
Portfolio Statement (unaudited) continued
BlackRock Collective Investment Funds 332

Holding orNominalValue Investment
MarketValue
£000’s
% ofTotal
NetAssets
€1,630,000 Bundesrepublik DeutschlandBundesanleihe 0.25%15/2/2029Ø
1,551 0.09
€3,470,000 Bundesrepublik DeutschlandBundesanleihe 0.5%15/2/2025Ø
3,264 0.19
€2,430,000 Bundesrepublik DeutschlandBundesanleihe 0.5%15/2/2026Ø
2,308 0.13
€1,856,000 Bundesrepublik DeutschlandBundesanleihe 0.5%15/8/2027
1,785 0.10
€2,524,000 Bundesrepublik DeutschlandBundesanleihe 0.5%15/2/2028
2,436 0.14
€1,726,000 Bundesrepublik DeutschlandBundesanleihe 1%15/8/2024Ø
1,645 0.09
€2,765,000 Bundesrepublik DeutschlandBundesanleihe 1%15/8/2025
2,676 0.15
€2,160,000 Bundesrepublik DeutschlandBundesanleihe 1.25%15/8/2048
2,581 0.15
€1,840,000 Bundesrepublik DeutschlandBundesanleihe 1.5%4/9/2022
1,716 0.10
€2,396,000 Bundesrepublik DeutschlandBundesanleihe 1.5%15/2/2023Ø
2,256 0.13
€1,520,000 Bundesrepublik DeutschlandBundesanleihe 1.5%15/5/2023
1,439 0.08
€2,041,000 Bundesrepublik DeutschlandBundesanleihe 1.5%15/5/2024
1,972 0.11
€2,261,000 Bundesrepublik DeutschlandBundesanleihe 1.75%4/7/2022
2,110 0.12
€1,976,000 Bundesrepublik DeutschlandBundesanleihe 1.75%15/2/2024Ø
1,916 0.11
€2,740,000 Bundesrepublik DeutschlandBundesanleihe 2% 4/1/2022
2,537 0.14
€2,170,000 Bundesrepublik DeutschlandBundesanleihe 2%15/8/2023
2,094 0.12
€2,590,000 Bundesrepublik DeutschlandBundesanleihe 2.5%4/7/2044
3,725 0.21
Holding orNominalValue Investment
MarketValue
£000’s
% ofTotal
NetAssets
€2,590,000 Bundesrepublik DeutschlandBundesanleihe 2.5%15/8/2046
3,817 0.22
€1,310,000 Bundesrepublik DeutschlandBundesanleihe 3.25%4/7/2042Ø
2,034 0.12
€2,140,000 Bundesrepublik DeutschlandBundesanleihe 4% 4/1/2037
3,248 0.18
€1,200,000 Bundesrepublik DeutschlandBundesanleihe 4.25%4/7/2039Ø
1,975 0.11
€1,445,000 Bundesrepublik DeutschlandBundesanleihe 4.75%4/7/2028
1,839 0.10
€1,780,000 Bundesrepublik DeutschlandBundesanleihe 4.75%4/7/2034
2,726 0.15
€1,560,000 Bundesrepublik DeutschlandBundesanleihe 4.75%4/7/2040
2,764 0.16
€1,689,000 Bundesrepublik DeutschlandBundesanleihe 5.5%4/1/2031
2,456 0.14
€1,478,000 Bundesrepublik DeutschlandBundesanleihe 5.625%4/1/2028
1,934 0.11
€1,459,000 Bundesrepublik DeutschlandBundesanleihe 6.25%4/1/2024Ø
1,609 0.09
€1,050,000 Bundesrepublik DeutschlandBundesanleihe 6.25%4/1/2030
1,543 0.09
€1,880,000 Bundesrepublik DeutschlandBundesanleihe 6.5%4/7/2027
2,512 0.14
€1,130,000 Bundesschatzanweisungen0% 10/12/2021
1,018 0.06
€1,060,000 Bundesschatzanweisungen0% 11/3/2022
956 0.05
€200,000 Bundesschatzanweisungen0% 10/6/2022
181 0.01
€800,000 Bundesschatzanweisungen0% 16/9/2022
724 0.04
€1,460,000 French RepublicGovernment Bond OAT 0%25/2/2022
1,316 0.07
€4,620,000 French RepublicGovernment Bond OAT 0%25/5/2022
4,169 0.24
€1,190,000 French RepublicGovernment Bond OAT 0%25/3/2023
1,079 0.06
iShares Overseas Government Bond Index Fund (UK)
Portfolio Statement (unaudited) continued
BlackRock Collective Investment Funds333

Holding orNominalValue Investment
MarketValue
£000’s
% ofTotal
NetAssets
€3,130,000 French RepublicGovernment Bond OAT 0%25/3/2024
2,851 0.16
€3,350,000 French RepublicGovernment Bond OAT 0%25/3/2025Ø
3,063 0.17
€790,000 French RepublicGovernment Bond OAT 0%25/2/2026
723 0.04
€2,880,000 French RepublicGovernment Bond OAT 0%25/11/2029
2,614 0.15
€980,000 French RepublicGovernment Bond OAT 0%25/11/2029
889 0.05
€1,060,000 French RepublicGovernment Bond OAT 0%25/11/2030
956 0.05
€3,220,000 French RepublicGovernment Bond OAT0.25% 25/11/2026
2,994 0.17
€3,915,000 French RepublicGovernment Bond OAT 0.5%25/5/2025
3,667 0.21
€3,280,000 French RepublicGovernment Bond OAT 0.5%25/5/2026
3,091 0.18
€2,940,000 French RepublicGovernment Bond OAT 0.5%25/5/2029Ø
2,794 0.16
€680,000 French RepublicGovernment Bond OAT 0.5%25/5/2040
624 0.04
€4,020,000 French RepublicGovernment Bond OAT0.75% 25/5/2028
3,883 0.22
€3,620,000 French RepublicGovernment Bond OAT0.75% 25/11/2028
3,510 0.20
€1,260,000 French RepublicGovernment Bond OAT0.75% 25/5/2052
1,167 0.07
€3,000,000 French RepublicGovernment Bond OAT 1%25/11/2025
2,891 0.16
€3,280,000 French RepublicGovernment Bond OAT 1%25/5/2027
3,202 0.18
€3,110,000 French RepublicGovernment Bond OAT1.25% 25/5/2034
3,219 0.18
Holding orNominalValue Investment
MarketValue
£000’s
% ofTotal
NetAssets
€3,010,000 French RepublicGovernment Bond OAT1.25% 25/5/2036
3,129 0.18
€4,100,000 French RepublicGovernment Bond OAT 1.5%25/5/2031
4,288 0.24
€2,280,000 French RepublicGovernment Bond OAT 1.5%25/5/2050
2,552 0.15
€3,200,000 French RepublicGovernment Bond OAT1.75% 25/5/2023
3,044 0.17
€3,760,000 French RepublicGovernment Bond OAT1.75% 25/11/2024
3,688 0.21
€2,500,000 French RepublicGovernment Bond OAT1.75% 25/6/2039
2,834 0.16
€1,180,000 French RepublicGovernment Bond OAT1.75% 25/5/2066
1,497 0.09
€2,590,000 French RepublicGovernment Bond OAT 2%25/5/2048
3,193 0.18
€4,620,000 French RepublicGovernment Bond OAT2.25% 25/10/2022
4,381 0.25
€4,650,000 French RepublicGovernment Bond OAT2.25% 25/5/2024
4,594 0.26
€4,350,000 French RepublicGovernment Bond OAT 2.5%25/5/2030
4,898 0.28
€4,100,000 French RepublicGovernment Bond OAT2.75% 25/10/2027
4,490 0.26
€4,100,000 French RepublicGovernment Bond OAT 3%25/4/2022
3,880 0.22
€3,340,000 French RepublicGovernment Bond OAT3.25% 25/10/2021Ø
3,115 0.18
€2,230,000 French RepublicGovernment Bond OAT3.25% 25/5/2045
3,294 0.19
€3,760,000 French RepublicGovernment Bond OAT 3.5%25/4/2026
4,123 0.23
€2,341,000 French RepublicGovernment Bond OAT 4%25/10/2038
3,494 0.20
iShares Overseas Government Bond Index Fund (UK)
Portfolio Statement (unaudited) continued
BlackRock Collective Investment Funds 334

Holding orNominalValue Investment
MarketValue
£000’s
% ofTotal
NetAssets
€89,000 French RepublicGovernment Bond OAT 4%25/10/2038
133 0.01
€1,610,000 French RepublicGovernment Bond OAT 4%25/4/2055
2,955 0.17
€1,380,000 French RepublicGovernment Bond OAT 4%25/4/2060
2,669 0.15
€5,472,000 French RepublicGovernment Bond OAT4.25% 25/10/2023
5,640 0.32
€3,270,000 French RepublicGovernment Bond OAT 4.5%25/4/2041
5,351 0.30
€2,480,000 French RepublicGovernment Bond OAT4.75% 25/4/2035
3,721 0.21
€150,000 French RepublicGovernment Bond OAT4.75% 25/4/2035
225 0.01
€3,282,000 French RepublicGovernment Bond OAT 5.5%25/4/2029
4,407 0.25
€528,000 French RepublicGovernment Bond OAT 5.5%25/4/2029
709 0.04
€2,819,000 French RepublicGovernment Bond OAT5.75% 25/10/2032
4,295 0.24
€200,000 French RepublicGovernment Bond OAT5.75% 25/10/2032Ø
305 0.02
€3,230,000 French RepublicGovernment Bond OAT 6%25/10/2025
3,867 0.22
€900,000 French RepublicGovernment Bond OAT 8.5%25/4/2023
1,000 0.06
€1,700,000 Italy Buoni Poliennali DelTesoro 0.05% 15/1/2023
1,519 0.09
€1,760,000 Italy Buoni Poliennali DelTesoro 0.35% 1/2/2025
1,568 0.09
€400,000 Italy Buoni Poliennali DelTesoro 0.6% 15/6/2023
363 0.02
€400,000 Italy Buoni Poliennali DelTesoro 0.65% 15/10/2023
363 0.02
€310,000 Italy Buoni Poliennali DelTesoro 0.85% 15/1/2027
279 0.02
€1,626,000 Italy Buoni Poliennali DelTesoro 0.9% 1/8/2022
1,479 0.08
Holding orNominalValue Investment
MarketValue
£000’s
% ofTotal
NetAssets
€1,280,000 Italy Buoni Poliennali DelTesoro 0.95% 1/3/2023
1,169 0.07
€1,450,000 Italy Buoni Poliennali DelTesoro 0.95% 15/3/2023
1,325 0.08
€300,000 Italy Buoni Poliennali DelTesoro 0.95% 15/9/2027
270 0.02
€1,380,000 Italy Buoni Poliennali DelTesoro 0.95% 1/8/2030
1,223 0.07
€1,060,000 Italy Buoni Poliennali DelTesoro 1% 15/7/2022
966 0.05
€1,145,000 Italy Buoni Poliennali DelTesoro 1.2% 1/4/2022
1,044 0.06
€620,000 Italy Buoni Poliennali DelTesoro 1.25% 1/12/2026
573 0.03
€2,226,000 Italy Buoni Poliennali DelTesoro 1.35% 15/4/2022
2,034 0.12
€1,940,000 Italy Buoni Poliennali DelTesoro 1.35% 1/4/2030
1,780 0.10
€1,054,000 Italy Buoni Poliennali DelTesoro 1.45% 15/9/2022
970 0.06
€1,159,000 Italy Buoni Poliennali DelTesoro 1.45% 15/11/2024
1,083 0.06
€2,084,000 Italy Buoni Poliennali DelTesoro 1.45% 15/5/2025
1,946 0.11
€1,130,000 Italy Buoni Poliennali DelTesoro 1.45% 1/3/2036
1,004 0.06
€1,932,000 Italy Buoni Poliennali DelTesoro 1.5% 1/6/2025
1,809 0.10
€1,010,000 Italy Buoni Poliennali DelTesoro 1.6% 1/6/2026
952 0.05
€1,380,000 Italy Buoni Poliennali DelTesoro 1.65% 1/12/2030
1,293 0.07
€2,035,000 Italy Buoni Poliennali DelTesoro 1.65% 1/3/2032
1,901 0.11
€940,000 Italy Buoni Poliennali DelTesoro 1.75% 1/7/2024
886 0.05
€2,240,000 Italy Buoni Poliennali DelTesoro 1.85% 15/5/2024
2,118 0.12
€1,240,000 Italy Buoni Poliennali DelTesoro 1.85% 1/7/2025
1,179 0.07
€3,991,000 Italy Buoni Poliennali DelTesoro 2% 1/12/2025
3,833 0.22
€3,120,000 Italy Buoni Poliennali DelTesoro 2% 1/2/2028
3,017 0.17
€2,000,000 Italy Buoni Poliennali DelTesoro 2.05% 1/8/2027
1,937 0.11
€200,000 Italy Buoni Poliennali DelTesoro 2.1% 15/7/2026
193 0.01
€4,065,000 Italy Buoni Poliennali DelTesoro 2.15% 15/12/2021
3,740 0.21
iShares Overseas Government Bond Index Fund (UK)
Portfolio Statement (unaudited) continued
BlackRock Collective Investment Funds335

Holding orNominalValue Investment
MarketValue
£000’s
% ofTotal
NetAssets
€2,440,000 Italy Buoni Poliennali DelTesoro 2.2% 1/6/2027
2,385 0.14
€1,400,000 Italy Buoni Poliennali DelTesoro 2.25% 1/9/2036
1,380 0.08
€110,000 Italy Buoni Poliennali DelTesoro 2.45% 1/10/2023
105 0.01
€1,530,000 Italy Buoni Poliennali DelTesoro 2.45% 1/9/2033
1,546 0.09
€1,280,000 Italy Buoni Poliennali DelTesoro 2.45% 1/9/2050
1,246 0.07
€970,000 Italy Buoni Poliennali DelTesoro 2.5% 1/12/2024
943 0.05
€1,970,000 Italy Buoni Poliennali DelTesoro 2.5% 15/11/2025
1,935 0.11
€1,574,000 Italy Buoni Poliennali DelTesoro 2.7% 1/3/2047
1,618 0.09
€2,220,000 Italy Buoni Poliennali DelTesoro 2.8% 1/12/2028
2,279 0.13
€880,000 Italy Buoni Poliennali DelTesoro 2.8% 1/3/2067
910 0.05
€1,670,000 Italy Buoni Poliennali DelTesoro 2.95% 1/9/2038
1,788 0.10
€1,990,000 Italy Buoni Poliennali DelTesoro 3% 1/8/2029Ø
2,082 0.12
€1,050,000 Italy Buoni Poliennali DelTesoro 3.1% 1/3/2040
1,143 0.07
€1,449,000 Italy Buoni Poliennali DelTesoro 3.25% 1/9/2046
1,631 0.09
€1,280,000 Italy Buoni Poliennali DelTesoro 3.35% 1/3/2035
1,424 0.08
€1,400,000 Italy Buoni Poliennali DelTesoro 3.45% 1/3/2048
1,637 0.09
€2,300,000 Italy Buoni Poliennali DelTesoro 3.5% 1/3/2030Ø
2,509 0.14
€1,682,000 Italy Buoni Poliennali DelTesoro 3.75% 1/9/2024
1,705 0.10
€1,310,000 Italy Buoni Poliennali DelTesoro 3.85% 1/9/2049Ø
1,637 0.09
€2,510,000 Italy Buoni Poliennali DelTesoro 4% 1/2/2037
3,010 0.17
€1,912,000 Italy Buoni Poliennali DelTesoro 4.5% 1/5/2023
1,909 0.11
€2,000,000 Italy Buoni Poliennali DelTesoro 4.5% 1/3/2024
2,051 0.12
€2,339,000 Italy Buoni Poliennali DelTesoro 4.5% 1/3/2026
2,528 0.14
€7,170,000 Italy Buoni Poliennali DelTesoro 4.75% 1/8/2023
7,270 0.41
€2,400,000 Italy Buoni Poliennali DelTesoro 4.75% 1/9/2028
2,779 0.16
Holding orNominalValue Investment
MarketValue
£000’s
% ofTotal
NetAssets
€1,630,000 Italy Buoni Poliennali DelTesoro 4.75% 1/9/2044
2,246 0.13
€2,270,000 Italy Buoni Poliennali DelTesoro 5% 1/3/2022
2,184 0.12
€2,000,000 Italy Buoni Poliennali DelTesoro 5% 1/3/2025
2,150 0.12
€2,238,000 Italy Buoni Poliennali DelTesoro 5% 1/8/2034
2,894 0.16
€2,070,000 Italy Buoni Poliennali DelTesoro 5% 1/8/2039
2,829 0.16
€1,970,000 Italy Buoni Poliennali DelTesoro 5% 1/9/2040
2,708 0.15
€2,744,000 Italy Buoni Poliennali DelTesoro 5.25% 1/11/2029
3,358 0.19
€1,235,000 Italy Buoni Poliennali DelTesoro 5.5% 1/9/2022
1,225 0.07
€1,554,000 Italy Buoni Poliennali DelTesoro 5.5% 1/11/2022
1,552 0.09
€1,970,000 Italy Buoni Poliennali DelTesoro 5.75% 1/2/2033
2,647 0.15
€2,651,000 Italy Buoni Poliennali DelTesoro 6% 1/5/2031Ø
3,503 0.20
€2,154,000 Italy Buoni Poliennali DelTesoro 6.5% 1/11/2027
2,673 0.15
€1,195,000 Italy Buoni Poliennali DelTesoro 7.25% 1/11/2026
1,489 0.08
€1,131,000 Italy Buoni Poliennali DelTesoro 9% 1/11/2023
1,292 0.07
€200,000 Kingdom of BelgiumGovernment Bond 0%22/10/2027
183 0.01
€950,000 Kingdom of BelgiumGovernment Bond 0.1%22/6/2030
868 0.05
€400,000 Kingdom of BelgiumGovernment Bond 0.2%22/10/2023
366 0.02
€520,000 Kingdom of BelgiumGovernment Bond 0.4%22/6/2040
465 0.03
€410,000 Kingdom of BelgiumGovernment Bond 0.5%22/10/2024
382 0.02
€750,000 Kingdom of BelgiumGovernment Bond 0.8%22/6/2025
713 0.04
€1,370,000 Kingdom of BelgiumGovernment Bond 0.8%22/6/2027
1,321 0.08
iShares Overseas Government Bond Index Fund (UK)
Portfolio Statement (unaudited) continued
BlackRock Collective Investment Funds 336

Holding orNominalValue Investment
MarketValue
£000’s
% ofTotal
NetAssets
€1,360,000 Kingdom of BelgiumGovernment Bond 0.8%22/6/2028
1,319 0.07
€1,650,000 Kingdom of BelgiumGovernment Bond 0.9%22/6/2029
1,620 0.09
€1,390,000 Kingdom of BelgiumGovernment Bond 1%22/6/2026
1,347 0.08
€1,040,000 Kingdom of BelgiumGovernment Bond 1%22/6/2031
1,037 0.06
€450,000 Kingdom of BelgiumGovernment Bond 1.25%22/4/2033Ø
464 0.03
€240,000 Kingdom of BelgiumGovernment Bond 1.45%22/6/2037
257 0.01
€1,260,000 Kingdom of BelgiumGovernment Bond 1.6%22/6/2047
1,421 0.08
€630,000 Kingdom of BelgiumGovernment Bond 1.7%22/6/2050
734 0.04
€620,000 Kingdom of BelgiumGovernment Bond 1.9%22/6/2038
708 0.04
€610,000 Kingdom of BelgiumGovernment Bond 2.15%22/6/2066
862 0.05
€560,000 Kingdom of BelgiumGovernment Bond 2.25%22/6/2057
764 0.04
€3,585,000 Kingdom of BelgiumGovernment Bond 2.6%22/6/2024
3,594 0.20
€630,000 Kingdom of BelgiumGovernment Bond 3%22/6/2034
788 0.04
€740,000 Kingdom of BelgiumGovernment Bond 3.75%22/6/2045
1,164 0.07
€665,000 Kingdom of BelgiumGovernment Bond 4%28/3/2022
638 0.04
€845,000 Kingdom of BelgiumGovernment Bond 4%28/3/2032
1,108 0.06
€2,770,000 Kingdom of BelgiumGovernment Bond 4.25%28/9/2022
2,726 0.15
Holding orNominalValue Investment
MarketValue
£000’s
% ofTotal
NetAssets
€1,690,000 Kingdom of BelgiumGovernment Bond 4.25%28/3/2041
2,659 0.15
€900,000 Kingdom of BelgiumGovernment Bond 4.5%28/3/2026
1,029 0.06
€2,100,000 Kingdom of BelgiumGovernment Bond 5%28/3/2035
3,199 0.18
€1,965,000 Kingdom of BelgiumGovernment Bond 5.5%28/3/2028
2,538 0.14
€960,000 Netherlands GovernmentBond 0% 15/1/2022
864 0.05
€1,250,000 Netherlands GovernmentBond 0% 15/1/2024
1,139 0.06
€300,000 Netherlands GovernmentBond 0% 15/1/2027
276 0.02
€670,000 Netherlands GovernmentBond 0% 15/7/2030
616 0.04
€560,000 Netherlands GovernmentBond 0% 15/7/2030
515 0.03
€1,540,000 Netherlands GovernmentBond 0.25% 15/7/2025
1,432 0.08
€1,480,000 Netherlands GovernmentBond 0.25% 15/7/2029
1,395 0.08
€1,273,000 Netherlands GovernmentBond 0.5% 15/7/2026
1,207 0.07
€730,000 Netherlands GovernmentBond 0.5% 15/1/2040
716 0.04
€1,230,000 Netherlands GovernmentBond 0.75% 15/7/2027
1,191 0.07
€1,134,000 Netherlands GovernmentBond 0.75% 15/7/2028
1,108 0.06
€1,354,000 Netherlands GovernmentBond 1.75% 15/7/2023
1,292 0.07
€1,620,000 Netherlands GovernmentBond 2% 15/7/2024
1,595 0.09
€1,286,000 Netherlands GovernmentBond 2.25% 15/7/2022
1,210 0.07
€1,040,000 Netherlands GovernmentBond 2.5% 15/1/2033
1,244 0.07
€1,490,000 Netherlands GovernmentBond 2.75% 15/1/2047
2,267 0.13
€400,000 Netherlands GovernmentBond 3.75% 15/1/2023
395 0.02
€1,510,000 Netherlands GovernmentBond 3.75% 15/1/2042
2,431 0.14
€1,532,000 Netherlands GovernmentBond 4% 15/1/2037
2,293 0.13
iShares Overseas Government Bond Index Fund (UK)
Portfolio Statement (unaudited) continued
BlackRock Collective Investment Funds337

Holding orNominalValue Investment
MarketValue
£000’s
% ofTotal
NetAssets
€1,480,000 Netherlands GovernmentBond 5.5% 15/1/2028
1,910 0.11
€1,165,000 Netherlands GovernmentBond 7.5% 15/1/2023
1,243 0.07
€1,020,000 Spain Government Bond 0%30/4/2023
920 0.05
€990,000 Spain Government Bond 0%31/1/2025
892 0.05
€1,710,000 Spain Government Bond0.05% 31/10/2021
1,537 0.09
€1,480,000 Spain Government Bond0.25% 30/7/2024
1,350 0.08
€1,950,000 Spain Government Bond0.35% 30/7/2023
1,777 0.10
€2,664,000 Spain Government Bond0.4% 30/4/2022
2,414 0.14
€1,774,000 Spain Government Bond0.45% 31/10/2022
1,615 0.09
€1,340,000 Spain Government Bond0.5% 30/4/2030
1,214 0.07
€1,800,000 Spain Government Bond0.6% 31/10/2029
1,653 0.09
€280,000 Spain Government Bond0.8% 30/7/2027
263 0.02
€290,000 Spain Government Bond0.8% 30/7/2027
272 0.02
€1,020,000 Spain Government Bond 1%31/10/2050
857 0.05
€1,090,000 Spain Government Bond1.2% 31/10/2040
1,010 0.06
€1,710,000 Spain Government Bond1.25% 31/10/2030
1,658 0.09
€1,915,000 Spain Government Bond1.3% 31/10/2026
1,853 0.11
€2,664,000 Spain Government Bond1.4% 30/4/2028
2,608 0.15
€2,070,000 Spain Government Bond1.4% 30/7/2028
2,028 0.12
€2,180,000 Spain Government Bond1.45% 31/10/2027
2,135 0.12
€1,880,000 Spain Government Bond1.45% 30/4/2029
1,850 0.11
€1,456,000 Spain Government Bond1.5% 30/4/2027
1,430 0.08
€1,670,000 Spain Government Bond1.6% 30/4/2025
1,618 0.09
€1,510,000 Spain Government Bond1.85% 30/7/2035
1,560 0.09
€2,330,000 Spain Government Bond1.95% 30/4/2026
2,323 0.13
Holding orNominalValue Investment
MarketValue
£000’s
% ofTotal
NetAssets
€2,350,000 Spain Government Bond1.95% 30/7/2030
2,423 0.14
€2,265,000 Spain Government Bond2.15% 31/10/2025
2,264 0.13
€1,720,000 Spain Government Bond2.35% 30/7/2033
1,869 0.11
€1,290,000 Spain Government Bond2.7% 31/10/2048
1,567 0.09
€2,006,000 Spain Government Bond2.75% 31/10/2024
2,018 0.11
€1,580,000 Spain Government Bond2.9% 31/10/2046
1,973 0.11
€1,220,000 Spain Government Bond3.45% 30/7/2066
1,806 0.10
€2,200,000 Spain Government Bond3.8% 30/4/2024
2,262 0.13
€1,800,000 Spain Government Bond4.2% 31/1/2037
2,460 0.14
€2,424,000 Spain Government Bond4.4% 31/10/2023
2,493 0.14
€2,280,000 Spain Government Bond4.65% 30/7/2025
2,522 0.14
€1,839,000 Spain Government Bond4.7% 30/7/2041
2,805 0.16
€1,696,000 Spain Government Bond4.8% 31/1/2024
1,782 0.10
€1,700,000 Spain Government Bond4.9% 30/7/2040
2,621 0.15
€1,708,000 Spain Government Bond5.15% 31/10/2028
2,137 0.12
€1,290,000 Spain Government Bond5.15% 31/10/2044
2,151 0.12
€1,959,000 Spain Government Bond5.4% 31/1/2023
1,996 0.11
€2,410,000 Spain Government Bond5.75% 30/7/2032Ø
3,462 0.20
€1,180,000 Spain Government Bond5.85% 31/1/2022
1,149 0.07
€2,430,000 Spain Government Bond5.9% 30/7/2026
2,938 0.17
€2,694,000 Spain Government Bond 6%31/1/2029
3,565 0.20
504,410 28.66
Japanese Yen Denominated GovernmentBonds − 20.67%; 29.2.2020 21.67%
¥22,900,000 Japan Government Five YearBond 0.1% 20/9/2021
162 0.01
¥205,550,000 Japan Government Five YearBond 0.1% 20/12/2021
1,452 0.08
iShares Overseas Government Bond Index Fund (UK)
Portfolio Statement (unaudited) continued
BlackRock Collective Investment Funds 338
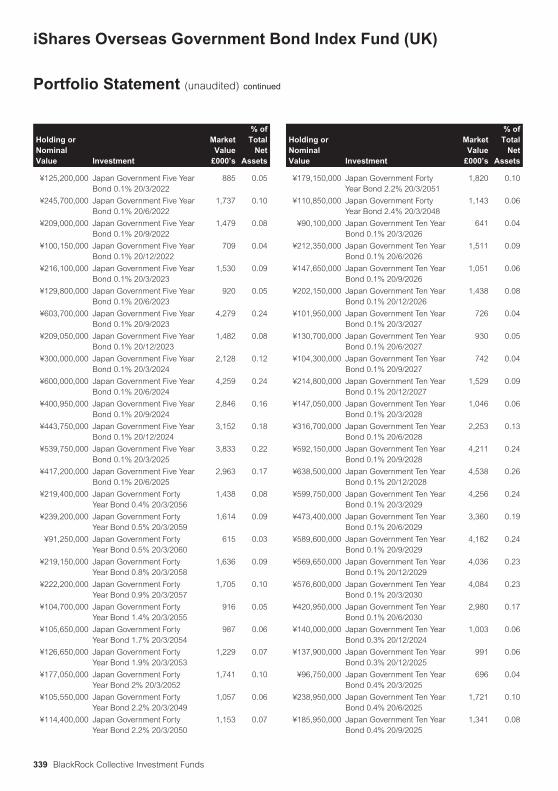
Holding orNominalValue Investment
MarketValue
£000’s
% ofTotal
NetAssets
¥125,200,000 Japan Government Five YearBond 0.1% 20/3/2022
885 0.05
¥245,700,000 Japan Government Five YearBond 0.1% 20/6/2022
1,737 0.10
¥209,000,000 Japan Government Five YearBond 0.1% 20/9/2022
1,479 0.08
¥100,150,000 Japan Government Five YearBond 0.1% 20/12/2022
709 0.04
¥216,100,000 Japan Government Five YearBond 0.1% 20/3/2023
1,530 0.09
¥129,800,000 Japan Government Five YearBond 0.1% 20/6/2023
920 0.05
¥603,700,000 Japan Government Five YearBond 0.1% 20/9/2023
4,279 0.24
¥209,050,000 Japan Government Five YearBond 0.1% 20/12/2023
1,482 0.08
¥300,000,000 Japan Government Five YearBond 0.1% 20/3/2024
2,128 0.12
¥600,000,000 Japan Government Five YearBond 0.1% 20/6/2024
4,259 0.24
¥400,950,000 Japan Government Five YearBond 0.1% 20/9/2024
2,846 0.16
¥443,750,000 Japan Government Five YearBond 0.1% 20/12/2024
3,152 0.18
¥539,750,000 Japan Government Five YearBond 0.1% 20/3/2025
3,833 0.22
¥417,200,000 Japan Government Five YearBond 0.1% 20/6/2025
2,963 0.17
¥219,400,000 Japan Government FortyYear Bond 0.4% 20/3/2056
1,438 0.08
¥239,200,000 Japan Government FortyYear Bond 0.5% 20/3/2059
1,614 0.09
¥91,250,000 Japan Government FortyYear Bond 0.5% 20/3/2060
615 0.03
¥219,150,000 Japan Government FortyYear Bond 0.8% 20/3/2058
1,636 0.09
¥222,200,000 Japan Government FortyYear Bond 0.9% 20/3/2057
1,705 0.10
¥104,700,000 Japan Government FortyYear Bond 1.4% 20/3/2055
916 0.05
¥105,650,000 Japan Government FortyYear Bond 1.7% 20/3/2054
987 0.06
¥126,650,000 Japan Government FortyYear Bond 1.9% 20/3/2053
1,229 0.07
¥177,050,000 Japan Government FortyYear Bond 2% 20/3/2052
1,741 0.10
¥105,550,000 Japan Government FortyYear Bond 2.2% 20/3/2049
1,057 0.06
¥114,400,000 Japan Government FortyYear Bond 2.2% 20/3/2050
1,153 0.07
Holding orNominalValue Investment
MarketValue
£000’s
% ofTotal
NetAssets
¥179,150,000 Japan Government FortyYear Bond 2.2% 20/3/2051
1,820 0.10
¥110,850,000 Japan Government FortyYear Bond 2.4% 20/3/2048
1,143 0.06
¥90,100,000 Japan Government Ten YearBond 0.1% 20/3/2026
641 0.04
¥212,350,000 Japan Government Ten YearBond 0.1% 20/6/2026
1,511 0.09
¥147,650,000 Japan Government Ten YearBond 0.1% 20/9/2026
1,051 0.06
¥202,150,000 Japan Government Ten YearBond 0.1% 20/12/2026
1,438 0.08
¥101,950,000 Japan Government Ten YearBond 0.1% 20/3/2027
726 0.04
¥130,700,000 Japan Government Ten YearBond 0.1% 20/6/2027
930 0.05
¥104,300,000 Japan Government Ten YearBond 0.1% 20/9/2027
742 0.04
¥214,800,000 Japan Government Ten YearBond 0.1% 20/12/2027
1,529 0.09
¥147,050,000 Japan Government Ten YearBond 0.1% 20/3/2028
1,046 0.06
¥316,700,000 Japan Government Ten YearBond 0.1% 20/6/2028
2,253 0.13
¥592,150,000 Japan Government Ten YearBond 0.1% 20/9/2028
4,211 0.24
¥638,500,000 Japan Government Ten YearBond 0.1% 20/12/2028
4,538 0.26
¥599,750,000 Japan Government Ten YearBond 0.1% 20/3/2029
4,256 0.24
¥473,400,000 Japan Government Ten YearBond 0.1% 20/6/2029
3,360 0.19
¥589,600,000 Japan Government Ten YearBond 0.1% 20/9/2029
4,182 0.24
¥569,650,000 Japan Government Ten YearBond 0.1% 20/12/2029
4,036 0.23
¥576,600,000 Japan Government Ten YearBond 0.1% 20/3/2030
4,084 0.23
¥420,950,000 Japan Government Ten YearBond 0.1% 20/6/2030
2,980 0.17
¥140,000,000 Japan Government Ten YearBond 0.3% 20/12/2024
1,003 0.06
¥137,900,000 Japan Government Ten YearBond 0.3% 20/12/2025
991 0.06
¥96,750,000 Japan Government Ten YearBond 0.4% 20/3/2025
696 0.04
¥238,950,000 Japan Government Ten YearBond 0.4% 20/6/2025
1,721 0.10
¥185,950,000 Japan Government Ten YearBond 0.4% 20/9/2025
1,341 0.08
iShares Overseas Government Bond Index Fund (UK)
Portfolio Statement (unaudited) continued
BlackRock Collective Investment Funds339

Holding orNominalValue Investment
MarketValue
£000’s
% ofTotal
NetAssets
¥400,800,000 Japan Government Ten YearBond 0.5% 20/9/2024
2,891 0.16
¥150,000,000 Japan Government Ten YearBond 0.5% 20/12/2024
1,084 0.06
¥691,500,000 Japan Government Ten YearBond 0.6% 20/3/2023
4,959 0.28
¥112,350,000 Japan Government Ten YearBond 0.6% 20/9/2023
809 0.05
¥438,850,000 Japan Government Ten YearBond 0.6% 20/12/2023
3,162 0.18
¥200,000,000 Japan Government Ten YearBond 0.6% 20/3/2024
1,444 0.08
¥248,500,000 Japan Government Ten YearBond 0.6% 20/6/2024
1,797 0.10
¥161,250,000 Japan Government Ten YearBond 0.7% 20/12/2022
1,157 0.07
¥496,000,000 Japan Government Ten YearBond 0.8% 20/6/2022
3,551 0.20
¥587,550,000 Japan Government Ten YearBond 0.8% 20/9/2022
4,216 0.24
¥372,400,000 Japan Government Ten YearBond 0.8% 20/12/2022
2,678 0.15
¥583,900,000 Japan Government Ten YearBond 0.8% 20/6/2023
4,217 0.24
¥230,400,000 Japan Government Ten YearBond 0.8% 20/9/2023
1,668 0.09
¥207,400,000 Japan Government Ten YearBond 0.9% 20/3/2022
1,484 0.08
¥418,100,000 Japan Government Ten YearBond 0.9% 20/6/2022
2,999 0.17
¥378,000,000 Japan Government Ten YearBond 1% 20/12/2021
2,701 0.15
¥609,200,000 Japan Government Ten YearBond 1% 20/3/2022
4,365 0.25
¥254,050,000 Japan Government Ten YearBond 1.1% 20/12/2021
1,818 0.10
¥115,150,000 Japan Government ThirtyYear Bond 0.3% 20/6/2046
765 0.04
¥184,750,000 Japan Government ThirtyYear Bond 0.4% 20/6/2049
1,235 0.07
¥182,050,000 Japan Government ThirtyYear Bond 0.4% 20/9/2049
1,215 0.07
¥204,650,000 Japan Government ThirtyYear Bond 0.4% 20/12/2049
1,364 0.08
¥191,400,000 Japan Government ThirtyYear Bond 0.4% 20/3/2050
1,273 0.07
¥202,550,000 Japan Government ThirtyYear Bond 0.5% 20/9/2046
1,412 0.08
¥171,750,000 Japan Government ThirtyYear Bond 0.5% 20/3/2049
1,181 0.07
Holding orNominalValue Investment
MarketValue
£000’s
% ofTotal
NetAssets
¥92,200,000 Japan Government ThirtyYear Bond 0.6% 20/12/2046
658 0.04
¥140,900,000 Japan Government ThirtyYear Bond 0.6% 20/6/2050
990 0.06
¥212,200,000 Japan Government ThirtyYear Bond 0.7% 20/6/2048
1,543 0.09
¥192,200,000 Japan Government ThirtyYear Bond 0.7% 20/12/2048
1,396 0.08
¥132,050,000 Japan Government ThirtyYear Bond 0.8% 20/3/2046
990 0.06
¥167,150,000 Japan Government ThirtyYear Bond 0.8% 20/3/2047
1,248 0.07
¥119,750,000 Japan Government ThirtyYear Bond 0.8% 20/6/2047
896 0.05
¥125,150,000 Japan Government ThirtyYear Bond 0.8% 20/9/2047
936 0.05
¥192,700,000 Japan Government ThirtyYear Bond 0.8% 20/12/2047
1,436 0.08
¥227,000,000 Japan Government ThirtyYear Bond 0.8% 20/3/2048
1,691 0.10
¥219,650,000 Japan Government ThirtyYear Bond 0.9% 20/9/2048
1,675 0.10
¥64,700,000 Japan Government ThirtyYear Bond 1.1% 20/3/2033
507 0.03
¥57,200,000 Japan Government ThirtyYear Bond 1.4% 20/9/2045
486 0.03
¥92,350,000 Japan Government ThirtyYear Bond 1.4% 20/12/2045
784 0.04
¥93,950,000 Japan Government ThirtyYear Bond 1.5% 20/12/2044
811 0.05
¥139,600,000 Japan Government ThirtyYear Bond 1.5% 20/3/2045
1,205 0.07
¥66,850,000 Japan Government ThirtyYear Bond 1.6% 20/6/2045
589 0.03
¥61,400,000 Japan Government ThirtyYear Bond 1.7% 20/6/2033
514 0.03
¥141,600,000 Japan Government ThirtyYear Bond 1.7% 20/12/2043
1,261 0.07
¥169,000,000 Japan Government ThirtyYear Bond 1.7% 20/3/2044
1,506 0.09
¥109,350,000 Japan Government ThirtyYear Bond 1.7% 20/6/2044
975 0.06
¥116,300,000 Japan Government ThirtyYear Bond 1.7% 20/9/2044
1,041 0.06
¥166,400,000 Japan Government ThirtyYear Bond 1.8% 20/3/2043
1,501 0.09
¥142,500,000 Japan Government ThirtyYear Bond 1.8% 20/9/2043
1,288 0.07
¥345,550,000 Japan Government ThirtyYear Bond 1.9% 20/9/2042
3,157 0.18
iShares Overseas Government Bond Index Fund (UK)
Portfolio Statement (unaudited) continued
BlackRock Collective Investment Funds 340

Holding orNominalValue Investment
MarketValue
£000’s
% ofTotal
NetAssets
¥174,000,000 Japan Government ThirtyYear Bond 1.9% 20/6/2043
1,596 0.09
¥68,450,000 Japan Government ThirtyYear Bond 2% 20/12/2033
595 0.03
¥280,350,000 Japan Government ThirtyYear Bond 2% 20/9/2040
2,567 0.15
¥295,300,000 Japan Government ThirtyYear Bond 2% 20/9/2041
2,723 0.15
¥275,800,000 Japan Government ThirtyYear Bond 2% 20/3/2042
2,551 0.14
¥49,050,000 Japan Government ThirtyYear Bond 2.1% 20/9/2033
430 0.02
¥200,000,000 Japan Government ThirtyYear Bond 2.2% 20/9/2039
1,871 0.11
¥260,050,000 Japan Government ThirtyYear Bond 2.2% 20/3/2041
2,464 0.14
¥102,300,000 Japan Government ThirtyYear Bond 2.3% 20/3/2035
928 0.05
¥74,800,000 Japan Government ThirtyYear Bond 2.3% 20/6/2035
680 0.04
¥101,950,000 Japan Government ThirtyYear Bond 2.3% 20/12/2035
931 0.05
¥93,300,000 Japan Government ThirtyYear Bond 2.3% 20/12/2036
861 0.05
¥238,350,000 Japan Government ThirtyYear Bond 2.3% 20/3/2039
2,246 0.13
¥278,100,000 Japan Government ThirtyYear Bond 2.3% 20/3/2040
2,651 0.15
¥83,050,000 Japan Government ThirtyYear Bond 2.4% 20/3/2034
755 0.04
¥71,300,000 Japan Government ThirtyYear Bond 2.4% 20/12/2034
653 0.04
¥190,550,000 Japan Government ThirtyYear Bond 2.4% 20/3/2037
1,783 0.10
¥238,500,000 Japan Government ThirtyYear Bond 2.4% 20/9/2038
2,267 0.13
¥99,250,000 Japan Government ThirtyYear Bond 2.5% 20/6/2034
914 0.05
¥52,600,000 Japan Government ThirtyYear Bond 2.5% 20/9/2034
485 0.03
¥89,450,000 Japan Government ThirtyYear Bond 2.5% 20/9/2035
833 0.05
¥75,250,000 Japan Government ThirtyYear Bond 2.5% 20/3/2036
705 0.04
¥105,550,000 Japan Government ThirtyYear Bond 2.5% 20/6/2036
992 0.06
¥128,000,000 Japan Government ThirtyYear Bond 2.5% 20/9/2036
1,206 0.07
¥163,250,000 Japan Government ThirtyYear Bond 2.5% 20/9/2037
1,556 0.09
Holding orNominalValue Investment
MarketValue
£000’s
% ofTotal
NetAssets
¥235,600,000 Japan Government ThirtyYear Bond 2.5% 20/3/2038
2,257 0.13
¥188,250,000 Japan Government TwentyYear Bond 0.2% 20/6/2036
1,300 0.07
¥288,600,000 Japan Government TwentyYear Bond 0.3% 20/6/2039
1,993 0.11
¥268,100,000 Japan Government TwentyYear Bond 0.3% 20/9/2039
1,852 0.11
¥269,700,000 Japan Government TwentyYear Bond 0.3% 20/12/2039
1,860 0.11
¥100,550,000 Japan Government TwentyYear Bond 0.4% 20/3/2036
717 0.04
¥251,250,000 Japan Government TwentyYear Bond 0.4% 20/3/2039
1,768 0.10
¥254,550,000 Japan Government TwentyYear Bond 0.4% 20/3/2040
1,785 0.10
¥188,300,000 Japan Government TwentyYear Bond 0.4% 20/6/2040
1,321 0.08
¥155,250,000 Japan Government TwentyYear Bond 0.5% 20/9/2036
1,122 0.06
¥256,400,000 Japan Government TwentyYear Bond 0.5% 20/3/2038
1,845 0.10
¥277,550,000 Japan Government TwentyYear Bond 0.5% 20/6/2038
1,994 0.11
¥317,750,000 Japan Government TwentyYear Bond 0.5% 20/12/2038
2,276 0.13
¥266,600,000 Japan Government TwentyYear Bond 0.6% 20/12/2036
1,955 0.11
¥162,450,000 Japan Government TwentyYear Bond 0.6% 20/6/2037
1,190 0.07
¥243,150,000 Japan Government TwentyYear Bond 0.6% 20/9/2037
1,780 0.10
¥192,200,000 Japan Government TwentyYear Bond 0.6% 20/12/2037
1,406 0.08
¥188,000,000 Japan Government TwentyYear Bond 0.7% 20/3/2037
1,399 0.08
¥277,900,000 Japan Government TwentyYear Bond 0.7% 20/9/2038
2,062 0.12
¥40,550,000 Japan Government TwentyYear Bond 0.8% 20/6/2023
293 0.02
¥87,600,000 Japan Government TwentyYear Bond 1% 20/3/2023
635 0.04
¥107,000,000 Japan Government TwentyYear Bond 1% 20/12/2035
831 0.05
¥211,050,000 Japan Government TwentyYear Bond 1.2% 20/12/2034
1,683 0.10
¥212,250,000 Japan Government TwentyYear Bond 1.2% 20/3/2035
1,693 0.10
¥163,900,000 Japan Government TwentyYear Bond 1.2% 20/9/2035
1,306 0.07
iShares Overseas Government Bond Index Fund (UK)
Portfolio Statement (unaudited) continued
BlackRock Collective Investment Funds341

Holding orNominalValue Investment
MarketValue
£000’s
% ofTotal
NetAssets
¥164,550,000 Japan Government TwentyYear Bond 1.3% 20/6/2035
1,329 0.08
¥36,200,000 Japan Government TwentyYear Bond 1.4% 20/12/2022
264 0.01
¥292,100,000 Japan Government TwentyYear Bond 1.4% 20/9/2034
2,384 0.14
¥124,700,000 Japan Government TwentyYear Bond 1.5% 20/6/2032
1,017 0.06
¥147,600,000 Japan Government TwentyYear Bond 1.5% 20/3/2033
1,209 0.07
¥200,400,000 Japan Government TwentyYear Bond 1.5% 20/3/2034
1,652 0.09
¥196,500,000 Japan Government TwentyYear Bond 1.5% 20/6/2034
1,621 0.09
¥99,400,000 Japan Government TwentyYear Bond 1.6% 20/6/2030
806 0.05
¥94,700,000 Japan Government TwentyYear Bond 1.6% 20/3/2032
779 0.04
¥109,700,000 Japan Government TwentyYear Bond 1.6% 20/6/2032
904 0.05
¥162,000,000 Japan Government TwentyYear Bond 1.6% 20/3/2033
1,341 0.08
¥180,550,000 Japan Government TwentyYear Bond 1.6% 20/12/2033
1,501 0.09
¥11,500,000 Japan Government TwentyYear Bond 1.7% 20/12/2022
84 0.00
¥136,550,000 Japan Government TwentyYear Bond 1.7% 20/9/2031
1,129 0.06
¥185,850,000 Japan Government TwentyYear Bond 1.7% 20/12/2031
1,541 0.09
¥126,450,000 Japan Government TwentyYear Bond 1.7% 20/3/2032
1,050 0.06
¥88,550,000 Japan Government TwentyYear Bond 1.7% 20/6/2032
737 0.04
¥180,700,000 Japan Government TwentyYear Bond 1.7% 20/9/2032
1,507 0.09
¥241,800,000 Japan Government TwentyYear Bond 1.7% 20/12/2032
2,020 0.11
¥250,550,000 Japan Government TwentyYear Bond 1.7% 20/6/2033
2,099 0.12
¥218,000,000 Japan Government TwentyYear Bond 1.7% 20/9/2033
1,830 0.10
¥153,300,000 Japan Government TwentyYear Bond 1.8% 20/6/2023
1,137 0.06
¥55,450,000 Japan Government TwentyYear Bond 1.8% 20/12/2023
415 0.02
¥47,200,000 Japan Government TwentyYear Bond 1.8% 20/6/2030
389 0.02
¥70,000,000 Japan Government TwentyYear Bond 1.8% 20/9/2030
579 0.03
Holding orNominalValue Investment
MarketValue
£000’s
% ofTotal
NetAssets
¥174,250,000 Japan Government TwentyYear Bond 1.8% 20/6/2031
1,450 0.08
¥229,900,000 Japan Government TwentyYear Bond 1.8% 20/9/2031
1,918 0.11
¥216,000,000 Japan Government TwentyYear Bond 1.8% 20/12/2031
1,808 0.10
¥138,200,000 Japan Government TwentyYear Bond 1.8% 20/3/2032
1,159 0.07
¥114,850,000 Japan Government TwentyYear Bond 1.8% 20/12/2032
969 0.06
¥184,050,000 Japan Government TwentyYear Bond 1.9% 20/9/2023
1,376 0.08
¥107,350,000 Japan Government TwentyYear Bond 1.9% 20/12/2023
806 0.05
¥169,350,000 Japan Government TwentyYear Bond 1.9% 20/3/2024
1,278 0.07
¥166,250,000 Japan Government TwentyYear Bond 1.9% 20/3/2025
1,277 0.07
¥131,300,000 Japan Government TwentyYear Bond 1.9% 20/6/2025
1,012 0.06
¥227,100,000 Japan Government TwentyYear Bond 1.9% 20/12/2028
1,853 0.11
¥105,800,000 Japan Government TwentyYear Bond 1.9% 20/3/2029
866 0.05
¥120,000,000 Japan Government TwentyYear Bond 1.9% 20/9/2030
1,000 0.06
¥55,950,000 Japan Government TwentyYear Bond 1.9% 20/3/2031
469 0.03
¥212,150,000 Japan Government TwentyYear Bond 1.9% 20/6/2031
1,782 0.10
¥39,700,000 Japan Government TwentyYear Bond 2% 21/3/2022
289 0.02
¥110,550,000 Japan Government TwentyYear Bond 2% 20/12/2024
849 0.05
¥140,000,000 Japan Government TwentyYear Bond 2% 20/3/2025
1,080 0.06
¥69,450,000 Japan Government TwentyYear Bond 2% 20/6/2025
538 0.03
¥50,000,000 Japan Government TwentyYear Bond 2% 20/9/2025
389 0.02
¥43,150,000 Japan Government TwentyYear Bond 2% 20/12/2025
337 0.02
¥120,150,000 Japan Government TwentyYear Bond 2% 20/3/2027
960 0.05
¥108,400,000 Japan Government TwentyYear Bond 2% 20/6/2030
909 0.05
¥87,050,000 Japan Government TwentyYear Bond 2% 20/12/2030
734 0.04
¥147,200,000 Japan Government TwentyYear Bond 2% 20/3/2031
1,244 0.07
iShares Overseas Government Bond Index Fund (UK)
Portfolio Statement (unaudited) continued
BlackRock Collective Investment Funds 342

Holding orNominalValue Investment
MarketValue
£000’s
% ofTotal
NetAssets
¥78,600,000 Japan Government TwentyYear Bond 2.1% 20/3/2024
597 0.03
¥122,950,000 Japan Government TwentyYear Bond 2.1% 20/9/2024
943 0.05
¥300,000,000 Japan Government TwentyYear Bond 2.1% 20/12/2024
2,313 0.13
¥146,250,000 Japan Government TwentyYear Bond 2.1% 20/3/2025
1,133 0.06
¥20,450,000 Japan Government TwentyYear Bond 2.1% 20/6/2025
159 0.01
¥12,000,000 Japan Government TwentyYear Bond 2.1% 20/9/2025
94 0.01
¥15,000,000 Japan Government TwentyYear Bond 2.1% 20/12/2025
118 0.01
¥44,400,000 Japan Government TwentyYear Bond 2.1% 20/3/2026
350 0.02
¥173,350,000 Japan Government TwentyYear Bond 2.1% 20/12/2026
1,387 0.08
¥107,650,000 Japan Government TwentyYear Bond 2.1% 20/3/2027
865 0.05
¥7,050,000 Japan Government TwentyYear Bond 2.1% 20/6/2027
57 0.00
¥77,750,000 Japan Government TwentyYear Bond 2.1% 20/9/2027
631 0.04
¥276,000,000 Japan Government TwentyYear Bond 2.1% 20/12/2027
2,248 0.13
¥96,350,000 Japan Government TwentyYear Bond 2.1% 20/6/2028
791 0.04
¥146,750,000 Japan Government TwentyYear Bond 2.1% 20/9/2028
1,210 0.07
¥79,300,000 Japan Government TwentyYear Bond 2.1% 20/12/2028
656 0.04
¥150,500,000 Japan Government TwentyYear Bond 2.1% 20/3/2029
1,250 0.07
¥215,900,000 Japan Government TwentyYear Bond 2.1% 20/6/2029
1,800 0.10
¥218,750,000 Japan Government TwentyYear Bond 2.1% 20/9/2029
1,830 0.10
¥135,950,000 Japan Government TwentyYear Bond 2.1% 20/12/2029
1,141 0.06
¥190,500,000 Japan Government TwentyYear Bond 2.1% 20/3/2030
1,604 0.09
¥222,000,000 Japan Government TwentyYear Bond 2.1% 20/12/2030
1,887 0.11
¥46,450,000 Japan Government TwentyYear Bond 2.2% 20/12/2021
337 0.02
¥19,050,000 Japan Government TwentyYear Bond 2.2% 20/3/2024
145 0.01
¥75,000,000 Japan Government TwentyYear Bond 2.2% 20/6/2024
574 0.03
Holding orNominalValue Investment
MarketValue
£000’s
% ofTotal
NetAssets
¥40,150,000 Japan Government TwentyYear Bond 2.2% 20/3/2026
318 0.02
¥40,650,000 Japan Government TwentyYear Bond 2.2% 20/6/2026
324 0.02
¥129,050,000 Japan Government TwentyYear Bond 2.2% 20/9/2026
1,034 0.06
¥36,150,000 Japan Government TwentyYear Bond 2.2% 20/9/2027
295 0.02
¥185,650,000 Japan Government TwentyYear Bond 2.2% 20/3/2028
1,528 0.09
¥78,050,000 Japan Government TwentyYear Bond 2.2% 20/9/2028
648 0.04
¥111,000,000 Japan Government TwentyYear Bond 2.2% 20/6/2029
932 0.05
¥138,400,000 Japan Government TwentyYear Bond 2.2% 20/12/2029
1,170 0.07
¥107,950,000 Japan Government TwentyYear Bond 2.2% 20/3/2030
916 0.05
¥202,200,000 Japan Government TwentyYear Bond 2.2% 20/3/2031
1,739 0.10
¥62,400,000 Japan Government TwentyYear Bond 2.3% 20/3/2026
497 0.03
¥75,800,000 Japan Government TwentyYear Bond 2.3% 20/6/2026
607 0.03
¥23,250,000 Japan Government TwentyYear Bond 2.3% 20/9/2026
187 0.01
¥101,850,000 Japan Government TwentyYear Bond 2.3% 20/6/2027
832 0.05
¥108,050,000 Japan Government TwentyYear Bond 2.3% 20/6/2028
899 0.05
¥122,450,000 Japan Government TwentyYear Bond 2.4% 20/6/2024
945 0.05
¥57,450,000 Japan Government TwentyYear Bond 2.4% 20/3/2028
479 0.03
¥110,750,000 Japan Government TwentyYear Bond 2.4% 20/6/2028
927 0.05
¥259,050,000 Japan Government Two YearBond 0.1% 1/10/2021
1,829 0.10
¥132,150,000 Japan Government Two YearBond 0.1% 1/11/2021
933 0.05
¥202,750,000 Japan Government Two YearBond 0.1% 1/1/2022
1,433 0.08
¥133,450,000 Japan Government Two YearBond 0.1% 1/2/2022
943 0.05
¥77,300,000 Japan Government Two YearBond 0.1% 1/3/2022
546 0.03
¥50,000,000 Japan Government Two YearBond 0.1% 1/4/2022
354 0.02
¥295,900,000 Japan Government Two YearBond 0.1% 1/5/2022
2,093 0.12
iShares Overseas Government Bond Index Fund (UK)
Portfolio Statement (unaudited) continued
BlackRock Collective Investment Funds343

Holding orNominalValue Investment
MarketValue
£000’s
% ofTotal
NetAssets
¥183,300,000 Japan Government Two YearBond 0.1% 1/6/2022
1,296 0.07
¥291,900,000 Japan Government Two YearBond 0.1% 1/7/2022
2,065 0.12
363,796 20.67
Swedish Krona Denominated GovernmentBonds − 0.21%; 29.2.2020 0.21%
SEK 1,780,000 Sweden Government Bond0.125% 12/5/2031
154 0.01
SEK 4,090,000 Sweden Government Bond0.75% 12/5/2028Ø
376 0.02
SEK 4,920,000 Sweden Government Bond0.75% 12/11/2029
454 0.03
SEK 6,120,000 Sweden Government Bond1% 12/11/2026
568 0.03
SEK 6,290,000 Sweden Government Bond1.5% 13/11/2023Ø
576 0.03
SEK 1,945,000 Sweden Government Bond2.25% 1/6/2032
207 0.01
SEK 8,720,000 Sweden Government Bond2.5% 12/5/2025Ø
853 0.05
SEK 4,660,000 Sweden Government Bond3.5% 30/3/2039
620 0.03
3,808 0.21
US Dollar Denominated GovernmentBonds − 45.75%; 29.2.2020 46.19%
$4,170,000 United States TreasuryNote/Bond 0.125%30/4/2022
3,114 0.18
$3,100,000 United States TreasuryNote/Bond 0.125%31/5/2022
2,315 0.13
$2,430,000 United States TreasuryNote/Bond 0.125%30/6/2022
1,814 0.10
$4,800,000 United States TreasuryNote/Bond 0.125%31/7/2022
3,584 0.20
$1,560,000 United States TreasuryNote/Bond 0.125%31/8/2022
1,165 0.07
$5,800,000 United States TreasuryNote/Bond 0.125%15/5/2023
4,329 0.25
$2,450,000 United States TreasuryNote/Bond 0.125%15/7/2023
1,828 0.10
Holding orNominalValue Investment
MarketValue
£000’s
% ofTotal
NetAssets
$4,080,000 United States TreasuryNote/Bond 0.125%15/8/2023
3,045 0.17
$3,380,000 United States TreasuryNote/Bond 0.25% 15/4/2023
2,531 0.14
$1,990,000 United States TreasuryNote/Bond 0.25% 15/6/2023
1,490 0.08
$3,330,000 United States TreasuryNote/Bond 0.25% 31/5/2025
2,486 0.14
$3,130,000 United States TreasuryNote/Bond 0.25% 30/6/2025
2,336 0.13
$3,810,000 United States TreasuryNote/Bond 0.25% 31/7/2025
2,843 0.16
$3,350,000 United States TreasuryNote/Bond 0.25% 31/8/2025
2,499 0.14
$3,230,000 United States TreasuryNote/Bond 0.375%31/3/2022
2,421 0.14
$3,410,000 United States TreasuryNote/Bond 0.375%30/4/2025
2,561 0.15
$3,460,000 United States TreasuryNote/Bond 0.375%31/7/2027
2,565 0.15
$3,400,000 United States TreasuryNote/Bond 0.5% 15/3/2023
2,562 0.15
$3,840,000 United States TreasuryNote/Bond 0.5% 31/3/2025
2,901 0.16
$2,240,000 United States TreasuryNote/Bond 0.5% 30/4/2027
1,677 0.10
$2,590,000 United States TreasuryNote/Bond 0.5% 31/5/2027
1,938 0.11
$3,640,000 United States TreasuryNote/Bond 0.5% 30/6/2027
2,723 0.15
$3,130,000 United States TreasuryNote/Bond 0.5% 31/8/2027
2,341 0.13
$3,210,000 United States TreasuryNote/Bond 0.625%31/3/2027
2,424 0.14
$8,660,000 United States TreasuryNote/Bond 0.625%15/5/2030
6,426 0.36
$4,800,000 United States TreasuryNote/Bond 0.625%15/8/2030
3,557 0.20
$6,130,000 United States TreasuryNote/Bond 1.125%28/2/2022
4,645 0.26
$3,940,000 United States TreasuryNote/Bond 1.125%28/2/2025
3,059 0.17
iShares Overseas Government Bond Index Fund (UK)
Portfolio Statement (unaudited) continued
BlackRock Collective Investment Funds 344

Holding orNominalValue Investment
MarketValue
£000’s
% ofTotal
NetAssets
$1,490,000 United States TreasuryNote/Bond 1.125%28/2/2027
1,161 0.07
$1,840,000 United States TreasuryNote/Bond 1.125%28/2/2027
1,434 0.08
$5,280,000 United States TreasuryNote/Bond 1.125%15/5/2040
3,878 0.22
$1,690,000 United States TreasuryNote/Bond 1.125%15/8/2040
1,236 0.07
$3,000,000 United States TreasuryNote/Bond 1.25%31/10/2021
2,269 0.13
$4,119,000 United States TreasuryNote/Bond 1.25% 31/7/2023
3,174 0.18
$4,000,000 United States TreasuryNote/Bond 1.25% 31/8/2024
3,111 0.18
$6,710,000 United States TreasuryNote/Bond 1.25% 15/5/2050
4,732 0.27
$480,000 United States TreasuryNote/Bond 1.375%31/1/2022
365 0.02
$3,000,000 United States TreasuryNote/Bond 1.375%15/10/2022
2,299 0.13
$5,010,000 United States TreasuryNote/Bond 1.375%15/2/2023Ø
3,855 0.22
$2,310,000 United States TreasuryNote/Bond 1.375%30/6/2023
1,785 0.10
$770,000 United States TreasuryNote/Bond 1.375%31/8/2023
596 0.03
$1,719,000 United States TreasuryNote/Bond 1.375%30/9/2023
1,332 0.08
$3,560,000 United States TreasuryNote/Bond 1.375%31/1/2025
2,791 0.16
$3,330,000 United States TreasuryNote/Bond 1.375%31/8/2026
2,632 0.15
$3,740,000 United States TreasuryNote/Bond 1.375%15/8/2050
2,724 0.15
$3,970,000 United States TreasuryNote/Bond 1.5% 31/10/2021
3,012 0.17
$4,000,000 United States TreasuryNote/Bond 1.5% 30/11/2021
3,038 0.17
Holding orNominalValue Investment
MarketValue
£000’s
% ofTotal
NetAssets
$3,301,000 United States TreasuryNote/Bond 1.5% 31/1/2022
2,512 0.14
$4,750,000 United States TreasuryNote/Bond 1.5% 15/8/2022Ø
3,641 0.21
$2,550,000 United States TreasuryNote/Bond 1.5% 15/9/2022
1,957 0.11
$3,240,000 United States TreasuryNote/Bond 1.5% 15/1/2023
2,498 0.14
$3,119,000 United States TreasuryNote/Bond 1.5% 28/2/2023
2,408 0.14
$2,120,000 United States TreasuryNote/Bond 1.5% 31/3/2023
1,639 0.09
$5,000,000 United States TreasuryNote/Bond 1.5% 30/9/2024
3,928 0.22
$5,500,000 United States TreasuryNote/Bond 1.5%31/10/2024Ø
4,325 0.25
$4,980,000 United States TreasuryNote/Bond 1.5% 30/11/2024
3,919 0.22
$5,611,000 United States TreasuryNote/Bond 1.5% 15/8/2026
4,464 0.25
$729,000 United States TreasuryNote/Bond 1.5% 15/8/2026
580 0.03
$2,890,000 United States TreasuryNote/Bond 1.5% 31/1/2027
2,304 0.13
$6,500,000 United States TreasuryNote/Bond 1.5% 15/2/2030
5,225 0.30
$4,060,000 United States TreasuryNote/Bond 1.625%31/12/2021
3,092 0.18
$5,490,000 United States TreasuryNote/Bond 1.625%15/8/2022
4,219 0.24
$1,700,000 United States TreasuryNote/Bond 1.625%31/8/2022
1,307 0.07
$12,059,000 United States TreasuryNote/Bond 1.625%15/11/2022
9,300 0.53
$4,410,000 United States TreasuryNote/Bond 1.625%15/12/2022
3,406 0.19
$4,129,000 United States TreasuryNote/Bond 1.625%30/4/2023
3,205 0.18
$3,563,000 United States TreasuryNote/Bond 1.625%31/5/2023Ø
2,769 0.16
$1,390,000 United States TreasuryNote/Bond 1.625%31/10/2023
1,086 0.06
iShares Overseas Government Bond Index Fund (UK)
Portfolio Statement (unaudited) continued
BlackRock Collective Investment Funds345

Holding orNominalValue Investment
MarketValue
£000’s
% ofTotal
NetAssets
$5,620,000 United States TreasuryNote/Bond 1.625%15/2/2026
4,490 0.26
$5,240,000 United States TreasuryNote/Bond 1.625%15/5/2026
4,193 0.24
$3,120,000 United States TreasuryNote/Bond 1.625%30/9/2026
2,502 0.14
$2,920,000 United States TreasuryNote/Bond 1.625%31/10/2026
2,342 0.13
$3,000,000 United States TreasuryNote/Bond 1.625%30/11/2026
2,407 0.14
$9,040,000 United States TreasuryNote/Bond 1.625%15/8/2029Ø
7,334 0.42
$3,640,000 United States TreasuryNote/Bond 1.75%30/11/2021
2,773 0.16
$1,596,000 United States TreasuryNote/Bond 1.75% 28/2/2022
1,220 0.07
$1,681,000 United States TreasuryNote/Bond 1.75% 31/3/2022
1,287 0.07
$4,511,000 United States TreasuryNote/Bond 1.75% 30/4/2022
3,459 0.20
$5,234,000 United States TreasuryNote/Bond 1.75% 15/5/2022
4,015 0.23
$8,140,000 United States TreasuryNote/Bond 1.75% 31/5/2022
6,249 0.35
$1,640,000 United States TreasuryNote/Bond 1.75% 15/6/2022
1,260 0.07
$4,138,000 United States TreasuryNote/Bond 1.75% 30/6/2022
3,181 0.18
$580,000 United States TreasuryNote/Bond 1.75% 15/7/2022
446 0.03
$2,181,000 United States TreasuryNote/Bond 1.75% 30/9/2022
1,683 0.10
$2,600,000 United States TreasuryNote/Bond 1.75% 31/1/2023
2,017 0.11
$10,780,000 United States TreasuryNote/Bond 1.75% 15/5/2023
8,399 0.48
$3,500,000 United States TreasuryNote/Bond 1.75% 30/6/2024
2,768 0.16
$3,880,000 United States TreasuryNote/Bond 1.75% 31/7/2024
3,072 0.17
$5,480,000 United States TreasuryNote/Bond 1.75%31/12/2024
4,360 0.25
Holding orNominalValue Investment
MarketValue
£000’s
% ofTotal
NetAssets
$3,000,000 United States TreasuryNote/Bond 1.75%31/12/2026
2,426 0.14
$7,810,000 United States TreasuryNote/Bond 1.75%15/11/2029Ø
6,409 0.36
$2,605,000 United States TreasuryNote/Bond 1.875%30/11/2021
1,987 0.11
$2,195,000 United States TreasuryNote/Bond 1.875%31/1/2022
1,679 0.10
$5,074,000 United States TreasuryNote/Bond 1.875%28/2/2022
3,887 0.22
$1,780,000 United States TreasuryNote/Bond 1.875%31/3/2022
1,366 0.08
$5,555,000 United States TreasuryNote/Bond 1.875%30/4/2022
4,268 0.24
$2,536,000 United States TreasuryNote/Bond 1.875%31/5/2022
1,951 0.11
$4,090,000 United States TreasuryNote/Bond 1.875%31/7/2022
3,155 0.18
$1,496,000 United States TreasuryNote/Bond 1.875%31/8/2022
1,156 0.07
$2,510,000 United States TreasuryNote/Bond 1.875%30/9/2022
1,942 0.11
$2,171,000 United States TreasuryNote/Bond 1.875%31/10/2022
1,682 0.10
$2,529,000 United States TreasuryNote/Bond 1.875%31/8/2024
2,014 0.11
$3,000,000 United States TreasuryNote/Bond 1.875%30/6/2026
2,435 0.14
$2,940,000 United States TreasuryNote/Bond 1.875%31/7/2026
2,388 0.14
$2,601,000 United States TreasuryNote/Bond 2% 31/10/2021
1,984 0.11
$5,925,000 United States TreasuryNote/Bond 2% 15/11/2021
4,524 0.26
$2,910,000 United States TreasuryNote/Bond 2% 31/12/2021
2,227 0.13
iShares Overseas Government Bond Index Fund (UK)
Portfolio Statement (unaudited) continued
BlackRock Collective Investment Funds 346

Holding orNominalValue Investment
MarketValue
£000’s
% ofTotal
NetAssets
$8,019,000 United States TreasuryNote/Bond 2% 15/2/2022
6,149 0.35
$2,136,000 United States TreasuryNote/Bond 2% 31/7/2022
1,652 0.09
$2,045,000 United States TreasuryNote/Bond 2% 31/10/2022
1,589 0.09
$6,456,000 United States TreasuryNote/Bond 2% 30/11/2022
5,022 0.29
$5,324,000 United States TreasuryNote/Bond 2% 15/2/2023
4,156 0.24
$2,580,000 United States TreasuryNote/Bond 2% 30/4/2024
2,054 0.12
$6,320,000 United States TreasuryNote/Bond 2% 31/5/2024
5,037 0.29
$3,301,000 United States TreasuryNote/Bond 2% 30/6/2024
2,634 0.15
$6,314,000 United States TreasuryNote/Bond 2% 15/2/2025
5,083 0.29
$4,970,000 United States TreasuryNote/Bond 2% 15/8/2025Ø
4,025 0.23
$5,600,000 United States TreasuryNote/Bond 2% 15/11/2026Ø
4,589 0.26
$5,330,000 United States TreasuryNote/Bond 2% 15/2/2050
4,486 0.25
$2,601,000 United States TreasuryNote/Bond 2.125%31/12/2021
1,993 0.11
$5,150,000 United States TreasuryNote/Bond 2.125%15/5/2022Ø
3,975 0.23
$1,960,000 United States TreasuryNote/Bond 2.125%30/6/2022
1,517 0.09
$6,461,000 United States TreasuryNote/Bond 2.125%31/12/2022
5,047 0.29
$3,209,000 United States TreasuryNote/Bond 2.125%30/11/2023
2,548 0.14
$2,634,000 United States TreasuryNote/Bond 2.125%29/2/2024
2,101 0.12
$8,410,000 United States TreasuryNote/Bond 2.125%31/3/2024
6,715 0.38
$3,074,000 United States TreasuryNote/Bond 2.125%31/7/2024
2,467 0.14
$2,500,000 United States TreasuryNote/Bond 2.125%30/9/2024
2,012 0.11
Holding orNominalValue Investment
MarketValue
£000’s
% ofTotal
NetAssets
$3,649,000 United States TreasuryNote/Bond 2.125%30/11/2024
2,943 0.17
$5,377,000 United States TreasuryNote/Bond 2.125%15/5/2025
4,366 0.25
$3,100,000 United States TreasuryNote/Bond 2.125%31/5/2026
2,547 0.14
$2,000,000 United States TreasuryNote/Bond 2.25% 15/4/2022
1,545 0.09
$2,359,000 United States TreasuryNote/Bond 2.25%31/12/2023
1,883 0.11
$1,990,000 United States TreasuryNote/Bond 2.25% 31/1/2024
1,591 0.09
$1,630,000 United States TreasuryNote/Bond 2.25% 30/4/2024
1,309 0.07
$1,840,000 United States TreasuryNote/Bond 2.25%31/10/2024
1,489 0.08
$6,769,000 United States TreasuryNote/Bond 2.25%15/11/2024
5,484 0.31
$2,199,000 United States TreasuryNote/Bond 2.25%31/12/2024
1,785 0.10
$7,381,000 United States TreasuryNote/Bond 2.25%15/11/2025
6,067 0.34
$2,890,000 United States TreasuryNote/Bond 2.25% 31/3/2026
2,386 0.14
$4,198,000 United States TreasuryNote/Bond 2.25%15/2/2027Ø
3,497 0.20
$6,666,000 United States TreasuryNote/Bond 2.25%15/8/2027Ø
5,580 0.32
$5,720,000 United States TreasuryNote/Bond 2.25%15/11/2027Ø
4,800 0.27
$3,504,000 United States TreasuryNote/Bond 2.25% 15/8/2046
3,072 0.17
$5,770,000 United States TreasuryNote/Bond 2.25% 15/8/2049
5,105 0.29
$4,210,000 United States TreasuryNote/Bond 2.375%15/3/2022
3,252 0.18
$3,950,000 United States TreasuryNote/Bond 2.375%31/1/2023
3,108 0.18
iShares Overseas Government Bond Index Fund (UK)
Portfolio Statement (unaudited) continued
BlackRock Collective Investment Funds347

Holding orNominalValue Investment
MarketValue
£000’s
% ofTotal
NetAssets
$2,620,000 United States TreasuryNote/Bond 2.375%29/2/2024Ø
2,106 0.12
$5,329,000 United States TreasuryNote/Bond 2.375%15/8/2024
4,319 0.25
$3,990,000 United States TreasuryNote/Bond 2.375%30/4/2026
3,318 0.19
$7,510,000 United States TreasuryNote/Bond 2.375%15/5/2027
6,318 0.36
$8,020,000 United States TreasuryNote/Bond 2.375%15/5/2029Ø
6,880 0.39
$5,450,000 United States TreasuryNote/Bond 2.375%15/11/2049
4,951 0.28
$3,410,000 United States TreasuryNote/Bond 2.5% 15/1/2022
2,629 0.15
$4,280,000 United States TreasuryNote/Bond 2.5% 15/2/2022
3,306 0.19
$4,792,000 United States TreasuryNote/Bond 2.5% 31/3/2023
3,796 0.22
$5,577,000 United States TreasuryNote/Bond 2.5% 15/8/2023Ø
4,453 0.25
$1,680,000 United States TreasuryNote/Bond 2.5% 31/1/2024
1,354 0.08
$6,894,000 United States TreasuryNote/Bond 2.5% 15/5/2024
5,587 0.32
$3,325,000 United States TreasuryNote/Bond 2.5% 31/1/2025
2,729 0.15
$4,000,000 United States TreasuryNote/Bond 2.5% 28/2/2026
3,342 0.19
$3,800,000 United States TreasuryNote/Bond 2.5% 15/2/2045
3,472 0.20
$3,520,000 United States TreasuryNote/Bond 2.5% 15/2/2046
3,226 0.18
$3,510,000 United States TreasuryNote/Bond 2.5% 15/5/2046
3,220 0.18
$4,500,000 United States TreasuryNote/Bond 2.625%15/12/2021
3,468 0.20
$6,130,000 United States TreasuryNote/Bond 2.625%28/2/2023
4,861 0.28
$3,711,000 United States TreasuryNote/Bond 2.625%30/6/2023
2,965 0.17
Holding orNominalValue Investment
MarketValue
£000’s
% ofTotal
NetAssets
$4,000,000 United States TreasuryNote/Bond 2.625%31/12/2023
3,230 0.18
$3,866,000 United States TreasuryNote/Bond 2.625%31/3/2025
3,199 0.18
$2,590,000 United States TreasuryNote/Bond 2.625%31/12/2025
2,171 0.12
$2,860,000 United States TreasuryNote/Bond 2.625%31/1/2026
2,400 0.14
$7,430,000 United States TreasuryNote/Bond 2.625%15/2/2029Ø
6,473 0.37
$400,000 United States TreasuryNote/Bond 2.75%30/4/2023Ø
319 0.02
$3,200,000 United States TreasuryNote/Bond 2.75% 31/5/2023
2,560 0.15
$4,044,000 United States TreasuryNote/Bond 2.75%31/7/2023Ø
3,248 0.18
$5,000,000 United States TreasuryNote/Bond 2.75% 31/8/2023
4,024 0.23
$5,868,000 United States TreasuryNote/Bond 2.75%15/11/2023
4,744 0.27
$5,589,000 United States TreasuryNote/Bond 2.75% 15/2/2024
4,544 0.26
$1,450,000 United States TreasuryNote/Bond 2.75% 28/2/2025
1,204 0.07
$1,817,000 United States TreasuryNote/Bond 2.75% 30/6/2025
1,519 0.09
$2,800,000 United States TreasuryNote/Bond 2.75% 31/8/2025
2,347 0.13
$5,440,000 United States TreasuryNote/Bond 2.75% 15/2/2028
4,724 0.27
$3,640,000 United States TreasuryNote/Bond 2.75% 15/8/2042
3,463 0.20
$3,810,000 United States TreasuryNote/Bond 2.75%15/11/2042
3,621 0.21
$3,520,000 United States TreasuryNote/Bond 2.75% 15/8/2047
3,396 0.19
$3,524,000 United States TreasuryNote/Bond 2.75%15/11/2047
3,404 0.19
$350,000 United States TreasuryNote/Bond 2.875%15/10/2021
269 0.02
iShares Overseas Government Bond Index Fund (UK)
Portfolio Statement (unaudited) continued
BlackRock Collective Investment Funds 348

Holding orNominalValue Investment
MarketValue
£000’s
% ofTotal
NetAssets
$3,320,000 United States TreasuryNote/Bond 2.875%15/11/2021
2,561 0.15
$2,080,000 United States TreasuryNote/Bond 2.875%30/9/2023
1,683 0.10
$3,180,000 United States TreasuryNote/Bond 2.875%31/10/2023
2,578 0.15
$2,839,000 United States TreasuryNote/Bond 2.875%30/11/2023
2,306 0.13
$4,730,000 United States TreasuryNote/Bond 2.875%30/4/2025
3,961 0.22
$5,990,000 United States TreasuryNote/Bond 2.875%31/5/2025
5,025 0.29
$3,299,000 United States TreasuryNote/Bond 2.875%31/7/2025
2,776 0.16
$3,800,000 United States TreasuryNote/Bond 2.875%30/11/2025
3,218 0.18
$6,962,000 United States TreasuryNote/Bond 2.875%15/5/2028
6,114 0.35
$7,270,000 United States TreasuryNote/Bond 2.875%15/8/2028
6,404 0.36
$3,797,000 United States TreasuryNote/Bond 2.875%15/5/2043
3,679 0.21
$3,750,000 United States TreasuryNote/Bond 2.875%15/8/2045
3,658 0.21
$3,650,000 United States TreasuryNote/Bond 2.875%15/11/2046
3,584 0.20
$5,190,000 United States TreasuryNote/Bond 2.875%15/5/2049Ø
5,191 0.29
$2,830,000 United States TreasuryNote/Bond 3% 30/9/2025
2,403 0.14
$1,340,000 United States TreasuryNote/Bond 3% 31/10/2025
1,139 0.06
$3,852,000 United States TreasuryNote/Bond 3% 15/5/2042
3,802 0.22
$3,790,000 United States TreasuryNote/Bond 3% 15/11/2044
3,760 0.21
$3,730,000 United States TreasuryNote/Bond 3% 15/5/2045
3,709 0.21
Holding orNominalValue Investment
MarketValue
£000’s
% ofTotal
NetAssets
$3,840,000 United States TreasuryNote/Bond 3% 15/11/2045
3,831 0.22
$3,510,000 United States TreasuryNote/Bond 3% 15/2/2047
3,527 0.20
$3,560,000 United States TreasuryNote/Bond 3% 15/5/2047
3,581 0.20
$3,790,000 United States TreasuryNote/Bond 3% 15/2/2048Ø
3,828 0.22
$4,350,000 United States TreasuryNote/Bond 3% 15/8/2048
4,409 0.25
$5,020,000 United States TreasuryNote/Bond 3% 15/2/2049
5,105 0.29
$7,580,000 United States TreasuryNote/Bond 3.125%15/11/2028
6,814 0.39
$3,730,000 United States TreasuryNote/Bond 3.125%15/11/2041
3,743 0.21
$3,722,000 United States TreasuryNote/Bond 3.125%15/2/2042
3,743 0.21
$3,810,000 United States TreasuryNote/Bond 3.125%15/2/2043
3,832 0.22
$3,750,000 United States TreasuryNote/Bond 3.125%15/8/2044
3,790 0.22
$4,159,000 United States TreasuryNote/Bond 3.125%15/5/2048
4,299 0.24
$3,780,000 United States TreasuryNote/Bond 3.375%15/5/2044
3,962 0.23
$4,610,000 United States TreasuryNote/Bond 3.375%15/11/2048
4,989 0.28
$2,270,000 United States TreasuryNote/Bond 3.5% 15/2/2039
2,370 0.13
$3,830,000 United States TreasuryNote/Bond 3.625%15/8/2043
4,147 0.24
$3,880,000 United States TreasuryNote/Bond 3.625%15/2/2044
4,210 0.24
$3,834,000 United States TreasuryNote/Bond 3.75% 15/8/2041
4,181 0.24
$3,770,000 United States TreasuryNote/Bond 3.75%15/11/2043
4,159 0.24
$3,812,000 United States TreasuryNote/Bond 3.875%15/8/2040
4,197 0.24
iShares Overseas Government Bond Index Fund (UK)
Portfolio Statement (unaudited) continued
BlackRock Collective Investment Funds349

Holding orNominalValue Investment
MarketValue
£000’s
% ofTotal
NetAssets
$3,136,000 United States TreasuryNote/Bond 4.25% 15/5/2039
3,576 0.20
$3,720,000 United States TreasuryNote/Bond 4.25%15/11/2040
4,295 0.24
$1,753,000 United States TreasuryNote/Bond 4.375%15/2/2038
2,008 0.11
$3,780,000 United States TreasuryNote/Bond 4.375%15/11/2039
4,389 0.25
$4,130,000 United States TreasuryNote/Bond 4.375%15/5/2040
4,819 0.27
$3,922,000 United States TreasuryNote/Bond 4.375%15/5/2041
4,612 0.26
$2,130,000 United States TreasuryNote/Bond 4.5% 15/2/2036
2,403 0.14
$1,800,000 United States TreasuryNote/Bond 4.5% 15/5/2038
2,092 0.12
$3,790,000 United States TreasuryNote/Bond 4.5% 15/8/2039
4,454 0.25
$3,820,000 United States TreasuryNote/Bond 4.625%15/2/2040
4,573 0.26
$1,050,000 United States TreasuryNote/Bond 4.75% 15/2/2037
1,232 0.07
$3,920,000 United States TreasuryNote/Bond 4.75% 15/2/2041
4,808 0.27
$1,240,000 United States TreasuryNote/Bond 5% 15/5/2037
1,497 0.08
$965,000 United States TreasuryNote/Bond 5.25%15/11/2028
991 0.06
$1,000,000 United States TreasuryNote/Bond 5.25% 15/2/2029
1,034 0.06
$2,691,000 United States TreasuryNote/Bond 5.375%15/2/2031
2,959 0.17
$925,000 United States TreasuryNote/Bond 5.5% 15/8/2028
957 0.05
$880,000 United States TreasuryNote/Bond 6% 15/2/2026
857 0.05
$2,724,000 United States TreasuryNote/Bond 6.125%15/11/2027
2,847 0.16
Holding orNominalValue Investment
MarketValue
£000’s
% ofTotal
NetAssets
$860,000 United States TreasuryNote/Bond 6.125%15/8/2029
951 0.05
$3,420,000 United States TreasuryNote/Bond 6.25% 15/8/2023
3,010 0.17
$1,609,000 United States TreasuryNote/Bond 6.25% 15/5/2030
1,834 0.10
$1,165,000 United States TreasuryNote/Bond 6.375%15/8/2027
1,221 0.07
$985,000 United States TreasuryNote/Bond 6.5% 15/11/2026
1,011 0.06
$900,000 United States TreasuryNote/Bond 6.625%15/2/2027
937 0.05
$1,340,000 United States TreasuryNote/Bond 6.75% 15/8/2026
1,376 0.08
$220,000 United States TreasuryNote/Bond 6.875%15/8/2025
217 0.01
$1,830,000 United States TreasuryNote/Bond 7.125%15/2/2023
1,599 0.09
$3,060,000 United States TreasuryNote/Bond 7.25% 15/8/2022
2,600 0.15
$500,000 United States TreasuryNote/Bond 7.5% 15/11/2024
487 0.03
$720,000 United States TreasuryNote/Bond 7.625%15/11/2022
626 0.04
$679,000 United States TreasuryNote/Bond 7.625%15/2/2025
673 0.04
$3,427,000 United States TreasuryNote/Bond 8% 15/11/2021
2,799 0.16
805,155 45.75
Portfolio of investments 1,746,953 99.26
Net other assets 13,055 0.74
Total net assets 1,760,008 100.00
Unless otherwise stated, all securities are either listed on a recognised exchange or traded on aneligible securities market.Ø All or a portion of this investment represents a security on loan.
iShares Overseas Government Bond Index Fund (UK)
Portfolio Statement (unaudited) continued
BlackRock Collective Investment Funds 350

£000’s31.8.2020
£000’s £000’s31.8.2019
£000’s
Income
Net capital (losses)/gains (9,802) 291,944
Revenue 10,553 13,869
Expenses (635) (695)
Interest payable and similarcharges (17) (11)
Net revenue before taxation 9,901 13,163
Taxation – –
Net revenue after taxation 9,901 13,163
Total return before distributions 99 305,107
Distributions (9,870) (13,163)
Change in net assetsattributable to unitholdersfrom investment activities (9,771) 291,944
Statement of Change in Net Assets Attributable to Unitholders(unaudited) for the six months ended 31 August 2020
£000’s31.8.2020
£000’s £000’s31.8.2019
£000’s
Opening net assets attributableto unitholders 1,899,314 1,713,691
Amounts receivable on issue of units 487,370 248,822
Amounts payable on cancellation of units (627,108) (314,693)
(139,738) (65,871)
Change in net assets attributable tounitholders from investment activities (9,771) 291,944
Retained distribution on accumulation units 10,203 12,589
Closing net assets attributableto unitholders 1,760,008 1,952,353
The above statement shows the comparative closing net assets at 31 August 2019 whereas the current accounting period commenced 1 March 2020.
iShares Overseas Government Bond Index Fund (UK)
Statement of Total Return (unaudited)
for the six months ended 31 August 2020
BlackRock Collective Investment Funds351

31.8.2020£000’s
29.2.2020£000’s
Assets:
Fixed assets
− Investment assets 1,746,953 1,882,427
Current assets
− Debtors 55,585 64,858
− Cash and bank balances 7,380 7,393
Total assets 1,809,918 1,954,678
Liabilities:
Creditors
− Distributions payable (186) (196)
− Other creditors (49,724) (55,168)
Total liabilities (49,910) (55,364)
Net assets attributable to unitholders 1,760,008 1,899,314
G D Bamping (Director)M T Zemek (Director)BlackRock Fund Managers Limited29 October 2020
iShares Overseas Government Bond Index Fund (UK)
Balance Sheet (unaudited)
at 31 August 2020
BlackRock Collective Investment Funds 352

The Fund is a sub-fund of BlackRock Collective Investment Funds (previously known as BlackRock QualifiedInvestor Schemes (1)), a UCITS scheme under the COLL Sourcebook. The Fund was established on 21 June2005 and was authorised by the FCA on 21 June 2005. The Fund’s FCA product reference number is 645672.
Risk and Reward ProfileLower riskTypically lower rewards
Higher riskTypically higher rewards
Unit Class
A Accumulation 1 2 3 4 5 6 7
L Accumulation 1 2 3 4 5 6 7
X Income 1 2 3 4 5 6 7
X Accumulation 1 2 3 4 5 6 7
D Accumulation 1 2 3 4 5 6 7
H Accumulation 1 2 3 4 5 6 7
• The risk indicator was calculated incorporating historical or simulated historical data and may not be a reliableindication of the future risk profile of the Fund.
• The risk category shown is not guaranteed and may change over time.
• The lowest category does not mean risk free.
• The use of derivatives will impact the value of the Fund and may expose the Fund to a higher degree of risk.Derivatives are highly sensitive to changes in the value of the asset on which they are based and can increasethe size of losses and gains, resulting in greater fluctuations in the value of the Fund. The impact to the Fundcan be greater where derivatives are used in an extensive or complex way.
For more information on this, please see the Fund’s Key Investor Information Documents (“KIIDs”), which areavailable at www.blackrock.com.
iShares Pacific Ex Japan Equity Index Fund (UK)
About the Fund
BlackRock Collective Investment Funds353

Net Asset Value
At 31 August 2020 Units in IssueNet Asset Value
£000’s
Net Asset Valueper Unit
p
A Accumulation 770,313 2,553 331.4
L Accumulation 167,866,583 574,628 342.3
X Income 4,487,665 6,429 143.3
X Accumulation 224,745,930 415,353 184.8
D Accumulation 36,962,704 125,273 338.9
H Accumulation 92,734,268 153,819 165.9
Distributions Payable for the period to 31 August 2020
Unit Class Distribution payable on 31.10.2020
Pence per Unit
A Accumulation 5.2047
L Accumulation 5.7585
X Income 2.6038
X Accumulation 3.2589
D Accumulation 5.8742
H Accumulation 2.8751
Operating Charges
Unit Class1.3.2020
to 31.8.20201.3.2019
to 29.2.2020
A Accumulation 0.54% 0.54%
L Accumulation 0.24% 0.24%
X Income 0.04% 0.04%
X Accumulation 0.04% 0.04%
D Accumulation 0.12% 0.12%
H Accumulation 0.12% 0.12%
Operating charges are annualised and exclude portfolio trade-related costs, except costs paid to the custodian/depositary and entry/exit charges paid to an underlyingcollective investment scheme (if any).
iShares Pacific Ex Japan Equity Index Fund (UK)
Performance Record
BlackRock Collective Investment Funds 354

Holding orNominalValue Investment1
MarketValue
£000’s
% ofTotal
NetAssets
ASIA AND PACIFIC − 97.56%; 29.2.2020 95.30%
EQUITIES − 97.56%; 29.2.2020 95.30%
Australia − 27.52%; 29.2.2020 27.21%
227,643 Adbri 321 0.03
96,421 Afterpay 4,869 0.38
294,383 AGL Energy 2,405 0.19
229,175 ALS 1,105 0.09
48,209 AltiumØ 972 0.08
1,152,089 AluminaØ 999 0.08
1,636,975 AMPØ 1,383 0.11
116,898 Ampol 1,679 0.13
62,295 Ansell 1,331 0.10
558,449 APAØ 3,214 0.25
301,924 Aristocrat LeisureØ 4,731 0.37
91,565 ASX 4,417 0.35
449,709 Atlas ArteriaØ 1,612 0.13
869,730 Aurizon 2,090 0.16
829,992 AusNet ServicesØ 837 0.07
1,324,179 Australia & New ZealandBanking
13,362 1.05
207,005 Bank of Queensland 699 0.05
877,167 Beach EnergyØ 736 0.06
256,327 Bendigo & AdelaideBankØ
925 0.07
2,223,675 BGP2 – 0.00
1,375,384 BHPØ 28,792 2.25
234,186 BlueScope Steel 1,641 0.13
559,384 BoralØ 1,236 0.10
719,484 BramblesØ 4,403 0.34
276,339 Challenger 623 0.05
217,786 Charter Hall 1,505 0.12
47,615 CIMICØ 557 0.04
584,313 Cleanaway WasteManagement
829 0.06
243,191 Coca-Cola Amatil 1,222 0.10
30,285 Cochlear 3,214 0.25
589,958 Coles 5,777 0.45
826,670 Commonwealth Bank ofAustralia
31,177 2.44
225,052 Computershare 1,652 0.13
155,220 Crown Resorts 772 0.06
211,587 CSL 33,425 2.62
212,742 CSR 430 0.03
511,964 Dexus 2,494 0.20
93,725 Domain Australia 193 0.02
27,664 Domino’s PizzaEnterprisesØ
1,234 0.10
Holding orNominalValue Investment1
MarketValue
£000’s
% ofTotal
NetAssets
347,936 Downer EDIØ 861 0.07
505,736 Evolution MiningØ 1,550 0.12
41,948 Flight Centre TravelØ 307 0.02
742,278 Fortescue MetalsØ 7,138 0.56
837,612 Goodman 8,471 0.66
879,101 GPT 1,860 0.15
302,120 Harvey Norman 736 0.06
63,362 IDP EducationØ 699 0.05
191,594 Iluka Resources 1,073 0.08
896,289 Incitec Pivot 1,040 0.08
1,093,172 Insurance Australia 2,874 0.22
171,549 IOOFØ 439 0.03
50,503 JB Hi-FiØ 1,399 0.11
312,218 Lendlease 2,004 0.16
149,667 Macquarie 10,556 0.83
63,689 Magellan FinancialØ 2,084 0.16
1,317,951 Medibank Pvt 1,987 0.16
463,044 MetcashØ 744 0.06
1,785,527 Mirvac 2,071 0.16
1,204,000 MMGØ 239 0.02
1,492,254 National Australia Bank 14,778 1.16
375,978 Newcrest Mining 6,635 0.52
338,811 Northern Star Resources 2,554 0.20
135,609 NufarmØ 301 0.02
899,067 Oil SearchØ 1,624 0.13
189,588 Orica 1,820 0.14
802,365 Origin EnergyØ 2,482 0.19
420,217 OroraØ 520 0.04
144,768 OZ MineralsØ 1,169 0.09
22,391 Perpetual 383 0.03
121,738 Platinum Asset Management 249 0.02
320,809 Qantas Airways 698 0.05
670,617 QBE Insurance 3,930 0.31
666,138 QubeØ 1,008 0.08
79,317 Ramsay Health Care 2,850 0.22
23,805 REA 1,501 0.12
836,948 Santos 2,621 0.21
2,419,124 Scentre 3,006 0.24
158,808 SEEKØ 1,813 0.14
55,325 SevenØ 583 0.05
529,758 Shopping Centres AustralasiaProperty
655 0.05
224,621 Sonic Healthcare 3,975 0.31
2,250,768 South32 2,611 0.20
346,893 Star Entertainment Grp 565 0.04
1,095,443 Stockland 2,396 0.19
596,455 Suncorp 3,064 0.24
600,811 Sydney Airport 1,895 0.15
iShares Pacific Ex Japan Equity Index Fund (UK)
Portfolio Statement (unaudited)
at 31 August 2020
BlackRock Collective Investment Funds355

Holding orNominalValue Investment1
MarketValue
£000’s
% ofTotal
NetAssets
926,774 Tabcorp 1,848 0.14
84,252 Tabcorp 151 0.01
1,959,794 Telstra 3,117 0.24
163,346 TPG Telecom 743 0.06
1,276,222 TransurbanØ 9,481 0.74
341,158 Treasury Wine Estates 1,743 0.14
96,990 TuasØ 27 0.00
1,688,964 Vicinity Centres 1,339 0.10
298,619 Vocus 549 0.04
42,000 Washington H Soul Pattinson &Ø 486 0.04
528,371 Wesfarmers 13,865 1.08
1,685,917 Westpac Banking 16,324 1.28
432,267 Whitehaven Coal 221 0.02
34,247 WiseTech GlobalØ 533 0.04
440,597 Woodside Petroleum 4,765 0.37
592,109 Woolworths 13,039 1.02
141,510 Worley 752 0.06
351,664 27.52
Cambodia − 0.05%; 29.2.2020 0.06%
712,000 NagaCorpØ 642 0.05
China − 0.98%; 29.2.2020 0.86%
316,000 AAC TechnologiesØ 1,488 0.12
1,678,000 FIH MobileØ 142 0.01
3,524,000 LenovoØ 1,756 0.14
318,000 MinthØ 795 0.06
1,441,100 Semiconductor ManufacturingInternationalØ
3,451 0.27
1,962,158 Shui On LandØ 200 0.02
876,394 Tingyi Cayman IslandsØ 1,230 0.10
590,000 Uni-President ChinaØ 401 0.03
2,593,117 Want Want ChinaØ 1,329 0.10
1,762,383 Xinyi SolarØ 1,658 0.13
12,450 0.98
Hong Kong − 13.48%; 29.2.2020 14.20%
5,645,919 AIAØ 43,390 3.40
148,706 ASM Pacific TechnologyØ 1,194 0.09
574,454 Bank of East AsiaØ 964 0.08
1,697,126 BOC Hong KongØ 3,598 0.28
1,533,000 Brightoil Petroleum3 89 0.01
544,200 Budweiser Brewing APACØ 1,366 0.11
132,000 Cafe de CoralØ 227 0.02
503,999 Cathay Pacific AirwaysØ 306 0.02
982,000 Champion REITØ 387 0.03
1,237,000 China Mengniu DairyØ 4,542 0.36
1,246,800 China Travel InternationalInvestment Hong KongØ
141 0.01
Holding orNominalValue Investment1
MarketValue
£000’s
% ofTotal
NetAssets
512,000 Chow Tai Fook JewelleryØ 429 0.03
1,240,109 CK AssetØ 5,019 0.39
1,245,609 CK HutchisonØ 6,092 0.48
280,500 CK InfrastructureØ 1,107 0.09
758,831 CLPØ 5,565 0.44
187,801 Dah Sing BankingØ 133 0.01
73,622 Dah Sing FinancialØ 156 0.01
119,100 Dairy Farm International 371 0.03
577,000 ESR CaymanØ 1,284 0.10
1,303,150 First PacificØ 271 0.02
995,300 Galaxy EntertainmentØ 5,856 0.46
743,000 Guotai Junan InternationalØ 82 0.01
1,287,738 Haitong InternationalØ 256 0.02
391,000 Hang LungØ 753 0.06
927,665 Hang Lung PropertiesØ 1,949 0.15
333,726 Hang Seng BankØ 3,920 0.31
605,324 Henderson Land DevelopmentØ 1,779 0.14
4,777,506 Hong Kong & China GasØ 5,184 0.41
600,081 Hong Kong Exchanges &ClearingØ
22,611 1.77
540,197 Hongkong Land 1,545 0.12
363,000 Huabao InternationalØ 241 0.02
2,559,000 Hutchison Port TrustØ 201 0.02
530,000 Hutchison TelecommunicationsHong KongØ
62 0.00
297,970 Hysan DevelopmentØ 704 0.06
98,893 Jardine Matheson 3,102 0.24
82,767 Jardine Strategic 1,240 0.10
178,554 Johnson ElectricØ 263 0.02
163,000 JS Global Lifestyle 196 0.02
279,109 Kerry Logistics NetworkØ 346 0.03
246,218 Kerry PropertiesØ 475 0.04
271,500 Lifestyle InternationalØ 183 0.01
955,096 Link REITØ 5,665 0.44
384,000 Melco InternationalDevelopmentØ
633 0.05
666,889 MTRØ 2,593 0.20
668,579 New World DevelopmentØ 2,587 0.20
634,718 NWSØ 403 0.03
1,916,382 PCCWØ 898 0.07
644,697 Power AssetsØ 2,758 0.22
416,000 Sa InternationalØ 53 0.00
558,969 Shangri-La AsiaØ 339 0.03
1,512,000 Shougang Fushan ResourcesØ 256 0.02
995,443 Shun TakØ 258 0.02
1,551,280 Sino LandØ 1,350 0.11
515,000 SITC InternationalØ 505 0.04
897,000 SJMØ 921 0.07
iShares Pacific Ex Japan Equity Index Fund (UK)
Portfolio Statement (unaudited) continued
BlackRock Collective Investment Funds 356

Holding orNominalValue Investment1
MarketValue
£000’s
% ofTotal
NetAssets
1,056,007 Sun Art RetailØ 1,026 0.08
660,897 Sun Hung Kai PropertiesØ 6,604 0.52
243,465 Swire PacificØ 988 0.08
443,193 Swire PacificØ 301 0.02
503,360 Swire PropertiesØ 1,019 0.08
579,000 Techtronic IndustriesØ 5,490 0.43
115,800 Television Broadcasts 96 0.01
621,000 Towngas ChinaØ 211 0.02
3,284,000 United EnergyØ 405 0.03
348,000 Vitasoy InternationalØ 924 0.07
80,100 VTechØ 348 0.03
3,953,000 WHØ 2,545 0.20
712,836 WharfØ 1,037 0.08
756,836 Wharf Real Estate InvestmentØ 2,348 0.18
964,712 Xinyi GlassØ 1,244 0.10
266,500 Yue Yuen IndustrialØ 344 0.03
171,728 13.48
Macau − 0.39%; 29.2.2020 0.45%
602,000 Macau Legend DevelopmentØ 53 0.00
373,298 MGM ChinaØ 404 0.03
1,126,423 Sands ChinaØ 3,712 0.29
676,000 Wynn MacauØ 949 0.07
5,118 0.39
Malaysia − 3.42%; 29.2.2020 3.57%
791,500 AirAsia 94 0.01
599,708 Alliance Bank Malaysia 234 0.02
848,812 AMMB 444 0.03
641,700 Astro Malaysia 89 0.01
2,134,963 Axiata 1,152 0.09
72,700 British American TobaccoMalaysia
133 0.01
3,301,737 CIMB 1,954 0.15
2,078,600 Dialog 1,338 0.10
1,767,588 DiGi.Com 1,252 0.10
721,000 FGV 158 0.01
49,500 Fraser & Neave 272 0.02
1,082,300 Gamuda 660 0.05
1,038,196 Genting 653 0.05
1,357,900 Genting Malaysia 555 0.04
327,600 HAP Seng Consolidated 423 0.03
687,300 Hartalega 2,036 0.16
263,400 Hong Leong Bank 661 0.05
121,194 Hong Leong Financial 268 0.02
1,446,500 IHH Healthcare 1,390 0.11
1,592,600 IJM 343 0.03
1,430,545 IOI 1,144 0.09
Holding orNominalValue Investment1
MarketValue
£000’s
% ofTotal
NetAssets
1,110,927 IOI Properties 179 0.01
212,200 Kuala Lumpur Kepong 862 0.07
2,835,729 Malayan Banking 3,727 0.29
465,420 Malaysia Airports 426 0.03
1,339,632 Maxis 1,201 0.09
685,400 MISC 935 0.07
28,800 Nestle Malaysia 719 0.06
1,355,526 Petronas Chemicals 1,327 0.10
155,900 Petronas Dagangan 576 0.05
262,724 Petronas Gas 777 0.06
305,080 PPB 985 0.08
883,100 Press Metal Aluminium 825 0.06
1,463,688 Public Bank 4,309 0.34
346,000 QL Resources 596 0.05
767,370 RHB Bank 630 0.05
1,713,567 Sime Darby 673 0.05
1,698,967 Sime Darby Plantation 1,551 0.12
1,875,167 Sime Darby Property 220 0.02
485,018 Telekom Malaysia 361 0.03
1,844,500 Tenaga Nasional 3,592 0.28
799,400 Top Glove 3,752 0.29
598,800 UEM Sunrise 43 0.00
455,600 Westports 298 0.02
2,376,211 YTL 285 0.02
44,102 3.42
New Zealand − 1.60%; 29.2.2020 1.42%
345,586 a2 Milk 3,236 0.25
144,139 Air New ZealandØ 101 0.01
554,478 Auckland International AirportØ 1,850 0.14
315,046 Contact Energy 989 0.08
262,537 Fisher & Paykel Healthcare 4,884 0.38
368,202 Fletcher BuildingØ 665 0.05
677,269 Kiwi Property 349 0.03
330,740 Mercury NZ 865 0.07
570,073 Meridian Energy 1,459 0.11
187,344 Ryman Healthcare 1,269 0.10
328,779 SKYCITY EntertainmentØ 415 0.03
847,583 Spark New Zealand 2,067 0.16
43,417 Xero 2,421 0.19
20,570 1.60
Singapore − 4.55%; 29.2.2020 5.36%
1,389,864 Ascendas Real EstateInvestment Trust
2,527 0.20
696,000 Ascott Residence TrustØ 342 0.03
90,000 BOC AviationØ 499 0.04
1,195,094 CapitaLand 1,818 0.14
iShares Pacific Ex Japan Equity Index Fund (UK)
Portfolio Statement (unaudited) continued
BlackRock Collective Investment Funds357

Holding orNominalValue Investment1
MarketValue
£000’s
% ofTotal
NetAssets
1,320,056 CapitaLand Commercial Trust 1,211 0.09
1,119,306 CapitaLand Mall Trust 1,199 0.09
218,446 City DevelopmentsØ 958 0.08
912,159 ComfortDelGro 737 0.06
844,566 DBSØ 9,682 0.76
176,900 Frasers PropertyØ 114 0.01
2,697,185 Genting SingaporeØ 1,030 0.08
3,186,508 Golden Agri-ResourcesØ 252 0.02
49,326 Jardine Cycle & CarriageØ 513 0.04
648,565 KeppelØ 1,628 0.13
933,400 Keppel REIT 538 0.04
967,855 Mapletree Commercial Trust 1,015 0.08
739,300 Mapletree Industrial TrustØ 1,239 0.10
1,194,800 Mapletree Logistics Trust 1,352 0.11
968,800 Mapletree North AsiaCommercial TrustØ
498 0.04
301,300 Olam International 218 0.02
1,655,043 Oversea-Chinese Banking 7,873 0.62
318,600 SATS 523 0.04
440,281 Sembcorp Industries 450 0.04
439,330 Sembcorp MarineØ 49 0.00
2,196,650 Sembcorp Marine Rights14/09/2020 Rights 14/9/2020
1 0.00
89,400 SIA EngineeringØ 90 0.01
599,682 Singapore AirlinesØ 1,202 0.09
404,497 Singapore ExchangeØ 1,913 0.15
758,400 Singapore PostØ 292 0.02
723,750 Singapore PressØ 429 0.03
703,800 Singapore TechnologiesEngineeringØ
1,314 0.10
3,415,339 Singapore TelecommunicationsØ 4,315 0.34
246,610 StarHub 164 0.01
953,600 Suntec Real Estate InvestmentTrustØ
733 0.06
617,434 United Overseas Bank 6,634 0.52
212,534 UOLØ 766 0.06
121,700 VentureØ 1,327 0.10
1,002,030 Wilmar International 2,400 0.19
153,821 Wing TaiØ 144 0.01
57,989 4.55
South Korea − 20.06%; 29.2.2020 18.51%
13,324 Amorepacific 427 0.03
14,602 Amorepacific 1,538 0.12
5,850 Amorepacific 220 0.02
3,145 BGF retailØ 252 0.02
140,156 BNK Financial 448 0.04
48,094 CelltrionØ 8,981 0.70
Holding orNominalValue Investment1
MarketValue
£000’s
% ofTotal
NetAssets
33,380 Celltrion HealthcareØ 2,101 0.16
33,320 Cheil WorldwideØ 381 0.03
6,281 CJ 320 0.03
3,577 CJ CheilJedang 915 0.07
1,187 CJ CheilJedang 122 0.01
5,033 CJ ENM 376 0.03
3,088 CJ Logistics 294 0.02
26,251 Coway 1,317 0.10
12,209 Daelim IndustrialØ 667 0.05
103,728 Daewoo Engineering &Construction
192 0.02
22,532 Daewoo Shipbuilding & MarineEngineering
313 0.02
23,337 DB Insurance 640 0.05
80,891 DGB Financial 269 0.02
11,660 Dongsuh Cos 187 0.01
10,963 Doosan Bobcat 181 0.01
64,047 Doosan Heavy Industries &Construction
646 0.05
58,300 Doosan InfracoreØ 295 0.02
3,814 Doosan SolusØ 96 0.01
8,299 E-MART 626 0.05
22,231 Fila 485 0.04
21,920 GS 448 0.04
28,117 GS Engineering & Construction 436 0.03
13,272 GS Retail 275 0.02
132,502 Hana Financial 2,349 0.18
38,011 Hankook Tire & Technology 705 0.06
3,602 Hanmi Pharm 694 0.05
7,773 Hanmi Science 286 0.02
75,141 Hanon Systems 609 0.05
3,864 HanssemØ 236 0.02
19,805 HanwhaØ 342 0.03
9,633 Hanwha 78 0.00
17,265 Hanwha Aerospace 280 0.02
143,997 Hanwha Life Insurance 139 0.01
39,544 Hanwha Solutions 992 0.08
20,720 HDC Hyundai Development Co-Engineering & Construction
300 0.02
10,913 HelixmithØ 338 0.03
14,491 Hite JinroØ 336 0.03
18,556 HLBØ 1,013 0.08
13,713 Hotel ShillaØ 606 0.05
7,626 Hyundai Department Store 257 0.02
33,301 Hyundai Engineering &Construction
674 0.05
8,186 Hyundai Glovis 746 0.06
4,938 Hyundai Heavy IndustriesØ 702 0.06
iShares Pacific Ex Japan Equity Index Fund (UK)
Portfolio Statement (unaudited) continued
BlackRock Collective Investment Funds 358

Holding orNominalValue Investment1
MarketValue
£000’s
% ofTotal
NetAssets
28,645 Hyundai Marine & FireInsurance
397 0.03
10,625 Hyundai Mipo Dockyard 205 0.02
29,606 Hyundai Mobis 4,170 0.33
16,741 Hyundai MotorØ 930 0.07
9,768 Hyundai Motor 534 0.04
64,955 Hyundai MotorØ 7,188 0.56
36,360 Hyundai SteelØ 574 0.05
6,824 Hyundai Wia 179 0.01
143,720 Industrial Bank of KoreaØ 731 0.06
24,769 Kakao 6,330 0.50
52,500 Kangwon Land 682 0.05
178,442 KB Financial 4,134 0.32
2,293 KCC 200 0.02
8,228 KEPCO Plant Service &Engineering
144 0.01
121,258 Kia Motors 3,232 0.25
29,419 Korea Aerospace Industries 415 0.03
134,990 Korea Electric Power 1,740 0.14
12,415 Korea Gas 184 0.01
16,902 Korea Investment 647 0.05
20,776 Korea Shipbuilding & OffshoreEngineeringØ
1,126 0.09
4,765 Korea Zinc 1,194 0.09
39,253 Korean Air Lines 436 0.03
51,221 KT&GØ 2,676 0.21
8,665 Kumho Petrochemical 548 0.04
42,406 LGØ 2,205 0.17
21,218 LG ChemØ 9,872 0.77
3,711 LG Chem 875 0.07
101,471 LG DisplayØ 931 0.07
49,679 LG Electronics 2,630 0.21
8,229 LG Electronics 168 0.01
4,133 LG Household & Health CareØ 3,828 0.30
839 LG Household & Health Care 370 0.03
85,115 LG Uplus 639 0.05
13,570 LotteØ 256 0.02
6,638 Lotte ChemicalØ 791 0.06
2,090 Lotte Chilsung Beverage 124 0.01
7,502 Lotte Fine Chemical 211 0.02
5,321 Lotte ShoppingØ 254 0.02
7,596 LSØ 216 0.02
17,990 Mando 355 0.03
2,027 MedytoxØ 318 0.02
174,691 Mirae Asset DaewooØ 1,021 0.08
59,296 Mirae Asset Daewoo 170 0.01
61,581 NAVER 12,486 0.98
7,900 NCSoftØ 4,098 0.32
Holding orNominalValue Investment1
MarketValue
£000’s
% ofTotal
NetAssets
8,372 NetmarbleØ 876 0.07
68,508 NH Investment & 386 0.03
4,389 NHN 201 0.02
1,515 NongShim 342 0.03
8,868 OCI 360 0.03
10,361 OrionØ 915 0.07
451 OttogiØ 171 0.01
15,902 Paradise 132 0.01
31,298 POSCOØ 3,621 0.28
9,981 POSCO Chemical 559 0.04
17,331 Posco International 148 0.01
9,233 S-1 506 0.04
28,963 Samsung 549 0.04
6,215 Samsung Biologics 3,040 0.24
38,021 Samsung C&T 2,582 0.20
11,622 Samsung Card 209 0.02
25,305 Samsung Electro-Mechanics 1,981 0.16
2,192,999 Samsung Electronics 74,454 5.83
384,312 Samsung Electronics 11,477 0.90
70,068 Samsung EngineeringØ 498 0.04
14,850 Samsung Fire & MarineInsurance
1,741 0.14
1,160 Samsung Fire & MarineInsuranceØ
96 0.01
207,464 Samsung Heavy IndustriesØ 673 0.05
28,929 Samsung Life Insurance 1,113 0.09
24,431 Samsung SDI 6,951 0.54
14,835 Samsung SDS 1,469 0.12
213,709 Shinhan Financial 3,977 0.31
3,170 ShinsegaeØ 405 0.03
25,798 SillaJen3 177 0.01
14,653 SK 1,972 0.15
240,800 SK Hynix 11,370 0.89
26,943 SK InnovationØ 2,456 0.19
64,378 SK Networks 210 0.02
10,957 SK Telecom 1,702 0.13
8,988 SKCØ 523 0.04
18,817 S-Oil 668 0.05
47,302 Ssangyong Cement IndustrialØ 167 0.01
276,169 Woori Financial 1,469 0.12
21,891 Yuhan 922 0.07
256,612 20.06
Taiwan − 21.79%; 29.2.2020 19.59%
240,000 Accton Technology 1,430 0.11
1,373,036 Acer 816 0.06
194,003 Advantech 1,499 0.12
1,602,120 ASE Technology 2,492 0.20
iShares Pacific Ex Japan Equity Index Fund (UK)
Portfolio Statement (unaudited) continued
BlackRock Collective Investment Funds359

Holding orNominalValue Investment1
MarketValue
£000’s
% ofTotal
NetAssets
1,058,198 Asia Cement 1,145 0.09
333,805 Asustek Computer 2,065 0.16
4,282,745 AU Optronics 1,134 0.09
947,458 Capital 265 0.02
349,222 Catcher Technology 1,778 0.14
3,909,144 Cathay Financial 3,960 0.31
575,786 Chailease 1,898 0.15
3,130,795 Chang Hwa Commercial Bank 1,454 0.11
820,256 Cheng Shin Rubber Industry 752 0.06
288,428 Chicony Electronics 649 0.05
1,029,448 China Airlines 224 0.02
6,591,210 China Development Financial 1,433 0.11
1,293,060 China Life Insurance Ltd/Taiwan 676 0.05
106,009 China Motor 114 0.01
5,804,956 China Steel 2,940 0.23
1,762,149 Chunghwa Telecom 4,867 0.38
1,903,444 Compal Electronics 896 0.07
8,582,083 CTBC Financial 4,140 0.32
1,000,891 Delta Electronics 4,802 0.38
5,493,039 E.Sun Financial 3,796 0.30
89,756 Eclat Textile 884 0.07
456,000 Epistar 463 0.04
381,438 Eternal Materials 335 0.03
1,142,993 Eva Airways 333 0.03
1,230,595 Evergreen Marine Taiwan 545 0.04
877,044 Far Eastern International Bank 250 0.02
1,850,379 Far Eastern New Century 1,243 0.10
766,710 Far EasToneTelecommunications
1,196 0.09
210,936 Feng TAY Enterprise 915 0.07
4,687,220 First Financial 2,535 0.20
484,000 FIT Hon TengØ 142 0.01
1,619,284 Formosa Chemicals & Fibre 2,795 0.22
641,953 Formosa Petrochemical 1,340 0.10
2,252,674 Formosa Plastics 4,478 0.35
532,590 Formosa Taffeta 429 0.03
506,287 Foxconn Technology 671 0.05
3,381,313 Fubon Financial 3,679 0.29
140,095 Giant Manufacturing 1,088 0.09
101,000 Globalwafers 1,012 0.08
5,587,241 Hon Hai Precision Industry 10,936 0.86
145,000 Hotai Motor 2,203 0.17
398,780 HTC 306 0.02
4,527,481 Hua Nan Financial 2,080 0.16
3,854,260 Innolux 895 0.07
1,419,282 Inventec 822 0.06
47,566 Largan Precision 4,092 0.32
952,305 Lite-On Technology 1,125 0.09
Holding orNominalValue Investment1
MarketValue
£000’s
% ofTotal
NetAssets
692,246 MediaTek 9,797 0.77
5,149,876 Mega Financial 3,834 0.30
2,605,441 Nan Ya Plastics 4,065 0.32
368,811 Nanya Technology 487 0.04
270,238 Novatek Microelectronics 1,651 0.13
52,133 OBI Pharma 157 0.01
299,509 Oriental Union Chemical 130 0.01
903,952 Pegatron 1,438 0.11
1,290,451 Pou Chen 908 0.07
265,895 President Chain Store 1,827 0.14
1,241,421 Quanta Computer 2,430 0.19
218,506 Realtek Semiconductor 2,114 0.17
1,516,000 Shanghai Commercial & SavingsBank
1,611 0.13
5,505,688 Shin Kong Financial 1,163 0.09
5,027,196 SinoPac Financial 1,382 0.11
662,885 Synnex Technology International 737 0.06
4,923,407 Taishin Financial 1,654 0.13
2,168,477 Taiwan Business Bank 552 0.04
2,355,503 Taiwan Cement 2,572 0.20
4,543,883 Taiwan Cooperative Financial 2,319 0.18
327,000 Taiwan Fertilizer 452 0.04
674,834 Taiwan Glass Industry 197 0.02
953,000 Taiwan High Speed Rail 787 0.06
763,453 Taiwan Mobile 1,972 0.15
115,937 Taiwan Secom 251 0.02
11,208,015 Taiwan SemiconductorManufacturing
121,675 9.52
799,000 Teco Electric and Machinery 596 0.05
127,835 TPK 160 0.01
111,318 Transcend Information 186 0.01
187,740 U-Ming Marine Transport 143 0.01
617,597 Unimicron Technology 1,157 0.09
2,207,186 Uni-President Enterprises 3,736 0.29
5,224,284 United Microelectronics 2,819 0.22
431,196 Vanguard InternationalSemiconductor
1,026 0.08
1,508,641 Walsin Lihwa 645 0.05
236,000 Walsin Technology 961 0.08
319,468 Wan Hai Lines 172 0.01
185,000 Win Semiconductors 1,347 0.11
1,307,719 Wistron 1,062 0.08
38,000 Wiwynn 756 0.06
179,237 YA Hsin Industrial∩ – 0.00
215,000 Yageo 1,822 0.14
5,500,948 Yuanta Financial 2,569 0.20
367,005 Yulon Motor 236 0.02
9,000 Yulon Nissan Motor 56 0.00
iShares Pacific Ex Japan Equity Index Fund (UK)
Portfolio Statement (unaudited) continued
BlackRock Collective Investment Funds 360

Holding orNominalValue Investment1
MarketValue
£000’s
% ofTotal
NetAssets
277,000 Zhen Ding Technology 867 0.07
278,495 21.79
Thailand − 3.72%; 29.2.2020 4.07%
205,800 Advanced Info ServiceØ 901 0.07
333,000 Advanced Info Service 1,458 0.11
1,278,300 Airports of Thailand 1,718 0.13
675,000 Airports of Thailand 907 0.07
3,449,800 Asset World 323 0.03
331,500 B Grimm Power 368 0.03
229,800 Bangkok Bank 587 0.05
3,710,500 Bangkok Dusit Medical Services 1,843 0.14
501,700 Bangkok Dusit MedicalServicesØ
249 0.02
3,885,600 Bangkok Expressway & MetroØ 844 0.07
187,380 Bangkok Life AssuranceØ 72 0.01
69,700 Bangkok Life AssuranceØ 28 0.00
1,854,800 BanpuØ 254 0.02
255,800 Banpu 35 0.00
211,500 Berli Jucker 188 0.01
273,800 Berli Jucker 243 0.02
4,359,536 BTS 1,078 0.08
152,100 Bumrungrad Hospital 403 0.03
932,900 Central Pattana 1,052 0.08
221,900 Central Pattana 250 0.02
1,042,700 Charoen Pokphand Foods 807 0.06
682,700 Charoen Pokphand FoodsØ 528 0.04
870,600 CP ALL 1,321 0.10
1,595,400 CP ALL 2,422 0.19
197,500 Delta Electronics Thailand 545 0.04
2,456,942 Digital TelecommunicationsInfrastructure Fund
873 0.07
60,800 Electricity GeneratingØ 324 0.03
56,900 Electricity Generating 303 0.02
804,900 Energy Absolute 806 0.06
345,516 Global Power SynergyØ 531 0.04
1,785,700 Gulf Energy DevelopmentØ 1,350 0.11
202,450 Gulf Energy DevelopmentRights 21/9/2020
7 0.00
2,706,512 Home Product Center 968 0.08
531,200 Indorama Ventures 302 0.02
364,300 Indorama VenturesØ 207 0.02
683,300 Intouch 894 0.07
318,500 IntouchØ 417 0.03
2,370,100 IRPCØ 133 0.01
2,588,700 IRPCØ 145 0.01
262,700 KasikornbankØ 531 0.04
563,600 Kasikornbank 1,139 0.09
Holding orNominalValue Investment1
MarketValue
£000’s
% ofTotal
NetAssets
2,369,900 Krung Thai Bank 540 0.04
493,700 Krung Thai Bank 113 0.01
582,200 Krungthai Card 426 0.03
1,052,480 Land & Houses 187 0.01
2,095,000 Land & Houses 372 0.03
207,785 Minor InternationalØ 112 0.01
1,655,136 Minor InternationalØ 890 0.07
9,260 Minor International Warrants30/9/2021
– 0.00
83,812 Minor International Warrants30/9/2021
2 0.00
75,233 Minor International Warrants31/7/2023
18 0.00
9,444 Minor International Warrants31/7/2023
2 0.00
343,200 Muangthai CapitalØ 410 0.03
574,200 Osotspa 534 0.04
5,264,600 PTTØ 4,548 0.36
1,494,900 PTT 1,291 0.10
256,777 PTT Exploration & Production 548 0.04
411,500 PTT Exploration & Production 879 0.07
69,500 PTT Global Chemical 77 0.01
326,800 PTT Global ChemicalØ 363 0.03
527,900 PTT Global Chemical 586 0.05
231,400 Ratch 310 0.02
151,100 RatchØ 202 0.02
135,000 Siam Cement 1,147 0.09
261,400 Siam CementØ 2,221 0.17
29,587 Siam City CementØ 100 0.01
21,636 Siam City Cement 73 0.01
831,600 Siam Commercial Bank 1,442 0.11
282,400 Siam Commercial Bank 490 0.04
160,300 Siam MakroØ 171 0.01
11,680 Srisawad Warrants 31/12/20494 – 0.00
292,000 Srisawad 321 0.03
145,000 Thai Oil 144 0.01
346,300 Thai Oil 345 0.03
914,000 Thai Union 309 0.02
492,480 Thai Union 167 0.01
14,719,389 TMB Bank 332 0.03
5,535,229 TMB Bank 125 0.01
126,700 Total Access Communication 108 0.01
137,900 Total Access Communication 117 0.01
5,278,478 TrueØ 421 0.03
47,797 3.72
iShares Pacific Ex Japan Equity Index Fund (UK)
Portfolio Statement (unaudited) continued
BlackRock Collective Investment Funds361

Holding orNominalValue Investment1
MarketValue
£000’s
% ofTotal
NetAssets
EUROPE − 1.58%; 29.2.2020 1.36%
EQUITIES − 1.58%; 29.2.2020 1.36%
Ireland − 0.28%; 29.2.2020 0.23%
209,117 James Hardie Industries 3,561 0.28
Italy − 0.05%; 29.2.2020 0.05%
215,000 PradaØ 630 0.05
Luxembourg − 0.03%; 29.2.2020 0.03%
256,750 L’Occitane InternationalØ 327 0.03
United Kingdom − 1.22%; 29.2.2020 1.05%
744,662 AmcorØ 6,227 0.49
Holding orNominalValue Investment1
MarketValue
£000’s
% ofTotal
NetAssets
173,317 Rio TintoØ 9,380 0.73
15,607 1.22
NORTH AMERICA − 0.09%; 29.2.2020 0.12%
EQUITIES − 0.09%; 29.2.2020 0.12%
United States of America − 0.09%; 29.2.2020 0.12%
395,000 Nexteer AutomotiveØ 192 0.02
535,200 Samsonite InternationalØ 461 0.04
77,139 SimsØ 345 0.03
998 0.09
Holding orNominalValue Investment
UnderlyingExposure − Derivatives
£000’s
MarketValue
£000’s
% ofTotal
NetAssets
DERIVATIVES − (0.01%); 29.2.2020 (0.22%)
Futures − (0.01%); 29.2.2020 (0.22%)
11 Hang Seng Index September 2020 1,329 (31) 0.00
41 Kopsi 200 Index September 2020 1,976 (62) (0.01)
51 MSCI Singapore Index ETS September 2020 816 (8) 0.00
52 MSCI Taiwan Index September 2020 1,907 (28) 0.00
34 SPI 200 September 2020 2,831 (13) 0.00
8,859 (142) (0.01)
Portfolio of investments 1,268,148 99.22
Net other assets 9,907 0.78
Total net assets 1,278,055 100.00
Unless otherwise stated, all securities are either listed on a recognised exchange or traded on an eligible securities market.
Underlying exposure has been calculated according to the guidelines issued by the European Securities and Markets Authority (“ESMA”) and represents the market value of an equivalent positionin the assets underlying each financial derivative instrument.1 All securities that have a value of less than £500 have been rounded to zero.2 Security fair valued by Manager at zero.3 Fair valued by the Manager4 Illiquid Security Fair Valued by the Manager.Ø All or a portion of this investment represents a security on loan.∩ Delisted investment fair valued at zero.
iShares Pacific Ex Japan Equity Index Fund (UK)
Portfolio Statement (unaudited) continued
BlackRock Collective Investment Funds 362

£000’s31.8.2020
£000’s £000’s31.8.2019
£000’s
Income
Net capital gains 50,567 45,376
Revenue 25,809 31,628
Expenses (1,198) (1,021)
Net revenue before taxation 24,611 30,607
Taxation (202) (2,700)
Net revenue after taxation 24,409 27,907
Total return before distributions 74,976 73,283
Distributions (24,409) (27,604)
Change in net assetsattributable to unitholdersfrom investment activities 50,567 45,679
Statement of Change in Net Assets Attributable to Unitholders(unaudited) for the six months ended 31 August 2020
£000’s31.8.2020
£000’s £000’s31.8.2019
£000’s
Opening net assets attributableto unitholders 1,382,163 1,239,004
Amounts receivable on issue of units 147,016 214,136
Amounts payable on cancellation of units (323,559) (147,102)
(176,543) 67,034
Change in net assets attributable tounitholders from investment activities 50,567 45,679
Retained distribution on accumulation units 21,868 27,724
Closing net assets attributableto unitholders 1,278,055 1,379,441
The above statement shows the comparative closing net assets at 31 August 2019 whereas the current accounting period commenced 1 March 2020.
iShares Pacific Ex Japan Equity Index Fund (UK)
Statement of Total Return (unaudited)
for the six months ended 31 August 2020
BlackRock Collective Investment Funds363

31.8.2020£000’s
29.2.2020£000’s
Assets:
Fixed assets
− Investment assets 1,268,290 1,337,603
Current assets
− Debtors 18,670 10,720
− Cash and bank balances 7,549 39,556
− Cash collateral posted 540 –
Total assets 1,295,049 1,387,879
Liabilities:
Investment liabilities (142) (2,970)
Creditors
− Amounts held at futures clearing houses and brokers (21) –
− Distributions payable (117) (83)
− Other creditors (16,714) (2,663)
Total liabilities (16,994) (5,716)
Net assets attributable to unitholders 1,278,055 1,382,163
G D Bamping (Director)M T Zemek (Director)BlackRock Fund Managers Limited29 October 2020
iShares Pacific Ex Japan Equity Index Fund (UK)
Balance Sheet (unaudited)
at 31 August 2020
BlackRock Collective Investment Funds 364

The Fund is a sub-fund of BlackRock Collective Investment Funds (previously known as BlackRock QualifiedInvestor Schemes (1)), a UCITS scheme under the COLL Sourcebook. The Fund was established on 21 June2005 and was authorised by the FCA on 21 June 2005. The Fund’s FCA product reference number is 645673.
Risk and Reward ProfileLower riskTypically lower rewards
Higher riskTypically higher rewards
Unit Class
A Accumulation 1 2 3 4 5 6 7
L Income 1 2 3 4 5 6 7
L Accumulation 1 2 3 4 5 6 7
X Income 1 2 3 4 5 6 7
X Accumulation 1 2 3 4 5 6 7
D Income 1 2 3 4 5 6 7
D Accumulation 1 2 3 4 5 6 7
H Accumulation 1 2 3 4 5 6 7
• The risk indicator was calculated incorporating historical or simulated historical data and may not be a reliableindication of the future risk profile of the Fund.
• The risk category shown is not guaranteed and may change over time.
• The lowest category does not mean risk free.
• The use of derivatives will impact the value of the Fund and may expose the Fund to a higher degree of risk.Derivatives are highly sensitive to changes in the value of the asset on which they are based and can increasethe size of losses and gains, resulting in greater fluctuations in the value of the Fund. The impact to the Fundcan be greater where derivatives are used in an extensive or complex way.
For more information on this, please see the Fund’s Key Investor Information Documents (“KIIDs”), which areavailable at www.blackrock.com.
iShares UK Equity Index Fund (UK)
About the Fund
BlackRock Collective Investment Funds365

Net Asset Value
At 31 August 2020 Units in IssueNet Asset Value
£000’s
Net Asset Valueper Unit
p
A Accumulation 2,500,918 4,829 193.1
L Income 4,244 4 85.00
L Accumulation 1,805,262,619 3,608,324 199.9
X Income 111,102,109 129,368 116.4
X Accumulation 3,496,485,362 5,464,023 156.3
D Income 204,116,277 165,019 80.90
D Accumulation 384,860,529 760,138 197.5
H Accumulation 120,379,706 136,614 113.5
Distributions Payable for the period to 31 August 2020
Unit Class Distribution payable on 31.10.2020
Pence per Unit
A Accumulation 3.1454
L Income 1.5006
L Accumulation 3.4331
X Income 2.1203
X Accumulation 2.7954
D Income 1.4612
D Accumulation 3.5020
H Accumulation 2.0123
Operating Charges
Unit Class1.3.2020
to 31.8.20201.3.2019
to 29.2.2020
A Accumulation 0.51% 0.51%
L Income 0.21% 0.20%
L Accumulation 0.21% 0.21%
X Income 0.01% 0.01%
X Accumulation 0.01% 0.01%
D Income 0.05% 0.05%
D Accumulation 0.05% 0.05%
H Accumulation 0.05% 0.05%
Operating charges are annualised and exclude portfolio trade-related costs, except costs paid to the custodian/depositary and entry/exit charges paid to an underlyingcollective investment scheme (if any).
iShares UK Equity Index Fund (UK)
Performance Record
BlackRock Collective Investment Funds 366
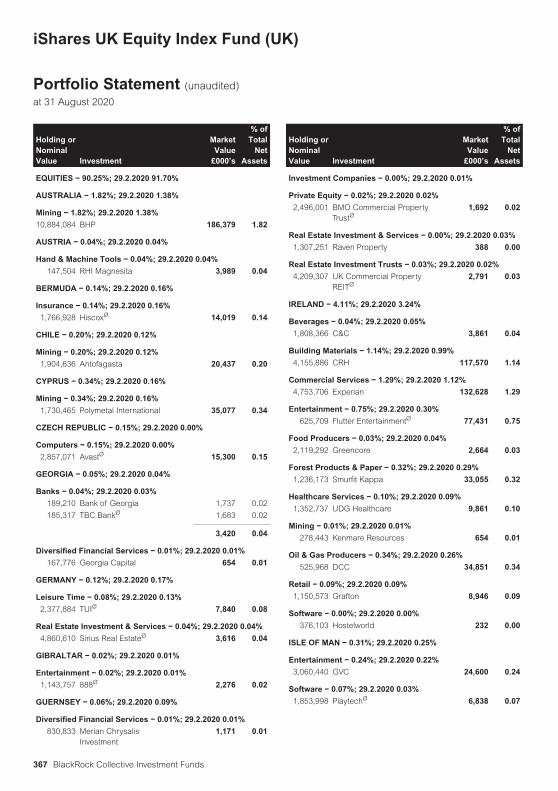
Holding orNominalValue Investment
MarketValue
£000’s
% ofTotal
NetAssets
EQUITIES − 90.25%; 29.2.2020 91.70%
AUSTRALIA − 1.82%; 29.2.2020 1.38%
Mining − 1.82%; 29.2.2020 1.38%
10,884,084 BHP 186,379 1.82
AUSTRIA − 0.04%; 29.2.2020 0.04%
Hand & Machine Tools − 0.04%; 29.2.2020 0.04%
147,504 RHI Magnesita 3,989 0.04
BERMUDA − 0.14%; 29.2.2020 0.16%
Insurance − 0.14%; 29.2.2020 0.16%
1,766,928 HiscoxØ 14,019 0.14
CHILE − 0.20%; 29.2.2020 0.12%
Mining − 0.20%; 29.2.2020 0.12%
1,904,636 Antofagasta 20,437 0.20
CYPRUS − 0.34%; 29.2.2020 0.16%
Mining − 0.34%; 29.2.2020 0.16%
1,730,465 Polymetal International 35,077 0.34
CZECH REPUBLIC − 0.15%; 29.2.2020 0.00%
Computers − 0.15%; 29.2.2020 0.00%
2,857,071 AvastØ 15,300 0.15
GEORGIA − 0.05%; 29.2.2020 0.04%
Banks − 0.04%; 29.2.2020 0.03%
189,210 Bank of Georgia 1,737 0.02
185,317 TBC BankØ 1,683 0.02
3,420 0.04
Diversified Financial Services − 0.01%; 29.2.2020 0.01%
167,776 Georgia Capital 654 0.01
GERMANY − 0.12%; 29.2.2020 0.17%
Leisure Time − 0.08%; 29.2.2020 0.13%
2,377,884 TUIØ 7,840 0.08
Real Estate Investment & Services − 0.04%; 29.2.2020 0.04%
4,860,610 Sirius Real EstateØ 3,616 0.04
GIBRALTAR − 0.02%; 29.2.2020 0.01%
Entertainment − 0.02%; 29.2.2020 0.01%
1,143,757 888Ø 2,276 0.02
GUERNSEY − 0.06%; 29.2.2020 0.09%
Diversified Financial Services − 0.01%; 29.2.2020 0.01%
830,833 Merian ChrysalisInvestment
1,171 0.01
Holding orNominalValue Investment
MarketValue
£000’s
% ofTotal
NetAssets
Investment Companies − 0.00%; 29.2.2020 0.01%
Private Equity − 0.02%; 29.2.2020 0.02%
2,496,001 BMO Commercial PropertyTrustØ
1,692 0.02
Real Estate Investment & Services − 0.00%; 29.2.2020 0.03%
1,307,251 Raven Property 388 0.00
Real Estate Investment Trusts − 0.03%; 29.2.2020 0.02%
4,209,307 UK Commercial PropertyREITØ
2,791 0.03
IRELAND − 4.11%; 29.2.2020 3.24%
Beverages − 0.04%; 29.2.2020 0.05%
1,808,366 C&C 3,861 0.04
Building Materials − 1.14%; 29.2.2020 0.99%
4,155,886 CRH 117,570 1.14
Commercial Services − 1.29%; 29.2.2020 1.12%
4,753,706 Experian 132,628 1.29
Entertainment − 0.75%; 29.2.2020 0.30%
625,709 Flutter EntertainmentØ 77,431 0.75
Food Producers − 0.03%; 29.2.2020 0.04%
2,119,292 Greencore 2,664 0.03
Forest Products & Paper − 0.32%; 29.2.2020 0.29%
1,236,173 Smurfit Kappa 33,055 0.32
Healthcare Services − 0.10%; 29.2.2020 0.09%
1,352,737 UDG Healthcare 9,861 0.10
Mining − 0.01%; 29.2.2020 0.01%
278,443 Kenmare Resources 654 0.01
Oil & Gas Producers − 0.34%; 29.2.2020 0.26%
525,968 DCC 34,851 0.34
Retail − 0.09%; 29.2.2020 0.09%
1,150,573 Grafton 8,946 0.09
Software − 0.00%; 29.2.2020 0.00%
376,103 Hostelworld 232 0.00
ISLE OF MAN − 0.31%; 29.2.2020 0.25%
Entertainment − 0.24%; 29.2.2020 0.22%
3,060,440 GVC 24,600 0.24
Software − 0.07%; 29.2.2020 0.03%
1,853,998 PlaytechØ 6,838 0.07
iShares UK Equity Index Fund (UK)
Portfolio Statement (unaudited)
at 31 August 2020
BlackRock Collective Investment Funds367
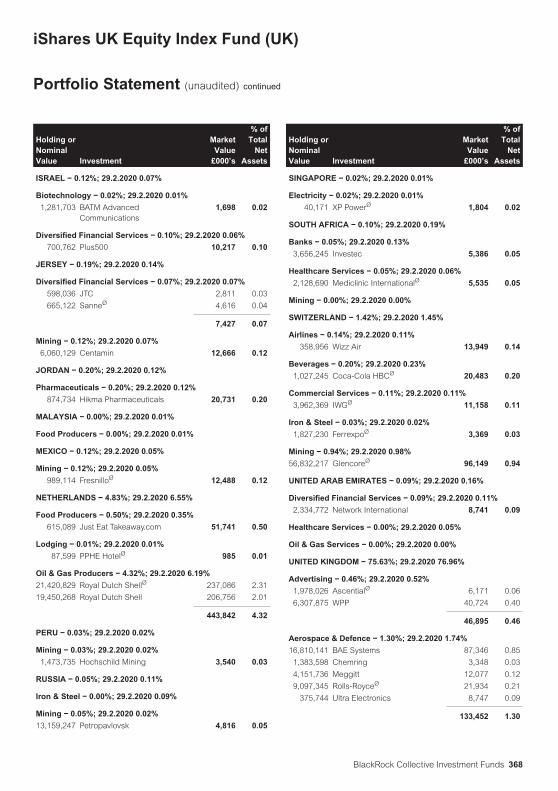
Holding orNominalValue Investment
MarketValue
£000’s
% ofTotal
NetAssets
ISRAEL − 0.12%; 29.2.2020 0.07%
Biotechnology − 0.02%; 29.2.2020 0.01%
1,281,703 BATM AdvancedCommunications
1,698 0.02
Diversified Financial Services − 0.10%; 29.2.2020 0.06%
700,762 Plus500 10,217 0.10
JERSEY − 0.19%; 29.2.2020 0.14%
Diversified Financial Services − 0.07%; 29.2.2020 0.07%
598,036 JTC 2,811 0.03
665,122 SanneØ 4,616 0.04
7,427 0.07
Mining − 0.12%; 29.2.2020 0.07%
6,060,129 Centamin 12,666 0.12
JORDAN − 0.20%; 29.2.2020 0.12%
Pharmaceuticals − 0.20%; 29.2.2020 0.12%
874,734 Hikma Pharmaceuticals 20,731 0.20
MALAYSIA − 0.00%; 29.2.2020 0.01%
Food Producers − 0.00%; 29.2.2020 0.01%
MEXICO − 0.12%; 29.2.2020 0.05%
Mining − 0.12%; 29.2.2020 0.05%
989,114 FresnilloØ 12,488 0.12
NETHERLANDS − 4.83%; 29.2.2020 6.55%
Food Producers − 0.50%; 29.2.2020 0.35%
615,089 Just Eat Takeaway.com 51,741 0.50
Lodging − 0.01%; 29.2.2020 0.01%
87,599 PPHE HotelØ 985 0.01
Oil & Gas Producers − 4.32%; 29.2.2020 6.19%
21,420,829 Royal Dutch ShellØ 237,086 2.31
19,450,268 Royal Dutch Shell 206,756 2.01
443,842 4.32
PERU − 0.03%; 29.2.2020 0.02%
Mining − 0.03%; 29.2.2020 0.02%
1,473,735 Hochschild Mining 3,540 0.03
RUSSIA − 0.05%; 29.2.2020 0.11%
Iron & Steel − 0.00%; 29.2.2020 0.09%
Mining − 0.05%; 29.2.2020 0.02%
13,159,247 Petropavlovsk 4,816 0.05
Holding orNominalValue Investment
MarketValue
£000’s
% ofTotal
NetAssets
SINGAPORE − 0.02%; 29.2.2020 0.01%
Electricity − 0.02%; 29.2.2020 0.01%
40,171 XP PowerØ 1,804 0.02
SOUTH AFRICA − 0.10%; 29.2.2020 0.19%
Banks − 0.05%; 29.2.2020 0.13%
3,656,245 Investec 5,386 0.05
Healthcare Services − 0.05%; 29.2.2020 0.06%
2,128,690 Mediclinic InternationalØ 5,535 0.05
Mining − 0.00%; 29.2.2020 0.00%
SWITZERLAND − 1.42%; 29.2.2020 1.45%
Airlines − 0.14%; 29.2.2020 0.11%
358,956 Wizz Air 13,949 0.14
Beverages − 0.20%; 29.2.2020 0.23%
1,027,245 Coca-Cola HBCØ 20,483 0.20
Commercial Services − 0.11%; 29.2.2020 0.11%
3,962,369 IWGØ 11,158 0.11
Iron & Steel − 0.03%; 29.2.2020 0.02%
1,827,230 FerrexpoØ 3,369 0.03
Mining − 0.94%; 29.2.2020 0.98%
56,832,217 GlencoreØ 96,149 0.94
UNITED ARAB EMIRATES − 0.09%; 29.2.2020 0.16%
Diversified Financial Services − 0.09%; 29.2.2020 0.11%
2,334,772 Network International 8,741 0.09
Healthcare Services − 0.00%; 29.2.2020 0.05%
Oil & Gas Services − 0.00%; 29.2.2020 0.00%
UNITED KINGDOM − 75.63%; 29.2.2020 76.96%
Advertising − 0.46%; 29.2.2020 0.52%
1,978,026 AscentialØ 6,171 0.06
6,307,875 WPP 40,724 0.40
46,895 0.46
Aerospace & Defence − 1.30%; 29.2.2020 1.74%
16,810,141 BAE Systems 87,346 0.85
1,383,598 Chemring 3,348 0.03
4,151,736 Meggitt 12,077 0.12
9,097,345 Rolls-RoyceØ 21,934 0.21
375,744 Ultra Electronics 8,747 0.09
133,452 1.30
iShares UK Equity Index Fund (UK)
Portfolio Statement (unaudited) continued
BlackRock Collective Investment Funds 368

Holding orNominalValue Investment
MarketValue
£000’s
% ofTotal
NetAssets
Agriculture − 3.66%; 29.2.2020 4.06%
73,604 Anglo-Eastern Plantations 377 0.00
11,927,470 British American Tobacco 302,004 2.94
198,966 Carr’s 242 0.00
338,724 Genus 11,415 0.11
4,966,906 Imperial Brands 62,235 0.61
376,273 3.66
Airlines − 0.24%; 29.2.2020 0.42%
1,279,279 easyJet 8,100 0.08
7,821,011 International ConsolidatedAirlinesØ
16,901 0.16
25,001 0.24
Alternative Energy Sources − 0.07%; 29.2.2020 0.09%
2,671,450 John LaingØ 7,619 0.07
969,075 StobartØ 235 0.00
7,854 0.07
Apparel − 0.30%; 29.2.2020 0.32%
2,111,082 BurberryØ 30,495 0.30
195,617 Ted Baker 216 0.00
30,711 0.30
Automobile Manufacturers − 0.02%; 29.2.2020 0.01%
3,057,409 Aston Martin Lagonda GlobalØ 1,714 0.02
Automobile Parts & Equipment − 0.01%; 29.2.2020 0.02%
975,841 TI Fluid SystemsØ 1,536 0.01
Banks − 6.31%; 29.2.2020 9.05%
90,134,211 Barclays 100,716 0.98
106,400,288 HSBC 351,227 3.42
366,746,005 Lloyds Banking 103,973 1.01
908,089 Metro BankØ 893 0.01
23,495,696 NatwestØ 26,491 0.26
1,436,614 Paragon BankingØ 5,111 0.05
13,725,640 Standard Chartered 53,846 0.52
6,456,148 Virgin Money UKØ 6,015 0.06
648,272 6.31
Beverages − 3.09%; 29.2.2020 3.15%
329,336 BarrØ 1,396 0.01
1,416,936 BritvicØ 12,001 0.12
12,008,838 Diageo 301,362 2.93
85,686 Fuller Smith & Turner 454 0.00
4,661,563 Marston’sØ 2,468 0.02
672,587 Stock SpiritsØ 1,480 0.01
319,161 3.09
Holding orNominalValue Investment
MarketValue
£000’s
% ofTotal
NetAssets
Biotechnology − 0.02%; 29.2.2020 0.01%
301,268 Oxford Biomedica 2,540 0.02
Building Materials − 0.17%; 29.2.2020 0.21%
1,261,341 Forterra 2,003 0.02
1,943,240 Ibstock 3,004 0.03
1,039,776 MarshallsØ 6,592 0.06
172,817 Norcros 237 0.00
1,013,098 PolypipeØ 4,407 0.04
402,524 Topps Tiles 213 0.00
1,032,942 Tyman 2,056 0.02
18,512 0.17
Chemicals − 0.78%; 29.2.2020 0.65%
655,848 Croda InternationalØ 38,682 0.38
2,605,252 Elementis 1,877 0.02
1,000,692 Johnson Matthey 23,766 0.23
1,627,812 Synthomer 5,102 0.05
193,059 Treatt 1,127 0.01
426,321 Victrex 8,228 0.08
130,583 Zotefoams 542 0.01
79,324 0.78
Commercial Services − 4.00%; 29.2.2020 3.92%
141,916 4imprint 3,080 0.03
2,609,750 AAØ 891 0.01
1,356,263 AggrekoØ 6,469 0.06
2,368,440 Ashtead 61,674 0.60
2,604,536 Babcock International 7,087 0.07
517,500 Calisen 910 0.01
9,454,180 CapitaØ 2,926 0.03
223,410 Clipper LogisticsØ 932 0.01
545,451 De La RueØ 793 0.01
209,134 DignityØ 1,129 0.01
1,782,054 EquinitiØ 2,021 0.02
762,030 Finablr1 8 0.00
8,001,231 G4SØ 11,478 0.11
7,462,033 Hays 8,999 0.09
1,504,893 HyveØ 1,294 0.01
848,476 IntertekØ 49,839 0.49
319,509 Mears 379 0.00
6,226,542 Mitie 2,070 0.02
1,666,604 PagegroupØ 6,420 0.06
3,028,954 QinetiQ 8,838 0.09
1,599,394 Redde Northgate 3,000 0.03
9,800,653 RELXØ 166,856 1.62
9,857,731 Rentokil InitialØ 52,502 0.51
184,486 Robert Walters 793 0.01
611,758 RPS 261 0.00
iShares UK Equity Index Fund (UK)
Portfolio Statement (unaudited) continued
BlackRock Collective Investment Funds369

Holding orNominalValue Investment
MarketValue
£000’s
% ofTotal
NetAssets
733,312 SavillsØ 5,980 0.06
1,447,252 Speedy Hire 747 0.01
816,374 SThree 2,041 0.02
46,045 Vp 285 0.00
526,278 XPS Pensions 695 0.01
410,397 4.00
Computers − 0.36%; 29.2.2020 0.46%
400,983 Computacenter 8,100 0.08
406,793 FDMØ 4,239 0.04
281,547 KainosØ 3,148 0.03
909,936 NCC 1,631 0.02
325,206 RM 602 0.01
6,527,586 Serco 9,139 0.09
676,547 SoftcatØ 9,357 0.09
36,216 0.36
Cosmetics & Personal Care − 2.49%; 29.2.2020 2.15%
946,692 PZ CussonsØ 1,950 0.02
5,693,884 UnileverØ 253,947 2.47
255,897 2.49
Distribution & Wholesale − 1.67%; 29.2.2020 1.44%
1,785,324 BunzlØ 43,241 0.42
616,271 Diploma 11,894 0.12
1,182,691 Ferguson 87,235 0.85
2,111,893 InchcapeØ 10,676 0.10
564,338 Macfarlane 518 0.01
3,145,605 SIG 997 0.01
1,336,872 Travis Perkins 16,437 0.16
170,998 1.67
Diversified Financial Services − 3.57%; 29.2.2020 3.13%
1,607,702 AJ BellØ 7,219 0.07
512,326 AmigoØ 67 0.00
628,865 Arrow GlobalØ 717 0.01
2,363,032 AshmoreØ 9,958 0.10
1,874,606 Brewin Dolphin 4,658 0.05
773,901 Close Brothers 8,683 0.08
125,392 CMC Markets 399 0.00
534,984 Funding CircleØ 412 0.00
1,838,069 Hargreaves LansdownØ 29,703 0.29
1,916,357 IG 15,130 0.15
1,312,549 IntegraFinØ 7,048 0.07
836,903 International PersonalFinanceØ
565 0.01
2,531,232 Jupiter Fund ManagementØ 5,300 0.05
299,943 Liontrust Asset Management 3,809 0.04
Holding orNominalValue Investment
MarketValue
£000’s
% ofTotal
NetAssets
1,647,655 London Stock Exchange 144,994 1.41
8,011,367 Man 9,818 0.10
1,634,965 Ninety OneØ 3,607 0.04
1,976,095 OneSavings Bank 5,988 0.06
273,493 PayPoint 1,723 0.02
1,424,645 Provident FinancialØ 3,507 0.03
9,786,909 QuilterØ 14,000 0.14
282,447 Rathbone Brothers 4,768 0.05
146,866 River & Mercantile 236 0.00
8,940 S&U 132 0.00
598,514 Schroders 17,345 0.17
2,739,304 St James’s Place 26,818 0.26
12,142,135 Standard Life AberdeenØ 28,789 0.28
3,015,090 TP ICAP 9,166 0.09
364,559 3.57
Electricity − 0.74%; 29.2.2020 0.81%
655,407 ContourGlobal 1,367 0.01
2,225,619 Drax 6,232 0.06
5,493,715 SSE 69,166 0.67
76,765 0.74
Electronics − 1.00%; 29.2.2020 0.83%
82,464 Dialight 243 0.00
213,666 DiscoverIE 1,303 0.01
2,306,720 Electrocomponents 15,663 0.15
2,017,256 Halma 44,723 0.44
172,885 Oxford Instruments 2,732 0.03
181,659 Renishaw 8,687 0.08
4,631,157 RotorkØ 13,866 0.13
615,048 Spectris 15,591 0.15
445,884 TT Electronics 789 0.01
103,597 1.00
Engineering & Construction − 0.47%; 29.2.2020 0.45%
3,634,835 Balfour Beatty 8,106 0.08
180,369 CostainØ 96 0.00
451,041 Galliford TryØ 388 0.00
279,189 Headlam 790 0.01
2,558,323 Helios TowersØ 3,909 0.04
1,456,986 HomeServeØ 18,926 0.18
184,870 John Menzies 220 0.00
248,877 Keller 1,543 0.01
651,023 Kier 386 0.00
210,184 Morgan Sindall 2,632 0.03
145,514 Ricardo 451 0.00
823,518 Severfield 427 0.00
iShares UK Equity Index Fund (UK)
Portfolio Statement (unaudited) continued
BlackRock Collective Investment Funds 370

Holding orNominalValue Investment
MarketValue
£000’s
% ofTotal
NetAssets
4,483,765 Signature AviationØ 11,828 0.12
49,702 0.47
Entertainment − 0.18%; 29.2.2020 0.18%
5,125,834 CineworldØ 3,231 0.03
416,808 Gamesys 4,835 0.05
822,958 Rank 1,111 0.01
5,211,590 William Hill 9,019 0.09
18,196 0.18
Environmental Control − 0.02%; 29.2.2020 0.02%
927,184 Biffa 1,896 0.02
2,313,250 Renewi 515 0.00
2,411 0.02
Food Producers − 2.86%; 29.2.2020 2.47%
1,800,754 Associated British Foods 36,825 0.36
537,880 BakkavorØ 313 0.00
279,653 Cranswick 10,431 0.10
460,447 Devro 798 0.01
520,450 GreggsØ 7,370 0.07
220,998 Hilton FoodØ 2,617 0.03
8,348,047 J SainsburyØ 15,340 0.15
2,384,942 OcadoØ 59,528 0.58
3,740,783 Premier FoodsØ 3,180 0.03
2,680,578 SSP 6,573 0.06
2,502,500 Tate & Lyle 17,062 0.17
50,705,412 Tesco 110,842 1.08
11,651,870 Wm Morrison Supermarkets 22,407 0.22
293,286 2.86
Food Services − 1.11%; 29.2.2020 1.27%
9,329,089 Compass 113,862 1.11
Forest Products & Paper − 0.36%; 29.2.2020 0.36%
2,558,091 MondiØ 37,361 0.36
Gas − 1.64%; 29.2.2020 1.80%
30,234,955 CentricaØ 13,920 0.14
18,316,844 National Grid 154,411 1.50
168,331 1.64
Healthcare Products − 0.85%; 29.2.2020 0.86%
8,332,121 ConvaTec 15,956 0.16
4,631,502 Smith & Nephew 70,468 0.69
86,424 0.85
Healthcare Services − 0.01%; 29.2.2020 0.01%
342,716 Medica 452 0.00
Holding orNominalValue Investment
MarketValue
£000’s
% ofTotal
NetAssets
1,239,927 Spire Healthcare 1,112 0.01
1,564 0.01
Home Builders − 1.59%; 29.2.2020 1.95%
5,370,786 Barratt Developments 28,197 0.27
646,936 Bellway 15,442 0.15
625,455 Berkeley 28,515 0.28
2,455,312 Countryside PropertiesØ 7,896 0.08
1,238,100 Crest NicholsonØ 2,454 0.02
167,410 MJ Gleeson 1,004 0.01
1,676,684 Persimmon 43,929 0.43
1,298,334 RedrowØ 5,918 0.06
18,827,890 Taylor Wimpey 23,055 0.22
1,129,670 Vistry 7,179 0.07
163,589 1.59
Home Furnishings − 0.17%; 29.2.2020 0.17%
3,043,667 Howden Joinery 17,105 0.17
Household Products − 2.42%; 29.2.2020 1.70%
976,972 McBride 571 0.01
3,296,929 Reckitt BenckiserØ 247,533 2.41
248,104 2.42
Insurance − 4.31%; 29.2.2020 4.31%
1,085,050 Admiral 28,613 0.28
20,361,734 Aviva 57,563 0.56
3,124,644 Beazley 13,442 0.13
467,171 Chesnara 1,378 0.01
7,299,838 Direct Line Insurance 21,527 0.21
1,701,514 Hastings 4,291 0.04
5,965,232 Just 3,036 0.03
1,148,844 Lancashire 8,817 0.09
30,867,590 Legal & General 67,075 0.65
13,387,313 M&GØ 23,153 0.23
2,825,935 PhoenixØ 19,555 0.19
13,631,461 Prudential 166,508 1.62
5,561,931 RSA InsuranceØ 24,990 0.24
1,241,946 Sabre InsuranceØ 3,285 0.03
443,233 4.31
Internet − 0.74%; 29.2.2020 0.67%
4,973,223 Auto TraderØ 27,999 0.27
1,004,743 GoCo 1,139 0.01
2,808,933 Moneysupermarket.comØ 8,550 0.08
4,558,849 RightmoveØ 28,894 0.28
2,502,081 TrainlineØ 9,913 0.10
76,495 0.74
iShares UK Equity Index Fund (UK)
Portfolio Statement (unaudited) continued
BlackRock Collective Investment Funds371

Holding orNominalValue Investment
MarketValue
£000’s
% ofTotal
NetAssets
Investment Companies − 0.27%; 29.2.2020 0.49%
62,529 City of London Investment 239 0.00
25,439,984 Melrose Industries 25,898 0.25
931,893 Octopus RenewablesInfrastructure TrustØ
997 0.01
745,554 Sdcl Energy Efficiency IncomeTrust
831 0.01
27,965 0.27
Iron & Steel − 0.09%; 29.2.2020 0.00%
2,986,158 Evraz 9,678 0.09
Leisure Time − 0.04%; 29.2.2020 0.06%
684,675 GymØ 1,087 0.01
613,741 Hollywood Bowl 924 0.01
422,589 On the BeachØ 1,283 0.01
4,839,130 Saga 656 0.01
146,275 TEN Entertainment 184 0.00
5,482,727 Thomas CookΔ – 0.00
4,134 0.04
Lodging − 0.68%; 29.2.2020 0.62%
961,921 InterContinental HotelsØ 42,373 0.41
1,080,225 WhitbreadØ 27,308 0.27
69,681 0.68
Machinery Construction & Mining − 0.17%; 29.2.2020 0.16%
1,392,004 Weir 17,658 0.17
Machinery Diversified − 0.39%; 29.2.2020 0.29%
387,116 Spirax-Sarco EngineeringØ 39,641 0.39
Media − 0.79%; 29.2.2020 0.94%
205,267 Bloomsbury PublishingØ 429 0.00
593,568 Euromoney InstitutionalInvestor
4,962 0.05
559,988 FutureØ 8,299 0.08
7,800,218 Informa 32,238 0.31
19,905,103 ITVØ 12,086 0.12
3,988,449 Pearson 22,303 0.22
1,347,053 Reach 709 0.01
110,646 STVØ 235 0.00
81,261 0.79
Metal & Hardware − 0.05%; 29.2.2020 0.07%
927,935 BodycoteØ 5,206 0.05
352,662 Trifast 360 0.00
5,566 0.05
Holding orNominalValue Investment
MarketValue
£000’s
% ofTotal
NetAssets
Mining − 3.81%; 29.2.2020 2.99%
6,464,015 Anglo American 118,447 1.15
1,202,783 KAZ MineralsØ 6,974 0.07
5,733,621 Rio Tinto 265,725 2.59
391,146 3.81
Miscellaneous Manufacturing − 0.67%; 29.2.2020 0.68%
148,750 Avon Rubber 5,682 0.06
438,878 Hill & Smith 5,337 0.05
1,441,626 IMI 15,209 0.15
1,489,071 Morgan Advanced Materials 3,432 0.03
652,209 Photo-Me International 315 0.00
134,359 Porvair 712 0.01
1,944,464 Senior 1,015 0.01
2,123,613 SmithsØ 29,773 0.29
1,162,861 Vesuvius 4,754 0.05
166,287 Vitec 1,137 0.01
484,929 Volution 803 0.01
68,169 0.67
Oil & Gas Producers − 2.82%; 29.2.2020 3.88%
103,865,793 BP 274,413 2.67
3,610,946 Cairn EnergyØ 5,091 0.05
475,297 EnergeanØ 2,721 0.03
6,434,721 EnQuestØ 830 0.01
1,498,056 PetrofacØ 2,412 0.02
784,253 Pharos EnergyØ 108 0.00
5,266,976 Premier OilØ 1,150 0.01
8,089,509 Tullow Oil 1,660 0.02
1,353,216 Vivo Energy 1,018 0.01
289,403 2.82
Oil & Gas Services − 0.10%; 29.2.2020 0.13%
691,963 Hunting 1,118 0.01
3,602,698 John WoodØ 8,927 0.09
10,045 0.10
Packaging & Containers − 0.21%; 29.2.2020 0.19%
6,689,710 DS Smith 17,306 0.17
1,299,240 EssentraØ 3,983 0.04
21,289 0.21
Pharmaceuticals − 9.51%; 29.2.2020 7.94%
6,859,391 AstraZeneca 571,936 5.57
558,033 Dechra Pharmaceuticals 17,533 0.17
25,759,803 GlaxoSmithKline 379,184 3.69
4,530,945 Indivior 5,374 0.05
iShares UK Equity Index Fund (UK)
Portfolio Statement (unaudited) continued
BlackRock Collective Investment Funds 372

Holding orNominalValue Investment
MarketValue
£000’s
% ofTotal
NetAssets
3,263,905 Vectura 3,571 0.03
977,598 9.51
Private Equity − 0.69%; 29.2.2020 0.70%
5,025,727 3i 47,141 0.46
723,986 Allied MindsØ 306 0.00
1,478,702 Intermediate CapitalØ 20,214 0.20
4,784,689 IPØ 3,502 0.03
71,163 0.69
Real Estate Investment & Services − 0.24%; 29.2.2020 0.32%
120,865 Capital & RegionalØ 82 0.00
439,935 CLS 863 0.01
2,735,686 Empiric Student PropertyØ 1,910 0.02
1,036,130 FoxtonsØ 402 0.00
3,410,242 GraingerØ 10,674 0.10
559,131 Harworth 549 0.01
291,957 Helical 831 0.01
275,283 Henry Boot 716 0.01
237,656 LSL Property Services 509 0.00
2,245,566 McCarthy & StoneØ 1,612 0.02
162,072 Palace Capital 305 0.00
159,305 Phoenix Spree Deutschland 486 0.00
2,328,547 Picton Property IncomeØ 1,637 0.02
643,976 St Modwen Properties 2,083 0.02
2,227,122 Tritax EuroBox 2,031 0.02
342,266 U & I 226 0.00
24,916 0.24
Real Estate Investment Trusts − 2.26%; 29.2.2020 2.33%
933,450 Aberdeen Standard EuropeanLogistics IncomeØ
985 0.01
13,490,895 Assura 10,914 0.11
841,046 Big Yellow 8,982 0.09
824,527 BMO Real Estate Investments 561 0.01
4,790,796 British Land 17,515 0.17
3,922,968 Capital & Counties PropertiesØ 5,072 0.05
2,083,932 Civitas Social Housing 2,301 0.02
1,645,543 Custodian ReitØ 1,417 0.01
532,918 Derwent London 15,071 0.15
2,906,270 GCP Student Living 4,005 0.04
1,444,485 Great Portland Estates 8,716 0.08
3,981,996 Hammerson 1,928 0.02
924,031 Impact Healthcare Reit 918 0.01
2,609,482 Intu Properties2 – 0.00
3,710,342 Land 21,449 0.21
4,680,718 LondonMetric PropertyØ 11,075 0.11
2,852,120 LXI REIT 3,223 0.03
Holding orNominalValue Investment
MarketValue
£000’s
% ofTotal
NetAssets
329,184 McKay 625 0.01
2,113,154 NewRiver REITØ 1,257 0.01
6,438,011 Primary Health PropertiesØ 9,786 0.10
570,824 RDI REITØ 486 0.00
1,720,042 Regional REIT 1,314 0.01
656,844 Residential Secure Income 591 0.01
1,785,056 Schroder Real EstateInvestment TrustØ
533 0.01
6,064,940 SegroØ 57,775 0.56
1,203,649 Shaftesbury 6,361 0.06
1,016,714 Standard Life InvestmentProperty Income Trust
534 0.01
941,783 Target Healthcare REIT 1,023 0.01
987,325 Triple Point Social Housing Reit 1,056 0.01
9,262,456 Tritax Big Box REITØ 14,422 0.14
1,600,325 Unite 15,459 0.15
566,451 Urban & CivicØ 1,306 0.01
739,805 Workspace 4,165 0.04
230,825 2.26
Retail − 1.72%; 29.2.2020 1.54%
4,439,359 B&M European Value RetailØ 21,131 0.21
1,227,608 Card FactoryØ 473 0.00
932,664 DFS FurnitureØ 1,576 0.02
5,619,412 Dixons Carphone 5,187 0.05
2,608,313 Domino’s PizzaØ 8,748 0.09
539,505 DunelmØ 7,704 0.07
900,057 FrasersØ 3,143 0.03
1,188,681 Halfords 1,961 0.02
426,470 J D Wetherspoon 4,354 0.04
2,287,554 JD Sports Fashion 16,553 0.16
11,000,183 KingfisherØ 29,723 0.29
806,727 Lookers1 161 0.00
10,033,816 Marks & SpencerØ 11,148 0.11
1,055,090 Mitchells & ButlersØ 1,817 0.02
130,544 MotorpointØ 354 0.00
674,955 NextØ 40,754 0.40
7,225,703 PendragonØ 556 0.01
2,433,866 Pets at HomeØ 7,160 0.07
2,082,557 RestaurantØ 1,176 0.01
237,272 Studio RetailØ 539 0.01
288,796 Superdry 386 0.00
619,891 Watches of SwitzerlandØ 2,120 0.02
667,174 WH SmithØ 7,853 0.08
572,954 World 1,152 0.01
175,729 1.72
iShares UK Equity Index Fund (UK)
Portfolio Statement (unaudited) continued
BlackRock Collective Investment Funds373

Holding orNominalValue Investment
MarketValue
£000’s
% ofTotal
NetAssets
Software − 0.67%; 29.2.2020 0.62%
1,135,141 Alfa Financial Software 988 0.01
194,538 Aptitude Software 856 0.01
349,358 Aveva 17,719 0.17
1,746,884 Micro Focus International 5,220 0.05
5,704,317 SageØ 42,246 0.41
224,993 SDL 1,647 0.02
68,676 0.67
Storage & Warehousing − 0.09%; 29.2.2020 0.09%
1,108,114 Safestore 8,660 0.08
302,680 Wincanton 581 0.01
9,241 0.09
Telecommunications − 2.16%; 29.2.2020 2.45%
4,600,204 Airtel AfricaØ 2,622 0.03
45,540,920 BTØ 47,659 0.46
3,287,830 Spirent Communications 9,568 0.09
3,081,992 TalkTalk TelecomØ 2,265 0.02
279,625 Telecom Plus 3,836 0.04
139,969,640 VodafoneØ 155,982 1.52
221,932 2.16
Textiles − 0.04%; 29.2.2020 0.04%
8,067,667 Coats 4,445 0.04
Toys, Games & Hobbies − 0.16%; 29.2.2020 0.10%
173,794 Games Workshop 16,015 0.16
Transportation − 0.22%; 29.2.2020 0.33%
126,624 Clarkson 3,109 0.03
7,591,157 Firstgroup 3,313 0.03
209,846 Go-Ahead 1,382 0.01
152,948 James Fisher & Sons 1,878 0.02
2,234,737 National Express 2,816 0.03
4,895,605 Royal MailØ 8,783 0.09
1,732,950 StagecoachØ 744 0.01
22,025 0.22
Water − 0.79%; 29.2.2020 0.79%
2,187,757 PennonØ 21,998 0.21
1,259,229 Severn Trent 29,340 0.29
3,599,734 United Utilities 29,921 0.29
81,259 0.79
UNITED STATES OF AMERICA − 0.09%; 29.2.2020 0.20%
Biotechnology − 0.01%; 29.2.2020 0.02%
554,508 PureTech HealthØ 1,539 0.01
Holding orNominalValue Investment
MarketValue
£000’s
% ofTotal
NetAssets
Leisure Time − 0.08%; 29.2.2020 0.18%
771,538 Carnival 8,132 0.08
COLLECTIVE INVESTMENTSCHEMES − 7.79%; 29.2.2020 6.65%
Equities − 0.00%; 29.2.2020 0.02%
Equity Funds − 1.37%; 29.2.2020 1.00%
547,072 Aberdeen Asian Income Fund 1,028 0.01
1,173,179 Apax Global AlphaØ 1,950 0.02
692,788 Baillie Gifford UK Growth Fund 1,254 0.01
3,429,318 BBGI Ø 5,878 0.06
119,186 BH Global 2,169 0.02
125,443 BH MacroØ 4,240 0.04
2,039,955 Bluefield Solar Income FundØ 2,683 0.03
1,637,100 CVC Credit Partners EuropeanOpportunities
1,392 0.01
549,460 Dexion AbsoluteΔ – 0.00
1,854,851 Foresight Solar Fund 1,994 0.02
1,924,575 GCP Asset Backed IncomeFund
1,805 0.02
4,808,616 GCP InfrastructureInvestmentsØ
5,780 0.06
459,505 Genesis Emerging MarketsFundØ
3,474 0.03
432,932 HarbourVest Global PrivateEquityØ
7,394 0.07
855,713 Henderson Far East IncomeØ 2,653 0.03
3,618,483 Hipgnosis Songs Fund Ø 4,360 0.04
8,913,029 International PublicPartnershipsØ
14,796 0.14
2,780,121 JLEN Environmental AssetsØ 3,336 0.03
950,055 JP Morgan Global Core RealAssets FundØ
1,040 0.01
1,339,179 KKV Secured Loan Fund 236 0.00
308,108 KKV Secured Loan Fund 136 0.00
256,257 NB Private Equity PartnersFundØ
2,327 0.02
1,121,290 Pershing Square FundØ 22,594 0.22
746,523 Real Estate CreditInvestmentsØ
944 0.01
9,473,172 Renewables Infrastructure 12,940 0.13
208,700 Riverstone EnergyØ 657 0.01
961,958 Ruffer Investment Company 2,309 0.02
1,554,773 Schroder Oriental IncomeFundØ
3,623 0.04
8,758,932 Sequoia EconomicInfrastructure Income FundØ
9,477 0.09
921,527 SME Credit Realisation FundØ 507 0.00
2,400,035 Syncona 5,664 0.06
iShares UK Equity Index Fund (UK)
Portfolio Statement (unaudited) continued
BlackRock Collective Investment Funds 374

Holding orNominalValue Investment
MarketValue
£000’s
% ofTotal
NetAssets
3,016,108 TwentyFour Income Fund 3,031 0.03
334,755 TwentyFour Select MonthlyIncome Fund
288 0.00
1,085,056 Vietnam EnterpriseInvestmentsØ
4,644 0.05
1,170,957 VinaCapital VietnamOpportunity Fund
3,724 0.04
140,327 1.37
Exchange Traded Funds − 1.26%; 29.2.2020 1.40%
13,581,328 iShares - iShares Core FTSE100 UCITS ETF†
80,116 0.78
2,942,085 iShares FTSE 250 UCITS ETF†Ø 49,657 0.48
129,773 1.26
Fixed Income Funds − 0.04%; 29.2.2020 0.05%
191,723 Alcentra European FloatingRate Income Fund
166 0.00
204,186 City Merchants High Yield Trust 351 0.00
829,900 CQS New City High YieldFundØ
396 0.01
4,105,889 NB Global Floating RateIncome Fund
3,395 0.03
4,308 0.04
Investment Trusts − 5.10%; 29.2.2020 4.16%
3,519,829 3i InfrastructureØ 10,278 0.10
1,304,192 Aberdeen Diversified Incomeand Growth Trust
1,213 0.01
350,450 Aberdeen New DawnInvestment Trust
904 0.01
166,849 Aberdeen New IndiaInvestment Trust
701 0.01
129,073 Aberdeen Standard Asia Focus 1,291 0.01
102,618 Aberdeen Standard EquityIncome Trust
271 0.00
470,953 Aberforth Smaller CompaniesTrust
4,064 0.04
711,872 Aberforth Split Level IncomeTrust
318 0.00
1,757,692 Alliance TrustØ 14,413 0.14
208,225 Allianz Technology Trust 5,195 0.05
124,185 Artemis Alpha Trust 355 0.00
565,018 Asia Dragon Trust 2,334 0.02
646,149 Avi Global Trust 4,633 0.05
213,573 Baillie Gifford EuropeanGrowth Trust
2,477 0.02
503,336 Baillie Gifford Japan Trust 4,087 0.04
1,582,603 Baillie Gifford Shin Nippon 3,105 0.03
Holding orNominalValue Investment
MarketValue
£000’s
% ofTotal
NetAssets
1,620,125 Baillie Gifford US GrowthTrustØ
3,888 0.04
710,960 Bankers Investment Trust 7,266 0.07
2,354,172 BB Healthcare Trust 3,696 0.04
224,427 Biotech Growth Trust 2,747 0.03
1,551,875 BlackRock Frontiers InvestmentTrust†Ø
1,453 0.01
286,618 BlackRock Greater EuropeInvestment Trust†
1,275 0.01
115,747 BlackRock Latin AmericanInvestment Trust†
353 0.00
293,671 Blackrock North AmericanIncome Trust†
446 0.00
298,091 BlackRock Smaller Cos Trust† 3,643 0.04
507,875 Blackrock Throgmorton Trust† 3,118 0.03
1,041,652 BlackRock World Mining Trust† 4,208 0.04
377,111 BMO Capital & IncomeInvestment Trust
962 0.01
3,101,693 BMO GlobalSmaller CompaniesØ
3,753 0.04
199,086 BMO Private Equity Trust 587 0.01
85,047 Brunner Investment Trust 646 0.01
180,403 Caledonia Investments 4,582 0.04
55,016 Capital Gearing Trust 2,459 0.02
663,214 CC Japan Income & GrowthTrust
766 0.01
2,319,504 City of London InvestmentTrust
7,480 0.07
1,127,281 Diverse Income Trust 967 0.01
427,332 Dunedin Income GrowthInvestment Trust
1,077 0.01
592,516 Ecofin Global Utilities andInfrastructure Trust
972 0.01
1,182,790 Edinburgh Investment Trust 5,482 0.05
1,647,616 Edinburgh WorldwideInvestment Trust
4,539 0.04
115,550 Electra Private Equity 214 0.00
139,170 EP Global Opportunities Trust 365 0.00
1,495,141 European Assets Trust 1,540 0.02
675,031 European Opportunities Trust 4,597 0.04
2,858,305 F&C Investment Trust 19,980 0.19
203,661 Fidelity Asian Values 697 0.01
2,205,482 Fidelity China SpecialSituationsØ
7,080 0.07
2,303,119 Fidelity European Trust 6,080 0.06
507,491 Fidelity Japan Trust 911 0.01
1,322,927 Fidelity Special Values 2,389 0.02
1,185,007 Finsbury Growth & IncomeTrust
9,836 0.10
iShares UK Equity Index Fund (UK)
Portfolio Statement (unaudited) continued
BlackRock Collective Investment Funds375

Holding orNominalValue Investment
MarketValue
£000’s
% ofTotal
NetAssets
97,880 Fundsmith Emerging EquitiesTrustØ
1,086 0.01
8,702,119 Greencoat UK Wind Ø 12,461 0.12
109,557 Henderson AlternativeStrategies Trust
309 0.00
403,273 Henderson Diversified IncomeTrustØ
347 0.00
48,205 Henderson European FocusTrust
600 0.01
55,191 Henderson EuroTrust 704 0.01
254,645 Henderson High Income Trust 335 0.00
577,596 Henderson InternationalIncome Trust
840 0.01
407,712 Henderson Smaller CompaniesInvestment Trust
3,156 0.03
372,563 Herald Investment Trust 6,147 0.06
2,084,837 HgCapital Trust Ø 5,692 0.06
10,026,476 Hicl Infrastructure 16,804 0.16
230,564 ICG Enterprise Trust 1,928 0.02
1,314,489 Impax Environmental Markets 4,574 0.04
116,207 Independent Investment Trust 499 0.00
169,977 International BiotechnologyTrust
1,241 0.01
270,330 INVESCO Asia Trust 779 0.01
164,220 Invesco Income Growth Trust 378 0.00
150,189 Invesco Perpetual UKSmaller Cos Investment Trust
583 0.01
1,225,081 JP Morgan AmericanInvestment Trust
6,334 0.06
214,293 JP Morgan China Growth &Income
1,119 0.01
525,884 JP Morgan EuropeanSmaller Companies TrustØ
2,083 0.02
433,842 JP Morgan Smaller CompaniesInvestment Trust
1,085 0.01
352,405 JPMorgan Asia Growth &Income
1,462 0.01
154,207 JPMorgan ClaverhouseInvestment Trust
842 0.01
767,390 JPMorgan Emerging MarketsInvestment Trust
8,211 0.08
278,412 JPMorgan EuropeanInvestment Trust - Growth
763 0.01
177,196 JPMorgan EuropeanInvestment Trust - Income
206 0.00
1,767,645 JPMorgan Global EmergingMarkets Income Trust
2,015 0.02
861,902 JPMorgan Global Growth &IncomeØ
3,008 0.03
Holding orNominalValue Investment
MarketValue
£000’s
% ofTotal
NetAssets
462,429 JPMorgan Indian InvestmentTrust
2,631 0.03
363,721 JPMorgan Japan Smaller CosTrust
1,568 0.02
923,311 JPMorgan JapaneseInvestment Trust
5,041 0.05
68,381 JPMorgan Mid Cap InvestmentTrust
632 0.01
152,383 JPMorgan RussianØ 960 0.01
212,195 JPMorgan USSmaller Companies InvestmentTrust
630 0.01
59,214 Jupiter US Smaller Companies 585 0.01
186,430 Keystone Investment Trust 481 0.01
651,789 Law Debenture 3,461 0.03
462 Lindsell Train Investment Trust 501 0.00
94,965 Lowland Investment Company 883 0.01
713,988 M&G Credit Income InvestmentTrust FundØ
689 0.01
79,822 Majedie Investments 148 0.00
295,653 Martin Currie Global PortfolioTrust
979 0.01
4,357,175 Mercantile Investment TrustØ 8,453 0.08
684,401 Merchants Trust 2,395 0.02
127,963 Mid Wynd InternationalInvestment Trust
819 0.01
222,410 Middlefield Canadian IncomePCC
179 0.00
1,224,329 Monks Investment TrustØ 14,031 0.14
26,131 Montanaro EuropeanSmaller Cos Trust
350 0.00
446,149 Montanaro UKSmaller Companies InvestmentTrust
526 0.01
209,693 Murray Income Trust 1,585 0.02
700,061 Murray International Trust 6,623 0.06
2,960,319 NextEnergy Solar FundØ 3,132 0.03
442,085 North American Income Trust 986 0.01
46,519 North Atlantic Smaller CosInvestment Trust
1,335 0.01
696,780 Pacific Assets Trust 1,840 0.02
166,068 Pacific Horizon InvestmentTrust
920 0.01
292,233 Pantheon International Fund 6,575 0.06
1,149,575 Perpetual Income and GrowthInvestment Trust
2,650 0.03
13,381 Personal Assets Trust 6,055 0.06
759,611 Polar Capital Global FinancialsTrust
801 0.01
iShares UK Equity Index Fund (UK)
Portfolio Statement (unaudited) continued
BlackRock Collective Investment Funds 376

Holding orNominalValue Investment
MarketValue
£000’s
% ofTotal
NetAssets
458,661 Polar Capital GlobalHealthcare Trust
1,082 0.01
733,844 Polar Capital Technology Trust 15,961 0.16
408,219 Pollen Street Secured Lending 3,445 0.03
678,814 RIT Capital Partners 12,341 0.12
408,824 Schroder Asian Total ReturnInvestment
1,668 0.02
870,010 Schroder AsiaPacific Fund 4,224 0.04
194,297 Schroder Income Growth Fund 461 0.00
337,696 Schroder Japan Growth Fund 561 0.01
101,772 Schroder UK Mid Cap Fund 464 0.00
5,543,400 Schroder UK Public Private 1,619 0.02
774,038 Scottish American Investment 3,305 0.03
411,920 Scottish Investment Trust 2,986 0.03
7,650,659 Scottish Mortgage InvestmentTrust
73,523 0.72
84,824 Scottish OrientalSmaller Companies Trust
718 0.01
658,088 Smithson Investment Trust 9,832 0.10
229,957 Standard Life Private EquityTrust
724 0.01
487,851 Standard Life UK Smaller CosTrust
2,595 0.03
202,000 Strategic Equity Capital 374 0.00
405,535 Temple Bar Investment Trust 2,973 0.03
Holding orNominalValue Investment
MarketValue
£000’s
% ofTotal
NetAssets
1,439,626 Templeton Emerging MarketsInvestment Trust
11,920 0.12
215,044 TR European Growth Trust 2,064 0.02
1,830,462 TR Property Investment Trust -Ordinary Shares
6,443 0.06
629,811 Troy Income & Growth Trust 443 0.00
282,103 Trust of Scotland 508 0.00
790,838 Utilico Emerging Markets TrustFund
1,392 0.01
108,642 Value and Income Trust 190 0.00
2,774,209 VPC Specialty LendingInvestments
1,737 0.02
4,987,284 Witan Investment Trust 9,316 0.09
187,040 Witan Pacific Investment Trust 683 0.01
298,087 Worldwide Healthcare Trust 10,209 0.10
523,489 5.10
Property Funds − 0.02%; 29.2.2020 0.02%
124,150 ICG-Longbow Senior SecuredUK Property Debt Investments
94 0.00
2,204,628 Starwood European RealEstate Finance
1,900 0.02
1,994 0.02
iShares UK Equity Index Fund (UK)
Portfolio Statement (unaudited) continued
BlackRock Collective Investment Funds377

Holding orNominalValue Investment
UnderlyingExposure − Derivatives
£000’s
MarketValue
£000’s
% ofTotal
NetAssets
DERIVATIVES − (0.03%); 29.2.2020 (0.17%)
Forward Currency Contracts − 0.00%; 29.2.2020 (0.01%)
£8,509,127 UK sterling vs US dollar 8,296 213 0.00
Futures − (0.03%); 29.2.2020 (0.16%)
3,440 FTSE 100 Index September 2020 205,076 (3,393) (0.03)
Portfolio of investments 10,064,144 98.01
CASH EQUIVALENTS
Short-term Money Market Funds − 0.75%; 29.2.2020 1.13%
76,776,394 BlackRock ICS Sterling Liquidity Fund - Agency Income Class† 76,776 0.75
Net other assets 127,399 1.24
Total net assets 10,268,319 100.00
Unless otherwise stated, all securities are either listed on a recognised exchange or traded on an eligible securities market.
Underlying exposure has been calculated according to the guidelines issued by the European Securities and Markets Authority (“ESMA”) and represents the market value of an equivalent positionin the assets underlying each financial derivative instrument.
The counterparty for the forward currency contracts is Barclays Bank Plc.1 Delisted security fair valued by the Manager.2 Security fair valued by Manager at zero.Ø All or a portion of this investment represents a security on loan.Δ Suspended investments fair valued at zero.† Managed by a related party.
iShares UK Equity Index Fund (UK)
Portfolio Statement (unaudited) continued
BlackRock Collective Investment Funds 378

£000’s31.8.2020
£000’s £000’s31.8.2019
£000’s
Income
Net capital (losses)/gains (872,567) 147,422
Revenue 183,666 254,399
Expenses (4,136) (3,957)
Interest payable and similarcharges (12) (3)
Net revenue before taxation 179,518 250,439
Taxation (949) (1,996)
Net revenue after taxation 178,569 248,443
Total return before distributions (693,998) 395,865
Distributions (178,577) (248,448)
Change in net assetsattributable to unitholdersfrom investment activities (872,575) 147,417
Statement of Change in Net Assets Attributable to Unitholders(unaudited) for the six months ended 31 August 2020
£000’s31.8.2020
£000’s £000’s31.8.2019
£000’s
Opening net assets attributableto unitholders 10,240,449 9,033,412
Amounts receivable on issue of units 2,057,815 1,429,554
Amounts payable on cancellation of units (1,333,064) (858,293)
724,751 571,261
Change in net assets attributable tounitholders from investment activities (872,575) 147,417
Retained distribution on accumulation units 175,694 249,646
Closing net assets attributableto unitholders 10,268,319 10,001,736
The above statement shows the comparative closing net assets at 31 August 2019 whereas the current accounting period commenced 1 March 2020.
iShares UK Equity Index Fund (UK)
Statement of Total Return (unaudited)
for the six months ended 31 August 2020
BlackRock Collective Investment Funds379

31.8.2020£000’s
29.2.2020£000’s
Assets:
Fixed assets
− Investment assets 10,067,537 10,071,886
Current assets
− Debtors 119,447 130,677
− Cash and bank balances 29,749 17,943
− Cash collateral posted – 7,609
− Cash equivalents 76,776 115,392
Total assets 10,293,509 10,343,507
Liabilities:
Investment liabilities (3,393) (17,561)
Creditors
− Distributions payable (5,338) (7,723)
− Other creditors (16,459) (77,774)
Total liabilities (25,190) (103,058)
Net assets attributable to unitholders 10,268,319 10,240,449
G D Bamping (Director)M T Zemek (Director)BlackRock Fund Managers Limited29 October 2020
iShares UK Equity Index Fund (UK)
Balance Sheet (unaudited)
at 31 August 2020
BlackRock Collective Investment Funds 380

The Fund is a sub-fund of BlackRock Collective Investment Funds (previously known as BlackRock QualifiedInvestor Schemes (1)), a UCITS scheme under the COLL Sourcebook. The Fund was established on 21 June2005 and was authorised by the FCA on 21 June 2005. The Fund’s FCA product reference number is 645669.
Risk and Reward ProfileLower riskTypically lower rewards
Higher riskTypically higher rewards
Unit Class
A Income 1 2 3 4 5 6 7
A Accumulation 1 2 3 4 5 6 7
L Accumulation 1 2 3 4 5 6 7
X Income 1 2 3 4 5 6 7
X Accumulation 1 2 3 4 5 6 7
D Income 1 2 3 4 5 6 7
D Accumulation 1 2 3 4 5 6 7
H Income 1 2 3 4 5 6 7
H Accumulation 1 2 3 4 5 6 7
• The risk indicator was calculated incorporating historical or simulated historical data and may not be a reliableindication of the future risk profile of the Fund.
• The risk category shown is not guaranteed and may change over time.
• The lowest category does not mean risk free.
For more information on this, please see the Fund’s Key Investor Information Documents (“KIIDs”), which areavailable at www.blackrock.com.
iShares UK Gilts All Stocks Index Fund (UK)
About the Fund
BlackRock Collective Investment Funds381
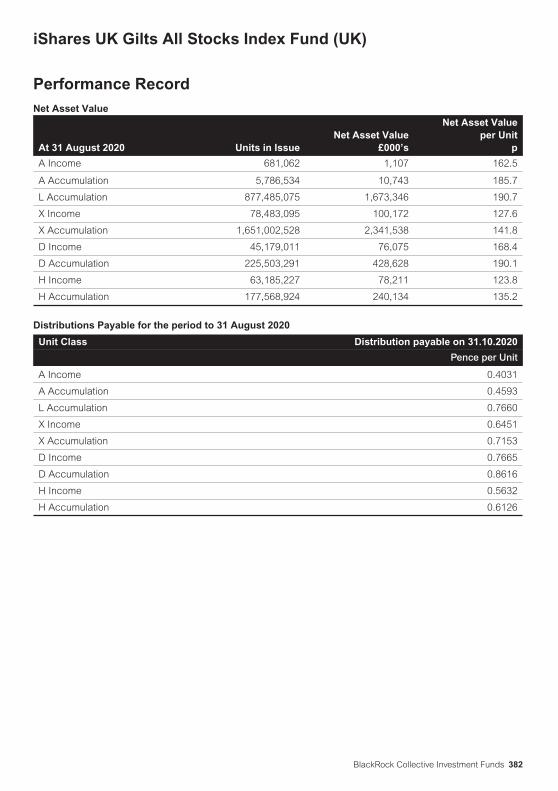
Net Asset Value
At 31 August 2020 Units in IssueNet Asset Value
£000’s
Net Asset Valueper Unit
p
A Income 681,062 1,107 162.5
A Accumulation 5,786,534 10,743 185.7
L Accumulation 877,485,075 1,673,346 190.7
X Income 78,483,095 100,172 127.6
X Accumulation 1,651,002,528 2,341,538 141.8
D Income 45,179,011 76,075 168.4
D Accumulation 225,503,291 428,628 190.1
H Income 63,185,227 78,211 123.8
H Accumulation 177,568,924 240,134 135.2
Distributions Payable for the period to 31 August 2020
Unit Class Distribution payable on 31.10.2020
Pence per Unit
A Income 0.4031
A Accumulation 0.4593
L Accumulation 0.7660
X Income 0.6451
X Accumulation 0.7153
D Income 0.7665
D Accumulation 0.8616
H Income 0.5632
H Accumulation 0.6126
iShares UK Gilts All Stocks Index Fund (UK)
Performance Record
BlackRock Collective Investment Funds 382

Operating Charges
Unit Class1.3.2020
to 31.8.20201.3.2019
to 29.2.2020
A Income 0.51% 0.51%
A Accumulation 0.51% 0.51%
L Accumulation 0.21% 0.21%
X Income 0.01% 0.01%
X Accumulation 0.01% 0.01%
D Income 0.11% 0.10%
D Accumulation 0.11% 0.11%
H Income 0.11% 0.11%
H Accumulation 0.11% 0.11%
Operating charges are annualised and exclude portfolio trade-related costs, except costs paid to the custodian/depositary and entry/exit charges paid to an underlyingcollective investment scheme (if any).
iShares UK Gilts All Stocks Index Fund (UK)
Performance Record continued
BlackRock Collective Investment Funds383

Holding orNominalValue Investment
MarketValue
£000’s
% ofTotal
NetAssets
BONDS − 99.22%; 29.2.2020 99.22%
UK Sterling Denominated GovernmentBonds − 99.22%; 29.2.2020 99.22%
£62,219,000 United Kingdom Gilt0.125% 31/1/2023
62,427 1.26
£48,439,000 United Kingdom Gilt0.125% 30/1/2026
48,610 0.98
£20,768,000 United Kingdom Gilt0.125% 31/1/2028Ø
20,655 0.42
£91,872,000 United Kingdom Gilt0.375% 22/10/2030
92,047 1.86
£84,212,278 United Kingdom Gilt0.5% 22/7/2022Ø
85,054 1.72
£20,618,000 United Kingdom Gilt0.5% 22/10/2061
18,224 0.37
£120,901,000 United Kingdom Gilt0.625% 7/6/2025Ø
124,489 2.52
£43,485,000 United Kingdom Gilt0.625% 22/10/2050
40,328 0.81
£108,342,702 United Kingdom Gilt0.75% 22/7/2023Ø
110,897 2.24
£111,786,000 United Kingdom Gilt0.875% 22/10/2029Ø
117,917 2.38
£78,037,000 United Kingdom Gilt 1%22/4/2024Ø
81,028 1.64
£89,284,701 United Kingdom Gilt1.25% 22/7/2027Ø
96,274 1.94
£42,653,000 United Kingdom Gilt1.25% 22/10/2041Ø
45,903 0.93
£93,968,000 United Kingdom Gilt1.5% 22/1/2021Ø
94,471 1.91
£115,440,372 United Kingdom Gilt1.5% 22/7/2026Ø
125,446 2.53
£65,922,593 United Kingdom Gilt1.5% 22/7/2047Ø
75,552 1.53
£84,641,203 United Kingdom Gilt1.625% 22/10/2028Ø
94,540 1.91
£52,089,000 United Kingdom Gilt1.625% 22/10/2054
63,500 1.28
£40,239,832 United Kingdom Gilt1.625% 22/10/2071Ø
55,317 1.12
£67,790,836 United Kingdom Gilt1.75% 7/9/2022Ø
70,249 1.42
£79,140,278 United Kingdom Gilt1.75% 7/9/2037
91,864 1.86
£73,315,000 United Kingdom Gilt1.75% 22/1/2049Ø
89,178 1.80
£68,791,892 United Kingdom Gilt1.75% 22/7/2057
88,176 1.78
Holding orNominalValue Investment
MarketValue
£000’s
% ofTotal
NetAssets
£107,140,746 United Kingdom Gilt 2%7/9/2025Ø
117,997 2.38
£102,613,333 United Kingdom Gilt 2.25%7/9/2023Ø
109,750 2.22
£54,306,387 United Kingdom Gilt 2.5%22/7/2065
88,127 1.78
£85,403,921 United Kingdom Gilt 2.75%7/9/2024Ø
95,003 1.92
£71,416,407 United Kingdom Gilt 3.25%22/1/2044
107,208 2.17
£79,797,319 United Kingdom Gilt 3.5%22/1/2045
125,607 2.54
£55,152,813 United Kingdom Gilt 3.5%22/7/2068
113,746 2.30
£47,175,821 United Kingdom Gilt 3.75%7/9/2020Ø
47,207 0.95
£118,902,637 United Kingdom Gilt 3.75%7/9/2021Ø
123,426 2.49
£64,646,019 United Kingdom Gilt 3.75%22/7/2052
116,406 2.35
£69,651,439 United Kingdom Gilt 4%7/3/2022Ø
73,887 1.49
£65,527,786 United Kingdom Gilt 4%22/1/2060
134,835 2.72
£101,720,058 United Kingdom Gilt 4.25%7/12/2027Ø
132,071 2.67
£98,993,621 United Kingdom Gilt 4.25%7/6/2032
142,142 2.87
£83,113,775 United Kingdom Gilt 4.25%7/3/2036
127,187 2.57
£64,072,032 United Kingdom Gilt 4.25%7/9/2039
103,603 2.09
£69,601,629 United Kingdom Gilt 4.25%7/12/2040
114,340 2.31
£71,831,604 United Kingdom Gilt 4.25%7/12/2046
128,462 2.60
£53,808,873 United Kingdom Gilt 4.25%7/12/2049
100,460 2.03
£72,265,829 United Kingdom Gilt 4.25%7/12/2055
146,467 2.96
£104,336,263 United Kingdom Gilt 4.5%7/9/2034
159,527 3.22
£79,433,104 United Kingdom Gilt 4.5%7/12/2042
138,442 2.80
£110,568,419 United Kingdom Gilt 4.75%7/12/2030Ø
160,056 3.23
£71,840,265 United Kingdom Gilt 4.75%7/12/2038Ø
121,344 2.45
£114,058,055 United Kingdom Gilt 5%7/3/2025Ø
139,906 2.83
iShares UK Gilts All Stocks Index Fund (UK)
Portfolio Statement (unaudited)
at 31 August 2020
BlackRock Collective Investment Funds 384

Holding orNominalValue Investment
MarketValue
£000’s
% ofTotal
NetAssets
£53,452,983 United Kingdom Gilt 6%7/12/2028
78,668 1.59
£68,979,957 United Kingdom Gilt 8%7/6/2021
73,178 1.48
4,911,198 99.22
Portfolio of investments 4,911,198 99.22
Net other assets 38,756 0.78
Total net assets 4,949,954 100.00
Unless otherwise stated, all securities are either listed on a recognised exchange or traded on aneligible securities market.
All securities in the portfolio at 31 August 2020 are investment grade.Ø All or a portion of this investment represents a security on loan.
iShares UK Gilts All Stocks Index Fund (UK)
Portfolio Statement (unaudited) continued
BlackRock Collective Investment Funds385

£000’s31.8.2020
£000’s £000’s31.8.2019
£000’s
Income
Net capital gains 36,054 449,899
Revenue 24,879 34,407
Expenses (2,354) (2,293)
Net revenue before taxation 22,525 32,114
Taxation – –
Net revenue after taxation 22,525 32,114
Total return before distributions 58,579 482,013
Distributions (22,525) (32,114)
Change in net assetsattributable to unitholdersfrom investment activities 36,054 449,899
Statement of Change in Net Assets Attributable to Unitholders(unaudited) for the six months ended 31 August 2020
£000’s31.8.2020
£000’s £000’s31.8.2019
£000’s
Opening net assets attributableto unitholders 5,563,816 4,594,478
Amounts receivable on issue of units 859,048 596,904
Amounts payable on cancellation of units (1,530,552) (462,151)
(671,504) 134,753
Change in net assets attributable tounitholders from investment activities 36,054 449,899
Retained distribution on accumulation units 21,588 31,142
Closing net assets attributableto unitholders 4,949,954 5,210,272
The above statement shows the comparative closing net assets at 31 August 2019 whereas the current accounting period commenced 1 March 2020.
iShares UK Gilts All Stocks Index Fund (UK)
Statement of Total Return (unaudited)
for the six months ended 31 August 2020
BlackRock Collective Investment Funds 386

31.8.2020£000’s
29.2.2020£000’s
Assets:
Fixed assets
− Investment assets 4,911,198 5,520,387
Current assets
− Debtors 103,501 154,859
− Cash and bank balances 32,154 8,210
Total assets 5,046,853 5,683,456
Liabilities:
Creditors
− Distributions payable (1,211) (1,528)
− Other creditors (95,688) (118,112)
Total liabilities (96,899) (119,640)
Net assets attributable to unitholders 4,949,954 5,563,816
G D Bamping (Director)M T Zemek (Director)BlackRock Fund Managers Limited29 October 2020
iShares UK Gilts All Stocks Index Fund (UK)
Balance Sheet (unaudited)
at 31 August 2020
BlackRock Collective Investment Funds387

The Fund is a sub-fund of BlackRock Collective Investment Funds (previously known as BlackRock QualifiedInvestor Schemes (1)), a UCITS scheme under the COLL Sourcebook. The Fund was established on 29 June2012 and was authorised by the FCA on 28 April 2010. The Fund’s FCA product reference number is 645682.
Risk and Reward ProfileLower riskTypically lower rewards
Higher riskTypically higher rewards
Unit Class
A Accumulation 1 2 3 4 5 6 7
L Income 1 2 3 4 5 6 7
L Accumulation 1 2 3 4 5 6 7
X Income 1 2 3 4 5 6 7
X Accumulation 1 2 3 4 5 6 7
D Accumulation 1 2 3 4 5 6 7
H Income 1 2 3 4 5 6 7
• The risk indicator was calculated incorporating simulated historical data and may not be a reliable indicationof the future risk profile of the Fund.
• The risk category shown is not guaranteed and may change over time.
• The lowest category does not mean risk free.
• The use of derivatives will impact the value of the Fund and may expose the Fund to a higher degree of risk.Derivatives are highly sensitive to changes in the value of the asset on which they are based and can increasethe size of losses and gains, resulting in greater fluctuations in the value of the Fund. The impact to the Fundcan be greater where derivatives are used in an extensive or complex way.
For more information on this, please see the Fund’s Key Investor Information Documents (“KIIDs”), which areavailable at www.blackrock.com.
iShares US Equity Index Fund (UK)
About the Fund
BlackRock Collective Investment Funds 388

Net Asset Value
At 31 August 2020 Units in IssueNet Asset Value
£000’s
Net Asset Valueper Unit
p
A Accumulation 795,767 2,676 336.3
L Income 48,865 115 235.0
L Accumulation 84,232,373 289,388 343.6
X Income 27,484,604 84,027 305.7
X Accumulation 96,813,911 331,422 342.3
D Accumulation 328,330,181 1,142,191 347.9
H Income 9,170,620 19,140 208.7
Distributions Payable for the period to 31 August 2020
Unit Class Distribution payable on 31.10.2020
Pence per Unit
A Accumulation 1.6475
L Income 1.4975
L Accumulation 2.1376
X Income 2.1726
X Accumulation 2.4155
D Accumulation 2.4024
H Income 1.4519
Operating Charges
Unit Class1.3.2020
to 31.8.20201.3.2019
to 29.2.2020
A Accumulation 0.51% 0.51%
L Income 0.21% 0.21%
L Accumulation 0.21% 0.21%
X Income 0.01% 0.01%
X Accumulation 0.01% 0.01%
D Accumulation 0.05% 0.05%
H Income 0.05% 0.05%
Operating charges are annualised and exclude portfolio trade-related costs, except costs paid to the custodian/depositary and entry/exit charges paid to an underlyingcollective investment scheme (if any).
iShares US Equity Index Fund (UK)
Performance Record
BlackRock Collective Investment Funds389

Holding orNominalValue Investment
MarketValue
£000’s
% ofTotal
NetAssets
EQUITIES − 99.58%; 29.2.2020 99.52%
ARGENTINA − 0.18%; 29.2.2020 0.11%
Internet − 0.18%; 29.2.2020 0.11%
3,807 MercadoLibre 3,316 0.18
AUSTRALIA − 0.08%; 29.2.2020 0.07%
Software − 0.08%; 29.2.2020 0.07%
10,660 AtlassianØ 1,527 0.08
BERMUDA − 0.10%; 29.2.2020 0.14%
Insurance − 0.10%; 29.2.2020 0.14%
32,367 Arch Capital 762 0.04
3,599 Everest Re 591 0.03
3,770 RenaissanceRe 517 0.03
1,870 0.10
CANADA − 0.14%; 29.2.2020 0.09%
Retail − 0.14%; 29.2.2020 0.09%
9,100 Lululemon Athletica 2,551 0.14
CHINA − 0.07%; 29.2.2020 0.06%
Retail − 0.07%; 29.2.2020 0.06%
28,934 Yum China 1,246 0.07
IRELAND − 1.23%; 29.2.2020 1.17%
Automobile Parts & Equipment − 0.07%; 29.2.2020 0.08%
21,002 AptivØ 1,350 0.07
Computers − 0.50%; 29.2.2020 0.45%
52,176 Accenture 9,344 0.50
Diversified Financial Services − 0.01%; 29.2.2020 0.02%
8,199 AerCapØ 181 0.01
Electronics − 0.03%; 29.2.2020 0.04%
7,923 Allegion 612 0.03
Healthcare Products − 0.47%; 29.2.2020 0.53%
109,801 Medtronic 8,811 0.47
Miscellaneous Manufacturing − 0.09%; 29.2.2020 0.00%
19,138 Trane Technologies 1,692 0.09
Pharmaceuticals − 0.06%; 29.2.2020 0.05%
5,037 Jazz Pharmaceuticals 506 0.03
12,282 Perrigo 480 0.03
986 0.06
Holding orNominalValue Investment
MarketValue
£000’s
% ofTotal
NetAssets
ISRAEL − 0.04%; 29.2.2020 0.05%
Computers − 0.04%; 29.2.2020 0.05%
8,311 Check Point SoftwareTechnologies
784 0.04
NETHERLANDS − 0.11%; 29.2.2020 0.13%
Semiconductors − 0.11%; 29.2.2020 0.13%
22,687 NXP Semiconductors 2,129 0.11
PERU − 0.05%; 29.2.2020 0.06%
Banks − 0.03%; 29.2.2020 0.05%
6,588 Credicorp 642 0.03
Mining − 0.02%; 29.2.2020 0.01%
8,570 Southern Copper 308 0.02
RUSSIA − 0.06%; 29.2.2020 0.04%
Internet − 0.06%; 29.2.2020 0.04%
22,257 Yandex 1,133 0.06
SWEDEN − 0.14%; 29.2.2020 0.08%
Automobile Parts & Equipment − 0.02%; 29.2.2020 0.02%
6,079 AutolivØ 356 0.02
Internet − 0.12%; 29.2.2020 0.06%
10,411 Spotify TechnologyØ 2,194 0.12
SWITZERLAND − 0.34%; 29.2.2020 0.42%
Electronics − 0.15%; 29.2.2020 0.16%
12,049 Garmin 932 0.05
27,079 TE Connectivity 1,952 0.10
2,884 0.15
Insurance − 0.19%; 29.2.2020 0.26%
37,532 Chubb 3,502 0.19
UNITED KINGDOM − 0.71%; 29.2.2020 0.89%
Apparel − 0.01%; 29.2.2020 0.01%
8,336 Capri 99 0.01
Beverages − 0.03%; 29.2.2020 0.03%
17,773 Coca-Cola European Partners 546 0.03
Chemicals − 0.43%; 29.2.2020 0.40%
42,995 Linde 8,019 0.43
Commercial Services − 0.10%; 29.2.2020 0.11%
31,440 IHS Markit 1,875 0.10
Environmental Control − 0.02%; 29.2.2020 0.02%
11,281 Pentair 380 0.02
iShares US Equity Index Fund (UK)
Portfolio Statement (unaudited)
at 31 August 2020
BlackRock Collective Investment Funds 390
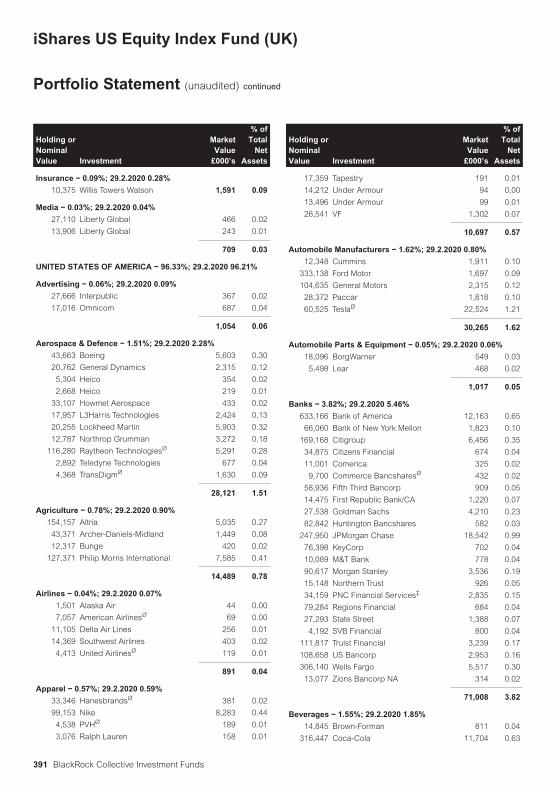
Holding orNominalValue Investment
MarketValue
£000’s
% ofTotal
NetAssets
Insurance − 0.09%; 29.2.2020 0.28%
10,375 Willis Towers Watson 1,591 0.09
Media − 0.03%; 29.2.2020 0.04%
27,110 Liberty Global 466 0.02
13,906 Liberty Global 243 0.01
709 0.03
UNITED STATES OF AMERICA − 96.33%; 29.2.2020 96.21%
Advertising − 0.06%; 29.2.2020 0.09%
27,666 Interpublic 367 0.02
17,016 Omnicom 687 0.04
1,054 0.06
Aerospace & Defence − 1.51%; 29.2.2020 2.28%
43,663 Boeing 5,603 0.30
20,762 General Dynamics 2,315 0.12
5,304 Heico 354 0.02
2,668 Heico 219 0.01
33,107 Howmet Aerospace 433 0.02
17,957 L3Harris Technologies 2,424 0.13
20,255 Lockheed Martin 5,903 0.32
12,787 Northrop Grumman 3,272 0.18
116,280 Raytheon TechnologiesØ 5,291 0.28
2,892 Teledyne Technologies 677 0.04
4,368 TransDigmØ 1,630 0.09
28,121 1.51
Agriculture − 0.78%; 29.2.2020 0.90%
154,157 Altria 5,035 0.27
43,371 Archer-Daniels-Midland 1,449 0.08
12,317 Bunge 420 0.02
127,371 Philip Morris International 7,585 0.41
14,489 0.78
Airlines − 0.04%; 29.2.2020 0.07%
1,501 Alaska Air 44 0.00
7,057 American AirlinesØ 69 0.00
11,105 Delta Air Lines 256 0.01
14,369 Southwest Airlines 403 0.02
4,413 United AirlinesØ 119 0.01
891 0.04
Apparel − 0.57%; 29.2.2020 0.59%
33,346 HanesbrandsØ 381 0.02
99,153 Nike 8,283 0.44
4,538 PVHØ 189 0.01
3,076 Ralph Lauren 158 0.01
Holding orNominalValue Investment
MarketValue
£000’s
% ofTotal
NetAssets
17,359 Tapestry 191 0.01
14,212 Under Armour 94 0.00
13,496 Under Armour 99 0.01
26,541 VF 1,302 0.07
10,697 0.57
Automobile Manufacturers − 1.62%; 29.2.2020 0.80%
12,348 Cummins 1,911 0.10
333,138 Ford Motor 1,697 0.09
104,635 General Motors 2,315 0.12
28,372 Paccar 1,818 0.10
60,525 TeslaØ 22,524 1.21
30,265 1.62
Automobile Parts & Equipment − 0.05%; 29.2.2020 0.06%
18,096 BorgWarner 549 0.03
5,498 Lear 468 0.02
1,017 0.05
Banks − 3.82%; 29.2.2020 5.46%
633,166 Bank of America 12,163 0.65
66,060 Bank of New York Mellon 1,823 0.10
169,168 Citigroup 6,456 0.35
34,875 Citizens Financial 674 0.04
11,001 Comerica 325 0.02
9,700 Commerce BancsharesØ 432 0.02
58,936 Fifth Third Bancorp 909 0.05
14,475 First Republic Bank/CA 1,220 0.07
27,538 Goldman Sachs 4,210 0.23
82,842 Huntington Bancshares 582 0.03
247,950 JPMorgan Chase 18,542 0.99
76,398 KeyCorp 702 0.04
10,089 M&T Bank 778 0.04
90,617 Morgan Stanley 3,536 0.19
15,148 Northern Trust 926 0.05
34,159 PNC Financial Services‡ 2,835 0.15
79,284 Regions Financial 684 0.04
27,293 State Street 1,388 0.07
4,192 SVB Financial 800 0.04
111,817 Truist Financial 3,239 0.17
108,658 US Bancorp 2,953 0.16
306,140 Wells Fargo 5,517 0.30
13,077 Zions Bancorp NA 314 0.02
71,008 3.82
Beverages − 1.55%; 29.2.2020 1.85%
14,845 Brown-Forman 811 0.04
316,447 Coca-Cola 11,704 0.63
iShares US Equity Index Fund (UK)
Portfolio Statement (unaudited) continued
BlackRock Collective Investment Funds391

Holding orNominalValue Investment
MarketValue
£000’s
% ofTotal
NetAssets
12,564 Constellation Brands 1,730 0.09
28,070 Keurig Dr Pepper 625 0.03
13,909 Molson Coors Beverage 391 0.02
30,036 Monster BeverageØ 1,880 0.10
113,618 PepsiCo 11,880 0.64
29,021 1.55
Biotechnology − 1.93%; 29.2.2020 1.91%
17,725 Alexion Pharmaceuticals 1,511 0.08
9,642 Alnylam Pharmaceuticals 955 0.05
48,184 Amgen 9,108 0.49
13,384 Biogen 2,875 0.15
15,216 BioMarin Pharmaceutical 885 0.05
62,781 Corteva 1,338 0.07
11,661 Exact SciencesØ 655 0.03
102,027 Gilead Sciences 5,085 0.27
11,921 Illumina 3,177 0.17
14,614 Incyte 1,052 0.06
8,039 Regeneron Pharmaceuticals 3,716 0.20
10,514 Seattle Genetics 1,242 0.07
21,243 Vertex Pharmaceuticals 4,423 0.24
36,022 1.93
Building Materials − 0.39%; 29.2.2020 0.35%
73,721 Carrier GlobalØ 1,643 0.09
12,399 Fortune Brands Home &Security
778 0.04
58,543 Johnson Controls International 1,780 0.10
5,152 Martin Marietta Materials 780 0.04
19,882 Masco 866 0.05
19,189 MDU Resources 338 0.02
10,157 Vulcan MaterialsØ 910 0.05
7,095 0.39
Chemicals − 1.17%; 29.2.2020 1.21%
18,366 Air Products and Chemicals 4,008 0.21
9,323 AlbemarleØ 633 0.03
9,677 Celanese 730 0.04
18,962 CF Industries 462 0.02
64,303 Dow 2,166 0.12
59,302 DuPont de Nemours 2,469 0.13
11,547 Eastman Chemical 630 0.03
20,152 Ecolab 2,964 0.16
10,689 FMC 853 0.05
8,529 International Flavors &FragrancesØ
788 0.04
20,025 LyondellBasell Industries 979 0.05
24,888 Mosaic 339 0.02
Holding orNominalValue Investment
MarketValue
£000’s
% ofTotal
NetAssets
19,551 PPG Industries 1,758 0.09
6,713 Sherwin-Williams 3,363 0.18
1,953 Westlake Chemical 86 0.00
22,228 1.17
Commercial Services − 2.48%; 29.2.2020 2.23%
34,573 Automatic Data Processing 3,588 0.19
7,005 Cintas 1,744 0.09
3,268 CoStar 2,068 0.11
10,282 EquifaxØ 1,292 0.07
6,895 FleetCor Technologies 1,294 0.07
6,929 Gartner 671 0.04
23,930 Global Payments 3,157 0.17
4,130 ManpowerGroup 226 0.01
3,124 MarketAxess 1,133 0.06
12,917 Moody’s 2,842 0.15
32,714 Nielsen 373 0.02
96,133 PayPal 14,642 0.78
9,970 Robert Half International 396 0.02
12,673 Rollins 522 0.03
19,708 S&P Global 5,392 0.29
30,018 Square 3,576 0.19
15,830 TransUnion 1,025 0.05
5,411 United Rentals 715 0.04
13,126 Verisk Analytics 1,829 0.10
46,485 2.48
Computers − 7.79%; 29.2.2020 5.90%
11,880 Amdocs 543 0.03
1,339,212 Apple 128,815 6.89
43,621 Cognizant Technology Solutions 2,177 0.12
10,947 Dell Technologies 540 0.03
17,673 DXC Technology 264 0.01
10,551 Fortinet 1,040 0.06
105,697 Hewlett Packard Enterprise 763 0.04
113,088 HP 1,651 0.09
72,414 International Business Machines 6,663 0.36
11,567 Leidos 781 0.04
19,822 NetApp 701 0.04
20,775 Seagate Technology 744 0.04
24,726 Western DigitalØ 709 0.04
145,391 7.79
Cosmetics & Personal Care − 1.48%; 29.2.2020 1.49%
68,400 Colgate-Palmolive 4,047 0.22
29,860 Coty 80 0.00
18,286 Estee Lauder Cos 3,028 0.16
iShares US Equity Index Fund (UK)
Portfolio Statement (unaudited) continued
BlackRock Collective Investment Funds 392

Holding orNominalValue Investment
MarketValue
£000’s
% ofTotal
NetAssets
199,486 Procter & Gamble 20,599 1.10
27,754 1.48
Distribution & Wholesale − 0.24%; 29.2.2020 0.23%
17,094 Copart 1,319 0.07
45,712 FastenalØ 1,667 0.09
22,879 LKQØ 542 0.03
3,460 WW Grainger 944 0.05
4,472 0.24
Diversified Financial Services − 3.87%; 29.2.2020 4.30%
3,498 Alliance Data Systems 118 0.01
32,038 Ally Financial 547 0.03
54,144 American Express 4,105 0.22
10,618 Ameriprise Financial 1,243 0.07
12,108 BlackRock‡ 5,372 0.29
36,874 Capital One Financial 1,901 0.10
9,604 Cboe Global Markets 656 0.04
95,186 Charles Schwab 2,524 0.13
29,243 CME 3,838 0.21
24,306 Discover Financial Services 964 0.05
20,797 Franklin Resources 327 0.02
43,795 Intercontinental Exchange 3,472 0.19
24,089 Invesco 183 0.01
16,967 Jefferies Financial 222 0.01
72,217 Mastercard 19,309 1.03
8,991 Nasdaq 902 0.05
10,601 Raymond James Financial 599 0.03
7,383 Santander Consumer USA 95 0.01
10,531 SEI Investments 412 0.02
45,595 Synchrony Financial 844 0.05
18,736 T Rowe Price 1,945 0.10
138,213 Visa 21,883 1.17
36,116 Western Union 636 0.03
72,097 3.87
Electrical Components &Equipment − 0.22%; 29.2.2020 0.24%
2,485 Acuity BrandsØ 203 0.01
17,798 AMETEK 1,338 0.07
48,860 Emerson Electric 2,534 0.14
4,075 0.22
Electricity − 2.57%; 29.2.2020 3.19%
53,741 AES 712 0.04
19,834 Alliant Energy 802 0.04
19,899 Ameren 1,175 0.06
39,518 American Electric Power 2,326 0.12
Holding orNominalValue Investment
MarketValue
£000’s
% ofTotal
NetAssets
2,752 Avangrid 99 0.01
43,254 CenterPoint EnergyØ 648 0.03
24,355 CMS Energy 1,100 0.06
26,863 Consolidated Edison 1,431 0.08
68,178 Dominion Energy 3,992 0.21
15,004 DTE EnergyØ 1,330 0.07
59,746 Duke Energy 3,583 0.19
28,126 Edison International 1,102 0.06
16,235 Entergy 1,202 0.06
18,910 Evergy 751 0.04
28,513 Eversource Energy 1,824 0.10
77,237 Exelon 2,128 0.11
44,977 FirstEnergy 959 0.05
40,059 NextEra Energy 8,348 0.45
18,758 NRG Energy 482 0.03
78,350 PG&E 542 0.03
10,054 Pinnacle West Capital 551 0.03
64,544 PPL 1,331 0.07
40,098 Public Service Enterprise 1,563 0.08
24,411 Sempra Energy 2,253 0.12
86,355 SouthernØ 3,365 0.18
41,454 Vistra 595 0.03
25,554 WEC Energy 1,795 0.10
42,282 Xcel Energy 2,194 0.12
48,183 2.57
Electronics − 1.11%; 29.2.2020 1.20%
24,615 Agilent Technologies 1,845 0.10
23,854 Amphenol 1,955 0.10
5,150 Arrow Electronics 302 0.02
46,755 Flex 378 0.02
25,603 Fortive 1,379 0.07
22,858 GentexØ 462 0.02
57,475 Honeywell International 7,099 0.38
14,439 Jabil 368 0.02
15,780 Keysight Technologies 1,161 0.06
1,859 Mettler-Toledo International 1,348 0.07
8,635 Roper Technologies 2,754 0.15
13,682 Sensata Technologies 425 0.02
21,492 TrimbleØ 841 0.04
5,136 Waters 829 0.04
21,146 1.11
Engineering & Construction − 0.04%; 29.2.2020 0.05%
10,513 Jacobs EngineeringØ 709 0.04
Entertainment − 0.05%; 29.2.2020 0.07%
10,932 Live Nation EntertainmentØ 464 0.02
iShares US Equity Index Fund (UK)
Portfolio Statement (unaudited) continued
BlackRock Collective Investment Funds393

Holding orNominalValue Investment
MarketValue
£000’s
% ofTotal
NetAssets
3,553 Vail ResortsØ 578 0.03
1,042 0.05
Environmental Control − 0.22%; 29.2.2020 0.27%
17,503 Republic Services 1,212 0.06
34,223 Waste Management 2,911 0.16
4,123 0.22
Food Producers − 1.16%; 29.2.2020 1.19%
14,667 Campbell Soup 576 0.03
41,109 Conagra BrandsØ 1,177 0.06
50,378 General Mills 2,406 0.13
12,127 Hershey 1,346 0.07
23,415 Hormel Foods 891 0.05
6,137 Ingredion 369 0.02
9,052 J M Smucker 812 0.04
20,331 KelloggØ 1,076 0.06
53,316 Kraft Heinz 1,395 0.07
60,570 Kroger 1,614 0.09
12,648 Lamb WestonØ 594 0.03
10,467 McCormick 1,612 0.09
113,642 Mondelez International 4,957 0.27
38,702 SyscoØ 1,738 0.09
24,203 Tyson Foods 1,135 0.06
21,698 1.16
Food Services − 0.02%; 29.2.2020 0.03%
17,334 Aramark 357 0.02
Forest Products & Paper − 0.05%; 29.2.2020 0.06%
32,895 International Paper 891 0.05
Gas − 0.07%; 29.2.2020 0.09%
9,998 Atmos Energy 745 0.04
30,160 NiSource 499 0.03
1,244 0.07
Hand & Machine Tools − 0.11%; 29.2.2020 0.11%
4,829 Snap-on 535 0.03
12,963 Stanley Black & Decker 1,560 0.08
2,095 0.11
Healthcare Products − 3.31%; 29.2.2020 3.07%
141,491 Abbott Laboratories 11,565 0.62
3,749 AbiomedØ 861 0.05
6,144 Align Technology 1,361 0.07
42,319 Baxter International 2,752 0.15
115,783 Boston Scientific 3,546 0.19
4,102 Cooper Cos 963 0.05
Holding orNominalValue Investment
MarketValue
£000’s
% ofTotal
NetAssets
51,062 Danaher 7,869 0.42
17,868 Dentsply Sirona 599 0.03
51,303 Edwards Lifesciences 3,289 0.18
12,475 Henry Schein 618 0.03
20,997 Hologic 936 0.05
6,635 IDEXX Laboratories 1,937 0.10
9,358 Intuitive Surgical 5,106 0.27
11,162 ResMed 1,506 0.08
7,063 Steris 842 0.05
28,350 Stryker 4,192 0.22
3,886 Teleflex 1,140 0.06
32,329 Thermo Fisher Scientific 10,355 0.55
7,606 Varian Medical Systems 986 0.05
16,764 Zimmer Biomet 1,764 0.09
62,187 3.31
Healthcare Services − 1.88%; 29.2.2020 1.90%
20,980 Anthem 4,410 0.24
48,065 Centene 2,200 0.12
6,129 DaVita 397 0.02
21,520 HCA Healthcare 2,180 0.12
10,571 Humana 3,276 0.18
15,870 IQVIA 1,940 0.10
7,443 Laboratory of America 978 0.05
10,790 Quest Diagnostics 896 0.05
77,276 UnitedHealth 18,038 0.97
5,855 Universal Health Services 482 0.03
34,797 1.88
Home Builders − 0.25%; 29.2.2020 0.25%
28,114 DR Horton 1,498 0.08
21,999 Lennar 1,229 0.07
267 NVR 829 0.04
22,608 PulteGroup 752 0.04
9,657 Toll BrothersØ 304 0.02
4,612 0.25
Home Furnishings − 0.06%; 29.2.2020 0.05%
11,861 Leggett & PlattØ 363 0.02
5,172 WhirlpoolØ 686 0.04
1,049 0.06
Household Products − 0.37%; 29.2.2020 0.36%
6,897 Avery Dennison 594 0.03
19,176 Church & Dwight 1,372 0.07
10,204 Clorox 1,703 0.09
28,108 Kimberly-Clark 3,310 0.18
6,979 0.37
iShares US Equity Index Fund (UK)
Portfolio Statement (unaudited) continued
BlackRock Collective Investment Funds 394

Holding orNominalValue Investment
MarketValue
£000’s
% ofTotal
NetAssets
Housewares − 0.02%; 29.2.2020 0.02%
31,103 Newell BrandsØ 371 0.02
Insurance − 2.99%; 29.2.2020 3.45%
58,351 AflacØ 1,581 0.08
1,111 Alleghany 462 0.02
25,818 Allstate 1,793 0.10
68,287 American InternationalØ 1,486 0.08
18,392 Aon 2,747 0.15
16,232 Arthur J Gallagher 1,276 0.07
5,378 Assurant 488 0.03
109,825 Berkshire Hathaway 17,881 0.96
33 Berkshire Hathaway 8,064 0.43
21,136 Brown & Brown 732 0.04
12,752 Cincinnati FinancialØ 756 0.04
1,098 CNA Financial 26 0.00
35,656 Equitable 564 0.03
22,179 Fidelity National Financial 544 0.03
8,983 Globe Life 553 0.03
27,026 Hartford Financial Services 816 0.04
14,975 Lincoln National 403 0.02
18,772 Loews 503 0.03
1,147 Markel 930 0.05
41,994 Marsh & McLennan Cos 3,604 0.19
62,055 MetLife 1,781 0.10
19,573 Old Republic International 235 0.01
23,032 Principal Financial 724 0.04
47,538 Progressive 3,371 0.18
31,291 Prudential Financial 1,584 0.08
21,207 Travelers Cos 1,836 0.10
14,957 Unum 206 0.01
10,580 Voya FinancialØ 410 0.02
12,885 W R Berkley 597 0.03
55,953 2.99
Internet − 12.32%; 29.2.2020 9.75%
24,573 Alphabet 29,859 1.60
24,256 Alphabet 29,565 1.58
34,710 Amazon.com 89,205 4.77
3,344 Booking 4,769 0.26
12,345 CDW 1,047 0.06
16,801 E*TRADE Financial 679 0.04
54,909 eBayØ 2,244 0.12
11,886 Expedia 871 0.05
5,094 F5 Networks 503 0.03
196,566 Facebook 43,027 2.30
12,435 GoDaddy 777 0.04
6,264 IAC 621 0.03
19,705 LyftØ 436 0.02
Holding orNominalValue Investment
MarketValue
£000’s
% ofTotal
NetAssets
17,985 Match 1,500 0.08
34,812 Netflix 13,755 0.74
43,366 NortonLifeLock 761 0.04
9,758 Okta 1,567 0.08
8,049 Palo Alto Networks 1,547 0.08
18,663 TD Ameritrade 535 0.03
62,646 Twitter 1,898 0.10
112,250 Uber Technologies 2,819 0.15
8,098 VeriSign 1,299 0.07
10,688 Zillow 684 0.04
3,577 Zillow 228 0.01
230,196 12.32
Iron & Steel − 0.06%; 29.2.2020 0.07%
23,452 Nucor 796 0.04
13,760 Steel Dynamics 303 0.02
1,099 0.06
Leisure Time − 0.10%; 29.2.2020 0.15%
33,139 Carnival 408 0.02
9,473 Harley-DavidsonØ 196 0.01
14,332 Norwegian Cruise Line 183 0.01
4,996 Polaris 377 0.02
13,058 Royal Caribbean CruisesØ 672 0.04
1,836 0.10
Lodging − 0.30%; 29.2.2020 0.43%
22,877 Hilton Worldwide 1,544 0.08
27,851 Las Vegas Sands 1,055 0.06
21,668 Marriott International 1,664 0.09
35,972 MGM Resorts International 604 0.03
6,529 Wyndham Hotels & Resorts 255 0.01
8,469 Wynn ResortsØ 553 0.03
5,675 0.30
Machinery Construction & Mining − 0.25%; 29.2.2020 0.26%
44,235 Caterpillar 4,700 0.25
Machinery Diversified − 0.60%; 29.2.2020 0.49%
25,904 Deere 4,062 0.22
10,850 Dover 889 0.05
9,387 FlowserveØ 208 0.01
6,425 IDEX 864 0.05
36,562 Otis WorldwideØ 1,716 0.09
9,739 Rockwell Automation 1,676 0.09
15,828 Westinghouse Air BrakeTechnologies
786 0.04
iShares US Equity Index Fund (UK)
Portfolio Statement (unaudited) continued
BlackRock Collective Investment Funds395

Holding orNominalValue Investment
MarketValue
£000’s
% ofTotal
NetAssets
14,223 Xylem Inc/NY 852 0.05
11,053 0.60
Media − 2.05%; 29.2.2020 2.20%
29,128 Altice USA 600 0.03
12,137 Charter CommunicationsØ 5,573 0.30
370,937 Comcast 12,414 0.66
30,074 Discovery 448 0.02
12,834 DiscoveryØ 211 0.01
21,447 DISH Network 569 0.03
28,695 FoxØ 597 0.03
9,900 Fox 205 0.01
9,199 Liberty Broadband 963 0.05
2,335 Liberty Broadband 241 0.01
15,611 Liberty Media Corp-LibertySiriusXM
420 0.02
8,471 Liberty Media Corp-LibertySiriusXM
230 0.01
35,902 News 405 0.02
6,056 News 68 0.00
105,926 Sirius XM 464 0.02
42,063 ViacomCBSØ 875 0.05
147,943 Walt Disney 14,558 0.78
38,841 2.05
Mining − 0.26%; 29.2.2020 0.20%
8,006 Arconic 133 0.01
120,831 Freeport-McMoRan 1,409 0.08
65,034 NewmontØ 3,266 0.17
4,808 0.26
Miscellaneous Manufacturing − 0.94%; 29.2.2020 1.30%
45,997 3M 5,595 0.30
33,484 Eaton 2,551 0.14
716,290 General Electric 3,386 0.18
25,613 Illinois Tool Works 3,777 0.20
10,335 Parker-Hannifin 1,590 0.09
16,037 TextronØ 472 0.03
17,371 0.94
Office & Business Equipment − 0.06%; 29.2.2020 0.02%
12,042 Xerox 170 0.01
4,321 Zebra Technologies 924 0.05
1,094 0.06
Oil & Gas Producers − 1.79%; 29.2.2020 2.76%
30,611 Apache 338 0.02
30,299 Cabot Oil & Gas 429 0.02
Holding orNominalValue Investment
MarketValue
£000’s
% ofTotal
NetAssets
153,033 Chevron 9,586 0.51
7,407 Cimarex Energy 154 0.01
16,250 Concho Resources 631 0.03
89,953 ConocoPhillips 2,545 0.14
4,414 Continental Resources 57 0.00
31,368 Devon Energy 255 0.01
13,321 Diamondback Energy 387 0.02
46,687 EOG Resources 1,580 0.08
346,449 Exxon Mobil 10,332 0.55
22,586 Hess 777 0.04
13,201 HollyFrontier 235 0.01
64,114 Marathon Oil 252 0.01
55,009 Marathon Petroleum 1,457 0.08
35,465 Noble Energy 264 0.01
70,544 Occidental PetroleumØ 671 0.04
21,385 Ovintiv 177 0.01
36,311 Phillips 66 1,586 0.08
12,663 Pioneer Natural Resources 982 0.05
31,187 Valero Energy 1,224 0.07
33,919 1.79
Oil & Gas Services − 0.18%; 29.2.2020 0.28%
55,504 Baker Hughes 591 0.03
70,334 HalliburtonØ 849 0.05
31,434 National Oilwell Varco 281 0.01
117,914 Schlumberger 1,673 0.09
3,394 0.18
Packaging & Containers − 0.16%; 29.2.2020 0.16%
27,100 Ball 1,626 0.09
8,327 Packaging of AmericaØ 629 0.03
14,765 Sealed Air 433 0.02
20,397 Westrock 462 0.02
3,150 0.16
Pharmaceuticals − 5.46%; 29.2.2020 6.00%
144,207 AbbVie 10,308 0.55
11,987 AmerisourceBergen 869 0.05
21,912 Becton Dickinson and 3,973 0.21
185,326 Bristol-Myers Squibb 8,606 0.46
25,060 Cardinal Health 949 0.05
29,056 Cigna 3,852 0.21
107,001 CVS Health 4,963 0.27
7,639 DexCom 2,423 0.13
33,230 Elanco Animal Health 721 0.04
68,649 Eli Lilly and 7,605 0.41
6,698 Herbalife Nutrition 246 0.01
215,857 Johnson & Johnson 24,714 1.32
iShares US Equity Index Fund (UK)
Portfolio Statement (unaudited) continued
BlackRock Collective Investment Funds 396

Holding orNominalValue Investment
MarketValue
£000’s
% ofTotal
NetAssets
13,036 McKesson 1,494 0.08
206,799 Merck 13,162 0.70
45,570 Mylan 557 0.03
455,213 Pfizer 12,838 0.69
38,320 Zoetis 4,580 0.25
101,860 5.46
Pipelines − 0.26%; 29.2.2020 0.42%
19,827 Cheniere Energy 771 0.04
164,393 Kinder Morgan 1,696 0.09
32,167 Oneok 660 0.04
15,248 Targa Resources 194 0.01
100,532 Williams Cos 1,558 0.08
4,879 0.26
Real Estate Investment & Services − 0.05%; 29.2.2020 0.07%
26,033 CBRE 914 0.05
Real Estate Investment Trusts − 2.69%; 29.2.2020 3.12%
45,303 AGNC Investment 477 0.03
10,208 Alexandria Real Estate Equities 1,283 0.07
36,099 American Tower 6,714 0.36
115,436 Annaly Capital Management 633 0.03
11,125 AvalonBay Communities 1,313 0.07
12,314 Boston Properties 799 0.04
34,174 Crown Castle International 4,165 0.22
21,932 Digital Realty Trust 2,548 0.14
30,314 Duke Realty 872 0.05
7,193 Equinix 4,239 0.23
14,004 Equity LifeStyle Properties 693 0.04
30,160 Equity Residential 1,270 0.07
5,480 Essex Property Trust 886 0.05
10,623 Extra Space StorageØ 845 0.05
5,279 Federal Realty Investment Trust 312 0.02
44,176 Healthpeak Properties 911 0.05
60,924 Host Hotels & Resorts 511 0.03
47,800 Invitation Homes 1,022 0.05
23,090 Iron MountainØ 519 0.03
32,240 Kimco Realty 288 0.02
9,435 Mid-America ApartmentCommunities
825 0.04
19,053 Park Hotels & Resorts 135 0.01
60,238 Prologis 4,581 0.25
12,185 Public Storage 1,932 0.10
29,190 Realty IncomeØ 1,351 0.07
15,860 Regency Centers 470 0.03
9,262 SBA Communications 2,116 0.11
25,002 Simon Property 1,266 0.07
6,852 SL Green RealtyØ 239 0.01
Holding orNominalValue Investment
MarketValue
£000’s
% ofTotal
NetAssets
7,283 Sun Communities 811 0.04
24,491 UDR 637 0.03
30,455 Ventas 936 0.05
91,491 VEREITØ 459 0.02
14,909 Vornado Realty Trust 399 0.02
35,649 Welltower 1,530 0.08
58,507 Weyerhaeuser 1,324 0.07
13,409 WP Carey 694 0.04
50,005 2.69
Retail − 5.21%; 29.2.2020 5.26%
4,905 Advance Auto Parts 572 0.03
1,991 AutoZone 1,777 0.10
18,247 Best Buy 1,511 0.08
5,049 Burlington StoresØ 743 0.04
13,203 CarMax 1,054 0.06
2,341 Chipotle Mexican Grill 2,291 0.12
36,104 Costco Wholesale 9,367 0.50
10,306 Darden Restaurants 667 0.04
20,119 Dollar General 3,033 0.16
19,871 Dollar Tree 1,427 0.08
3,045 Domino’s Pizza 930 0.05
14,104 Gap 183 0.01
11,337 Genuine Parts 799 0.04
87,934 Home Depot 18,695 1.00
13,363 Kohl’s 213 0.01
61,868 Lowe’s Cos 7,609 0.41
17,305 Macy’s 90 0.00
60,939 McDonald’s 9,714 0.52
6,712 Nordstrom 80 0.00
6,045 O’Reilly Automotive 2,099 0.11
29,431 Ross Stores 2,001 0.11
95,238 Starbucks 6,008 0.32
41,548 Target 4,691 0.25
9,804 Tiffany 896 0.05
96,791 TJX Cos 3,959 0.21
9,609 Tractor Supply 1,067 0.06
3,979 Ulta BeautyØ 689 0.04
60,549 Walgreens Boots Alliance 1,719 0.09
114,070 Walmart 11,829 0.63
24,124 Yum! Brands 1,726 0.09
97,439 5.21
Savings & Loans − 0.02%; 29.2.2020 0.03%
37,861 People’s United Financial 299 0.02
Semiconductors − 4.61%; 29.2.2020 4.17%
95,438 Advanced Micro Devices 6,471 0.35
29,184 Analog Devices 2,546 0.14
iShares US Equity Index Fund (UK)
Portfolio Statement (unaudited) continued
BlackRock Collective Investment Funds397

Holding orNominalValue Investment
MarketValue
£000’s
% ofTotal
NetAssets
73,661 Applied Materials 3,387 0.18
31,877 Broadcom 8,254 0.44
346,981 Intel 13,196 0.71
3,344 IPG Photonics 403 0.02
12,270 KLA 1,878 0.10
11,981 Lam Research 3,009 0.16
51,092 Marvell Technology 1,479 0.08
22,976 Maxim Integrated Products 1,173 0.06
19,763 Microchip TechnologyØ 1,618 0.09
92,392 Micron Technology 3,139 0.17
48,324 NVIDIA 19,304 1.03
8,969 Qorvo 859 0.05
92,126 QUALCOMM 8,193 0.44
13,456 Skyworks Solutions 1,455 0.08
75,139 Texas Instruments 7,970 0.43
19,017 Xilinx 1,478 0.08
85,812 4.61
Shipbuilding − 0.02%; 29.2.2020 0.03%
3,137 Huntington Ingalls Industries 355 0.02
Software − 10.74%; 29.2.2020 9.15%
62,466 Activision Blizzard 3,896 0.21
39,378 Adobe 15,087 0.81
13,560 Akamai Technologies 1,178 0.06
6,725 ANSYSØ 1,700 0.09
17,916 Autodesk 3,286 0.18
9,643 Broadridge Financial Solutions 989 0.05
22,551 Cadence Design Systems 1,867 0.10
10,850 CDK Global 378 0.02
23,772 Cerner 1,301 0.07
10,742 Citrix Systems 1,164 0.06
14,494 DocuSign 2,412 0.13
22,554 Electronic Arts 2,348 0.13
50,220 Fidelity National InformationServices
5,658 0.30
45,002 Fiserv 3,346 0.18
20,624 Intuit 5,317 0.28
613,002 Microsoft 103,010 5.51
6,848 MSCI 1,909 0.10
160,963 Oracle 6,873 0.37
26,363 Paychex 1,505 0.08
4,253 Paycom Software 951 0.05
9,542 PTC 651 0.03
6,045 RingCentral 1,313 0.07
70,894 salesforce.com 14,417 0.77
15,471 ServiceNow 5,569 0.30
30,817 Slack Technologies 755 0.04
12,976 SplunkØ 2,124 0.11
Holding orNominalValue Investment
MarketValue
£000’s
% ofTotal
NetAssets
18,783 SS&C Technologies 893 0.05
12,568 Synopsys 2,077 0.11
9,398 Take-Two Interactive Software 1,202 0.06
11,081 Twilio 2,234 0.12
10,746 Veeva Systems 2,266 0.12
6,596 VMwareØ 711 0.04
14,376 Workday 2,573 0.14
200,960 10.74
Telecommunications − 2.59%; 29.2.2020 2.97%
5,104 Arista NetworksØ 852 0.05
583,727 AT&T 12,992 0.70
88,235 CenturyLinkØ 708 0.04
347,603 Cisco Systems 10,955 0.59
62,544 Corning 1,516 0.08
29,133 Juniper NetworksØ 544 0.03
14,416 Motorola Solutions 1,666 0.09
45,720 T-Mobile US 3,983 0.21
339,187 Verizon Communications 15,004 0.80
48,220 2.59
Textiles − 0.02%; 29.2.2020 0.02%
5,182 Mohawk Industries 357 0.02
Toys, Games & Hobbies − 0.03%; 29.2.2020 0.04%
10,405 HasbroØ 613 0.03
Transportation − 1.62%; 29.2.2020 1.46%
10,512 CH Robinson Worldwide 771 0.04
63,394 CSX 3,619 0.19
14,581 Expeditors International ofWashingtonØ
962 0.05
19,628 FedExØ 3,222 0.17
6,954 JB Hunt Transport Services 730 0.04
7,284 Kansas City Southern 990 0.05
21,019 Norfolk Southern 3,336 0.18
7,957 Old Dominion Freight Line 1,200 0.06
55,571 Union Pacific 7,980 0.43
57,721 United Parcel Service 7,050 0.38
7,849 XPO LogisticsØ 517 0.03
30,377 1.62
Water − 0.09%; 29.2.2020 0.08%
15,247 American Water Works 1,609 0.09
iShares US Equity Index Fund (UK)
Portfolio Statement (unaudited) continued
BlackRock Collective Investment Funds 398

Holding orNominalValue Investment
MarketValue
£000’s
% ofTotal
NetAssets
COLLECTIVE INVESTMENTSCHEMES − 0.19%; 29.2.2020 0.19%
Short-term Money Market Funds − 0.19%; 29.2.2020 0.19%
4,703,398 BlackRock ICS US DollarLiquidity Fund - Agency IncomeClass†
3,513 0.19
Holding orNominalValue Investment
UnderlyingExposure − Derivatives
£000’s
MarketValue
£000’s
% ofTotal
NetAssets
DERIVATIVES − 0.01%; 29.2.2020 (0.06%)
Futures − 0.01%; 29.2.2020 (0.06%)
63 S&P 500 E-Mini September 2020 8,232 296 0.01
Portfolio of investments 1,864,899 99.78
Net other assets 4,060 0.22
Total net assets 1,868,959 100.00
Unless otherwise stated, all securities are either listed on a recognised exchange or traded on an eligible securities market.
Underlying exposure has been calculated according to the guidelines issued by the European Securities and Markets Authority (“ESMA”) and represents the market value of an equivalent positionin the assets underlying each financial derivative instrument.Ø All or a portion of this investment represents a security on loan.‡ Related party to the Fund.† Managed by a related party.
iShares US Equity Index Fund (UK)
Portfolio Statement (unaudited) continued
BlackRock Collective Investment Funds399

£000’s31.8.2020
£000’s £000’s31.8.2019
£000’s
Income
Net capital gains 240,399 159,493
Revenue 15,522 12,357
Expenses (576) (537)
Interest payable and similarcharges (2) –
Net revenue before taxation 14,944 11,820
Taxation (2,118) (1,708)
Net revenue after taxation 12,826 10,112
Total return before distributions 253,225 169,605
Distributions (12,826) (10,112)
Change in net assetsattributable to unitholdersfrom investment activities 240,399 159,493
Statement of Change in Net Assets Attributable to Unitholders(unaudited) for the six months ended 31 August 2020
£000’s31.8.2020
£000’s £000’s31.8.2019
£000’s
Opening net assets attributableto unitholders 1,540,370 1,039,116
Amounts receivable on issue of units 321,692 227,439
Amounts payable on cancellation of units (245,542) (79,705)
76,150 147,734
Change in net assets attributable tounitholders from investment activities 240,399 159,493
Retained distribution on accumulation units 12,040 10,175
Closing net assets attributableto unitholders 1,868,959 1,356,518
The above statement shows the comparative closing net assets at 31 August 2019 whereas the current accounting period commenced 1 March 2020.
iShares US Equity Index Fund (UK)
Statement of Total Return (unaudited)
for the six months ended 31 August 2020
BlackRock Collective Investment Funds 400

31.8.2020£000’s
29.2.2020£000’s
Assets:
Fixed assets
− Investment assets 1,864,899 1,535,918
Current assets
− Debtors 44,588 7,168
− Cash and bank balances 11,742 1,676
− Cash collateral posted 571 350
Total assets 1,921,800 1,545,112
Liabilities:
Investment liabilities – (883)
Creditors
− Amounts held at futures clearing houses and brokers (264) –
− Distributions payable (731) (763)
− Other creditors (51,846) (3,096)
Total liabilities (52,841) (4,742)
Net assets attributable to unitholders 1,868,959 1,540,370
G D Bamping (Director)M T Zemek (Director)BlackRock Fund Managers Limited29 October 2020
iShares US Equity Index Fund (UK)
Balance Sheet (unaudited)
at 31 August 2020
BlackRock Collective Investment Funds401

Efficient Portfolio Management Techniques
The Manager may, on behalf of certain Funds and subject to the conditions and within the limits laid down by theFCA and the Prospectus, employ techniques and instruments relating to transferable securities, includinginvestments in Over-the-Counter Financial Derivative Instruments (OTC FDIs) provided that such techniques andinstruments are used for efficient portfolio management purposes or to provide protection against exchange riskor for direct investment purposes, where applicable.
In addition to the investments in OTC FDIs, the Funds may employ other techniques and instruments relating totransferable securities and money market instruments, subject to the conditions set out in the Trust’s Prospectus,as amended from time to time, and the ESMA Guidelines, such as repurchase / reverse repurchase transactions(“repo transactions”) and securities lending.
Securities Lending and Total Return Swaps (TRS)
Securities lending transactions entered into by the Funds are subject to a written legal agreement between theFunds and the Securities Lending Agent, BlackRock Advisors (UK) Limited, a related party to the Funds, andseparately between the Securities Lending Agent and the approved borrowing counterparty. Collateral receivedin exchange for securities lent is transferred under a title transfer arrangement and is delivered to and held in anaccount with a tri-party collateral manager in the name of The Bank of New York Mellon (International) Limited(“the Trustee”) on behalf of the Funds. Collateral received is segregated from the assets belonging to the Funds’Trustee or the Lending Agent.
TRS are entered into by the Funds under an International Swaps and Derivatives Association, Inc. Masteragreement (“ISDA Master Agreement”) or similar agreement. An ISDA Master Agreement is a bilateral agreementbetween the Funds and a counterparty that governs OTC FDIs (including TRS) entered into by the parties. Theparties’ exposures under the ISDA Master Agreement are netted and collateralised together, therefore anycollateral disclosures provided are in respect of all OTC FDIs entered into by the Funds under the ISDA MasterAgreement, not just TRS. All collateral received/posted by the Funds under the ISDA Master Agreement istransferred bilaterally under a title transfer arrangement.
Supplementary Information
BlackRock Collective Investment Funds 402

The following table details the value of securities on loan as a proportion of the Funds’ total lendable assets andNet Asset Value (NAV) and the value of TRS as a proportion of the Funds’ NAV, as at 31 August 2020. Theincome/returns earned from securities lending and TRS respectively are also shown for the period ended31 August 2020. Total lendable assets represents the aggregate value of assets forming part of the Funds’securities lending programme. This excludes any assets held by the Funds that are not considered lendable dueto any market, regulatory, investment or other restriction. The value of TRS is based on the underlying exposurevalue on a gross absolute basis as disclosed in the Funds’ Portfolio Statements.
Securities on loan TRS
Fund
%of lendableassets
%of NAV
Incomeearned£000’s
%of NAV
Returnsearned£000’s
BlackRock Balanced Managed Fund 9.74 5.38 12 11.70 (161)
BlackRock Corporate Bond 1-10 Year Fund 4.17 3.93 48 – –
iShares 100 UK Equity Index Fund (UK) 5.47 5.05 53 – –
iShares 350 UK Equity Index Fund (UK) 7.93 7.53 71 – –
iShares Continental European Equity IndexFund (UK) 13.03 12.33 693 – –
iShares Corporate Bond Index Fund (UK) 5.49 4.96 219 – –
iShares Emerging Markets Equity Index Fund(UK) 14.10 6.33 272 – –
iShares Global Property Securities EquityIndex Fund (UK) 17.95 16.47 497 – –
iShares Japan Equity Index Fund (UK) 43.86 40.54 425 – –
iShares Mid Cap UK Equity Index Fund (UK) 16.11 15.21 135 – –
iShares North American Equity Index Fund(UK) 4.57 4.22 234 – –
iShares Over 15 Years Corporate Bond IndexFund (UK) 4.06 3.82 9 – –
iShares Over 15 Years Gilts Index Fund (UK) 12.91 12.22 10 – –
iShares Overseas Corporate Bond Index Fund(UK) 2.15 1.95 102 – –
iShares Overseas Government Bond IndexFund (UK) 6.91 6.40 38 – –
iShares Pacific Ex Japan Equity Index Fund(UK) 33.94 24.01 286 – –
iShares UK Equity Index Fund (UK) 8.84 8.19 1,029 – –
iShares UK Gilts All Stocks Index Fund (UK) 50.44 46.84 469 – –
iShares US Equity Index Fund (UK) 2.93 2.77 43 – –
Supplementary Information continued
BlackRock Collective Investment Funds403

The total income earned from securities lending transactions is split between the relevant Fund and the SecuritiesLending Agent. The Fund receives 62.5% while the Securities Lending Agent receives 37.5% of such income,with all operational costs borne out of the Securities Lending Agent’s share.
All returns and costs from OTC FDIs/TRS will accrue to the Funds and are not subject to any returns or costssharing arrangements with the Fund’s Manager or any other third parties.
The following table details the value of securities on loan (individually identified in the Fund’s portfolio statement)and associated collateral received and the underlying exposure value on a gross absolute basis for TRS,analysed by counterparty as at 31 August 2020.
Securities Lending TRS
Counterparty
Counterparty’scountry of
establishmentAmounton loan
Collateralreceived
Underlyingexposure
BlackRock Balanced Managed Fund £000’s £000’s £000’s
Barclays Capital Securities Limited UK 518 559 12,630
BNP Paribas Arbitrage SNC France 627 651 19,466
Citigroup Global Markets Limited UK 7,787 8,099 20,657
Credit Suisse Securities (Europe) Limited UK 540 571 –
Deutsche Bank AG Germany 177 196 –
J.P. Morgan Securities Plc UK 145 162 –
J.P. Morgan Securities Plc (Euroclear) UK 17,425 18,130 –
Merrill Lynch International UK – – 5,609
Morgan Stanley & Co. International Plc UK 2,273 2,358 –
Société Générale SA France – – 6,895
The Bank of Nova Scotia Canada 145 159 –
UBS AG Switzerland 362 396 –
Total 29,999 31,281 65,257
Supplementary Information continued
BlackRock Collective Investment Funds 404

Securities Lending
Counterparty
Counterparty’scountry of
establishmentAmounton loan
Collateralreceived
BlackRock Corporate Bond 1-10 Year Fund £000’s £000’s
Barclays Bank Plc UK 2,892 3,014
BNP Paribas Arbitrage SNC France 9,380 9,774
Citigroup Global Markets Limited UK 6,681 6,906
Deutsche Bank AG (Euroclear) Germany 1,348 1,404
Goldman Sachs International UK 9,178 9,861
HSBC Bank Plc UK 939 1,024
J.P. Morgan Securities Plc UK 3,523 3,883
J.P. Morgan Securities Plc (Euroclear) UK 8,868 9,227
Morgan Stanley & Co. International Plc UK 2,394 2,514
RBC Europe Limited (Euroclear) UK 2,732 2,849
Société Générale SA France 305 322
Total 48,240 50,778
Securities Lending
Counterparty
Counterparty’scountry of
establishmentAmounton loan
Collateralreceived
iShares 100 UK Equity Index Fund (UK) £000’s £000’s
Banco Santander, S.A. Spain 29,419 32,365
Barclays Capital Securities Limited UK 11,484 12,398
BNP Paribas Arbitrage SNC France 2,430 2,681
Citigroup Global Markets Limited UK 1,931 2,181
Credit Suisse AG Dublin Branch Ireland 792 855
Deutsche Bank AG Germany 319 353
J.P. Morgan Securities Plc UK 7,068 7,873
The Bank of Nova Scotia Canada 9,915 10,960
UBS AG Switzerland 652 714
Total 64,010 70,380
Supplementary Information continued
BlackRock Collective Investment Funds405

Securities Lending
Counterparty
Counterparty’scountry of
establishmentAmounton loan
Collateralreceived
iShares 350 UK Equity Index Fund (UK) £000’s £000’s
Banco Santander, S.A. Spain 25,524 28,081
Barclays Capital Securities Limited UK 5,516 5,955
BNP Paribas Arbitrage SNC France 1,000 1,102
Citigroup Global Markets Limited UK 4,456 5,032
Credit Suisse AG Dublin Branch Ireland 419 453
Credit Suisse Securities (Europe) Limited UK 275 291
Goldman Sachs International UK 3,683 4,288
HSBC Bank Plc UK 126 138
J.P. Morgan Securities Plc UK 1,445 1,609
Macquarie Bank Limited Australia 21 24
Morgan Stanley & Co. International Plc UK 1,341 1,488
Natixis S.A. France 4,555 5,014
Société Générale France 118 143
The Bank of Nova Scotia Canada 4,165 4,604
UBS AG Switzerland 14,585 15,964
Total 67,229 74,186
Supplementary Information continued
BlackRock Collective Investment Funds 406

Securities Lending
Counterparty
Counterparty’scountry of
establishmentAmounton loan
Collateralreceived
iShares Continental European Equity Index Fund (UK) £000’s £000’s
Barclays Capital Securities Limited UK 39,464 42,606
BNP Paribas Arbitrage SNC France 5,436 5,995
Citigroup Global Markets Limited UK 22,400 25,294
Credit Suisse AG Dublin Branch Ireland 37,082 40,069
Credit Suisse International UK 11,230 12,759
Credit Suisse Securities (Europe) Limited UK 75,503 79,852
Deutsche Bank AG Germany 60,538 67,052
Goldman Sachs International UK 4,955 5,770
HSBC Bank Plc UK 29,895 32,792
J.P. Morgan Securities Plc UK 27,554 30,692
Macquarie Bank Limited Australia 4,222 4,704
Merrill Lynch International UK 21,839 23,001
Morgan Stanley & Co. International Plc UK 32,277 35,818
Natixis S.A. France 5,187 5,709
Société Générale SA France 72,549 87,836
UBS AG Switzerland 1,965 2,151
Total 452,096 502,100
Securities Lending
Counterparty
Counterparty’scountry of
establishmentAmounton loan
Collateralreceived
iShares Corporate Bond Index Fund (UK) £000’s £000’s
Barclays Bank Plc UK 21,944 22,867
BNP Paribas Arbitrage SNC France 24,709 25,748
Citigroup Global Markets Limited UK 70,383 72,758
Credit Suisse Securities (Europe) Limited UK 6,428 6,887
Deutsche Bank AG (Euroclear) Germany 33,756 35,152
Goldman Sachs International UK 11,086 11,909
HSBC Bank Plc UK 47,115 51,361
J.P. Morgan Securities Plc UK 6,637 7,315
J.P. Morgan Securities Plc (Euroclear) UK 24,722 25,721
Morgan Stanley & Co. International Plc UK 11,906 12,506
RBC Europe Limited (Euroclear) UK 22,903 23,891
The Bank of Nova Scotia Canada 3,078 3,420
Total 284,667 299,535
Supplementary Information continued
BlackRock Collective Investment Funds407

Securities Lending
Counterparty
Counterparty’scountry of
establishmentAmounton loan
Collateralreceived
iShares Emerging Markets Equity Index Fund (UK) £000’s £000’s
Barclays Capital Securities Limited UK 3,981 4,298
BNP Paribas Arbitrage SNC France 433 477
Citigroup Global Markets Limited UK 14,376 16,233
Credit Suisse AG Dublin Branch Ireland 33,190 35,864
Credit Suisse Securities (Europe) Limited UK 2,791 2,952
Deutsche Bank AG Germany 8,191 9,072
Goldman Sachs International UK 568 661
HSBC Bank Plc UK 30,081 32,996
J.P. Morgan Securities Plc UK 25,740 28,671
Macquarie Bank Limited Australia 3,237 3,606
Merrill Lynch International UK 5,023 5,291
Morgan Stanley & Co. International Plc UK 1,192 1,323
Société Générale SA France 9,764 11,821
UBS AG Switzerland 25,679 28,107
Total 164,246 181,372
Supplementary Information continued
BlackRock Collective Investment Funds 408

Securities Lending
Counterparty
Counterparty’scountry of
establishmentAmounton loan
Collateralreceived
iShares Global Property Securities Equity Index Fund(UK) £000’s £000’s
Barclays Capital Securities Limited UK 27,062 29,217
BNP Paribas Arbitrage SNC France 3,173 3,500
Citigroup Global Markets Limited UK 27,825 31,420
Credit Suisse AG Dublin Branch Ireland 53,343 57,641
Deutsche Bank AG Germany 120,917 133,928
Goldman Sachs International UK 15,447 17,986
HSBC Bank Plc UK 27,207 29,843
J.P. Morgan Securities Plc UK 105,660 117,694
Macquarie Bank Limited Australia 1,905 2,122
Merrill Lynch International UK 2,705 2,849
Morgan Stanley & Co. International Plc UK 23,525 26,106
Société Générale SA France 38,751 46,916
The Bank of Nova Scotia Canada 37,384 41,323
UBS AG Switzerland 20,210 22,120
Total 505,114 562,665
Securities Lending
Counterparty
Counterparty’scountry of
establishmentAmounton loan
Collateralreceived
iShares Japan Equity Index Fund (UK) £000’s £000’s
Barclays Capital Securities Limited UK 304,595 328,847
Citigroup Global Markets Limited UK 7,688 8,681
Credit Suisse AG Dublin Branch Ireland 35,023 37,845
Credit Suisse Securities (Europe) Limited UK 2,221 2,348
Deutsche Bank AG Germany 1,032 1,143
Goldman Sachs International UK 183 213
HSBC Bank Plc UK 1,123 1,232
J.P. Morgan Securities Plc UK 315,764 351,729
Merrill Lynch International UK 11,358 11,963
Natixis S.A. France 71 79
Nomura International UK 9,913 10,837
Société Générale SA France 51,948 62,893
UBS AG Switzerland 8,960 9,807
Total 749,879 827,617
Supplementary Information continued
BlackRock Collective Investment Funds409

Securities Lending
Counterparty
Counterparty’scountry of
establishmentAmounton loan
Collateralreceived
iShares Mid Cap UK Equity Index Fund (UK) £000’s £000’s
Barclays Capital Securities Limited UK 13,045 14,084
BNP Paribas Arbitrage SNC France 2,739 3,021
Citigroup Global Markets Limited UK 6,424 7,254
Goldman Sachs International UK 5,445 6,340
HSBC Bank Plc UK 1,177 1,291
J.P. Morgan Securities Plc UK 5,517 6,145
Macquarie Bank Limited Australia 433 483
Merrill Lynch International UK 4,207 4,431
Morgan Stanley & Co. International Plc UK 2,814 3,123
Natixis S.A. France 347 382
Société Générale SA France 2,464 2,983
The Bank of Nova Scotia Canada 17,149 18,956
UBS AG Switzerland 28,832 31,557
Total 90,593 100,050
Securities Lending
Counterparty
Counterparty’scountry of
establishmentAmounton loan
Collateralreceived
iShares North American Equity Index Fund (UK) £000’s £000’s
Citigroup Global Markets Limited UK 27,136 30,641
Credit Suisse AG Dublin Branch Ireland 19,558 21,133
Credit Suisse Securities (Europe) Limited UK 9,671 10,228
Deutsche Bank AG Germany 3,438 3,808
Goldman Sachs International UK 3,427 3,990
HSBC Bank Plc UK 9,300 10,202
Merrill Lynch International UK 4,648 4,895
Morgan Stanley & Co. International Plc UK 507 563
Société Générale SA France 58,160 70,414
The Bank of Nova Scotia Canada 36,109 39,914
UBS AG Switzerland 88,998 97,412
Total 260,952 293,200
Supplementary Information continued
BlackRock Collective Investment Funds 410

Securities Lending
Counterparty
Counterparty’scountry of
establishmentAmounton loan
Collateralreceived
iShares Over 15 Years Corporate Bond Index Fund (UK) £000’s £000’s
Barclays Bank Plc UK 784 817
BNP Paribas Arbitrage SNC France 2,130 2,219
Citigroup Global Markets Limited UK 833 861
HSBC Bank Plc UK 2,610 2,846
J.P. Morgan Securities Plc (Euroclear) UK 2,252 2,343
Société Générale SA France 1,981 2,089
Total 10,590 11,175
Securities Lending
Counterparty
Counterparty’scountry of
establishmentAmounton loan
Collateralreceived
iShares Over 15 Years Gilts Index Fund (UK) £000’s £000’s
Barclays Bank Plc UK 33,528 34,939
J.P. Morgan Securities Plc UK 86,838 93,246
J.P. Morgan Securities Plc (Euroclear) UK 90,834 94,508
Total 211,200 222,693
Supplementary Information continued
BlackRock Collective Investment Funds411

Securities Lending
Counterparty
Counterparty’scountry of
establishmentAmounton loan
Collateralreceived
iShares Overseas Corporate Bond Index Fund (UK) £000’s £000’s
Banco Santander, S.A. UK 893 990
Barclays Bank Plc UK 4,635 4,831
BNP Paribas Arbitrage SNC France 2,739 2,854
Citigroup Global Markets Limited UK 14,133 14,610
Deutsche Bank AG (Euroclear) Germany 512 533
Goldman Sachs International UK 4,938 5,305
HSBC Bank Plc UK 1,557 1,698
J.P. Morgan Securities Plc UK 6,090 6,712
J.P. Morgan Securities Plc (Euroclear) UK 7,269 7,563
Merrill Lynch International UK 2,848 3,016
Morgan Stanley & Co. International Plc UK 4,034 4,237
Nomura International UK 2,423 2,604
Société Générale SA France 574 605
The Bank of Nova Scotia Canada 579 643
UBS AG Switzerland 3,310 3,614
Total 56,534 59,815
Securities Lending
Counterparty
Counterparty’scountry of
establishmentAmounton loan
Collateralreceived
iShares Overseas Government Bond Index Fund (UK) £000’s £000’s
Barclays Bank Plc UK 1,792 1,867
BNP Paribas France 22,835 24,915
Citigroup Global Markets Limited UK 3,584 3,734
J.P. Morgan Securities Plc UK 1,731 1,983
J.P. Morgan Securities Plc (Euroclear) UK 4,127 4,294
Merrill Lynch International UK 552 617
Morgan Stanley & Co. International Plc UK 17,061 17,574
Natixis S.A. France 13,524 14,960
Société Générale SA France 44,906 49,655
The Bank of Nova Scotia Canada 1,609 1,894
UBS AG Switzerland 953 1,105
Total 112,674 122,598
Supplementary Information continued
BlackRock Collective Investment Funds 412

Securities Lending
Counterparty
Counterparty’scountry of
establishmentAmounton loan
Collateralreceived
iShares Pacific Ex Japan Equity Index Fund (UK) £000’s £000’s
Barclays Capital Securities Limited UK 8 9
Citigroup Global Markets Limited UK 802 905
Credit Suisse AG Dublin Branch Ireland 3,156 3,410
Credit Suisse Securities (Europe) Limited UK 2,449 2,590
Deutsche Bank AG Germany 5,623 6,228
HSBC Bank Plc UK 1,907 2,092
J.P. Morgan Securities Plc UK 11,187 12,461
Macquarie Bank Limited Australia 18,553 20,671
Merrill Lynch International UK 203,905 214,755
Morgan Stanley & Co. International Plc UK 5,789 6,424
Nomura International UK 3,591 3,925
Société Générale SA France 47,721 57,777
The Bank of Nova Scotia Canada 254 280
UBS AG Switzerland 1,926 2,108
Total 306,871 333,635
Supplementary Information continued
BlackRock Collective Investment Funds413

Securities Lending
Counterparty
Counterparty’scountry of
establishmentAmounton loan
Collateralreceived
iShares UK Equity Index Fund (UK) £000’s £000’s
Banco Santander, S.A. Spain 88,935 97,844
Barclays Capital Securities Limited UK 152,947 165,125
BNP Paribas Arbitrage SNC France 16,101 17,758
Citigroup Global Markets Limited UK 19,677 22,219
Credit Suisse AG Dublin Branch Ireland 9,852 10,646
Credit Suisse Securities (Europe) Limited UK 80,414 85,045
Deutsche Bank AG Germany 60,523 67,036
Goldman Sachs International UK 9,028 10,512
HSBC Bank Plc UK 4,828 5,295
J.P. Morgan Securities Plc UK 30,088 33,515
Macquarie Bank Limited Australia 4,233 4,716
Merrill Lynch International UK 26,573 27,987
Morgan Stanley & Co. International Plc UK 15,758 17,487
Natixis S.A. France 4,300 4,732
Nomura International UK 1,891 2,067
Société Générale SA France 49,386 59,792
The Bank of Nova Scotia Canada 131,981 145,888
UBS AG Switzerland 134,408 147,115
Total 840,923 924,779
Securities Lending
Counterparty
Counterparty’scountry of
establishmentAmounton loan
Collateralreceived
iShares UK Gilts All Stocks Index Fund (UK) £000’s £000’s
Banco Santander, S.A. (Euroclear) Spain 1,148 1,245
Banco Santander, S.A. Spain 21,993 24,200
Barclays Bank Plc UK 46,719 48,685
BNP Paribas Arbitrage SNC France 488,518 506,723
Citigroup Global Markets Limited UK 340,071 353,718
J.P. Morgan Securities Plc (Euroclear) UK 737,946 767,792
Morgan Stanley & Co. International Plc UK 646,605 670,757
Société Générale SA France 20,276 22,049
The Bank of Nova Scotia Canada 15,097 16,577
Total 2,318,373 2,411,746
Supplementary Information continued
BlackRock Collective Investment Funds 414

Securities Lending
Counterparty
Counterparty’scountry of
establishmentAmounton loan
Collateralreceived
iShares US Equity Index Fund (UK) £000’s £000’s
Credit Suisse AG Dublin Branch Ireland 12,143 13,122
HSBC Bank Plc UK 7,888 8,652
Merrill Lynch International UK 7,051 7,426
The Bank of Nova Scotia Canada 8,337 9,215
UBS AG Switzerland 16,357 17,903
Total 51,776 56,318
The following table details the underlying exposure value on a gross absolute basis for TRS, analysed bycounterparty as at 31 August 2020 for the BlackRock Balanced Managed Fund. Note no other funds held TRS asat 31 August 2020.
Maturity Tenor
Fund1 - 30days
31 - 90days
91 - 365days
More than365 days
Opentransactions Total
BlackRock Balanced Managed Fund £000’s £000’s £000’s £000’s £000’s £000’s
TRS 24,115 – 41,142 – – 65,257
The above maturity tenor analysis has been based on the respective transaction contractual maturity date. Allsecurities on loan and CFDs have an open maturity tenor as they are recallable or terminable on a daily basis.
Supplementary Information continued
BlackRock Collective Investment Funds415

Collateral
The Funds engage in activities which may require collateral to be provided to a counterparty (“collateral posted”)or may hold collateral received (“collateral received”) from a counterparty.
The following table provides an analysis by currency of the cash and underlying non-cash collateralreceived/posted by way of title transfer collateral arrangement by the Funds, in respect of securities lendingtransactions and OTC FDIs (including TRS), as at 31 August 2020.
Currency
Cashcollateralreceived
Cashcollateral
posted
Non-cashcollateralreceived
Non-cashcollateral
posted
BlackRock Balanced Managed Fund £000’s £000’s £000’s £000’s
Securities lending transactions
AUD – – 9 –
CAD – – 78 –
CHF – – 66 –
CNY – – 145 –
DKK – – 6 –
EUR – – 19,121 –
GBP – – 4,306 –
HKD – – 13 –
JPY – – 310 –
NOK – – 1,146 –
SEK – – 23 –
SGD – – 18 –
USD – – 6,040 –
Total – – 31,281 –
OTC FDIs
GBP 9,202 – – –
9,202 – – –
Total 9,202 – 31,281 –
Supplementary Information continued
BlackRock Collective Investment Funds 416
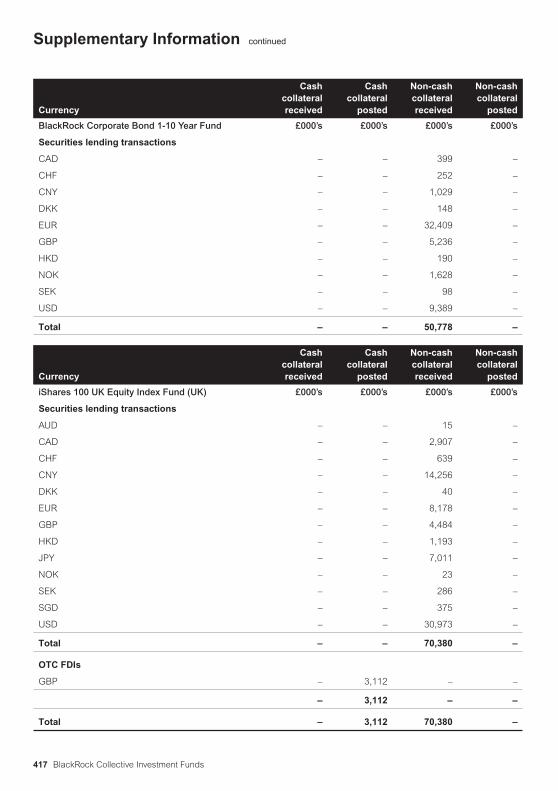
Currency
Cashcollateralreceived
Cashcollateral
posted
Non-cashcollateralreceived
Non-cashcollateral
posted
BlackRock Corporate Bond 1-10 Year Fund £000’s £000’s £000’s £000’s
Securities lending transactions
CAD – – 399 –
CHF – – 252 –
CNY – – 1,029 –
DKK – – 148 –
EUR – – 32,409 –
GBP – – 5,236 –
HKD – – 190 –
NOK – – 1,628 –
SEK – – 98 –
USD – – 9,389 –
Total – – 50,778 –
Currency
Cashcollateralreceived
Cashcollateral
posted
Non-cashcollateralreceived
Non-cashcollateral
posted
iShares 100 UK Equity Index Fund (UK) £000’s £000’s £000’s £000’s
Securities lending transactions
AUD – – 15 –
CAD – – 2,907 –
CHF – – 639 –
CNY – – 14,256 –
DKK – – 40 –
EUR – – 8,178 –
GBP – – 4,484 –
HKD – – 1,193 –
JPY – – 7,011 –
NOK – – 23 –
SEK – – 286 –
SGD – – 375 –
USD – – 30,973 –
Total – – 70,380 –
OTC FDIs
GBP – 3,112 – –
– 3,112 – –
Total – 3,112 70,380 –
Supplementary Information continued
BlackRock Collective Investment Funds417

Currency
Cashcollateralreceived
Cashcollateral
posted
Non-cashcollateralreceived
Non-cashcollateral
posted
iShares 350 UK Equity Index Fund (UK) £000’s £000’s £000’s £000’s
Securities lending transactions
AUD – – 266 –
CAD – – 1,476 –
CHF – – 691 –
CNY – – 11,483 –
DKK – – 159 –
EUR – – 9,905 –
GBP – – 6,526 –
HKD – – 1,552 –
JPY – – 7,321 –
NOK – – 31 –
NZD – – 1 –
SEK – – 246 –
SGD – – 175 –
USD – – 34,354 –
Total – – 74,186 –
OTC FDIs
GBP – 1,254 – –
– 1,254 – –
Total – 1,254 74,186 –
Supplementary Information continued
BlackRock Collective Investment Funds 418

Currency
Cashcollateralreceived
Cashcollateral
posted
Non-cashcollateralreceived
Non-cashcollateral
posted
iShares Continental European Equity Index Fund(UK) £000’s £000’s £000’s £000’s
Securities lending transactions
AUD – – 1,141 –
CAD – – 767 –
CHF – – 17,488 –
CNY – – 53,893 –
DKK – – 4,638 –
EUR – – 130,409 –
GBP – – 47,314 –
HKD – – 7,587 –
ILS – – 112 –
JPY – – 44,093 –
NOK – – 1,148 –
NZD – – 553 –
SEK – – 2,409 –
SGD – – 2,146 –
USD – – 188,402 –
Total – – 502,100 –
OTC FDIs
GBP – 6,422 – –
– 6,422 – –
Total – 6,422 502,100 –
Supplementary Information continued
BlackRock Collective Investment Funds419

Currency
Cashcollateralreceived
Cashcollateral
posted
Non-cashcollateralreceived
Non-cashcollateral
posted
iShares Corporate Bond Index Fund (UK) £000’s £000’s £000’s £000’s
Securities lending transactions
CAD – – 2,729 –
CHF – – 475 –
CNY – – 15,096 –
DKK – – 3,496 –
EUR – – 183,008 –
GBP – – 21,450 –
HKD – – 3,886 –
JPY – – 230 –
NOK – – 11,610 –
SEK – – 4,727 –
USD – – 52,828 –
Total – – 299,535 –
Supplementary Information continued
BlackRock Collective Investment Funds 420

Currency
Cashcollateralreceived
Cashcollateral
posted
Non-cashcollateralreceived
Non-cashcollateral
posted
iShares Emerging Markets Equity Index Fund (UK) £000’s £000’s £000’s £000’s
Securities lending transactions
AUD – – 1,022 –
CAD – – 215 –
CHF – – 3,656 –
CNY – – 17,655 –
DKK – – 3,766 –
EUR – – 32,961 –
GBP – – 14,584 –
HKD – – 3,471 –
ILS – – 86 –
JPY – – 29,398 –
NOK – – 969 –
NZD – – 74 –
SEK – – 619 –
SGD – – 146 –
USD – – 72,750 –
Total – – 181,372 –
OTC FDIs
GBP – 5,791 – –
– 5,791 – –
Total – 5,791 181,372 –
Supplementary Information continued
BlackRock Collective Investment Funds421

Currency
Cashcollateralreceived
Cashcollateral
posted
Non-cashcollateralreceived
Non-cashcollateral
posted
iShares Global Property Securities Equity IndexFund (UK) £000’s £000’s £000’s £000’s
Securities lending transactions
AUD – – 2,067 –
CAD – – 11,940 –
CHF – – 9,299 –
CNY – – 52,519 –
DKK – – 5,774 –
EUR – – 114,783 –
GBP – – 48,217 –
HKD – – 5,949 –
ILS – – 50 –
JPY – – 83,082 –
NOK – – 1,740 –
NZD – – 296 –
SEK – – 2,160 –
SGD – – 748 –
USD – – 224,041 –
Total – – 562,665 –
OTC FDIs
GBP – 1,777 – –
– 1,777 – –
Total – 1,777 562,665 –
Supplementary Information continued
BlackRock Collective Investment Funds 422

Currency
Cashcollateralreceived
Cashcollateral
posted
Non-cashcollateralreceived
Non-cashcollateral
posted
iShares Japan Equity Index Fund (UK) £000’s £000’s £000’s £000’s
Securities lending transactions
AUD – – 191 –
CAD – – 3,482 –
CHF – – 18,328 –
CNY – – 111,492 –
DKK – – 796 –
EUR – – 179,421 –
GBP – – 72,186 –
HKD – – 6,167 –
JPY – – 223,390 –
NOK – – 983 –
NZD – – 396 –
SEK – – 6,291 –
SGD – – 6,567 –
USD – – 197,927 –
Total – – 827,617 –
Supplementary Information continued
BlackRock Collective Investment Funds423

Currency
Cashcollateralreceived
Cashcollateral
posted
Non-cashcollateralreceived
Non-cashcollateral
posted
iShares Mid Cap UK Equity Index Fund (UK) £000’s £000’s £000’s £000’s
Securities lending transactions
AUD – – 541 –
CAD – – 5,335 –
CHF – – 1,725 –
CNY – – 3,723 –
DKK – – 352 –
EUR – – 21,619 –
GBP – – 12,597 –
HKD – – 1,407 –
ILS – – 11 –
JPY – – 13,942 –
NOK – – 38 –
NZD – – 19 –
SEK – – 452 –
SGD – – 425 –
USD – – 37,864 –
Total – – 100,050 –
OTC FDIs
GBP – 371 – –
– 371 – –
Total – 371 100,050 –
Supplementary Information continued
BlackRock Collective Investment Funds 424

Currency
Cashcollateralreceived
Cashcollateral
posted
Non-cashcollateralreceived
Non-cashcollateral
posted
iShares North American Equity Index Fund (UK) £000’s £000’s £000’s £000’s
Securities lending transactions
AUD – – 1,795 –
CAD – – 10,571 –
CHF – – 6,709 –
CNY – – 20,983 –
DKK – – 1,997 –
EUR – – 53,504 –
GBP – – 30,458 –
HKD – – 5,843 –
JPY – – 30,949 –
NOK – – 665 –
NZD – – 443 –
SEK – – 940 –
SGD – – 130 –
USD – – 128,213 –
Total – – 293,200 –
OTC FDIs
GBP – 11,063 – –
– 11,063 – –
Total – 11,063 293,200 –
Supplementary Information continued
BlackRock Collective Investment Funds425

Currency
Cashcollateralreceived
Cashcollateral
posted
Non-cashcollateralreceived
Non-cashcollateral
posted
iShares Over 15 Years Corporate Bond Index Fund(UK) £000’s £000’s £000’s £000’s
Securities lending transactions
CAD – – 397 –
CNY – – 758 –
DKK – – 574 –
EUR – – 6,117 –
GBP – – 995 –
HKD – – 203 –
NOK – – 209 –
SEK – – 262 –
USD – – 1,660 –
Total – – 11,175 –
Currency
Cashcollateralreceived
Cashcollateral
posted
Non-cashcollateralreceived
Non-cashcollateral
posted
iShares Over 15 Years Gilts Index Fund (UK) £000’s £000’s £000’s £000’s
Securities lending transactions
CAD – – 10,003 –
EUR – – 112,303 –
GBP – – 35,180 –
NOK – – 5,791 –
SEK – – 40 –
USD – – 59,376 –
Total – – 222,693 –
Supplementary Information continued
BlackRock Collective Investment Funds 426

Currency
Cashcollateralreceived
Cashcollateral
posted
Non-cashcollateralreceived
Non-cashcollateral
posted
iShares Overseas Corporate Bond Index Fund(UK) £000’s £000’s £000’s £000’s
Securities lending transactions
CAD – – 982 –
CHF – – 435 –
CNY – – 1,850 –
DKK – – 341 –
EUR – – 37,198 –
GBP – – 6,269 –
HKD – – 323 –
JPY – – 232 –
NOK – – 1,567 –
SEK – – 159 –
USD – – 10,459 –
Total – – 59,815 –
Currency
Cashcollateralreceived
Cashcollateral
posted
Non-cashcollateralreceived
Non-cashcollateral
posted
iShares Overseas Government Bond Index Fund(UK) £000’s £000’s £000’s £000’s
Securities lending transactions
AUD – – 2,885 –
CAD – – 1,329 –
CHF – – 4,733 –
CNY – – 7,626 –
DKK – – 228 –
EUR – – 39,259 –
GBP – – 6,576 –
HKD – – 4,751 –
JPY – – 16,036 –
NOK – – 1,263 –
SEK – – 3,249 –
SGD – – 1,360 –
USD – – 33,303 –
Total – – 122,598 –
Supplementary Information continued
BlackRock Collective Investment Funds427
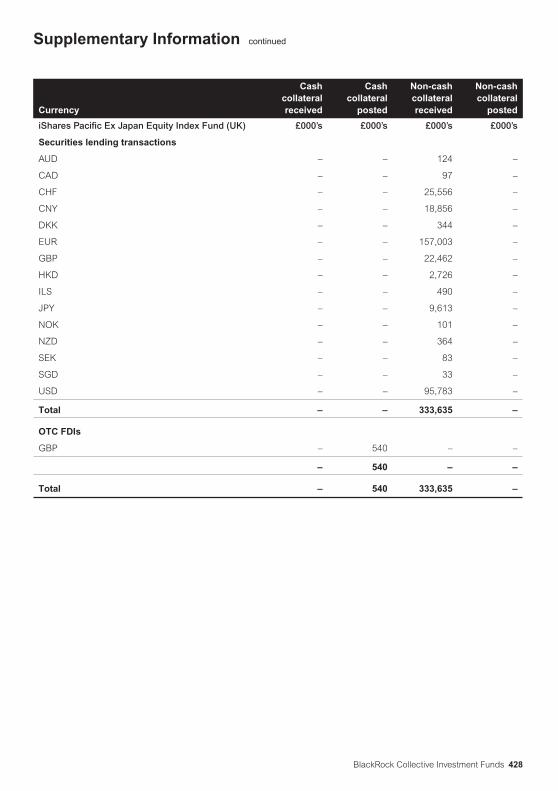
Currency
Cashcollateralreceived
Cashcollateral
posted
Non-cashcollateralreceived
Non-cashcollateral
posted
iShares Pacific Ex Japan Equity Index Fund (UK) £000’s £000’s £000’s £000’s
Securities lending transactions
AUD – – 124 –
CAD – – 97 –
CHF – – 25,556 –
CNY – – 18,856 –
DKK – – 344 –
EUR – – 157,003 –
GBP – – 22,462 –
HKD – – 2,726 –
ILS – – 490 –
JPY – – 9,613 –
NOK – – 101 –
NZD – – 364 –
SEK – – 83 –
SGD – – 33 –
USD – – 95,783 –
Total – – 333,635 –
OTC FDIs
GBP – 540 – –
– 540 – –
Total – 540 333,635 –
Supplementary Information continued
BlackRock Collective Investment Funds 428

Currency
Cashcollateralreceived
Cashcollateral
posted
Non-cashcollateralreceived
Non-cashcollateral
posted
iShares UK Equity Index Fund (UK) £000’s £000’s £000’s £000’s
Securities lending transactions
AUD – – 3,151 –
CAD – – 39,418 –
CHF – – 19,728 –
CNY – – 81,277 –
DKK – – 2,849 –
EUR – – 185,308 –
GBP – – 106,474 –
HKD – – 11,853 –
ILS – – 112 –
JPY – – 101,069 –
NOK – – 567 –
NZD – – 377 –
SEK – – 4,531 –
SGD – – 5,210 –
USD – – 362,855 –
Total – – 924,779 –
Currency
Cashcollateralreceived
Cashcollateral
posted
Non-cashcollateralreceived
Non-cashcollateral
posted
iShares UK Gilts All Stocks Index Fund (UK) £000’s £000’s £000’s £000’s
Securities lending transactions
CAD – – 7,509 –
CHF – – 327 –
CNY – – 8,466 –
DKK – – 1,965 –
EUR – – 1,600,780 –
GBP – – 380,338 –
HKD – – 3,632 –
JPY – – 3,487 –
NOK – – 48,547 –
SEK – – 325 –
USD – – 356,370 –
Total – – 2,411,746 –
Supplementary Information continued
BlackRock Collective Investment Funds429

Currency
Cashcollateralreceived
Cashcollateral
posted
Non-cashcollateralreceived
Non-cashcollateral
posted
iShares US Equity Index Fund (UK) £000’s £000’s £000’s £000’s
Securities lending transactions
AUD – – 420 –
CAD – – 2,395 –
CHF – – 956 –
CNY – – 809 –
DKK – – 1,004 –
EUR – – 11,867 –
GBP – – 6,853 –
HKD – – 930 –
JPY – – 7,165 –
NOK – – 358 –
SEK – – 7 –
USD – – 23,554 –
Total – – 56,318 –
OTC FDIs
GBP – 571 – –
– 571 – –
Total – 571 56,318 –
The returns earned by the Fund from the reinvestment of cash collateral in money market funds during the periodended 31 August 2020 is summarised below. These returns represent the accumulative total return of therepresentative money market fund for the period ended 31 August 2020. These returns do not take into accountany interest payable to the counterparty under the relevant collateral arrangements.
Money market fund Total return %
Institutional Cash Series plc
BlackRock ICS Sterling Liquid Environmentally Aware Fund - Agency Income Class 0.14
Supplementary Information continued
BlackRock Collective Investment Funds 430

The following table provides an analysis of the type, quality and maturity tenor of non-cash collateralreceived/posted by the Funds by way of title transfer collateral arrangement in respect of securities lendingtransactions and OTC FDIs (BlackRock Balanced Managed Fund only) as at 31 August 2020.
Maturity Tenor
Fund1 - 7days
8 - 30days
31 - 90days
91 - 365days
More than365 days
Opentransactions Total
BlackRock BalancedManaged Fund £000’s £000’s £000’s £000’s £000’s £000’s £000’s
Collateral received -securities lending
Fixed income
Investment grade 504 292 217 2,121 26,689 – 29,823
Equities
Recognised equity index – – – – – 1,453 1,453
ETFs
Non-UCITS – – – – – 5 5
Total 504 292 217 2,121 26,689 1,458 31,281
BlackRock Corporate Bond1-10 Year Fund £000’s £000’s £000’s £000’s £000’s £000’s £000’s
Collateral received -securities lending
Fixed income
Investment grade 804 43 23 1,345 40,138 – 42,353
Equities
Recognised equity index – – – – – 8,415 8,415
ETFs
Non-UCITS – – – – – 10 10
Total 804 43 23 1,345 40,138 8,425 50,778
iShares 100 UK Equity IndexFund (UK) £000’s £000’s £000’s £000’s £000’s £000’s £000’s
Collateral received -securities lending
Fixed income
Investment grade – 2 506 601 8,830 – 9,939
Equities
Recognised equity index – – – – – 51,606 51,606
ETFs
Non-UCITS – – – – – 8,835 8,835
Total – 2 506 601 8,830 60,441 70,380
Supplementary Information continued
BlackRock Collective Investment Funds431
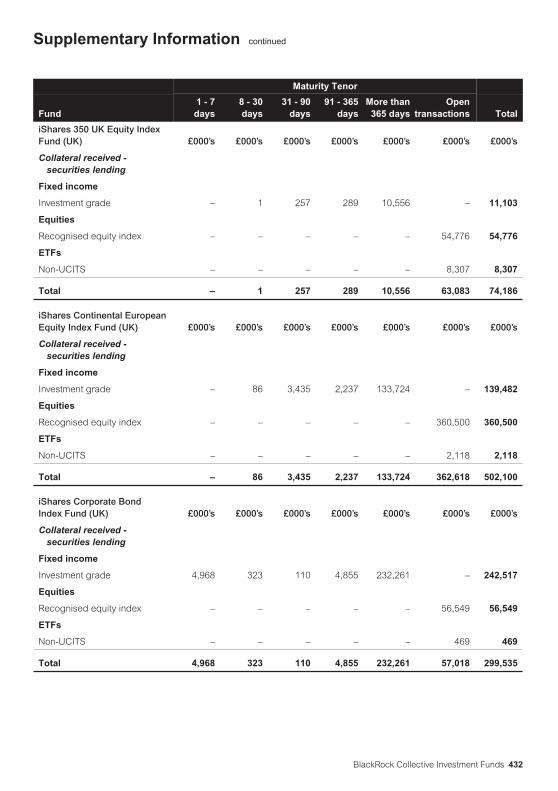
Maturity Tenor
Fund1 - 7days
8 - 30days
31 - 90days
91 - 365days
More than365 days
Opentransactions Total
iShares 350 UK Equity IndexFund (UK) £000’s £000’s £000’s £000’s £000’s £000’s £000’s
Collateral received -securities lending
Fixed income
Investment grade – 1 257 289 10,556 – 11,103
Equities
Recognised equity index – – – – – 54,776 54,776
ETFs
Non-UCITS – – – – – 8,307 8,307
Total – 1 257 289 10,556 63,083 74,186
iShares Continental EuropeanEquity Index Fund (UK) £000’s £000’s £000’s £000’s £000’s £000’s £000’s
Collateral received -securities lending
Fixed income
Investment grade – 86 3,435 2,237 133,724 – 139,482
Equities
Recognised equity index – – – – – 360,500 360,500
ETFs
Non-UCITS – – – – – 2,118 2,118
Total – 86 3,435 2,237 133,724 362,618 502,100
iShares Corporate BondIndex Fund (UK) £000’s £000’s £000’s £000’s £000’s £000’s £000’s
Collateral received -securities lending
Fixed income
Investment grade 4,968 323 110 4,855 232,261 – 242,517
Equities
Recognised equity index – – – – – 56,549 56,549
ETFs
Non-UCITS – – – – – 469 469
Total 4,968 323 110 4,855 232,261 57,018 299,535
Supplementary Information continued
BlackRock Collective Investment Funds 432

Maturity Tenor
Fund1 - 7days
8 - 30days
31 - 90days
91 - 365days
More than365 days
Opentransactions Total
iShares Emerging MarketsEquity Index Fund (UK) £000’s £000’s £000’s £000’s £000’s £000’s £000’s
Collateral received -securities lending
Fixed income
Investment grade – 77 823 340 39,667 – 40,907
Equities
Recognised equity index – – – – – 139,693 139,693
ETFs
Non-UCITS – – – – – 772 772
Total – 77 823 340 39,667 140,465 181,372
iShares Global PropertySecurities Equity Index Fund(UK) £000’s £000’s £000’s £000’s £000’s £000’s £000’s
Collateral received -securities lending
Fixed income
Investment grade – 124 2,184 1,693 103,519 – 107,520
Equities
Recognised equity index – – – – – 453,944 453,944
ETFs
Non-UCITS – – – – – 1,201 1,201
Total – 124 2,184 1,693 103,519 455,145 562,665
iShares Japan Equity IndexFund (UK) £000’s £000’s £000’s £000’s £000’s £000’s £000’s
Collateral received -securities lending
Fixed income
Investment grade – 81 13,670 16,001 228,328 – 258,080
Equities
Recognised equity index – – – – – 568,461 568,461
ETFs
Non-UCITS – – – – – 1,076 1,076
Total – 81 13,670 16,001 228,328 569,537 827,617
Supplementary Information continued
BlackRock Collective Investment Funds433

Maturity Tenor
Fund1 - 7days
8 - 30days
31 - 90days
91 - 365days
More than365 days
Opentransactions Total
iShares Mid Cap UK EquityIndex Fund (UK) £000’s £000’s £000’s £000’s £000’s £000’s £000’s
Collateral received -securities lending
Fixed income
Investment grade – – 585 679 25,597 – 26,861
Equities
Recognised equity index – – – – – 72,724 72,724
ETFs
Non-UCITS – – – – – 465 465
Total – – 585 679 25,597 73,189 100,050
iShares North AmericanEquity Index Fund (UK) £000’s £000’s £000’s £000’s £000’s £000’s £000’s
Collateral received -securities lending
Fixed income
Investment grade – 45 457 76 44,439 – 45,017
Equities
Recognised equity index – – – – – 245,877 245,877
ETFs
Non-UCITS – – – – – 2,306 2,306
Total – 45 457 76 44,439 248,183 293,200
iShares Over 15 YearsCorporate Bond Index Fund(UK) £000’s £000’s £000’s £000’s £000’s £000’s £000’s
Collateral received -securities lending
Fixed income
Investment grade 214 12 6 224 8,370 – 8,826
Equities
Recognised equity index – – – – – 2,323 2,323
ETFs
Non-UCITS – – – – – 26 26
Total 214 12 6 224 8,370 2,349 11,175
Supplementary Information continued
BlackRock Collective Investment Funds 434

Maturity Tenor
Fund1 - 7days
8 - 30days
31 - 90days
91 - 365days
More than365 days
Opentransactions Total
iShares Over 15 Years GiltsIndex Fund (UK) £000’s £000’s £000’s £000’s £000’s £000’s £000’s
Collateral received -securities lending
Fixed income
Investment grade 9,002 500 247 8,940 156,909 – 175,598
Equities
Recognised equity index – – – – – 42,530 42,530
ETFs
Non-UCITS – – – – – 4,565 4,565
Total 9,002 500 247 8,940 156,909 47,095 222,693
iShares Overseas CorporateBond Index Fund (UK) £000’s £000’s £000’s £000’s £000’s £000’s £000’s
Collateral received -securities lending
Fixed income
Investment grade 1,104 388 27 1,517 43,672 – 46,708
Equities
Recognised equity index – – – – – 12,821 12,821
ETFs
Non-UCITS – – – – – 286 286
Total 1,104 388 27 1,517 43,672 13,107 59,815
iShares OverseasGovernment Bond Index Fund(UK) £000’s £000’s £000’s £000’s £000’s £000’s £000’s
Collateral received -securities lending
Fixed income
Investment grade 462 26 13 487 32,104 – 33,092
Equities
Recognised equity index – – – – – 87,242 87,242
ETFs
UCITS – – – – – 904 904
Non-UCITS – – – – – 1,360 1,360
Total 462 26 13 487 32,104 89,506 122,598
Supplementary Information continued
BlackRock Collective Investment Funds435

Maturity Tenor
Fund1 - 7days
8 - 30days
31 - 90days
91 - 365days
More than365 days
Opentransactions Total
iShares Pacific Ex JapanEquity Index Fund (UK) £000’s £000’s £000’s £000’s £000’s £000’s £000’s
Collateral received -securities lending
Fixed income
Investment grade – 7 61 16 224,435 – 224,519
Equities
Recognised equity index – – – – – 109,074 109,074
ETFs
Non-UCITS – – – – – 42 42
Total – 7 61 16 224,435 109,116 333,635
iShares UK Equity Index Fund(UK) £000’s £000’s £000’s £000’s £000’s £000’s £000’s
Collateral received -securities lending
Fixed income
Investment grade – 23 6,841 8,046 205,515 – 220,425
Equities
Recognised equity index – – – – – 674,551 674,551
ETFs
Non-UCITS – – – – – 29,803 29,803
Total – 23 6,841 8,046 205,515 704,354 924,779
iShares UK Gilts All StocksIndex Fund (UK) £000’s £000’s £000’s £000’s £000’s £000’s £000’s
Collateral received -securities lending
Fixed income
Investment grade 59,952 13,433 46,899 165,916 2,069,713 – 2,355,913
Equities
Recognised equity index – – – – – 49,233 49,233
ETFs
Non-UCITS – – – – – 6,600 6,600
Total 59,952 13,433 46,899 165,916 2,069,713 55,833 2,411,746
Supplementary Information continued
BlackRock Collective Investment Funds 436

Maturity Tenor
Fund1 - 7days
8 - 30days
31 - 90days
91 - 365days
More than365 days
Opentransactions Total
iShares US Equity Index Fund(UK) £000’s £000’s £000’s £000’s £000’s £000’s £000’s
Collateral received -securities lending
Fixed income
Investment grade – 28 246 46 17,363 – 17,683
Equities
Recognised equity index – – – – – 38,354 38,354
ETFs
Non-UCITS – – – – – 281 281
Total – 28 246 46 17,363 38,635 56,318
Investment grade securities are those issued by an entity with a minimum investment grade credit rating from atleast one globally recognised credit rating agency; Standard & Poor’s, Moody’s or Fitch.
A recognised equity index contains at least 20 equities where no single equity represents more than 20% of thetotal index and no five equities combined represent more than 60% of the total index.
The maturity tenor analysis for fixed income securities received or posted as collateral is based on the respectivecontractual maturity date, while for equity securities and ETFs received or posted as collateral are presented asopen transactions as they are not subject to a contractual maturity date.
As at 31 August 2020, all non-cash collateral received by the Funds in respect of securities lending transactionsand OTC FDIs (including TRS) is held by the Funds’ Trustee (or through their delegates), with the exception of theamounts disclosed in the following table which are held through a securities settlement system.
Non-cash collateral received
Fund Securities lending OTC FDIs
BlackRock Balanced Managed Fund £000’s £000’s
Euroclear Bank SA/NAV 26,880 –
BlackRock Corporate Bond 1-10 Year Fund £000’s £000’s
Euroclear Bank SA/NAV 33,496 –
iShares 100 UK Equity Index Fund (UK) £000’s £000’s
Euroclear Bank SA/NAV – –
iShares 350 UK Equity Index Fund (UK) £000’s £000’s
Euroclear Bank SA/NAV – –
iShares Continental European Equity Index Fund (UK) £000’s £000’s
Euroclear Bank SA/NAV – –
Supplementary Information continued
BlackRock Collective Investment Funds437

Non-cash collateral received
Fund Securities lending OTC FDIs
iShares Corporate Bond Index Fund (UK) £000’s £000’s
Euroclear Bank SA/NAV 213,024 –
iShares Emerging Markets Equity Index Fund (UK) £000’s £000’s
Euroclear Bank SA/NAV – –
iShares Global Property Securities Equity Index Fund (UK) £000’s £000’s
Euroclear Bank SA/NAV – –
iShares Japan Equity Index Fund (UK) £000’s £000’s
Euroclear Bank SA/NAV – –
iShares Mid Cap UK Equity Index Fund (UK) £000’s £000’s
Euroclear Bank SA/NAV – –
iShares North American Equity Index Fund (UK) £000’s £000’s
Euroclear Bank SA/NAV – –
iShares Over 15 Years Corporate Bond Index Fund (UK) £000’s £000’s
Euroclear Bank SA/NAV 8,329 –
iShares Over 15 Years Gilts Index Fund (UK) £000’s £000’s
Euroclear Bank SA/NAV 129,447 –
iShares Overseas Corporate Bond Index Fund (UK) £000’s £000’s
Euroclear Bank SA/NAV 38,390 –
iShares Overseas Government Bond Index Fund (UK) £000’s £000’s
Euroclear Bank SA/NAV 14,900 –
iShares Pacific Ex Japan Equity Index Fund (UK) £000’s £000’s
Euroclear Bank SA/NAV – –
iShares UK Equity Index Fund (UK) £000’s £000’s
Euroclear Bank SA/NAV – –
iShares UK Gilts All Stocks Index Fund (UK) £000’s £000’s
Euroclear Bank SA/NAV 1,678,163 –
iShares US Equity Index Fund (UK) £000’s £000’s
Euroclear Bank SA/NAV – –
Supplementary Information continued
BlackRock Collective Investment Funds 438

The following table lists the top ten issuers (or all the issuers if less than ten) of non-cash collateral received bythe Fund by way of the title transfer collateral arrangement across securities lending transactions and OTC FDIsas at 31 August 2020.
Fund Value % of the Fund’s NAV
BlackRock Balanced Managed Fund £000’s
J.P. Morgan Securities Plc (Euroclear) 18,130 3.25
Citigroup Global Markets Limited (Euroclear) 8,099 1.45
Morgan Stanley & Co. International Plc 2,358 0.42
BNP Paribas Arbitrage SNC 651 0.12
Credit Suisse Securities (Europe) Limited 571 0.10
Barclays Capital Securities Limited 559 0.10
UBS AG 396 0.07
Deutsche Bank AG 196 0.04
J.P. Morgan Securities Plc 162 0.03
The Bank of Nova Scotia 159 0.03
Total 31,281 5.61
BlackRock Corporate Bond 1-10 Year Fund £000’s
Goldman Sachs International 9,861 0.80
BNP Paribas Arbitrage SNC 9,774 0.80
J.P. Morgan Securities Plc (Euroclear) 9,227 0.75
Citigroup Global Markets Limited (Euroclear) 6,906 0.56
J.P. Morgan Securities Plc 3,883 0.32
Barclays Bank Plc 3,014 0.25
RBC Europe Limited (Euroclear) 2,849 0.23
Morgan Stanley & Co. International Plc 2,514 0.21
Deutsche Bank AG (Euroclear) 1,404 0.11
HSBC Bank Plc 1,024 0.08
Other issuers 322 0.03
Total 50,778 4.14
iShares 100 UK Equity Index Fund (UK) £000’s
Banco Santander, S.A. 32,365 2.55
Barclays Capital Securities Limited 12,398 0.98
The Bank of Nova Scotia 10,960 0.86
J.P. Morgan Securities Plc 7,873 0.62
BNP Paribas Arbitrage SNC 2,681 0.21
Citigroup Global Markets Limited 2,181 0.17
Credit Suisse AG Dublin Branch 855 0.07
UBS AG 714 0.06
Deutsche Bank AG 353 0.03
Total 70,380 5.55
Supplementary Information continued
BlackRock Collective Investment Funds439

Fund Value % of the Fund’s NAV
iShares 350 UK Equity Index Fund (UK) £000’s
Banco Santander, S.A. 28,081 3.14
UBS AG 15,964 1.79
Barclays Capital Securities Limited 5,955 0.67
Citigroup Global Markets Limited 5,032 0.56
Natixis S.A. 5,014 0.56
The Bank of Nova Scotia 4,604 0.52
Goldman Sachs International 4,288 0.48
J.P. Morgan Securities Plc 1,609 0.18
Morgan Stanley & Co. International Plc 1,488 0.17
BNP Paribas Arbitrage SNC 1,102 0.12
Other issuers 1,049 0.00
Total 74,186 8.31
iShares Continental European Equity Index Fund (UK) £000’s
Société Générale SA 87,836 2.40
Credit Suisse Securities (Europe) Limited 79,852 2.18
Deutsche Bank AG 67,052 1.83
Barclays Capital Securities Limited 42,606 1.16
Credit Suisse AG Dublin Branch 40,069 1.09
Morgan Stanley & Co. International Plc 35,818 0.98
HSBC Bank Plc 32,792 0.89
J.P. Morgan Securities Plc 30,692 0.84
Citigroup Global Markets Limited 25,294 0.69
Merrill Lynch International 23,001 0.63
Other issuers 37,088 0.06
Total 502,100 13.70
iShares Corporate Bond Index Fund (UK) £000’s
Citigroup Global Markets Limited (Euroclear) 72,758 1.27
HSBC Bank Plc 51,361 0.89
Deutsche Bank AG (Euroclear) 35,152 0.61
BNP Paribas Arbitrage SNC 25,748 0.45
J.P. Morgan Securities Plc (Euroclear) 25,721 0.45
RBC Europe Limited (Euroclear) 23,891 0.41
Barclays Bank Plc 22,867 0.40
Morgan Stanley & Co. International Plc 12,506 0.22
Goldman Sachs International 11,909 0.21
J.P. Morgan Securities Plc 7,315 0.13
Other issuers 10,307 0.06
Total 299,535 5.22
Supplementary Information continued
BlackRock Collective Investment Funds 440

Fund Value % of the Fund’s NAV
iShares Emerging Markets Equity Index Fund (UK) £000’s
Credit Suisse AG Dublin Branch 35,864 1.38
HSBC Bank Plc 32,996 1.27
J.P. Morgan Securities Plc 28,671 1.10
UBS AG 28,107 1.08
Citigroup Global Markets Limited 16,233 0.63
Société Générale SA 11,821 0.46
Deutsche Bank AG 9,072 0.35
Merrill Lynch International 5,291 0.20
Barclays Capital Securities Limited 4,298 0.17
Macquarie Bank Limited 3,606 0.14
Other issuers 5,413 0.02
Total 181,372 6.99
iShares Global Property Securities Equity Index Fund(UK) £000’s
Deutsche Bank AG 133,928 4.37
J.P. Morgan Securities Plc 117,694 3.84
Credit Suisse AG Dublin Branch 57,641 1.88
Société Générale SA 46,916 1.53
The Bank of Nova Scotia 41,323 1.35
Citigroup Global Markets Limited 31,420 1.03
HSBC Bank Plc 29,843 0.97
Barclays Capital Securities Limited 29,217 0.95
Morgan Stanley & Co. International Plc 26,106 0.85
UBS AG 22,120 0.72
Other issuers 26,457 0.86
Total 562,665 18.35
iShares Japan Equity Index Fund (UK) £000’s
J.P. Morgan Securities Plc 351,729 19.01
Barclays Capital Securities Limited 328,847 17.78
Société Générale SA 62,893 3.40
Credit Suisse AG Dublin Branch 37,845 2.05
Merrill Lynch International 11,963 0.65
Nomura International Plc 10,837 0.58
UBS AG 9,807 0.53
Citigroup Global Markets Limited 8,681 0.47
Credit Suisse Securities (Europe) Limited 2,348 0.13
HSBC Bank Plc 1,232 0.07
Other issuers 1,435 0.07
Total 827,617 44.74
Supplementary Information continued
BlackRock Collective Investment Funds441

Fund Value % of the Fund’s NAV
iShares Mid Cap UK Equity Index Fund (UK) £000’s
UBS AG 31,557 5.30
The Bank of Nova Scotia 18,956 3.18
Barclays Capital Securities Limited 14,084 2.37
Citigroup Global Markets Limited 7,254 1.22
Goldman Sachs International 6,340 1.07
J.P. Morgan Securities Plc 6,145 1.03
Merrill Lynch International 4,431 0.74
Morgan Stanley & Co. International Plc 3,123 0.52
BNP Paribas Arbitrage SNC 3,021 0.51
Société Générale SA 2,983 0.50
Other issuers 2,156 0.36
Total 100,050 16.80
iShares North American Equity Index Fund (UK) £000’s
UBS AG 97,412 1.57
Société Générale SA 70,414 1.14
The Bank of Nova Scotia 39,914 0.65
Citigroup Global Markets Limited 30,641 0.50
Credit Suisse AG Dublin Branch 21,133 0.34
Credit Suisse Securities (Europe) Limited 10,228 0.17
HSBC Bank Plc 10,202 0.16
Merrill Lynch International 4,895 0.08
Goldman Sachs International 3,990 0.06
Deutsche Bank AG 3,808 0.06
Other issuers 563 0.01
Total 293,200 4.74
iShares Over 15 Years Corporate Bond Index Fund (UK) £000’s
HSBC Bank Plc 2,846 1.03
J.P. Morgan Securities Plc (Euroclear) 2,343 0.85
BNP Paribas Arbitrage SNC 2,219 0.80
Société Générale SA 2,089 0.75
Citigroup Global Markets Limited (Euroclear) 861 0.31
Barclays Bank Plc 817 0.29
Total 11,175 4.03
iShares Over 15 Years Gilts Index Fund (UK) £000’s
J.P. Morgan Securities Plc (Euroclear) 94,508 5.47
J.P. Morgan Securities Plc 93,246 5.40
Barclays Bank Plc 34,939 2.02
Total 222,693 12.89
Supplementary Information continued
BlackRock Collective Investment Funds 442

Fund Value % of the Fund’s NAV
iShares Overseas Corporate Bond Index Fund (UK) £000’s
Citigroup Global Markets Limited (Euroclear) 14,610 0.51
J.P. Morgan Securities Plc (Euroclear) 7,563 0.26
J.P. Morgan Securities Plc 6,712 0.23
Goldman Sachs International 5,305 0.18
Barclays Bank Plc 4,831 0.17
Morgan Stanley & Co. International Plc 4,237 0.15
Merrill Lynch International (Euroclear) 3,016 0.10
BNP Paribas Arbitrage SNC 2,854 0.10
Nomura International Plc 2,604 0.09
UBS AG 3,614 0.12
Other issuers 4,469 0.15
Total 59,815 2.06
iShares Overseas Government Bond Index Fund (UK) £000’s
Société Générale SA 49,655 2.82
BNP Paribas Arbitrage SNC 24,915 1.42
Morgan Stanley & Co. International Plc 17,574 1.00
Natixis S.A. 14,960 0.85
J.P. Morgan Securities Plc (Euroclear) 4,294 0.24
Citigroup Global Markets Limited (Euroclear) 3,734 0.21
J.P. Morgan Securities Plc 1,983 0.11
The Bank of Nova Scotia 1,894 0.11
Barclays Bank Plc 1,867 0.11
UBS AG 1,105 0.06
Other issuers 617 0.04
Total 122,598 6.97
iShares Pacific Ex Japan Equity Index Fund (UK) £000’s
Merrill Lynch International 214,755 16.80
Société Générale SA 57,777 4.52
Macquarie Bank Limited 20,671 1.62
J.P. Morgan Securities Plc 12,461 0.98
Morgan Stanley & Co. International Plc 6,424 0.50
Deutsche Bank AG 6,228 0.49
Nomura International Plc 3,925 0.31
Credit Suisse AG Dublin Branch 3,410 0.27
Credit Suisse Securities (Europe) Limited 2,590 0.20
UBS AG 2,108 0.16
Other issuers 3,286 0.25
Total 333,635 26.10
Supplementary Information continued
BlackRock Collective Investment Funds443

Fund Value % of the Fund’s NAV
iShares UK Equity Index Fund (UK) £000’s
Barclays Capital Securities Limited 165,125 1.61
UBS AG 147,115 1.43
The Bank of Nova Scotia 145,888 1.42
Banco Santander, S.A. 97,844 0.95
Credit Suisse Securities (Europe) Limited 85,045 0.83
Deutsche Bank AG 67,036 0.65
Société Générale SA 59,792 0.58
J.P. Morgan Securities Plc 33,515 0.33
Merrill Lynch International 27,987 0.27
Citigroup Global Markets Limited 22,219 0.22
Other issuers 73,213 0.02
Total 924,779 9.01
iShares UK Gilts All Stocks Index Fund (UK) £000’s
J.P. Morgan Securities Plc (Euroclear) 767,792 15.51
Morgan Stanley & Co. International Plc 670,757 13.55
BNP Paribas Arbitrage SNC 506,723 10.24
Citigroup Global Markets Limited (Euroclear) 353,718 7.15
Barclays Bank Plc 48,685 0.98
Banco Santander, S.A. 24,200 0.49
Société Générale SA 22,049 0.45
The Bank of Nova Scotia 16,577 0.33
Banco Santander, S.A. (Euroclear) 1,245 0.02
Total 2,411,746 48.72
iShares US Equity Index Fund (UK) £000’s
UBS AG 17,903 0.96
Credit Suisse AG Dublin Branch 13,122 0.70
The Bank of Nova Scotia 9,215 0.49
HSBC Bank Plc 8,652 0.46
Merrill Lynch International 7,426 0.40
Total 56,318 3.01
Supplementary Information continued
BlackRock Collective Investment Funds 444

About us
BlackRock is a premier provider of asset management, risk management, and advisory services to institutional,intermediary, and individual clients worldwide. As of 30 September 2020, the firm manages £5.92 trillion acrossasset classes in separate accounts, mutual funds, other pooled investment vehicles, and the industry-leadingiShares® exchange-traded funds.
Through BlackRock Solutions®, the firm offers risk management and advisory services that combine capitalmarkets expertise with proprietarily-developed analytics, systems, and technology. Through BlackRockSolutions, the Firm provides risk management and enterprise investment services for over 200 clients.
BlackRock serves clients in North and South America, Europe, Asia, Australia, Africa, and the Middle East.Headquartered in New York, the firm maintains offices in over 30 countries around the world.
Want to know more?blackrockinternational.com +44 (0)20 7743 3300
© 2020 BlackRock, Inc. All Rights reserved. BLACKROCK, BLACKROCK SOLUTIONS, iSHARES, SO WHAT DOI DO WITH MY MONEY, INVESTING FOR A NEW WORLD, and BUILT FOR THESE TIMES are registered andunregistered trademarks of BlackRock, Inc. or its subsidiaries in the United States and elsewhere. All othertrademarks are those of their respective owners.