iShares V plc Interim Report and Financial Statements 2018
327
For the fina Interim unaud iSHAR ancial perio m repo dited f RES V P od ended 31 ort an financ PLC 1 May 2018 d cial sta atemen nts
-
Upload
khangminh22 -
Category
Documents
-
view
0 -
download
0
Transcript of iShares V plc Interim Report and Financial Statements 2018
For the fina
InterimunaudiSHAR
ancial perio
m repodited f
RES V P
od ended 31
ort anfinancPLC
1 May 2018
d cial sta
atemennts

iSHARES V PLC
i S H A R E S V P L C I N T E R I M R E P O R T [ 1 ]
Contents Overview
General information 2
Background 4
Performance
Investment Manager’s report 7
Financial Statements
Condensed income statement 15
Condensed statement of changes in net assets attributable to redeemable participating shareholders 24
Condensed balance sheet 33
Notes to the unaudited financial statements 42
Schedules of investments 74
Additional Information and Regulatory Disclosures
Schedules of material purchases and sales 262
Calendar year performance 295
Transactions with connected parties 297
Leverage 297
Supplementary Information 298
Glossary 323
Disclaimers 324 This interim report and unaudited financial statements (the “Report and Accounts”) may be translated into other languages. Any such translation shall only contain the same information and have the same meaning as the English language Report and Accounts. To the extent that there is any inconsistency between the English language Report and Accounts and the Report and Accounts in another language, the English language Report and Accounts will prevail, except to the extent (and only to the extent) that it is required by law of any jurisdiction where the shares are sold, that in an action based upon disclosure in a Report and Accounts in a language other than English, the language of the Report and Accounts on which such action is based shall prevail. Any disputes as to the terms of the Report and Accounts, regardless of the language of the Report and Accounts, shall be governed by and construed in accordance with the laws of Ireland.
iSHARES V PLC
[ 2 ] i S H A R E S V P L C I N T E R I M R E P O R T
General information Board of Directors1 Sub-Investment Managers (continued) Paul McNaughton (Chairman) (Irish) BlackRock (Singapore) Limited
Paul McGowan (Irish) 20 Anson Road
Barry O’Dwyer (Irish) #18-01
Teresa O’Flynn (Irish) Singapore 079912
David Moroney (Irish) Singapore
Jessica Irschick (British)
BlackRock Asset Management North Asia Limited
Audit Committee Members 16/F Champion Tower
Paul McGowan (Chairman) Three Garden Road
Paul McNaughton Central
Hong Kong
Nomination Committee Members Paul McNaughton (Chairman) BlackRock Asset Management Deutschland AG
Paul McGowan Lenbachplatz 1 1st Floor
Barry O’Dwyer Munich 80333-MN3
Germany
Manager BlackRock Asset Management Ireland Limited Depositary J.P. Morgan House State Street Custodial Services (Ireland) Limited
International Financial Services Centre 78 Sir John Rogerson’s Quay
Dublin 1 Dublin 2
Ireland Ireland
Administrator and Registrar Registered office of the Company
State Street Fund Services (Ireland) Limited J.P. Morgan House
78 Sir John Rogerson’s Quay International Financial Services Centre
Dublin 2 Dublin 1
Ireland Ireland
Company Secretary Legal Advisors to the CompanySanne Corporate Administration Services Ireland Limited William Fry
Fourth Floor 2 Grand Canal Square
76 Baggot Street Lower Dublin 2
Dublin 2 Ireland
Ireland
Independent Auditors Investment Manager, Promoter and Securities lending Agent PricewaterhouseCoopers
BlackRock Advisors (UK) Limited Chartered Accountants and Registered Auditors
12 Throgmorton Avenue One Spencer Dock
London EC2N 2DL North Wall Quay
England Dublin 1
Ireland
Sub-Investment Managers BlackRock Financial Management Inc. Paying Agent 40 East 52nd Street Citibank N.A., London Branch
New York Citigroup Centre
NY 10022 25 Canada Square
United States Canary Wharf
London E14 5LB
England
1 All Directors are non-executive Directors.
iSHARES V PLC
i S H A R E S V P L C I N T E R I M R E P O R T [ 3 ]
General information (continued) Representative in Switzerland German Information Agent BlackRock Asset Management Schweiz AG State Street Bank International GmbH
Bahnhofstrasse 39 Briennerstrasse 59
8001 Zurich 80333 Munich
Switzerland Germany
Paying Agent in Switzerland Austrian Paying and Information Agent State Street Bank International GmbH UniCredit Bank Austria AG
Munich Attn: 8398/Custody
Zurich Branch Julius Tandler Platz 3
Beethovenstrasse 19 1090 Vienna
CH-8027 Zurich Austria
Switzerland The Company is duly registered with the Comisión Nacional del Mercado de Valores in Spain under number 977.
iSHARES V PLC
Background
[ 4 ] i S H A R E S V P L C I N T E R I M R E P O R T
iShares V public limited company (the "Company") is organised as an open-ended investment company with variable capital (an "Investment
Company"). The Company was incorporated in Ireland on 2 December 2009 with limited liability and segregated liability between its Funds and is
organised under the laws of Ireland as a Public Limited Company (“plc”) pursuant to the Companies Act 2014 (as amended) and the European
Communities (Undertakings for Collective Investment in Transferable Securities) Regulations, 2011 (as amended) (the "UCITS Regulations") and
is regulated by the Central Bank of Ireland ("CBI").
The term “Fund” shall be deemed to mean either a fund of the Company, or if the context so requires, the Manager or its delegate acting for the
account of the relevant Fund. The term “BlackRock” is used to represent BlackRock Advisors (UK) Limited. The investment objectives and policies
of each Fund are set out in the prospectus.
The Company is structured as an umbrella Fund and comprises separate Funds (“Funds”) of the Company. Each Fund of the Company comprises
a distinct portfolio of investments. The shares of each Fund may be issued with different rights, features and on different terms and conditions to
those of other Funds. Shares of a Fund may be divided into different share classes with different dividend policies, currency hedging and valuation
currencies and may therefore have different fees and expenses. A currency hedged share class is a share class of a Fund which allows the use of
hedging transactions to reduce the effect of exchange rate fluctuations. Unhedged share classes are also available to investors. The Company
may issue currency hedged share classes in Funds that are not currency hedged Funds. Currency hedged Funds are identified on the Fund
details table on page 6.
While assets and liabilities that are specific to a share class within a Fund would be attributable to (and should be borne by) only that share class,
there is no segregation of liabilities between share classes as a matter of Irish law. Due to the lack of segregation of liabilities, there is a risk that
the creditors of a share class may bring a claim against the assets of the Fund notionally allocated to other share classes. The financial
instruments and risks section of the financial statements provides more details on the management of foreign currency risk in relation to the
currency hedged share classes.
The Investment Manager may use derivatives (for example, forward currency contracts, futures contracts, options and swaps, or such other
instruments as are permitted) to hedge the rate of exchange between the currency of all or some of the currencies in which the assets of a Fund
(including cash and income) are dominated and the share class valuation currencies.
The transactions, costs and related liabilities and benefits arising from instruments entered into for the purposes of hedging the currency exposure
for the benefit of any particular currency hedged share classes shall be attributed only to the relevant currency hedged share classes. Currency
exposures of different share classes may not be combined or offset and currency exposures of the assets of a Fund may not be allocated to
separate share classes.
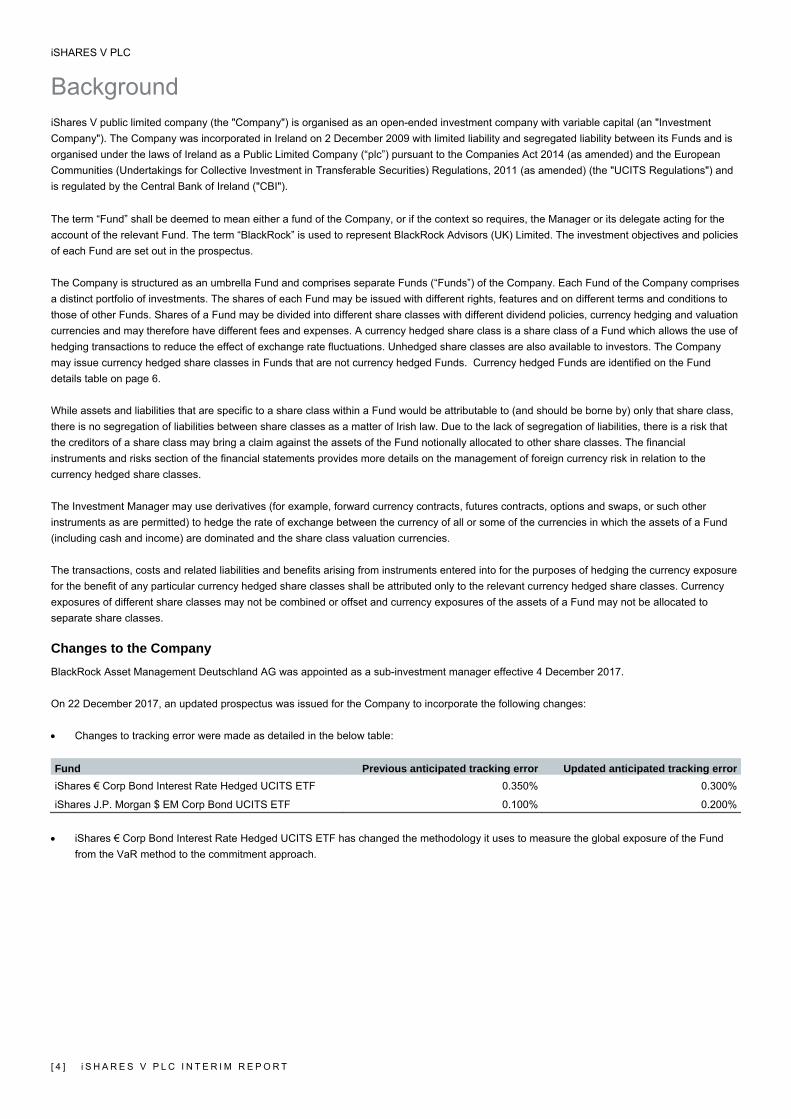
Changes to the Company BlackRock Asset Management Deutschland AG was appointed as a sub-investment manager effective 4 December 2017.
On 22 December 2017, an updated prospectus was issued for the Company to incorporate the following changes:
Changes to tracking error were made as detailed in the below table:
Fund Previous anticipated tracking error Updated anticipated tracking erroriShares € Corp Bond Interest Rate Hedged UCITS ETF 0.350% 0.300%
iShares J.P. Morgan $ EM Corp Bond UCITS ETF 0.100% 0.200%
iShares € Corp Bond Interest Rate Hedged UCITS ETF has changed the methodology it uses to measure the global exposure of the Fund
from the VaR method to the commitment approach.
iSHARES V PLC
Background (continued)
i S H A R E S V P L C I N T E R I M R E P O R T [ 5 ]
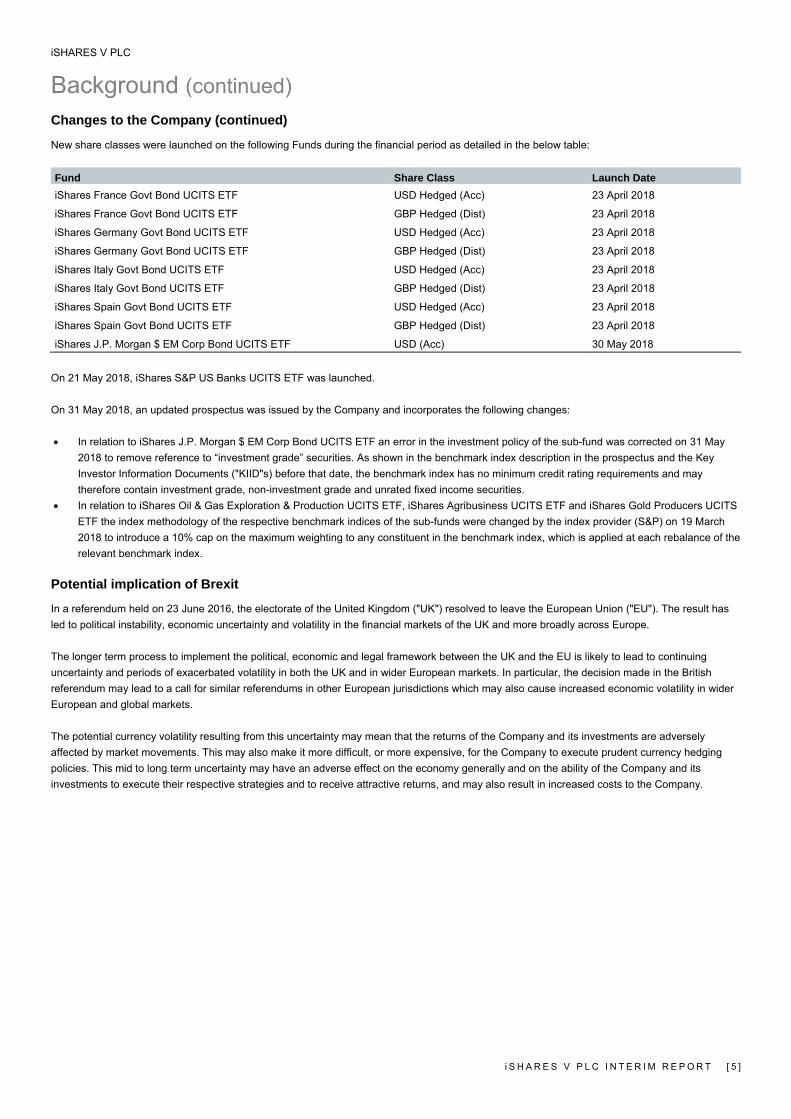
Changes to the Company (continued)
New share classes were launched on the following Funds during the financial period as detailed in the below table:
Fund Share Class Launch Date iShares France Govt Bond UCITS ETF USD Hedged (Acc) 23 April 2018
iShares France Govt Bond UCITS ETF GBP Hedged (Dist) 23 April 2018
iShares Germany Govt Bond UCITS ETF USD Hedged (Acc) 23 April 2018
iShares Germany Govt Bond UCITS ETF GBP Hedged (Dist) 23 April 2018
iShares Italy Govt Bond UCITS ETF USD Hedged (Acc) 23 April 2018
iShares Italy Govt Bond UCITS ETF GBP Hedged (Dist) 23 April 2018
iShares Spain Govt Bond UCITS ETF USD Hedged (Acc) 23 April 2018
iShares Spain Govt Bond UCITS ETF GBP Hedged (Dist) 23 April 2018
iShares J.P. Morgan $ EM Corp Bond UCITS ETF USD (Acc) 30 May 2018
On 21 May 2018, iShares S&P US Banks UCITS ETF was launched.
On 31 May 2018, an updated prospectus was issued by the Company and incorporates the following changes:
In relation to iShares J.P. Morgan $ EM Corp Bond UCITS ETF an error in the investment policy of the sub-fund was corrected on 31 May
2018 to remove reference to “investment grade” securities. As shown in the benchmark index description in the prospectus and the Key
Investor Information Documents ("KIID"s) before that date, the benchmark index has no minimum credit rating requirements and may
therefore contain investment grade, non-investment grade and unrated fixed income securities.
In relation to iShares Oil & Gas Exploration & Production UCITS ETF, iShares Agribusiness UCITS ETF and iShares Gold Producers UCITS
ETF the index methodology of the respective benchmark indices of the sub-funds were changed by the index provider (S&P) on 19 March
2018 to introduce a 10% cap on the maximum weighting to any constituent in the benchmark index, which is applied at each rebalance of the
relevant benchmark index.
Potential implication of Brexit
In a referendum held on 23 June 2016, the electorate of the United Kingdom ("UK") resolved to leave the European Union ("EU"). The result has
led to political instability, economic uncertainty and volatility in the financial markets of the UK and more broadly across Europe.
The longer term process to implement the political, economic and legal framework between the UK and the EU is likely to lead to continuing
uncertainty and periods of exacerbated volatility in both the UK and in wider European markets. In particular, the decision made in the British
referendum may lead to a call for similar referendums in other European jurisdictions which may also cause increased economic volatility in wider
European and global markets.
The potential currency volatility resulting from this uncertainty may mean that the returns of the Company and its investments are adversely
affected by market movements. This may also make it more difficult, or more expensive, for the Company to execute prudent currency hedging
policies. This mid to long term uncertainty may have an adverse effect on the economy generally and on the ability of the Company and its
investments to execute their respective strategies and to receive attractive returns, and may also result in increased costs to the Company.

iSHARES V PLC
Background (continued)
[ 6 ] i S H A R E S V P L C I N T E R I M R E P O R T
Fund details
There were 29 Funds in operation at 31 May 2018. The investment objective of the Funds is to provide investors with a total return, taking into
account the capital and income returns, which reflect the total returns of the respective benchmark listed in the table below:
Fund Benchmark Index
Investment Management Approach*
iShares € Corp Bond Interest Rate Hedged UCITS ETF Bloomberg Barclays EUR Corporate Interest Rate Hedged Index Non-replicating
iShares Agribusiness UCITS ETF S&P Commodity Producers Agribusiness Index Replicating
iShares EM Dividend UCITS ETF Dow Jones Emerging Markets Select Dividend Index Non-replicating
iShares France Govt Bond UCITS ETF Bloomberg Barclays France Treasury Bond Index Non-replicating
iShares Germany Govt Bond UCITS ETF Bloomberg Barclays Germany Treasury Bond Index Non-replicating
iShares Gold Producers UCITS ETF S&P Commodity Producers Gold Index Replicating
iShares Italy Govt Bond UCITS ETF Bloomberg Barclays Italy Treasury Bond Index Non-replicating
iShares J.P. Morgan $ EM Corp Bond UCITS ETF J.P. Morgan CEMBI Broad Diversified Core Index Non-replicating
iShares MSCI ACWI UCITS ETF MSCI All Countries World Index Net USD Non-replicating
iShares MSCI EM Consumer Growth UCITS ETF MSCI ACWI Emerging Market Consumer Growth Index Non-replicating
iShares MSCI Japan EUR Hedged UCITS ETF (Acc)^ MSCI Japan 100% Hedged to EUR Index Net Non-replicating
iShares MSCI Japan GBP Hedged UCITS ETF (Acc)^ MSCI Japan 100% Hedged to GBP Net TR Index Non-replicating
iShares MSCI Poland UCITS ETF MSCI Poland Index Replicating
iShares MSCI World EUR Hedged UCITS ETF (Acc)^ MSCI World 100% Hedged to EUR Index Net Non-replicating
iShares MSCI World GBP Hedged UCITS ETF (Acc)^ MSCI World 100% Hedged to GBP Index Net Non-replicating
iShares Oil & Gas Exploration & Production
UCITS ETF
S&P Commodity Producers Oil & Gas Exploration & Production
Index
Replicating
iShares S&P 500 Consumer Discretionary Sector
UCITS ETF
S&P 500 Capped 35/20 Consumer Discretionary Index Replicating
iShares S&P 500 Consumer Staples Sector UCITS ETF S&P 500 Capped 35/20 Consumer Staples Index Replicating
iShares S&P 500 Energy Sector UCITS ETF S&P 500 Capped 35/20 Energy Index Replicating
iShares S&P 500 EUR Hedged UCITS ETF (Acc)^ S&P 500 EUR Hedged Non-replicating
iShares S&P 500 Financials Sector UCITS ETF S&P 500 Capped 35/20 Financials Index Replicating
iShares S&P 500 GBP Hedged UCITS ETF (Acc)^ S&P 500 GBP Non-replicating
iShares S&P 500 Health Care Sector UCITS ETF S&P 500 Capped 35/20 Health Care Index Replicating
iShares S&P 500 Industrials Sector UCITS ETF S&P 500 Capped 35/20 Industrials Index Replicating
iShares S&P 500 Information Technology Sector
UCITS ETF
S&P 500 Capped 35/20 Information Technology Index Replicating
iShares S&P 500 Materials Sector UCITS ETF S&P 500 Capped 35/20 Materials Index Replicating
iShares S&P 500 Utilities Sector UCITS ETF S&P 500 Capped 35/20 Utilities Index Replicating
iShares Spain Govt Bond UCITS ETF Bloomberg Barclays Spain Treasury Bond Index Non-replicating
iShares S&P US Banks UCITS ETF S&P 900 Banks (Industry) 7/4 Capped Index Replicating
* Please refer to the Investment Manager’s report for further information on the meaning of replicating and non-replicating Funds. ^ Currency hedged Fund.
All figures relating to each Fund/Share class are shown in the relevant functional currency. The financial statements of the Company are
presented in Sterling. These Funds are Exchange Traded Funds (“ETFs”), which provide the flexibility of a share with the diversification of a Fund.
They can be bought and sold like any other share listed on a stock exchange, but provide instant exposure to many companies or various
financial instruments relevant to the Fund and its benchmark index.
Stock exchange listings
The Company maintained a primary listing on the London Stock Exchange (“LSE”).

iSHARES V PLC
Investment Manager’s report
i S H A R E S V P L C I N T E R I M R E P O R T [ 7 ]
INVESTMENT OBJECTIVE
The investment objective of the Funds is to provide investors with a total return, taking into account the capital and income returns, which reflect
the total returns of the respective benchmark listed in Fund details in the Background section.
FUND PERFORMANCE AND TRACKING ERROR
The Fund performance figures are the aggregated net monthly returns based on the Net Asset Value ("NAV") calculated in accordance with the
prospectus for the financial period under review. Due to Financial Reporting Standard ("FRS") 102 requirements which apply to the financial
statements, there may be differences between the NAV per share as recorded in the financial statements and the NAV per share calculated in
accordance with the prospectus. The returns are net of Total Expense Ratio ("TER").
Realised tracking error is the annualised standard deviation of the difference in monthly returns between a Fund and its benchmark index.
Tracking error shows the consistency of the returns relative to the benchmark index over a defined period of time. Tracking error is based on the
NAV calculated in accordance with the prospectus.
Anticipated tracking error is based on the expected volatility of differences between the returns of a Fund and the returns of its benchmark index.
For physically replicating Funds, the investment management approach is to buy a portfolio of securities that as far as practicable consist of the
securities that make up the benchmark index, in similar proportion to the weights represented in the benchmark index.
For non-replicating Funds, the investment management approach aims to match the main risk characteristics of the benchmark index by investing
in a portfolio that is primarily made up of securities that represent the benchmark index. The objective is to generate a return which is as close as
practicable to the total return of the index net of transaction costs, gross of fees and other costs.
Cash management, efficient portfolio management techniques including securities lending, transaction costs from rebalancing and currency
hedging can have an impact on tracking error as well as the return differential between a Fund and its benchmark index. Importantly, these
impacts can be either positive or negative depending on the underlying circumstances.
Each Fund’s TER is accrued on a daily basis throughout the financial period, which can impact the measurement of a tracking error in a positive or
negative manner depending on the performance in the market and the TER rate applied. The extent and magnitude of this effect on performance
measurement is subject to the timing of the market performance relative to the performance period and can be greater than the headline TER in a
positive market and lower than the TER in a negative market.
In addition to the above, the Funds may also have a tracking error due to withholding tax suffered by the Funds on any income received from its
investments. The level and quantum of tracking error arising due to withholding taxes depends on various factors such as any reclaims filed on
behalf of the Funds with various tax authorities, any benefits obtained by the Funds under a tax treaty or any securities lending activities carried
out by the Funds.
The following table compares the realised performance of the Funds against the performance of the relevant benchmark index during the financial
period ended 31 May 2018 and the anticipated tracking error of the Funds (disclosed in the prospectus on an ex-ante basis) against the actual
realised tracking error of the Funds as at 31 May 2018. The realised tracking error is annualised and calculated using data from the preceding 36
month observation period. Where a Fund has not been trading for 36 months, the annualised tracking error since inception has been presented.
Fund
Fund return for the
financial period ended 31/05/2018
%
Benchmark return for the
financial period ended 31/05/2018
%
Anticipated tracking error
%
Realised tracking error
%iShares € Corp Bond Interest Rate Hedged
UCITS ETF (2.01) (1.86) Up to 0.300 0.14
iShares Agribusiness UCITS ETF (1.23) (1.12) Up to 0.150 0.09
iSHARES V PLC
Investment Manager’s report (continued)
[ 8 ] i S H A R E S V P L C I N T E R I M R E P O R T
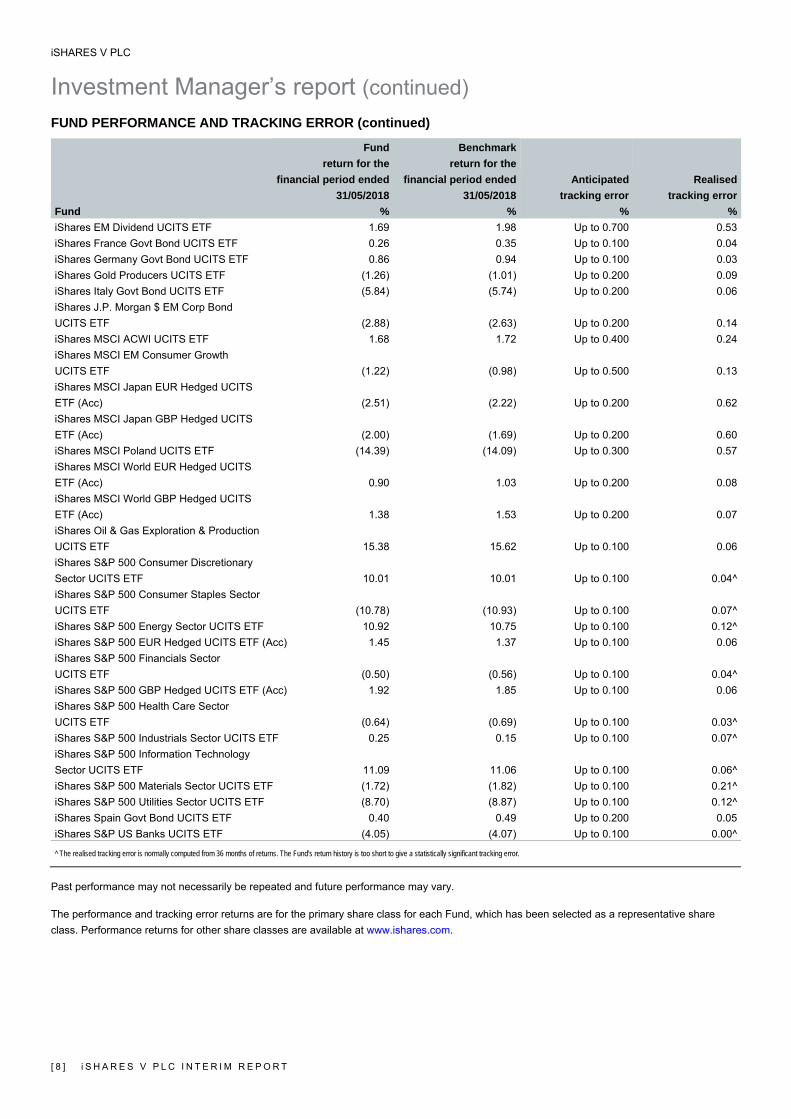
FUND PERFORMANCE AND TRACKING ERROR (continued)
Fund
Fund return for the
financial period ended 31/05/2018
%
Benchmark return for the
financial period ended 31/05/2018
%
Anticipated tracking error
%
Realised tracking error
%iShares EM Dividend UCITS ETF 1.69 1.98 Up to 0.700 0.53
iShares France Govt Bond UCITS ETF 0.26 0.35 Up to 0.100 0.04
iShares Germany Govt Bond UCITS ETF 0.86 0.94 Up to 0.100 0.03
iShares Gold Producers UCITS ETF (1.26) (1.01) Up to 0.200 0.09
iShares Italy Govt Bond UCITS ETF (5.84) (5.74) Up to 0.200 0.06
iShares J.P. Morgan $ EM Corp Bond
UCITS ETF (2.88) (2.63) Up to 0.200 0.14
iShares MSCI ACWI UCITS ETF 1.68 1.72 Up to 0.400 0.24
iShares MSCI EM Consumer Growth
UCITS ETF (1.22) (0.98) Up to 0.500 0.13
iShares MSCI Japan EUR Hedged UCITS
ETF (Acc) (2.51) (2.22) Up to 0.200 0.62
iShares MSCI Japan GBP Hedged UCITS
ETF (Acc) (2.00) (1.69) Up to 0.200 0.60
iShares MSCI Poland UCITS ETF (14.39) (14.09) Up to 0.300 0.57
iShares MSCI World EUR Hedged UCITS
ETF (Acc) 0.90 1.03 Up to 0.200 0.08
iShares MSCI World GBP Hedged UCITS
ETF (Acc) 1.38 1.53 Up to 0.200 0.07
iShares Oil & Gas Exploration & Production
UCITS ETF 15.38 15.62 Up to 0.100 0.06
iShares S&P 500 Consumer Discretionary
Sector UCITS ETF 10.01 10.01 Up to 0.100 0.04^
iShares S&P 500 Consumer Staples Sector
UCITS ETF (10.78) (10.93) Up to 0.100 0.07^
iShares S&P 500 Energy Sector UCITS ETF 10.92 10.75 Up to 0.100 0.12^
iShares S&P 500 EUR Hedged UCITS ETF (Acc) 1.45 1.37 Up to 0.100 0.06
iShares S&P 500 Financials Sector
UCITS ETF (0.50) (0.56) Up to 0.100 0.04^
iShares S&P 500 GBP Hedged UCITS ETF (Acc) 1.92 1.85 Up to 0.100 0.06
iShares S&P 500 Health Care Sector
UCITS ETF (0.64) (0.69) Up to 0.100 0.03^
iShares S&P 500 Industrials Sector UCITS ETF 0.25 0.15 Up to 0.100 0.07^
iShares S&P 500 Information Technology
Sector UCITS ETF 11.09 11.06 Up to 0.100 0.06^
iShares S&P 500 Materials Sector UCITS ETF (1.72) (1.82) Up to 0.100 0.21^
iShares S&P 500 Utilities Sector UCITS ETF (8.70) (8.87) Up to 0.100 0.12^
iShares Spain Govt Bond UCITS ETF 0.40 0.49 Up to 0.200 0.05
iShares S&P US Banks UCITS ETF (4.05) (4.07) Up to 0.100 0.00^
^ The realised tracking error is normally computed from 36 months of returns. The Fund's return history is too short to give a statistically significant tracking error.
Past performance may not necessarily be repeated and future performance may vary.
The performance and tracking error returns are for the primary share class for each Fund, which has been selected as a representative share
class. Performance returns for other share classes are available at www.ishares.com.
iSHARES V PLC
Investment Manager’s report (continued)
i S H A R E S V P L C I N T E R I M R E P O R T [ 9 ]
MARKET REVIEW Equities Global equities
This market review summary covers iShares MSCI ACWI UCITS ETF, iShares MSCI World EUR Hedged UCITS ETF (Acc) and iShares MSCI World GBP Hedged UCITS ETF (Acc).
Global equities produced modest positive returns over the Company’s review period. Despite confidence that the supportive global economic
backdrop should continue to bolster corporate earnings, concerns over the likely pace and extent of further US interest rate rises, uncertainty over
US trade policy and a return of Eurozone political tension limited global equities’ gains.
Having rallied modestly in December 2017, global equities surged in early January 2018, bolstered by investors’ positive reaction to political
agreement over sweeping US tax cuts, robust corporate earnings and rising oil prices as the Organization of the Petroleum Exporting Countries
(“OPEC”) and Russia agreed to extend production cuts to the end of 2018. Nevertheless, the stock market gains were dramatically reversed in
late January and early February 2018 on concerns that rising US inflation and pay growth could force the Federal Reserve (“Fed”) to raise
borrowing costs more rapidly and to a greater extent than had been expected. Market volatility would be a feature for the remainder of the first
quarter of 2018 as investors balanced reassuring company level news flow against mixed geopolitical headlines. Although North Korea related
tensions eased as the hermit state increased dialogue with its southern neighbour and prepared for a summit with President Trump, Middle East
tensions rose and increasingly tough rhetoric from the US administration heightened fears over its international trade policy. Having rallied in April
and early May 2018 on encouraging US economic data and hopes that President Trump’s ultimate motive was to seek better terms on trade
deals rather than abandon existing agreements completely, global equities sold off in late May 2018 after Italy’s Eurosceptic M5* and Lega
parties won Presidential approval to form a coalition government. Although ongoing positive US economic data helped to reassure investors,
President Trump irked his allies with the imposition of tariffs on steel and aluminium imports, raising concerns over the risk of a trade war with
China. Meanwhile, the stresses from the gradual ratcheting up of US interest rates became apparent in some emerging markets, with countries
such as Argentina and Turkey hit by rapid currency depreciation.
Equities complying with the size, liquidity and free-float criteria specified for inclusion in MSCI’s All Country World Index (“ACWI”) Net USD Index
performed broadly in line with wider global equity indices over the review period. The two currency hedged funds underperformed slightly relative
to the conventional MSCI World Index; the Euro and Sterling both made gains against the US Dollar over the review period, despite the US
currency’s partial recovery in May 2018.
US equities
This market review summary covers iShares S&P 500 Consumer Discretionary Sector UCITS ETF, iShares S&P 500 Consumer Staples Sector UCITS ETF, iShares S&P 500 Energy Sector UCITS ETF, iShares S&P 500 EUR Hedged UCITS ETF (Acc), iShares S&P 500 Financials Sector UCITS ETF, iShares S&P 500 GBP Hedged UCITS ETF (Acc), iShares S&P 500 Health Care Sector UCITS ETF , iShares S&P 500 Industrials Sector UCITS ETF, iShares S&P 500 Information Technology Sector UCITS ETF, iShares S&P 500 Materials Sector UCITS ETF, iShares S&P 500 Utilities Sector UCITS ETF and iShares S&P US Banks UCITS ETF.
US equities produced positive returns over the six month period, marginally outperforming relative to their global counterparts. Having rallied
dramatically around the turn of the calendar year amid robust economic data and investors’ enthusiastic reaction to the tax cuts, US stocks
subsequently gave back the bulk of their gains as investors gauged the potential effect of further rises in borrowing costs and uncertainty over US
trade policy.
iSHARES V PLC
Investment Manager’s report (continued)
[ 1 0 ] i S H A R E S V P L C I N T E R I M R E P O R T
MARKET REVIEW (continued)
Equities (continued) US equities (continued)
The US market began the review period on a positive note, underpinned by optimism over the growing potential for political agreement over cuts in
US taxes, notably corporate taxes. Meanwhile, further evidence as to the strength of the US economy, particularly robust data from the jobs
market, saw investors largely price in a 0.25% rise in interest rates in December 2017. US equities led their global counterparts dramatically higher
in mid-December 2017 and during January 2018, buoyed by confirmation that the key corporate tax rate would be slashed from 35% to 21%.
Meanwhile, buoyant global economic data and OPEC’s agreement with Russia over production cuts pushed energy prices higher, with the
strength of the US energy sector giving the rally further impetus. However, higher than expected inflation and pay data, and hawkish rhetoric from
the Fed, unsettled investors in late January 2018, with US equities leading their global counterparts sharply lower. Concerns that US borrowing
costs could rise more rapidly and to a greater extent than had been expected continued to weigh on sentiment for the remainder of the first quarter
of 2018. With further strength in oil prices and the extended weakness in the US Dollar since the first quarter of 2017 fanning inflationary concerns,
worries mounted that rising borrowing costs could crimp economic growth – particularly as 10-year Treasury bond yields approached 3.00%.
Nevertheless, with investors having largely priced in March 2018’s 0.25% interest rate rise, a move that lifted borrowing costs to 1.75%, US
equities staged a tentative recovery in April 2018, underpinned by encouraging economic and corporate earnings data. However, trade tensions
continued to act as a dampener on sentiment, particularly as President Trump imposed import tariffs on steel and aluminum, to the chagrin of key
allies, while investors remained concerned over the risk of a full blown trade war with China.
During the review period the currency hedged indices underperformed compared to the unhedged S&P index; despite the US Dollar’s late
recovery, the US currency lost ground against its Eurozone and UK counterparts over the six month period as a whole. In sector terms, robust
earnings helped IT companies to perform strongly, more than offsetting a brief setback as the Facebook data sharing scandal broke and fears over
the safety of self-driving cars mounted during the first quarter of 2018. Rising oil & gas prices helped the energy sector to outperform while the
buoyant domestic economy and robust labour market boosted retail activity, helping the consumer discretionary sector to generate strong gains.
The health care sector produced modest negative returns with investors fretting over the strength of new drug pipelines as patent expiries exposed
big earning products to generic competition. Financials also struggled as following strong performance since the November 2016 election, with
valuations looking stretched given the lack of sweeping banking sector reform so far. Despite the cyclical nature of these sectors, industrials and
materials recorded largely flat to modestly negative returns, partly reflecting valuation concerns given the risk of a global trade war. However,
consumer staples and utilities produced negative returns, underperforming the S&P index by a considerable margin, weighed by their defensive
qualities and the limited appeal of relatively low but reliable cash flows in an environment of healthy economic growth and rising interest rates.
Since inception on 21 May 2018, the iShares S&P US Banks UCITS ETF, which aims to provide targeted exposure to US large and mid-sized
banks, largely mirrored the softer tone of US financials as global equities lost ground amid uncertainties related to US trade policy and political
developments in Italy.
Japanese equities
This market review summary covers iShares MSCI Japan EUR Hedged UCITS ETF (Acc) and iShares MSCI Japan GBP Hedged UCITS ETF (Acc).
Japanese stocks generated positive returns but slightly underperformed compared to their global counterparts in US Dollar terms over the six
month period under review, largely reflecting disappointing relative returns late in the period. Doubts over US trade policy and concerns that
softer than expected consumer activity could drag on economic growth acted as a slight headwind to Japanese equities. The Euro and UK
Sterling hedged funds trailed the unhedged MSCI Japan index; over the review period the single currency and its UK counterpart both lost ground
against the Japanese Yen.
Japanese stocks performed strongly around the turn of the calendar year, both on an outright basis and relative to their global counterparts. This
reflected a combination of encouraging signs from the domestic economy and optimism that the US administration would retain a cautious
approach before imposing any new trade tariffs. In particular, the robust employment market pushed the jobless rate to a 24 year low while the
Bank of Japan’s (“BoJ”) Tankan survey showed business confidence at its best level in almost 11 years.
iSHARES V PLC
Investment Manager’s report (continued)
i S H A R E S V P L C I N T E R I M R E P O R T [ 1 1 ]
MARKET REVIEW (continued)
Equities (continued) Japanese equities (continued)
Investors also drew comfort from confirmation that Japan’s economy had grown by a healthy 0.60% during the third quarter of 2017. However,
after rallying sharply alongside their global counterparts in January 2018 following the US tax cut news, Japanese stocks sold off sharply as
concerns over the prospect of faster than expected rises in US interest rates shook investors’ confidence. A rise in the Japanese Yen against the
US Dollar, partly founded on the view that the Fed’s gradual reversal of quantitative easing (“QE”) could add to medium term pressure on the BoJ
to gradually pare back its own stimulus programme, also acted as a headwind to exporters.
Japanese equities broadly tracked the gyrations of their global counterparts in March and April 2018, albeit sporadic worries that tariff
brinksmanship between the US and China could stoke a global trade war acted as a slight drag on Japanese equities. The market also suffered
from an element of political uncertainty as Prime Minister Shinzo Abe was dragged into a property scandal amid allegations over the sale of land
to an education provider with connections to his wife. Although a decline in regional tension as the North and South Korea leaders held a historic
summit lent some support to Japanese equities, concerns that the domestic economic outlook was softening weighed to some extent to
Japanese equities late in the review period. Data released in May 2018 showed that following growth of 0.30% during the final quarter of 2017,
the Japanese economy contracted by (0.20%) during the first quarter of 2018 as consumer activity slowed. Meanwhile, President Trump’s
decision to impose tariffs on aluminium and steel imports raised concerns that the US administration could yet turn its attention to other goods,
such as cars and consumer electronics. Against this backdrop Japanese equities ended the review period on a relatively weak note.
Emerging markets
This market review summary covers iShares EM Dividend UCITS ETF, iShares MSCI EM Consumer Growth UCITS ETF and iShares MSCI Poland UCITS ETF.
Emerging market equities produced only modest positive returns, underperforming relative to their developed market and global counterparts over
the review period. Despite the generally encouraging outlook for global economic growth, concerns over the risk that the US could extend import
tariffs weighed on sentiment towards export orientated emerging markets. In regional terms, the solid performance of Far Eastern markets
contrasted with negative returns from Latin American markets, reflecting rising political and economic concerns in the latter during the final weeks
of the review period.
Emerging markets began the review period on a very strong footing, with the MSCI Emerging Markets Index soaring by over 13% in US Dollar
terms by late January 2018. These gains largely reflected optimism that the positive global economic outlook would continue to support demand
for exports from emerging markets. Sentiment also benefitted from the effects of the sweeping cuts to US corporate taxes and optimism that
President Trump would refrain from implementing sweeping new import tariffs that could impact disproportionately on emerging economies.
Nevertheless, having peaked on 26th January 2018, emerging market equities subsequently fell sharply as investors factored in the risk that US
interest rates could rise more quickly than consensus expectations suggested, with a knock on effect on markets widely seen as higher risk.
Having plunged back to their levels of early December 2017 by the start of February 2018, emerging market equities largely stabilised for the
remainder of the first quarter 2018, helped by reassuring economic data from the Far East. Although growing concern over the risk of trade
barriers to the US market stoked volatility in Chinese equities, data from the manufacturing sector supported the view that the economic backdrop
remained positive. Data would subsequently show that China’s economy had grown by 6.80% on a year on year basis during the first quarter of
2018, matching its performance over the previous two quarters.
However, while emerging market equities generated largely flat returns in April 2018, sentiment took at distinct turn for the worse in May 2018,
after the US administration imposed import tariffs on steel and aluminium. With investors increasingly vigilant to risk as Turkey faced a growing
currency crisis as the Turkish Lira plunged and Argentina applied to the IMF for emergency funds, a series of further negative headlines from Latin
America weighed heavily on the region’s stock markets. Political uncertainty ahead of October 2018’s election in Brazil heightened as industrial
unrest and some wider resistance to reform raised questions over the economic outlook. Meanwhile, Mexican equities plunged amid concerns
over the potential impact of President Trump’s renegotiation of the North America Free Trade Agreement (“NAFTA”). With incumbent President
Enrique Peña Nieto not contesting the 1st July 2018 election, investors reacted with concern as several polls showed maverick left wing candidate
Andrés Manuel López Obrador stretching his lead to around 25%.
iSHARES V PLC
Investment Manager’s report (continued)
[ 1 2 ] i S H A R E S V P L C I N T E R I M R E P O R T
MARKET REVIEW (continued)
Equities (continued) Emerging market equities (continued)
Stocks paying attractive levels of dividends marginally outperformed broader emerging market equities, reflecting the formers’ lower relative
weightings among underperforming financials. At the stock level, relatively large exposure to Russian mining group Severstal further supported
returns. Meanwhile, emerging market companies focused on consumer growth generated negative share price performance, lagging compared to
wider emerging market equities. Relatively large exposure to the poorly performing consumer discretionary sector acted as a drag on returns,
particularly during bouts of investor risk aversion in early 2018. Following robust performance earlier in 2017, Polish equities performed particularly
poorly over the review period, underperforming by a substantial margin compared to their global and emerging market counterparts. Given
ongoing governance worries, some investors took the view that valuations were excessive in view of deepening discord between the Polish
government and the EU, while a general reduction in risk appetite also weighed on sentiment.
Fixed income European government bonds
This market review summary covers iShares France Govt Bond UCITS ETF, iShares Germany Govt Bond UCITS ETF, iShares Italy Govt Bond UCITS ETF and iShares Spain Govt Bond UCITS ETF.
European government bond markets produced disappointing returns, underperforming their broader global market counterparts over the
Company’s review period. While rising US interest rates represented a challenging backdrop for fixed income assets generally, European
government bonds faced further headwinds as inflation picked up sharply late in the review period while peripheral Eurozone uncertainties
resurfaced, particularly in Italy as Eurosceptic parties finally formed a coalition government following the March 2018 elections.
Eurozone government bond prices began the six month period on a weak note, unsettled by firm economic data. Robust Eurozone composite
Purchasing Managers survey data and news that consumer confidence had hit its highest level in over 10 years suggested that the single currency
zone’s economy was ending 2017 on a high note. Against this backdrop, comments from European Central Bank (“ECB”) officials suggesting that
the bond buying QE programme could be wound down in 2018 should the economy no longer warrant extraordinary levels of support further
undermined sentiment towards Eurozone government bonds into 2017 year end. The poor performance extended throughout January 2018 as
positive global economic data and the US tax reform measures highlighted the appeal of growth friendly equities over low risk government bonds.
Nevertheless, bond markets found support in early February 2018 following the abrupt selloff in global equities, with Eurozone debt in particular
demand following the release of softer inflation data. Compared to 1.50% as recently as November 2017, Eurozone inflation eased to just 1.10% in
February 2018, far below the ECB’s official target of just below 2.00%.
Having largely tracked the uptrend in global government bond markets in March and early April 2018 as ongoing volatility in global equities,
particularly in regions regarded as higher risk highlighted the appeal of safe haven government bonds, Eurozone bonds performed very poorly in
May 2018. The decline was largely founded on a sharp rise in Italian government bond yields as the left leaning Five Star Movement and right
leaning Lega parties extended their talks over forming a coalition government. Although President Mattarella seemingly scuppered the potential
coalition by vetoing the Eurosceptic parties’ original anti-Euro finance minister, a revised choice paved the way for a new government that would
subsequently be headed by Giuseppe Conte, a law professor and political newcomer. With the government’s spending plans seemingly setting a
collision course with the EU’s deficit rules, Italian 10 year government bond yields soared from 1.80% in late April 2018 to 3.10% in late May 2018.
Meanwhile, political uncertainty also weighed, albeit to a much lesser extent on Spanish government bonds after Prime Minister Mariano Rajoy
lost a confidence vote and was replaced by Pedro Sánchez. During the last day of the review period news that Eurozone inflation had spiked to
1.90% in May 2018, the highest level since April 2017, lifted by rising oil prices, further unsettled investors.
In country terms, Italian government debt performed very poorly, reflecting uncertainty related to the Eurosceptic government’s tax and spending
plans. Similarly, peripheral Eurozone political risks extended to Spanish debt, which produced only modest price gains. Meanwhile, French debt
also generated only muted price gains, partly reflecting a surge in French inflation late in the review period. However, German debt produced more
solid gains, underpinned by some signs that economic growth in Europe’s largest economy could be slowing slightly.
iSHARES V PLC
Investment Manager’s report (continued)
i S H A R E S V P L C I N T E R I M R E P O R T [ 1 3 ]
MARKET REVIEW (continued)
Fixed income (continued) Corporate bonds
This market review summary covers iShares € Corp Bond Interest Rate Hedged UCITS ETF and iShares J.P. Morgan $ EM Corp Bond UCITS ETF.
Credit markets generated poor returns over the review period. This reflected both the flat to negative performance of underlying government bond
markets and some widening in credit spreads, particularly as investors adopted a more cautious attitude to risk late in the review period. While
Euro denominated credit lost ground late in the review period as Italy related uncertainties mounted, US Dollar denominated emerging market
credit’s performance also largely reflected country specific concerns, included those related to Mexico and Turkey.
Credit markets generally tracked their global government bond peers lower during December 2017 and January 2018, largely reflecting investors’
preference for growth friendly equities on the basis of the positive global economic growth outlook, rising oil prices and the effects of US tax cuts.
However, following equities’ dramatic sell off at the end of January 2018, although government bonds markets attracted some degree of safe
haven buying as investors priced in the risk of faster than expected rises in US interest rates, corporate bonds generally underperformed
compared to their government counterparts. This general widening of credit spreads from early February 2018 reflected concerns that the gradual
end to the global era of ‘cheap money’ could, over time, create some headwinds to corporate earnings growth, potentially affecting companies’
ability to service their debt burdens and thereby raising the risk of default.
Although global economic data remained broadly reassuring, country specific concerns came to the fore during the second half of the review
period, weighing on both Euro and emerging market credit. While lingering uncertainties over the threat of new barriers to trade with the US
hampered investors’ enthusiasm for risk, emerging market credit also suffered amid rising bond yields in countries such as Turkey. Investors were
left unimpressed by President Erdoğan’s interventionist approach as the Turkish Lira slid – a development that looked likely to stress banks’
balance sheets given their extensive foreign currency borrowing. Although Russian credit benefitted from lower underlying Russian government
bond yields and improving sentiment towards the energy sector as oil & gas prices rose, this was partly offset by rising underlying bond yields in
countries such as Mexico and Indonesia. In May 2018, a pronounced reversal of the US Dollar’s yearlong weakness against a basket of
international currencies acted as headwinds for US Dollar bond borrowers. Meanwhile, political uncertainties, centred on Italy as the Eurosceptic
coalition government laid out an economic agenda than looked set to clash with the EU rules, weighed on Euro denominated credit over the final
weeks of the review period, with Italian and Spanish corporate bonds performing particularly poorly. This reflected both rises in underlying
government bond yields and a widening of credit spreads.
Commodities Agriculture
This market review summary covers iShares Agribusiness UCITS ETF.
Investing in the largest publicly traded companies involved in agribusiness from around the world, the Fund produced negative returns over the
Company’s review period, underperforming relative to mainstream global stock markets.
Global agribusiness equities pushed higher in December 2017, largely outpacing the rise in global equities, boosted by very strong returns from
Deere after the US based agricultural machinery giant reported robust quarterly earnings. The sector’s strength extended deep into January 2018,
boosted by very positive sentiment towards global equities and strong returns from Japanese tractor manufacturer Kubota. However, against the
backdrop of a dramatic slide in broader global equities in late January and early February 2018, global agribusiness equities also suffered steep
falls, with the sector firmly on the back foot for the remainder of the first quarter of 2018. This extended weakness largely reflected growing
concerns over the risk of a global trade war as President Trump’s “America First” rhetoric suggested that the US was getting a raw deal from
existing trading arrangements. Given the possible impact on leading companies in the global agribusiness sector of a full scale trade war, the
share prices of companies such as Deere and Canadian fertiliser producer Nutrien, formerly known as PotashCorp prior to its January 2018
merger with Agrium, slid.
iSHARES V PLC
Investment Manager’s report (continued)
[ 1 4 ] i S H A R E S V P L C I N T E R I M R E P O R T
MARKET REVIEW (continued)
Commodities (continued) Agriculture (continued)
Although agribusiness equities largely followed their global counterparts higher during the final weeks of the review period, the sector lagged
marginally behind the rally in global equities. Disappointing returns from US based Tyson Foods, one of the world’s largest producers &
processors of chicken and beef, and machinery heavyweights Deere and Kubota, acted as a drag on returns as President Trump’s decision to
impose import tariffs on steel and aluminium looked set to be met with retaliatory measures, thereby raising the risk of a damaging global trade
war.
Energy
This market review summary covers iShares Oil & Gas Exploration & Production UCITS ETF.
Having suffered steep losses earlier in 2017, Exploration & Production (“E&P”) equities achieved strong gains over the six month review period,
outperforming broad global equity markets by a double digit margin. E&P stocks also outperformed compared to conventional energy companies,
boosted by strong returns from several leading stocks within the E&P sector, such as Anadarko Petroleum and ConocoPhillips.
E&P equities opened the review period on a firm note, buoyed both by rising energy prices following the agreement between OPEC and Russia
over extending the production cut timeframe and the strong performance of individual E&P stocks, notably Anadarko Petroleum and EOG
Resources. Although valuations across the sector also reflected the 2017 year end surge and dramatic subsequent selloff in global equities from
late January 2018, the E&P sector demonstrated considerable resilience over the remainder of the first quarter of 2018, underpinned by ongoing
strength in EOG Resources after the Texas based firm reported better than expected quarterly results.
With Brent crude oil prices pushing above $70 in early April 2018 amid a combination of supply concerns related to Iran and optimism over the
global demand outlook, the firm broader oil & gas sector provided a supportive backdrop for E&P equities. Strong share price performance from
companies such as ConocoPhillips lent further support to the sector’s rally after the firm won a $2bn arbitration award against PDVSA,
Venezuela’s state owned oil company, over asset seizures. As US West Texas Intermediate crude prices topped $70 for the first time since 2014
during the final weeks of the review period, sentiment towards E&P equities remained firm, particularly given ongoing strength in both
ConocoPhillips and Anadarko Petroleum after both firms reported quarterly earnings ahead of consensus forecasts.
Gold
This market review summary covers iShares Gold Producers UCITS ETF.
Companies involved in gold exploration and the production of gold and related products suffered modest share price declines over the review
period, underperforming compared to broader global equities and the returns from physical gold.
Following a brief dip in early December 2017, gold E&P equities tracked physical gold prices higher into year end, with ongoing weakness in the
US Dollar continuing to underpin commodity and precious metal prices. After broadly following the late December 2017 and early January 2018
climb and subsequent slide in global equities, gold E&P equities demonstrated some degree of resilience in mid-February 2018, underpinned by
solid returns from Colorado based gold and copper producer Newmont Mining. However, gold equities suffered declines for much of the remainder
of the first quarter of 2018, partly reflecting disappointing returns from sector heavyweight Barrick Gold.
The E&P sector’s muted performance extended into April 2018, even as physical gold prices and global stock markets recovered. E&P companies’
collective underperformance was partly attributable to poor returns from Franco-Nevada after the Toronto based royalties & streams owner’s share
price continued to languish following March 2018’s quarterly earnings disappointment. Nevertheless, helped by an upturn in underlying gold prices
– even with the US Dollar staging a partial recovery – as gold’s traditional anti-inflation and ‘safe haven’ appeal attracted buyers amid concerns
over US pricing pressures and Eurozone political uncertainty, gold E&P valuations firmed during the final weeks of the review period. The recovery
was partly driven by a positive quarterly update from Barrick Gold after the Toronto based firm reported better than expected earnings as higher
gold prices offset the effects of a slight fall in production, while a decline in year on year cost of sales also supported the company’s earnings.
BlackRock Advisors (UK) Limited July 2018
iSHARES V PLC CONDENSED INCOME STATEMENT (unaudited)
i S H A R E S V P L C I N T E R I M R E P O R T [ 1 5 ]
For the financial period ended 31 May 2018 and 31 May 2017
Company Total iShares € Corp Bond Interest Rate
Hedged UCITS ETF iShares Agribusiness
UCITS ETF iShares Austria Govt Bond
UCITS ETF*
Note31 May 2018
£’00031 May 2017
£’00031 May 2018
€’000 31 May 2017
€’00031 May 2018
$’00031 May 2017
$’000 31 May 2017
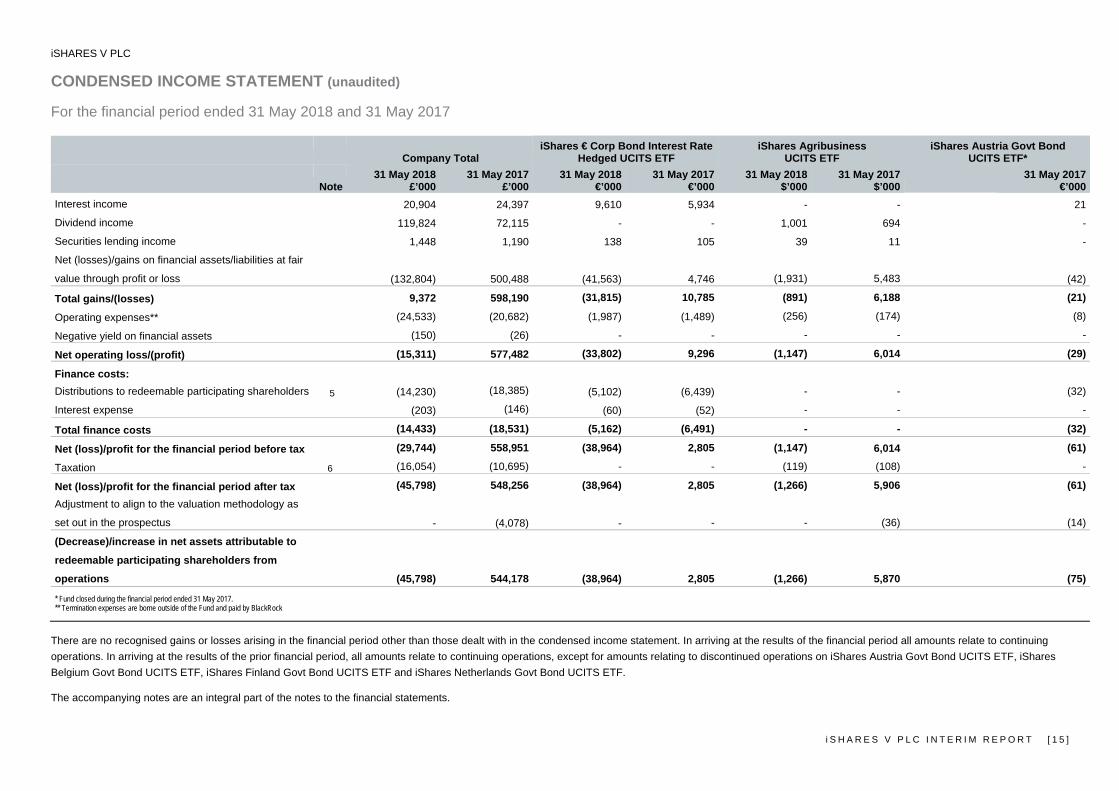
€’000 Interest income 20,904 24,397 9,610 5,934 - - 21
Dividend income 119,824 72,115 - - 1,001 694 -
Securities lending income 1,448 1,190 138 105 39 11 -
Net (losses)/gains on financial assets/liabilities at fair
value through profit or loss (132,804) 500,488 (41,563) 4,746 (1,931) 5,483 (42)
Total gains/(losses) 9,372 598,190 (31,815) 10,785 (891) 6,188 (21)
Operating expenses** (24,533) (20,682) (1,987) (1,489) (256) (174) (8)
Negative yield on financial assets (150) (26) - - - - -
Net operating loss/(profit) (15,311) 577,482 (33,802) 9,296 (1,147) 6,014 (29)
Finance costs: Distributions to redeemable participating shareholders 5 (14,230) (18,385) (5,102) (6,439) - - (32)
Interest expense (203) (146) (60) (52) - - -
Total finance costs (14,433) (18,531) (5,162) (6,491) - - (32)
Net (loss)/profit for the financial period before tax (29,744) 558,951 (38,964) 2,805 (1,147) 6,014 (61)
Taxation 6 (16,054) (10,695) - - (119) (108) -
Net (loss)/profit for the financial period after tax (45,798) 548,256 (38,964) 2,805 (1,266) 5,906 (61)
Adjustment to align to the valuation methodology as
set out in the prospectus - (4,078) - - - (36) (14)
(Decrease)/increase in net assets attributable to
redeemable participating shareholders from
operations (45,798) 544,178 (38,964) 2,805 (1,266) 5,870 (75)
* Fund closed during the financial period ended 31 May 2017. ** Termination expenses are borne outside of the Fund and paid by BlackRock
There are no recognised gains or losses arising in the financial period other than those dealt with in the condensed income statement. In arriving at the results of the financial period all amounts relate to continuing operations. In arriving at the results of the prior financial period, all amounts relate to continuing operations, except for amounts relating to discontinued operations on iShares Austria Govt Bond UCITS ETF, iShares Belgium Govt Bond UCITS ETF, iShares Finland Govt Bond UCITS ETF and iShares Netherlands Govt Bond UCITS ETF. The accompanying notes are an integral part of the notes to the financial statements.

iSHARES V PLC CONDENSED INCOME STATEMENT (unaudited) (continued)
[ 1 6 ] i S H A R E S V P L C I N T E R I M R E P O R T
For the financial period ended 31 May 2018 and 31 May 2017
iShares Belgium Govt Bond
UCITS ETF* iShares EM Dividend
UCITS ETF iShares Finland Govt Bond
UCITS ETF* iShares France Govt Bond
UCITS ETF
Note31 May 2017
€’00031 May 2018
$’000 31 May 2017
$’00031 May 2017
€’00031 May 2018
€’000 31 May 2017
€’000 Interest income 41 2 - 3 532 155
Dividend income - 7,292 5,001 - - -
Securities lending income - 116 175 - 14 11
Net (losses)/gains on financial assets/liabilities at fair
value through profit or loss (203) 2,068 39,417 (1) 270 1,751
Total (losses)/gains (162) 9,478 44,593 2 816 1,917
Operating expenses** (14) (1,139) (880) (3) (230) (162)
Negative yield on financial assets - - - - (147) (26)
Net operating (loss)/profit (176) 8,339 43,713 (1) 439 1,729
Finance costs:
Distributions to redeemable participating shareholders 5 (47) (3,654) (1,798) (1) (53) (39)
Interest expense - (9) (6) - (1) (2)
Total finance costs (47) (3,663) (1,804) (1) (54) (41)
Net (loss)/profit for the financial period before tax (223) 4,676 41,909 (2) 385 1,688
Taxation 6 - (745) (790) - - -
Net (loss)/profit for the financial period after tax (223) 3,931 41,119 (2) 385 1,688
Adjustment to align to the valuation methodology as
set out in the prospectus (22) - (177) (2) - (183)
(Decrease)/increase in net assets attributable to
redeemable participating shareholders from
operations (245) 3,931 40,942 (4) 385 1,505
* Fund closed during the financial period ended 31 May 2017. ** Termination expenses are borne outside of the Fund and paid by BlackRock.
There are no recognised gains or losses arising in the financial period other than those dealt with in the condensed income statement. In arriving at the results of the financial period all amounts relate to continuing operations. In arriving at the results of the prior financial period, all amounts relate to continuing operations, except for amounts relating to discontinued operations on iShares Austria Govt Bond UCITS ETF, iShares Belgium Govt Bond UCITS ETF, iShares Finland Govt Bond UCITS ETF and iShares Netherlands Govt Bond UCITS ETF. The accompanying notes are an integral part of the notes to the financial statements.
iSHARES V PLC CONDENSED INCOME STATEMENT (unaudited) (continued)
i S H A R E S V P L C I N T E R I M R E P O R T [ 1 7 ]
For the financial period ended 31 May 2018 and 31 May 2017
iShares Germany Govt Bond
UCITS ETF iShares Gold Producers
UCITS ETF iShares Italy Govt Bond
UCITS ETF iShares J.P. Morgan $ EM Corp
Bond UCITS ETF
Note31 May 2018
€’00031 May 2017
€’00031 May 2018
$’000 31 May 2017
$’00031 May 2018
€’00031 May 2017
€’00031 May 2018
$’000 31 May 2017
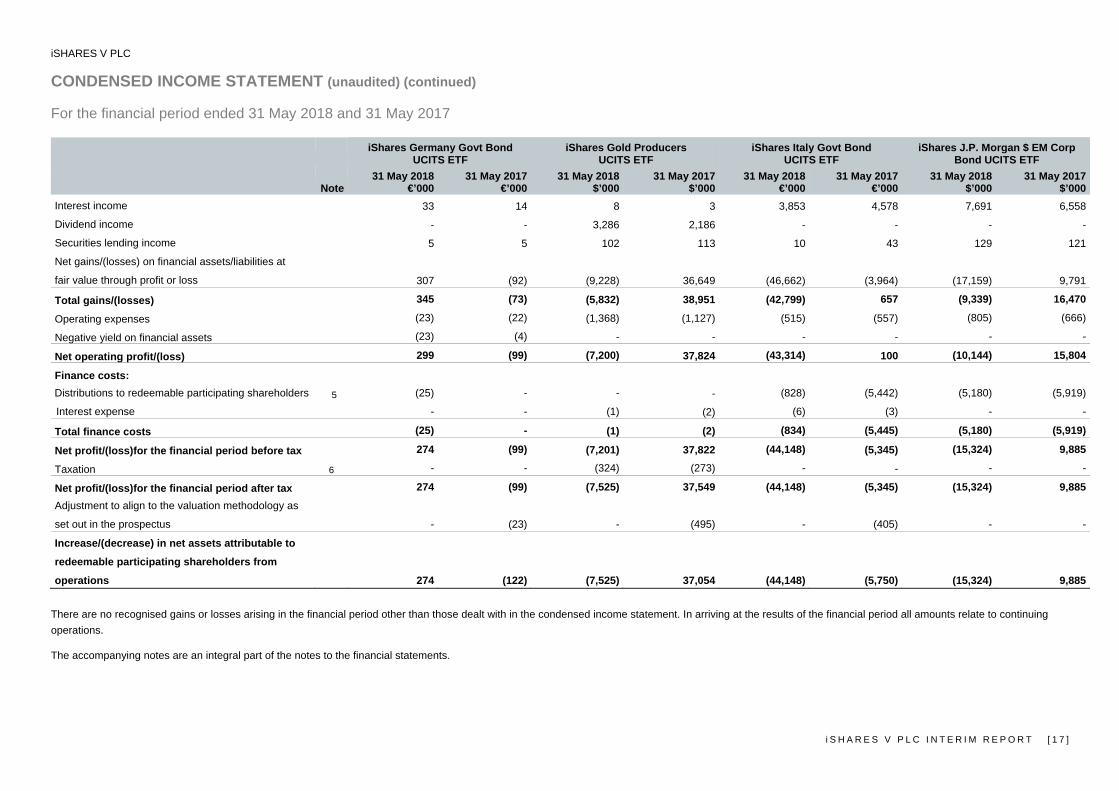
$’000 Interest income 33 14 8 3 3,853 4,578 7,691 6,558
Dividend income - - 3,286 2,186 - - - -
Securities lending income 5 5 102 113 10 43 129 121
Net gains/(losses) on financial assets/liabilities at
fair value through profit or loss 307 (92) (9,228) 36,649 (46,662) (3,964) (17,159) 9,791
Total gains/(losses) 345 (73) (5,832) 38,951 (42,799) 657 (9,339) 16,470
Operating expenses (23) (22) (1,368) (1,127) (515) (557) (805) (666)
Negative yield on financial assets (23) (4) - - - - - -
Net operating profit/(loss) 299 (99) (7,200) 37,824 (43,314) 100 (10,144) 15,804
Finance costs:
Distributions to redeemable participating shareholders 5 (25) - - - (828) (5,442) (5,180) (5,919)
Interest expense - - (1) (2) (6) (3) - -
Total finance costs (25) - (1) (2) (834) (5,445) (5,180) (5,919)
Net profit/(loss)for the financial period before tax 274 (99) (7,201) 37,822 (44,148) (5,345) (15,324) 9,885
Taxation 6 - - (324) (273) - - - -
Net profit/(loss)for the financial period after tax 274 (99) (7,525) 37,549 (44,148) (5,345) (15,324) 9,885
Adjustment to align to the valuation methodology as
set out in the prospectus - (23) - (495) - (405) - -
Increase/(decrease) in net assets attributable to
redeemable participating shareholders from
operations 274 (122) (7,525) 37,054 (44,148) (5,750) (15,324) 9,885 There are no recognised gains or losses arising in the financial period other than those dealt with in the condensed income statement. In arriving at the results of the financial period all amounts relate to continuing operations. The accompanying notes are an integral part of the notes to the financial statements.
iSHARES V PLC CONDENSED INCOME STATEMENT (unaudited) (continued)
[ 1 8 ] i S H A R E S V P L C I N T E R I M R E P O R T
For the financial period ended 31 May 2018 and 31 May 2017
iShares MSCI ACWI
UCITS ETF iShares MSCI EM Consumer
Growth UCITS ETF iShares MSCI Japan EUR Hedged UCITS ETF (Acc)
iShares MSCI Japan GBP Hedged UCITS ETF (Acc)
Note31 May 2018
$’00031 May 2017
$’00031 May 2018
$’000 31 May 2017
$’00031 May 2018
€’00031 May 2017
€’00031 May 2018
£’000 31 May 2017
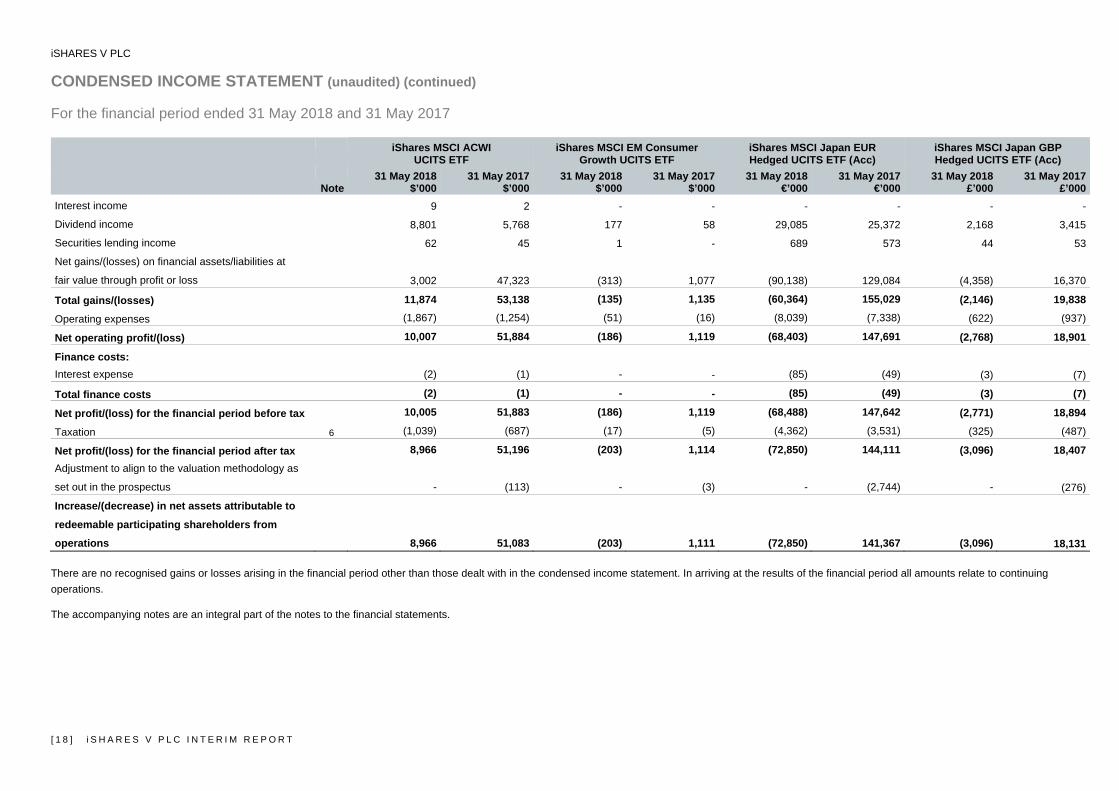
£’000 Interest income 9 2 - - - - - -
Dividend income 8,801 5,768 177 58 29,085 25,372 2,168 3,415
Securities lending income 62 45 1 - 689 573 44 53
Net gains/(losses) on financial assets/liabilities at
fair value through profit or loss 3,002 47,323 (313) 1,077 (90,138) 129,084 (4,358) 16,370
Total gains/(losses) 11,874 53,138 (135) 1,135 (60,364) 155,029 (2,146) 19,838
Operating expenses (1,867) (1,254) (51) (16) (8,039) (7,338) (622) (937)
Net operating profit/(loss) 10,007 51,884 (186) 1,119 (68,403) 147,691 (2,768) 18,901
Finance costs:
Interest expense (2) (1) - - (85) (49) (3) (7)
Total finance costs (2) (1) - - (85) (49) (3) (7)
Net profit/(loss) for the financial period before tax 10,005 51,883 (186) 1,119 (68,488) 147,642 (2,771) 18,894
Taxation 6 (1,039) (687) (17) (5) (4,362) (3,531) (325) (487)
Net profit/(loss) for the financial period after tax 8,966 51,196 (203) 1,114 (72,850) 144,111 (3,096) 18,407 Adjustment to align to the valuation methodology as
set out in the prospectus - (113) - (3) - (2,744) - (276)
Increase/(decrease) in net assets attributable to
redeemable participating shareholders from
operations 8,966 51,083 (203) 1,111 (72,850) 141,367 (3,096) 18,131 There are no recognised gains or losses arising in the financial period other than those dealt with in the condensed income statement. In arriving at the results of the financial period all amounts relate to continuing operations. The accompanying notes are an integral part of the notes to the financial statements.

iSHARES V PLC CONDENSED INCOME STATEMENT (unaudited) (continued)
i S H A R E S V P L C I N T E R I M R E P O R T [ 1 9 ]
For the financial period ended 31 May 2018 and 31 May 2017
iShares MSCI Poland
UCITS ETF iShares MSCI World EUR Hedged UCITS ETF (Acc)
iShares MSCI World GBP Hedged UCITS ETF (Acc)
iShares Netherlands Govt Bond UCITS ETF*
Note31 May 2018
$’00031 May 2017
$’00031 May 2018
€’000 31 May 2017
€’00031 May 2018
£’00031 May 2017
£’000 31 May 2017
€’000 Interest income - - 49 4 3 2 9
Dividend income 192 332 21,577 10,001 3,039 6,920 -
Securities lending income 17 96 153 63 28 37 -
Net (losses)/gains on financial assets/liabilities at fair
value through profit or loss (15,385) 28,098 (8,989) 61,055 767 30,326 (25)
Total (losses)/gains (15,176) 28,526 12,790 71,123 3,837 37,285 (16)
Operating expenses** (378) (329) (4,134) (1,935) (603) (1,165) (6)
Net operating (loss)/profit (15,554) 28,197 8,656 69,188 3,234 36,120 (22) Finance costs:
Distributions to redeemable participating shareholders 5 - - - - - - (10)
Interest expense - - (29) (12) (1) (4) -
Total finance costs - - (29) (12) (1) (4) (10)
Net (loss)/profit for the financial period before tax (15,554) 28,197 8,627 69,176 3,233 36,116 (32)
Taxation 6 (18) - (2,509) (1,163) (347) (819) -
Net (loss)/profit for the financial period after tax (15,572) 28,197 6,118 68,013 2,886 35,297 (32) Adjustment to align to the valuation methodology as
set out in the prospectus - (88) - (153) - (28) (9)
(Decrease)/increase in net assets attributable to
redeemable participating shareholders from operations (15,572) 28,109 6,118 67,860 2,886 35,269 (41)
* Fund closed during the financial period ended 31 May 2017. ** Termination expenses are borne outside of the Fund and paid by BlackRock.
There are no recognised gains or losses arising in the financial period other than those dealt with in the condensed income statement. In arriving at the results of the financial period all amounts relate to continuing operations. In arriving at the results of the prior financial period, all amounts relate to continuing operations, except for amounts relating to discontinued operations on iShares Austria Govt Bond UCITS ETF, iShares Belgium Govt Bond UCITS ETF, iShares Finland Govt Bond UCITS ETF and iShares Netherlands Govt Bond UCITS ETF. The accompanying notes are an integral part of the notes to the financial statements.
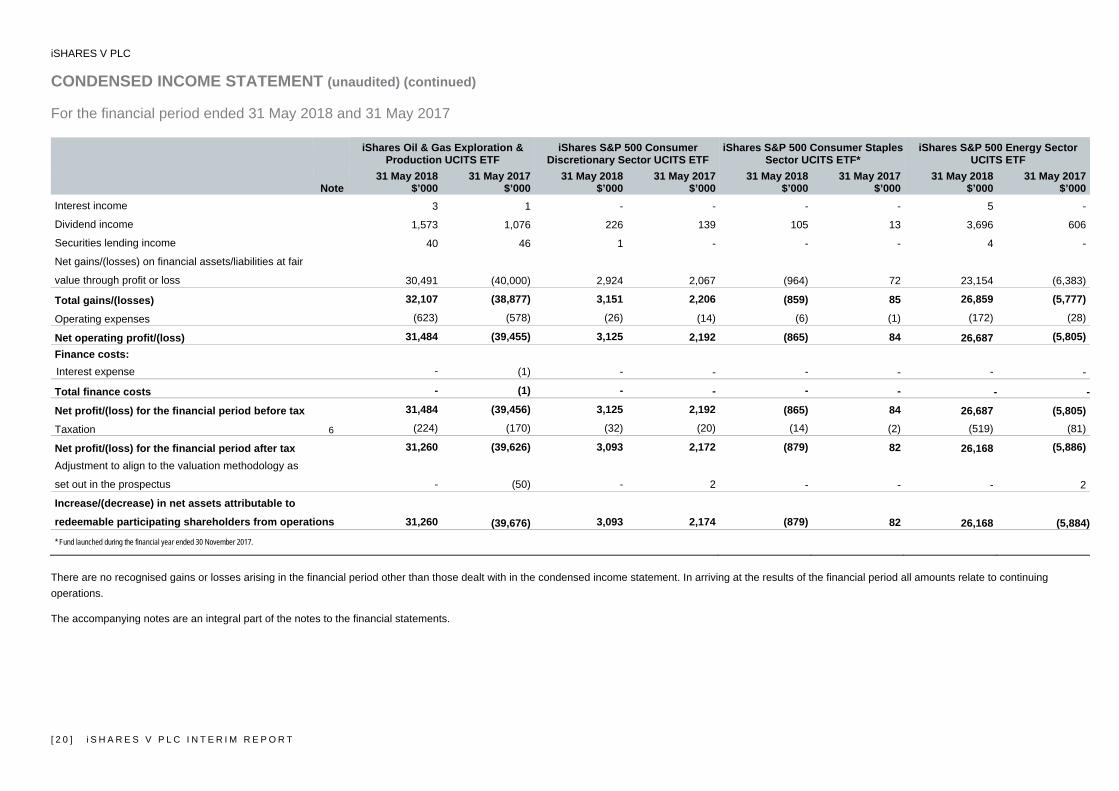
iSHARES V PLC CONDENSED INCOME STATEMENT (unaudited) (continued)
[ 2 0 ] i S H A R E S V P L C I N T E R I M R E P O R T
For the financial period ended 31 May 2018 and 31 May 2017
iShares Oil & Gas Exploration &
Production UCITS ETF iShares S&P 500 Consumer
Discretionary Sector UCITS ETF iShares S&P 500 Consumer Staples
Sector UCITS ETF* iShares S&P 500 Energy Sector
UCITS ETF
Note31 May 2018
$’00031 May 2017
$’00031 May 2018
$’000 31 May 2017
$’00031 May 2018
$’00031 May 2017
$’00031 May 2018
$’000 31 May 2017
$’000 Interest income 3 1 - - - - 5 -
Dividend income 1,573 1,076 226 139 105 13 3,696 606
Securities lending income 40 46 1 - - - 4 -
Net gains/(losses) on financial assets/liabilities at fair
value through profit or loss 30,491 (40,000) 2,924 2,067 (964) 72 23,154 (6,383)
Total gains/(losses) 32,107 (38,877) 3,151 2,206 (859) 85 26,859 (5,777)
Operating expenses (623) (578) (26) (14) (6) (1) (172) (28)
Net operating profit/(loss) 31,484 (39,455) 3,125 2,192 (865) 84 26,687 (5,805) Finance costs:
Interest expense - (1) - - - - - -
Total finance costs - (1) - - - - - -
Net profit/(loss) for the financial period before tax 31,484 (39,456) 3,125 2,192 (865) 84 26,687 (5,805)
Taxation 6 (224) (170) (32) (20) (14) (2) (519) (81)
Net profit/(loss) for the financial period after tax 31,260 (39,626) 3,093 2,172 (879) 82 26,168 (5,886)
Adjustment to align to the valuation methodology as
set out in the prospectus - (50) - 2 - - - 2
Increase/(decrease) in net assets attributable to
redeemable participating shareholders from operations 31,260 (39,676) 3,093 2,174 (879) 82 26,168 (5,884)* Fund launched during the financial year ended 30 November 2017.
There are no recognised gains or losses arising in the financial period other than those dealt with in the condensed income statement. In arriving at the results of the financial period all amounts relate to continuing operations. The accompanying notes are an integral part of the notes to the financial statements.
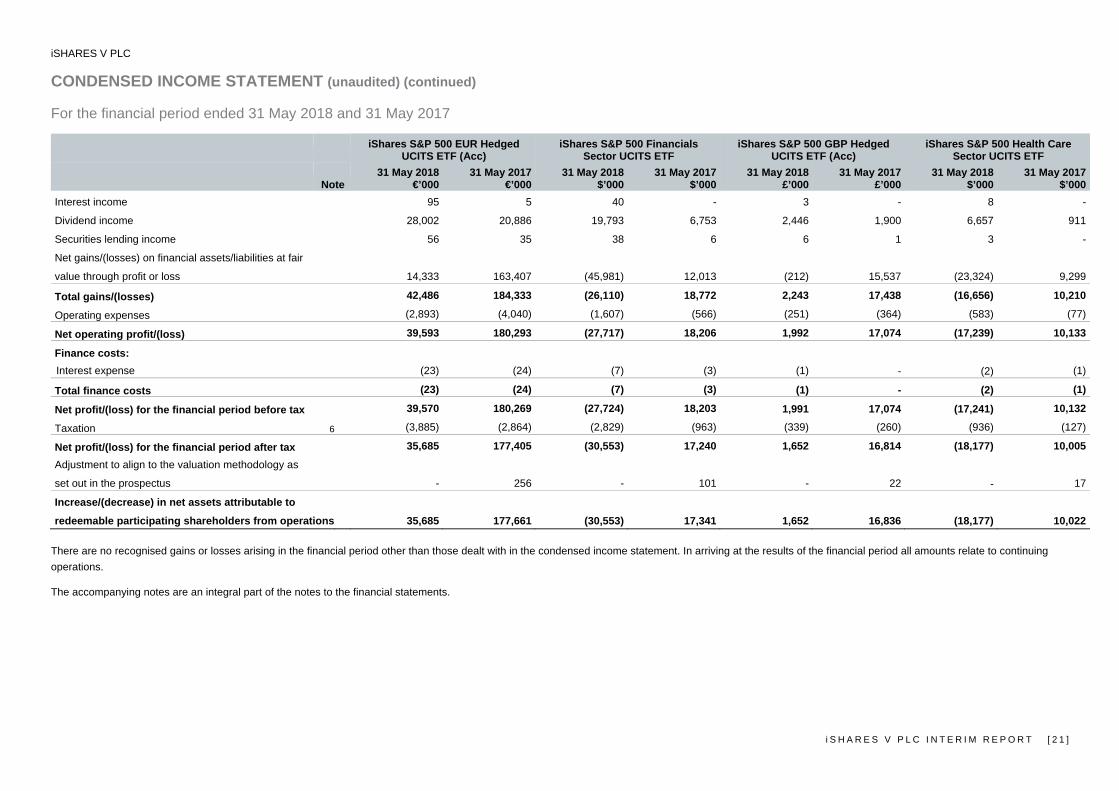
iSHARES V PLC CONDENSED INCOME STATEMENT (unaudited) (continued)
i S H A R E S V P L C I N T E R I M R E P O R T [ 2 1 ]
For the financial period ended 31 May 2018 and 31 May 2017
iShares S&P 500 EUR Hedged
UCITS ETF (Acc) iShares S&P 500 Financials
Sector UCITS ETF iShares S&P 500 GBP Hedged
UCITS ETF (Acc) iShares S&P 500 Health Care
Sector UCITS ETF
Note 31 May 2018
€’00031 May 2017
€’00031 May 2018
$’000 31 May 2017
$’00031 May 2018
£’00031 May 2017
£’00031 May 2018
$’000 31 May 2017
$’000 Interest income 95 5 40 - 3 - 8 -
Dividend income 28,002 20,886 19,793 6,753 2,446 1,900 6,657 911
Securities lending income 56 35 38 6 6 1 3 -
Net gains/(losses) on financial assets/liabilities at fair
value through profit or loss 14,333 163,407 (45,981) 12,013 (212) 15,537 (23,324) 9,299
Total gains/(losses) 42,486 184,333 (26,110) 18,772 2,243 17,438 (16,656) 10,210
Operating expenses (2,893) (4,040) (1,607) (566) (251) (364) (583) (77)
Net operating profit/(loss) 39,593 180,293 (27,717) 18,206 1,992 17,074 (17,239) 10,133
Finance costs:
Interest expense (23) (24) (7) (3) (1) - (2) (1)
Total finance costs (23) (24) (7) (3) (1) - (2) (1)
Net profit/(loss) for the financial period before tax 39,570 180,269 (27,724) 18,203 1,991 17,074 (17,241) 10,132
Taxation 6 (3,885) (2,864) (2,829) (963) (339) (260) (936) (127)
Net profit/(loss) for the financial period after tax 35,685 177,405 (30,553) 17,240 1,652 16,814 (18,177) 10,005
Adjustment to align to the valuation methodology as
set out in the prospectus - 256 - 101 - 22 - 17
Increase/(decrease) in net assets attributable to
redeemable participating shareholders from operations 35,685 177,661 (30,553) 17,341 1,652 16,836 (18,177) 10,022 There are no recognised gains or losses arising in the financial period other than those dealt with in the condensed income statement. In arriving at the results of the financial period all amounts relate to continuing operations. The accompanying notes are an integral part of the notes to the financial statements.

iSHARES V PLC CONDENSED INCOME STATEMENT (unaudited) (continued)
[ 2 2 ] i S H A R E S V P L C I N T E R I M R E P O R T
For the financial period ended 31 May 2018 and 31 May 2017
iShares S&P 500 Industrials
Sector UCITS ETF* iShares S&P 500 Information
Technology Sector UCITS ETF iShares S&P 500 Materials
Sector UCITS ETF* iShares S&P 500 Utilities
Sector UCITS ETF*
Note 31 May 2018
$’00031 May 2017
$’00031 May 2018
$’000 31 May 2017
$’00031 May 2018
$’00031 May 2017
$’00031 May 2018
$’000 31 May 2017
$’000 Interest income - - 17 - - - - -
Dividend income 64 8 6,210 847 38 5 59 9
Securities lending income - - 19 - - - - -
Net (losses)/gains on financial assets/liabilities at fair
value through profit or loss (165) 36 85,113 20,875 (83) 5 (309) 63
Total (losses)/gains (101) 44 91,359 21,722 (45) 10 (250) 72
Operating expenses (5) - (682) (82) (3) - (2) -
Net operating (loss)/profit (106) 44 90,677 21,640 (48) 10 (252) 72
Net (loss)/profit for the financial period before tax (106) 44 90,677 21,640 (48) 10 (252) 72
Taxation 6 (8) (1) (847) (118) (5) (1) (9) (1)
Net (loss)/profit for the financial period after tax (114) 43 89,830 21,522 (53) 9 (261) 71
Adjustment to align to the valuation methodology as
set out in the prospectus - - - (2) - - - -
(Decrease)/increase in net assets attributable to
redeemable participating shareholders from operations (114) 43 89,830 21,520 (53) 9 (261) 71
* Fund launched during the financial year ended 30 November 2017. There are no recognised gains or losses arising in the financial period other than those dealt with in the condensed income statement. In arriving at the results of the financial period all amounts relate to continuing operations. The accompanying notes are an integral part of the notes to the financial statements.
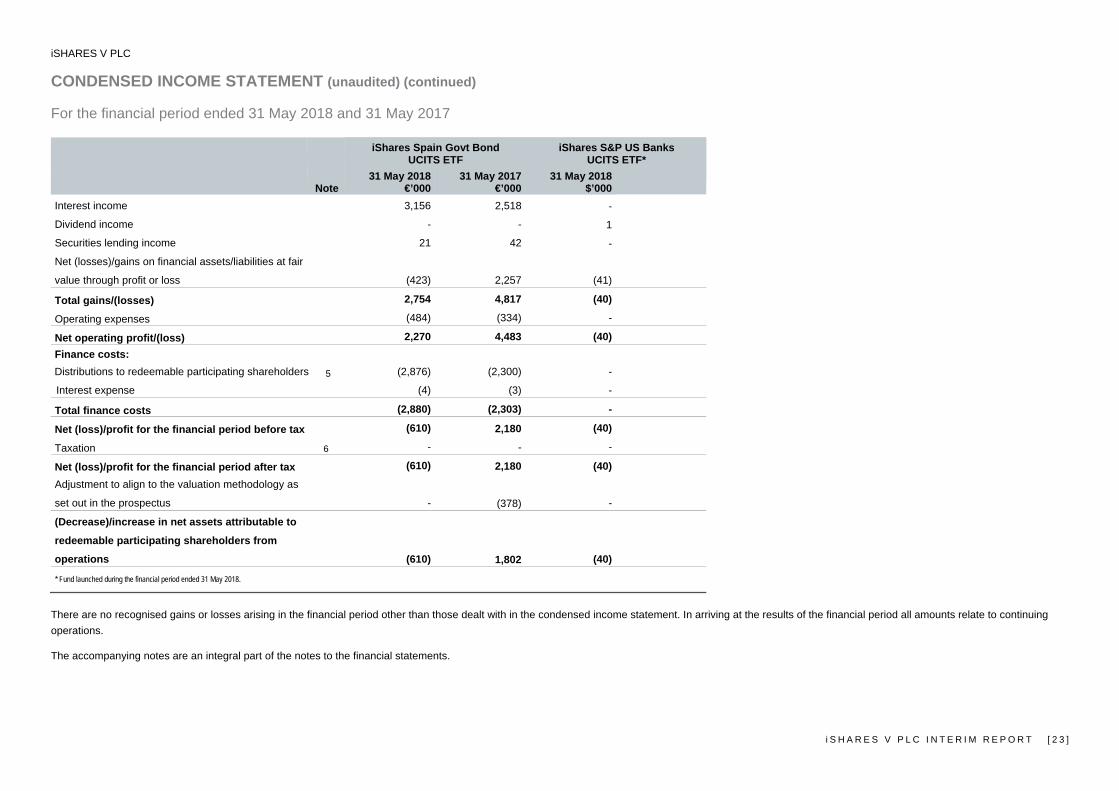
iSHARES V PLC CONDENSED INCOME STATEMENT (unaudited) (continued)
i S H A R E S V P L C I N T E R I M R E P O R T [ 2 3 ]
For the financial period ended 31 May 2018 and 31 May 2017
iShares Spain Govt Bond
UCITS ETF iShares S&P US Banks
UCITS ETF*
Note31 May 2018
€’00031 May 2017
€’00031 May 2018
$’000Interest income 3,156 2,518 -
Dividend income - - 1
Securities lending income 21 42 -
Net (losses)/gains on financial assets/liabilities at fair
value through profit or loss (423) 2,257 (41)
Total gains/(losses) 2,754 4,817 (40)
Operating expenses (484) (334) -
Net operating profit/(loss) 2,270 4,483 (40)Finance costs:
Distributions to redeemable participating shareholders 5 (2,876) (2,300) -
Interest expense (4) (3) -
Total finance costs (2,880) (2,303) -
Net (loss)/profit for the financial period before tax (610) 2,180 (40)
Taxation 6 - - -
Net (loss)/profit for the financial period after tax (610) 2,180 (40)Adjustment to align to the valuation methodology as
set out in the prospectus - (378) -
(Decrease)/increase in net assets attributable to
redeemable participating shareholders from
operations (610) 1,802 (40)
* Fund launched during the financial period ended 31 May 2018. There are no recognised gains or losses arising in the financial period other than those dealt with in the condensed income statement. In arriving at the results of the financial period all amounts relate to continuing operations. The accompanying notes are an integral part of the notes to the financial statements.

iSHARES V PLC CONDENSED STATEMENT OF CHANGES IN NET ASSETS ATTRIBUTABLE TO REDEEMABLE PARTICIPATING SHAREHOLDERS (unaudited)
[ 2 4 ] i S H A R E S V P L C I N T E R I M R E P O R T
For the financial period ended 31 May 2018 and 31 May 2017
Company Total iShares € Corp Bond Interest Rate
Hedged UCITS ETF iShares Agribusiness
UCITS ETF iShares Austria Govt Bond
UCITS ETF**
31 May 2018
£’00031 May 2017
£’00031 May 2018
€’000 31 May 2017
€’00031 May 2018
$’00031 May 2017
$’000 31 May 2017
€’000 Net assets attributable to redeemable participating
shareholders at the beginning of the financial period 11,817,653 8,309,450 1,480,117 1,112,906 95,772 56,437 10,274
Notional foreign exchange adjustment* 79,444 85,546 - - - - -
(Decrease)/increase in net assets attributable to
redeemable participating shareholders from operations (45,798) 544,178 (38,964) 2,805 (1,266) 5,870 (75)
Share transactions: Proceeds from issue of redeemable participating shares 5,746,043 2,990,882 355,805 416,515 10,507 26,843 7,263
Payments on redemption of redeemable participating shares (2,938,952) (2,295,762) (294,512) (82,593) (27,308) (11,815) (17,462)
Increase/(decrease) in net assets resulting from
share transactions 2,807,091 695,120 61,293 333,922 (16,801) 15,028 (10,199)
Net assets attributable to redeemable participating
shareholders at the end of the financial period 14,658,390 9,634,294 1,502,446 1,449,633 77,705 77,335 -
* The notional foreign exchange adjustment arises from the retranslation of the net assets at the beginning of the financial period using the exchange rate as at 31 May 2018. The average rate for the financial period is applied to condensed income statement items and share transactions (see note 9). ** Fund closed during the financial period ended 31 May 2017.
The accompanying notes form an integral part of these financial statements.
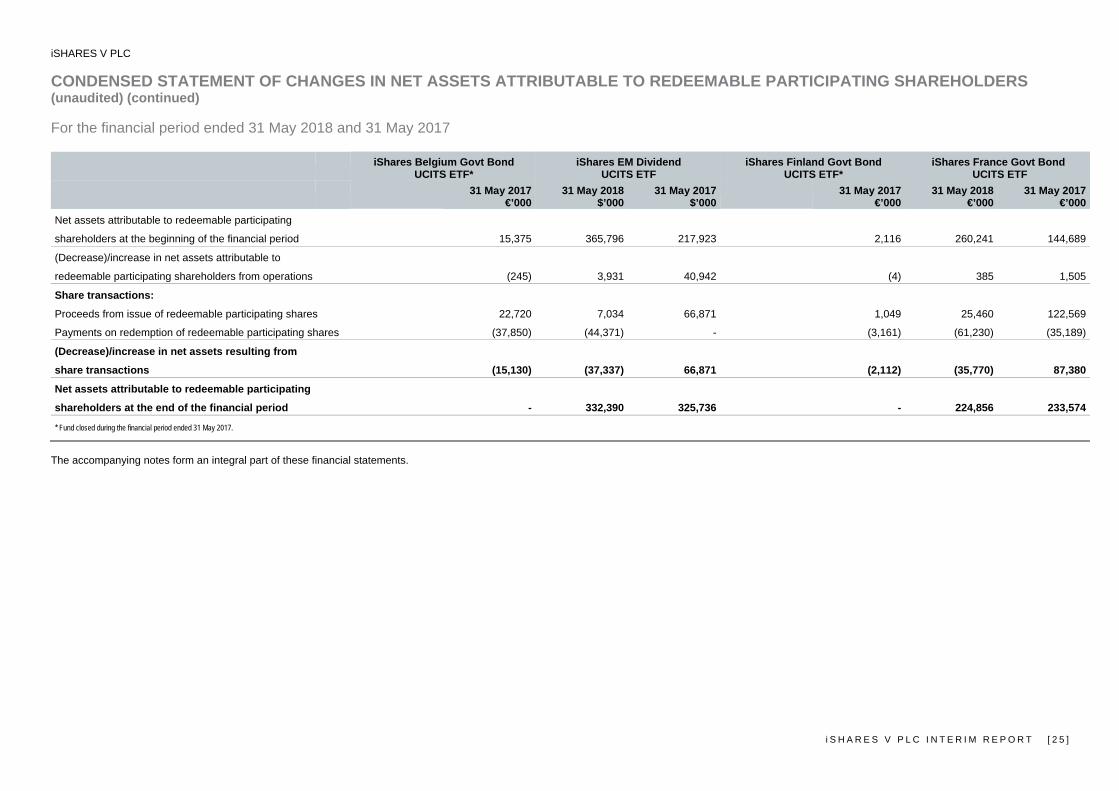
iSHARES V PLC CONDENSED STATEMENT OF CHANGES IN NET ASSETS ATTRIBUTABLE TO REDEEMABLE PARTICIPATING SHAREHOLDERS (unaudited) (continued)
i S H A R E S V P L C I N T E R I M R E P O R T [ 2 5 ]
For the financial period ended 31 May 2018 and 31 May 2017
iShares Belgium Govt Bond
UCITS ETF* iShares EM Dividend
UCITS ETF iShares Finland Govt Bond
UCITS ETF* iShares France Govt Bond
UCITS ETF
31 May 2017
€’00031 May 2018
$’000 31 May 2017
$’00031 May 2017
€’00031 May 2018
€’000 31 May 2017
€’000 Net assets attributable to redeemable participating
shareholders at the beginning of the financial period 15,375 365,796 217,923 2,116 260,241 144,689
(Decrease)/increase in net assets attributable to
redeemable participating shareholders from operations (245) 3,931 40,942 (4) 385 1,505
Share transactions:
Proceeds from issue of redeemable participating shares 22,720 7,034 66,871 1,049 25,460 122,569
Payments on redemption of redeemable participating shares (37,850) (44,371) - (3,161) (61,230) (35,189)
(Decrease)/increase in net assets resulting from
share transactions (15,130) (37,337) 66,871 (2,112) (35,770) 87,380
Net assets attributable to redeemable participating
shareholders at the end of the financial period - 332,390 325,736 - 224,856 233,574
* Fund closed during the financial period ended 31 May 2017.
The accompanying notes form an integral part of these financial statements.

iSHARES V PLC CONDENSED STATEMENT OF CHANGES IN NET ASSETS ATTRIBUTABLE TO REDEEMABLE PARTICIPATING SHAREHOLDERS (unaudited) (continued)
[ 2 6 ] i S H A R E S V P L C I N T E R I M R E P O R T
For the financial period ended 31 May 2018 and 31 May 2017
iShares Germany Govt Bond
UCITS ETF iShares Gold Producers
UCITS ETF iShares Italy Govt Bond
UCITS ETF iShares J.P. Morgan $ EM Corp
Bond UCITS ETF
31 May 2018
€’00031 May 2017
€’00031 May 2018
$’000 31 May 2017
$’00031 May 2018
€’00031 May 2017
€’00031 May 2018
$’000 31 May 2017
$’000 Net assets attributable to redeemable participating
shareholders at the beginning of the financial period 19,437 22,382 518,191 354,585 374,990 502,121 277,966 258,875
Increase/(decrease) in net assets attributable to
redeemable participating shareholders from operations 274 (122) (7,525) 37,054 (44,148) (5,750) (15,324) 9,885
Share transactions: Proceeds from issue of redeemable participating shares 19,809 13,954 175,681 144,860 496,283 257,332 83,845 43,687
Payments on redemption of redeemable participating shares (2,729) (13,950) (211,768) (122,099) (118,170) (432,329) - (39,027)
Increase/(decrease) in net assets resulting from
share transactions 17,080 4 (36,087) 22,761 378,113 (174,997) 83,845 4,660
Net assets attributable to redeemable participating
shareholders at the end of the financial period 36,791 22,264 474,579 414,400 708,955 321,374 346,487 273,420 The accompanying notes form an integral part of these financial statements.

iSHARES V PLC CONDENSED STATEMENT OF CHANGES IN NET ASSETS ATTRIBUTABLE TO REDEEMABLE PARTICIPATING SHAREHOLDERS (unaudited) (continued)
i S H A R E S V P L C I N T E R I M R E P O R T [ 2 7 ]
For the financial period ended 31 May 2018 and 31 May 2017
iShares MSCI ACWI
UCITS ETF iShares MSCI EM Consumer
Growth UCITS ETF iShares MSCI Japan EUR Hedged UCITS ETF (Acc)
iShares MSCI Japan GBP Hedged UCITS ETF (Acc)
31 May 2018
$’00031 May 2017
$’00031 May 2018
$’000 31 May 2017
$’00031 May 2018
€’00031 May 2017
€’00031 May 2018
£’000 31 May 2017
£’000 Net assets attributable to redeemable participating
shareholders at the beginning of the financial period 520,836 388,337 12,852 4,742 2,428,226 2,436,458 209,616 261,615
Increase/(decrease) in net assets attributable to
redeemable participating shareholders from operations 8,966 51,083 (203) 1,111 (72,850) 141,367 (3,096) 18,131
Share transactions:
Proceeds from issue of redeemable participating shares 289,095 25,293 6,392 - 429,466 120,861 6,885 61,939
Payments on redemption of redeemable participating shares (29,326) (8,415) - - (521,261) (458,915) (22,155) (81,887)
Increase/(decrease) in net assets resulting from
share transactions 259,769 16,878 6,392 - (91,795) (338,054) (15,270) (19,948) Net assets attributable to redeemable participating
shareholders at the end of the financial period 789,571 456,298 19,041 5,853 2,263,581 2,239,771 191,250 259,798 The accompanying notes form an integral part of these financial statements.
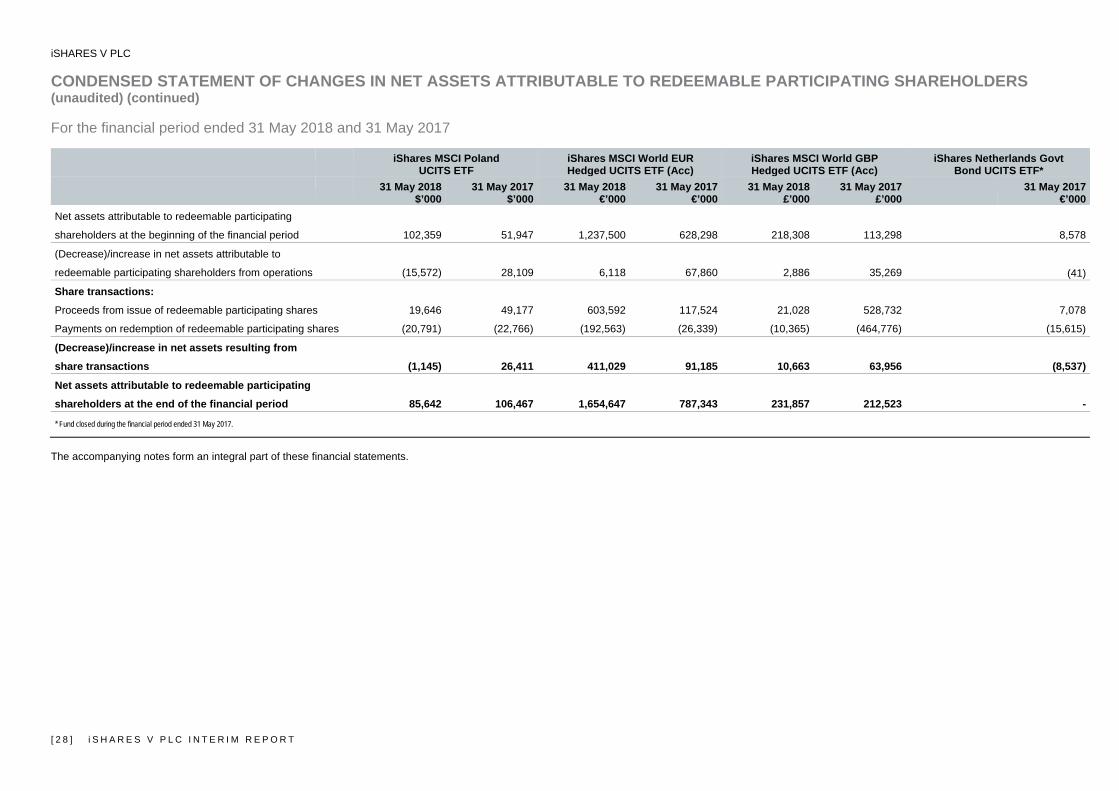
iSHARES V PLC CONDENSED STATEMENT OF CHANGES IN NET ASSETS ATTRIBUTABLE TO REDEEMABLE PARTICIPATING SHAREHOLDERS (unaudited) (continued)
[ 2 8 ] i S H A R E S V P L C I N T E R I M R E P O R T
For the financial period ended 31 May 2018 and 31 May 2017
iShares MSCI Poland
UCITS ETF iShares MSCI World EUR Hedged UCITS ETF (Acc)
iShares MSCI World GBP Hedged UCITS ETF (Acc)
iShares Netherlands Govt Bond UCITS ETF*
31 May 2018
$’00031 May 2017
$’00031 May 2018
€’000 31 May 2017
€’00031 May 2018
£’00031 May 2017
£’000 31 May 2017
€’000 Net assets attributable to redeemable participating
shareholders at the beginning of the financial period 102,359 51,947 1,237,500 628,298 218,308 113,298 8,578
(Decrease)/increase in net assets attributable to
redeemable participating shareholders from operations (15,572) 28,109 6,118 67,860 2,886 35,269 (41)
Share transactions:
Proceeds from issue of redeemable participating shares 19,646 49,177 603,592 117,524 21,028 528,732 7,078
Payments on redemption of redeemable participating shares (20,791) (22,766) (192,563) (26,339) (10,365) (464,776) (15,615)
(Decrease)/increase in net assets resulting from
share transactions (1,145) 26,411 411,029 91,185 10,663 63,956 (8,537)
Net assets attributable to redeemable participating
shareholders at the end of the financial period 85,642 106,467 1,654,647 787,343 231,857 212,523 -
* Fund closed during the financial period ended 31 May 2017.
The accompanying notes form an integral part of these financial statements.
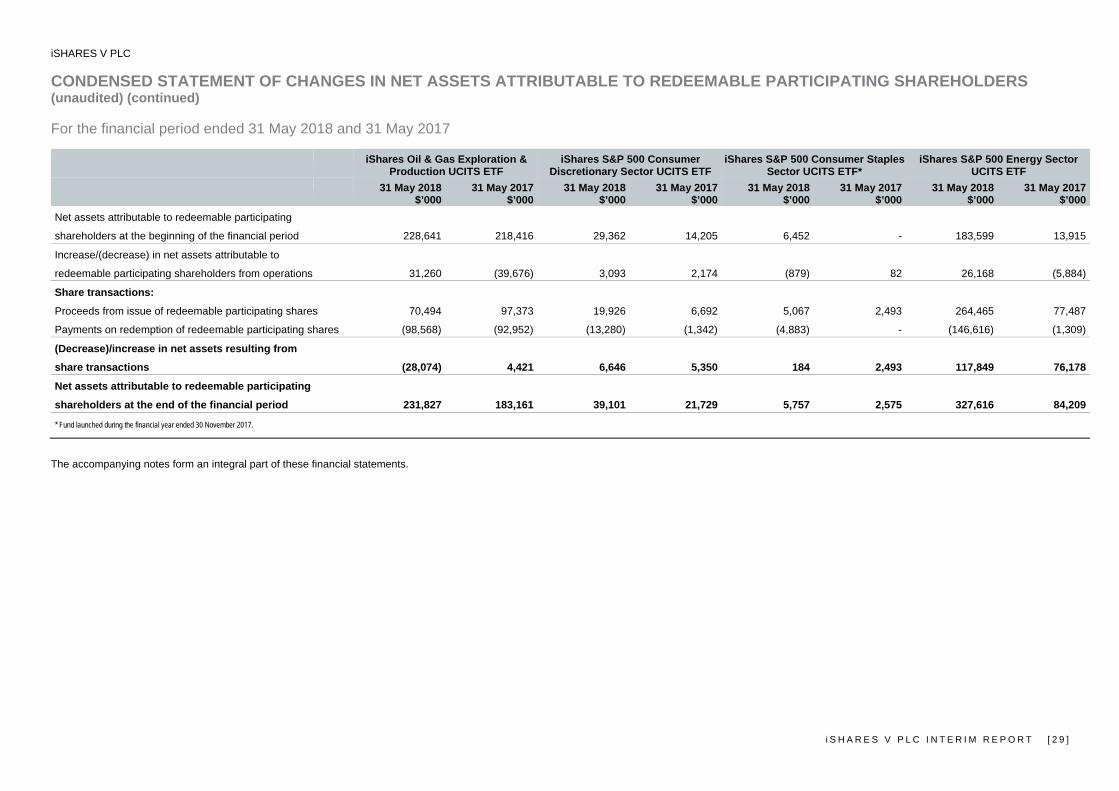
iSHARES V PLC CONDENSED STATEMENT OF CHANGES IN NET ASSETS ATTRIBUTABLE TO REDEEMABLE PARTICIPATING SHAREHOLDERS (unaudited) (continued)
i S H A R E S V P L C I N T E R I M R E P O R T [ 2 9 ]
For the financial period ended 31 May 2018 and 31 May 2017
iShares Oil & Gas Exploration &
Production UCITS ETF iShares S&P 500 Consumer
Discretionary Sector UCITS ETF iShares S&P 500 Consumer Staples
Sector UCITS ETF* iShares S&P 500 Energy Sector
UCITS ETF
31 May 2018
$’00031 May 2017
$’00031 May 2018
$’000 31 May 2017
$’00031 May 2018
$’00031 May 2017
$’00031 May 2018
$’000 31 May 2017
$’000 Net assets attributable to redeemable participating
shareholders at the beginning of the financial period 228,641 218,416 29,362 14,205 6,452 - 183,599 13,915
Increase/(decrease) in net assets attributable to
redeemable participating shareholders from operations 31,260 (39,676) 3,093 2,174 (879) 82 26,168 (5,884)
Share transactions:
Proceeds from issue of redeemable participating shares 70,494 97,373 19,926 6,692 5,067 2,493 264,465 77,487
Payments on redemption of redeemable participating shares (98,568) (92,952) (13,280) (1,342) (4,883) - (146,616) (1,309)
(Decrease)/increase in net assets resulting from
share transactions (28,074) 4,421 6,646 5,350 184 2,493 117,849 76,178
Net assets attributable to redeemable participating
shareholders at the end of the financial period 231,827 183,161 39,101 21,729 5,757 2,575 327,616 84,209
* Fund launched during the financial year ended 30 November 2017.
The accompanying notes form an integral part of these financial statements.
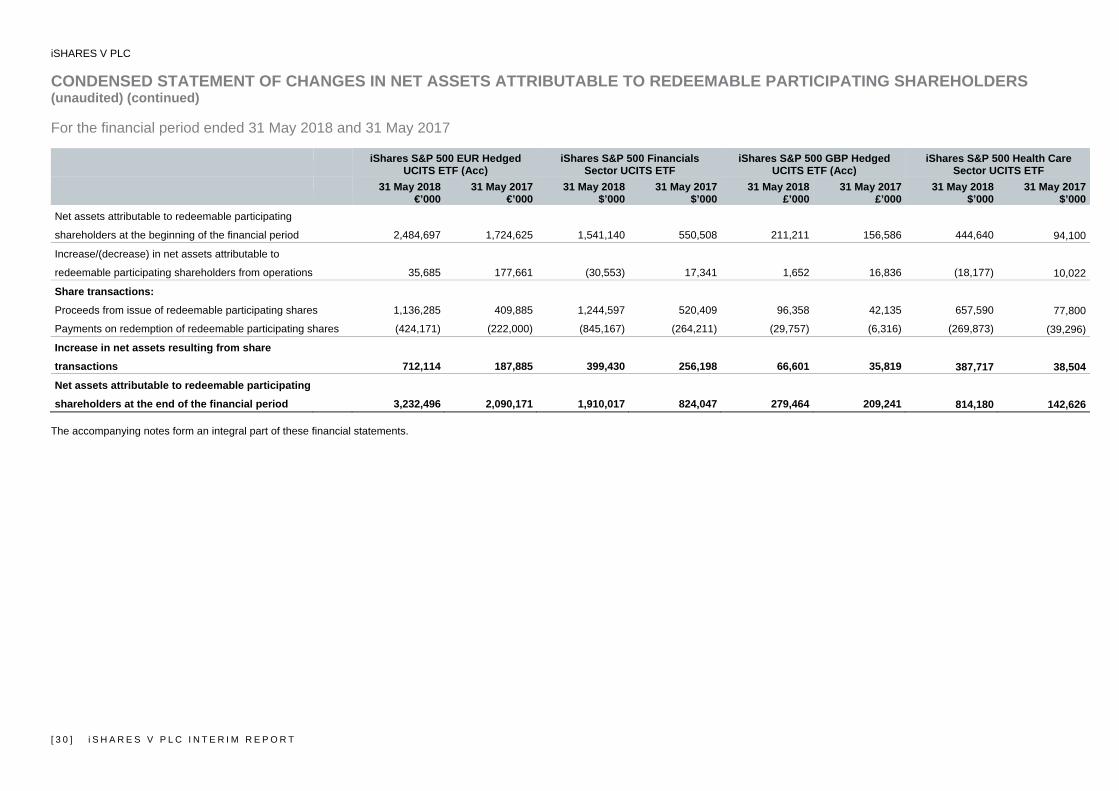
iSHARES V PLC CONDENSED STATEMENT OF CHANGES IN NET ASSETS ATTRIBUTABLE TO REDEEMABLE PARTICIPATING SHAREHOLDERS (unaudited) (continued)
[ 3 0 ] i S H A R E S V P L C I N T E R I M R E P O R T
For the financial period ended 31 May 2018 and 31 May 2017
iShares S&P 500 EUR Hedged
UCITS ETF (Acc) iShares S&P 500 Financials
Sector UCITS ETF iShares S&P 500 GBP Hedged
UCITS ETF (Acc) iShares S&P 500 Health Care
Sector UCITS ETF
31 May 2018
€’00031 May 2017
€’00031 May 2018
$’000 31 May 2017
$’00031 May 2018
£’00031 May 2017
£’00031 May 2018
$’000 31 May 2017
$’000 Net assets attributable to redeemable participating
shareholders at the beginning of the financial period 2,484,697 1,724,625 1,541,140 550,508 211,211 156,586 444,640 94,100
Increase/(decrease) in net assets attributable to
redeemable participating shareholders from operations 35,685 177,661 (30,553) 17,341 1,652 16,836 (18,177) 10,022
Share transactions:
Proceeds from issue of redeemable participating shares 1,136,285 409,885 1,244,597 520,409 96,358 42,135 657,590 77,800
Payments on redemption of redeemable participating shares (424,171) (222,000) (845,167) (264,211) (29,757) (6,316) (269,873) (39,296)
Increase in net assets resulting from share
transactions 712,114 187,885 399,430 256,198 66,601 35,819 387,717 38,504 Net assets attributable to redeemable participating
shareholders at the end of the financial period 3,232,496 2,090,171 1,910,017 824,047 279,464 209,241 814,180 142,626 The accompanying notes form an integral part of these financial statements.
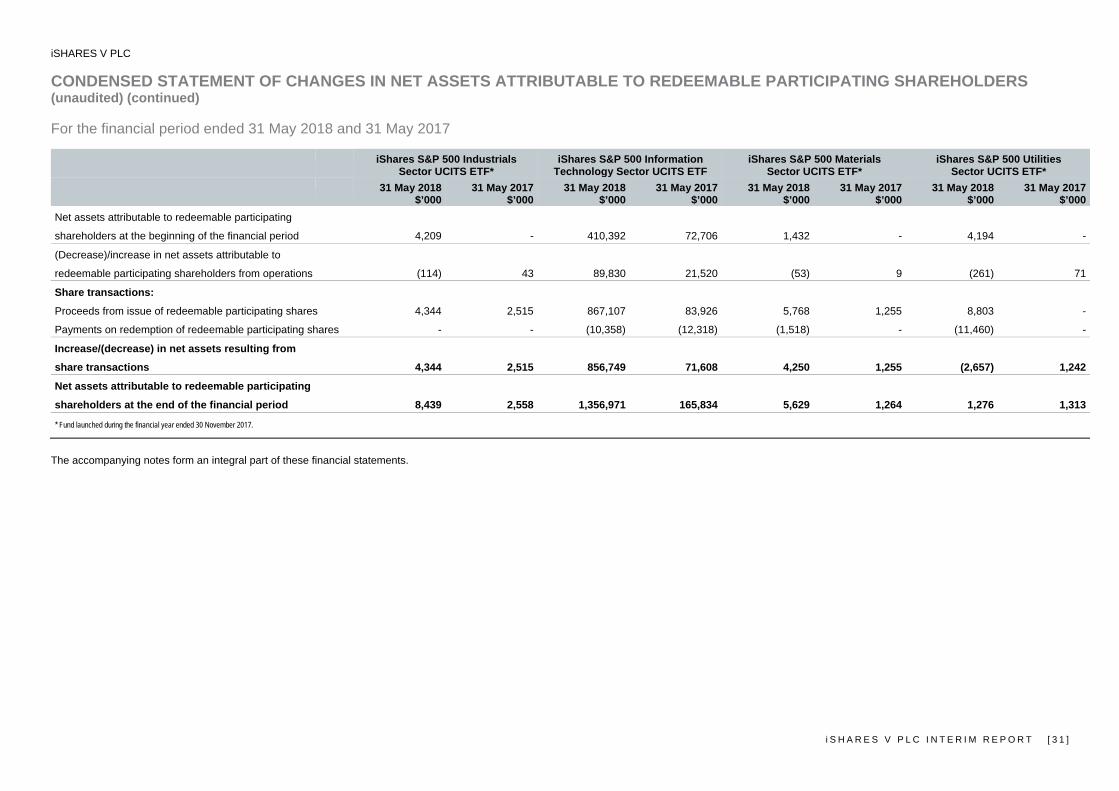
iSHARES V PLC CONDENSED STATEMENT OF CHANGES IN NET ASSETS ATTRIBUTABLE TO REDEEMABLE PARTICIPATING SHAREHOLDERS (unaudited) (continued)
i S H A R E S V P L C I N T E R I M R E P O R T [ 3 1 ]
For the financial period ended 31 May 2018 and 31 May 2017
iShares S&P 500 Industrials
Sector UCITS ETF* iShares S&P 500 Information
Technology Sector UCITS ETF iShares S&P 500 Materials
Sector UCITS ETF* iShares S&P 500 Utilities
Sector UCITS ETF*
31 May 2018
$’00031 May 2017
$’00031 May 2018
$’000 31 May 2017
$’00031 May 2018
$’00031 May 2017
$’00031 May 2018
$’000 31 May 2017
$’000 Net assets attributable to redeemable participating
shareholders at the beginning of the financial period 4,209 - 410,392 72,706 1,432 - 4,194 -
(Decrease)/increase in net assets attributable to
redeemable participating shareholders from operations (114) 43 89,830 21,520 (53) 9 (261) 71
Share transactions:
Proceeds from issue of redeemable participating shares 4,344 2,515 867,107 83,926 5,768 1,255 8,803 -
Payments on redemption of redeemable participating shares - - (10,358) (12,318) (1,518) - (11,460) -
Increase/(decrease) in net assets resulting from
share transactions 4,344 2,515 856,749 71,608 4,250 1,255 (2,657) 1,242
Net assets attributable to redeemable participating
shareholders at the end of the financial period 8,439 2,558 1,356,971 165,834 5,629 1,264 1,276 1,313
* Fund launched during the financial year ended 30 November 2017.
The accompanying notes form an integral part of these financial statements.
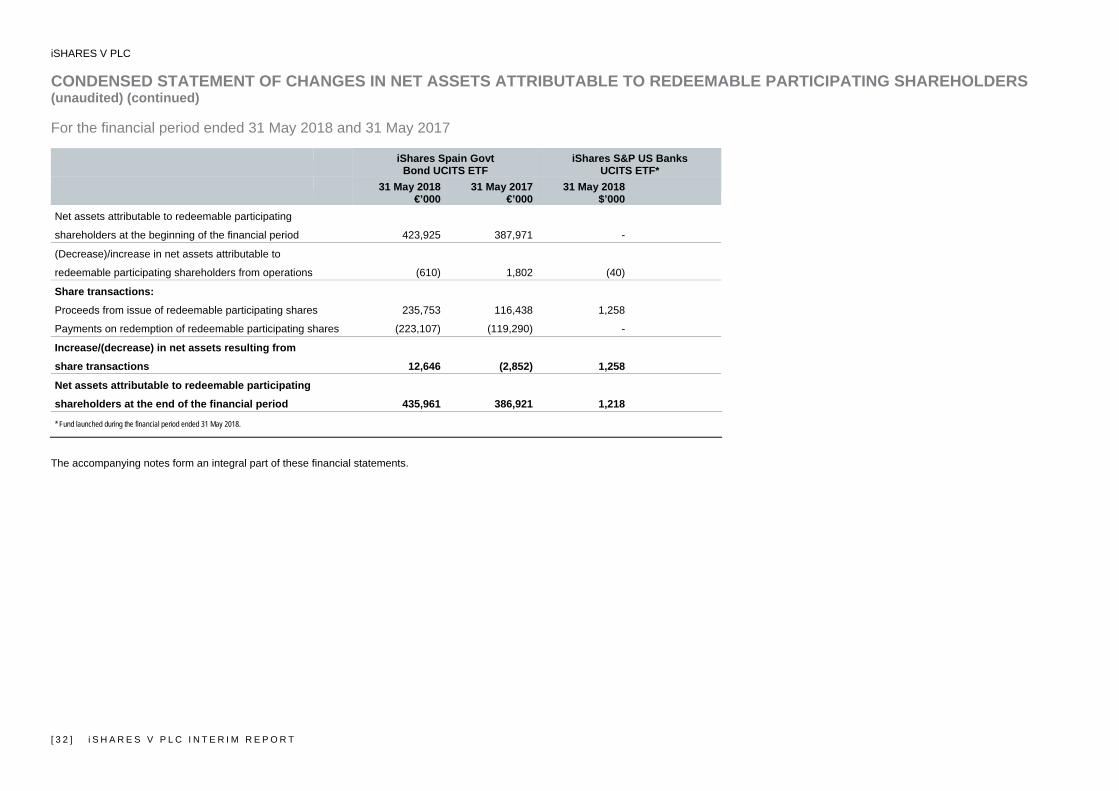
iSHARES V PLC CONDENSED STATEMENT OF CHANGES IN NET ASSETS ATTRIBUTABLE TO REDEEMABLE PARTICIPATING SHAREHOLDERS (unaudited) (continued)
[ 3 2 ] i S H A R E S V P L C I N T E R I M R E P O R T
For the financial period ended 31 May 2018 and 31 May 2017
iShares Spain Govt
Bond UCITS ETF iShares S&P US Banks
UCITS ETF*
31 May 2018
€’00031 May 2017
€’00031 May 2018
$’000
Net assets attributable to redeemable participating
shareholders at the beginning of the financial period 423,925 387,971 -
(Decrease)/increase in net assets attributable to
redeemable participating shareholders from operations (610) 1,802 (40)
Share transactions: Proceeds from issue of redeemable participating shares 235,753 116,438 1,258
Payments on redemption of redeemable participating shares (223,107) (119,290) -
Increase/(decrease) in net assets resulting from
share transactions 12,646 (2,852) 1,258
Net assets attributable to redeemable participating
shareholders at the end of the financial period 435,961 386,921 1,218
* Fund launched during the financial period ended 31 May 2018.
The accompanying notes form an integral part of these financial statements.
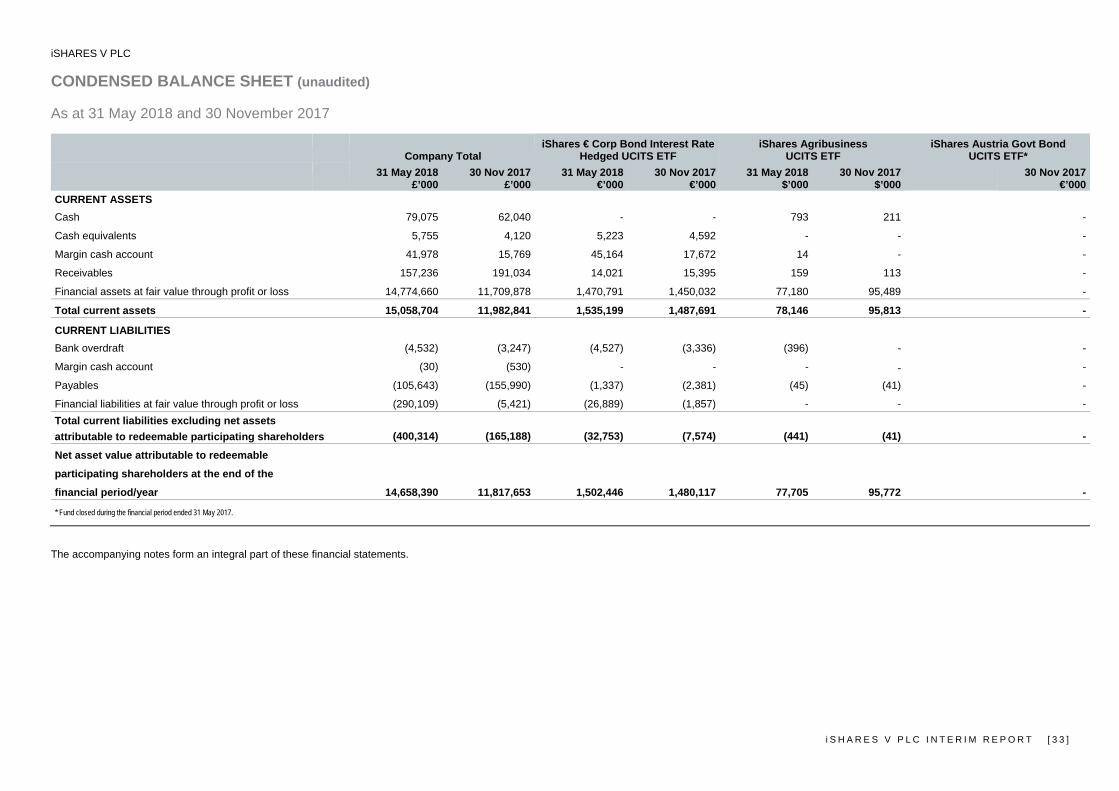
iSHARES V PLC CONDENSED BALANCE SHEET (unaudited)
i S H A R E S V P L C I N T E R I M R E P O R T [ 3 3 ]
As at 31 May 2018 and 30 November 2017
Company Total iShares € Corp Bond Interest Rate
Hedged UCITS ETF iShares Agribusiness
UCITS ETF iShares Austria Govt Bond
UCITS ETF*
31 May 2018
£’00030 Nov 2017
£’00031 May 2018
€’000 30 Nov 2017
€’00031 May 2018
$’00030 Nov 2017
$’000 30 Nov 2017
€’000 CURRENT ASSETS Cash 79,075 62,040 - - 793 211 -
Cash equivalents 5,755 4,120 5,223 4,592 - - -
Margin cash account 41,978 15,769 45,164 17,672 14 - -
Receivables 157,236 191,034 14,021 15,395 159 113 -
Financial assets at fair value through profit or loss 14,774,660 11,709,878 1,470,791 1,450,032 77,180 95,489 -
Total current assets 15,058,704 11,982,841 1,535,199 1,487,691 78,146 95,813 -
CURRENT LIABILITIES
Bank overdraft (4,532) (3,247) (4,527) (3,336) (396) - -
Margin cash account (30) (530) - - - - -
Payables (105,643) (155,990) (1,337) (2,381) (45) (41) -
Financial liabilities at fair value through profit or loss (290,109) (5,421) (26,889) (1,857) - - - Total current liabilities excluding net assets attributable to redeemable participating shareholders (400,314) (165,188) (32,753) (7,574) (441) (41) -
Net asset value attributable to redeemable
participating shareholders at the end of the
financial period/year 14,658,390 11,817,653 1,502,446 1,480,117 77,705 95,772 -
* Fund closed during the financial period ended 31 May 2017.
The accompanying notes form an integral part of these financial statements.

iSHARES V PLC CONDENSED BALANCE SHEET (unaudited) (continued)
[ 3 4 ] i S H A R E S V P L C I N T E R I M R E P O R T
As at 31 May 2018 and 30 November 2017
iShares Belgium Govt Bond
UCITS ETF* iShares EM Dividend
UCITS ETF iShares Finland Govt Bond
UCITS ETF* iShares France Govt Bond
UCITS ETF
30 Nov 2017
€’00031 May 2018
$’000 30 Nov 2017
$’00030 Nov 2017
€’00031 May 2018
€’000 30 Nov 2017
€’000 CURRENT ASSETS Cash - 3,059 3,230 - 254 300
Cash equivalents - - - - 580 85
Margin cash account - 241 39 - - -
Receivables - 3,412 549 - 1,533 2,152
Financial assets at fair value through profit or loss - 328,508 362,587 - 222,527 257,743
Total current assets - 335,220 366,405 - 224,894 260,280
CURRENT LIABILITIES
Bank overdraft - (333) (410) - - -
Margin cash account - - - - - -
Payables - (2,418) (198) - (38) (39)
Financial liabilities at fair value through profit or loss - (79) (1) - - - Total current liabilities excluding net assets attributable to redeemable participating shareholders - (2,830) (609) - (38) (39)
Net asset value attributable to redeemable
participating shareholders at the end of the
financial period/year - 332,390 365,796 - 224,856 260,241
* Fund closed during the financial period ended 31 May 2017.
The accompanying notes form an integral part of these financial statements.

iSHARES V PLC CONDENSED BALANCE SHEET (unaudited) (continued)
i S H A R E S V P L C I N T E R I M R E P O R T [ 3 5 ]
As at 31 May 2018 and 30 November 2017
iShares Germany Govt Bond
UCITS ETF iShares Gold Producers
UCITS ETF iShares Italy Govt Bond
UCITS ETF iShares J.P. Morgan $ EM Corp
Bond UCITS ETF
31 May 2018
€’00030 Nov 2017
€’00031 May 2018
$’000 30 Nov 2017
$’00031 May 2018
€’00030 Nov 2017
€’00031 May 2018
$’000 30 Nov 2017
$’000 CURRENT ASSETS Cash 75 15 6,421 543 101 169 3,494 3,386
Cash equivalents - - - - 689 - - -
Margin cash account - - 9 2 - - - -
Receivables 396 194 444 256 5,575 2,968 5,559 3,258
Financial assets at fair value through profit or loss 36,324 19,231 473,479 517,653 702,717 371,914 338,786 272,676
Total current assets 36,795 19,440 480,353 518,454 709,082 375,051 347,839 279,320
CURRENT LIABILITIES
Bank overdraft - - - (8) - - - -
Margin cash account - - - - - - - -
Payables (4) (3) (5,774) (255) (127) (61) (1,352) (1,354)
Financial liabilities at fair value through profit or loss - - - - - - - - Total current liabilities excluding net assets attributable to redeemable participating shareholders (4) (3) (5,774) (263) (127) (61) (1,352) (1,354)
Net asset value attributable to redeemable
participating shareholders at the end of the
financial period/year 36,791 19,437 474,579 518,191 708,955 374,990 346,487 277,966
The accompanying notes form an integral part of these financial statements.
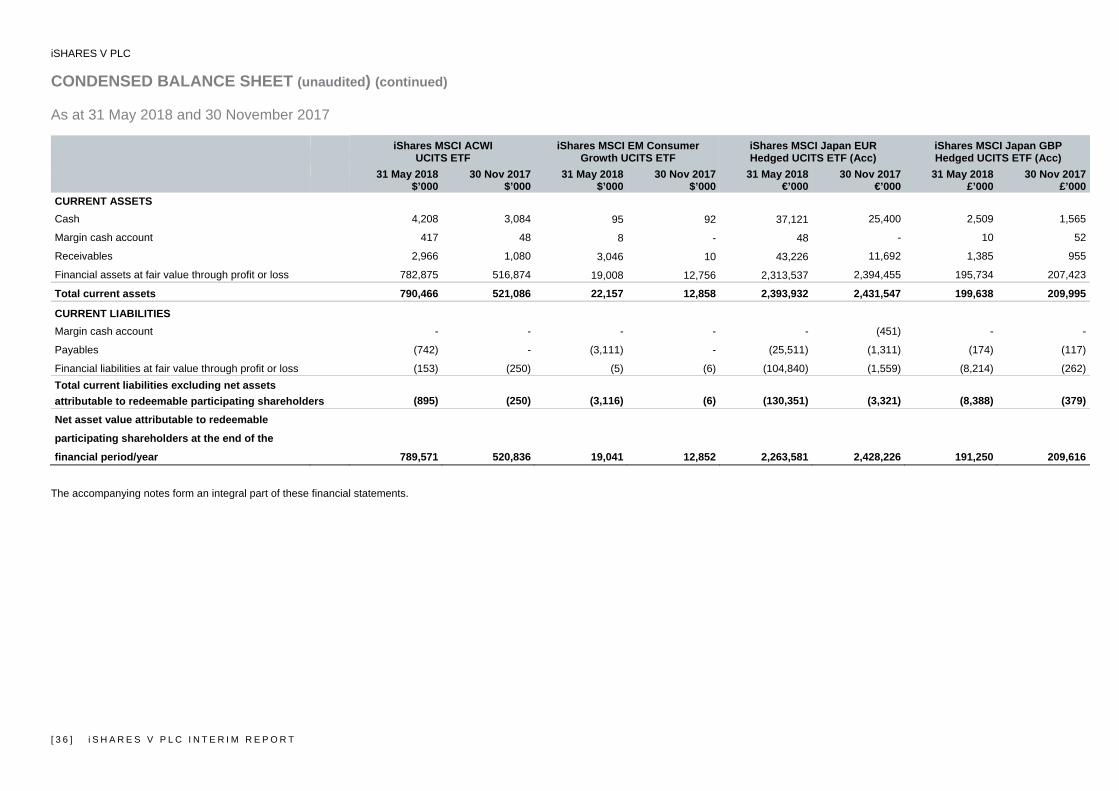
iSHARES V PLC CONDENSED BALANCE SHEET (unaudited) (continued)
[ 3 6 ] i S H A R E S V P L C I N T E R I M R E P O R T
As at 31 May 2018 and 30 November 2017
iShares MSCI ACWI
UCITS ETF iShares MSCI EM Consumer
Growth UCITS ETF iShares MSCI Japan EUR Hedged UCITS ETF (Acc)
iShares MSCI Japan GBP Hedged UCITS ETF (Acc)
31 May 2018
$’00030 Nov 2017
$’00031 May 2018
$’000 30 Nov 2017
$’00031 May 2018
€’00030 Nov 2017
€’00031 May 2018
£’000 30 Nov 2017
£’000 CURRENT ASSETS Cash 4,208 3,084 95 92 37,121 25,400 2,509 1,565
Margin cash account 417 48 8 - 48 - 10 52
Receivables 2,966 1,080 3,046 10 43,226 11,692 1,385 955
Financial assets at fair value through profit or loss 782,875 516,874 19,008 12,756 2,313,537 2,394,455 195,734 207,423
Total current assets 790,466 521,086 22,157 12,858 2,393,932 2,431,547 199,638 209,995
CURRENT LIABILITIES
Margin cash account - - - - - (451) - -
Payables (742) - (3,111) - (25,511) (1,311) (174) (117)
Financial liabilities at fair value through profit or loss (153) (250) (5) (6) (104,840) (1,559) (8,214) (262) Total current liabilities excluding net assets attributable to redeemable participating shareholders (895) (250) (3,116) (6) (130,351) (3,321) (8,388) (379)
Net asset value attributable to redeemable
participating shareholders at the end of the
financial period/year 789,571 520,836 19,041 12,852 2,263,581 2,428,226 191,250 209,616
The accompanying notes form an integral part of these financial statements.
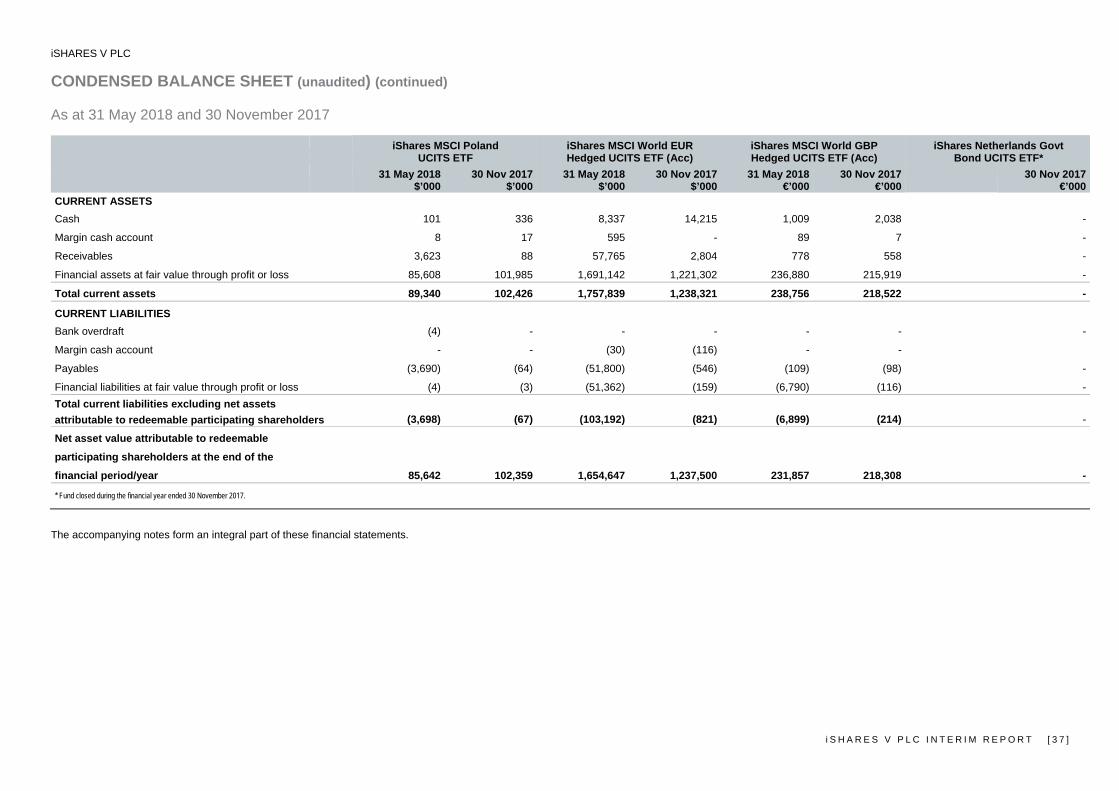
iSHARES V PLC CONDENSED BALANCE SHEET (unaudited) (continued)
i S H A R E S V P L C I N T E R I M R E P O R T [ 3 7 ]
As at 31 May 2018 and 30 November 2017
iShares MSCI Poland
UCITS ETF iShares MSCI World EUR Hedged UCITS ETF (Acc)
iShares MSCI World GBP Hedged UCITS ETF (Acc)
iShares Netherlands Govt Bond UCITS ETF*
31 May 2018
$’00030 Nov 2017
$’00031 May 2018
$’000 30 Nov 2017
$’00031 May 2018
€’00030 Nov 2017
€’000 30 Nov 2017
€’000 CURRENT ASSETS Cash 101 336 8,337 14,215 1,009 2,038 -
Margin cash account 8 17 595 - 89 7 -
Receivables 3,623 88 57,765 2,804 778 558 -
Financial assets at fair value through profit or loss 85,608 101,985 1,691,142 1,221,302 236,880 215,919 -
Total current assets 89,340 102,426 1,757,839 1,238,321 238,756 218,522 -
CURRENT LIABILITIES
Bank overdraft (4) - - - - - -
Margin cash account - - (30) (116) - -
Payables (3,690) (64) (51,800) (546) (109) (98) -
Financial liabilities at fair value through profit or loss (4) (3) (51,362) (159) (6,790) (116) - Total current liabilities excluding net assets attributable to redeemable participating shareholders (3,698) (67) (103,192) (821) (6,899) (214) -
Net asset value attributable to redeemable
participating shareholders at the end of the
financial period/year 85,642 102,359 1,654,647 1,237,500 231,857 218,308 -
* Fund closed during the financial year ended 30 November 2017.
The accompanying notes form an integral part of these financial statements.
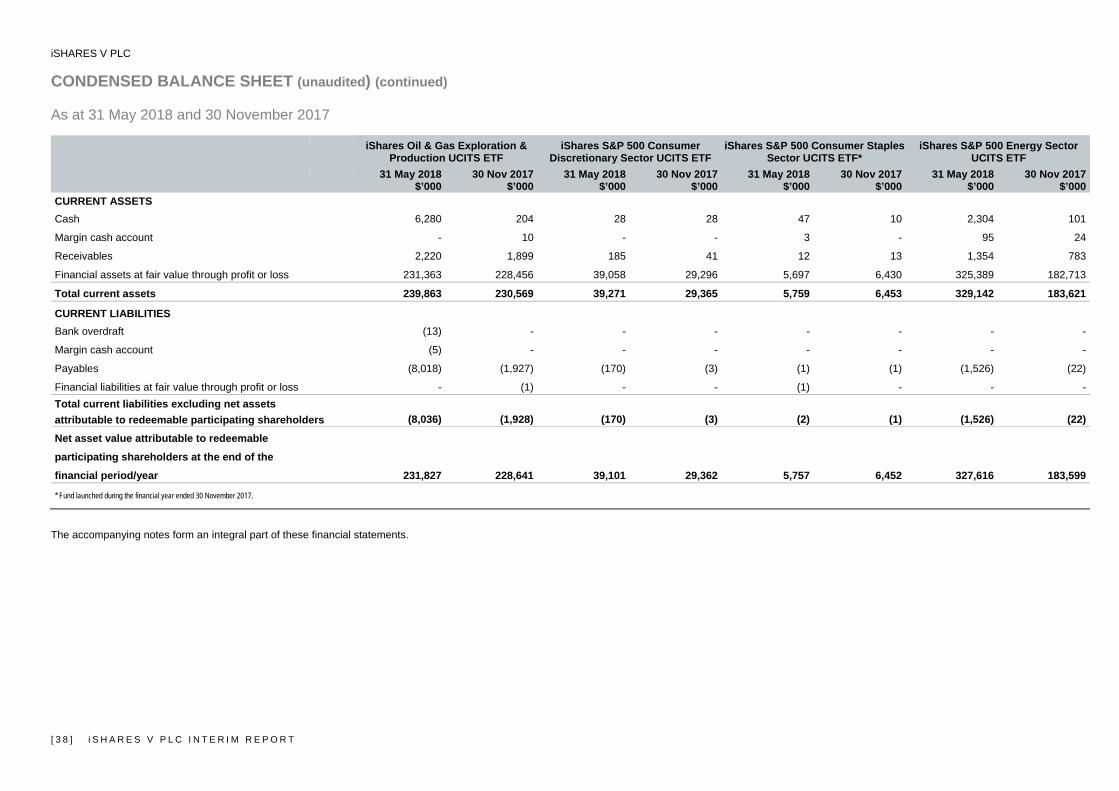
iSHARES V PLC CONDENSED BALANCE SHEET (unaudited) (continued)
[ 3 8 ] i S H A R E S V P L C I N T E R I M R E P O R T
As at 31 May 2018 and 30 November 2017
iShares Oil & Gas Exploration &
Production UCITS ETF iShares S&P 500 Consumer
Discretionary Sector UCITS ETF iShares S&P 500 Consumer Staples
Sector UCITS ETF* iShares S&P 500 Energy Sector
UCITS ETF
31 May 2018
$’00030 Nov 2017
$’00031 May 2018
$’000 30 Nov 2017
$’00031 May 2018
$’00030 Nov 2017
$’00031 May 2018
$’000 30 Nov 2017
$’000 CURRENT ASSETS Cash 6,280 204 28 28 47 10 2,304 101
Margin cash account - 10 - - 3 - 95 24
Receivables 2,220 1,899 185 41 12 13 1,354 783
Financial assets at fair value through profit or loss 231,363 228,456 39,058 29,296 5,697 6,430 325,389 182,713
Total current assets 239,863 230,569 39,271 29,365 5,759 6,453 329,142 183,621
CURRENT LIABILITIES
Bank overdraft (13) - - - - - - -
Margin cash account (5) - - - - - - -
Payables (8,018) (1,927) (170) (3) (1) (1) (1,526) (22)
Financial liabilities at fair value through profit or loss - (1) - - (1) - - - Total current liabilities excluding net assets attributable to redeemable participating shareholders (8,036) (1,928) (170) (3) (2) (1) (1,526) (22)
Net asset value attributable to redeemable
participating shareholders at the end of the
financial period/year 231,827 228,641 39,101 29,362 5,757 6,452 327,616 183,599
* Fund launched during the financial year ended 30 November 2017.
The accompanying notes form an integral part of these financial statements.
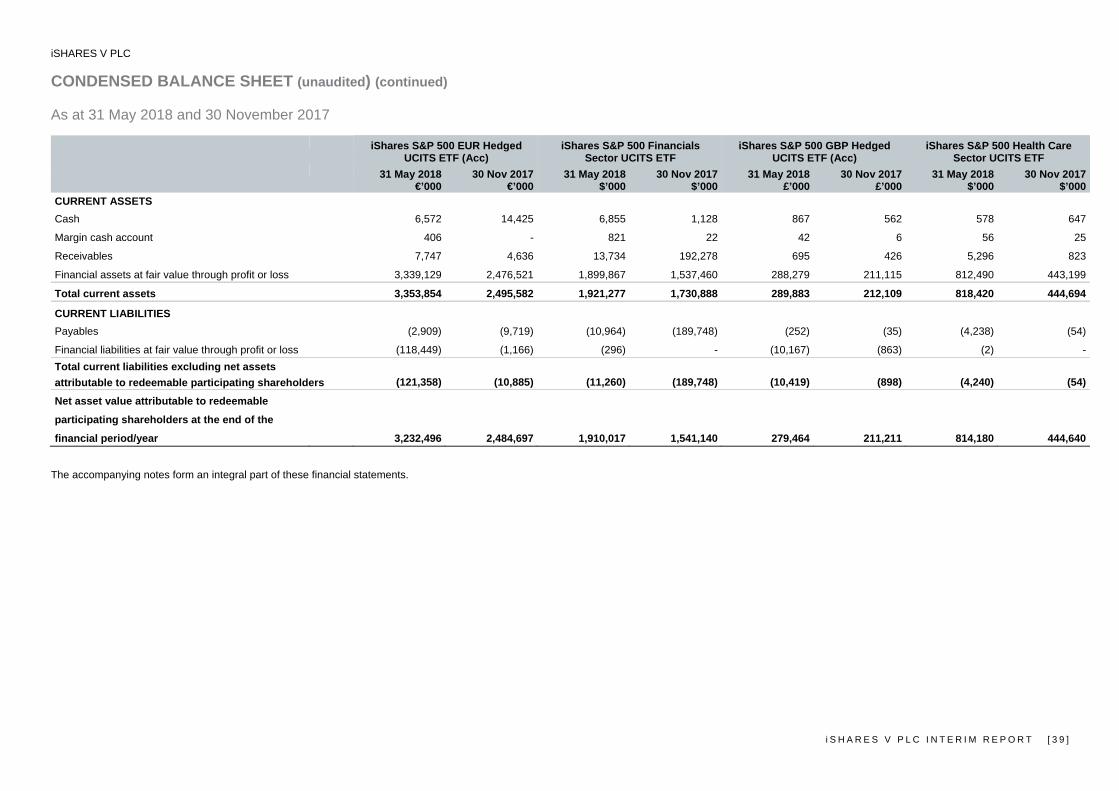
iSHARES V PLC CONDENSED BALANCE SHEET (unaudited) (continued)
i S H A R E S V P L C I N T E R I M R E P O R T [ 3 9 ]
As at 31 May 2018 and 30 November 2017
iShares S&P 500 EUR Hedged
UCITS ETF (Acc) iShares S&P 500 Financials
Sector UCITS ETF iShares S&P 500 GBP Hedged
UCITS ETF (Acc) iShares S&P 500 Health Care
Sector UCITS ETF
31 May 2018
€’00030 Nov 2017
€’00031 May 2018
$’000 30 Nov 2017
$’00031 May 2018
£’00030 Nov 2017
£’00031 May 2018
$’000 30 Nov 2017
$’000 CURRENT ASSETS Cash 6,572 14,425 6,855 1,128 867 562 578 647
Margin cash account 406 - 821 22 42 6 56 25
Receivables 7,747 4,636 13,734 192,278 695 426 5,296 823
Financial assets at fair value through profit or loss 3,339,129 2,476,521 1,899,867 1,537,460 288,279 211,115 812,490 443,199
Total current assets 3,353,854 2,495,582 1,921,277 1,730,888 289,883 212,109 818,420 444,694
CURRENT LIABILITIES
Payables (2,909) (9,719) (10,964) (189,748) (252) (35) (4,238) (54)
Financial liabilities at fair value through profit or loss (118,449) (1,166) (296) - (10,167) (863) (2) - Total current liabilities excluding net assets attributable to redeemable participating shareholders (121,358) (10,885) (11,260) (189,748) (10,419) (898) (4,240) (54)
Net asset value attributable to redeemable
participating shareholders at the end of the
financial period/year 3,232,496 2,484,697 1,910,017 1,541,140 279,464 211,211 814,180 444,640
The accompanying notes form an integral part of these financial statements.
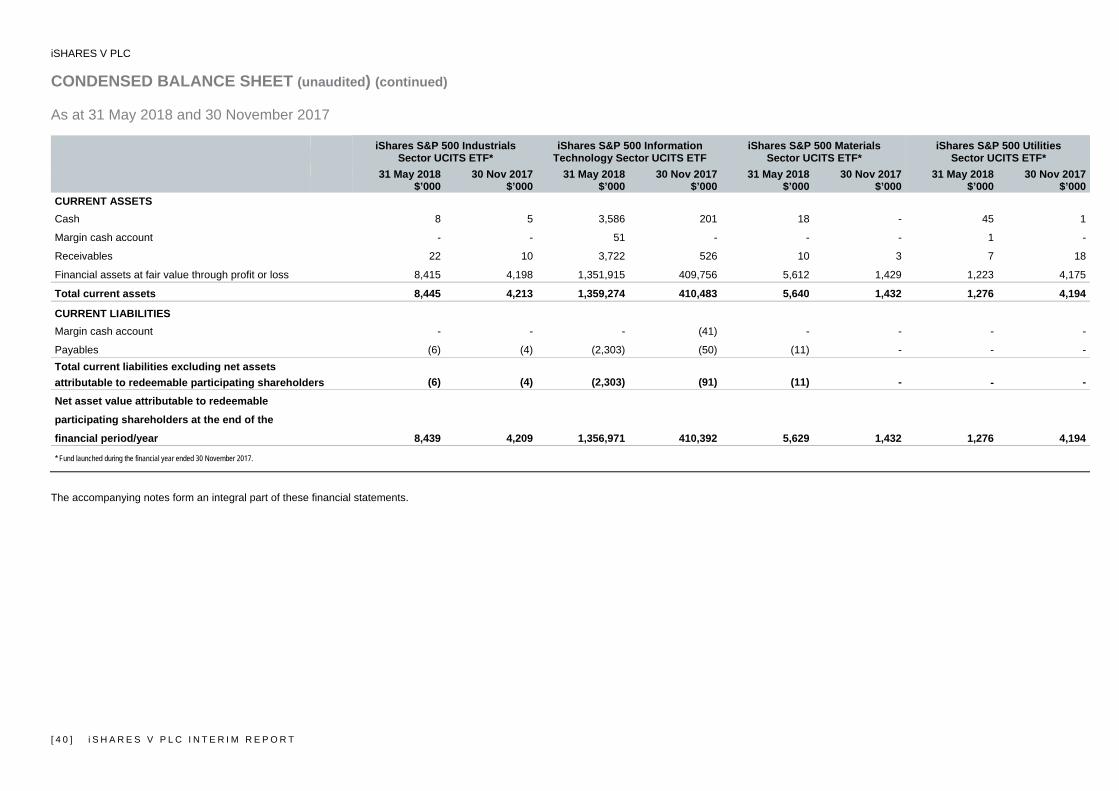
iSHARES V PLC CONDENSED BALANCE SHEET (unaudited) (continued)
[ 4 0 ] i S H A R E S V P L C I N T E R I M R E P O R T
As at 31 May 2018 and 30 November 2017
iShares S&P 500 Industrials
Sector UCITS ETF* iShares S&P 500 Information
Technology Sector UCITS ETF iShares S&P 500 Materials
Sector UCITS ETF* iShares S&P 500 Utilities
Sector UCITS ETF*
31 May 2018
$’00030 Nov 2017
$’00031 May 2018
$’000 30 Nov 2017
$’00031 May 2018
$’00030 Nov 2017
$’00031 May 2018
$’000 30 Nov 2017
$’000 CURRENT ASSETS Cash 8 5 3,586 201 18 - 45 1
Margin cash account - - 51 - - - 1 -
Receivables 22 10 3,722 526 10 3 7 18
Financial assets at fair value through profit or loss 8,415 4,198 1,351,915 409,756 5,612 1,429 1,223 4,175
Total current assets 8,445 4,213 1,359,274 410,483 5,640 1,432 1,276 4,194
CURRENT LIABILITIES
Margin cash account - - - (41) - - - -
Payables (6) (4) (2,303) (50) (11) - - - Total current liabilities excluding net assets attributable to redeemable participating shareholders (6) (4) (2,303) (91) (11) - - -
Net asset value attributable to redeemable
participating shareholders at the end of the
financial period/year 8,439 4,209 1,356,971 410,392 5,629 1,432 1,276 4,194
* Fund launched during the financial year ended 30 November 2017.
The accompanying notes form an integral part of these financial statements.
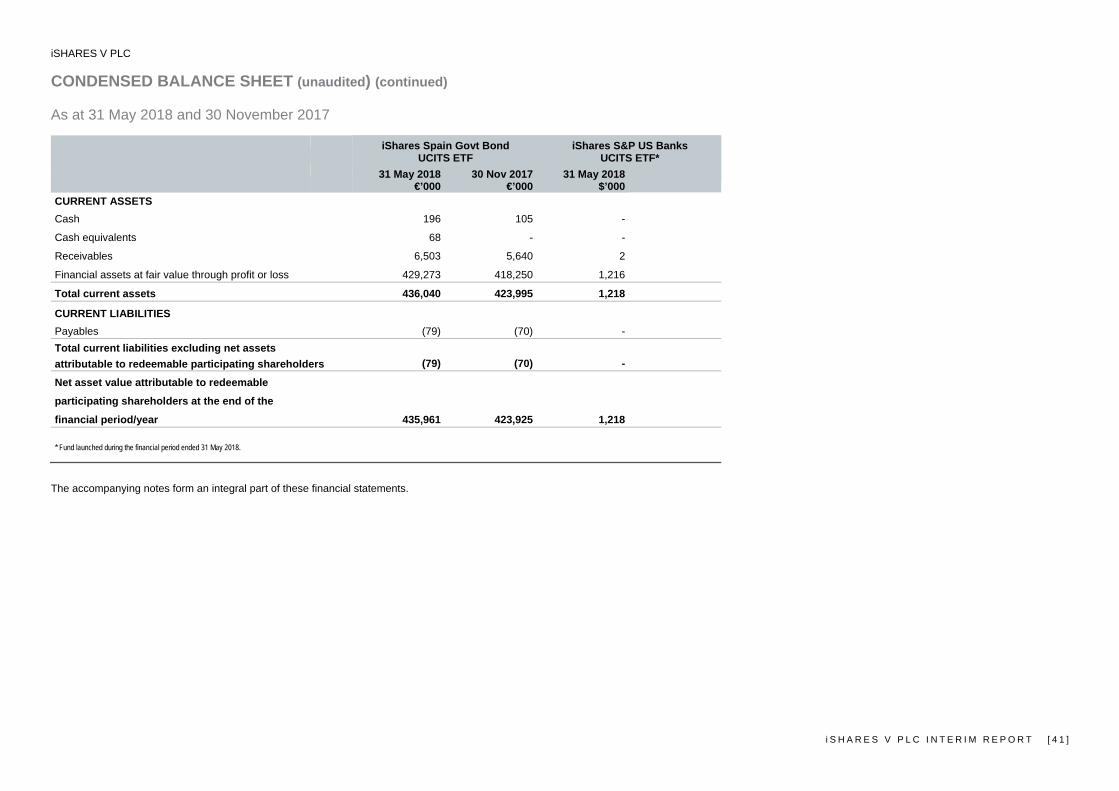
iSHARES V PLC CONDENSED BALANCE SHEET (unaudited) (continued)
i S H A R E S V P L C I N T E R I M R E P O R T [ 4 1 ]
As at 31 May 2018 and 30 November 2017
iShares Spain Govt Bond
UCITS ETF iShares S&P US Banks
UCITS ETF*
31 May 2018
€’00030 Nov 2017
€’00031 May 2018
$’000
CURRENT ASSETS Cash 196 105 -
Cash equivalents 68 - -
Receivables 6,503 5,640 2
Financial assets at fair value through profit or loss 429,273 418,250 1,216
Total current assets 436,040 423,995 1,218
CURRENT LIABILITIES
Payables (79) (70) - Total current liabilities excluding net assets attributable to redeemable participating shareholders (79) (70) -
Net asset value attributable to redeemable
participating shareholders at the end of the
financial period/year 435,961 423,925 1,218
* Fund launched during the financial period ended 31 May 2018.
The accompanying notes form an integral part of these financial statements.

iSHARES V PLC NOTES TO THE UNAUDITED FINANCIAL STATEMENTS For the financial period ended 31 May 2018
[ 4 2 ] i S H A R E S V P L C I N T E R I M R E P O R T
1. COMPANY DETAILS
iShares V public limited company is organised as an open-ended Investment Company with variable capital. The Company was incorporated in Ireland on 2 December 2009 with limited liability and segregated liability between its Funds and is organised under the laws of Ireland as a Public Limited Company (“plc”) pursuant to the Companies Act 2014 (as amended) and the UCITS Regulations and is regulated by the CBI. The registered office of the Company is J.P. Morgan House, International Financial Services Centre, Dublin 1, Ireland. 2. SIGNIFICANT ACCOUNTING POLICIES
Statement of compliance The financial statements of the Company are prepared in accordance with FRS 104 and Irish statute pursuant to the Companies Act 2014 (as amended) and the provisions of the UCITS Regulations. Accounting standards generally accepted in Ireland in preparing financial statements which present a true and fair view are promulgated and issued by the Financial Reporting Council ("FRC"). Due to the special nature of the Company's business, the directors have adapted the arrangement and headings and sub-headings of the financial statements otherwise required by Schedule 3 to the Companies Act 2014 (as amended). All amounts are rounded to the nearest thousand, unless otherwise stated. The principal accounting policies and estimation techniques are consistent with those applied to the previous annual financial statements. 3. FINANCIAL INSTRUMENTS AND RISKS
Introduction and overview The Company's investment activities expose it to the various types of risk which are associated with the financial instruments and markets in which it invests. The following information is not intended to be a comprehensive summary of all risks and investors should refer to the prospectus for a more detailed discussion of the risks inherent in investing in the Company. Risk management framework The principal risks and uncertainties of the Company and related risk management policies are consistent with those disclosed in the Company’s audited financial statements as at and for the financial year ended 30 November 2017. The Directors of the Company consider the following risks to be the principal risks and uncertainties facing the Company for the financial period: a) Market risk
Market risk arises mainly from uncertainty about future values of financial instruments influenced by other price, currency and interest rate movements. It represents the potential loss the Funds may suffer through holding market positions in the face of market movements. i) Market risk arising from foreign currency risk
Exposure to foreign currency risk Foreign currency risk is the risk that the fair value or future cash flows of a financial instrument will fluctuate because of changes in foreign exchange rates. The Funds may invest in securities, which as far as possible and practicable, consist of the component securities of the benchmark index of each Fund, and which may be denominated in currencies other than its reporting currency.

iSHARES V PLC NOTES TO THE UNAUDITED FINANCIAL STATEMENTS (continued) For the financial period ended 31 May 2018
i S H A R E S V P L C I N T E R I M R E P O R T [ 4 3 ]
3. FINANCIAL INSTRUMENT AND RISKS (continued)
a) Market risk (continued)
i) Market risk arising from foreign currency risk (continued)
Exposure to foreign currency risk (continued) The Funds with the exception of the currency hedged Funds, in line with their benchmarks, are unhedged and are therefore exposed to foreign currency risk. Consequently, each Fund is exposed to the risk of currency fluctuations between the base currency of the benchmark index and the base currency of the constituent securities of the benchmark index. In addition, certain Funds may have share classes which have different valuation currencies from the base currency of the Fund. Consequently, the investments of a share class may be acquired in currencies which are not the valuation currency of the share class. Currency hedged share classes use a currency hedging approach whereby the hedge is proportionately adjusted for net subscriptions and redemptions in the relevant currency hedged share class. An adjustment is made to the hedge to account for the price movements of the underlying securities held for the relevant currency hedged share class, however, the hedge will only be reset or adjusted on a monthly basis and as and when a pre-determined tolerance is triggered intramonth, and not whenever there is market movement in the underlying securities. In the event that, the over-hedged or under-hedged position on any single underlying portfolio currency exposure of a currency hedged share class exceeds the pre-determined tolerance as at the close of a Business Day (for example, due to market movement), the hedge in respect of that underlying currency will be reset on the next Business Day (on which the relevant currency markets are open). Over-hedged positions shall not exceed 105% of the NAV of the relevant currency hedged share class and under-hedged positions shall not fall short of 95% of the portion of the NAV of the relevant currency hedged share class that is to be hedged against currency risk. As a result of this currency hedging approach, the currency hedged share classes are considered to be immaterially exposed to foreign currency risk. Currency hedged share classes, where offered in a Fund, aim to reduce the impact of exchange rate fluctuations between the underlying portfolio currency exposures of the Fund and the valuation currency of the currency hedged share class on returns of the relevant benchmark index to investors in that share class, through entering into foreign exchange contracts for currency hedging. The realised or unrealised gains or losses relating to these forward currency contracts are allocated to the relevant share class. The details of such contracts are disclosed as hedged forwards in the Fund’s schedule of investments. The Funds may also invest in forward currency contracts and thus gain further exposure to foreign currency risk. Management of foreign currency risk To minimise this risk, the currency hedged Funds invest in forward currency contracts that as far as possible track the hedging methodology of the benchmark index. The benchmark indices of the currency hedged Funds are designed to represent a close approximation of the return that can be achieved by hedging the currency exposures of the index in the one month forward market at the end of each month.
Exchange rate exposures are managed where appropriate and in compliance with the prospectus utilising forward currency contracts. The details of the contracts in place at the financial period-end date are disclosed in the schedules of investments. The Investment Manager will monitor the currency exposure and gain or loss arising from hedge positions of each currency hedged share class against the pre-determined tolerances daily and will determine when a currency hedge should be reset and the gain or loss arising from the currency forwards reinvested or settled, while taking into consideration the frequency and associated transaction and reinvestment costs of resetting the currency forwards. ii) Market risk arising from other price risk
Exposure to other price risk Other price risk is the risk that the fair value or future cash flows of a financial instrument will fluctuate because of changes in market prices (other than those arising from interest rate risk or currency risk), whether those changes are caused by factors specific to the individual financial instrument or its issuer, or factors affecting similar financial instruments traded in the market.
iSHARES V PLC NOTES TO THE UNAUDITED FINANCIAL STATEMENTS (continued) For the financial period ended 31 May 2018
[ 4 4 ] i S H A R E S V P L C I N T E R I M R E P O R T
3. FINANCIAL INSTRUMENT AND RISKS (continued)
a) Market risk (continued)
ii) Market risk arising from other price risk (continued)
Exposure to other price risk (continued) The Funds are exposed to market risk arising by virtue of their investments in equities, rights, bonds, forward currency contracts and futures contracts. The movements in the prices of these investments result in movements in the performance of the Funds. The investment concentrations within the portfolio are disclosed in the schedules of investments by investment type. Management of other price risk The Investment Manager manages the Funds’ market risk on a daily basis in accordance with the Funds’ investment objective. The investment objective of the Funds is to provide investors with a total return, taking into account the capital and income returns, which reflect the total returns of the respective benchmark. The Fund’s performance is correlated to its benchmark. The correlation of the Fund’s performance against the benchmark is a metric monitored by key management personnel. iii) Market risk arising from interest rate risk
Exposure to interest rate risk Interest rate risk is the risk that the fair value or future cash flows of a financial instrument will fluctuate because of changes in market interest rates. The Funds are exposed to interest rate risk through their cash and cash equivalent holdings including margin cash held with brokers. The Funds are also exposed to interest rate risk through their investments in bonds, where the value of these securities may fluctuate as a result of a change in interest rates. The Funds also have indirect exposure to interest rate risk through their investments into futures contracts, whereby the value of the underlying asset may fluctuate as a result of a change in interest rates. Management of interest rate risk iShares € Corp Bond Interest Rate Hedged UCITS ETF (the "Interest Rate Hedged Fund") sells German government bond futures contracts in order to hedge the underlying German government bond yield risk, which is part of the Fund's European corporate bond exposure. The Interest Rate Hedged Fund, as far as possible and practicable, tracks the hedging methodology of the benchmark index. The benchmark index of the Interest Rate Hedged Fund aims to measure the total return of Euro denominated corporate bonds in the Bloomberg Barclays EUR Corporate Interest Rate Hedged Index while hedging against underlying interest rate risk of euro corporate bonds in the form of German government bond yield risk. The benchmark index hedges against underlying interest rate risk by subtracting from the total return of the Bloomberg Barclays EUR Corporate Interest Rate Hedged Index, the return on a basket of German government bond futures contracts on a monthly basis. The hedge aims to minimise exposure to movements in the yield of German government bonds, which is a part of European corporate bond exposure. Movements in the prices of these investments are derived from movements in market interest rates and issuer creditworthiness. Issuer creditworthiness and credit spreads are monitored by the Investment Manager regularly. The securities in which the Funds invest will generally have a minimum rating of "investment grade" (Investment grade securities are those issued by an entity with a minimum investment grade credit rating from at least one globally recognised credit rating agency; Standard & Poor’s, Moody’s or Fitch) from a ratings agency as set out in the investment policy of the Funds.
iSHARES V PLC NOTES TO THE UNAUDITED FINANCIAL STATEMENTS (continued) For the financial period ended 31 May 2018
i S H A R E S V P L C I N T E R I M R E P O R T [ 4 5 ]
3. FINANCIAL INSTRUMENT AND RISKS (continued)
b) Counterparty credit risk
Exposure to counterparty credit risk Counterparty credit risk is the risk that one party to a financial instrument will cause a financial loss for the other party by failing to discharge an obligation.
The Funds are exposed to counterparty credit risk from the parties with which they trade and will bear the risk of settlement default. Management of counterparty credit risk Counterparty credit risk is monitored and managed by BlackRock’s Risk and Quantitative Analysis ("RQA") Counterparty & Concentration Risk Team. The team is headed by BlackRock’s Chief Counterparty Credit Officer who reports to the Global Head of RQA. Credit authority resides with the Chief Counterparty Credit Officer and selected team members to whom specific credit authority has been delegated. As such, counterparty approvals may be granted by the Chief Counterparty Credit Officer, or by identified RQA Credit Risk Officers who have been formally delegated authority by the Chief Counterparty Credit Officer. The BlackRock RQA Counterparty & Concentration Risk Team completes a formal review of each new counterparty, monitors and reviews all approved counterparties on an ongoing basis and maintains an active oversight of counterparty exposures and the collateral management process. There were no past due or impaired balances in relation to transactions with counterparties as at 31 May 2018 or 30 November 2017. i) Financial derivative instruments
The Funds’ holdings in exchange traded futures contracts and Over the Counter ("OTC") financial derivative instruments exposes the Funds to counterparty credit risk. Management of counterparty credit risk related to financial derivative instruments
Exchange traded financial derivative instruments The exposure to futures contracts is limited by trading the contracts through a clearing house. The Funds’ exposure to counterparty credit risk on contracts in which it currently has a gain position is reduced by such gains received in cash from the counterparty under the daily mark-to-market mechanism on exchange traded futures contracts (variation margin). The Funds’ exposure to credit risk on contracts in which they currently have a loss position is equal to the amount of margin posted to the counterparty which has not been transferred to the exchange under the daily mark-to-market mechanism. Margin is paid or received on futures contracts to cover any exposure by the counterparty or the Funds to each other. “Margin cash account” on the condensed balance sheet consists of margin receivable from or payable to the Fund's clearing brokers and various counterparties. OTC financial derivative instruments Counterparty credit risk in relation to OTC financial derivative instruments arises from the failure of the counterparty to perform according to the terms of the contract. The Funds exposure to counterparty credit risk is limited to the contracts in which it currently has a financial asset position reduced by any collateral received from the counterparty, or to counterparties who have received collateral from the Funds. All OTC derivative transactions are entered into by the Funds under an International Swaps and Derivatives Associations, Inc. Master Agreement (“ISDA Master Agreement”) or similar agreement. An ISDA Master Agreement is a bilateral agreement between the Funds and a counterparty that governs OTC derivative transactions entered into by the parties.

iSHARES V PLC NOTES TO THE UNAUDITED FINANCIAL STATEMENTS (continued) For the financial period ended 31 May 2018
[ 4 6 ] i S H A R E S V P L C I N T E R I M R E P O R T
3. FINANCIAL INSTRUMENT AND RISKS (continued)
b) Counterparty credit risk (continued)
i) Financial derivative instruments (continued)
Management of counterparty credit risk related to financial derivative instruments (continued)
OTC financial derivative instruments (continued) The parties’ exposures under the ISDA Master Agreement are netted and collateralised together, therefore any collateral disclosures provided are in respect of all OTC derivative transactions entered into by the Funds under the ISDA Master Agreement. All non-cash collateral received/posted by the Funds under the ISDA Master Agreement is transferred bilaterally under a title transfer arrangement. The carrying value of financial assets together with cash held with counterparties best represents the Fund’s gross maximum exposure to counterparty credit risk at the reporting date, before including the effect of ISDA Master Agreements and close-out netting, which reduces the overall counterparty credit risk exposure. Cash held as security by the counterparty to derivative contracts is subject to the credit risk of the counterparty. The Funds’ maximum exposure to counterparty credit risk from holding forward currency contracts will be equal to the notional amount of the currency and any net unrealised gains as disclosed in the schedule of investments. Management of counterparty credit risk related to OTC financial derivative instruments Forward currency contracts do not require variation margins and thus the counterparty credit risk is monitored through the BlackRock RQA Counterparty & Concentration Risk Team who monitor the creditworthiness of the counterparty. The counterparties for forward currency contracts are disclosed in the relevant schedules of investments. ii) Depositary
The Funds’ Depositary is State Street Custodial Services (Ireland) Limited (the “Depositary”). The majority of the investments are held by the Depositary at financial period end. Investments are segregated from the assets of the Depositary, with ownership rights remaining with the Funds. Bankruptcy or insolvency of the Depositary may cause the Funds’ rights with respect to its investments held by the Depositary to be delayed or limited. The maximum exposure to this risk is the amount of long investments disclosed in the schedules of investments. The Depositary has appointed State Street Bank and Trust Company (the “Sub-Custodian”) as its global Sub-Custodian. Substantially all of the cash of the Company is held with the Sub-Custodian. The Funds’ cash balances are held by the Sub-Custodian in its account together with its own cash balances and with those cash balances that are held on behalf of other clients. The Funds’ cash balances are separately identifiable within the records of the Sub-Custodian. In respect of the cash held by the Sub-Custodian or other depositaries it appoints, the Funds will be exposed to counterparty credit risk of the Sub-Custodian or those depositaries. In the event of the insolvency or bankruptcy of the Sub-Custodian or other depositaries, the Funds will be treated as a general creditor of the Sub-Custodian or the depositaries. Management of counterparty credit risk related to the Depositary To mitigate the Funds’ exposure to the Depositary, the Investment Manager employs specific procedures to ensure that the Depositary is a reputable institution and that the counterparty credit risk is acceptable to the Funds. The Funds only transacts with Depositary’s that are regulated entities subject to prudential supervision, or with "high credit ratings" assigned by international credit rating agencies. The long term credit rating of the parent company of the Depositary and Sub-Custodian, State Street Corporation, as at 31 May 2018, is A (30 November 2017: A) (Standard and Poor’s rating). In order to further mitigate the Fund's counterparty credit risk exposure to the Sub-Custodian or depositary banks, the Funds may enter into additional arrangements such as the placing of residual cash in a money market fund for example Institutional Cash Series Plc ("ICS") shown as a cash equivalent on the condensed balance sheet. ICS is a BlackRock umbrella fund and an open-ended Investment Company with variable capital incorporated in Ireland and having segregated liability between its funds. ICS is authorised as a UCITS.
iSHARES V PLC NOTES TO THE UNAUDITED FINANCIAL STATEMENTS (continued) For the financial period ended 31 May 2018
i S H A R E S V P L C I N T E R I M R E P O R T [ 4 7 ]
3. FINANCIAL INSTRUMENT AND RISKS (continued)
b) Counterparty credit risk (continued)
iii) Counterparties
All transactions in listed securities are settled/paid for upon delivery using approved brokers. The risk of default is considered minimal, as delivery of securities sold is only made once the broker has received payment. Payment is made on a purchase once the securities have been received by the broker. The trade will fail if either party fails to meet its obligation. Counterparty credit risk arising on transactions with brokers relates to transactions awaiting settlement. Risk relating to unsettled transactions is considered small due to the short settlement period involved and the high credit quality of the brokers used. Management of counterparty credit risk related to counterparties RQA monitors the credit rating and financial position of the brokers used to further mitigate this risk. iv) Securities lending
The Funds that engage in securities lending activities expose such Funds to counterparty credit risk. The maximum exposure to each Fund is equal to the value of the securities loaned. Securities lending transactions entered into by the Funds are subject to a written legal agreement between the Funds and the Securities Lending Agent, BlackRock Advisors (UK) Limited, a related party to the Company, and separately between the Securities Lending Agent and the approved borrowing counterparty.
Collateral received in exchange for securities lent is transferred under a title transfer arrangement and is delivered to and held in an account with a tri-party collateral manager in the name of the Depositary on behalf of the Funds. Collateral received is segregated from the assets belonging to the Funds’ Depositary or the Lending Agent.
Management of counterparty credit risk related to securities lending To mitigate this risk, the Funds which undertake securities lending transactions receive either cash or securities as collateral equal to a certain percentage in excess of the fair value of the securities loaned. The Investment Manager monitors the fair value of the securities loaned and additional collateral is obtained, if necessary. As at the condensed balance sheet date, all non-cash collateral received consists of securities admitted to or dealt on a regulated market. The Funds also benefit from a borrower default indemnity provided by BlackRock, Inc. The indemnity allows for full replacement of securities lent. BlackRock, Inc. bears the cost of indemnification against borrower default.
c) Issuer credit risk relating to debt securities
Issuer credit risk is the default risk of one of the issuers of any securities held by the Funds. Bonds or other debt securities involve credit risk to the issuer which may be evidenced by the issuer’s credit rating. Securities which are subordinated and/or have a lower credit rating are generally considered to have a higher credit risk and a greater possibility of default than more highly rated. A number of the Funds invest into sovereign and corporate debt. This exposes the Funds to the risk that the issuer of the bonds may default on interest or principal payments.
Management of issuer credit risk related to debt securities To manage this risk, the Investment Manager invests in a wide range of debt securities, subject to the investment objectives of each Fund and monitors the credit ratings of the investments as disclosed in the schedules of investments. The ratings of the debt securities are continually monitored by the BlackRock Portfolio Management Group (“PMG”).

iSHARES V PLC NOTES TO THE UNAUDITED FINANCIAL STATEMENTS (continued) For the financial period ended 31 May 2018
[ 4 8 ] i S H A R E S V P L C I N T E R I M R E P O R T
3. FINANCIAL INSTRUMENT AND RISKS (continued)
d) Liquidity risk
Exposure to liquidity risk Liquidity risk is the risk that the Funds will encounter difficulties in meeting their obligations associated with financial liabilities. Liquidity risk to the Funds arises from the redemption requests of investors and the liquidity of the underlying investments the Funds are invested in. The Funds’ shareholders may redeem their shares on the close of any daily dealing deadline for cash equal to a proportionate share of the Funds’ NAV. The Funds are therefore potentially exposed to the liquidity risk of meeting the shareholders’ redemptions and may need to sell assets at prevailing market prices to meet liquidity demands. It is also exposed to the liquidity risk of daily margin calls on derivatives. Management of liquidity risk Liquidity risk is minimised by holding sufficient liquid investments which can be readily realised to meet liquidity demands. To manage this risk, if redemption requests on any dealing day represent 10% or more of the shares in issue in respect of any Fund, the Manager may, in its discretion, refuse to redeem any shares in excess of 10% (at any time including after the cut-off time on the dealing day). Any request for redemptions on such dealing day shall be reduced rateably and the redemption requests shall be treated as if they were received on each subsequent dealing day until all shares to which the original request related have been redeemed. In any event settlement for redemptions will normally be made within fourteen days of the dealing day. The Fund's liquidity risk is managed on a daily basis by the Investment Manager in accordance with established policies and procedures in place. The portfolio managers review daily forward looking cash reports which project cash obligations. These reports allow them to manage their cash obligations. The Funds benefit from the ETF creation and redemption process which, through the use of Authorised Participants, benefit from economies of scale and access to market participants with a visible market presence and a driver of large trading volumes. Investors and the Funds benefit from the ETF creation and redemption process, which allows an investor, through Authorised Participants, to create and redeem a large number of shares, therefore giving them access to significant market depth. This helps to mitigate liquidity risk and investor concentration risks for the Funds and mitigates investor concentration risks given that the Authorised Participants either receive the assets directly from the Fund on redemption, or for the minority of Funds a fee is charged to cover trading costs. e) Valuation of financial instruments
The Funds classify financial instruments measured at fair value using a fair value hierarchy. The fair value hierarchy has the following categories: Level 1 - Quoted prices for identical instruments in active markets A financial instrument is regarded as quoted in an active market if quoted prices are readily and regularly available and those prices represent actual and regularly occurring market transactions on an arm’s length basis. The Fund does not adjust the quoted price for these instruments. Level 2 - Valuation techniques using observable inputs This category includes instruments valued using: quoted prices in active markets for similar instruments; quoted prices for similar instruments in markets that are considered less than active; or other valuation techniques where all significant inputs are directly or indirectly observable from market data. Valuation techniques used for non-standardised financial instruments such as OTC derivatives, include the use of comparable recent arm’s length transactions, reference to other instruments that are substantially the same, discounted cash flow analysis, option pricing models and other valuation techniques commonly used by market participants making the maximum use of market inputs and relying as little as possible on entity determined inputs.
iSHARES V PLC NOTES TO THE UNAUDITED FINANCIAL STATEMENTS (continued) For the financial period ended 31 May 2018
i S H A R E S V P L C I N T E R I M R E P O R T [ 4 9 ]
3. FINANCIAL INSTRUMENT AND RISKS (continued)
e) Valuation of financial instruments (continued)
Level 3 - Valuation techniques using significant unobservable inputs This category includes all instruments where the valuation techniques used include inputs not based on market data and these inputs could have a significant impact on the instrument’s valuation. This category also includes instruments that are valued based on quoted prices for similar instruments where significant entity determined adjustments or assumptions are required to reflect differences between the instruments and instruments for which there is no active market. The level in the fair value hierarchy within which the fair value measurement is categorised in its entirety is determined on the basis of the lowest level input that is significant to the fair value measurement in its entirety. For this purpose, the significance of an input is assessed against the fair value measurement in its entirety. If a fair value measurement uses observable inputs that require significant adjustment based on unobservable inputs, that measurement is a level 3 measurement. Assessing the significance of a particular input to the fair value measurement in its entirety requires judgement, considering factors specific to the asset or liability. The determination of what constitutes ‘observable’ inputs requires significant judgement by the Investment Manager. The Investment Manager considers observable inputs to be that market data that is readily available, regularly distributed or updated, reliable and verifiable, not proprietary, and provided by independent sources that are actively involved in the relevant market. There were no level 3 securities held on the Funds with a fair value greater than 1% of the relevant Fund’s NAV at the financial period ended 31 May 2018 or 30 November 2017. The tables below and overleaf are an analysis of the Funds’ financial assets and financial liabilities measured at fair value at 31 May 2018.
31 May 2018
Level 1 Level 2 Level 3 TotaliShares € Corp Bond Interest Rate Hedged UCITS ETF €‘000 €‘000 €‘000 €‘000
Financial assets at fair value through profit or loss
- Bonds - 1,470,791 - 1,470,791
Total - 1,470,791 - 1,470,791
Financial liabilities at fair value through profit or loss
- Futures contracts (26,889) - - (26,889)
Total (26,889) - - (26,889)
iShares Agribusiness UCITS ETF $’000 $’000 $’000 $’000
Financial assets at fair value through profit or loss
- Equities 77,175 - - 77,175
- Futures contracts 5 - - 5
Total 77,180 - - 77,180
iShares EM Dividend UCITS ETF $’000 $’000 $’000 $’000
Financial assets at fair value through profit or loss
- Equities 327,945 - - 327,945
- Rights 563 - - 563
Total 328,508 - - 328,508
Financial liabilities at fair value through profit or loss
- Futures contracts (79) - - (79)
Total (79) - - (79)
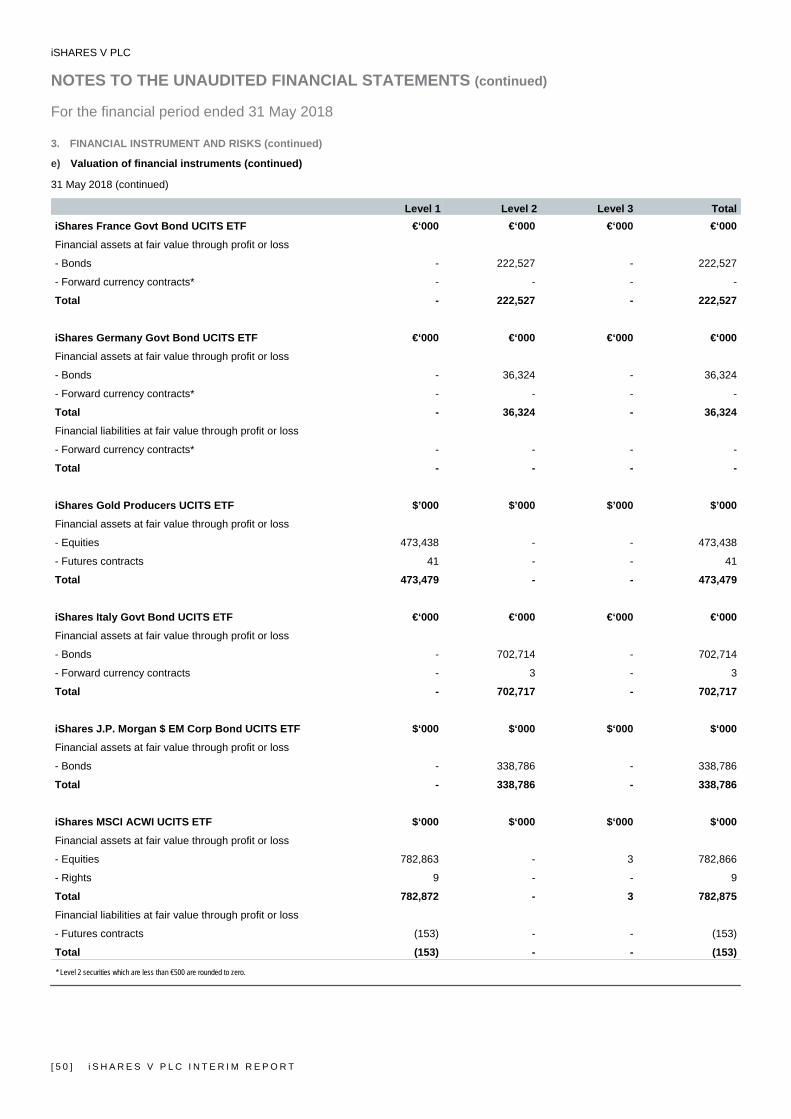
iSHARES V PLC NOTES TO THE UNAUDITED FINANCIAL STATEMENTS (continued) For the financial period ended 31 May 2018
[ 5 0 ] i S H A R E S V P L C I N T E R I M R E P O R T
3. FINANCIAL INSTRUMENT AND RISKS (continued)
e) Valuation of financial instruments (continued)
31 May 2018 (continued)
Level 1 Level 2 Level 3 TotaliShares France Govt Bond UCITS ETF €‘000 €‘000 €‘000 €‘000
Financial assets at fair value through profit or loss
- Bonds - 222,527 - 222,527
- Forward currency contracts* - - - -
Total - 222,527 - 222,527
iShares Germany Govt Bond UCITS ETF €‘000 €‘000 €‘000 €‘000
Financial assets at fair value through profit or loss
- Bonds - 36,324 - 36,324
- Forward currency contracts* - - - -
Total - 36,324 - 36,324
Financial liabilities at fair value through profit or loss
- Forward currency contracts* - - - -
Total - - - -
iShares Gold Producers UCITS ETF $’000 $’000 $’000 $’000
Financial assets at fair value through profit or loss
- Equities 473,438 - - 473,438
- Futures contracts 41 - - 41
Total 473,479 - - 473,479
iShares Italy Govt Bond UCITS ETF €‘000 €‘000 €‘000 €‘000
Financial assets at fair value through profit or loss
- Bonds - 702,714 - 702,714
- Forward currency contracts - 3 - 3
Total - 702,717 - 702,717
iShares J.P. Morgan $ EM Corp Bond UCITS ETF $‘000 $‘000 $‘000 $‘000
Financial assets at fair value through profit or loss
- Bonds - 338,786 - 338,786
Total - 338,786 - 338,786
iShares MSCI ACWI UCITS ETF $‘000 $‘000 $‘000 $‘000
Financial assets at fair value through profit or loss
- Equities 782,863 - 3 782,866
- Rights 9 - - 9
Total 782,872 - 3 782,875
Financial liabilities at fair value through profit or loss
- Futures contracts (153) - - (153)
Total (153) - - (153)
* Level 2 securities which are less than €500 are rounded to zero.
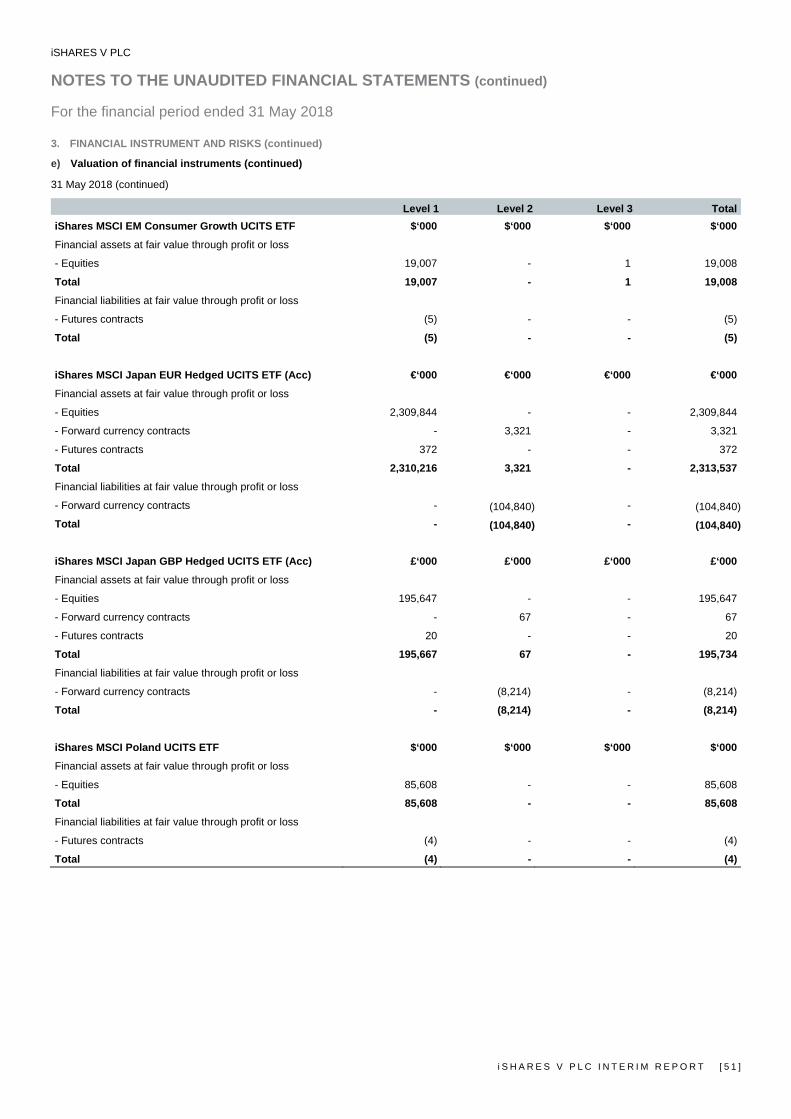
iSHARES V PLC NOTES TO THE UNAUDITED FINANCIAL STATEMENTS (continued) For the financial period ended 31 May 2018
i S H A R E S V P L C I N T E R I M R E P O R T [ 5 1 ]
3. FINANCIAL INSTRUMENT AND RISKS (continued)
e) Valuation of financial instruments (continued)
31 May 2018 (continued)
Level 1 Level 2 Level 3 TotaliShares MSCI EM Consumer Growth UCITS ETF $‘000 $‘000 $‘000 $‘000
Financial assets at fair value through profit or loss
- Equities 19,007 - 1 19,008
Total 19,007 - 1 19,008
Financial liabilities at fair value through profit or loss
- Futures contracts (5) - - (5)
Total (5) - - (5)
iShares MSCI Japan EUR Hedged UCITS ETF (Acc) €‘000 €‘000 €‘000 €‘000
Financial assets at fair value through profit or loss
- Equities 2,309,844 - - 2,309,844
- Forward currency contracts - 3,321 - 3,321
- Futures contracts 372 - - 372
Total 2,310,216 3,321 - 2,313,537
Financial liabilities at fair value through profit or loss
- Forward currency contracts - (104,840) - (104,840)Total - (104,840) - (104,840)
iShares MSCI Japan GBP Hedged UCITS ETF (Acc) £‘000 £‘000 £‘000 £‘000
Financial assets at fair value through profit or loss
- Equities 195,647 - - 195,647
- Forward currency contracts - 67 - 67
- Futures contracts 20 - - 20
Total 195,667 67 - 195,734
Financial liabilities at fair value through profit or loss
- Forward currency contracts - (8,214) - (8,214)
Total - (8,214) - (8,214)
iShares MSCI Poland UCITS ETF $‘000 $‘000 $‘000 $‘000
Financial assets at fair value through profit or loss
- Equities 85,608 - - 85,608
Total 85,608 - - 85,608
Financial liabilities at fair value through profit or loss
- Futures contracts (4) - - (4)
Total (4) - - (4)

iSHARES V PLC NOTES TO THE UNAUDITED FINANCIAL STATEMENTS (continued) For the financial period ended 31 May 2018
[ 5 2 ] i S H A R E S V P L C I N T E R I M R E P O R T
3. FINANCIAL INSTRUMENT AND RISKS (continued)
e) Valuation of financial instruments (continued)
31 May 2018 (continued)
Level 1 Level 2 Level 3 TotaliShares MSCI World EUR Hedged UCITS ETF (Acc) €‘000 €‘000 €‘000 €‘000
Financial assets at fair value through profit or loss
- Equities 1,691,024 - 7 1,691,031
- Rights 9 - - 9
- Forward currency contracts - 23 - 23
- Futures contracts 79 - - 79
Total 1,691,112 23 7 1,691,142
Financial liabilities at fair value through profit or loss
- Forward currency contracts - (51,229) - (51,229)- Futures contracts (133) - - (133)Total (133) (51,229) - (51,362) iShares MSCI World GBP Hedged UCITS ETF (Acc) £‘000 £‘000 £‘000 £‘000
Financial assets at fair value through profit or loss
- Equities 236,848 - 1 236,849
- Rights 1 - - 1
- Forward currency contracts - 24 - 24
- Futures contracts 6 - - 6
Total 236,855 24 1 236,880
Financial liabilities at fair value through profit or loss - Forward currency contracts - (6,775) - (6,775)
- Futures contracts (15) - - (15)
Total (15) (6,775) - (6,790)
iShares Oil & Gas Exploration & Production UCITS ETF $’000 $’000 $’000 $’000
Financial assets at fair value through profit or loss
- Equities 231,329 - - 231,329
- Futures contracts 34 - - 34
Total 231,363 - - 231,363
iShares S&P 500 Consumer Discretionary Sector UCITS ETF $’000 $’000 $’000 $’000
Financial assets at fair value through profit or loss - Equities 39,058 - - 39,058
Total 39,058 - - 39,058
iShares S&P 500 Consumer Staples Sector UCITS ETF $’000 $’000 $’000 $’000
Financial assets at fair value through profit or loss - Equities 5,697 - - 5,697
Total 5,697 - - 5,697
Financial liabilities at fair value through profit or loss
- Futures contracts (1) - - (1)
Total (1) - - (1)
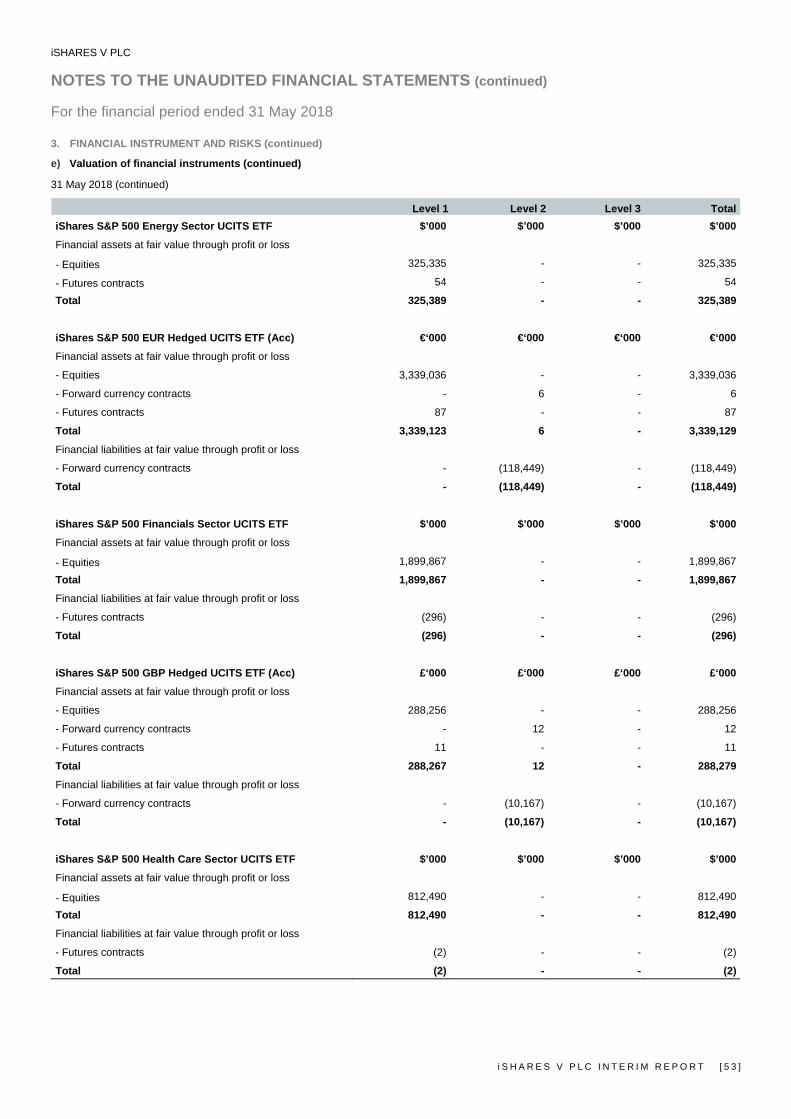
iSHARES V PLC NOTES TO THE UNAUDITED FINANCIAL STATEMENTS (continued) For the financial period ended 31 May 2018
i S H A R E S V P L C I N T E R I M R E P O R T [ 5 3 ]
3. FINANCIAL INSTRUMENT AND RISKS (continued)
e) Valuation of financial instruments (continued)
31 May 2018 (continued)
Level 1 Level 2 Level 3 TotaliShares S&P 500 Energy Sector UCITS ETF $’000 $’000 $’000 $’000
Financial assets at fair value through profit or loss - Equities 325,335 - - 325,335
- Futures contracts 54 - - 54
Total 325,389 - - 325,389
iShares S&P 500 EUR Hedged UCITS ETF (Acc) €‘000 €‘000 €‘000 €‘000
Financial assets at fair value through profit or loss
- Equities 3,339,036 - - 3,339,036
- Forward currency contracts - 6 - 6
- Futures contracts 87 - - 87
Total 3,339,123 6 - 3,339,129
Financial liabilities at fair value through profit or loss
- Forward currency contracts - (118,449) - (118,449)
Total - (118,449) - (118,449)
iShares S&P 500 Financials Sector UCITS ETF $’000 $’000 $’000 $’000
Financial assets at fair value through profit or loss - Equities 1,899,867 - - 1,899,867
Total 1,899,867 - - 1,899,867
Financial liabilities at fair value through profit or loss
- Futures contracts (296) - - (296)
Total (296) - - (296)
iShares S&P 500 GBP Hedged UCITS ETF (Acc) £‘000 £‘000 £‘000 £‘000
Financial assets at fair value through profit or loss
- Equities 288,256 - - 288,256
- Forward currency contracts - 12 - 12
- Futures contracts 11 - - 11
Total 288,267 12 - 288,279
Financial liabilities at fair value through profit or loss
- Forward currency contracts - (10,167) - (10,167)
Total - (10,167) - (10,167)
iShares S&P 500 Health Care Sector UCITS ETF $’000 $’000 $’000 $’000
Financial assets at fair value through profit or loss - Equities 812,490 - - 812,490
Total 812,490 - - 812,490
Financial liabilities at fair value through profit or loss
- Futures contracts (2) - - (2)
Total (2) - - (2)
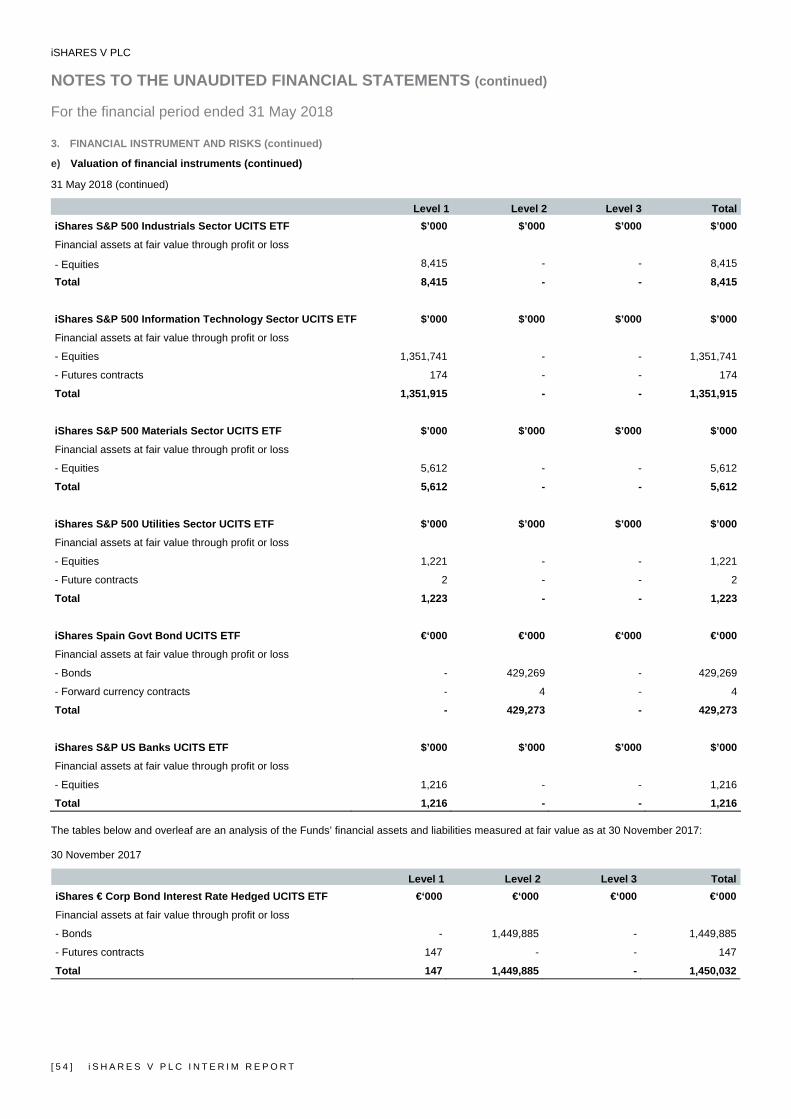
iSHARES V PLC NOTES TO THE UNAUDITED FINANCIAL STATEMENTS (continued) For the financial period ended 31 May 2018
[ 5 4 ] i S H A R E S V P L C I N T E R I M R E P O R T
3. FINANCIAL INSTRUMENT AND RISKS (continued)
e) Valuation of financial instruments (continued)
31 May 2018 (continued)
Level 1 Level 2 Level 3 TotaliShares S&P 500 Industrials Sector UCITS ETF $’000 $’000 $’000 $’000
Financial assets at fair value through profit or loss - Equities 8,415 - - 8,415
Total 8,415 - - 8,415
iShares S&P 500 Information Technology Sector UCITS ETF $’000 $’000 $’000 $’000
Financial assets at fair value through profit or loss
- Equities 1,351,741 - - 1,351,741
- Futures contracts 174 - - 174
Total 1,351,915 - - 1,351,915
iShares S&P 500 Materials Sector UCITS ETF $’000 $’000 $’000 $’000
Financial assets at fair value through profit or loss
- Equities 5,612 - - 5,612
Total 5,612 - - 5,612
iShares S&P 500 Utilities Sector UCITS ETF $’000 $’000 $’000 $’000
Financial assets at fair value through profit or loss
- Equities 1,221 - - 1,221
- Future contracts 2 - - 2
Total 1,223 - - 1,223
iShares Spain Govt Bond UCITS ETF €‘000 €‘000 €‘000 €‘000
Financial assets at fair value through profit or loss
- Bonds - 429,269 - 429,269
- Forward currency contracts - 4 - 4
Total - 429,273 - 429,273
iShares S&P US Banks UCITS ETF $’000 $’000 $’000 $’000
Financial assets at fair value through profit or loss
- Equities 1,216 - - 1,216
Total 1,216 - - 1,216 The tables below and overleaf are an analysis of the Funds’ financial assets and liabilities measured at fair value as at 30 November 2017: 30 November 2017
Level 1 Level 2 Level 3 TotaliShares € Corp Bond Interest Rate Hedged UCITS ETF €‘000 €‘000 €‘000 €‘000
Financial assets at fair value through profit or loss
- Bonds - 1,449,885 - 1,449,885
- Futures contracts 147 - - 147
Total 147 1,449,885 - 1,450,032
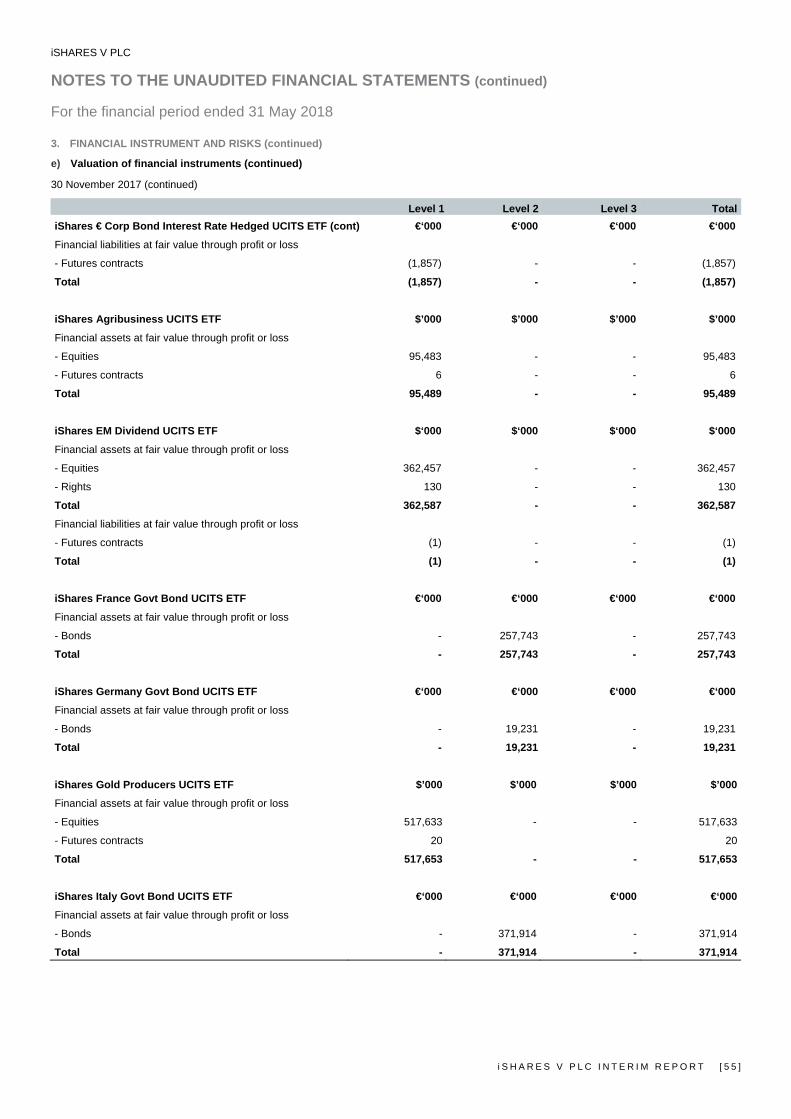
iSHARES V PLC NOTES TO THE UNAUDITED FINANCIAL STATEMENTS (continued) For the financial period ended 31 May 2018
i S H A R E S V P L C I N T E R I M R E P O R T [ 5 5 ]
3. FINANCIAL INSTRUMENT AND RISKS (continued)
e) Valuation of financial instruments (continued)
30 November 2017 (continued)
Level 1 Level 2 Level 3 TotaliShares € Corp Bond Interest Rate Hedged UCITS ETF (cont) €‘000 €‘000 €‘000 €‘000
Financial liabilities at fair value through profit or loss
- Futures contracts (1,857) - - (1,857)
Total (1,857) - - (1,857)
iShares Agribusiness UCITS ETF $’000 $’000 $’000 $’000
Financial assets at fair value through profit or loss
- Equities 95,483 - - 95,483
- Futures contracts 6 - - 6
Total 95,489 - - 95,489
iShares EM Dividend UCITS ETF $‘000 $‘000 $‘000 $‘000
Financial assets at fair value through profit or loss
- Equities 362,457 - - 362,457
- Rights 130 - - 130
Total 362,587 - - 362,587
Financial liabilities at fair value through profit or loss
- Futures contracts (1) - - (1)
Total (1) - - (1)
iShares France Govt Bond UCITS ETF €‘000 €‘000 €‘000 €‘000
Financial assets at fair value through profit or loss
- Bonds - 257,743 - 257,743
Total - 257,743 - 257,743
iShares Germany Govt Bond UCITS ETF €‘000 €‘000 €‘000 €‘000
Financial assets at fair value through profit or loss
- Bonds - 19,231 - 19,231
Total - 19,231 - 19,231
iShares Gold Producers UCITS ETF $’000 $’000 $’000 $’000
Financial assets at fair value through profit or loss
- Equities 517,633 - - 517,633
- Futures contracts 20 20
Total 517,653 - - 517,653
iShares Italy Govt Bond UCITS ETF €‘000 €‘000 €‘000 €‘000
Financial assets at fair value through profit or loss
- Bonds - 371,914 - 371,914
Total - 371,914 - 371,914
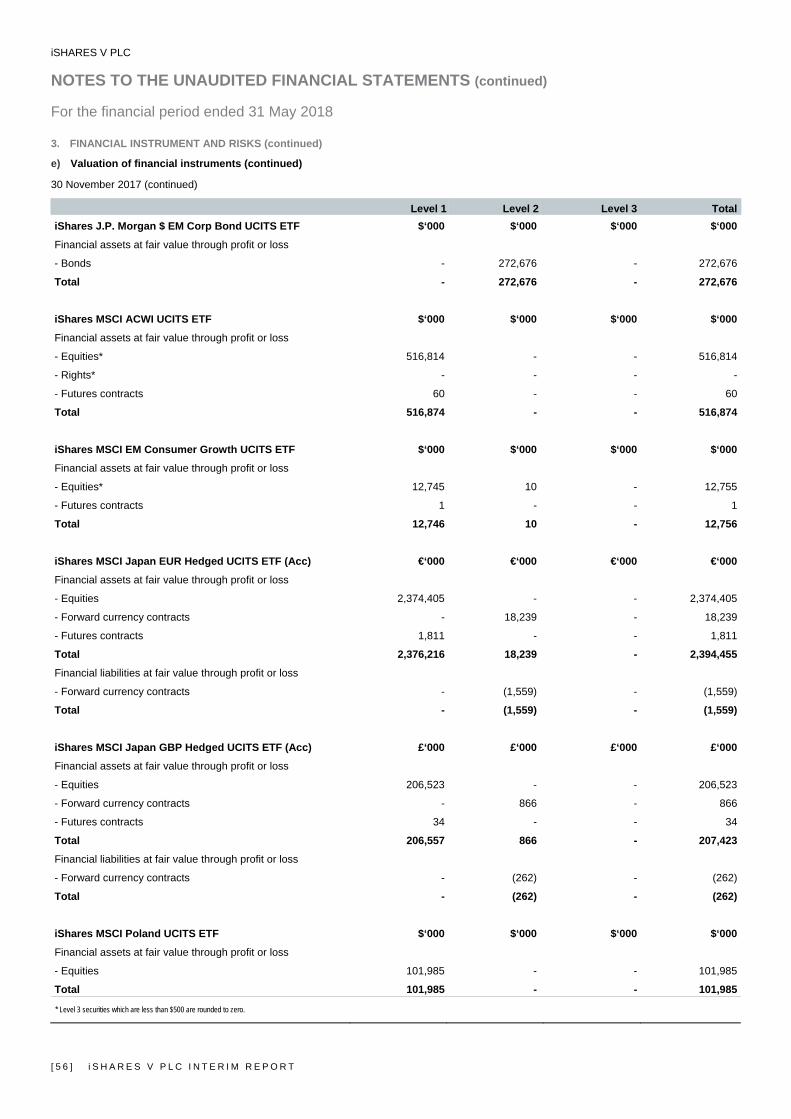
iSHARES V PLC NOTES TO THE UNAUDITED FINANCIAL STATEMENTS (continued) For the financial period ended 31 May 2018
[ 5 6 ] i S H A R E S V P L C I N T E R I M R E P O R T
3. FINANCIAL INSTRUMENT AND RISKS (continued)
e) Valuation of financial instruments (continued)
30 November 2017 (continued)
Level 1 Level 2 Level 3 TotaliShares J.P. Morgan $ EM Corp Bond UCITS ETF $‘000 $‘000 $‘000 $‘000
Financial assets at fair value through profit or loss
- Bonds - 272,676 - 272,676
Total - 272,676 - 272,676
iShares MSCI ACWI UCITS ETF $‘000 $‘000 $‘000 $‘000
Financial assets at fair value through profit or loss
- Equities* 516,814 - - 516,814
- Rights* - - - -
- Futures contracts 60 - - 60
Total 516,874 - - 516,874
iShares MSCI EM Consumer Growth UCITS ETF $‘000 $‘000 $‘000 $‘000
Financial assets at fair value through profit or loss
- Equities* 12,745 10 - 12,755
- Futures contracts 1 - - 1
Total 12,746 10 - 12,756
iShares MSCI Japan EUR Hedged UCITS ETF (Acc) €‘000 €‘000 €‘000 €‘000
Financial assets at fair value through profit or loss
- Equities 2,374,405 - - 2,374,405
- Forward currency contracts - 18,239 - 18,239
- Futures contracts 1,811 - - 1,811
Total 2,376,216 18,239 - 2,394,455
Financial liabilities at fair value through profit or loss
- Forward currency contracts - (1,559) - (1,559)
Total - (1,559) - (1,559)
iShares MSCI Japan GBP Hedged UCITS ETF (Acc) £‘000 £‘000 £‘000 £‘000
Financial assets at fair value through profit or loss
- Equities 206,523 - - 206,523
- Forward currency contracts - 866 - 866
- Futures contracts 34 - - 34
Total 206,557 866 - 207,423
Financial liabilities at fair value through profit or loss
- Forward currency contracts - (262) - (262)
Total - (262) - (262)
iShares MSCI Poland UCITS ETF $‘000 $‘000 $‘000 $‘000
Financial assets at fair value through profit or loss
- Equities 101,985 - - 101,985
Total 101,985 - - 101,985
* Level 3 securities which are less than $500 are rounded to zero.
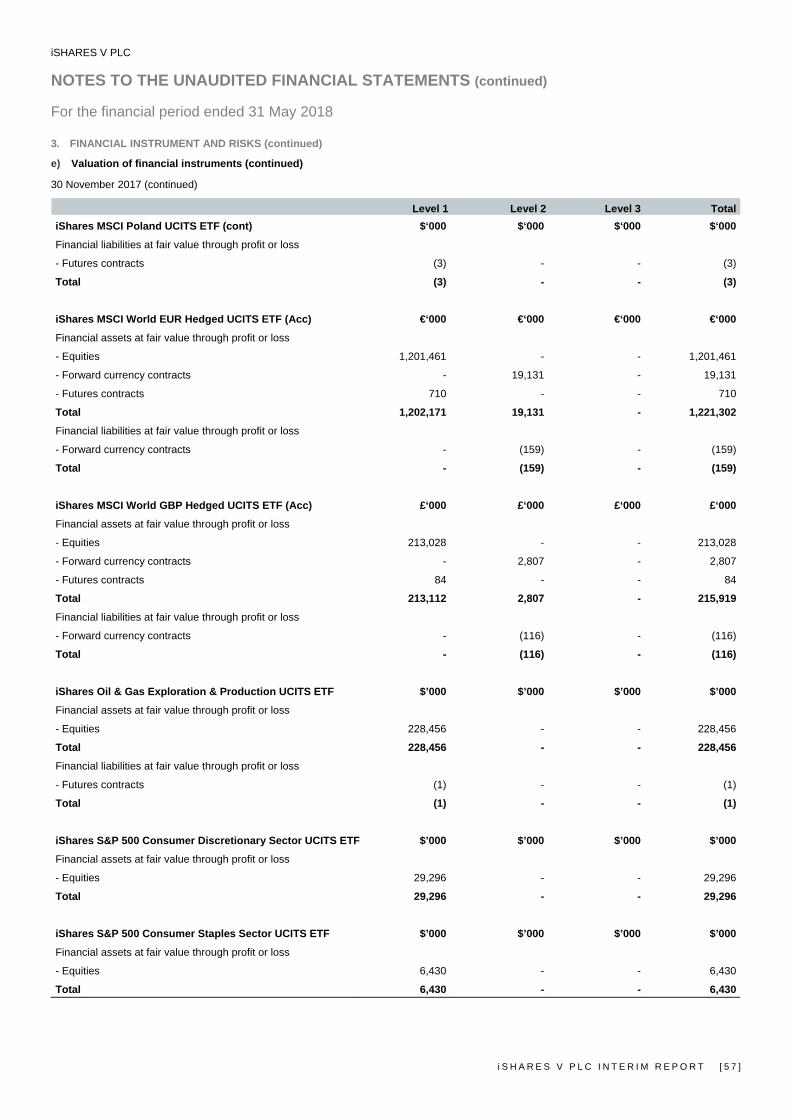
iSHARES V PLC NOTES TO THE UNAUDITED FINANCIAL STATEMENTS (continued) For the financial period ended 31 May 2018
i S H A R E S V P L C I N T E R I M R E P O R T [ 5 7 ]
3. FINANCIAL INSTRUMENT AND RISKS (continued)
e) Valuation of financial instruments (continued)
30 November 2017 (continued)
Level 1 Level 2 Level 3 TotaliShares MSCI Poland UCITS ETF (cont) $‘000 $‘000 $‘000 $‘000
Financial liabilities at fair value through profit or loss
- Futures contracts (3) - - (3)
Total (3) - - (3)
iShares MSCI World EUR Hedged UCITS ETF (Acc) €‘000 €‘000 €‘000 €‘000
Financial assets at fair value through profit or loss
- Equities 1,201,461 - - 1,201,461
- Forward currency contracts - 19,131 - 19,131
- Futures contracts 710 - - 710
Total 1,202,171 19,131 - 1,221,302
Financial liabilities at fair value through profit or loss
- Forward currency contracts - (159) - (159)
Total - (159) - (159)
iShares MSCI World GBP Hedged UCITS ETF (Acc) £‘000 £‘000 £‘000 £‘000
Financial assets at fair value through profit or loss
- Equities 213,028 - - 213,028
- Forward currency contracts - 2,807 - 2,807
- Futures contracts 84 - - 84
Total 213,112 2,807 - 215,919
Financial liabilities at fair value through profit or loss
- Forward currency contracts - (116) - (116)
Total - (116) - (116)
iShares Oil & Gas Exploration & Production UCITS ETF $’000 $’000 $’000 $’000
Financial assets at fair value through profit or loss
- Equities 228,456 - - 228,456
Total 228,456 - - 228,456
Financial liabilities at fair value through profit or loss
- Futures contracts (1) - - (1)
Total (1) - - (1)
iShares S&P 500 Consumer Discretionary Sector UCITS ETF $’000 $’000 $’000 $’000
Financial assets at fair value through profit or loss - Equities 29,296 - - 29,296
Total 29,296 - - 29,296
iShares S&P 500 Consumer Staples Sector UCITS ETF $’000 $’000 $’000 $’000
Financial assets at fair value through profit or loss - Equities 6,430 - - 6,430
Total 6,430 - - 6,430
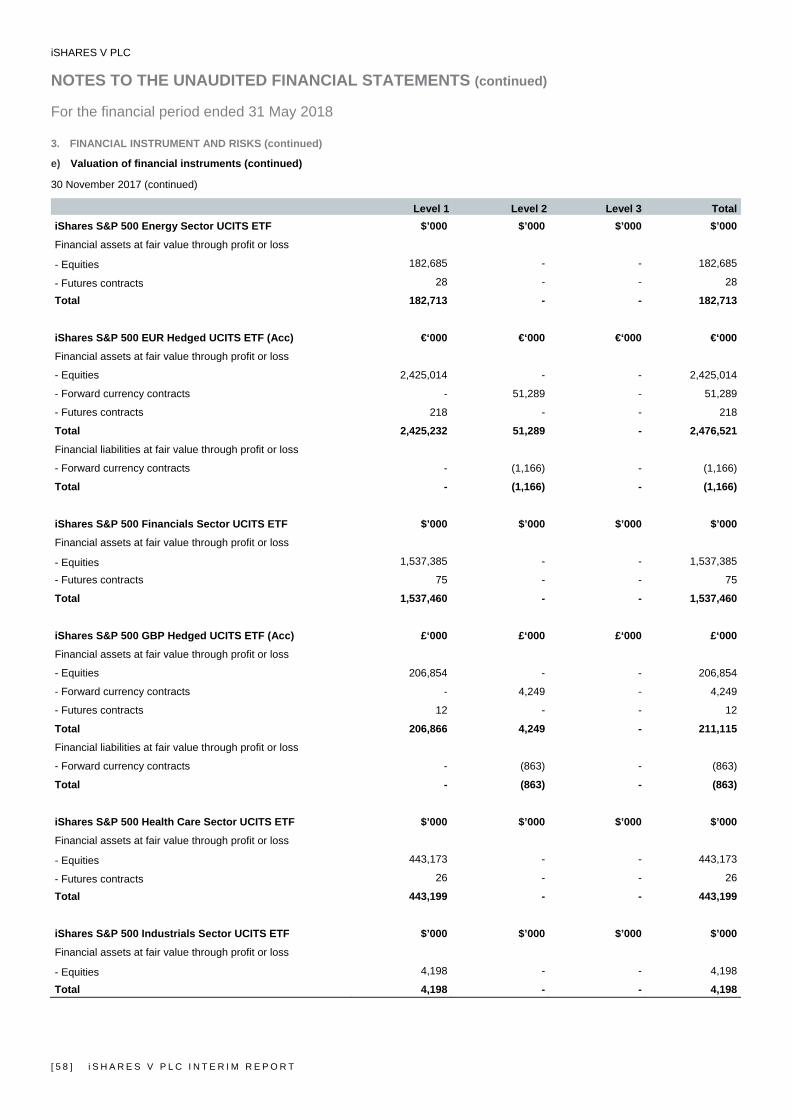
iSHARES V PLC NOTES TO THE UNAUDITED FINANCIAL STATEMENTS (continued) For the financial period ended 31 May 2018
[ 5 8 ] i S H A R E S V P L C I N T E R I M R E P O R T
3. FINANCIAL INSTRUMENT AND RISKS (continued)
e) Valuation of financial instruments (continued)
30 November 2017 (continued)
Level 1 Level 2 Level 3 TotaliShares S&P 500 Energy Sector UCITS ETF $’000 $’000 $’000 $’000
Financial assets at fair value through profit or loss - Equities 182,685 - - 182,685
- Futures contracts 28 - - 28
Total 182,713 - - 182,713
iShares S&P 500 EUR Hedged UCITS ETF (Acc) €‘000 €‘000 €‘000 €‘000
Financial assets at fair value through profit or loss
- Equities 2,425,014 - - 2,425,014
- Forward currency contracts - 51,289 - 51,289
- Futures contracts 218 - - 218
Total 2,425,232 51,289 - 2,476,521
Financial liabilities at fair value through profit or loss
- Forward currency contracts - (1,166) - (1,166)
Total - (1,166) - (1,166)
iShares S&P 500 Financials Sector UCITS ETF $’000 $’000 $’000 $’000
Financial assets at fair value through profit or loss - Equities 1,537,385 - - 1,537,385
- Futures contracts 75 - - 75
Total 1,537,460 - - 1,537,460
iShares S&P 500 GBP Hedged UCITS ETF (Acc) £‘000 £‘000 £‘000 £‘000
Financial assets at fair value through profit or loss
- Equities 206,854 - - 206,854
- Forward currency contracts - 4,249 - 4,249
- Futures contracts 12 - - 12
Total 206,866 4,249 - 211,115
Financial liabilities at fair value through profit or loss
- Forward currency contracts - (863) - (863)
Total - (863) - (863)
iShares S&P 500 Health Care Sector UCITS ETF $’000 $’000 $’000 $’000
Financial assets at fair value through profit or loss - Equities 443,173 - - 443,173
- Futures contracts 26 - - 26
Total 443,199 - - 443,199
iShares S&P 500 Industrials Sector UCITS ETF $’000 $’000 $’000 $’000
Financial assets at fair value through profit or loss - Equities 4,198 - - 4,198
Total 4,198 - - 4,198
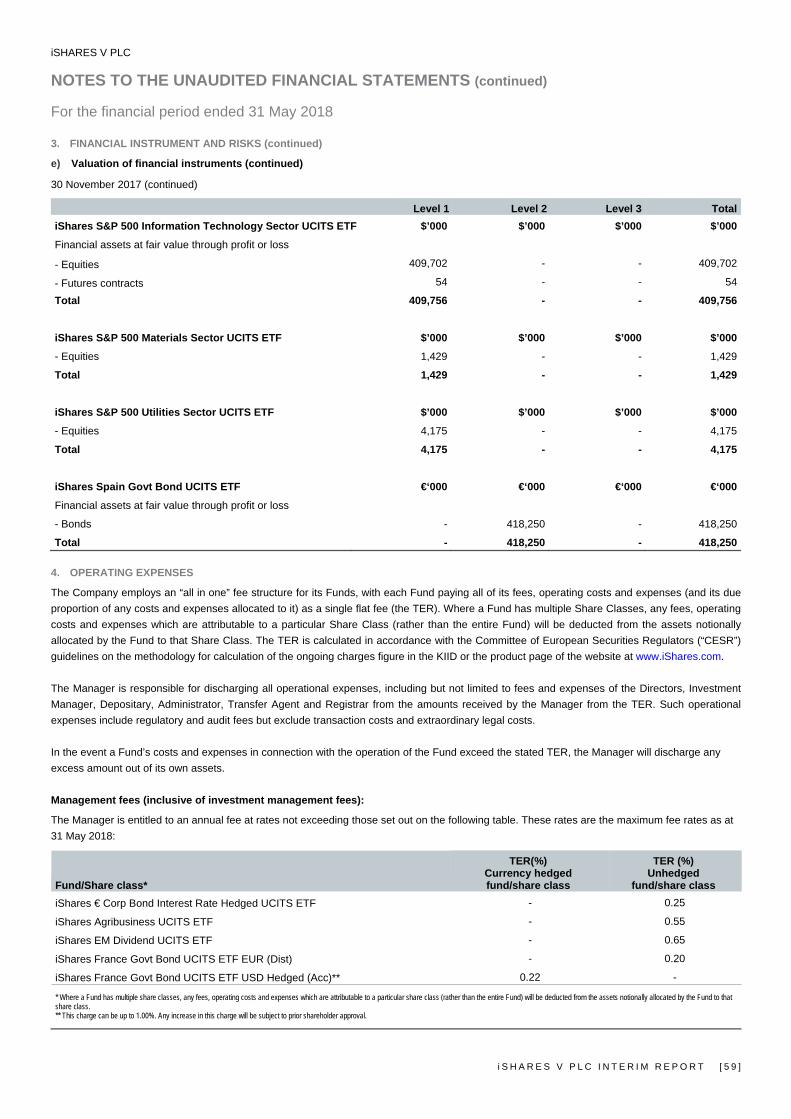
iSHARES V PLC NOTES TO THE UNAUDITED FINANCIAL STATEMENTS (continued) For the financial period ended 31 May 2018
i S H A R E S V P L C I N T E R I M R E P O R T [ 5 9 ]
3. FINANCIAL INSTRUMENT AND RISKS (continued)
e) Valuation of financial instruments (continued)
30 November 2017 (continued)
Level 1 Level 2 Level 3 TotaliShares S&P 500 Information Technology Sector UCITS ETF $’000 $’000 $’000 $’000
Financial assets at fair value through profit or loss - Equities 409,702 - - 409,702
- Futures contracts 54 - - 54
Total 409,756 - - 409,756
iShares S&P 500 Materials Sector UCITS ETF $’000 $’000 $’000 $’000
- Equities 1,429 - - 1,429
Total 1,429 - - 1,429
iShares S&P 500 Utilities Sector UCITS ETF $’000 $’000 $’000 $’000
- Equities 4,175 - - 4,175
Total 4,175 - - 4,175
iShares Spain Govt Bond UCITS ETF €‘000 €‘000 €‘000 €‘000
Financial assets at fair value through profit or loss
- Bonds - 418,250 - 418,250
Total - 418,250 - 418,250 4. OPERATING EXPENSES
The Company employs an “all in one” fee structure for its Funds, with each Fund paying all of its fees, operating costs and expenses (and its due proportion of any costs and expenses allocated to it) as a single flat fee (the TER). Where a Fund has multiple Share Classes, any fees, operating costs and expenses which are attributable to a particular Share Class (rather than the entire Fund) will be deducted from the assets notionally allocated by the Fund to that Share Class. The TER is calculated in accordance with the Committee of European Securities Regulators (“CESR”) guidelines on the methodology for calculation of the ongoing charges figure in the KIID or the product page of the website at www.iShares.com. The Manager is responsible for discharging all operational expenses, including but not limited to fees and expenses of the Directors, Investment Manager, Depositary, Administrator, Transfer Agent and Registrar from the amounts received by the Manager from the TER. Such operational expenses include regulatory and audit fees but exclude transaction costs and extraordinary legal costs. In the event a Fund’s costs and expenses in connection with the operation of the Fund exceed the stated TER, the Manager will discharge any excess amount out of its own assets. Management fees (inclusive of investment management fees):
The Manager is entitled to an annual fee at rates not exceeding those set out on the following table. These rates are the maximum fee rates as at 31 May 2018:
Fund/Share class*
TER(%) Currency hedged fund/share class
TER (%) Unhedged
fund/share class iShares € Corp Bond Interest Rate Hedged UCITS ETF - 0.25
iShares Agribusiness UCITS ETF - 0.55
iShares EM Dividend UCITS ETF - 0.65
iShares France Govt Bond UCITS ETF EUR (Dist) - 0.20
iShares France Govt Bond UCITS ETF USD Hedged (Acc)** 0.22 -
* Where a Fund has multiple share classes, any fees, operating costs and expenses which are attributable to a particular share class (rather than the entire Fund) will be deducted from the assets notionally allocated by the Fund to that share class. ** This charge can be up to 1.00%. Any increase in this charge will be subject to prior shareholder approval.
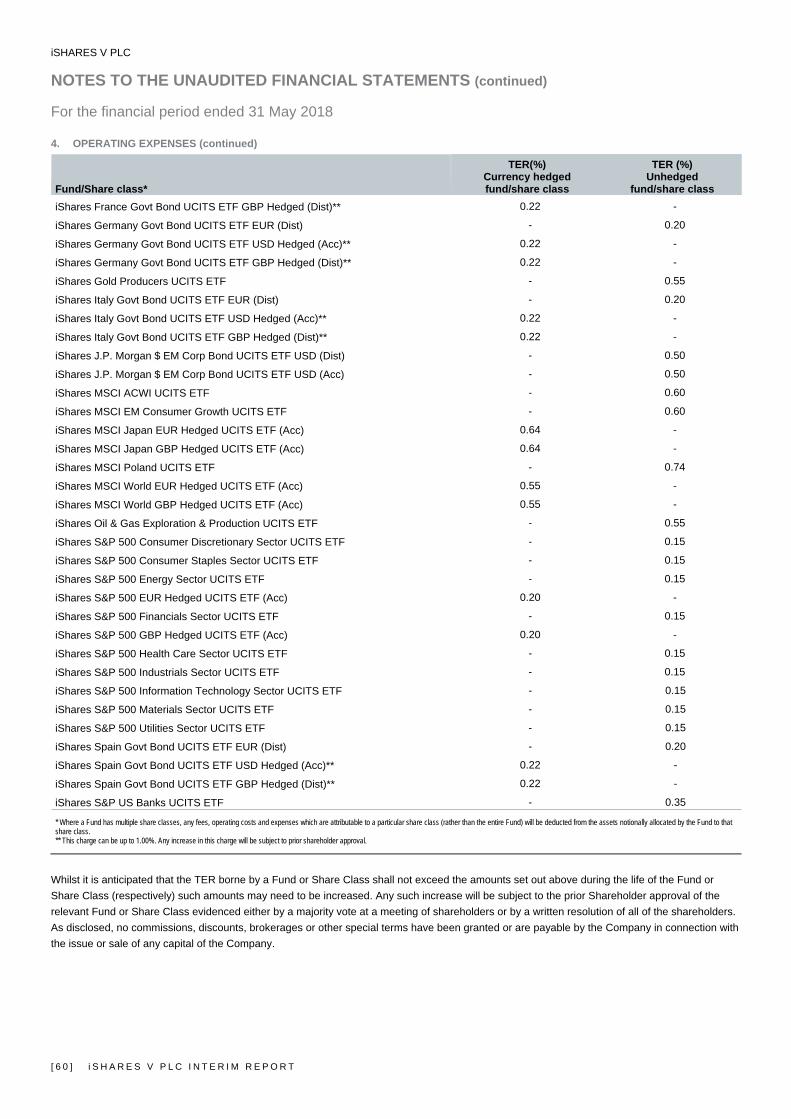
iSHARES V PLC NOTES TO THE UNAUDITED FINANCIAL STATEMENTS (continued) For the financial period ended 31 May 2018
[ 6 0 ] i S H A R E S V P L C I N T E R I M R E P O R T
4. OPERATING EXPENSES (continued)
Fund/Share class*
TER(%) Currency hedged fund/share class
TER (%) Unhedged
fund/share class iShares France Govt Bond UCITS ETF GBP Hedged (Dist)** 0.22 -
iShares Germany Govt Bond UCITS ETF EUR (Dist) - 0.20
iShares Germany Govt Bond UCITS ETF USD Hedged (Acc)** 0.22 -
iShares Germany Govt Bond UCITS ETF GBP Hedged (Dist)** 0.22 -
iShares Gold Producers UCITS ETF - 0.55
iShares Italy Govt Bond UCITS ETF EUR (Dist) - 0.20
iShares Italy Govt Bond UCITS ETF USD Hedged (Acc)** 0.22 -
iShares Italy Govt Bond UCITS ETF GBP Hedged (Dist)** 0.22 -
iShares J.P. Morgan $ EM Corp Bond UCITS ETF USD (Dist) - 0.50
iShares J.P. Morgan $ EM Corp Bond UCITS ETF USD (Acc) - 0.50
iShares MSCI ACWI UCITS ETF - 0.60
iShares MSCI EM Consumer Growth UCITS ETF - 0.60
iShares MSCI Japan EUR Hedged UCITS ETF (Acc) 0.64 -
iShares MSCI Japan GBP Hedged UCITS ETF (Acc) 0.64 -
iShares MSCI Poland UCITS ETF - 0.74
iShares MSCI World EUR Hedged UCITS ETF (Acc) 0.55 -
iShares MSCI World GBP Hedged UCITS ETF (Acc) 0.55 -
iShares Oil & Gas Exploration & Production UCITS ETF - 0.55
iShares S&P 500 Consumer Discretionary Sector UCITS ETF - 0.15
iShares S&P 500 Consumer Staples Sector UCITS ETF - 0.15
iShares S&P 500 Energy Sector UCITS ETF - 0.15
iShares S&P 500 EUR Hedged UCITS ETF (Acc) 0.20 -
iShares S&P 500 Financials Sector UCITS ETF - 0.15
iShares S&P 500 GBP Hedged UCITS ETF (Acc) 0.20 -
iShares S&P 500 Health Care Sector UCITS ETF - 0.15
iShares S&P 500 Industrials Sector UCITS ETF - 0.15
iShares S&P 500 Information Technology Sector UCITS ETF - 0.15
iShares S&P 500 Materials Sector UCITS ETF - 0.15
iShares S&P 500 Utilities Sector UCITS ETF - 0.15
iShares Spain Govt Bond UCITS ETF EUR (Dist) - 0.20
iShares Spain Govt Bond UCITS ETF USD Hedged (Acc)** 0.22 -
iShares Spain Govt Bond UCITS ETF GBP Hedged (Dist)** 0.22 -
iShares S&P US Banks UCITS ETF - 0.35
* Where a Fund has multiple share classes, any fees, operating costs and expenses which are attributable to a particular share class (rather than the entire Fund) will be deducted from the assets notionally allocated by the Fund to that share class. ** This charge can be up to 1.00%. Any increase in this charge will be subject to prior shareholder approval.
Whilst it is anticipated that the TER borne by a Fund or Share Class shall not exceed the amounts set out above during the life of the Fund or Share Class (respectively) such amounts may need to be increased. Any such increase will be subject to the prior Shareholder approval of the relevant Fund or Share Class evidenced either by a majority vote at a meeting of shareholders or by a written resolution of all of the shareholders. As disclosed, no commissions, discounts, brokerages or other special terms have been granted or are payable by the Company in connection with the issue or sale of any capital of the Company.

iSHARES V PLC NOTES TO THE UNAUDITED FINANCIAL STATEMENTS (continued) For the financial period ended 31 May 2018
i S H A R E S V P L C I N T E R I M R E P O R T [ 6 1 ]
5. DISTRIBUTIONS TO REDEEMABLE PARTICIPATING SHAREHOLDERS
The Company may declare and pay dividends on any distributing class of shares in the Company. In accordance with the prospectus, any dividend which has remained unclaimed for twelve years from the date of its declaration shall be forfeited and cease to remain owing by the Company to investors and become the property of the relevant Fund.
Distributions declared during the financial period were as follows:
Company Total iShares € Corp Bond Interest Rate
Hedged UCITS ETF iShares Austria Govt Bond
UCITS ETF* iShares Belgium Govt Bond
UCITS ETF*
31 May 2018
£’00031 May 2017
£’00031 May 2018
€’000 31 May 2017
€’00031 May 2017
€’000 31 May 2017
€’000 December 15,141 18,400 5,010 7,532 22 47 March 977 571 - - - -
Distributions declared during the financial period 16,118 18,971 5,010 7,532 22 47 Equalisation income (3,612) (3,444) (429) (1,206) (7) (32) Equalisation expense 1,724 2,858 521 113 17 32
Total 14,230 18,385 5,102 6,439 32 47
iShares EM Dividend
UCITS ETF iShares Finland Govt Bond
UCITS ETF* iShares France Govt Bond
UCITS ETF iShares Germany Govt Bond
UCITS ETF
31 May 2018
$’00031 May 2017
$’000 31 May 2017
€’00031 May 2018
€’00031 May 2017
€’00031 May 2018
€’000 31 May 2017
€’000 December 2,175 1,284 2 44 - - - March 1,346 716 - - - - -
Distributions declared during the financial period 3,521 2,000 2 44 - - - Equalisation income (28) (202) (1) (7) 50 29 4 Equalisation expense 161 - - 16 (11) (4) (4)
Total 3,654 1,798 1 53 39 25 -
* Fund closed during the financial period ended 31 May 2017.
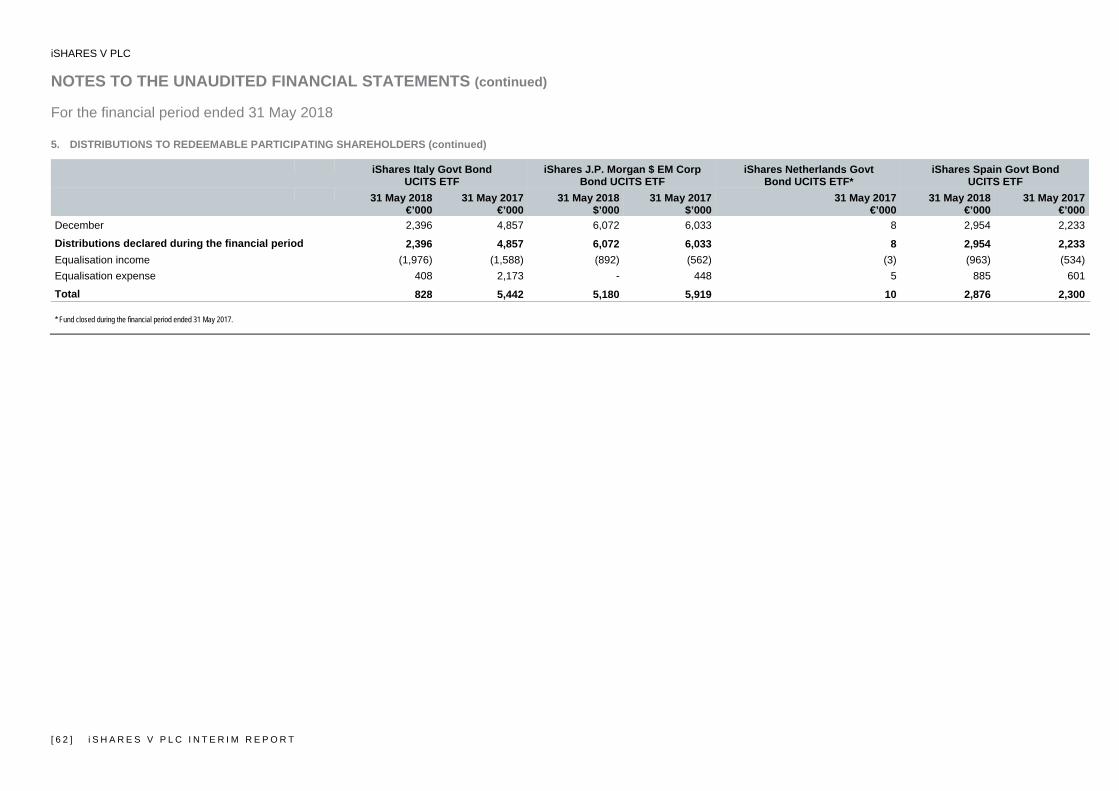
iSHARES V PLC NOTES TO THE UNAUDITED FINANCIAL STATEMENTS (continued) For the financial period ended 31 May 2018
[ 6 2 ] i S H A R E S V P L C I N T E R I M R E P O R T
5. DISTRIBUTIONS TO REDEEMABLE PARTICIPATING SHAREHOLDERS (continued)
iShares Italy Govt Bond
UCITS ETF iShares J.P. Morgan $ EM Corp
Bond UCITS ETF iShares Netherlands Govt
Bond UCITS ETF* iShares Spain Govt Bond
UCITS ETF
31 May 2018
€’00031 May 2017
€’00031 May 2018
$’000 31 May 2017
$’00031 May 2017
€’00031 May 2018
€’000 31 May 2017
€’000 December 2,396 4,857 6,072 6,033 8 2,954 2,233
Distributions declared during the financial period 2,396 4,857 6,072 6,033 8 2,954 2,233 Equalisation income (1,976) (1,588) (892) (562) (3) (963) (534) Equalisation expense 408 2,173 - 448 5 885 601
Total 828 5,442 5,180 5,919 10 2,876 2,300
* Fund closed during the financial period ended 31 May 2017.

iSHARES V PLC NOTES TO THE UNAUDITED FINANCIAL STATEMENTS (continued) For the financial period ended 31 May 2018
i S H A R E S V P L C I N T E R I M R E P O R T [ 6 3 ]
6. TAXATION
Below is an analysis of the tax charge for the Company during the financial period:
Financial period ended
31 May 2018
£’000
Financialperiod ended
31 May2017
£’000
Current tax Non-reclaimable overseas income withholding tax (15,912) (10,412) Non-reclaimable overseas capital gains tax (142) (283)
Total tax (16,054) (10,695) Irish tax Under current law and practice, the Company qualifies as an investment undertaking as defined in Section 739B of the Taxes Consolidation Act, 1997, as amended. On that basis it is not chargeable to Irish tax on its income or gains. However, Irish tax may arise on the occurrence of a 'chargeable event'. A chargeable event includes any distribution payments to shareholders or any encashment, redemption, cancellation or transfer of shares and the holding of shares at the end of each eight year period beginning with the acquisition of such shares. No Irish tax will arise on the Company in respect of chargeable events in respect of: a) A shareholder who is neither Irish resident nor ordinarily resident in Ireland for tax purposes, at the time of the chargeable event, provided
appropriate valid declarations in accordance with the provisions of the Taxes Consolidation Act, 1997, as amended, are held by the Company; or the Company has been authorised by the Irish Revenue to make gross payments in the absence of appropriate declarations; and
b) Certain exempted Irish tax resident shareholders who have provided the Company with the necessary signed annual declarations; and
c) Any transaction (which might otherwise be a chargeable event) in relation to shares held in a recognised clearing system as designated by order of the Irish Revenue Commissioners (such as CREST) will not constitute a chargeable event. It is the current intention of the Directors that all the shares in the Company will be held in CREST or another recognised clearing system.
Dividends, interest and capital gains (if any) received on investments made by the Company may be subject to withholding taxes imposed by the country from which the investment income/gains are received and such taxes may not be recoverable by the Company or its shareholders. Overseas tax In September 2016, the Brazilian Tax Authorities issued Normative Instruction 1658/16 amending the list of countries considered to be ‘low tax jurisdictions’ to include Curacao, Saint Martin and Ireland and exclude the Netherlands Antilles and Saint Kitts and Nevis. The changes were effective from 1 October 2016 onwards. As a consequence, Brazilian Capital Gains Tax ("CGT") and increased income withholding tax rates on interest on capital distributions apply to the Company.
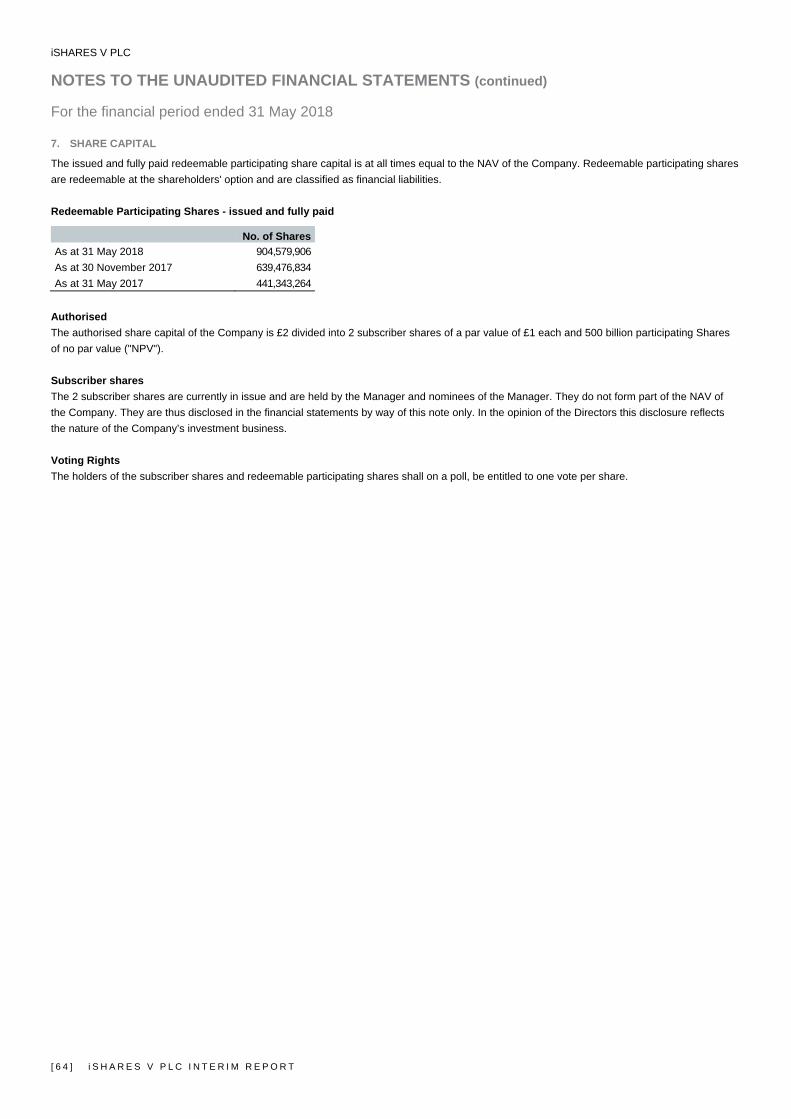
iSHARES V PLC NOTES TO THE UNAUDITED FINANCIAL STATEMENTS (continued) For the financial period ended 31 May 2018
[ 6 4 ] i S H A R E S V P L C I N T E R I M R E P O R T
7. SHARE CAPITAL
The issued and fully paid redeemable participating share capital is at all times equal to the NAV of the Company. Redeemable participating shares are redeemable at the shareholders' option and are classified as financial liabilities. Redeemable Participating Shares - issued and fully paid
No. of Shares As at 31 May 2018 904,579,906 As at 30 November 2017 639,476,834 As at 31 May 2017 441,343,264
Authorised The authorised share capital of the Company is £2 divided into 2 subscriber shares of a par value of £1 each and 500 billion participating Shares of no par value ("NPV"). Subscriber shares The 2 subscriber shares are currently in issue and are held by the Manager and nominees of the Manager. They do not form part of the NAV of the Company. They are thus disclosed in the financial statements by way of this note only. In the opinion of the Directors this disclosure reflects the nature of the Company’s investment business. Voting Rights The holders of the subscriber shares and redeemable participating shares shall on a poll, be entitled to one vote per share.
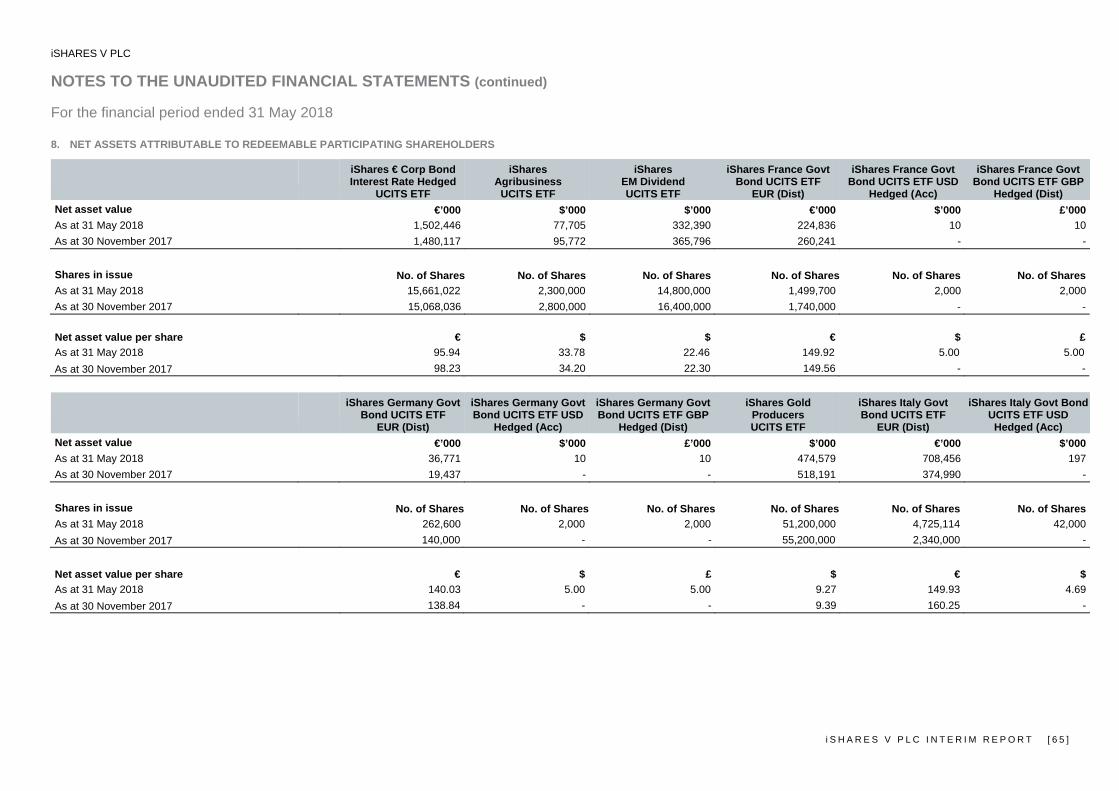
iSHARES V PLC NOTES TO THE UNAUDITED FINANCIAL STATEMENTS (continued) For the financial period ended 31 May 2018
i S H A R E S V P L C I N T E R I M R E P O R T [ 6 5 ]
8. NET ASSETS ATTRIBUTABLE TO REDEEMABLE PARTICIPATING SHAREHOLDERS
iShares € Corp Bond Interest Rate Hedged
UCITS ETF
iShares Agribusiness
UCITS ETF
iShares EM Dividend UCITS ETF
iShares France Govt Bond UCITS ETF
EUR (Dist)
iShares France Govt Bond UCITS ETF USD
Hedged (Acc)
iShares France Govt Bond UCITS ETF GBP
Hedged (Dist) Net asset value €’000 $’000 $’000 €’000 $’000 £’000 As at 31 May 2018 1,502,446 77,705 332,390 224,836 10 10 As at 30 November 2017 1,480,117 95,772 365,796 260,241 - -
Shares in issue No. of Shares No. of Shares No. of Shares No. of Shares No. of Shares No. of Shares As at 31 May 2018 15,661,022 2,300,000 14,800,000 1,499,700 2,000 2,000 As at 30 November 2017 15,068,036 2,800,000 16,400,000 1,740,000 - -
Net asset value per share € $ $ € $ £ As at 31 May 2018 95.94 33.78 22.46 149.92 5.00 5.00 As at 30 November 2017 98.23 34.20 22.30 149.56 - -
iShares Germany Govt Bond UCITS ETF
EUR (Dist)
iShares Germany Govt Bond UCITS ETF USD
Hedged (Acc)
iShares Germany Govt Bond UCITS ETF GBP
Hedged (Dist)
iShares Gold Producers UCITS ETF
iShares Italy Govt Bond UCITS ETF
EUR (Dist)
iShares Italy Govt Bond UCITS ETF USD
Hedged (Acc) Net asset value €’000 $’000 £’000 $’000 €’000 $’000 As at 31 May 2018 36,771 10 10 474,579 708,456 197 As at 30 November 2017 19,437 - - 518,191 374,990 -
Shares in issue No. of Shares No. of Shares No. of Shares No. of Shares No. of Shares No. of Shares As at 31 May 2018 262,600 2,000 2,000 51,200,000 4,725,114 42,000 As at 30 November 2017 140,000 - - 55,200,000 2,340,000 -
Net asset value per share € $ £ $ € $ As at 31 May 2018 140.03 5.00 5.00 9.27 149.93 4.69 As at 30 November 2017 138.84 - - 9.39 160.25 -
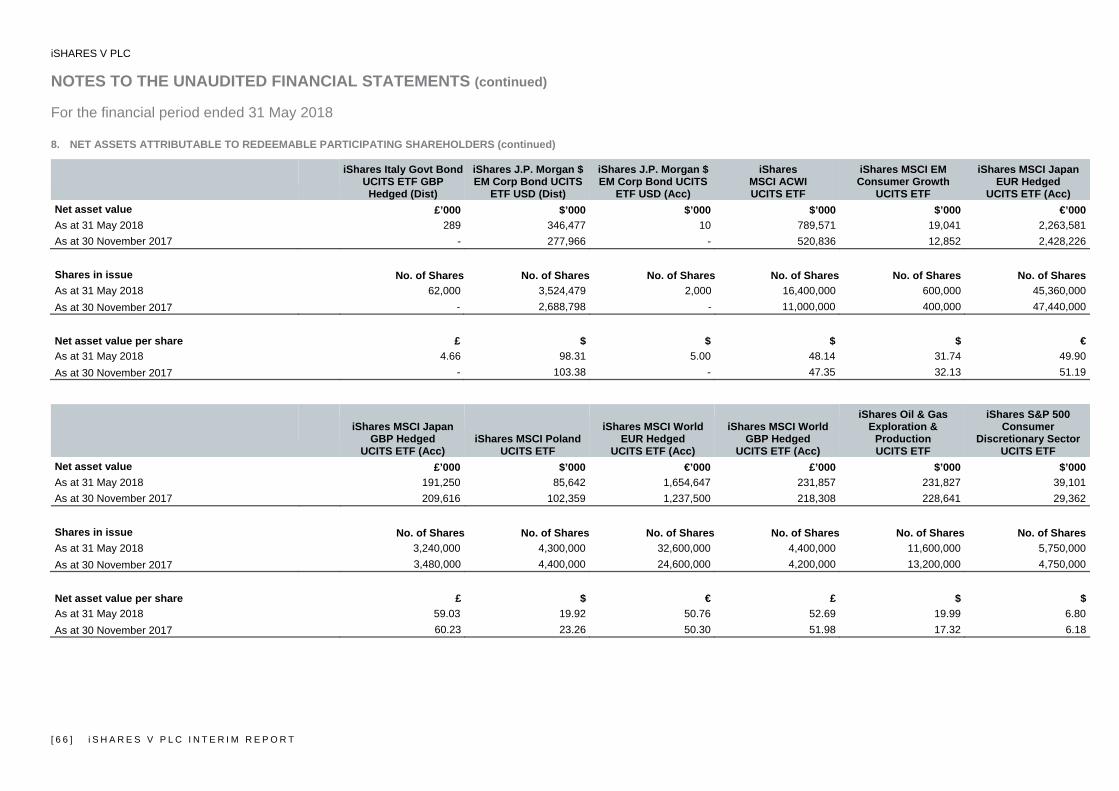
iSHARES V PLC NOTES TO THE UNAUDITED FINANCIAL STATEMENTS (continued) For the financial period ended 31 May 2018
[ 6 6 ] i S H A R E S V P L C I N T E R I M R E P O R T
8. NET ASSETS ATTRIBUTABLE TO REDEEMABLE PARTICIPATING SHAREHOLDERS (continued)
iShares Italy Govt Bond UCITS ETF GBP
Hedged (Dist)
iShares J.P. Morgan $ EM Corp Bond UCITS
ETF USD (Dist)
iShares J.P. Morgan $ EM Corp Bond UCITS
ETF USD (Acc)
iShares MSCI ACWI UCITS ETF
iShares MSCI EM Consumer Growth
UCITS ETF
iShares MSCI Japan EUR Hedged
UCITS ETF (Acc) Net asset value £’000 $’000 $’000 $’000 $’000 €’000 As at 31 May 2018 289 346,477 10 789,571 19,041 2,263,581 As at 30 November 2017 - 277,966 - 520,836 12,852 2,428,226
Shares in issue No. of Shares No. of Shares No. of Shares No. of Shares No. of Shares No. of Shares As at 31 May 2018 62,000 3,524,479 2,000 16,400,000 600,000 45,360,000 As at 30 November 2017 - 2,688,798 - 11,000,000 400,000 47,440,000
Net asset value per share £ $ $ $ $ € As at 31 May 2018 4.66 98.31 5.00 48.14 31.74 49.90 As at 30 November 2017 - 103.38 - 47.35 32.13 51.19
iShares MSCI Japan GBP Hedged
UCITS ETF (Acc) iShares MSCI Poland
UCITS ETF
iShares MSCI World EUR Hedged
UCITS ETF (Acc)
iShares MSCI World GBP Hedged
UCITS ETF (Acc)
iShares Oil & Gas Exploration &
Production UCITS ETF
iShares S&P 500 Consumer
Discretionary Sector UCITS ETF
Net asset value £’000 $’000 €’000 £’000 $’000 $’000 As at 31 May 2018 191,250 85,642 1,654,647 231,857 231,827 39,101 As at 30 November 2017 209,616 102,359 1,237,500 218,308 228,641 29,362 Shares in issue No. of Shares No. of Shares No. of Shares No. of Shares No. of Shares No. of Shares As at 31 May 2018 3,240,000 4,300,000 32,600,000 4,400,000 11,600,000 5,750,000 As at 30 November 2017 3,480,000 4,400,000 24,600,000 4,200,000 13,200,000 4,750,000
Net asset value per share £ $ € £ $ $ As at 31 May 2018 59.03 19.92 50.76 52.69 19.99 6.80 As at 30 November 2017 60.23 23.26 50.30 51.98 17.32 6.18
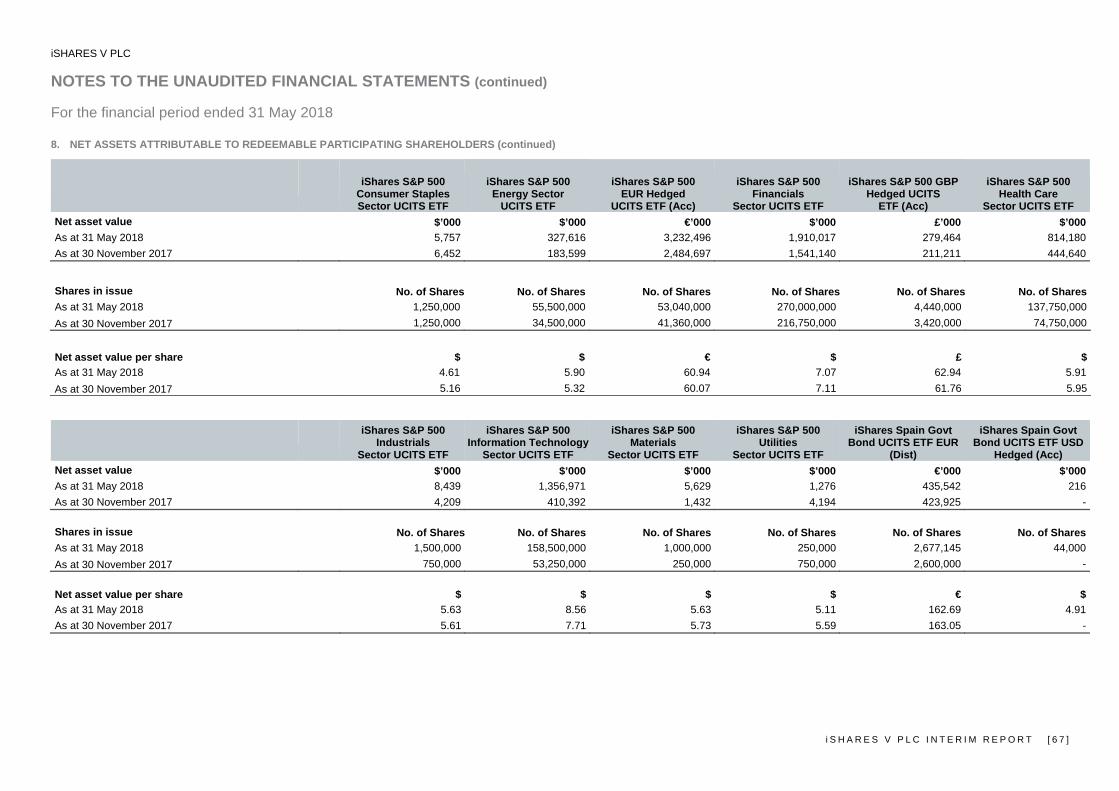
iSHARES V PLC NOTES TO THE UNAUDITED FINANCIAL STATEMENTS (continued) For the financial period ended 31 May 2018
i S H A R E S V P L C I N T E R I M R E P O R T [ 6 7 ]
8. NET ASSETS ATTRIBUTABLE TO REDEEMABLE PARTICIPATING SHAREHOLDERS (continued)
iShares S&P 500 Consumer Staples Sector UCITS ETF
iShares S&P 500
Energy Sector UCITS ETF
iShares S&P 500 EUR Hedged
UCITS ETF (Acc)
iShares S&P 500 Financials
Sector UCITS ETF
iShares S&P 500 GBP
Hedged UCITS ETF (Acc)
iShares S&P 500 Health Care
Sector UCITS ETF Net asset value $’000 $’000 €’000 $’000 £’000 $’000 As at 31 May 2018 5,757 327,616 3,232,496 1,910,017 279,464 814,180 As at 30 November 2017 6,452 183,599 2,484,697 1,541,140 211,211 444,640
Shares in issue No. of Shares No. of Shares No. of Shares No. of Shares No. of Shares No. of Shares As at 31 May 2018 1,250,000 55,500,000 53,040,000 270,000,000 4,440,000 137,750,000 As at 30 November 2017 1,250,000 34,500,000 41,360,000 216,750,000 3,420,000 74,750,000
Net asset value per share $ $ € $ £ $ As at 31 May 2018 4.61 5.90 60.94 7.07 62.94 5.91 As at 30 November 2017 5.16 5.32 60.07 7.11 61.76 5.95
iShares S&P 500 Industrials
Sector UCITS ETF
iShares S&P 500 Information Technology
Sector UCITS ETF
iShares S&P 500 Materials
Sector UCITS ETF
iShares S&P 500 Utilities
Sector UCITS ETF
iShares Spain Govt Bond UCITS ETF EUR
(Dist)
iShares Spain Govt Bond UCITS ETF USD
Hedged (Acc) Net asset value $’000 $’000 $’000 $’000 €’000 $’000 As at 31 May 2018 8,439 1,356,971 5,629 1,276 435,542 216 As at 30 November 2017 4,209 410,392 1,432 4,194 423,925 -
Shares in issue No. of Shares No. of Shares No. of Shares No. of Shares No. of Shares No. of Shares As at 31 May 2018 1,500,000 158,500,000 1,000,000 250,000 2,677,145 44,000 As at 30 November 2017 750,000 53,250,000 250,000 750,000 2,600,000 -
Net asset value per share $ $ $ $ € $ As at 31 May 2018 5.63 8.56 5.63 5.11 162.69 4.91 As at 30 November 2017 5.61 7.71 5.73 5.59 163.05 -

iSHARES V PLC NOTES TO THE UNAUDITED FINANCIAL STATEMENTS (continued) For the financial period ended 31 May 2018
[ 6 8 ] i S H A R E S V P L C I N T E R I M R E P O R T
8. NET ASSETS ATTRIBUTABLE TO REDEEMABLE PARTICIPATING SHAREHOLDERS (continued)
iShares Spain Govt Bond UCITS ETF GBP
Hedged (Dist)
iShares S&P US Banks
UCITS ETF
Net asset value £’000 $’000 As at 31 May 2018 205 1,218 As at 30 November 2017 - -
Shares in issue No. of Shares No. of Shares As at 31 May 2018 41,846 250,000 As at 30 November 2017 - -
Net asset value per share £ $ As at 31 May 2018 4.90 4.87 As at 30 November 2017 - -
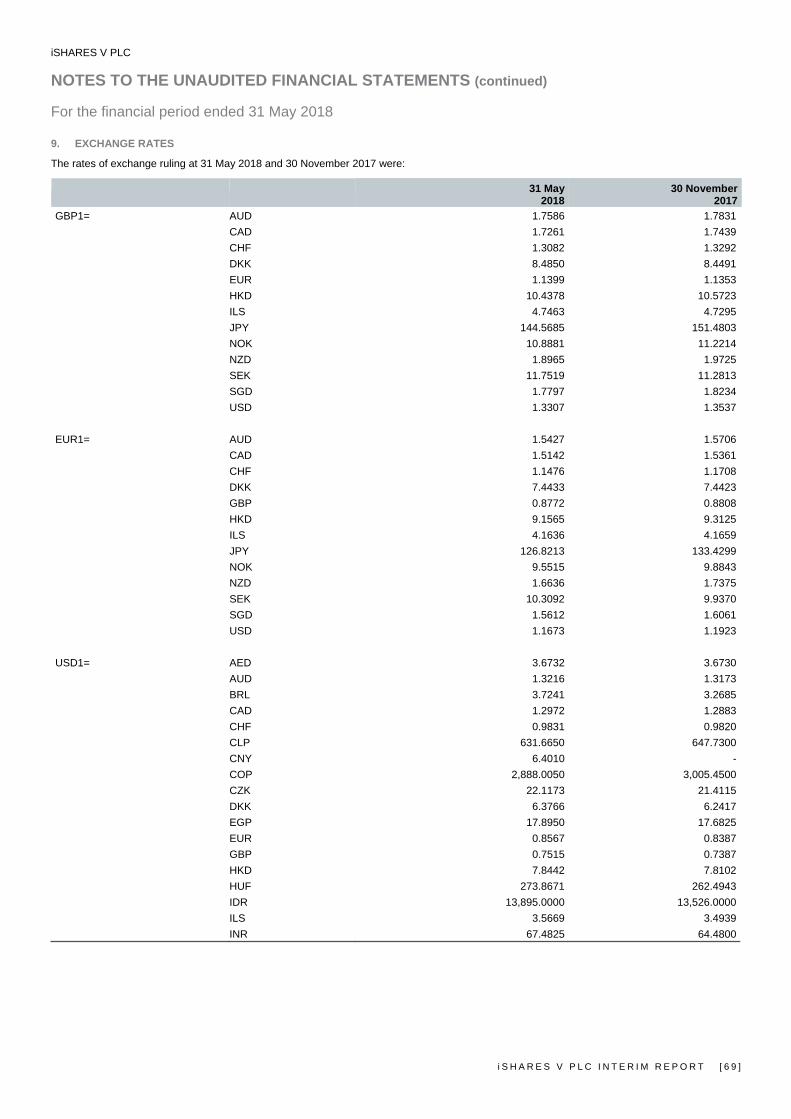
iSHARES V PLC NOTES TO THE UNAUDITED FINANCIAL STATEMENTS (continued) For the financial period ended 31 May 2018
i S H A R E S V P L C I N T E R I M R E P O R T [ 6 9 ]
9. EXCHANGE RATES
The rates of exchange ruling at 31 May 2018 and 30 November 2017 were:
31 May
2018 30 November
2017GBP1= AUD 1.7586 1.7831 CAD 1.7261 1.7439 CHF 1.3082 1.3292 DKK 8.4850 8.4491 EUR 1.1399 1.1353 HKD 10.4378 10.5723 ILS 4.7463 4.7295 JPY 144.5685 151.4803 NOK 10.8881 11.2214 NZD 1.8965 1.9725 SEK 11.7519 11.2813 SGD 1.7797 1.8234 USD 1.3307 1.3537 EUR1= AUD 1.5427 1.5706 CAD 1.5142 1.5361 CHF 1.1476 1.1708 DKK 7.4433 7.4423 GBP 0.8772 0.8808 HKD 9.1565 9.3125 ILS 4.1636 4.1659 JPY 126.8213 133.4299 NOK 9.5515 9.8843 NZD 1.6636 1.7375 SEK 10.3092 9.9370 SGD 1.5612 1.6061 USD 1.1673 1.1923 USD1= AED 3.6732 3.6730 AUD 1.3216 1.3173 BRL 3.7241 3.2685 CAD 1.2972 1.2883 CHF 0.9831 0.9820
CLP 631.6650 647.7300 CNY 6.4010 - COP 2,888.0050 3,005.4500 CZK 22.1173 21.4115 DKK 6.3766 6.2417 EGP 17.8950 17.6825 EUR 0.8567 0.8387 GBP 0.7515 0.7387 HKD 7.8442 7.8102 HUF 273.8671 262.4943 IDR 13,895.0000 13,526.0000 ILS 3.5669 3.4939 INR 67.4825 64.4800
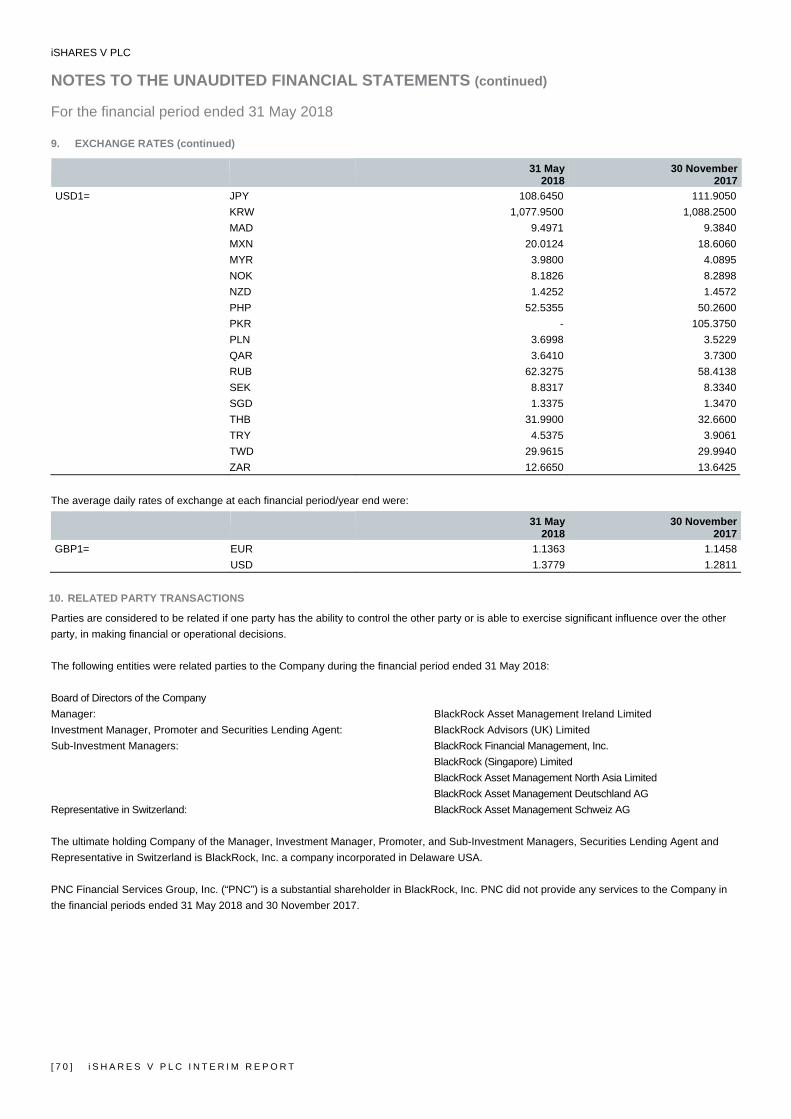
iSHARES V PLC NOTES TO THE UNAUDITED FINANCIAL STATEMENTS (continued) For the financial period ended 31 May 2018
[ 7 0 ] i S H A R E S V P L C I N T E R I M R E P O R T
9. EXCHANGE RATES (continued)
31 May
2018 30 November
2017USD1= JPY 108.6450 111.9050
KRW 1,077.9500 1,088.2500 MAD 9.4971 9.3840 MXN 20.0124 18.6060 MYR 3.9800 4.0895 NOK 8.1826 8.2898 NZD 1.4252 1.4572 PHP 52.5355 50.2600 PKR - 105.3750 PLN 3.6998 3.5229 QAR 3.6410 3.7300 RUB 62.3275 58.4138 SEK 8.8317 8.3340 SGD 1.3375 1.3470 THB 31.9900 32.6600 TRY 4.5375 3.9061 TWD 29.9615 29.9940 ZAR 12.6650 13.6425 The average daily rates of exchange at each financial period/year end were:
31 May
2018 30 November
2017GBP1= EUR 1.1363 1.1458
USD 1.3779 1.2811 10. RELATED PARTY TRANSACTIONS
Parties are considered to be related if one party has the ability to control the other party or is able to exercise significant influence over the other party, in making financial or operational decisions. The following entities were related parties to the Company during the financial period ended 31 May 2018: Board of Directors of the Company Manager: BlackRock Asset Management Ireland Limited Investment Manager, Promoter and Securities Lending Agent: BlackRock Advisors (UK) Limited Sub-Investment Managers: BlackRock Financial Management, Inc. BlackRock (Singapore) Limited BlackRock Asset Management North Asia Limited BlackRock Asset Management Deutschland AG Representative in Switzerland: BlackRock Asset Management Schweiz AG The ultimate holding Company of the Manager, Investment Manager, Promoter, and Sub-Investment Managers, Securities Lending Agent and Representative in Switzerland is BlackRock, Inc. a company incorporated in Delaware USA. PNC Financial Services Group, Inc. (“PNC”) is a substantial shareholder in BlackRock, Inc. PNC did not provide any services to the Company in the financial periods ended 31 May 2018 and 30 November 2017.

iSHARES V PLC NOTES TO THE UNAUDITED FINANCIAL STATEMENTS (continued) For the financial period ended 31 May 2018
i S H A R E S V P L C I N T E R I M R E P O R T [ 7 1 ]
10. RELATED PARTY TRANSACTIONS (continued)
Fees payable to the Manager and Investment Manager are paid out of the TER charged to the Funds. The TER forms part of the operating expenses which are included in the condensed income statement. The Investment Manager will discharge the fees and expenses of the Sub-Investment Managers. Securities lending income earned by the Funds is disclosed in condensed income statements of the Funds.
There were no soft commissions arrangements entered into by the Investment Manager on behalf of the Company during the financial period ended 31 May 2018 (31 May 2017: Nil). The non-executive Directors of the Company as at 31 May 2018 are presented in the table below:
Director Employee of the BlackRock Group Director of BlackRock affiliates and/or other
funds managed by BlackRock Paul McNaughton No Yes Paul McGowan No Yes Barry O’Dwyer Yes Yes Teresa O'Flynn Yes Yes David Moroney Yes Yes Jessica Irschick Yes Yes
The Directors of the Company and the Manager who are also employees of the BlackRock Group are not entitled to receive Directors’ fees. David Moroney has been appointed as a non-executive Director effective 15 November 2017. Jessica Irschick has been appointed as a non-executive Director effective 20 November 2017. Holdings in other Funds managed by BlackRock
Investments in Funds managed by BlackRock, Inc. and BlackRock affiliates are listed below and marked on the relevant Funds’ schedules of investments. The investments into ICS funds is included in cash equivalents and is managed by BlackRock Asset Management Ireland Limited. No management fees are included as a result of any of the investments in ICS however an annual expense capped at 0.03% of NAV is charged. The Company invested in the following Funds which are also managed by BlackRock Asset Management Ireland Limited. Further information on the fees charged from investing in these underlying funds is presented in the table below. These disclosed fees are the maximum charges capped as per the prospectus of the underlying funds and actual fees charged may be lower.
Investments Fee paid by Fund Investment Company – UCITS authorised in Ireland by CBI iShares € Corp Bond Interest Rate Hedged UCITS ETF ICS Institutional Euro Liquidity Fund - Agency (Dis) Shares Annual expense capped at 0.03% of NAV iShares France Govt Bond UCITS ETF ICS Institutional Euro Liquidity Fund - Agency (Dis) Shares Annual expense capped at 0.03% of NAV iShares Italy Govt Bond UCITS ETF ICS Institutional Euro Liquidity Fund - Agency (Dis) Shares Annual expense capped at 0.03% of NAV iShares Spain Govt Bond UCITS ETF ICS Institutional Euro Liquidity Fund - Agency (Dis) Shares Annual expense capped at 0.03% of NAV
All related party transactions were carried out at arm’s length in the ordinary course of business. The terms and returns received by the related parties in making the investments above were no more favourable than those received by other investors investing into the same share classes.
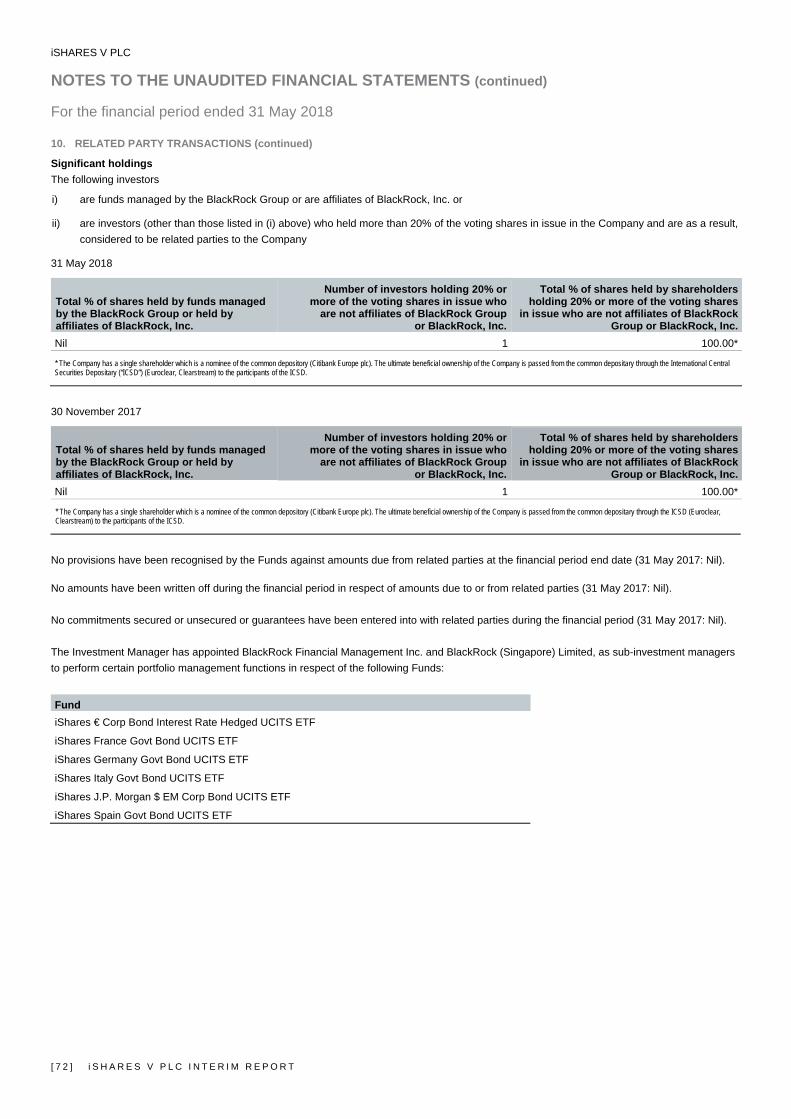
iSHARES V PLC NOTES TO THE UNAUDITED FINANCIAL STATEMENTS (continued) For the financial period ended 31 May 2018
[ 7 2 ] i S H A R E S V P L C I N T E R I M R E P O R T
10. RELATED PARTY TRANSACTIONS (continued)
Significant holdings The following investors
i) are funds managed by the BlackRock Group or are affiliates of BlackRock, Inc. or
ii) are investors (other than those listed in (i) above) who held more than 20% of the voting shares in issue in the Company and are as a result, considered to be related parties to the Company
31 May 2018
Total % of shares held by funds managed by the BlackRock Group or held by affiliates of BlackRock, Inc.
Number of investors holding 20% or more of the voting shares in issue who
are not affiliates of BlackRock Group or BlackRock, Inc.
Total % of shares held by shareholders holding 20% or more of the voting shares
in issue who are not affiliates of BlackRock Group or BlackRock, Inc.
Nil 1 100.00*
* The Company has a single shareholder which is a nominee of the common depository (Citibank Europe plc). The ultimate beneficial ownership of the Company is passed from the common depositary through the International Central Securities Depositary (“ICSD”) (Euroclear, Clearstream) to the participants of the ICSD.
30 November 2017
Total % of shares held by funds managed by the BlackRock Group or held by affiliates of BlackRock, Inc.
Number of investors holding 20% or more of the voting shares in issue who
are not affiliates of BlackRock Group or BlackRock, Inc.
Total % of shares held by shareholders holding 20% or more of the voting shares
in issue who are not affiliates of BlackRock Group or BlackRock, Inc.
Nil 1 100.00*
* The Company has a single shareholder which is a nominee of the common depository (Citibank Europe plc). The ultimate beneficial ownership of the Company is passed from the common depositary through the ICSD (Euroclear, Clearstream) to the participants of the ICSD.
No provisions have been recognised by the Funds against amounts due from related parties at the financial period end date (31 May 2017: Nil). No amounts have been written off during the financial period in respect of amounts due to or from related parties (31 May 2017: Nil). No commitments secured or unsecured or guarantees have been entered into with related parties during the financial period (31 May 2017: Nil). The Investment Manager has appointed BlackRock Financial Management Inc. and BlackRock (Singapore) Limited, as sub-investment managers to perform certain portfolio management functions in respect of the following Funds:
Fund iShares € Corp Bond Interest Rate Hedged UCITS ETF
iShares France Govt Bond UCITS ETF
iShares Germany Govt Bond UCITS ETF
iShares Italy Govt Bond UCITS ETF
iShares J.P. Morgan $ EM Corp Bond UCITS ETF
iShares Spain Govt Bond UCITS ETF

iSHARES V PLC NOTES TO THE UNAUDITED FINANCIAL STATEMENTS (continued) For the financial period ended 31 May 2018
i S H A R E S V P L C I N T E R I M R E P O R T [ 7 3 ]
10. RELATED PARTY TRANSACTIONS (continued)
The Investment Manager has appointed BlackRock Asset Management North Asia Limited and BlackRock Asset Management Deutschland AG, as a sub-investment manager to perform certain portfolio management functions in respect of the following Funds: Fund iShares Agribusiness UCITS ETF
iShares EM Dividend UCITS ETF
iShares Gold Producers UCITS ETF
iShares MSCI ACWI UCITS ETF
iShares MSCI EM Consumer Growth UCITS ETF
iShares MSCI Japan EUR Hedged UCITS ETF (Acc)
iShares MSCI Japan GBP Hedged UCITS ETF (Acc)
iShares MSCI Poland UCITS ETF
iShares MSCI World EUR Hedged UCITS ETF (Acc)
iShares MSCI World GBP Hedged UCITS ETF (Acc)
iShares Oil & Gas Exploration & Production UCITS ETF
iShares S&P 500 Consumer Discretionary Sector UCITS ETF
iShares S&P 500 Consumer Staples Sector UCITS ETF
iShares S&P 500 Energy Sector UCITS ETF
iShares S&P 500 EUR Hedged UCITS ETF (Acc)
iShares S&P 500 Financials Sector UCITS ETF
iShares S&P 500 GBP Hedged UCITS ETF (Acc)
iShares S&P 500 Health Care Sector UCITS ETF
iShares S&P 500 Industrials Sector UCITS ETF
iShares S&P 500 Information Technology Sector UCITS ETF
iShares S&P 500 Materials Sector UCITS ETF
iShares S&P 500 Utilities Sector UCITS ETF
Securities Lending
The total income earned from securities lending transactions is split between the relevant Fund and the Securities Lending Agent. The Funds which undertake securities lending transactions receive at least 62.5%, while the Securities Lending Agent receives up to 37.5% of such income, with all operational costs borne out of the Securities Lending Agent’s share. Income earned during the financial period by the Funds from securities lending transactions is disclosed in the condensed income statement. 11. SUBSEQUENT EVENTS
The ex-date and pay date for distributions of the below Fund occurred post financial period end to date of signing.
Fund Distribution Amount ('000)iShares € Corp Bond Interest Rate Hedged UCITS ETF €8,803iShares EM Dividend UCITS ETF £7,738iShares France Govt Bond UCITS ETF €208iShares Italy Govt Bond UCITS ETF €7,232iShares J.P. Morgan $ EM Corp Bond UCITS ETF $14,119iShares Spain Govt Bond UCITS ETF €5,414
Other than the above, there have been no events subsequent to the financial period end, which, in the opinion of the Directors of the Company, may have had an impact on the financial statements for the financial period ended 31 May 2018. 12. APPROVAL DATE
The financial statements were approved and authorised for issue by the Directors on 25 July 2018.
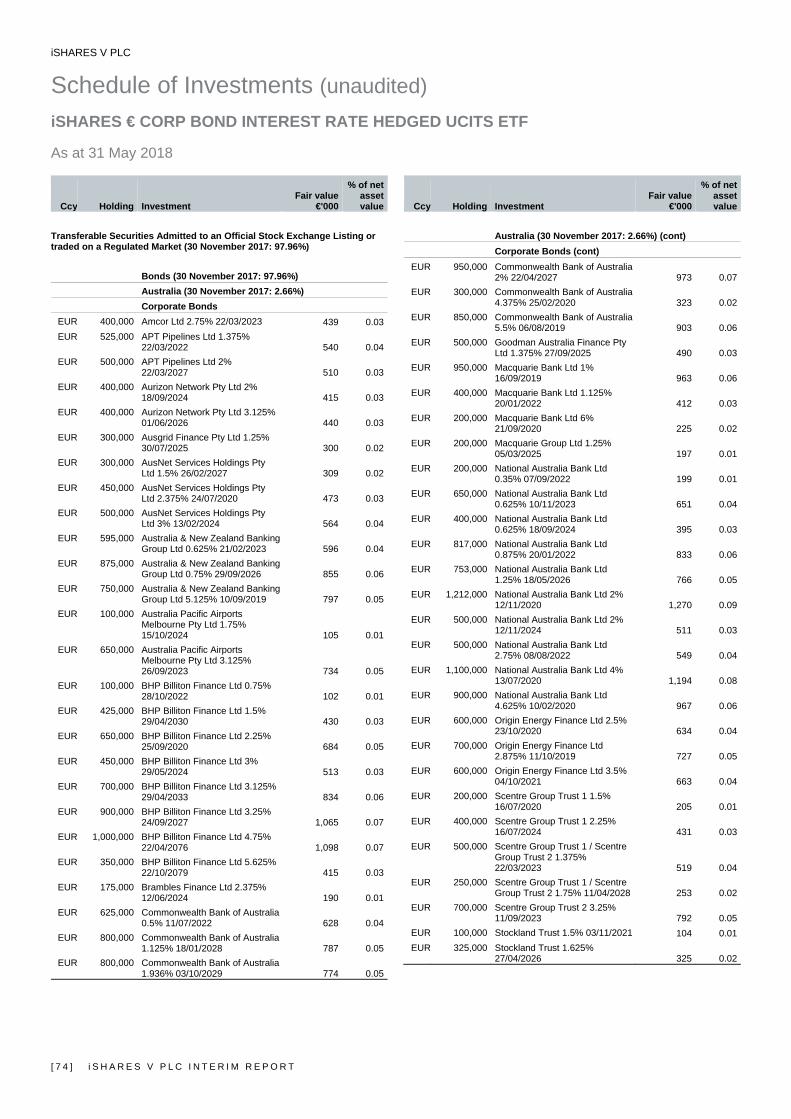
iSHARES V PLC
Schedule of Investments (unaudited) iSHARES € CORP BOND INTEREST RATE HEDGED UCITS ETF As at 31 May 2018
[ 7 4 ] i S H A R E S V P L C I N T E R I M R E P O R T
Ccy Holding Investment Fair value
€'000
% of net asset value
Transferable Securities Admitted to an Official Stock Exchange Listing or traded on a Regulated Market (30 November 2017: 97.96%)
Bonds (30 November 2017: 97.96%) Australia (30 November 2017: 2.66%) Corporate Bonds
EUR 400,000 Amcor Ltd 2.75% 22/03/2023 439 0.03EUR 525,000 APT Pipelines Ltd 1.375%
22/03/2022 540 0.04EUR 500,000 APT Pipelines Ltd 2%
22/03/2027 510 0.03EUR 400,000 Aurizon Network Pty Ltd 2%
18/09/2024 415 0.03EUR 400,000 Aurizon Network Pty Ltd 3.125%
01/06/2026 440 0.03EUR 300,000 Ausgrid Finance Pty Ltd 1.25%
30/07/2025 300 0.02EUR 300,000 AusNet Services Holdings Pty
Ltd 1.5% 26/02/2027 309 0.02EUR 450,000 AusNet Services Holdings Pty
Ltd 2.375% 24/07/2020 473 0.03EUR 500,000 AusNet Services Holdings Pty
Ltd 3% 13/02/2024 564 0.04EUR 595,000 Australia & New Zealand Banking
Group Ltd 0.625% 21/02/2023 596 0.04EUR 875,000 Australia & New Zealand Banking
Group Ltd 0.75% 29/09/2026 855 0.06EUR 750,000 Australia & New Zealand Banking
Group Ltd 5.125% 10/09/2019 797 0.05EUR 100,000 Australia Pacific Airports
Melbourne Pty Ltd 1.75% 15/10/2024 105 0.01
EUR 650,000 Australia Pacific Airports Melbourne Pty Ltd 3.125% 26/09/2023 734 0.05
EUR 100,000 BHP Billiton Finance Ltd 0.75% 28/10/2022 102 0.01
EUR 425,000 BHP Billiton Finance Ltd 1.5% 29/04/2030 430 0.03
EUR 650,000 BHP Billiton Finance Ltd 2.25% 25/09/2020 684 0.05
EUR 450,000 BHP Billiton Finance Ltd 3% 29/05/2024 513 0.03
EUR 700,000 BHP Billiton Finance Ltd 3.125% 29/04/2033 834 0.06
EUR 900,000 BHP Billiton Finance Ltd 3.25% 24/09/2027 1,065 0.07
EUR 1,000,000 BHP Billiton Finance Ltd 4.75% 22/04/2076 1,098 0.07
EUR 350,000 BHP Billiton Finance Ltd 5.625% 22/10/2079 415 0.03
EUR 175,000 Brambles Finance Ltd 2.375% 12/06/2024 190 0.01
EUR 625,000 Commonwealth Bank of Australia 0.5% 11/07/2022 628 0.04
EUR 800,000 Commonwealth Bank of Australia 1.125% 18/01/2028 787 0.05
EUR 800,000 Commonwealth Bank of Australia 1.936% 03/10/2029 774 0.05
Ccy Holding Investment Fair value
€'000
% of net asset value
Australia (30 November 2017: 2.66%) (cont) Corporate Bonds (cont)
EUR 950,000 Commonwealth Bank of Australia 2% 22/04/2027 973 0.07
EUR 300,000 Commonwealth Bank of Australia 4.375% 25/02/2020 323 0.02
EUR 850,000 Commonwealth Bank of Australia 5.5% 06/08/2019 903 0.06
EUR 500,000 Goodman Australia Finance Pty Ltd 1.375% 27/09/2025 490 0.03
EUR 950,000 Macquarie Bank Ltd 1% 16/09/2019 963 0.06
EUR 400,000 Macquarie Bank Ltd 1.125% 20/01/2022 412 0.03
EUR 200,000 Macquarie Bank Ltd 6% 21/09/2020 225 0.02
EUR 200,000 Macquarie Group Ltd 1.25% 05/03/2025 197 0.01
EUR 200,000 National Australia Bank Ltd 0.35% 07/09/2022 199 0.01
EUR 650,000 National Australia Bank Ltd 0.625% 10/11/2023 651 0.04
EUR 400,000 National Australia Bank Ltd 0.625% 18/09/2024 395 0.03
EUR 817,000 National Australia Bank Ltd 0.875% 20/01/2022 833 0.06
EUR 753,000 National Australia Bank Ltd 1.25% 18/05/2026 766 0.05
EUR 1,212,000 National Australia Bank Ltd 2% 12/11/2020 1,270 0.09
EUR 500,000 National Australia Bank Ltd 2% 12/11/2024 511 0.03
EUR 500,000 National Australia Bank Ltd 2.75% 08/08/2022 549 0.04
EUR 1,100,000 National Australia Bank Ltd 4% 13/07/2020 1,194 0.08
EUR 900,000 National Australia Bank Ltd 4.625% 10/02/2020 967 0.06
EUR 600,000 Origin Energy Finance Ltd 2.5% 23/10/2020 634 0.04
EUR 700,000 Origin Energy Finance Ltd 2.875% 11/10/2019 727 0.05
EUR 600,000 Origin Energy Finance Ltd 3.5% 04/10/2021 663 0.04
EUR 200,000 Scentre Group Trust 1 1.5% 16/07/2020 205 0.01
EUR 400,000 Scentre Group Trust 1 2.25% 16/07/2024 431 0.03
EUR 500,000 Scentre Group Trust 1 / Scentre Group Trust 2 1.375% 22/03/2023 519 0.04
EUR 250,000 Scentre Group Trust 1 / Scentre Group Trust 2 1.75% 11/04/2028 253 0.02
EUR 700,000 Scentre Group Trust 2 3.25% 11/09/2023 792 0.05
EUR 100,000 Stockland Trust 1.5% 03/11/2021 104 0.01EUR 325,000 Stockland Trust 1.625%
27/04/2026 325 0.02

iSHARES V PLC
Schedule of Investments (unaudited) (continued) iSHARES € CORP BOND INTEREST RATE HEDGED UCITS ETF (continued) As at 31 May 2018
i S H A R E S V P L C I N T E R I M R E P O R T [ 7 5 ]
Ccy Holding Investment Fair value
€'000
% of net asset value
Bonds (30 November 2017: 97.96%) (cont) Australia (30 November 2017: 2.66%) (cont) Corporate Bonds (cont)
EUR 275,000 Sydney Airport Finance Co Pty Ltd 1.75% 26/04/2028 278 0.02
EUR 520,000 Sydney Airport Finance Co Pty Ltd 2.75% 23/04/2024 574 0.04
EUR 375,000 Telstra Corp Ltd 1.125% 14/04/2026 375 0.03
EUR 700,000 Telstra Corp Ltd 2.5% 15/09/2023 770 0.05
EUR 850,000 Telstra Corp Ltd 3.5% 21/09/2022 964 0.06
EUR 400,000 Telstra Corp Ltd 3.625% 15/03/2021 440 0.03
EUR 1,100,000 Telstra Corp Ltd 3.75% 16/05/2022 1,249 0.08
EUR 250,000 Telstra Corp Ltd 4.25% 23/03/2020 270 0.02
EUR 450,000 Transurban Finance Co Pty Ltd 1.75% 29/03/2028 444 0.03
EUR 825,000 Transurban Finance Co Pty Ltd 1.875% 16/09/2024^ 864 0.06
EUR 175,000 Transurban Finance Co Pty Ltd 2% 28/08/2025 183 0.01
EUR 200,000 Transurban Finance Co Pty Ltd 2.5% 08/10/2020 210 0.01
EUR 300,000 Wesfarmers Ltd 1.25% 07/10/2021 312 0.02
EUR 700,000 Wesfarmers Ltd 2.75% 02/08/2022 771 0.05
EUR 650,000 Westpac Banking Corp 0.375% 05/03/2023 643 0.04
EUR 600,000 Westpac Banking Corp 0.625% 22/11/2024 591 0.04
EUR 500,000 Westpac Banking Corp 0.25% 17/01/2022 498 0.03
EUR 300,000 Westpac Banking Corp 0.875% 16/02/2021 306 0.02
EUR 200,000 Westpac Banking Corp 0.875% 17/04/2027 196 0.01
EUR 775,000 Westpac Banking Corp 1.125% 05/09/2027 771 0.05Total Australia 41,780 2.78
Austria (30 November 2017: 0.77%) Corporate Bonds
EUR 200,000 BAWAG PSK Bank fuer Arbeit und Wirtschaft und Oesterreichische Postsparkasse AG 8.125% 30/10/2023 263 0.02
EUR 450,000 Erste Group Bank AG 7.125% 10/10/2022 560 0.04
EUR 525,000 Novomatic AG 1.625% 20/09/2023 540 0.04
EUR 750,000 OMV AG 1% 14/12/2026 739 0.05EUR 700,000 OMV AG 1.75% 25/11/2019 719 0.05EUR 200,000 OMV AG 2.625% 27/09/2022 219 0.01EUR 500,000 OMV AG 3.5% 27/09/2027 597 0.04EUR 300,000 OMV AG 4.25% 12/10/2021 341 0.02
Ccy Holding Investment Fair value
€'000
% of net asset value
Austria (30 November 2017: 0.77%) (cont) Corporate Bonds (cont)
EUR 500,000 OMV AG 4.375% 10/02/2020 538 0.04EUR 550,000 OMV AG 5.25% * 619 0.04EUR 750,000 OMV AG 6.25% * 911 0.06EUR 500,000 Raiffeisen Bank International AG
6% 16/10/2023 588 0.04EUR 800,000 Raiffeisen Bank International AG
6.625% 18/05/2021 910 0.06EUR 800,000 Raiffeisenlandesbank
Oberoesterreich AG 0.75% 22/05/2023 797 0.05
EUR 800,000 Telekom Finanzmanagement GmbH 1.5% 07/12/2026^ 813 0.05
EUR 418,000 Telekom Finanzmanagement GmbH 3.125% 03/12/2021 460 0.03
EUR 100,000 Telekom Finanzmanagement GmbH 3.5% 04/07/2023 115 0.01
EUR 744,000 Telekom Finanzmanagement GmbH 4% 04/04/2022 847 0.06
EUR 400,000 UNIQA Insurance Group AG 6% 27/07/2046 471 0.03
EUR 300,000 UNIQA Insurance Group AG 6.875% 31/07/2043 356 0.02
EUR 500,000 Vienna Insurance Group AG Wiener Versicherung Gruppe 3.75% 02/03/2046^ 532 0.03
EUR 100,000 Vienna Insurance Group AG Wiener Versicherung Gruppe 5.5% 09/10/2043 116 0.01
EUR 500,000 Volksbank Wien AG 2.75% 06/10/2027 495 0.03Total Austria 12,546 0.83
Belgium (30 November 2017: 1.84%) Corporate Bonds
EUR 300,000 AG Insurance SA 3.5% 30/06/2047 300 0.02
EUR 1,750,000 Anheuser-Busch InBev SA/NV 0.625% 17/03/2020 1,773 0.12
EUR 1,131,000 Anheuser-Busch InBev SA/NV 0.8% 20/04/2023 1,154 0.08
EUR 1,254,000 Anheuser-Busch InBev SA/NV 0.875% 17/03/2022 1,285 0.09
EUR 1,525,000 Anheuser-Busch InBev SA/NV 1.15% 22/01/2027 1,509 0.10
EUR 1,648,000 Anheuser-Busch InBev SA/NV 1.5% 17/03/2025 1,712 0.11
EUR 1,079,000 Anheuser-Busch InBev SA/NV 1.5% 18/04/2030 1,059 0.07
EUR 800,000 Anheuser-Busch InBev SA/NV 1.875% 20/01/2020 826 0.05
EUR 600,000 Anheuser-Busch InBev SA/NV 1.95% 30/09/2021^ 638 0.04
EUR 591,000 Anheuser-Busch InBev SA/NV 2% 16/12/2019 610 0.04
EUR 1,766,000 Anheuser-Busch InBev SA/NV 2% 17/03/2028 1,854 0.12
EUR 725,000 Anheuser-Busch InBev SA/NV 2% 23/01/2035 702 0.05
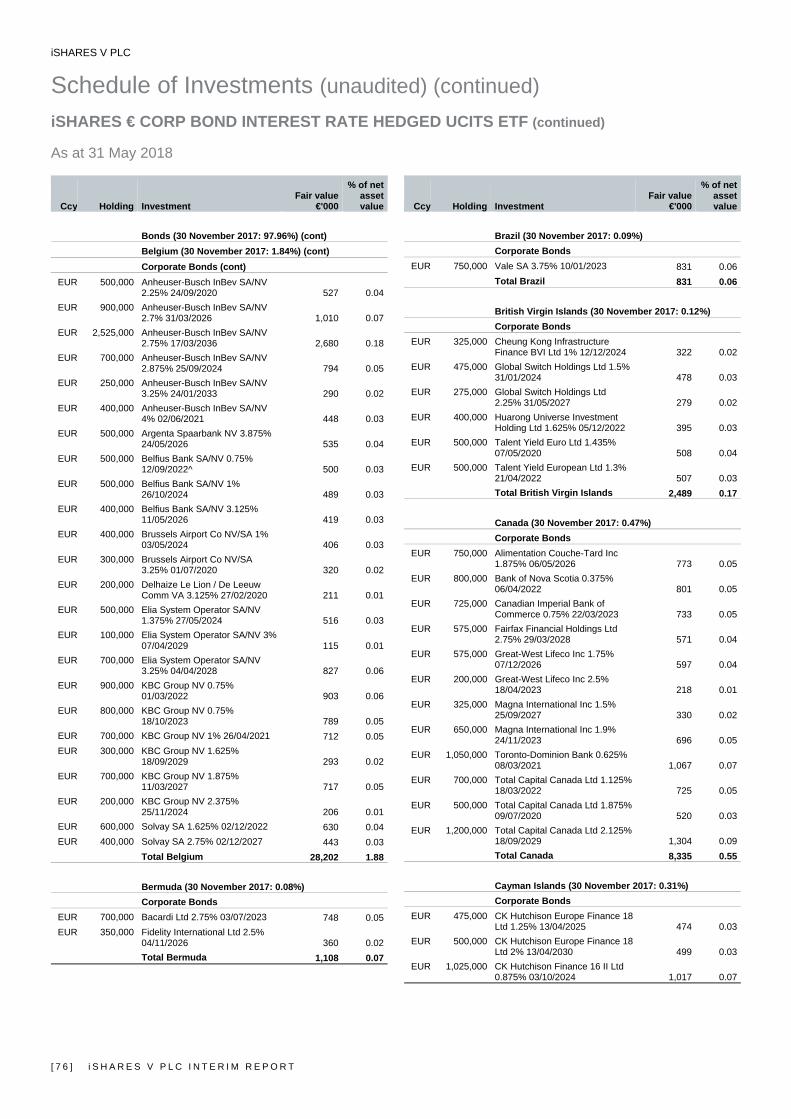
iSHARES V PLC
Schedule of Investments (unaudited) (continued) iSHARES € CORP BOND INTEREST RATE HEDGED UCITS ETF (continued) As at 31 May 2018
[ 7 6 ] i S H A R E S V P L C I N T E R I M R E P O R T
Ccy Holding Investment Fair value
€'000
% of net asset value
Bonds (30 November 2017: 97.96%) (cont) Belgium (30 November 2017: 1.84%) (cont) Corporate Bonds (cont)
EUR 500,000 Anheuser-Busch InBev SA/NV 2.25% 24/09/2020 527 0.04
EUR 900,000 Anheuser-Busch InBev SA/NV 2.7% 31/03/2026 1,010 0.07
EUR 2,525,000 Anheuser-Busch InBev SA/NV 2.75% 17/03/2036 2,680 0.18
EUR 700,000 Anheuser-Busch InBev SA/NV 2.875% 25/09/2024 794 0.05
EUR 250,000 Anheuser-Busch InBev SA/NV 3.25% 24/01/2033 290 0.02
EUR 400,000 Anheuser-Busch InBev SA/NV 4% 02/06/2021 448 0.03
EUR 500,000 Argenta Spaarbank NV 3.875% 24/05/2026 535 0.04
EUR 500,000 Belfius Bank SA/NV 0.75% 12/09/2022^ 500 0.03
EUR 500,000 Belfius Bank SA/NV 1% 26/10/2024 489 0.03
EUR 400,000 Belfius Bank SA/NV 3.125% 11/05/2026 419 0.03
EUR 400,000 Brussels Airport Co NV/SA 1% 03/05/2024 406 0.03
EUR 300,000 Brussels Airport Co NV/SA 3.25% 01/07/2020 320 0.02
EUR 200,000 Delhaize Le Lion / De Leeuw Comm VA 3.125% 27/02/2020 211 0.01
EUR 500,000 Elia System Operator SA/NV 1.375% 27/05/2024 516 0.03
EUR 100,000 Elia System Operator SA/NV 3% 07/04/2029 115 0.01
EUR 700,000 Elia System Operator SA/NV 3.25% 04/04/2028 827 0.06
EUR 900,000 KBC Group NV 0.75% 01/03/2022 903 0.06
EUR 800,000 KBC Group NV 0.75% 18/10/2023 789 0.05
EUR 700,000 KBC Group NV 1% 26/04/2021 712 0.05EUR 300,000 KBC Group NV 1.625%
18/09/2029 293 0.02EUR 700,000 KBC Group NV 1.875%
11/03/2027 717 0.05EUR 200,000 KBC Group NV 2.375%
25/11/2024 206 0.01EUR 600,000 Solvay SA 1.625% 02/12/2022 630 0.04EUR 400,000 Solvay SA 2.75% 02/12/2027 443 0.03
Total Belgium 28,202 1.88
Bermuda (30 November 2017: 0.08%) Corporate Bonds
EUR 700,000 Bacardi Ltd 2.75% 03/07/2023 748 0.05EUR 350,000 Fidelity International Ltd 2.5%
04/11/2026 360 0.02Total Bermuda 1,108 0.07
Ccy Holding Investment Fair value
€'000
% of net asset value
Brazil (30 November 2017: 0.09%) Corporate Bonds
EUR 750,000 Vale SA 3.75% 10/01/2023 831 0.06Total Brazil 831 0.06
British Virgin Islands (30 November 2017: 0.12%) Corporate Bonds
EUR 325,000 Cheung Kong Infrastructure Finance BVI Ltd 1% 12/12/2024 322 0.02
EUR 475,000 Global Switch Holdings Ltd 1.5% 31/01/2024 478 0.03
EUR 275,000 Global Switch Holdings Ltd 2.25% 31/05/2027 279 0.02
EUR 400,000 Huarong Universe Investment Holding Ltd 1.625% 05/12/2022 395 0.03
EUR 500,000 Talent Yield Euro Ltd 1.435% 07/05/2020 508 0.04
EUR 500,000 Talent Yield European Ltd 1.3% 21/04/2022 507 0.03Total British Virgin Islands 2,489 0.17
Canada (30 November 2017: 0.47%) Corporate Bonds
EUR 750,000 Alimentation Couche-Tard Inc 1.875% 06/05/2026 773 0.05
EUR 800,000 Bank of Nova Scotia 0.375% 06/04/2022 801 0.05
EUR 725,000 Canadian Imperial Bank of Commerce 0.75% 22/03/2023 733 0.05
EUR 575,000 Fairfax Financial Holdings Ltd 2.75% 29/03/2028 571 0.04
EUR 575,000 Great-West Lifeco Inc 1.75% 07/12/2026 597 0.04
EUR 200,000 Great-West Lifeco Inc 2.5% 18/04/2023 218 0.01
EUR 325,000 Magna International Inc 1.5% 25/09/2027 330 0.02
EUR 650,000 Magna International Inc 1.9% 24/11/2023 696 0.05
EUR 1,050,000 Toronto-Dominion Bank 0.625% 08/03/2021 1,067 0.07
EUR 700,000 Total Capital Canada Ltd 1.125% 18/03/2022 725 0.05
EUR 500,000 Total Capital Canada Ltd 1.875% 09/07/2020 520 0.03
EUR 1,200,000 Total Capital Canada Ltd 2.125% 18/09/2029 1,304 0.09Total Canada 8,335 0.55
Cayman Islands (30 November 2017: 0.31%) Corporate Bonds
EUR 475,000 CK Hutchison Europe Finance 18 Ltd 1.25% 13/04/2025 474 0.03
EUR 500,000 CK Hutchison Europe Finance 18 Ltd 2% 13/04/2030 499 0.03
EUR 1,025,000 CK Hutchison Finance 16 II Ltd 0.875% 03/10/2024 1,017 0.07
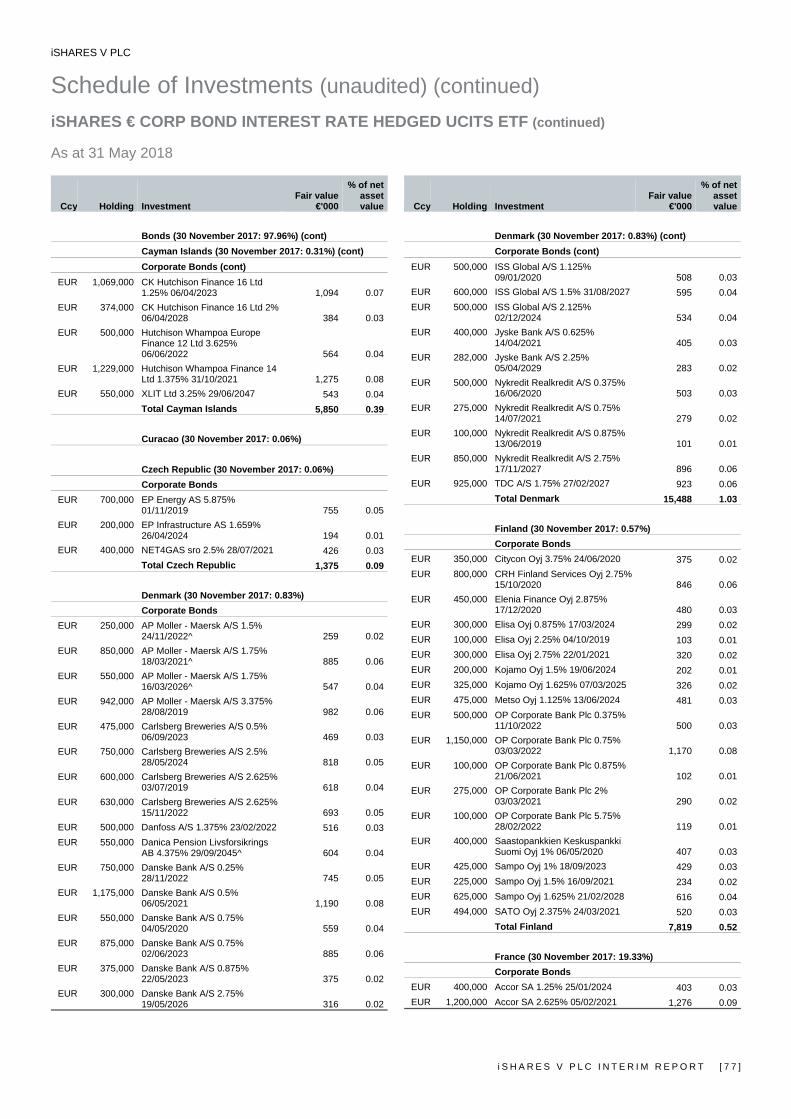
iSHARES V PLC
Schedule of Investments (unaudited) (continued) iSHARES € CORP BOND INTEREST RATE HEDGED UCITS ETF (continued) As at 31 May 2018
i S H A R E S V P L C I N T E R I M R E P O R T [ 7 7 ]
Ccy Holding Investment Fair value
€'000
% of net asset value
Bonds (30 November 2017: 97.96%) (cont) Cayman Islands (30 November 2017: 0.31%) (cont) Corporate Bonds (cont)
EUR 1,069,000 CK Hutchison Finance 16 Ltd 1.25% 06/04/2023 1,094 0.07
EUR 374,000 CK Hutchison Finance 16 Ltd 2% 06/04/2028 384 0.03
EUR 500,000 Hutchison Whampoa Europe Finance 12 Ltd 3.625% 06/06/2022 564 0.04
EUR 1,229,000 Hutchison Whampoa Finance 14 Ltd 1.375% 31/10/2021 1,275 0.08
EUR 550,000 XLIT Ltd 3.25% 29/06/2047 543 0.04Total Cayman Islands 5,850 0.39
Curacao (30 November 2017: 0.06%) Czech Republic (30 November 2017: 0.06%) Corporate Bonds
EUR 700,000 EP Energy AS 5.875% 01/11/2019 755 0.05
EUR 200,000 EP Infrastructure AS 1.659% 26/04/2024 194 0.01
EUR 400,000 NET4GAS sro 2.5% 28/07/2021 426 0.03Total Czech Republic 1,375 0.09
Denmark (30 November 2017: 0.83%) Corporate Bonds
EUR 250,000 AP Moller - Maersk A/S 1.5% 24/11/2022^ 259 0.02
EUR 850,000 AP Moller - Maersk A/S 1.75% 18/03/2021^ 885 0.06
EUR 550,000 AP Moller - Maersk A/S 1.75% 16/03/2026^ 547 0.04
EUR 942,000 AP Moller - Maersk A/S 3.375% 28/08/2019 982 0.06
EUR 475,000 Carlsberg Breweries A/S 0.5% 06/09/2023 469 0.03
EUR 750,000 Carlsberg Breweries A/S 2.5% 28/05/2024 818 0.05
EUR 600,000 Carlsberg Breweries A/S 2.625% 03/07/2019 618 0.04
EUR 630,000 Carlsberg Breweries A/S 2.625% 15/11/2022 693 0.05
EUR 500,000 Danfoss A/S 1.375% 23/02/2022 516 0.03EUR 550,000 Danica Pension Livsforsikrings
AB 4.375% 29/09/2045^ 604 0.04EUR 750,000 Danske Bank A/S 0.25%
28/11/2022 745 0.05EUR 1,175,000 Danske Bank A/S 0.5%
06/05/2021 1,190 0.08EUR 550,000 Danske Bank A/S 0.75%
04/05/2020 559 0.04EUR 875,000 Danske Bank A/S 0.75%
02/06/2023 885 0.06EUR 375,000 Danske Bank A/S 0.875%
22/05/2023 375 0.02EUR 300,000 Danske Bank A/S 2.75%
19/05/2026 316 0.02
Ccy Holding Investment Fair value
€'000
% of net asset value
Denmark (30 November 2017: 0.83%) (cont) Corporate Bonds (cont)
EUR 500,000 ISS Global A/S 1.125% 09/01/2020 508 0.03
EUR 600,000 ISS Global A/S 1.5% 31/08/2027 595 0.04EUR 500,000 ISS Global A/S 2.125%
02/12/2024 534 0.04EUR 400,000 Jyske Bank A/S 0.625%
14/04/2021 405 0.03EUR 282,000 Jyske Bank A/S 2.25%
05/04/2029 283 0.02EUR 500,000 Nykredit Realkredit A/S 0.375%
16/06/2020 503 0.03EUR 275,000 Nykredit Realkredit A/S 0.75%
14/07/2021 279 0.02EUR 100,000 Nykredit Realkredit A/S 0.875%
13/06/2019 101 0.01EUR 850,000 Nykredit Realkredit A/S 2.75%
17/11/2027 896 0.06EUR 925,000 TDC A/S 1.75% 27/02/2027 923 0.06
Total Denmark 15,488 1.03
Finland (30 November 2017: 0.57%) Corporate Bonds
EUR 350,000 Citycon Oyj 3.75% 24/06/2020 375 0.02EUR 800,000 CRH Finland Services Oyj 2.75%
15/10/2020 846 0.06EUR 450,000 Elenia Finance Oyj 2.875%
17/12/2020 480 0.03EUR 300,000 Elisa Oyj 0.875% 17/03/2024 299 0.02EUR 100,000 Elisa Oyj 2.25% 04/10/2019 103 0.01EUR 300,000 Elisa Oyj 2.75% 22/01/2021 320 0.02EUR 200,000 Kojamo Oyj 1.5% 19/06/2024 202 0.01EUR 325,000 Kojamo Oyj 1.625% 07/03/2025 326 0.02EUR 475,000 Metso Oyj 1.125% 13/06/2024 481 0.03EUR 500,000 OP Corporate Bank Plc 0.375%
11/10/2022 500 0.03EUR 1,150,000 OP Corporate Bank Plc 0.75%
03/03/2022 1,170 0.08EUR 100,000 OP Corporate Bank Plc 0.875%
21/06/2021 102 0.01EUR 275,000 OP Corporate Bank Plc 2%
03/03/2021 290 0.02EUR 100,000 OP Corporate Bank Plc 5.75%
28/02/2022 119 0.01EUR 400,000 Saastopankkien Keskuspankki
Suomi Oyj 1% 06/05/2020 407 0.03EUR 425,000 Sampo Oyj 1% 18/09/2023 429 0.03EUR 225,000 Sampo Oyj 1.5% 16/09/2021 234 0.02EUR 625,000 Sampo Oyj 1.625% 21/02/2028 616 0.04EUR 494,000 SATO Oyj 2.375% 24/03/2021 520 0.03
Total Finland 7,819 0.52
France (30 November 2017: 19.33%) Corporate Bonds
EUR 400,000 Accor SA 1.25% 25/01/2024 403 0.03EUR 1,200,000 Accor SA 2.625% 05/02/2021 1,276 0.09

iSHARES V PLC
Schedule of Investments (unaudited) (continued) iSHARES € CORP BOND INTEREST RATE HEDGED UCITS ETF (continued) As at 31 May 2018
[ 7 8 ] i S H A R E S V P L C I N T E R I M R E P O R T
Ccy Holding Investment Fair value
€'000
% of net asset value
Bonds (30 November 2017: 97.96%) (cont) France (30 November 2017: 19.33%) (cont) Corporate Bonds (cont)
EUR 600,000 Air Liquide Finance SA 0.125% 13/06/2020 603 0.04
EUR 100,000 Air Liquide Finance SA 0.375% 18/04/2022 101 0.01
EUR 700,000 Air Liquide Finance SA 0.75% 13/06/2024 704 0.05
EUR 400,000 Air Liquide Finance SA 1% 08/03/2027 394 0.03
EUR 200,000 Air Liquide Finance SA 1.25% 03/06/2025 205 0.01
EUR 1,000,000 Air Liquide Finance SA 1.25% 13/06/2028 999 0.07
EUR 100,000 Air Liquide Finance SA 1.875% 05/06/2024 107 0.01
EUR 900,000 Air Liquide Finance SA 2.125% 15/10/2021 962 0.06
EUR 200,000 Air Liquide Finance SA 3.889% 09/06/2020 216 0.01
EUR 500,000 Air Liquide SA 2.375% 06/09/2023 549 0.04
EUR 600,000 ALD SA 0.875% 18/07/2022 596 0.04EUR 250,000 Alstom SA 4.5% 18/03/2020 271 0.02EUR 600,000 APRR SA 1.125% 15/01/2021 616 0.04EUR 400,000 APRR SA 1.125% 09/01/2026 404 0.03EUR 200,000 APRR SA 1.25% 06/01/2027 202 0.01EUR 800,000 APRR SA 1.5% 15/01/2024 838 0.06EUR 600,000 APRR SA 1.5% 17/01/2033 584 0.04EUR 100,000 APRR SA 1.625% 13/01/2032 100 0.01EUR 800,000 APRR SA 1.875% 15/01/2025 855 0.06EUR 500,000 APRR SA 1.875% 06/01/2031^ 517 0.03EUR 400,000 APRR SA 2.25% 16/01/2020 415 0.03EUR 600,000 Arkema SA 1.5% 20/01/2025 616 0.04EUR 900,000 Arkema SA 1.5% 20/04/2027 907 0.06EUR 500,000 Arkema SA 3.85% 30/04/2020 537 0.04EUR 1,000,000 Auchan Holding SADIR 0.625%
07/02/2022^ 1,008 0.07EUR 700,000 Auchan Holding SADIR 1.75%
23/04/2021 732 0.05EUR 500,000 Auchan Holding SADIR 2.25%
06/04/2023 540 0.04EUR 300,000 Auchan Holding SADIR 2.375%
12/12/2022 325 0.02EUR 600,000 Autoroutes du Sud de la France
SA 1% 13/05/2026 596 0.04EUR 400,000 Autoroutes du Sud de la France
SA 1.125% 20/04/2026 402 0.03EUR 600,000 Autoroutes du Sud de la France
SA 1.25% 18/01/2027 605 0.04EUR 800,000 Autoroutes du Sud de la France
SA 1.375% 22/01/2030 786 0.05EUR 900,000 Autoroutes du Sud de la France
SA 2.875% 18/01/2023 1,001 0.07EUR 400,000 Autoroutes du Sud de la France
SA 2.95% 17/01/2024 450 0.03EUR 600,000 Autoroutes du Sud de la France
SA 4.125% 13/04/2020 646 0.04
Ccy Holding Investment Fair value
€'000
% of net asset value
France (30 November 2017: 19.33%) (cont) Corporate Bonds (cont)
EUR 900,000 Autoroutes du Sud de la France SA 5.625% 04/07/2022 1,094 0.07
EUR 300,000 AXA SA 1.125% 15/05/2028^ 303 0.02EUR 1,525,000 AXA SA 3.25% 28/05/2049 1,487 0.10EUR 1,025,000 AXA SA 3.375% 06/07/2047 1,049 0.07EUR 775,000 AXA SA 3.875% * 806 0.05EUR 800,000 AXA SA 3.941% * 838 0.06EUR 900,000 AXA SA 5.125% 04/07/2043 1,042 0.07EUR 950,000 AXA SA 5.25% 16/04/2040 1,028 0.07EUR 1,200,000 Banque Federative du Credit
Mutuel SA 0.375% 13/01/2022 1,204 0.08EUR 1,300,000 Banque Federative du Credit
Mutuel SA 0.75% 17/07/2025 1,275 0.09EUR 1,200,000 Banque Federative du Credit
Mutuel SA 1.25% 14/01/2025 1,227 0.08EUR 1,100,000 Banque Federative du Credit
Mutuel SA 1.25% 26/05/2027 1,100 0.07EUR 1,000,000 Banque Federative du Credit
Mutuel SA 1.625% 19/01/2026 1,040 0.07EUR 300,000 Banque Federative du Credit
Mutuel SA 1.625% 15/11/2027 279 0.02EUR 500,000 Banque Federative du Credit
Mutuel SA 1.875% 04/11/2026^ 485 0.03EUR 1,000,000 Banque Federative du Credit
Mutuel SA 2.375% 24/03/2026 1,013 0.07EUR 400,000 Banque Federative du Credit
Mutuel SA 2.5% 25/05/2028 399 0.03EUR 1,800,000 Banque Federative du Credit
Mutuel SA 2.625% 24/02/2021 1,924 0.13EUR 1,200,000 Banque Federative du Credit
Mutuel SA 2.625% 18/03/2024 1,330 0.09EUR 300,000 Banque Federative du Credit
Mutuel SA 2.625% 31/03/2027 306 0.02EUR 1,100,000 Banque Federative du Credit
Mutuel SA 3% 28/11/2023 1,241 0.08EUR 925,000 Banque Federative du Credit
Mutuel SA 3% 21/05/2024 989 0.07EUR 500,000 Banque Federative du Credit
Mutuel SA 3% 11/09/2025 532 0.04EUR 1,200,000 Banque Federative du Credit
Mutuel SA 3.25% 23/08/2022 1,347 0.09EUR 1,000,000 Banque Federative du Credit
Mutuel SA 4% 22/10/2020 1,085 0.07EUR 1,100,000 Banque Federative du Credit
Mutuel SA 4.125% 20/07/2020 1,198 0.08EUR 500,000 BNP Paribas Cardif SA 1%
29/11/2024 472 0.03EUR 900,000 BNP Paribas Cardif SA 4.032% * 943 0.06EUR 250,000 BNP Paribas SA 0.5%
01/06/2022 252 0.02EUR 1,250,000 BNP Paribas SA 0.75%
11/11/2022 1,267 0.08EUR 700,000 BNP Paribas SA 1% 17/04/2024 691 0.05EUR 625,000 BNP Paribas SA 1% 27/06/2024 614 0.04EUR 946,000 BNP Paribas SA 1.125%
15/01/2023 974 0.06EUR 1,050,000 BNP Paribas SA 1.125%
10/10/2023 1,052 0.07

iSHARES V PLC
Schedule of Investments (unaudited) (continued) iSHARES € CORP BOND INTEREST RATE HEDGED UCITS ETF (continued) As at 31 May 2018
i S H A R E S V P L C I N T E R I M R E P O R T [ 7 9 ]
Ccy Holding Investment Fair value
€'000
% of net asset value
Bonds (30 November 2017: 97.96%) (cont) France (30 November 2017: 19.33%) (cont) Corporate Bonds (cont)
EUR 700,000 BNP Paribas SA 1.125% 11/06/2026 672 0.04
EUR 1,100,000 BNP Paribas SA 1.25% 19/03/2025 1,089 0.07
EUR 675,000 BNP Paribas SA 1.5% 17/11/2025^ 674 0.05
EUR 875,000 BNP Paribas SA 1.5% 23/05/2028^ 847 0.06
EUR 900,000 BNP Paribas SA 1.5% 25/05/2028^ 922 0.06
EUR 600,000 BNP Paribas SA 1.625% 23/02/2026 627 0.04
EUR 1,250,000 BNP Paribas SA 2.25% 13/01/2021 1,322 0.09
EUR 775,000 BNP Paribas SA 2.25% 11/01/2027^ 771 0.05
EUR 900,000 BNP Paribas SA 2.375% 20/05/2024 988 0.07
EUR 1,200,000 BNP Paribas SA 2.375% 17/02/2025 1,231 0.08
EUR 700,000 BNP Paribas SA 2.625% 14/10/2027 732 0.05
EUR 750,000 BNP Paribas SA 2.75% 27/01/2026 783 0.05
EUR 850,000 BNP Paribas SA 2.875% 24/10/2022 942 0.06
EUR 1,652,000 BNP Paribas SA 2.875% 26/09/2023 1,851 0.12
EUR 1,125,000 BNP Paribas SA 2.875% 20/03/2026 1,176 0.08
EUR 425,000 BNP Paribas SA 2.875% 01/10/2026 447 0.03
EUR 1,795,000 BNP Paribas SA 3.75% 25/11/2020 1,962 0.13
EUR 1,325,000 BNP Paribas SA 4.125% 14/01/2022 1,511 0.10
EUR 650,000 BNP Paribas SA 4.5% 21/03/2023 774 0.05
EUR 500,000 Bouygues SA 1.375% 07/06/2027 501 0.03
EUR 700,000 Bouygues SA 3.625% 16/01/2023 799 0.05
EUR 200,000 Bouygues SA 3.641% 29/10/2019 210 0.01
EUR 1,200,000 Bouygues SA 4.25% 22/07/2020 1,308 0.09EUR 800,000 Bouygues SA 4.5% 09/02/2022 922 0.06EUR 1,200,000 BPCE SA 0.375% 05/10/2023 1,184 0.08EUR 300,000 BPCE SA 0.625% 20/04/2020 304 0.02EUR 1,100,000 BPCE SA 0.875% 31/01/2024 1,077 0.07EUR 700,000 BPCE SA 1% 05/10/2028 681 0.05EUR 300,000 BPCE SA 1.125% 14/12/2022 310 0.02EUR 900,000 BPCE SA 1.125% 18/01/2023 906 0.06EUR 100,000 BPCE SA 1.375% 23/03/2026 98 0.01EUR 500,000 BPCE SA 1.625% 31/01/2028 487 0.03EUR 700,000 BPCE SA 2.125% 17/03/2021 740 0.05EUR 1,000,000 BPCE SA 2.75% 08/07/2026^ 1,048 0.07
Ccy Holding Investment Fair value
€'000
% of net asset value
France (30 November 2017: 19.33%) (cont) Corporate Bonds (cont)
EUR 800,000 BPCE SA 2.75% 30/11/2027^ 841 0.06EUR 800,000 BPCE SA 2.875% 16/01/2024 897 0.06EUR 100,000 BPCE SA 2.875% 22/04/2026 105 0.01EUR 700,000 BPCE SA 3% 19/07/2024 798 0.05EUR 1,000,000 BPCE SA 4.25% 06/02/2023 1,175 0.08EUR 900,000 BPCE SA 4.5% 10/02/2022 1,043 0.07EUR 1,000,000 BPCE SA 4.625% 18/07/2023 1,158 0.08EUR 300,000 Caisse Federale du Credit Mutuel
Nord Europe SCOFAV 2.125% 12/09/2026 292 0.02
EUR 300,000 Capgemini SE 0.5% 09/11/2021 303 0.02EUR 1,100,000 Capgemini SE 1% 18/10/2024 1,096 0.07EUR 200,000 Capgemini SE 1.75% 01/07/2020 207 0.01EUR 200,000 Capgemini SE 1.75%
18/04/2028^ 202 0.01EUR 600,000 Capgemini SE 2.5% 01/07/2023 651 0.04EUR 300,000 Carmila SA 2.125% 07/03/2028 299 0.02EUR 300,000 Carmila SA 2.375% 18/09/2023 320 0.02EUR 500,000 Carmila SA 2.375% 16/09/2024 530 0.04EUR 600,000 Carrefour SA 1.25% 03/06/2025^ 598 0.04EUR 850,000 Carrefour SA 1.75% 15/07/2022 891 0.06EUR 800,000 Carrefour SA 3.875%
25/04/2021^ 886 0.06EUR 1,100,000 Carrefour SA 4% 09/04/2020 1,182 0.08EUR 900,000 Cie de Saint-Gobain 0%
27/03/2020 900 0.06EUR 1,200,000 Cie de Saint-Gobain 1%
17/03/2025 1,185 0.08EUR 500,000 Cie de Saint-Gobain 1.375%
14/06/2027 490 0.03EUR 550,000 Cie de Saint-Gobain 3.625%
15/06/2021 607 0.04EUR 950,000 Cie de Saint-Gobain 3.625%
28/03/2022 1,067 0.07EUR 750,000 Cie de Saint-Gobain 4.5%
30/09/2019 795 0.05EUR 800,000 Cie Financiere et Industrielle des
Autoroutes SA 0.375% 07/02/2025^ 771 0.05
EUR 500,000 Cie Financiere et Industrielle des Autoroutes SA 0.75% 09/09/2028 468 0.03
EUR 500,000 Cie Financiere et Industrielle des Autoroutes SA 1.125% 13/10/2027 493 0.03
EUR 800,000 Cie Financiere et Industrielle des Autoroutes SA 5% 24/05/2021 916 0.06
EUR 700,000 CNP Assurances 1.875% 20/10/2022 718 0.05
EUR 500,000 CNP Assurances 4% * 522 0.03EUR 400,000 CNP Assurances 4.25%
05/06/2045^ 434 0.03EUR 600,000 CNP Assurances 4.5%
10/06/2047 658 0.04EUR 600,000 CNP Assurances 6% 14/09/2040 667 0.04EUR 600,000 CNP Assurances 6.875%
30/09/2041 706 0.05
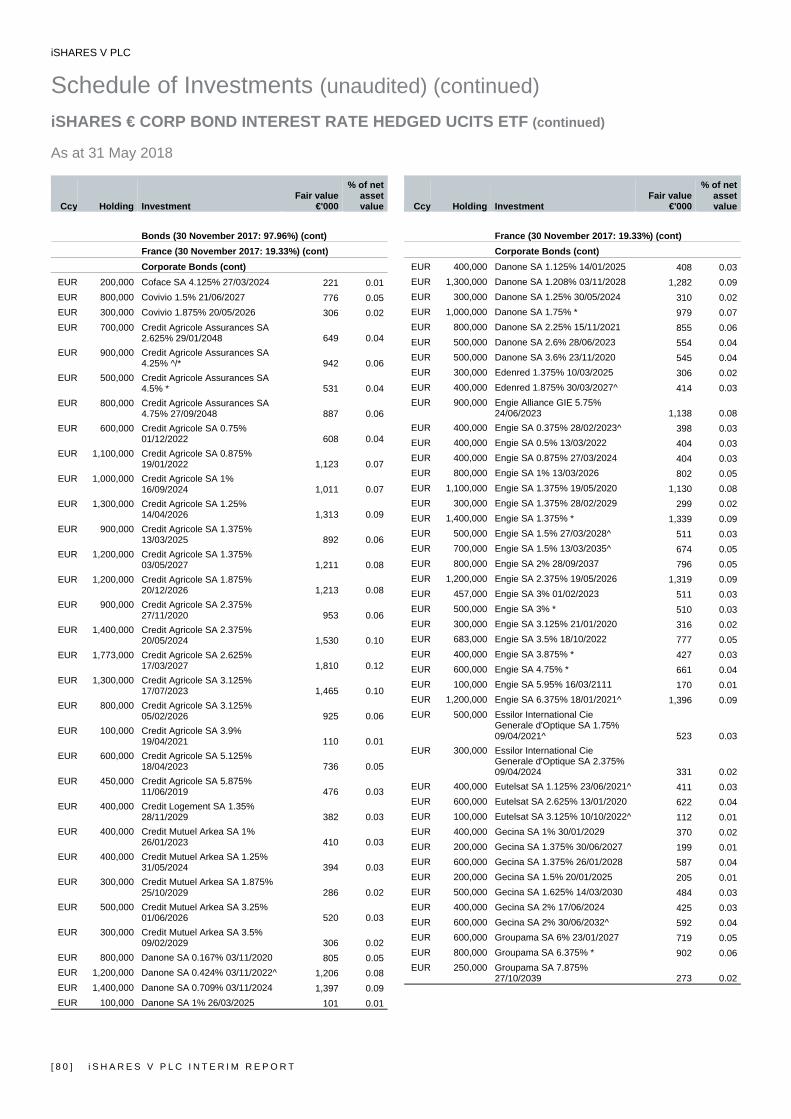
iSHARES V PLC
Schedule of Investments (unaudited) (continued) iSHARES € CORP BOND INTEREST RATE HEDGED UCITS ETF (continued) As at 31 May 2018
[ 8 0 ] i S H A R E S V P L C I N T E R I M R E P O R T
Ccy Holding Investment Fair value
€'000
% of net asset value
Bonds (30 November 2017: 97.96%) (cont) France (30 November 2017: 19.33%) (cont) Corporate Bonds (cont)
EUR 200,000 Coface SA 4.125% 27/03/2024 221 0.01EUR 800,000 Covivio 1.5% 21/06/2027 776 0.05EUR 300,000 Covivio 1.875% 20/05/2026 306 0.02EUR 700,000 Credit Agricole Assurances SA
2.625% 29/01/2048 649 0.04EUR 900,000 Credit Agricole Assurances SA
4.25% ^/* 942 0.06EUR 500,000 Credit Agricole Assurances SA
4.5% * 531 0.04EUR 800,000 Credit Agricole Assurances SA
4.75% 27/09/2048 887 0.06EUR 600,000 Credit Agricole SA 0.75%
01/12/2022 608 0.04EUR 1,100,000 Credit Agricole SA 0.875%
19/01/2022 1,123 0.07EUR 1,000,000 Credit Agricole SA 1%
16/09/2024 1,011 0.07EUR 1,300,000 Credit Agricole SA 1.25%
14/04/2026 1,313 0.09EUR 900,000 Credit Agricole SA 1.375%
13/03/2025 892 0.06EUR 1,200,000 Credit Agricole SA 1.375%
03/05/2027 1,211 0.08EUR 1,200,000 Credit Agricole SA 1.875%
20/12/2026 1,213 0.08EUR 900,000 Credit Agricole SA 2.375%
27/11/2020 953 0.06EUR 1,400,000 Credit Agricole SA 2.375%
20/05/2024 1,530 0.10EUR 1,773,000 Credit Agricole SA 2.625%
17/03/2027 1,810 0.12EUR 1,300,000 Credit Agricole SA 3.125%
17/07/2023 1,465 0.10EUR 800,000 Credit Agricole SA 3.125%
05/02/2026 925 0.06EUR 100,000 Credit Agricole SA 3.9%
19/04/2021 110 0.01EUR 600,000 Credit Agricole SA 5.125%
18/04/2023 736 0.05EUR 450,000 Credit Agricole SA 5.875%
11/06/2019 476 0.03EUR 400,000 Credit Logement SA 1.35%
28/11/2029 382 0.03EUR 400,000 Credit Mutuel Arkea SA 1%
26/01/2023 410 0.03EUR 400,000 Credit Mutuel Arkea SA 1.25%
31/05/2024 394 0.03EUR 300,000 Credit Mutuel Arkea SA 1.875%
25/10/2029 286 0.02EUR 500,000 Credit Mutuel Arkea SA 3.25%
01/06/2026 520 0.03EUR 300,000 Credit Mutuel Arkea SA 3.5%
09/02/2029 306 0.02EUR 800,000 Danone SA 0.167% 03/11/2020 805 0.05EUR 1,200,000 Danone SA 0.424% 03/11/2022^ 1,206 0.08EUR 1,400,000 Danone SA 0.709% 03/11/2024 1,397 0.09EUR 100,000 Danone SA 1% 26/03/2025 101 0.01
Ccy Holding Investment Fair value
€'000
% of net asset value
France (30 November 2017: 19.33%) (cont) Corporate Bonds (cont)
EUR 400,000 Danone SA 1.125% 14/01/2025 408 0.03EUR 1,300,000 Danone SA 1.208% 03/11/2028 1,282 0.09EUR 300,000 Danone SA 1.25% 30/05/2024 310 0.02EUR 1,000,000 Danone SA 1.75% * 979 0.07EUR 800,000 Danone SA 2.25% 15/11/2021 855 0.06EUR 500,000 Danone SA 2.6% 28/06/2023 554 0.04EUR 500,000 Danone SA 3.6% 23/11/2020 545 0.04EUR 300,000 Edenred 1.375% 10/03/2025 306 0.02EUR 400,000 Edenred 1.875% 30/03/2027^ 414 0.03EUR 900,000 Engie Alliance GIE 5.75%
24/06/2023 1,138 0.08EUR 400,000 Engie SA 0.375% 28/02/2023^ 398 0.03EUR 400,000 Engie SA 0.5% 13/03/2022 404 0.03EUR 400,000 Engie SA 0.875% 27/03/2024 404 0.03EUR 800,000 Engie SA 1% 13/03/2026 802 0.05EUR 1,100,000 Engie SA 1.375% 19/05/2020 1,130 0.08EUR 300,000 Engie SA 1.375% 28/02/2029 299 0.02EUR 1,400,000 Engie SA 1.375% * 1,339 0.09EUR 500,000 Engie SA 1.5% 27/03/2028^ 511 0.03EUR 700,000 Engie SA 1.5% 13/03/2035^ 674 0.05EUR 800,000 Engie SA 2% 28/09/2037 796 0.05EUR 1,200,000 Engie SA 2.375% 19/05/2026 1,319 0.09EUR 457,000 Engie SA 3% 01/02/2023 511 0.03EUR 500,000 Engie SA 3% * 510 0.03EUR 300,000 Engie SA 3.125% 21/01/2020 316 0.02EUR 683,000 Engie SA 3.5% 18/10/2022 777 0.05EUR 400,000 Engie SA 3.875% * 427 0.03EUR 600,000 Engie SA 4.75% * 661 0.04EUR 100,000 Engie SA 5.95% 16/03/2111 170 0.01EUR 1,200,000 Engie SA 6.375% 18/01/2021^ 1,396 0.09EUR 500,000 Essilor International Cie
Generale d'Optique SA 1.75% 09/04/2021^ 523 0.03
EUR 300,000 Essilor International Cie Generale d'Optique SA 2.375% 09/04/2024 331 0.02
EUR 400,000 Eutelsat SA 1.125% 23/06/2021^ 411 0.03EUR 600,000 Eutelsat SA 2.625% 13/01/2020 622 0.04EUR 100,000 Eutelsat SA 3.125% 10/10/2022^ 112 0.01EUR 400,000 Gecina SA 1% 30/01/2029 370 0.02EUR 200,000 Gecina SA 1.375% 30/06/2027 199 0.01EUR 600,000 Gecina SA 1.375% 26/01/2028 587 0.04EUR 200,000 Gecina SA 1.5% 20/01/2025 205 0.01EUR 500,000 Gecina SA 1.625% 14/03/2030 484 0.03EUR 400,000 Gecina SA 2% 17/06/2024 425 0.03EUR 600,000 Gecina SA 2% 30/06/2032^ 592 0.04EUR 600,000 Groupama SA 6% 23/01/2027 719 0.05EUR 800,000 Groupama SA 6.375% * 902 0.06EUR 250,000 Groupama SA 7.875%
27/10/2039 273 0.02
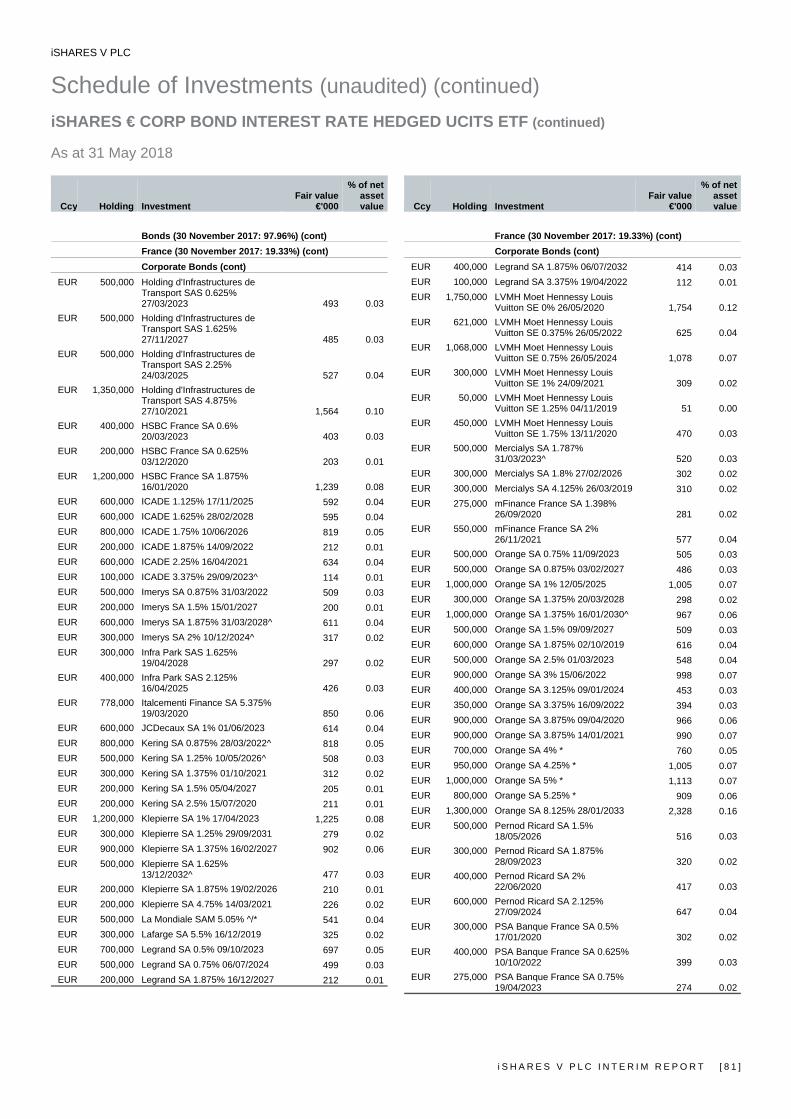
iSHARES V PLC
Schedule of Investments (unaudited) (continued) iSHARES € CORP BOND INTEREST RATE HEDGED UCITS ETF (continued) As at 31 May 2018
i S H A R E S V P L C I N T E R I M R E P O R T [ 8 1 ]
Ccy Holding Investment Fair value
€'000
% of net asset value
Bonds (30 November 2017: 97.96%) (cont) France (30 November 2017: 19.33%) (cont) Corporate Bonds (cont)
EUR 500,000 Holding d'Infrastructures de Transport SAS 0.625% 27/03/2023 493 0.03
EUR 500,000 Holding d'Infrastructures de Transport SAS 1.625% 27/11/2027 485 0.03
EUR 500,000 Holding d'Infrastructures de Transport SAS 2.25% 24/03/2025 527 0.04
EUR 1,350,000 Holding d'Infrastructures de Transport SAS 4.875% 27/10/2021 1,564 0.10
EUR 400,000 HSBC France SA 0.6% 20/03/2023 403 0.03
EUR 200,000 HSBC France SA 0.625% 03/12/2020 203 0.01
EUR 1,200,000 HSBC France SA 1.875% 16/01/2020 1,239 0.08
EUR 600,000 ICADE 1.125% 17/11/2025 592 0.04EUR 600,000 ICADE 1.625% 28/02/2028 595 0.04EUR 800,000 ICADE 1.75% 10/06/2026 819 0.05EUR 200,000 ICADE 1.875% 14/09/2022 212 0.01EUR 600,000 ICADE 2.25% 16/04/2021 634 0.04EUR 100,000 ICADE 3.375% 29/09/2023^ 114 0.01EUR 500,000 Imerys SA 0.875% 31/03/2022 509 0.03EUR 200,000 Imerys SA 1.5% 15/01/2027 200 0.01EUR 600,000 Imerys SA 1.875% 31/03/2028^ 611 0.04EUR 300,000 Imerys SA 2% 10/12/2024^ 317 0.02EUR 300,000 Infra Park SAS 1.625%
19/04/2028 297 0.02EUR 400,000 Infra Park SAS 2.125%
16/04/2025 426 0.03EUR 778,000 Italcementi Finance SA 5.375%
19/03/2020 850 0.06EUR 600,000 JCDecaux SA 1% 01/06/2023 614 0.04EUR 800,000 Kering SA 0.875% 28/03/2022^ 818 0.05EUR 500,000 Kering SA 1.25% 10/05/2026^ 508 0.03EUR 300,000 Kering SA 1.375% 01/10/2021 312 0.02EUR 200,000 Kering SA 1.5% 05/04/2027 205 0.01EUR 200,000 Kering SA 2.5% 15/07/2020 211 0.01EUR 1,200,000 Klepierre SA 1% 17/04/2023 1,225 0.08EUR 300,000 Klepierre SA 1.25% 29/09/2031 279 0.02EUR 900,000 Klepierre SA 1.375% 16/02/2027 902 0.06EUR 500,000 Klepierre SA 1.625%
13/12/2032^ 477 0.03EUR 200,000 Klepierre SA 1.875% 19/02/2026 210 0.01EUR 200,000 Klepierre SA 4.75% 14/03/2021 226 0.02EUR 500,000 La Mondiale SAM 5.05% ^/* 541 0.04EUR 300,000 Lafarge SA 5.5% 16/12/2019 325 0.02EUR 700,000 Legrand SA 0.5% 09/10/2023 697 0.05EUR 500,000 Legrand SA 0.75% 06/07/2024 499 0.03EUR 200,000 Legrand SA 1.875% 16/12/2027 212 0.01
Ccy Holding Investment Fair value
€'000
% of net asset value
France (30 November 2017: 19.33%) (cont) Corporate Bonds (cont)
EUR 400,000 Legrand SA 1.875% 06/07/2032 414 0.03EUR 100,000 Legrand SA 3.375% 19/04/2022 112 0.01EUR 1,750,000 LVMH Moet Hennessy Louis
Vuitton SE 0% 26/05/2020 1,754 0.12EUR 621,000 LVMH Moet Hennessy Louis
Vuitton SE 0.375% 26/05/2022 625 0.04EUR 1,068,000 LVMH Moet Hennessy Louis
Vuitton SE 0.75% 26/05/2024 1,078 0.07EUR 300,000 LVMH Moet Hennessy Louis
Vuitton SE 1% 24/09/2021 309 0.02EUR 50,000 LVMH Moet Hennessy Louis
Vuitton SE 1.25% 04/11/2019 51 0.00EUR 450,000 LVMH Moet Hennessy Louis
Vuitton SE 1.75% 13/11/2020 470 0.03EUR 500,000 Mercialys SA 1.787%
31/03/2023^ 520 0.03EUR 300,000 Mercialys SA 1.8% 27/02/2026 302 0.02EUR 300,000 Mercialys SA 4.125% 26/03/2019 310 0.02EUR 275,000 mFinance France SA 1.398%
26/09/2020 281 0.02EUR 550,000 mFinance France SA 2%
26/11/2021 577 0.04EUR 500,000 Orange SA 0.75% 11/09/2023 505 0.03EUR 500,000 Orange SA 0.875% 03/02/2027 486 0.03EUR 1,000,000 Orange SA 1% 12/05/2025 1,005 0.07EUR 300,000 Orange SA 1.375% 20/03/2028 298 0.02EUR 1,000,000 Orange SA 1.375% 16/01/2030^ 967 0.06EUR 500,000 Orange SA 1.5% 09/09/2027 509 0.03EUR 600,000 Orange SA 1.875% 02/10/2019 616 0.04EUR 500,000 Orange SA 2.5% 01/03/2023 548 0.04EUR 900,000 Orange SA 3% 15/06/2022 998 0.07EUR 400,000 Orange SA 3.125% 09/01/2024 453 0.03EUR 350,000 Orange SA 3.375% 16/09/2022 394 0.03EUR 900,000 Orange SA 3.875% 09/04/2020 966 0.06EUR 900,000 Orange SA 3.875% 14/01/2021 990 0.07EUR 700,000 Orange SA 4% * 760 0.05EUR 950,000 Orange SA 4.25% * 1,005 0.07EUR 1,000,000 Orange SA 5% * 1,113 0.07EUR 800,000 Orange SA 5.25% * 909 0.06EUR 1,300,000 Orange SA 8.125% 28/01/2033 2,328 0.16EUR 500,000 Pernod Ricard SA 1.5%
18/05/2026 516 0.03EUR 300,000 Pernod Ricard SA 1.875%
28/09/2023 320 0.02EUR 400,000 Pernod Ricard SA 2%
22/06/2020 417 0.03EUR 600,000 Pernod Ricard SA 2.125%
27/09/2024 647 0.04EUR 300,000 PSA Banque France SA 0.5%
17/01/2020 302 0.02EUR 400,000 PSA Banque France SA 0.625%
10/10/2022 399 0.03EUR 275,000 PSA Banque France SA 0.75%
19/04/2023 274 0.02
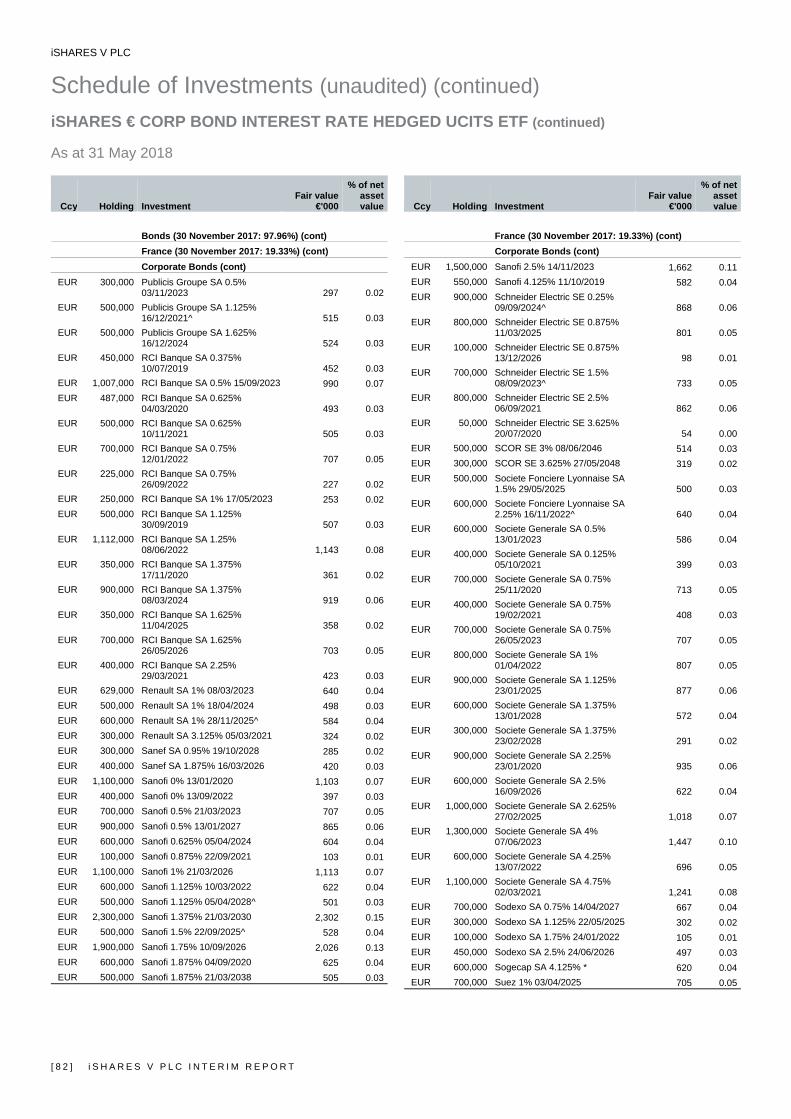
iSHARES V PLC
Schedule of Investments (unaudited) (continued) iSHARES € CORP BOND INTEREST RATE HEDGED UCITS ETF (continued) As at 31 May 2018
[ 8 2 ] i S H A R E S V P L C I N T E R I M R E P O R T
Ccy Holding Investment Fair value
€'000
% of net asset value
Bonds (30 November 2017: 97.96%) (cont) France (30 November 2017: 19.33%) (cont) Corporate Bonds (cont)
EUR 300,000 Publicis Groupe SA 0.5% 03/11/2023 297 0.02
EUR 500,000 Publicis Groupe SA 1.125% 16/12/2021^ 515 0.03
EUR 500,000 Publicis Groupe SA 1.625% 16/12/2024 524 0.03
EUR 450,000 RCI Banque SA 0.375% 10/07/2019 452 0.03
EUR 1,007,000 RCI Banque SA 0.5% 15/09/2023 990 0.07EUR 487,000 RCI Banque SA 0.625%
04/03/2020 493 0.03EUR 500,000 RCI Banque SA 0.625%
10/11/2021 505 0.03EUR 700,000 RCI Banque SA 0.75%
12/01/2022 707 0.05EUR 225,000 RCI Banque SA 0.75%
26/09/2022 227 0.02EUR 250,000 RCI Banque SA 1% 17/05/2023 253 0.02EUR 500,000 RCI Banque SA 1.125%
30/09/2019 507 0.03EUR 1,112,000 RCI Banque SA 1.25%
08/06/2022 1,143 0.08EUR 350,000 RCI Banque SA 1.375%
17/11/2020 361 0.02EUR 900,000 RCI Banque SA 1.375%
08/03/2024 919 0.06EUR 350,000 RCI Banque SA 1.625%
11/04/2025 358 0.02EUR 700,000 RCI Banque SA 1.625%
26/05/2026 703 0.05EUR 400,000 RCI Banque SA 2.25%
29/03/2021 423 0.03EUR 629,000 Renault SA 1% 08/03/2023 640 0.04EUR 500,000 Renault SA 1% 18/04/2024 498 0.03EUR 600,000 Renault SA 1% 28/11/2025^ 584 0.04EUR 300,000 Renault SA 3.125% 05/03/2021 324 0.02EUR 300,000 Sanef SA 0.95% 19/10/2028 285 0.02EUR 400,000 Sanef SA 1.875% 16/03/2026 420 0.03EUR 1,100,000 Sanofi 0% 13/01/2020 1,103 0.07EUR 400,000 Sanofi 0% 13/09/2022 397 0.03EUR 700,000 Sanofi 0.5% 21/03/2023 707 0.05EUR 900,000 Sanofi 0.5% 13/01/2027 865 0.06EUR 600,000 Sanofi 0.625% 05/04/2024 604 0.04EUR 100,000 Sanofi 0.875% 22/09/2021 103 0.01EUR 1,100,000 Sanofi 1% 21/03/2026 1,113 0.07EUR 600,000 Sanofi 1.125% 10/03/2022 622 0.04EUR 500,000 Sanofi 1.125% 05/04/2028^ 501 0.03EUR 2,300,000 Sanofi 1.375% 21/03/2030 2,302 0.15EUR 500,000 Sanofi 1.5% 22/09/2025^ 528 0.04EUR 1,900,000 Sanofi 1.75% 10/09/2026 2,026 0.13EUR 600,000 Sanofi 1.875% 04/09/2020 625 0.04EUR 500,000 Sanofi 1.875% 21/03/2038 505 0.03
Ccy Holding Investment Fair value
€'000
% of net asset value
France (30 November 2017: 19.33%) (cont) Corporate Bonds (cont)
EUR 1,500,000 Sanofi 2.5% 14/11/2023 1,662 0.11EUR 550,000 Sanofi 4.125% 11/10/2019 582 0.04EUR 900,000 Schneider Electric SE 0.25%
09/09/2024^ 868 0.06EUR 800,000 Schneider Electric SE 0.875%
11/03/2025 801 0.05EUR 100,000 Schneider Electric SE 0.875%
13/12/2026 98 0.01EUR 700,000 Schneider Electric SE 1.5%
08/09/2023^ 733 0.05EUR 800,000 Schneider Electric SE 2.5%
06/09/2021 862 0.06EUR 50,000 Schneider Electric SE 3.625%
20/07/2020 54 0.00EUR 500,000 SCOR SE 3% 08/06/2046 514 0.03EUR 300,000 SCOR SE 3.625% 27/05/2048 319 0.02EUR 500,000 Societe Fonciere Lyonnaise SA
1.5% 29/05/2025 500 0.03EUR 600,000 Societe Fonciere Lyonnaise SA
2.25% 16/11/2022^ 640 0.04EUR 600,000 Societe Generale SA 0.5%
13/01/2023 586 0.04EUR 400,000 Societe Generale SA 0.125%
05/10/2021 399 0.03EUR 700,000 Societe Generale SA 0.75%
25/11/2020 713 0.05EUR 400,000 Societe Generale SA 0.75%
19/02/2021 408 0.03EUR 700,000 Societe Generale SA 0.75%
26/05/2023 707 0.05EUR 800,000 Societe Generale SA 1%
01/04/2022 807 0.05EUR 900,000 Societe Generale SA 1.125%
23/01/2025 877 0.06EUR 600,000 Societe Generale SA 1.375%
13/01/2028 572 0.04EUR 300,000 Societe Generale SA 1.375%
23/02/2028 291 0.02EUR 900,000 Societe Generale SA 2.25%
23/01/2020 935 0.06EUR 600,000 Societe Generale SA 2.5%
16/09/2026 622 0.04EUR 1,000,000 Societe Generale SA 2.625%
27/02/2025 1,018 0.07EUR 1,300,000 Societe Generale SA 4%
07/06/2023 1,447 0.10EUR 600,000 Societe Generale SA 4.25%
13/07/2022 696 0.05EUR 1,100,000 Societe Generale SA 4.75%
02/03/2021 1,241 0.08EUR 700,000 Sodexo SA 0.75% 14/04/2027 667 0.04EUR 300,000 Sodexo SA 1.125% 22/05/2025 302 0.02EUR 100,000 Sodexo SA 1.75% 24/01/2022 105 0.01EUR 450,000 Sodexo SA 2.5% 24/06/2026 497 0.03EUR 600,000 Sogecap SA 4.125% * 620 0.04EUR 700,000 Suez 1% 03/04/2025 705 0.05
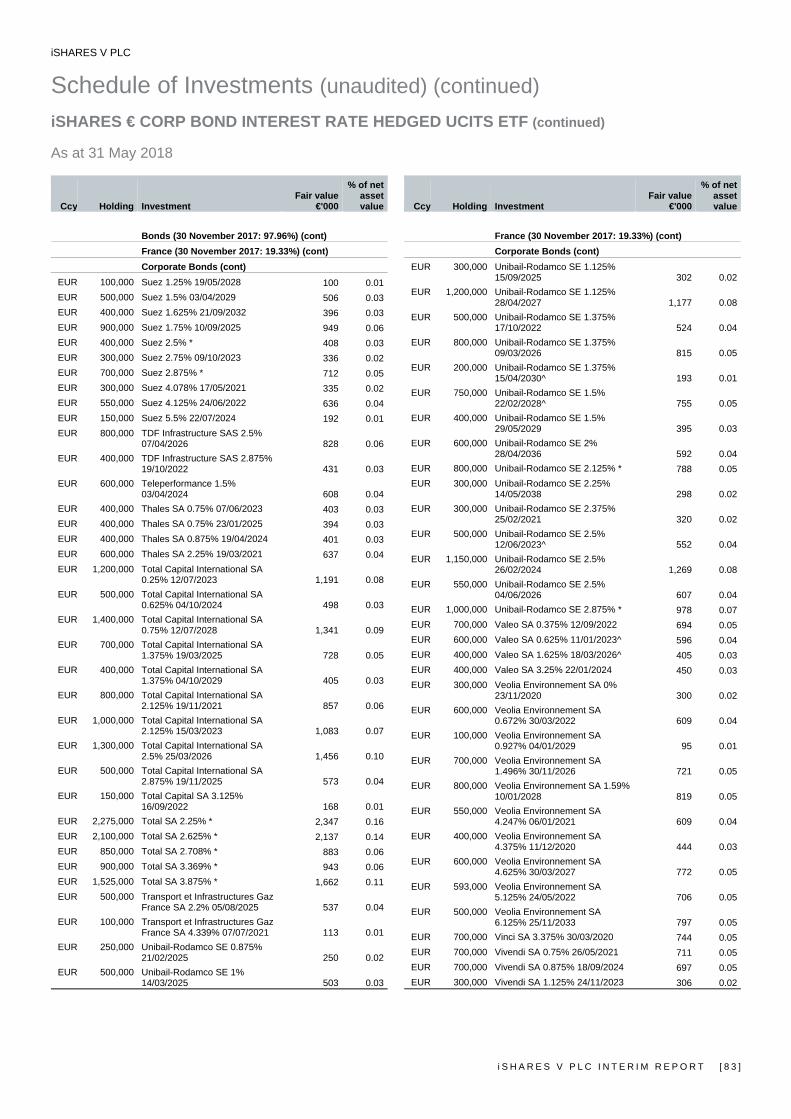
iSHARES V PLC
Schedule of Investments (unaudited) (continued) iSHARES € CORP BOND INTEREST RATE HEDGED UCITS ETF (continued) As at 31 May 2018
i S H A R E S V P L C I N T E R I M R E P O R T [ 8 3 ]
Ccy Holding Investment Fair value
€'000
% of net asset value
Bonds (30 November 2017: 97.96%) (cont) France (30 November 2017: 19.33%) (cont) Corporate Bonds (cont)
EUR 100,000 Suez 1.25% 19/05/2028 100 0.01EUR 500,000 Suez 1.5% 03/04/2029 506 0.03EUR 400,000 Suez 1.625% 21/09/2032 396 0.03EUR 900,000 Suez 1.75% 10/09/2025 949 0.06EUR 400,000 Suez 2.5% * 408 0.03EUR 300,000 Suez 2.75% 09/10/2023 336 0.02EUR 700,000 Suez 2.875% * 712 0.05EUR 300,000 Suez 4.078% 17/05/2021 335 0.02EUR 550,000 Suez 4.125% 24/06/2022 636 0.04EUR 150,000 Suez 5.5% 22/07/2024 192 0.01EUR 800,000 TDF Infrastructure SAS 2.5%
07/04/2026 828 0.06EUR 400,000 TDF Infrastructure SAS 2.875%
19/10/2022 431 0.03EUR 600,000 Teleperformance 1.5%
03/04/2024 608 0.04EUR 400,000 Thales SA 0.75% 07/06/2023 403 0.03EUR 400,000 Thales SA 0.75% 23/01/2025 394 0.03EUR 400,000 Thales SA 0.875% 19/04/2024 401 0.03EUR 600,000 Thales SA 2.25% 19/03/2021 637 0.04EUR 1,200,000 Total Capital International SA
0.25% 12/07/2023 1,191 0.08EUR 500,000 Total Capital International SA
0.625% 04/10/2024 498 0.03EUR 1,400,000 Total Capital International SA
0.75% 12/07/2028 1,341 0.09EUR 700,000 Total Capital International SA
1.375% 19/03/2025 728 0.05EUR 400,000 Total Capital International SA
1.375% 04/10/2029 405 0.03EUR 800,000 Total Capital International SA
2.125% 19/11/2021 857 0.06EUR 1,000,000 Total Capital International SA
2.125% 15/03/2023 1,083 0.07EUR 1,300,000 Total Capital International SA
2.5% 25/03/2026 1,456 0.10EUR 500,000 Total Capital International SA
2.875% 19/11/2025 573 0.04EUR 150,000 Total Capital SA 3.125%
16/09/2022 168 0.01EUR 2,275,000 Total SA 2.25% * 2,347 0.16EUR 2,100,000 Total SA 2.625% * 2,137 0.14EUR 850,000 Total SA 2.708% * 883 0.06EUR 900,000 Total SA 3.369% * 943 0.06EUR 1,525,000 Total SA 3.875% * 1,662 0.11EUR 500,000 Transport et Infrastructures Gaz
France SA 2.2% 05/08/2025 537 0.04EUR 100,000 Transport et Infrastructures Gaz
France SA 4.339% 07/07/2021 113 0.01EUR 250,000 Unibail-Rodamco SE 0.875%
21/02/2025 250 0.02EUR 500,000 Unibail-Rodamco SE 1%
14/03/2025 503 0.03
Ccy Holding Investment Fair value
€'000
% of net asset value
France (30 November 2017: 19.33%) (cont) Corporate Bonds (cont)
EUR 300,000 Unibail-Rodamco SE 1.125% 15/09/2025 302 0.02
EUR 1,200,000 Unibail-Rodamco SE 1.125% 28/04/2027 1,177 0.08
EUR 500,000 Unibail-Rodamco SE 1.375% 17/10/2022 524 0.04
EUR 800,000 Unibail-Rodamco SE 1.375% 09/03/2026 815 0.05
EUR 200,000 Unibail-Rodamco SE 1.375% 15/04/2030^ 193 0.01
EUR 750,000 Unibail-Rodamco SE 1.5% 22/02/2028^ 755 0.05
EUR 400,000 Unibail-Rodamco SE 1.5% 29/05/2029 395 0.03
EUR 600,000 Unibail-Rodamco SE 2% 28/04/2036 592 0.04
EUR 800,000 Unibail-Rodamco SE 2.125% * 788 0.05EUR 300,000 Unibail-Rodamco SE 2.25%
14/05/2038 298 0.02EUR 300,000 Unibail-Rodamco SE 2.375%
25/02/2021 320 0.02EUR 500,000 Unibail-Rodamco SE 2.5%
12/06/2023^ 552 0.04EUR 1,150,000 Unibail-Rodamco SE 2.5%
26/02/2024 1,269 0.08EUR 550,000 Unibail-Rodamco SE 2.5%
04/06/2026 607 0.04EUR 1,000,000 Unibail-Rodamco SE 2.875% * 978 0.07EUR 700,000 Valeo SA 0.375% 12/09/2022 694 0.05EUR 600,000 Valeo SA 0.625% 11/01/2023^ 596 0.04EUR 400,000 Valeo SA 1.625% 18/03/2026^ 405 0.03EUR 400,000 Valeo SA 3.25% 22/01/2024 450 0.03EUR 300,000 Veolia Environnement SA 0%
23/11/2020 300 0.02EUR 600,000 Veolia Environnement SA
0.672% 30/03/2022 609 0.04EUR 100,000 Veolia Environnement SA
0.927% 04/01/2029 95 0.01EUR 700,000 Veolia Environnement SA
1.496% 30/11/2026 721 0.05EUR 800,000 Veolia Environnement SA 1.59%
10/01/2028 819 0.05EUR 550,000 Veolia Environnement SA
4.247% 06/01/2021 609 0.04EUR 400,000 Veolia Environnement SA
4.375% 11/12/2020 444 0.03EUR 600,000 Veolia Environnement SA
4.625% 30/03/2027 772 0.05EUR 593,000 Veolia Environnement SA
5.125% 24/05/2022 706 0.05EUR 500,000 Veolia Environnement SA
6.125% 25/11/2033 797 0.05EUR 700,000 Vinci SA 3.375% 30/03/2020 744 0.05EUR 700,000 Vivendi SA 0.75% 26/05/2021 711 0.05EUR 700,000 Vivendi SA 0.875% 18/09/2024 697 0.05EUR 300,000 Vivendi SA 1.125% 24/11/2023 306 0.02
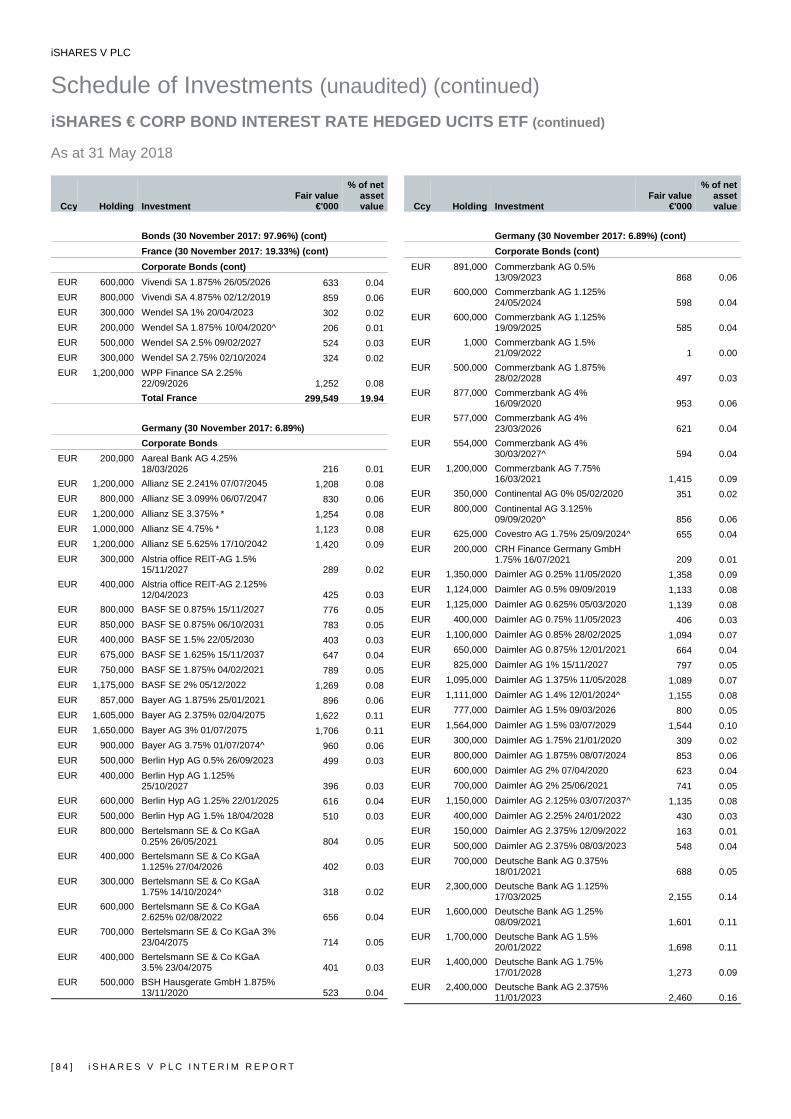
iSHARES V PLC
Schedule of Investments (unaudited) (continued) iSHARES € CORP BOND INTEREST RATE HEDGED UCITS ETF (continued) As at 31 May 2018
[ 8 4 ] i S H A R E S V P L C I N T E R I M R E P O R T
Ccy Holding Investment Fair value
€'000
% of net asset value
Bonds (30 November 2017: 97.96%) (cont) France (30 November 2017: 19.33%) (cont) Corporate Bonds (cont)
EUR 600,000 Vivendi SA 1.875% 26/05/2026 633 0.04EUR 800,000 Vivendi SA 4.875% 02/12/2019 859 0.06EUR 300,000 Wendel SA 1% 20/04/2023 302 0.02EUR 200,000 Wendel SA 1.875% 10/04/2020^ 206 0.01EUR 500,000 Wendel SA 2.5% 09/02/2027 524 0.03EUR 300,000 Wendel SA 2.75% 02/10/2024 324 0.02EUR 1,200,000 WPP Finance SA 2.25%
22/09/2026 1,252 0.08Total France 299,549 19.94
Germany (30 November 2017: 6.89%) Corporate Bonds
EUR 200,000 Aareal Bank AG 4.25% 18/03/2026 216 0.01
EUR 1,200,000 Allianz SE 2.241% 07/07/2045 1,208 0.08EUR 800,000 Allianz SE 3.099% 06/07/2047 830 0.06EUR 1,200,000 Allianz SE 3.375% * 1,254 0.08EUR 1,000,000 Allianz SE 4.75% * 1,123 0.08EUR 1,200,000 Allianz SE 5.625% 17/10/2042 1,420 0.09EUR 300,000 Alstria office REIT-AG 1.5%
15/11/2027 289 0.02EUR 400,000 Alstria office REIT-AG 2.125%
12/04/2023 425 0.03EUR 800,000 BASF SE 0.875% 15/11/2027 776 0.05EUR 850,000 BASF SE 0.875% 06/10/2031 783 0.05EUR 400,000 BASF SE 1.5% 22/05/2030 403 0.03EUR 675,000 BASF SE 1.625% 15/11/2037 647 0.04EUR 750,000 BASF SE 1.875% 04/02/2021 789 0.05EUR 1,175,000 BASF SE 2% 05/12/2022 1,269 0.08EUR 857,000 Bayer AG 1.875% 25/01/2021 896 0.06EUR 1,605,000 Bayer AG 2.375% 02/04/2075 1,622 0.11EUR 1,650,000 Bayer AG 3% 01/07/2075 1,706 0.11EUR 900,000 Bayer AG 3.75% 01/07/2074^ 960 0.06EUR 500,000 Berlin Hyp AG 0.5% 26/09/2023 499 0.03EUR 400,000 Berlin Hyp AG 1.125%
25/10/2027 396 0.03EUR 600,000 Berlin Hyp AG 1.25% 22/01/2025 616 0.04EUR 500,000 Berlin Hyp AG 1.5% 18/04/2028 510 0.03EUR 800,000 Bertelsmann SE & Co KGaA
0.25% 26/05/2021 804 0.05EUR 400,000 Bertelsmann SE & Co KGaA
1.125% 27/04/2026 402 0.03EUR 300,000 Bertelsmann SE & Co KGaA
1.75% 14/10/2024^ 318 0.02EUR 600,000 Bertelsmann SE & Co KGaA
2.625% 02/08/2022 656 0.04EUR 700,000 Bertelsmann SE & Co KGaA 3%
23/04/2075 714 0.05EUR 400,000 Bertelsmann SE & Co KGaA
3.5% 23/04/2075 401 0.03EUR 500,000 BSH Hausgerate GmbH 1.875%
13/11/2020 523 0.04
Ccy Holding Investment Fair value
€'000
% of net asset value
Germany (30 November 2017: 6.89%) (cont) Corporate Bonds (cont)
EUR 891,000 Commerzbank AG 0.5% 13/09/2023 868 0.06
EUR 600,000 Commerzbank AG 1.125% 24/05/2024 598 0.04
EUR 600,000 Commerzbank AG 1.125% 19/09/2025 585 0.04
EUR 1,000 Commerzbank AG 1.5% 21/09/2022 1 0.00
EUR 500,000 Commerzbank AG 1.875% 28/02/2028 497 0.03
EUR 877,000 Commerzbank AG 4% 16/09/2020 953 0.06
EUR 577,000 Commerzbank AG 4% 23/03/2026 621 0.04
EUR 554,000 Commerzbank AG 4% 30/03/2027^ 594 0.04
EUR 1,200,000 Commerzbank AG 7.75% 16/03/2021 1,415 0.09
EUR 350,000 Continental AG 0% 05/02/2020 351 0.02EUR 800,000 Continental AG 3.125%
09/09/2020^ 856 0.06EUR 625,000 Covestro AG 1.75% 25/09/2024^ 655 0.04EUR 200,000 CRH Finance Germany GmbH
1.75% 16/07/2021 209 0.01EUR 1,350,000 Daimler AG 0.25% 11/05/2020 1,358 0.09EUR 1,124,000 Daimler AG 0.5% 09/09/2019 1,133 0.08EUR 1,125,000 Daimler AG 0.625% 05/03/2020 1,139 0.08EUR 400,000 Daimler AG 0.75% 11/05/2023 406 0.03EUR 1,100,000 Daimler AG 0.85% 28/02/2025 1,094 0.07EUR 650,000 Daimler AG 0.875% 12/01/2021 664 0.04EUR 825,000 Daimler AG 1% 15/11/2027 797 0.05EUR 1,095,000 Daimler AG 1.375% 11/05/2028 1,089 0.07EUR 1,111,000 Daimler AG 1.4% 12/01/2024^ 1,155 0.08EUR 777,000 Daimler AG 1.5% 09/03/2026 800 0.05EUR 1,564,000 Daimler AG 1.5% 03/07/2029 1,544 0.10EUR 300,000 Daimler AG 1.75% 21/01/2020 309 0.02EUR 800,000 Daimler AG 1.875% 08/07/2024 853 0.06EUR 600,000 Daimler AG 2% 07/04/2020 623 0.04EUR 700,000 Daimler AG 2% 25/06/2021 741 0.05EUR 1,150,000 Daimler AG 2.125% 03/07/2037^ 1,135 0.08EUR 400,000 Daimler AG 2.25% 24/01/2022 430 0.03EUR 150,000 Daimler AG 2.375% 12/09/2022 163 0.01EUR 500,000 Daimler AG 2.375% 08/03/2023 548 0.04EUR 700,000 Deutsche Bank AG 0.375%
18/01/2021 688 0.05EUR 2,300,000 Deutsche Bank AG 1.125%
17/03/2025 2,155 0.14EUR 1,600,000 Deutsche Bank AG 1.25%
08/09/2021 1,601 0.11EUR 1,700,000 Deutsche Bank AG 1.5%
20/01/2022 1,698 0.11EUR 1,400,000 Deutsche Bank AG 1.75%
17/01/2028 1,273 0.09EUR 2,400,000 Deutsche Bank AG 2.375%
11/01/2023 2,460 0.16
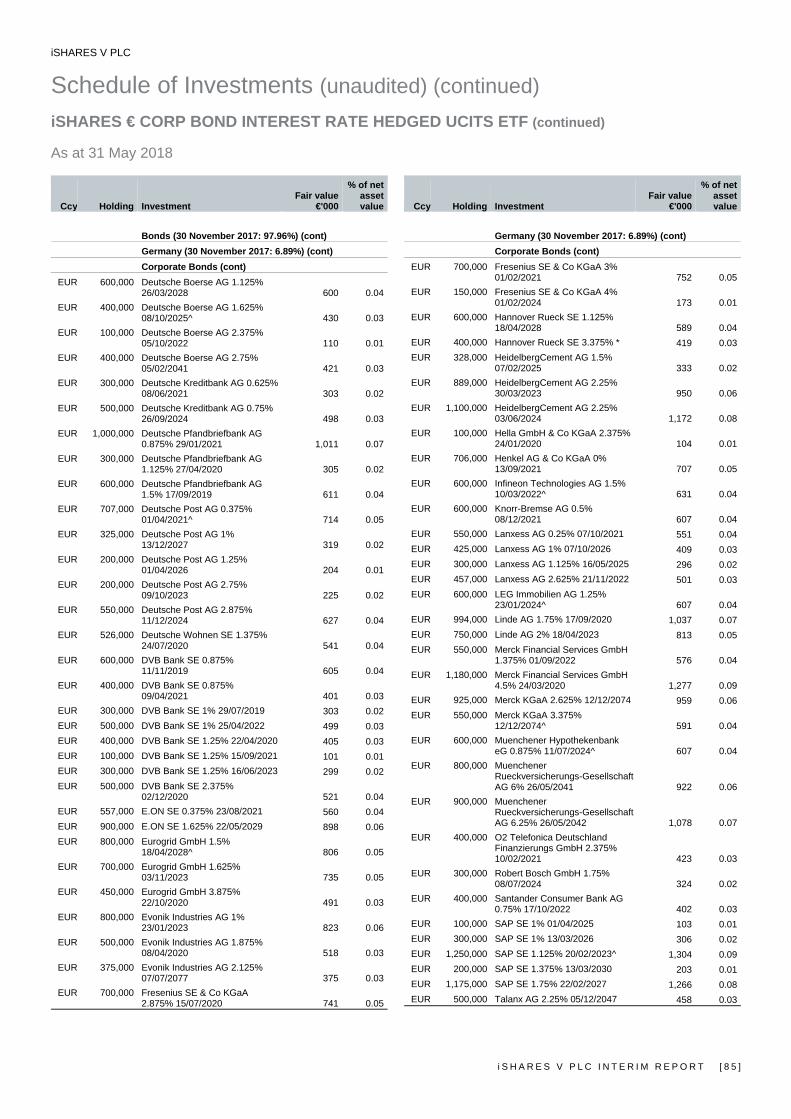
iSHARES V PLC
Schedule of Investments (unaudited) (continued) iSHARES € CORP BOND INTEREST RATE HEDGED UCITS ETF (continued) As at 31 May 2018
i S H A R E S V P L C I N T E R I M R E P O R T [ 8 5 ]
Ccy Holding Investment Fair value
€'000
% of net asset value
Bonds (30 November 2017: 97.96%) (cont) Germany (30 November 2017: 6.89%) (cont) Corporate Bonds (cont)
EUR 600,000 Deutsche Boerse AG 1.125% 26/03/2028 600 0.04
EUR 400,000 Deutsche Boerse AG 1.625% 08/10/2025^ 430 0.03
EUR 100,000 Deutsche Boerse AG 2.375% 05/10/2022 110 0.01
EUR 400,000 Deutsche Boerse AG 2.75% 05/02/2041 421 0.03
EUR 300,000 Deutsche Kreditbank AG 0.625% 08/06/2021 303 0.02
EUR 500,000 Deutsche Kreditbank AG 0.75% 26/09/2024 498 0.03
EUR 1,000,000 Deutsche Pfandbriefbank AG 0.875% 29/01/2021 1,011 0.07
EUR 300,000 Deutsche Pfandbriefbank AG 1.125% 27/04/2020 305 0.02
EUR 600,000 Deutsche Pfandbriefbank AG 1.5% 17/09/2019 611 0.04
EUR 707,000 Deutsche Post AG 0.375% 01/04/2021^ 714 0.05
EUR 325,000 Deutsche Post AG 1% 13/12/2027 319 0.02
EUR 200,000 Deutsche Post AG 1.25% 01/04/2026 204 0.01
EUR 200,000 Deutsche Post AG 2.75% 09/10/2023 225 0.02
EUR 550,000 Deutsche Post AG 2.875% 11/12/2024 627 0.04
EUR 526,000 Deutsche Wohnen SE 1.375% 24/07/2020 541 0.04
EUR 600,000 DVB Bank SE 0.875% 11/11/2019 605 0.04
EUR 400,000 DVB Bank SE 0.875% 09/04/2021 401 0.03
EUR 300,000 DVB Bank SE 1% 29/07/2019 303 0.02EUR 500,000 DVB Bank SE 1% 25/04/2022 499 0.03EUR 400,000 DVB Bank SE 1.25% 22/04/2020 405 0.03EUR 100,000 DVB Bank SE 1.25% 15/09/2021 101 0.01EUR 300,000 DVB Bank SE 1.25% 16/06/2023 299 0.02EUR 500,000 DVB Bank SE 2.375%
02/12/2020 521 0.04EUR 557,000 E.ON SE 0.375% 23/08/2021 560 0.04EUR 900,000 E.ON SE 1.625% 22/05/2029 898 0.06EUR 800,000 Eurogrid GmbH 1.5%
18/04/2028^ 806 0.05EUR 700,000 Eurogrid GmbH 1.625%
03/11/2023 735 0.05EUR 450,000 Eurogrid GmbH 3.875%
22/10/2020 491 0.03EUR 800,000 Evonik Industries AG 1%
23/01/2023 823 0.06EUR 500,000 Evonik Industries AG 1.875%
08/04/2020 518 0.03EUR 375,000 Evonik Industries AG 2.125%
07/07/2077 375 0.03EUR 700,000 Fresenius SE & Co KGaA
2.875% 15/07/2020 741 0.05
Ccy Holding Investment Fair value
€'000
% of net asset value
Germany (30 November 2017: 6.89%) (cont) Corporate Bonds (cont)
EUR 700,000 Fresenius SE & Co KGaA 3% 01/02/2021 752 0.05
EUR 150,000 Fresenius SE & Co KGaA 4% 01/02/2024 173 0.01
EUR 600,000 Hannover Rueck SE 1.125% 18/04/2028 589 0.04
EUR 400,000 Hannover Rueck SE 3.375% * 419 0.03EUR 328,000 HeidelbergCement AG 1.5%
07/02/2025 333 0.02EUR 889,000 HeidelbergCement AG 2.25%
30/03/2023 950 0.06EUR 1,100,000 HeidelbergCement AG 2.25%
03/06/2024 1,172 0.08EUR 100,000 Hella GmbH & Co KGaA 2.375%
24/01/2020 104 0.01EUR 706,000 Henkel AG & Co KGaA 0%
13/09/2021 707 0.05EUR 600,000 Infineon Technologies AG 1.5%
10/03/2022^ 631 0.04EUR 600,000 Knorr-Bremse AG 0.5%
08/12/2021 607 0.04EUR 550,000 Lanxess AG 0.25% 07/10/2021 551 0.04EUR 425,000 Lanxess AG 1% 07/10/2026 409 0.03EUR 300,000 Lanxess AG 1.125% 16/05/2025 296 0.02EUR 457,000 Lanxess AG 2.625% 21/11/2022 501 0.03EUR 600,000 LEG Immobilien AG 1.25%
23/01/2024^ 607 0.04EUR 994,000 Linde AG 1.75% 17/09/2020 1,037 0.07EUR 750,000 Linde AG 2% 18/04/2023 813 0.05EUR 550,000 Merck Financial Services GmbH
1.375% 01/09/2022 576 0.04EUR 1,180,000 Merck Financial Services GmbH
4.5% 24/03/2020 1,277 0.09EUR 925,000 Merck KGaA 2.625% 12/12/2074 959 0.06EUR 550,000 Merck KGaA 3.375%
12/12/2074^ 591 0.04EUR 600,000 Muenchener Hypothekenbank
eG 0.875% 11/07/2024^ 607 0.04EUR 800,000 Muenchener
Rueckversicherungs-Gesellschaft AG 6% 26/05/2041 922 0.06
EUR 900,000 Muenchener Rueckversicherungs-Gesellschaft AG 6.25% 26/05/2042 1,078 0.07
EUR 400,000 O2 Telefonica Deutschland Finanzierungs GmbH 2.375% 10/02/2021 423 0.03
EUR 300,000 Robert Bosch GmbH 1.75% 08/07/2024 324 0.02
EUR 400,000 Santander Consumer Bank AG 0.75% 17/10/2022 402 0.03
EUR 100,000 SAP SE 1% 01/04/2025 103 0.01EUR 300,000 SAP SE 1% 13/03/2026 306 0.02EUR 1,250,000 SAP SE 1.125% 20/02/2023^ 1,304 0.09EUR 200,000 SAP SE 1.375% 13/03/2030 203 0.01EUR 1,175,000 SAP SE 1.75% 22/02/2027 1,266 0.08EUR 500,000 Talanx AG 2.25% 05/12/2047 458 0.03
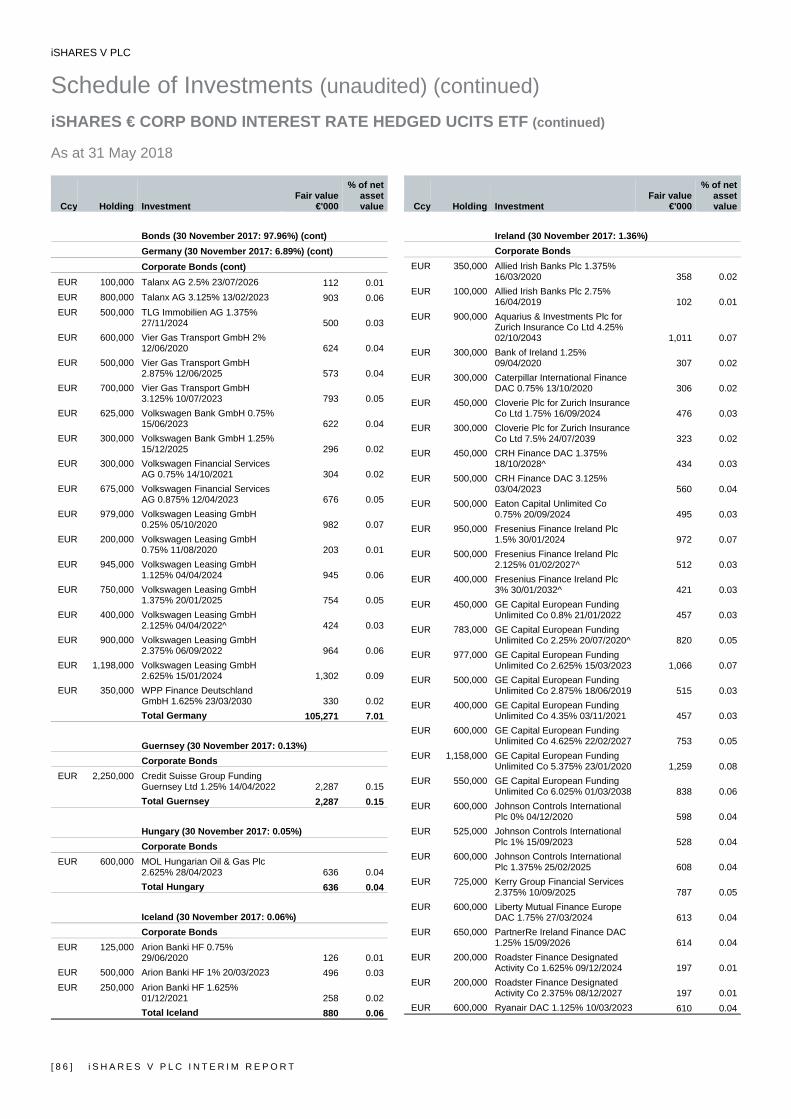
iSHARES V PLC
Schedule of Investments (unaudited) (continued) iSHARES € CORP BOND INTEREST RATE HEDGED UCITS ETF (continued) As at 31 May 2018
[ 8 6 ] i S H A R E S V P L C I N T E R I M R E P O R T
Ccy Holding Investment Fair value
€'000
% of net asset value
Bonds (30 November 2017: 97.96%) (cont) Germany (30 November 2017: 6.89%) (cont) Corporate Bonds (cont)
EUR 100,000 Talanx AG 2.5% 23/07/2026 112 0.01EUR 800,000 Talanx AG 3.125% 13/02/2023 903 0.06EUR 500,000 TLG Immobilien AG 1.375%
27/11/2024 500 0.03EUR 600,000 Vier Gas Transport GmbH 2%
12/06/2020 624 0.04EUR 500,000 Vier Gas Transport GmbH
2.875% 12/06/2025 573 0.04EUR 700,000 Vier Gas Transport GmbH
3.125% 10/07/2023 793 0.05EUR 625,000 Volkswagen Bank GmbH 0.75%
15/06/2023 622 0.04EUR 300,000 Volkswagen Bank GmbH 1.25%
15/12/2025 296 0.02EUR 300,000 Volkswagen Financial Services
AG 0.75% 14/10/2021 304 0.02EUR 675,000 Volkswagen Financial Services
AG 0.875% 12/04/2023 676 0.05EUR 979,000 Volkswagen Leasing GmbH
0.25% 05/10/2020 982 0.07EUR 200,000 Volkswagen Leasing GmbH
0.75% 11/08/2020 203 0.01EUR 945,000 Volkswagen Leasing GmbH
1.125% 04/04/2024 945 0.06EUR 750,000 Volkswagen Leasing GmbH
1.375% 20/01/2025 754 0.05EUR 400,000 Volkswagen Leasing GmbH
2.125% 04/04/2022^ 424 0.03EUR 900,000 Volkswagen Leasing GmbH
2.375% 06/09/2022 964 0.06EUR 1,198,000 Volkswagen Leasing GmbH
2.625% 15/01/2024 1,302 0.09EUR 350,000 WPP Finance Deutschland
GmbH 1.625% 23/03/2030 330 0.02Total Germany 105,271 7.01
Guernsey (30 November 2017: 0.13%) Corporate Bonds
EUR 2,250,000 Credit Suisse Group Funding Guernsey Ltd 1.25% 14/04/2022 2,287 0.15Total Guernsey 2,287 0.15
Hungary (30 November 2017: 0.05%) Corporate Bonds
EUR 600,000 MOL Hungarian Oil & Gas Plc 2.625% 28/04/2023 636 0.04Total Hungary 636 0.04
Iceland (30 November 2017: 0.06%) Corporate Bonds
EUR 125,000 Arion Banki HF 0.75% 29/06/2020 126 0.01
EUR 500,000 Arion Banki HF 1% 20/03/2023 496 0.03EUR 250,000 Arion Banki HF 1.625%
01/12/2021 258 0.02Total Iceland 880 0.06
Ccy Holding Investment Fair value
€'000
% of net asset value
Ireland (30 November 2017: 1.36%) Corporate Bonds
EUR 350,000 Allied Irish Banks Plc 1.375% 16/03/2020 358 0.02
EUR 100,000 Allied Irish Banks Plc 2.75% 16/04/2019 102 0.01
EUR 900,000 Aquarius & Investments Plc for Zurich Insurance Co Ltd 4.25% 02/10/2043 1,011 0.07
EUR 300,000 Bank of Ireland 1.25% 09/04/2020 307 0.02
EUR 300,000 Caterpillar International Finance DAC 0.75% 13/10/2020 306 0.02
EUR 450,000 Cloverie Plc for Zurich Insurance Co Ltd 1.75% 16/09/2024 476 0.03
EUR 300,000 Cloverie Plc for Zurich Insurance Co Ltd 7.5% 24/07/2039 323 0.02
EUR 450,000 CRH Finance DAC 1.375% 18/10/2028^ 434 0.03
EUR 500,000 CRH Finance DAC 3.125% 03/04/2023 560 0.04
EUR 500,000 Eaton Capital Unlimited Co 0.75% 20/09/2024 495 0.03
EUR 950,000 Fresenius Finance Ireland Plc 1.5% 30/01/2024 972 0.07
EUR 500,000 Fresenius Finance Ireland Plc 2.125% 01/02/2027^ 512 0.03
EUR 400,000 Fresenius Finance Ireland Plc 3% 30/01/2032^ 421 0.03
EUR 450,000 GE Capital European Funding Unlimited Co 0.8% 21/01/2022 457 0.03
EUR 783,000 GE Capital European Funding Unlimited Co 2.25% 20/07/2020^ 820 0.05
EUR 977,000 GE Capital European Funding Unlimited Co 2.625% 15/03/2023 1,066 0.07
EUR 500,000 GE Capital European Funding Unlimited Co 2.875% 18/06/2019 515 0.03
EUR 400,000 GE Capital European Funding Unlimited Co 4.35% 03/11/2021 457 0.03
EUR 600,000 GE Capital European Funding Unlimited Co 4.625% 22/02/2027 753 0.05
EUR 1,158,000 GE Capital European Funding Unlimited Co 5.375% 23/01/2020 1,259 0.08
EUR 550,000 GE Capital European Funding Unlimited Co 6.025% 01/03/2038 838 0.06
EUR 600,000 Johnson Controls International Plc 0% 04/12/2020 598 0.04
EUR 525,000 Johnson Controls International Plc 1% 15/09/2023 528 0.04
EUR 600,000 Johnson Controls International Plc 1.375% 25/02/2025 608 0.04
EUR 725,000 Kerry Group Financial Services 2.375% 10/09/2025 787 0.05
EUR 600,000 Liberty Mutual Finance Europe DAC 1.75% 27/03/2024 613 0.04
EUR 650,000 PartnerRe Ireland Finance DAC 1.25% 15/09/2026 614 0.04
EUR 200,000 Roadster Finance Designated Activity Co 1.625% 09/12/2024 197 0.01
EUR 200,000 Roadster Finance Designated Activity Co 2.375% 08/12/2027 197 0.01
EUR 600,000 Ryanair DAC 1.125% 10/03/2023 610 0.04

iSHARES V PLC
Schedule of Investments (unaudited) (continued) iSHARES € CORP BOND INTEREST RATE HEDGED UCITS ETF (continued) As at 31 May 2018
i S H A R E S V P L C I N T E R I M R E P O R T [ 8 7 ]
Ccy Holding Investment Fair value
€'000
% of net asset value
Bonds (30 November 2017: 97.96%) (cont) Ireland (30 November 2017: 1.36%) (cont) Corporate Bonds (cont)
EUR 675,000 Ryanair DAC 1.125% 15/08/2023 683 0.05EUR 800,000 Ryanair DAC 1.875% 17/06/2021 838 0.06EUR 275,000 Transmission Finance DAC 1.5%
24/05/2023 286 0.02EUR 100,000 Willow No 2 Ireland Plc for Zurich
Insurance Co Ltd 3.375% 27/06/2022 112 0.01Total Ireland 19,113 1.27
Italy (30 November 2017: 4.91%) Corporate Bonds
EUR 775,000 2i Rete Gas SpA 1.608% 31/10/2027 744 0.05
EUR 131,000 2i Rete Gas SpA 1.75% 16/07/2019 133 0.01
EUR 675,000 2i Rete Gas SpA 3% 16/07/2024^ 750 0.05
EUR 450,000 Aeroporti di Roma SpA 1.625% 08/06/2027 445 0.03
EUR 150,000 Aeroporti di Roma SpA 3.25% 20/02/2021 161 0.01
EUR 1,350,000 Assicurazioni Generali SpA 2.875% 14/01/2020 1,407 0.09
EUR 900,000 Assicurazioni Generali SpA 4.125% 04/05/2026^ 961 0.06
EUR 650,000 Assicurazioni Generali SpA 5% 08/06/2048^ 679 0.05
EUR 1,450,000 Assicurazioni Generali SpA 5.125% 16/09/2024^ 1,762 0.12
EUR 1,000,000 Assicurazioni Generali SpA 5.5% 27/10/2047 1,085 0.07
EUR 1,100,000 Assicurazioni Generali SpA 7.75% 12/12/2042 1,323 0.09
EUR 500,000 Assicurazioni Generali SpA 10.125% 10/07/2042 642 0.04
EUR 350,000 Atlantia SpA 1.625% 03/02/2025 346 0.02EUR 1,275,000 Atlantia SpA 1.875% 13/07/2027 1,222 0.08EUR 1,000,000 Autostrade per l'Italia SpA
1.125% 04/11/2021^ 1,023 0.07EUR 700,000 Autostrade per l'Italia SpA 1.75%
26/06/2026 688 0.05EUR 350,000 Autostrade per l'Italia SpA 1.75%
01/02/2027^ 342 0.02EUR 400,000 Autostrade per l'Italia SpA
1.875% 04/11/2025 401 0.03EUR 550,000 Autostrade per l'Italia SpA
1.875% 26/09/2029 520 0.03EUR 300,000 Autostrade per l'Italia SpA
2.875% 26/02/2021 321 0.02EUR 400,000 Autostrade per l'Italia SpA
4.375% 16/03/2020 431 0.03EUR 350,000 Autostrade per l'Italia SpA
4.375% 16/09/2025 414 0.03EUR 500,000 Autostrade per l'Italia SpA
5.875% 09/06/2024 632 0.04EUR 275,000 Azimut Holding SpA 2%
28/03/2022 277 0.02
Ccy Holding Investment Fair value
€'000
% of net asset value
Italy (30 November 2017: 4.91%) (cont) Corporate Bonds (cont)
EUR 325,000 Beni Stabili SpA SIIQ 1.625% 17/10/2024 328 0.02
EUR 200,000 Beni Stabili SpA SIIQ 2.375% 20/02/2028 198 0.01
EUR 1,025,000 Enel SpA 2.5% 24/11/2078 981 0.07EUR 250,000 Enel SpA 3.375% 24/11/2081 239 0.02EUR 425,000 Enel SpA 5% 15/01/2075 447 0.03EUR 650,000 Enel SpA 5.25% 20/05/2024 799 0.05EUR 650,000 Enel SpA 5.625% 21/06/2027 844 0.06EUR 600,000 Eni SpA 0.625% 19/09/2024 582 0.04EUR 600,000 Eni SpA 0.75% 17/05/2022 606 0.04EUR 250,000 Eni SpA 1% 14/03/2025 247 0.02EUR 650,000 Eni SpA 1.125% 19/09/2028^ 601 0.04EUR 778,000 Eni SpA 1.5% 02/02/2026 777 0.05EUR 100,000 Eni SpA 1.5% 17/01/2027 99 0.01EUR 475,000 Eni SpA 1.625% 17/05/2028 464 0.03EUR 750,000 Eni SpA 1.75% 18/01/2024 781 0.05EUR 900,000 Eni SpA 2.625% 22/11/2021 971 0.06EUR 1,102,000 Eni SpA 3.25% 10/07/2023 1,237 0.08EUR 750,000 Eni SpA 3.625% 29/01/2029 869 0.06EUR 1,350,000 Eni SpA 3.75% 12/09/2025 1,574 0.11EUR 1,050,000 Eni SpA 4% 29/06/2020 1,133 0.08EUR 800,000 Eni SpA 4.125% 16/09/2019 842 0.06EUR 850,000 Eni SpA 4.25% 03/02/2020 909 0.06EUR 225,000 Esselunga SpA 0.875%
25/10/2023 224 0.02EUR 600,000 Esselunga SpA 1.875%
25/10/2027^ 593 0.04EUR 1,140,000 FCA Bank SpA 0.25%
12/10/2020^ 1,136 0.08EUR 740,000 FCA Bank SpA 1% 15/11/2021 746 0.05EUR 500,000 FCA Bank SpA 1.25%
23/09/2020 511 0.03EUR 200,000 FCA Bank SpA 1.25%
21/01/2021 203 0.01EUR 450,000 FCA Bank SpA 1.375%
17/04/2020 459 0.03EUR 350,000 FCA Bank SpA 2% 23/10/2019 359 0.02EUR 100,000 Immobiliare Grande Distribuzione
SIIQ SpA 2.5% 31/05/2021 102 0.01EUR 475,000 Intesa Sanpaolo SpA 0.875%
27/06/2022 464 0.03EUR 1,400,000 Intesa Sanpaolo SpA 1.125%
14/01/2020 1,408 0.09EUR 800,000 Intesa Sanpaolo SpA 1.125%
04/03/2022 792 0.05EUR 825,000 Intesa Sanpaolo SpA 1.375%
18/01/2024 798 0.05EUR 1,350,000 Intesa Sanpaolo SpA 1.75%
20/03/2028 1,227 0.08EUR 800,000 Intesa Sanpaolo SpA 2%
18/06/2021 821 0.05EUR 550,000 Intesa Sanpaolo SpA 2.75%
20/03/2020 570 0.04
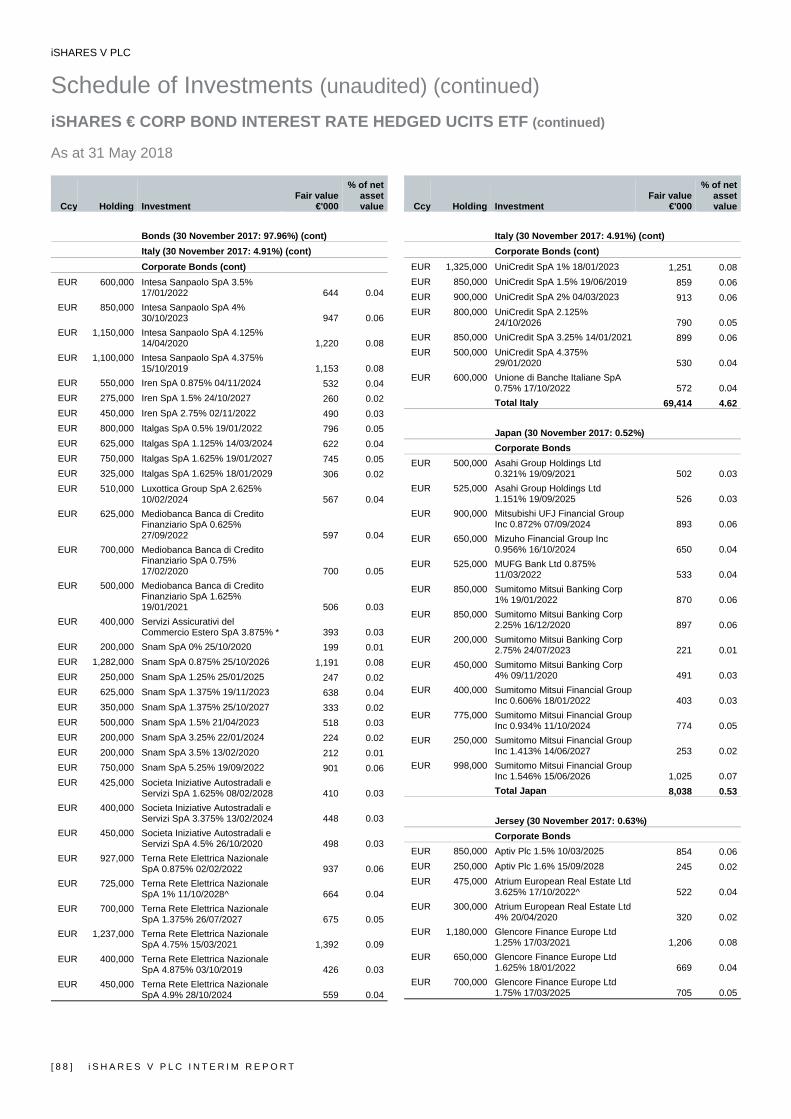
iSHARES V PLC
Schedule of Investments (unaudited) (continued) iSHARES € CORP BOND INTEREST RATE HEDGED UCITS ETF (continued) As at 31 May 2018
[ 8 8 ] i S H A R E S V P L C I N T E R I M R E P O R T
Ccy Holding Investment Fair value
€'000
% of net asset value
Bonds (30 November 2017: 97.96%) (cont) Italy (30 November 2017: 4.91%) (cont) Corporate Bonds (cont)
EUR 600,000 Intesa Sanpaolo SpA 3.5% 17/01/2022 644 0.04
EUR 850,000 Intesa Sanpaolo SpA 4% 30/10/2023 947 0.06
EUR 1,150,000 Intesa Sanpaolo SpA 4.125% 14/04/2020 1,220 0.08
EUR 1,100,000 Intesa Sanpaolo SpA 4.375% 15/10/2019 1,153 0.08
EUR 550,000 Iren SpA 0.875% 04/11/2024 532 0.04EUR 275,000 Iren SpA 1.5% 24/10/2027 260 0.02EUR 450,000 Iren SpA 2.75% 02/11/2022 490 0.03EUR 800,000 Italgas SpA 0.5% 19/01/2022 796 0.05EUR 625,000 Italgas SpA 1.125% 14/03/2024 622 0.04EUR 750,000 Italgas SpA 1.625% 19/01/2027 745 0.05EUR 325,000 Italgas SpA 1.625% 18/01/2029 306 0.02EUR 510,000 Luxottica Group SpA 2.625%
10/02/2024 567 0.04EUR 625,000 Mediobanca Banca di Credito
Finanziario SpA 0.625% 27/09/2022 597 0.04
EUR 700,000 Mediobanca Banca di Credito Finanziario SpA 0.75% 17/02/2020 700 0.05
EUR 500,000 Mediobanca Banca di Credito Finanziario SpA 1.625% 19/01/2021 506 0.03
EUR 400,000 Servizi Assicurativi del Commercio Estero SpA 3.875% * 393 0.03
EUR 200,000 Snam SpA 0% 25/10/2020 199 0.01EUR 1,282,000 Snam SpA 0.875% 25/10/2026 1,191 0.08EUR 250,000 Snam SpA 1.25% 25/01/2025 247 0.02EUR 625,000 Snam SpA 1.375% 19/11/2023 638 0.04EUR 350,000 Snam SpA 1.375% 25/10/2027 333 0.02EUR 500,000 Snam SpA 1.5% 21/04/2023 518 0.03EUR 200,000 Snam SpA 3.25% 22/01/2024 224 0.02EUR 200,000 Snam SpA 3.5% 13/02/2020 212 0.01EUR 750,000 Snam SpA 5.25% 19/09/2022 901 0.06EUR 425,000 Societa Iniziative Autostradali e
Servizi SpA 1.625% 08/02/2028 410 0.03EUR 400,000 Societa Iniziative Autostradali e
Servizi SpA 3.375% 13/02/2024 448 0.03EUR 450,000 Societa Iniziative Autostradali e
Servizi SpA 4.5% 26/10/2020 498 0.03EUR 927,000 Terna Rete Elettrica Nazionale
SpA 0.875% 02/02/2022 937 0.06EUR 725,000 Terna Rete Elettrica Nazionale
SpA 1% 11/10/2028^ 664 0.04EUR 700,000 Terna Rete Elettrica Nazionale
SpA 1.375% 26/07/2027 675 0.05EUR 1,237,000 Terna Rete Elettrica Nazionale
SpA 4.75% 15/03/2021 1,392 0.09EUR 400,000 Terna Rete Elettrica Nazionale
SpA 4.875% 03/10/2019 426 0.03EUR 450,000 Terna Rete Elettrica Nazionale
SpA 4.9% 28/10/2024 559 0.04
Ccy Holding Investment Fair value
€'000
% of net asset value
Italy (30 November 2017: 4.91%) (cont) Corporate Bonds (cont)
EUR 1,325,000 UniCredit SpA 1% 18/01/2023 1,251 0.08EUR 850,000 UniCredit SpA 1.5% 19/06/2019 859 0.06EUR 900,000 UniCredit SpA 2% 04/03/2023 913 0.06EUR 800,000 UniCredit SpA 2.125%
24/10/2026 790 0.05EUR 850,000 UniCredit SpA 3.25% 14/01/2021 899 0.06EUR 500,000 UniCredit SpA 4.375%
29/01/2020 530 0.04EUR 600,000 Unione di Banche Italiane SpA
0.75% 17/10/2022 572 0.04Total Italy 69,414 4.62
Japan (30 November 2017: 0.52%) Corporate Bonds
EUR 500,000 Asahi Group Holdings Ltd 0.321% 19/09/2021 502 0.03
EUR 525,000 Asahi Group Holdings Ltd 1.151% 19/09/2025 526 0.03
EUR 900,000 Mitsubishi UFJ Financial Group Inc 0.872% 07/09/2024 893 0.06
EUR 650,000 Mizuho Financial Group Inc 0.956% 16/10/2024 650 0.04
EUR 525,000 MUFG Bank Ltd 0.875% 11/03/2022 533 0.04
EUR 850,000 Sumitomo Mitsui Banking Corp 1% 19/01/2022 870 0.06
EUR 850,000 Sumitomo Mitsui Banking Corp 2.25% 16/12/2020 897 0.06
EUR 200,000 Sumitomo Mitsui Banking Corp 2.75% 24/07/2023 221 0.01
EUR 450,000 Sumitomo Mitsui Banking Corp 4% 09/11/2020 491 0.03
EUR 400,000 Sumitomo Mitsui Financial Group Inc 0.606% 18/01/2022 403 0.03
EUR 775,000 Sumitomo Mitsui Financial Group Inc 0.934% 11/10/2024 774 0.05
EUR 250,000 Sumitomo Mitsui Financial Group Inc 1.413% 14/06/2027 253 0.02
EUR 998,000 Sumitomo Mitsui Financial Group Inc 1.546% 15/06/2026 1,025 0.07Total Japan 8,038 0.53
Jersey (30 November 2017: 0.63%) Corporate Bonds
EUR 850,000 Aptiv Plc 1.5% 10/03/2025 854 0.06EUR 250,000 Aptiv Plc 1.6% 15/09/2028 245 0.02EUR 475,000 Atrium European Real Estate Ltd
3.625% 17/10/2022^ 522 0.04EUR 300,000 Atrium European Real Estate Ltd
4% 20/04/2020 320 0.02EUR 1,180,000 Glencore Finance Europe Ltd
1.25% 17/03/2021 1,206 0.08EUR 650,000 Glencore Finance Europe Ltd
1.625% 18/01/2022 669 0.04EUR 700,000 Glencore Finance Europe Ltd
1.75% 17/03/2025 705 0.05

iSHARES V PLC
Schedule of Investments (unaudited) (continued) iSHARES € CORP BOND INTEREST RATE HEDGED UCITS ETF (continued) As at 31 May 2018
i S H A R E S V P L C I N T E R I M R E P O R T [ 8 9 ]
Ccy Holding Investment Fair value
€'000
% of net asset value
Bonds (30 November 2017: 97.96%) (cont) Jersey (30 November 2017: 0.63%) (cont) Corporate Bonds (cont)
EUR 800,000 Glencore Finance Europe Ltd 1.875% 13/09/2023 827 0.06
EUR 1,000,000 Glencore Finance Europe Ltd 2.75% 01/04/2021 1,060 0.07
EUR 300,000 Glencore Finance Europe Ltd 3.375% 30/09/2020 322 0.02
EUR 550,000 Heathrow Funding Ltd 1.5% 11/02/2030 543 0.04
EUR 200,000 Heathrow Funding Ltd 1.875% 23/05/2022 212 0.01
EUR 475,000 Heathrow Funding Ltd 1.875% 12/07/2032 476 0.03
EUR 500,000 Kennedy Wilson Europe Real Estate Ltd 3.25% 12/11/2025 509 0.03
EUR 500,000 Swiss Re ReAssure Ltd 1.375% 27/05/2023 515 0.03Total Jersey 8,985 0.60
Luxembourg (30 November 2017: 2.35%) Corporate Bonds
EUR 400,000 ADO Properties SA 1.5% 26/07/2024 399 0.03
EUR 550,000 Allergan Funding SCS 0.5% 01/06/2021 550 0.04
EUR 500,000 Allergan Funding SCS 1.25% 01/06/2024 489 0.03
EUR 550,000 Allergan Funding SCS 2.125% 01/06/2029 532 0.04
EUR 300,000 Alpha Trains Finance SA 2.064% 30/06/2025 313 0.02
EUR 600,000 Aroundtown SA 1% 07/01/2025 572 0.04EUR 600,000 Aroundtown SA 1.5% 15/07/2024 597 0.04EUR 800,000 Aroundtown SA 1.625%
31/01/2028 745 0.05EUR 100,000 Aroundtown SA 1.875%
19/01/2026 99 0.01EUR 600,000 Aroundtown SA 2% 02/11/2026 591 0.04EUR 200,000 Aroundtown SA 2.125%
13/03/2023 210 0.01EUR 200,000 Aroundtown SA 2.125% * 183 0.01EUR 400,000 CNH Industrial Finance Europe
SA 1.375% 23/05/2022 408 0.03EUR 600,000 CNH Industrial Finance Europe
SA 1.75% 12/09/2025 598 0.04EUR 600,000 CNH Industrial Finance Europe
SA 2.875% 27/09/2021 646 0.04EUR 425,000 CNH Industrial Finance Europe
SA 2.875% 17/05/2023 459 0.03EUR 725,000 CPI Property Group SA 2.125%
04/10/2024 712 0.05EUR 750,000 DH Europe Finance SA 1.7%
04/01/2022 788 0.05EUR 1,200,000 DH Europe Finance SA 2.5%
08/07/2025 1,322 0.09EUR 300,000 Dream Global Funding I Sarl
1.375% 21/12/2021 301 0.02
Ccy Holding Investment Fair value
€'000
% of net asset value
Luxembourg (30 November 2017: 2.35%) (cont) Corporate Bonds (cont)
EUR 500,000 Euroclear Investments SA 1.125% 07/12/2026 505 0.03
EUR 200,000 Euroclear Investments SA 1.5% 11/04/2030 201 0.01
EUR 300,000 Euroclear Investments SA 2.625% 11/04/2048 300 0.02
EUR 500,000 FMC Finance VII SA 5.25% 15/02/2021 565 0.04
EUR 200,000 GELF Bond Issuer I SA 0.875% 20/10/2022 202 0.01
EUR 400,000 GELF Bond Issuer I SA 1.625% 20/10/2026 401 0.03
EUR 200,000 GELF Bond Issuer I SA 1.75% 22/11/2021 209 0.01
EUR 700,000 Grand City Properties SA 1.375% 03/08/2026 678 0.04
EUR 500,000 Grand City Properties SA 1.5% 17/04/2025 499 0.03
EUR 300,000 Grand City Properties SA 1.5% 22/02/2027 289 0.02
EUR 400,000 Grand City Properties SA 2.5% * 386 0.03EUR 600,000 Hannover Finance Luxembourg
SA 5% 30/06/2043 699 0.05EUR 250,000 Hannover Finance Luxembourg
SA 5.75% 14/09/2040 278 0.02EUR 400,000 Harman Finance International
SCA 2% 27/05/2022 423 0.03EUR 150,000 HeidelbergCement Finance
Luxembourg SA 0.5% 18/01/2021 151 0.01
EUR 550,000 HeidelbergCement Finance Luxembourg SA 1.5% 14/06/2027^ 540 0.04
EUR 800,000 HeidelbergCement Finance Luxembourg SA 1.625% 07/04/2026 808 0.05
EUR 350,000 HeidelbergCement Finance Luxembourg SA 1.75% 24/04/2028 346 0.02
EUR 250,000 HeidelbergCement Finance Luxembourg SA 3.25% 21/10/2020 269 0.02
EUR 350,000 HeidelbergCement Finance Luxembourg SA 3.25% 21/10/2021 385 0.03
EUR 800,000 HeidelbergCement Finance Luxembourg SA 7.5% 03/04/2020 909 0.06
EUR 300,000 HeidelbergCement Finance Luxembourg SA 8.5% 31/10/2019 336 0.02
EUR 720,000 Holcim Finance Luxembourg SA 1.375% 26/05/2023 739 0.05
EUR 950,000 Holcim Finance Luxembourg SA 1.75% 29/08/2029 911 0.06
EUR 900,000 Holcim Finance Luxembourg SA 2.25% 26/05/2028 923 0.06
EUR 100,000 Holcim US Finance Sarl & Cie SCS 2.625% 07/09/2020 106 0.01
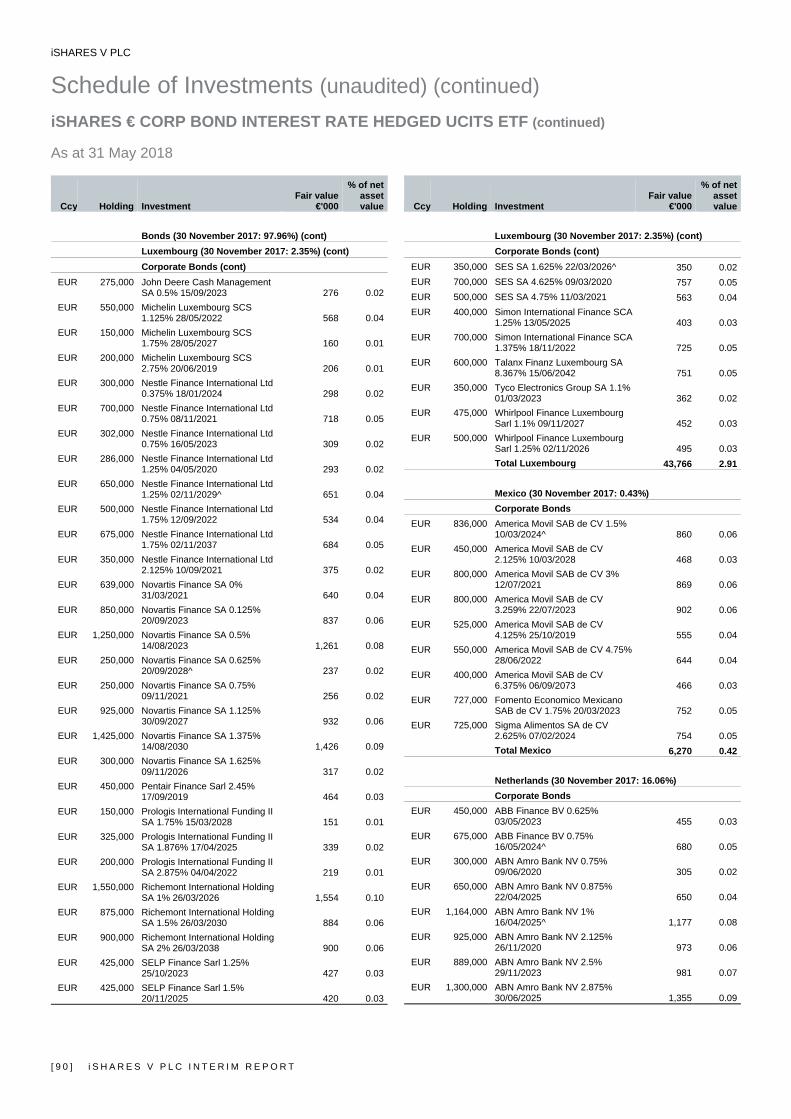
iSHARES V PLC
Schedule of Investments (unaudited) (continued) iSHARES € CORP BOND INTEREST RATE HEDGED UCITS ETF (continued) As at 31 May 2018
[ 9 0 ] i S H A R E S V P L C I N T E R I M R E P O R T
Ccy Holding Investment Fair value
€'000
% of net asset value
Bonds (30 November 2017: 97.96%) (cont) Luxembourg (30 November 2017: 2.35%) (cont) Corporate Bonds (cont)
EUR 275,000 John Deere Cash Management SA 0.5% 15/09/2023 276 0.02
EUR 550,000 Michelin Luxembourg SCS 1.125% 28/05/2022 568 0.04
EUR 150,000 Michelin Luxembourg SCS 1.75% 28/05/2027 160 0.01
EUR 200,000 Michelin Luxembourg SCS 2.75% 20/06/2019 206 0.01
EUR 300,000 Nestle Finance International Ltd 0.375% 18/01/2024 298 0.02
EUR 700,000 Nestle Finance International Ltd 0.75% 08/11/2021 718 0.05
EUR 302,000 Nestle Finance International Ltd 0.75% 16/05/2023 309 0.02
EUR 286,000 Nestle Finance International Ltd 1.25% 04/05/2020 293 0.02
EUR 650,000 Nestle Finance International Ltd 1.25% 02/11/2029^ 651 0.04
EUR 500,000 Nestle Finance International Ltd 1.75% 12/09/2022 534 0.04
EUR 675,000 Nestle Finance International Ltd 1.75% 02/11/2037 684 0.05
EUR 350,000 Nestle Finance International Ltd 2.125% 10/09/2021 375 0.02
EUR 639,000 Novartis Finance SA 0% 31/03/2021 640 0.04
EUR 850,000 Novartis Finance SA 0.125% 20/09/2023 837 0.06
EUR 1,250,000 Novartis Finance SA 0.5% 14/08/2023 1,261 0.08
EUR 250,000 Novartis Finance SA 0.625% 20/09/2028^ 237 0.02
EUR 250,000 Novartis Finance SA 0.75% 09/11/2021 256 0.02
EUR 925,000 Novartis Finance SA 1.125% 30/09/2027 932 0.06
EUR 1,425,000 Novartis Finance SA 1.375% 14/08/2030 1,426 0.09
EUR 300,000 Novartis Finance SA 1.625% 09/11/2026 317 0.02
EUR 450,000 Pentair Finance Sarl 2.45% 17/09/2019 464 0.03
EUR 150,000 Prologis International Funding II SA 1.75% 15/03/2028 151 0.01
EUR 325,000 Prologis International Funding II SA 1.876% 17/04/2025 339 0.02
EUR 200,000 Prologis International Funding II SA 2.875% 04/04/2022 219 0.01
EUR 1,550,000 Richemont International Holding SA 1% 26/03/2026 1,554 0.10
EUR 875,000 Richemont International Holding SA 1.5% 26/03/2030 884 0.06
EUR 900,000 Richemont International Holding SA 2% 26/03/2038 900 0.06
EUR 425,000 SELP Finance Sarl 1.25% 25/10/2023 427 0.03
EUR 425,000 SELP Finance Sarl 1.5% 20/11/2025 420 0.03
Ccy Holding Investment Fair value
€'000
% of net asset value
Luxembourg (30 November 2017: 2.35%) (cont) Corporate Bonds (cont)
EUR 350,000 SES SA 1.625% 22/03/2026^ 350 0.02EUR 700,000 SES SA 4.625% 09/03/2020 757 0.05EUR 500,000 SES SA 4.75% 11/03/2021 563 0.04EUR 400,000 Simon International Finance SCA
1.25% 13/05/2025 403 0.03EUR 700,000 Simon International Finance SCA
1.375% 18/11/2022 725 0.05EUR 600,000 Talanx Finanz Luxembourg SA
8.367% 15/06/2042 751 0.05EUR 350,000 Tyco Electronics Group SA 1.1%
01/03/2023 362 0.02EUR 475,000 Whirlpool Finance Luxembourg
Sarl 1.1% 09/11/2027 452 0.03EUR 500,000 Whirlpool Finance Luxembourg
Sarl 1.25% 02/11/2026 495 0.03Total Luxembourg 43,766 2.91
Mexico (30 November 2017: 0.43%) Corporate Bonds
EUR 836,000 America Movil SAB de CV 1.5% 10/03/2024^ 860 0.06
EUR 450,000 America Movil SAB de CV 2.125% 10/03/2028 468 0.03
EUR 800,000 America Movil SAB de CV 3% 12/07/2021 869 0.06
EUR 800,000 America Movil SAB de CV 3.259% 22/07/2023 902 0.06
EUR 525,000 America Movil SAB de CV 4.125% 25/10/2019 555 0.04
EUR 550,000 America Movil SAB de CV 4.75% 28/06/2022 644 0.04
EUR 400,000 America Movil SAB de CV 6.375% 06/09/2073 466 0.03
EUR 727,000 Fomento Economico Mexicano SAB de CV 1.75% 20/03/2023 752 0.05
EUR 725,000 Sigma Alimentos SA de CV 2.625% 07/02/2024 754 0.05Total Mexico 6,270 0.42
Netherlands (30 November 2017: 16.06%) Corporate Bonds
EUR 450,000 ABB Finance BV 0.625% 03/05/2023 455 0.03
EUR 675,000 ABB Finance BV 0.75% 16/05/2024^ 680 0.05
EUR 300,000 ABN Amro Bank NV 0.75% 09/06/2020 305 0.02
EUR 650,000 ABN Amro Bank NV 0.875% 22/04/2025 650 0.04
EUR 1,164,000 ABN Amro Bank NV 1% 16/04/2025^ 1,177 0.08
EUR 925,000 ABN Amro Bank NV 2.125% 26/11/2020 973 0.06
EUR 889,000 ABN Amro Bank NV 2.5% 29/11/2023 981 0.07
EUR 1,300,000 ABN Amro Bank NV 2.875% 30/06/2025 1,355 0.09
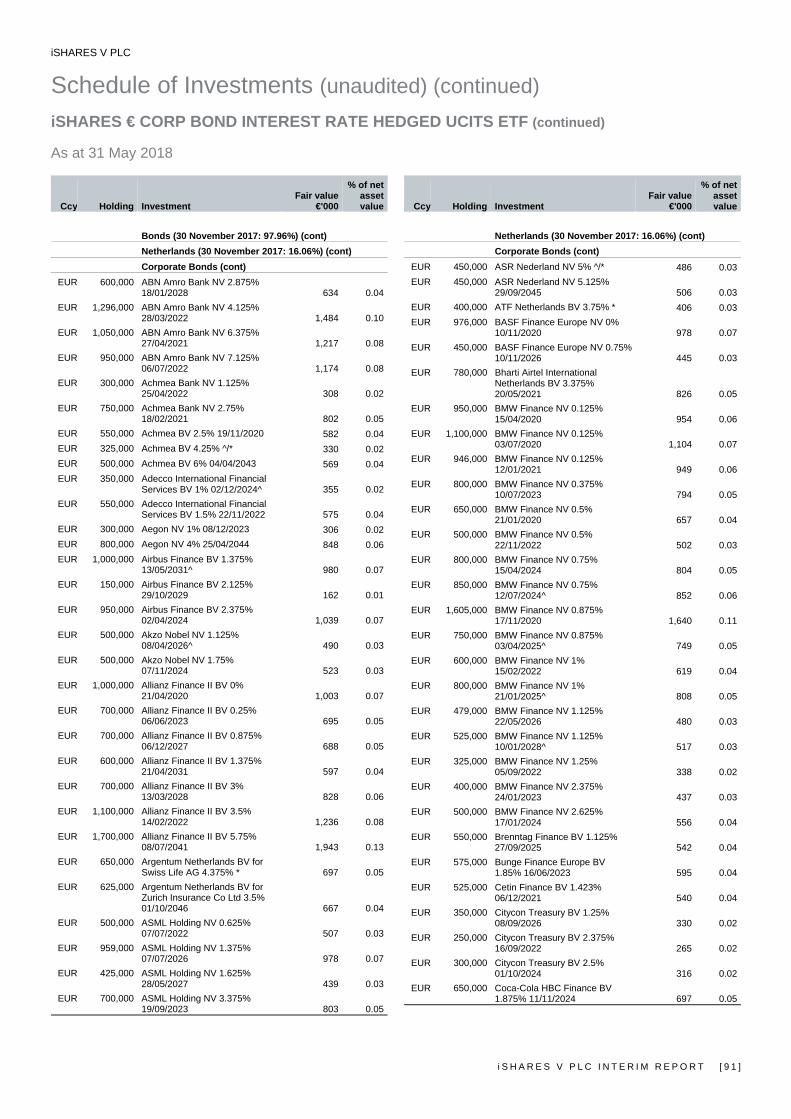
iSHARES V PLC
Schedule of Investments (unaudited) (continued) iSHARES € CORP BOND INTEREST RATE HEDGED UCITS ETF (continued) As at 31 May 2018
i S H A R E S V P L C I N T E R I M R E P O R T [ 9 1 ]
Ccy Holding Investment Fair value
€'000
% of net asset value
Bonds (30 November 2017: 97.96%) (cont) Netherlands (30 November 2017: 16.06%) (cont) Corporate Bonds (cont)
EUR 600,000 ABN Amro Bank NV 2.875% 18/01/2028 634 0.04
EUR 1,296,000 ABN Amro Bank NV 4.125% 28/03/2022 1,484 0.10
EUR 1,050,000 ABN Amro Bank NV 6.375% 27/04/2021 1,217 0.08
EUR 950,000 ABN Amro Bank NV 7.125% 06/07/2022 1,174 0.08
EUR 300,000 Achmea Bank NV 1.125% 25/04/2022 308 0.02
EUR 750,000 Achmea Bank NV 2.75% 18/02/2021 802 0.05
EUR 550,000 Achmea BV 2.5% 19/11/2020 582 0.04EUR 325,000 Achmea BV 4.25% ^/* 330 0.02EUR 500,000 Achmea BV 6% 04/04/2043 569 0.04EUR 350,000 Adecco International Financial
Services BV 1% 02/12/2024^ 355 0.02EUR 550,000 Adecco International Financial
Services BV 1.5% 22/11/2022 575 0.04EUR 300,000 Aegon NV 1% 08/12/2023 306 0.02EUR 800,000 Aegon NV 4% 25/04/2044 848 0.06EUR 1,000,000 Airbus Finance BV 1.375%
13/05/2031^ 980 0.07EUR 150,000 Airbus Finance BV 2.125%
29/10/2029 162 0.01EUR 950,000 Airbus Finance BV 2.375%
02/04/2024 1,039 0.07EUR 500,000 Akzo Nobel NV 1.125%
08/04/2026^ 490 0.03EUR 500,000 Akzo Nobel NV 1.75%
07/11/2024 523 0.03EUR 1,000,000 Allianz Finance II BV 0%
21/04/2020 1,003 0.07EUR 700,000 Allianz Finance II BV 0.25%
06/06/2023 695 0.05EUR 700,000 Allianz Finance II BV 0.875%
06/12/2027 688 0.05EUR 600,000 Allianz Finance II BV 1.375%
21/04/2031 597 0.04EUR 700,000 Allianz Finance II BV 3%
13/03/2028 828 0.06EUR 1,100,000 Allianz Finance II BV 3.5%
14/02/2022 1,236 0.08EUR 1,700,000 Allianz Finance II BV 5.75%
08/07/2041 1,943 0.13EUR 650,000 Argentum Netherlands BV for
Swiss Life AG 4.375% * 697 0.05EUR 625,000 Argentum Netherlands BV for
Zurich Insurance Co Ltd 3.5% 01/10/2046 667 0.04
EUR 500,000 ASML Holding NV 0.625% 07/07/2022 507 0.03
EUR 959,000 ASML Holding NV 1.375% 07/07/2026 978 0.07
EUR 425,000 ASML Holding NV 1.625% 28/05/2027 439 0.03
EUR 700,000 ASML Holding NV 3.375% 19/09/2023 803 0.05
Ccy Holding Investment Fair value
€'000
% of net asset value
Netherlands (30 November 2017: 16.06%) (cont) Corporate Bonds (cont)
EUR 450,000 ASR Nederland NV 5% ^/* 486 0.03EUR 450,000 ASR Nederland NV 5.125%
29/09/2045 506 0.03EUR 400,000 ATF Netherlands BV 3.75% * 406 0.03EUR 976,000 BASF Finance Europe NV 0%
10/11/2020 978 0.07EUR 450,000 BASF Finance Europe NV 0.75%
10/11/2026 445 0.03EUR 780,000 Bharti Airtel International
Netherlands BV 3.375% 20/05/2021 826 0.05
EUR 950,000 BMW Finance NV 0.125% 15/04/2020 954 0.06
EUR 1,100,000 BMW Finance NV 0.125% 03/07/2020 1,104 0.07
EUR 946,000 BMW Finance NV 0.125% 12/01/2021 949 0.06
EUR 800,000 BMW Finance NV 0.375% 10/07/2023 794 0.05
EUR 650,000 BMW Finance NV 0.5% 21/01/2020 657 0.04
EUR 500,000 BMW Finance NV 0.5% 22/11/2022 502 0.03
EUR 800,000 BMW Finance NV 0.75% 15/04/2024 804 0.05
EUR 850,000 BMW Finance NV 0.75% 12/07/2024^ 852 0.06
EUR 1,605,000 BMW Finance NV 0.875% 17/11/2020 1,640 0.11
EUR 750,000 BMW Finance NV 0.875% 03/04/2025^ 749 0.05
EUR 600,000 BMW Finance NV 1% 15/02/2022 619 0.04
EUR 800,000 BMW Finance NV 1% 21/01/2025^ 808 0.05
EUR 479,000 BMW Finance NV 1.125% 22/05/2026 480 0.03
EUR 525,000 BMW Finance NV 1.125% 10/01/2028^ 517 0.03
EUR 325,000 BMW Finance NV 1.25% 05/09/2022 338 0.02
EUR 400,000 BMW Finance NV 2.375% 24/01/2023 437 0.03
EUR 500,000 BMW Finance NV 2.625% 17/01/2024 556 0.04
EUR 550,000 Brenntag Finance BV 1.125% 27/09/2025 542 0.04
EUR 575,000 Bunge Finance Europe BV 1.85% 16/06/2023 595 0.04
EUR 525,000 Cetin Finance BV 1.423% 06/12/2021 540 0.04
EUR 350,000 Citycon Treasury BV 1.25% 08/09/2026 330 0.02
EUR 250,000 Citycon Treasury BV 2.375% 16/09/2022 265 0.02
EUR 300,000 Citycon Treasury BV 2.5% 01/10/2024 316 0.02
EUR 650,000 Coca-Cola HBC Finance BV 1.875% 11/11/2024 697 0.05

iSHARES V PLC
Schedule of Investments (unaudited) (continued) iSHARES € CORP BOND INTEREST RATE HEDGED UCITS ETF (continued) As at 31 May 2018
[ 9 2 ] i S H A R E S V P L C I N T E R I M R E P O R T
Ccy Holding Investment Fair value
€'000
% of net asset value
Bonds (30 November 2017: 97.96%) (cont) Netherlands (30 November 2017: 16.06%) (cont) Corporate Bonds (cont)
EUR 400,000 Coca-Cola HBC Finance BV 2.375% 18/06/2020 418 0.03
EUR 475,000 Compass Group International BV 0.625% 03/07/2024 470 0.03
EUR 700,000 Cooperatieve Rabobank UA 0.125% 11/10/2021^ 701 0.05
EUR 1,050,000 Cooperatieve Rabobank UA 0.5% 06/12/2022^ 1,057 0.07
EUR 1,625,000 Cooperatieve Rabobank UA 1.25% 23/03/2026 1,665 0.11
EUR 920,000 Cooperatieve Rabobank UA 1.375% 03/02/2027 954 0.06
EUR 900,000 Cooperatieve Rabobank UA 2.375% 22/05/2023 985 0.07
EUR 1,175,000 Cooperatieve Rabobank UA 2.5% 26/05/2026 1,229 0.08
EUR 850,000 Cooperatieve Rabobank UA 3.75% 09/11/2020 919 0.06
EUR 750,000 Cooperatieve Rabobank UA 3.875% 25/07/2023 856 0.06
EUR 1,677,000 Cooperatieve Rabobank UA 4% 11/01/2022 1,907 0.13
EUR 2,950,000 Cooperatieve Rabobank UA 4.125% 14/01/2020 3,152 0.21
EUR 1,100,000 Cooperatieve Rabobank UA 4.125% 12/01/2021 1,218 0.08
EUR 900,000 Cooperatieve Rabobank UA 4.125% 14/09/2022 1,021 0.07
EUR 2,600,000 Cooperatieve Rabobank UA 4.125% 14/07/2025 3,201 0.21
EUR 1,200,000 Cooperatieve Rabobank UA 4.375% 07/06/2021 1,356 0.09
EUR 1,500,000 Cooperatieve Rabobank UA 4.75% 06/06/2022 1,766 0.12
EUR 525,000 CRH Funding BV 1.875% 09/01/2024^ 555 0.04
EUR 600,000 Daimler International Finance BV 0.2% 13/09/2021 602 0.04
EUR 500,000 de Volksbank NV 0.125% 28/09/2020 501 0.03
EUR 550,000 de Volksbank NV 3.75% 05/11/2025 585 0.04
EUR 450,000 Delta Lloyd Levensverzekering NV 9% 29/08/2042 579 0.04
EUR 800,000 Deutsche Post Finance BV 2.95% 27/06/2022 889 0.06
EUR 550,000 Deutsche Telekom International Finance BV 0.25% 19/04/2021 553 0.04
EUR 950,000 Deutsche Telekom International Finance BV 0.375% 30/10/2021 956 0.06
EUR 275,000 Deutsche Telekom International Finance BV 0.625% 01/12/2022 277 0.02
EUR 1,277,000 Deutsche Telekom International Finance BV 0.625% 03/04/2023^ 1,279 0.09
EUR 950,000 Deutsche Telekom International Finance BV 0.875% 30/01/2024 956 0.06
EUR 600,000 Deutsche Telekom International Finance BV 1.125% 22/05/2026 593 0.04
Ccy Holding Investment Fair value
€'000
% of net asset value
Netherlands (30 November 2017: 16.06%) (cont) Corporate Bonds (cont)
EUR 766,000 Deutsche Telekom International Finance BV 1.375% 30/01/2027 763 0.05
EUR 1,125,000 Deutsche Telekom International Finance BV 1.5% 03/04/2028 1,114 0.07
EUR 725,000 Deutsche Telekom International Finance BV 2% 01/12/2029 742 0.05
EUR 1,000,000 Deutsche Telekom International Finance BV 2.125% 18/01/2021 1,055 0.07
EUR 600,000 Deutsche Telekom International Finance BV 2.75% 24/10/2024 671 0.04
EUR 900,000 Deutsche Telekom International Finance BV 3.25% 17/01/2028 1,039 0.07
EUR 200,000 Deutsche Telekom International Finance BV 4.25% 16/03/2020 216 0.01
EUR 1,200,000 Deutsche Telekom International Finance BV 4.25% 13/07/2022 1,389 0.09
EUR 300,000 Deutsche Telekom International Finance BV 4.5% 28/10/2030 386 0.03
EUR 650,000 Deutsche Telekom International Finance BV 4.875% 22/04/2025 817 0.05
EUR 350,000 Deutsche Telekom International Finance BV 7.5% 24/01/2033 589 0.04
EUR 200,000 E.ON International Finance BV 5.528% 21/02/2023 247 0.02
EUR 1,200,000 E.ON International Finance BV 5.75% 07/05/2020 1,335 0.09
EUR 625,000 EDP Finance BV 1.125% 12/02/2024 621 0.04
EUR 100,000 EDP Finance BV 1.5% 22/11/2027 96 0.01
EUR 400,000 EDP Finance BV 1.875% 29/09/2023 419 0.03
EUR 625,000 EDP Finance BV 2% 22/04/2025^ 642 0.04
EUR 1,025,000 EDP Finance BV 2.375% 23/03/2023 1,100 0.07
EUR 760,000 EDP Finance BV 2.625% 18/01/2022 816 0.05
EUR 650,000 EDP Finance BV 4.125% 20/01/2021 716 0.05
EUR 1,000,000 EDP Finance BV 4.875% 14/09/2020 1,107 0.07
EUR 300,000 ELM BV for Helvetia Schweizerische Versicherungsgesellschaft AG 3.375% 29/09/2047 305 0.02
EUR 500,000 ELM BV for RELX Finance BV 2.5% 24/09/2020 529 0.04
EUR 625,000 ELM BV for Swiss Life Insurance & Pension Group 4.5% * 669 0.04
EUR 950,000 ELM BV for Swiss Reinsurance Co Ltd 2.6% * 942 0.06
EUR 1,100,000 Enel Finance International NV 1% 16/09/2024^ 1,078 0.07
EUR 700,000 Enel Finance International NV 1.125% 16/09/2026 662 0.04
EUR 1,497,000 Enel Finance International NV 1.375% 01/06/2026 1,450 0.10
EUR 1,238,000 Enel Finance International NV 1.966% 27/01/2025 1,278 0.09
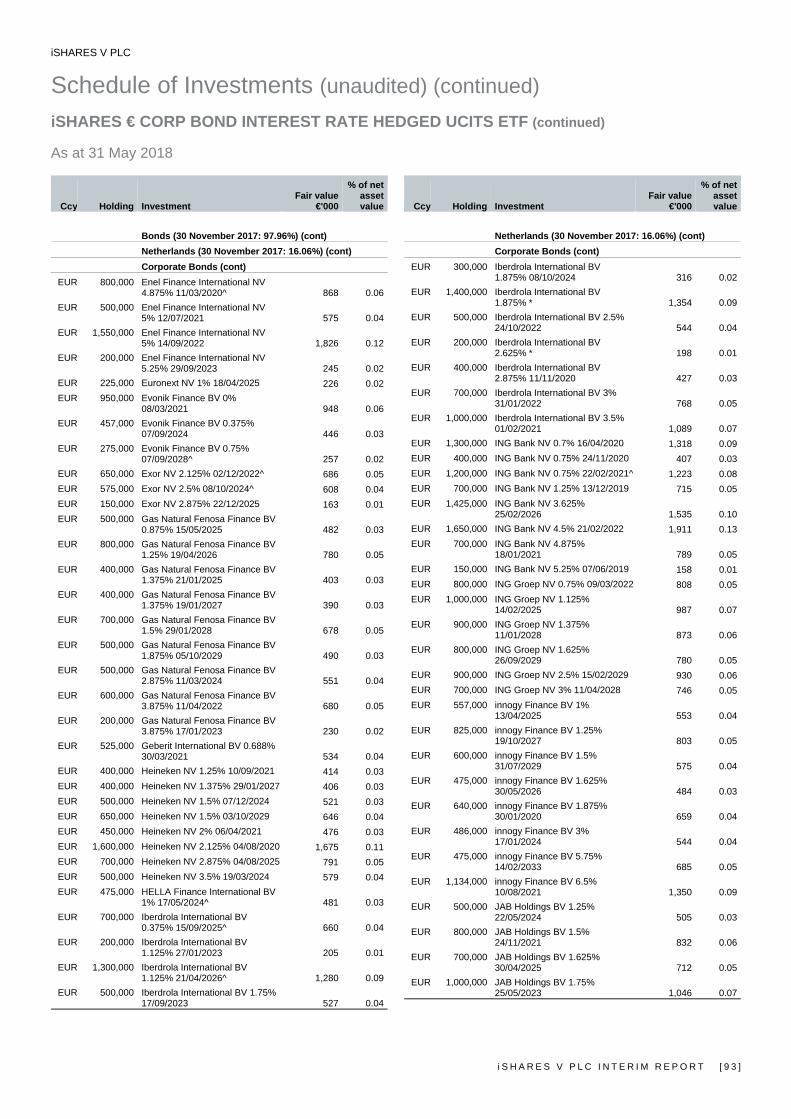
iSHARES V PLC
Schedule of Investments (unaudited) (continued) iSHARES € CORP BOND INTEREST RATE HEDGED UCITS ETF (continued) As at 31 May 2018
i S H A R E S V P L C I N T E R I M R E P O R T [ 9 3 ]
Ccy Holding Investment Fair value
€'000
% of net asset value
Bonds (30 November 2017: 97.96%) (cont) Netherlands (30 November 2017: 16.06%) (cont) Corporate Bonds (cont)
EUR 800,000 Enel Finance International NV 4.875% 11/03/2020^ 868 0.06
EUR 500,000 Enel Finance International NV 5% 12/07/2021 575 0.04
EUR 1,550,000 Enel Finance International NV 5% 14/09/2022 1,826 0.12
EUR 200,000 Enel Finance International NV 5.25% 29/09/2023 245 0.02
EUR 225,000 Euronext NV 1% 18/04/2025 226 0.02EUR 950,000 Evonik Finance BV 0%
08/03/2021 948 0.06EUR 457,000 Evonik Finance BV 0.375%
07/09/2024 446 0.03EUR 275,000 Evonik Finance BV 0.75%
07/09/2028^ 257 0.02EUR 650,000 Exor NV 2.125% 02/12/2022^ 686 0.05EUR 575,000 Exor NV 2.5% 08/10/2024^ 608 0.04EUR 150,000 Exor NV 2.875% 22/12/2025 163 0.01EUR 500,000 Gas Natural Fenosa Finance BV
0.875% 15/05/2025 482 0.03EUR 800,000 Gas Natural Fenosa Finance BV
1.25% 19/04/2026 780 0.05EUR 400,000 Gas Natural Fenosa Finance BV
1.375% 21/01/2025 403 0.03EUR 400,000 Gas Natural Fenosa Finance BV
1.375% 19/01/2027 390 0.03EUR 700,000 Gas Natural Fenosa Finance BV
1.5% 29/01/2028 678 0.05EUR 500,000 Gas Natural Fenosa Finance BV
1.875% 05/10/2029 490 0.03EUR 500,000 Gas Natural Fenosa Finance BV
2.875% 11/03/2024 551 0.04EUR 600,000 Gas Natural Fenosa Finance BV
3.875% 11/04/2022 680 0.05EUR 200,000 Gas Natural Fenosa Finance BV
3.875% 17/01/2023 230 0.02EUR 525,000 Geberit International BV 0.688%
30/03/2021 534 0.04EUR 400,000 Heineken NV 1.25% 10/09/2021 414 0.03EUR 400,000 Heineken NV 1.375% 29/01/2027 406 0.03EUR 500,000 Heineken NV 1.5% 07/12/2024 521 0.03EUR 650,000 Heineken NV 1.5% 03/10/2029 646 0.04EUR 450,000 Heineken NV 2% 06/04/2021 476 0.03EUR 1,600,000 Heineken NV 2.125% 04/08/2020 1,675 0.11EUR 700,000 Heineken NV 2.875% 04/08/2025 791 0.05EUR 500,000 Heineken NV 3.5% 19/03/2024 579 0.04EUR 475,000 HELLA Finance International BV
1% 17/05/2024^ 481 0.03EUR 700,000 Iberdrola International BV
0.375% 15/09/2025^ 660 0.04EUR 200,000 Iberdrola International BV
1.125% 27/01/2023 205 0.01EUR 1,300,000 Iberdrola International BV
1.125% 21/04/2026^ 1,280 0.09EUR 500,000 Iberdrola International BV 1.75%
17/09/2023 527 0.04
Ccy Holding Investment Fair value
€'000
% of net asset value
Netherlands (30 November 2017: 16.06%) (cont) Corporate Bonds (cont)
EUR 300,000 Iberdrola International BV 1.875% 08/10/2024 316 0.02
EUR 1,400,000 Iberdrola International BV 1.875% * 1,354 0.09
EUR 500,000 Iberdrola International BV 2.5% 24/10/2022 544 0.04
EUR 200,000 Iberdrola International BV 2.625% * 198 0.01
EUR 400,000 Iberdrola International BV 2.875% 11/11/2020 427 0.03
EUR 700,000 Iberdrola International BV 3% 31/01/2022 768 0.05
EUR 1,000,000 Iberdrola International BV 3.5% 01/02/2021 1,089 0.07
EUR 1,300,000 ING Bank NV 0.7% 16/04/2020 1,318 0.09EUR 400,000 ING Bank NV 0.75% 24/11/2020 407 0.03EUR 1,200,000 ING Bank NV 0.75% 22/02/2021^ 1,223 0.08EUR 700,000 ING Bank NV 1.25% 13/12/2019 715 0.05EUR 1,425,000 ING Bank NV 3.625%
25/02/2026 1,535 0.10EUR 1,650,000 ING Bank NV 4.5% 21/02/2022 1,911 0.13EUR 700,000 ING Bank NV 4.875%
18/01/2021 789 0.05EUR 150,000 ING Bank NV 5.25% 07/06/2019 158 0.01EUR 800,000 ING Groep NV 0.75% 09/03/2022 808 0.05EUR 1,000,000 ING Groep NV 1.125%
14/02/2025 987 0.07EUR 900,000 ING Groep NV 1.375%
11/01/2028 873 0.06EUR 800,000 ING Groep NV 1.625%
26/09/2029 780 0.05EUR 900,000 ING Groep NV 2.5% 15/02/2029 930 0.06EUR 700,000 ING Groep NV 3% 11/04/2028 746 0.05EUR 557,000 innogy Finance BV 1%
13/04/2025 553 0.04EUR 825,000 innogy Finance BV 1.25%
19/10/2027 803 0.05EUR 600,000 innogy Finance BV 1.5%
31/07/2029 575 0.04EUR 475,000 innogy Finance BV 1.625%
30/05/2026 484 0.03EUR 640,000 innogy Finance BV 1.875%
30/01/2020 659 0.04EUR 486,000 innogy Finance BV 3%
17/01/2024 544 0.04EUR 475,000 innogy Finance BV 5.75%
14/02/2033 685 0.05EUR 1,134,000 innogy Finance BV 6.5%
10/08/2021 1,350 0.09EUR 500,000 JAB Holdings BV 1.25%
22/05/2024 505 0.03EUR 800,000 JAB Holdings BV 1.5%
24/11/2021 832 0.06EUR 700,000 JAB Holdings BV 1.625%
30/04/2025 712 0.05EUR 1,000,000 JAB Holdings BV 1.75%
25/05/2023 1,046 0.07

iSHARES V PLC
Schedule of Investments (unaudited) (continued) iSHARES € CORP BOND INTEREST RATE HEDGED UCITS ETF (continued) As at 31 May 2018
[ 9 4 ] i S H A R E S V P L C I N T E R I M R E P O R T
Ccy Holding Investment Fair value
€'000
% of net asset value
Bonds (30 November 2017: 97.96%) (cont) Netherlands (30 November 2017: 16.06%) (cont) Corporate Bonds (cont)
EUR 200,000 JAB Holdings BV 2% 18/05/2028 202 0.01EUR 600,000 JAB Holdings BV 2.125%
16/09/2022 638 0.04EUR 875,000 Koninklijke Ahold Delhaize NV
0.875% 19/09/2024 877 0.06EUR 275,000 Koninklijke Ahold Delhaize NV
1.125% 19/03/2026 272 0.02EUR 700,000 Koninklijke DSM NV 0.75%
28/09/2026 685 0.05EUR 200,000 Koninklijke DSM NV 1%
09/04/2025 203 0.01EUR 500,000 Koninklijke DSM NV 1.375%
26/09/2022 526 0.03EUR 525,000 Koninklijke DSM NV 2.375%
03/04/2024 578 0.04EUR 600,000 Koninklijke KPN NV 0.625%
09/04/2025 578 0.04EUR 600,000 Koninklijke KPN NV 1.125%
11/09/2028 570 0.04EUR 285,000 Koninklijke KPN NV 3.75%
21/09/2020 310 0.02EUR 450,000 Koninklijke KPN NV 4.25%
01/03/2022 514 0.03EUR 300,000 Koninklijke KPN NV 5.625%
30/09/2024 382 0.03EUR 550,000 Koninklijke Philips NV 0.5%
06/09/2023 551 0.04EUR 525,000 Koninklijke Philips NV 0.75%
02/05/2024 526 0.03EUR 600,000 LeasePlan Corp NV 0.75%
03/10/2022 600 0.04EUR 700,000 LeasePlan Corp NV 1%
08/04/2020 712 0.05EUR 400,000 LeasePlan Corp NV 1%
24/05/2021 407 0.03EUR 500,000 LeasePlan Corp NV 1%
02/05/2023 501 0.03EUR 1,100,000 Linde Finance BV 0.25%
18/01/2022 1,108 0.07EUR 200,000 Linde Finance BV 1% 20/04/2028 196 0.01EUR 250,000 Linde Finance BV 1.875%
22/05/2024 271 0.02EUR 750,000 LYB International Finance II BV
1.875% 02/03/2022 784 0.05EUR 475,000 Madrilena Red de Gas Finance
BV 2.25% 11/04/2029^ 477 0.03EUR 475,000 Mylan NV 1.25% 23/11/2020 485 0.03EUR 950,000 Mylan NV 2.25% 22/11/2024 982 0.07EUR 675,000 Mylan NV 3.125% 22/11/2028 704 0.05EUR 400,000 NE Property Cooperatief UA
1.75% 23/11/2024^ 380 0.03EUR 500,000 NE Property Cooperatief UA
3.75% 26/02/2021 531 0.04EUR 250,000 NIBC Bank NV 1.125%
19/04/2023 250 0.02EUR 450,000 NIBC Bank NV 1.5% 31/01/2022 462 0.03
Ccy Holding Investment Fair value
€'000
% of net asset value
Netherlands (30 November 2017: 16.06%) (cont) Corporate Bonds (cont)
EUR 700,000 NIBC Bank NV 2.25% 24/09/2019 720 0.05
EUR 200,000 NN Group NV 0.25% 01/06/2020 201 0.01EUR 550,000 NN Group NV 1% 18/03/2022 563 0.04EUR 475,000 NN Group NV 1.625%
01/06/2027 481 0.03EUR 500,000 NN Group NV 4.375% * 528 0.04EUR 850,000 NN Group NV 4.5% * 900 0.06EUR 1,000,000 NN Group NV 4.625%
08/04/2044 1,099 0.07EUR 575,000 NN Group NV 4.625%
13/01/2048 621 0.04EUR 650,000 Nomura Europe Finance NV
1.125% 03/06/2020 663 0.04EUR 525,000 Nomura Europe Finance NV
1.5% 12/05/2021 544 0.04EUR 800,000 Opel Finance International BV
1.168% 18/05/2020^ 817 0.05EUR 300,000 Opel Finance International BV
1.875% 15/10/2019 308 0.02EUR 400,000 PostNL NV 1% 21/11/2024 400 0.03EUR 600,000 Redexis Gas Finance BV 1.875%
27/04/2027 583 0.04EUR 150,000 Redexis Gas Finance BV 2.75%
08/04/2021 159 0.01EUR 725,000 RELX Finance BV 1%
22/03/2024 732 0.05EUR 500,000 RELX Finance BV 1.375%
12/05/2026 504 0.03EUR 400,000 RELX Finance BV 1.5%
13/05/2027^ 398 0.03EUR 225,000 Ren Finance BV 1.75%
18/01/2028 222 0.01EUR 800,000 Ren Finance BV 2.5%
12/02/2025 856 0.06EUR 500,000 Repsol International Finance BV
2.125% 16/12/2020 524 0.03EUR 400,000 Repsol International Finance BV
2.25% 10/12/2026 430 0.03EUR 1,000,000 Repsol International Finance BV
2.625% 28/05/2020 1,050 0.07EUR 1,200,000 Repsol International Finance BV
3.625% 07/10/2021 1,334 0.09EUR 600,000 Robert Bosch Investment
Nederland BV 1.625% 24/05/2021 629 0.04
EUR 500,000 Robert Bosch Investment Nederland BV 2.625% 24/05/2028 582 0.04
EUR 1,100,000 Roche Finance Europe BV 0.5% 27/02/2023^ 1,117 0.07
EUR 827,000 Roche Finance Europe BV 0.875% 25/02/2025 843 0.06
EUR 1,050,000 Schaeffler Finance BV 3.25% 15/05/2025 1,117 0.07
EUR 1,053,000 Shell International Finance BV 0.375% 15/02/2025 1,028 0.07
EUR 800,000 Shell International Finance BV 0.75% 12/05/2024^ 808 0.05
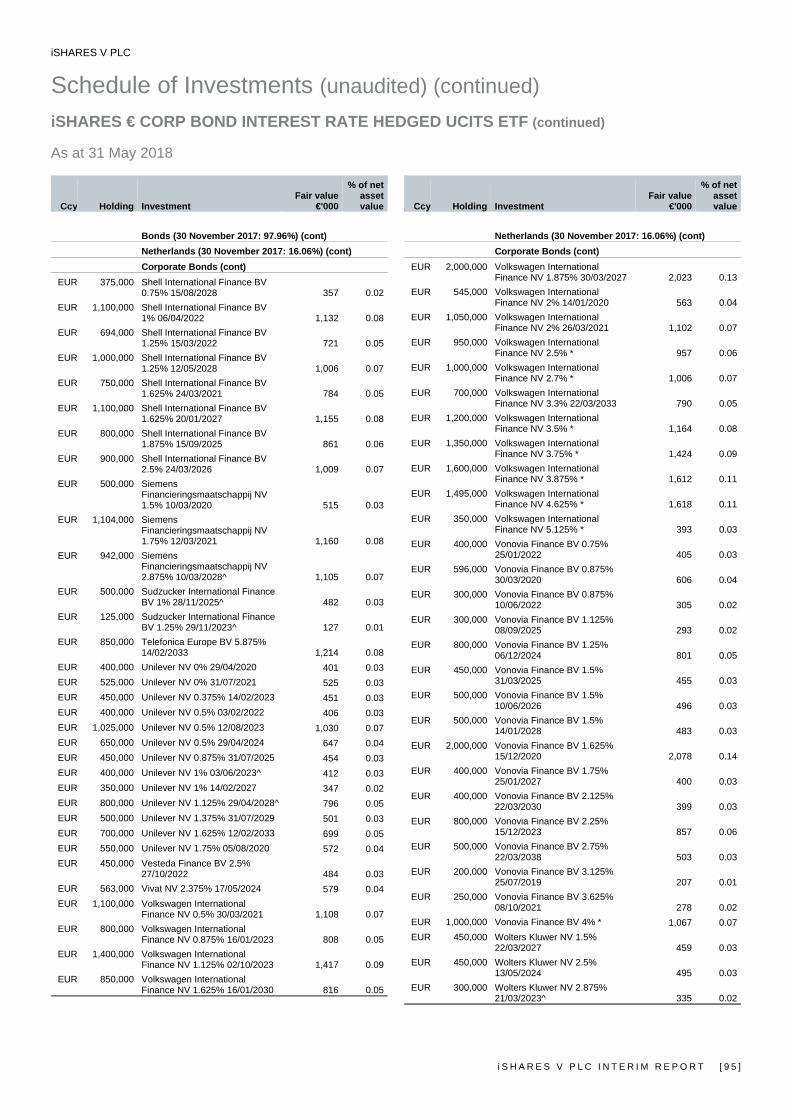
iSHARES V PLC
Schedule of Investments (unaudited) (continued) iSHARES € CORP BOND INTEREST RATE HEDGED UCITS ETF (continued) As at 31 May 2018
i S H A R E S V P L C I N T E R I M R E P O R T [ 9 5 ]
Ccy Holding Investment Fair value
€'000
% of net asset value
Bonds (30 November 2017: 97.96%) (cont) Netherlands (30 November 2017: 16.06%) (cont) Corporate Bonds (cont)
EUR 375,000 Shell International Finance BV 0.75% 15/08/2028 357 0.02
EUR 1,100,000 Shell International Finance BV 1% 06/04/2022 1,132 0.08
EUR 694,000 Shell International Finance BV 1.25% 15/03/2022 721 0.05
EUR 1,000,000 Shell International Finance BV 1.25% 12/05/2028 1,006 0.07
EUR 750,000 Shell International Finance BV 1.625% 24/03/2021 784 0.05
EUR 1,100,000 Shell International Finance BV 1.625% 20/01/2027 1,155 0.08
EUR 800,000 Shell International Finance BV 1.875% 15/09/2025 861 0.06
EUR 900,000 Shell International Finance BV 2.5% 24/03/2026 1,009 0.07
EUR 500,000 Siemens Financieringsmaatschappij NV 1.5% 10/03/2020 515 0.03
EUR 1,104,000 Siemens Financieringsmaatschappij NV 1.75% 12/03/2021 1,160 0.08
EUR 942,000 Siemens Financieringsmaatschappij NV 2.875% 10/03/2028^ 1,105 0.07
EUR 500,000 Sudzucker International Finance BV 1% 28/11/2025^ 482 0.03
EUR 125,000 Sudzucker International Finance BV 1.25% 29/11/2023^ 127 0.01
EUR 850,000 Telefonica Europe BV 5.875% 14/02/2033 1,214 0.08
EUR 400,000 Unilever NV 0% 29/04/2020 401 0.03EUR 525,000 Unilever NV 0% 31/07/2021 525 0.03EUR 450,000 Unilever NV 0.375% 14/02/2023 451 0.03EUR 400,000 Unilever NV 0.5% 03/02/2022 406 0.03EUR 1,025,000 Unilever NV 0.5% 12/08/2023 1,030 0.07EUR 650,000 Unilever NV 0.5% 29/04/2024 647 0.04EUR 450,000 Unilever NV 0.875% 31/07/2025 454 0.03EUR 400,000 Unilever NV 1% 03/06/2023^ 412 0.03EUR 350,000 Unilever NV 1% 14/02/2027 347 0.02EUR 800,000 Unilever NV 1.125% 29/04/2028^ 796 0.05EUR 500,000 Unilever NV 1.375% 31/07/2029 501 0.03EUR 700,000 Unilever NV 1.625% 12/02/2033 699 0.05EUR 550,000 Unilever NV 1.75% 05/08/2020 572 0.04EUR 450,000 Vesteda Finance BV 2.5%
27/10/2022 484 0.03EUR 563,000 Vivat NV 2.375% 17/05/2024 579 0.04EUR 1,100,000 Volkswagen International
Finance NV 0.5% 30/03/2021 1,108 0.07EUR 800,000 Volkswagen International
Finance NV 0.875% 16/01/2023 808 0.05EUR 1,400,000 Volkswagen International
Finance NV 1.125% 02/10/2023 1,417 0.09EUR 850,000 Volkswagen International
Finance NV 1.625% 16/01/2030 816 0.05
Ccy Holding Investment Fair value
€'000
% of net asset value
Netherlands (30 November 2017: 16.06%) (cont) Corporate Bonds (cont)
EUR 2,000,000 Volkswagen International Finance NV 1.875% 30/03/2027 2,023 0.13
EUR 545,000 Volkswagen International Finance NV 2% 14/01/2020 563 0.04
EUR 1,050,000 Volkswagen International Finance NV 2% 26/03/2021 1,102 0.07
EUR 950,000 Volkswagen International Finance NV 2.5% * 957 0.06
EUR 1,000,000 Volkswagen International Finance NV 2.7% * 1,006 0.07
EUR 700,000 Volkswagen International Finance NV 3.3% 22/03/2033 790 0.05
EUR 1,200,000 Volkswagen International Finance NV 3.5% * 1,164 0.08
EUR 1,350,000 Volkswagen International Finance NV 3.75% * 1,424 0.09
EUR 1,600,000 Volkswagen International Finance NV 3.875% * 1,612 0.11
EUR 1,495,000 Volkswagen International Finance NV 4.625% * 1,618 0.11
EUR 350,000 Volkswagen International Finance NV 5.125% * 393 0.03
EUR 400,000 Vonovia Finance BV 0.75% 25/01/2022 405 0.03
EUR 596,000 Vonovia Finance BV 0.875% 30/03/2020 606 0.04
EUR 300,000 Vonovia Finance BV 0.875% 10/06/2022 305 0.02
EUR 300,000 Vonovia Finance BV 1.125% 08/09/2025 293 0.02
EUR 800,000 Vonovia Finance BV 1.25% 06/12/2024 801 0.05
EUR 450,000 Vonovia Finance BV 1.5% 31/03/2025 455 0.03
EUR 500,000 Vonovia Finance BV 1.5% 10/06/2026 496 0.03
EUR 500,000 Vonovia Finance BV 1.5% 14/01/2028 483 0.03
EUR 2,000,000 Vonovia Finance BV 1.625% 15/12/2020 2,078 0.14
EUR 400,000 Vonovia Finance BV 1.75% 25/01/2027 400 0.03
EUR 400,000 Vonovia Finance BV 2.125% 22/03/2030 399 0.03
EUR 800,000 Vonovia Finance BV 2.25% 15/12/2023 857 0.06
EUR 500,000 Vonovia Finance BV 2.75% 22/03/2038 503 0.03
EUR 200,000 Vonovia Finance BV 3.125% 25/07/2019 207 0.01
EUR 250,000 Vonovia Finance BV 3.625% 08/10/2021 278 0.02
EUR 1,000,000 Vonovia Finance BV 4% * 1,067 0.07EUR 450,000 Wolters Kluwer NV 1.5%
22/03/2027 459 0.03EUR 450,000 Wolters Kluwer NV 2.5%
13/05/2024 495 0.03EUR 300,000 Wolters Kluwer NV 2.875%
21/03/2023^ 335 0.02
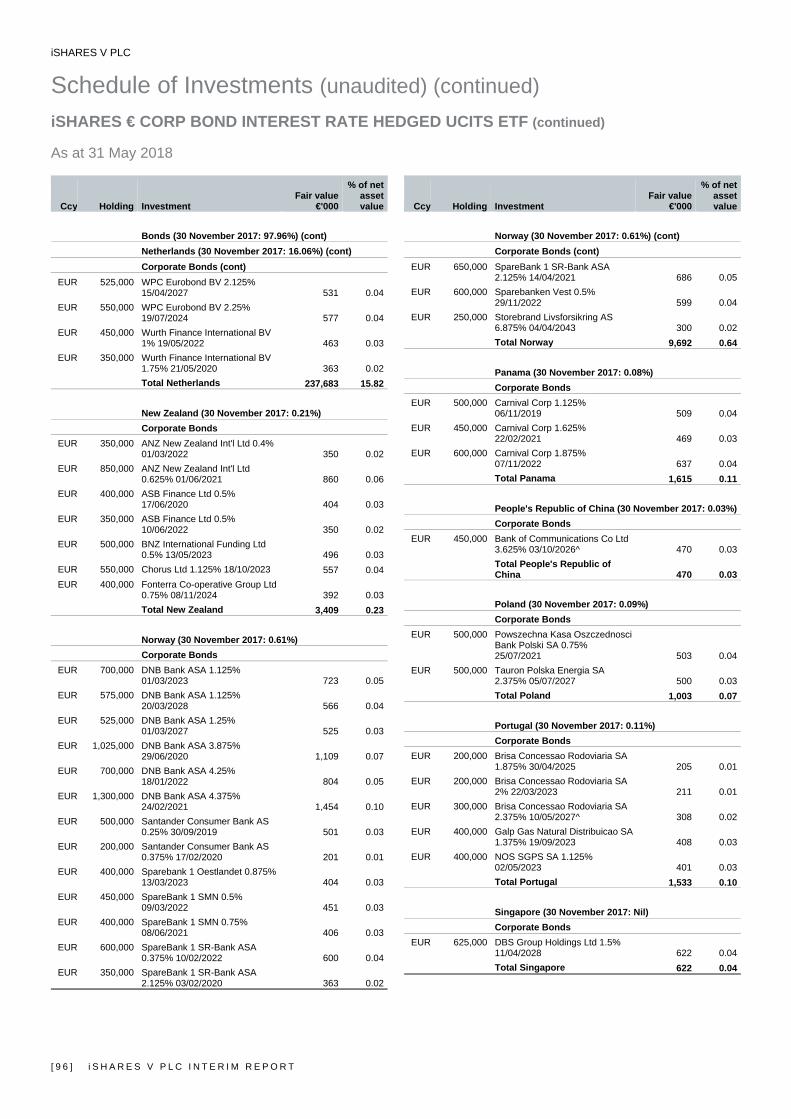
iSHARES V PLC
Schedule of Investments (unaudited) (continued) iSHARES € CORP BOND INTEREST RATE HEDGED UCITS ETF (continued) As at 31 May 2018
[ 9 6 ] i S H A R E S V P L C I N T E R I M R E P O R T
Ccy Holding Investment Fair value
€'000
% of net asset value
Bonds (30 November 2017: 97.96%) (cont) Netherlands (30 November 2017: 16.06%) (cont) Corporate Bonds (cont)
EUR 525,000 WPC Eurobond BV 2.125% 15/04/2027 531 0.04
EUR 550,000 WPC Eurobond BV 2.25% 19/07/2024 577 0.04
EUR 450,000 Wurth Finance International BV 1% 19/05/2022 463 0.03
EUR 350,000 Wurth Finance International BV 1.75% 21/05/2020 363 0.02Total Netherlands 237,683 15.82
New Zealand (30 November 2017: 0.21%) Corporate Bonds
EUR 350,000 ANZ New Zealand Int'l Ltd 0.4% 01/03/2022 350 0.02
EUR 850,000 ANZ New Zealand Int'l Ltd 0.625% 01/06/2021 860 0.06
EUR 400,000 ASB Finance Ltd 0.5% 17/06/2020 404 0.03
EUR 350,000 ASB Finance Ltd 0.5% 10/06/2022 350 0.02
EUR 500,000 BNZ International Funding Ltd 0.5% 13/05/2023 496 0.03
EUR 550,000 Chorus Ltd 1.125% 18/10/2023 557 0.04EUR 400,000 Fonterra Co-operative Group Ltd
0.75% 08/11/2024 392 0.03Total New Zealand 3,409 0.23
Norway (30 November 2017: 0.61%) Corporate Bonds
EUR 700,000 DNB Bank ASA 1.125% 01/03/2023 723 0.05
EUR 575,000 DNB Bank ASA 1.125% 20/03/2028 566 0.04
EUR 525,000 DNB Bank ASA 1.25% 01/03/2027 525 0.03
EUR 1,025,000 DNB Bank ASA 3.875% 29/06/2020 1,109 0.07
EUR 700,000 DNB Bank ASA 4.25% 18/01/2022 804 0.05
EUR 1,300,000 DNB Bank ASA 4.375% 24/02/2021 1,454 0.10
EUR 500,000 Santander Consumer Bank AS 0.25% 30/09/2019 501 0.03
EUR 200,000 Santander Consumer Bank AS 0.375% 17/02/2020 201 0.01
EUR 400,000 Sparebank 1 Oestlandet 0.875% 13/03/2023 404 0.03
EUR 450,000 SpareBank 1 SMN 0.5% 09/03/2022 451 0.03
EUR 400,000 SpareBank 1 SMN 0.75% 08/06/2021 406 0.03
EUR 600,000 SpareBank 1 SR-Bank ASA 0.375% 10/02/2022 600 0.04
EUR 350,000 SpareBank 1 SR-Bank ASA 2.125% 03/02/2020 363 0.02
Ccy Holding Investment Fair value
€'000
% of net asset value
Norway (30 November 2017: 0.61%) (cont) Corporate Bonds (cont)
EUR 650,000 SpareBank 1 SR-Bank ASA 2.125% 14/04/2021 686 0.05
EUR 600,000 Sparebanken Vest 0.5% 29/11/2022 599 0.04
EUR 250,000 Storebrand Livsforsikring AS 6.875% 04/04/2043 300 0.02Total Norway 9,692 0.64
Panama (30 November 2017: 0.08%) Corporate Bonds
EUR 500,000 Carnival Corp 1.125% 06/11/2019 509 0.04
EUR 450,000 Carnival Corp 1.625% 22/02/2021 469 0.03
EUR 600,000 Carnival Corp 1.875% 07/11/2022 637 0.04Total Panama 1,615 0.11
People's Republic of China (30 November 2017: 0.03%)Corporate Bonds
EUR 450,000 Bank of Communications Co Ltd 3.625% 03/10/2026^ 470 0.03Total People's Republic of China 470 0.03
Poland (30 November 2017: 0.09%) Corporate Bonds
EUR 500,000 Powszechna Kasa Oszczednosci Bank Polski SA 0.75% 25/07/2021 503 0.04
EUR 500,000 Tauron Polska Energia SA 2.375% 05/07/2027 500 0.03Total Poland 1,003 0.07
Portugal (30 November 2017: 0.11%) Corporate Bonds
EUR 200,000 Brisa Concessao Rodoviaria SA 1.875% 30/04/2025 205 0.01
EUR 200,000 Brisa Concessao Rodoviaria SA 2% 22/03/2023 211 0.01
EUR 300,000 Brisa Concessao Rodoviaria SA 2.375% 10/05/2027^ 308 0.02
EUR 400,000 Galp Gas Natural Distribuicao SA 1.375% 19/09/2023 408 0.03
EUR 400,000 NOS SGPS SA 1.125% 02/05/2023 401 0.03Total Portugal 1,533 0.10
Singapore (30 November 2017: Nil) Corporate Bonds
EUR 625,000 DBS Group Holdings Ltd 1.5% 11/04/2028 622 0.04Total Singapore 622 0.04
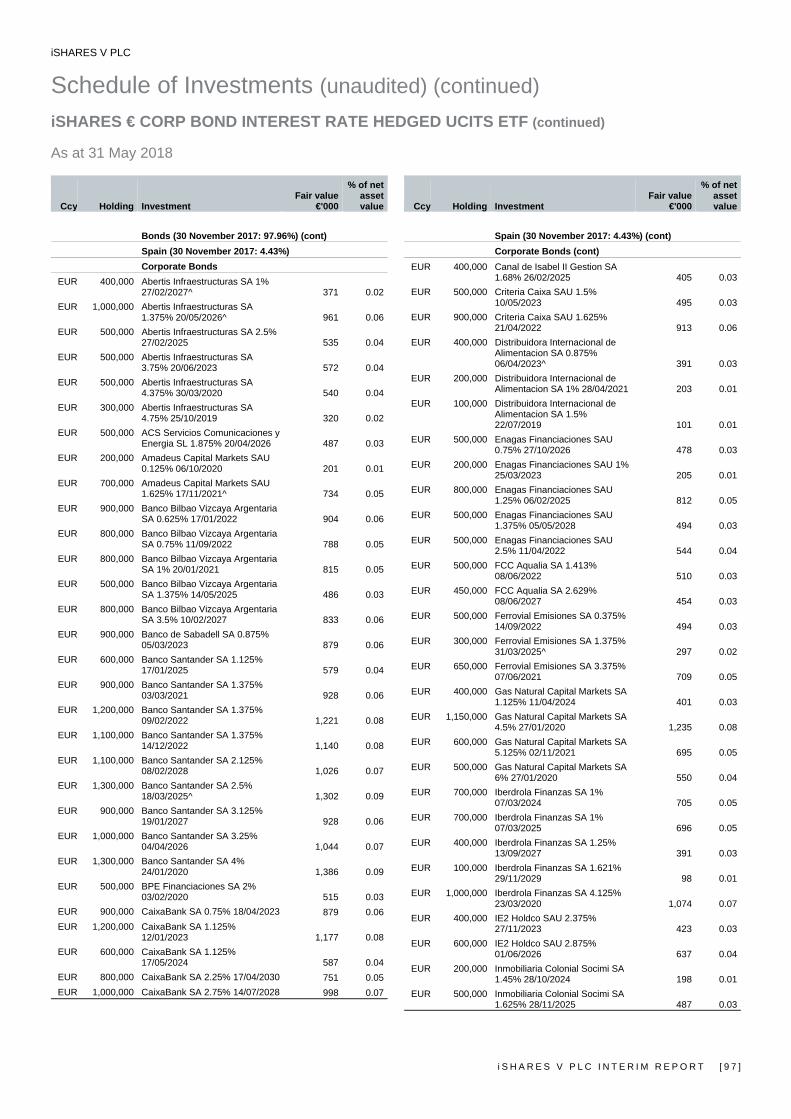
iSHARES V PLC
Schedule of Investments (unaudited) (continued) iSHARES € CORP BOND INTEREST RATE HEDGED UCITS ETF (continued) As at 31 May 2018
i S H A R E S V P L C I N T E R I M R E P O R T [ 9 7 ]
Ccy Holding Investment Fair value
€'000
% of net asset value
Bonds (30 November 2017: 97.96%) (cont)
Spain (30 November 2017: 4.43%) Corporate Bonds
EUR 400,000 Abertis Infraestructuras SA 1% 27/02/2027^ 371 0.02
EUR 1,000,000 Abertis Infraestructuras SA 1.375% 20/05/2026^ 961 0.06
EUR 500,000 Abertis Infraestructuras SA 2.5% 27/02/2025 535 0.04
EUR 500,000 Abertis Infraestructuras SA 3.75% 20/06/2023 572 0.04
EUR 500,000 Abertis Infraestructuras SA 4.375% 30/03/2020 540 0.04
EUR 300,000 Abertis Infraestructuras SA 4.75% 25/10/2019 320 0.02
EUR 500,000 ACS Servicios Comunicaciones y Energia SL 1.875% 20/04/2026 487 0.03
EUR 200,000 Amadeus Capital Markets SAU 0.125% 06/10/2020 201 0.01
EUR 700,000 Amadeus Capital Markets SAU 1.625% 17/11/2021^ 734 0.05
EUR 900,000 Banco Bilbao Vizcaya Argentaria SA 0.625% 17/01/2022 904 0.06
EUR 800,000 Banco Bilbao Vizcaya Argentaria SA 0.75% 11/09/2022 788 0.05
EUR 800,000 Banco Bilbao Vizcaya Argentaria SA 1% 20/01/2021 815 0.05
EUR 500,000 Banco Bilbao Vizcaya Argentaria SA 1.375% 14/05/2025 486 0.03
EUR 800,000 Banco Bilbao Vizcaya Argentaria SA 3.5% 10/02/2027 833 0.06
EUR 900,000 Banco de Sabadell SA 0.875% 05/03/2023 879 0.06
EUR 600,000 Banco Santander SA 1.125% 17/01/2025 579 0.04
EUR 900,000 Banco Santander SA 1.375% 03/03/2021 928 0.06
EUR 1,200,000 Banco Santander SA 1.375% 09/02/2022 1,221 0.08
EUR 1,100,000 Banco Santander SA 1.375% 14/12/2022 1,140 0.08
EUR 1,100,000 Banco Santander SA 2.125% 08/02/2028 1,026 0.07
EUR 1,300,000 Banco Santander SA 2.5% 18/03/2025^ 1,302 0.09
EUR 900,000 Banco Santander SA 3.125% 19/01/2027 928 0.06
EUR 1,000,000 Banco Santander SA 3.25% 04/04/2026 1,044 0.07
EUR 1,300,000 Banco Santander SA 4% 24/01/2020 1,386 0.09
EUR 500,000 BPE Financiaciones SA 2% 03/02/2020 515 0.03
EUR 900,000 CaixaBank SA 0.75% 18/04/2023 879 0.06EUR 1,200,000 CaixaBank SA 1.125%
12/01/2023 1,177 0.08EUR 600,000 CaixaBank SA 1.125%
17/05/2024 587 0.04EUR 800,000 CaixaBank SA 2.25% 17/04/2030 751 0.05EUR 1,000,000 CaixaBank SA 2.75% 14/07/2028 998 0.07
Ccy Holding Investment Fair value
€'000
% of net asset value
Spain (30 November 2017: 4.43%) (cont) Corporate Bonds (cont)
EUR 400,000 Canal de Isabel II Gestion SA 1.68% 26/02/2025 405 0.03
EUR 500,000 Criteria Caixa SAU 1.5% 10/05/2023 495 0.03
EUR 900,000 Criteria Caixa SAU 1.625% 21/04/2022 913 0.06
EUR 400,000 Distribuidora Internacional de Alimentacion SA 0.875% 06/04/2023^ 391 0.03
EUR 200,000 Distribuidora Internacional de Alimentacion SA 1% 28/04/2021 203 0.01
EUR 100,000 Distribuidora Internacional de Alimentacion SA 1.5% 22/07/2019 101 0.01
EUR 500,000 Enagas Financiaciones SAU 0.75% 27/10/2026 478 0.03
EUR 200,000 Enagas Financiaciones SAU 1% 25/03/2023 205 0.01
EUR 800,000 Enagas Financiaciones SAU 1.25% 06/02/2025 812 0.05
EUR 500,000 Enagas Financiaciones SAU 1.375% 05/05/2028 494 0.03
EUR 500,000 Enagas Financiaciones SAU 2.5% 11/04/2022 544 0.04
EUR 500,000 FCC Aqualia SA 1.413% 08/06/2022 510 0.03
EUR 450,000 FCC Aqualia SA 2.629% 08/06/2027 454 0.03
EUR 500,000 Ferrovial Emisiones SA 0.375% 14/09/2022 494 0.03
EUR 300,000 Ferrovial Emisiones SA 1.375% 31/03/2025^ 297 0.02
EUR 650,000 Ferrovial Emisiones SA 3.375% 07/06/2021 709 0.05
EUR 400,000 Gas Natural Capital Markets SA 1.125% 11/04/2024 401 0.03
EUR 1,150,000 Gas Natural Capital Markets SA 4.5% 27/01/2020 1,235 0.08
EUR 600,000 Gas Natural Capital Markets SA 5.125% 02/11/2021 695 0.05
EUR 500,000 Gas Natural Capital Markets SA 6% 27/01/2020 550 0.04
EUR 700,000 Iberdrola Finanzas SA 1% 07/03/2024 705 0.05
EUR 700,000 Iberdrola Finanzas SA 1% 07/03/2025 696 0.05
EUR 400,000 Iberdrola Finanzas SA 1.25% 13/09/2027 391 0.03
EUR 100,000 Iberdrola Finanzas SA 1.621% 29/11/2029 98 0.01
EUR 1,000,000 Iberdrola Finanzas SA 4.125% 23/03/2020 1,074 0.07
EUR 400,000 IE2 Holdco SAU 2.375% 27/11/2023 423 0.03
EUR 600,000 IE2 Holdco SAU 2.875% 01/06/2026 637 0.04
EUR 200,000 Inmobiliaria Colonial Socimi SA 1.45% 28/10/2024 198 0.01
EUR 500,000 Inmobiliaria Colonial Socimi SA 1.625% 28/11/2025 487 0.03
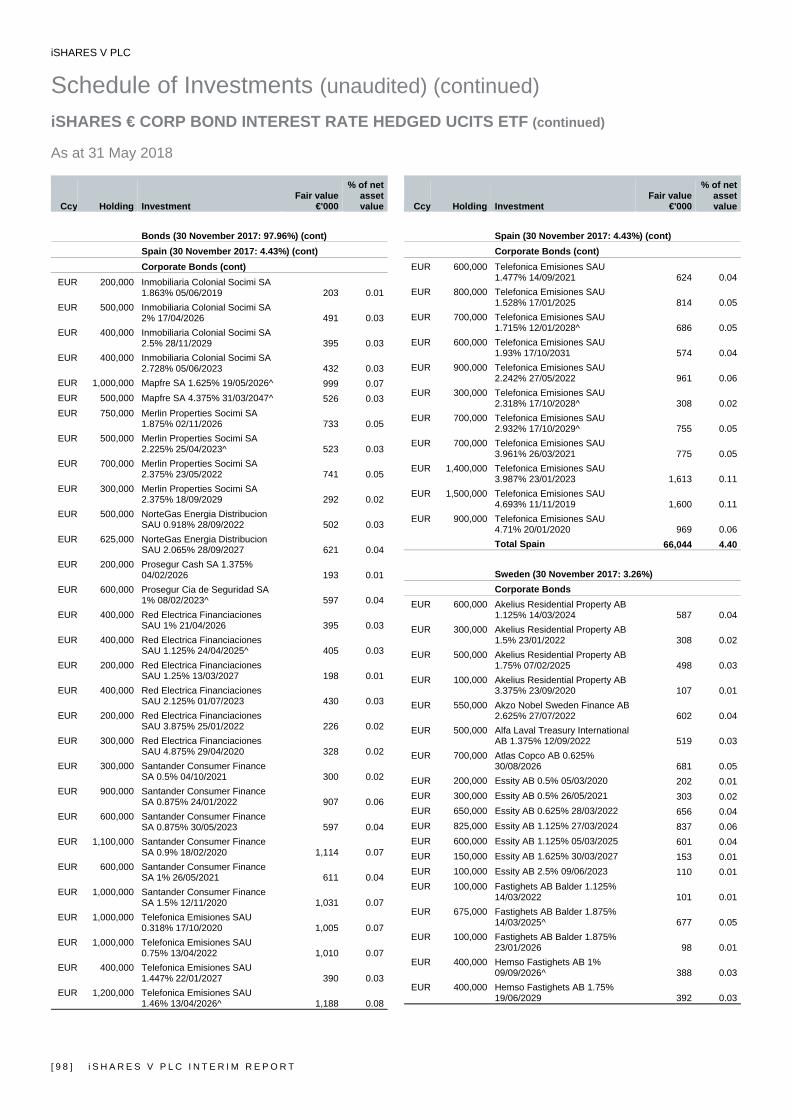
iSHARES V PLC
Schedule of Investments (unaudited) (continued) iSHARES € CORP BOND INTEREST RATE HEDGED UCITS ETF (continued) As at 31 May 2018
[ 9 8 ] i S H A R E S V P L C I N T E R I M R E P O R T
Ccy Holding Investment Fair value
€'000
% of net asset value
Bonds (30 November 2017: 97.96%) (cont) Spain (30 November 2017: 4.43%) (cont) Corporate Bonds (cont)
EUR 200,000 Inmobiliaria Colonial Socimi SA 1.863% 05/06/2019 203 0.01
EUR 500,000 Inmobiliaria Colonial Socimi SA 2% 17/04/2026 491 0.03
EUR 400,000 Inmobiliaria Colonial Socimi SA 2.5% 28/11/2029 395 0.03
EUR 400,000 Inmobiliaria Colonial Socimi SA 2.728% 05/06/2023 432 0.03
EUR 1,000,000 Mapfre SA 1.625% 19/05/2026^ 999 0.07EUR 500,000 Mapfre SA 4.375% 31/03/2047^ 526 0.03EUR 750,000 Merlin Properties Socimi SA
1.875% 02/11/2026 733 0.05EUR 500,000 Merlin Properties Socimi SA
2.225% 25/04/2023^ 523 0.03EUR 700,000 Merlin Properties Socimi SA
2.375% 23/05/2022 741 0.05EUR 300,000 Merlin Properties Socimi SA
2.375% 18/09/2029 292 0.02EUR 500,000 NorteGas Energia Distribucion
SAU 0.918% 28/09/2022 502 0.03EUR 625,000 NorteGas Energia Distribucion
SAU 2.065% 28/09/2027 621 0.04EUR 200,000 Prosegur Cash SA 1.375%
04/02/2026 193 0.01EUR 600,000 Prosegur Cia de Seguridad SA
1% 08/02/2023^ 597 0.04EUR 400,000 Red Electrica Financiaciones
SAU 1% 21/04/2026 395 0.03EUR 400,000 Red Electrica Financiaciones
SAU 1.125% 24/04/2025^ 405 0.03EUR 200,000 Red Electrica Financiaciones
SAU 1.25% 13/03/2027 198 0.01EUR 400,000 Red Electrica Financiaciones
SAU 2.125% 01/07/2023 430 0.03EUR 200,000 Red Electrica Financiaciones
SAU 3.875% 25/01/2022 226 0.02EUR 300,000 Red Electrica Financiaciones
SAU 4.875% 29/04/2020 328 0.02EUR 300,000 Santander Consumer Finance
SA 0.5% 04/10/2021 300 0.02EUR 900,000 Santander Consumer Finance
SA 0.875% 24/01/2022 907 0.06EUR 600,000 Santander Consumer Finance
SA 0.875% 30/05/2023 597 0.04EUR 1,100,000 Santander Consumer Finance
SA 0.9% 18/02/2020 1,114 0.07EUR 600,000 Santander Consumer Finance
SA 1% 26/05/2021 611 0.04EUR 1,000,000 Santander Consumer Finance
SA 1.5% 12/11/2020 1,031 0.07EUR 1,000,000 Telefonica Emisiones SAU
0.318% 17/10/2020 1,005 0.07EUR 1,000,000 Telefonica Emisiones SAU
0.75% 13/04/2022 1,010 0.07EUR 400,000 Telefonica Emisiones SAU
1.447% 22/01/2027 390 0.03EUR 1,200,000 Telefonica Emisiones SAU
1.46% 13/04/2026^ 1,188 0.08
Ccy Holding Investment Fair value
€'000
% of net asset value
Spain (30 November 2017: 4.43%) (cont) Corporate Bonds (cont)
EUR 600,000 Telefonica Emisiones SAU 1.477% 14/09/2021 624 0.04
EUR 800,000 Telefonica Emisiones SAU 1.528% 17/01/2025 814 0.05
EUR 700,000 Telefonica Emisiones SAU 1.715% 12/01/2028^ 686 0.05
EUR 600,000 Telefonica Emisiones SAU 1.93% 17/10/2031 574 0.04
EUR 900,000 Telefonica Emisiones SAU 2.242% 27/05/2022 961 0.06
EUR 300,000 Telefonica Emisiones SAU 2.318% 17/10/2028^ 308 0.02
EUR 700,000 Telefonica Emisiones SAU 2.932% 17/10/2029^ 755 0.05
EUR 700,000 Telefonica Emisiones SAU 3.961% 26/03/2021 775 0.05
EUR 1,400,000 Telefonica Emisiones SAU 3.987% 23/01/2023 1,613 0.11
EUR 1,500,000 Telefonica Emisiones SAU 4.693% 11/11/2019 1,600 0.11
EUR 900,000 Telefonica Emisiones SAU 4.71% 20/01/2020 969 0.06Total Spain 66,044 4.40
Sweden (30 November 2017: 3.26%) Corporate Bonds
EUR 600,000 Akelius Residential Property AB 1.125% 14/03/2024 587 0.04
EUR 300,000 Akelius Residential Property AB 1.5% 23/01/2022 308 0.02
EUR 500,000 Akelius Residential Property AB 1.75% 07/02/2025 498 0.03
EUR 100,000 Akelius Residential Property AB 3.375% 23/09/2020 107 0.01
EUR 550,000 Akzo Nobel Sweden Finance AB 2.625% 27/07/2022 602 0.04
EUR 500,000 Alfa Laval Treasury International AB 1.375% 12/09/2022 519 0.03
EUR 700,000 Atlas Copco AB 0.625% 30/08/2026 681 0.05
EUR 200,000 Essity AB 0.5% 05/03/2020 202 0.01EUR 300,000 Essity AB 0.5% 26/05/2021 303 0.02EUR 650,000 Essity AB 0.625% 28/03/2022 656 0.04EUR 825,000 Essity AB 1.125% 27/03/2024 837 0.06EUR 600,000 Essity AB 1.125% 05/03/2025 601 0.04EUR 150,000 Essity AB 1.625% 30/03/2027 153 0.01EUR 100,000 Essity AB 2.5% 09/06/2023 110 0.01EUR 100,000 Fastighets AB Balder 1.125%
14/03/2022 101 0.01EUR 675,000 Fastighets AB Balder 1.875%
14/03/2025^ 677 0.05EUR 100,000 Fastighets AB Balder 1.875%
23/01/2026 98 0.01EUR 400,000 Hemso Fastighets AB 1%
09/09/2026^ 388 0.03EUR 400,000 Hemso Fastighets AB 1.75%
19/06/2029 392 0.03
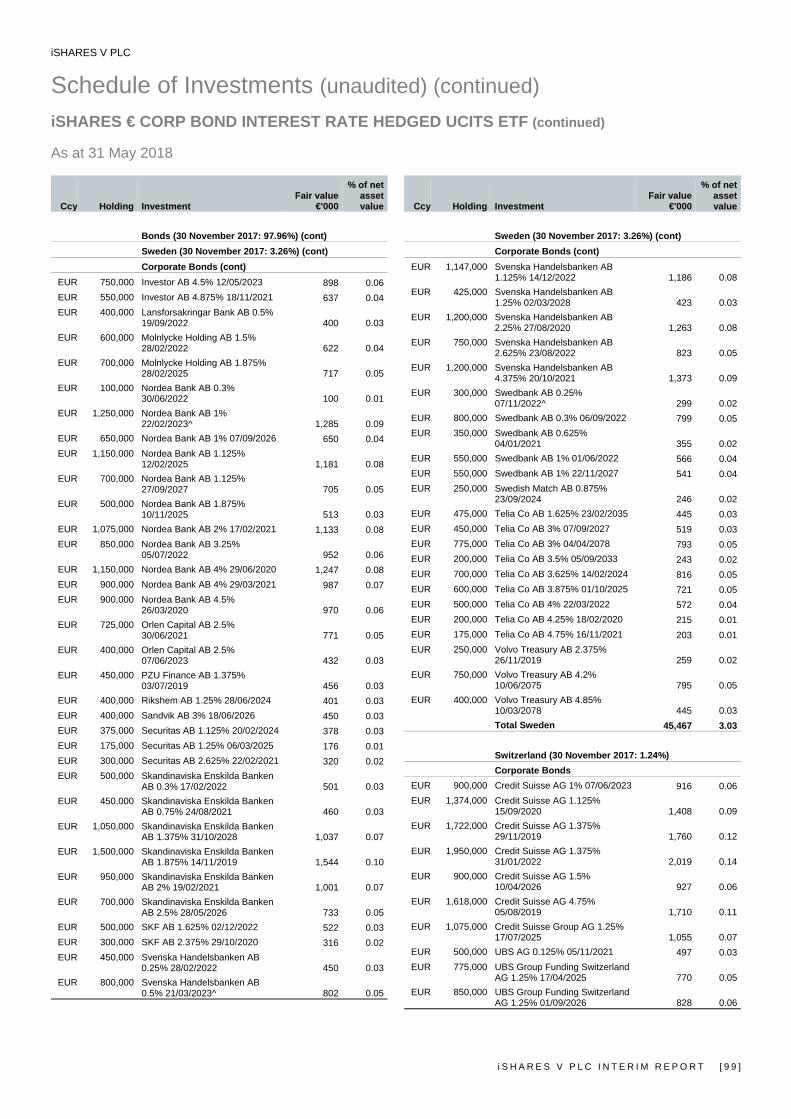
iSHARES V PLC
Schedule of Investments (unaudited) (continued) iSHARES € CORP BOND INTEREST RATE HEDGED UCITS ETF (continued) As at 31 May 2018
i S H A R E S V P L C I N T E R I M R E P O R T [ 9 9 ]
Ccy Holding Investment Fair value
€'000
% of net asset value
Bonds (30 November 2017: 97.96%) (cont) Sweden (30 November 2017: 3.26%) (cont) Corporate Bonds (cont)
EUR 750,000 Investor AB 4.5% 12/05/2023 898 0.06EUR 550,000 Investor AB 4.875% 18/11/2021 637 0.04EUR 400,000 Lansforsakringar Bank AB 0.5%
19/09/2022 400 0.03EUR 600,000 Molnlycke Holding AB 1.5%
28/02/2022 622 0.04EUR 700,000 Molnlycke Holding AB 1.875%
28/02/2025 717 0.05EUR 100,000 Nordea Bank AB 0.3%
30/06/2022 100 0.01EUR 1,250,000 Nordea Bank AB 1%
22/02/2023^ 1,285 0.09EUR 650,000 Nordea Bank AB 1% 07/09/2026 650 0.04EUR 1,150,000 Nordea Bank AB 1.125%
12/02/2025 1,181 0.08EUR 700,000 Nordea Bank AB 1.125%
27/09/2027 705 0.05EUR 500,000 Nordea Bank AB 1.875%
10/11/2025 513 0.03EUR 1,075,000 Nordea Bank AB 2% 17/02/2021 1,133 0.08EUR 850,000 Nordea Bank AB 3.25%
05/07/2022 952 0.06EUR 1,150,000 Nordea Bank AB 4% 29/06/2020 1,247 0.08EUR 900,000 Nordea Bank AB 4% 29/03/2021 987 0.07EUR 900,000 Nordea Bank AB 4.5%
26/03/2020 970 0.06EUR 725,000 Orlen Capital AB 2.5%
30/06/2021 771 0.05EUR 400,000 Orlen Capital AB 2.5%
07/06/2023 432 0.03EUR 450,000 PZU Finance AB 1.375%
03/07/2019 456 0.03EUR 400,000 Rikshem AB 1.25% 28/06/2024 401 0.03EUR 400,000 Sandvik AB 3% 18/06/2026 450 0.03EUR 375,000 Securitas AB 1.125% 20/02/2024 378 0.03EUR 175,000 Securitas AB 1.25% 06/03/2025 176 0.01EUR 300,000 Securitas AB 2.625% 22/02/2021 320 0.02EUR 500,000 Skandinaviska Enskilda Banken
AB 0.3% 17/02/2022 501 0.03EUR 450,000 Skandinaviska Enskilda Banken
AB 0.75% 24/08/2021 460 0.03EUR 1,050,000 Skandinaviska Enskilda Banken
AB 1.375% 31/10/2028 1,037 0.07EUR 1,500,000 Skandinaviska Enskilda Banken
AB 1.875% 14/11/2019 1,544 0.10EUR 950,000 Skandinaviska Enskilda Banken
AB 2% 19/02/2021 1,001 0.07EUR 700,000 Skandinaviska Enskilda Banken
AB 2.5% 28/05/2026 733 0.05EUR 500,000 SKF AB 1.625% 02/12/2022 522 0.03EUR 300,000 SKF AB 2.375% 29/10/2020 316 0.02EUR 450,000 Svenska Handelsbanken AB
0.25% 28/02/2022 450 0.03EUR 800,000 Svenska Handelsbanken AB
0.5% 21/03/2023^ 802 0.05
Ccy Holding Investment Fair value
€'000
% of net asset value
Sweden (30 November 2017: 3.26%) (cont) Corporate Bonds (cont)
EUR 1,147,000 Svenska Handelsbanken AB 1.125% 14/12/2022 1,186 0.08
EUR 425,000 Svenska Handelsbanken AB 1.25% 02/03/2028 423 0.03
EUR 1,200,000 Svenska Handelsbanken AB 2.25% 27/08/2020 1,263 0.08
EUR 750,000 Svenska Handelsbanken AB 2.625% 23/08/2022 823 0.05
EUR 1,200,000 Svenska Handelsbanken AB 4.375% 20/10/2021 1,373 0.09
EUR 300,000 Swedbank AB 0.25% 07/11/2022^ 299 0.02
EUR 800,000 Swedbank AB 0.3% 06/09/2022 799 0.05EUR 350,000 Swedbank AB 0.625%
04/01/2021 355 0.02EUR 550,000 Swedbank AB 1% 01/06/2022 566 0.04EUR 550,000 Swedbank AB 1% 22/11/2027 541 0.04EUR 250,000 Swedish Match AB 0.875%
23/09/2024 246 0.02EUR 475,000 Telia Co AB 1.625% 23/02/2035 445 0.03EUR 450,000 Telia Co AB 3% 07/09/2027 519 0.03EUR 775,000 Telia Co AB 3% 04/04/2078 793 0.05EUR 200,000 Telia Co AB 3.5% 05/09/2033 243 0.02EUR 700,000 Telia Co AB 3.625% 14/02/2024 816 0.05EUR 600,000 Telia Co AB 3.875% 01/10/2025 721 0.05EUR 500,000 Telia Co AB 4% 22/03/2022 572 0.04EUR 200,000 Telia Co AB 4.25% 18/02/2020 215 0.01EUR 175,000 Telia Co AB 4.75% 16/11/2021 203 0.01EUR 250,000 Volvo Treasury AB 2.375%
26/11/2019 259 0.02EUR 750,000 Volvo Treasury AB 4.2%
10/06/2075 795 0.05EUR 400,000 Volvo Treasury AB 4.85%
10/03/2078 445 0.03Total Sweden 45,467 3.03
Switzerland (30 November 2017: 1.24%) Corporate Bonds
EUR 900,000 Credit Suisse AG 1% 07/06/2023 916 0.06EUR 1,374,000 Credit Suisse AG 1.125%
15/09/2020 1,408 0.09EUR 1,722,000 Credit Suisse AG 1.375%
29/11/2019 1,760 0.12EUR 1,950,000 Credit Suisse AG 1.375%
31/01/2022 2,019 0.14EUR 900,000 Credit Suisse AG 1.5%
10/04/2026 927 0.06EUR 1,618,000 Credit Suisse AG 4.75%
05/08/2019 1,710 0.11EUR 1,075,000 Credit Suisse Group AG 1.25%
17/07/2025 1,055 0.07EUR 500,000 UBS AG 0.125% 05/11/2021 497 0.03EUR 775,000 UBS Group Funding Switzerland
AG 1.25% 17/04/2025 770 0.05EUR 850,000 UBS Group Funding Switzerland
AG 1.25% 01/09/2026 828 0.06
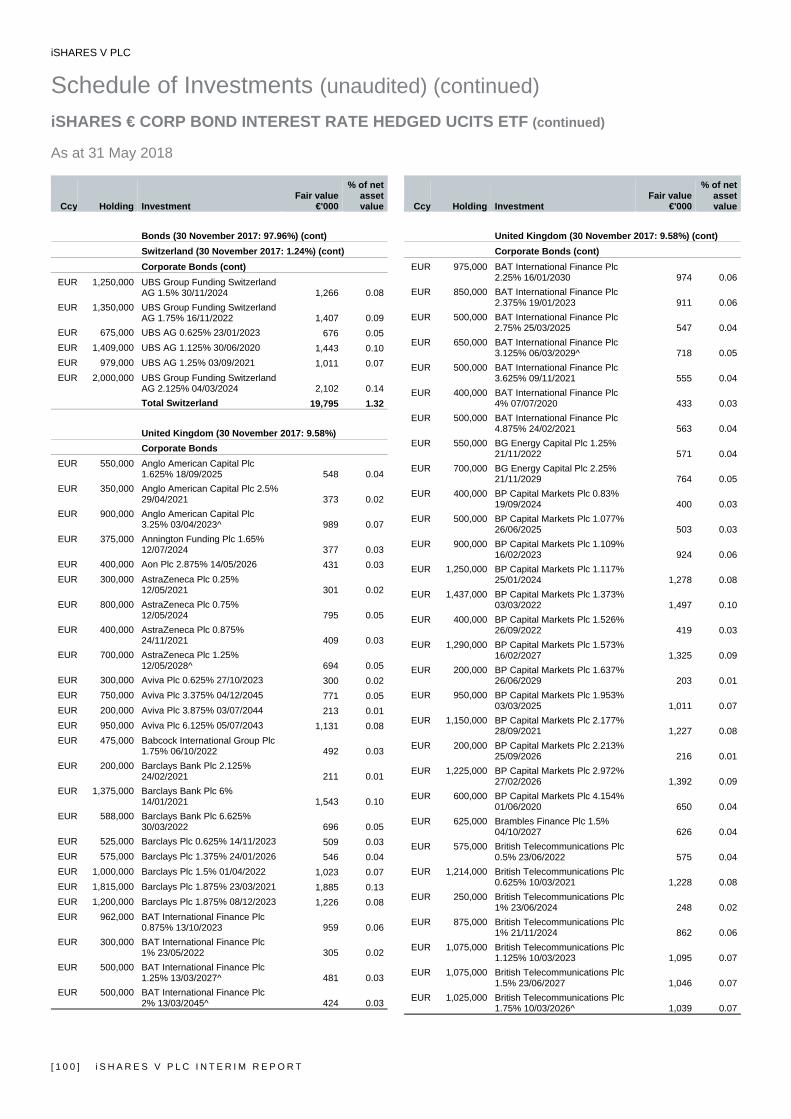
iSHARES V PLC
Schedule of Investments (unaudited) (continued) iSHARES € CORP BOND INTEREST RATE HEDGED UCITS ETF (continued) As at 31 May 2018
[ 1 0 0 ] i S H A R E S V P L C I N T E R I M R E P O R T
Ccy Holding Investment Fair value
€'000
% of net asset value
Bonds (30 November 2017: 97.96%) (cont) Switzerland (30 November 2017: 1.24%) (cont) Corporate Bonds (cont)
EUR 1,250,000 UBS Group Funding Switzerland AG 1.5% 30/11/2024 1,266 0.08
EUR 1,350,000 UBS Group Funding Switzerland AG 1.75% 16/11/2022 1,407 0.09
EUR 675,000 UBS AG 0.625% 23/01/2023 676 0.05EUR 1,409,000 UBS AG 1.125% 30/06/2020 1,443 0.10EUR 979,000 UBS AG 1.25% 03/09/2021 1,011 0.07EUR 2,000,000 UBS Group Funding Switzerland
AG 2.125% 04/03/2024 2,102 0.14Total Switzerland 19,795 1.32
United Kingdom (30 November 2017: 9.58%) Corporate Bonds
EUR 550,000 Anglo American Capital Plc 1.625% 18/09/2025 548 0.04
EUR 350,000 Anglo American Capital Plc 2.5% 29/04/2021 373 0.02
EUR 900,000 Anglo American Capital Plc 3.25% 03/04/2023^ 989 0.07
EUR 375,000 Annington Funding Plc 1.65% 12/07/2024 377 0.03
EUR 400,000 Aon Plc 2.875% 14/05/2026 431 0.03EUR 300,000 AstraZeneca Plc 0.25%
12/05/2021 301 0.02EUR 800,000 AstraZeneca Plc 0.75%
12/05/2024 795 0.05EUR 400,000 AstraZeneca Plc 0.875%
24/11/2021 409 0.03EUR 700,000 AstraZeneca Plc 1.25%
12/05/2028^ 694 0.05EUR 300,000 Aviva Plc 0.625% 27/10/2023 300 0.02EUR 750,000 Aviva Plc 3.375% 04/12/2045 771 0.05EUR 200,000 Aviva Plc 3.875% 03/07/2044 213 0.01EUR 950,000 Aviva Plc 6.125% 05/07/2043 1,131 0.08EUR 475,000 Babcock International Group Plc
1.75% 06/10/2022 492 0.03EUR 200,000 Barclays Bank Plc 2.125%
24/02/2021 211 0.01EUR 1,375,000 Barclays Bank Plc 6%
14/01/2021 1,543 0.10EUR 588,000 Barclays Bank Plc 6.625%
30/03/2022 696 0.05EUR 525,000 Barclays Plc 0.625% 14/11/2023 509 0.03EUR 575,000 Barclays Plc 1.375% 24/01/2026 546 0.04EUR 1,000,000 Barclays Plc 1.5% 01/04/2022 1,023 0.07EUR 1,815,000 Barclays Plc 1.875% 23/03/2021 1,885 0.13EUR 1,200,000 Barclays Plc 1.875% 08/12/2023 1,226 0.08EUR 962,000 BAT International Finance Plc
0.875% 13/10/2023 959 0.06EUR 300,000 BAT International Finance Plc
1% 23/05/2022 305 0.02EUR 500,000 BAT International Finance Plc
1.25% 13/03/2027^ 481 0.03EUR 500,000 BAT International Finance Plc
2% 13/03/2045^ 424 0.03
Ccy Holding Investment Fair value
€'000
% of net asset value
United Kingdom (30 November 2017: 9.58%) (cont) Corporate Bonds (cont)
EUR 975,000 BAT International Finance Plc 2.25% 16/01/2030 974 0.06
EUR 850,000 BAT International Finance Plc 2.375% 19/01/2023 911 0.06
EUR 500,000 BAT International Finance Plc 2.75% 25/03/2025 547 0.04
EUR 650,000 BAT International Finance Plc 3.125% 06/03/2029^ 718 0.05
EUR 500,000 BAT International Finance Plc 3.625% 09/11/2021 555 0.04
EUR 400,000 BAT International Finance Plc 4% 07/07/2020 433 0.03
EUR 500,000 BAT International Finance Plc 4.875% 24/02/2021 563 0.04
EUR 550,000 BG Energy Capital Plc 1.25% 21/11/2022 571 0.04
EUR 700,000 BG Energy Capital Plc 2.25% 21/11/2029 764 0.05
EUR 400,000 BP Capital Markets Plc 0.83% 19/09/2024 400 0.03
EUR 500,000 BP Capital Markets Plc 1.077% 26/06/2025 503 0.03
EUR 900,000 BP Capital Markets Plc 1.109% 16/02/2023 924 0.06
EUR 1,250,000 BP Capital Markets Plc 1.117% 25/01/2024 1,278 0.08
EUR 1,437,000 BP Capital Markets Plc 1.373% 03/03/2022 1,497 0.10
EUR 400,000 BP Capital Markets Plc 1.526% 26/09/2022 419 0.03
EUR 1,290,000 BP Capital Markets Plc 1.573% 16/02/2027 1,325 0.09
EUR 200,000 BP Capital Markets Plc 1.637% 26/06/2029 203 0.01
EUR 950,000 BP Capital Markets Plc 1.953% 03/03/2025 1,011 0.07
EUR 1,150,000 BP Capital Markets Plc 2.177% 28/09/2021 1,227 0.08
EUR 200,000 BP Capital Markets Plc 2.213% 25/09/2026 216 0.01
EUR 1,225,000 BP Capital Markets Plc 2.972% 27/02/2026 1,392 0.09
EUR 600,000 BP Capital Markets Plc 4.154% 01/06/2020 650 0.04
EUR 625,000 Brambles Finance Plc 1.5% 04/10/2027 626 0.04
EUR 575,000 British Telecommunications Plc 0.5% 23/06/2022 575 0.04
EUR 1,214,000 British Telecommunications Plc 0.625% 10/03/2021 1,228 0.08
EUR 250,000 British Telecommunications Plc 1% 23/06/2024 248 0.02
EUR 875,000 British Telecommunications Plc 1% 21/11/2024 862 0.06
EUR 1,075,000 British Telecommunications Plc 1.125% 10/03/2023 1,095 0.07
EUR 1,075,000 British Telecommunications Plc 1.5% 23/06/2027 1,046 0.07
EUR 1,025,000 British Telecommunications Plc 1.75% 10/03/2026^ 1,039 0.07

iSHARES V PLC
Schedule of Investments (unaudited) (continued) iSHARES € CORP BOND INTEREST RATE HEDGED UCITS ETF (continued) As at 31 May 2018
i S H A R E S V P L C I N T E R I M R E P O R T [ 1 0 1 ]
Ccy Holding Investment Fair value
€'000
% of net asset value
Bonds (30 November 2017: 97.96%) (cont) United Kingdom (30 November 2017: 9.58%) (cont) Corporate Bonds (cont)
EUR 675,000 Cadent Finance Plc 0.625% 22/09/2024 661 0.04
EUR 800,000 Centrica Plc 3% 10/04/2076 819 0.05EUR 400,000 Coca-Cola European Partners
Plc 1.125% 26/05/2024 407 0.03EUR 100,000 Coca-Cola European Partners
Plc 1.75% 26/05/2028 102 0.01EUR 550,000 Coca-Cola European Partners
Plc 1.875% 18/03/2030 567 0.04EUR 550,000 Coca-Cola European Partners
Plc 2% 05/12/2019 564 0.04EUR 350,000 Coca-Cola European Partners
Plc 2.375% 07/05/2025 382 0.03EUR 250,000 Coca-Cola European Partners
Plc 2.625% 06/11/2023 276 0.02EUR 425,000 Compass Group Plc 1.875%
27/01/2023 452 0.03EUR 600,000 Coventry Building Society 2.5%
18/11/2020 635 0.04EUR 600,000 Diageo Finance Plc 0%
17/11/2020 601 0.04EUR 550,000 Diageo Finance Plc 0.5%
19/06/2024 545 0.04EUR 350,000 Diageo Finance Plc 1.75%
23/09/2024 372 0.02EUR 850,000 Diageo Finance Plc 2.375%
20/05/2026 938 0.06EUR 775,000 DS Smith Plc 1.375% 26/07/2024 774 0.05EUR 450,000 DS Smith Plc 2.25% 16/09/2022 478 0.03EUR 700,000 easyJet Plc 1.125% 18/10/2023^ 707 0.05EUR 200,000 easyJet Plc 1.75% 09/02/2023 209 0.01EUR 400,000 Experian Finance Plc 1.375%
25/06/2026 400 0.03EUR 750,000 Experian Finance Plc 4.75%
04/02/2020 811 0.05EUR 300,000 FCE Bank Plc 0.869%
13/09/2021 303 0.02EUR 750,000 FCE Bank Plc 1.114%
13/05/2020 765 0.05EUR 500,000 FCE Bank Plc 1.134%
10/02/2022 508 0.03EUR 400,000 FCE Bank Plc 1.528%
09/11/2020 414 0.03EUR 600,000 FCE Bank Plc 1.615%
11/05/2023^ 616 0.04EUR 875,000 FCE Bank Plc 1.66%
11/02/2021^ 907 0.06EUR 600,000 FCE Bank Plc 1.875%
24/06/2021 626 0.04EUR 275,000 G4S International Finance Plc
1.5% 09/01/2023 281 0.02EUR 350,000 G4S International Finance Plc
1.5% 02/06/2024 352 0.02EUR 325,000 G4S International Finance Plc
1.875% 24/05/2025 328 0.02EUR 450,000 G4S International Finance Plc
2.625% 06/12/2018 456 0.03
Ccy Holding Investment Fair value
€'000
% of net asset value
United Kingdom (30 November 2017: 9.58%) (cont) Corporate Bonds (cont)
EUR 1,250,000 GlaxoSmithKline Capital Plc 0% 12/09/2020 1,252 0.08
EUR 775,000 GlaxoSmithKline Capital Plc 1% 12/09/2026 767 0.05
EUR 850,000 GlaxoSmithKline Capital Plc 1.375% 02/12/2024 884 0.06
EUR 275,000 GlaxoSmithKline Capital Plc 1.375% 12/09/2029 273 0.02
EUR 325,000 GlaxoSmithKline Capital Plc 1.75% 21/05/2030 333 0.02
EUR 1,007,000 GlaxoSmithKline Capital Plc 4% 16/06/2025^ 1,217 0.08
EUR 500,000 Hammerson Plc 2% 01/07/2022 527 0.03EUR 400,000 Hammerson Plc 2.75%
26/09/2019 414 0.03EUR 800,000 HBOS Plc 4.5% 18/03/2030 912 0.06EUR 1,150,000 HSBC Bank Plc 4% 15/01/2021 1,268 0.08EUR 1,881,000 HSBC Holdings Plc 0.875%
06/09/2024 1,853 0.12EUR 1,850,000 HSBC Holdings Plc 1.5%
15/03/2022 1,909 0.13EUR 875,000 HSBC Holdings Plc 2.5%
15/03/2027 944 0.06EUR 1,125,000 HSBC Holdings Plc 3%
30/06/2025 1,199 0.08EUR 1,025,000 HSBC Holdings Plc 3.125%
07/06/2028^ 1,093 0.07EUR 1,425,000 HSBC Holdings Plc 6%
10/06/2019 1,510 0.10EUR 300,000 Imperial Brands Finance Plc
0.5% 27/07/2021 302 0.02EUR 500,000 Imperial Brands Finance Plc
1.375% 27/01/2025 500 0.03EUR 725,000 Imperial Brands Finance Plc
2.25% 26/02/2021 762 0.05EUR 650,000 Imperial Brands Finance Plc
3.375% 26/02/2026 730 0.05EUR 600,000 Imperial Brands Finance Plc 5%
02/12/2019 645 0.04EUR 350,000 ITV Plc 2% 01/12/2023 364 0.02EUR 500,000 ITV Plc 2.125% 21/09/2022 526 0.03EUR 350,000 Leeds Building Society 1.375%
05/05/2022 358 0.02EUR 300,000 Leeds Building Society 2.625%
01/04/2021 318 0.02EUR 909,000 Lloyds Bank Plc 1% 19/11/2021 932 0.06EUR 800,000 Lloyds Bank Plc 1.25%
13/01/2025^ 817 0.05EUR 950,000 Lloyds Bank Plc 1.375%
08/09/2022 986 0.07EUR 1,250,000 Lloyds Bank Plc 6.5%
24/03/2020 1,387 0.09EUR 875,000 Lloyds Banking Group Plc
0.625% 15/01/2024 851 0.06EUR 262,000 Lloyds Banking Group Plc 0.75%
09/11/2021^ 265 0.02EUR 1,142,000 Lloyds Banking Group Plc 1%
09/11/2023 1,132 0.08
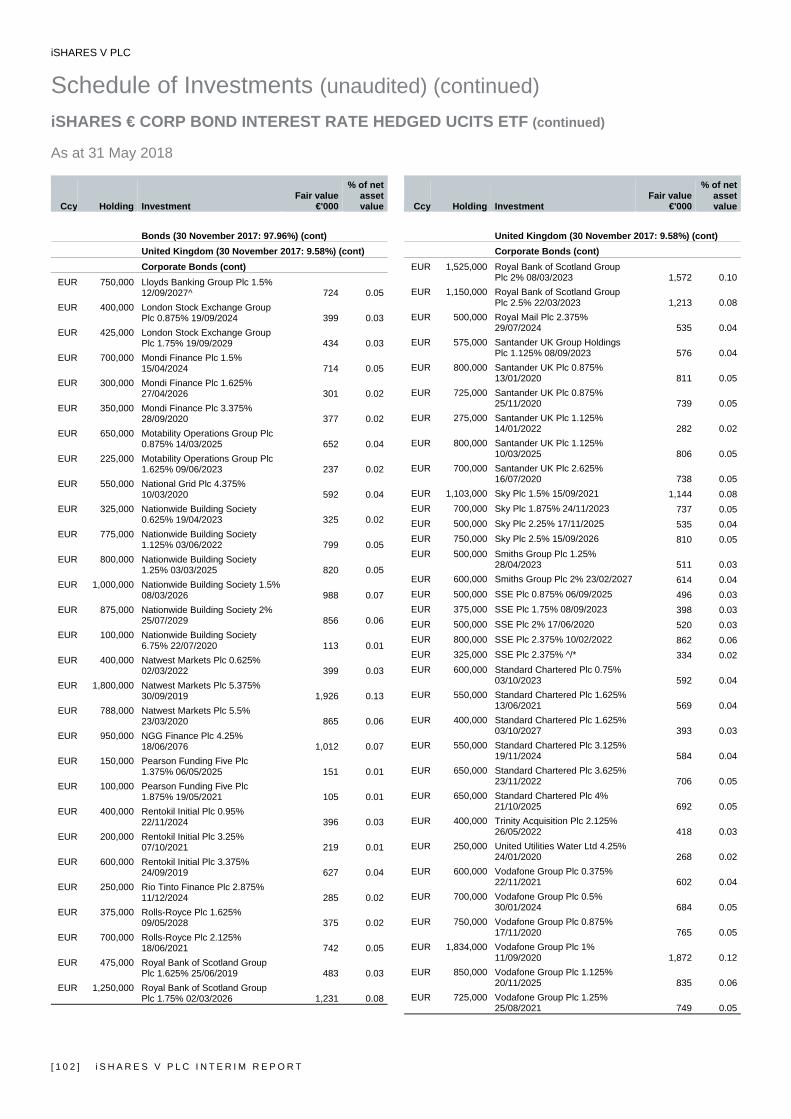
iSHARES V PLC
Schedule of Investments (unaudited) (continued) iSHARES € CORP BOND INTEREST RATE HEDGED UCITS ETF (continued) As at 31 May 2018
[ 1 0 2 ] i S H A R E S V P L C I N T E R I M R E P O R T
Ccy Holding Investment Fair value
€'000
% of net asset value
Bonds (30 November 2017: 97.96%) (cont) United Kingdom (30 November 2017: 9.58%) (cont) Corporate Bonds (cont)
EUR 750,000 Lloyds Banking Group Plc 1.5% 12/09/2027^ 724 0.05
EUR 400,000 London Stock Exchange Group Plc 0.875% 19/09/2024 399 0.03
EUR 425,000 London Stock Exchange Group Plc 1.75% 19/09/2029 434 0.03
EUR 700,000 Mondi Finance Plc 1.5% 15/04/2024 714 0.05
EUR 300,000 Mondi Finance Plc 1.625% 27/04/2026 301 0.02
EUR 350,000 Mondi Finance Plc 3.375% 28/09/2020 377 0.02
EUR 650,000 Motability Operations Group Plc 0.875% 14/03/2025 652 0.04
EUR 225,000 Motability Operations Group Plc 1.625% 09/06/2023 237 0.02
EUR 550,000 National Grid Plc 4.375% 10/03/2020 592 0.04
EUR 325,000 Nationwide Building Society 0.625% 19/04/2023 325 0.02
EUR 775,000 Nationwide Building Society 1.125% 03/06/2022 799 0.05
EUR 800,000 Nationwide Building Society 1.25% 03/03/2025 820 0.05
EUR 1,000,000 Nationwide Building Society 1.5% 08/03/2026 988 0.07
EUR 875,000 Nationwide Building Society 2% 25/07/2029 856 0.06
EUR 100,000 Nationwide Building Society 6.75% 22/07/2020 113 0.01
EUR 400,000 Natwest Markets Plc 0.625% 02/03/2022 399 0.03
EUR 1,800,000 Natwest Markets Plc 5.375% 30/09/2019 1,926 0.13
EUR 788,000 Natwest Markets Plc 5.5% 23/03/2020 865 0.06
EUR 950,000 NGG Finance Plc 4.25% 18/06/2076 1,012 0.07
EUR 150,000 Pearson Funding Five Plc 1.375% 06/05/2025 151 0.01
EUR 100,000 Pearson Funding Five Plc 1.875% 19/05/2021 105 0.01
EUR 400,000 Rentokil Initial Plc 0.95% 22/11/2024 396 0.03
EUR 200,000 Rentokil Initial Plc 3.25% 07/10/2021 219 0.01
EUR 600,000 Rentokil Initial Plc 3.375% 24/09/2019 627 0.04
EUR 250,000 Rio Tinto Finance Plc 2.875% 11/12/2024 285 0.02
EUR 375,000 Rolls-Royce Plc 1.625% 09/05/2028 375 0.02
EUR 700,000 Rolls-Royce Plc 2.125% 18/06/2021 742 0.05
EUR 475,000 Royal Bank of Scotland Group Plc 1.625% 25/06/2019 483 0.03
EUR 1,250,000 Royal Bank of Scotland Group Plc 1.75% 02/03/2026 1,231 0.08
Ccy Holding Investment Fair value
€'000
% of net asset value
United Kingdom (30 November 2017: 9.58%) (cont) Corporate Bonds (cont)
EUR 1,525,000 Royal Bank of Scotland Group Plc 2% 08/03/2023 1,572 0.10
EUR 1,150,000 Royal Bank of Scotland Group Plc 2.5% 22/03/2023 1,213 0.08
EUR 500,000 Royal Mail Plc 2.375% 29/07/2024 535 0.04
EUR 575,000 Santander UK Group Holdings Plc 1.125% 08/09/2023 576 0.04
EUR 800,000 Santander UK Plc 0.875% 13/01/2020 811 0.05
EUR 725,000 Santander UK Plc 0.875% 25/11/2020 739 0.05
EUR 275,000 Santander UK Plc 1.125% 14/01/2022 282 0.02
EUR 800,000 Santander UK Plc 1.125% 10/03/2025 806 0.05
EUR 700,000 Santander UK Plc 2.625% 16/07/2020 738 0.05
EUR 1,103,000 Sky Plc 1.5% 15/09/2021 1,144 0.08EUR 700,000 Sky Plc 1.875% 24/11/2023 737 0.05EUR 500,000 Sky Plc 2.25% 17/11/2025 535 0.04EUR 750,000 Sky Plc 2.5% 15/09/2026 810 0.05EUR 500,000 Smiths Group Plc 1.25%
28/04/2023 511 0.03EUR 600,000 Smiths Group Plc 2% 23/02/2027 614 0.04EUR 500,000 SSE Plc 0.875% 06/09/2025 496 0.03EUR 375,000 SSE Plc 1.75% 08/09/2023 398 0.03EUR 500,000 SSE Plc 2% 17/06/2020 520 0.03EUR 800,000 SSE Plc 2.375% 10/02/2022 862 0.06EUR 325,000 SSE Plc 2.375% ^/* 334 0.02EUR 600,000 Standard Chartered Plc 0.75%
03/10/2023 592 0.04EUR 550,000 Standard Chartered Plc 1.625%
13/06/2021 569 0.04EUR 400,000 Standard Chartered Plc 1.625%
03/10/2027 393 0.03EUR 550,000 Standard Chartered Plc 3.125%
19/11/2024 584 0.04EUR 650,000 Standard Chartered Plc 3.625%
23/11/2022 706 0.05EUR 650,000 Standard Chartered Plc 4%
21/10/2025 692 0.05EUR 400,000 Trinity Acquisition Plc 2.125%
26/05/2022 418 0.03EUR 250,000 United Utilities Water Ltd 4.25%
24/01/2020 268 0.02EUR 600,000 Vodafone Group Plc 0.375%
22/11/2021 602 0.04EUR 700,000 Vodafone Group Plc 0.5%
30/01/2024 684 0.05EUR 750,000 Vodafone Group Plc 0.875%
17/11/2020 765 0.05EUR 1,834,000 Vodafone Group Plc 1%
11/09/2020 1,872 0.12EUR 850,000 Vodafone Group Plc 1.125%
20/11/2025 835 0.06EUR 725,000 Vodafone Group Plc 1.25%
25/08/2021 749 0.05

iSHARES V PLC
Schedule of Investments (unaudited) (continued) iSHARES € CORP BOND INTEREST RATE HEDGED UCITS ETF (continued) As at 31 May 2018
i S H A R E S V P L C I N T E R I M R E P O R T [ 1 0 3 ]
Ccy Holding Investment Fair value
€'000
% of net asset value
Bonds (30 November 2017: 97.96%) (cont) United Kingdom (30 November 2017: 9.58%) (cont) Corporate Bonds (cont)
EUR 300,000 Vodafone Group Plc 1.5% 24/07/2027 294 0.02
EUR 1,025,000 Vodafone Group Plc 1.6% 29/07/2031 946 0.06
EUR 1,000,000 Vodafone Group Plc 1.75% 25/08/2023 1,053 0.07
EUR 800,000 Vodafone Group Plc 1.875% 11/09/2025 834 0.06
EUR 400,000 Vodafone Group Plc 1.875% 20/11/2029 392 0.03
EUR 1,523,000 Vodafone Group Plc 2.2% 25/08/2026 1,600 0.11
EUR 650,000 Vodafone Group Plc 2.875% 20/11/2037^ 642 0.04
EUR 872,000 Vodafone Group Plc 4.65% 20/01/2022 1,005 0.07
EUR 450,000 Vodafone Group Plc 5.375% 06/06/2022 539 0.04
EUR 200,000 Wellcome Trust Ltd 1.125% 21/01/2027 205 0.01
EUR 400,000 WPP Finance 2013 0.75% 18/11/2019 404 0.03
EUR 550,000 WPP Finance 2013 3% 20/11/2023^ 608 0.04
EUR 300,000 Yorkshire Building Society 0.875% 20/03/2023 301 0.02
EUR 700,000 Yorkshire Building Society 1.25% 17/03/2022 716 0.05Total United Kingdom 135,566 9.02
United States (30 November 2017: 17.74%) Corporate Bonds
EUR 100,000 3M Co 0.375% 15/02/2022 101 0.01EUR 500,000 3M Co 0.95% 15/05/2023 517 0.03EUR 1,050,000 3M Co 1.5% 09/11/2026 1,105 0.07EUR 400,000 3M Co 1.5% 02/06/2031 410 0.03EUR 200,000 3M Co 1.75% 15/05/2030 213 0.01EUR 550,000 3M Co 1.875% 15/11/2021 585 0.04EUR 1,250,000 AbbVie Inc 0.375% 18/11/2019 1,257 0.08EUR 814,000 AbbVie Inc 1.375% 17/05/2024 826 0.06EUR 750,000 AbbVie Inc 2.125% 17/11/2028 767 0.05EUR 330,000 Air Products & Chemicals Inc
0.375% 01/06/2021 333 0.02EUR 235,000 Air Products & Chemicals Inc 1%
12/02/2025 239 0.02EUR 300,000 Air Products & Chemicals Inc 2%
07/08/2020 314 0.02EUR 500,000 Albemarle Corp 1.875%
08/12/2021 525 0.04EUR 1,000,000 American Express Credit Corp
0.625% 22/11/2021 1,010 0.07EUR 250,000 American Honda Finance Corp
0.55% 17/03/2023 251 0.02EUR 600,000 American Honda Finance Corp
0.75% 17/01/2024 601 0.04
Ccy Holding Investment Fair value
€'000
% of net asset value
United States (30 November 2017: 17.74%) (cont) Corporate Bonds (cont)
EUR 600,000 American Honda Finance Corp 1.375% 10/11/2022 626 0.04
EUR 550,000 American International Group Inc 1.5% 08/06/2023 563 0.04
EUR 1,000,000 American International Group Inc 1.875% 21/06/2027 984 0.07
EUR 175,000 American Tower Corp 1.375% 04/04/2025 172 0.01
EUR 375,000 American Tower Corp 1.95% 22/05/2026 379 0.03
EUR 1,125,000 Amgen Inc 1.25% 25/02/2022 1,163 0.08EUR 725,000 Amgen Inc 2% 25/02/2026 771 0.05EUR 200,000 Amgen Inc 2.125% 13/09/2019 206 0.01EUR 850,000 Apple Inc 0.875% 24/05/2025 859 0.06EUR 1,300,000 Apple Inc 1% 10/11/2022 1,349 0.09EUR 700,000 Apple Inc 1.375% 17/01/2024 733 0.05EUR 1,000,000 Apple Inc 1.375% 24/05/2029 1,012 0.07EUR 900,000 Apple Inc 1.625% 10/11/2026 951 0.06EUR 850,000 Apple Inc 2% 17/09/2027 922 0.06EUR 300,000 Archer-Daniels-Midland Co
1.75% 23/06/2023 320 0.02EUR 475,000 AT&T Inc 1.05% 05/09/2023 481 0.03EUR 1,000,000 AT&T Inc 1.3% 05/09/2023 1,025 0.07EUR 1,350,000 AT&T Inc 1.45% 01/06/2022 1,400 0.09EUR 975,000 AT&T Inc 1.8% 05/09/2026 988 0.07EUR 700,000 AT&T Inc 1.875% 04/12/2020 730 0.05EUR 1,350,000 AT&T Inc 2.35% 05/09/2029 1,372 0.09EUR 1,250,000 AT&T Inc 2.4% 15/03/2024 1,344 0.09EUR 875,000 AT&T Inc 2.45% 15/03/2035 821 0.05EUR 1,150,000 AT&T Inc 2.5% 15/03/2023 1,246 0.08EUR 625,000 AT&T Inc 2.6% 17/12/2029 652 0.04EUR 800,000 AT&T Inc 2.65% 17/12/2021 863 0.06EUR 250,000 AT&T Inc 2.75% 19/05/2023 275 0.02EUR 1,613,000 AT&T Inc 3.15% 04/09/2036 1,639 0.11EUR 150,000 AT&T Inc 3.375% 15/03/2034 162 0.01EUR 600,000 AT&T Inc 3.5% 17/12/2025 689 0.05EUR 1,000,000 AT&T Inc 3.55% 17/12/2032^ 1,109 0.07EUR 400,000 Avery Dennison Corp 1.25%
03/03/2025 399 0.03EUR 1,150,000 Bank of America Corp 0.736%
07/02/2022 1,158 0.08EUR 700,000 Bank of America Corp 0.75%
26/07/2023 695 0.05EUR 1,300,000 Bank of America Corp 1.375%
10/09/2021 1,344 0.09EUR 500,000 Bank of America Corp 1.375%
26/03/2025 502 0.03EUR 1,400,000 Bank of America Corp 1.379%
07/02/2025 1,409 0.09EUR 1,184,000 Bank of America Corp 1.625%
14/09/2022 1,232 0.08EUR 650,000 Bank of America Corp 1.662%
25/04/2028 645 0.04EUR 1,575,000 Bank of America Corp 1.776%
04/05/2027 1,597 0.11
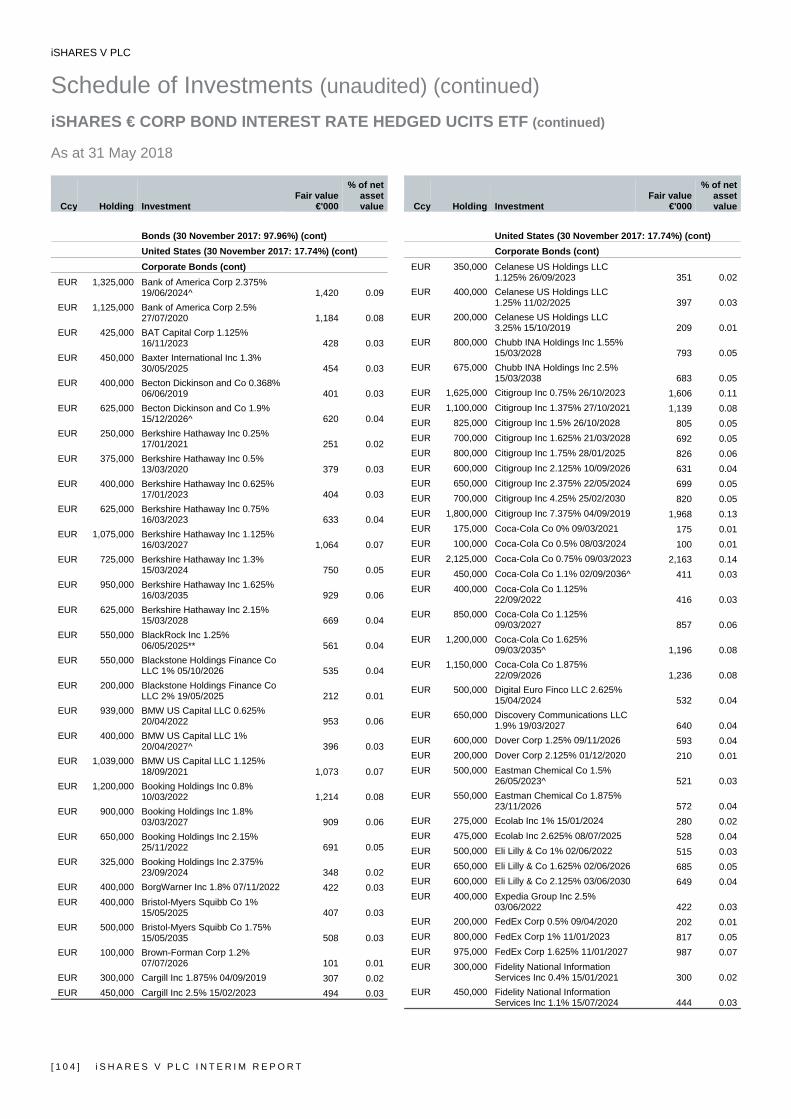
iSHARES V PLC
Schedule of Investments (unaudited) (continued) iSHARES € CORP BOND INTEREST RATE HEDGED UCITS ETF (continued) As at 31 May 2018
[ 1 0 4 ] i S H A R E S V P L C I N T E R I M R E P O R T
Ccy Holding Investment Fair value
€'000
% of net asset value
Bonds (30 November 2017: 97.96%) (cont) United States (30 November 2017: 17.74%) (cont) Corporate Bonds (cont)
EUR 1,325,000 Bank of America Corp 2.375% 19/06/2024^ 1,420 0.09
EUR 1,125,000 Bank of America Corp 2.5% 27/07/2020 1,184 0.08
EUR 425,000 BAT Capital Corp 1.125% 16/11/2023 428 0.03
EUR 450,000 Baxter International Inc 1.3% 30/05/2025 454 0.03
EUR 400,000 Becton Dickinson and Co 0.368% 06/06/2019 401 0.03
EUR 625,000 Becton Dickinson and Co 1.9% 15/12/2026^ 620 0.04
EUR 250,000 Berkshire Hathaway Inc 0.25% 17/01/2021 251 0.02
EUR 375,000 Berkshire Hathaway Inc 0.5% 13/03/2020 379 0.03
EUR 400,000 Berkshire Hathaway Inc 0.625% 17/01/2023 404 0.03
EUR 625,000 Berkshire Hathaway Inc 0.75% 16/03/2023 633 0.04
EUR 1,075,000 Berkshire Hathaway Inc 1.125% 16/03/2027 1,064 0.07
EUR 725,000 Berkshire Hathaway Inc 1.3% 15/03/2024 750 0.05
EUR 950,000 Berkshire Hathaway Inc 1.625% 16/03/2035 929 0.06
EUR 625,000 Berkshire Hathaway Inc 2.15% 15/03/2028 669 0.04
EUR 550,000 BlackRock Inc 1.25% 06/05/2025** 561 0.04
EUR 550,000 Blackstone Holdings Finance Co LLC 1% 05/10/2026 535 0.04
EUR 200,000 Blackstone Holdings Finance Co LLC 2% 19/05/2025 212 0.01
EUR 939,000 BMW US Capital LLC 0.625% 20/04/2022 953 0.06
EUR 400,000 BMW US Capital LLC 1% 20/04/2027^ 396 0.03
EUR 1,039,000 BMW US Capital LLC 1.125% 18/09/2021 1,073 0.07
EUR 1,200,000 Booking Holdings Inc 0.8% 10/03/2022 1,214 0.08
EUR 900,000 Booking Holdings Inc 1.8% 03/03/2027 909 0.06
EUR 650,000 Booking Holdings Inc 2.15% 25/11/2022 691 0.05
EUR 325,000 Booking Holdings Inc 2.375% 23/09/2024 348 0.02
EUR 400,000 BorgWarner Inc 1.8% 07/11/2022 422 0.03EUR 400,000 Bristol-Myers Squibb Co 1%
15/05/2025 407 0.03EUR 500,000 Bristol-Myers Squibb Co 1.75%
15/05/2035 508 0.03EUR 100,000 Brown-Forman Corp 1.2%
07/07/2026 101 0.01EUR 300,000 Cargill Inc 1.875% 04/09/2019 307 0.02EUR 450,000 Cargill Inc 2.5% 15/02/2023 494 0.03
Ccy Holding Investment Fair value
€'000
% of net asset value
United States (30 November 2017: 17.74%) (cont) Corporate Bonds (cont)
EUR 350,000 Celanese US Holdings LLC 1.125% 26/09/2023 351 0.02
EUR 400,000 Celanese US Holdings LLC 1.25% 11/02/2025 397 0.03
EUR 200,000 Celanese US Holdings LLC 3.25% 15/10/2019 209 0.01
EUR 800,000 Chubb INA Holdings Inc 1.55% 15/03/2028 793 0.05
EUR 675,000 Chubb INA Holdings Inc 2.5% 15/03/2038 683 0.05
EUR 1,625,000 Citigroup Inc 0.75% 26/10/2023 1,606 0.11EUR 1,100,000 Citigroup Inc 1.375% 27/10/2021 1,139 0.08EUR 825,000 Citigroup Inc 1.5% 26/10/2028 805 0.05EUR 700,000 Citigroup Inc 1.625% 21/03/2028 692 0.05EUR 800,000 Citigroup Inc 1.75% 28/01/2025 826 0.06EUR 600,000 Citigroup Inc 2.125% 10/09/2026 631 0.04EUR 650,000 Citigroup Inc 2.375% 22/05/2024 699 0.05EUR 700,000 Citigroup Inc 4.25% 25/02/2030 820 0.05EUR 1,800,000 Citigroup Inc 7.375% 04/09/2019 1,968 0.13EUR 175,000 Coca-Cola Co 0% 09/03/2021 175 0.01EUR 100,000 Coca-Cola Co 0.5% 08/03/2024 100 0.01EUR 2,125,000 Coca-Cola Co 0.75% 09/03/2023 2,163 0.14EUR 450,000 Coca-Cola Co 1.1% 02/09/2036^ 411 0.03EUR 400,000 Coca-Cola Co 1.125%
22/09/2022 416 0.03EUR 850,000 Coca-Cola Co 1.125%
09/03/2027 857 0.06EUR 1,200,000 Coca-Cola Co 1.625%
09/03/2035^ 1,196 0.08EUR 1,150,000 Coca-Cola Co 1.875%
22/09/2026 1,236 0.08EUR 500,000 Digital Euro Finco LLC 2.625%
15/04/2024 532 0.04EUR 650,000 Discovery Communications LLC
1.9% 19/03/2027 640 0.04EUR 600,000 Dover Corp 1.25% 09/11/2026 593 0.04EUR 200,000 Dover Corp 2.125% 01/12/2020 210 0.01EUR 500,000 Eastman Chemical Co 1.5%
26/05/2023^ 521 0.03EUR 550,000 Eastman Chemical Co 1.875%
23/11/2026 572 0.04EUR 275,000 Ecolab Inc 1% 15/01/2024 280 0.02EUR 475,000 Ecolab Inc 2.625% 08/07/2025 528 0.04EUR 500,000 Eli Lilly & Co 1% 02/06/2022 515 0.03EUR 650,000 Eli Lilly & Co 1.625% 02/06/2026 685 0.05EUR 600,000 Eli Lilly & Co 2.125% 03/06/2030 649 0.04EUR 400,000 Expedia Group Inc 2.5%
03/06/2022 422 0.03EUR 200,000 FedEx Corp 0.5% 09/04/2020 202 0.01EUR 800,000 FedEx Corp 1% 11/01/2023 817 0.05EUR 975,000 FedEx Corp 1.625% 11/01/2027 987 0.07EUR 300,000 Fidelity National Information
Services Inc 0.4% 15/01/2021 300 0.02EUR 450,000 Fidelity National Information
Services Inc 1.1% 15/07/2024 444 0.03

iSHARES V PLC
Schedule of Investments (unaudited) (continued) iSHARES € CORP BOND INTEREST RATE HEDGED UCITS ETF (continued) As at 31 May 2018
i S H A R E S V P L C I N T E R I M R E P O R T [ 1 0 5 ]
Ccy Holding Investment Fair value
€'000
% of net asset value
Bonds (30 November 2017: 97.96%) (cont) United States (30 November 2017: 17.74%) (cont) Corporate Bonds (cont)
EUR 400,000 Flowserve Corp 1.25% 17/03/2022 400 0.03
EUR 550,000 Fluor Corp 1.75% 21/03/2023 572 0.04EUR 1,800,000 General Electric Co 0.375%
17/05/2022 1,796 0.12EUR 1,725,000 General Electric Co 0.875%
17/05/2025 1,684 0.11EUR 600,000 General Electric Co 1.25%
26/05/2023 615 0.04EUR 1,900,000 General Electric Co 1.5%
17/05/2029 1,838 0.12EUR 650,000 General Electric Co 1.875%
28/05/2027 668 0.04EUR 1,675,000 General Electric Co 2.125%
17/05/2037 1,566 0.10EUR 825,000 General Electric Co 4.125%
19/09/2035 1,018 0.07EUR 450,000 General Mills Inc 1%
27/04/2023^ 460 0.03EUR 450,000 General Mills Inc 1.5%
27/04/2027^ 452 0.03EUR 200,000 General Mills Inc 2.1%
16/11/2020 209 0.01EUR 850,000 General Motors Financial Co Inc
0.955% 07/09/2023 845 0.06EUR 300,000 General Motors Financial Co Inc
1.694% 26/03/2025 302 0.02EUR 475,000 Goldman Sachs Group Inc 1.25%
01/05/2025 470 0.03EUR 750,000 Goldman Sachs Group Inc
1.375% 26/07/2022 772 0.05EUR 1,779,000 Goldman Sachs Group Inc
1.375% 15/05/2024 1,792 0.12EUR 1,731,000 Goldman Sachs Group Inc
1.625% 27/07/2026 1,726 0.11EUR 1,143,000 Goldman Sachs Group Inc 2%
27/07/2023 1,201 0.08EUR 700,000 Goldman Sachs Group Inc 2%
22/03/2028 707 0.05EUR 1,000,000 Goldman Sachs Group Inc
2.125% 30/09/2024 1,053 0.07EUR 800,000 Goldman Sachs Group Inc 2.5%
18/10/2021 856 0.06EUR 1,180,000 Goldman Sachs Group Inc
2.625% 19/08/2020 1,244 0.08EUR 550,000 Goldman Sachs Group Inc
2.875% 03/06/2026 600 0.04EUR 775,000 Goldman Sachs Group Inc 3%
12/02/2031^ 858 0.06EUR 750,000 Goldman Sachs Group Inc 3.25%
01/02/2023 832 0.06EUR 850,000 Goldman Sachs Group Inc 4.75%
12/10/2021 961 0.06EUR 650,000 Goldman Sachs Group Inc
5.125% 23/10/2019 696 0.05EUR 1,195,000 Honeywell International Inc
0.65% 21/02/2020 1,209 0.08
Ccy Holding Investment Fair value
€'000
% of net asset value
United States (30 November 2017: 17.74%) (cont) Corporate Bonds (cont)
EUR 650,000 Honeywell International Inc 1.3% 22/02/2023 676 0.05
EUR 700,000 Honeywell International Inc 2.25% 22/02/2028 768 0.05
EUR 650,000 Illinois Tool Works Inc 1.75% 20/05/2022 688 0.05
EUR 400,000 Illinois Tool Works Inc 2.125% 22/05/2030 432 0.03
EUR 450,000 Illinois Tool Works Inc 3% 19/05/2034 529 0.04
EUR 800,000 International Business Machines Corp 0.5% 07/09/2021 811 0.05
EUR 925,000 International Business Machines Corp 0.95% 23/05/2025 926 0.06
EUR 900,000 International Business Machines Corp 1.125% 06/09/2024 921 0.06
EUR 650,000 International Business Machines Corp 1.25% 26/05/2023 674 0.04
EUR 952,000 International Business Machines Corp 1.5% 23/05/2029 961 0.06
EUR 400,000 International Business Machines Corp 1.75% 07/03/2028 419 0.03
EUR 1,350,000 International Business Machines Corp 1.875% 06/11/2020 1,413 0.09
EUR 600,000 International Business Machines Corp 2.875% 07/11/2025 683 0.05
EUR 450,000 International Flavors & Fragrances Inc 1.75% 14/03/2024 466 0.03
EUR 400,000 Jefferies Group LLC 2.375% 20/05/2020 417 0.03
EUR 1,500,000 Johnson & Johnson 0.25% 20/01/2022 1,512 0.10
EUR 800,000 Johnson & Johnson 0.65% 20/05/2024 808 0.05
EUR 500,000 Johnson & Johnson 1.15% 20/11/2028 506 0.03
EUR 1,100,000 Johnson & Johnson 1.65% 20/05/2035 1,138 0.08
EUR 825,000 JPMorgan Chase & Co 0.625% 25/01/2024 809 0.05
EUR 1,200,000 JPMorgan Chase & Co 1.375% 16/09/2021 1,241 0.08
EUR 1,100,000 JPMorgan Chase & Co 1.5% 26/10/2022 1,144 0.08
EUR 1,500,000 JPMorgan Chase & Co 1.5% 27/01/2025 1,531 0.10
EUR 1,254,000 JPMorgan Chase & Co 1.5% 29/10/2026 1,259 0.08
EUR 1,750,000 JPMorgan Chase & Co 1.638% 18/05/2028 1,748 0.12
EUR 1,350,000 JPMorgan Chase & Co 2.625% 23/04/2021 1,443 0.10
EUR 1,200,000 JPMorgan Chase & Co 2.75% 24/08/2022 1,310 0.09
EUR 1,000,000 JPMorgan Chase & Co 2.75% 01/02/2023 1,095 0.07
EUR 1,000,000 JPMorgan Chase & Co 2.875% 24/05/2028^ 1,126 0.07
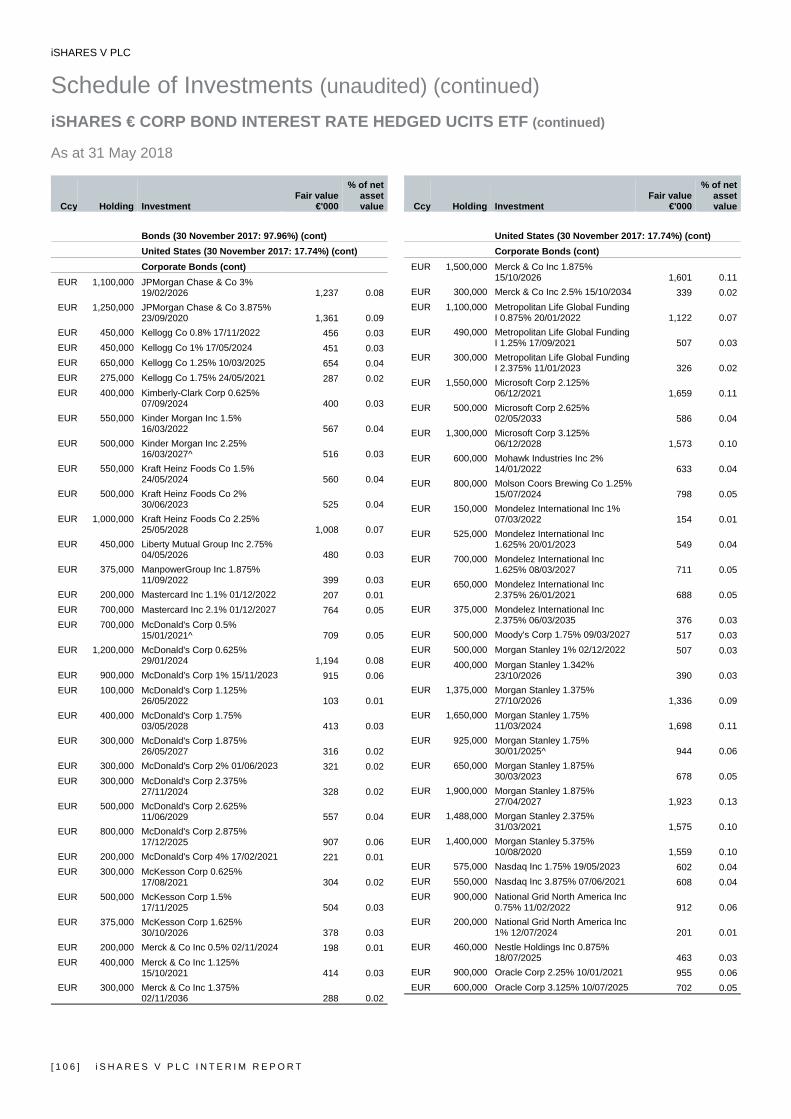
iSHARES V PLC
Schedule of Investments (unaudited) (continued) iSHARES € CORP BOND INTEREST RATE HEDGED UCITS ETF (continued) As at 31 May 2018
[ 1 0 6 ] i S H A R E S V P L C I N T E R I M R E P O R T
Ccy Holding Investment Fair value
€'000
% of net asset value
Bonds (30 November 2017: 97.96%) (cont) United States (30 November 2017: 17.74%) (cont) Corporate Bonds (cont)
EUR 1,100,000 JPMorgan Chase & Co 3% 19/02/2026 1,237 0.08
EUR 1,250,000 JPMorgan Chase & Co 3.875% 23/09/2020 1,361 0.09
EUR 450,000 Kellogg Co 0.8% 17/11/2022 456 0.03EUR 450,000 Kellogg Co 1% 17/05/2024 451 0.03EUR 650,000 Kellogg Co 1.25% 10/03/2025 654 0.04EUR 275,000 Kellogg Co 1.75% 24/05/2021 287 0.02EUR 400,000 Kimberly-Clark Corp 0.625%
07/09/2024 400 0.03EUR 550,000 Kinder Morgan Inc 1.5%
16/03/2022 567 0.04EUR 500,000 Kinder Morgan Inc 2.25%
16/03/2027^ 516 0.03EUR 550,000 Kraft Heinz Foods Co 1.5%
24/05/2024 560 0.04EUR 500,000 Kraft Heinz Foods Co 2%
30/06/2023 525 0.04EUR 1,000,000 Kraft Heinz Foods Co 2.25%
25/05/2028 1,008 0.07EUR 450,000 Liberty Mutual Group Inc 2.75%
04/05/2026 480 0.03EUR 375,000 ManpowerGroup Inc 1.875%
11/09/2022 399 0.03EUR 200,000 Mastercard Inc 1.1% 01/12/2022 207 0.01EUR 700,000 Mastercard Inc 2.1% 01/12/2027 764 0.05EUR 700,000 McDonald's Corp 0.5%
15/01/2021^ 709 0.05EUR 1,200,000 McDonald's Corp 0.625%
29/01/2024 1,194 0.08EUR 900,000 McDonald's Corp 1% 15/11/2023 915 0.06EUR 100,000 McDonald's Corp 1.125%
26/05/2022 103 0.01EUR 400,000 McDonald's Corp 1.75%
03/05/2028 413 0.03EUR 300,000 McDonald's Corp 1.875%
26/05/2027 316 0.02EUR 300,000 McDonald's Corp 2% 01/06/2023 321 0.02EUR 300,000 McDonald's Corp 2.375%
27/11/2024 328 0.02EUR 500,000 McDonald's Corp 2.625%
11/06/2029 557 0.04EUR 800,000 McDonald's Corp 2.875%
17/12/2025 907 0.06EUR 200,000 McDonald's Corp 4% 17/02/2021 221 0.01EUR 300,000 McKesson Corp 0.625%
17/08/2021 304 0.02EUR 500,000 McKesson Corp 1.5%
17/11/2025 504 0.03EUR 375,000 McKesson Corp 1.625%
30/10/2026 378 0.03EUR 200,000 Merck & Co Inc 0.5% 02/11/2024 198 0.01EUR 400,000 Merck & Co Inc 1.125%
15/10/2021 414 0.03EUR 300,000 Merck & Co Inc 1.375%
02/11/2036 288 0.02
Ccy Holding Investment Fair value
€'000
% of net asset value
United States (30 November 2017: 17.74%) (cont) Corporate Bonds (cont)
EUR 1,500,000 Merck & Co Inc 1.875% 15/10/2026 1,601 0.11
EUR 300,000 Merck & Co Inc 2.5% 15/10/2034 339 0.02EUR 1,100,000 Metropolitan Life Global Funding
I 0.875% 20/01/2022 1,122 0.07EUR 490,000 Metropolitan Life Global Funding
I 1.25% 17/09/2021 507 0.03EUR 300,000 Metropolitan Life Global Funding
I 2.375% 11/01/2023 326 0.02EUR 1,550,000 Microsoft Corp 2.125%
06/12/2021 1,659 0.11EUR 500,000 Microsoft Corp 2.625%
02/05/2033 586 0.04EUR 1,300,000 Microsoft Corp 3.125%
06/12/2028 1,573 0.10EUR 600,000 Mohawk Industries Inc 2%
14/01/2022 633 0.04EUR 800,000 Molson Coors Brewing Co 1.25%
15/07/2024 798 0.05EUR 150,000 Mondelez International Inc 1%
07/03/2022 154 0.01EUR 525,000 Mondelez International Inc
1.625% 20/01/2023 549 0.04EUR 700,000 Mondelez International Inc
1.625% 08/03/2027 711 0.05EUR 650,000 Mondelez International Inc
2.375% 26/01/2021 688 0.05EUR 375,000 Mondelez International Inc
2.375% 06/03/2035 376 0.03EUR 500,000 Moody's Corp 1.75% 09/03/2027 517 0.03EUR 500,000 Morgan Stanley 1% 02/12/2022 507 0.03EUR 400,000 Morgan Stanley 1.342%
23/10/2026 390 0.03EUR 1,375,000 Morgan Stanley 1.375%
27/10/2026 1,336 0.09EUR 1,650,000 Morgan Stanley 1.75%
11/03/2024 1,698 0.11EUR 925,000 Morgan Stanley 1.75%
30/01/2025^ 944 0.06EUR 650,000 Morgan Stanley 1.875%
30/03/2023 678 0.05EUR 1,900,000 Morgan Stanley 1.875%
27/04/2027 1,923 0.13EUR 1,488,000 Morgan Stanley 2.375%
31/03/2021 1,575 0.10EUR 1,400,000 Morgan Stanley 5.375%
10/08/2020 1,559 0.10EUR 575,000 Nasdaq Inc 1.75% 19/05/2023 602 0.04EUR 550,000 Nasdaq Inc 3.875% 07/06/2021 608 0.04EUR 900,000 National Grid North America Inc
0.75% 11/02/2022 912 0.06EUR 200,000 National Grid North America Inc
1% 12/07/2024 201 0.01EUR 460,000 Nestle Holdings Inc 0.875%
18/07/2025 463 0.03EUR 900,000 Oracle Corp 2.25% 10/01/2021 955 0.06EUR 600,000 Oracle Corp 3.125% 10/07/2025 702 0.05
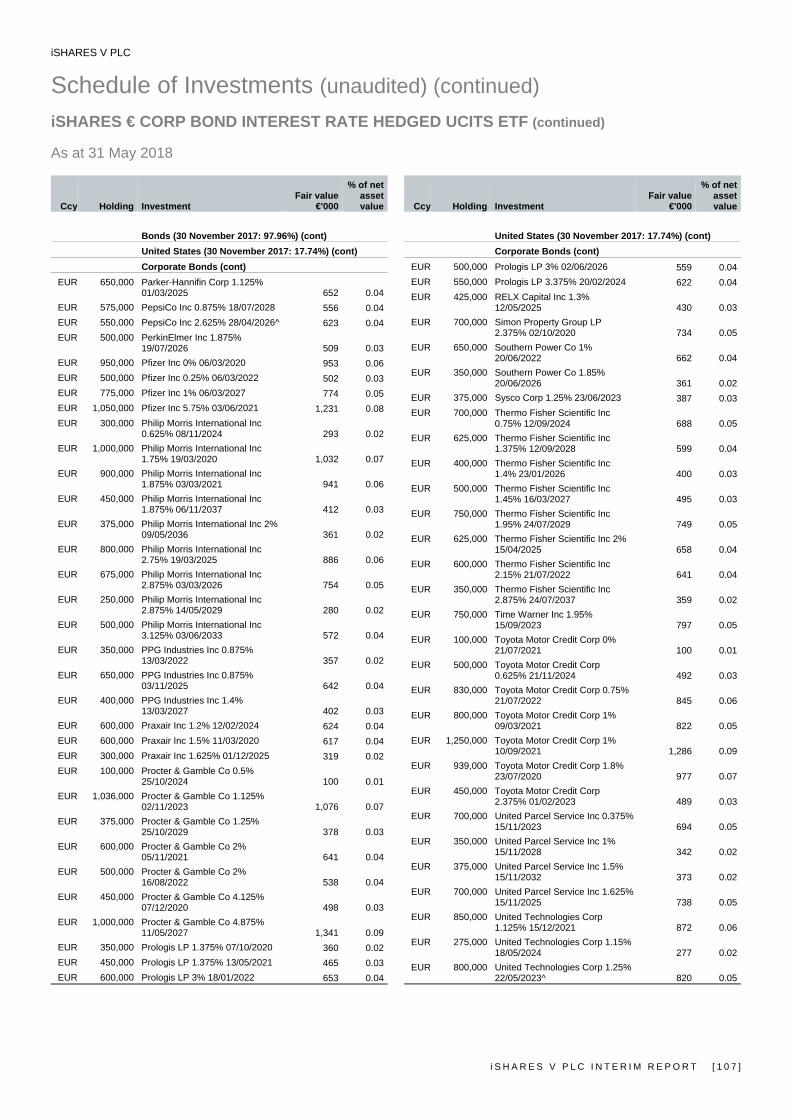
iSHARES V PLC
Schedule of Investments (unaudited) (continued) iSHARES € CORP BOND INTEREST RATE HEDGED UCITS ETF (continued) As at 31 May 2018
i S H A R E S V P L C I N T E R I M R E P O R T [ 1 0 7 ]
Ccy Holding Investment Fair value
€'000
% of net asset value
Bonds (30 November 2017: 97.96%) (cont) United States (30 November 2017: 17.74%) (cont) Corporate Bonds (cont)
EUR 650,000 Parker-Hannifin Corp 1.125% 01/03/2025 652 0.04
EUR 575,000 PepsiCo Inc 0.875% 18/07/2028 556 0.04EUR 550,000 PepsiCo Inc 2.625% 28/04/2026^ 623 0.04EUR 500,000 PerkinElmer Inc 1.875%
19/07/2026 509 0.03EUR 950,000 Pfizer Inc 0% 06/03/2020 953 0.06EUR 500,000 Pfizer Inc 0.25% 06/03/2022 502 0.03EUR 775,000 Pfizer Inc 1% 06/03/2027 774 0.05EUR 1,050,000 Pfizer Inc 5.75% 03/06/2021 1,231 0.08EUR 300,000 Philip Morris International Inc
0.625% 08/11/2024 293 0.02EUR 1,000,000 Philip Morris International Inc
1.75% 19/03/2020 1,032 0.07EUR 900,000 Philip Morris International Inc
1.875% 03/03/2021 941 0.06EUR 450,000 Philip Morris International Inc
1.875% 06/11/2037 412 0.03EUR 375,000 Philip Morris International Inc 2%
09/05/2036 361 0.02EUR 800,000 Philip Morris International Inc
2.75% 19/03/2025 886 0.06EUR 675,000 Philip Morris International Inc
2.875% 03/03/2026 754 0.05EUR 250,000 Philip Morris International Inc
2.875% 14/05/2029 280 0.02EUR 500,000 Philip Morris International Inc
3.125% 03/06/2033 572 0.04EUR 350,000 PPG Industries Inc 0.875%
13/03/2022 357 0.02EUR 650,000 PPG Industries Inc 0.875%
03/11/2025 642 0.04EUR 400,000 PPG Industries Inc 1.4%
13/03/2027 402 0.03EUR 600,000 Praxair Inc 1.2% 12/02/2024 624 0.04EUR 600,000 Praxair Inc 1.5% 11/03/2020 617 0.04EUR 300,000 Praxair Inc 1.625% 01/12/2025 319 0.02EUR 100,000 Procter & Gamble Co 0.5%
25/10/2024 100 0.01EUR 1,036,000 Procter & Gamble Co 1.125%
02/11/2023 1,076 0.07EUR 375,000 Procter & Gamble Co 1.25%
25/10/2029 378 0.03EUR 600,000 Procter & Gamble Co 2%
05/11/2021 641 0.04EUR 500,000 Procter & Gamble Co 2%
16/08/2022 538 0.04EUR 450,000 Procter & Gamble Co 4.125%
07/12/2020 498 0.03EUR 1,000,000 Procter & Gamble Co 4.875%
11/05/2027 1,341 0.09EUR 350,000 Prologis LP 1.375% 07/10/2020 360 0.02EUR 450,000 Prologis LP 1.375% 13/05/2021 465 0.03EUR 600,000 Prologis LP 3% 18/01/2022 653 0.04
Ccy Holding Investment Fair value
€'000
% of net asset value
United States (30 November 2017: 17.74%) (cont) Corporate Bonds (cont)
EUR 500,000 Prologis LP 3% 02/06/2026 559 0.04EUR 550,000 Prologis LP 3.375% 20/02/2024 622 0.04EUR 425,000 RELX Capital Inc 1.3%
12/05/2025 430 0.03EUR 700,000 Simon Property Group LP
2.375% 02/10/2020 734 0.05EUR 650,000 Southern Power Co 1%
20/06/2022 662 0.04EUR 350,000 Southern Power Co 1.85%
20/06/2026 361 0.02EUR 375,000 Sysco Corp 1.25% 23/06/2023 387 0.03EUR 700,000 Thermo Fisher Scientific Inc
0.75% 12/09/2024 688 0.05EUR 625,000 Thermo Fisher Scientific Inc
1.375% 12/09/2028 599 0.04EUR 400,000 Thermo Fisher Scientific Inc
1.4% 23/01/2026 400 0.03EUR 500,000 Thermo Fisher Scientific Inc
1.45% 16/03/2027 495 0.03EUR 750,000 Thermo Fisher Scientific Inc
1.95% 24/07/2029 749 0.05EUR 625,000 Thermo Fisher Scientific Inc 2%
15/04/2025 658 0.04EUR 600,000 Thermo Fisher Scientific Inc
2.15% 21/07/2022 641 0.04EUR 350,000 Thermo Fisher Scientific Inc
2.875% 24/07/2037 359 0.02EUR 750,000 Time Warner Inc 1.95%
15/09/2023 797 0.05EUR 100,000 Toyota Motor Credit Corp 0%
21/07/2021 100 0.01EUR 500,000 Toyota Motor Credit Corp
0.625% 21/11/2024 492 0.03EUR 830,000 Toyota Motor Credit Corp 0.75%
21/07/2022 845 0.06EUR 800,000 Toyota Motor Credit Corp 1%
09/03/2021 822 0.05EUR 1,250,000 Toyota Motor Credit Corp 1%
10/09/2021 1,286 0.09EUR 939,000 Toyota Motor Credit Corp 1.8%
23/07/2020 977 0.07EUR 450,000 Toyota Motor Credit Corp
2.375% 01/02/2023 489 0.03EUR 700,000 United Parcel Service Inc 0.375%
15/11/2023 694 0.05EUR 350,000 United Parcel Service Inc 1%
15/11/2028 342 0.02EUR 375,000 United Parcel Service Inc 1.5%
15/11/2032 373 0.02EUR 700,000 United Parcel Service Inc 1.625%
15/11/2025 738 0.05EUR 850,000 United Technologies Corp
1.125% 15/12/2021 872 0.06EUR 275,000 United Technologies Corp 1.15%
18/05/2024 277 0.02EUR 800,000 United Technologies Corp 1.25%
22/05/2023^ 820 0.05
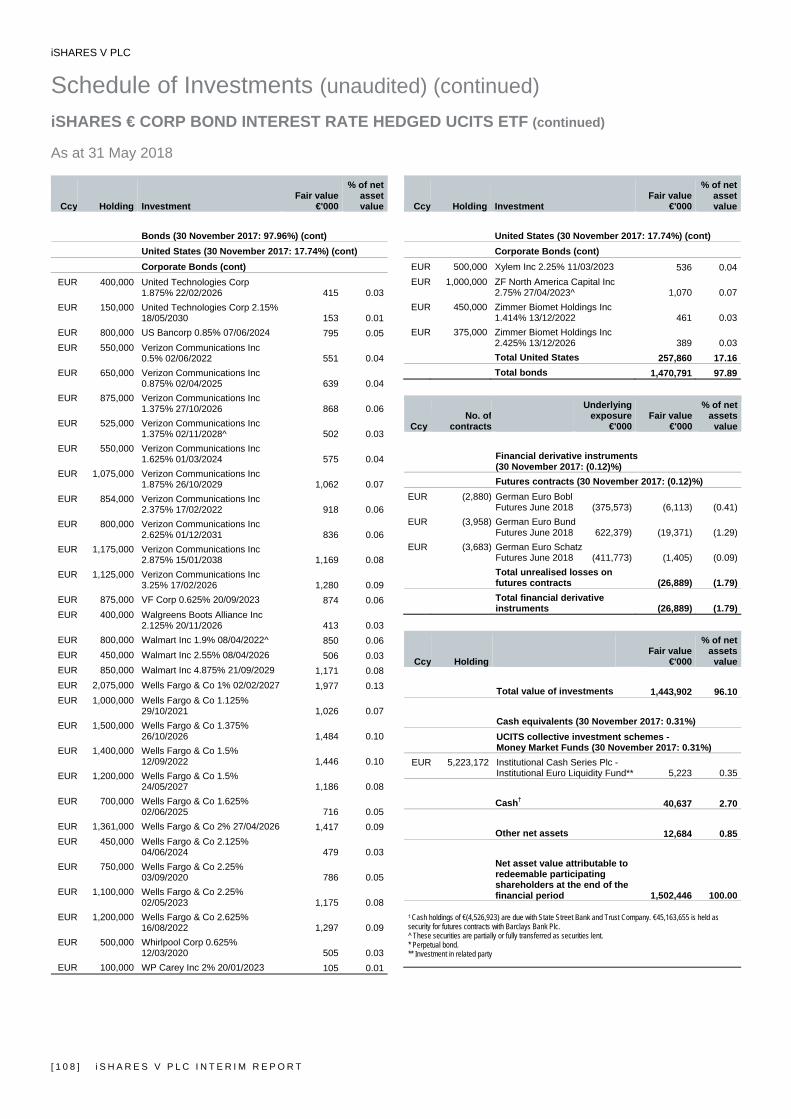
iSHARES V PLC
Schedule of Investments (unaudited) (continued) iSHARES € CORP BOND INTEREST RATE HEDGED UCITS ETF (continued) As at 31 May 2018
[ 1 0 8 ] i S H A R E S V P L C I N T E R I M R E P O R T
Ccy Holding Investment Fair value
€'000
% of net asset value
Bonds (30 November 2017: 97.96%) (cont) United States (30 November 2017: 17.74%) (cont) Corporate Bonds (cont)
EUR 400,000 United Technologies Corp 1.875% 22/02/2026 415 0.03
EUR 150,000 United Technologies Corp 2.15% 18/05/2030 153 0.01
EUR 800,000 US Bancorp 0.85% 07/06/2024 795 0.05EUR 550,000 Verizon Communications Inc
0.5% 02/06/2022 551 0.04EUR 650,000 Verizon Communications Inc
0.875% 02/04/2025 639 0.04EUR 875,000 Verizon Communications Inc
1.375% 27/10/2026 868 0.06EUR 525,000 Verizon Communications Inc
1.375% 02/11/2028^ 502 0.03EUR 550,000 Verizon Communications Inc
1.625% 01/03/2024 575 0.04EUR 1,075,000 Verizon Communications Inc
1.875% 26/10/2029 1,062 0.07EUR 854,000 Verizon Communications Inc
2.375% 17/02/2022 918 0.06EUR 800,000 Verizon Communications Inc
2.625% 01/12/2031 836 0.06EUR 1,175,000 Verizon Communications Inc
2.875% 15/01/2038 1,169 0.08EUR 1,125,000 Verizon Communications Inc
3.25% 17/02/2026 1,280 0.09EUR 875,000 VF Corp 0.625% 20/09/2023 874 0.06EUR 400,000 Walgreens Boots Alliance Inc
2.125% 20/11/2026 413 0.03EUR 800,000 Walmart Inc 1.9% 08/04/2022^ 850 0.06EUR 450,000 Walmart Inc 2.55% 08/04/2026 506 0.03EUR 850,000 Walmart Inc 4.875% 21/09/2029 1,171 0.08EUR 2,075,000 Wells Fargo & Co 1% 02/02/2027 1,977 0.13EUR 1,000,000 Wells Fargo & Co 1.125%
29/10/2021 1,026 0.07EUR 1,500,000 Wells Fargo & Co 1.375%
26/10/2026 1,484 0.10EUR 1,400,000 Wells Fargo & Co 1.5%
12/09/2022 1,446 0.10EUR 1,200,000 Wells Fargo & Co 1.5%
24/05/2027 1,186 0.08EUR 700,000 Wells Fargo & Co 1.625%
02/06/2025 716 0.05EUR 1,361,000 Wells Fargo & Co 2% 27/04/2026 1,417 0.09EUR 450,000 Wells Fargo & Co 2.125%
04/06/2024 479 0.03EUR 750,000 Wells Fargo & Co 2.25%
03/09/2020 786 0.05EUR 1,100,000 Wells Fargo & Co 2.25%
02/05/2023 1,175 0.08EUR 1,200,000 Wells Fargo & Co 2.625%
16/08/2022 1,297 0.09EUR 500,000 Whirlpool Corp 0.625%
12/03/2020 505 0.03EUR 100,000 WP Carey Inc 2% 20/01/2023 105 0.01
Ccy Holding Investment Fair value
€'000
% of net asset value
United States (30 November 2017: 17.74%) (cont) Corporate Bonds (cont)
EUR 500,000 Xylem Inc 2.25% 11/03/2023 536 0.04EUR 1,000,000 ZF North America Capital Inc
2.75% 27/04/2023^ 1,070 0.07EUR 450,000 Zimmer Biomet Holdings Inc
1.414% 13/12/2022 461 0.03EUR 375,000 Zimmer Biomet Holdings Inc
2.425% 13/12/2026 389 0.03Total United States 257,860 17.16Total bonds 1,470,791 97.89
CcyNo. of
contracts
Underlying exposure
€'000 Fair value
€'000
% of net assets
value Financial derivative instruments (30 November 2017: (0.12)%) Futures contracts (30 November 2017: (0.12)%)
EUR (2,880) German Euro Bobl Futures June 2018 (375,573) (6,113) (0.41)
EUR (3,958) German Euro Bund Futures June 2018 622,379) (19,371) (1.29)
EUR (3,683) German Euro Schatz Futures June 2018 (411,773) (1,405) (0.09)Total unrealised losses on futures contracts (26,889) (1.79)Total financial derivative instruments (26,889) (1.79)
Ccy Holding Fair value
€'000
% of net assets
value Total value of investments 1,443,902 96.10
Cash equivalents (30 November 2017: 0.31%) UCITS collective investment schemes - Money Market Funds (30 November 2017: 0.31%)
EUR 5,223,172 Institutional Cash Series Plc - Institutional Euro Liquidity Fund** 5,223 0.35
Cash† 40,637 2.70
Other net assets 12,684 0.85 Net asset value attributable to redeemable participating shareholders at the end of the financial period 1,502,446 100.00
† Cash holdings of €(4,526,923) are due with State Street Bank and Trust Company. €45,163,655 is held as security for futures contracts with Barclays Bank Plc. ^ These securities are partially or fully transferred as securities lent. * Perpetual bond. ** Investment in related party
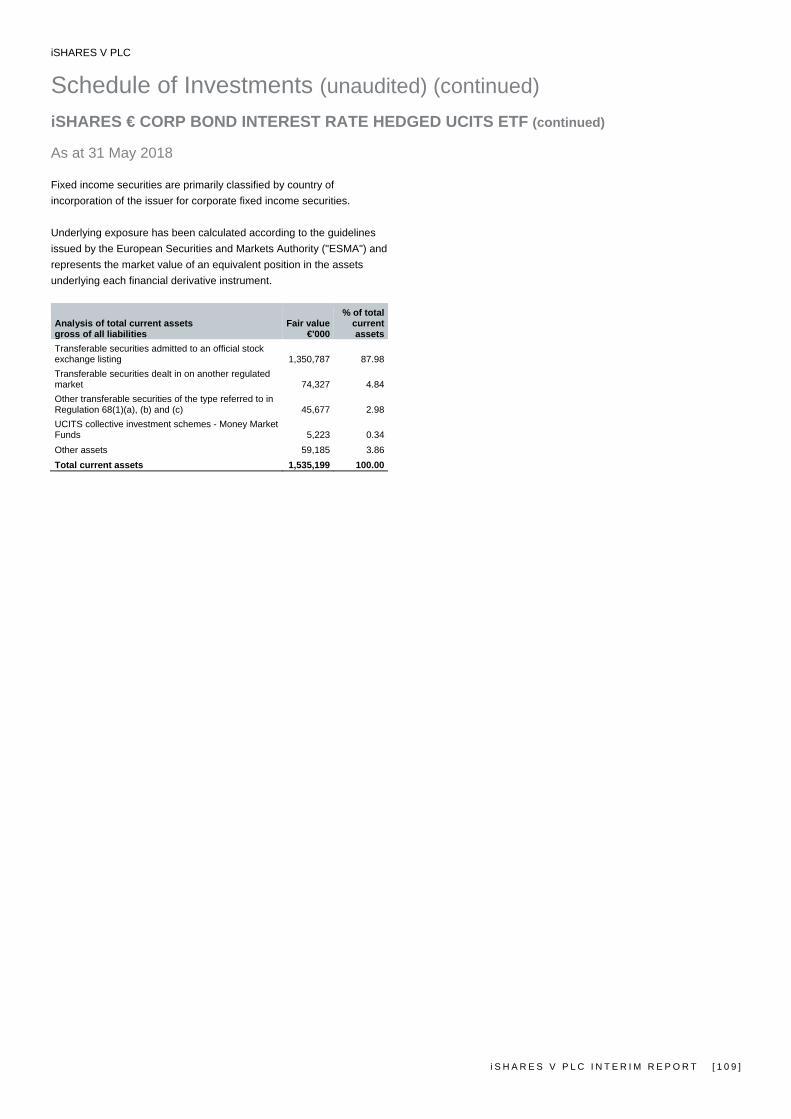
iSHARES V PLC
Schedule of Investments (unaudited) (continued) iSHARES € CORP BOND INTEREST RATE HEDGED UCITS ETF (continued) As at 31 May 2018
i S H A R E S V P L C I N T E R I M R E P O R T [ 1 0 9 ]
Fixed income securities are primarily classified by country of incorporation of the issuer for corporate fixed income securities. Underlying exposure has been calculated according to the guidelines issued by the European Securities and Markets Authority ("ESMA") and represents the market value of an equivalent position in the assets underlying each financial derivative instrument.
Analysis of total current assets gross of all liabilities
Fair value€'000
% of total current assets
Transferable securities admitted to an official stock exchange listing 1,350,787 87.98Transferable securities dealt in on another regulated market 74,327 4.84Other transferable securities of the type referred to in Regulation 68(1)(a), (b) and (c) 45,677 2.98UCITS collective investment schemes - Money Market Funds 5,223 0.34Other assets 59,185 3.86Total current assets 1,535,199 100.00
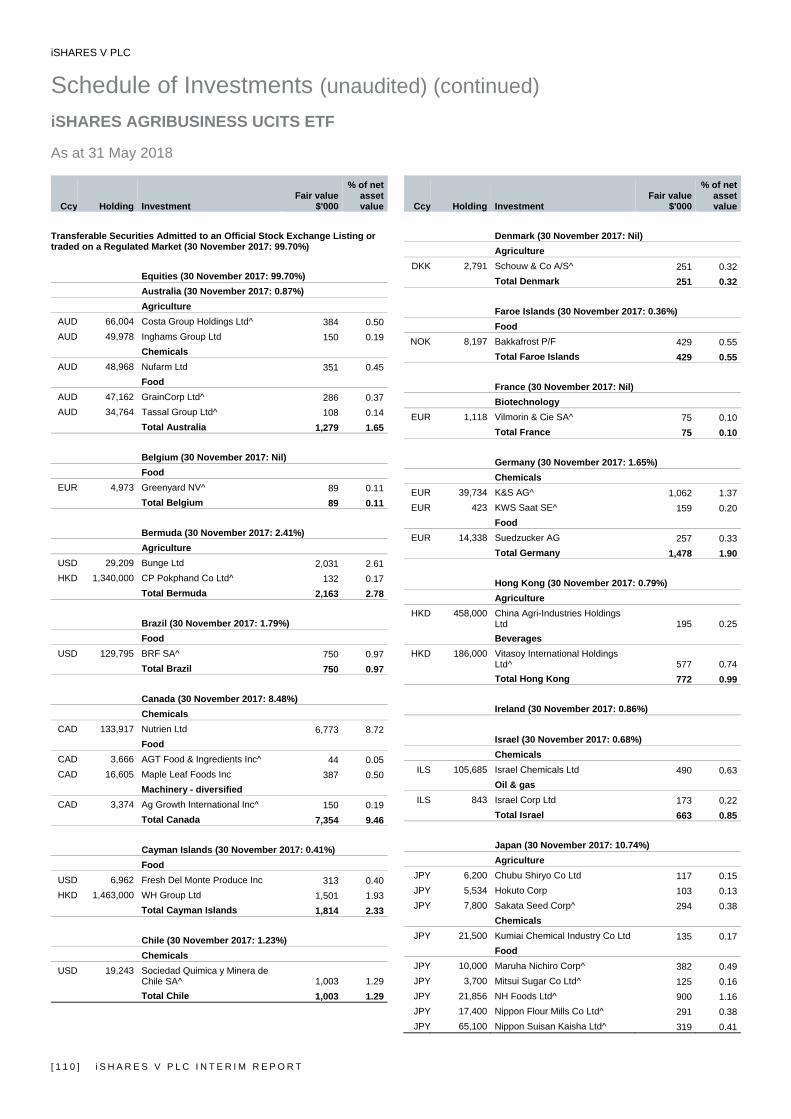
iSHARES V PLC
Schedule of Investments (unaudited) (continued) iSHARES AGRIBUSINESS UCITS ETF As at 31 May 2018
[ 1 1 0 ] i S H A R E S V P L C I N T E R I M R E P O R T
Ccy Holding Investment Fair value
$'000
% of net asset value
Transferable Securities Admitted to an Official Stock Exchange Listing or traded on a Regulated Market (30 November 2017: 99.70%)
Equities (30 November 2017: 99.70%) Australia (30 November 2017: 0.87%) Agriculture
AUD 66,004 Costa Group Holdings Ltd^ 384 0.50AUD 49,978 Inghams Group Ltd 150 0.19
Chemicals AUD 48,968 Nufarm Ltd 351 0.45
Food AUD 47,162 GrainCorp Ltd^ 286 0.37AUD 34,764 Tassal Group Ltd^ 108 0.14
Total Australia 1,279 1.65
Belgium (30 November 2017: Nil) Food
EUR 4,973 Greenyard NV^ 89 0.11Total Belgium 89 0.11
Bermuda (30 November 2017: 2.41%) Agriculture
USD 29,209 Bunge Ltd 2,031 2.61HKD 1,340,000 CP Pokphand Co Ltd^ 132 0.17
Total Bermuda 2,163 2.78
Brazil (30 November 2017: 1.79%) Food
USD 129,795 BRF SA^ 750 0.97Total Brazil 750 0.97
Canada (30 November 2017: 8.48%) Chemicals
CAD 133,917 Nutrien Ltd 6,773 8.72Food
CAD 3,666 AGT Food & Ingredients Inc^ 44 0.05CAD 16,605 Maple Leaf Foods Inc 387 0.50
Machinery - diversified CAD 3,374 Ag Growth International Inc^ 150 0.19
Total Canada 7,354 9.46
Cayman Islands (30 November 2017: 0.41%) Food
USD 6,962 Fresh Del Monte Produce Inc 313 0.40HKD 1,463,000 WH Group Ltd 1,501 1.93
Total Cayman Islands 1,814 2.33
Chile (30 November 2017: 1.23%) Chemicals
USD 19,243 Sociedad Quimica y Minera de Chile SA^ 1,003 1.29Total Chile 1,003 1.29
Ccy Holding Investment Fair value
$'000
% of net asset value
Denmark (30 November 2017: Nil) Agriculture
DKK 2,791 Schouw & Co A/S^ 251 0.32Total Denmark 251 0.32
Faroe Islands (30 November 2017: 0.36%) Food
NOK 8,197 Bakkafrost P/F 429 0.55Total Faroe Islands 429 0.55
France (30 November 2017: Nil) Biotechnology
EUR 1,118 Vilmorin & Cie SA^ 75 0.10Total France 75 0.10
Germany (30 November 2017: 1.65%) Chemicals
EUR 39,734 K&S AG^ 1,062 1.37EUR 423 KWS Saat SE^ 159 0.20
Food EUR 14,338 Suedzucker AG 257 0.33
Total Germany 1,478 1.90
Hong Kong (30 November 2017: 0.79%) Agriculture
HKD 458,000 China Agri-Industries Holdings Ltd 195 0.25Beverages
HKD 186,000 Vitasoy International Holdings Ltd^ 577 0.74Total Hong Kong 772 0.99
Ireland (30 November 2017: 0.86%) Israel (30 November 2017: 0.68%) Chemicals
ILS 105,685 Israel Chemicals Ltd 490 0.63Oil & gas
ILS 843 Israel Corp Ltd 173 0.22Total Israel 663 0.85
Japan (30 November 2017: 10.74%) Agriculture
JPY 6,200 Chubu Shiryo Co Ltd 117 0.15JPY 5,534 Hokuto Corp 103 0.13JPY 7,800 Sakata Seed Corp^ 294 0.38
Chemicals JPY 21,500 Kumiai Chemical Industry Co Ltd 135 0.17
Food JPY 10,000 Maruha Nichiro Corp^ 382 0.49JPY 3,700 Mitsui Sugar Co Ltd^ 125 0.16JPY 21,856 NH Foods Ltd^ 900 1.16JPY 17,400 Nippon Flour Mills Co Ltd^ 291 0.38JPY 65,100 Nippon Suisan Kaisha Ltd^ 319 0.41

iSHARES V PLC
Schedule of Investments (unaudited) (continued) iSHARES AGRIBUSINESS UCITS ETF (continued) As at 31 May 2018
i S H A R E S V P L C I N T E R I M R E P O R T [ 1 1 1 ]
Ccy Holding Investment Fair value
$'000
% of net asset value
Equities (30 November 2017: 99.70%) (cont) Japan (30 November 2017: 10.74%) (cont) Machinery - diversified
JPY 4,940 Iseki & Co Ltd 90 0.12JPY 243,789 Kubota Corp 4,113 5.29
Total Japan 6,869 8.84
Mauritius (30 November 2017: 0.44%) Agriculture
SGD 1,369,209 Golden Agri-Resources Ltd^ 323 0.42Total Mauritius 323 0.42
Netherlands (30 November 2017: 3.82%) Chemicals
EUR 13,081 OCI NV 358 0.46Food
EUR 14,133 Wessanen^ 293 0.38Machinery - diversified
EUR 206,469 CNH Industrial NV^ 2,415 3.11Total Netherlands 3,066 3.95
Norway (30 November 2017: 4.37%) Chemicals
NOK 36,565 Yara International ASA 1,507 1.94Food
NOK 18,408 Austevoll Seafood ASA 221 0.28NOK 11,452 Grieg Seafood ASA 128 0.17NOK 45,579 Leroy Seafood Group ASA 302 0.39NOK 85,437 Marine Harvest ASA 1,709 2.20NOK 11,034 Salmar ASA^ 482 0.62
Total Norway 4,349 5.60
People's Republic of China (30 November 2017: 0.12%)Chemicals
HKD 368,670 China BlueChemical Ltd 123 0.16Total People's Republic of China 123 0.16
Republic of South Korea (30 November 2017: 0.74%) Food
KRW 2,141 CJ CheilJedang Corp^ 696 0.90Total Republic of South Korea 696 0.90
Russian Federation (30 November 2017: 0.37%) Chemicals
USD 20,130 PhosAgro PJSC 268 0.34Total Russian Federation 268 0.34
Singapore (30 November 2017: 2.19%) Agriculture
SGD 97,763 First Resources Ltd 119 0.15
Ccy Holding Investment Fair value
$'000
% of net asset value
Singapore (30 November 2017: 2.19%) (cont) Food
SGD 749,298 Wilmar International Ltd^ 1,815 2.34Total Singapore 1,934 2.49
Sweden (30 November 2017: 0.56%) Food
SEK 5,848 AAK AB 529 0.68Total Sweden 529 0.68
Switzerland (30 November 2017: 1.34%) Food
CHF 470 Barry Callebaut AG^ 824 1.06Total Switzerland 824 1.06
United Kingdom (30 November 2017: 4.49%) Food
GBP 74,029 Associated British Foods Plc 2,610 3.36GBP 96,704 Tate & Lyle Plc 886 1.14
Total United Kingdom 3,496 4.50
United States (30 November 2017: 50.99%) Agriculture
USD 116,249 Archer-Daniels-Midland Co 5,083 6.54Auto parts & equipment
USD 10,177 Titan International Inc 118 0.15Chemicals
USD 5,372 American Vanguard Corp^ 116 0.15USD 48,457 CF Industries Holdings Inc 1,994 2.56USD 27,914 FMC Corp 2,431 3.13USD 64,385 Monsanto Co 8,206 10.56USD 72,832 Mosaic Co^ 2,002 2.58
Food USD 6,154 Cal-Maine Foods Inc 296 0.38USD 3,264 Calavo Growers Inc 287 0.37USD 34,155 Darling Ingredients Inc 642 0.83USD 15,005 Ingredion Inc 1,671 2.15USD 1,793 John B Sanfilippo & Son Inc 122 0.16USD 10,778 Pilgrim's Pride Corp 210 0.27USD 4,162 Sanderson Farms Inc 407 0.52USD 58 Seaboard Corp^ 236 0.30USD 61,856 Tyson Foods Inc 4,174 5.37
Machinery - diversified USD 13,704 AGCO Corp 872 1.12USD 50,133 Deere & Co 7,495 9.65USD 2,196 Lindsay Corp 216 0.28
Total United States 36,578 47.07Total equities 77,175 99.31
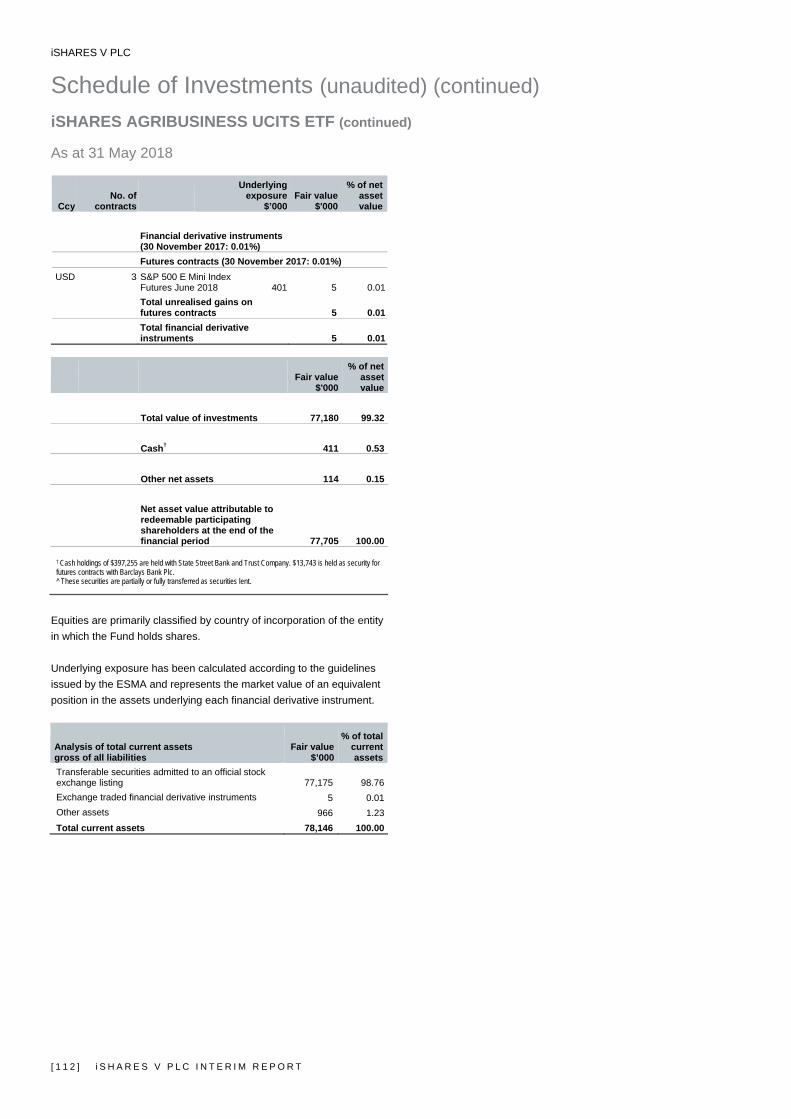
iSHARES V PLC
Schedule of Investments (unaudited) (continued) iSHARES AGRIBUSINESS UCITS ETF (continued) As at 31 May 2018
[ 1 1 2 ] i S H A R E S V P L C I N T E R I M R E P O R T
Ccy
No. of contracts
Underlying exposure
$’000 Fair value
$'000
% of net asset
value Financial derivative instruments
(30 November 2017: 0.01%) Futures contracts (30 November 2017: 0.01%)
USD 3 S&P 500 E Mini Index Futures June 2018 401 5 0.01
Total unrealised gains on futures contracts 5 0.01
Total financial derivative instruments 5 0.01
Fair value
$'000
% of netassetvalue
Total value of investments 77,180 99.32 Cash† 411 0.53 Other net assets 114 0.15
Net asset value attributable to redeemable participating shareholders at the end of the financial period 77,705 100.00
† Cash holdings of $397,255 are held with State Street Bank and Trust Company. $13,743 is held as security for futures contracts with Barclays Bank Plc. ^ These securities are partially or fully transferred as securities lent.
Equities are primarily classified by country of incorporation of the entity in which the Fund holds shares. Underlying exposure has been calculated according to the guidelines issued by the ESMA and represents the market value of an equivalent position in the assets underlying each financial derivative instrument.
Analysis of total current assets gross of all liabilities
Fair value$’000
% of total current assets
Transferable securities admitted to an official stock exchange listing 77,175 98.76Exchange traded financial derivative instruments 5 0.01Other assets 966 1.23Total current assets 78,146 100.00
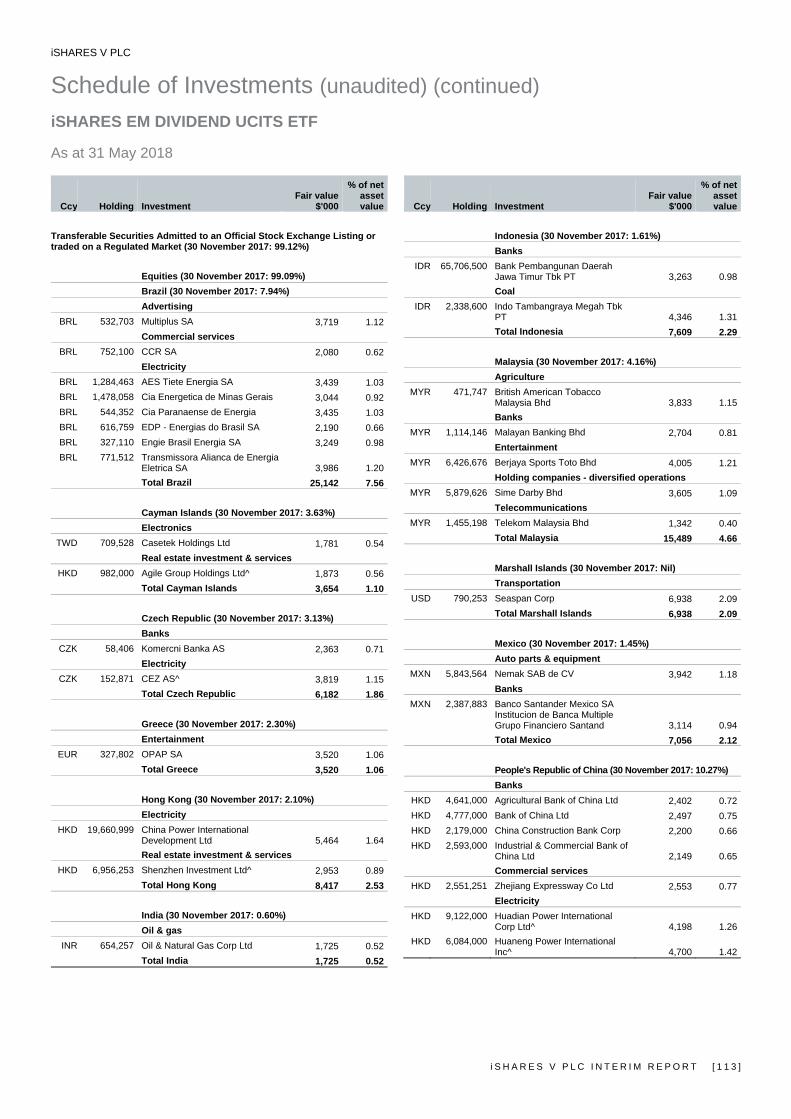
iSHARES V PLC
Schedule of Investments (unaudited) (continued) iSHARES EM DIVIDEND UCITS ETF As at 31 May 2018
i S H A R E S V P L C I N T E R I M R E P O R T [ 1 1 3 ]
Ccy Holding Investment Fair value
$'000
% of net asset value
Transferable Securities Admitted to an Official Stock Exchange Listing or traded on a Regulated Market (30 November 2017: 99.12%)
Equities (30 November 2017: 99.09%) Brazil (30 November 2017: 7.94%) Advertising
BRL 532,703 Multiplus SA 3,719 1.12Commercial services
BRL 752,100 CCR SA 2,080 0.62Electricity
BRL 1,284,463 AES Tiete Energia SA 3,439 1.03BRL 1,478,058 Cia Energetica de Minas Gerais 3,044 0.92BRL 544,352 Cia Paranaense de Energia 3,435 1.03BRL 616,759 EDP - Energias do Brasil SA 2,190 0.66BRL 327,110 Engie Brasil Energia SA 3,249 0.98BRL 771,512 Transmissora Alianca de Energia
Eletrica SA 3,986 1.20Total Brazil 25,142 7.56
Cayman Islands (30 November 2017: 3.63%) Electronics
TWD 709,528 Casetek Holdings Ltd 1,781 0.54Real estate investment & services
HKD 982,000 Agile Group Holdings Ltd^ 1,873 0.56Total Cayman Islands 3,654 1.10
Czech Republic (30 November 2017: 3.13%) Banks
CZK 58,406 Komercni Banka AS 2,363 0.71Electricity
CZK 152,871 CEZ AS^ 3,819 1.15Total Czech Republic 6,182 1.86
Greece (30 November 2017: 2.30%) Entertainment
EUR 327,802 OPAP SA 3,520 1.06Total Greece 3,520 1.06
Hong Kong (30 November 2017: 2.10%) Electricity
HKD 19,660,999 China Power International Development Ltd 5,464 1.64Real estate investment & services
HKD 6,956,253 Shenzhen Investment Ltd^ 2,953 0.89Total Hong Kong 8,417 2.53
India (30 November 2017: 0.60%) Oil & gas
INR 654,257 Oil & Natural Gas Corp Ltd 1,725 0.52Total India 1,725 0.52
Ccy Holding Investment Fair value
$'000
% of net asset value
Indonesia (30 November 2017: 1.61%) Banks
IDR 65,706,500 Bank Pembangunan Daerah Jawa Timur Tbk PT 3,263 0.98Coal
IDR 2,338,600 Indo Tambangraya Megah Tbk PT 4,346 1.31Total Indonesia 7,609 2.29
Malaysia (30 November 2017: 4.16%) Agriculture
MYR 471,747 British American Tobacco Malaysia Bhd 3,833 1.15Banks
MYR 1,114,146 Malayan Banking Bhd 2,704 0.81Entertainment
MYR 6,426,676 Berjaya Sports Toto Bhd 4,005 1.21Holding companies - diversified operations
MYR 5,879,626 Sime Darby Bhd 3,605 1.09Telecommunications
MYR 1,455,198 Telekom Malaysia Bhd 1,342 0.40Total Malaysia 15,489 4.66
Marshall Islands (30 November 2017: Nil) Transportation
USD 790,253 Seaspan Corp 6,938 2.09Total Marshall Islands 6,938 2.09
Mexico (30 November 2017: 1.45%) Auto parts & equipment
MXN 5,843,564 Nemak SAB de CV 3,942 1.18Banks
MXN 2,387,883 Banco Santander Mexico SA Institucion de Banca Multiple Grupo Financiero Santand 3,114 0.94Total Mexico 7,056 2.12
People's Republic of China (30 November 2017: 10.27%) Banks
HKD 4,641,000 Agricultural Bank of China Ltd 2,402 0.72HKD 4,777,000 Bank of China Ltd 2,497 0.75HKD 2,179,000 China Construction Bank Corp 2,200 0.66HKD 2,593,000 Industrial & Commercial Bank of
China Ltd 2,149 0.65Commercial services
HKD 2,551,251 Zhejiang Expressway Co Ltd 2,553 0.77Electricity
HKD 9,122,000 Huadian Power International Corp Ltd^ 4,198 1.26
HKD 6,084,000 Huaneng Power International Inc^ 4,700 1.42
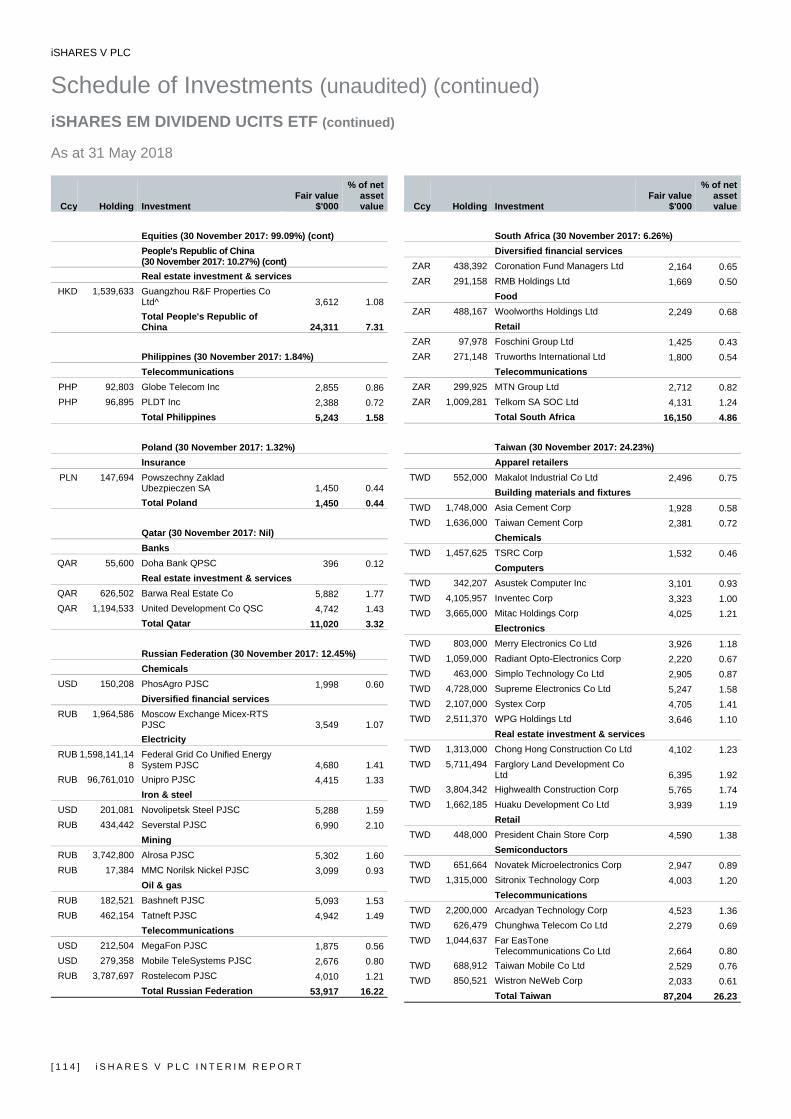
iSHARES V PLC
Schedule of Investments (unaudited) (continued) iSHARES EM DIVIDEND UCITS ETF (continued) As at 31 May 2018
[ 1 1 4 ] i S H A R E S V P L C I N T E R I M R E P O R T
Ccy Holding Investment Fair value
$'000
% of net asset value
Equities (30 November 2017: 99.09%) (cont) People's Republic of China (30 November 2017: 10.27%) (cont) Real estate investment & services
HKD 1,539,633 Guangzhou R&F Properties Co Ltd^ 3,612 1.08Total People's Republic of China 24,311 7.31
Philippines (30 November 2017: 1.84%) Telecommunications
PHP 92,803 Globe Telecom Inc 2,855 0.86PHP 96,895 PLDT Inc 2,388 0.72
Total Philippines 5,243 1.58
Poland (30 November 2017: 1.32%) Insurance
PLN 147,694 Powszechny Zaklad Ubezpieczen SA 1,450 0.44Total Poland 1,450 0.44
Qatar (30 November 2017: Nil) Banks
QAR 55,600 Doha Bank QPSC 396 0.12Real estate investment & services
QAR 626,502 Barwa Real Estate Co 5,882 1.77QAR 1,194,533 United Development Co QSC 4,742 1.43
Total Qatar 11,020 3.32
Russian Federation (30 November 2017: 12.45%) Chemicals
USD 150,208 PhosAgro PJSC 1,998 0.60Diversified financial services
RUB 1,964,586 Moscow Exchange Micex-RTS PJSC 3,549 1.07Electricity
RUB 1,598,141,148
Federal Grid Co Unified Energy System PJSC 4,680 1.41
RUB 96,761,010 Unipro PJSC 4,415 1.33Iron & steel
USD 201,081 Novolipetsk Steel PJSC 5,288 1.59RUB 434,442 Severstal PJSC 6,990 2.10
Mining RUB 3,742,800 Alrosa PJSC 5,302 1.60RUB 17,384 MMC Norilsk Nickel PJSC 3,099 0.93
Oil & gas RUB 182,521 Bashneft PJSC 5,093 1.53RUB 462,154 Tatneft PJSC 4,942 1.49
Telecommunications USD 212,504 MegaFon PJSC 1,875 0.56USD 279,358 Mobile TeleSystems PJSC 2,676 0.80RUB 3,787,697 Rostelecom PJSC 4,010 1.21
Total Russian Federation 53,917 16.22
Ccy Holding Investment Fair value
$'000
% of net asset value
South Africa (30 November 2017: 6.26%) Diversified financial services
ZAR 438,392 Coronation Fund Managers Ltd 2,164 0.65ZAR 291,158 RMB Holdings Ltd 1,669 0.50
Food ZAR 488,167 Woolworths Holdings Ltd 2,249 0.68
Retail ZAR 97,978 Foschini Group Ltd 1,425 0.43ZAR 271,148 Truworths International Ltd 1,800 0.54
Telecommunications ZAR 299,925 MTN Group Ltd 2,712 0.82ZAR 1,009,281 Telkom SA SOC Ltd 4,131 1.24
Total South Africa 16,150 4.86
Taiwan (30 November 2017: 24.23%) Apparel retailers
TWD 552,000 Makalot Industrial Co Ltd 2,496 0.75Building materials and fixtures
TWD 1,748,000 Asia Cement Corp 1,928 0.58TWD 1,636,000 Taiwan Cement Corp 2,381 0.72
Chemicals TWD 1,457,625 TSRC Corp 1,532 0.46
Computers TWD 342,207 Asustek Computer Inc 3,101 0.93TWD 4,105,957 Inventec Corp 3,323 1.00TWD 3,665,000 Mitac Holdings Corp 4,025 1.21
Electronics TWD 803,000 Merry Electronics Co Ltd 3,926 1.18TWD 1,059,000 Radiant Opto-Electronics Corp 2,220 0.67TWD 463,000 Simplo Technology Co Ltd 2,905 0.87TWD 4,728,000 Supreme Electronics Co Ltd 5,247 1.58TWD 2,107,000 Systex Corp 4,705 1.41TWD 2,511,370 WPG Holdings Ltd 3,646 1.10
Real estate investment & services TWD 1,313,000 Chong Hong Construction Co Ltd 4,102 1.23TWD 5,711,494 Farglory Land Development Co
Ltd 6,395 1.92TWD 3,804,342 Highwealth Construction Corp 5,765 1.74TWD 1,662,185 Huaku Development Co Ltd 3,939 1.19
Retail TWD 448,000 President Chain Store Corp 4,590 1.38
Semiconductors TWD 651,664 Novatek Microelectronics Corp 2,947 0.89TWD 1,315,000 Sitronix Technology Corp 4,003 1.20
Telecommunications TWD 2,200,000 Arcadyan Technology Corp 4,523 1.36TWD 626,479 Chunghwa Telecom Co Ltd 2,279 0.69TWD 1,044,637 Far EasTone
Telecommunications Co Ltd 2,664 0.80TWD 688,912 Taiwan Mobile Co Ltd 2,529 0.76TWD 850,521 Wistron NeWeb Corp 2,033 0.61
Total Taiwan 87,204 26.23
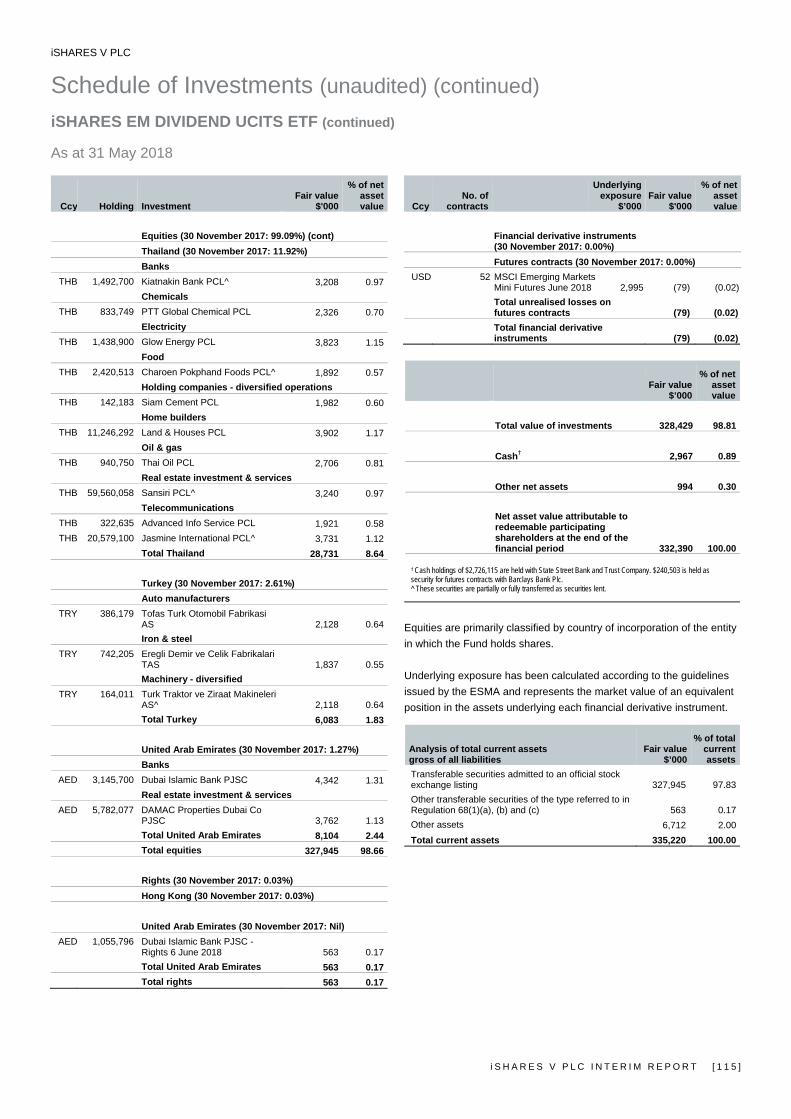
iSHARES V PLC
Schedule of Investments (unaudited) (continued) iSHARES EM DIVIDEND UCITS ETF (continued) As at 31 May 2018
i S H A R E S V P L C I N T E R I M R E P O R T [ 1 1 5 ]
Ccy Holding Investment Fair value
$'000
% of net asset value
Equities (30 November 2017: 99.09%) (cont)
Thailand (30 November 2017: 11.92%) Banks
THB 1,492,700 Kiatnakin Bank PCL^ 3,208 0.97Chemicals
THB 833,749 PTT Global Chemical PCL 2,326 0.70Electricity
THB 1,438,900 Glow Energy PCL 3,823 1.15Food
THB 2,420,513 Charoen Pokphand Foods PCL^ 1,892 0.57Holding companies - diversified operations
THB 142,183 Siam Cement PCL 1,982 0.60Home builders
THB 11,246,292 Land & Houses PCL 3,902 1.17Oil & gas
THB 940,750 Thai Oil PCL 2,706 0.81Real estate investment & services
THB 59,560,058 Sansiri PCL^ 3,240 0.97Telecommunications
THB 322,635 Advanced Info Service PCL 1,921 0.58THB 20,579,100 Jasmine International PCL^ 3,731 1.12
Total Thailand 28,731 8.64
Turkey (30 November 2017: 2.61%) Auto manufacturers
TRY 386,179 Tofas Turk Otomobil Fabrikasi AS 2,128 0.64Iron & steel
TRY 742,205 Eregli Demir ve Celik Fabrikalari TAS 1,837 0.55Machinery - diversified
TRY 164,011 Turk Traktor ve Ziraat Makineleri AS^ 2,118 0.64Total Turkey 6,083 1.83
United Arab Emirates (30 November 2017: 1.27%) Banks
AED 3,145,700 Dubai Islamic Bank PJSC 4,342 1.31Real estate investment & services
AED 5,782,077 DAMAC Properties Dubai Co PJSC 3,762 1.13Total United Arab Emirates 8,104 2.44Total equities 327,945 98.66
Rights (30 November 2017: 0.03%) Hong Kong (30 November 2017: 0.03%) United Arab Emirates (30 November 2017: Nil)
AED 1,055,796 Dubai Islamic Bank PJSC - Rights 6 June 2018 563 0.17Total United Arab Emirates 563 0.17Total rights 563 0.17
CcyNo. of
contracts
Underlying exposure
$’000 Fair value
$'000
% of net asset value
Financial derivative instruments (30 November 2017: 0.00%) Futures contracts (30 November 2017: 0.00%)
USD 52 MSCI Emerging Markets Mini Futures June 2018 2,995 (79) (0.02)Total unrealised losses on futures contracts (79) (0.02)Total financial derivative instruments (79) (0.02)
Fair value
$’000
% of net asset value
Total value of investments 328,429 98.81 Cash† 2,967 0.89 Other net assets 994 0.30 Net asset value attributable to redeemable participating shareholders at the end of the financial period 332,390 100.00
† Cash holdings of $2,726,115 are held with State Street Bank and Trust Company. $240,503 is held as security for futures contracts with Barclays Bank Plc. ^ These securities are partially or fully transferred as securities lent.
Equities are primarily classified by country of incorporation of the entity in which the Fund holds shares. Underlying exposure has been calculated according to the guidelines issued by the ESMA and represents the market value of an equivalent position in the assets underlying each financial derivative instrument.
Analysis of total current assets gross of all liabilities
Fair value$’000
% of total current assets
Transferable securities admitted to an official stock exchange listing 327,945 97.83Other transferable securities of the type referred to in Regulation 68(1)(a), (b) and (c) 563 0.17Other assets 6,712 2.00Total current assets 335,220 100.00

iSHARES V PLC
Schedule of Investments (unaudited) (continued) iSHARES FRANCE GOVT BOND UCITS ETF As at 31 May 2018
[ 1 1 6 ] i S H A R E S V P L C I N T E R I M R E P O R T
Ccy Holding Investment Fair value
€'000
% of net asset value
Transferable Securities Admitted to an Official Stock Exchange Listing or traded on a Regulated Market (30 November 2017: 99.04%)
Bonds (30 November 2017: 99.04%) France (30 November 2017: 99.04%) Government Bonds
EUR 4,200,000 French Republic Government Bond OAT 0% 25/02/2020 4,239 1.89
EUR 2,700,000 French Republic Government Bond OAT 0% 25/05/2020 2,728 1.21
EUR 476,000 French Republic Government Bond OAT 0% 25/02/2021 481 0.21
EUR 5,045,000 French Republic Government Bond OAT 0% 25/05/2021 5,107 2.27
EUR 3,525,000 French Republic Government Bond OAT 0% 25/05/2022 3,560 1.58
EUR 3,143,000 French Republic Government Bond OAT 0% 25/03/2023 3,159 1.41
EUR 3,675,000 French Republic Government Bond OAT 0.25% 25/11/2020 3,741 1.66
EUR 4,535,000 French Republic Government Bond OAT 0.25% 25/11/2026^ 4,461 1.98
EUR 4,650,000 French Republic Government Bond OAT 0.5% 25/11/2019 4,724 2.10
EUR 5,025,000 French Republic Government Bond OAT 0.5% 25/05/2025 5,120 2.28
EUR 4,574,000 French Republic Government Bond OAT 0.5% 25/05/2026 4,621 2.06
EUR 4,288,000 French Republic Government Bond OAT 0.75% 25/05/2028 4,326 1.92
EUR 1,780,000 French Republic Government Bond OAT 1% 25/05/2019 1,807 0.81
EUR 4,425,000 French Republic Government Bond OAT 1% 25/11/2025 4,655 2.07
EUR 4,500,000 French Republic Government Bond OAT 1% 25/05/2027 4,686 2.08
EUR 739,000 French Republic Government Bond OAT 1.25% 25/05/2034 756 0.34
EUR 3,300,000 French Republic Government Bond OAT 1.25% 25/05/2036 3,323 1.48
EUR 5,550,000 French Republic Government Bond OAT 1.5% 25/05/2031 5,950 2.65
EUR 5,474,000 French Republic Government Bond OAT 1.75% 25/05/2023 5,981 2.66
EUR 5,325,000 French Republic Government Bond OAT 1.75% 25/11/2024 5,877 2.61
EUR 1,747,000 French Republic Government Bond OAT 1.75% 25/06/2039 1,887 0.84
EUR 1,350,000 French Republic Government Bond OAT 1.75% 25/05/2066 1,353 0.60
Ccy Holding InvestmentFair value
€'000
% of net asset value
France (30 November 2017: 99.04%) (cont) Government Bonds (cont)
EUR 2,922,000 French Republic Government Bond OAT 2% 25/05/2048 3,206 1.43
EUR 4,950,000 French Republic Government Bond OAT 2.25% 25/10/2022 5,486 2.44
EUR 5,174,000 French Republic Government Bond OAT 2.25% 25/05/2024^ 5,850 2.60
EUR 5,625,000 French Republic Government Bond OAT 2.5% 25/10/2020 6,027 2.68
EUR 4,950,000 French Republic Government Bond OAT 2.5% 25/05/2030 5,900 2.62
EUR 5,767,000 French Republic Government Bond OAT 2.75% 25/10/2027^ 6,934 3.08
EUR 6,750,000 French Republic Government Bond OAT 3% 25/04/2022 7,621 3.39
EUR 6,374,000 French Republic Government Bond OAT 3.25% 25/10/2021 7,163 3.19
EUR 3,825,000 French Republic Government Bond OAT 3.25% 25/05/2045 5,322 2.37
EUR 6,074,000 French Republic Government Bond OAT 3.5% 25/04/2020 6,538 2.91
EUR 5,700,000 French Republic Government Bond OAT 3.5% 25/04/2026 7,125 3.17
EUR 4,800,000 French Republic Government Bond OAT 3.75% 25/10/2019 5,088 2.26
EUR 6,074,000 French Republic Government Bond OAT 3.75% 25/04/2021 6,814 3.03
EUR 4,117,000 French Republic Government Bond OAT 4% 25/10/2038 6,171 2.75
EUR 2,237,000 French Republic Government Bond OAT 4% 25/04/2055 3,684 1.64
EUR 1,973,000 French Republic Government Bond OAT 4% 25/04/2060 3,338 1.48
EUR 6,825,000 French Republic Government Bond OAT 4.25% 25/10/2023 8,416 3.74
EUR 4,884,000 French Republic Government Bond OAT 4.5% 25/04/2041 7,938 3.53
EUR 4,125,000 French Republic Government Bond OAT 4.75% 25/04/2035 6,477 2.88
EUR 4,350,000 French Republic Government Bond OAT 5.5% 25/04/2029^ 6,549 2.91
EUR 4,725,000 French Republic Government Bond OAT 5.75% 25/10/2032 7,796 3.47
EUR 4,484,000 French Republic Government Bond OAT 6% 25/10/2025 6,394 2.84
EUR 1,500,000 French Republic Government Bond OAT 8.5% 25/10/2019 1,690 0.75
EUR 1,725,000 French Republic Government Bond OAT 8.5% 25/04/2023 2,458 1.09Total France 222,527 98.96Total bonds 222,527 98.96
Currency Amount
Purchased Currency Amount
SoldUnderlying
Exposure (€)Maturity
date
Unrealised gain/(loss)
€'000
% of net assetvalue
Financial derivative instruments (30 November 2017: Nil) Forward currency contracts* (30 November 2017: Nil)
EUR 123 GBP 108 123 04/06/2018 - 0.00EUR 14 USD 17 15 04/06/2018 - 0.00
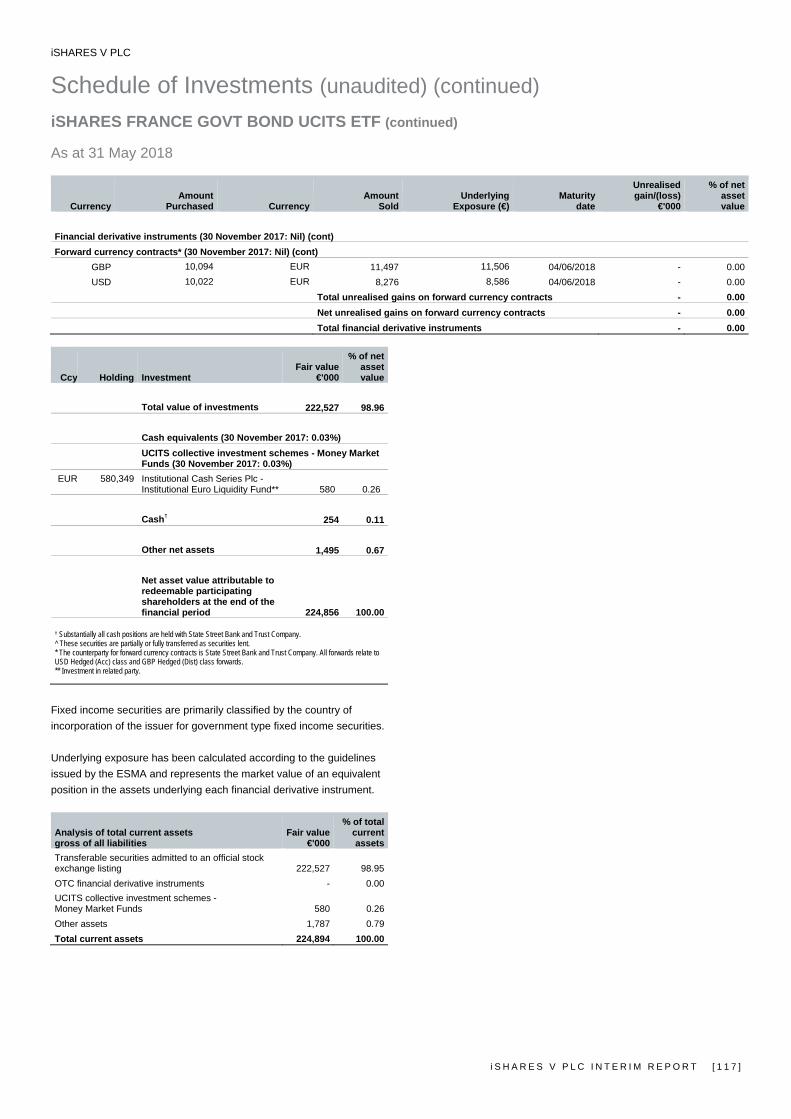
iSHARES V PLC
Schedule of Investments (unaudited) (continued) iSHARES FRANCE GOVT BOND UCITS ETF (continued) As at 31 May 2018
i S H A R E S V P L C I N T E R I M R E P O R T [ 1 1 7 ]
Currency Amount
Purchased Currency Amount
SoldUnderlying
Exposure (€)Maturity
date
Unrealised gain/(loss)
€'000
% of net assetvalue
Financial derivative instruments (30 November 2017: Nil) (cont) Forward currency contracts* (30 November 2017: Nil) (cont)
GBP 10,094 EUR 11,497 11,506 04/06/2018 - 0.00USD 10,022 EUR 8,276 8,586 04/06/2018 - 0.00
Total unrealised gains on forward currency contracts - 0.00 Net unrealised gains on forward currency contracts - 0.00 Total financial derivative instruments - 0.00
Ccy Holding Investment Fair value
€'000
% of net asset value
Total value of investments 222,527 98.96 Cash equivalents (30 November 2017: 0.03%) UCITS collective investment schemes - Money Market Funds (30 November 2017: 0.03%)
EUR 580,349 Institutional Cash Series Plc - Institutional Euro Liquidity Fund** 580 0.26 Cash† 254 0.11 Other net assets 1,495 0.67 Net asset value attributable to redeemable participating shareholders at the end of the financial period 224,856 100.00
† Substantially all cash positions are held with State Street Bank and Trust Company. ^ These securities are partially or fully transferred as securities lent. * The counterparty for forward currency contracts is State Street Bank and Trust Company. All forwards relate to USD Hedged (Acc) class and GBP Hedged (Dist) class forwards. ** Investment in related party.
Fixed income securities are primarily classified by the country of incorporation of the issuer for government type fixed income securities. Underlying exposure has been calculated according to the guidelines issued by the ESMA and represents the market value of an equivalent position in the assets underlying each financial derivative instrument.
Analysis of total current assets gross of all liabilities
Fair value€'000
% of total current assets
Transferable securities admitted to an official stock exchange listing 222,527 98.95OTC financial derivative instruments - 0.00UCITS collective investment schemes - Money Market Funds 580 0.26Other assets 1,787 0.79Total current assets 224,894 100.00
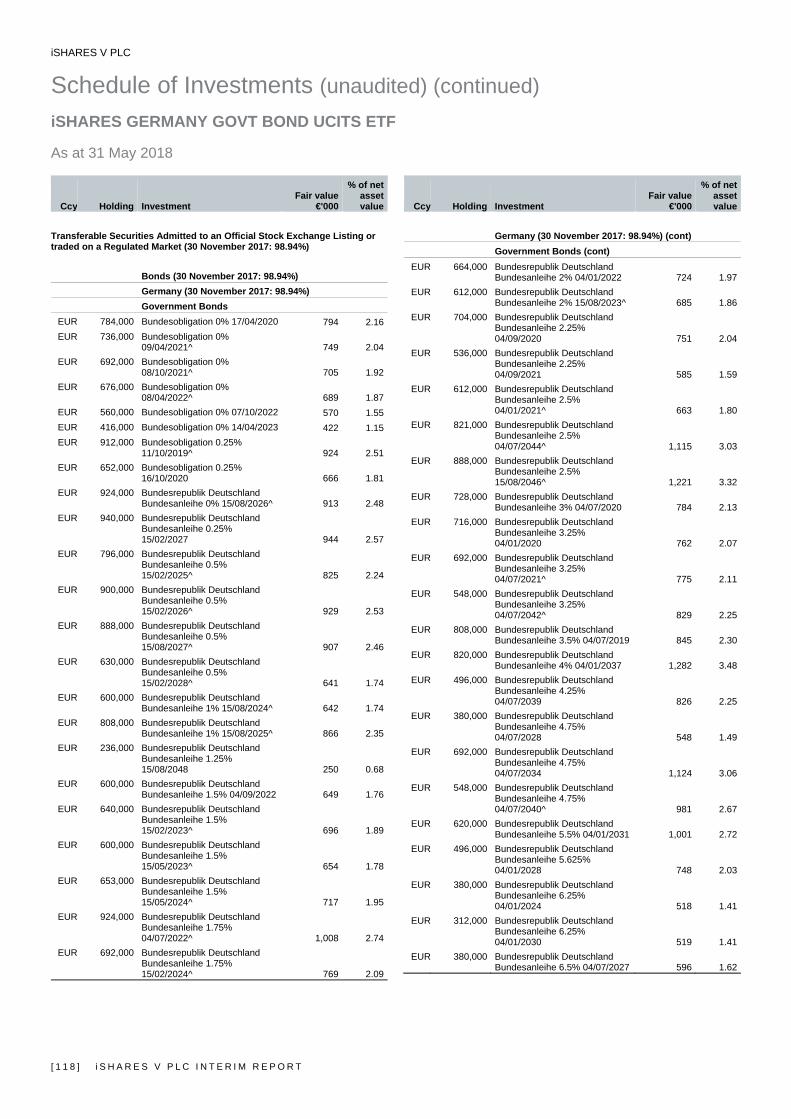
iSHARES V PLC
Schedule of Investments (unaudited) (continued) iSHARES GERMANY GOVT BOND UCITS ETF As at 31 May 2018
[ 1 1 8 ] i S H A R E S V P L C I N T E R I M R E P O R T
Ccy Holding Investment Fair value
€'000
% of net asset value
Transferable Securities Admitted to an Official Stock Exchange Listing or traded on a Regulated Market (30 November 2017: 98.94%)
Bonds (30 November 2017: 98.94%) Germany (30 November 2017: 98.94%) Government Bonds
EUR 784,000 Bundesobligation 0% 17/04/2020 794 2.16EUR 736,000 Bundesobligation 0%
09/04/2021^ 749 2.04EUR 692,000 Bundesobligation 0%
08/10/2021^ 705 1.92EUR 676,000 Bundesobligation 0%
08/04/2022^ 689 1.87EUR 560,000 Bundesobligation 0% 07/10/2022 570 1.55EUR 416,000 Bundesobligation 0% 14/04/2023 422 1.15EUR 912,000 Bundesobligation 0.25%
11/10/2019^ 924 2.51EUR 652,000 Bundesobligation 0.25%
16/10/2020 666 1.81EUR 924,000 Bundesrepublik Deutschland
Bundesanleihe 0% 15/08/2026^ 913 2.48EUR 940,000 Bundesrepublik Deutschland
Bundesanleihe 0.25% 15/02/2027 944 2.57
EUR 796,000 Bundesrepublik Deutschland Bundesanleihe 0.5% 15/02/2025^ 825 2.24
EUR 900,000 Bundesrepublik Deutschland Bundesanleihe 0.5% 15/02/2026^ 929 2.53
EUR 888,000 Bundesrepublik Deutschland Bundesanleihe 0.5% 15/08/2027^ 907 2.46
EUR 630,000 Bundesrepublik Deutschland Bundesanleihe 0.5% 15/02/2028^ 641 1.74
EUR 600,000 Bundesrepublik Deutschland Bundesanleihe 1% 15/08/2024^ 642 1.74
EUR 808,000 Bundesrepublik Deutschland Bundesanleihe 1% 15/08/2025^ 866 2.35
EUR 236,000 Bundesrepublik Deutschland Bundesanleihe 1.25% 15/08/2048 250 0.68
EUR 600,000 Bundesrepublik Deutschland Bundesanleihe 1.5% 04/09/2022 649 1.76
EUR 640,000 Bundesrepublik Deutschland Bundesanleihe 1.5% 15/02/2023^ 696 1.89
EUR 600,000 Bundesrepublik Deutschland Bundesanleihe 1.5% 15/05/2023^ 654 1.78
EUR 653,000 Bundesrepublik Deutschland Bundesanleihe 1.5% 15/05/2024^ 717 1.95
EUR 924,000 Bundesrepublik Deutschland Bundesanleihe 1.75% 04/07/2022^ 1,008 2.74
EUR 692,000 Bundesrepublik Deutschland Bundesanleihe 1.75% 15/02/2024^ 769 2.09
Ccy Holding InvestmentFair value
€'000
% of net asset value
Germany (30 November 2017: 98.94%) (cont) Government Bonds (cont)
EUR 664,000 Bundesrepublik Deutschland Bundesanleihe 2% 04/01/2022 724 1.97
EUR 612,000 Bundesrepublik Deutschland Bundesanleihe 2% 15/08/2023^ 685 1.86
EUR 704,000 Bundesrepublik Deutschland Bundesanleihe 2.25% 04/09/2020 751 2.04
EUR 536,000 Bundesrepublik Deutschland Bundesanleihe 2.25% 04/09/2021 585 1.59
EUR 612,000 Bundesrepublik Deutschland Bundesanleihe 2.5% 04/01/2021^ 663 1.80
EUR 821,000 Bundesrepublik Deutschland Bundesanleihe 2.5% 04/07/2044^ 1,115 3.03
EUR 888,000 Bundesrepublik Deutschland Bundesanleihe 2.5% 15/08/2046^ 1,221 3.32
EUR 728,000 Bundesrepublik Deutschland Bundesanleihe 3% 04/07/2020 784 2.13
EUR 716,000 Bundesrepublik Deutschland Bundesanleihe 3.25% 04/01/2020 762 2.07
EUR 692,000 Bundesrepublik Deutschland Bundesanleihe 3.25% 04/07/2021^ 775 2.11
EUR 548,000 Bundesrepublik Deutschland Bundesanleihe 3.25% 04/07/2042^ 829 2.25
EUR 808,000 Bundesrepublik Deutschland Bundesanleihe 3.5% 04/07/2019 845 2.30
EUR 820,000 Bundesrepublik Deutschland Bundesanleihe 4% 04/01/2037 1,282 3.48
EUR 496,000 Bundesrepublik Deutschland Bundesanleihe 4.25% 04/07/2039 826 2.25
EUR 380,000 Bundesrepublik Deutschland Bundesanleihe 4.75% 04/07/2028 548 1.49
EUR 692,000 Bundesrepublik Deutschland Bundesanleihe 4.75% 04/07/2034 1,124 3.06
EUR 548,000 Bundesrepublik Deutschland Bundesanleihe 4.75% 04/07/2040^ 981 2.67
EUR 620,000 Bundesrepublik Deutschland Bundesanleihe 5.5% 04/01/2031 1,001 2.72
EUR 496,000 Bundesrepublik Deutschland Bundesanleihe 5.625% 04/01/2028 748 2.03
EUR 380,000 Bundesrepublik Deutschland Bundesanleihe 6.25% 04/01/2024 518 1.41
EUR 312,000 Bundesrepublik Deutschland Bundesanleihe 6.25% 04/01/2030 519 1.41
EUR 380,000 Bundesrepublik Deutschland Bundesanleihe 6.5% 04/07/2027 596 1.62
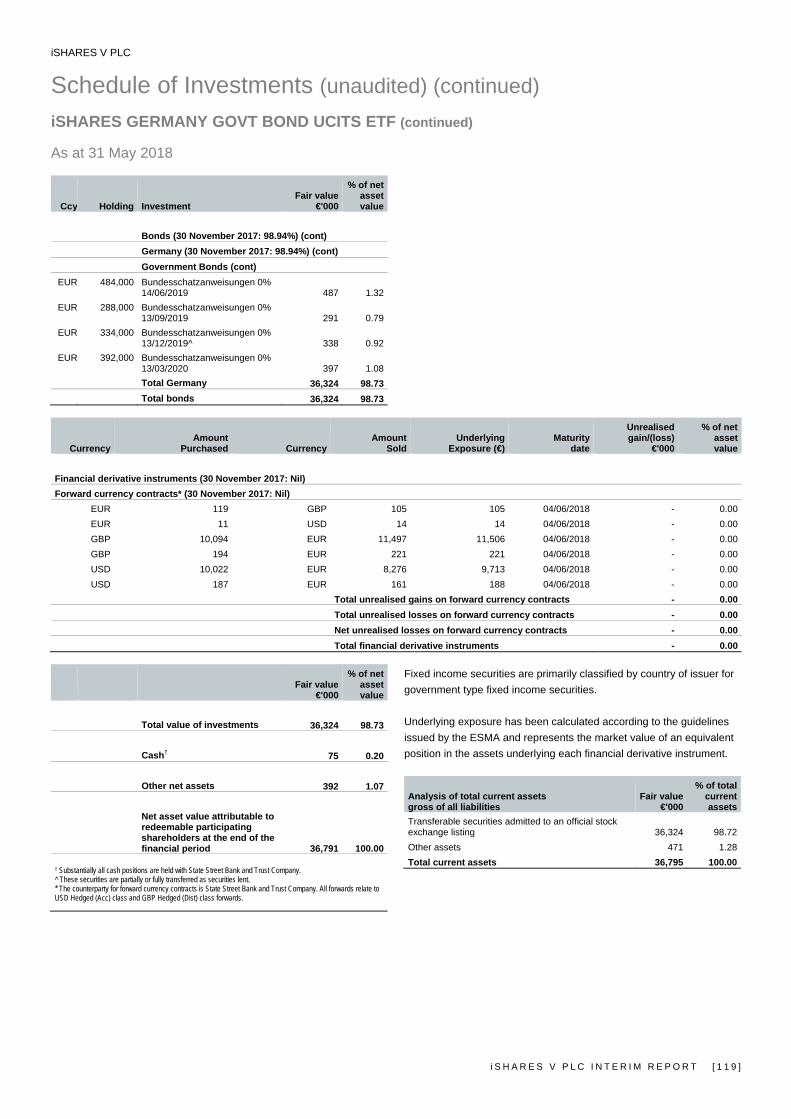
iSHARES V PLC
Schedule of Investments (unaudited) (continued) iSHARES GERMANY GOVT BOND UCITS ETF (continued) As at 31 May 2018
i S H A R E S V P L C I N T E R I M R E P O R T [ 1 1 9 ]
Ccy Holding Investment Fair value
€'000
% of net asset value
Bonds (30 November 2017: 98.94%) (cont) Germany (30 November 2017: 98.94%) (cont) Government Bonds (cont)
EUR 484,000 Bundesschatzanweisungen 0% 14/06/2019 487 1.32
EUR 288,000 Bundesschatzanweisungen 0% 13/09/2019 291 0.79
EUR 334,000 Bundesschatzanweisungen 0% 13/12/2019^ 338 0.92
EUR 392,000 Bundesschatzanweisungen 0% 13/03/2020 397 1.08Total Germany 36,324 98.73Total bonds 36,324 98.73
Currency Amount
Purchased Currency Amount
SoldUnderlying
Exposure (€)Maturity
date
Unrealisedgain/(loss)
€'000
% of netassetvalue
Financial derivative instruments (30 November 2017: Nil) Forward currency contracts* (30 November 2017: Nil)
EUR 119 GBP 105 105 04/06/2018 - 0.00EUR 11 USD 14 14 04/06/2018 - 0.00GBP 10,094 EUR 11,497 11,506 04/06/2018 - 0.00GBP 194 EUR 221 221 04/06/2018 - 0.00USD 10,022 EUR 8,276 9,713 04/06/2018 - 0.00USD 187 EUR 161 188 04/06/2018 - 0.00
Total unrealised gains on forward currency contracts - 0.00 Total unrealised losses on forward currency contracts - 0.00 Net unrealised losses on forward currency contracts - 0.00 Total financial derivative instruments - 0.00
Fair value€'000
% of net asset value
Total value of investments 36,324 98.73 Cash† 75 0.20 Other net assets 392 1.07 Net asset value attributable to redeemable participating shareholders at the end of the financial period 36,791 100.00
† Substantially all cash positions are held with State Street Bank and Trust Company. ^ These securities are partially or fully transferred as securities lent. * The counterparty for forward currency contracts is State Street Bank and Trust Company. All forwards relate to USD Hedged (Acc) class and GBP Hedged (Dist) class forwards.
Fixed income securities are primarily classified by country of issuer for government type fixed income securities. Underlying exposure has been calculated according to the guidelines issued by the ESMA and represents the market value of an equivalent position in the assets underlying each financial derivative instrument.
Analysis of total current assets gross of all liabilities
Fair value€'000
% of total current assets
Transferable securities admitted to an official stock exchange listing 36,324 98.72Other assets 471 1.28Total current assets 36,795 100.00

iSHARES V PLC
Schedule of Investments (unaudited) (continued) iSHARES GOLD PRODUCERS UCITS ETF As at 31 May 2018
[ 1 2 0 ] i S H A R E S V P L C I N T E R I M R E P O R T
Ccy Holding Investment Fair value
$'000
% of net asset value
Transferable Securities Admitted to an Official Stock Exchange Listing or traded on a Regulated Market (30 November 2017: 99.89%)
Equities (30 November 2017: 99.89%) Australia (30 November 2017: 13.55%) Mining
AUD 4,230,115 Evolution Mining Ltd^ 10,434 2.20AUD 2,264,026 Newcrest Mining Ltd 35,564 7.49AUD 1,779,261 Northern Star Resources Ltd 8,441 1.78AUD 1,458,694 Regis Resources Ltd^ 5,232 1.10AUD 2,170,928 Resolute Mining Ltd^ 2,037 0.43AUD 2,205,007 Saracen Mineral Holdings Ltd 3,604 0.76AUD 1,521,610 St Barbara Ltd^ 5,503 1.16
Total Australia 70,815 14.92
Canada (30 November 2017: 53.57%) Mining
CAD 691,576 Agnico Eagle Mines Ltd^ 31,023 6.54CAD 872,028 Alacer Gold Corp 1,600 0.34CAD 1,153,620 Alamos Gold Inc 6,376 1.34CAD 2,910,799 B2Gold Corp^ 7,966 1.68CAD 3,460,000 Barrick Gold Corp^ 45,531 9.59CAD 631,453 Centerra Gold Inc 3,315 0.70CAD 716,676 China Gold International
Resources Corp Ltd^ 1,414 0.30CAD 518,416 Detour Gold Corp 4,096 0.86CAD 2,353,961 Eldorado Gold Corp^ 2,668 0.56CAD 551,479 Franco-Nevada Corp 38,870 8.19CAD 2,572,485 Goldcorp Inc^ 36,747 7.74CAD 513,084 Guyana Goldfields Inc 1,934 0.41CAD 1,382,687 Iamgold Corp 8,634 1.82CAD 3,698,082 Kinross Gold Corp 13,342 2.81CAD 562,779 Kirkland Lake Gold Ltd 10,343 2.18CAD 532,500 Klondex Mines Ltd^ 1,297 0.27CAD 1,715,363 New Gold Inc 3,980 0.84CAD 649,683 Novagold Resources Inc^ 3,140 0.66CAD 1,825,953 OceanaGold Corp 4,490 0.95CAD 369,650 Osisko Gold Royalties Ltd 3,781 0.80CAD 599,788 Premier Gold Mines Ltd 1,248 0.26USD 454,156 Pretium Resources Inc 3,279 0.69CAD 541,622 Sandstorm Gold Ltd^ 2,464 0.52CAD 131,683 Seabridge Gold Inc^ 1,473 0.31CAD 963,393 SEMAFO Inc 2,622 0.55CAD 355,367 SSR Mining Inc^ 3,635 0.77CAD 927,204 Tahoe Resources Inc 4,853 1.02CAD 251,626 Torex Gold Resources Inc^ 2,456 0.52CAD 2,811,888 Yamana Gold Inc^ 8,172 1.72
Total Canada 260,749 54.94
Ccy Holding Investment Fair value
$'000
% of net asset value
Cayman Islands (30 November 2017: 0.80%) Mining
CAD 223,129 Endeavour Mining Corp 3,868 0.81Total Cayman Islands 3,868 0.81
Jersey (30 November 2017: 6.49%) Mining
GBP 3,415,326 Centamin Plc 5,856 1.24GBP 278,054 Randgold Resources Ltd 22,081 4.65
Total Jersey 27,937 5.89
People's Republic of China (30 November 2017: 1.70%)Mining
HKD 3,114,500 Zhaojin Mining Industry Co Ltd^ 2,601 0.55HKD 16,962,000 Zijin Mining Group Co Ltd^ 7,071 1.49
Total People's Republic of China 9,672 2.04
Peru (30 November 2017: 1.69%) Mining
USD 594,893 Cia de Minas Buenaventura SAA 9,203 1.94Total Peru 9,203 1.94
South Africa (30 November 2017: 6.40%) Mining
USD 1,210,336 AngloGold Ashanti Ltd 10,433 2.20USD 2,264,879 Gold Fields Ltd^ 8,086 1.70USD 1,120,245 Harmony Gold Mining Co Ltd^ 1,904 0.40USD 1,337,233 Sibanye Gold Ltd^ 3,450 0.73
Total South Africa 23,873 5.03
United Kingdom (30 November 2017: 0.21%) Mining
GBP 441,667 Acacia Mining Plc^ 759 0.16Total United Kingdom 759 0.16
United States (30 November 2017: 15.48%) Mining
USD 739,467 McEwen Mining Inc 1,664 0.35USD 1,220,169 Newmont Mining Corp 47,501 10.01USD 194,035 Royal Gold Inc 17,397 3.67
Total United States 66,562 14.03Total equities 473,438 99.76

iSHARES V PLC
Schedule of Investments (unaudited) (continued) iSHARES GOLD PRODUCERS UCITS ETF (continued) As at 31 May 2018
i S H A R E S V P L C I N T E R I M R E P O R T [ 1 2 1 ]
Ccy No. of
contracts
Underlying exposure
$'000 Fair value
$'000
% of net assets
value Financial derivative instruments
(30 November 2017: 0.01%) Futures contracts (30 November 2017: 0.01%)
CAD 6 S&P TSX 60 Index Futures June 2018 837 41 0.01Total unrealised gains on futures contracts 41 0.01Total financial derivative instruments 41 0.01
Fair value$'000
% of net asset value
Total value of investments 473,479 99.77 Cash† 6,430 1.35 Other net liabilities (5,330) (1.12) Net asset value attributable to redeemable participating shareholders at the end of the financial period 474,579 100.00
† Cash holdings of $6,420,651 are held with State Street and Bank Trust Company. $8,993 is held as security for futures contracts with Barclays Bank Plc. ^ These securities are partially or fully transferred as securities lent.
Equities are primarily classified by country of incorporation of the entity in which the Fund holds shares. Underlying exposure has been calculated according to the guidelines issued by the ESMA and represents the market value of an equivalent position in the assets underlying each financial derivative instrument.
Analysis of total current assets gross of all liabilities
Fair value$'000
% of total current assets
Transferable securities admitted to an official stock exchange listing 473,438 98.56Exchange traded financial derivative instruments 41 0.01Other assets 6,874 1.43Total current assets 480,353 100.00
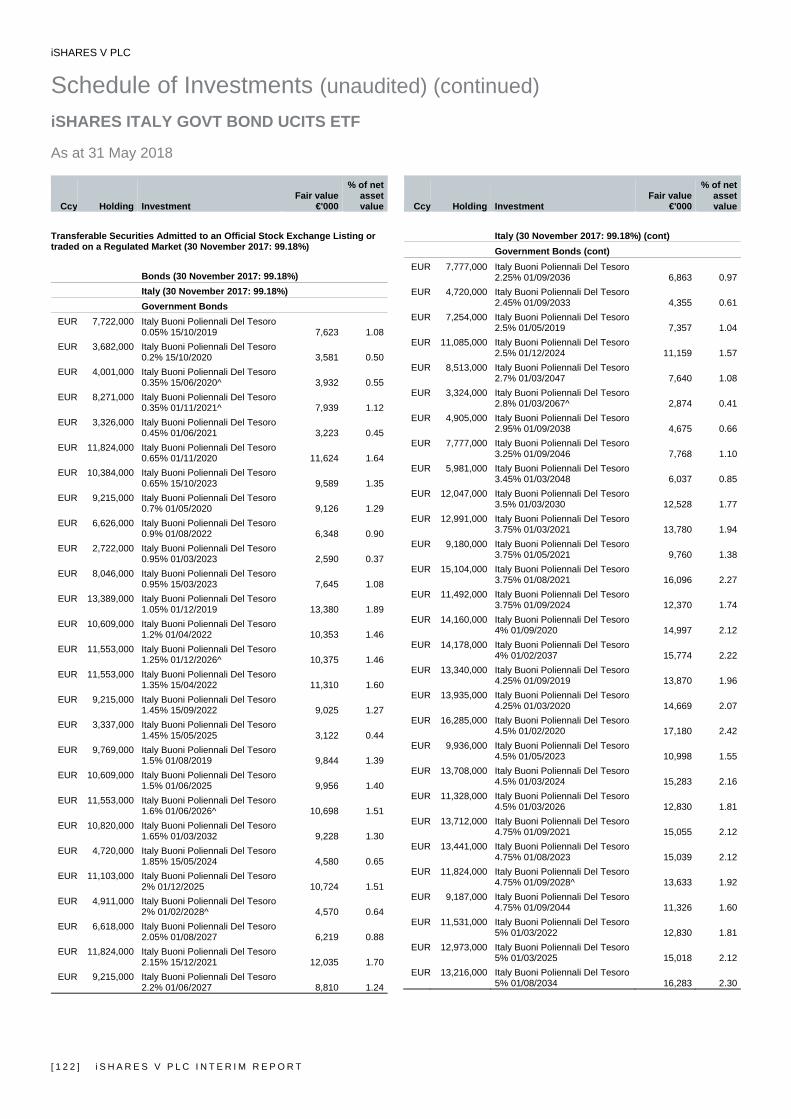
iSHARES V PLC
Schedule of Investments (unaudited) (continued) iSHARES ITALY GOVT BOND UCITS ETF As at 31 May 2018
[ 1 2 2 ] i S H A R E S V P L C I N T E R I M R E P O R T
Ccy Holding Investment Fair value
€'000
% of net asset value
Transferable Securities Admitted to an Official Stock Exchange Listing or traded on a Regulated Market (30 November 2017: 99.18%)
Bonds (30 November 2017: 99.18%) Italy (30 November 2017: 99.18%) Government Bonds
EUR 7,722,000 Italy Buoni Poliennali Del Tesoro 0.05% 15/10/2019 7,623 1.08
EUR 3,682,000 Italy Buoni Poliennali Del Tesoro 0.2% 15/10/2020 3,581 0.50
EUR 4,001,000 Italy Buoni Poliennali Del Tesoro 0.35% 15/06/2020^ 3,932 0.55
EUR 8,271,000 Italy Buoni Poliennali Del Tesoro 0.35% 01/11/2021^ 7,939 1.12
EUR 3,326,000 Italy Buoni Poliennali Del Tesoro 0.45% 01/06/2021 3,223 0.45
EUR 11,824,000 Italy Buoni Poliennali Del Tesoro 0.65% 01/11/2020 11,624 1.64
EUR 10,384,000 Italy Buoni Poliennali Del Tesoro 0.65% 15/10/2023 9,589 1.35
EUR 9,215,000 Italy Buoni Poliennali Del Tesoro 0.7% 01/05/2020 9,126 1.29
EUR 6,626,000 Italy Buoni Poliennali Del Tesoro 0.9% 01/08/2022 6,348 0.90
EUR 2,722,000 Italy Buoni Poliennali Del Tesoro 0.95% 01/03/2023 2,590 0.37
EUR 8,046,000 Italy Buoni Poliennali Del Tesoro 0.95% 15/03/2023 7,645 1.08
EUR 13,389,000 Italy Buoni Poliennali Del Tesoro 1.05% 01/12/2019 13,380 1.89
EUR 10,609,000 Italy Buoni Poliennali Del Tesoro 1.2% 01/04/2022 10,353 1.46
EUR 11,553,000 Italy Buoni Poliennali Del Tesoro 1.25% 01/12/2026^ 10,375 1.46
EUR 11,553,000 Italy Buoni Poliennali Del Tesoro 1.35% 15/04/2022 11,310 1.60
EUR 9,215,000 Italy Buoni Poliennali Del Tesoro 1.45% 15/09/2022 9,025 1.27
EUR 3,337,000 Italy Buoni Poliennali Del Tesoro 1.45% 15/05/2025 3,122 0.44
EUR 9,769,000 Italy Buoni Poliennali Del Tesoro 1.5% 01/08/2019 9,844 1.39
EUR 10,609,000 Italy Buoni Poliennali Del Tesoro 1.5% 01/06/2025 9,956 1.40
EUR 11,553,000 Italy Buoni Poliennali Del Tesoro 1.6% 01/06/2026^ 10,698 1.51
EUR 10,820,000 Italy Buoni Poliennali Del Tesoro 1.65% 01/03/2032 9,228 1.30
EUR 4,720,000 Italy Buoni Poliennali Del Tesoro 1.85% 15/05/2024 4,580 0.65
EUR 11,103,000 Italy Buoni Poliennali Del Tesoro 2% 01/12/2025 10,724 1.51
EUR 4,911,000 Italy Buoni Poliennali Del Tesoro 2% 01/02/2028^ 4,570 0.64
EUR 6,618,000 Italy Buoni Poliennali Del Tesoro 2.05% 01/08/2027 6,219 0.88
EUR 11,824,000 Italy Buoni Poliennali Del Tesoro 2.15% 15/12/2021 12,035 1.70
EUR 9,215,000 Italy Buoni Poliennali Del Tesoro 2.2% 01/06/2027 8,810 1.24
Ccy Holding Investment Fair value
€'000
% of net asset value
Italy (30 November 2017: 99.18%) (cont) Government Bonds (cont)
EUR 7,777,000 Italy Buoni Poliennali Del Tesoro 2.25% 01/09/2036 6,863 0.97
EUR 4,720,000 Italy Buoni Poliennali Del Tesoro 2.45% 01/09/2033 4,355 0.61
EUR 7,254,000 Italy Buoni Poliennali Del Tesoro 2.5% 01/05/2019 7,357 1.04
EUR 11,085,000 Italy Buoni Poliennali Del Tesoro 2.5% 01/12/2024 11,159 1.57
EUR 8,513,000 Italy Buoni Poliennali Del Tesoro 2.7% 01/03/2047 7,640 1.08
EUR 3,324,000 Italy Buoni Poliennali Del Tesoro 2.8% 01/03/2067^ 2,874 0.41
EUR 4,905,000 Italy Buoni Poliennali Del Tesoro 2.95% 01/09/2038 4,675 0.66
EUR 7,777,000 Italy Buoni Poliennali Del Tesoro 3.25% 01/09/2046 7,768 1.10
EUR 5,981,000 Italy Buoni Poliennali Del Tesoro 3.45% 01/03/2048 6,037 0.85
EUR 12,047,000 Italy Buoni Poliennali Del Tesoro 3.5% 01/03/2030 12,528 1.77
EUR 12,991,000 Italy Buoni Poliennali Del Tesoro 3.75% 01/03/2021 13,780 1.94
EUR 9,180,000 Italy Buoni Poliennali Del Tesoro 3.75% 01/05/2021 9,760 1.38
EUR 15,104,000 Italy Buoni Poliennali Del Tesoro 3.75% 01/08/2021 16,096 2.27
EUR 11,492,000 Italy Buoni Poliennali Del Tesoro 3.75% 01/09/2024 12,370 1.74
EUR 14,160,000 Italy Buoni Poliennali Del Tesoro 4% 01/09/2020 14,997 2.12
EUR 14,178,000 Italy Buoni Poliennali Del Tesoro 4% 01/02/2037 15,774 2.22
EUR 13,340,000 Italy Buoni Poliennali Del Tesoro 4.25% 01/09/2019 13,870 1.96
EUR 13,935,000 Italy Buoni Poliennali Del Tesoro 4.25% 01/03/2020 14,669 2.07
EUR 16,285,000 Italy Buoni Poliennali Del Tesoro 4.5% 01/02/2020 17,180 2.42
EUR 9,936,000 Italy Buoni Poliennali Del Tesoro 4.5% 01/05/2023 10,998 1.55
EUR 13,708,000 Italy Buoni Poliennali Del Tesoro 4.5% 01/03/2024 15,283 2.16
EUR 11,328,000 Italy Buoni Poliennali Del Tesoro 4.5% 01/03/2026 12,830 1.81
EUR 13,712,000 Italy Buoni Poliennali Del Tesoro 4.75% 01/09/2021 15,055 2.12
EUR 13,441,000 Italy Buoni Poliennali Del Tesoro 4.75% 01/08/2023 15,039 2.12
EUR 11,824,000 Italy Buoni Poliennali Del Tesoro 4.75% 01/09/2028^ 13,633 1.92
EUR 9,187,000 Italy Buoni Poliennali Del Tesoro 4.75% 01/09/2044 11,326 1.60
EUR 11,531,000 Italy Buoni Poliennali Del Tesoro 5% 01/03/2022 12,830 1.81
EUR 12,973,000 Italy Buoni Poliennali Del Tesoro 5% 01/03/2025 15,018 2.12
EUR 13,216,000 Italy Buoni Poliennali Del Tesoro 5% 01/08/2034 16,283 2.30
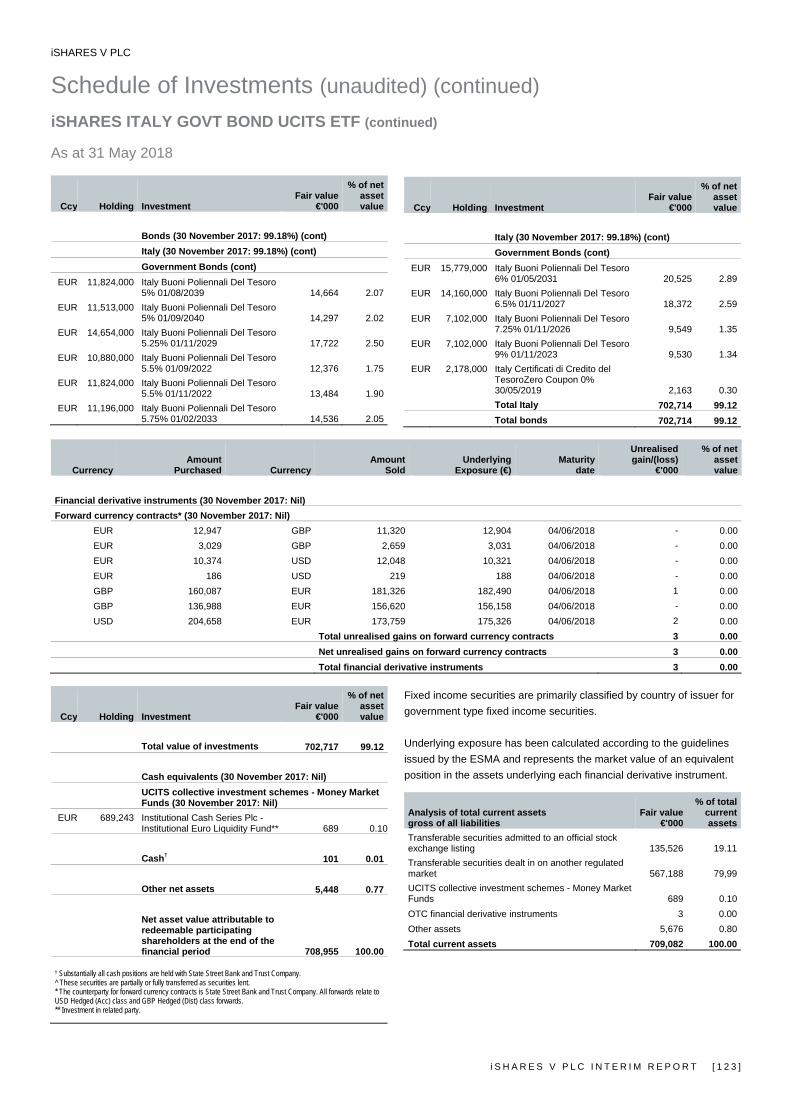
iSHARES V PLC
Schedule of Investments (unaudited) (continued) iSHARES ITALY GOVT BOND UCITS ETF (continued) As at 31 May 2018
i S H A R E S V P L C I N T E R I M R E P O R T [ 1 2 3 ]
Ccy Holding Investment Fair value
€'000
% of net asset value
Bonds (30 November 2017: 99.18%) (cont) Italy (30 November 2017: 99.18%) (cont) Government Bonds (cont)
EUR 11,824,000 Italy Buoni Poliennali Del Tesoro 5% 01/08/2039 14,664 2.07
EUR 11,513,000 Italy Buoni Poliennali Del Tesoro 5% 01/09/2040 14,297 2.02
EUR 14,654,000 Italy Buoni Poliennali Del Tesoro 5.25% 01/11/2029 17,722 2.50
EUR 10,880,000 Italy Buoni Poliennali Del Tesoro 5.5% 01/09/2022 12,376 1.75
EUR 11,824,000 Italy Buoni Poliennali Del Tesoro 5.5% 01/11/2022 13,484 1.90
EUR 11,196,000 Italy Buoni Poliennali Del Tesoro 5.75% 01/02/2033 14,536 2.05
Ccy Holding Investment Fair value
€'000
% of net asset value
Italy (30 November 2017: 99.18%) (cont) Government Bonds (cont)
EUR 15,779,000 Italy Buoni Poliennali Del Tesoro 6% 01/05/2031 20,525 2.89
EUR 14,160,000 Italy Buoni Poliennali Del Tesoro 6.5% 01/11/2027 18,372 2.59
EUR 7,102,000 Italy Buoni Poliennali Del Tesoro 7.25% 01/11/2026 9,549 1.35
EUR 7,102,000 Italy Buoni Poliennali Del Tesoro 9% 01/11/2023 9,530 1.34
EUR 2,178,000 Italy Certificati di Credito del TesoroZero Coupon 0% 30/05/2019 2,163 0.30Total Italy 702,714 99.12Total bonds 702,714 99.12
Currency Amount
Purchased Currency Amount
SoldUnderlying
Exposure (€)Maturity
date
Unrealisedgain/(loss)
€'000
% of netassetvalue
Financial derivative instruments (30 November 2017: Nil) Forward currency contracts* (30 November 2017: Nil)
EUR 12,947 GBP 11,320 12,904 04/06/2018 - 0.00EUR 3,029 GBP 2,659 3,031 04/06/2018 - 0.00EUR 10,374 USD 12,048 10,321 04/06/2018 - 0.00EUR 186 USD 219 188 04/06/2018 - 0.00GBP 160,087 EUR 181,326 182,490 04/06/2018 1 0.00GBP 136,988 EUR 156,620 156,158 04/06/2018 - 0.00USD 204,658 EUR 173,759 175,326 04/06/2018 2 0.00
Total unrealised gains on forward currency contracts 3 0.00 Net unrealised gains on forward currency contracts 3 0.00 Total financial derivative instruments 3 0.00
Ccy Holding Investment Fair value
€'000
% of net asset value
Total value of investments 702,717 99.12
Cash equivalents (30 November 2017: Nil) UCITS collective investment schemes - Money Market Funds (30 November 2017: Nil)
EUR 689,243 Institutional Cash Series Plc - Institutional Euro Liquidity Fund** 689 0.10 Cash† 101 0.01 Other net assets 5,448 0.77 Net asset value attributable to redeemable participating shareholders at the end of the financial period 708,955 100.00
† Substantially all cash positions are held with State Street Bank and Trust Company. ^ These securities are partially or fully transferred as securities lent. * The counterparty for forward currency contracts is State Street Bank and Trust Company. All forwards relate to USD Hedged (Acc) class and GBP Hedged (Dist) class forwards. ** Investment in related party.
Fixed income securities are primarily classified by country of issuer for government type fixed income securities. Underlying exposure has been calculated according to the guidelines issued by the ESMA and represents the market value of an equivalent position in the assets underlying each financial derivative instrument.
Analysis of total current assets gross of all liabilities
Fair value€'000
% of total current assets
Transferable securities admitted to an official stock exchange listing 135,526 19.11Transferable securities dealt in on another regulated market 567,188 79,99UCITS collective investment schemes - Money Market Funds 689 0.10OTC financial derivative instruments 3 0.00Other assets 5,676 0.80Total current assets 709,082 100.00

iSHARES V PLC
Schedule of Investments (unaudited) (continued) iSHARES J.P. MORGAN $ EM CORP BOND UCITS ETF As at 31 May 2018
[ 1 2 4 ] i S H A R E S V P L C I N T E R I M R E P O R T
Ccy Holding Investment Fair value
$'000
% of net asset value
Transferable Securities Admitted to an Official Stock Exchange Listing or traded on a Regulated Market (30 November 2017: 98.10%)
Bonds (30 November 2017: 98.10%) Argentina (30 November 2017: 1.87%) Corporate Bonds
USD 450,000 Agua y Saneamientos Argentinos SA 6.625% 01/02/2023 408 0.12
USD 300,000 Arcor SAIC 6% 06/07/2023^ 301 0.09USD 400,000 Cablevision SA 6.5%
15/06/2021^ 400 0.11USD 1,000,000 Pampa Energia SA 7.5%
24/01/2027 954 0.27USD 600,000 Rio Energy / UGEN / UENSA SA
6.875% 01/02/2025 540 0.16USD 650,000 Tecpetrol SA 4.875% 12/12/2022 606 0.17USD 700,000 YPF SA 6.95% 21/07/2027 650 0.19USD 700,000 YPF SA 7% 15/12/2047^ 581 0.17USD 550,000 YPF SA 8.5% 23/03/2021 575 0.17USD 975,000 YPF SA 8.5% 28/07/2025 987 0.28USD 500,000 YPF SA 8.75% 04/04/2024^ 515 0.15USD 1,500,000 YPF SA 8.75% 04/04/2024 1,545 0.45
Total Argentina 8,062 2.33
Australia (30 November 2017: 0.07%) Austria (30 November 2017: 0.30%) Corporate Bonds
USD 400,000 JBS Investments GmbH 7.25% 03/04/2024^ 392 0.11
USD 200,000 JBS Investments GmbH 7.75% 28/10/2020 204 0.06
USD 200,000 Suzano Austria GmbH 7% 16/03/2047 212 0.06Total Austria 808 0.23
Bermuda (30 November 2017: 2.82%) Corporate Bonds
USD 800,000 CBQ Finance Ltd 3.25% 13/06/2021 769 0.22
USD 1,000,000 Digicel Group Ltd 7.125% 01/04/2022^ 686 0.20
USD 1,500,000 Digicel Group Ltd 8.25% 30/09/2020^ 1,132 0.33
USD 1,230,000 Digicel Ltd 6% 15/04/2021^ 1,127 0.32USD 800,000 Digicel Ltd 6.75% 01/03/2023^ 692 0.20USD 400,000 Inkia Energy Ltd 5.875%
09/11/2027 373 0.11USD 600,000 Li & Fung Ltd 5.25% * 472 0.14USD 800,000 Ooredoo International Finance
Ltd 3.25% 21/02/2023 772 0.22USD 1,200,000 Ooredoo International Finance
Ltd 3.75% 22/06/2026 1,135 0.33USD 200,000 Ooredoo International Finance
Ltd 3.875% 31/01/2028 189 0.05
Ccy Holding Investment Fair value
$'000
% of net asset value
Bermuda (30 November 2017: 2.82%) (cont) Corporate Bonds (cont)
USD 200,000 Ooredoo International Finance Ltd 4.5% 31/01/2043 187 0.05
USD 400,000 Ooredoo International Finance Ltd 4.75% 16/02/2021^ 411 0.12
USD 800,000 Ooredoo International Finance Ltd 5% 19/10/2025 823 0.24
USD 600,000 Tengizchevroil Finance Co International Ltd 4% 15/08/2026 565 0.16Total Bermuda 9,333 2.69
Brazil (30 November 2017: 2.41%) Corporate Bonds
USD 750,000 Banco Bradesco SA 5.9% 16/01/2021 765 0.22
USD 200,000 Banco BTG Pactual SA 8.75% * 203 0.06USD 600,000 Banco do Brasil SA 3.875%
10/10/2022 566 0.16USD 500,000 Banco do Brasil SA 4.625%
15/01/2025 470 0.14USD 200,000 Banco do Brasil SA 5.375%
15/01/2021^ 201 0.06USD 400,000 Banco do Brasil SA 5.875%
19/01/2023 399 0.11USD 400,000 Banco do Brasil SA 6.25% * 331 0.10USD 300,000 Banco do Brasil SA 8.5% */^ 322 0.09USD 600,000 Banco do Brasil SA 9% * 604 0.17USD 400,000 Banco Safra SA 4.125%
08/02/2023^ 384 0.11USD 200,000 BRF SA 3.95% 22/05/2023 175 0.05USD 200,000 BRF SA 4.75% 22/05/2024 175 0.05USD 400,000 Cemig Geracao e Transmissao
SA 9.25% 05/12/2024 421 0.12USD 400,000 Centrais Eletricas Brasileiras SA
5.75% 27/10/2021 400 0.12USD 400,000 Cielo / Cielo USA Inc 3.75%
16/11/2022 375 0.11USD 800,000 Itau Unibanco Holding SA
5.125% 13/05/2023^ 792 0.23USD 400,000 Itau Unibanco Holding SA 5.75%
22/01/2021^ 409 0.12USD 779,000 Itau Unibanco Holding SA 6.2%
21/12/2021 805 0.23USD 200,000 Natura Cosmeticos SA 5.375%
01/02/2023 195 0.06USD 200,000 Votorantim Cimentos SA 7.25%
05/04/2041 204 0.06Total Brazil 8,196 2.37
British Virgin Islands (30 November 2017: 5.39%) Corporate Bonds
USD 200,000 Blue Skyview Co Ltd 7.125% * 179 0.05USD 400,000 Bluestar Finance Holdings Ltd
3.5% 30/09/2021 391 0.11
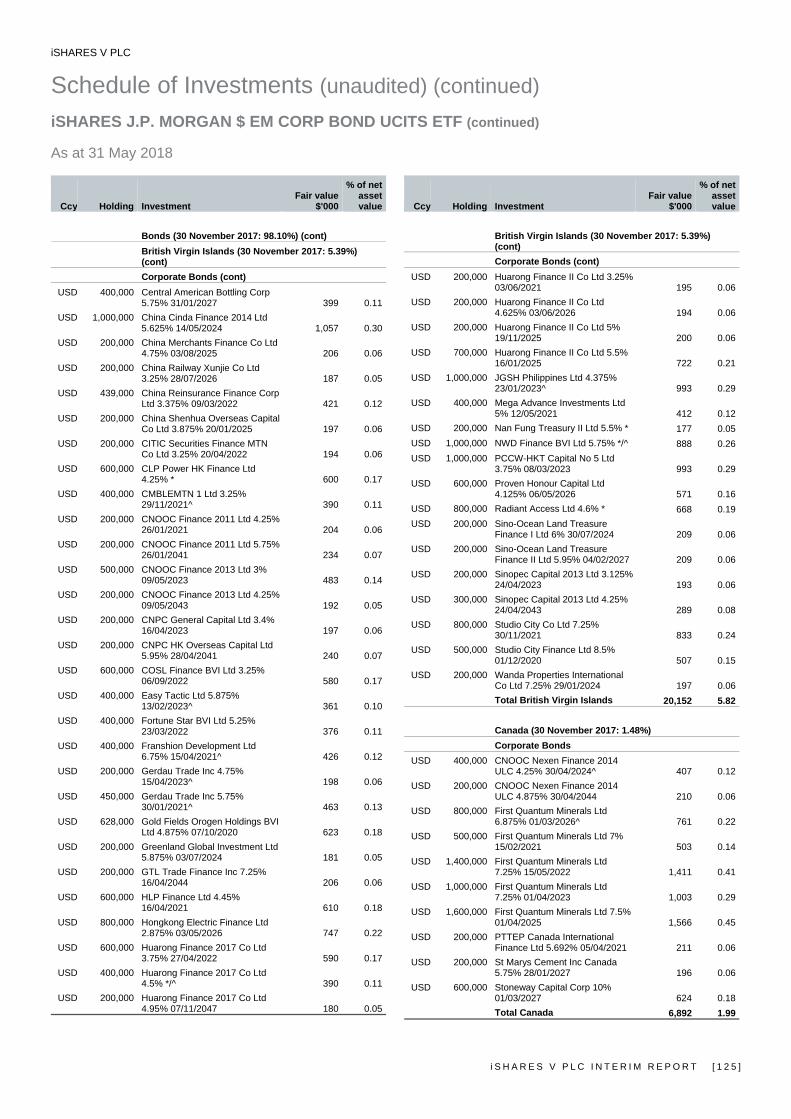
iSHARES V PLC
Schedule of Investments (unaudited) (continued) iSHARES J.P. MORGAN $ EM CORP BOND UCITS ETF (continued) As at 31 May 2018
i S H A R E S V P L C I N T E R I M R E P O R T [ 1 2 5 ]
Ccy Holding Investment Fair value
$'000
% of net asset value
Bonds (30 November 2017: 98.10%) (cont) British Virgin Islands (30 November 2017: 5.39%)
(cont) Corporate Bonds (cont)
USD 400,000 Central American Bottling Corp 5.75% 31/01/2027 399 0.11
USD 1,000,000 China Cinda Finance 2014 Ltd 5.625% 14/05/2024 1,057 0.30
USD 200,000 China Merchants Finance Co Ltd 4.75% 03/08/2025 206 0.06
USD 200,000 China Railway Xunjie Co Ltd 3.25% 28/07/2026 187 0.05
USD 439,000 China Reinsurance Finance Corp Ltd 3.375% 09/03/2022 421 0.12
USD 200,000 China Shenhua Overseas Capital Co Ltd 3.875% 20/01/2025 197 0.06
USD 200,000 CITIC Securities Finance MTN Co Ltd 3.25% 20/04/2022 194 0.06
USD 600,000 CLP Power HK Finance Ltd 4.25% * 600 0.17
USD 400,000 CMBLEMTN 1 Ltd 3.25% 29/11/2021^ 390 0.11
USD 200,000 CNOOC Finance 2011 Ltd 4.25% 26/01/2021 204 0.06
USD 200,000 CNOOC Finance 2011 Ltd 5.75% 26/01/2041 234 0.07
USD 500,000 CNOOC Finance 2013 Ltd 3% 09/05/2023 483 0.14
USD 200,000 CNOOC Finance 2013 Ltd 4.25% 09/05/2043 192 0.05
USD 200,000 CNPC General Capital Ltd 3.4% 16/04/2023 197 0.06
USD 200,000 CNPC HK Overseas Capital Ltd 5.95% 28/04/2041 240 0.07
USD 600,000 COSL Finance BVI Ltd 3.25% 06/09/2022 580 0.17
USD 400,000 Easy Tactic Ltd 5.875% 13/02/2023^ 361 0.10
USD 400,000 Fortune Star BVI Ltd 5.25% 23/03/2022 376 0.11
USD 400,000 Franshion Development Ltd 6.75% 15/04/2021^ 426 0.12
USD 200,000 Gerdau Trade Inc 4.75% 15/04/2023^ 198 0.06
USD 450,000 Gerdau Trade Inc 5.75% 30/01/2021^ 463 0.13
USD 628,000 Gold Fields Orogen Holdings BVI Ltd 4.875% 07/10/2020 623 0.18
USD 200,000 Greenland Global Investment Ltd 5.875% 03/07/2024 181 0.05
USD 200,000 GTL Trade Finance Inc 7.25% 16/04/2044 206 0.06
USD 600,000 HLP Finance Ltd 4.45% 16/04/2021 610 0.18
USD 800,000 Hongkong Electric Finance Ltd 2.875% 03/05/2026 747 0.22
USD 600,000 Huarong Finance 2017 Co Ltd 3.75% 27/04/2022 590 0.17
USD 400,000 Huarong Finance 2017 Co Ltd 4.5% */^ 390 0.11
USD 200,000 Huarong Finance 2017 Co Ltd 4.95% 07/11/2047 180 0.05
Ccy Holding Investment Fair value
$'000
% of net asset value
British Virgin Islands (30 November 2017: 5.39%) (cont) Corporate Bonds (cont)
USD 200,000 Huarong Finance II Co Ltd 3.25% 03/06/2021 195 0.06
USD 200,000 Huarong Finance II Co Ltd 4.625% 03/06/2026 194 0.06
USD 200,000 Huarong Finance II Co Ltd 5% 19/11/2025 200 0.06
USD 700,000 Huarong Finance II Co Ltd 5.5% 16/01/2025 722 0.21
USD 1,000,000 JGSH Philippines Ltd 4.375% 23/01/2023^ 993 0.29
USD 400,000 Mega Advance Investments Ltd 5% 12/05/2021 412 0.12
USD 200,000 Nan Fung Treasury II Ltd 5.5% * 177 0.05USD 1,000,000 NWD Finance BVI Ltd 5.75% */^ 888 0.26USD 1,000,000 PCCW-HKT Capital No 5 Ltd
3.75% 08/03/2023 993 0.29USD 600,000 Proven Honour Capital Ltd
4.125% 06/05/2026 571 0.16USD 800,000 Radiant Access Ltd 4.6% * 668 0.19USD 200,000 Sino-Ocean Land Treasure
Finance I Ltd 6% 30/07/2024 209 0.06USD 200,000 Sino-Ocean Land Treasure
Finance II Ltd 5.95% 04/02/2027 209 0.06USD 200,000 Sinopec Capital 2013 Ltd 3.125%
24/04/2023 193 0.06USD 300,000 Sinopec Capital 2013 Ltd 4.25%
24/04/2043 289 0.08USD 800,000 Studio City Co Ltd 7.25%
30/11/2021 833 0.24USD 500,000 Studio City Finance Ltd 8.5%
01/12/2020 507 0.15USD 200,000 Wanda Properties International
Co Ltd 7.25% 29/01/2024 197 0.06Total British Virgin Islands 20,152 5.82
Canada (30 November 2017: 1.48%) Corporate Bonds
USD 400,000 CNOOC Nexen Finance 2014 ULC 4.25% 30/04/2024^ 407 0.12
USD 200,000 CNOOC Nexen Finance 2014 ULC 4.875% 30/04/2044 210 0.06
USD 800,000 First Quantum Minerals Ltd 6.875% 01/03/2026^ 761 0.22
USD 500,000 First Quantum Minerals Ltd 7% 15/02/2021 503 0.14
USD 1,400,000 First Quantum Minerals Ltd 7.25% 15/05/2022 1,411 0.41
USD 1,000,000 First Quantum Minerals Ltd 7.25% 01/04/2023 1,003 0.29
USD 1,600,000 First Quantum Minerals Ltd 7.5% 01/04/2025 1,566 0.45
USD 200,000 PTTEP Canada International Finance Ltd 5.692% 05/04/2021 211 0.06
USD 200,000 St Marys Cement Inc Canada 5.75% 28/01/2027 196 0.06
USD 600,000 Stoneway Capital Corp 10% 01/03/2027 624 0.18Total Canada 6,892 1.99
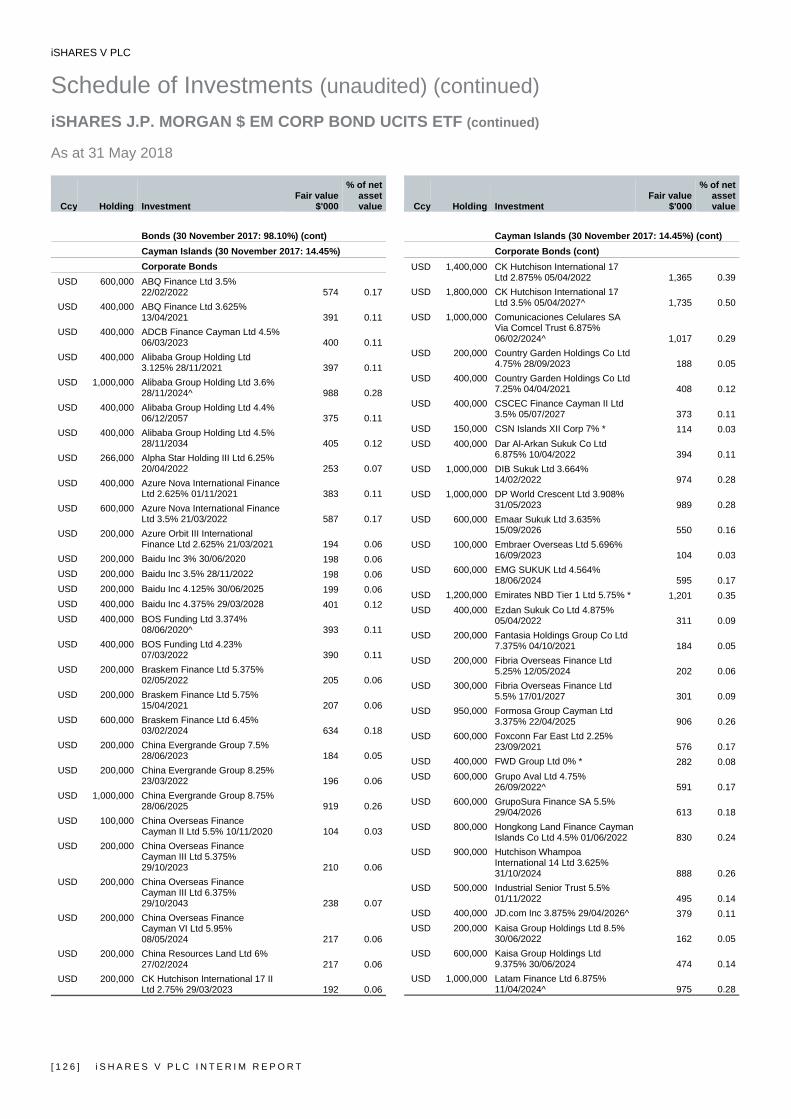
iSHARES V PLC
Schedule of Investments (unaudited) (continued) iSHARES J.P. MORGAN $ EM CORP BOND UCITS ETF (continued) As at 31 May 2018
[ 1 2 6 ] i S H A R E S V P L C I N T E R I M R E P O R T
Ccy Holding Investment Fair value
$'000
% of net asset value
Bonds (30 November 2017: 98.10%) (cont)
Cayman Islands (30 November 2017: 14.45%) Corporate Bonds
USD 600,000 ABQ Finance Ltd 3.5% 22/02/2022 574 0.17
USD 400,000 ABQ Finance Ltd 3.625% 13/04/2021 391 0.11
USD 400,000 ADCB Finance Cayman Ltd 4.5% 06/03/2023 400 0.11
USD 400,000 Alibaba Group Holding Ltd 3.125% 28/11/2021 397 0.11
USD 1,000,000 Alibaba Group Holding Ltd 3.6% 28/11/2024^ 988 0.28
USD 400,000 Alibaba Group Holding Ltd 4.4% 06/12/2057 375 0.11
USD 400,000 Alibaba Group Holding Ltd 4.5% 28/11/2034 405 0.12
USD 266,000 Alpha Star Holding III Ltd 6.25% 20/04/2022 253 0.07
USD 400,000 Azure Nova International Finance Ltd 2.625% 01/11/2021 383 0.11
USD 600,000 Azure Nova International Finance Ltd 3.5% 21/03/2022 587 0.17
USD 200,000 Azure Orbit III International Finance Ltd 2.625% 21/03/2021 194 0.06
USD 200,000 Baidu Inc 3% 30/06/2020 198 0.06USD 200,000 Baidu Inc 3.5% 28/11/2022 198 0.06USD 200,000 Baidu Inc 4.125% 30/06/2025 199 0.06USD 400,000 Baidu Inc 4.375% 29/03/2028 401 0.12USD 400,000 BOS Funding Ltd 3.374%
08/06/2020^ 393 0.11USD 400,000 BOS Funding Ltd 4.23%
07/03/2022 390 0.11USD 200,000 Braskem Finance Ltd 5.375%
02/05/2022 205 0.06USD 200,000 Braskem Finance Ltd 5.75%
15/04/2021 207 0.06USD 600,000 Braskem Finance Ltd 6.45%
03/02/2024 634 0.18USD 200,000 China Evergrande Group 7.5%
28/06/2023 184 0.05USD 200,000 China Evergrande Group 8.25%
23/03/2022 196 0.06USD 1,000,000 China Evergrande Group 8.75%
28/06/2025 919 0.26USD 100,000 China Overseas Finance
Cayman II Ltd 5.5% 10/11/2020 104 0.03USD 200,000 China Overseas Finance
Cayman III Ltd 5.375% 29/10/2023 210 0.06
USD 200,000 China Overseas Finance Cayman III Ltd 6.375% 29/10/2043 238 0.07
USD 200,000 China Overseas Finance Cayman VI Ltd 5.95% 08/05/2024 217 0.06
USD 200,000 China Resources Land Ltd 6% 27/02/2024 217 0.06
USD 200,000 CK Hutchison International 17 II Ltd 2.75% 29/03/2023 192 0.06
Ccy Holding Investment Fair value
$'000
% of net asset value
Cayman Islands (30 November 2017: 14.45%) (cont) Corporate Bonds (cont)
USD 1,400,000 CK Hutchison International 17 Ltd 2.875% 05/04/2022 1,365 0.39
USD 1,800,000 CK Hutchison International 17 Ltd 3.5% 05/04/2027^ 1,735 0.50
USD 1,000,000 Comunicaciones Celulares SA Via Comcel Trust 6.875% 06/02/2024^ 1,017 0.29
USD 200,000 Country Garden Holdings Co Ltd 4.75% 28/09/2023 188 0.05
USD 400,000 Country Garden Holdings Co Ltd 7.25% 04/04/2021 408 0.12
USD 400,000 CSCEC Finance Cayman II Ltd 3.5% 05/07/2027 373 0.11
USD 150,000 CSN Islands XII Corp 7% * 114 0.03USD 400,000 Dar Al-Arkan Sukuk Co Ltd
6.875% 10/04/2022 394 0.11USD 1,000,000 DIB Sukuk Ltd 3.664%
14/02/2022 974 0.28USD 1,000,000 DP World Crescent Ltd 3.908%
31/05/2023 989 0.28USD 600,000 Emaar Sukuk Ltd 3.635%
15/09/2026 550 0.16USD 100,000 Embraer Overseas Ltd 5.696%
16/09/2023 104 0.03USD 600,000 EMG SUKUK Ltd 4.564%
18/06/2024 595 0.17USD 1,200,000 Emirates NBD Tier 1 Ltd 5.75% * 1,201 0.35USD 400,000 Ezdan Sukuk Co Ltd 4.875%
05/04/2022 311 0.09USD 200,000 Fantasia Holdings Group Co Ltd
7.375% 04/10/2021 184 0.05USD 200,000 Fibria Overseas Finance Ltd
5.25% 12/05/2024 202 0.06USD 300,000 Fibria Overseas Finance Ltd
5.5% 17/01/2027 301 0.09USD 950,000 Formosa Group Cayman Ltd
3.375% 22/04/2025 906 0.26USD 600,000 Foxconn Far East Ltd 2.25%
23/09/2021 576 0.17USD 400,000 FWD Group Ltd 0% * 282 0.08USD 600,000 Grupo Aval Ltd 4.75%
26/09/2022^ 591 0.17USD 600,000 GrupoSura Finance SA 5.5%
29/04/2026 613 0.18USD 800,000 Hongkong Land Finance Cayman
Islands Co Ltd 4.5% 01/06/2022 830 0.24USD 900,000 Hutchison Whampoa
International 14 Ltd 3.625% 31/10/2024 888 0.26
USD 500,000 Industrial Senior Trust 5.5% 01/11/2022 495 0.14
USD 400,000 JD.com Inc 3.875% 29/04/2026^ 379 0.11USD 200,000 Kaisa Group Holdings Ltd 8.5%
30/06/2022 162 0.05USD 600,000 Kaisa Group Holdings Ltd
9.375% 30/06/2024 474 0.14USD 1,000,000 Latam Finance Ltd 6.875%
11/04/2024^ 975 0.28
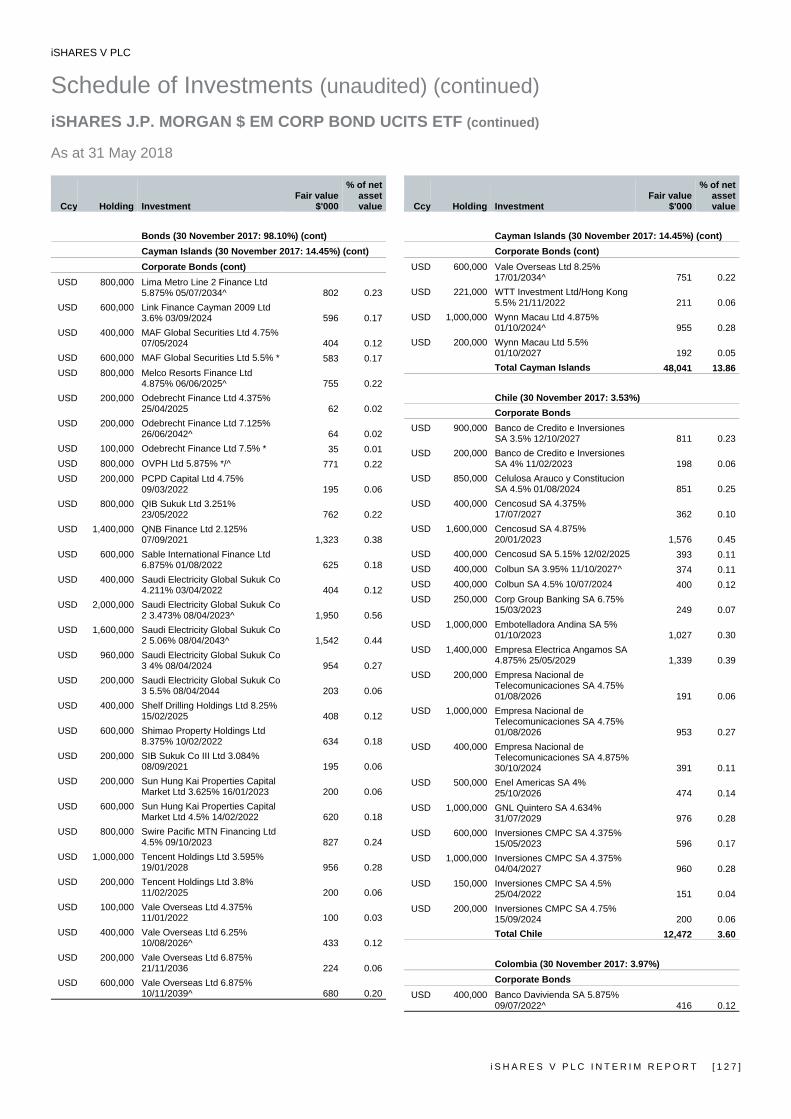
iSHARES V PLC
Schedule of Investments (unaudited) (continued) iSHARES J.P. MORGAN $ EM CORP BOND UCITS ETF (continued) As at 31 May 2018
i S H A R E S V P L C I N T E R I M R E P O R T [ 1 2 7 ]
Ccy Holding Investment Fair value
$'000
% of net asset value
Bonds (30 November 2017: 98.10%) (cont) Cayman Islands (30 November 2017: 14.45%) (cont) Corporate Bonds (cont)
USD 800,000 Lima Metro Line 2 Finance Ltd 5.875% 05/07/2034^ 802 0.23
USD 600,000 Link Finance Cayman 2009 Ltd 3.6% 03/09/2024 596 0.17
USD 400,000 MAF Global Securities Ltd 4.75% 07/05/2024 404 0.12
USD 600,000 MAF Global Securities Ltd 5.5% * 583 0.17USD 800,000 Melco Resorts Finance Ltd
4.875% 06/06/2025^ 755 0.22USD 200,000 Odebrecht Finance Ltd 4.375%
25/04/2025 62 0.02USD 200,000 Odebrecht Finance Ltd 7.125%
26/06/2042^ 64 0.02USD 100,000 Odebrecht Finance Ltd 7.5% * 35 0.01USD 800,000 OVPH Ltd 5.875% */^ 771 0.22USD 200,000 PCPD Capital Ltd 4.75%
09/03/2022 195 0.06USD 800,000 QIB Sukuk Ltd 3.251%
23/05/2022 762 0.22USD 1,400,000 QNB Finance Ltd 2.125%
07/09/2021 1,323 0.38USD 600,000 Sable International Finance Ltd
6.875% 01/08/2022 625 0.18USD 400,000 Saudi Electricity Global Sukuk Co
4.211% 03/04/2022 404 0.12USD 2,000,000 Saudi Electricity Global Sukuk Co
2 3.473% 08/04/2023^ 1,950 0.56USD 1,600,000 Saudi Electricity Global Sukuk Co
2 5.06% 08/04/2043^ 1,542 0.44USD 960,000 Saudi Electricity Global Sukuk Co
3 4% 08/04/2024 954 0.27USD 200,000 Saudi Electricity Global Sukuk Co
3 5.5% 08/04/2044 203 0.06USD 400,000 Shelf Drilling Holdings Ltd 8.25%
15/02/2025 408 0.12USD 600,000 Shimao Property Holdings Ltd
8.375% 10/02/2022 634 0.18USD 200,000 SIB Sukuk Co III Ltd 3.084%
08/09/2021 195 0.06USD 200,000 Sun Hung Kai Properties Capital
Market Ltd 3.625% 16/01/2023 200 0.06USD 600,000 Sun Hung Kai Properties Capital
Market Ltd 4.5% 14/02/2022 620 0.18USD 800,000 Swire Pacific MTN Financing Ltd
4.5% 09/10/2023 827 0.24USD 1,000,000 Tencent Holdings Ltd 3.595%
19/01/2028 956 0.28USD 200,000 Tencent Holdings Ltd 3.8%
11/02/2025 200 0.06USD 100,000 Vale Overseas Ltd 4.375%
11/01/2022 100 0.03USD 400,000 Vale Overseas Ltd 6.25%
10/08/2026^ 433 0.12USD 200,000 Vale Overseas Ltd 6.875%
21/11/2036 224 0.06USD 600,000 Vale Overseas Ltd 6.875%
10/11/2039^ 680 0.20
Ccy Holding Investment Fair value
$'000
% of net asset value
Cayman Islands (30 November 2017: 14.45%) (cont) Corporate Bonds (cont)
USD 600,000 Vale Overseas Ltd 8.25% 17/01/2034^ 751 0.22
USD 221,000 WTT Investment Ltd/Hong Kong 5.5% 21/11/2022 211 0.06
USD 1,000,000 Wynn Macau Ltd 4.875% 01/10/2024^ 955 0.28
USD 200,000 Wynn Macau Ltd 5.5% 01/10/2027 192 0.05Total Cayman Islands 48,041 13.86
Chile (30 November 2017: 3.53%) Corporate Bonds
USD 900,000 Banco de Credito e Inversiones SA 3.5% 12/10/2027 811 0.23
USD 200,000 Banco de Credito e Inversiones SA 4% 11/02/2023 198 0.06
USD 850,000 Celulosa Arauco y Constitucion SA 4.5% 01/08/2024 851 0.25
USD 400,000 Cencosud SA 4.375% 17/07/2027 362 0.10
USD 1,600,000 Cencosud SA 4.875% 20/01/2023 1,576 0.45
USD 400,000 Cencosud SA 5.15% 12/02/2025 393 0.11USD 400,000 Colbun SA 3.95% 11/10/2027^ 374 0.11USD 400,000 Colbun SA 4.5% 10/07/2024 400 0.12USD 250,000 Corp Group Banking SA 6.75%
15/03/2023 249 0.07USD 1,000,000 Embotelladora Andina SA 5%
01/10/2023 1,027 0.30USD 1,400,000 Empresa Electrica Angamos SA
4.875% 25/05/2029 1,339 0.39USD 200,000 Empresa Nacional de
Telecomunicaciones SA 4.75% 01/08/2026 191 0.06
USD 1,000,000 Empresa Nacional de Telecomunicaciones SA 4.75% 01/08/2026 953 0.27
USD 400,000 Empresa Nacional de Telecomunicaciones SA 4.875% 30/10/2024 391 0.11
USD 500,000 Enel Americas SA 4% 25/10/2026 474 0.14
USD 1,000,000 GNL Quintero SA 4.634% 31/07/2029 976 0.28
USD 600,000 Inversiones CMPC SA 4.375% 15/05/2023 596 0.17
USD 1,000,000 Inversiones CMPC SA 4.375% 04/04/2027 960 0.28
USD 150,000 Inversiones CMPC SA 4.5% 25/04/2022 151 0.04
USD 200,000 Inversiones CMPC SA 4.75% 15/09/2024 200 0.06Total Chile 12,472 3.60
Colombia (30 November 2017: 3.97%) Corporate Bonds
USD 400,000 Banco Davivienda SA 5.875% 09/07/2022^ 416 0.12

iSHARES V PLC
Schedule of Investments (unaudited) (continued) iSHARES J.P. MORGAN $ EM CORP BOND UCITS ETF (continued) As at 31 May 2018
[ 1 2 8 ] i S H A R E S V P L C I N T E R I M R E P O R T
Ccy Holding Investment Fair value
$'000
% of net asset value
Bonds (30 November 2017: 98.10%) (cont) Colombia (30 November 2017: 3.97%) (cont) Corporate Bonds (cont)
USD 400,000 Banco de Bogota SA 4.375% 03/08/2027 371 0.11
USD 1,200,000 Banco de Bogota SA 5.375% 19/02/2023 1,218 0.35
USD 600,000 Banco de Bogota SA 6.25% 12/05/2026 607 0.18
USD 400,000 Bancolombia SA 4.875% 18/10/2027 379 0.11
USD 1,668,000 Bancolombia SA 5.125% 11/09/2022^ 1,681 0.49
USD 550,000 Bancolombia SA 5.95% 03/06/2021 572 0.17
USD 800,000 Colombia Telecomunicaciones SA ESP 5.375% 27/09/2022 785 0.23
USD 300,000 Colombia Telecomunicaciones SA ESP 8.5% * 311 0.09
USD 1,100,000 Ecopetrol SA 4.125% 16/01/2025^ 1,056 0.30
USD 1,200,000 Ecopetrol SA 5.375% 26/06/2026 1,229 0.35USD 1,554,000 Ecopetrol SA 5.875% 18/09/2023 1,642 0.47USD 1,900,000 Ecopetrol SA 5.875%
28/05/2045^ 1,816 0.52USD 600,000 Ecopetrol SA 7.375% 18/09/2043 674 0.19USD 400,000 Oleoducto Central SA 4%
07/05/2021 399 0.12USD 1,000,000 Transportadora de Gas
Internacional SA ESP 5.7% 20/03/2022 1,014 0.29Total Colombia 14,170 4.09
Curacao (30 November 2017: 0.18%) Corporate Bonds
USD 200,000 SUAM Finance BV 4.875% 17/04/2024 202 0.06
USD 768,000 Teva Pharmaceutical Finance Co BV 2.95% 18/12/2022 689 0.20
USD 600,000 Teva Pharmaceutical Finance Co BV 3.65% 10/11/2021 566 0.16Total Curacao 1,457 0.42
Equatorial Guinea (30 November 2017: Nil) Corporate Bonds
USD 300,000 Fresnillo Plc 5.5% 13/11/2023 311 0.09USD 200,000 MARB BondCo Plc 6.875%
19/01/2025 185 0.05USD 200,000 MARB BondCo Plc 7%
15/03/2024 189 0.06USD 400,000 Polyus Finance Plc 5.25%
07/02/2023 387 0.11USD 600,000 Tullow Oil Plc 7% 01/03/2025 595 0.17
Total Equatorial Guinea 1,667 0.48
Hong Kong (30 November 2017: 2.01%) Corporate Bonds
USD 1,000,000 AIA Group Ltd 3.2% 11/03/2025 960 0.28
Ccy Holding Investment Fair value
$'000
% of net asset value
Hong Kong (30 November 2017: 2.01%) (cont) Corporate Bonds (cont)
USD 400,000 AIA Group Ltd 4.875% 11/03/2044 439 0.13
USD 300,000 Bank of East Asia Ltd 4.25% 20/11/2024 300 0.09
USD 200,000 Bank of East Asia Ltd 5.625% * 193 0.06USD 1,000,000 Bank of East Asia Ltd 6.125%
16/07/2020^ 1,047 0.30USD 200,000 China Construction Bank Asia
Corp Ltd 4.25% 20/08/2024 200 0.06USD 400,000 CITIC Ltd 3.125% 28/02/2022 388 0.11USD 200,000 CITIC Ltd 3.875% 28/02/2027 188 0.05USD 300,000 CITIC Ltd 6.625% 15/04/2021 322 0.09USD 200,000 CITIC Ltd 6.8% 17/01/2023 222 0.06USD 400,000 CRCC Yuxiang Ltd 3.5%
16/05/2023 391 0.11USD 400,000 ICBCIL Finance Co Ltd 3.2%
10/11/2020 394 0.11USD 400,000 Industrial & Commercial Bank of
China Asia Ltd 4.25% * 378 0.11USD 400,000 Nanyang Commercial Bank Ltd
5% * 375 0.11USD 800,000 Swire Properties MTN Financing
Ltd 3.625% 13/01/2026^ 784 0.23USD 400,000 Vanke Real Estate Hong Kong
Co Ltd 3.975% 09/11/2027 374 0.11Total Hong Kong 6,955 2.01
India (30 November 2017: 3.21%) Corporate Bonds
USD 400,000 Adani Ports & Special Economic Zone Ltd 3.5% 29/07/2020^ 395 0.11
USD 200,000 Adani Ports & Special Economic Zone Ltd 4% 30/07/2027 184 0.05
USD 600,000 Adani Transmission Ltd 4% 03/08/2026 550 0.16
USD 400,000 Axis Bank Ltd 2.875% 01/06/2021^ 388 0.11
USD 200,000 Bank of India 6.25% 16/02/2021 210 0.06USD 200,000 Bharat Petroleum Corp Ltd 4%
08/05/2025 192 0.06USD 200,000 Bharat Petroleum Corp Ltd
4.625% 25/10/2022 203 0.06USD 600,000 Bharti Airtel Ltd 4.375%
10/06/2025^ 564 0.16USD 600,000 Delhi International Airport Ltd
6.125% 31/10/2026^ 596 0.17USD 800,000 ICICI Bank Ltd 3.125%
12/08/2020 786 0.23USD 200,000 ICICI Bank Ltd 4% 18/03/2026 190 0.06USD 400,000 ICICI Bank Ltd 5.75% 16/11/2020 417 0.12USD 600,000 ICICI Bank Ltd/Dubai 3.8%
14/12/2027^ 553 0.16USD 400,000 Indian Oil Corp Ltd 5.625%
02/08/2021^ 419 0.12USD 200,000 Indian Oil Corp Ltd 5.75%
01/08/2023 212 0.06USD 800,000 JSW Steel Ltd 5.25%
13/04/2022^ 788 0.23

iSHARES V PLC
Schedule of Investments (unaudited) (continued) iSHARES J.P. MORGAN $ EM CORP BOND UCITS ETF (continued) As at 31 May 2018
i S H A R E S V P L C I N T E R I M R E P O R T [ 1 2 9 ]
Ccy Holding Investment Fair value
$'000
% of net asset value
Bonds (30 November 2017: 98.10%) (cont) India (30 November 2017: 3.21%) (cont) Corporate Bonds (cont)
USD 400,000 NTPC Ltd 4.25% 26/02/2026 389 0.11USD 200,000 NTPC Ltd 4.375% 26/11/2024 200 0.06USD 200,000 NTPC Ltd 5.625% 14/07/2021 210 0.06USD 600,000 Oil India Ltd 5.375% 17/04/2024 620 0.18USD 400,000 ONGC Videsh Ltd 3.75%
07/05/2023 392 0.11USD 400,000 ONGC Videsh Ltd 4.625%
15/07/2024 402 0.12USD 250,000 Reliance Industries Ltd 3.667%
30/11/2027 232 0.07USD 500,000 Reliance Industries Ltd 4.125%
28/01/2025^ 491 0.14USD 500,000 Reliance Industries Ltd 4.875%
10/02/2045^ 496 0.14USD 400,000 State Bank of India 4.875%
17/04/2024^ 412 0.12USD 400,000 Yes Bank Ifsc Banking Unit
Branch 3.75% 06/02/2023 387 0.11Total India 10,878 3.14
Indonesia (30 November 2017: 0.45%) Corporate Bonds
USD 1,300,000 Perusahaan Gas Negara Persero Tbk 5.125% 16/05/2024^ 1,333 0.39
USD 600,000 Saka Energi Indonesia PT 4.45% 05/05/2024^ 566 0.16Total Indonesia 1,899 0.55
Ireland (30 November 2017: 1.52%) Corporate Bonds
USD 414,000 Alfa Bank AO Via Alfa Bond Issuance Plc 7.75% 28/04/2021 443 0.13
USD 600,000 Alfa Bank AO Via Alfa Bond Issuance Plc 8% * 585 0.17
USD 800,000 C&W Senior Financing DAC 6.875% 15/09/2027 778 0.22
USD 200,000 Credit Bank of Moscow Via CBOM Finance Plc 5.55% 14/02/2023 186 0.05
USD 400,000 Credit Bank of Moscow Via CBOM Finance Plc 7.5% 05/10/2027 314 0.09
USD 250,000 Credit Bank of Moscow Via CBOM Finance Plc 8.875% * 194 0.06
USD 200,000 Gazprombank OJSC Via GPB Eurobond Finance Plc 7.496% 28/12/2023 200 0.06
USD 400,000 Koks OAO Via Koks Finance DAC 7.5% 04/05/2022 401 0.12
USD 600,000 Metalloinvest Finance DAC 4.85% 02/05/2024 566 0.16
USD 400,000 MMC Norilsk Nickel OJSC via MMC Finance DAC 5.55% 28/10/2020 411 0.12
USD 600,000 MMC Norilsk Nickel OJSC Via MMC Finance DAC 6.625% 14/10/2022 635 0.18
Ccy Holding Investment Fair value
$'000
% of net asset value
Ireland (30 November 2017: 1.52%) (cont) Corporate Bonds (cont)
USD 300,000 Mobile Telesystems OJSC via MTS International Funding Ltd 5% 30/05/2023 297 0.09
USD 200,000 Novatek OAO via Novatek Finance DAC 6.604% 03/02/2021 210 0.06
USD 600,000 Novolipetsk Steel Via Steel Funding DAC 4.5% 15/06/2023 577 0.17
USD 800,000 Rosneft Oil Co Via Rosneft International Finance DAC 4.199% 06/03/2022 780 0.22Total Ireland 6,577 1.90
Isle of Man (30 November 2017: 0.96%) Corporate Bonds
USD 380,000 AngloGold Ashanti Holdings Plc 5.125% 01/08/2022 381 0.11
USD 1,200,000 Gohl Capital Ltd 4.25% 24/01/2027 1,156 0.34
USD 1,000,000 Sasol Financing International Ltd 4.5% 14/11/2022 976 0.28Total Isle of Man 2,513 0.73
Israel (30 November 2017: 0.66%) Corporate Bonds
USD 400,000 Israel Electric Corp Ltd 4.25% 14/08/2028 381 0.11
USD 1,200,000 Israel Electric Corp Ltd 5% 12/11/2024 1,227 0.35
USD 800,000 Israel Electric Corp Ltd 6.875% 21/06/2023^ 882 0.26Total Israel 2,490 0.72
Jersey (30 November 2017: Nil) Corporate Bonds
USD 200,000 Petropavlovsk 2016 Ltd 8.125% 14/11/2022 177 0.05Total Jersey 177 0.05
Kazakhstan (30 November 2017: 0.29%) Corporate Bonds
USD 200,000 Halyk Savings Bank of Kazakhstan JSC 7.25% 28/01/2021 214 0.06
USD 600,000 Kazkommertsbank JSC 5.5% 21/12/2022^ 596 0.17Total Kazakhstan 810 0.23
Luxembourg (30 November 2017: 6.07%) Corporate Bonds
USD 500,000 Adecoagro SA 6% 21/09/2027 436 0.13USD 600,000 ALROSA Finance SA 7.75%
03/11/2020 645 0.19USD 1,200,000 Altice Financing SA 6.625%
15/02/2023 1,183 0.34USD 2,000,000 Altice Financing SA 7.5%
15/05/2026 1,912 0.55
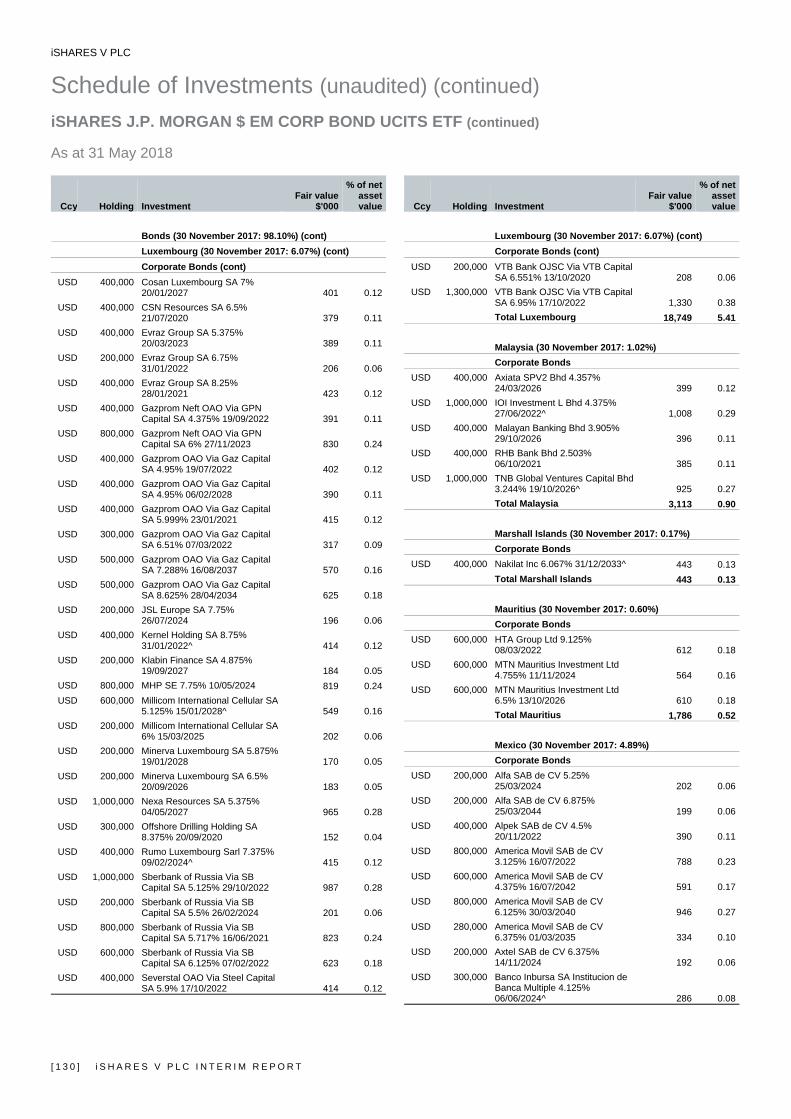
iSHARES V PLC
Schedule of Investments (unaudited) (continued) iSHARES J.P. MORGAN $ EM CORP BOND UCITS ETF (continued) As at 31 May 2018
[ 1 3 0 ] i S H A R E S V P L C I N T E R I M R E P O R T
Ccy Holding Investment Fair value
$'000
% of net asset value
Bonds (30 November 2017: 98.10%) (cont) Luxembourg (30 November 2017: 6.07%) (cont) Corporate Bonds (cont)
USD 400,000 Cosan Luxembourg SA 7% 20/01/2027 401 0.12
USD 400,000 CSN Resources SA 6.5% 21/07/2020 379 0.11
USD 400,000 Evraz Group SA 5.375% 20/03/2023 389 0.11
USD 200,000 Evraz Group SA 6.75% 31/01/2022 206 0.06
USD 400,000 Evraz Group SA 8.25% 28/01/2021 423 0.12
USD 400,000 Gazprom Neft OAO Via GPN Capital SA 4.375% 19/09/2022 391 0.11
USD 800,000 Gazprom Neft OAO Via GPN Capital SA 6% 27/11/2023 830 0.24
USD 400,000 Gazprom OAO Via Gaz Capital SA 4.95% 19/07/2022 402 0.12
USD 400,000 Gazprom OAO Via Gaz Capital SA 4.95% 06/02/2028 390 0.11
USD 400,000 Gazprom OAO Via Gaz Capital SA 5.999% 23/01/2021 415 0.12
USD 300,000 Gazprom OAO Via Gaz Capital SA 6.51% 07/03/2022 317 0.09
USD 500,000 Gazprom OAO Via Gaz Capital SA 7.288% 16/08/2037 570 0.16
USD 500,000 Gazprom OAO Via Gaz Capital SA 8.625% 28/04/2034 625 0.18
USD 200,000 JSL Europe SA 7.75% 26/07/2024 196 0.06
USD 400,000 Kernel Holding SA 8.75% 31/01/2022^ 414 0.12
USD 200,000 Klabin Finance SA 4.875% 19/09/2027 184 0.05
USD 800,000 MHP SE 7.75% 10/05/2024 819 0.24USD 600,000 Millicom International Cellular SA
5.125% 15/01/2028^ 549 0.16USD 200,000 Millicom International Cellular SA
6% 15/03/2025 202 0.06USD 200,000 Minerva Luxembourg SA 5.875%
19/01/2028 170 0.05USD 200,000 Minerva Luxembourg SA 6.5%
20/09/2026 183 0.05USD 1,000,000 Nexa Resources SA 5.375%
04/05/2027 965 0.28USD 300,000 Offshore Drilling Holding SA
8.375% 20/09/2020 152 0.04USD 400,000 Rumo Luxembourg Sarl 7.375%
09/02/2024^ 415 0.12USD 1,000,000 Sberbank of Russia Via SB
Capital SA 5.125% 29/10/2022 987 0.28USD 200,000 Sberbank of Russia Via SB
Capital SA 5.5% 26/02/2024 201 0.06USD 800,000 Sberbank of Russia Via SB
Capital SA 5.717% 16/06/2021 823 0.24USD 600,000 Sberbank of Russia Via SB
Capital SA 6.125% 07/02/2022 623 0.18USD 400,000 Severstal OAO Via Steel Capital
SA 5.9% 17/10/2022 414 0.12
Ccy Holding Investment Fair value
$'000
% of net asset value
Luxembourg (30 November 2017: 6.07%) (cont) Corporate Bonds (cont)
USD 200,000 VTB Bank OJSC Via VTB Capital SA 6.551% 13/10/2020 208 0.06
USD 1,300,000 VTB Bank OJSC Via VTB Capital SA 6.95% 17/10/2022 1,330 0.38Total Luxembourg 18,749 5.41
Malaysia (30 November 2017: 1.02%) Corporate Bonds
USD 400,000 Axiata SPV2 Bhd 4.357% 24/03/2026 399 0.12
USD 1,000,000 IOI Investment L Bhd 4.375% 27/06/2022^ 1,008 0.29
USD 400,000 Malayan Banking Bhd 3.905% 29/10/2026 396 0.11
USD 400,000 RHB Bank Bhd 2.503% 06/10/2021 385 0.11
USD 1,000,000 TNB Global Ventures Capital Bhd 3.244% 19/10/2026^ 925 0.27Total Malaysia 3,113 0.90
Marshall Islands (30 November 2017: 0.17%) Corporate Bonds
USD 400,000 Nakilat Inc 6.067% 31/12/2033^ 443 0.13Total Marshall Islands 443 0.13
Mauritius (30 November 2017: 0.60%) Corporate Bonds
USD 600,000 HTA Group Ltd 9.125% 08/03/2022 612 0.18
USD 600,000 MTN Mauritius Investment Ltd 4.755% 11/11/2024 564 0.16
USD 600,000 MTN Mauritius Investment Ltd 6.5% 13/10/2026 610 0.18Total Mauritius 1,786 0.52
Mexico (30 November 2017: 4.89%) Corporate Bonds
USD 200,000 Alfa SAB de CV 5.25% 25/03/2024 202 0.06
USD 200,000 Alfa SAB de CV 6.875% 25/03/2044 199 0.06
USD 400,000 Alpek SAB de CV 4.5% 20/11/2022 390 0.11
USD 800,000 America Movil SAB de CV 3.125% 16/07/2022 788 0.23
USD 600,000 America Movil SAB de CV 4.375% 16/07/2042 591 0.17
USD 800,000 America Movil SAB de CV 6.125% 30/03/2040 946 0.27
USD 280,000 America Movil SAB de CV 6.375% 01/03/2035 334 0.10
USD 200,000 Axtel SAB de CV 6.375% 14/11/2024 192 0.06
USD 300,000 Banco Inbursa SA Institucion de Banca Multiple 4.125% 06/06/2024^ 286 0.08
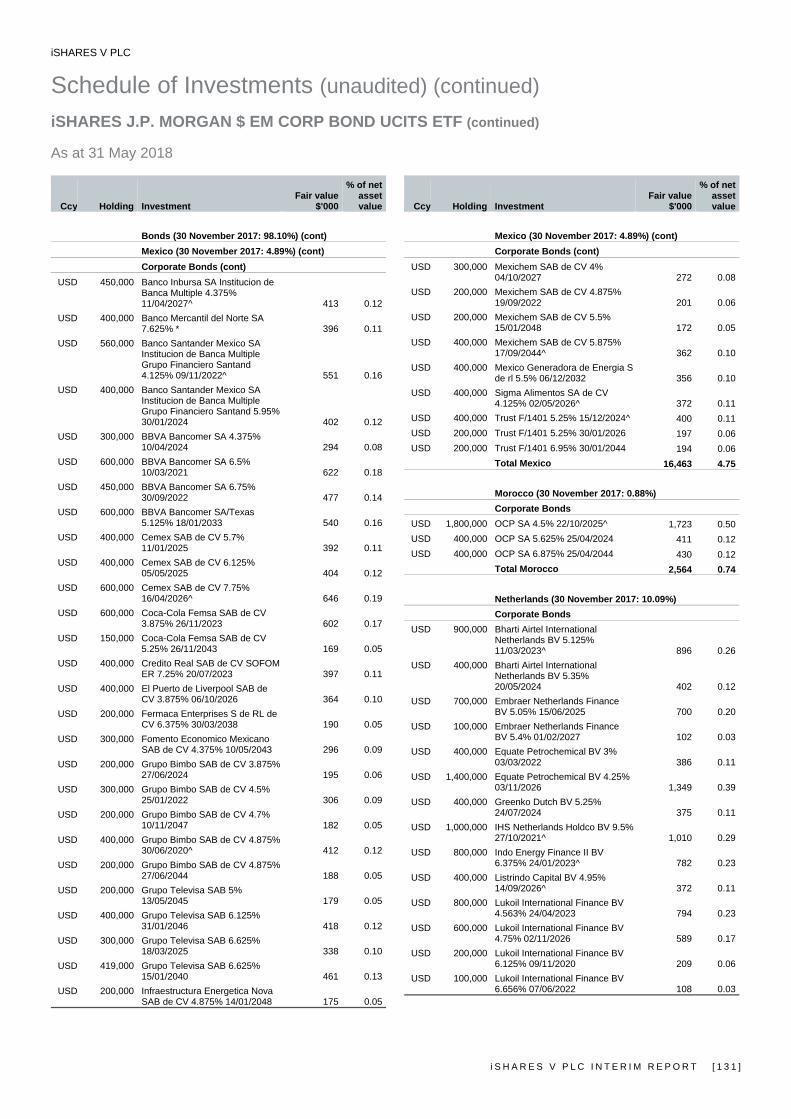
iSHARES V PLC
Schedule of Investments (unaudited) (continued) iSHARES J.P. MORGAN $ EM CORP BOND UCITS ETF (continued) As at 31 May 2018
i S H A R E S V P L C I N T E R I M R E P O R T [ 1 3 1 ]
Ccy Holding Investment Fair value
$'000
% of net asset value
Bonds (30 November 2017: 98.10%) (cont) Mexico (30 November 2017: 4.89%) (cont) Corporate Bonds (cont)
USD 450,000 Banco Inbursa SA Institucion de Banca Multiple 4.375% 11/04/2027^ 413 0.12
USD 400,000 Banco Mercantil del Norte SA 7.625% * 396 0.11
USD 560,000 Banco Santander Mexico SA Institucion de Banca Multiple Grupo Financiero Santand 4.125% 09/11/2022^ 551 0.16
USD 400,000 Banco Santander Mexico SA Institucion de Banca Multiple Grupo Financiero Santand 5.95% 30/01/2024 402 0.12
USD 300,000 BBVA Bancomer SA 4.375% 10/04/2024 294 0.08
USD 600,000 BBVA Bancomer SA 6.5% 10/03/2021 622 0.18
USD 450,000 BBVA Bancomer SA 6.75% 30/09/2022 477 0.14
USD 600,000 BBVA Bancomer SA/Texas 5.125% 18/01/2033 540 0.16
USD 400,000 Cemex SAB de CV 5.7% 11/01/2025 392 0.11
USD 400,000 Cemex SAB de CV 6.125% 05/05/2025 404 0.12
USD 600,000 Cemex SAB de CV 7.75% 16/04/2026^ 646 0.19
USD 600,000 Coca-Cola Femsa SAB de CV 3.875% 26/11/2023 602 0.17
USD 150,000 Coca-Cola Femsa SAB de CV 5.25% 26/11/2043 169 0.05
USD 400,000 Credito Real SAB de CV SOFOM ER 7.25% 20/07/2023 397 0.11
USD 400,000 El Puerto de Liverpool SAB de CV 3.875% 06/10/2026 364 0.10
USD 200,000 Fermaca Enterprises S de RL de CV 6.375% 30/03/2038 190 0.05
USD 300,000 Fomento Economico Mexicano SAB de CV 4.375% 10/05/2043 296 0.09
USD 200,000 Grupo Bimbo SAB de CV 3.875% 27/06/2024 195 0.06
USD 300,000 Grupo Bimbo SAB de CV 4.5% 25/01/2022 306 0.09
USD 200,000 Grupo Bimbo SAB de CV 4.7% 10/11/2047 182 0.05
USD 400,000 Grupo Bimbo SAB de CV 4.875% 30/06/2020^ 412 0.12
USD 200,000 Grupo Bimbo SAB de CV 4.875% 27/06/2044 188 0.05
USD 200,000 Grupo Televisa SAB 5% 13/05/2045 179 0.05
USD 400,000 Grupo Televisa SAB 6.125% 31/01/2046 418 0.12
USD 300,000 Grupo Televisa SAB 6.625% 18/03/2025 338 0.10
USD 419,000 Grupo Televisa SAB 6.625% 15/01/2040 461 0.13
USD 200,000 Infraestructura Energetica Nova SAB de CV 4.875% 14/01/2048 175 0.05
Ccy Holding Investment Fair value
$'000
% of net asset value
Mexico (30 November 2017: 4.89%) (cont) Corporate Bonds (cont)
USD 300,000 Mexichem SAB de CV 4% 04/10/2027 272 0.08
USD 200,000 Mexichem SAB de CV 4.875% 19/09/2022 201 0.06
USD 200,000 Mexichem SAB de CV 5.5% 15/01/2048 172 0.05
USD 400,000 Mexichem SAB de CV 5.875% 17/09/2044^ 362 0.10
USD 400,000 Mexico Generadora de Energia S de rl 5.5% 06/12/2032 356 0.10
USD 400,000 Sigma Alimentos SA de CV 4.125% 02/05/2026^ 372 0.11
USD 400,000 Trust F/1401 5.25% 15/12/2024^ 400 0.11USD 200,000 Trust F/1401 5.25% 30/01/2026 197 0.06USD 200,000 Trust F/1401 6.95% 30/01/2044 194 0.06
Total Mexico 16,463 4.75
Morocco (30 November 2017: 0.88%) Corporate Bonds
USD 1,800,000 OCP SA 4.5% 22/10/2025^ 1,723 0.50USD 400,000 OCP SA 5.625% 25/04/2024 411 0.12USD 400,000 OCP SA 6.875% 25/04/2044 430 0.12
Total Morocco 2,564 0.74
Netherlands (30 November 2017: 10.09%) Corporate Bonds
USD 900,000 Bharti Airtel International Netherlands BV 5.125% 11/03/2023^ 896 0.26
USD 400,000 Bharti Airtel International Netherlands BV 5.35% 20/05/2024 402 0.12
USD 700,000 Embraer Netherlands Finance BV 5.05% 15/06/2025 700 0.20
USD 100,000 Embraer Netherlands Finance BV 5.4% 01/02/2027 102 0.03
USD 400,000 Equate Petrochemical BV 3% 03/03/2022 386 0.11
USD 1,400,000 Equate Petrochemical BV 4.25% 03/11/2026 1,349 0.39
USD 400,000 Greenko Dutch BV 5.25% 24/07/2024 375 0.11
USD 1,000,000 IHS Netherlands Holdco BV 9.5% 27/10/2021^ 1,010 0.29
USD 800,000 Indo Energy Finance II BV 6.375% 24/01/2023^ 782 0.23
USD 400,000 Listrindo Capital BV 4.95% 14/09/2026^ 372 0.11
USD 800,000 Lukoil International Finance BV 4.563% 24/04/2023 794 0.23
USD 600,000 Lukoil International Finance BV 4.75% 02/11/2026 589 0.17
USD 200,000 Lukoil International Finance BV 6.125% 09/11/2020 209 0.06
USD 100,000 Lukoil International Finance BV 6.656% 07/06/2022 108 0.03
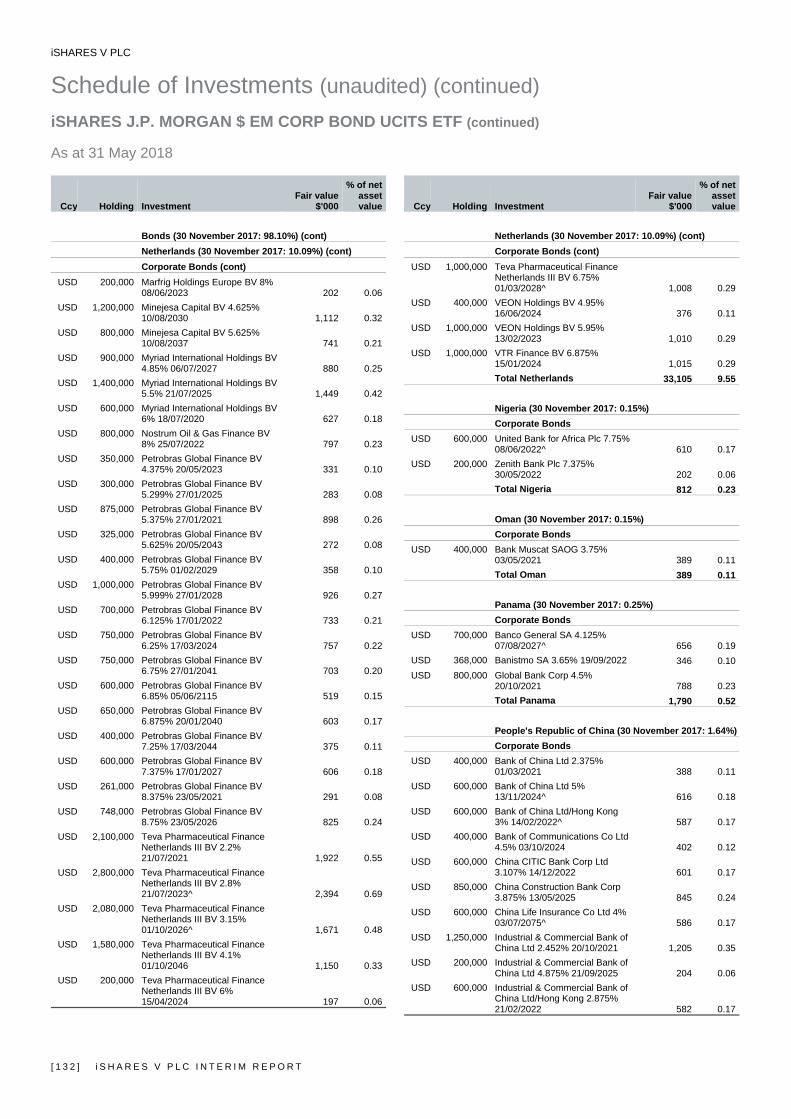
iSHARES V PLC
Schedule of Investments (unaudited) (continued) iSHARES J.P. MORGAN $ EM CORP BOND UCITS ETF (continued) As at 31 May 2018
[ 1 3 2 ] i S H A R E S V P L C I N T E R I M R E P O R T
Ccy Holding Investment Fair value
$'000
% of net asset value
Bonds (30 November 2017: 98.10%) (cont) Netherlands (30 November 2017: 10.09%) (cont) Corporate Bonds (cont)
USD 200,000 Marfrig Holdings Europe BV 8% 08/06/2023 202 0.06
USD 1,200,000 Minejesa Capital BV 4.625% 10/08/2030 1,112 0.32
USD 800,000 Minejesa Capital BV 5.625% 10/08/2037 741 0.21
USD 900,000 Myriad International Holdings BV 4.85% 06/07/2027 880 0.25
USD 1,400,000 Myriad International Holdings BV 5.5% 21/07/2025 1,449 0.42
USD 600,000 Myriad International Holdings BV 6% 18/07/2020 627 0.18
USD 800,000 Nostrum Oil & Gas Finance BV 8% 25/07/2022 797 0.23
USD 350,000 Petrobras Global Finance BV 4.375% 20/05/2023 331 0.10
USD 300,000 Petrobras Global Finance BV 5.299% 27/01/2025 283 0.08
USD 875,000 Petrobras Global Finance BV 5.375% 27/01/2021 898 0.26
USD 325,000 Petrobras Global Finance BV 5.625% 20/05/2043 272 0.08
USD 400,000 Petrobras Global Finance BV 5.75% 01/02/2029 358 0.10
USD 1,000,000 Petrobras Global Finance BV 5.999% 27/01/2028 926 0.27
USD 700,000 Petrobras Global Finance BV 6.125% 17/01/2022 733 0.21
USD 750,000 Petrobras Global Finance BV 6.25% 17/03/2024 757 0.22
USD 750,000 Petrobras Global Finance BV 6.75% 27/01/2041 703 0.20
USD 600,000 Petrobras Global Finance BV 6.85% 05/06/2115 519 0.15
USD 650,000 Petrobras Global Finance BV 6.875% 20/01/2040 603 0.17
USD 400,000 Petrobras Global Finance BV 7.25% 17/03/2044 375 0.11
USD 600,000 Petrobras Global Finance BV 7.375% 17/01/2027 606 0.18
USD 261,000 Petrobras Global Finance BV 8.375% 23/05/2021 291 0.08
USD 748,000 Petrobras Global Finance BV 8.75% 23/05/2026 825 0.24
USD 2,100,000 Teva Pharmaceutical Finance Netherlands III BV 2.2% 21/07/2021 1,922 0.55
USD 2,800,000 Teva Pharmaceutical Finance Netherlands III BV 2.8% 21/07/2023^ 2,394 0.69
USD 2,080,000 Teva Pharmaceutical Finance Netherlands III BV 3.15% 01/10/2026^ 1,671 0.48
USD 1,580,000 Teva Pharmaceutical Finance Netherlands III BV 4.1% 01/10/2046 1,150 0.33
USD 200,000 Teva Pharmaceutical Finance Netherlands III BV 6% 15/04/2024 197 0.06
Ccy Holding Investment Fair value
$'000
% of net asset value
Netherlands (30 November 2017: 10.09%) (cont) Corporate Bonds (cont)
USD 1,000,000 Teva Pharmaceutical Finance Netherlands III BV 6.75% 01/03/2028^ 1,008 0.29
USD 400,000 VEON Holdings BV 4.95% 16/06/2024 376 0.11
USD 1,000,000 VEON Holdings BV 5.95% 13/02/2023 1,010 0.29
USD 1,000,000 VTR Finance BV 6.875% 15/01/2024 1,015 0.29Total Netherlands 33,105 9.55
Nigeria (30 November 2017: 0.15%) Corporate Bonds
USD 600,000 United Bank for Africa Plc 7.75% 08/06/2022^ 610 0.17
USD 200,000 Zenith Bank Plc 7.375% 30/05/2022 202 0.06Total Nigeria 812 0.23
Oman (30 November 2017: 0.15%) Corporate Bonds
USD 400,000 Bank Muscat SAOG 3.75% 03/05/2021 389 0.11Total Oman 389 0.11
Panama (30 November 2017: 0.25%) Corporate Bonds
USD 700,000 Banco General SA 4.125% 07/08/2027^ 656 0.19
USD 368,000 Banistmo SA 3.65% 19/09/2022 346 0.10USD 800,000 Global Bank Corp 4.5%
20/10/2021 788 0.23Total Panama 1,790 0.52
People's Republic of China (30 November 2017: 1.64%)Corporate Bonds
USD 400,000 Bank of China Ltd 2.375% 01/03/2021 388 0.11
USD 600,000 Bank of China Ltd 5% 13/11/2024^ 616 0.18
USD 600,000 Bank of China Ltd/Hong Kong 3% 14/02/2022^ 587 0.17
USD 400,000 Bank of Communications Co Ltd 4.5% 03/10/2024 402 0.12
USD 600,000 China CITIC Bank Corp Ltd 3.107% 14/12/2022 601 0.17
USD 850,000 China Construction Bank Corp 3.875% 13/05/2025 845 0.24
USD 600,000 China Life Insurance Co Ltd 4% 03/07/2075^ 586 0.17
USD 1,250,000 Industrial & Commercial Bank of China Ltd 2.452% 20/10/2021 1,205 0.35
USD 200,000 Industrial & Commercial Bank of China Ltd 4.875% 21/09/2025 204 0.06
USD 600,000 Industrial & Commercial Bank of China Ltd/Hong Kong 2.875% 21/02/2022 582 0.17
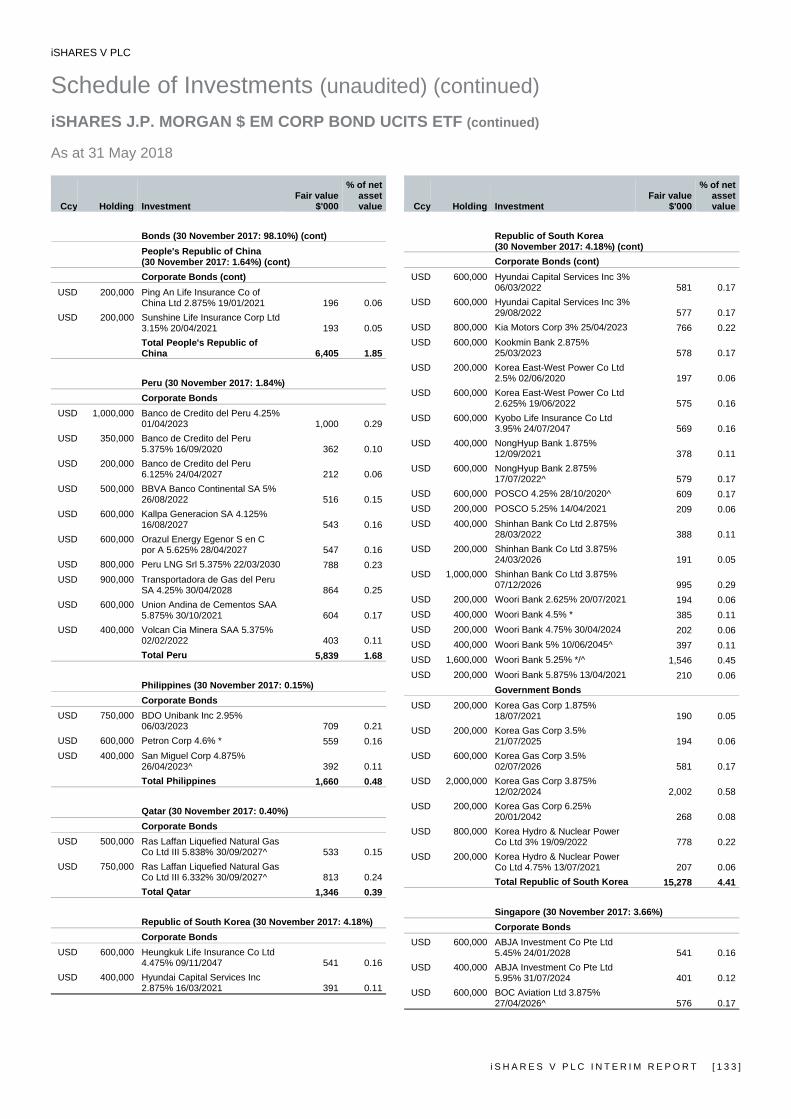
iSHARES V PLC
Schedule of Investments (unaudited) (continued) iSHARES J.P. MORGAN $ EM CORP BOND UCITS ETF (continued) As at 31 May 2018
i S H A R E S V P L C I N T E R I M R E P O R T [ 1 3 3 ]
Ccy Holding Investment Fair value
$'000
% of net asset value
Bonds (30 November 2017: 98.10%) (cont) People's Republic of China
(30 November 2017: 1.64%) (cont) Corporate Bonds (cont)
USD 200,000 Ping An Life Insurance Co of China Ltd 2.875% 19/01/2021 196 0.06
USD 200,000 Sunshine Life Insurance Corp Ltd 3.15% 20/04/2021 193 0.05Total People's Republic of China 6,405 1.85
Peru (30 November 2017: 1.84%) Corporate Bonds
USD 1,000,000 Banco de Credito del Peru 4.25% 01/04/2023 1,000 0.29
USD 350,000 Banco de Credito del Peru 5.375% 16/09/2020 362 0.10
USD 200,000 Banco de Credito del Peru 6.125% 24/04/2027 212 0.06
USD 500,000 BBVA Banco Continental SA 5% 26/08/2022 516 0.15
USD 600,000 Kallpa Generacion SA 4.125% 16/08/2027 543 0.16
USD 600,000 Orazul Energy Egenor S en C por A 5.625% 28/04/2027 547 0.16
USD 800,000 Peru LNG Srl 5.375% 22/03/2030 788 0.23USD 900,000 Transportadora de Gas del Peru
SA 4.25% 30/04/2028 864 0.25USD 600,000 Union Andina de Cementos SAA
5.875% 30/10/2021 604 0.17USD 400,000 Volcan Cia Minera SAA 5.375%
02/02/2022 403 0.11Total Peru 5,839 1.68
Philippines (30 November 2017: 0.15%) Corporate Bonds
USD 750,000 BDO Unibank Inc 2.95% 06/03/2023 709 0.21
USD 600,000 Petron Corp 4.6% * 559 0.16USD 400,000 San Miguel Corp 4.875%
26/04/2023^ 392 0.11Total Philippines 1,660 0.48
Qatar (30 November 2017: 0.40%) Corporate Bonds
USD 500,000 Ras Laffan Liquefied Natural Gas Co Ltd III 5.838% 30/09/2027^ 533 0.15
USD 750,000 Ras Laffan Liquefied Natural Gas Co Ltd III 6.332% 30/09/2027^ 813 0.24Total Qatar 1,346 0.39
Republic of South Korea (30 November 2017: 4.18%) Corporate Bonds
USD 600,000 Heungkuk Life Insurance Co Ltd 4.475% 09/11/2047 541 0.16
USD 400,000 Hyundai Capital Services Inc 2.875% 16/03/2021 391 0.11
Ccy Holding Investment Fair value
$'000
% of net asset value
Republic of South Korea (30 November 2017: 4.18%) (cont) Corporate Bonds (cont)
USD 600,000 Hyundai Capital Services Inc 3% 06/03/2022 581 0.17
USD 600,000 Hyundai Capital Services Inc 3% 29/08/2022 577 0.17
USD 800,000 Kia Motors Corp 3% 25/04/2023 766 0.22USD 600,000 Kookmin Bank 2.875%
25/03/2023 578 0.17USD 200,000 Korea East-West Power Co Ltd
2.5% 02/06/2020 197 0.06USD 600,000 Korea East-West Power Co Ltd
2.625% 19/06/2022 575 0.16USD 600,000 Kyobo Life Insurance Co Ltd
3.95% 24/07/2047 569 0.16USD 400,000 NongHyup Bank 1.875%
12/09/2021 378 0.11USD 600,000 NongHyup Bank 2.875%
17/07/2022^ 579 0.17USD 600,000 POSCO 4.25% 28/10/2020^ 609 0.17USD 200,000 POSCO 5.25% 14/04/2021 209 0.06USD 400,000 Shinhan Bank Co Ltd 2.875%
28/03/2022 388 0.11USD 200,000 Shinhan Bank Co Ltd 3.875%
24/03/2026 191 0.05USD 1,000,000 Shinhan Bank Co Ltd 3.875%
07/12/2026 995 0.29USD 200,000 Woori Bank 2.625% 20/07/2021 194 0.06USD 400,000 Woori Bank 4.5% * 385 0.11USD 200,000 Woori Bank 4.75% 30/04/2024 202 0.06USD 400,000 Woori Bank 5% 10/06/2045^ 397 0.11USD 1,600,000 Woori Bank 5.25% */^ 1,546 0.45USD 200,000 Woori Bank 5.875% 13/04/2021 210 0.06
Government Bonds
USD 200,000 Korea Gas Corp 1.875% 18/07/2021 190 0.05
USD 200,000 Korea Gas Corp 3.5% 21/07/2025 194 0.06
USD 600,000 Korea Gas Corp 3.5% 02/07/2026 581 0.17
USD 2,000,000 Korea Gas Corp 3.875% 12/02/2024 2,002 0.58
USD 200,000 Korea Gas Corp 6.25% 20/01/2042 268 0.08
USD 800,000 Korea Hydro & Nuclear Power Co Ltd 3% 19/09/2022 778 0.22
USD 200,000 Korea Hydro & Nuclear Power Co Ltd 4.75% 13/07/2021 207 0.06Total Republic of South Korea 15,278 4.41
Singapore (30 November 2017: 3.66%) Corporate Bonds
USD 600,000 ABJA Investment Co Pte Ltd 5.45% 24/01/2028 541 0.16
USD 400,000 ABJA Investment Co Pte Ltd 5.95% 31/07/2024 401 0.12
USD 600,000 BOC Aviation Ltd 3.875% 27/04/2026^ 576 0.17
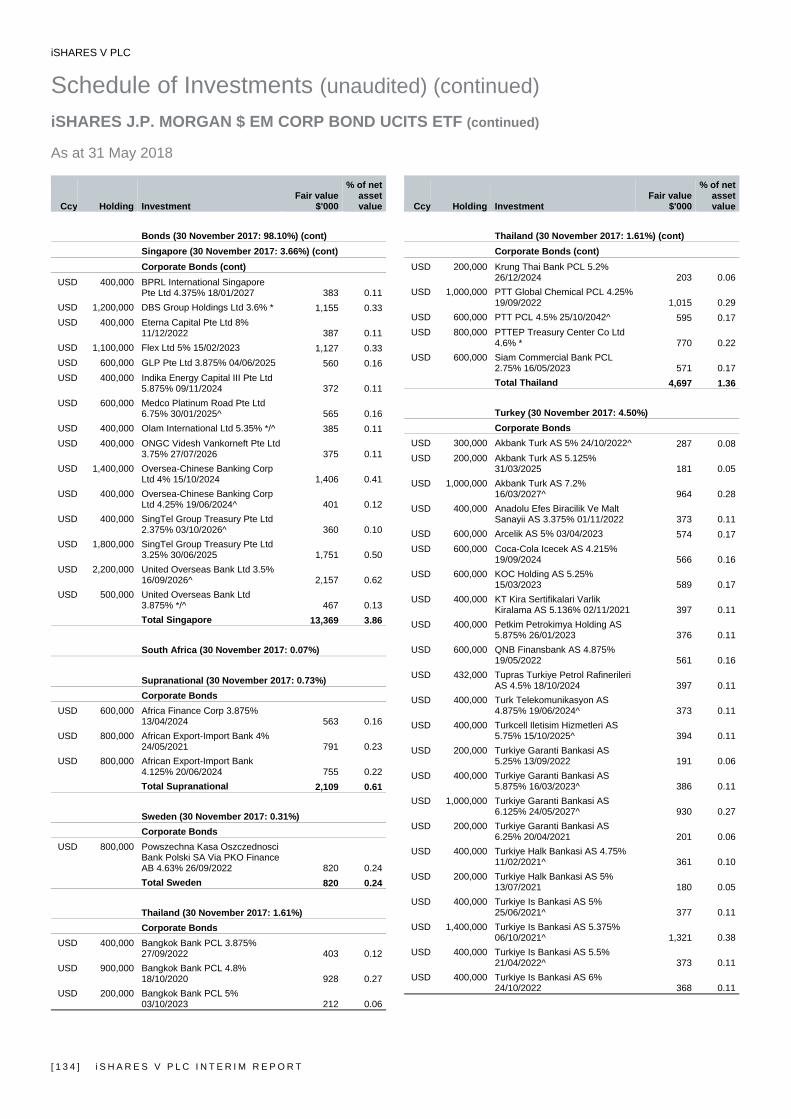
iSHARES V PLC
Schedule of Investments (unaudited) (continued) iSHARES J.P. MORGAN $ EM CORP BOND UCITS ETF (continued) As at 31 May 2018
[ 1 3 4 ] i S H A R E S V P L C I N T E R I M R E P O R T
Ccy Holding Investment Fair value
$'000
% of net asset value
Bonds (30 November 2017: 98.10%) (cont) Singapore (30 November 2017: 3.66%) (cont) Corporate Bonds (cont)
USD 400,000 BPRL International Singapore Pte Ltd 4.375% 18/01/2027 383 0.11
USD 1,200,000 DBS Group Holdings Ltd 3.6% * 1,155 0.33USD 400,000 Eterna Capital Pte Ltd 8%
11/12/2022 387 0.11USD 1,100,000 Flex Ltd 5% 15/02/2023 1,127 0.33USD 600,000 GLP Pte Ltd 3.875% 04/06/2025 560 0.16USD 400,000 Indika Energy Capital III Pte Ltd
5.875% 09/11/2024 372 0.11USD 600,000 Medco Platinum Road Pte Ltd
6.75% 30/01/2025^ 565 0.16USD 400,000 Olam International Ltd 5.35% */^ 385 0.11USD 400,000 ONGC Videsh Vankorneft Pte Ltd
3.75% 27/07/2026 375 0.11USD 1,400,000 Oversea-Chinese Banking Corp
Ltd 4% 15/10/2024 1,406 0.41USD 400,000 Oversea-Chinese Banking Corp
Ltd 4.25% 19/06/2024^ 401 0.12USD 400,000 SingTel Group Treasury Pte Ltd
2.375% 03/10/2026^ 360 0.10USD 1,800,000 SingTel Group Treasury Pte Ltd
3.25% 30/06/2025 1,751 0.50USD 2,200,000 United Overseas Bank Ltd 3.5%
16/09/2026^ 2,157 0.62USD 500,000 United Overseas Bank Ltd
3.875% */^ 467 0.13Total Singapore 13,369 3.86
South Africa (30 November 2017: 0.07%) Supranational (30 November 2017: 0.73%) Corporate Bonds
USD 600,000 Africa Finance Corp 3.875% 13/04/2024 563 0.16
USD 800,000 African Export-Import Bank 4% 24/05/2021 791 0.23
USD 800,000 African Export-Import Bank 4.125% 20/06/2024 755 0.22Total Supranational 2,109 0.61
Sweden (30 November 2017: 0.31%) Corporate Bonds
USD 800,000 Powszechna Kasa Oszczednosci Bank Polski SA Via PKO Finance AB 4.63% 26/09/2022 820 0.24Total Sweden 820 0.24
Thailand (30 November 2017: 1.61%) Corporate Bonds
USD 400,000 Bangkok Bank PCL 3.875% 27/09/2022 403 0.12
USD 900,000 Bangkok Bank PCL 4.8% 18/10/2020 928 0.27
USD 200,000 Bangkok Bank PCL 5% 03/10/2023 212 0.06
Ccy Holding Investment Fair value
$'000
% of net asset value
Thailand (30 November 2017: 1.61%) (cont) Corporate Bonds (cont)
USD 200,000 Krung Thai Bank PCL 5.2% 26/12/2024 203 0.06
USD 1,000,000 PTT Global Chemical PCL 4.25% 19/09/2022 1,015 0.29
USD 600,000 PTT PCL 4.5% 25/10/2042^ 595 0.17USD 800,000 PTTEP Treasury Center Co Ltd
4.6% * 770 0.22USD 600,000 Siam Commercial Bank PCL
2.75% 16/05/2023 571 0.17Total Thailand 4,697 1.36
Turkey (30 November 2017: 4.50%) Corporate Bonds
USD 300,000 Akbank Turk AS 5% 24/10/2022^ 287 0.08USD 200,000 Akbank Turk AS 5.125%
31/03/2025 181 0.05USD 1,000,000 Akbank Turk AS 7.2%
16/03/2027^ 964 0.28USD 400,000 Anadolu Efes Biracilik Ve Malt
Sanayii AS 3.375% 01/11/2022 373 0.11USD 600,000 Arcelik AS 5% 03/04/2023 574 0.17USD 600,000 Coca-Cola Icecek AS 4.215%
19/09/2024 566 0.16USD 600,000 KOC Holding AS 5.25%
15/03/2023 589 0.17USD 400,000 KT Kira Sertifikalari Varlik
Kiralama AS 5.136% 02/11/2021 397 0.11USD 400,000 Petkim Petrokimya Holding AS
5.875% 26/01/2023 376 0.11USD 600,000 QNB Finansbank AS 4.875%
19/05/2022 561 0.16USD 432,000 Tupras Turkiye Petrol Rafinerileri
AS 4.5% 18/10/2024 397 0.11USD 400,000 Turk Telekomunikasyon AS
4.875% 19/06/2024^ 373 0.11USD 400,000 Turkcell Iletisim Hizmetleri AS
5.75% 15/10/2025^ 394 0.11USD 200,000 Turkiye Garanti Bankasi AS
5.25% 13/09/2022 191 0.06USD 400,000 Turkiye Garanti Bankasi AS
5.875% 16/03/2023^ 386 0.11USD 1,000,000 Turkiye Garanti Bankasi AS
6.125% 24/05/2027^ 930 0.27USD 200,000 Turkiye Garanti Bankasi AS
6.25% 20/04/2021 201 0.06USD 400,000 Turkiye Halk Bankasi AS 4.75%
11/02/2021^ 361 0.10USD 200,000 Turkiye Halk Bankasi AS 5%
13/07/2021 180 0.05USD 400,000 Turkiye Is Bankasi AS 5%
25/06/2021^ 377 0.11USD 1,400,000 Turkiye Is Bankasi AS 5.375%
06/10/2021^ 1,321 0.38USD 400,000 Turkiye Is Bankasi AS 5.5%
21/04/2022^ 373 0.11USD 400,000 Turkiye Is Bankasi AS 6%
24/10/2022 368 0.11
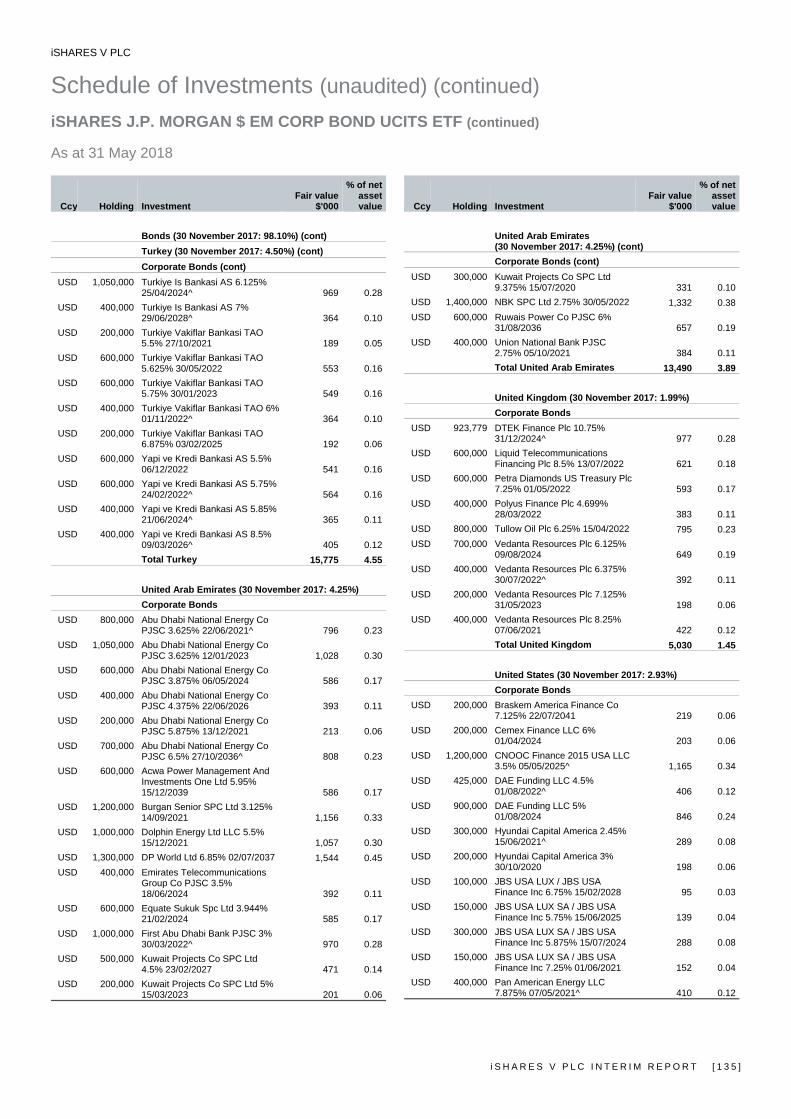
iSHARES V PLC
Schedule of Investments (unaudited) (continued) iSHARES J.P. MORGAN $ EM CORP BOND UCITS ETF (continued) As at 31 May 2018
i S H A R E S V P L C I N T E R I M R E P O R T [ 1 3 5 ]
Ccy Holding Investment Fair value
$'000
% of net asset value
Bonds (30 November 2017: 98.10%) (cont) Turkey (30 November 2017: 4.50%) (cont) Corporate Bonds (cont)
USD 1,050,000 Turkiye Is Bankasi AS 6.125% 25/04/2024^ 969 0.28
USD 400,000 Turkiye Is Bankasi AS 7% 29/06/2028^ 364 0.10
USD 200,000 Turkiye Vakiflar Bankasi TAO 5.5% 27/10/2021 189 0.05
USD 600,000 Turkiye Vakiflar Bankasi TAO 5.625% 30/05/2022 553 0.16
USD 600,000 Turkiye Vakiflar Bankasi TAO 5.75% 30/01/2023 549 0.16
USD 400,000 Turkiye Vakiflar Bankasi TAO 6% 01/11/2022^ 364 0.10
USD 200,000 Turkiye Vakiflar Bankasi TAO 6.875% 03/02/2025 192 0.06
USD 600,000 Yapi ve Kredi Bankasi AS 5.5% 06/12/2022 541 0.16
USD 600,000 Yapi ve Kredi Bankasi AS 5.75% 24/02/2022^ 564 0.16
USD 400,000 Yapi ve Kredi Bankasi AS 5.85% 21/06/2024^ 365 0.11
USD 400,000 Yapi ve Kredi Bankasi AS 8.5% 09/03/2026^ 405 0.12Total Turkey 15,775 4.55
United Arab Emirates (30 November 2017: 4.25%) Corporate Bonds
USD 800,000 Abu Dhabi National Energy Co PJSC 3.625% 22/06/2021^ 796 0.23
USD 1,050,000 Abu Dhabi National Energy Co PJSC 3.625% 12/01/2023 1,028 0.30
USD 600,000 Abu Dhabi National Energy Co PJSC 3.875% 06/05/2024 586 0.17
USD 400,000 Abu Dhabi National Energy Co PJSC 4.375% 22/06/2026 393 0.11
USD 200,000 Abu Dhabi National Energy Co PJSC 5.875% 13/12/2021 213 0.06
USD 700,000 Abu Dhabi National Energy Co PJSC 6.5% 27/10/2036^ 808 0.23
USD 600,000 Acwa Power Management And Investments One Ltd 5.95% 15/12/2039 586 0.17
USD 1,200,000 Burgan Senior SPC Ltd 3.125% 14/09/2021 1,156 0.33
USD 1,000,000 Dolphin Energy Ltd LLC 5.5% 15/12/2021 1,057 0.30
USD 1,300,000 DP World Ltd 6.85% 02/07/2037 1,544 0.45USD 400,000 Emirates Telecommunications
Group Co PJSC 3.5% 18/06/2024 392 0.11
USD 600,000 Equate Sukuk Spc Ltd 3.944% 21/02/2024 585 0.17
USD 1,000,000 First Abu Dhabi Bank PJSC 3% 30/03/2022^ 970 0.28
USD 500,000 Kuwait Projects Co SPC Ltd 4.5% 23/02/2027 471 0.14
USD 200,000 Kuwait Projects Co SPC Ltd 5% 15/03/2023 201 0.06
Ccy Holding Investment Fair value
$'000
% of net asset value
United Arab Emirates (30 November 2017: 4.25%) (cont) Corporate Bonds (cont)
USD 300,000 Kuwait Projects Co SPC Ltd 9.375% 15/07/2020 331 0.10
USD 1,400,000 NBK SPC Ltd 2.75% 30/05/2022 1,332 0.38USD 600,000 Ruwais Power Co PJSC 6%
31/08/2036 657 0.19USD 400,000 Union National Bank PJSC
2.75% 05/10/2021 384 0.11Total United Arab Emirates 13,490 3.89
United Kingdom (30 November 2017: 1.99%) Corporate Bonds
USD 923,779 DTEK Finance Plc 10.75% 31/12/2024^ 977 0.28
USD 600,000 Liquid Telecommunications Financing Plc 8.5% 13/07/2022 621 0.18
USD 600,000 Petra Diamonds US Treasury Plc 7.25% 01/05/2022 593 0.17
USD 400,000 Polyus Finance Plc 4.699% 28/03/2022 383 0.11
USD 800,000 Tullow Oil Plc 6.25% 15/04/2022 795 0.23USD 700,000 Vedanta Resources Plc 6.125%
09/08/2024 649 0.19USD 400,000 Vedanta Resources Plc 6.375%
30/07/2022^ 392 0.11USD 200,000 Vedanta Resources Plc 7.125%
31/05/2023 198 0.06USD 400,000 Vedanta Resources Plc 8.25%
07/06/2021 422 0.12Total United Kingdom 5,030 1.45
United States (30 November 2017: 2.93%) Corporate Bonds
USD 200,000 Braskem America Finance Co 7.125% 22/07/2041 219 0.06
USD 200,000 Cemex Finance LLC 6% 01/04/2024 203 0.06
USD 1,200,000 CNOOC Finance 2015 USA LLC 3.5% 05/05/2025^ 1,165 0.34
USD 425,000 DAE Funding LLC 4.5% 01/08/2022^ 406 0.12
USD 900,000 DAE Funding LLC 5% 01/08/2024 846 0.24
USD 300,000 Hyundai Capital America 2.45% 15/06/2021^ 289 0.08
USD 200,000 Hyundai Capital America 3% 30/10/2020 198 0.06
USD 100,000 JBS USA LUX / JBS USA Finance Inc 6.75% 15/02/2028 95 0.03
USD 150,000 JBS USA LUX SA / JBS USA Finance Inc 5.75% 15/06/2025 139 0.04
USD 300,000 JBS USA LUX SA / JBS USA Finance Inc 5.875% 15/07/2024 288 0.08
USD 150,000 JBS USA LUX SA / JBS USA Finance Inc 7.25% 01/06/2021 152 0.04
USD 400,000 Pan American Energy LLC 7.875% 07/05/2021^ 410 0.12
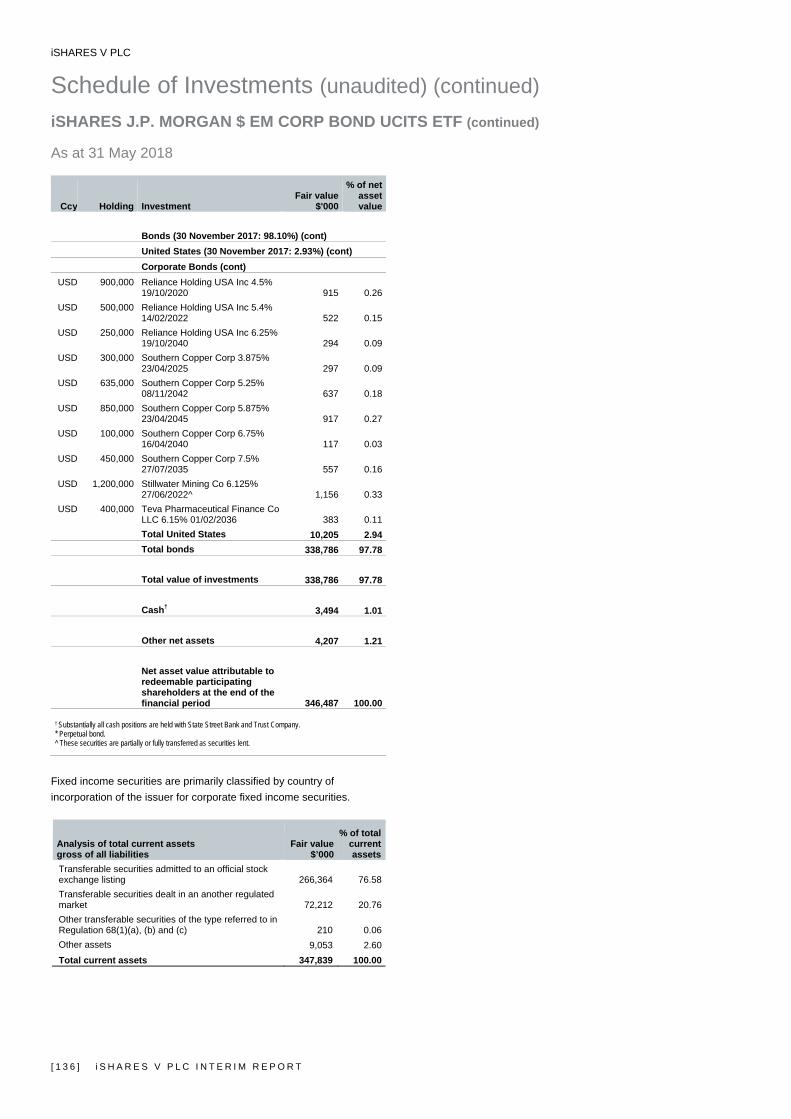
iSHARES V PLC
Schedule of Investments (unaudited) (continued) iSHARES J.P. MORGAN $ EM CORP BOND UCITS ETF (continued) As at 31 May 2018
[ 1 3 6 ] i S H A R E S V P L C I N T E R I M R E P O R T
Ccy Holding Investment Fair value
$'000
% of net asset value
Bonds (30 November 2017: 98.10%) (cont) United States (30 November 2017: 2.93%) (cont) Corporate Bonds (cont)
USD 900,000 Reliance Holding USA Inc 4.5% 19/10/2020 915 0.26
USD 500,000 Reliance Holding USA Inc 5.4% 14/02/2022 522 0.15
USD 250,000 Reliance Holding USA Inc 6.25% 19/10/2040 294 0.09
USD 300,000 Southern Copper Corp 3.875% 23/04/2025 297 0.09
USD 635,000 Southern Copper Corp 5.25% 08/11/2042 637 0.18
USD 850,000 Southern Copper Corp 5.875% 23/04/2045 917 0.27
USD 100,000 Southern Copper Corp 6.75% 16/04/2040 117 0.03
USD 450,000 Southern Copper Corp 7.5% 27/07/2035 557 0.16
USD 1,200,000 Stillwater Mining Co 6.125% 27/06/2022^ 1,156 0.33
USD 400,000 Teva Pharmaceutical Finance Co LLC 6.15% 01/02/2036 383 0.11Total United States 10,205 2.94Total bonds 338,786 97.78 Total value of investments 338,786 97.78 Cash† 3,494 1.01 Other net assets 4,207 1.21 Net asset value attributable to redeemable participating shareholders at the end of the financial period 346,487 100.00
† Substantially all cash positions are held with State Street Bank and Trust Company. * Perpetual bond. ^ These securities are partially or fully transferred as securities lent.
Fixed income securities are primarily classified by country of incorporation of the issuer for corporate fixed income securities.
Analysis of total current assets gross of all liabilities
Fair value$’000
% of total current assets
Transferable securities admitted to an official stock exchange listing 266,364 76.58Transferable securities dealt in an another regulated market 72,212 20.76Other transferable securities of the type referred to in Regulation 68(1)(a), (b) and (c) 210 0.06Other assets 9,053 2.60Total current assets 347,839 100.00
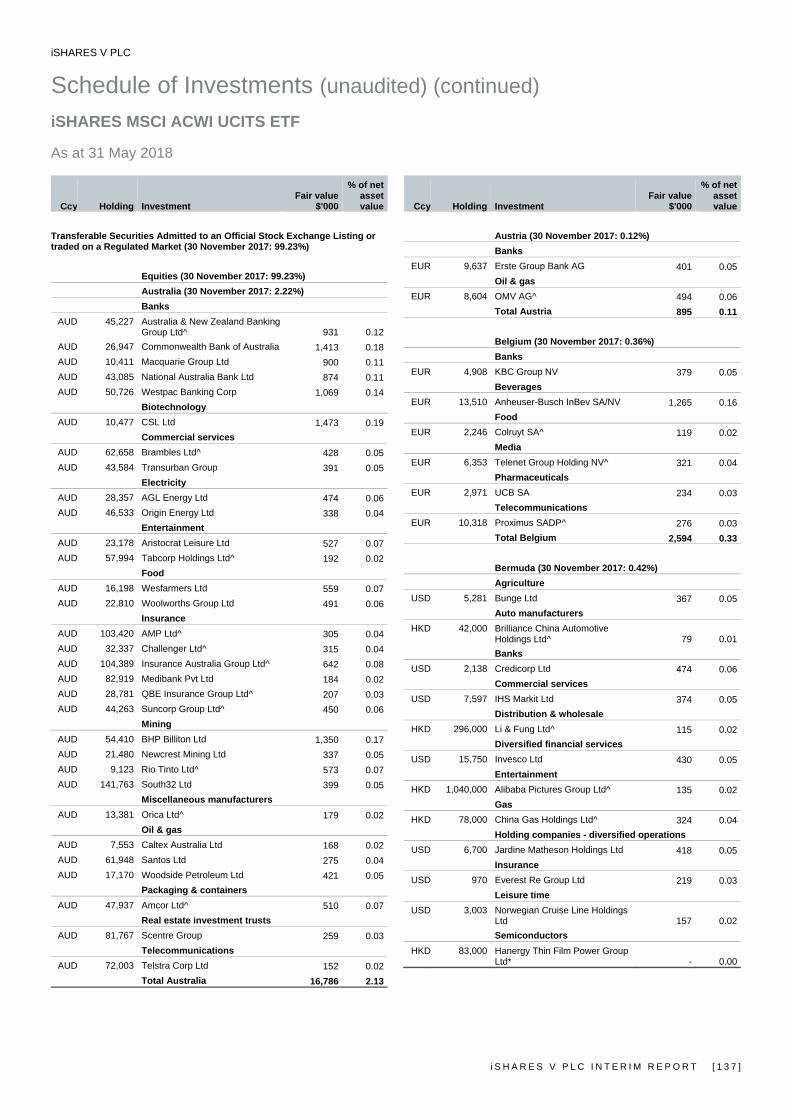
iSHARES V PLC
Schedule of Investments (unaudited) (continued) iSHARES MSCI ACWI UCITS ETF As at 31 May 2018
i S H A R E S V P L C I N T E R I M R E P O R T [ 1 3 7 ]
Ccy Holding Investment Fair value
$'000
% of net asset value
Transferable Securities Admitted to an Official Stock Exchange Listing or traded on a Regulated Market (30 November 2017: 99.23%)
Equities (30 November 2017: 99.23%) Australia (30 November 2017: 2.22%) Banks
AUD 45,227 Australia & New Zealand Banking Group Ltd^ 931 0.12
AUD 26,947 Commonwealth Bank of Australia 1,413 0.18AUD 10,411 Macquarie Group Ltd 900 0.11AUD 43,085 National Australia Bank Ltd 874 0.11AUD 50,726 Westpac Banking Corp 1,069 0.14
Biotechnology AUD 10,477 CSL Ltd 1,473 0.19
Commercial services AUD 62,658 Brambles Ltd^ 428 0.05AUD 43,584 Transurban Group 391 0.05
Electricity AUD 28,357 AGL Energy Ltd 474 0.06AUD 46,533 Origin Energy Ltd 338 0.04
Entertainment AUD 23,178 Aristocrat Leisure Ltd 527 0.07AUD 57,994 Tabcorp Holdings Ltd^ 192 0.02
Food AUD 16,198 Wesfarmers Ltd 559 0.07AUD 22,810 Woolworths Group Ltd 491 0.06
Insurance AUD 103,420 AMP Ltd^ 305 0.04AUD 32,337 Challenger Ltd^ 315 0.04AUD 104,389 Insurance Australia Group Ltd^ 642 0.08AUD 82,919 Medibank Pvt Ltd 184 0.02AUD 28,781 QBE Insurance Group Ltd^ 207 0.03AUD 44,263 Suncorp Group Ltd^ 450 0.06
Mining AUD 54,410 BHP Billiton Ltd 1,350 0.17AUD 21,480 Newcrest Mining Ltd 337 0.05AUD 9,123 Rio Tinto Ltd^ 573 0.07AUD 141,763 South32 Ltd 399 0.05
Miscellaneous manufacturers AUD 13,381 Orica Ltd^ 179 0.02
Oil & gas AUD 7,553 Caltex Australia Ltd 168 0.02AUD 61,948 Santos Ltd 275 0.04AUD 17,170 Woodside Petroleum Ltd 421 0.05
Packaging & containers AUD 47,937 Amcor Ltd^ 510 0.07
Real estate investment trusts AUD 81,767 Scentre Group 259 0.03
Telecommunications AUD 72,003 Telstra Corp Ltd 152 0.02
Total Australia 16,786 2.13
Ccy Holding InvestmentFair value
$'000
% of net asset value
Austria (30 November 2017: 0.12%) Banks
EUR 9,637 Erste Group Bank AG 401 0.05Oil & gas
EUR 8,604 OMV AG^ 494 0.06Total Austria 895 0.11
Belgium (30 November 2017: 0.36%) Banks
EUR 4,908 KBC Group NV 379 0.05Beverages
EUR 13,510 Anheuser-Busch InBev SA/NV 1,265 0.16Food
EUR 2,246 Colruyt SA^ 119 0.02Media
EUR 6,353 Telenet Group Holding NV^ 321 0.04Pharmaceuticals
EUR 2,971 UCB SA 234 0.03Telecommunications
EUR 10,318 Proximus SADP^ 276 0.03Total Belgium 2,594 0.33
Bermuda (30 November 2017: 0.42%) Agriculture
USD 5,281 Bunge Ltd 367 0.05Auto manufacturers
HKD 42,000 Brilliance China Automotive Holdings Ltd^ 79 0.01Banks
USD 2,138 Credicorp Ltd 474 0.06Commercial services
USD 7,597 IHS Markit Ltd 374 0.05Distribution & wholesale
HKD 296,000 Li & Fung Ltd^ 115 0.02Diversified financial services
USD 15,750 Invesco Ltd 430 0.05Entertainment
HKD 1,040,000 Alibaba Pictures Group Ltd^ 135 0.02Gas
HKD 78,000 China Gas Holdings Ltd^ 324 0.04Holding companies - diversified operations
USD 6,700 Jardine Matheson Holdings Ltd 418 0.05Insurance
USD 970 Everest Re Group Ltd 219 0.03Leisure time
USD 3,003 Norwegian Cruise Line Holdings Ltd 157 0.02Semiconductors
HKD 83,000 Hanergy Thin Film Power Group Ltd* - 0.00
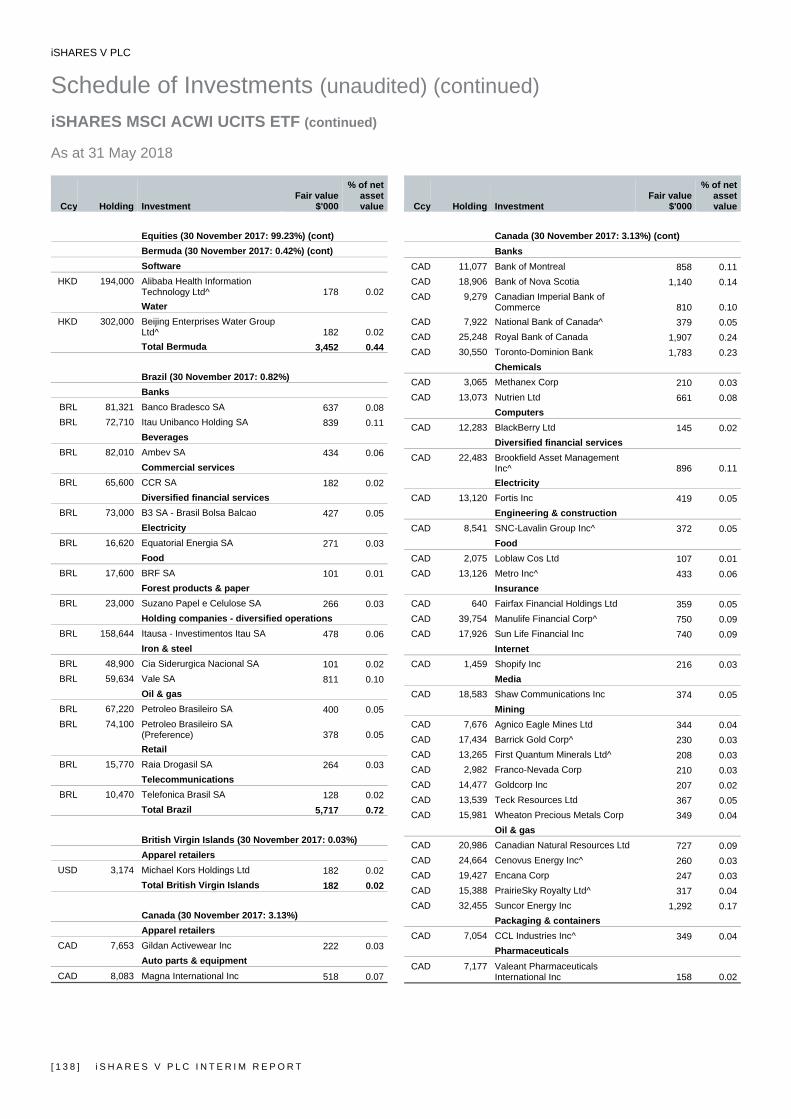
iSHARES V PLC
Schedule of Investments (unaudited) (continued) iSHARES MSCI ACWI UCITS ETF (continued) As at 31 May 2018
[ 1 3 8 ] i S H A R E S V P L C I N T E R I M R E P O R T
Ccy Holding Investment Fair value
$'000
% of net asset value
Equities (30 November 2017: 99.23%) (cont) Bermuda (30 November 2017: 0.42%) (cont) Software
HKD 194,000 Alibaba Health Information Technology Ltd^ 178 0.02Water
HKD 302,000 Beijing Enterprises Water Group Ltd^ 182 0.02Total Bermuda 3,452 0.44
Brazil (30 November 2017: 0.82%) Banks
BRL 81,321 Banco Bradesco SA 637 0.08BRL 72,710 Itau Unibanco Holding SA 839 0.11
Beverages BRL 82,010 Ambev SA 434 0.06
Commercial services BRL 65,600 CCR SA 182 0.02
Diversified financial services BRL 73,000 B3 SA - Brasil Bolsa Balcao 427 0.05
Electricity BRL 16,620 Equatorial Energia SA 271 0.03
Food BRL 17,600 BRF SA 101 0.01
Forest products & paper BRL 23,000 Suzano Papel e Celulose SA 266 0.03
Holding companies - diversified operations BRL 158,644 Itausa - Investimentos Itau SA 478 0.06
Iron & steel BRL 48,900 Cia Siderurgica Nacional SA 101 0.02BRL 59,634 Vale SA 811 0.10
Oil & gas BRL 67,220 Petroleo Brasileiro SA 400 0.05BRL 74,100 Petroleo Brasileiro SA
(Preference) 378 0.05Retail
BRL 15,770 Raia Drogasil SA 264 0.03Telecommunications
BRL 10,470 Telefonica Brasil SA 128 0.02Total Brazil 5,717 0.72
British Virgin Islands (30 November 2017: 0.03%) Apparel retailers
USD 3,174 Michael Kors Holdings Ltd 182 0.02Total British Virgin Islands 182 0.02
Canada (30 November 2017: 3.13%) Apparel retailers
CAD 7,653 Gildan Activewear Inc 222 0.03Auto parts & equipment
CAD 8,083 Magna International Inc 518 0.07
Ccy Holding InvestmentFair value
$'000
% of net asset value
Canada (30 November 2017: 3.13%) (cont) Banks
CAD 11,077 Bank of Montreal 858 0.11CAD 18,906 Bank of Nova Scotia 1,140 0.14CAD 9,279 Canadian Imperial Bank of
Commerce 810 0.10CAD 7,922 National Bank of Canada^ 379 0.05CAD 25,248 Royal Bank of Canada 1,907 0.24CAD 30,550 Toronto-Dominion Bank 1,783 0.23
Chemicals CAD 3,065 Methanex Corp 210 0.03CAD 13,073 Nutrien Ltd 661 0.08
Computers CAD 12,283 BlackBerry Ltd 145 0.02
Diversified financial services CAD 22,483 Brookfield Asset Management
Inc^ 896 0.11Electricity
CAD 13,120 Fortis Inc 419 0.05Engineering & construction
CAD 8,541 SNC-Lavalin Group Inc^ 372 0.05Food
CAD 2,075 Loblaw Cos Ltd 107 0.01CAD 13,126 Metro Inc^ 433 0.06
Insurance CAD 640 Fairfax Financial Holdings Ltd 359 0.05CAD 39,754 Manulife Financial Corp^ 750 0.09CAD 17,926 Sun Life Financial Inc 740 0.09
Internet CAD 1,459 Shopify Inc 216 0.03
Media CAD 18,583 Shaw Communications Inc 374 0.05
Mining CAD 7,676 Agnico Eagle Mines Ltd 344 0.04CAD 17,434 Barrick Gold Corp^ 230 0.03CAD 13,265 First Quantum Minerals Ltd^ 208 0.03CAD 2,982 Franco-Nevada Corp 210 0.03CAD 14,477 Goldcorp Inc 207 0.02CAD 13,539 Teck Resources Ltd 367 0.05CAD 15,981 Wheaton Precious Metals Corp 349 0.04
Oil & gas CAD 20,986 Canadian Natural Resources Ltd 727 0.09CAD 24,664 Cenovus Energy Inc^ 260 0.03CAD 19,427 Encana Corp 247 0.03CAD 15,388 PrairieSky Royalty Ltd^ 317 0.04CAD 32,455 Suncor Energy Inc 1,292 0.17
Packaging & containers CAD 7,054 CCL Industries Inc^ 349 0.04
Pharmaceuticals CAD 7,177 Valeant Pharmaceuticals
International Inc 158 0.02
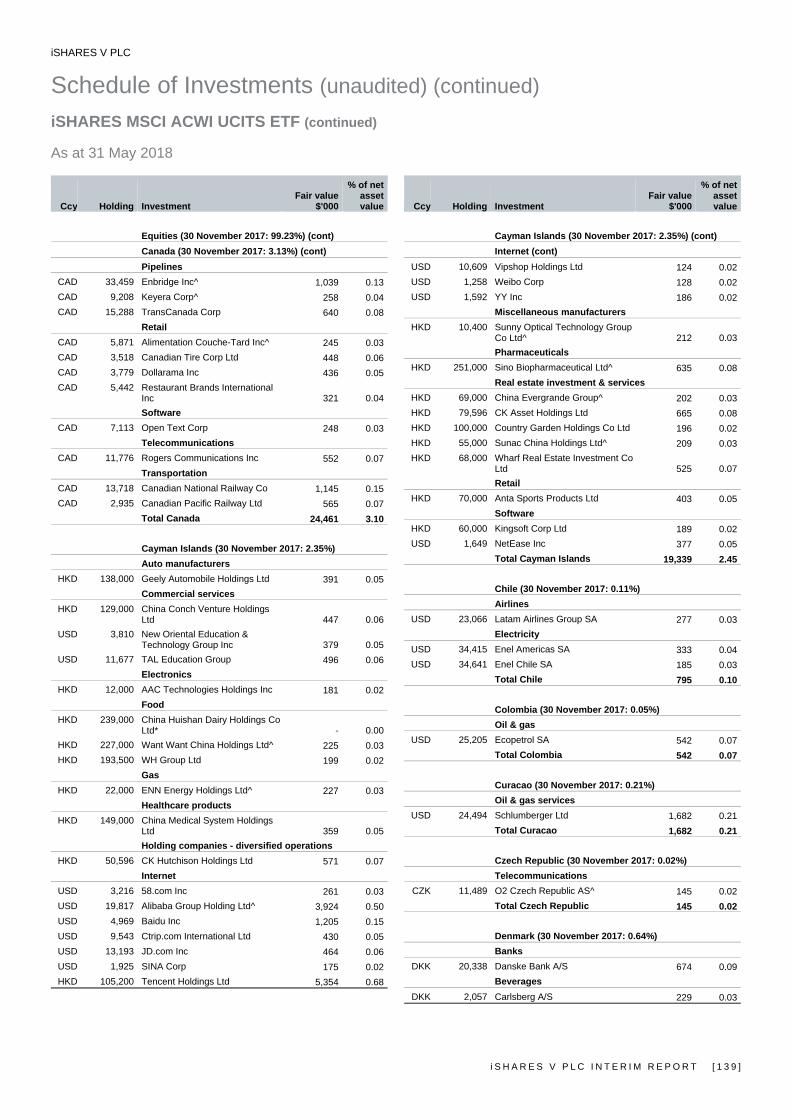
iSHARES V PLC
Schedule of Investments (unaudited) (continued) iSHARES MSCI ACWI UCITS ETF (continued) As at 31 May 2018
i S H A R E S V P L C I N T E R I M R E P O R T [ 1 3 9 ]
Ccy Holding Investment Fair value
$'000
% of net asset value
Equities (30 November 2017: 99.23%) (cont) Canada (30 November 2017: 3.13%) (cont)
Pipelines CAD 33,459 Enbridge Inc^ 1,039 0.13CAD 9,208 Keyera Corp^ 258 0.04CAD 15,288 TransCanada Corp 640 0.08
Retail CAD 5,871 Alimentation Couche-Tard Inc^ 245 0.03CAD 3,518 Canadian Tire Corp Ltd 448 0.06CAD 3,779 Dollarama Inc 436 0.05CAD 5,442 Restaurant Brands International
Inc 321 0.04Software
CAD 7,113 Open Text Corp 248 0.03Telecommunications
CAD 11,776 Rogers Communications Inc 552 0.07Transportation
CAD 13,718 Canadian National Railway Co 1,145 0.15CAD 2,935 Canadian Pacific Railway Ltd 565 0.07
Total Canada 24,461 3.10
Cayman Islands (30 November 2017: 2.35%) Auto manufacturers
HKD 138,000 Geely Automobile Holdings Ltd 391 0.05Commercial services
HKD 129,000 China Conch Venture Holdings Ltd 447 0.06
USD 3,810 New Oriental Education & Technology Group Inc 379 0.05
USD 11,677 TAL Education Group 496 0.06Electronics
HKD 12,000 AAC Technologies Holdings Inc 181 0.02Food
HKD 239,000 China Huishan Dairy Holdings Co Ltd* - 0.00
HKD 227,000 Want Want China Holdings Ltd^ 225 0.03HKD 193,500 WH Group Ltd 199 0.02
Gas HKD 22,000 ENN Energy Holdings Ltd^ 227 0.03
Healthcare products HKD 149,000 China Medical System Holdings
Ltd 359 0.05Holding companies - diversified operations
HKD 50,596 CK Hutchison Holdings Ltd 571 0.07Internet
USD 3,216 58.com Inc 261 0.03USD 19,817 Alibaba Group Holding Ltd^ 3,924 0.50USD 4,969 Baidu Inc 1,205 0.15USD 9,543 Ctrip.com International Ltd 430 0.05USD 13,193 JD.com Inc 464 0.06USD 1,925 SINA Corp 175 0.02HKD 105,200 Tencent Holdings Ltd 5,354 0.68
Ccy Holding InvestmentFair value
$'000
% of net asset value
Cayman Islands (30 November 2017: 2.35%) (cont) Internet (cont)
USD 10,609 Vipshop Holdings Ltd 124 0.02USD 1,258 Weibo Corp 128 0.02USD 1,592 YY Inc 186 0.02
Miscellaneous manufacturers HKD 10,400 Sunny Optical Technology Group
Co Ltd^ 212 0.03Pharmaceuticals
HKD 251,000 Sino Biopharmaceutical Ltd^ 635 0.08Real estate investment & services
HKD 69,000 China Evergrande Group^ 202 0.03HKD 79,596 CK Asset Holdings Ltd 665 0.08HKD 100,000 Country Garden Holdings Co Ltd 196 0.02HKD 55,000 Sunac China Holdings Ltd^ 209 0.03HKD 68,000 Wharf Real Estate Investment Co
Ltd 525 0.07Retail
HKD 70,000 Anta Sports Products Ltd 403 0.05Software
HKD 60,000 Kingsoft Corp Ltd 189 0.02USD 1,649 NetEase Inc 377 0.05
Total Cayman Islands 19,339 2.45
Chile (30 November 2017: 0.11%) Airlines
USD 23,066 Latam Airlines Group SA 277 0.03Electricity
USD 34,415 Enel Americas SA 333 0.04USD 34,641 Enel Chile SA 185 0.03
Total Chile 795 0.10
Colombia (30 November 2017: 0.05%) Oil & gas
USD 25,205 Ecopetrol SA 542 0.07Total Colombia 542 0.07
Curacao (30 November 2017: 0.21%) Oil & gas services
USD 24,494 Schlumberger Ltd 1,682 0.21Total Curacao 1,682 0.21
Czech Republic (30 November 2017: 0.02%) Telecommunications
CZK 11,489 O2 Czech Republic AS^ 145 0.02Total Czech Republic 145 0.02
Denmark (30 November 2017: 0.64%) Banks
DKK 20,338 Danske Bank A/S 674 0.09Beverages
DKK 2,057 Carlsberg A/S 229 0.03

iSHARES V PLC
Schedule of Investments (unaudited) (continued) iSHARES MSCI ACWI UCITS ETF (continued) As at 31 May 2018
[ 1 4 0 ] i S H A R E S V P L C I N T E R I M R E P O R T
Ccy Holding Investment Fair value
$'000
% of net asset value
Equities (30 November 2017: 99.23%) (cont) Denmark (30 November 2017: 0.64%) (cont)
Biotechnology DKK 1,574 Genmab A/S 237 0.03
Chemicals DKK 7,508 Novozymes A/S 382 0.05
Energy - alternate sources DKK 4,557 Vestas Wind Systems A/S^ 298 0.04
Food DKK 3,574 Chr Hansen Holding A/S^ 343 0.04
Healthcare products DKK 2,802 Coloplast A/S 266 0.03
Pharmaceuticals DKK 32,810 Novo Nordisk A/S 1,556 0.20
Retail DKK 2,218 Pandora A/S 174 0.02
Transportation DKK 175 AP Moller - Maersk A/S^ 262 0.03DKK 2,800 DSV A/S 232 0.03
Total Denmark 4,653 0.59
Finland (30 November 2017: 0.32%) Electricity
EUR 11,001 Fortum Oyj 258 0.04Forest products & paper
EUR 19,824 Stora Enso Oyj 405 0.05EUR 19,101 UPM-Kymmene Oyj 701 0.09
Insurance EUR 6,848 Sampo Oyj 336 0.04
Oil & gas EUR 4,047 Neste Oyj 329 0.04
Telecommunications EUR 2,566 Elisa Oyj 114 0.01EUR 104,856 Nokia Oyj 605 0.08
Total Finland 2,748 0.35
France (30 November 2017: 3.12%) Advertising
EUR 2,482 JCDecaux SA 77 0.01EUR 3,132 Publicis Groupe SA 218 0.03
Aerospace & defence EUR 4,922 Safran SA 587 0.07
Apparel retailers EUR 330 Hermes International 234 0.03EUR 2,076 Kering SA 1,187 0.15EUR 4,512 LVMH Moet Hennessy Louis
Vuitton SE 1,565 0.20Auto manufacturers
EUR 10,835 Peugeot SA 252 0.03EUR 3,149 Renault SA 304 0.04
Ccy Holding InvestmentFair value
$'000
% of net asset value
France (30 November 2017: 3.12%) (cont) Auto parts & equipment
EUR 5,346 Cie Generale des Etablissements Michelin SCA 691 0.09
EUR 3,680 Valeo SA 233 0.03Banks
EUR 20,918 BNP Paribas SA 1,296 0.16EUR 35,262 Credit Agricole SA 483 0.06EUR 13,715 Societe Generale SA 590 0.08
Beverages EUR 5,101 Pernod Ricard SA 856 0.11
Building materials and fixtures EUR 9,942 Cie de Saint-Gobain 498 0.06
Chemicals EUR 7,631 Air Liquide SA 939 0.12
Computers EUR 3,285 Atos SE^ 445 0.06EUR 2,785 Capgemini SE 366 0.05EUR 1,549 Ingenico Group SA 124 0.01
Cosmetics & personal care EUR 4,264 L'Oreal SA 1,023 0.13
Electrical components & equipment EUR 7,447 Legrand SA 561 0.07EUR 9,849 Schneider Electric SE 848 0.11
Electricity EUR 12,287 Electricite de France SA 164 0.02EUR 29,011 Engie SA 458 0.06
Engineering & construction EUR 11,394 Vinci SA 1,114 0.14
Food EUR 16,083 Carrefour SA^ 290 0.04EUR 11,782 Danone SA 899 0.11
Healthcare products EUR 5,998 Essilor International Cie
Generale d'Optique SA 818 0.10Insurance
EUR 34,766 AXA SA 865 0.11Internet
EUR 575 Iliad SA 97 0.01Media
EUR 28,384 Vivendi SA 713 0.09Miscellaneous manufacturers
EUR 7,655 Alstom SA 362 0.05Oil & gas
EUR 39,078 Total SA 2,374 0.30Pharmaceuticals
EUR 19,695 Sanofi 1,509 0.19Real estate investment trusts
EUR 2,797 Unibail-Rodamco SE 629 0.08Telecommunications
EUR 38,094 Orange SA^ 655 0.08
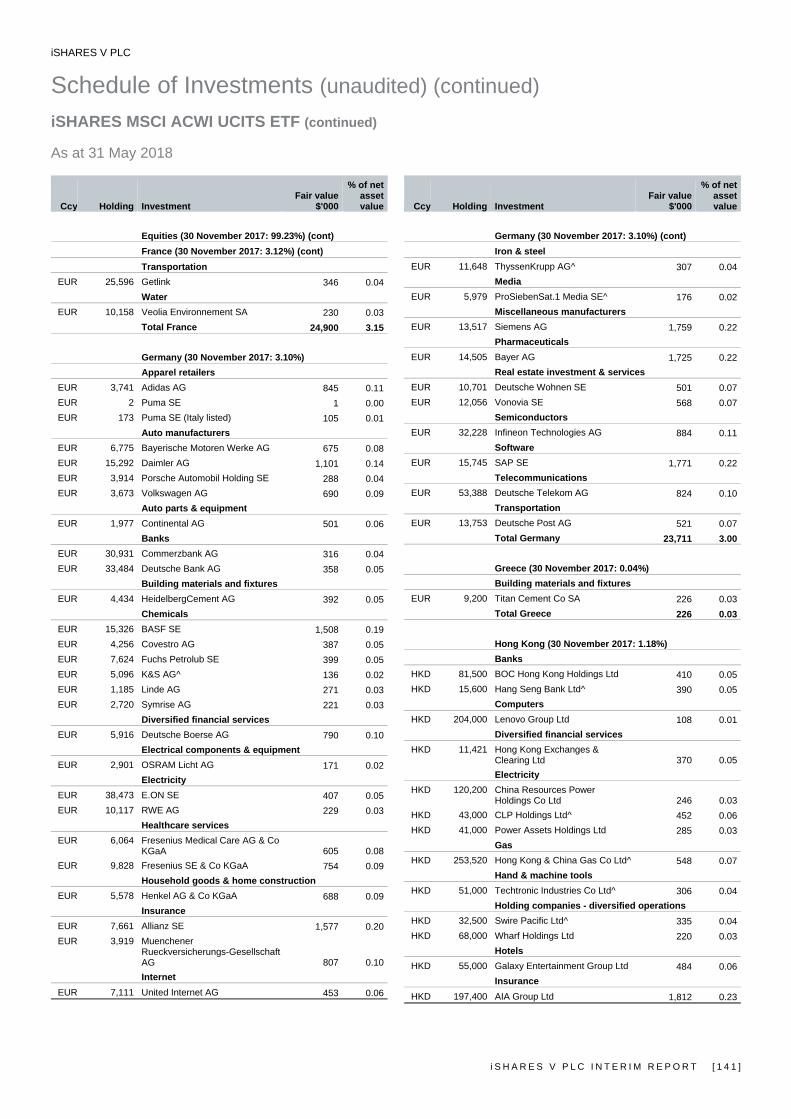
iSHARES V PLC
Schedule of Investments (unaudited) (continued) iSHARES MSCI ACWI UCITS ETF (continued) As at 31 May 2018
i S H A R E S V P L C I N T E R I M R E P O R T [ 1 4 1 ]
Ccy Holding Investment Fair value
$'000
% of net asset value
Equities (30 November 2017: 99.23%) (cont) France (30 November 2017: 3.12%) (cont)
Transportation EUR 25,596 Getlink 346 0.04
Water EUR 10,158 Veolia Environnement SA 230 0.03
Total France 24,900 3.15
Germany (30 November 2017: 3.10%) Apparel retailers
EUR 3,741 Adidas AG 845 0.11EUR 2 Puma SE 1 0.00EUR 173 Puma SE (Italy listed) 105 0.01
Auto manufacturers EUR 6,775 Bayerische Motoren Werke AG 675 0.08EUR 15,292 Daimler AG 1,101 0.14EUR 3,914 Porsche Automobil Holding SE 288 0.04EUR 3,673 Volkswagen AG 690 0.09
Auto parts & equipment EUR 1,977 Continental AG 501 0.06
Banks EUR 30,931 Commerzbank AG 316 0.04EUR 33,484 Deutsche Bank AG 358 0.05
Building materials and fixtures EUR 4,434 HeidelbergCement AG 392 0.05
Chemicals EUR 15,326 BASF SE 1,508 0.19EUR 4,256 Covestro AG 387 0.05EUR 7,624 Fuchs Petrolub SE 399 0.05EUR 5,096 K&S AG^ 136 0.02EUR 1,185 Linde AG 271 0.03EUR 2,720 Symrise AG 221 0.03
Diversified financial services EUR 5,916 Deutsche Boerse AG 790 0.10
Electrical components & equipment EUR 2,901 OSRAM Licht AG 171 0.02
Electricity EUR 38,473 E.ON SE 407 0.05EUR 10,117 RWE AG 229 0.03
Healthcare services EUR 6,064 Fresenius Medical Care AG & Co
KGaA 605 0.08EUR 9,828 Fresenius SE & Co KGaA 754 0.09
Household goods & home construction EUR 5,578 Henkel AG & Co KGaA 688 0.09
Insurance EUR 7,661 Allianz SE 1,577 0.20EUR 3,919 Muenchener
Rueckversicherungs-Gesellschaft AG 807 0.10Internet
EUR 7,111 United Internet AG 453 0.06
Ccy Holding InvestmentFair value
$'000
% of net asset value
Germany (30 November 2017: 3.10%) (cont) Iron & steel
EUR 11,648 ThyssenKrupp AG^ 307 0.04Media
EUR 5,979 ProSiebenSat.1 Media SE^ 176 0.02Miscellaneous manufacturers
EUR 13,517 Siemens AG 1,759 0.22Pharmaceuticals
EUR 14,505 Bayer AG 1,725 0.22Real estate investment & services
EUR 10,701 Deutsche Wohnen SE 501 0.07EUR 12,056 Vonovia SE 568 0.07
Semiconductors EUR 32,228 Infineon Technologies AG 884 0.11
Software EUR 15,745 SAP SE 1,771 0.22
Telecommunications EUR 53,388 Deutsche Telekom AG 824 0.10
Transportation EUR 13,753 Deutsche Post AG 521 0.07
Total Germany 23,711 3.00
Greece (30 November 2017: 0.04%) Building materials and fixtures
EUR 9,200 Titan Cement Co SA 226 0.03Total Greece 226 0.03
Hong Kong (30 November 2017: 1.18%) Banks
HKD 81,500 BOC Hong Kong Holdings Ltd 410 0.05HKD 15,600 Hang Seng Bank Ltd^ 390 0.05
Computers HKD 204,000 Lenovo Group Ltd 108 0.01
Diversified financial services HKD 11,421 Hong Kong Exchanges &
Clearing Ltd 370 0.05Electricity
HKD 120,200 China Resources Power Holdings Co Ltd 246 0.03
HKD 43,000 CLP Holdings Ltd^ 452 0.06HKD 41,000 Power Assets Holdings Ltd 285 0.03
Gas HKD 253,520 Hong Kong & China Gas Co Ltd^ 548 0.07
Hand & machine tools HKD 51,000 Techtronic Industries Co Ltd^ 306 0.04
Holding companies - diversified operations HKD 32,500 Swire Pacific Ltd^ 335 0.04HKD 68,000 Wharf Holdings Ltd 220 0.03
Hotels HKD 55,000 Galaxy Entertainment Group Ltd 484 0.06
Insurance HKD 197,400 AIA Group Ltd 1,812 0.23

iSHARES V PLC
Schedule of Investments (unaudited) (continued) iSHARES MSCI ACWI UCITS ETF (continued) As at 31 May 2018
[ 1 4 2 ] i S H A R E S V P L C I N T E R I M R E P O R T
Ccy Holding Investment Fair value
$'000
% of net asset value
Equities (30 November 2017: 99.23%) (cont) Hong Kong (30 November 2017: 1.18%) (cont)
Oil & gas HKD 328,000 CNOOC Ltd 552 0.07
Real estate investment & services HKD 164,000 China Overseas Land &
Investment Ltd 549 0.07HKD 18,082 Sun Hung Kai Properties Ltd 292 0.04
Real estate investment trusts HKD 81,500 Link REIT^ 721 0.09
Telecommunications HKD 123,000 China Mobile Ltd 1,097 0.14HKD 164,000 China Unicom Hong Kong Ltd 223 0.03
Total Hong Kong 9,400 1.19
India (30 November 2017: 0.90%) Agriculture
INR 58,222 ITC Ltd 234 0.03Auto manufacturers
INR 12,616 Mahindra & Mahindra Ltd 172 0.02INR 1,809 Maruti Suzuki India Ltd 229 0.03
USD 13,127 Tata Motors Ltd 274 0.04Banks
USD 4,559 Axis Bank Ltd 180 0.02USD 65,213 ICICI Bank Ltd 547 0.07INR 29,755 State Bank of India 119 0.02INR 16,685 Yes Bank Ltd 86 0.01
Computers USD 47,174 Infosys Ltd 858 0.12INR 8,023 Tata Consultancy Services Ltd 207 0.02INR 8,023 Tata Consultancy Services Ltd
(voting) 207 0.02USD 72,901 Wipro Ltd 335 0.04
Diversified financial services INR 45,133 Housing Development Finance
Corp Ltd 1,226 0.16Engineering & construction
USD 23,679 Larsen & Toubro Ltd^ 475 0.06Household goods & home construction
INR 11,124 Hindustan Unilever Ltd 266 0.03Mining
USD 28,942 Vedanta Ltd 425 0.05Oil & gas
USD 19,306 Reliance Industries Ltd^ 512 0.07Pharmaceuticals
USD 9,253 Dr Reddy's Laboratories Ltd 264 0.03INR 23,185 Sun Pharmaceutical Industries
Ltd 165 0.02Total India 6,781 0.86
Ccy Holding InvestmentFair value
$'000
% of net asset value
Indonesia (30 November 2017: 0.29%) Banks
IDR 409,300 Bank Central Asia Tbk PT 669 0.09IDR 826,200 Bank Mandiri Persero Tbk PT 419 0.05IDR 1,763,700 Bank Rakyat Indonesia Persero
Tbk PT 391 0.05Retail
IDR 416,700 Astra International Tbk PT 207 0.03Telecommunications
IDR 1,408,700 Telekomunikasi Indonesia Persero Tbk PT 357 0.04Total Indonesia 2,043 0.26
Ireland (30 November 2017: 1.25%) Banks
EUR 17,936 Bank of Ireland Group Plc 148 0.02Building materials and fixtures
EUR 17,484 CRH Plc 645 0.08AUD 11,484 James Hardie Industries Plc 192 0.03USD 22,104 Johnson Controls International
Plc 742 0.09Computers
USD 10,818 Accenture Plc 1,685 0.21USD 5,424 Seagate Technology Plc 306 0.04
Entertainment EUR 1,767 Paddy Power Betfair Plc 215 0.03
Food EUR 988 Kerry Group Plc 104 0.01
Healthcare products USD 24,263 Medtronic Plc 2,094 0.27
Insurance USD 1,554 Willis Towers Watson Plc 235 0.03
Machinery - diversified USD 2,694 Pentair Plc 118 0.01
Miscellaneous manufacturers USD 9,883 Eaton Corp Plc 757 0.10USD 8,134 Ingersoll-Rand Plc 712 0.09
Oil & gas GBP 4,742 DCC Plc 455 0.06
Pharmaceuticals USD 2,976 Alkermes Plc 141 0.02USD 6,481 Allergan Plc 977 0.12USD 1,841 Jazz Pharmaceuticals Plc 311 0.04USD 2,574 Perrigo Co Plc 188 0.02
Total Ireland 10,025 1.27
Isle of Man (30 November 2017: 0.03%) Real estate investment & services
ZAR 15,336 NEPI Rockcastle Plc 150 0.02Total Isle of Man 150 0.02

iSHARES V PLC
Schedule of Investments (unaudited) (continued) iSHARES MSCI ACWI UCITS ETF (continued) As at 31 May 2018
i S H A R E S V P L C I N T E R I M R E P O R T [ 1 4 3 ]
Ccy Holding Investment Fair value
$'000
% of net asset value
Equities (30 November 2017: 99.23%) (cont)
Israel (30 November 2017: 0.09%) Chemicals
ILS 36,478 Israel Chemicals Ltd 169 0.02Computers
USD 1,752 Check Point Software Technologies Ltd 170 0.02Pharmaceuticals
ILS 18,522 Teva Pharmaceutical Industries Ltd 402 0.05Telecommunications
ILS 3,706 Nice Ltd 389 0.05Total Israel 1,130 0.14
Italy (30 November 2017: 0.66%) Banks
EUR 247,318 Intesa Sanpaolo SpA^ 726 0.09EUR 41,024 UniCredit SpA 677 0.09
Commercial services EUR 18,603 Atlantia SpA 538 0.07
Electricity EUR 161,384 Enel SpA^ 886 0.11
Gas EUR 55,840 Snam SpA 229 0.03
Insurance EUR 29,582 Assicurazioni Generali SpA^ 502 0.06
Oil & gas EUR 43,169 Eni SpA 781 0.10
Telecommunications EUR 350,465 Telecom Italia SpA 281 0.03
Total Italy 4,620 0.58
Japan (30 November 2017: 7.77%) Advertising
JPY 2,700 Dentsu Inc 129 0.02Agriculture
JPY 17,000 Japan Tobacco Inc 459 0.06Auto manufacturers
JPY 31,800 Honda Motor Co Ltd 1,009 0.13JPY 8,700 Mazda Motor Corp 110 0.01JPY 24,000 Mitsubishi Motors Corp^ 182 0.02JPY 49,200 Nissan Motor Co Ltd 489 0.06JPY 8,000 Subaru Corp 245 0.03JPY 2,600 Suzuki Motor Corp^ 150 0.02JPY 47,700 Toyota Motor Corp^ 3,039 0.39
Auto parts & equipment JPY 16,400 Bridgestone Corp 659 0.09JPY 8,100 Denso Corp 394 0.05JPY 32,800 Sumitomo Electric Industries Ltd^ 497 0.06JPY 8,400 Toyota Industries Corp^ 492 0.06
Ccy Holding InvestmentFair value
$'000
% of net asset value
Japan (30 November 2017: 7.77%) (cont) Banks
JPY 49,100 Kyushu Financial Group Inc 235 0.03JPY 197,400 Mitsubishi UFJ Financial Group
Inc 1,192 0.15JPY 395,100 Mizuho Financial Group Inc^ 690 0.09JPY 48,100 Resona Holdings Inc 269 0.04JPY 23,100 Sumitomo Mitsui Financial Group
Inc 957 0.12JPY 8,100 Sumitomo Mitsui Trust Holdings
Inc 339 0.04Beverages
JPY 15,000 Asahi Group Holdings Ltd 786 0.10JPY 16,000 Kirin Holdings Co Ltd 456 0.06
Building materials and fixtures JPY 5,400 Daikin Industries Ltd^ 625 0.08
Chemicals JPY 41,000 Mitsubishi Chemical Holdings
Corp 380 0.05JPY 2,000 Nippon Paint Holdings Co Ltd^ 84 0.01JPY 5,400 Nitto Denko Corp 425 0.05JPY 8,200 Shin-Etsu Chemical Co Ltd 822 0.10JPY 75,000 Sumitomo Chemical Co Ltd^ 455 0.06JPY 59,000 Toray Industries Inc^ 484 0.06
Commercial services JPY 1,300 Park24 Co Ltd^ 35 0.01JPY 17,200 Recruit Holdings Co Ltd 480 0.06JPY 8,100 Secom Co Ltd^ 605 0.08JPY 2,100 Sohgo Security Services Co Ltd 96 0.01JPY 22,000 Toppan Printing Co Ltd 180 0.02
Computers JPY 69,000 Fujitsu Ltd^ 424 0.05JPY 10,200 NEC Corp 288 0.04JPY 2,200 Otsuka Corp 91 0.01
Cosmetics & personal care JPY 15,000 Kao Corp 1,166 0.15JPY 9,600 Shiseido Co Ltd 762 0.10JPY 8,200 Unicharm Corp^ 255 0.03
Distribution & wholesale JPY 32,900 ITOCHU Corp^ 619 0.08JPY 73,900 Marubeni Corp 577 0.07JPY 24,600 Mitsubishi Corp 686 0.09JPY 32,800 Mitsui & Co Ltd 579 0.07JPY 32,800 Sumitomo Corp^ 552 0.07
Diversified financial services JPY 70,000 Daiwa Securities Group Inc 407 0.05JPY 88,100 Nomura Holdings Inc 458 0.06JPY 32,800 ORIX Corp^ 551 0.07
Electrical components & equipment JPY 8,000 Casio Computer Co Ltd 123 0.01JPY 1,600 Mabuchi Motor Co Ltd^ 74 0.01

iSHARES V PLC
Schedule of Investments (unaudited) (continued) iSHARES MSCI ACWI UCITS ETF (continued) As at 31 May 2018
[ 1 4 4 ] i S H A R E S V P L C I N T E R I M R E P O R T
Ccy Holding Investment Fair value
$'000
% of net asset value
Equities (30 November 2017: 99.23%) (cont) Japan (30 November 2017: 7.77%) (cont)
Electricity JPY 22,300 Chubu Electric Power Co Inc 346 0.05JPY 16,400 Kansai Electric Power Co Inc 236 0.03JPY 14,900 Kyushu Electric Power Co Inc^ 176 0.02JPY 49,500 Tokyo Electric Power Co
Holdings Inc 236 0.03Electronics
JPY 7,400 Hoya Corp 441 0.05JPY 6,400 Kyocera Corp^ 380 0.05JPY 15,300 Minebea Mitsumi Inc 291 0.04JPY 6,200 Murata Manufacturing Co Ltd^ 924 0.12JPY 2,300 Nidec Corp^ 358 0.04
Engineering & construction JPY 20,000 Kajima Corp 163 0.02JPY 25,200 Obayashi Corp 255 0.03
Entertainment JPY 2,200 Oriental Land Co Ltd^ 226 0.03
Food JPY 15,200 Ajinomoto Co Inc 291 0.04JPY 1,800 MEIJI Holdings Co Ltd 154 0.02JPY 2,500 NH Foods Ltd^ 103 0.01JPY 15,800 Seven & i Holdings Co Ltd^ 701 0.09JPY 14,100 Yamazaki Baking Co Ltd^ 306 0.04
Gas JPY 14,000 Osaka Gas Co Ltd^ 306 0.04JPY 17,200 Tokyo Gas Co Ltd 469 0.06
Healthcare products JPY 8,600 Cyberdyne Inc^ 111 0.01JPY 6,100 Olympus Corp 217 0.03JPY 1,400 Sysmex Corp 126 0.02JPY 10,400 Terumo Corp^ 618 0.08
Home builders JPY 7,300 Daiwa House Industry Co Ltd 265 0.03JPY 8,800 Iida Group Holdings Co Ltd^ 169 0.02
Home furnishings JPY 1,400 Hoshizaki Corp^ 141 0.02JPY 49,200 Panasonic Corp 675 0.08JPY 24,600 Sony Corp 1,168 0.15
Insurance JPY 24,900 Dai-ichi Life Holdings Inc 466 0.06JPY 15,400 MS&AD Insurance Group
Holdings Inc 491 0.06JPY 32,800 T&D Holdings Inc 518 0.07JPY 16,400 Tokio Marine Holdings Inc^ 791 0.10
Internet JPY 7,000 Kakaku.com Inc^ 153 0.02JPY 7,400 M3 Inc^ 310 0.04JPY 17,400 Rakuten Inc 117 0.02JPY 5,600 Start Today Co Ltd^ 195 0.02
Ccy Holding InvestmentFair value
$'000
% of net asset value
Japan (30 November 2017: 7.77%) (cont) Iron & steel
JPY 13,900 Kobe Steel Ltd 140 0.02JPY 10,900 Nippon Steel & Sumitomo Metal
Corp 229 0.03Leisure time
JPY 800 Shimano Inc^ 113 0.01Machinery - diversified
JPY 3,000 Fanuc Corp 642 0.08JPY 1,500 Keyence Corp 923 0.12JPY 18,600 Kubota Corp 314 0.04JPY 6,200 Mitsubishi Heavy Industries Ltd^ 235 0.03JPY 7,200 Nabtesco Corp^ 236 0.03JPY 1,100 SMC Corp^ 419 0.05JPY 5,500 Yaskawa Electric Corp^ 223 0.03
Machinery, construction & mining JPY 82,000 Hitachi Ltd 601 0.07JPY 16,000 Komatsu Ltd 528 0.07JPY 23,600 Mitsubishi Electric Corp^ 336 0.04
Miscellaneous manufacturers JPY 15,900 FUJIFILM Holdings Corp 612 0.08JPY 14,100 Nikon Corp 229 0.03JPY 87,000 Toshiba Corp 245 0.03
Office & business equipment JPY 16,400 Canon Inc^ 561 0.07
Oil & gas JPY 31,900 Inpex Corp 357 0.05JPY 74,400 JXTG Holdings Inc 481 0.06
Pharmaceuticals JPY 48,000 Astellas Pharma Inc^ 736 0.09JPY 23,700 Daiichi Sankyo Co Ltd^ 763 0.10JPY 7,700 Eisai Co Ltd^ 558 0.07JPY 8,100 Ono Pharmaceutical Co Ltd 201 0.03JPY 8,000 Otsuka Holdings Co Ltd 399 0.05JPY 10,100 Santen Pharmaceutical Co Ltd 176 0.02JPY 7,400 Shionogi & Co Ltd^ 389 0.05JPY 16,400 Takeda Pharmaceutical Co Ltd 672 0.08
Real estate investment & services JPY 18,000 Mitsubishi Estate Co Ltd 327 0.04JPY 15,000 Mitsui Fudosan Co Ltd 378 0.05JPY 8,200 Nomura Real Estate Holdings Inc 193 0.02JPY 4,000 Sumitomo Realty & Development
Co Ltd^ 151 0.02Real estate investment trusts
JPY 79 Japan Real Estate Investment Corp 415 0.05
JPY 107 Japan Retail Fund Investment Corp 194 0.02
JPY 61 Nippon Building Fund Inc 343 0.04JPY 149 Nippon Prologis REIT Inc 311 0.04JPY 98 Nomura Real Estate Master Fund
Inc^ 138 0.02JPY 178 United Urban Investment Corp^ 273 0.04
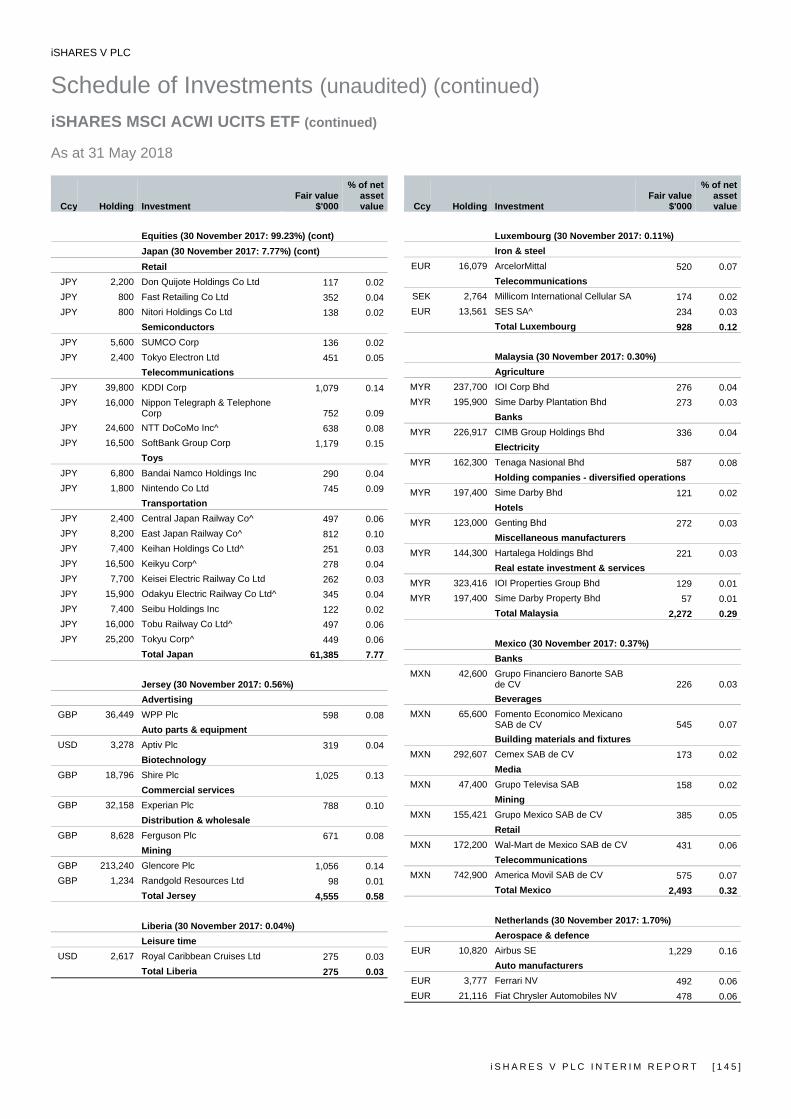
iSHARES V PLC
Schedule of Investments (unaudited) (continued) iSHARES MSCI ACWI UCITS ETF (continued) As at 31 May 2018
i S H A R E S V P L C I N T E R I M R E P O R T [ 1 4 5 ]
Ccy Holding Investment Fair value
$'000
% of net asset value
Equities (30 November 2017: 99.23%) (cont) Japan (30 November 2017: 7.77%) (cont)
Retail JPY 2,200 Don Quijote Holdings Co Ltd 117 0.02JPY 800 Fast Retailing Co Ltd 352 0.04JPY 800 Nitori Holdings Co Ltd 138 0.02
Semiconductors JPY 5,600 SUMCO Corp 136 0.02JPY 2,400 Tokyo Electron Ltd 451 0.05
Telecommunications JPY 39,800 KDDI Corp 1,079 0.14JPY 16,000 Nippon Telegraph & Telephone
Corp 752 0.09JPY 24,600 NTT DoCoMo Inc^ 638 0.08JPY 16,500 SoftBank Group Corp 1,179 0.15
Toys JPY 6,800 Bandai Namco Holdings Inc 290 0.04JPY 1,800 Nintendo Co Ltd 745 0.09
Transportation JPY 2,400 Central Japan Railway Co^ 497 0.06JPY 8,200 East Japan Railway Co^ 812 0.10JPY 7,400 Keihan Holdings Co Ltd^ 251 0.03JPY 16,500 Keikyu Corp^ 278 0.04JPY 7,700 Keisei Electric Railway Co Ltd 262 0.03JPY 15,900 Odakyu Electric Railway Co Ltd^ 345 0.04JPY 7,400 Seibu Holdings Inc 122 0.02JPY 16,000 Tobu Railway Co Ltd^ 497 0.06JPY 25,200 Tokyu Corp^ 449 0.06
Total Japan 61,385 7.77
Jersey (30 November 2017: 0.56%) Advertising
GBP 36,449 WPP Plc 598 0.08Auto parts & equipment
USD 3,278 Aptiv Plc 319 0.04Biotechnology
GBP 18,796 Shire Plc 1,025 0.13Commercial services
GBP 32,158 Experian Plc 788 0.10Distribution & wholesale
GBP 8,628 Ferguson Plc 671 0.08Mining
GBP 213,240 Glencore Plc 1,056 0.14GBP 1,234 Randgold Resources Ltd 98 0.01
Total Jersey 4,555 0.58
Liberia (30 November 2017: 0.04%) Leisure time
USD 2,617 Royal Caribbean Cruises Ltd 275 0.03Total Liberia 275 0.03
Ccy Holding InvestmentFair value
$'000
% of net asset value
Luxembourg (30 November 2017: 0.11%) Iron & steel
EUR 16,079 ArcelorMittal 520 0.07Telecommunications
SEK 2,764 Millicom International Cellular SA 174 0.02EUR 13,561 SES SA^ 234 0.03
Total Luxembourg 928 0.12
Malaysia (30 November 2017: 0.30%) Agriculture
MYR 237,700 IOI Corp Bhd 276 0.04MYR 195,900 Sime Darby Plantation Bhd 273 0.03
Banks MYR 226,917 CIMB Group Holdings Bhd 336 0.04
Electricity MYR 162,300 Tenaga Nasional Bhd 587 0.08
Holding companies - diversified operations MYR 197,400 Sime Darby Bhd 121 0.02
Hotels MYR 123,000 Genting Bhd 272 0.03
Miscellaneous manufacturers MYR 144,300 Hartalega Holdings Bhd 221 0.03
Real estate investment & services MYR 323,416 IOI Properties Group Bhd 129 0.01MYR 197,400 Sime Darby Property Bhd 57 0.01
Total Malaysia 2,272 0.29
Mexico (30 November 2017: 0.37%) Banks
MXN 42,600 Grupo Financiero Banorte SAB de CV 226 0.03Beverages
MXN 65,600 Fomento Economico Mexicano SAB de CV 545 0.07Building materials and fixtures
MXN 292,607 Cemex SAB de CV 173 0.02Media
MXN 47,400 Grupo Televisa SAB 158 0.02Mining
MXN 155,421 Grupo Mexico SAB de CV 385 0.05Retail
MXN 172,200 Wal-Mart de Mexico SAB de CV 431 0.06Telecommunications
MXN 742,900 America Movil SAB de CV 575 0.07Total Mexico 2,493 0.32
Netherlands (30 November 2017: 1.70%) Aerospace & defence
EUR 10,820 Airbus SE 1,229 0.16Auto manufacturers
EUR 3,777 Ferrari NV 492 0.06EUR 21,116 Fiat Chrysler Automobiles NV 478 0.06
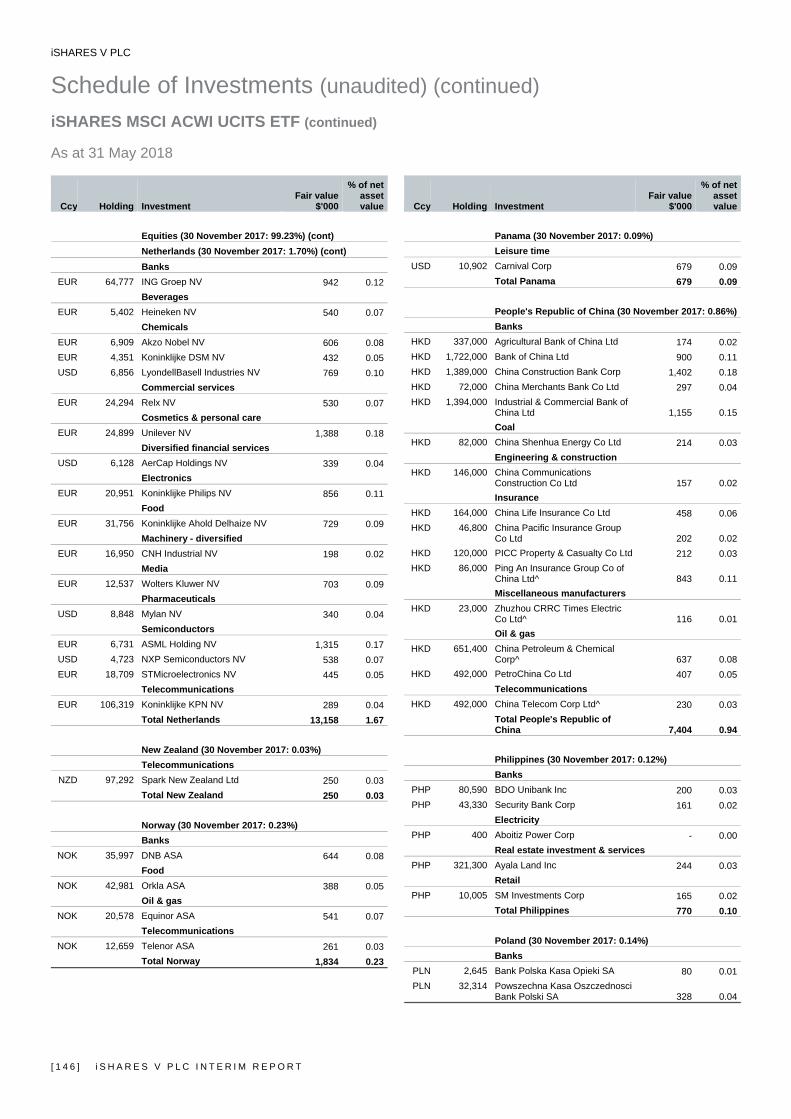
iSHARES V PLC
Schedule of Investments (unaudited) (continued) iSHARES MSCI ACWI UCITS ETF (continued) As at 31 May 2018
[ 1 4 6 ] i S H A R E S V P L C I N T E R I M R E P O R T
Ccy Holding Investment Fair value
$'000
% of net asset value
Equities (30 November 2017: 99.23%) (cont) Netherlands (30 November 2017: 1.70%) (cont)
Banks EUR 64,777 ING Groep NV 942 0.12
Beverages EUR 5,402 Heineken NV 540 0.07
Chemicals EUR 6,909 Akzo Nobel NV 606 0.08EUR 4,351 Koninklijke DSM NV 432 0.05USD 6,856 LyondellBasell Industries NV 769 0.10
Commercial services EUR 24,294 Relx NV 530 0.07
Cosmetics & personal care EUR 24,899 Unilever NV 1,388 0.18
Diversified financial services USD 6,128 AerCap Holdings NV 339 0.04
Electronics EUR 20,951 Koninklijke Philips NV 856 0.11
Food EUR 31,756 Koninklijke Ahold Delhaize NV 729 0.09
Machinery - diversified EUR 16,950 CNH Industrial NV 198 0.02
Media EUR 12,537 Wolters Kluwer NV 703 0.09
Pharmaceuticals USD 8,848 Mylan NV 340 0.04
Semiconductors EUR 6,731 ASML Holding NV 1,315 0.17USD 4,723 NXP Semiconductors NV 538 0.07EUR 18,709 STMicroelectronics NV 445 0.05
Telecommunications EUR 106,319 Koninklijke KPN NV 289 0.04
Total Netherlands 13,158 1.67
New Zealand (30 November 2017: 0.03%) Telecommunications
NZD 97,292 Spark New Zealand Ltd 250 0.03Total New Zealand 250 0.03
Norway (30 November 2017: 0.23%) Banks
NOK 35,997 DNB ASA 644 0.08Food
NOK 42,981 Orkla ASA 388 0.05Oil & gas
NOK 20,578 Equinor ASA 541 0.07Telecommunications
NOK 12,659 Telenor ASA 261 0.03Total Norway 1,834 0.23
Ccy Holding InvestmentFair value
$'000
% of net asset value
Panama (30 November 2017: 0.09%) Leisure time
USD 10,902 Carnival Corp 679 0.09Total Panama 679 0.09
People's Republic of China (30 November 2017: 0.86%)Banks
HKD 337,000 Agricultural Bank of China Ltd 174 0.02HKD 1,722,000 Bank of China Ltd 900 0.11HKD 1,389,000 China Construction Bank Corp 1,402 0.18HKD 72,000 China Merchants Bank Co Ltd 297 0.04HKD 1,394,000 Industrial & Commercial Bank of
China Ltd 1,155 0.15Coal
HKD 82,000 China Shenhua Energy Co Ltd 214 0.03Engineering & construction
HKD 146,000 China Communications Construction Co Ltd 157 0.02Insurance
HKD 164,000 China Life Insurance Co Ltd 458 0.06HKD 46,800 China Pacific Insurance Group
Co Ltd 202 0.02HKD 120,000 PICC Property & Casualty Co Ltd 212 0.03HKD 86,000 Ping An Insurance Group Co of
China Ltd^ 843 0.11Miscellaneous manufacturers
HKD 23,000 Zhuzhou CRRC Times Electric Co Ltd^ 116 0.01Oil & gas
HKD 651,400 China Petroleum & Chemical Corp^ 637 0.08
HKD 492,000 PetroChina Co Ltd 407 0.05Telecommunications
HKD 492,000 China Telecom Corp Ltd^ 230 0.03Total People's Republic of China 7,404 0.94
Philippines (30 November 2017: 0.12%) Banks
PHP 80,590 BDO Unibank Inc 200 0.03PHP 43,330 Security Bank Corp 161 0.02
Electricity PHP 400 Aboitiz Power Corp - 0.00
Real estate investment & services PHP 321,300 Ayala Land Inc 244 0.03
Retail PHP 10,005 SM Investments Corp 165 0.02
Total Philippines 770 0.10
Poland (30 November 2017: 0.14%) Banks
PLN 2,645 Bank Polska Kasa Opieki SA 80 0.01PLN 32,314 Powszechna Kasa Oszczednosci
Bank Polski SA 328 0.04

iSHARES V PLC
Schedule of Investments (unaudited) (continued) iSHARES MSCI ACWI UCITS ETF (continued) As at 31 May 2018
i S H A R E S V P L C I N T E R I M R E P O R T [ 1 4 7 ]
Ccy Holding Investment Fair value
$'000
% of net asset value
Equities (30 November 2017: 99.23%) (cont) Poland (30 November 2017: 0.14%) (cont)
Insurance PLN 15,448 Powszechny Zaklad
Ubezpieczen SA 152 0.02Mining
PLN 7,358 KGHM Polska Miedz SA 168 0.02Oil & gas
PLN 9,023 Polski Koncern Naftowy Orlen SA 199 0.03Total Poland 927 0.12
Portugal (30 November 2017: 0.07%) Electricity
EUR 124,603 EDP - Energias de Portugal SA^ 487 0.06Oil & gas
EUR 11,526 Galp Energia SGPS SA^ 214 0.03Total Portugal 701 0.09
Qatar (30 November 2017: 0.05%) Banks
QAR 23,873 Masraf Al Rayan QSC 219 0.02QAR 5,049 Qatar National Bank QPSC 219 0.03
Total Qatar 438 0.05
Republic of South Korea (30 November 2017: 1.74%) Aerospace & defence
KRW 1,261 Korea Aerospace Industries Ltd^ 51 0.01Agriculture
KRW 5,128 KT&G Corp^ 457 0.06Airlines
KRW 5,154 Korean Air Lines Co Ltd 153 0.02Auto manufacturers
KRW 3,705 Hyundai Motor Co 478 0.06KRW 6,642 Kia Motors Corp 192 0.02
Auto parts & equipment KRW 1,132 Hyundai Mobis Co Ltd 229 0.03
Banks KRW 11,980 Industrial Bank of Korea 173 0.02
Chemicals KRW 1,389 LG Chem Ltd 436 0.06
Cosmetics & personal care KRW 1,241 Amorepacific Corp^ 383 0.05KRW 163 LG Household & Health Care Ltd 203 0.02
Diversified financial services KRW 5,130 Hana Financial Group Inc 198 0.02KRW 6,028 KB Financial Group Inc 290 0.04KRW 8,314 Shinhan Financial Group Co Ltd 337 0.04
Electrical components & equipment KRW 1,583 LG Innotek Co Ltd^ 211 0.03
Food KRW 1,005 Lotte Corp 55 0.01
Ccy Holding InvestmentFair value
$'000
% of net asset value
Republic of South Korea (30 November 2017: 1.74%) (cont) Healthcare services
KRW 747 SillaJen Inc^ 56 0.01Home furnishings
KRW 1,154 Hanssem Co Ltd^ 121 0.01KRW 1,588 LG Electronics Inc 136 0.02
Insurance KRW 1,793 Samsung Fire & Marine
Insurance Co Ltd 416 0.05KRW 2,624 Samsung Life Insurance Co Ltd 251 0.03
Internet KRW 2,043 Kakao Corp 196 0.03KRW 926 NAVER Corp^ 575 0.07
Investment services KRW 404 Hyundai Heavy Industries
Holdings Co Ltd^ 145 0.02Iron & steel
KRW 1,327 POSCO 418 0.05Marine transportation
KRW 1,344 Hyundai Heavy Industries Co Ltd 143 0.02Pharmaceuticals
KRW 1,798 Celltrion Inc 443 0.06Retail
KRW 1,065 E-Mart Inc 247 0.03KRW 1,596 Samsung C&T Corp 186 0.02
Semiconductors KRW 87,650 Samsung Electronics Co Ltd 4,123 0.52KRW 12,749 Samsung Electronics Co Ltd
(Preference) 479 0.06KRW 12,133 SK Hynix Inc 1,051 0.14
Telecommunications KRW 1,011 Samsung SDI Co Ltd 188 0.02
Transportation KRW 1,071 CJ Logistics Corp 149 0.02
Total Republic of South Korea 13,169 1.67
Russian Federation (30 November 2017: 0.37%) Banks
USD 22,529 Sberbank of Russia PJSC 324 0.04USD 68,398 VTB Bank PJSC 109 0.01
Food USD 7,216 Magnit PJSC 145 0.02
Mining RUB 2,314 MMC Norilsk Nickel PJSC 412 0.05
Oil & gas RUB 61,531 Gazprom PJSC 143 0.02USD 71,562 Gazprom PJSC ADR 325 0.04USD 6,121 Lukoil PJSC 409 0.05USD 4,040 Novatek PJSC 582 0.07RUB 27,747 Tatneft PJSC 297 0.04
Telecommunications USD 29,889 Mobile TeleSystems PJSC 286 0.04
Total Russian Federation 3,032 0.38
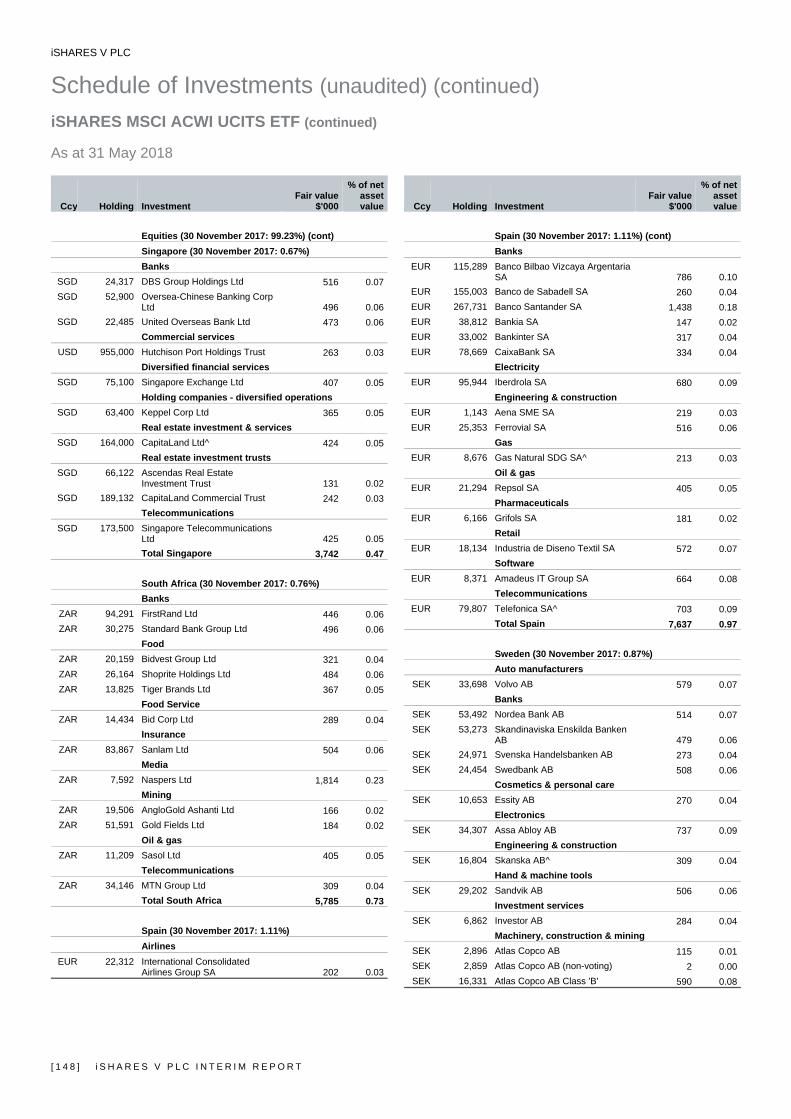
iSHARES V PLC
Schedule of Investments (unaudited) (continued) iSHARES MSCI ACWI UCITS ETF (continued) As at 31 May 2018
[ 1 4 8 ] i S H A R E S V P L C I N T E R I M R E P O R T
Ccy Holding Investment Fair value
$'000
% of net asset value
Equities (30 November 2017: 99.23%) (cont)
Singapore (30 November 2017: 0.67%) Banks
SGD 24,317 DBS Group Holdings Ltd 516 0.07SGD 52,900 Oversea-Chinese Banking Corp
Ltd 496 0.06SGD 22,485 United Overseas Bank Ltd 473 0.06
Commercial services USD 955,000 Hutchison Port Holdings Trust 263 0.03
Diversified financial services SGD 75,100 Singapore Exchange Ltd 407 0.05
Holding companies - diversified operations SGD 63,400 Keppel Corp Ltd 365 0.05
Real estate investment & services SGD 164,000 CapitaLand Ltd^ 424 0.05
Real estate investment trusts SGD 66,122 Ascendas Real Estate
Investment Trust 131 0.02SGD 189,132 CapitaLand Commercial Trust 242 0.03
Telecommunications SGD 173,500 Singapore Telecommunications
Ltd 425 0.05Total Singapore 3,742 0.47
South Africa (30 November 2017: 0.76%) Banks
ZAR 94,291 FirstRand Ltd 446 0.06ZAR 30,275 Standard Bank Group Ltd 496 0.06
Food ZAR 20,159 Bidvest Group Ltd 321 0.04ZAR 26,164 Shoprite Holdings Ltd 484 0.06ZAR 13,825 Tiger Brands Ltd 367 0.05
Food Service ZAR 14,434 Bid Corp Ltd 289 0.04
Insurance ZAR 83,867 Sanlam Ltd 504 0.06
Media ZAR 7,592 Naspers Ltd 1,814 0.23
Mining ZAR 19,506 AngloGold Ashanti Ltd 166 0.02ZAR 51,591 Gold Fields Ltd 184 0.02
Oil & gas ZAR 11,209 Sasol Ltd 405 0.05
Telecommunications ZAR 34,146 MTN Group Ltd 309 0.04
Total South Africa 5,785 0.73
Spain (30 November 2017: 1.11%) Airlines
EUR 22,312 International Consolidated Airlines Group SA 202 0.03
Ccy Holding InvestmentFair value
$'000
% of net asset value
Spain (30 November 2017: 1.11%) (cont) Banks
EUR 115,289 Banco Bilbao Vizcaya Argentaria SA 786 0.10
EUR 155,003 Banco de Sabadell SA 260 0.04EUR 267,731 Banco Santander SA 1,438 0.18EUR 38,812 Bankia SA 147 0.02EUR 33,002 Bankinter SA 317 0.04EUR 78,669 CaixaBank SA 334 0.04
Electricity EUR 95,944 Iberdrola SA 680 0.09
Engineering & construction EUR 1,143 Aena SME SA 219 0.03EUR 25,353 Ferrovial SA 516 0.06
Gas EUR 8,676 Gas Natural SDG SA^ 213 0.03
Oil & gas EUR 21,294 Repsol SA 405 0.05
Pharmaceuticals EUR 6,166 Grifols SA 181 0.02
Retail EUR 18,134 Industria de Diseno Textil SA 572 0.07
Software EUR 8,371 Amadeus IT Group SA 664 0.08
Telecommunications EUR 79,807 Telefonica SA^ 703 0.09
Total Spain 7,637 0.97
Sweden (30 November 2017: 0.87%) Auto manufacturers
SEK 33,698 Volvo AB 579 0.07Banks
SEK 53,492 Nordea Bank AB 514 0.07SEK 53,273 Skandinaviska Enskilda Banken
AB 479 0.06SEK 24,971 Svenska Handelsbanken AB 273 0.04SEK 24,454 Swedbank AB 508 0.06
Cosmetics & personal care SEK 10,653 Essity AB 270 0.04
Electronics SEK 34,307 Assa Abloy AB 737 0.09
Engineering & construction SEK 16,804 Skanska AB^ 309 0.04
Hand & machine tools SEK 29,202 Sandvik AB 506 0.06
Investment services SEK 6,862 Investor AB 284 0.04
Machinery, construction & mining SEK 2,896 Atlas Copco AB 115 0.01SEK 2,859 Atlas Copco AB (non-voting) 2 0.00SEK 16,331 Atlas Copco AB Class 'B' 590 0.08
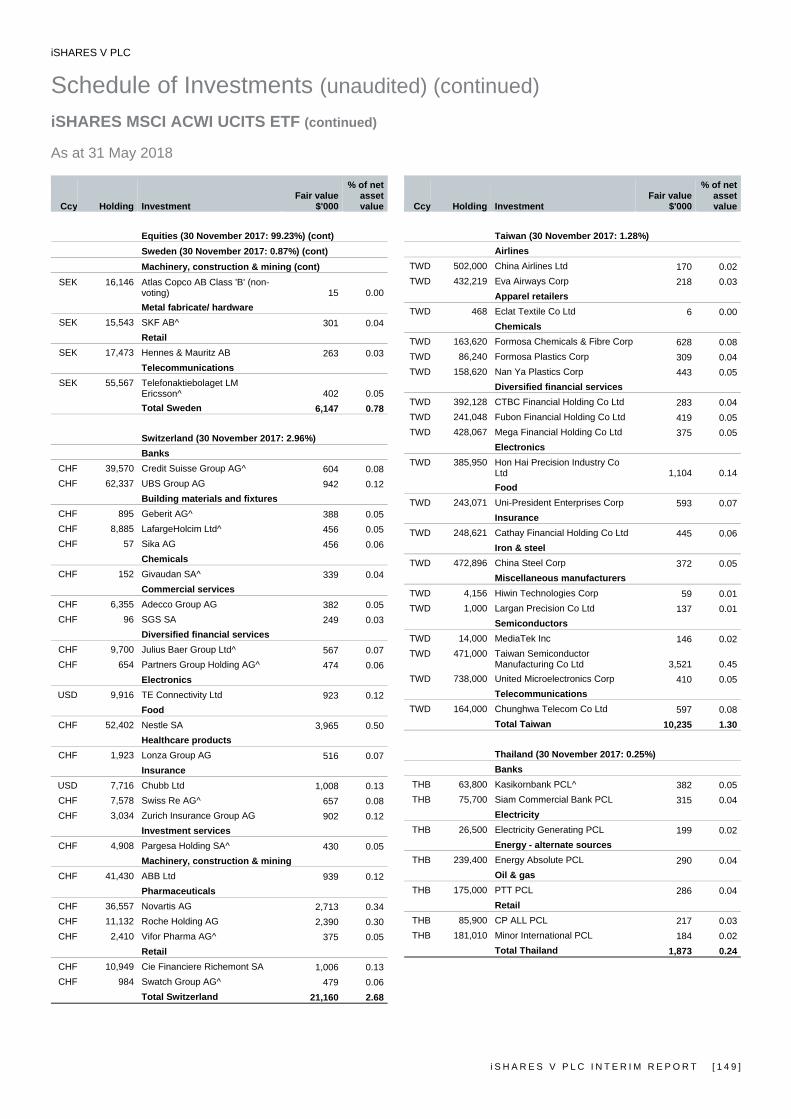
iSHARES V PLC
Schedule of Investments (unaudited) (continued) iSHARES MSCI ACWI UCITS ETF (continued) As at 31 May 2018
i S H A R E S V P L C I N T E R I M R E P O R T [ 1 4 9 ]
Ccy Holding Investment Fair value
$'000
% of net asset value
Equities (30 November 2017: 99.23%) (cont) Sweden (30 November 2017: 0.87%) (cont) Machinery, construction & mining (cont)
SEK 16,146 Atlas Copco AB Class 'B' (non-voting) 15 0.00Metal fabricate/ hardware
SEK 15,543 SKF AB^ 301 0.04Retail
SEK 17,473 Hennes & Mauritz AB 263 0.03Telecommunications
SEK 55,567 Telefonaktiebolaget LM Ericsson^ 402 0.05Total Sweden 6,147 0.78
Switzerland (30 November 2017: 2.96%) Banks
CHF 39,570 Credit Suisse Group AG^ 604 0.08CHF 62,337 UBS Group AG 942 0.12
Building materials and fixtures CHF 895 Geberit AG^ 388 0.05CHF 8,885 LafargeHolcim Ltd^ 456 0.05CHF 57 Sika AG 456 0.06
Chemicals CHF 152 Givaudan SA^ 339 0.04
Commercial services CHF 6,355 Adecco Group AG 382 0.05CHF 96 SGS SA 249 0.03
Diversified financial services CHF 9,700 Julius Baer Group Ltd^ 567 0.07CHF 654 Partners Group Holding AG^ 474 0.06
Electronics USD 9,916 TE Connectivity Ltd 923 0.12
Food CHF 52,402 Nestle SA 3,965 0.50
Healthcare products CHF 1,923 Lonza Group AG 516 0.07
Insurance USD 7,716 Chubb Ltd 1,008 0.13CHF 7,578 Swiss Re AG^ 657 0.08CHF 3,034 Zurich Insurance Group AG 902 0.12
Investment services CHF 4,908 Pargesa Holding SA^ 430 0.05
Machinery, construction & mining CHF 41,430 ABB Ltd 939 0.12
Pharmaceuticals CHF 36,557 Novartis AG 2,713 0.34CHF 11,132 Roche Holding AG 2,390 0.30CHF 2,410 Vifor Pharma AG^ 375 0.05
Retail CHF 10,949 Cie Financiere Richemont SA 1,006 0.13CHF 984 Swatch Group AG^ 479 0.06
Total Switzerland 21,160 2.68
Ccy Holding InvestmentFair value
$'000
% of net asset value
Taiwan (30 November 2017: 1.28%) Airlines
TWD 502,000 China Airlines Ltd 170 0.02TWD 432,219 Eva Airways Corp 218 0.03
Apparel retailers TWD 468 Eclat Textile Co Ltd 6 0.00
Chemicals TWD 163,620 Formosa Chemicals & Fibre Corp 628 0.08TWD 86,240 Formosa Plastics Corp 309 0.04TWD 158,620 Nan Ya Plastics Corp 443 0.05
Diversified financial services TWD 392,128 CTBC Financial Holding Co Ltd 283 0.04TWD 241,048 Fubon Financial Holding Co Ltd 419 0.05TWD 428,067 Mega Financial Holding Co Ltd 375 0.05
Electronics TWD 385,950 Hon Hai Precision Industry Co
Ltd 1,104 0.14Food
TWD 243,071 Uni-President Enterprises Corp 593 0.07Insurance
TWD 248,621 Cathay Financial Holding Co Ltd 445 0.06Iron & steel
TWD 472,896 China Steel Corp 372 0.05Miscellaneous manufacturers
TWD 4,156 Hiwin Technologies Corp 59 0.01TWD 1,000 Largan Precision Co Ltd 137 0.01
Semiconductors TWD 14,000 MediaTek Inc 146 0.02TWD 471,000 Taiwan Semiconductor
Manufacturing Co Ltd 3,521 0.45TWD 738,000 United Microelectronics Corp 410 0.05
Telecommunications TWD 164,000 Chunghwa Telecom Co Ltd 597 0.08
Total Taiwan 10,235 1.30
Thailand (30 November 2017: 0.25%) Banks
THB 63,800 Kasikornbank PCL^ 382 0.05THB 75,700 Siam Commercial Bank PCL 315 0.04
Electricity THB 26,500 Electricity Generating PCL 199 0.02
Energy - alternate sources THB 239,400 Energy Absolute PCL 290 0.04
Oil & gas THB 175,000 PTT PCL 286 0.04
Retail THB 85,900 CP ALL PCL 217 0.03THB 181,010 Minor International PCL 184 0.02
Total Thailand 1,873 0.24
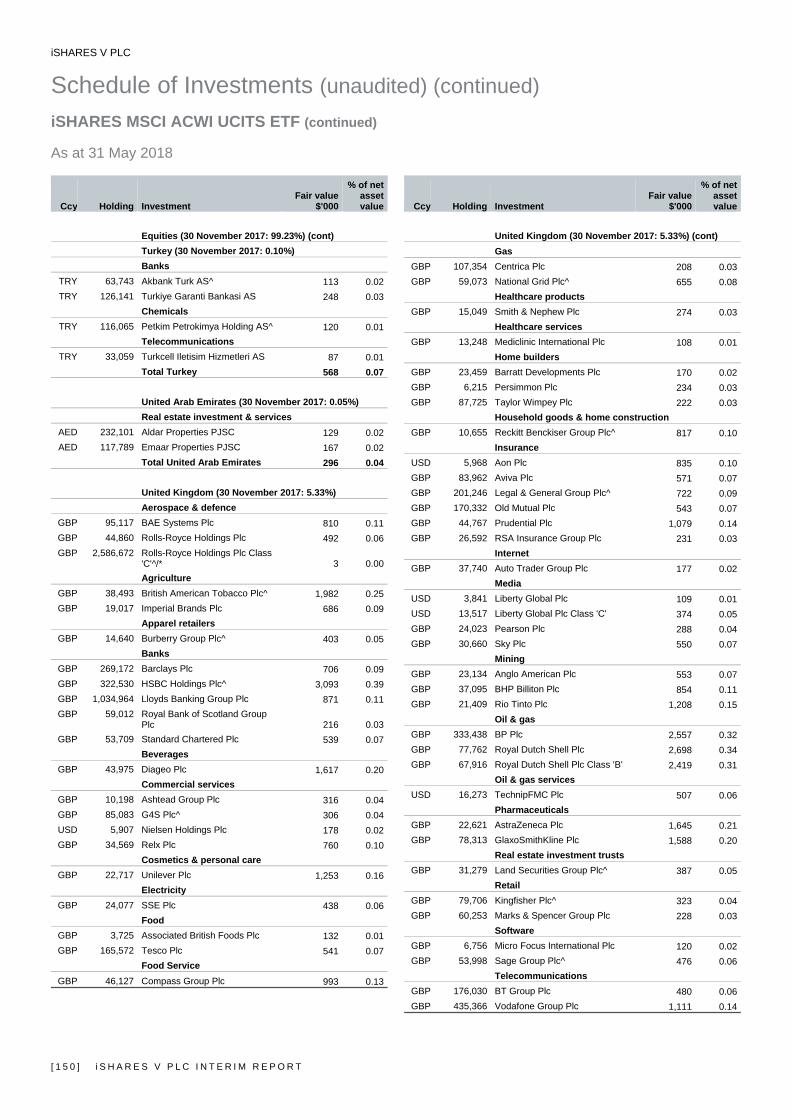
iSHARES V PLC
Schedule of Investments (unaudited) (continued) iSHARES MSCI ACWI UCITS ETF (continued) As at 31 May 2018
[ 1 5 0 ] i S H A R E S V P L C I N T E R I M R E P O R T
Ccy Holding Investment Fair value
$'000
% of net asset value
Equities (30 November 2017: 99.23%) (cont) Turkey (30 November 2017: 0.10%) Banks
TRY 63,743 Akbank Turk AS^ 113 0.02TRY 126,141 Turkiye Garanti Bankasi AS 248 0.03
Chemicals TRY 116,065 Petkim Petrokimya Holding AS^ 120 0.01
Telecommunications TRY 33,059 Turkcell Iletisim Hizmetleri AS 87 0.01
Total Turkey 568 0.07
United Arab Emirates (30 November 2017: 0.05%) Real estate investment & services
AED 232,101 Aldar Properties PJSC 129 0.02AED 117,789 Emaar Properties PJSC 167 0.02
Total United Arab Emirates 296 0.04
United Kingdom (30 November 2017: 5.33%) Aerospace & defence
GBP 95,117 BAE Systems Plc 810 0.11GBP 44,860 Rolls-Royce Holdings Plc 492 0.06GBP 2,586,672 Rolls-Royce Holdings Plc Class
'C'^/* 3 0.00Agriculture
GBP 38,493 British American Tobacco Plc^ 1,982 0.25GBP 19,017 Imperial Brands Plc 686 0.09
Apparel retailers GBP 14,640 Burberry Group Plc^ 403 0.05
Banks GBP 269,172 Barclays Plc 706 0.09GBP 322,530 HSBC Holdings Plc^ 3,093 0.39GBP 1,034,964 Lloyds Banking Group Plc 871 0.11GBP 59,012 Royal Bank of Scotland Group
Plc 216 0.03GBP 53,709 Standard Chartered Plc 539 0.07
Beverages GBP 43,975 Diageo Plc 1,617 0.20
Commercial services GBP 10,198 Ashtead Group Plc 316 0.04GBP 85,083 G4S Plc^ 306 0.04USD 5,907 Nielsen Holdings Plc 178 0.02GBP 34,569 Relx Plc 760 0.10
Cosmetics & personal care GBP 22,717 Unilever Plc 1,253 0.16
Electricity GBP 24,077 SSE Plc 438 0.06
Food GBP 3,725 Associated British Foods Plc 132 0.01GBP 165,572 Tesco Plc 541 0.07
Food Service GBP 46,127 Compass Group Plc 993 0.13
Ccy Holding InvestmentFair value
$'000
% of net asset value
United Kingdom (30 November 2017: 5.33%) (cont) Gas
GBP 107,354 Centrica Plc 208 0.03GBP 59,073 National Grid Plc^ 655 0.08
Healthcare products GBP 15,049 Smith & Nephew Plc 274 0.03
Healthcare services GBP 13,248 Mediclinic International Plc 108 0.01
Home builders GBP 23,459 Barratt Developments Plc 170 0.02GBP 6,215 Persimmon Plc 234 0.03GBP 87,725 Taylor Wimpey Plc 222 0.03
Household goods & home construction GBP 10,655 Reckitt Benckiser Group Plc^ 817 0.10
Insurance USD 5,968 Aon Plc 835 0.10GBP 83,962 Aviva Plc 571 0.07GBP 201,246 Legal & General Group Plc^ 722 0.09GBP 170,332 Old Mutual Plc 543 0.07GBP 44,767 Prudential Plc 1,079 0.14GBP 26,592 RSA Insurance Group Plc 231 0.03
Internet GBP 37,740 Auto Trader Group Plc 177 0.02
Media USD 3,841 Liberty Global Plc 109 0.01USD 13,517 Liberty Global Plc Class 'C' 374 0.05GBP 24,023 Pearson Plc 288 0.04GBP 30,660 Sky Plc 550 0.07
Mining GBP 23,134 Anglo American Plc 553 0.07GBP 37,095 BHP Billiton Plc 854 0.11GBP 21,409 Rio Tinto Plc 1,208 0.15
Oil & gas GBP 333,438 BP Plc 2,557 0.32GBP 77,762 Royal Dutch Shell Plc 2,698 0.34GBP 67,916 Royal Dutch Shell Plc Class 'B' 2,419 0.31
Oil & gas services USD 16,273 TechnipFMC Plc 507 0.06
Pharmaceuticals GBP 22,621 AstraZeneca Plc 1,645 0.21GBP 78,313 GlaxoSmithKline Plc 1,588 0.20
Real estate investment trusts GBP 31,279 Land Securities Group Plc^ 387 0.05
Retail GBP 79,706 Kingfisher Plc^ 323 0.04GBP 60,253 Marks & Spencer Group Plc 228 0.03
Software GBP 6,756 Micro Focus International Plc 120 0.02GBP 53,998 Sage Group Plc^ 476 0.06
Telecommunications GBP 176,030 BT Group Plc 480 0.06GBP 435,366 Vodafone Group Plc 1,111 0.14
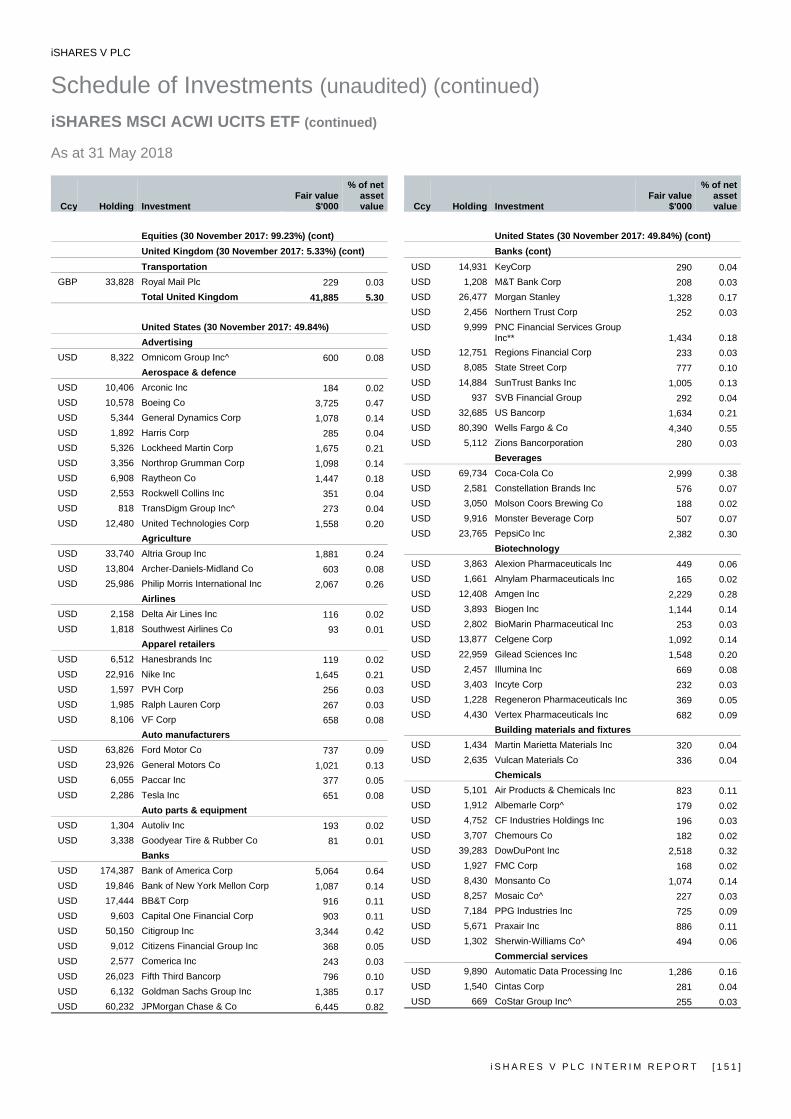
iSHARES V PLC
Schedule of Investments (unaudited) (continued) iSHARES MSCI ACWI UCITS ETF (continued) As at 31 May 2018
i S H A R E S V P L C I N T E R I M R E P O R T [ 1 5 1 ]
Ccy Holding Investment Fair value
$'000
% of net asset value
Equities (30 November 2017: 99.23%) (cont) United Kingdom (30 November 2017: 5.33%) (cont)
Transportation GBP 33,828 Royal Mail Plc 229 0.03
Total United Kingdom 41,885 5.30
United States (30 November 2017: 49.84%) Advertising
USD 8,322 Omnicom Group Inc^ 600 0.08Aerospace & defence
USD 10,406 Arconic Inc 184 0.02USD 10,578 Boeing Co 3,725 0.47USD 5,344 General Dynamics Corp 1,078 0.14USD 1,892 Harris Corp 285 0.04USD 5,326 Lockheed Martin Corp 1,675 0.21USD 3,356 Northrop Grumman Corp 1,098 0.14USD 6,908 Raytheon Co 1,447 0.18USD 2,553 Rockwell Collins Inc 351 0.04USD 818 TransDigm Group Inc^ 273 0.04USD 12,480 United Technologies Corp 1,558 0.20
Agriculture USD 33,740 Altria Group Inc 1,881 0.24USD 13,804 Archer-Daniels-Midland Co 603 0.08USD 25,986 Philip Morris International Inc 2,067 0.26
Airlines USD 2,158 Delta Air Lines Inc 116 0.02USD 1,818 Southwest Airlines Co 93 0.01
Apparel retailers USD 6,512 Hanesbrands Inc 119 0.02USD 22,916 Nike Inc 1,645 0.21USD 1,597 PVH Corp 256 0.03USD 1,985 Ralph Lauren Corp 267 0.03USD 8,106 VF Corp 658 0.08
Auto manufacturers USD 63,826 Ford Motor Co 737 0.09USD 23,926 General Motors Co 1,021 0.13USD 6,055 Paccar Inc 377 0.05USD 2,286 Tesla Inc 651 0.08
Auto parts & equipment USD 1,304 Autoliv Inc 193 0.02USD 3,338 Goodyear Tire & Rubber Co 81 0.01
Banks USD 174,387 Bank of America Corp 5,064 0.64USD 19,846 Bank of New York Mellon Corp 1,087 0.14USD 17,444 BB&T Corp 916 0.11USD 9,603 Capital One Financial Corp 903 0.11USD 50,150 Citigroup Inc 3,344 0.42USD 9,012 Citizens Financial Group Inc 368 0.05USD 2,577 Comerica Inc 243 0.03USD 26,023 Fifth Third Bancorp 796 0.10USD 6,132 Goldman Sachs Group Inc 1,385 0.17USD 60,232 JPMorgan Chase & Co 6,445 0.82
Ccy Holding InvestmentFair value
$'000
% of net asset value
United States (30 November 2017: 49.84%) (cont) Banks (cont)
USD 14,931 KeyCorp 290 0.04USD 1,208 M&T Bank Corp 208 0.03USD 26,477 Morgan Stanley 1,328 0.17USD 2,456 Northern Trust Corp 252 0.03USD 9,999 PNC Financial Services Group
Inc** 1,434 0.18USD 12,751 Regions Financial Corp 233 0.03USD 8,085 State Street Corp 777 0.10USD 14,884 SunTrust Banks Inc 1,005 0.13USD 937 SVB Financial Group 292 0.04USD 32,685 US Bancorp 1,634 0.21USD 80,390 Wells Fargo & Co 4,340 0.55USD 5,112 Zions Bancorporation 280 0.03
Beverages USD 69,734 Coca-Cola Co 2,999 0.38USD 2,581 Constellation Brands Inc 576 0.07USD 3,050 Molson Coors Brewing Co 188 0.02USD 9,916 Monster Beverage Corp 507 0.07USD 23,765 PepsiCo Inc 2,382 0.30
Biotechnology USD 3,863 Alexion Pharmaceuticals Inc 449 0.06USD 1,661 Alnylam Pharmaceuticals Inc 165 0.02USD 12,408 Amgen Inc 2,229 0.28USD 3,893 Biogen Inc 1,144 0.14USD 2,802 BioMarin Pharmaceutical Inc 253 0.03USD 13,877 Celgene Corp 1,092 0.14USD 22,959 Gilead Sciences Inc 1,548 0.20USD 2,457 Illumina Inc 669 0.08USD 3,403 Incyte Corp 232 0.03USD 1,228 Regeneron Pharmaceuticals Inc 369 0.05USD 4,430 Vertex Pharmaceuticals Inc 682 0.09
Building materials and fixtures USD 1,434 Martin Marietta Materials Inc 320 0.04USD 2,635 Vulcan Materials Co 336 0.04
Chemicals USD 5,101 Air Products & Chemicals Inc 823 0.11USD 1,912 Albemarle Corp^ 179 0.02USD 4,752 CF Industries Holdings Inc 196 0.03USD 3,707 Chemours Co 182 0.02USD 39,283 DowDuPont Inc 2,518 0.32USD 1,927 FMC Corp 168 0.02USD 8,430 Monsanto Co 1,074 0.14USD 8,257 Mosaic Co^ 227 0.03USD 7,184 PPG Industries Inc 725 0.09USD 5,671 Praxair Inc 886 0.11USD 1,302 Sherwin-Williams Co^ 494 0.06
Commercial services USD 9,890 Automatic Data Processing Inc 1,286 0.16USD 1,540 Cintas Corp 281 0.04USD 669 CoStar Group Inc^ 255 0.03
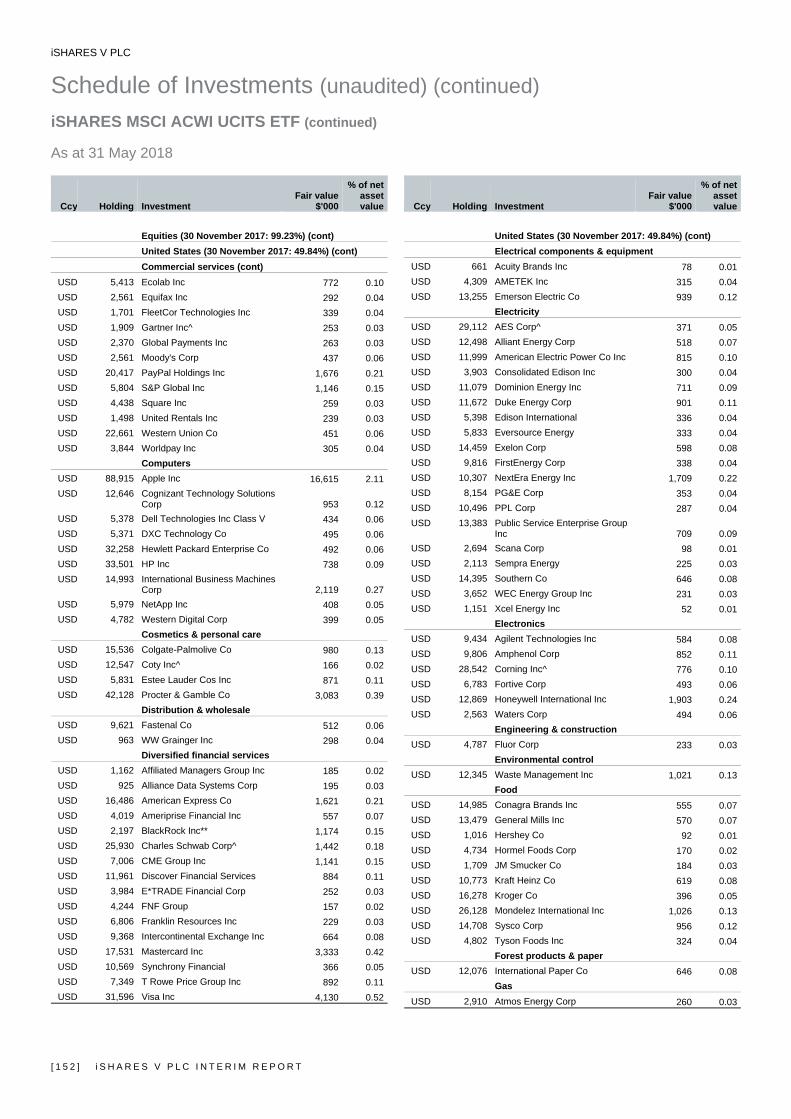
iSHARES V PLC
Schedule of Investments (unaudited) (continued) iSHARES MSCI ACWI UCITS ETF (continued) As at 31 May 2018
[ 1 5 2 ] i S H A R E S V P L C I N T E R I M R E P O R T
Ccy Holding Investment Fair value
$'000
% of net asset value
Equities (30 November 2017: 99.23%) (cont) United States (30 November 2017: 49.84%) (cont) Commercial services (cont)
USD 5,413 Ecolab Inc 772 0.10USD 2,561 Equifax Inc 292 0.04USD 1,701 FleetCor Technologies Inc 339 0.04USD 1,909 Gartner Inc^ 253 0.03USD 2,370 Global Payments Inc 263 0.03USD 2,561 Moody's Corp 437 0.06USD 20,417 PayPal Holdings Inc 1,676 0.21USD 5,804 S&P Global Inc 1,146 0.15USD 4,438 Square Inc 259 0.03USD 1,498 United Rentals Inc 239 0.03USD 22,661 Western Union Co 451 0.06USD 3,844 Worldpay Inc 305 0.04
Computers USD 88,915 Apple Inc 16,615 2.11USD 12,646 Cognizant Technology Solutions
Corp 953 0.12USD 5,378 Dell Technologies Inc Class V 434 0.06USD 5,371 DXC Technology Co 495 0.06USD 32,258 Hewlett Packard Enterprise Co 492 0.06USD 33,501 HP Inc 738 0.09USD 14,993 International Business Machines
Corp 2,119 0.27USD 5,979 NetApp Inc 408 0.05USD 4,782 Western Digital Corp 399 0.05
Cosmetics & personal care USD 15,536 Colgate-Palmolive Co 980 0.13USD 12,547 Coty Inc^ 166 0.02USD 5,831 Estee Lauder Cos Inc 871 0.11USD 42,128 Procter & Gamble Co 3,083 0.39
Distribution & wholesale USD 9,621 Fastenal Co 512 0.06USD 963 WW Grainger Inc 298 0.04
Diversified financial services USD 1,162 Affiliated Managers Group Inc 185 0.02USD 925 Alliance Data Systems Corp 195 0.03USD 16,486 American Express Co 1,621 0.21USD 4,019 Ameriprise Financial Inc 557 0.07USD 2,197 BlackRock Inc** 1,174 0.15USD 25,930 Charles Schwab Corp^ 1,442 0.18USD 7,006 CME Group Inc 1,141 0.15USD 11,961 Discover Financial Services 884 0.11USD 3,984 E*TRADE Financial Corp 252 0.03USD 4,244 FNF Group 157 0.02USD 6,806 Franklin Resources Inc 229 0.03USD 9,368 Intercontinental Exchange Inc 664 0.08USD 17,531 Mastercard Inc 3,333 0.42USD 10,569 Synchrony Financial 366 0.05USD 7,349 T Rowe Price Group Inc 892 0.11USD 31,596 Visa Inc 4,130 0.52
Ccy Holding InvestmentFair value
$'000
% of net asset value
United States (30 November 2017: 49.84%) (cont) Electrical components & equipment
USD 661 Acuity Brands Inc 78 0.01USD 4,309 AMETEK Inc 315 0.04USD 13,255 Emerson Electric Co 939 0.12
Electricity USD 29,112 AES Corp^ 371 0.05USD 12,498 Alliant Energy Corp 518 0.07USD 11,999 American Electric Power Co Inc 815 0.10USD 3,903 Consolidated Edison Inc 300 0.04USD 11,079 Dominion Energy Inc 711 0.09USD 11,672 Duke Energy Corp 901 0.11USD 5,398 Edison International 336 0.04USD 5,833 Eversource Energy 333 0.04USD 14,459 Exelon Corp 598 0.08USD 9,816 FirstEnergy Corp 338 0.04USD 10,307 NextEra Energy Inc 1,709 0.22USD 8,154 PG&E Corp 353 0.04USD 10,496 PPL Corp 287 0.04USD 13,383 Public Service Enterprise Group
Inc 709 0.09USD 2,694 Scana Corp 98 0.01USD 2,113 Sempra Energy 225 0.03USD 14,395 Southern Co 646 0.08USD 3,652 WEC Energy Group Inc 231 0.03USD 1,151 Xcel Energy Inc 52 0.01
Electronics USD 9,434 Agilent Technologies Inc 584 0.08USD 9,806 Amphenol Corp 852 0.11USD 28,542 Corning Inc^ 776 0.10USD 6,783 Fortive Corp 493 0.06USD 12,869 Honeywell International Inc 1,903 0.24USD 2,563 Waters Corp 494 0.06
Engineering & construction USD 4,787 Fluor Corp 233 0.03
Environmental control USD 12,345 Waste Management Inc 1,021 0.13
Food USD 14,985 Conagra Brands Inc 555 0.07USD 13,479 General Mills Inc 570 0.07USD 1,016 Hershey Co 92 0.01USD 4,734 Hormel Foods Corp 170 0.02USD 1,709 JM Smucker Co 184 0.03USD 10,773 Kraft Heinz Co 619 0.08USD 16,278 Kroger Co 396 0.05USD 26,128 Mondelez International Inc 1,026 0.13USD 14,708 Sysco Corp 956 0.12USD 4,802 Tyson Foods Inc 324 0.04
Forest products & paper USD 12,076 International Paper Co 646 0.08
Gas USD 2,910 Atmos Energy Corp 260 0.03
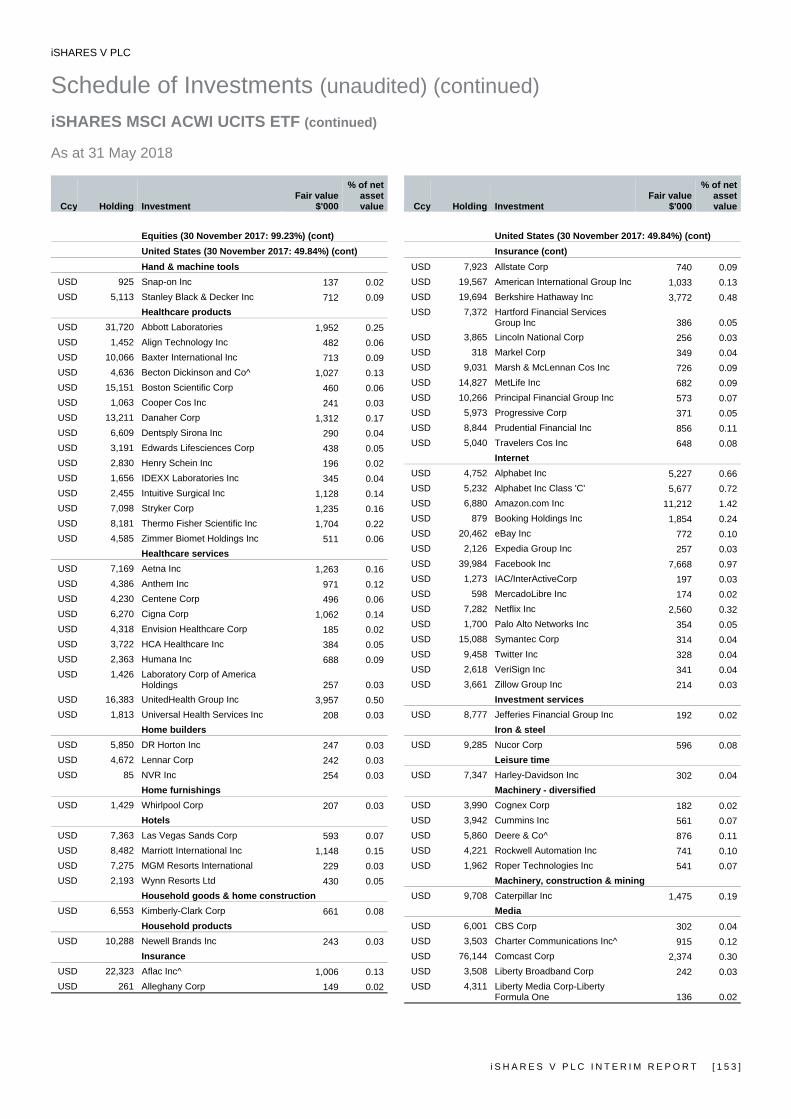
iSHARES V PLC
Schedule of Investments (unaudited) (continued) iSHARES MSCI ACWI UCITS ETF (continued) As at 31 May 2018
i S H A R E S V P L C I N T E R I M R E P O R T [ 1 5 3 ]
Ccy Holding Investment Fair value
$'000
% of net asset value
Equities (30 November 2017: 99.23%) (cont) United States (30 November 2017: 49.84%) (cont)
Hand & machine tools USD 925 Snap-on Inc 137 0.02USD 5,113 Stanley Black & Decker Inc 712 0.09
Healthcare products USD 31,720 Abbott Laboratories 1,952 0.25USD 1,452 Align Technology Inc 482 0.06USD 10,066 Baxter International Inc 713 0.09USD 4,636 Becton Dickinson and Co^ 1,027 0.13USD 15,151 Boston Scientific Corp 460 0.06USD 1,063 Cooper Cos Inc 241 0.03USD 13,211 Danaher Corp 1,312 0.17USD 6,609 Dentsply Sirona Inc 290 0.04USD 3,191 Edwards Lifesciences Corp 438 0.05USD 2,830 Henry Schein Inc 196 0.02USD 1,656 IDEXX Laboratories Inc 345 0.04USD 2,455 Intuitive Surgical Inc 1,128 0.14USD 7,098 Stryker Corp 1,235 0.16USD 8,181 Thermo Fisher Scientific Inc 1,704 0.22USD 4,585 Zimmer Biomet Holdings Inc 511 0.06
Healthcare services USD 7,169 Aetna Inc 1,263 0.16USD 4,386 Anthem Inc 971 0.12USD 4,230 Centene Corp 496 0.06USD 6,270 Cigna Corp 1,062 0.14USD 4,318 Envision Healthcare Corp 185 0.02USD 3,722 HCA Healthcare Inc 384 0.05USD 2,363 Humana Inc 688 0.09USD 1,426 Laboratory Corp of America
Holdings 257 0.03USD 16,383 UnitedHealth Group Inc 3,957 0.50USD 1,813 Universal Health Services Inc 208 0.03
Home builders USD 5,850 DR Horton Inc 247 0.03USD 4,672 Lennar Corp 242 0.03USD 85 NVR Inc 254 0.03
Home furnishings USD 1,429 Whirlpool Corp 207 0.03
Hotels USD 7,363 Las Vegas Sands Corp 593 0.07USD 8,482 Marriott International Inc 1,148 0.15USD 7,275 MGM Resorts International 229 0.03USD 2,193 Wynn Resorts Ltd 430 0.05
Household goods & home construction USD 6,553 Kimberly-Clark Corp 661 0.08
Household products USD 10,288 Newell Brands Inc 243 0.03
Insurance USD 22,323 Aflac Inc^ 1,006 0.13USD 261 Alleghany Corp 149 0.02
Ccy Holding InvestmentFair value
$'000
% of net asset value
United States (30 November 2017: 49.84%) (cont) Insurance (cont)
USD 7,923 Allstate Corp 740 0.09USD 19,567 American International Group Inc 1,033 0.13USD 19,694 Berkshire Hathaway Inc 3,772 0.48USD 7,372 Hartford Financial Services
Group Inc 386 0.05USD 3,865 Lincoln National Corp 256 0.03USD 318 Markel Corp 349 0.04USD 9,031 Marsh & McLennan Cos Inc 726 0.09USD 14,827 MetLife Inc 682 0.09USD 10,266 Principal Financial Group Inc 573 0.07USD 5,973 Progressive Corp 371 0.05USD 8,844 Prudential Financial Inc 856 0.11USD 5,040 Travelers Cos Inc 648 0.08
Internet USD 4,752 Alphabet Inc 5,227 0.66USD 5,232 Alphabet Inc Class 'C' 5,677 0.72USD 6,880 Amazon.com Inc 11,212 1.42USD 879 Booking Holdings Inc 1,854 0.24USD 20,462 eBay Inc 772 0.10USD 2,126 Expedia Group Inc 257 0.03USD 39,984 Facebook Inc 7,668 0.97USD 1,273 IAC/InterActiveCorp 197 0.03USD 598 MercadoLibre Inc 174 0.02USD 7,282 Netflix Inc 2,560 0.32USD 1,700 Palo Alto Networks Inc 354 0.05USD 15,088 Symantec Corp 314 0.04USD 9,458 Twitter Inc 328 0.04USD 2,618 VeriSign Inc 341 0.04USD 3,661 Zillow Group Inc 214 0.03
Investment services USD 8,777 Jefferies Financial Group Inc 192 0.02
Iron & steel USD 9,285 Nucor Corp 596 0.08
Leisure time USD 7,347 Harley-Davidson Inc 302 0.04
Machinery - diversified USD 3,990 Cognex Corp 182 0.02USD 3,942 Cummins Inc 561 0.07USD 5,860 Deere & Co^ 876 0.11USD 4,221 Rockwell Automation Inc 741 0.10USD 1,962 Roper Technologies Inc 541 0.07
Machinery, construction & mining USD 9,708 Caterpillar Inc 1,475 0.19
Media USD 6,001 CBS Corp 302 0.04USD 3,503 Charter Communications Inc^ 915 0.12USD 76,144 Comcast Corp 2,374 0.30USD 3,508 Liberty Broadband Corp 242 0.03USD 4,311 Liberty Media Corp-Liberty
Formula One 136 0.02
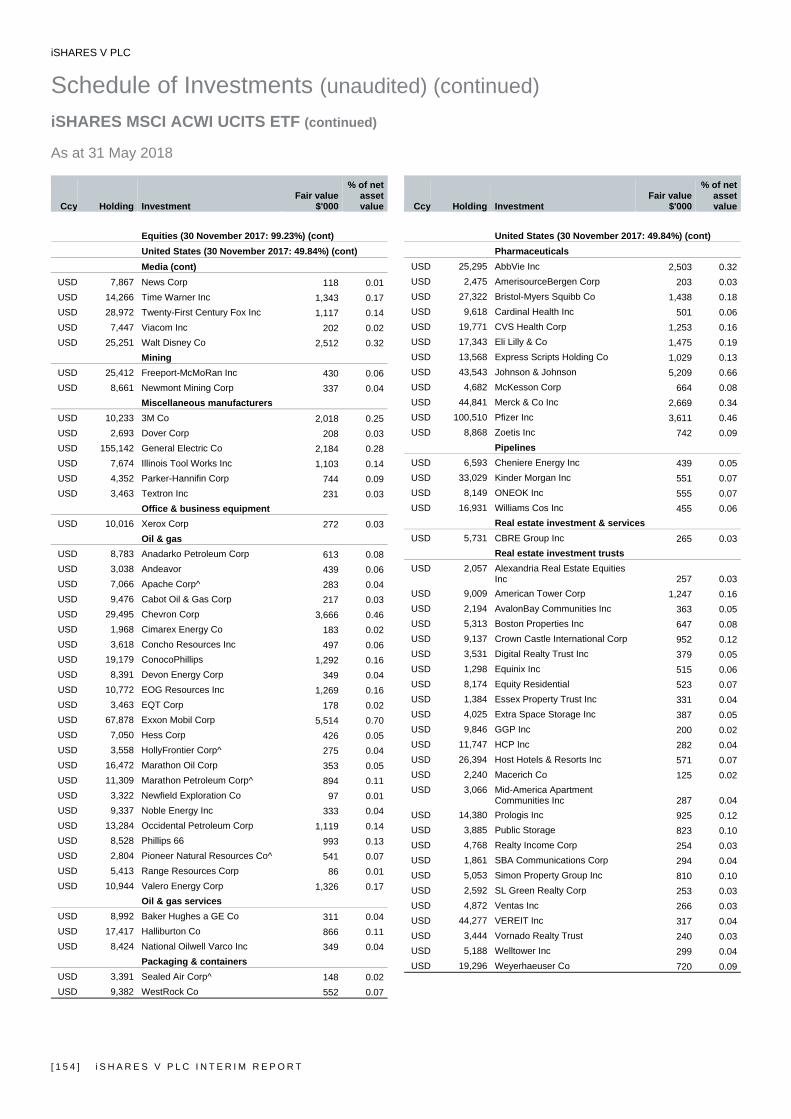
iSHARES V PLC
Schedule of Investments (unaudited) (continued) iSHARES MSCI ACWI UCITS ETF (continued) As at 31 May 2018
[ 1 5 4 ] i S H A R E S V P L C I N T E R I M R E P O R T
Ccy Holding Investment Fair value
$'000
% of net asset value
Equities (30 November 2017: 99.23%) (cont) United States (30 November 2017: 49.84%) (cont) Media (cont)
USD 7,867 News Corp 118 0.01USD 14,266 Time Warner Inc 1,343 0.17USD 28,972 Twenty-First Century Fox Inc 1,117 0.14USD 7,447 Viacom Inc 202 0.02USD 25,251 Walt Disney Co 2,512 0.32
Mining USD 25,412 Freeport-McMoRan Inc 430 0.06USD 8,661 Newmont Mining Corp 337 0.04
Miscellaneous manufacturers USD 10,233 3M Co 2,018 0.25USD 2,693 Dover Corp 208 0.03USD 155,142 General Electric Co 2,184 0.28USD 7,674 Illinois Tool Works Inc 1,103 0.14USD 4,352 Parker-Hannifin Corp 744 0.09USD 3,463 Textron Inc 231 0.03
Office & business equipment USD 10,016 Xerox Corp 272 0.03
Oil & gas USD 8,783 Anadarko Petroleum Corp 613 0.08USD 3,038 Andeavor 439 0.06USD 7,066 Apache Corp^ 283 0.04USD 9,476 Cabot Oil & Gas Corp 217 0.03USD 29,495 Chevron Corp 3,666 0.46USD 1,968 Cimarex Energy Co 183 0.02USD 3,618 Concho Resources Inc 497 0.06USD 19,179 ConocoPhillips 1,292 0.16USD 8,391 Devon Energy Corp 349 0.04USD 10,772 EOG Resources Inc 1,269 0.16USD 3,463 EQT Corp 178 0.02USD 67,878 Exxon Mobil Corp 5,514 0.70USD 7,050 Hess Corp 426 0.05USD 3,558 HollyFrontier Corp^ 275 0.04USD 16,472 Marathon Oil Corp 353 0.05USD 11,309 Marathon Petroleum Corp^ 894 0.11USD 3,322 Newfield Exploration Co 97 0.01USD 9,337 Noble Energy Inc 333 0.04USD 13,284 Occidental Petroleum Corp 1,119 0.14USD 8,528 Phillips 66 993 0.13USD 2,804 Pioneer Natural Resources Co^ 541 0.07USD 5,413 Range Resources Corp 86 0.01USD 10,944 Valero Energy Corp 1,326 0.17
Oil & gas services USD 8,992 Baker Hughes a GE Co 311 0.04USD 17,417 Halliburton Co 866 0.11USD 8,424 National Oilwell Varco Inc 349 0.04
Packaging & containers USD 3,391 Sealed Air Corp^ 148 0.02USD 9,382 WestRock Co 552 0.07
Ccy Holding InvestmentFair value
$'000
% of net asset value
United States (30 November 2017: 49.84%) (cont) Pharmaceuticals
USD 25,295 AbbVie Inc 2,503 0.32USD 2,475 AmerisourceBergen Corp 203 0.03USD 27,322 Bristol-Myers Squibb Co 1,438 0.18USD 9,618 Cardinal Health Inc 501 0.06USD 19,771 CVS Health Corp 1,253 0.16USD 17,343 Eli Lilly & Co 1,475 0.19USD 13,568 Express Scripts Holding Co 1,029 0.13USD 43,543 Johnson & Johnson 5,209 0.66USD 4,682 McKesson Corp 664 0.08USD 44,841 Merck & Co Inc 2,669 0.34USD 100,510 Pfizer Inc 3,611 0.46USD 8,868 Zoetis Inc 742 0.09
Pipelines USD 6,593 Cheniere Energy Inc 439 0.05USD 33,029 Kinder Morgan Inc 551 0.07USD 8,149 ONEOK Inc 555 0.07USD 16,931 Williams Cos Inc 455 0.06
Real estate investment & services USD 5,731 CBRE Group Inc 265 0.03
Real estate investment trusts USD 2,057 Alexandria Real Estate Equities
Inc 257 0.03USD 9,009 American Tower Corp 1,247 0.16USD 2,194 AvalonBay Communities Inc 363 0.05USD 5,313 Boston Properties Inc 647 0.08USD 9,137 Crown Castle International Corp 952 0.12USD 3,531 Digital Realty Trust Inc 379 0.05USD 1,298 Equinix Inc 515 0.06USD 8,174 Equity Residential 523 0.07USD 1,384 Essex Property Trust Inc 331 0.04USD 4,025 Extra Space Storage Inc 387 0.05USD 9,846 GGP Inc 200 0.02USD 11,747 HCP Inc 282 0.04USD 26,394 Host Hotels & Resorts Inc 571 0.07USD 2,240 Macerich Co 125 0.02USD 3,066 Mid-America Apartment
Communities Inc 287 0.04USD 14,380 Prologis Inc 925 0.12USD 3,885 Public Storage 823 0.10USD 4,768 Realty Income Corp 254 0.03USD 1,861 SBA Communications Corp 294 0.04USD 5,053 Simon Property Group Inc 810 0.10USD 2,592 SL Green Realty Corp 253 0.03USD 4,872 Ventas Inc 266 0.03USD 44,277 VEREIT Inc 317 0.04USD 3,444 Vornado Realty Trust 240 0.03USD 5,188 Welltower Inc 299 0.04USD 19,296 Weyerhaeuser Co 720 0.09
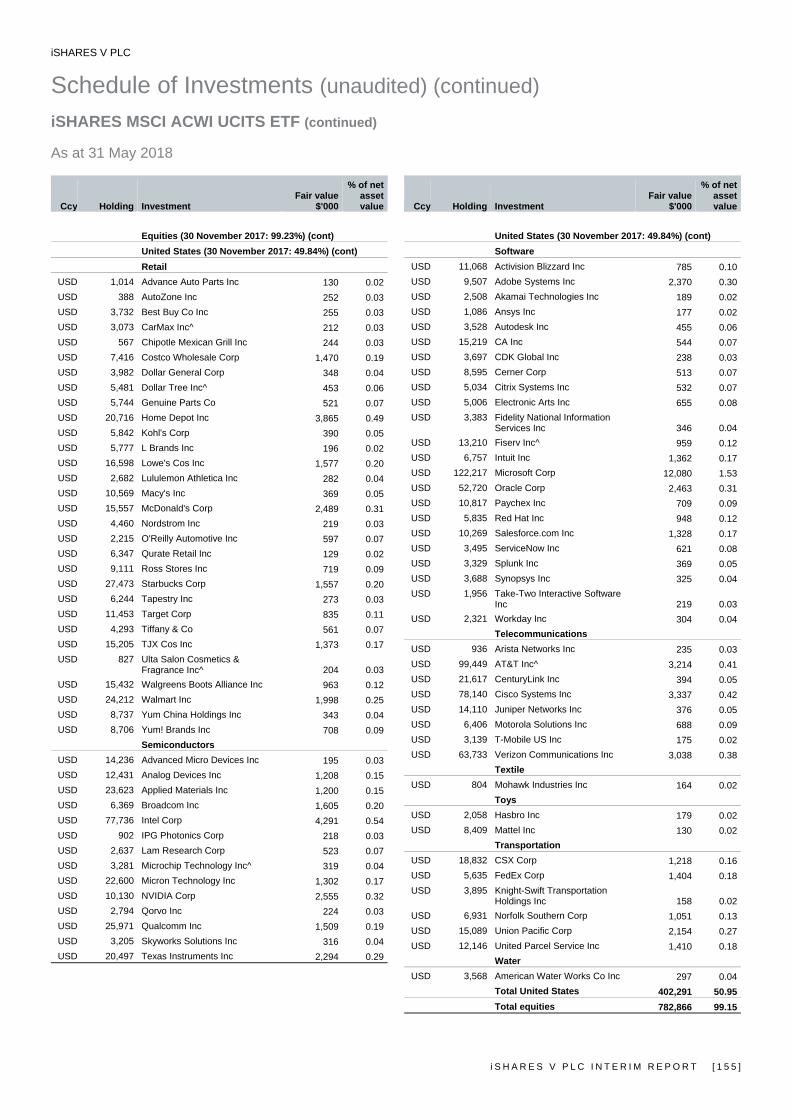
iSHARES V PLC
Schedule of Investments (unaudited) (continued) iSHARES MSCI ACWI UCITS ETF (continued) As at 31 May 2018
i S H A R E S V P L C I N T E R I M R E P O R T [ 1 5 5 ]
Ccy Holding Investment Fair value
$'000
% of net asset value
Equities (30 November 2017: 99.23%) (cont) United States (30 November 2017: 49.84%) (cont)
Retail USD 1,014 Advance Auto Parts Inc 130 0.02USD 388 AutoZone Inc 252 0.03USD 3,732 Best Buy Co Inc 255 0.03USD 3,073 CarMax Inc^ 212 0.03USD 567 Chipotle Mexican Grill Inc 244 0.03USD 7,416 Costco Wholesale Corp 1,470 0.19USD 3,982 Dollar General Corp 348 0.04USD 5,481 Dollar Tree Inc^ 453 0.06USD 5,744 Genuine Parts Co 521 0.07USD 20,716 Home Depot Inc 3,865 0.49USD 5,842 Kohl's Corp 390 0.05USD 5,777 L Brands Inc 196 0.02USD 16,598 Lowe's Cos Inc 1,577 0.20USD 2,682 Lululemon Athletica Inc 282 0.04USD 10,569 Macy's Inc 369 0.05USD 15,557 McDonald's Corp 2,489 0.31USD 4,460 Nordstrom Inc 219 0.03USD 2,215 O'Reilly Automotive Inc 597 0.07USD 6,347 Qurate Retail Inc 129 0.02USD 9,111 Ross Stores Inc 719 0.09USD 27,473 Starbucks Corp 1,557 0.20USD 6,244 Tapestry Inc 273 0.03USD 11,453 Target Corp 835 0.11USD 4,293 Tiffany & Co 561 0.07USD 15,205 TJX Cos Inc 1,373 0.17USD 827 Ulta Salon Cosmetics &
Fragrance Inc^ 204 0.03USD 15,432 Walgreens Boots Alliance Inc 963 0.12USD 24,212 Walmart Inc 1,998 0.25USD 8,737 Yum China Holdings Inc 343 0.04USD 8,706 Yum! Brands Inc 708 0.09
Semiconductors USD 14,236 Advanced Micro Devices Inc 195 0.03USD 12,431 Analog Devices Inc 1,208 0.15USD 23,623 Applied Materials Inc 1,200 0.15USD 6,369 Broadcom Inc 1,605 0.20USD 77,736 Intel Corp 4,291 0.54USD 902 IPG Photonics Corp 218 0.03USD 2,637 Lam Research Corp 523 0.07USD 3,281 Microchip Technology Inc^ 319 0.04USD 22,600 Micron Technology Inc 1,302 0.17USD 10,130 NVIDIA Corp 2,555 0.32USD 2,794 Qorvo Inc 224 0.03USD 25,971 Qualcomm Inc 1,509 0.19USD 3,205 Skyworks Solutions Inc 316 0.04USD 20,497 Texas Instruments Inc 2,294 0.29
Ccy Holding InvestmentFair value
$'000
% of net asset value
United States (30 November 2017: 49.84%) (cont) Software
USD 11,068 Activision Blizzard Inc 785 0.10USD 9,507 Adobe Systems Inc 2,370 0.30USD 2,508 Akamai Technologies Inc 189 0.02USD 1,086 Ansys Inc 177 0.02USD 3,528 Autodesk Inc 455 0.06USD 15,219 CA Inc 544 0.07USD 3,697 CDK Global Inc 238 0.03USD 8,595 Cerner Corp 513 0.07USD 5,034 Citrix Systems Inc 532 0.07USD 5,006 Electronic Arts Inc 655 0.08USD 3,383 Fidelity National Information
Services Inc 346 0.04USD 13,210 Fiserv Inc^ 959 0.12USD 6,757 Intuit Inc 1,362 0.17USD 122,217 Microsoft Corp 12,080 1.53USD 52,720 Oracle Corp 2,463 0.31USD 10,817 Paychex Inc 709 0.09USD 5,835 Red Hat Inc 948 0.12USD 10,269 Salesforce.com Inc 1,328 0.17USD 3,495 ServiceNow Inc 621 0.08USD 3,329 Splunk Inc 369 0.05USD 3,688 Synopsys Inc 325 0.04USD 1,956 Take-Two Interactive Software
Inc 219 0.03USD 2,321 Workday Inc 304 0.04
Telecommunications USD 936 Arista Networks Inc 235 0.03USD 99,449 AT&T Inc^ 3,214 0.41USD 21,617 CenturyLink Inc 394 0.05USD 78,140 Cisco Systems Inc 3,337 0.42USD 14,110 Juniper Networks Inc 376 0.05USD 6,406 Motorola Solutions Inc 688 0.09USD 3,139 T-Mobile US Inc 175 0.02USD 63,733 Verizon Communications Inc 3,038 0.38
Textile USD 804 Mohawk Industries Inc 164 0.02
Toys USD 2,058 Hasbro Inc 179 0.02USD 8,409 Mattel Inc 130 0.02
Transportation USD 18,832 CSX Corp 1,218 0.16USD 5,635 FedEx Corp 1,404 0.18USD 3,895 Knight-Swift Transportation
Holdings Inc 158 0.02USD 6,931 Norfolk Southern Corp 1,051 0.13USD 15,089 Union Pacific Corp 2,154 0.27USD 12,146 United Parcel Service Inc 1,410 0.18
Water USD 3,568 American Water Works Co Inc 297 0.04
Total United States 402,291 50.95Total equities 782,866 99.15
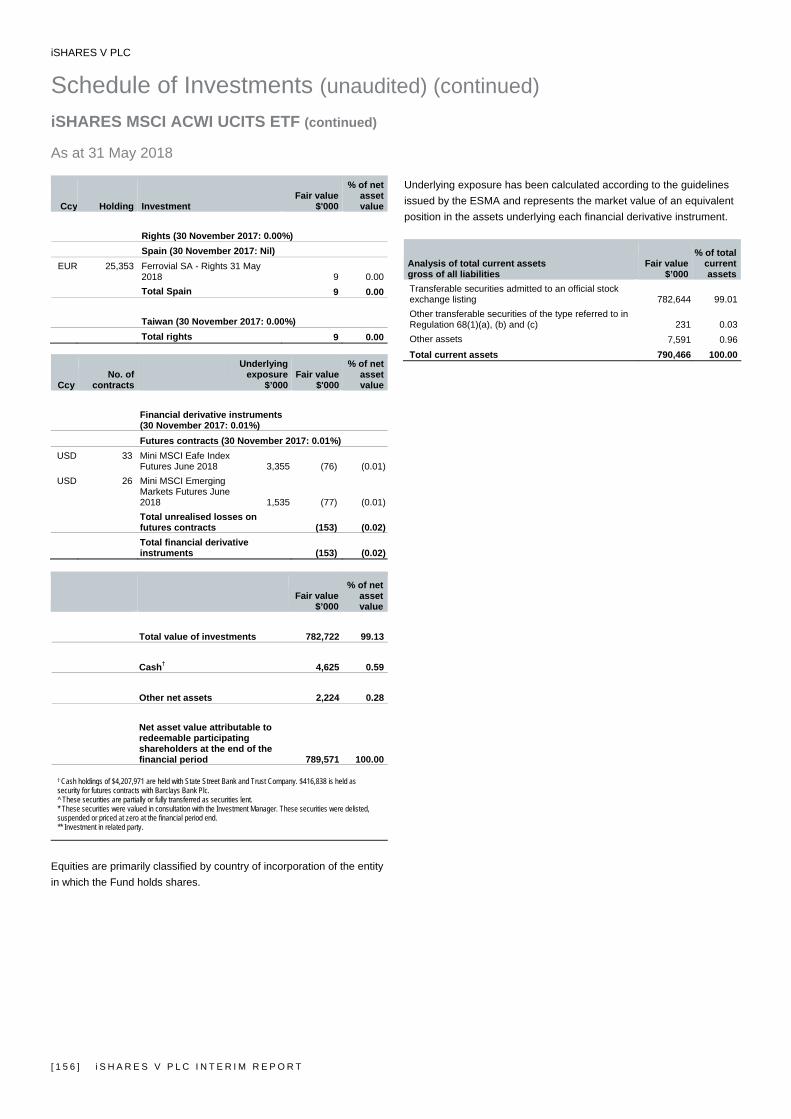
iSHARES V PLC
Schedule of Investments (unaudited) (continued) iSHARES MSCI ACWI UCITS ETF (continued) As at 31 May 2018
[ 1 5 6 ] i S H A R E S V P L C I N T E R I M R E P O R T
Ccy Holding Investment Fair value
$'000
% of net asset value
Rights (30 November 2017: 0.00%) Spain (30 November 2017: Nil)
EUR 25,353 Ferrovial SA - Rights 31 May 2018 9 0.00Total Spain 9 0.00
Taiwan (30 November 2017: 0.00%) Total rights 9 0.00
Ccy No. of
contracts
Underlying exposure
$’000 Fair value
$'000
% of net asset value
Financial derivative instruments
(30 November 2017: 0.01%) Futures contracts (30 November 2017: 0.01%)
USD 33 Mini MSCI Eafe Index Futures June 2018 3,355 (76) (0.01)
USD 26 Mini MSCI Emerging Markets Futures June 2018 1,535 (77) (0.01)
Total unrealised losses on futures contracts (153) (0.02)
Total financial derivative instruments (153) (0.02)
Fair value
$’000
% of net asset value
Total value of investments 782,722 99.13 Cash† 4,625 0.59 Other net assets 2,224 0.28
Net asset value attributable to redeemable participating shareholders at the end of the financial period 789,571 100.00
† Cash holdings of $4,207,971 are held with State Street Bank and Trust Company. $416,838 is held as security for futures contracts with Barclays Bank Plc. ^ These securities are partially or fully transferred as securities lent. * These securities were valued in consultation with the Investment Manager. These securities were delisted, suspended or priced at zero at the financial period end. ** Investment in related party.
Equities are primarily classified by country of incorporation of the entity in which the Fund holds shares.
Underlying exposure has been calculated according to the guidelines issued by the ESMA and represents the market value of an equivalent position in the assets underlying each financial derivative instrument.
Analysis of total current assets gross of all liabilities
Fair value$’000
% of total current assets
Transferable securities admitted to an official stock exchange listing 782,644 99.01Other transferable securities of the type referred to in Regulation 68(1)(a), (b) and (c) 231 0.03Other assets 7,591 0.96Total current assets 790,466 100.00
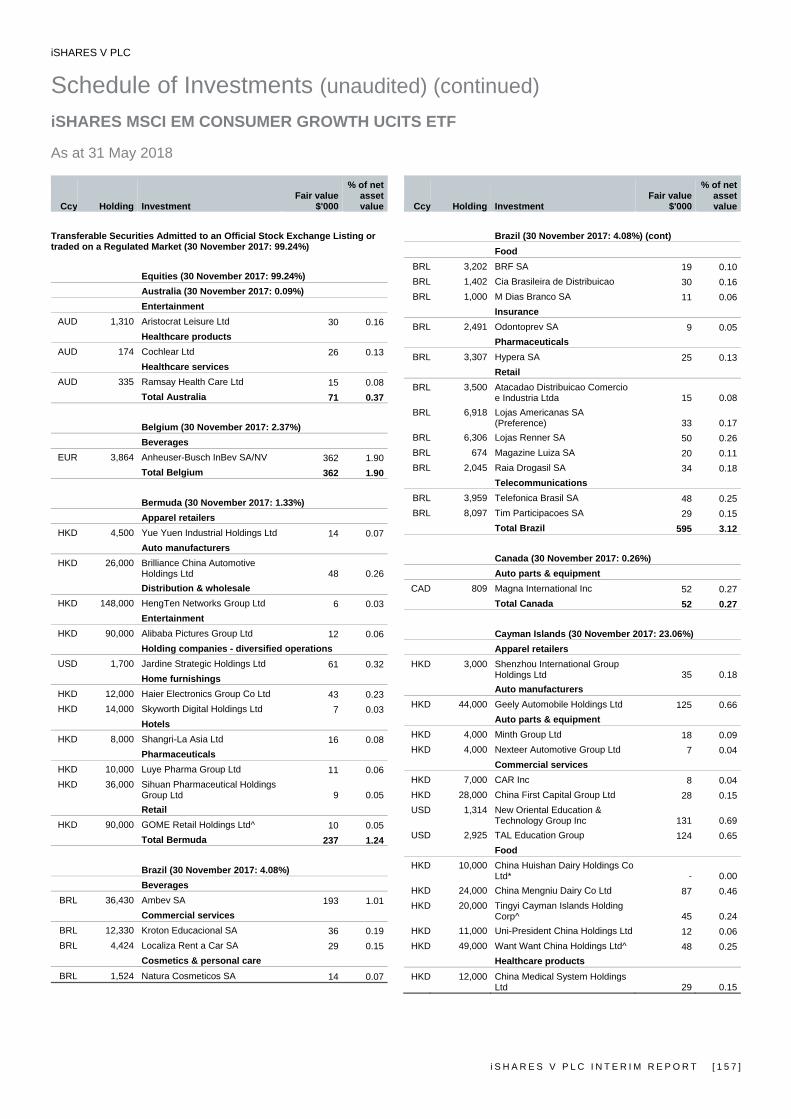
iSHARES V PLC
Schedule of Investments (unaudited) (continued) iSHARES MSCI EM CONSUMER GROWTH UCITS ETF As at 31 May 2018
i S H A R E S V P L C I N T E R I M R E P O R T [ 1 5 7 ]
Ccy Holding Investment Fair value
$'000
% of net asset value
Transferable Securities Admitted to an Official Stock Exchange Listing or traded on a Regulated Market (30 November 2017: 99.24%)
Equities (30 November 2017: 99.24%) Australia (30 November 2017: 0.09%) Entertainment
AUD 1,310 Aristocrat Leisure Ltd 30 0.16Healthcare products
AUD 174 Cochlear Ltd 26 0.13Healthcare services
AUD 335 Ramsay Health Care Ltd 15 0.08Total Australia 71 0.37
Belgium (30 November 2017: 2.37%) Beverages
EUR 3,864 Anheuser-Busch InBev SA/NV 362 1.90Total Belgium 362 1.90
Bermuda (30 November 2017: 1.33%) Apparel retailers
HKD 4,500 Yue Yuen Industrial Holdings Ltd 14 0.07Auto manufacturers
HKD 26,000 Brilliance China Automotive Holdings Ltd 48 0.26Distribution & wholesale
HKD 148,000 HengTen Networks Group Ltd 6 0.03Entertainment
HKD 90,000 Alibaba Pictures Group Ltd 12 0.06Holding companies - diversified operations
USD 1,700 Jardine Strategic Holdings Ltd 61 0.32Home furnishings
HKD 12,000 Haier Electronics Group Co Ltd 43 0.23HKD 14,000 Skyworth Digital Holdings Ltd 7 0.03
Hotels HKD 8,000 Shangri-La Asia Ltd 16 0.08
Pharmaceuticals HKD 10,000 Luye Pharma Group Ltd 11 0.06HKD 36,000 Sihuan Pharmaceutical Holdings
Group Ltd 9 0.05Retail
HKD 90,000 GOME Retail Holdings Ltd^ 10 0.05Total Bermuda 237 1.24
Brazil (30 November 2017: 4.08%) Beverages
BRL 36,430 Ambev SA 193 1.01Commercial services
BRL 12,330 Kroton Educacional SA 36 0.19BRL 4,424 Localiza Rent a Car SA 29 0.15
Cosmetics & personal care BRL 1,524 Natura Cosmeticos SA 14 0.07
Ccy Holding Investment Fair value
$'000
% of net asset value
Brazil (30 November 2017: 4.08%) (cont) Food
BRL 3,202 BRF SA 19 0.10BRL 1,402 Cia Brasileira de Distribuicao 30 0.16BRL 1,000 M Dias Branco SA 11 0.06
Insurance BRL 2,491 Odontoprev SA 9 0.05
Pharmaceuticals BRL 3,307 Hypera SA 25 0.13
Retail BRL 3,500 Atacadao Distribuicao Comercio
e Industria Ltda 15 0.08BRL 6,918 Lojas Americanas SA
(Preference) 33 0.17BRL 6,306 Lojas Renner SA 50 0.26BRL 674 Magazine Luiza SA 20 0.11BRL 2,045 Raia Drogasil SA 34 0.18
Telecommunications BRL 3,959 Telefonica Brasil SA 48 0.25BRL 8,097 Tim Participacoes SA 29 0.15
Total Brazil 595 3.12
Canada (30 November 2017: 0.26%) Auto parts & equipment
CAD 809 Magna International Inc 52 0.27Total Canada 52 0.27
Cayman Islands (30 November 2017: 23.06%) Apparel retailers
HKD 3,000 Shenzhou International Group Holdings Ltd 35 0.18Auto manufacturers
HKD 44,000 Geely Automobile Holdings Ltd 125 0.66Auto parts & equipment
HKD 4,000 Minth Group Ltd 18 0.09HKD 4,000 Nexteer Automotive Group Ltd 7 0.04
Commercial services HKD 7,000 CAR Inc 8 0.04HKD 28,000 China First Capital Group Ltd 28 0.15USD 1,314 New Oriental Education &
Technology Group Inc 131 0.69USD 2,925 TAL Education Group 124 0.65
Food HKD 10,000 China Huishan Dairy Holdings Co
Ltd* - 0.00HKD 24,000 China Mengniu Dairy Co Ltd 87 0.46HKD 20,000 Tingyi Cayman Islands Holding
Corp^ 45 0.24HKD 11,000 Uni-President China Holdings Ltd 12 0.06HKD 49,000 Want Want China Holdings Ltd^ 48 0.25
Healthcare products HKD 12,000 China Medical System Holdings
Ltd 29 0.15
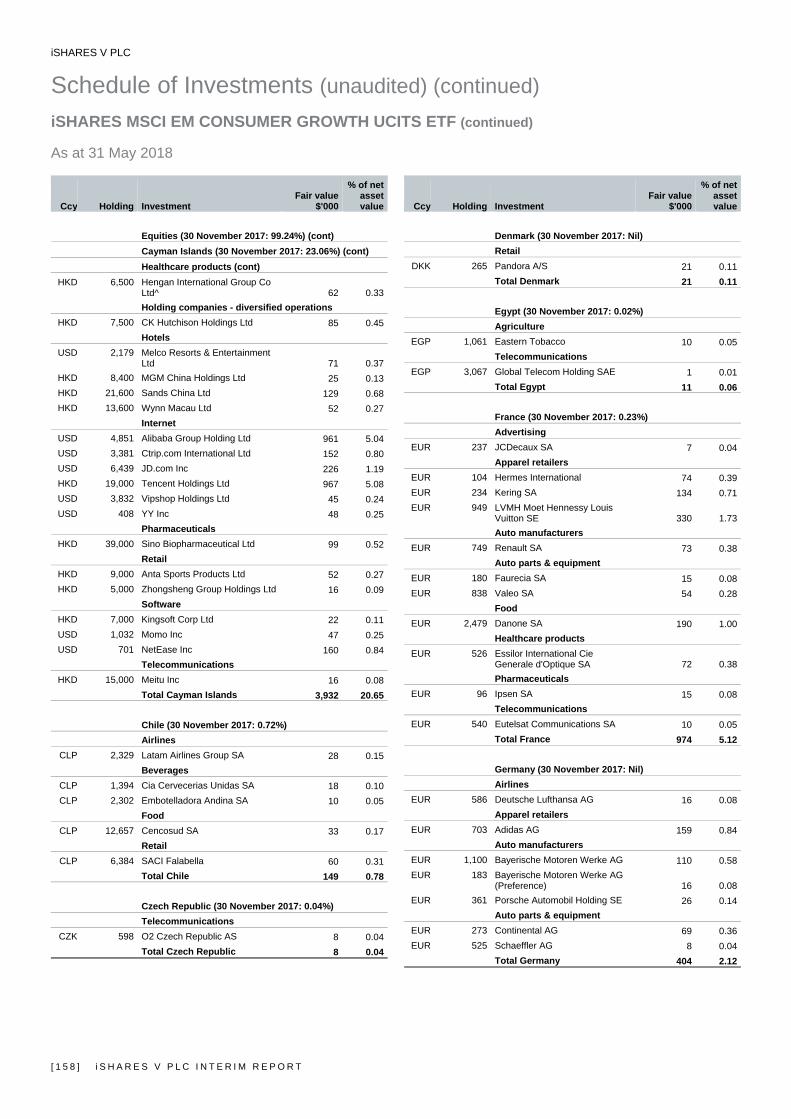
iSHARES V PLC
Schedule of Investments (unaudited) (continued) iSHARES MSCI EM CONSUMER GROWTH UCITS ETF (continued) As at 31 May 2018
[ 1 5 8 ] i S H A R E S V P L C I N T E R I M R E P O R T
Ccy Holding Investment Fair value
$'000
% of net asset value
Equities (30 November 2017: 99.24%) (cont) Cayman Islands (30 November 2017: 23.06%) (cont) Healthcare products (cont)
HKD 6,500 Hengan International Group Co Ltd^ 62 0.33Holding companies - diversified operations
HKD 7,500 CK Hutchison Holdings Ltd 85 0.45Hotels
USD 2,179 Melco Resorts & Entertainment Ltd 71 0.37
HKD 8,400 MGM China Holdings Ltd 25 0.13HKD 21,600 Sands China Ltd 129 0.68HKD 13,600 Wynn Macau Ltd 52 0.27
Internet USD 4,851 Alibaba Group Holding Ltd 961 5.04USD 3,381 Ctrip.com International Ltd 152 0.80USD 6,439 JD.com Inc 226 1.19HKD 19,000 Tencent Holdings Ltd 967 5.08USD 3,832 Vipshop Holdings Ltd 45 0.24USD 408 YY Inc 48 0.25
Pharmaceuticals HKD 39,000 Sino Biopharmaceutical Ltd 99 0.52
Retail HKD 9,000 Anta Sports Products Ltd 52 0.27HKD 5,000 Zhongsheng Group Holdings Ltd 16 0.09
Software HKD 7,000 Kingsoft Corp Ltd 22 0.11USD 1,032 Momo Inc 47 0.25USD 701 NetEase Inc 160 0.84
Telecommunications HKD 15,000 Meitu Inc 16 0.08
Total Cayman Islands 3,932 20.65
Chile (30 November 2017: 0.72%) Airlines
CLP 2,329 Latam Airlines Group SA 28 0.15Beverages
CLP 1,394 Cia Cervecerias Unidas SA 18 0.10CLP 2,302 Embotelladora Andina SA 10 0.05
Food CLP 12,657 Cencosud SA 33 0.17
Retail CLP 6,384 SACI Falabella 60 0.31
Total Chile 149 0.78
Czech Republic (30 November 2017: 0.04%) Telecommunications
CZK 598 O2 Czech Republic AS 8 0.04Total Czech Republic 8 0.04
Ccy Holding Investment Fair value
$'000
% of net asset value
Denmark (30 November 2017: Nil) Retail
DKK 265 Pandora A/S 21 0.11Total Denmark 21 0.11
Egypt (30 November 2017: 0.02%) Agriculture
EGP 1,061 Eastern Tobacco 10 0.05Telecommunications
EGP 3,067 Global Telecom Holding SAE 1 0.01Total Egypt 11 0.06
France (30 November 2017: 0.23%) Advertising
EUR 237 JCDecaux SA 7 0.04Apparel retailers
EUR 104 Hermes International 74 0.39EUR 234 Kering SA 134 0.71EUR 949 LVMH Moet Hennessy Louis
Vuitton SE 330 1.73Auto manufacturers
EUR 749 Renault SA 73 0.38Auto parts & equipment
EUR 180 Faurecia SA 15 0.08EUR 838 Valeo SA 54 0.28
Food EUR 2,479 Danone SA 190 1.00
Healthcare products EUR 526 Essilor International Cie
Generale d'Optique SA 72 0.38Pharmaceuticals
EUR 96 Ipsen SA 15 0.08Telecommunications
EUR 540 Eutelsat Communications SA 10 0.05Total France 974 5.12
Germany (30 November 2017: Nil) Airlines
EUR 586 Deutsche Lufthansa AG 16 0.08Apparel retailers
EUR 703 Adidas AG 159 0.84Auto manufacturers
EUR 1,100 Bayerische Motoren Werke AG 110 0.58EUR 183 Bayerische Motoren Werke AG
(Preference) 16 0.08EUR 361 Porsche Automobil Holding SE 26 0.14
Auto parts & equipment EUR 273 Continental AG 69 0.36EUR 525 Schaeffler AG 8 0.04
Total Germany 404 2.12
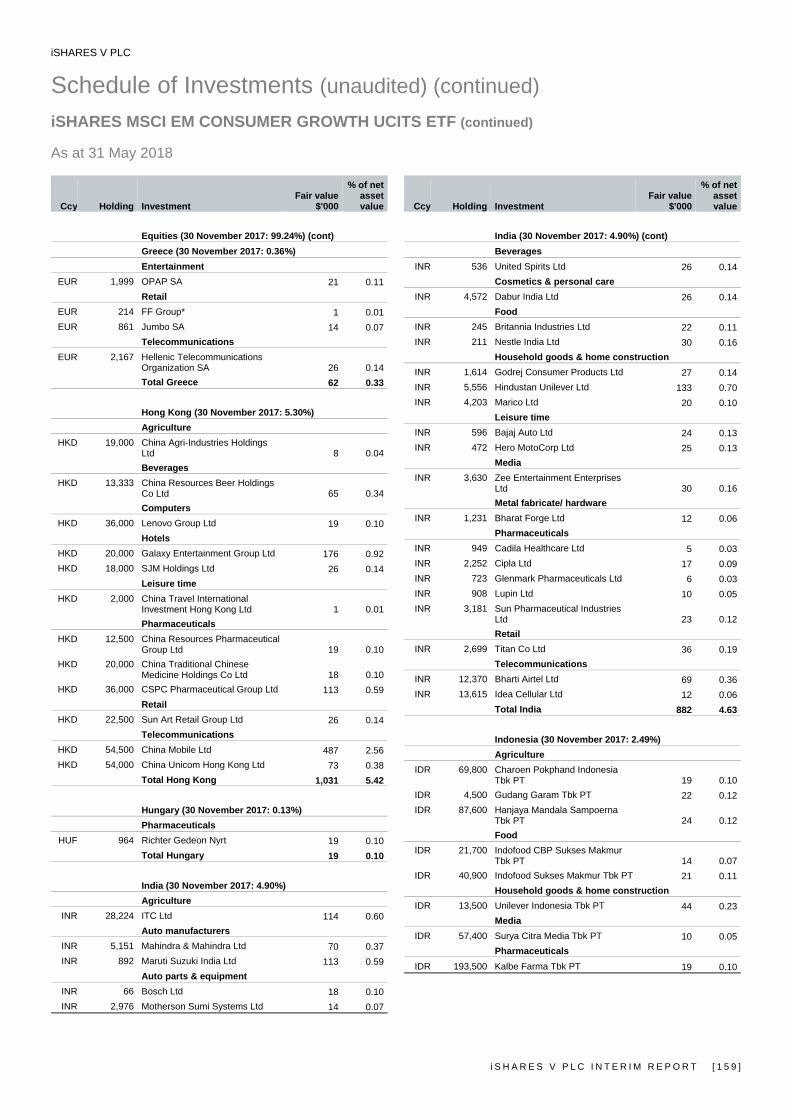
iSHARES V PLC
Schedule of Investments (unaudited) (continued) iSHARES MSCI EM CONSUMER GROWTH UCITS ETF (continued) As at 31 May 2018
i S H A R E S V P L C I N T E R I M R E P O R T [ 1 5 9 ]
Ccy Holding Investment Fair value
$'000
% of net asset value
Equities (30 November 2017: 99.24%) (cont)
Greece (30 November 2017: 0.36%) Entertainment
EUR 1,999 OPAP SA 21 0.11Retail
EUR 214 FF Group* 1 0.01EUR 861 Jumbo SA 14 0.07
Telecommunications EUR 2,167 Hellenic Telecommunications
Organization SA 26 0.14Total Greece 62 0.33
Hong Kong (30 November 2017: 5.30%) Agriculture
HKD 19,000 China Agri-Industries Holdings Ltd 8 0.04Beverages
HKD 13,333 China Resources Beer Holdings Co Ltd 65 0.34Computers
HKD 36,000 Lenovo Group Ltd 19 0.10Hotels
HKD 20,000 Galaxy Entertainment Group Ltd 176 0.92HKD 18,000 SJM Holdings Ltd 26 0.14
Leisure time HKD 2,000 China Travel International
Investment Hong Kong Ltd 1 0.01Pharmaceuticals
HKD 12,500 China Resources Pharmaceutical Group Ltd 19 0.10
HKD 20,000 China Traditional Chinese Medicine Holdings Co Ltd 18 0.10
HKD 36,000 CSPC Pharmaceutical Group Ltd 113 0.59Retail
HKD 22,500 Sun Art Retail Group Ltd 26 0.14Telecommunications
HKD 54,500 China Mobile Ltd 487 2.56HKD 54,000 China Unicom Hong Kong Ltd 73 0.38
Total Hong Kong 1,031 5.42
Hungary (30 November 2017: 0.13%) Pharmaceuticals
HUF 964 Richter Gedeon Nyrt 19 0.10Total Hungary 19 0.10
India (30 November 2017: 4.90%) Agriculture
INR 28,224 ITC Ltd 114 0.60Auto manufacturers
INR 5,151 Mahindra & Mahindra Ltd 70 0.37INR 892 Maruti Suzuki India Ltd 113 0.59
Auto parts & equipment INR 66 Bosch Ltd 18 0.10INR 2,976 Motherson Sumi Systems Ltd 14 0.07
Ccy Holding Investment Fair value
$'000
% of net asset value
India (30 November 2017: 4.90%) (cont) Beverages
INR 536 United Spirits Ltd 26 0.14Cosmetics & personal care
INR 4,572 Dabur India Ltd 26 0.14Food
INR 245 Britannia Industries Ltd 22 0.11INR 211 Nestle India Ltd 30 0.16
Household goods & home construction INR 1,614 Godrej Consumer Products Ltd 27 0.14INR 5,556 Hindustan Unilever Ltd 133 0.70INR 4,203 Marico Ltd 20 0.10
Leisure time INR 596 Bajaj Auto Ltd 24 0.13INR 472 Hero MotoCorp Ltd 25 0.13
Media INR 3,630 Zee Entertainment Enterprises
Ltd 30 0.16Metal fabricate/ hardware
INR 1,231 Bharat Forge Ltd 12 0.06Pharmaceuticals
INR 949 Cadila Healthcare Ltd 5 0.03INR 2,252 Cipla Ltd 17 0.09INR 723 Glenmark Pharmaceuticals Ltd 6 0.03INR 908 Lupin Ltd 10 0.05INR 3,181 Sun Pharmaceutical Industries
Ltd 23 0.12Retail
INR 2,699 Titan Co Ltd 36 0.19Telecommunications
INR 12,370 Bharti Airtel Ltd 69 0.36INR 13,615 Idea Cellular Ltd 12 0.06
Total India 882 4.63
Indonesia (30 November 2017: 2.49%) Agriculture
IDR 69,800 Charoen Pokphand Indonesia Tbk PT 19 0.10
IDR 4,500 Gudang Garam Tbk PT 22 0.12IDR 87,600 Hanjaya Mandala Sampoerna
Tbk PT 24 0.12Food
IDR 21,700 Indofood CBP Sukses Makmur Tbk PT 14 0.07
IDR 40,900 Indofood Sukses Makmur Tbk PT 21 0.11Household goods & home construction
IDR 13,500 Unilever Indonesia Tbk PT 44 0.23Media
IDR 57,400 Surya Citra Media Tbk PT 10 0.05Pharmaceuticals
IDR 193,500 Kalbe Farma Tbk PT 19 0.10
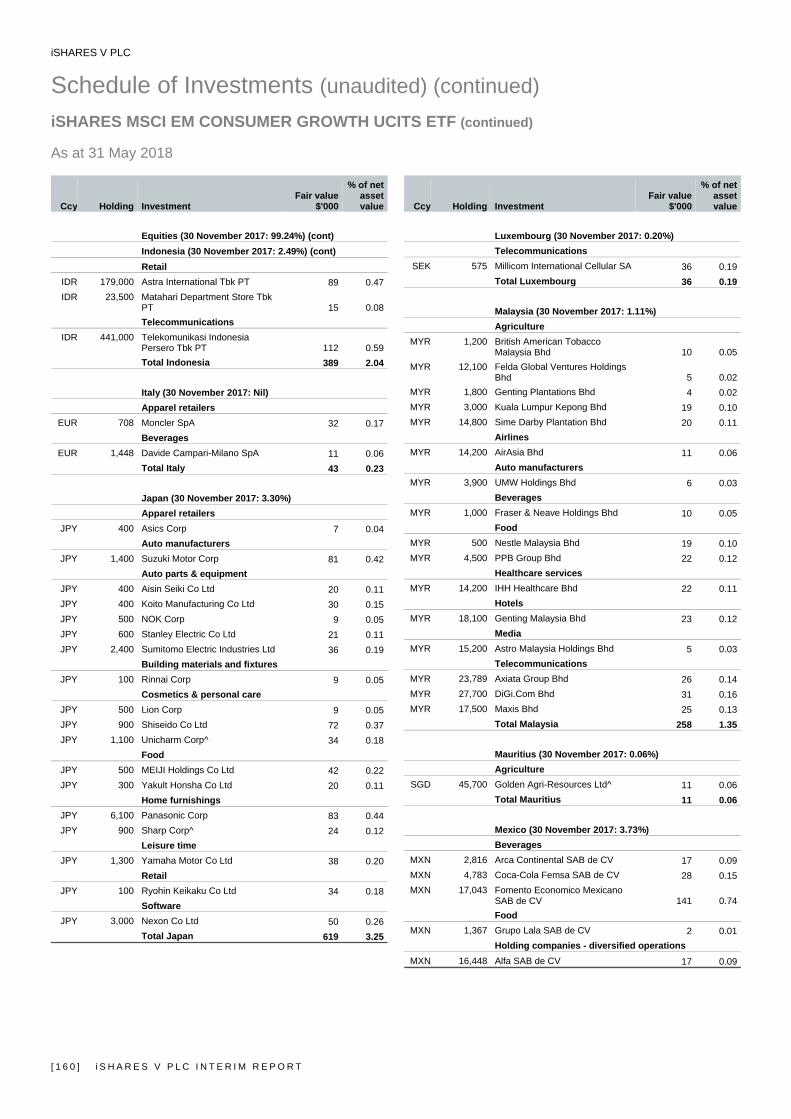
iSHARES V PLC
Schedule of Investments (unaudited) (continued) iSHARES MSCI EM CONSUMER GROWTH UCITS ETF (continued) As at 31 May 2018
[ 1 6 0 ] i S H A R E S V P L C I N T E R I M R E P O R T
Ccy Holding Investment Fair value
$'000
% of net asset value
Equities (30 November 2017: 99.24%) (cont) Indonesia (30 November 2017: 2.49%) (cont)
Retail IDR 179,000 Astra International Tbk PT 89 0.47IDR 23,500 Matahari Department Store Tbk
PT 15 0.08Telecommunications
IDR 441,000 Telekomunikasi Indonesia Persero Tbk PT 112 0.59Total Indonesia 389 2.04
Italy (30 November 2017: Nil) Apparel retailers
EUR 708 Moncler SpA 32 0.17Beverages
EUR 1,448 Davide Campari-Milano SpA 11 0.06Total Italy 43 0.23
Japan (30 November 2017: 3.30%) Apparel retailers
JPY 400 Asics Corp 7 0.04Auto manufacturers
JPY 1,400 Suzuki Motor Corp 81 0.42Auto parts & equipment
JPY 400 Aisin Seiki Co Ltd 20 0.11JPY 400 Koito Manufacturing Co Ltd 30 0.15JPY 500 NOK Corp 9 0.05JPY 600 Stanley Electric Co Ltd 21 0.11JPY 2,400 Sumitomo Electric Industries Ltd 36 0.19
Building materials and fixtures JPY 100 Rinnai Corp 9 0.05
Cosmetics & personal care JPY 500 Lion Corp 9 0.05JPY 900 Shiseido Co Ltd 72 0.37JPY 1,100 Unicharm Corp^ 34 0.18
Food JPY 500 MEIJI Holdings Co Ltd 42 0.22JPY 300 Yakult Honsha Co Ltd 20 0.11
Home furnishings JPY 6,100 Panasonic Corp 83 0.44JPY 900 Sharp Corp^ 24 0.12
Leisure time JPY 1,300 Yamaha Motor Co Ltd 38 0.20
Retail JPY 100 Ryohin Keikaku Co Ltd 34 0.18
Software JPY 3,000 Nexon Co Ltd 50 0.26
Total Japan 619 3.25
Ccy Holding Investment Fair value
$'000
% of net asset value
Luxembourg (30 November 2017: 0.20%) Telecommunications
SEK 575 Millicom International Cellular SA 36 0.19Total Luxembourg 36 0.19
Malaysia (30 November 2017: 1.11%) Agriculture
MYR 1,200 British American Tobacco Malaysia Bhd 10 0.05
MYR 12,100 Felda Global Ventures Holdings Bhd 5 0.02
MYR 1,800 Genting Plantations Bhd 4 0.02MYR 3,000 Kuala Lumpur Kepong Bhd 19 0.10MYR 14,800 Sime Darby Plantation Bhd 20 0.11
Airlines MYR 14,200 AirAsia Bhd 11 0.06
Auto manufacturers MYR 3,900 UMW Holdings Bhd 6 0.03
Beverages MYR 1,000 Fraser & Neave Holdings Bhd 10 0.05
Food MYR 500 Nestle Malaysia Bhd 19 0.10MYR 4,500 PPB Group Bhd 22 0.12
Healthcare services MYR 14,200 IHH Healthcare Bhd 22 0.11
Hotels MYR 18,100 Genting Malaysia Bhd 23 0.12
Media MYR 15,200 Astro Malaysia Holdings Bhd 5 0.03
Telecommunications MYR 23,789 Axiata Group Bhd 26 0.14MYR 27,700 DiGi.Com Bhd 31 0.16MYR 17,500 Maxis Bhd 25 0.13
Total Malaysia 258 1.35
Mauritius (30 November 2017: 0.06%) Agriculture
SGD 45,700 Golden Agri-Resources Ltd^ 11 0.06Total Mauritius 11 0.06
Mexico (30 November 2017: 3.73%) Beverages
MXN 2,816 Arca Continental SAB de CV 17 0.09MXN 4,783 Coca-Cola Femsa SAB de CV 28 0.15MXN 17,043 Fomento Economico Mexicano
SAB de CV 141 0.74Food
MXN 1,367 Grupo Lala SAB de CV 2 0.01Holding companies - diversified operations
MXN 16,448 Alfa SAB de CV 17 0.09

iSHARES V PLC
Schedule of Investments (unaudited) (continued) iSHARES MSCI EM CONSUMER GROWTH UCITS ETF (continued) As at 31 May 2018
i S H A R E S V P L C I N T E R I M R E P O R T [ 1 6 1 ]
Ccy Holding Investment Fair value
$'000
% of net asset value
Equities (30 November 2017: 99.24%) (cont) Mexico (30 November 2017: 3.73%) (cont) Household goods & home construction
MXN 13,899 Kimberly-Clark de Mexico SAB de CV 23 0.12Media
MXN 19,817 Grupo Televisa SAB 66 0.35Retail
MXN 3,552 Alsea SAB de CV 12 0.06MXN 2,052 El Puerto de Liverpool SAB de
CV 11 0.06MXN 46,316 Wal-Mart de Mexico SAB de CV 116 0.61
Telecommunications MXN 232,245 America Movil SAB de CV 180 0.94
Total Mexico 613 3.22
Netherlands (30 November 2017: 2.39%) Auto manufacturers
EUR 353 Ferrari NV 46 0.24Beverages
EUR 367 Heineken Holding NV 36 0.19EUR 826 Heineken NV 82 0.43
Cosmetics & personal care EUR 6,958 Unilever NV 388 2.04
Pharmaceuticals USD 1,692 Mylan NV 65 0.34
Total Netherlands 617 3.24
Norway (30 November 2017: 0.44%) Telecommunications
NOK 3,451 Telenor ASA 71 0.37Total Norway 71 0.37
People's Republic of China (30 November 2017: 1.78%)Airlines
HKD 14,000 Air China Ltd 16 0.09HKD 10,000 China Eastern Airlines Corp Ltd 8 0.04HKD 14,000 China Southern Airlines Co Ltd 14 0.07
Auto manufacturers HKD 5,000 Byd Co Ltd 32 0.17HKD 6,300 Chongqing Changan Automobile
Co Ltd 7 0.04HKD 26,000 Dongfeng Motor Group Co Ltd 30 0.15HKD 30,000 Great Wall Motor Co Ltd 29 0.15HKD 20,000 Guangzhou Automobile Group
Co Ltd 34 0.18Auto parts & equipment
HKD 3,600 Fuyao Glass Industry Group Co Ltd^ 13 0.07Beverages
CNY 97 Kweichow Moutai Co Ltd 11 0.06HKD 2,000 Tsingtao Brewery Co Ltd 13 0.06
Ccy Holding Investment Fair value
$'000
% of net asset value
People's Republic of China (30 November 2017: 1.78%) (cont) Commercial services
HKD 12,000 Jiangsu Expressway Co Ltd 18 0.10HKD 12,000 Zhejiang Expressway Co Ltd 12 0.06
Pharmaceuticals HKD 11,200 Sinopharm Group Co Ltd 50 0.26HKD 4,000 Tong Ren Tang Technologies Co
Ltd 7 0.04Software
CNY 400 Giant Network Group Co Ltd 2 0.01Total People's Republic of China 296 1.55
Philippines (30 November 2017: 0.86%) Food
PHP 24,960 JG Summit Holdings Inc 27 0.14PHP 7,980 Universal Robina Corp 20 0.11
Holding companies - diversified operations PHP 37,400 Alliance Global Group Inc 9 0.05
Retail PHP 3,560 Jollibee Foods Corp 19 0.10PHP 2,135 SM Investments Corp 35 0.18
Telecommunications PHP 315 Globe Telecom Inc 10 0.05PHP 815 PLDT Inc 20 0.11
Total Philippines 140 0.74
Poland (30 November 2017: 0.21%) Food
PLN 433 Dino Polska SA 13 0.07Media
PLN 2,113 Cyfrowy Polsat SA 14 0.07Retail
PLN 163 CCC SA 12 0.06Telecommunications
PLN 6,197 Orange Polska SA 9 0.05Total Poland 48 0.25
Portugal (30 November 2017: 0.17%) Food
EUR 1,635 Jeronimo Martins SGPS SA 26 0.14Total Portugal 26 0.14
Qatar (30 November 2017: 0.08%) Telecommunications
QAR 707 Ooredoo QPSC 13 0.07Total Qatar 13 0.07
Republic of South Korea (30 November 2017: 6.55%) Advertising
KRW 504 Cheil Worldwide Inc 9 0.05

iSHARES V PLC
Schedule of Investments (unaudited) (continued) iSHARES MSCI EM CONSUMER GROWTH UCITS ETF (continued) As at 31 May 2018
[ 1 6 2 ] i S H A R E S V P L C I N T E R I M R E P O R T
Ccy Holding Investment Fair value
$'000
% of net asset value
Equities (30 November 2017: 99.24%) (cont) Republic of South Korea
(30 November 2017: 6.55%) (cont) Agriculture
KRW 880 KT&G Corp 78 0.41Airlines
KRW 427 Korean Air Lines Co Ltd 13 0.07Auto manufacturers
KRW 726 Hyundai Motor Co 94 0.49KRW 175 Hyundai Motor Co 2nd
(Preference) 15 0.08KRW 121 Hyundai Motor Co (Preference) 10 0.05
Auto parts & equipment KRW 973 Hanon Systems 9 0.05KRW 371 Hyundai Mobis Co Ltd 75 0.39
Cosmetics & personal care KRW 258 Amorepacific Corp 80 0.42KRW 72 Amorepacific Corp (Preference) 11 0.06KRW 235 Amorepacific Group 27 0.14KRW 78 LG Household & Health Care Ltd 97 0.51KRW 18 LG Household & Health Care Ltd
(Preference) 12 0.06Food
KRW 73 BGF retail Co Ltd 12 0.06KRW 66 CJ CheilJedang Corp 22 0.11KRW 300 Dongsuh Cos Inc 7 0.04KRW 238 Lotte Corp 13 0.07KRW 172 Orion Corp 21 0.11KRW 12 Ottogi Corp 9 0.05
Holding companies - diversified operations KRW 116 CJ Corp 16 0.08
Home furnishings KRW 411 Coway Co Ltd 33 0.17KRW 99 Hanssem Co Ltd 11 0.06KRW 572 LG Electronics Inc 49 0.26
Hotels KRW 1,040 Kangwon Land Inc 26 0.14
Internet KRW 120 NCSoft Corp 39 0.21
Marine transportation KRW 156 HLB Inc 20 0.11
Media KRW 181 CJ E&M Corp 15 0.08
Pharmaceuticals KRW 311 Celltrion Inc 76 0.40KRW 135 Celltrion Pharm Inc 12 0.06KRW 42 Hanmi Pharm Co Ltd 19 0.10KRW 120 Hanmi Science Co Ltd 8 0.04KRW 81 Yuhan Corp 18 0.10
Retail KRW 185 E-Mart Inc 43 0.23KRW 255 GS Retail Co Ltd 9 0.05
Ccy Holding Investment Fair value
$'000
% of net asset value
Republic of South Korea (30 November 2017: 6.55%) (cont) Retail (cont)
KRW 269 Hotel Shilla Co Ltd 31 0.16KRW 133 Hyundai Department Store Co
Ltd 14 0.07KRW 105 Lotte Shopping Co Ltd 22 0.11KRW 65 Shinsegae Inc 26 0.14
Software KRW 170 Netmarble Corp 25 0.13
Telecommunications KRW 178 SK Telecom Co Ltd 37 0.19
Total Republic of South Korea 1,163 6.11
Russian Federation (30 November 2017: 0.66%) Food
USD 2,960 Magnit PJSC GDR 60 0.32Telecommunications
USD 4,417 Mobile TeleSystems PJSC 42 0.22Total Russian Federation 102 0.54
Singapore (30 November 2017: 0.40%) Airlines
SGD 2,700 Singapore Airlines Ltd 23 0.12Distribution & wholesale
SGD 922 Jardine Cycle & Carriage Ltd 24 0.12Food
SGD 12,600 Wilmar International Ltd 30 0.16Total Singapore 77 0.40
South Africa (30 November 2017: 7.46%) Food
ZAR 1,168 Pioneer Foods Group Ltd 10 0.05ZAR 3,488 Shoprite Holdings Ltd 64 0.34ZAR 1,216 SPAR Group Ltd 18 0.09ZAR 1,427 Tiger Brands Ltd 38 0.20ZAR 5,788 Woolworths Holdings Ltd 27 0.14
Healthcare services ZAR 9,832 Life Healthcare Group Holdings
Ltd 22 0.12ZAR 4,847 Netcare Ltd 12 0.06
Holding companies - diversified operations ZAR 1,153 Imperial Holdings Ltd 19 0.10
Media ZAR 2,837 Naspers Ltd 678 3.56
Retail ZAR 2,245 Clicks Group Ltd 36 0.19ZAR 1,800 Foschini Group Ltd 26 0.13ZAR 2,198 Mr Price Group Ltd 44 0.23ZAR 3,459 Pick n Pay Stores Ltd 20 0.11ZAR 2,897 Truworths International Ltd 19 0.10
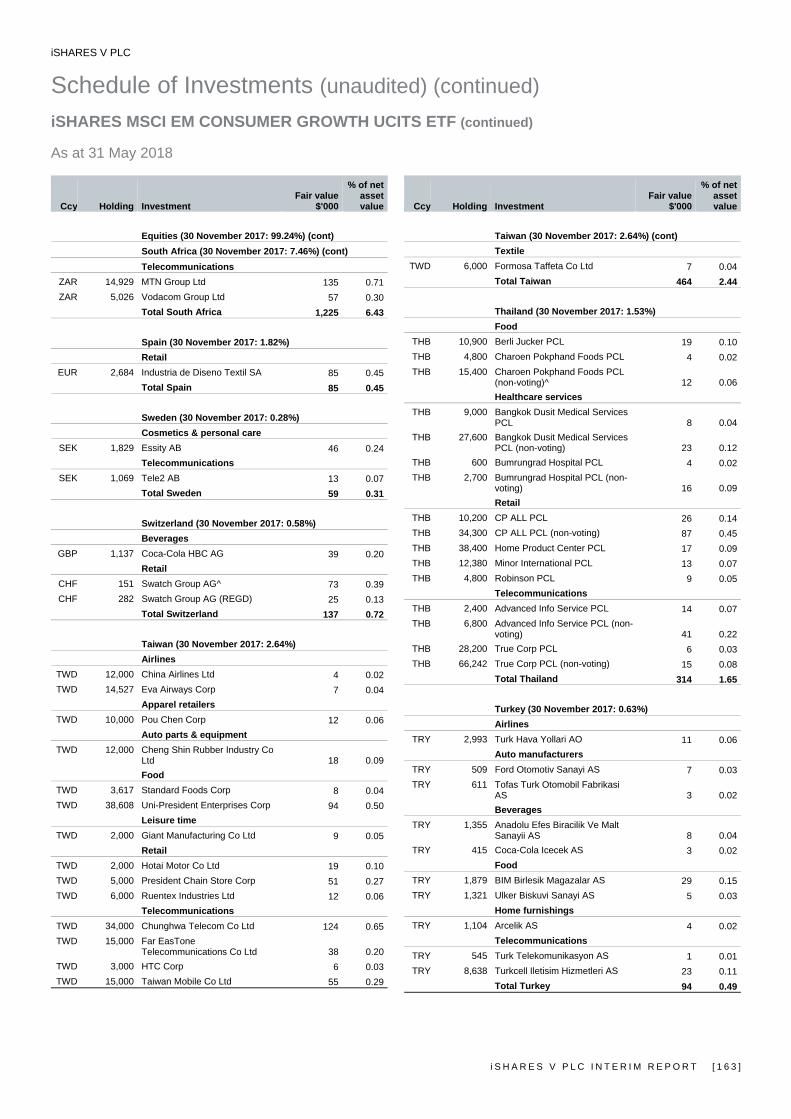
iSHARES V PLC
Schedule of Investments (unaudited) (continued) iSHARES MSCI EM CONSUMER GROWTH UCITS ETF (continued) As at 31 May 2018
i S H A R E S V P L C I N T E R I M R E P O R T [ 1 6 3 ]
Ccy Holding Investment Fair value
$'000
% of net asset value
Equities (30 November 2017: 99.24%) (cont) South Africa (30 November 2017: 7.46%) (cont)
Telecommunications ZAR 14,929 MTN Group Ltd 135 0.71ZAR 5,026 Vodacom Group Ltd 57 0.30
Total South Africa 1,225 6.43
Spain (30 November 2017: 1.82%) Retail
EUR 2,684 Industria de Diseno Textil SA 85 0.45Total Spain 85 0.45
Sweden (30 November 2017: 0.28%) Cosmetics & personal care
SEK 1,829 Essity AB 46 0.24Telecommunications
SEK 1,069 Tele2 AB 13 0.07Total Sweden 59 0.31
Switzerland (30 November 2017: 0.58%) Beverages
GBP 1,137 Coca-Cola HBC AG 39 0.20Retail
CHF 151 Swatch Group AG^ 73 0.39CHF 282 Swatch Group AG (REGD) 25 0.13
Total Switzerland 137 0.72
Taiwan (30 November 2017: 2.64%) Airlines
TWD 12,000 China Airlines Ltd 4 0.02TWD 14,527 Eva Airways Corp 7 0.04
Apparel retailers TWD 10,000 Pou Chen Corp 12 0.06
Auto parts & equipment TWD 12,000 Cheng Shin Rubber Industry Co
Ltd 18 0.09Food
TWD 3,617 Standard Foods Corp 8 0.04TWD 38,608 Uni-President Enterprises Corp 94 0.50
Leisure time TWD 2,000 Giant Manufacturing Co Ltd 9 0.05
Retail TWD 2,000 Hotai Motor Co Ltd 19 0.10TWD 5,000 President Chain Store Corp 51 0.27TWD 6,000 Ruentex Industries Ltd 12 0.06
Telecommunications TWD 34,000 Chunghwa Telecom Co Ltd 124 0.65TWD 15,000 Far EasTone
Telecommunications Co Ltd 38 0.20TWD 3,000 HTC Corp 6 0.03TWD 15,000 Taiwan Mobile Co Ltd 55 0.29
Ccy Holding Investment Fair value
$'000
% of net asset value
Taiwan (30 November 2017: 2.64%) (cont) Textile
TWD 6,000 Formosa Taffeta Co Ltd 7 0.04Total Taiwan 464 2.44
Thailand (30 November 2017: 1.53%) Food
THB 10,900 Berli Jucker PCL 19 0.10THB 4,800 Charoen Pokphand Foods PCL 4 0.02THB 15,400 Charoen Pokphand Foods PCL
(non-voting)^ 12 0.06Healthcare services
THB 9,000 Bangkok Dusit Medical Services PCL 8 0.04
THB 27,600 Bangkok Dusit Medical Services PCL (non-voting) 23 0.12
THB 600 Bumrungrad Hospital PCL 4 0.02THB 2,700 Bumrungrad Hospital PCL (non-
voting) 16 0.09Retail
THB 10,200 CP ALL PCL 26 0.14THB 34,300 CP ALL PCL (non-voting) 87 0.45THB 38,400 Home Product Center PCL 17 0.09THB 12,380 Minor International PCL 13 0.07THB 4,800 Robinson PCL 9 0.05
Telecommunications THB 2,400 Advanced Info Service PCL 14 0.07THB 6,800 Advanced Info Service PCL (non-
voting) 41 0.22THB 28,200 True Corp PCL 6 0.03THB 66,242 True Corp PCL (non-voting) 15 0.08
Total Thailand 314 1.65
Turkey (30 November 2017: 0.63%) Airlines
TRY 2,993 Turk Hava Yollari AO 11 0.06Auto manufacturers
TRY 509 Ford Otomotiv Sanayi AS 7 0.03TRY 611 Tofas Turk Otomobil Fabrikasi
AS 3 0.02Beverages
TRY 1,355 Anadolu Efes Biracilik Ve Malt Sanayii AS 8 0.04
TRY 415 Coca-Cola Icecek AS 3 0.02Food
TRY 1,879 BIM Birlesik Magazalar AS 29 0.15TRY 1,321 Ulker Biskuvi Sanayi AS 5 0.03
Home furnishings TRY 1,104 Arcelik AS 4 0.02
Telecommunications TRY 545 Turk Telekomunikasyon AS 1 0.01TRY 8,638 Turkcell Iletisim Hizmetleri AS 23 0.11
Total Turkey 94 0.49
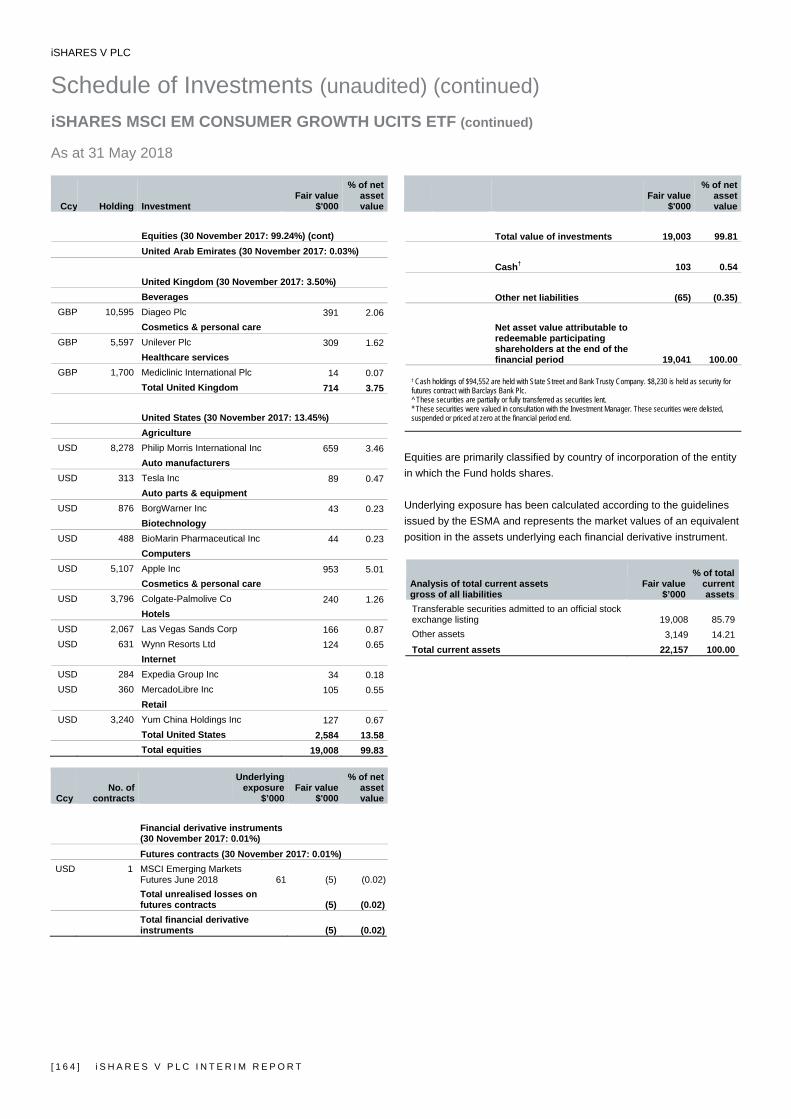
iSHARES V PLC
Schedule of Investments (unaudited) (continued) iSHARES MSCI EM CONSUMER GROWTH UCITS ETF (continued) As at 31 May 2018
[ 1 6 4 ] i S H A R E S V P L C I N T E R I M R E P O R T
Ccy Holding Investment Fair value
$'000
% of net asset value
Equities (30 November 2017: 99.24%) (cont)
United Arab Emirates (30 November 2017: 0.03%) United Kingdom (30 November 2017: 3.50%) Beverages
GBP 10,595 Diageo Plc 391 2.06Cosmetics & personal care
GBP 5,597 Unilever Plc 309 1.62Healthcare services
GBP 1,700 Mediclinic International Plc 14 0.07Total United Kingdom 714 3.75
United States (30 November 2017: 13.45%) Agriculture
USD 8,278 Philip Morris International Inc 659 3.46Auto manufacturers
USD 313 Tesla Inc 89 0.47Auto parts & equipment
USD 876 BorgWarner Inc 43 0.23Biotechnology
USD 488 BioMarin Pharmaceutical Inc 44 0.23Computers
USD 5,107 Apple Inc 953 5.01Cosmetics & personal care
USD 3,796 Colgate-Palmolive Co 240 1.26Hotels
USD 2,067 Las Vegas Sands Corp 166 0.87USD 631 Wynn Resorts Ltd 124 0.65
Internet USD 284 Expedia Group Inc 34 0.18USD 360 MercadoLibre Inc 105 0.55
Retail USD 3,240 Yum China Holdings Inc 127 0.67
Total United States 2,584 13.58Total equities 19,008 99.83
Ccy No. of
contracts
Underlying exposure
$’000 Fair value
$'000
% of net asset value
Financial derivative instruments
(30 November 2017: 0.01%) Futures contracts (30 November 2017: 0.01%)
USD 1 MSCI Emerging Markets Futures June 2018 61 (5) (0.02)
Total unrealised losses on futures contracts (5) (0.02)
Total financial derivative instruments (5) (0.02)
Fair value
$'000
% of net asset value
Total value of investments 19,003 99.81 Cash† 103 0.54 Other net liabilities (65) (0.35)
Net asset value attributable to redeemable participating shareholders at the end of the financial period 19,041 100.00
† Cash holdings of $94,552 are held with State Street and Bank Trusty Company. $8,230 is held as security for futures contract with Barclays Bank Plc. ^ These securities are partially or fully transferred as securities lent. * These securities were valued in consultation with the Investment Manager. These securities were delisted, suspended or priced at zero at the financial period end.
Equities are primarily classified by country of incorporation of the entity in which the Fund holds shares. Underlying exposure has been calculated according to the guidelines issued by the ESMA and represents the market values of an equivalent position in the assets underlying each financial derivative instrument.
Analysis of total current assets gross of all liabilities
Fair value$’000
% of total current assets
Transferable securities admitted to an official stock exchange listing 19,008 85.79Other assets 3,149 14.21Total current assets 22,157 100.00
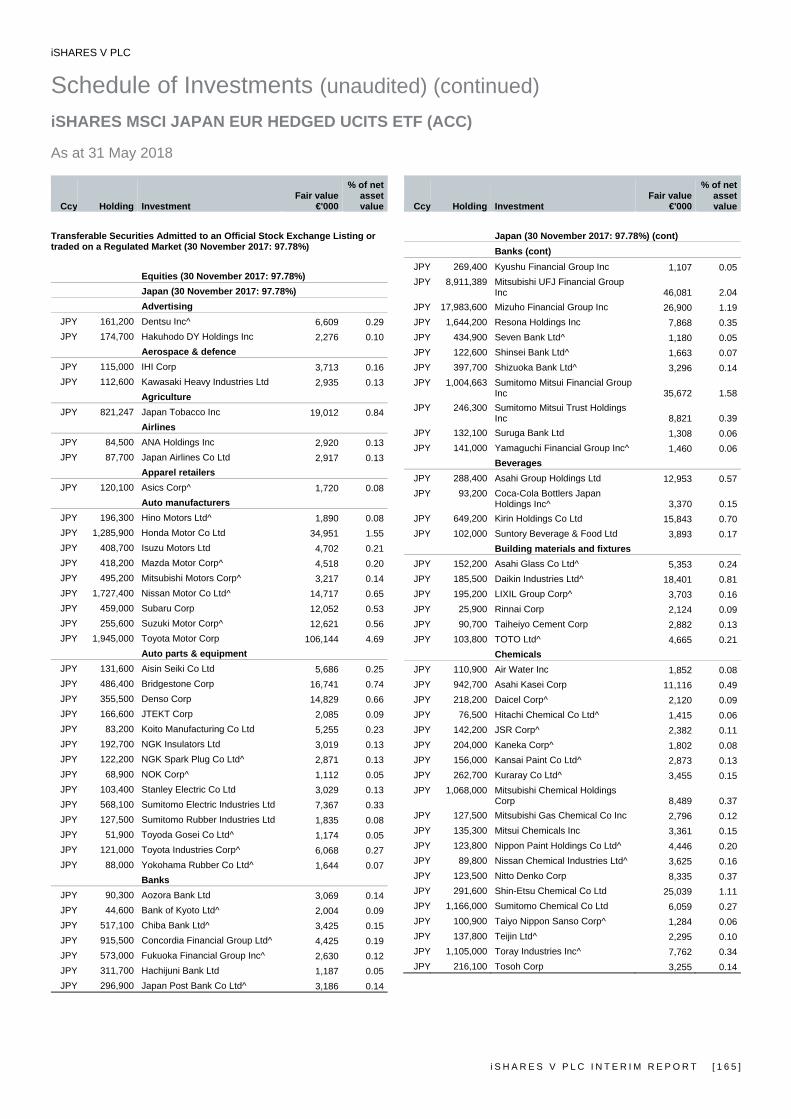
iSHARES V PLC
Schedule of Investments (unaudited) (continued) iSHARES MSCI JAPAN EUR HEDGED UCITS ETF (ACC) As at 31 May 2018
i S H A R E S V P L C I N T E R I M R E P O R T [ 1 6 5 ]
Ccy Holding Investment Fair value
€'000
% of net asset value
Transferable Securities Admitted to an Official Stock Exchange Listing or traded on a Regulated Market (30 November 2017: 97.78%)
Equities (30 November 2017: 97.78%) Japan (30 November 2017: 97.78%) Advertising
JPY 161,200 Dentsu Inc^ 6,609 0.29JPY 174,700 Hakuhodo DY Holdings Inc 2,276 0.10
Aerospace & defence JPY 115,000 IHI Corp 3,713 0.16JPY 112,600 Kawasaki Heavy Industries Ltd 2,935 0.13
Agriculture JPY 821,247 Japan Tobacco Inc 19,012 0.84
Airlines JPY 84,500 ANA Holdings Inc 2,920 0.13JPY 87,700 Japan Airlines Co Ltd 2,917 0.13
Apparel retailers JPY 120,100 Asics Corp^ 1,720 0.08
Auto manufacturers JPY 196,300 Hino Motors Ltd^ 1,890 0.08JPY 1,285,900 Honda Motor Co Ltd 34,951 1.55JPY 408,700 Isuzu Motors Ltd 4,702 0.21JPY 418,200 Mazda Motor Corp^ 4,518 0.20JPY 495,200 Mitsubishi Motors Corp^ 3,217 0.14JPY 1,727,400 Nissan Motor Co Ltd^ 14,717 0.65JPY 459,000 Subaru Corp 12,052 0.53JPY 255,600 Suzuki Motor Corp^ 12,621 0.56JPY 1,945,000 Toyota Motor Corp 106,144 4.69
Auto parts & equipment JPY 131,600 Aisin Seiki Co Ltd 5,686 0.25JPY 486,400 Bridgestone Corp 16,741 0.74JPY 355,500 Denso Corp 14,829 0.66JPY 166,600 JTEKT Corp 2,085 0.09JPY 83,200 Koito Manufacturing Co Ltd 5,255 0.23JPY 192,700 NGK Insulators Ltd 3,019 0.13JPY 122,200 NGK Spark Plug Co Ltd^ 2,871 0.13JPY 68,900 NOK Corp^ 1,112 0.05JPY 103,400 Stanley Electric Co Ltd 3,029 0.13JPY 568,100 Sumitomo Electric Industries Ltd 7,367 0.33JPY 127,500 Sumitomo Rubber Industries Ltd 1,835 0.08JPY 51,900 Toyoda Gosei Co Ltd^ 1,174 0.05JPY 121,000 Toyota Industries Corp^ 6,068 0.27JPY 88,000 Yokohama Rubber Co Ltd^ 1,644 0.07
Banks JPY 90,300 Aozora Bank Ltd 3,069 0.14JPY 44,600 Bank of Kyoto Ltd^ 2,004 0.09JPY 517,100 Chiba Bank Ltd^ 3,425 0.15JPY 915,500 Concordia Financial Group Ltd^ 4,425 0.19JPY 573,000 Fukuoka Financial Group Inc^ 2,630 0.12JPY 311,700 Hachijuni Bank Ltd 1,187 0.05JPY 296,900 Japan Post Bank Co Ltd^ 3,186 0.14
Ccy Holding InvestmentFair value
€'000
% of net asset value
Japan (30 November 2017: 97.78%) (cont) Banks (cont)
JPY 269,400 Kyushu Financial Group Inc 1,107 0.05JPY 8,911,389 Mitsubishi UFJ Financial Group
Inc 46,081 2.04JPY 17,983,600 Mizuho Financial Group Inc 26,900 1.19JPY 1,644,200 Resona Holdings Inc 7,868 0.35JPY 434,900 Seven Bank Ltd^ 1,180 0.05JPY 122,600 Shinsei Bank Ltd^ 1,663 0.07JPY 397,700 Shizuoka Bank Ltd^ 3,296 0.14JPY 1,004,663 Sumitomo Mitsui Financial Group
Inc 35,672 1.58JPY 246,300 Sumitomo Mitsui Trust Holdings
Inc 8,821 0.39JPY 132,100 Suruga Bank Ltd 1,308 0.06JPY 141,000 Yamaguchi Financial Group Inc^ 1,460 0.06
Beverages JPY 288,400 Asahi Group Holdings Ltd 12,953 0.57JPY 93,200 Coca-Cola Bottlers Japan
Holdings Inc^ 3,370 0.15JPY 649,200 Kirin Holdings Co Ltd 15,843 0.70JPY 102,000 Suntory Beverage & Food Ltd 3,893 0.17
Building materials and fixtures JPY 152,200 Asahi Glass Co Ltd^ 5,353 0.24JPY 185,500 Daikin Industries Ltd^ 18,401 0.81JPY 195,200 LIXIL Group Corp^ 3,703 0.16JPY 25,900 Rinnai Corp 2,124 0.09JPY 90,700 Taiheiyo Cement Corp 2,882 0.13JPY 103,800 TOTO Ltd^ 4,665 0.21
Chemicals JPY 110,900 Air Water Inc 1,852 0.08JPY 942,700 Asahi Kasei Corp 11,116 0.49JPY 218,200 Daicel Corp^ 2,120 0.09JPY 76,500 Hitachi Chemical Co Ltd^ 1,415 0.06JPY 142,200 JSR Corp^ 2,382 0.11JPY 204,000 Kaneka Corp^ 1,802 0.08JPY 156,000 Kansai Paint Co Ltd^ 2,873 0.13JPY 262,700 Kuraray Co Ltd^ 3,455 0.15JPY 1,068,000 Mitsubishi Chemical Holdings
Corp 8,489 0.37JPY 127,500 Mitsubishi Gas Chemical Co Inc 2,796 0.12JPY 135,300 Mitsui Chemicals Inc 3,361 0.15JPY 123,800 Nippon Paint Holdings Co Ltd^ 4,446 0.20JPY 89,800 Nissan Chemical Industries Ltd^ 3,625 0.16JPY 123,500 Nitto Denko Corp 8,335 0.37JPY 291,600 Shin-Etsu Chemical Co Ltd 25,039 1.11JPY 1,166,000 Sumitomo Chemical Co Ltd 6,059 0.27JPY 100,900 Taiyo Nippon Sanso Corp^ 1,284 0.06JPY 137,800 Teijin Ltd^ 2,295 0.10JPY 1,105,000 Toray Industries Inc^ 7,762 0.34JPY 216,100 Tosoh Corp 3,255 0.14
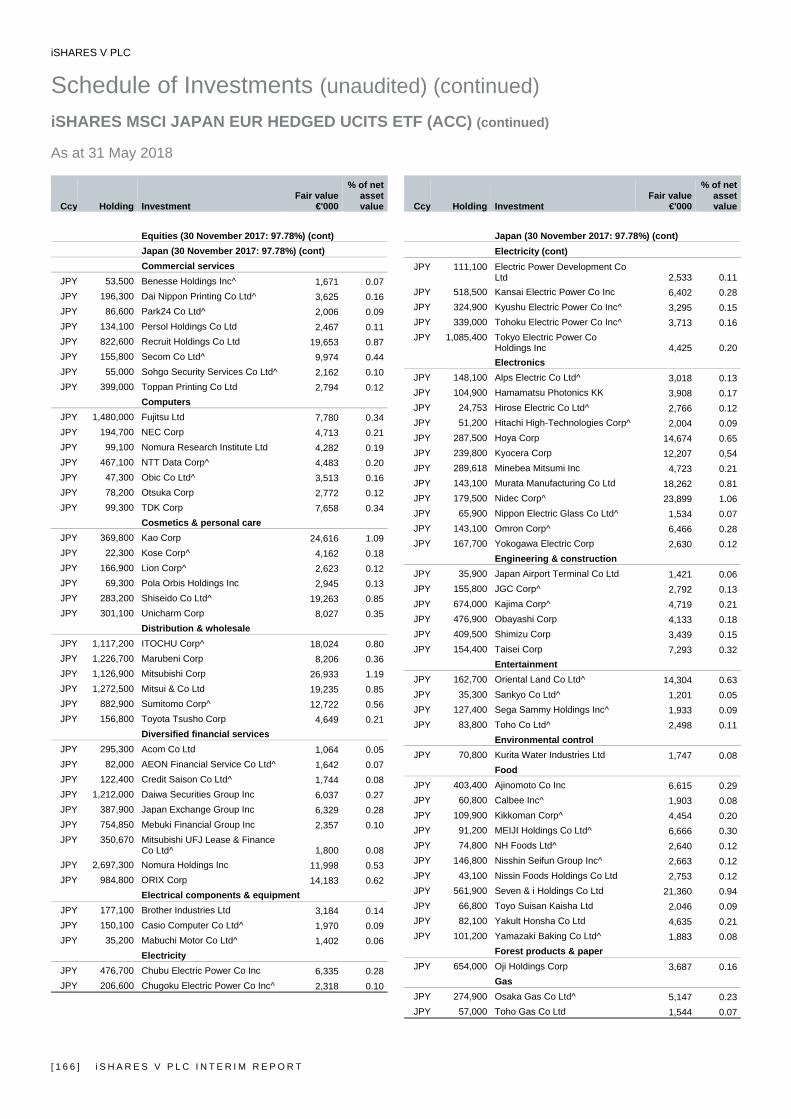
iSHARES V PLC
Schedule of Investments (unaudited) (continued) iSHARES MSCI JAPAN EUR HEDGED UCITS ETF (ACC) (continued) As at 31 May 2018
[ 1 6 6 ] i S H A R E S V P L C I N T E R I M R E P O R T
Ccy Holding Investment Fair value
€'000
% of net asset value
Equities (30 November 2017: 97.78%) (cont) Japan (30 November 2017: 97.78%) (cont) Commercial services
JPY 53,500 Benesse Holdings Inc^ 1,671 0.07JPY 196,300 Dai Nippon Printing Co Ltd^ 3,625 0.16JPY 86,600 Park24 Co Ltd^ 2,006 0.09JPY 134,100 Persol Holdings Co Ltd 2,467 0.11JPY 822,600 Recruit Holdings Co Ltd 19,653 0.87JPY 155,800 Secom Co Ltd^ 9,974 0.44JPY 55,000 Sohgo Security Services Co Ltd^ 2,162 0.10JPY 399,000 Toppan Printing Co Ltd 2,794 0.12
Computers JPY 1,480,000 Fujitsu Ltd 7,780 0.34JPY 194,700 NEC Corp 4,713 0.21JPY 99,100 Nomura Research Institute Ltd 4,282 0.19JPY 467,100 NTT Data Corp^ 4,483 0.20JPY 47,300 Obic Co Ltd^ 3,513 0.16JPY 78,200 Otsuka Corp 2,772 0.12JPY 99,300 TDK Corp 7,658 0.34
Cosmetics & personal care JPY 369,800 Kao Corp 24,616 1.09JPY 22,300 Kose Corp^ 4,162 0.18JPY 166,900 Lion Corp^ 2,623 0.12JPY 69,300 Pola Orbis Holdings Inc 2,945 0.13JPY 283,200 Shiseido Co Ltd^ 19,263 0.85JPY 301,100 Unicharm Corp 8,027 0.35
Distribution & wholesale JPY 1,117,200 ITOCHU Corp^ 18,024 0.80JPY 1,226,700 Marubeni Corp 8,206 0.36JPY 1,126,900 Mitsubishi Corp 26,933 1.19JPY 1,272,500 Mitsui & Co Ltd 19,235 0.85JPY 882,900 Sumitomo Corp^ 12,722 0.56JPY 156,800 Toyota Tsusho Corp 4,649 0.21
Diversified financial services JPY 295,300 Acom Co Ltd 1,064 0.05JPY 82,000 AEON Financial Service Co Ltd^ 1,642 0.07JPY 122,400 Credit Saison Co Ltd^ 1,744 0.08JPY 1,212,000 Daiwa Securities Group Inc 6,037 0.27JPY 387,900 Japan Exchange Group Inc 6,329 0.28JPY 754,850 Mebuki Financial Group Inc 2,357 0.10JPY 350,670 Mitsubishi UFJ Lease & Finance
Co Ltd^ 1,800 0.08JPY 2,697,300 Nomura Holdings Inc 11,998 0.53JPY 984,800 ORIX Corp 14,183 0.62
Electrical components & equipment JPY 177,100 Brother Industries Ltd 3,184 0.14JPY 150,100 Casio Computer Co Ltd^ 1,970 0.09JPY 35,200 Mabuchi Motor Co Ltd^ 1,402 0.06
Electricity JPY 476,700 Chubu Electric Power Co Inc 6,335 0.28JPY 206,600 Chugoku Electric Power Co Inc^ 2,318 0.10
Ccy Holding InvestmentFair value
€'000
% of net asset value
Japan (30 November 2017: 97.78%) (cont) Electricity (cont)
JPY 111,100 Electric Power Development Co Ltd 2,533 0.11
JPY 518,500 Kansai Electric Power Co Inc 6,402 0.28JPY 324,900 Kyushu Electric Power Co Inc^ 3,295 0.15JPY 339,000 Tohoku Electric Power Co Inc^ 3,713 0.16JPY 1,085,400 Tokyo Electric Power Co
Holdings Inc 4,425 0.20Electronics
JPY 148,100 Alps Electric Co Ltd^ 3,018 0.13JPY 104,900 Hamamatsu Photonics KK 3,908 0.17JPY 24,753 Hirose Electric Co Ltd^ 2,766 0.12JPY 51,200 Hitachi High-Technologies Corp^ 2,004 0.09JPY 287,500 Hoya Corp 14,674 0.65JPY 239,800 Kyocera Corp 12,207 0.54JPY 289,618 Minebea Mitsumi Inc 4,723 0.21JPY 143,100 Murata Manufacturing Co Ltd 18,262 0.81JPY 179,500 Nidec Corp^ 23,899 1.06JPY 65,900 Nippon Electric Glass Co Ltd^ 1,534 0.07JPY 143,100 Omron Corp^ 6,466 0.28JPY 167,700 Yokogawa Electric Corp 2,630 0.12
Engineering & construction JPY 35,900 Japan Airport Terminal Co Ltd 1,421 0.06JPY 155,800 JGC Corp^ 2,792 0.13JPY 674,000 Kajima Corp^ 4,719 0.21JPY 476,900 Obayashi Corp 4,133 0.18JPY 409,500 Shimizu Corp 3,439 0.15JPY 154,400 Taisei Corp 7,293 0.32
Entertainment JPY 162,700 Oriental Land Co Ltd^ 14,304 0.63JPY 35,300 Sankyo Co Ltd^ 1,201 0.05JPY 127,400 Sega Sammy Holdings Inc^ 1,933 0.09JPY 83,800 Toho Co Ltd^ 2,498 0.11
Environmental control JPY 70,800 Kurita Water Industries Ltd 1,747 0.08
Food JPY 403,400 Ajinomoto Co Inc 6,615 0.29JPY 60,800 Calbee Inc^ 1,903 0.08JPY 109,900 Kikkoman Corp^ 4,454 0.20JPY 91,200 MEIJI Holdings Co Ltd^ 6,666 0.30JPY 74,800 NH Foods Ltd^ 2,640 0.12JPY 146,800 Nisshin Seifun Group Inc^ 2,663 0.12JPY 43,100 Nissin Foods Holdings Co Ltd 2,753 0.12JPY 561,900 Seven & i Holdings Co Ltd 21,360 0.94JPY 66,800 Toyo Suisan Kaisha Ltd 2,046 0.09JPY 82,100 Yakult Honsha Co Ltd 4,635 0.21JPY 101,200 Yamazaki Baking Co Ltd^ 1,883 0.08
Forest products & paper JPY 654,000 Oji Holdings Corp 3,687 0.16
Gas JPY 274,900 Osaka Gas Co Ltd^ 5,147 0.23JPY 57,000 Toho Gas Co Ltd 1,544 0.07
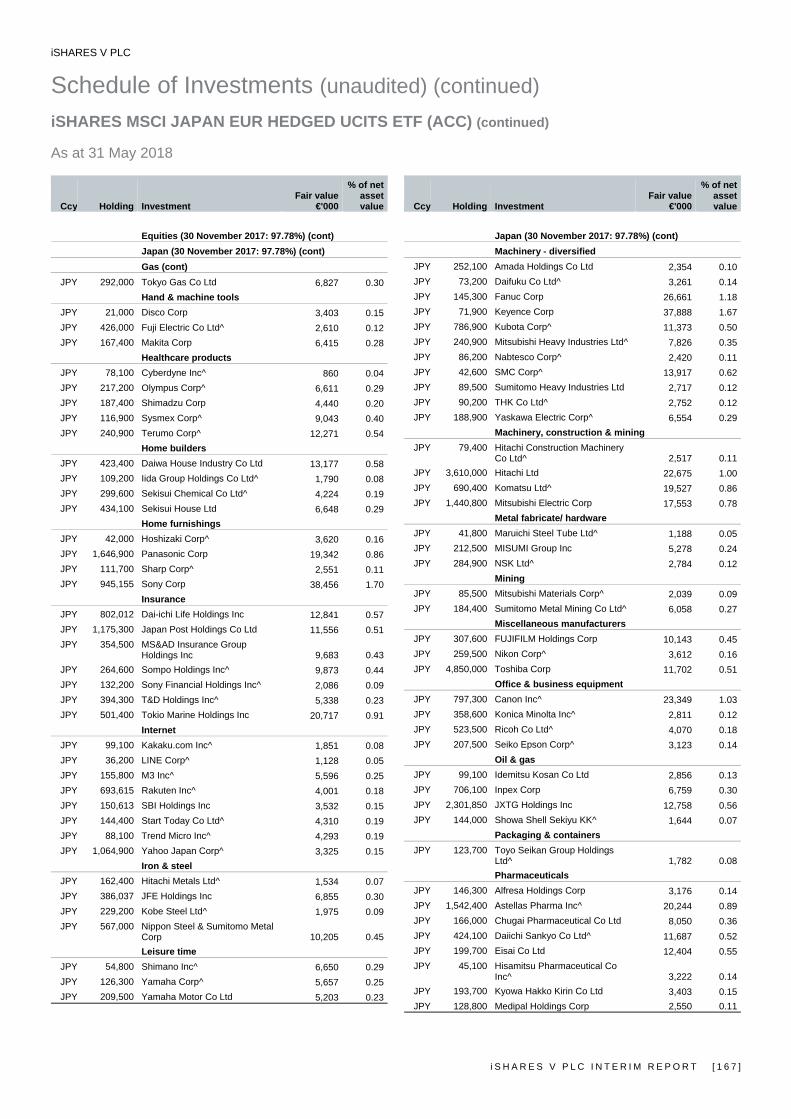
iSHARES V PLC
Schedule of Investments (unaudited) (continued) iSHARES MSCI JAPAN EUR HEDGED UCITS ETF (ACC) (continued) As at 31 May 2018
i S H A R E S V P L C I N T E R I M R E P O R T [ 1 6 7 ]
Ccy Holding Investment Fair value
€'000
% of net asset value
Equities (30 November 2017: 97.78%) (cont) Japan (30 November 2017: 97.78%) (cont) Gas (cont)
JPY 292,000 Tokyo Gas Co Ltd 6,827 0.30Hand & machine tools
JPY 21,000 Disco Corp 3,403 0.15JPY 426,000 Fuji Electric Co Ltd^ 2,610 0.12JPY 167,400 Makita Corp 6,415 0.28
Healthcare products JPY 78,100 Cyberdyne Inc^ 860 0.04JPY 217,200 Olympus Corp^ 6,611 0.29JPY 187,400 Shimadzu Corp 4,440 0.20JPY 116,900 Sysmex Corp^ 9,043 0.40JPY 240,900 Terumo Corp^ 12,271 0.54
Home builders JPY 423,400 Daiwa House Industry Co Ltd 13,177 0.58JPY 109,200 Iida Group Holdings Co Ltd^ 1,790 0.08JPY 299,600 Sekisui Chemical Co Ltd^ 4,224 0.19JPY 434,100 Sekisui House Ltd 6,648 0.29
Home furnishings JPY 42,000 Hoshizaki Corp^ 3,620 0.16JPY 1,646,900 Panasonic Corp 19,342 0.86JPY 111,700 Sharp Corp^ 2,551 0.11JPY 945,155 Sony Corp 38,456 1.70
Insurance JPY 802,012 Dai-ichi Life Holdings Inc 12,841 0.57JPY 1,175,300 Japan Post Holdings Co Ltd 11,556 0.51JPY 354,500 MS&AD Insurance Group
Holdings Inc 9,683 0.43JPY 264,600 Sompo Holdings Inc^ 9,873 0.44JPY 132,200 Sony Financial Holdings Inc^ 2,086 0.09JPY 394,300 T&D Holdings Inc^ 5,338 0.23JPY 501,400 Tokio Marine Holdings Inc 20,717 0.91
Internet JPY 99,100 Kakaku.com Inc^ 1,851 0.08JPY 36,200 LINE Corp^ 1,128 0.05JPY 155,800 M3 Inc^ 5,596 0.25JPY 693,615 Rakuten Inc^ 4,001 0.18JPY 150,613 SBI Holdings Inc 3,532 0.15JPY 144,400 Start Today Co Ltd^ 4,310 0.19JPY 88,100 Trend Micro Inc^ 4,293 0.19JPY 1,064,900 Yahoo Japan Corp^ 3,325 0.15
Iron & steel JPY 162,400 Hitachi Metals Ltd^ 1,534 0.07JPY 386,037 JFE Holdings Inc 6,855 0.30JPY 229,200 Kobe Steel Ltd^ 1,975 0.09JPY 567,000 Nippon Steel & Sumitomo Metal
Corp 10,205 0.45Leisure time
JPY 54,800 Shimano Inc^ 6,650 0.29JPY 126,300 Yamaha Corp^ 5,657 0.25JPY 209,500 Yamaha Motor Co Ltd 5,203 0.23
Ccy Holding InvestmentFair value
€'000
% of net asset value
Japan (30 November 2017: 97.78%) (cont) Machinery - diversified
JPY 252,100 Amada Holdings Co Ltd 2,354 0.10JPY 73,200 Daifuku Co Ltd^ 3,261 0.14JPY 145,300 Fanuc Corp 26,661 1.18JPY 71,900 Keyence Corp 37,888 1.67JPY 786,900 Kubota Corp^ 11,373 0.50JPY 240,900 Mitsubishi Heavy Industries Ltd^ 7,826 0.35JPY 86,200 Nabtesco Corp^ 2,420 0.11JPY 42,600 SMC Corp^ 13,917 0.62JPY 89,500 Sumitomo Heavy Industries Ltd 2,717 0.12JPY 90,200 THK Co Ltd^ 2,752 0.12JPY 188,900 Yaskawa Electric Corp^ 6,554 0.29
Machinery, construction & mining JPY 79,400 Hitachi Construction Machinery
Co Ltd^ 2,517 0.11JPY 3,610,000 Hitachi Ltd 22,675 1.00JPY 690,400 Komatsu Ltd^ 19,527 0.86JPY 1,440,800 Mitsubishi Electric Corp 17,553 0.78
Metal fabricate/ hardware JPY 41,800 Maruichi Steel Tube Ltd^ 1,188 0.05JPY 212,500 MISUMI Group Inc 5,278 0.24JPY 284,900 NSK Ltd^ 2,784 0.12
Mining JPY 85,500 Mitsubishi Materials Corp^ 2,039 0.09JPY 184,400 Sumitomo Metal Mining Co Ltd^ 6,058 0.27
Miscellaneous manufacturers JPY 307,600 FUJIFILM Holdings Corp 10,143 0.45JPY 259,500 Nikon Corp^ 3,612 0.16JPY 4,850,000 Toshiba Corp 11,702 0.51
Office & business equipment JPY 797,300 Canon Inc^ 23,349 1.03JPY 358,600 Konica Minolta Inc^ 2,811 0.12JPY 523,500 Ricoh Co Ltd^ 4,070 0.18JPY 207,500 Seiko Epson Corp^ 3,123 0.14
Oil & gas JPY 99,100 Idemitsu Kosan Co Ltd 2,856 0.13JPY 706,100 Inpex Corp 6,759 0.30JPY 2,301,850 JXTG Holdings Inc 12,758 0.56JPY 144,000 Showa Shell Sekiyu KK^ 1,644 0.07
Packaging & containers JPY 123,700 Toyo Seikan Group Holdings
Ltd^ 1,782 0.08Pharmaceuticals
JPY 146,300 Alfresa Holdings Corp 3,176 0.14JPY 1,542,400 Astellas Pharma Inc^ 20,244 0.89JPY 166,000 Chugai Pharmaceutical Co Ltd 8,050 0.36JPY 424,100 Daiichi Sankyo Co Ltd^ 11,687 0.52JPY 199,700 Eisai Co Ltd 12,404 0.55JPY 45,100 Hisamitsu Pharmaceutical Co
Inc^ 3,222 0.14JPY 193,700 Kyowa Hakko Kirin Co Ltd 3,403 0.15JPY 128,800 Medipal Holdings Corp 2,550 0.11
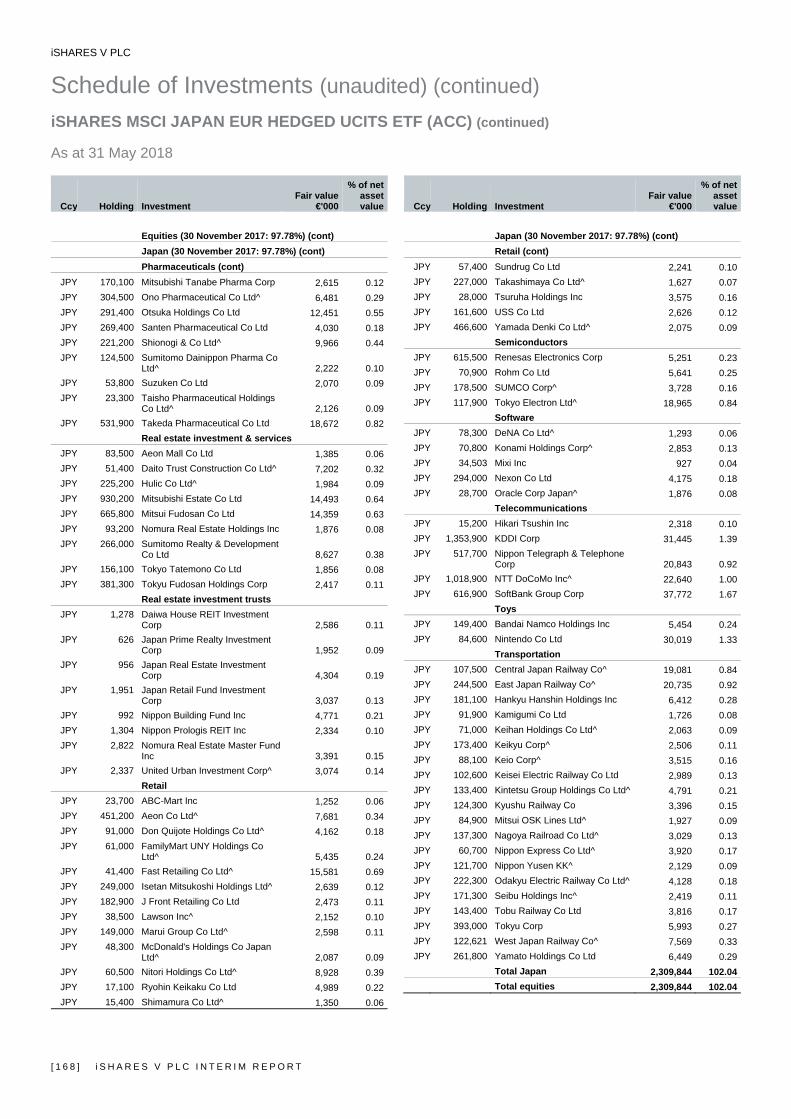
iSHARES V PLC
Schedule of Investments (unaudited) (continued) iSHARES MSCI JAPAN EUR HEDGED UCITS ETF (ACC) (continued) As at 31 May 2018
[ 1 6 8 ] i S H A R E S V P L C I N T E R I M R E P O R T
Ccy Holding Investment Fair value
€'000
% of net asset value
Equities (30 November 2017: 97.78%) (cont) Japan (30 November 2017: 97.78%) (cont) Pharmaceuticals (cont)
JPY 170,100 Mitsubishi Tanabe Pharma Corp 2,615 0.12JPY 304,500 Ono Pharmaceutical Co Ltd^ 6,481 0.29JPY 291,400 Otsuka Holdings Co Ltd 12,451 0.55JPY 269,400 Santen Pharmaceutical Co Ltd 4,030 0.18JPY 221,200 Shionogi & Co Ltd^ 9,966 0.44JPY 124,500 Sumitomo Dainippon Pharma Co
Ltd^ 2,222 0.10JPY 53,800 Suzuken Co Ltd 2,070 0.09JPY 23,300 Taisho Pharmaceutical Holdings
Co Ltd^ 2,126 0.09JPY 531,900 Takeda Pharmaceutical Co Ltd 18,672 0.82
Real estate investment & services JPY 83,500 Aeon Mall Co Ltd 1,385 0.06JPY 51,400 Daito Trust Construction Co Ltd^ 7,202 0.32JPY 225,200 Hulic Co Ltd^ 1,984 0.09JPY 930,200 Mitsubishi Estate Co Ltd 14,493 0.64JPY 665,800 Mitsui Fudosan Co Ltd 14,359 0.63JPY 93,200 Nomura Real Estate Holdings Inc 1,876 0.08JPY 266,000 Sumitomo Realty & Development
Co Ltd 8,627 0.38JPY 156,100 Tokyo Tatemono Co Ltd 1,856 0.08JPY 381,300 Tokyu Fudosan Holdings Corp 2,417 0.11
Real estate investment trusts JPY 1,278 Daiwa House REIT Investment
Corp 2,586 0.11JPY 626 Japan Prime Realty Investment
Corp 1,952 0.09JPY 956 Japan Real Estate Investment
Corp 4,304 0.19JPY 1,951 Japan Retail Fund Investment
Corp 3,037 0.13JPY 992 Nippon Building Fund Inc 4,771 0.21JPY 1,304 Nippon Prologis REIT Inc 2,334 0.10JPY 2,822 Nomura Real Estate Master Fund
Inc 3,391 0.15JPY 2,337 United Urban Investment Corp^ 3,074 0.14
Retail JPY 23,700 ABC-Mart Inc 1,252 0.06JPY 451,200 Aeon Co Ltd^ 7,681 0.34JPY 91,000 Don Quijote Holdings Co Ltd^ 4,162 0.18JPY 61,000 FamilyMart UNY Holdings Co
Ltd^ 5,435 0.24JPY 41,400 Fast Retailing Co Ltd^ 15,581 0.69JPY 249,000 Isetan Mitsukoshi Holdings Ltd^ 2,639 0.12JPY 182,900 J Front Retailing Co Ltd 2,473 0.11JPY 38,500 Lawson Inc^ 2,152 0.10JPY 149,000 Marui Group Co Ltd^ 2,598 0.11JPY 48,300 McDonald's Holdings Co Japan
Ltd^ 2,087 0.09JPY 60,500 Nitori Holdings Co Ltd^ 8,928 0.39JPY 17,100 Ryohin Keikaku Co Ltd 4,989 0.22JPY 15,400 Shimamura Co Ltd^ 1,350 0.06
Ccy Holding InvestmentFair value
€'000
% of net asset value
Japan (30 November 2017: 97.78%) (cont) Retail (cont)
JPY 57,400 Sundrug Co Ltd 2,241 0.10JPY 227,000 Takashimaya Co Ltd^ 1,627 0.07JPY 28,000 Tsuruha Holdings Inc 3,575 0.16JPY 161,600 USS Co Ltd 2,626 0.12JPY 466,600 Yamada Denki Co Ltd^ 2,075 0.09
Semiconductors JPY 615,500 Renesas Electronics Corp 5,251 0.23JPY 70,900 Rohm Co Ltd 5,641 0.25JPY 178,500 SUMCO Corp^ 3,728 0.16JPY 117,900 Tokyo Electron Ltd^ 18,965 0.84
Software JPY 78,300 DeNA Co Ltd^ 1,293 0.06JPY 70,800 Konami Holdings Corp^ 2,853 0.13JPY 34,503 Mixi Inc 927 0.04JPY 294,000 Nexon Co Ltd 4,175 0.18JPY 28,700 Oracle Corp Japan^ 1,876 0.08
Telecommunications JPY 15,200 Hikari Tsushin Inc 2,318 0.10JPY 1,353,900 KDDI Corp 31,445 1.39JPY 517,700 Nippon Telegraph & Telephone
Corp 20,843 0.92JPY 1,018,900 NTT DoCoMo Inc^ 22,640 1.00JPY 616,900 SoftBank Group Corp 37,772 1.67
Toys JPY 149,400 Bandai Namco Holdings Inc 5,454 0.24JPY 84,600 Nintendo Co Ltd 30,019 1.33
Transportation JPY 107,500 Central Japan Railway Co^ 19,081 0.84JPY 244,500 East Japan Railway Co^ 20,735 0.92JPY 181,100 Hankyu Hanshin Holdings Inc 6,412 0.28JPY 91,900 Kamigumi Co Ltd 1,726 0.08JPY 71,000 Keihan Holdings Co Ltd^ 2,063 0.09JPY 173,400 Keikyu Corp^ 2,506 0.11JPY 88,100 Keio Corp^ 3,515 0.16JPY 102,600 Keisei Electric Railway Co Ltd 2,989 0.13JPY 133,400 Kintetsu Group Holdings Co Ltd^ 4,791 0.21JPY 124,300 Kyushu Railway Co 3,396 0.15JPY 84,900 Mitsui OSK Lines Ltd^ 1,927 0.09JPY 137,300 Nagoya Railroad Co Ltd^ 3,029 0.13JPY 60,700 Nippon Express Co Ltd^ 3,920 0.17JPY 121,700 Nippon Yusen KK^ 2,129 0.09JPY 222,300 Odakyu Electric Railway Co Ltd^ 4,128 0.18JPY 171,300 Seibu Holdings Inc^ 2,419 0.11JPY 143,400 Tobu Railway Co Ltd 3,816 0.17JPY 393,000 Tokyu Corp 5,993 0.27JPY 122,621 West Japan Railway Co^ 7,569 0.33JPY 261,800 Yamato Holdings Co Ltd 6,449 0.29
Total Japan 2,309,844 102.04Total equities 2,309,844 102.04

iSHARES V PLC
Schedule of Investments (unaudited) (continued) iSHARES MSCI JAPAN EUR HEDGED UCITS ETF (ACC) (continued) As at 31 May 2018
i S H A R E S V P L C I N T E R I M R E P O R T [ 1 6 9 ]
Currency Amount
Purchased Currency Amount
SoldUnderlying
Exposure (€)Maturity
date
Unrealisedgain/(loss)
€'000
% of netassetvalue
Financial derivative instruments (30 November 2017: 0.76%) Forward currency contracts* (30 November 2017: 0.69%)
EUR 2,400,880,406 JPY 304,493,000,000 2,400,334,349 04/07/2018 547 0.02EUR 2,440,186,829 JPY 322,751,948,687 2,544,912,335 05/06/2018 (104,724) (4.63)JPY 15,036,687,421 EUR 115,790,555 118,564,896 05/06/2018 2,774 0.13JPY 20,317,602,564 EUR 160,201,209 160,164,731 04/07/2018 (36) 0.00JPY 3,222,147,304 EUR 25,486,647 25,406,763 05/06/2018 (80) 0.00
Total unrealised gains on forward currency contracts 3,321 0.15 Total unrealised losses on forward currency contracts (104,840) (4.63) Net unrealised losses on forward currency contracts (101,519) (4.48)
Ccy No. of
contracts
Underlying exposure
€’000 Fair value
€'000
% of net asset value
Futures contracts (30 November 2017: 0.07%)
JPY 373 Topix Index Futures June 2018 50,937 372 0.02
Total unrealised gains on futures contracts 372 0.02
Total financial derivative instruments (101,147) (4.46)
Fair value
€’000
% of net asset value
Total value of investments 2,208,697 97.58 Cash† 37,169 1.64 Other net assets 17,715 0.78
Net asset value attributable to redeemable participating shareholders at the end of the financial period 2,263,581 100.00
† Cash holdings of €37,121,401 are held with State Street Bank and Trust Company. €47,764 is held as security for futures contracts with Barclays Bank Plc. ^ These securities are partially or fully transferred as securities lent. * The counterparty for forward currency contracts is State Street Bank.
Equities are primarily classified by country of incorporation of the entity in which the Fund holds shares.
Underlying exposure has been calculated according to the guidelines issued by the ESMA and represents the market value of an equivalent position in the assets underlying each financial derivative instrument.
Analysis of total current assets gross of all liabilities
Fair value€’000
% of total current assets
Transferable securities admitted to an official stock exchange listing 2,309,844 96.47Exchange traded financial derivative instruments 372 0.02OTC financial derivative instruments 3,321 0.15Other assets 80,395 3.36Total current assets 2,393,932 100.00
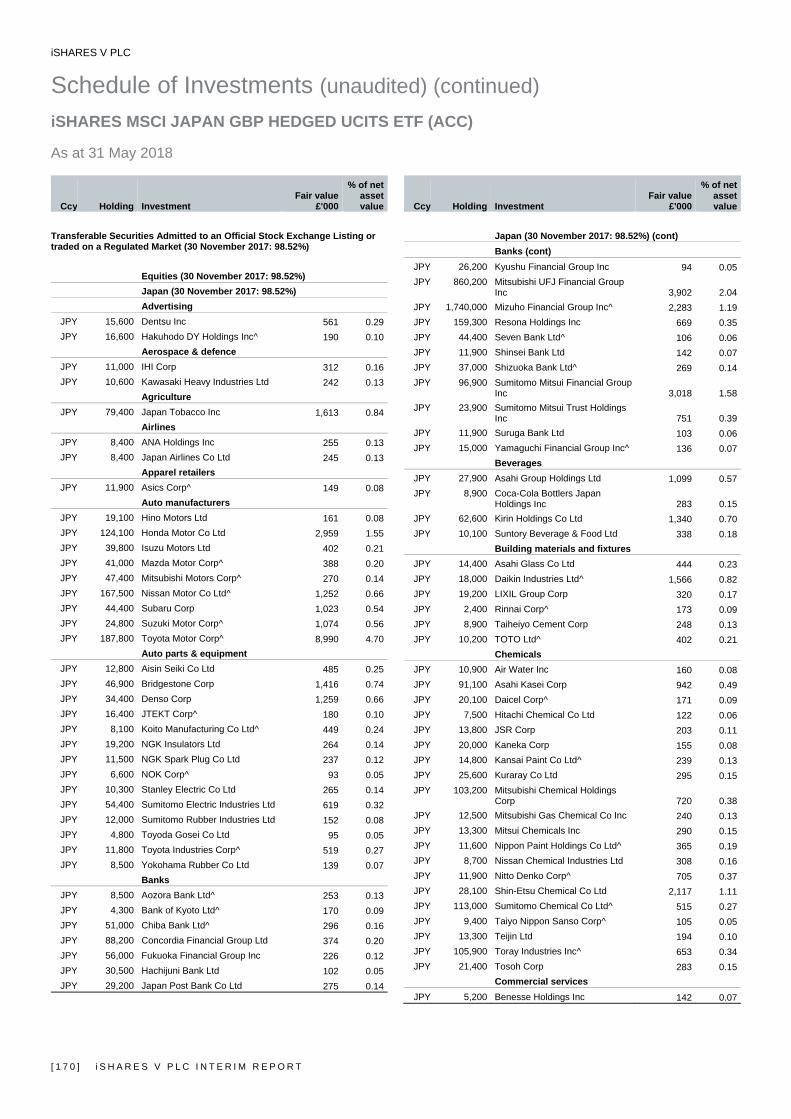
iSHARES V PLC
Schedule of Investments (unaudited) (continued) iSHARES MSCI JAPAN GBP HEDGED UCITS ETF (ACC) As at 31 May 2018
[ 1 7 0 ] i S H A R E S V P L C I N T E R I M R E P O R T
Ccy Holding Investment Fair value
£'000
% of net asset value
Transferable Securities Admitted to an Official Stock Exchange Listing or traded on a Regulated Market (30 November 2017: 98.52%)
Equities (30 November 2017: 98.52%) Japan (30 November 2017: 98.52%) Advertising
JPY 15,600 Dentsu Inc 561 0.29JPY 16,600 Hakuhodo DY Holdings Inc^ 190 0.10
Aerospace & defence JPY 11,000 IHI Corp 312 0.16JPY 10,600 Kawasaki Heavy Industries Ltd 242 0.13
Agriculture JPY 79,400 Japan Tobacco Inc 1,613 0.84
Airlines JPY 8,400 ANA Holdings Inc 255 0.13JPY 8,400 Japan Airlines Co Ltd 245 0.13
Apparel retailers JPY 11,900 Asics Corp^ 149 0.08
Auto manufacturers JPY 19,100 Hino Motors Ltd 161 0.08JPY 124,100 Honda Motor Co Ltd 2,959 1.55JPY 39,800 Isuzu Motors Ltd 402 0.21JPY 41,000 Mazda Motor Corp^ 388 0.20JPY 47,400 Mitsubishi Motors Corp^ 270 0.14JPY 167,500 Nissan Motor Co Ltd^ 1,252 0.66JPY 44,400 Subaru Corp 1,023 0.54JPY 24,800 Suzuki Motor Corp^ 1,074 0.56JPY 187,800 Toyota Motor Corp^ 8,990 4.70
Auto parts & equipment JPY 12,800 Aisin Seiki Co Ltd 485 0.25JPY 46,900 Bridgestone Corp 1,416 0.74JPY 34,400 Denso Corp 1,259 0.66JPY 16,400 JTEKT Corp^ 180 0.10JPY 8,100 Koito Manufacturing Co Ltd^ 449 0.24JPY 19,200 NGK Insulators Ltd 264 0.14JPY 11,500 NGK Spark Plug Co Ltd 237 0.12JPY 6,600 NOK Corp^ 93 0.05JPY 10,300 Stanley Electric Co Ltd 265 0.14JPY 54,400 Sumitomo Electric Industries Ltd 619 0.32JPY 12,000 Sumitomo Rubber Industries Ltd 152 0.08JPY 4,800 Toyoda Gosei Co Ltd 95 0.05JPY 11,800 Toyota Industries Corp^ 519 0.27JPY 8,500 Yokohama Rubber Co Ltd 139 0.07
Banks JPY 8,500 Aozora Bank Ltd^ 253 0.13JPY 4,300 Bank of Kyoto Ltd^ 170 0.09JPY 51,000 Chiba Bank Ltd^ 296 0.16JPY 88,200 Concordia Financial Group Ltd 374 0.20JPY 56,000 Fukuoka Financial Group Inc 226 0.12JPY 30,500 Hachijuni Bank Ltd 102 0.05JPY 29,200 Japan Post Bank Co Ltd 275 0.14
Ccy Holding InvestmentFair value
£'000
% of net asset value
Japan (30 November 2017: 98.52%) (cont) Banks (cont)
JPY 26,200 Kyushu Financial Group Inc 94 0.05JPY 860,200 Mitsubishi UFJ Financial Group
Inc 3,902 2.04JPY 1,740,000 Mizuho Financial Group Inc^ 2,283 1.19JPY 159,300 Resona Holdings Inc 669 0.35JPY 44,400 Seven Bank Ltd^ 106 0.06JPY 11,900 Shinsei Bank Ltd 142 0.07JPY 37,000 Shizuoka Bank Ltd^ 269 0.14JPY 96,900 Sumitomo Mitsui Financial Group
Inc 3,018 1.58JPY 23,900 Sumitomo Mitsui Trust Holdings
Inc 751 0.39JPY 11,900 Suruga Bank Ltd 103 0.06JPY 15,000 Yamaguchi Financial Group Inc^ 136 0.07
Beverages JPY 27,900 Asahi Group Holdings Ltd 1,099 0.57JPY 8,900 Coca-Cola Bottlers Japan
Holdings Inc 283 0.15JPY 62,600 Kirin Holdings Co Ltd 1,340 0.70JPY 10,100 Suntory Beverage & Food Ltd 338 0.18
Building materials and fixtures JPY 14,400 Asahi Glass Co Ltd 444 0.23JPY 18,000 Daikin Industries Ltd^ 1,566 0.82JPY 19,200 LIXIL Group Corp 320 0.17JPY 2,400 Rinnai Corp^ 173 0.09JPY 8,900 Taiheiyo Cement Corp 248 0.13JPY 10,200 TOTO Ltd^ 402 0.21
Chemicals JPY 10,900 Air Water Inc 160 0.08JPY 91,100 Asahi Kasei Corp 942 0.49JPY 20,100 Daicel Corp^ 171 0.09JPY 7,500 Hitachi Chemical Co Ltd 122 0.06JPY 13,800 JSR Corp 203 0.11JPY 20,000 Kaneka Corp 155 0.08JPY 14,800 Kansai Paint Co Ltd^ 239 0.13JPY 25,600 Kuraray Co Ltd 295 0.15JPY 103,200 Mitsubishi Chemical Holdings
Corp 720 0.38JPY 12,500 Mitsubishi Gas Chemical Co Inc 240 0.13JPY 13,300 Mitsui Chemicals Inc 290 0.15JPY 11,600 Nippon Paint Holdings Co Ltd^ 365 0.19JPY 8,700 Nissan Chemical Industries Ltd 308 0.16JPY 11,900 Nitto Denko Corp^ 705 0.37JPY 28,100 Shin-Etsu Chemical Co Ltd 2,117 1.11JPY 113,000 Sumitomo Chemical Co Ltd^ 515 0.27JPY 9,400 Taiyo Nippon Sanso Corp^ 105 0.05JPY 13,300 Teijin Ltd 194 0.10JPY 105,900 Toray Industries Inc^ 653 0.34JPY 21,400 Tosoh Corp 283 0.15
Commercial services JPY 5,200 Benesse Holdings Inc 142 0.07
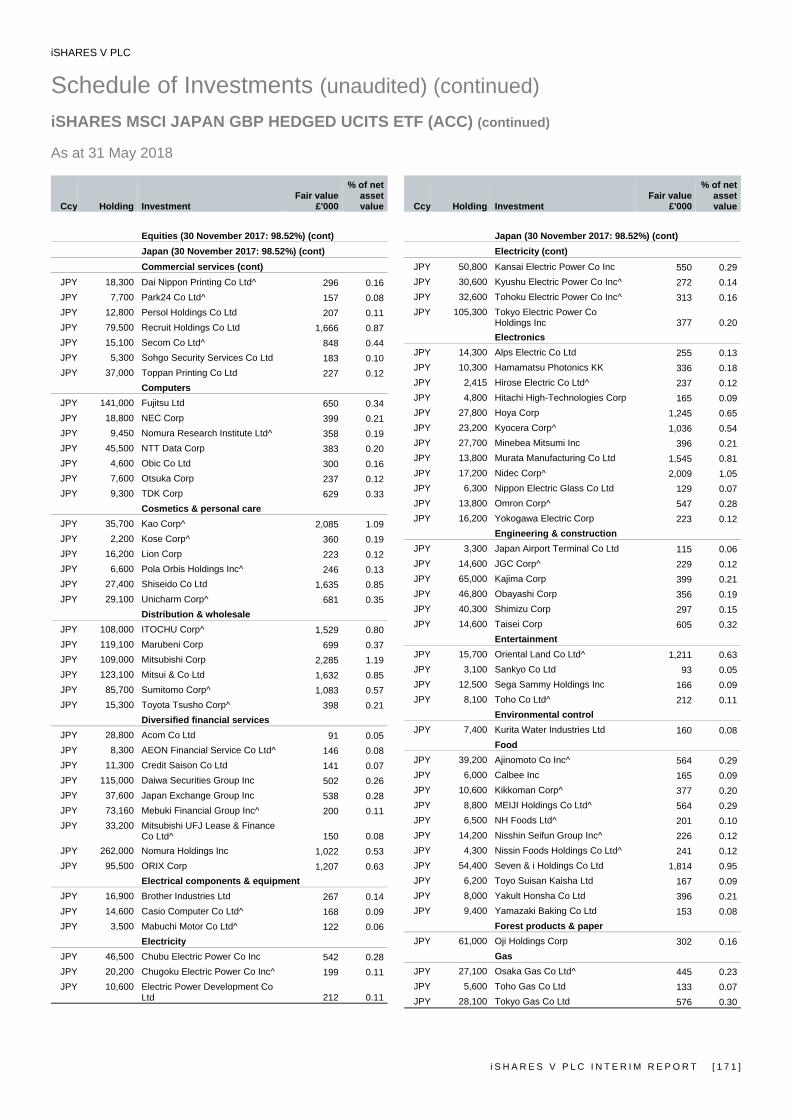
iSHARES V PLC
Schedule of Investments (unaudited) (continued) iSHARES MSCI JAPAN GBP HEDGED UCITS ETF (ACC) (continued) As at 31 May 2018
i S H A R E S V P L C I N T E R I M R E P O R T [ 1 7 1 ]
Ccy Holding Investment Fair value
£'000
% of net asset value
Equities (30 November 2017: 98.52%) (cont) Japan (30 November 2017: 98.52%) (cont) Commercial services (cont)
JPY 18,300 Dai Nippon Printing Co Ltd^ 296 0.16JPY 7,700 Park24 Co Ltd^ 157 0.08JPY 12,800 Persol Holdings Co Ltd 207 0.11JPY 79,500 Recruit Holdings Co Ltd 1,666 0.87JPY 15,100 Secom Co Ltd^ 848 0.44JPY 5,300 Sohgo Security Services Co Ltd 183 0.10JPY 37,000 Toppan Printing Co Ltd 227 0.12
Computers JPY 141,000 Fujitsu Ltd 650 0.34JPY 18,800 NEC Corp 399 0.21JPY 9,450 Nomura Research Institute Ltd^ 358 0.19JPY 45,500 NTT Data Corp 383 0.20JPY 4,600 Obic Co Ltd 300 0.16JPY 7,600 Otsuka Corp 237 0.12JPY 9,300 TDK Corp 629 0.33
Cosmetics & personal care JPY 35,700 Kao Corp^ 2,085 1.09JPY 2,200 Kose Corp^ 360 0.19JPY 16,200 Lion Corp 223 0.12JPY 6,600 Pola Orbis Holdings Inc^ 246 0.13JPY 27,400 Shiseido Co Ltd 1,635 0.85JPY 29,100 Unicharm Corp^ 681 0.35
Distribution & wholesale JPY 108,000 ITOCHU Corp^ 1,529 0.80JPY 119,100 Marubeni Corp 699 0.37JPY 109,000 Mitsubishi Corp 2,285 1.19JPY 123,100 Mitsui & Co Ltd 1,632 0.85JPY 85,700 Sumitomo Corp^ 1,083 0.57JPY 15,300 Toyota Tsusho Corp^ 398 0.21
Diversified financial services JPY 28,800 Acom Co Ltd 91 0.05JPY 8,300 AEON Financial Service Co Ltd^ 146 0.08JPY 11,300 Credit Saison Co Ltd 141 0.07JPY 115,000 Daiwa Securities Group Inc 502 0.26JPY 37,600 Japan Exchange Group Inc 538 0.28JPY 73,160 Mebuki Financial Group Inc^ 200 0.11JPY 33,200 Mitsubishi UFJ Lease & Finance
Co Ltd^ 150 0.08JPY 262,000 Nomura Holdings Inc 1,022 0.53JPY 95,500 ORIX Corp 1,207 0.63
Electrical components & equipment JPY 16,900 Brother Industries Ltd 267 0.14JPY 14,600 Casio Computer Co Ltd^ 168 0.09JPY 3,500 Mabuchi Motor Co Ltd^ 122 0.06
Electricity JPY 46,500 Chubu Electric Power Co Inc 542 0.28JPY 20,200 Chugoku Electric Power Co Inc^ 199 0.11JPY 10,600 Electric Power Development Co
Ltd 212 0.11
Ccy Holding InvestmentFair value
£'000
% of net asset value
Japan (30 November 2017: 98.52%) (cont) Electricity (cont)
JPY 50,800 Kansai Electric Power Co Inc 550 0.29JPY 30,600 Kyushu Electric Power Co Inc^ 272 0.14JPY 32,600 Tohoku Electric Power Co Inc^ 313 0.16JPY 105,300 Tokyo Electric Power Co
Holdings Inc 377 0.20Electronics
JPY 14,300 Alps Electric Co Ltd 255 0.13JPY 10,300 Hamamatsu Photonics KK 336 0.18JPY 2,415 Hirose Electric Co Ltd^ 237 0.12JPY 4,800 Hitachi High-Technologies Corp 165 0.09JPY 27,800 Hoya Corp 1,245 0.65JPY 23,200 Kyocera Corp^ 1,036 0.54JPY 27,700 Minebea Mitsumi Inc 396 0.21JPY 13,800 Murata Manufacturing Co Ltd 1,545 0.81JPY 17,200 Nidec Corp^ 2,009 1.05JPY 6,300 Nippon Electric Glass Co Ltd 129 0.07JPY 13,800 Omron Corp^ 547 0.28JPY 16,200 Yokogawa Electric Corp 223 0.12
Engineering & construction JPY 3,300 Japan Airport Terminal Co Ltd 115 0.06JPY 14,600 JGC Corp^ 229 0.12JPY 65,000 Kajima Corp 399 0.21JPY 46,800 Obayashi Corp 356 0.19JPY 40,300 Shimizu Corp 297 0.15JPY 14,600 Taisei Corp 605 0.32
Entertainment JPY 15,700 Oriental Land Co Ltd^ 1,211 0.63JPY 3,100 Sankyo Co Ltd 93 0.05JPY 12,500 Sega Sammy Holdings Inc 166 0.09JPY 8,100 Toho Co Ltd^ 212 0.11
Environmental control JPY 7,400 Kurita Water Industries Ltd 160 0.08
Food JPY 39,200 Ajinomoto Co Inc^ 564 0.29JPY 6,000 Calbee Inc 165 0.09JPY 10,600 Kikkoman Corp^ 377 0.20JPY 8,800 MEIJI Holdings Co Ltd^ 564 0.29JPY 6,500 NH Foods Ltd^ 201 0.10JPY 14,200 Nisshin Seifun Group Inc^ 226 0.12JPY 4,300 Nissin Foods Holdings Co Ltd^ 241 0.12JPY 54,400 Seven & i Holdings Co Ltd 1,814 0.95JPY 6,200 Toyo Suisan Kaisha Ltd 167 0.09JPY 8,000 Yakult Honsha Co Ltd 396 0.21JPY 9,400 Yamazaki Baking Co Ltd 153 0.08
Forest products & paper JPY 61,000 Oji Holdings Corp 302 0.16
Gas JPY 27,100 Osaka Gas Co Ltd^ 445 0.23JPY 5,600 Toho Gas Co Ltd 133 0.07JPY 28,100 Tokyo Gas Co Ltd 576 0.30
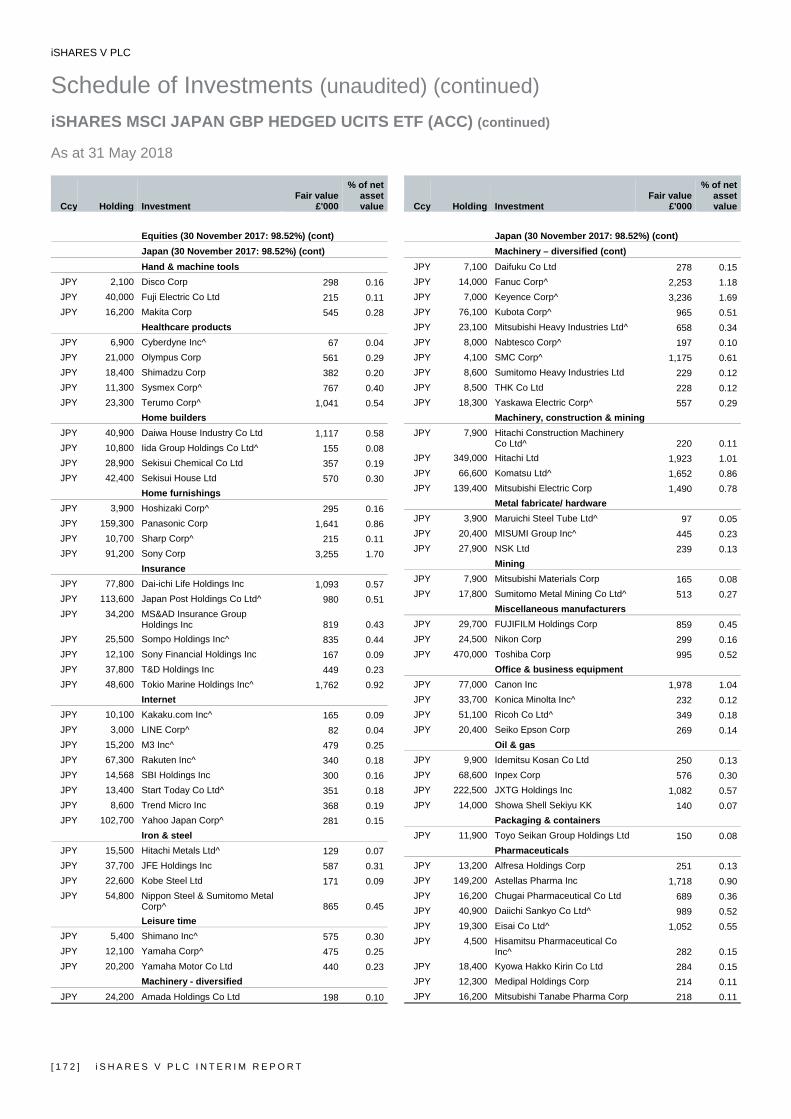
iSHARES V PLC
Schedule of Investments (unaudited) (continued) iSHARES MSCI JAPAN GBP HEDGED UCITS ETF (ACC) (continued) As at 31 May 2018
[ 1 7 2 ] i S H A R E S V P L C I N T E R I M R E P O R T
Ccy Holding Investment Fair value
£'000
% of net asset value
Equities (30 November 2017: 98.52%) (cont) Japan (30 November 2017: 98.52%) (cont)
Hand & machine tools JPY 2,100 Disco Corp 298 0.16JPY 40,000 Fuji Electric Co Ltd 215 0.11JPY 16,200 Makita Corp 545 0.28
Healthcare products JPY 6,900 Cyberdyne Inc^ 67 0.04JPY 21,000 Olympus Corp 561 0.29JPY 18,400 Shimadzu Corp 382 0.20JPY 11,300 Sysmex Corp^ 767 0.40JPY 23,300 Terumo Corp^ 1,041 0.54
Home builders JPY 40,900 Daiwa House Industry Co Ltd 1,117 0.58JPY 10,800 Iida Group Holdings Co Ltd^ 155 0.08JPY 28,900 Sekisui Chemical Co Ltd 357 0.19JPY 42,400 Sekisui House Ltd 570 0.30
Home furnishings JPY 3,900 Hoshizaki Corp^ 295 0.16JPY 159,300 Panasonic Corp 1,641 0.86JPY 10,700 Sharp Corp^ 215 0.11JPY 91,200 Sony Corp 3,255 1.70
Insurance JPY 77,800 Dai-ichi Life Holdings Inc 1,093 0.57JPY 113,600 Japan Post Holdings Co Ltd^ 980 0.51JPY 34,200 MS&AD Insurance Group
Holdings Inc 819 0.43JPY 25,500 Sompo Holdings Inc^ 835 0.44JPY 12,100 Sony Financial Holdings Inc 167 0.09JPY 37,800 T&D Holdings Inc 449 0.23JPY 48,600 Tokio Marine Holdings Inc^ 1,762 0.92
Internet JPY 10,100 Kakaku.com Inc^ 165 0.09JPY 3,000 LINE Corp^ 82 0.04JPY 15,200 M3 Inc^ 479 0.25JPY 67,300 Rakuten Inc^ 340 0.18JPY 14,568 SBI Holdings Inc 300 0.16JPY 13,400 Start Today Co Ltd^ 351 0.18JPY 8,600 Trend Micro Inc 368 0.19JPY 102,700 Yahoo Japan Corp^ 281 0.15
Iron & steel JPY 15,500 Hitachi Metals Ltd^ 129 0.07JPY 37,700 JFE Holdings Inc 587 0.31JPY 22,600 Kobe Steel Ltd 171 0.09JPY 54,800 Nippon Steel & Sumitomo Metal
Corp^ 865 0.45Leisure time
JPY 5,400 Shimano Inc^ 575 0.30JPY 12,100 Yamaha Corp^ 475 0.25JPY 20,200 Yamaha Motor Co Ltd 440 0.23
Machinery - diversified JPY 24,200 Amada Holdings Co Ltd 198 0.10
Ccy Holding InvestmentFair value
£'000
% of net asset value
Japan (30 November 2017: 98.52%) (cont) Machinery – diversified (cont)
JPY 7,100 Daifuku Co Ltd 278 0.15JPY 14,000 Fanuc Corp^ 2,253 1.18JPY 7,000 Keyence Corp^ 3,236 1.69JPY 76,100 Kubota Corp^ 965 0.51JPY 23,100 Mitsubishi Heavy Industries Ltd^ 658 0.34JPY 8,000 Nabtesco Corp^ 197 0.10JPY 4,100 SMC Corp^ 1,175 0.61JPY 8,600 Sumitomo Heavy Industries Ltd 229 0.12JPY 8,500 THK Co Ltd 228 0.12JPY 18,300 Yaskawa Electric Corp^ 557 0.29
Machinery, construction & mining JPY 7,900 Hitachi Construction Machinery
Co Ltd^ 220 0.11JPY 349,000 Hitachi Ltd 1,923 1.01JPY 66,600 Komatsu Ltd^ 1,652 0.86JPY 139,400 Mitsubishi Electric Corp 1,490 0.78
Metal fabricate/ hardware JPY 3,900 Maruichi Steel Tube Ltd^ 97 0.05JPY 20,400 MISUMI Group Inc^ 445 0.23JPY 27,900 NSK Ltd 239 0.13
Mining JPY 7,900 Mitsubishi Materials Corp 165 0.08JPY 17,800 Sumitomo Metal Mining Co Ltd^ 513 0.27
Miscellaneous manufacturers JPY 29,700 FUJIFILM Holdings Corp 859 0.45JPY 24,500 Nikon Corp 299 0.16JPY 470,000 Toshiba Corp 995 0.52
Office & business equipment JPY 77,000 Canon Inc 1,978 1.04JPY 33,700 Konica Minolta Inc^ 232 0.12JPY 51,100 Ricoh Co Ltd^ 349 0.18JPY 20,400 Seiko Epson Corp 269 0.14
Oil & gas JPY 9,900 Idemitsu Kosan Co Ltd 250 0.13JPY 68,600 Inpex Corp 576 0.30JPY 222,500 JXTG Holdings Inc 1,082 0.57JPY 14,000 Showa Shell Sekiyu KK 140 0.07
Packaging & containers JPY 11,900 Toyo Seikan Group Holdings Ltd 150 0.08
Pharmaceuticals JPY 13,200 Alfresa Holdings Corp 251 0.13JPY 149,200 Astellas Pharma Inc 1,718 0.90JPY 16,200 Chugai Pharmaceutical Co Ltd 689 0.36JPY 40,900 Daiichi Sankyo Co Ltd^ 989 0.52JPY 19,300 Eisai Co Ltd^ 1,052 0.55JPY 4,500 Hisamitsu Pharmaceutical Co
Inc^ 282 0.15JPY 18,400 Kyowa Hakko Kirin Co Ltd 284 0.15JPY 12,300 Medipal Holdings Corp 214 0.11JPY 16,200 Mitsubishi Tanabe Pharma Corp 218 0.11
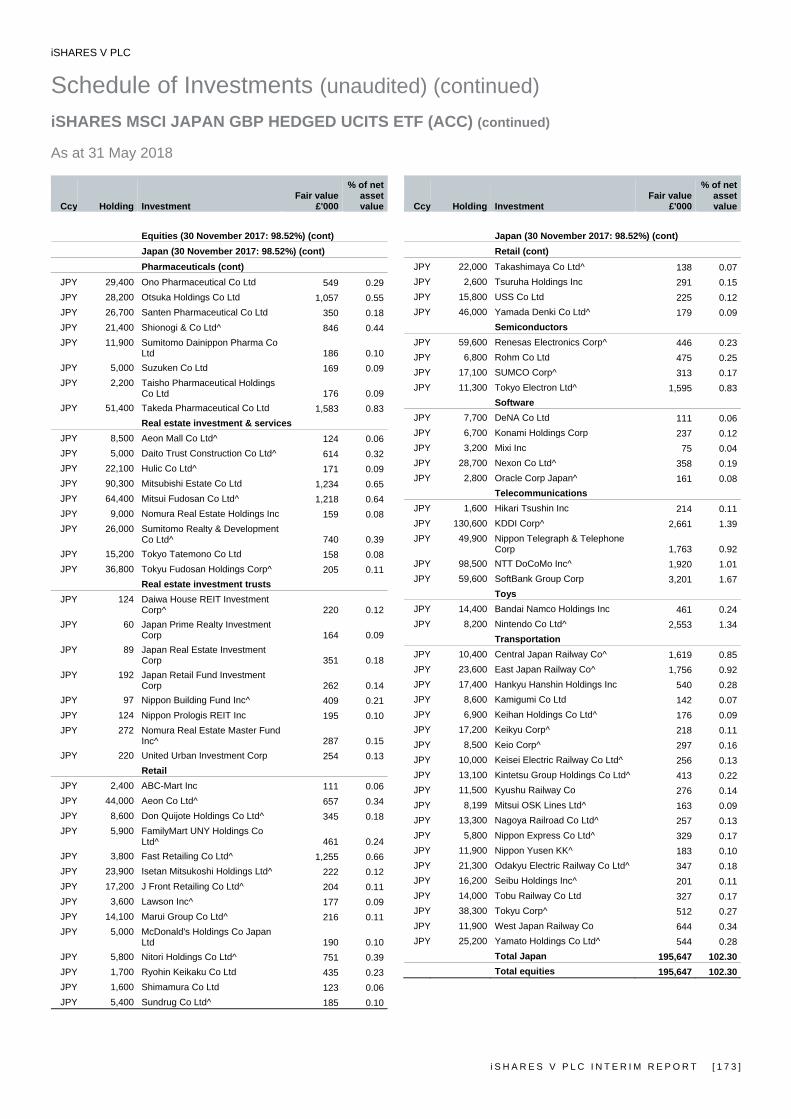
iSHARES V PLC
Schedule of Investments (unaudited) (continued) iSHARES MSCI JAPAN GBP HEDGED UCITS ETF (ACC) (continued) As at 31 May 2018
i S H A R E S V P L C I N T E R I M R E P O R T [ 1 7 3 ]
Ccy Holding Investment Fair value
£'000
% of net asset value
Equities (30 November 2017: 98.52%) (cont) Japan (30 November 2017: 98.52%) (cont) Pharmaceuticals (cont)
JPY 29,400 Ono Pharmaceutical Co Ltd 549 0.29JPY 28,200 Otsuka Holdings Co Ltd 1,057 0.55JPY 26,700 Santen Pharmaceutical Co Ltd 350 0.18JPY 21,400 Shionogi & Co Ltd^ 846 0.44JPY 11,900 Sumitomo Dainippon Pharma Co
Ltd 186 0.10JPY 5,000 Suzuken Co Ltd 169 0.09JPY 2,200 Taisho Pharmaceutical Holdings
Co Ltd 176 0.09JPY 51,400 Takeda Pharmaceutical Co Ltd 1,583 0.83
Real estate investment & services JPY 8,500 Aeon Mall Co Ltd^ 124 0.06JPY 5,000 Daito Trust Construction Co Ltd^ 614 0.32JPY 22,100 Hulic Co Ltd^ 171 0.09JPY 90,300 Mitsubishi Estate Co Ltd 1,234 0.65JPY 64,400 Mitsui Fudosan Co Ltd^ 1,218 0.64JPY 9,000 Nomura Real Estate Holdings Inc 159 0.08JPY 26,000 Sumitomo Realty & Development
Co Ltd^ 740 0.39JPY 15,200 Tokyo Tatemono Co Ltd 158 0.08JPY 36,800 Tokyu Fudosan Holdings Corp^ 205 0.11
Real estate investment trusts JPY 124 Daiwa House REIT Investment
Corp^ 220 0.12JPY 60 Japan Prime Realty Investment
Corp 164 0.09JPY 89 Japan Real Estate Investment
Corp 351 0.18JPY 192 Japan Retail Fund Investment
Corp 262 0.14JPY 97 Nippon Building Fund Inc^ 409 0.21JPY 124 Nippon Prologis REIT Inc 195 0.10JPY 272 Nomura Real Estate Master Fund
Inc^ 287 0.15JPY 220 United Urban Investment Corp 254 0.13
Retail JPY 2,400 ABC-Mart Inc 111 0.06JPY 44,000 Aeon Co Ltd^ 657 0.34JPY 8,600 Don Quijote Holdings Co Ltd^ 345 0.18JPY 5,900 FamilyMart UNY Holdings Co
Ltd^ 461 0.24JPY 3,800 Fast Retailing Co Ltd^ 1,255 0.66JPY 23,900 Isetan Mitsukoshi Holdings Ltd^ 222 0.12JPY 17,200 J Front Retailing Co Ltd^ 204 0.11JPY 3,600 Lawson Inc^ 177 0.09JPY 14,100 Marui Group Co Ltd^ 216 0.11JPY 5,000 McDonald's Holdings Co Japan
Ltd 190 0.10JPY 5,800 Nitori Holdings Co Ltd^ 751 0.39JPY 1,700 Ryohin Keikaku Co Ltd 435 0.23JPY 1,600 Shimamura Co Ltd 123 0.06JPY 5,400 Sundrug Co Ltd^ 185 0.10
Ccy Holding InvestmentFair value
£'000
% of net asset value
Japan (30 November 2017: 98.52%) (cont) Retail (cont)
JPY 22,000 Takashimaya Co Ltd^ 138 0.07JPY 2,600 Tsuruha Holdings Inc 291 0.15JPY 15,800 USS Co Ltd 225 0.12JPY 46,000 Yamada Denki Co Ltd^ 179 0.09
Semiconductors JPY 59,600 Renesas Electronics Corp^ 446 0.23JPY 6,800 Rohm Co Ltd 475 0.25JPY 17,100 SUMCO Corp^ 313 0.17JPY 11,300 Tokyo Electron Ltd^ 1,595 0.83
Software JPY 7,700 DeNA Co Ltd 111 0.06JPY 6,700 Konami Holdings Corp 237 0.12JPY 3,200 Mixi Inc 75 0.04JPY 28,700 Nexon Co Ltd^ 358 0.19JPY 2,800 Oracle Corp Japan^ 161 0.08
Telecommunications JPY 1,600 Hikari Tsushin Inc 214 0.11JPY 130,600 KDDI Corp^ 2,661 1.39JPY 49,900 Nippon Telegraph & Telephone
Corp 1,763 0.92JPY 98,500 NTT DoCoMo Inc^ 1,920 1.01JPY 59,600 SoftBank Group Corp 3,201 1.67
Toys JPY 14,400 Bandai Namco Holdings Inc 461 0.24JPY 8,200 Nintendo Co Ltd^ 2,553 1.34
Transportation JPY 10,400 Central Japan Railway Co^ 1,619 0.85JPY 23,600 East Japan Railway Co^ 1,756 0.92JPY 17,400 Hankyu Hanshin Holdings Inc 540 0.28JPY 8,600 Kamigumi Co Ltd 142 0.07JPY 6,900 Keihan Holdings Co Ltd^ 176 0.09JPY 17,200 Keikyu Corp^ 218 0.11JPY 8,500 Keio Corp^ 297 0.16JPY 10,000 Keisei Electric Railway Co Ltd^ 256 0.13JPY 13,100 Kintetsu Group Holdings Co Ltd^ 413 0.22JPY 11,500 Kyushu Railway Co 276 0.14JPY 8,199 Mitsui OSK Lines Ltd^ 163 0.09JPY 13,300 Nagoya Railroad Co Ltd^ 257 0.13JPY 5,800 Nippon Express Co Ltd^ 329 0.17JPY 11,900 Nippon Yusen KK^ 183 0.10JPY 21,300 Odakyu Electric Railway Co Ltd^ 347 0.18JPY 16,200 Seibu Holdings Inc^ 201 0.11JPY 14,000 Tobu Railway Co Ltd 327 0.17JPY 38,300 Tokyu Corp^ 512 0.27JPY 11,900 West Japan Railway Co 644 0.34JPY 25,200 Yamato Holdings Co Ltd^ 544 0.28
Total Japan 195,647 102.30Total equities 195,647 102.30
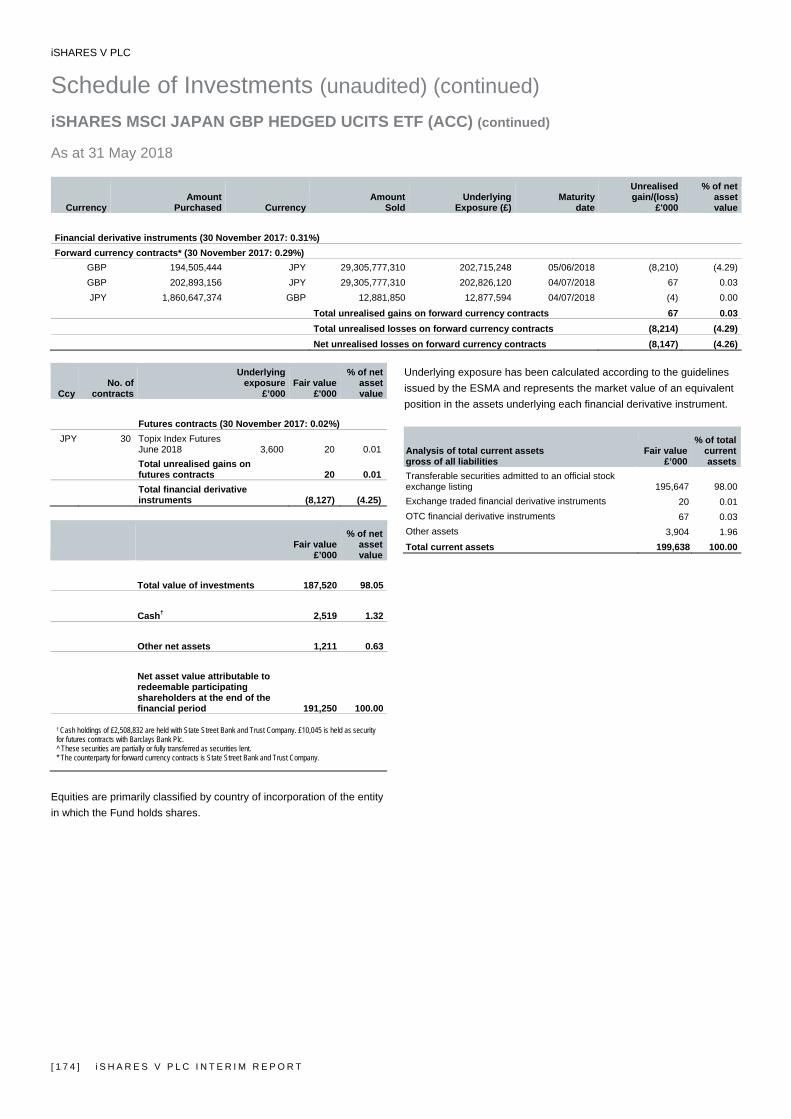
iSHARES V PLC
Schedule of Investments (unaudited) (continued) iSHARES MSCI JAPAN GBP HEDGED UCITS ETF (ACC) (continued) As at 31 May 2018
[ 1 7 4 ] i S H A R E S V P L C I N T E R I M R E P O R T
Currency Amount
Purchased Currency Amount
SoldUnderlying
Exposure (£)Maturity
date
Unrealisedgain/(loss)
£'000
% of netassetvalue
Financial derivative instruments (30 November 2017: 0.31%) Forward currency contracts* (30 November 2017: 0.29%)
GBP 194,505,444 JPY 29,305,777,310 202,715,248 05/06/2018 (8,210) (4.29)GBP 202,893,156 JPY 29,305,777,310 202,826,120 04/07/2018 67 0.03JPY 1,860,647,374 GBP 12,881,850 12,877,594 04/07/2018 (4) 0.00
Total unrealised gains on forward currency contracts 67 0.03 Total unrealised losses on forward currency contracts (8,214) (4.29) Net unrealised losses on forward currency contracts (8,147) (4.26)
Ccy No. of
contracts
Underlying exposure
£’000 Fair value
£'000
% of net asset value
Futures contracts (30 November 2017: 0.02%)
JPY 30 Topix Index Futures June 2018 3,600 20 0.01
Total unrealised gains on futures contracts 20 0.01
Total financial derivative instruments (8,127) (4.25)
Fair value
£’000
% of net asset value
Total value of investments 187,520 98.05 Cash† 2,519 1.32 Other net assets 1,211 0.63
Net asset value attributable to redeemable participating shareholders at the end of the financial period 191,250 100.00
† Cash holdings of £2,508,832 are held with State Street Bank and Trust Company. £10,045 is held as security for futures contracts with Barclays Bank Plc. ^ These securities are partially or fully transferred as securities lent. * The counterparty for forward currency contracts is State Street Bank and Trust Company.
Equities are primarily classified by country of incorporation of the entity in which the Fund holds shares.
Underlying exposure has been calculated according to the guidelines issued by the ESMA and represents the market value of an equivalent position in the assets underlying each financial derivative instrument.
Analysis of total current assets gross of all liabilities
Fair value£’000
% of totalcurrentassets
Transferable securities admitted to an official stock exchange listing 195,647 98.00Exchange traded financial derivative instruments 20 0.01OTC financial derivative instruments 67 0.03Other assets 3,904 1.96Total current assets 199,638 100.00

iSHARES V PLC
Schedule of Investments (unaudited) (continued) iSHARES MSCI POLAND UCITS ETF As at 31 May 2018
i S H A R E S V P L C I N T E R I M R E P O R T [ 1 7 5 ]
Ccy Holding Investment Fair value
$'000
% of net asset value
Transferable Securities Admitted to an Official Stock Exchange Listing or traded on a Regulated Market (30 November 2017: 99.63%)
Equities (30 November 2017: 99.63%) Luxembourg (30 November 2017: Nil) Telecommunications
PLN 163,827 PLAY Communications SA^ 1,103 1.29Total Luxembourg 1,103 1.29
Poland (30 November 2017: 99.63%) Apparel retailers
PLN 1,867 LPP SA 4,754 5.55Banks
PLN 130,229 Alior Bank SA 2,438 2.85PLN 46,549 Bank Handlowy w Warszawie SA 1,003 1.17PLN 872,868 Bank Millennium SA 1,892 2.21PLN 245,525 Bank Polska Kasa Opieki SA^ 7,419 8.66PLN 50,034 Bank Zachodni WBK SA 4,693 5.48PLN 21,312 mBank SA 2,427 2.83PLN 1,276,599 Powszechna Kasa Oszczednosci
Bank Polski SA 12,953 15.12Chemicals
PLN 64,384 Grupa Azoty SA 741 0.87Coal
PLN 76,032 Jastrzebska Spolka Weglowa SA 1,714 2.00Electricity
PLN 1,210,842 PGE Polska Grupa Energetyczna SA 3,220 3.76Food
PLN 70,543 Dino Polska SA 2,124 2.48Insurance
PLN 869,911 Powszechny Zaklad Ubezpieczen SA 8,537 9.97Media
PLN 368,141 Cyfrowy Polsat SA 2,478 2.89Mining
PLN 201,477 KGHM Polska Miedz SA 4,614 5.39Oil & gas
PLN 132,886 Grupa Lotos SA 1,960 2.29PLN 430,874 Polski Koncern Naftowy ORLEN
SA 9,492 11.08PLN 2,494,687 Polskie Gornictwo Naftowe i
Gazownictwo SA 3,857 4.51Retail
PLN 41,468 CCC SA 3,058 3.57Software
PLN 96,829 CD Projekt SA 3,852 4.50Telecommunications
PLN 944,237 Orange Polska SA^ 1,279 1.49Total Poland 84,505 98.67Total equities 85,608 99.96
CcyNo. of
contracts
Underlying exposure
$’000 Fair value
$'000
% of net asset value
Financial derivative instruments (30 November 2017: 0.00%)Futures contracts (30 November 2017: 0.00%)
PLN 9 WIG 20 Index Futures June 2018 109 (4) 0.00Total unrealised losses on futures contracts (4) 0.00Total financial derivative instruments (4) 0.00
Fair value
$’000
% of net asset value
Total value of investments 85,604 99.96 Cash† 105 0.12 Other net liabilities (67) (0.08) Net asset value attributable to redeemable participating shareholders at the end of the financial period 85,642 100.00
† Cash holdings of $96,737 are held with State Street Bank and Trust Company. $8,097 is held as security for futures contracts with Barclays Bank Plc. ^ These securities are partially or fully transferred as securities lent.
Equities are primarily classified by country of incorporation of the entity in which the Fund holds shares. Underlying exposure has been calculated according to the guidelines issued by the ESMA and represents the market value of an equivalent position in the assets underlying each financial derivative instrument.
Analysis of total current assets gross of all liabilities
Fair value$’000
% of totalcurrentassets
Transferable securities admitted to an official stock exchange listing 85,608 95.82Other assets 3,732 4.18Total current assets 89,340 100.00

iSHARES V PLC
Schedule of Investments (unaudited) (continued) iSHARES MSCI WORLD EUR HEDGED UCITS ETF (ACC) As at 31 May 2018
[ 1 7 6 ] i S H A R E S V P L C I N T E R I M R E P O R T
Ccy Holding Investment Fair value
€'000
% of net asset value
Transferable Securities Admitted to an Official Stock Exchange Listing or traded on a Regulated Market (30 November 2017: 97.09%)
Equities (30 November 2017: 97.09%) Australia (30 November 2017: 2.39%) Banks
AUD 141,608 Australia & New Zealand Banking Group Ltd^ 2,498 0.15
AUD 16,509 Bank of Queensland Ltd 109 0.01AUD 20,314 Bendigo & Adelaide Bank Ltd^ 142 0.01AUD 87,763 Commonwealth Bank of Australia 3,942 0.24AUD 16,993 Macquarie Group Ltd 1,259 0.08AUD 129,526 National Australia Bank Ltd 2,250 0.13AUD 167,510 Westpac Banking Corp 3,024 0.18
Beverages AUD 35,975 Coca-Cola Amatil Ltd 207 0.01AUD 36,758 Treasury Wine Estates Ltd 395 0.03
Biotechnology AUD 22,951 CSL Ltd^ 2,765 0.17
Building materials and fixtures AUD 51,039 Boral Ltd 207 0.01
Chemicals AUD 106,303 Incitec Pivot Ltd 237 0.01
Commercial services AUD 70,248 Brambles Ltd 411 0.02AUD 103,835 Transurban Group^ 799 0.05
Computers AUD 21,331 Computershare Ltd 240 0.01
Diversified financial services AUD 8,191 ASX Ltd 322 0.02
Electricity AUD 32,062 AGL Energy Ltd 459 0.03AUD 319,029 AusNet Services^ 336 0.02AUD 99,281 Origin Energy Ltd 618 0.04
Engineering & construction AUD 5,454 CIMIC Group Ltd 146 0.01AUD 24,223 LendLease Group 295 0.02AUD 55,971 Sydney Airport 264 0.01
Entertainment AUD 29,743 Aristocrat Leisure Ltd 579 0.04AUD 116,522 Tabcorp Holdings Ltd 330 0.02
Food AUD 53,894 Wesfarmers Ltd^ 1,592 0.10AUD 67,459 Woolworths Group Ltd 1,244 0.07
Healthcare products AUD 3,059 Cochlear Ltd 389 0.02
Healthcare services AUD 81,209 Healthscope Ltd 124 0.01AUD 6,117 Ramsay Health Care Ltd 243 0.01AUD 17,427 Sonic Healthcare Ltd 266 0.02
Hotels AUD 16,447 Crown Resorts Ltd 142 0.01
Ccy Holding Investment Fair value
€'000
% of net asset value
Australia (30 November 2017: 2.39%) (cont) Insurance
AUD 132,600 AMP Ltd^ 335 0.02AUD 25,675 Challenger Ltd 215 0.01AUD 119,782 Insurance Australia Group Ltd 632 0.04AUD 124,292 Medibank Pvt Ltd 236 0.02AUD 64,315 QBE Insurance Group Ltd 395 0.02AUD 59,528 Suncorp Group Ltd^ 518 0.03
Internet AUD 13,684 Seek Ltd^ 179 0.01
Iron & steel AUD 26,836 BlueScope Steel Ltd 302 0.02AUD 72,585 Fortescue Metals Group Ltd 221 0.01
Leisure time AUD 3,726 Flight Centre Travel Group Ltd^ 149 0.01
Mining AUD 143,821 Alumina Ltd 250 0.02AUD 158,475 BHP Billiton Ltd^ 3,368 0.20AUD 36,746 Newcrest Mining Ltd 495 0.03AUD 20,795 Rio Tinto Ltd^ 1,118 0.07AUD 236,961 South32 Ltd 572 0.03
Miscellaneous manufacturers AUD 21,100 Orica Ltd 242 0.01
Oil & gas AUD 12,315 Caltex Australia Ltd 235 0.01AUD 77,154 Santos Ltd 293 0.02AUD 46,779 Woodside Petroleum Ltd 983 0.06
Packaging & containers AUD 54,987 Amcor Ltd^ 501 0.03
Pipelines AUD 54,172 APA Group 305 0.02
Real estate investment & services AUD 2,415 REA Group Ltd 134 0.01
Real estate investment trusts AUD 41,738 Dexus 268 0.01AUD 77,837 Goodman Group^ 471 0.03AUD 86,050 GPT Group 280 0.02AUD 152,991 Mirvac Group 228 0.01AUD 291,659 Scentre Group 790 0.05AUD 104,657 Stockland 282 0.02AUD 148,159 Vicinity Centres 256 0.02
Retail AUD 2,871 Domino's Pizza Enterprises Ltd 92 0.00AUD 43,498 Harvey Norman Holdings Ltd^ 101 0.01
Software AUD 4,422 OneMarket Ltd 4 0.00
Telecommunications AUD 191,354 Telstra Corp Ltd 347 0.02AUD 23,235 TPG Telecom Ltd^ 84 0.01
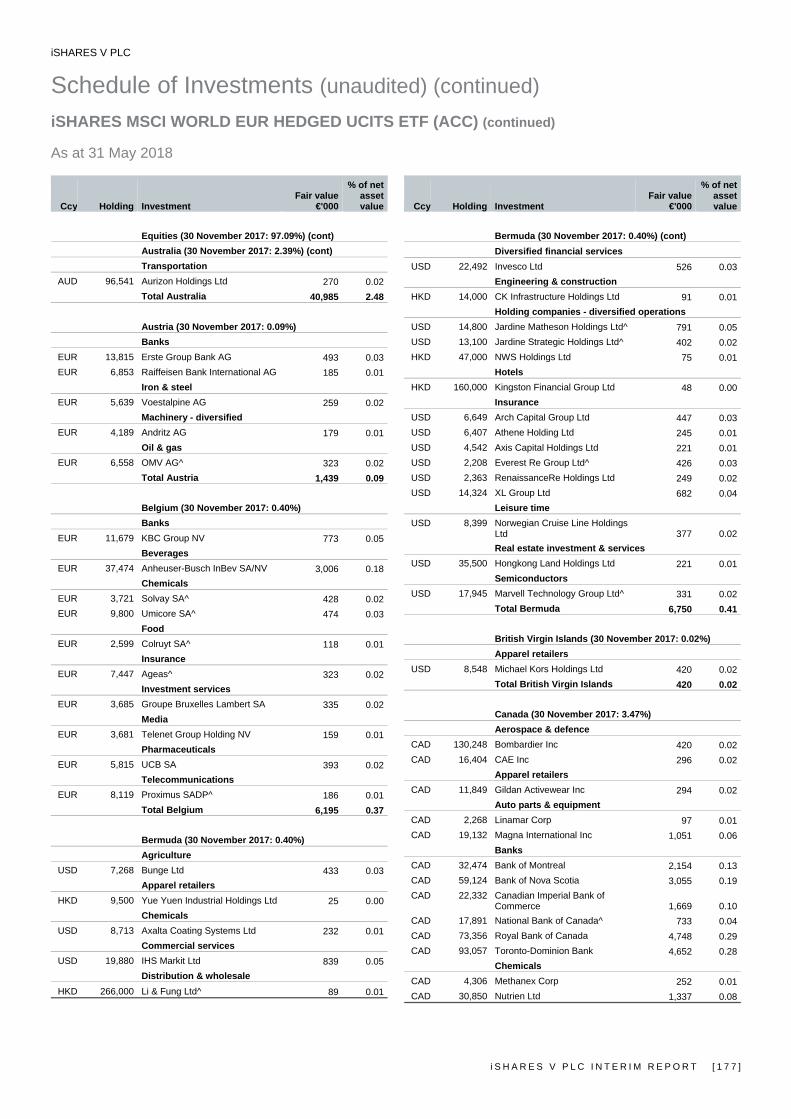
iSHARES V PLC
Schedule of Investments (unaudited) (continued) iSHARES MSCI WORLD EUR HEDGED UCITS ETF (ACC) (continued) As at 31 May 2018
i S H A R E S V P L C I N T E R I M R E P O R T [ 1 7 7 ]
Ccy Holding Investment Fair value
€'000
% of net asset value
Equities (30 November 2017: 97.09%) (cont) Australia (30 November 2017: 2.39%) (cont) Transportation
AUD 96,541 Aurizon Holdings Ltd 270 0.02Total Australia 40,985 2.48 Austria (30 November 2017: 0.09%) Banks
EUR 13,815 Erste Group Bank AG 493 0.03EUR 6,853 Raiffeisen Bank International AG 185 0.01
Iron & steel EUR 5,639 Voestalpine AG 259 0.02
Machinery - diversified EUR 4,189 Andritz AG 179 0.01
Oil & gas EUR 6,558 OMV AG^ 323 0.02
Total Austria 1,439 0.09
Belgium (30 November 2017: 0.40%) Banks
EUR 11,679 KBC Group NV 773 0.05Beverages
EUR 37,474 Anheuser-Busch InBev SA/NV 3,006 0.18Chemicals
EUR 3,721 Solvay SA^ 428 0.02EUR 9,800 Umicore SA^ 474 0.03
Food EUR 2,599 Colruyt SA^ 118 0.01
Insurance EUR 7,447 Ageas^ 323 0.02
Investment services EUR 3,685 Groupe Bruxelles Lambert SA 335 0.02
Media EUR 3,681 Telenet Group Holding NV 159 0.01
Pharmaceuticals EUR 5,815 UCB SA 393 0.02
Telecommunications EUR 8,119 Proximus SADP^ 186 0.01
Total Belgium 6,195 0.37
Bermuda (30 November 2017: 0.40%) Agriculture
USD 7,268 Bunge Ltd 433 0.03Apparel retailers
HKD 9,500 Yue Yuen Industrial Holdings Ltd 25 0.00Chemicals
USD 8,713 Axalta Coating Systems Ltd 232 0.01Commercial services
USD 19,880 IHS Markit Ltd 839 0.05Distribution & wholesale
HKD 266,000 Li & Fung Ltd^ 89 0.01
Ccy Holding Investment Fair value
€'000
% of net asset value
Bermuda (30 November 2017: 0.40%) (cont) Diversified financial services
USD 22,492 Invesco Ltd 526 0.03Engineering & construction
HKD 14,000 CK Infrastructure Holdings Ltd 91 0.01Holding companies - diversified operations
USD 14,800 Jardine Matheson Holdings Ltd^ 791 0.05USD 13,100 Jardine Strategic Holdings Ltd^ 402 0.02HKD 47,000 NWS Holdings Ltd 75 0.01
Hotels HKD 160,000 Kingston Financial Group Ltd 48 0.00
Insurance USD 6,649 Arch Capital Group Ltd 447 0.03USD 6,407 Athene Holding Ltd 245 0.01USD 4,542 Axis Capital Holdings Ltd 221 0.01USD 2,208 Everest Re Group Ltd^ 426 0.03USD 2,363 RenaissanceRe Holdings Ltd 249 0.02USD 14,324 XL Group Ltd 682 0.04
Leisure time USD 8,399 Norwegian Cruise Line Holdings
Ltd 377 0.02Real estate investment & services
USD 35,500 Hongkong Land Holdings Ltd 221 0.01Semiconductors
USD 17,945 Marvell Technology Group Ltd^ 331 0.02Total Bermuda 6,750 0.41
British Virgin Islands (30 November 2017: 0.02%) Apparel retailers
USD 8,548 Michael Kors Holdings Ltd 420 0.02Total British Virgin Islands 420 0.02
Canada (30 November 2017: 3.47%) Aerospace & defence
CAD 130,248 Bombardier Inc 420 0.02CAD 16,404 CAE Inc 296 0.02
Apparel retailers CAD 11,849 Gildan Activewear Inc 294 0.02
Auto parts & equipment CAD 2,268 Linamar Corp 97 0.01CAD 19,132 Magna International Inc 1,051 0.06
Banks CAD 32,474 Bank of Montreal 2,154 0.13CAD 59,124 Bank of Nova Scotia 3,055 0.19CAD 22,332 Canadian Imperial Bank of
Commerce 1,669 0.10CAD 17,891 National Bank of Canada^ 733 0.04CAD 73,356 Royal Bank of Canada 4,748 0.29CAD 93,057 Toronto-Dominion Bank 4,652 0.28
Chemicals CAD 4,306 Methanex Corp 252 0.01CAD 30,850 Nutrien Ltd 1,337 0.08
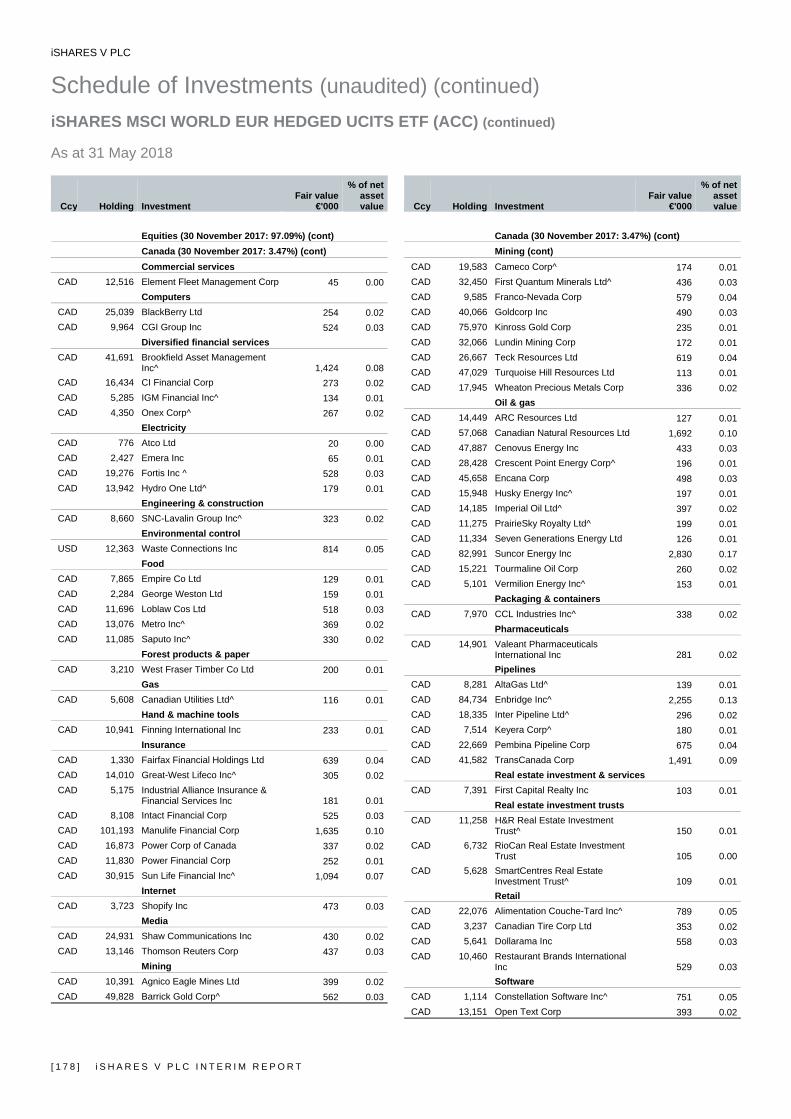
iSHARES V PLC
Schedule of Investments (unaudited) (continued) iSHARES MSCI WORLD EUR HEDGED UCITS ETF (ACC) (continued) As at 31 May 2018
[ 1 7 8 ] i S H A R E S V P L C I N T E R I M R E P O R T
Ccy Holding Investment Fair value
€'000
% of net asset value
Equities (30 November 2017: 97.09%) (cont) Canada (30 November 2017: 3.47%) (cont)
Commercial services CAD 12,516 Element Fleet Management Corp 45 0.00
Computers CAD 25,039 BlackBerry Ltd 254 0.02CAD 9,964 CGI Group Inc 524 0.03
Diversified financial services CAD 41,691 Brookfield Asset Management
Inc^ 1,424 0.08CAD 16,434 CI Financial Corp 273 0.02CAD 5,285 IGM Financial Inc^ 134 0.01CAD 4,350 Onex Corp^ 267 0.02
Electricity CAD 776 Atco Ltd 20 0.00CAD 2,427 Emera Inc 65 0.01CAD 19,276 Fortis Inc ^ 528 0.03CAD 13,942 Hydro One Ltd^ 179 0.01
Engineering & construction CAD 8,660 SNC-Lavalin Group Inc^ 323 0.02
Environmental control USD 12,363 Waste Connections Inc 814 0.05
Food CAD 7,865 Empire Co Ltd 129 0.01CAD 2,284 George Weston Ltd 159 0.01CAD 11,696 Loblaw Cos Ltd 518 0.03CAD 13,076 Metro Inc^ 369 0.02CAD 11,085 Saputo Inc^ 330 0.02
Forest products & paper CAD 3,210 West Fraser Timber Co Ltd 200 0.01
Gas CAD 5,608 Canadian Utilities Ltd^ 116 0.01
Hand & machine tools CAD 10,941 Finning International Inc 233 0.01
Insurance CAD 1,330 Fairfax Financial Holdings Ltd 639 0.04CAD 14,010 Great-West Lifeco Inc^ 305 0.02CAD 5,175 Industrial Alliance Insurance &
Financial Services Inc 181 0.01CAD 8,108 Intact Financial Corp 525 0.03CAD 101,193 Manulife Financial Corp 1,635 0.10CAD 16,873 Power Corp of Canada 337 0.02CAD 11,830 Power Financial Corp 252 0.01CAD 30,915 Sun Life Financial Inc^ 1,094 0.07
Internet CAD 3,723 Shopify Inc 473 0.03
Media CAD 24,931 Shaw Communications Inc 430 0.02CAD 13,146 Thomson Reuters Corp 437 0.03
Mining CAD 10,391 Agnico Eagle Mines Ltd 399 0.02CAD 49,828 Barrick Gold Corp^ 562 0.03
Ccy Holding Investment Fair value
€'000
% of net asset value
Canada (30 November 2017: 3.47%) (cont) Mining (cont)
CAD 19,583 Cameco Corp^ 174 0.01CAD 32,450 First Quantum Minerals Ltd^ 436 0.03CAD 9,585 Franco-Nevada Corp 579 0.04CAD 40,066 Goldcorp Inc 490 0.03CAD 75,970 Kinross Gold Corp 235 0.01CAD 32,066 Lundin Mining Corp 172 0.01CAD 26,667 Teck Resources Ltd 619 0.04CAD 47,029 Turquoise Hill Resources Ltd 113 0.01CAD 17,945 Wheaton Precious Metals Corp 336 0.02
Oil & gas CAD 14,449 ARC Resources Ltd 127 0.01CAD 57,068 Canadian Natural Resources Ltd 1,692 0.10CAD 47,887 Cenovus Energy Inc 433 0.03CAD 28,428 Crescent Point Energy Corp^ 196 0.01CAD 45,658 Encana Corp 498 0.03CAD 15,948 Husky Energy Inc^ 197 0.01CAD 14,185 Imperial Oil Ltd^ 397 0.02CAD 11,275 PrairieSky Royalty Ltd^ 199 0.01CAD 11,334 Seven Generations Energy Ltd 126 0.01CAD 82,991 Suncor Energy Inc 2,830 0.17CAD 15,221 Tourmaline Oil Corp 260 0.02CAD 5,101 Vermilion Energy Inc^ 153 0.01
Packaging & containers CAD 7,970 CCL Industries Inc^ 338 0.02
Pharmaceuticals CAD 14,901 Valeant Pharmaceuticals
International Inc 281 0.02Pipelines
CAD 8,281 AltaGas Ltd^ 139 0.01CAD 84,734 Enbridge Inc^ 2,255 0.13CAD 18,335 Inter Pipeline Ltd^ 296 0.02CAD 7,514 Keyera Corp^ 180 0.01CAD 22,669 Pembina Pipeline Corp 675 0.04CAD 41,582 TransCanada Corp 1,491 0.09
Real estate investment & services CAD 7,391 First Capital Realty Inc 103 0.01
Real estate investment trusts CAD 11,258 H&R Real Estate Investment
Trust^ 150 0.01CAD 6,732 RioCan Real Estate Investment
Trust 105 0.00CAD 5,628 SmartCentres Real Estate
Investment Trust^ 109 0.01Retail
CAD 22,076 Alimentation Couche-Tard Inc^ 789 0.05CAD 3,237 Canadian Tire Corp Ltd 353 0.02CAD 5,641 Dollarama Inc 558 0.03CAD 10,460 Restaurant Brands International
Inc 529 0.03Software
CAD 1,114 Constellation Software Inc^ 751 0.05CAD 13,151 Open Text Corp 393 0.02
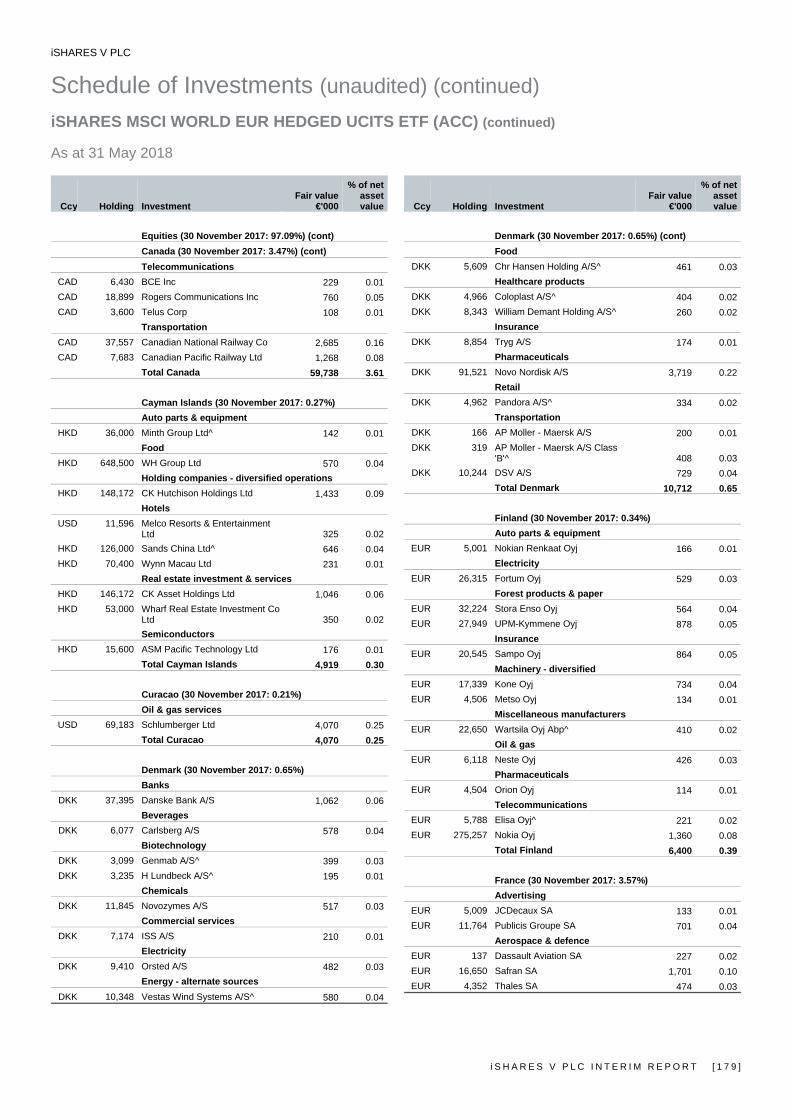
iSHARES V PLC
Schedule of Investments (unaudited) (continued) iSHARES MSCI WORLD EUR HEDGED UCITS ETF (ACC) (continued) As at 31 May 2018
i S H A R E S V P L C I N T E R I M R E P O R T [ 1 7 9 ]
Ccy Holding Investment Fair value
€'000
% of net asset value
Equities (30 November 2017: 97.09%) (cont) Canada (30 November 2017: 3.47%) (cont)
Telecommunications CAD 6,430 BCE Inc 229 0.01CAD 18,899 Rogers Communications Inc 760 0.05CAD 3,600 Telus Corp 108 0.01
Transportation CAD 37,557 Canadian National Railway Co 2,685 0.16CAD 7,683 Canadian Pacific Railway Ltd 1,268 0.08
Total Canada 59,738 3.61
Cayman Islands (30 November 2017: 0.27%) Auto parts & equipment
HKD 36,000 Minth Group Ltd^ 142 0.01Food
HKD 648,500 WH Group Ltd 570 0.04Holding companies - diversified operations
HKD 148,172 CK Hutchison Holdings Ltd 1,433 0.09Hotels
USD 11,596 Melco Resorts & Entertainment Ltd 325 0.02
HKD 126,000 Sands China Ltd^ 646 0.04HKD 70,400 Wynn Macau Ltd 231 0.01
Real estate investment & services HKD 146,172 CK Asset Holdings Ltd 1,046 0.06HKD 53,000 Wharf Real Estate Investment Co
Ltd 350 0.02Semiconductors
HKD 15,600 ASM Pacific Technology Ltd 176 0.01Total Cayman Islands 4,919 0.30
Curacao (30 November 2017: 0.21%) Oil & gas services
USD 69,183 Schlumberger Ltd 4,070 0.25Total Curacao 4,070 0.25
Denmark (30 November 2017: 0.65%) Banks
DKK 37,395 Danske Bank A/S 1,062 0.06Beverages
DKK 6,077 Carlsberg A/S 578 0.04Biotechnology
DKK 3,099 Genmab A/S^ 399 0.03DKK 3,235 H Lundbeck A/S^ 195 0.01
Chemicals DKK 11,845 Novozymes A/S 517 0.03
Commercial services DKK 7,174 ISS A/S 210 0.01
Electricity DKK 9,410 Orsted A/S 482 0.03
Energy - alternate sources DKK 10,348 Vestas Wind Systems A/S^ 580 0.04
Ccy Holding Investment Fair value
€'000
% of net asset value
Denmark (30 November 2017: 0.65%) (cont) Food
DKK 5,609 Chr Hansen Holding A/S^ 461 0.03Healthcare products
DKK 4,966 Coloplast A/S^ 404 0.02DKK 8,343 William Demant Holding A/S^ 260 0.02
Insurance DKK 8,854 Tryg A/S 174 0.01
Pharmaceuticals DKK 91,521 Novo Nordisk A/S 3,719 0.22
Retail DKK 4,962 Pandora A/S^ 334 0.02
Transportation DKK 166 AP Moller - Maersk A/S 200 0.01DKK 319 AP Moller - Maersk A/S Class
'B'^ 408 0.03DKK 10,244 DSV A/S 729 0.04
Total Denmark 10,712 0.65
Finland (30 November 2017: 0.34%) Auto parts & equipment
EUR 5,001 Nokian Renkaat Oyj 166 0.01Electricity
EUR 26,315 Fortum Oyj 529 0.03Forest products & paper
EUR 32,224 Stora Enso Oyj 564 0.04EUR 27,949 UPM-Kymmene Oyj 878 0.05
Insurance EUR 20,545 Sampo Oyj 864 0.05
Machinery - diversified EUR 17,339 Kone Oyj 734 0.04EUR 4,506 Metso Oyj 134 0.01
Miscellaneous manufacturers EUR 22,650 Wartsila Oyj Abp^ 410 0.02
Oil & gas EUR 6,118 Neste Oyj 426 0.03
Pharmaceuticals EUR 4,504 Orion Oyj 114 0.01
Telecommunications EUR 5,788 Elisa Oyj^ 221 0.02EUR 275,257 Nokia Oyj 1,360 0.08
Total Finland 6,400 0.39
France (30 November 2017: 3.57%) Advertising
EUR 5,009 JCDecaux SA 133 0.01EUR 11,764 Publicis Groupe SA 701 0.04
Aerospace & defence EUR 137 Dassault Aviation SA 227 0.02EUR 16,650 Safran SA 1,701 0.10EUR 4,352 Thales SA 474 0.03
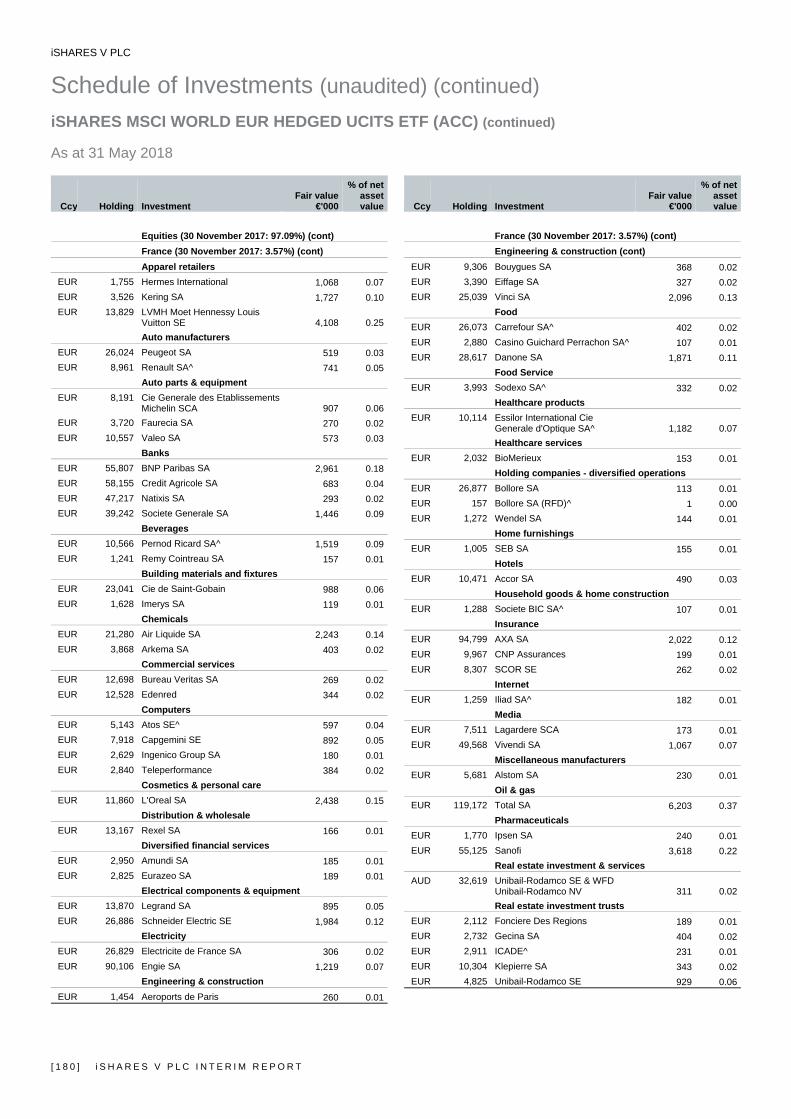
iSHARES V PLC
Schedule of Investments (unaudited) (continued) iSHARES MSCI WORLD EUR HEDGED UCITS ETF (ACC) (continued) As at 31 May 2018
[ 1 8 0 ] i S H A R E S V P L C I N T E R I M R E P O R T
Ccy Holding Investment Fair value
€'000
% of net asset value
Equities (30 November 2017: 97.09%) (cont) France (30 November 2017: 3.57%) (cont)
Apparel retailers EUR 1,755 Hermes International 1,068 0.07EUR 3,526 Kering SA 1,727 0.10EUR 13,829 LVMH Moet Hennessy Louis
Vuitton SE 4,108 0.25Auto manufacturers
EUR 26,024 Peugeot SA 519 0.03EUR 8,961 Renault SA^ 741 0.05
Auto parts & equipment EUR 8,191 Cie Generale des Etablissements
Michelin SCA 907 0.06EUR 3,720 Faurecia SA 270 0.02EUR 10,557 Valeo SA 573 0.03
Banks EUR 55,807 BNP Paribas SA 2,961 0.18EUR 58,155 Credit Agricole SA 683 0.04EUR 47,217 Natixis SA 293 0.02EUR 39,242 Societe Generale SA 1,446 0.09
Beverages EUR 10,566 Pernod Ricard SA^ 1,519 0.09EUR 1,241 Remy Cointreau SA 157 0.01
Building materials and fixtures EUR 23,041 Cie de Saint-Gobain 988 0.06EUR 1,628 Imerys SA 119 0.01
Chemicals EUR 21,280 Air Liquide SA 2,243 0.14EUR 3,868 Arkema SA 403 0.02
Commercial services EUR 12,698 Bureau Veritas SA 269 0.02EUR 12,528 Edenred 344 0.02
Computers EUR 5,143 Atos SE^ 597 0.04EUR 7,918 Capgemini SE 892 0.05EUR 2,629 Ingenico Group SA 180 0.01EUR 2,840 Teleperformance 384 0.02
Cosmetics & personal care EUR 11,860 L'Oreal SA 2,438 0.15
Distribution & wholesale EUR 13,167 Rexel SA 166 0.01
Diversified financial services EUR 2,950 Amundi SA 185 0.01EUR 2,825 Eurazeo SA 189 0.01
Electrical components & equipment EUR 13,870 Legrand SA 895 0.05EUR 26,886 Schneider Electric SE 1,984 0.12
Electricity EUR 26,829 Electricite de France SA 306 0.02EUR 90,106 Engie SA 1,219 0.07
Engineering & construction EUR 1,454 Aeroports de Paris 260 0.01
Ccy Holding Investment Fair value
€'000
% of net asset value
France (30 November 2017: 3.57%) (cont) Engineering & construction (cont)
EUR 9,306 Bouygues SA 368 0.02EUR 3,390 Eiffage SA 327 0.02EUR 25,039 Vinci SA 2,096 0.13
Food EUR 26,073 Carrefour SA^ 402 0.02EUR 2,880 Casino Guichard Perrachon SA^ 107 0.01EUR 28,617 Danone SA 1,871 0.11
Food Service EUR 3,993 Sodexo SA^ 332 0.02
Healthcare products EUR 10,114 Essilor International Cie
Generale d'Optique SA^ 1,182 0.07Healthcare services
EUR 2,032 BioMerieux 153 0.01Holding companies - diversified operations
EUR 26,877 Bollore SA 113 0.01EUR 157 Bollore SA (RFD)^ 1 0.00EUR 1,272 Wendel SA 144 0.01
Home furnishings EUR 1,005 SEB SA 155 0.01
Hotels EUR 10,471 Accor SA 490 0.03
Household goods & home construction EUR 1,288 Societe BIC SA^ 107 0.01
Insurance EUR 94,799 AXA SA 2,022 0.12EUR 9,967 CNP Assurances 199 0.01EUR 8,307 SCOR SE 262 0.02
Internet EUR 1,259 Iliad SA^ 182 0.01
Media EUR 7,511 Lagardere SCA 173 0.01EUR 49,568 Vivendi SA 1,067 0.07
Miscellaneous manufacturers EUR 5,681 Alstom SA 230 0.01
Oil & gas EUR 119,172 Total SA 6,203 0.37
Pharmaceuticals EUR 1,770 Ipsen SA 240 0.01EUR 55,125 Sanofi 3,618 0.22
Real estate investment & services AUD 32,619 Unibail-Rodamco SE & WFD
Unibail-Rodamco NV 311 0.02Real estate investment trusts
EUR 2,112 Fonciere Des Regions 189 0.01EUR 2,732 Gecina SA 404 0.02EUR 2,911 ICADE^ 231 0.01EUR 10,304 Klepierre SA 343 0.02EUR 4,825 Unibail-Rodamco SE 929 0.06
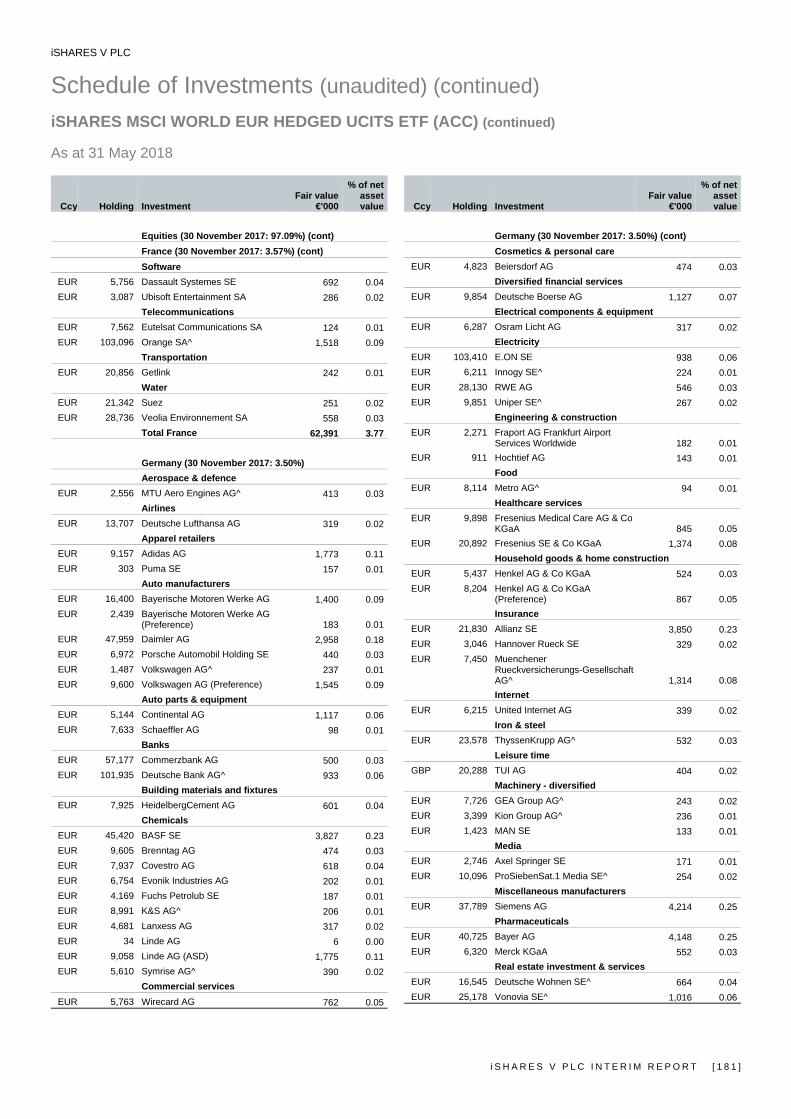
iSHARES V PLC
Schedule of Investments (unaudited) (continued) iSHARES MSCI WORLD EUR HEDGED UCITS ETF (ACC) (continued) As at 31 May 2018
i S H A R E S V P L C I N T E R I M R E P O R T [ 1 8 1 ]
Ccy Holding Investment Fair value
€'000
% of net asset value
Equities (30 November 2017: 97.09%) (cont) France (30 November 2017: 3.57%) (cont)
Software EUR 5,756 Dassault Systemes SE 692 0.04EUR 3,087 Ubisoft Entertainment SA 286 0.02
Telecommunications EUR 7,562 Eutelsat Communications SA 124 0.01EUR 103,096 Orange SA^ 1,518 0.09
Transportation EUR 20,856 Getlink 242 0.01
Water EUR 21,342 Suez 251 0.02EUR 28,736 Veolia Environnement SA 558 0.03
Total France 62,391 3.77
Germany (30 November 2017: 3.50%) Aerospace & defence
EUR 2,556 MTU Aero Engines AG^ 413 0.03Airlines
EUR 13,707 Deutsche Lufthansa AG 319 0.02Apparel retailers
EUR 9,157 Adidas AG 1,773 0.11EUR 303 Puma SE 157 0.01
Auto manufacturers EUR 16,400 Bayerische Motoren Werke AG 1,400 0.09EUR 2,439 Bayerische Motoren Werke AG
(Preference) 183 0.01EUR 47,959 Daimler AG 2,958 0.18EUR 6,972 Porsche Automobil Holding SE 440 0.03EUR 1,487 Volkswagen AG^ 237 0.01EUR 9,600 Volkswagen AG (Preference) 1,545 0.09
Auto parts & equipment EUR 5,144 Continental AG 1,117 0.06EUR 7,633 Schaeffler AG 98 0.01
Banks EUR 57,177 Commerzbank AG 500 0.03EUR 101,935 Deutsche Bank AG^ 933 0.06
Building materials and fixtures EUR 7,925 HeidelbergCement AG 601 0.04
Chemicals EUR 45,420 BASF SE 3,827 0.23EUR 9,605 Brenntag AG 474 0.03EUR 7,937 Covestro AG 618 0.04EUR 6,754 Evonik Industries AG 202 0.01EUR 4,169 Fuchs Petrolub SE 187 0.01EUR 8,991 K&S AG^ 206 0.01EUR 4,681 Lanxess AG 317 0.02EUR 34 Linde AG 6 0.00EUR 9,058 Linde AG (ASD) 1,775 0.11EUR 5,610 Symrise AG^ 390 0.02
Commercial services EUR 5,763 Wirecard AG 762 0.05
Ccy Holding Investment Fair value
€'000
% of net asset value
Germany (30 November 2017: 3.50%) (cont) Cosmetics & personal care
EUR 4,823 Beiersdorf AG 474 0.03Diversified financial services
EUR 9,854 Deutsche Boerse AG 1,127 0.07Electrical components & equipment
EUR 6,287 Osram Licht AG 317 0.02Electricity
EUR 103,410 E.ON SE 938 0.06EUR 6,211 Innogy SE^ 224 0.01EUR 28,130 RWE AG 546 0.03EUR 9,851 Uniper SE^ 267 0.02
Engineering & construction EUR 2,271 Fraport AG Frankfurt Airport
Services Worldwide 182 0.01EUR 911 Hochtief AG 143 0.01
Food EUR 8,114 Metro AG^ 94 0.01
Healthcare services EUR 9,898 Fresenius Medical Care AG & Co
KGaA 845 0.05EUR 20,892 Fresenius SE & Co KGaA 1,374 0.08
Household goods & home construction EUR 5,437 Henkel AG & Co KGaA 524 0.03EUR 8,204 Henkel AG & Co KGaA
(Preference) 867 0.05Insurance
EUR 21,830 Allianz SE 3,850 0.23EUR 3,046 Hannover Rueck SE 329 0.02EUR 7,450 Muenchener
Rueckversicherungs-Gesellschaft AG^ 1,314 0.08Internet
EUR 6,215 United Internet AG 339 0.02Iron & steel
EUR 23,578 ThyssenKrupp AG^ 532 0.03Leisure time
GBP 20,288 TUI AG 404 0.02Machinery - diversified
EUR 7,726 GEA Group AG^ 243 0.02EUR 3,399 Kion Group AG^ 236 0.01EUR 1,423 MAN SE 133 0.01
Media EUR 2,746 Axel Springer SE 171 0.01EUR 10,096 ProSiebenSat.1 Media SE^ 254 0.02
Miscellaneous manufacturers EUR 37,789 Siemens AG 4,214 0.25
Pharmaceuticals EUR 40,725 Bayer AG 4,148 0.25EUR 6,320 Merck KGaA 552 0.03
Real estate investment & services EUR 16,545 Deutsche Wohnen SE^ 664 0.04EUR 25,178 Vonovia SE^ 1,016 0.06
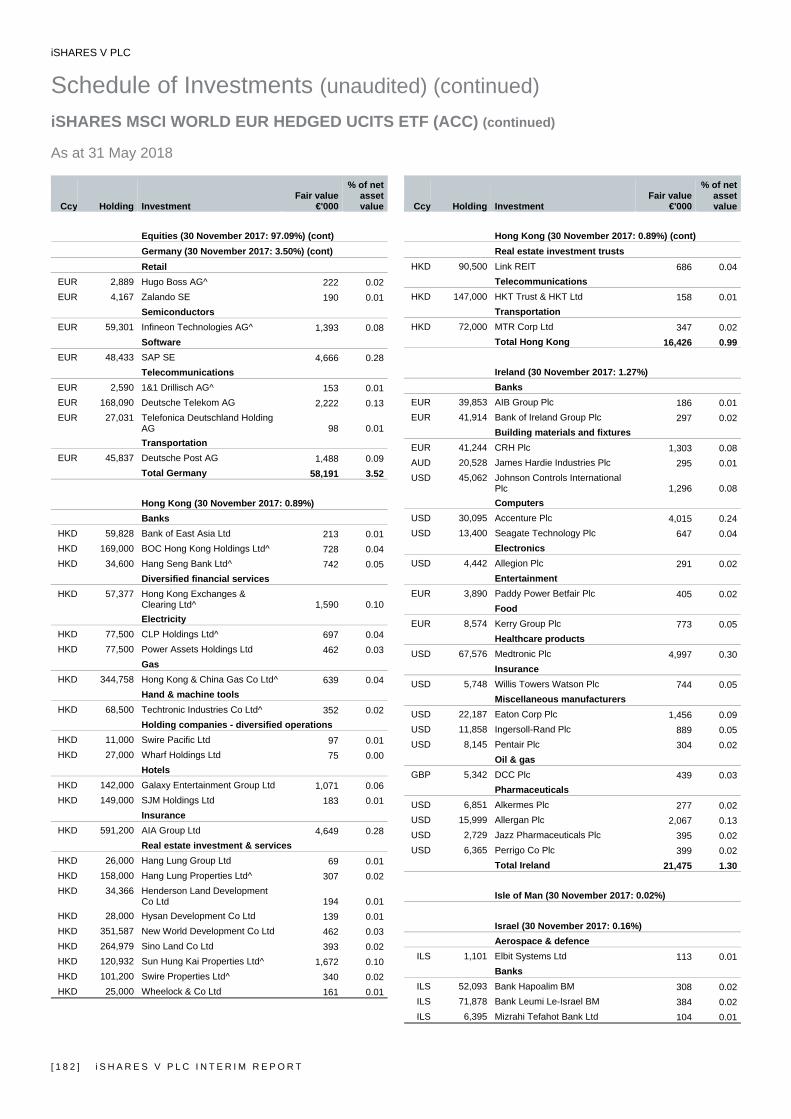
iSHARES V PLC
Schedule of Investments (unaudited) (continued) iSHARES MSCI WORLD EUR HEDGED UCITS ETF (ACC) (continued) As at 31 May 2018
[ 1 8 2 ] i S H A R E S V P L C I N T E R I M R E P O R T
Ccy Holding Investment Fair value
€'000
% of net asset value
Equities (30 November 2017: 97.09%) (cont) Germany (30 November 2017: 3.50%) (cont)
Retail EUR 2,889 Hugo Boss AG^ 222 0.02EUR 4,167 Zalando SE 190 0.01
Semiconductors EUR 59,301 Infineon Technologies AG^ 1,393 0.08
Software EUR 48,433 SAP SE 4,666 0.28
Telecommunications EUR 2,590 1&1 Drillisch AG^ 153 0.01EUR 168,090 Deutsche Telekom AG 2,222 0.13EUR 27,031 Telefonica Deutschland Holding
AG 98 0.01Transportation
EUR 45,837 Deutsche Post AG 1,488 0.09Total Germany 58,191 3.52
Hong Kong (30 November 2017: 0.89%) Banks
HKD 59,828 Bank of East Asia Ltd 213 0.01HKD 169,000 BOC Hong Kong Holdings Ltd^ 728 0.04HKD 34,600 Hang Seng Bank Ltd^ 742 0.05
Diversified financial services HKD 57,377 Hong Kong Exchanges &
Clearing Ltd^ 1,590 0.10Electricity
HKD 77,500 CLP Holdings Ltd^ 697 0.04HKD 77,500 Power Assets Holdings Ltd 462 0.03
Gas HKD 344,758 Hong Kong & China Gas Co Ltd^ 639 0.04
Hand & machine tools HKD 68,500 Techtronic Industries Co Ltd^ 352 0.02
Holding companies - diversified operations HKD 11,000 Swire Pacific Ltd 97 0.01HKD 27,000 Wharf Holdings Ltd 75 0.00
Hotels HKD 142,000 Galaxy Entertainment Group Ltd 1,071 0.06HKD 149,000 SJM Holdings Ltd 183 0.01
Insurance HKD 591,200 AIA Group Ltd 4,649 0.28
Real estate investment & services HKD 26,000 Hang Lung Group Ltd 69 0.01HKD 158,000 Hang Lung Properties Ltd^ 307 0.02HKD 34,366 Henderson Land Development
Co Ltd 194 0.01HKD 28,000 Hysan Development Co Ltd 139 0.01HKD 351,587 New World Development Co Ltd 462 0.03HKD 264,979 Sino Land Co Ltd 393 0.02HKD 120,932 Sun Hung Kai Properties Ltd^ 1,672 0.10HKD 101,200 Swire Properties Ltd^ 340 0.02HKD 25,000 Wheelock & Co Ltd 161 0.01
Ccy Holding Investment Fair value
€'000
% of net asset value
Hong Kong (30 November 2017: 0.89%) (cont) Real estate investment trusts
HKD 90,500 Link REIT 686 0.04Telecommunications
HKD 147,000 HKT Trust & HKT Ltd 158 0.01Transportation
HKD 72,000 MTR Corp Ltd 347 0.02Total Hong Kong 16,426 0.99
Ireland (30 November 2017: 1.27%) Banks
EUR 39,853 AIB Group Plc 186 0.01EUR 41,914 Bank of Ireland Group Plc 297 0.02
Building materials and fixtures EUR 41,244 CRH Plc 1,303 0.08AUD 20,528 James Hardie Industries Plc 295 0.01USD 45,062 Johnson Controls International
Plc 1,296 0.08Computers
USD 30,095 Accenture Plc 4,015 0.24USD 13,400 Seagate Technology Plc 647 0.04
Electronics USD 4,442 Allegion Plc 291 0.02
Entertainment EUR 3,890 Paddy Power Betfair Plc 405 0.02
Food EUR 8,574 Kerry Group Plc 773 0.05
Healthcare products USD 67,576 Medtronic Plc 4,997 0.30
Insurance USD 5,748 Willis Towers Watson Plc 744 0.05
Miscellaneous manufacturers USD 22,187 Eaton Corp Plc 1,456 0.09USD 11,858 Ingersoll-Rand Plc 889 0.05USD 8,145 Pentair Plc 304 0.02
Oil & gas GBP 5,342 DCC Plc 439 0.03
Pharmaceuticals USD 6,851 Alkermes Plc 277 0.02USD 15,999 Allergan Plc 2,067 0.13USD 2,729 Jazz Pharmaceuticals Plc 395 0.02USD 6,365 Perrigo Co Plc 399 0.02
Total Ireland 21,475 1.30
Isle of Man (30 November 2017: 0.02%) Israel (30 November 2017: 0.16%) Aerospace & defence
ILS 1,101 Elbit Systems Ltd 113 0.01Banks
ILS 52,093 Bank Hapoalim BM 308 0.02ILS 71,878 Bank Leumi Le-Israel BM 384 0.02ILS 6,395 Mizrahi Tefahot Bank Ltd 104 0.01
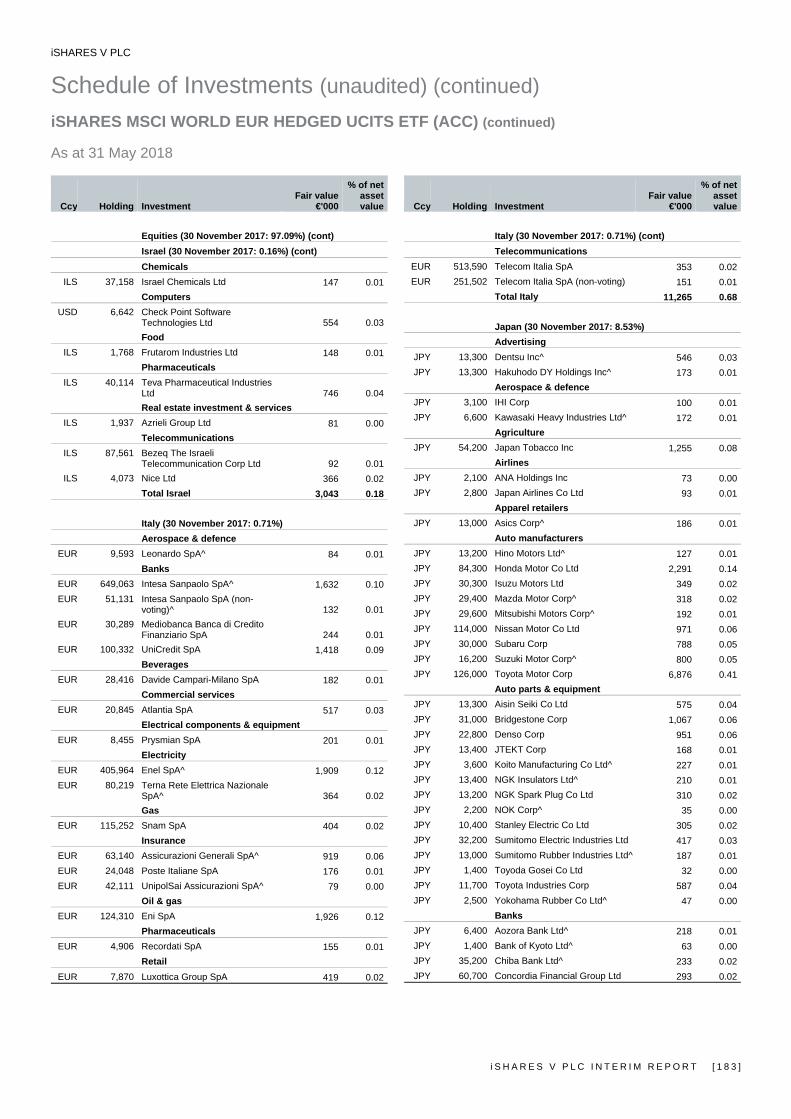
iSHARES V PLC
Schedule of Investments (unaudited) (continued) iSHARES MSCI WORLD EUR HEDGED UCITS ETF (ACC) (continued) As at 31 May 2018
i S H A R E S V P L C I N T E R I M R E P O R T [ 1 8 3 ]
Ccy Holding Investment Fair value
€'000
% of net asset value
Equities (30 November 2017: 97.09%) (cont) Israel (30 November 2017: 0.16%) (cont)
Chemicals ILS 37,158 Israel Chemicals Ltd 147 0.01
Computers USD 6,642 Check Point Software
Technologies Ltd 554 0.03Food
ILS 1,768 Frutarom Industries Ltd 148 0.01Pharmaceuticals
ILS 40,114 Teva Pharmaceutical Industries Ltd 746 0.04Real estate investment & services
ILS 1,937 Azrieli Group Ltd 81 0.00Telecommunications
ILS 87,561 Bezeq The Israeli Telecommunication Corp Ltd 92 0.01
ILS 4,073 Nice Ltd 366 0.02Total Israel 3,043 0.18
Italy (30 November 2017: 0.71%) Aerospace & defence
EUR 9,593 Leonardo SpA^ 84 0.01Banks
EUR 649,063 Intesa Sanpaolo SpA^ 1,632 0.10EUR 51,131 Intesa Sanpaolo SpA (non-
voting)^ 132 0.01EUR 30,289 Mediobanca Banca di Credito
Finanziario SpA 244 0.01EUR 100,332 UniCredit SpA 1,418 0.09
Beverages EUR 28,416 Davide Campari-Milano SpA 182 0.01
Commercial services EUR 20,845 Atlantia SpA 517 0.03
Electrical components & equipment EUR 8,455 Prysmian SpA 201 0.01
Electricity EUR 405,964 Enel SpA^ 1,909 0.12EUR 80,219 Terna Rete Elettrica Nazionale
SpA^ 364 0.02Gas
EUR 115,252 Snam SpA 404 0.02Insurance
EUR 63,140 Assicurazioni Generali SpA^ 919 0.06EUR 24,048 Poste Italiane SpA 176 0.01EUR 42,111 UnipolSai Assicurazioni SpA^ 79 0.00
Oil & gas EUR 124,310 Eni SpA 1,926 0.12
Pharmaceuticals EUR 4,906 Recordati SpA 155 0.01
Retail EUR 7,870 Luxottica Group SpA 419 0.02
Ccy Holding Investment Fair value
€'000
% of net asset value
Italy (30 November 2017: 0.71%) (cont) Telecommunications
EUR 513,590 Telecom Italia SpA 353 0.02EUR 251,502 Telecom Italia SpA (non-voting) 151 0.01
Total Italy 11,265 0.68
Japan (30 November 2017: 8.53%) Advertising
JPY 13,300 Dentsu Inc^ 546 0.03JPY 13,300 Hakuhodo DY Holdings Inc^ 173 0.01
Aerospace & defence JPY 3,100 IHI Corp 100 0.01JPY 6,600 Kawasaki Heavy Industries Ltd^ 172 0.01
Agriculture JPY 54,200 Japan Tobacco Inc 1,255 0.08
Airlines JPY 2,100 ANA Holdings Inc 73 0.00JPY 2,800 Japan Airlines Co Ltd 93 0.01
Apparel retailers JPY 13,000 Asics Corp^ 186 0.01
Auto manufacturers JPY 13,200 Hino Motors Ltd^ 127 0.01JPY 84,300 Honda Motor Co Ltd 2,291 0.14JPY 30,300 Isuzu Motors Ltd 349 0.02JPY 29,400 Mazda Motor Corp^ 318 0.02JPY 29,600 Mitsubishi Motors Corp^ 192 0.01JPY 114,000 Nissan Motor Co Ltd 971 0.06JPY 30,000 Subaru Corp 788 0.05JPY 16,200 Suzuki Motor Corp^ 800 0.05JPY 126,000 Toyota Motor Corp 6,876 0.41
Auto parts & equipment JPY 13,300 Aisin Seiki Co Ltd 575 0.04JPY 31,000 Bridgestone Corp 1,067 0.06JPY 22,800 Denso Corp 951 0.06JPY 13,400 JTEKT Corp 168 0.01JPY 3,600 Koito Manufacturing Co Ltd^ 227 0.01JPY 13,400 NGK Insulators Ltd^ 210 0.01JPY 13,200 NGK Spark Plug Co Ltd 310 0.02JPY 2,200 NOK Corp^ 35 0.00JPY 10,400 Stanley Electric Co Ltd 305 0.02JPY 32,200 Sumitomo Electric Industries Ltd 417 0.03JPY 13,000 Sumitomo Rubber Industries Ltd^ 187 0.01JPY 1,400 Toyoda Gosei Co Ltd 32 0.00JPY 11,700 Toyota Industries Corp 587 0.04JPY 2,500 Yokohama Rubber Co Ltd^ 47 0.00
Banks JPY 6,400 Aozora Bank Ltd^ 218 0.01JPY 1,400 Bank of Kyoto Ltd^ 63 0.00JPY 35,200 Chiba Bank Ltd^ 233 0.02JPY 60,700 Concordia Financial Group Ltd 293 0.02
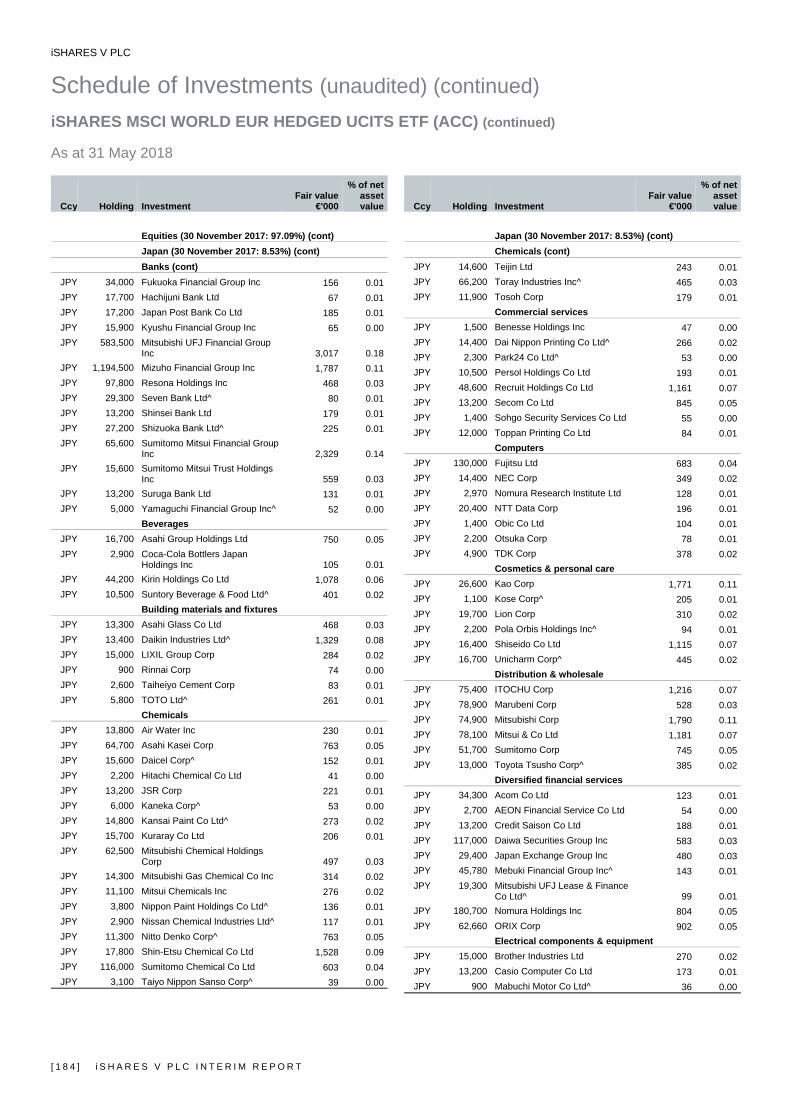
iSHARES V PLC
Schedule of Investments (unaudited) (continued) iSHARES MSCI WORLD EUR HEDGED UCITS ETF (ACC) (continued) As at 31 May 2018
[ 1 8 4 ] i S H A R E S V P L C I N T E R I M R E P O R T
Ccy Holding Investment Fair value
€'000
% of net asset value
Equities (30 November 2017: 97.09%) (cont) Japan (30 November 2017: 8.53%) (cont) Banks (cont)
JPY 34,000 Fukuoka Financial Group Inc 156 0.01JPY 17,700 Hachijuni Bank Ltd 67 0.01JPY 17,200 Japan Post Bank Co Ltd 185 0.01JPY 15,900 Kyushu Financial Group Inc 65 0.00JPY 583,500 Mitsubishi UFJ Financial Group
Inc 3,017 0.18JPY 1,194,500 Mizuho Financial Group Inc 1,787 0.11JPY 97,800 Resona Holdings Inc 468 0.03JPY 29,300 Seven Bank Ltd^ 80 0.01JPY 13,200 Shinsei Bank Ltd 179 0.01JPY 27,200 Shizuoka Bank Ltd^ 225 0.01JPY 65,600 Sumitomo Mitsui Financial Group
Inc 2,329 0.14JPY 15,600 Sumitomo Mitsui Trust Holdings
Inc 559 0.03JPY 13,200 Suruga Bank Ltd 131 0.01JPY 5,000 Yamaguchi Financial Group Inc^ 52 0.00
Beverages JPY 16,700 Asahi Group Holdings Ltd 750 0.05JPY 2,900 Coca-Cola Bottlers Japan
Holdings Inc 105 0.01JPY 44,200 Kirin Holdings Co Ltd 1,078 0.06JPY 10,500 Suntory Beverage & Food Ltd^ 401 0.02
Building materials and fixtures JPY 13,300 Asahi Glass Co Ltd 468 0.03JPY 13,400 Daikin Industries Ltd^ 1,329 0.08JPY 15,000 LIXIL Group Corp 284 0.02JPY 900 Rinnai Corp 74 0.00JPY 2,600 Taiheiyo Cement Corp 83 0.01JPY 5,800 TOTO Ltd^ 261 0.01
Chemicals JPY 13,800 Air Water Inc 230 0.01JPY 64,700 Asahi Kasei Corp 763 0.05JPY 15,600 Daicel Corp^ 152 0.01JPY 2,200 Hitachi Chemical Co Ltd 41 0.00JPY 13,200 JSR Corp 221 0.01JPY 6,000 Kaneka Corp^ 53 0.00JPY 14,800 Kansai Paint Co Ltd^ 273 0.02JPY 15,700 Kuraray Co Ltd 206 0.01JPY 62,500 Mitsubishi Chemical Holdings
Corp 497 0.03JPY 14,300 Mitsubishi Gas Chemical Co Inc 314 0.02JPY 11,100 Mitsui Chemicals Inc 276 0.02JPY 3,800 Nippon Paint Holdings Co Ltd^ 136 0.01JPY 2,900 Nissan Chemical Industries Ltd^ 117 0.01JPY 11,300 Nitto Denko Corp^ 763 0.05JPY 17,800 Shin-Etsu Chemical Co Ltd 1,528 0.09JPY 116,000 Sumitomo Chemical Co Ltd 603 0.04JPY 3,100 Taiyo Nippon Sanso Corp^ 39 0.00
Ccy Holding Investment Fair value
€'000
% of net asset value
Japan (30 November 2017: 8.53%) (cont) Chemicals (cont)
JPY 14,600 Teijin Ltd 243 0.01JPY 66,200 Toray Industries Inc^ 465 0.03JPY 11,900 Tosoh Corp 179 0.01
Commercial services JPY 1,500 Benesse Holdings Inc 47 0.00JPY 14,400 Dai Nippon Printing Co Ltd^ 266 0.02JPY 2,300 Park24 Co Ltd^ 53 0.00JPY 10,500 Persol Holdings Co Ltd 193 0.01JPY 48,600 Recruit Holdings Co Ltd 1,161 0.07JPY 13,200 Secom Co Ltd 845 0.05JPY 1,400 Sohgo Security Services Co Ltd 55 0.00JPY 12,000 Toppan Printing Co Ltd 84 0.01
Computers JPY 130,000 Fujitsu Ltd 683 0.04JPY 14,400 NEC Corp 349 0.02JPY 2,970 Nomura Research Institute Ltd 128 0.01JPY 20,400 NTT Data Corp 196 0.01JPY 1,400 Obic Co Ltd 104 0.01JPY 2,200 Otsuka Corp 78 0.01JPY 4,900 TDK Corp 378 0.02
Cosmetics & personal care JPY 26,600 Kao Corp 1,771 0.11JPY 1,100 Kose Corp^ 205 0.01JPY 19,700 Lion Corp 310 0.02JPY 2,200 Pola Orbis Holdings Inc^ 94 0.01JPY 16,400 Shiseido Co Ltd 1,115 0.07JPY 16,700 Unicharm Corp^ 445 0.02
Distribution & wholesale JPY 75,400 ITOCHU Corp 1,216 0.07JPY 78,900 Marubeni Corp 528 0.03JPY 74,900 Mitsubishi Corp 1,790 0.11JPY 78,100 Mitsui & Co Ltd 1,181 0.07JPY 51,700 Sumitomo Corp 745 0.05JPY 13,000 Toyota Tsusho Corp^ 385 0.02
Diversified financial services JPY 34,300 Acom Co Ltd 123 0.01JPY 2,700 AEON Financial Service Co Ltd 54 0.00JPY 13,200 Credit Saison Co Ltd 188 0.01JPY 117,000 Daiwa Securities Group Inc 583 0.03JPY 29,400 Japan Exchange Group Inc 480 0.03JPY 45,780 Mebuki Financial Group Inc^ 143 0.01JPY 19,300 Mitsubishi UFJ Lease & Finance
Co Ltd^ 99 0.01JPY 180,700 Nomura Holdings Inc 804 0.05JPY 62,660 ORIX Corp 902 0.05
Electrical components & equipment JPY 15,000 Brother Industries Ltd 270 0.02JPY 13,200 Casio Computer Co Ltd 173 0.01JPY 900 Mabuchi Motor Co Ltd^ 36 0.00

iSHARES V PLC
Schedule of Investments (unaudited) (continued) iSHARES MSCI WORLD EUR HEDGED UCITS ETF (ACC) (continued) As at 31 May 2018
i S H A R E S V P L C I N T E R I M R E P O R T [ 1 8 5 ]
Ccy Holding Investment Fair value
€'000
% of net asset value
Equities (30 November 2017: 97.09%) (cont) Japan (30 November 2017: 8.53%) (cont)
Electricity JPY 31,600 Chubu Electric Power Co Inc^ 420 0.03JPY 15,600 Chugoku Electric Power Co Inc^ 175 0.01JPY 10,300 Electric Power Development Co
Ltd 235 0.01JPY 32,900 Kansai Electric Power Co Inc 406 0.02JPY 18,400 Kyushu Electric Power Co Inc^ 187 0.01JPY 18,600 Tohoku Electric Power Co Inc 204 0.01JPY 66,300 Tokyo Electric Power Co
Holdings Inc^ 270 0.02Electronics
JPY 13,200 Alps Electric Co Ltd 269 0.02JPY 2,800 Hamamatsu Photonics KK 104 0.01JPY 630 Hirose Electric Co Ltd^ 70 0.00JPY 1,100 Hitachi High-Technologies Corp 43 0.00JPY 17,500 Hoya Corp 893 0.05JPY 15,100 Kyocera Corp 769 0.05JPY 15,800 Minebea Mitsumi Inc 258 0.02JPY 12,400 Murata Manufacturing Co Ltd 1,583 0.09JPY 13,200 Nidec Corp^ 1,758 0.11JPY 1,800 Nippon Electric Glass Co Ltd 42 0.00JPY 13,200 Omron Corp^ 596 0.04JPY 14,300 Yokogawa Electric Corp 224 0.01
Engineering & construction JPY 900 Japan Airport Terminal Co Ltd 35 0.00JPY 13,400 JGC Corp^ 240 0.01JPY 36,000 Kajima Corp 252 0.01JPY 29,200 Obayashi Corp 253 0.02JPY 31,400 Shimizu Corp 264 0.02JPY 10,900 Taisei Corp 515 0.03
Entertainment JPY 13,200 Oriental Land Co Ltd^ 1,161 0.07JPY 800 Sankyo Co Ltd 27 0.00JPY 13,200 Sega Sammy Holdings Inc 200 0.01JPY 3,000 Toho Co Ltd^ 89 0.01
Environmental control JPY 2,400 Kurita Water Industries Ltd 59 0.00
Food JPY 29,600 Ajinomoto Co Inc 485 0.03JPY 1,800 Calbee Inc 56 0.00JPY 10,900 Kikkoman Corp^ 442 0.03JPY 4,100 MEIJI Holdings Co Ltd^ 300 0.02JPY 2,000 NH Foods Ltd^ 71 0.00JPY 13,200 Nisshin Seifun Group Inc^ 239 0.02JPY 1,300 Nissin Foods Holdings Co Ltd 83 0.01JPY 34,300 Seven & i Holdings Co Ltd^ 1,304 0.08JPY 1,700 Toyo Suisan Kaisha Ltd 52 0.00JPY 3,900 Yakult Honsha Co Ltd 220 0.01JPY 3,000 Yamazaki Baking Co Ltd^ 56 0.00
Ccy Holding Investment Fair value
€'000
% of net asset value
Japan (30 November 2017: 8.53%) (cont) Forest products & paper
JPY 19,000 Oji Holdings Corp 107 0.01Gas
JPY 21,500 Osaka Gas Co Ltd^ 402 0.03JPY 2,200 Toho Gas Co Ltd 60 0.00JPY 26,400 Tokyo Gas Co Ltd 617 0.04
Hand & machine tools JPY 700 Disco Corp 114 0.01JPY 11,000 Fuji Electric Co Ltd 67 0.00JPY 13,200 Makita Corp 506 0.03
Healthcare products JPY 3,300 Cyberdyne Inc^ 36 0.00JPY 14,200 Olympus Corp 432 0.03JPY 14,200 Shimadzu Corp 337 0.02JPY 11,600 Sysmex Corp^ 897 0.05JPY 15,000 Terumo Corp^ 764 0.05
Home builders JPY 29,000 Daiwa House Industry Co Ltd 902 0.05JPY 1,700 Iida Group Holdings Co Ltd^ 28 0.00JPY 18,800 Sekisui Chemical Co Ltd 265 0.02JPY 31,600 Sekisui House Ltd 484 0.03
Home furnishings JPY 1,800 Hoshizaki Corp^ 155 0.01JPY 111,000 Panasonic Corp 1,304 0.08JPY 3,500 Sharp Corp^ 80 0.01JPY 61,700 Sony Corp 2,510 0.15
Insurance JPY 48,700 Dai-ichi Life Holdings Inc^ 780 0.05JPY 77,000 Japan Post Holdings Co Ltd^ 757 0.05JPY 25,100 MS&AD Insurance Group
Holdings Inc 685 0.04JPY 16,600 Sompo Holdings Inc 619 0.04JPY 13,300 Sony Financial Holdings Inc 210 0.01JPY 29,600 T&D Holdings Inc 401 0.02JPY 31,600 Tokio Marine Holdings Inc^ 1,306 0.08
Internet JPY 2,500 Kakaku.com Inc 47 0.01JPY 13,600 M3 Inc 488 0.03JPY 47,100 Rakuten Inc^ 272 0.02JPY 14,500 SBI Holdings Inc 340 0.02JPY 12,500 Start Today Co Ltd^ 373 0.02JPY 3,800 Trend Micro Inc 185 0.01JPY 63,600 Yahoo Japan Corp^ 199 0.01
Iron & steel JPY 13,400 Hitachi Metals Ltd^ 127 0.01JPY 19,000 JFE Holdings Inc 337 0.02JPY 14,200 Kobe Steel Ltd 122 0.01JPY 34,400 Nippon Steel & Sumitomo Metal
Corp 619 0.03
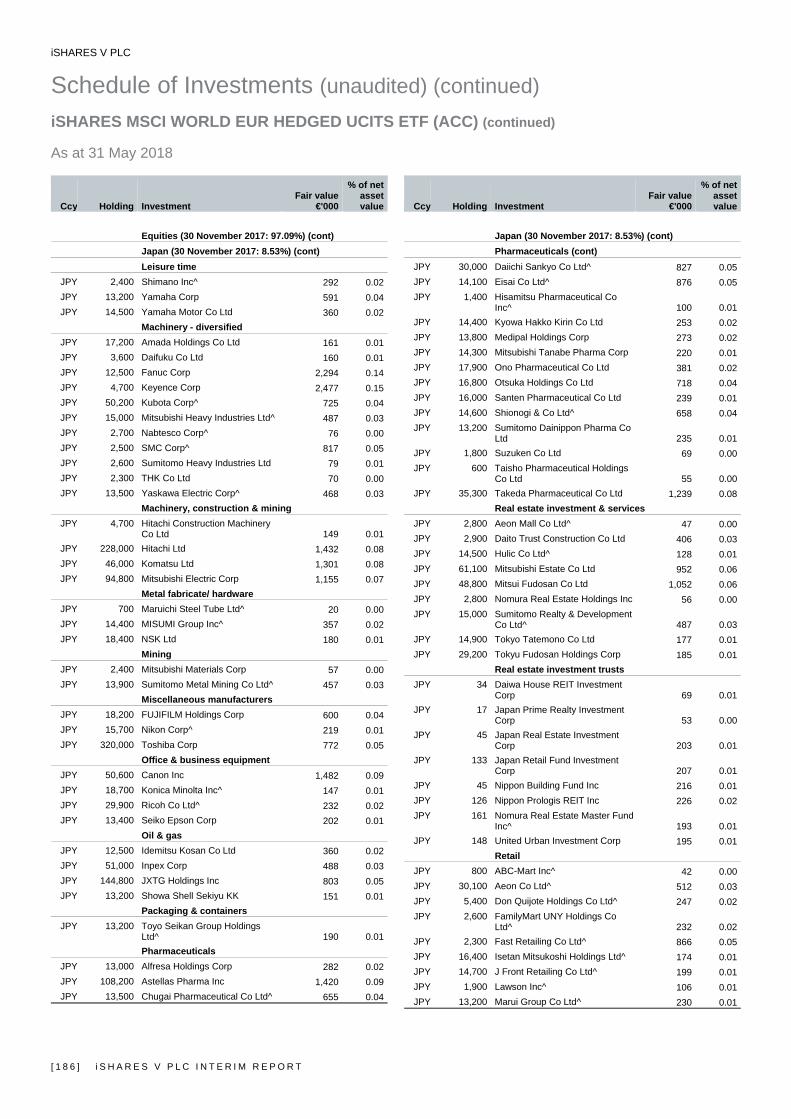
iSHARES V PLC
Schedule of Investments (unaudited) (continued) iSHARES MSCI WORLD EUR HEDGED UCITS ETF (ACC) (continued) As at 31 May 2018
[ 1 8 6 ] i S H A R E S V P L C I N T E R I M R E P O R T
Ccy Holding Investment Fair value
€'000
% of net asset value
Equities (30 November 2017: 97.09%) (cont) Japan (30 November 2017: 8.53%) (cont)
Leisure time JPY 2,400 Shimano Inc^ 292 0.02JPY 13,200 Yamaha Corp 591 0.04JPY 14,500 Yamaha Motor Co Ltd 360 0.02
Machinery - diversified JPY 17,200 Amada Holdings Co Ltd 161 0.01JPY 3,600 Daifuku Co Ltd 160 0.01JPY 12,500 Fanuc Corp 2,294 0.14JPY 4,700 Keyence Corp 2,477 0.15JPY 50,200 Kubota Corp^ 725 0.04JPY 15,000 Mitsubishi Heavy Industries Ltd^ 487 0.03JPY 2,700 Nabtesco Corp^ 76 0.00JPY 2,500 SMC Corp^ 817 0.05JPY 2,600 Sumitomo Heavy Industries Ltd 79 0.01JPY 2,300 THK Co Ltd 70 0.00JPY 13,500 Yaskawa Electric Corp^ 468 0.03
Machinery, construction & mining JPY 4,700 Hitachi Construction Machinery
Co Ltd 149 0.01JPY 228,000 Hitachi Ltd 1,432 0.08JPY 46,000 Komatsu Ltd 1,301 0.08JPY 94,800 Mitsubishi Electric Corp 1,155 0.07
Metal fabricate/ hardware JPY 700 Maruichi Steel Tube Ltd^ 20 0.00JPY 14,400 MISUMI Group Inc^ 357 0.02JPY 18,400 NSK Ltd 180 0.01
Mining JPY 2,400 Mitsubishi Materials Corp 57 0.00JPY 13,900 Sumitomo Metal Mining Co Ltd^ 457 0.03
Miscellaneous manufacturers JPY 18,200 FUJIFILM Holdings Corp 600 0.04JPY 15,700 Nikon Corp^ 219 0.01JPY 320,000 Toshiba Corp 772 0.05
Office & business equipment JPY 50,600 Canon Inc 1,482 0.09JPY 18,700 Konica Minolta Inc^ 147 0.01JPY 29,900 Ricoh Co Ltd^ 232 0.02JPY 13,400 Seiko Epson Corp 202 0.01
Oil & gas JPY 12,500 Idemitsu Kosan Co Ltd 360 0.02JPY 51,000 Inpex Corp 488 0.03JPY 144,800 JXTG Holdings Inc 803 0.05JPY 13,200 Showa Shell Sekiyu KK 151 0.01
Packaging & containers JPY 13,200 Toyo Seikan Group Holdings
Ltd^ 190 0.01Pharmaceuticals
JPY 13,000 Alfresa Holdings Corp 282 0.02JPY 108,200 Astellas Pharma Inc 1,420 0.09JPY 13,500 Chugai Pharmaceutical Co Ltd^ 655 0.04
Ccy Holding Investment Fair value
€'000
% of net asset value
Japan (30 November 2017: 8.53%) (cont) Pharmaceuticals (cont)
JPY 30,000 Daiichi Sankyo Co Ltd^ 827 0.05JPY 14,100 Eisai Co Ltd^ 876 0.05JPY 1,400 Hisamitsu Pharmaceutical Co
Inc^ 100 0.01JPY 14,400 Kyowa Hakko Kirin Co Ltd 253 0.02JPY 13,800 Medipal Holdings Corp 273 0.02JPY 14,300 Mitsubishi Tanabe Pharma Corp 220 0.01JPY 17,900 Ono Pharmaceutical Co Ltd 381 0.02JPY 16,800 Otsuka Holdings Co Ltd 718 0.04JPY 16,000 Santen Pharmaceutical Co Ltd 239 0.01JPY 14,600 Shionogi & Co Ltd^ 658 0.04JPY 13,200 Sumitomo Dainippon Pharma Co
Ltd 235 0.01JPY 1,800 Suzuken Co Ltd 69 0.00JPY 600 Taisho Pharmaceutical Holdings
Co Ltd 55 0.00JPY 35,300 Takeda Pharmaceutical Co Ltd 1,239 0.08
Real estate investment & services JPY 2,800 Aeon Mall Co Ltd^ 47 0.00JPY 2,900 Daito Trust Construction Co Ltd 406 0.03JPY 14,500 Hulic Co Ltd^ 128 0.01JPY 61,100 Mitsubishi Estate Co Ltd 952 0.06JPY 48,800 Mitsui Fudosan Co Ltd 1,052 0.06JPY 2,800 Nomura Real Estate Holdings Inc 56 0.00JPY 15,000 Sumitomo Realty & Development
Co Ltd^ 487 0.03JPY 14,900 Tokyo Tatemono Co Ltd 177 0.01JPY 29,200 Tokyu Fudosan Holdings Corp 185 0.01
Real estate investment trusts JPY 34 Daiwa House REIT Investment
Corp 69 0.01JPY 17 Japan Prime Realty Investment
Corp 53 0.00JPY 45 Japan Real Estate Investment
Corp 203 0.01JPY 133 Japan Retail Fund Investment
Corp 207 0.01JPY 45 Nippon Building Fund Inc 216 0.01JPY 126 Nippon Prologis REIT Inc 226 0.02JPY 161 Nomura Real Estate Master Fund
Inc^ 193 0.01JPY 148 United Urban Investment Corp 195 0.01
Retail JPY 800 ABC-Mart Inc^ 42 0.00JPY 30,100 Aeon Co Ltd^ 512 0.03JPY 5,400 Don Quijote Holdings Co Ltd^ 247 0.02JPY 2,600 FamilyMart UNY Holdings Co
Ltd^ 232 0.02JPY 2,300 Fast Retailing Co Ltd^ 866 0.05JPY 16,400 Isetan Mitsukoshi Holdings Ltd^ 174 0.01JPY 14,700 J Front Retailing Co Ltd^ 199 0.01JPY 1,900 Lawson Inc^ 106 0.01JPY 13,200 Marui Group Co Ltd^ 230 0.01
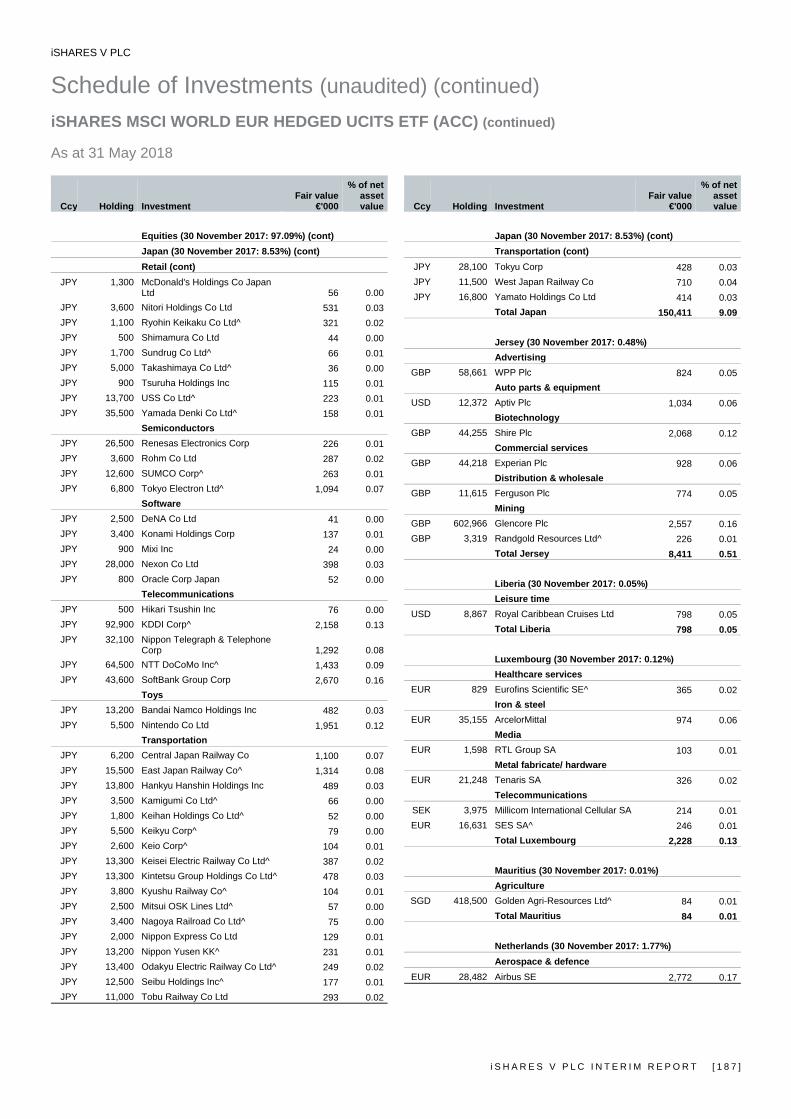
iSHARES V PLC
Schedule of Investments (unaudited) (continued) iSHARES MSCI WORLD EUR HEDGED UCITS ETF (ACC) (continued) As at 31 May 2018
i S H A R E S V P L C I N T E R I M R E P O R T [ 1 8 7 ]
Ccy Holding Investment Fair value
€'000
% of net asset value
Equities (30 November 2017: 97.09%) (cont) Japan (30 November 2017: 8.53%) (cont) Retail (cont)
JPY 1,300 McDonald's Holdings Co Japan Ltd 56 0.00
JPY 3,600 Nitori Holdings Co Ltd 531 0.03JPY 1,100 Ryohin Keikaku Co Ltd^ 321 0.02JPY 500 Shimamura Co Ltd 44 0.00JPY 1,700 Sundrug Co Ltd^ 66 0.01JPY 5,000 Takashimaya Co Ltd^ 36 0.00JPY 900 Tsuruha Holdings Inc 115 0.01JPY 13,700 USS Co Ltd^ 223 0.01JPY 35,500 Yamada Denki Co Ltd^ 158 0.01
Semiconductors JPY 26,500 Renesas Electronics Corp 226 0.01JPY 3,600 Rohm Co Ltd 287 0.02JPY 12,600 SUMCO Corp^ 263 0.01JPY 6,800 Tokyo Electron Ltd^ 1,094 0.07
Software JPY 2,500 DeNA Co Ltd 41 0.00JPY 3,400 Konami Holdings Corp 137 0.01JPY 900 Mixi Inc 24 0.00JPY 28,000 Nexon Co Ltd 398 0.03JPY 800 Oracle Corp Japan 52 0.00
Telecommunications JPY 500 Hikari Tsushin Inc 76 0.00JPY 92,900 KDDI Corp^ 2,158 0.13JPY 32,100 Nippon Telegraph & Telephone
Corp 1,292 0.08JPY 64,500 NTT DoCoMo Inc^ 1,433 0.09JPY 43,600 SoftBank Group Corp 2,670 0.16
Toys JPY 13,200 Bandai Namco Holdings Inc 482 0.03JPY 5,500 Nintendo Co Ltd 1,951 0.12
Transportation JPY 6,200 Central Japan Railway Co 1,100 0.07JPY 15,500 East Japan Railway Co^ 1,314 0.08JPY 13,800 Hankyu Hanshin Holdings Inc 489 0.03JPY 3,500 Kamigumi Co Ltd^ 66 0.00JPY 1,800 Keihan Holdings Co Ltd^ 52 0.00JPY 5,500 Keikyu Corp^ 79 0.00JPY 2,600 Keio Corp^ 104 0.01JPY 13,300 Keisei Electric Railway Co Ltd^ 387 0.02JPY 13,300 Kintetsu Group Holdings Co Ltd^ 478 0.03JPY 3,800 Kyushu Railway Co^ 104 0.01JPY 2,500 Mitsui OSK Lines Ltd^ 57 0.00JPY 3,400 Nagoya Railroad Co Ltd^ 75 0.00JPY 2,000 Nippon Express Co Ltd 129 0.01JPY 13,200 Nippon Yusen KK^ 231 0.01JPY 13,400 Odakyu Electric Railway Co Ltd^ 249 0.02JPY 12,500 Seibu Holdings Inc^ 177 0.01JPY 11,000 Tobu Railway Co Ltd 293 0.02
Ccy Holding Investment Fair value
€'000
% of net asset value
Japan (30 November 2017: 8.53%) (cont) Transportation (cont)
JPY 28,100 Tokyu Corp 428 0.03JPY 11,500 West Japan Railway Co 710 0.04JPY 16,800 Yamato Holdings Co Ltd 414 0.03
Total Japan 150,411 9.09
Jersey (30 November 2017: 0.48%) Advertising
GBP 58,661 WPP Plc 824 0.05Auto parts & equipment
USD 12,372 Aptiv Plc 1,034 0.06Biotechnology
GBP 44,255 Shire Plc 2,068 0.12Commercial services
GBP 44,218 Experian Plc 928 0.06Distribution & wholesale
GBP 11,615 Ferguson Plc 774 0.05Mining
GBP 602,966 Glencore Plc 2,557 0.16GBP 3,319 Randgold Resources Ltd^ 226 0.01
Total Jersey 8,411 0.51
Liberia (30 November 2017: 0.05%) Leisure time
USD 8,867 Royal Caribbean Cruises Ltd 798 0.05Total Liberia 798 0.05
Luxembourg (30 November 2017: 0.12%) Healthcare services
EUR 829 Eurofins Scientific SE^ 365 0.02Iron & steel
EUR 35,155 ArcelorMittal 974 0.06Media
EUR 1,598 RTL Group SA 103 0.01Metal fabricate/ hardware
EUR 21,248 Tenaris SA 326 0.02Telecommunications
SEK 3,975 Millicom International Cellular SA 214 0.01EUR 16,631 SES SA^ 246 0.01
Total Luxembourg 2,228 0.13
Mauritius (30 November 2017: 0.01%) Agriculture
SGD 418,500 Golden Agri-Resources Ltd^ 84 0.01Total Mauritius 84 0.01
Netherlands (30 November 2017: 1.77%) Aerospace & defence
EUR 28,482 Airbus SE 2,772 0.17

iSHARES V PLC
Schedule of Investments (unaudited) (continued) iSHARES MSCI WORLD EUR HEDGED UCITS ETF (ACC) (continued) As at 31 May 2018
[ 1 8 8 ] i S H A R E S V P L C I N T E R I M R E P O R T
Ccy Holding Investment Fair value
€'000
% of net asset value
Equities (30 November 2017: 97.09%) (cont) Netherlands (30 November 2017: 1.77%) (cont)
Auto manufacturers EUR 5,651 Ferrari NV 630 0.04EUR 57,357 Fiat Chrysler Automobiles NV^ 1,113 0.07
Banks EUR 18,032 ABN Amro Group NV^ 401 0.03EUR 187,129 ING Groep NV 2,331 0.14
Beverages EUR 5,619 Heineken Holding NV^ 468 0.03EUR 12,495 Heineken NV 1,070 0.06
Chemicals EUR 12,218 Akzo Nobel NV 917 0.06EUR 8,661 Koninklijke DSM NV 738 0.04USD 15,764 LyondellBasell Industries NV 1,514 0.09
Commercial services EUR 5,300 Randstad NV 271 0.02EUR 52,154 Relx NV^ 974 0.06
Cosmetics & personal care EUR 81,012 Unilever NV 3,867 0.23
Diversified financial services USD 5,190 AerCap Holdings NV 246 0.01
Electronics EUR 46,506 Koninklijke Philips NV 1,629 0.10
Engineering & construction EUR 5,622 Boskalis Westminster^ 133 0.01
Food EUR 66,868 Koninklijke Ahold Delhaize NV^ 1,314 0.08
Healthcare products EUR 10,966 Qiagen NV 341 0.02
Insurance EUR 99,217 Aegon NV^ 528 0.03EUR 13,464 NN Group NV 495 0.03
Investment services EUR 5,035 Exor NV 312 0.02
Machinery - diversified EUR 55,558 CNH Industrial NV 557 0.03
Media EUR 14,922 Wolters Kluwer NV 717 0.04
Pharmaceuticals USD 22,335 Mylan NV 736 0.04
Pipelines EUR 3,398 Koninklijke Vopak NV^ 143 0.01
Semiconductors EUR 19,560 ASML Holding NV 3,274 0.20USD 16,947 NXP Semiconductors NV 1,655 0.10EUR 32,005 STMicroelectronics NV 652 0.04
Telecommunications EUR 160,080 Koninklijke KPN NV 372 0.02
Total Netherlands 30,170 1.82
Ccy Holding Investment Fair value
€'000
% of net asset value
New Zealand (30 November 2017: 0.06%) Building materials and fixtures
NZD 39,936 Fletcher Building Ltd^ 158 0.01Electricity
NZD 58,239 Mercury NZ Ltd 113 0.00NZD 68,063 Meridian Energy Ltd 122 0.01
Engineering & construction NZD 59,543 Auckland International Airport Ltd 236 0.02
Healthcare products NZD 27,884 Fisher & Paykel Healthcare Corp
Ltd^ 223 0.01Healthcare services
NZD 18,401 Ryman Healthcare Ltd^ 126 0.01Telecommunications
NZD 87,874 Spark New Zealand Ltd 194 0.01Total New Zealand 1,172 0.07
Norway (30 November 2017: 0.23%) Banks
NOK 45,114 DNB ASA 692 0.04Chemicals
NOK 8,705 Yara International ASA 307 0.02Food
NOK 16,098 Marine Harvest ASA 276 0.02NOK 34,645 Orkla ASA 268 0.01
Insurance NOK 8,922 Gjensidige Forsikring ASA 118 0.01
Media NOK 4,798 Schibsted ASA 111 0.01
Mining NOK 68,112 Norsk Hydro ASA 366 0.02
Oil & gas NOK 60,852 Equinor ASA 1,372 0.08
Telecommunications NOK 34,886 Telenor ASA 616 0.04
Total Norway 4,126 0.25
Panama (30 November 2017: 0.06%) Leisure time
USD 18,374 Carnival Corp 980 0.06Total Panama 980 0.06
Papua New Guinea (30 November 2017: 0.02%) Oil & gas
AUD 65,697 Oil Search Ltd 352 0.02Total Papua New Guinea 352 0.02
Portugal (30 November 2017: 0.04%) Electricity
EUR 107,627 EDP - Energias de Portugal SA^ 361 0.02Food
EUR 12,077 Jeronimo Martins SGPS SA 162 0.01
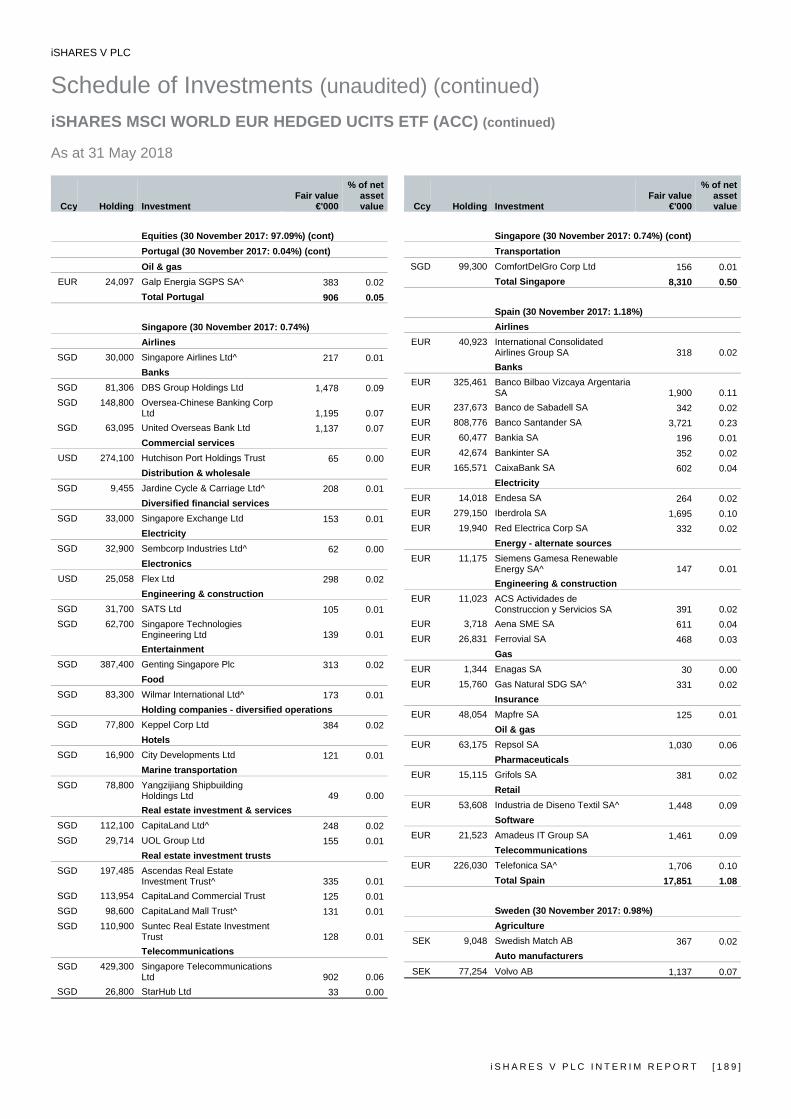
iSHARES V PLC
Schedule of Investments (unaudited) (continued) iSHARES MSCI WORLD EUR HEDGED UCITS ETF (ACC) (continued) As at 31 May 2018
i S H A R E S V P L C I N T E R I M R E P O R T [ 1 8 9 ]
Ccy Holding Investment Fair value
€'000
% of net asset value
Equities (30 November 2017: 97.09%) (cont) Portugal (30 November 2017: 0.04%) (cont)
Oil & gas EUR 24,097 Galp Energia SGPS SA^ 383 0.02
Total Portugal 906 0.05
Singapore (30 November 2017: 0.74%) Airlines
SGD 30,000 Singapore Airlines Ltd^ 217 0.01Banks
SGD 81,306 DBS Group Holdings Ltd 1,478 0.09SGD 148,800 Oversea-Chinese Banking Corp
Ltd 1,195 0.07SGD 63,095 United Overseas Bank Ltd 1,137 0.07
Commercial services USD 274,100 Hutchison Port Holdings Trust 65 0.00
Distribution & wholesale SGD 9,455 Jardine Cycle & Carriage Ltd^ 208 0.01
Diversified financial services SGD 33,000 Singapore Exchange Ltd 153 0.01
Electricity SGD 32,900 Sembcorp Industries Ltd^ 62 0.00
Electronics USD 25,058 Flex Ltd 298 0.02
Engineering & construction SGD 31,700 SATS Ltd 105 0.01SGD 62,700 Singapore Technologies
Engineering Ltd 139 0.01Entertainment
SGD 387,400 Genting Singapore Plc 313 0.02Food
SGD 83,300 Wilmar International Ltd^ 173 0.01Holding companies - diversified operations
SGD 77,800 Keppel Corp Ltd 384 0.02Hotels
SGD 16,900 City Developments Ltd 121 0.01Marine transportation
SGD 78,800 Yangzijiang Shipbuilding Holdings Ltd 49 0.00Real estate investment & services
SGD 112,100 CapitaLand Ltd^ 248 0.02SGD 29,714 UOL Group Ltd 155 0.01
Real estate investment trusts SGD 197,485 Ascendas Real Estate
Investment Trust^ 335 0.01SGD 113,954 CapitaLand Commercial Trust 125 0.01SGD 98,600 CapitaLand Mall Trust^ 131 0.01SGD 110,900 Suntec Real Estate Investment
Trust 128 0.01Telecommunications
SGD 429,300 Singapore Telecommunications Ltd 902 0.06
SGD 26,800 StarHub Ltd 33 0.00
Ccy Holding Investment Fair value
€'000
% of net asset value
Singapore (30 November 2017: 0.74%) (cont) Transportation
SGD 99,300 ComfortDelGro Corp Ltd 156 0.01Total Singapore 8,310 0.50
Spain (30 November 2017: 1.18%) Airlines
EUR 40,923 International Consolidated Airlines Group SA 318 0.02Banks
EUR 325,461 Banco Bilbao Vizcaya Argentaria SA 1,900 0.11
EUR 237,673 Banco de Sabadell SA 342 0.02EUR 808,776 Banco Santander SA 3,721 0.23EUR 60,477 Bankia SA 196 0.01EUR 42,674 Bankinter SA 352 0.02EUR 165,571 CaixaBank SA 602 0.04
Electricity EUR 14,018 Endesa SA 264 0.02EUR 279,150 Iberdrola SA 1,695 0.10EUR 19,940 Red Electrica Corp SA 332 0.02
Energy - alternate sources EUR 11,175 Siemens Gamesa Renewable
Energy SA^ 147 0.01Engineering & construction
EUR 11,023 ACS Actividades de Construccion y Servicios SA 391 0.02
EUR 3,718 Aena SME SA 611 0.04EUR 26,831 Ferrovial SA 468 0.03
Gas EUR 1,344 Enagas SA 30 0.00EUR 15,760 Gas Natural SDG SA^ 331 0.02
Insurance EUR 48,054 Mapfre SA 125 0.01
Oil & gas EUR 63,175 Repsol SA 1,030 0.06
Pharmaceuticals EUR 15,115 Grifols SA 381 0.02
Retail EUR 53,608 Industria de Diseno Textil SA^ 1,448 0.09
Software EUR 21,523 Amadeus IT Group SA 1,461 0.09
Telecommunications EUR 226,030 Telefonica SA^ 1,706 0.10
Total Spain 17,851 1.08
Sweden (30 November 2017: 0.98%) Agriculture
SEK 9,048 Swedish Match AB 367 0.02Auto manufacturers
SEK 77,254 Volvo AB 1,137 0.07
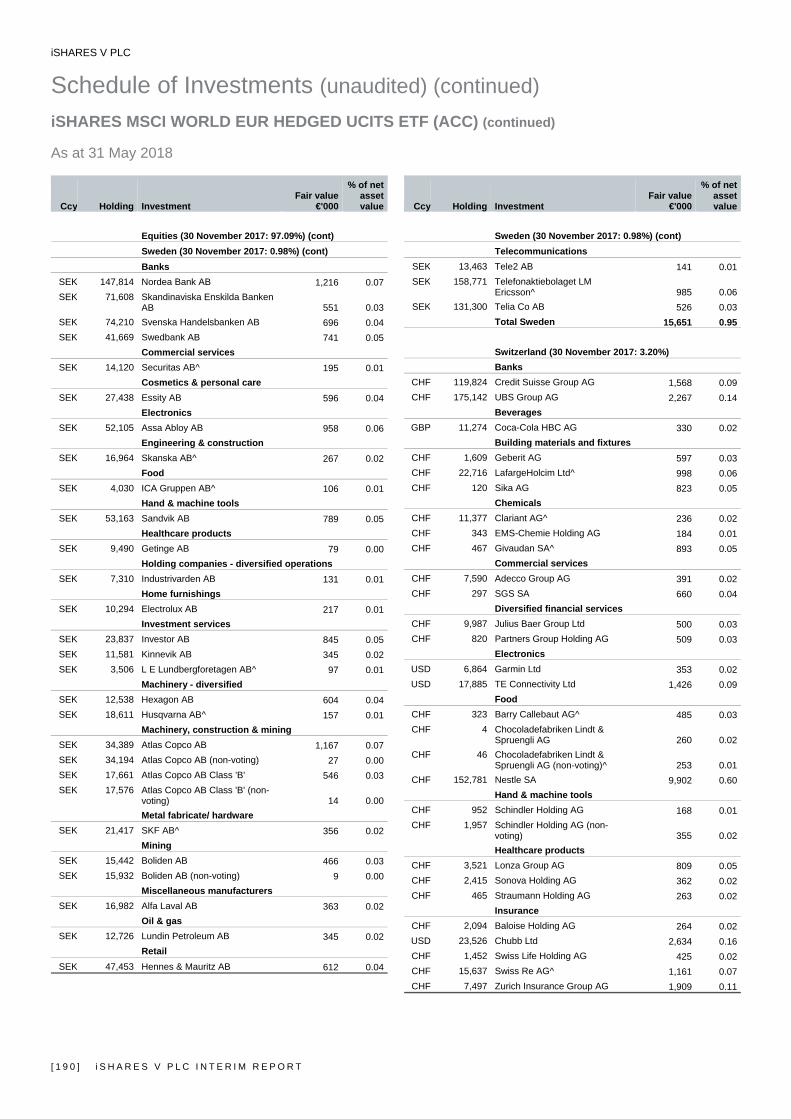
iSHARES V PLC
Schedule of Investments (unaudited) (continued) iSHARES MSCI WORLD EUR HEDGED UCITS ETF (ACC) (continued) As at 31 May 2018
[ 1 9 0 ] i S H A R E S V P L C I N T E R I M R E P O R T
Ccy Holding Investment Fair value
€'000
% of net asset value
Equities (30 November 2017: 97.09%) (cont) Sweden (30 November 2017: 0.98%) (cont)
Banks SEK 147,814 Nordea Bank AB 1,216 0.07SEK 71,608 Skandinaviska Enskilda Banken
AB 551 0.03SEK 74,210 Svenska Handelsbanken AB 696 0.04SEK 41,669 Swedbank AB 741 0.05
Commercial services SEK 14,120 Securitas AB^ 195 0.01
Cosmetics & personal care SEK 27,438 Essity AB 596 0.04
Electronics SEK 52,105 Assa Abloy AB 958 0.06
Engineering & construction SEK 16,964 Skanska AB^ 267 0.02
Food SEK 4,030 ICA Gruppen AB^ 106 0.01
Hand & machine tools SEK 53,163 Sandvik AB 789 0.05
Healthcare products SEK 9,490 Getinge AB 79 0.00
Holding companies - diversified operations SEK 7,310 Industrivarden AB 131 0.01
Home furnishings SEK 10,294 Electrolux AB 217 0.01
Investment services SEK 23,837 Investor AB 845 0.05SEK 11,581 Kinnevik AB 345 0.02SEK 3,506 L E Lundbergforetagen AB^ 97 0.01
Machinery - diversified SEK 12,538 Hexagon AB 604 0.04SEK 18,611 Husqvarna AB^ 157 0.01
Machinery, construction & mining SEK 34,389 Atlas Copco AB 1,167 0.07SEK 34,194 Atlas Copco AB (non-voting) 27 0.00SEK 17,661 Atlas Copco AB Class 'B' 546 0.03SEK 17,576 Atlas Copco AB Class 'B' (non-
voting) 14 0.00Metal fabricate/ hardware
SEK 21,417 SKF AB^ 356 0.02Mining
SEK 15,442 Boliden AB 466 0.03SEK 15,932 Boliden AB (non-voting) 9 0.00
Miscellaneous manufacturers SEK 16,982 Alfa Laval AB 363 0.02
Oil & gas SEK 12,726 Lundin Petroleum AB 345 0.02
Retail SEK 47,453 Hennes & Mauritz AB 612 0.04
Ccy Holding Investment Fair value
€'000
% of net asset value
Sweden (30 November 2017: 0.98%) (cont) Telecommunications
SEK 13,463 Tele2 AB 141 0.01SEK 158,771 Telefonaktiebolaget LM
Ericsson^ 985 0.06SEK 131,300 Telia Co AB 526 0.03
Total Sweden 15,651 0.95
Switzerland (30 November 2017: 3.20%) Banks
CHF 119,824 Credit Suisse Group AG 1,568 0.09CHF 175,142 UBS Group AG 2,267 0.14
Beverages GBP 11,274 Coca-Cola HBC AG 330 0.02
Building materials and fixtures CHF 1,609 Geberit AG 597 0.03CHF 22,716 LafargeHolcim Ltd^ 998 0.06CHF 120 Sika AG 823 0.05
Chemicals CHF 11,377 Clariant AG^ 236 0.02CHF 343 EMS-Chemie Holding AG 184 0.01CHF 467 Givaudan SA^ 893 0.05
Commercial services CHF 7,590 Adecco Group AG 391 0.02CHF 297 SGS SA 660 0.04
Diversified financial services CHF 9,987 Julius Baer Group Ltd 500 0.03CHF 820 Partners Group Holding AG 509 0.03
Electronics USD 6,864 Garmin Ltd 353 0.02USD 17,885 TE Connectivity Ltd 1,426 0.09
Food CHF 323 Barry Callebaut AG^ 485 0.03CHF 4 Chocoladefabriken Lindt &
Spruengli AG 260 0.02CHF 46 Chocoladefabriken Lindt &
Spruengli AG (non-voting)^ 253 0.01CHF 152,781 Nestle SA 9,902 0.60
Hand & machine tools CHF 952 Schindler Holding AG 168 0.01CHF 1,957 Schindler Holding AG (non-
voting) 355 0.02Healthcare products
CHF 3,521 Lonza Group AG 809 0.05CHF 2,415 Sonova Holding AG 362 0.02CHF 465 Straumann Holding AG 263 0.02
Insurance CHF 2,094 Baloise Holding AG 264 0.02USD 23,526 Chubb Ltd 2,634 0.16CHF 1,452 Swiss Life Holding AG 425 0.02CHF 15,637 Swiss Re AG^ 1,161 0.07CHF 7,497 Zurich Insurance Group AG 1,909 0.11
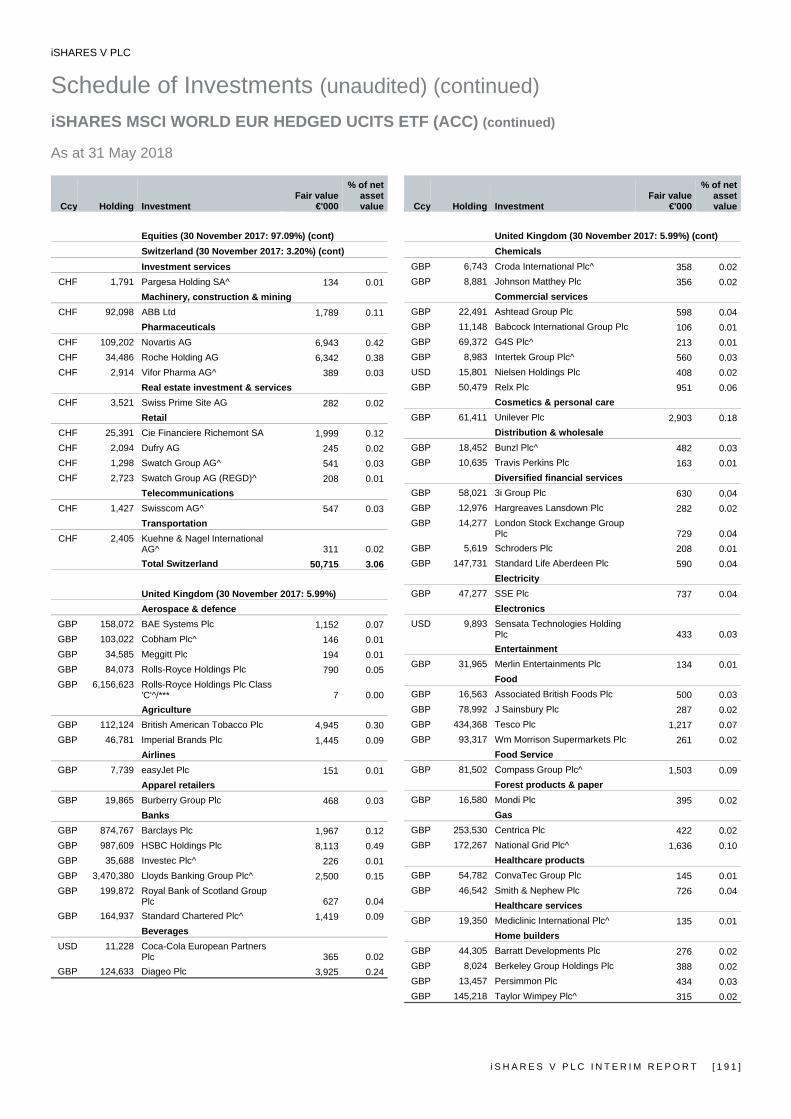
iSHARES V PLC
Schedule of Investments (unaudited) (continued) iSHARES MSCI WORLD EUR HEDGED UCITS ETF (ACC) (continued) As at 31 May 2018
i S H A R E S V P L C I N T E R I M R E P O R T [ 1 9 1 ]
Ccy Holding Investment Fair value
€'000
% of net asset value
Equities (30 November 2017: 97.09%) (cont) Switzerland (30 November 2017: 3.20%) (cont)
Investment services CHF 1,791 Pargesa Holding SA^ 134 0.01
Machinery, construction & mining CHF 92,098 ABB Ltd 1,789 0.11
Pharmaceuticals CHF 109,202 Novartis AG 6,943 0.42CHF 34,486 Roche Holding AG 6,342 0.38CHF 2,914 Vifor Pharma AG^ 389 0.03
Real estate investment & services CHF 3,521 Swiss Prime Site AG 282 0.02
Retail CHF 25,391 Cie Financiere Richemont SA 1,999 0.12CHF 2,094 Dufry AG 245 0.02CHF 1,298 Swatch Group AG^ 541 0.03CHF 2,723 Swatch Group AG (REGD)^ 208 0.01
Telecommunications CHF 1,427 Swisscom AG^ 547 0.03
Transportation CHF 2,405 Kuehne & Nagel International
AG^ 311 0.02Total Switzerland 50,715 3.06
United Kingdom (30 November 2017: 5.99%) Aerospace & defence
GBP 158,072 BAE Systems Plc 1,152 0.07GBP 103,022 Cobham Plc^ 146 0.01GBP 34,585 Meggitt Plc 194 0.01GBP 84,073 Rolls-Royce Holdings Plc 790 0.05GBP 6,156,623 Rolls-Royce Holdings Plc Class
'C'^/*** 7 0.00Agriculture
GBP 112,124 British American Tobacco Plc 4,945 0.30GBP 46,781 Imperial Brands Plc 1,445 0.09
Airlines GBP 7,739 easyJet Plc 151 0.01
Apparel retailers GBP 19,865 Burberry Group Plc 468 0.03
Banks GBP 874,767 Barclays Plc 1,967 0.12GBP 987,609 HSBC Holdings Plc 8,113 0.49GBP 35,688 Investec Plc^ 226 0.01GBP 3,470,380 Lloyds Banking Group Plc^ 2,500 0.15GBP 199,872 Royal Bank of Scotland Group
Plc 627 0.04GBP 164,937 Standard Chartered Plc^ 1,419 0.09
Beverages USD 11,228 Coca-Cola European Partners
Plc 365 0.02GBP 124,633 Diageo Plc 3,925 0.24
Ccy Holding Investment Fair value
€'000
% of net asset value
United Kingdom (30 November 2017: 5.99%) (cont) Chemicals
GBP 6,743 Croda International Plc^ 358 0.02GBP 8,881 Johnson Matthey Plc 356 0.02
Commercial services GBP 22,491 Ashtead Group Plc 598 0.04GBP 11,148 Babcock International Group Plc 106 0.01GBP 69,372 G4S Plc^ 213 0.01GBP 8,983 Intertek Group Plc^ 560 0.03USD 15,801 Nielsen Holdings Plc 408 0.02GBP 50,479 Relx Plc 951 0.06
Cosmetics & personal care GBP 61,411 Unilever Plc 2,903 0.18
Distribution & wholesale GBP 18,452 Bunzl Plc^ 482 0.03GBP 10,635 Travis Perkins Plc 163 0.01
Diversified financial services GBP 58,021 3i Group Plc 630 0.04GBP 12,976 Hargreaves Lansdown Plc 282 0.02GBP 14,277 London Stock Exchange Group
Plc 729 0.04GBP 5,619 Schroders Plc 208 0.01GBP 147,731 Standard Life Aberdeen Plc 590 0.04
Electricity GBP 47,277 SSE Plc 737 0.04
Electronics USD 9,893 Sensata Technologies Holding
Plc 433 0.03Entertainment
GBP 31,965 Merlin Entertainments Plc 134 0.01Food
GBP 16,563 Associated British Foods Plc 500 0.03GBP 78,992 J Sainsbury Plc 287 0.02GBP 434,368 Tesco Plc 1,217 0.07GBP 93,317 Wm Morrison Supermarkets Plc 261 0.02
Food Service GBP 81,502 Compass Group Plc^ 1,503 0.09
Forest products & paper GBP 16,580 Mondi Plc 395 0.02
Gas GBP 253,530 Centrica Plc 422 0.02GBP 172,267 National Grid Plc^ 1,636 0.10
Healthcare products GBP 54,782 ConvaTec Group Plc 145 0.01GBP 46,542 Smith & Nephew Plc 726 0.04
Healthcare services GBP 19,350 Mediclinic International Plc^ 135 0.01
Home builders GBP 44,305 Barratt Developments Plc 276 0.02GBP 8,024 Berkeley Group Holdings Plc 388 0.02GBP 13,457 Persimmon Plc 434 0.03GBP 145,218 Taylor Wimpey Plc^ 315 0.02
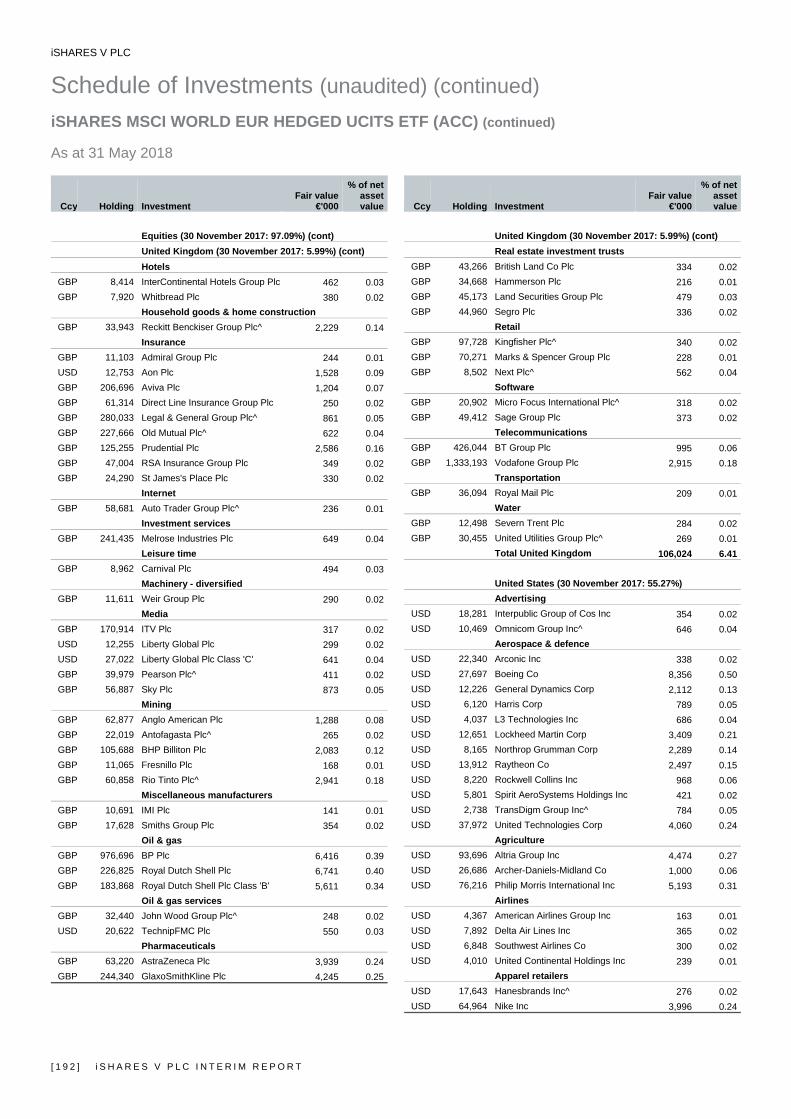
iSHARES V PLC
Schedule of Investments (unaudited) (continued) iSHARES MSCI WORLD EUR HEDGED UCITS ETF (ACC) (continued) As at 31 May 2018
[ 1 9 2 ] i S H A R E S V P L C I N T E R I M R E P O R T
Ccy Holding Investment Fair value
€'000
% of net asset value
Equities (30 November 2017: 97.09%) (cont) United Kingdom (30 November 2017: 5.99%) (cont)
Hotels GBP 8,414 InterContinental Hotels Group Plc 462 0.03GBP 7,920 Whitbread Plc 380 0.02
Household goods & home construction GBP 33,943 Reckitt Benckiser Group Plc^ 2,229 0.14
Insurance GBP 11,103 Admiral Group Plc 244 0.01USD 12,753 Aon Plc 1,528 0.09GBP 206,696 Aviva Plc 1,204 0.07GBP 61,314 Direct Line Insurance Group Plc 250 0.02GBP 280,033 Legal & General Group Plc^ 861 0.05GBP 227,666 Old Mutual Plc^ 622 0.04GBP 125,255 Prudential Plc 2,586 0.16GBP 47,004 RSA Insurance Group Plc 349 0.02GBP 24,290 St James's Place Plc 330 0.02
Internet GBP 58,681 Auto Trader Group Plc^ 236 0.01
Investment services GBP 241,435 Melrose Industries Plc 649 0.04
Leisure time GBP 8,962 Carnival Plc 494 0.03
Machinery - diversified GBP 11,611 Weir Group Plc 290 0.02
Media GBP 170,914 ITV Plc 317 0.02USD 12,255 Liberty Global Plc 299 0.02USD 27,022 Liberty Global Plc Class 'C' 641 0.04GBP 39,979 Pearson Plc^ 411 0.02GBP 56,887 Sky Plc 873 0.05
Mining GBP 62,877 Anglo American Plc 1,288 0.08GBP 22,019 Antofagasta Plc^ 265 0.02GBP 105,688 BHP Billiton Plc 2,083 0.12GBP 11,065 Fresnillo Plc 168 0.01GBP 60,858 Rio Tinto Plc^ 2,941 0.18
Miscellaneous manufacturers GBP 10,691 IMI Plc 141 0.01GBP 17,628 Smiths Group Plc 354 0.02
Oil & gas GBP 976,696 BP Plc 6,416 0.39GBP 226,825 Royal Dutch Shell Plc 6,741 0.40GBP 183,868 Royal Dutch Shell Plc Class 'B' 5,611 0.34
Oil & gas services GBP 32,440 John Wood Group Plc^ 248 0.02USD 20,622 TechnipFMC Plc 550 0.03
Pharmaceuticals GBP 63,220 AstraZeneca Plc 3,939 0.24GBP 244,340 GlaxoSmithKline Plc 4,245 0.25
Ccy Holding Investment Fair value
€'000
% of net asset value
United Kingdom (30 November 2017: 5.99%) (cont) Real estate investment trusts
GBP 43,266 British Land Co Plc 334 0.02GBP 34,668 Hammerson Plc 216 0.01GBP 45,173 Land Securities Group Plc 479 0.03GBP 44,960 Segro Plc 336 0.02
Retail GBP 97,728 Kingfisher Plc^ 340 0.02GBP 70,271 Marks & Spencer Group Plc 228 0.01GBP 8,502 Next Plc^ 562 0.04
Software GBP 20,902 Micro Focus International Plc^ 318 0.02GBP 49,412 Sage Group Plc 373 0.02
Telecommunications GBP 426,044 BT Group Plc 995 0.06GBP 1,333,193 Vodafone Group Plc 2,915 0.18
Transportation GBP 36,094 Royal Mail Plc 209 0.01
Water GBP 12,498 Severn Trent Plc 284 0.02GBP 30,455 United Utilities Group Plc^ 269 0.01
Total United Kingdom 106,024 6.41
United States (30 November 2017: 55.27%) Advertising
USD 18,281 Interpublic Group of Cos Inc 354 0.02USD 10,469 Omnicom Group Inc^ 646 0.04
Aerospace & defence USD 22,340 Arconic Inc 338 0.02USD 27,697 Boeing Co 8,356 0.50USD 12,226 General Dynamics Corp 2,112 0.13USD 6,120 Harris Corp 789 0.05USD 4,037 L3 Technologies Inc 686 0.04USD 12,651 Lockheed Martin Corp 3,409 0.21USD 8,165 Northrop Grumman Corp 2,289 0.14USD 13,912 Raytheon Co 2,497 0.15USD 8,220 Rockwell Collins Inc 968 0.06USD 5,801 Spirit AeroSystems Holdings Inc 421 0.02USD 2,738 TransDigm Group Inc^ 784 0.05USD 37,972 United Technologies Corp 4,060 0.24
Agriculture USD 93,696 Altria Group Inc 4,474 0.27USD 26,686 Archer-Daniels-Midland Co 1,000 0.06USD 76,216 Philip Morris International Inc 5,193 0.31
Airlines USD 4,367 American Airlines Group Inc 163 0.01USD 7,892 Delta Air Lines Inc 365 0.02USD 6,848 Southwest Airlines Co 300 0.02USD 4,010 United Continental Holdings Inc 239 0.01
Apparel retailers USD 17,643 Hanesbrands Inc^ 276 0.02USD 64,964 Nike Inc 3,996 0.24
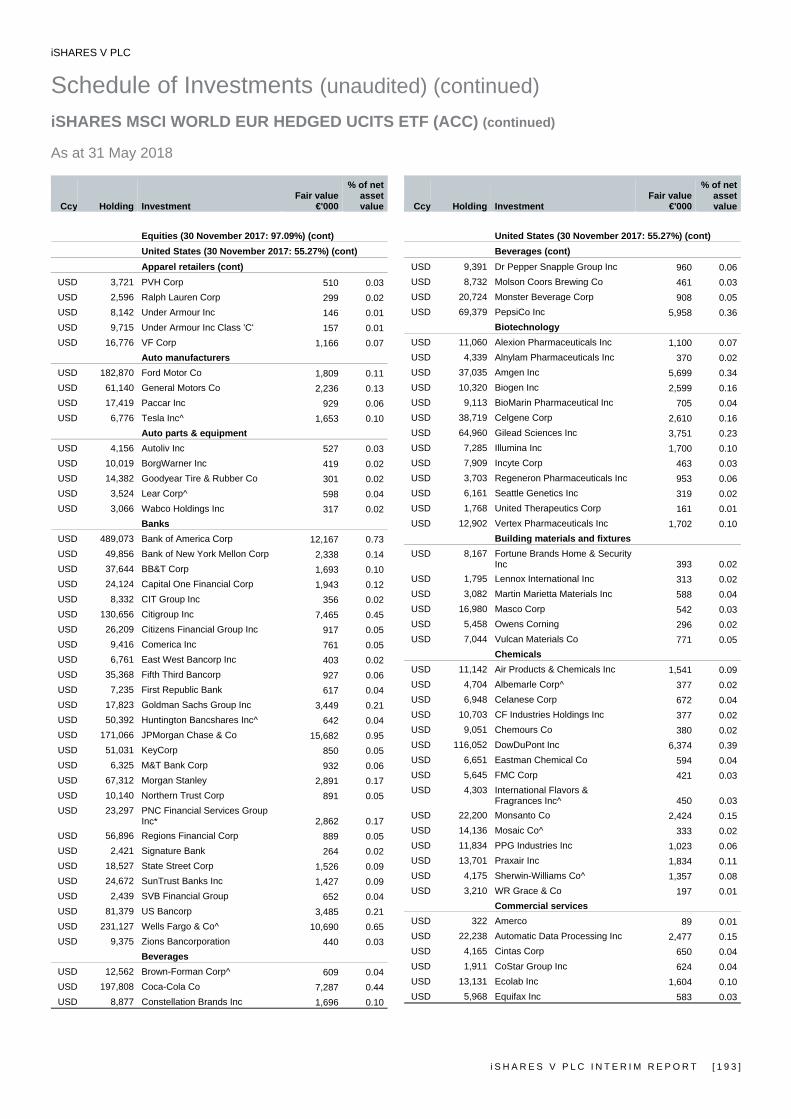
iSHARES V PLC
Schedule of Investments (unaudited) (continued) iSHARES MSCI WORLD EUR HEDGED UCITS ETF (ACC) (continued) As at 31 May 2018
i S H A R E S V P L C I N T E R I M R E P O R T [ 1 9 3 ]
Ccy Holding Investment Fair value
€'000
% of net asset value
Equities (30 November 2017: 97.09%) (cont) United States (30 November 2017: 55.27%) (cont) Apparel retailers (cont)
USD 3,721 PVH Corp 510 0.03USD 2,596 Ralph Lauren Corp 299 0.02USD 8,142 Under Armour Inc 146 0.01USD 9,715 Under Armour Inc Class 'C' 157 0.01USD 16,776 VF Corp 1,166 0.07
Auto manufacturers USD 182,870 Ford Motor Co 1,809 0.11USD 61,140 General Motors Co 2,236 0.13USD 17,419 Paccar Inc 929 0.06USD 6,776 Tesla Inc^ 1,653 0.10
Auto parts & equipment USD 4,156 Autoliv Inc 527 0.03USD 10,019 BorgWarner Inc 419 0.02USD 14,382 Goodyear Tire & Rubber Co 301 0.02USD 3,524 Lear Corp^ 598 0.04USD 3,066 Wabco Holdings Inc 317 0.02
Banks USD 489,073 Bank of America Corp 12,167 0.73USD 49,856 Bank of New York Mellon Corp 2,338 0.14USD 37,644 BB&T Corp 1,693 0.10USD 24,124 Capital One Financial Corp 1,943 0.12USD 8,332 CIT Group Inc 356 0.02USD 130,656 Citigroup Inc 7,465 0.45USD 26,209 Citizens Financial Group Inc 917 0.05USD 9,416 Comerica Inc 761 0.05USD 6,761 East West Bancorp Inc 403 0.02USD 35,368 Fifth Third Bancorp 927 0.06USD 7,235 First Republic Bank 617 0.04USD 17,823 Goldman Sachs Group Inc 3,449 0.21USD 50,392 Huntington Bancshares Inc^ 642 0.04USD 171,066 JPMorgan Chase & Co 15,682 0.95USD 51,031 KeyCorp 850 0.05USD 6,325 M&T Bank Corp 932 0.06USD 67,312 Morgan Stanley 2,891 0.17USD 10,140 Northern Trust Corp 891 0.05USD 23,297 PNC Financial Services Group
Inc* 2,862 0.17USD 56,896 Regions Financial Corp 889 0.05USD 2,421 Signature Bank 264 0.02USD 18,527 State Street Corp 1,526 0.09USD 24,672 SunTrust Banks Inc 1,427 0.09USD 2,439 SVB Financial Group 652 0.04USD 81,379 US Bancorp 3,485 0.21USD 231,127 Wells Fargo & Co^ 10,690 0.65USD 9,375 Zions Bancorporation 440 0.03
Beverages USD 12,562 Brown-Forman Corp^ 609 0.04USD 197,808 Coca-Cola Co 7,287 0.44USD 8,877 Constellation Brands Inc 1,696 0.10
Ccy Holding Investment Fair value
€'000
% of net asset value
United States (30 November 2017: 55.27%) (cont) Beverages (cont)
USD 9,391 Dr Pepper Snapple Group Inc 960 0.06USD 8,732 Molson Coors Brewing Co 461 0.03USD 20,724 Monster Beverage Corp 908 0.05USD 69,379 PepsiCo Inc 5,958 0.36
Biotechnology USD 11,060 Alexion Pharmaceuticals Inc 1,100 0.07USD 4,339 Alnylam Pharmaceuticals Inc 370 0.02USD 37,035 Amgen Inc 5,699 0.34USD 10,320 Biogen Inc 2,599 0.16USD 9,113 BioMarin Pharmaceutical Inc 705 0.04USD 38,719 Celgene Corp 2,610 0.16USD 64,960 Gilead Sciences Inc 3,751 0.23USD 7,285 Illumina Inc 1,700 0.10USD 7,909 Incyte Corp 463 0.03USD 3,703 Regeneron Pharmaceuticals Inc 953 0.06USD 6,161 Seattle Genetics Inc 319 0.02USD 1,768 United Therapeutics Corp 161 0.01USD 12,902 Vertex Pharmaceuticals Inc 1,702 0.10
Building materials and fixtures USD 8,167 Fortune Brands Home & Security
Inc 393 0.02USD 1,795 Lennox International Inc 313 0.02USD 3,082 Martin Marietta Materials Inc 588 0.04USD 16,980 Masco Corp 542 0.03USD 5,458 Owens Corning 296 0.02USD 7,044 Vulcan Materials Co 771 0.05
Chemicals USD 11,142 Air Products & Chemicals Inc 1,541 0.09USD 4,704 Albemarle Corp^ 377 0.02USD 6,948 Celanese Corp 672 0.04USD 10,703 CF Industries Holdings Inc 377 0.02USD 9,051 Chemours Co 380 0.02USD 116,052 DowDuPont Inc 6,374 0.39USD 6,651 Eastman Chemical Co 594 0.04USD 5,645 FMC Corp 421 0.03USD 4,303 International Flavors &
Fragrances Inc^ 450 0.03USD 22,200 Monsanto Co 2,424 0.15USD 14,136 Mosaic Co^ 333 0.02USD 11,834 PPG Industries Inc 1,023 0.06USD 13,701 Praxair Inc 1,834 0.11USD 4,175 Sherwin-Williams Co^ 1,357 0.08USD 3,210 WR Grace & Co 197 0.01
Commercial services USD 322 Amerco 89 0.01USD 22,238 Automatic Data Processing Inc 2,477 0.15USD 4,165 Cintas Corp 650 0.04USD 1,911 CoStar Group Inc 624 0.04USD 13,131 Ecolab Inc 1,604 0.10USD 5,968 Equifax Inc 583 0.03
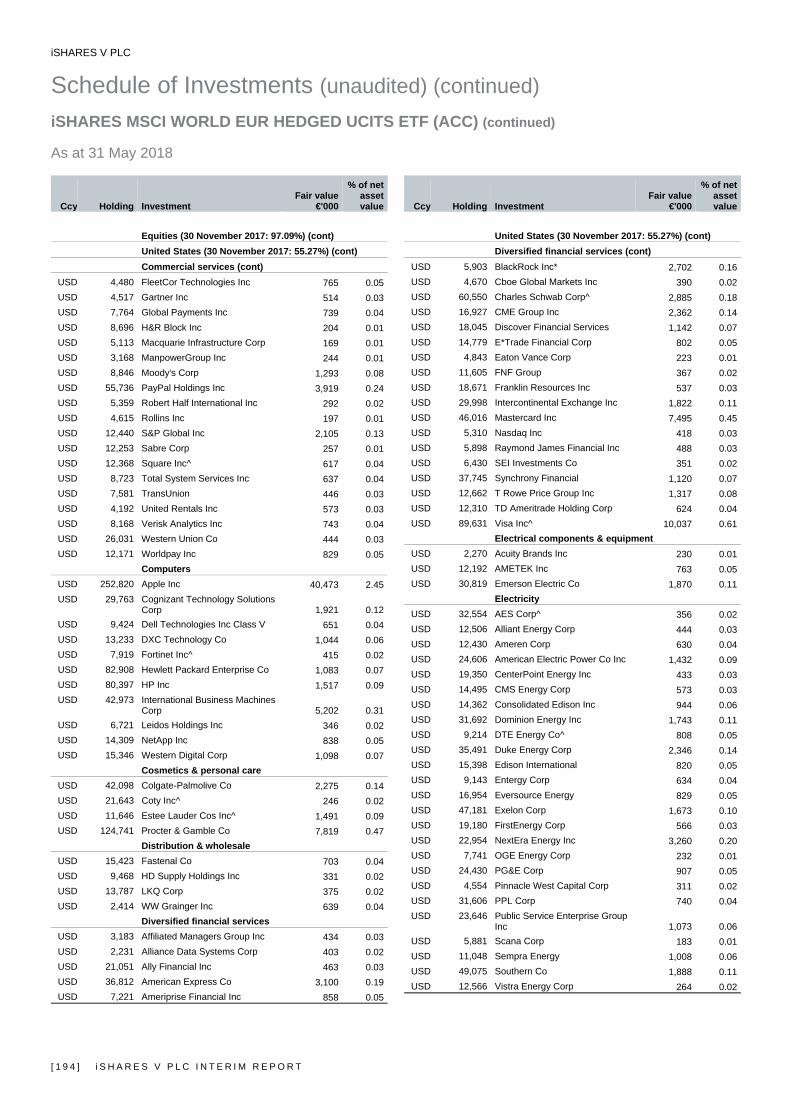
iSHARES V PLC
Schedule of Investments (unaudited) (continued) iSHARES MSCI WORLD EUR HEDGED UCITS ETF (ACC) (continued) As at 31 May 2018
[ 1 9 4 ] i S H A R E S V P L C I N T E R I M R E P O R T
Ccy Holding Investment Fair value
€'000
% of net asset value
Equities (30 November 2017: 97.09%) (cont) United States (30 November 2017: 55.27%) (cont) Commercial services (cont)
USD 4,480 FleetCor Technologies Inc 765 0.05USD 4,517 Gartner Inc 514 0.03USD 7,764 Global Payments Inc 739 0.04USD 8,696 H&R Block Inc 204 0.01USD 5,113 Macquarie Infrastructure Corp 169 0.01USD 3,168 ManpowerGroup Inc 244 0.01USD 8,846 Moody's Corp 1,293 0.08USD 55,736 PayPal Holdings Inc 3,919 0.24USD 5,359 Robert Half International Inc 292 0.02USD 4,615 Rollins Inc 197 0.01USD 12,440 S&P Global Inc 2,105 0.13USD 12,253 Sabre Corp 257 0.01USD 12,368 Square Inc^ 617 0.04USD 8,723 Total System Services Inc 637 0.04USD 7,581 TransUnion 446 0.03USD 4,192 United Rentals Inc 573 0.03USD 8,168 Verisk Analytics Inc 743 0.04USD 26,031 Western Union Co 444 0.03USD 12,171 Worldpay Inc 829 0.05
Computers USD 252,820 Apple Inc 40,473 2.45USD 29,763 Cognizant Technology Solutions
Corp 1,921 0.12USD 9,424 Dell Technologies Inc Class V 651 0.04USD 13,233 DXC Technology Co 1,044 0.06USD 7,919 Fortinet Inc^ 415 0.02USD 82,908 Hewlett Packard Enterprise Co 1,083 0.07USD 80,397 HP Inc 1,517 0.09USD 42,973 International Business Machines
Corp 5,202 0.31USD 6,721 Leidos Holdings Inc 346 0.02USD 14,309 NetApp Inc 838 0.05USD 15,346 Western Digital Corp 1,098 0.07
Cosmetics & personal care USD 42,098 Colgate-Palmolive Co 2,275 0.14USD 21,643 Coty Inc^ 246 0.02USD 11,646 Estee Lauder Cos Inc^ 1,491 0.09USD 124,741 Procter & Gamble Co 7,819 0.47
Distribution & wholesale USD 15,423 Fastenal Co 703 0.04USD 9,468 HD Supply Holdings Inc 331 0.02USD 13,787 LKQ Corp 375 0.02USD 2,414 WW Grainger Inc 639 0.04
Diversified financial services USD 3,183 Affiliated Managers Group Inc 434 0.03USD 2,231 Alliance Data Systems Corp 403 0.02USD 21,051 Ally Financial Inc 463 0.03USD 36,812 American Express Co 3,100 0.19USD 7,221 Ameriprise Financial Inc 858 0.05
Ccy Holding Investment Fair value
€'000
% of net asset value
United States (30 November 2017: 55.27%) (cont) Diversified financial services (cont)
USD 5,903 BlackRock Inc* 2,702 0.16USD 4,670 Cboe Global Markets Inc 390 0.02USD 60,550 Charles Schwab Corp^ 2,885 0.18USD 16,927 CME Group Inc 2,362 0.14USD 18,045 Discover Financial Services 1,142 0.07USD 14,779 E*Trade Financial Corp 802 0.05USD 4,843 Eaton Vance Corp 223 0.01USD 11,605 FNF Group 367 0.02USD 18,671 Franklin Resources Inc 537 0.03USD 29,998 Intercontinental Exchange Inc 1,822 0.11USD 46,016 Mastercard Inc 7,495 0.45USD 5,310 Nasdaq Inc 418 0.03USD 5,898 Raymond James Financial Inc 488 0.03USD 6,430 SEI Investments Co 351 0.02USD 37,745 Synchrony Financial 1,120 0.07USD 12,662 T Rowe Price Group Inc 1,317 0.08USD 12,310 TD Ameritrade Holding Corp 624 0.04USD 89,631 Visa Inc^ 10,037 0.61
Electrical components & equipment USD 2,270 Acuity Brands Inc 230 0.01USD 12,192 AMETEK Inc 763 0.05USD 30,819 Emerson Electric Co 1,870 0.11
Electricity USD 32,554 AES Corp^ 356 0.02USD 12,506 Alliant Energy Corp 444 0.03USD 12,430 Ameren Corp 630 0.04USD 24,606 American Electric Power Co Inc 1,432 0.09USD 19,350 CenterPoint Energy Inc 433 0.03USD 14,495 CMS Energy Corp 573 0.03USD 14,362 Consolidated Edison Inc 944 0.06USD 31,692 Dominion Energy Inc 1,743 0.11USD 9,214 DTE Energy Co^ 808 0.05USD 35,491 Duke Energy Corp 2,346 0.14USD 15,398 Edison International 820 0.05USD 9,143 Entergy Corp 634 0.04USD 16,954 Eversource Energy 829 0.05USD 47,181 Exelon Corp 1,673 0.10USD 19,180 FirstEnergy Corp 566 0.03USD 22,954 NextEra Energy Inc 3,260 0.20USD 7,741 OGE Energy Corp 232 0.01USD 24,430 PG&E Corp 907 0.05USD 4,554 Pinnacle West Capital Corp 311 0.02USD 31,606 PPL Corp 740 0.04USD 23,646 Public Service Enterprise Group
Inc 1,073 0.06USD 5,881 Scana Corp 183 0.01USD 11,048 Sempra Energy 1,008 0.06USD 49,075 Southern Co 1,888 0.11USD 12,566 Vistra Energy Corp 264 0.02
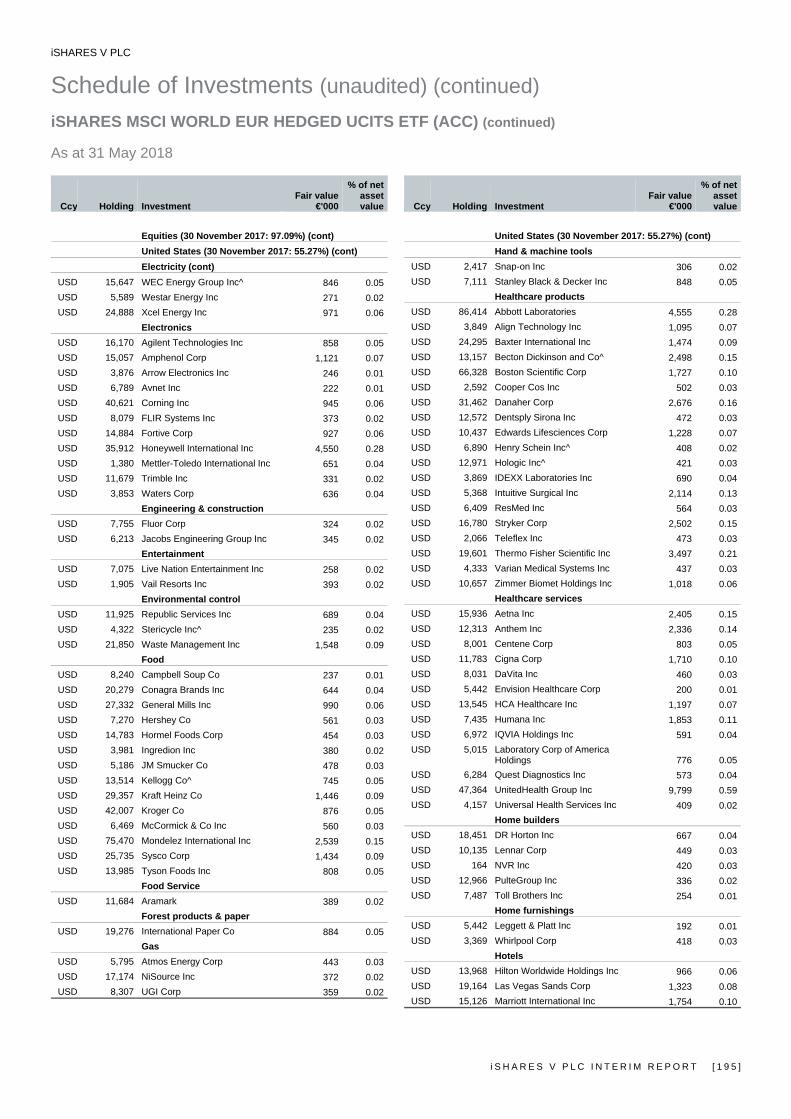
iSHARES V PLC
Schedule of Investments (unaudited) (continued) iSHARES MSCI WORLD EUR HEDGED UCITS ETF (ACC) (continued) As at 31 May 2018
i S H A R E S V P L C I N T E R I M R E P O R T [ 1 9 5 ]
Ccy Holding Investment Fair value
€'000
% of net asset value
Equities (30 November 2017: 97.09%) (cont) United States (30 November 2017: 55.27%) (cont) Electricity (cont)
USD 15,647 WEC Energy Group Inc^ 846 0.05USD 5,589 Westar Energy Inc 271 0.02USD 24,888 Xcel Energy Inc 971 0.06
Electronics USD 16,170 Agilent Technologies Inc 858 0.05USD 15,057 Amphenol Corp 1,121 0.07USD 3,876 Arrow Electronics Inc 246 0.01USD 6,789 Avnet Inc 222 0.01USD 40,621 Corning Inc 945 0.06USD 8,079 FLIR Systems Inc 373 0.02USD 14,884 Fortive Corp 927 0.06USD 35,912 Honeywell International Inc 4,550 0.28USD 1,380 Mettler-Toledo International Inc 651 0.04USD 11,679 Trimble Inc 331 0.02USD 3,853 Waters Corp 636 0.04
Engineering & construction USD 7,755 Fluor Corp 324 0.02USD 6,213 Jacobs Engineering Group Inc 345 0.02
Entertainment USD 7,075 Live Nation Entertainment Inc 258 0.02USD 1,905 Vail Resorts Inc 393 0.02
Environmental control USD 11,925 Republic Services Inc 689 0.04USD 4,322 Stericycle Inc^ 235 0.02USD 21,850 Waste Management Inc 1,548 0.09
Food USD 8,240 Campbell Soup Co 237 0.01USD 20,279 Conagra Brands Inc 644 0.04USD 27,332 General Mills Inc 990 0.06USD 7,270 Hershey Co 561 0.03USD 14,783 Hormel Foods Corp 454 0.03USD 3,981 Ingredion Inc 380 0.02USD 5,186 JM Smucker Co 478 0.03USD 13,514 Kellogg Co^ 745 0.05USD 29,357 Kraft Heinz Co 1,446 0.09USD 42,007 Kroger Co 876 0.05USD 6,469 McCormick & Co Inc 560 0.03USD 75,470 Mondelez International Inc 2,539 0.15USD 25,735 Sysco Corp 1,434 0.09USD 13,985 Tyson Foods Inc 808 0.05
Food Service USD 11,684 Aramark 389 0.02
Forest products & paper USD 19,276 International Paper Co 884 0.05
Gas USD 5,795 Atmos Energy Corp 443 0.03USD 17,174 NiSource Inc 372 0.02USD 8,307 UGI Corp 359 0.02
Ccy Holding Investment Fair value
€'000
% of net asset value
United States (30 November 2017: 55.27%) (cont) Hand & machine tools
USD 2,417 Snap-on Inc 306 0.02USD 7,111 Stanley Black & Decker Inc 848 0.05
Healthcare products USD 86,414 Abbott Laboratories 4,555 0.28USD 3,849 Align Technology Inc 1,095 0.07USD 24,295 Baxter International Inc 1,474 0.09USD 13,157 Becton Dickinson and Co^ 2,498 0.15USD 66,328 Boston Scientific Corp 1,727 0.10USD 2,592 Cooper Cos Inc 502 0.03USD 31,462 Danaher Corp 2,676 0.16USD 12,572 Dentsply Sirona Inc 472 0.03USD 10,437 Edwards Lifesciences Corp 1,228 0.07USD 6,890 Henry Schein Inc^ 408 0.02USD 12,971 Hologic Inc^ 421 0.03USD 3,869 IDEXX Laboratories Inc 690 0.04USD 5,368 Intuitive Surgical Inc 2,114 0.13USD 6,409 ResMed Inc 564 0.03USD 16,780 Stryker Corp 2,502 0.15USD 2,066 Teleflex Inc 473 0.03USD 19,601 Thermo Fisher Scientific Inc 3,497 0.21USD 4,333 Varian Medical Systems Inc 437 0.03USD 10,657 Zimmer Biomet Holdings Inc 1,018 0.06
Healthcare services USD 15,936 Aetna Inc 2,405 0.15USD 12,313 Anthem Inc 2,336 0.14USD 8,001 Centene Corp 803 0.05USD 11,783 Cigna Corp 1,710 0.10USD 8,031 DaVita Inc 460 0.03USD 5,442 Envision Healthcare Corp 200 0.01USD 13,545 HCA Healthcare Inc 1,197 0.07USD 7,435 Humana Inc 1,853 0.11USD 6,972 IQVIA Holdings Inc 591 0.04USD 5,015 Laboratory Corp of America
Holdings 776 0.05USD 6,284 Quest Diagnostics Inc 573 0.04USD 47,364 UnitedHealth Group Inc 9,799 0.59USD 4,157 Universal Health Services Inc 409 0.02
Home builders USD 18,451 DR Horton Inc 667 0.04USD 10,135 Lennar Corp 449 0.03USD 164 NVR Inc 420 0.03USD 12,966 PulteGroup Inc 336 0.02USD 7,487 Toll Brothers Inc 254 0.01
Home furnishings USD 5,442 Leggett & Platt Inc 192 0.01USD 3,369 Whirlpool Corp 418 0.03
Hotels USD 13,968 Hilton Worldwide Holdings Inc 966 0.06USD 19,164 Las Vegas Sands Corp 1,323 0.08USD 15,126 Marriott International Inc 1,754 0.10

iSHARES V PLC
Schedule of Investments (unaudited) (continued) iSHARES MSCI WORLD EUR HEDGED UCITS ETF (ACC) (continued) As at 31 May 2018
[ 1 9 6 ] i S H A R E S V P L C I N T E R I M R E P O R T
Ccy Holding Investment Fair value
€'000
% of net asset value
Equities (30 November 2017: 97.09%) (cont) United States (30 November 2017: 55.27%) (cont) Hotels (cont)
USD 22,368 MGM Resorts International 603 0.04USD 5,480 Wyndham Destinations Inc 509 0.03USD 3,692 Wynn Resorts Ltd 620 0.04
Household goods & home construction USD 5,049 Avery Dennison Corp 454 0.02USD 11,683 Church & Dwight Co Inc 470 0.03USD 6,646 Clorox Co 688 0.04USD 17,074 Kimberly-Clark Corp 1,475 0.09USD 1,261 Spectrum Brands Holdings Inc 86 0.01
Household products USD 23,806 Newell Brands Inc 481 0.03
Insurance USD 38,372 Aflac Inc 1,481 0.09USD 475 Alleghany Corp 232 0.01USD 18,205 Allstate Corp 1,458 0.09USD 3,508 American Financial Group Inc 330 0.02USD 44,099 American International Group Inc 1,994 0.12USD 9,962 Arthur J Gallagher & Co 566 0.03USD 2,950 Assurant Inc 236 0.01USD 61,840 Berkshire Hathaway Inc 10,147 0.61USD 5,200 Brighthouse Financial Inc 210 0.01USD 7,263 Cincinnati Financial Corp 432 0.03USD 18,526 Hartford Financial Services
Group Inc 830 0.05USD 10,822 Lincoln National Corp 615 0.04USD 15,373 Loews Corp 644 0.04USD 638 Markel Corp 600 0.04USD 25,261 Marsh & McLennan Cos Inc 1,739 0.11USD 45,918 MetLife Inc 1,809 0.11USD 15,447 Principal Financial Group Inc 738 0.04USD 30,257 Progressive Corp 1,609 0.10USD 20,874 Prudential Financial Inc 1,732 0.11USD 3,036 Reinsurance Group of America
Inc 389 0.02USD 5,145 Torchmark Corp 374 0.02USD 13,341 Travelers Cos Inc 1,469 0.09USD 10,300 Unum Group 342 0.02USD 10,331 Voya Financial Inc 460 0.03USD 4,537 WR Berkley Corp 297 0.02
Internet USD 14,669 Alphabet Inc 13,823 0.84USD 15,424 Alphabet Inc Class 'C' 14,336 0.87USD 20,194 Amazon.com Inc 28,192 1.70USD 2,370 Booking Holdings Inc 4,282 0.26USD 8,717 CDW Corp 598 0.04USD 49,472 eBay Inc 1,599 0.10USD 6,792 Expedia Group Inc 704 0.04USD 3,534 F5 Networks Inc 524 0.03USD 117,899 Facebook Inc 19,370 1.17
Ccy Holding Investment Fair value
€'000
% of net asset value
United States (30 November 2017: 55.27%) (cont) Internet (cont)
USD 3,642 IAC/InterActiveCorp 484 0.03USD 2,246 MercadoLibre Inc 560 0.03USD 21,475 Netflix Inc 6,468 0.39USD 4,316 Palo Alto Networks Inc 769 0.05USD 31,768 Symantec Corp 566 0.03USD 5,274 TripAdvisor Inc 236 0.01USD 30,046 Twitter Inc 893 0.05USD 4,017 VeriSign Inc 449 0.03USD 5,641 Zillow Group Inc 282 0.02
Investment services USD 15,257 Jefferies Financial Group Inc 286 0.02
Iron & steel USD 14,793 Nucor Corp 813 0.05USD 11,381 Steel Dynamics Inc 482 0.03
Leisure time USD 9,112 Harley-Davidson Inc 321 0.02USD 2,755 Polaris Industries Inc^ 264 0.02
Machinery - diversified USD 3,716 AGCO Corp 202 0.01USD 8,500 Cognex Corp 333 0.02USD 8,148 Cummins Inc 994 0.06USD 13,075 Deere & Co^ 1,675 0.10USD 7,054 Flowserve Corp 250 0.01USD 3,566 IDEX Corp 423 0.03USD 2,951 Middleby Corp^ 252 0.02USD 6,214 Rockwell Automation Inc 934 0.06USD 5,337 Roper Technologies Inc 1,261 0.08USD 4,356 Wabtec Corp 364 0.02USD 9,506 Xylem Inc 573 0.03
Machinery, construction & mining USD 29,577 Caterpillar Inc 3,849 0.23
Marine transportation USD 2,104 Huntington Ingalls Industries Inc 399 0.02
Media USD 16,815 CBS Corp 726 0.04USD 9,291 Charter Communications Inc 2,078 0.13USD 229,350 Comcast Corp 6,126 0.37USD 8,057 Discovery Inc 146 0.01USD 11,216 Discovery Inc Class 'C' 190 0.01USD 9,942 DISH Network Corp 252 0.02USD 4,916 Liberty Broadband Corp 290 0.02USD 9,893 Liberty Media Corp-Liberty
Formula One 268 0.02USD 4,293 Liberty Media Corp-Liberty
SiriusXM 170 0.01USD 9,630 Liberty Media Corp-Liberty
SiriusXM Class 'C' 381 0.02USD 17,185 News Corp 221 0.01USD 76,839 Sirius XM Holdings Inc^ 467 0.03USD 38,185 Time Warner Inc 3,080 0.19USD 52,516 Twenty-First Century Fox Inc 1,734 0.10

iSHARES V PLC
Schedule of Investments (unaudited) (continued) iSHARES MSCI WORLD EUR HEDGED UCITS ETF (ACC) (continued) As at 31 May 2018
i S H A R E S V P L C I N T E R I M R E P O R T [ 1 9 7 ]
Ccy Holding Investment Fair value
€'000
% of net asset value
Equities (30 November 2017: 97.09%) (cont) United States (30 November 2017: 55.27%) (cont) Media (cont)
USD 23,389 Twenty-First Century Fox Inc Class 'B' 765 0.05
USD 16,154 Viacom Inc^ 375 0.02USD 74,251 Walt Disney Co 6,327 0.38
Mining USD 69,222 Freeport-McMoRan Inc 1,002 0.06USD 26,387 Newmont Mining Corp 880 0.05
Miscellaneous manufacturers USD 29,057 3M Co 4,910 0.30USD 7,826 AO Smith Corp 423 0.03USD 7,511 Dover Corp 497 0.03USD 430,616 General Electric Co 5,194 0.31USD 15,328 Illinois Tool Works Inc 1,887 0.11USD 6,273 Parker-Hannifin Corp 918 0.06USD 11,926 Textron Inc 680 0.04
Office & business equipment USD 11,512 Xerox Corp 268 0.02
Oil & gas USD 25,892 Anadarko Petroleum Corp 1,548 0.09USD 7,451 Andeavor 922 0.06USD 12,936 Antero Resources Corp^ 212 0.01USD 16,863 Apache Corp^ 578 0.03USD 24,883 Cabot Oil & Gas Corp 487 0.03USD 94,259 Chevron Corp 10,037 0.61USD 4,175 Cimarex Energy Co 332 0.02USD 6,888 Concho Resources Inc 810 0.05USD 57,632 ConocoPhillips 3,327 0.20USD 5,305 Continental Resources Inc 306 0.02USD 24,087 Devon Energy Corp 858 0.05USD 4,864 Diamondback Energy Inc 503 0.03USD 28,313 EOG Resources Inc 2,858 0.17USD 12,327 EQT Corp 544 0.03USD 208,414 Exxon Mobil Corp 14,505 0.88USD 4,656 Helmerich & Payne Inc^ 265 0.02USD 15,453 Hess Corp 800 0.05USD 8,793 HollyFrontier Corp^ 581 0.04USD 39,318 Marathon Oil Corp 722 0.04USD 23,779 Marathon Petroleum Corp^ 1,610 0.10USD 11,194 Newfield Exploration Co 281 0.02USD 21,690 Noble Energy Inc 663 0.04USD 37,738 Occidental Petroleum Corp 2,722 0.16USD 13,753 Parsley Energy Inc 347 0.02USD 20,722 Phillips 66 2,068 0.13USD 8,041 Pioneer Natural Resources Co 1,330 0.08USD 14,477 Range Resources Corp 197 0.01USD 22,226 Valero Energy Corp 2,308 0.14
Oil & gas services USD 19,096 Baker Hughes a GE Co 566 0.03USD 43,414 Halliburton Co 1,850 0.11
Ccy Holding Investment Fair value
€'000
% of net asset value
United States (30 November 2017: 55.27%) (cont) Oil & gas services (cont)
USD 17,638 National Oilwell Varco Inc 626 0.04Packaging & containers
USD 17,798 Ball Corp 564 0.03USD 6,113 Crown Holdings Inc 227 0.01USD 4,969 Packaging Corp of America 500 0.03USD 8,951 Sealed Air Corp^ 334 0.02USD 11,398 WestRock Co 575 0.04
Pharmaceuticals USD 77,863 AbbVie Inc 6,599 0.40USD 7,985 AmerisourceBergen Corp 562 0.03USD 80,238 Bristol-Myers Squibb Co 3,617 0.22USD 16,532 Cardinal Health Inc 738 0.05USD 49,532 CVS Health Corp 2,690 0.16USD 47,752 Eli Lilly & Co 3,479 0.21USD 28,178 Express Scripts Holding Co 1,830 0.11USD 132,151 Johnson & Johnson 13,542 0.82USD 10,494 McKesson Corp 1,276 0.08USD 132,630 Merck & Co Inc 6,764 0.41USD 291,234 Pfizer Inc 8,964 0.54USD 1,761 TESARO Inc 69 0.00USD 23,831 Zoetis Inc 1,709 0.10
Pipelines USD 10,498 Cheniere Energy Inc 599 0.04USD 102,650 Kinder Morgan Inc 1,467 0.09USD 18,210 ONEOK Inc 1,063 0.06USD 5,577 Plains GP Holdings LP 118 0.01USD 10,111 Targa Resources Corp 421 0.02USD 38,302 Williams Cos Inc 881 0.05
Real estate investment & services USD 16,553 CBRE Group Inc 655 0.04USD 2,069 Jones Lang LaSalle Inc 290 0.02
Real estate investment trusts USD 17,029 AGNC Investment Corp 275 0.02USD 4,778 Alexandria Real Estate Equities
Inc 511 0.03USD 20,904 American Tower Corp 2,478 0.15USD 61,075 Annaly Capital Management Inc 546 0.03USD 6,574 AvalonBay Communities Inc 932 0.06USD 8,368 Boston Properties Inc 873 0.05USD 11,993 Brixmor Property Group Inc 163 0.01USD 3,867 Camden Property Trust 292 0.02USD 31,688 Colony NorthStar Inc 160 0.01USD 19,361 Crown Castle International Corp 1,727 0.10USD 9,984 Digital Realty Trust Inc 919 0.06USD 15,103 Duke Realty Corp 364 0.02USD 3,719 Equinix Inc 1,264 0.08USD 18,191 Equity Residential 997 0.06USD 3,651 Essex Property Trust Inc 748 0.04USD 6,871 Extra Space Storage Inc 567 0.03USD 2,947 Federal Realty Investment Trust 300 0.02

iSHARES V PLC
Schedule of Investments (unaudited) (continued) iSHARES MSCI WORLD EUR HEDGED UCITS ETF (ACC) (continued) As at 31 May 2018
[ 1 9 8 ] i S H A R E S V P L C I N T E R I M R E P O R T
Ccy Holding Investment Fair value
€'000
% of net asset value
Equities (30 November 2017: 97.09%) (cont) United States (30 November 2017: 55.27%) (cont) Real estate investment trusts (cont)
USD 28,261 GGP Inc 491 0.03USD 23,493 HCP Inc 482 0.03USD 33,392 Host Hotels & Resorts Inc 619 0.04USD 15,265 Invitation Homes Inc 288 0.02USD 10,782 Iron Mountain Inc 307 0.02USD 19,109 Kimco Realty Corp 253 0.01USD 6,755 Liberty Property Trust 256 0.02USD 6,434 Macerich Co 307 0.02USD 5,277 Mid-America Apartment
Communities Inc 423 0.03USD 6,618 National Retail Properties Inc 235 0.01USD 26,098 Prologis Inc 1,439 0.09USD 8,146 Public Storage 1,478 0.09USD 15,327 Realty Income Corp^ 700 0.04USD 7,427 Regency Centers Corp 370 0.02USD 5,378 SBA Communications Corp 728 0.04USD 15,491 Simon Property Group Inc 2,126 0.13USD 4,203 SL Green Realty Corp 351 0.02USD 11,447 UDR Inc 358 0.02USD 16,446 Ventas Inc 770 0.05USD 41,596 VEREIT Inc 255 0.01USD 7,610 Vornado Realty Trust 454 0.03USD 18,945 Welltower Inc 936 0.06USD 38,286 Weyerhaeuser Co 1,224 0.07
Retail USD 3,238 Advance Auto Parts Inc 357 0.02USD 3,238 AutoNation Inc 127 0.01USD 1,325 AutoZone Inc 737 0.04USD 14,281 Best Buy Co Inc 835 0.05USD 9,285 CarMax Inc 548 0.03USD 1,440 Chipotle Mexican Grill Inc 531 0.03USD 21,371 Costco Wholesale Corp 3,629 0.22USD 5,629 Darden Restaurants Inc 422 0.03USD 13,924 Dollar General Corp 1,043 0.06USD 12,440 Dollar Tree Inc 880 0.05USD 2,131 Domino's Pizza Inc 459 0.03USD 11,490 Gap Inc^ 275 0.02USD 7,919 Genuine Parts Co 616 0.04USD 57,726 Home Depot Inc 9,225 0.56USD 9,004 Kohl's Corp 515 0.03USD 11,668 L Brands Inc 339 0.02USD 41,239 Lowe's Cos Inc 3,357 0.20USD 5,004 Lululemon Athletica Inc 450 0.03USD 14,792 Macy's Inc 442 0.03USD 39,195 McDonald's Corp 5,373 0.32USD 5,889 Nordstrom Inc 247 0.01USD 4,007 O'Reilly Automotive Inc 925 0.06USD 19,850 Qurate Retail Inc 346 0.02
Ccy Holding Investment Fair value
€'000
% of net asset value
United States (30 November 2017: 55.27%) (cont) Retail (cont)
USD 18,357 Ross Stores Inc 1,240 0.08USD 69,896 Starbucks Corp 3,393 0.21USD 14,085 Tapestry Inc 528 0.03USD 24,435 Target Corp 1,526 0.09USD 5,632 Tiffany & Co 631 0.04USD 31,343 TJX Cos Inc 2,425 0.15USD 5,892 Tractor Supply Co 375 0.02USD 2,773 Ulta Salon Cosmetics &
Fragrance Inc^ 587 0.04USD 41,304 Walgreens Boots Alliance Inc 2,208 0.13USD 72,978 Walmart Inc 5,160 0.31USD 16,576 Yum! Brands Inc 1,155 0.07
Savings & loans USD 28,355 New York Community Bancorp
Inc^ 282 0.02USD 13,854 People's United Financial Inc 218 0.01
Semiconductors USD 35,678 Advanced Micro Devices Inc 420 0.03USD 18,755 Analog Devices Inc 1,561 0.10USD 51,528 Applied Materials Inc 2,242 0.14USD 19,837 Broadcom Inc 4,284 0.26USD 230,167 Intel Corp 10,884 0.66USD 1,872 IPG Photonics Corp 387 0.02USD 7,433 KLA-Tencor Corp 721 0.04USD 8,047 Lam Research Corp 1,366 0.08USD 12,825 Maxim Integrated Products Inc 644 0.04USD 11,765 Microchip Technology Inc^ 982 0.06USD 50,523 Micron Technology Inc 2,493 0.15USD 30,058 NVIDIA Corp 6,494 0.39USD 6,114 Qorvo Inc^ 420 0.03USD 73,956 Qualcomm Inc 3,682 0.22USD 8,633 Skyworks Solutions Inc 729 0.04USD 48,235 Texas Instruments Inc 4,624 0.28USD 11,787 Xilinx Inc 688 0.04
Software USD 35,306 Activision Blizzard Inc 2,145 0.13USD 24,019 Adobe Systems Inc 5,129 0.31USD 8,569 Akamai Technologies Inc 553 0.03USD 4,635 Ansys Inc 646 0.04USD 9,802 Autodesk Inc 1,084 0.07USD 5,938 Broadridge Financial Solutions
Inc 587 0.04USD 13,921 CA Inc 426 0.03USD 13,326 Cadence Design Systems Inc 485 0.03USD 5,320 CDK Global Inc 293 0.02USD 16,042 Cerner Corp 820 0.05USD 7,772 Citrix Systems Inc 703 0.04USD 15,228 Electronic Arts Inc 1,708 0.10USD 16,973 Fidelity National Information
Services Inc 1,486 0.09
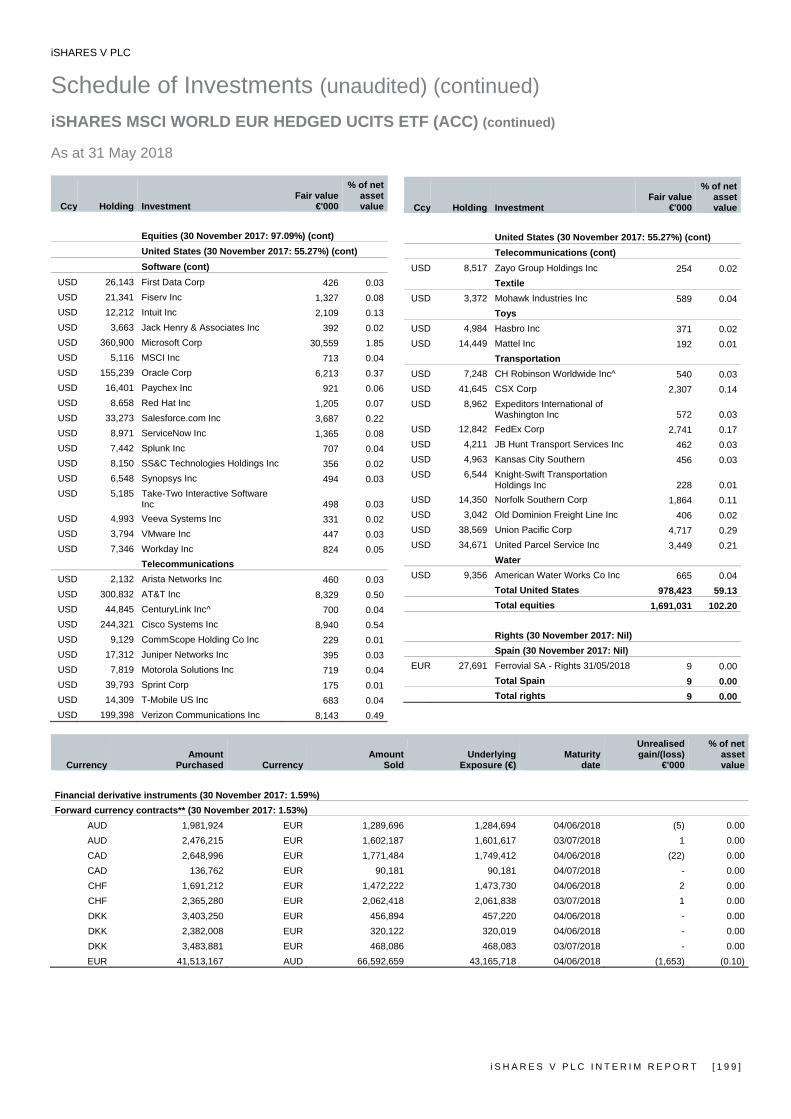
iSHARES V PLC
Schedule of Investments (unaudited) (continued) iSHARES MSCI WORLD EUR HEDGED UCITS ETF (ACC) (continued) As at 31 May 2018
i S H A R E S V P L C I N T E R I M R E P O R T [ 1 9 9 ]
Ccy Holding Investment Fair value
€'000
% of net asset value
Equities (30 November 2017: 97.09%) (cont) United States (30 November 2017: 55.27%) (cont) Software (cont)
USD 26,143 First Data Corp 426 0.03USD 21,341 Fiserv Inc 1,327 0.08USD 12,212 Intuit Inc 2,109 0.13USD 3,663 Jack Henry & Associates Inc 392 0.02USD 360,900 Microsoft Corp 30,559 1.85USD 5,116 MSCI Inc 713 0.04USD 155,239 Oracle Corp 6,213 0.37USD 16,401 Paychex Inc 921 0.06USD 8,658 Red Hat Inc 1,205 0.07USD 33,273 Salesforce.com Inc 3,687 0.22USD 8,971 ServiceNow Inc 1,365 0.08USD 7,442 Splunk Inc 707 0.04USD 8,150 SS&C Technologies Holdings Inc 356 0.02USD 6,548 Synopsys Inc 494 0.03USD 5,185 Take-Two Interactive Software
Inc 498 0.03USD 4,993 Veeva Systems Inc 331 0.02USD 3,794 VMware Inc 447 0.03USD 7,346 Workday Inc 824 0.05
Telecommunications USD 2,132 Arista Networks Inc 460 0.03USD 300,832 AT&T Inc 8,329 0.50USD 44,845 CenturyLink Inc^ 700 0.04USD 244,321 Cisco Systems Inc 8,940 0.54USD 9,129 CommScope Holding Co Inc 229 0.01USD 17,312 Juniper Networks Inc 395 0.03USD 7,819 Motorola Solutions Inc 719 0.04USD 39,793 Sprint Corp 175 0.01USD 14,309 T-Mobile US Inc 683 0.04USD 199,398 Verizon Communications Inc 8,143 0.49
Ccy Holding Investment Fair value
€'000
% of netassetvalue
United States (30 November 2017: 55.27%) (cont) Telecommunications (cont)
USD 8,517 Zayo Group Holdings Inc 254 0.02Textile
USD 3,372 Mohawk Industries Inc 589 0.04Toys
USD 4,984 Hasbro Inc 371 0.02USD 14,449 Mattel Inc 192 0.01
Transportation USD 7,248 CH Robinson Worldwide Inc^ 540 0.03USD 41,645 CSX Corp 2,307 0.14USD 8,962 Expeditors International of
Washington Inc 572 0.03USD 12,842 FedEx Corp 2,741 0.17USD 4,211 JB Hunt Transport Services Inc 462 0.03USD 4,963 Kansas City Southern 456 0.03USD 6,544 Knight-Swift Transportation
Holdings Inc 228 0.01USD 14,350 Norfolk Southern Corp 1,864 0.11USD 3,042 Old Dominion Freight Line Inc 406 0.02USD 38,569 Union Pacific Corp 4,717 0.29USD 34,671 United Parcel Service Inc 3,449 0.21
Water USD 9,356 American Water Works Co Inc 665 0.04
Total United States 978,423 59.13Total equities 1,691,031 102.20
Rights (30 November 2017: Nil) Spain (30 November 2017: Nil)
EUR 27,691 Ferrovial SA - Rights 31/05/2018 9 0.00Total Spain 9 0.00Total rights 9 0.00
Currency Amount
Purchased Currency Amount
SoldUnderlying
Exposure (€)Maturity
date
Unrealisedgain/(loss)
€'000
% of netassetvalue
Financial derivative instruments (30 November 2017: 1.59%) Forward currency contracts** (30 November 2017: 1.53%)
AUD 1,981,924 EUR 1,289,696 1,284,694 04/06/2018 (5) 0.00AUD 2,476,215 EUR 1,602,187 1,601,617 03/07/2018 1 0.00CAD 2,648,996 EUR 1,771,484 1,749,412 04/06/2018 (22) 0.00CAD 136,762 EUR 90,181 90,181 04/07/2018 - 0.00CHF 1,691,212 EUR 1,472,222 1,473,730 04/06/2018 2 0.00CHF 2,365,280 EUR 2,062,418 2,061,838 03/07/2018 1 0.00DKK 3,403,250 EUR 456,894 457,220 04/06/2018 - 0.00DKK 2,382,008 EUR 320,122 320,019 04/06/2018 - 0.00DKK 3,483,881 EUR 468,086 468,083 03/07/2018 - 0.00EUR 41,513,167 AUD 66,592,659 43,165,718 04/06/2018 (1,653) (0.10)

iSHARES V PLC
Schedule of Investments (unaudited) (continued) iSHARES MSCI WORLD EUR HEDGED UCITS ETF (ACC) (continued) As at 31 May 2018
[ 2 0 0 ] i S H A R E S V P L C I N T E R I M R E P O R T
Currency Amount
Purchased Currency Amount
SoldUnderlying
Exposure (€)Maturity
date
Unrealisedgain/(loss)
€'000
% of netassetvalue
Financial derivative instruments (30 November 2017: 1.59%) (cont) Forward currency contracts** (30 November 2017: 1.53%) (cont)
EUR 41,793,845 AUD 64,610,735 41,790,250 03/07/2018 3 0.00EUR 57,375,892 CAD 89,006,261 58,780,231 04/06/2018 (1,404) (0.08)EUR 56,943,875 CAD 86,357,265 56,943,724 04/07/2018 - 0.00EUR 47,527,419 CHF 56,824,709 49,517,336 04/06/2018 (1,990) (0.12)EUR 48,058,892 CHF 55,133,497 48,060,400 03/07/2018 (2) 0.00EUR 11,200,504 DKK 83,438,723 11,209,842 04/06/2018 (9) 0.00EUR 10,433,346 DKK 77,653,465 10,433,269 03/07/2018 - 0.00EUR 111,925,668 GBP 98,264,289 112,015,285 04/06/2018 (90) (0.01)EUR 108,602,388 GBP 95,339,756 108,595,090 03/07/2018 6 0.00EUR 20,897,495 HKD 198,443,444 21,672,474 04/06/2018 (775) (0.05)EUR 20,988,318 HKD 192,477,106 20,988,300 04/07/2018 - 0.00EUR 1,631,243 ILS 7,094,090 1,703,819 04/06/2018 (73) 0.00EUR 1,652,804 ILS 6,882,957 1,652,767 03/07/2018 - 0.00EUR 153,673,051 JPY 20,321,217,050 160,235,074 04/06/2018 (6,562) (0.41)EUR 155,430,322 JPY 19,716,418,924 155,426,906 03/07/2018 3 0.00EUR 4,344,781 NOK 42,105,524 4,408,269 04/06/2018 (63) 0.00EUR 4,281,761 NOK 40,942,580 4,281,581 03/07/2018 - 0.00EUR 1,039,732 NZD 1,787,350 1,074,355 05/06/2018 (35) 0.00EUR 1,229,713 NZD 2,050,283 1,229,592 03/07/2018 - 0.00EUR 16,223,252 SEK 171,363,693 16,622,338 04/06/2018 (399) (0.02)EUR 16,128,499 SEK 166,263,583 16,128,396 03/07/2018 - 0.00EUR 8,668,553 SGD 13,890,667 8,897,401 04/06/2018 (229) (0.01)EUR 8,617,374 SGD 13,477,254 8,616,785 03/07/2018 1 0.00EUR 1,008,552,897 USD 1,221,317,430 1,046,275,533 04/06/2018 (37,724) (2.29)EUR 1,012,835,311 USD 1,184,968,697 1,012,831,848 03/07/2018 4 0.00GBP 2,924,532 EUR 3,343,641 3,333,788 04/06/2018 (10) 0.00GBP 1,300,218 EUR 1,480,625 1,480,991 03/07/2018 - 0.00HKD 62,132 EUR 6,542 6,786 04/06/2018 - 0.00HKD 5,904,206 EUR 647,949 644,812 04/06/2018 (3) 0.00HKD 4,829,156 EUR 526,587 526,586 04/07/2018 - 0.00
ILS 211,134 EUR 50,863 50,709 04/06/2018 - 0.00ILS 68,804 EUR 16,522 16,522 03/07/2018 - 0.00
JPY 604,798,126 EUR 4,783,893 4,768,901 04/06/2018 (15) 0.00JPY 1,429,264,624 EUR 11,269,717 11,267,065 03/07/2018 (3) 0.00
NOK 1,253,141 EUR 131,673 131,198 04/06/2018 - 0.00NZD 53,195 EUR 31,974 31,975 05/06/2018 - 0.00SEK 5,100,110 EUR 497,405 494,712 04/06/2018 (3) 0.00SEK 8,420,592 EUR 816,845 816,839 03/07/2018 - 0.00SGD 413,413 EUR 265,568 264,804 04/06/2018 1 0.00SGD 812,751 EUR 519,674 519,638 03/07/2018 - 0.00USD 36,348,733 EUR 31,299,417 31,139,153 04/06/2018 (160) (0.01)USD 9,536,020 EUR 8,150,082 8,150,751 03/07/2018 1 0.00
Total unrealised gains on forward currency contracts 23 0.00 Total unrealised losses on forward currency contracts (51,229) (3.10) Net unrealised losses on forward currency contracts (51,206) (3.10)
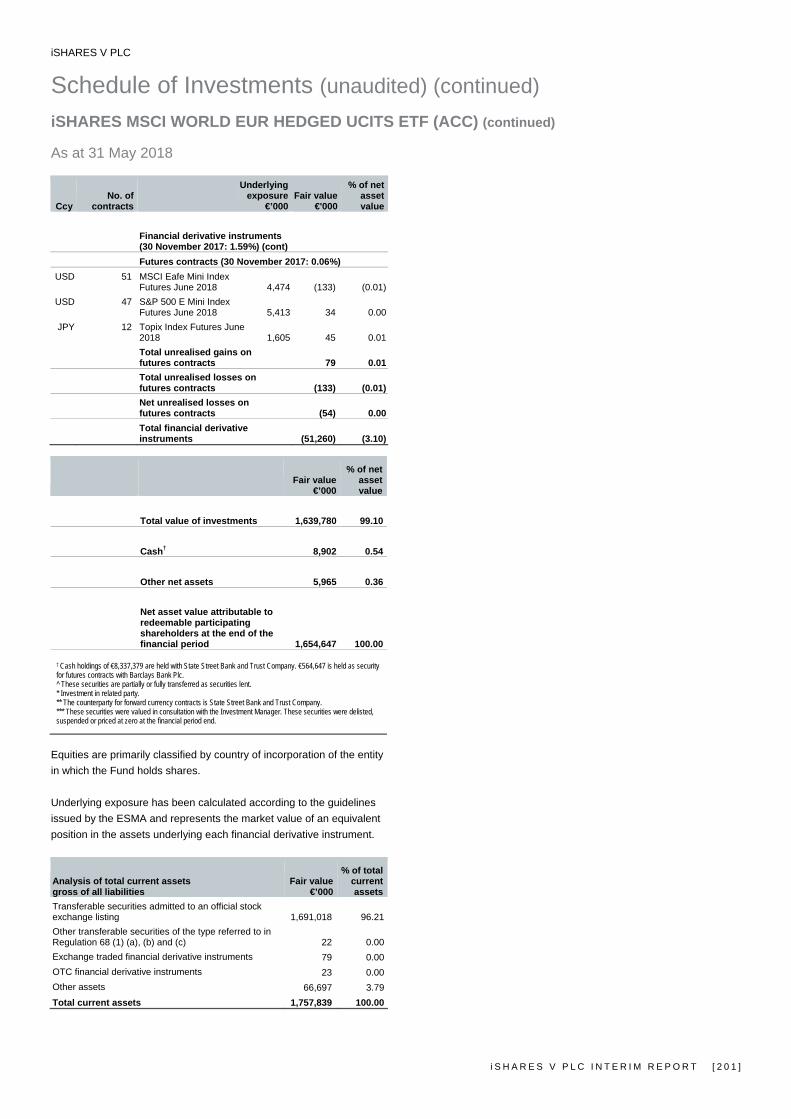
iSHARES V PLC
Schedule of Investments (unaudited) (continued) iSHARES MSCI WORLD EUR HEDGED UCITS ETF (ACC) (continued) As at 31 May 2018
i S H A R E S V P L C I N T E R I M R E P O R T [ 2 0 1 ]
Ccy No. of
contracts
Underlying exposure
€’000 Fair value
€'000
% of net asset value
Financial derivative instruments
(30 November 2017: 1.59%) (cont) Futures contracts (30 November 2017: 0.06%)
USD 51 MSCI Eafe Mini Index Futures June 2018 4,474 (133) (0.01)
USD 47 S&P 500 E Mini Index Futures June 2018 5,413 34 0.00
JPY 12 Topix Index Futures June 2018 1,605 45 0.01
Total unrealised gains on futures contracts 79 0.01
Total unrealised losses on futures contracts (133) (0.01)
Net unrealised losses on futures contracts (54) 0.00
Total financial derivative instruments (51,260) (3.10)
Fair value
€’000
% of net asset value
Total value of investments 1,639,780 99.10 Cash† 8,902 0.54 Other net assets 5,965 0.36
Net asset value attributable to redeemable participating shareholders at the end of the financial period 1,654,647 100.00
† Cash holdings of €8,337,379 are held with State Street Bank and Trust Company. €564,647 is held as security for futures contracts with Barclays Bank Plc. ^ These securities are partially or fully transferred as securities lent. * Investment in related party. ** The counterparty for forward currency contracts is State Street Bank and Trust Company. *** These securities were valued in consultation with the Investment Manager. These securities were delisted, suspended or priced at zero at the financial period end.
Equities are primarily classified by country of incorporation of the entity in which the Fund holds shares. Underlying exposure has been calculated according to the guidelines issued by the ESMA and represents the market value of an equivalent position in the assets underlying each financial derivative instrument.
Analysis of total current assets gross of all liabilities
Fair value€’000
% of totalcurrentassets
Transferable securities admitted to an official stock exchange listing 1,691,018 96.21Other transferable securities of the type referred to in Regulation 68 (1) (a), (b) and (c) 22 0.00Exchange traded financial derivative instruments 79 0.00OTC financial derivative instruments 23 0.00Other assets 66,697 3.79Total current assets 1,757,839 100.00
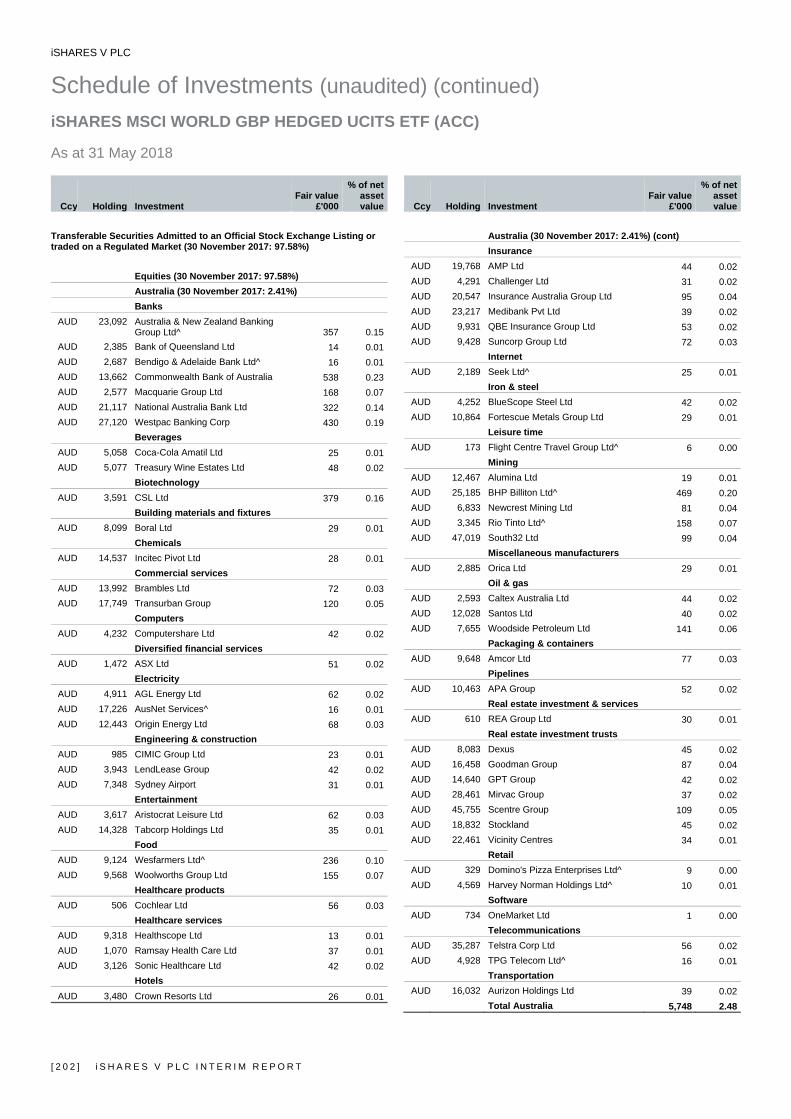
iSHARES V PLC
Schedule of Investments (unaudited) (continued) iSHARES MSCI WORLD GBP HEDGED UCITS ETF (ACC) As at 31 May 2018
[ 2 0 2 ] i S H A R E S V P L C I N T E R I M R E P O R T
Ccy Holding Investment Fair value
£'000
% of net asset value
Transferable Securities Admitted to an Official Stock Exchange Listing or traded on a Regulated Market (30 November 2017: 97.58%)
Equities (30 November 2017: 97.58%) Australia (30 November 2017: 2.41%) Banks
AUD 23,092 Australia & New Zealand Banking Group Ltd^ 357 0.15
AUD 2,385 Bank of Queensland Ltd 14 0.01AUD 2,687 Bendigo & Adelaide Bank Ltd^ 16 0.01AUD 13,662 Commonwealth Bank of Australia 538 0.23AUD 2,577 Macquarie Group Ltd 168 0.07AUD 21,117 National Australia Bank Ltd 322 0.14AUD 27,120 Westpac Banking Corp 430 0.19
Beverages AUD 5,058 Coca-Cola Amatil Ltd 25 0.01AUD 5,077 Treasury Wine Estates Ltd 48 0.02
Biotechnology AUD 3,591 CSL Ltd 379 0.16
Building materials and fixtures AUD 8,099 Boral Ltd 29 0.01
Chemicals AUD 14,537 Incitec Pivot Ltd 28 0.01
Commercial services AUD 13,992 Brambles Ltd 72 0.03AUD 17,749 Transurban Group 120 0.05
Computers AUD 4,232 Computershare Ltd 42 0.02
Diversified financial services AUD 1,472 ASX Ltd 51 0.02
Electricity AUD 4,911 AGL Energy Ltd 62 0.02AUD 17,226 AusNet Services^ 16 0.01AUD 12,443 Origin Energy Ltd 68 0.03
Engineering & construction AUD 985 CIMIC Group Ltd 23 0.01AUD 3,943 LendLease Group 42 0.02AUD 7,348 Sydney Airport 31 0.01
Entertainment AUD 3,617 Aristocrat Leisure Ltd 62 0.03AUD 14,328 Tabcorp Holdings Ltd 35 0.01
Food AUD 9,124 Wesfarmers Ltd^ 236 0.10AUD 9,568 Woolworths Group Ltd 155 0.07
Healthcare products AUD 506 Cochlear Ltd 56 0.03
Healthcare services AUD 9,318 Healthscope Ltd 13 0.01AUD 1,070 Ramsay Health Care Ltd 37 0.01AUD 3,126 Sonic Healthcare Ltd 42 0.02
Hotels AUD 3,480 Crown Resorts Ltd 26 0.01
Ccy Holding Investment Fair value
£'000
% of net asset value
Australia (30 November 2017: 2.41%) (cont) Insurance
AUD 19,768 AMP Ltd 44 0.02AUD 4,291 Challenger Ltd 31 0.02AUD 20,547 Insurance Australia Group Ltd 95 0.04AUD 23,217 Medibank Pvt Ltd 39 0.02AUD 9,931 QBE Insurance Group Ltd 53 0.02AUD 9,428 Suncorp Group Ltd 72 0.03
Internet AUD 2,189 Seek Ltd^ 25 0.01
Iron & steel AUD 4,252 BlueScope Steel Ltd 42 0.02AUD 10,864 Fortescue Metals Group Ltd 29 0.01
Leisure time AUD 173 Flight Centre Travel Group Ltd^ 6 0.00
Mining AUD 12,467 Alumina Ltd 19 0.01AUD 25,185 BHP Billiton Ltd^ 469 0.20AUD 6,833 Newcrest Mining Ltd 81 0.04AUD 3,345 Rio Tinto Ltd^ 158 0.07AUD 47,019 South32 Ltd 99 0.04
Miscellaneous manufacturers AUD 2,885 Orica Ltd 29 0.01
Oil & gas AUD 2,593 Caltex Australia Ltd 44 0.02AUD 12,028 Santos Ltd 40 0.02AUD 7,655 Woodside Petroleum Ltd 141 0.06
Packaging & containers AUD 9,648 Amcor Ltd 77 0.03
Pipelines AUD 10,463 APA Group 52 0.02
Real estate investment & services AUD 610 REA Group Ltd 30 0.01
Real estate investment trusts AUD 8,083 Dexus 45 0.02AUD 16,458 Goodman Group 87 0.04AUD 14,640 GPT Group 42 0.02AUD 28,461 Mirvac Group 37 0.02AUD 45,755 Scentre Group 109 0.05AUD 18,832 Stockland 45 0.02AUD 22,461 Vicinity Centres 34 0.01
Retail AUD 329 Domino's Pizza Enterprises Ltd^ 9 0.00AUD 4,569 Harvey Norman Holdings Ltd^ 10 0.01
Software AUD 734 OneMarket Ltd 1 0.00
Telecommunications AUD 35,287 Telstra Corp Ltd 56 0.02AUD 4,928 TPG Telecom Ltd^ 16 0.01
Transportation AUD 16,032 Aurizon Holdings Ltd 39 0.02
Total Australia 5,748 2.48
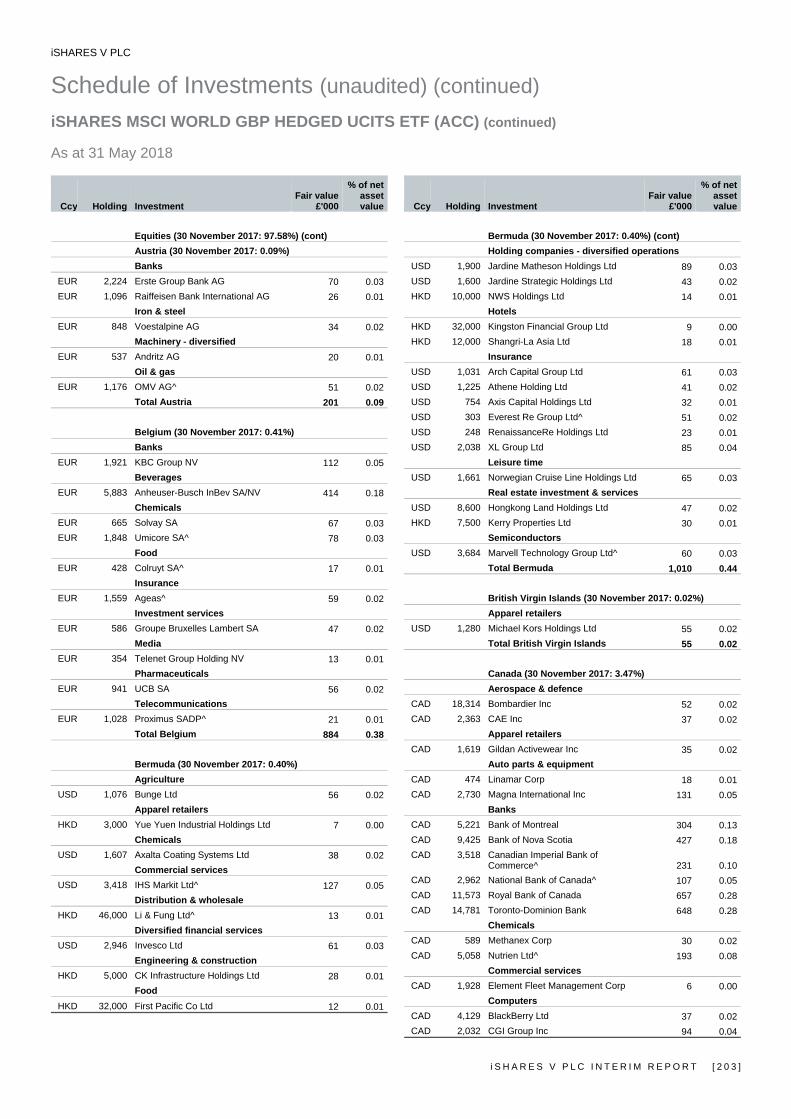
iSHARES V PLC
Schedule of Investments (unaudited) (continued) iSHARES MSCI WORLD GBP HEDGED UCITS ETF (ACC) (continued) As at 31 May 2018
i S H A R E S V P L C I N T E R I M R E P O R T [ 2 0 3 ]
Ccy Holding Investment Fair value
£'000
% of net asset value
Equities (30 November 2017: 97.58%) (cont) Austria (30 November 2017: 0.09%) Banks
EUR 2,224 Erste Group Bank AG 70 0.03EUR 1,096 Raiffeisen Bank International AG 26 0.01
Iron & steel EUR 848 Voestalpine AG 34 0.02
Machinery - diversified EUR 537 Andritz AG 20 0.01
Oil & gas EUR 1,176 OMV AG^ 51 0.02
Total Austria 201 0.09
Belgium (30 November 2017: 0.41%) Banks
EUR 1,921 KBC Group NV 112 0.05Beverages
EUR 5,883 Anheuser-Busch InBev SA/NV 414 0.18Chemicals
EUR 665 Solvay SA 67 0.03EUR 1,848 Umicore SA^ 78 0.03
Food EUR 428 Colruyt SA^ 17 0.01
Insurance EUR 1,559 Ageas^ 59 0.02
Investment services EUR 586 Groupe Bruxelles Lambert SA 47 0.02
Media EUR 354 Telenet Group Holding NV 13 0.01
Pharmaceuticals EUR 941 UCB SA 56 0.02
Telecommunications EUR 1,028 Proximus SADP^ 21 0.01
Total Belgium 884 0.38
Bermuda (30 November 2017: 0.40%) Agriculture
USD 1,076 Bunge Ltd 56 0.02Apparel retailers
HKD 3,000 Yue Yuen Industrial Holdings Ltd 7 0.00Chemicals
USD 1,607 Axalta Coating Systems Ltd 38 0.02Commercial services
USD 3,418 IHS Markit Ltd^ 127 0.05Distribution & wholesale
HKD 46,000 Li & Fung Ltd^ 13 0.01Diversified financial services
USD 2,946 Invesco Ltd 61 0.03Engineering & construction
HKD 5,000 CK Infrastructure Holdings Ltd 28 0.01Food
HKD 32,000 First Pacific Co Ltd 12 0.01
Ccy Holding Investment Fair value
£'000
% of net asset value
Bermuda (30 November 2017: 0.40%) (cont) Holding companies - diversified operations
USD 1,900 Jardine Matheson Holdings Ltd 89 0.03USD 1,600 Jardine Strategic Holdings Ltd 43 0.02HKD 10,000 NWS Holdings Ltd 14 0.01
Hotels HKD 32,000 Kingston Financial Group Ltd 9 0.00HKD 12,000 Shangri-La Asia Ltd 18 0.01
Insurance USD 1,031 Arch Capital Group Ltd 61 0.03USD 1,225 Athene Holding Ltd 41 0.02USD 754 Axis Capital Holdings Ltd 32 0.01USD 303 Everest Re Group Ltd^ 51 0.02USD 248 RenaissanceRe Holdings Ltd 23 0.01USD 2,038 XL Group Ltd 85 0.04
Leisure time USD 1,661 Norwegian Cruise Line Holdings Ltd 65 0.03
Real estate investment & services USD 8,600 Hongkong Land Holdings Ltd 47 0.02HKD 7,500 Kerry Properties Ltd 30 0.01
Semiconductors USD 3,684 Marvell Technology Group Ltd^ 60 0.03
Total Bermuda 1,010 0.44
British Virgin Islands (30 November 2017: 0.02%) Apparel retailers
USD 1,280 Michael Kors Holdings Ltd 55 0.02Total British Virgin Islands 55 0.02
Canada (30 November 2017: 3.47%) Aerospace & defence
CAD 18,314 Bombardier Inc 52 0.02CAD 2,363 CAE Inc 37 0.02
Apparel retailers CAD 1,619 Gildan Activewear Inc 35 0.02
Auto parts & equipment CAD 474 Linamar Corp 18 0.01CAD 2,730 Magna International Inc 131 0.05
Banks CAD 5,221 Bank of Montreal 304 0.13CAD 9,425 Bank of Nova Scotia 427 0.18CAD 3,518 Canadian Imperial Bank of
Commerce^ 231 0.10CAD 2,962 National Bank of Canada^ 107 0.05CAD 11,573 Royal Bank of Canada 657 0.28CAD 14,781 Toronto-Dominion Bank 648 0.28
Chemicals CAD 589 Methanex Corp 30 0.02CAD 5,058 Nutrien Ltd^ 193 0.08
Commercial services CAD 1,928 Element Fleet Management Corp 6 0.00
Computers CAD 4,129 BlackBerry Ltd 37 0.02CAD 2,032 CGI Group Inc 94 0.04
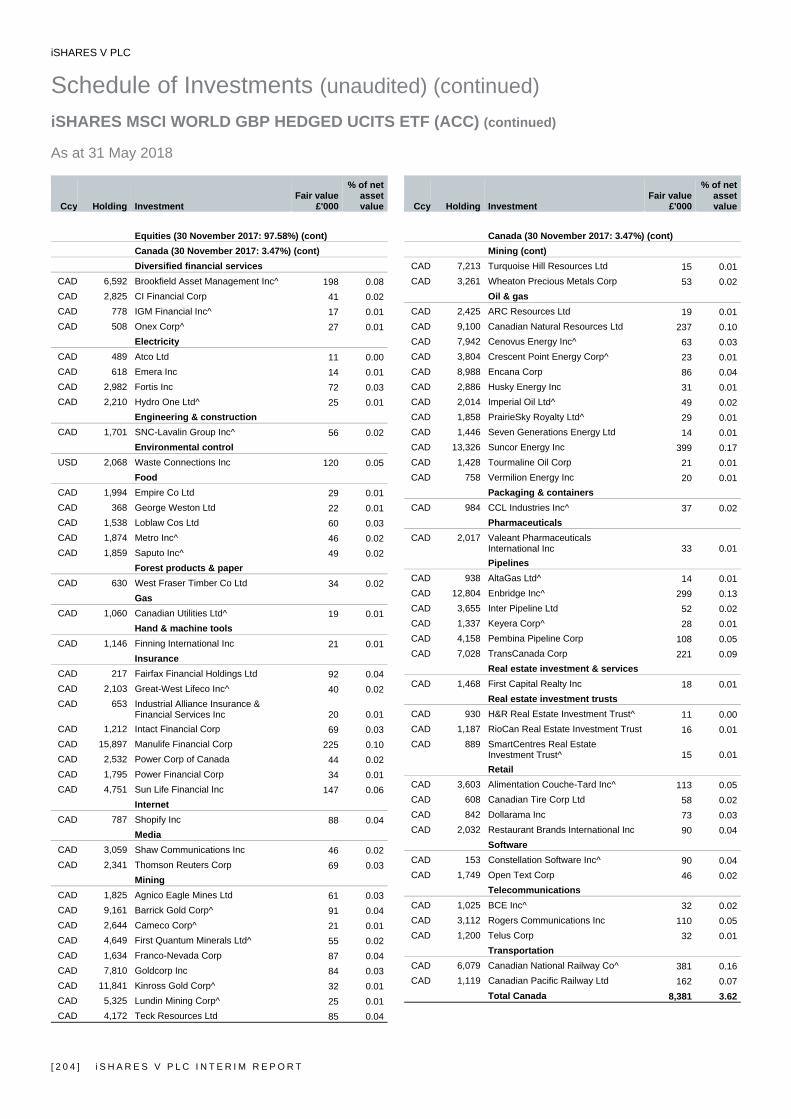
iSHARES V PLC
Schedule of Investments (unaudited) (continued) iSHARES MSCI WORLD GBP HEDGED UCITS ETF (ACC) (continued) As at 31 May 2018
[ 2 0 4 ] i S H A R E S V P L C I N T E R I M R E P O R T
Ccy Holding Investment Fair value
£'000
% of net asset value
Equities (30 November 2017: 97.58%) (cont) Canada (30 November 2017: 3.47%) (cont) Diversified financial services
CAD 6,592 Brookfield Asset Management Inc^ 198 0.08CAD 2,825 CI Financial Corp 41 0.02CAD 778 IGM Financial Inc^ 17 0.01CAD 508 Onex Corp^ 27 0.01
Electricity CAD 489 Atco Ltd 11 0.00CAD 618 Emera Inc 14 0.01CAD 2,982 Fortis Inc 72 0.03CAD 2,210 Hydro One Ltd^ 25 0.01
Engineering & construction CAD 1,701 SNC-Lavalin Group Inc^ 56 0.02
Environmental control USD 2,068 Waste Connections Inc 120 0.05
Food CAD 1,994 Empire Co Ltd 29 0.01CAD 368 George Weston Ltd 22 0.01CAD 1,538 Loblaw Cos Ltd 60 0.03CAD 1,874 Metro Inc^ 46 0.02CAD 1,859 Saputo Inc^ 49 0.02
Forest products & paper CAD 630 West Fraser Timber Co Ltd 34 0.02
Gas CAD 1,060 Canadian Utilities Ltd^ 19 0.01
Hand & machine tools CAD 1,146 Finning International Inc 21 0.01
Insurance CAD 217 Fairfax Financial Holdings Ltd 92 0.04CAD 2,103 Great-West Lifeco Inc^ 40 0.02CAD 653 Industrial Alliance Insurance &
Financial Services Inc 20 0.01CAD 1,212 Intact Financial Corp 69 0.03CAD 15,897 Manulife Financial Corp 225 0.10CAD 2,532 Power Corp of Canada 44 0.02CAD 1,795 Power Financial Corp 34 0.01CAD 4,751 Sun Life Financial Inc 147 0.06
Internet CAD 787 Shopify Inc 88 0.04
Media CAD 3,059 Shaw Communications Inc 46 0.02CAD 2,341 Thomson Reuters Corp 69 0.03
Mining CAD 1,825 Agnico Eagle Mines Ltd 61 0.03CAD 9,161 Barrick Gold Corp^ 91 0.04CAD 2,644 Cameco Corp^ 21 0.01CAD 4,649 First Quantum Minerals Ltd^ 55 0.02CAD 1,634 Franco-Nevada Corp 87 0.04CAD 7,810 Goldcorp Inc 84 0.03CAD 11,841 Kinross Gold Corp^ 32 0.01CAD 5,325 Lundin Mining Corp^ 25 0.01CAD 4,172 Teck Resources Ltd 85 0.04
Ccy Holding Investment Fair value
£'000
% of net asset value
Canada (30 November 2017: 3.47%) (cont) Mining (cont)
CAD 7,213 Turquoise Hill Resources Ltd 15 0.01CAD 3,261 Wheaton Precious Metals Corp 53 0.02
Oil & gas CAD 2,425 ARC Resources Ltd 19 0.01CAD 9,100 Canadian Natural Resources Ltd 237 0.10CAD 7,942 Cenovus Energy Inc^ 63 0.03CAD 3,804 Crescent Point Energy Corp^ 23 0.01CAD 8,988 Encana Corp 86 0.04CAD 2,886 Husky Energy Inc 31 0.01CAD 2,014 Imperial Oil Ltd^ 49 0.02CAD 1,858 PrairieSky Royalty Ltd^ 29 0.01CAD 1,446 Seven Generations Energy Ltd 14 0.01CAD 13,326 Suncor Energy Inc 399 0.17CAD 1,428 Tourmaline Oil Corp 21 0.01CAD 758 Vermilion Energy Inc 20 0.01
Packaging & containers CAD 984 CCL Industries Inc^ 37 0.02
Pharmaceuticals CAD 2,017 Valeant Pharmaceuticals
International Inc 33 0.01Pipelines
CAD 938 AltaGas Ltd^ 14 0.01CAD 12,804 Enbridge Inc^ 299 0.13CAD 3,655 Inter Pipeline Ltd 52 0.02CAD 1,337 Keyera Corp^ 28 0.01CAD 4,158 Pembina Pipeline Corp 108 0.05CAD 7,028 TransCanada Corp 221 0.09
Real estate investment & services CAD 1,468 First Capital Realty Inc 18 0.01
Real estate investment trusts CAD 930 H&R Real Estate Investment Trust^ 11 0.00CAD 1,187 RioCan Real Estate Investment Trust 16 0.01CAD 889 SmartCentres Real Estate
Investment Trust^ 15 0.01Retail
CAD 3,603 Alimentation Couche-Tard Inc^ 113 0.05CAD 608 Canadian Tire Corp Ltd 58 0.02CAD 842 Dollarama Inc 73 0.03CAD 2,032 Restaurant Brands International Inc 90 0.04
Software CAD 153 Constellation Software Inc^ 90 0.04CAD 1,749 Open Text Corp 46 0.02
Telecommunications CAD 1,025 BCE Inc^ 32 0.02CAD 3,112 Rogers Communications Inc 110 0.05CAD 1,200 Telus Corp 32 0.01
Transportation CAD 6,079 Canadian National Railway Co^ 381 0.16CAD 1,119 Canadian Pacific Railway Ltd 162 0.07
Total Canada 8,381 3.62
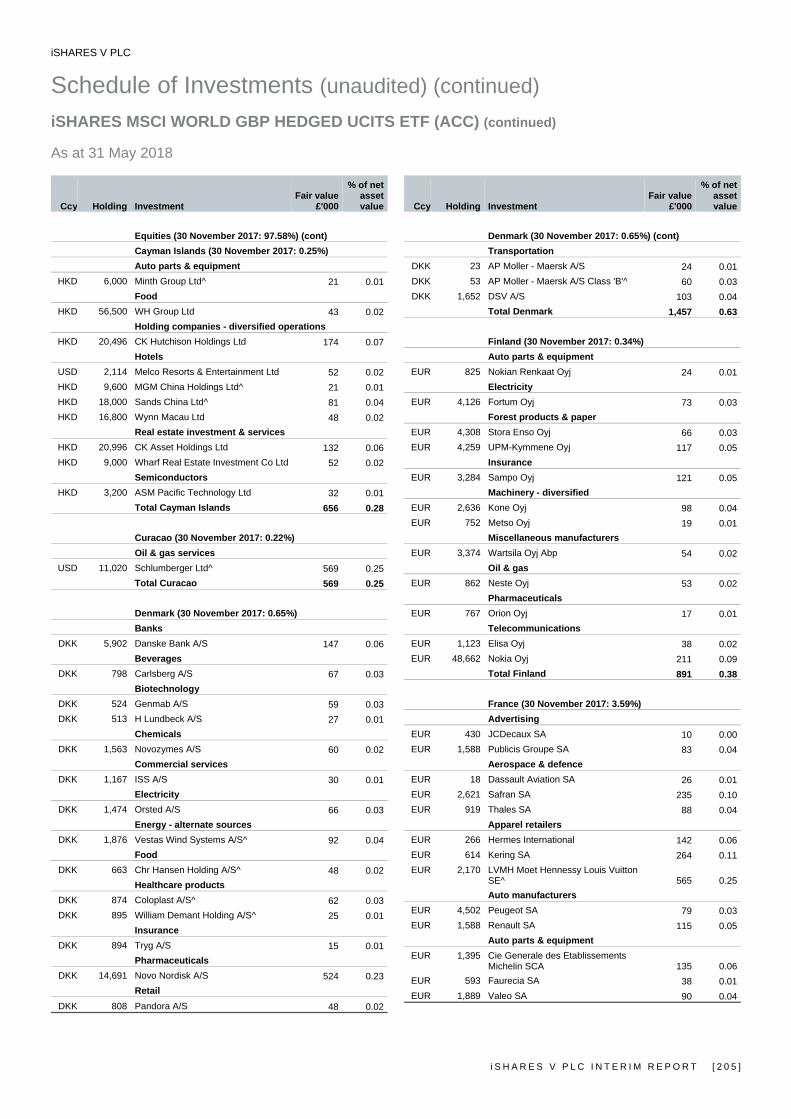
iSHARES V PLC
Schedule of Investments (unaudited) (continued) iSHARES MSCI WORLD GBP HEDGED UCITS ETF (ACC) (continued) As at 31 May 2018
i S H A R E S V P L C I N T E R I M R E P O R T [ 2 0 5 ]
Ccy Holding Investment Fair value
£'000
% of net asset value
Equities (30 November 2017: 97.58%) (cont) Cayman Islands (30 November 2017: 0.25%) Auto parts & equipment
HKD 6,000 Minth Group Ltd^ 21 0.01Food
HKD 56,500 WH Group Ltd 43 0.02Holding companies - diversified operations
HKD 20,496 CK Hutchison Holdings Ltd 174 0.07Hotels
USD 2,114 Melco Resorts & Entertainment Ltd 52 0.02HKD 9,600 MGM China Holdings Ltd^ 21 0.01HKD 18,000 Sands China Ltd^ 81 0.04HKD 16,800 Wynn Macau Ltd 48 0.02
Real estate investment & services HKD 20,996 CK Asset Holdings Ltd 132 0.06HKD 9,000 Wharf Real Estate Investment Co Ltd 52 0.02
Semiconductors HKD 3,200 ASM Pacific Technology Ltd 32 0.01
Total Cayman Islands 656 0.28
Curacao (30 November 2017: 0.22%) Oil & gas services
USD 11,020 Schlumberger Ltd^ 569 0.25Total Curacao 569 0.25
Denmark (30 November 2017: 0.65%) Banks
DKK 5,902 Danske Bank A/S 147 0.06Beverages
DKK 798 Carlsberg A/S 67 0.03Biotechnology
DKK 524 Genmab A/S 59 0.03DKK 513 H Lundbeck A/S 27 0.01
Chemicals DKK 1,563 Novozymes A/S 60 0.02
Commercial services DKK 1,167 ISS A/S 30 0.01
Electricity DKK 1,474 Orsted A/S 66 0.03
Energy - alternate sources DKK 1,876 Vestas Wind Systems A/S^ 92 0.04
Food DKK 663 Chr Hansen Holding A/S^ 48 0.02
Healthcare products DKK 874 Coloplast A/S^ 62 0.03DKK 895 William Demant Holding A/S^ 25 0.01
Insurance DKK 894 Tryg A/S 15 0.01
Pharmaceuticals DKK 14,691 Novo Nordisk A/S 524 0.23
Retail DKK 808 Pandora A/S 48 0.02
Ccy Holding Investment Fair value
£'000
% of net asset value
Denmark (30 November 2017: 0.65%) (cont) Transportation
DKK 23 AP Moller - Maersk A/S 24 0.01DKK 53 AP Moller - Maersk A/S Class 'B'^ 60 0.03DKK 1,652 DSV A/S 103 0.04
Total Denmark 1,457 0.63
Finland (30 November 2017: 0.34%) Auto parts & equipment
EUR 825 Nokian Renkaat Oyj 24 0.01Electricity
EUR 4,126 Fortum Oyj 73 0.03Forest products & paper
EUR 4,308 Stora Enso Oyj 66 0.03EUR 4,259 UPM-Kymmene Oyj 117 0.05
Insurance EUR 3,284 Sampo Oyj 121 0.05
Machinery - diversified EUR 2,636 Kone Oyj 98 0.04EUR 752 Metso Oyj 19 0.01
Miscellaneous manufacturers EUR 3,374 Wartsila Oyj Abp 54 0.02
Oil & gas EUR 862 Neste Oyj 53 0.02
Pharmaceuticals EUR 767 Orion Oyj 17 0.01
Telecommunications EUR 1,123 Elisa Oyj 38 0.02EUR 48,662 Nokia Oyj 211 0.09
Total Finland 891 0.38
France (30 November 2017: 3.59%) Advertising
EUR 430 JCDecaux SA 10 0.00EUR 1,588 Publicis Groupe SA 83 0.04
Aerospace & defence EUR 18 Dassault Aviation SA 26 0.01EUR 2,621 Safran SA 235 0.10EUR 919 Thales SA 88 0.04
Apparel retailers EUR 266 Hermes International 142 0.06EUR 614 Kering SA 264 0.11EUR 2,170 LVMH Moet Hennessy Louis Vuitton
SE^ 565 0.25Auto manufacturers
EUR 4,502 Peugeot SA 79 0.03EUR 1,588 Renault SA 115 0.05
Auto parts & equipment EUR 1,395 Cie Generale des Etablissements
Michelin SCA 135 0.06EUR 593 Faurecia SA 38 0.01EUR 1,889 Valeo SA 90 0.04
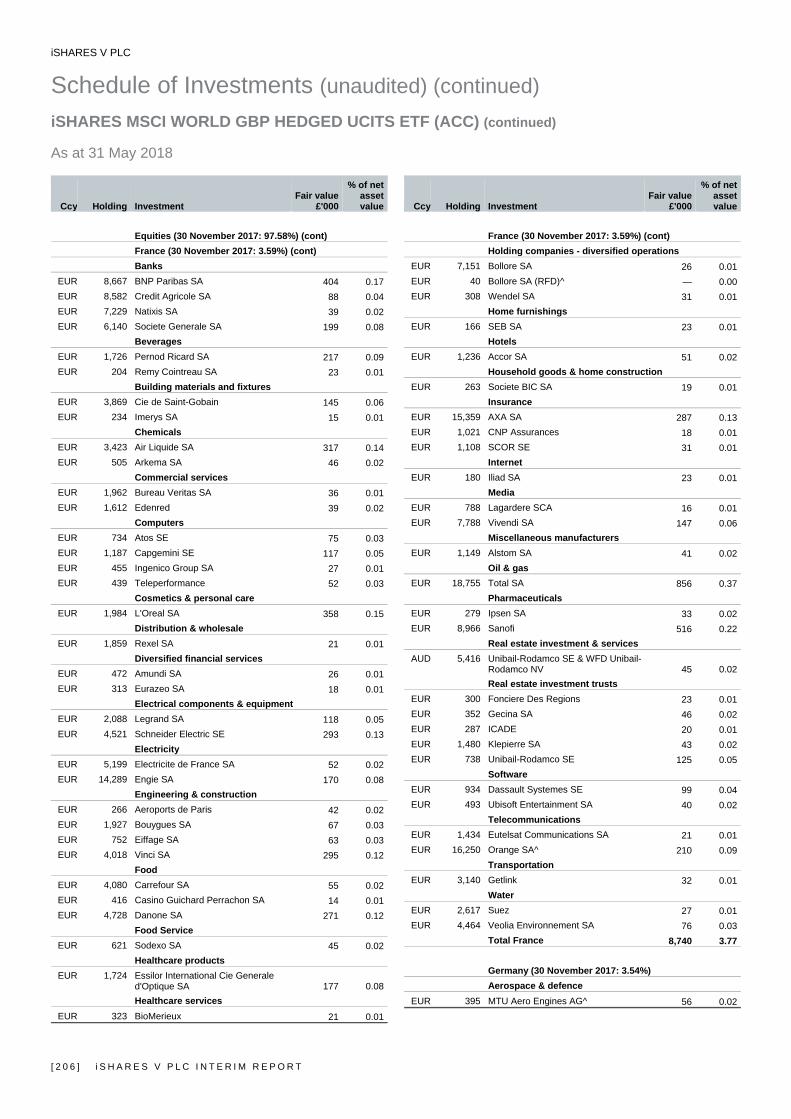
iSHARES V PLC
Schedule of Investments (unaudited) (continued) iSHARES MSCI WORLD GBP HEDGED UCITS ETF (ACC) (continued) As at 31 May 2018
[ 2 0 6 ] i S H A R E S V P L C I N T E R I M R E P O R T
Ccy Holding Investment Fair value
£'000
% of net asset value
Equities (30 November 2017: 97.58%) (cont) France (30 November 2017: 3.59%) (cont) Banks
EUR 8,667 BNP Paribas SA 404 0.17EUR 8,582 Credit Agricole SA 88 0.04EUR 7,229 Natixis SA 39 0.02EUR 6,140 Societe Generale SA 199 0.08
Beverages EUR 1,726 Pernod Ricard SA 217 0.09EUR 204 Remy Cointreau SA 23 0.01
Building materials and fixtures EUR 3,869 Cie de Saint-Gobain 145 0.06EUR 234 Imerys SA 15 0.01
Chemicals EUR 3,423 Air Liquide SA 317 0.14EUR 505 Arkema SA 46 0.02
Commercial services EUR 1,962 Bureau Veritas SA 36 0.01EUR 1,612 Edenred 39 0.02
Computers EUR 734 Atos SE 75 0.03EUR 1,187 Capgemini SE 117 0.05EUR 455 Ingenico Group SA 27 0.01EUR 439 Teleperformance 52 0.03
Cosmetics & personal care EUR 1,984 L'Oreal SA 358 0.15
Distribution & wholesale EUR 1,859 Rexel SA 21 0.01
Diversified financial services EUR 472 Amundi SA 26 0.01EUR 313 Eurazeo SA 18 0.01
Electrical components & equipment EUR 2,088 Legrand SA 118 0.05EUR 4,521 Schneider Electric SE 293 0.13
Electricity EUR 5,199 Electricite de France SA 52 0.02EUR 14,289 Engie SA 170 0.08
Engineering & construction EUR 266 Aeroports de Paris 42 0.02EUR 1,927 Bouygues SA 67 0.03EUR 752 Eiffage SA 63 0.03EUR 4,018 Vinci SA 295 0.12
Food EUR 4,080 Carrefour SA 55 0.02EUR 416 Casino Guichard Perrachon SA 14 0.01EUR 4,728 Danone SA 271 0.12
Food Service EUR 621 Sodexo SA 45 0.02
Healthcare products EUR 1,724 Essilor International Cie Generale
d'Optique SA 177 0.08Healthcare services
EUR 323 BioMerieux 21 0.01
Ccy Holding Investment Fair value
£'000
% of net asset value
France (30 November 2017: 3.59%) (cont) Holding companies - diversified operations
EUR 7,151 Bollore SA 26 0.01EUR 40 Bollore SA (RFD)^ — 0.00EUR 308 Wendel SA 31 0.01
Home furnishings EUR 166 SEB SA 23 0.01
Hotels EUR 1,236 Accor SA 51 0.02
Household goods & home construction EUR 263 Societe BIC SA 19 0.01
Insurance EUR 15,359 AXA SA 287 0.13EUR 1,021 CNP Assurances 18 0.01EUR 1,108 SCOR SE 31 0.01
Internet EUR 180 Iliad SA 23 0.01
Media EUR 788 Lagardere SCA 16 0.01EUR 7,788 Vivendi SA 147 0.06
Miscellaneous manufacturers EUR 1,149 Alstom SA 41 0.02
Oil & gas EUR 18,755 Total SA 856 0.37
Pharmaceuticals EUR 279 Ipsen SA 33 0.02EUR 8,966 Sanofi 516 0.22
Real estate investment & services AUD 5,416 Unibail-Rodamco SE & WFD Unibail-
Rodamco NV 45 0.02Real estate investment trusts
EUR 300 Fonciere Des Regions 23 0.01EUR 352 Gecina SA 46 0.02EUR 287 ICADE 20 0.01EUR 1,480 Klepierre SA 43 0.02EUR 738 Unibail-Rodamco SE 125 0.05
Software EUR 934 Dassault Systemes SE 99 0.04EUR 493 Ubisoft Entertainment SA 40 0.02
Telecommunications EUR 1,434 Eutelsat Communications SA 21 0.01EUR 16,250 Orange SA^ 210 0.09
Transportation EUR 3,140 Getlink 32 0.01
Water EUR 2,617 Suez 27 0.01EUR 4,464 Veolia Environnement SA 76 0.03
Total France 8,740 3.77
Germany (30 November 2017: 3.54%) Aerospace & defence
EUR 395 MTU Aero Engines AG^ 56 0.02
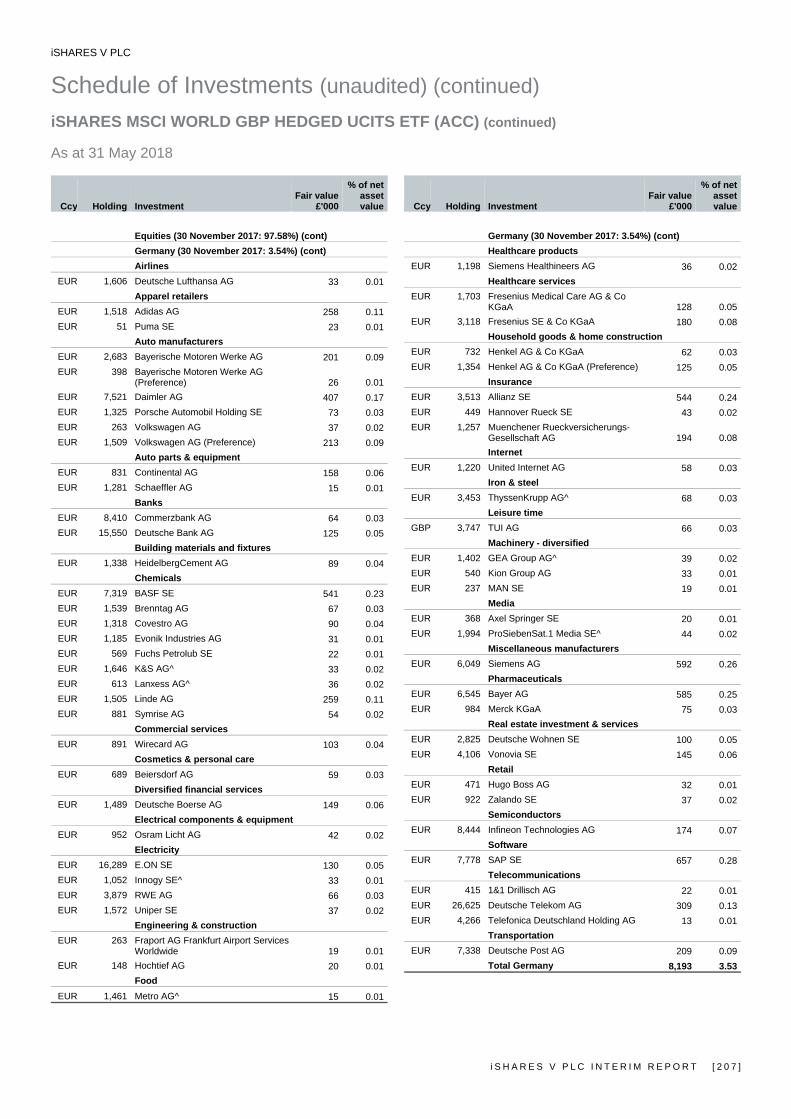
iSHARES V PLC
Schedule of Investments (unaudited) (continued) iSHARES MSCI WORLD GBP HEDGED UCITS ETF (ACC) (continued) As at 31 May 2018
i S H A R E S V P L C I N T E R I M R E P O R T [ 2 0 7 ]
Ccy Holding Investment Fair value
£'000
% of net asset value
Equities (30 November 2017: 97.58%) (cont) Germany (30 November 2017: 3.54%) (cont) Airlines
EUR 1,606 Deutsche Lufthansa AG 33 0.01Apparel retailers
EUR 1,518 Adidas AG 258 0.11EUR 51 Puma SE 23 0.01
Auto manufacturers EUR 2,683 Bayerische Motoren Werke AG 201 0.09EUR 398 Bayerische Motoren Werke AG
(Preference) 26 0.01EUR 7,521 Daimler AG 407 0.17EUR 1,325 Porsche Automobil Holding SE 73 0.03EUR 263 Volkswagen AG 37 0.02EUR 1,509 Volkswagen AG (Preference) 213 0.09
Auto parts & equipment EUR 831 Continental AG 158 0.06EUR 1,281 Schaeffler AG 15 0.01
Banks EUR 8,410 Commerzbank AG 64 0.03EUR 15,550 Deutsche Bank AG 125 0.05
Building materials and fixtures EUR 1,338 HeidelbergCement AG 89 0.04
Chemicals EUR 7,319 BASF SE 541 0.23EUR 1,539 Brenntag AG 67 0.03EUR 1,318 Covestro AG 90 0.04EUR 1,185 Evonik Industries AG 31 0.01EUR 569 Fuchs Petrolub SE 22 0.01EUR 1,646 K&S AG^ 33 0.02EUR 613 Lanxess AG^ 36 0.02EUR 1,505 Linde AG 259 0.11EUR 881 Symrise AG 54 0.02
Commercial services EUR 891 Wirecard AG 103 0.04
Cosmetics & personal care EUR 689 Beiersdorf AG 59 0.03
Diversified financial services EUR 1,489 Deutsche Boerse AG 149 0.06
Electrical components & equipment EUR 952 Osram Licht AG 42 0.02
Electricity EUR 16,289 E.ON SE 130 0.05EUR 1,052 Innogy SE^ 33 0.01EUR 3,879 RWE AG 66 0.03EUR 1,572 Uniper SE 37 0.02
Engineering & construction EUR 263 Fraport AG Frankfurt Airport Services
Worldwide 19 0.01EUR 148 Hochtief AG 20 0.01
Food EUR 1,461 Metro AG^ 15 0.01
Ccy Holding Investment Fair value
£'000
% of net asset value
Germany (30 November 2017: 3.54%) (cont) Healthcare products
EUR 1,198 Siemens Healthineers AG 36 0.02Healthcare services
EUR 1,703 Fresenius Medical Care AG & Co KGaA 128 0.05
EUR 3,118 Fresenius SE & Co KGaA 180 0.08Household goods & home construction
EUR 732 Henkel AG & Co KGaA 62 0.03EUR 1,354 Henkel AG & Co KGaA (Preference) 125 0.05
Insurance EUR 3,513 Allianz SE 544 0.24EUR 449 Hannover Rueck SE 43 0.02EUR 1,257 Muenchener Rueckversicherungs-
Gesellschaft AG 194 0.08Internet
EUR 1,220 United Internet AG 58 0.03Iron & steel
EUR 3,453 ThyssenKrupp AG^ 68 0.03Leisure time
GBP 3,747 TUI AG 66 0.03Machinery - diversified
EUR 1,402 GEA Group AG^ 39 0.02EUR 540 Kion Group AG 33 0.01EUR 237 MAN SE 19 0.01
Media EUR 368 Axel Springer SE 20 0.01EUR 1,994 ProSiebenSat.1 Media SE^ 44 0.02
Miscellaneous manufacturers EUR 6,049 Siemens AG 592 0.26
Pharmaceuticals EUR 6,545 Bayer AG 585 0.25EUR 984 Merck KGaA 75 0.03
Real estate investment & services EUR 2,825 Deutsche Wohnen SE 100 0.05EUR 4,106 Vonovia SE 145 0.06
Retail EUR 471 Hugo Boss AG 32 0.01EUR 922 Zalando SE 37 0.02
Semiconductors EUR 8,444 Infineon Technologies AG 174 0.07
Software EUR 7,778 SAP SE 657 0.28
Telecommunications EUR 415 1&1 Drillisch AG 22 0.01EUR 26,625 Deutsche Telekom AG 309 0.13EUR 4,266 Telefonica Deutschland Holding AG 13 0.01
Transportation EUR 7,338 Deutsche Post AG 209 0.09
Total Germany 8,193 3.53
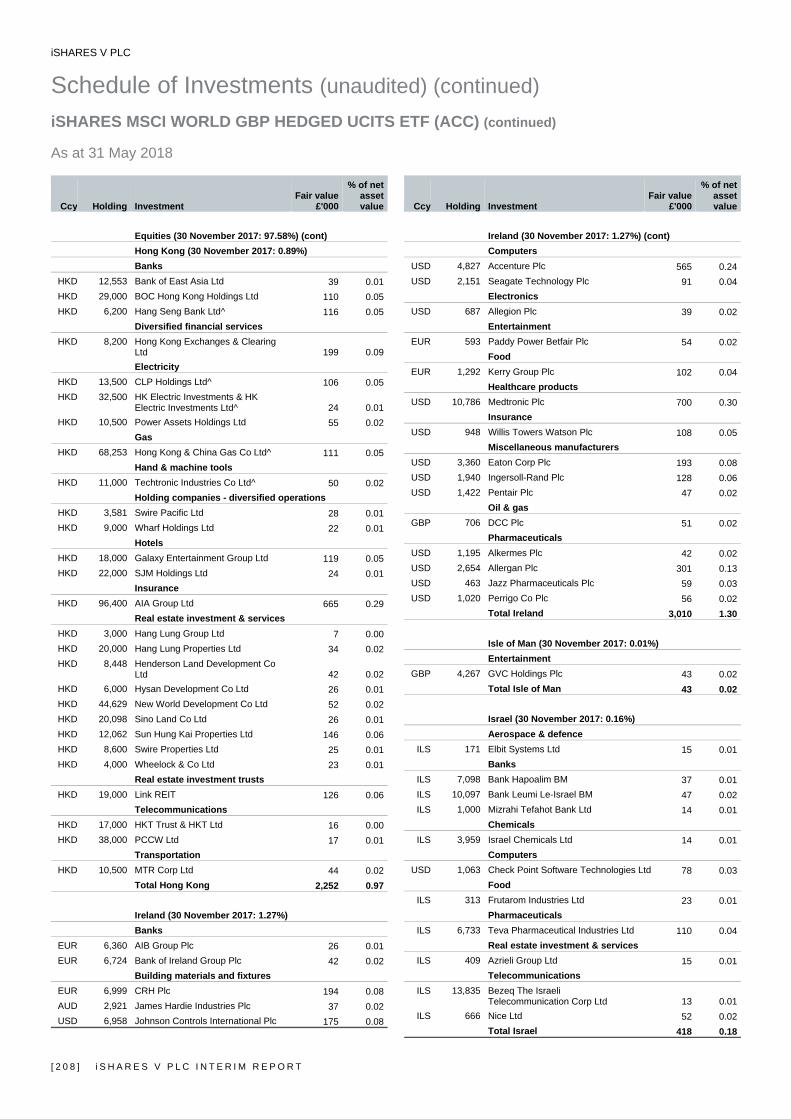
iSHARES V PLC
Schedule of Investments (unaudited) (continued) iSHARES MSCI WORLD GBP HEDGED UCITS ETF (ACC) (continued) As at 31 May 2018
[ 2 0 8 ] i S H A R E S V P L C I N T E R I M R E P O R T
Ccy Holding Investment Fair value
£'000
% of net asset value
Equities (30 November 2017: 97.58%) (cont) Hong Kong (30 November 2017: 0.89%) Banks
HKD 12,553 Bank of East Asia Ltd 39 0.01HKD 29,000 BOC Hong Kong Holdings Ltd 110 0.05HKD 6,200 Hang Seng Bank Ltd^ 116 0.05
Diversified financial services HKD 8,200 Hong Kong Exchanges & Clearing
Ltd 199 0.09Electricity
HKD 13,500 CLP Holdings Ltd^ 106 0.05HKD 32,500 HK Electric Investments & HK
Electric Investments Ltd^ 24 0.01HKD 10,500 Power Assets Holdings Ltd 55 0.02
Gas HKD 68,253 Hong Kong & China Gas Co Ltd^ 111 0.05
Hand & machine tools HKD 11,000 Techtronic Industries Co Ltd^ 50 0.02
Holding companies - diversified operations HKD 3,581 Swire Pacific Ltd 28 0.01HKD 9,000 Wharf Holdings Ltd 22 0.01
Hotels HKD 18,000 Galaxy Entertainment Group Ltd 119 0.05HKD 22,000 SJM Holdings Ltd 24 0.01
Insurance HKD 96,400 AIA Group Ltd 665 0.29
Real estate investment & services HKD 3,000 Hang Lung Group Ltd 7 0.00HKD 20,000 Hang Lung Properties Ltd 34 0.02HKD 8,448 Henderson Land Development Co
Ltd 42 0.02HKD 6,000 Hysan Development Co Ltd 26 0.01HKD 44,629 New World Development Co Ltd 52 0.02HKD 20,098 Sino Land Co Ltd 26 0.01HKD 12,062 Sun Hung Kai Properties Ltd 146 0.06HKD 8,600 Swire Properties Ltd 25 0.01HKD 4,000 Wheelock & Co Ltd 23 0.01
Real estate investment trusts HKD 19,000 Link REIT 126 0.06
Telecommunications HKD 17,000 HKT Trust & HKT Ltd 16 0.00HKD 38,000 PCCW Ltd 17 0.01
Transportation HKD 10,500 MTR Corp Ltd 44 0.02
Total Hong Kong 2,252 0.97
Ireland (30 November 2017: 1.27%) Banks
EUR 6,360 AIB Group Plc 26 0.01EUR 6,724 Bank of Ireland Group Plc 42 0.02
Building materials and fixtures EUR 6,999 CRH Plc 194 0.08AUD 2,921 James Hardie Industries Plc 37 0.02USD 6,958 Johnson Controls International Plc 175 0.08
Ccy Holding Investment Fair value
£'000
% of net asset value
Ireland (30 November 2017: 1.27%) (cont) Computers
USD 4,827 Accenture Plc 565 0.24USD 2,151 Seagate Technology Plc 91 0.04
Electronics USD 687 Allegion Plc 39 0.02
Entertainment EUR 593 Paddy Power Betfair Plc 54 0.02
Food EUR 1,292 Kerry Group Plc 102 0.04
Healthcare products USD 10,786 Medtronic Plc 700 0.30
Insurance USD 948 Willis Towers Watson Plc 108 0.05
Miscellaneous manufacturers USD 3,360 Eaton Corp Plc 193 0.08USD 1,940 Ingersoll-Rand Plc 128 0.06USD 1,422 Pentair Plc 47 0.02
Oil & gas GBP 706 DCC Plc 51 0.02
Pharmaceuticals USD 1,195 Alkermes Plc 42 0.02USD 2,654 Allergan Plc 301 0.13USD 463 Jazz Pharmaceuticals Plc 59 0.03USD 1,020 Perrigo Co Plc 56 0.02
Total Ireland 3,010 1.30
Isle of Man (30 November 2017: 0.01%) Entertainment
GBP 4,267 GVC Holdings Plc 43 0.02Total Isle of Man 43 0.02
Israel (30 November 2017: 0.16%) Aerospace & defence
ILS 171 Elbit Systems Ltd 15 0.01Banks
ILS 7,098 Bank Hapoalim BM 37 0.01ILS 10,097 Bank Leumi Le-Israel BM 47 0.02ILS 1,000 Mizrahi Tefahot Bank Ltd 14 0.01
Chemicals ILS 3,959 Israel Chemicals Ltd 14 0.01
Computers USD 1,063 Check Point Software Technologies Ltd 78 0.03
Food ILS 313 Frutarom Industries Ltd 23 0.01
Pharmaceuticals ILS 6,733 Teva Pharmaceutical Industries Ltd 110 0.04
Real estate investment & services ILS 409 Azrieli Group Ltd 15 0.01
Telecommunications ILS 13,835 Bezeq The Israeli
Telecommunication Corp Ltd 13 0.01ILS 666 Nice Ltd 52 0.02
Total Israel 418 0.18
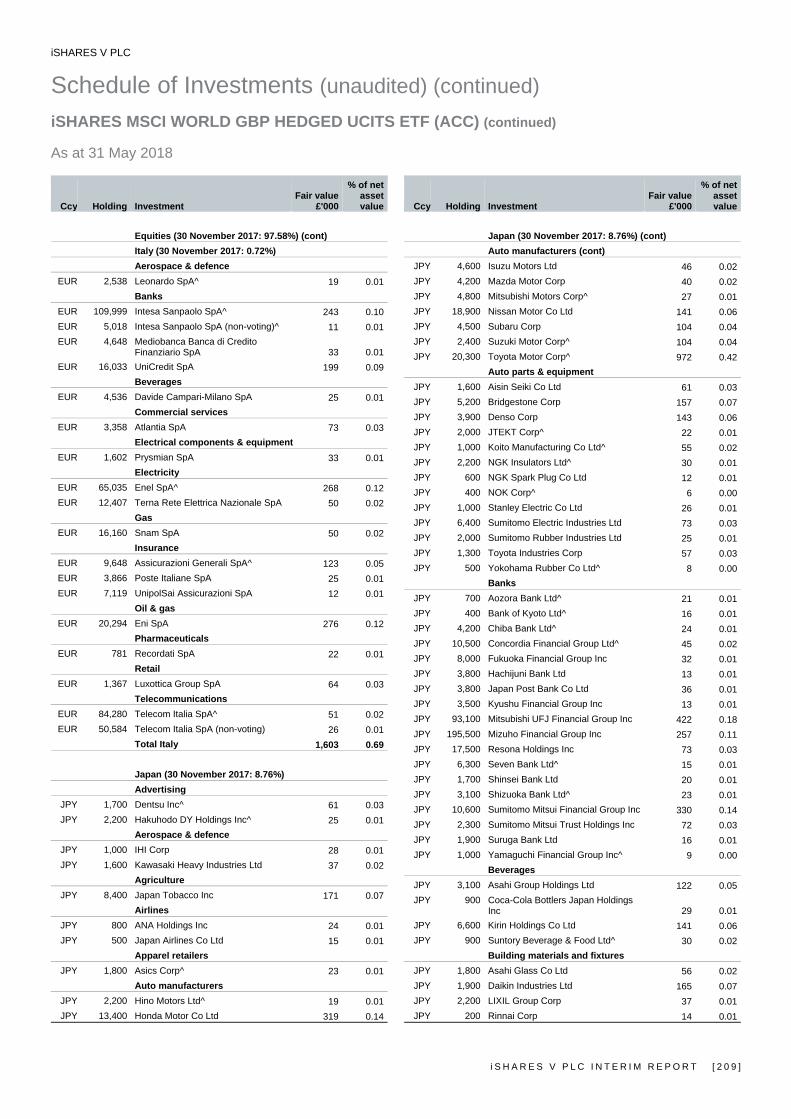
iSHARES V PLC
Schedule of Investments (unaudited) (continued) iSHARES MSCI WORLD GBP HEDGED UCITS ETF (ACC) (continued) As at 31 May 2018
i S H A R E S V P L C I N T E R I M R E P O R T [ 2 0 9 ]
Ccy Holding Investment Fair value
£'000
% of net asset value
Equities (30 November 2017: 97.58%) (cont) Italy (30 November 2017: 0.72%) Aerospace & defence
EUR 2,538 Leonardo SpA^ 19 0.01Banks
EUR 109,999 Intesa Sanpaolo SpA^ 243 0.10EUR 5,018 Intesa Sanpaolo SpA (non-voting)^ 11 0.01EUR 4,648 Mediobanca Banca di Credito
Finanziario SpA 33 0.01EUR 16,033 UniCredit SpA 199 0.09
Beverages EUR 4,536 Davide Campari-Milano SpA 25 0.01
Commercial services EUR 3,358 Atlantia SpA 73 0.03
Electrical components & equipment EUR 1,602 Prysmian SpA 33 0.01
Electricity EUR 65,035 Enel SpA^ 268 0.12EUR 12,407 Terna Rete Elettrica Nazionale SpA 50 0.02
Gas EUR 16,160 Snam SpA 50 0.02
Insurance EUR 9,648 Assicurazioni Generali SpA^ 123 0.05EUR 3,866 Poste Italiane SpA 25 0.01EUR 7,119 UnipolSai Assicurazioni SpA 12 0.01
Oil & gas EUR 20,294 Eni SpA 276 0.12
Pharmaceuticals EUR 781 Recordati SpA 22 0.01
Retail EUR 1,367 Luxottica Group SpA 64 0.03
Telecommunications EUR 84,280 Telecom Italia SpA^ 51 0.02EUR 50,584 Telecom Italia SpA (non-voting) 26 0.01
Total Italy 1,603 0.69
Japan (30 November 2017: 8.76%) Advertising
JPY 1,700 Dentsu Inc^ 61 0.03JPY 2,200 Hakuhodo DY Holdings Inc^ 25 0.01
Aerospace & defence JPY 1,000 IHI Corp 28 0.01JPY 1,600 Kawasaki Heavy Industries Ltd 37 0.02
Agriculture JPY 8,400 Japan Tobacco Inc 171 0.07
Airlines JPY 800 ANA Holdings Inc 24 0.01JPY 500 Japan Airlines Co Ltd 15 0.01
Apparel retailers JPY 1,800 Asics Corp^ 23 0.01
Auto manufacturers JPY 2,200 Hino Motors Ltd^ 19 0.01JPY 13,400 Honda Motor Co Ltd 319 0.14
Ccy Holding Investment Fair value
£'000
% of net asset value
Japan (30 November 2017: 8.76%) (cont) Auto manufacturers (cont)
JPY 4,600 Isuzu Motors Ltd 46 0.02JPY 4,200 Mazda Motor Corp 40 0.02JPY 4,800 Mitsubishi Motors Corp^ 27 0.01JPY 18,900 Nissan Motor Co Ltd 141 0.06JPY 4,500 Subaru Corp 104 0.04JPY 2,400 Suzuki Motor Corp^ 104 0.04JPY 20,300 Toyota Motor Corp^ 972 0.42
Auto parts & equipment JPY 1,600 Aisin Seiki Co Ltd 61 0.03JPY 5,200 Bridgestone Corp 157 0.07JPY 3,900 Denso Corp 143 0.06JPY 2,000 JTEKT Corp^ 22 0.01JPY 1,000 Koito Manufacturing Co Ltd^ 55 0.02JPY 2,200 NGK Insulators Ltd^ 30 0.01JPY 600 NGK Spark Plug Co Ltd 12 0.01JPY 400 NOK Corp^ 6 0.00JPY 1,000 Stanley Electric Co Ltd 26 0.01JPY 6,400 Sumitomo Electric Industries Ltd 73 0.03JPY 2,000 Sumitomo Rubber Industries Ltd 25 0.01JPY 1,300 Toyota Industries Corp 57 0.03JPY 500 Yokohama Rubber Co Ltd^ 8 0.00
Banks JPY 700 Aozora Bank Ltd^ 21 0.01JPY 400 Bank of Kyoto Ltd^ 16 0.01JPY 4,200 Chiba Bank Ltd^ 24 0.01JPY 10,500 Concordia Financial Group Ltd^ 45 0.02JPY 8,000 Fukuoka Financial Group Inc 32 0.01JPY 3,800 Hachijuni Bank Ltd 13 0.01JPY 3,800 Japan Post Bank Co Ltd 36 0.01JPY 3,500 Kyushu Financial Group Inc 13 0.01JPY 93,100 Mitsubishi UFJ Financial Group Inc 422 0.18JPY 195,500 Mizuho Financial Group Inc 257 0.11JPY 17,500 Resona Holdings Inc 73 0.03JPY 6,300 Seven Bank Ltd^ 15 0.01JPY 1,700 Shinsei Bank Ltd 20 0.01JPY 3,100 Shizuoka Bank Ltd^ 23 0.01JPY 10,600 Sumitomo Mitsui Financial Group Inc 330 0.14JPY 2,300 Sumitomo Mitsui Trust Holdings Inc 72 0.03JPY 1,900 Suruga Bank Ltd 16 0.01JPY 1,000 Yamaguchi Financial Group Inc^ 9 0.00
Beverages JPY 3,100 Asahi Group Holdings Ltd 122 0.05JPY 900 Coca-Cola Bottlers Japan Holdings
Inc 29 0.01JPY 6,600 Kirin Holdings Co Ltd 141 0.06JPY 900 Suntory Beverage & Food Ltd^ 30 0.02
Building materials and fixtures JPY 1,800 Asahi Glass Co Ltd 56 0.02JPY 1,900 Daikin Industries Ltd 165 0.07JPY 2,200 LIXIL Group Corp 37 0.01JPY 200 Rinnai Corp 14 0.01

iSHARES V PLC
Schedule of Investments (unaudited) (continued) iSHARES MSCI WORLD GBP HEDGED UCITS ETF (ACC) (continued) As at 31 May 2018
[ 2 1 0 ] i S H A R E S V P L C I N T E R I M R E P O R T
Ccy Holding Investment Fair value
£'000
% of net asset value
Equities (30 November 2017: 97.58%) (cont) Japan (30 November 2017: 8.76%) (cont) Building materials and fixtures (cont)
JPY 800 Taiheiyo Cement Corp 22 0.01JPY 1,000 Toto Ltd^ 40 0.02
Chemicals JPY 1,900 Air Water Inc 28 0.01JPY 10,500 Asahi Kasei Corp 109 0.05JPY 2,000 Daicel Corp^ 17 0.01JPY 900 Hitachi Chemical Co Ltd 15 0.01JPY 1,900 JSR Corp 28 0.01JPY 1,000 Kaneka Corp^ 8 0.00JPY 2,200 Kansai Paint Co Ltd^ 35 0.02JPY 2,300 Kuraray Co Ltd 26 0.01JPY 12,500 Mitsubishi Chemical Holdings Corp 87 0.04JPY 1,900 Mitsubishi Gas Chemical Co Inc 37 0.02JPY 1,700 Mitsui Chemicals Inc 37 0.02JPY 1,000 Nippon Paint Holdings Co Ltd^ 31 0.01JPY 800 Nissan Chemical Industries Ltd^ 28 0.01JPY 1,300 Nitto Denko Corp 77 0.03JPY 2,900 Shin-Etsu Chemical Co Ltd 218 0.09JPY 10,000 Sumitomo Chemical Co Ltd 46 0.02JPY 1,800 Taiyo Nippon Sanso Corp^ 20 0.01JPY 1,700 Teijin Ltd 25 0.01JPY 10,700 Toray Industries Inc^ 66 0.03JPY 2,100 Tosoh Corp 28 0.01
Commercial services JPY 400 Benesse Holdings Inc 11 0.00JPY 2,100 Dai Nippon Printing Co Ltd 34 0.02JPY 1,000 Park24 Co Ltd^ 20 0.01JPY 1,400 Persol Holdings Co Ltd 23 0.01JPY 8,800 Recruit Holdings Co Ltd 184 0.08JPY 1,700 Secom Co Ltd 95 0.04JPY 600 Sohgo Security Services Co Ltd 21 0.01JPY 4,000 Toppan Printing Co Ltd 25 0.01
Computers JPY 16,000 Fujitsu Ltd 74 0.03JPY 2,300 NEC Corp 49 0.02JPY 880 Nomura Research Institute Ltd 33 0.02JPY 4,500 NTT Data Corp 38 0.02JPY 500 Obic Co Ltd 33 0.01JPY 1,300 Otsuka Corp 40 0.02JPY 1,100 TDK Corp 74 0.03
Cosmetics & personal care JPY 4,000 Kao Corp 234 0.10JPY 300 Kose Corp^ 49 0.02JPY 1,700 Lion Corp 23 0.01JPY 1,000 Pola Orbis Holdings Inc^ 37 0.01JPY 3,100 Shiseido Co Ltd 185 0.08JPY 2,800 Unicharm Corp^ 66 0.03
Distribution & wholesale JPY 11,100 ITOCHU Corp 157 0.07JPY 12,600 Marubeni Corp 74 0.03
Ccy Holding Investment Fair value
£'000
% of net asset value
Japan (30 November 2017: 8.76%) (cont) Distribution & wholesale
JPY 12,100 Mitsubishi Corp 254 0.11JPY 13,100 Mitsui & Co Ltd 174 0.07JPY 8,800 Sumitomo Corp^ 111 0.05JPY 2,000 Toyota Tsusho Corp 52 0.02
Diversified financial services JPY 5,800 Acom Co Ltd 18 0.01JPY 1,400 Aeon Financial Service Co Ltd 25 0.01JPY 600 Credit Saison Co Ltd 7 0.00JPY 15,000 Daiwa Securities Group Inc 66 0.03JPY 4,000 Japan Exchange Group Inc 57 0.02JPY 8,280 Mebuki Financial Group Inc^ 23 0.01JPY 4,200 Mitsubishi UFJ Lease & Finance Co
Ltd^ 19 0.01JPY 26,700 Nomura Holdings Inc 104 0.05JPY 10,900 ORIX Corp 138 0.06
Electrical components & equipment JPY 2,100 Brother Industries Ltd 33 0.02JPY 2,000 Casio Computer Co Ltd 23 0.01JPY 200 Mabuchi Motor Co Ltd^ 7 0.00
Electricity JPY 4,300 Chubu Electric Power Co Inc 50 0.02JPY 1,800 Chugoku Electric Power Co Inc^ 18 0.01JPY 1,800 Electric Power Development Co Ltd 36 0.01JPY 4,900 Kansai Electric Power Co Inc 53 0.02JPY 4,200 Kyushu Electric Power Co Inc^ 37 0.02JPY 4,300 Tohoku Electric Power Co Inc^ 41 0.02JPY 8,800 Tokyo Electric Power Co Holdings
Inc 32 0.01Electronics
JPY 1,600 Alps Electric Co Ltd 29 0.01JPY 800 Hamamatsu Photonics KK 26 0.01JPY 209 Hirose Electric Co Ltd^ 21 0.01JPY 300 Hitachi High-Technologies Corp 10 0.00JPY 2,900 Hoya Corp 130 0.06JPY 2,400 Kyocera Corp^ 107 0.05JPY 3,800 Minebea Mitsumi Inc^ 54 0.02JPY 1,600 Murata Manufacturing Co Ltd^ 179 0.08JPY 1,900 Nidec Corp^ 222 0.09JPY 600 Nippon Electric Glass Co Ltd 12 0.01JPY 1,600 Omron Corp^ 64 0.03JPY 2,100 Yokogawa Electric Corp 29 0.01
Engineering & construction JPY 300 Japan Airport Terminal Co Ltd 10 0.00JPY 1,900 JGC Corp^ 30 0.01JPY 6,000 Kajima Corp 37 0.02JPY 4,600 Obayashi Corp 35 0.02JPY 3,000 Shimizu Corp 22 0.01JPY 1,700 Taisei Corp 71 0.03
Entertainment JPY 1,800 Oriental Land Co Ltd^ 139 0.05JPY 400 Sankyo Co Ltd 12 0.01JPY 2,200 Sega Sammy Holdings Inc 29 0.01
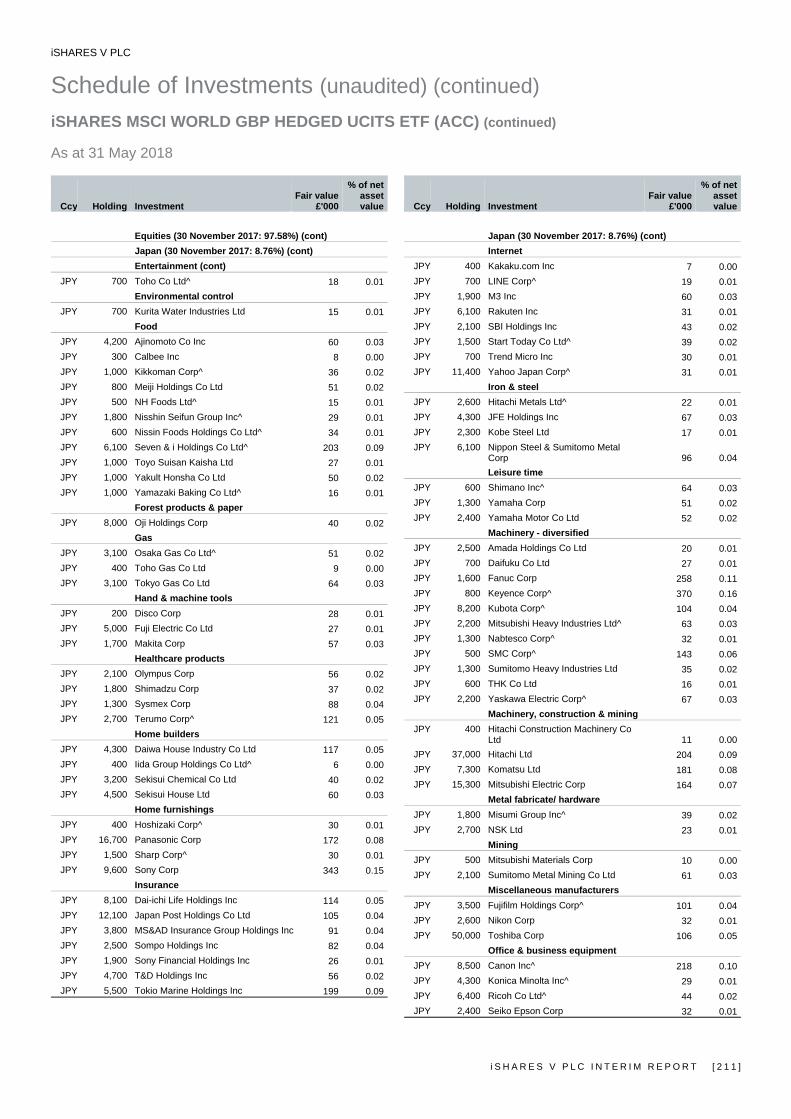
iSHARES V PLC
Schedule of Investments (unaudited) (continued) iSHARES MSCI WORLD GBP HEDGED UCITS ETF (ACC) (continued) As at 31 May 2018
i S H A R E S V P L C I N T E R I M R E P O R T [ 2 1 1 ]
Ccy Holding Investment Fair value
£'000
% of net asset value
Equities (30 November 2017: 97.58%) (cont) Japan (30 November 2017: 8.76%) (cont) Entertainment (cont)
JPY 700 Toho Co Ltd^ 18 0.01Environmental control
JPY 700 Kurita Water Industries Ltd 15 0.01Food
JPY 4,200 Ajinomoto Co Inc 60 0.03JPY 300 Calbee Inc 8 0.00JPY 1,000 Kikkoman Corp^ 36 0.02JPY 800 Meiji Holdings Co Ltd 51 0.02JPY 500 NH Foods Ltd^ 15 0.01JPY 1,800 Nisshin Seifun Group Inc^ 29 0.01JPY 600 Nissin Foods Holdings Co Ltd^ 34 0.01JPY 6,100 Seven & i Holdings Co Ltd^ 203 0.09JPY 1,000 Toyo Suisan Kaisha Ltd 27 0.01JPY 1,000 Yakult Honsha Co Ltd 50 0.02JPY 1,000 Yamazaki Baking Co Ltd^ 16 0.01
Forest products & paper JPY 8,000 Oji Holdings Corp 40 0.02
Gas JPY 3,100 Osaka Gas Co Ltd^ 51 0.02JPY 400 Toho Gas Co Ltd 9 0.00JPY 3,100 Tokyo Gas Co Ltd 64 0.03
Hand & machine tools JPY 200 Disco Corp 28 0.01JPY 5,000 Fuji Electric Co Ltd 27 0.01JPY 1,700 Makita Corp 57 0.03
Healthcare products JPY 2,100 Olympus Corp 56 0.02JPY 1,800 Shimadzu Corp 37 0.02JPY 1,300 Sysmex Corp 88 0.04JPY 2,700 Terumo Corp^ 121 0.05
Home builders JPY 4,300 Daiwa House Industry Co Ltd 117 0.05JPY 400 Iida Group Holdings Co Ltd^ 6 0.00JPY 3,200 Sekisui Chemical Co Ltd 40 0.02JPY 4,500 Sekisui House Ltd 60 0.03
Home furnishings JPY 400 Hoshizaki Corp^ 30 0.01JPY 16,700 Panasonic Corp 172 0.08JPY 1,500 Sharp Corp^ 30 0.01JPY 9,600 Sony Corp 343 0.15
Insurance JPY 8,100 Dai-ichi Life Holdings Inc 114 0.05JPY 12,100 Japan Post Holdings Co Ltd 105 0.04JPY 3,800 MS&AD Insurance Group Holdings Inc 91 0.04JPY 2,500 Sompo Holdings Inc 82 0.04JPY 1,900 Sony Financial Holdings Inc 26 0.01JPY 4,700 T&D Holdings Inc 56 0.02JPY 5,500 Tokio Marine Holdings Inc 199 0.09
Ccy Holding Investment Fair value
£'000
% of net asset value
Japan (30 November 2017: 8.76%) (cont) Internet
JPY 400 Kakaku.com Inc 7 0.00JPY 700 LINE Corp^ 19 0.01JPY 1,900 M3 Inc 60 0.03JPY 6,100 Rakuten Inc 31 0.01JPY 2,100 SBI Holdings Inc 43 0.02JPY 1,500 Start Today Co Ltd^ 39 0.02JPY 700 Trend Micro Inc 30 0.01JPY 11,400 Yahoo Japan Corp^ 31 0.01
Iron & steel JPY 2,600 Hitachi Metals Ltd^ 22 0.01JPY 4,300 JFE Holdings Inc 67 0.03JPY 2,300 Kobe Steel Ltd 17 0.01JPY 6,100 Nippon Steel & Sumitomo Metal
Corp 96 0.04Leisure time
JPY 600 Shimano Inc^ 64 0.03JPY 1,300 Yamaha Corp 51 0.02JPY 2,400 Yamaha Motor Co Ltd 52 0.02
Machinery - diversified JPY 2,500 Amada Holdings Co Ltd 20 0.01JPY 700 Daifuku Co Ltd 27 0.01JPY 1,600 Fanuc Corp 258 0.11JPY 800 Keyence Corp^ 370 0.16JPY 8,200 Kubota Corp^ 104 0.04JPY 2,200 Mitsubishi Heavy Industries Ltd^ 63 0.03JPY 1,300 Nabtesco Corp^ 32 0.01JPY 500 SMC Corp^ 143 0.06JPY 1,300 Sumitomo Heavy Industries Ltd 35 0.02JPY 600 THK Co Ltd 16 0.01JPY 2,200 Yaskawa Electric Corp^ 67 0.03
Machinery, construction & mining JPY 400 Hitachi Construction Machinery Co
Ltd 11 0.00JPY 37,000 Hitachi Ltd 204 0.09JPY 7,300 Komatsu Ltd 181 0.08JPY 15,300 Mitsubishi Electric Corp 164 0.07
Metal fabricate/ hardware JPY 1,800 Misumi Group Inc^ 39 0.02JPY 2,700 NSK Ltd 23 0.01
Mining JPY 500 Mitsubishi Materials Corp 10 0.00JPY 2,100 Sumitomo Metal Mining Co Ltd 61 0.03
Miscellaneous manufacturers JPY 3,500 Fujifilm Holdings Corp^ 101 0.04JPY 2,600 Nikon Corp 32 0.01JPY 50,000 Toshiba Corp 106 0.05
Office & business equipment JPY 8,500 Canon Inc^ 218 0.10JPY 4,300 Konica Minolta Inc^ 29 0.01JPY 6,400 Ricoh Co Ltd^ 44 0.02JPY 2,400 Seiko Epson Corp 32 0.01
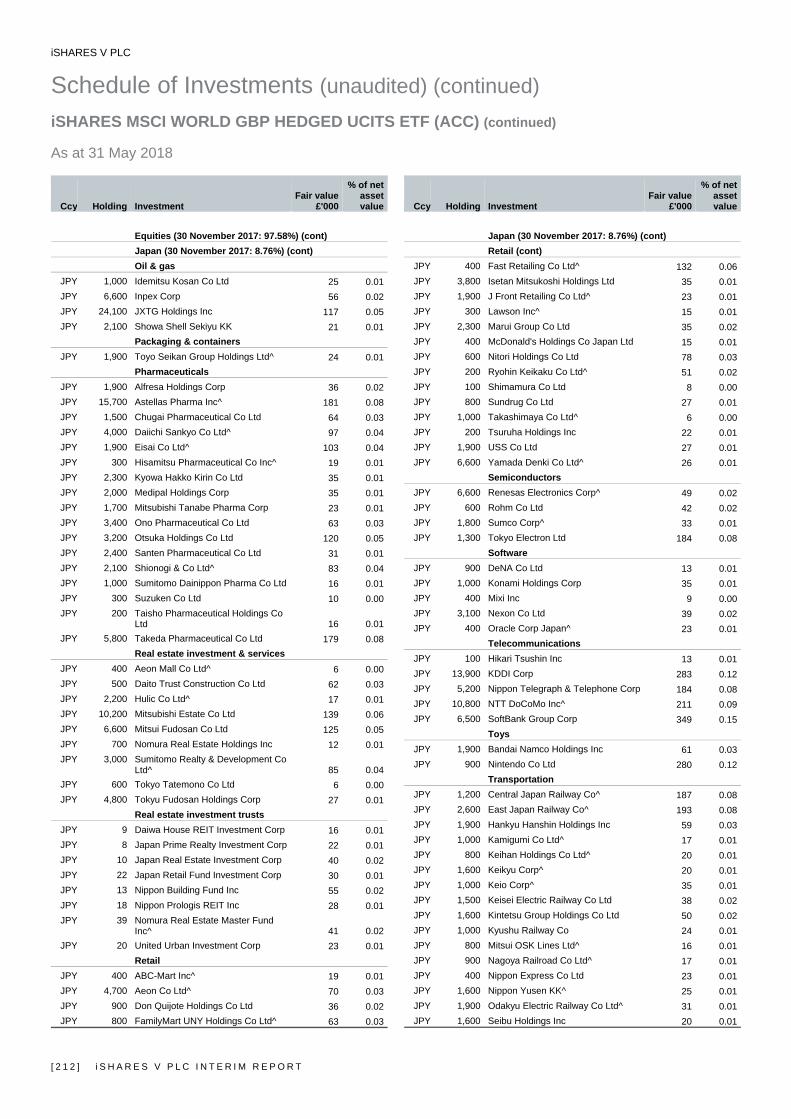
iSHARES V PLC
Schedule of Investments (unaudited) (continued) iSHARES MSCI WORLD GBP HEDGED UCITS ETF (ACC) (continued) As at 31 May 2018
[ 2 1 2 ] i S H A R E S V P L C I N T E R I M R E P O R T
Ccy Holding Investment Fair value
£'000
% of net asset value
Equities (30 November 2017: 97.58%) (cont) Japan (30 November 2017: 8.76%) (cont) Oil & gas
JPY 1,000 Idemitsu Kosan Co Ltd 25 0.01JPY 6,600 Inpex Corp 56 0.02JPY 24,100 JXTG Holdings Inc 117 0.05JPY 2,100 Showa Shell Sekiyu KK 21 0.01
Packaging & containers JPY 1,900 Toyo Seikan Group Holdings Ltd^ 24 0.01
Pharmaceuticals JPY 1,900 Alfresa Holdings Corp 36 0.02JPY 15,700 Astellas Pharma Inc^ 181 0.08JPY 1,500 Chugai Pharmaceutical Co Ltd 64 0.03JPY 4,000 Daiichi Sankyo Co Ltd^ 97 0.04JPY 1,900 Eisai Co Ltd^ 103 0.04JPY 300 Hisamitsu Pharmaceutical Co Inc^ 19 0.01JPY 2,300 Kyowa Hakko Kirin Co Ltd 35 0.01JPY 2,000 Medipal Holdings Corp 35 0.01JPY 1,700 Mitsubishi Tanabe Pharma Corp 23 0.01JPY 3,400 Ono Pharmaceutical Co Ltd 63 0.03JPY 3,200 Otsuka Holdings Co Ltd 120 0.05JPY 2,400 Santen Pharmaceutical Co Ltd 31 0.01JPY 2,100 Shionogi & Co Ltd^ 83 0.04JPY 1,000 Sumitomo Dainippon Pharma Co Ltd 16 0.01JPY 300 Suzuken Co Ltd 10 0.00JPY 200 Taisho Pharmaceutical Holdings Co
Ltd 16 0.01JPY 5,800 Takeda Pharmaceutical Co Ltd 179 0.08
Real estate investment & services JPY 400 Aeon Mall Co Ltd^ 6 0.00JPY 500 Daito Trust Construction Co Ltd 62 0.03JPY 2,200 Hulic Co Ltd^ 17 0.01JPY 10,200 Mitsubishi Estate Co Ltd 139 0.06JPY 6,600 Mitsui Fudosan Co Ltd 125 0.05JPY 700 Nomura Real Estate Holdings Inc 12 0.01JPY 3,000 Sumitomo Realty & Development Co
Ltd^ 85 0.04JPY 600 Tokyo Tatemono Co Ltd 6 0.00JPY 4,800 Tokyu Fudosan Holdings Corp 27 0.01
Real estate investment trusts JPY 9 Daiwa House REIT Investment Corp 16 0.01JPY 8 Japan Prime Realty Investment Corp 22 0.01JPY 10 Japan Real Estate Investment Corp 40 0.02JPY 22 Japan Retail Fund Investment Corp 30 0.01JPY 13 Nippon Building Fund Inc 55 0.02JPY 18 Nippon Prologis REIT Inc 28 0.01JPY 39 Nomura Real Estate Master Fund
Inc^ 41 0.02JPY 20 United Urban Investment Corp 23 0.01
Retail JPY 400 ABC-Mart Inc^ 19 0.01JPY 4,700 Aeon Co Ltd^ 70 0.03JPY 900 Don Quijote Holdings Co Ltd 36 0.02JPY 800 FamilyMart UNY Holdings Co Ltd^ 63 0.03
Ccy Holding Investment Fair value
£'000
% of net asset value
Japan (30 November 2017: 8.76%) (cont) Retail (cont)
JPY 400 Fast Retailing Co Ltd^ 132 0.06JPY 3,800 Isetan Mitsukoshi Holdings Ltd 35 0.01JPY 1,900 J Front Retailing Co Ltd^ 23 0.01JPY 300 Lawson Inc^ 15 0.01JPY 2,300 Marui Group Co Ltd 35 0.02JPY 400 McDonald's Holdings Co Japan Ltd 15 0.01JPY 600 Nitori Holdings Co Ltd 78 0.03JPY 200 Ryohin Keikaku Co Ltd^ 51 0.02JPY 100 Shimamura Co Ltd 8 0.00JPY 800 Sundrug Co Ltd 27 0.01JPY 1,000 Takashimaya Co Ltd^ 6 0.00JPY 200 Tsuruha Holdings Inc 22 0.01JPY 1,900 USS Co Ltd 27 0.01JPY 6,600 Yamada Denki Co Ltd^ 26 0.01
Semiconductors JPY 6,600 Renesas Electronics Corp^ 49 0.02JPY 600 Rohm Co Ltd 42 0.02JPY 1,800 Sumco Corp^ 33 0.01JPY 1,300 Tokyo Electron Ltd 184 0.08
Software JPY 900 DeNA Co Ltd 13 0.01JPY 1,000 Konami Holdings Corp 35 0.01JPY 400 Mixi Inc 9 0.00JPY 3,100 Nexon Co Ltd 39 0.02JPY 400 Oracle Corp Japan^ 23 0.01
Telecommunications JPY 100 Hikari Tsushin Inc 13 0.01JPY 13,900 KDDI Corp 283 0.12JPY 5,200 Nippon Telegraph & Telephone Corp 184 0.08JPY 10,800 NTT DoCoMo Inc^ 211 0.09JPY 6,500 SoftBank Group Corp 349 0.15
Toys JPY 1,900 Bandai Namco Holdings Inc 61 0.03JPY 900 Nintendo Co Ltd 280 0.12
Transportation JPY 1,200 Central Japan Railway Co^ 187 0.08JPY 2,600 East Japan Railway Co^ 193 0.08JPY 1,900 Hankyu Hanshin Holdings Inc 59 0.03JPY 1,000 Kamigumi Co Ltd^ 17 0.01JPY 800 Keihan Holdings Co Ltd^ 20 0.01JPY 1,600 Keikyu Corp^ 20 0.01JPY 1,000 Keio Corp^ 35 0.01JPY 1,500 Keisei Electric Railway Co Ltd 38 0.02JPY 1,600 Kintetsu Group Holdings Co Ltd 50 0.02JPY 1,000 Kyushu Railway Co 24 0.01JPY 800 Mitsui OSK Lines Ltd^ 16 0.01JPY 900 Nagoya Railroad Co Ltd^ 17 0.01JPY 400 Nippon Express Co Ltd 23 0.01JPY 1,600 Nippon Yusen KK^ 25 0.01JPY 1,900 Odakyu Electric Railway Co Ltd^ 31 0.01JPY 1,600 Seibu Holdings Inc 20 0.01
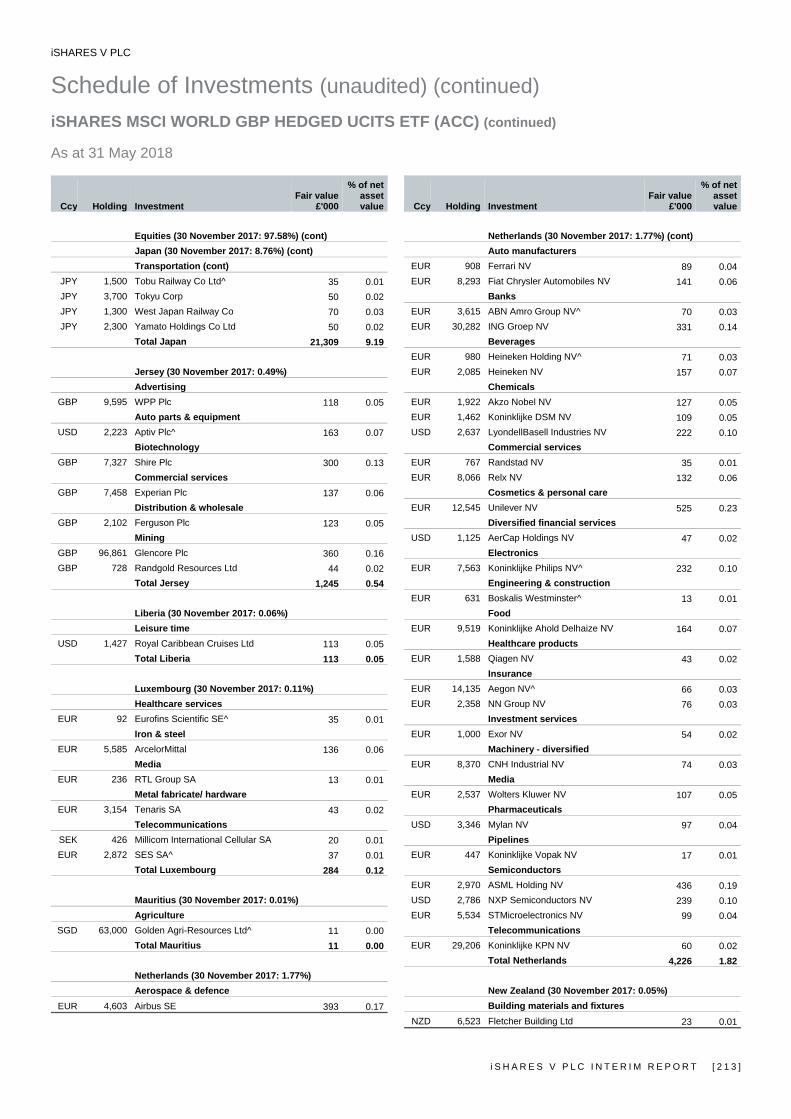
iSHARES V PLC
Schedule of Investments (unaudited) (continued) iSHARES MSCI WORLD GBP HEDGED UCITS ETF (ACC) (continued) As at 31 May 2018
i S H A R E S V P L C I N T E R I M R E P O R T [ 2 1 3 ]
Ccy Holding Investment Fair value
£'000
% of net asset value
Equities (30 November 2017: 97.58%) (cont) Japan (30 November 2017: 8.76%) (cont) Transportation (cont)
JPY 1,500 Tobu Railway Co Ltd^ 35 0.01JPY 3,700 Tokyu Corp 50 0.02JPY 1,300 West Japan Railway Co 70 0.03JPY 2,300 Yamato Holdings Co Ltd 50 0.02
Total Japan 21,309 9.19
Jersey (30 November 2017: 0.49%) Advertising
GBP 9,595 WPP Plc 118 0.05Auto parts & equipment
USD 2,223 Aptiv Plc^ 163 0.07Biotechnology
GBP 7,327 Shire Plc 300 0.13Commercial services
GBP 7,458 Experian Plc 137 0.06Distribution & wholesale
GBP 2,102 Ferguson Plc 123 0.05Mining
GBP 96,861 Glencore Plc 360 0.16GBP 728 Randgold Resources Ltd 44 0.02
Total Jersey 1,245 0.54
Liberia (30 November 2017: 0.06%) Leisure time
USD 1,427 Royal Caribbean Cruises Ltd 113 0.05Total Liberia 113 0.05
Luxembourg (30 November 2017: 0.11%) Healthcare services
EUR 92 Eurofins Scientific SE^ 35 0.01Iron & steel
EUR 5,585 ArcelorMittal 136 0.06Media
EUR 236 RTL Group SA 13 0.01Metal fabricate/ hardware
EUR 3,154 Tenaris SA 43 0.02Telecommunications
SEK 426 Millicom International Cellular SA 20 0.01EUR 2,872 SES SA^ 37 0.01
Total Luxembourg 284 0.12
Mauritius (30 November 2017: 0.01%) Agriculture
SGD 63,000 Golden Agri-Resources Ltd^ 11 0.00Total Mauritius 11 0.00
Netherlands (30 November 2017: 1.77%) Aerospace & defence
EUR 4,603 Airbus SE 393 0.17
Ccy Holding Investment Fair value
£'000
% of net asset value
Netherlands (30 November 2017: 1.77%) (cont) Auto manufacturers
EUR 908 Ferrari NV 89 0.04EUR 8,293 Fiat Chrysler Automobiles NV 141 0.06
Banks EUR 3,615 ABN Amro Group NV^ 70 0.03EUR 30,282 ING Groep NV 331 0.14
Beverages EUR 980 Heineken Holding NV^ 71 0.03EUR 2,085 Heineken NV 157 0.07
Chemicals EUR 1,922 Akzo Nobel NV 127 0.05EUR 1,462 Koninklijke DSM NV 109 0.05USD 2,637 LyondellBasell Industries NV 222 0.10
Commercial services EUR 767 Randstad NV 35 0.01EUR 8,066 Relx NV 132 0.06
Cosmetics & personal care EUR 12,545 Unilever NV 525 0.23
Diversified financial services USD 1,125 AerCap Holdings NV 47 0.02
Electronics EUR 7,563 Koninklijke Philips NV^ 232 0.10
Engineering & construction EUR 631 Boskalis Westminster^ 13 0.01
Food EUR 9,519 Koninklijke Ahold Delhaize NV 164 0.07
Healthcare products EUR 1,588 Qiagen NV 43 0.02
Insurance EUR 14,135 Aegon NV^ 66 0.03EUR 2,358 NN Group NV 76 0.03
Investment services EUR 1,000 Exor NV 54 0.02
Machinery - diversified EUR 8,370 CNH Industrial NV 74 0.03
Media EUR 2,537 Wolters Kluwer NV 107 0.05
Pharmaceuticals USD 3,346 Mylan NV 97 0.04
Pipelines EUR 447 Koninklijke Vopak NV 17 0.01
Semiconductors EUR 2,970 ASML Holding NV 436 0.19USD 2,786 NXP Semiconductors NV 239 0.10EUR 5,534 STMicroelectronics NV 99 0.04
Telecommunications EUR 29,206 Koninklijke KPN NV 60 0.02
Total Netherlands 4,226 1.82
New Zealand (30 November 2017: 0.05%) Building materials and fixtures
NZD 6,523 Fletcher Building Ltd 23 0.01

iSHARES V PLC
Schedule of Investments (unaudited) (continued) iSHARES MSCI WORLD GBP HEDGED UCITS ETF (ACC) (continued) As at 31 May 2018
[ 2 1 4 ] i S H A R E S V P L C I N T E R I M R E P O R T
Ccy Holding Investment Fair value
£'000
% of net asset value
Equities (30 November 2017: 97.58%) (cont) New Zealand (30 November 2017: 0.05%) (cont) Electricity
NZD 15,296 Meridian Energy Ltd 24 0.01Engineering & construction
NZD 8,782 Auckland International Airport Ltd 30 0.01Healthcare products
NZD 4,387 Fisher & Paykel Healthcare Corp Ltd 31 0.02Healthcare services
NZD 3,648 Ryman Healthcare Ltd^ 22 0.01Telecommunications
NZD 13,980 Spark New Zealand Ltd 27 0.01Total New Zealand 157 0.07
Norway (30 November 2017: 0.24%) Banks
NOK 7,817 DNB ASA 105 0.05Chemicals
NOK 1,144 Yara International ASA 35 0.01Food
NOK 2,736 Marine Harvest ASA 41 0.02NOK 4,818 Orkla ASA 33 0.01
Insurance NOK 1,534 Gjensidige Forsikring ASA 18 0.01
Media NOK 1,061 Schibsted ASA 21 0.01
Mining NOK 10,177 Norsk Hydro ASA 48 0.02
Oil & gas NOK 9,249 Equinor ASA 183 0.08
Telecommunications NOK 6,182 Telenor ASA 96 0.04
Total Norway 580 0.25
Panama (30 November 2017: 0.05%) Leisure time
USD 2,935 Carnival Corp 137 0.06Total Panama 137 0.06
Papua New Guinea (30 November 2017: 0.02%) Oil & gas
AUD 10,287 Oil Search Ltd 48 0.02Total Papua New Guinea 48 0.02
Portugal (30 November 2017: 0.05%) Electricity
EUR 15,157 EDP - Energias de Portugal SA 45 0.02Food
EUR 1,863 Jeronimo Martins SGPS SA 22 0.01Oil & gas
EUR 3,669 Galp Energia SGPS SA^ 51 0.02Total Portugal 118 0.05
Ccy Holding Investment Fair value
£'000
% of net asset value
Singapore (30 November 2017: 0.78%) Airlines
SGD 4,700 Singapore Airlines Ltd^ 30 0.01Banks
SGD 13,762 DBS Group Holdings Ltd 220 0.10SGD 22,050 Oversea-Chinese Banking Corp Ltd 155 0.07SGD 10,635 United Overseas Bank Ltd 168 0.07
Commercial services USD 37,200 Hutchison Port Holdings Trust 8 0.00
Distribution & wholesale SGD 1,233 Jardine Cycle & Carriage Ltd 24 0.01
Diversified financial services SGD 6,300 Singapore Exchange Ltd 26 0.01
Electricity SGD 10,400 Sembcorp Industries Ltd^ 17 0.01
Electronics USD 4,030 Flex Ltd 42 0.02
Engineering & construction SGD 6,300 SATS Ltd 18 0.01SGD 13,500 Singapore Technologies Engineering
Ltd 27 0.01Entertainment
SGD 40,400 Genting Singapore Plc 28 0.01Food
SGD 11,800 Wilmar International Ltd^ 21 0.01Holding companies - diversified operations
SGD 12,900 Keppel Corp Ltd 56 0.02Hotels
SGD 3,600 City Developments Ltd 23 0.01Marine transportation
SGD 28,500 Yangzijiang Shipbuilding Holdings Ltd 15 0.01Real estate investment & services
SGD 19,200 CapitaLand Ltd 37 0.02SGD 6,969 UOL Group Ltd 32 0.01
Real estate investment trusts SGD 18,800 Ascendas Real Estate Investment
Trust 28 0.01SGD 24,000 CapitaLand Commercial Trust 23 0.01SGD 18,400 CapitaLand Mall Trust^ 21 0.01SGD 21,500 Suntec Real Estate Investment Trust 22 0.01
Telecommunications SGD 62,900 Singapore Telecommunications Ltd 116 0.05
Transportation SGD 19,400 ComfortDelGro Corp Ltd 27 0.01
Total Singapore 1,184 0.51
Spain (30 November 2017: 1.20%) Airlines
EUR 7,725 International Consolidated Airlines Group SA 53 0.02Banks
EUR 52,775 Banco Bilbao Vizcaya Argentaria SA 270 0.12EUR 39,523 Banco de Sabadell SA 50 0.02
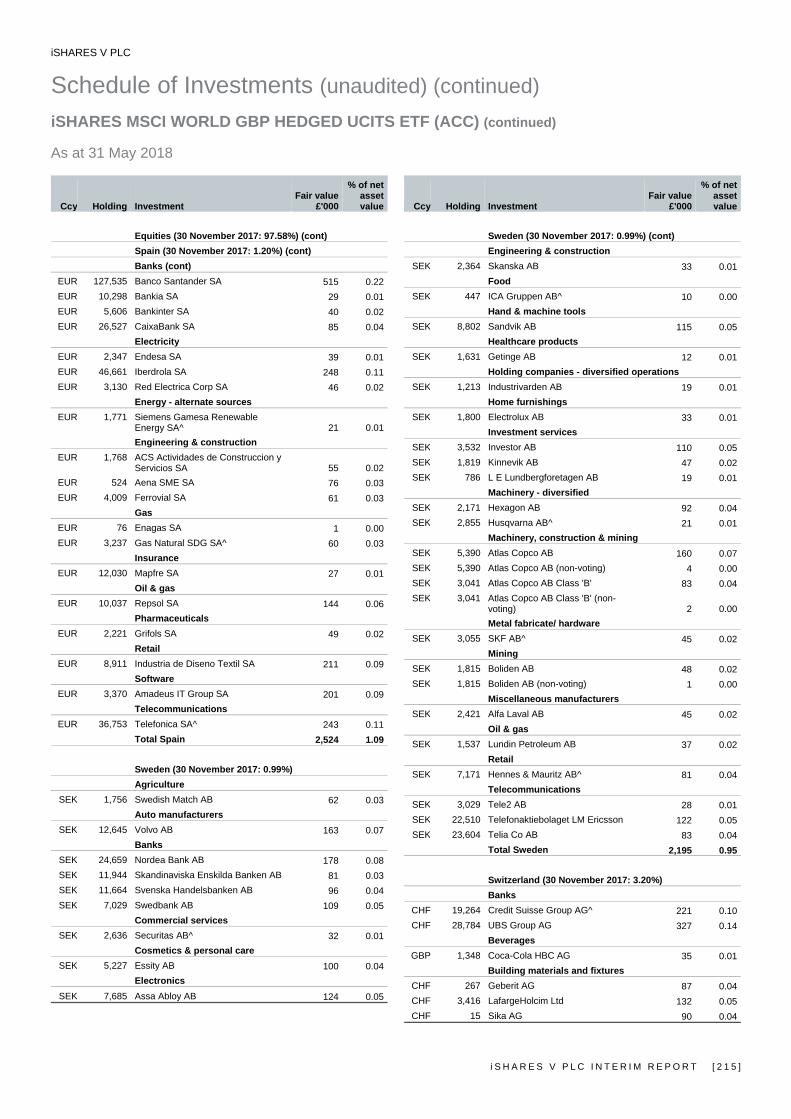
iSHARES V PLC
Schedule of Investments (unaudited) (continued) iSHARES MSCI WORLD GBP HEDGED UCITS ETF (ACC) (continued) As at 31 May 2018
i S H A R E S V P L C I N T E R I M R E P O R T [ 2 1 5 ]
Ccy Holding Investment Fair value
£'000
% of net asset value
Equities (30 November 2017: 97.58%) (cont) Spain (30 November 2017: 1.20%) (cont) Banks (cont)
EUR 127,535 Banco Santander SA 515 0.22EUR 10,298 Bankia SA 29 0.01EUR 5,606 Bankinter SA 40 0.02EUR 26,527 CaixaBank SA 85 0.04
Electricity EUR 2,347 Endesa SA 39 0.01EUR 46,661 Iberdrola SA 248 0.11EUR 3,130 Red Electrica Corp SA 46 0.02
Energy - alternate sources EUR 1,771 Siemens Gamesa Renewable
Energy SA^ 21 0.01Engineering & construction
EUR 1,768 ACS Actividades de Construccion y Servicios SA 55 0.02
EUR 524 Aena SME SA 76 0.03EUR 4,009 Ferrovial SA 61 0.03
Gas EUR 76 Enagas SA 1 0.00EUR 3,237 Gas Natural SDG SA^ 60 0.03
Insurance EUR 12,030 Mapfre SA 27 0.01
Oil & gas EUR 10,037 Repsol SA 144 0.06
Pharmaceuticals EUR 2,221 Grifols SA 49 0.02
Retail EUR 8,911 Industria de Diseno Textil SA 211 0.09
Software EUR 3,370 Amadeus IT Group SA 201 0.09
Telecommunications EUR 36,753 Telefonica SA^ 243 0.11
Total Spain 2,524 1.09
Sweden (30 November 2017: 0.99%) Agriculture
SEK 1,756 Swedish Match AB 62 0.03Auto manufacturers
SEK 12,645 Volvo AB 163 0.07Banks
SEK 24,659 Nordea Bank AB 178 0.08SEK 11,944 Skandinaviska Enskilda Banken AB 81 0.03SEK 11,664 Svenska Handelsbanken AB 96 0.04SEK 7,029 Swedbank AB 109 0.05
Commercial services SEK 2,636 Securitas AB^ 32 0.01
Cosmetics & personal care SEK 5,227 Essity AB 100 0.04
Electronics SEK 7,685 Assa Abloy AB 124 0.05
Ccy Holding Investment Fair value
£'000
% of net asset value
Sweden (30 November 2017: 0.99%) (cont) Engineering & construction
SEK 2,364 Skanska AB 33 0.01Food
SEK 447 ICA Gruppen AB^ 10 0.00Hand & machine tools
SEK 8,802 Sandvik AB 115 0.05Healthcare products
SEK 1,631 Getinge AB 12 0.01Holding companies - diversified operations
SEK 1,213 Industrivarden AB 19 0.01Home furnishings
SEK 1,800 Electrolux AB 33 0.01Investment services
SEK 3,532 Investor AB 110 0.05SEK 1,819 Kinnevik AB 47 0.02SEK 786 L E Lundbergforetagen AB 19 0.01
Machinery - diversified SEK 2,171 Hexagon AB 92 0.04SEK 2,855 Husqvarna AB^ 21 0.01
Machinery, construction & mining SEK 5,390 Atlas Copco AB 160 0.07SEK 5,390 Atlas Copco AB (non-voting) 4 0.00SEK 3,041 Atlas Copco AB Class 'B' 83 0.04SEK 3,041 Atlas Copco AB Class 'B' (non-
voting) 2 0.00Metal fabricate/ hardware
SEK 3,055 SKF AB^ 45 0.02Mining
SEK 1,815 Boliden AB 48 0.02SEK 1,815 Boliden AB (non-voting) 1 0.00
Miscellaneous manufacturers SEK 2,421 Alfa Laval AB 45 0.02
Oil & gas SEK 1,537 Lundin Petroleum AB 37 0.02
Retail SEK 7,171 Hennes & Mauritz AB^ 81 0.04
Telecommunications SEK 3,029 Tele2 AB 28 0.01SEK 22,510 Telefonaktiebolaget LM Ericsson 122 0.05SEK 23,604 Telia Co AB 83 0.04
Total Sweden 2,195 0.95
Switzerland (30 November 2017: 3.20%) Banks
CHF 19,264 Credit Suisse Group AG^ 221 0.10CHF 28,784 UBS Group AG 327 0.14
Beverages GBP 1,348 Coca-Cola HBC AG 35 0.01
Building materials and fixtures CHF 267 Geberit AG 87 0.04CHF 3,416 LafargeHolcim Ltd 132 0.05CHF 15 Sika AG 90 0.04
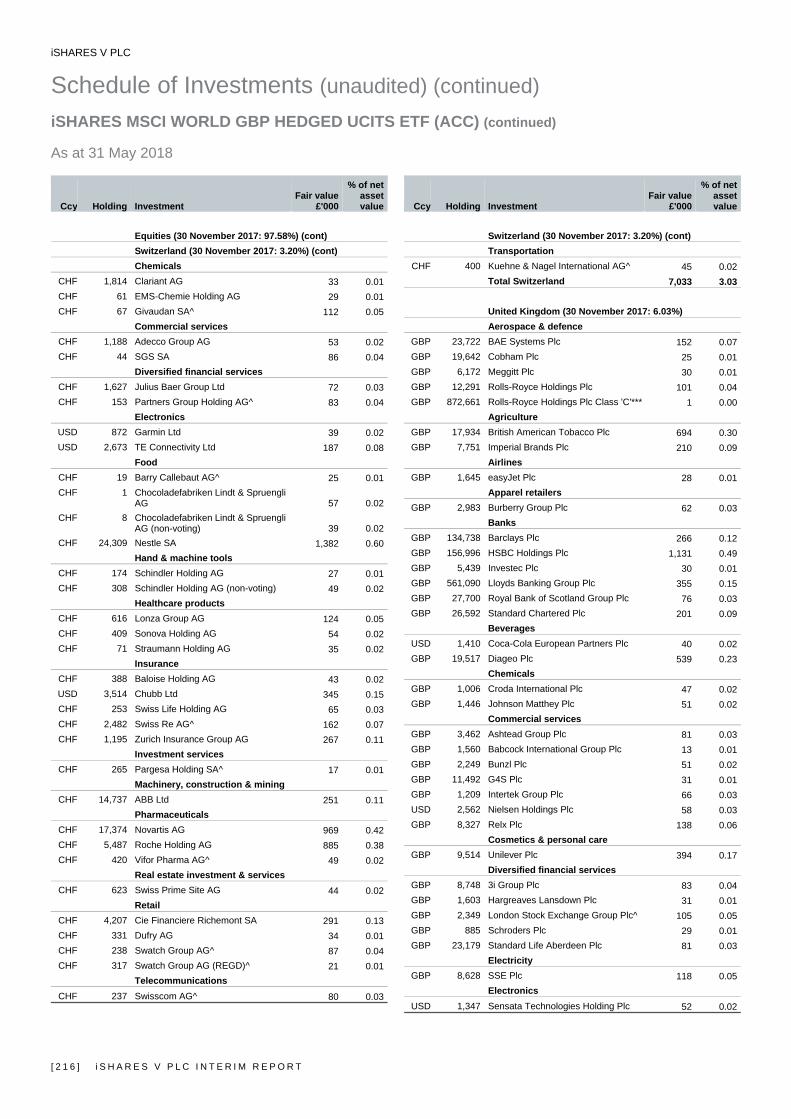
iSHARES V PLC
Schedule of Investments (unaudited) (continued) iSHARES MSCI WORLD GBP HEDGED UCITS ETF (ACC) (continued) As at 31 May 2018
[ 2 1 6 ] i S H A R E S V P L C I N T E R I M R E P O R T
Ccy Holding Investment Fair value
£'000
% of net asset value
Equities (30 November 2017: 97.58%) (cont) Switzerland (30 November 2017: 3.20%) (cont) Chemicals
CHF 1,814 Clariant AG 33 0.01CHF 61 EMS-Chemie Holding AG 29 0.01CHF 67 Givaudan SA^ 112 0.05
Commercial services CHF 1,188 Adecco Group AG 53 0.02CHF 44 SGS SA 86 0.04
Diversified financial services CHF 1,627 Julius Baer Group Ltd 72 0.03CHF 153 Partners Group Holding AG^ 83 0.04
Electronics USD 872 Garmin Ltd 39 0.02USD 2,673 TE Connectivity Ltd 187 0.08
Food CHF 19 Barry Callebaut AG^ 25 0.01CHF 1 Chocoladefabriken Lindt & Spruengli
AG 57 0.02CHF 8 Chocoladefabriken Lindt & Spruengli
AG (non-voting) 39 0.02CHF 24,309 Nestle SA 1,382 0.60
Hand & machine tools CHF 174 Schindler Holding AG 27 0.01CHF 308 Schindler Holding AG (non-voting) 49 0.02
Healthcare products CHF 616 Lonza Group AG 124 0.05CHF 409 Sonova Holding AG 54 0.02CHF 71 Straumann Holding AG 35 0.02
Insurance CHF 388 Baloise Holding AG 43 0.02USD 3,514 Chubb Ltd 345 0.15CHF 253 Swiss Life Holding AG 65 0.03CHF 2,482 Swiss Re AG^ 162 0.07CHF 1,195 Zurich Insurance Group AG 267 0.11
Investment services CHF 265 Pargesa Holding SA^ 17 0.01
Machinery, construction & mining CHF 14,737 ABB Ltd 251 0.11
Pharmaceuticals CHF 17,374 Novartis AG 969 0.42CHF 5,487 Roche Holding AG 885 0.38CHF 420 Vifor Pharma AG^ 49 0.02
Real estate investment & services CHF 623 Swiss Prime Site AG 44 0.02
Retail CHF 4,207 Cie Financiere Richemont SA 291 0.13CHF 331 Dufry AG 34 0.01CHF 238 Swatch Group AG^ 87 0.04CHF 317 Swatch Group AG (REGD)^ 21 0.01
Telecommunications CHF 237 Swisscom AG^ 80 0.03
Ccy Holding Investment Fair value
£'000
% of net asset value
Switzerland (30 November 2017: 3.20%) (cont) Transportation
CHF 400 Kuehne & Nagel International AG^ 45 0.02Total Switzerland 7,033 3.03
United Kingdom (30 November 2017: 6.03%) Aerospace & defence
GBP 23,722 BAE Systems Plc 152 0.07GBP 19,642 Cobham Plc 25 0.01GBP 6,172 Meggitt Plc 30 0.01GBP 12,291 Rolls-Royce Holdings Plc 101 0.04GBP 872,661 Rolls-Royce Holdings Plc Class 'C'*** 1 0.00
Agriculture GBP 17,934 British American Tobacco Plc 694 0.30GBP 7,751 Imperial Brands Plc 210 0.09
Airlines GBP 1,645 easyJet Plc 28 0.01
Apparel retailers GBP 2,983 Burberry Group Plc 62 0.03
Banks GBP 134,738 Barclays Plc 266 0.12GBP 156,996 HSBC Holdings Plc 1,131 0.49GBP 5,439 Investec Plc 30 0.01GBP 561,090 Lloyds Banking Group Plc 355 0.15GBP 27,700 Royal Bank of Scotland Group Plc 76 0.03GBP 26,592 Standard Chartered Plc 201 0.09
Beverages USD 1,410 Coca-Cola European Partners Plc 40 0.02GBP 19,517 Diageo Plc 539 0.23
Chemicals GBP 1,006 Croda International Plc 47 0.02GBP 1,446 Johnson Matthey Plc 51 0.02
Commercial services GBP 3,462 Ashtead Group Plc 81 0.03GBP 1,560 Babcock International Group Plc 13 0.01GBP 2,249 Bunzl Plc 51 0.02GBP 11,492 G4S Plc 31 0.01GBP 1,209 Intertek Group Plc 66 0.03USD 2,562 Nielsen Holdings Plc 58 0.03GBP 8,327 Relx Plc 138 0.06
Cosmetics & personal care GBP 9,514 Unilever Plc 394 0.17
Diversified financial services GBP 8,748 3i Group Plc 83 0.04GBP 1,603 Hargreaves Lansdown Plc 31 0.01GBP 2,349 London Stock Exchange Group Plc^ 105 0.05GBP 885 Schroders Plc 29 0.01GBP 23,179 Standard Life Aberdeen Plc 81 0.03
Electricity GBP 8,628 SSE Plc 118 0.05
Electronics USD 1,347 Sensata Technologies Holding Plc 52 0.02
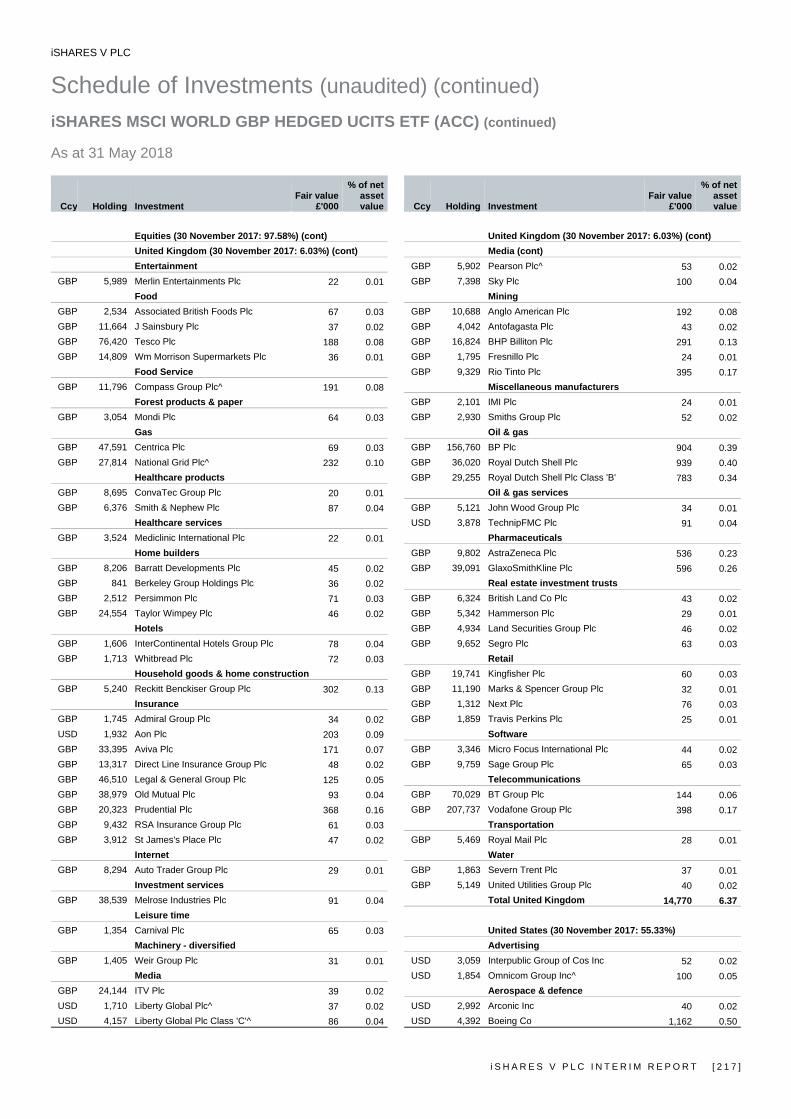
iSHARES V PLC
Schedule of Investments (unaudited) (continued) iSHARES MSCI WORLD GBP HEDGED UCITS ETF (ACC) (continued) As at 31 May 2018
i S H A R E S V P L C I N T E R I M R E P O R T [ 2 1 7 ]
Ccy Holding Investment Fair value
£'000
% of net asset value
Equities (30 November 2017: 97.58%) (cont) United Kingdom (30 November 2017: 6.03%) (cont) Entertainment
GBP 5,989 Merlin Entertainments Plc 22 0.01Food
GBP 2,534 Associated British Foods Plc 67 0.03GBP 11,664 J Sainsbury Plc 37 0.02GBP 76,420 Tesco Plc 188 0.08GBP 14,809 Wm Morrison Supermarkets Plc 36 0.01
Food Service GBP 11,796 Compass Group Plc^ 191 0.08
Forest products & paper GBP 3,054 Mondi Plc 64 0.03
Gas GBP 47,591 Centrica Plc 69 0.03GBP 27,814 National Grid Plc^ 232 0.10
Healthcare products GBP 8,695 ConvaTec Group Plc 20 0.01GBP 6,376 Smith & Nephew Plc 87 0.04
Healthcare services GBP 3,524 Mediclinic International Plc 22 0.01
Home builders GBP 8,206 Barratt Developments Plc 45 0.02GBP 841 Berkeley Group Holdings Plc 36 0.02GBP 2,512 Persimmon Plc 71 0.03GBP 24,554 Taylor Wimpey Plc 46 0.02
Hotels GBP 1,606 InterContinental Hotels Group Plc 78 0.04GBP 1,713 Whitbread Plc 72 0.03
Household goods & home construction GBP 5,240 Reckitt Benckiser Group Plc 302 0.13
Insurance GBP 1,745 Admiral Group Plc 34 0.02USD 1,932 Aon Plc 203 0.09GBP 33,395 Aviva Plc 171 0.07GBP 13,317 Direct Line Insurance Group Plc 48 0.02GBP 46,510 Legal & General Group Plc 125 0.05GBP 38,979 Old Mutual Plc 93 0.04GBP 20,323 Prudential Plc 368 0.16GBP 9,432 RSA Insurance Group Plc 61 0.03GBP 3,912 St James's Place Plc 47 0.02
Internet GBP 8,294 Auto Trader Group Plc 29 0.01
Investment services GBP 38,539 Melrose Industries Plc 91 0.04
Leisure time GBP 1,354 Carnival Plc 65 0.03
Machinery - diversified GBP 1,405 Weir Group Plc 31 0.01
Media GBP 24,144 ITV Plc 39 0.02USD 1,710 Liberty Global Plc^ 37 0.02USD 4,157 Liberty Global Plc Class 'C'^ 86 0.04
Ccy Holding Investment Fair value
£'000
% of net asset value
United Kingdom (30 November 2017: 6.03%) (cont) Media (cont)
GBP 5,902 Pearson Plc^ 53 0.02GBP 7,398 Sky Plc 100 0.04
Mining GBP 10,688 Anglo American Plc 192 0.08GBP 4,042 Antofagasta Plc 43 0.02GBP 16,824 BHP Billiton Plc 291 0.13GBP 1,795 Fresnillo Plc 24 0.01GBP 9,329 Rio Tinto Plc 395 0.17
Miscellaneous manufacturers GBP 2,101 IMI Plc 24 0.01GBP 2,930 Smiths Group Plc 52 0.02
Oil & gas GBP 156,760 BP Plc 904 0.39GBP 36,020 Royal Dutch Shell Plc 939 0.40GBP 29,255 Royal Dutch Shell Plc Class 'B' 783 0.34
Oil & gas services GBP 5,121 John Wood Group Plc 34 0.01USD 3,878 TechnipFMC Plc 91 0.04
Pharmaceuticals GBP 9,802 AstraZeneca Plc 536 0.23GBP 39,091 GlaxoSmithKline Plc 596 0.26
Real estate investment trusts GBP 6,324 British Land Co Plc 43 0.02GBP 5,342 Hammerson Plc 29 0.01GBP 4,934 Land Securities Group Plc 46 0.02GBP 9,652 Segro Plc 63 0.03
Retail GBP 19,741 Kingfisher Plc 60 0.03GBP 11,190 Marks & Spencer Group Plc 32 0.01GBP 1,312 Next Plc 76 0.03GBP 1,859 Travis Perkins Plc 25 0.01
Software GBP 3,346 Micro Focus International Plc 44 0.02GBP 9,759 Sage Group Plc 65 0.03
Telecommunications GBP 70,029 BT Group Plc 144 0.06GBP 207,737 Vodafone Group Plc 398 0.17
Transportation GBP 5,469 Royal Mail Plc 28 0.01
Water GBP 1,863 Severn Trent Plc 37 0.01GBP 5,149 United Utilities Group Plc 40 0.02
Total United Kingdom 14,770 6.37
United States (30 November 2017: 55.33%) Advertising
USD 3,059 Interpublic Group of Cos Inc 52 0.02USD 1,854 Omnicom Group Inc^ 100 0.05
Aerospace & defence USD 2,992 Arconic Inc 40 0.02USD 4,392 Boeing Co 1,162 0.50
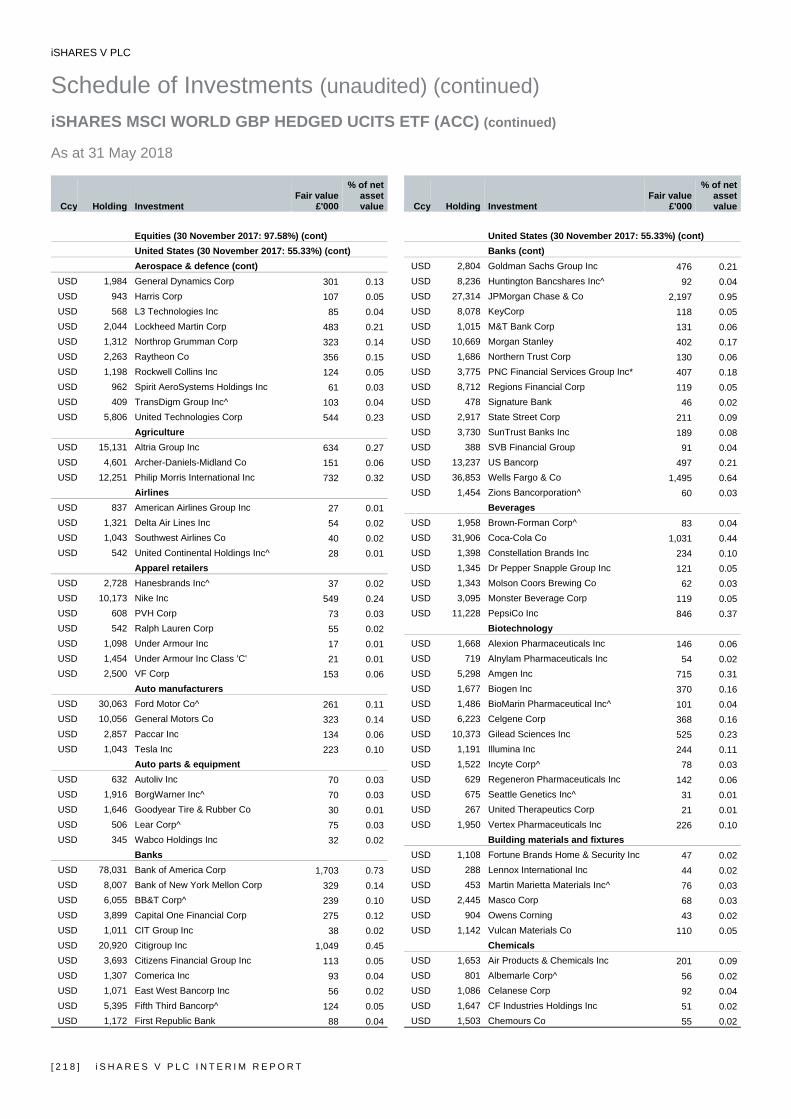
iSHARES V PLC
Schedule of Investments (unaudited) (continued) iSHARES MSCI WORLD GBP HEDGED UCITS ETF (ACC) (continued) As at 31 May 2018
[ 2 1 8 ] i S H A R E S V P L C I N T E R I M R E P O R T
Ccy Holding Investment Fair value
£'000
% of net asset value
Equities (30 November 2017: 97.58%) (cont) United States (30 November 2017: 55.33%) (cont) Aerospace & defence (cont)
USD 1,984 General Dynamics Corp 301 0.13USD 943 Harris Corp 107 0.05USD 568 L3 Technologies Inc 85 0.04USD 2,044 Lockheed Martin Corp 483 0.21USD 1,312 Northrop Grumman Corp 323 0.14USD 2,263 Raytheon Co 356 0.15USD 1,198 Rockwell Collins Inc 124 0.05USD 962 Spirit AeroSystems Holdings Inc 61 0.03USD 409 TransDigm Group Inc^ 103 0.04USD 5,806 United Technologies Corp 544 0.23
Agriculture USD 15,131 Altria Group Inc 634 0.27USD 4,601 Archer-Daniels-Midland Co 151 0.06USD 12,251 Philip Morris International Inc 732 0.32
Airlines USD 837 American Airlines Group Inc 27 0.01USD 1,321 Delta Air Lines Inc 54 0.02USD 1,043 Southwest Airlines Co 40 0.02USD 542 United Continental Holdings Inc^ 28 0.01
Apparel retailers USD 2,728 Hanesbrands Inc^ 37 0.02USD 10,173 Nike Inc 549 0.24USD 608 PVH Corp 73 0.03USD 542 Ralph Lauren Corp 55 0.02USD 1,098 Under Armour Inc 17 0.01USD 1,454 Under Armour Inc Class 'C' 21 0.01USD 2,500 VF Corp 153 0.06
Auto manufacturers USD 30,063 Ford Motor Co^ 261 0.11USD 10,056 General Motors Co 323 0.14USD 2,857 Paccar Inc 134 0.06USD 1,043 Tesla Inc 223 0.10
Auto parts & equipment USD 632 Autoliv Inc 70 0.03USD 1,916 BorgWarner Inc^ 70 0.03USD 1,646 Goodyear Tire & Rubber Co 30 0.01USD 506 Lear Corp^ 75 0.03USD 345 Wabco Holdings Inc 32 0.02
Banks USD 78,031 Bank of America Corp 1,703 0.73USD 8,007 Bank of New York Mellon Corp 329 0.14USD 6,055 BB&T Corp^ 239 0.10USD 3,899 Capital One Financial Corp 275 0.12USD 1,011 CIT Group Inc 38 0.02USD 20,920 Citigroup Inc 1,049 0.45USD 3,693 Citizens Financial Group Inc 113 0.05USD 1,307 Comerica Inc 93 0.04USD 1,071 East West Bancorp Inc 56 0.02USD 5,395 Fifth Third Bancorp^ 124 0.05USD 1,172 First Republic Bank 88 0.04
Ccy Holding Investment Fair value
£'000
% of net asset value
United States (30 November 2017: 55.33%) (cont) Banks (cont)
USD 2,804 Goldman Sachs Group Inc 476 0.21USD 8,236 Huntington Bancshares Inc^ 92 0.04USD 27,314 JPMorgan Chase & Co 2,197 0.95USD 8,078 KeyCorp 118 0.05USD 1,015 M&T Bank Corp 131 0.06USD 10,669 Morgan Stanley 402 0.17USD 1,686 Northern Trust Corp 130 0.06USD 3,775 PNC Financial Services Group Inc* 407 0.18USD 8,712 Regions Financial Corp 119 0.05USD 478 Signature Bank 46 0.02USD 2,917 State Street Corp 211 0.09USD 3,730 SunTrust Banks Inc 189 0.08USD 388 SVB Financial Group 91 0.04USD 13,237 US Bancorp 497 0.21USD 36,853 Wells Fargo & Co 1,495 0.64USD 1,454 Zions Bancorporation^ 60 0.03
Beverages USD 1,958 Brown-Forman Corp^ 83 0.04USD 31,906 Coca-Cola Co 1,031 0.44USD 1,398 Constellation Brands Inc 234 0.10USD 1,345 Dr Pepper Snapple Group Inc 121 0.05USD 1,343 Molson Coors Brewing Co 62 0.03USD 3,095 Monster Beverage Corp 119 0.05USD 11,228 PepsiCo Inc 846 0.37
Biotechnology USD 1,668 Alexion Pharmaceuticals Inc 146 0.06USD 719 Alnylam Pharmaceuticals Inc 54 0.02USD 5,298 Amgen Inc 715 0.31USD 1,677 Biogen Inc 370 0.16USD 1,486 BioMarin Pharmaceutical Inc^ 101 0.04USD 6,223 Celgene Corp 368 0.16USD 10,373 Gilead Sciences Inc 525 0.23USD 1,191 Illumina Inc 244 0.11USD 1,522 Incyte Corp^ 78 0.03USD 629 Regeneron Pharmaceuticals Inc 142 0.06USD 675 Seattle Genetics Inc^ 31 0.01USD 267 United Therapeutics Corp 21 0.01USD 1,950 Vertex Pharmaceuticals Inc 226 0.10
Building materials and fixtures USD 1,108 Fortune Brands Home & Security Inc 47 0.02USD 288 Lennox International Inc 44 0.02USD 453 Martin Marietta Materials Inc^ 76 0.03USD 2,445 Masco Corp 68 0.03USD 904 Owens Corning 43 0.02USD 1,142 Vulcan Materials Co 110 0.05
Chemicals USD 1,653 Air Products & Chemicals Inc 201 0.09USD 801 Albemarle Corp^ 56 0.02USD 1,086 Celanese Corp 92 0.04USD 1,647 CF Industries Holdings Inc 51 0.02USD 1,503 Chemours Co 55 0.02
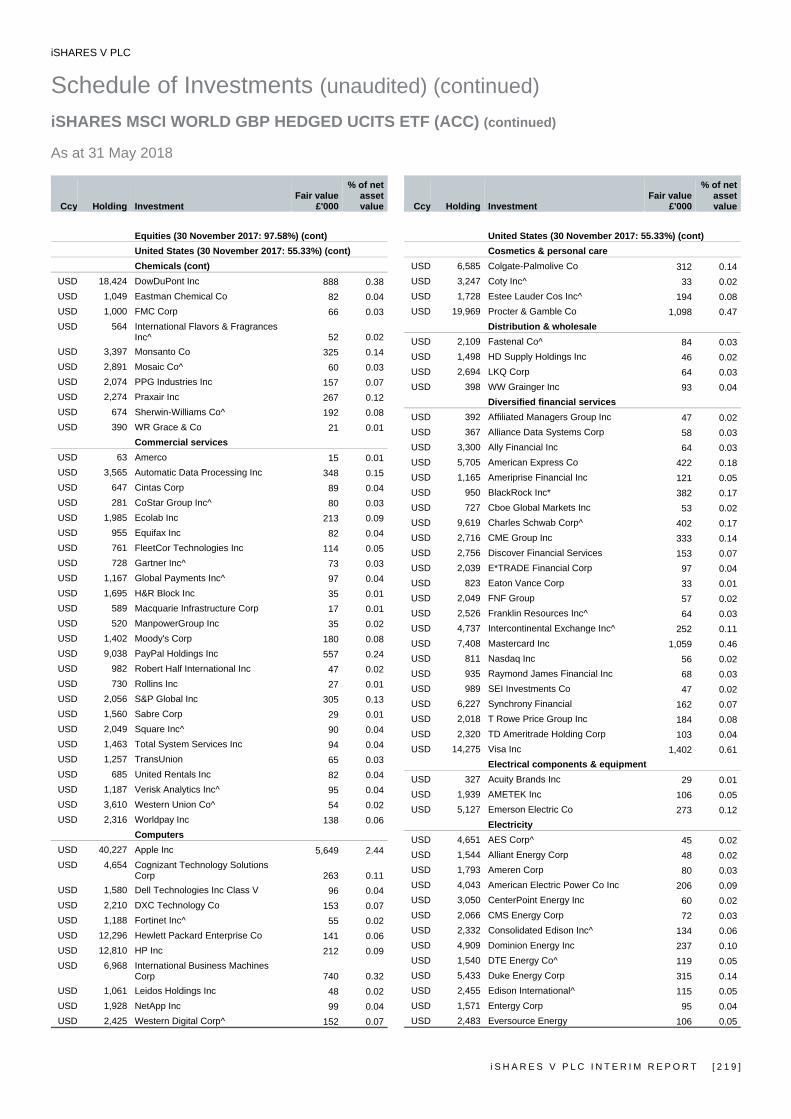
iSHARES V PLC
Schedule of Investments (unaudited) (continued) iSHARES MSCI WORLD GBP HEDGED UCITS ETF (ACC) (continued) As at 31 May 2018
i S H A R E S V P L C I N T E R I M R E P O R T [ 2 1 9 ]
Ccy Holding Investment Fair value
£'000
% of net asset value
Equities (30 November 2017: 97.58%) (cont) United States (30 November 2017: 55.33%) (cont) Chemicals (cont)
USD 18,424 DowDuPont Inc 888 0.38USD 1,049 Eastman Chemical Co 82 0.04USD 1,000 FMC Corp 66 0.03USD 564 International Flavors & Fragrances
Inc^ 52 0.02USD 3,397 Monsanto Co 325 0.14USD 2,891 Mosaic Co^ 60 0.03USD 2,074 PPG Industries Inc 157 0.07USD 2,274 Praxair Inc 267 0.12USD 674 Sherwin-Williams Co^ 192 0.08USD 390 WR Grace & Co 21 0.01
Commercial services USD 63 Amerco 15 0.01USD 3,565 Automatic Data Processing Inc 348 0.15USD 647 Cintas Corp 89 0.04USD 281 CoStar Group Inc^ 80 0.03USD 1,985 Ecolab Inc 213 0.09USD 955 Equifax Inc 82 0.04USD 761 FleetCor Technologies Inc 114 0.05USD 728 Gartner Inc^ 73 0.03USD 1,167 Global Payments Inc^ 97 0.04USD 1,695 H&R Block Inc 35 0.01USD 589 Macquarie Infrastructure Corp 17 0.01USD 520 ManpowerGroup Inc 35 0.02USD 1,402 Moody's Corp 180 0.08USD 9,038 PayPal Holdings Inc 557 0.24USD 982 Robert Half International Inc 47 0.02USD 730 Rollins Inc 27 0.01USD 2,056 S&P Global Inc 305 0.13USD 1,560 Sabre Corp 29 0.01USD 2,049 Square Inc^ 90 0.04USD 1,463 Total System Services Inc 94 0.04USD 1,257 TransUnion 65 0.03USD 685 United Rentals Inc 82 0.04USD 1,187 Verisk Analytics Inc^ 95 0.04USD 3,610 Western Union Co^ 54 0.02USD 2,316 Worldpay Inc 138 0.06
Computers USD 40,227 Apple Inc 5,649 2.44USD 4,654 Cognizant Technology Solutions
Corp 263 0.11USD 1,580 Dell Technologies Inc Class V 96 0.04USD 2,210 DXC Technology Co 153 0.07USD 1,188 Fortinet Inc^ 55 0.02USD 12,296 Hewlett Packard Enterprise Co 141 0.06USD 12,810 HP Inc 212 0.09USD 6,968 International Business Machines
Corp 740 0.32USD 1,061 Leidos Holdings Inc 48 0.02USD 1,928 NetApp Inc 99 0.04USD 2,425 Western Digital Corp^ 152 0.07
Ccy Holding Investment Fair value
£'000
% of net asset value
United States (30 November 2017: 55.33%) (cont) Cosmetics & personal care
USD 6,585 Colgate-Palmolive Co 312 0.14USD 3,247 Coty Inc^ 33 0.02USD 1,728 Estee Lauder Cos Inc^ 194 0.08USD 19,969 Procter & Gamble Co 1,098 0.47
Distribution & wholesale USD 2,109 Fastenal Co^ 84 0.03USD 1,498 HD Supply Holdings Inc 46 0.02USD 2,694 LKQ Corp 64 0.03USD 398 WW Grainger Inc 93 0.04
Diversified financial services USD 392 Affiliated Managers Group Inc 47 0.02USD 367 Alliance Data Systems Corp 58 0.03USD 3,300 Ally Financial Inc 64 0.03USD 5,705 American Express Co 422 0.18USD 1,165 Ameriprise Financial Inc 121 0.05USD 950 BlackRock Inc* 382 0.17USD 727 Cboe Global Markets Inc 53 0.02USD 9,619 Charles Schwab Corp^ 402 0.17USD 2,716 CME Group Inc 333 0.14USD 2,756 Discover Financial Services 153 0.07USD 2,039 E*TRADE Financial Corp 97 0.04USD 823 Eaton Vance Corp 33 0.01USD 2,049 FNF Group 57 0.02USD 2,526 Franklin Resources Inc^ 64 0.03USD 4,737 Intercontinental Exchange Inc^ 252 0.11USD 7,408 Mastercard Inc 1,059 0.46USD 811 Nasdaq Inc 56 0.02USD 935 Raymond James Financial Inc 68 0.03USD 989 SEI Investments Co 47 0.02USD 6,227 Synchrony Financial 162 0.07USD 2,018 T Rowe Price Group Inc 184 0.08USD 2,320 TD Ameritrade Holding Corp 103 0.04USD 14,275 Visa Inc 1,402 0.61
Electrical components & equipment USD 327 Acuity Brands Inc 29 0.01USD 1,939 AMETEK Inc 106 0.05USD 5,127 Emerson Electric Co 273 0.12
Electricity USD 4,651 AES Corp^ 45 0.02USD 1,544 Alliant Energy Corp 48 0.02USD 1,793 Ameren Corp 80 0.03USD 4,043 American Electric Power Co Inc 206 0.09USD 3,050 CenterPoint Energy Inc 60 0.02USD 2,066 CMS Energy Corp 72 0.03USD 2,332 Consolidated Edison Inc^ 134 0.06USD 4,909 Dominion Energy Inc 237 0.10USD 1,540 DTE Energy Co^ 119 0.05USD 5,433 Duke Energy Corp 315 0.14USD 2,455 Edison International^ 115 0.05USD 1,571 Entergy Corp 95 0.04USD 2,483 Eversource Energy 106 0.05
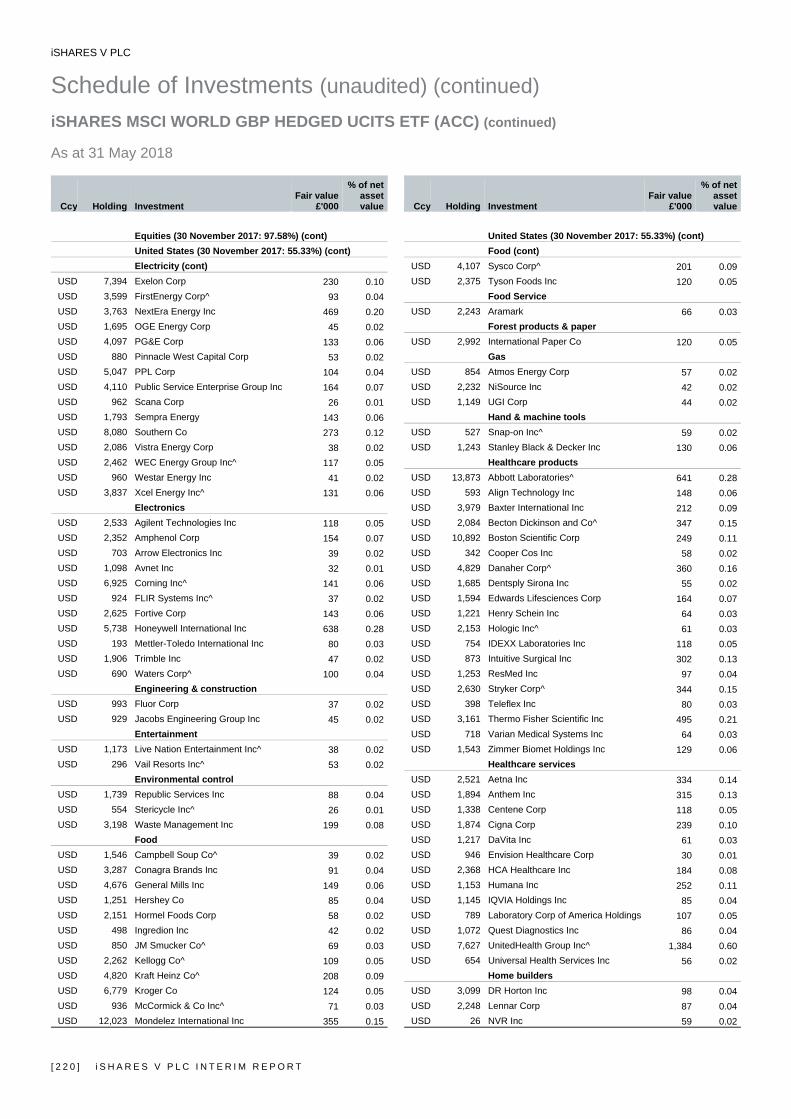
iSHARES V PLC
Schedule of Investments (unaudited) (continued) iSHARES MSCI WORLD GBP HEDGED UCITS ETF (ACC) (continued) As at 31 May 2018
[ 2 2 0 ] i S H A R E S V P L C I N T E R I M R E P O R T
Ccy Holding Investment Fair value
£'000
% of net asset value
Equities (30 November 2017: 97.58%) (cont) United States (30 November 2017: 55.33%) (cont) Electricity (cont)
USD 7,394 Exelon Corp 230 0.10USD 3,599 FirstEnergy Corp^ 93 0.04USD 3,763 NextEra Energy Inc 469 0.20USD 1,695 OGE Energy Corp 45 0.02USD 4,097 PG&E Corp 133 0.06USD 880 Pinnacle West Capital Corp 53 0.02USD 5,047 PPL Corp 104 0.04USD 4,110 Public Service Enterprise Group Inc 164 0.07USD 962 Scana Corp 26 0.01USD 1,793 Sempra Energy 143 0.06USD 8,080 Southern Co 273 0.12USD 2,086 Vistra Energy Corp 38 0.02USD 2,462 WEC Energy Group Inc^ 117 0.05USD 960 Westar Energy Inc 41 0.02USD 3,837 Xcel Energy Inc^ 131 0.06
Electronics USD 2,533 Agilent Technologies Inc 118 0.05USD 2,352 Amphenol Corp 154 0.07USD 703 Arrow Electronics Inc 39 0.02USD 1,098 Avnet Inc 32 0.01USD 6,925 Corning Inc^ 141 0.06USD 924 FLIR Systems Inc^ 37 0.02USD 2,625 Fortive Corp 143 0.06USD 5,738 Honeywell International Inc 638 0.28USD 193 Mettler-Toledo International Inc 80 0.03USD 1,906 Trimble Inc 47 0.02USD 690 Waters Corp^ 100 0.04
Engineering & construction USD 993 Fluor Corp 37 0.02USD 929 Jacobs Engineering Group Inc 45 0.02
Entertainment USD 1,173 Live Nation Entertainment Inc^ 38 0.02USD 296 Vail Resorts Inc^ 53 0.02
Environmental control USD 1,739 Republic Services Inc 88 0.04USD 554 Stericycle Inc^ 26 0.01USD 3,198 Waste Management Inc 199 0.08
Food USD 1,546 Campbell Soup Co^ 39 0.02USD 3,287 Conagra Brands Inc 91 0.04USD 4,676 General Mills Inc 149 0.06USD 1,251 Hershey Co 85 0.04USD 2,151 Hormel Foods Corp 58 0.02USD 498 Ingredion Inc 42 0.02USD 850 JM Smucker Co^ 69 0.03USD 2,262 Kellogg Co^ 109 0.05USD 4,820 Kraft Heinz Co^ 208 0.09USD 6,779 Kroger Co 124 0.05USD 936 McCormick & Co Inc^ 71 0.03USD 12,023 Mondelez International Inc 355 0.15
Ccy Holding Investment Fair value
£'000
% of net asset value
United States (30 November 2017: 55.33%) (cont) Food (cont)
USD 4,107 Sysco Corp^ 201 0.09USD 2,375 Tyson Foods Inc 120 0.05
Food Service USD 2,243 Aramark 66 0.03
Forest products & paper USD 2,992 International Paper Co 120 0.05
Gas USD 854 Atmos Energy Corp 57 0.02USD 2,232 NiSource Inc 42 0.02USD 1,149 UGI Corp 44 0.02
Hand & machine tools USD 527 Snap-on Inc^ 59 0.02USD 1,243 Stanley Black & Decker Inc 130 0.06
Healthcare products USD 13,873 Abbott Laboratories^ 641 0.28USD 593 Align Technology Inc 148 0.06USD 3,979 Baxter International Inc 212 0.09USD 2,084 Becton Dickinson and Co^ 347 0.15USD 10,892 Boston Scientific Corp 249 0.11USD 342 Cooper Cos Inc 58 0.02USD 4,829 Danaher Corp^ 360 0.16USD 1,685 Dentsply Sirona Inc 55 0.02USD 1,594 Edwards Lifesciences Corp 164 0.07USD 1,221 Henry Schein Inc 64 0.03USD 2,153 Hologic Inc^ 61 0.03USD 754 IDEXX Laboratories Inc 118 0.05USD 873 Intuitive Surgical Inc 302 0.13USD 1,253 ResMed Inc 97 0.04USD 2,630 Stryker Corp^ 344 0.15USD 398 Teleflex Inc 80 0.03USD 3,161 Thermo Fisher Scientific Inc 495 0.21USD 718 Varian Medical Systems Inc 64 0.03USD 1,543 Zimmer Biomet Holdings Inc 129 0.06
Healthcare services USD 2,521 Aetna Inc 334 0.14USD 1,894 Anthem Inc 315 0.13USD 1,338 Centene Corp 118 0.05USD 1,874 Cigna Corp 239 0.10USD 1,217 DaVita Inc 61 0.03USD 946 Envision Healthcare Corp 30 0.01USD 2,368 HCA Healthcare Inc 184 0.08USD 1,153 Humana Inc 252 0.11USD 1,145 IQVIA Holdings Inc 85 0.04USD 789 Laboratory Corp of America Holdings 107 0.05USD 1,072 Quest Diagnostics Inc 86 0.04USD 7,627 UnitedHealth Group Inc^ 1,384 0.60USD 654 Universal Health Services Inc 56 0.02
Home builders USD 3,099 DR Horton Inc 98 0.04USD 2,248 Lennar Corp 87 0.04USD 26 NVR Inc 59 0.02
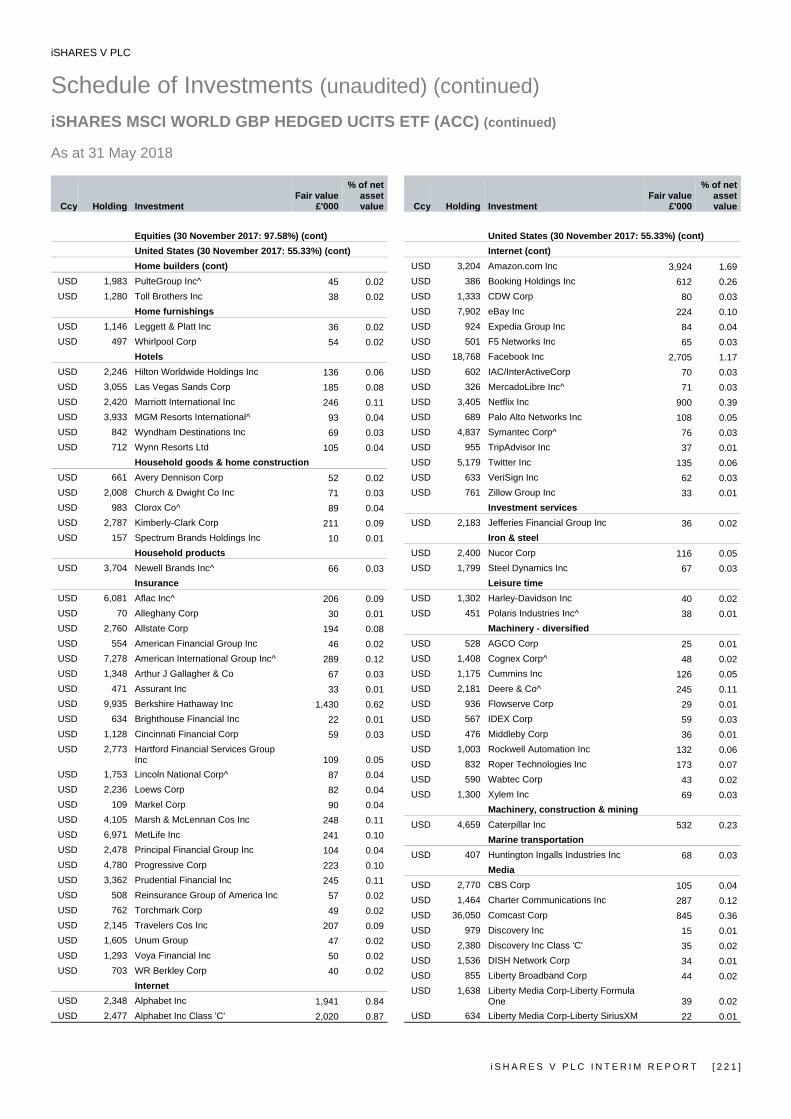
iSHARES V PLC
Schedule of Investments (unaudited) (continued) iSHARES MSCI WORLD GBP HEDGED UCITS ETF (ACC) (continued) As at 31 May 2018
i S H A R E S V P L C I N T E R I M R E P O R T [ 2 2 1 ]
Ccy Holding Investment Fair value
£'000
% of net asset value
Equities (30 November 2017: 97.58%) (cont) United States (30 November 2017: 55.33%) (cont) Home builders (cont)
USD 1,983 PulteGroup Inc^ 45 0.02USD 1,280 Toll Brothers Inc 38 0.02
Home furnishings USD 1,146 Leggett & Platt Inc 36 0.02USD 497 Whirlpool Corp 54 0.02
Hotels USD 2,246 Hilton Worldwide Holdings Inc 136 0.06USD 3,055 Las Vegas Sands Corp 185 0.08USD 2,420 Marriott International Inc 246 0.11USD 3,933 MGM Resorts International^ 93 0.04USD 842 Wyndham Destinations Inc 69 0.03USD 712 Wynn Resorts Ltd 105 0.04
Household goods & home construction USD 661 Avery Dennison Corp 52 0.02USD 2,008 Church & Dwight Co Inc 71 0.03USD 983 Clorox Co^ 89 0.04USD 2,787 Kimberly-Clark Corp 211 0.09USD 157 Spectrum Brands Holdings Inc 10 0.01
Household products USD 3,704 Newell Brands Inc^ 66 0.03
Insurance USD 6,081 Aflac Inc^ 206 0.09USD 70 Alleghany Corp 30 0.01USD 2,760 Allstate Corp 194 0.08USD 554 American Financial Group Inc 46 0.02USD 7,278 American International Group Inc^ 289 0.12USD 1,348 Arthur J Gallagher & Co 67 0.03USD 471 Assurant Inc 33 0.01USD 9,935 Berkshire Hathaway Inc 1,430 0.62USD 634 Brighthouse Financial Inc 22 0.01USD 1,128 Cincinnati Financial Corp 59 0.03USD 2,773 Hartford Financial Services Group
Inc 109 0.05USD 1,753 Lincoln National Corp^ 87 0.04USD 2,236 Loews Corp 82 0.04USD 109 Markel Corp 90 0.04USD 4,105 Marsh & McLennan Cos Inc 248 0.11USD 6,971 MetLife Inc 241 0.10USD 2,478 Principal Financial Group Inc 104 0.04USD 4,780 Progressive Corp 223 0.10USD 3,362 Prudential Financial Inc 245 0.11USD 508 Reinsurance Group of America Inc 57 0.02USD 762 Torchmark Corp 49 0.02USD 2,145 Travelers Cos Inc 207 0.09USD 1,605 Unum Group 47 0.02USD 1,293 Voya Financial Inc 50 0.02USD 703 WR Berkley Corp 40 0.02
Internet USD 2,348 Alphabet Inc 1,941 0.84USD 2,477 Alphabet Inc Class 'C' 2,020 0.87
Ccy Holding Investment Fair value
£'000
% of net asset value
United States (30 November 2017: 55.33%) (cont) Internet (cont)
USD 3,204 Amazon.com Inc 3,924 1.69USD 386 Booking Holdings Inc 612 0.26USD 1,333 CDW Corp 80 0.03USD 7,902 eBay Inc 224 0.10USD 924 Expedia Group Inc 84 0.04USD 501 F5 Networks Inc 65 0.03USD 18,768 Facebook Inc 2,705 1.17USD 602 IAC/InterActiveCorp 70 0.03USD 326 MercadoLibre Inc^ 71 0.03USD 3,405 Netflix Inc 900 0.39USD 689 Palo Alto Networks Inc 108 0.05USD 4,837 Symantec Corp^ 76 0.03USD 955 TripAdvisor Inc 37 0.01USD 5,179 Twitter Inc 135 0.06USD 633 VeriSign Inc 62 0.03USD 761 Zillow Group Inc 33 0.01
Investment services USD 2,183 Jefferies Financial Group Inc 36 0.02
Iron & steel USD 2,400 Nucor Corp 116 0.05USD 1,799 Steel Dynamics Inc 67 0.03
Leisure time USD 1,302 Harley-Davidson Inc 40 0.02USD 451 Polaris Industries Inc^ 38 0.01
Machinery - diversified USD 528 AGCO Corp 25 0.01USD 1,408 Cognex Corp^ 48 0.02USD 1,175 Cummins Inc 126 0.05USD 2,181 Deere & Co^ 245 0.11USD 936 Flowserve Corp 29 0.01USD 567 IDEX Corp 59 0.03USD 476 Middleby Corp 36 0.01USD 1,003 Rockwell Automation Inc 132 0.06USD 832 Roper Technologies Inc 173 0.07USD 590 Wabtec Corp 43 0.02USD 1,300 Xylem Inc 69 0.03
Machinery, construction & mining USD 4,659 Caterpillar Inc 532 0.23
Marine transportation USD 407 Huntington Ingalls Industries Inc 68 0.03
Media USD 2,770 CBS Corp 105 0.04USD 1,464 Charter Communications Inc 287 0.12USD 36,050 Comcast Corp 845 0.36USD 979 Discovery Inc 15 0.01USD 2,380 Discovery Inc Class 'C' 35 0.02USD 1,536 DISH Network Corp 34 0.01USD 855 Liberty Broadband Corp 44 0.02USD 1,638 Liberty Media Corp-Liberty Formula
One 39 0.02USD 634 Liberty Media Corp-Liberty SiriusXM 22 0.01

iSHARES V PLC
Schedule of Investments (unaudited) (continued) iSHARES MSCI WORLD GBP HEDGED UCITS ETF (ACC) (continued) As at 31 May 2018
[ 2 2 2 ] i S H A R E S V P L C I N T E R I M R E P O R T
Ccy Holding Investment Fair value
£'000
% of net asset value
Equities (30 November 2017: 97.58%) (cont) United States (30 November 2017: 55.33%) (cont) Media (cont)
USD 1,348 Liberty Media Corp-Liberty SiriusXM Class 'C' 47 0.02
USD 2,727 News Corp 31 0.01USD 12,671 Sirius XM Holdings Inc^ 68 0.03USD 6,129 Time Warner Inc 434 0.19USD 8,104 Twenty-First Century Fox Inc^ 235 0.10USD 3,708 Twenty-First Century Fox Inc Class
'B' 106 0.05USD 2,489 Viacom Inc 51 0.02USD 11,696 Walt Disney Co 874 0.38
Mining USD 11,363 Freeport-McMoRan Inc 144 0.06USD 4,481 Newmont Mining Corp 131 0.06
Miscellaneous manufacturers USD 4,711 3M Co 698 0.30USD 1,079 AO Smith Corp^ 51 0.02USD 1,110 Dover Corp 64 0.03USD 68,316 General Electric Co 723 0.31USD 2,474 Illinois Tool Works Inc 267 0.12USD 1,025 Parker-Hannifin Corp^ 132 0.06USD 1,891 Textron Inc 95 0.04
Office & business equipment USD 1,579 Xerox Corp 32 0.01
Oil & gas USD 4,170 Anadarko Petroleum Corp 219 0.09USD 1,126 Andeavor 122 0.05USD 1,802 Antero Resources Corp 26 0.01USD 2,981 Apache Corp^ 90 0.04USD 3,350 Cabot Oil & Gas Corp 58 0.02USD 14,948 Chevron Corp 1,396 0.60USD 863 Cimarex Energy Co 60 0.03USD 1,238 Concho Resources Inc^ 128 0.06USD 9,118 ConocoPhillips 462 0.20USD 613 Continental Resources Inc 31 0.01USD 3,692 Devon Energy Corp 115 0.05USD 669 Diamondback Energy Inc 61 0.03USD 4,523 EOG Resources Inc^ 401 0.17USD 2,041 EQT Corp 79 0.03USD 33,349 Exxon Mobil Corp 2,036 0.88USD 820 Helmerich & Payne Inc^ 41 0.02USD 2,250 Hess Corp 102 0.04USD 1,145 HollyFrontier Corp^ 66 0.03USD 7,287 Marathon Oil Corp 117 0.05USD 3,945 Marathon Petroleum Corp^ 234 0.10USD 2,006 Newfield Exploration Co^ 44 0.02USD 3,623 Noble Energy Inc 97 0.04USD 5,990 Occidental Petroleum Corp 379 0.16USD 1,637 Parsley Energy Inc^ 36 0.02USD 3,332 Phillips 66 292 0.13USD 1,405 Pioneer Natural Resources Co 204 0.09
Ccy Holding Investment Fair value
£'000
% of net asset value
United States (30 November 2017: 55.33%) (cont) Oil & gas (cont)
USD 2,226 Range Resources Corp 27 0.01USD 3,463 Valero Energy Corp 315 0.14
Oil & gas services USD 3,188 Baker Hughes a GE Co 83 0.04USD 6,879 Halliburton Co 257 0.11USD 3,340 National Oilwell Varco Inc^ 104 0.04
Packaging & containers USD 2,670 Ball Corp 74 0.03USD 941 Crown Holdings Inc 31 0.01USD 659 Packaging Corp of America 58 0.02USD 1,300 Sealed Air Corp 43 0.02USD 1,856 WestRock Co^ 82 0.04
Pharmaceuticals USD 12,616 AbbVie Inc 938 0.40USD 1,167 AmerisourceBergen Corp 72 0.03USD 12,946 Bristol-Myers Squibb Co 512 0.22USD 2,613 Cardinal Health Inc 102 0.04USD 8,011 CVS Health Corp^ 382 0.16USD 7,810 Eli Lilly & Co 499 0.22USD 4,610 Express Scripts Holding Co 263 0.11USD 21,145 Johnson & Johnson 1,901 0.82USD 1,705 McKesson Corp 182 0.08USD 21,488 Merck & Co Inc 961 0.42USD 46,915 Pfizer Inc 1,267 0.55USD 279 TESARO Inc 9 0.00USD 3,962 Zoetis Inc 249 0.11
Pipelines USD 1,454 Cheniere Energy Inc 73 0.03USD 15,971 Kinder Morgan Inc 200 0.09USD 2,897 ONEOK Inc 148 0.06USD 826 Plains GP Holdings LP 15 0.01USD 1,601 Targa Resources Corp 59 0.02USD 6,843 Williams Cos Inc 138 0.06
Real estate investment & services USD 2,367 CBRE Group Inc 82 0.04USD 408 Jones Lang LaSalle Inc^ 50 0.02
Real estate investment trusts USD 3,700 AGNC Investment Corp 52 0.02USD 708 Alexandria Real Estate Equities Inc 67 0.03USD 3,369 American Tower Corp 350 0.15USD 9,763 Annaly Capital Management Inc 77 0.03USD 1,036 AvalonBay Communities Inc 129 0.06USD 1,126 Boston Properties Inc 103 0.04USD 3,160 Brixmor Property Group Inc 38 0.02USD 629 Camden Property Trust^ 42 0.02USD 3,597 Colony NorthStar Inc 16 0.01USD 3,311 Crown Castle International Corp 259 0.11USD 1,564 Digital Realty Trust Inc 126 0.06USD 2,461 Duke Realty Corp 52 0.02USD 635 Equinix Inc 189 0.08

iSHARES V PLC
Schedule of Investments (unaudited) (continued) iSHARES MSCI WORLD GBP HEDGED UCITS ETF (ACC) (continued) As at 31 May 2018
i S H A R E S V P L C I N T E R I M R E P O R T [ 2 2 3 ]
Ccy Holding Investment Fair value
£'000
% of net asset value
Equities (30 November 2017: 97.58%) (cont) United States (30 November 2017: 55.33%) (cont) Real estate investment trusts (cont)
USD 2,755 Equity Residential 133 0.06USD 574 Essex Property Trust Inc 103 0.05USD 914 Extra Space Storage Inc^ 66 0.03USD 551 Federal Realty Investment Trust^ 49 0.02USD 4,661 GGP Inc 71 0.03USD 3,467 HCP Inc 63 0.03USD 5,485 Host Hotels & Resorts Inc^ 89 0.04USD 2,532 Invitation Homes Inc 42 0.02USD 2,103 Iron Mountain Inc 53 0.02USD 2,921 Kimco Realty Corp 34 0.02USD 993 Liberty Property Trust 33 0.01USD 943 Macerich Co 39 0.02USD 1,035 Mid-America Apartment
Communities Inc 73 0.03USD 1,063 National Retail Properties Inc^ 33 0.01USD 4,268 Prologis Inc 206 0.09USD 1,185 Public Storage^ 189 0.08USD 2,301 Realty Income Corp^ 92 0.04USD 1,145 Regency Centers Corp 50 0.02USD 996 SBA Communications Corp 118 0.05USD 2,332 Simon Property Group Inc 281 0.12USD 756 SL Green Realty Corp 55 0.02USD 1,950 UDR Inc 53 0.02USD 2,956 Ventas Inc 121 0.05USD 6,862 VEREIT Inc 37 0.02USD 1,228 Vornado Realty Trust 64 0.03USD 2,701 Welltower Inc 117 0.05USD 5,755 Weyerhaeuser Co^ 162 0.07
Retail USD 693 Advance Auto Parts Inc 67 0.03USD 519 AutoNation Inc 18 0.01USD 215 AutoZone Inc 105 0.05USD 2,160 Best Buy Co Inc 111 0.05USD 1,431 CarMax Inc^ 74 0.03USD 218 Chipotle Mexican Grill Inc 70 0.03USD 3,457 Costco Wholesale Corp 515 0.22USD 1,108 Darden Restaurants Inc 73 0.03USD 2,254 Dollar General Corp 148 0.06USD 1,931 Dollar Tree Inc^ 120 0.05USD 332 Domino's Pizza Inc 63 0.03USD 1,818 Gap Inc^ 38 0.02USD 1,294 Genuine Parts Co^ 88 0.04USD 9,217 Home Depot Inc 1,292 0.56USD 1,343 Kohl's Corp^ 67 0.03USD 1,710 L Brands Inc 43 0.02USD 6,633 Lowe's Cos Inc 474 0.20USD 733 Lululemon Athletica Inc 58 0.02USD 2,215 Macy's Inc 58 0.02USD 6,217 McDonald's Corp 747 0.32USD 902 Nordstrom Inc 33 0.01
Ccy Holding Investment Fair value
£'000
% of net asset value
United States (30 November 2017: 55.33%) (cont) Retail (cont)
USD 655 O'Reilly Automotive Inc^ 133 0.06USD 3,222 Qurate Retail Inc 49 0.02USD 2,929 Ross Stores Inc 174 0.07USD 11,273 Starbucks Corp 480 0.21USD 2,061 Tapestry Inc 68 0.03USD 4,106 Target Corp 225 0.10USD 892 Tiffany & Co 88 0.04USD 5,117 TJX Cos Inc 347 0.15USD 979 Tractor Supply Co 55 0.02USD 447 Ulta Salon Cosmetics & Fragrance
Inc^ 83 0.04USD 6,504 Walgreens Boots Alliance Inc 305 0.13USD 11,781 Walmart Inc^ 731 0.32USD 2,464 Yum! Brands Inc 151 0.06
Savings & loans USD 3,854 New York Community Bancorp Inc 33 0.01USD 2,644 People's United Financial Inc 37 0.02
Semiconductors USD 5,447 Advanced Micro Devices Inc 56 0.03USD 2,838 Analog Devices Inc^ 207 0.09USD 8,531 Applied Materials Inc^ 326 0.14USD 3,207 Broadcom Inc 607 0.26USD 36,835 Intel Corp 1,528 0.66USD 307 IPG Photonics Corp 56 0.02USD 1,149 KLA-Tencor Corp 98 0.04USD 1,289 Lam Research Corp^ 192 0.08USD 2,421 Maxim Integrated Products Inc 107 0.05USD 1,863 Microchip Technology Inc^ 136 0.06USD 9,077 Micron Technology Inc 393 0.17USD 4,727 NVIDIA Corp 896 0.39USD 918 Qorvo Inc^ 55 0.02USD 11,528 Qualcomm Inc 504 0.22USD 1,526 Skyworks Solutions Inc 113 0.05USD 7,731 Texas Instruments Inc 650 0.28USD 1,865 Xilinx Inc 95 0.04
Software USD 5,541 Activision Blizzard Inc 295 0.13USD 3,849 Adobe Systems Inc 721 0.31USD 1,260 Akamai Technologies Inc^ 71 0.03USD 677 Ansys Inc 83 0.04USD 1,492 Autodesk Inc 145 0.06USD 850 Broadridge Financial Solutions Inc 74 0.03USD 2,384 CA Inc 64 0.03USD 2,512 Cadence Design Systems Inc 80 0.03USD 892 CDK Global Inc 43 0.02USD 2,186 Cerner Corp 98 0.04USD 1,166 Citrix Systems Inc 93 0.04USD 2,467 Electronic Arts Inc 243 0.10USD 2,697 Fidelity National Information Services
Inc 207 0.09USD 3,146 First Data Corp 45 0.02
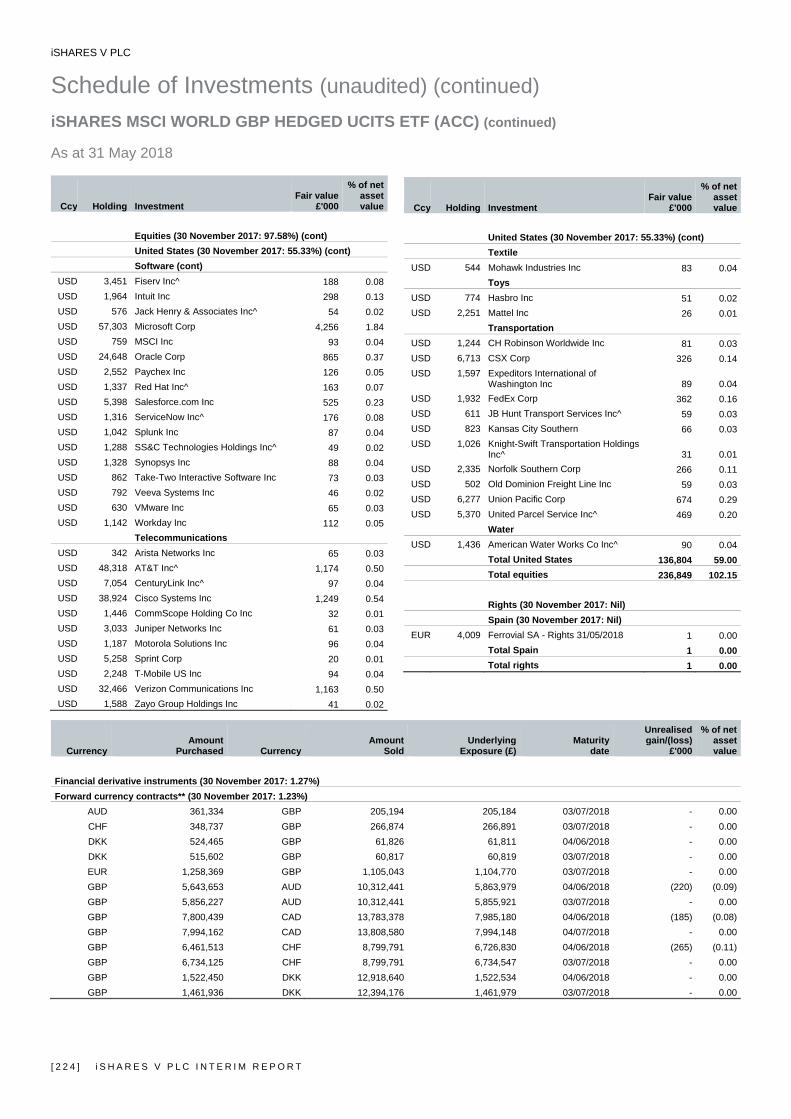
iSHARES V PLC
Schedule of Investments (unaudited) (continued) iSHARES MSCI WORLD GBP HEDGED UCITS ETF (ACC) (continued) As at 31 May 2018
[ 2 2 4 ] i S H A R E S V P L C I N T E R I M R E P O R T
Ccy Holding Investment Fair value
£'000
% of net asset value
Equities (30 November 2017: 97.58%) (cont) United States (30 November 2017: 55.33%) (cont) Software (cont)
USD 3,451 Fiserv Inc^ 188 0.08USD 1,964 Intuit Inc 298 0.13USD 576 Jack Henry & Associates Inc^ 54 0.02USD 57,303 Microsoft Corp 4,256 1.84USD 759 MSCI Inc 93 0.04USD 24,648 Oracle Corp 865 0.37USD 2,552 Paychex Inc 126 0.05USD 1,337 Red Hat Inc^ 163 0.07USD 5,398 Salesforce.com Inc 525 0.23USD 1,316 ServiceNow Inc^ 176 0.08USD 1,042 Splunk Inc 87 0.04USD 1,288 SS&C Technologies Holdings Inc^ 49 0.02USD 1,328 Synopsys Inc 88 0.04USD 862 Take-Two Interactive Software Inc 73 0.03USD 792 Veeva Systems Inc 46 0.02USD 630 VMware Inc 65 0.03USD 1,142 Workday Inc 112 0.05
Telecommunications USD 342 Arista Networks Inc 65 0.03USD 48,318 AT&T Inc^ 1,174 0.50USD 7,054 CenturyLink Inc^ 97 0.04USD 38,924 Cisco Systems Inc 1,249 0.54USD 1,446 CommScope Holding Co Inc 32 0.01USD 3,033 Juniper Networks Inc 61 0.03USD 1,187 Motorola Solutions Inc 96 0.04USD 5,258 Sprint Corp 20 0.01USD 2,248 T-Mobile US Inc 94 0.04USD 32,466 Verizon Communications Inc 1,163 0.50USD 1,588 Zayo Group Holdings Inc 41 0.02
Ccy Holding Investment Fair value
£'000
% of netassetvalue
United States (30 November 2017: 55.33%) (cont) Textile
USD 544 Mohawk Industries Inc 83 0.04Toys
USD 774 Hasbro Inc 51 0.02USD 2,251 Mattel Inc 26 0.01
Transportation USD 1,244 CH Robinson Worldwide Inc 81 0.03USD 6,713 CSX Corp 326 0.14USD 1,597 Expeditors International of
Washington Inc 89 0.04USD 1,932 FedEx Corp 362 0.16USD 611 JB Hunt Transport Services Inc^ 59 0.03USD 823 Kansas City Southern 66 0.03USD 1,026 Knight-Swift Transportation Holdings
Inc^ 31 0.01USD 2,335 Norfolk Southern Corp 266 0.11USD 502 Old Dominion Freight Line Inc 59 0.03USD 6,277 Union Pacific Corp 674 0.29USD 5,370 United Parcel Service Inc^ 469 0.20
Water USD 1,436 American Water Works Co Inc^ 90 0.04
Total United States 136,804 59.00Total equities 236,849 102.15
Rights (30 November 2017: Nil) Spain (30 November 2017: Nil)
EUR 4,009 Ferrovial SA - Rights 31/05/2018 1 0.00Total Spain 1 0.00Total rights 1 0.00
Currency Amount
Purchased Currency Amount
SoldUnderlying
Exposure (£)Maturity
date
Unrealisedgain/(loss)
£'000
% of netassetvalue
Financial derivative instruments (30 November 2017: 1.27%) Forward currency contracts** (30 November 2017: 1.23%)
AUD 361,334 GBP 205,194 205,184 03/07/2018 - 0.00CHF 348,737 GBP 266,874 266,891 03/07/2018 - 0.00DKK 524,465 GBP 61,826 61,811 04/06/2018 - 0.00DKK 515,602 GBP 60,817 60,819 03/07/2018 - 0.00EUR 1,258,369 GBP 1,105,043 1,104,770 03/07/2018 - 0.00GBP 5,643,653 AUD 10,312,441 5,863,979 04/06/2018 (220) (0.09)GBP 5,856,227 AUD 10,312,441 5,855,921 03/07/2018 - 0.00GBP 7,800,439 CAD 13,783,378 7,985,180 04/06/2018 (185) (0.08)GBP 7,994,162 CAD 13,808,580 7,994,148 04/07/2018 - 0.00GBP 6,461,513 CHF 8,799,791 6,726,830 04/06/2018 (265) (0.11)GBP 6,734,125 CHF 8,799,791 6,734,547 03/07/2018 - 0.00GBP 1,522,450 DKK 12,918,640 1,522,534 04/06/2018 - 0.00GBP 1,461,936 DKK 12,394,176 1,461,979 03/07/2018 - 0.00
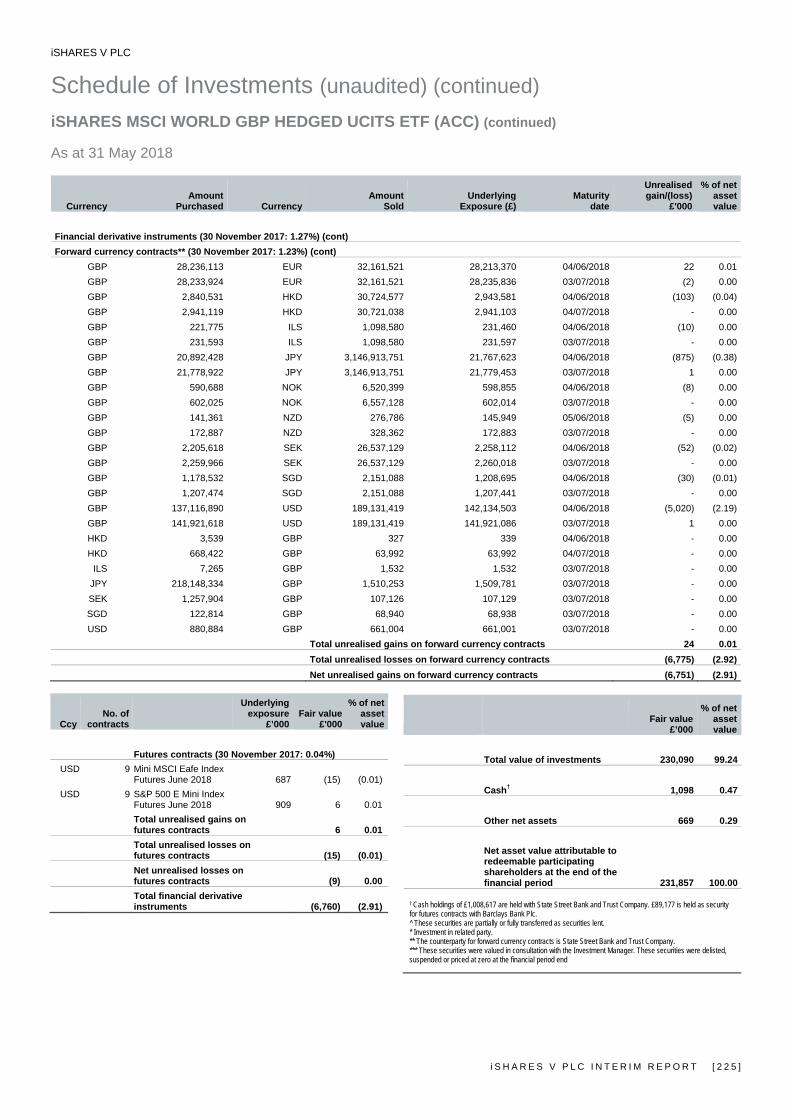
iSHARES V PLC
Schedule of Investments (unaudited) (continued) iSHARES MSCI WORLD GBP HEDGED UCITS ETF (ACC) (continued) As at 31 May 2018
i S H A R E S V P L C I N T E R I M R E P O R T [ 2 2 5 ]
Currency Amount
Purchased Currency Amount
SoldUnderlying
Exposure (£)Maturity
date
Unrealisedgain/(loss)
£'000
% of netassetvalue
Financial derivative instruments (30 November 2017: 1.27%) (cont) Forward currency contracts** (30 November 2017: 1.23%) (cont)
GBP 28,236,113 EUR 32,161,521 28,213,370 04/06/2018 22 0.01GBP 28,233,924 EUR 32,161,521 28,235,836 03/07/2018 (2) 0.00GBP 2,840,531 HKD 30,724,577 2,943,581 04/06/2018 (103) (0.04)GBP 2,941,119 HKD 30,721,038 2,941,103 04/07/2018 - 0.00GBP 221,775 ILS 1,098,580 231,460 04/06/2018 (10) 0.00GBP 231,593 ILS 1,098,580 231,597 03/07/2018 - 0.00GBP 20,892,428 JPY 3,146,913,751 21,767,623 04/06/2018 (875) (0.38)GBP 21,778,922 JPY 3,146,913,751 21,779,453 03/07/2018 1 0.00GBP 590,688 NOK 6,520,399 598,855 04/06/2018 (8) 0.00GBP 602,025 NOK 6,557,128 602,014 03/07/2018 - 0.00GBP 141,361 NZD 276,786 145,949 05/06/2018 (5) 0.00GBP 172,887 NZD 328,362 172,883 03/07/2018 - 0.00GBP 2,205,618 SEK 26,537,129 2,258,112 04/06/2018 (52) (0.02)GBP 2,259,966 SEK 26,537,129 2,260,018 03/07/2018 - 0.00GBP 1,178,532 SGD 2,151,088 1,208,695 04/06/2018 (30) (0.01)GBP 1,207,474 SGD 2,151,088 1,207,441 03/07/2018 - 0.00GBP 137,116,890 USD 189,131,419 142,134,503 04/06/2018 (5,020) (2.19)GBP 141,921,618 USD 189,131,419 141,921,086 03/07/2018 1 0.00HKD 3,539 GBP 327 339 04/06/2018 - 0.00HKD 668,422 GBP 63,992 63,992 04/07/2018 - 0.00
ILS 7,265 GBP 1,532 1,532 03/07/2018 - 0.00JPY 218,148,334 GBP 1,510,253 1,509,781 03/07/2018 - 0.00SEK 1,257,904 GBP 107,126 107,129 03/07/2018 - 0.00SGD 122,814 GBP 68,940 68,938 03/07/2018 - 0.00USD 880,884 GBP 661,004 661,001 03/07/2018 - 0.00
Total unrealised gains on forward currency contracts 24 0.01 Total unrealised losses on forward currency contracts (6,775) (2.92) Net unrealised gains on forward currency contracts (6,751) (2.91)
Ccy No. of
contracts
Underlying exposure
£’000 Fair value
£'000
% of net asset value
Futures contracts (30 November 2017: 0.04%)
USD 9 Mini MSCI Eafe Index Futures June 2018 687 (15) (0.01)
USD 9 S&P 500 E Mini Index Futures June 2018 909 6 0.01
Total unrealised gains on futures contracts 6 0.01
Total unrealised losses on futures contracts (15) (0.01)
Net unrealised losses on futures contracts (9) 0.00
Total financial derivative instruments (6,760) (2.91)
Fair value
£’000
% of net asset value
Total value of investments 230,090 99.24 Cash† 1,098 0.47 Other net assets 669 0.29 Net asset value attributable to redeemable participating shareholders at the end of the financial period 231,857 100.00
† Cash holdings of £1,008,617 are held with State Street Bank and Trust Company. £89,177 is held as security for futures contracts with Barclays Bank Plc. ^ These securities are partially or fully transferred as securities lent. * Investment in related party. ** The counterparty for forward currency contracts is State Street Bank and Trust Company. *** These securities were valued in consultation with the Investment Manager. These securities were delisted, suspended or priced at zero at the financial period end

iSHARES V PLC
Schedule of Investments (unaudited) (continued) iSHARES MSCI WORLD GBP HEDGED UCITS ETF (ACC) (continued) As at 31 May 2018
[ 2 2 6 ] i S H A R E S V P L C I N T E R I M R E P O R T
Equities are primarily classified by country of incorporation of the entity in which the Fund holds shares. Underlying exposure has been calculated according to the guidelines issued by the ESMA and represents the market value of an equivalent position in the assets underlying each financial derivative instrument.
Analysis of total current assets gross of all liabilities
Fair value£’000
% of totalcurrentassets
Transferable securities admitted to an official stock exchange listing or traded on a regulated market 236,850 99.20Exchange traded financial derivative instruments 6 0.00OTC financial derivative instruments 24 0.01Other assets 1,876 0.79Total current assets 238,756 100.00
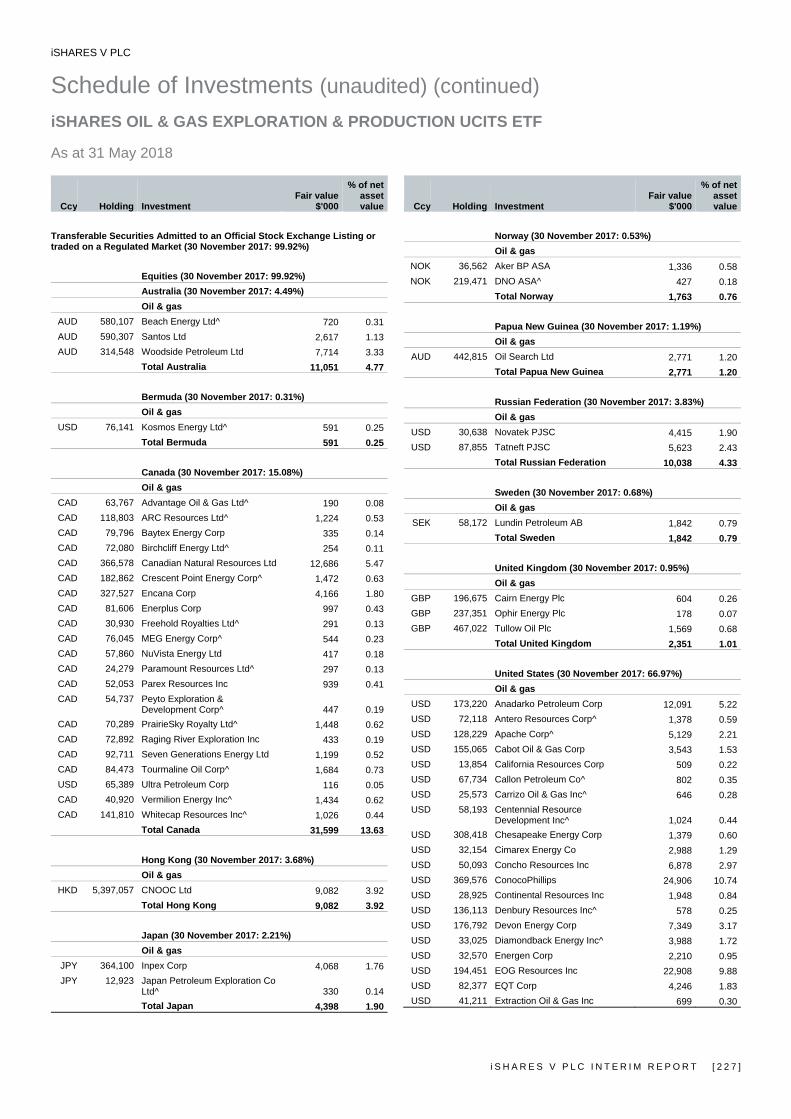
iSHARES V PLC
Schedule of Investments (unaudited) (continued) iSHARES OIL & GAS EXPLORATION & PRODUCTION UCITS ETF As at 31 May 2018
i S H A R E S V P L C I N T E R I M R E P O R T [ 2 2 7 ]
Ccy Holding Investment Fair value
$'000
% of net asset value
Transferable Securities Admitted to an Official Stock Exchange Listing or traded on a Regulated Market (30 November 2017: 99.92%)
Equities (30 November 2017: 99.92%) Australia (30 November 2017: 4.49%) Oil & gas
AUD 580,107 Beach Energy Ltd^ 720 0.31AUD 590,307 Santos Ltd 2,617 1.13AUD 314,548 Woodside Petroleum Ltd 7,714 3.33
Total Australia 11,051 4.77
Bermuda (30 November 2017: 0.31%) Oil & gas
USD 76,141 Kosmos Energy Ltd^ 591 0.25Total Bermuda 591 0.25
Canada (30 November 2017: 15.08%) Oil & gas
CAD 63,767 Advantage Oil & Gas Ltd^ 190 0.08CAD 118,803 ARC Resources Ltd^ 1,224 0.53CAD 79,796 Baytex Energy Corp 335 0.14CAD 72,080 Birchcliff Energy Ltd^ 254 0.11CAD 366,578 Canadian Natural Resources Ltd 12,686 5.47CAD 182,862 Crescent Point Energy Corp^ 1,472 0.63CAD 327,527 Encana Corp 4,166 1.80CAD 81,606 Enerplus Corp 997 0.43CAD 30,930 Freehold Royalties Ltd^ 291 0.13CAD 76,045 MEG Energy Corp^ 544 0.23CAD 57,860 NuVista Energy Ltd 417 0.18CAD 24,279 Paramount Resources Ltd^ 297 0.13CAD 52,053 Parex Resources Inc 939 0.41CAD 54,737 Peyto Exploration &
Development Corp^ 447 0.19CAD 70,289 PrairieSky Royalty Ltd^ 1,448 0.62CAD 72,892 Raging River Exploration Inc 433 0.19CAD 92,711 Seven Generations Energy Ltd 1,199 0.52CAD 84,473 Tourmaline Oil Corp^ 1,684 0.73USD 65,389 Ultra Petroleum Corp 116 0.05CAD 40,920 Vermilion Energy Inc^ 1,434 0.62CAD 141,810 Whitecap Resources Inc^ 1,026 0.44
Total Canada 31,599 13.63
Hong Kong (30 November 2017: 3.68%) Oil & gas
HKD 5,397,057 CNOOC Ltd 9,082 3.92Total Hong Kong 9,082 3.92
Japan (30 November 2017: 2.21%) Oil & gas
JPY 364,100 Inpex Corp 4,068 1.76JPY 12,923 Japan Petroleum Exploration Co
Ltd^ 330 0.14Total Japan 4,398 1.90
Ccy Holding Investment Fair value
$'000
% of net asset value
Norway (30 November 2017: 0.53%) Oil & gas
NOK 36,562 Aker BP ASA 1,336 0.58NOK 219,471 DNO ASA^ 427 0.18
Total Norway 1,763 0.76
Papua New Guinea (30 November 2017: 1.19%) Oil & gas
AUD 442,815 Oil Search Ltd 2,771 1.20Total Papua New Guinea 2,771 1.20
Russian Federation (30 November 2017: 3.83%) Oil & gas
USD 30,638 Novatek PJSC 4,415 1.90USD 87,855 Tatneft PJSC 5,623 2.43
Total Russian Federation 10,038 4.33
Sweden (30 November 2017: 0.68%) Oil & gas
SEK 58,172 Lundin Petroleum AB 1,842 0.79Total Sweden 1,842 0.79
United Kingdom (30 November 2017: 0.95%) Oil & gas
GBP 196,675 Cairn Energy Plc 604 0.26GBP 237,351 Ophir Energy Plc 178 0.07GBP 467,022 Tullow Oil Plc 1,569 0.68
Total United Kingdom 2,351 1.01
United States (30 November 2017: 66.97%) Oil & gas
USD 173,220 Anadarko Petroleum Corp 12,091 5.22USD 72,118 Antero Resources Corp^ 1,378 0.59USD 128,229 Apache Corp^ 5,129 2.21USD 155,065 Cabot Oil & Gas Corp 3,543 1.53USD 13,854 California Resources Corp 509 0.22USD 67,734 Callon Petroleum Co^ 802 0.35USD 25,573 Carrizo Oil & Gas Inc^ 646 0.28USD 58,193 Centennial Resource
Development Inc^ 1,024 0.44USD 308,418 Chesapeake Energy Corp 1,379 0.60USD 32,154 Cimarex Energy Co 2,988 1.29USD 50,093 Concho Resources Inc 6,878 2.97USD 369,576 ConocoPhillips 24,906 10.74USD 28,925 Continental Resources Inc 1,948 0.84USD 136,113 Denbury Resources Inc^ 578 0.25USD 176,792 Devon Energy Corp 7,349 3.17USD 33,025 Diamondback Energy Inc^ 3,988 1.72USD 32,570 Energen Corp 2,210 0.95USD 194,451 EOG Resources Inc 22,908 9.88USD 82,377 EQT Corp 4,246 1.83USD 41,211 Extraction Oil & Gas Inc 699 0.30

iSHARES V PLC
Schedule of Investments (unaudited) (continued) iSHARES OIL & GAS EXPLORATION & PRODUCTION UCITS ETF (continued) As at 31 May 2018
[ 2 2 8 ] i S H A R E S V P L C I N T E R I M R E P O R T
Ccy Holding Investment Fair value
$'000
% of net asset value
Equities (30 November 2017: 99.92%) (cont) United States (30 November 2017: 66.97%) (cont) Oil & gas (cont)
CAD 130,091 Gran Tierra Energy Inc 423 0.18USD 54,775 Gulfport Energy Corp^ 609 0.26USD 52,708 Halcon Resources Corp^ 255 0.11USD 90,042 Hess Corp 5,440 2.35USD 45,021 Laredo Petroleum Inc 418 0.18USD 285,697 Marathon Oil Corp 6,122 2.64USD 34,760 Matador Resources Co^ 976 0.42USD 54,356 Murphy Oil Corp^ 1,671 0.72USD 66,916 Newfield Exploration Co 1,957 0.84USD 165,456 Noble Energy Inc 5,907 2.55USD 89,677 Oasis Petroleum Inc^ 1,168 0.50USD 84,055 Parsley Energy Inc 2,478 1.07USD 22,149 PDC Energy Inc^ 1,340 0.58USD 57,231 Pioneer Natural Resources Co 11,051 4.77USD 80,718 QEP Resources Inc 976 0.42USD 75,950 Range Resources Corp^ 1,203 0.52USD 41,987 RSP Permian Inc 1,837 0.79USD 34,670 SM Energy Co^ 908 0.39USD 171,666 Southwestern Energy Co^ 812 0.35USD 82,139 SRC Energy Inc 1,063 0.46USD 30,521 Whiting Petroleum Corp^ 1,600 0.69USD 133,429 WPX Energy Inc^ 2,430 1.05
Total United States 155,843 67.22Total equities 231,329 99.78
Ccy No. of
contracts
Underlying exposure
$’000 Fair value
$’000
% of net asset value
Financial derivative instruments
(30 November 2017: 0.00%) Futures contracts (30 November 2017: 0.00%)
USD 6 XAE Energy Futures June 2018 423 34 0.02
Total unrealised gains on futures contracts 34 0.02
Total financial derivative instruments 34 0.02
Fair value
$'000
% of net asset value
Total value of investments 231,363 99.80 Cash† 6,262 2.70 Other net liabilities (5,798) (2.50) Net asset value attributable to redeemable participating shareholders at the end of the financial period 231,827 100.00
† Cash holdings of $6,266,507 are held with State Street Bank and Trust Company. ($4,660) is due as security for futures contracts with Barclays Bank Plc. ^ These securities are partially or fully transferred as securities lent.
Equities are primarily classified by country of incorporation of the entity in which the Fund holds shares. Underlying exposure has been calculated according to the guidelines issued by the ESMA and represents the market value of an equivalent position in the assets underlying each financial derivative instrument.
Analysis of total current assets gross of all liabilities
Fair value$’000
% of totalcurrentassets
Transferable securities admitted to an official stock exchange listing or traded on a regulated market 231,329 96.45Exchange traded financial derivative instruments 34 0.01Other assets 8,500 3.54Total current assets 239,863 100.00
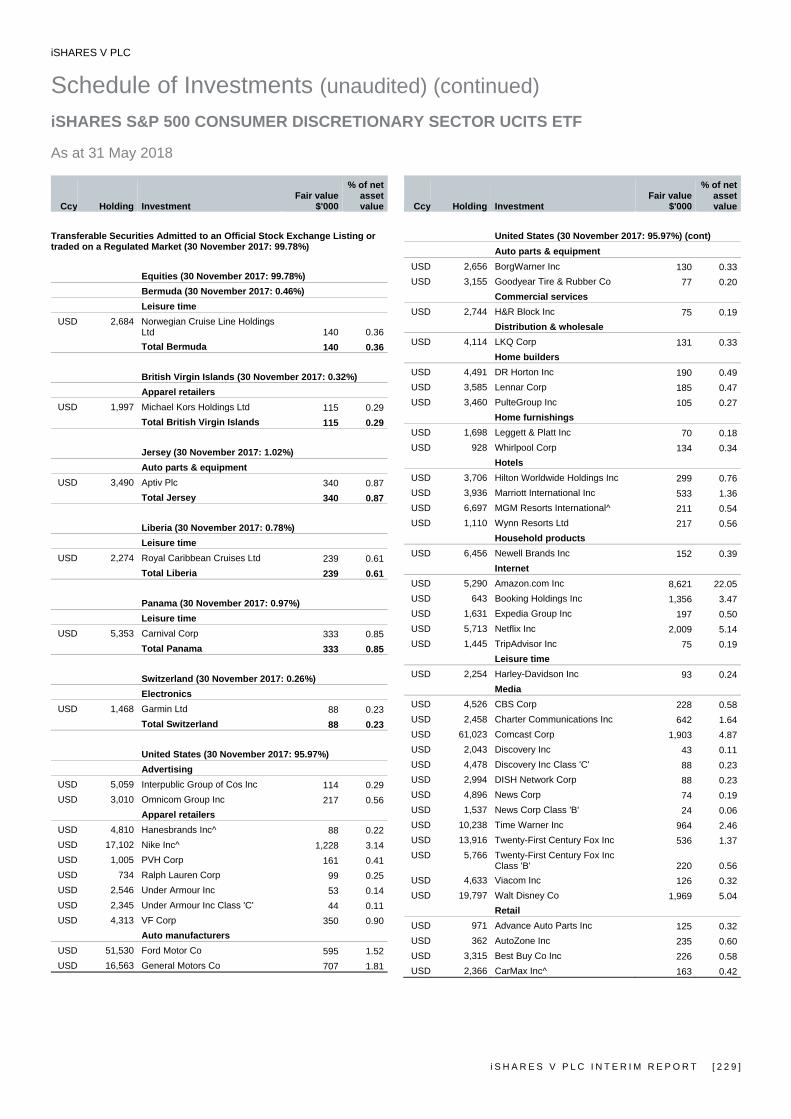
iSHARES V PLC
Schedule of Investments (unaudited) (continued) iSHARES S&P 500 CONSUMER DISCRETIONARY SECTOR UCITS ETF As at 31 May 2018
i S H A R E S V P L C I N T E R I M R E P O R T [ 2 2 9 ]
Ccy Holding Investment Fair value
$'000
% of net asset value
Transferable Securities Admitted to an Official Stock Exchange Listing or traded on a Regulated Market (30 November 2017: 99.78%)
Equities (30 November 2017: 99.78%) Bermuda (30 November 2017: 0.46%) Leisure time
USD 2,684 Norwegian Cruise Line Holdings Ltd 140 0.36Total Bermuda 140 0.36
British Virgin Islands (30 November 2017: 0.32%) Apparel retailers
USD 1,997 Michael Kors Holdings Ltd 115 0.29Total British Virgin Islands 115 0.29
Jersey (30 November 2017: 1.02%) Auto parts & equipment
USD 3,490 Aptiv Plc 340 0.87Total Jersey 340 0.87
Liberia (30 November 2017: 0.78%) Leisure time
USD 2,274 Royal Caribbean Cruises Ltd 239 0.61Total Liberia 239 0.61
Panama (30 November 2017: 0.97%) Leisure time
USD 5,353 Carnival Corp 333 0.85Total Panama 333 0.85
Switzerland (30 November 2017: 0.26%) Electronics
USD 1,468 Garmin Ltd 88 0.23Total Switzerland 88 0.23
United States (30 November 2017: 95.97%) Advertising
USD 5,059 Interpublic Group of Cos Inc 114 0.29USD 3,010 Omnicom Group Inc 217 0.56
Apparel retailers USD 4,810 Hanesbrands Inc^ 88 0.22USD 17,102 Nike Inc^ 1,228 3.14USD 1,005 PVH Corp 161 0.41USD 734 Ralph Lauren Corp 99 0.25USD 2,546 Under Armour Inc 53 0.14USD 2,345 Under Armour Inc Class 'C' 44 0.11USD 4,313 VF Corp 350 0.90
Auto manufacturers USD 51,530 Ford Motor Co 595 1.52USD 16,563 General Motors Co 707 1.81
Ccy Holding Investment Fair value
$'000
% of net asset value
United States (30 November 2017: 95.97%) (cont) Auto parts & equipment
USD 2,656 BorgWarner Inc 130 0.33USD 3,155 Goodyear Tire & Rubber Co 77 0.20
Commercial services USD 2,744 H&R Block Inc 75 0.19
Distribution & wholesale USD 4,114 LKQ Corp 131 0.33
Home builders USD 4,491 DR Horton Inc 190 0.49USD 3,585 Lennar Corp 185 0.47USD 3,460 PulteGroup Inc 105 0.27
Home furnishings USD 1,698 Leggett & Platt Inc 70 0.18USD 928 Whirlpool Corp 134 0.34
Hotels USD 3,706 Hilton Worldwide Holdings Inc 299 0.76USD 3,936 Marriott International Inc 533 1.36USD 6,697 MGM Resorts International^ 211 0.54USD 1,110 Wynn Resorts Ltd 217 0.56
Household products USD 6,456 Newell Brands Inc 152 0.39
Internet USD 5,290 Amazon.com Inc 8,621 22.05USD 643 Booking Holdings Inc 1,356 3.47USD 1,631 Expedia Group Inc 197 0.50USD 5,713 Netflix Inc 2,009 5.14USD 1,445 TripAdvisor Inc 75 0.19
Leisure time USD 2,254 Harley-Davidson Inc 93 0.24
Media USD 4,526 CBS Corp 228 0.58USD 2,458 Charter Communications Inc 642 1.64USD 61,023 Comcast Corp 1,903 4.87USD 2,043 Discovery Inc 43 0.11USD 4,478 Discovery Inc Class 'C' 88 0.23USD 2,994 DISH Network Corp 88 0.23USD 4,896 News Corp 74 0.19USD 1,537 News Corp Class 'B' 24 0.06USD 10,238 Time Warner Inc 964 2.46USD 13,916 Twenty-First Century Fox Inc 536 1.37USD 5,766 Twenty-First Century Fox Inc
Class 'B' 220 0.56USD 4,633 Viacom Inc 126 0.32USD 19,797 Walt Disney Co 1,969 5.04
Retail USD 971 Advance Auto Parts Inc 125 0.32USD 362 AutoZone Inc 235 0.60USD 3,315 Best Buy Co Inc 226 0.58USD 2,366 CarMax Inc^ 163 0.42
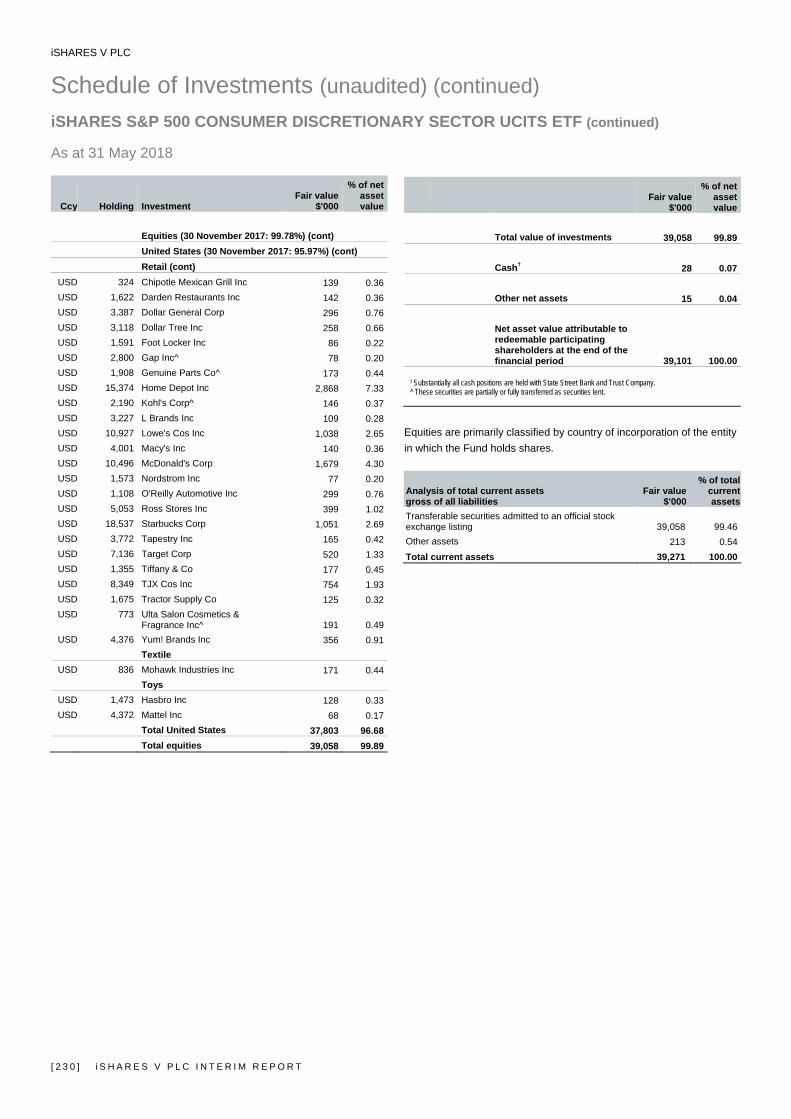
iSHARES V PLC
Schedule of Investments (unaudited) (continued) iSHARES S&P 500 CONSUMER DISCRETIONARY SECTOR UCITS ETF (continued) As at 31 May 2018
[ 2 3 0 ] i S H A R E S V P L C I N T E R I M R E P O R T
Ccy Holding Investment Fair value
$'000
% of net asset value
Equities (30 November 2017: 99.78%) (cont) United States (30 November 2017: 95.97%) (cont) Retail (cont)
USD 324 Chipotle Mexican Grill Inc 139 0.36USD 1,622 Darden Restaurants Inc 142 0.36USD 3,387 Dollar General Corp 296 0.76USD 3,118 Dollar Tree Inc 258 0.66USD 1,591 Foot Locker Inc 86 0.22USD 2,800 Gap Inc^ 78 0.20USD 1,908 Genuine Parts Co^ 173 0.44USD 15,374 Home Depot Inc 2,868 7.33USD 2,190 Kohl's Corp^ 146 0.37USD 3,227 L Brands Inc 109 0.28USD 10,927 Lowe's Cos Inc 1,038 2.65USD 4,001 Macy's Inc 140 0.36USD 10,496 McDonald's Corp 1,679 4.30USD 1,573 Nordstrom Inc 77 0.20USD 1,108 O'Reilly Automotive Inc 299 0.76USD 5,053 Ross Stores Inc 399 1.02USD 18,537 Starbucks Corp 1,051 2.69USD 3,772 Tapestry Inc 165 0.42USD 7,136 Target Corp 520 1.33USD 1,355 Tiffany & Co 177 0.45USD 8,349 TJX Cos Inc 754 1.93USD 1,675 Tractor Supply Co 125 0.32USD 773 Ulta Salon Cosmetics &
Fragrance Inc^ 191 0.49USD 4,376 Yum! Brands Inc 356 0.91
Textile USD 836 Mohawk Industries Inc 171 0.44
Toys USD 1,473 Hasbro Inc 128 0.33USD 4,372 Mattel Inc 68 0.17
Total United States 37,803 96.68Total equities 39,058 99.89
Fair value
$'000
% of net asset value
Total value of investments 39,058 99.89 Cash† 28 0.07 Other net assets 15 0.04 Net asset value attributable to redeemable participating shareholders at the end of the financial period 39,101 100.00
† Substantially all cash positions are held with State Street Bank and Trust Company. ^ These securities are partially or fully transferred as securities lent.
Equities are primarily classified by country of incorporation of the entity in which the Fund holds shares.
Analysis of total current assets gross of all liabilities
Fair value$'000
% of total current assets
Transferable securities admitted to an official stock exchange listing 39,058 99.46Other assets 213 0.54Total current assets 39,271 100.00
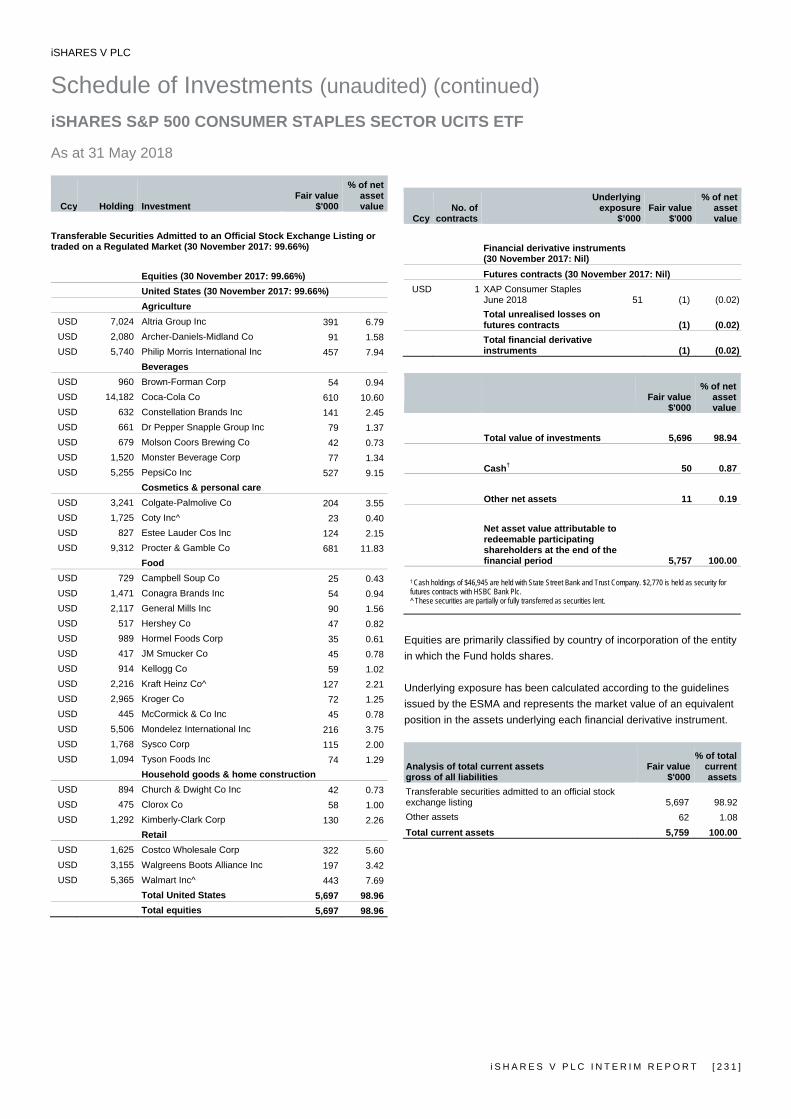
iSHARES V PLC
Schedule of Investments (unaudited) (continued) iSHARES S&P 500 CONSUMER STAPLES SECTOR UCITS ETF As at 31 May 2018
i S H A R E S V P L C I N T E R I M R E P O R T [ 2 3 1 ]
Ccy Holding Investment Fair value
$'000
% of net asset value
Transferable Securities Admitted to an Official Stock Exchange Listing or traded on a Regulated Market (30 November 2017: 99.66%)
Equities (30 November 2017: 99.66%) United States (30 November 2017: 99.66%) Agriculture
USD 7,024 Altria Group Inc 391 6.79USD 2,080 Archer-Daniels-Midland Co 91 1.58USD 5,740 Philip Morris International Inc 457 7.94
Beverages USD 960 Brown-Forman Corp 54 0.94USD 14,182 Coca-Cola Co 610 10.60USD 632 Constellation Brands Inc 141 2.45USD 661 Dr Pepper Snapple Group Inc 79 1.37USD 679 Molson Coors Brewing Co 42 0.73USD 1,520 Monster Beverage Corp 77 1.34USD 5,255 PepsiCo Inc 527 9.15
Cosmetics & personal care USD 3,241 Colgate-Palmolive Co 204 3.55USD 1,725 Coty Inc^ 23 0.40USD 827 Estee Lauder Cos Inc 124 2.15USD 9,312 Procter & Gamble Co 681 11.83
Food USD 729 Campbell Soup Co 25 0.43USD 1,471 Conagra Brands Inc 54 0.94USD 2,117 General Mills Inc 90 1.56USD 517 Hershey Co 47 0.82USD 989 Hormel Foods Corp 35 0.61USD 417 JM Smucker Co 45 0.78USD 914 Kellogg Co 59 1.02USD 2,216 Kraft Heinz Co^ 127 2.21USD 2,965 Kroger Co 72 1.25USD 445 McCormick & Co Inc 45 0.78USD 5,506 Mondelez International Inc 216 3.75USD 1,768 Sysco Corp 115 2.00USD 1,094 Tyson Foods Inc 74 1.29
Household goods & home construction USD 894 Church & Dwight Co Inc 42 0.73USD 475 Clorox Co 58 1.00USD 1,292 Kimberly-Clark Corp 130 2.26
Retail USD 1,625 Costco Wholesale Corp 322 5.60USD 3,155 Walgreens Boots Alliance Inc 197 3.42USD 5,365 Walmart Inc^ 443 7.69
Total United States 5,697 98.96Total equities 5,697 98.96
CcyNo. of
contracts
Underlying exposure
$’000 Fair value
$'000
% of net asset value
Financial derivative instruments (30 November 2017: Nil) Futures contracts (30 November 2017: Nil)
USD 1 XAP Consumer Staples June 2018 51 (1) (0.02)Total unrealised losses on futures contracts (1) (0.02)Total financial derivative instruments (1) (0.02)
Fair value
$'000
% of net asset value
Total value of investments 5,696 98.94 Cash† 50 0.87 Other net assets 11 0.19 Net asset value attributable to redeemable participating shareholders at the end of the financial period 5,757 100.00
† Cash holdings of $46,945 are held with State Street Bank and Trust Company. $2,770 is held as security for futures contracts with HSBC Bank Plc. ^ These securities are partially or fully transferred as securities lent.
Equities are primarily classified by country of incorporation of the entity in which the Fund holds shares. Underlying exposure has been calculated according to the guidelines issued by the ESMA and represents the market value of an equivalent position in the assets underlying each financial derivative instrument.
Analysis of total current assets gross of all liabilities
Fair value$'000
% of total current assets
Transferable securities admitted to an official stock exchange listing 5,697 98.92Other assets 62 1.08Total current assets 5,759 100.00
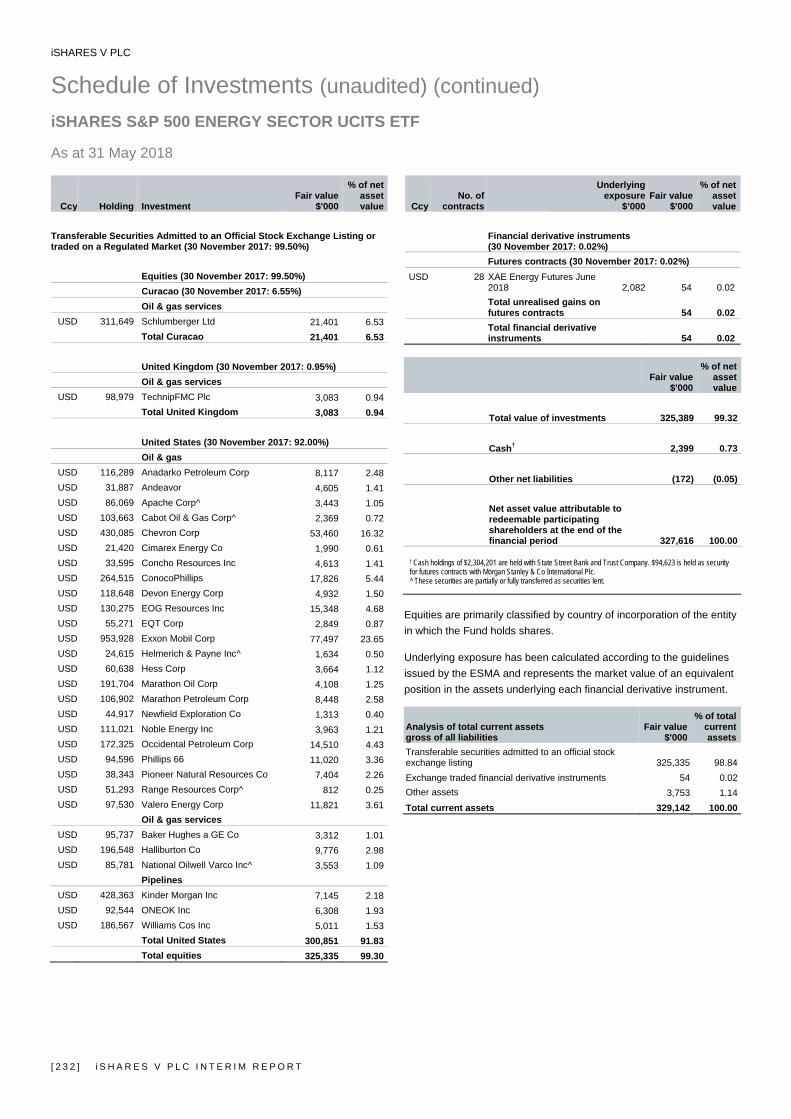
iSHARES V PLC
Schedule of Investments (unaudited) (continued) iSHARES S&P 500 ENERGY SECTOR UCITS ETF As at 31 May 2018
[ 2 3 2 ] i S H A R E S V P L C I N T E R I M R E P O R T
Ccy Holding Investment Fair value
$'000
% of net asset value
Transferable Securities Admitted to an Official Stock Exchange Listing or traded on a Regulated Market (30 November 2017: 99.50%)
Equities (30 November 2017: 99.50%) Curacao (30 November 2017: 6.55%) Oil & gas services
USD 311,649 Schlumberger Ltd 21,401 6.53Total Curacao 21,401 6.53
United Kingdom (30 November 2017: 0.95%) Oil & gas services
USD 98,979 TechnipFMC Plc 3,083 0.94Total United Kingdom 3,083 0.94
United States (30 November 2017: 92.00%) Oil & gas
USD 116,289 Anadarko Petroleum Corp 8,117 2.48USD 31,887 Andeavor 4,605 1.41USD 86,069 Apache Corp^ 3,443 1.05USD 103,663 Cabot Oil & Gas Corp^ 2,369 0.72USD 430,085 Chevron Corp 53,460 16.32USD 21,420 Cimarex Energy Co 1,990 0.61USD 33,595 Concho Resources Inc 4,613 1.41USD 264,515 ConocoPhillips 17,826 5.44USD 118,648 Devon Energy Corp 4,932 1.50USD 130,275 EOG Resources Inc 15,348 4.68USD 55,271 EQT Corp 2,849 0.87USD 953,928 Exxon Mobil Corp 77,497 23.65USD 24,615 Helmerich & Payne Inc^ 1,634 0.50USD 60,638 Hess Corp 3,664 1.12USD 191,704 Marathon Oil Corp 4,108 1.25USD 106,902 Marathon Petroleum Corp 8,448 2.58USD 44,917 Newfield Exploration Co 1,313 0.40USD 111,021 Noble Energy Inc 3,963 1.21USD 172,325 Occidental Petroleum Corp 14,510 4.43USD 94,596 Phillips 66 11,020 3.36USD 38,343 Pioneer Natural Resources Co 7,404 2.26USD 51,293 Range Resources Corp^ 812 0.25USD 97,530 Valero Energy Corp 11,821 3.61
Oil & gas services USD 95,737 Baker Hughes a GE Co 3,312 1.01USD 196,548 Halliburton Co 9,776 2.98USD 85,781 National Oilwell Varco Inc^ 3,553 1.09
Pipelines USD 428,363 Kinder Morgan Inc 7,145 2.18USD 92,544 ONEOK Inc 6,308 1.93USD 186,567 Williams Cos Inc 5,011 1.53
Total United States 300,851 91.83Total equities 325,335 99.30
CcyNo. of
contracts
Underlying exposure
$’000 Fair value
$'000
% of net asset
value Financial derivative instruments (30 November 2017: 0.02%) Futures contracts (30 November 2017: 0.02%)
USD 28 XAE Energy Futures June 2018 2,082 54 0.02 Total unrealised gains on futures contracts 54 0.02 Total financial derivative instruments 54 0.02
Fair value
$'000
% of net asset value
Total value of investments 325,389 99.32 Cash† 2,399 0.73 Other net liabilities (172) (0.05) Net asset value attributable to redeemable participating shareholders at the end of the financial period 327,616 100.00
† Cash holdings of $2,304,201 are held with State Street Bank and Trust Company. $94,623 is held as security for futures contracts with Morgan Stanley & Co International Plc. ^ These securities are partially or fully transferred as securities lent.
Equities are primarily classified by country of incorporation of the entity in which the Fund holds shares. Underlying exposure has been calculated according to the guidelines issued by the ESMA and represents the market value of an equivalent position in the assets underlying each financial derivative instrument.
Analysis of total current assets gross of all liabilities
Fair value$'000
% of total current assets
Transferable securities admitted to an official stock exchange listing 325,335 98.84Exchange traded financial derivative instruments 54 0.02Other assets 3,753 1.14Total current assets 329,142 100.00
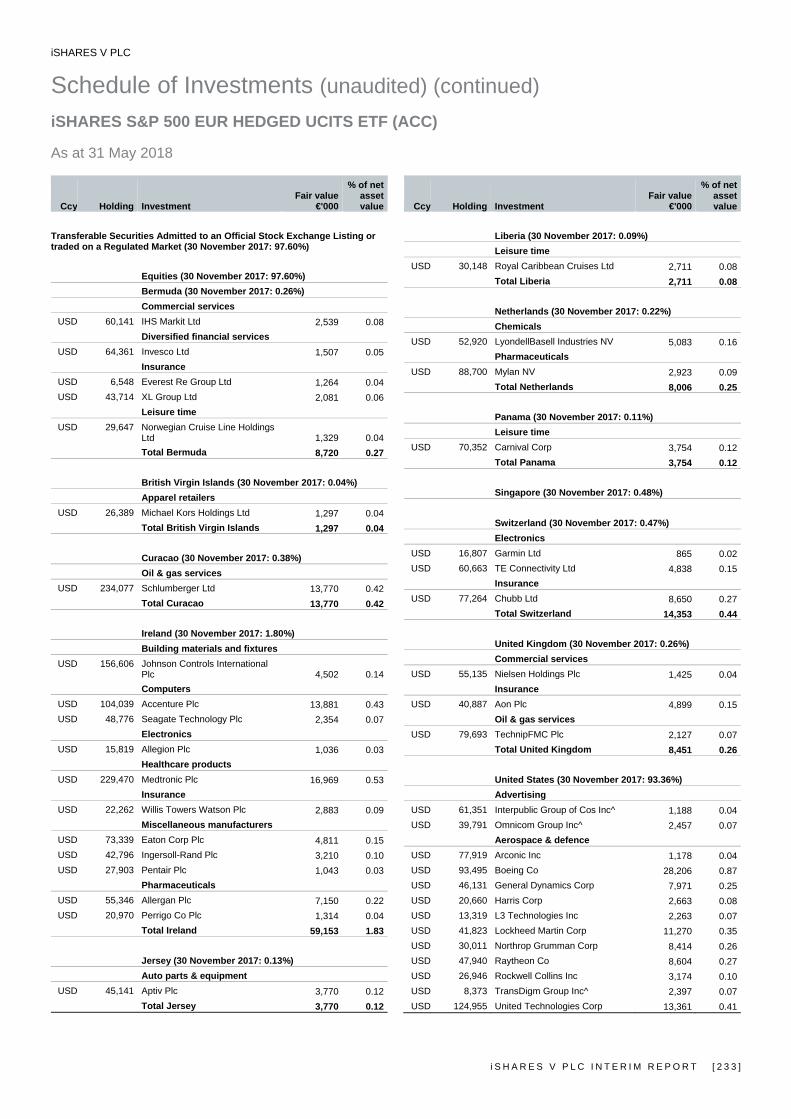
iSHARES V PLC
Schedule of Investments (unaudited) (continued) iSHARES S&P 500 EUR HEDGED UCITS ETF (ACC) As at 31 May 2018
i S H A R E S V P L C I N T E R I M R E P O R T [ 2 3 3 ]
Ccy Holding Investment Fair value
€'000
% of net asset value
Transferable Securities Admitted to an Official Stock Exchange Listing or traded on a Regulated Market (30 November 2017: 97.60%)
Equities (30 November 2017: 97.60%) Bermuda (30 November 2017: 0.26%) Commercial services
USD 60,141 IHS Markit Ltd 2,539 0.08Diversified financial services
USD 64,361 Invesco Ltd 1,507 0.05Insurance
USD 6,548 Everest Re Group Ltd 1,264 0.04USD 43,714 XL Group Ltd 2,081 0.06
Leisure time USD 29,647 Norwegian Cruise Line Holdings
Ltd 1,329 0.04Total Bermuda 8,720 0.27
British Virgin Islands (30 November 2017: 0.04%) Apparel retailers
USD 26,389 Michael Kors Holdings Ltd 1,297 0.04Total British Virgin Islands 1,297 0.04
Curacao (30 November 2017: 0.38%) Oil & gas services
USD 234,077 Schlumberger Ltd 13,770 0.42Total Curacao 13,770 0.42
Ireland (30 November 2017: 1.80%) Building materials and fixtures
USD 156,606 Johnson Controls International Plc 4,502 0.14Computers
USD 104,039 Accenture Plc 13,881 0.43USD 48,776 Seagate Technology Plc 2,354 0.07
Electronics USD 15,819 Allegion Plc 1,036 0.03
Healthcare products USD 229,470 Medtronic Plc 16,969 0.53
Insurance USD 22,262 Willis Towers Watson Plc 2,883 0.09
Miscellaneous manufacturers USD 73,339 Eaton Corp Plc 4,811 0.15USD 42,796 Ingersoll-Rand Plc 3,210 0.10USD 27,903 Pentair Plc 1,043 0.03
Pharmaceuticals USD 55,346 Allergan Plc 7,150 0.22USD 20,970 Perrigo Co Plc 1,314 0.04
Total Ireland 59,153 1.83
Jersey (30 November 2017: 0.13%) Auto parts & equipment
USD 45,141 Aptiv Plc 3,770 0.12Total Jersey 3,770 0.12
Ccy Holding Investment Fair value
€'000
% of net asset value
Liberia (30 November 2017: 0.09%) Leisure time
USD 30,148 Royal Caribbean Cruises Ltd 2,711 0.08Total Liberia 2,711 0.08
Netherlands (30 November 2017: 0.22%) Chemicals
USD 52,920 LyondellBasell Industries NV 5,083 0.16Pharmaceuticals
USD 88,700 Mylan NV 2,923 0.09Total Netherlands 8,006 0.25
Panama (30 November 2017: 0.11%) Leisure time
USD 70,352 Carnival Corp 3,754 0.12Total Panama 3,754 0.12
Singapore (30 November 2017: 0.48%) Switzerland (30 November 2017: 0.47%) Electronics
USD 16,807 Garmin Ltd 865 0.02USD 60,663 TE Connectivity Ltd 4,838 0.15
Insurance USD 77,264 Chubb Ltd 8,650 0.27
Total Switzerland 14,353 0.44
United Kingdom (30 November 2017: 0.26%) Commercial services
USD 55,135 Nielsen Holdings Plc 1,425 0.04Insurance
USD 40,887 Aon Plc 4,899 0.15Oil & gas services
USD 79,693 TechnipFMC Plc 2,127 0.07Total United Kingdom 8,451 0.26
United States (30 November 2017: 93.36%) Advertising
USD 61,351 Interpublic Group of Cos Inc^ 1,188 0.04USD 39,791 Omnicom Group Inc^ 2,457 0.07
Aerospace & defence USD 77,919 Arconic Inc 1,178 0.04USD 93,495 Boeing Co 28,206 0.87USD 46,131 General Dynamics Corp 7,971 0.25USD 20,660 Harris Corp 2,663 0.08USD 13,319 L3 Technologies Inc 2,263 0.07USD 41,823 Lockheed Martin Corp 11,270 0.35USD 30,011 Northrop Grumman Corp 8,414 0.26USD 47,940 Raytheon Co 8,604 0.27USD 26,946 Rockwell Collins Inc 3,174 0.10USD 8,373 TransDigm Group Inc^ 2,397 0.07USD 124,955 United Technologies Corp 13,361 0.41
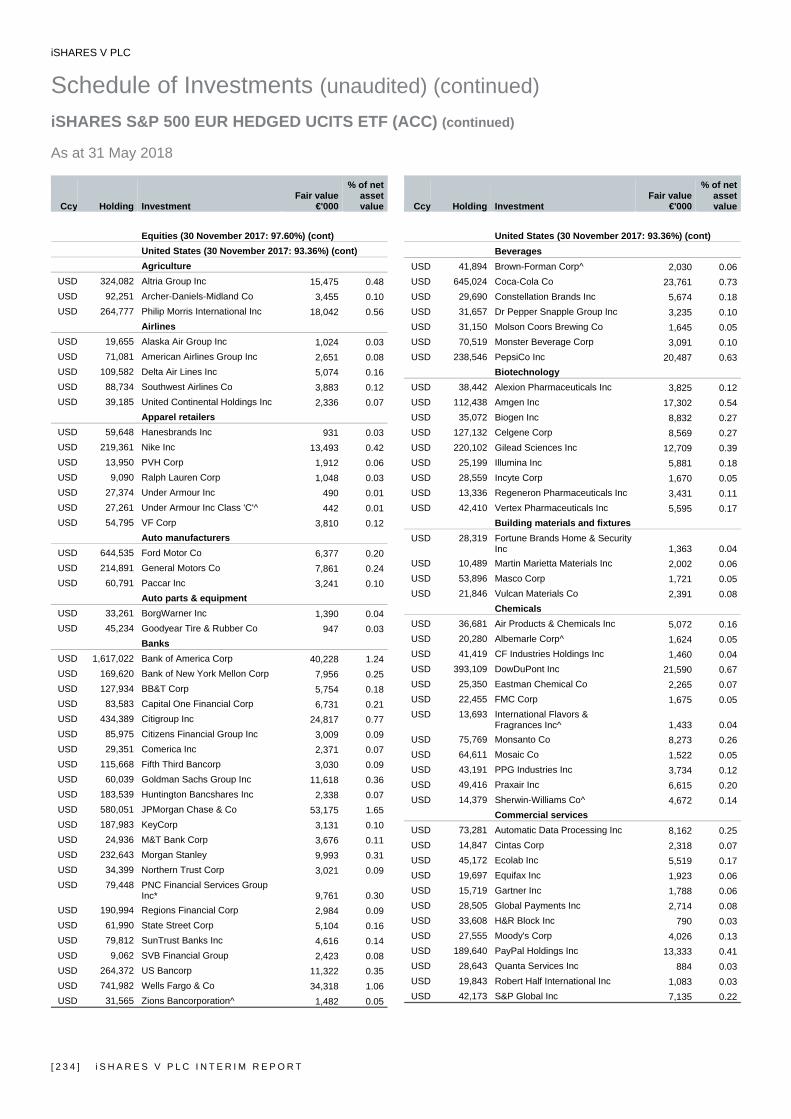
iSHARES V PLC
Schedule of Investments (unaudited) (continued) iSHARES S&P 500 EUR HEDGED UCITS ETF (ACC) (continued) As at 31 May 2018
[ 2 3 4 ] i S H A R E S V P L C I N T E R I M R E P O R T
Ccy Holding Investment Fair value
€'000
% of net asset value
Equities (30 November 2017: 97.60%) (cont) United States (30 November 2017: 93.36%) (cont) Agriculture
USD 324,082 Altria Group Inc 15,475 0.48USD 92,251 Archer-Daniels-Midland Co 3,455 0.10USD 264,777 Philip Morris International Inc 18,042 0.56
Airlines USD 19,655 Alaska Air Group Inc 1,024 0.03USD 71,081 American Airlines Group Inc 2,651 0.08USD 109,582 Delta Air Lines Inc 5,074 0.16USD 88,734 Southwest Airlines Co 3,883 0.12USD 39,185 United Continental Holdings Inc 2,336 0.07
Apparel retailers USD 59,648 Hanesbrands Inc 931 0.03USD 219,361 Nike Inc 13,493 0.42USD 13,950 PVH Corp 1,912 0.06USD 9,090 Ralph Lauren Corp 1,048 0.03USD 27,374 Under Armour Inc 490 0.01USD 27,261 Under Armour Inc Class 'C'^ 442 0.01USD 54,795 VF Corp 3,810 0.12
Auto manufacturers USD 644,535 Ford Motor Co 6,377 0.20USD 214,891 General Motors Co 7,861 0.24USD 60,791 Paccar Inc 3,241 0.10
Auto parts & equipment USD 33,261 BorgWarner Inc 1,390 0.04USD 45,234 Goodyear Tire & Rubber Co 947 0.03
Banks USD 1,617,022 Bank of America Corp 40,228 1.24USD 169,620 Bank of New York Mellon Corp 7,956 0.25USD 127,934 BB&T Corp 5,754 0.18USD 83,583 Capital One Financial Corp 6,731 0.21USD 434,389 Citigroup Inc 24,817 0.77USD 85,975 Citizens Financial Group Inc 3,009 0.09USD 29,351 Comerica Inc 2,371 0.07USD 115,668 Fifth Third Bancorp 3,030 0.09USD 60,039 Goldman Sachs Group Inc 11,618 0.36USD 183,539 Huntington Bancshares Inc 2,338 0.07USD 580,051 JPMorgan Chase & Co 53,175 1.65USD 187,983 KeyCorp 3,131 0.10USD 24,936 M&T Bank Corp 3,676 0.11USD 232,643 Morgan Stanley 9,993 0.31USD 34,399 Northern Trust Corp 3,021 0.09USD 79,448 PNC Financial Services Group
Inc* 9,761 0.30USD 190,994 Regions Financial Corp 2,984 0.09USD 61,990 State Street Corp 5,104 0.16USD 79,812 SunTrust Banks Inc 4,616 0.14USD 9,062 SVB Financial Group 2,423 0.08USD 264,372 US Bancorp 11,322 0.35USD 741,982 Wells Fargo & Co 34,318 1.06USD 31,565 Zions Bancorporation^ 1,482 0.05
Ccy Holding Investment Fair value
€'000
% of net asset value
United States (30 November 2017: 93.36%) (cont) Beverages
USD 41,894 Brown-Forman Corp^ 2,030 0.06USD 645,024 Coca-Cola Co 23,761 0.73USD 29,690 Constellation Brands Inc 5,674 0.18USD 31,657 Dr Pepper Snapple Group Inc 3,235 0.10USD 31,150 Molson Coors Brewing Co 1,645 0.05USD 70,519 Monster Beverage Corp 3,091 0.10USD 238,546 PepsiCo Inc 20,487 0.63
Biotechnology USD 38,442 Alexion Pharmaceuticals Inc 3,825 0.12USD 112,438 Amgen Inc 17,302 0.54USD 35,072 Biogen Inc 8,832 0.27USD 127,132 Celgene Corp 8,569 0.27USD 220,102 Gilead Sciences Inc 12,709 0.39USD 25,199 Illumina Inc 5,881 0.18USD 28,559 Incyte Corp 1,670 0.05USD 13,336 Regeneron Pharmaceuticals Inc 3,431 0.11USD 42,410 Vertex Pharmaceuticals Inc 5,595 0.17
Building materials and fixtures USD 28,319 Fortune Brands Home & Security
Inc 1,363 0.04USD 10,489 Martin Marietta Materials Inc 2,002 0.06USD 53,896 Masco Corp 1,721 0.05USD 21,846 Vulcan Materials Co 2,391 0.08
Chemicals USD 36,681 Air Products & Chemicals Inc 5,072 0.16USD 20,280 Albemarle Corp^ 1,624 0.05USD 41,419 CF Industries Holdings Inc 1,460 0.04USD 393,109 DowDuPont Inc 21,590 0.67USD 25,350 Eastman Chemical Co 2,265 0.07USD 22,455 FMC Corp 1,675 0.05USD 13,693 International Flavors &
Fragrances Inc^ 1,433 0.04USD 75,769 Monsanto Co 8,273 0.26USD 64,611 Mosaic Co 1,522 0.05USD 43,191 PPG Industries Inc 3,734 0.12USD 49,416 Praxair Inc 6,615 0.20USD 14,379 Sherwin-Williams Co^ 4,672 0.14
Commercial services USD 73,281 Automatic Data Processing Inc 8,162 0.25USD 14,847 Cintas Corp 2,318 0.07USD 45,172 Ecolab Inc 5,519 0.17USD 19,697 Equifax Inc 1,923 0.06USD 15,719 Gartner Inc 1,788 0.06USD 28,505 Global Payments Inc 2,714 0.08USD 33,608 H&R Block Inc 790 0.03USD 27,555 Moody's Corp 4,026 0.13USD 189,640 PayPal Holdings Inc 13,333 0.41USD 28,643 Quanta Services Inc 884 0.03USD 19,843 Robert Half International Inc 1,083 0.03USD 42,173 S&P Global Inc 7,135 0.22
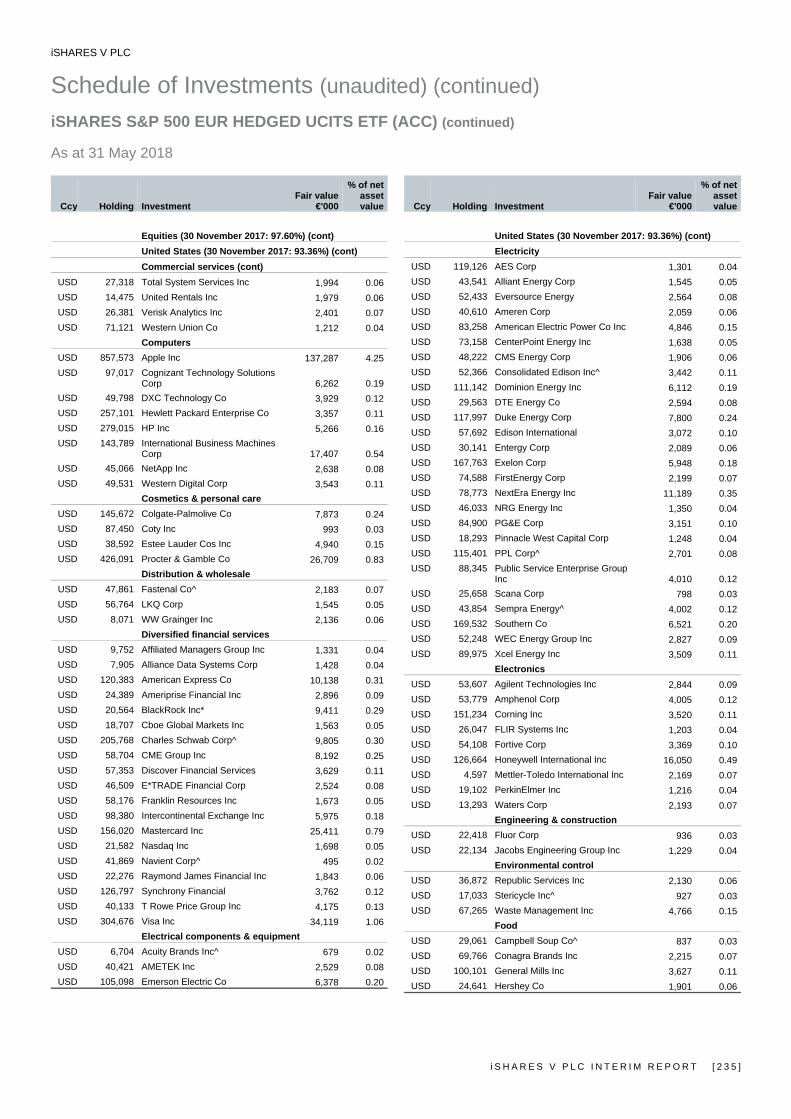
iSHARES V PLC
Schedule of Investments (unaudited) (continued) iSHARES S&P 500 EUR HEDGED UCITS ETF (ACC) (continued) As at 31 May 2018
i S H A R E S V P L C I N T E R I M R E P O R T [ 2 3 5 ]
Ccy Holding Investment Fair value
€'000
% of net asset value
Equities (30 November 2017: 97.60%) (cont) United States (30 November 2017: 93.36%) (cont) Commercial services (cont)
USD 27,318 Total System Services Inc 1,994 0.06USD 14,475 United Rentals Inc 1,979 0.06USD 26,381 Verisk Analytics Inc 2,401 0.07USD 71,121 Western Union Co 1,212 0.04
Computers USD 857,573 Apple Inc 137,287 4.25USD 97,017 Cognizant Technology Solutions
Corp 6,262 0.19USD 49,798 DXC Technology Co 3,929 0.12USD 257,101 Hewlett Packard Enterprise Co 3,357 0.11USD 279,015 HP Inc 5,266 0.16USD 143,789 International Business Machines
Corp 17,407 0.54USD 45,066 NetApp Inc 2,638 0.08USD 49,531 Western Digital Corp 3,543 0.11
Cosmetics & personal care USD 145,672 Colgate-Palmolive Co 7,873 0.24USD 87,450 Coty Inc 993 0.03USD 38,592 Estee Lauder Cos Inc 4,940 0.15USD 426,091 Procter & Gamble Co 26,709 0.83
Distribution & wholesale USD 47,861 Fastenal Co^ 2,183 0.07USD 56,764 LKQ Corp 1,545 0.05USD 8,071 WW Grainger Inc 2,136 0.06
Diversified financial services USD 9,752 Affiliated Managers Group Inc 1,331 0.04USD 7,905 Alliance Data Systems Corp 1,428 0.04USD 120,383 American Express Co 10,138 0.31USD 24,389 Ameriprise Financial Inc 2,896 0.09USD 20,564 BlackRock Inc* 9,411 0.29USD 18,707 Cboe Global Markets Inc 1,563 0.05USD 205,768 Charles Schwab Corp^ 9,805 0.30USD 58,704 CME Group Inc 8,192 0.25USD 57,353 Discover Financial Services 3,629 0.11USD 46,509 E*TRADE Financial Corp 2,524 0.08USD 58,176 Franklin Resources Inc 1,673 0.05USD 98,380 Intercontinental Exchange Inc 5,975 0.18USD 156,020 Mastercard Inc 25,411 0.79USD 21,582 Nasdaq Inc 1,698 0.05USD 41,869 Navient Corp^ 495 0.02USD 22,276 Raymond James Financial Inc 1,843 0.06USD 126,797 Synchrony Financial 3,762 0.12USD 40,133 T Rowe Price Group Inc 4,175 0.13USD 304,676 Visa Inc 34,119 1.06
Electrical components & equipment USD 6,704 Acuity Brands Inc^ 679 0.02USD 40,421 AMETEK Inc 2,529 0.08USD 105,098 Emerson Electric Co 6,378 0.20
Ccy Holding Investment Fair value
€'000
% of net asset value
United States (30 November 2017: 93.36%) (cont) Electricity
USD 119,126 AES Corp 1,301 0.04USD 43,541 Alliant Energy Corp 1,545 0.05USD 52,433 Eversource Energy 2,564 0.08USD 40,610 Ameren Corp 2,059 0.06USD 83,258 American Electric Power Co Inc 4,846 0.15USD 73,158 CenterPoint Energy Inc 1,638 0.05USD 48,222 CMS Energy Corp 1,906 0.06USD 52,366 Consolidated Edison Inc^ 3,442 0.11USD 111,142 Dominion Energy Inc 6,112 0.19USD 29,563 DTE Energy Co 2,594 0.08USD 117,997 Duke Energy Corp 7,800 0.24USD 57,692 Edison International 3,072 0.10USD 30,141 Entergy Corp 2,089 0.06USD 167,763 Exelon Corp 5,948 0.18USD 74,588 FirstEnergy Corp 2,199 0.07USD 78,773 NextEra Energy Inc 11,189 0.35USD 46,033 NRG Energy Inc 1,350 0.04USD 84,900 PG&E Corp 3,151 0.10USD 18,293 Pinnacle West Capital Corp 1,248 0.04USD 115,401 PPL Corp^ 2,701 0.08USD 88,345 Public Service Enterprise Group
Inc 4,010 0.12USD 25,658 Scana Corp 798 0.03USD 43,854 Sempra Energy^ 4,002 0.12USD 169,532 Southern Co 6,521 0.20USD 52,248 WEC Energy Group Inc 2,827 0.09USD 89,975 Xcel Energy Inc 3,509 0.11
Electronics USD 53,607 Agilent Technologies Inc 2,844 0.09USD 53,779 Amphenol Corp 4,005 0.12USD 151,234 Corning Inc 3,520 0.11USD 26,047 FLIR Systems Inc 1,203 0.04USD 54,108 Fortive Corp 3,369 0.10USD 126,664 Honeywell International Inc 16,050 0.49USD 4,597 Mettler-Toledo International Inc 2,169 0.07USD 19,102 PerkinElmer Inc 1,216 0.04USD 13,293 Waters Corp 2,193 0.07
Engineering & construction USD 22,418 Fluor Corp 936 0.03USD 22,134 Jacobs Engineering Group Inc 1,229 0.04
Environmental control USD 36,872 Republic Services Inc 2,130 0.06USD 17,033 Stericycle Inc^ 927 0.03USD 67,265 Waste Management Inc 4,766 0.15
Food USD 29,061 Campbell Soup Co^ 837 0.03USD 69,766 Conagra Brands Inc 2,215 0.07USD 100,101 General Mills Inc 3,627 0.11USD 24,641 Hershey Co 1,901 0.06
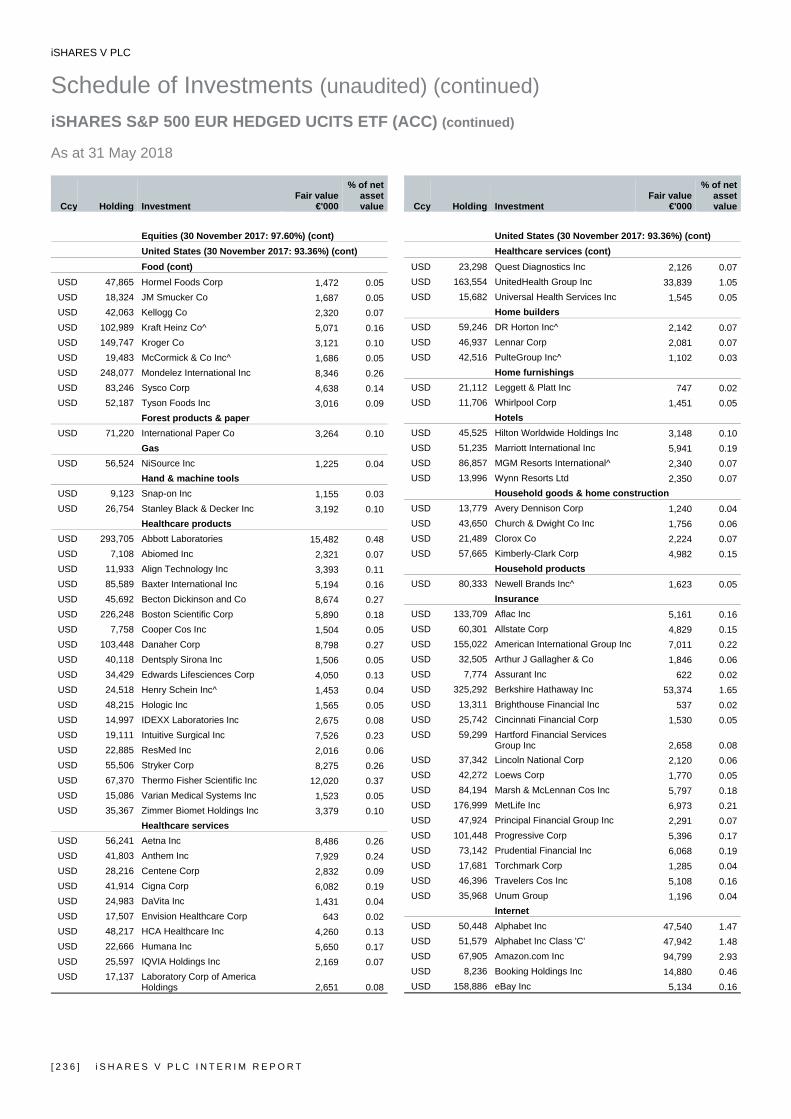
iSHARES V PLC
Schedule of Investments (unaudited) (continued) iSHARES S&P 500 EUR HEDGED UCITS ETF (ACC) (continued) As at 31 May 2018
[ 2 3 6 ] i S H A R E S V P L C I N T E R I M R E P O R T
Ccy Holding Investment Fair value
€'000
% of net asset value
Equities (30 November 2017: 97.60%) (cont) United States (30 November 2017: 93.36%) (cont) Food (cont)
USD 47,865 Hormel Foods Corp 1,472 0.05USD 18,324 JM Smucker Co 1,687 0.05USD 42,063 Kellogg Co 2,320 0.07USD 102,989 Kraft Heinz Co^ 5,071 0.16USD 149,747 Kroger Co 3,121 0.10USD 19,483 McCormick & Co Inc^ 1,686 0.05USD 248,077 Mondelez International Inc 8,346 0.26USD 83,246 Sysco Corp 4,638 0.14USD 52,187 Tyson Foods Inc 3,016 0.09
Forest products & paper USD 71,220 International Paper Co 3,264 0.10
Gas USD 56,524 NiSource Inc 1,225 0.04
Hand & machine tools USD 9,123 Snap-on Inc 1,155 0.03USD 26,754 Stanley Black & Decker Inc 3,192 0.10
Healthcare products USD 293,705 Abbott Laboratories 15,482 0.48USD 7,108 Abiomed Inc 2,321 0.07USD 11,933 Align Technology Inc 3,393 0.11USD 85,589 Baxter International Inc 5,194 0.16USD 45,692 Becton Dickinson and Co 8,674 0.27USD 226,248 Boston Scientific Corp 5,890 0.18USD 7,758 Cooper Cos Inc 1,504 0.05USD 103,448 Danaher Corp 8,798 0.27USD 40,118 Dentsply Sirona Inc 1,506 0.05USD 34,429 Edwards Lifesciences Corp 4,050 0.13USD 24,518 Henry Schein Inc^ 1,453 0.04USD 48,215 Hologic Inc 1,565 0.05USD 14,997 IDEXX Laboratories Inc 2,675 0.08USD 19,111 Intuitive Surgical Inc 7,526 0.23USD 22,885 ResMed Inc 2,016 0.06USD 55,506 Stryker Corp 8,275 0.26USD 67,370 Thermo Fisher Scientific Inc 12,020 0.37USD 15,086 Varian Medical Systems Inc 1,523 0.05USD 35,367 Zimmer Biomet Holdings Inc 3,379 0.10
Healthcare services USD 56,241 Aetna Inc 8,486 0.26USD 41,803 Anthem Inc 7,929 0.24USD 28,216 Centene Corp 2,832 0.09USD 41,914 Cigna Corp 6,082 0.19USD 24,983 DaVita Inc 1,431 0.04USD 17,507 Envision Healthcare Corp 643 0.02USD 48,217 HCA Healthcare Inc 4,260 0.13USD 22,666 Humana Inc 5,650 0.17USD 25,597 IQVIA Holdings Inc 2,169 0.07USD 17,137 Laboratory Corp of America
Holdings 2,651 0.08
Ccy Holding Investment Fair value
€'000
% of net asset value
United States (30 November 2017: 93.36%) (cont) Healthcare services (cont)
USD 23,298 Quest Diagnostics Inc 2,126 0.07USD 163,554 UnitedHealth Group Inc 33,839 1.05USD 15,682 Universal Health Services Inc 1,545 0.05
Home builders USD 59,246 DR Horton Inc^ 2,142 0.07USD 46,937 Lennar Corp 2,081 0.07USD 42,516 PulteGroup Inc^ 1,102 0.03
Home furnishings USD 21,112 Leggett & Platt Inc 747 0.02USD 11,706 Whirlpool Corp 1,451 0.05
Hotels USD 45,525 Hilton Worldwide Holdings Inc 3,148 0.10USD 51,235 Marriott International Inc 5,941 0.19USD 86,857 MGM Resorts International^ 2,340 0.07USD 13,996 Wynn Resorts Ltd 2,350 0.07
Household goods & home construction USD 13,779 Avery Dennison Corp 1,240 0.04USD 43,650 Church & Dwight Co Inc 1,756 0.06USD 21,489 Clorox Co 2,224 0.07USD 57,665 Kimberly-Clark Corp 4,982 0.15
Household products USD 80,333 Newell Brands Inc^ 1,623 0.05
Insurance USD 133,709 Aflac Inc 5,161 0.16USD 60,301 Allstate Corp 4,829 0.15USD 155,022 American International Group Inc 7,011 0.22USD 32,505 Arthur J Gallagher & Co 1,846 0.06USD 7,774 Assurant Inc 622 0.02USD 325,292 Berkshire Hathaway Inc 53,374 1.65USD 13,311 Brighthouse Financial Inc 537 0.02USD 25,742 Cincinnati Financial Corp 1,530 0.05USD 59,299 Hartford Financial Services
Group Inc 2,658 0.08USD 37,342 Lincoln National Corp 2,120 0.06USD 42,272 Loews Corp 1,770 0.05USD 84,194 Marsh & McLennan Cos Inc 5,797 0.18USD 176,999 MetLife Inc 6,973 0.21USD 47,924 Principal Financial Group Inc 2,291 0.07USD 101,448 Progressive Corp 5,396 0.17USD 73,142 Prudential Financial Inc 6,068 0.19USD 17,681 Torchmark Corp 1,285 0.04USD 46,396 Travelers Cos Inc 5,108 0.16USD 35,968 Unum Group 1,196 0.04
Internet USD 50,448 Alphabet Inc 47,540 1.47USD 51,579 Alphabet Inc Class 'C' 47,942 1.48USD 67,905 Amazon.com Inc 94,799 2.93USD 8,236 Booking Holdings Inc 14,880 0.46USD 158,886 eBay Inc 5,134 0.16
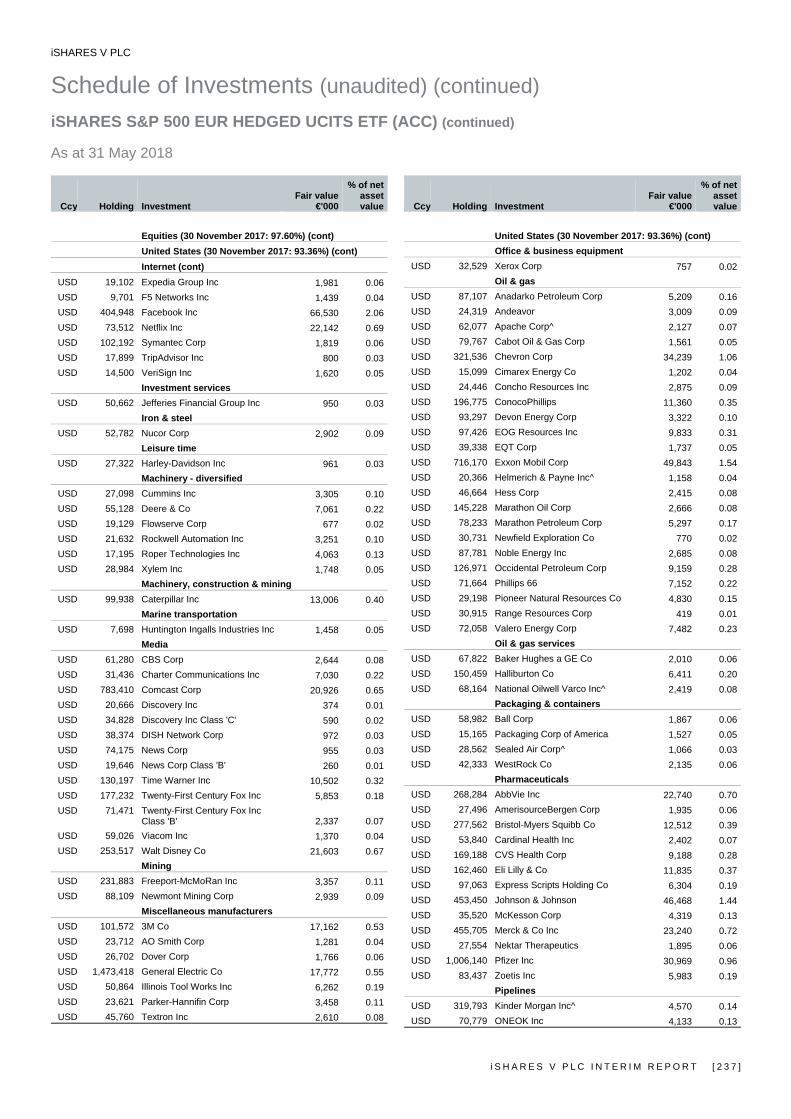
iSHARES V PLC
Schedule of Investments (unaudited) (continued) iSHARES S&P 500 EUR HEDGED UCITS ETF (ACC) (continued) As at 31 May 2018
i S H A R E S V P L C I N T E R I M R E P O R T [ 2 3 7 ]
Ccy Holding Investment Fair value
€'000
% of net asset value
Equities (30 November 2017: 97.60%) (cont) United States (30 November 2017: 93.36%) (cont) Internet (cont)
USD 19,102 Expedia Group Inc 1,981 0.06USD 9,701 F5 Networks Inc 1,439 0.04USD 404,948 Facebook Inc 66,530 2.06USD 73,512 Netflix Inc 22,142 0.69USD 102,192 Symantec Corp 1,819 0.06USD 17,899 TripAdvisor Inc 800 0.03USD 14,500 VeriSign Inc 1,620 0.05
Investment services USD 50,662 Jefferies Financial Group Inc 950 0.03
Iron & steel USD 52,782 Nucor Corp 2,902 0.09
Leisure time USD 27,322 Harley-Davidson Inc 961 0.03
Machinery - diversified USD 27,098 Cummins Inc 3,305 0.10USD 55,128 Deere & Co 7,061 0.22USD 19,129 Flowserve Corp 677 0.02USD 21,632 Rockwell Automation Inc 3,251 0.10USD 17,195 Roper Technologies Inc 4,063 0.13USD 28,984 Xylem Inc 1,748 0.05
Machinery, construction & mining USD 99,938 Caterpillar Inc 13,006 0.40
Marine transportation USD 7,698 Huntington Ingalls Industries Inc 1,458 0.05
Media USD 61,280 CBS Corp 2,644 0.08USD 31,436 Charter Communications Inc 7,030 0.22USD 783,410 Comcast Corp 20,926 0.65USD 20,666 Discovery Inc 374 0.01USD 34,828 Discovery Inc Class 'C' 590 0.02USD 38,374 DISH Network Corp 972 0.03USD 74,175 News Corp 955 0.03USD 19,646 News Corp Class 'B' 260 0.01USD 130,197 Time Warner Inc 10,502 0.32USD 177,232 Twenty-First Century Fox Inc 5,853 0.18USD 71,471 Twenty-First Century Fox Inc
Class 'B' 2,337 0.07USD 59,026 Viacom Inc 1,370 0.04USD 253,517 Walt Disney Co 21,603 0.67
Mining USD 231,883 Freeport-McMoRan Inc 3,357 0.11USD 88,109 Newmont Mining Corp 2,939 0.09
Miscellaneous manufacturers USD 101,572 3M Co 17,162 0.53USD 23,712 AO Smith Corp 1,281 0.04USD 26,702 Dover Corp 1,766 0.06USD 1,473,418 General Electric Co 17,772 0.55USD 50,864 Illinois Tool Works Inc 6,262 0.19USD 23,621 Parker-Hannifin Corp 3,458 0.11USD 45,760 Textron Inc 2,610 0.08
Ccy Holding Investment Fair value
€'000
% of net asset value
United States (30 November 2017: 93.36%) (cont) Office & business equipment
USD 32,529 Xerox Corp 757 0.02Oil & gas
USD 87,107 Anadarko Petroleum Corp 5,209 0.16USD 24,319 Andeavor 3,009 0.09USD 62,077 Apache Corp^ 2,127 0.07USD 79,767 Cabot Oil & Gas Corp 1,561 0.05USD 321,536 Chevron Corp 34,239 1.06USD 15,099 Cimarex Energy Co 1,202 0.04USD 24,446 Concho Resources Inc 2,875 0.09USD 196,775 ConocoPhillips 11,360 0.35USD 93,297 Devon Energy Corp 3,322 0.10USD 97,426 EOG Resources Inc 9,833 0.31USD 39,338 EQT Corp 1,737 0.05USD 716,170 Exxon Mobil Corp 49,843 1.54USD 20,366 Helmerich & Payne Inc^ 1,158 0.04USD 46,664 Hess Corp 2,415 0.08USD 145,228 Marathon Oil Corp 2,666 0.08USD 78,233 Marathon Petroleum Corp 5,297 0.17USD 30,731 Newfield Exploration Co 770 0.02USD 87,781 Noble Energy Inc 2,685 0.08USD 126,971 Occidental Petroleum Corp 9,159 0.28USD 71,664 Phillips 66 7,152 0.22USD 29,198 Pioneer Natural Resources Co 4,830 0.15USD 30,915 Range Resources Corp 419 0.01USD 72,058 Valero Energy Corp 7,482 0.23
Oil & gas services USD 67,822 Baker Hughes a GE Co 2,010 0.06USD 150,459 Halliburton Co 6,411 0.20USD 68,164 National Oilwell Varco Inc^ 2,419 0.08
Packaging & containers USD 58,982 Ball Corp 1,867 0.06USD 15,165 Packaging Corp of America 1,527 0.05USD 28,562 Sealed Air Corp^ 1,066 0.03USD 42,333 WestRock Co 2,135 0.06
Pharmaceuticals USD 268,284 AbbVie Inc 22,740 0.70USD 27,496 AmerisourceBergen Corp 1,935 0.06USD 277,562 Bristol-Myers Squibb Co 12,512 0.39USD 53,840 Cardinal Health Inc 2,402 0.07USD 169,188 CVS Health Corp 9,188 0.28USD 162,460 Eli Lilly & Co 11,835 0.37USD 97,063 Express Scripts Holding Co 6,304 0.19USD 453,450 Johnson & Johnson 46,468 1.44USD 35,520 McKesson Corp 4,319 0.13USD 455,705 Merck & Co Inc 23,240 0.72USD 27,554 Nektar Therapeutics 1,895 0.06USD 1,006,140 Pfizer Inc 30,969 0.96USD 83,437 Zoetis Inc 5,983 0.19
Pipelines USD 319,793 Kinder Morgan Inc^ 4,570 0.14USD 70,779 ONEOK Inc 4,133 0.13
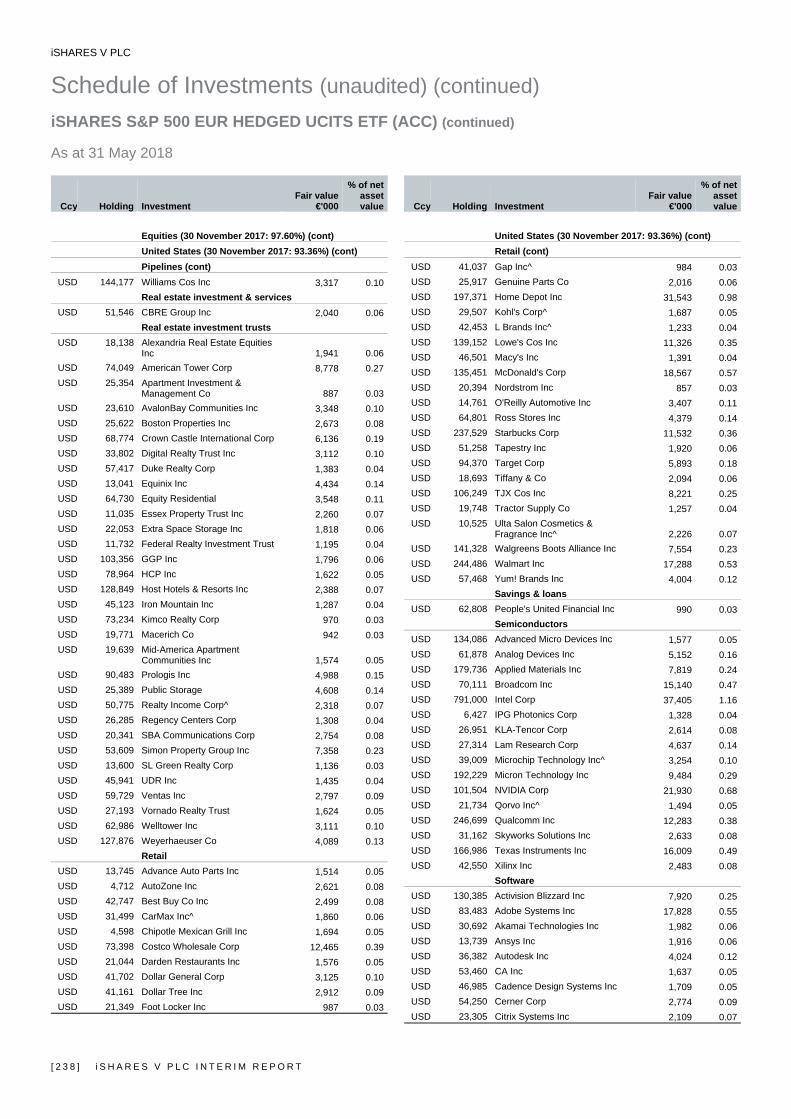
iSHARES V PLC
Schedule of Investments (unaudited) (continued) iSHARES S&P 500 EUR HEDGED UCITS ETF (ACC) (continued) As at 31 May 2018
[ 2 3 8 ] i S H A R E S V P L C I N T E R I M R E P O R T
Ccy Holding Investment Fair value
€'000
% of net asset value
Equities (30 November 2017: 97.60%) (cont) United States (30 November 2017: 93.36%) (cont) Pipelines (cont)
USD 144,177 Williams Cos Inc 3,317 0.10Real estate investment & services
USD 51,546 CBRE Group Inc 2,040 0.06Real estate investment trusts
USD 18,138 Alexandria Real Estate Equities Inc 1,941 0.06
USD 74,049 American Tower Corp 8,778 0.27USD 25,354 Apartment Investment &
Management Co 887 0.03USD 23,610 AvalonBay Communities Inc 3,348 0.10USD 25,622 Boston Properties Inc 2,673 0.08USD 68,774 Crown Castle International Corp 6,136 0.19USD 33,802 Digital Realty Trust Inc 3,112 0.10USD 57,417 Duke Realty Corp 1,383 0.04USD 13,041 Equinix Inc 4,434 0.14USD 64,730 Equity Residential 3,548 0.11USD 11,035 Essex Property Trust Inc 2,260 0.07USD 22,053 Extra Space Storage Inc 1,818 0.06USD 11,732 Federal Realty Investment Trust 1,195 0.04USD 103,356 GGP Inc 1,796 0.06USD 78,964 HCP Inc 1,622 0.05USD 128,849 Host Hotels & Resorts Inc 2,388 0.07USD 45,123 Iron Mountain Inc 1,287 0.04USD 73,234 Kimco Realty Corp 970 0.03USD 19,771 Macerich Co 942 0.03USD 19,639 Mid-America Apartment
Communities Inc 1,574 0.05USD 90,483 Prologis Inc 4,988 0.15USD 25,389 Public Storage 4,608 0.14USD 50,775 Realty Income Corp^ 2,318 0.07USD 26,285 Regency Centers Corp 1,308 0.04USD 20,341 SBA Communications Corp 2,754 0.08USD 53,609 Simon Property Group Inc 7,358 0.23USD 13,600 SL Green Realty Corp 1,136 0.03USD 45,941 UDR Inc 1,435 0.04USD 59,729 Ventas Inc 2,797 0.09USD 27,193 Vornado Realty Trust 1,624 0.05USD 62,986 Welltower Inc 3,111 0.10USD 127,876 Weyerhaeuser Co 4,089 0.13
Retail USD 13,745 Advance Auto Parts Inc 1,514 0.05USD 4,712 AutoZone Inc 2,621 0.08USD 42,747 Best Buy Co Inc 2,499 0.08USD 31,499 CarMax Inc^ 1,860 0.06USD 4,598 Chipotle Mexican Grill Inc 1,694 0.05USD 73,398 Costco Wholesale Corp 12,465 0.39USD 21,044 Darden Restaurants Inc 1,576 0.05USD 41,702 Dollar General Corp 3,125 0.10USD 41,161 Dollar Tree Inc 2,912 0.09USD 21,349 Foot Locker Inc 987 0.03
Ccy Holding Investment Fair value
€'000
% of net asset value
United States (30 November 2017: 93.36%) (cont) Retail (cont)
USD 41,037 Gap Inc^ 984 0.03USD 25,917 Genuine Parts Co 2,016 0.06USD 197,371 Home Depot Inc 31,543 0.98USD 29,507 Kohl's Corp^ 1,687 0.05USD 42,453 L Brands Inc^ 1,233 0.04USD 139,152 Lowe's Cos Inc 11,326 0.35USD 46,501 Macy's Inc 1,391 0.04USD 135,451 McDonald's Corp 18,567 0.57USD 20,394 Nordstrom Inc 857 0.03USD 14,761 O'Reilly Automotive Inc 3,407 0.11USD 64,801 Ross Stores Inc 4,379 0.14USD 237,529 Starbucks Corp 11,532 0.36USD 51,258 Tapestry Inc 1,920 0.06USD 94,370 Target Corp 5,893 0.18USD 18,693 Tiffany & Co 2,094 0.06USD 106,249 TJX Cos Inc 8,221 0.25USD 19,748 Tractor Supply Co 1,257 0.04USD 10,525 Ulta Salon Cosmetics &
Fragrance Inc^ 2,226 0.07USD 141,328 Walgreens Boots Alliance Inc 7,554 0.23USD 244,486 Walmart Inc 17,288 0.53USD 57,468 Yum! Brands Inc 4,004 0.12
Savings & loans USD 62,808 People's United Financial Inc 990 0.03
Semiconductors USD 134,086 Advanced Micro Devices Inc 1,577 0.05USD 61,878 Analog Devices Inc 5,152 0.16USD 179,736 Applied Materials Inc 7,819 0.24USD 70,111 Broadcom Inc 15,140 0.47USD 791,000 Intel Corp 37,405 1.16USD 6,427 IPG Photonics Corp 1,328 0.04USD 26,951 KLA-Tencor Corp 2,614 0.08USD 27,314 Lam Research Corp 4,637 0.14USD 39,009 Microchip Technology Inc^ 3,254 0.10USD 192,229 Micron Technology Inc 9,484 0.29USD 101,504 NVIDIA Corp 21,930 0.68USD 21,734 Qorvo Inc^ 1,494 0.05USD 246,699 Qualcomm Inc 12,283 0.38USD 31,162 Skyworks Solutions Inc 2,633 0.08USD 166,986 Texas Instruments Inc 16,009 0.49USD 42,550 Xilinx Inc 2,483 0.08
Software USD 130,385 Activision Blizzard Inc 7,920 0.25USD 83,483 Adobe Systems Inc 17,828 0.55USD 30,692 Akamai Technologies Inc 1,982 0.06USD 13,739 Ansys Inc 1,916 0.06USD 36,382 Autodesk Inc 4,024 0.12USD 53,460 CA Inc 1,637 0.05USD 46,985 Cadence Design Systems Inc 1,709 0.05USD 54,250 Cerner Corp 2,774 0.09USD 23,305 Citrix Systems Inc 2,109 0.07
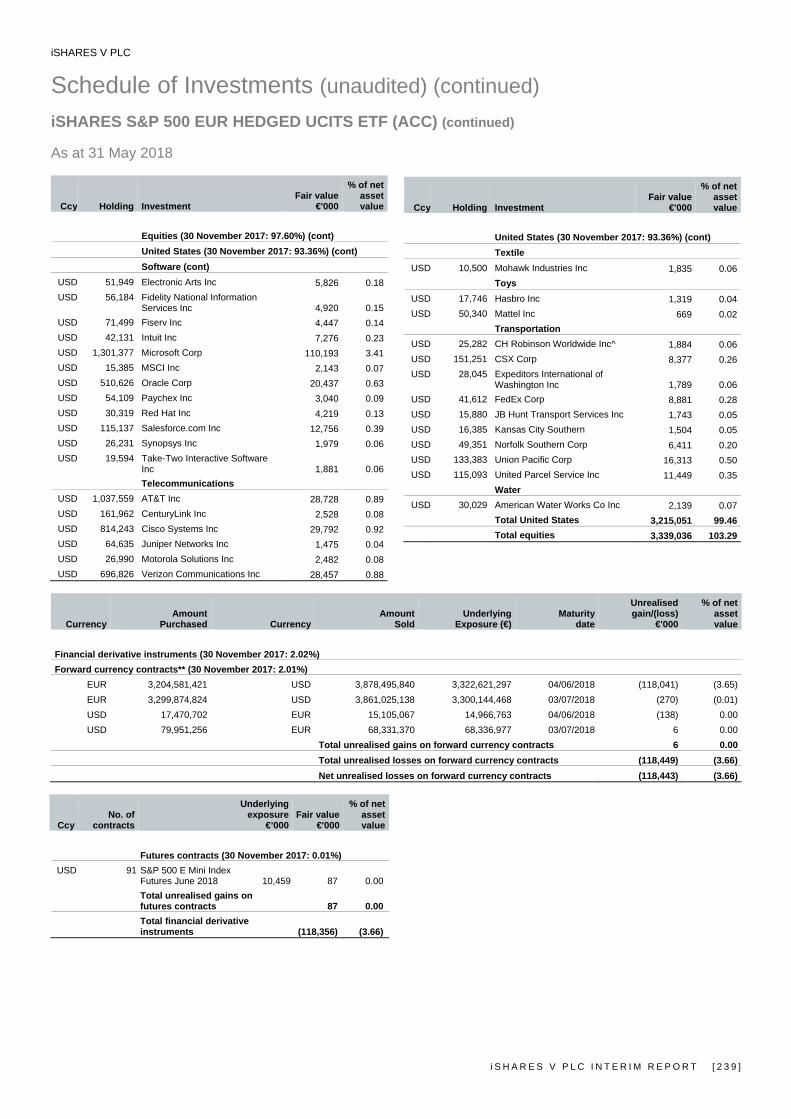
iSHARES V PLC
Schedule of Investments (unaudited) (continued) iSHARES S&P 500 EUR HEDGED UCITS ETF (ACC) (continued) As at 31 May 2018
i S H A R E S V P L C I N T E R I M R E P O R T [ 2 3 9 ]
Ccy Holding Investment Fair value
€'000
% of net asset value
Equities (30 November 2017: 97.60%) (cont) United States (30 November 2017: 93.36%) (cont) Software (cont)
USD 51,949 Electronic Arts Inc 5,826 0.18USD 56,184 Fidelity National Information
Services Inc 4,920 0.15USD 71,499 Fiserv Inc 4,447 0.14USD 42,131 Intuit Inc 7,276 0.23USD 1,301,377 Microsoft Corp 110,193 3.41USD 15,385 MSCI Inc 2,143 0.07USD 510,626 Oracle Corp 20,437 0.63USD 54,109 Paychex Inc 3,040 0.09USD 30,319 Red Hat Inc 4,219 0.13USD 115,137 Salesforce.com Inc 12,756 0.39USD 26,231 Synopsys Inc 1,979 0.06USD 19,594 Take-Two Interactive Software
Inc 1,881 0.06Telecommunications
USD 1,037,559 AT&T Inc 28,728 0.89USD 161,962 CenturyLink Inc 2,528 0.08USD 814,243 Cisco Systems Inc 29,792 0.92USD 64,635 Juniper Networks Inc 1,475 0.04USD 26,990 Motorola Solutions Inc 2,482 0.08USD 696,826 Verizon Communications Inc 28,457 0.88
Ccy Holding Investment Fair value
€'000
% of netassetvalue
United States (30 November 2017: 93.36%) (cont) Textile
USD 10,500 Mohawk Industries Inc 1,835 0.06Toys
USD 17,746 Hasbro Inc 1,319 0.04USD 50,340 Mattel Inc 669 0.02
Transportation USD 25,282 CH Robinson Worldwide Inc^ 1,884 0.06USD 151,251 CSX Corp 8,377 0.26USD 28,045 Expeditors International of
Washington Inc 1,789 0.06USD 41,612 FedEx Corp 8,881 0.28USD 15,880 JB Hunt Transport Services Inc 1,743 0.05USD 16,385 Kansas City Southern 1,504 0.05USD 49,351 Norfolk Southern Corp 6,411 0.20USD 133,383 Union Pacific Corp 16,313 0.50USD 115,093 United Parcel Service Inc 11,449 0.35
Water USD 30,029 American Water Works Co Inc 2,139 0.07
Total United States 3,215,051 99.46Total equities 3,339,036 103.29
Currency Amount
Purchased Currency Amount
SoldUnderlying
Exposure (€)Maturity
date
Unrealisedgain/(loss)
€'000
% of netassetvalue
Financial derivative instruments (30 November 2017: 2.02%) Forward currency contracts** (30 November 2017: 2.01%)
EUR 3,204,581,421 USD 3,878,495,840 3,322,621,297 04/06/2018 (118,041) (3.65)EUR 3,299,874,824 USD 3,861,025,138 3,300,144,468 03/07/2018 (270) (0.01)USD 17,470,702 EUR 15,105,067 14,966,763 04/06/2018 (138) 0.00USD 79,951,256 EUR 68,331,370 68,336,977 03/07/2018 6 0.00
Total unrealised gains on forward currency contracts 6 0.00 Total unrealised losses on forward currency contracts (118,449) (3.66) Net unrealised losses on forward currency contracts (118,443) (3.66)
Ccy No. of
contracts
Underlying exposure
€’000 Fair value
€'000
% of net asset value
Futures contracts (30 November 2017: 0.01%)
USD 91 S&P 500 E Mini Index Futures June 2018 10,459 87 0.00
Total unrealised gains on futures contracts 87 0.00
Total financial derivative instruments (118,356) (3.66)
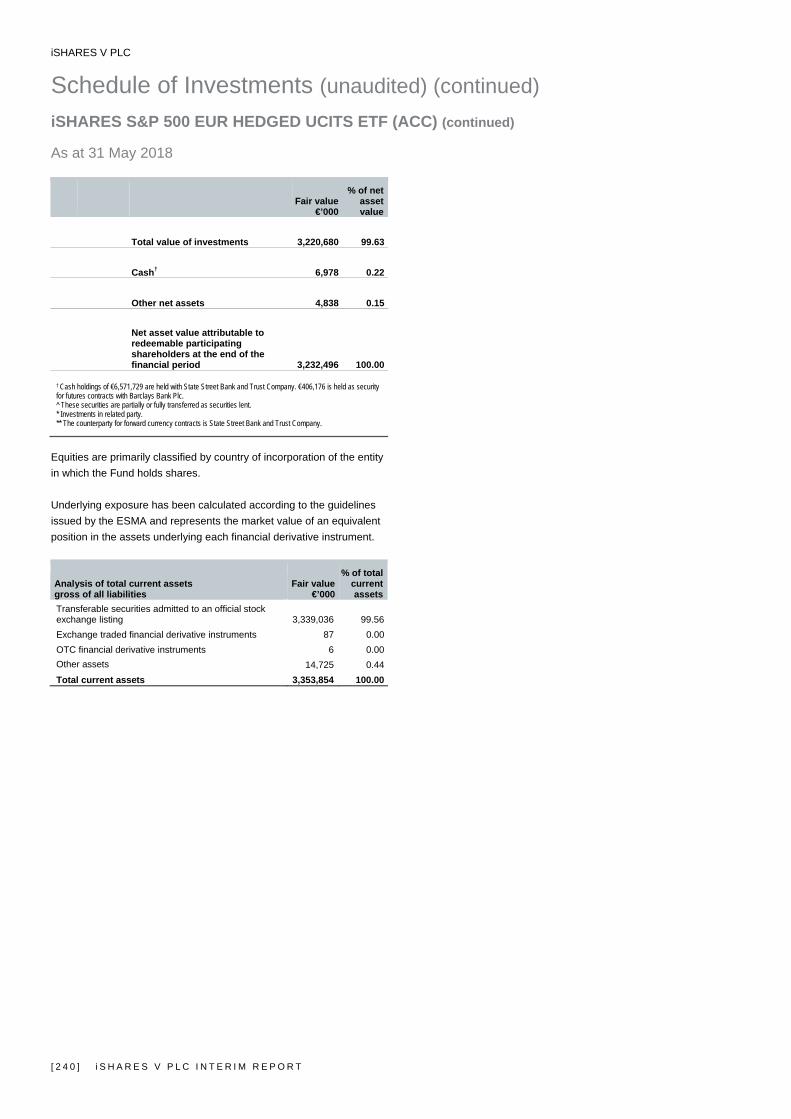
iSHARES V PLC
Schedule of Investments (unaudited) (continued) iSHARES S&P 500 EUR HEDGED UCITS ETF (ACC) (continued) As at 31 May 2018
[ 2 4 0 ] i S H A R E S V P L C I N T E R I M R E P O R T
Fair value
€’000
% of net asset value
Total value of investments 3,220,680 99.63 Cash† 6,978 0.22 Other net assets 4,838 0.15
Net asset value attributable to redeemable participating shareholders at the end of the financial period 3,232,496 100.00
† Cash holdings of €6,571,729 are held with State Street Bank and Trust Company. €406,176 is held as security for futures contracts with Barclays Bank Plc. ^ These securities are partially or fully transferred as securities lent. * Investments in related party. ** The counterparty for forward currency contracts is State Street Bank and Trust Company.
Equities are primarily classified by country of incorporation of the entity in which the Fund holds shares. Underlying exposure has been calculated according to the guidelines issued by the ESMA and represents the market value of an equivalent position in the assets underlying each financial derivative instrument.
Analysis of total current assets gross of all liabilities
Fair value€’000
% of total current assets
Transferable securities admitted to an official stock exchange listing 3,339,036 99.56Exchange traded financial derivative instruments 87 0.00OTC financial derivative instruments 6 0.00Other assets 14,725 0.44Total current assets 3,353,854 100.00

iSHARES V PLC
Schedule of Investments (unaudited) (continued) iSHARES S&P 500 FINANCIALS SECTOR UCITS ETF As at 31 May 2018
i S H A R E S V P L C I N T E R I M R E P O R T [ 2 4 1 ]
Ccy Holding Investment Fair value
$'000
% of net asset value
Transferable Securities Admitted to an Official Stock Exchange Listing or traded on a Regulated Market (30 November 2017: 99.76%)
Equities (30 November 2017: 99.76%) Bermuda (30 November 2017: 1.01%) Diversified financial services
USD 234,439 Invesco Ltd 6,405 0.34Insurance
USD 23,549 Everest Re Group Ltd 5,305 0.28USD 153,521 XL Group Ltd 8,533 0.44
Total Bermuda 20,243 1.06
Ireland (30 November 2017: 0.64%) Insurance
USD 76,500 Willis Towers Watson Plc 11,563 0.60Total Ireland 11,563 0.60
Switzerland (30 November 2017: 2.11%) Insurance
USD 268,668 Chubb Ltd 35,112 1.84Total Switzerland 35,112 1.84
United Kingdom (30 November 2017: 1.06%) Insurance
USD 142,793 Aon Plc 19,973 1.05Total United Kingdom 19,973 1.05
United States (30 November 2017: 94.94%) Banks
USD 5,555,152 Bank of America Corp 161,322 8.45USD 585,816 Bank of New York Mellon Corp 32,073 1.68USD 450,831 BB&T Corp 23,669 1.24USD 280,380 Capital One Financial Corp 26,356 1.38USD 1,492,140 Citigroup Inc 99,511 5.21USD 286,383 Citizens Financial Group Inc 11,699 0.61USD 100,082 Comerica Inc 9,437 0.49USD 401,883 Fifth Third Bancorp 12,290 0.64USD 205,144 Goldman Sachs Group Inc 46,338 2.43USD 621,420 Huntington Bancshares Inc 9,241 0.48USD 1,992,946 JPMorgan Chase & Co 213,265 11.17USD 620,031 KeyCorp 12,053 0.63USD 87,232 M&T Bank Corp 15,011 0.79USD 800,646 Morgan Stanley 40,144 2.10USD 123,966 Northern Trust Corp 12,709 0.67USD 273,662 PNC Financial Services Group
Inc* 39,246 2.05USD 650,057 Regions Financial Corp 11,857 0.62USD 213,364 State Street Corp 20,506 1.07USD 273,727 SunTrust Banks Inc 18,479 0.97USD 30,899 SVB Financial Group 9,645 0.50USD 912,522 US Bancorp 45,617 2.39USD 2,548,944 Wells Fargo & Co 137,617 7.21
Ccy Holding Investment Fair value
$'000
% of net asset value
United States (30 November 2017: 94.94%) (cont) Banks (cont)
USD 114,859 Zions Bancorporation^ 6,295 0.33Commercial services
USD 96,095 Moody's Corp^ 16,391 0.86USD 146,777 S&P Global Inc 28,988 1.52
Diversified financial services USD 32,166 Affiliated Managers Group Inc 5,123 0.27USD 417,116 American Express Co 41,002 2.15USD 84,779 Ameriprise Financial Inc 11,753 0.62USD 71,819 BlackRock Inc* 38,368 2.01USD 64,395 Cboe Global Markets Inc 6,282 0.33USD 698,160 Charles Schwab Corp^ 38,832 2.03USD 197,007 CME Group Inc 32,092 1.68USD 205,599 Discover Financial Services 15,186 0.79USD 155,067 E*Trade Financial Corp 9,823 0.51USD 188,233 Franklin Resources Inc 6,319 0.33USD 338,484 Intercontinental Exchange Inc 23,995 1.26USD 66,479 Nasdaq Inc 6,107 0.32USD 154,816 Navient Corp^ 2,138 0.11USD 74,107 Raymond James Financial Inc 7,156 0.37USD 413,994 Synchrony Financial 14,337 0.75USD 140,149 T Rowe Price Group Inc 17,017 0.89
Insurance USD 456,907 Aflac Inc^ 20,588 1.08USD 205,521 Allstate Corp 19,212 1.01USD 519,984 American International Group Inc 27,450 1.44USD 102,488 Arthur J Gallagher & Co 6,793 0.36USD 30,941 Assurant Inc 2,888 0.15USD 1,117,603 Berkshire Hathaway Inc 214,054 11.21USD 54,439 Brighthouse Financial Inc 2,565 0.13USD 84,722 Cincinnati Financial Corp 5,877 0.31USD 206,036 Hartford Financial Services
Group Inc 10,782 0.56USD 127,982 Lincoln National Corp 8,484 0.44USD 159,114 Loews Corp 7,776 0.41USD 295,275 Marsh & McLennan Cos Inc 23,731 1.24USD 601,313 MetLife Inc 27,654 1.45USD 152,926 Principal Financial Group Inc 8,533 0.45USD 336,273 Progressive Corp 20,879 1.09USD 245,381 Prudential Financial Inc 23,763 1.24USD 61,283 Torchmark Corp 5,199 0.27USD 158,661 Travelers Cos Inc 20,391 1.07USD 128,759 Unum Group 4,997 0.26
Investment services USD 184,097 Jefferies Financial Group Inc 4,028 0.21
Savings & loans USD 193,644 People's United Financial Inc 3,565 0.19
Software USD 52,149 MSCI Inc 8,478 0.44
Total United States 1,812,976 94.92Total equities 1,899,867 99.47
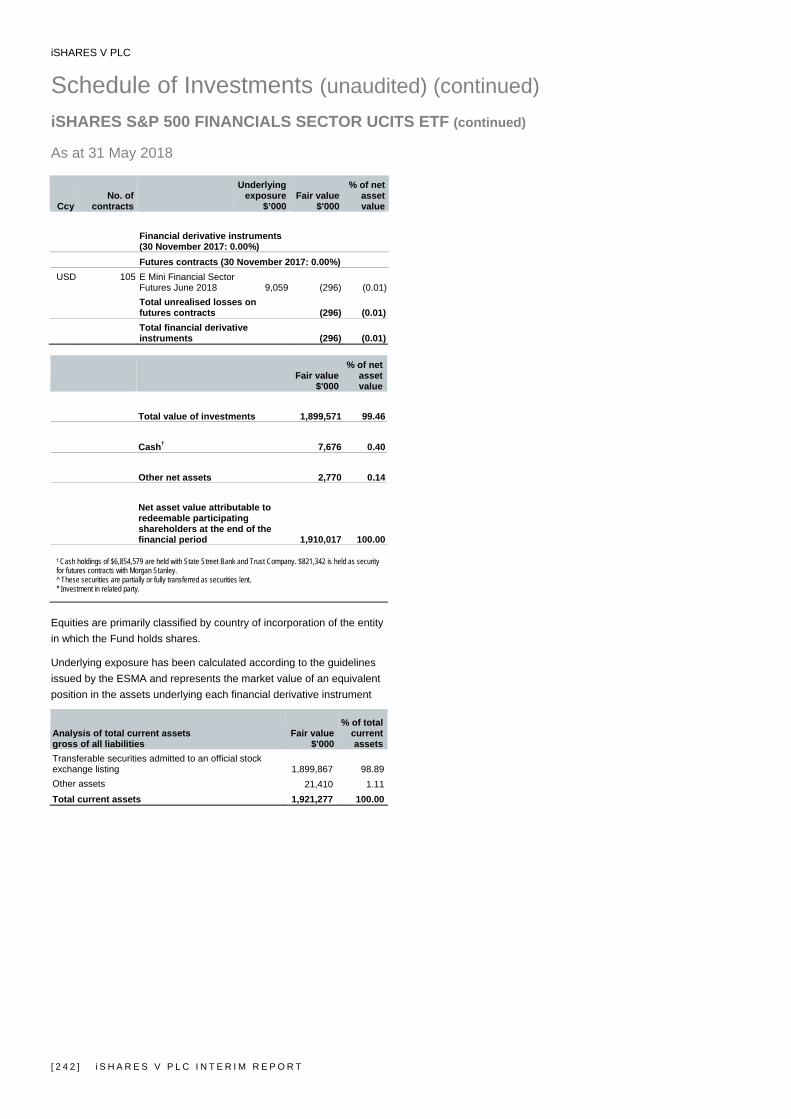
iSHARES V PLC
Schedule of Investments (unaudited) (continued) iSHARES S&P 500 FINANCIALS SECTOR UCITS ETF (continued) As at 31 May 2018
[ 2 4 2 ] i S H A R E S V P L C I N T E R I M R E P O R T
Ccy No. of
contracts
Underlying exposure
$’000 Fair value
$'000
% of net asset value
Financial derivative instruments
(30 November 2017: 0.00%) Futures contracts (30 November 2017: 0.00%)
USD 105 E Mini Financial Sector Futures June 2018 9,059 (296) (0.01)
Total unrealised losses on futures contracts (296) (0.01)
Total financial derivative instruments (296) (0.01)
Fair value
$'000
% of net asset value
Total value of investments 1,899,571 99.46 Cash† 7,676 0.40 Other net assets 2,770 0.14
Net asset value attributable to redeemable participating shareholders at the end of the financial period 1,910,017 100.00
† Cash holdings of $6,854,579 are held with State Street Bank and Trust Company. $821,342 is held as security for futures contracts with Morgan Stanley. ^ These securities are partially or fully transferred as securities lent. * Investment in related party.
Equities are primarily classified by country of incorporation of the entity in which the Fund holds shares.
Underlying exposure has been calculated according to the guidelines issued by the ESMA and represents the market value of an equivalent position in the assets underlying each financial derivative instrument
Analysis of total current assets gross of all liabilities
Fair value$'000
% of total current assets
Transferable securities admitted to an official stock exchange listing 1,899,867 98.89Other assets 21,410 1.11Total current assets 1,921,277 100.00
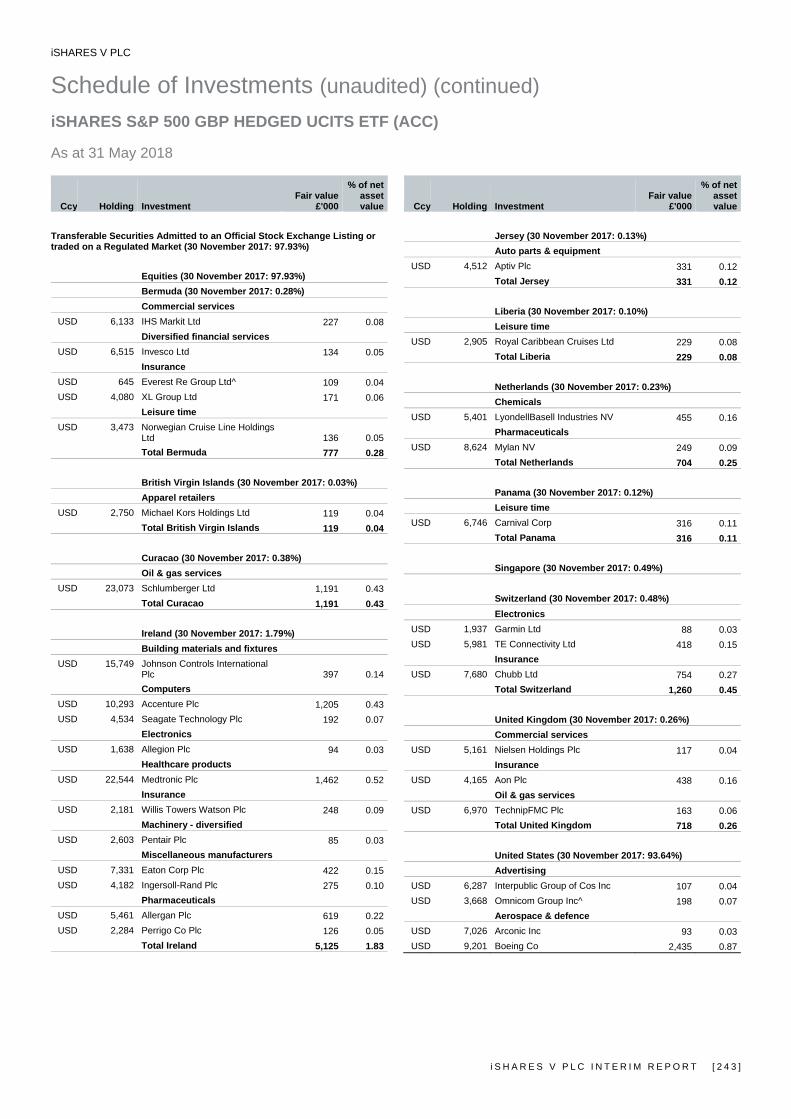
iSHARES V PLC
Schedule of Investments (unaudited) (continued) iSHARES S&P 500 GBP HEDGED UCITS ETF (ACC) As at 31 May 2018
i S H A R E S V P L C I N T E R I M R E P O R T [ 2 4 3 ]
Ccy Holding Investment Fair value
£'000
% of net asset value
Transferable Securities Admitted to an Official Stock Exchange Listing or traded on a Regulated Market (30 November 2017: 97.93%)
Equities (30 November 2017: 97.93%) Bermuda (30 November 2017: 0.28%) Commercial services
USD 6,133 IHS Markit Ltd 227 0.08Diversified financial services
USD 6,515 Invesco Ltd 134 0.05Insurance
USD 645 Everest Re Group Ltd^ 109 0.04USD 4,080 XL Group Ltd 171 0.06
Leisure time USD 3,473 Norwegian Cruise Line Holdings
Ltd 136 0.05Total Bermuda 777 0.28
British Virgin Islands (30 November 2017: 0.03%) Apparel retailers
USD 2,750 Michael Kors Holdings Ltd 119 0.04Total British Virgin Islands 119 0.04
Curacao (30 November 2017: 0.38%) Oil & gas services
USD 23,073 Schlumberger Ltd 1,191 0.43Total Curacao 1,191 0.43
Ireland (30 November 2017: 1.79%) Building materials and fixtures
USD 15,749 Johnson Controls International Plc 397 0.14Computers
USD 10,293 Accenture Plc 1,205 0.43USD 4,534 Seagate Technology Plc 192 0.07
Electronics USD 1,638 Allegion Plc 94 0.03
Healthcare products USD 22,544 Medtronic Plc 1,462 0.52
Insurance USD 2,181 Willis Towers Watson Plc 248 0.09
Machinery - diversified USD 2,603 Pentair Plc 85 0.03
Miscellaneous manufacturers USD 7,331 Eaton Corp Plc 422 0.15USD 4,182 Ingersoll-Rand Plc 275 0.10
Pharmaceuticals USD 5,461 Allergan Plc 619 0.22USD 2,284 Perrigo Co Plc 126 0.05
Total Ireland 5,125 1.83
Ccy Holding Investment Fair value
£'000
% of net asset value
Jersey (30 November 2017: 0.13%) Auto parts & equipment
USD 4,512 Aptiv Plc 331 0.12Total Jersey 331 0.12
Liberia (30 November 2017: 0.10%) Leisure time
USD 2,905 Royal Caribbean Cruises Ltd 229 0.08Total Liberia 229 0.08
Netherlands (30 November 2017: 0.23%) Chemicals
USD 5,401 LyondellBasell Industries NV 455 0.16Pharmaceuticals
USD 8,624 Mylan NV 249 0.09Total Netherlands 704 0.25
Panama (30 November 2017: 0.12%) Leisure time
USD 6,746 Carnival Corp 316 0.11Total Panama 316 0.11
Singapore (30 November 2017: 0.49%) Switzerland (30 November 2017: 0.48%) Electronics
USD 1,937 Garmin Ltd 88 0.03USD 5,981 TE Connectivity Ltd 418 0.15
Insurance USD 7,680 Chubb Ltd 754 0.27
Total Switzerland 1,260 0.45
United Kingdom (30 November 2017: 0.26%) Commercial services
USD 5,161 Nielsen Holdings Plc 117 0.04Insurance
USD 4,165 Aon Plc 438 0.16Oil & gas services
USD 6,970 TechnipFMC Plc 163 0.06Total United Kingdom 718 0.26
United States (30 November 2017: 93.64%) Advertising
USD 6,287 Interpublic Group of Cos Inc 107 0.04USD 3,668 Omnicom Group Inc^ 198 0.07
Aerospace & defence USD 7,026 Arconic Inc 93 0.03USD 9,201 Boeing Co 2,435 0.87
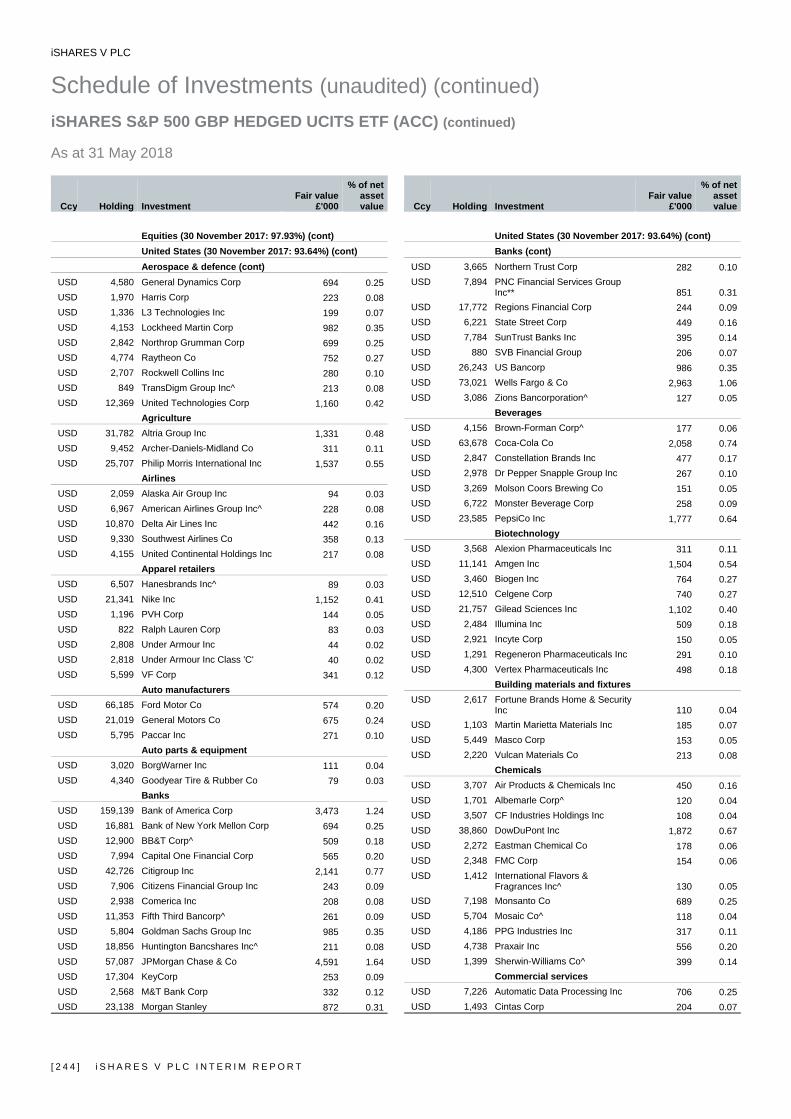
iSHARES V PLC
Schedule of Investments (unaudited) (continued) iSHARES S&P 500 GBP HEDGED UCITS ETF (ACC) (continued) As at 31 May 2018
[ 2 4 4 ] i S H A R E S V P L C I N T E R I M R E P O R T
Ccy Holding Investment Fair value
£'000
% of net asset value
Equities (30 November 2017: 97.93%) (cont) United States (30 November 2017: 93.64%) (cont) Aerospace & defence (cont)
USD 4,580 General Dynamics Corp 694 0.25USD 1,970 Harris Corp 223 0.08USD 1,336 L3 Technologies Inc 199 0.07USD 4,153 Lockheed Martin Corp 982 0.35USD 2,842 Northrop Grumman Corp 699 0.25USD 4,774 Raytheon Co 752 0.27USD 2,707 Rockwell Collins Inc 280 0.10USD 849 TransDigm Group Inc^ 213 0.08USD 12,369 United Technologies Corp 1,160 0.42
Agriculture USD 31,782 Altria Group Inc 1,331 0.48USD 9,452 Archer-Daniels-Midland Co 311 0.11USD 25,707 Philip Morris International Inc 1,537 0.55
Airlines USD 2,059 Alaska Air Group Inc 94 0.03USD 6,967 American Airlines Group Inc^ 228 0.08USD 10,870 Delta Air Lines Inc 442 0.16USD 9,330 Southwest Airlines Co 358 0.13USD 4,155 United Continental Holdings Inc 217 0.08
Apparel retailers USD 6,507 Hanesbrands Inc^ 89 0.03USD 21,341 Nike Inc 1,152 0.41USD 1,196 PVH Corp 144 0.05USD 822 Ralph Lauren Corp 83 0.03USD 2,808 Under Armour Inc 44 0.02USD 2,818 Under Armour Inc Class 'C' 40 0.02USD 5,599 VF Corp 341 0.12
Auto manufacturers USD 66,185 Ford Motor Co 574 0.20USD 21,019 General Motors Co 675 0.24USD 5,795 Paccar Inc 271 0.10
Auto parts & equipment USD 3,020 BorgWarner Inc 111 0.04USD 4,340 Goodyear Tire & Rubber Co 79 0.03
Banks USD 159,139 Bank of America Corp 3,473 1.24USD 16,881 Bank of New York Mellon Corp 694 0.25USD 12,900 BB&T Corp^ 509 0.18USD 7,994 Capital One Financial Corp 565 0.20USD 42,726 Citigroup Inc 2,141 0.77USD 7,906 Citizens Financial Group Inc 243 0.09USD 2,938 Comerica Inc 208 0.08USD 11,353 Fifth Third Bancorp^ 261 0.09USD 5,804 Goldman Sachs Group Inc 985 0.35USD 18,856 Huntington Bancshares Inc^ 211 0.08USD 57,087 JPMorgan Chase & Co 4,591 1.64USD 17,304 KeyCorp 253 0.09USD 2,568 M&T Bank Corp 332 0.12USD 23,138 Morgan Stanley 872 0.31
Ccy Holding Investment Fair value
£'000
% of net asset value
United States (30 November 2017: 93.64%) (cont) Banks (cont)
USD 3,665 Northern Trust Corp 282 0.10USD 7,894 PNC Financial Services Group
Inc** 851 0.31USD 17,772 Regions Financial Corp 244 0.09USD 6,221 State Street Corp 449 0.16USD 7,784 SunTrust Banks Inc 395 0.14USD 880 SVB Financial Group 206 0.07USD 26,243 US Bancorp 986 0.35USD 73,021 Wells Fargo & Co 2,963 1.06USD 3,086 Zions Bancorporation^ 127 0.05
Beverages USD 4,156 Brown-Forman Corp^ 177 0.06USD 63,678 Coca-Cola Co 2,058 0.74USD 2,847 Constellation Brands Inc 477 0.17USD 2,978 Dr Pepper Snapple Group Inc 267 0.10USD 3,269 Molson Coors Brewing Co 151 0.05USD 6,722 Monster Beverage Corp 258 0.09USD 23,585 PepsiCo Inc 1,777 0.64
Biotechnology USD 3,568 Alexion Pharmaceuticals Inc 311 0.11USD 11,141 Amgen Inc 1,504 0.54USD 3,460 Biogen Inc 764 0.27USD 12,510 Celgene Corp 740 0.27USD 21,757 Gilead Sciences Inc 1,102 0.40USD 2,484 Illumina Inc 509 0.18USD 2,921 Incyte Corp 150 0.05USD 1,291 Regeneron Pharmaceuticals Inc 291 0.10USD 4,300 Vertex Pharmaceuticals Inc 498 0.18
Building materials and fixtures USD 2,617 Fortune Brands Home & Security
Inc 110 0.04USD 1,103 Martin Marietta Materials Inc 185 0.07USD 5,449 Masco Corp 153 0.05USD 2,220 Vulcan Materials Co 213 0.08
Chemicals USD 3,707 Air Products & Chemicals Inc 450 0.16USD 1,701 Albemarle Corp^ 120 0.04USD 3,507 CF Industries Holdings Inc 108 0.04USD 38,860 DowDuPont Inc 1,872 0.67USD 2,272 Eastman Chemical Co 178 0.06USD 2,348 FMC Corp 154 0.06USD 1,412 International Flavors &
Fragrances Inc^ 130 0.05USD 7,198 Monsanto Co 689 0.25USD 5,704 Mosaic Co^ 118 0.04USD 4,186 PPG Industries Inc 317 0.11USD 4,738 Praxair Inc 556 0.20USD 1,399 Sherwin-Williams Co^ 399 0.14
Commercial services USD 7,226 Automatic Data Processing Inc 706 0.25USD 1,493 Cintas Corp 204 0.07

iSHARES V PLC
Schedule of Investments (unaudited) (continued) iSHARES S&P 500 GBP HEDGED UCITS ETF (ACC) (continued) As at 31 May 2018
i S H A R E S V P L C I N T E R I M R E P O R T [ 2 4 5 ]
Ccy Holding Investment Fair value
£'000
% of net asset value
Equities (30 November 2017: 97.93%) (cont) United States (30 November 2017: 93.64%) (cont) Commercial services (cont)
USD 4,427 Ecolab Inc 474 0.17USD 2,094 Equifax Inc 179 0.06USD 1,579 Gartner Inc^ 158 0.06USD 2,710 Global Payments Inc 226 0.08USD 4,053 H&R Block Inc 84 0.03USD 2,725 Moody's Corp 349 0.12USD 18,821 PayPal Holdings Inc 1,161 0.42USD 2,838 Quanta Services Inc 77 0.03USD 2,056 Robert Half International Inc 98 0.04USD 4,208 S&P Global Inc 625 0.22USD 2,930 Total System Services Inc 188 0.07USD 1,331 United Rentals Inc 160 0.06USD 2,697 Verisk Analytics Inc 215 0.08USD 8,216 Western Union Co 123 0.04
Computers USD 84,401 Apple Inc 11,853 4.24USD 9,562 Cognizant Technology Solutions
Corp 541 0.19USD 4,890 DXC Technology Co 338 0.12USD 26,388 Hewlett Packard Enterprise Co 302 0.11USD 26,671 HP Inc 442 0.16USD 14,337 International Business Machines
Corp 1,523 0.55USD 4,304 NetApp Inc 221 0.08USD 5,034 Western Digital Corp 316 0.11
Cosmetics & personal care USD 14,487 Colgate-Palmolive Co 687 0.25USD 7,924 Coty Inc^ 79 0.03USD 3,807 Estee Lauder Cos Inc 427 0.15USD 41,917 Procter & Gamble Co 2,305 0.82
Distribution & wholesale USD 4,990 Fastenal Co 200 0.07USD 5,437 LKQ Corp 130 0.05USD 825 WW Grainger Inc 191 0.07
Diversified financial services USD 959 Affiliated Managers Group Inc 115 0.04USD 742 Alliance Data Systems Corp 117 0.04USD 11,937 American Express Co 882 0.32USD 2,420 Ameriprise Financial Inc 252 0.09USD 2,042 BlackRock Inc** 820 0.29USD 1,886 Cboe Global Markets Inc 138 0.05USD 19,623 Charles Schwab Corp 820 0.30USD 5,548 CME Group Inc 679 0.24USD 6,050 Discover Financial Services 336 0.12USD 4,723 E*TRADE Financial Corp 225 0.08USD 5,816 Franklin Resources Inc^ 147 0.05USD 9,424 Intercontinental Exchange Inc^ 502 0.18USD 15,253 Mastercard Inc 2,179 0.78USD 2,100 Nasdaq Inc 145 0.05
Ccy Holding Investment Fair value
£'000
% of net asset value
United States (30 November 2017: 93.64%) (cont) Diversified financial services (cont)
USD 3,768 Navient Corp^ 39 0.02USD 2,265 Raymond James Financial Inc 164 0.06USD 11,901 Synchrony Financial 310 0.11USD 3,941 T Rowe Price Group Inc 360 0.13USD 29,898 Visa Inc 2,937 1.05
Electrical components & equipment USD 660 Acuity Brands Inc 59 0.02USD 3,937 AMETEK Inc 216 0.08USD 10,498 Emerson Electric Co 559 0.20
Electricity USD 10,373 AES Corp^ 99 0.04USD 3,601 Alliant Energy Corp 112 0.04USD 3,935 Ameren Corp 175 0.06USD 8,383 American Electric Power Co Inc 428 0.15USD 6,951 CenterPoint Energy Inc 137 0.05USD 4,839 CMS Energy Corp 168 0.06USD 5,125 Consolidated Edison Inc^ 296 0.11USD 10,964 Dominion Energy Inc 529 0.19USD 3,111 DTE Energy Co 240 0.09USD 11,407 Duke Energy Corp^ 662 0.24USD 5,074 Edison International 237 0.08USD 3,157 Entergy Corp 192 0.07USD 5,325 Eversource Energy 228 0.08USD 16,302 Exelon Corp 507 0.18USD 7,421 FirstEnergy Corp 192 0.07USD 7,795 NextEra Energy Inc 971 0.35USD 5,254 NRG Energy Inc 135 0.05USD 8,820 PG&E Corp 287 0.10USD 1,929 Pinnacle West Capital Corp 115 0.04USD 11,060 PPL Corp 227 0.08USD 8,507 Public Service Enterprise Group
Inc 339 0.12USD 2,557 Scana Corp 70 0.03USD 4,336 Sempra Energy 347 0.12USD 17,021 Southern Co 574 0.21USD 5,456 WEC Energy Group Inc^ 259 0.09USD 8,402 Xcel Energy Inc^ 287 0.10
Electronics USD 5,527 Agilent Technologies Inc 257 0.09USD 5,131 Amphenol Corp 335 0.12USD 14,417 Corning Inc 294 0.11USD 2,517 FLIR Systems Inc 102 0.04USD 5,005 Fortive Corp 273 0.10USD 12,429 Honeywell International Inc 1,382 0.49USD 428 Mettler-Toledo International Inc 177 0.06USD 1,924 PerkinElmer Inc 108 0.04USD 1,326 Waters Corp^ 192 0.07
Engineering & construction USD 2,141 Fluor Corp 79 0.03USD 2,121 Jacobs Engineering Group Inc 103 0.03
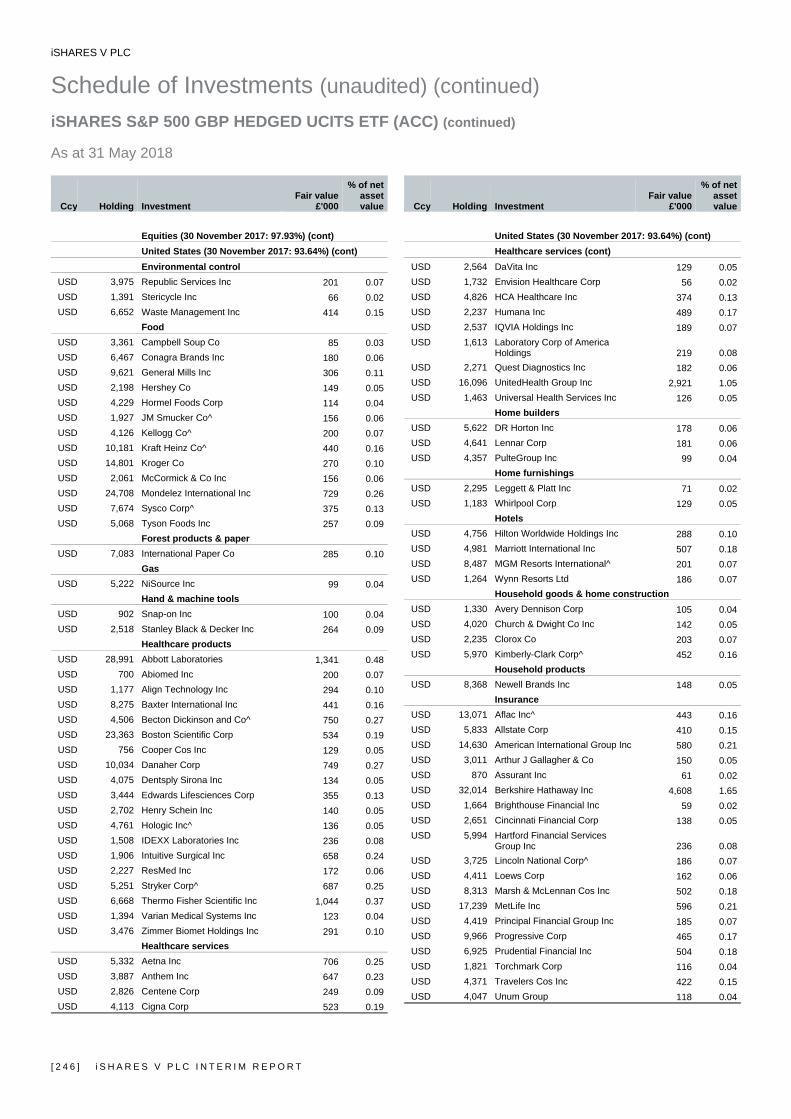
iSHARES V PLC
Schedule of Investments (unaudited) (continued) iSHARES S&P 500 GBP HEDGED UCITS ETF (ACC) (continued) As at 31 May 2018
[ 2 4 6 ] i S H A R E S V P L C I N T E R I M R E P O R T
Ccy Holding Investment Fair value
£'000
% of net asset value
Equities (30 November 2017: 97.93%) (cont) United States (30 November 2017: 93.64%) (cont)
Environmental control USD 3,975 Republic Services Inc 201 0.07USD 1,391 Stericycle Inc 66 0.02USD 6,652 Waste Management Inc 414 0.15
Food USD 3,361 Campbell Soup Co 85 0.03USD 6,467 Conagra Brands Inc 180 0.06USD 9,621 General Mills Inc 306 0.11USD 2,198 Hershey Co 149 0.05USD 4,229 Hormel Foods Corp 114 0.04USD 1,927 JM Smucker Co^ 156 0.06USD 4,126 Kellogg Co^ 200 0.07USD 10,181 Kraft Heinz Co^ 440 0.16USD 14,801 Kroger Co 270 0.10USD 2,061 McCormick & Co Inc 156 0.06USD 24,708 Mondelez International Inc 729 0.26USD 7,674 Sysco Corp^ 375 0.13USD 5,068 Tyson Foods Inc 257 0.09
Forest products & paper USD 7,083 International Paper Co 285 0.10
Gas USD 5,222 NiSource Inc 99 0.04
Hand & machine tools USD 902 Snap-on Inc 100 0.04USD 2,518 Stanley Black & Decker Inc 264 0.09
Healthcare products USD 28,991 Abbott Laboratories 1,341 0.48USD 700 Abiomed Inc 200 0.07USD 1,177 Align Technology Inc 294 0.10USD 8,275 Baxter International Inc 441 0.16USD 4,506 Becton Dickinson and Co^ 750 0.27USD 23,363 Boston Scientific Corp 534 0.19USD 756 Cooper Cos Inc 129 0.05USD 10,034 Danaher Corp 749 0.27USD 4,075 Dentsply Sirona Inc 134 0.05USD 3,444 Edwards Lifesciences Corp 355 0.13USD 2,702 Henry Schein Inc 140 0.05USD 4,761 Hologic Inc^ 136 0.05USD 1,508 IDEXX Laboratories Inc 236 0.08USD 1,906 Intuitive Surgical Inc 658 0.24USD 2,227 ResMed Inc 172 0.06USD 5,251 Stryker Corp^ 687 0.25USD 6,668 Thermo Fisher Scientific Inc 1,044 0.37USD 1,394 Varian Medical Systems Inc 123 0.04USD 3,476 Zimmer Biomet Holdings Inc 291 0.10
Healthcare services USD 5,332 Aetna Inc 706 0.25USD 3,887 Anthem Inc 647 0.23USD 2,826 Centene Corp 249 0.09USD 4,113 Cigna Corp 523 0.19
Ccy Holding Investment Fair value
£'000
% of net asset value
United States (30 November 2017: 93.64%) (cont) Healthcare services (cont)
USD 2,564 DaVita Inc 129 0.05USD 1,732 Envision Healthcare Corp 56 0.02USD 4,826 HCA Healthcare Inc 374 0.13USD 2,237 Humana Inc 489 0.17USD 2,537 IQVIA Holdings Inc 189 0.07USD 1,613 Laboratory Corp of America
Holdings 219 0.08USD 2,271 Quest Diagnostics Inc 182 0.06USD 16,096 UnitedHealth Group Inc 2,921 1.05USD 1,463 Universal Health Services Inc 126 0.05
Home builders USD 5,622 DR Horton Inc 178 0.06USD 4,641 Lennar Corp 181 0.06USD 4,357 PulteGroup Inc 99 0.04
Home furnishings USD 2,295 Leggett & Platt Inc 71 0.02USD 1,183 Whirlpool Corp 129 0.05
Hotels USD 4,756 Hilton Worldwide Holdings Inc 288 0.10USD 4,981 Marriott International Inc 507 0.18USD 8,487 MGM Resorts International^ 201 0.07USD 1,264 Wynn Resorts Ltd 186 0.07
Household goods & home construction USD 1,330 Avery Dennison Corp 105 0.04USD 4,020 Church & Dwight Co Inc 142 0.05USD 2,235 Clorox Co 203 0.07USD 5,970 Kimberly-Clark Corp^ 452 0.16
Household products USD 8,368 Newell Brands Inc 148 0.05
Insurance USD 13,071 Aflac Inc^ 443 0.16USD 5,833 Allstate Corp 410 0.15USD 14,630 American International Group Inc 580 0.21USD 3,011 Arthur J Gallagher & Co 150 0.05USD 870 Assurant Inc 61 0.02USD 32,014 Berkshire Hathaway Inc 4,608 1.65USD 1,664 Brighthouse Financial Inc 59 0.02USD 2,651 Cincinnati Financial Corp 138 0.05USD 5,994 Hartford Financial Services
Group Inc 236 0.08USD 3,725 Lincoln National Corp^ 186 0.07USD 4,411 Loews Corp 162 0.06USD 8,313 Marsh & McLennan Cos Inc 502 0.18USD 17,239 MetLife Inc 596 0.21USD 4,419 Principal Financial Group Inc 185 0.07USD 9,966 Progressive Corp 465 0.17USD 6,925 Prudential Financial Inc 504 0.18USD 1,821 Torchmark Corp 116 0.04USD 4,371 Travelers Cos Inc 422 0.15USD 4,047 Unum Group 118 0.04
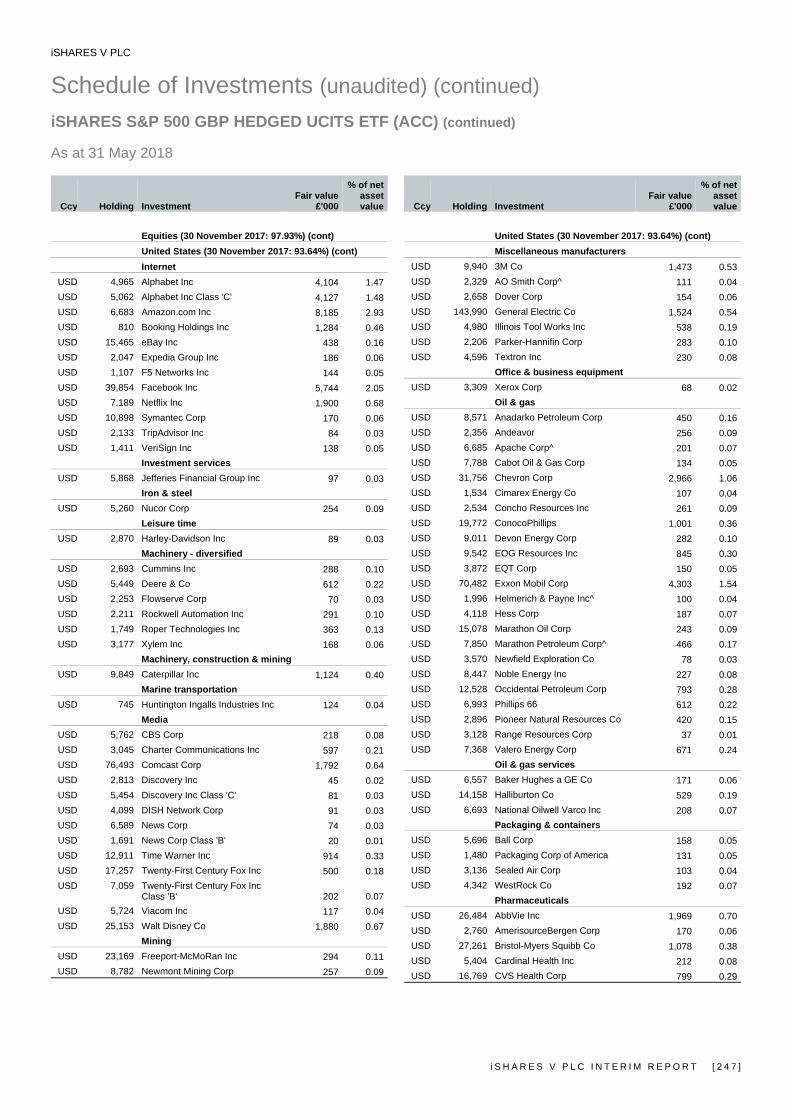
iSHARES V PLC
Schedule of Investments (unaudited) (continued) iSHARES S&P 500 GBP HEDGED UCITS ETF (ACC) (continued) As at 31 May 2018
i S H A R E S V P L C I N T E R I M R E P O R T [ 2 4 7 ]
Ccy Holding Investment Fair value
£'000
% of net asset value
Equities (30 November 2017: 97.93%) (cont) United States (30 November 2017: 93.64%) (cont)
Internet USD 4,965 Alphabet Inc 4,104 1.47USD 5,062 Alphabet Inc Class 'C' 4,127 1.48USD 6,683 Amazon.com Inc 8,185 2.93USD 810 Booking Holdings Inc 1,284 0.46USD 15,465 eBay Inc 438 0.16USD 2,047 Expedia Group Inc 186 0.06USD 1,107 F5 Networks Inc 144 0.05USD 39,854 Facebook Inc 5,744 2.05USD 7,189 Netflix Inc 1,900 0.68USD 10,898 Symantec Corp 170 0.06USD 2,133 TripAdvisor Inc 84 0.03USD 1,411 VeriSign Inc 138 0.05
Investment services USD 5,868 Jefferies Financial Group Inc 97 0.03
Iron & steel USD 5,260 Nucor Corp 254 0.09
Leisure time USD 2,870 Harley-Davidson Inc 89 0.03
Machinery - diversified USD 2,693 Cummins Inc 288 0.10USD 5,449 Deere & Co 612 0.22USD 2,253 Flowserve Corp 70 0.03USD 2,211 Rockwell Automation Inc 291 0.10USD 1,749 Roper Technologies Inc 363 0.13USD 3,177 Xylem Inc 168 0.06
Machinery, construction & mining USD 9,849 Caterpillar Inc 1,124 0.40
Marine transportation USD 745 Huntington Ingalls Industries Inc 124 0.04
Media USD 5,762 CBS Corp 218 0.08USD 3,045 Charter Communications Inc 597 0.21USD 76,493 Comcast Corp 1,792 0.64USD 2,813 Discovery Inc 45 0.02USD 5,454 Discovery Inc Class 'C' 81 0.03USD 4,099 DISH Network Corp 91 0.03USD 6,589 News Corp 74 0.03USD 1,691 News Corp Class 'B' 20 0.01USD 12,911 Time Warner Inc 914 0.33USD 17,257 Twenty-First Century Fox Inc 500 0.18USD 7,059 Twenty-First Century Fox Inc
Class 'B' 202 0.07USD 5,724 Viacom Inc 117 0.04USD 25,153 Walt Disney Co 1,880 0.67
Mining USD 23,169 Freeport-McMoRan Inc 294 0.11USD 8,782 Newmont Mining Corp 257 0.09
Ccy Holding Investment Fair value
£'000
% of net asset value
United States (30 November 2017: 93.64%) (cont) Miscellaneous manufacturers
USD 9,940 3M Co 1,473 0.53USD 2,329 AO Smith Corp^ 111 0.04USD 2,658 Dover Corp 154 0.06USD 143,990 General Electric Co 1,524 0.54USD 4,980 Illinois Tool Works Inc 538 0.19USD 2,206 Parker-Hannifin Corp 283 0.10USD 4,596 Textron Inc 230 0.08
Office & business equipment USD 3,309 Xerox Corp 68 0.02
Oil & gas USD 8,571 Anadarko Petroleum Corp 450 0.16USD 2,356 Andeavor 256 0.09USD 6,685 Apache Corp^ 201 0.07USD 7,788 Cabot Oil & Gas Corp 134 0.05USD 31,756 Chevron Corp 2,966 1.06USD 1,534 Cimarex Energy Co 107 0.04USD 2,534 Concho Resources Inc 261 0.09USD 19,772 ConocoPhillips 1,001 0.36USD 9,011 Devon Energy Corp 282 0.10USD 9,542 EOG Resources Inc 845 0.30USD 3,872 EQT Corp 150 0.05USD 70,482 Exxon Mobil Corp 4,303 1.54USD 1,996 Helmerich & Payne Inc^ 100 0.04USD 4,118 Hess Corp 187 0.07USD 15,078 Marathon Oil Corp 243 0.09USD 7,850 Marathon Petroleum Corp^ 466 0.17USD 3,570 Newfield Exploration Co 78 0.03USD 8,447 Noble Energy Inc 227 0.08USD 12,528 Occidental Petroleum Corp 793 0.28USD 6,993 Phillips 66 612 0.22USD 2,896 Pioneer Natural Resources Co 420 0.15USD 3,128 Range Resources Corp 37 0.01USD 7,368 Valero Energy Corp 671 0.24
Oil & gas services USD 6,557 Baker Hughes a GE Co 171 0.06USD 14,158 Halliburton Co 529 0.19USD 6,693 National Oilwell Varco Inc 208 0.07
Packaging & containers USD 5,696 Ball Corp 158 0.05USD 1,480 Packaging Corp of America 131 0.05USD 3,136 Sealed Air Corp 103 0.04USD 4,342 WestRock Co 192 0.07
Pharmaceuticals USD 26,484 AbbVie Inc 1,969 0.70USD 2,760 AmerisourceBergen Corp 170 0.06USD 27,261 Bristol-Myers Squibb Co 1,078 0.38USD 5,404 Cardinal Health Inc 212 0.08USD 16,769 CVS Health Corp 799 0.29

iSHARES V PLC
Schedule of Investments (unaudited) (continued) iSHARES S&P 500 GBP HEDGED UCITS ETF (ACC) (continued) As at 31 May 2018
[ 2 4 8 ] i S H A R E S V P L C I N T E R I M R E P O R T
Ccy Holding Investment Fair value
£'000
% of net asset value
Equities (30 November 2017: 97.93%) (cont) United States (30 November 2017: 93.64%) (cont) Pharmaceuticals (cont)
USD 16,082 Eli Lilly & Co 1,028 0.37USD 9,238 Express Scripts Holding Co 526 0.19USD 44,627 Johnson & Johnson 4,012 1.43USD 3,498 McKesson Corp 373 0.13USD 44,849 Merck & Co Inc 2,006 0.72USD 2,684 Nektar Therapeutics 162 0.06USD 99,019 Pfizer Inc 2,674 0.96USD 7,998 Zoetis Inc 503 0.18
Pipelines USD 30,310 Kinder Morgan Inc 380 0.13USD 6,989 ONEOK Inc 358 0.13USD 13,686 Williams Cos Inc 276 0.10
Real estate investment & services USD 5,064 CBRE Group Inc 176 0.06
Real estate investment trusts USD 1,566 Alexandria Real Estate Equities
Inc 147 0.05USD 7,400 American Tower Corp 769 0.28USD 2,544 Apartment Investment &
Management Co^ 78 0.03USD 2,244 AvalonBay Communities Inc 279 0.10USD 2,673 Boston Properties Inc 245 0.09USD 6,960 Crown Castle International Corp 545 0.20USD 3,496 Digital Realty Trust Inc 282 0.10USD 5,608 Duke Realty Corp 119 0.04USD 1,329 Equinix Inc 396 0.14USD 6,285 Equity Residential 302 0.11USD 1,010 Essex Property Trust Inc 181 0.07USD 2,124 Extra Space Storage Inc^ 154 0.06USD 1,304 Federal Realty Investment Trust^ 117 0.04USD 9,985 GGP Inc 152 0.05USD 8,417 HCP Inc 152 0.05USD 12,144 Host Hotels & Resorts Inc 197 0.07USD 4,618 Iron Mountain Inc 116 0.04USD 6,616 Kimco Realty Corp 77 0.03USD 1,979 Macerich Co 83 0.03USD 2,055 Mid-America Apartment
Communities Inc 144 0.05USD 8,719 Prologis Inc 422 0.15USD 2,466 Public Storage 393 0.14USD 4,977 Realty Income Corp 199 0.07USD 2,736 Regency Centers Corp 119 0.04USD 1,932 SBA Communications Corp 230 0.08USD 5,032 Simon Property Group Inc 606 0.22USD 1,516 SL Green Realty Corp 111 0.04USD 4,270 UDR Inc 117 0.04USD 6,219 Ventas Inc 255 0.09USD 2,731 Vornado Realty Trust 143 0.05USD 6,230 Welltower Inc 270 0.10USD 12,846 Weyerhaeuser Co 360 0.13
Ccy Holding Investment Fair value
£'000
% of net asset value
United States (30 November 2017: 93.64%) (cont) Retail
USD 1,362 Advance Auto Parts Inc 132 0.05USD 447 AutoZone Inc 218 0.08USD 3,962 Best Buy Co Inc 203 0.07USD 3,269 CarMax Inc^ 169 0.06USD 426 Chipotle Mexican Grill Inc 138 0.05USD 7,235 Costco Wholesale Corp 1,078 0.39USD 1,980 Darden Restaurants Inc 130 0.05USD 4,345 Dollar General Corp 286 0.10USD 4,015 Dollar Tree Inc^ 249 0.09USD 2,283 Foot Locker Inc 93 0.03USD 3,941 Gap Inc 83 0.03USD 2,344 Genuine Parts Co^ 160 0.06USD 19,416 Home Depot Inc 2,722 0.97USD 2,733 Kohl's Corp 137 0.05USD 3,938 L Brands Inc 100 0.04USD 13,835 Lowe's Cos Inc 988 0.35USD 5,040 Macy's Inc 132 0.05USD 13,276 McDonald's Corp 1,596 0.57USD 2,035 Nordstrom Inc 75 0.03USD 1,323 O'Reilly Automotive Inc 268 0.10USD 6,559 Ross Stores Inc 389 0.14USD 23,643 Starbucks Corp 1,007 0.36USD 4,511 Tapestry Inc 148 0.05USD 9,261 Target Corp 507 0.18USD 1,841 Tiffany & Co 181 0.07USD 10,417 TJX Cos Inc 707 0.25USD 2,214 Tractor Supply Co 124 0.04USD 961 Ulta Salon Cosmetics &
Fragrance Inc^ 178 0.06USD 13,901 Walgreens Boots Alliance Inc 652 0.23USD 23,946 Walmart Inc 1,485 0.53USD 5,362 Yum! Brands Inc 328 0.12
Savings & loans USD 5,824 People's United Financial Inc 81 0.03
Semiconductors USD 14,186 Advanced Micro Devices Inc 146 0.05USD 6,089 Analog Devices Inc 445 0.16USD 17,600 Applied Materials Inc 672 0.24USD 6,895 Broadcom Inc 1,306 0.47USD 77,821 Intel Corp 3,228 1.16USD 622 IPG Photonics Corp 113 0.04USD 2,508 KLA-Tencor Corp 213 0.08USD 2,662 Lam Research Corp 396 0.14USD 3,784 Microchip Technology Inc^ 277 0.10USD 19,550 Micron Technology Inc 846 0.30USD 10,093 NVIDIA Corp 1,913 0.69USD 2,032 Qorvo Inc 123 0.04USD 24,558 Qualcomm Inc 1,073 0.38USD 2,941 Skyworks Solutions Inc 218 0.08USD 16,415 Texas Instruments Inc 1,381 0.49USD 4,168 Xilinx Inc 213 0.08
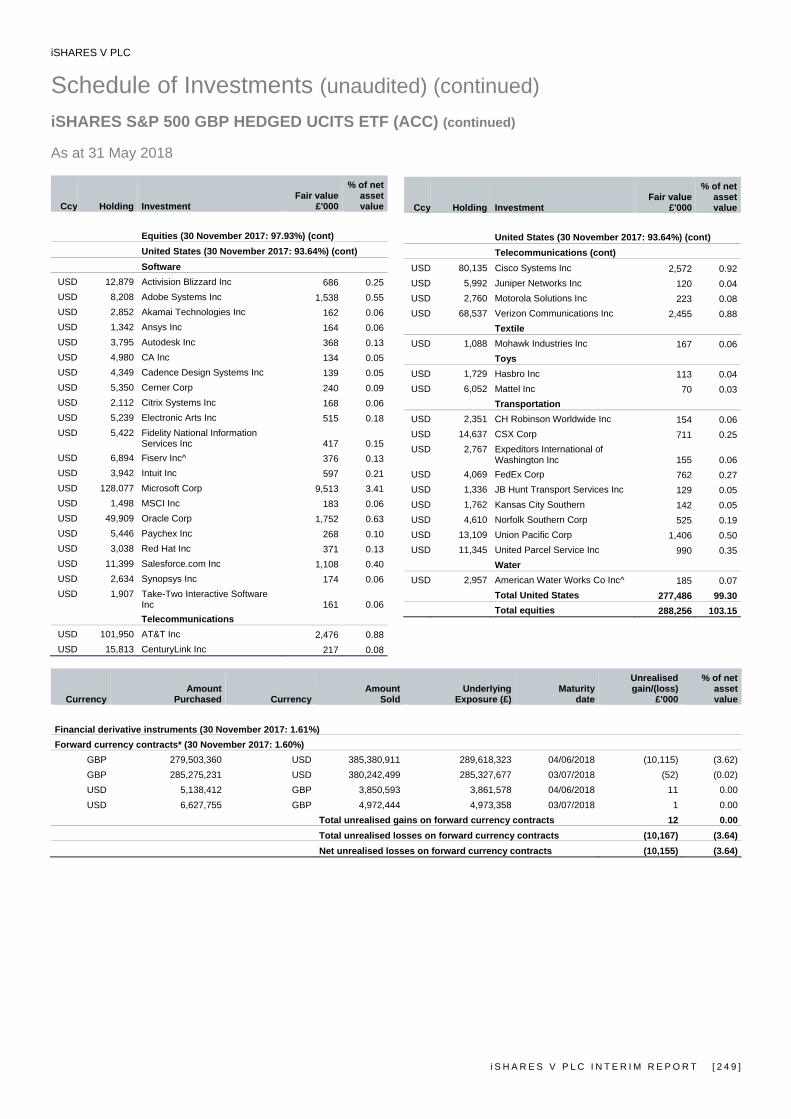
iSHARES V PLC
Schedule of Investments (unaudited) (continued) iSHARES S&P 500 GBP HEDGED UCITS ETF (ACC) (continued) As at 31 May 2018
i S H A R E S V P L C I N T E R I M R E P O R T [ 2 4 9 ]
Ccy Holding Investment Fair value
£'000
% of net asset value
Equities (30 November 2017: 97.93%) (cont) United States (30 November 2017: 93.64%) (cont)
Software USD 12,879 Activision Blizzard Inc 686 0.25USD 8,208 Adobe Systems Inc 1,538 0.55USD 2,852 Akamai Technologies Inc 162 0.06USD 1,342 Ansys Inc 164 0.06USD 3,795 Autodesk Inc 368 0.13USD 4,980 CA Inc 134 0.05USD 4,349 Cadence Design Systems Inc 139 0.05USD 5,350 Cerner Corp 240 0.09USD 2,112 Citrix Systems Inc 168 0.06USD 5,239 Electronic Arts Inc 515 0.18USD 5,422 Fidelity National Information
Services Inc 417 0.15USD 6,894 Fiserv Inc^ 376 0.13USD 3,942 Intuit Inc 597 0.21USD 128,077 Microsoft Corp 9,513 3.41USD 1,498 MSCI Inc 183 0.06USD 49,909 Oracle Corp 1,752 0.63USD 5,446 Paychex Inc 268 0.10USD 3,038 Red Hat Inc 371 0.13USD 11,399 Salesforce.com Inc 1,108 0.40USD 2,634 Synopsys Inc 174 0.06USD 1,907 Take-Two Interactive Software
Inc 161 0.06Telecommunications
USD 101,950 AT&T Inc 2,476 0.88USD 15,813 CenturyLink Inc 217 0.08
Ccy Holding Investment Fair value
£'000
% of netassetvalue
United States (30 November 2017: 93.64%) (cont) Telecommunications (cont)
USD 80,135 Cisco Systems Inc 2,572 0.92USD 5,992 Juniper Networks Inc 120 0.04USD 2,760 Motorola Solutions Inc 223 0.08USD 68,537 Verizon Communications Inc 2,455 0.88
Textile USD 1,088 Mohawk Industries Inc 167 0.06
Toys USD 1,729 Hasbro Inc 113 0.04USD 6,052 Mattel Inc 70 0.03
Transportation USD 2,351 CH Robinson Worldwide Inc 154 0.06USD 14,637 CSX Corp 711 0.25USD 2,767 Expeditors International of
Washington Inc 155 0.06USD 4,069 FedEx Corp 762 0.27USD 1,336 JB Hunt Transport Services Inc 129 0.05USD 1,762 Kansas City Southern 142 0.05USD 4,610 Norfolk Southern Corp 525 0.19USD 13,109 Union Pacific Corp 1,406 0.50USD 11,345 United Parcel Service Inc 990 0.35
Water USD 2,957 American Water Works Co Inc^ 185 0.07
Total United States 277,486 99.30Total equities 288,256 103.15
Currency Amount
Purchased Currency Amount
SoldUnderlying
Exposure (£)Maturity
date
Unrealisedgain/(loss)
£'000
% of netassetvalue
Financial derivative instruments (30 November 2017: 1.61%) Forward currency contracts* (30 November 2017: 1.60%)
GBP 279,503,360 USD 385,380,911 289,618,323 04/06/2018 (10,115) (3.62)GBP 285,275,231 USD 380,242,499 285,327,677 03/07/2018 (52) (0.02)USD 5,138,412 GBP 3,850,593 3,861,578 04/06/2018 11 0.00USD 6,627,755 GBP 4,972,444 4,973,358 03/07/2018 1 0.00
Total unrealised gains on forward currency contracts 12 0.00 Total unrealised losses on forward currency contracts (10,167) (3.64) Net unrealised losses on forward currency contracts (10,155) (3.64)

iSHARES V PLC
Schedule of Investments (unaudited) (continued) iSHARES S&P 500 GBP HEDGED UCITS ETF (ACC) (continued) As at 31 May 2018
[ 2 5 0 ] i S H A R E S V P L C I N T E R I M R E P O R T
Ccy No. of
contracts
Underlying exposure
£’000 Fair value
£'000
% of net asset value
Futures contracts (30 November 2017: 0.01%)
USD 11 S&P 500 E Mini Index Futures June 2018 1,107 11 0.00
Total unrealised gains on futures contracts 11 0.00
Total financial derivative instruments (10,144) (3.64)
Fair value
£’000
% of net asset value
Total value of investments 278,112 99.51 Cash† 909 0.33 Other net assets 443 0.16
Net asset value attributable to redeemable participating shareholders at the end of the financial period 279,464 100.00
† Cash holdings of £867,228 are held with State Street Bank and Trust Company. £41,970 is held as security for futures contracts with Barclays Bank Plc. ^ These securities are partially or fully transferred as securities lent. * The counterparty for forward currency contracts is State Street Bank and Trust Company. ** Investment in related party.
Equities are primarily classified by country of incorporation of the entity in which the Fund holds shares. Underlying exposure has been calculated according to the guidelines issued by the ESMA and represents the market value of an equivalent position in the assets underlying each financial derivative instrument.
Analysis of total current assets gross of all liabilities
Fair value£’000
% of totalcurrentassets
Transferable securities admitted to an official stock exchange listing 288,256 99.45Exchange traded financial derivative instruments 11 0.00OTC financial derivative instruments 12 0.00Other assets 1,604 0.55Total current assets 289,883 100.00

iSHARES V PLC
Schedule of Investments (unaudited) (continued) iSHARES S&P 500 HEALTH CARE SECTOR UCITS ETF As at 31 May 2018
i S H A R E S V P L C I N T E R I M R E P O R T [ 2 5 1 ]
Ccy Holding Investment Fair value
$'000
% of net asset value
Transferable Securities Admitted to an Official Stock Exchange Listing or traded on a Regulated Market (30 November 2017: 99.67%)
Equities (30 November 2017: 99.67%) Ireland (30 November 2017: 5.67%) Healthcare products
USD 342,820 Medtronic Plc 29,592 3.63Pharmaceuticals
USD 83,699 Allergan Plc 12,622 1.55USD 33,286 Perrigo Co Plc 2,435 0.30
Total Ireland 44,649 5.48
Netherlands (30 November 2017: 0.61%) Pharmaceuticals
USD 129,472 Mylan NV 4,979 0.61Total Netherlands 4,979 0.61
United States (30 November 2017: 93.39%) Biotechnology
USD 55,905 Alexion Pharmaceuticals Inc 6,492 0.80USD 169,103 Amgen Inc 30,374 3.73USD 53,651 Biogen Inc 15,771 1.94USD 190,722 Celgene Corp 15,006 1.84USD 331,742 Gilead Sciences Inc 22,359 2.75USD 37,188 Illumina Inc 10,132 1.24USD 44,761 Incyte Corp 3,056 0.38USD 19,448 Regeneron Pharmaceuticals Inc 5,841 0.72USD 64,233 Vertex Pharmaceuticals Inc 9,892 1.21
Electronics USD 81,166 Agilent Technologies Inc 5,026 0.62USD 6,492 Mettler-Toledo International Inc 3,575 0.44USD 28,051 PerkinElmer Inc 2,085 0.26USD 20,047 Waters Corp 3,862 0.47
Healthcare products USD 441,118 Abbott Laboratories 27,142 3.33USD 10,646 Abiomed Inc 4,058 0.50USD 18,152 Align Technology Inc 6,026 0.74USD 125,652 Baxter International Inc 8,901 1.09USD 67,506 Becton Dickinson and Co 14,959 1.84USD 348,022 Boston Scientific Corp 10,577 1.30USD 12,342 Cooper Cos Inc 2,793 0.34USD 155,686 Danaher Corp 15,457 1.90USD 57,900 Dentsply Sirona Inc 2,537 0.31USD 52,998 Edwards Lifesciences Corp 7,277 0.89USD 39,163 Henry Schein Inc^ 2,710 0.33USD 70,469 Hologic Inc^ 2,670 0.33USD 22,180 IDEXX Laboratories Inc 4,618 0.57USD 28,456 Intuitive Surgical Inc 13,080 1.61USD 36,400 ResMed Inc 3,742 0.46USD 81,671 Stryker Corp 14,212 1.75USD 101,710 Thermo Fisher Scientific Inc 21,183 2.60
Ccy Holding Investment Fair value
$'000
% of net asset value
United States (30 November 2017: 93.39%) (cont) Healthcare products (cont)
USD 23,094 Varian Medical Systems Inc 2,722 0.33USD 51,144 Zimmer Biomet Holdings Inc 5,703 0.70
Healthcare services USD 82,888 Aetna Inc 14,599 1.79USD 64,688 Anthem Inc 14,323 1.76USD 50,273 Centene Corp 5,890 0.72USD 61,473 Cigna Corp 10,412 1.28USD 37,105 DaVita Inc 2,480 0.30USD 29,619 Envision Healthcare Corp 1,270 0.16USD 70,663 HCA Healthcare Inc 7,288 0.90USD 34,847 Humana Inc 10,140 1.25USD 37,140 IQVIA Holdings Inc 3,674 0.45USD 25,589 Laboratory Corp of America
Holdings 4,621 0.57USD 34,550 Quest Diagnostics Inc 3,681 0.45USD 245,076 UnitedHealth Group Inc 59,188 7.27USD 22,053 Universal Health Services Inc 2,536 0.31
Pharmaceuticals USD 404,019 AbbVie Inc 39,973 4.91USD 41,415 AmerisourceBergen Corp 3,402 0.42USD 413,286 Bristol-Myers Squibb Co 21,747 2.67USD 80,168 Cardinal Health Inc 4,176 0.51USD 256,737 CVS Health Corp 16,274 2.00USD 243,943 Eli Lilly & Co 20,745 2.55USD 142,881 Express Scripts Holding Co 10,832 1.33USD 679,459 Johnson & Johnson 81,277 9.98USD 52,090 McKesson Corp 7,394 0.91USD 683,284 Merck & Co Inc 40,676 4.99USD 40,174 Nektar Therapeutics 3,225 0.40USD 1,506,851 Pfizer Inc 54,141 6.65USD 123,322 Zoetis Inc 10,322 1.27
Software USD 79,394 Cerner Corp 4,738 0.58
Total United States 762,862 93.70Total equities 812,490 99.79
CcyNo. of
contracts
Underlying exposure
$'000 Fair value
$'000
% of netassetsvalue
Financial derivative instruments (30 November 2017: 0.01%) Futures contracts (30 November 2017: 0.01%)
USD 14 E Mini Health Care Select Sector Futures June 2018 1,158 (2) 0.00Total unrealised losses on futures contracts (2) 0.00Total financial derivative instruments (2) 0.00

iSHARES V PLC
Schedule of Investments (unaudited) (continued) iSHARES S&P 500 HEALTH CARE SECTOR UCITS ETF (continued) As at 31 May 2018
[ 2 5 2 ] i S H A R E S V P L C I N T E R I M R E P O R T
Fair value
$'000
% of net asset value
Total value of investments 812,488 99.79 Cash† 634 0.08 Other net assets 1,058 0.13
Net asset value attributable to redeemable participating shareholders at the end of the financial period 814,180 100.00
† Cash holdings of $578,077 are held with State Street Bank and Trust Company. $55,921 is held as security for futures contracts with Morgan Stanley. ^ These securities are partially or fully transferred as securities lent.
Equities are primarily classified by country of incorporation of the entity in which the Fund holds shares. Underlying exposure has been calculated according to the guidelines issued by the ESMA and represents the market value of an equivalent position in the assets underlying each financial derivative instrument.
Analysis of total current assets gross of all liabilities
Fair value$'000
% of total current assets
Transferable securities admitted to an official stock exchange listing 812,490 99.28Other assets 5,930 0.72Total current assets 818,420 100.00

iSHARES V PLC
Schedule of Investments (unaudited) (continued) iSHARES S&P 500 INDUSTRIALS SECTOR UCITS ETF As at 31 May 2018
i S H A R E S V P L C I N T E R I M R E P O R T [ 2 5 3 ]
Ccy Holding Investment Fair value
$'000
% of net asset value
Transferable Securities Admitted to an Official Stock Exchange Listing or traded on a Regulated Market (30 November 2017: 99.74%)
Equities (30 November 2017: 99.74%) Bermuda (30 November 2017: 0.71%) Commercial services
USD 1,330 IHS Markit Ltd 65 0.77Total Bermuda 65 0.77
Ireland (30 November 2017: 4.85%) Building materials and fixtures
USD 3,409 Johnson Controls International Plc 114 1.35Electronics
USD 347 Allegion Plc 27 0.32Machinery - diversified
USD 605 Pentair Plc 26 0.31Miscellaneous manufacturers
USD 1,612 Eaton Corp Plc 124 1.47USD 930 Ingersoll-Rand Plc 81 0.96
Total Ireland 372 4.41
United Kingdom (30 November 2017: 0.52%) Commercial services
USD 1,218 Nielsen Holdings Plc 37 0.44Total United Kingdom 37 0.44
United States (30 November 2017: 93.66%) Aerospace & defence
USD 1,547 Arconic Inc 27 0.32USD 2,041 Boeing Co 719 8.52USD 1,015 General Dynamics Corp 205 2.43USD 439 Harris Corp 66 0.78USD 287 L3 Technologies Inc 57 0.68USD 918 Lockheed Martin Corp 289 3.42USD 642 Northrop Grumman Corp 210 2.49USD 1,061 Raytheon Co 222 2.63USD 603 Rockwell Collins Inc 83 0.98USD 178 TransDigm Group Inc 59 0.70USD 2,736 United Technologies Corp 342 4.05
Airlines USD 450 Alaska Air Group Inc 27 0.32USD 1,554 American Airlines Group Inc^ 68 0.81USD 2,398 Delta Air Lines Inc 129 1.53USD 1,992 Southwest Airlines Co 102 1.21USD 887 United Continental Holdings Inc 62 0.73
Auto manufacturers USD 1,298 Paccar Inc 81 0.96
Building materials and fixtures USD 564 Fortune Brands Home & Security Inc 32 0.38USD 1,144 Masco Corp 42 0.50
Ccy Holding Investment Fair value
$'000
% of net asset value
United States (30 November 2017: 93.66%) (cont) Commercial services
USD 318 Cintas Corp 58 0.69USD 438 Equifax Inc 50 0.59USD 569 Quanta Services Inc 21 0.25USD 462 Robert Half International Inc 29 0.35USD 314 United Rentals Inc 50 0.59USD 569 Verisk Analytics Inc 60 0.71
Distribution & wholesale USD 1,050 Fastenal Co^ 56 0.66USD 190 WW Grainger Inc 58 0.69
Electrical components & equipment USD 155 Acuity Brands Inc 18 0.21USD 873 AMETEK Inc 64 0.76USD 2,339 Emerson Electric Co 166 1.97
Electronics USD 1,130 Fortive Corp 82 0.97USD 2,771 Honeywell International Inc 410 4.86
Engineering & construction USD 521 Fluor Corp 26 0.31USD 438 Jacobs Engineering Group Inc 28 0.33
Environmental control USD 832 Republic Services Inc 56 0.66USD 317 Stericycle Inc^ 20 0.24USD 1,471 Waste Management Inc 122 1.45
Hand & machine tools USD 210 Snap-on Inc 31 0.37USD 566 Stanley Black & Decker Inc 79 0.93
Machinery - diversified USD 571 Cummins Inc 81 0.96USD 1,202 Deere & Co^ 180 2.13USD 474 Flowserve Corp 20 0.24USD 467 Rockwell Automation Inc 82 0.97USD 378 Roper Technologies Inc 104 1.23USD 658 Xylem Inc 46 0.55
Machinery, construction & mining USD 2,198 Caterpillar Inc 334 3.96
Marine transportation USD 167 Huntington Ingalls Industries Inc 37 0.44
Miscellaneous manufacturers USD 2,190 3M Co 432 5.12USD 534 AO Smith Corp^ 34 0.40USD 564 Dover Corp 44 0.52USD 31,988 General Electric Co 450 5.33USD 1,142 Illinois Tool Works Inc 164 1.94USD 492 Parker-Hannifin Corp 84 1.00USD 977 Textron Inc 65 0.77
Transportation USD 517 CH Robinson Worldwide Inc 45 0.53USD 3,268 CSX Corp 211 2.50USD 648 Expeditors International of
Washington Inc 48 0.57
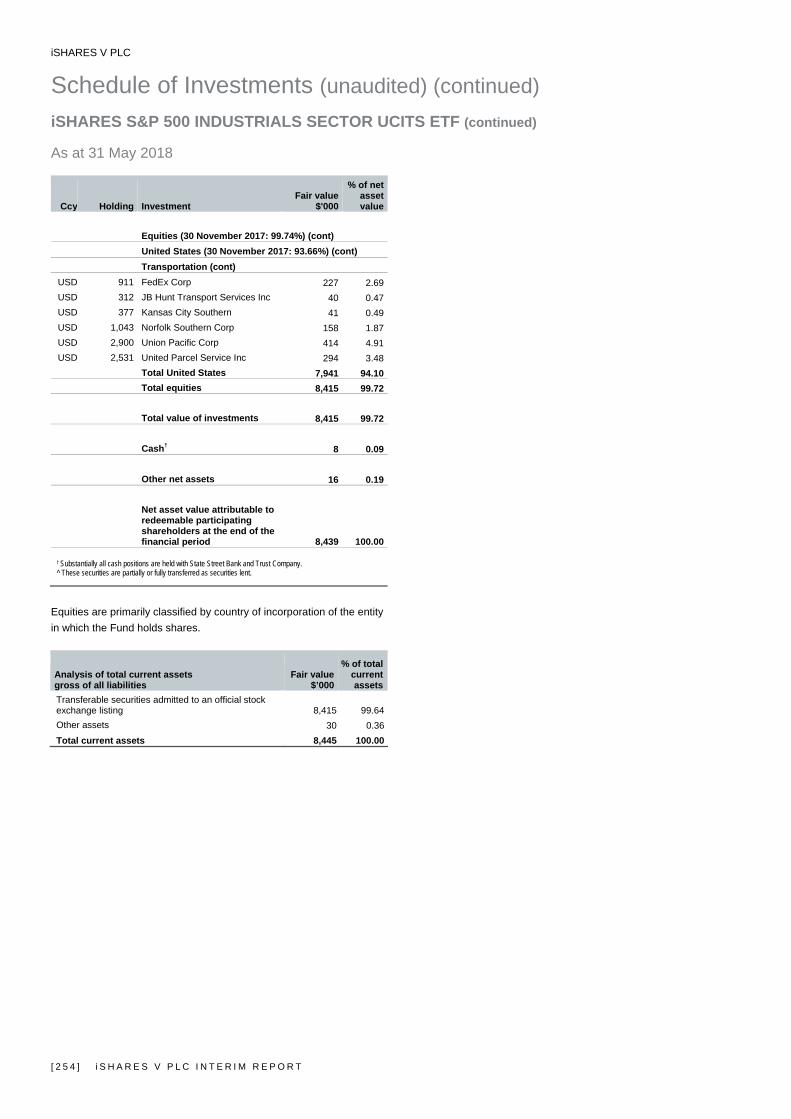
iSHARES V PLC
Schedule of Investments (unaudited) (continued) iSHARES S&P 500 INDUSTRIALS SECTOR UCITS ETF (continued) As at 31 May 2018
[ 2 5 4 ] i S H A R E S V P L C I N T E R I M R E P O R T
Ccy Holding Investment Fair value
$'000
% of net asset value
Equities (30 November 2017: 99.74%) (cont) United States (30 November 2017: 93.66%) (cont) Transportation (cont)
USD 911 FedEx Corp 227 2.69USD 312 JB Hunt Transport Services Inc 40 0.47USD 377 Kansas City Southern 41 0.49USD 1,043 Norfolk Southern Corp 158 1.87USD 2,900 Union Pacific Corp 414 4.91USD 2,531 United Parcel Service Inc 294 3.48
Total United States 7,941 94.10Total equities 8,415 99.72 Total value of investments 8,415 99.72 Cash† 8 0.09 Other net assets 16 0.19 Net asset value attributable to redeemable participating shareholders at the end of the financial period 8,439 100.00
† Substantially all cash positions are held with State Street Bank and Trust Company. ^ These securities are partially or fully transferred as securities lent.
Equities are primarily classified by country of incorporation of the entity in which the Fund holds shares.
Analysis of total current assets gross of all liabilities
Fair value$’000
% of total current assets
Transferable securities admitted to an official stock exchange listing 8,415 99.64Other assets 30 0.36Total current assets 8,445 100.00
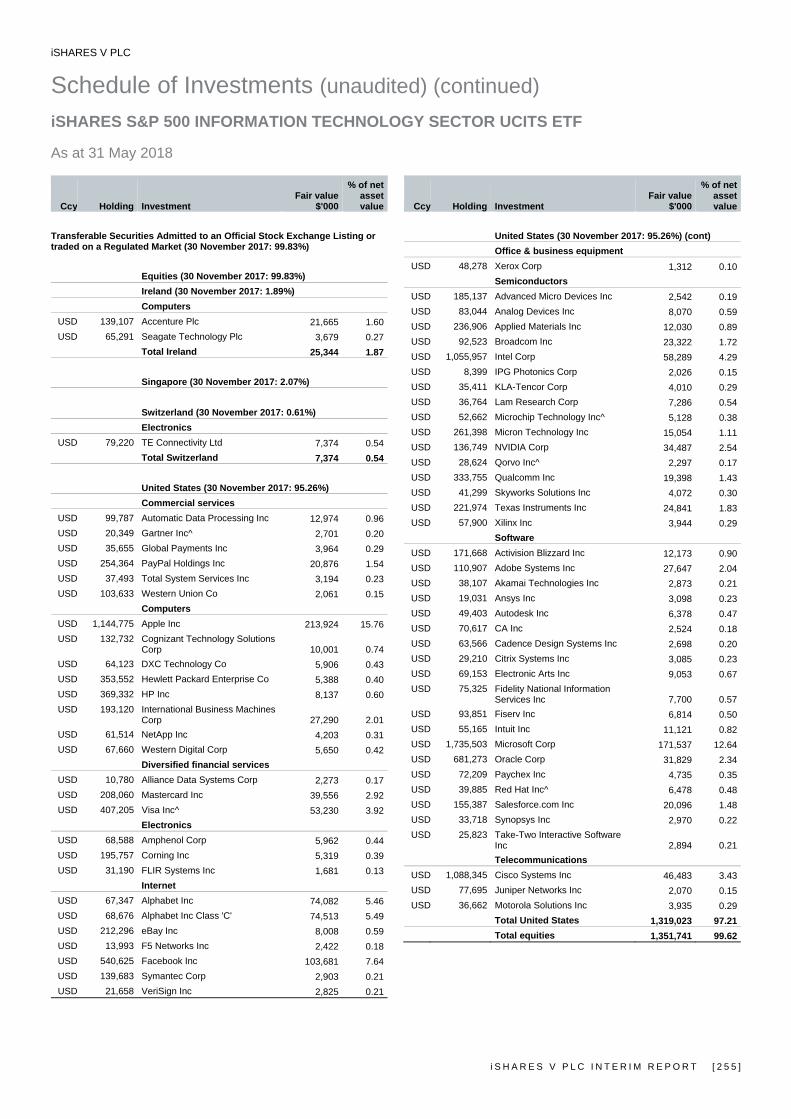
iSHARES V PLC
Schedule of Investments (unaudited) (continued) iSHARES S&P 500 INFORMATION TECHNOLOGY SECTOR UCITS ETF As at 31 May 2018
i S H A R E S V P L C I N T E R I M R E P O R T [ 2 5 5 ]
Ccy Holding Investment Fair value
$'000
% of net asset value
Transferable Securities Admitted to an Official Stock Exchange Listing or traded on a Regulated Market (30 November 2017: 99.83%)
Equities (30 November 2017: 99.83%) Ireland (30 November 2017: 1.89%) Computers
USD 139,107 Accenture Plc 21,665 1.60USD 65,291 Seagate Technology Plc 3,679 0.27
Total Ireland 25,344 1.87
Singapore (30 November 2017: 2.07%) Switzerland (30 November 2017: 0.61%) Electronics
USD 79,220 TE Connectivity Ltd 7,374 0.54Total Switzerland 7,374 0.54
United States (30 November 2017: 95.26%) Commercial services
USD 99,787 Automatic Data Processing Inc 12,974 0.96USD 20,349 Gartner Inc^ 2,701 0.20USD 35,655 Global Payments Inc 3,964 0.29USD 254,364 PayPal Holdings Inc 20,876 1.54USD 37,493 Total System Services Inc 3,194 0.23USD 103,633 Western Union Co 2,061 0.15
Computers USD 1,144,775 Apple Inc 213,924 15.76USD 132,732 Cognizant Technology Solutions
Corp 10,001 0.74USD 64,123 DXC Technology Co 5,906 0.43USD 353,552 Hewlett Packard Enterprise Co 5,388 0.40USD 369,332 HP Inc 8,137 0.60USD 193,120 International Business Machines
Corp 27,290 2.01USD 61,514 NetApp Inc 4,203 0.31USD 67,660 Western Digital Corp 5,650 0.42
Diversified financial services USD 10,780 Alliance Data Systems Corp 2,273 0.17USD 208,060 Mastercard Inc 39,556 2.92USD 407,205 Visa Inc^ 53,230 3.92
Electronics USD 68,588 Amphenol Corp 5,962 0.44USD 195,757 Corning Inc 5,319 0.39USD 31,190 FLIR Systems Inc 1,681 0.13
Internet USD 67,347 Alphabet Inc 74,082 5.46USD 68,676 Alphabet Inc Class 'C' 74,513 5.49USD 212,296 eBay Inc 8,008 0.59USD 13,993 F5 Networks Inc 2,422 0.18USD 540,625 Facebook Inc 103,681 7.64USD 139,683 Symantec Corp 2,903 0.21USD 21,658 VeriSign Inc 2,825 0.21
Ccy Holding Investment Fair value
$'000
% of net asset value
United States (30 November 2017: 95.26%) (cont) Office & business equipment
USD 48,278 Xerox Corp 1,312 0.10Semiconductors
USD 185,137 Advanced Micro Devices Inc 2,542 0.19USD 83,044 Analog Devices Inc 8,070 0.59USD 236,906 Applied Materials Inc 12,030 0.89USD 92,523 Broadcom Inc 23,322 1.72USD 1,055,957 Intel Corp 58,289 4.29USD 8,399 IPG Photonics Corp 2,026 0.15USD 35,411 KLA-Tencor Corp 4,010 0.29USD 36,764 Lam Research Corp 7,286 0.54USD 52,662 Microchip Technology Inc^ 5,128 0.38USD 261,398 Micron Technology Inc 15,054 1.11USD 136,749 NVIDIA Corp 34,487 2.54USD 28,624 Qorvo Inc^ 2,297 0.17USD 333,755 Qualcomm Inc 19,398 1.43USD 41,299 Skyworks Solutions Inc 4,072 0.30USD 221,974 Texas Instruments Inc 24,841 1.83USD 57,900 Xilinx Inc 3,944 0.29
Software USD 171,668 Activision Blizzard Inc 12,173 0.90USD 110,907 Adobe Systems Inc 27,647 2.04USD 38,107 Akamai Technologies Inc 2,873 0.21USD 19,031 Ansys Inc 3,098 0.23USD 49,403 Autodesk Inc 6,378 0.47USD 70,617 CA Inc 2,524 0.18USD 63,566 Cadence Design Systems Inc 2,698 0.20USD 29,210 Citrix Systems Inc 3,085 0.23USD 69,153 Electronic Arts Inc 9,053 0.67USD 75,325 Fidelity National Information
Services Inc 7,700 0.57USD 93,851 Fiserv Inc 6,814 0.50USD 55,165 Intuit Inc 11,121 0.82USD 1,735,503 Microsoft Corp 171,537 12.64USD 681,273 Oracle Corp 31,829 2.34USD 72,209 Paychex Inc 4,735 0.35USD 39,885 Red Hat Inc^ 6,478 0.48USD 155,387 Salesforce.com Inc 20,096 1.48USD 33,718 Synopsys Inc 2,970 0.22USD 25,823 Take-Two Interactive Software
Inc 2,894 0.21Telecommunications
USD 1,088,345 Cisco Systems Inc 46,483 3.43USD 77,695 Juniper Networks Inc 2,070 0.15USD 36,662 Motorola Solutions Inc 3,935 0.29
Total United States 1,319,023 97.21Total equities 1,351,741 99.62
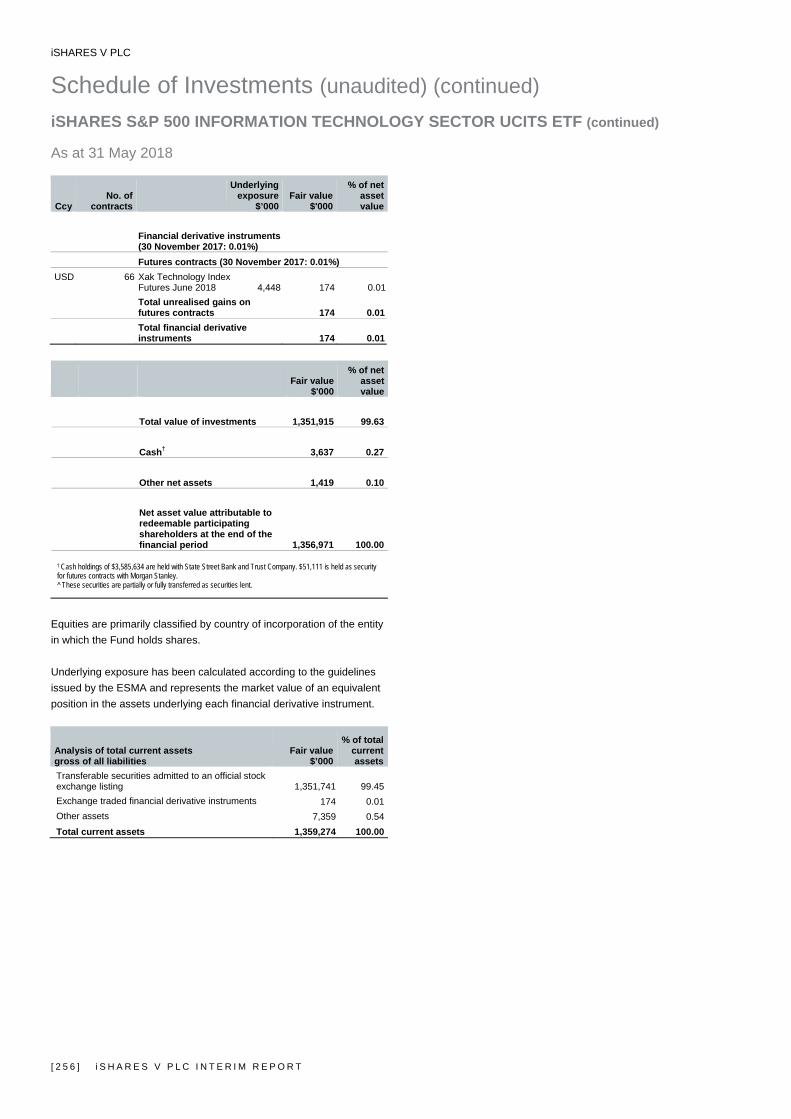
iSHARES V PLC
Schedule of Investments (unaudited) (continued) iSHARES S&P 500 INFORMATION TECHNOLOGY SECTOR UCITS ETF (continued) As at 31 May 2018
[ 2 5 6 ] i S H A R E S V P L C I N T E R I M R E P O R T
Ccy No. of
contracts
Underlying exposure
$’000 Fair value
$'000
% of net asset value
Financial derivative instruments
(30 November 2017: 0.01%) Futures contracts (30 November 2017: 0.01%)
USD 66 Xak Technology Index Futures June 2018 4,448 174 0.01
Total unrealised gains on futures contracts 174 0.01
Total financial derivative instruments 174 0.01
Fair value
$'000
% of netassetvalue
Total value of investments 1,351,915 99.63 Cash† 3,637 0.27 Other net assets 1,419 0.10
Net asset value attributable to redeemable participating shareholders at the end of the financial period 1,356,971 100.00
† Cash holdings of $3,585,634 are held with State Street Bank and Trust Company. $51,111 is held as security for futures contracts with Morgan Stanley. ^ These securities are partially or fully transferred as securities lent.
Equities are primarily classified by country of incorporation of the entity in which the Fund holds shares. Underlying exposure has been calculated according to the guidelines issued by the ESMA and represents the market value of an equivalent position in the assets underlying each financial derivative instrument.
Analysis of total current assets gross of all liabilities
Fair value$’000
% of total current assets
Transferable securities admitted to an official stock exchange listing 1,351,741 99.45Exchange traded financial derivative instruments 174 0.01Other assets 7,359 0.54Total current assets 1,359,274 100.00
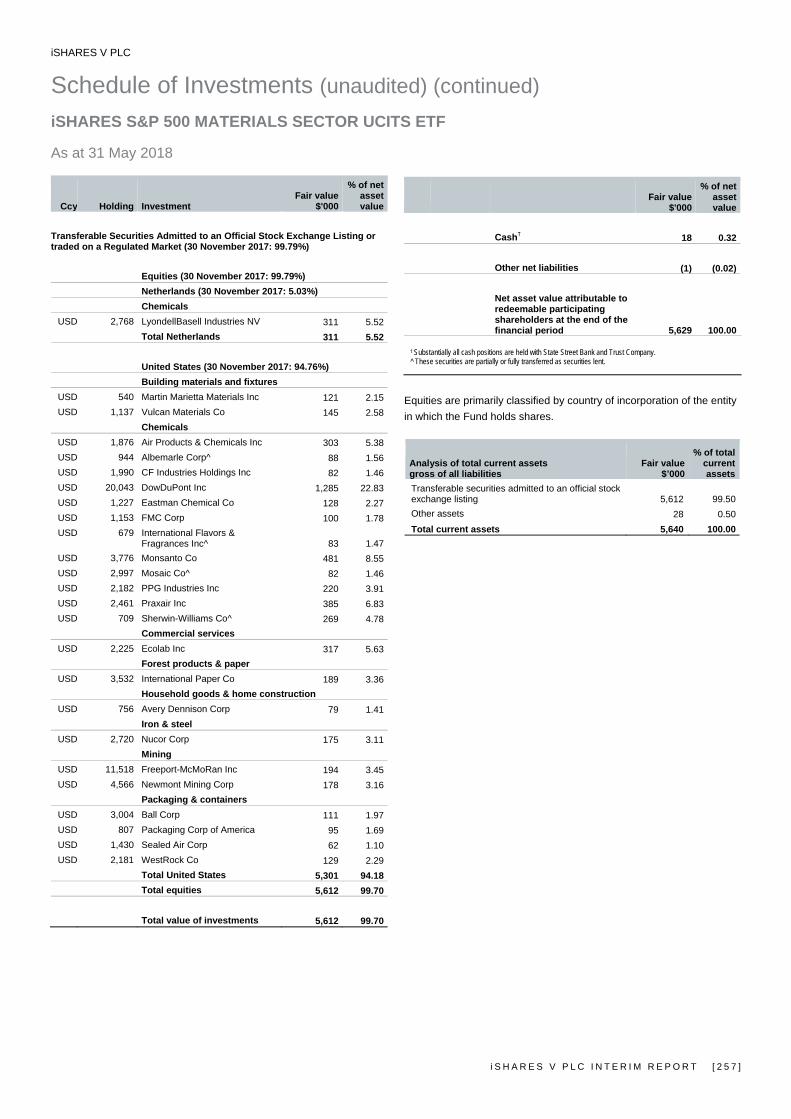
iSHARES V PLC
Schedule of Investments (unaudited) (continued) iSHARES S&P 500 MATERIALS SECTOR UCITS ETF As at 31 May 2018
i S H A R E S V P L C I N T E R I M R E P O R T [ 2 5 7 ]
Ccy Holding Investment Fair value
$'000
% of net asset value
Transferable Securities Admitted to an Official Stock Exchange Listing or traded on a Regulated Market (30 November 2017: 99.79%)
Equities (30 November 2017: 99.79%) Netherlands (30 November 2017: 5.03%) Chemicals
USD 2,768 LyondellBasell Industries NV 311 5.52Total Netherlands 311 5.52
United States (30 November 2017: 94.76%) Building materials and fixtures
USD 540 Martin Marietta Materials Inc 121 2.15USD 1,137 Vulcan Materials Co 145 2.58
Chemicals USD 1,876 Air Products & Chemicals Inc 303 5.38USD 944 Albemarle Corp^ 88 1.56USD 1,990 CF Industries Holdings Inc 82 1.46USD 20,043 DowDuPont Inc 1,285 22.83USD 1,227 Eastman Chemical Co 128 2.27USD 1,153 FMC Corp 100 1.78USD 679 International Flavors &
Fragrances Inc^ 83 1.47USD 3,776 Monsanto Co 481 8.55USD 2,997 Mosaic Co^ 82 1.46USD 2,182 PPG Industries Inc 220 3.91USD 2,461 Praxair Inc 385 6.83USD 709 Sherwin-Williams Co^ 269 4.78
Commercial services USD 2,225 Ecolab Inc 317 5.63
Forest products & paper USD 3,532 International Paper Co 189 3.36
Household goods & home construction USD 756 Avery Dennison Corp 79 1.41
Iron & steel USD 2,720 Nucor Corp 175 3.11
Mining USD 11,518 Freeport-McMoRan Inc 194 3.45USD 4,566 Newmont Mining Corp 178 3.16
Packaging & containers USD 3,004 Ball Corp 111 1.97USD 807 Packaging Corp of America 95 1.69USD 1,430 Sealed Air Corp 62 1.10USD 2,181 WestRock Co 129 2.29
Total United States 5,301 94.18Total equities 5,612 99.70 Total value of investments 5,612 99.70
Fair value
$'000
% of net asset value
Cash† 18 0.32 Other net liabilities (1) (0.02) Net asset value attributable to redeemable participating shareholders at the end of the financial period 5,629 100.00
† Substantially all cash positions are held with State Street Bank and Trust Company. ^ These securities are partially or fully transferred as securities lent.
Equities are primarily classified by country of incorporation of the entity in which the Fund holds shares.
Analysis of total current assets gross of all liabilities
Fair value$’000
% of total current assets
Transferable securities admitted to an official stock exchange listing 5,612 99.50Other assets 28 0.50Total current assets 5,640 100.00
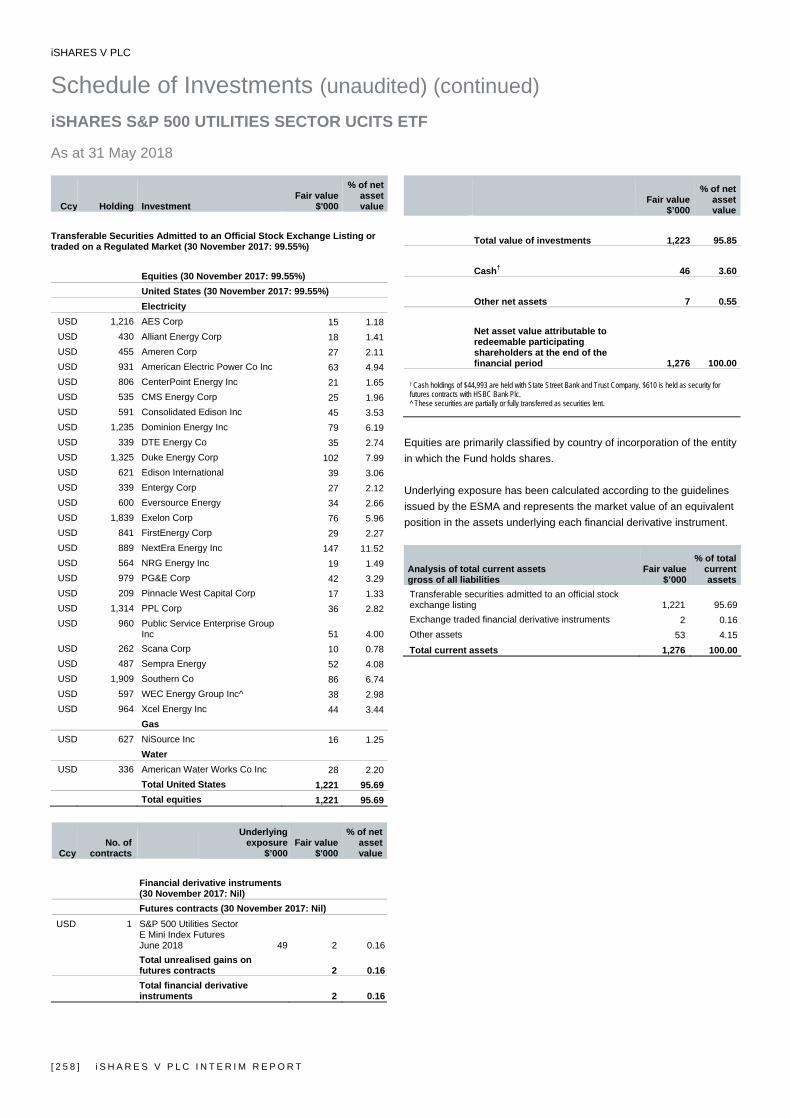
iSHARES V PLC
Schedule of Investments (unaudited) (continued) iSHARES S&P 500 UTILITIES SECTOR UCITS ETF As at 31 May 2018
[ 2 5 8 ] i S H A R E S V P L C I N T E R I M R E P O R T
Ccy Holding Investment Fair value
$'000
% of net asset value
Transferable Securities Admitted to an Official Stock Exchange Listing or traded on a Regulated Market (30 November 2017: 99.55%)
Equities (30 November 2017: 99.55%) United States (30 November 2017: 99.55%) Electricity
USD 1,216 AES Corp 15 1.18USD 430 Alliant Energy Corp 18 1.41USD 455 Ameren Corp 27 2.11USD 931 American Electric Power Co Inc 63 4.94USD 806 CenterPoint Energy Inc 21 1.65USD 535 CMS Energy Corp 25 1.96USD 591 Consolidated Edison Inc 45 3.53USD 1,235 Dominion Energy Inc 79 6.19USD 339 DTE Energy Co 35 2.74USD 1,325 Duke Energy Corp 102 7.99USD 621 Edison International 39 3.06USD 339 Entergy Corp 27 2.12USD 600 Eversource Energy 34 2.66USD 1,839 Exelon Corp 76 5.96USD 841 FirstEnergy Corp 29 2.27USD 889 NextEra Energy Inc 147 11.52USD 564 NRG Energy Inc 19 1.49USD 979 PG&E Corp 42 3.29USD 209 Pinnacle West Capital Corp 17 1.33USD 1,314 PPL Corp 36 2.82USD 960 Public Service Enterprise Group
Inc 51 4.00USD 262 Scana Corp 10 0.78USD 487 Sempra Energy 52 4.08USD 1,909 Southern Co 86 6.74USD 597 WEC Energy Group Inc^ 38 2.98USD 964 Xcel Energy Inc 44 3.44
Gas USD 627 NiSource Inc 16 1.25
Water USD 336 American Water Works Co Inc 28 2.20
Total United States 1,221 95.69Total equities 1,221 95.69
Ccy
No. of contracts
Underlying exposure
$’000 Fair value
$'000
% of net assetvalue
Financial derivative instruments
(30 November 2017: Nil) Futures contracts (30 November 2017: Nil)
USD 1 S&P 500 Utilities Sector E Mini Index Futures June 2018 49 2 0.16
Total unrealised gains on futures contracts 2 0.16
Total financial derivative instruments 2 0.16
Fair value
$’000
% of net asset value
Total value of investments 1,223 95.85 Cash† 46 3.60 Other net assets 7 0.55 Net asset value attributable to redeemable participating shareholders at the end of the financial period 1,276 100.00
† Cash holdings of $44,993 are held with State Street Bank and Trust Company. $610 is held as security for futures contracts with HSBC Bank Plc. ^ These securities are partially or fully transferred as securities lent.
Equities are primarily classified by country of incorporation of the entity in which the Fund holds shares. Underlying exposure has been calculated according to the guidelines issued by the ESMA and represents the market value of an equivalent position in the assets underlying each financial derivative instrument.
Analysis of total current assets gross of all liabilities
Fair value$’000
% of total current assets
Transferable securities admitted to an official stock exchange listing 1,221 95.69Exchange traded financial derivative instruments 2 0.16Other assets 53 4.15Total current assets 1,276 100.00
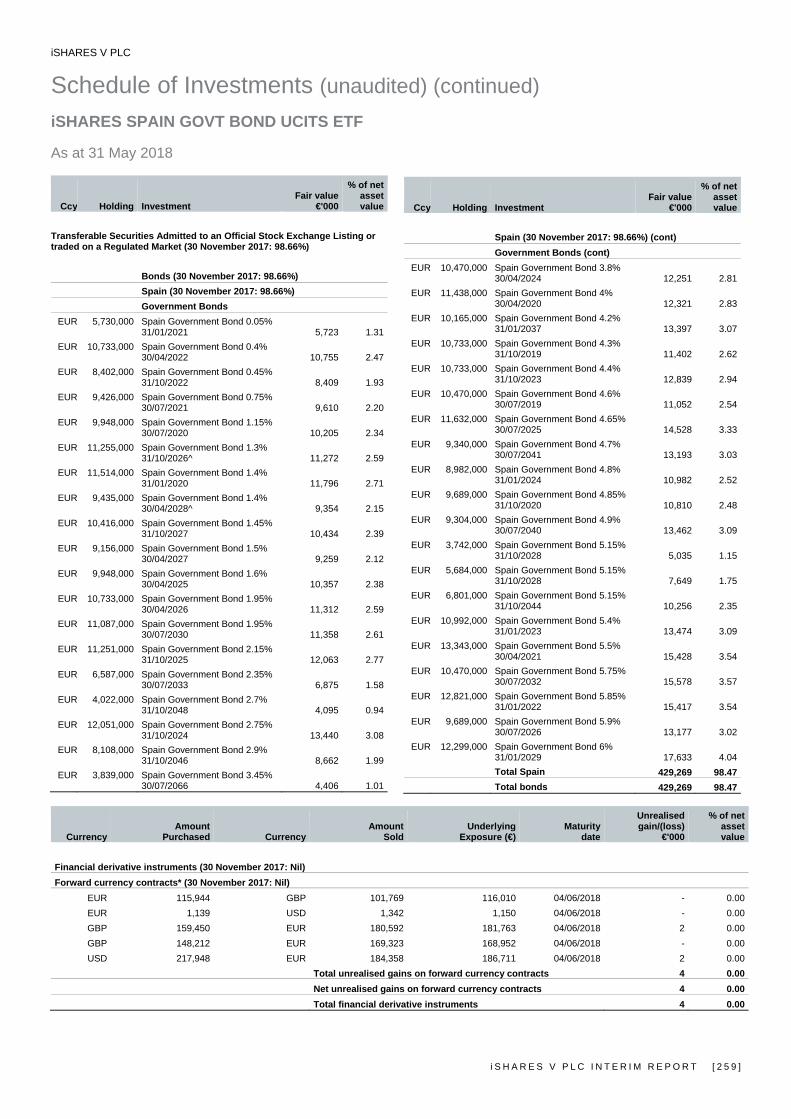
iSHARES V PLC
Schedule of Investments (unaudited) (continued) iSHARES SPAIN GOVT BOND UCITS ETF As at 31 May 2018
i S H A R E S V P L C I N T E R I M R E P O R T [ 2 5 9 ]
Ccy Holding Investment Fair value
€'000
% of net asset value
Transferable Securities Admitted to an Official Stock Exchange Listing or traded on a Regulated Market (30 November 2017: 98.66%)
Bonds (30 November 2017: 98.66%) Spain (30 November 2017: 98.66%) Government Bonds
EUR 5,730,000 Spain Government Bond 0.05% 31/01/2021 5,723 1.31
EUR 10,733,000 Spain Government Bond 0.4% 30/04/2022 10,755 2.47
EUR 8,402,000 Spain Government Bond 0.45% 31/10/2022 8,409 1.93
EUR 9,426,000 Spain Government Bond 0.75% 30/07/2021 9,610 2.20
EUR 9,948,000 Spain Government Bond 1.15% 30/07/2020 10,205 2.34
EUR 11,255,000 Spain Government Bond 1.3% 31/10/2026^ 11,272 2.59
EUR 11,514,000 Spain Government Bond 1.4% 31/01/2020 11,796 2.71
EUR 9,435,000 Spain Government Bond 1.4% 30/04/2028^ 9,354 2.15
EUR 10,416,000 Spain Government Bond 1.45% 31/10/2027 10,434 2.39
EUR 9,156,000 Spain Government Bond 1.5% 30/04/2027 9,259 2.12
EUR 9,948,000 Spain Government Bond 1.6% 30/04/2025 10,357 2.38
EUR 10,733,000 Spain Government Bond 1.95% 30/04/2026 11,312 2.59
EUR 11,087,000 Spain Government Bond 1.95% 30/07/2030 11,358 2.61
EUR 11,251,000 Spain Government Bond 2.15% 31/10/2025 12,063 2.77
EUR 6,587,000 Spain Government Bond 2.35% 30/07/2033 6,875 1.58
EUR 4,022,000 Spain Government Bond 2.7% 31/10/2048 4,095 0.94
EUR 12,051,000 Spain Government Bond 2.75% 31/10/2024 13,440 3.08
EUR 8,108,000 Spain Government Bond 2.9% 31/10/2046 8,662 1.99
EUR 3,839,000 Spain Government Bond 3.45% 30/07/2066 4,406 1.01
Ccy Holding Investment Fair value
€'000
% of net asset value
Spain (30 November 2017: 98.66%) (cont) Government Bonds (cont)
EUR 10,470,000 Spain Government Bond 3.8% 30/04/2024 12,251 2.81
EUR 11,438,000 Spain Government Bond 4% 30/04/2020 12,321 2.83
EUR 10,165,000 Spain Government Bond 4.2% 31/01/2037 13,397 3.07
EUR 10,733,000 Spain Government Bond 4.3% 31/10/2019 11,402 2.62
EUR 10,733,000 Spain Government Bond 4.4% 31/10/2023 12,839 2.94
EUR 10,470,000 Spain Government Bond 4.6% 30/07/2019 11,052 2.54
EUR 11,632,000 Spain Government Bond 4.65% 30/07/2025 14,528 3.33
EUR 9,340,000 Spain Government Bond 4.7% 30/07/2041 13,193 3.03
EUR 8,982,000 Spain Government Bond 4.8% 31/01/2024 10,982 2.52
EUR 9,689,000 Spain Government Bond 4.85% 31/10/2020 10,810 2.48
EUR 9,304,000 Spain Government Bond 4.9% 30/07/2040 13,462 3.09
EUR 3,742,000 Spain Government Bond 5.15% 31/10/2028 5,035 1.15
EUR 5,684,000 Spain Government Bond 5.15% 31/10/2028 7,649 1.75
EUR 6,801,000 Spain Government Bond 5.15% 31/10/2044 10,256 2.35
EUR 10,992,000 Spain Government Bond 5.4% 31/01/2023 13,474 3.09
EUR 13,343,000 Spain Government Bond 5.5% 30/04/2021 15,428 3.54
EUR 10,470,000 Spain Government Bond 5.75% 30/07/2032 15,578 3.57
EUR 12,821,000 Spain Government Bond 5.85% 31/01/2022 15,417 3.54
EUR 9,689,000 Spain Government Bond 5.9% 30/07/2026 13,177 3.02
EUR 12,299,000 Spain Government Bond 6% 31/01/2029 17,633 4.04Total Spain 429,269 98.47Total bonds 429,269 98.47
Currency Amount
Purchased Currency Amount
SoldUnderlying
Exposure (€)Maturity
date
Unrealisedgain/(loss)
€'000
% of net assetvalue
Financial derivative instruments (30 November 2017: Nil) Forward currency contracts* (30 November 2017: Nil)
EUR 115,944 GBP 101,769 116,010 04/06/2018 - 0.00EUR 1,139 USD 1,342 1,150 04/06/2018 - 0.00GBP 159,450 EUR 180,592 181,763 04/06/2018 2 0.00GBP 148,212 EUR 169,323 168,952 04/06/2018 - 0.00USD 217,948 EUR 184,358 186,711 04/06/2018 2 0.00
Total unrealised gains on forward currency contracts 4 0.00 Net unrealised gains on forward currency contracts 4 0.00 Total financial derivative instruments 4 0.00

iSHARES V PLC
Schedule of Investments (unaudited) (continued) iSHARES SPAIN GOVT BOND UCITS ETF (continued) As at 31 May 2018
[ 2 6 0 ] i S H A R E S V P L C I N T E R I M R E P O R T
Ccy Holding Investment Fair value
€'000
% of net asset value
Total value of investments 429,273 98.47 Cash equivalents (30 November 2017: Nil) UCITS collective investment schemes - Money Market Funds (30 November 2017: Nil)
EUR 67,662 Institutional Cash Series Plc - Institutional Euro Liquidity Fund** 68 0.02 Cash† 196 0.04 Other net assets 6,424 1.47 Net asset value attributable to redeemable participating shareholders at the end of the financial period 435,961 100.00
† Substantially all cash positions are held with State Street Bank and Trust Company. ^ These securities are partially or fully transferred as securities lent. * The counterparty for forward currency contracts is State Street Bank and Trust Company. All forwards relate to GBP Hedged (Dist) class and USD Hedged (Acc) class. ** Investment in related party
Fixed income securities are primarily classified by country of issuer for government type fixed income securities. Underlying exposure has been calculated according to the guidelines issued by the ESMA and represents the market value of an equivalent position in the assets underlying each financial derivative instrument.
Analysis of total current assets gross of all liabilities
Fair value€'000
% of total current assets
Transferable securities admitted to an official stock exchange listing 429,269 98.44OTC financial derivative instruments 4 0.00UCITS collective investment schemes - Money Market Funds 68 0.02Other assets 6,699 1.54Total current assets 436,040 100.00
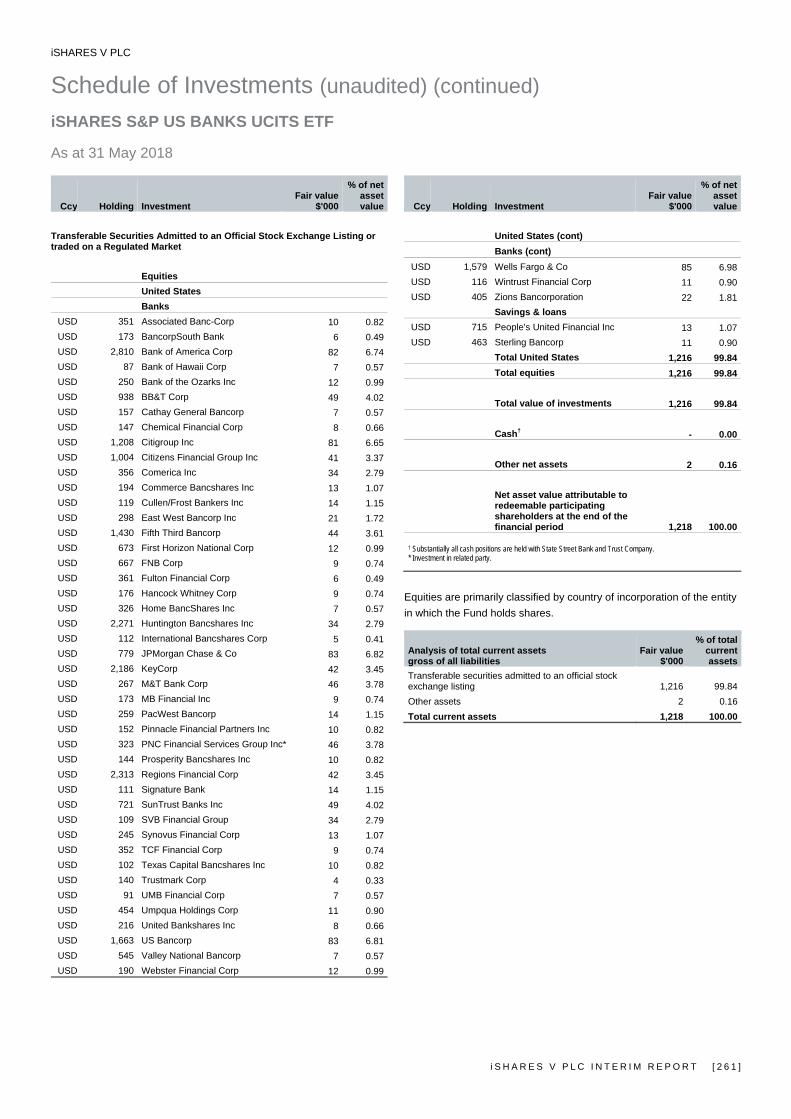
iSHARES V PLC
Schedule of Investments (unaudited) (continued) iSHARES S&P US BANKS UCITS ETF As at 31 May 2018
i S H A R E S V P L C I N T E R I M R E P O R T [ 2 6 1 ]
Ccy Holding Investment Fair value
$'000
% of net asset value
Transferable Securities Admitted to an Official Stock Exchange Listing or traded on a Regulated Market
Equities United States Banks
USD 351 Associated Banc-Corp 10 0.82USD 173 BancorpSouth Bank 6 0.49USD 2,810 Bank of America Corp 82 6.74USD 87 Bank of Hawaii Corp 7 0.57USD 250 Bank of the Ozarks Inc 12 0.99USD 938 BB&T Corp 49 4.02USD 157 Cathay General Bancorp 7 0.57USD 147 Chemical Financial Corp 8 0.66USD 1,208 Citigroup Inc 81 6.65USD 1,004 Citizens Financial Group Inc 41 3.37USD 356 Comerica Inc 34 2.79USD 194 Commerce Bancshares Inc 13 1.07USD 119 Cullen/Frost Bankers Inc 14 1.15USD 298 East West Bancorp Inc 21 1.72USD 1,430 Fifth Third Bancorp 44 3.61USD 673 First Horizon National Corp 12 0.99USD 667 FNB Corp 9 0.74USD 361 Fulton Financial Corp 6 0.49USD 176 Hancock Whitney Corp 9 0.74USD 326 Home BancShares Inc 7 0.57USD 2,271 Huntington Bancshares Inc 34 2.79USD 112 International Bancshares Corp 5 0.41USD 779 JPMorgan Chase & Co 83 6.82USD 2,186 KeyCorp 42 3.45USD 267 M&T Bank Corp 46 3.78USD 173 MB Financial Inc 9 0.74USD 259 PacWest Bancorp 14 1.15USD 152 Pinnacle Financial Partners Inc 10 0.82USD 323 PNC Financial Services Group Inc* 46 3.78USD 144 Prosperity Bancshares Inc 10 0.82USD 2,313 Regions Financial Corp 42 3.45USD 111 Signature Bank 14 1.15USD 721 SunTrust Banks Inc 49 4.02USD 109 SVB Financial Group 34 2.79USD 245 Synovus Financial Corp 13 1.07USD 352 TCF Financial Corp 9 0.74USD 102 Texas Capital Bancshares Inc 10 0.82USD 140 Trustmark Corp 4 0.33USD 91 UMB Financial Corp 7 0.57USD 454 Umpqua Holdings Corp 11 0.90USD 216 United Bankshares Inc 8 0.66USD 1,663 US Bancorp 83 6.81USD 545 Valley National Bancorp 7 0.57USD 190 Webster Financial Corp 12 0.99
Ccy Holding Investment Fair value
$'000
% of net asset value
United States (cont) Banks (cont)
USD 1,579 Wells Fargo & Co 85 6.98USD 116 Wintrust Financial Corp 11 0.90USD 405 Zions Bancorporation 22 1.81
Savings & loans USD 715 People's United Financial Inc 13 1.07USD 463 Sterling Bancorp 11 0.90
Total United States 1,216 99.84Total equities 1,216 99.84 Total value of investments 1,216 99.84 Cash† - 0.00 Other net assets 2 0.16 Net asset value attributable to redeemable participating shareholders at the end of the financial period 1,218 100.00
† Substantially all cash positions are held with State Street Bank and Trust Company. * Investment in related party.
Equities are primarily classified by country of incorporation of the entity in which the Fund holds shares.
Analysis of total current assets gross of all liabilities
Fair value$'000
% of total current assets
Transferable securities admitted to an official stock exchange listing 1,216 99.84Other assets 2 0.16Total current assets 1,218 100.00
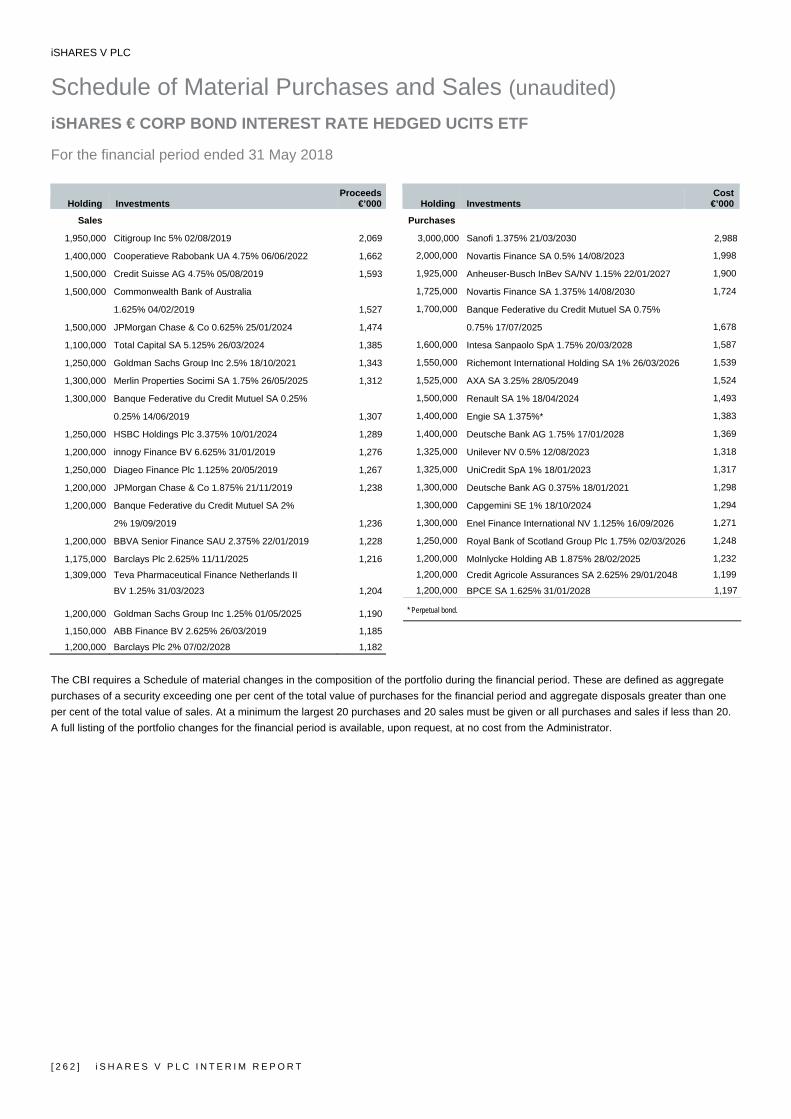
iSHARES V PLC
Schedule of Material Purchases and Sales (unaudited) iSHARES € CORP BOND INTEREST RATE HEDGED UCITS ETF For the financial period ended 31 May 2018
[ 2 6 2 ] i S H A R E S V P L C I N T E R I M R E P O R T
Holding Investments Proceeds
€’000 Holding Investments Cost
€’000
Sales Purchases
1,950,000 Citigroup Inc 5% 02/08/2019 2,069 3,000,000 Sanofi 1.375% 21/03/2030 2,988
1,400,000 Cooperatieve Rabobank UA 4.75% 06/06/2022 1,662 2,000,000 Novartis Finance SA 0.5% 14/08/2023 1,998
1,500,000 Credit Suisse AG 4.75% 05/08/2019 1,593 1,925,000 Anheuser-Busch InBev SA/NV 1.15% 22/01/2027 1,900
1,500,000 Commonwealth Bank of Australia 1,725,000 Novartis Finance SA 1.375% 14/08/2030 1,724
1.625% 04/02/2019 1,527 1,700,000 Banque Federative du Credit Mutuel SA 0.75%
1,500,000 JPMorgan Chase & Co 0.625% 25/01/2024 1,474 0.75% 17/07/2025 1,678
1,100,000 Total Capital SA 5.125% 26/03/2024 1,385 1,600,000 Intesa Sanpaolo SpA 1.75% 20/03/2028 1,587
1,250,000 Goldman Sachs Group Inc 2.5% 18/10/2021 1,343 1,550,000 Richemont International Holding SA 1% 26/03/2026 1,539
1,300,000 Merlin Properties Socimi SA 1.75% 26/05/2025 1,312 1,525,000 AXA SA 3.25% 28/05/2049 1,524
1,300,000 Banque Federative du Credit Mutuel SA 0.25% 1,500,000 Renault SA 1% 18/04/2024 1,493
0.25% 14/06/2019 1,307 1,400,000 Engie SA 1.375%* 1,383
1,250,000 HSBC Holdings Plc 3.375% 10/01/2024 1,289 1,400,000 Deutsche Bank AG 1.75% 17/01/2028 1,369
1,200,000 innogy Finance BV 6.625% 31/01/2019 1,276 1,325,000 Unilever NV 0.5% 12/08/2023 1,318
1,250,000 Diageo Finance Plc 1.125% 20/05/2019 1,267 1,325,000 UniCredit SpA 1% 18/01/2023 1,317
1,200,000 JPMorgan Chase & Co 1.875% 21/11/2019 1,238 1,300,000 Deutsche Bank AG 0.375% 18/01/2021 1,298
1,200,000 Banque Federative du Credit Mutuel SA 2% 1,300,000 Capgemini SE 1% 18/10/2024 1,294
2% 19/09/2019 1,236 1,300,000 Enel Finance International NV 1.125% 16/09/2026 1,271
1,200,000 BBVA Senior Finance SAU 2.375% 22/01/2019 1,228 1,250,000 Royal Bank of Scotland Group Plc 1.75% 02/03/2026 1,248
1,175,000 Barclays Plc 2.625% 11/11/2025 1,216 1,200,000 Molnlycke Holding AB 1.875% 28/02/2025 1,232
1,309,000 Teva Pharmaceutical Finance Netherlands II 1,200,000 Credit Agricole Assurances SA 2.625% 29/01/2048 1,199
BV 1.25% 31/03/2023 1,204 1,200,000 BPCE SA 1.625% 31/01/2028 1,197
1,200,000 Goldman Sachs Group Inc 1.25% 01/05/2025 1,190 * Perpetual bond.
1,150,000 ABB Finance BV 2.625% 26/03/2019 1,185
1,200,000 Barclays Plc 2% 07/02/2028 1,182
The CBI requires a Schedule of material changes in the composition of the portfolio during the financial period. These are defined as aggregate purchases of a security exceeding one per cent of the total value of purchases for the financial period and aggregate disposals greater than one per cent of the total value of sales. At a minimum the largest 20 purchases and 20 sales must be given or all purchases and sales if less than 20. A full listing of the portfolio changes for the financial period is available, upon request, at no cost from the Administrator.
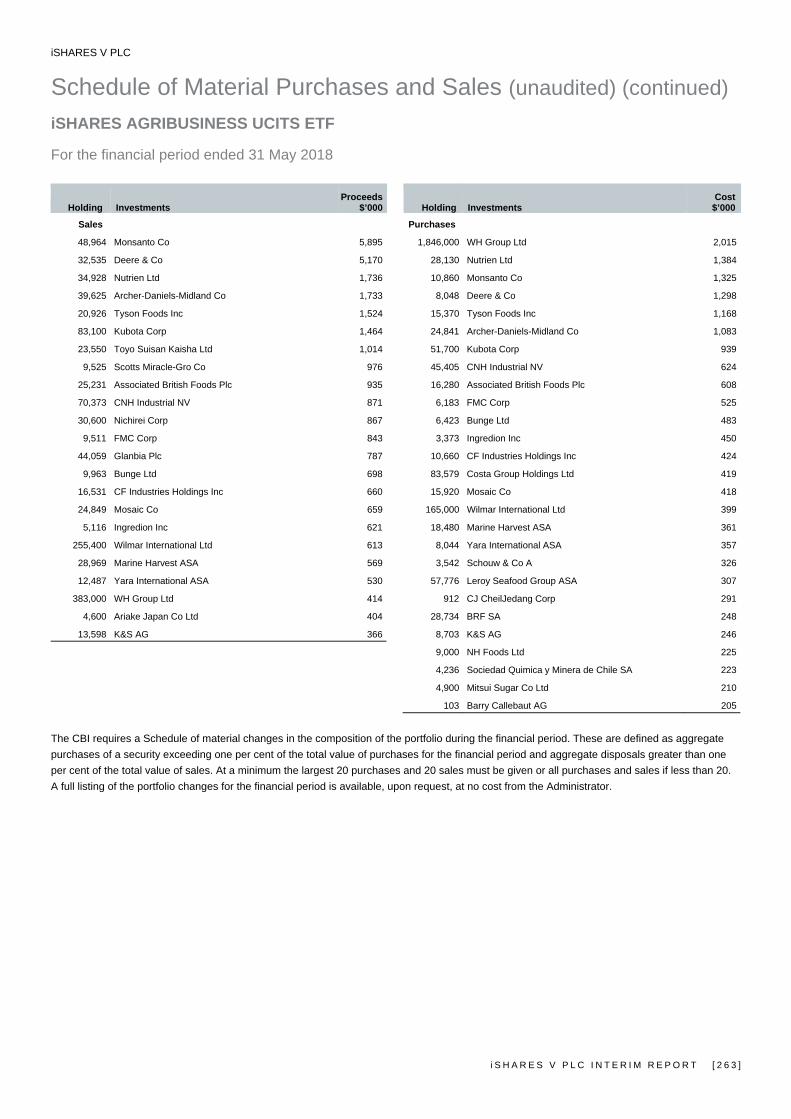
iSHARES V PLC
Schedule of Material Purchases and Sales (unaudited) (continued) iSHARES AGRIBUSINESS UCITS ETF For the financial period ended 31 May 2018
i S H A R E S V P L C I N T E R I M R E P O R T [ 2 6 3 ]
Holding Investments Proceeds
$’000 Holding Investments Cost
$’000
Sales Purchases
48,964 Monsanto Co 5,895 1,846,000 WH Group Ltd 2,015
32,535 Deere & Co 5,170 28,130 Nutrien Ltd 1,384
34,928 Nutrien Ltd 1,736 10,860 Monsanto Co 1,325
39,625 Archer-Daniels-Midland Co 1,733 8,048 Deere & Co 1,298
20,926 Tyson Foods Inc 1,524 15,370 Tyson Foods Inc 1,168
83,100 Kubota Corp 1,464 24,841 Archer-Daniels-Midland Co 1,083
23,550 Toyo Suisan Kaisha Ltd 1,014 51,700 Kubota Corp 939
9,525 Scotts Miracle-Gro Co 976 45,405 CNH Industrial NV 624
25,231 Associated British Foods Plc 935 16,280 Associated British Foods Plc 608
70,373 CNH Industrial NV 871 6,183 FMC Corp 525
30,600 Nichirei Corp 867 6,423 Bunge Ltd 483
9,511 FMC Corp 843 3,373 Ingredion Inc 450
44,059 Glanbia Plc 787 10,660 CF Industries Holdings Inc 424
9,963 Bunge Ltd 698 83,579 Costa Group Holdings Ltd 419
16,531 CF Industries Holdings Inc 660 15,920 Mosaic Co 418
24,849 Mosaic Co 659 165,000 Wilmar International Ltd 399
5,116 Ingredion Inc 621 18,480 Marine Harvest ASA 361
255,400 Wilmar International Ltd 613 8,044 Yara International ASA 357
28,969 Marine Harvest ASA 569 3,542 Schouw & Co A 326
12,487 Yara International ASA 530 57,776 Leroy Seafood Group ASA 307
383,000 WH Group Ltd 414 912 CJ CheilJedang Corp 291
4,600 Ariake Japan Co Ltd 404 28,734 BRF SA 248
13,598 K&S AG 366 8,703 K&S AG 246
9,000 NH Foods Ltd 225
4,236 Sociedad Quimica y Minera de Chile SA 223
4,900 Mitsui Sugar Co Ltd 210
103 Barry Callebaut AG 205
The CBI requires a Schedule of material changes in the composition of the portfolio during the financial period. These are defined as aggregate purchases of a security exceeding one per cent of the total value of purchases for the financial period and aggregate disposals greater than one per cent of the total value of sales. At a minimum the largest 20 purchases and 20 sales must be given or all purchases and sales if less than 20. A full listing of the portfolio changes for the financial period is available, upon request, at no cost from the Administrator.
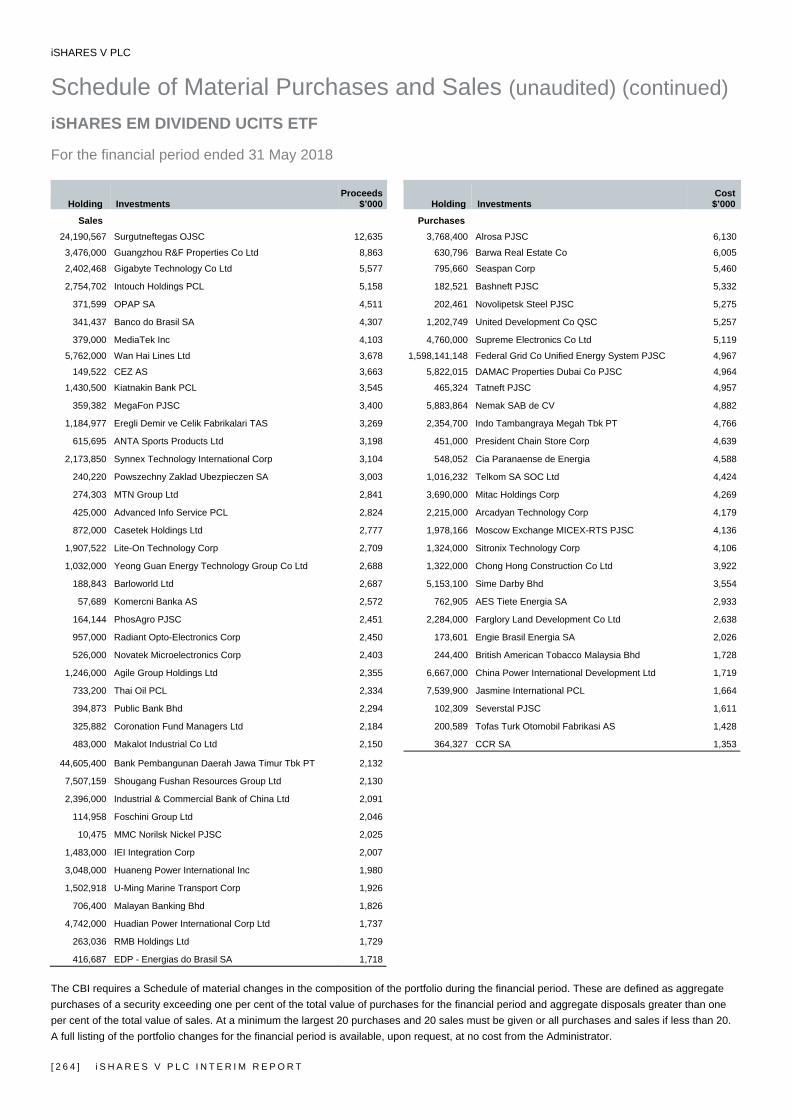
iSHARES V PLC
Schedule of Material Purchases and Sales (unaudited) (continued) iSHARES EM DIVIDEND UCITS ETF For the financial period ended 31 May 2018
[ 2 6 4 ] i S H A R E S V P L C I N T E R I M R E P O R T
Holding Investments Proceeds
$’000 Holding Investments Cost
$’000
Sales Purchases
24,190,567 Surgutneftegas OJSC 12,635 3,768,400 Alrosa PJSC 6,130
3,476,000 Guangzhou R&F Properties Co Ltd 8,863 630,796 Barwa Real Estate Co 6,005
2,402,468 Gigabyte Technology Co Ltd 5,577 795,660 Seaspan Corp 5,460
2,754,702 Intouch Holdings PCL 5,158 182,521 Bashneft PJSC 5,332
371,599 OPAP SA 4,511 202,461 Novolipetsk Steel PJSC 5,275
341,437 Banco do Brasil SA 4,307 1,202,749 United Development Co QSC 5,257
379,000 MediaTek Inc 4,103 4,760,000 Supreme Electronics Co Ltd 5,119
5,762,000 Wan Hai Lines Ltd 3,678 1,598,141,148 Federal Grid Co Unified Energy System PJSC 4,967
149,522 CEZ AS 3,663 5,822,015 DAMAC Properties Dubai Co PJSC 4,964
1,430,500 Kiatnakin Bank PCL 3,545 465,324 Tatneft PJSC 4,957
359,382 MegaFon PJSC 3,400 5,883,864 Nemak SAB de CV 4,882
1,184,977 Eregli Demir ve Celik Fabrikalari TAS 3,269 2,354,700 Indo Tambangraya Megah Tbk PT 4,766
615,695 ANTA Sports Products Ltd 3,198 451,000 President Chain Store Corp 4,639
2,173,850 Synnex Technology International Corp 3,104 548,052 Cia Paranaense de Energia 4,588
240,220 Powszechny Zaklad Ubezpieczen SA 3,003 1,016,232 Telkom SA SOC Ltd 4,424
274,303 MTN Group Ltd 2,841 3,690,000 Mitac Holdings Corp 4,269
425,000 Advanced Info Service PCL 2,824 2,215,000 Arcadyan Technology Corp 4,179
872,000 Casetek Holdings Ltd 2,777 1,978,166 Moscow Exchange MICEX-RTS PJSC 4,136
1,907,522 Lite-On Technology Corp 2,709 1,324,000 Sitronix Technology Corp 4,106
1,032,000 Yeong Guan Energy Technology Group Co Ltd 2,688 1,322,000 Chong Hong Construction Co Ltd 3,922
188,843 Barloworld Ltd 2,687 5,153,100 Sime Darby Bhd 3,554
57,689 Komercni Banka AS 2,572 762,905 AES Tiete Energia SA 2,933
164,144 PhosAgro PJSC 2,451 2,284,000 Farglory Land Development Co Ltd 2,638
957,000 Radiant Opto-Electronics Corp 2,450 173,601 Engie Brasil Energia SA 2,026
526,000 Novatek Microelectronics Corp 2,403 244,400 British American Tobacco Malaysia Bhd 1,728
1,246,000 Agile Group Holdings Ltd 2,355 6,667,000 China Power International Development Ltd 1,719
733,200 Thai Oil PCL 2,334 7,539,900 Jasmine International PCL 1,664
394,873 Public Bank Bhd 2,294 102,309 Severstal PJSC 1,611
325,882 Coronation Fund Managers Ltd 2,184 200,589 Tofas Turk Otomobil Fabrikasi AS 1,428
483,000 Makalot Industrial Co Ltd 2,150 364,327 CCR SA 1,353
44,605,400 Bank Pembangunan Daerah Jawa Timur Tbk PT 2,132
7,507,159 Shougang Fushan Resources Group Ltd 2,130
2,396,000 Industrial & Commercial Bank of China Ltd 2,091
114,958 Foschini Group Ltd 2,046
10,475 MMC Norilsk Nickel PJSC 2,025
1,483,000 IEI Integration Corp 2,007
3,048,000 Huaneng Power International Inc 1,980
1,502,918 U-Ming Marine Transport Corp 1,926
706,400 Malayan Banking Bhd 1,826
4,742,000 Huadian Power International Corp Ltd 1,737
263,036 RMB Holdings Ltd 1,729
416,687 EDP - Energias do Brasil SA 1,718 The CBI requires a Schedule of material changes in the composition of the portfolio during the financial period. These are defined as aggregate purchases of a security exceeding one per cent of the total value of purchases for the financial period and aggregate disposals greater than one per cent of the total value of sales. At a minimum the largest 20 purchases and 20 sales must be given or all purchases and sales if less than 20. A full listing of the portfolio changes for the financial period is available, upon request, at no cost from the Administrator.

iSHARES V PLC
Schedule of Material Purchases and Sales (unaudited) (continued) iSHARES FRANCE GOVT BOND UCITS ETF For the financial period ended 31 May 2018
i S H A R E S V P L C I N T E R I M R E P O R T [ 2 6 5 ]
Holding Investments Proceeds
€’000 Holding Investments Cost
€’000
Sales Purchases
6,342,000 French Republic Government Bond OAT 4,204,000 French Republic Government Bond OAT
4.25% 25/04/2019 6,682 0.75% 25/05/2028 4,190
4,069,000 French Republic Government Bond OAT 2,202,000 French Republic Government Bond OAT
0% 25/02/2019 4,098 0% 25/03/2023 2,194
2,326,000 French Republic Government Bond OAT 1,669,000 French Republic Government Bond OAT
4.25% 25/10/2023 2,897 4.25% 25/10/2023 2,091
2,436,000 French Republic Government Bond OAT 1,699,000 French Republic Government Bond OAT
1% 25/11/2018 2,476 0% 25/05/2021 1,717
1,292,000 French Republic Government Bond OAT 1,104,000 French Republic Government Bond OAT
5.75% 25/10/2032 2,139 6% 25/10/2025 1,577
1,318,000 French Republic Government Bond OAT 1,382,000 French Republic Government Bond OAT
4.5% 25/04/2041 2,136 2% 25/05/2048 1,502
1,846,000 French Republic Government Bond OAT 1,308,000 French Republic Government Bond OAT
3% 25/04/2022 2,105 0.25% 25/11/2026 1,276
1,743,000 French Republic Government Bond OAT 729,000 French Republic Government Bond OAT
3.25% 25/10/2021 1,981 4.75% 25/04/2035 1,150
1,558,000 French Republic Government Bond OAT 634,000 French Republic Government Bond OAT
3.5% 25/04/2026 1,962 4.5% 25/04/2041 1,033
1,828,000 French Republic Government Bond OAT 940,000 French Republic Government Bond OAT
1.5% 25/05/2031 1,950 1.5% 25/05/2031 1,002
1,880,000 French Republic Government Bond OAT 968,000 French Republic Government Bond OAT
1% 25/05/2019 1,911 0% 25/05/2022 970
1,578,000 French Republic Government Bond OAT 938,000 French Republic Government Bond OAT
2.75% 25/10/2027 1,901 0.25% 25/11/2020 958
1,661,000 French Republic Government Bond OAT 918,000 French Republic Government Bond OAT
3.75% 25/04/2021 1,890 0.5% 25/05/2025 937
1,661,000 French Republic Government Bond OAT 536,000 French Republic Government Bond OAT
3.5% 25/04/2020 1,816 5.75% 25/10/2032 891
1,190,000 French Republic Government Bond OAT 736,000 French Republic Government Bond OAT
5.5% 25/04/2029 1,805 2.5% 25/05/2030 879
1,128,000 French Republic Government Bond OAT 866,000 French Republic Government Bond OAT
4.75% 25/04/2035 1,771 0% 25/05/2020 875
1,128,000 French Republic Government Bond OAT 766,000 French Republic Government Bond OAT
4% 25/10/2038 1,686 3% 25/04/2022 874
1,538,000 French Republic Government Bond OAT 722,000 French Republic Government Bond OAT
2.5% 25/10/2020 1,667 3.25% 25/10/2021 821
1,497,000 French Republic Government Bond OAT 646,000 French Republic Government Bond OAT
1.75% 25/05/2023 1,644 3.5% 25/04/2026 814
1,456,000 French Republic Government Bond OAT 688,000 French Republic Government Bond OAT
1.75% 25/11/2024 1,614 3.75% 25/04/2021 783
1,354,000 French Republic Government Bond OAT 646,000 French Republic Government Bond OAT
2.5% 25/05/2030 1,612 2.75% 25/10/2027 780
1,415,000 French Republic Government Bond OAT 762,000 French Republic Government Bond OAT
2.25% 25/05/2024 1,611 1.25% 25/05/2034 762
1,526,000 French Republic Government Bond OAT 688,000 French Republic Government Bond OAT
0% 25/05/2021 1,544 3.5% 25/04/2020 752
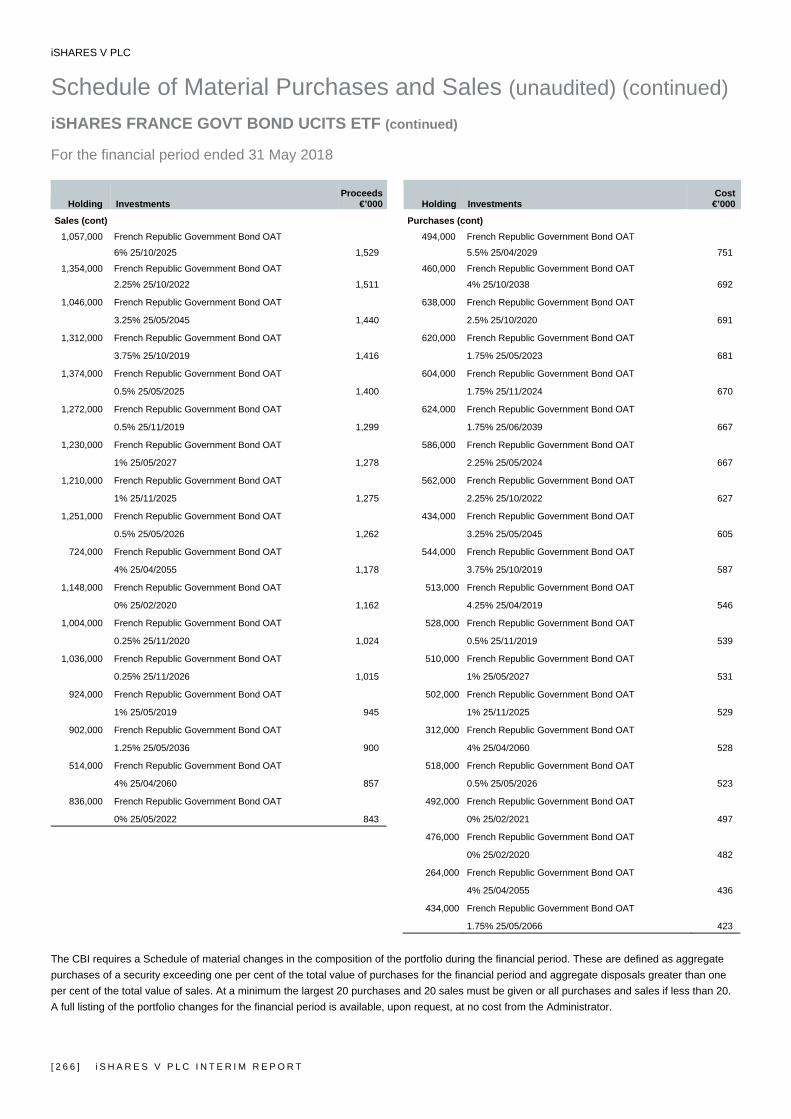
iSHARES V PLC
Schedule of Material Purchases and Sales (unaudited) (continued) iSHARES FRANCE GOVT BOND UCITS ETF (continued) For the financial period ended 31 May 2018
[ 2 6 6 ] i S H A R E S V P L C I N T E R I M R E P O R T
Holding Investments Proceeds
€’000 Holding Investments Cost
€’000
Sales (cont) Purchases (cont) 1,057,000 French Republic Government Bond OAT 494,000 French Republic Government Bond OAT
6% 25/10/2025 1,529 5.5% 25/04/2029 751
1,354,000 French Republic Government Bond OAT 460,000 French Republic Government Bond OAT
2.25% 25/10/2022 1,511 4% 25/10/2038 692
1,046,000 French Republic Government Bond OAT 638,000 French Republic Government Bond OAT
3.25% 25/05/2045 1,440 2.5% 25/10/2020 691
1,312,000 French Republic Government Bond OAT 620,000 French Republic Government Bond OAT
3.75% 25/10/2019 1,416 1.75% 25/05/2023 681
1,374,000 French Republic Government Bond OAT 604,000 French Republic Government Bond OAT
0.5% 25/05/2025 1,400 1.75% 25/11/2024 670
1,272,000 French Republic Government Bond OAT 624,000 French Republic Government Bond OAT
0.5% 25/11/2019 1,299 1.75% 25/06/2039 667
1,230,000 French Republic Government Bond OAT 586,000 French Republic Government Bond OAT
1% 25/05/2027 1,278 2.25% 25/05/2024 667
1,210,000 French Republic Government Bond OAT 562,000 French Republic Government Bond OAT
1% 25/11/2025 1,275 2.25% 25/10/2022 627
1,251,000 French Republic Government Bond OAT 434,000 French Republic Government Bond OAT
0.5% 25/05/2026 1,262 3.25% 25/05/2045 605
724,000 French Republic Government Bond OAT 544,000 French Republic Government Bond OAT
4% 25/04/2055 1,178 3.75% 25/10/2019 587
1,148,000 French Republic Government Bond OAT 513,000 French Republic Government Bond OAT
0% 25/02/2020 1,162 4.25% 25/04/2019 546
1,004,000 French Republic Government Bond OAT 528,000 French Republic Government Bond OAT
0.25% 25/11/2020 1,024 0.5% 25/11/2019 539
1,036,000 French Republic Government Bond OAT 510,000 French Republic Government Bond OAT
0.25% 25/11/2026 1,015 1% 25/05/2027 531
924,000 French Republic Government Bond OAT 502,000 French Republic Government Bond OAT
1% 25/05/2019 945 1% 25/11/2025 529
902,000 French Republic Government Bond OAT 312,000 French Republic Government Bond OAT
1.25% 25/05/2036 900 4% 25/04/2060 528
514,000 French Republic Government Bond OAT 518,000 French Republic Government Bond OAT
4% 25/04/2060 857 0.5% 25/05/2026 523
836,000 French Republic Government Bond OAT 492,000 French Republic Government Bond OAT
0% 25/05/2022 843 0% 25/02/2021 497
476,000 French Republic Government Bond OAT
0% 25/02/2020 482
264,000 French Republic Government Bond OAT
4% 25/04/2055 436
434,000 French Republic Government Bond OAT
1.75% 25/05/2066 423
The CBI requires a Schedule of material changes in the composition of the portfolio during the financial period. These are defined as aggregate purchases of a security exceeding one per cent of the total value of purchases for the financial period and aggregate disposals greater than one per cent of the total value of sales. At a minimum the largest 20 purchases and 20 sales must be given or all purchases and sales if less than 20. A full listing of the portfolio changes for the financial period is available, upon request, at no cost from the Administrator.
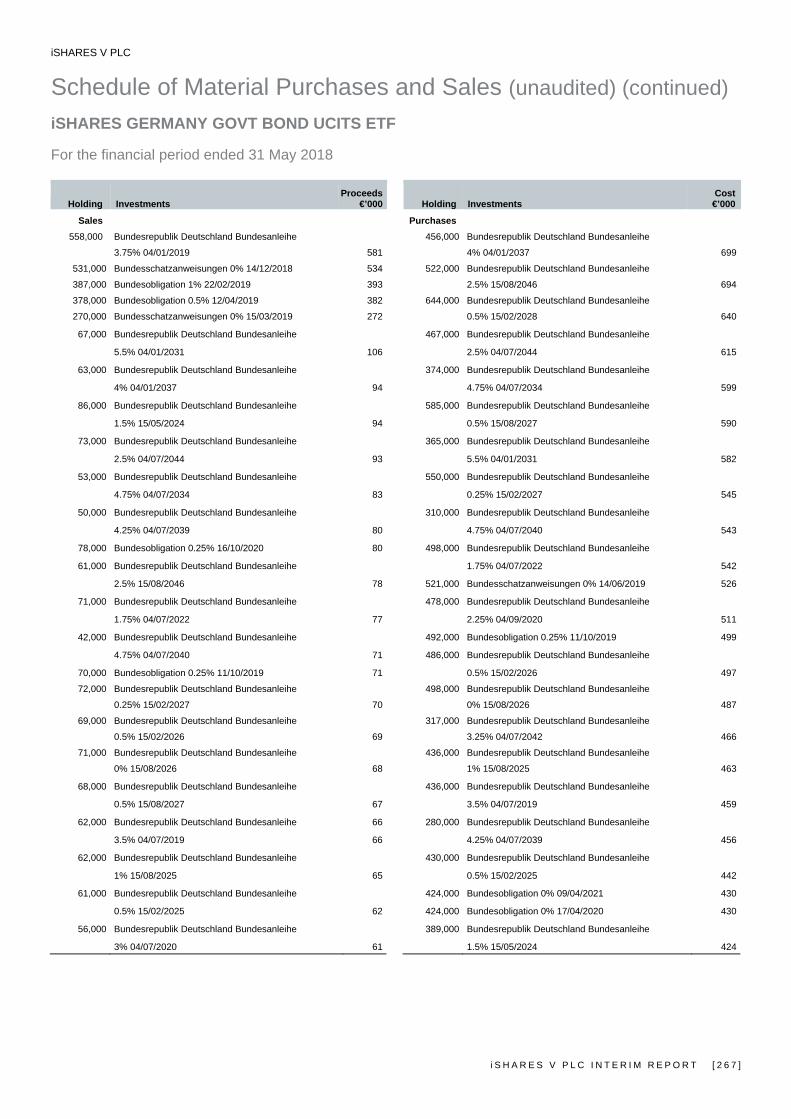
iSHARES V PLC
Schedule of Material Purchases and Sales (unaudited) (continued) iSHARES GERMANY GOVT BOND UCITS ETF For the financial period ended 31 May 2018
i S H A R E S V P L C I N T E R I M R E P O R T [ 2 6 7 ]
Holding Investments Proceeds
€’000 Holding Investments Cost
€’000
Sales Purchases
558,000 Bundesrepublik Deutschland Bundesanleihe 456,000 Bundesrepublik Deutschland Bundesanleihe
3.75% 04/01/2019 581 4% 04/01/2037 699
531,000 Bundesschatzanweisungen 0% 14/12/2018 534 522,000 Bundesrepublik Deutschland Bundesanleihe
387,000 Bundesobligation 1% 22/02/2019 393 2.5% 15/08/2046 694
378,000 Bundesobligation 0.5% 12/04/2019 382 644,000 Bundesrepublik Deutschland Bundesanleihe
270,000 Bundesschatzanweisungen 0% 15/03/2019 272 0.5% 15/02/2028 640
67,000 Bundesrepublik Deutschland Bundesanleihe 467,000 Bundesrepublik Deutschland Bundesanleihe
5.5% 04/01/2031 106 2.5% 04/07/2044 615
63,000 Bundesrepublik Deutschland Bundesanleihe 374,000 Bundesrepublik Deutschland Bundesanleihe
4% 04/01/2037 94 4.75% 04/07/2034 599
86,000 Bundesrepublik Deutschland Bundesanleihe 585,000 Bundesrepublik Deutschland Bundesanleihe
1.5% 15/05/2024 94 0.5% 15/08/2027 590
73,000 Bundesrepublik Deutschland Bundesanleihe 365,000 Bundesrepublik Deutschland Bundesanleihe
2.5% 04/07/2044 93 5.5% 04/01/2031 582
53,000 Bundesrepublik Deutschland Bundesanleihe 550,000 Bundesrepublik Deutschland Bundesanleihe
4.75% 04/07/2034 83 0.25% 15/02/2027 545
50,000 Bundesrepublik Deutschland Bundesanleihe 310,000 Bundesrepublik Deutschland Bundesanleihe
4.25% 04/07/2039 80 4.75% 04/07/2040 543
78,000 Bundesobligation 0.25% 16/10/2020 80 498,000 Bundesrepublik Deutschland Bundesanleihe
61,000 Bundesrepublik Deutschland Bundesanleihe 1.75% 04/07/2022 542
2.5% 15/08/2046 78 521,000 Bundesschatzanweisungen 0% 14/06/2019 526
71,000 Bundesrepublik Deutschland Bundesanleihe 478,000 Bundesrepublik Deutschland Bundesanleihe
1.75% 04/07/2022 77 2.25% 04/09/2020 511
42,000 Bundesrepublik Deutschland Bundesanleihe 492,000 Bundesobligation 0.25% 11/10/2019 499
4.75% 04/07/2040 71 486,000 Bundesrepublik Deutschland Bundesanleihe
70,000 Bundesobligation 0.25% 11/10/2019 71 0.5% 15/02/2026 497
72,000 Bundesrepublik Deutschland Bundesanleihe 498,000 Bundesrepublik Deutschland Bundesanleihe
0.25% 15/02/2027 70 0% 15/08/2026 487
69,000 Bundesrepublik Deutschland Bundesanleihe 317,000 Bundesrepublik Deutschland Bundesanleihe
0.5% 15/02/2026 69 3.25% 04/07/2042 466
71,000 Bundesrepublik Deutschland Bundesanleihe 436,000 Bundesrepublik Deutschland Bundesanleihe
0% 15/08/2026 68 1% 15/08/2025 463
68,000 Bundesrepublik Deutschland Bundesanleihe 436,000 Bundesrepublik Deutschland Bundesanleihe
0.5% 15/08/2027 67 3.5% 04/07/2019 459
62,000 Bundesrepublik Deutschland Bundesanleihe 66 280,000 Bundesrepublik Deutschland Bundesanleihe
3.5% 04/07/2019 66 4.25% 04/07/2039 456
62,000 Bundesrepublik Deutschland Bundesanleihe 430,000 Bundesrepublik Deutschland Bundesanleihe
1% 15/08/2025 65 0.5% 15/02/2025 442
61,000 Bundesrepublik Deutschland Bundesanleihe 424,000 Bundesobligation 0% 09/04/2021 430
0.5% 15/02/2025 62 424,000 Bundesobligation 0% 17/04/2020 430
56,000 Bundesrepublik Deutschland Bundesanleihe 389,000 Bundesrepublik Deutschland Bundesanleihe
3% 04/07/2020 61 1.5% 15/05/2024 424

iSHARES V PLC
Schedule of Material Purchases and Sales (unaudited) (continued) iSHARES GERMANY GOVT BOND UCITS ETF (continued) For the financial period ended 31 May 2018
[ 2 6 8 ] i S H A R E S V P L C I N T E R I M R E P O R T
Holding Investments Proceeds
€’000 Holding Investments Cost
€’000
Sales (cont) Purchases (cont)
60,000 Bundesobligation 0% 17/04/2020 61 392,000 Bundesrepublik Deutschland Bundesanleihe
42,000 Bundesrepublik Deutschland Bundesanleihe 60 3% 04/07/2020 424
3.25% 04/07/2042 60 374,000 Bundesrepublik Deutschland Bundesanleihe
53,000 Bundesrepublik Deutschland Bundesanleihe 3.25% 04/07/2021 420
3.25% 04/07/2021 59 413,000 Bundesobligation 0% 08/04/2022 418
55,000 Bundesrepublik Deutschland Bundesanleihe 416,000 Bundesobligation 0% 14/04/2023 417
3.25% 04/01/2020 59 374,000 Bundesrepublik Deutschland Bundesanleihe
53,000 Bundesrepublik Deutschland Bundesanleihe 1.75% 15/02/2024 413
1.75% 15/02/2024 58 386,000 Bundesrepublik Deutschland Bundesanleihe
54,000 Bundesrepublik Deutschland Bundesanleihe 3.25% 04/01/2020 413
2.25% 04/09/2020 58 297,000 Bundesrepublik Deutschland Bundesanleihe
38,000 Bundesrepublik Deutschland Bundesanleihe 6.25% 04/01/2024 404
5.625% 04/01/2028 56 268,000 Bundesrepublik Deutschland Bundesanleihe
51,000 Bundesrepublik Deutschland Bundesanleihe 5.625% 04/01/2028 402
2% 04/01/2022 55 392,000 Bundesschatzanweisungen 0% 13/03/2020 396
53,000 Bundesobligation 0% 08/10/2021 53 358,000 Bundesrepublik Deutschland Bundesanleihe
49,000 Bundesrepublik Deutschland Bundesanleihe 2% 04/01/2022 390
1.5% 15/02/2023 53 374,000 Bundesobligation 0% 08/10/2021 380
52,000 Bundesobligation 0% 09/04/2021 53 346,000 Bundesrepublik Deutschland Bundesanleihe
47,000 Bundesobligation 0% 08/04/2022 52 1.5% 15/02/2023 375
47,000 Bundesrepublik Deutschland Bundesanleihe 330,000 Bundesrepublik Deutschland Bundesanleihe
2% 15/08/2023 52 2% 15/08/2023 368
46,000 Bundesrepublik Deutschland Bundesanleihe 356,000 Bundesschatzanweisungen 0% 13/12/2019 360
2.5% 04/01/2021 51 352,000 Bundesobligation 0.25% 16/10/2020 359
46,000 Bundesrepublik Deutschland Bundesanleihe 330,000 Bundesrepublik Deutschland Bundesanleihe
1.5% 15/05/2023 49 2.5% 04/01/2021 358
324,000 Bundesrepublik Deutschland Bundesanleihe
1.5% 15/05/2023 352
324,000 Bundesrepublik Deutschland Bundesanleihe
1.5% 04/09/2022 350
324,000 Bundesrepublik Deutschland Bundesanleihe
1% 15/08/2024 344
330,000 Bundesobligation 0% 07/10/2022 334
206,000 Bundesrepublik Deutschland Bundesanleihe
6.5% 04/07/2027 321
290,000 Bundesrepublik Deutschland Bundesanleihe
2.25% 04/09/2021 317
206,000 Bundesrepublik Deutschland Bundesanleihe
4.75% 04/07/2028 295
168,000 Bundesrepublik Deutschland Bundesanleihe
6.25% 04/01/2030 277
The CBI requires a Schedule of material changes in the composition of the portfolio during the financial period. These are defined as aggregate purchases of a security exceeding one per cent of the total value of purchases for the financial period and aggregate disposals greater than one per cent of the total value of sales. At a minimum the largest 20 purchases and 20 sales must be given or all purchases and sales if less than 20. A full listing of the portfolio changes for the financial period is available, upon request, at no cost from the Administrator.

iSHARES V PLC
Schedule of Material Purchases and Sales (unaudited) (continued) iSHARES GOLD PRODUCERS UCITS ETF For the financial period ended 31 May 2018
i S H A R E S V P L C I N T E R I M R E P O R T [ 2 6 9 ]
Holding Investments Proceeds
$’000 Holding Investments Cost
$’000
Sales Purchases
992,547 Newmont Mining Corp 37,596 543,244 Newmont Mining Corp 20,959
1,536,610 Barrick Gold Corp 20,368 1,346,751 Barrick Gold Corp 17,984
242,018 Franco-Nevada Corp 17,632 223,835 Franco-Nevada Corp 16,229
1,004,265 Newcrest Mining Ltd 16,609 878,397 Newcrest Mining Ltd 14,890
1,139,969 Goldcorp Inc 15,117 998,249 Goldcorp Inc 13,402
304,268 Agnico Eagle Mines Ltd 13,128 270,387 Agnico Eagle Mines Ltd 11,708
123,368 Randgold Resources Ltd 10,750 107,766 Randgold Resources Ltd 9,587
85,725 Royal Gold Inc 7,242 75,194 Royal Gold Inc 6,406
1,649,927 Kinross Gold Corp 6,414 1,444,221 Kinross Gold Corp 5,728
541,485 AngloGold Ashanti Ltd 5,141 2,280,877 Evolution Mining Ltd 5,105
1,003,725 Gold Fields Ltd 3,958 474,087 AngloGold Ashanti Ltd 4,675
263,659 Cia de Minas Buenaventura SAA 3,951 230,903 Cia de Minas Buenaventura SAA 3,452
252,674 Kirkland Lake Gold Ltd 3,949 226,521 Kirkland Lake Gold Ltd 3,445
785,616 Northern Star Resources Ltd 3,814 878,266 Gold Fields Ltd 3,444
1,679,466 Evolution Mining Ltd 3,791 1,102,127 Yamana Gold Inc 3,328
1,281,548 B2Gold Corp 3,662 689,572 Northern Star Resources Ltd 3,326
1,253,939 Yamana Gold Inc 3,583 1,137,678 B2Gold Corp 3,282
616,312 Iamgold Corp 3,368 6,558,000 Zijin Mining Group Co Ltd 2,992
7,522,000 Zijin Mining Group Co Ltd 3,261 546,374 Iamgold Corp 2,967
1,508,783 Centamin Plc 3,142 1,326,274 Centamin Plc 2,873
513,188 Alamos Gold Inc 2,922 449,486 Alamos Gold Inc 2,481
577,655 Sibanye Gold Ltd 2,463 849,663 Premier Gold Mines Ltd 2,305
228,235 Detour Gold Corp 2,392 498,641 Sibanye Gold Ltd 2,107
201,781 Detour Gold Corp 1,989
The CBI requires a Schedule of material changes in the composition of the portfolio during the financial period. These are defined as aggregate purchases of a security exceeding one per cent of the total value of purchases for the financial period and aggregate disposals greater than one per cent of the total value of sales. At a minimum the largest 20 purchases and 20 sales must be given or all purchases and sales if less than 20. A full listing of the portfolio changes for the financial period is available, upon request, at no cost from the Administrator.
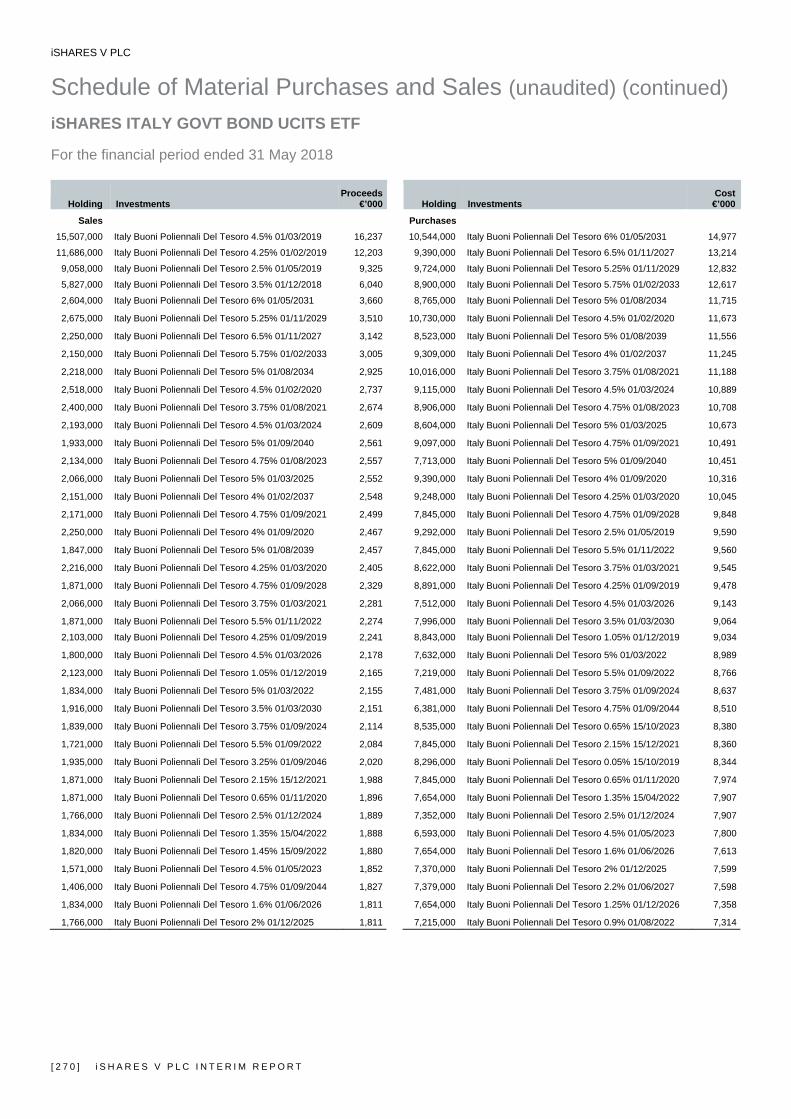
iSHARES V PLC
Schedule of Material Purchases and Sales (unaudited) (continued) iSHARES ITALY GOVT BOND UCITS ETF For the financial period ended 31 May 2018
[ 2 7 0 ] i S H A R E S V P L C I N T E R I M R E P O R T
Holding Investments Proceeds
€’000 Holding Investments Cost
€’000
Sales Purchases
15,507,000 Italy Buoni Poliennali Del Tesoro 4.5% 01/03/2019 16,237 10,544,000 Italy Buoni Poliennali Del Tesoro 6% 01/05/2031 14,977
11,686,000 Italy Buoni Poliennali Del Tesoro 4.25% 01/02/2019 12,203 9,390,000 Italy Buoni Poliennali Del Tesoro 6.5% 01/11/2027 13,214
9,058,000 Italy Buoni Poliennali Del Tesoro 2.5% 01/05/2019 9,325 9,724,000 Italy Buoni Poliennali Del Tesoro 5.25% 01/11/2029 12,832
5,827,000 Italy Buoni Poliennali Del Tesoro 3.5% 01/12/2018 6,040 8,900,000 Italy Buoni Poliennali Del Tesoro 5.75% 01/02/2033 12,617
2,604,000 Italy Buoni Poliennali Del Tesoro 6% 01/05/2031 3,660 8,765,000 Italy Buoni Poliennali Del Tesoro 5% 01/08/2034 11,715
2,675,000 Italy Buoni Poliennali Del Tesoro 5.25% 01/11/2029 3,510 10,730,000 Italy Buoni Poliennali Del Tesoro 4.5% 01/02/2020 11,673
2,250,000 Italy Buoni Poliennali Del Tesoro 6.5% 01/11/2027 3,142 8,523,000 Italy Buoni Poliennali Del Tesoro 5% 01/08/2039 11,556
2,150,000 Italy Buoni Poliennali Del Tesoro 5.75% 01/02/2033 3,005 9,309,000 Italy Buoni Poliennali Del Tesoro 4% 01/02/2037 11,245
2,218,000 Italy Buoni Poliennali Del Tesoro 5% 01/08/2034 2,925 10,016,000 Italy Buoni Poliennali Del Tesoro 3.75% 01/08/2021 11,188
2,518,000 Italy Buoni Poliennali Del Tesoro 4.5% 01/02/2020 2,737 9,115,000 Italy Buoni Poliennali Del Tesoro 4.5% 01/03/2024 10,889
2,400,000 Italy Buoni Poliennali Del Tesoro 3.75% 01/08/2021 2,674 8,906,000 Italy Buoni Poliennali Del Tesoro 4.75% 01/08/2023 10,708
2,193,000 Italy Buoni Poliennali Del Tesoro 4.5% 01/03/2024 2,609 8,604,000 Italy Buoni Poliennali Del Tesoro 5% 01/03/2025 10,673
1,933,000 Italy Buoni Poliennali Del Tesoro 5% 01/09/2040 2,561 9,097,000 Italy Buoni Poliennali Del Tesoro 4.75% 01/09/2021 10,491
2,134,000 Italy Buoni Poliennali Del Tesoro 4.75% 01/08/2023 2,557 7,713,000 Italy Buoni Poliennali Del Tesoro 5% 01/09/2040 10,451
2,066,000 Italy Buoni Poliennali Del Tesoro 5% 01/03/2025 2,552 9,390,000 Italy Buoni Poliennali Del Tesoro 4% 01/09/2020 10,316
2,151,000 Italy Buoni Poliennali Del Tesoro 4% 01/02/2037 2,548 9,248,000 Italy Buoni Poliennali Del Tesoro 4.25% 01/03/2020 10,045
2,171,000 Italy Buoni Poliennali Del Tesoro 4.75% 01/09/2021 2,499 7,845,000 Italy Buoni Poliennali Del Tesoro 4.75% 01/09/2028 9,848
2,250,000 Italy Buoni Poliennali Del Tesoro 4% 01/09/2020 2,467 9,292,000 Italy Buoni Poliennali Del Tesoro 2.5% 01/05/2019 9,590
1,847,000 Italy Buoni Poliennali Del Tesoro 5% 01/08/2039 2,457 7,845,000 Italy Buoni Poliennali Del Tesoro 5.5% 01/11/2022 9,560
2,216,000 Italy Buoni Poliennali Del Tesoro 4.25% 01/03/2020 2,405 8,622,000 Italy Buoni Poliennali Del Tesoro 3.75% 01/03/2021 9,545
1,871,000 Italy Buoni Poliennali Del Tesoro 4.75% 01/09/2028 2,329 8,891,000 Italy Buoni Poliennali Del Tesoro 4.25% 01/09/2019 9,478
2,066,000 Italy Buoni Poliennali Del Tesoro 3.75% 01/03/2021 2,281 7,512,000 Italy Buoni Poliennali Del Tesoro 4.5% 01/03/2026 9,143
1,871,000 Italy Buoni Poliennali Del Tesoro 5.5% 01/11/2022 2,274 7,996,000 Italy Buoni Poliennali Del Tesoro 3.5% 01/03/2030 9,064
2,103,000 Italy Buoni Poliennali Del Tesoro 4.25% 01/09/2019 2,241 8,843,000 Italy Buoni Poliennali Del Tesoro 1.05% 01/12/2019 9,034
1,800,000 Italy Buoni Poliennali Del Tesoro 4.5% 01/03/2026 2,178 7,632,000 Italy Buoni Poliennali Del Tesoro 5% 01/03/2022 8,989
2,123,000 Italy Buoni Poliennali Del Tesoro 1.05% 01/12/2019 2,165 7,219,000 Italy Buoni Poliennali Del Tesoro 5.5% 01/09/2022 8,766
1,834,000 Italy Buoni Poliennali Del Tesoro 5% 01/03/2022 2,155 7,481,000 Italy Buoni Poliennali Del Tesoro 3.75% 01/09/2024 8,637
1,916,000 Italy Buoni Poliennali Del Tesoro 3.5% 01/03/2030 2,151 6,381,000 Italy Buoni Poliennali Del Tesoro 4.75% 01/09/2044 8,510
1,839,000 Italy Buoni Poliennali Del Tesoro 3.75% 01/09/2024 2,114 8,535,000 Italy Buoni Poliennali Del Tesoro 0.65% 15/10/2023 8,380
1,721,000 Italy Buoni Poliennali Del Tesoro 5.5% 01/09/2022 2,084 7,845,000 Italy Buoni Poliennali Del Tesoro 2.15% 15/12/2021 8,360
1,935,000 Italy Buoni Poliennali Del Tesoro 3.25% 01/09/2046 2,020 8,296,000 Italy Buoni Poliennali Del Tesoro 0.05% 15/10/2019 8,344
1,871,000 Italy Buoni Poliennali Del Tesoro 2.15% 15/12/2021 1,988 7,845,000 Italy Buoni Poliennali Del Tesoro 0.65% 01/11/2020 7,974
1,871,000 Italy Buoni Poliennali Del Tesoro 0.65% 01/11/2020 1,896 7,654,000 Italy Buoni Poliennali Del Tesoro 1.35% 15/04/2022 7,907
1,766,000 Italy Buoni Poliennali Del Tesoro 2.5% 01/12/2024 1,889 7,352,000 Italy Buoni Poliennali Del Tesoro 2.5% 01/12/2024 7,907
1,834,000 Italy Buoni Poliennali Del Tesoro 1.35% 15/04/2022 1,888 6,593,000 Italy Buoni Poliennali Del Tesoro 4.5% 01/05/2023 7,800
1,820,000 Italy Buoni Poliennali Del Tesoro 1.45% 15/09/2022 1,880 7,654,000 Italy Buoni Poliennali Del Tesoro 1.6% 01/06/2026 7,613
1,571,000 Italy Buoni Poliennali Del Tesoro 4.5% 01/05/2023 1,852 7,370,000 Italy Buoni Poliennali Del Tesoro 2% 01/12/2025 7,599
1,406,000 Italy Buoni Poliennali Del Tesoro 4.75% 01/09/2044 1,827 7,379,000 Italy Buoni Poliennali Del Tesoro 2.2% 01/06/2027 7,598
1,834,000 Italy Buoni Poliennali Del Tesoro 1.6% 01/06/2026 1,811 7,654,000 Italy Buoni Poliennali Del Tesoro 1.25% 01/12/2026 7,358
1,766,000 Italy Buoni Poliennali Del Tesoro 2% 01/12/2025 1,811 7,215,000 Italy Buoni Poliennali Del Tesoro 0.9% 01/08/2022 7,314
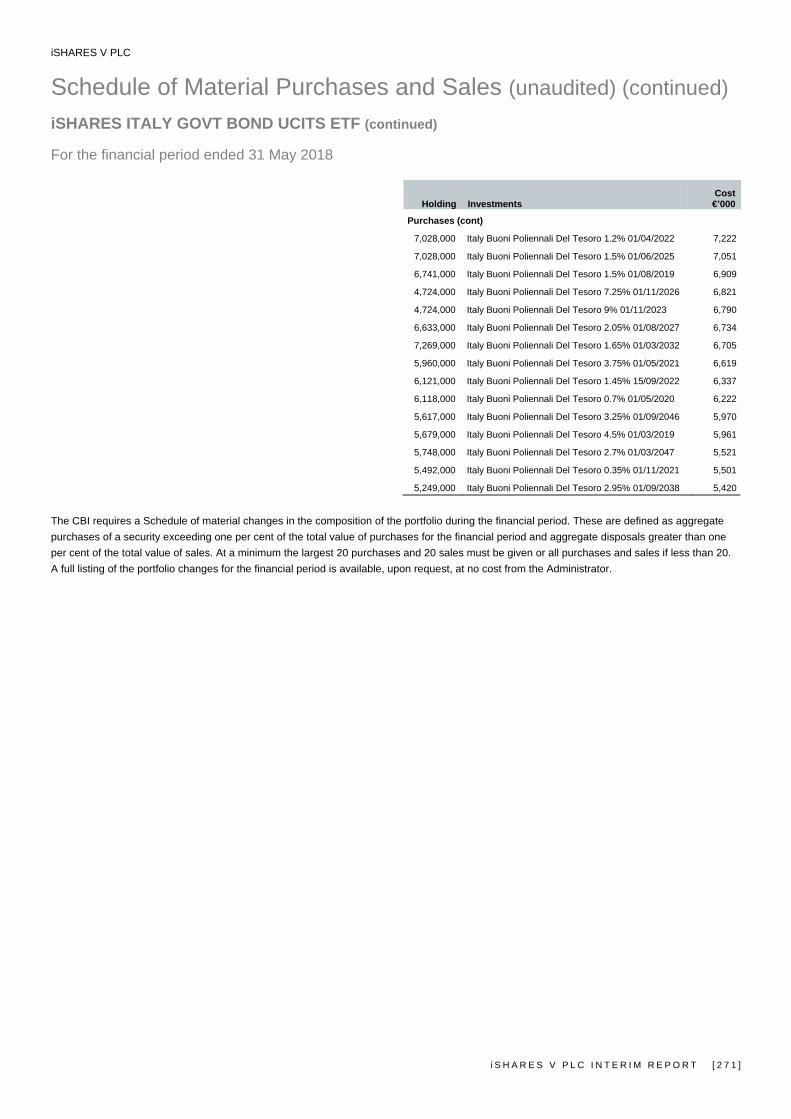
iSHARES V PLC
Schedule of Material Purchases and Sales (unaudited) (continued) iSHARES ITALY GOVT BOND UCITS ETF (continued) For the financial period ended 31 May 2018
i S H A R E S V P L C I N T E R I M R E P O R T [ 2 7 1 ]
Holding Investments Cost
€’000
Purchases (cont)
7,028,000 Italy Buoni Poliennali Del Tesoro 1.2% 01/04/2022 7,222
7,028,000 Italy Buoni Poliennali Del Tesoro 1.5% 01/06/2025 7,051
6,741,000 Italy Buoni Poliennali Del Tesoro 1.5% 01/08/2019 6,909
4,724,000 Italy Buoni Poliennali Del Tesoro 7.25% 01/11/2026 6,821
4,724,000 Italy Buoni Poliennali Del Tesoro 9% 01/11/2023 6,790
6,633,000 Italy Buoni Poliennali Del Tesoro 2.05% 01/08/2027 6,734
7,269,000 Italy Buoni Poliennali Del Tesoro 1.65% 01/03/2032 6,705
5,960,000 Italy Buoni Poliennali Del Tesoro 3.75% 01/05/2021 6,619
6,121,000 Italy Buoni Poliennali Del Tesoro 1.45% 15/09/2022 6,337
6,118,000 Italy Buoni Poliennali Del Tesoro 0.7% 01/05/2020 6,222
5,617,000 Italy Buoni Poliennali Del Tesoro 3.25% 01/09/2046 5,970
5,679,000 Italy Buoni Poliennali Del Tesoro 4.5% 01/03/2019 5,961
5,748,000 Italy Buoni Poliennali Del Tesoro 2.7% 01/03/2047 5,521
5,492,000 Italy Buoni Poliennali Del Tesoro 0.35% 01/11/2021 5,501
5,249,000 Italy Buoni Poliennali Del Tesoro 2.95% 01/09/2038 5,420
The CBI requires a Schedule of material changes in the composition of the portfolio during the financial period. These are defined as aggregate purchases of a security exceeding one per cent of the total value of purchases for the financial period and aggregate disposals greater than one per cent of the total value of sales. At a minimum the largest 20 purchases and 20 sales must be given or all purchases and sales if less than 20. A full listing of the portfolio changes for the financial period is available, upon request, at no cost from the Administrator.
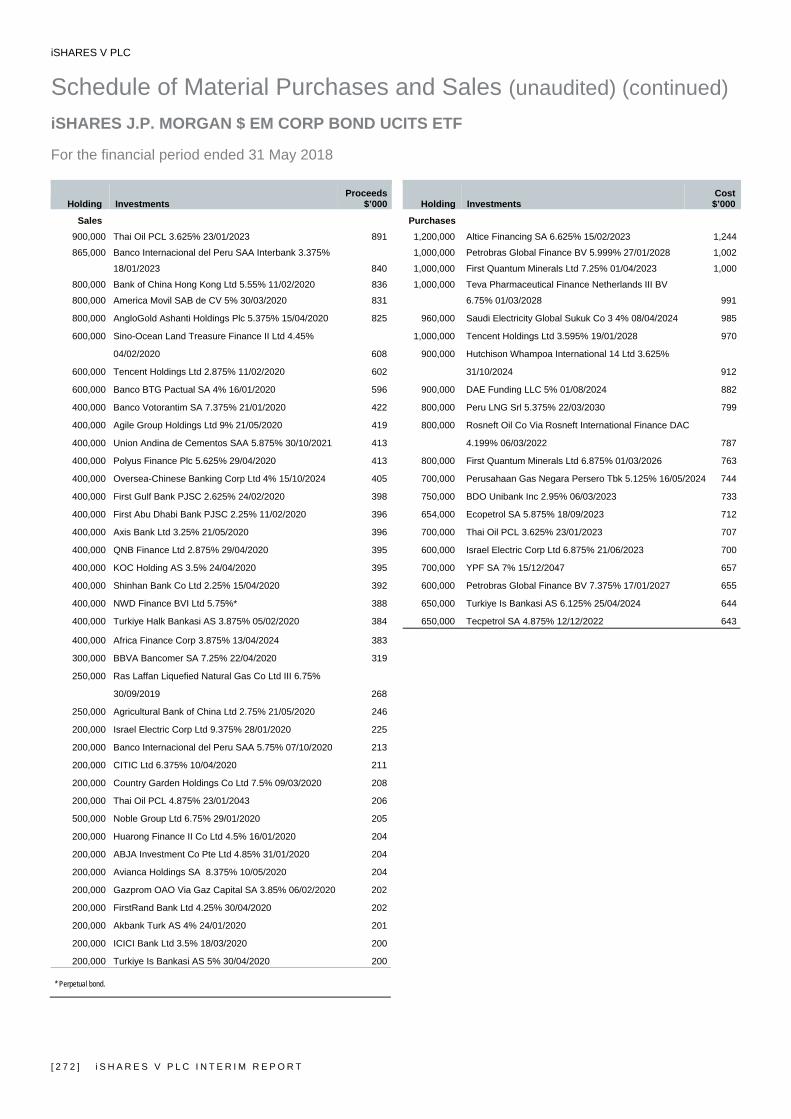
iSHARES V PLC
Schedule of Material Purchases and Sales (unaudited) (continued) iSHARES J.P. MORGAN $ EM CORP BOND UCITS ETF For the financial period ended 31 May 2018
[ 2 7 2 ] i S H A R E S V P L C I N T E R I M R E P O R T
Holding Investments Proceeds
$’000 Holding Investments Cost
$’000
Sales Purchases
900,000 Thai Oil PCL 3.625% 23/01/2023 891 1,200,000 Altice Financing SA 6.625% 15/02/2023 1,244
865,000 Banco Internacional del Peru SAA Interbank 3.375% 1,000,000 Petrobras Global Finance BV 5.999% 27/01/2028 1,002
18/01/2023 840 1,000,000 First Quantum Minerals Ltd 7.25% 01/04/2023 1,000
800,000 Bank of China Hong Kong Ltd 5.55% 11/02/2020 836 1,000,000 Teva Pharmaceutical Finance Netherlands III BV
800,000 America Movil SAB de CV 5% 30/03/2020 831 6.75% 01/03/2028 991
800,000 AngloGold Ashanti Holdings Plc 5.375% 15/04/2020 825 960,000 Saudi Electricity Global Sukuk Co 3 4% 08/04/2024 985
600,000 Sino-Ocean Land Treasure Finance II Ltd 4.45% 1,000,000 Tencent Holdings Ltd 3.595% 19/01/2028 970
04/02/2020 608 900,000 Hutchison Whampoa International 14 Ltd 3.625%
600,000 Tencent Holdings Ltd 2.875% 11/02/2020 602 31/10/2024 912
600,000 Banco BTG Pactual SA 4% 16/01/2020 596 900,000 DAE Funding LLC 5% 01/08/2024 882
400,000 Banco Votorantim SA 7.375% 21/01/2020 422 800,000 Peru LNG Srl 5.375% 22/03/2030 799
400,000 Agile Group Holdings Ltd 9% 21/05/2020 419 800,000 Rosneft Oil Co Via Rosneft International Finance DAC
400,000 Union Andina de Cementos SAA 5.875% 30/10/2021 413 4.199% 06/03/2022 787
400,000 Polyus Finance Plc 5.625% 29/04/2020 413 800,000 First Quantum Minerals Ltd 6.875% 01/03/2026 763
400,000 Oversea-Chinese Banking Corp Ltd 4% 15/10/2024 405 700,000 Perusahaan Gas Negara Persero Tbk 5.125% 16/05/2024 744
400,000 First Gulf Bank PJSC 2.625% 24/02/2020 398 750,000 BDO Unibank Inc 2.95% 06/03/2023 733
400,000 First Abu Dhabi Bank PJSC 2.25% 11/02/2020 396 654,000 Ecopetrol SA 5.875% 18/09/2023 712
400,000 Axis Bank Ltd 3.25% 21/05/2020 396 700,000 Thai Oil PCL 3.625% 23/01/2023 707
400,000 QNB Finance Ltd 2.875% 29/04/2020 395 600,000 Israel Electric Corp Ltd 6.875% 21/06/2023 700
400,000 KOC Holding AS 3.5% 24/04/2020 395 700,000 YPF SA 7% 15/12/2047 657
400,000 Shinhan Bank Co Ltd 2.25% 15/04/2020 392 600,000 Petrobras Global Finance BV 7.375% 17/01/2027 655
400,000 NWD Finance BVI Ltd 5.75%* 388 650,000 Turkiye Is Bankasi AS 6.125% 25/04/2024 644
400,000 Turkiye Halk Bankasi AS 3.875% 05/02/2020 384 650,000 Tecpetrol SA 4.875% 12/12/2022 643
400,000 Africa Finance Corp 3.875% 13/04/2024 383
300,000 BBVA Bancomer SA 7.25% 22/04/2020 319
250,000 Ras Laffan Liquefied Natural Gas Co Ltd III 6.75%
30/09/2019 268
250,000 Agricultural Bank of China Ltd 2.75% 21/05/2020 246
200,000 Israel Electric Corp Ltd 9.375% 28/01/2020 225
200,000 Banco Internacional del Peru SAA 5.75% 07/10/2020 213
200,000 CITIC Ltd 6.375% 10/04/2020 211
200,000 Country Garden Holdings Co Ltd 7.5% 09/03/2020 208
200,000 Thai Oil PCL 4.875% 23/01/2043 206
500,000 Noble Group Ltd 6.75% 29/01/2020 205
200,000 Huarong Finance II Co Ltd 4.5% 16/01/2020 204
200,000 ABJA Investment Co Pte Ltd 4.85% 31/01/2020 204
200,000 Avianca Holdings SA 8.375% 10/05/2020 204
200,000 Gazprom OAO Via Gaz Capital SA 3.85% 06/02/2020 202
200,000 FirstRand Bank Ltd 4.25% 30/04/2020 202
200,000 Akbank Turk AS 4% 24/01/2020 201
200,000 ICICI Bank Ltd 3.5% 18/03/2020 200
200,000 Turkiye Is Bankasi AS 5% 30/04/2020 200
* Perpetual bond.
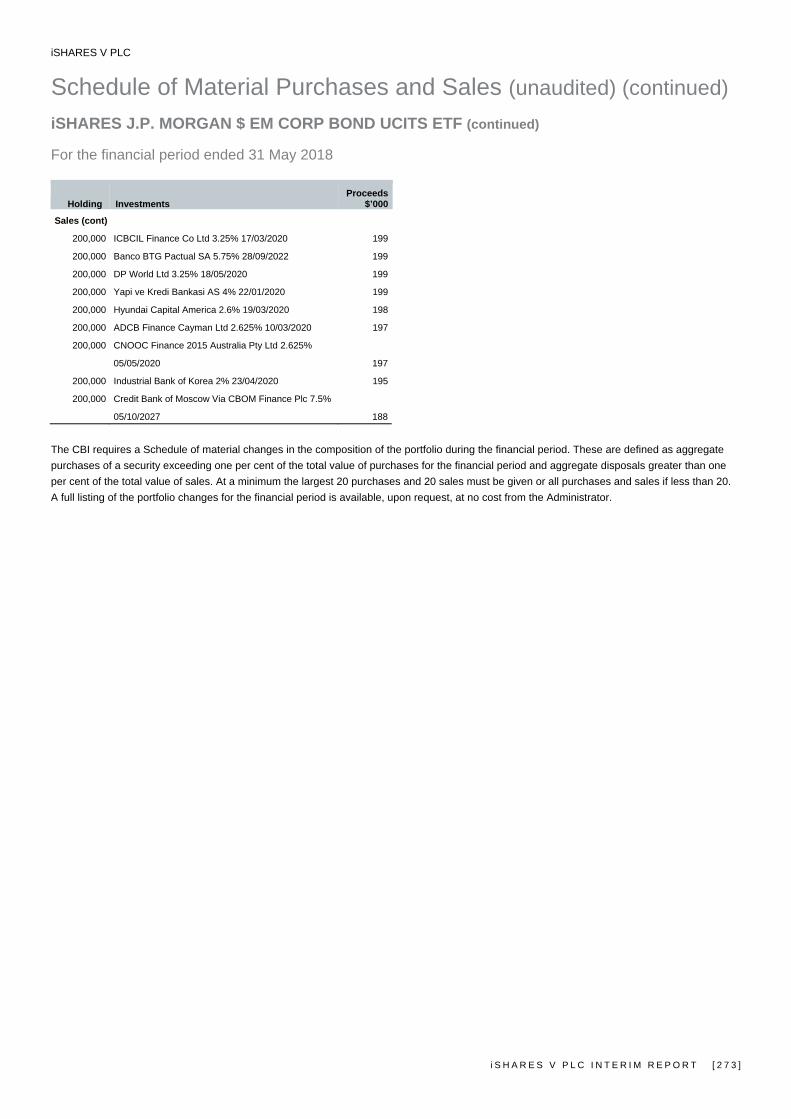
iSHARES V PLC
Schedule of Material Purchases and Sales (unaudited) (continued) iSHARES J.P. MORGAN $ EM CORP BOND UCITS ETF (continued) For the financial period ended 31 May 2018
i S H A R E S V P L C I N T E R I M R E P O R T [ 2 7 3 ]
Holding Investments Proceeds
$’000
Sales (cont)
200,000 ICBCIL Finance Co Ltd 3.25% 17/03/2020 199
200,000 Banco BTG Pactual SA 5.75% 28/09/2022 199
200,000 DP World Ltd 3.25% 18/05/2020 199
200,000 Yapi ve Kredi Bankasi AS 4% 22/01/2020 199
200,000 Hyundai Capital America 2.6% 19/03/2020 198
200,000 ADCB Finance Cayman Ltd 2.625% 10/03/2020 197
200,000 CNOOC Finance 2015 Australia Pty Ltd 2.625%
05/05/2020 197
200,000 Industrial Bank of Korea 2% 23/04/2020 195
200,000 Credit Bank of Moscow Via CBOM Finance Plc 7.5%
05/10/2027 188
The CBI requires a Schedule of material changes in the composition of the portfolio during the financial period. These are defined as aggregate purchases of a security exceeding one per cent of the total value of purchases for the financial period and aggregate disposals greater than one per cent of the total value of sales. At a minimum the largest 20 purchases and 20 sales must be given or all purchases and sales if less than 20. A full listing of the portfolio changes for the financial period is available, upon request, at no cost from the Administrator.
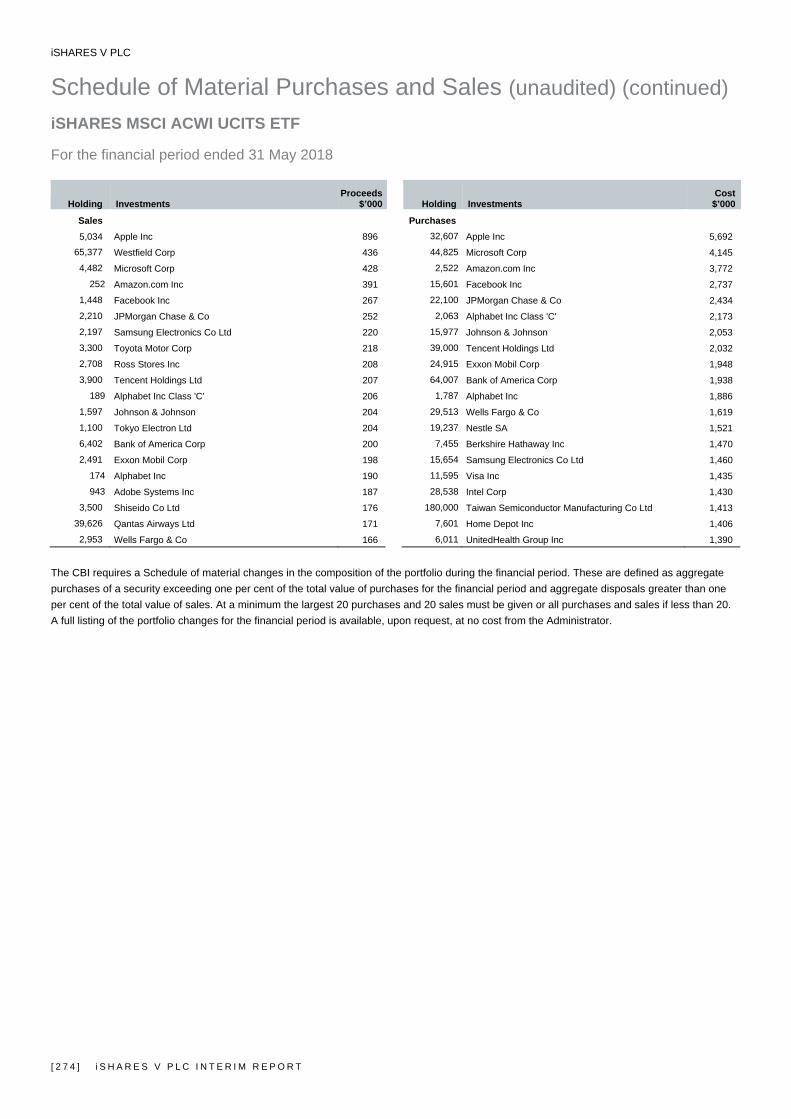
iSHARES V PLC
Schedule of Material Purchases and Sales (unaudited) (continued) iSHARES MSCI ACWI UCITS ETF For the financial period ended 31 May 2018
[ 2 7 4 ] i S H A R E S V P L C I N T E R I M R E P O R T
Holding Investments Proceeds
$’000 Holding Investments Cost
$’000
Sales Purchases
5,034 Apple Inc 896 32,607 Apple Inc 5,692 65,377 Westfield Corp 436 44,825 Microsoft Corp 4,145 4,482 Microsoft Corp 428 2,522 Amazon.com Inc 3,772 252 Amazon.com Inc 391 15,601 Facebook Inc 2,737 1,448 Facebook Inc 267 22,100 JPMorgan Chase & Co 2,434 2,210 JPMorgan Chase & Co 252 2,063 Alphabet Inc Class 'C' 2,173 2,197 Samsung Electronics Co Ltd 220 15,977 Johnson & Johnson 2,053 3,300 Toyota Motor Corp 218 39,000 Tencent Holdings Ltd 2,032 2,708 Ross Stores Inc 208 24,915 Exxon Mobil Corp 1,948 3,900 Tencent Holdings Ltd 207 64,007 Bank of America Corp 1,938 189 Alphabet Inc Class 'C' 206 1,787 Alphabet Inc 1,886 1,597 Johnson & Johnson 204 29,513 Wells Fargo & Co 1,619 1,100 Tokyo Electron Ltd 204 19,237 Nestle SA 1,521 6,402 Bank of America Corp 200 7,455 Berkshire Hathaway Inc 1,470 2,491 Exxon Mobil Corp 198 15,654 Samsung Electronics Co Ltd 1,460 174 Alphabet Inc 190 11,595 Visa Inc 1,435 943 Adobe Systems Inc 187 28,538 Intel Corp 1,430 3,500 Shiseido Co Ltd 176 180,000 Taiwan Semiconductor Manufacturing Co Ltd 1,413 39,626 Qantas Airways Ltd 171 7,601 Home Depot Inc 1,406 2,953 Wells Fargo & Co 166 6,011 UnitedHealth Group Inc 1,390
The CBI requires a Schedule of material changes in the composition of the portfolio during the financial period. These are defined as aggregate purchases of a security exceeding one per cent of the total value of purchases for the financial period and aggregate disposals greater than one per cent of the total value of sales. At a minimum the largest 20 purchases and 20 sales must be given or all purchases and sales if less than 20. A full listing of the portfolio changes for the financial period is available, upon request, at no cost from the Administrator.

iSHARES V PLC
Schedule of Material Purchases and Sales (unaudited) (continued) iSHARES MSCI EM CONSUMER GROWTH UCITS ETF For the financial period ended 31 May 2018
i S H A R E S V P L C I N T E R I M R E P O R T [ 2 7 5 ]
Holding Investments Proceeds
$’000 Holding Investments Cost
$’000
Sales Purchases
2,467 Alibaba Group Holding Ltd 488 9,100 Tencent Holdings Ltd 473
7,600 Tencent Holdings Ltd 386 2,475 Alibaba Group Holding Ltd 432
4,717 AstraZeneca Plc 343 10,595 Diageo Plc 391
24,464 Telefonica SA 215 949 LVMH Moet Hennessy Louis Vuitton SE 330
842 Apple Inc 157 2,022 Apple Inc 316
4,500 Honda Motor Co Ltd 143 3,089 Philip Morris International Inc 301
421 Naspers Ltd 101 1,117 Naspers Ltd 276
1,104 Unilever NV 62 20,500 China Mobile Ltd 198
1,200 Denso Corp 58 2,479 Danone SA 190
5,500 China Mobile Ltd 49 703 Adidas AG 159
2,377 Aspen Pharmacare Holdings Ltd 47 2,739 Unilever NV 147
842 Unilever Plc 46 1,359 Anheuser-Busch InBev SA/NV 141
4,500 Shanghai Fosun Pharmaceutical Group Co Ltd 29 234 Kering SA 134
3,000 Galaxy Entertainment Group Ltd 26 2,178 Unilever Plc 115
4,000 Tsingtao Brewery Co Ltd 23 1,100 Bayerische Motoren Werke AG 110
355 Colgate-Palmolive Co 22 1,596 AstraZeneca Plc 106
4,000 Minth Group Ltd 22 360 MercadoLibre Inc 105
400 Yamaha Corp 21 1,429 Colgate-Palmolive Co 99
26,210 America Movil SAB de CV 20 2,210 JD.com Inc 95
3,790 Ambev SA 20 313 Tesla Inc 89
The CBI requires a Schedule of material changes in the composition of the portfolio during the financial period. These are defined as aggregate purchases of a security exceeding one per cent of the total value of purchases for the financial period and aggregate disposals greater than one per cent of the total value of sales. At a minimum the largest 20 purchases and 20 sales must be given or all purchases and sales if less than 20. A full listing of the portfolio changes for the financial period is available, upon request, at no cost from the Administrator.

iSHARES V PLC
Schedule of Material Purchases and Sales (unaudited) (continued) iSHARES MSCI JAPAN EUR HEDGED UCITS ETF (ACC) For the financial period ended 31 May 2018
[ 2 7 6 ] i S H A R E S V P L C I N T E R I M R E P O R T
Holding Investments Proceeds
€’000 Holding Investments Cost
€’000
Sales Purchases
546,000 Toyota Motor Corp 29,478 422,900 Toyota Motor Corp 23,005
2,529,400 Mitsubishi UFJ Financial Group Inc 13,995 1,918,000 Mitsubishi UFJ Financial Group Inc 11,393
23,600 Keyence Corp 11,773 18,900 Keyence Corp 9,155
170,700 SoftBank Group Corp 10,879 133,700 SoftBank Group Corp 8,882
257,400 Sony Corp 10,287 202,200 Sony Corp 7,956
352,400 Honda Motor Co Ltd 9,880 276,300 Honda Motor Co Ltd 7,901
271,700 Sumitomo Mitsui Financial Group Inc 9,467 213,300 Sumitomo Mitsui Financial Group Inc 7,665
22,700 Nintendo Co Ltd 8,161 3,070,000 Toshiba Corp 6,967
373,600 KDDI Corp 7,809 29,400 Fanuc Corp 6,067
37,900 Fanuc Corp 7,534 293,700 KDDI Corp 5,973
4,945,300 Mizuho Financial Group Inc 7,406 17,500 Nintendo Co Ltd 5,924
313,600 Mitsubishi Corp 7,123 3,843,300 Mizuho Financial Group Inc 5,800
79,700 Shin-Etsu Chemical Co Ltd 6,736 244,100 Mitsubishi Corp 5,516
218,800 Canon Inc 6,510 63,800 Shin-Etsu Chemical Co Ltd 5,513
48,700 Nidec Corp 6,195 116,800 Takeda Pharmaceutical Co Ltd 5,345
102,500 Kao Corp 6,145 171,200 Canon Inc 5,262
148,300 Takeda Pharmaceutical Co Ltd 6,124 775,000 Hitachi Ltd 4,873
995,000 Hitachi Ltd 6,098 39,000 Nidec Corp 4,836
280,200 NTT DoCoMo Inc 5,877 80,100 Kao Corp 4,635
71,900 East Japan Railway Co 5,574 218,100 SUMCO Corp 4,633
The CBI requires a Schedule of material changes in the composition of the portfolio during the financial period. These are defined as aggregate purchases of a security exceeding one per cent of the total value of purchases for the financial period and aggregate disposals greater than one per cent of the total value of sales. At a minimum the largest 20 purchases and 20 sales must be given or all purchases and sales if less than 20. A full listing of the portfolio changes for the financial period is available, upon request, at no cost from the Administrator.
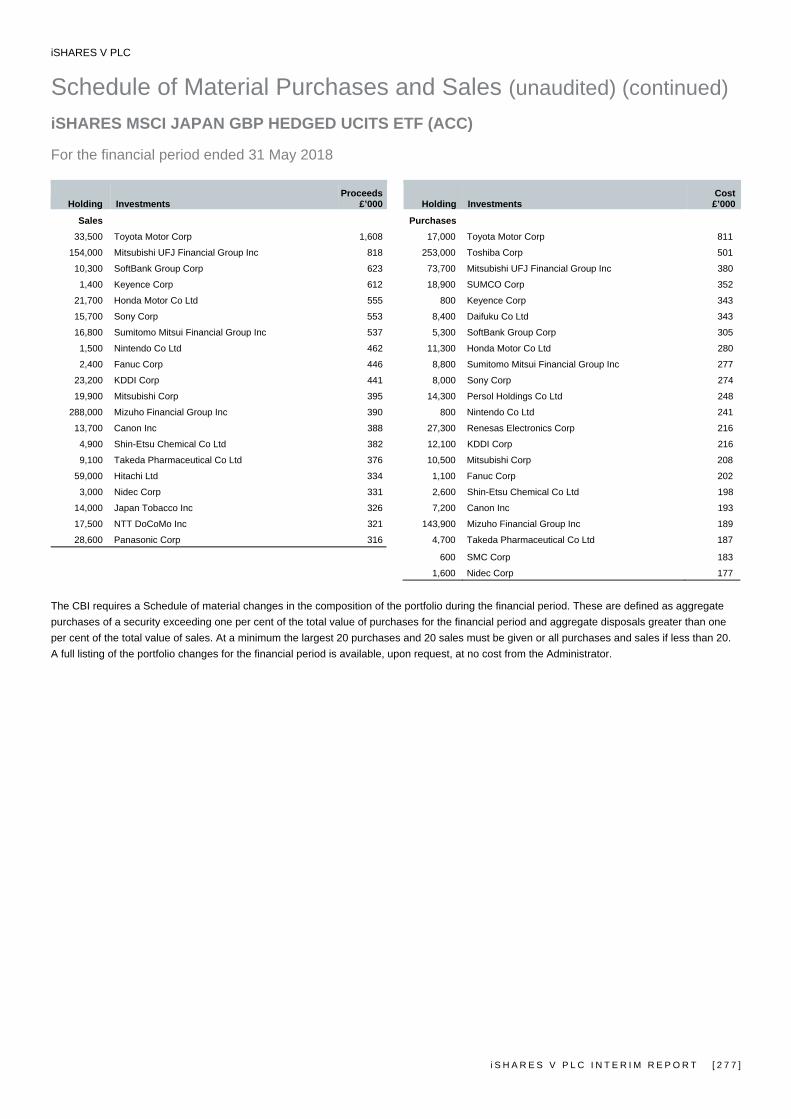
iSHARES V PLC
Schedule of Material Purchases and Sales (unaudited) (continued) iSHARES MSCI JAPAN GBP HEDGED UCITS ETF (ACC) For the financial period ended 31 May 2018
i S H A R E S V P L C I N T E R I M R E P O R T [ 2 7 7 ]
Holding Investments Proceeds
£’000 Holding Investments Cost
£’000
Sales Purchases
33,500 Toyota Motor Corp 1,608 17,000 Toyota Motor Corp 811
154,000 Mitsubishi UFJ Financial Group Inc 818 253,000 Toshiba Corp 501
10,300 SoftBank Group Corp 623 73,700 Mitsubishi UFJ Financial Group Inc 380
1,400 Keyence Corp 612 18,900 SUMCO Corp 352
21,700 Honda Motor Co Ltd 555 800 Keyence Corp 343
15,700 Sony Corp 553 8,400 Daifuku Co Ltd 343
16,800 Sumitomo Mitsui Financial Group Inc 537 5,300 SoftBank Group Corp 305
1,500 Nintendo Co Ltd 462 11,300 Honda Motor Co Ltd 280
2,400 Fanuc Corp 446 8,800 Sumitomo Mitsui Financial Group Inc 277
23,200 KDDI Corp 441 8,000 Sony Corp 274
19,900 Mitsubishi Corp 395 14,300 Persol Holdings Co Ltd 248
288,000 Mizuho Financial Group Inc 390 800 Nintendo Co Ltd 241
13,700 Canon Inc 388 27,300 Renesas Electronics Corp 216
4,900 Shin-Etsu Chemical Co Ltd 382 12,100 KDDI Corp 216
9,100 Takeda Pharmaceutical Co Ltd 376 10,500 Mitsubishi Corp 208
59,000 Hitachi Ltd 334 1,100 Fanuc Corp 202
3,000 Nidec Corp 331 2,600 Shin-Etsu Chemical Co Ltd 198
14,000 Japan Tobacco Inc 326 7,200 Canon Inc 193
17,500 NTT DoCoMo Inc 321 143,900 Mizuho Financial Group Inc 189
28,600 Panasonic Corp 316 4,700 Takeda Pharmaceutical Co Ltd 187
600 SMC Corp 183
1,600 Nidec Corp 177
The CBI requires a Schedule of material changes in the composition of the portfolio during the financial period. These are defined as aggregate purchases of a security exceeding one per cent of the total value of purchases for the financial period and aggregate disposals greater than one per cent of the total value of sales. At a minimum the largest 20 purchases and 20 sales must be given or all purchases and sales if less than 20. A full listing of the portfolio changes for the financial period is available, upon request, at no cost from the Administrator.
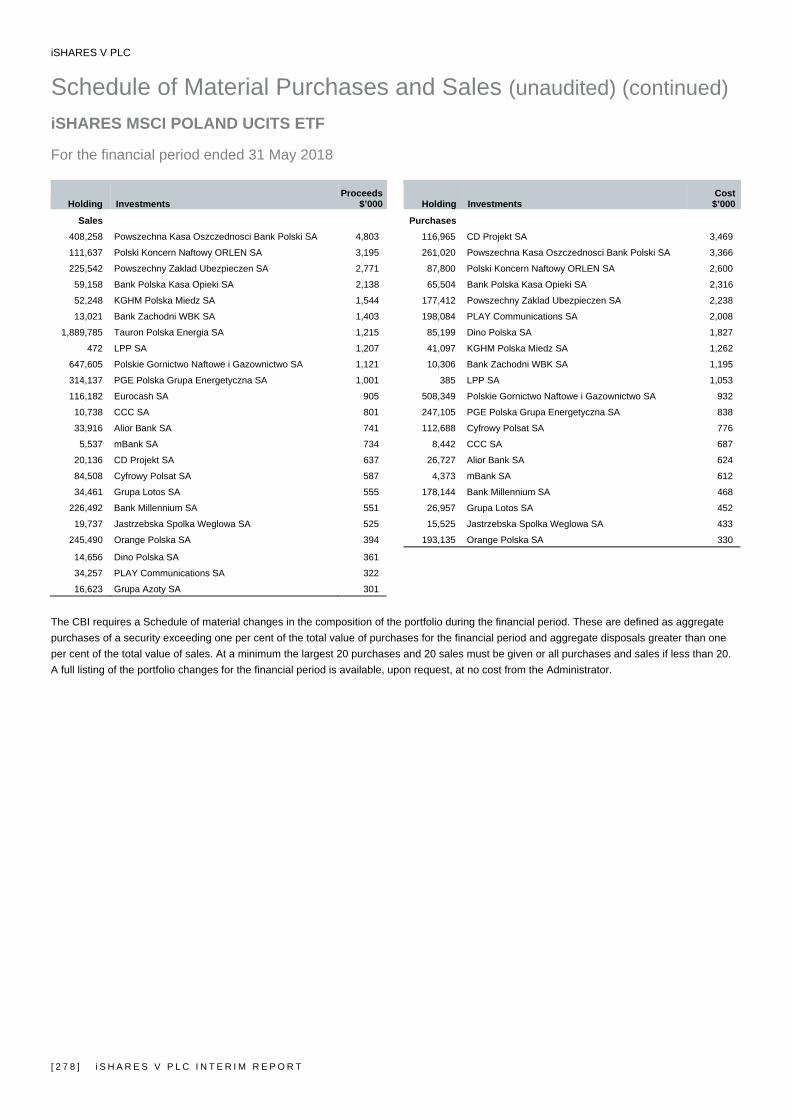
iSHARES V PLC
Schedule of Material Purchases and Sales (unaudited) (continued) iSHARES MSCI POLAND UCITS ETF For the financial period ended 31 May 2018
[ 2 7 8 ] i S H A R E S V P L C I N T E R I M R E P O R T
Holding Investments Proceeds
$’000 Holding Investments Cost
$’000
Sales Purchases
408,258 Powszechna Kasa Oszczednosci Bank Polski SA 4,803 116,965 CD Projekt SA 3,469
111,637 Polski Koncern Naftowy ORLEN SA 3,195 261,020 Powszechna Kasa Oszczednosci Bank Polski SA 3,366
225,542 Powszechny Zaklad Ubezpieczen SA 2,771 87,800 Polski Koncern Naftowy ORLEN SA 2,600
59,158 Bank Polska Kasa Opieki SA 2,138 65,504 Bank Polska Kasa Opieki SA 2,316
52,248 KGHM Polska Miedz SA 1,544 177,412 Powszechny Zaklad Ubezpieczen SA 2,238
13,021 Bank Zachodni WBK SA 1,403 198,084 PLAY Communications SA 2,008
1,889,785 Tauron Polska Energia SA 1,215 85,199 Dino Polska SA 1,827
472 LPP SA 1,207 41,097 KGHM Polska Miedz SA 1,262
647,605 Polskie Gornictwo Naftowe i Gazownictwo SA 1,121 10,306 Bank Zachodni WBK SA 1,195
314,137 PGE Polska Grupa Energetyczna SA 1,001 385 LPP SA 1,053
116,182 Eurocash SA 905 508,349 Polskie Gornictwo Naftowe i Gazownictwo SA 932
10,738 CCC SA 801 247,105 PGE Polska Grupa Energetyczna SA 838
33,916 Alior Bank SA 741 112,688 Cyfrowy Polsat SA 776
5,537 mBank SA 734 8,442 CCC SA 687
20,136 CD Projekt SA 637 26,727 Alior Bank SA 624
84,508 Cyfrowy Polsat SA 587 4,373 mBank SA 612
34,461 Grupa Lotos SA 555 178,144 Bank Millennium SA 468
226,492 Bank Millennium SA 551 26,957 Grupa Lotos SA 452
19,737 Jastrzebska Spolka Weglowa SA 525 15,525 Jastrzebska Spolka Weglowa SA 433
245,490 Orange Polska SA 394 193,135 Orange Polska SA 330
14,656 Dino Polska SA 361
34,257 PLAY Communications SA 322
16,623 Grupa Azoty SA 301
The CBI requires a Schedule of material changes in the composition of the portfolio during the financial period. These are defined as aggregate purchases of a security exceeding one per cent of the total value of purchases for the financial period and aggregate disposals greater than one per cent of the total value of sales. At a minimum the largest 20 purchases and 20 sales must be given or all purchases and sales if less than 20. A full listing of the portfolio changes for the financial period is available, upon request, at no cost from the Administrator.

iSHARES V PLC
Schedule of Material Purchases and Sales (unaudited) (continued) iSHARES MSCI WORLD EUR HEDGED UCITS ETF (ACC) For the financial period ended 31 May 2018
i S H A R E S V P L C I N T E R I M R E P O R T [ 2 7 9 ]
Holding Investments Proceeds
€’000 Holding Investments Cost
€’000
Sales Purchases
33,733 Apple Inc 5,051 97,292 Apple Inc 13,516
44,959 Microsoft Corp 3,458 141,179 Microsoft Corp 10,420
2,473 Amazon.com Inc 2,897 8,033 Amazon.com Inc 8,912
24,093 JPMorgan Chase & Co 2,222 46,661 Facebook Inc 6,817
13,715 Facebook Inc 2,092 66,080 JPMorgan Chase & Co 6,027
16,760 Johnson & Johnson 1,866 85,577 Exxon Mobil Corp 5,790
26,703 Exxon Mobil Corp 1,796 51,025 Johnson & Johnson 5,708
1,951 Alphabet Inc Class 'C' 1,761 6,102 Alphabet Inc Class 'C' 5,429
66,968 Bank of America Corp 1,704 5,822 Alphabet Inc 5,215
1,865 Alphabet Inc 1,694 194,402 Bank of America Corp 4,893
30,603 Wells Fargo & Co 1,492 89,752 Wells Fargo & Co 4,397
8,044 Berkshire Hathaway Inc 1,345 25,339 Berkshire Hathaway Inc 4,212
30,475 Intel Corp 1,269 58,578 Nestle SA 3,997
20,369 Citigroup Inc 1,247 36,803 Chevron Corp 3,673
7,803 Home Depot Inc 1,209 119,092 AT&T Inc 3,585
17,747 Nestle SA 1,209 18,782 UnitedHealth Group Inc 3,518
39,790 AT&T Inc 1,207 49,240 Procter & Gamble Co 3,433
6,273 UnitedHealth Group Inc 1,205 114,747 Pfizer Inc 3,403
11,879 Visa Inc 1,195 89,175 Intel Corp 3,386
38,730 Pfizer Inc 1,184 34,255 Visa Inc 3,358
The CBI requires a Schedule of material changes in the composition of the portfolio during the financial period. These are defined as aggregate purchases of a security exceeding one per cent of the total value of purchases for the financial period and aggregate disposals greater than one per cent of the total value of sales. At a minimum the largest 20 purchases and 20 sales must be given or all purchases and sales if less than 20. A full listing of the portfolio changes for the financial period is available, upon request, at no cost from the Administrator.
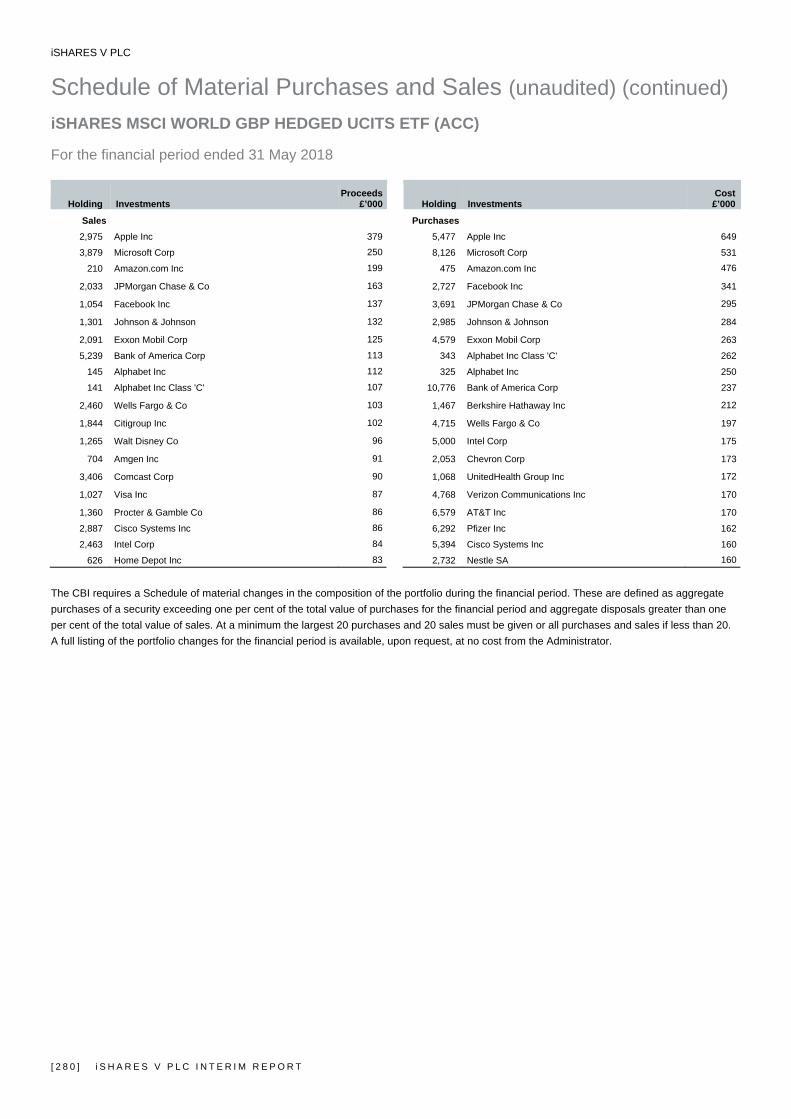
iSHARES V PLC
Schedule of Material Purchases and Sales (unaudited) (continued) iSHARES MSCI WORLD GBP HEDGED UCITS ETF (ACC) For the financial period ended 31 May 2018
[ 2 8 0 ] i S H A R E S V P L C I N T E R I M R E P O R T
Holding Investments Proceeds
£’000 Holding Investments Cost
£’000
Sales Purchases
2,975 Apple Inc 379 5,477 Apple Inc 649
3,879 Microsoft Corp 250 8,126 Microsoft Corp 531
210 Amazon.com Inc 199 475 Amazon.com Inc 476
2,033 JPMorgan Chase & Co 163 2,727 Facebook Inc 341
1,054 Facebook Inc 137 3,691 JPMorgan Chase & Co 295
1,301 Johnson & Johnson 132 2,985 Johnson & Johnson 284
2,091 Exxon Mobil Corp 125 4,579 Exxon Mobil Corp 263
5,239 Bank of America Corp 113 343 Alphabet Inc Class 'C' 262
145 Alphabet Inc 112 325 Alphabet Inc 250
141 Alphabet Inc Class 'C' 107 10,776 Bank of America Corp 237
2,460 Wells Fargo & Co 103 1,467 Berkshire Hathaway Inc 212
1,844 Citigroup Inc 102 4,715 Wells Fargo & Co 197
1,265 Walt Disney Co 96 5,000 Intel Corp 175
704 Amgen Inc 91 2,053 Chevron Corp 173
3,406 Comcast Corp 90 1,068 UnitedHealth Group Inc 172
1,027 Visa Inc 87 4,768 Verizon Communications Inc 170
1,360 Procter & Gamble Co 86 6,579 AT&T Inc 170
2,887 Cisco Systems Inc 86 6,292 Pfizer Inc 162
2,463 Intel Corp 84 5,394 Cisco Systems Inc 160
626 Home Depot Inc 83 2,732 Nestle SA 160
The CBI requires a Schedule of material changes in the composition of the portfolio during the financial period. These are defined as aggregate purchases of a security exceeding one per cent of the total value of purchases for the financial period and aggregate disposals greater than one per cent of the total value of sales. At a minimum the largest 20 purchases and 20 sales must be given or all purchases and sales if less than 20. A full listing of the portfolio changes for the financial period is available, upon request, at no cost from the Administrator.

iSHARES V PLC
Schedule of Material Purchases and Sales (unaudited) (continued) iSHARES OIL & GAS EXPLORATION & PRODUCTION UCITS ETF For the financial period ended 31 May 2018
i S H A R E S V P L C I N T E R I M R E P O R T [ 2 8 1 ]
Holding Investments Proceeds
$’000 Holding Investments Cost
$’000
Sales Purchases
227,222 ConocoPhillips 13,096 126,738 ConocoPhillips 7,560
94,307 EOG Resources Inc 10,187 65,711 EOG Resources Inc 7,192
103,340 Anadarko Petroleum Corp 5,996 125,281 Canadian Natural Resources Ltd 4,229
176,373 Canadian Natural Resources Ltd 5,899 60,122 Anadarko Petroleum Corp 3,614
27,843 Pioneer Natural Resources Co 4,931 19,372 Pioneer Natural Resources Co 3,497
2,632,000 CNOOC Ltd 4,023 120,057 Woodside Petroleum Ltd 2,837
24,422 Concho Resources Inc 3,559 1,820,000 CNOOC Ltd 2,804
137,879 Woodside Petroleum Ltd 3,388 17,074 Concho Resources Inc 2,510
86,046 Devon Energy Corp 3,189 59,780 Devon Energy Corp 2,196
42,702 Tatneft PJSC 2,499 29,572 Tatneft PJSC 1,788
62,266 Apache Corp 2,455 57,394 Noble Energy Inc 1,767
138,984 Marathon Oil Corp 2,395 43,356 Apache Corp 1,739
79,871 Noble Energy Inc 2,361 96,364 Marathon Oil Corp 1,683
44,104 Hess Corp 2,209 84,489 Centennial Resource Development Inc 1,588
176,500 Inpex Corp 2,166 29,767 Hess Corp 1,548
38,699 EQT Corp 1,978 122,600 Inpex Corp 1,525
14,861 Novatek PJSC 1,916 27,854 EQT Corp 1,444
16,047 Diamondback Energy Inc 1,909 11,169 Diamondback Energy Inc 1,384
159,308 Encana Corp 1,866 10,353 Novatek PJSC 1,380
75,671 Cabot Oil & Gas Corp 1,861 111,104 Encana Corp 1,333
15,570 Cimarex Energy Co 1,593 52,089 Cabot Oil & Gas Corp 1,280
214,315 Oil Search Ltd 1,267 10,920 Cimarex Energy Co 1,112
285,132 Santos Ltd 1,188 32,440 Parsley Energy Inc 915
148,009 Oil Search Ltd 885
60,043 Extraction Oil & Gas Inc 870
197,513 Santos Ltd 845
The CBI requires a Schedule of material changes in the composition of the portfolio during the financial period. These are defined as aggregate purchases of a security exceeding one per cent of the total value of purchases for the financial period and aggregate disposals greater than one per cent of the total value of sales. At a minimum the largest 20 purchases and 20 sales must be given or all purchases and sales if less than 20. A full listing of the portfolio changes for the financial period is available, upon request, at no cost from the Administrator.
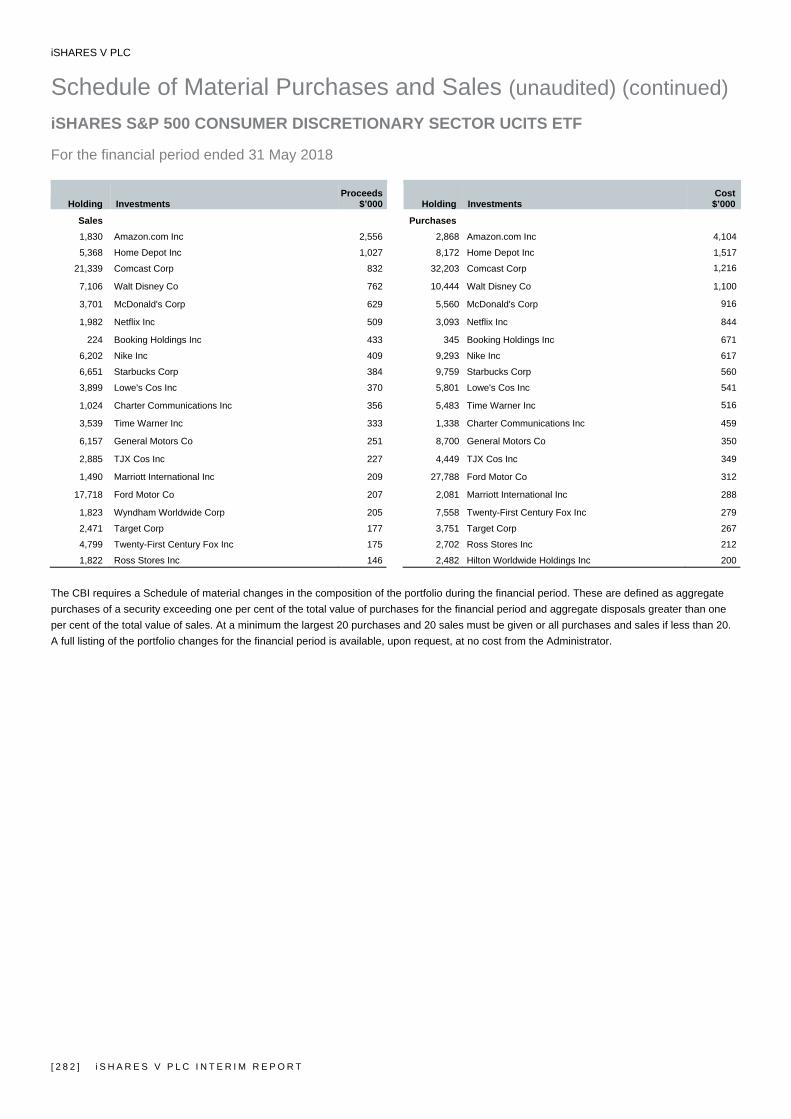
iSHARES V PLC
Schedule of Material Purchases and Sales (unaudited) (continued) iSHARES S&P 500 CONSUMER DISCRETIONARY SECTOR UCITS ETF For the financial period ended 31 May 2018
[ 2 8 2 ] i S H A R E S V P L C I N T E R I M R E P O R T
Holding Investments Proceeds
$’000 Holding Investments Cost
$’000
Sales Purchases
1,830 Amazon.com Inc 2,556 2,868 Amazon.com Inc 4,104
5,368 Home Depot Inc 1,027 8,172 Home Depot Inc 1,517
21,339 Comcast Corp 832 32,203 Comcast Corp 1,216
7,106 Walt Disney Co 762 10,444 Walt Disney Co 1,100
3,701 McDonald's Corp 629 5,560 McDonald's Corp 916
1,982 Netflix Inc 509 3,093 Netflix Inc 844
224 Booking Holdings Inc 433 345 Booking Holdings Inc 671
6,202 Nike Inc 409 9,293 Nike Inc 617
6,651 Starbucks Corp 384 9,759 Starbucks Corp 560
3,899 Lowe's Cos Inc 370 5,801 Lowe's Cos Inc 541
1,024 Charter Communications Inc 356 5,483 Time Warner Inc 516
3,539 Time Warner Inc 333 1,338 Charter Communications Inc 459
6,157 General Motors Co 251 8,700 General Motors Co 350
2,885 TJX Cos Inc 227 4,449 TJX Cos Inc 349
1,490 Marriott International Inc 209 27,788 Ford Motor Co 312
17,718 Ford Motor Co 207 2,081 Marriott International Inc 288
1,823 Wyndham Worldwide Corp 205 7,558 Twenty-First Century Fox Inc 279
2,471 Target Corp 177 3,751 Target Corp 267
4,799 Twenty-First Century Fox Inc 175 2,702 Ross Stores Inc 212
1,822 Ross Stores Inc 146 2,482 Hilton Worldwide Holdings Inc 200
The CBI requires a Schedule of material changes in the composition of the portfolio during the financial period. These are defined as aggregate purchases of a security exceeding one per cent of the total value of purchases for the financial period and aggregate disposals greater than one per cent of the total value of sales. At a minimum the largest 20 purchases and 20 sales must be given or all purchases and sales if less than 20. A full listing of the portfolio changes for the financial period is available, upon request, at no cost from the Administrator.
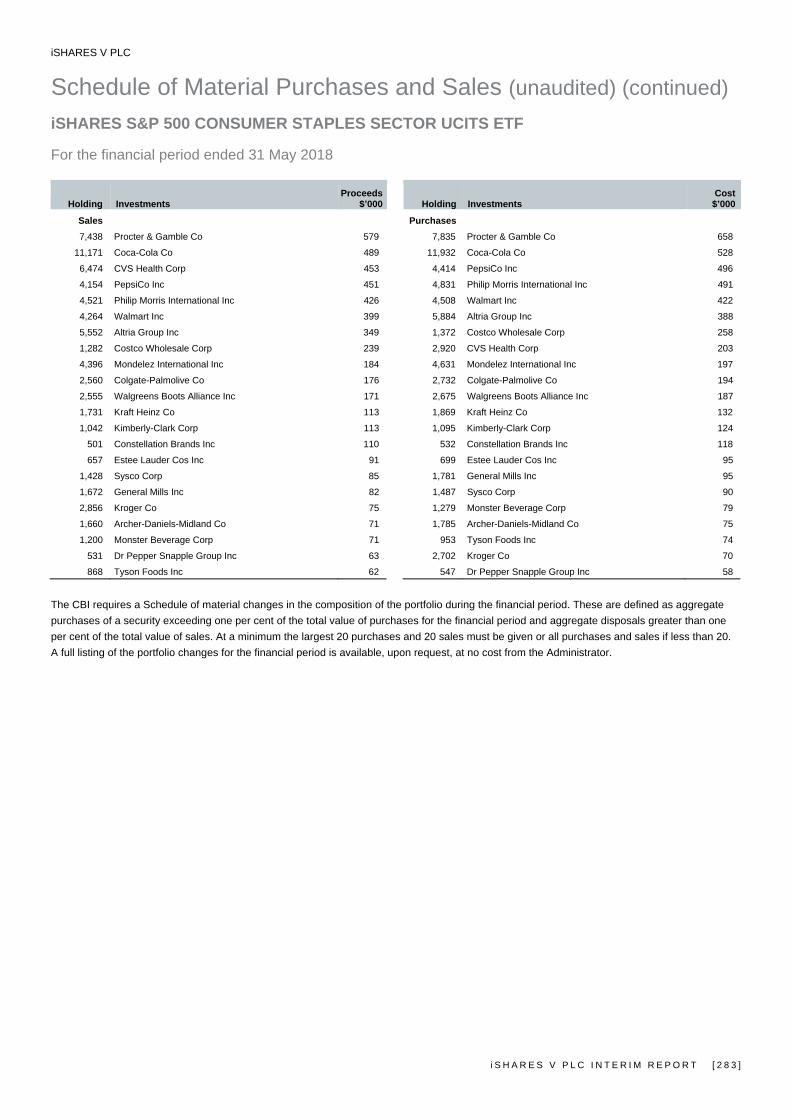
iSHARES V PLC
Schedule of Material Purchases and Sales (unaudited) (continued) iSHARES S&P 500 CONSUMER STAPLES SECTOR UCITS ETF For the financial period ended 31 May 2018
i S H A R E S V P L C I N T E R I M R E P O R T [ 2 8 3 ]
Holding Investments Proceeds
$’000 Holding Investments Cost
$’000
Sales Purchases
7,438 Procter & Gamble Co 579 7,835 Procter & Gamble Co 658
11,171 Coca-Cola Co 489 11,932 Coca-Cola Co 528
6,474 CVS Health Corp 453 4,414 PepsiCo Inc 496
4,154 PepsiCo Inc 451 4,831 Philip Morris International Inc 491
4,521 Philip Morris International Inc 426 4,508 Walmart Inc 422
4,264 Walmart Inc 399 5,884 Altria Group Inc 388
5,552 Altria Group Inc 349 1,372 Costco Wholesale Corp 258
1,282 Costco Wholesale Corp 239 2,920 CVS Health Corp 203
4,396 Mondelez International Inc 184 4,631 Mondelez International Inc 197
2,560 Colgate-Palmolive Co 176 2,732 Colgate-Palmolive Co 194
2,555 Walgreens Boots Alliance Inc 171 2,675 Walgreens Boots Alliance Inc 187
1,731 Kraft Heinz Co 113 1,869 Kraft Heinz Co 132
1,042 Kimberly-Clark Corp 113 1,095 Kimberly-Clark Corp 124
501 Constellation Brands Inc 110 532 Constellation Brands Inc 118
657 Estee Lauder Cos Inc 91 699 Estee Lauder Cos Inc 95
1,428 Sysco Corp 85 1,781 General Mills Inc 95
1,672 General Mills Inc 82 1,487 Sysco Corp 90
2,856 Kroger Co 75 1,279 Monster Beverage Corp 79
1,660 Archer-Daniels-Midland Co 71 1,785 Archer-Daniels-Midland Co 75
1,200 Monster Beverage Corp 71 953 Tyson Foods Inc 74
531 Dr Pepper Snapple Group Inc 63 2,702 Kroger Co 70
868 Tyson Foods Inc 62 547 Dr Pepper Snapple Group Inc 58
The CBI requires a Schedule of material changes in the composition of the portfolio during the financial period. These are defined as aggregate purchases of a security exceeding one per cent of the total value of purchases for the financial period and aggregate disposals greater than one per cent of the total value of sales. At a minimum the largest 20 purchases and 20 sales must be given or all purchases and sales if less than 20. A full listing of the portfolio changes for the financial period is available, upon request, at no cost from the Administrator.
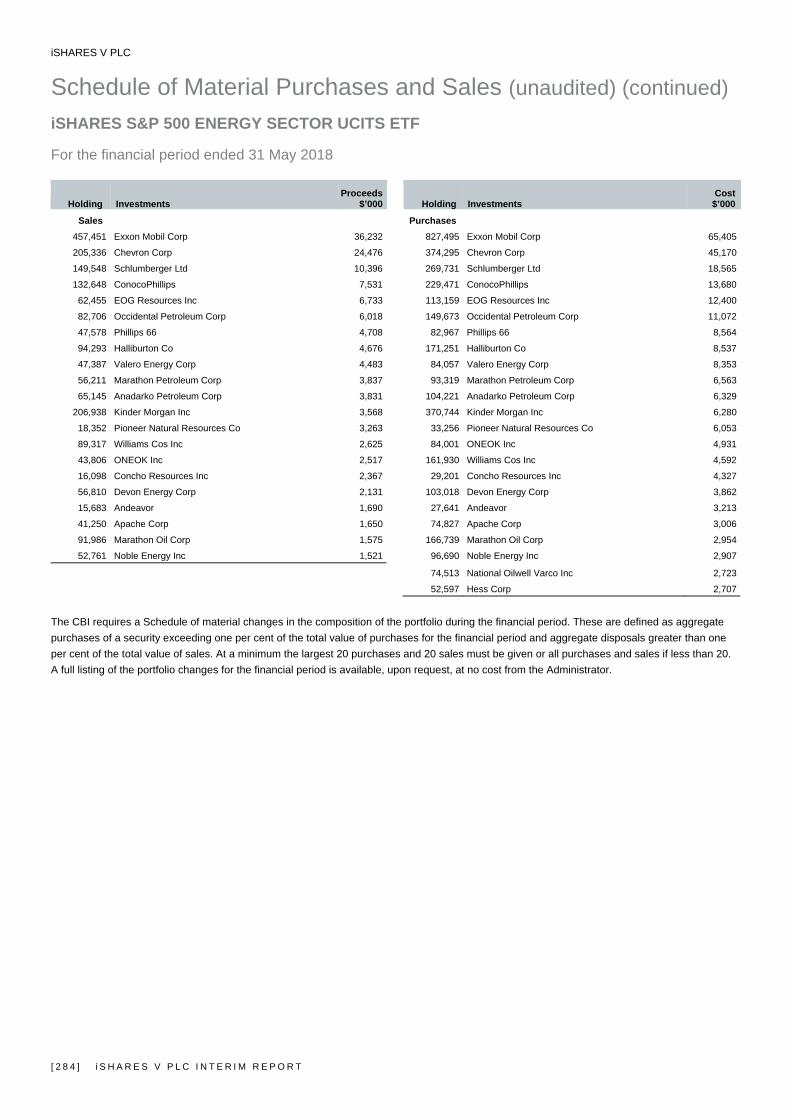
iSHARES V PLC
Schedule of Material Purchases and Sales (unaudited) (continued) iSHARES S&P 500 ENERGY SECTOR UCITS ETF For the financial period ended 31 May 2018
[ 2 8 4 ] i S H A R E S V P L C I N T E R I M R E P O R T
Holding Investments Proceeds
$’000 Holding Investments Cost
$’000
Sales Purchases
457,451 Exxon Mobil Corp 36,232 827,495 Exxon Mobil Corp 65,405
205,336 Chevron Corp 24,476 374,295 Chevron Corp 45,170
149,548 Schlumberger Ltd 10,396 269,731 Schlumberger Ltd 18,565
132,648 ConocoPhillips 7,531 229,471 ConocoPhillips 13,680
62,455 EOG Resources Inc 6,733 113,159 EOG Resources Inc 12,400
82,706 Occidental Petroleum Corp 6,018 149,673 Occidental Petroleum Corp 11,072
47,578 Phillips 66 4,708 82,967 Phillips 66 8,564
94,293 Halliburton Co 4,676 171,251 Halliburton Co 8,537
47,387 Valero Energy Corp 4,483 84,057 Valero Energy Corp 8,353
56,211 Marathon Petroleum Corp 3,837 93,319 Marathon Petroleum Corp 6,563
65,145 Anadarko Petroleum Corp 3,831 104,221 Anadarko Petroleum Corp 6,329
206,938 Kinder Morgan Inc 3,568 370,744 Kinder Morgan Inc 6,280
18,352 Pioneer Natural Resources Co 3,263 33,256 Pioneer Natural Resources Co 6,053
89,317 Williams Cos Inc 2,625 84,001 ONEOK Inc 4,931
43,806 ONEOK Inc 2,517 161,930 Williams Cos Inc 4,592
16,098 Concho Resources Inc 2,367 29,201 Concho Resources Inc 4,327
56,810 Devon Energy Corp 2,131 103,018 Devon Energy Corp 3,862
15,683 Andeavor 1,690 27,641 Andeavor 3,213
41,250 Apache Corp 1,650 74,827 Apache Corp 3,006
91,986 Marathon Oil Corp 1,575 166,739 Marathon Oil Corp 2,954
52,761 Noble Energy Inc 1,521 96,690 Noble Energy Inc 2,907
74,513 National Oilwell Varco Inc 2,723
52,597 Hess Corp 2,707
The CBI requires a Schedule of material changes in the composition of the portfolio during the financial period. These are defined as aggregate purchases of a security exceeding one per cent of the total value of purchases for the financial period and aggregate disposals greater than one per cent of the total value of sales. At a minimum the largest 20 purchases and 20 sales must be given or all purchases and sales if less than 20. A full listing of the portfolio changes for the financial period is available, upon request, at no cost from the Administrator.
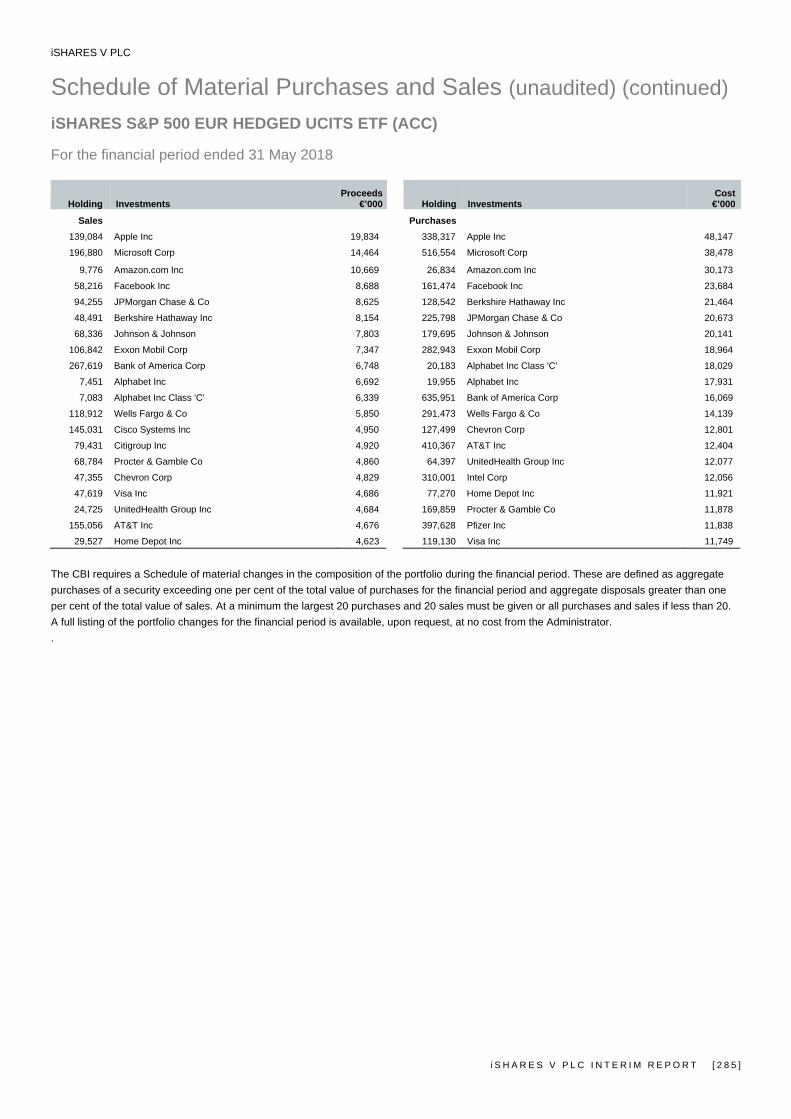
iSHARES V PLC
Schedule of Material Purchases and Sales (unaudited) (continued) iSHARES S&P 500 EUR HEDGED UCITS ETF (ACC) For the financial period ended 31 May 2018
i S H A R E S V P L C I N T E R I M R E P O R T [ 2 8 5 ]
Holding Investments Proceeds
€’000 Holding Investments Cost
€’000
Sales Purchases
139,084 Apple Inc 19,834 338,317 Apple Inc 48,147
196,880 Microsoft Corp 14,464 516,554 Microsoft Corp 38,478
9,776 Amazon.com Inc 10,669 26,834 Amazon.com Inc 30,173
58,216 Facebook Inc 8,688 161,474 Facebook Inc 23,684
94,255 JPMorgan Chase & Co 8,625 128,542 Berkshire Hathaway Inc 21,464
48,491 Berkshire Hathaway Inc 8,154 225,798 JPMorgan Chase & Co 20,673
68,336 Johnson & Johnson 7,803 179,695 Johnson & Johnson 20,141
106,842 Exxon Mobil Corp 7,347 282,943 Exxon Mobil Corp 18,964
267,619 Bank of America Corp 6,748 20,183 Alphabet Inc Class 'C' 18,029
7,451 Alphabet Inc 6,692 19,955 Alphabet Inc 17,931
7,083 Alphabet Inc Class 'C' 6,339 635,951 Bank of America Corp 16,069
118,912 Wells Fargo & Co 5,850 291,473 Wells Fargo & Co 14,139
145,031 Cisco Systems Inc 4,950 127,499 Chevron Corp 12,801
79,431 Citigroup Inc 4,920 410,367 AT&T Inc 12,404
68,784 Procter & Gamble Co 4,860 64,397 UnitedHealth Group Inc 12,077
47,355 Chevron Corp 4,829 310,001 Intel Corp 12,056
47,619 Visa Inc 4,686 77,270 Home Depot Inc 11,921
24,725 UnitedHealth Group Inc 4,684 169,859 Procter & Gamble Co 11,878
155,056 AT&T Inc 4,676 397,628 Pfizer Inc 11,838
29,527 Home Depot Inc 4,623 119,130 Visa Inc 11,749
The CBI requires a Schedule of material changes in the composition of the portfolio during the financial period. These are defined as aggregate purchases of a security exceeding one per cent of the total value of purchases for the financial period and aggregate disposals greater than one per cent of the total value of sales. At a minimum the largest 20 purchases and 20 sales must be given or all purchases and sales if less than 20. A full listing of the portfolio changes for the financial period is available, upon request, at no cost from the Administrator. .
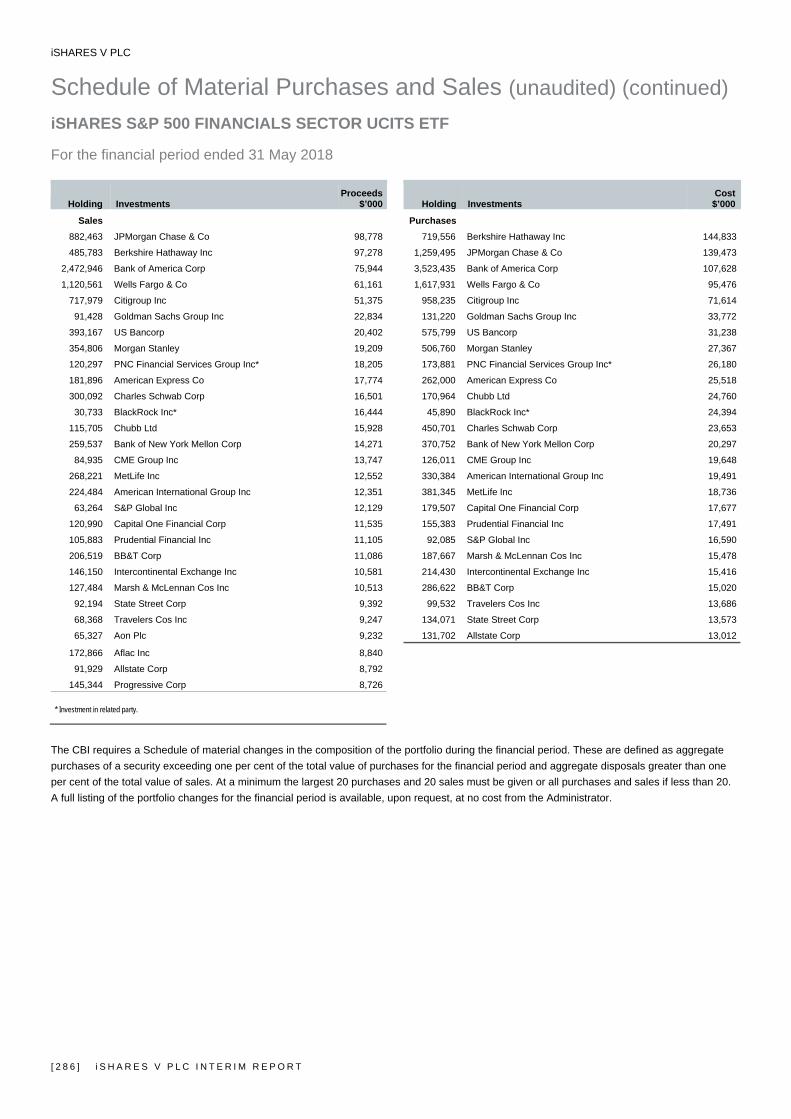
iSHARES V PLC
Schedule of Material Purchases and Sales (unaudited) (continued) iSHARES S&P 500 FINANCIALS SECTOR UCITS ETF For the financial period ended 31 May 2018
[ 2 8 6 ] i S H A R E S V P L C I N T E R I M R E P O R T
Holding Investments Proceeds
$’000 Holding Investments Cost
$’000
Sales Purchases
882,463 JPMorgan Chase & Co 98,778 719,556 Berkshire Hathaway Inc 144,833
485,783 Berkshire Hathaway Inc 97,278 1,259,495 JPMorgan Chase & Co 139,473
2,472,946 Bank of America Corp 75,944 3,523,435 Bank of America Corp 107,628
1,120,561 Wells Fargo & Co 61,161 1,617,931 Wells Fargo & Co 95,476
717,979 Citigroup Inc 51,375 958,235 Citigroup Inc 71,614
91,428 Goldman Sachs Group Inc 22,834 131,220 Goldman Sachs Group Inc 33,772
393,167 US Bancorp 20,402 575,799 US Bancorp 31,238
354,806 Morgan Stanley 19,209 506,760 Morgan Stanley 27,367
120,297 PNC Financial Services Group Inc* 18,205 173,881 PNC Financial Services Group Inc* 26,180
181,896 American Express Co 17,774 262,000 American Express Co 25,518
300,092 Charles Schwab Corp 16,501 170,964 Chubb Ltd 24,760
30,733 BlackRock Inc* 16,444 45,890 BlackRock Inc* 24,394
115,705 Chubb Ltd 15,928 450,701 Charles Schwab Corp 23,653
259,537 Bank of New York Mellon Corp 14,271 370,752 Bank of New York Mellon Corp 20,297
84,935 CME Group Inc 13,747 126,011 CME Group Inc 19,648
268,221 MetLife Inc 12,552 330,384 American International Group Inc 19,491
224,484 American International Group Inc 12,351 381,345 MetLife Inc 18,736
63,264 S&P Global Inc 12,129 179,507 Capital One Financial Corp 17,677
120,990 Capital One Financial Corp 11,535 155,383 Prudential Financial Inc 17,491
105,883 Prudential Financial Inc 11,105 92,085 S&P Global Inc 16,590
206,519 BB&T Corp 11,086 187,667 Marsh & McLennan Cos Inc 15,478
146,150 Intercontinental Exchange Inc 10,581 214,430 Intercontinental Exchange Inc 15,416
127,484 Marsh & McLennan Cos Inc 10,513 286,622 BB&T Corp 15,020
92,194 State Street Corp 9,392 99,532 Travelers Cos Inc 13,686
68,368 Travelers Cos Inc 9,247 134,071 State Street Corp 13,573
65,327 Aon Plc 9,232 131,702 Allstate Corp 13,012
172,866 Aflac Inc 8,840
91,929 Allstate Corp 8,792
145,344 Progressive Corp 8,726
* Investment in related party.
The CBI requires a Schedule of material changes in the composition of the portfolio during the financial period. These are defined as aggregate purchases of a security exceeding one per cent of the total value of purchases for the financial period and aggregate disposals greater than one per cent of the total value of sales. At a minimum the largest 20 purchases and 20 sales must be given or all purchases and sales if less than 20. A full listing of the portfolio changes for the financial period is available, upon request, at no cost from the Administrator.
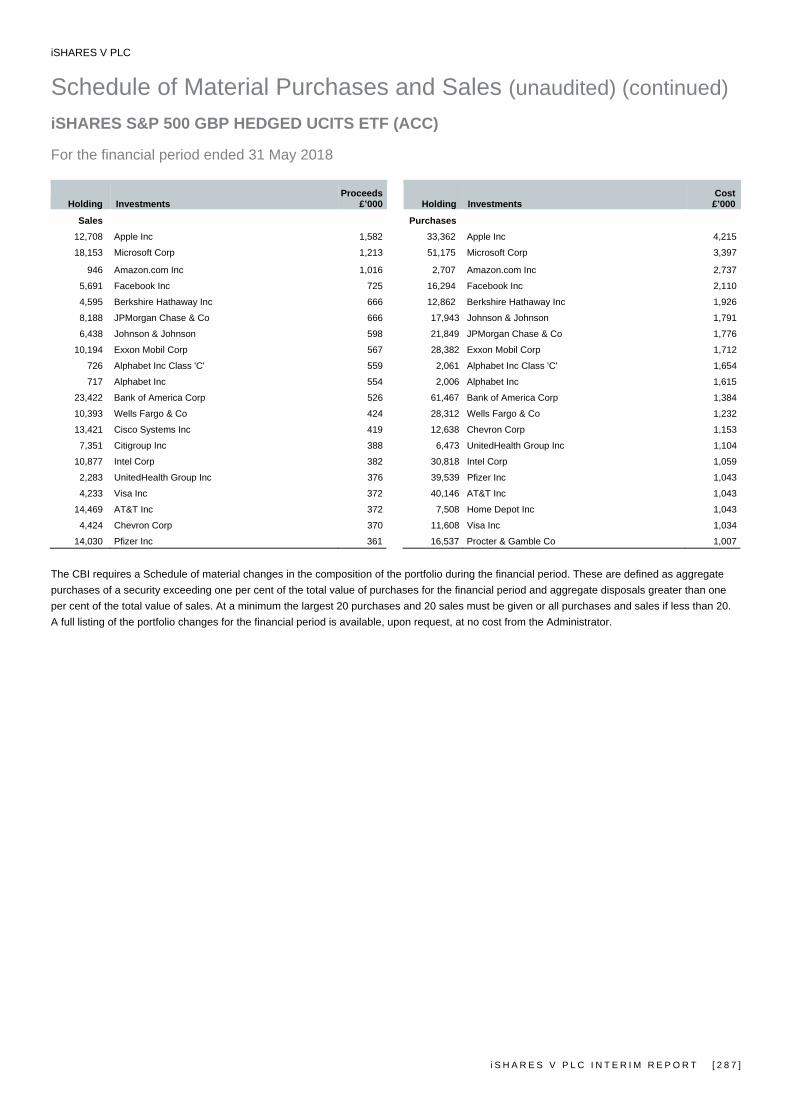
iSHARES V PLC
Schedule of Material Purchases and Sales (unaudited) (continued) iSHARES S&P 500 GBP HEDGED UCITS ETF (ACC) For the financial period ended 31 May 2018
i S H A R E S V P L C I N T E R I M R E P O R T [ 2 8 7 ]
Holding Investments Proceeds
£’000 Holding Investments Cost
£’000
Sales Purchases
12,708 Apple Inc 1,582 33,362 Apple Inc 4,215
18,153 Microsoft Corp 1,213 51,175 Microsoft Corp 3,397
946 Amazon.com Inc 1,016 2,707 Amazon.com Inc 2,737
5,691 Facebook Inc 725 16,294 Facebook Inc 2,110
4,595 Berkshire Hathaway Inc 666 12,862 Berkshire Hathaway Inc 1,926
8,188 JPMorgan Chase & Co 666 17,943 Johnson & Johnson 1,791
6,438 Johnson & Johnson 598 21,849 JPMorgan Chase & Co 1,776
10,194 Exxon Mobil Corp 567 28,382 Exxon Mobil Corp 1,712
726 Alphabet Inc Class 'C' 559 2,061 Alphabet Inc Class 'C' 1,654
717 Alphabet Inc 554 2,006 Alphabet Inc 1,615
23,422 Bank of America Corp 526 61,467 Bank of America Corp 1,384
10,393 Wells Fargo & Co 424 28,312 Wells Fargo & Co 1,232
13,421 Cisco Systems Inc 419 12,638 Chevron Corp 1,153
7,351 Citigroup Inc 388 6,473 UnitedHealth Group Inc 1,104
10,877 Intel Corp 382 30,818 Intel Corp 1,059
2,283 UnitedHealth Group Inc 376 39,539 Pfizer Inc 1,043
4,233 Visa Inc 372 40,146 AT&T Inc 1,043
14,469 AT&T Inc 372 7,508 Home Depot Inc 1,043
4,424 Chevron Corp 370 11,608 Visa Inc 1,034
14,030 Pfizer Inc 361 16,537 Procter & Gamble Co 1,007
The CBI requires a Schedule of material changes in the composition of the portfolio during the financial period. These are defined as aggregate purchases of a security exceeding one per cent of the total value of purchases for the financial period and aggregate disposals greater than one per cent of the total value of sales. At a minimum the largest 20 purchases and 20 sales must be given or all purchases and sales if less than 20. A full listing of the portfolio changes for the financial period is available, upon request, at no cost from the Administrator.
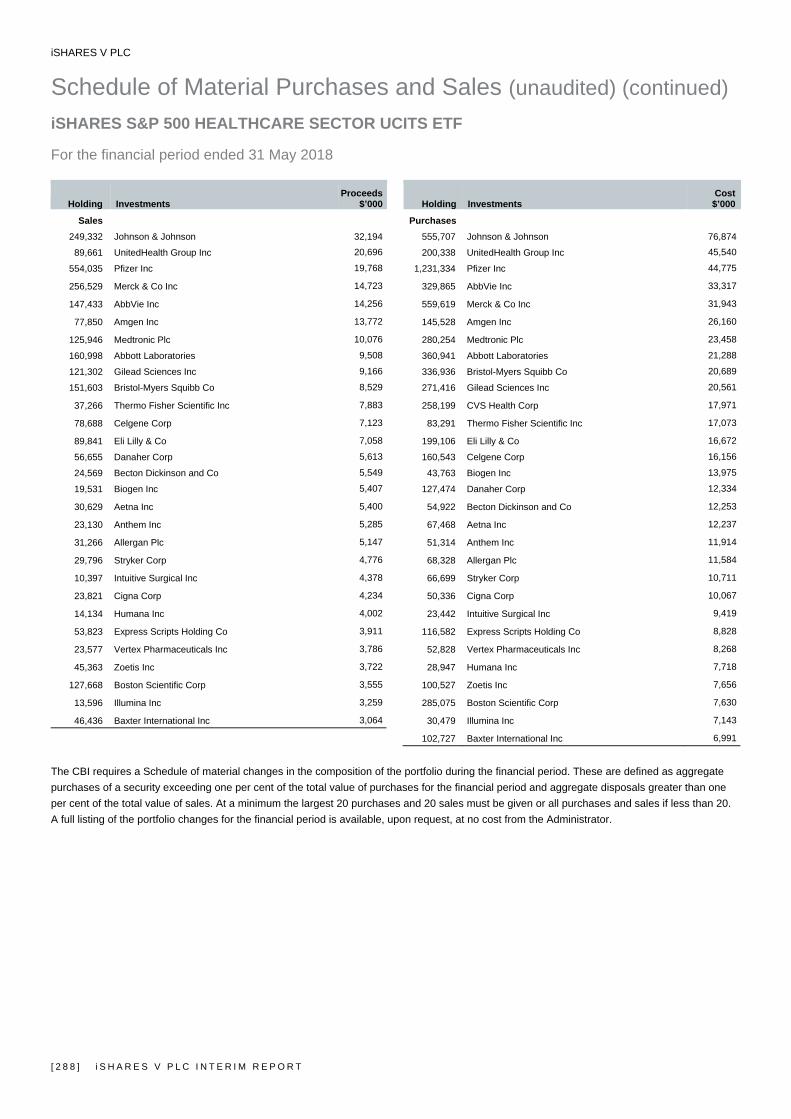
iSHARES V PLC
Schedule of Material Purchases and Sales (unaudited) (continued) iSHARES S&P 500 HEALTHCARE SECTOR UCITS ETF For the financial period ended 31 May 2018
[ 2 8 8 ] i S H A R E S V P L C I N T E R I M R E P O R T
Holding Investments Proceeds
$’000 Holding Investments Cost
$’000
Sales Purchases
249,332 Johnson & Johnson 32,194 555,707 Johnson & Johnson 76,874
89,661 UnitedHealth Group Inc 20,696 200,338 UnitedHealth Group Inc 45,540
554,035 Pfizer Inc 19,768 1,231,334 Pfizer Inc 44,775
256,529 Merck & Co Inc 14,723 329,865 AbbVie Inc 33,317
147,433 AbbVie Inc 14,256 559,619 Merck & Co Inc 31,943
77,850 Amgen Inc 13,772 145,528 Amgen Inc 26,160
125,946 Medtronic Plc 10,076 280,254 Medtronic Plc 23,458
160,998 Abbott Laboratories 9,508 360,941 Abbott Laboratories 21,288
121,302 Gilead Sciences Inc 9,166 336,936 Bristol-Myers Squibb Co 20,689
151,603 Bristol-Myers Squibb Co 8,529 271,416 Gilead Sciences Inc 20,561
37,266 Thermo Fisher Scientific Inc 7,883 258,199 CVS Health Corp 17,971
78,688 Celgene Corp 7,123 83,291 Thermo Fisher Scientific Inc 17,073
89,841 Eli Lilly & Co 7,058 199,106 Eli Lilly & Co 16,672
56,655 Danaher Corp 5,613 160,543 Celgene Corp 16,156
24,569 Becton Dickinson and Co 5,549 43,763 Biogen Inc 13,975
19,531 Biogen Inc 5,407 127,474 Danaher Corp 12,334
30,629 Aetna Inc 5,400 54,922 Becton Dickinson and Co 12,253
23,130 Anthem Inc 5,285 67,468 Aetna Inc 12,237
31,266 Allergan Plc 5,147 51,314 Anthem Inc 11,914
29,796 Stryker Corp 4,776 68,328 Allergan Plc 11,584
10,397 Intuitive Surgical Inc 4,378 66,699 Stryker Corp 10,711
23,821 Cigna Corp 4,234 50,336 Cigna Corp 10,067
14,134 Humana Inc 4,002 23,442 Intuitive Surgical Inc 9,419
53,823 Express Scripts Holding Co 3,911 116,582 Express Scripts Holding Co 8,828
23,577 Vertex Pharmaceuticals Inc 3,786 52,828 Vertex Pharmaceuticals Inc 8,268
45,363 Zoetis Inc 3,722 28,947 Humana Inc 7,718
127,668 Boston Scientific Corp 3,555 100,527 Zoetis Inc 7,656
13,596 Illumina Inc 3,259 285,075 Boston Scientific Corp 7,630
46,436 Baxter International Inc 3,064 30,479 Illumina Inc 7,143
102,727 Baxter International Inc 6,991
The CBI requires a Schedule of material changes in the composition of the portfolio during the financial period. These are defined as aggregate purchases of a security exceeding one per cent of the total value of purchases for the financial period and aggregate disposals greater than one per cent of the total value of sales. At a minimum the largest 20 purchases and 20 sales must be given or all purchases and sales if less than 20. A full listing of the portfolio changes for the financial period is available, upon request, at no cost from the Administrator.

iSHARES V PLC
Schedule of Material Purchases and Sales (unaudited) (continued) iSHARES S&P 500 INDUSTRIALS SECTOR UCITS ETF For the financial period ended 31 May 2018
i S H A R E S V P L C I N T E R I M R E P O R T [ 2 8 9 ]
Holding Investments Proceeds
$’000 Holding Investments Cost
$’000
Sales Purchases
605 nVent Electric Plc 14 1,035 Boeing Co 360
282 Apergy Corp 12 1,103 3M Co 260
38 Union Pacific Corp 5 16,194 General Electric Co 232
30 Honeywell International Inc 5 1,405 Honeywell International Inc 213
14 Boeing Co 5 1,466 Union Pacific Corp 198
41 United Continental Holdings Inc 3 1,383 United Technologies Corp 179
49 CSX Corp 3 1,115 Caterpillar Inc 175
37 Delta Air Lines Inc 2 459 Lockheed Martin Corp 160
11 Illinois Tool Works Inc 2 1,282 United Parcel Service Inc 138
86 General Electric Co 2 462 FedEx Corp 115
12 United Technologies Corp 2 531 Raytheon Co 114
17 Waste Management Inc 1 507 General Dynamics Corp 112
12 United Parcel Service Inc 1 321 Northrop Grumman Corp 112
6 3M Co 1 620 Deere & Co 101
5 FedEx Corp 1 582 Illinois Tool Works Inc 96
11 Verisk Analytics Inc 1 1,643 CSX Corp 91
12 Ingersoll-Rand Plc 1 1,170 Emerson Electric Co 84
16 Southwest Airlines Co 1 522 Norfolk Southern Corp 74
20 American Airlines Group Inc 1 442 Harris Corp 67
6 Cummins Inc 1 812 Eaton Corp Plc 66
27 Johnson Controls International Plc 1 1,207 Delta Air Lines Inc 66
13 Eaton Corp Plc 1 1,729 Johnson Controls International Plc 64
14 AMETEK Inc 1 742 Waste Management Inc 63
3 Roper Technologies Inc 1 996 Southwest Airlines Co 59
192 Roper Technologies Inc 54
288 Cummins Inc 48
287 Stanley Black & Decker Inc 46
250 Parker-Hannifin Corp 45
658 Paccar Inc 45
The CBI requires a Schedule of material changes in the composition of the portfolio during the financial period. These are defined as aggregate purchases of a security exceeding one per cent of the total value of purchases for the financial period and aggregate disposals greater than one per cent of the total value of sales. At a minimum the largest 20 purchases and 20 sales must be given or all purchases and sales if less than 20. A full listing of the portfolio changes for the financial period is available, upon request, at no cost from the Administrator.
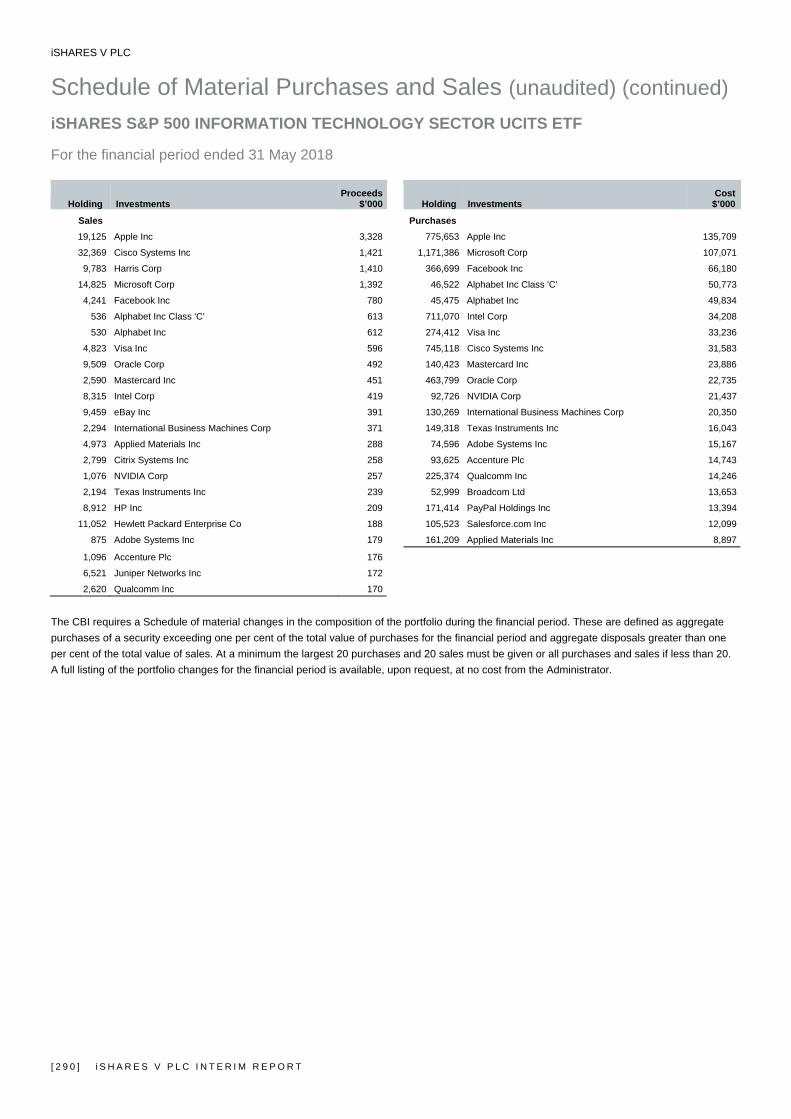
iSHARES V PLC
Schedule of Material Purchases and Sales (unaudited) (continued) iSHARES S&P 500 INFORMATION TECHNOLOGY SECTOR UCITS ETF For the financial period ended 31 May 2018
[ 2 9 0 ] i S H A R E S V P L C I N T E R I M R E P O R T
Holding Investments Proceeds
$’000 Holding Investments Cost
$’000
Sales Purchases
19,125 Apple Inc 3,328 775,653 Apple Inc 135,709
32,369 Cisco Systems Inc 1,421 1,171,386 Microsoft Corp 107,071
9,783 Harris Corp 1,410 366,699 Facebook Inc 66,180
14,825 Microsoft Corp 1,392 46,522 Alphabet Inc Class 'C' 50,773
4,241 Facebook Inc 780 45,475 Alphabet Inc 49,834
536 Alphabet Inc Class 'C' 613 711,070 Intel Corp 34,208
530 Alphabet Inc 612 274,412 Visa Inc 33,236
4,823 Visa Inc 596 745,118 Cisco Systems Inc 31,583
9,509 Oracle Corp 492 140,423 Mastercard Inc 23,886
2,590 Mastercard Inc 451 463,799 Oracle Corp 22,735
8,315 Intel Corp 419 92,726 NVIDIA Corp 21,437
9,459 eBay Inc 391 130,269 International Business Machines Corp 20,350
2,294 International Business Machines Corp 371 149,318 Texas Instruments Inc 16,043
4,973 Applied Materials Inc 288 74,596 Adobe Systems Inc 15,167
2,799 Citrix Systems Inc 258 93,625 Accenture Plc 14,743
1,076 NVIDIA Corp 257 225,374 Qualcomm Inc 14,246
2,194 Texas Instruments Inc 239 52,999 Broadcom Ltd 13,653
8,912 HP Inc 209 171,414 PayPal Holdings Inc 13,394
11,052 Hewlett Packard Enterprise Co 188 105,523 Salesforce.com Inc 12,099
875 Adobe Systems Inc 179 161,209 Applied Materials Inc 8,897
1,096 Accenture Plc 176
6,521 Juniper Networks Inc 172
2,620 Qualcomm Inc 170
The CBI requires a Schedule of material changes in the composition of the portfolio during the financial period. These are defined as aggregate purchases of a security exceeding one per cent of the total value of purchases for the financial period and aggregate disposals greater than one per cent of the total value of sales. At a minimum the largest 20 purchases and 20 sales must be given or all purchases and sales if less than 20. A full listing of the portfolio changes for the financial period is available, upon request, at no cost from the Administrator.
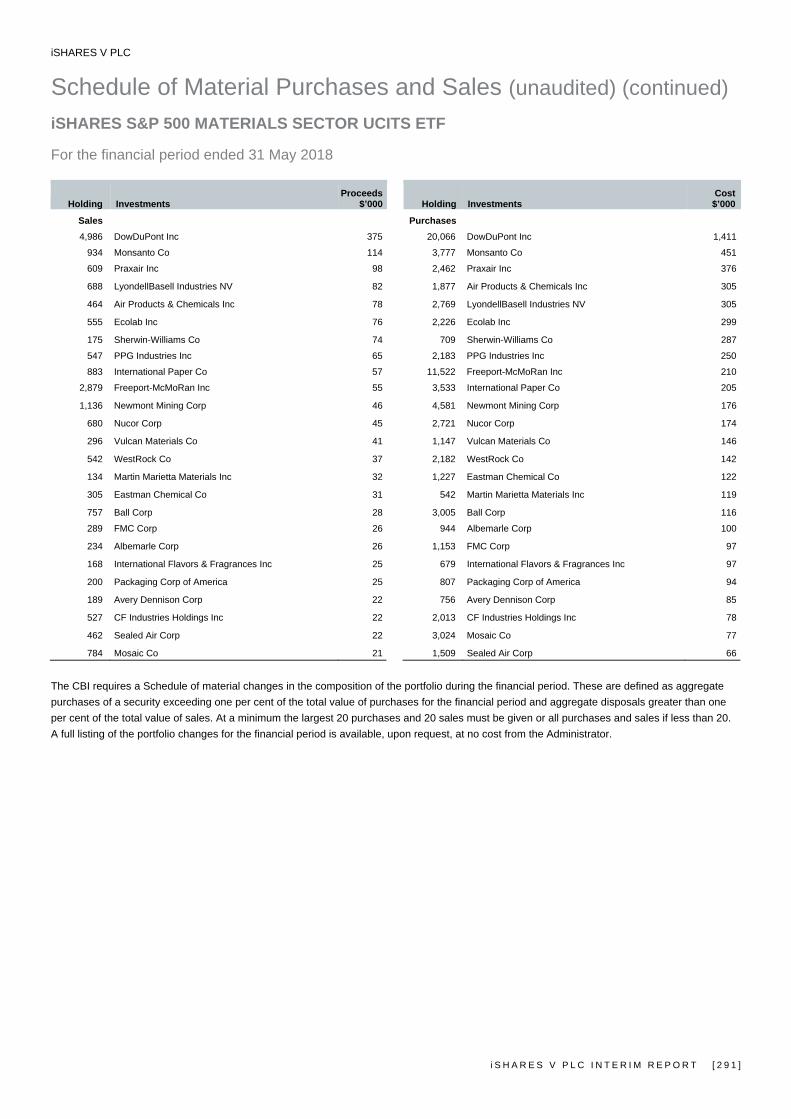
iSHARES V PLC
Schedule of Material Purchases and Sales (unaudited) (continued) iSHARES S&P 500 MATERIALS SECTOR UCITS ETF For the financial period ended 31 May 2018
i S H A R E S V P L C I N T E R I M R E P O R T [ 2 9 1 ]
Holding Investments Proceeds
$’000 Holding Investments Cost
$’000
Sales Purchases
4,986 DowDuPont Inc 375 20,066 DowDuPont Inc 1,411
934 Monsanto Co 114 3,777 Monsanto Co 451
609 Praxair Inc 98 2,462 Praxair Inc 376
688 LyondellBasell Industries NV 82 1,877 Air Products & Chemicals Inc 305
464 Air Products & Chemicals Inc 78 2,769 LyondellBasell Industries NV 305
555 Ecolab Inc 76 2,226 Ecolab Inc 299
175 Sherwin-Williams Co 74 709 Sherwin-Williams Co 287
547 PPG Industries Inc 65 2,183 PPG Industries Inc 250
883 International Paper Co 57 11,522 Freeport-McMoRan Inc 210
2,879 Freeport-McMoRan Inc 55 3,533 International Paper Co 205
1,136 Newmont Mining Corp 46 4,581 Newmont Mining Corp 176
680 Nucor Corp 45 2,721 Nucor Corp 174
296 Vulcan Materials Co 41 1,147 Vulcan Materials Co 146
542 WestRock Co 37 2,182 WestRock Co 142
134 Martin Marietta Materials Inc 32 1,227 Eastman Chemical Co 122
305 Eastman Chemical Co 31 542 Martin Marietta Materials Inc 119
757 Ball Corp 28 3,005 Ball Corp 116
289 FMC Corp 26 944 Albemarle Corp 100
234 Albemarle Corp 26 1,153 FMC Corp 97
168 International Flavors & Fragrances Inc 25 679 International Flavors & Fragrances Inc 97
200 Packaging Corp of America 25 807 Packaging Corp of America 94
189 Avery Dennison Corp 22 756 Avery Dennison Corp 85
527 CF Industries Holdings Inc 22 2,013 CF Industries Holdings Inc 78
462 Sealed Air Corp 22 3,024 Mosaic Co 77
784 Mosaic Co 21 1,509 Sealed Air Corp 66
The CBI requires a Schedule of material changes in the composition of the portfolio during the financial period. These are defined as aggregate purchases of a security exceeding one per cent of the total value of purchases for the financial period and aggregate disposals greater than one per cent of the total value of sales. At a minimum the largest 20 purchases and 20 sales must be given or all purchases and sales if less than 20. A full listing of the portfolio changes for the financial period is available, upon request, at no cost from the Administrator.
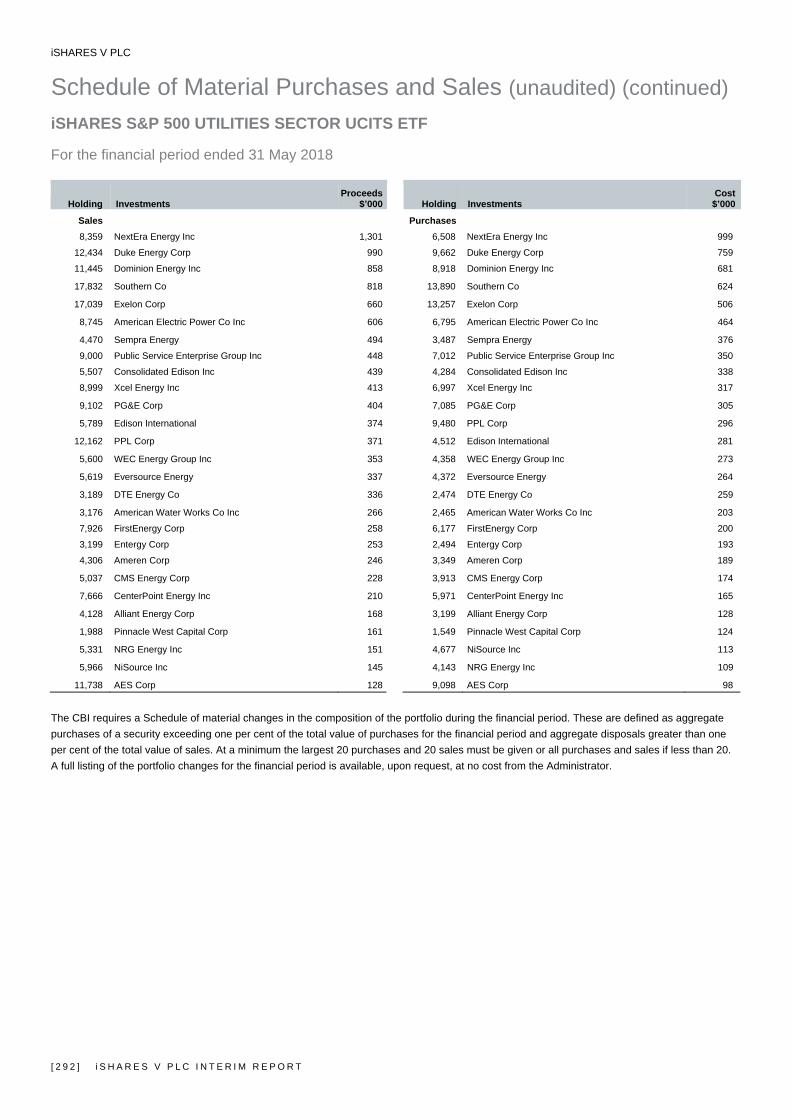
iSHARES V PLC
Schedule of Material Purchases and Sales (unaudited) (continued) iSHARES S&P 500 UTILITIES SECTOR UCITS ETF For the financial period ended 31 May 2018
[ 2 9 2 ] i S H A R E S V P L C I N T E R I M R E P O R T
Holding Investments Proceeds
$’000 Holding Investments Cost
$’000
Sales Purchases
8,359 NextEra Energy Inc 1,301 6,508 NextEra Energy Inc 999
12,434 Duke Energy Corp 990 9,662 Duke Energy Corp 759
11,445 Dominion Energy Inc 858 8,918 Dominion Energy Inc 681
17,832 Southern Co 818 13,890 Southern Co 624
17,039 Exelon Corp 660 13,257 Exelon Corp 506
8,745 American Electric Power Co Inc 606 6,795 American Electric Power Co Inc 464
4,470 Sempra Energy 494 3,487 Sempra Energy 376
9,000 Public Service Enterprise Group Inc 448 7,012 Public Service Enterprise Group Inc 350
5,507 Consolidated Edison Inc 439 4,284 Consolidated Edison Inc 338
8,999 Xcel Energy Inc 413 6,997 Xcel Energy Inc 317
9,102 PG&E Corp 404 7,085 PG&E Corp 305
5,789 Edison International 374 9,480 PPL Corp 296
12,162 PPL Corp 371 4,512 Edison International 281
5,600 WEC Energy Group Inc 353 4,358 WEC Energy Group Inc 273
5,619 Eversource Energy 337 4,372 Eversource Energy 264
3,189 DTE Energy Co 336 2,474 DTE Energy Co 259
3,176 American Water Works Co Inc 266 2,465 American Water Works Co Inc 203
7,926 FirstEnergy Corp 258 6,177 FirstEnergy Corp 200
3,199 Entergy Corp 253 2,494 Entergy Corp 193
4,306 Ameren Corp 246 3,349 Ameren Corp 189
5,037 CMS Energy Corp 228 3,913 CMS Energy Corp 174
7,666 CenterPoint Energy Inc 210 5,971 CenterPoint Energy Inc 165
4,128 Alliant Energy Corp 168 3,199 Alliant Energy Corp 128
1,988 Pinnacle West Capital Corp 161 1,549 Pinnacle West Capital Corp 124
5,331 NRG Energy Inc 151 4,677 NiSource Inc 113
5,966 NiSource Inc 145 4,143 NRG Energy Inc 109
11,738 AES Corp 128 9,098 AES Corp 98
The CBI requires a Schedule of material changes in the composition of the portfolio during the financial period. These are defined as aggregate purchases of a security exceeding one per cent of the total value of purchases for the financial period and aggregate disposals greater than one per cent of the total value of sales. At a minimum the largest 20 purchases and 20 sales must be given or all purchases and sales if less than 20. A full listing of the portfolio changes for the financial period is available, upon request, at no cost from the Administrator.
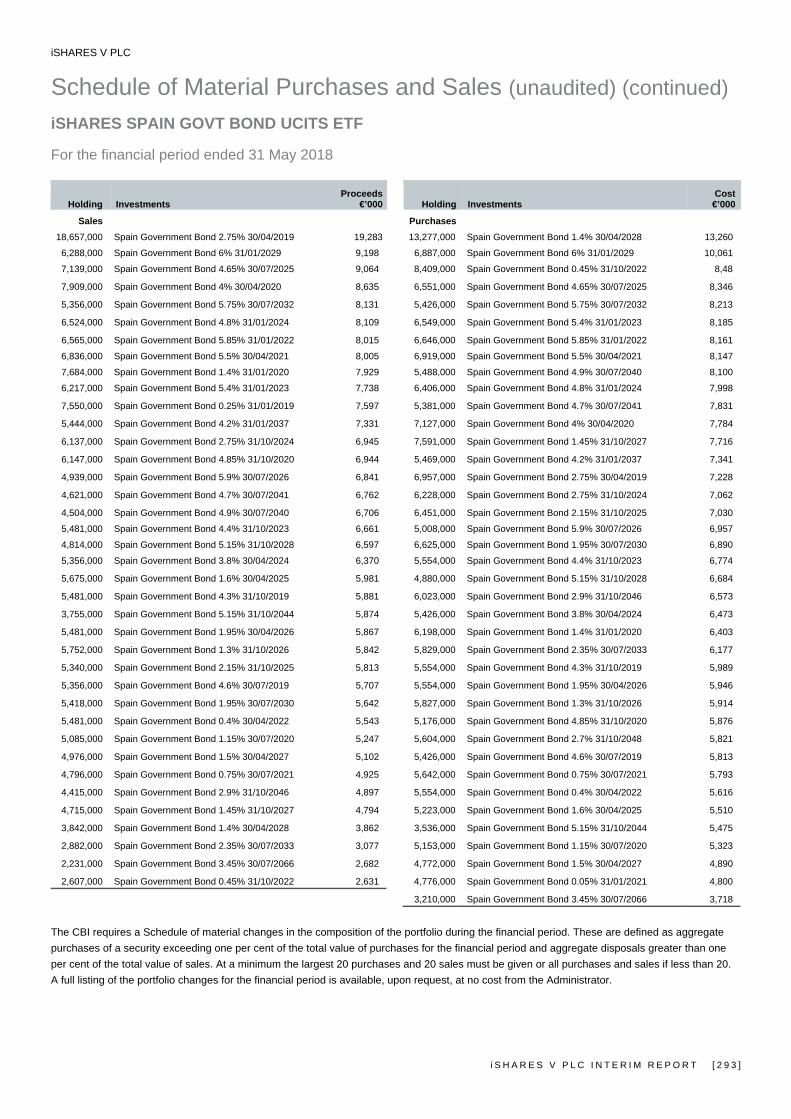
iSHARES V PLC
Schedule of Material Purchases and Sales (unaudited) (continued) iSHARES SPAIN GOVT BOND UCITS ETF For the financial period ended 31 May 2018
i S H A R E S V P L C I N T E R I M R E P O R T [ 2 9 3 ]
Holding Investments Proceeds
€’000 Holding Investments Cost
€’000
Sales Purchases
18,657,000 Spain Government Bond 2.75% 30/04/2019 19,283 13,277,000 Spain Government Bond 1.4% 30/04/2028 13,260
6,288,000 Spain Government Bond 6% 31/01/2029 9,198 6,887,000 Spain Government Bond 6% 31/01/2029 10,061
7,139,000 Spain Government Bond 4.65% 30/07/2025 9,064 8,409,000 Spain Government Bond 0.45% 31/10/2022 8,48
7,909,000 Spain Government Bond 4% 30/04/2020 8,635 6,551,000 Spain Government Bond 4.65% 30/07/2025 8,346
5,356,000 Spain Government Bond 5.75% 30/07/2032 8,131 5,426,000 Spain Government Bond 5.75% 30/07/2032 8,213
6,524,000 Spain Government Bond 4.8% 31/01/2024 8,109 6,549,000 Spain Government Bond 5.4% 31/01/2023 8,185
6,565,000 Spain Government Bond 5.85% 31/01/2022 8,015 6,646,000 Spain Government Bond 5.85% 31/01/2022 8,161
6,836,000 Spain Government Bond 5.5% 30/04/2021 8,005 6,919,000 Spain Government Bond 5.5% 30/04/2021 8,147
7,684,000 Spain Government Bond 1.4% 31/01/2020 7,929 5,488,000 Spain Government Bond 4.9% 30/07/2040 8,100
6,217,000 Spain Government Bond 5.4% 31/01/2023 7,738 6,406,000 Spain Government Bond 4.8% 31/01/2024 7,998
7,550,000 Spain Government Bond 0.25% 31/01/2019 7,597 5,381,000 Spain Government Bond 4.7% 30/07/2041 7,831
5,444,000 Spain Government Bond 4.2% 31/01/2037 7,331 7,127,000 Spain Government Bond 4% 30/04/2020 7,784
6,137,000 Spain Government Bond 2.75% 31/10/2024 6,945 7,591,000 Spain Government Bond 1.45% 31/10/2027 7,716
6,147,000 Spain Government Bond 4.85% 31/10/2020 6,944 5,469,000 Spain Government Bond 4.2% 31/01/2037 7,341
4,939,000 Spain Government Bond 5.9% 30/07/2026 6,841 6,957,000 Spain Government Bond 2.75% 30/04/2019 7,228
4,621,000 Spain Government Bond 4.7% 30/07/2041 6,762 6,228,000 Spain Government Bond 2.75% 31/10/2024 7,062
4,504,000 Spain Government Bond 4.9% 30/07/2040 6,706 6,451,000 Spain Government Bond 2.15% 31/10/2025 7,030
5,481,000 Spain Government Bond 4.4% 31/10/2023 6,661 5,008,000 Spain Government Bond 5.9% 30/07/2026 6,957
4,814,000 Spain Government Bond 5.15% 31/10/2028 6,597 6,625,000 Spain Government Bond 1.95% 30/07/2030 6,890
5,356,000 Spain Government Bond 3.8% 30/04/2024 6,370 5,554,000 Spain Government Bond 4.4% 31/10/2023 6,774
5,675,000 Spain Government Bond 1.6% 30/04/2025 5,981 4,880,000 Spain Government Bond 5.15% 31/10/2028 6,684
5,481,000 Spain Government Bond 4.3% 31/10/2019 5,881 6,023,000 Spain Government Bond 2.9% 31/10/2046 6,573
3,755,000 Spain Government Bond 5.15% 31/10/2044 5,874 5,426,000 Spain Government Bond 3.8% 30/04/2024 6,473
5,481,000 Spain Government Bond 1.95% 30/04/2026 5,867 6,198,000 Spain Government Bond 1.4% 31/01/2020 6,403
5,752,000 Spain Government Bond 1.3% 31/10/2026 5,842 5,829,000 Spain Government Bond 2.35% 30/07/2033 6,177
5,340,000 Spain Government Bond 2.15% 31/10/2025 5,813 5,554,000 Spain Government Bond 4.3% 31/10/2019 5,989
5,356,000 Spain Government Bond 4.6% 30/07/2019 5,707 5,554,000 Spain Government Bond 1.95% 30/04/2026 5,946
5,418,000 Spain Government Bond 1.95% 30/07/2030 5,642 5,827,000 Spain Government Bond 1.3% 31/10/2026 5,914
5,481,000 Spain Government Bond 0.4% 30/04/2022 5,543 5,176,000 Spain Government Bond 4.85% 31/10/2020 5,876
5,085,000 Spain Government Bond 1.15% 30/07/2020 5,247 5,604,000 Spain Government Bond 2.7% 31/10/2048 5,821
4,976,000 Spain Government Bond 1.5% 30/04/2027 5,102 5,426,000 Spain Government Bond 4.6% 30/07/2019 5,813
4,796,000 Spain Government Bond 0.75% 30/07/2021 4,925 5,642,000 Spain Government Bond 0.75% 30/07/2021 5,793
4,415,000 Spain Government Bond 2.9% 31/10/2046 4,897 5,554,000 Spain Government Bond 0.4% 30/04/2022 5,616
4,715,000 Spain Government Bond 1.45% 31/10/2027 4,794 5,223,000 Spain Government Bond 1.6% 30/04/2025 5,510
3,842,000 Spain Government Bond 1.4% 30/04/2028 3,862 3,536,000 Spain Government Bond 5.15% 31/10/2044 5,475
2,882,000 Spain Government Bond 2.35% 30/07/2033 3,077 5,153,000 Spain Government Bond 1.15% 30/07/2020 5,323
2,231,000 Spain Government Bond 3.45% 30/07/2066 2,682 4,772,000 Spain Government Bond 1.5% 30/04/2027 4,890
2,607,000 Spain Government Bond 0.45% 31/10/2022 2,631 4,776,000 Spain Government Bond 0.05% 31/01/2021 4,800
3,210,000 Spain Government Bond 3.45% 30/07/2066 3,718
The CBI requires a Schedule of material changes in the composition of the portfolio during the financial period. These are defined as aggregate purchases of a security exceeding one per cent of the total value of purchases for the financial period and aggregate disposals greater than one per cent of the total value of sales. At a minimum the largest 20 purchases and 20 sales must be given or all purchases and sales if less than 20. A full listing of the portfolio changes for the financial period is available, upon request, at no cost from the Administrator.
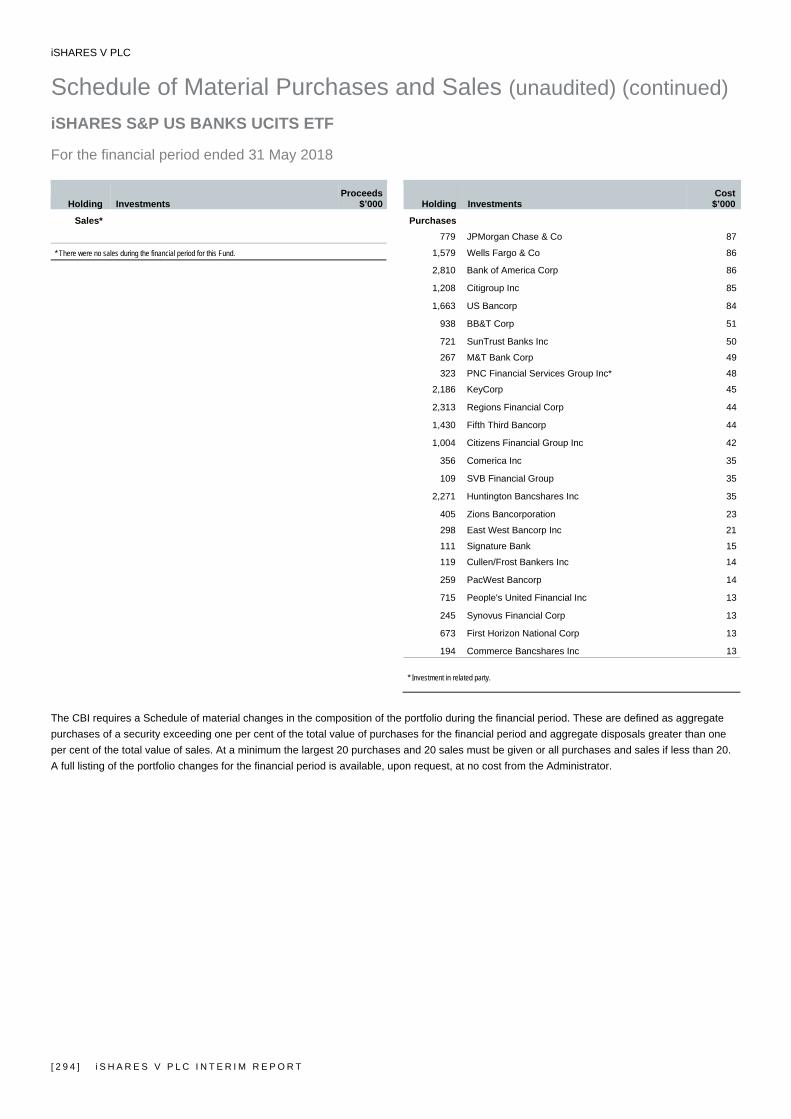
iSHARES V PLC
Schedule of Material Purchases and Sales (unaudited) (continued) iSHARES S&P US BANKS UCITS ETF For the financial period ended 31 May 2018
[ 2 9 4 ] i S H A R E S V P L C I N T E R I M R E P O R T
Holding Investments Proceeds
$’000 Holding Investments Cost
$’000
Sales* Purchases
779 JPMorgan Chase & Co 87
* There were no sales during the financial period for this Fund. 1,579 Wells Fargo & Co 86
2,810 Bank of America Corp 86
1,208 Citigroup Inc 85
1,663 US Bancorp 84
938 BB&T Corp 51
721 SunTrust Banks Inc 50
267 M&T Bank Corp 49
323 PNC Financial Services Group Inc* 48
2,186 KeyCorp 45
2,313 Regions Financial Corp 44
1,430 Fifth Third Bancorp 44
1,004 Citizens Financial Group Inc 42
356 Comerica Inc 35
109 SVB Financial Group 35
2,271 Huntington Bancshares Inc 35
405 Zions Bancorporation 23
298 East West Bancorp Inc 21
111 Signature Bank 15
119 Cullen/Frost Bankers Inc 14
259 PacWest Bancorp 14
715 People's United Financial Inc 13
245 Synovus Financial Corp 13
673 First Horizon National Corp 13
194 Commerce Bancshares Inc 13
* Investment in related party.
The CBI requires a Schedule of material changes in the composition of the portfolio during the financial period. These are defined as aggregate purchases of a security exceeding one per cent of the total value of purchases for the financial period and aggregate disposals greater than one per cent of the total value of sales. At a minimum the largest 20 purchases and 20 sales must be given or all purchases and sales if less than 20. A full listing of the portfolio changes for the financial period is available, upon request, at no cost from the Administrator.
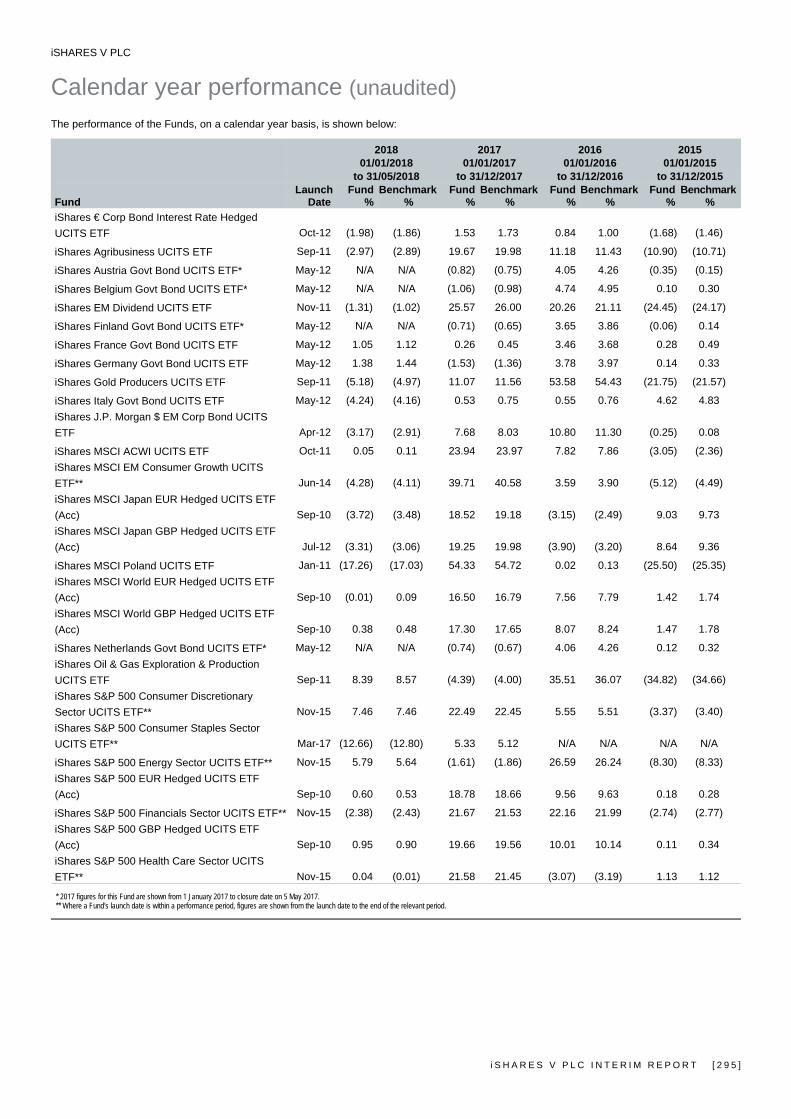
iSHARES V PLC
Calendar year performance (unaudited)
i S H A R E S V P L C I N T E R I M R E P O R T [ 2 9 5 ]
The performance of the Funds, on a calendar year basis, is shown below:
2018 2017 2016 2015 01/01/2018 01/01/2017 01/01/2016 01/01/2015 to 31/05/2018 to 31/12/2017 to 31/12/2016 to 31/12/2015 Launch Fund Benchmark Fund Benchmark Fund Benchmark Fund BenchmarkFund Date % % % % % % % % iShares € Corp Bond Interest Rate Hedged UCITS ETF Oct-12 (1.98) (1.86) 1.53 1.73 0.84 1.00 (1.68) (1.46)
iShares Agribusiness UCITS ETF Sep-11 (2.97) (2.89) 19.67 19.98 11.18 11.43 (10.90) (10.71)
iShares Austria Govt Bond UCITS ETF* May-12 N/A N/A (0.82) (0.75) 4.05 4.26 (0.35) (0.15)
iShares Belgium Govt Bond UCITS ETF* May-12 N/A N/A (1.06) (0.98) 4.74 4.95 0.10 0.30
iShares EM Dividend UCITS ETF Nov-11 (1.31) (1.02) 25.57 26.00 20.26 21.11 (24.45) (24.17)
iShares Finland Govt Bond UCITS ETF* May-12 N/A N/A (0.71) (0.65) 3.65 3.86 (0.06) 0.14
iShares France Govt Bond UCITS ETF May-12 1.05 1.12 0.26 0.45 3.46 3.68 0.28 0.49
iShares Germany Govt Bond UCITS ETF May-12 1.38 1.44 (1.53) (1.36) 3.78 3.97 0.14 0.33
iShares Gold Producers UCITS ETF Sep-11 (5.18) (4.97) 11.07 11.56 53.58 54.43 (21.75) (21.57)
iShares Italy Govt Bond UCITS ETF May-12 (4.24) (4.16) 0.53 0.75 0.55 0.76 4.62 4.83 iShares J.P. Morgan $ EM Corp Bond UCITS ETF Apr-12 (3.17) (2.91) 7.68 8.03 10.80 11.30 (0.25) 0.08
iShares MSCI ACWI UCITS ETF Oct-11 0.05 0.11 23.94 23.97 7.82 7.86 (3.05) (2.36) iShares MSCI EM Consumer Growth UCITS ETF** Jun-14 (4.28) (4.11) 39.71 40.58 3.59 3.90 (5.12) (4.49) iShares MSCI Japan EUR Hedged UCITS ETF (Acc) Sep-10 (3.72) (3.48) 18.52 19.18 (3.15) (2.49) 9.03 9.73 iShares MSCI Japan GBP Hedged UCITS ETF (Acc) Jul-12 (3.31) (3.06) 19.25 19.98 (3.90) (3.20) 8.64 9.36
iShares MSCI Poland UCITS ETF Jan-11 (17.26) (17.03) 54.33 54.72 0.02 0.13 (25.50) (25.35) iShares MSCI World EUR Hedged UCITS ETF (Acc) Sep-10 (0.01) 0.09 16.50 16.79 7.56 7.79 1.42 1.74 iShares MSCI World GBP Hedged UCITS ETF (Acc) Sep-10 0.38 0.48 17.30 17.65 8.07 8.24 1.47 1.78
iShares Netherlands Govt Bond UCITS ETF* May-12 N/A N/A (0.74) (0.67) 4.06 4.26 0.12 0.32 iShares Oil & Gas Exploration & Production UCITS ETF Sep-11 8.39 8.57 (4.39) (4.00) 35.51 36.07 (34.82) (34.66) iShares S&P 500 Consumer Discretionary Sector UCITS ETF** Nov-15 7.46 7.46 22.49 22.45 5.55 5.51 (3.37) (3.40) iShares S&P 500 Consumer Staples Sector UCITS ETF** Mar-17 (12.66) (12.80) 5.33 5.12 N/A N/A N/A N/A
iShares S&P 500 Energy Sector UCITS ETF** Nov-15 5.79 5.64 (1.61) (1.86) 26.59 26.24 (8.30) (8.33) iShares S&P 500 EUR Hedged UCITS ETF (Acc) Sep-10 0.60 0.53 18.78 18.66 9.56 9.63 0.18 0.28
iShares S&P 500 Financials Sector UCITS ETF** Nov-15 (2.38) (2.43) 21.67 21.53 22.16 21.99 (2.74) (2.77) iShares S&P 500 GBP Hedged UCITS ETF (Acc) Sep-10 0.95 0.90 19.66 19.56 10.01 10.14 0.11 0.34 iShares S&P 500 Health Care Sector UCITS ETF** Nov-15 0.04 (0.01) 21.58 21.45 (3.07) (3.19) 1.13 1.12
* 2017 figures for this Fund are shown from 1 January 2017 to closure date on 5 May 2017. ** Where a Fund's launch date is within a performance period, figures are shown from the launch date to the end of the relevant period.
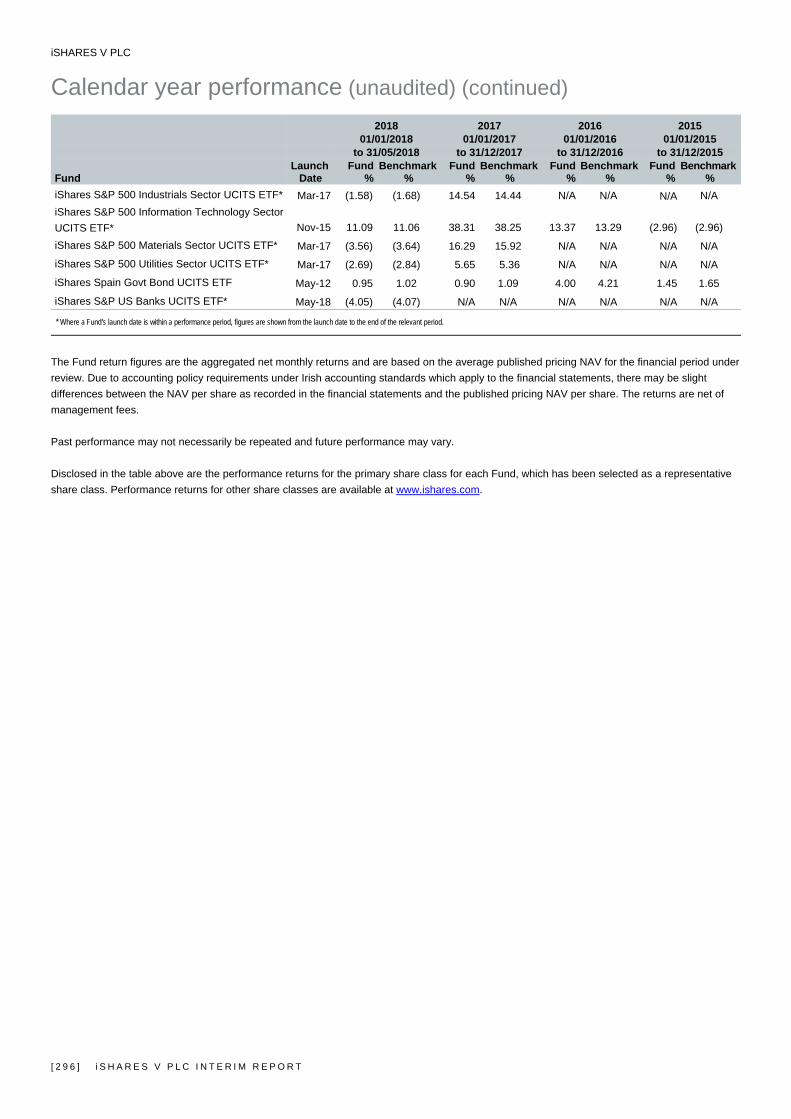
iSHARES V PLC
Calendar year performance (unaudited) (continued)
[ 2 9 6 ] i S H A R E S V P L C I N T E R I M R E P O R T
2018 2017 2016 2015 01/01/2018 01/01/2017 01/01/2016 01/01/2015 to 31/05/2018 to 31/12/2017 to 31/12/2016 to 31/12/2015 Launch Fund Benchmark Fund Benchmark Fund Benchmark Fund BenchmarkFund Date % % % % % % % % iShares S&P 500 Industrials Sector UCITS ETF* Mar-17 (1.58) (1.68) 14.54 14.44 N/A N/A N/A N/A iShares S&P 500 Information Technology Sector UCITS ETF* Nov-15 11.09 11.06 38.31 38.25 13.37 13.29 (2.96) (2.96)
iShares S&P 500 Materials Sector UCITS ETF* Mar-17 (3.56) (3.64) 16.29 15.92 N/A N/A N/A N/A
iShares S&P 500 Utilities Sector UCITS ETF* Mar-17 (2.69) (2.84) 5.65 5.36 N/A N/A N/A N/A
iShares Spain Govt Bond UCITS ETF May-12 0.95 1.02 0.90 1.09 4.00 4.21 1.45 1.65
iShares S&P US Banks UCITS ETF* May-18 (4.05) (4.07) N/A N/A N/A N/A N/A N/A
* Where a Fund's launch date is within a performance period, figures are shown from the launch date to the end of the relevant period.
The Fund return figures are the aggregated net monthly returns and are based on the average published pricing NAV for the financial period under review. Due to accounting policy requirements under Irish accounting standards which apply to the financial statements, there may be slight differences between the NAV per share as recorded in the financial statements and the published pricing NAV per share. The returns are net of management fees. Past performance may not necessarily be repeated and future performance may vary. Disclosed in the table above are the performance returns for the primary share class for each Fund, which has been selected as a representative share class. Performance returns for other share classes are available at www.ishares.com.
iSHARES V PLC
Other regulatory disclosures (unaudited)
i S H A R E S V P L C I N T E R I M R E P O R T [ 2 9 7 ]
Transactions with connected parties In accordance with the requirements of the CBI, the Manager shall ensure that any transactions carried out between the Funds and the Manager or Depositary to the Funds, the delegates or sub-delegates of the Manager or Depositary (excluding any non-group company sub-custodians appointed by a Depositary) and any associated or group company of the Manager, Depositary, delegate or sub-delegate (“Connected Parties”) must be conducted at arm’s length and in the best interests of the shareholders. The board of directors of the Manager are satisfied that there are arrangements in place, as evidenced by written procedures, to ensure that the obligations set out above are applied to all transactions with Connected Parties and that transactions with Connected Parties entered into during the financial period complied with this obligation.
Leverage
The use of derivatives may expose Funds to a higher degree of risk. In particular, derivative contracts can be highly volatile, and the amount of initial margin is generally small relative to the size of the contract so that transactions may be leveraged in terms of market exposure. A relatively small market movement may have a potentially larger impact on derivatives than on non-derivative instruments. Leveraged derivative positions can therefore increase Fund volatility.
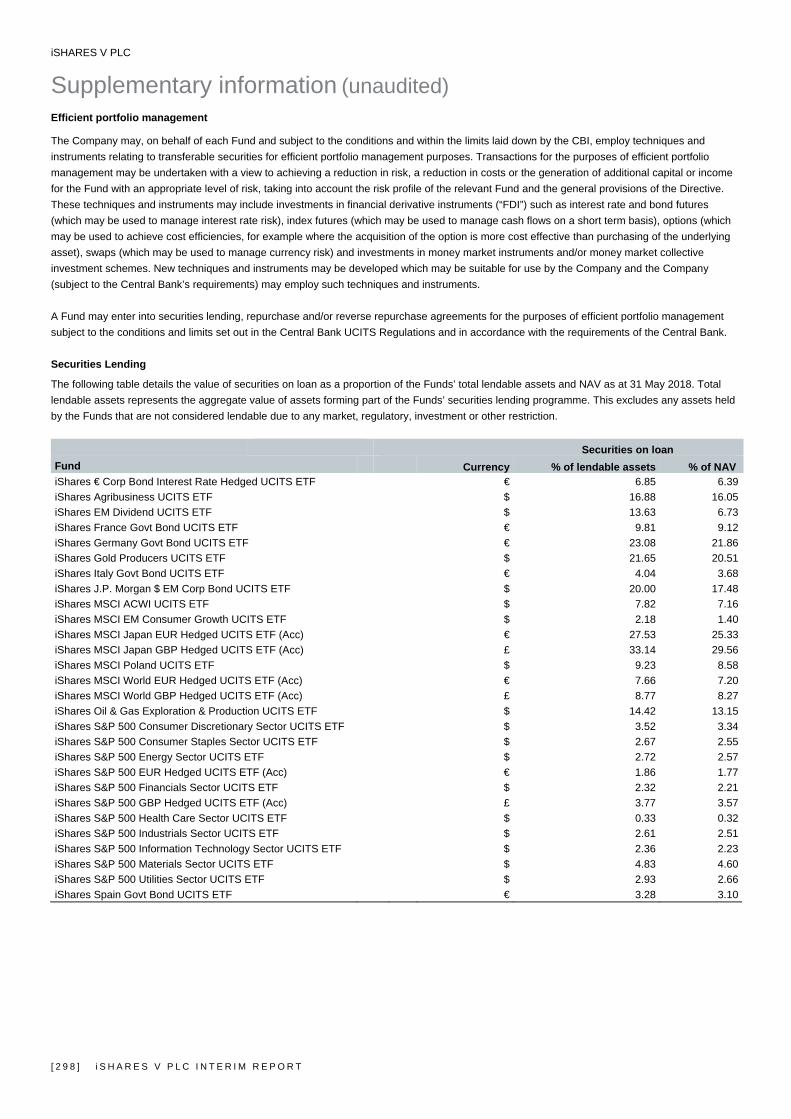
iSHARES V PLC
Supplementary information (unaudited)
[ 2 9 8 ] i S H A R E S V P L C I N T E R I M R E P O R T
Efficient portfolio management
The Company may, on behalf of each Fund and subject to the conditions and within the limits laid down by the CBI, employ techniques and instruments relating to transferable securities for efficient portfolio management purposes. Transactions for the purposes of efficient portfolio management may be undertaken with a view to achieving a reduction in risk, a reduction in costs or the generation of additional capital or income for the Fund with an appropriate level of risk, taking into account the risk profile of the relevant Fund and the general provisions of the Directive. These techniques and instruments may include investments in financial derivative instruments (“FDI”) such as interest rate and bond futures (which may be used to manage interest rate risk), index futures (which may be used to manage cash flows on a short term basis), options (which may be used to achieve cost efficiencies, for example where the acquisition of the option is more cost effective than purchasing of the underlying asset), swaps (which may be used to manage currency risk) and investments in money market instruments and/or money market collective investment schemes. New techniques and instruments may be developed which may be suitable for use by the Company and the Company (subject to the Central Bank’s requirements) may employ such techniques and instruments. A Fund may enter into securities lending, repurchase and/or reverse repurchase agreements for the purposes of efficient portfolio management subject to the conditions and limits set out in the Central Bank UCITS Regulations and in accordance with the requirements of the Central Bank. Securities Lending
The following table details the value of securities on loan as a proportion of the Funds’ total lendable assets and NAV as at 31 May 2018. Total lendable assets represents the aggregate value of assets forming part of the Funds’ securities lending programme. This excludes any assets held by the Funds that are not considered lendable due to any market, regulatory, investment or other restriction.
Securities on loan Fund Currency % of lendable assets % of NAV iShares € Corp Bond Interest Rate Hedged UCITS ETF € 6.85 6.39iShares Agribusiness UCITS ETF $ 16.88 16.05 iShares EM Dividend UCITS ETF $ 13.63 6.73 iShares France Govt Bond UCITS ETF € 9.81 9.12 iShares Germany Govt Bond UCITS ETF € 23.08 21.86 iShares Gold Producers UCITS ETF $ 21.65 20.51 iShares Italy Govt Bond UCITS ETF € 4.04 3.68 iShares J.P. Morgan $ EM Corp Bond UCITS ETF $ 20.00 17.48 iShares MSCI ACWI UCITS ETF $ 7.82 7.16 iShares MSCI EM Consumer Growth UCITS ETF $ 2.18 1.40 iShares MSCI Japan EUR Hedged UCITS ETF (Acc) € 27.53 25.33 iShares MSCI Japan GBP Hedged UCITS ETF (Acc) £ 33.14 29.56 iShares MSCI Poland UCITS ETF $ 9.23 8.58 iShares MSCI World EUR Hedged UCITS ETF (Acc) € 7.66 7.20 iShares MSCI World GBP Hedged UCITS ETF (Acc) £ 8.77 8.27 iShares Oil & Gas Exploration & Production UCITS ETF $ 14.42 13.15 iShares S&P 500 Consumer Discretionary Sector UCITS ETF $ 3.52 3.34 iShares S&P 500 Consumer Staples Sector UCITS ETF $ 2.67 2.55 iShares S&P 500 Energy Sector UCITS ETF $ 2.72 2.57 iShares S&P 500 EUR Hedged UCITS ETF (Acc) € 1.86 1.77 iShares S&P 500 Financials Sector UCITS ETF $ 2.32 2.21 iShares S&P 500 GBP Hedged UCITS ETF (Acc) £ 3.77 3.57 iShares S&P 500 Health Care Sector UCITS ETF $ 0.33 0.32 iShares S&P 500 Industrials Sector UCITS ETF $ 2.61 2.51 iShares S&P 500 Information Technology Sector UCITS ETF $ 2.36 2.23 iShares S&P 500 Materials Sector UCITS ETF $ 4.83 4.60 iShares S&P 500 Utilities Sector UCITS ETF $ 2.93 2.66 iShares Spain Govt Bond UCITS ETF € 3.28 3.10

iSHARES V PLC
Supplementary information (unaudited) (continued)
i S H A R E S V P L C I N T E R I M R E P O R T [ 2 9 9 ]
Securities Lending (continued)
The following tables detail the value of securities on loan and associated collateral received, analysed by borrowing counterparty as at 31 May 2018.
Counterparty* Amount on loan
Collateralreceived
iShares € Corp Bond Interest Rate Hedged UCITS ETF €'000 €'000Citigroup Global Markets Ltd 19,962 21,095BNP Paribas SA 19,074 19,870 J.P. Morgan Securities Plc 14,063 15,300 Societe Generale SA 10,903 11,327 Barclays Bank Plc 9,877 10,399 Morgan Stanley & Co. International Plc 9,203 9,614 Credit Suisse Securities (Europe) Limited 4,711 5,129 Nomura International Plc 2,141 2,305 UBS AG 1,927 2,396 HSBC Bank Plc 1,786 1,964 Other 2,432 2,693 Total 96,079 102,092
Counterparty* Amount on loan
Collateralreceived
iShares Agribusiness UCITS ETF $'000 $'000UBS AG 4,226 4,691 Merrill Lynch International 3,667 4,179 Barclays Capital Securities Ltd. 1,370 1,541 Goldman Sachs International 1,011 1,112 Morgan Stanley & Co. International Plc 711 756 Citigroup Global Markets Ltd 578 632 HSBC Bank Plc 367 398 J.P. Morgan Securities Plc 363 402 Macquarie Bank Limited 91 101 Societe Generale SA 86 91 Total 12,470 13,903
Counterparty* Amount on loan
Collateralreceived
iShares EM Dividend UCITS ETF $'000 $'000UBS AG 8,394 9,316 Merrill Lynch International 8,190 9,337 HSBC Bank Plc 1,760 1,910 Goldman Sachs International 1,637 1,799 The Bank of Nova Scotia 1,365 1,549 Barclays Capital Securities Ltd. 415 466 Morgan Stanley & Co. International Plc 343 364 Societe Generale SA 279 296 Total 22,383 25,037
Counterparty* Amounton loan
Collateralreceived
iShares France Govt Bond UCITS ETF €'000 €'000J.P. Morgan Securities Plc 14,393 15,819 Barclays Bank Plc 6,121 6,444 Total 20,514 22,263
Counterparty* Amounton loan
Collateralreceived
iShares Germany Govt Bond UCITS ETF €'000 €'000Societe Generale SA 3,493 3,838 J.P. Morgan Securities Plc 2,020 2,220 The Bank of Nova Scotia 1,788 1,964 Morgan Stanley & Co. International Plc 740 761 Total 8,041 8,783
Counterparty* Amounton loan
Collateralreceived
iShares Gold Producers UCITS ETF $'000 $'000Societe Generale SA 43,719 46,351 BNP Paribas Arbitrage SNC 27,017 36,478 Merrill Lynch International 9,617 10,961 The Bank of Nova Scotia 7,220 8,194 UBS AG 4,164 4,621 J.P. Morgan Securities Plc 4,036 4,475 Macquarie Bank Limited 903 1,003 Goldman Sachs International 271 298 Barclays Capital Securities Ltd. 255 287 Nomura International Plc 91 98 HSBC Bank Plc 35 38 Total 97,328 112,804
Counterparty* Amounton loan
Collateralreceived
iShares Italy Govt Bond UCITS ETF €'000 €'000The Bank of Nova Scotia 12,785 14,045 J.P. Morgan Securities Plc 9,494 10,434 Citigroup Global Markets Ltd 3,613 3,915 UBS AG 170 187 Total 26,062 28,581
* The respective counterparty’s country of establishment is detailed on page 322.
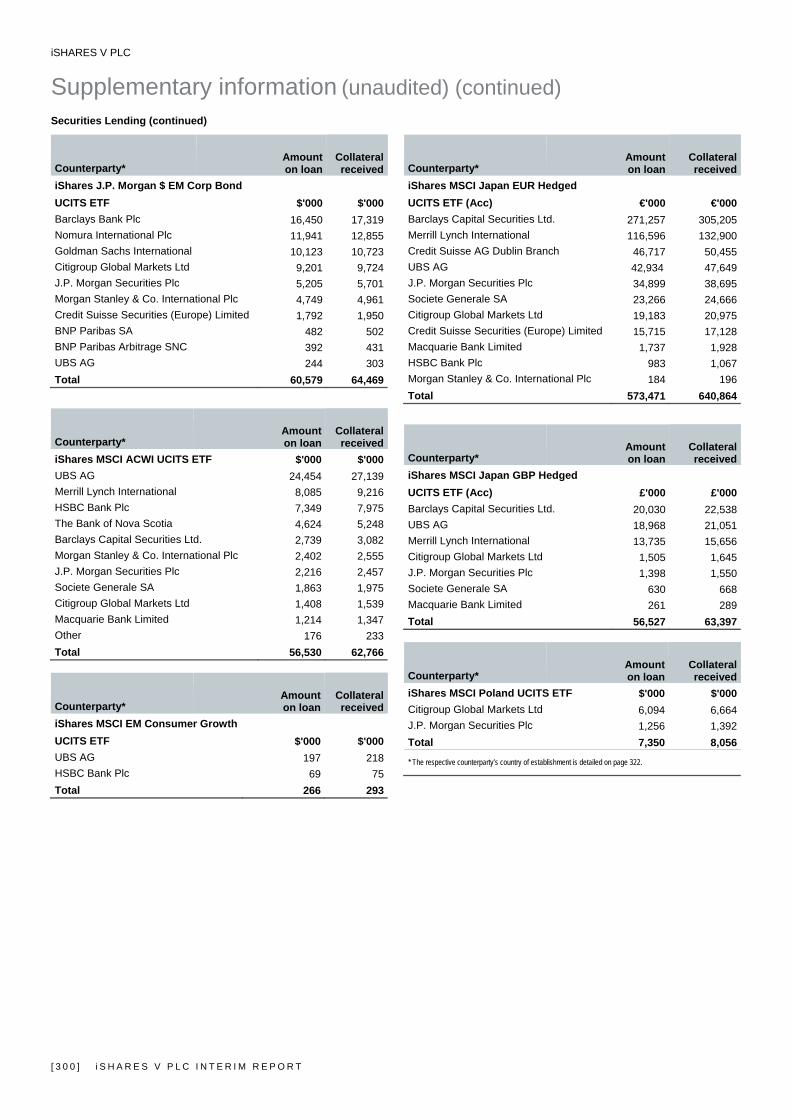
iSHARES V PLC
Supplementary information (unaudited) (continued)
[ 3 0 0 ] i S H A R E S V P L C I N T E R I M R E P O R T
Securities Lending (continued)
Counterparty* Amount on loan
Collateralreceived
iShares J.P. Morgan $ EM Corp Bond UCITS ETF $'000 $'000Barclays Bank Plc 16,450 17,319 Nomura International Plc 11,941 12,855 Goldman Sachs International 10,123 10,723 Citigroup Global Markets Ltd 9,201 9,724 J.P. Morgan Securities Plc 5,205 5,701 Morgan Stanley & Co. International Plc 4,749 4,961 Credit Suisse Securities (Europe) Limited 1,792 1,950 BNP Paribas SA 482 502 BNP Paribas Arbitrage SNC 392 431 UBS AG 244 303 Total 60,579 64,469
Counterparty* Amount on loan
Collateralreceived
iShares MSCI ACWI UCITS ETF $'000 $'000UBS AG 24,454 27,139 Merrill Lynch International 8,085 9,216 HSBC Bank Plc 7,349 7,975 The Bank of Nova Scotia 4,624 5,248 Barclays Capital Securities Ltd. 2,739 3,082 Morgan Stanley & Co. International Plc 2,402 2,555 J.P. Morgan Securities Plc 2,216 2,457 Societe Generale SA 1,863 1,975 Citigroup Global Markets Ltd 1,408 1,539 Macquarie Bank Limited 1,214 1,347 Other 176 233 Total 56,530 62,766
Counterparty* Amount on loan
Collateralreceived
iShares MSCI EM Consumer Growth UCITS ETF $'000 $'000UBS AG 197 218 HSBC Bank Plc 69 75 Total 266 293
Counterparty* Amounton loan
Collateralreceived
iShares MSCI Japan EUR Hedged UCITS ETF (Acc) €'000 €'000Barclays Capital Securities Ltd. 271,257 305,205 Merrill Lynch International 116,596 132,900 Credit Suisse AG Dublin Branch 46,717 50,455 UBS AG 42,934 47,649 J.P. Morgan Securities Plc 34,899 38,695 Societe Generale SA 23,266 24,666 Citigroup Global Markets Ltd 19,183 20,975 Credit Suisse Securities (Europe) Limited 15,715 17,128 Macquarie Bank Limited 1,737 1,928 HSBC Bank Plc 983 1,067 Morgan Stanley & Co. International Plc 184 196 Total 573,471 640,864
Counterparty* Amounton loan
Collateralreceived
iShares MSCI Japan GBP Hedged UCITS ETF (Acc) £'000 £'000Barclays Capital Securities Ltd. 20,030 22,538 UBS AG 18,968 21,051 Merrill Lynch International 13,735 15,656 Citigroup Global Markets Ltd 1,505 1,645 J.P. Morgan Securities Plc 1,398 1,550 Societe Generale SA 630 668 Macquarie Bank Limited 261 289 Total 56,527 63,397
Counterparty* Amounton loan
Collateralreceived
iShares MSCI Poland UCITS ETF $'000 $'000Citigroup Global Markets Ltd 6,094 6,664 J.P. Morgan Securities Plc 1,256 1,392 Total 7,350 8,056
* The respective counterparty’s country of establishment is detailed on page 322.

iSHARES V PLC
Supplementary information (unaudited) (continued)
i S H A R E S V P L C I N T E R I M R E P O R T [ 3 0 1 ]
Securities Lending (continued)
Counterparty* Amount on loan
Collateralreceived
iShares MSCI World EUR Hedged UCITS ETF (Acc) €'000 €'000UBS AG 44,274 49,135 Merrill Lynch International 24,341 27,745 The Bank of Nova Scotia 13,565 15,395 J.P. Morgan Securities Plc 11,216 12,436 Societe Generale SA 8,639 9,159 HSBC Bank Plc 6,465 7,015 Citigroup Global Markets Ltd 4,810 5,260 BNP Paribas Arbitrage SNC 1,643 2,219 Morgan Stanley & Co. International Plc 957 1,018 Goldman Sachs International 957 1,052 Other 2,239 2,431 Total 119,106 132,865
Counterparty* Amount on loan
Collateralreceived
iShares MSCI World GBP Hedged UCITS ETF (Acc) £'000 £'000UBS AG 14,652 16,262 Societe Generale SA 1,092 1,159 The Bank of Nova Scotia 1,053 1,195 J.P. Morgan Securities Plc 931 1,032 Barclays Capital Securities Ltd. 619 696 Citigroup Global Markets Ltd 372 406 HSBC Bank Plc 231 250 Merrill Lynch International 90 103 Goldman Sachs International 87 95 Morgan Stanley & Co. International Plc 30 32 BNP Paribas Arbitrage SNC 7 10 Total 19,164 21,240
Counterparty* Amount on loan
Collateralreceived
iShares Oil & Gas Exploration & Production UCITS ETF $’000 $’000The Bank of Nova Scotia 12,583 14,281 UBS AG 5,998 6,656 HSBC Bank Plc 4,208 4,566 Societe Generale SA 2,871 3,044 Citigroup Global Markets Ltd 2,347 2,566 Merrill Lynch International 1,839 2,096 J.P. Morgan Securities Plc 593 658 Morgan Stanley & Co. International Plc 40 43 Total 30,479 33,910
Counterparty* Amounton loan
Collateralreceived
iShares S&P 500 Consumer Discretionary Sector UCITS ETF $’000 $’000UBS AG 1,306 1,449Total 1,306 1,449
Counterparty* Amounton loan
Collateralreceived
iShares S&P 500 Consumer Staples Sector UCITS ETF $’000 $’000UBS AG 147 163Total 147 163
Counterparty* Amounton loan
Collateralreceived
iShares S&P 500 Energy Sector UCITS ETF $’000 $’000The Bank of Nova Scotia 6,988 7,932UBS AG 764 847 HSBC Bank Plc 673 730 Total 8,425 9,509
Counterparty* Amounton loan
Collateralreceived
iShares S&P 500 EUR Hedged UCITS ETF (Acc) €'000 €'000UBS AG 35,761 39,689 The Bank of Nova Scotia 18,396 20,879 HSBC Bank Plc 2,259 2,451 Merrill Lynch International 633 721 Goldman Sachs International 43 47 Total 57,092 63,787
Counterparty* Amounton loan
Collateralreceived
iShares S&P 500 Financials Sector UCITS ETF $'000 $'000UBS AG 27,747 30,794 HSBC Bank Plc 13,728 14,897 J.P. Morgan Securities Plc 751 833 Total 42,226 46,524
* The respective counterparty’s country of establishment is detailed on page 322.

iSHARES V PLC
Supplementary information (unaudited) (continued)
[ 3 0 2 ] i S H A R E S V P L C I N T E R I M R E P O R T
Securities Lending (continued)
Counterparty* Amount on loan
Collateralreceived
iShares S&P 500 GBP Hedged UCITS ETF (Acc) £'000 £'000UBS AG 8,772 9,736 The Bank of Nova Scotia 966 1,096 Merrill Lynch International 196 223 HSBC Bank Plc 42 45 Goldman Sachs International 3 3 Total 9,979 11,103
Counterparty* Amount on loan
Collateralreceived
iShares S&P 500 Health Care Sector UCITS ETF $'000 $'000The Bank of Nova Scotia 2,591 2,941Total 2,591 2,941
Counterparty* Amount on loan
Collateralreceived
iShares S&P 500 Industrials Sector UCITS ETF $'000 $'000UBS AG 212 236Total 212 236
Counterparty* Amount on loan
Collateralreceived
iShares S&P 500 Information Technology Sector UCITS ETF $'000 $'000The Bank of Nova Scotia 28,825 32,715 HSBC Bank Plc 1,457 1,581 Total 30,282 34,296
Counterparty* Amounton loan
Collateralreceived
iShares S&P 500 Materials Sector UCITS ETF $'000 $'000UBS AG 259 288Total 259 288
Counterparty* Amounton loan
Collateralreceived
iShares S&P 500 Utilities Sector UCITS ETF $'000 $'000UBS AG 34 38Total 34 38
Counterparty* Amounton loan
Collateralreceived
iShares Spain Govt Bond UCITS ETF €'000 €'000J.P. Morgan Securities Plc 13,499 14,836Total 13,499 14,836
* The respective counterparty’s country of establishment is detailed on page 322.
All securities on loan have an open maturity tenor as they are recallable or terminable on a daily basis.

iSHARES V PLC
Supplementary information (unaudited) (continued)
i S H A R E S V P L C I N T E R I M R E P O R T [ 3 0 3 ]
Collateral
The Funds engage in activities which may require collateral to be provided to a counterparty (“collateral posted”) or may hold collateral received (“collateral received”) from a counterparty. The following table provides an analysis by currency of the underlying non-cash collateral received by way of title transfer collateral arrangement by the Funds, in respect of securities lending transactions, as at 31 May 2018.
Currency
Non-cashCollateralreceived
iShares € Corp Bond Interest Rate Hedged UCITS ETF €’000AUD 76CAD 11 CHF 573 DKK 1,079 EUR 69,604 GBP 6,642 JPY 3,952 NOK 1,402 SEK 632 USD 18,121 Total 102,092
Currency
Non-cashCollateralreceived
iShares Agribusiness UCITS ETF $’000AUD 55 CAD 39 CHF 219 DKK 63 EUR 2,903 GBP 1,195 JPY 2,866 NOK 29 USD 6,534 Total 13,903
Currency
Non-cashCollateralreceived
iShares EM Dividend UCITS ETF $’000AUD 112 CAD 440 CHF 468 DKK 49 EUR 2,927 GBP 1,902 JPY 5,948 NOK 64 USD 13,127 Total 25,037
Currency
Non-cashCollateralreceived
iShares France Govt Bond UCITS ETF €’000AUD 279 CHF 275 EUR 8,918 GBP 810 JPY 4,774 USD 7,207
Total 22,263
Currency
Non-cashCollateralreceived
iShares Germany Govt Bond UCITS ETF €’000AUD 39 CAD 213 CHF 106 DKK 4 EUR 2,093 GBP 1,266 JPY 855 NOK 2 SEK 44 USD 4,161 Total 8,783
Currency
Non-cashCollateralreceived
iShares Gold Producers UCITS ETF $’000AUD 150 CAD 1,971 CHF 2,810 DKK 58 EUR 26,332 GBP 10,616 JPY 19,830 NOK 76 SEK 270 USD 50,691
Total 112,804
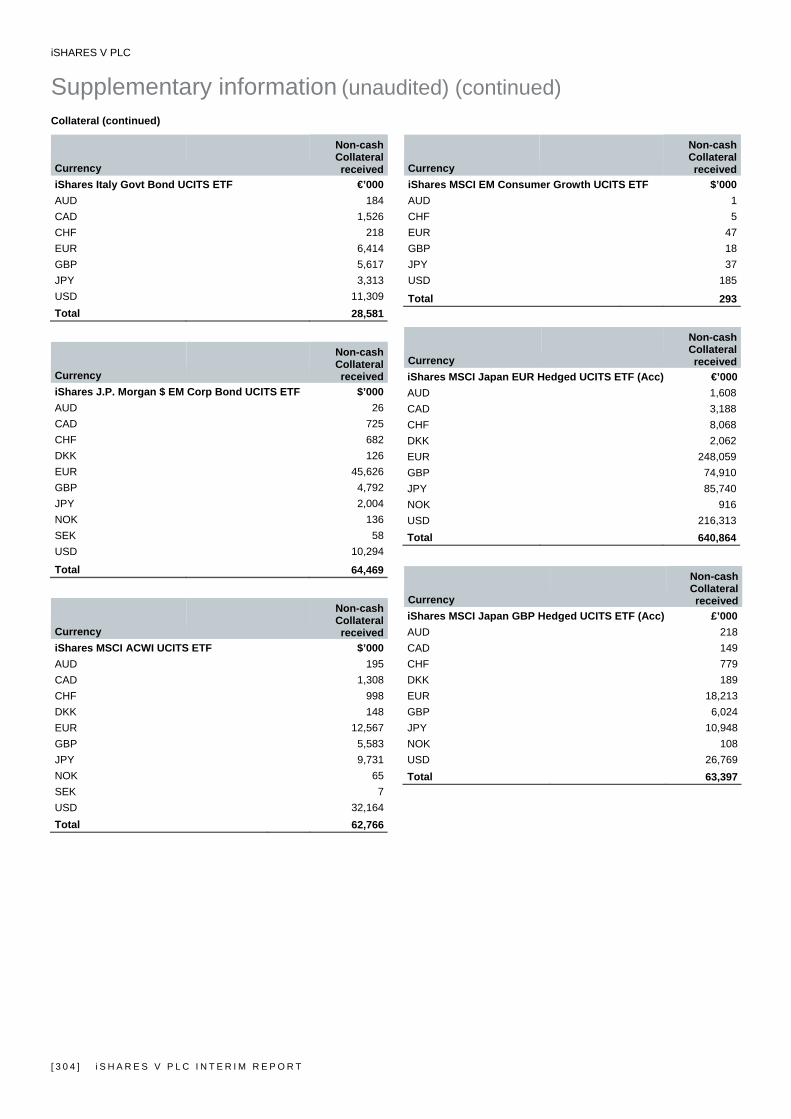
iSHARES V PLC
Supplementary information (unaudited) (continued)
[ 3 0 4 ] i S H A R E S V P L C I N T E R I M R E P O R T
Collateral (continued)
Currency
Non-cashCollateralreceived
iShares Italy Govt Bond UCITS ETF €’000AUD 184 CAD 1,526 CHF 218 EUR 6,414 GBP 5,617 JPY 3,313 USD 11,309 Total 28,581
Currency
Non-cashCollateralreceived
iShares J.P. Morgan $ EM Corp Bond UCITS ETF $’000AUD 26 CAD 725 CHF 682 DKK 126 EUR 45,626 GBP 4,792 JPY 2,004 NOK 136 SEK 58 USD 10,294
Total 64,469
Currency
Non-cashCollateralreceived
iShares MSCI ACWI UCITS ETF $’000AUD 195 CAD 1,308 CHF 998 DKK 148 EUR 12,567 GBP 5,583 JPY 9,731 NOK 65 SEK 7 USD 32,164 Total 62,766
Currency
Non-cashCollateralreceived
iShares MSCI EM Consumer Growth UCITS ETF $’000AUD 1 CHF 5 EUR 47 GBP 18 JPY 37 USD 185
Total 293
Currency
Non-cashCollateralreceived
iShares MSCI Japan EUR Hedged UCITS ETF (Acc) €’000AUD 1,608 CAD 3,188 CHF 8,068 DKK 2,062 EUR 248,059 GBP 74,910 JPY 85,740 NOK 916 USD 216,313 Total 640,864
Currency
Non-cashCollateralreceived
iShares MSCI Japan GBP Hedged UCITS ETF (Acc) £’000AUD 218 CAD 149 CHF 779 DKK 189 EUR 18,213 GBP 6,024 JPY 10,948 NOK 108 USD 26,769 Total 63,397
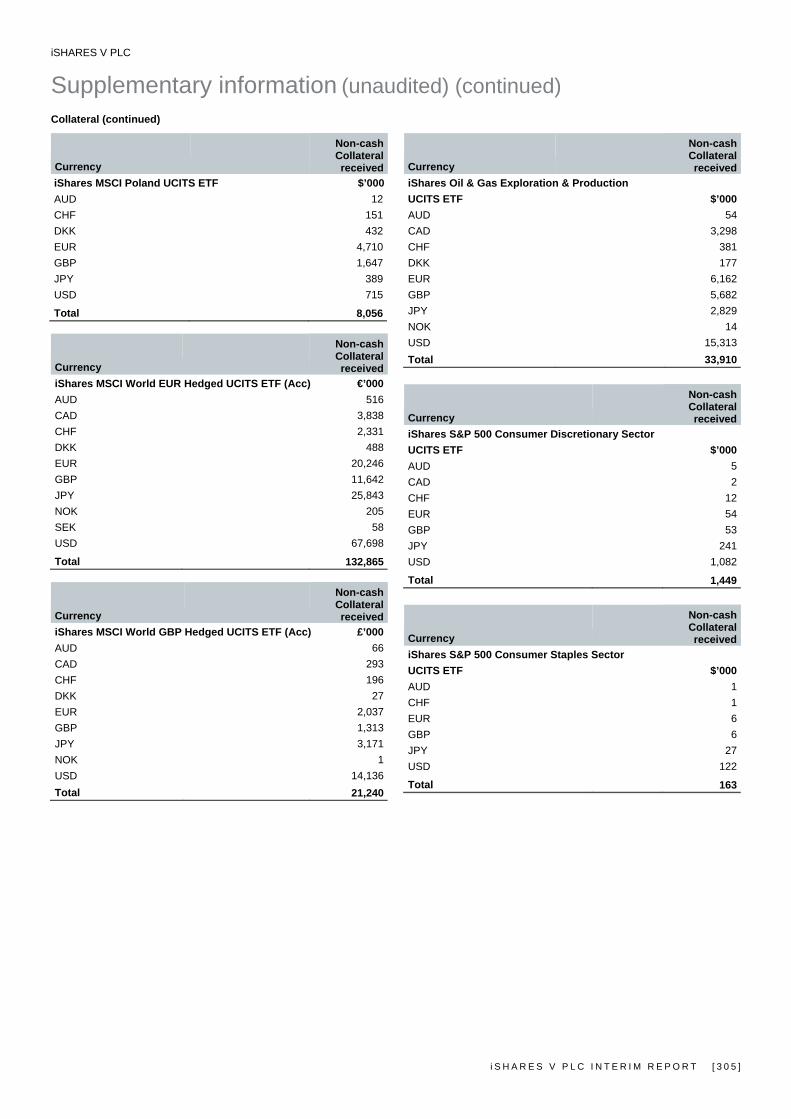
iSHARES V PLC
Supplementary information (unaudited) (continued)
i S H A R E S V P L C I N T E R I M R E P O R T [ 3 0 5 ]
Collateral (continued)
Currency
Non-cashCollateralreceived
iShares MSCI Poland UCITS ETF $’000AUD 12 CHF 151 DKK 432 EUR 4,710 GBP 1,647 JPY 389 USD 715
Total 8,056
Currency
Non-cashCollateralreceived
iShares MSCI World EUR Hedged UCITS ETF (Acc) €’000AUD 516 CAD 3,838 CHF 2,331 DKK 488 EUR 20,246 GBP 11,642 JPY 25,843 NOK 205 SEK 58 USD 67,698
Total 132,865
Currency
Non-cashCollateralreceived
iShares MSCI World GBP Hedged UCITS ETF (Acc) £’000AUD 66 CAD 293 CHF 196 DKK 27 EUR 2,037 GBP 1,313 JPY 3,171 NOK 1 USD 14,136 Total 21,240
Currency
Non-cashCollateralreceived
iShares Oil & Gas Exploration & Production UCITS ETF $’000AUD 54 CAD 3,298 CHF 381 DKK 177 EUR 6,162 GBP 5,682 JPY 2,829 NOK 14 USD 15,313 Total 33,910
Currency
Non-cashCollateralreceived
iShares S&P 500 Consumer Discretionary Sector UCITS ETF $’000AUD 5 CAD 2 CHF 12 EUR 54 GBP 53 JPY 241 USD 1,082
Total 1,449
Currency
Non-cashCollateralreceived
iShares S&P 500 Consumer Staples Sector UCITS ETF $’000AUD 1 CHF 1 EUR 6 GBP 6 JPY 27 USD 122
Total 163

iSHARES V PLC
Supplementary information (unaudited) (continued)
[ 3 0 6 ] i S H A R E S V P L C I N T E R I M R E P O R T
Collateral (continued)
Currency
Non-cashCollateralreceived
iShares S&P 500 Energy Sector UCITS ETF $’000AUD 8 CAD 1,820 CHF 38 EUR 1,017 GBP 2,402 JPY 306 USD 3,918
Total 9,509
Currency
Non-cashCollateralreceived
iShares S&P 500 EUR Hedged UCITS ETF (Acc) €’000AUD 156 CAD 4,838 CHF 462 DKK 4 EUR 4,416 GBP 7,789 JPY 7,355 NOK 5 USD 38,762
Total 63,787
Currency
Non-cashCollateralreceived
iShares S&P 500 Financials Sector UCITS ETF $’000AUD 114 CAD 35 CHF 918 EUR 9,198 GBP 3,156 JPY 5,560 USD 27,543
Total 46,524
Currency
Non-cashCollateralreceived
iShares S&P 500 GBP Hedged UCITS ETF (Acc) £’000AUD 36 CAD 264 CHF 91 DKK 1 EUR 490 GBP 683 JPY 1,737 NOK 2 USD 7,799
Total 11,103
Currency
Non-cashCollateralreceived
iShares S&P 500 Health Care Sector UCITS ETF $’000AUD 2 CAD 674 EUR 224 GBP 844 JPY 57 USD 1,140
Total 2,941
Currency
Non-cashCollateralreceived
iShares S&P 500 Industrials Sector UCITS ETF $’000AUD 1 CHF 2 EUR 9 GBP 9 JPY 39 USD 176
Total 236
Currency
Non-cashCollateralreceived
iShares S&P 500 Information Technology Sector UCITS ETF $’000AUD 19 CAD 7,501 CHF 67 EUR 3,317 GBP 9,593 JPY 661 USD 13,138
Total 34,296
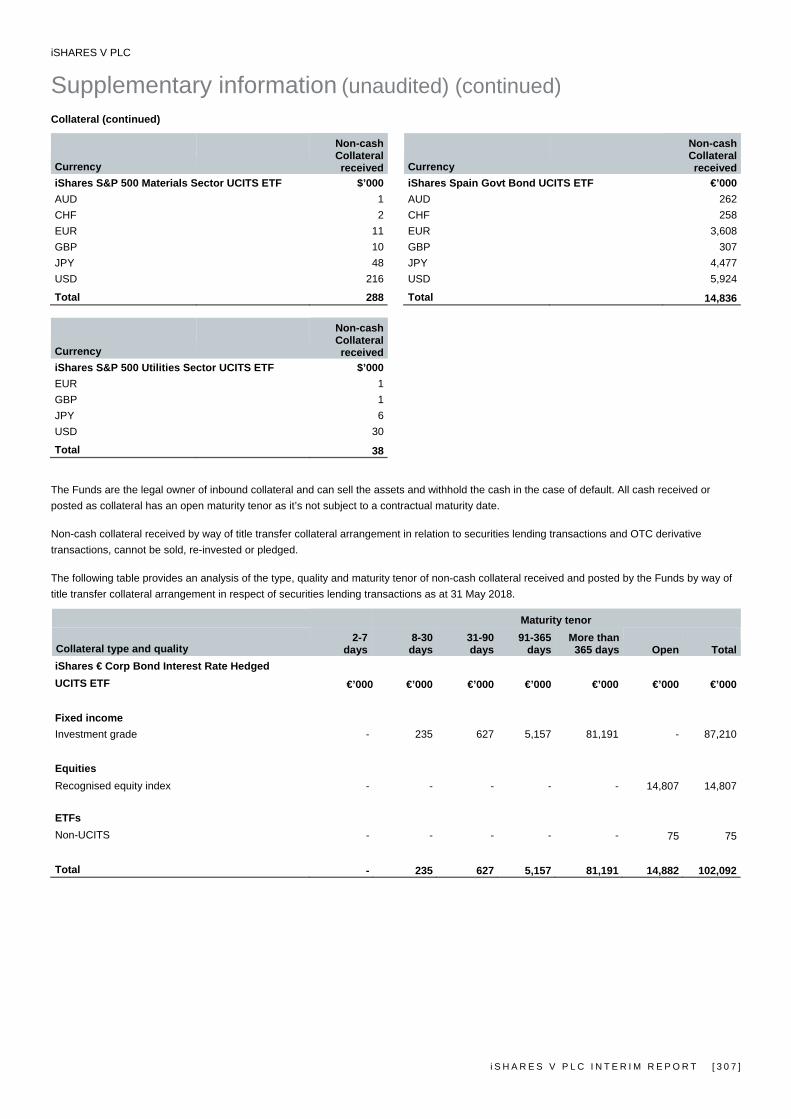
iSHARES V PLC
Supplementary information (unaudited) (continued)
i S H A R E S V P L C I N T E R I M R E P O R T [ 3 0 7 ]
Collateral (continued)
Currency
Non-cashCollateralreceived
iShares S&P 500 Materials Sector UCITS ETF $’000AUD 1 CHF 2 EUR 11 GBP 10 JPY 48 USD 216
Total 288
Currency
Non-cashCollateralreceived
iShares S&P 500 Utilities Sector UCITS ETF $’000EUR 1 GBP 1 JPY 6 USD 30
Total 38
Currency
Non-cashCollateralreceived
iShares Spain Govt Bond UCITS ETF €’000AUD 262 CHF 258 EUR 3,608 GBP 307 JPY 4,477 USD 5,924
Total 14,836
The Funds are the legal owner of inbound collateral and can sell the assets and withhold the cash in the case of default. All cash received or posted as collateral has an open maturity tenor as it’s not subject to a contractual maturity date. Non-cash collateral received by way of title transfer collateral arrangement in relation to securities lending transactions and OTC derivative transactions, cannot be sold, re-invested or pledged. The following table provides an analysis of the type, quality and maturity tenor of non-cash collateral received and posted by the Funds by way of title transfer collateral arrangement in respect of securities lending transactions as at 31 May 2018.
Maturity tenor
Collateral type and quality 2-7
days8-30
days31-90days
91-365days
More than 365 days Open Total
iShares € Corp Bond Interest Rate Hedged UCITS ETF €’000 €’000 €’000 €’000 €’000 €’000 €’000 Fixed income Investment grade - 235 627 5,157 81,191 - 87,210 Equities Recognised equity index - - - - - 14,807 14,807 ETFs Non-UCITS - - - - - 75 75 Total - 235 627 5,157 81,191 14,882 102,092
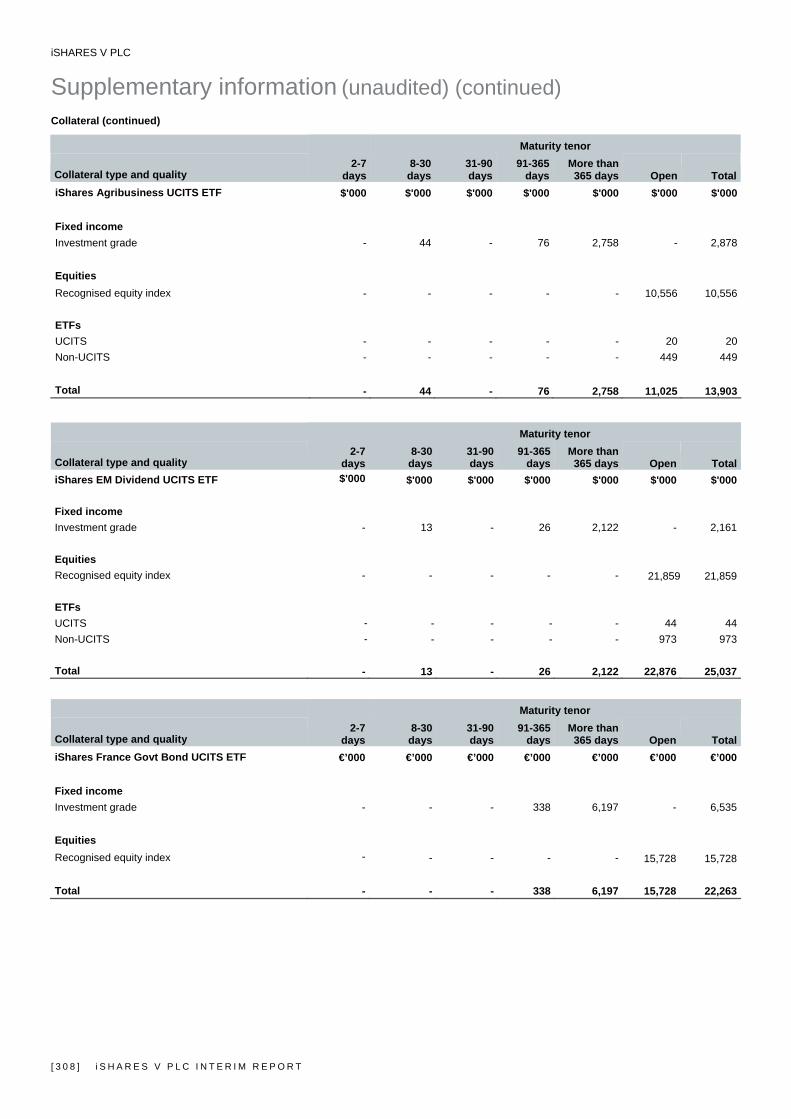
iSHARES V PLC
Supplementary information (unaudited) (continued)
[ 3 0 8 ] i S H A R E S V P L C I N T E R I M R E P O R T
Collateral (continued)
Maturity tenor
Collateral type and quality 2-7
days8-30
days31-90days
91-365days
More than 365 days Open Total
iShares Agribusiness UCITS ETF $'000 $'000 $'000 $'000 $'000 $'000 $'000 Fixed income Investment grade - 44 - 76 2,758 - 2,878 Equities Recognised equity index - - - - - 10,556 10,556 ETFs UCITS - - - - - 20 20Non-UCITS - - - - - 449 449 Total - 44 - 76 2,758 11,025 13,903
Maturity tenor
Collateral type and quality 2-7
days8-30
days31-90days
91-365days
More than 365 days Open Total
iShares EM Dividend UCITS ETF $'000 $'000 $'000 $'000 $'000 $'000 $'000 Fixed income Investment grade - 13 - 26 2,122 - 2,161 Equities Recognised equity index - - - - - 21,859 21,859 ETFs UCITS - - - - - 44 44Non-UCITS - - - - - 973 973 Total - 13 - 26 2,122 22,876 25,037
Maturity tenor
Collateral type and quality 2-7
days8-30
days31-90days
91-365days
More than 365 days Open Total
iShares France Govt Bond UCITS ETF €’000 €’000 €’000 €’000 €’000 €’000 €’000 Fixed income Investment grade - - - 338 6,197 - 6,535 Equities Recognised equity index - - - - - 15,728 15,728 Total - - - 338 6,197 15,728 22,263

iSHARES V PLC
Supplementary information (unaudited) (continued)
i S H A R E S V P L C I N T E R I M R E P O R T [ 3 0 9 ]
Collateral (continued)
Maturity tenor
Collateral type and quality 2-7
days8-30
days31-90days
91-365days
More than 365 days Open Total
iShares Germany Govt Bond UCITS ETF €’000 €’000 €’000 €’000 €’000 €’000 €’000 Fixed income Investment grade - - - 15 879 - 894 Equities Recognised equity index - - - - - 7,889 7,889 Total - - - 15 879 7,889 8,783
Maturity tenor
Collateral type and quality 2-7
days8-30
days31-90days
91-365days
More than 365 days Open Total
iShares Gold Producers UCITS ETF $’000 $’000 $’000 $’000 $’000 $’000 $’000 Fixed income Investment grade - 8 - 11 594 - 613 Equities Recognised equity index - - - - - 111,369 111,369 ETFs UCITS - - - - - 51 51Non-UCITS - - - - - 771 771 Total - 8 - 11 594 112,191 112,804
Maturity tenor
Collateral type and quality 2-7
days8-30
days31-90days
91-365days
More than 365 days Open Total
iShares Italy Govt Bond UCITS ETF €’000 €’000 €’000 €’000 €’000 €’000 €’000 Fixed income Investment grade - - - 2 4,199 - 4,201 Equities Recognised equity index - - - - - 24,380 24,380 Total - - - 2 4,199 24,380 28,581
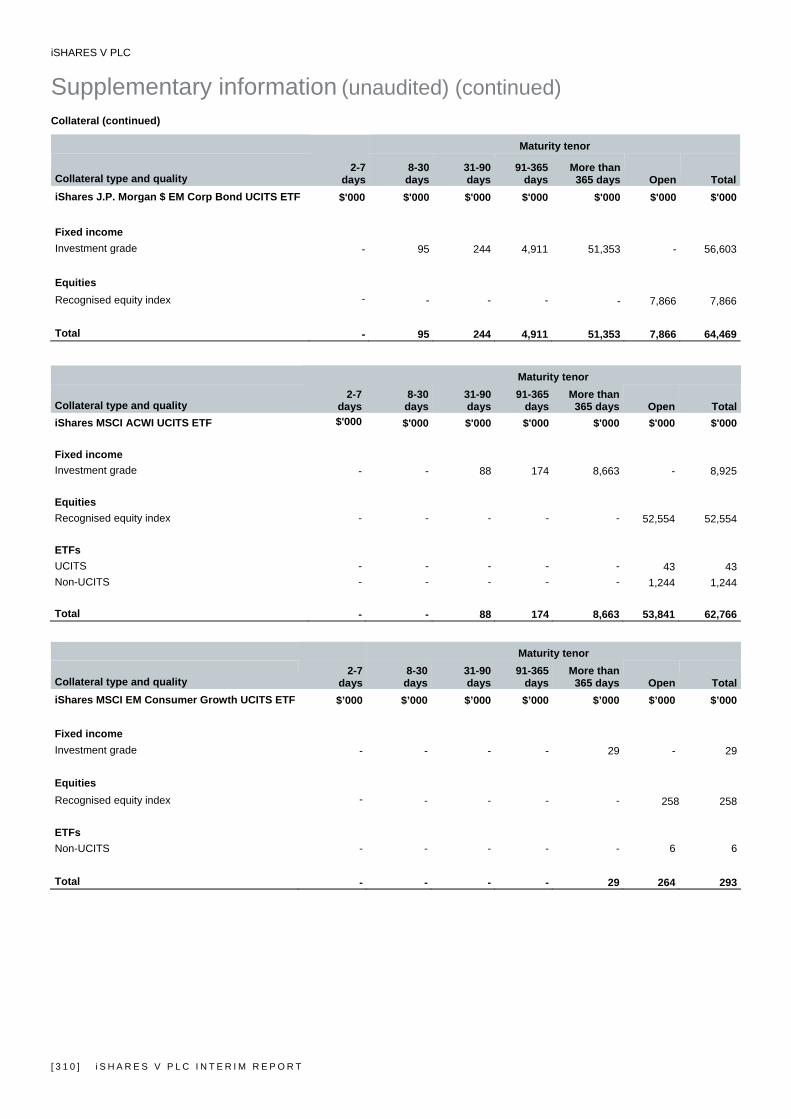
iSHARES V PLC
Supplementary information (unaudited) (continued)
[ 3 1 0 ] i S H A R E S V P L C I N T E R I M R E P O R T
Collateral (continued)
Maturity tenor
Collateral type and quality 2-7
days8-30
days31-90days
91-365days
More than 365 days Open Total
iShares J.P. Morgan $ EM Corp Bond UCITS ETF $'000 $'000 $'000 $'000 $'000 $'000 $'000 Fixed income Investment grade - 95 244 4,911 51,353 - 56,603 Equities Recognised equity index - - - - - 7,866 7,866 Total - 95 244 4,911 51,353 7,866 64,469
Maturity tenor
Collateral type and quality 2-7
days8-30
days31-90days
91-365days
More than 365 days Open Total
iShares MSCI ACWI UCITS ETF $'000 $'000 $'000 $'000 $'000 $'000 $'000 Fixed income Investment grade - - 88 174 8,663 - 8,925 Equities Recognised equity index - - - - - 52,554 52,554 ETFs UCITS - - - - - 43 43Non-UCITS - - - - - 1,244 1,244 Total - - 88 174 8,663 53,841 62,766
Maturity tenor
Collateral type and quality 2-7
days8-30
days31-90days
91-365days
More than 365 days Open Total
iShares MSCI EM Consumer Growth UCITS ETF $’000 $’000 $’000 $’000 $’000 $’000 $’000 Fixed income Investment grade - - - - 29 - 29 Equities Recognised equity index - - - - - 258 258 ETFs Non-UCITS - - - - - 6 6 Total - - - - 29 264 293
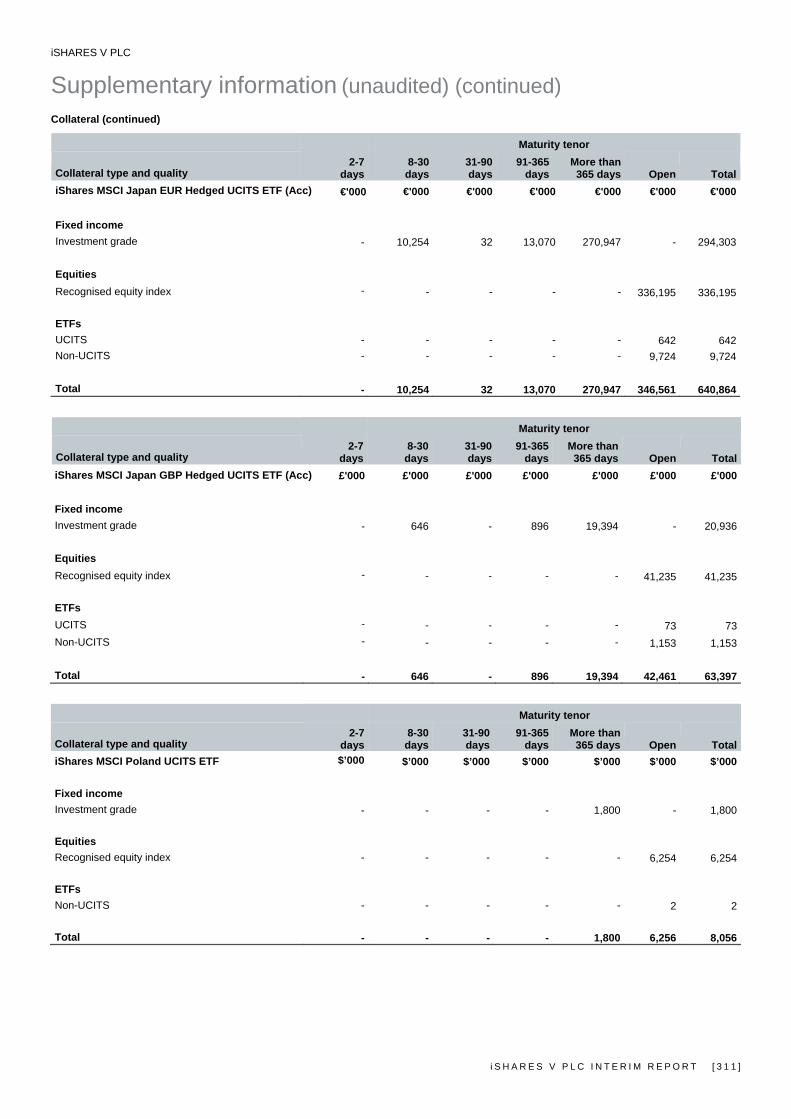
iSHARES V PLC
Supplementary information (unaudited) (continued)
i S H A R E S V P L C I N T E R I M R E P O R T [ 3 1 1 ]
Collateral (continued)
Maturity tenor
Collateral type and quality 2-7
days8-30
days31-90days
91-365days
More than 365 days Open Total
iShares MSCI Japan EUR Hedged UCITS ETF (Acc) €'000 €'000 €'000 €'000 €'000 €'000 €'000 Fixed income Investment grade - 10,254 32 13,070 270,947 - 294,303 Equities Recognised equity index - - - - - 336,195 336,195 ETFs UCITS - - - - - 642 642Non-UCITS - - - - - 9,724 9,724 Total - 10,254 32 13,070 270,947 346,561 640,864
Maturity tenor
Collateral type and quality 2-7
days8-30
days31-90days
91-365days
More than 365 days Open Total
iShares MSCI Japan GBP Hedged UCITS ETF (Acc) £'000 £'000 £'000 £'000 £'000 £'000 £'000 Fixed income Investment grade - 646 - 896 19,394 - 20,936 Equities Recognised equity index - - - - - 41,235 41,235 ETFs UCITS - - - - - 73 73Non-UCITS - - - - - 1,153 1,153 Total - 646 - 896 19,394 42,461 63,397
Maturity tenor
Collateral type and quality 2-7
days8-30
days31-90days
91-365days
More than 365 days Open Total
iShares MSCI Poland UCITS ETF $’000 $’000 $’000 $’000 $’000 $’000 $’000 Fixed income Investment grade - - - - 1,800 - 1,800 Equities Recognised equity index - - - - - 6,254 6,254 ETFs Non-UCITS - - - - - 2 2 Total - - - - 1,800 6,256 8,056
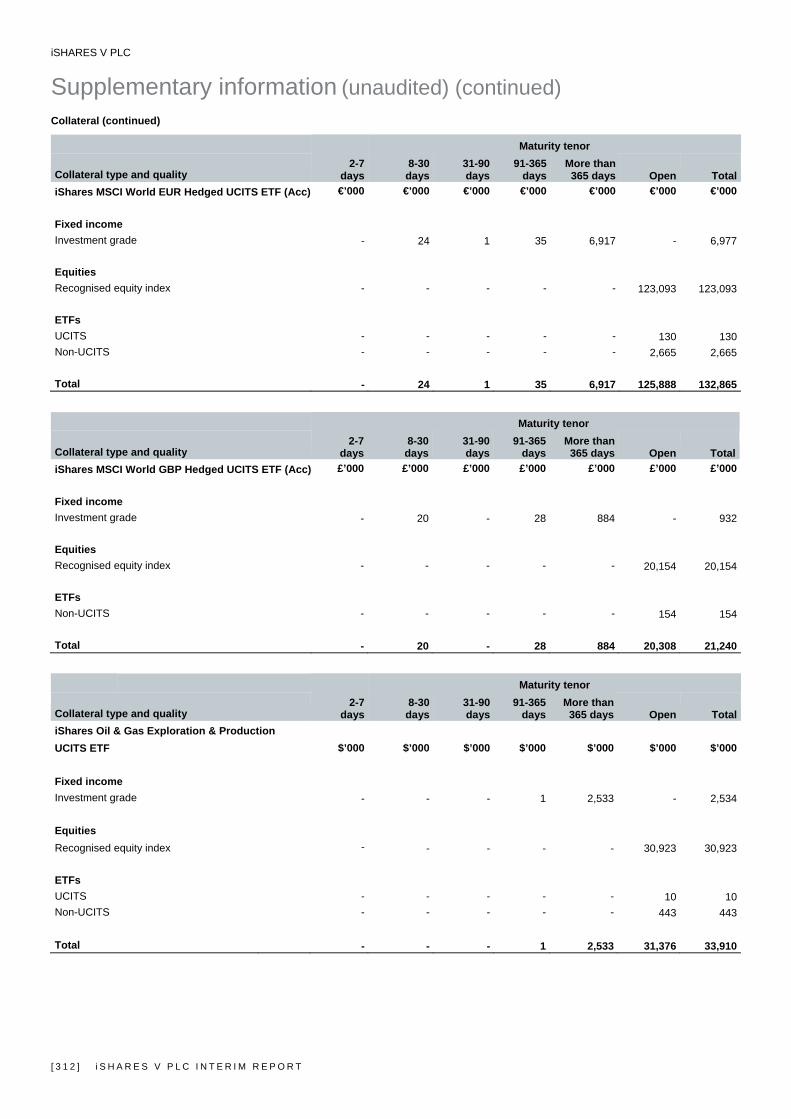
iSHARES V PLC
Supplementary information (unaudited) (continued)
[ 3 1 2 ] i S H A R E S V P L C I N T E R I M R E P O R T
Collateral (continued)
Maturity tenor
Collateral type and quality 2-7
days8-30
days31-90days
91-365days
More than 365 days Open Total
iShares MSCI World EUR Hedged UCITS ETF (Acc) €’000 €’000 €’000 €’000 €’000 €’000 €’000 Fixed income Investment grade - 24 1 35 6,917 - 6,977 Equities Recognised equity index - - - - - 123,093 123,093 ETFs UCITS - - - - - 130 130Non-UCITS - - - - - 2,665 2,665 Total - 24 1 35 6,917 125,888 132,865
Maturity tenor
Collateral type and quality 2-7
days8-30
days31-90days
91-365days
More than 365 days Open Total
iShares MSCI World GBP Hedged UCITS ETF (Acc) £’000 £’000 £’000 £’000 £’000 £’000 £’000 Fixed income Investment grade - 20 - 28 884 - 932 Equities Recognised equity index - - - - - 20,154 20,154 ETFs Non-UCITS - - - - - 154 154 Total - 20 - 28 884 20,308 21,240
Maturity tenor
Collateral type and quality 2-7
days8-30
days31-90days
91-365days
More than 365 days Open Total
iShares Oil & Gas Exploration & Production UCITS ETF $’000 $’000 $’000 $’000 $’000 $’000 $’000 Fixed income Investment grade - - - 1 2,533 - 2,534 Equities Recognised equity index - - - - - 30,923 30,923 ETFs UCITS - - - - - 10 10Non-UCITS - - - - - 443 443 Total - - - 1 2,533 31,376 33,910
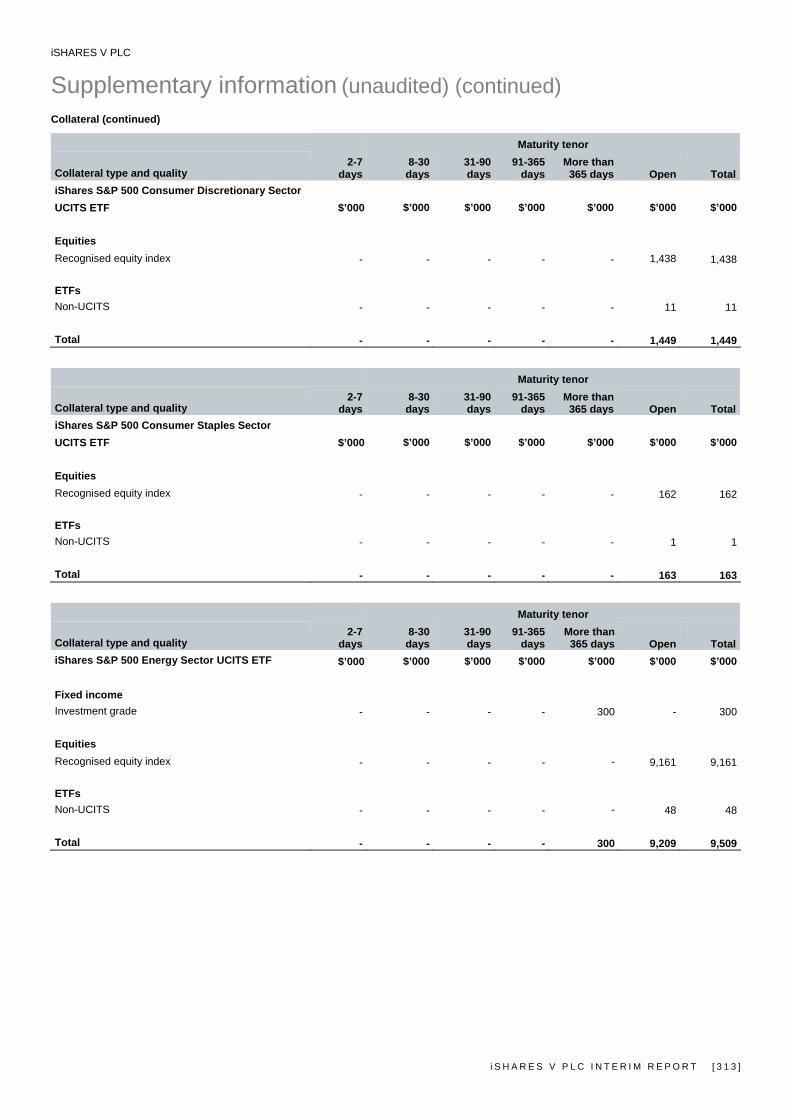
iSHARES V PLC
Supplementary information (unaudited) (continued)
i S H A R E S V P L C I N T E R I M R E P O R T [ 3 1 3 ]
Collateral (continued)
Maturity tenor
Collateral type and quality 2-7
days8-30
days31-90days
91-365days
More than 365 days Open Total
iShares S&P 500 Consumer Discretionary Sector UCITS ETF $’000 $’000 $’000 $’000 $’000 $’000 $’000 Equities Recognised equity index - - - - - 1,438 1,438 ETFs Non-UCITS - - - - - 11 11 Total - - - - - 1,449 1,449
Maturity tenor
Collateral type and quality 2-7
days8-30
days31-90days
91-365days
More than 365 days Open Total
iShares S&P 500 Consumer Staples Sector UCITS ETF $’000 $’000 $’000 $’000 $’000 $’000 $’000 Equities Recognised equity index - - - - - 162 162 ETFs Non-UCITS - - - - - 1 1 Total - - - - - 163 163
Maturity tenor
Collateral type and quality 2-7
days8-30
days31-90days
91-365days
More than 365 days Open Total
iShares S&P 500 Energy Sector UCITS ETF $’000 $’000 $’000 $’000 $’000 $’000 $’000 Fixed income Investment grade - - - - 300 - 300 Equities Recognised equity index - - - - - 9,161 9,161 ETFs Non-UCITS - - - - - 48 48 Total - - - - 300 9,209 9,509
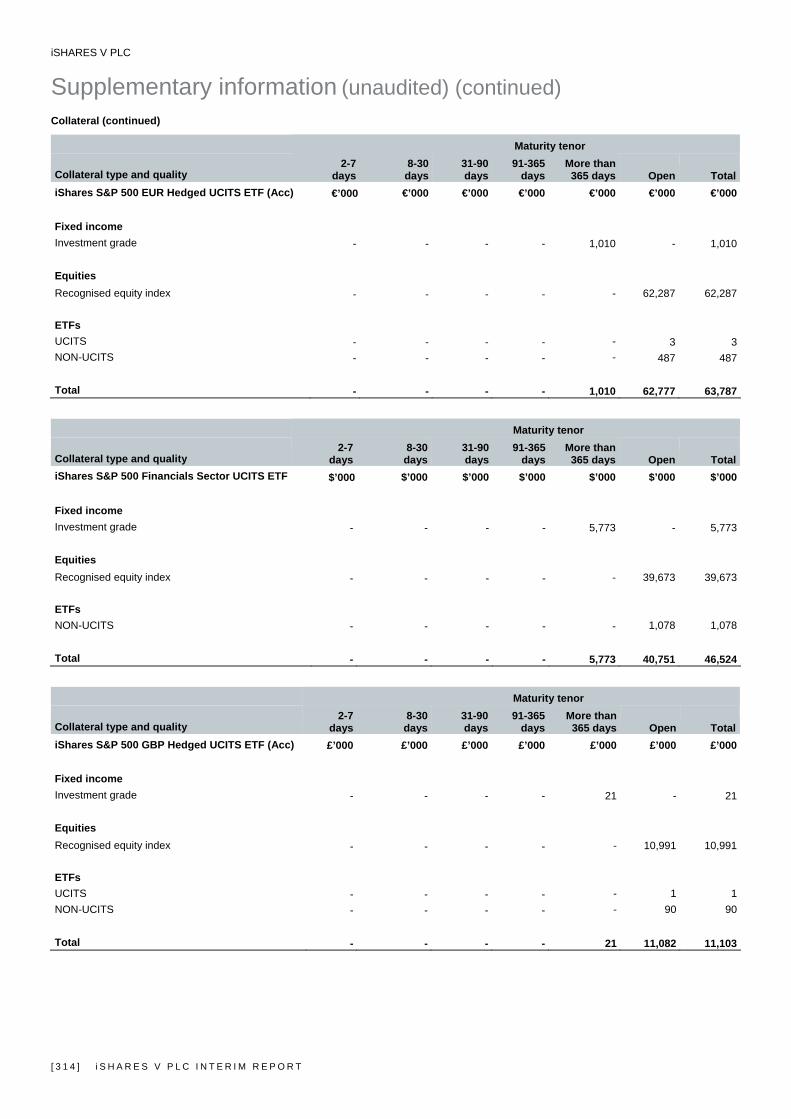
iSHARES V PLC
Supplementary information (unaudited) (continued)
[ 3 1 4 ] i S H A R E S V P L C I N T E R I M R E P O R T
Collateral (continued)
Maturity tenor
Collateral type and quality 2-7
days8-30
days31-90days
91-365days
More than 365 days Open Total
iShares S&P 500 EUR Hedged UCITS ETF (Acc) €’000 €’000 €’000 €’000 €’000 €’000 €’000 Fixed income Investment grade - - - - 1,010 - 1,010 Equities Recognised equity index - - - - - 62,287 62,287 ETFs UCITS - - - - - 3 3NON-UCITS - - - - - 487 487 Total - - - - 1,010 62,777 63,787
Maturity tenor
Collateral type and quality 2-7
days8-30
days31-90days
91-365days
More than 365 days Open Total
iShares S&P 500 Financials Sector UCITS ETF $’000 $’000 $’000 $’000 $’000 $’000 $’000 Fixed income Investment grade - - - - 5,773 - 5,773 Equities Recognised equity index - - - - - 39,673 39,673 ETFs NON-UCITS - - - - - 1,078 1,078 Total - - - - 5,773 40,751 46,524
Maturity tenor
Collateral type and quality 2-7
days8-30
days31-90days
91-365days
More than 365 days Open Total
iShares S&P 500 GBP Hedged UCITS ETF (Acc) £’000 £’000 £’000 £’000 £’000 £’000 £’000 Fixed income Investment grade - - - - 21 - 21 Equities Recognised equity index - - - - - 10,991 10,991 ETFs UCITS - - - - - 1 1NON-UCITS - - - - - 90 90 Total - - - - 21 11,082 11,103

iSHARES V PLC
Supplementary information (unaudited) (continued)
i S H A R E S V P L C I N T E R I M R E P O R T [ 3 1 5 ]
Collateral (continued)
Maturity tenor
Collateral type and quality 2-7
days8-30
days31-90days
91-365days
More than 365 days Open Total
iShares S&P 500 Health Care Sector UCITS ETF $'000 $'000 $'000 $'000 $'000 $'000 $'000 Fixed income Investment grade - - - - 7 - 7 Equities Recognised equity index - - - - - 2,934 2,934 Total - - - - 7 2,934 2,941
Maturity tenor
Collateral type and quality 2-7
days8-30
days31-90days
91-365days
More than 365 days Open Total
iShares S&P 500 Industrials Sector UCITS ETF $'000 $'000 $'000 $'000 $'000 $'000 $'000 Equities Recognised equity index - - - - - 234 234 ETFs NON-UCITS - - - - - 2 2 Total - - - - - 236 236
Maturity tenor
Collateral type and quality 2-7
days8-30
days31-90days
91-365days
More than 365 days Open Total
iShares S&P 500 Information Technology Sector UCITS ETF $'000 $’000 $’000 $’000 $’000 $’000 $’000 Fixed income Investment grade - - - - 684 - 684 Equities Recognised equity index - - - - - 33,522 33,522 ETFs NON-UCITS - - - - - 90 90 Total - - - - 684 33,612 34,296

iSHARES V PLC
Supplementary information (unaudited) (continued)
[ 3 1 6 ] i S H A R E S V P L C I N T E R I M R E P O R T
Collateral (continued)
Maturity tenor
Collateral type and quality 2-7
days8-30
days31-90days
91-365days
More than 365 days Open Total
iShares S&P 500 Materials Sector UCITS ETF $'000 $’000 $’000 $’000 $’000 $’000 $’000 Equities Recognised equity index - - - - - 286 286 ETFs NON-UCITS - - - - - 2 2 Total - - - - - 288 288
Maturity tenor
Collateral type and quality 2-7
days8-30
days31-90days
91-365days
More than 365 days Open Total
iShares S&P 500 Utilities Sector UCITS ETF $'000 $’000 $’000 $’000 $’000 $’000 $’000 Equities Recognised equity index - - - - - 38 38 Total - - - - - 38 38
Maturity tenor
Collateral type and quality 2-7
days8-30
days31-90days
91-365days
More than 365 days Open Total
iShares Spain Govt Bond UCITS ETF €’000 €’000 €’000 €’000 €’000 €’000 €’000 Fixed income Investment grade - - - - 86 - 86 Equities Recognised equity index - - - - - 14,750 14,750 Total - - - - 86 14,750 14,836
No collateral had a maturity tenor of less than 8 days. Investment grade securities are those issued by an entity with a minimum investment grade credit rating from at least one globally recognised credit rating agency; Standard & Poor’s, Moody’s or Fitch. A recognised equity index contains at least 20 equities where no single equity represents more than 20% of the total index and no five equities combined represent more than 60% of the total index. The maturity tenor analysis for fixed income securities received or posted as collateral is based on the respective contractual maturity date, while for equity securities, ETFs and money market funds received or posted as collateral are presented as open transactions as they are not subject to a contractual maturity date.
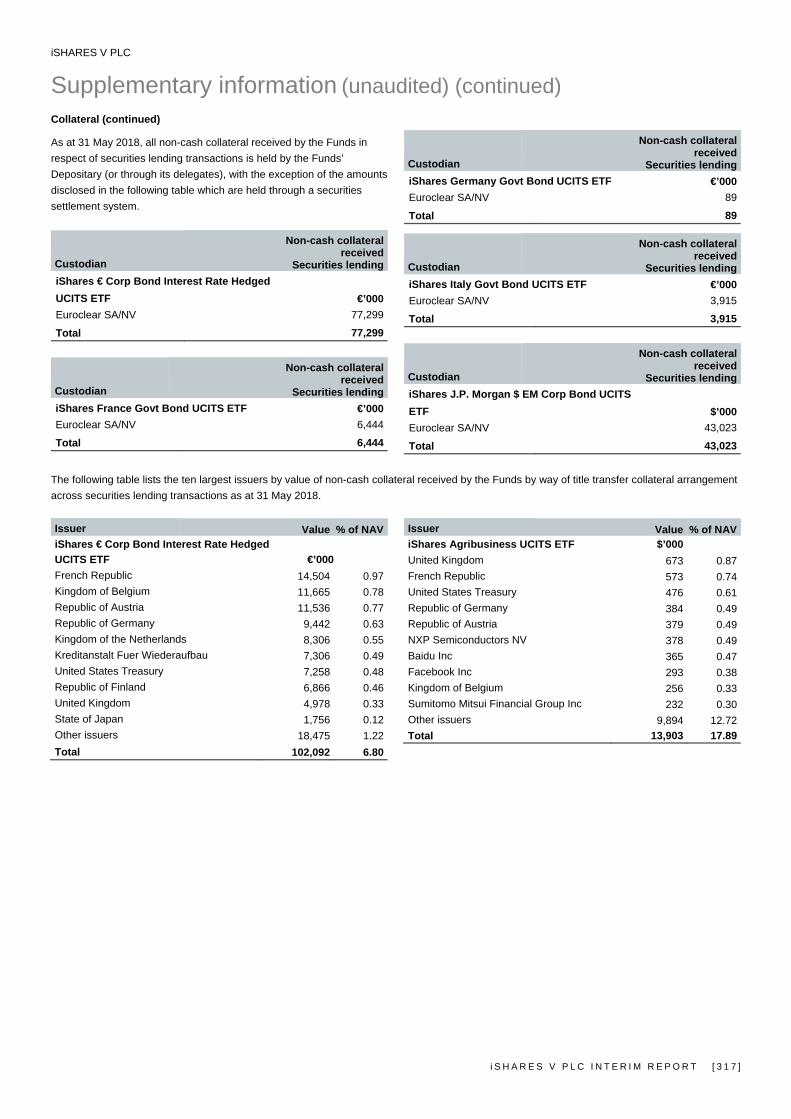
iSHARES V PLC
Supplementary information (unaudited) (continued)
i S H A R E S V P L C I N T E R I M R E P O R T [ 3 1 7 ]
Collateral (continued)
As at 31 May 2018, all non-cash collateral received by the Funds in respect of securities lending transactions is held by the Funds’ Depositary (or through its delegates), with the exception of the amounts disclosed in the following table which are held through a securities settlement system.
Custodian
Non-cash collateral received
Securities lendingiShares € Corp Bond Interest Rate Hedged UCITS ETF €’000Euroclear SA/NV 77,299
Total 77,299
Custodian
Non-cash collateral received
Securities lendingiShares France Govt Bond UCITS ETF €’000Euroclear SA/NV 6,444
Total 6,444
Custodian
Non-cash collateral received
Securities lendingiShares Germany Govt Bond UCITS ETF €’000Euroclear SA/NV 89
Total 89
Custodian
Non-cash collateral received
Securities lendingiShares Italy Govt Bond UCITS ETF €’000Euroclear SA/NV 3,915
Total 3,915
Custodian
Non-cash collateral received
Securities lendingiShares J.P. Morgan $ EM Corp Bond UCITS ETF $’000Euroclear SA/NV 43,023
Total 43,023
The following table lists the ten largest issuers by value of non-cash collateral received by the Funds by way of title transfer collateral arrangement across securities lending transactions as at 31 May 2018. Issuer Value % of NAViShares € Corp Bond Interest Rate Hedged UCITS ETF €’000French Republic 14,504 0.97Kingdom of Belgium 11,665 0.78Republic of Austria 11,536 0.77 Republic of Germany 9,442 0.63 Kingdom of the Netherlands 8,306 0.55 Kreditanstalt Fuer Wiederaufbau 7,306 0.49 United States Treasury 7,258 0.48 Republic of Finland 6,866 0.46 United Kingdom 4,978 0.33 State of Japan 1,756 0.12 Other issuers 18,475 1.22 Total 102,092 6.80
Issuer Value % of NAViShares Agribusiness UCITS ETF $’000United Kingdom 673 0.87 French Republic 573 0.74 United States Treasury 476 0.61 Republic of Germany 384 0.49 Republic of Austria 379 0.49 NXP Semiconductors NV 378 0.49 Baidu Inc 365 0.47 Facebook Inc 293 0.38 Kingdom of Belgium 256 0.33 Sumitomo Mitsui Financial Group Inc 232 0.30 Other issuers 9,894 12.72 Total 13,903 17.89
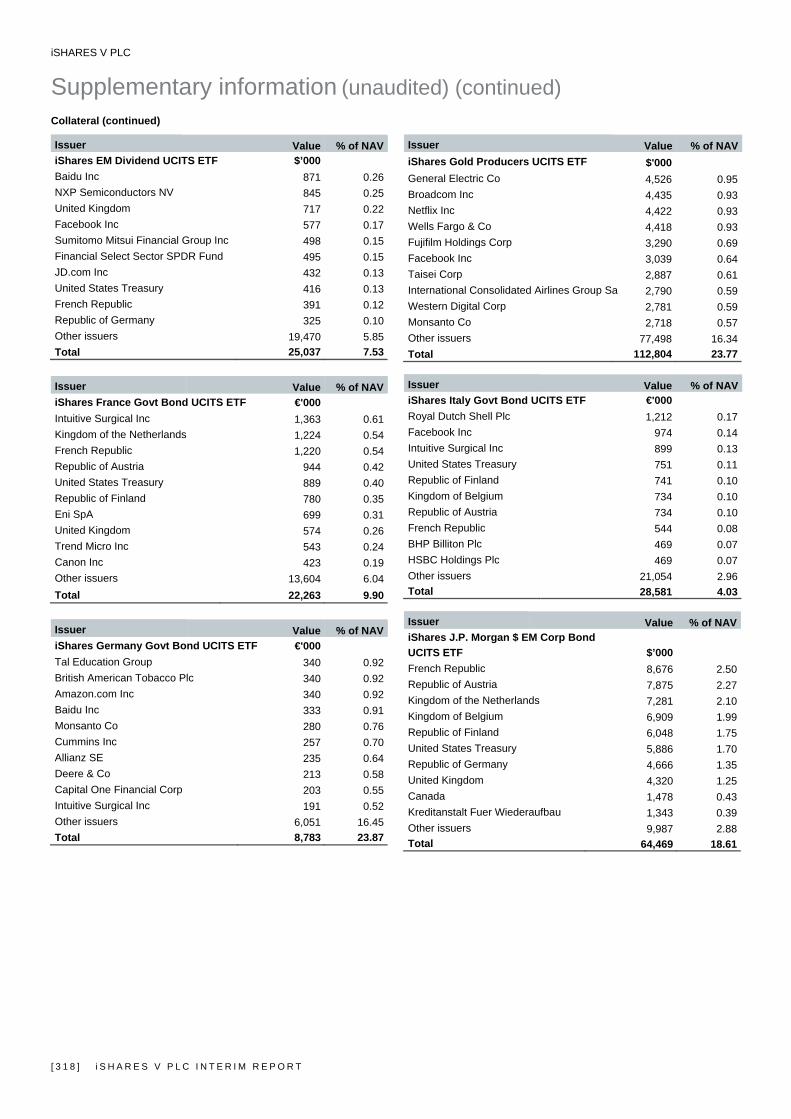
iSHARES V PLC
Supplementary information (unaudited) (continued)
[ 3 1 8 ] i S H A R E S V P L C I N T E R I M R E P O R T
Collateral (continued)
Issuer Value % of NAViShares EM Dividend UCITS ETF $’000 Baidu Inc 871 0.26 NXP Semiconductors NV 845 0.25 United Kingdom 717 0.22 Facebook Inc 577 0.17 Sumitomo Mitsui Financial Group Inc 498 0.15 Financial Select Sector SPDR Fund 495 0.15 JD.com Inc 432 0.13 United States Treasury 416 0.13 French Republic 391 0.12 Republic of Germany 325 0.10 Other issuers 19,470 5.85 Total 25,037 7.53
Issuer Value % of NAViShares France Govt Bond UCITS ETF €'000 Intuitive Surgical Inc 1,363 0.61 Kingdom of the Netherlands 1,224 0.54 French Republic 1,220 0.54 Republic of Austria 944 0.42 United States Treasury 889 0.40 Republic of Finland 780 0.35 Eni SpA 699 0.31 United Kingdom 574 0.26 Trend Micro Inc 543 0.24 Canon Inc 423 0.19 Other issuers 13,604 6.04 Total 22,263 9.90
Issuer Value % of NAViShares Germany Govt Bond UCITS ETF €'000 Tal Education Group 340 0.92 British American Tobacco Plc 340 0.92 Amazon.com Inc 340 0.92 Baidu Inc 333 0.91 Monsanto Co 280 0.76 Cummins Inc 257 0.70 Allianz SE 235 0.64 Deere & Co 213 0.58 Capital One Financial Corp 203 0.55 Intuitive Surgical Inc 191 0.52 Other issuers 6,051 16.45 Total 8,783 23.87
Issuer Value % of NAViShares Gold Producers UCITS ETF $'000General Electric Co 4,526 0.95 Broadcom Inc 4,435 0.93 Netflix Inc 4,422 0.93 Wells Fargo & Co 4,418 0.93 Fujifilm Holdings Corp 3,290 0.69 Facebook Inc 3,039 0.64 Taisei Corp 2,887 0.61 International Consolidated Airlines Group Sa 2,790 0.59 Western Digital Corp 2,781 0.59 Monsanto Co 2,718 0.57 Other issuers 77,498 16.34 Total 112,804 23.77
Issuer Value % of NAViShares Italy Govt Bond UCITS ETF €'000Royal Dutch Shell Plc 1,212 0.17 Facebook Inc 974 0.14 Intuitive Surgical Inc 899 0.13 United States Treasury 751 0.11 Republic of Finland 741 0.10 Kingdom of Belgium 734 0.10 Republic of Austria 734 0.10 French Republic 544 0.08 BHP Billiton Plc 469 0.07 HSBC Holdings Plc 469 0.07 Other issuers 21,054 2.96 Total 28,581 4.03
Issuer Value % of NAViShares J.P. Morgan $ EM Corp Bond UCITS ETF $’000French Republic 8,676 2.50 Republic of Austria 7,875 2.27 Kingdom of the Netherlands 7,281 2.10 Kingdom of Belgium 6,909 1.99 Republic of Finland 6,048 1.75 United States Treasury 5,886 1.70 Republic of Germany 4,666 1.35 United Kingdom 4,320 1.25 Canada 1,478 0.43 Kreditanstalt Fuer Wiederaufbau 1,343 0.39 Other issuers 9,987 2.88 Total 64,469 18.61
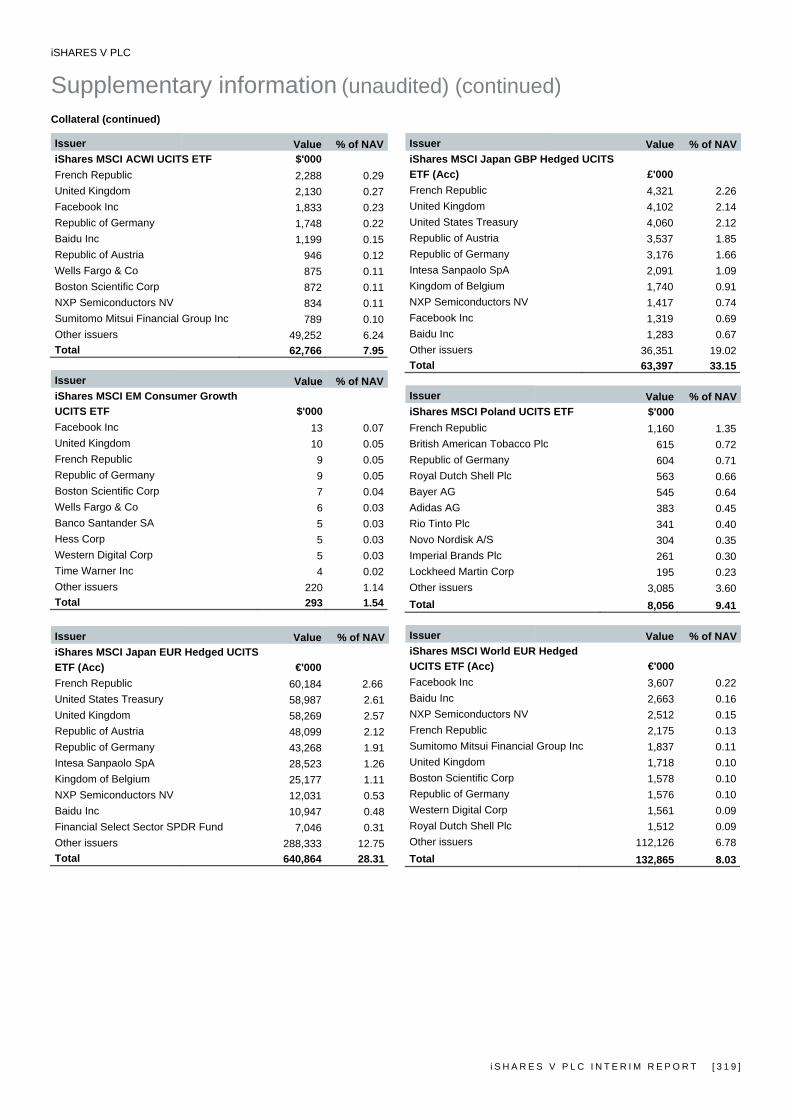
iSHARES V PLC
Supplementary information (unaudited) (continued)
i S H A R E S V P L C I N T E R I M R E P O R T [ 3 1 9 ]
Collateral (continued)
Issuer Value % of NAViShares MSCI ACWI UCITS ETF $'000 French Republic 2,288 0.29 United Kingdom 2,130 0.27 Facebook Inc 1,833 0.23 Republic of Germany 1,748 0.22 Baidu Inc 1,199 0.15 Republic of Austria 946 0.12 Wells Fargo & Co 875 0.11 Boston Scientific Corp 872 0.11 NXP Semiconductors NV 834 0.11 Sumitomo Mitsui Financial Group Inc 789 0.10 Other issuers 49,252 6.24 Total 62,766 7.95
Issuer Value % of NAViShares MSCI EM Consumer Growth UCITS ETF $'000 Facebook Inc 13 0.07 United Kingdom 10 0.05 French Republic 9 0.05 Republic of Germany 9 0.05 Boston Scientific Corp 7 0.04 Wells Fargo & Co 6 0.03 Banco Santander SA 5 0.03 Hess Corp 5 0.03 Western Digital Corp 5 0.03 Time Warner Inc 4 0.02 Other issuers 220 1.14 Total 293 1.54
Issuer Value % of NAViShares MSCI Japan EUR Hedged UCITS ETF (Acc) €'000 French Republic 60,184 2.66 United States Treasury 58,987 2.61 United Kingdom 58,269 2.57 Republic of Austria 48,099 2.12 Republic of Germany 43,268 1.91 Intesa Sanpaolo SpA 28,523 1.26 Kingdom of Belgium 25,177 1.11 NXP Semiconductors NV 12,031 0.53 Baidu Inc 10,947 0.48 Financial Select Sector SPDR Fund 7,046 0.31 Other issuers 288,333 12.75 Total 640,864 28.31
Issuer Value % of NAViShares MSCI Japan GBP Hedged UCITS ETF (Acc) £'000French Republic 4,321 2.26 United Kingdom 4,102 2.14 United States Treasury 4,060 2.12 Republic of Austria 3,537 1.85 Republic of Germany 3,176 1.66 Intesa Sanpaolo SpA 2,091 1.09 Kingdom of Belgium 1,740 0.91 NXP Semiconductors NV 1,417 0.74 Facebook Inc 1,319 0.69 Baidu Inc 1,283 0.67 Other issuers 36,351 19.02 Total 63,397 33.15
Issuer Value % of NAViShares MSCI Poland UCITS ETF $'000French Republic 1,160 1.35 British American Tobacco Plc 615 0.72 Republic of Germany 604 0.71 Royal Dutch Shell Plc 563 0.66 Bayer AG 545 0.64 Adidas AG 383 0.45 Rio Tinto Plc 341 0.40 Novo Nordisk A/S 304 0.35 Imperial Brands Plc 261 0.30 Lockheed Martin Corp 195 0.23 Other issuers 3,085 3.60 Total 8,056 9.41
Issuer Value % of NAViShares MSCI World EUR Hedged UCITS ETF (Acc) €'000Facebook Inc 3,607 0.22 Baidu Inc 2,663 0.16 NXP Semiconductors NV 2,512 0.15 French Republic 2,175 0.13 Sumitomo Mitsui Financial Group Inc 1,837 0.11 United Kingdom 1,718 0.10 Boston Scientific Corp 1,578 0.10 Republic of Germany 1,576 0.10 Western Digital Corp 1,561 0.09 Royal Dutch Shell Plc 1,512 0.09 Other issuers 112,126 6.78 Total 132,865 8.03

iSHARES V PLC
Supplementary information (unaudited) (continued)
[ 3 2 0 ] i S H A R E S V P L C I N T E R I M R E P O R T
Collateral (continued)
Issuer Value % of NAViShares MSCI World GBP Hedged UCITS ETF (Acc) £'000 Facebook Inc 1,047 0.45 Boston Scientific Corp 522 0.23 Western Digital Corp 408 0.18 Royal Dutch Shell Plc 358 0.15 Hess Corp 342 0.15 Time Warner Inc 325 0.14 Cognizant Technology Solutions Corp 318 0.14 Thermo Fisher Scientific Inc 290 0.13 Sumitomo Mitsui Financial Group Inc 273 0.12 Exxon Mobil Corp 248 0.11 Other issuers 17,109 7.36 Total 21,240 9.16
Issuer Value % of NAViShares Oil & Gas Exploration & Production UCITS ETF $'000 French Republic 1,031 0.44 Republic of Germany 781 0.34 Wells Fargo & Co 683 0.29 United Kingdom 625 0.27 Facebook Inc 618 0.27 Monsanto Co 594 0.26 Adobe Systems Inc 573 0.25 General Electric Co 485 0.21 Toronto-Dominion Bank 472 0.20 Royal Bank of Canada 449 0.19 Other issuers 27,599 11.91 Total 33,910 14.63
Issuer Value % of NAViShares S&P 500 Consumer Discretionary Sector UCITS ETF $'000 Facebook Inc 86 0.22 Boston Scientific Corp 47 0.12 Hess Corp 30 0.08 Western Digital Corp 30 0.08 Time Warner Inc 28 0.07 Cognizant Technology Solutions Corp 28 0.07 Royal Dutch Shell Plc 28 0.07 Thermo Fisher Scientific Inc 26 0.07 Sumitomo Mitsui Financial Group Inc 24 0.06 Exxon Mobil Corp 22 0.06 Other issuers 1,100 2.81 Total 1,449 3.71
Issuer Value % of NAViShares S&P 500 Consumer Staples Sector UCITS ETF $'000Facebook Inc 10 0.18 Boston Scientific Corp 5 0.09 Hess Corp 3 0.05 Western Digital Corp 3 0.05 Time Warner Inc 3 0.05 Cognizant Technology Solutions Corp 3 0.05 Royal Dutch Shell Plc 3 0.05 Thermo Fisher Scientific Inc 3 0.05 Sumitomo Mitsui Financial Group Inc 3 0.05 Exxon Mobil Corp 2 0.03 Other issuers 125 2.18 Total 163 2.83
Issuer Value % of NAViShares S&P 500 Energy Sector UCITS ETF $'000Adobe Systems Inc 313 0.10 Toronto-Dominion Bank 262 0.08 Royal Bank Of Canada 249 0.08 Monsanto Co 240 0.07 Vodafone Group Plc 194 0.06 Sky Plc 179 0.05 Astrazeneca Plc 178 0.05 Alphabet Inc 170 0.05 Bce Inc 161 0.05 Rio Tinto Plc 157 0.05 Other issuers 7,406 2.26 Total 9,509 2.90
Issuer Value % of NAViShares S&P 500 EUR Hedged UCITS ETF (Acc) €'000Facebook Inc 2,430 0.08 Boston Scientific Corp 1,275 0.04 Royal Dutch Shell Plc 911 0.03 Time Warner Inc 909 0.03 Adobe Systems Inc 887 0.03 Hess Corp 834 0.03 Western Digital Corp 833 0.03 Cognizant Technology Solutions Corp 768 0.02 Worldpay Inc 755 0.02 Thermo Fisher Scientific Inc 707 0.02 Other issuers 53,478 1.66 Total 63,787 1.99

iSHARES V PLC
Supplementary information (unaudited) (continued)
i S H A R E S V P L C I N T E R I M R E P O R T [ 3 2 1 ]
Collateral (continued)
Issuer Value % of NAViShares S&P 500 Financials Sector UCITS ETF $'000 United Kingdom 1,979 0.10 French Republic 1,880 0.10 Facebook Inc 1,843 0.10 Republic of Germany 1,777 0.09 Wells Fargo & Co 1,283 0.07 Boston Scientific Corp 989 0.05 Banco Santander SA 951 0.05 Baidu Inc 829 0.04 Deutsche Boerse AG 729 0.04 Intesa Sanpaolo SpA 657 0.03 Other issuers 33,607 1.77 Total 46,524 2.44
Issuer Value % of NAViShares S&P 500 GBP Hedged UCITS ETF (Acc) £'000 Facebook Inc 584 0.21 Boston Scientific Corp 313 0.11 Hess Corp 205 0.07 Western Digital Corp 204 0.07 Time Warner Inc 197 0.07 Royal Dutch Shell Plc 196 0.07 Cognizant Technology Solutions Corp 188 0.07 Thermo Fisher Scientific Inc 173 0.06 Sumitomo Mitsui Financial Group Inc 170 0.06 Exxon Mobil Corp 149 0.05 Other issuers 8,724 3.13 Total 11,103 3.97
Issuer Value % of NAViShares S&P 500 Health Care Sector UCITS ETF $'000 Adobe Systems Inc 116 0.01 Toronto-Dominion Bank 97 0.01 Royal Bank of Canada 92 0.01 Monsanto Co 89 0.01 Vodafone Group Plc 72 0.01 Sky Plc 66 0.01 Astrazeneca Plc 65 0.01 Alphabet Inc 63 0.01 BCE Inc 60 0.01 Rio Tinto Plc 58 0.01 Other issuers 2,163 0.26 Total 2,941 0.36
Issuer Value % of NAViShares S&P 500 Industrials Sector UCITS ETF $'000Facebook Inc 14 0.16 Boston Scientific Corp 8 0.09 Hess Corp 5 0.06 Western Digital Corp 5 0.06 Time Warner Inc 5 0.06 Cognizant Technology Solutions Corp 5 0.06 Royal Dutch Shell Plc 5 0.06 Thermo Fisher Scientific Inc 4 0.05 Sumitomo Mitsui Financial Group Inc 4 0.05 Exxon Mobil Corp 4 0.05 Other issuers 177 2.10 Total 236 2.80
Issuer Value % of NAViShares S&P 500 Information Technology Sector UCITS ETF $'000Adobe Systems Inc 1,287 0.09 Toronto-Dominion Bank 1,080 0.08 Royal Bank of Canada 1,028 0.08 Monsanto Co 989 0.07 Vodafone Group Plc 802 0.06 Sky Plc 737 0.05 Astrazeneca Plc 728 0.05 Alphabet Inc 701 0.05 BCE Inc 663 0.05 Rio Tinto Plc 647 0.05 Other issuers 25,634 1.90 Total 34,296 2.53
Issuer Value % of NAViShares S&P 500 Materials Sector UCITS ETF $'000Facebook Inc 17 0.30 Boston Scientific Corp 9 0.16 Hess Corp 6 0.11 Western Digital Corp 6 0.11 Time Warner Inc 6 0.11 Cognizant Technology Solutions Corp 6 0.11 Royal Dutch Shell Plc 6 0.11 Thermo Fisher Scientific Inc 5 0.09 Sumitomo Mitsui Financial Group Inc 5 0.09 Exxon Mobil Corp 4 0.07 Other issuers 218 3.86 Total 288 5.12

iSHARES V PLC
Supplementary information (unaudited) (continued)
[ 3 2 2 ] i S H A R E S V P L C I N T E R I M R E P O R T
Collateral (continued)
Issuer Value % of NAViShares S&P 500 Utilities Sector UCITS ETF $'000 Facebook Inc 2 0.16 Boston Scientific Corp 1 0.08 Hess Corp 1 0.08 Western Digital Corp 1 0.08 Time Warner Inc 1 0.08 Cognizant Technology Solutions Corp 1 0.08 Royal Dutch Shell Plc 1 0.08 Thermo Fisher Scientific Inc 1 0.08 Sumitomo Mitsui Financial Group Inc 1 0.08 Exxon Mobil Corp 1 0.08 Other issuers 27 2.10 Total 38 2.98
Issuer Value % of NAViShares Spain Govt Bond UCITS ETF €'000Intuitive Surgical Inc 1,279 0.29 Eni SpA 656 0.15 Trend Micro Inc 509 0.12 Canon Inc 397 0.09 Banco Santander SA 396 0.09 Unicredit SpA 394 0.09 Softbank Group Corp 366 0.08 Ceconomy AG 335 0.08 Murata Manufacturing Co Ltd 292 0.07 Mitsubishi Corp 281 0.06 Other issuers 9,931 2.28 Total 14,836 3.40
No securities collateral received from a single issuer, in relation to efficient portfolio management and OTC financial derivative instruments, has exceeded 20% of any of the respective Funds’ NAV at the financial period end date. None of the Funds have been fully collateralised in securities issued or guaranteed by an EU member state at the financial period end date. Counterparties to securities lending transactions
Counterparty name Country of establishment Barclays Bank Plc United Kingdom
Barclays Capital Securities Ltd United Kingdom
BNP Paribas Arbitrage SNC France
BNP Paribas SA France
Citigroup Global Markets Ltd United Kingdom
Credit Suisse AG Dublin Branch Ireland
Credit Suisse Securities (Europe) Limited United Kingdom
Goldman Sachs International United States
HSBC Bank Plc United Kingdom
J.P. Morgan Securities Plc United Kingdom
Macquarie Bank Limited Australia
Merrill Lynch International United Kingdom
Morgan Stanley & Co. International Plc United Kingdom
Nomura International Plc United Kingdom
Skandinaviska Enskilda Banken AB Sweden
Societe Generale SA France
The Bank of Nova Scotia Canada
UBS AG Switzerland
iSHARES V PLC
Glossary* (unaudited)
i S H A R E S V P L C I N T E R I M R E P O R T [ 3 2 3 ]
Futures contracts A futures contract is a contract, traded on an exchange, to buy or sell a certain underlying instrument at a certain date in the future, at a specified price. They are entered into for the purposes of gaining exposure to or hedging against changes in interest rates, changes in the value of securities or foreign currencies. Depending on the terms of a particular contract, futures can be settled either through physical delivery of the underlying instrument or by payment of a cash amount on the settlement date. Upon entering into the contract the Fund is required to deposit initial margin with the broker in the form of cash or securities in an amount that varies depending on the contracts size and risk profile. During the life of the contract the Fund agrees to pay or receive an amount of cash equal to the daily fluctuation in the value of the contract known as variation margin. When the contract is closed, the Fund records a realised gain or loss equal to the difference between the value of the contract at the time it was open and the value at the time it was closed. Forward currency contracts A forward currency contract is an agreement between two parties to buy or sell a currency at a set exchange rate at a certain date in the future. The Fund enters into forward currency contracts as an economic hedge against transactions or financial instruments and to obtain exposure to foreign currencies. The unrealised gain or loss on open forward currency contracts is calculated by reference to the difference between the contracted rate and the rate to close out the contract as at the financial period end date. Realised gains or losses are recognised on the maturity of a contract as the difference between the rate that the contract was entered into and the closing spot rate at the settlement date of the contract. Redeemable participating shares The redeemable participating shares can be redeemed for cash equal to a proportionate share of the NAV calculated in accordance with the Company’s prospectus. The redeemable participating share is valued at the redemption amount that is payable at the condensed balance sheet date if the shareholder exercised their right to put the shares back to the Company. The fair value of the financial liabilities for the redeemable participating shares is the redemption amount per share, calculated as the NAV per share less any associated duties and charges and any redemption fee which is payable on the shares redeemed. Any potential duties and charges are at the discretion of the Board of Directors. Any distributions on these shares are recognised in the condensed income statement as finance costs. Transaction costs Transaction costs are incremental costs that are directly attributable to the acquisition, issue or disposal of a financial asset or financial liability. An incremental cost is one that would not have been incurred if the entity had not acquired, issued or disposed of the financial instrument. When a financial asset or financial liability is recognised initially, it is measured at its fair value through profit or loss, plus transaction costs that are directly attributable to the acquisition or issue of the financial asset or financial liability. Equalisation on Distributions Equalisation arrangements are applied in the case of shares in the Company. These arrangements are intended to ensure that the income distribution per share is not affected by changes in the number of shares in issue during the financial period. To ensure that each shareholder receives the same rate of distribution per share, the buying price of each share contains an amount called equalisation. This is equivalent to the net of distributable income less expenses, accrued in the Company at the time of purchase/sale. As part of the distribution payment, the average amount of this equalisation is returned to shareholders who subscribed to or redeemed from the Company during the financial period. The equalisation element of the distribution is treated as a repayment of capital. * The Glossary is an integral part of the notes to the financial statements.
iSHARES V PLC
Disclaimers (unaudited)
[ 3 2 4 ] i S H A R E S V P L C I N T E R I M R E P O R T
Regulatory Information BlackRock Advisors (UK) Limited, which is authorised and regulated by the Financial Conduct Authority ('FCA'), registered office at 12 Throgmorton Avenue, London, EC2N 2DL, England, Tel +44 (0)20 7743 3000. For your protection, calls are usually recorded. iShares plc, iShares II plc, iShares III plc, iShares IV plc, iShares V plc, iShares VI plc and iShares VII plc (together 'the Companies') are open-ended investment companies with variable capital having segregated liability between their funds organised under the laws of Ireland and authorised by the CBI. Further information about the Fund and the Share Class, such as details of the key underlying investments of the Share Class and share prices, is available on the iShares website at www.ishares.com or by calling +44 (0)845 357 7000 or from your broker or financial adviser. The indicative intra-day NAV of the Share Class is available at http://deutsche-boerse.com and/or http://www.reuters.com. A UCITS ETF’s units / shares that have been acquired on the secondary market cannot usually be sold directly back to the UCITS ETF itself. Investors who are not Authorised Participants must buy and sell shares on a secondary market with the assistance of an intermediary (e.g. a stockbroker) and may incur fees and additional taxes in doing so. In addition, as the market price at which the Shares are traded on the secondary market may differ from the Net Asset Value per Share, investors may pay more than the then current Net Asset Value per Share when buying shares and may receive less than the current Net Asset Value per Share when selling them. For investors in the UK Most of the protections provided by the UK regulatory system do not apply to the operation of the Companies, and compensation will not be available under the UK Financial Services Compensation Scheme on its default. The Companies are recognised schemes for the purposes of the Financial Services and Markets Act 2000. Any decision to invest must be based solely on the information contained in the Company’s Prospectus, Key Investor Information Document and the latest half-yearly report and unaudited accounts and/or annual report and audited accounts. Investors should read the fund specific risks in the Key Investor Information Document and the Company’s Prospectus. Restricted Investors This document is not, and under no circumstances is to be construed as an advertisement or any other step in furtherance of a public offering of shares in the United States or Canada. This document is not aimed at persons who are resident in the United States, Canada or any province or territory thereof, where the companies/securities are not authorised or registered for distribution and where no prospectus has been filed with any securities commission or regulatory authority. The companies/securities may not be acquired or owned by, or acquired with the assets of, an Employee Retirement Income Security Act Plan. Risk Warnings Investment in the products mentioned in this document may not be suitable for all investors. Past performance is not a reliable indicator of current or future results and should not be the sole factor of consideration when selecting a product or strategy. The price of the investments may go up or down and the investor may not get back the amount invested. Your income is not fixed and may fluctuate. The value of investments involving exposure to foreign currencies can be affected by exchange rate movements. We remind you that the levels and bases of, and reliefs from, taxation can change. BlackRock has not considered the suitability of this investment against your individual needs and risk tolerance. The data displayed provides summary information. Investment should be made on the basis of the relevant Prospectus which is available from the manager. In respect of the products mentioned this document is intended for information purposes only and does not constitute investment advice or an offer to sell or a solicitation of an offer to buy the securities described within. This document may not be distributed without authorisation from BlackRock Advisors (UK) Limited.
iSHA
Di IndeBlooand incluFundBlooCorp'BlooBondSpaithe iIndeTreaBarcor an S&PTradcertaJoneBlactheirregaJone "J.P.BlacUndeprovEMBMarkopin or anBlac The Blac(“S&licenby Ssuch © 20WITHand
ARES V PLC
isclaimeex Disclaimers omberg® is a traservice mark of
uding Barclays, od Advisors or itsomberg nor Barcporate Interest Romberg Barclayd Index', 'Bloomn Treasury BonShares ETFs orx', 'Bloomberg B
asury Bond Indeclays Italy Treasny data included
P® is a registeredemark Holdingsain purposes byes Emerging MakRock. The iSh
r respective affilarding the advisaes Indices LLC.
. Morgan" and "kRock Institutioerlying Index. J.ides financial, e
BISM Global Cokets Bond Indexion in the invest
iSny index on whickRock and any
Index is a produkRock. Standar
&P”); Dow Jonesnsed for use by SPDJI, Dow Jone
h product(s) nor
018 BlackRock, H MY MONEY aelsewhere. All o
ers (una
ademark and sef Barclays Bankown all propriet
s affiliates, and nclays guaranteeRate Hedged Ins Finland Treas
mberg Barclays Ind Index'. Neither to other third pBarclays Austriaex', 'Bloomberg sury Bond Indexd therein
ed trademark of s LLC (“Dow Joy BlackRock Funarkets Select Divhares ETF (the “iates, and noneability of investin
J.P. Morgan EMonal Trust Comp.P. Morgan is no
economic and inre Index, J.P. Mx Global Diversitment merits of
Shares funds ach such funds arelated funds.
uct of S&P Dowrd & Poor’s® ans® is a registereSPDJI and subles, S&P, their redo they have a
Inc. All Rights rand the stylizedother trademark
audited)
ervice mark of Bk Plc (collectivelytary rights in theneither Bloombe
es the timelinessdex', 'Bloomber
sury Bond IndexItaly Treasury Ber Bloomberg noparties in respeca Treasury BondBarclays France
x', 'Bloomberg B
Standard & Poones”) and have nd Advisors or itvidend Index ar“Funds”) are note of S&P Dow Jong in the Funds
MBISM Global Cpany, N.A. ("BTCot affiliated with
nvestment informMorgan Emergin
fied. Security adthe security.
re not sponsoreare based. The
w Jones Indices nd S&P® are reged trademark of licensed for certespective affilia
any liability for a
reserved. BLACd i logo are regisks are those of t
(continu
loomberg Finany with its affiliate
e Bloomberg Baerg nor Barclayss, accuratenessrg Barclays Ausx', 'Bloomberg BBond Index', 'Bloor Barclays shact of the use or ad Index', 'Bloome Treasury Bon
Barclays Netherl
or’s Financial Sbeen licensed f
ts affiliates (“Blare products of St sponsored, enones Indices LLs. BlackRock is n
Core Index" are C"). iShares® is the Fund, BFA
mation to the finng Markets Bonddditions and de
ed, endorsed, orProspectus con
LLC, a division gistered trademDow Jones Tratain purposes b
ates, and none ony errors, omiss
CKROCK, BLACstered and unreheir respective
ued)
nce L.P. (collectes, “Barclays”),
arclays Indices. ys approves, ends, or completenestria Treasury BoBarclays Franceoomberg Barclaall be liable in anaccuracy of the
mberg Barclays d Index', 'Bloomlands Treasury
ervices LLC (“Sfor use by S&P ackRock”). The
S&P Dow Jones ndorsed, sold orLC, Dow Jones, not affiliated wit
trademarks of Js a registered tra
A, State Street, tnancial commund Index Plus, J.letions into the
r promoted by Mntains a more de
of S&P Global,marks of Standarademark Holdingby BlackRock. Tof such parties msions, or interru
CKROCK SOLUegistered tradem
owners.
i S
tively with its affused under liceNeither Bloombdorses, reviewsess of any data ond Index', 'Bloo Treasury Bondys Netherlands ny way to the Bl 'Bloomberg BaBelgium Treasu
mberg Barclays Bond Index' and
S&P”) and “Dow Dow Jones IndDow Jones U.SIndices LLC or
r promoted by SS&P nor their r
th the companie
JPMorgan Chasademark of BTCthe Distributor onity. J.P. MorganP. Morgan Emeemerging marke
MSCI, and MSCetailed descripti
, or its affiliates rd & Poor’s Finags LLC (“Dow JThe iShares ETmake any repreptions of the Ind
TIONS, iSHAREmarks of BlackR
H A R E S V P L
filiates, “Bloombense. Bloombergberg nor Barclay, or recommendor information reomberg Barclay Index', 'BloombTreasury Bond ackRock Fund A
arclays EUR Corury Bond Index',Germany Treasd 'Bloomberg B
Jones®” is a reices LLC and its
S. Select Aerospits affiliates, an&P Dow Jones espective affilia
es listed above.
se & Co. licenseC.J.P. Morgan isor any of their ren calculates anderging Markets Bets bond indexe
CI bears no liabilon of the limited
(“SPDJI”) and hancial Services ones”); and theFs are not sponsentation regarddex.
ES, BUILD ON ock, Inc. or its s
L C I N T E R I M
berg”). Barclaysrg or Bloombergys are affiliated ds the iShares Erelating to 'Bloomys Belgium Treaberg Barclays G Index' and 'BloAdvisors or its arporate Interest, 'Bloomberg Basury Bond Index
Barclays Spain T
egistered trademts affiliates and pace & Defense
nd have been licIndices LLC, D
ates makes any Index data sou
ed for use for ces the Index Prov
espective affiliatd maintains the Bond Index Gloes do not in any
lity with respectd relationship th
has been licensLLC, a division ese trademarksnsored, endorseding the advisa
BLACKROCK, subsidiaries in th
R E P O R T [
® is a trademarg’s licensors, with BlackRockETFs. Neither mberg Barclaysasury Bond IndeGermany Treasuoomberg Barclayaffiliates, investt Rate Hedged arclays Finland x', 'Bloomberg Treasury Bond I
mark of Dow Jonsublicensed for
e Index and Dowcensed for use bow Jones, S&Prepresentation rce: S&P Dow
ertain purposes vider for the es. J.P. MorganJ.P. Morgan bal and Emergi
y way reflect an
to any such funhat MSCI has wi
ed for use by of S&P Global have been
ed, sold or prombility of investin
SO WHAT DO he United State
3 2 5 ]
rk
k
EUR ex', ury ys ors in
ndex'
nes
w by
P,
by
n
ng
nds ith
oted g in
I DO es

Want to +44 © 2018 BlackRINVESTING FOsubsidiaries in
o know (0)800 917
Rock, Inc. All RigOR A NEW WO the United Stat
more? 7 1770
ghts reserved. BORLD, and BUILtes and elsewhe
iSh
BLACKROCK, BLT FOR THESEere. All other tra
hares.com
BLACKROCK SE TIMES are regademarks are th
SOLUTIONS, iSgistered and unrhose of their res
HARES, SO Wregistered tradepective owners
WHAT DO I DO Wemarks of Blacks.
WITH MY MONERock, Inc. or its
EY, s