Reports and Financial Statements iShares Asia Trust
163
Reports and Financial Statements iShares Asia Trust • iShares Core MSCI China ETF • iShares FTSE China A50 ETF • iShares Core S&P BSE SENSEX India ETF • iShares Core MSCI Asia ex Japan ETF • iShares MSCI Emerging Asia ETF • iShares Core CSI 300 ETF • iShares Core MSCI Taiwan ETF • iShares NASDAQ 100 ETF • iShares Core Hang Seng Index ETF • iShares MSCI Emerging Markets ETF (HK) • iShares Hang Seng TECH ETF • iShares Core KOSPI 200 ETF (Sub-funds of iShares Asia Trust) For the year ended 31st December 2021 NM0522U-2194143-1/163
-
Upload
khangminh22 -
Category
Documents
-
view
1 -
download
0
Transcript of Reports and Financial Statements iShares Asia Trust

Reports and Financial Statements iShares Asia Trust• iShares Core MSCI China ETF
• iShares FTSE China A50 ETF
• iShares Core S&P BSE SENSEX India ETF
• iShares Core MSCI Asia ex Japan ETF
• iShares MSCI Emerging Asia ETF
• iShares Core CSI 300 ETF
• iShares Core MSCI Taiwan ETF
• iShares NASDAQ 100 ETF
• iShares Core Hang Seng Index ETF
• iShares MSCI Emerging Markets ETF (HK)
• iShares Hang Seng TECH ETF
• iShares Core KOSPI 200 ETF
(Sub-funds of iShares Asia Trust)
For the year ended 31st December 2021
NM0522U-2194143-1/163

Reports and Financial Statements 1
Contents
Report of the Manager to the Unitholders 3
Report of the Trustee to the Unitholders 5
Statement of Responsibilities of the Manager and the Trustee 6
Independent Auditor’s Report 7
Statement of Financial Position 11
Statement of Comprehensive Income 16
Statement of Changes in Net Assets Attributable to Unitholders 19
Statement of Cash Flows 22
Notes to the Financial Statements 27
iShares Core MSCI China ETF 71
– Investment Portfolio (unaudited)
– Details in Respect of Financial Derivative Instruments (unaudited)
– Information on Exposure Arising from Financial Derivative Instruments (unaudited)
– Statement of Movements in Investment Portfolio (unaudited)
– Performance Record (unaudited)
iShares FTSE China A50 ETF 81
– Investment Portfolio (unaudited)
– Statement of Movements in Investment Portfolio (unaudited)
– Performance Record (unaudited)
iShares Core S&P BSE SENSEX India ETF 84
– Investment Portfolio (unaudited)
– Information on Exposure Arising from Financial Derivative Instruments (unaudited)
– Statement of Movements in Investment Portfolio (unaudited)
– Performance Record (unaudited)
iShares Core MSCI Asia ex Japan ETF 88
– Investment Portfolio (unaudited)
– Details in Respect of Financial Derivative Instruments (unaudited)
– Information on Exposure Arising from Financial Derivative Instruments (unaudited)
– Statement of Movements in Investment Portfolio (unaudited)
– Performance Record (unaudited)
iShares MSCI Emerging Asia ETF 101
– Investment Portfolio (unaudited)
– Details in Respect of Financial Derivative Instruments (unaudited)
– Information on Exposure Arising from Financial Derivative Instruments (unaudited)
– Statement of Movements in Investment Portfolio (unaudited)
– Performance Record (unaudited)
iShares Core CSI 300 ETF 112
– Investment Portfolio (unaudited)
– Statement of Movements in Investment Portfolio (unaudited)
– Performance Record (unaudited)
NM0522U-2194143-2/163

2 iShares Asia Trust
iShares Core MSCI Taiwan ETF 117
– Investment Portfolio (unaudited)
– Details in Respect of Financial Derivative Instruments (unaudited)
– Information on Exposure Arising from Financial Derivative Instruments (unaudited)
– Statement of Movements in Investment Portfolio (unaudited)
– Performance Record (unaudited)
iShares NASDAQ 100 ETF 122
– Investment Portfolio (unaudited)
– Statement of Movements in Investment Portfolio (unaudited)
– Performance Record (unaudited)
iShares Core Hang Seng Index ETF 125
– Investment Portfolio (unaudited)
– Details in Respect of Financial Derivative Instruments (unaudited)
– Information on Exposure Arising from Financial Derivative Instruments (unaudited)
– Statement of Movements in Investment Portfolio (unaudited)
– Performance Record (unaudited)
iShares MSCI Emerging Markets ETF (HK) 130
– Investment Portfolio (unaudited)
– Investment Portfolio of iShares MSCI EM UCITS ETF USD (Dist) (unaudited)
– Details in Respect of Financial Derivative Instruments (unaudited)
– Information on Exposure Arising from Financial Derivative Instruments (unaudited)
– Statement of Movements in Investment Portfolio (unaudited)
– Performance Record (unaudited)
iShares Hang Seng TECH ETF 154
– Investment Portfolio (unaudited)
– Details in Respect of Financial Derivative Instruments (unaudited)
– Information on Exposure Arising from Financial Derivative Instruments (unaudited)
– Statement of Movements in Investment Portfolio (unaudited)
– Performance Record (unaudited)
iShares Core KOSPI 200 ETF 159
– Information on Exposure Arising from Financial Derivative Instruments (unaudited)
– Statement of Movements in Investment Portfolio (unaudited)
– Performance Record (unaudited)
Management and Administration 162
Contents (continued)
NM0522U-2194143-3/163

Reports and Financial Statements 3
Report of the Manager to the UnitholdersiShares Asia Trust
iShares Asia Trust (the “Trust”) is an umbrella unit trust governed by its Trust Deed dated 16th November 2001, as amended, (the “Trust Deed”) and authorized by the Securities and Futures Commission of Hong Kong (the “SFC”) pursuant to Section 104(1) of the Securities and Futures Ordinance.
iShares Core MSCI China ETFThe iShares Core MSCI China ETF (the “MSCI China ETF”), a sub-fund of the Trust, was launched on 23rd November 2001 and commenced trading under the stock code 2801 on the Stock Exchange of Hong Kong Limited (the “SEHK”) on 28th November 2001 and under stock code 9801 for the USD counter on 17th August 2021 on the SEHK. The MSCI China ETF is benchmarked against the MSCI China Index.
iShares FTSE China A50 ETFThe iShares FTSE China A50 ETF (the “China A50 ETF”), a sub-fund of the Trust, was launched on 15th November 2004 and commenced trading under the stock codes 2823 for the HKD counter on 18th November 2004 and 82823 for the RMB counter on 7th July 2017 on the SEHK. The China A50 ETF is benchmarked against the FTSE China A50 Index.
iShares Core S&P BSE SENSEX India ETFThe iShares Core S&P BSE SENSEX India ETF (the “SENSEX India ETF”), a sub-fund of the Trust, was launched on 31st October 2006 and commenced trading under the stock code 2836 for the HKD counter on 2nd November 2006, under the stock codes 9836 for the USD counter and 82836 for the RMB counter on 14th October 2016 on the SEHK. With effect from 24th August 2021, stock code 82836 for the RMB counter was terminated. The SENSEX India ETF is benchmarked against the S&P BSE SENSEX Index.
iShares Core MSCI Asia ex Japan ETFThe iShares Core MSCI Asia ex Japan ETF (the “MSCI Asia ex Japan ETF”), a sub-fund of the Trust, was launched on 12th March 2009 and commenced trading under the stock code 3010 for the HKD counter on 23rd April 2009, under the stock codes 9010 for the USD counter and 83010 for the RMB counter on 14th October 2016 on the SEHK. The MSCI Asia ex Japan ETF is benchmarked against the MSCI All Country Asia ex Japan Index.
iShares MSCI Emerging Asia ETFThe iShares MSCI Emerging Asia ETF (the “MSCI Emerging Asia ETF”), a sub-fund of the Trust, was launched on 12th March 2009 and commenced trading under the stock code 2802 on the SEHK on 23rd April 2009. The MSCI Emerging Asia ETF is benchmarked against the MSCI EM Asia Index.
iShares Core CSI 300 ETFThe iShares Core CSI 300 ETF (the “CSI 300 ETF”), a sub-fund of the Trust, was launched on 12th November 2009 and commenced trading under the stock code 2846 on 18th November 2009, under the stock codes 9846 for the USD counter and 82846 for RMB counter on the SEHK on 28th February 2017. The CSI 300 ETF is benchmarked against the CSI 300 Index.
iShares Core MSCI Taiwan ETFThe iShares Core MSCI Taiwan ETF (the “MSCI Taiwan ETF”), a sub-fund of the Trust, was launched on 22nd June 2016 and commenced trading under the stock codes 83074 for the RMB counter, 9074 for the USD counter and 3074 for the HKD counter on the SEHK on 29th June 2016. With effect from 24th August 2021, stock code 83074 for the RMB counter was terminated. The MSCI Taiwan ETF is benchmarked against the MSCI Taiwan 20/35 Index.
iShares NASDAQ 100 ETFThe iShares NASDAQ 100 ETF (the “NASDAQ 100 ETF”), a sub-fund of the Trust, was launched on 22nd June 2016 and commenced trading under the stock codes 82834 for the RMB counter, 9834 for the USD counter and 2834 for the HKD counter on the SEHK on 29th June 2016. With effect from 24th August 2021, stock code 82834 for the RMB counter was terminated. The NASDAQ 100 ETF is benchmarked against the NASDAQ 100 Index.
iShares Core Hang Seng Index ETFThe iShares Core Hang Seng Index ETF (the “Hang Seng ETF”), a sub-fund of the Trust, was launched on 18th November 2016 and commenced trading under the stock codes 83115 for the RMB counter, 9115 for the USD counter and 3115 for the HKD counter on the SEHK on 23rd November 2016. The Hang Seng ETF is benchmarked against the Hang Seng Index (net total return version).
iShares MSCI Emerging Markets ETF (HK)The iShares MSCI Emerging Markets ETF (HK) (the “MSCI Emerging Markets ETF (HK)”), a sub-fund of the Trust, was launched on 17th July 2020 and commenced trading under the stock codes 3022 for the HKD counter and 9022 for the USD counter on the SEHK on 22nd July 2020. The Emerging Markets ETF (HK) is benchmarked against the MSCI Emerging Markets Index.
iShares Hang Seng TECH ETFThe iShares Hang Seng TECH ETF (the “Hang Seng TECH ETF”), a sub-fund of the Trust, was launched on 14th September 2020 and commenced trading under the stock codes 9067 for the USD counter and 3067 for the HKD counter on the SEHK on 17th September 2020. The Hang Seng TECH ETF is benchmarked against the Hang Seng TECH Index (net total return version).
iShares Core KOSPI 200 ETF (This ETF has been terminated)The iShares Core KOSPI 200 ETF (the “KOSPI 200 ETF”), a sub-fund of the Trust, was launched on 22nd June 2016 and commenced trading under the stock codes 83170 for the RMB counter, 9170 for the USD counter and 3170 for the HKD counter on the SEHK on 29th June 2016. The KOSPI 200 ETF is benchmarked against the KOSPI 200 Capped 30% Net Total Return USD Index.
NM0522U-2194143-4/163

4 iShares Asia Trust
Taking into account the relevant factors, including in particular the relatively small Net Asset Value of the KOSPI 200 ETF, the Manager decided to exercise its power under the Trust Deed to terminate the KOSPI 200 ETF. Pursuant to the Announcement and Notice on 16th August 2021, the termination of the KOSPI 200 ETF and de-authorization of the KOSPI 200 ETF from the SFC became effective on 18th August 2021. The delisting of the KOSPI 200 ETF from the SEHK became effective on 18th August 2021.
Outbreak of COVID-19The infectious respiratory illness caused by a novel coronavirus known as COVID-19 has had a profound impact on all aspects of society in recent years. The impact of this significant event on the Fund’s financial risk exposure is disclosed in Note 12(a)(i).
The Manager has assessed the impact of market conditions arising from the COVID-19 outbreak on the Funds’ ability to meet their investment objectives. Based on the latest available information, the Funds continue to be managed in line with their investment objectives, with no disruption to the operations of the Funds and the publication of net asset values.
Report of the Manager to the UnitholdersiShares Asia Trust (continued)
NM0522U-2194143-5/163

Reports and Financial Statements 5
We hereby confirm that, in our opinion, the Manager of iShares Core MSCI China ETF, iShares FTSE China A50 ETF, iShares Core S&P BSE SENSEX India ETF, iShares Core MSCI Asia ex Japan ETF, iShares MSCI Emerging Asia ETF, iShares Core CSI 300 ETF, iShares Core MSCI Taiwan ETF, iShares NASDAQ 100 ETF, iShares Core Hang Seng Index ETF, iShares MSCI Emerging Markets ETF (HK) and iShares Hang Seng TECH ETF (the “Sub-Funds”) has, in all material respects, managed the Sub-Funds in accordance with the provisions of the Trust Deed dated 16th November 2001, as amended, for the year ended 31st December 2021 and has, in all material respects, managed the iShares Core KOSPI 200 ETF in accordance with the provisions of the Trust Deed dated 16th November 2001, as amended, for the period from 1st January 2021 to 18th August 2021 (date of delisting from the SEHK).
HSBC Institutional Trust Services (Asia) Limited26th April 2022
Report of the Trustee to the UnitholdersiShares Asia Trust
NM0522U-2194143-6/163

6 iShares Asia Trust
Manager’s ResponsibilitiesThe Manager of iShares Core MSCI China ETF, iShares FTSE China A50 ETF, iShares Core S&P BSE SENSEX India ETF, iShares Core MSCI Asia ex Japan ETF, iShares MSCI Emerging Asia ETF, iShares Core CSI 300 ETF, iShares Core MSCI Taiwan ETF, iShares NASDAQ 100 ETF, iShares Core Hang Seng Index ETF, iShares MSCI Emerging Markets ETF (HK), iShares Hang Seng TECH ETF and iShares Core KOSPI 200 ETF (the Sub-Funds of iShares Asia Trust) (the “Sub-Funds”) is required by the Code on Unit Trusts and Mutual Funds issued by the Securities and Futures Commission of Hong Kong and the Trust Deed dated 16th November 2001, as amended (the “Trust Deed”), to prepare financial statements for each annual accounting period which give a true and fair view of the financial position of the Sub-Funds at the end of that period and of the transactions for the period then ended. In preparing these financial statements the Manager is required to:
– select suitable accounting policies and then apply them consistently;
– make judgments and estimates that are prudent and reasonable; and
– prepare the financial statements on the basis that the Sub-Funds will continue in operation unless it is inappropriate to presume this.
The Manager is also required to manage the Sub-Funds in accordance with the Trust Deed and take reasonable steps for the prevention and detection of fraud and other irregularities in relation to the Sub-Funds.
iShares Asia Trust (the “Trust”) is an umbrella unit trust governed by its Trust Deed. As at 31st December 2021, the Trust has established thirteen sub-funds, namely iShares Core MSCI China ETF, iShares FTSE China A50 ETF, iShares Core S&P BSE SENSEX India ETF, iShares Core MSCI Asia ex Japan ETF, iShares MSCI Emerging Asia ETF, iShares Core CSI 300 ETF, iShares Core MSCI Taiwan ETF, iShares NASDAQ 100 ETF, iShares Core Hang Seng Index ETF, iShares MSCI Emerging Markets ETF (HK), iShares Hang Seng TECH ETF, iShares China Government Bond ETF and iShares Short Duration China Policy Bank Bond ETF. The financial information about the iShares China Government Bond ETF and iShares Short Duration China Policy Bank Bond ETF have not been included in this annual report but will be included in the semi-annual report for 2022.
Taking into account the relevant factors, including in particular the relatively small Net Asset Value of the iShares Core KOSPI 200 ETF, the Manager decided to exercise its power under the Trust Deed to terminate the iShares Core KOSPI 200 ETF. Pursuant to the Announcement and Notice on 16th August 2021, the termination of the iShares Core KOSPI 200 ETF and de-authorization of the iShares Core KOSPI 200 ETF from the SFC became effective on 18th August 2021. The delisting of
the KOSPI 200 ETF from the SEHK became effective on 18th August 2021.
Trustee’s ResponsibilitiesThe Trustee of the Sub-Funds is required to:
– ensure that the Sub-Funds in all material respects are managed in accordance with the Trust Deed and that the investment and borrowing powers are complied with;
– satisfy itself that sufficient accounting and other records have been maintained;
– safeguard the property of the Sub-Funds and rights attaching thereto; and
– report to the Unitholders for each annual accounting period should the Manager not managing the Sub-Funds in accordance of the Trust Deed.
Statement of Responsibilities of the Manager and the TrusteeiShares Asia Trust
NM0522U-2194143-7/163

Reports and Financial Statements 7
Independent Auditor’s ReportTo the Unitholders of iShares Core MSCI China ETF, iShares FTSE China A50 ETF, iShares Core S&P BSE SENSEX India ETF, iShares Core MSCI Asia ex Japan ETF, iShares MSCI Emerging Asia ETF, iShares Core CSI 300 ETF, iShares Core MSCI Taiwan ETF, iShares NASDAQ 100 ETF, iShares Core Hang Seng Index ETF, iShares MSCI Emerging Markets ETF (HK), iShares Hang Seng TECH ETF and iShares Core KOSPI 200 ETF
Report on the Audit of the Financial Statements
Opinion
What we have auditedThe financial statements of iShares Core MSCI China ETF, iShares FTSE China A50 ETF, iShares Core S&P BSE SENSEX India ETF, iShares Core MSCI Asia ex Japan ETF, iShares MSCI Emerging Asia ETF, iShares Core CSI 300 ETF, iShares Core MSCI Taiwan ETF, iShares NASDAQ 100 ETF, iShares Core Hang Seng Index ETF for the year ended 31st December 2021, iShares MSCI Emerging Markets ETF (HK) for the period from 17th July 2020 (date of inception) to 31st December 2021, iShares Hang Seng TECH ETF for the period from 14th September 2020 (date of inception) to 31st December 2021 and iShares Core KOSPI 200 ETF for the period from 1st January 2021 to 18th August 2021 (date of delisting from the SEHK) (“relevant periods”) (each a separate sub-fund of the iShares Asia Trust and referred to individually or collectively as the “Sub-Funds”) which are set out on pages 11 to 70, comprise:
• the Statement of financial position as at year/period ended;
• the Statement of comprehensive income for the relevant periods;
• the Statement of changes in net assets attributable to unitholders for the relevant periods;
• the Statement of cash flows for the relevant periods; and
• the notes to the financial statements, which include significant accounting policies and other explanatory information.
Our opinionIn our opinion, the financial statements give a true and fair view of the financial position of each of the Sub-Funds as at year/period end, and of each of their financial transactions and their cash flows for the year/period then ended in accordance with International Financial Reporting Standards (“IFRSs”).
Basis for Opinion We conducted our audit in accordance with International Standards on Auditing (“ISAs”). Our responsibilities under those standards are further described in the Auditor’s Responsibilities for the Audit of the Financial Statements section of our report.
We believe that the audit evidence we have obtained is sufficient and appropriate to provide a basis for our opinion.
IndependenceWe are independent of the Sub-Funds in accordance with the International Code of Ethics for Professional Accountants (including International Independence Standards) issued by the International Ethics Standards Board for Accountants (“IESBA Code”), and we have fulfilled our other ethical responsibilities in accordance with the IESBA Code.
Emphasis of Matter We draw your attention to Note 2 to the financial statements, which states that the Manager has decided to terminate the iShares Core KOSPI 200 ETF. As a result, the financial statements of the iShares Core KOSPI 200 ETF have not been prepared on a going concern basis of accounting, and are prepared in accordance with the basis set out in Note 2. Our opinion is not modified in respect of this matter.
Key Audit Matters Key audit matters are those matters that, in our professional judgement, were of most significance in our audit of the financial reports for the current period. These matters were addressed in the context of our audit of the financial reports, and in forming our opinion thereon, and we do not provide a separate opinion on these matters.
NM0522U-2194143-8/163

8 iShares Asia Trust
Independent Auditor’s ReportTo the Unitholders of iShares Core MSCI China ETF, iShares FTSE China A50 ETF, iShares Core S&P BSE SENSEX India ETF, iShares Core MSCI Asia ex Japan ETF, iShares MSCI Emerging Asia ETF, iShares Core CSI 300 ETF, iShares Core MSCI Taiwan ETF, iShares NASDAQ 100 ETF, iShares Core Hang Seng Index ETF, iShares MSCI Emerging Markets ETF (HK), iShares Hang Seng TECH ETF and iShares Core KOSPI 200 ETF (continued)
Key Audit Matter How our audit addressed the Key Audit Matter
Existence and valuation of investments
The investments held by each of the Sub-Funds as at 31st December 2021 mainly comprised of equities, including exchange traded funds, in their respective financial statements, which were valued as follows:
iShares Core MSCI China ETF Listed equities:HK$4,439,077,987
iShares FTSE China A50 ETF Listed equities:RMB15,326,796,292
iShares Core S&P BSE SENSEX India ETF
Listed equities:US$96,869,362
iShares Core MSCI Asia ex Japan ETF Listed equities:US$2,493,802,627
iShares MSCI Emerging Asia ETF Listed equities:HK$140,809,179
iShares Core CSI 300 ETF Listed equities:RMB361,389,951
iShares Core MSCI Taiwan ETF Listed equities:US$78,988,411
iShares NASDAQ 100 ETF Listed equities:US$48,833,008
iShares Core Hang Seng Index ETF Listed equities:HK$641,775,179
iShares MSCI Emerging Markets ETF (HK)
Listed equities:US$14,058,877
iShares Hang Seng TECH ETF Listed equities:HK$9,888,633,335
We focused on the existence and valuation of the investments because the investments represented the principal element of each of the Sub-Fund’s net asset value as at 31st December 2021. In addition, we also focused on the valuation of listed equities that have had their trading suspended as at 31st December 2021 because the judgements made by the Manager in determining their fair values involved a higher degree of subjectivity.
Refer to note 12 to the financial statements.
Our work included an assessment of the key controls of the trustee and its affiliates, as applicable, over the existence and valuation of the investments, which included the following:
1. We developed an understanding of the control objectives and related controls relevant to the Sub-Funds by obtaining the reports provided by the trustee setting out the controls in place at that trustee and its affiliates, as applicable, and that included an independent service auditor’s assurance report over the design and operating effectiveness of those controls.
2. We evaluated the tests undertaken by the service auditor and the results of the tests undertaken and the opinions formed by the service auditor on the design and operating effectiveness of the controls, to the extent relevant to our audit of the Sub-Funds.
We also performed the following tests:1. We tested the existence of investments by obtaining direct
confirmations from the Sub-Funds’ custodians and agreeing the Sub-Funds’ holdings of investments to those confirmations. No material exceptions were identified from our testing.
2. For the marketable listed equities held by each of the Sub-Funds, we agreed their valuations by comparing the pricing used by the Sub-Funds to external pricing sources as at 31st December 2021. No material exceptions were identified from our testing.
3. For any suspended listed equities held by the Sub-Funds, where material, we (i) obtained an understanding of how management have fair valued the investments, (ii) performed independent research on the company and industry, (iii) assessed the underlying assumptions and valuation inputs for each suspended stock valuation, and (iv) evaluated the reasonableness of the assumptions and inputs. No material exceptions were identified from our testing.
NM0522U-2194143-9/163

Reports and Financial Statements 9
Independent Auditor’s ReportTo the Unitholders of iShares Core MSCI China ETF, iShares FTSE China A50 ETF, iShares Core S&P BSE SENSEX India ETF, iShares Core MSCI Asia ex Japan ETF, iShares MSCI Emerging Asia ETF, iShares Core CSI 300 ETF, iShares Core MSCI Taiwan ETF, iShares NASDAQ 100 ETF, iShares Core Hang Seng Index ETF, iShares MSCI Emerging Markets ETF (HK), iShares Hang Seng TECH ETF and iShares Core KOSPI 200 ETF (continued)
Other InformationThe Manager and the Trustee (the “Management”) of the Sub-Funds are responsible for the other information. The other information comprises all of the information included in the annual report other than the financial statements and our auditor’s report thereon.
Our opinion on the financial statements of the Sub-Funds does not cover the other information and we do not express any form of assurance conclusion thereon.
In connection with our audit of the financial statements, our responsibility is to read the other information and, in doing so, consider whether the other information is materially inconsistent with the financial statements or our knowledge obtained in the audit or otherwise appears to be materially misstated.
If, based on the work we have performed, we conclude that there is a material misstatement of this other information, we are required to report that fact. We have nothing to report in this regard.
Responsibilities of Management for the Financial StatementsThe Management of the Sub-Funds is responsible for the preparation of the financial statements that give a true and fair view in accordance with IFRSs, and for such internal control as the Management determines is necessary to enable the preparation of financial statements that are free from material misstatement, whether due to fraud or error.
In preparing the financial statements, the Management of the Sub-Funds is responsible for assessing the Sub-Funds’ ability to continue as a going concern, disclosing, as applicable, matters related to going concern and using the going concern basis of accounting unless the Management either intends to liquidate the Sub-Funds or to cease operations, or has no realistic alternative but to do so.
In addition, the Management of the Sub-Funds is required to ensure that the financial statements have been properly prepared in accordance with the relevant disclosure provisions of the Trust Deed dated 16th November 2001, as amended (“Trust Deed”) and the relevant disclosure provisions of Appendix E of the Code on Unit Trusts and Mutual Funds issued by the Hong Kong Securities and Futures Commission (the “SFC Code”).
Auditor’s Responsibilities for the Audit of the Financial StatementsOur objectives are to obtain reasonable assurance about whether the financial statements as a whole are free from material misstatement, whether due to fraud or error, and to issue an auditor’s report that includes our opinion. We report our opinion solely to you, as a body, and for no other purpose. We do not assume responsibility towards or accept liability to any other person for the contents of this report. Reasonable
assurance is a high level of assurance, but is not a guarantee that an audit conducted in accordance with ISAs will always detect a material misstatement when it exists. Misstatements can arise from fraud or error and are considered material if, individually or in the aggregate, they could reasonably be expected to influence the economic decisions of users taken on the basis of these financial statements. In addition, we are required to assess whether the financial statements of the Sub-Funds have been properly prepared, in all material respects, in accordance with the relevant disclosure provisions of the Trust Deed and the relevant disclosure provisions of Appendix E of the SFC Code.
As part of an audit in accordance with ISAs, we exercise professional judgment and maintain professional scepticism throughout the audit. We also:
• Identify and assess the risks of material misstatement of the financial statements, whether due to fraud or error, design and perform audit procedures responsive to those risks, and obtain audit evidence that is sufficient and appropriate to provide a basis for our opinion. The risk of not detecting a material misstatement resulting from fraud is higher than for one resulting from error, as fraud may involve collusion, forgery, intentional omissions, misrepresentations, or the override of internal control.
• Obtain an understanding of internal control relevant to the audit in order to design audit procedures that are appropriate in the circumstances, but not for the purpose of expressing an opinion on the effectiveness of the Sub-Funds’ internal control.
• Evaluate the appropriateness of accounting policies used and the reasonableness of accounting estimates and related disclosures made by the Management.
• Conclude on the appropriateness of the Management’s use of the going concern basis of accounting and, based on the audit evidence obtained, whether a material uncertainty exists related to events or conditions that may cast significant doubt on the Sub-Funds’ ability to continue as a going concern. If we conclude that a material uncertainty exists, we are required to draw attention in our auditor’s report to the related disclosures in the financial statements or, if such disclosures are inadequate, to modify our opinion. Our conclusions are based on the audit evidence obtained up to the date of our auditor’s report. However, future events or conditions may cause the Sub-Funds to cease to continue as a going concern.
• Evaluate the overall presentation, structure and content of the financial statements, including the disclosures, and whether the financial statements represent the underlying transactions and events in a manner that achieves fair presentation.
NM0522U-2194143-10/163

10 iShares Asia Trust
Independent Auditor’s ReportTo the Unitholders of iShares Core MSCI China ETF, iShares FTSE China A50 ETF, iShares Core S&P BSE SENSEX India ETF, iShares Core MSCI Asia ex Japan ETF, iShares MSCI Emerging Asia ETF, iShares Core CSI 300 ETF, iShares Core MSCI Taiwan ETF, iShares NASDAQ 100 ETF, iShares Core Hang Seng Index ETF, iShares MSCI Emerging Markets ETF (HK), iShares Hang Seng TECH ETF and iShares Core KOSPI 200 ETF (continued)
We communicate with the Management regarding, among other matters, the planned scope and timing of the audit and significant audit findings, including any significant deficiencies in internal control that we identify during our audit.
We also provide the Management with a statement that we have complied with relevant ethical requirements regarding independence, and to communicate with them all relationships and other matters that may reasonably be thought to bear on our independence, and where applicable, actions taken to eliminate threats or safeguards applied.
From the matters communicated with the Management, we determine those matters that were of most significance in the audit of the financial statements of the current period and are therefore the key audit matters. We describe these matters in our auditor’s report unless law or regulation precludes public disclosure about the matter or when, in extremely rare circumstances, we determine that a matter should not be communicated in our report because the adverse consequences of doing so would reasonably be expected to outweigh the public interest benefits of such communication.
Report on matters under the relevant disclosure provisions of the Trust Deed and the relevant disclosure provisions of Appendix E of the SFC Code
In our opinion, the financial statements of the Sub-Funds have been properly prepared, in all material respects, in accordance with the relevant disclosure provisions of the Trust Deed and the relevant disclosure provisions of Appendix E of the SFC Code.
The engagement partner on the audit resulting in this independent auditor’s report is Paul John Walters.
PricewaterhouseCoopersCertified Public Accountants
Hong Kong, 26th April 2022
NM0522U-2194143-11/163

Reports and Financial Statements 11
Statement of Financial PositionAs at 31st December 2021
iShares Core MSCI China ETF iShares FTSE China A50 ETF
Note2021HK$
2020HK$
2021RMB
2020RMB
AssetsCurrent assetsFinancial assets at fair value through profit or loss 12(a) 4,439,077,993 5,284,220,822 15,326,796,292 16,189,341,117Dividends receivable 863,513 973,204 – –Interest receivable 3 19 – –Amounts due from brokers 12(b) – 4,610,625 – –Amounts due from unitholders for subscription 15,727,893 – – –Other accounts receivable 28,011,826 – – –Margin deposits 12(b) 1,638,256 705,058 – –Bank balances 8(d), 12(b) 11,823,242 10,246,641 11,233,594 26,412,775 Total assets 4,497,142,726 5,300,756,369 15,338,029,886 16,215,753,892 LiabilitiesCurrent liabilitiesFinancial liabilities at fair value through profit or loss 151,209 – – –Amounts due to brokers 14,456,692 – – –Amounts due to unitholders for repayment of subscription – – – 4,263,419Margin deposits 8(e), 12(b) – – 67 459,322Management fee payable 8(c) 766,306 872,453 4,515,495 12,907,948Other accounts payable 28,007,327 – – – Total liabilities 43,381,534 872,453 4,515,562 17,630,689 Net assets attributable to unitholders 4,453,761,192 5,299,883,916 15,333,514,324 16,198,123,203
Approved by the Trustee and the Manager on 26th April 2022.
HSBC Institutional Trust Services (Asia) Limited as Trustee of the Trust.
BlackRock Asset Management North Asia Limited as Manager of the Trust.
The accompanying notes form part of these financial statements.
NM0522U-2194143-12/163

12 iShares Asia Trust
Statement of Financial Position (continued)
As at 31st December 2021
iShares Core S&P BSE SENSEX India ETF iShares Core MSCI Asia ex Japan ETF
Note2021
US$2020
US$2021
US$2020
US$
AssetsCurrent assetsFinancial assets at fair value through profit or loss 12(a) 96,869,362 93,069,773 2,493,945,193 2,126,596,843Dividends receivable 27,774 – 3,681,676 3,454,054Interest receivable – – – 2Amounts due from brokers 12(b) 2,665,089 – – 701,124Other accounts receivable 671 – 19,147,004 38Margin deposits 12(b) – – 598,967 47,160Current tax recoverable 7 – – 138,384 129,819Bank balances 8(d), 12(b) 679,261 3,894 8,757,806 5,525,618 Total assets 100,242,157 93,073,667 2,526,269,030 2,136,454,658 LiabilitiesCurrent liabilitiesBank overdraft 8(f) 626,678 – – –Amounts due to unitholders for redemption 2,667,246 – – –Margin deposits 8(e), 12(b) 15 – – –Management fee payable 8(c) – 26,948 589,101 487,884Other accounts payable 37,065 – 19,143,577 –
3,331,004 26,948 19,732,678 487,884 Non-current liabilitiesDeferred tax liabilities 7 113,645 – 8,835,230 3,849,085 Total liabilities 3,444,649 26,948 28,567,908 4,336,969 Net assets attributable to unitholders 96,797,508 93,046,719 2,497,701,122 2,132,117,689
Approved by the Trustee and the Manager on 26th April 2022.
HSBC Institutional Trust Services (Asia) Limited as Trustee of the Trust.
BlackRock Asset Management North Asia Limited as Manager of the Trust.
The accompanying notes form part of these financial statements.
NM0522U-2194143-13/163

Reports and Financial Statements 13
Statement of Financial Position (continued)
As at 31st December 2021
iShares MSCI Emerging Asia ETF iShares Core CSI 300 ETF
Note2021HK$
2020HK$
2021RMB
2020RMB
AssetsCurrent assetsFinancial assets at fair value through profit or loss 12(a) 140,812,469 260,970,998 361,389,951 245,141,704Dividends receivable 203,996 452,623 – –Other accounts receivable 12(b) 318,696 – – –Margin deposits 12(b) 150 – – –Bank balances 8(d), 12(b) 83,805 152,878 480,190 143,614 Total assets 141,419,116 261,576,499 361,870,141 245,285,318 LiabilitiesCurrent liabilitiesMargin deposit 3 – – –Management fee payable 8(c) 58,095 110,363 117,074 77,450Other accounts payable 318,696 1 – – Total liabilities 376,794 110,364 117,074 77,450 Net assets attributable to unitholders 141,042,322 261,466,135 361,753,067 245,207,868
Approved by the Trustee and the Manager on 26th April 2022.
HSBC Institutional Trust Services (Asia) Limited as Trustee of the Trust.
BlackRock Asset Management North Asia Limited as Manager of the Trust.
The accompanying notes form part of these financial statements.
NM0522U-2194143-14/163

14 iShares Asia Trust
Statement of Financial Position (continued)
As at 31st December 2021
iShares Core MSCI Taiwan ETF iShares NASDAQ 100 ETF
Note2021
US$2020
US$2021
US$2020
US$
AssetsCurrent assetsFinancial assets at fair value through profit or loss 12(a) 78,989,151 79,521,640 48,833,008 36,009,739Dividends receivable 86,322 92,840 8,057 6,246Margin deposits 12(b) 7,954 1,868 – –Bank balances 8(d), 12(b) 104,856 45,081 811,477 7,329 Total assets 79,188,283 79,661,429 49,652,542 36,023,314 LiabilitiesCurrent liabilitiesAmounts due to brokers – – 791,570 –Amounts due to unitholders for repayment of subscription – – 2,000 –Management fee payable 8(c) 19,827 19,564 11,285 8,374 Total liabilities 19,827 19,564 804,855 8,374 Net assets attributable to unitholders 79,168,456 79,641,865 48,847,687 36,014,940
iShares Core Hang Seng Index ETF
iShares MSCI Emerging Markets
ETF (HK)iShares Hang Seng
TECH ETF
Note2021HK$
2020HK$
2021US$
2021HK$
AssetsCurrent assetsFinancial assets at fair value through profit or loss 12(a) 641,799,799 253,658,145 14,058,998 9,889,224,535Interest receivable – – – 1Amounts due from unitholder – – – 10,291,050Dividends receivable 52,756 – – –Margin deposits 8(e), 12(b) 305,080 19,901 3,529 2,748,700Bank balances 8(d), 12(b) 3,201,389 295,688 61,678 22,145,067 Total assets 645,359,024 253,973,734 14,124,205 9,924,409,353 LiabilitiesCurrent liabilitiesAmounts due to brokers – – – 10,266,213Management fee payable 8(c) 49,407 18,826 – 2,091,167 Total liabilities 49,407 18,826 – 12,357,380 Net assets attributable to unitholders 645,309,617 253,954,908 14,124,205 9,912,051,973
Approved by the Trustee and the Manager on 26th April 2022.
HSBC Institutional Trust Services (Asia) Limited as Trustee of the Trust.
BlackRock Asset Management North Asia Limited as Manager of the Trust.
The accompanying notes form part of these financial statements.
NM0522U-2194143-15/163

Reports and Financial Statements 15
iShares Core KOSPI 200 ETF
Note
18.08.2021 (date of delisting
from the SEHK)US$
31.12.2020US$
AssetsCurrent assetsFinancial assets at fair value through profit or loss 12(a) – 6,351,672Dividends receivable – 51,861Bank balances 8(d), 12(b) – 5,035 Total assets – 6,408,568 LiabilitiesCurrent liabilitiesManagement fee payable 8(c) – 1,536 Total liabilities – 1,536 Net assets attributable to unitholders – 6,407,032
Approved by the Trustee and the Manager on 26th April 2022.
HSBC Institutional Trust Services (Asia) Limited as Trustee of the Trust.
BlackRock Asset Management North Asia Limited as Manager of the Trust.
The accompanying notes form part of these financial statements.
Statement of Financial Position (continued)
As at 18th August 2021 (date of delisting from the SEHK)
NM0522U-2194143-16/163

16 iShares Asia Trust
Statement of Comprehensive IncomeFor the year ended 31st December 2021
iShares Core MSCI China ETF iShares FTSE China A50 ETF
Note2021HK$
2020HK$
2021RMB
2020RMB
IncomeDividend income 75,019,362 84,178,881 320,663,137 505,701,609Bank interest income 8(d) 7,599 28,783 289,935 441,569Net gain/(loss) on financial assets at fair value through
profit or loss 5 (1,153,825,010) 785,579,750 (1,788,409,230) 3,502,164,153Net foreign currency gain/(loss) (60,397) (227) (88,918) (16,763) Total net income/(loss) (1,078,858,446) 869,787,187 (1,467,545,076) 4,008,290,568 ExpensesManagement fee 8(c) (9,859,124) (10,474,708) (74,754,947) (172,507,308)Transaction costs on financial assets at fair value through
profit or loss 6, 8(j) (5,771,736) (11,564,701) (10,075,916) (27,303,903) Total operating expenses (15,630,860) (22,039,409) (84,830,863) (199,811,211) Operating profit/(loss) (1,094,489,306) 847,747,778 (1,552,375,939) 3,808,479,357Finance costsInterest expense 8(f) (1,028) (2,203) (435,128) – Profit/(loss) before taxation (1,094,490,334) 847,745,575 (1,552,811,067) 3,808,479,357Taxation 7 (4,947,179) (6,059,492) (32,219,792) (50,722,759) Total comprehensive income/(loss) (1,099,437,513) 841,686,083 (1,585,030,859) 3,757,756,598
iShares Core S&P BSE SENSEX India ETF iShares Core MSCI Asia ex Japan ETF
Note2021
US$2020
US$2021
US$2020
US$
IncomeDividend income 35,896 – 49,103,457 16,849,821Bank interest income 8(d) 1 33 10,321 1,204Net gain/(loss) on financial assets at fair value through
profit or loss 5 17,245,361 8,090,241 (183,618,668) 281,034,542Net foreign currency gain/(loss) 81,184 – (572,082) (1,644,394) Total net income/(loss) 17,362,442 8,090,274 (135,076,972) 296,241,173 ExpensesManagement fee 8(c) (343,955) (268,560) (6,784,496) (2,065,033)Transaction costs on financial assets at fair value through
profit or loss 6, 8(j) (153,180) – (2,253,963) (2,470,835) Total operating expenses (497,135) (268,560) (9,038,459) (4,535,868) Operating profit/(loss) 16,865,307 7,821,714 (144,115,431) 291,705,305Finance costsInterest expense 8(f) – – (927) (123) Profit/(loss) before taxation 16,865,307 7,821,714 (144,116,358) 291,705,182Taxation 7 (122,232) – (14,319,747) (6,077,505) Total comprehensive income/(loss) 16,743,075 7,821,714 (158,436,105) 285,627,677
The accompanying notes form part of these financial statements.
NM0522U-2194143-17/163

Reports and Financial Statements 17
Statement of Comprehensive Income (continued)
For the year ended 31st December 2021
iShares MSCI Emerging Asia ETF iShares Core CSI 300 ETF
Note2021HK$
2020HK$
2021RMB
2020RMB
IncomeDividend income 3,899,423 4,165,745 4,692,075 4,734,714Bank interest income 8(d) 126 114 14,211 4,164Net gain/(loss) on financial assets at fair value through
profit or loss 5 (13,235,888) 59,252,745 (16,057,584) 57,164,262Net foreign currency loss (178,215) (107,343) (8) (22)Other income – – 22,320 – Total net income/(loss) (9,514,554) 63,311,261 (11,328,986) 61,903,118 ExpensesManagement fee 8(c) (1,086,433) (1,069,242) (1,171,533) (857,458)Transaction costs on financial assets at fair value through
profit or loss 6, 8(j) (325,535) (220,515) (595,135) (201,622) Total operating expenses (1,411,968) (1,289,757) (1,766,668) (1,059,080) Operating profit/(loss) (10,926,522) 62,021,504 (13,095,654) 60,844,038Finance costsInterest expense 8(f) (18) – (27,651) – Profit/(loss) before taxation (10,926,540) 62,021,504 (13,123,305) 60,844,038Taxation 7 (525,257) (556,646) (472,465) (475,588) Total comprehensive income/(loss) (11,451,797) 61,464,858 (13,595,770) 60,368,450
iShares Core MSCI Taiwan ETF iShares NASDAQ 100 ETF
Note2021
US$2020
US$2021
US$2020
US$
IncomeDividend income 2,122,017 2,110,948 289,687 238,036Bank interest income 8(d) 2 312 – 5Net gain/(loss) on financial assets at fair value through
profit or loss 5 18,706,898 21,212,704 9,999,230 12,895,997Net foreign currency gain/(loss) (1,951) (10,943) – 1Other income – 1,300 – – Total net income/(loss) 20,826,966 23,314,321 10,288,917 13,134,039 ExpensesManagement fee 8(c) (240,725) (180,412) (117,317) (75,240)Transaction costs on financial assets at fair value through
profit or loss 6 (103,253) (120,894) (372) (1,296) Total operating expenses (343,978) (301,306) (117,689) (76,536) Operating profit/(loss) 20,482,988 23,013,015 10,171,228 13,057,503Finance costsInterest expense (84) (10) – – Profit/(loss) before taxation 20,482,904 23,013,005 10,171,228 13,057,503Taxation 7 (450,334) (463,165) (86,213) (70,860) Total comprehensive income/(loss) 20,032,570 22,549,840 10,085,015 12,986,643
The accompanying notes form part of these financial statements.
NM0522U-2194143-18/163

18 iShares Asia Trust
iShares Core Hang Seng Index ETF
iShares MSCI Emerging
Markets ETF (HK)iShares Hang Seng
TECH ETF
Note2021HK$
2020HK$
17.07.2020(date of inception)
to 31.12.2021US$
14.09.2020(date of inception)
to 31.12.2021HK$
IncomeDividend income 12,771,297 7,153,248 467,207 30,411,408Bank interest income 8(d) 80 36 – 409Net gain/(loss) on financial assets at fair value through
profit or loss 5 (123,463,902) (10,436,626) 2,502,146 (3,348,207,874)Net foreign currency gain/(loss) 508 (45) – 5,277 Total net income/(loss) (110,692,017) (3,283,387) 2,969,353 (3,317,790,780) ExpensesManagement fee 8(c) (443,223) (211,244) – (21,585,758)Transaction costs on financial assets at fair value through
profit or loss 6, 8(j) (438,223) (173,575) (2,367) (14,006,211) Total operating expenses (881,446) (384,819) (2,367) (35,591,969) Operating profit/(loss) (111,573,463) (3,668,206) – –Finance costsInterest expense (650) (177) – – Profit/(loss) before taxation (111,574,113) (3,668,383) 2,966,986 (3,353,382,749)Taxation 7 (693,938) (389,976) – (443,205) Total comprehensive income/(loss) (112,268,051) (4,058,359) 2,966,986 (3,353,825,954)
iShares Core KOSPI 200 ETF
Note
01.01.2021to 18.08.2021
(date of delistingfrom the SEHK)
US$
01.01.2020to 31.12.2020
US$
IncomeDividend income 58,061 93,687Bank interest income 8(d) 2 3Net gain on financial assets at fair value through profit or loss 5 405,123 1,870,143Net foreign currency loss (2,361) (2,428) Total net income 460,825 1,961,405 ExpensesManagement fee 8(c) (13,036) (13,699)Transaction costs on financial assets at fair value through profit or loss 6 (27,808) (3,535) Total operating expenses (40,844) (17,234) Profit before taxation 419,981 1,944,171Taxation 7 (12,475) (20,416) Total comprehensive income 407,506 1,923,755
The accompanying notes form part of these financial statements.
Statement of Comprehensive Income (continued)
For the year/period ended 31st December 2021/18th August 2021 (date of delisting from the SEHK)
NM0522U-2194143-19/163

Reports and Financial Statements 19
Statement of Changes in Net Assets Attributable to UnitholdersFor the year ended 31st December 2021
iShares Core MSCI China ETF iShares FTSE China A50 ETF
Note2021HK$
2020HK$
2021RMB
2020RMB
Net assets attributable to unitholders at 1st January 5,299,883,916 6,042,343,120 16,198,123,203 20,515,230,063 Proceeds on issue of units 4, 9
– in-kind – 98,852,644 – –– cash component and cash subscription 2,008,439,589 5,168,787,426 2,940,226,926 3,160,179,839
Payments on redemption of units 4, 9– in-kind – (103,343,975) – –– cash component and cash redemption (1,696,643,294) (6,679,441,980) (2,008,964,946) (10,978,543,297)
Distributions to unitholders 13 (58,481,506) (68,999,402) (210,840,000) (256,500,000)
253,314,789 (1,584,145,287) 720,421,980 (8,074,863,458) Total comprehensive income/(loss) for the year (1,099,437,513) 841,686,083 (1,585,030,859) 3,757,756,598 Net assets attributable to unitholders at 31st December 4,453,761,192 5,299,883,916 15,333,514,324 16,198,123,203
The movements of the redeemable units are as follows:
2021Number of units
2020Number of units
2021Number of units
2020Number of units
Units in issue at the beginning of the year 154,198,699 223,198,699 958,000,000 1,488,000,000Issue of units 63,300,000 187,200,000 182,000,000 246,000,000Redemption of units (50,400,000) (256,200,000) (118,000,000) (776,000,000) Units in issue at the end of the year 167,098,699 154,198,699 1,022,000,000 958,000,000
iShares Core S&P BSE SENSEX India ETF iShares Core MSCI Asia ex Japan ETF
Note2021
US$2020
US$2021
US$2020
US$
Net assets attributable to unitholders at 1st January 93,046,719 109,951,125 2,132,117,689 381,952,492 Proceeds on issue of units 4, 9
– cash component and cash subscription – 981,160 1,078,234,609 2,011,839,203Payments on redemption of units 4, 9
– cash component and cash redemption (12,992,286) (25,707,280) (513,592,671) (534,564,883)Distributions to unitholders 13 – – (40,622,400) (12,736,800)
(12,992,286) (24,726,120) 524,019,538 1,464,537,520 Total comprehensive income/(loss) for the year 16,743,075 7,821,714 (158,436,105) 285,627,677 Net assets attributable to unitholders at 31st December 96,797,508 93,046,719 2,497,701,122 2,132,117,689
The movements of the redeemable units are as follows:
2021Number of units
2020Number of units
2021Number of units
2020Number of units
Units in issue at the beginning of the year 24,600,000 32,600,000 250,720,000 55,280,000Issue of units – 400,000 123,040,000 273,680,000Redemption of units (3,000,000) (8,400,000) (58,560,000) (78,240,000) Units in issue at the end of the year 21,600,000 24,600,000 315,200,000 250,720,000
The accompanying notes form part of these financial statements.
NM0522U-2194143-20/163

20 iShares Asia Trust
Statement of Changes in Net Assets Attributable to Unitholders (continued)
For the year ended 31st December 2021
iShares MSCI Emerging Asia ETF iShares Core CSI 300 ETF
Note2021HK$
2020HK$
2021RMB
2020RMB
Net assets attributable to unitholders at 1st January 261,466,135 208,918,347 245,207,868 205,678,867 Proceeds on issue of units 4, 9
– cash component and cash subscription 44,693,938 73,627,593 314,834,489 50,236,143Payments on redemption of units 4, 9
– cash component and cash redemption (151,267,954) (79,732,663) (181,656,020) (68,053,092)Distributions to unitholders 13 (2,398,000) (2,812,000) (3,037,500) (3,022,500) (108,972,016) (8,917,070) 130,140,969 (20,839,449) Total comprehensive income/(loss) for the year (11,451,797) 61,464,858 (13,595,770) 60,368,450 Net assets attributable to unitholders at 31st December 141,042,322 261,466,135 361,753,067 245,207,868
The movements of the redeemable units are as follows:
2021Number of units
2020Number of units
2021Number of units
2020Number of units
Units in issue at the beginning of the year 3,800,000 3,800,000 7,250,000 7,750,000Issue of units 600,000 1,400,000 9,250,000 1,750,000Redemption of units (2,200,000) (1,400,000) (5,250,000) (2,250,000) Units in issue at the end of the year 2,200,000 3,800,000 11,250,000 7,250,000
iShares Core MSCI Taiwan ETF iShares NASDAQ 100 ETF
Note2021
US$2020
US$2021
US$2020
US$
Net assets attributable to unitholders at 1st January 79,641,865 64,571,473 36,014,940 13,011,070 Proceeds on issue of units 4, 9
– cash component and cash subscription – 19,680,438 2,747,732 14,378,913Payments on redemption of units 4, 9
– cash component and cash redemption (19,067,779) (25,671,886) – (4,361,686)Distributions to unitholders 13 (1,438,200) (1,488,000) – – (20,505,979) (7,479,448) 2,747,732 10,017,227 Total comprehensive income/(loss) for the year 20,032,570 22,549,840 10,085,015 12,986,643 Net assets attributable to unitholders at 31st December 79,168,456 79,641,865 48,847,687 36,014,940
The movements of the redeemable units are as follows:
2021Number of units
2020Number of units
2021Number of units
2020Number of units
Units in issue at the beginning of the year 3,720,000 4,020,000 1,160,000 620,000Issue of units – 1,340,000 80,000 720,000Redemption of units (780,000) (1,640,000) – (180,000) Units in issue at the end of the year 2,940,000 3,720,000 1,240,000 1,160,000
The accompanying notes form part of these financial statements.
NM0522U-2194143-21/163

Reports and Financial Statements 21
iShares Core Hang Seng Index ETF
iShares MSCI Emerging
Markets ETF (HK)iShares Hang Seng
TECH ETF
Note2021HK$
2020HK$
17.07.2020(date of inception)
to 31.12.2021US$
14.09.2020(date of inception)
to 31.12.2021HK$
Net assets attributable to unitholders at 1st January/ date of inception 253,954,908 298,026,766 – –
Proceeds on issue of units 4, 9
– in-kind 487,609,129 12,964,181 – 11,201,738,723– cash component and cash subscription 27,271,631 1,000,069 13,864,627 2,803,680,965
Payments on redemption of units 4, 9– in-kind – (26,118,523) – (730,736,901)– cash component and cash redemption – (21,326,226) (2,354,708) (8,804,860)
Distributions to unitholders 13 (11,258,000) (6,533,000) (352,700) – 503,622,760 (40,013,499) 11,157,219 13,265,877,927 Total comprehensive income/(loss) for the year (112,268,051) (4,058,359) 2,966,986 (3,353,825,954) Net assets attributable to unitholders at 31st December 645,309,617 253,954,908 14,124,205 9,912,051,973
The movements of the redeemable units are as follows:
2021Number of units
2020Number of units
17.07.2020(date of inception)
to 31.12.2021Number of units
14.09.2020(date of inception)
to 31.12.2021Number of units
Units in issue at the beginning of the year/period 2,600,000 2,950,000 – –Issue of units 5,100,000 150,000 230,000 890,400,000Redemption of units – (500,000) (30,000) (53,400,000) Units in issue at the end of the year/period 7,700,000 2,600,000 200,000 837,000,000
iShares Core KOSPI 200 ETF
Note
01.01.2021to 18.08.2021
(date of delistingfrom the SEHK)
US$
01.01.2020to 31.12.2020
US$
Net assets attributable to unitholders at 1st January 6,407,032 5,324,970 Proceeds on issue of units 4, 9
– cash component and cash subscription 3,422,185 –Payments on redemption of units 4, 9
– cash component and cash redemption (3,461,343) (773,293)Distributions to unitholders 13 (6,775,380) (68,400) (6,814,538) (841,693) Total comprehensive income for the period/year 407,506 1,923,755 Net assets attributable to unitholders at 18th August 2021 (date of delisting from SEHK) – 6,407,032
The movements of the redeemable units are as follows:
01.01.2021to 18.08.2021
(date of delistingfrom the SEHK)
Number of units
01.01.2020to 31.12.2020
Number of units
Units in issue at the beginning of the period/year 360,000 420,000Issue of units 180,000 –Redemption of units (180,000) (60,000)Redemption of units through final distribution (360,000) – Units in issue at the end of the period/year – 360,000
The accompanying notes form part of these financial statements.
Statement of Changes in Net Assets Attributable to Unitholders (continued)
For the year/period ended 31st December 2021/18th August 2021 (date of delisting from the SEHK)
NM0522U-2194143-22/163

22 iShares Asia Trust
Statement of Cash FlowsFor the year ended 31st December 2021
iShares Core MSCI China ETF iShares FTSE China A50 ETF
Note2021HK$
2020HK$
2021RMB
2020RMB
Operating activitiesPayments for purchase of financial assets at fair value
through profit or loss (3,361,415,548) (5,817,422,694) (5,422,733,135) (6,193,373,094)Proceeds from sale of financial assets at fair value through
profit or loss 3,071,891,496 7,339,164,460 4,496,779,812 14,023,464,087Dividends received 75,129,053 83,756,870 320,663,137 505,701,609Bank interest received 7,615 28,835 289,935 441,569Management fee paid (9,965,271) (10,610,041) (83,147,400) (176,685,074)Taxation paid (4,947,179) (6,059,492) (32,219,792) (50,722,759)Transaction costs paid (5,771,736) (11,564,701) (10,075,916) (27,303,903)Other fees paid (4,499) – – –Margin deposits received/(paid) (933,198) (367,349) (459,255) 459,322 Net cash generated from/(used in) operating activities (236,009,267) 1,576,925,888 (730,902,614) 8,081,981,757 Financing activitiesInterest paid (1,028) (2,203) (435,128) –Cash component and cash subscription received on issue
of units 9 1,992,711,696 5,168,787,426 2,935,963,507 3,164,443,258Cash component and cash redemption paid on
redemption of units 9 (1,696,643,294) (6,679,441,980) (2,008,964,946) (10,978,543,297)Final distribution paid 13 (58,481,506) (68,999,402) (210,840,000) (256,500,000) Net cash generated from/(used in) financing activities 237,585,868 (1,579,656,159) 715,723,433 (8,070,600,039) Net increase/(decrease) in cash and cash equivalents 1,576,601 (2,730,271) (15,179,181) 11,381,718 Cash and cash equivalents at the beginning of the year 10,246,641 12,976,912 26,412,775 15,031,057 Cash and cash equivalents at the end of the year 11,823,242 10,246,641 11,233,594 26,412,775 Analysis of balances of cash and cash equivalentsBank balances 8(d) 11,823,242 10,246,641 11,233,594 26,412,775
The accompanying notes form part of these financial statements.
NM0522U-2194143-23/163

Reports and Financial Statements 23
Statement of Cash Flows (continued)
For the year ended 31st December 2021
iShares Core S&P BSE SENSEX India ETF iShares Core MSCI Asia ex Japan ETF
Note2021
US$2020
US$2021
US$2020
US$
Operating activitiesPayments for purchase of financial assets at fair value
through profit or loss (98,252,982) (981,449) (1,501,206,147) (2,123,340,434)Proceeds from sale of financial assets at fair value through
profit or loss 109,114,849 25,939,998 950,368,171 656,847,835Dividends received 8,122 – 48,875,835 14,141,235Bank interest received 1 33 10,323 1,205Management fee paid (333,838) (276,757) (6,683,279) (1,672,374)Taxation paid (8,587) – (9,342,167) (2,752,258)Transaction costs paid (153,180) – (2,253,963) (2,470,835)Other fees refunded/(paid) (671) – (3,389) 578Margin deposits received/(paid) 15 – (551,807) (47,160) Net cash generated from/(used in) operating activities 10,373,729 24,681,825 (520,786,423) (1,459,292,208) Financing activitiesInterest paid – – (927) (123)Cash component and cash subscription received on issue
of units 9 – 981,160 1,078,234,609 2,011,839,203Cash component and cash redemption paid on
redemption of units 9 (10,325,040) (25,707,280) (513,592,671) (534,564,883)Final distribution paid 13 – – (40,622,400) (12,736,800) Net cash generated from/(used in) financing activities (10,325,040) (24,726,120) 524,018,611 1,464,537,397 Net increase/(decrease) in cash and cash equivalents 48,689 (44,295) 3,232,188 5,245,189 Cash and cash equivalents at the beginning of the year 3,894 48,189 5,525,618 280,429 Cash and cash equivalents at the end of the year 52,583 3,894 8,757,806 5,525,618 Analysis of balances of cash and cash equivalentsBank balances 8(d) 679,261 3,894 8,757,806 5,525,618Bank overdraft 8(f) (626,678) – – –
52,583 3,894 8,757,806 5,525,618
NM0522U-2194143-24/163

24 iShares Asia Trust
Statement of Cash Flows (continued)
For the year ended 31st December 2021
iShares MSCI Emerging Asia ETF iShares Core CSI 300 ETF
Note2021HK$
2020HK$
2021RMB
2020RMB
Operating activitiesPayments for purchase of financial assets at fair value
through profit or loss (81,165,764) (125,351,769) (383,098,568) (85,529,749)Proceeds from sale of financial assets at fair value through
profit or loss 187,910,190 131,794,855 250,792,729 103,190,990Dividends received 4,148,050 4,158,324 4,692,075 4,734,714Bank interest received 126 114 14,211 4,165Other income received – – 22,320 –Management fee paid (1,138,701) (1,051,300) (1,131,909) (846,817)Taxation paid (525,257) (556,646) (472,465) (475,588)Transaction costs paid (325,535) (220,515) (595,135) (201,622)Other fees refunded/(paid) (1) (3) – –Margin deposits paid (147) – – – Net cash generated from/(used in) operating activities 108,902,961 8,773,060 (129,776,742) 20,876,093 Financing activitiesInterest paid (18) – (27,651) –Cash component and cash subscription received on issue
of units 9 44,693,938 73,627,593 314,834,489 50,236,143Cash component and cash redemption paid on
redemption of units 9 (151,267,954) (79,732,663) (181,656,020) (68,053,092)Final distribution paid 13 (2,398,000) (2,812,000) (3,037,500) (3,022,500) Net cash generated from/(used in) financing activities (108,972,034) (8,917,070) 130,113,318 (20,839,449) Net increase/(decrease) in cash and cash equivalents (69,073) (144,010) 336,576 36,644 Cash and cash equivalents at the beginning of the year 152,878 296,888 143,614 106,970 Cash and cash equivalents at the end of the year 83,805 152,878 480,190 143,614 Analysis of balances of cash and cash equivalentsBank balances 8(d) 83,805 152,878 480,190 143,614
The accompanying notes form part of these financial statements.
NM0522U-2194143-25/163

Reports and Financial Statements 25
Statement of Cash Flows (continued)
For the year ended 31st December 2021
iShares Core MSCI Taiwan ETF iShares NASDAQ 100 ETF
Note2021
US$2020
US$2021
US$2020
US$
Operating activitiesPayments for purchase of financial assets at fair value
through profit or loss (14,992,371) (32,988,447) (5,454,529) (17,434,624)Proceeds from sale of financial assets at fair value through
profit or loss 34,229,807 39,103,532 3,422,060 7,328,870Dividends received 2,128,535 2,147,022 287,876 235,330Bank interest received 2 312 – 5Other income received – 1,300 – –Management fee paid (240,462) (177,762) (114,406) (69,988)Taxation paid (450,334) (463,165) (86,213) (70,860)Transaction costs paid (103,253) (120,894) (372) (1,296)Margin deposit received/(paid) (6,086) (1,868) – – Net cash generated from/(used in) operating activities 20,565,838 7,500,030 (1,945,584) (10,012,563) Financing activitiesInterest paid (84) (10) – –Cash component and cash subscription received on issue
of units 9 – 19,680,438 2,749,732 14,378,913Cash component and cash redemption paid on
redemption of units 9 (19,067,779) (25,671,886) – (4,361,686)Interim and final distribution paid 13 (1,438,200) (1,488,000) – – Net cash generated from/(used in) financing activities (20,506,063) (7,479,458) 2,749,732 10,017,227 Net increase/(decrease) in cash and cash equivalents 59,775 20,572 804,148 4,664 Cash and cash equivalents at the beginning of the year 45,081 24,509 7,329 2,665 Cash and cash equivalents at the end of the year 104,856 45,081 811,477 7,329 Analysis of balances of cash and cash equivalentsBank balances 8(d) 104,856 45,081 811,477 7,329
The accompanying notes form part of these financial statements.
NM0522U-2194143-26/163

26 iShares Asia Trust
iShares Core Hang Seng Index ETF
iShares MSCI Emerging
Markets ETF (HK)iShares Hang Seng
TECH ETF
Note2021
US$2020
US$
17.07.2020(date of inception)
to 31.12.2021US$
14.09.2020(date of inception)
to 31.12.2021HK$
Operating activitiesPayments for purchase of financial assets at fair value
through profit or loss (155,103,831) (69,064,975) (14,277,833) (6,646,443,117)Proceeds from sale of financial assets at fair value through
profit or loss 131,107,912 88,919,967 2,720,981 3,890,284,020Dividends received 12,718,541 7,153,248 467,207 30,411,408Bank interest received 80 36 – 408Management fee paid (412,642) (215,693) – (19,494,591)Taxation paid (693,938) (389,976) – (443,205)Transaction costs paid (438,223) (173,575) (2,367) (14,006,211)Margin deposit received/(paid) (285,179) 32,609 (3,529) (2,748,700) Net cash generated from/(used in) operating activities (13,107,280) 26,261,641 (11,095,541) (2,762,439,988) Financing activitiesInterest paid (650) (177) – –Cash component and cash subscription received on issue
of units 9 27,271,631 1,000,069 13,864,627 2,793,389,915Cash component and cash redemption paid on
redemption of units 9 – (21,326,226) (2,354,708) (8,804,860)Interim and final distribution paid 13 (11,258,000) (6,533,000) (352,700) – Net cash generated from/(used in) financing activities 16,012,981 (26,859,334) 11,157,219 2,784,585,055 Net increase/(decrease) in cash and cash equivalents 2,905,701 (597,693) 61,678 22,145,067 Cash and cash equivalents at the beginning of the year/
period 295,688 893,381 – – Cash and cash equivalents at the end of the year/period 3,201,389 295,688 61,678 22,145,067 Analysis of balances of cash and cash equivalentsBank balances 8(d) 3,201,389 295,688 61,678 22,145,067
iShares Core KOSPI 200 ETF
Note
01.01.2021to 18.08.2021
(date of delistingfrom the SEHK)
US$
01.01.2020to 31.12.2020
US$
Operating activitiesPayments for purchase of financial assets at fair value through profit or loss (3,606,809) (457,861)Proceeds from sale of financial assets at fair value through profit or loss 10,361,243 1,237,583Dividends received 109,922 101,222Bank interest received 2 3Management fee paid (14,572) (13,519)Taxation paid (12,475) (20,416)Transaction costs paid (27,808) (3,535) Net cash generated from operating activities 6,809,503 843,477 Financing activitiesCash component and cash subscription received on issue of units 9 3,422,185 –Cash component and cash redemption paid on redemption of units 9 (3,461,343) (773,293)Final distribution paid 13 (6,775,380) (68,400) Net cash used in financing activities (6,814,538) (841,693) Net (decrease)/increase in cash and cash equivalents (5,035) 1,784 Cash and cash equivalents at the beginning of the period/year 5,035 3,251 Cash and cash equivalents at the end of the period/year – 5,035 Analysis of balances of cash and cash equivalentsBank balances 8(d) – 5,035
The accompanying notes form part of these financial statements.
Statement of Cash Flows (continued)
For the year/period ended 31st December 2021/18th August 2021 (date of delisting from the SEHK)
NM0522U-2194143-27/163

Reports and Financial Statements 27
Notes to the Financial Statements
1 The TrustiShares Asia Trust (the “Trust”) is an umbrella unit trust governed by its Trust Deed dated 16th November 2001, as amended, (the “Trust Deed”) and authorized by the Securities and Futures Commission of Hong Kong (the “SFC”) pursuant to Section 104(1) of the Securities and Futures Ordinance.
As at 31st December 2021, the Trust has established thirteen sub-funds which are authorized by the SFC:
Name of Sub-Fund
Listing date on The Stock Exchange of Hong Kong Limited (The “SEHK”)
iShares Core MSCI China ETF 28th November 2001 for HKD counter
17th August 2021 for USD counter
iShares FTSE China A50 ETF 18th November 2004 for HKD counter
7th July 2017 for RMB counter
iShares Core S&P BSE SENSEX India ETF
2nd November 2006 for HKD counter
14th October 2016 for USD and RMB counters1
iShares Core MSCI Asia ex Japan ETF 23rd April 2009 for HKD counter
14th October 2016 for USD and RMB counters
iShares MSCI Emerging Asia ETF 23rd April 2009 for HKD counter
iShares Core CSI 300 ETF 18th November 2009 for HKD counter
28th February 2017 for USD and RMB counters
iShares Core MSCI Taiwan ETF 29th June 2016 for HKD, USD and RMB counters1
iShares NASDAQ 100 ETF 29th June 2016 for HKD, USD and RMB counters1
iShares Core Hang Seng Index ETF 23rd November 2016 for HKD, USD and RMB counters
1 The RMB counter for the Sub-Funds were terminated with effect from 24th August 2021.2 This Sub-Fund was delisted from the SEHK and deauthorized by the SFC with effect from
18th August 2021.
Name of Sub-Fund
Listing date on The Stock Exchange of Hong Kong Limited (The “SEHK”)
iShares MSCI Emerging Markets ETF (HK)
22nd July 2020 for HKD and USD counters
iShares Hang Seng TECH ETF 17th September 2020 for HKD and USD counters
iShares Core KOSPI 200 ETF2 29th June 2016 for HKD, USD and RMB counters
iShares China Government Bond ETF 21st October 2021 for HKD, USD and RMB counters
iShares Short Duration China Policy Bank Bond ETF
21st October 2021 for HKD, USD and RMB counters
These financial statements relate to the first twelve sub-funds (each a separate sub-fund of the Trust and referred to individually or collectively as the “Sub-Funds”). The first financial reporting period for the iShares China Government Bond ETF and iShares Short Duration China Policy Bank Bond ETF will be for the period from the launch date up to and including 31st December 2022.
The manager of the Trust is BlackRock Asset Management North Asia Limited (the “Manager”) and the trustee is HSBC Institutional Trust Services (Asia) Limited (the “Trustee”).
iShares Core MSCI China ETF (“MSCI China ETF”)The objective of the MSCI China ETF is to provide investment results that, before fees and expenses, closely correspond to the performance of the MSCI China Index. The MSCI China Index is designed to track the equity market performance of (i) Chinese securities (including H-Shares, Red Chips and P Chips) listed on the SEHK (ii) B-shares of Chinese securities listed on the Shanghai Stock Exchange and Shenzhen Stock Exchange (and effective from 1st June 2018, China A-shares via Stock Connect) and (iii) companies traded outside the country of classification (i.e. foreign listed companies) including those traded by way of depositary receipts.
iShares FTSE China A50 ETF (“China A50 ETF”)The objective of the China A50 ETF is to provide investment results that, before fees and expenses, closely correspond to the performance of the FTSE China A50 Index. The FTSE China A50 Index comprises the 50 (2020: 50) largest companies by full market capitalization of the FTSE China A All-Cap Free Index.
NM0522U-2194143-28/163

28 iShares Asia Trust
Notes to the Financial Statements (continued)
Until 2nd August 2013, the China A50 ETF did not hold A-Shares directly but rather gained access to the FTSE China A50 Index through China A-Share Access Products (“CAAPs”). Since 2nd August 2013, the China A50 ETF invests in A-Shares directly in addition to CAAPs. A CAAP represents only an obligation of each CAAP Issuer (“CAAP Issuer”) to provide the economic performance equivalent to holding the underlying A-Shares or A-Share index.
On 1st December 2017, the Manager announced that the China A50 ETF had completed its transition from a “synthetic representative” strategy to a “physical representative” strategy under which its holdings in A-Shares and Physical A-Share ETFs (for cash management and contingency purposes) in aggregate comprise 90% or more of its Net Asset Value on an ongoing basis, and that the Manager had applied to the SFC for, and has been granted, approval to remove the authorization condition imposed on the China A50 ETF by the SFC on 29th August 2011 whereby the Manager was (i) required to collateralize all counterparty exposures with a view to ensuring that the collateral held by the China A50 ETF must represent at least 100% of the China A50 ETF’s gross total counterparty exposure and (ii) where the China A50 ETF accepted collateral in the nature of equity securities, the China A50 ETF had to obtain collateral that has a market value of at least 120%, and for not-equity collateral, the Manager was required to adopt a prudent haircut policy (“SFC Collateral Condition”). The removal of the SFC Collateral Condition took effect from 1st January 2018.
iShares Core S&P BSE SENSEX India ETF (“SENSEX India ETF”)The objective of the SENSEX India ETF is to provide investment results that, before fees and expenses, closely correspond to the performance of the S&P BSE SENSEX Index. The S&P BSE SENSEX Index comprises the 30 (2020: 30) largest and most actively traded stocks, representative of various sectors, on BSE Limited.
Until 14th December 2021, the iShares BSE SENSEX Mauritius Company, a wholly-owned subsidiary of the SENSEX India ETF was incorporated in Mauritius (the “Mauritius Subsidiary”), to hold Indian securities and India Access Products (“IAPs”) on behalf of the SENSEX India ETF.
The Mauritius Subsidiary was a private company with limited liability by shares incorporated in Mauritius. The Mauritius Subsidiary was a wholly owned subsidiary of SENSEX India ETF. SENSEX India ETF and its Mauritius Subsidiary operated as an integrated structure whereby SENSEX India ETF invested solely into the Mauritius Subsidiary by subscribing all of the Mauritius Subsidiary’s participating shares. The Mauritius subsidiary is not authorized by the SFC under Section 104 of the Securities and Futures Ordinance in Hong Kong and is not available for direct investment by Hong Kong residents.
On 5th November 2021, the Manager announced that the investment strategy of the SENSEX India ETF would be changed such that it will invest substantially all of its assets directly in India-listed securities as a Foreign Portfolio Investor registered with the Securities and Exchange Board of India. The Mauritius Subsidiary would be removed from the investment strategy of the SENSEX India ETF. On 14th December 2021, the Manager announced that the change of investment strategy commenced on 8th December 2021 and has been completed.
For the years ended 31st December 2021 and 2020, the SENSEX India ETF did not hold any IAPs.
iShares Core MSCI Asia ex Japan ETF (“MSCI Asia ex Japan ETF”)The objective of the MSCI Asia ex Japan ETF is to provide investment results that, before fees and expenses, closely correspond to the performance of the MSCI All Country Asia ex Japan Index. The MSCI All Country Asia ex Japan Index consists of large and mid-cap stocks across two Developed Markets (Hong Kong and Singapore) and nine Emerging Markets countries in Asia.
iShares MSCI Emerging Asia ETF (“MSCI Emerging Asia ETF”)The objective of the MSCI Emerging Asia ETF is to provide investment results that, before fees and expenses, closely correspond to the performance of the MSCI EM Asia Index. The MSCI Emerging Asia ETF is designed to track the equity market performance of emerging countries in Asia.
iShares Core CSI 300 ETF (“CSI 300 ETF”)The objective of the CSI 300 ETF is to provide investment results that, before fees and expenses, closely correspond to the performance of the CSI 300 Index. The CSI 300 Index is a diversified index consisting of 300 (2020: 300) constituent stocks traded on the Shanghai and Shenzhen stock exchanges.
Until 21st November 2016, the CSI 300 ETF did not hold A-Shares directly but rather gained access to the CSI 300 Index through investing in a combination of the iShares CSI Sector Index Funds and CAAPs or solely in CAAPs. Since 21st November 2016, the CSI 300 ETF primarily invests in A-Shares directly.
On 17th February 2017, the Manager announced that the CSI 300 ETF had completed its transition from a “synthetic representative” strategy to a “physical representative” strategy under which its holding in A-Shares and Physical A-Share ETFs (for cash management and contingency purposes) in aggregate comprise 90% or more of its Net Asset Value on an ongoing basis. As at 31st December 2021 and 2020, the CSI 300 ETF solely invested in directly held A-Shares.
NM0522U-2194143-29/163

Reports and Financial Statements 29
Notes to the Financial Statements (continued)
iShares Core MSCI Taiwan ETF (“MSCI Taiwan ETF”)The objective of the MSCI Taiwan ETF is to provide investment results that, before fees and expenses, closely correspond to the performance of the MSCI Taiwan 20/35 Index. The MSCI Taiwan 20/35 Index is a free float-adjusted market capitalization-weighted index covering approximately 85% of the Taiwan investable equity universe on a net total return basis with dividends net of tax reinvested, subject to a global minimum size requirement. It is calculated and maintained by MSCI Inc.
iShares NASDAQ 100 ETF (“NASDAQ 100 ETF”)The objective of the NASDAQ 100 ETF is to provide investment results that, before fees and expenses, closely correspond to the performance of the NASDAQ 100 Index. The NASDAQ 100 Index is a modified market capitalization-weighted index. It includes 100 (2020: 100) of the largest US and international non-financial companies listed on the NASDAQ Stock Market LLC (“NASDAQ”) based on market capitalization.
iShares Core Hang Seng Index ETF (“Hang Seng ETF”)The objective of the Hang Seng ETF is to provide investment results that, before fees and expenses, closely correspond to performance of the Hang Seng Index (net total return version) (“HSI Net Total Return Index”). The HSI Net Total Return Index measures the performance of the largest and most liquid companies listed on the main board of the SEHK.
iShares MSCI Emerging Markets ETF (HK) (“MSCI Emerging Markets ETF (HK)”)The objective of the MSCI Emerging Markets ETF (HK) is to provide investment results that, before fees and expenses, closely correspond to the performance of the MSCI Emerging Markets Index. The MSCI Emerging Markets Index is designed to represent the performance of large and mid-cap securities in emerging markets, and covers approximately 85% of the free float-adjusted market capitalization in each emerging markets country.
The MSCI Emerging Markets ETF (HK) is a feeder fund and seeks to achieve its investment objective by investing substantially (at least 90% of its net asset value) into iShares MSCI EM UCITS ETF USD (Dist) (the “Master ETF”). The Master ETF is not authorized by the SFC under Section 104 of the Securities and Futures Ordinance in Hong Kong and is not available for direct investment by retail investors in Hong Kong on the SEHK.
iShares Hang Seng TECH ETF (“Hang Seng TECH ETF”)The objective of the Hang Seng TECH ETF is to provide investment results that, before fees and expenses, closely correspond to the performance of the Hang Seng TECH Index (net total return version). The Hang Seng TECH Index is a free float adjusted market capitalization weighted index the objective of which is to represent the 30 largest technology companies listed in Hong Kong which have high business exposure to selected technology themes, including internet
(including mobile), fintech, cloud, e-commerce, or digital activities.
iShares Core KOSPI 200 ETF (“KOSPI 200 ETF”)The objective of the KOSPI 200 ETF was to provide investment results that, before fees and expenses, closely correspond to the performance of the KOSPI 200 Capped 30% Net Total Return USD Index. The KOSPI 200 Capped 30% Net Total Return USD Index is a free float-adjusted market capitalization-weighted index based on 200 (31st December 2020: 200) blue chip companies listed on the Korea stock market, which are selected on the basis of such factors as their market and sector representation and liquidity.
Taking into account the relevant factors, including in particular the relatively small Net Asset Value of the KOSPI 200 ETF, the Manager decided to exercise its power under the Trust Deed to terminate the KOSPI 200 ETF. Pursuant to the Announcement and Notice on 16th August 2021, the termination of the KOSPI 200 ETF and de-authorization of the KOSPI 200 ETF from the SFC became effective on 18th August 2021. The delisting of the KOSPI 200 ETF from the SEHK became effective on 18th August 2021.
iShares China Government Bond ETF (“CGB ETF”)The objective of the CGB ETF is to provide investment results that, before fees and expenses, closely correspond to the performance of the FTSE Chinese Government Bond Index. The FTSE Chinese Government Bond Index is a market capitalization-weighted index and comprises RMB-denominated fixed-rate government bonds issued in mainland China. The composition of the FTSE Chinese Government Bond Index excludes zero-coupon bonds, saving bonds, special government bonds, bonds with maturity greater than 30 years from issuance, and bonds issued prior to 1st January 2005.
iShares Short Duration China Policy Bank Bond ETF (“Policy Bank Bond ETF”)The objective of the Policy Bank Bond ETF is to provide investment results that, before fees and expenses, closely correspond to the performance of the FTSE Chinese Policy Bank Bond 6 Months-3 Years Index. The FTSE Chinese Policy Bank Bond 6 Months-3 Years Index is a market capitalization-weighted index and comprises fixed-rate and zero coupon policy bank bonds issued by the China Development Bank, the Agricultural Development Bank of China, and the Export-Import Bank of China in mainland China with a remaining term to final maturity of 6 months to 3 years. The eligible Chinese policy banks are state-owned and their objectives typically include providing social benefit, stimulating the economy, and supporting growing local industries. The composition of the FTSE Chinese Policy Bank Bond 6 Months-3 Years Index excludes central bank bills, private placements, callable and puttable bonds, and bonds issued prior to 1st January 2005.
NM0522U-2194143-30/163

30 iShares Asia Trust
Notes to the Financial Statements (continued)
2 Summary of Significant Accounting Policies
The principal accounting policies applied in the preparation of these financial statements are set out below. These policies have been consistently applied to all the years presented, unless otherwise stated.
(a) Basis of preparation
The financial statements of the Sub-Funds have been prepared in accordance with International Financial Reporting Standard (“IFRS”). The financial statements have been prepared under the historical cost convention, as modified by the revaluation of financial assets and liabilities (including derivative financial instruments) at fair value through profit or loss.
As referred to Note 1, the Manager has decided to terminate the KOSPI 200 ETF. As a result, the financial statements of the KOSPI 200 ETF for the period from 1st January 2021 to 18th August 2021 (date of delisting from the SEHK) have not been prepared on a going concern basis. The Trustee and the Manager have assessed that the values of all assets and liabilities of the KOSPI 200 ETF at the reporting date approximate their net realizable value, and therefore no changes to accounting policies or adjustments have been made in the financial statements of the KOSPI 200 ETF in order to reflect the fact that it will be able to realize its assets or to extinguish its liabilities in the normal course of business.
The preparation of financial statements in conformity with IFRS requires the use of certain critical accounting estimates. It also requires the Manager and the Trustee (collectively, the “Management”) to exercise their judgment in the process of applying the Sub-Funds’ accounting policies. The areas involving a higher degree of judgment or complexity, or areas where assumptions and estimates are significant to the financial statements are disclosed in note 3.
The SENSEX India ETF meets the definition of an investment entity as defined by IFRS 10 and is required to account for the investment in its subsidiary, the Mauritius Subsidiary, (up until 14th December 2021) at fair value through profit or loss. As such, the consolidated financial statements have not been prepared by the SENSEX India ETF. The financial statements of the SENSEX India ETF are the only financial statements presented by the SENSEX India ETF. Please refer to note 2(b) for details.
Standards and amendments to existing standards effective 1st January 2021There are no standards, amendments to standards or interpretations that are effective for annual periods beginning on 1st January 2021 that have a material effect on the financial statements of the Sub-Funds.
New standards, amendments and interpretations effective after 1st January 2021 and have not been early adoptedA number of new standards, amendments to standards and interpretations are effective for annual periods beginning after 1st January 2021, and have not been early adopted in preparing these financial statements. None of these are expected to have a material effect on the financial statements of the Sub-Funds.
(b) Investment entity
The SENSEX India ETF has multiple unrelated investors and indirectly holds multiple investments through the Mauritius Subsidiary (up until 14th December 2021). Ownership interests in the SENSEX India ETF are in the form of redeemable units which are classified as equity in accordance with IAS 32 and which are exposed to variable returns from changes in the fair value of the SENSEX India ETF’s net assets. The SENSEX India ETF has been deemed to meet the definition of an investment entity per IFRS 10 as the following conditions exist:
(i) The SENSEX India ETF has obtained funds for the purpose of providing investors with investment management services.
(ii) The SENSEX India ETF’s business purpose, which was communicated directly to investors, is investing solely for returns from capital appreciation and investment income, through the Mauritius Subsidiary (up until 14th December 2021). The Mauritius Subsidiary is set up to hold Indian securities and IAPs on behalf of the SENSEX India ETF (up until 14th December 2021).
(iii) The performance of investments made through the Mauritius Subsidiary (up until 14th December 2021) is measured and evaluated on a fair value basis.
Although (up until 14th December 2021) the SENSEX India ETF does not meet all of the typical characteristics of an investment entity (namely, the SENSEX India ETF does not have multiple investments), Management believes it is nevertheless an investment entity because it was formed in conjunction with the Mauritius Subsidiary and effects multiple investments through the Mauritius Subsidiary (up until 14th December 2021).
As such, consolidated financial statements have not been prepared by the SENSEX India ETF. In these non-consolidated financial statements, the SENSEX India ETF’s investment in its subsidiary is accounted for at fair value through profit or loss.
Movement in the fair value of the Mauritius Subsidiary’s portfolio and corresponding movements in the fair value of the Mauritius Subsidiary may expose the SENSEX India ETF to a loss.
NM0522U-2194143-31/163

Reports and Financial Statements 31
Notes to the Financial Statements (continued)
(c) Investments
(i) Classification
(I) Assets
The Sub-Funds classify their investments based on both the Sub-Funds’ business model for managing those financial assets and the contractual cash flow characteristics of the financial assets. The portfolio of financial assets is managed and performance is evaluated on a fair value basis. The Sub-Funds have not taken the option to irrevocably designate any equity securities as fair value through other comprehensive income. Investments are classified as financial assets at fair value through profit or loss.
Derivative contracts that have a positive fair value are presented as assets at fair value through profit or loss.
(II) Liabilities
Derivative contracts that have a negative fair value are presented as liabilities at fair value through profit or loss.
As such, the Sub-Funds classify all of its investment portfolio as financial assets or liabilities at fair value through profit or loss.
The Sub-Funds’ policy require the Manager to evaluate the information about these financial assets and liabilities on a fair value basis together with other related financial information.
(ii) Recognition/derecognition
Purchases and sales of investments are accounted for on the trade date basis – the date on which the Sub-Funds commit to purchase or sell the investment. Investments are derecognized when the rights to receive cash flows from the investments have expired or the Sub-Funds have transferred substantially all risks and rewards of ownership.
(iii) Measurement
Investments are initially recognized at fair value. Transaction costs are expensed as incurred in the Statement of Comprehensive Income.
Subsequent to initial recognition, all investments are measured at fair value. Realized and unrealized gains and losses on investments are recognized in the Statement of Comprehensive Income in the period in which they arise.
(iv) Fair value estimation
Fair value is the price that would be received to sell an asset or paid to transfer a liability in an orderly transaction between market participants at the measurement date. The fair value of investments traded in active markets (such as publicly traded derivatives and trading securities) are based on quoted market prices at the close of trading on the reporting date. The Sub-Funds use last traded market price to determine the fair valuation of investments, where the last traded price falls within the bid-ask spread. In circumstances where the last traded price is not within the bid-ask spread, the Management will determine the point within the bid-ask spread that is most representative of fair value.
In the case of CAAPs held by the China A50 ETF and CSI 300 ETF and IAPs held by the SENSEX India ETF, such investments have only nominal exercise prices. Their fair value is based on the quoted market prices of the securities underlying the CAAPs and IAPs, adjusted for the expected amount payable to the issuer in respect of potential capital gains tax (if any) as described in note 7 below. For the years ended 31st December 2021 and 2020, the SENSEX India ETF did not hold any IAPs. For the years ended 31st December 2021 and 2020, China A50 ETF and CSI 300 ETF did not hold any CAAPs.
Investments that are not listed on an exchange or are thinly traded are valued by using quotes from brokers or based on the Manager’s judgments and estimates.
The SENSEX India ETF’s investment in the Mauritius Subsidiary and the underlying investments held by the Mauritius Subsidiary have been designated at fair value through profit or loss at inception as they are managed as portfolio and their performance evaluated on a fair value basis in accordance with the SENSEX India ETF’s offering document.
The Mauritius Subsidiary is fair valued based on its latest net asset value as reported by its administrator.
(v) Transfers between levels of the fair value hierarchy
Transfers between levels of the fair value hierarchy are deemed to have occurred at the end of the reporting period.
(d) Offsetting financial instruments
Financial assets and liabilities are offset and the net amount reported in the Statement of Financial Position where the Sub-Funds currently have a legally enforceable right to set-off the recognized amounts and there is an intention to settle on a net basis or realize the asset and settle the liability simultaneously. The legally enforceable right must not be contingent on future events and must be enforceable in the normal course of business and in the event of default, insolvency or bankruptcy of the Sub-Funds or the counterparty.
NM0522U-2194143-32/163

32 iShares Asia Trust
Notes to the Financial Statements (continued)
(e) Amounts due from and to brokers
Amounts due from and to brokers represent receivables for securities sold and payables for securities purchased that have been contracted for but not yet settled or delivered on the statement of financial position date respectively. The amounts due from brokers balance is held for collection.
These amounts are recognized initially at fair value and subsequently measured at amortized cost. At each reporting date, the Sub-Funds shall measure the loss allowance on amounts due from broker at an amount equal to the lifetime expected credit losses if the credit risk has increased significantly since initial recognition. If, at the reporting date, the credit risk has not increased significantly since initial recognition, the Sub-Funds shall measure the loss allowance at an amount equal to 12-month expected credit losses. Significant known financial difficulties of the broker, probability that the broker will enter bankruptcy or financial reorganization, and default in payments are all considered indicators that a loss allowance may be required. If the credit risk increases to the point that it is considered to be credit impaired, interest income will be calculated based on the gross carrying amount adjusted for the loss allowance. For the purposes of measurement for presentation in the financial statements, a significant increase in credit risk is defined by the Manager as any contractual payment which is more than 30 days past due and any contractual payment which is more than 90 days past due is considered credit impaired. Management has measures in place to monitor exposures and increase in credit risk.
(f) Dividend income and bank interest income
Dividend income is recorded on an ex-dividend basis. Dividend income on equity securities where no ex-dividend date is quoted is accounted for when the Sub-Funds’ right to receive payment is established.
Interest income from bank balances is recognized in the Statement of Comprehensive Income on a time proportionate basis using the effective interest method.
(g) Distributions to Unitholders
Distributions to Unitholders are recognized in the Statement of Changes in Net Assets Attributable to Unitholders when they are approved by the Manager.
(h) Expenses
Expenses are accounted for on an accrual basis.
(i) Cash and cash equivalents
Cash and cash equivalents includes cash at bank and bank deposits with maturity of three months or less from the date of placement that are readily convertible to known amounts of cash and which are subject to an insignificant risk of change in value.
(j) Translation of foreign currencies
Functional and presentation currency
MSCI China ETF, MSCI Emerging Asia ETF, Hang Seng ETF and Hang Seng TECH ETFItems included in the financial statements are measured using the currency of the primary economic environment in which the Sub-Funds operate (the “functional currency”). The performance of the Sub-Funds are measured and reported to the unitholders in Hong Kong dollar. The Management considers the Hong Kong dollar as the currency that most faithfully represents the economic effects of the underlying transactions, events and conditions. The financial statements are presented in Hong Kong dollar, which is each Sub-Fund’s functional and presentation currency.
China A50 ETF and CSI 300 ETFItems included in the financial statements are measured using the currency of the primary economic environment in which the Sub-Funds operate (the “functional currency”). The performance of the Sub-Funds are measured and reported to the unitholders in Renminbi (“RMB”). The Management considers the RMB as the currency that most faithfully represents the economic effects of the underlying transactions, events and conditions. The financial statements are presented in RMB, which is each Sub-Fund’s functional and presentation currency.
SENSEX India ETF, MSCI Asia ex Japan ETF, MSCI Taiwan ETF, NASDAQ 100 ETF, MSCI Emerging Markets ETF (HK) and KOSPI 200 ETFItems included in the financial statements are measured using the currency of the primary economic environment in which the Sub-Funds operate (the “functional currency”). The performance of the Sub-Funds are measured and reported to the unitholders in the United States dollar (“US dollar”). The Management considers the US dollar as the currency that most faithfully represents the economic effects of the underlying transactions, events and conditions. The financial statements are presented in US dollar, which is each Sub-Fund’s functional and presentation currency.
Transactions and balancesForeign currency transactions are translated into the functional currency using the exchange rates prevailing at the dates of the transactions. Foreign currency assets and liabilities are translated into the functional currency using the exchange rate prevailing at the year end date. Foreign exchange gains and losses arising from translation are included in the Statement of Comprehensive Income.
NM0522U-2194143-33/163

Reports and Financial Statements 33
Notes to the Financial Statements (continued)
Foreign exchange gains and losses relating to cash and cash equivalents are presented in the Statement of Comprehensive Income within “Net foreign currency gain/(loss)”. Foreign exchange gains and losses relating to financial assets and liabilities carried at fair value through profit or loss are presented in the Statement of Comprehensive Income within “Net gain/(loss) on financial assets at fair value through profit or loss”.
(k) Redeemable units
The Sub-Funds issue redeemable units, which are redeemable at the holder’s option. These units represent puttable financial instruments of the Sub-Funds. The Sub-Funds classify their puttable financial instruments as equity in accordance with IAS 32 (Amendment), “Financial instruments: Presentation” as those puttable financial instruments meet all the following criteria.
• the puttable financial instruments entitle the holder to a pro-rata share of net asset value;
• the puttable financial instruments are the most subordinated units in issue and unit features are identical;
• there are no contractual obligations to deliver cash or another financial asset; and
• the total expected cash flows from the puttable financial instrument over their life are based substantially on the profit or loss of the Sub-Funds.
Units are issued and redeemed at the holder’s option at prices based on the Sub-Funds’ net asset value per unit at the time of issue or redemption. The Sub-Funds’ net asset value per unit is calculated by dividing the net assets attributable to unitholders by the total number of outstanding units. In accordance with the Prospectus of the Sub-Funds, investment positions are valued based on the official closing price for the purpose of determining the net asset value per unit for subscriptions and redemptions.
(l) Transaction costs
Transactions costs are costs incurred to acquire/dispose financial assets or liabilities at fair value through profit or loss. They include fees and commissions paid to agents, brokers and dealers. Transaction costs are expensed as incurred in the Statement of Comprehensive Income.
(m) Taxation
Withholding tax
The Sub-Funds currently incur withholding tax imposed by certain countries on investment income. Such income is recorded gross of withholding tax in the Statement of Comprehensive Income. Withholding tax is included as taxation in the Statement of Comprehensive Income.
Capital gains tax
The tax expense for capital gains tax for the period comprises current and deferred taxes. Tax is recognized in the Statement of Comprehensive Income, except to the extent that it relates to items recognized in other comprehensive income or directly in equity. In this case the tax is also recognized in other comprehensive income or directly in equity, respectively.
The current tax charge is calculated on the basis of the tax laws enacted or substantively enacted by the end of the reporting period in the countries where the Sub-Funds operate and generate taxable income. Management periodically evaluates positions taken with respect to situations in which applicable tax regulation is subject to interpretation or judgment. It establishes provisions where appropriate on the basis of amounts expected to be paid to the tax authorities.
Deferred tax is recognized, using the liability method, on temporary differences arising between the tax bases of assets and liabilities and their carrying amounts in the financial statements. Deferred tax is determined using tax rates (and laws) that have been enacted or substantively enacted by the end of reporting period and are expected to apply when the related deferred tax asset is realized or the deferred tax liability is settled.
Deferred tax assets are recognized only to the extent that it is probable that future taxable profit will be available against which the temporary differences can be utilized.
Deferred tax assets and liabilities are offset when there is a legally enforceable right to offset current tax assets against current tax liabilities and when the deferred tax assets and liabilities relate to income taxes levied by the same tax authority on either the taxable entity or different taxable entities where there is an intention to settle the balances on a net basis.
(n) Changes to presentation and comparative information
When the presentation or classification of items in the financial statements is amended, comparative amounts have been updated to conform with the current year’s presentation or classification.
NM0522U-2194143-34/163

34 iShares Asia Trust
Notes to the Financial Statements (continued)
3 Critical Accounting Estimates and Judgements
The preparation of financial statements in conformity with IFRS requires the Management to make estimates and assumptions that affect the amounts reported in the financial statements and accompanying notes. Actual results could differ from those estimates.
Management makes estimates and assumptions concerning the future. The resulting accounting estimates will, by definition, seldom equal the related actual results. The estimates and assumptions that have a significant risk of causing a material adjustment to the carrying amounts of assets and liabilities within the next financial period are outlined below. (a) Functional Currency
MSCI China ETF, MSCI Emerging Asia ETF, Hang Seng ETF and Hang Seng TECH ETFManagement considers the Hong Kong dollar to be the currency that most faithfully represents the economic effect of the underlying transactions, events and conditions. The Hong Kong dollar is the currency in which the Sub-Funds measure their performance and report their results, as well as the currency in which the Sub-Funds determine the net asset value per unit at the time of issue or redemption. This determination also considers that the Sub-Funds are all listed on SEHK and their units are quoted in Hong Kong dollars.
China A50 ETF and CSI 300 ETFManagement considers the RMB to be the currency that most faithfully represents the economic effect of the underlying transactions, events and conditions. The RMB is the currency in which the Sub-Fund measures its performance and reports its results, as well as the currency in which the Sub-Fund determines the net asset value per unit at the time of issue or redemption. This determination also considers that the Sub-Fund is listed on SEHK with its units quoted in RMB.
SENSEX India ETF, MSCI Asia ex Japan ETF, MSCI Taiwan ETF, NASDAQ 100 ETF, MSCI Emerging Markets ETF (HK) and KOSPI 200 ETFManagement considers the US dollar to be the currency that most faithfully represents the economic effect of the underlying transactions, events and conditions. The US dollar is the currency in which the Sub-Funds measure their performance and report their results, as well as the currency in which the Sub-Funds determine the net asset value per unit at the time of issue or redemption. This determination also considers that the Sub-Funds are all listed on SEHK and their units are quoted in US dollar.
(b) Fair value of securities not quoted in an active market
The fair value of such securities not quoted in an active market may be determined by the Management using reputable pricing sources (such as pricing agencies). Broker quotes as obtained from the pricing sources may be indicative and not executable or binding. The Management would exercise judgment and estimates on the quantity and quality of pricing sources used. Where no market data is available, the Management may value positions using their own models, which are usually based on valuation methods and techniques generally recognized as standard within the industry. The inputs into these models include earning multiples and discounted cash flows. The models used to determine fair values are validated and periodically reviewed by experienced personnel at the Manager.
Models use observable data, to the extent practicable. However, areas such as credit risk (both own and counterparty), volatilities and correlations require the Management to make estimates. Changes in assumptions about these factors could affect the reported fair value of financial instruments.
The determination of what constitutes “observable” requires significant judgment by the Management. The Management considers observable data to be market data that is readily available, regularly distributed or updated, reliable and verifiable, not proprietary, and provided by independent sources that are actively involved in the relevant market.
4 Number of units in issue and net assets attributable to unitholders per unit
Net assets attributable to unitholders per unit are calculated based on the net assets attributable to unitholders divided by the total units in issue as at 31st December 2021 and 31st December 2020. The detailed breakdowns are as follows:
MSCI China ETFNumber of units
China A50 ETFNumber of units
2021 2020 2021 2020
Number of units in issue at the end of the year 167,098,699 154,198,699 1,022,000,000 958,000,000
HK$ HK$ RMB RMB
Accounting NAV 4,453,761,192 5,299,883,916 15,333,514,324 16,198,123,203
Accounting NAV (per unit) 26.65 34.37 15.00 16.91
NM0522U-2194143-35/163

Reports and Financial Statements 35
Notes to the Financial Statements (continued)
SENSEX India ETFNumber of units
MSCI Asia ex Japan ETFNumber of units
2021 2020 2021 2020
Number of units in issue at the end of the year 21,600,000 24,600,000 315,200,000 250,720,000
US$ US$ US$ US$
Accounting NAV 96,797,508 93,046,719 2,497,701,122 2,132,117,689
Accounting NAV (per unit) 4.48 3.78 7.92 8.50
MSCI Emerging Asia ETFNumber of units
CSI 300 ETFNumber of units
2021 2020 2021 2020
Number of units in issue at the end of the year 2,200,000 3,800,000 11,250,000 7,250,000
HK$ HK$ RMB RMB
Accounting NAV 141,042,322 261,466,135 361,753,067 245,207,868
Accounting NAV (per unit) 64.11 68.81 32.16 33.82
MSCI Taiwan ETFNumber of units
NASDAQ 100 ETFNumber of units
2021 2020 2021 2020
Number of units in issue at the end of the year 2,940,000 3,720,000 1,240,000 1,160,000
US$ US$ US$ US$
Accounting NAV 79,168,456 79,641,865 48,847,687 36,014,940
Accounting NAV (per unit) 26.93 21.41 39.39 31.05
Hang Seng ETFNumber of units
MSCI EmergingMarkets ETF (HK)Number of units
Hang SengTECH ETF
Number of units
2021 2020 2021 2020
Number of units in issue at the end of the year/period 7,700,000 2,600,000 200,000 837,000,000
HK$ HK$ US$ HK$
Accounting NAV 645,309,617 253,954,908 14,124,205 9,912,051,973
Accounting NAV (per unit) 83.81 97.67 70.62 11.84
Net assets attributable to unitholders per unit are calculated based on the net assets attributable to unitholders divided by the total units in issue as at 18th August 2021 (date of delisting from the SEHK) and 31st December 2020. The detailed breakdowns are as follows:
KOSPI 200 ETFNumber of units
18.08.2021(date of
delisting fromthe SEHK) 31.12.2020
Number of units in issue at the end of the period/year – 360,000
US$ US$
Accounting NAV – 6,407,032
Accounting NAV (per unit) – 17.80
5 Net gain/(loss) on Financial Assets at Fair Value through Profit or Loss
MSCI China ETF China A50 ETF
01.01.2021to
31.12.2021HK$
01.01.2020to
31.12.2020HK$
01.01.2021to
31.12.2021RMB
01.01.2020to
31.12.2020RMB
Change in unrealized gain/loss in value of financial assets at fair value through profit or loss (1,419,714,905) 544,637,797 (2,647,910,976) 496,040,164
Net realized gain on sale of financial assets at fair value through profit or loss 265,889,895 240,941,953 859,501,746 3,006,123,989
(1,153,825,010) 785,579,750 (1,788,409,230) 3,502,164,153
SENSEX India ETF MSCI Asia ex Japan ETF
01.01.2021to
31.12.2021US$
01.01.2020to
31.12.2020US$
01.01.2021to
31.12.2021US$
01.01.2020to
31.12.2020US$
Change in unrealized gain/loss in value of financial assets at fair value through profit or loss (41,802,605) (1,023,094) (246,761,715) 243,583,689
Net realized gain on sale of financial assets at fair value through profit or loss 59,047,966 9,113,335 63,143,047 37,450,853
17,245,361 8,090,241 (183,618,668) 281,034,542
NM0522U-2194143-36/163

36 iShares Asia Trust
Notes to the Financial Statements (continued)
MSCI Emerging Asia ETF CSI 300 ETF
01.01.2021to
31.12.2021HK$
01.01.2020to
31.12.2020HK$
01.01.2021to
31.12.2021RMB
01.01.2020to
31.12.2020RMB
Change in unrealized gain/loss in value of financial assets at fair value through profit or loss (51,806,095) 33,706,171 (52,625,860) 38,774,698
Net realized gain on sale of financial assets at fair value through profit or loss 38,570,207 25,546,574 36,568,276 18,389,564
(13,235,888) 59,252,745 (16,057,584) 57,164,262
MSCI Taiwan ETF NASDAQ 100 ETF
01.01.2021to
31.12.2021US$
01.01.2020to
31.12.2020US$
01.01.2021to
31.12.2021US$
01.01.2020to
31.12.2020US$
Change in unrealized gain/loss in value of financial assets at fair value through profit or loss 7,292,048 15,231,463 8,117,893 10,122,413
Net realized gain on sale of financial assets at fair value through profit or loss 11,414,850 5,981,241 1,881,337 2,773,584
18,706,898 21,212,704 9,999,230 12,895,997
Hang Seng ETFMSCI Emerging
Markets ETF (HK)Hang SengTECH ETF
01.01.2021to
31.12.2021HK$
01.01.2020to
31.12.2020HK$
17.07.2020(date of
inception)to 31.12.2021
US$
14.09.2020(date of
inception)31.12.2021
HK$
Change in unrealized gain/loss in value of financial assets at fair value through profit or loss (119,404,675) (16,834,109) 1,934,753 (3,197,101,526)
Net realized gain/(loss) on sale of financial assets at fair value through profit or loss (4,059,227) 6,397,483 567,393 (151,106,348)
(123,463,902) (10,436,626) 2,502,146 (3,348,207,874)
KOSPI 200 ETF
01.01.2021to 18.08.2021
(date of delisting from
the SEHK)US$
01.01.2020to 31.12.2020
US$
Change in unrealized gain/loss in value of financial assets at fair value through profit or loss (2,263,086) 1,698,449
Net realized gain/(loss) on sale of financial assets at fair value through profit or loss 2,668,209 171,694
405,123 1,870,143
6 Transaction costs on Financial Assets at Fair Value through Profit or Loss
Transaction costs on financial assets at fair value through profit or loss of each Sub-Fund represents:
MSCI China ETF China A50 ETF
01.01.2021to
31.12.2021HK$
01.01.2020to
31.12.2020HK$
01.01.2021to
31.12.2021RMB
01.01.2020to
31.12.2020RMB
Transaction costs on financial assets at fair value through profit or loss
– Broker commission 1,491,517 2,285,466 4,652,340 11,476,886– Other transaction costs 4,280,219 9,279,235 5,423,576 15,827,017
5,771,736 11,564,701 10,075,916 27,303,903
SENSEX India ETF MSCI Asia ex Japan ETF
01.01.2021to
31.12.2021US$
01.01.2020to
31.12.2020US$
01.01.2021to
31.12.2021US$
01.01.2020to
31.12.2020US$
Transaction costs on financial assets at fair value through profit or loss
– Broker commission 43,163 – 476,749 535,190– Other transaction costs 110,017 – 1,777,214 1,935,645
153,180 – 2,253,963 2,470,835
NM0522U-2194143-37/163
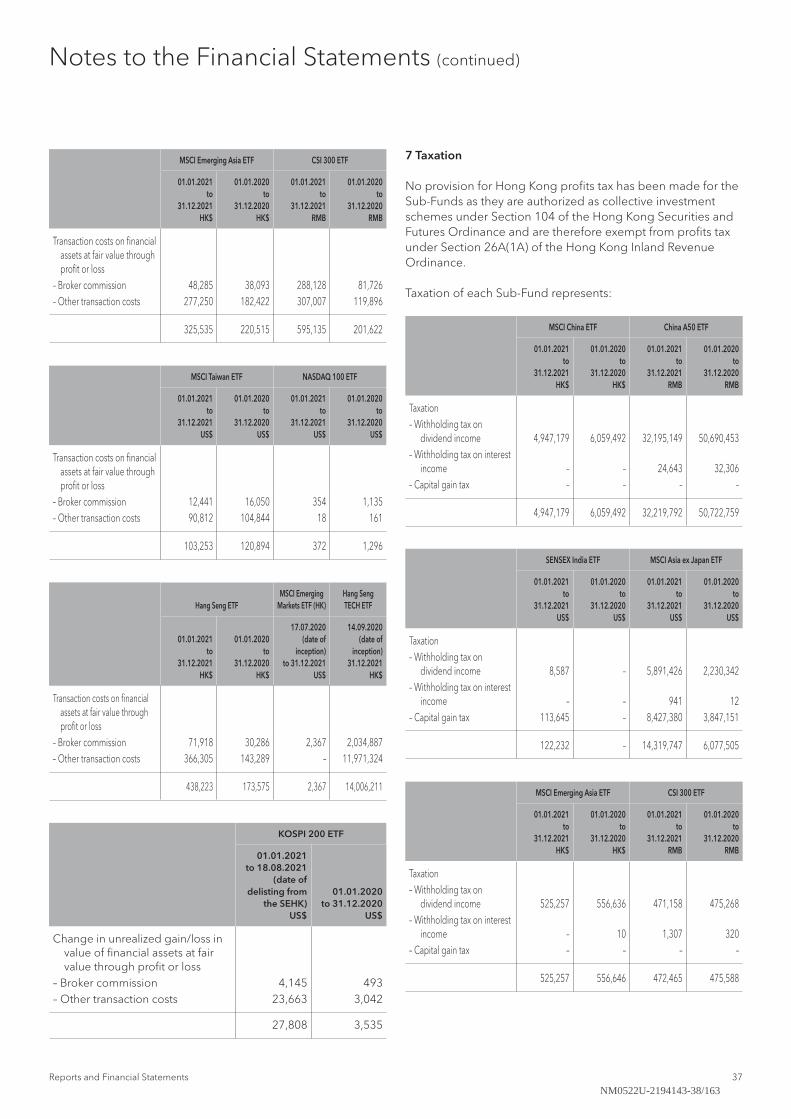
Reports and Financial Statements 37
Notes to the Financial Statements (continued)
MSCI Emerging Asia ETF CSI 300 ETF
01.01.2021to
31.12.2021HK$
01.01.2020to
31.12.2020HK$
01.01.2021to
31.12.2021RMB
01.01.2020to
31.12.2020RMB
Transaction costs on financial assets at fair value through profit or loss
– Broker commission 48,285 38,093 288,128 81,726– Other transaction costs 277,250 182,422 307,007 119,896
325,535 220,515 595,135 201,622
MSCI Taiwan ETF NASDAQ 100 ETF
01.01.2021to
31.12.2021US$
01.01.2020to
31.12.2020US$
01.01.2021to
31.12.2021US$
01.01.2020to
31.12.2020US$
Transaction costs on financial assets at fair value through profit or loss
– Broker commission 12,441 16,050 354 1,135– Other transaction costs 90,812 104,844 18 161
103,253 120,894 372 1,296
Hang Seng ETFMSCI Emerging
Markets ETF (HK)Hang SengTECH ETF
01.01.2021to
31.12.2021HK$
01.01.2020to
31.12.2020HK$
17.07.2020(date of
inception)to 31.12.2021
US$
14.09.2020(date of
inception)31.12.2021
HK$
Transaction costs on financial assets at fair value through profit or loss
– Broker commission 71,918 30,286 2,367 2,034,887– Other transaction costs 366,305 143,289 – 11,971,324
438,223 173,575 2,367 14,006,211
KOSPI 200 ETF
01.01.2021to 18.08.2021
(date of delisting from
the SEHK)US$
01.01.2020to 31.12.2020
US$
Change in unrealized gain/loss in value of financial assets at fair value through profit or loss
– Broker commission 4,145 493– Other transaction costs 23,663 3,042
27,808 3,535
7 Taxation
No provision for Hong Kong profits tax has been made for the Sub-Funds as they are authorized as collective investment schemes under Section 104 of the Hong Kong Securities and Futures Ordinance and are therefore exempt from profits tax under Section 26A(1A) of the Hong Kong Inland Revenue Ordinance.
Taxation of each Sub-Fund represents:
MSCI China ETF China A50 ETF
01.01.2021to
31.12.2021HK$
01.01.2020to
31.12.2020HK$
01.01.2021to
31.12.2021RMB
01.01.2020to
31.12.2020RMB
Taxation– Withholding tax on
dividend income 4,947,179 6,059,492 32,195,149 50,690,453– Withholding tax on interest
income – – 24,643 32,306– Capital gain tax – – – –
4,947,179 6,059,492 32,219,792 50,722,759
SENSEX India ETF MSCI Asia ex Japan ETF
01.01.2021to
31.12.2021US$
01.01.2020to
31.12.2020US$
01.01.2021to
31.12.2021US$
01.01.2020to
31.12.2020US$
Taxation– Withholding tax on
dividend income 8,587 – 5,891,426 2,230,342– Withholding tax on interest
income – – 941 12– Capital gain tax 113,645 – 8,427,380 3,847,151
122,232 – 14,319,747 6,077,505
MSCI Emerging Asia ETF CSI 300 ETF
01.01.2021to
31.12.2021HK$
01.01.2020to
31.12.2020HK$
01.01.2021to
31.12.2021RMB
01.01.2020to
31.12.2020RMB
Taxation– Withholding tax on
dividend income 525,257 556,636 471,158 475,268– Withholding tax on interest
income – 10 1,307 320– Capital gain tax – – – –
525,257 556,646 472,465 475,588
NM0522U-2194143-38/163

38 iShares Asia Trust
Notes to the Financial Statements (continued)
MSCI Taiwan ETF NASDAQ 100 ETF
01.01.2021to
31.12.2021US$
01.01.2020to
31.12.2020US$
01.01.2021to
31.12.2021US$
01.01.2020to
31.12.2020US$
Taxation– Withholding tax on
dividend income 450,334 463,165 86,213 70,860
450,334 463,165 86,213 70,860
Hang Seng ETFMSCI Emerging
Markets ETF (HK)Hang SengTECH ETF
01.01.2021to
31.12.2021HK$
01.01.2020to
31.12.2020HK$
17.07.2020(date of
inception)to 31.12.2021
US$
14.09.2020(date of
inception)31.12.2021
HK$
Taxation– Withholding tax on
dividend income 693,938 389,976 – 443,205
693,938 389,976 – 443,205
KOSPI 200 ETF
01.01.2021to 18.08.2021
(date of delisting from
the SEHK)US$
01.01.2020to 31.12.2020
US$
Taxation– Withholding tax on dividend
income 12,475 20,416
12,475 20,416
India Withholding Tax on Dividends
Dividends received from an Indian company are taxed in the hands of the shareholder at applicable tax rates. For non-resident shareholders, a withholding tax rate of 20% (2020: 20%) will be levied on dividends received, subject to tax treaty relief, if any.
India Capital Gains Tax
Up until 14th December 2021, the SENSEX India ETF invests in India listed securities through the Mauritius Subsidiary. To
obtain benefits under the double taxation treaty between Mauritius and India (“the tax treaty”), the Mauritius Subsidiary must meet certain tests and conditions annually, including the establishment of Mauritius tax residency status and related requirements. The Mauritius Subsidiary has obtained a tax residence certification (“TRC”) from the Mauritius Revenue Authority and should be eligible for benefits under the tax treaty.
On 10th May 2016, the Indian Tax Board announced a phased removal of the capital gains tax (“CGT”) exemption under the tax treaty. The change, effective from 1st April 2017, resulted in India retaining taxation rights on capital gains arising from sales of shares of Indian resident companies acquired by a Mauritius entity on or after 1st April 2017. Shares acquired prior to 1st April 2017 would still be protected from taxing rights in India.
Further, effective 1st April 2018, capital gains (exceeding INR 100,000) realized from the sale of direct investments in India listed securities which were held for a period of more than 12 months are subject to long term CGT under new provisions included in the Income Tax Act. For India listed securities held on or before 31st January 2018, any notional long term capital gains up to that date are grandfathered and sheltered from tax via a cost base step up to fair market value as at 31st January 2018 (where applicable).
Based on the above, gains arising on disposal of shares by the Mauritius Subsidiary acquired prior to 1st April 2017 were not subject to tax. Gains arising on shares acquired on or after 1st April 2017 will be taxed fully in India as per the Indian tax laws. The Manager established a provisioning policy which requires the Sub-Funds investing directly into Indian securities to provision for the unrealized capital gains tax. In the current reporting period, MSCI Asia ex Japan ETF invested directly in Indian securities and (up until 14th December 2021) Sensex India ETF invested via its Mauritius Subsidiary. The year end CGT exposures for both entities are reflected in the table above. The Manager will continue to monitor and review the impact of India tax law changes on the Mauritius Subsidiary and MSCI Asia ex Japan ETF.
In preparing these financial statements, Management has made certain assumptions and used various estimates concerning the tax exposure which is dependent on what might happen in the future. The resulting accounting estimates may not equal the related actual results.
NM0522U-2194143-39/163

Reports and Financial Statements 39
Notes to the Financial Statements (continued)
The table below shows the movement in current tax recoverable and deferred tax liabilities arising from Indian Capital Gains Tax for the SENSEX India ETF and MSCI Asia ex Japan ETF during the years ended 31st December 2021 and 2020:
SENSEX India ETF
As 31st December 2021 and 2020, there were no balance on current tax recoverable for the Sub-fund.
Deferred tax liabilities2021
US$2020
US$
At 1st January – –Charged to the Statement of
Comprehensive Income (113,645) –
At 31st December (113,645) –
MSCI Asia ex Japan ETF
Current tax recoverable2021
US$2020
US$
At 1st January 129,819 90,926Charged to the Statement of
Comprehensive Income (3,441,235) (483,011)Indian Capital Gains Tax paid during
the year 3,449,800 521,904
At 31st December 138,384 129,819
Deferred tax liabilities2021
US$2020
US$
At 1st January (3,849,085) (484,945)Charged to the Statement of
Comprehensive Income (4,986,145) (3,364,140)
At 31st December (8,835,230) (3,849,085)
Mauritius Income Tax
The taxation of income and capital gains of the Mauritius Subsidiary is subject to the fiscal law and practice of Mauritius and the countries in which the Mauritius Subsidiary invests.
The Mauritius Subsidiary is centrally managed and controlled from Mauritius and is therefore a tax resident in Mauritius. Capital gains from the sales of units and securities are exempted from Mauritius tax and any dividend paid by the Mauritius Subsidiary to its shareholder are exempt in Mauritius from any withholding tax.
The Mauritius Subsidiary, under current laws and regulations, is liable to pay income tax on its net income at the rate of 15% for the financial year ended 31st December 2021 (2020: 15%). However, the Mauritius Subsidiary is entitled to a tax credit equivalent to the higher of the actual foreign tax suffered or 80% of the Mauritius tax on its foreign source income, thus reducing its maximum effective tax rate to 3%. A company holding at least 5% of share capital of an Indian company and receiving dividends may claim a credit for tax paid by the Indian company on its profit out of which the dividends were distributed including the DDT.
Mauritius introduced new tax measures in the Finance Act 2018. Effective 1st January 2019, an 80% partial exemption will be available on certain income including foreign sourced dividend, subject to certain conditions. The above deemed foreign tax credit of 80% will continue to apply until 30th June 2021 for the Mauritius Subsidiary under the grandfathering provisions.
The foregoing is based on current interpretation and practice and is subject to any future changes in Indian and Mauritian tax laws and the tax treaty between India and Mauritius.
PRC Withholding Tax on Dividends
The investments of the MSCI China ETF, China A50 ETF, MSCI Asia ex Japan ETF, MSCI Emerging Asia ETF and CSI 300 ETF in the A-Shares of PRC listed companies are held directly through the Manager’s QFII and RQFII quotas or through Stock Connect. A 10% (2020: 10%) tax is withheld at source on all PRC sourced dividends.
PRC Capital Gains Tax
Generally under the PRC Corporate Income Tax Law, investors will be liable to pay PRC tax on capital gains realized from the trading of PRC securities.
MSCI China ETF, MSCI Asia ex Japan ETF, Hang Seng ETF and Hang Seng TECH ETFThe Sub-Funds invest in Chinese securities (including H-shares, Red Chips and P Chips) listed on the SEHK, B-shares of Chinese securities listed on the Shanghai Stock Exchange and the Shenzhen Stock Exchange and depositary receipts.
No provision was made for taxation from capital gains derived from sale of these securities in the financial statements as the Manager believes that the Sub-Funds can sustain a position for not filing a tax return based on the existing tax regulations and that the enforcement of PRC tax on the capital gains is not probable.
NM0522U-2194143-40/163

40 iShares Asia Trust
Notes to the Financial Statements (continued)
MSCI China ETF, China A50 ETF, MSCI Asia ex Japan ETF, MSCI Emerging Asia ETF and CSI 300 ETFThe Sub-Funds invest in China A-Shares through a combination of the Manager’s QFII and RQFII license quotas and Stock Connect. Via the release of Caishui [2014] No.79 (“Circular 79”), Caishui [2014] No.81 (“Circular 81”) and Caishui [2016] No.127 (“Circular 127”) by the Ministry of Finance (“MOF”) in the PRC, the China Securities Regulatory Commission (“CSRC”) and the State Administration of Taxation (“SAT”), acting with State Council’s approval, a temporary exemption from tax on capital gains derived from the trading of A-Shares on or after 17th November 2014 was provided to (i) QFII/RQFIIs; and (ii) foreign investors trading in A-Shares via Stock Connect.
Pursuant to Circulars 79, 81 and 127, the Manager realigned the provisioning policy of the Sub-Funds in respect of their direct A-Shares investments. As such, the Sub-Funds do not currently provision for unrealized capital gains, or for capital gains realized on or after 17th November 2014.
In preparing these financial statements, Management has made certain assumptions and used various estimates concerning the tax exposure which is dependent on what might happen in the future. The resulting accounting estimates may not equal the related actual results.
8 Transactions with the Trustee, Manager and Connected Persons
The following is a summary of significant related party transactions/transactions entered into during the year between the Sub-Funds and their related parties, including the Trustee, the Manager and their Connected Persons. Connected Persons are those as defined in the Code on Unit Trusts and Mutual Funds issued by the Securities and Futures Commission of Hong Kong (the “SFC Code”). All transactions entered into during the year between the Sub-Funds and their related parties, including the Trustee, the Manager and their Connected Persons were carried out in the normal course of business and on normal commercial terms. To the best of the Manager’s knowledge, the Sub-Funds do not have any other transactions with their related parties, including the Trustee, the Manager and their Connected Persons except for those disclosed below.
(a) Manager’s holding in the Sub-Funds
The directors and officers of the Manager may transact in the units of the Sub-Funds as a principal. As at 31st December 2021 and 2020, the directors and officers of the Manager together did not hold any units in the Sub-Funds. During the year ended 31st December 2021 and 2020, the directors and officers of the Manager did not enter into any transactions in units of the Sub-Funds.
(b) Trustee’s holding in the Sub-Funds
The directors and officers of the Trustee may transact in the units of the Sub-Funds as a principal. As at 31st December 2021 and 2020, the directors and officers of the Trustee together did not hold any units in the Sub-Funds. During the year ended 31st December 2021 and 2020, the directors and officers of the Trustee did not enter into any transactions in units of the Sub-Funds.
(c) Management Fee
The Manager is entitled to receive a management fee at the annual rate of the net asset value of the respective Sub-Funds. The fee is accrued daily and calculated as at each dealing day and payable monthly in arrears. The Sub-Funds employ a single management fee structure, with each Sub-Fund paying all of its fees, costs and expenses (and its due proportion of any costs and expenses of the Trust allocated to it) as a single flat fee. Fees and expenses taken into account in determining an Sub-Funds’ Management Fee include, but are not limited to, the Manager’s fee, Trustee’s fee, fees and expenses of the auditor, fees of service agents, ordinary legal and out-of-pocket expenses incurred by the Trustee or Manager, and the costs and expenses of licensing indices used in connection with an Sub-Funds.
The following table presents the annual rate of the respective Sub-Funds for the years ended 31st December 2021 and 2020, except for those disclosed separately below:
Sub-Funds
Annual rate of the net assets
value
MSCI China ETF 0.20%China A50 ETF 0.35%SENSEX India ETF 0.64%MSCI Asia ex Japan ETF 0.28%MSCI Emerging Asia ETF 0.59%CSI 300 ETF 0.38%MSCI Taiwan ETF 0.30%NASDAQ 100 ETF 0.28%Hang Seng ETF 0.09%MSCI Emerging Markets ETF (HK) 0.18%*Hang Seng TECH ETF 0.25%
China A50 ETFFrom 22nd March 2021, the management fee of China A50 ETF was reduced from 0.99% per annum to 0.35% per annum (as a percentage of the net asset value of the China A50 ETF).
NM0522U-2194143-41/163

Reports and Financial Statements 41
Notes to the Financial Statements (continued)
SENSEX India ETFThe management fee includes fees and expenses of the Mauritius Subsidiary (up until 10th December 2021) but does not include certain expenses as disclosed in the prospectus.
MSCI Emerging Asia ETFDuring the years ended 31st December 2021 and 2020, MSCI Emerging Asia ETF invested in the iShares MSCI India UCITS ETF (the “MSCI India UCITS ETF”), an exchange traded fund managed by BlackRock Asset Management Ireland Limited (“BAMIL”). BAMIL is affiliated company of the Manager. The Manager has waived the portion of the management fee charged on the MSCI India UCITS ETF, which represented MSCI Emerging Asia ETF’s holding in the MSCI India UCITS ETF. The MSCI India UCITS ETF is not authorized by the SFC under Section 104 of the Securities and Futures Ordinance in Hong Kong and not available to Hong Kong residents. During the year ended 31st December 2020, MSCI Emerging Asia ETF invested in the SENSEX India ETF, the Manager has waived the portion of the management fee charged on the SENSEX India ETF, which represented MSCI Emerging Asia ETF’s holding in the SENSEX India ETF.
MSCI Emerging Markets ETF (HK)As the MSCI Emerging Markets ETF (HK) is a feeder fund investing substantially in the Master ETF and the Master ETF is also managed by the Manager or its connected persons, the Manager will not charge any management fee in respect of the MSCI Emerging Markets ETF (HK). The Master ETF charges a single flat fee of 0.18% per annum of the net asset value of the Master ETF.
The Master ETF is a sub-fund of iShares Public Limited Company (the “Company”). The Master ETF employs an “all in one” fee structure whereby the Master ETF pays all of its fees, operating costs and expenses as a single flat fee (the “Master ETF Fee”). Expenses paid out of this fee include, but are not limited to, fees and expenses paid to the management company of the Master ETF, regulators and auditors and certain legal expenses of the Company, but exclude transaction costs and extraordinary legal costs. The management company of the Master ETF is responsible for discharging all operational expenses, including but not limited to fees and expenses of the directors of the Company, the investment manager of the Master ETF, the depository of the Master ETF and the administrator of the Master ETF from the amounts received by the Manager from the Master ETF Fee.
As the MSCI Emerging Markets ETF (HK) is a feeder fund investing substantially in the Master ETF, in relation to the shares in the Master ETF held by the iShares MSCI Emerging Markets ETF (HK), the MSCI Emerging Markets ETF (HK) will indirectly bear a proportion of the Master ETF Fee of the Master ETF. Such Master ETF Fee will be deducted from the net asset value of the Master ETF and reflected in the net asset value per share of the Master ETF.
KOSPI 200 ETFThe following table presents the annual rate of the respective KOSPI 200 ETF for the period from 1st January 2021 to 18th August 2021 (date of delisting from the SEHK) and year ended 31st December 2020:
Sub-Fund
Annual rate of the net assets
value
KOSPI 200 ETF 0.30%
(d) Bank Balances
Bank balances are maintained with a group company of the Trustee, i.e. The Hongkong and Shanghai Banking Corporation Limited. Bank balances held with the group company of the Trustee as at 31st December 2021 and 2020 were as follows:
Sub-Funds2021HK$
2020HK$
MSCI China ETF 11,823,242 10,246,641MSCI Emerging Asia ETF 83,805 152,878Hang Seng ETF 3,201,389 295,688Hang Seng TECH ETF 22,145,067 N/A
Sub-Funds2021RMB
2020RMB
China A50 ETF 154,160 11,223,237CSI 300 ETF 5,620 4,048
Sub-Funds2021
US$2020
US$
SENSEX India ETF 679,261 3,894MSCI Asia ex Japan ETF 8,757,806 5,525,618MSCI Taiwan ETF 104,856 45,081NASDAQ 100 ETF 811,477 7,329MSCI Emerging Markets ETF (HK) 61,678 N/A
Bank balances are maintained with a group company of the Trustee, i.e. HSBC Bank (China) Company Limited. Bank balances held with the group company of the Trustee as at 31st December 2021 and 2020 were as follows:
Sub-Funds2021RMB
2020RMB
China A50 ETF 10,961,786 15,071,925CSI 300 ETF 474,570 139,566
During the years ended 31st December 2021 and 2020, the bank interest income of each Sub-Fund stated in the Statement of Comprehensive Income was earned from The Hongkong and Shanghai Banking Corporation Limited, a group company of the Trustee except for China A50 ETF and CSI 300 ETF.
NM0522U-2194143-42/163

42 iShares Asia Trust
Notes to the Financial Statements (continued)
China A50 ETFDuring the year ended 31st December 2021, RMB43,502 (2020: RMB118,500) and RMB246,363 (2020: RMB322,685) were earned from The Hongkong and Shanghai Banking Corporation Limited and HSBC Bank (China) Company Limited respectively, which are group companies of the Trustee.
CSI 300 ETFDuring the year ended 31st December 2021, RMB1,140 (2020: RMB965) and RMB13,071 (2020: RMB3,199) were earned from The Hongkong and Shanghai Banking Corporation Limited and HSBC Bank (China) Company Limited respectively, which are group companies of the Trustee.
KOSPI 200 ETFBank balances are maintained with a group company of the Trustee, i.e. The Hongkong and Shanghai Banking Corporation Limited. Bank balances held with the group company of the Trustee as at 18th August 2021 (date of delisting from the SEHK) and 31st December 2020 were as follows:
Sub-Fund
18.08.2021(date of
delistingfrom the SEHK)
US$31.12.2020
US$
KOSPI 200 ETF – 5,035
During the period from 1st January 2021 to 18th August 2021 (date of delisting from the SEHK) and year ended 31st December 2020, the bank interest income of KOSPI 200 ETF stated in the Statement of Comprehensive Income was earned from The Hongkong and Shanghai Banking Corporation Limited, a group company of the Trustee.
(e) Margin Deposits
Margin deposits are maintained with a group company of the Trustee, i.e. HSBC Bank Plc. Margin deposits held with the group company of the Trustee as at 31st December 2021 and 2020 were as follows:
Sub-Fund2021RMB
2020RMB
China A50 ETF (67) (459,322)
Sub-Funds2021
US$2020
US$
SENSEX India ETF (15) N/AMSCI Emerging Markets ETF (HK) 3,529 N/A
Sub-Fund2021HK$
2020HK$
Hang Seng TECH ETF 2,748,700 N/A
During the years ended 31st December 2021 and 2020, margin deposit interest expenses paid to HSBC Bank Plc were as follows:
Sub-Fund2021RMB
2020RMB
China A50 ETF 290 N/A
(f) Bank Overdraft
Bank overdraft balance held with the group company of the Trustee, i.e. The Hongkong and Shanghai Banking Corporation Limited, as at 31st December 2021 and 2020 was as follows:
Sub-Fund2021
US$2020
US$
SENSEX India ETF 626,678 N/A
The bank overdraft as at 31st December 2021 was unsecured and repaid on 3rd January 2022.
During the years ended 31st December 2021 and 2020, interest expenses paid to The Hongkong and Shanghai Banking Corporation Limited were as follows:
Sub-Funds 2021 2020
MSCI China ETF HK$109 N/AChina A50 ETF RMB434,838 N/AMSCI Asia ex Japan ETF US$347 N/ACSI 300 ETF RMB27,651 N/AMSCI Taiwan ETF US$78 N/AHang Seng ETF HK$18 N/A
(g) Bank Overdraft Facility
The Hongkong and Shanghai Banking Corporation Limited (“HSBC”), which is the group company of the Trustee, has granted uncommitted banking overdraft facility lines to the Sub-Funds. With effect from 29th June 2020, the facility limit for each of the following Sub-Funds shall be the lesser of (i) the banking overdraft facility line applicable to such Sub-Fund or (ii) an amount which is 10% of the net asset value of such Sub-Fund under the custody of HSBC, the Trustee or any of its affiliates. In addition to the facility limit for each sub-fund, the overall limit applicable to all of the facilities shall not exceed US$500 million. The total amount outstanding at any time under all of the facilities shall not exceed the overall limit.
NM0522U-2194143-43/163

Reports and Financial Statements 43
Notes to the Financial Statements (continued)
Prior to 29th June 2020, the facility limit for each of the following Sub-Funds shall be the lesser of (i) the banking overdraft facility line applicable to such Sub-Fund or (ii) an amount which is 10% of the net asset value of such Sub-Fund, except for SENSEX India ETF, which shall be the lesser of (i) the banking overdraft facility line applicable or (ii) an amount subject to 5% of it’s net asset value under the custody of HSBC, the Trustee or any of its affiliates. For Sub-Funds of the Trust, HSBC may grant temporary overdraft from time to time with prior approval for ad hoc funding purposes.
As at 31st December 2021 and 2020, the banking overdraft facility lines available to the following Sub-Funds were as follows:
Sub-Funds 2021 2020
MSCI China ETF HK$604,234,312 HK$604,234,312China A50 ETF RMB2,051,523,006 RMB2,051,523,006SENSEX India ETF US$10,995,112 US$10,995,112MSCI Asia ex Japan ETF US$38,195,249 US$38,195,249MSCI Emerging Asia ETF HK$20,891,834 HK$20,891,834CSI 300 ETF RMB20,567,886 RMB20,567,886MSCI Taiwan ETF US$6,457,147 US$6,457,147NASDAQ 100 ETF US$1,301,107 US$1,301,107Hang Seng ETF HK$29,802,676 HK$29,802,676MSCI Emerging Markets ETF
(HK) US$1,320,000 N/AHang Seng TECH ETF N/A N/A
As at 18th August 2021 (date of delisting from the SEHK) and 31st December 2020, the banking overdraft facility lines available to the following KOSPI 200 ETF were as follows:
Sub-Fund
18.08.2021(date of
delistingfrom the SEHK) 31.12.2020
KOSPI 200 ETF US$532,497 US$532,497
(h) Financial Assets at Fair Value through Profit or Loss
MSCI China ETFAs at 31st December 2021, the Sub-Fund had an investment of HK$11,854,582 (2020: HK$11,178,052) in Bank of Communications Co, which is a related party of the Trustee.
During the year ended 31st December 2021, the Sub-Fund received dividend income of HK$826,285 (2020: HK$975,260) from its investments in Bank of Communications Co, which is a related party of the Trustee.
China A50 ETFAs at 31st December 2021, the Sub-Fund had an investment of RMB198,184,707 (2020: RMB186,814,992) in Bank of Communications Co, which is a related party of the Trustee.
During the year ended 31st December 2021, the Sub-Fund received dividend income of RMB13,240,955 (2020: RMB18,941,919) from its investments in Bank of Communications Co, which is a related party of the Trustee.
MSCI Asia ex Japan ETFAs at 31st December 2021, the Sub-Fund had an investment of US$2,430,560 (2020: US$1,940,333) in Bank of Communications Co, which is a related party of the Trustee.
During the year ended 31st December 2021, the Sub-Fund received dividend income of US$167,099 (2020: US$66,356) from its investments in Bank of Communications Co, which is a related party of the Trustee.
As at 31st December 2021, the Sub-Fund had an investment of US$5,138,247 (2020: US$3,997,628) in Hang Seng Bank Ltd, which is a fellow subsidiary of the Trustee.
During the year ended 31st December 2021, the Sub-Fund received dividend income of US$201,937 (2020: US$52,779) from its investments in Hang Seng Bank Ltd, which is a fellow subsidiary of the Trustee.
MSCI Emerging Asia ETFAs at 31st December 2021, the Sub-Fund had an investment of HK$147,881 (2020: HK$302,811) in Bank of Communications Co, which is a related party of the Trustee.
During the year ended 31st December 2021, the Sub-Fund received dividend income of HK$23,079 (2020: HK$23,430) from its investments in Bank of Communications Co, which is a related party of the Trustee.
For the Sub-Fund’s investments in the MSCI India UCITS ETF and SENSEX India ETF, please refer to note 12(a)(i) for details.
During the years ended 31st December 2021 and 2020, the Sub-Fund did not receive dividend income from its investments in MSCI India UCITS ETF or SENSEX India ETF.
CSI 300 ETFAs at 31st December 2021, the Sub-Fund had an investment of RMB2,061,131 (2020: RMB1,541,568) in Bank of Communications Co, which is a related party of the Trustee.
During the year ended 31st December 2021, the Sub-Fund received dividend income of RMB110,189 (2020: RMB128,898 from its investments in Bank of Communications Co, which is a related party of the Trustee.
Hang Seng ETFAs at 31st December 2021, the Sub-Fund had HK$Nil investment (2020: HK$833,206) in Bank of Communications Co, which is a related party of the Trustee.
NM0522U-2194143-44/163

44 iShares Asia Trust
Notes to the Financial Statements (continued)
During the year ended 31st December 2021, the Sub-Fund received dividend income of HK$182,315 (2020: HK$79,722) from its investments in Bank of Communications Co, which is a related party of the Trustee.
As at 31st December 2021, the Sub-Fund had an investment of HK$49,464,070 (2020: HK$19,496,063) in HSBC Holdings Plc, which is the ultimate holding company of the Trustee, and HK$5,557,594 (2020: HK$2,368,094) in Hang Seng Bank Ltd, which is a fellow subsidiary of the Trustee.
During the year ended 31st December 2021, the Sub-Fund received dividend income of HK$1,154,718 from its investments in HSBC Holdings Plc, which is the ultimate holding company of the Trustee, and HK$157,718 from its investments in Hang Seng Bank Ltd, which is a fellow subsidiary of the Trustee. During the year ended 31st December 2020, the Sub-Fund did not receive dividend income from its investments in HSBC Holdings Plc, which is the ultimate holding company of the Trustee, and the Sub-Fund received dividend income of HK$145,459 from its investments in Hang Seng Bank Ltd, which is a fellow subsidiary of the Trustee.
MSCI Emerging Markets ETF (HK)For the Sub-Fund’s investments in the Master ETF, please refer to note 12(a)(i) for details.
During the period ended 31st December 2021, the Sub-Fund received dividend income of US$467,207 from its investments in Master ETF.
(i) Unitholders
As at 31st December, the following table discloses the units subscribed and redeemed by one of the Participating Dealers of the Sub-Funds, The Hongkong and Shanghai Banking Corporation Limited, which is a group company of the Trustee:
Sub-Funds
2021Subscriptions/ (Redemptions)
units
2020Subscriptions/ (Redemptions)
units
China A50 ETF 2,000,000/(28,000,000)
20,000,000/(28,000,000)
SENSEX India ETF – (600,000)MSCI Emerging Asia ETF (200,000) (600,000)MSCI Taiwan ETF (100,000) (80,000)NASDAQ 100 ETF – (80,000)Hang Seng ETF – (200,000)Hang Seng TECH ETF 10,350,000 N/A
As at 18th August 2021 (date of delisting from the SEHK) and 31st December 2020, the following table discloses the units subscribed and redeemed by one of the Participating Dealers of the KOSPI 200 ETF, The Hongkong and Shanghai Banking Corporation Limited, which is a group company of the Trustee:
Sub-Fund
18.08.2021(date of delisting
from the SEHK)Subscriptions/(Redemptions)
units
31.12.2020Subscriptions/(Redemptions)
units
KOSPI 200 ETF – (60,000)
(j) Investment transactions with connected persons of the Trustee
Investment transaction with connected persons of the Trustee are set out below:
Sub-Fund
Aggregate value of purchases and
sales of investments
% of the Sub-Fund’s total aggregate value
of transactions during the year
%
Brokerage commission paid
Average rate of commission
%
2021MSCI China ETF– The Hongkong and
Shanghai Banking Corporation Limited HK$187,210 0.00 HK$150 0.08
China A50 ETF– HSBC Bank Plc – – RMB785* N/A
SENSEX India ETF– HSBC Bank Plc US$107,853 0.05 US$183 0.17
MSCI Asia ex Japan ETF– The Hongkong and
Shanghai Banking Corporation Limited US$551,485 0.02 US$130 0.02
MSCI Emerging Asia ETF– The Hongkong and
Shanghai Banking Corporation Limited HK$186,028 0.07 HK$56 0.03
MSCI Emerging Markets ETF (HK)3
– HSBC Bank Plc US$2,861 0.02 US$31 1.07– HSBC Investment
Bank, London US$61,616 0.36 US$12 0.02
Hang Seng TECH ETF4
– HSBC Bank Plc HK$16,298,500 0.07 HK$61,174 0.38
2020China A50 ETF– HSBC Bank Plc RMB456,750 0.00 RMB2,579 0.56
* For the year ended 31st December 2021, China A50 ETF paid RMB785 to HSBC Bank Plc, which is a group company of the Trustee, for the broker commission of the futures transactions in December 2020.
3 For the period from 17th July 2020 (date of inception) to 31st December 2021.4 For the period from 14th September 2020 (date of inception) to 31st December 2021.
NM0522U-2194143-45/163

Reports and Financial Statements 45
Notes to the Financial Statements (continued)
For the year ended 31st December 2020, MSCI China ETF, SENSEX India ETF, MSCI Asia ex Japan ETF and MSCI Emerging Asia ETF, the Sub-Funds did not have investment transactions with connected persons of the Trustee.
9 Major Non-Cash Transactions
(a) Subscriptions
Units can be subscribed either (a) in-kind for an “Application Basket” plus a “Cash Component” (where the “Application Basket” means a portfolio of securities determined by the Manager for the relevant Sub-Fund at the start of business on the relevant dealing day for the purpose of the creation and redemption of units in an Application Unit size, notified on the relevant date by the Manager to Participating Dealers for the relevant Sub-Fund, the “Cash Component” means the difference between the aggregate Net Asset Value of the units comprising an Application Unit and the “Application Basket Value”, and the “Application Basket Value” means the aggregate value of the securities constituting the Application Basket as at the valuation point on the relevant dealing day) or (b) for a cash payment equivalent to the relevant Application Basket Value plus an amount equivalent to any Cash Component, which the Manager shall use to purchase the securities comprised in the Application Basket to replicate the underlying index applicable to that Sub-Fund, provided that the Manager shall be entitled in its discretion to charge (for the account of the relevant Sub-Fund) to the applicant of any units for which cash is paid in lieu of delivering any securities such additional sum as represents the appropriate provision for duties and charges.
During the years ended 31st December 2021 and 2020, the Sub-Funds issued units through cash subscriptions and/or in exchange for Application Baskets consisting of investments plus the relevant cash component as stated in the Statement of Changes in Net Assets Attributable to Unitholders.
(b) Redemptions
Units can be redeemed either (a) in-kind for an Application Basket plus a cash component or (b) for a cash amount equivalent to the Application Basket Value plus a cash component.
During the years ended 31st December 2021 and 2020, the Sub-Funds redeemed units through cash redemptions and/or in exchange for Application Baskets consisting of investments plus the relevant cash component as stated in the Statement of Changes in Net Assets Attributable to Unitholders.
10 Soft Commission Arrangements
There have been no soft commission arrangements existing during the year ended 31st December 2021 in relation to directing transactions of the Sub-Funds through a broker or dealer (2020: Nil).
11 Investment Limitation and Prohibitions under the SFC Code
Pursuant to Chapter 8.6(h)(a) of the SFC Code, the Manager is permitted to overweight the holdings of the Sub-Funds relative to their respective weightings in the underlying index, on the condition that the maximum extra weighting in any constituent securities will not exceed the maximum limit reasonably determined by the Sub-Funds and after consultation with the SFC. The maximum limit for each of the Sub-Funds has been disclosed in their respective prospectus.
The Manager and Trustee have confirmed that all Sub-Funds have complied with this limit during the years ended 31st December 2021 and 2020.
The SFC Code allows the Sub-Funds to invest in constituent securities issued by a single issuer for more than 10% of the Sub-Funds’ net asset value provided that the investment is limited to any constituent securities that each accounts for more than 10% of the weighting of the Index and the Sub-Funds’ holding of any such constituent securities may not exceed their respective weightings in the Index (except as a result of changes in the composition of the Index and the excess is transitional and temporary in nature).
The following Sub-Funds held constituent securities that individually accounted for more than 10% of the Sub-Funds’ net asset value and their respective weightings of the underlying index as at 31st December 2021 and 2020:
MSCI China ETF
Index Weight (%) % of Net Asset Value
31.12.2021 31.12.2020 31.12.2021 31.12.2020
Alibaba Group Holding – SP ADR 9.09 14.30 9.06 14.27
Tencent Holdings Ltd 13.26 13.57 13.21 13.55
22.35 27.87 22.27 27.82
China A50 ETF
Index Weight (%) % of Net Asset Value
31.12.2021 31.12.2020 31.12.2021 31.12.2020
Kweichow Moutai Co Ltd – A 12.70 11.37 12.70 11.36Ping An Insurance Group
Co – A 6.50 10.31 6.50 10.31
19.20 21.68 19.20 21.67
NM0522U-2194143-46/163

46 iShares Asia Trust
Notes to the Financial Statements (continued)
SENSEX India ETF
Index Weight (%) % of Net Asset Value
31.12.2021 31.12.2020 31.12.2021 31.12.2020
HDFC Bank Limited 9.85 11.20 9.86 11.54Infosys Ltd 10.51 8.81 10.52 9.08Reliance Industries Ltd 12.42 12.29 12.43 12.66
32.78 32.30 32.81 33.28
MSCI Taiwan ETF
Index Weight (%) % of Net Asset Value
31.12.2021 31.12.2020 31.12.2021 31.12.2020
Taiwan Semiconductor Manufacturing 30.94 31.33 30.87 31.28
NASDAQ 100 ETF
Index Weight (%) % of Net Asset Value
31.12.2021 31.12.2020 31.12.2021 31.12.2020
Apple Inc 11.64 12.26 11.64 12.25Microsoft Corp 10.09 9.14 10.09 9.13
21.73 21.40 21.73 21.38
Hang Seng ETF
Index Weight (%) % of Net Asset Value
31.12.2021 31.12.2020 31.12.2021 31.12.2020
AIA Group Ltd 7.53 10.48 7.49 10.46
As at 18th August 2021 (date of delisting from the SEHK), the Sub-Fund did not hold any investments in constituent securities. As at 31 December 2020, KOSPI 200 ETF held constituent securities that individually accounted for more than 10% of the Sub-Funds’ net asset value and their respective weightings of the underlying index:
KOSPI 200 ETF
Index Weight (%) % of Net Asset Value
18.08.2021(date of
delistingfrom the
SEHK) 31.12.2020
18.08.2021(date of
delistingfrom the
SEHK) 31.12.2020
Samsung Electronics Co Ltd – 33.01 – 32.76
Except as disclosed above, there were no other securities that individually accounted for more than 10% of the net asset value of the respective Sub-Funds as at 31st December 2021 and 2020.
The following table presents the movement in the Sub-Funds’ NAV per unit and their underlying index during the years/periods ended 31st December 2021 and 2020.
Sub-Funds Underlying indexNAV per unit
movement (%)Underlying index
movement (%)
2021 2020 2021 2020
MSCI China ETF MSCI China Index (21.42) 28.65 (21.29) 28.86China A50 ETF FTSE China A50 Index (10.04) 24.69 (9.63) 26.16SENSEX India ETF BSE SENSEX Index 18.48 12.15 21.12 14.45MSCI Asia ex Japan ETF MSCI All Country Asia ex
Japan Index (5.33) 24.49 (4.72) 25.02MSCI Emerging Asia ETF MSCI EM Asia Index (5.28) 26.61 (4.56) 27.75CSI 300 ETF CSI 300 Index (4.11) 29.01 (3.69) 29.62MSCI Taiwan ETF MSCI Taiwan 20/35 Index 28.07 36.17 28.74 40.99NASDAQ 100 ETF NASDAQ 100 Index 26.88 47.95 27.24 48.48Hang Seng ETF HSI Net Total Return
Index (12.54) (0.65) (11.94) (0.46)MSCI Emerging
Markets ETF (HK)5MSCI Emerging Markets
Index 20.54 N/A 20.06 N/AHang Seng TECH ETF6 Hang Seng TECH Index
(net total return version) (22.88) N/A (22.54) N/A
The following table presents the movement in the KOSPI 200 ETF’s NAV per unit and its underlying index during the period from 1st January 2021 to 18th August 2021 (date of delisting from the SEHK) and year ended 31st December 2020.
Sub-Funds Underlying indexUnderlying index
movement (%)NAV per unit
movement (%)
01.01.2021to
18.08.2021(date of
delistingfrom
SEHK)
01.01.2020to
31.12.2020
01.01.2021to
18.08.2021(date of
delistingfrom
SEHK)
01.01.2020to
31.12.2020
KOSPI200 ETF
KOSPI 200 Capped 30% Net Total Return USD Index 5.75 42.25 5.54 42.78
5 This is the movement in Sub-Fund’s NAV per unit and its underlying index since inception. The Sub-Fund was launched on 17th July 2020.
6 This is the movement in Sub-Fund’s NAV per unit and its underlying index since inception. The Sub-Fund was launched on 14th September 2020.
NM0522U-2194143-47/163

Reports and Financial Statements 47
Notes to the Financial Statements (continued)
12 Financial Risk Management
The objective of the Sub-Funds is to provide investment results that, before fees and expenses, closely correspond to the performance of their respective indices. The Sub-Funds’ activities may expose them to a variety of risks including but not limited to market risk (including market price risk, interest rate risk and currency risk), credit and counterparty risk and liquidity risk which are associated with the markets in which the Sub-Funds invest.
The following is a summary of the main risks and risk management policies.
(a) Market Risk
(i) Market Price Risk
Price risk is the risk that the fair value or future cash flows of a financial instrument will fluctuate because of changes in market prices (other than those arising from interest rate risk or currency risk), whether those changes are caused by factors specific to the individual financial instrument or its issuer, or factors affecting similar financial instruments traded in the market. Local, regional or global events such as war, acts of terrorism, the spread of infectious illness or other public health issue, recessions, or other events could have a significant impact on the Fund and its investments.
The coronavirus outbreak has had a profound impact on all aspects of society in recent years. While there is a growing consensus in developed economies that the worst of the impact is now over, there is an expectation that travel restrictions, enhanced health screenings at ports of entry and elsewhere, disruption of and delays in healthcare service preparation and delivery, cancellations, supply chain disruptions, and lower consumer demand will create ongoing challenges. While widescale vaccination programmes are now in place in many countries and are having a positive effect, the impact of COVID-19 continues to adversely affect the economies of many nations across the globe and this impact may be greater where vaccination rates are lower, such as in certain emerging markets. Although it is difficult to make timing predictions, it is expected that the economic effects of COVID-19 will continue to be felt for a period after the virus itself has moved from being pandemic to endemic in nature, and this in turn may continue to impact investments held by the Fund.
As at 31st December, the Sub-Funds’ financial assets and financial liabilities at fair value through profit or loss were concentrated in the following industries:
MSCI China ETF
As at 31st December 2021 As at 31st December 2020
Fair valueHK$
% of net asset value
Fair valueHK$
% of net asset value
Financial assetsListed equities – By SectorCommunication Services 813,347,876 18.27 1,062,301,013 20.05Consumer Discretionary 1,310,812,051 29.46 1,860,979,746 35.08Consumer Staples 264,933,858 5.95 237,669,355 4.50Energy 74,647,086 1.68 83,251,036 1.57Financials 640,527,857 14.39 715,260,797 13.48Health Care 312,811,498 7.01 342,054,499 6.47Industrials 252,763,465 5.65 233,876,285 4.42Information Technology 315,657,954 7.09 351,926,881 6.61Materials 153,333,857 3.45 109,209,483 2.10Real Estate 176,580,279 3.94 191,319,250 3.61Utilities 123,662,206 2.78 96,111,011 1.81
Unlisted equities – By SectorConsumer Staples 5 0.00 5 0.00Information Technology 1 0.00 1 0.00
Unlisted rights – By SectorInformation Technology – – 0∆ 0.00Real Estate 0∆ 0.00 – –
FuturesMSCI China Free Index Futures (151,209) 0.00 261,460 0.00
4,438,926,784 99.67 5,284,220,822 99.70
The summarized VaR Analysis in Note 12(a)(iv) explains how the price risk is measured and summarizes the potential exposure of the Sub-Fund’s net assets attributable to unitholders.
As at 31st December 2021, the MSCI China ETF held 676 out of 737 constituents (2020: 601 out of 714 constituents) in the MSCI China Index. The MSCI China ETF is therefore exposed to substantially the same market price risk as the MSCI China Index.
∆ Amount is less than HK$1.
NM0522U-2194143-48/163

48 iShares Asia Trust
Notes to the Financial Statements (continued)
China A50 ETF
As at 31st December 2021 As at 31st December 2020
Fair valueRMB
% of net asset value
Fair valueRMB
% of net asset value
Financial assetsListed equities – By SectorConsumer Discretionary 1,270,191,736 8.29 1,705,618,084 10.53Consumer Staples 4,300,335,801 28.05 4,198,946,851 25.93Energy 256,061,375 1.67 205,253,808 1.27Financials 5,443,353,181 35.51 6,530,430,165 40.34Health Care 995,155,762 6.48 1,046,358,191 6.45Industrials 1,224,358,058 7.99 510,334,899 3.14Information Technology 811,153,200 5.29 986,271,161 6.08Materials 552,289,239 3.60 456,254,741 2.82Real Estate 274,339,244 1.78 386,688,704 2.38Utilities 199,558,696 1.30 163,184,513 1.01
15,326,796,292 99.96 16,189,341,117 99.95
The summarized VaR Analysis in Note 12(a)(iv) explains how the price risk is measured and summarizes the potential exposure of the Sub-Fund’s net assets attributable to unitholders.
As at 31st December 2021 and 2020, the China A50 ETF held all constituents in the FTSE China A50 Index. The China A50 ETF is therefore exposed to substantially the same market price risk as the FTSE China A50 Index.
SENSEX India ETF
As at 31st December 2021 As at 31st December 2020
Fair valueUS$
% of net asset value
Fair valueUS$7
% of net asset value
Financial assetsListed equities – By IndustryCapital Goods 3,372,324 3.48 2,855,668 3.07Finance 37,769,857 39.03 40,183,292 43.19FMCG 6,948,411 7.18 8,486,818 9.12Healthcare 2,222,687 2.30 2,333,693 2.51Information Technology 21,189,308 21.89 16,968,545 18.23Metal, Metal Products & Mining 4,817,225 4.97 3,406,643 3.66Oil & Gas 12,029,880 12.43 12,408,229 13.33Power 1,899,455 1.96 1,776,347 1.91Telecom 2,434,120 2.51 2,243,485 2.41Transport Equipment 4,186,095 4.32 5,155,384 5.55
96,869,362 100.07 95,818,104 102.98
The summarized VaR Analysis in Note 12(a)(iv) explains how the price risk is measured and summarizes the potential exposure of the Sub-Fund’s net assets attributable to unitholders.
7 Represents the figures of the Mauritius Subsidiary.# Amount is less than US$1.
As at 31st December 2021, the SENSEX India ETF held all constituents in the BSE SENEX Index, The SENSEX India ETF is therefore exposed to substantially the same market price risk as the BSE SENSEX Index.
As at 31st December 2020, the SENSEX India ETF invested all, or substantially all, of its assets in Indian equity securities through the Mauritius Subsidiary, in substantially the same weightings as constituted in the BSE SENSEX Index. The SENSEX India ETF is therefore exposed to substantially the same market price risk as the BSE SENSEX Index.
MSCI Asia ex Japan ETF
As at 31st December 2021 As at 31st December 2020
Fair valueUS$
% of net asset value
Fair valueUS$
% of net asset value
Financial assetsListed equities – By SectorCommunication Services 260,513,357 10.42 246,022,720 11.53Consumer Discretionary 364,185,852 14.55 405,995,417 19.03Consumer Staples 125,135,855 4.99 105,391,515 4.93Energy 71,711,454 2.90 58,582,825 2.75Financials 466,047,667 18.70 380,254,464 17.80Health Care 110,877,846 4.42 106,880,801 5.02Industrials 157,028,017 6.29 111,609,919 5.22Information Technology 644,932,532 25.80 491,415,345 23.08Materials 130,330,562 5.23 91,443,545 4.35Real Estate 92,189,176 3.70 81,996,162 3.82Utilities 70,850,309 2.85 46,736,922 2.20
Listed rights – By SectorMaterials – – 40,168 0.00
Unlisted equities – By SectorConsumer Staples 0# 0.00 0# 0.00
Unlisted rights – By SectorIndustrials 52,393 0.00 0# 0.00Real Estate 0# 0.00 – –
FuturesMSCI All Country Asia Pacific ex
Japan NTR Index Futures 90,173 0.00 227,040 0.01
2,493,945,193 99.85 2,126,596,843 99.74
NM0522U-2194143-49/163

Reports and Financial Statements 49
Notes to the Financial Statements (continued)
As at 31st December 2021 As at 31st December 2020
Fair valueUS$
% of net asset value
Fair valueUS$
% of net asset value
Financial assetsListed equities – By Geographical
AreaAustralia 5,685,736 0.23 – –Cayman Islands 859,406 0.03 763,688 0.04China 996,557,157 39.90 1,011,628,037 47.45Hong Kong 103,798,802 4.16 87,501,430 4.10India 353,777,948 14.16 222,263,448 10.42Indonesia 41,558,527 1.66 32,389,817 1.52Malaysia 39,936,242 1.60 36,372,810 1.71Pakistan – – 522,816 0.02Philippines 20,199,015 0.81 17,633,846 0.83Singapore 69,108,096 2.77 48,580,832 2.28South Korea 363,784,055 14.57 322,761,491 15.14Taiwan 449,933,675 18.01 302,405,917 14.18Thailand 48,077,415 1.93 43,505,503 2.04United States 526,553 0.02 – –
Listed rights – By GeographicalSouth Korea – – 40,168 0.00
Unlisted equities – By Geographical Area
China 0# 0.00 0# 0.00
Unlisted rights – By Geographical Area
China 0# 0.00 0# 0.00South Korea 52,393 0.00 – –
FuturesMSCI All Country Asia Pacific ex
Japan NTR Index Futures 90,173 0.00 227,040 0.01
2,493,945,193 99.85 2,126,596,843 99.74
The summarized VaR Analysis in Note 12(a)(iv) explains how the price risk is measured and summarizes the potential exposure of the Sub-Fund’s net assets attributable to unitholders.
As at 31st December 2021, the MSCI Asia ex Japan ETF held 1,017 out of 1,211 constituents (2020: 942 out of 1,186 constituents) in the MSCI All Country Asia ex Japan Index. The MSCI Asia ex Japan ETF is therefore exposed to substantially the same market price risk as the MSCI All Country Asia ex Japan Index.
# Amount is less than US$1.∆ Amount is less than HK$1.8 As at 31st December 2021, the MSCI Emerging Asia ETF directly held 774 constituents and
indirectly held 106 constituents through MSCI India UCITS ETF out of 1,157 constituents comprising the MSCI EM Asia Index. As at 31st December 2020, the MSCI Emerging Asia ETF directly held 688 constituents and indirectly held 96 constituents through SENSEX India ETF out of 1,129 constituents comprising the MSCI EM Asia Index.
MSCI Emerging Asia ETF
As at 31st December 2021 As at 31st December 2020
Fair valueHK$
% of net asset value
Fair valueHK$
% of net asset value
Financial assetsListed equities – By SectorCommunication Services 14,637,041 10.37 31,879,749 12.20Consumer Discretionary 20,461,423 14.46 51,029,366 19.46Consumer Staples 5,582,978 3.95 10,353,401 3.96Energy 1,950,292 1.39 3,944,677 1.50Financials 16,558,577 11.76 29,926,478 11.45Health Care 5,809,362 4.15 12,662,065 4.84Industrials 6,671,049 4.74 10,834,925 4.17Information Technology 35,832,448 25.40 61,056,100 23.35Materials 5,929,140 4.18 9,868,677 3.76Real Estate 2,783,200 2.00 5,472,860 2.13Utilities 2,276,564 1.62 3,691,163 1.42
Listed rights – By SectorMaterials – – 6,086 0.00
Exchange traded fundMSCI India UCITS ETF8 22,317,105 15.82 30,245,451 11.57
Unlisted equities – By SectorConsumer Staples 0∆ 0.00 0∆ 0.00
Unlisted rights – By SectorMaterials 3,290 0.00 – –Real Estate 0∆ 0.00 – –
140,812,469 99.84 260,970,998 99.81 Listed equities – By Geographical
AreaAustralia 18,328 0.01 – –Cayman Islands 49,163 0.04 94,377 0.04China 57,565,028 40.82 127,897,159 48.92Hong Kong 524,857 0.37 – –Indonesia 2,592,408 1.84 4,303,075 1.64Malaysia 2,469,342 1.75 5,063,244 1.94Philippines 1,229,398 0.87 2,383,288 0.91Singapore 99,599 0.07 80,400 0.03South Korea 22,791,512 16.16 43,981,825 16.82Taiwan 28,138,917 19.95 41,033,593 15.69Thailand 2,975,367 2.11 5,882,500 2.25United States 38,155 0.03 – –
Listed rights – By Geographical Area
South Korea – – 6,086 0.00
Exchange traded fundIreland8 22,317,105 15.82 30,245,451 11.57
Unlisted equities – By Geographical Area
China 0∆ 0.00 0∆ 0.00
Unlisted rights – By Geographical Area
China 0∆ 0.00 – –South Korea 3,290 0.00 – –
140,812,469 99.84 260,970,998 99.81
NM0522U-2194143-50/163

50 iShares Asia Trust
Notes to the Financial Statements (continued)
The summarized VaR Analysis in Note 12(a)(iv) explains how the price risk is measured and summarizes the potential exposure of the Sub-Fund’s net assets attributable to unitholders.
As at 31st December 2021, the MSCI Emerging Asia ETF held 8808 out of 1,157 constituents (2020: 7848 out of 1,129 constituents) comprising the MSCI EM Asia Index. The MSCI Emerging Asia ETF is exposed to substantially the same market price risk as the MSCI EM Asia Index.
CSI 300 ETF
As at 31st December 2021 As at 31st December 2020
Fair valueRMB
% of net asset value
Fair valueRMB
% of net asset value
Financial assetsListed equities – By SectorCommunication Services 5,335,695 1.48 4,384,403 1.80Consumer Discretionary 29,384,589 8.13 24,392,346 9.95Consumer Staples 53,778,986 14.86 39,915,219 16.30Energy 4,047,187 1.11 2,774,773 1.13Financials 76,088,227 21.05 64,826,069 26.43Health Care 34,640,791 9.59 23,318,512 9.47Industrials 53,259,605 14.72 25,621,116 10.47Information Technology 58,762,630 16.20 33,381,529 13.62Materials 31,279,588 8.66 15,375,578 6.26Real Estate 6,062,508 1.68 7,040,136 2.87Utilities 8,750,145 2.42 4,112,023 1.67
361,389,951 99.90 245,141,704 99.97
The summarized VaR Analysis in Note 12(a)(iv) explains how the price risk is measured and summarizes the potential exposure of the Sub-Fund’s net assets attributable to unitholders.
As at 31st December 2021 and 2020, the CSI 300 ETF held all constituents in the CSI 300 Index. The CSI 300 ETF is exposed to substantially the same market price risk as the CSI 300 Index.
8 As at 31st December 2021, the MSCI Emerging Asia ETF directly held 774 constituents and indirectly held 106 constituents through MSCI India UCITS ETF out of 1,157 constituents comprising the MSCI EM Asia Index. As at 31st December 2020, the MSCI Emerging Asia ETF directly held 688 constituents and indirectly held 96 constituents through SENSEX India ETF out of 1,129 constituents comprising the MSCI EM Asia Index.
MSCI Taiwan ETF
As at 31st December 2021 As at 31st December 2020
Fair valueUS$
% of net asset value
Fair valueUS$
% of net asset value
Financial assetsListed equities – By SectorCommunication Services 1,952,832 2.47 2,418,535 3.04Consumer Discretionary 2,196,527 2.77 2,303,120 2.88Consumer Staples 1,338,288 1.69 1,812,765 2.28Energy 299,409 0.38 411,443 0.52Financials 12,489,938 15.76 12,156,811 15.26Health Care 182,588 0.23 162,965 0.21Industrials 3,192,134 4.04 1,633,034 2.06Information Technology 51,954,410 65.62 52,496,577 65.92Materials 5,182,611 6.56 5,872,707 7.37Real Estate 199,674 0.25 249,763 0.31
FuturesMSCI Taiwan Index Futures 740 0.00 3,920 0.00
78,989,151 99.77 79,521,640 99.85
The summarized VaR Analysis in Note 12(a)(iv) explains how the price risk is measured and summarizes the potential exposure of the Sub-Fund’s net assets attributable to unitholders.
As at 31st December 2021 and 2020, the MSCI Taiwan ETF held all constituents in the MSCI Taiwan 20/35 Index. The MSCI Taiwan ETF is therefore exposed to substantially the same market price risk as the MSCI Taiwan 20/35 Index.
NM0522U-2194143-51/163

Reports and Financial Statements 51
Notes to the Financial Statements (continued)
NASDAQ 100 ETF
As at 31st December 2021 As at 31st December 2020
Fair valueUS$
% of net asset value
Fair valueUS$
% of net asset value
Financial assetsListed equities – By SectorCommunication Services 8,979,683 18.38 6,624,363 18.39Consumer Discretionary 7,880,902 16.15 6,931,053 19.24Consumer Staples 2,510,131 5.14 1,863,560 5.17Health Care 2,769,863 5.65 2,315,182 6.43Industrials 1,335,259 2.72 679,480 1.89Information Technology 24,910,709 51.01 17,245,915 47.90Utilities 446,461 0.92 350,186 0.97
48,833,008 99.97 36,009,739 99.99
Listed equities – By Geographical Area
Argentina 221,138 0.45 247,933 0.69Canada 155,014 0.32 129,467 0.36China 461,688 0.95 711,466 1.98Israel – – 55,556 0.16Netherlands 405,503 0.83 242,680 0.67United States 47,589,665 97.42 34,622,637 96.13
48,833,008 99.97 36,009,739 99.99
The summarized VaR Analysis in Note 12(a)(iv) explains how the price risk is measured and summarizes the potential exposure of the Sub-Fund’s net assets attributable to unitholders.
As at 31st December 2021 and 2020, the NASDAQ 100 ETF held all constituents in the NASDAQ 100 Index. The NASDAQ 100 ETF is therefore exposed to substantially the same market price risk as the NASDAQ 100 Index.
Hang Seng ETF
As at 31st December 2021 As at 31st December 2020
Fair valueHK$
% of net asset value
Fair valueHK$
% of net asset value
Financial assetsListed equities – By SectorCommunication Services 71,275,521 11.05 31,067,158 12.23Consumer Discretionary 152,217,772 23.61 38,635,106 15.22Consumer Staples 16,708,284 2.58 6,313,896 2.48Energy 15,513,182 2.40 6,089,492 2.40Financials 228,641,987 35.42 107,398,167 42.28Health Care 25,543,260 3.95 11,366,346 4.48Industrials 27,433,879 4.25 9,862,230 3.88Information Technology 30,255,022 4.70 15,568,119 6.13Real Estate 47,866,079 7.43 19,018,810 7.49Utilities 26,320,193 4.07 8,328,781 3.29
FuturesMini Hang Seng Futures 24,620 0.00 10,040 0.00
641,799,799 99.46 253,658,145 99.88
The summarized VaR Analysis in Note 12(a)(iv) explains how the price risk is measured and summarizes the potential exposure of the Sub-Fund’s net assets attributable to unitholders.
As at 31st December 2021 and 2020, the Hang Seng ETF held all constituents in the HSI Net Total Return Index. The Hang Seng ETF is therefore exposed to substantially the same market price risk as the HSI Net Total Return Index.
NM0522U-2194143-52/163

52 iShares Asia Trust
Notes to the Financial Statements (continued)
MSCI Emerging Markets ETF (HK)
As at 31 December 2021, the fair value of investments and derivatives of the Master ETF by industrial sector and geographical area, based on the Master ETF unaudited financial records were as follows:
As at 31st December 2021
Fair valueUS$’000
% of net asset value
Financial assetsEquities – By SectorAdvertising 1,223 0.04Aerospace & defence 5,403 0.14Agriculture 23,097 0.60Airlines 5,636 0.14Apparel retailers 17,181 0.44Auto manufacturers 117,386 3.04Auto parts & equipment 22,638 0.58Banks 448,288 11.67Beverages 60,057 1.57Biotechnology 31,183 0.81Building materials and fixtures 34,698 0.90Chemicals 113,377 2.96Coal 8,104 0.21Commercial services 24,505 0.64Computers 115,476 2.99Cosmetics & personal care 15,196 0.40Distribution & wholesale 4,157 0.11Diversified financial services 181,782 4.72Electrical components & equipment 27,368 0.71Electricity 59,838 1.55Electronics 80,250 2.08Energy – alternate sources 13,607 0.36Engineering & construction 36,335 0.94Entertainment 5,444 0.14Environmental control 4,412 0.12Food 82,845 2.13Forest products & paper 5,269 0.13Gas 20,080 0.52Healthcare products 10,282 0.27Healthcare services 48,104 1.26Holding companies – diversified operations 9,824 0.25Home builders 988 0.03Home furnishings 17,995 0.46Hotels 9,403 0.26Household goods & home construction 14,885 0.39Household products 1,905 0.05Insurance 84,582 2.19Internet 494,840 12.83Investment services 7,388 0.21Iron & steel 59,320 1.52Leisure time 4,990 0.13Machinery – diversified 6,664 0.17Machinery, construction & mining 6,664 0.17Marine transportation 4,916 0.13
As at 31st December 2021
Fair valueUS$’000
% of net asset value
Media 4,770 0.13Metal fabricate/ hardware 3,842 0.10Mining 89,543 2.33Miscellaneous manufacturers 33,149 0.86Oil & gas 193,122 5.02Oil & gas services 2,054 0.05Packaging & containers 3,001 0.07Pharmaceuticals 67,430 1.75Pipelines 2,752 0.07Real estate investment & services 72,914 1.89Real estate investment trusts 3,338 0.08Retail 105,632 2.74Semiconductors 564,593 14.66Software 66,019 1.72Storage & warehousing 1,872 0.05Telecommunications 151,299 3.92Textile 2,064 0.06Transportation 38,785 1.01Water 4,190 0.11
Exchange Traded FundsiShares MSCI Brazil UCITS ETF (DE)β 50,620 1.31iShares MSCI Saudi Arabia Capped UCITS ETFβ 29,592 0.77
Rights – By SectorMachinery, construction & mining 71 0.00Real estate investment & services 0# 0.00
FuturesMSCI Emerging Markets Index Futures 39 0.00
3,838,276 99.66
Equities – By Geographical AreaBermuda 20,286 0.53Brazil 102,523 2.66British Virgin Islands 634 0.02Cayman Islands 742,516 19.28Chile 14,297 0.37Colombia 6,645 0.17Cyprus 5,576 0.15Czech Republic 5,259 0.14Egypt 3,435 0.09Greece 8,011 0.21Hong Kong 44,815 1.16Hungary 9,017 0.23India 477,924 12.41Indonesia 55,504 1.44Isle of Man 1,447 0.04Jersey 3,049 0.08Kuwait 23,358 0.61Luxembourg 2,936 0.08Malaysia 53,557 1.39Mexico 78,677 2.04
β Not authorized by the SFC under Section 104 of the Securities and Futures Ordinance in Hong Kong and is not available for direct investment by Hong Kong residents.
# Amount is less than US$1,000.
NM0522U-2194143-53/163

Reports and Financial Statements 53
Notes to the Financial Statements (continued)
As at 31st December 2021
Fair valueUS$’000
% of net asset value
Netherlands 10,532 0.27People’s Republic of China 448,459 11.64Peru 811 0.02Philippines 27,140 0.71Poland 27,438 0.71Qatar 29,553 0.77Republic of South Korea 491,491 12.76Russian Federation 117,430 3.05Saudi Arabia 99,020 2.57Singapore 790 0.02South Africa 119,179 3.09Taiwan 597,664 15.52Thailand 64,508 1.68Turkey 8,798 0.23United Arab Emirates 42,801 1.11United States 12,874 0.33
Exchange traded fundsGermany 50,620 1.31Ireland 29,592 0.77
Rights – By Geographical AreaCayman Islands 0# 0.00Republic of South Korea 71 0.00
FuturesMSCI Emerging Markets Index Futures 39 0.00
3,838,276 99.66
As at 31st December 2021, the MSCI Emerging Markets ETF (HK) invested in 1,254 out of 1,418 constituents through the Master ETF, in substantially the same weightings as constituted in the MSCI Emerging Markets Index. The MSCI Emerging Markets ETF (HK) is therefore exposed to substantially the same market price risk as the MSCI Emerging Markets Index.
The summarized VaR Analysis in Note 12(a)(iv) explains how the price risk is measured and summarizes the potential exposure of the Sub-Fund’s net assets attributable to unitholders.
# Amount is less than US$1,000.
Hang Seng TECH ETF
As at 31st December 2021
Fair valueHK$
% of net asset value
Financial assetsListed equities – By SectorCommunication Services 2,630,615,203 26.55Consumer Discretionary 3,236,850,528 32.66Financials 110,285,455 1.11Health Care 233,823,158 2.35Information Technology 3,677,058,991 37.09
FuturesHang Seng TECH Index Futures 591,200 0.01
9,889,224,535 99.77
The summarized VaR Analysis in Note 12(a)(iv) explains how the price risk is measured and summarizes the potential exposure of the Sub-Fund’s net assets attributable to unitholders.
As at 31st December 2021, the Hang Seng TECH ETF held all constituents in the Hang Seng TECH Index. The Hang Seng TECH ETF is therefore exposed to substantially the same market price risk as the Hang Seng TECH Index.
The KOSPI 200 ETF’s financial assets and financial liabilities at fair value through profit or loss were concentrated in the following industries:
KOSPI 200 ETF
As at 18th June 2021 As at 31st December 2020
Fair valueUS$
% of net asset value
Fair valueUS$
% of net asset value
Financial assetsListed equities – By SectorCommunication Services 876,087 12.73 623,770 9.72Consumer Discretionary 717,132 10.43 606,551 9.45Consumer Staples 302,113 4.38 285,145 4.48Energy 114,005 1.65 83,135 1.29Financials 522,191 7.58 431,113 6.73Health Care 329,644 4.78 426,676 6.63Industrials 693,823 10.08 527,610 8.26Information Technology 2,706,249 39.32 2,791,299 43.56Materials 575,627 8.37 521,047 8.16Utilities 52,524 0.77 54,059 0.84
Listed rights – By SectorMaterials – – 869 0.01
Unlisted rights – By SectorHealth Care 115 0.00 – –Industrials – – 398 0.01
6,889,510 100.09 6,351,672 99.14
NM0522U-2194143-54/163

54 iShares Asia Trust
Notes to the Financial Statements (continued)
The KOSPI 200 ETF did not hold any investments as at 18th August 2021 and were not exposed to market price risk, therefore, the market exposure as at 18th June 2021 are presented, which is the last day on which investors may buy or sell units on the SEHK and it represents the exposure to market price risk up to 18th June 2021.
The summarized VaR Analysis in Note 12(a)(iv) explains how the price risk is measured and summarizes the potential exposure of the Sub-Fund’s net assets attributable to unitholders.
As at 31st December 2020, the KOSPI 200 ETF held 199 out of 200 constituents in the KOSPI 200 Capped 30% Net Total Return USD Index. The KOSPI 200 ETF is therefore exposed to substantially the same market price risk as the KOSPI 200 Capped 30% Net Total Return USD Index.
(ii) Interest Rate Risk
Interest rate risk arises from the effects of fluctuations in the prevailing levels of market interest rates on the fair value of financial assets and liabilities and future cash flow.
As at 31st December 2021 and 2020, interest rate risk for all Sub-Funds arises only from bank balances which are reset from time to time. As these interest bearing assets are short-term in nature, the Manager considers that changes in their fair value and future cash flows in the event of a change in market interest rates will not be material. Therefore, no sensitivity analysis has been disclosed for these bank balances.
KOSPI 200 ETFAs at 18th August 2021 (date of delisting from the SEHK), the KOSPI 200 ETF did not hold any interest bearing assets and liabilities, therefore, no exposure to the interest rate risk and sensitivity analysis are presented. As at 31st December 2020, interest rate risk for the KOSPI 200 ETF arose only from bank balances which were reset from time to time. As these interest bearing assets are short-term in nature, the Manager considers that changes in their fair value and future cash flows in the event of a change in market interest rates will not be material. Therefore, no sensitivity analysis has been disclosed for these bank balances.
(iii) Currency risk
The table below summarizes the currency exposure of the Sub-Funds.
Currency Code
British Pound GBPEuro EURHong Kong dollar HK$Indian Rupee INRIndonesian Rupiah IDRKorean Won KRWMalaysian Ringgit MYRNew Taiwan dollar TWDPakistan Rupee PKRPhilippine Peso PHPRenminbi RMBSingapore dollar SGDThai Baht THBUS dollar US$
MSCI China ETF
The Sub-Fund is exposed to currency risk related to the HK$ against RMB.
The table below summarizes the Sub-Fund’s net exposure in monetary and non-monetary assets:
As at 31st December 2021HK$ equivalent
Currency Monetary Non-monetary
RMB (417,181) 730,427,860
As at 31st December 2020HK$ equivalent
Currency Monetary Non-monetary
RMB 2,661,365 649,959,499
The summarized VaR Analysis in Note 12(a)(iv) explains how the currency risk is measured and summarizes the potential exposure of the Sub-Fund’s net assets attributable to unitholders.
China A50 ETF
The Sub-Fund is exposed to currency risk related to the RMB against the HK$ and US$.
The table below summarizes the Sub-Fund’s net exposure in monetary and non-monetary assets:
As at 31st December 2021RMB equivalent
Currency Monetary Non-monetary
HK$ 9,124,280 –US$ 1,295 –
As at 31st December 2020RMB equivalent
Currency Monetary Non-monetary
HK$ 6,042,947 –US$ 66,922 –
The summarized VaR Analysis in Note 12(a)(iv) explains how the currency risk is measured and summarizes the potential exposure of the Sub-Fund’s net assets attributable to unitholders.
SENSEX India ETF
The Sub-Fund is exposed to currency risk related to the US$ against the INR.
NM0522U-2194143-55/163

Reports and Financial Statements 55
Notes to the Financial Statements (continued)
The table below summarizes the Sub-Fund’s net exposure in monetary and non-monetary assets:
As at 31st December 2021US$ equivalent
Currency Monetary Non-monetary
INR 981,945 96,869,362
As at 31st December 20209
US$ equivalent
Currency Monetary Non-monetary
INR 17,895 95,818,104
The summarized VaR Analysis in Note 12(a)(iv) explains how the currency risk is measured and summarizes the potential exposure of the Sub-Fund’s net assets attributable to unitholders.
MSCI Asia ex Japan ETF
The Sub-Fund is exposed to currency risk related to the US$ against the IDR, INR, KRW, MYR, PHP, PKR, RMB, SGD, THB and TWD.
The table below summarizes the Sub-Fund’s net exposure in monetary and non-monetary assets:
As at 31st December 2021US$ equivalent
Currency Monetary Non-monetary
IDR 62,200 41,558,527INR 304,048 353,777,947KRW 2,345,367 363,836,448MYR 10,482 39,936,242PHP 4,946 20,199,014RMB 2,619 151,830,775SGD 179,064 64,025,103THB – 48,077,415TWD 862,849 457,650,818
As at 31st December 2020US$ equivalent
Currency Monetary Non-monetary
IDR – 32,389,818INR 158,683 222,263,448KRW 2,509,199 322,801,659MYR 105,317 36,372,810PHP 5,697 17,633,844PKR 4,051 522,817RMB 321,830 115,823,116SGD 93,157 49,965,310THB 7,480 43,505,503TWD 528,372 306,255,964 9 Represents the figures of the Mauritius Subsidiary.
The summarized VaR Analysis in Note 12(a)(iv) explains how the currency risk is measured and summarizes the potential exposure of the Sub-Fund’s net assets attributable to unitholders.
MSCI Emerging Asia ETF
The Sub-Fund is exposed to currency risk related to the HK$ against the IDR, KRW, MYR, PHP, RMB, THB and TWD.
The table below summarizes the Sub-Fund’s net exposure in monetary and non-monetary assets:
As at 31st December 2021HK$ equivalent
Currency Monetary Non-monetary
IDR 2,708 2,592,408KRW 144,862 22,794,802MYR 798 2,469,341PHP 304 1,229,398RMB 507 9,562,817THB – 2,975,367TWD 63,378 28,633,967
As at 31st December 2020HK$ equivalent
Currency Monetary Non-monetary
IDR 1 4,365,221KRW 398,941 43,987,910MYR 14,191 5,001,099PHP 1,008 2,383,288RMB 494 15,769,261THB 1,005 5,882,500TWD 71,739 41,562,677
The summarized VaR Analysis in Note 12(a)(iv) explains how the currency risk is measured and summarizes the potential exposure of the Sub-Fund’s net assets attributable to unitholders.
CSI 300 ETF
The Sub-Fund is exposed to currency risk related to the RMB against the HK$ and US$.
The table below summarizes the Sub-Fund’s net exposure in monetary and non-monetary assets:
As at 31st December 2021RMB equivalent
Currency Monetary Non-monetary
HK$ 263 –US$ 56 –
NM0522U-2194143-56/163

56 iShares Asia Trust
Notes to the Financial Statements (continued)
As at 31st December 2020RMB equivalent
Currency Monetary Non-monetary
HK$ 270 –US$ 57 –
The summarized VaR Analysis in Note 12(a)(iv) explains how the currency risk is measured and summarizes the potential exposure of the Sub-Fund’s net assets attributable to unitholders.
MSCI Taiwan ETF
The Sub-Fund is exposed to currency risk related to the US$ against the TWD.
The table below summarizes the Sub-Fund’s net exposure in monetary and non-monetary assets:
As at 31st December 2021US$ equivalent
Currency Monetary Non-monetary
TWD 86,322 78,988,411
As at 31st December 2020US$ equivalent
Currency Monetary Non-monetary
TWD 92,840 79,517,720
The summarized VaR Analysis in Note 12(a)(iv) explains how the currency risk is measured and summarizes the potential exposure of the Sub-Fund’s net assets attributable to unitholders.
NASDAQ 100 ETF, Hang Seng ETF, MSCI Emerging Markets ETF (HK ) and Hang Seng TECH ETF
As at 31st December 2021 and 2020, no exposure in monetary and non-monetary assets. Since the assets and liabilities of the Sub-Fund are denominated in HK$ and US$ only.
The summarized VaR Analysis in Note 12(a)(iv) explains how the currency risk is measured and summarizes the potential exposure of the Sub-Fund’s net assets attributable to holders of redeemable participating shares.
Currency risk of Master ETF
The functional currency of the Master ETF is US dollar. The Master ETF may invest in financial instruments denominated in currencies other than its functional currency. Consequently, the Master ETF is exposed, directly and/or indirectly, to risks that the
exchange rate of its functional currency relative to other currencies may change in a manner which has an adverse effect on the value of the portion of the Master ETF’s assets which are denominated in currencies other than its own currency.
In addition, the Master ETF may issue share classes denominated in currencies other than the functional currency of the Master ETF.
The Master ETF may engage in foreign currency hedging to minimize the effect of currency movements between the currencies of the investments held by the Master ETF and the Master ETF’s functional currency and the Master ETF’s currency hedged share classes (if any).
The Investment Manager of the Master ETF would monitor foreign currency risk exposure against pre-determined tolerances and determines when a currency hedge should be reset and the gain or loss arising from such hedge reinvested or settled, while taking into consideration the frequency and associated transaction and reinvestment costs of resetting the currency hedge.
KOSPI 200 ETF
The Sub-Fund is exposed to currency risk related to the US$ against the KRW.
The table below summarizes the Sub-Fund’s net exposure in monetary and non-monetary assets:
As at 18th August 2021(date of delisting from the SEHK)
US$ equivalent
Currency Monetary Non-monetary
KRW – –
As at 31st December 2020US$ equivalent
Currency Monetary Non-monetary
KRW 51,861 6,351,672
The summarized VaR Analysis in Note 12(a)(iv) explains how the currency risk is measured and summarizes the potential exposure of the Sub-Fund’s net assets attributable to unitholders.
(iv) Summarized VaR Analysis
Value at Risk (“VaR”) is a risk model used to estimate the potential losses that could occur on the Sub-Funds’ net asset value position due to movements in interest rates, currency and market prices ozver a given period and for a specified degree of confidence.
NM0522U-2194143-57/163

Reports and Financial Statements 57
Notes to the Financial Statements (continued)
The Management uses VaR analysis and/or tracking error estimates to measure and manage risk as these are commonly used and understood models, and are consistent across different types of asset classes and types of funds. For the purpose of these accounts VaR analysis has been presented. The objective in all cases is to estimate potential losses and manage the downside risk.
The following table summarizes the outputs of the VaR model in relation to interest rate, currency and price risk exposures. The total VaR figures are not the sum of individual risk components as VaR takes into account correlations between different risk factors.
The Management calculates the VaR relative to the Sub-Funds’ total value. The analysis implies that the Manager can be 99% confident that the value of the portfolio will not decrease by any more than the figures in the table below over the 20 business day period from 31st December.
2021
Amount %
MSCI China ETF HK$728,635,331 16.36China A50 ETF RMB2,316,894,014 15.11SENSEX India ETF US$15,536,000 16.05MSCI Asia ex Japan ETF US$317,457,813 12.71MSCI Emerging Asia ETF HK$18,081,626 12.82CSI 300 ETF RMB53,141,526 14.69MSCI Taiwan ETF US$11,384,424 14.38NASDAQ 100 ETF US$6,057,113 12.40Hang Seng ETF HK$92,150,213 14.28MSCI Emerging Markets ETF
(HK) US$1,751,401 12.40Hang Seng TECH ETF HK$2,044,856,322 20.63KOSPI 200 ETF N/A N/A
2020
Amount %
MSCI China ETF HK$817,242,100 15.42China A50 ETF RMB2,684,029,015 16.57SENSEX India ETF US$17,548,611 18.86MSCI Asia ex Japan ETF US$288,901,947 13.55MSCI Emerging Asia ETF HK$35,951,594 13.75CSI 300 ETF RMB40,116,007 16.36MSCI Taiwan ETF US$11,619,748 14.59NASDAQ 100 ETF US$5,330,211 14.80Hang Seng ETF HK$34,664,845 13.65MSCI Emerging Markets ETF
(HK) N/A N/AHang Seng TECH ETF N/A N/AKOSPI 200 ETF US$1,087,914 16.98
Detailed information about the models
There are a number of different VaR models used within the Funds Management industry. The Management uses one or more of ex-ante and ex-post estimates of portfolio risk and the Monte Carlo simulation model depending on the fund type. Models are calculated using historical data and a covariance matrix where applicable.
The VaR model did not wholly represent the ‘abnormal period’ of the month of March 2020 due to the disruption caused by the COVID-19.
The models used by the Management have the following features:
• VaR is calculated to a 99 per cent confidence level.• VaR at a confidence level identifies the maximum expected
loss under that confidence level;• VaR is calculated for a 20 business day holding period. The
time horizon of twenty days is selected to coincide with the period used to analyze the portfolio positions. The risk data is examined in various daily, weekly and monthly forums; and
• The portfolio VaR is not the simple sum of individual asset standalone VaRs; the correlations among assets in the portfolio are considered.
Although VaR is a valuable risk management tool it should be interpreted, as with all predictive models, with consideration to its assumptions and limitations.
The main assumptions and limitations are listed below:
• Some models assume certain financial variables are normally distributed: The normality assumption allows the Management to scale portfolio risk estimates to the appropriate confidence levels. The normality assumption is derived from statistical analysis for examining sample populations of observations and the implications of not assuming normality would preclude the use of most statistical tools including mainstream commercial models for risk measurement.
• The use of historical returns and correlations between assets would not take into account future potential events: It is a commonly stated and well recognized limitation that past performance is not a reliable indicator of future performance.
• Model risk, in general terms, is a known limitation that includes: the quality or accuracy of the underlying data, where significant events occur within the data, the changing sensitivity of the Sub-Funds’ assets to external market factors over time, and appreciating that using only one model may be limiting in itself to obtaining the best understanding of Sub-Funds’ risk position.
The Management acknowledges these limitations and thus compares ex-ante and ex-post risk estimates to review expectations versus actual outcomes. Should ex-post values differ significantly from ex-ante returns, an assessment of the reasons for this will be made.
NM0522U-2194143-58/163

58 iShares Asia Trust
Notes to the Financial Statements (continued)
The Sub-Funds’ risk is managed with constant review of both performance and risk numbers by the investment professionals within the business. These reviews consist of:
• Weekly meetings between the global members of Risk & Quantitative Analysis (“RQA”). These meetings include RQA Hong Kong.
• Monthly meetings between RQA and the Fund Managers.• Monthly meetings between RQA and the Chief Investment
Officer.• Ad hoc presentations to the Investment Risk Management
Working Group IRMWG to keep IRMWG abreast of RQA processes and latest updates.
• Daily report of performance figures along with a comparison of ex-ante versus ex-post returns sent to RQA London.
• RQA professionals sitting and working closely with the Fund Managers every day.
(b) Credit and Counterparty Risk
Credit and counterparty risk is the risk that an issuer of a security or counterparty to a transaction will fail to fulfil an obligation or commitment that it has entered into with the Sub-Funds.
Financial assets which potentially cause the Sub-Funds to be subject to concentrations of credit and counterparty risk consist principally of investments issued by IAP Issuers, and bank balances.
The SENSEX India ETF may invest up to 15% of its net asset value in IAPs; with a maximum exposure to any single issuer of 10% of its net asset value. For the years ended 31st December 2021 and 2020, the SENSEX India ETF did not hold any IAPs.
The Manager takes steps to minimize counterparty risk in the Sub-Funds by carrying out the majority of their investment transactions and contractual commitment activities with well established broker-dealers, banks and regulated exchanges with high credit ratings.
All transactions in listed investments are settled or paid for upon delivery using approved and reputable brokers. The risk of default is considered minimal since delivery of investments sold is made only when the Sub-Funds’ custodians have received payment. For a purchase, payment is made once the investments have been received by the broker. If either party fails to meet their obligation, the trade will fail.
The following table sets out the net exposure of the Sub-Funds to counterparties as at 31st December 2021 and 2020 respectively together with their credit ratings of senior long-term debt by Standard & Poor’s Rating Services:
MSCI China ETF China A50 ETF
2021Net exposure
tocounterparties
HK$
2020Net exposure
tocounterparties
HK$
2021Net exposure
tocounterparties
RMB
2020Net exposure
tocounterparties
RMB
Margin deposits– Credit Suisse International 1,638,256 705,058 N/A N/ARating A+ A+ N/A N/A
– HSBC Bank Plc N/A N/A (67) (459,322)Rating N/A N/A A+ A+
Amounts due from brokers– Credit Suisse International 28,006,447 N/A N/A N/ARating A+ N/A N/A N/A
– Citigroup Global Markets Inc. N/A 3,011,119 N/A N/ARating N/A A+ N/A N/A
– Credit Suisse Securities (Europe) Limited N/A 1,599,506 N/A N/A
Rating N/A A+ N/A N/A
SENSEX India ETF MSCI Asia ex Japan ETF
2021Net exposure
tocounterparties
US$
2020Net exposure
tocounterparties
US$
2021Net exposure
tocounterparties
US$
2020Net exposure
tocounterparties
US$
Margin deposits– Credit Suisse International N/A N/A 598,967 47,160Rating N/A N/A A+ A+
– HSBC Bank Plc (15) N/A N/A N/ARating A+ N/A N/A N/A
Amounts due from brokers– Citigroup Global Markets Inc. N/A N/A N/A 416,052Rating N/A N/A N/A A+
– Credit Suisse Securities (Europe) Limited N/A N/A N/A 285,072
Rating N/A N/A N/A A+
– Macquarie Capital (USA) Inc., guaranteed by Macquarie Group Limited 282,768 N/A N/A N/A
Rating BBB+ N/A N/A N/A
– UBS Securities LLC 2,382,321 N/A N/A N/ARating A+ N/A N/A N/A
NM0522U-2194143-59/163

Reports and Financial Statements 59
Notes to the Financial Statements (continued)
MSCI Emerging Asia ETF MSCI Taiwan ETF
2021Net exposure
tocounterparties
HK$
2020Net exposure
tocounterparties
HK$
2021Net exposure
tocounterparties
US$
2020Net exposure
tocounterparties
US$
Margin deposits– Credit Suisse International 150 N/A 7,954 1,868Rating A+ N/A A+ A+
Hang Seng ETF
MSCI Emerging Markets ETF
(HK)Hang SengTECH ETF
2021Net exposure
tocounterparties
HK$
2020Net exposure
tocounterparties
HK$
2021Net exposure
tocounterparties
US$
2021Net exposure
tocounterparties
HK$
Margin deposits– Credit Suisse International 305,080 19,901 N/A N/ARating A+ A+ N/A N/A
– HSBC Bank Plc N/A N/A 3,529 2,748,700Rating N/A N/A A+ A+
The maximum exposure to credit risk at the end of the reporting period is the carrying amount of the assets as shown in the Statement of Financial Position.
The Sub-Funds are also exposed to credit and counterparty risk on assets held by custodian.
MSCI China ETF, SENSEX India ETF, MSCI Asia ex Japan ETF, MSCI Emerging Asia ETF, MSCI Taiwan ETF, NASDAQ 100 ETF, Hang Seng ETF, MSCI Emerging Markets ETF (HK), and Hang Seng TECH ETF
2021 2020
Bank Balances– The Hongkong and Shanghai
Banking Corporation LimitedSenior Long Term Debt by
Standard & Poor’s AA- AA-Investments– HSBC Institutional Trust Services
(Asia) LimitedSenior Long Term Debt by
Standard & Poor’s AA- AA-
China A50 ETF
2021RMB
2020RMB
Bank Balances– The Hongkong and Shanghai
Banking Corporation Limited154,160 11,223,237
– Rating Senior Long Term Debt by Standard & Poor’s
AA- AA-
– HSBC Bank (China) Company Limited
10,961,786 15,071,925
– Rating Senior Long Term Debt by Standard & Poor’s
A+ A+
– Citibank, N.A. 117,648 117,613– Rating Senior Long Term Debt by
Standard & Poor’sA+ A+
Direct A Share investment held with:
– HSBC Bank (China) Company Limited
12,381,035,135 15,063,915,546
– Rating Senior Long Term Debt by Standard & Poor’s
A+ A+
– The Hongkong and Shanghai Banking Corporation Limited
2,945,761,157 1,125,425,571
– Rating Senior Long Term Debt by Standard & Poor’s
AA- AA-
CSI 300 ETF
2021RMB
2020RMB
Bank Balances– The Hongkong and Shanghai
Banking Corporation Limited5,620 4,048
– Rating Senior Long Term Debt by Standard & Poor’s
AA- AA-
– HSBC Bank (China) Company Limited
474,570 139,566
–Rating Senior Long Term Debt by Standard & Poor’s
A+ A+
Direct A Share investment held with:
– HSBC Bank (China) Company Limited
361,369,521 245,123,824
– Rating Senior Long Term Debt by Standard & Poor’s
A+ A+
– The Hongkong and Shanghai Banking Corporation Limited
20,430 17,880
– Rating Senior Long Term Debt by Standard & Poor’s
AA- AA-
NM0522U-2194143-60/163

60 iShares Asia Trust
Notes to the Financial Statements (continued)
The Sub-Funds measure credit risk and expected losses using probability of default, exposure at default and loss given default. Management consider both historical analysis and forward looking information in determining any expected credit loss. As at 31st December 2021 and 2020, all financial assets categorized as amortized cost are held with counterparties with high credit ratings and due to be settled within 3 months. Management consider the probability of default to be close to zero as the counterparties have a strong capacity to meet their contractual obligations in the near term. As a result, no loss allowance has been recognized based on 12-month expected credit losses as any such impairment would be wholly insignificant to the Sub-Funds.
KOSPI 200 ETF
31.12.2020
Bank Balances– The Hongkong and Shanghai Banking
Corporation LimitedSenior Long Term Debt by
Standard & Poor’sAA-
Investments– HSBC Institutional Trust Services (Asia)
LimitedSenior Long Term Debt by
Standard & Poor’sAA-
As at 18th August 2021, the KOSPI 200 ETF did not hold any bank balances and investments, therefore, no exposure to the credit and counterparty risk on assets held by custodian.
(c) Liquidity Risk
Liquidity risk is the risk that the Sub-Funds may not be able to generate sufficient cash resources to settle their obligations in full as they fall due or can only do so on terms that are materially disadvantageous.
As at 31st December 2021 and 2020, all of the Sub-Funds’ financial liabilities are due within twelve months and therefore equal their carrying balances, as the impact of discounting is not significant. As at 31st December 2021 and 2020, each Sub-Fund held financial assets at fair value through profit or loss and other liquid assets as stated in the Statement of Financial Position that are expected to readily generate cash inflows, normally within one month, for managing liquidity risk.
As at 18th August 2021 (date of delisting from the SEHK) and 31st December 2020, the KOSPI 200 ETF’s financial liabilities are due within twelve months and therefore equal their carrying balances, as the impact of discounting is not significant. As at 18th August 2021 (date of delisting from the SEHK) and 31st December 2020, the KOSPI 200 ETF held financial assets at fair value through profit or loss and other liquid assets as stated in the Statement of Financial Position that are expected to readily generate cash inflows, normally within one month, for managing liquidity risk.
Each of the MSCI China ETF, China A50 ETF, MSCI Asia ex Japan ETF, MSCI Emerging Asia ETF, CSI 300 ETF, KOSPI 200 ETF, MSCI Taiwan ETF, NASDAQ 100 ETF, Hang Seng ETF MSCI Emerging Markets ETF (HK) and Hang Seng TECH ETF invest the majority of their assets in investments that are traded in active markets and can be readily disposed of.
As at 31st December 2021, the SENSEX India ETF invests the majority of its assets in investments that are traded in active markets and can be readily disposed of. As at 31st December 2020, the SENSEX India ETF invests the majority of its assets, through the Mauritius Subsidiary, in investments that are traded in an active market and can be readily disposed of, but may hold up to 15% of its net asset value in IAPs which do not have an active market. However, where a participating dealer subscribes or redeems in cash, such transactions would be effected with an IAP Issuer nominated by the participating dealer. For the years and as of 31st December 2021 and 2020, the SENSEX India ETF did not hold any IAPs.
(d) Fair Value Estimation
The fair value of investments traded in active markets (such as publicly traded derivatives and trading securities) are based on quoted market prices at the close of trading on the reporting date. Investments that are listed or traded on an exchange are fair valued based on the last traded market prices.
An active market is a market in which transactions for the asset or liability take place with sufficient frequency and volume to provide pricing information on an ongoing basis.
As at 31st December 2020, 100% of the financial assets at fair value through profit or loss relate to the SENSEX India ETF’s investment in the Mauritius Subsidiary that has been fair valued in accordance with the policies set out in note 2(c). The shares of the Mauritius Subsidiary are not publicly traded; redemptions can only be made by the SENSEX India ETF on the redemption dates as specified in the offering document. As a result, the carrying value of the Mauritius Subsidiary may not be indicative of the value ultimately realized on redemption.
The fair value of the investment in Mauritius Subsidiary is primarily based on the latest net asset value of the Mauritius Subsidiary’s participating shares as reported by its administrator. The SENSEX India ETF may make adjustments to the value based on considerations such as; liquidity of the SENSEX India ETF’s holding in the Mauritius Subsidiary or its underlying investments.
IFRS 13 requires the Sub-Funds to classify their fair value measurements using a fair value hierarchy that reflects the significance of the inputs used in making the measurements. The fair value hierarchy has the following levels:
NM0522U-2194143-61/163

Reports and Financial Statements 61
Notes to the Financial Statements (continued)
• Quoted prices (unadjusted) in active markets for identical assets or liabilities that the entity can access at the measurement date (level 1).
• Inputs other than quoted prices included within level 1 that are observable for the asset or liability, either directly or indirectly (level 2).
• Inputs for the asset or liability that are unobservable inputs (level 3).
The level in the fair value hierarchy within which the fair value measurement is categorized in its entirety is determined on the basis of the lowest level input that is significant to the fair value measurement in its entirety. For this purpose, the significance of an input is assessed against the fair value measurement in its entirety. If a fair value measurement uses observable inputs that require significant adjustment based on unobservable inputs, that measurement is a level 3 measurement. Assessing the significance of a particular input to the fair value measurement in its entirety requires judgment, considering factors specific to the asset or liability.
The determination of what constitutes “observable” requires significant judgment by the Manager. The Manager considers observable data to be that market data that is readily available, regularly distributed or updated, reliable and verifiable, not proprietary, and provided by independent sources that are actively involved in the relevant market.
The following tables analyze within the fair value hierarchy the Sub-Funds’ financial assets and liabilities at fair value through profit or loss (by class) measured at fair value at 31st December:
MSCI China ETF
31st December 2021
Level 1 Level 2 Level 3 Total
HK$ HK$ HK$ HK$
Assets– Equity securities 4,437,470,467 – 1,607,520 4,439,077,987– Unlisted equities – – 6 6– Unlisted rights – – 0∆ 0∆
Total assets 4,437,470,467 – 1,607,526 4,439,077,993
Liabilities– Futures (151,209) – – (151,209)
Total liabilities (151,209) – – (151,209)
∆ Amount is less than HK$1.
31st December 2020
Level 1 Level 2 Level 3 Total
HK$ HK$ HK$ HK$
Assets– Equity securities 5,283,959,356 – – 5,283,959,356– Futures 261,460 – – 261,460– Unlisted equities – – 6 6– Unlisted rights – – 0∆ 0∆
Total assets 5,284,220,816 – 6 5,284,220,822
China A50 ETF
31st December 2021
Level 1 Level 2 Level 3 Total
RMB RMB RMB RMB
Assets– Equity securities 15,326,796,292 – – 15,326,796,292
Total assets 15,326,796,292 – – 15,326,796,292
31st December 2020
Level 1 Level 2 Level 3 Total
RMB RMB RMB RMB
Assets– Equity securities 16,189,341,117 – – 16,189,341,117
Total assets 16,189,341,117 – – 16,189,341,117
SENSEX India ETF
31st December 2021
Level 1 Level 2 Level 3 Total
US$ US$ US$ US$
Assets– Equity securities 96,869,362 – – 96,869,362
Total assets 96,869,362 – – 96,869,362
NM0522U-2194143-62/163

62 iShares Asia Trust
Notes to the Financial Statements (continued)
31st December 2020
Level 1 Level 2 Level 3 Total
US$ US$ US$ US$
Assets– Investment fund – 93,069,773 – 93,069,773
Total assets – 93,069,773 – 93,069,773
MSCI Asia ex Japan ETF
31st December 2021
Level 1 Level 2 Level 3 Total
US$ US$ US$ US$
Assets– Equity securities 2,492,096,138 1,297,304 409,185 2,493,802,627– Listed rights – – – –– Unlisted equities – – 0# 0#
– Unlisted rights – 52,393 0# 52,393– Futures 90,173 – – 90,173
Total assets 2,492,186,311 1,349,697 409,185 2,493,945,193
31st December 2020
Level 1 Level 2 Level 3 Total
US$ US$ US$ US$
Assets– Equity securities 2,126,329,635 – – 2,126,329,635– Listed rights 40,168 – – 40,168– Unlisted equities – – 0# 0#
– Unlisted rights – – 0# 0#
– Futures 227,040 – – 227,040
Total assets 2,126,596,843 – 0# 2,126,596,843
MSCI Emerging Asia ETF
31st December 2021
Level 1 Level 2 Level 3 Total
HK$ HK$ HK$ HK$
Assets– Equity securities 118,443,993 – 48,081 118,492,074– Exchange traded fund 22,317,105 – – 22,317,105– Unlisted equities – – 0∆ 0∆
– Unlised rights – 3,290 0∆ 3,290
Total assets 140,761,098 3,290 48,081 140,812,469
# Amount is less than US$1.∆ Amount is less than HK$1.
31st December 2020
Level 1 Level 2 Level 3 Total
HK$ HK$ HK$ HK$
Assets– Equity securities 230,719,461 – – 230,719,461– Exchange traded fund 30,245,451 – – 30,245,451– Listed rights 6,086 – – 6,086– Unlisted equities – – 0∆ 0∆
Total assets 260,970,998 – 0∆ 260,970,998
CSI 300 ETF
31st December 2021
Level 1 Level 2 Level 3 Total
RMB RMB RMB RMB
Assets– Equity securities 361,389,951 – – 361,389,951
Total assets 361,389,951 – – 361,389,951
31st December 2020
Level 1 Level 2 Level 3 Total
RMB RMB RMB RMB
Assets– Equity securities 245,141,704 – – 245,141,704
Total assets 245,141,704 – – 245,141,704
MSCI Taiwan ETF
31st December 2021
Level 1 Level 2 Level 3 Total
US$ US$ US$ US$
Assets– Equity securities 78,988,411 – – 78,988,411– Futures 740 – – 740
Total assets 78,989,151 – – 78,989,151
NM0522U-2194143-63/163

Reports and Financial Statements 63
Notes to the Financial Statements (continued)
31st December 2020
Level 1 Level 2 Level 3 Total
US$ US$ US$ US$
Assets– Equity securities 79,517,720 – – 79,517,720– Futures 3,920 – – 3,920
Total assets 79,521,640 – – 79,521,640
NASDAQ 100 ETF
31st December 2021
Level 1 Level 2 Level 3 Total
US$ US$ US$ US$
Assets– Equity securities 48,833,008 – – 48,833,008
Total assets 48,833,008 – – 48,833,008
31st December 2020
Level 1 Level 2 Level 3 Total
US$ US$ US$ US$
Assets– Equity securities 36,009,739 – – 36,009,739
Total assets 36,009,739 – – 36,009,739
Hang Seng ETF
31st December 2021
Level 1 Level 2 Level 3 Total
HK$ HK$ HK$ HK$
Assets– Equity securities 641,775,179 – – 641,775,179– Futures 24,620 – – 24,620
Total assets 641,799,799 – – 641,799,799
31st December 2020
Level 1 Level 2 Level 3 Total
HK$ HK$ HK$ HK$
Assets– Equity securities 253,648,105 – – 253,648,105– Futures 10,040 – – 10,040
Total assets 253,658,145 – – 253,658,145
MSCI Emerging Markets ETF (HK)
31st December 2021
Level 1 Level 2 Level 3 Total
US$ US$ US$ US$
Assets– Exchange traded fund 14,058,877 – – 14,058,877– Futures 121 – – 121
Total assets 14,058,998 – – 14,058,998
Hang Seng TECH ETF
31st December 2021
Level 1 Level 2 Level 3 Total
HK$ HK$ HK$ HK$
Assets– Equity securities 9,888,633,335 – – 9,888,633,335– Futures 591,200 – – 591,200
Total assets 9,889,224,535 – – 9,889,224,535
As at 18th August 2021 (date of delisting from the SEHK), the KOSPI 200 ETF did not hold any investments.
The following tables analyze within the fair value hierarchy the KOSPI 200 ETF’s financial assets at fair value through profit or loss (by class) measured at fair value as at 31st December 2020:
KOSPI 200 ETF
31st December 2020
Level 1 Level 2 Level 3 Total
US$ US$ US$ US$
Assets– Equity securities 6,333,726 16,679 – 6,350,405– Listed rights 869 – – 869– Unlisted rights – 398 – 398
Total assets 6,334,595 17,077 – 6,351,672
Investments whose values are based on quoted market prices in active markets are classified within level 1. The Sub-Funds do not adjust the quoted price for these instruments.
Investments that trade in markets that are not considered to be active but are valued based on quoted market prices, dealer quotations or alternative pricing sources supported by observable inputs are classified within level 2. The Sub-Funds’ level 2 investments are mainly suspended equity securities, unlisted equities and unlisted rights.
NM0522U-2194143-64/163

64 iShares Asia Trust
Notes to the Financial Statements (continued)
As at 31st December 2020, the SENSEX India ETF classified its investment in the Mauritius Subsidiary as level 2 within the fair value hierarchy, as the Manager believes the SENSEX India ETF could have redeemed its investment at the net asset value per share, as at the statement of financial position date. The investment was valued at fair value using the net asset value as reported by the Mauritius Subsidiary’s administrator.
Investments classified within level 3 have significant unobservable inputs, as they are infrequently traded. As at 31st December 2021, the level 3 investments consisted of equity securities held by the MSCI China ETF, MSCI Asia ex Japan ETF and MSCI Emerging Asia ETF (2020: MSCI China ETF, MSCI Asia ex Japan ETF and MSCI Emerging Asia ETF) priced using an external pricing source, that are suspended from trading, unlisted equities, unlisted rights and unlisted warrants.
Level 3 valuations are reviewed bi-monthly by the Manager’s valuation committee who evaluates the appropriateness of the valuation of the investments.
The following present the sensitivity analysis for the level 3 investments held by the Sub-Funds as at 31st December 2021 and 2020.
MSCI China ETF, MSCI Asia ex Japan ETF, MSCI Emerging Asia ETFA sensitivity analysis for level 3 investments held by the Sub-Funds as at 31st December 2021 and 2020 were not presented, as it was deemed that the impact of reasonable changes in inputs were not significant.
During the years ended 31st December 2021 and 2020, there were no transfers between levels of investments held by the Sub-Funds, except for the below.
The following table presents the transfers between levels of investments held for the year ended 31st December 2021:
MSCI China ETF
Level 1 Level 2 Level 3
HK$ HK$ HK$
Transfers from level 1 to 3:AssetsFinancial assets at fair value through
profit or loss– Equity securitiesFinancials (1,607,520) – 1,607,520
(1,607,520) – 1,607,520
The equity securities transferred from level 1 to level 3 related to securities which were suspended over two months from trading as at 31st December 2021 but were actively traded on 31st December 2020.
MSCI Asia ex Japan ETF
Level 1 Level 2 Level 3
US$ US$ US$
Transfers from level 1 to 2:AssetsFinancial assets at fair value through
profit or loss– Equity securitiesReal Estate (1,297,304) 1,297,304 –
(1,297,304) 1,297,304 –
Transfers from level 1 to 3:AssetsFinancial assets at fair value through
profit or loss– Equity securitiesFinancials (409,185) – 409,185
(409,185) – 409,185
The equity securities transferred from level 1 to level 2 related to securities which were suspended from trading for two months or less as at 31st December 2021 but were actively traded on 31st December 2020. The equity securities transferred from level 1 to level 3 related to securities which were suspended over two months from trading as at 31st December 2021 but were actively traded on 31st December 2020.
MSCI Emerging Asia ETF
Level 1 Level 2 Level 3
HK$ HK$ HK$
Transfers from level 1 to 3:AssetsFinancial assets at fair value through
profit or loss– Equity securitiesFinancials (48,081) – 48,081
(48,081) – 48,081
The equity securities transferred from level 1 to level 3 related to securities which were suspended over two months from trading as at 31st December 2021 but were actively traded on 31st December 2020.
During the period from 1st January 2021 to 18th August 2021 (date of delisting from the SEHK), there were no transfers between levels of investments held by the KOSPI 200 ETF.
The following table presents the transfers between levels of investments held for the year ended 31st December 2020:
NM0522U-2194143-65/163

Reports and Financial Statements 65
Notes to the Financial Statements (continued)
MSCI Asia ex Japan ETF
Level 1 Level 2 Level 3
US$ US$ US$
Transfers from level 2 to 1:AssetsFinancial assets at fair value through
profit or loss– Equity securitiesMaterials 60,385 (60,385) –
60,385 (60,385) –
The equity securities transferred from level 2 to level 1 related to securities which were actively traded on 31st December 2020 but were suspended from trading for two months or less as at 31st December 2019.
CSI 300 ETF
Level 1 Level 2 Level 3
RMB RMB RMB
Transfers from level 2 to 1:AssetsFinancial assets at fair value through
profit or loss– Equity securitiesMaterials 349,951 (349,951) –
349,951 (349,951) –
The equity securities transferred from level 2 to level 1 related to securities which were actively traded on 31st December 2020 but were suspended from trading for two months or less as at 31st December 2019.
KOSPI 200 ETF
Level 1 Level 2 Level 3
US$ US$ US$
Transfers from level 1 to 2:AssetsFinancial assets at fair value through
profit or loss– Equity securitiesIndustrials (16,679) 16,679 –
(16,679) 16,679 –
The equity securities transferred from level 1 to level 2 related to securities which were suspended from trading for two months or less as at 31st December 2020 but were actively traded on 31st December 2019.
The following table presents the movement in level 3 equity securities held by MSCI China ETF for the year ended 31st December.
2021HK$
2020HK$
Equity securities and rightsOpening balance 6 15,729Transfers from level 1 to level 3 1,607,520 –Purchases 0∆ –Sales – (180,513)Gains recognized in Statement of
Comprehensive Income – 164,790
Closing balance 1,607,526 6
Total losses for the year included in Statement of Comprehensive Income for assets held at the end of the reporting year (199,627) (9,698)
The following table presents the movement in level 3 equity securities held by MSCI Asia ex Japan ETF for the year ended 31st December.
2021US$
2020US$
Equity securities and rightsOpening balance 0# 1,868Transfers from level 1 to level 3 409,185 –Purchases 0# –Sales – (30,332)Gains recognized in Statement of
Comprehensive Income – 28,464
Closing balance 409,185 0#
Total losses for the year included in Statement of Comprehensive Income for assets held at the end of the reporting year (52,679) (898)
The following table presents the movement in level 3 equity securities held by MSCI Emerging Asia ETF for the year ended 31st December.
2021HK$
2020HK$
Equity securities and rightsOpening balance 0∆ 152Transfers from level 1 to level 3 48,081 –Purchase 0∆ –Losses recognized in Statement of
Comprehensive Income – (152)
Closing balance 48,081 0
Total losses for the year included in Statement of Comprehensive Income for assets held at the end of the reporting year (5,971) (152)
∆ Amount is less than HK$1.# Amount is less than US$1.
NM0522U-2194143-66/163
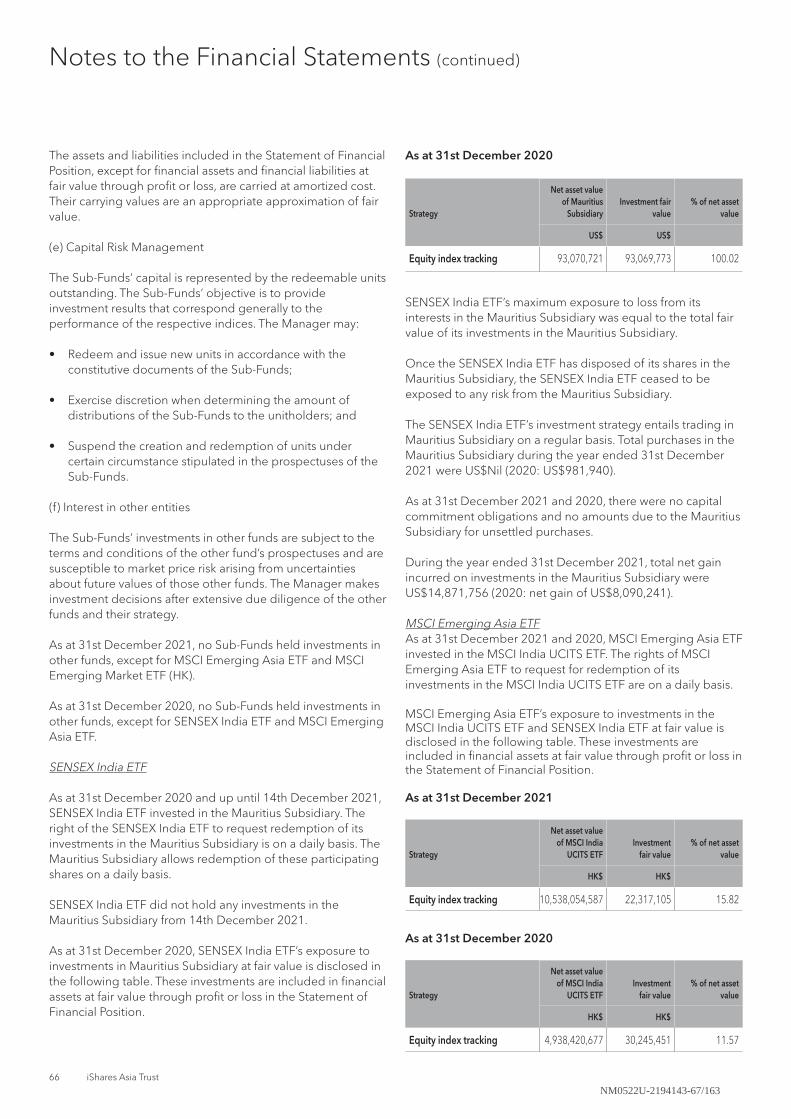
66 iShares Asia Trust
Notes to the Financial Statements (continued)
The assets and liabilities included in the Statement of Financial Position, except for financial assets and financial liabilities at fair value through profit or loss, are carried at amortized cost. Their carrying values are an appropriate approximation of fair value.
(e) Capital Risk Management
The Sub-Funds’ capital is represented by the redeemable units outstanding. The Sub-Funds’ objective is to provide investment results that correspond generally to the performance of the respective indices. The Manager may:
• Redeem and issue new units in accordance with the constitutive documents of the Sub-Funds;
• Exercise discretion when determining the amount of distributions of the Sub-Funds to the unitholders; and
• Suspend the creation and redemption of units under certain circumstance stipulated in the prospectuses of the Sub-Funds.
(f) Interest in other entities
The Sub-Funds’ investments in other funds are subject to the terms and conditions of the other fund’s prospectuses and are susceptible to market price risk arising from uncertainties about future values of those other funds. The Manager makes investment decisions after extensive due diligence of the other funds and their strategy.
As at 31st December 2021, no Sub-Funds held investments in other funds, except for MSCI Emerging Asia ETF and MSCI Emerging Market ETF (HK).
As at 31st December 2020, no Sub-Funds held investments in other funds, except for SENSEX India ETF and MSCI Emerging Asia ETF.
SENSEX India ETF
As at 31st December 2020 and up until 14th December 2021, SENSEX India ETF invested in the Mauritius Subsidiary. The right of the SENSEX India ETF to request redemption of its investments in the Mauritius Subsidiary is on a daily basis. The Mauritius Subsidiary allows redemption of these participating shares on a daily basis.
SENSEX India ETF did not hold any investments in the Mauritius Subsidiary from 14th December 2021.
As at 31st December 2020, SENSEX India ETF’s exposure to investments in Mauritius Subsidiary at fair value is disclosed in the following table. These investments are included in financial assets at fair value through profit or loss in the Statement of Financial Position.
As at 31st December 2020
Strategy
Net asset valueof Mauritius
SubsidiaryInvestment fair
value% of net asset
value
US$ US$
Equity index tracking 93,070,721 93,069,773 100.02
SENSEX India ETF’s maximum exposure to loss from its interests in the Mauritius Subsidiary was equal to the total fair value of its investments in the Mauritius Subsidiary.
Once the SENSEX India ETF has disposed of its shares in the Mauritius Subsidiary, the SENSEX India ETF ceased to be exposed to any risk from the Mauritius Subsidiary.
The SENSEX India ETF’s investment strategy entails trading in Mauritius Subsidiary on a regular basis. Total purchases in the Mauritius Subsidiary during the year ended 31st December 2021 were US$Nil (2020: US$981,940).
As at 31st December 2021 and 2020, there were no capital commitment obligations and no amounts due to the Mauritius Subsidiary for unsettled purchases.
During the year ended 31st December 2021, total net gain incurred on investments in the Mauritius Subsidiary were US$14,871,756 (2020: net gain of US$8,090,241).
MSCI Emerging Asia ETFAs at 31st December 2021 and 2020, MSCI Emerging Asia ETF invested in the MSCI India UCITS ETF. The rights of MSCI Emerging Asia ETF to request for redemption of its investments in the MSCI India UCITS ETF are on a daily basis.
MSCI Emerging Asia ETF’s exposure to investments in the MSCI India UCITS ETF and SENSEX India ETF at fair value is disclosed in the following table. These investments are included in financial assets at fair value through profit or loss in the Statement of Financial Position.
As at 31st December 2021
Strategy
Net asset valueof MSCI India
UCITS ETFInvestment
fair value% of net asset
value
HK$ HK$
Equity index tracking 10,538,054,587 22,317,105 15.82
As at 31st December 2020
Strategy
Net asset valueof MSCI India
UCITS ETFInvestment
fair value% of net asset
value
HK$ HK$
Equity index tracking 4,938,420,677 30,245,451 11.57
NM0522U-2194143-67/163

Reports and Financial Statements 67
Notes to the Financial Statements (continued)
MSCI Emerging Asia ETF’s maximum exposure to loss from its interests in the MSCI India UCITS ETF and SENSEX India ETF are equal to the total fair value of its investments in the MSCI India UCITS ETF and SENSEX India ETF.
Once the MSCI Emerging Asia ETF has disposed of its shares in the MSCI India UCITS ETF and SENSEX India ETF, the MSCI Emerging Asia ETF ceases to be exposed to any risk from the MSCI India UCITS ETF and SENSEX India ETF.
The MSCI Emerging Asia ETF’s investment strategy entails trading in the MSCI India UCITS ETF and SENSEX India ETF on a regular basis. Total purchases in the MSCI India UCITS ETF and SENSEX India ETF during the year ended 31st December 2021 were HK$6,065,363 (2020: HK$3,531,456) and HK$Nil (2020: HK$8,660,070) respectively.
As at 31st December 2021 and 2020, there were no capital commitment obligations and no amounts due to the MSCI India UCITS ETF or SENSEX India ETF for unsettled purchases.
During the year ended 31st December 2021, total net gain or loss incurred on investments in the MSCI India UCITS ETF and SENSEX India ETF were net gain of HK$6,220,563 (2020: net gain of HK$4,480,870) and HK$Nil (2020: net loss of HK$360,165) respectively.
MSCI Emerging Markets ETF (HK)As at 31st December 2021, MSCI Emerging Markets ETF (HK) invested in the Master ETF. The right of the MSCI Emerging Markets ETF (HK) to request redemption of its investments in the Master ETF is on a daily basis. The Master ETF allows redemption of these participating shares on a daily basis.
MSCI Emerging Markets ETF (HK)’s exposure to investments in Master ETF at fair value is disclosed in the following table. These investments are included in financial assets at fair value through profit or loss in the Statement of Financial Position.
As at 31st December 2021
StrategyNet asset value of
Master ETFInvestment
fair value% of net asset
value
US$ US$
Equity index tracking 3,851,372,268 14,058,877 99.54
MSCI Emerging Markets ETF (HK)’s maximum exposure to loss from its interests in the Master ETF is equal to the total fair value of its investments in the Master ETF.
Once the MSCI Emerging Markets ETF (HK) has disposed of its shares in the Master ETF, the MSCI Emerging Markets ETF (HK) ceases to be exposed to any risk from the Master ETF.
The MSCI Emerging Markets ETF (HK)’s investment strategy entails trading in Master ETF on a regular basis. Total purchases in the Master ETF during the period ended 31st December 2021 were US$244,910.
As at 31st December 2021, there were no capital commitment obligations and no amounts due to the Master ETF for unsettled purchases.
During the period ended 31st December 2021, total net gain incurred on investments in the Master ETF were US$2,495,157.
13 Distributions
MSCI China ETF
2021HK$
2020HK$
Undistributed income brought forward at the beginning of the year – –
Net (loss)/income for the year (1,099,437,513) 841,686,083Final distributions– HK$0.460 on 149,998,699 units paid
on 12th November 2020 – (68,999,402)– HK$0.380 on 153,898,699 units paid
on 15th November 2021 (58,481,506) –– RMB0.270 on 950,000,000 units paid
on 28th December 2020 – –– RMB0.210 on 1,004,000,000 units
paid on 30th December 2021 – –Undistributed loss/(income)
transferred to net assets attributable to unitholders for the year 1,157,919,019 (772,686,681)
Undistributed income carried forward at the ending of the year – –
China A50 ETF
2021RMB
2020RMB
Undistributed income brought forward at the beginning of the year – –
Net (loss)/income for the year (1,585,030,859) 3,757,756,598Final distributions– HK$0.460 on 149,998,699 units paid
on 12th November 2020 – –– HK$0.380 on 153,898,699 units paid
on 15th November 2021 – –– RMB0.270 on 950,000,000 units paid
on 28th December 2020 – (256,500,000)– RMB0.210 on 1,004,000,000 units
paid on 30th December 2021 (210,840,000) –Undistributed loss/(income)
transferred to net assets attributable to unitholders for the year 1,795,870,859 (3,501,256,598)
Undistributed income carried forward at the ending of the year – –
NM0522U-2194143-68/163

68 iShares Asia Trust
Notes to the Financial Statements (continued)
MSCI Asia ex Japan ETF
2021US$
2020US$
Undistributed income brought forward at the beginning of the year – –
Net (loss)/income for the year (158,436,105) 285,627,677Final distributions– US$0.090 on 141,520,000 units paid
on 12th November 2020 – (12,736,800)– US$0.130 on 312,480,000 units paid
on 15th November 2021 (40,622,400) –– HK$0.740 on 3,800,000 units paid on
12th November 2020 – –– HK$1.090 on 2,200,000 units paid on
15th November 2021 – –Undistributed loss/(income)
transferred to net assets attributable to unitholders for the year 199,058,505 (272,890,877)
Undistributed income carried forward at the ending of the year – –
MSCI Emerging Asia ETF
2021HK$
2020HK$
Undistributed income brought forward at the beginning of the year – –
Net (loss)/income for the year (11,451,797) 61,464,858Final distributions– US$0.090 on 141,520,000 units paid
on 12th November 2020 – –– US$0.130 on 312,480,000 units paid
on 15th November 2021 – –– HK$0.740 on 3,800,000 units paid on
12th November 2020 – (2,812,000)– HK$1.090 on 2,200,000 units paid on
15th November 2021 (2,398,000) –Undistributed loss/(income)
transferred to net assets attributable to unitholders for the year 13,849,797 (58,652,858)
Undistributed income carried forward at the ending of the year – –
CSI 300 ETF
2021RMB
2020RMB
Undistributed income brought forward at the beginning of the year – –
Net (loss)/income for the year (13,595,770) 60,368,450Final distributions– RMB0.390 on 7,750,000 units paid
on 12th November 2020 – (3,022,500)– RMB0.270 on 11,250,000 units paid
on 15th November 2021 (3,037,500) –– US$0.400 on 3,720,000 units paid on
12th November 2020 – –– US$0.470 on 3,060,000 units paid on
15th November 2021 – –Undistributed loss/(income)
transferred to net assets attributable to unitholders for the year 16,633,270 (57,345,950)
Undistributed income carried forward at the ending of the year – –
MSCI Taiwan ETF
2021US$
2020US$
Undistributed income brought forward at the beginning of the year – –
Net (loss)/income for the year 20,032,570 22,549,840Final distributions– RMB0.390 on 7,750,000 units paid
on 12th November 2020 – –– RMB0.270 on 11,250,000 units paid
on 15th November 2021 – –– US$0.400 on 3,720,000 units paid on
12th November 2020 – (1,488,000)– US$0.470 on 3,060,000 units paid on
15th November 2021 (1,438,200) –Undistributed loss/(income)
transferred to net assets attributable to unitholders for the year (18,594,370) (21,061,840)
Undistributed income carried forward at the ending of the year – –
NM0522U-2194143-69/163

Reports and Financial Statements 69
Notes to the Financial Statements (continued)
Hang Seng ETF
2021HK$
2020HK$
Undistributed income brought forward at the beginning of the year/period – –
Net (loss)/income for the year/period (112,268,051) (4,058,359)Interim distributions– HK$0.300 on 2,450,000 units paid on
30th June 2020 – (735,000)– HK$0.480 on 2,600,000 units paid on
30th June 2021 (1,248,000) –Final distributions– HK$2.230 on 2,600,000 units paid on
12th November 2020 – (5,798,000)– HK$1.300 on 7,700,000 units paid on
15th November 2021 (10,010,000) –– US$0.290 on 230,000 units paid on
12th November 2020 – –– US$1.430 on 200,000 units paid on
15th November 2021 – –– US$18.8205 on 360,000 units paid
on 2nd August 2021 – –– US$0.190 on 360,000 units paid on
12th November 2020 – –Undistributed loss/(income)
transferred to net assets attributable to unitholders for the year/period 123,526,051 10,591,359
Undistributed income carried forward at the ending of the year/period – –
MSCI Emerging Markets ETF (HK)
17.07.2020(date of inception)
from the SEHK)to 31.12.2021
US$
Undistributed income brought forward at the beginning of the year/period –
Net (loss)/income for the year/period 2,966,986Interim distributions– HK$0.300 on 2,450,000 units paid on 30th
June 2020 –– HK$0.480 on 2,600,000 units paid on 30th
June 2021 –Final distributions– HK$2.230 on 2,600,000 units paid on 12th
November 2020 –– HK$1.300 on 7,700,000 units paid on 15th
November 2021 –– US$0.290 on 230,000 units paid on 12th
November 2020 (66,700)– US$1.430 on 200,000 units paid on 15th
November 2021 (286,000)– US$18.8205 on 360,000 units paid on 2nd
August 2021 –– US$0.190 on 360,000 units paid on 12th
November 2020 –Undistributed loss/(income) transferred to net
assets attributable to unitholders for the year/period (2,614,286)
Undistributed income carried forward at the ending of the year/period –
NM0522U-2194143-70/163

70 iShares Asia Trust
Notes to the Financial Statements (continued)
KOSPI 200 ETF
01.01.2021to 18.08.2021
(date of delistingfrom the SEHK)
US$
01.01.2020to 31.12.2020
US$
Undistributed income brought forward at the beginning of the year/period – –
Net (loss)/income for the year/period 407,506 1,923,755Interim distributions– HK$0.300 on 2,450,000 units paid on
30th June 2020 – –– HK$0.480 on 2,600,000 units paid on
30th June 2021 – –Final distributions– HK$2.230 on 2,600,000 units paid on
12th November 2020 – –– HK$1.300 on 7,700,000 units paid on
15th November 2021 – –– US$0.290 on 230,000 units paid on
12th November 2020 – –– US$1.430 on 200,000 units paid on
15th November 2021 – –– US$18.8205 on 360,000 units paid
on 2nd August 2021 (6,775,380) –– US$0.190 on 360,000 units paid on
12th November 2020 – (68,400)Undistributed loss/(income)
transferred to net assets attributable to unitholders for the year/period 6,367,874 (1,855,355)
Undistributed income carried forward at the ending of the year/period – –
There were no distributions during the years ended 31st December 2021 and 2020 for SENSEX India ETF and NASDAQ 100 ETF.
There were no distributions during the period ended 31st December 2021 for Hang Seng TECH ETF.
14 Segment Information
The Manager makes the strategic resource allocations on behalf of the Sub-Funds and has determined the operating segments based on the reports reviewed which are used to make strategic decisions.
The Manager considers that each Sub-Fund has a single operating segment which is investing in securities. The objectives of the Sub-Funds are to track the performance of their respective index and invest, directly or indirectly, in substantially all the index constituents with security weight and industry weight that are closely aligned with the characteristics of the tracked indices.
The internal financial information used by the Manager for the Sub-Funds’ assets, liabilities and performance is the same as that disclosed in the Statement of Financial Position and Statement of Comprehensive Income.
The Sub-Funds are domiciled in Hong Kong. All of the Sub-Funds’ income is derived from investments in securities which constitute the relevant tracked indices. The Sub-Funds’ investments have been categorized by relevant geography but no geographical information for performance is provided as the Manager considers that the cost to develop it would be excessive and the information is generally not used by the Manager in managing the Sub-Funds.
The Sub-Funds have no assets classified as non-current assets. The Sub-Funds have portfolios that closely correspond to the security weight and industry weight of the relevant tracked indices. Refer to note 11 for investment holdings that account for more than 10% of each Sub-Fund’s net asset value.
15 SUBSEQUENT EVENT
No significant events have occurred since the year end date which would impact on the financial position of the Sub-Funds disclosed in the Statement of Financial Position as at 31st December 2021 or on the results and cash flows of the Sub-Funds for the year ended on that date.
16 Approval of Financial Statements
The financial statements were approved by the Trustee and the Manager on 26th April 2022.
NM0522U-2194143-71/163

Reports and Financial Statements 71
iShares Core MSCI China ETF Investment Portfolio (unaudited) as at 31st December 2021
HoldingsFair value
HK$
% of Net
Assets
Investments (99.67%)
Listed equities (99.67%)
China (99.67%)19,408 360 Digitech Inc 3,469,552 0.0883,123 360 Security Technology In – A 1,296,297 0.03
325,678 3Sbio Inc 2,116,907 0.056,992 51Job Inc – ADR 2,667,259 0.06
165,453 AAC Technologies Holdings In 5,095,952 0.1122,570 Addsino Co Ltd – A 462,109 0.01
7,488 Advanced Micro-Fabrication – A 1,162,240 0.0316,730 Aecc Aero-Engine Control – A 621,081 0.0135,708 AECC Aviation Power Co – A 2,778,190 0.06
261,300 Agile Group Holdings Ltd 1,105,299 0.0210,924 Agora Inc – ADR 1,380,554 0.03
1,098,136 Agricultural Bank of China – A 3,958,218 0.095,827,305 Agricultural Bank of China – H 15,617,177 0.35
72,599 Aier Eye Hospital Group Co – A 3,763,240 0.0889,781 Air China Ltd – A 1,004,966 0.02
399,316 Air China Ltd – H 2,172,279 0.0563,586 Akeso Inc 2,161,924 0.05
3,395,428 Alibaba Group Holding Ltd 403,716,389 9.06917,130 Alibaba Health Information T 6,043,887 0.14
2,952,405 Alibaba Pictures Group Ltd 2,096,208 0.05132,802 A-Living Smart City Services 1,766,267 0.04225,328 Aluminum Corp of China Ltd – A 1,682,398 0.04876,340 Aluminum Corp of China Ltd – H 3,777,025 0.08
12,180 Angel Yeast Co Ltd – A 901,349 0.0259,095 Anhui Conch Cement Co Ltd – A 2,919,793 0.07
280,669 Anhui Conch Cement Co Ltd – H 10,932,058 0.255,865 Anhui Gujing Distillery Co – A 1,754,503 0.04
23,859 Anhui Gujing Distillery Co – B 2,648,349 0.0611,224 Anhui Kouzi Distillery Co – A 975,228 0.0210,639 Anhui Yingjia Distillery C – A 905,877 0.02
240,072 Anta Sports Products Ltd 28,064,417 0.6314,887 Apeloa Pharmaceutical Co – A 640,452 0.01
3,241 Asymchem Laboratories Tian – A 1,728,481 0.047,323 Autel Intelligent Technolo – A 712,863 0.026,385 Autobio Diagnostics Co Ltd – A 431,016 0.01
17,573 Autohome Inc – ADR 4,038,889 0.0921,200 Avary Holding Shenzhen Co – A 1,102,821 0.0255,841 AVIC Electromechanical Sy – A 1,244,639 0.03
126,125 AVIC Industry-Finance Hold – A (formerly known as AVIC Capital Co Ltd – A) 613,886 0.01
538,380 Avichina Industry & Tech – H 2,901,868 0.078,080 Avicopter Plc – A 795,469 0.02
62,179 Baidu Inc – Spon ADR 72,128,354 1.62366,471 Bank of Beijing Co Ltd – A 1,994,890 0.04
48,201 Bank of Chengdu Co Ltd – A 709,143 0.02419,540 Bank of China Ltd – A 1,568,807 0.04
17,669,325 Bank of China Ltd – H 49,650,803 1.11501,796 Bank of Communications Co – A 2,836,119 0.06
1,914,748 Bank of Communications Co – H 9,018,463 0.2068,643 Bank of Hangzhou Co Ltd – A 1,078,898 0.02
225,217 Bank of Jiangsu Co Ltd – A 1,609,778 0.04150,751 Bank of Nanjing Co Ltd – A 1,656,016 0.04
95,587 Bank of Ningbo Co Ltd – A 4,486,080 0.10231,360 Bank of Shanghai Co Ltd – A 2,022,433 0.05308,296 Baoshan Iron & Steel Co – A 2,706,308 0.06233,496 BBMG Corporation – A 813,007 0.02
10,427 Beigene Ltd – ADR 22,024,447 0.49443,260 Beijing Capital Intl Airpo – H 2,114,350 0.05
70,289 Beijing Dabeinong Technolo – A 903,981 0.025,510 Beijing Easpring Material – A 586,837 0.01
31,090 Beijing Enlight Media Co L – A 489,802 0.01127,309 Beijing Enterprises Hldgs 3,424,612 0.08978,760 Beijing Enterprises Water Gr 2,965,643 0.07
HoldingsFair value
HK$
% of Net
Assets
China (99.67%) Continued4,669 Beijing Kingsoft Office So – A 1,516,932 0.03
32,162 Beijing New Building Mater – A 1,412,818 0.0340,658 Beijing Originwater Techno – A 358,403 0.01
850 Beijing Roborock Technolog – A 847,239 0.0225,394 Beijing Shiji Information – A 894,776 0.0211,547 Beijing Shunxin Agricult – A 540,507 0.0136,540 Beijing Sinnet Technology – A 664,812 0.0129,706 Beijing Tiantan Biological – A 1,054,724 0.02
4,073 Beijing United Information – A 536,808 0.015,493 Beijing Wantai Biological – A 1,491,694 0.033,867 Beijing Yuanliu Hongyuan E – A 850,726 0.02
638,160 Beijing-Shanghai High Spe – A 3,778,966 0.087,896 Betta Pharmaceuticals Co L – A 772,804 0.025,823 BGI Genomics Co Ltd – A 626,812 0.01
36,438 Bilibili Inc – Sponsored ADR 13,181,385 0.3046,875 BOC Aviation Ltd 2,676,562 0.06
520,931 BOE Technology Group Co Lt – A 3,225,283 0.07790,940 Bosideng Intl Hldgs Ltd 3,883,515 0.09
24,146 BYD Co Ltd – A 7,937,261 0.18174,877 BYD Co Ltd – H 46,622,208 1.05162,268 BYD Electronic Intl Co Ltd 4,632,751 0.10
20,965 By-Health Co Ltd – A 692,965 0.0219,955 C&S Paper Co Ltd – A 408,813 0.0170,118 Caitong Securities Co Ltd – A 955,940 0.02
1,022 Cansino Biologics Inc – A 375,333 0.0117,728 Cansino Biologics Inc – H 3,194,586 0.07
2,344,213 CGN Power Co Ltd – H 5,555,785 0.124,982 Changchun High & New Tech – A 1,657,715 0.04
87,958 Changjiang Securities Co L – A 813,098 0.023,051 Changzhou Xingyu Automotiv – A 764,013 0.02
32,226 Chaozhou Three-Circle Grou – A 1,762,128 0.0410,920 Chengxin Lithium Group Co – A 775,840 0.0234,728 China Baoan Group – A 614,388 0.01
594,832 China Bohai Bank Co Ltd – H 1,784,496 0.042,042,622 China Cinda Asset Manageme – H 2,900,523 0.072,026,580 China Citic Bank Corp Ltd – H 6,849,840 0.15
439,459 China Coal Energy Co – H 1,977,565 0.04596,942 China Communications Servi – H 2,268,380 0.05368,202 China Conch Venture Holdings 14,028,496 0.32
98,969 China Construction Bank – A 711,038 0.0221,469,047 China Construction Bank – H 115,932,854 2.60
60,768 China Cssc Holdings Ltd – A 1,846,919 0.04128,141 China Eastern Airlines Co – A 810,651 0.02178,609 China Education Group Holdin 2,261,190 0.05681,543 China Everbright Bank Co – A 2,774,135 0.06765,268 China Everbright Bank Co L – H 2,112,140 0.05790,272 China Everbright Environment 4,947,103 0.11855,256 China Evergrande Group 1,359,857 0.03793,909 China Feihe Ltd 8,304,288 0.19
63,224 China Galaxy Securities Co – A 867,378 0.02838,452 China Galaxy Securities Co – H 3,756,265 0.08676,122 China Gas Holdings Ltd 10,953,176 0.25
37,427 China Great Wall Securitie – A 594,225 0.0143,319 China Greatwall Technology – A 752,035 0.02
523,953 China Hongqiao Group Ltd 4,312,133 0.102,101,333 China Huarong Asset Manage – H 1,607,520 0.04
315,092 China International Capita – H 6,774,478 0.1511,328 China International Captal – A 680,944 0.02
1,216,721 China Jinmao Holdings Group 2,932,298 0.0763,244 China Jushi Co Ltd – A 1,411,195 0.03
248,263 China Lesso Group Holdings L 2,780,546 0.0634,258 China Life Insurance Co – A 1,263,806 0.03
1,678,550 China Life Insurance Co – H 21,686,866 0.4992,267 China Literature Ltd 4,521,083 0.10
757,458 China Longyuan Power Group – H 13,785,736 0.31309,440 China Medical System Holding 4,028,909 0.09133,760 China Meidong Auto Holdings 5,377,152 0.12
NM0522U-2194143-72/163

72 iShares Asia Trust
iShares Core MSCI China ETF (continued)
Investment Portfolio (unaudited) as at 31st December 2021
HoldingsFair value
HK$
% of Net
Assets
China (99.67%) Continued711,628 China Mengniu Dairy Co 31,453,958 0.71275,351 China Merchants Bank – A 16,443,758 0.37870,258 China Merchants Bank – H 52,694,122 1.18316,825 China Merchants Port Holding 4,498,915 0.10
88,366 China Merchants Securities – A 1,912,169 0.04102,267 China Merchants Shekou Ind – A 1,672,583 0.04
12,282 China Minmetals Rare Earth – A 587,561 0.01460,600 China Minsheng Banking – A 2,202,342 0.05
1,347,395 China Minsheng Banking Cor – H 4,015,237 0.09235,957 China Molybdenum Co Ltd – A 1,614,222 0.04765,698 China Molybdenum Co Ltd – H 3,147,019 0.07882,119 China National Building Ma – H 8,433,058 0.19
67,244 China National Chemical – A 989,307 0.0214,842 China National Medicines – A 573,737 0.01
220,732 China National Nuclear Pow – A 2,246,155 0.0548,320 China Northern Rare Earth – A 2,713,243 0.06
432,390 China Oilfield Services – H 2,953,224 0.07856,302 China Overseas Land & Invest 15,807,335 0.35326,933 China Overseas Property Hold 2,703,736 0.06
96,898 China Pacific Insurance Gr – A 3,221,816 0.07586,160 China Pacific Insurance Gr – H 12,397,284 0.28431,956 China Petroleum & Chemical – A 2,240,145 0.05
5,393,636 China Petroleum & Chemical – H 19,578,899 0.441,210,408 China Power International 6,354,642 0.14
245,071 China Railway Group Ltd – A 1,739,670 0.04966,553 China Railway Group Ltd – H 3,982,198 0.09
98,921 China Railway Signal & Com – A 603,968 0.01328,684 China Resources Beer Holding 20,986,473 0.47532,050 China Resources Cement 3,133,774 0.07206,826 China Resources Gas Group Lt 9,110,685 0.20724,350 China Resources Land Ltd 23,758,680 0.53130,515 China Resources Mixc Lifesty 4,744,220 0.11438,559 China Resources Power Holdin 11,446,390 0.26
94,783 China Shenhua Energy Co – A 2,616,948 0.06744,106 China Shenhua Energy Co – H 13,602,258 0.31181,393 China Southern Airlines Co – A 1,514,481 0.03360,705 China Southern Airlines Co – H 1,684,492 0.04607,388 China State Construction – A 3,723,338 0.08460,600 China State Construction Int 4,463,214 0.10373,801 China Suntien Green Energy – H 2,272,710 0.05374,099 China Taiping Insurance Hold 4,002,859 0.09
27,035 China Tourism Group Duty F – A 7,272,422 0.169,568,249 China Tower Corp Ltd – H 8,228,694 0.18
569,391 China Traditional Chinese Me 2,943,751 0.0723,737 China Transinfo Technology – A 435,074 0.01
424,919 China United Network – A 2,047,364 0.05129,941 China Vanke Co Ltd – A 3,147,962 0.07377,543 China Vanke Co Ltd – H 6,848,630 0.15294,725 China Yangtze Power Co Ltd – A 8,202,365 0.18
3,311,305 China Youzan Ltd 1,788,105 0.04295,515 China Yuhua Education Corp L 824,487 0.02
6,091 China Zhenhua Group Scienc – A 928,082 0.02157,840 China Zheshang Bank Co Ltd – A 677,300 0.02597,152 Chinasoft International Ltd 6,067,064 0.14
25,989 Chindata Group Holdings – ADR 1,335,253 0.035,604 Chongqing Brewery Co – A 1,039,659 0.02
88,028 Chongqing Changan Automob – A 1,639,362 0.0414,265 Chongqing Fuling Zhacai – A 661,089 0.01
152,919 Chongqing Rural Commercial – A 721,803 0.0222,849 Chongqing Zhifei Biologica – A 3,490,451 0.08
172,454 Cifi Ever Sunshine Services 2,083,244 0.05748,298 CIFI Holdings Group Co Ltd 3,509,518 0.08
1,330,650 Citic Ltd 10,246,005 0.23157,216 Citic Securities Co – A 5,090,511 0.11504,398 Citic Securities Co Ltd – H 10,264,499 0.23
31,125 Contemporary Amperex Techn – A 22,437,939 0.50182,294 Cosco Shipping Holdings Co – A 4,177,130 0.09733,729 Cosco Shipping Holdings Co – H 11,093,982 0.25
HoldingsFair value
HK$
% of Net
Assets
China (99.67%) Continued418,487 Cosco Shipping Ports Ltd 2,833,157 0.06
1,704,596 Country Garden Holdings Co 11,795,804 0.26394,389 Country Garden Services Hold 18,417,966 0.41332,388 CRRC Corp Ltd – A 2,481,755 0.06936,111 CRRC Corp Ltd – H 3,135,972 0.07
60,138 CSC Financial Co Ltd – A 2,156,608 0.052,005,325 CSPC Pharmaceutical Group Lt 16,985,103 0.38
13,461 Dada Nexus Ltd – ADR 1,381,089 0.03388,481 Dali Foods Group Co Ltd 1,585,002 0.04
13,568 Daqo New Energy Corp – ADR 4,265,058 0.109,806 Dashenlin Pharmaceutical G – A 506,260 0.01
12,602 Dawning Information Indust – A 425,964 0.0176,884 DHC Software Co Ltd – A 735,236 0.0270,483 Didi Global Inc 2,736,543 0.06
9,577 Do-Fluoride New Materials – A 528,253 0.0112,017 Dong-E-E-Jiaoco Ltd – A 718,236 0.0237,488 Dongfang Electric Corp Ltd – A 984,483 0.02
614,465 Dongfeng Motor Grp Co Ltd – H 3,981,733 0.0963,953 Dongxing Securities Co Lt – A 911,878 0.02
314,515 Dongyue Group 3,824,502 0.09141,404 East Money Information Co – A 6,433,524 0.14
5,701 Ecovacs Robotics Co Ltd – A 1,055,068 0.02175,696 ENN Energy Holdings Ltd 25,792,173 0.58
30,455 Enn Natural Gas Co Ltd – A 685,532 0.0224,272 EVE Energy Co Ltd – A 3,516,785 0.0845,635 Everbright Securitie Co – A 835,322 0.0250,901 Fangda Carbon New Material – A 675,227 0.02
383,834 Far East Horizon Ltd 2,656,131 0.0642,278 Faw Jiefang Group Co Ltd – A 533,367 0.0128,129 Fiberhome Telecom Tech Co – A 620,069 0.0183,519 First Capital Securities C – A 749,536 0.0220,778 Flat Glass Group Co Ltd – A 1,475,973 0.0392,101 Flat Glass Group Co Ltd – H 3,647,200 0.08
199,058 Focus Media Information Te – A 1,998,756 0.0446,357 Foshan Haitian Flavouring – A 5,973,868 0.13
561,521 Fosun International Ltd 4,722,392 0.1186,494 Founder Securities Co Ltd – A 831,378 0.02
107,737 Foxconn Industrial Interne – A 1,574,481 0.042,366 Fu Jian Anjoy Foods Co Ltd – A 495,391 0.01
28,621 Fujian Sunner Development – A 848,121 0.0231,091 Fuyao Glass Industry Group – A 1,796,886 0.04
130,081 Fuyao Glass Industry Group – H 5,242,264 0.1214,904 Ganfeng Lithium Co Ltd – A 2,610,234 0.0656,586 Ganfeng Lithium Co Ltd – H 6,943,102 0.16
925 G-Bits Network Technology – A 478,405 0.01113,368 GCL System Integration Tec – A 528,166 0.01299,678 GD Power Development Co – A 1,164,690 0.03
19,985 GDS Holdings Ltd – ADR 7,347,955 0.171,313,330 Geely Automobile Holdings Lt 27,973,929 0.63
78,647 Gem Co Ltd – A 997,973 0.0257,434 Gemdale Corp – A 913,283 0.02
265,249 Genscript Biotech Corp 9,151,090 0.2175,460 GF Securities Co Ltd – A 2,274,949 0.05
231,678 GF Securities Co Ltd – H 3,442,735 0.0839,866 Giant Network Group Co Ltd – A 585,050 0.01
9,183 Gigadevice Semiconductor B – A 1,979,809 0.042,905 Ginlong Technologies Co Lt – A 824,683 0.02
47,393 Goertek Inc – A 3,143,459 0.072,871,506 Gome Retail Holdings Ltd 1,895,194 0.04
17,521 Gotion High-Tech Co Ltd – A 1,100,903 0.02
30,681 Great Wall Motor Co Ltd – A 1,825,852 0.04699,437 Great Wall Motor Company – H 18,744,912 0.42126,346 Greenland Holdings Corp Lt – A 672,276 0.02208,875 Greentown China Holdings 2,623,470 0.06364,763 Greentown Service Group Co L 2,626,294 0.06
22,347 Guangdong Haid Group Co – A 2,008,258 0.05649,979 Guangdong Investment Ltd 6,441,292 0.14
3,525 Guangdong Kinlong Hardware – A 784,779 0.02
NM0522U-2194143-73/163

Reports and Financial Statements 73
iShares Core MSCI China ETF (continued)
Investment Portfolio (unaudited) as at 31st December 2021
HoldingsFair value
HK$
% of Net
Assets
China (99.67%) Continued59,925 Guanghui Energy Co Ltd – A 480,487 0.01
682,789 Guangzhou Automobile Group – H 5,250,647 0.1215,355 Guangzhou Baiyunshan Phar – A 643,831 0.0140,653 Guangzhou Haige Communicat – A 544,266 0.01
5,463 Guangzhou Kingmed Diagnost – A 745,926 0.02370,427 Guangzhou R&F Properties – H 1,074,238 0.02
7,887 Guangzhou Shiyuan Electron – A 787,105 0.0213,802 Guangzhou Tinci Materials – A 1,940,047 0.0491,214 Guosen Securities Co Ltd – A 1,283,807 0.03
106,972 Guotai Junan Securities Co – A 2,346,263 0.0587,574 Guoyuan Securities Co Ltd – A 826,727 0.02
241,278 Haidilao International Holdi 4,246,493 0.1088,880 Haier Smart Home Co Ltd – A 3,257,064 0.07
494,553 Haier Smart Home Co Ltd – H 16,295,521 0.37137,659 Haitian International Hldgs 2,980,317 0.07128,530 Haitong Securities Co Ltd – A 1,931,929 0.04616,397 Haitong Securities Co Ltd – H 4,259,303 0.10
17,756 Hang Zhou Great Star Indus – A 664,177 0.0113,093 Hangzhou First Applied Mat – A 2,095,619 0.0520,997 Hangzhou Robam Appliances – A 927,251 0.0217,073 Hangzhou Silan Microelectr – A 1,134,502 0.03
6,323 Hangzhou Tigermed Consulti – A 990,719 0.0229,497 Hangzhou Tigermed Consulti – H 2,920,203 0.07
281,758 Hansoh Pharmaceutical Group 5,353,402 0.1216,699 Hefei Meiya Optoelectronic – A 766,928 0.0235,418 Hello Group Inc – SPN ADR 2,479,642 0.0639,868 Henan Shuanghui Investment – A 1,542,127 0.03
140,063 Hengan Intl Group Co Ltd 5,623,529 0.1390,927 Hengli Petrochemical Co L – A 2,560,649 0.06
622,782 Hengten Networks Group Ltd 1,837,207 0.0422,621 Hengtong Optic-Electric Co – A 419,334 0.0149,675 Hengyi Petrochemical Co – A 646,783 0.01
143,767 Hesteel Co Ltd – A 433,601 0.015,572 Hithink Royalflush Informa – A 987,679 0.028,186 Hongfa Technology Co Ltd – A 749,100 0.02
148,883 Hopson Development Holdings 2,420,838 0.055,129 Hoshine Silicon Industry C – A 829,859 0.02
114,997 Hua Hong Semiconductor Ltd 4,944,871 0.11207,568 Huabao International Holding 2,988,979 0.07
55,946 Huadian Power Intl Corp – A 366,960 0.0127,973 Huadong Medicine Co Ltd – A 1,378,673 0.0363,089 Huafon Chemical Co Ltd – A 807,515 0.0222,899 Hualan Biological Engineer – A 818,092 0.02
148,274 Huaneng Power Intl Inc – A 1,761,510 0.04749,740 Huaneng Power Intl Inc – H 3,906,145 0.09111,681 Huatai Securities Co Ltd – A 2,431,748 0.05327,558 Huatai Securities Co Ltd – H 4,251,703 0.10
32,123 Huaxi Securities Co Ltd – A 387,926 0.01154,839 Huaxia Bank Co Ltd – A 1,063,077 0.02
20,852 Huaxin Cement Co Ltd – A 493,402 0.0143,753 Huayu Automotive Systems – A 1,518,066 0.0339,571 Huazhu Group Ltd – ADR 11,519,666 0.2614,206 Hubei Xingfa Chemicals Grp – A 659,748 0.01
5,385 Huizhou Desay Sv Automotiv – A 934,263 0.0217,726 Humanwell Healthcare Group – A 489,413 0.0198,588 Hunan Valin Steel Co Ltd – A 617,648 0.0115,658 Hundsun Technologies Inc – A 1,193,091 0.0319,664 Hutchmed China – ADR (formerly
known as Hutchison China Meditech – ADR) 5,377,990 0.12
72,861 Hygeia Healthcare Holdings C 3,555,617 0.0830,528 Iflytek Co Ltd – A 1,965,335 0.04
8,249 I-Mab-Sponsored ADR 3,047,730 0.073,062 Imeik Technology Developme – A 2,012,590 0.05
888,546 Ind & Comm Bk of China – A 5,043,792 0.1112,614,381 Ind & Comm Bk of China – H 55,503,276 1.25
278,575 Industrial Bank Co Ltd – A 6,502,874 0.1589,878 Industrial Securities Co – A 1,088,696 0.02
HoldingsFair value
HK$
% of Net
Assets
China (99.67%) Continued6,407 Ingenic Semiconductor Co – A 1,052,582 0.02
626,651 Inner Mongolia Baotou Ste – A 2,143,513 0.05147,651 Inner Mongolia Junzheng En – A 946,748 0.02
84,071 Inner Mongolia Yili Indus – A 4,273,383 0.10263,038 Innovent Biologics Inc 12,691,583 0.29
23,863 Inspur Electronic Informat – A 1,048,258 0.025,576 Intco Medical Technology C – A 395,410 0.01
67,044 Iqiyi Inc – ADR 2,383,490 0.0523,914 JA Solar Technology Co Ltd – A 2,717,867 0.0614,064 Jafron Biomedical Co Ltd – A 919,036 0.02
7,612 Jason Furniture Hangzhou C – A 720,091 0.0221,722 Jcet Group Co Ltd – A 826,110 0.0282,012 JD Health International Inc 5,039,637 0.11
390,213 JD.Com Inc – CL A 106,918,362 2.4042,928 Jiangsu Eastern Shenghong – A 1,017,873 0.02
309,595 Jiangsu Express Co Ltd – H 2,473,664 0.0621,183 Jiangsu Hengli Hydraulic C – A 2,124,404 0.0590,584 Jiangsu Hengrui Medicine C – A 5,631,724 0.1320,927 Jiangsu King’s Luck Brewer – A 1,395,732 0.0321,137 Jiangsu Yanghe Brewery – A 4,268,864 0.10
4,720 Jiangsu Yangnong Chemical – A 759,228 0.025,850 Jiangsu Yoke Technology – A 582,167 0.01
16,431 Jiangsu Yuyue Medical Equ – A 761,469 0.0244,220 Jiangsu Zhongtian Technolo – A 919,477 0.0235,713 Jiangxi Copper Co Ltd – A 977,713 0.02
248,194 Jiangxi Copper Co Ltd – H 3,097,461 0.0746,561 Jiangxi Zhengbang Tech – A 551,437 0.01
112,979 Jinke Properties Group Co – A 620,543 0.01273,479 Jinxin Fertility Group Ltd 2,382,002 0.05
5,321 Jiugui Liquor Co Ltd – A 1,386,272 0.03158,645 Jiumaojiu International Hold 2,173,436 0.05
4,718 Joinn Laboratories China C – A 667,687 0.0124,788 Jointown Pharmaceutical – A 447,348 0.0113,569 Jonjee High-Tech Industria – A 631,662 0.0112,500 Joyy Inc – ADR 4,427,324 0.10
7,428 Juewei Food Co Ltd – A 622,271 0.0114,505 Kanzhun Ltd 3,944,416 0.0979,614 KE Holdings Inc – ADR 12,488,376 0.28
160,425 Kingboard Holdings Ltd 6,088,129 0.14219,558 Kingboard Laminates Hldg Ltd 2,911,339 0.07577,452 Kingdee International Sftwr 13,858,848 0.31
41,659 Kingfa Sci.& Tech Co Ltd – A 642,519 0.0113,066 Kingsoft Cloud Holdings – ADR 1,604,397 0.04
220,393 Kingsoft Corp Ltd 7,548,460 0.17103,646 Kuaishou Technology 7,467,694 0.17
32,779 Kuang-Chi Technologies Co – A 964,904 0.02848,101 Kunlun Energy Co Ltd 6,199,618 0.14
16,722 Kweichow Moutai Co Ltd – A 42,027,965 0.94321,842 KWG Group Holdings Ltd 1,641,394 0.04
35,899 LB Group Co Ltd – A (formerly known as Lomon Billions Group Co – A) 1,258,325 0.03
316,323 Lee & Man Paper Manufacturin 1,714,471 0.0410,216 Legend Biotech Corp – ADR 3,712,347 0.08
1,600,763 Lenovo Group Ltd 14,342,836 0.3262,031 Lens Technology Co Ltd – A 1,747,653 0.0428,080 Lepu Medical Technology – A 779,073 0.02
123,178 Li Auto Inc – ADR 30,826,678 0.69500,579 Li Ning Co Ltd 42,724,418 0.96
89,582 Lingyi Itech Guangdong Co – A 808,341 0.02280,913 Logan Group Co Ltd 1,674,241 0.04413,333 Longfor Group Holdings Ltd 15,169,321 0.34
72,903 Longi Green Energy Technol – A 7,704,580 0.1795,872 Luxshare Precision Industr – A 5,783,000 0.1319,751 Luzhou Laojiao Co Ltd – A 6,147,475 0.1428,042 Mango Excellent Media Co L – A 1,967,221 0.04
4,173 Maxscend Microelectronics – A 1,671,963 0.0441,622 Meinian Onehealth Healthca – A 400,580 0.01
914,730 Meituan – Class B 206,180,142 4.63
NM0522U-2194143-74/163

74 iShares Asia Trust
iShares Core MSCI China ETF (continued)
Investment Portfolio (unaudited) as at 31st December 2021
HoldingsFair value
HK$
% of Net
Assets
China (99.67%) Continued233,814 Metallurgical Corp of Chin – A 1,097,907 0.02141,446 Microport Scientific Corp 4,017,066 0.09
27,700 Ming Yang Smart Energy Gro – A 886,373 0.02130,316 Ming Yuan Cloud Group Holdin 2,314,412 0.05164,990 Minth Group Ltd 5,667,406 0.13754,113 MMG Ltd 1,885,282 0.04
10,647 Montage Technology Co Ltd – A 1,094,788 0.0273,898 Muyuan Foodstuff Co Ltd – A 4,834,425 0.1115,821 Nanjing King-Friend Bioche – A 814,666 0.0257,136 Nanjing Securities Co Ltd – A 694,192 0.0274,561 Nari Technology Co Ltd – A 3,659,263 0.0827,388 National Silicon Industry – A 866,987 0.02
7,579 Naura Technology Group Co – A 3,224,502 0.0744,830 Navinfo Co Ltd – A 875,000 0.02
453,307 Netease Inc 71,395,852 1.6029,745 New China Life Insurance C – A 1,417,870 0.03
192,358 New China Life Insurance C – H 4,010,664 0.0975,399 New Hope Liuhe Co Ltd – A 1,406,019 0.03
331,582 New Oriental Educatio – SP ADR 5,428,737 0.12408,588 Nine Dragons Paper Holdings 3,419,882 0.08
21,799 Ninestar Corp – A 1,276,430 0.0323,069 Ningbo Joyson Electronic – A 621,377 0.0120,402 Ningbo Tuopu Group Co Ltd – A 1,325,699 0.0381,229 Ningxia Baofeng Energy Gro – A 1,728,849 0.04
304,520 Nio Inc – ADR 75,212,415 1.697,497 Noah Holdings Ltd – Spon ADS 1,793,796 0.04
395,428 Nongfu Spring Co Ltd – H 20,344,771 0.4617,692 North Industries Group Red – A 578,490 0.0157,733 Ofilm Group Co Ltd – A 686,582 0.02
7,689 Oppein Home Group Inc – A 1,390,459 0.0388,753 Orient Securities Co Ltd – A 1,603,898 0.04
8,769 Ovctek China Inc – A 616,781 0.01117,656 Pangang Group Vanadium Tit – A 561,125 0.01
1,994,315 People’s Insurance Co Grou – H 4,706,583 0.1130,068 Perfect World Co Ltd – A 748,705 0.02
263,519 Petrochina Co Ltd – A 1,586,316 0.044,744,509 Petrochina Co Ltd – H 16,463,446 0.37
10,548 Pharmaron Beijing Co Ltd – A 1,826,907 0.0430,595 Pharmaron Beijing Co Ltd – H 3,680,578 0.08
100,311 PICC Holding Co – A 578,020 0.011,529,880 PICC Property & Casualty – H 9,745,336 0.22
98,018 Pinduoduo Inc – ADR 44,551,562 1.00279,011 Ping An Bank Co Ltd – A 5,637,348 0.13105,527 Ping An Healthcare and Techn 2,991,690 0.07144,994 Ping An Insurance Group Co – A 8,961,135 0.20
1,413,831 Ping An Insurance Group Co – H 79,386,611 1.78169,040 Poly Developments and Hold – A 3,239,252 0.07386,748 Postal Savings Bank of Chi – A 2,418,213 0.05
1,741,848 Postal Savings Bank of Chi – H 9,527,909 0.21182,611 Power Construction Corp of – A 1,808,983 0.04330,045 Powerlong Real Estate Holdin 1,346,584 0.03
3,269 Proya Cosmetics Co Ltd – A 834,875 0.025,369 Raytron Technology Co Ltd – A 517,186 0.01
83,777 Risesun Real Estate Devel – A 446,797 0.0112,182 Riyue Heavy Industry Co Lt – A 492,119 0.01
141,624 RLX Technology Inc – ADR 4,306,158 0.10148,623 Rongsheng Petrochemical Co – A 3,309,011 0.07
64,453 S F Holding Co Ltd – A 5,446,088 0.12112,505 Saic Motor Corp Ltd – A 2,845,557 0.06
47,738 Sailun Group Co Ltd – A 865,623 0.024,097 Sangfor Technologies Inc – A 959,391 0.02
250,001 Sany Heavy Equipment Intl 1,885,008 0.04121,494 Sany Heavy Industry Co Ltd – A 3,396,143 0.08
22,767 Satellite Chemical Co Ltd – A 1,117,346 0.0384,092 Sdic Capital Co Ltd – A 847,467 0.02
133,459 Sdic Power Holdings Co Ltd – A 1,876,755 0.04481,850 Seazen Group Ltd 2,539,349 0.06
30,851 Seazen Holdings Co Ltd – A 1,101,808 0.02
HoldingsFair value
HK$
% of Net
Assets
China (99.67%) Continued2,374 SG Micro Corp – A 899,364 0.02
153,379 Shaanxi Coal Industry Co L – A 2,294,151 0.0551,561 Shandong Gold Mining Co Lt – A 1,189,699 0.03
134,043 Shandong Gold Mining Co Lt – H 1,788,134 0.0429,158 Shandong Hualu Hengsheng – A 1,118,918 0.0318,039 Shandong Linglong Tyre Co – A 808,344 0.02
196,296 Shandong Nanshan Aluminum – A 1,133,519 0.0334,656 Shandong Sun Paper Industr – A 488,197 0.01
558,671 Shandong Weigao Gp Medical – H 5,435,869 0.128,848 Shanghai Bairun Investment – A 649,023 0.01
15,750 Shanghai Baosight Software – A 1,174,613 0.0382,007 Shanghai Baosight Software – B 3,086,148 0.07
197,157 Shanghai Construction Grou – A 870,184 0.02140,205 Shanghai Electric Grp Co L – A 835,403 0.02
29,180 Shanghai Fosun Pharmaceuti – A 1,750,836 0.04114,385 Shanghai Fosun Pharmaceuti – H 3,929,125 0.09
9,024 Shanghai International Air – A 516,558 0.01133,415 Shanghai International Por – A 896,358 0.02
11,917 Shanghai Jahwa United Co – A 590,408 0.019,996 Shanghai Jinjiang Internat – A 718,158 0.025,989 Shanghai Junshi Bioscience – A 491,808 0.01
204,941 Shanghai Lujiazui Fin&Trad – B 1,455,579 0.0312,925 Shanghai M&G Stationery In – A 1,022,242 0.0236,923 Shanghai Pharmaceuticals – A 899,479 0.02
186,753 Shanghai Pharmaceuticals – H 2,760,209 0.06406,733 Shanghai Pudong Devel Bank – A 4,253,581 0.10
10,099 Shanghai Putailai New Ener – A 1,988,599 0.0473,221 Shanghai Raas Blood Produc – A 612,232 0.0145,998 Shanghai Yuyuan Tourist Ma – A 580,861 0.0132,142 Shanghai Zhangjiang High – A 593,464 0.0138,459 Shanxi Coking Coal Energy – A 389,942 0.0145,456 Shanxi Lu’An Environmental – A 630,304 0.0189,858 Shanxi Meijin Energy Co Lt – A 1,788,017 0.04
111,300 Shanxi Taigang Stainless – A 960,648 0.0216,612 Shanxi Xinghuacun Fen Wine – A 6,431,360 0.1422,430 Shenghe Resources Holdings – A 539,541 0.0135,197 Shengyi Technology Co Ltd – A 1,016,232 0.02
4,984 Shennan Circuits Co Ltd – A 744,377 0.02306,355 Shenwan Hongyuan Group Co – A 1,923,053 0.04
5,119 Shenzhen Capchem Technolog – A 709,186 0.0251,910 Shenzhen Energy Group Co L – A 515,504 0.01
4,077 Shenzhen Goodix Technology – A 538,685 0.0134,795 Shenzhen Inovance Technolo – A 2,926,424 0.07
246,352 Shenzhen Intl Holdings 1,995,451 0.0422,490 Shenzhen Kaifa Technology – A 436,758 0.01
7,890 Shenzhen Kangtai Biologica – A 953,204 0.023,086 Shenzhen Kedali Industry C – A 606,644 0.01
16,408 Shenzhen Mindray Bio-Medic – A 7,660,354 0.17142,006 Shenzhen Overseas Chinese – A 1,225,676 0.03
5,799 Shenzhen SC New Energy Tec – A 812,635 0.029,577 Shenzhen Senior Technology – A 431,267 0.01
15,336 Shenzhen Sunway Communicat – A 476,071 0.017,843 Shenzhen Transsion Holding – A 1,508,695 0.03
184,701 Shenzhou International Group 27,686,680 0.6225,568 Shijiazhuang Yiling Pharma – A 614,397 0.01
294,280 Shimao Group Holdings Ltd 1,500,828 0.03133,760 Shimao Services Holdings Ltd 724,979 0.02
59,173 Sichuan Chuantou Energy Co – A 906,838 0.0213,801 Sichuan Kelun Pharmaceutic – A 320,300 0.0116,149 Sichuan New Energy Power Co 525,266 0.0165,558 Sichuan Road&Bridge Co Lt – A 967,717 0.02
5,699 Sichuan Swellfun Co Ltd – A 838,378 0.0214,606 Sichuan Yahua Industrial – A 513,220 0.01
9,577 Sieyuan Electric Co Ltd – A 577,802 0.012,363,942 Sino Biopharmaceutical 12,907,123 0.29
70,333 Sinolink Securities Co Ltd – A 976,979 0.0222,764 Sinoma Science&Technology – A 949,465 0.02
305,547 Sinopharm Group Co – H 5,182,077 0.12
NM0522U-2194143-75/163

Reports and Financial Statements 75
iShares Core MSCI China ETF (continued)
Investment Portfolio (unaudited) as at 31st December 2021
HoldingsFair value
HK$
% of Net
Assets
China (99.67%) Continued165,978 Sinotruk Hong Kong Ltd 1,991,736 0.04
5,664 Skshu Paint Co Ltd – A 966,279 0.02399,132 Smoore International Holding 15,865,497 0.36
44,802 Songcheng Performance Deve – A 786,569 0.02113,261 Soochow Securities Co Ltd – A 1,230,298 0.03
74,864 Southwest Securities Co Lt – A 485,540 0.011,919 Starpower Semiconductor Lt – A 896,388 0.02
457,909 Sun Art Retail Group Ltd 1,433,255 0.03646,829 Sunac China Holdings Ltd 7,619,646 0.17238,821 Sunac Services Holdings Ltd 1,898,627 0.04
19,031 Sungrow Power Supply Co Lt – A 3,401,852 0.08156,793 Suning.Com Co Ltd – A 791,991 0.02158,905 Sunny Optical Tech 39,185,973 0.88
21,200 Sunwoda Electronic Co Ltd – A 1,095,804 0.0232,245 Suzhou Dongshan Precision – A 1,071,342 0.02
1,269 Suzhou Maxwell Technologie – A 999,300 0.027,253 Suzhou Ta&A Ultra Clean Te – A 720,276 0.02
95,693 Tal Education Group – ADR 2,931,982 0.0750,053 TBEA Co Ltd – A 1,299,114 0.03
210,816 TCL Technology Group Corp – A 1,594,722 0.041,287,786 Tencent Holdings Ltd 588,260,645 13.21
146,901 Tencent Music Entertainm – ADR 7,845,197 0.186,282 Thunder Software Technolog – A 1,066,088 0.02
113,997 Tianfeng Securities Co Ltd – A 566,037 0.0147,824 Tianjin Zhonghuan Semicond – A 2,447,928 0.0546,071 Tianma Microelectronics – A 735,419 0.0260,630 Tianshan Aluminum Group Co – A 605,817 0.0144,879 Tianshui Huatian Technolog – A 699,335 0.0211,601 Tibet Summit Resources Co – A 535,639 0.01
436,797 Tingyi (Cayman Isln) Hldg Co 6,997,488 0.1626,488 Titan Wind Energy Suzhou – A 629,685 0.01
214,754 Tongcheng Travel Holdings Ltd (formerly known as Tongcheng-Elong Holdings Ltd) 3,101,048 0.07
43,139 Tongkun Group Co Ltd – A 1,120,192 0.03142,557 Tongling Nonferrous Metals – A 608,225 0.01
61,332 Tongwei Co Ltd – A 3,380,724 0.084,432 Topchoice Medical Corporat – A 1,081,307 0.02
369,696 Topsports International Hold 2,916,901 0.07236,818 Travelsky Technology Ltd – H 3,107,052 0.07115,166 Trip.Com Group Ltd – ADR 22,105,527 0.50
8,743 Tsingtao Brewery Co Ltd – A 1,061,187 0.02124,487 Tsingtao Brewery Co Ltd – H 9,087,551 0.20
8,642 Unigroup Guoxin Microelect – A 2,383,928 0.05251,134 Uni-President China Holdings 1,898,573 0.04
45,443 Unisplendour Corp Ltd – A 1,273,062 0.0348,796 Venus Medtech Hangzhou Inc – H 1,444,362 0.0367,409 Vinda International Holdings 1,280,771 0.03
101,584 Vipshop Holdings Ltd – ADR 6,652,626 0.1520,560 Vnet Group Inc – ADR (formerly
known as 21Vianet Group Inc – ADR) 1,447,436 0.03
19,254 Walvax Biotechnology Co – A 1,326,641 0.0346,363 Wanhua Chemical Group Co – A 5,741,022 0.13
1,055,403 Want Want China Holdings Ltd 7,556,685 0.1714,089 Weibo Corp – Spon ADR 3,402,907 0.0895,142 Weichai Power Co Ltd – A 2,086,791 0.05
429,325 Weichai Power Co Ltd – H 6,551,499 0.156,453 Weihai Guangwei Composites – A 668,362 0.02
438,563 Weimob Inc 3,460,262 0.0891,576 Wens Foodstuffs Group Co – A 2,162,391 0.0574,435 Western Securities Co Ltd – A 736,456 0.02
5,274 Western Superconducting Te – A 626,815 0.0110,539 Westone Information Indust – A 722,800 0.02
312,562 Wharf Holdings Ltd 7,485,860 0.1710,857 Will Semiconductor Co Ltd – A 4,136,616 0.0917,126 Wingtech Technology Co Ltd – A 2,714,881 0.06
HoldingsFair value
HK$
% of Net
Assets
China (99.67%) Continued27,879 Winning Health Technology – A 572,859 0.0168,250 Wuchan Zhongda Group Co L – A 495,360 0.0138,814 Wuhan Guide Infrared Co Lt – A 1,152,072 0.0328,055 Wuhu Sanqi Interactive Ent – A 929,377 0.0252,550 Wuliangye Yibin Co Ltd – A 14,345,352 0.3234,480 Wus Printed Circuit Kunsha – A 700,887 0.0234,725 Wuxi Apptec Co Ltd – A 5,048,356 0.1177,874 Wuxi Apptec Co Ltd – H 10,512,990 0.24
804,898 Wuxi Biologics Cayman Inc 74,493,310 1.6711,247 Wuxi Lead Intelligent Equi – A 1,025,488 0.02
3,269 Wuxi Shangji Automation Co – A 669,230 0.02160,260 XCMG Construction Machin – A 1,176,924 0.03
46,800 Xiamen C & D Inc – A 520,415 0.012,705 Xiamen Faratronic Co Ltd – A 770,725 0.02
17,992 Xiamen Tungsten Co Ltd – A 499,184 0.013,193,060 Xiaomi Corp – Class B 60,348,834 1.36
162,244 Xinjiang Goldwind Sci&Tec – H 2,469,354 0.0649,928 Xinjiang Goldwind Sci&Tech – A 1,008,171 0.02
1,100,642 Xinyi Solar Holdings Ltd 14,550,487 0.3387,264 Xpeng Inc – ADR 34,241,327 0.77
252,209 Yadea Group Holdings Ltd 3,833,577 0.0941,298 Yankuang Energy Group Co – A
(formerly known as Yanzhou Coal Mining Co – A) 1,191,372 0.03
345,975 Yankuang Energy Group Co – H (formerly known as Yanzhou Coal Mining Co – H) 5,362,612 0.12
13,298 Yantai Eddie Precision Mac – A 520,410 0.0120,528 Yantai Jereh Oilfield – A 1,006,707 0.0213,007 Yealink Network Technology – A 1,298,866 0.0312,901 Yifeng Pharmacy Chain Co L – A 871,666 0.02
106,039 Yihai International Holding 3,822,706 0.0916,931 Yihai Kerry Arawana Holdin – A 1,306,281 0.0337,147 Yintai Gold Co Ltd – A 399,866 0.01
143,369 Yonghui Superstores Co Ltd – A 711,880 0.024,929 Yongxing Special Materials – A 894,490 0.02
47,848 Yonyou Network Technology – A 2,104,808 0.0585,597 Youngor Group Co – A 723,060 0.02
3,867 Youngy Co Ltd – A 617,042 0.0143,281 YTO Express Group Co Ltd – A 885,094 0.0229,869 Yuan Longping High-Tech Ag – A 851,778 0.02
338,686 Yuexiu Property Co Ltd 2,326,773 0.0593,772 Yum China Holdings Inc 36,436,760 0.8223,364 Yunda Holding Co Ltd – A 586,069 0.0149,834 Yunnan Aluminium Co Ltd – A 682,457 0.0220,006 Yunnan Baiyao Group Co Ltd – A 2,566,822 0.0612,467 Yunnan Energy New Material – A 3,827,301 0.0923,883 Yunnan Tin Co Ltd – A 571,857 0.0116,751 Zai Lab Ltd – ADR 8,207,947 0.18
8,189 Zhangzhou Pientzehuang Pha – A 4,388,920 0.1070,106 Zhefu Holding Group Co Ltd – A 611,972 0.0173,200 Zhejiang Century Huatong – A 752,956 0.0222,030 Zhejiang Chint Electrics – A 1,455,523 0.0340,079 Zhejiang Dahua Technology – A 1,153,749 0.03
7,258 Zhejiang Dingli Machinery – A 714,188 0.02309,023 Zhejiang Expressway Co – H 2,147,710 0.05
4,919 Zhejiang Hangke Technology – A 648,791 0.0119,001 Zhejiang Huahai Pharmaceut – A 504,581 0.0117,772 Zhejiang Huayou Cobalt Co – A 2,403,518 0.0516,899 Zhejiang Jingsheng Mechani – A 1,439,932 0.0313,590 Zhejiang Jiuzhou Pharmaceu – A 937,380 0.0238,770 Zhejiang Juhua Co – A 613,647 0.0147,305 Zhejiang Longsheng Group C – A 732,498 0.0237,893 Zhejiang Nhu Co Ltd – A 1,445,756 0.0361,230 Zhejiang Sanhua Intelligen – A 1,899,245 0.04
7,568 Zhejiang Supor Co Ltd – A 577,493 0.0116,049 Zhejiang Weiming Environme – A 718,777 0.02
NM0522U-2194143-76/163

76 iShares Asia Trust
iShares Core MSCI China ETF (continued)
Investment Portfolio (unaudited) as at 31st December 2021
HoldingsFair value
HK$
% of Net
Assets
China (99.67%) Continued10,218 Zhejiang Wolwo Bio-Pharmac – A 717,822 0.0211,020 Zhejiang Yongtai Tech – A 691,883 0.0246,269 Zheshang Securities Co Ltd – A 747,656 0.02
114,847 Zhongan Online P&C Insuran – H 3,112,354 0.0710,886 Zhongji Innolight Co Ltd – A 567,223 0.01
128,779 Zhongsheng Group Holdings 7,829,763 0.1879,069 Zhongtai Securities Co Ltd – A 966,491 0.02
122,415 Zhuzhou CRRC Times Electri – H 5,527,037 0.124,067 Zhuzhou Hongda Electronics – A 498,920 0.01
39,778 Zhuzhou Kibing Group Co Lt – A 833,941 0.02287,331 Zijin Mining Group Co Ltd – A 3,417,043 0.08
1,294,699 Zijin Mining Group Co Ltd – H 12,014,807 0.27336,913 Zoomlion Heavy Industry – H 1,654,243 0.04138,823 Zoomlion Heavy Industry S – A 1,220,329 0.03
60,802 ZTE Corp – A 2,497,232 0.06169,368 ZTE Corp – H 3,616,007 0.08
96,715 ZTO Express Cayman Inc – ADR 21,278,421 0.48
Total listed equities 4,439,077,987 99.67
Unlisted equities (0.00%)
China (0.00%)560,670 China Common Rich Renewable
Energy Investments Limited 1 0.00485,149 China Huishan Dairy Holdings 5 0.00
Total unlisted equities 6 0.00
Unlisted rights (0.00%)
China (0.00%)23,233 Seazen Group Ltd – Rights∆ 0 0.00
Total unlisted rights 0 0.00
Futures (0.00%)
China (0.00%)50 MSCI China Free Index Futures Mar
2022 (151,209) (0.00)
Total Futures (151,209) (0.00)
Total investments 4,438,926,784 99.67Other net assets 14,834,408 0.33
Net assets attributable to unitholders
at 31st December 2021 4,453,761,192 100.00
Total investments, at cost 4,725,175,049
D Amount is less than HK$1.
NM0522U-2194143-77/163

Reports and Financial Statements 77
iShares Core MSCI China ETF Details in Respect of Financial Derivative Instruments (unaudited) as at 31st December 2021
Futures
Underlying assets CounterpartyFair value
HK$Description
Financial liabilities:MSCI China Free Index Futures Mar 2022 MSCI China Free Index Credit Suisse International (151,209)
(151,209)
Unlisted rights
Underlying assets IssuerFair value
HK$Description
Financial assets:Seazen Group Ltd – Rights Seazen Group Ltd Seazen Group Ltd 0∆
0∆
D Amount is less than HK$1.
The financial derivative instruments held by the Sub-Fund as at 31st December 2021 are summarized below:
NM0522U-2194143-78/163

78 iShares Asia Trust
iShares Core MSCI China ETF Information on Exposure Arising from Financial Derivative Instruments (unaudited) for the year ended 31st December 2021
2021% of net asset
value
Lowest gross exposure 0.00%
Highest gross exposure 1.02%
Average gross exposure 0.39%
The lowest, highest and average net exposure arising from the use of financial derivative instruments for investment purpose as a proportion to the Sub-Fund’s total net asset value for the year ended 31st December 2021 as shown below:
2021% of net asset
value
Lowest net exposure 0.00%
Highest net exposure 1.02%
Average net exposure 0.39%
The lowest, highest and average gross exposure arising from the use of financial derivative instruments for any purpose as a proportion to the Sub-Fund’s total net asset value for the year ended 31st December 2021 as shown below:
NM0522U-2194143-79/163

Reports and Financial Statements 79
iShares Core MSCI China ETF Statement of Movements in Investment Portfolio (unaudited) for the year ended 31st December 2021
% of net asset value
2021
% of net asset value
2020
Financial assets at fair value through profit or lossListed equitiesCommunication Services 18.27 20.05Consumer Discretionary 29.46 35.08Consumer Staples 5.95 4.50Energy 1.68 1.57Financials 14.39 13.48Health Care 7.01 6.47Industrials 5.65 4.42Information Technology 7.09 6.61Materials 3.45 2.10Real Estate 3.94 3.61Utilities 2.78 1.81
99.67 99.70 Unlisted equitiesConsumer Staples 0.00 0.00Information Technology 0.00 0.00
0.00 0.00 Unlisted rightsInformation Technology – 0.00Real Estate 0.00 –
0.00 0.00 FuturesMSCI China Free Index Futures 0.00 0.00
0.00 0.01 Total investments 99.67 99.70Other net assets 0.33 0.30 Net assets attributable to unitholders at 31st December 100.00 100.00
NM0522U-2194143-80/163

80 iShares Asia Trust
iShares Core MSCI China ETF Performance Record (unaudited)
Net Asset Value
DealingNet asset value
per unitHK$
DealingNet asset value
of the Sub-FundHK$
At end of financial period dated31st December 2019 27.07 6,042,343,12031st December 2020 34.37 5,299,887,79631st December 2021 26.65 4,453,804,124
Highest and lowest net asset value per unit
Highest net assetvalue per unit
HK$
Lowest net assetvalue per unit
HK$
Financial period ended31st December 2012 20.66 16.9231st December 2013 21.89 17.0031st December 2014 22.56 18.1031st December 2015 27.37 18.2131st December 2016 21.02 15.2831st December 2017 29.42 18.5831st December 2018 32.11 21.9131st December 2019 27.47 21.5731st December 2020 34.73 21.9931st December 2021 41.10 25.68
NM0522U-2194143-81/163

Reports and Financial Statements 81
HoldingsFair value
RMB
% ofNet
Assets
Investments (99.96%)
Listed equities (99.96%)
China (99.96%)82,268,911 Agricultural Bank of China – A 241,870,598 1.58
3,485,710 Aier Eye Hospital Group Co – A 147,375,819 0.9645,307,411 Bank of China Ltd – A 138,187,603 0.9042,990,175 Bank of Communications Co – A 198,184,707 1.30
5,619,500 Beijing-Shanghai High Spe – A 27,142,185 0.181,644,108 BYD Co Ltd – A 440,818,237 2.88
19,320,519 China Construction Bank – A 113,218,241 0.743,128,422 China Life Insurance Co – A 94,134,218 0.61
25,253,528 China Merchants Bank – A 1,230,099,349 8.035,880,099 China Pacific Insurance Gr – A 159,468,285 1.04
20,521,131 China Petroleum & Chemical – A 86,804,384 0.574,247,580 China Shenhua Energy Co – A 95,655,502 0.621,677,422 China Tourism Group Duty F – A 368,043,161 2.40
13,883,565 China Vanke Co Ltd – A 274,339,244 1.788,791,132 China Yangtze Power Co Ltd – A 199,558,696 1.30
755,650 Chongqing Zhifei Biologica – A 94,153,990 0.6218,066,570 Citic Securities Co – A 477,138,114 3.11
1,400,502 Contemporary Amperex Techn – A 823,495,176 5.377,006,700 Cosco Shipping Holdings Co – A 130,955,223 0.86
12,429,997 East Money Information Co – A 461,277,189 3.011,135,700 EVE Energy Co Ltd – A 134,217,026 0.87
904,380 Foshan Haitian Flavouring – A 95,059,382 0.622,432,202 Foxconn Industrial Interne – A 28,991,848 0.191,974,700 Great Wall Motor Co Ltd – A 95,851,938 0.623,556,837 Gree Electric Appliances I – A 131,709,674 0.863,800,100 Haier Smart Home Co Ltd – A 113,584,989 0.74
46,315,642 Ind & Comm Bk of China – A 214,441,422 1.4029,750,700 Industrial Bank Co Ltd – A 566,453,328 3.7010,713,803 Inner Mongolia Yili Indus – A 444,194,272 2.90
6,318,326 Jiangsu Hengrui Medicine C – A 320,402,312 2.09946,819 Jiangsu Yanghe Brewery – A 155,969,494 1.02949,513 Kweichow Moutai Co Ltd – A 1,946,501,650 12.70
5,861,916 Longi Green Energy Technol – A 505,297,159 3.305,627,321 Luxshare Precision Industr – A 276,864,193 1.801,436,793 Luzhou Laojiao Co Ltd – A 364,758,639 2.383,013,052 Muyuan Foodstuff Co Ltd – A 160,776,454 1.04
14,990,120 Petrochina Co Ltd – A 73,601,489 0.4817,504,965 Ping An Bank Co Ltd – A 288,481,824 1.8819,776,506 Ping An Insurance Group Co – A 996,933,668 6.50
1,574,992 S F Holding Co Ltd – A 108,548,448 0.715,825,678 Saic Motor Corp Ltd – A 120,183,737 0.79
30,886,827 Shanghai Pudong Devel Bank – A 263,464,635 1.71769,090 Shanxi Xinghuacun Fen Wine – A 242,863,240 1.58549,624 Shenzhen Mindray Bio-Medic – A 209,296,820 1.36
3,057,229 Wanhua Chemical Group Co – A 308,780,129 2.013,781,418 Wuliangye Yibin Co Ltd – A 841,970,532 5.49
549,820 Wuxi Apptec Co Ltd – A 65,197,656 0.42766,600 Yihai Kerry Arawana Holdin – A 48,242,138 0.32363,100 Zhangzhou Pientzehuang Pha – A 158,729,165 1.03
25,104,032 Zijin Mining Group Co Ltd – A 243,509,110 1.59
Total investments 15,326,796,292 99.96Other net assets 6,718,032 0.04
Net assets attributable to
unitholders at 31st December 2021 15,333,514,324 100.00
Total investments, at cost 12,423,401,086
iShares FTSE China A50 ETF Investment Portfolio (unaudited) as at 31st December 2021
NM0522U-2194143-82/163

82 iShares Asia Trust
iShares FTSE China A50 ETF Statement of Movements in Investment Portfolio (unaudited) for the year ended 31st December 2021
% of net asset value
2021
% of net asset value
2020
Financial assets at fair value through profit or lossListed equitiesConsumer Discretionary 8.29 10.53Consumer Staples 28.05 25.93Energy 1.67 1.27Financials 35.51 40.34Health Care 6.48 6.45Industrials 7.99 3.14Information Technology 5.29 6.08Materials 3.60 2.82Real Estate 1.78 2.38Utilities 1.30 1.01 Total investments 99.96 99.95Other net assets 0.04 0.05 Net assets attributable to unitholders at 31st December 100.00 100.00
NM0522U-2194143-83/163

Reports and Financial Statements 83
iShares FTSE China A50 ETF Performance Record (unaudited)
Net Asset Value
DealingNet asset value
per unitRMB
DealingNet asset value
of the Sub-FundRMB
At end of financial period dated31st December 2019 13.79 20,515,230,06331st December 2020 16.91 16,198,111,49631st December 2021 15.00 15,333,508,027
Highest and lowest net asset value per unit
Highest net assetvalue per unit
Lowest net assetvalue per unit
Financial period ended31st December 2012 HK$10.85 HK$8.7931st December 2013 HK$11.55 HK$8.5331st December 2014 HK$14.00 HK$7.8431st December 2015 HK$18.18 HK$9.9931st December 2016 HK$11.99 HK$9.7031st December 2017 HK$15.97 HK$10.9431st December 2018* RMB14.15 RMB9.8831st December 2019 RMB13.97 RMB9.8431st December 2020 RMB16.91 RMB11.4431st December 2021 RMB19.21 RMB14.30
* For iShares FTSE China A50 ETF, the base currency was changed from Hong Kong dollar (“HK$”) to Renminbi (“RMB”), effective from 1st January 2018.
NM0522U-2194143-84/163

84 iShares Asia Trust
iShares Core S&P BSE SENSEX India ETF Investment Portfolio (unaudited) as at 31st December 2021
HoldingsFair value
US$
% ofNet
Assets
Investments (100.07%)
Listed equities (100.07%)
India (100.07%)49,363 Asian Paints Ltd 2,245,803 2.32
298,647 Axis Bank Ltd 2,726,107 2.8229,081 Bajaj Finance Ltd 2,729,447 2.82
6,622 Bajaj Finserv Ltd 1,460,079 1.51264,593 Bharti Airtel Ltd 2,434,120 2.51
13,300 Dr. Reddy’s Laboratories 878,247 0.91118,854 HCL Technologies Ltd 2,107,967 2.18479,250 HDFC Bank Limited 9,540,431 9.86
97,761 Hindustan Unilever Ltd 3,103,377 3.21197,990 Housing Development Finance 6,889,970 7.12760,022 ICICI Bank Ltd 7,568,459 7.82
66,119 Indusind Bank Ltd 789,534 0.81400,620 Infosys Ltd 10,183,964 10.52957,898 ITC Ltd 2,809,174 2.90143,311 Kotak Mahindra Bank Ltd 3,463,070 3.58132,287 Larsen & Toubro Ltd 3,372,324 3.48104,813 Mahindra & Mahindra Ltd 1,180,590 1.22
14,553 Maruti Suzuki India Ltd 1,453,995 1.503,907 Nestle India Ltd 1,035,860 1.07
520,250 NTPC Ltd 870,633 0.90374,251 Power Grid Corp of India Ltd 1,028,822 1.06377,615 Reliance Industries Ltd 12,029,880 12.43420,193 State Bank of India 2,602,760 2.69118,216 Sun Pharmaceutical Indus 1,344,440 1.39113,408 Tata Consultancy Svcs Ltd 5,701,015 5.89
85,617 Tata Steel Ltd 1,280,184 1.3267,977 Tech Mahindra Ltd 1,637,387 1.6945,688 Titan Co Ltd 1,551,510 1.6012,643 Ultratech Cement Ltd 1,291,238 1.33
162,035 Wipro Ltd 1,558,975 1.61
Total investments 96,869,362 100.07Other net liabilities (71,854) (0.07)
Net assets attributable to
unitholders at 31st December 2021 96,797,508 100.00
Total investments, at cost 94,402,103
NM0522U-2194143-85/163

Reports and Financial Statements 85
iShares Core S&P BSE SENSEX India ETF Information on Exposure Arising from Financial Derivative Instruments (unaudited) for the year ended 31st December 2021
2021% of net asset
value
Lowest gross exposure 0.00%
Highest gross exposure 2.97%
Average gross exposure 0.04%
The lowest, highest and average net exposure arising from the use of financial derivative instruments for investment purpose as a proportion to the Sub-Fund’s total net asset value for the year ended 31st December 2021 as shown below:
2021% of net asset
value
Lowest net exposure 0.00%
Highest net exposure 2.97%
Average net exposure 0.04%
The lowest, highest and average gross exposure arising from the use of financial derivative instruments for any purpose as a proportion to the Sub-Fund’s total net asset value for the year ended 31st December 2021 as shown below:
NM0522U-2194143-86/163

86 iShares Asia Trust
iShares Core S&P BSE SENSEX India ETF Statement of Movements in Investment Portfolio (unaudited) for the year ended 31st December 2021
% of net asset value
2021
% of net asset value
2020
Financial assets at fair value through profit or lossListed equitiesCapital Goods 3.48 –Finance 39.03 –FMCG 7.18 –Health Care 2.30 –Information technology 21.89 –Metal, Metal Products & Mining 4.97 –Oil & Gas 12.43 –Power 1.96 –Telecom 2.51 –Transport Equipments 4.32 –
100.07 – Investment fundsiShares BSE SENSEX Mauritius Company – 100.02 Total investments 100.07 100.02Other net liabilities (0.07) (0.02) Net assets attributable to unitholders at 31st December 100.00 100.00
NM0522U-2194143-87/163

Reports and Financial Statements 87
iShares Core S&P BSE SENSEX India ETF Performance Record (unaudited)
Net Asset Value
DealingNet asset value
per unitUS$
DealingNet asset value
of the Sub-FundUS$
At end of financial period dated31st December 2019 3.37 109,951,12531st December 2020 3.78 93,046,71931st December 2021 4.48 96,797,508
Highest and lowest net asset value per unit
Highest net assetvalue per unit
Lowest net assetvalue per unit
Financial period ended31st December 2012 HK$16.57 HK$12.5831st December 2013 HK$16.58 HK$11.8031st December 2014 HK$20.75 HK$14.4331st December 2015 HK$21.59 HK$16.8031st December 2016 HK$19.82 HK$15.0931st December 2017 HK$24.57 HK$17.6731st December 2018* US$3.36 US$2.6831st December 2019 US$3.44 US$2.9231st December 2020 US$3.78 US$2.0131st December 2021 US$4.69 US$3.68
* For iShares Core S&P BSE SENSEX India ETF, the base currency was changed from Hong Kong dollar (“HK$”) to United States dollar (“US$”), effective from 1st January 2018.
NM0522U-2194143-88/163

88 iShares Asia Trust
iShares Core MSCI Asia ex Japan ETF Investment Portfolio (unaudited) as at 31st December 2021
HoldingsFair value
US$
% ofNet
Assets
Investments (99.85%)
Listed equities (99.85%)
Australia (0.23%)807,845 MMG Ltd 259,048 0.01
3,153,444 Singapore Telecommunications 5,426,688 0.22
5,685,736 0.23
Cayman Islands (0.03%)236,589 Zhen Ding Technology Holding 859,406 0.03
859,406 0.03
China (39.90%)
30,835 360 Digitech Inc 707,047 0.03124,132 360 Security Technology In – A 248,301 0.01575,428 3Sbio Inc 479,751 0.02
12,102 51Job Inc – ADR 592,151 0.02295,734 AAC Technologies Holdings In 1,168,324 0.05
14,449 Advanced Micro-Fabrication – A 287,660 0.0168,233 AECC Aviation Power Co – A 680,930 0.03
559,527 Agile Group Holdings Ltd 303,580 0.0116,507 Agora Inc – ADR 267,578 0.01
1,747,603 Agricultural Bank of China – A 807,975 0.039,164,179 Agricultural Bank of China – H 3,150,212 0.134,356,683 AIA Group Ltd 43,922,795 1.76
147,168 Aier Eye Hospital Group Co – A 978,489 0.04633,449 Air China Ltd – H 442,000 0.02
47,909 Airtac International Group 1,766,262 0.07105,043 Akeso Inc 458,097 0.02
5,480,828 Alibaba Group Holding Ltd 83,587,144 3.351,532,878 Alibaba Health Information T 1,295,700 0.053,951,808 Alibaba Pictures Group Ltd 359,887 0.01
213,069 A-Living Smart City Services 363,482 0.01528,225 Aluminum Corp of China Ltd – A 505,876 0.02
1,238,686 Aluminum Corp of China Ltd – H 684,778 0.0325,157 Angel Yeast Co Ltd – A 238,790 0.01
104,654 Anhui Conch Cement Co Ltd – A 663,237 0.03473,017 Anhui Conch Cement Co Ltd – H 2,363,174 0.09
10,891 Anhui Gujing Distillery Co – A 417,893 0.0229,716 Anhui Gujing Distillery Co – B 423,082 0.0219,700 Anhui Yingjia Distillery C – A 215,152 0.01
403,539 Anta Sports Products Ltd 6,050,782 0.246,581 Asymchem Laboratories Tian – A 450,183 0.02
23,650 Autohome Inc – ADR 697,202 0.03442,889 AVIC Industry-Finance Hold – A
(formerly known as AVIC Capital Co Ltd – A) 276,499 0.01
1,048,230 Avichina Industry & Tech – H 724,698 0.0326,639 Avicopter Plc – A 336,389 0.01
100,302 Baidu Inc – Spon ADR 14,923,935 0.60541,977 Bank of Beijing Co Ltd – A 378,418 0.01
1,121,372 Bank of China Ltd – A 537,845 0.0228,261,656 Bank of China Ltd – H 10,186,275 0.41
1,125,632 Bank of Communications Co – A 816,028 0.032,672,479 Bank of Communications Co – H 1,614,532 0.06
119,627 Bank of Hangzhou Co Ltd – A 241,171 0.01380,883 Bank of Jiangsu Co Ltd – A 349,195 0.01400,262 Bank of Nanjing Co Ltd – A 563,975 0.02157,043 Bank of Ningbo Co Ltd – A 945,362 0.04351,927 Bank of Shanghai Co Ltd – A 394,593 0.02478,861 Baoshan Iron & Steel Co – A 539,176 0.02
16,988 Beigene Ltd – ADR 4,602,559 0.18784,249 Beijing Capital Intl Airpo – H 479,826 0.02
12,600 Beijing Easpring Material – A 172,127 0.01240,535 Beijing Enterprises Hldgs 829,931 0.03
HoldingsFair value
US$
% ofNet
Assets
China (39.90%) Continued2,060,429 Beijing Enterprises Water Gr 800,777 0.03
7,914 Beijing Kingsoft Office So – A 329,799 0.0138,870 Beijing New Building Mater – A 219,013 0.01
1,057 Beijing Roborock Technolog – A 135,137 0.0110,500 Beijing United Information – A 177,503 0.01
8,300 Beijing Wantai Biological – A 289,108 0.01921,783 Beijing-Shanghai High Spe – A 700,138 0.03
10,346 BGI Genomics Co Ltd – A 142,848 0.0161,507 Bilibili Inc – Sponsored ADR 2,853,925 0.11
1,340,106 BOC Hong Kong Holdings Ltd 4,391,789 0.181,011,010 BOE Technology Group Co Lt – A 802,887 0.03
38,591 BYD Co Ltd – A 1,627,133 0.06288,000 BYD Co Ltd – H 9,848,364 0.39236,197 BYD Electronic Intl Co Ltd 864,952 0.03161,448 Caitong Securities Co Ltd – A 282,322 0.01
27,778 Cansino Biologics Inc – H 642,048 0.033,583,993 CGN Power Co Ltd – H 1,089,499 0.04
10,186 Changchun High & New Tech – A 434,732 0.02267,298 Changjiang Securities Co L – A 316,938 0.01
7,404 Changzhou Xingyu Automotiv – A 237,813 0.0181,870 Chaozhou Three-Circle Grou – A 574,206 0.0222,900 Chengxin Lithium Group Co – A 208,688 0.0190,425 Chifeng Jilong Gold Mining – A 211,876 0.0172,500 China Baoan Group – A 164,517 0.01
709,320 China Bohai Bank Co Ltd – H 272,945 0.014,263,275 China Cinda Asset Manageme – H 776,503 0.033,266,436 China Citic Bank Corp Ltd – H 1,416,127 0.06
494,000 China Coal Energy Co – H 285,135 0.011,059,913 China Communications Servi – H 516,613 0.02
594,495 China Conch Venture Holdings 2,905,258 0.12278,015 China Construction Bank – A 256,197 0.01
34,799,129 China Construction Bank – H 24,103,138 0.96100,020 China Cssc Holdings Ltd – A 389,916 0.02443,977 China Eastern Airlines Co – A 360,262 0.01877,735 China Everbright Bank Co – A 458,257 0.02
1,068,799 China Everbright Bank Co L – H 378,370 0.011,524,968 China Everbright Environment 1,224,465 0.05
615,733 China Evergrande Group 125,574 0.001,282,154 China Feihe Ltd 1,720,217 0.071,414,650 China Galaxy Securities Co – H 812,903 0.031,146,551 China Gas Holdings Ltd 2,382,428 0.10
839,536 China Hongqiao Group Ltd 886,238 0.044,170,104 China Huarong Asset Manage – H 409,185 0.02
453,289 China International Capita – H 1,250,043 0.0539,060 China International Captal – A 301,163 0.01
2,434,809 China Jinmao Holdings Group 752,651 0.03176,784 China Jushi Co Ltd – A 505,967 0.02307,500 China Lesso Group Holdings L 441,748 0.02
62,423 China Life Insurance Co – A 295,376 0.012,581,711 China Life Insurance Co – H 4,278,402 0.17
146,884 China Literature Ltd 923,171 0.041,208,700 China Longyuan Power Group – H 2,821,638 0.11
505,363 China Medical System Holding 843,968 0.03194,501 China Meidong Auto Holdings 1,002,904 0.04
1,157,273 China Mengniu Dairy Co 6,560,993 0.26474,293 China Merchants Bank – A 3,633,060 0.15
1,430,574 China Merchants Bank – H 11,110,560 0.44559,671 China Merchants Port Holding 1,019,372 0.04242,965 China Merchants Securities – A 674,367 0.03155,947 China Merchants Shekou Ind – A 327,145 0.01
30,700 China Minmetals Rare Earth – A 188,379 0.01588,514 China Minsheng Banking – A 360,935 0.01
2,036,658 China Minsheng Banking Cor – H 778,477 0.03526,633 China Molybdenum Co Ltd – A 462,115 0.02
1,284,084 China Molybdenum Co Ltd – H 676,935 0.031,520,284 China National Building Ma – H 1,864,207 0.07
132,600 China National Chemical – A 250,226 0.01
NM0522U-2194143-89/163

Reports and Financial Statements 89
iShares Core MSCI Asia ex Japan ETF (continued)
Investment Portfolio (unaudited) as at 31st December 2021
HoldingsFair value
US$
% ofNet
Assets
China (39.90%) Continued395,010 China National Nuclear Pow – A 515,577 0.02
82,854 China Northern Rare Earth – A 596,742 0.02618,734 China Oilfield Services – H 542,046 0.02
1,379,893 China Overseas Land & Invest 3,267,297 0.13187,720 China Pacific Insurance Gr – A 800,586 0.03906,307 China Pacific Insurance Gr – H 2,458,653 0.10631,896 China Petroleum & Chemical – A 420,333 0.02
8,810,203 China Petroleum & Chemical – H 4,102,079 0.161,485,458 China Power International 1,000,302 0.04
590,463 China Railway Group Ltd – A 537,624 0.021,713,947 China Railway Group Ltd – H 905,745 0.04
532,651 China Resources Beer Holding 4,362,296 0.17897,845 China Resources Cement 678,310 0.03366,194 China Resources Gas Group Lt 2,069,039 0.08
1,128,539 China Resources Land Ltd 4,747,903 0.19192,585 China Resources Mixc Lifesty 897,921 0.04665,167 China Resources Power Holdin 2,226,807 0.09179,927 China Shenhua Energy Co – A 637,195 0.03
1,150,688 China Shenhua Energy Co – H 2,698,020 0.11266,389 China Southern Airlines Co – A 285,280 0.01481,952 China Southern Airlines Co – H 288,690 0.01898,958 China State Construction – A 706,834 0.03878,813 China State Construction Int 1,092,274 0.04531,000 China Suntien Green Energy – H 414,104 0.02665,846 China Taiping Insurance Hold 913,838 0.04
46,207 China Tourism Group Duty F – A 1,594,307 0.0615,040,360 China Tower Corp Ltd – H 1,659,083 0.07
77,345 China Transinfo Technology – A 181,837 0.01717,200 China United Network – A 443,242 0.02294,377 China Vanke Co Ltd – A 914,742 0.04475,348 China Vanke Co Ltd – H 1,106,013 0.04536,478 China Yangtze Power Co Ltd – A 1,915,074 0.08418,250 China Yuhua Education Corp L 149,676 0.01
11,600 China Zhenhua Group Scienc – A 226,708 0.01735,667 China Zheshang Bank Co Ltd – A 404,909 0.02863,732 Chinasoft International Ltd 1,125,600 0.04
33,207 Chindata Group Holdings – ADR 218,834 0.0114,268 Chongqing Brewery Co – A 339,521 0.01
129,881 Chongqing Changan Automob – A 310,250 0.0138,339 Chongqing Zhifei Biologica – A 751,219 0.03
251,808 Cifi Ever Sunshine Services 390,165 0.021,216,444 CIFI Holdings Group Co Ltd 731,773 0.031,963,486 Citic Ltd 1,939,233 0.08
321,843 Citic Securities Co – A 1,336,658 0.05724,916 Citic Securities Co Ltd – H 1,892,185 0.08582,852 CLP Holdings Ltd 5,887,356 0.24
51,719 Contemporary Amperex Techn – A 4,782,282 0.19325,957 Cosco Shipping Holdings Co – A 958,026 0.04
1,229,034 Cosco Shipping Holdings Co – H 2,383,566 0.10787,808 Cosco Shipping Ports Ltd 684,101 0.03
2,554,471 Country Garden Holdings Co 2,267,350 0.09622,047 Country Garden Services Hold 3,726,075 0.15562,600 CRRC Corp Ltd – A 538,796 0.02
1,248,000 CRRC Corp Ltd – H 536,254 0.0278,174 CSC Financial Co Ltd – A 359,580 0.01
3,403,800 CSPC Pharmaceutical Group Lt 3,697,932 0.1522,014 Dada Nexus Ltd – ADR 289,704 0.01
842,969 Dali Foods Group Co Ltd 441,147 0.0221,369 Daqo New Energy Corp – ADR 861,598 0.0322,642 Dashenlin Pharmaceutical G – A 149,937 0.01
114,365 Didi Global Inc 569,538 0.0224,900 Do-Fluoride New Materials – A 176,166 0.0167,200 Dongfang Electric Corp Ltd – A 226,358 0.01
1,068,071 Dongfeng Motor Grp Co Ltd – H 887,742 0.04128,607 Dongxing Securities Co Lt – A 235,208 0.01499,000 Dongyue Group 778,297 0.03253,240 East Money Information Co – A 1,477,852 0.06
14,480 Ecovacs Robotics Co Ltd – A 343,724 0.01
HoldingsFair value
US$
% ofNet
Assets
China (39.90%) Continued289,044 ENN Energy Holdings Ltd 5,442,538 0.22
42,698 EVE Energy Co Ltd – A 793,523 0.03121,774 Everbright Securitie Co – A 285,905 0.01654,716 Far East Horizon Ltd 581,126 0.02160,947 First Capital Securities C – A 185,269 0.01
30,700 Flat Glass Group Co Ltd – A 279,721 0.01180,814 Flat Glass Group Co Ltd – H 918,414 0.04451,873 Focus Media Information Te – A 581,980 0.02
87,879 Foshan Haitian Flavouring – A 1,452,569 0.06933,919 Fosun International Ltd 1,007,434 0.04345,285 Founder Securities Co Ltd – A 425,698 0.02117,305 Foxconn Industrial Interne – A 219,887 0.01
8,906 Fu Jian Anjoy Foods Co Ltd – A 239,181 0.0116,696 Futu Holdings Ltd – ADR 722,937 0.0344,834 Fuyao Glass Industry Group – A 332,357 0.01
227,618 Fuyao Glass Industry Group – H 1,176,584 0.0527,833 Ganfeng Lithium Co Ltd – A 625,242 0.0297,443 Ganfeng Lithium Co Ltd – H 1,533,581 0.0631,350 GDS Holdings Ltd – ADR 1,478,466 0.06
2,132,975 Geely Automobile Holdings Lt 5,827,427 0.23124,200 Gem Co Ltd – A 202,148 0.01
94,554 Gemdale Corp – A 192,854 0.01444,730 Genscript Biotech Corp 1,968,009 0.08137,073 GF Securities Co Ltd – A 530,052 0.02523,830 GF Securities Co Ltd – H 998,437 0.04
14,657 GigaDevice Semiconductor B – A 405,317 0.025,900 Ginlong Technologies Co Lt – A 214,835 0.01
62,876 Goertek Inc – A 534,921 0.024,456,333 Gome Retail Holdings Ltd 377,253 0.01
32,538 Gotion High-Tech Co Ltd – A 262,236 0.0158,455 Great Wall Motor Co Ltd – A 446,200 0.02
1,111,948 Great Wall Motor Company – H 3,822,352 0.15120,634 Greenland Holdings Corp Lt – A 82,332 0.00267,532 Greentown China Holdings 431,000 0.02523,787 Greentown Service Group Co L 483,725 0.02
50,624 Guangdong Haid Group Co – A 583,537 0.021,013,068 Guangdong Investment Ltd 1,287,727 0.05
12,101 Guangdong Kinlong Hardware – A 345,558 0.011,020,477 Guangzhou Automobile Group – H 1,006,563 0.04
38,520 Guangzhou Baiyunshan Phar – A 207,167 0.0118,335 Guangzhou Kingmed Diagnost – A 321,112 0.01
472,735 Guangzhou R&F Properties – H 175,844 0.0114,649 Guangzhou Shiyuan Electron – A 187,517 0.0132,584 Guangzhou Tinci Materials – A 587,471 0.02
124,327 Guosen Securities Co Ltd – A 224,448 0.01180,133 Guotai Junan Securities Co – A 506,771 0.02390,864 Haidilao International Holdi 882,368 0.04145,613 Haier Smart Home Co Ltd – A 684,438 0.03790,442 Haier Smart Home Co Ltd – H 3,340,695 0.13263,851 Haitian International Hldgs 732,703 0.03196,406 Haitong Securities Co Ltd – A 378,663 0.01764,397 Haitong Securities Co Ltd – H 677,499 0.03280,724 Hang Seng Bank Ltd 5,138,247 0.21
30,760 Hangzhou First Applied Mat – A 631,497 0.0227,490 Hangzhou Silan Microelectr – A 234,305 0.0118,091 Hangzhou Tigermed Consulti – A 363,581 0.0135,541 Hangzhou Tigermed Consulti – H 451,311 0.02
448,730 Hansoh Pharmaceutical Group 1,093,579 0.0449,957 Hello Group Inc – SPN ADR 448,614 0.0258,307 Henan Shuanghui Investment – A 289,286 0.01
236,686 Hengan Intl Group Co Ltd 1,218,904 0.05153,389 Hengli Petrochemical Co L – A 554,068 0.02155,770 Hengyi Petrochemical Co – A 260,145 0.01
10,560 Hithink Royalflush Informa – A 240,093 0.014,138,455 Hong Kong & China Gas 6,444,191 0.26
9,700 Hoshine Silicon Industry C – A 201,305 0.01200,752 Hua Hong Semiconductor Ltd 1,107,235 0.04280,388 Huabao International Holding 517,885 0.02
NM0522U-2194143-90/163

90 iShares Asia Trust
iShares Core MSCI Asia ex Japan ETF (continued)
Investment Portfolio (unaudited) as at 31st December 2021
HoldingsFair value
US$
% ofNet
Assets
China (39.90%) Continued55,380 Huadong Medicine Co Ltd – A 350,096 0.0145,591 Hualan Biological Engineer – A 208,918 0.01
1,836,153 Huaneng Power Intl Inc – H 1,227,038 0.05191,870 Huatai Securities Co Ltd – A 535,868 0.02673,929 Huatai Securities Co Ltd – H 1,122,019 0.04514,537 Huaxia Bank Co Ltd – A 453,119 0.02116,808 Huayu Automotive Systems – A 519,836 0.02
64,424 Huazhu Group Ltd – ADR 2,405,592 0.1031,900 Hubei Xingfa Chemicals Grp – A 190,024 0.01
9,600 Huizhou Desay Sv Automotiv – A 213,632 0.0141,925 Hundsun Technologies Inc – A 409,753 0.0231,484 Hutchmed China – ADR (formerly
known as Hutchison China Meditech – ADR) 1,104,459 0.04
114,200 Hygeia Healthcare Holdings C 714,821 0.0381,089 Iflytek Co Ltd – A 669,594 0.0314,555 I-Mab-Sponsored ADR 689,761 0.03
3,900 Imeik Technology Developme – A 328,796 0.011,385,100 Ind & Comm Bk of China – A 1,008,486 0.04
20,187,747 Ind & Comm Bk of China – H 11,393,364 0.46445,649 Industrial Bank Co Ltd – A 1,334,343 0.05322,085 Industrial Securities Co – A 500,421 0.02
8,450 Ingenic Semiconductor Co – A 178,061 0.011,349,697 Inner Mongolia Baotou Ste – A 592,172 0.02
231,237 Inner Mongolia Junzheng En – A 190,181 0.01162,878 Inner Mongolia Yili Indus – A 1,061,939 0.04439,010 Innovent Biologics Inc 2,716,960 0.11
37,818 Inspur Electronic Informat – A 213,085 0.01106,865 iqiyi Inc – ADR 487,304 0.02
36,150 Ja Solar Technology Co Ltd – A 526,982 0.0218,200 Jafron Biomedical Co Ltd – A 152,548 0.0144,040 Jcet Group Co Ltd – A 214,831 0.01
125,655 JD Health International Inc 990,406 0.04633,718 JD.Com Inc – CL A 22,271,941 0.89
52,075 Jiangsu Eastern Shenghong – A 158,377 0.01598,685 Jiangsu Express Co Ltd – H 613,559 0.02
43,770 Jiangsu Hengli Hydraulic C – A 563,038 0.02161,285 Jiangsu Hengrui Medicine C – A 1,286,161 0.05
57,667 Jiangsu King’s Luck Brewer – A 493,326 0.0238,053 Jiangsu Yanghe Brewery – A 985,756 0.0472,100 Jiangsu Zhongtian Technolo – A 192,295 0.01
446,396 Jiangxi Copper Co Ltd – H 714,573 0.0373,644 Jiangxi Zhengbang Tech – A 111,872 0.00
167,793 Jinke Properties Group Co – A 118,211 0.00442,288 Jinxin Fertility Group Ltd 494,123 0.02
10,310 Jiugui Liquor Co Ltd – A 344,529 0.01274,854 Jiumaojiu International Hold 482,985 0.02
22,206 Jonjee High-Tech Industria – A 132,592 0.0119,401 Kanzhun Ltd 676,707 0.03
132,915 KE Holdings Inc – ADR 2,674,250 0.11225,003 Kingboard Holdings Ltd 1,095,246 0.04469,053 Kingboard Laminates Hldg Ltd 797,769 0.03970,389 Kingdee International Sftwr 2,987,229 0.12100,742 Kingfa Sci.& Tech Co Ltd – A 199,296 0.01
20,075 Kingsoft Cloud Holdings – ADR 316,181 0.01169,153 Kuaishou Technology 1,563,238 0.06
79,440 Kuang-Chi Technologies Co – A 299,943 0.011,493,070 Kunlun Energy Co Ltd 1,399,939 0.06
27,529 Kweichow Moutai Co Ltd – A 8,874,667 0.35559,268 KWG Group Holdings Ltd 365,849 0.01
49,395 LB Group Co Ltd – A (formerly known as Lomon Billions Group Co – A) 222,078 0.01
539,591 Lee & Man Paper Manufacturin 375,124 0.012,821,363 Lenovo Group Ltd 3,242,488 0.13
84,988 Lens Technology Co Ltd – A 307,125 0.0161,189 Lepu Medical Technology – A 217,754 0.01
200,997 Li Auto Inc – ADR 6,452,004 0.26172,633 Lingyi Itech Guangdong Co – A 199,806 0.01
HoldingsFair value
US$
% ofNet
Assets
China (39.90%) Continued825,151 Li Ning Co Ltd 9,033,341 0.36610,870 Logan Group Co Ltd 466,989 0.02665,481 Longfor Group Holdings Ltd 3,132,659 0.13124,797 Longi Green Energy Technol – A 1,691,684 0.07
5,900 Luoyang Xinqianglian Slewi – A 165,624 0.01158,996 Luxshare Precision Industr – A 1,230,153 0.05
35,778 Luzhou Laojiao Co Ltd – A 1,428,352 0.0656,496 Mango Excellent Media Co L – A 508,362 0.02
5,074 Maxscend Microelectronics – A 260,760 0.01144,854 Meinian Onehealth Healthca – A 178,817 0.01
1,476,815 Meituan – Class B 42,696,420 1.7167,374 Melco Resorts & Entert – ADR 685,867 0.03
522,897 Metallurgical Corp of Chin – A 314,936 0.01263,435 Microport Scientific Corp 959,629 0.04
46,500 Ming Yang Smart Energy Gro – A 190,854 0.01138,395 Ming Yuan Cloud Group Holdin 315,264 0.01260,634 Minth Group Ltd 1,148,337 0.05
15,665 Montage Technology Co Ltd – A 206,607 0.01554,053 MTR Corp 2,974,118 0.12125,624 Muyuan Foodstuff Co Ltd – A 1,054,135 0.04160,650 Nari Technology Co Ltd – A 1,011,286 0.04
44,439 National Silicon Industry – A 180,438 0.0110,548 Naura Technology Group Co – A 575,615 0.02
731,630 Netease Inc 14,780,309 0.5964,403 New China Life Insurance C – A 393,768 0.02
267,097 New China Life Insurance C – H 714,310 0.0374,031 New Hope Liuhe Co Ltd – A 177,072 0.01
582,612 New Oriental Educatio – SP ADR 1,223,485 0.05602,586 Nine Dragons Paper Holdings 646,928 0.03
22,000 Ningbo Tuopu Group Co Ltd – A 183,361 0.01169,610 Ningxia Baofeng Energy Gro – A 463,030 0.02491,867 Nio Inc – ADR 15,582,347 0.62
12,010 Noah Holdings Ltd – Spon ADS 368,587 0.01610,170 Nongfu Spring Co Ltd – H 4,026,685 0.16
43,100 North Industries Group Red – A 180,762 0.0119,750 Oppein Home Group Inc – A 458,107 0.02
176,659 Orient Securities Co Ltd – A 409,488 0.0236,472 Ovctek China Inc – A 329,043 0.01
3,675,957 People’s Insurance Co Grou – H 1,112,740 0.0461,135 Perfect World Co Ltd – A 195,257 0.01
313,696 Petrochina Co Ltd – A 242,213 0.017,764,402 Petrochina Co Ltd – H 3,455,803 0.14
16,420 Pharmaron Beijing Co Ltd – A 364,780 0.0150,377 Pharmaron Beijing Co Ltd – H 777,337 0.03
2,334,959 PICC Property & Casualty – H 1,907,788 0.08159,839 Pinduoduo Inc – ADR 9,318,614 0.37451,761 Ping An Bank Co Ltd – A 1,170,776 0.05186,483 Ping An Healthcare And Techn 678,116 0.03241,363 Ping An Insurance Group Co – A 1,913,353 0.08
2,296,695 Ping An Insurance Group Co – H 16,541,106 0.66321,504 Poly Developments and Hold – A 790,229 0.03622,528 Postal Savings Bank of Chi – A 499,272 0.02
3,100,728 Postal Savings Bank of Chi – H 2,175,517 0.09282,406 Power Construction Corp of – A 358,834 0.01379,264 Powerlong Real Estate Holdin 198,478 0.01230,158 RLX Technology Inc – ADR 897,616 0.04242,689 Rongsheng Petrochemica
Chemical – A 693,065 0.0399,876 S F Holding Co Ltd – A 1,082,466 0.04
203,859 Saic Motor Corp Ltd – A 661,358 0.03859,420 Sands China Ltd 2,001,856 0.08
6,602 Sangfor Technologies Inc – A 198,297 0.01350,401 Sany Heavy Equipment Intl 338,882 0.01222,119 Sany Heavy Industry Co Ltd – A 796,395 0.03
33,900 Satellite Chemical Co Ltd – A 213,399 0.01321,956 Sdic Capital Co Ltd – A 416,175 0.02203,320 Sdic Power Holdings Co Ltd – A 366,734 0.01795,686 Seazen Group Ltd 537,853 0.02
NM0522U-2194143-91/163

Reports and Financial Statements 91
iShares Core MSCI Asia ex Japan ETF (continued)
Investment Portfolio (unaudited) as at 31st December 2021
HoldingsFair value
US$
% ofNet
Assets
China (39.90%) Continued85,922 Seazen Holdings Co Ltd – A 393,598 0.02
7,294 SG Micro Corp – A 354,431 0.01254,309 Shaanxi Coal Industry Co L – A 487,898 0.02145,890 Shandong Gold Mining Co Lt – A 431,770 0.02233,016 Shandong Gold Mining Co Lt – H 398,706 0.02
51,080 Shandong Hualu Hengsheng – A 251,422 0.0162,080 Shandong Linglong Tyre Co – A 356,818 0.01
252,300 Shandong Nanshan Aluminum – A 186,873 0.01981,727 Shandong Weigao Gp Medical – H 1,225,223 0.05
49,229 Shanghai Baosight Software – A 470,919 0.0271,400 Shanghai Baosight Software – B 344,648 0.01
277,500 Shanghai Electric Grp Co L – A 212,084 0.0149,736 Shanghai Fosun Pharmaceuti – A 382,774 0.01
193,334 Shanghai Fosun Pharmaceuti – H 851,817 0.0324,198 Shanghai International Air – A 177,669 0.01
420,085 Shanghai International Por – A 362,014 0.01413,239 Shanghai Lujiazui Fin&Trad – B 376,461 0.01
42,002 Shanghai M&G Stationery In – A 426,093 0.0264,404 Shanghai Pharmaceuticals – A 201,242 0.01
232,216 Shanghai Pharmaceuticals – H 440,228 0.02712,697 Shanghai Pudong Devel Bank – A 956,008 0.04
19,643 Shanghai Putailai New Ener – A 496,122 0.0288,800 Shanxi Coking Coal Energy – A 115,485 0.00
132,300 Shanxi Meijin Energy Co Lt – A 337,665 0.0130,783 Shanxi Xinghuacun Fen Wine – A 1,528,633 0.0653,218 Shengyi Technology Co Ltd – A 197,087 0.0114,669 Shennan Circuits Co Ltd – A 281,013 0.01
554,275 Shenwan Hongyuan Group Co – A 446,275 0.0210,300 Shenzhen Capchem Technolog – A 183,030 0.0110,620 Shenzhen Goodix Technology – A 179,982 0.0174,115 Shenzhen Inovance Technolo – A 799,536 0.03
378,432 Shenzhen Intl Holdings 393,174 0.0222,050 Shenzhen Kangtai Biologica – A 341,687 0.0126,568 Shenzhen Mindray Bio-Medic – A 1,590,976 0.06
253,420 Shenzhen Overseas Chinese – A 280,557 0.017,700 Shenzhen Sc New Energy Tec – A 138,403 0.01
26,841 Shenzhen Sunway Communicat – A 106,874 0.0010,672 Shenzhen Transsion Holding – A 263,316 0.01
311,307 Shenzhou International Group 5,985,521 0.24422,727 Shimao Group Holdings Ltd 276,530 0.01190,632 Shimao Services Holdings Ltd 132,528 0.01219,820 Sichuan Chuantou Energy Co – A 432,101 0.02117,300 Sichuan Road&Bridge Co Lt – A 222,092 0.01
12,120 Sichuan Swellfun Co Ltd – A 228,694 0.0128,033 Silergy Corp 5,091,474 0.20
4,007,378 Sino Biopharmaceutical 2,806,496 0.11136,180 Sinolink Securities Co Ltd – A 242,634 0.01
35,300 Sinoma Science&Technology – A 188,850 0.01492,390 Sinopharm Group Co – H 1,071,141 0.04299,250 Sinotruk Hong Kong Ltd 460,603 0.02402,656 Sitc International Holdings 1,456,447 0.06
15,167 Skshu Paint Co Ltd – A 331,887 0.01640,695 Smoore International Holding 3,266,630 0.13
68,329 Songcheng Performance Deve – A 153,871 0.013,700 Starpower Semiconductor Lt – A 221,684 0.01
497,634 Sun Art Retail Group Ltd 199,786 0.01835,258 Sunac China Holdings Ltd 1,262,052 0.05328,268 Sunac Services Holdings Ltd 334,740 0.01
32,908 Sungrow Power Supply Co Lt – A 754,513 0.03435,622 Suning.Com Co Ltd – A 282,238 0.01258,742 Sunny Optical Tech 8,184,110 0.33
37,300 Sunwoda Electronic Co Ltd – A 247,296 0.012,175 Suzhou Maxwell Technologie – A 219,687 0.01
14,300 Suzhou Ta&A Ultra Clean Te – A 182,150 0.01154,551 Tal Education Group – ADR 607,385 0.02
60,000 TBEA Co Ltd – A 199,747 0.01329,807 TCL Technology Group Corp – A 320,002 0.01
2,080,555 Tencent Holdings Ltd 121,903,662 4.88
HoldingsFair value
US$
% ofNet
Assets
China (39.90%) Continued248,985 Tencent Music Entertainm – ADR 1,705,547 0.07
18,335 Thunder Software Technolog – A 399,105 0.0297,938 Tianjin Zhonghuan Semicond – A 643,007 0.03
102,342 Tianshui Huatian Technolog – A 204,554 0.0136,900 Tibet Summit Resources Co – A 218,532 0.01
660,786 Tingyi (Cayman Isln) Hldg Co 1,357,797 0.05351,354 Tongcheng – Travel Holdings Ltd
(formerly known as Tongcheng – Elong Holdings Ltd) 650,764 0.03
120,352 Tongwei Co Ltd – A 850,917 0.037,002 Topchoice Medical Corporat – A 219,120 0.01
538,087 Topsports International Hold 544,554 0.02390,256 Travelsky Technology Ltd – H 656,742 0.03183,139 Trip.Com Group Ltd – ADR 4,508,882 0.18
10,533 Tsingtao Brewery Co Ltd – A 163,982 0.01176,575 Tsingtao Brewery Co Ltd – H 1,653,345 0.07555,352 Uni – President China Holdings 538,520 0.02
18,255 Unigroup Guoxin Microelect – A 645,910 0.03111,700 Unisplendour Corp Ltd – A 401,372 0.02
77,680 Venus Medtech Hangzhou Inc – H 294,926 0.01113,972 Vinda International Holdings 277,756 0.01169,209 Vipshop Holdings Ltd – ADR 1,421,356 0.06
28,844 Vnet Group Inc – ADR (formerly known as 21Vianet Group Inc – ADR) 260,461 0.01
38,389 Walvax Biotechnology Co – A 339,274 0.0172,108 Wanhua Chemical Group Co – A 1,145,282 0.05
2,048,827 Want Want China Holdings Ltd 1,881,611 0.0723,830 Weibo Corp – Spon ADR 738,253 0.03
175,522 Weichai Power Co Ltd – A 493,798 0.02756,715 Weichai Power Co Ltd – H 1,481,148 0.06583,556 Weimob Inc 590,569 0.02203,434 Wens Foodstuffs Group Co – A 616,152 0.02171,651 Western Securities Co Ltd – A 217,835 0.01
21,800 Westone Information Indust – A 191,773 0.0122,954 Will Semiconductor Co Ltd – A 1,121,774 0.04
726,069 Wilmar International Ltd 2,229,667 0.0942,735 Wingtech Technology Co Ltd – A 868,940 0.0365,527 Wuhan Guide Infrared Co Lt – A 249,473 0.0142,020 Wuhu Sanqi Interactive Ent – A 178,546 0.0181,281 Wuliangye Yibin Co Ltd – A 2,846,027 0.1169,533 Wuxi Apptec Co Ltd – A 1,296,612 0.05
110,608 Wuxi Apptec Co Ltd – H 1,915,278 0.081,312,745 WuXi Biologics Cayman Inc 15,583,617 0.62
24,466 WuXi Lead Intelligent Equi – A 286,133 0.016,400 Wuxi Shangji Automation Co – A 168,055 0.01
181,545 XCMG Construction Machin – A 171,009 0.015,300 Xiamen Faratronic Co Ltd – A 193,696 0.01
5,243,918 Xiaomi Corp – Class B 12,712,447 0.51256,293 Xinjiang Goldwind Sci&Tec – H 500,337 0.02132,631 Xinjiang Goldwind Sci&Tech – A 343,516 0.01648,089 Xinyi Glass Holdings Ltd 1,620,991 0.06
1,819,731 Xinyi Solar Holdings Ltd 3,085,674 0.12140,181 Xpeng Inc – ADR 7,055,310 0.28382,053 Yadea Group Holdings Ltd 744,867 0.03
42,600 Yankuang Energy Group Co – A 157,630 0.01587,781 Yanzhou Coal Mining Co – H 1,168,581 0.05
20,338 Yealink Network Technology – A 260,500 0.01184,930 Yihai International Holding 855,114 0.03
26,166 Yihai Kerry Arawana Holdin – A 258,942 0.01113,272 Yintai Gold Co Ltd – A 156,396 0.01329,799 Yonghui Superstores Co Ltd – A 210,045 0.01
11,300 Yongxing Special Materials – A 263,031 0.01115,722 Yonyou Network Technology – A 652,944 0.03546,913 Yuexiu Property Co Ltd 481,933 0.02149,833 Yum China Holdings Inc 7,467,677 0.30104,642 Yunda Holding Co Ltd – A 336,682 0.01
62,300 Yunnan Aluminium Co Ltd – A 109,433 0.00
NM0522U-2194143-92/163

92 iShares Asia Trust
iShares Core MSCI Asia ex Japan ETF (continued)
Investment Portfolio (unaudited) as at 31st December 2021
HoldingsFair value
US$
% ofNet
Assets
China (39.90%) Continued41,979 Yunnan Baiyao Group Co Ltd – A 690,843 0.0322,489 Yunnan Energy New Material – A 885,548 0.0428,441 Zai Lab Ltd – ADR 1,787,517 0.0714,541 Zhangzhou Pientzehuang Pha – A 999,614 0.04
132,332 Zhejiang Century Huatong – A 174,596 0.0157,241 Zhejiang Chint Electrics – A 485,091 0.02
143,302 Zhejiang Dahua Technology – A 529,125 0.0215,468 Zhejiang Dingli Machinery – A 195,228 0.01
784,249 Zhejiang Expressway Co – H 699,118 0.0334,359 Zhejiang Huahai Pharmaceut – A 117,033 0.0033,962 Zhejiang Huayou Cobalt Co – A 589,136 0.0227,400 Zhejiang Jingsheng Mechani – A 299,463 0.01
104,549 Zhejiang Longsheng Group C – A 207,650 0.0175,757 Zhejiang Nhu Co Ltd – A 370,741 0.0188,135 Zhejiang Sanhua Intelligen – A 350,652 0.0126,029 Zhejiang Supor Co Ltd – A 254,762 0.0122,500 Zhejiang Yongtai Tech – A 181,195 0.01
103,684 Zheshang Securities Co Ltd – A 214,899 0.01189,904 Zhongan Online P&C Insuran – H 660,108 0.03218,119 Zhongsheng Group Holdings 1,701,017 0.07185,601 Zhuzhou CRRC Times Electri – H 1,074,854 0.04521,336 Zijin Mining Group Co Ltd – A 795,238 0.03
2,127,576 Zijin Mining Group Co Ltd – H 2,532,471 0.10520,000 Zoomlion Heavy Industry – H 327,489 0.01160,270 Zoomlion Heavy Industry S – A 180,709 0.01
99,874 ZTE Corp – A 526,144 0.02279,549 ZTE Corp – H 765,539 0.03155,768 ZTO Express Cayman Inc – ADR 4,395,773 0.18
996,557,157 39.90
Hong Kong (4.16%) 1,115,093 Bosideng Intl Hldgs Ltd 702,270 0.03
653,362 Budweiser Brewing Co Apac Lt 1,713,794 0.07369,469 China Education Group Holdin 599,961 0.02406,004 China Overseas Property Hold 430,673 0.02
1,020,272 China Traditional Chinese Me 676,578 0.036,536,531 China Youzan Ltd 452,744 0.02
675,513 Chow Tai Fook Jewellery Grou 1,214,768 0.05747,446 CK Asset Holdings Ltd 4,712,103 0.19953,643 CK Hutchison Holdings Ltd 6,152,693 0.25219,582 CK Infrastructure Holdings L 1,398,387 0.06747,110 ESR Cayman Ltd 2,525,089 0.10773,079 Galaxy Entertainment Group L 4,006,053 0.16791,510 Hang Lung Properties Ltd 1,628,442 0.07513,609 Henderson Land Development 2,187,168 0.09
1,004,295 Hengten Networks Group Ltd 380,010 0.021,142,530 HK Electric Investments – SS 1,121,090 0.041,556,445 HKT Trust And HKT Ltd – SS 2,092,216 0.08
432,617 Hong Kong Exchanges & Clear 25,270,164 1.01429,839 Hongkong Land Holdings Ltd 2,235,163 0.09212,976 Hopson Development Holdings 444,184 0.02
78,726 Jardine Matheson Hldgs Ltd 4,330,717 0.17359,753 Kingsoft Corp Ltd 1,580,434 0.06745,203 Link Reit 6,561,854 0.26525,691 New World Development 2,080,162 0.08494,061 Power Assets Holdings Ltd 3,079,841 0.12
1,324,035 Sino Land Co 1,649,036 0.07463,431 Sun Hung Kai Properties 5,623,254 0.23204,703 Swire Pacific Ltd – Cl A 1,164,473 0.05404,145 Swire Properties Ltd 1,012,915 0.04507,772 Techtronic Industries Co Ltd 10,108,156 0.40
2,939,540 WH Group Ltd 1,843,740 0.07520,358 Wharf Holdings Ltd 1,598,524 0.06634,364 Wharf Real Estate Investment 3,222,146 0.13
103,798,802 4.16
HoldingsFair value
US$
% ofNet
Assets
India (14.16%)23,648 ACC Ltd 704,885 0.0391,276 Adani Enterprises Ltd 2,099,017 0.08
145,206 Adani Green Energy Ltd 2,598,488 0.10173,287 Adani Ports and Special Econ 1,702,433 0.07102,257 Adani Total Gas Ltd 2,368,528 0.09102,180 Adani Transmission Ltd 2,392,931 0.10240,529 Ambuja Cements Ltd 1,221,483 0.05
35,641 Apollo Hospitals Enterprise 2,403,727 0.10141,178 Asian Paints Ltd 6,424,887 0.26114,072 Aurobindo Pharma Ltd 1,126,899 0.04
58,893 Avenue Supermarts Ltd 3,700,993 0.15831,069 Axis Bank Ltd 7,586,156 0.30
27,268 Bajaj Auto Ltd 1,191,899 0.0599,302 Bajaj Finance Ltd 9,320,694 0.3714,334 Bajaj Finserv Ltd 3,163,576 0.1328,631 Balkrishna Industries Ltd 894,877 0.03
230,205 Bandhan Bank Ltd 782,569 0.0387,863 Berger Paints India Ltd 912,190 0.04
369,289 Bharat Electronics Ltd 1,043,002 0.0490,429 Bharat Forge Ltd 848,932 0.03
328,493 Bharat Petroleum Corp Ltd 1,703,323 0.07906,373 Bharti Airtel Ltd 8,337,559 0.33152,823 Biocon Ltd 749,666 0.03
39,461 Britannia Industries Ltd 1,914,241 0.08118,014 Cholamandalam Investment And 826,178 0.03172,303 Cipla Ltd 2,188,334 0.09527,769 Coal India Ltd 1,036,927 0.04
38,626 Colgate Palmolive (India) 769,707 0.0382,926 Container Corp of India Ltd 685,568 0.03
236,588 Dabur India Ltd 1,846,125 0.0750,307 Divi’s Laboratories Ltd 3,165,994 0.13
181,046 DLF Ltd 950,949 0.0443,926 Dr. Reddy’s Laboratories 2,899,617 0.1254,117 Eicher Motors Ltd 1,886,926 0.07
708,960 Gail India Ltd 1,232,217 0.05128,853 Godrej Consumer Products Ltd 1,678,532 0.07
35,237 Godrej Properties Ltd 887,281 0.03100,246 Grasim Industries Ltd 2,187,700 0.09
90,614 Havells India Ltd 1,702,921 0.07394,944 HCL Technologies Ltd 7,008,355 0.28
22,947 HDFC Asset Management Co Ltd 755,097 0.03293,672 HDFC Life Insurance Co Ltd 2,566,126 0.10
37,151 Hero Motocorp Ltd 1,230,493 0.05562,162 Hindalco Industries Ltd 3,596,338 0.14255,868 Hindustan Petroleum Corp 1,006,287 0.04296,948 Hindustan Unilever Ltd 9,428,072 0.38622,091 Housing Development Finance 21,645,163 0.87
1,865,606 ICICI Bank Ltd 18,575,586 0.7489,078 ICICI Lombard General Insura 1,679,148 0.07
171,400 ICICI Prudential Life Insura 1,293,069 0.05638,512 Indian Oil Corp Ltd 957,738 0.04
77,694 Indian Railway Catering & To 869,327 0.03113,025 Indraprastha Gas Ltd 715,228 0.03200,860 Indus Towers Ltd 670,924 0.03
26,804 Info Edge India Ltd 2,010,850 0.081,239,615 Infosys Ltd 31,479,959 1.26
39,212 Interglobe Aviation Ltd 1,064,256 0.041,029,219 ITC Ltd 3,019,025 0.12
331,725 JSW Steel Ltd 2,927,196 0.1231,177 Jubilant Foodworks Ltd 1,506,138 0.06
204,596 Kotak Mahindra Bank Ltd 4,943,454 0.2017,073 Larsen & Toubro Infotech Ltd 1,683,973 0.07
255,273 Larsen & Toubro Ltd 6,510,632 0.2698,481 Lupin Ltd 1,259,568 0.05
311,455 Mahindra & Mahindra Ltd 3,507,530 0.14192,869 Marico Ltd 1,330,106 0.05
51,676 Maruti Suzuki India Ltd 5,162,654 0.21
20,005 Mindtree Ltd 1,286,380 0.05
NM0522U-2194143-93/163

Reports and Financial Statements 93
iShares Core MSCI Asia ex Japan ETF (continued)
Investment Portfolio (unaudited) as at 31st December 2021
HoldingsFair value
US$
% ofNet
Assets
India (14.16%) Continued413,717 Motherson Sumi Systems Ltd 1,242,782 0.05
25,383 Mphasis Ltd 1,159,853 0.05499 MRF Ltd 492,303 0.02
48,627 Muthoot Finance Ltd 978,386 0.0412,033 Nestle India Ltd 3,189,838 0.13
1,603,398 NTPC Ltd 2,683,271 0.11936,294 Oil & Natural Gas Corp Ltd 1,793,598 0.07
1,284 Page Industries Ltd 698,202 0.03256,290 Petronet LNG Ltd 746,091 0.03
24,769 PI Industries Ltd 1,011,010 0.0455,037 Pidilite Industries Ltd 1,823,420 0.0743,198 Piramal Enterprises Ltd 1,536,426 0.06
1,104,872 Power Grid Corp of India Ltd 3,038,056 0.121,030,582 Reliance Industries Ltd 32,831,794 1.31
88,142 SBI Cards & Payment Services 1,100,535 0.04153,124 SBI Life Insurance Co Ltd 2,463,640 0.10
4,474 Shree Cement Ltd 1,624,279 0.0673,908 Shriram Transport Finance 1,209,999 0.0519,565 Siemens Ltd 621,503 0.0254,970 Srf Ltd 1,789,624 0.07
630,092 State Bank of India 3,902,917 0.16310,618 Sun Pharmaceutical Indus 3,533,831 0.14336,297 Tata Consultancy Svcs Ltd 16,912,422 0.68220,341 Tata Consumer Products Ltd 2,203,687 0.09603,404 Tata Motors Ltd 3,915,781 0.16483,538 Tata Power Co Ltd 1,437,234 0.06263,755 Tata Steel Ltd 3,943,606 0.16229,713 Tech Mahindra Ltd 5,533,181 0.22135,196 Titan Co Ltd 4,587,548 0.18
15,782 Torrent Pharmaceuticals Ltd 696,039 0.0362,789 Trent Ltd 899,572 0.0437,150 Ultratech Cement Ltd 3,793,705 0.15
121,951 United Spirits Ltd 1,473,620 0.06189,734 UPL Ltd 1,906,895 0.08416,040 Vedanta Ltd 1,909,620 0.08493,517 Wipro Ltd 4,749,234 0.19
3,706,396 Yes Bank Ltd 683,086 0.03451,617 Zomato Ltd 834,757 0.03
353,777,948 14.16
Indonesia (1.66%)
6,150,092 Adaro Energy TBK PT 970,897 0.042,605,017 Aneka Tambang TBK 411,246 0.027,683,091 Astra International TBK PT 3,072,697 0.12
19,987,914 Bank Central Asia TBK PT 10,237,627 0.417,068,359 Bank Mandiri Persero TBK PT 3,483,966 0.143,053,293 Bank Negara Indonesia Perser 1,446,043 0.06
24,349,506 Bank Rakyat Indonesia Perser 7,021,678 0.2810,602,351 Barito Pacific TBK PT 636,029 0.02
2,516,041 Charoen Pokphand Indonesi PT 1,050,373 0.04204,691 Gudang Garam TBK PT 439,470 0.02
1,047,953 Indah Kiat Pulp & Paper TBK 575,354 0.02453,601 Indocement Tunggal Prakarsa 385,095 0.01
1,052,168 Indofood CBP Sukses Makmur T 642,264 0.021,772,812 Indofood Sukses Makmur TBK P 786,742 0.038,340,791 Kalbe Farma TBK PT 945,124 0.043,316,558 Merdeka Copper Gold TBK PT 905,203 0.04
10,023,916 Sarana Menara Nusantara PT 791,223 0.031,020,011 Semen Indonesia Persero TBK 518,862 0.02
17,510,053 Telkom Indonesia Persero TBK 4,963,383 0.202,174,168 Tower Bersama Infrastructure 450,012 0.023,120,713 Unilever Indonesia TBK PT 899,921 0.04
595,399 United Tractors TBK PT 925,318 0.04
41,558,527 1.66
HoldingsFair value
US$
% ofNet
Assets
Malaysia (1.60%)705,475 AMMB Holdings BHD 536,811 0.02
1,138,596 Axiata Group Berhad 1,136,956 0.042,399,183 Cimb Group Holdings BHD 3,138,634 0.131,489,463 Dialog Group BHD 936,724 0.041,076,898 Digi.Com BHD 1,127,046 0.04
58,894 Fraser & Neave Holdings BHD 349,745 0.01870,582 Genting BHD 975,904 0.04
1,166,401 Genting Malaysia BHD 806,345 0.03152,377 Hap Seng Consolidated 281,638 0.01646,277 Hartalega Holdings BHD 888,902 0.04255,802 Hong Leong Bank Berhad 1,143,311 0.05
86,489 Hong Leong Financial Group 359,990 0.01684,454 IHH Healthcare BHD 1,205,927 0.05723,200 Inari Amertron Bhd 694,383 0.03791,713 IOI Corp BHD 708,855 0.03185,365 Kuala Lumpur Kepong BHD 969,095 0.04
1,553,808 Malayan Banking BHD 3,095,681 0.12452,854 Malaysia Airports Hldgs BHD 650,040 0.03929,802 Maxis BHD 1,082,463 0.04484,582 MISC BHD 820,044 0.03
23,832 Nestle (Malaysia) Berhad 767,704 0.03933,842 Petronas Chemicals Group BHD 1,999,489 0.08121,949 Petronas Dagangan BHD 603,012 0.02334,693 Petronas Gas BHD 1,446,105 0.06255,874 PPB Group Berhad 1,050,275 0.04
1,199,256 Press Metal Aluminium Holdin 1,663,874 0.075,206,872 Public Bank Berhad 5,199,373 0.21
432,775 QL Resources BHD 474,744 0.02704,984 RHB Bank BHD 908,729 0.04
1,186,155 Sime Darby Berhad 660,557 0.03565,440 Sime Darby Plantation BHD 510,335 0.02429,653 Telekom Malaysia BHD 567,233 0.02757,815 Tenaga Nasional BHD 1,698,990 0.07
1,951,413 Top Glove Corp BHD 1,213,192 0.05271,701 Westports Holdings BHD 264,136 0.01
39,936,242 1.60
Philippines (0.81%)
756,565 Aboitiz Equity Ventures Inc 807,863 0.031,752,900 Ac Energy Corp 378,132 0.02
97,182 Ayala Corporation 1,583,728 0.063,124,651 Ayala Land Inc 2,248,854 0.09
545,153 Bank of The Philippine Islan 985,162 0.04712,950 BDO Unibank Inc 1,687,563 0.07
9,489 Globe Telecom Inc 618,178 0.0339,229 GT Capital Holdings Inc 415,427 0.02
370,495 Intl Container Term Svcs Inc 1,453,135 0.061,240,870 JG Summit Holdings Inc 1,289,721 0.05
177,060 Jollibee Foods Corp 751,401 0.0390,388 Manila Electric Company 523,264 0.02
7,355,792 Metro Pacific Investments Co 562,585 0.02693,226 Metropolitan Bank & Trust 757,223 0.03841,700 Monde Nissin Corp 267,403 0.01
23,807 PLDT Inc 845,973 0.0386,053 SM Investments Corp 1,591,371 0.06
3,793,717 SM Prime Holdings Inc 2,522,077 0.10362,507 Universal Robina Corp 909,955 0.04
20,199,015 0.81
Singapore (2.77%)
1,212,861 Ascendas Real Estate Inv Trt 2,653,963 0.1194,370 BOC Aviation Ltd 691,165 0.03
1,893,579 Capitaland Integrated Commer 2,865,335 0.11962,759 Capitaland Investment Ltd/Si 2,435,195 0.10
NM0522U-2194143-94/163
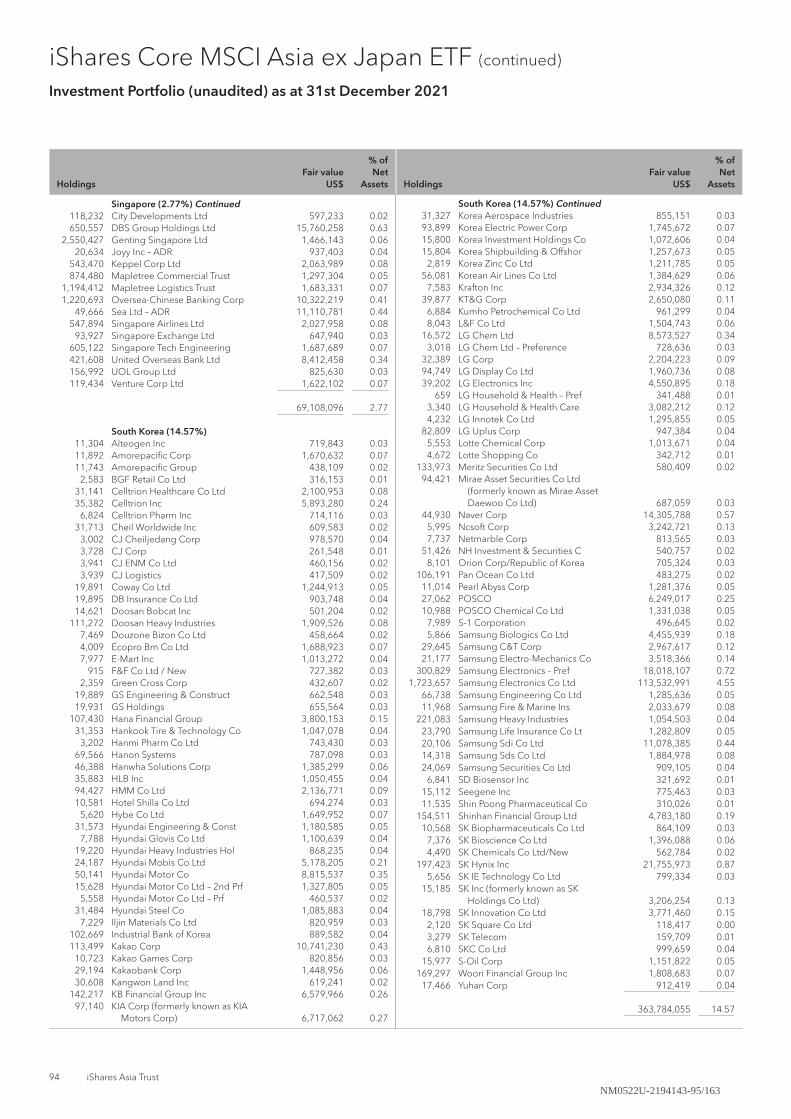
94 iShares Asia Trust
iShares Core MSCI Asia ex Japan ETF (continued)
Investment Portfolio (unaudited) as at 31st December 2021
HoldingsFair value
US$
% ofNet
Assets
Singapore (2.77%) Continued118,232 City Developments Ltd 597,233 0.02650,557 DBS Group Holdings Ltd 15,760,258 0.63
2,550,427 Genting Singapore Ltd 1,466,143 0.0620,634 Joyy Inc – ADR 937,403 0.04
543,470 Keppel Corp Ltd 2,063,989 0.08874,480 Mapletree Commercial Trust 1,297,304 0.05
1,194,412 Mapletree Logistics Trust 1,683,331 0.071,220,693 Oversea-Chinese Banking Corp 10,322,219 0.41
49,666 Sea Ltd – ADR 11,110,781 0.44547,894 Singapore Airlines Ltd 2,027,958 0.08
93,927 Singapore Exchange Ltd 647,940 0.03605,122 Singapore Tech Engineering 1,687,689 0.07421,608 United Overseas Bank Ltd 8,412,458 0.34156,992 UOL Group Ltd 825,630 0.03119,434 Venture Corp Ltd 1,622,102 0.07
69,108,096 2.77
South Korea (14.57%)
11,304 Alteogen Inc 719,843 0.0311,892 Amorepacific Corp 1,670,632 0.0711,743 Amorepacific Group 438,109 0.02
2,583 BGF Retail Co Ltd 316,153 0.0131,141 Celltrion Healthcare Co Ltd 2,100,953 0.0835,382 Celltrion Inc 5,893,280 0.24
6,824 Celltrion Pharm Inc 714,116 0.0331,713 Cheil Worldwide Inc 609,583 0.02
3,002 CJ Cheiljedang Corp 978,570 0.043,728 CJ Corp 261,548 0.013,941 CJ ENM Co Ltd 460,156 0.023,939 CJ Logistics 417,509 0.02
19,891 Coway Co Ltd 1,244,913 0.0519,895 DB Insurance Co Ltd 903,748 0.0414,621 Doosan Bobcat Inc 501,204 0.02
111,272 Doosan Heavy Industries 1,909,526 0.087,469 Douzone Bizon Co Ltd 458,664 0.024,009 Ecopro Bm Co Ltd 1,688,923 0.077,977 E-Mart Inc 1,013,272 0.04
915 F&F Co Ltd / New 727,382 0.032,359 Green Cross Corp 432,607 0.02
19,889 GS Engineering & Construct 662,548 0.0319,931 GS Holdings 655,564 0.03
107,430 Hana Financial Group 3,800,153 0.1531,353 Hankook Tire & Technology Co 1,047,078 0.04
3,202 Hanmi Pharm Co Ltd 743,430 0.0369,566 Hanon Systems 787,098 0.0346,388 Hanwha Solutions Corp 1,385,299 0.0635,883 HLB Inc 1,050,455 0.0494,427 HMM Co Ltd 2,136,771 0.0910,581 Hotel Shilla Co Ltd 694,274 0.03
5,620 Hybe Co Ltd 1,649,952 0.0731,573 Hyundai Engineering & Const 1,180,585 0.05
7,788 Hyundai Glovis Co Ltd 1,100,639 0.0419,220 Hyundai Heavy Industries Hol 868,235 0.0424,187 Hyundai Mobis Co Ltd 5,178,205 0.2150,141 Hyundai Motor Co 8,815,537 0.3515,628 Hyundai Motor Co Ltd – 2nd Prf 1,327,805 0.05
5,558 Hyundai Motor Co Ltd – Prf 460,537 0.0231,484 Hyundai Steel Co 1,085,883 0.04
7,229 Iljin Materials Co Ltd 820,959 0.03102,669 Industrial Bank of Korea 889,582 0.04113,499 Kakao Corp 10,741,230 0.43
10,723 Kakao Games Corp 820,856 0.0329,194 Kakaobank Corp 1,448,956 0.0630,608 Kangwon Land Inc 619,241 0.02
142,217 KB Financial Group Inc 6,579,966 0.2697,140 KIA Corp (formerly known as KIA
Motors Corp) 6,717,062 0.27
HoldingsFair value
US$
% ofNet
Assets
South Korea (14.57%) Continued31,327 Korea Aerospace Industries 855,151 0.0393,899 Korea Electric Power Corp 1,745,672 0.0715,800 Korea Investment Holdings Co 1,072,606 0.0415,804 Korea Shipbuilding & Offshor 1,257,673 0.05
2,819 Korea Zinc Co Ltd 1,211,785 0.0556,081 Korean Air Lines Co Ltd 1,384,629 0.06
7,583 Krafton Inc 2,934,326 0.1239,877 KT&G Corp 2,650,080 0.11
6,884 Kumho Petrochemical Co Ltd 961,299 0.048,043 L&F Co Ltd 1,504,743 0.06
16,572 LG Chem Ltd 8,573,527 0.343,018 LG Chem Ltd – Preference 728,636 0.03
32,389 LG Corp 2,204,223 0.0994,749 LG Display Co Ltd 1,960,736 0.0839,202 LG Electronics Inc 4,550,895 0.18
659 LG Household & Health – Pref 341,488 0.013,340 LG Household & Health Care 3,082,212 0.124,232 LG Innotek Co Ltd 1,295,855 0.05
82,809 LG Uplus Corp 947,384 0.045,553 Lotte Chemical Corp 1,013,671 0.044,672 Lotte Shopping Co 342,712 0.01
133,973 Meritz Securities Co Ltd 580,409 0.0294,421 Mirae Asset Securities Co Ltd
(formerly known as Mirae Asset Daewoo Co Ltd) 687,059 0.03
44,930 Naver Corp 14,305,788 0.575,995 Ncsoft Corp 3,242,721 0.137,737 Netmarble Corp 813,565 0.03
51,426 NH Investment & Securities C 540,757 0.028,101 Orion Corp/Republic of Korea 705,324 0.03
106,191 Pan Ocean Co Ltd 483,275 0.0211,014 Pearl Abyss Corp 1,281,376 0.0527,062 POSCO 6,249,017 0.2510,988 POSCO Chemical Co Ltd 1,331,038 0.05
7,989 S-1 Corporation 496,645 0.025,866 Samsung Biologics Co Ltd 4,455,939 0.18
29,645 Samsung C&T Corp 2,967,617 0.1221,177 Samsung Electro-Mechanics Co 3,518,366 0.14
300,829 Samsung Electronics – Pref 18,018,107 0.721,723,657 Samsung Electronics Co Ltd 113,532,991 4.55
66,738 Samsung Engineering Co Ltd 1,285,636 0.0511,968 Samsung Fire & Marine Ins 2,033,679 0.08
221,083 Samsung Heavy Industries 1,054,503 0.0423,790 Samsung Life Insurance Co Lt 1,282,809 0.0520,106 Samsung Sdi Co Ltd 11,078,385 0.4414,318 Samsung Sds Co Ltd 1,884,978 0.0824,069 Samsung Securities Co Ltd 909,105 0.04
6,841 SD Biosensor Inc 321,692 0.0115,112 Seegene Inc 775,463 0.0311,535 Shin Poong Pharmaceutical Co 310,026 0.01
154,511 Shinhan Financial Group Ltd 4,783,180 0.1910,568 SK Biopharmaceuticals Co Ltd 864,109 0.03
7,376 SK Bioscience Co Ltd 1,396,088 0.064,490 SK Chemicals Co Ltd/New 562,784 0.02
197,423 SK Hynix Inc 21,755,973 0.875,656 SK IE Technology Co Ltd 799,334 0.03
15,185 SK Inc (formerly known as SK Holdings Co Ltd) 3,206,254 0.13
18,798 SK Innovation Co Ltd 3,771,460 0.152,120 SK Square Co Ltd 118,417 0.003,279 SK Telecom 159,709 0.016,810 SKC Co Ltd 999,659 0.04
15,977 S-Oil Corp 1,151,822 0.05169,297 Woori Financial Group Inc 1,808,683 0.07
17,466 Yuhan Corp 912,419 0.04
363,784,055 14.57
NM0522U-2194143-95/163

Reports and Financial Statements 95
iShares Core MSCI Asia ex Japan ETF (continued)
Investment Portfolio (unaudited) as at 31st December 2021
HoldingsFair value
US$
% ofNet
Assets
Taiwan (18.01%)185,212 Accton Technology Corp 1,740,526 0.07
1,035,437 Acer Inc 1,139,591 0.05157,389 Advantech Co Ltd 2,255,566 0.09
1,226,119 ASE Technology Holding Co Lt 4,719,763 0.19689,956 Asia Cement Corp 1,104,748 0.04
8,250 Asmedia Technology Inc 542,704 0.02264,053 Asustek Computer Inc 3,588,532 0.14
2,863,498 Au Optronics Corp 2,370,120 0.10267,781 Catcher Technology Co Ltd 1,514,719 0.06
2,913,121 Cathay Financial Holding Co 6,580,766 0.26492,016 Chailease Holding Co Ltd 4,685,951 0.19
1,929,997 Chang Hwa Commercial Bank 1,185,887 0.05642,250 Cheng Shin Rubber Ind Co Ltd 838,010 0.03
5,552,043 China Development Financial 3,511,792 0.14288,327 China Development Fin-PFD 99,941 0.00
4,327,779 China Steel Corp 5,529,584 0.221,324,917 Chunghwa Telecom Co Ltd 5,578,951 0.221,509,278 Compal Electronics 1,320,148 0.056,543,624 CTBC Financial Holding Co Lt 6,137,530 0.25
716,630 Delta Electronics Inc 7,123,044 0.294,606,596 E.Sun Financial Holding Co 4,670,366 0.19
66,413 Eclat Textile Company Ltd 1,514,678 0.0622,000 Ememory Technology Inc 1,741,425 0.07
923,892 Evergreen Marine Corp Ltd 4,758,543 0.19754,481 Far Eastern New Century Corp 799,013 0.03494,687 Far Eastone Telecomm Co Ltd 1,155,050 0.05135,062 Feng Tay Enterprise Co Ltd 1,130,114 0.05
3,898,173 First Financial Holding Co 3,451,955 0.141,275,012 Formosa Chemicals & Fibre 3,723,605 0.15
413,289 Formosa Petrochemical Corp 1,432,552 0.061,399,195 Formosa Plastics Corp 5,259,561 0.21
331,068 Foxconn Technology Co Ltd 776,604 0.032,716,932 Fubon Financial Holding Co 7,492,750 0.30
100,897 Giant Manufacturing 1,258,158 0.0574,828 Globalwafers Co Ltd 2,401,679 0.1098,371 Hiwin Technologies Corp 1,089,772 0.04
4,467,901 Hon Hai Precision Industry 16,794,799 0.67113,635 Hotai Motor Company Ltd 2,521,845 0.10
3,215,465 Hua Nan Financial Holdings C 2,463,869 0.103,224,658 Innolux Corp 2,284,429 0.091,036,028 Inventec Corp 934,286 0.04
36,319 Largan Precision Co Ltd 3,235,853 0.13866,608 Lite-On Technology Corp 1,998,395 0.08551,261 Mediatek Inc 23,710,579 0.95
3,686,184 Mega Financial Holding Co Lt 4,736,467 0.19248,211 Micro-Star International Co 1,439,905 0.06
16,823 Momo.Com Inc 988,086 0.041,816,489 Nan Ya Plastics Corp 5,606,974 0.22
79,449 Nan Ya Printed Circuit Board 1,642,564 0.07484,432 Nanya Technology Corp 1,367,483 0.05
74,735 Nien Made Enterprise Co Ltd 1,114,258 0.04219,933 Novatek Microelectronics Cor 4,284,667 0.17
74,031 Oneness Biotech Co Ltd 769,289 0.0323,000 Parade Technologies Ltd 1,758,232 0.07
698,086 Pegatron Corp 1,743,512 0.071,016,709 Pou Chen 1,218,199 0.05
197,437 President Chain Store Corp 1,951,748 0.08977,722 Quanta Computer Inc 3,346,596 0.13171,792 Realtek Semiconductor Corp 3,601,379 0.14406,020 Ruentex Development Co Ltd 936,281 0.04
3,681,476 Shin Kong Financial Holding 1,470,355 0.064,075,136 Sinopac Financial Holdings 2,378,771 0.10
547,865 Synnex Technology Intl Corp 1,310,900 0.054,218,102 Taishin Financial Holding 2,889,111 0.121,907,075 Taiwan Cement 3,308,620 0.133,458,643 Taiwan Cooperative Financial 3,181,497 0.13
815,398 Taiwan High Speed Rail Corp 872,367 0.03591,641 Taiwan Mobile Co Ltd 2,138,436 0.09
HoldingsFair value
US$
% ofNet
Assets
Taiwan (18.01%) Continued8,903,996 Taiwan Semiconductor Manufacturing 197,923,792 7.921,253,109 The Shanghai Commercial & Sa 2,140,073 0.09
449,186 Unimicron Technology Corp 3,750,387 0.151,694,800 Uni-President Enterprises Co 4,202,237 0.174,293,434 United Microelectronics Corp 10,086,862 0.40
338,109 Vanguard International Semi 1,930,864 0.0817,000 Voltronic Power Technology 949,326 0.04
207,605 Wan Hai Lines Ltd 1,489,485 0.06115,017 Win Semiconductors Corp 1,556,868 0.06
1,217,265 Winbond Electronics Corp 1,495,898 0.061,028,323 Wistron Corp 1,083,443 0.04
27,372 Wiwynn Corp 1,103,111 0.04701,527 WPG Holdings Ltd 1,333,730 0.05160,200 Yageo Corporation 2,776,445 0.11610,496 Yang Ming Marine Transport 2,669,968 0.11
3,518,779 Yuanta Financial Holding Co 3,217,736 0.13
449,933,675 18.01
Thailand (1.93%)412,497 Advanced Info Service – NVDR 2,840,123 0.11
1,438,792 Airports of Thailand Pc – NVDR 2,627,340 0.112,735,346 Asset World Corp Pcl – NVDR 379,943 0.02
224,876 B.Grimm Power PCL – NVDR 272,638 0.01814,228 Bangkok Commercial Asse – NVDR 526,488 0.02
3,359,450 Bangkok Dusit Med Services – NVDR 2,313,047 0.093,392,282 Bangkok Expressway – NVDR 858,099 0.03
385,252 Berli Jucker Public Co – NVDR 357,516 0.012,828,706 BTS Group Holdings PCL – NVDR 791,750 0.03
193,079 Bumrungrad Hospital PCL – NVDR 814,972 0.032,067,186 C.P. All PCL – NVDR 3,651,069 0.15
102,034 Carabao Group PCL – NVDR 365,007 0.01840,608 Central Pattana PCL – NVDR 1,421,774 0.06362,265 Central Retail Corp PCL – NVDR 347,028 0.01
1,638,849 Charoen Pokphand Foods – NVDR 1,251,030 0.05118,470 Delta Electronics Thai – NVDR 1,461,148 0.06134,152 Electricity Genera PCL – NVDR 704,795 0.03538,725 Energy Absolute PCL – NVDR 1,548,199 0.06287,427 Global Power Synergy – NVDR 763,633 0.03848,355 Gulf Energy Development – NVDR 1,161,869 0.05
2,576,571 Home Product Center PCL – NVDR 1,118,404 0.04644,154 Indorama Ventures PCL – NVDR 833,997 0.03438,430 Intouch Holdings PCL – NVDR 1,053,256 0.04
1,611,639 Krung Thai Bank – NVDR 636,840 0.03294,525 Krungthai Card PCL – NVDR 522,395 0.02
3,640,373 Land & Houses Pub – NVDR 958,997 0.041,240,867 Minor International PCL – NVDR 1,067,952 0.04
279,960 Muangthai Capital PCL – NVDR 492,371 0.02416,154 Osotspa PCL – NVDR 426,681 0.02460,891 PTT Explor & Prod PCL – NVDR 1,628,054 0.07887,001 PTT Global Chemical PCL – NVDR 1,559,985 0.06
1,214,636 PTT Oil & Retail Busine – NVDR 981,744 0.043,623,141 PTT PCL – NVDR 4,121,519 0.17
299,194 Ratch Group PCL – NVDR 403,045 0.02442,808 SCG Packaging PCL – NVDR 917,960 0.04282,120 Siam Cement PCL – NVDR 3,259,941 0.13247,406 Siam Commercial Bank P – NVDR 940,594 0.04343,383 Sri Trang Gloves Thaila – NVDR 310,951 0.01212,276 Srisawad Corp PCL – NVDR 392,398 0.02480,662 Thai Oil PCL – NVDR 712,252 0.03
1,013,631 Thai Union Group PCL – NVDR 591,702 0.024,814,435 True Corp PCL – NVDR 688,909 0.03
48,077,415 1.93
NM0522U-2194143-96/163

96 iShares Asia Trust
iShares Core MSCI Asia ex Japan ETF (continued)
Investment Portfolio (unaudited) as at 31st December 2021
HoldingsFair value
US$
% ofNet
Assets
United States (0.02%)11,297 Legend Biotech Corp – ADR 526,553 0.02
526,553 0.02
Total listed equities 2,493,802,627 99.85
Unlisted equities (0.00%)
China (0.00%)350,205 China Huishan Dairy Holdings# 0 0.00
Total unlisted equities 0 0.00
Futures (0.00%)
Hong Kong (0.01%)183 MSCI All Country Asia Pacific ex
Japan NTR Index Futures Mar 2022 90,173 0.00
Total Futures 90,173 0.00
Unlisted rights (0.00%)
China (0.00%)37,890 Seazen Group Ltd – Rights# 0 0.00
0 0.00
South Korea (0.00%)14,155 Doosan Heavy Industries – Rights 52,393 0.00
52,393 0.00
Total unlisted rights 52,393 0.00
Total investments 2,493,945,193 99.85Other net assets 3,755,929 0.15
Net assets attributable to
unitholders at 31st December 2021 2,497,701,122 100.00
Total investments, at cost 2,453,820,667
# Amount is less than US$1.
NM0522U-2194143-97/163

Reports and Financial Statements 97
iShares Core MSCI Asia ex Japan ETF Details in Respect of Financial Derivative Instruments (unaudited) as at 31st December 2021
Futures
Underlying assets CounterpartyFair value
US$Description
Financial assets:MSCI All Country Asia Pacific ex Japan NTR Index Futures Mar 2022
MSCI All Country Asia Pacific ex Japan NTR Index Credit Suisse International 90,173
90,173
Unlisted rights
Underlying assets IssuerFair value
US$Description
Financial assets:Doosan Heavy Industries – Rights Doosan Heavy Industries Doosan Heavy Industries 52,393Seazen Group Ltd – Rights Seazen Group Ltd Seazen Group Ltd 0#
52,393
The financial derivative instruments held by the Sub-Fund as at 31st December 2021 are summarized below:
# Amount is less than US$1.
NM0522U-2194143-98/163

98 iShares Asia Trust
iShares Core MSCI Asia ex Japan ETF Information on Exposure Arising from Financial Derivative Instruments (unaudited) for the year ended 31st December 2021
2021% of net asset
value
Lowest gross exposure 0.24%
Highest gross exposure 1.72%
Average gross exposure 0.98%
The lowest, highest and average net exposure arising from the use of financial derivative instruments for investment purpose as a proportion to the Sub-Fund’s total net asset value for the year ended 31st December 2021 as shown below:
2021% of net asset
value
Lowest net exposure 0.24%
Highest net exposure 1.72%
Average net exposure 0.98%
The lowest, highest and average gross exposure arising from the use of financial derivative instruments for any purpose as a proportion to the Sub-Fund’s total net asset value for the year ended 31st December 2021 as shown below:
NM0522U-2194143-99/163

Reports and Financial Statements 99
% of net asset value
2021
% of net asset value
2020
Financial assets at fair value through profit or lossListed equitiesAustralia 0.23 –Cayman Islands 0.03 0.04China 39.90 47.45Hong Kong 4.16 4.10India 14.16 10.42Indonesia 1.66 1.52Malaysia 1.60 1.71Pakistan – 0.02Philippines 0.81 0.83Singapore 2.77 2.28South Korea 14.57 15.14Taiwan 18.01 14.18Thailand 1.93 2.04United States 0.02 –
99.85 99.73 Unlisted equitiesChina 0.00 0.00
0.00 0.00 FuturesMSCI All Country Asia Pacific ex Japan NTR Index Futures 0.00 0.01 0.00 0.01 Listed rightsSouth Korea – 0.00
– 0.00 Unlisted rightsChina 0.00 0.00South Korea 0.00 –
0.00 0.00 Total investments 99.85 99.74Other net assets 0.15 0.26 Net assets attributable to unitholders at 31st December 100.00 100.00
iShares Core MSCI Asia ex Japan ETF Statement of Movements in Investment Portfolio (unaudited) for the year ended 31st December 2021
NM0522U-2194143-100/163

100 iShares Asia Trust
iShares Core MSCI Asia ex Japan ETF Performance Record (unaudited)
Net Asset Value
DealingNet asset value
per unitUS$
DealingNet asset value
of the Sub-FundUS$
At end of financial period dated31st December 2019 6.91 381,952,49231st December 2020 8.50 2,132,118,39631st December 2021 7.92 2,497,660,483
Highest and lowest net asset value per unit
Highest net assetvalue per unit
Lowest net assetvalue per unit
Financial period ended31st December 2012 HK$41.51 HK$33.4831st December 2013 HK$43.78 HK$35.6131st December 2014 HK$46.45 HK$38.3331st December 2015 HK$49.56 HK$36.6031st December 2016 HK$43.99 HK$33.7331st December 2017 HK$57.39 HK$40.3031st December 2018* US$7.81 US$5.8631st December 2019 US$7.04 US$5.8531st December 2020 US$8.50 US$5.0431st December 2021 US$9.67 US$7.64
* For iShares Core MSCI AC Asia ex Japan ETF, the base currency was changed from Hong Kong dollar (“HK$”) to United States dollar (“US$”), effective from 1st January 2018.
NM0522U-2194143-101/163

Reports and Financial Statements 101
iShares MSCI Emerging Asia ETF Investment Portfolio (unaudited) as at 31st December 2021
HoldingsFair value
HK$
% ofNet
Assets
Investments (99.84%)
Listed equities (84.02%)
Australia (0.01%)7,331 MMG Ltd 18,328 0.01
18,328 0.01
Cayman Islands (0.04%)
1,736 Zhen Ding Technology Holding 49,163 0.04
49,163 0.04
China (40.82%)257 360 Digitech Inc 45,944 0.03
2,500 360 Security Technology In – A 38,987 0.034,125 3Sbio Inc 26,813 0.02
93 51Job Inc – ADR 35,477 0.032,410 AAC Technologies Holdings In 74,228 0.05
200 Advanced Micro-Fabrication – A 31,043 0.02458 AECC Aviation Power Co – A 35,634 0.03
3,054 Agile Group Holdings Ltd 12,918 0.01147 Agora Inc – ADR 18,578 0.01
14,451 Agricultural Bank of China – A 52,088 0.0477,710 Agricultural Bank of China – H 208,263 0.15
983 Aier Eye Hospital Group Co – A 50,955 0.041,162 Air China Ltd – A 13,007 0.016,875 Air China Ltd – H 37,400 0.03
433 Airtac International Group 124,456 0.09612 Akeso Inc 20,808 0.01
44,199 Alibaba Group Holding Ltd 5,255,261 3.7312,217 Alibaba Health Information T 80,510 0.0642,777 Alibaba Pictures Group Ltd 30,372 0.02
1,590 A-Living Smart City Services 21,147 0.024,125 Aluminum Corp of China Ltd – A 30,799 0.02
12,492 Aluminum Corp of China Ltd – H 53,841 0.04846 Anhui Conch Cement Co Ltd – A 41,800 0.03
3,868 Anhui Conch Cement Co Ltd – H 150,659 0.11138 Anhui Gujing Distillery Co – A 41,282 0.03276 Anhui Gujing Distillery Co – B 30,636 0.02
3,074 Anta Sports Products Ltd 359,351 0.2555 Asymchem Laboratories Tian – A 29,332 0.02
206 Autohome Inc – ADR 47,346 0.038,800 Avichina Industry & Tech – H 47,432 0.03
805 Baidu Inc – Spon ADR 933,809 0.666,900 Bank of Beijing Co Ltd – A 37,560 0.036,132 Bank of China Ltd – A 22,930 0.02
227,053 Bank of China Ltd – H 638,019 0.456,867 Bank of Communications Co – A 38,812 0.03
23,157 Bank of Communications Co – H 109,069 0.082,652 Bank of Hangzhou Co Ltd – A 41,683 0.034,844 Bank of Jiangsu Co Ltd – A 34,623 0.023,973 Bank of Nanjing Co Ltd – A 43,644 0.031,674 Bank of Ningbo Co Ltd – A 78,564 0.064,536 Bank of Shanghai Co Ltd – A 39,651 0.036,105 Baoshan Iron & Steel Co – A 53,591 0.04
136 Beigene Ltd – ADR 287,266 0.206,057 Beijing Capital Intl Airpo – H 28,892 0.021,379 Beijing Enlight Media Co L – A 21,725 0.021,266 Beijing Enterprises Hldgs 34,055 0.02
13,228 Beijing Enterprises Water Gr 40,081 0.03100 Beijing Kingsoft Office So – A 32,489 0.02616 Beijing Tiantan Biological – A 21,871 0.02190 Beijing Wantai Biological – A 51,597 0.04
7,394 Beijing-Shanghai High Spe – A 43,785 0.03187 BGI Genomics Co Ltd – A 20,129 0.01477 Bilibili Inc – Sponsored ADR 172,554 0.12
6,149 BOE Technology Group Co Lt – A 38,071 0.03
HoldingsFair value
HK$
% ofNet
Assets
China (40.82%) Continued368 BYD Co Ltd – A 120,969 0.09
2,323 BYD Co Ltd – H 619,312 0.442,317 BYD Electronic Intl Co Ltd 66,150 0.05
249 Cansino Biologics Inc – H 44,870 0.0323,169 CGN Power Co Ltd – H 54,911 0.04
117 Changchun High & New Tech – A 38,931 0.03110 Changzhou Xingyu Automotiv – A 27,546 0.02700 Chaozhou Three-Circle Grou – A 38,276 0.03
7,236 China Bohai Bank Co Ltd – H 21,708 0.0231,169 China Cinda Asset Manageme – H 44,260 0.0325,661 China Citic Bank Corp Ltd – H 86,734 0.06
6,000 China Coal Energy Co – H 27,000 0.029,625 China Communications Servi – H 36,575 0.034,622 China Conch Venture Holdings 176,098 0.122,740 China Construction Bank – A 19,685 0.01
278,197 China Construction Bank – H 1,502,264 1.07796 China Cssc Holdings Ltd – A 24,193 0.02
3,806 China Eastern Airlines Co – A 24,078 0.0212,400 China Everbright Bank Co – A 50,473 0.0410,424 China Everbright Bank Co L – H 28,770 0.02
9,399 China Everbright Environment 58,838 0.046,152 China Evergrande Group 9,782 0.01
10,842 China Feihe Ltd 113,407 0.089,051 China Galaxy Securities Co – H 40,548 0.038,683 China Gas Holdings Ltd 140,665 0.108,208 China Hongqiao Group Ltd 67,552 0.05
62,851 China Huarong Asset Manage – H 48,081 0.033,850 China International Capita – H 82,775 0.06
19,250 China Jinmao Holdings Group 46,393 0.03700 China Jushi Co Ltd – A 15,619 0.01
4,125 China Lesso Group Holdings L 46,200 0.03673 China Life Insurance Co – A 24,828 0.02
20,378 China Life Insurance Co – H 263,284 0.191,177 China Literature Ltd 57,673 0.049,772 China Longyuan Power Group – H 177,850 0.134,804 China Medical System Holding 62,548 0.041,814 China Meidong Auto Holdings 72,923 0.059,355 China Mengniu Dairy Co 413,491 0.293,851 China Merchants Bank – A 229,979 0.16
11,154 China Merchants Bank – H 675,375 0.485,826 China Merchants Port Holding 82,729 0.062,330 China Merchants Securities – A 50,419 0.041,893 China Merchants Shekou Ind – A 30,960 0.02
10,202 China Minsheng Banking – A 48,780 0.0316,968 China Minsheng Banking Cor – H 50,565 0.04
5,922 China Molybdenum Co Ltd – A 40,513 0.037,839 China Molybdenum Co Ltd – H 32,218 0.02
11,868 China National Building Ma – H 113,458 0.084,093 China National Nuclear Pow – A 41,650 0.03
825 China Northern Rare Earth – A 46,325 0.037,520 China Oilfield Services – H 51,362 0.04
11,314 China Overseas Land & Invest 208,856 0.151,606 China Pacific Insurance Gr – A 53,399 0.047,654 China Pacific Insurance Gr – H 161,882 0.114,822 China Petroleum & Chemical – A 25,007 0.02
71,086 China Petroleum & Chemical – H 258,042 0.187,169 China Power International 37,637 0.035,922 China Railway Group Ltd – A 42,038 0.03
11,213 China Railway Group Ltd – H 46,198 0.034,372 China Resources Beer Holding 279,152 0.209,668 China Resources Cement 56,945 0.042,449 China Resources Gas Group Lt 107,878 0.089,751 China Resources Land Ltd 319,833 0.231,777 China Resources Mixc Lifesty 64,594 0.055,866 China Resources Power Holdin 153,103 0.111,165 China Shenhua Energy Co – A 32,166 0.029,079 China Shenhua Energy Co – H 165,964 0.12
NM0522U-2194143-102/163

102 iShares Asia Trust
iShares MSCI Emerging Asia ETF (continued)
Investment Portfolio (unaudited) as at 31st December 2021
HoldingsFair value
HK$
% ofNet
Assets
China (40.82%) Continued6,875 China Southern Airlines Co – H 32,106 0.02
13,299 China State Construction – A 81,524 0.065,472 China State Construction Int 53,024 0.043,000 China Suntien Green Energy – H 18,240 0.015,174 China Taiping Insurance Hold 55,362 0.04
422 China Tourism Group Duty F – A 113,518 0.08133,375 China Tower Corp Ltd – H 114,702 0.08
8,600 China United Network – A 41,437 0.031,602 China Vanke Co Ltd – A 38,810 0.035,256 China Vanke Co Ltd – H 95,344 0.074,974 China Yangtze Power Co Ltd – A 138,429 0.105,792 China Yuhua Education Corp L 16,160 0.018,000 Chinasoft International Ltd 81,280 0.06
257 Chindata Group Holdings – ADR 13,204 0.012,399 Chongqing Changan Automob – A 44,677 0.03
235 Chongqing Zhifei Biologica – A 35,899 0.032,200 Cifi Ever Sunshine Services 26,576 0.02
12,994 CIFI Holdings Group Co Ltd 60,942 0.0415,929 Citic Ltd 122,653 0.09
2,432 Citic Securities Co – A 78,746 0.066,142 Citic Securities Co Ltd – H 124,990 0.09
443 Contemporary Amperex Techn – A 319,358 0.231,814 Cosco Shipping Holdings Co – A 41,566 0.039,971 Cosco Shipping Holdings Co – H 150,762 0.114,383 Cosco Shipping Ports Ltd 29,673 0.02
21,285 Country Garden Holdings Co 147,292 0.104,547 Country Garden Services Hold 212,345 0.156,000 CRRC Corp Ltd – A 44,799 0.03
10,000 CRRC Corp Ltd – H 33,500 0.02673 CSC Financial Co Ltd – A 24,134 0.02
26,545 CSPC Pharmaceutical Group Lt 224,836 0.16181 Dada Nexus Ltd – ADR 18,570 0.01
7,905 Dali Foods Group Co Ltd 32,252 0.02169 Daqo New Energy Corp – ADR 53,125 0.04917 Didi Global Inc 35,603 0.03
10,436 Dongfeng Motor Grp Co Ltd – H 67,625 0.054,000 Dongyue Group 48,640 0.031,665 East Money Information Co – A 75,753 0.05
128 Ecovacs Robotics Co Ltd – A 23,689 0.022,254 ENN Energy Holdings Ltd 330,887 0.23
551 EVE Energy Co Ltd – A 79,835 0.061,393 Everbright Securitie Co – A 25,498 0.024,888 Far East Horizon Ltd 33,825 0.021,223 Flat Glass Group Co Ltd – H 48,431 0.034,099 Focus Media Information Te – A 41,158 0.03
762 Foshan Haitian Flavouring – A 98,196 0.078,639 Fosun International Ltd 72,654 0.054,668 Founder Securities Co Ltd – A 44,869 0.031,165 Foxconn Industrial Interne – A 17,025 0.01
55 Fu Jian Anjoy Foods Co Ltd – A 11,516 0.01827 Fuyao Glass Industry Group – A 47,796 0.03
1,861 Fuyao Glass Industry Group – H 74,998 0.05170 Ganfeng Lithium Co Ltd – A 29,773 0.02731 Ganfeng Lithium Co Ltd – H 89,694 0.06259 GDS Holdings Ltd – ADR 95,227 0.07
17,462 Geely Automobile Holdings Lt 371,941 0.261,485 Gemdale Corp – A 23,614 0.022,750 Genscript Biotech Corp 94,875 0.071,368 GF Securities Co Ltd – A 41,242 0.032,688 GF Securities Co Ltd – H 39,944 0.03
70 Gigadevice Semiconductor B – A 15,092 0.01793 Goertek Inc – A 52,598 0.04
20,118 Gome Retail Holdings Ltd 13,278 0.01495 Great Wall Motor Co Ltd – A 29,458 0.02
8,950 Great Wall Motor Company – H 239,860 0.173,472 Greentown China Holdings 43,608 0.033,472 Greentown Service Group Co L 24,998 0.02
532 Guangdong Haid Group Co – A 47,809 0.03
HoldingsFair value
HK$
% ofNet
Assets
China (40.82%) Continued6,546 Guangdong Investment Ltd 64,871 0.05
110 Guangdong Kinlong Hardware – A 24,490 0.027,303 Guangzhou Automobile Group – H 56,160 0.04
495 Guangzhou Baiyunshan Phar – A 20,755 0.01110 Guangzhou Kingmed Diagnost – A 15,020 0.01
3,575 Guangzhou R&F Properties – H 10,367 0.01220 Guangzhou Shiyuan Electron – A 21,955 0.02370 Guangzhou Tinci Materials – A 52,008 0.04
2,398 Guotai Junan Securities Co – A 52,596 0.042,954 Haidilao International Holdi 51,990 0.041,400 Haier Smart Home Co Ltd – A 51,304 0.046,032 Haier Smart Home Co Ltd – H 198,754 0.142,527 Haitian International Hldgs 54,710 0.042,468 Haitong Securities Co Ltd – A 37,096 0.036,577 Haitong Securities Co Ltd – H 45,447 0.03
264 Hangzhou First Applied Mat – A 42,255 0.03400 Hangzhou Silan Microelectr – A 26,580 0.02197 Hangzhou Tigermed Consulti – A 30,867 0.02292 Hangzhou Tigermed Consulti – H 28,908 0.02
3,360 Hansoh Pharmaceutical Group 63,840 0.05533 Hello Group Inc -SPN ADR 37,316 0.03506 Henan Shuanghui Investment – A 19,572 0.01
2,218 Hengan Intl Group Co Ltd 89,053 0.06982 Hengli Petrochemical Co L – A 27,655 0.02935 Hengyi Petrochemical Co – A 12,174 0.01160 Hithink Royalflush Informa – A 28,361 0.02100 Hoshine Silicon Industry C – A 16,180 0.01
1,375 Hua Hong Semiconductor Ltd 59,125 0.043,000 Huabao International Holding 43,200 0.03
488 Huadong Medicine Co Ltd – A 24,052 0.02563 Hualan Biological Engineer – A 20,114 0.01
3,604 Huaneng Power Intl Inc – A 42,816 0.038,452 Huaneng Power Intl Inc – H 44,035 0.032,200 Huatai Securities Co Ltd – A 47,903 0.033,061 Huatai Securities Co Ltd – H 39,732 0.033,568 Huaxia Bank Co Ltd – A 24,497 0.02
605 Huayu Automotive Systems – A 20,991 0.01492 Huazhu Group Ltd – ADR 143,228 0.10
40 Huizhou Desay Sv Automotiv – A 6,940 0.00425 Hundsun Technologies Inc – A 32,384 0.02205 Hutchmed China – ADR (formerly
known as Hutchison China Meditech – ADR) 56,066 0.04
800 Hygeia Healthcare Holdings C 39,040 0.03440 Iflytek Co Ltd – A 28,326 0.02
96 I-Mab-Sponsored ADR 35,469 0.03100 Imeik Technology Developme – A 65,728 0.05
10,402 Ind & Comm Bk of China – A 59,046 0.04164,319 Ind & Comm Bk of China – H 723,004 0.51
3,844 Industrial Bank Co Ltd – A 89,732 0.062,035 Industrial Securities Co – A 24,650 0.02
200 Ingenic Semiconductor Co – A 32,857 0.0211,793 Inner Mongolia Baotou Ste – A 40,339 0.03
1,352 Inner Mongolia Yili Indus – A 68,723 0.053,504 Innovent Biologics Inc 169,068 0.12
874 Iqiyi Inc – ADR 31,072 0.02290 JA Solar Technology Co Ltd – A 32,959 0.02402 Jason Furniture Hangzhou C – A 38,029 0.03770 JD Health International Inc 47,316 0.03
5,118 JD.Com Inc – CL A 1,402,332 0.99600 Jiangsu Eastern Shenghong – A 14,227 0.01
4,024 Jiangsu Express Co Ltd – H 32,152 0.02403 Jiangsu Hengli Hydraulic C – A 40,416 0.03
1,115 Jiangsu Hengrui Medicine C – A 69,321 0.05330 Jiangsu King’s Luck Brewer – A 22,009 0.02300 Jiangsu Yanghe Brewery – A 60,589 0.04605 Jiangxi Copper Co Ltd – A 16,563 0.01
4,094 Jiangxi Copper Co Ltd – H 51,093 0.04
NM0522U-2194143-103/163

Reports and Financial Statements 103
iShares MSCI Emerging Asia ETF (continued)
Investment Portfolio (unaudited) as at 31st December 2021
HoldingsFair value
HK$
% ofNet
Assets
China (40.82%) Continued4,632 Jinxin Fertility Group Ltd 40,345 0.031,650 Jiumaojiu International Hold 22,605 0.02
197 Kanzhun Ltd 53,571 0.041,074 KE Holdings Inc – ADR 168,469 0.122,405 Kingboard Holdings Ltd 91,270 0.068,098 Kingdee International Sftwr 194,352 0.14
172 Kingsoft Cloud Holdings – ADR 21,120 0.011,341 Kuaishou Technology 96,619 0.079,731 Kunlun Energy Co Ltd 71,134 0.05
216 Kweichow Moutai Co Ltd – A 542,880 0.384,814 KWG Group Holdings Ltd 24,551 0.02
385 LB Group Co Ltd – A (formerly known as Lomon Billions Group Co – A) 13,495 0.01
6,189 Lee & Man Paper Manufacturin 33,544 0.0221,289 Lenovo Group Ltd 190,749 0.14
1,100 Lens Technology Co Ltd – A 30,991 0.02422 Lepu Medical Technology – A 11,708 0.01
1,629 Li Auto Inc – ADR 407,676 0.296,673 Li Ning Co Ltd 569,541 0.401,674 Lingyi Itech Guangdong Co – A 15,105 0.015,500 Logan Group Co Ltd 32,780 0.025,500 Longfor Group Holdings Ltd 201,850 0.14
907 Longi Green Energy Technol – A 95,854 0.071,761 Luxshare Precision Industr – A 106,224 0.08
268 Luzhou Laojiao Co Ltd – A 83,415 0.06495 Mango Excellent Media Co L – A 34,726 0.02
88 Maxscend Microelectronics – A 35,258 0.03760 Meinian Onehealth Healthca – A 7,314 0.01
11,890 Meituan – Class B 2,680,006 1.905,170 Metallurgical Corp Of Chin – A 24,276 0.021,703 Microport Scientific Corp 48,365 0.031,100 Ming Yuan Cloud Group Holdin 19,536 0.012,314 Minth Group Ltd 79,486 0.06
873 Muyuan Foodstuff Co Ltd – A 57,112 0.04966 Nari Technology Co Ltd – A 47,409 0.03
80 Naura Technology Group Co – A 34,036 0.025,925 Netease Inc 933,188 0.66
540 New China Life Insurance C – A 25,740 0.022,217 New China Life Insurance C – H 46,224 0.031,199 New Hope Liuhe Co Ltd – A 22,359 0.024,833 New Oriental Educatio – SP ADR 79,127 0.063,618 Nine Dragons Paper Holdings 30,283 0.02
103 Ningbo Tuopu Group Co Ltd – A 6,693 0.001,500 Ningxia Baofeng Energy Gro – A 31,925 0.023,961 Nio Inc – ADR 978,315 0.69
108 Noah Holdings Ltd – Spon ADS 25,841 0.025,148 Nongfu Spring Co Ltd – H 264,865 0.19
196 Oppein Home Group Inc – A 35,444 0.031,815 Orient Securities Co Ltd – A 32,800 0.02
230 Ovctek China Inc – A 16,177 0.0118,331 People’s Insurance Co Grou – H 43,261 0.03
907 Perfect World Co Ltd – A 22,585 0.023,300 Petrochina Co Ltd – A 19,865 0.01
62,929 Petrochina Co Ltd – H 218,364 0.15158 Pharmaron Beijing Co Ltd – A 27,366 0.02404 Pharmaron Beijing Co Ltd – H 48,601 0.03
17,882 PICC Property & Casualty – H 113,908 0.081,269 Pinduoduo Inc – ADR 576,791 0.414,499 Ping An Bank Co Ltd – A 90,901 0.061,372 Ping An Healthcare And Techn 38,896 0.031,700 Ping An Insurance Group Co – A 105,066 0.07
18,515 Ping An Insurance Group Co – H 1,039,617 0.742,265 Poly Developments and Hold – A 43,403 0.034,345 Postal Savings Bank of Chi – A 27,168 0.02
23,811 Postal Savings Bank of Chi – H 130,246 0.094,620 Power Construction Corp of – A 45,767 0.034,277 Powerlong Real Estate Holdin 17,450 0.011,823 RLX Technology Inc – ADR 55,429 0.04
HoldingsFair value
HK$
% ofNet
Assets
China (40.82%) Continued2,478 Rongsheng Petrochemical Co – A 55,171 0.04
914 S F Holding Co Ltd – A 77,230 0.051,181 Saic Motor Corp Ltd – A 29,871 0.02
147 Sangfor Technologies Inc – A 34,423 0.023,054 Sany Heavy Equipment Intl 23,027 0.022,138 Sany Heavy Industry Co Ltd – A 59,764 0.04
400 Satellite Chemical Co Ltd – A 19,631 0.012,145 Sdic Power Holdings Co Ltd – A 30,164 0.026,948 Seazen Group Ltd 36,616 0.03
506 Seazen Holdings Co Ltd – A 18,071 0.01100 SG Micro Corp – A 37,884 0.03
2,347 Shaanxi Coal Industry Co L – A 35,105 0.021,122 Shandong Gold Mining Co Lt – A 25,889 0.022,174 Shandong Gold Mining Co Lt – H 29,001 0.02
385 Shandong Linglong Tyre Co – A 17,252 0.013,850 Shandong Nanshan Aluminum – A 22,232 0.026,774 Shandong Weigao Gp Medical – H 65,911 0.05
400 Shanghai Baosight Software – A 29,831 0.021,100 Shanghai Baosight Software – B 41,396 0.03
612 Shanghai Fosun Pharmaceuti – A 36,721 0.031,643 Shanghai Fosun Pharmaceuti – H 56,437 0.04
268 Shanghai International Air – A 15,341 0.012,976 Shanghai Lujiazui Fin&Trad – B 21,137 0.01
220 Shanghai M&G Stationery In – A 17,400 0.013,296 Shanghai Pharmaceuticals – H 48,715 0.035,636 Shanghai Pudong Devel Bank – A 58,941 0.04
260 Shanghai Putailai New Ener – A 51,197 0.04213 Shanxi Xinghuacun Fen Wine – A 82,463 0.06109 Shennan Circuits Co Ltd – A 16,280 0.01
7,239 Shenwan Hongyuan Group Co – A 45,441 0.031,896 Shenzhen Energy Group Co L – A 18,829 0.01
99 Shenzhen Goodix Technology – A 13,081 0.01394 Shenzhen Inovance Technolo – A 33,137 0.02
3,439 Shenzhen Intl Holdings 27,856 0.02191 Shenzhen Kangtai Biologica – A 23,075 0.02213 Shenzhen Mindray Bio-Medic – A 99,443 0.07
3,065 Shenzhen Overseas Chinese – A 26,454 0.02170 Shenzhen Transsion Holding – A 32,702 0.02
2,420 Shenzhou International Group 362,758 0.264,470 Shimao Group Holdings Ltd 22,797 0.021,831 Shimao Services Holdings Ltd 9,924 0.011,712 Sichuan Chuantou Energy Co – A 26,237 0.02
227 Silergy Corp 321,431 0.2330,540 Sino Biopharmaceutical 166,748 0.12
3,756 Sinopharm Group Co – H 63,702 0.052,317 Sinotruk Hong Kong Ltd 27,804 0.025,541 Smoore International Holding 220,255 0.16
532 Songcheng Performance Deve – A 9,340 0.01100 Starpower Semiconductor Lt – A 46,711 0.03
5,755 Sun Art Retail Group Ltd 18,013 0.017,674 Sunac China Holdings Ltd 90,400 0.061,831 Sunac Services Holdings Ltd 14,556 0.01
233 Sungrow Power Supply Co Lt – A 41,649 0.032,398 Suning.Com Co Ltd – A 12,113 0.012,040 Sunny Optical Tech 503,064 0.361,258 Tal Education Group – ADR 38,544 0.032,502 TCL Technology Group Corp – A 18,926 0.01
16,796 Tencent Holdings Ltd 7,672,413 5.442,014 Tencent Music Entertainm – ADR 107,557 0.08
693 Tianjin Zhonghuan Semicond – A 35,472 0.035,091 Tingyi (Cayman Isln) Hldg Co 81,558 0.062,776 Tongcheng Travel Holdings Ltd
(formerly known as Tongcheng-Elong Holdings Ltd) 40,085 0.03
1,303 Tongwei Co Ltd – A 71,824 0.0578 Topchoice Medical Corporat – A 19,030 0.01
4,055 Topsports International Hold 31,994 0.022,064 Travelsky Technology Ltd – H 27,080 0.02
NM0522U-2194143-104/163

104 iShares Asia Trust
iShares MSCI Emerging Asia ETF (continued)
Investment Portfolio (unaudited) as at 31st December 2021
HoldingsFair value
HK$
% ofNet
Assets
China (40.82%) Continued1,471 Trip.Com Group Ltd – ADR 282,351 0.20
20 Tsingtao Brewery Co Ltd – A 2,428 0.001,502 Tsingtao Brewery Co Ltd – H 109,646 0.08
200 Unigroup Guoxin Microelect – A 55,171 0.045,208 Uni-President China Holdings 39,372 0.03
947 Unisplendour Corp Ltd – A 26,530 0.02612 Venus Medtech Hangzhou Inc – H 18,115 0.01
1,736 Vinda International Holdings 32,984 0.021,343 Vipshop Holdings Ltd – ADR 87,952 0.06
224 Vnet Group Inc – ADR (formerly known as 21Vianet Group Inc – ADR) 15,770 0.01
373 Walvax Biotechnology Co – A 25,700 0.02793 Wanhua Chemical Group Co – A 98,195 0.07
13,996 Want Want China Holdings Ltd 100,211 0.07213 Weibo Corp – Spon ADR 51,446 0.04
1,400 Weichai Power Co Ltd – A 30,707 0.025,775 Weichai Power Co Ltd – H 88,127 0.063,850 Weimob Inc 30,377 0.021,889 Wens Foodstuffs Group Co – A 44,605 0.03
197 Will Semiconductor Co Ltd – A 75,059 0.05301 Wingtech Technology Co Ltd – A 47,716 0.03612 Wuhu Sanqi Interactive Ent – A 20,274 0.01593 Wuliangye Yibin Co Ltd – A 161,880 0.11365 Wuxi Apptec Co Ltd – A 53,064 0.04
1,022 Wuxi Apptec Co Ltd – H 137,970 0.1010,497 Wuxi Biologics Cayman Inc 971,497 0.69
352 Wuxi Lead Intelligent Equi – A 32,095 0.0241,321 Xiaomi Corp – Class B 780,967 0.55
2,314 Xinjiang Goldwind Sci&Tec – H 35,219 0.022,333 Xinjiang Goldwind Sci&Tech – A 47,109 0.03
13,896 Xinyi Solar Holdings Ltd 183,705 0.131,123 Xpeng Inc – ADR 440,651 0.313,472 Yadea Group Holdings Ltd 52,774 0.04
235 Yantai Jereh Oilfield – A 11,525 0.013,206 Yanzhou Coal Mining Co – H 49,693 0.04
304 Yealink Network Technology – A 30,357 0.02359 Yifeng Pharmacy Chain Co L – A 24,256 0.02
1,627 Yihai International Holding 58,653 0.04275 Yihai Kerry Arawana Holdin – A 21,217 0.02
4,567 Yonghui Superstores Co Ltd – A 22,677 0.02531 Yonyou Network Technology – A 23,358 0.02
1,244 Yum China Holdings Inc 483,378 0.34440 Yunnan Baiyao Group Co Ltd – A 56,453 0.04193 Yunnan Energy New Material – A 59,250 0.04221 Zai Lab Ltd – ADR 108,289 0.08
88 Zhangzhou Pientzehuang Pha – A 47,164 0.033,300 Zhejiang Century Huatong – A 33,945 0.02
655 Zhejiang Chint Electrics – A 43,276 0.031,000 Zhejiang Dahua Technology – A 28,787 0.025,351 Zhejiang Expressway Co – H 37,189 0.03
330 Zhejiang Huayou Cobalt Co – A 44,630 0.03400 Zhejiang Jingsheng Mechani – A 34,083 0.02784 Zhejiang Nhu Co Ltd – A 29,912 0.02
1,346 Zhejiang Sanhua Intelligen – A 41,751 0.03197 Zhejiang Supor Co Ltd – A 15,033 0.01
1,217 Zhongan Online P&C Insuran – H 32,981 0.021,564 Zhongsheng Group Holdings 95,091 0.071,790 Zhuzhou CRRC Times Electri – H 80,819 0.063,498 Zijin Mining Group Co Ltd – A 41,599 0.03
15,371 Zijin Mining Group Co Ltd – H 142,643 0.104,510 Zoomlion Heavy Industry – H 22,144 0.022,381 Zoomlion Heavy Industry S – A 20,930 0.011,298 ZTE Corp – A 53,311 0.041,716 ZTE Corp – H 36,637 0.031,249 ZTO Express Cayman Inc – ADR 274,794 0.19
57,565,028 40.82
HoldingsFair value
HK$
% ofNet
Assets
Hong Kong (0.37%)11,576 Bosideng Intl Hldgs Ltd 56,838 0.04
2,750 China Education Group Holdin 34,815 0.025,792 China Overseas Property Hold 47,900 0.036,419 China Traditional Chinese Me 33,186 0.02
46,314 China Youzan Ltd 25,010 0.027,331 Hengten Networks Group Ltd 21,626 0.012,545 Hopson Development Holdings 41,382 0.032,902 Kingboard Laminates Hldg Ltd 38,480 0.032,750 Kingsoft Corp Ltd 94,187 0.073,989 Wharf Holdings Ltd 95,537 0.075,225 Yuexiu Property Co Ltd 35,896 0.03
524,857 0.37
Indonesia (1.84%)
34,335 Adaro Energy TBK PT 42,259 0.0325,362 Aneka Tambang TBK 31,215 0.0254,970 Astra International TBK PT 171,395 0.12
159,400 Bank Central Asia TBK PT 636,515 0.4552,963 Bank Mandiri Persero TBK PT 203,524 0.1425,317 Bank Negara Indonesia Perser 93,479 0.07
196,283 Bank Rakyat Indonesia Perser 441,288 0.3194,308 Barito Pacific TBK PT 44,107 0.0317,626 Charoen Pokphand Indonesi PT 57,368 0.04
1,375 Gudang Garam TBK PT 23,015 0.029,436 Indah Kiat Pulp & Paper TBK 40,390 0.036,729 Indocement Tunggal Prakarsa 44,538 0.037,583 Indofood Cbp Sukses Makmur T 36,088 0.02
15,460 Indofood Sukses Makmur TBK P 53,489 0.0457,306 Kalbe Farma TBK PT 50,626 0.0430,740 Merdeka Copper Gold TBK PT 65,411 0.0567,908 Sarana Menara Nusantara PT 41,790 0.0311,000 Semen Indonesia Persero TBK 43,624 0.03
140,656 Telkom Indonesia Persero TBK 310,840 0.2223,896 Tower Bersama Infrastructure 38,561 0.0325,018 Unilever Indonesia TBK PT 56,246 0.04
5,500 United Tractors TBK PT 66,640 0.05
2,592,408 1.84
Malaysia (1.75%)4,745 AMMB Holdings BHD 28,149 0.026,892 Axiata Group Berhad 53,655 0.04
18,628 Cimb Group Holdings BHD 189,991 0.1311,109 Dialog Group BHD 54,469 0.04
8,271 Digi.Com BHD 67,486 0.05576 Fraser & Neave Holdings BHD 26,668 0.02
5,221 Genting BHD 45,629 0.038,606 Genting Malaysia BHD 46,383 0.032,064 Hap Seng Consolidated 29,742 0.024,668 Hartalega Holdings BHD 50,056 0.041,698 Hong Leong Bank Berhad 59,168 0.04
673 Hong Leong Financial Group 21,839 0.025,003 IHH Healthcare BHD 68,722 0.058,600 Inari Amertron BHD 64,377 0.057,044 IOI Corp BHD 49,170 0.031,203 Kuala Lumpur Kepong BHD 49,033 0.03
13,556 Malayan Banking BHD 210,562 0.153,505 Malaysia Airports Hldgs BHD 39,225 0.035,794 Maxis BHD 52,588 0.043,897 MISC BHD 51,415 0.04
232 Nestle (Malaysia) Berhad 58,265 0.046,879 Petronas Chemicals Group BHD 114,831 0.081,040 Petronas Dagangan BHD 40,093 0.032,819 Petronas Gas BHD 94,959 0.071,448 PPB Group Berhad 46,338 0.039,774 Press Metal Aluminium Holdin 105,723 0.07
42,227 Public Bank Berhad 328,740 0.233,558 QL Resources BHD 30,429 0.02
NM0522U-2194143-105/163

Reports and Financial Statements 105
iShares MSCI Emerging Asia ETF (continued)
Investment Portfolio (unaudited) as at 31st December 2021
HoldingsFair value
HK$
% ofNet
Assets
Malaysia (1.75%) Continued3,936 RHB Bank BHD 39,555 0.03
10,094 Sime Darby Berhad 43,825 0.035,207 Sime Darby Plantation BHD 36,639 0.034,168 Telekom Malaysia BHD 42,900 0.037,443 Tenaga Nasional BHD 130,096 0.09
15,470 Top Glove Corp BHD 74,982 0.053,119 Westports Holdings BHD 23,640 0.02
2,469,342 1.75
Philippines (0.87%)
5,520 Aboitiz Equity Ventures Inc 45,954 0.0317,100 Ac Energy Corp 28,759 0.02
765 Ayala Corporation 97,195 0.0723,599 Ayala Land Inc 132,416 0.09
5,080 Bank of The Philippine Islan 71,572 0.055,551 BDO Unibank Inc 102,438 0.07
95 Globe Telecom Inc 48,251 0.03159 GT Capital Holdings Inc 13,127 0.01
3,285 Intl Container Term Svcs Inc 100,449 0.078,400 JG Summit Holdings Inc 68,067 0.051,063 Jollibee Foods Corp 35,170 0.03
744 Manila Electric Company 33,579 0.0217,892 Metro Pacific Investments Co 10,669 0.01
6,104 Metropolitan Bank & Trust 51,982 0.0410,800 Monde Nissin Corp 26,750 0.02
224 PLDT Inc 62,057 0.04700 SM Investments Corp 100,923 0.07
28,714 SM Prime Holdings Inc 148,825 0.112,617 Universal Robina Corp 51,215 0.04
1,229,398 0.87
Singapore (0.07%)696 BOC Aviation Ltd 39,742 0.03169 Joyy Inc – ADR 59,857 0.04
99,599 0.07
South Korea (16.16%)96 Alteogen Inc 47,661 0.0396 Amorepacific Corp 105,144 0.0791 Amorepacific Group 26,469 0.0222 BGF Retail Co Ltd 20,993 0.01
262 Celltrion Healthcare Co Ltd 137,808 0.10284 Celltrion Inc 368,792 0.26
52 Celltrion Pharm Inc 42,425 0.03246 Cheil Worldwide Inc 36,865 0.03
29 CJ Cheiljedang Corp 73,700 0.0540 CJ Corp 21,879 0.0248 CJ ENM Co Ltd 43,695 0.0317 CJ Logistics 14,048 0.01
174 Coway Co Ltd 84,902 0.06126 DB Insurance Co Ltd 44,623 0.03172 Doosan Bobcat Inc 45,968 0.03897 Doosan Heavy Industries 120,011 0.08
60 Douzone Bizon Co Ltd 28,726 0.0234 Ecopro Bm Co Ltd 111,671 0.0856 E-Mart Inc 55,458 0.0410 F&F Co Ltd/New 61,977 0.0415 Green Cross Corp 21,446 0.02
199 GS Engineering & Construct 51,683 0.04121 GS Holdings 31,028 0.02897 Hana Financial Group 247,375 0.18260 Hankook Tire & Technology Co 67,696 0.05
24 Hanmi Pharm Co Ltd 43,443 0.03513 Hanon Systems 45,252 0.03412 Hanwha Solutions Corp 95,923 0.07
HoldingsFair value
HK$
% ofNet
Assets
South Korea (16.16%) Continued286 HLB Inc 65,274 0.05777 HMM Co Ltd 137,079 0.10
92 Hotel Shilla Co Ltd 47,063 0.0340 Hybe Co Ltd 91,555 0.06
182 Hyundai Engineering & Const 53,057 0.0454 Hyundai Glovis Co Ltd 59,498 0.04
170 Hyundai Heavy Industries Hol 59,872 0.04194 Hyundai Mobis Co Ltd 323,808 0.23404 Hyundai Motor Co 553,765 0.39
98 Hyundai Motor Co Ltd – 2nd Prf 64,915 0.0574 Hyundai Motor Co Ltd – Prf 47,804 0.03
244 Hyundai Steel Co 65,610 0.0567 Iljin Materials Co Ltd 59,321 0.04
780 Industrial Bank of Korea 52,690 0.04904 Kakao Corp 666,989 0.47
87 Kakao Games Corp 51,923 0.04276 Kakaobank Corp 106,797 0.08238 Kangwon Land Inc 37,540 0.03
1,131 KB Financial Group Inc 407,965 0.29753 KIA Corp (formerly known as KIA
Motors Corp) 405,943 0.29228 Korea Aerospace Industries 48,523 0.03774 Korea Electric Power Corp 112,184 0.08112 Korea Investment Holdings Co 59,277 0.04108 Korea Shipbuilding & Offshor 67,006 0.05
26 Korea Zinc Co Ltd 87,135 0.06528 Korean Air Lines Co Ltd 101,634 0.07
64 Krafton Inc 193,079 0.14315 KT&G Corp 163,206 0.12
54 Kumho Petrochemical Co Ltd 58,790 0.0465 L&F Co Ltd 94,808 0.07
132 LG Chem Ltd 532,411 0.3818 LG Chem Ltd – Preference 33,881 0.02
239 LG Corp 126,807 0.09785 LG Display Co Ltd 126,649 0.09312 LG Electronics Inc 282,379 0.20
5 LG Household & Health – Pref 20,200 0.0126 LG Household & Health Care 187,059 0.1329 LG Innotek Co Ltd 69,230 0.05
633 LG Uplus Corp 56,460 0.0453 Lotte Chemical Corp 75,428 0.0551 Lotte Shopping Co 29,167 0.02
917 Meritz Securities Co Ltd 30,972 0.02672 Mirae Asset Securities Co Ltd
(formerly known as Mirae Asset Daewoo Co Ltd) 38,123 0.03
357 Naver Corp 886,201 0.6346 Ncsoft Corp 193,984 0.1471 Netmarble Corp 58,206 0.04
325 NH Investment & Securities C 26,644 0.0259 Orion Corp/Republic of Korea 40,049 0.03
972 Pan Ocean Co Ltd 34,487 0.0294 Pearl Abyss Corp 85,261 0.06
217 POSCO 390,661 0.2882 POSCO Chemical Co Ltd 77,442 0.0550 S-1 Corporation 24,233 0.0248 Samsung Biologics Co Ltd 284,267 0.20
246 Samsung C&T Corp 191,991 0.14165 Samsung Electro-Mechanics Co 213,722 0.15
2,422 Samsung Electronics – Pref 1,130,973 0.8013,884 Samsung Electronics Co Ltd 7,129,751 5.05
453 Samsung Engineering Co Ltd 68,035 0.0591 Samsung Fire & Marine Ins 120,557 0.09
1,815 Samsung Heavy Industries 67,493 0.05204 Samsung Life Insurance Co Lt 85,760 0.06159 Samsung Sdi Co Ltd 683,025 0.48117 Samsung Sds Co Ltd 120,088 0.08129 Samsung Securities Co Ltd 37,987 0.03
NM0522U-2194143-106/163

106 iShares Asia Trust
iShares MSCI Emerging Asia ETF (continued)
Investment Portfolio (unaudited) as at 31st December 2021
HoldingsFair value
HK$
% ofNet
Assets
South Korea (16.16%) Continued105 SD Biosensor Inc 38,495 0.03
75 Seegene Inc 30,005 0.02116 Shin Poong Pharmaceutical Co 24,307 0.02
1,291 Shinhan Financial Group Ltd 311,582 0.2282 SK Biopharmaceuticals Co Ltd 52,273 0.0452 SK Bioscience Co Ltd 76,733 0.0537 SK Chemicals Co Ltd/New 36,156 0.03
1,584 SK Hynix Inc 1,360,895 0.9643 SK IE Technology Co Ltd 47,378 0.03
122 SK Inc (formerly known as SK Holdings Co Ltd) 200,831 0.14
153 SK Innovation Co Ltd 239,319 0.1751 SK Square Co Ltd 22,209 0.0278 SK Telecom 29,619 0.0260 SKC Co Ltd 68,666 0.05
139 S-Oil Corp 78,126 0.061,289 Woori Financial Group Inc 107,363 0.08
165 Yuhan Corp 67,201 0.05
22,791,512 16.16
Taiwan (19.95%)1,736 Accton Technology Corp 127,189 0.098,346 Acer Inc 71,613 0.05
970 Advantech Co Ltd 108,378 0.089,073 ASE Technology Holding Co Lt 272,287 0.196,601 Asia Cement Corp 82,402 0.06
66 Asmedia Technology Inc 33,849 0.022,251 Asustek Computer Inc 238,501 0.17
24,581 Au Optronics Corp 158,621 0.112,138 Catcher Technology Co Ltd 94,286 0.07
22,456 Cathay Financial Holding Co 395,493 0.284,004 Chailease Holding Co Ltd 297,304 0.21
14,458 Chang Hwa Commercial Bank 69,260 0.055,606 Cheng Shin Rubber Ind Co Ltd 57,028 0.044,414 China Development Fin – PFD 11,928 0.01
43,336 China Development Financial 213,704 0.1535,756 China Steel Corp 356,176 0.2510,933 Chunghwa Telecom Co Ltd 358,915 0.2512,097 Compal Electronics 82,494 0.0652,789 CTBC Financial Holding Co Lt 386,018 0.27
5,653 Delta Electronics Inc 438,065 0.3133,141 E.Sun Financial Holding Co 261,954 0.19
466 Eclat Textile Company Ltd 82,859 0.06200 Ememory Technology Inc 123,424 0.09
7,167 Evergreen Marine Corp Ltd 287,792 0.209,071 Far Eastern New Century Corp 74,894 0.055,019 Far Eastone Telecomm Co Ltd 91,364 0.061,358 Feng Tay Enterprise Co Ltd 88,589 0.06
32,154 First Financial Holding Co 221,987 0.1611,330 Formosa Chemicals & Fibre 257,969 0.18
2,899 Formosa Petrochemical Corp 78,342 0.0611,427 Formosa Plastics Corp 334,882 0.24
1,545 Foxconn Technology Co Ltd 28,255 0.0222,758 Fubon Financial Holding Co 489,311 0.35
612 Giant Manufacturing 59,497 0.04689 Globalwafers Co Ltd 172,409 0.12896 Hiwin Technologies Corp 77,387 0.06
36,452 Hon Hai Precision Industry 1,068,270 0.761,016 Hotai Motor Company Ltd 175,788 0.12
26,177 Hua Nan Financial Holdings C 156,380 0.1123,336 Innolux Corp 128,887 0.09
7,332 Inventec Corp 51,549 0.04304 Largan Precision Co Ltd 211,163 0.15
6,472 Lite-On Technology Corp 116,355 0.084,350 Mediatek Inc 1,458,689 1.03
31,896 Mega Financial Holding Co Ltd 319,523 0.231,832 Micro-Star International Co 82,857 0.06
HoldingsFair value
HK$
% ofNet
Assets
Taiwan (19.95%) Continued150 Momo.Com Inc 68,687 0.05
14,733 Nan Ya Plastics Corp 354,548 0.25550 Nan Ya Printed Circuit Board 88,651 0.06
2,896 Nanya Technology Corp 63,735 0.05488 Nien Made Enterprise Co Ltd 56,725 0.04
1,833 Novatek Microelectronics Cor 278,405 0.20576 Oneness Biotech Co Ltd 46,665 0.03200 Parade Technologies Ltd 119,197 0.08
5,648 Pegatron Corp 109,976 0.085,861 Pou Chen 54,750 0.041,866 President Chain Store Corp 143,812 0.107,683 Quanta Computer Inc 205,025 0.151,468 Realtek Semiconductor Corp 239,928 0.172,860 Ruentex Development Co Ltd 51,418 0.04
38,392 Shin Kong Financial Holding 119,545 0.0830,332 Sinopac Financial Holdings 138,039 0.10
4,608 Synnex Technology Intl Corp 85,960 0.0631,159 Taishin Financial Holding 166,387 0.1214,898 Taiwan Cement 201,510 0.1428,407 Taiwan Cooperative Financial 203,723 0.14
3,472 Taiwan High Speed Rail Corp 28,960 0.024,745 Taiwan Mobile Co Ltd 133,710 0.10
71,611 Taiwan Semiconductor Manufacturing 12,410,273 8.8010,582 The Shanghai Commercial & Sa 140,895 0.10
3,472 Unimicron Technology Corp 226,005 0.1614,350 Uni-President Enterprises Co 277,398 0.2034,184 United Microelectronics Corp 626,127 0.44
2,323 Vanguard International Semi 103,427 0.07200 Voltronic Power Technology 87,073 0.06
2,014 Wan Hai Lines Ltd 112,654 0.08799 Win Semiconductors Corp 84,319 0.06
8,689 Winbond Electronics Corp 83,248 0.067,754 Wistron Corp 63,693 0.05
165 Wiwynn Corp 51,842 0.043,496 WPG Holdings Ltd 51,818 0.041,071 Yageo Corporation 144,712 0.104,540 Yang Ming Marine Transport 154,799 0.11
29,090 Yuanta Financial Holding Co 207,391 0.15
28,138,917 19.95
Thailand (2.11%)3,546 Advanced Info Service – NVDR 190,346 0.13
12,140 Airports of Thailand Pc – NVDR 172,833 0.1228,104 Bangkok Dusit Medical Services –
NVDR 150,860 0.1126,055 Bangkok Expressway – NVDR 51,384 0.04
3,504 Berli Jucker Public Co – NVDR 25,351 0.0222,722 BTS Group Holdings PCL – NVDR 49,583 0.04
1,400 Bumrungrad Hospital PCL – NVDR 46,071 0.0316,999 C.P. All PCL – NVDR 234,074 0.17
977 Carabao Group PCL – NVDR 27,248 0.025,907 Central Pattana PCL – NVDR 77,892 0.066,405 Central Retail Corp PCL – NVDR 47,835 0.03
11,051 Charoen Pokphand Foods – NVDR 65,769 0.05983 Delta Electronics Thai – NVDR 94,521 0.07
1,100 Electricity Genera PCL – NVDR 45,055 0.034,495 Energy Absolute PCL – NVDR 100,711 0.072,017 Global Power Synergy – NVDR 41,778 0.038,698 Gulf Energy Development – NVDR 92,873 0.07
17,168 Home Product Center PCL – NVDR 58,098 0.045,079 Indorama Ventures PCL – NVDR 51,267 0.042,514 Intouch Holdings PCL – NVDR 47,085 0.032,381 Krungthai Card PCL – NVDR 32,925 0.02
25,100 Land & Houses Pub – NVDR 51,551 0.049,092 Minor International PCL – NVDR 61,006 0.042,323 Muangthai Capital PCL – NVDR 31,852 0.023,362 Osotspa PCL – NVDR 26,874 0.02
NM0522U-2194143-107/163

Reports and Financial Statements 107
iShares MSCI Emerging Asia ETF (continued)
Investment Portfolio (unaudited) as at 31st December 2021
HoldingsFair value
HK$
% ofNet
Assets
Thailand (2.11%) Continued3,840 PTT Explor & Prod PCL – NVDR 105,752 0.076,783 PTT Global Chemical PCL – NVDR 93,005 0.07
10,045 PTT Oil & Retail Busine – NVDR 63,298 0.0430,048 PTT PCL – NVDR 266,487 0.19
3,936 Ratch Group PCL – NVDR 41,338 0.033,850 SGC Packaging PCL – NVDR 62,224 0.042,375 Siam Cement PCL – NVDR 213,958 0.152,842 Siam Commercial Bank P – NVDR 84,237 0.062,688 Sri Trang Gloves Thaila – NVDR 18,977 0.012,381 Srisawad Corp PCL – NVDR 34,314 0.023,068 Thai Oil PCL – NVDR 35,444 0.039,596 Thai Union Group PCL – NVDR 43,672 0.03
33,900 True Corp PCL – NVDR 37,819 0.03
2,975,367 2.11
United States (0.03%)105 Legend Biotech Corp – ADR 38,155 0.03
38,155 0.03
Total listed equities 118,492,074 84.02
Exchange traded funds (15.82%)
Ireland (15.82%)364,560 iShares MSCI India UCITS ETF 22,317,105 15.82
Total exchange traded fund 22,317,105 15.82
Unlisted equity (0.00%)
China (0.00%)7,579 China Huishan Dairy Holdings ∆ 0 0.00
Total unlisted equity 0 0.00
Unlisted rights (0.00%)
China (0.00%)331 Seazen Group Ltd – Rights ∆ 0 0.00
0 0.00
South Korea (0.00%)114 Doosan Heavy Industries – Rights 3,290 0.00
3,290 0.00
Total unlisted equity 3,290 0.00
Total investments 140,812,469 99.84Other net assets 229,853 0.16
Net assets attributable to
unitholders at 31st December 2021 141,042,322 100.00
Total investments, at cost 114,593,279
∆ Amount is less than HK$1.
NM0522U-2194143-108/163

108 iShares Asia Trust
iShares MSCI Emerging Asia ETF Details in Respect of Financial Derivative Instruments (unaudited) as at 31st December 2021
Listed rights
Underlying assets IssuerFair value
HK$Description
Financial assets:Doosan Heavy Industries – Rights Doosan Heavy Industries Doosan Heavy Industries 3,290Seazen Group Ltd – Rights Seazen Group Ltd Seazen Group Ltd 0∆
3,290
The financial derivative instruments held by the Sub-Fund as at 31st December 2021 are summarized below:
∆ Amount is less than HK$1.
NM0522U-2194143-109/163

Reports and Financial Statements 109
2021% of net asset
value
Lowest gross exposure 0.00%
Highest gross exposure 0.68%
Average gross exposure 0.25%
The lowest, highest and average net exposure arising from the use of financial derivative instruments for investment purpose as a proportion to the Sub-Fund’s total net asset value for the year ended 31st December 2021 as shown below:
2021% of net asset
value
Lowest net exposure 0.00%
Highest net exposure 0.68%
Average net exposure 0.25%
The lowest, highest and average gross exposure arising from the use of financial derivative instruments for any purpose as a proportion to the Sub-Fund’s total net asset value for the year ended 31st December 2021 as shown below:
iShares MSCI Emerging Asia ETF Information on Exposure Arising from Financial Derivative Instruments (unaudited) for the year ended 31st December 2021
NM0522U-2194143-110/163

110 iShares Asia Trust
iShares MSCI Emerging Asia ETF Statement of Movements in Investment Portfolio (unaudited) for the year ended 31st December 2021
% of net asset value
2021
% of net asset value
2020
Financial assets at fair value through profit or lossListed equitiesAustralia 0.01 –Cayman Islands 0.04 0.04China 40.82 48.92Hong Kong 0.37 –Indonesia 1.84 1.64Malaysia 1.75 1.94Philippines 0.87 0.91Singapore 0.07 0.03South Korea 16.16 16.82Taiwan 19.95 15.69Thailand 2.11 2.25United States 0.03 –
84.02 88.24 Listed rightsSouth Korea – 0.00
– 0.00 Exchange traded fundsIreland 15.82 11.57
15.82 11.57 Unlisted equityChina 0.00 0.00
0.00 0.00 Unlisted rightsChina 0.00 –South Korea 0.00 –
0.00 – Total investments 99.84 99.81Other net assets 0.16 0.19 Net assets attributable to unitholders as 31st December 100.00 100.00
NM0522U-2194143-111/163

Reports and Financial Statements 111
Net Asset Value
DealingNet asset value
per unitHK$
DealingNet asset value
of the Sub-FundHK$
At end of financial period dated31st December 2019 54.98 208,918,34731st December 2020 68.81 261,466,13631st December 2021 64.11 141,040,162
Highest and lowest net asset value per unit
Highest net assetvalue per unit
HK$
Lowest net assetvalue per unit
HK$
Financial period ended31st December 2012 43.99 36.3031st December 2013 44.41 37.5631st December 2014 48.00 39.3331st December 2015 50.31 36.6031st December 2016 44.18 33.7031st December 2017 57.77 40.0231st December 2018 61.74 45.8431st December 2019 55.35 45.6931st December 2020 68.81 39.9831st December 2021 78.59 61.81
iShares MSCI Emerging Asia ETF Performance Record (unaudited)
NM0522U-2194143-112/163

112 iShares Asia Trust
iShares Core CSI 300 ETF Investment Portfolio (unaudited) as at 31st December 2021
HoldingsFair value
RMB
% ofNet
Assets
Investments (99.90%)
Listed equities (99.90%)
China (99.90%)46,500 360 Security Technology In – A 591,480 0.16
4,200 Advanced Micro-Fabrication – A 531,720 0.1521,100 AECC Aviation Power Co – A 1,339,006 0.37
571,500 Agricultural Bank of China – A 1,680,210 0.4644,006 Aier Eye Hospital Group Co – A 1,860,574 0.5148,600 Air China Ltd – A 443,718 0.12
127,300 Aluminum Corp of China Ltd – A 775,257 0.2140,100 Anhui Conch Cement Co Ltd – A 1,616,030 0.45
2,000 Anhui Gujing Distillery Co – A 488,000 0.132,900 Anker Innovations Technolo – A 297,250 0.082,400 Asymchem Laboratories Tian – A 1,044,000 0.294,310 Autobio Diagnostics Co Ltd – A 237,309 0.07
11,690 Avary Holding Shenzhen Co – A 496,007 0.149,403 Avic Jonhon Optronic Tech – A 945,566 0.26
10,140 Avic Shenyang Aircraft Co – A 689,926 0.1923,500 Avic Xi’An Aircraft Indust – A 857,750 0.24
240,840 Bank of Beijing Co Ltd – A 1,069,330 0.3033,600 Bank of Chengdu Co Ltd – A 403,200 0.11
343,000 Bank of China Ltd – A 1,046,150 0.29447,100 Bank of Communications Co – A 2,061,131 0.57
48,240 Bank of Hangzhou Co Ltd – A 618,437 0.17192,240 Bank of Jiangsu Co Ltd – A 1,120,759 0.31
81,460 Bank of Nanjing Co Ltd – A 729,882 0.2064,518 Bank of Ningbo Co Ltd – A 2,469,749 0.68
161,874 Bank of Shanghai Co Ltd – A 1,154,162 0.32144,916 Baoshan Iron & Steel Co – A 1,037,599 0.29
3,124 Beijing Kingsoft office So – A 827,860 0.2316,501 Beijing New Building Mater – A 591,231 0.1630,150 Beijing Oriental Yuhong – A 1,588,302 0.44
400 Beijing Roborock Technolog – A 325,200 0.0911,200 Beijing Tiantan Biological – A 324,352 0.0911,206 Beijing Tongrentang Co – A 504,046 0.14
2,040 Beijing Wantai Biological – A 451,860 0.12311,900 Beijing-Shanghai High Spe – A 1,506,477 0.42
3,900 Betta Pharmaceuticals Co L – A 311,337 0.094,100 BGI Genomics Co Ltd – A 359,980 0.101,584 Bloomage Biotechnology Cor – A 245,995 0.07
22,600 BOC International China Co – A 303,970 0.08488,100 BOE Technology Group Co Lt – A 2,464,905 0.68
14,700 BYD Co Ltd – A 3,941,364 1.0940,800 Caitong Securities Co Ltd – A 453,696 0.13
179,800 CGN Power Co Ltd – A 562,774 0.165,300 Changchun High & New Tech – A 1,438,420 0.40
63,000 Changjiang Securities Co L – A 475,020 0.132,400 Changzhou Xingyu Automotiv – A 490,200 0.14
18,700 Chaozhou Three-Circle Grou – A 834,020 0.2349,800 China Citic Bank Corp Ltd – A 230,076 0.0629,800 China Coal Energy Co – A 187,442 0.0563,000 China Communications Const – A 540,540 0.15
109,300 China Construction Bank – A 640,498 0.1829,100 China CSSC Holdings Ltd – A 721,389 0.2089,200 China Eastern Airlines Co – A 460,272 0.13
211,100 China Energy Engineering Cor 576,303 0.16269,200 China Everbright Bank Co – A 893,744 0.25
19,700 China Galaxy Securities Co – A 220,443 0.0628,700 China Greatwall Technology – A 406,392 0.11
5,400 China International Captal – A 264,762 0.0739,118 China Jushi Co Ltd – A 711,948 0.2027,100 China Life Insurance Co – A 815,439 0.23
201,400 China Merchants Bank – A 9,810,194 2.7160,410 China Merchants Securities – A 1,066,237 0.2951,613 China Merchants Shekou Ind – A 688,517 0.19
404,020 China Minsheng Banking – A 1,575,678 0.44115,000 China Molybdenum Co Ltd – A 641,700 0.18
HoldingsFair value
RMB
% ofNet
Assets
China (99.90%) Continued113,700 China National Nuclear Pow – A 943,710 0.26
35,500 China Northern Rare Earth – A 1,625,900 0.459,500 China Oilfield Services – A 142,500 0.04
55,700 China Pacific Insurance Gr – A 1,510,584 0.42217,800 China Petroleum & Chemical – A 921,294 0.25
80,600 China Railway Construction – A 628,680 0.17165,700 China Railway Group Ltd – A 959,403 0.27
38,551 China Railway Signal & Com – A 191,984 0.054,236 China Resources Microelect – A 273,646 0.089,100 China Satellite Communicat – A 130,949 0.04
55,500 China Shenhua Energy Co – A 1,249,860 0.35194,300 China Shipbuilding Industry
Co Ltd – A 819,946 0.2382,500 China Southern Airlines Co – A 561,825 0.16
341,320 China State Construction – A 1,706,600 0.4784,300 China Telecom Corp Ltd-DM – A 365,019 0.10
134,200 China Three Gorges Renewab – A 1,007,842 0.2815,800 China Tourism Group Duty F – A 3,466,678 0.96
312,200 China United Network – A 1,226,946 0.34110,818 China Vanke Co Ltd – A 2,189,764 0.61186,882 China Yangtze Power Co Ltd – A 4,242,221 1.17136,000 China Zheshang Bank Co Ltd – A 476,000 0.13
3,900 Chongqing Brewery Co – A 590,148 0.1663,412 Chongqing Changan Automob – A 963,228 0.2713,000 Chongqing Zhifei Biologica – A 1,619,800 0.4516,200 Citi Pacific Special Stee – A 331,776 0.09
138,600 Citic Securities Co – A 3,660,426 1.0122,800 Contemporary Amperex Techn – A 13,406,400 3.71
102,990 Cosco Shipping Holdings Co – A 1,924,883 0.53204,000 CRRC Corp Ltd – A 1,242,360 0.34
21,100 CSC Financial Co Ltd – A 617,175 0.1796,800 Daqin Railway Co Ltd – A 619,520 0.17
5,300 Dashenlin Pharmaceutical G – A 223,183 0.0618,260 Dawning Information Indust – A 503,428 0.14
135,666 East Money Information Co – A 5,034,565 1.39900 Eastroc Beverage Group Co – A 163,656 0.05
3,800 Ecovacs Robotics Co Ltd – A 573,610 0.1618,400 EVE Energy Co Ltd – A 2,174,512 0.6030,400 Everbright Securitie Co – A 453,872 0.1313,500 Faw Jiefang Group Co Ltd 138,915 0.04
8,300 Flat Glass Group Co Ltd – A 480,902 0.13164,376 Focus Media Information Te – A 1,346,239 0.37
20,600 Foshan Haitian Flavouring – A 2,165,266 0.6067,000 Founder Securities Co Ltd – A 525,280 0.1564,700 Foxconn Industrial Interne – A 771,224 0.2123,300 Fuyao Glass Industry Group – A 1,098,362 0.30
3,100 Gan & Lee Pharmaceuticals – A 218,054 0.0612,903 Ganfeng Lithium Co Ltd – A 1,843,194 0.51
157,600 GD Power Development Co – A 499,592 0.1436,700 Gemdale Corp – A 475,999 0.1348,200 GF Securities Co Ltd – A 1,185,238 0.33
8,504 Gigadevice Semiconductor B – A 1,495,428 0.4116,100 Glodon Co Ltd – A 1,030,078 0.2838,900 Goertek Inc – A 2,104,490 0.58
1,400 Gongniu Group Co Ltd – A 234,220 0.0620,200 Great Wall Motor Co Ltd – A 980,508 0.2776,800 Gree Electric Appliances I – A 2,843,904 0.7957,350 Greenland Holdings Corp Lt – A 248,899 0.0713,500 Guangdong Haid Group Co – A 989,550 0.27
2,100 Guangdong Kinlong Hardware – A 381,339 0.1135,460 Guangzhou Automobile Group – A 538,637 0.1511,400 Guangzhou Baiyunshan Phar – A 389,880 0.11
4,400 Guangzhou Kingmed Diagnost – A 490,028 0.145,500 Guangzhou Shiyuan Electron – A 447,700 0.129,300 Guangzhou Tinci Materials – A 1,066,245 0.29
46,900 Guosen Securities Co Ltd – A 538,412 0.1573,400 Guotai Junan Securities Co – A 1,313,126 0.3661,700 Haier Smart Home Co Ltd – A 1,844,213 0.51
NM0522U-2194143-113/163

Reports and Financial Statements 113
iShares Core CSI 300 ETF (continued)
Investment Portfolio (unaudited) as at 31st December 2021
HoldingsFair value
RMB
% ofNet
Assets
China (99.90%) Continued157,100 Haitong Securities Co Ltd – A 1,926,046 0.53
6,000 Hangzhou First Applied Mat – A 783,300 0.2276,700 Hangzhou Hikvision Digital – A 4,012,944 1.11
8,700 Hangzhou Tigermed Consulti – A 1,111,860 0.3113,700 Han’s Laser Technology In – A 739,800 0.2028,200 Henan Shuanghui Investment – A 889,710 0.2534,340 Hengli Petrochemical Co L – A 788,790 0.2235,750 Hengyi Petrochemical Co – A 379,665 0.10
3,500 Hithink Royalflush Informa – A 506,030 0.1415,010 Hongta Securities Co Ltd – A 178,919 0.05
2,600 Hoshine Silicon Industry C – A 343,122 0.0914,240 Huadong Medicine Co Ltd – A 572,448 0.1622,600 Huafon Chemical Co Ltd – A 235,944 0.0717,600 Hualan Biological Engineer – A 512,864 0.1434,800 Huaneng Lancang River Hydr – A 229,332 0.0670,500 Huaneng Power Intl Inc – A 683,145 0.1983,800 Huatai Securities Co Ltd – A 1,488,288 0.41
100,120 Huaxia Bank Co Ltd – A 560,672 0.1526,100 Huayu Automotive Systems – A 738,630 0.2015,800 Humanwell Healthcare Group – A 355,816 0.1019,032 Hundsun Technologies Inc – A 1,182,839 0.3329,950 Iflytek Co Ltd – A 1,572,674 0.43
1,500 Imeik Technology Developme – A 804,165 0.22570,500 Ind & Comm Bk of China – A 2,641,415 0.73238,700 Industrial Bank Co Ltd – A 4,544,848 1.26
87,200 Industrial Securities Co – A 861,536 0.24370,680 Inner Mongolia Baotou Ste – A 1,034,197 0.29
52,400 Inner Mongolia Junzheng En – A 274,052 0.0883,400 Inner Mongolia Yili Indus – A 3,457,764 0.9616,600 Inspur Electronic Informat – A 594,778 0.16
5,850 Intco Medical Technology C – A 338,364 0.0910,000 JA Solar Technology Co Ltd – A 927,000 0.26
8,500 Jafron Biomedical Co Ltd – A 453,050 0.1320,300 JCET Group Co Ltd – A 629,706 0.1723,600 Jiangsu Eastern Shenghong – A 456,424 0.13
8,476 Jiangsu Hengli Hydraulic C – A 693,337 0.1972,181 Jiangsu Hengrui Medicine C – A 3,660,299 1.0110,216 Jiangsu King’s Luck Brewer – A 555,750 0.15
9,800 Jiangsu Yanghe Brewery – A 1,614,354 0.4516,500 Jiangxi Copper Co Ltd – A 368,445 0.1022,900 Jiangxi Zhengbang Tech – A 221,214 0.06
9,100 Jonjee High-Tech Industria – A 345,527 0.106,000 Juewei Food Co Ltd – A 409,980 0.11
29,200 Kingfa Sci.& Tech Co Ltd – A 367,336 0.1010,200 Kweichow Moutai Co Ltd – A 20,910,000 5.7819,400 LB Group Co Ltd – A (formerly known
as Lomon Billions Group Co – A) 554,646 0.1532,399 Lens Technology Co Ltd – A 744,529 0.2120,300 Lepu Medical Technology – A 459,389 0.1346,000 Lingyi Itech Guangdong Co – A 338,560 0.0970,120 Longi Green Energy Technol – A 6,044,344 1.6781,068 Luxshare Precision Industr – A 3,988,546 1.1011,800 Luzhou Laojiao Co Ltd – A 2,995,666 0.8311,940 Mango Excellent Media Co L – A 683,207 0.19
3,700 Maxscend Microelectronics – A 1,209,160 0.3341,404 Meinian Onehealth Healthca – A 325,021 0.09
116,200 Metallurgical Corp of Chin – A 445,046 0.1280,300 Midea Group Co Ltd – A 5,926,943 1.64
7,403 Montage Technology Co Ltd – A 620,890 0.1742,774 Muyuan Foodstuff Co Ltd – A 2,282,421 0.6338,600 Nanjing Securities Co Ltd – A 382,526 0.1144,360 Nari Technology Co Ltd – A 1,775,731 0.4912,172 National Silicon Industry – A 314,281 0.09
4,300 Naura Technology Group Co – A 1,492,186 0.4113,400 New China Life Insurance C – A 520,992 0.1436,700 New Hope Liuhe Co Ltd – A 558,207 0.1534,900 Ningxia Baofeng Energy Gro – A 605,864 0.1728,500 Offcn Education Technology – A 224,010 0.06
HoldingsFair value
RMB
% ofNet
Assets
China (99.90%) Continued2,978 Oppein Home Group Inc – A 439,255 0.12
68,000 Orient Securities Co Ltd – A 1,002,320 0.288,300 Ovctek China Inc – A 476,171 0.13
19,100 Perfect World Co Ltd – A 387,921 0.11158,100 Petrochina Co Ltd – A 776,271 0.21
4,100 Pharmaron Beijing Co Ltd – A 579,207 0.1644,000 PICC Holding Co – A 206,800 0.06
157,930 Ping An Bank Co Ltd – A 2,602,686 0.72177,100 Ping An Insurance Group Co – A 8,927,611 2.47116,900 Poly Developments and Hold – A 1,827,147 0.51177,000 Postal Savings Bank of Chi – A 902,700 0.25124,500 Power Construction Corp of – A 1,005,960 0.28
4,440 Qi An Xin Technology Group – A 390,365 0.1149,450 Rongsheng Petrochemical Co – A 898,012 0.2531,900 S F Holding Co Ltd – A 2,198,548 0.6174,400 Saic Motor Corp Ltd – A 1,534,872 0.4296,800 Sany Heavy Industry Co Ltd – A 2,207,040 0.6141,796 Sdic Capital Co Ltd – A 343,563 0.1050,700 Sdic Power Holdings Co Ltd – A 581,529 0.1613,800 Seazen Holdings Co Ltd – A 401,994 0.1132,204 Semiconductor Manufacturin – A 1,706,490 0.4763,100 Shaanxi Coal Industry Co L – A 769,820 0.2129,376 Shandong Gold Mining Co Lt – A 552,856 0.1524,100 Shandong Hualu Hengsheng – A 754,330 0.2111,200 Shandong Linglong Tyre Co – A 409,360 0.11
6,700 Shanghai Bairun Investment – A 400,861 0.115,520 Shanghai Baosight Software – A 335,782 0.09
19,693 Shanghai Fosun Pharmaceuti – A 963,775 0.2715,634 Shanghai International Air – A 729,951 0.2051,600 Shanghai International Por – A 282,768 0.0815,480 Shanghai Lingang Holdings – A 230,188 0.06
6,100 Shanghai M&G Stationery In – A 393,511 0.1117,500 Shanghai Pharmaceuticals – A 347,725 0.10
191,082 Shanghai Pudong Devel Bank – A 1,629,929 0.455,500 Shanghai Putailai New Ener – A 883,355 0.24
66,200 Shanghai RAAS Blood Produc – A 451,484 0.1225,300 Shanghai Yuyuan Tourist Ma – A 260,590 0.07
8,020 Shanxi Xinghuacun Fen Wine – A 2,532,556 0.7018,800 Shengyi Technology Co Ltd – A 442,740 0.12
3,200 Shennan Circuits Co Ltd – A 389,824 0.11183,400 Shenwan Hongyuan Group Co – A 939,008 0.26
3,700 Shenzhen Goodix Technology – A 398,749 0.1129,900 Shenzhen Inovance Technolo – A 2,051,140 0.57
6,700 Shenzhen Kangtai Biologica – A 660,218 0.187,900 Shenzhen Mindray Bio-Medic – A 3,008,320 0.83
65,500 Shenzhen Overseas Chinese – A 461,120 0.133,858 Shenzhen Transsion Holding – A 605,320 0.17
39,400 Sinolink Securities Co Ltd – A 446,402 0.1224,111 Songcheng Performance Deve – A 345,270 0.10
5,700 Spring Airlines Co Ltd – A 323,760 0.0917,200 Sungrow Power Supply Co Lt – A 2,507,760 0.6959,520 Suning.Com Co Ltd – A 245,222 0.07
232,200 TCL Technology Group Corp – A 1,432,674 0.4067,910 Tianfeng Securities Co Ltd – A 275,035 0.0836,800 Tianjin Zhonghuan Semicond – A 1,536,400 0.4216,800 Tianqi Lithium Corp – A 1,797,600 0.5044,000 Tongwei Co Ltd – A 1,978,240 0.55
3,700 Topchoice Medical Corporat – A 736,300 0.2013,440 Trina Solar Co Ltd – A 1,060,416 0.29
5,900 Tsingtao Brewery Co Ltd – A 584,100 0.166,900 Unigroup Guoxin Microelect – A 1,552,500 0.43
23,227 Unisplendour Corp Ltd – A 530,737 0.1510,700 Universal Scientific Indus – A 171,842 0.0525,500 Walvax Biotechnology Co – A 1,433,100 0.4025,980 Wanhua Chemical Group Co – A 2,623,980 0.7375,235 Weichai Power Co Ltd – A 1,345,954 0.3772,398 Wens Foodstuffs Group Co – A 1,394,385 0.39
8,400 Will Semiconductor Co Ltd – A 2,610,468 0.72
NM0522U-2194143-114/163

114 iShares Asia Trust
iShares Core CSI 300 ETF (continued)
Investment Portfolio (unaudited) as at 31st December 2021
HoldingsFair value
RMB
% ofNet
Assets
China (99.90%) Continued12,400 Wingtech Technology Co Ltd – A 1,603,320 0.44
1,400 Winner Medical Co Ltd – A 115,430 0.0315,320 Wuhan Guide Infrared Co Lt – A 370,897 0.1021,700 Wuhu Sanqi Interactive Ent – A 586,334 0.1631,578 Wuliangye Yibin Co Ltd – A 7,031,157 1.9433,619 Wuxi Apptec Co Ltd – A 3,986,541 1.1017,800 Wuxi Lead Intelligent Equi – A 1,323,786 0.3786,900 XCMG Construction Machin – A 520,531 0.1442,974 Xinjiang Goldwind Sci&Tech – A 707,782 0.20
5,900 Yealink Network Technology – A 480,555 0.135,800 Yifeng Pharmacy Chain Co L – A 319,638 0.097,100 Yihai Kerry Arawana Holdin – A 446,803 0.12
57,000 Yonghui Superstores Co Ltd – A 230,850 0.0626,591 Yonyou Network Technology – A 954,085 0.2618,856 Yunda Holding Co Ltd – A 385,794 0.11
8,300 Yunnan Baiyao Group Co Ltd – A 868,595 0.248,700 Yunnan Energy New Material – A 2,178,480 0.604,900 Zhangzhou Pientzehuang Pha – A 2,142,035 0.59
72,596 Zhejiang Century Huatong – A 609,080 0.1717,500 Zhejiang Chint Electrics – A 943,075 0.2629,252 Zhejiang Dahua Technology – A 686,837 0.19
3,700 Zhejiang Dingli Machinery – A 296,962 0.0815,813 Zhejiang Huayou Cobalt Co – A 1,744,332 0.4810,500 Zhejiang Jingsheng Mechani – A 729,750 0.2042,400 Zhejiang Longsheng Group C – A 535,512 0.1525,160 Zhejiang Nhu Co Ltd – A 782,979 0.2229,230 Zhejiang Sanhua Intelligen – A 739,519 0.20
2,600 Zhejiang Supor Co Ltd – A 161,824 0.0425,100 Zheshang Securities Co Ltd – A 330,818 0.0947,300 Zhongjin Gold Corp – A 389,279 0.1145,400 Zhongtai Securities Co Ltd – A 452,638 0.13
234,579 Zijin Mining Group Co Ltd – A 2,275,416 0.6380,800 Zoomlion Heavy Industry S – A 579,336 0.1651,700 ZTE Corp – A 1,731,950 0.48
Total investments 361,389,951 99.90Other net assets 363,116 0.10
Net assets attributable to unitholders
at 31st December 2021 361,753,067 100.00
Total investments, at cost 340,329,750
NM0522U-2194143-115/163

Reports and Financial Statements 115
iShares Core CSI 300 ETF Statement of Movements in Investment Portfolio (unaudited) for the year ended 31st December 2021
% of net asset value
2021
% of net asset value
2020
Financial assets at fair value through profit or lossListed equitiesCommunication Services 1.48 1.80Consumer Discretionary 8.13 9.95Consumer Staples 14.86 16.30Energy 1.11 1.13Financials 21.05 26.43Health Care 9.59 9.47Industrials 14.72 10.47Information Technology 16.20 13.62Materials 8.66 6.26Real Estate 1.68 2.87Utilities 2.42 1.67 Total investments 99.90 99.97Other net assets 0.10 0.03 Net assets attributable to unitholders at 31st December 100.00 100.00
NM0522U-2194143-116/163

116 iShares Asia Trust
iShares Core CSI 300 ETF Performance Record (unaudited)
Net Asset Value
DealingNet asset value
per unitRMB
DealingNet asset value
of the Sub-FundRMB
At end of financial period dated31st December 2019 26.54 205,678,86731st December 2020 33.82 245,207,86831st December 2021 32.16 361,753,067
Highest and lowest net asset value per unit
Highest net assetvalue per unit
Lowest net assetvalue per unit
Financial period ended31st December 2012 HK$25.01 HK$18.6631st December 2013 HK$23.86 HK$18.8731st December 2014 HK$29.59 HK$17.7131st December 2015 HK$44.41 HK$23.9631st December 2016 HK$27.54 HK$21.9731st December 2017 HK$32.69 HK$24.2231st December 2018* RMB28.50 RMB19.3831st December 2019 RMB26.54 RMB19.2131st December 2020 RMB33.82 RMB22.8531st December 2021 RMB37.68 RMB31.12
* For iShares Core CSI 300 ETF, the base currency was changed from Hong Kong dollar (“HK$”) to Renminbi (“RMB”), effective from 1st January 2018.
NM0522U-2194143-117/163

Reports and Financial Statements 117
iShares Core MSCI Taiwan ETF Investment Portfolio (unaudited) as at 31st December 2021
HoldingsFair value
US$
% ofNet
Assets
Investments (99.77%)
Listed equities (99.77%)
Cayman Islands (0.23%)50,199 Zhen Ding Technology Holding 182,347 0.23
182,347 0.23
China (1.88%)
10,499 Airtac International Group 387,067 0.496,072 Silergy Corp 1,102,823 1.39
1,489,890 1.88
Taiwan (97.66%)
38,492 Accton Technology Corp 361,728 0.46217,925 Acer Inc 239,846 0.30
29,389 Advantech Co Ltd 421,178 0.53249,783 ASE Technology Holding Co Lt 961,502 1.21166,065 Asia Cement Corp 265,901 0.34
2,036 ASMedia Technology Inc 133,933 0.1753,575 Asustek Computer Inc 728,095 0.92
622,599 Au Optronics Corp 515,326 0.6551,915 Catcher Technology Co Ltd 293,660 0.37
600,913 Cathay Financial Holding Co 1,357,468 1.7199,034 Chailease Holding Co Ltd 943,198 1.19
316,584 Chang Hwa Commercial Bank 194,525 0.25139,666 Cheng Shin Rubber Ind Co Ltd 182,237 0.23
1,166,867 China Development Financial 738,070 0.93897,018 China Steel Corp 1,146,116 1.45288,813 Chunghwa Telecom Co Ltd 1,216,132 1.54324,658 Compal Electronics 283,974 0.36
1,409,058 CTBC Financial Holding Co Lt 1,321,613 1.67147,911 Delta Electronics Inc 1,470,182 1.86913,731 E.Sun Financial Holding Co 926,380 1.17
14,568 Eclat Textile Company Ltd 332,252 0.424,902 Ememory Technology Inc 388,021 0.49
194,114 Evergreen Marine Corp Ltd 999,792 1.26223,386 Far Eastern New Century Corp 236,571 0.30120,964 Far Eastone Telecomm Co Ltd 282,440 0.36
33,320 Feng Tay Enterprise Co Ltd 278,801 0.35788,500 First Financial Holding Co 698,242 0.88267,573 Formosa Chemicals & Fibre 781,433 0.99
86,379 Formosa Petrochemical Corp 299,409 0.38290,745 Formosa Plastics Corp 1,092,908 1.38
72,046 Foxconn Technology Co Ltd 169,002 0.21575,542 Fubon Financial Holding Co 1,587,229 2.00
22,860 Giant Manufacturing 285,058 0.3616,736 Globalwafers Co Ltd 537,159 0.6820,662 Hiwin Technologies Corp 228,897 0.29
948,904 Hon Hai Precision Industry 3,566,921 4.5122,946 Hotai Motor Company Ltd 509,229 0.64
659,052 Hua Nan Financial Holdings C 505,002 0.64719,107 Innolux Corp 509,433 0.64205,842 Inventec Corp 185,628 0.23
7,696 Largan Precision Co Ltd 685,677 0.87160,590 Lite-On Technology Corp 370,320 0.47115,069 Mediatek Inc 4,949,294 6.25827,574 Mega Financial Holding Co Lt 1,063,370 1.34
51,110 Micro-Star International Co 296,496 0.373,556 Momo.Com Inc 208,859 0.26
392,054 Nan Ya Plastics Corp 1,210,157 1.5317,441 Nan Ya Printed Circuit Board 360,583 0.4694,387 Nanya Technology Corp 266,441 0.3412,543 Nien Made Enterprise Co Ltd 187,009 0.2443,905 Novatek Microelectronics Cor 855,344 1.0817,571 Oneness Biotech Co Ltd 182,588 0.23
5,766 Parade Technologies Ltd 440,781 0.56
HoldingsFair value
US$
% ofNet
Assets
Taiwan (97.66%) Continued152,863 Pegatron Corp 381,784 0.48177,838 Pou Chen 213,082 0.27
43,304 President Chain Store Corp 428,078 0.54207,071 Quanta Computer Inc 708,773 0.90
35,005 Realtek Semiconductor Corp 733,831 0.9386,589 Ruentex Development Co Ltd 199,674 0.25
909,224 Shin Kong Financial Holding 363,137 0.46776,159 Sinopac Financial Holdings 453,066 0.57103,015 Synnex Technology Intl Corp 246,488 0.31778,505 Taishin Financial Holding 533,223 0.67395,463 Taiwan Cement 686,096 0.87723,057 Taiwan Cooperative Financial 665,117 0.84154,821 Taiwan High Speed Rail Corp 165,638 0.21125,680 Taiwan Mobile Co Ltd 454,260 0.57
1,099,326 Taiwan Semiconductor Manufacturing 24,436,530 30.87272,543 The Shanghai Commercial & Sa 465,452 0.59
92,187 Unimicron Technology Corp 769,697 0.97367,096 Uni-President Enterprises Co 910,210 1.15897,274 United Microelectronics Corp 2,108,028 2.66
68,521 Vanguard International Semi 391,308 0.494,614 Voltronic Power Technology 257,658 0.33
47,046 Wan Hai Lines Ltd 337,537 0.4325,658 Win Semiconductors Corp 347,306 0.44
227,409 Winbond Electronics Corp 279,463 0.35211,196 Wistron Corp 222,516 0.28
6,103 Wiwynn Corp 245,955 0.31120,274 WPG Holdings Ltd 228,663 0.29
33,372 Yageo Corporation 578,374 0.73132,384 Yang Ming Marine Transport 578,974 0.73737,983 Yuanta Financial Holding Co 674,846 0.85
77,316,174 97.66
Total listed equity 78,988,411 99.77
Futures (0.00%)
Taiwan (0.00%)2 MSCI Taiwan Index Futures Jan 2022 740 0.00
Total futures 740 0.00
Total investments 78,989,151 99.77Other net assets 179,305 0.23
Net assets attributable to
unitholders at 31st December 2021 79,168,456 100.00
Total investments, at cost 47,108,603
NM0522U-2194143-118/163

118 iShares Asia Trust
iShares Core MSCI Taiwan ETF Details in Respect of Financial Derivative Instruments (unaudited) as at 31st December 2021
Futures
Underlying assets CounterpartyFair value
US$Description
Financial assets:MSCI Taiwan Index Futures Jan 2022 MSCI Taiwan Index Credit Suisse International 740
740
The financial derivative instruments held by the Sub-Fund as at 31st December 2021 are summarized below:
NM0522U-2194143-119/163

Reports and Financial Statements 119
2021% of net asset
value
Lowest gross exposure 0.00%
Highest gross exposure 1.58%
Average gross exposure 0.34%
The lowest, highest and average net exposure arising from the use of financial derivative instruments for investment purpose as a proportion to the Sub-Fund’s total net asset value for the year ended 31st December 2021 as shown below:
2021% of net asset
value
Lowest net exposure 0.00%
Highest net exposure 1.58%
Average net exposure 0.34%
The lowest, highest and average gross exposure arising from the use of financial derivative instruments for any purpose as a proportion to the Sub-Fund’s total net asset value for the year ended 31st December 2021 as shown below:
iShares Core MSCI Taiwan ETF Information on Exposure Arising from Financial Derivative Instruments (unaudited) for the year ended 31st December 2021
NM0522U-2194143-120/163

120 iShares Asia Trust
% of net asset value
2021
% of net asset value
2020
Financial assets at fair value through profit or lossListed equitiesCommunication Services 2.47 3.04Consumer Discretionary 2.77 2.88Consumer Staples 1.69 2.28Energy 0.38 0.52Financials 15.76 15.26Health Care 0.23 0.21Industrials 4.04 2.06Information Technology 65.62 65.92Materials 6.56 7.37Real Estate 0.25 0.31
99.77 99.85 Futures MSCI Taiwan Index Futures 0.00 0.00 0.00 0.00 Total investments 99.77 99.85Other net assets 0.23 0.15 Net assets attributable to unitholders at 31st December 100.00 100.00
iShares Core MSCI Taiwan ETF Statement of Movements in Investment Portfolio (unaudited) for the year ended 31st December 2021
NM0522U-2194143-121/163

Reports and Financial Statements 121
iShares Core MSCI Taiwan ETF Performance Record (unaudited)
Net Asset Value
DealingNet asset value
per unitUS$
DealingNet asset value
of the Sub-FundUS$
At end of financial period dated31st December 2019 16.06 64,571,47331st December 2020 21.41 79,641,86531st December 2021 26.93 79,168,533
Highest and lowest net asset value per unit
Highest net assetvalue per unit
US$
Lowest net assetvalue per unit
US$
Financial period ended31st December 2016 (since inception) 12.04# 10.12#
31st December 2017 14.53# 11.32#
31st December 2018 15.44# 12.00#
31st December 2019 16.67 11.57#
31st December 2020 21.41 11.5931st December 2021 26.98 21.69
# Pursuant to Change of Trading Board Lot Size and Units Consolidations Announcement dated 18th December 2018, with effect from 18th January 2019, every 10 units in the Sub-Fund are consolidated into 1 consolidated unit. The net asset value per unit disclosed was adjusted to reflect the unit consolidations.
NM0522U-2194143-122/163

122 iShares Asia Trust
iShares NASDAQ 100 ETF Investment Portfolio (unaudited) as at 31st December 2021
HoldingsFair value
US$
% ofNet
Assets
Investments (99.97%)
Listed equities (99.97%)
Argentina (0.45%)164 Mercadolibre Inc 221,138 0.45
221,138 0.45
Canada (0.32%)
396 Lululemon Athletica Inc 155,014 0.32
155,014 0.32
China (0.95%)792 Baidu Inc – Spon ADR 117,842 0.24
2,403 JD.Com Inc – ADR 168,378 0.35953 Netease Inc – ADR 96,996 0.20
1,346 Pinduoduo Inc – ADR 78,472 0.16
461,688 0.95
Netherlands (0.83%)263 ASML Holding NV – NY Reg Shs 209,385 0.43861 NXP Semiconductors NV 196,118 0.40
405,503 0.83
United States (97.42%)
2,544 Activision Blizzard Inc 169,252 0.351,541 Adobe Inc 873,839 1.793,911 Advanced Micro Devices 562,793 1.151,123 Airbnb Inc – Class A 186,968 0.38
259 Align Technology Inc 170,210 0.35587 Alphabet Inc – Cl A 1,700,563 3.48620 Alphabet Inc – Cl C 1,794,026 3.67990 Amazon.Com Inc 3,300,997 6.76
1,639 American Electric Power 145,822 0.301,824 Amgen Inc 410,345 0.841,741 Analog Devices Inc 306,016 0.63
276 Ansys Inc 110,709 0.2332,030 Apple Inc 5,687,567 11.64
2,924 Applied Materials Inc 460,121 0.94454 Atlassian Corp Plc – Class A 173,106 0.36716 Autodesk Inc 201,332 0.41
1,365 Automatic Data Processing 336,582 0.69469 Biogen Inc 112,522 0.23133 Booking Holdings Inc 319,098 0.65
1,334 Broadcom Inc 887,657 1.82887 Cadence Design Sys Inc 165,292 0.34578 Charter Communications Inc – A 376,839 0.77335 Cintas Corp 148,462 0.30
13,660 Cisco Systems Inc 865,634 1.771,709 Cognizant Tech Solutions – A 151,622 0.31
14,768 Comcast Corp – Class A 743,273 1.52785 Copart Inc 119,022 0.24
1,431 Costco Wholesale Corp 812,379 1.66667 Crowdstrike Holdings Inc – A 136,568 0.28
7,191 Csx Corp 270,382 0.55833 Datadog Inc – Class A 148,366 0.30315 Dexcom Inc 169,139 0.35640 Docusign Inc 97,478 0.20714 Dollar Tree Inc 100,331 0.21
2,041 Ebay Inc 135,727 0.28898 Electronic Arts Inc 118,446 0.24
3,196 Exelon Corp 184,601 0.386,918 Facebook Inc – Class A 2,326,869 4.761,826 Fastenal Co 116,974 0.242,148 Fiserv Inc 222,941 0.46
HoldingsFair value
US$
% ofNet
Assets
United States (97.42%) Continued530 Fortinet Inc 190,482 0.39
4,063 Gilead Sciences Inc 295,014 0.602,230 Honeywell International Inc 464,955 0.95
270 Idexx Laboratories Inc 177,784 0.36506 Illumina Inc 192,503 0.39
13,172 Intel Corp 678,358 1.39917 Intuit Inc 589,833 1.21
1,157 Intuitive Surgical Inc 415,710 0.854,617 Keurig Dr Pepper Inc 170,113 0.35
492 Kla Corp 211,614 0.433,894 Kraft Heinz Co/The 139,795 0.29
456 Lam Research Corp 327,932 0.675,333 Lucid Group Inc 202,921 0.421,065 Marriott International – Cl A 175,981 0.362,668 Marvell Technology Inc 233,423 0.48
917 Match Group Inc 121,273 0.251,797 Microchip Technology Inc 156,447 0.323,623 Micron Technology Inc 337,482 0.69
14,657 Microsoft Corp 4,929,442 10.091,313 Moderna Inc 333,476 0.684,518 Mondelez International Inc – A 299,589 0.611,735 Monster Beverage Corp 166,629 0.341,435 Netflix Inc 864,501 1.776,869 Nvidia Corp 2,020,242 4.14
478 Okta Inc 107,153 0.22219 O’Reilly Automotive Inc 154,664 0.32
1,104 Paccar Inc 97,439 0.20319 Palo Alto Networks Inc 177,606 0.36
1,183 Paychex Inc 161,480 0.333,805 Paypal Holdings Inc 717,547 1.47
976 Peloton Interactive Inc – A 34,902 0.074,478 Pepsico Inc 777,873 1.593,628 Qualcomm Inc 663,452 1.36
343 Regeneron Pharmaceuticals 216,611 0.441,133 Ross Stores Inc 129,479 0.27
607 Seagen Inc 93,842 0.1912,703 Sirius Xm Holdings Inc 80,664 0.17
542 Skyworks Solutions Inc 84,086 0.17510 Splunk Inc 59,017 0.12
3,800 Starbucks Corp 444,486 0.91498 Synopsys Inc 183,513 0.38
1,961 Tesla Inc 2,072,346 4.242,991 Texas Instruments Inc 563,714 1.154,045 T-Mobile Us Inc 469,139 0.96
368 Verisign Inc 93,406 0.19516 Verisk Analytics Inc 118,025 0.24832 Vertex Pharmaceuticals Inc 182,707 0.37
2,756 Walgreens Boots Alliance Inc 143,753 0.30625 Workday Inc – Class A 170,738 0.35
1,714 Xcel Energy Inc 116,038 0.24805 Xilinx Inc 170,684 0.35785 Zoom Video Communications – A 144,369 0.30453 Zscaler Inc 145,563 0.30
47,589,665 97.42
Total investments 48,833,008 99.97Other net assets 14,679 0.03
Net assets attributable to
unitholders at 31st December 2021 48,847,687 100.00
Total investments, at cost 25,559,657
NM0522U-2194143-123/163

Reports and Financial Statements 123
iShares NASDAQ 100 ETF Statement of Movements in Investment Portfolio (unaudited) for the year ended 31st December 2021
% of net asset value
2021
% of net asset value
2020
Financial assets at fair value through profit or lossListed equitiesCommunication Services 18.38 18.39Consumer Discretionary 16.15 19.24Consumer Staples 5.14 5.17Health Care 5.65 6.43Industrials 2.72 1.89Information Technology 51.01 47.90Utilities 0.92 0.97 Total investments 99.97 99.99Other net assets 0.03 0.01 Net assets attributable to unitholders at 31st December 100.00 100.00
NM0522U-2194143-124/163

124 iShares Asia Trust
iShares NASDAQ 100 ETF Performance Record (unaudited)
Net Asset Value
DealingNet asset value
per unitUS$
DealingNet asset value
of the Sub-FundUS$
At end of financial period dated31st December 2019 20.99 13,011,07031st December 2020 31.05 36,014,94031st December 2021 39.39 48,847,687
Highest and lowest net asset value per unit
Highest net assetvalue per unit
US$
Lowest net assetvalue per unit
US$
Financial period ended31st December 2016 (since inception) 11.75# 9.94#
31st December 2017 15.51# 11.65#
31st December 2018 18.29# 14.12#
31st December 2019 21.08 14.71#
31st December 2020 31.05 16.8331st December 2021 40.00 29.64
# Pursuant to the Change of Trading Board Lot Size and Units Consolidations Announcement dated 18th December 2018, with effect from 18th January 2019, every 10 units in the Sub-Fund are consolidated into 1 consolidated unit. The net asset value per unit disclosed was adjusted to reflect the unit consolidations.
NM0522U-2194143-125/163

Reports and Financial Statements 125
iShares Core Hang Seng Index ETF Investment Portfolio (unaudited) as at 31st December 2021
HoldingsFair value
HK$
% ofNet
Assets
Investments (99.46%)
Listed equities (99.46%)
China (78.06%)36,720 AAC Technologies Holdings In 1,130,976 0.18
614,977 AIA Group Ltd 48,337,192 7.49384,562 Alibaba Group Holding Ltd 45,724,422 7.09240,257 Alibaba Health Information T 1,583,294 0.24
55,091 Anta Sports Products Ltd 6,440,138 1.004,043,581 Bank of China Ltd – H 11,362,463 1.76
188,220 BOC Hong Kong Holdings Ltd 4,809,021 0.7542,821 BYD Co Ltd – H 11,416,079 1.77
5,495,018 China Construction Bank – H 29,673,097 4.60378,356 China Life Insurance Co – H 4,888,360 0.76140,602 China Mengniu Dairy Co 6,214,608 0.96198,750 China Merchants Bank-H 12,034,312 1.86311,863 China Mobile Ltd 14,595,188 2.26195,159 China Overseas Land & Invest 3,602,635 0.56
1,234,167 China Petroleum & Chemical – H 4,480,026 0.6982,000 China Resources Beer Holding 5,235,700 0.81
163,801 China Resources Land Ltd 5,372,673 0.83312,296 China Unicom Hong Kong Ltd 1,217,954 0.19370,638 Citic Ltd 2,853,913 0.44102,808 CLP Holdings Ltd 8,096,130 1.25909,579 CNOOC Ltd 7,303,919 1.13407,706 Country Garden Holdings Co 2,821,326 0.44
89,308 Country Garden Services Hold 4,170,684 0.65457,473 CSPC Pharmaceutical Group Lt 3,874,796 0.60
40,300 Enn Energy Holdings Ltd 5,916,040 0.92300,094 Geely Automobile Holdings Lt 6,392,002 0.99
53,656 Haidilao International Holdi 944,346 0.1538,946 Hang Seng Bank Ltd 5,557,594 0.8636,174 Hengan Intl Group Co Ltd 1,452,386 0.22
569,796 Hong Kong & China Gas 6,917,323 1.073,740,488 Ind & Comm Bk of China – H 16,458,147 2.55
31,450 JD.Com Inc – CL A 8,617,300 1.34114,420 Li Ning Co Ltd 9,765,747 1.51
91,622 Longfor Group Holdings Ltd 3,362,527 0.52217,036 Meituan – Class B 48,919,914 7.58
94,752 MTR Corp 3,965,371 0.6126,100 Netease Inc 4,110,750 0.64
1,074,708 Petrochina Co Ltd – H 3,729,237 0.58322,161 Ping An Insurance Group Co – H 18,089,340 2.80144,349 Sands China Ltd 2,621,378 0.41
45,931 Shenzhou International Group 6,885,057 1.07575,923 Sino Biopharmaceutical 3,144,540 0.49
36,270 Sunny Optical Tech 8,944,182 1.39112,416 Tencent Holdings Ltd 51,351,629 7.96183,043 Wuxi Biologics Cayman Inc 16,940,630 2.62894,095 Xiaomi Corp – Class B 16,898,396 2.62112,850 Xinyi Glass Holdings Ltd 2,200,575 0.34248,220 Xinyi Solar Holdings Ltd 3,281,468 0.51
503,704,785 78.06
Hong Kong (21.40%)
101,120 Budweiser Brewing Co APAC Lt 2,067,904 0.32101,932 CK Asset Holdings Ltd 5,009,958 0.78136,897 CK Hutchison Holdings Ltd 6,885,919 1.07
40,720 CK Infrastructure Holdings L 2,021,748 0.31111,173 Galaxy Entertainment Group L 4,491,389 0.70103,510 Hang Lung Properties Ltd 1,660,300 0.26
74,086 Henderson Land Development 2,459,655 0.3861,415 Hong Kong Exchanges & Clear 27,968,391 4.33
1,054,671 HSBC Holdings Plc 49,464,070 7.66106,449 Link Reit 7,307,724 1.13
70,460 New World Development 2,173,691 0.3469,320 Power Assets Holdings Ltd 3,368,952 0.52
HoldingsFair value
HK$
% ofNet
Assets
Hong Kong (21.40%) Continued66,191 Sun Hung Kai Properties 6,261,669 0.9774,279 Techtronic Industries Co Ltd 11,528,101 1.79
355,355 WH Group Ltd 1,737,686 0.2792,506 Wharf Real Estate Investment 3,663,237 0.57
138,070,394 21.40
Total listed equities 641,775,179 99.46
Futures (0.00%)
Hong Kong (0.00%)14 Mini Hang Seng Index Futures Jan
2022 24,620 0.00
Total futures 24,620 0.00
Total investments 641,799,799 99.46Other net assets 3,509,818 0.54
Net assets attributable to
unitholders at 31st December 2021 645,309,617 100.00
Total investments, at cost 740,170,221
NM0522U-2194143-126/163

126 iShares Asia Trust
iShares Core Hang Seng Index ETF Details in Respect of Financial Derivative Instruments (unaudited) as at 31st December 2021
Futures
Underlying assets CounterpartyFair value
HK$Description
Financial assetsMini Hang Seng Index Futures Jan 2022 Hang Seng Index Credit Suisse International 24,620
24,620
The financial derivative instruments held by the Sub-Fund as at 31st December 2021 are summarized below:
NM0522U-2194143-127/163

Reports and Financial Statements 127
2021% of net asset
value
Lowest gross exposure 0.00%
Highest gross exposure 4.68%
Average gross exposure 1.40%
The lowest, highest and average net exposure arising from the use of financial derivative instruments for investment purpose as a proportion to the Sub-Fund’s total net asset value for the year ended 31st December 2021 as shown below:
2021% of net asset
value
Lowest net exposure 0.00%
Highest net exposure 4.68%
Average net exposure 1.40%
The lowest, highest and average gross exposure arising from the use of financial derivative instruments for any purpose as a proportion to the Sub-Fund’s total net asset value for the year ended 31st December 2021 as shown below:
iShares Core Hang Seng Index ETFInformation on Exposure Arising from Financial Derivative Instruments (unaudited) for the year ended 31st December 2021
NM0522U-2194143-128/163

128 iShares Asia Trust
iShares Core Hang Seng Index ETF Statement of Movements in Investment Portfolio (unaudited) for the year ended 31st December 2021
% of net asset value
2021
% of net asset value
2020
Financial assets at fair value through profit or lossListed equitiesCommunication Services 11.05 12.23Consumer Discretionary 23.61 15.22Consumer Staples 2.58 2.48Energy 2.40 2.40Financials 35.42 42.28Health Care 3.95 4.48Industrials 4.25 3.88Information Technology 4.70 6.13Real Estate 7.43 7.49Utilities 4.07 3.29
99.46 99.88 FuturesMini Hang Seng Index Futures 0.00 0.00
0.00 0.00 Total investments 99.46 99.88Other net assets 0.54 0.12 Net assets attributable to unitholders at 31st December 100.00 100.00
NM0522U-2194143-129/163

Reports and Financial Statements 129
iShares Core Hang Seng Index ETF Performance Record (unaudited)
Net Asset Value
DealingNet asset value
per unitHK$
DealingNet asset value
of the Sub-FundHK$
At end of financial period dated31st December 2019 101.03 298,026,76531st December 2020 97.68 253,954,90831st December 2021 83.81 645,309,617
Highest and lowest net asset value per unit
Highest net assetvalue per unit
HK$
Lowest net assetvalue per unit
HK$
Financial period ended31st December 2017 (since inception) 110.79 77.5831st December 2018 119.02 90.5931st December 2019 108.40 89.7831st December 2020 104.13 78.1031st December 2021 111.48 81.47
NM0522U-2194143-130/163

130 iShares Asia Trust
HoldingsFair value
US$
% ofNet
Assets
Investments (99.54%)
Exchange traded fund (99.54%)
Ireland (99.45%)294,859 iShares MSCI EM UCITS ETF USD
(Dist) 14,058,877 99.54
Total exchange traded fund 14,058,877 99.54
Futures (0.00%)
United States (0.00%)1 MSCI Emerging Markets Index
Futures Mar 2022 121 0.00
Total futures 121 0.00
Total investments 14,058,998 99.54Other net assets 65,207 0.46
Net assets attributable to
unitholders at 31st December 2021 14,124,205 100.00
Total investments, at cost 12,124,245
iShares MSCI Emerging Markets ETF (HK) Investment Protfolio (unaudited) as at 31st December 2021
NM0522U-2194143-131/163

Reports and Financial Statements 131
HoldingsFair valueUS$’000
% ofNet
Assets
Investments (99.66%)
Equities (97.58%)
Bermuda (0.53%)
Banks32,802 Credicorp Ltd 4,004 0.10
Chemicals444,000 Huabao International Holdings Ltd 820 0.02
Commercial services984,000 COSCO SHIPPING Ports Ltd 854 0.02601,500 Shenzhen International Holdings Ltd 625 0.02
Entertainment6,770,000 Alibaba Pictures Group Ltd 617 0.02
Forest products & paper818,000 Nine Dragons Paper Holdings Ltd 878 0.02
Gas1,504,000 China Gas Holdings Ltd 3,125 0.08
468,000 China Resources Gas Group Ltd 2,644 0.07
Internet1,452,000 HengTen Networks Group Ltd 549 0.01
Oil & gas1,930,000 Kunlun Energy Co Ltd 1,810 0.05
Real estate investment & services358,600 Hopson Development Holdings Ltd 748 0.02
Retail1,982,000 Alibaba Health Information
Technology Ltd 1,675 0.055,922,260 GOME Retail Holdings Ltd 502 0.01
Software7,091,050 China Youzan Ltd 491 0.01
Water2,428,000 Beijing Enterprises Water Group Ltd 944 0.03
20,286 0.53
Brazil (2.66%)
Apparel retailers66,200 Alpargatas SA (Pref) 440 0.01
Banks465,469 Banco Bradesco SA 1,353 0.04
1,581,138 Banco Bradesco SA (Pref) 5,453 0.14264,537 Banco do Brasil SA 1,370 0.04107,700 Banco Inter SA 553 0.01118,301 Banco Santander Brasil SA 637 0.02
1,563,132 Itau Unibanco Holding SA (Pref) 5,879 0.15
Beverages1,551,537 Ambev SA 4,295 0.11
Chemicals59,831 Braskem SA (Pref) – A 619 0.02
Commercial services386,755 CCR SA 805 0.02200,960 Localiza Rent a Car SA 1,912 0.05
iShares MSCI Emerging Markets ETF (HK) Investment Protfolio of iShares MSCI EM UCITS ETF USD (Dist) (unaudited) as at 31st December 2021
HoldingsFair valueUS$’000
% ofNet
Assets
Brazil (2.66%) (Continued)
Cosmetics & personal care296,110 Natura & Co Holding SA 1,352 0.04
Diversified financial services2,018,544 B3 SA – Brasil Bolsa Balcao 4,037 0.10
375,408 Banco BTG Pactual SA 1,415 0.04
Electricity120,802 Centrais Eletricas Brasileiras SA 725 0.02
70,847 Centrais Eletricas Brasileiras SA (Pref) – B 420 0.01
363,627 Cia Energetica de Minas Gerais (Pref) 856 0.0356,928 Energisa SA 453 0.0159,247 Engie Brasil Energia SA 409 0.01
304,775 Equatorial Energia SA 1,237 0.03
Food207,928 BRF SA 841 0.02295,317 JBS SA 2,012 0.05
Forest products & paper250,731 Suzano SA 2,706 0.07
Healthcare services406,655 Hapvida Participacoes e
Investimentos SA 758 0.02177,259 Notre Dame Intermedica
Participacoes SA 1,920 0.05129,714 Rede D’Or Sao Luiz SA 1,044 0.03
Insurance232,865 BB Seguridade Participacoes SA 867 0.02
Internet135,500 Americanas SA 768 0.02
Investment services1,376,454 Itausa SA (Pref) 2,207 0.06
Iron & steel234,383 Cia Siderurgica Nacional SA 1,051 0.03391,421 Gerdau SA (Pref) 1,916 0.05
1,339,683 Vale SA 18,751 0.48
Machinery – diversified555,595 WEG SA 3,290 0.09
Oil & gas337,518 Cosan SA 1,314 0.03
1,247,100 Petroleo Brasileiro SA 6,874 0.181,565,578 Petroleo Brasileiro SA (Pref) 7,997 0.21
235,358 Ultrapar Participacoes SA 614 0.02330,519 Vibra Energia SA 1,270 0.03
Packaging & containers248,143 Klabin SA 1,143 0.03
Pharmaceuticals134,055 Hypera SA 680 0.02
Retail146,729 Atacadao SA 402 0.01331,751 Lojas Renner SA 1,455 0.04
1,014,468 Magazine Luiza SA 1,315 0.03367,444 Raia Drogasil SA 1,603 0.04437,181 Via SA 412 0.01
Software161,400 TOTVS SA 830 0.02
NM0522U-2194143-132/163

132 iShares Asia Trust
iShares MSCI Emerging Markets ETF (HK) (continued)
Investment Protfolio of iShares MSCI EM UCITS ETF USD (Dist) (unaudited) as at 31st December 2021
HoldingsFair valueUS$’000
% ofNet
Assets
Brazil (2.66%) (Continued)
Telecommunications158,242 Telefonica Brasil SA 1,369 0.03292,160 TIM SA 690 0.02
Transportation422,197 Rumo SA 1,346 0.03
Water118,923 Cia de Saneamento Basico do Estado
de Sao Paulo 858 0.02
102,523 2.66
British Virgin Islands (0.02%)
Internet54,502 VK Co Ltd GDR 634 0.02
634 0.02
Cayman Islands (19.28%)
Agriculture298,983 RLX Technology Inc ADR 1,166 0.03881,000 Smoore International Holdings Ltd 4,492 0.12
Apparel retailers407,600 Shenzhou International Group
Holdings Ltd 7,837 0.20
Auto manufacturers2,887,000 Geely Automobile Holdings Ltd 7,887 0.20
270,181 Li Auto Inc ADR 8,673 0.23666,051 NIO Inc ADR 21,101 0.55189,950 XPeng Inc ADR 9,560 0.25602,000 Yadea Group Holdings Ltd 1,174 0.03
Auto parts & equipment388,000 Minth Group Ltd 1,710 0.04
Biotechnology647,500 3SBio Inc 540 0.02142,000 Akeso Inc 619 0.02
22,844 BeiGene Ltd ADR 6,189 0.1643,789 HUTCHMED China Ltd ADR 1,536 0.0419,325 I-Mab ADR 916 0.02
578,500 Innovent Biologics Inc 3,580 0.0917,440 Legend Biotech Corp ADR 813 0.0237,377 Zai Lab Ltd ADR 2,349 0.06
Building materials and fixtures572,000 China Lesso Group Holdings Ltd 822 0.02
1,216,000 China Resources Cement Holdings Ltd 918 0.03
Chemicals29,220 Daqo New Energy Corp ADR 1,178 0.03
726,000 Dongyue Group Ltd 1,132 0.03344,500 Kingboard Holdings Ltd 1,677 0.05492,500 Kingboard Laminates Holdings Ltd 838 0.02
Commercial services401,000 China Education Group Holdings Ltd 651 0.02848,000 China Yuhua Education Corp Ltd 303 0.01768,319 New Oriental Education &
Technology Group Inc ADR 1,614 0.04205,071 TAL Education Group ADR 806 0.02
HoldingsFair valueUS$’000
% ofNet
Assets
Cayman Islands (19.28%) (Continued)
Computers1,276,000 Chinasoft International Ltd 1,663 0.04
Cosmetics & personal care203,000 Vinda International Holdings Ltd 495 0.01
Diversified financial services41,782 360 DigiTech Inc ADR 958 0.03
646,989 Chailease Holding Co Ltd 6,162 0.1618,526 Noah Holdings Ltd ADR 569 0.01
1 XP Inc – 0.00
Electronics358,500 AAC Technologies Holdings Inc 1,416 0.04
39,000 Silergy Corp 7,083 0.18314,850 Zhen Ding Technology Holding Ltd 1,144 0.03
Energy – alternate sources2,386,000 Xinyi Solar Holdings Ltd 4,046 0.11
Engineering & construction1,024,250 China State Construction
International Holdings Ltd 1,273 0.03
Environmental control837,000 China Conch Venture Holdings Ltd 4,090 0.11
Food1,557,000 China Mengniu Dairy Co Ltd 8,827 0.23
996,500 Dali Foods Group Co Ltd 522 0.01996,000 Tingyi Cayman Islands Holding Corp 2,047 0.05712,000 Uni-President China Holdings Ltd 690 0.02
2,494,000 Want Want China Holdings Ltd 2,291 0.06241,000 Yihai International Holding Ltd 1,114 0.03
Gas390,700 ENN Energy Holdings Ltd 7,357 0.19
Healthcare products695,000 China Medical System Holdings Ltd 1,161 0.03330,000 Hengan International Group Co Ltd 1,699 0.05323,000 Microport Scientific Corp 1,177 0.03
Healthcare services564,000 Genscript Biotech Corp 2,496 0.07165,800 Hygeia Healthcare Holdings Co Ltd 1,038 0.03654,000 Jinxin Fertility Group Ltd 730 0.02
1,767,000 Wuxi Biologics Cayman Inc 20,976 0.54
Hotels88,378 Huazhu Group Ltd ADR 3,300 0.09
Internet15,642 51job Inc ADR 765 0.02
7,417,764 Alibaba Group Holding Ltd 113,127 2.9437,610 Autohome Inc ADR 1,109 0.03
135,729 Baidu Inc ADR 20,195 0.52199,800 China Literature Ltd 1,256 0.03
30,263 Dada Nexus Ltd ADR 398 0.0179,239 Hello Group Inc ADR 712 0.02
142,192 iQIYI Inc ADR 648 0.02849,052 JD.com Inc – A 29,840 0.77
27,452 JOYY Inc ADR 1,247 0.0328,077 Kanzhun Ltd ADR 979 0.03
231,800 Kuaishou Technology 2,142 0.061,997,900 Meituan ‘B’ 57,762 1.50
NM0522U-2194143-133/163

Reports and Financial Statements 133
iShares MSCI Emerging Markets ETF (HK) (continued)
Investment Protfolio of iShares MSCI EM UCITS ETF USD (Dist) (unaudited) as at 31st December 2021
HoldingsFair valueUS$’000
% ofNet
Assets
Cayman Islands (19.28%) (Continued)
Internet (Continued)214,234 Pinduoduo Inc ADR 12,490 0.32
2,814,500 Tencent Holdings Ltd 164,907 4.28326,058 Tencent Music Entertainment Group
ADR 2,234 0.06491,200 Tongcheng-Elong Holdings Ltd 910 0.02249,549 Trip.com Group Ltd ADR 6,144 0.16219,104 Vipshop Holdings Ltd ADR 1,840 0.05
48,976 Vnet Group Inc ADR 442 0.0131,073 Weibo Corp ADR 963 0.02
953,000 Weimob Inc 964 0.03
Machinery – diversified344,000 Haitian International Holdings Ltd 955 0.02
Machinery, construction & mining568,000 Sany Heavy Equipment International
Holdings Co Ltd 549 0.01
Mining1,131,500 China Hongqiao Group Ltd 1,195 0.03
Miscellaneous manufacturers66,973 Airtac International Group 2,469 0.06
350,900 Sunny Optical Technology Group Co Ltd 11,099 0.29
Packaging & containers713,000 Lee & Man Paper Manufacturing Ltd 496 0.01
Pharmaceuticals1,744,000 China Feihe Ltd 2,340 0.06
584,000 Hansoh Pharmaceutical Group Co Ltd 1,423 0.04
5,140,750 Sino Biopharmaceutical Ltd 3,600 0.09
Real estate investment & services536,000 Agile Group Holdings Ltd 291 0.01
1,212,000 China Evergrande Group 247 0.01665,000 China Overseas Property Holdings
Ltd 705 0.021,571,999 China Resources Land Ltd 6,614 0.17
277,200 China Resources Mixc Lifestyle Services Ltd 1,292 0.03
374,000 CIFI Ever Sunshine Services Group Ltd 580 0.01
1,774,500 CIFI Holdings Group Co Ltd 1,068 0.033,748,799 Country Garden Holdings Co Ltd 3,327 0.09
864,000 Country Garden Services Holdings Co Ltd 5,175 0.13
435,500 Greentown China Holdings Ltd 702 0.02742,000 Greentown Service Group Co Ltd 685 0.02174,741 KE Holdings Inc ADR 3,516 0.09636,500 KWG Group Holdings Ltd 416 0.01675,000 Logan Group Co Ltd 516 0.01893,000 Longfor Group Holdings Ltd 4,204 0.11661,000 Powerlong Real Estate Holdings Ltd 346 0.01
1,086,000 Seazen Group Ltd 734 0.02557,500 Shimao Group Holdings Ltd 365 0.01281,000 Shimao Services Holdings Ltd 195 0.01
1,231,000 Sunac China Holdings Ltd 1,860 0.05519,000 Sunac Services Holdings Ltd 529 0.01
Retail530,600 ANTA Sports Products Ltd 7,956 0.21
1,646,000 Bosideng International Holdings Ltd 1,037 0.03
HoldingsFair valueUS$’000
% ofNet
Assets
Cayman Islands (19.28%) (Continued)
Retail (Continued)286,000 China Meidong Auto Holdings Ltd 1,475 0.04523,000 Haidilao International Holding Ltd 1,181 0.03171,700 JD Health International Inc 1,353 0.03366,000 Jiumaojiu International Holdings Ltd 643 0.02
1,104,500 Li Ning Co Ltd 12,091 0.31222,900 Ping An Healthcare and Technology
Co Ltd 810 0.02775,000 Topsports International Holdings Ltd 784 0.02290,000 Zhongsheng Group Holdings Ltd 2,262 0.06
Semiconductors36,000 Parade Technologies Ltd 2,752 0.07
Software23,400 Agora Inc ADR 380 0.0180,615 Bilibili Inc ADR 3,741 0.10
1,292,000 Kingdee International Software Group Co Ltd 3,977 0.10
27,694 Kingsoft Cloud Holdings Ltd ADR 436 0.01478,000 Kingsoft Corp Ltd 2,100 0.05274,000 Ming Yuan Cloud Group Holdings Ltd 624 0.02983,285 NetEase Inc 19,864 0.52
Telecommunications53,983 Chindata Group Holdings Ltd ADR 356 0.0143,999 GDS Holdings Ltd ADR 2,075 0.05
6,986,400 Xiaomi Corp ‘B’ 16,936 0.44
Transportation141,503 DiDi Global Inc ADR 704 0.02212,853 ZTO Express Cayman Inc ADR 6,007 0.15
742,516 19.28
Chile (0.37%)
Banks22,456,356 Banco de Chile 1,754 0.05
28,768 Banco de Credito e Inversiones SA 840 0.0232,403,251 Banco Santander Chile 1,303 0.03
Beverages71,410 Cia Cervecerias Unidas SA 581 0.02
Chemicals67,549 Sociedad Quimica y Minera de Chile
SA (Pref) ‘B’ 3,448 0.09
Electricity10,204,533 Enel Americas SA 1,114 0.0311,661,290 Enel Chile SA 408 0.01
Food723,246 Cencosud SA 1,210 0.03
Forest products & paper528,823 Empresas CMPC SA 886 0.02
Oil & gas197,981 Empresas COPEC SA 1,530 0.04
Retail374,975 Falabella SA 1,223 0.03
14,297 0.37
NM0522U-2194143-134/163

134 iShares Asia Trust
iShares MSCI Emerging Markets ETF (HK) (continued)
Investment Protfolio of iShares MSCI EM UCITS ETF USD (Dist) (unaudited) as at 31st December 2021
HoldingsFair valueUS$’000
% ofNet
Assets
Colombia (0.17%)
Banks121,028 Bancolombia SA 1,032 0.02230,280 Bancolombia SA (Pref) 1,810 0.05
Electricity231,050 Interconexion Electrica SA ESP 1,272 0.03
Investment services126,861 Grupo de Inversiones Suramericana
SA 935 0.03
Oil & gas2,414,518 Ecopetrol SA 1,596 0.04
6,645 0.17
Cyprus (0.15%)
Banks59,219 TCS Group Holding Plc RegS GDR 4,818 0.13
Internet24,960 Ozon Holdings Plc ADR 758 0.02
5,576 0.15
Czech Republic (0.14%)
Banks39,055 Komercni Banka AS 1,671 0.05
181,736 Moneta Money Bank AS 780 0.02
Electricity74,207 CEZ AS 2,808 0.07
5,259 0.14
Egypt (0.09%)
Agriculture709,217 Eastern Co SAE 484 0.01
Banks825,602 Commercial International Bank Egypt
SAE 2,785 0.07
Diversified financial services204,002 Fawry for Banking & Payment
Technology Services SAE 166 0.01
3,435 0.09
Greece (0.21%)
Banks1,108,745 Alpha Services and Holdings SA 1,358 0.041,162,985 Eurobank Ergasias Services and
Holdings SA 1,179 0.03
Electricity104,123 Public Power Corp SA 1,113 0.03
Entertainment103,786 OPAP SA 1,472 0.04
Retail42,875 FF Group – 0.0059,614 JUMBO SA 854 0.02
HoldingsFair valueUS$’000
% ofNet
Assets
Greece (0.21%) (Continued)
Telecommunications110,082 Hellenic Telecommunications
Organization SA 2,035 0.05
8,011 0.21
Hong Kong (1.16%)
Auto manufacturers362,500 Sinotruk Hong Kong Ltd 558 0.01
Beverages722,666 China Resources Beer Holdings Co
Ltd 5,918 0.15
Commercial services777,750 China Merchants Port Holdings Co
Ltd 1,416 0.04
Computers3,588,000 Lenovo Group Ltd 4,123 0.11
Diversified financial services884,000 Far East Horizon Ltd 785 0.02
Electricity2,650,000 China Power International
Development Ltd 1,785 0.05961,029 China Resources Power Holdings Co
Ltd 3,217 0.08
Electronics331,500 BYD Electronic International Co Ltd 1,214 0.03
Energy – alternate sources410,400 China Common Rich Renewable
Energy Investments – 0.001,888,443 China Everbright Environment Group
Ltd 1,516 0.04
Food3,192,669 China Huishan Dairy Holdings Co Ltd – 0.00
Gas262,500 Beijing Enterprises Holdings Ltd 906 0.02
Holding companies – diversified operations
2,828,000 CITIC Ltd 2,793 0.07
Hotels1,292,460 Fosun International Ltd 1,394 0.04
Insurance790,082 China Taiping Insurance Holdings Co
Ltd 1,084 0.03
Mining1,624,000 MMG Ltd 521 0.01
Pharmaceuticals1,450,000 China Traditional Chinese Medicine
Holdings Co Ltd 962 0.024,435,280 CSPC Pharmaceutical Group Ltd 4,818 0.13
Real estate investment & services2,878,000 China Jinmao Holdings Group Ltd 890 0.02
NM0522U-2194143-135/163

Reports and Financial Statements 135
iShares MSCI Emerging Markets ETF (HK) (continued)
Investment Protfolio of iShares MSCI EM UCITS ETF USD (Dist) (unaudited) as at 31st December 2021
HoldingsFair valueUS$’000
% ofNet
Assets
Hong Kong (1.16%) (Continued)
Pharmaceuticals (Continued)1,869,760 China Overseas Land & Investment
Ltd 4,427 0.12685,000 Wharf Holdings Ltd 2,104 0.05740,800 Yuexiu Property Co Ltd 653 0.02
Retail983,000 Sun Art Retail Group Ltd 395 0.01
Semiconductors265,000 Hua Hong Semiconductor Ltd 1,462 0.04
Water1,474,000 Guangdong Investment Ltd 1,874 0.05
44,815 1.16
Hungary (0.23%)
Banks109,585 OTP Bank Nyrt 5,613 0.14
Oil & gas196,544 MOL Hungarian Oil & Gas Plc 1,528 0.04
Pharmaceuticals69,690 Richter Gedeon Nyrt 1,876 0.05
9,017 0.23
India (12.41%)
Aerospace & defence626,532 Bharat Electronics Ltd 1,770 0.05
Agriculture1,432,948 ITC Ltd 4,203 0.11
Airlines48,422 InterGlobe Aviation Ltd 1,314 0.03
Apparel retailers2,855 Page Industries Ltd 1,552 0.04
Auto manufacturers66,637 Eicher Motors Ltd 2,324 0.06
427,210 Mahindra & Mahindra Ltd 4,811 0.1266,758 Maruti Suzuki India Ltd 6,669 0.17
813,737 Tata Motors Ltd 5,281 0.14
Auto parts & equipment45,268 Balkrishna Industries Ltd 1,415 0.04
629,857 Motherson Sumi Systems Ltd 1,892 0.05946 MRF Ltd 933 0.02
Banks1,108,090 Axis Bank Ltd 10,115 0.26
319,575 Bandhan Bank Ltd 1,086 0.032,511,321 ICICI Bank Ltd 25,005 0.65
270,969 Kotak Mahindra Bank Ltd 6,547 0.17772,148 State Bank of India 4,783 0.12
9,743 State Bank of India RegS GDR 601 0.025,533,306 Yes Bank Ltd (Restricted) 1,020 0.03
Beverages265,559 Tata Consumer Products Ltd 2,656 0.07149,108 United Spirits Ltd 1,802 0.05
HoldingsFair valueUS$’000
% ofNet
Assets
India (12.41%) (Continued)
Biotechnology210,018 Biocon Ltd 1,030 0.03
Building materials and fixtures35,534 ACC Ltd 1,059 0.03
341,790 Ambuja Cements Ltd 1,736 0.04133,959 Grasim Industries Ltd 2,923 0.08
5,271 Shree Cement Ltd 1,914 0.0549,632 UltraTech Cement Ltd 5,068 0.13
Chemicals188,386 Asian Paints Ltd 8,574 0.22127,422 Berger Paints India Ltd 1,323 0.04
41,577 PI Industries Ltd 1,697 0.0465,398 SRF Ltd 2,129 0.06
246,475 UPL Ltd 2,477 0.06
Coal760,134 Coal India Ltd 1,493 0.04
Commercial services250,954 Adani Ports & Special Economic Zone
Lt 2,465 0.06247,765 Marico Ltd 1,709 0.05
Computers1,664,470 Infosys Ltd 42,269 1.10
25,840 Larsen & Toubro Infotech Ltd 2,549 0.0630,280 Mindtree Ltd 1,947 0.0535,904 Mphasis Ltd 1,640 0.04
449,982 Tata Consultancy Services Ltd 22,630 0.59520,213 Wipro Ltd 5,006 0.13150,793 Wipro Ltd ADR 1,472 0.04
Cosmetics & personal care57,741 Colgate-Palmolive India Ltd 1,151 0.03
305,341 Dabur India Ltd 2,382 0.06177,022 Godrej Consumer Products Ltd 2,306 0.06
Distribution & wholesale135,371 Adani Enterprises Ltd 3,113 0.08
Diversified financial services132,956 Bajaj Finance Ltd 12,479 0.32197,684 Cholamandalam Investment and
Finance Co Ltd 1,384 0.0427,584 HDFC Asset Management Co Ltd 908 0.02
839,070 Housing Development Finance Corp Ltd 29,195 0.76
63,515 Muthoot Finance Ltd 1,278 0.0352,324 Piramal Enterprises Ltd 1,861 0.05
113,982 SBI Cards & Payment Services Ltd 1,423 0.0498,020 Shriram Transport Finance Co Ltd 1,605 0.04
Electrical components & equipment26,627 Siemens Ltd 846 0.02
Electricity192,828 Adani Green Energy Ltd 3,451 0.09134,338 Adani Transmission Ltd 3,146 0.08
2,381,382 NTPC Ltd 3,985 0.101,488,384 Power Grid Corp of India Ltd 4,093 0.11
694,863 Tata Power Co Ltd 2,065 0.05
Electronics120,682 Havells India Ltd 2,268 0.06
NM0522U-2194143-136/163

136 iShares Asia Trust
iShares MSCI Emerging Markets ETF (HK) (continued)
Investment Protfolio of iShares MSCI EM UCITS ETF USD (Dist) (unaudited) as at 31st December 2021
HoldingsFair valueUS$’000
% ofNet
Assets
India (12.41%) (Continued)
Engineering & construction311,064 Larsen & Toubro Ltd 7,934 0.20
24,830 Larsen & Toubro Ltd RegS GDR 632 0.02
Food80,182 Avenue Supermarts Ltd 5,039 0.1353,056 Britannia Industries Ltd 2,574 0.0716,591 Nestle India Ltd 4,398 0.11
Gas133,452 Adani Gas Ltd 3,091 0.08762,638 GAIL India Ltd 1,326 0.03150,472 Indraprastha Gas Ltd 952 0.03
Healthcare services49,537 Apollo Hospitals Enterprise Ltd 3,341 0.09
Household goods & home construction
401,476 Hindustan Unilever Ltd 12,747 0.33
Insurance19,147 Bajaj Finserv Ltd 4,226 0.11
415,373 HDFC Life Insurance Co Ltd 3,630 0.09108,174 ICICI Lombard General Insurance Co
Ltd 2,039 0.05182,285 ICICI Prudential Life Insurance Co Ltd 1,375 0.04214,505 SBI Life Insurance Co Ltd 3,451 0.09
Internet38,391 Info Edge India Ltd 2,880 0.08
719,395 Zomato Ltd 1,330 0.03
Iron & steel418,005 JSW Steel Ltd 3,688 0.09352,972 Tata Steel Ltd 5,278 0.14
Leisure time33,601 Bajaj Auto Ltd 1,469 0.0452,479 Hero MotoCorp Ltd 1,738 0.04
Metal fabricate/ hardware121,702 Bharat Forge Ltd 1,143 0.03
Mining784,728 Hindalco Industries Ltd 5,020 0.13557,837 Vedanta Ltd 2,561 0.07
Miscellaneous manufacturers76,638 Pidilite Industries Ltd 2,539 0.07
Oil & gas421,754 Bharat Petroleum Corp Ltd 2,187 0.06316,657 Hindustan Petroleum Corp Ltd 1,245 0.03899,631 Indian Oil Corp Ltd 1,349 0.04
1,234,832 Oil & Natural Gas Corp Ltd 2,366 0.061,392,822 Reliance Industries Ltd 44,372 1.15
Pharmaceuticals140,850 Aurobindo Pharma Ltd 1,391 0.03234,141 Cipla Ltd 2,974 0.08
66,002 Divi’s Laboratories Ltd 4,154 0.1154,207 Dr Reddy’s Laboratories Ltd 3,578 0.09
1,675 Dr Reddy’s Laboratories Ltd ADR 109 0.00109,389 Lupin Ltd 1,399 0.04410,285 Sun Pharmaceutical Industries Ltd 4,668 0.12
26,252 Torrent Pharmaceuticals Ltd 1,158 0.03
HoldingsFair valueUS$’000
% ofNet
Assets
India (12.41%) (Continued)
Pipelines369,321 Petronet LNG Ltd 1,075 0.03
Real estate investment & services312,488 DLF Ltd 1,641 0.04
57,907 Godrej Properties Ltd 1,458 0.04
Retail39,731 Jubilant Foodworks Ltd 1,920 0.05
175,112 Titan Co Ltd 5,942 0.1593,064 Trent Ltd 1,333 0.04
Software529,553 HCL Technologies Ltd 9,397 0.25309,469 Tech Mahindra Ltd 7,454 0.19
Telecommunications1,210,451 Bharti Airtel Ltd 11,135 0.29
315,990 Indus Towers Ltd 1,055 0.03
Transportation124,807 Container Corp Of India Ltd 1,032 0.03116,479 Indian Railway Catering & Tourism
Corp Ltd 1,303 0.03
477,924 12.41
Indonesia (1.44%)
Agriculture3,722,400 Charoen Pokphand Indonesia Tbk PT 1,554 0.04
228,200 Gudang Garam Tbk PT 490 0.01
Banks26,894,200 Bank Central Asia Tbk PT 13,775 0.36
9,046,418 Bank Mandiri Persero Tbk PT 4,459 0.123,590,800 Bank Negara Indonesia Persero Tbk
PT 1,701 0.0433,047,545 Bank Rakyat Indonesia Persero Tbk PT 9,530 0.25
Building materials and fixtures737,374 Indocement Tunggal Prakarsa Tbk PT 626 0.02
1,453,000 Semen Indonesia Persero Tbk PT 739 0.02
Chemicals14,133,100 Barito Pacific Tbk PT 848 0.02
Coal7,486,200 Adaro Energy Tbk PT 1,182 0.03
Engineering & construction11,194,900 Sarana Menara Nusantara Tbk PT 884 0.02
Food1,085,800 Indofood CBP Sukses Makmur Tbk PT 663 0.022,094,800 Indofood Sukses Makmur Tbk PT 929 0.02
Forest products & paper1,455,600 Indah Kiat Pulp & Paper Tbk PT 799 0.02
Household goods & home construction
3,567,800 Unilever Indonesia Tbk PT 1,029 0.03
Mining4,335,200 Aneka Tambang Tbk 684 0.025,949,300 Merdeka Copper Gold Tbk PT 1,624 0.04
826,723 United Tractors Tbk PT 1,285 0.03
NM0522U-2194143-137/163

Reports and Financial Statements 137
iShares MSCI Emerging Markets ETF (HK) (continued)
Investment Protfolio of iShares MSCI EM UCITS ETF USD (Dist) (unaudited) as at 31st December 2021
HoldingsFair valueUS$’000
% ofNet
Assets
Indonesia (1.44%) (Continued)
Pharmaceuticals9,920,100 Kalbe Farma Tbk PT 1,124 0.03
Retail9,891,500 Astra International Tbk PT 3,956 0.10
Telecommunications24,130,100 Telkom Indonesia Persero Tbk PT 6,840 0.18
3,784,600 Tower Bersama Infrastructure Tbk PT 783 0.02
55,504 1.44
Isle of Man (0.04%)
Real estate investment & services217,870 NEPI Rockcastle Plc 1,447 0.04
1,447 0.04
Jersey (0.08%)
Mining174,257 Polymetal International Plc 3,049 0.08
3,049 0.08
Kuwait (0.61%)
Banks567,920 Boubyan Bank KSCP 1,484 0.04
2,316,141 Kuwait Finance House KSCP 6,376 0.173,272,104 National Bank of Kuwait SAKP 10,793 0.28
Real estate investment & services293,572 Mabanee Co KPSC 770 0.02
Storage & warehousing598,574 Agility Public Warehousing Co KSC 1,872 0.05
Telecommunications1,047,886 Mobile Telecommunications Co KSCP 2,063 0.05
23,358 0.61
Luxembourg (0.08%)
Internet171,563 Allegro.eu SA 1,654 0.04
Investment services71,497 Reinet Investments SCA 1,282 0.04
2,936 0.08
Malaysia (1.39%)
Agriculture1,303,835 IOI Corp Bhd 1,167 0.03
207,250 Kuala Lumpur Kepong Bhd 1,084 0.03574,650 QL Resources Bhd 630 0.02
Banks942,600 AMMB Holdings Bhd 717 0.02
3,093,163 CIMB Group Holdings Bhd 4,047 0.10320,430 Hong Leong Bank Bhd 1,432 0.04
2,284,400 Malayan Banking Bhd 4,551 0.127,115,000 Public Bank Bhd 7,105 0.18
809,900 RHB Bank Bhd 1,044 0.03
HoldingsFair valueUS$’000
% ofNet
Assets
Malaysia (1.39%) (Continued)
Beverages76,300 Fraser & Neave Holdings Bhd 453 0.01
Chemicals1,151,800 Petronas Chemicals Group Bhd 2,466 0.06
Commercial services389,600 Westports Holdings Bhd 379 0.01
Distribution & wholesale1,435,121 Sime Darby Bhd 799 0.02
Diversified financial services145,828 Hong Leong Financial Group Bhd 607 0.02
Electricity1,087,700 Tenaga Nasional Bhd 2,439 0.06
Engineering & construction541,820 Malaysia Airports Holdings Bhd 778 0.02
Food265,600 HAP Seng Consolidated Bhd 491 0.01
33,900 Nestle Malaysia Bhd 1,092 0.03332,720 PPB Group Bhd 1,365 0.04920,421 Sime Darby Plantation Bhd 831 0.02
Healthcare services911,600 IHH Healthcare Bhd 1,606 0.04
Hotels1,069,800 Genting Bhd 1,199 0.031,481,600 Genting Malaysia Bhd 1,024 0.03
Mining1,631,200 Press Metal Aluminium Holdings Bhd 2,263 0.06
Miscellaneous manufacturers826,300 Hartalega Holdings Bhd 1,136 0.03
2,563,700 Top Glove Corp Bhd 1,594 0.04
Oil & gas155,500 Petronas Dagangan Bhd 769 0.02
Oil & gas services1,978,826 Dialog Group Bhd 1,245 0.03
Pipelines388,200 Petronas Gas Bhd 1,677 0.04
Semiconductors1,367,200 Inari Amertron Bhd 1,313 0.03
Telecommunications1,414,773 Axiata Group Bhd 1,413 0.041,597,100 DiGi.Com Bhd 1,671 0.041,190,600 Maxis Bhd 1,386 0.04
540,500 Telekom Malaysia Bhd 714 0.02
Transportation632,120 MISC Bhd 1,070 0.03
53,557 1.39
Mexico (2.04%)
Banks1,269,705 Grupo Financiero Banorte SAB de
CV – O 8,253 0.211,165,014 Grupo Financiero Inbursa SAB de
CV – O 1,396 0.04
NM0522U-2194143-138/163

138 iShares Asia Trust
iShares MSCI Emerging Markets ETF (HK) (continued)
Investment Protfolio of iShares MSCI EM UCITS ETF USD (Dist) (unaudited) as at 31st December 2021
HoldingsFair valueUS$’000
% ofNet
Assets
Mexico (2.04%) (Continued)
Beverages205,112 Arca Continental SAB de CV 1,308 0.03256,200 Becle SAB de CV 643 0.02263,590 Coca-Cola Femsa SAB de CV 1,439 0.04943,142 Fomento Economico Mexicano SAB
de CV 7,342 0.19
Building materials and fixtures7,551,153 Cemex SAB de CV 5,162 0.13
Chemicals539,812 Orbia Advance Corp SAB de CV 1,379 0.04
Commercial services109,019 Promotora y Operadora de
Infraestructura SAB de CV 852 0.02
Engineering & construction184,067 Grupo Aeroportuario del Pacifico
SAB de CV ‘B’ 2,538 0.07104,035 Grupo Aeroportuario del Sureste SAB
de CV ‘B’ 2,149 0.05626,000 Telesites SAB de CV 641 0.02
Food109,568 Gruma SAB de CV ‘B’ 1,405 0.04765,658 Grupo Bimbo SAB de CV – A 2,356 0.06
Holding companies – diversified operations
1,208,000 Alfa SAB de CV – A 887 0.02
Household goods & home construction
732,154 Kimberly-Clark de Mexico SAB de CV – A 1,109 0.03
Media1,182,487 Grupo Televisa SAB 2,228 0.06
Mining1,534,831 Grupo Mexico SAB de CV ‘B’ 6,697 0.18
74,644 Industrias Penoles SAB de CV 859 0.02
Real estate investment trusts1,595,121 Fibra Uno Administracion SA de CV
(REIT) 1,687 0.04
Retail199,205 Grupo Carso SAB de CV ‘A1’ 644 0.02
2,528,426 Wal-Mart de Mexico SAB de CV 9,401 0.24
Telecommunications16,750,669 America Movil SAB de CV ‘L’ 17,753 0.46
160,903 Megacable Holdings SAB de CV 549 0.01
78,677 2.04
Netherlands (0.27%)
Food56,000 X5 Retail Group NV GDR 1,464 0.04
Internet150,656 Yandex NV – A 9,068 0.23
10,532 0.27
HoldingsFair valueUS$’000
% ofNet
Assets
People’s Republic of China (11.64%)
Advertising488,200 Focus Media Information Technology
Co Ltd – A 629 0.02
Aerospace & defence80,499 AECC Aviation Power Co Ltd – A 803 0.02
140,100 AVIC Electromechanical Systems Co Ltd – A 401 0.01
1,266,000 AviChina Industry & Technology Co Ltd – H 875 0.02
Agriculture56,300 Guangdong Haid Group Co Ltd – A 649 0.02
139,500 Jiangxi Zhengbang Technology Co Ltd – A 212 0.01
158,940 Muyuan Foodstuff Co Ltd – A 1,334 0.03150,600 New Hope Liuhe Co Ltd – A 360 0.01130,700 Tongwei Co Ltd – A 924 0.02231,129 Wens Foodstuffs Group Co Ltd – A 700 0.02
Airlines318,300 Air China Ltd – A 457 0.01722,000 Air China Ltd – H 504 0.02526,495 China Eastern Airlines Corp Ltd – A 427 0.01424,422 China Southern Airlines Co Ltd – A 455 0.01703,018 China Southern Airlines Co Ltd – H 421 0.01
Auto manufacturers54,800 BYD Co Ltd – A 2,311 0.06
383,500 BYD Co Ltd – H 13,114 0.34196,557 Chongqing Changan Automobile Co
Ltd – A 470 0.011,348,000 Dongfeng Motor Group Co Ltd – H 1,120 0.03
68,000 Great Wall Motor Co Ltd – A 519 0.011,519,750 Great Wall Motor Co Ltd – H 5,224 0.141,457,990 Guangzhou Automobile Group Co
Ltd – H 1,438 0.04240,697 SAIC Motor Corp Ltd – A 781 0.02
Auto parts & equipment71,300 Fuyao Glass Industry Group Co Ltd
– A 528 0.01283,600 Fuyao Glass Industry Group Co Ltd
– H 1,466 0.0445,900 Gotion High-tech Co Ltd – A 370 0.01
114,600 Huayu Automotive Systems Co Ltd – A 510 0.01
16,900 Huizhou Desay Sv Automotive Co Ltd – A 376 0.01
36,600 Ningbo Tuopu Group Co Ltd – A 305 0.0148,640 Shandong Linglong Tyre Co Ltd – A 280 0.01
237,075 Weichai Power Co Ltd – A 667 0.02907,000 Weichai Power Co Ltd – H 1,775 0.04
Banks2,307,500 Agricultural Bank of China Ltd – A 1,067 0.03
12,182,000 Agricultural Bank of China Ltd – H 4,188 0.11851,900 Bank of Beijing Co Ltd – A 595 0.02182,495 Bank of Chengdu Co Ltd – A 344 0.01
1,259,500 Bank of China Ltd – A 604 0.0238,292,000 Bank of China Ltd – H 13,801 0.36
1,395,097 Bank of Communications Co Ltd – A 1,011 0.034,015,340 Bank of Communications Co Ltd – H 2,426 0.06
215,700 Bank of Hangzhou Co Ltd – A 435 0.01562,428 Bank of Jiangsu Co Ltd – A 516 0.01372,868 Bank of Nanjing Co Ltd – A 525 0.01224,004 Bank of Ningbo Co Ltd – A 1,348 0.04558,337 Bank of Shanghai Co Ltd – A 626 0.02
NM0522U-2194143-139/163

Reports and Financial Statements 139
iShares MSCI Emerging Markets ETF (HK) (continued)
Investment Protfolio of iShares MSCI EM UCITS ETF USD (Dist) (unaudited) as at 31st December 2021
HoldingsFair valueUS$’000
% ofNet
Assets
People’s Republic of China (11.64%) (Continued)
Banks (Continued)1,436,000 China Bohai Bank Co Ltd – H 553 0.014,150,400 China CITIC Bank Corp Ltd – H 1,799 0.05
310,698 China Construction Bank Corp – A 286 0.0146,657,160 China Construction Bank Corp – H 32,316 0.84
1,453,300 China Everbright Bank Co Ltd – A 759 0.021,172,000 China Everbright Bank Co Ltd – H 415 0.01
626,797 China Merchants Bank Co Ltd – A 4,801 0.121,889,232 China Merchants Bank Co Ltd – H 14,673 0.381,290,997 China Minsheng Banking Corp Ltd
– A 792 0.022,418,160 China Minsheng Banking Corp Ltd
– H 924 0.02701,700 China Zheshang Bank Co Ltd – A 386 0.01548,200 Huaxia Bank Co Ltd – A 483 0.01
1,774,800 Industrial & Commercial Bank of China Ltd – A 1,292 0.03
27,298,880 Industrial & Commercial Bank of China Ltd – H 15,407 0.40
615,493 Industrial Bank Co Ltd – A 1,843 0.05575,899 Ping An Bank Co Ltd – A 1,493 0.04715,500 Postal Savings Bank of China Co Ltd
– A 574 0.013,953,000 Postal Savings Bank of China Co Ltd
– H 2,773 0.07902,552 Shanghai Pudong Development Bank
Co Ltd – A 1,211 0.03
Beverages13,998 Anhui Gujing Distillery Co Ltd – A 537 0.0150,917 Anhui Gujing Distillery Co Ltd ‘B’ 725 0.0224,100 Anhui Kouzi Distillery Co Ltd – A 269 0.0137,700 Beijing Shunxin Agriculture Co Ltd
– A 226 0.0015,400 Chongqing Brewery Co Ltd – A 366 0.0144,000 Jiangsu King’s Luck Brewery JSC Ltd
– A 376 0.0145,562 Jiangsu Yanghe Brewery Joint-Stock
Co Ltd – A 1,180 0.0310,400 JiuGui Liquor Co Ltd – A 348 0.0136,900 Kweichow Moutai Co Ltd – A 11,896 0.3144,800 Luzhou Laojiao Co Ltd – A 1,788 0.05
854,600 Nongfu Spring Co Ltd – H 5,640 0.1528,140 Shanghai Bairun Investment Holding
Group Co Ltd – A 265 0.0136,620 Shanxi Xinghuacun Fen Wine Factory
Co Ltd – A 1,818 0.0517,200 Sichuan Swellfun Co Ltd – A 325 0.0124,845 Tsingtao Brewery Co Ltd – A 387 0.01
254,000 Tsingtao Brewery Co Ltd – H 2,378 0.06114,895 Wuliangye Yibin Co Ltd – A 4,023 0.10
Biotechnology46,558 Beijing Tiantan Biological Products
Corp Ltd – A 212 0.006,255 CanSino Biologics Inc – A 295 0.01
39,800 CanSino Biologics Inc – H 920 0.0262,650 Hualan Biological Engineering Inc – A 287 0.0122,293 Shenzhen Kangtai Biological Products
Co Ltd – A 345 0.01
Building materials and fixtures146,500 Anhui Conch Cement Co Ltd – A 928 0.02572,000 Anhui Conch Cement Co Ltd – H 2,858 0.07529,499 BBMG Corp – A 236 0.01
HoldingsFair valueUS$’000
% ofNet
Assets
People’s Republic of China (11.64%) (Continued)
Building materials and fixtures (Continued)
61,000 Beijing New Building Materials Plc – A 344 0.011,930,000 China National Building Material Co
Ltd – H 2,367 0.0628,800 Hongfa Technology Co Ltd – A 338 0.0199,500 Zhuzhou Kibing Group Co Ltd – A 267 0.01
Chemicals31,900 Guangzhou Tinci Materials
Technology Co Ltd – A 575 0.01186,200 Hengli Petrochemical Co Ltd – A 673 0.02101,200 Kingfa Sci & Tech Co Ltd – A 200 0.01
82,800 Lomon Billions Group Co Ltd – A 372 0.01204,800 Ningxia Baofeng Energy Group Co
Ltd – A 559 0.01309,750 Rongsheng Petrochemical Co Ltd – A 885 0.02
65,000 Satellite Chemical Co Ltd – A 409 0.0175,460 Shandong Hualu Hengsheng
Chemical Co Ltd – A 371 0.0122,800 Shanghai Putailai New Energy
Technology Co Ltd – A 576 0.0159,046 Sinoma Science & Technology Co
Ltd – A 316 0.01291,400 Sinopec Shanghai Petrochemical Co
Ltd – A 191 0.0111,900 Skshu Paint Co Ltd – A 260 0.0197,594 Wanhua Chemical Group Co Ltd – A 1,550 0.0427,900 Yunnan Energy New Material Co
Ltd – A 1,099 0.03134,300 Zhejiang Longsheng Group Co
Ltd – A 267 0.01
Coal985,000 China Coal Energy Co Ltd – H 569 0.01233,355 China Shenhua Energy Co Ltd – A 826 0.02344,300 Shaanxi Coal Industry Co Ltd – A 661 0.02117,200 Shanxi Lu’an Environmental Energy
Development Co Ltd – A 209 0.0134,400 Yankuang Energy Group Co Ltd – A 127 0.00
894,000 Yankuang Energy Group Co Ltd – H 1,777 0.05
Commercial services1,350,100 Beijing-Shanghai High Speed Railway
Co Ltd – A 1,026 0.0314,600 Hangzhou Tigermed Consulting Co
Ltd – A 293 0.0156,400 Hangzhou Tigermed Consulting Co
Ltd – H 716 0.02710,000 Jiangsu Expressway Co Ltd – H 728 0.02
67,200 Ninestar Corp – A 505 0.01433,100 Shanghai International Port Group Co
Ltd – A 373 0.01478,000 TravelSky Technology Ltd – H 804 0.02816,000 Zhejiang Expressway Co Ltd – H 727 0.02
Computers298,699 360 Security Technology Inc – A 597 0.01
1,118,000 BOE Technology Group Co Ltd – A 888 0.02232,300 DHC Software Co Ltd – A 285 0.01
16,000 Ingenic Semiconductor Co Ltd – A 337 0.0157,116 Inspur Electronic Information Industry
Co Ltd – A 322 0.0114,800 Sangfor Technologies Inc – A 445 0.0199,660 Unisplendour Corp Ltd – A 358 0.0199,980 Wuhan Guide Infrared Co Ltd – A 381 0.01
NM0522U-2194143-140/163

140 iShares Asia Trust
iShares MSCI Emerging Markets ETF (HK) (continued)
Investment Protfolio of iShares MSCI EM UCITS ETF USD (Dist) (unaudited) as at 31st December 2021
HoldingsFair valueUS$’000
% ofNet
Assets
People’s Republic of China (11.64%) (Continued)
Distribution & wholesale146,430 Hengyi Petrochemical Co Ltd – A 245 0.01
Diversified financial services230,000 Caitong Securities Co Ltd – A 402 0.01378,700 Changjiang Securities Co Ltd – A 449 0.01
4,339,000 China Cinda Asset Management Co Ltd – H 790 0.02
2,139,500 China Galaxy Securities Co Ltd – H 1,229 0.035,705,000 China Huarong Asset Management
Co Ltd – H 560 0.0118,000 China International Capital Corp
Ltd – A 139 0.00764,800 China International Capital Corp
Ltd – H 2,109 0.05248,667 China Merchants Securities Co
Ltd – A 690 0.02344,200 CITIC Securities Co Ltd – A 1,429 0.04
1,058,000 CITIC Securities Co Ltd – H 2,762 0.07132,000 CSC Financial Co Ltd – A 607 0.02230,797 Dongxing Securities Co Ltd – A 422 0.01326,436 East Money Information Co Ltd – A 1,905 0.05129,699 Everbright Securities Co Ltd – A 305 0.01157,298 Founder Securities Co Ltd – A 194 0.01210,098 GF Securities Co Ltd – A 812 0.02490,000 GF Securities Co Ltd – H 934 0.02314,008 Guosen Securities Co Ltd – A 567 0.01257,200 Guotai Junan Securities Co Ltd – A 724 0.02348,898 Haitong Securities Co Ltd – A 673 0.02
1,166,000 Haitong Securities Co Ltd – H 1,033 0.03275,596 Huatai Securities Co Ltd – A 770 0.02694,600 Huatai Securities Co Ltd – H 1,156 0.03275,400 Industrial Securities Co Ltd – A 428 0.01211,400 Orient Securities Co Ltd – A 490 0.01349,600 SDIC Capital Co Ltd – A 452 0.01769,640 Shenwan Hongyuan Group Co
Ltd – A 620 0.02326,698 Western Securities Co Ltd – A 415 0.01146,400 Zheshang Securities Co Ltd – A 303 0.01182,400 Zhongtai Securities Co Ltd – A 286 0.01
Electrical components & equipment11,630 Changzhou Xingyu Automotive
Lighting Systems Co Ltd – A 374 0.0169,400 Contemporary Amperex Technology
Co Ltd – A 6,417 0.16107,300 Dongfang Electric Corp Ltd – A 361 0.01
58,577 Eve Energy Co Ltd – A 1,089 0.03178,100 Shanxi Meijin Energy Co Ltd – A 455 0.01116,000 TBEA Co Ltd – A 386 0.01
30,435 Wuxi Lead Intelligent Equipment Co Ltd – A 356 0.01
163,511 Xinjiang Goldwind Science & Technology Co Ltd – A 423 0.01
336,888 Xinjiang Goldwind Science & Technology Co Ltd – H 658 0.02
Electricity5,795,000 CGN Power Co Ltd – H 1,762 0.051,657,000 China Longyuan Power Group Corp
Ltd – H 3,868 0.10542,795 China National Nuclear Power Co
Ltd – A 708 0.02694,385 China Yangtze Power Co Ltd – A 2,479 0.06338,700 Huadian Power International Corp
Ltd – A 285 0.01
HoldingsFair valueUS$’000
% ofNet
Assets
People’s Republic of China (11.64%) (Continued)
Electricity (Continued)2,180,000 Huaneng Power International Inc – H 1,457 0.04
106,400 Jiangsu Eastern Shenghong Co Ltd – A 324 0.01
252,100 SDIC Power Holdings Co Ltd – A 455 0.01151,960 Shenzhen Energy Group Co Ltd – A 193 0.00183,800 Sichuan Chuantou Energy Co Ltd – A 361 0.01
Electronics50,700 Avary Holding Shenzhen Co Ltd – A 338 0.0172,396 Chaozhou Three-Circle Group Co
Ltd – A 508 0.0196,000 China Baoan Group Co Ltd – A 218 0.01
117,500 China Greatwall Technology Group Co Ltd – A 262 0.01
42,878 Flat Glass Group Co Ltd – A 391 0.01197,000 Flat Glass Group Co Ltd – H 1,001 0.03258,295 Foxconn Industrial Internet Co Ltd – A 484 0.01110,296 GoerTek Inc – A 938 0.02
22,500 Guangzhou Shiyuan Electronic Technology Co Ltd – A 288 0.01
271,800 Lingyi iTech Guangdong Co – A 315 0.01213,935 Luxshare Precision Industry Co Ltd – A 1,655 0.04123,100 OFILM Group Co Ltd – A 188 0.00
18,662 Raytron Technology Co Ltd – A 231 0.0190,600 Shengyi Technology Co Ltd – A 335 0.0118,180 Shennan Circuits Co Ltd – A 348 0.0184,850 Shenzhen Inovance Technology Co
Ltd – A 915 0.0252,700 Sunwoda Electronic Co Ltd – A 349 0.01
104,599 Tianjin Zhonghuan Semiconductor Co Ltd – A 687 0.02
27,161 Tianma Microelectronics Co Ltd – A 56 0.0040,400 Wingtech Technology Co Ltd – A 821 0.02
9,900 Xiamen Faratronic Co Ltd – A 362 0.0171,097 Zhejiang Chint Electrics Co Ltd – A 602 0.01
Energy – alternate sources8,500 Ginlong Technologies Co Ltd – A 309 0.01
31,400 Hangzhou First Applied Material Co Ltd – A 645 0.01
50,300 JA Solar Technology Co Ltd – A 733 0.02162,456 LONGi Green Energy Technology Co
Ltd – A 2,202 0.0670,400 Ming Yang Smart Energy Group
Ltd – A 289 0.0145,046 Sungrow Power Supply Co Ltd – A 1,033 0.03
3,700 Suzhou Maxwell Technologies Co Ltd – A 374 0.01
9,500 Wuxi Shangji Automation Co Ltd – A 249 0.00
Engineering & construction918,000 Beijing Capital International Airport
Co Ltd – H 562 0.011,308,000 China Communications Services
Corp Ltd – H 637 0.02210,494 China National Chemical Engineering
Co Ltd – A 397 0.01679,198 China Railway Group Ltd – A 618 0.01
1,719,000 China Railway Group Ltd – H 908 0.021,281,619 China State Construction Engineering
Corp Ltd – A 1,008 0.0321,168,000 China Tower Corp Ltd – H 2,335 0.06
665,300 Metallurgical Corp of China Ltd – A 401 0.01490,000 Power Construction Corp of China
Ltd – A 623 0.0234,158 Shanghai International Airport Co
Ltd – A 251 0.01
NM0522U-2194143-141/163

Reports and Financial Statements 141
iShares MSCI Emerging Markets ETF (HK) (continued)
Investment Protfolio of iShares MSCI EM UCITS ETF USD (Dist) (unaudited) as at 31st December 2021
HoldingsFair valueUS$’000
% ofNet
Assets
People’s Republic of China (11.64%) (Continued)
Entertainment129,600 Beijing Enlight Media Co Ltd – A 262 0.01102,220 Songcheng Performance
Development Co Ltd – A 230 0.00
Environmental control198,100 GEM Co Ltd – A 322 0.01
Food32,000 Angel Yeast Co Ltd – A 304 0.0138,600 Chongqing Fuling Zhacai Group Co
Ltd – A 230 0.00104,805 Foshan Haitian Flavouring & Food Co
Ltd – A 1,732 0.049,100 Fu Jian Anjoy Foods Co Ltd – A 244 0.01
97,600 Henan Shuanghui Investment & Development Co Ltd – A 484 0.01
187,299 Inner Mongolia Yili Industrial Group Co Ltd – A 1,221 0.03
24,300 Juewei Food Co Ltd – A 261 0.0143,900 Yihai Kerry Arawana Holdings Co
Ltd – A 435 0.01363,992 Yonghui Superstores Co Ltd – A 232 0.01
Gas871,000 China Suntien Green Energy Corp
Ltd – H 679 0.02
Healthcare products25,008 Autobio Diagnostics Co Ltd – A 216 0.0014,400 BGI Genomics Co Ltd – A 199 0.0020,327 Intco Medical Technology Co Ltd – A 185 0.0027,640 Jafron Biomedical Co Ltd – A 232 0.0175,000 Lepu Medical Technology Beijing Co
Ltd – A 267 0.0131,600 Ovctek China Inc – A 285 0.01
1,235,600 Shandong Weigao Group Medical Polymer Co Ltd – H 1,542 0.04
36,500 Shenzhen Mindray Bio-Medical Electronics Co Ltd – A 2,186 0.06
106,500 Venus MedTech Hangzhou Inc – H 404 0.01
Healthcare services165,959 Aier Eye Hospital Group Co Ltd – A 1,103 0.03
8,500 Asymchem Laboratories Tianjin Co Ltd – A 582 0.01
15,100 Guangzhou Kingmed Diagnostics Group Co Ltd – A 265 0.01
147,558 Meinian Onehealth Healthcare Holdings Co Ltd – A 182 0.00
20,300 Pharmaron Beijing Co Ltd – A 451 0.0169,000 Pharmaron Beijing Co Ltd – H 1,065 0.0310,700 Topchoice Medical Corp – A 335 0.0180,778 WuXi AppTec Co Ltd – A 1,506 0.04
167,092 WuXi AppTec Co Ltd – H 2,893 0.08
Home furnishings2,665 Beijing Roborock Technology Co
Ltd – A 341 0.0116,178 Ecovacs Robotics Co Ltd – A 384 0.01
215,500 Haier Smart Home Co Ltd – A 1,013 0.021,077,400 Haier Smart Home Co Ltd – H 4,553 0.12
46,100 Hangzhou Robam Appliances Co Ltd – A 261 0.01
26,654 Jason Furniture Hangzhou Co Ltd – A 323 0.0120,200 Oppein Home Group Inc – A 469 0.01
485,199 TCL Technology Group Corp – A 471 0.01
HoldingsFair valueUS$’000
% ofNet
Assets
People’s Republic of China (11.64%) (Continued)
Hotels31,491 Shanghai Jinjiang International
Hotels Co Ltd – A 290 0.01
Insurance105,600 China Life Insurance Co Ltd – A 500 0.01
3,502,000 China Life Insurance Co Ltd – H 5,804 0.15220,198 China Pacific Insurance Group Co Ltd
– A 939 0.031,267,800 China Pacific Insurance Group Co Ltd
– H 3,439 0.091,637,000 China Shenhua Energy Co Ltd – H 3,838 0.10
79,437 New China Life Insurance Co Ltd – A 486 0.01360,500 New China Life Insurance Co Ltd – H 964 0.03
4,348,000 People’s Insurance Co Group of China Ltd – H 1,316 0.03
3,313,872 PICC Property & Casualty Co Ltd – H 2,708 0.07333,897 Ping An Insurance Group Co of China
Ltd – A 2,647 0.073,067,000 Ping An Insurance Group Co of China
Ltd – H 22,089 0.57247,800 ZhongAn Online P&C Insurance Co
Ltd – H 861 0.02
Internet18,200 Hithink RoyalFlush Information
Network Co Ltd – A 414 0.01
Iron & steel706,896 Baoshan Iron & Steel Co Ltd – A 796 0.02
1,476,494 Inner Mongolia BaoTou Steel Union Co Ltd – A 648 0.02
223,800 Shanxi Taigang Stainless Steel Co Ltd – A 247 0.00
Machinery – diversified44,800 Jiangsu Hengli Hydraulic Co Ltd – A 576 0.01
181,138 NARI Technology Co Ltd – A 1,140 0.0313,000 Shenzhen SC New Energy
Technology Corp – A 234 0.0142,900 Zhejiang Jingsheng Mechanical &
Electrical Co Ltd – A 469 0.01
Machinery, construction & mining265,100 Sany Heavy Industry Co Ltd – A 950 0.02513,600 Shanghai Electric Group Co Ltd – A 393 0.01314,000 XCMG Construction Machinery Co
Ltd – A 296 0.0116,704 Zhejiang HangKe Technology Inc Co
– A 283 0.01274,194 Zoomlion Heavy Industry Science and
Technology Co Ltd – A 309 0.01600,600 Zoomlion Heavy Industry Science and
Technology Co Ltd – H 378 0.01
Marine transportation157,800 China CSSC Holdings Ltd – A 615 0.02
Metal fabricate/ hardware11,800 Guangdong Kinlong Hardware
Products Co Ltd – A 337 0.01137,000 Zhejiang Sanhua Intelligent Controls
Co Ltd – A 545 0.01
NM0522U-2194143-142/163

142 iShares Asia Trust
iShares MSCI Emerging Markets ETF (HK) (continued)
Investment Protfolio of iShares MSCI EM UCITS ETF USD (Dist) (unaudited) as at 31st December 2021
HoldingsFair valueUS$’000
% ofNet
Assets
People’s Republic of China (11.64%) (Continued)
Mining495,097 Aluminum Corp of China Ltd – A 474 0.01
1,820,000 Aluminum Corp of China Ltd – H 1,006 0.03637,598 China Molybdenum Co Ltd – A 559 0.01
1,521,000 China Molybdenum Co Ltd – H 802 0.02115,400 China Northern Rare Earth Group
High-Tech Co Ltd – A' 831 0.0235,600 Ganfeng Lithium Co Ltd – A 800 0.02
126,800 Ganfeng Lithium Co Ltd – H 1,996 0.0590,500 Jiangxi Copper Co Ltd – A 318 0.01
542,000 Jiangxi Copper Co Ltd – H 868 0.02138,620 Shandong Gold Mining Co Ltd – A 410 0.01338,250 Shandong Gold Mining Co Ltd – H 579 0.01466,400 Shandong Nanshan Aluminum Co
Ltd – A 345 0.01125,400 Yunnan Aluminium Co Ltd – A 220 0.01
38,600 Zhejiang Huayou Cobalt Co Ltd – A 670 0.02651,800 Zijin Mining Group Co Ltd – A 994 0.03
2,782,500 Zijin Mining Group Co Ltd – H 3,312 0.09
Miscellaneous manufacturers144,475 China Jushi Co Ltd – A 414 0.01882,000 CRRC Corp Ltd – A 845 0.02
1,748,000 CRRC Corp Ltd – H 751 0.0239,700 Jonjee Hi-Tech Industrial and
Commercial Holding Co Ltd – A 237 0.0181,400 Kuang-Chi Technologies Co Ltd – A 307 0.01
170,100 Lens Technology Co Ltd – A 615 0.01274,800 Zhuzhou CRRC Times Electric Co Ltd 1,591 0.04
Oil & gas1,014,000 China Petroleum & Chemical Corp – A 674 0.02
11,809,000 China Petroleum & Chemical Corp – H 5,498 0.14729,100 PetroChina Co Ltd – A 563 0.01
10,278,000 PetroChina Co Ltd – H 4,575 0.12
Oil & gas services924,000 China Oilfield Services Ltd – H 809 0.02
Pharmaceuticals13,200 Beijing Wantai Biological Pharmacy
Enterprise Co Ltd – A 460 0.0168,100 By-health Co Ltd – A 289 0.0113,200 Changchun High & New Technology
Industry Group Inc – A 563 0.0174,997 China Resources Sanjiu Medical
&Pharmaceutical Co Ltd – A 404 0.0148,500 Chongqing Zhifei Biological Products
Co Ltd – A 950 0.0387,000 Guangzhou Baiyunshan
Pharmaceutical Holdings Co Ltd – A 468 0.01
61,390 Huadong Medicine Co Ltd – A 388 0.016,800 Imeik Technology Development Co
Ltd – A 573 0.02196,824 Jiangsu Hengrui Medicine Co Ltd – A 1,570 0.04107,510 Shandong Buchang Pharmaceuticals
Co Ltd – A 357 0.0164,500 Shanghai Fosun Pharmaceutical
Group Co Ltd – A 496 0.01237,000 Shanghai Fosun Pharmaceutical
Group Co Ltd – H 1,044 0.03318,000 Shanghai RAAS Blood Products Co
Ltd – A 341 0.01
HoldingsFair valueUS$’000
% ofNet
Assets
People’s Republic of China (11.64%) (Continued)
Pharmaceuticals (Continued)94,600 Sichuan Kelun Pharmaceutical Co
Ltd – A 282 0.01642,800 Sinopharm Group Co Ltd – H 1,398 0.04
49,700 Walvax Biotechnology Co Ltd – A 439 0.0140,099 Yunnan Baiyao Group Co Ltd – A 660 0.0219,081 Zhangzhou Pientzehuang
Pharmaceutical Co Ltd – A 1,312 0.0397,978 Zhejiang NHU Co Ltd – A 480 0.0119,664 Zhejiang Wolwo Bio-Pharmaceutical
Co Ltd – A 177 0.00
Real estate investment & services282,750 A-Living Smart City Services Co Ltd 482 0.01221,397 China Merchants Shekou Industrial
Zone Holdings Co Ltd – A 465 0.01312,498 China Vanke Co Ltd – A 971 0.03787,800 China Vanke Co Ltd – H 1,833 0.05157,697 Gemdale Corp – A 322 0.01290,743 Greenland Holdings Corp Ltd – A 199 0.00780,000 Guangzhou R&F Properties Co
Ltd – H 290 0.01224,100 Jinke Properties Group Co Ltd – A 158 0.00366,493 Poly Developments and Holdings
Group Co Ltd – A 901 0.02295,600 RiseSun Real Estate Development Co
Ltd – A 202 0.0174,680 Seazen Holdings Co Ltd – A 342 0.01
555,736 Shanghai Lujiazui Finance & Trade Zone Development Co Ltd ‘B’ 506 0.01
296,600 Shenzhen Overseas Chinese Town Co Ltd – A 328 0.01
Retail57,759 China Tourism Group Duty Free Corp
Ltd – A 1,993 0.0559,710 Mango Excellent Media Co Ltd – A 537 0.0132,400 Shanghai M&G Stationery Inc – A 329 0.01
111,792 Shanghai Pharmaceuticals Holding Co Ltd – A 349 0.01
349,400 Shanghai Pharmaceuticals Holding Co Ltd – H 662 0.02
374,192 Suning.com Co Ltd – A 243 0.0133,874 Yifeng Pharmacy Chain Co Ltd – A 294 0.01
Semiconductors19,010 Advanced Micro-Fabrication
Equipment Inc China – A 378 0.01218,800 GCL System Integration Technology
Co Ltd – A 131 0.0021,417 Gigadevice Semiconductor Beijing
Inc – A 592 0.0143,600 Hangzhou Silan Microelectronics Co
Ltd – A 372 0.0114,400 Hoshine Silicon Industry Co Ltd – A 299 0.0159,900 JCET Group Co Ltd – A 292 0.0110,540 Maxscend Microelectronics Co
Ltd – A 542 0.0126,800 Montage Technology Co Ltd – A 353 0.0176,186 National Silicon Industry Group Co
Ltd – A 309 0.0116,200 NAURA Technology Group Co Ltd – A 884 0.02
8,020 SG Micro Corp – A 390 0.0117,600 Shenzhen Goodix Technology Co
Ltd – A 298 0.01
NM0522U-2194143-143/163

Reports and Financial Statements 143
iShares MSCI Emerging Markets ETF (HK) (continued)
Investment Protfolio of iShares MSCI EM UCITS ETF USD (Dist) (unaudited) as at 31st December 2021
HoldingsFair valueUS$’000
% ofNet
Assets
People’s Republic of China (11.64%) (Continued)
Semiconductors (Continued)5,700 StarPower Semiconductor Ltd – A 342 0.01
21,000 Suzhou TA&A Ultra Clean Technology Co Ltd – A 267 0.01
19,800 Unigroup Guoxin Microelectronics Co Ltd – A 701 0.02
26,400 Will Semiconductor Co Ltd – A 1,290 0.03
Software11,925 Beijing Kingsoft Office Software
Inc – A 497 0.0146,200 Beijing Shiji Information Technology
Co Ltd – A 209 0.00105,799 Beijing Sinnet Technology Co Ltd – A 247 0.01160,967 Giant Network Group Co Ltd – A 303 0.01
57,316 Hundsun Technologies Inc – A 560 0.0175,474 Iflytek Co Ltd – A 623 0.02
118,400 NavInfo Co Ltd – A 297 0.0181,200 Perfect World Co Ltd – A 259 0.0144,170 Shanghai Baosight Software Co
Ltd – A 423 0.01157,315 Shanghai Baosight Software Co
Ltd – B 759 0.0216,800 Thunder Software Technology Co Ltd
– A 366 0.0185,900 Wuhu Sanqi Interactive Entertainment
NetworkTechnology Group Co Ltd – A 365 0.01
113,856 Yonyou Network Technology Co Ltd – A 642 0.02
262,900 Zhejiang Century Huatong Group Co Ltd – A 347 0.01
131,398 Zhejiang Dahua Technology Co Ltd – A 485 0.01
Telecommunications1,205,000 China United Network
Communications Ltd – A 745 0.0218,700 China Zhenhua Group Science &
Technology Co Ltd – A 366 0.01186,787 Guangzhou Haige Communications
Group Inc Co – A 321 0.01102,100 Jiangsu Zhongtian Technology Co
Ltd – A 272 0.0145,900 Shenzhen Sunway Communication
Co Ltd – A 183 0.0122,679 Shenzhen Transsion Holdings Co
Ltd – A 560 0.0134,147 Yealink Network Technology Corp
Ltd – A 437 0.01142,800 ZTE Corp – A 752 0.02339,720 ZTE Corp – H 930 0.02
Textile82,300 Tongkun Group Co Ltd – A 274 0.01
173,955 Zhejiang Huafeng Spandex Co Ltd – A 286 0.01
Transportation395,198 COSCO SHIPPING Holdings Co
Ltd – A 1,162 0.031,627,249 COSCO SHIPPING Holdings Co
Ltd – H 3,156 0.08139,300 SF Holding Co Ltd – A 1,510 0.04222,600 Xiamen C & D Inc – A 317 0.01104,769 Yunda Holding Co Ltd – A 337 0.01
448,459 11.64
HoldingsFair valueUS$’000
% ofNet
Assets
Peru (0.02%)
Mining110,827 Cia de Minas Buenaventura SAAADR 811 0.02
811 0.02
Philippines (0.71%)
Auto manufacturers47,113 GT Capital Holdings Inc 499 0.01
Banks858,330 Bank of the Philippine Islands 1,551 0.04962,788 BDO Unibank Inc 2,279 0.06909,876 Metropolitan Bank & Trust Co 994 0.03
Commercial services505,680 International Container Terminal
Services Inc 1,983 0.05
Electricity3,530,600 AC Energy Corp 761 0.02
97,570 Manila Electric Co 565 0.02
Food1,487,862 JG Summit Holdings Inc 1,547 0.041,713,400 Monde Nissin Corp 544 0.01
442,610 Universal Robina Corp 1,111 0.03
Holding companies – diversified operations
1,036,560 Aboitiz Equity Ventures Inc 1,107 0.03
Real estate investment & services136,534 Ayala Corp 2,225 0.06
4,037,170 Ayala Land Inc 2,906 0.075,002,292 SM Prime Holdings Inc 3,325 0.09
Retail216,180 Jollibee Foods Corp 917 0.02121,220 SM Investments Corp 2,242 0.06
Telecommunications12,493 Globe Telecom Inc 814 0.0235,349 PLDT Inc 1,256 0.04
Water6,713,900 Metro Pacific Investments Corp 514 0.01
27,140 0.71
Poland (0.71%)
Apparel retailers481 LPP SA 2,053 0.05
Banks91,347 Bank Polska Kasa Opieki SA 2,765 0.07
6,244 mBank SA 671 0.02430,748 Powszechna Kasa Oszczednosci Bank
Polski SA 4,802 0.1318,587 Santander Bank Polska SA 1,607 0.04
Electricity425,058 PGE Polska Grupa Energetyczna SA 850 0.02
Food24,347 Dino Polska SA 2,219 0.06
NM0522U-2194143-144/163

144 iShares Asia Trust
iShares MSCI Emerging Markets ETF (HK) (continued)
Investment Protfolio of iShares MSCI EM UCITS ETF USD (Dist) (unaudited) as at 31st December 2021
HoldingsFair valueUS$’000
% ofNet
Assets
Poland (0.71%) (Continued)
Insurance290,013 Powszechny Zaklad Ubezpieczen SA 2,544 0.07
Media131,064 Cyfrowy Polsat SA 1,129 0.03
Mining68,198 KGHM Polska Miedz SA 2,359 0.06
Oil & gas146,484 Polski Koncern Naftowy ORLEN SA 2,702 0.07869,873 Polskie Gornictwo Naftowe i
Gazownictwo SA 1,359 0.03
Software34,217 CD Projekt SA 1,638 0.04
Telecommunications353,101 Orange Polska SA 740 0.02
27,438 0.71
Qatar (0.77%)
Banks1,057,200 Commercial Bank PSQC 1,943 0.052,227,816 Masraf Al Rayan QSC 2,815 0.07
401,475 Qatar International Islamic Bank QSC 1,007 0.03572,441 Qatar Islamic Bank SAQ 2,858 0.07
2,211,151 Qatar National Bank QPSC 12,157 0.32
Chemicals2,394,385 Mesaieed Petrochemical Holding Co 1,363 0.04
Electricity175,284 Qatar Electricity & Water Co QSC 793 0.02
Iron & steel678,084 Industries Qatar QSC 2,860 0.07
Oil & gas196,874 Qatar Fuel QSC 980 0.03
Real estate investment & services1,021,629 Barwa Real Estate Co 851 0.02
Telecommunications442,721 Ooredoo QPSC 846 0.02
Transportation1,201,978 Qatar Gas Transport Co Ltd 1,080 0.03
29,553 0.77
Republic of South Korea (12.76%)
Advertising30,927 Cheil Worldwide Inc 594 0.02
Aerospace & defence36,523 Korea Aerospace Industries Ltd 997 0.03
Agriculture54,890 KT&G Corp 3,648 0.09
Airlines83,367 Korean Air Lines Co Ltd 2,058 0.05
HoldingsFair valueUS$’000
% ofNet
Assets
Republic of South Korea (12.76%) (Continued)
Auto manufacturers68,113 Hyundai Motor Co 11,975 0.3117,384 Hyundai Motor Co (2nd Pref) 1,477 0.0410,419 Hyundai Motor Co (Pref) 863 0.02
128,659 Kia Corp 8,897 0.23
Auto parts & equipment38,082 Hankook Tire & Technology Co Ltd 1,272 0.0394,820 Hanon Systems 1,073 0.0332,163 Hyundai Mobis Co Ltd 6,885 0.18
Banks125,538 Industrial Bank of Korea 1,088 0.03
42,618 KakaoBank Corp 2,115 0.05210,441 Shinhan Financial Group Co Ltd 6,514 0.17245,863 Woori Financial Group Inc 2,627 0.07
Biotechnology8,140 Samsung Biologics Co Ltd 6,183 0.16
18,570 Seegene Inc 953 0.0213,922 SK Biopharmaceuticals Co Ltd 1,138 0.0311,167 SK Bioscience Co Ltd 2,114 0.06
Chemicals60,354 Hanwha Solutions Corp 1,802 0.05
9,163 Kumho Petrochemical Co Ltd 1,280 0.0322,399 LG Chem Ltd 11,588 0.30
3,649 LG Chem Ltd (Pref) 881 0.028,082 Lotte Chemical Corp 1,475 0.045,923 SK Chemicals Co Ltd 743 0.028,513 SK IE Technology Co Ltd 1,203 0.03
Commercial services9,044 S-1 Corp 562 0.01
Computers42,565 LG Corp 2,897 0.0717,125 Samsung SDS Co Ltd 2,254 0.06
Cosmetics & personal care15,719 Amorepacific Corp 2,208 0.0615,703 AMOREPACIFIC Group 586 0.02
4,528 LG Household & Health Care Ltd 4,178 0.111,038 LG Household & Health Care Ltd
(Pref) 538 0.01
Diversified financial services145,782 Hana Financial Group Inc 5,157 0.13192,160 KB Financial Group Inc 8,891 0.23
20,483 Korea Investment Holdings Co Ltd 1,391 0.03153,544 Meritz Securities Co Ltd 665 0.02138,987 Mirae Asset Securities Co Ltd 1,011 0.03
62,598 NH Investment & Securities Co Ltd 658 0.0232,075 Samsung Securities Co Ltd 1,211 0.03
Electrical components & equipment5,436 Ecopro BM Co Ltd 2,290 0.06
11,118 L&F Co Ltd 2,080 0.057,072 LG Innotek Co Ltd 2,166 0.06
Electricity122,641 Korea Electric Power Corp 2,280 0.06
Electronics11,150 Iljin Materials Co Ltd 1,266 0.03
114,842 LG Display Co Ltd 2,377 0.0627,545 Samsung Electro-Mechanics Co Ltd 4,576 0.12
NM0522U-2194143-145/163

Reports and Financial Statements 145
iShares MSCI Emerging Markets ETF (HK) (continued)
Investment Protfolio of iShares MSCI EM UCITS ETF USD (Dist) (unaudited) as at 31st December 2021
HoldingsFair valueUS$’000
% ofNet
Assets
Republic of South Korea (12.76%) (Continued)
Engineering & construction30,617 GS Engineering & Construction Corp 1,020 0.0338,055 Hyundai Engineering & Construction
Co Ltd 1,423 0.0440,597 Samsung C&T Corp 4,064 0.1078,005 Samsung Engineering Co Ltd 1,502 0.04
Entertainment5,245 CJ ENM Co Ltd 612 0.017,666 HYBE Co Ltd 2,251 0.06
Food3,981 CJ CheilJedang Corp 1,298 0.037,652 CJ Corp 537 0.02
25,266 GS Holdings Corp 831 0.0212,352 Orion Corp 1,075 0.03
Healthcare products15,493 SD Biosensor Inc 729 0.02
Home furnishings26,713 Coway Co Ltd 1,672 0.0452,082 LG Electronics Inc 6,046 0.16
Hotels49,130 Kangwon Land Inc 994 0.03
Insurance23,836 DB Insurance Co Ltd 1,083 0.0315,006 Samsung Fire & Marine Insurance Co
Ltd 2,550 0.0633,305 Samsung Life Insurance Co Ltd 1,796 0.05
Internet152,674 Kakao Corp 14,449 0.38
60,242 NAVER Corp 19,181 0.508,090 NCSoft Corp 4,376 0.11
Investment services8,683 SK Square Co Ltd 485 0.01
Iron & steel42,355 Hyundai Steel Co 1,461 0.0436,056 POSCO 8,326 0.21
Machinery, construction & mining26,564 Doosan Bobcat Inc 911 0.02
151,218 Doosan Heavy Industries & Construction Co Ltd 2,595 0.07
Marine transportation44,412 HLB Inc 1,300 0.0319,148 Korea Shipbuilding & Offshore
Engineering Co Ltd 1,524 0.04309,701 Samsung Heavy Industries Co Ltd 1,477 0.04
Mining4,237 Korea Zinc Co Ltd 1,821 0.05
Miscellaneous manufacturers15,171 POSCO Chemical Co Ltd 1,838 0.0510,538 SKC Co Ltd 1,547 0.04
Oil & gas23,195 Hyundai Heavy Industries Holdings
Co Ltd 1,048 0.0320,528 SK Inc 4,334 0.1124,976 SK Innovation Co Ltd 5,011 0.1322,638 S-Oil Corp 1,632 0.04
HoldingsFair valueUS$’000
% ofNet
Assets
Republic of South Korea (12.76%) (Continued)
Pharmaceuticals14,376 Alteogen Inc 915 0.0242,555 Celltrion Healthcare Co Ltd 2,871 0.0848,174 Celltrion Inc 8,024 0.21
8,554 Celltrion Pharm Inc 895 0.022,839 Green Cross Corp 521 0.013,525 Hanmi Pharm Co Ltd 818 0.02
15,916 Shin Poong Pharmaceutical Co Ltd 428 0.0126,125 Yuhan Corp 1,365 0.04
Retail4,170 BGF retail Co Ltd 510 0.029,291 E-MART Inc 1,180 0.031,572 F&F Co Ltd 1,250 0.03
15,649 Hotel Shilla Co Ltd 1,027 0.036,255 Lotte Shopping Co Ltd 459 0.01
Semiconductors2,332,093 Samsung Electronics Co Ltd 153,609 3.99
403,021 Samsung Electronics Co Ltd (Pref) 24,139 0.63266,449 SK Hynix Inc 29,363 0.76
Software10,491 Douzone Bizon Co Ltd 644 0.0214,683 Kakao Games Corp 1,124 0.0310,470 Krafton Inc 4,052 0.1110,886 Netmarble Corp 1,145 0.0314,959 Pearl Abyss Corp 1,740 0.04
Telecommunications101,563 LG Uplus Corp 1,162 0.03
26,961 Samsung SDI Co Ltd 14,856 0.3813,432 SK Telecom Co Ltd 654 0.02
Transportation4,351 CJ Logistics Corp 461 0.01
128,039 HMM Co Ltd 2,898 0.088,871 Hyundai Glovis Co Ltd 1,254 0.03
141,367 Pan Ocean Co Ltd 643 0.02
491,491 12.76
Russian Federation (3.05%)
Banks5,227,454 Sberbank of Russia PJSC 20,463 0.53
1,566,607,713 VTB Bank PJSC 1,009 0.03
Chemicals69,612 PhosAgro PJSC RegS GDR 1,502 0.04
Diversified financial services713,151 Moscow Exchange MICEX-RTS PJSC 1,456 0.04
Electricity17,531,682 Inter RAO UES PJSC 999 0.03
Food166,612 Magnit PJSC GDR 2,499 0.06
Iron & steel740,874 Novolipetsk Steel PJSC 2,150 0.06107,832 Severstal PAO 2,307 0.06
NM0522U-2194143-146/163

146 iShares Asia Trust
iShares MSCI Emerging Markets ETF (HK) (continued)
Investment Protfolio of iShares MSCI EM UCITS ETF USD (Dist) (unaudited) as at 31st December 2021
HoldingsFair valueUS$’000
% ofNet
Assets
Russian Federation (3.05%)(Continued)
Mining1,301,681 Alrosa PJSC 2,131 0.05
31,052 MMC Norilsk Nickel PJSC 9,451 0.2416,770 Polyus PJSC 2,923 0.08
1,407,330 United Co RUSAL International PJSC 1,389 0.04
Oil & gas5,792,329 Gazprom PJSC 26,510 0.69
203,395 LUKOIL PJSC 17,816 0.4644,321 Novatek PJSC RegS GDR 10,380 0.27
560,247 Rosneft Oil Co PJSC 4,481 0.123,529,268 Surgutneftegas PJSC 1,872 0.053,327,795 Surgutneftegas PJSC (Pref) 1,707 0.04
702,152 Tatneft PJSC 4,685 0.12
Telecommunications213,791 Mobile TeleSystems PJSC ADR 1,700 0.04
117,430 3.05
Saudi Arabia (2.57%)
Banks463,404 Al Rajhi Bank 17,502 0.45375,616 Alinma Bank 2,397 0.06237,181 Arab National Bank 1,444 0.04121,038 Bank AlBilad 1,494 0.04185,708 Bank Al-Jazira 955 0.02229,174 Banque Saudi Fransi 2,884 0.07518,605 Riyad Bank 3,744 0.10289,685 Saudi British Bank 2,546 0.07827,038 Saudi National Bank 14,187 0.37
Building materials and fixtures31,841 Saudi Cement Co 465 0.01
Chemicals44,905 Advanced Petrochemical Co 842 0.02
148,869 National Industrialization Co 791 0.0235,346 National Petrochemical Co 377 0.0196,978 Rabigh Refining & Petrochemical Co 535 0.0182,710 SABIC Agri-Nutrients Co 3,890 0.10
146,245 Sahara International Petrochemical Co 1,636 0.04
167,586 Saudi Arabian Mining Co 3,504 0.09336,677 Saudi Basic Industries Corp 10,402 0.27292,899 Saudi Kayan Petrochemical Co 1,328 0.04
95,360 Yanbu National Petrochemical Co 1,745 0.05
Electricity313,199 Saudi Electricity Co 2,000 0.05
Food89,162 Almarai Co JSC 1,158 0.0397,845 Savola Group 832 0.02
Healthcare services21,837 Dr Sulaiman Al Habib Medical
Services Group Co 939 0.0214,749 Mouwasat Medical Services Co 683 0.02
Insurance25,944 Bupa Arabia for Cooperative
Insurance Co 908 0.0228,313 Co for Cooperative Insurance 584 0.02
HoldingsFair valueUS$’000
% ofNet
Assets
Saudi Arabia (2.57%) (Continued)
Investment services94,250 Saudi Industrial Investment Group 782 0.02
Oil & gas825,862 Saudi Arabian Oil Co 7,875 0.21
Real estate investment & services219,045 Dar Al Arkan Real Estate
Development Co 587 0.01110,276 Emaar Economic City 351 0.01
Retail8,693 Abdullah Al Othaim Markets Co 250 0.01
21,611 Jarir Marketing Co 1,133 0.03
Telecommunications142,208 Etihad Etisalat Co 1,180 0.03132,436 Mobile Telecommunications Co
Saudi Arabia 425 0.01222,624 Saudi Telecom Co 6,665 0.18
99,020 2.57
Singapore (0.02%)
Diversified financial services107,800 BOC Aviation Ltd 790 0.02
790 0.02
South Africa (3.09%)
Banks352,550 Absa Group Ltd 3,370 0.09
2,457,282 FirstRand Ltd 9,361 0.24221,891 Nedbank Group Ltd 2,433 0.07625,158 Standard Bank Group Ltd 5,484 0.14
Chemicals278,015 Sasol Ltd 4,512 0.12
Coal131,499 Exxaro Resources Ltd 1,260 0.03
Commercial services137,875 Bidvest Group Ltd 1,637 0.04
Diversified financial services39,673 Capitec Bank Holdings Ltd 5,070 0.13
2,389,170 Old Mutual Ltd 1,961 0.05904,168 Sanlam Ltd 3,363 0.09
Food167,212 Bid Corp Ltd 3,420 0.09261,603 Remgro Ltd 2,150 0.06246,724 Shoprite Holdings Ltd 3,229 0.08
89,245 SPAR Group Ltd 934 0.0283,397 Tiger Brands Ltd 946 0.03
497,407 Woolworths Holdings Ltd 1,616 0.04
Insurance210,905 Discovery Ltd 1,897 0.05
Internet105,589 Naspers Ltd – N 16,354 0.42
NM0522U-2194143-147/163

Reports and Financial Statements 147
iShares MSCI Emerging Markets ETF (HK) (continued)
Investment Protfolio of iShares MSCI EM UCITS ETF USD (Dist) (unaudited) as at 31st December 2021
HoldingsFair valueUS$’000
% ofNet
Assets
South Africa (3.09%) (Continued)
Investment services375,362 Rand Merchant Investment Holdings
Ltd 1,062 0.03
Iron & steel32,381 Kumba Iron Ore Ltd 934 0.02
Media184,857 MultiChoice Group 1,413 0.04
Mining55,337 African Rainbow Minerals Ltd 802 0.0226,369 Anglo American Platinum Ltd 3,002 0.08
204,315 AngloGold Ashanti Ltd 4,208 0.11438,758 Gold Fields Ltd 4,787 0.12284,471 Harmony Gold Mining Co Ltd 1,187 0.03397,669 Impala Platinum Holdings Ltd 5,606 0.15178,620 Northam Platinum Holdings Ltd 2,345 0.06
1,351,405 Sibanye Stillwater Ltd 4,157 0.11
Pharmaceuticals191,116 Aspen Pharmacare Holdings Ltd 2,688 0.07
Real estate investment trusts1,713,970 Growthpoint Properties Ltd (REIT) 1,651 0.04
Retail124,511 Clicks Group Ltd 2,462 0.06127,629 Mr Price Group Ltd 1,595 0.04538,526 Pepkor Holdings Ltd 739 0.02
Telecommunications835,621 MTN Group Ltd 8,938 0.23308,969 Vodacom Group Ltd 2,606 0.07
119,179 3.09
Taiwan (15.52%)
Apparel retailers92,418 Eclat Textile Co Ltd 2,108 0.05
217,630 Feng TAY Enterprise Co Ltd 1,821 0.051,143,614 Pou Chen Corp 1,370 0.04
Auto parts & equipment904,800 Cheng Shin Rubber Industry Co Ltd 1,181 0.03
Banks1,956,674 Chang Hwa Commercial Bank Ltd 1,202 0.031,742,313 Shanghai Commercial & Savings
Bank Ltd 2,976 0.08
Biotechnology112,000 Oneness Biotech Co Ltd 1,164 0.03
Building materials and fixtures1,046,757 Asia Cement Corp 1,676 0.042,450,900 Taiwan Cement Corp 4,252 0.11
Chemicals1,722,828 Formosa Chemicals & Fibre Corp 5,031 0.131,881,584 Formosa Plastics Corp 7,073 0.182,558,335 Nan Ya Plastics Corp 7,897 0.21
Computers1,500,550 Acer Inc 1,651 0.04
175,167 Advantech Co Ltd 2,510 0.07
HoldingsFair valueUS$’000
% ofNet
Assets
Taiwan (15.52%) (Continued)
Computers (Continued)346,480 Asustek Computer Inc 4,709 0.12
1,858,163 Compal Electronics Inc 1,625 0.04467,865 Foxconn Technology Co Ltd 1,098 0.03
4,618,057 Innolux Corp 3,272 0.081,244,000 Inventec Corp 1,122 0.031,317,789 Quanta Computer Inc 4,511 0.121,313,660 Wistron Corp 1,384 0.04
38,000 Wiwynn Corp 1,531 0.04
Diversified financial services7,527,102 China Development Financial
Holding Corp 4,761 0.12779,244 China Development Financial
Holding Corp (Pref) 270 0.018,986,402 CTBC Financial Holding Co Ltd 8,429 0.225,976,891 E.Sun Financial Holding Co Ltd 6,059 0.165,190,296 First Financial Holding Co Ltd 4,596 0.123,705,142 Fubon Financial Holding Co Ltd 10,218 0.264,056,999 Hua Nan Financial Holdings Co Ltd 3,109 0.085,291,000 Mega Financial Holding Co Ltd 6,798 0.185,188,675 SinoPac Financial Holdings Co Ltd 3,029 0.085,289,662 Taishin Financial Holding Co Ltd 3,623 0.094,477,502 Taiwan Cooperative Financial Holding
Co Ltd 4,119 0.114,805,975 Yuanta Financial Holding Co Ltd 4,395 0.11
Electrical components & equipment952,449 Delta Electronics Inc 9,467 0.25
Electronics4,028,939 AU Optronics Corp 3,335 0.096,055,883 Hon Hai Precision Industry Co Ltd 22,764 0.59
340,000 Micro-Star International Co Ltd 1,972 0.05113,000 Nan Ya Printed Circuit Board Corp 2,336 0.06942,097 Pegatron Corp 2,353 0.06541,150 Synnex Technology International
Corp 1,295 0.03595,000 Unimicron Technology Corp 4,968 0.13
28,000 Voltronic Power Technology Corp 1,563 0.04755,720 WPG Holdings Ltd 1,437 0.04212,576 Yageo Corp 3,684 0.10
Food2,341,567 Uni-President Enterprises Corp 5,806 0.15
Home furnishings1,067,472 Lite-On Technology Corp 2,462 0.06
Household products81,000 Nien Made Enterprise Co Ltd 1,208 0.03
Insurance3,853,620 Cathay Financial Holding Co Ltd 8,705 0.225,637,253 Shin Kong Financial Holding Co Ltd 2,252 0.06
Internet23,000 momo.com Inc 1,351 0.03
Iron & steel5,809,103 China Steel Corp 7,422 0.19
Leisure time143,000 Giant Manufacturing Co Ltd 1,783 0.05
Metal fabricate/ hardware321,197 Catcher Technology Co Ltd 1,817 0.05
NM0522U-2194143-148/163

148 iShares Asia Trust
iShares MSCI Emerging Markets ETF (HK) (continued)
Investment Protfolio of iShares MSCI EM UCITS ETF USD (Dist) (unaudited) as at 31st December 2021
HoldingsFair valueUS$’000
% ofNet
Assets
Taiwan (15.52%) (Continued)
Miscellaneous manufacturers130,847 Hiwin Technologies Corp 1,450 0.04
47,773 Largan Precision Co Ltd 4,256 0.11
Oil & gas529,000 Formosa Petrochemical Corp 1,834 0.05
Real estate investment & services571,627 Ruentex Development Co Ltd 1,318 0.03
Retail148,000 Hotai Motor Co Ltd 3,284 0.09273,000 President Chain Store Corp 2,699 0.07
Semiconductors1,604,248 ASE Technology Holding Co Ltd 6,175 0.16
14,000 ASMedia Technology Inc 921 0.0231,000 eMemory Technology Inc 2,454 0.06
108,000 Globalwafers Co Ltd 3,466 0.09738,259 MediaTek Inc 31,754 0.83606,000 Nanya Technology Corp 1,711 0.05284,000 Novatek Microelectronics Corp 5,533 0.14227,410 Realtek Semiconductor Corp 4,767 0.12
12,036,762 Taiwan Semiconductor Manufacturing Co Ltd 267,561 6.95
5,775,154 United Microelectronics Corp 13,568 0.35446,000 Vanguard International
Semiconductor Corp 2,547 0.07165,000 Win Semiconductors Corp 2,233 0.06
1,485,000 Winbond Electronics Corp 1,825 0.05
Telecommunications218,000 Accton Technology Corp 2,049 0.05
1,856,170 Chunghwa Telecom Co Ltd 7,816 0.20848,000 Far EasTone Telecommunications Co
Ltd 1,980 0.05826,720 Taiwan Mobile Co Ltd 2,988 0.08
Textile1,420,137 Far Eastern New Century Corp 1,504 0.04
Transportation1,248,656 Evergreen Marine Corp Taiwan Ltd 6,431 0.171,006,000 Taiwan High Speed Rail Corp 1,076 0.03
302,500 Wan Hai Lines Ltd 2,170 0.05856,000 Yang Ming Marine Transport Corp 3,744 0.10
597,664 15.52
Thailand (1.68%)
Banks1,629,600 Krung Thai Bank PCL NVDR 644 0.02
408,600 Siam Commercial Bank PCL NVDR 1,553 0.04
Beverages148,200 Carabao Group PCL NVDR 530 0.01529,400 Osotspa PCL NVDR 543 0.02
Chemicals874,855 Indorama Ventures PCL NVDR 1,133 0.03
1,101,100 PTT Global Chemical PCL NVDR 1,936 0.05
Commercial services3,003,500 Bangkok Expressway & Metro PCL
NVDR 760 0.02
HoldingsFair valueUS$’000
% ofNet
Assets
Thailand (1.68%) (Continued)
Diversified financial services457,100 Krungthai Card PCL NVDR 811 0.02404,800 Muangthai Capital PCL NVDR 712 0.02401,600 Srisawad Corp PCL NVDR 742 0.02
Electricity385,800 B Grimm Power PCL NVDR 468 0.01154,800 Electricity Generating PCL NVDR 813 0.02352,600 Global Power Synergy PCL NVDR 937 0.03
1,422,590 Gulf Energy Development PCL NVDR 1,948 0.05397,700 Ratch Group PCL NVDR 536 0.01
Electronics154,600 Delta Electronics Thailand PCL NVDR 1,907 0.05
Energy – alternate sources769,500 Energy Absolute PCL NVDR 2,211 0.06
Engineering & construction2,057,200 Airports of Thailand PCL NVDR 3,757 0.10
Food587,800 Berli Jucker PCL NVDR 546 0.01
1,801,390 Charoen Pokphand Foods PCL NVDR 1,375 0.041,523,500 Thai Union Group PCL NVDR 889 0.02
Healthcare services4,640,600 Bangkok Dusit Medical Services PCL
NVDR 3,195 0.08236,000 Bumrungrad Hospital PCL NVDR 996 0.03
Holding companies – diversified operations
371,300 Siam Cement PCL NVDR 4,290 0.11
Home builders3,749,384 Land & Houses PCL NVDR 988 0.03
Hotels1,396,567 Minor International PCL NVDR 1,202 0.03
Investment services981,500 Bangkok Commercial Asset
Management PCL NVDR 635 0.02
Miscellaneous manufacturers509,100 Sri Trang Gloves Thailand PCL NVDR 461 0.01
Oil & gas706,854 PTT Exploration & Production PCL
NVDR 2,497 0.071,471,700 PTT Oil & Retail Business PCL NVDR 1,190 0.034,841,200 PTT PCL NVDR 5,507 0.14
569,100 Thai Oil PCL NVDR 843 0.02
Packaging & containers656,800 SCG Packaging PCL NVDR 1,362 0.03
Real estate investment & services3,848,900 Asset World Corp PCL NVDR 534 0.011,000,200 Central Pattana PCL NVDR 1,692 0.05
Retail950,399 Central Retail Corp PCL NVDR 910 0.02
2,796,800 CP ALL PCL NVDR 4,940 0.132,934,583 Home Product Center PCL NVDR 1,274 0.03
NM0522U-2194143-149/163

Reports and Financial Statements 149
iShares MSCI Emerging Markets ETF (HK) (continued)
Investment Protfolio of iShares MSCI EM UCITS ETF USD (Dist) (unaudited) as at 31st December 2021
HoldingsFair valueUS$’000
% ofNet
Assets
Thailand (1.68%) (Continued)
Telecommunications572,600 Advanced Info Service PCL NVDR 3,943 0.10556,250 Intouch Holdings PCL NVDR 1,336 0.04
6,136,941 TRUE Corp PCL NVDR 878 0.02
Transportation3,874,400 BTS Group Holdings PCL NVDR 1,084 0.03
64,508 1.68
Turkey (0.23%)
Aerospace & defence354,177 Aselsan Elektronik Sanayi Ve Ticaret
AS 557 0.01
Auto manufacturers36,822 Ford Otomotiv Sanayi AS 660 0.02
Banks1,503,080 Akbank T.A.S. 815 0.021,123,794 Turkiye Garanti Bankasi AS 954 0.03
711,758 Turkiye Is Bankasi AS ‘C’ 385 0.01
Food212,088 BIM Birlesik Magazalar AS 979 0.02
Holding companies – diversified operations
349,788 KOC Holding AS 747 0.02
Household products691,913 Turkiye Sise ve Cam Fabrikalari AS 697 0.02
Iron & steel700,498 Eregli Demir ve Celik Fabrikalari TAS 1,485 0.04
Oil & gas62,579 Turkiye Petrol Rafinerileri AS 728 0.02
Telecommunications568,693 Turkcell Iletisim Hizmetleri AS 791 0.02
8,798 0.23
United Arab Emirates (1.11%)
Banks1,412,937 Abu Dhabi Commercial Bank PJSC 3,281 0.09
640,665 Abu Dhabi Islamic Bank PJSC 1,198 0.031,414,534 Dubai Islamic Bank PJSC 2,072 0.051,272,052 Emirates NBD Bank PJSC 4,693 0.122,177,877 First Abu Dhabi Bank PJSC 11,171 0.29
Real estate investment & services1,945,296 Aldar Properties PJSC 2,113 0.051,883,816 Emaar Properties PJSC 2,508 0.07
Retail1,270,683 Abu Dhabi National Oil Co for
Distribution PJSC 1,478 0.04
Telecommunications1,655,439 Emirates Telecommunications Group
Co PJSC 14,287 0.37
42,801 1.11
HoldingsFair valueUS$’000
% ofNet
Assets
United States (0.33%)
Mining42,489 Southern Copper Corp 2,622 0.07
Retail205,697 Yum China Holdings Inc 10,252 0.26
12,874 0.33
Total equities 3,757,954 97.58
ETFs (2.08%)
Germany (1.31%)
1,773,022 iShares MSCI Brazil UCITS ETF (DE)~β 50,620 1.31
50,620 1.31
Ireland (0.77%)
4,823,785 iShares MSCI Saudi Arabia Capped UCITS ETF~β 29,592 0.77
29,592 0.77
Total ETFs 80,212 2.08
Rights (0.00%)
Cayman Islands (0.00%)
51,714 Seazen Group Ltd – 0.00 – 0.00
Republic of South Korea (0.00%)
19,237 Doosan Heavy Industries & Construction Co Ltd 71 0.00
71 0.00
Total rights 71 0.00
Financial derivative instruments
(0.00%)
Futures contracts (0.00%)
196 MSCI Emerging Markets Index Futures March 2022 39 0.00
Total unrealised gains on futures contracts 39 0.00
Total financial derivative instruments 39 0.00
Total value of investments 3,838,276 99.66
Cash equivalents (0.00%)
UCITS collective investment schemes – Money Market Funds (0.00%)
113 BlackRock ICS US Dollar Liquidity Fund – 0.00
– 0.00
Cash 5,993 0.16Other net assets 7,103 0.18
Net asset value attributable to
redeemable shareholders 3,851,372 100.00
~ Investment in related party.β Not authorized by the SFC under Section 104 of the Securities and Futures Ordinance in Hong
Kong and is not available for direct investment by Hong Kong residents.
NM0522U-2194143-150/163

150 iShares Asia Trust
iShares MSCI Emerging Markets ETF (HK) Details in Respect of Financial Derivative Instruments (unaudited) as at 31st December 2021
The financial derivative instruments held by the Sub-Fund as at 31st December 2021 are summarized below:
Futures
Underlying assets CounterpartyFair value
US$Description
Financial Assets:MSCI Emerging Markets Index Futures Mar 2022
MSCI Emerging Markets Index (USD)
HSBC Bank Plc121
121
NM0522U-2194143-151/163
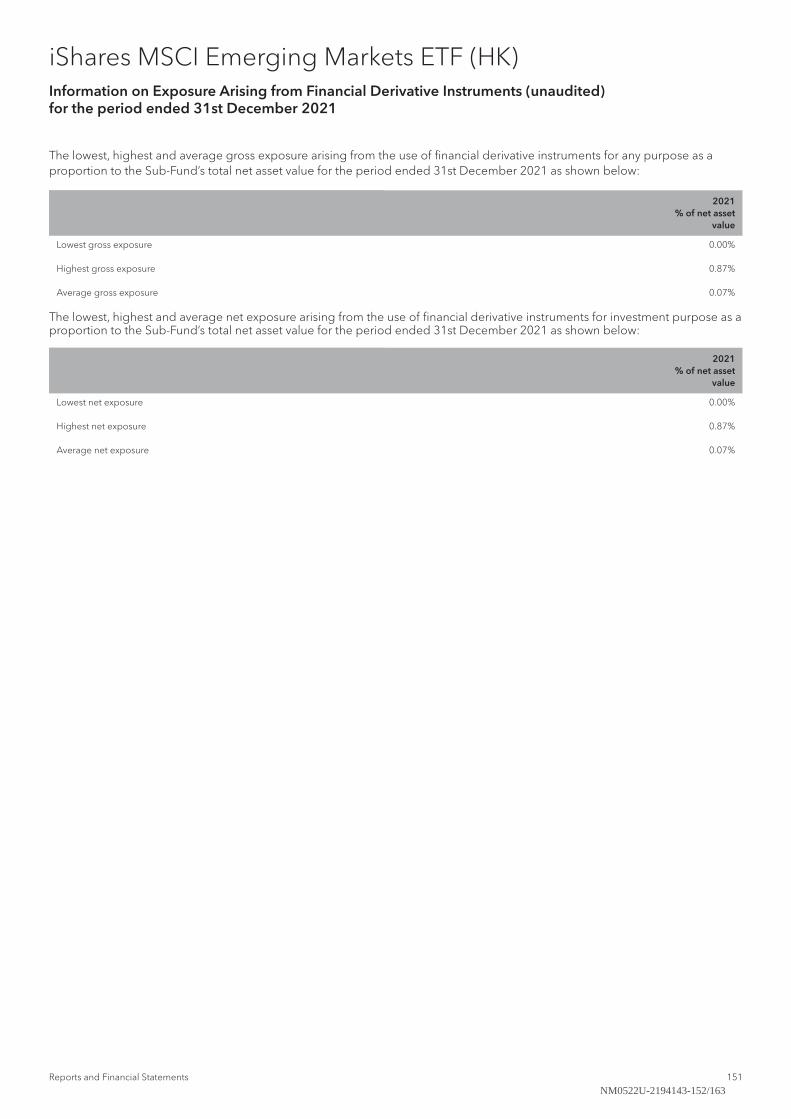
Reports and Financial Statements 151
iShares MSCI Emerging Markets ETF (HK) Information on Exposure Arising from Financial Derivative Instruments (unaudited) for the period ended 31st December 2021
The lowest, highest and average gross exposure arising from the use of financial derivative instruments for any purpose as a proportion to the Sub-Fund’s total net asset value for the period ended 31st December 2021 as shown below:
2021% of net asset
value
Lowest gross exposure 0.00%
Highest gross exposure 0.87%
Average gross exposure 0.07%
The lowest, highest and average net exposure arising from the use of financial derivative instruments for investment purpose as a proportion to the Sub-Fund’s total net asset value for the period ended 31st December 2021 as shown below:
2021% of net asset
value
Lowest net exposure 0.00%
Highest net exposure 0.87%
Average net exposure 0.07%
NM0522U-2194143-152/163

152 iShares Asia Trust
% of net asset value
2021
Financial assets at fair value through profit or lossExchange traded fundiShares MSCI EM UCITS ETF USD (Dist) 99.54
99.54 FuturesMSCI Emerging Markets Index Futures 0.00
0.00 Total investments 99.54Other net assets 0.46 Net assets attributable to unitholders at 31st December 100.00
iShares MSCI Emerging Markets ETF (HK) Statement of Movements in Investment Portfolio (unaudited) for the period ended 31st December
2021
NM0522U-2194143-153/163

Reports and Financial Statements 153
iShares MSCI Emerging Markets ETF (HK) Performance Record (unaudited)
Net Asset Value
DealingNet asset value
per unitUS$
DealingNet asset value
of the Sub-FundUS$
At end of financial period dated31st December 2021 70.62 14,124,205
Highest and lowest net asset value per unit
Highest net assetvalue per unit
US$
Lowest net assetvalue per unit
US$
Financial period ended31st December 2021 (since inception) 83.36 60.28
NM0522U-2194143-154/163

154 iShares Asia Trust
HoldingsFair value
HK$
% ofNet
Assets
Investments (99.77%)
Listed equities (99.76%)
China (97.99%)4,156,749 AAC Technologies Holdings In 128,027,869 1.296,606,962 Alibaba Group Holding Ltd 785,567,782 7.93
26,992,850 Alibaba Health Information T 177,882,881 1.791,766,370 ASM Pacific Technology 148,816,672 1.50
100,295 Autohome Inc – Class A 5,651,623 0.061,164,807 Baidu Inc – Class A 168,431,092 1.70
391,564 Bilibili Inc – Class Z 140,414,850 1.424,520,692 BYD Electronic Intl Co Ltd 129,065,757 1.302,636,400 China Literature Ltd 129,183,600 1.301,473,899 GDS Holdings Ltd – Cl A 66,767,625 0.67
13,696,369 Haier Smart Home Co Ltd – H 451,295,359 4.553,354,525 Hua Hong Semiconductor Ltd 144,244,575 1.466,384,835 JD Health International Inc 392,348,111 3.962,475,326 JD.Com Inc – CL A 678,239,324 6.84
13,905,591 Kingdee International Sftwr 333,734,184 3.379,900,720 Kuaishou Technology 713,346,876 7.20
41,354,653 Lenovo Group Ltd 370,537,691 3.743,533,872 Meituan – Class B 796,534,749 8.044,514,312 Ming Yuan Cloud Group Holdin 80,174,181 0.812,933,800 Netease Inc 462,073,500 4.661,973,202 Ping An Healthcare And Techn 55,940,277 0.56
25,622,524 Semiconductor Manufacturing 478,116,298 4.823,566,808 Sunny Optical Tech 879,574,853 8.871,830,823 Tencent Holdings Ltd 836,319,946 8.446,974,883 Tongcheng – Travel Holdings Ltd
(formerly known as Tongcheng – Elong Holdings Ltd) 100,717,311 1.02
168,490 Trip.Com Group Ltd 32,147,892 0.3211,850,345 Weimob Inc 93,499,222 0.9443,624,342 Xiaomi Corp – Class B 824,500,064 8.32
4,069,574 Zhongan Online P&C Insuran – H 110,285,455 1.11
9,713,439,619 97.99
Hong Kong (1.77%)5,115,145 Kingsoft Corp Ltd 175,193,716 1.77
Total listed rights 175,193,716 1.77
Total listed equities 9,888,633,335 99.76
Futures (0.01%)
Hong Kong (0.01%)79 Hang Seng TECH Index Futures Jan
2022 591,200 0.01
Total futures 591,200 0.01
Total investments 9,889,224,535 99.77Other net assets 22,827,438 0.23
Net assets attributable to
unitholders at 31st December 2021 9,912,051,973 100.00
Total investments, at cost 13,086,326,061
iShares Hang Seng TECH ETF Investment Portfolio (unaudited) as at 31st December 2021
NM0522U-2194143-155/163

Reports and Financial Statements 155
The financial derivative instruments held by the Sub-Fund as at 31st December 2021 are summarized below:
Futures
Underlying assets CounterpartyFair value
HK$Description
Financial AssetsHang Seng TECH Index Futures Jan 2022 Hang Seng TECH Index HSBC Bank Plc 591,200
iShares Hang Seng TECH ETF Details in Respect of Financial Derivative Instruments (unaudited) as at 31st December 2021
NM0522U-2194143-156/163

156 iShares Asia Trust
iShares Hang Seng TECH ETF Information on Exposure Arising from Financial Derivative Instruments (unaudited) for the period
ended 31st December 2021
The lowest, highest and average gross exposure arising from the use of financial derivative instruments for any purpose as a proportion to the Sub-Fund’s total net asset value for the period ended 31st December 2021 as shown below:
2021% of net asset
value
Lowest gross exposure 0.00%
Highest gross exposure 2.49%
Average gross exposure 0.63%
The lowest, highest and average net exposure arising from the use of financial derivative instruments for investment purpose as a proportion to the Sub-Fund’s total net asset value for the period ended 31st December 2021 as shown below:
2021% of net asset
value
Lowest net exposure 0.00%
Highest net exposure 2.49%
Average net exposure 0.63%
NM0522U-2194143-157/163

Reports and Financial Statements 157
iShares Hang Seng TECH ETFStatement of Movements in Investment Portfolio (unaudited) for the period ended 31st December 2021
% of net asset value
2021
Financial assets at fair value through profit or lossListed equitiesCommunication Services 26.55Consumer Discretionary 32.66Financials 1.11Health Care 2.35Information Technology 37.09
99.76 FuturesHang Seng TECH Index Futures 0.01
0.01 Total investments 99.77Other net assets 0.23 Net assets attributable to unitholders 100.00
NM0522U-2194143-158/163

158 iShares Asia Trust
iShares Hang Seng TECH ETFPerformance Record (unaudited)
Net Asset Value
DealingNet asset value
per unitHK$
DealingNet asset value
of the Sub-FundHK$
At end of financial period dated31st December 2021 11.84 9,912,051,972
Highest and lowest net asset value per unit
Highest net assetvalue per unit
HK$
Lowest net assetvalue per unit
HK$
Financial period ended31st December 2021 (since inception) 22.84 11.43
NM0522U-2194143-159/163

Reports and Financial Statements 159
iShares Core KOSPI 200 ETF Information on Exposure Arising from Financial Derivative Instruments (unaudited) for the period ended 18th August 2021 (date of delisting from the SEHK)
The lowest, highest and average gross exposure arising from the use of financial derivative instruments for any purpose as a proportion to the Sub-Fund’s total net asset value for the period ended 18th August 2021 (date of delisting from the SEHK) as shown below::
2021% of net asset
value
Lowest gross exposure 0.00%
Highest gross exposure 0.16%
Average gross exposure 0.03%
The lowest, highest and average net exposure arising from the use of financial derivative instruments for investment purpose as a proportion to the Sub-Fund’s total net asset value for the period ended 18th August 2021 (date of delisting from the SEHK) as shown below:
2021% of net asset
value
Lowest net exposure 0.00%
Highest net exposure 0.16%
Average net exposure 0.03%
NM0522U-2194143-160/163

160 iShares Asia Trust
iShares Core KOSPI 200 ETF Statement of Movements in Investment Portfolio (unaudited) for the period ended 18th August 2021 (date of delisting from the SEHK)
% of net asset value
18.08.2021 (date of
delisting fromthe SEHK
% of net asset value
31.12.2020
Financial assets at fair value through profit or lossListed equitiesCommunication Services – 9.72Consumer Discretionary – 9.45Consumer Staples – 4.48Energy – 1.29Financials – 6.73Health Care – 6.63Industrials – 8.26Information Technology – 43.56Materials – 8.16Utilities – 0.84
– 99.12 Listed rightsMaterials – 0.01
– 0.01 Unlisted rightsIndustrials – 0.01
– 0.01 Total investments – 99.14Other net assets – 0.86 Net assets attributable to unitholders at 18th August 2021 (date of delisting from the SEHK)/31st December
2020 – 100.00
NM0522U-2194143-161/163

Reports and Financial Statements 161
iShares Core KOSPI 200 ETF Performance Record (unaudited)
Net Asset Value
DealingNet asset value
per unitUS$
DealingNet asset value
of the Sub-FundUS$
At end of financial period dated31st December 2019 12.68 5,324,97031st December 2020 17.80 6,407,032From 1st January 2021 to 18th August 2021 (date of delisting from the SEHK) N/A N/A
Highest and lowest net asset value per unit
Highest net assetvalue per unit
US$
Lowest net assetvalue per unit
US$
Financial period ended31st December 2016 (since inception) 11.75# 9.97#
31st December 2017 15.41# 10.84#
31st December 2018 15.94# 11.51#
31st December 2019 12.97 10.4431st December 2020 17.80 7.78From 1st January 2021 to 18th August 2021 (date of delisting from the SEHK) 19.72 17.61
# Pursuant to Change of Trading Board Lot Size and Units Consolidations Announcement dated 18th December 2018, with effect from 18th January 2019, every 10 units in the Sub-Fund are consolidated into 1 consolidation units. The net asset value per unit disclosed was adjusted to reflect the unit consolidations.
NM0522U-2194143-162/163

162 iShares Asia Trust
iShares Asia Trust Management and Administration
Directors of the ManagerBelinda Mary BoaGeraldine Joyce Buckingham (resigned on19th February 2021)Graham Douglas TurlRachel Lord (appointed on 23rd July 2021)Susan Wai-Lan Chan
ManagerBlackRock Asset Management North Asia Limited16/F, Champion Tower3 Garden RoadCentralHong Kong
TrusteeHSBC Institutional Trust Services (Asia) Limited1 Queen’s Road CentralHong Kong
RegistrarHSBC Institutional Trust Services (Asia) Limited1 Queen’s Road CentralHong Kong
Custodian (excluding China A50 ETF and CSI 300 ETF)HSBC Institutional Trust Services (Asia) Limited1 Queen’s Road CentralHong Kong
Custodian for China A50 ETF and CSI 300 ETF onlyThe Hongkong and Shanghai Banking Corporation Limited1 Queen’s Road CentralHong Kong
QFII/RQFII Custodian for China A50 ETFHSBC Bank (China) Company Limited33rd Floor, HSBC Building, Shanghai IFC8 Century Avenue, Pudong DistrictShanghai 200120 PRC
and
Citibank (China) Co., LimitedCitigroup TowerNo.33, Hua Yuan Shi Qiao RoadLu Jia Zui Finance and Trade AreaShanghai 200120 PRC
QFII/RQFII Licence Holder for China A50 ETFBlackRock Asset Management North Asia Limited16/F, Champion Tower3 Garden RoadCentralHong Kong
and
BlackRock (Singapore) Limited#18-01, Twenty Anson20 Anson Road,Singapore 079912
RQFII Custodian for CSI 300 ETFHSBC Bank (China) Company Limited33rd Floor, HSBC Building, Shanghai IFC8 Century Avenue, Pudong DistrictShanghai 200120 PRC
RQFII Licence Holder for CSI 300 ETFBlackRock (Singapore) Limited#18-01, Twenty Anson20 Anson Road,Singapore 079912
AuditorPricewaterhouseCoopersCertified Public AccountantsRegistered Public Interest Entity Auditor22nd FloorPrince’s BuildingCentralHong Kong
Service Agent HK Conversion Agency Services Limited8th Floor, Two Exchange Square8 Connaught PlaceCentralHong Kong
NM0522U-2194143-163/163