iShares VII plc - Annual report and audited financial statements
330
Annual report and audited financial statements iShares VII PLC For the financial year ended 31 July 2020
-
Upload
khangminh22 -
Category
Documents
-
view
0 -
download
0
Transcript of iShares VII plc - Annual report and audited financial statements
Annual report and auditedfinancial statements
iShares VII PLC
For the financial year ended 31 July 2020

CONTENTS Page
Overview
General information 3
Chairman’s statement 5
Background 7
Performance
Investment manager’s report 9
Governance
Board of directors 16
Corporate governance statement 18
Audit committee report 25
Director’s report 28
Depositary’s report to the shareholders 32
Independent Auditors report 33
Financial Statements
Income statement 39
Statement of changes in net assets attributable to redeemable shareholders 47
Balance sheet 55
Notes to the financial statements 63
Schedules of investments 129
Additional information and regulatory disclosures (unaudited)
Schedules of material purchases and sales 251
Calendar year performance 285
PEA Eligibility 286
Transactions with connected persons 286
Transaction costs 286
Soft commissions 287
Cross investments 287
Global exposure 287
Leverage 287
iSHARES VII PLC
[1 ]
CONTENTS (continued) Page
Additional information and regulatory disclosures (unaudited) (continued)
Report on remuneration 288
Efficient portfolio management and securities financing transactions 293
Disclaimers 326
iSHARES VII PLC
This annual report and audited financial statements (the “Report and Financial Statements”) may be translated into other languages. Any such translationshall only contain the same information and have the same meaning as the English language Report and Accounts. To the extent that there is anyinconsistency between the English language Report and Financial Statements and the Report and Financial Statements in another language, the Englishlanguage Report and Financial Statements will prevail, except to the extent (and only to the extent) that it is required by law of any jurisdiction where theshares are sold, that in an action based upon disclosure in a Report and Accounts in a language other than English, the language of the Report and FinancialStatements on which such action is based shall prevail. Any disputes as to the terms of the Report and Accounts, regardless of the language of the Reportand Accounts, shall be governed by and construed in accordance with the laws of Ireland.
[2 ]
Board of Directors1
Paul McNaughton (Chairman) (Irish)
Jessica Irschick (British)
Paul McGowan (Irish)
Barry O’Dwyer (Irish)
Teresa O’Flynn (Irish)
Ros O’Shea (Irish)
Deirdre Somers (Irish)1All Directors are non-executive.
Audit Committee Members
Paul McGowan (Chairman)
Ros O’Shea
Deirdre Somers
Nominations Committee Members
Paul McNaughton (Chairman)
Paul McGowan
Barry O’Dwyer
Ros O’Shea
Deirdre Somers
Manager
BlackRock Asset Management Ireland Limited
1st Floor
2 Ballsbridge Park
Ballsbridge
Dublin 4
D04 YW83
Ireland
Currency Hedging Manager2
State Street Global Markets Currency Manager
5th Floor
One Lincoln Street
Boston
MA 02111-2900
United States
Administrator and Registrar
State Street Fund Services (Ireland) Limited
78 Sir John Rogerson’s Quay
Dublin 2
Ireland
Depositary
State Street Custodial Services (Ireland) Limited
78 Sir John Rogerson’s Quay
Dublin 2
Ireland
Secretary of the Manager
Sanne Corporate Administration Services (Ireland) Limited
4th Floor
76 Baggot Street Lower
Dublin 2
Ireland
Entity’s registered office
J.P. Morgan
200 Capital Dock
79 Sir John Rogerson’s Quay
Dublin 2
D02 RK57
Ireland
Promoter, Investment Manager and Securities Lending Agent
BlackRock Advisors (UK) Limited
12 Throgmorton Avenue
London EC2N 2DL
England
Sub-Investment Managers3
BlackRock Financial Management Inc.
40 East 52nd Street
New York
NY 10022
United States
BlackRock (Singapore) Limited
20 Anson Road
#18-01
Singapore 079912
Singapore
BlackRock Asset Management North Asia Limited
16/F Champion Tower
Three Garden Road
Central
Hong Kong
iSHARES VII PLC
GENERAL INFORMATION
[3 ]
Sub-Investment Managers3 (continued)
BlackRock Asset Management Deutschland AG
Lenbachplatz 1 1st Floor
Munich 80333-MN3
Germany
Independent Auditor
Deloitte Ireland LLP
Chartered Accountants & Statutory Auditors
Deloitte & Touche House
Earlsfort Terrace
Dublin 2
Ireland
Irish Legal Advisers
William Fry
2 Grand Canal Square
Dublin 2
Ireland
Paying Agent
Citibank N.A., London Branch
Citigroup Centre
25 Canada Square
Canary Wharf
London E14 5LB
England
Paying Agent in Switzerland
State Street Bank International GmbH
Munich
Zurich Branch
Beethovenstrasse 19
CH-8027 Zurich
Switzerland
Information Agent in Germany
State Street Bank International GmbH
Briennerstrasse 59
80333 Munich
Germany
Paying and Information Agent in Austria
UniCredit Bank Austria AG
Attn: 8398/Custody
Julius Tandler Platz 3
1090 Vienna
Austria
Representative in Switzerland
BlackRock Asset Management Schweiz AG
Bahnhofstrasse 39
8001 Zurich
Switzerland
2In respect of the currency hedged share classes of certain Funds only.3In respect of certain Funds only.
Entity registration number: 469617
For Swiss investors: The prospectus of the Entity, the Key Investor Information Documents (“KIID”), the articles of incorporation, the latest annual
report and audited financial statements and interim report and unaudited financial statements as applicable and a detailed list of investments
purchased and sold for each Fund during the financial year may be obtained on request and free of charge from the representative in Switzerland.
For German investors: The prospectus and KIID are available, free of charge, from the Information Agent in Germany.
The Entity is duly registered with the Comisión Nacional del Mercado de Valores in Spain under number 886.
iSHARES VII PLC
GENERAL INFORMATION (continued)
[4 ]
The Board of Directors of the Entity (“the Board”) considers corporate governance matters and adherence to codes of best practice to be of the
utmost importance. As Chairman of the Board, I believe that it has operated effectively throughout the financial year and that its role and its
composition are well defined, appropriate and support the long-term development of the Entity.
Overview of the Entity
iShares VII public limited company (the "Entity") is an open-ended investment company with variable capital. The Entity was incorporated in Ireland
on 9 April 2009 with limited liability and segregated liability between its Funds and is organised under the laws of Ireland as a Public Limited Company
(“plc”) pursuant to the Companies Act 2014 (the "Companies Act") and the European Communities (Undertakings for Collective Investment in
Transferable Securities) Regulation 2011 (as amended) (the “UCITS Regulations”) and is regulated by the Central Bank of Ireland (the "CBI").
The Entity is structured as an umbrella fund and comprised of separate funds (“Funds”) of the Entity.
The term “Fund” shall be deemed to mean a Fund of the Entity. The term “BlackRock” is used to represent BlackRock Advisors (UK) Limited. The
investment objectives and policies of each Fund are set out in the prospectus.
The Funds pursue strategies of either tracking or replicating the performance of a benchmark index in order to deliver the objectives of each Fund.
The Manager has delegated the administration of the Entity and its Funds to State Street Fund Services (Ireland) Limited (the “Administrator”)
including the calculation of the daily net asset value ("NAV"), and the preparation of the financial statements of the Entity subject to the overall
supervision of the Board and the Manager. State Street Fund Services (Ireland) Limited (the “Registrar”) has also been appointed as the registrar
of the Entity. The Entity has appointed State Street Custodial Services (Ireland) Limited (the “Depositary”) as Depositary of the assets with
responsibility for the safe keeping of such assets, pursuant to the UCITS Regulations. As part of its fiduciary responsibility to the Entity, the
Depositary provides a certain level of ongoing oversight of the Entity, as well as reporting on the conduct of the Entity in each annual accounting
period as set out in the Statement of the Depositary’s Responsibilities.
In accordance with Guidance Note 4/07 on the Organisation of Management Companies issued by the CBI, the Board of Directors of the Manager
has identified BlackRock group personnel who monitor and control the management functions as outlined therein. These BlackRock Group
personnel report to the Manager and the Board on a regular basis. The management functions delegated by the Manager are subject to appropriate
reporting and ratification procedures, which are designed to ensure that the appropriate reports are received in a timely fashion such that the
Manager and the Board can discharge their duties, as part of the governance framework put in place by the Manager and the Entity. The Board
reviews risk reporting on a regular basis together with an annual review of internal controls and risk management from the Manager.
The Board
The Board currently comprises seven Directors, four of whom are independent. The members of the Board were chosen for their range of skills and
experience. Paul McGowan has extensive experience in the area of tax, financial services and corporate governance. Barry O’Dwyer has extensive
knowledge and experience in corporate governance. Jessica Irschick has considerable experience in Exchange Traded Funds ("ETFs"), index
investments, trading, financing, securities lending and foreign exchange. Ros O’Shea also has considerable experience in governance and
accountancy. Deirdre Somers has extensive experience in markets regulation, listings and financial services, as well as a background in tax. Teresa
O’Flynn has over twenty years experience in tax, corporate finance, project and renewable energy infrastructure sectors, and I have over thirty years’
experience in the banking and finance, fund management and securities processing industries.
Teresa O’Flynn was re-appointed as a non-executive Director on 4 October 2019.
Ros O’Shea and Deirdre Somers were appointed as members of the Audit Committee on 28 May 2019. Paul McNaughton resigned as a member
of the Audit Committee in August 2019, in accordance with the Code the Chairman of the Board should not be a member of the Audit Committee.
Paul McNaughton remained on the Audit Committee following the appointment of Ros O’Shea and Deirdre Somers to allow for a period of transition.
iSHARES VII PLC
CHAIRMAN’S STATEMENT
[5 ]
Matters relating to the Entity during the financial year
There were 29 Funds in operation at 31 July 2020.
It is the opinion of the Board that all Funds have performed in line with their objectives and that any tracking differences have been explained in the
Investment Manager’s report. Additional information on the Funds’ performance can be found in the Investment Manager’s report.
The coronavirus (COVID-19) pandemic is sweeping the globe leaving almost no community or economy untouched. The impact of this coronavirus
could affect the economies of many nations, individual companies and the market in general in ways that cannot necessarily be foreseen at the
present time. Since the start of the coronavirus outbreak, the Manager has been moving promptly and deliberately to assure full operational
capabilities as well as employee health and safety. Portfolio management teams are fully resourced and engaged in their markets and strategies.
The Manager, Investment Manager and service providers have full capabilities even as the vast majority of employees work from home. As the global
economy, governments and society weather this situation, we will continue to monitor the outbreak and the impact on the Entity.
Paul McNaughton
Chairman
28 October 2020
iSHARES VII PLC
CHAIRMAN’S STATEMENT (continued)
[6 ]
iShares VII public limited company (the "Entity") is an open-ended investment company with variable capital. The Entity was incorporated in Ireland
on 9 April 2009 with limited liability and segregated liability between its Funds and is organised under the laws of Ireland and is regulated by the
Central Bank of Ireland ("CBI") as a public limited company pursuant to the Companies Act 2014 (as amended) and the European Communities
(Undertakings for Collective Investment in Transferable Securities) Regulations, 2011 (as amended) (the "UCITS Regulations").
The Entity is structured as an umbrella fund and will comprise separate Funds of the Entity. The shares of each Fund may be grouped into different
classes of shares (each a “share class”). Each Fund will represent a separate portfolio of assets and may consist of one or more share classes.
Each share class may apply different subscription and redemption provisions, charges, fees or brokerage arrangements. The creation of an
additional class of shares will be notified to the CBI in advance. The portfolio of assets maintained for each Fund will be invested in accordance with
the investment objectives and policies applicable to each Fund as set out in the prospectus.
While assets and liabilities that are specific to a share class within a Fund would be attributable to (and should be borne by) only that share class,
there is no segregation of liabilities between share classes as a matter of Irish law. Due to the lack of segregation of liabilities as a matter of law,
there is a risk that the creditors of a share class may bring a claim against the assets of the Fund notionally allocated to other share classes.
The term “Fund” shall be deemed to mean either a Fund or Funds of the Entity, or if the context so requires, the Manager or its delegate acting for
the accounts of the relevant Fund. The term “BlackRock” and “Investment Manager” are used to represent BlackRock Advisors (UK) Limited as
appropriate. All references to “redeemable shares” shall be deemed to mean redeemable participating shares when Fund shares are classified as
financial liabilities. The term “Directors” means the directors of the Entity.
Further details, including the investment objectives and minimum subscription requirements, are set out in the Entity’s prospectus.
Changes to the Entity during the financial year
On 31 August 2019, Paul McNaughton resigned as a member of the Audit Committee.
On 3 September 2019, a new Prospectus was issued by the Entity which incorporated permanent total expense ratio (“TER”) reductions applied to
certain share classes. The new Prospectus also reflects the change in the Benchmark Index on iShares MSCI Russia ADR/GDR UCITS ETF, from
the MSCI Russia ADR/GDR Index Net USD to the MSCI Russia ADR/GDR 20/35 Capped Index.
On 25 September 2019, Ros O’Shea and Deirdre Somers were appointed as members of the Nominations Committee.
On 25 September 2019, iShares MSCI Brazil UCITS ETF USD (Acc) ceased operations.
On 4 October 2019,Teresa O’Flynn was appointed as a non-executive Director.
The following share classes were launched during the financial year:
Fund name Share class Launch Date
iShares Core MSCI EMU UCITS ETF MXN Hedged (Acc) 10 December 2019
iShares Core S&P 500 UCITS ETF MXN Hedged (Acc) 10 December 2019
On 11 February 2020, a new prospectus was issued by the Entity, which reflects a change in the benchmark index of iShares MSCI Korea UCITS
ETF USD (Acc) from MSCI Korea Index Net USD to MSCI Korea 20/35 Index. This change is effective from 11 February 2020.
On 11 May 2020, PNC Financial Services Group, Inc. ("PNC") announced its intent to sell its investment in BlackRock, Inc. through a registered
offering and related buyback by BlackRock, Inc.
iSHARES VII PLC
BACKGROUND
[7 ]
Changes to the Entity during the financial year (continued)
On 23 June 2020, a new prospectus was issued by the entity, to reflect updates to the risk factors relating to investing in the Funds and the removal
of PNC as a significant shareholder in the Entity.
Fund details
The Entity had 29 Funds in operation as at 31 July 2020.
These Funds are ETFs, which provide the flexibility of a share with the diversification of a Fund, can be bought and sold like any other share listed
on a stock exchange, but provide instant exposure to many companies or various financial instruments relevant to the Fund and its benchmark index.
United Kingdom exit from the European Union
On 31 January 2020 the United Kingdom (the “UK”) formally withdrew and ceased being a member of the European Union (the “EU”). The UK and
the EU have now entered into a transition period until 31 December 2020 (the “Transition Period”). During the Transition Period, the UK will be subject
to applicable EU laws and regulations.
The negotiation and implementation of the political, economic and legal framework may extend beyond the Transition Period, and lead to continued
uncertainty and periods of volatility in both the UK and wider European markets throughout the Transition Period and beyond. The terms of the future
relationship may cause continued uncertainty in the global financial markets, and adversely affect the performance of the Funds.
Volatility resulting from this uncertainty may mean that the returns of the Funds’ investments are adversely affected by market movements, potential
decline in the value of Sterling and/or Euro, and any downgrading of UK sovereign credit rating. This may also make it more difficult, or more
expensive, for the Funds to execute prudent currency hedging policies.
Outbreak of COVID-19
An outbreak of an infectious respiratory illness caused by a novel coronavirus known as COVID-19 was first detected in China in December 2019
and has now developed into a global pandemic. The impact of this significant event on the Funds’ financial risk exposure is disclosed in Note 3.2.3.
The Directors have assessed the impact of market conditions arising from the COVID-19 outbreak on the Funds’ ability to meet their investment
objectives. Based on the latest available information, the Funds continue to be managed in line with their investment objectives, with no disruption
to the operations of the Funds and the publication of net asset values.
Stock exchange listings
The Entity maintained a primary listing on the London Stock Exchange (“LSE”).
iSHARES VII PLC
BACKGROUND (continued)
[8 ]

Investment objective
The investment objective of the Funds is to provide investors with a total return, taking into account the capital and income returns, which reflect the
total returns of the respective benchmark listed in the below table.
Fund name Benchmark index
Investmentmanagementapproach1
iShares $ Treasury Bond 1-3yr UCITS ETF USD (Acc) B ICE U.S. Treasury 1-3 Year Bond Index Non-replicating
iShares $ Treasury Bond 3-7yr UCITS ETF ICE U.S. Treasury 3-7 Year Bond Index Non-replicating
iShares $ Treasury Bond 7-10yr UCITS ETF USD (Acc) ICE U.S. Treasury 7-10 Year Bond Index Non-replicating
iShares € Govt Bond 1-3yr UCITS ETF EUR (Acc) Bloomberg Barclays Euro Government Bond 1-3 Year TermIndex
Non-replicating
iShares € Govt Bond 3-7yr UCITS ETF Bloomberg Barclays Euro Government Bond 3-7 Year TermIndex
Non-replicating
iShares € Govt Bond 7-10yr UCITS ETF EUR (Acc) Bloomberg Barclays Euro Government Bond 10 Year TermIndex
Non-replicating
iShares Core EURO STOXX 50 UCITS ETF EURO STOXX 50 Index Replicating
iShares Core FTSE 100 UCITS ETF GBP (Acc) FTSE 100 Index Replicating
iShares Core MSCI EMU UCITS ETF MSCI EMU Index Replicating
iShares Core MSCI Pacific ex-Japan UCITS ETF MSCI Pacific ex Japan Index Replicating
iShares Core S&P 500 UCITS ETF S&P 500 Index Replicating
iShares Dow Jones Industrial Average UCITS ETF Dow Jones Industrial Average Index Replicating
iShares FTSE Italia Mid-Small Cap UCITS ETF FTSE Italia PIR Mid Small Cap Index Replicating
iShares FTSE MIB UCITS ETF EUR (Acc) FTSE MIB Index Replicating
iShares MSCI Brazil UCITS ETF USD (Acc)2 MSCI Brazil Index Net USD Replicating
iShares MSCI Canada UCITS ETF MSCI Canada Index Replicating
iShares MSCI EM Asia UCITS ETF MSCI EM Asia Index Net USD Non-replicating
iShares MSCI EMU CHF Hedged UCITS ETF (Acc) MSCI EMU 100% Hedged to CHF Index Replicating
iShares MSCI EMU Small Cap UCITS ETF MSCI EMU Small Cap Index Non-replicating
iShares MSCI EMU USD Hedged UCITS ETF (Acc) MSCI EMU 100% Hedged to USD Index Replicating
iShares MSCI Japan UCITS ETF MSCI Japan Index Replicating
iShares MSCI Korea UCITS ETF USD (Acc) MSCI Korea 20/35 Index Replicating
iShares MSCI Mexico Capped UCITS ETF MSCI Mexico Capped Index Net USD Replicating
iShares MSCI Russia ADR/GDR UCITS ETF MSCI Russia ADR/GDR 20/35 Index Replicating
iShares MSCI UK Small Cap UCITS ETF MSCI UK Small Cap Index Non-replicating
iShares MSCI UK UCITS ETF MSCI UK Index Replicating
iShares MSCI USA Small Cap UCITS ETF MSCI USA Small Cap Index Non-replicating
iShares MSCI USA UCITS ETF MSCI USA Index Replicating
iShares NASDAQ 100 UCITS ETF NASDAQ 100 Index Replicating
iShares Nikkei 225 UCITS ETF Nikkei 225 Index Replicating
1 For physically replicating funds, the investment management approach is to buy a portfolio of securities that as far as practicable consist ofthe securities that make up the benchmark index, in similar proportion to the weights represented in the benchmark index over a definedperiod of time. For non-replicating funds, the investment management approach aims to match the main risk characteristics of the benchmarkindex by investing in a portfolio that is primarily made up of securities that represent the benchmark index. The objective is to generate areturn which is as close as practicable to the total return of the benchmark index net of transaction costs and gross of fees and other cost.2 The Fund ceased operations on 25 September 2019.
iSHARES VII PLC
INVESTMENT MANAGER’S REPORT
[9 ]
Performance summary, tracking difference and tracking error
The following table compares the realised Fund performance against the performance of the relevant benchmark index measure during the financial
year ended 31 July 2020. It also discloses the anticipated tracking error of the Fund (disclosed in the prospectus on an ex-ante basis) against the
actual realised tracking error of the Fund as at 31 July 2020.
Further information on these performance measures and calculation methodologies used is detailed below:
● Fund returns disclosed are the performance returns for the primary share class for each Fund, net of fees, which has been selected as a
representative share class. The primary share class represents the class of share invested in by the majority of investors in the Fund and also
takes into account other relevant factors such as the Fund’s base currency. The returns disclosed for the comparative are in the same currency
as the primary share class, unless otherwise stated. Performance returns for any other share class can be made available on request.
● Fund returns are based on the NAV calculated in accordance with the prospectus for the financial year under review with any dividends
reinvested. Due to FRS 102 requirements which apply to the financial statements, there may be differences between the NAV per share as
recorded in the financial statements and the NAV per share calculated in accordance with the prospectus.
● Tracking difference is defined as the difference in returns between a Fund and its benchmark index.
● Each Fund’s TER is accrued on a daily basis throughout the financial year, which can impact the measurement of a tracking error in a positive
or negative manner depending on the performance in the market and the TER rate applied. The extent and magnitude of this effect on
performance measurement is subject to the timing of the market performance relative to the performance period of the Fund and can be greater
than the headline TER in a positive market and lower than the TER in a negative market.The TER expresses the sum of all fees, operating costs
and expenses, with the exception of direct trading costs and performance fees, charged to each Fund’s assets as a percentage of the average
Fund assets based on a twelve-month period ended 31 July 2020.
● Anticipated tracking error is based on the expected volatility of differences between the returns of a Fund and the returns of its benchmark index.
● Realised tracking error is the annualised standard deviation of the difference in monthly returns between a Fund and its benchmark index.
Tracking error shows the consistency of the returns relative to the benchmark index over a defined period of time. The realised tracking error
is annualised and calculated using data from the preceding 36 month observation period. Where a Fund has not been trading for 36 months,
the annualised tracking error since inception has been presented.
iSHARES VII PLC
INVESTMENT MANAGER’S REPORT (continued)
[10 ]
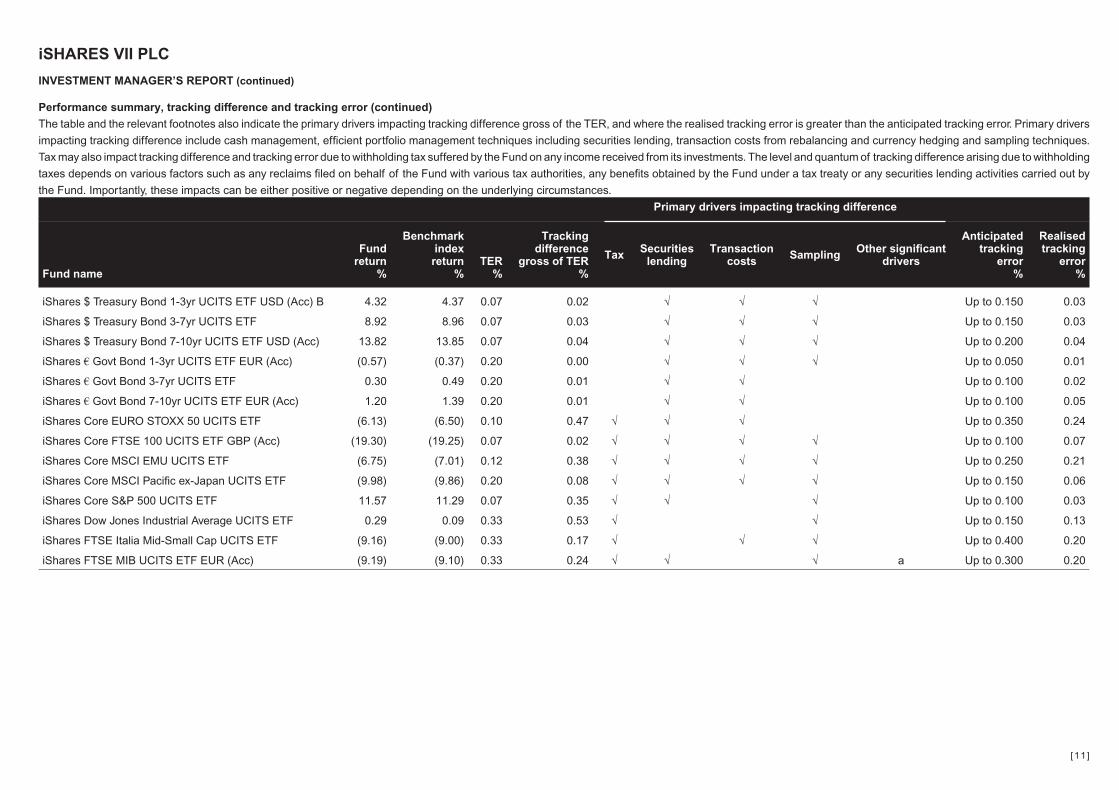
Performance summary, tracking difference and tracking error (continued)
The table and the relevant footnotes also indicate the primary drivers impacting tracking difference gross of the TER, and where the realised tracking error is greater than the anticipated tracking error. Primary drivers
impacting tracking difference include cash management, efficient portfolio management techniques including securities lending, transaction costs from rebalancing and currency hedging and sampling techniques.
Tax may also impact tracking difference and tracking error due to withholding tax suffered by the Fund on any income received from its investments. The level and quantum of tracking difference arising due to withholding
taxes depends on various factors such as any reclaims filed on behalf of the Fund with various tax authorities, any benefits obtained by the Fund under a tax treaty or any securities lending activities carried out by
the Fund. Importantly, these impacts can be either positive or negative depending on the underlying circumstances.
Primary drivers impacting tracking difference
Fund name
Fundreturn
%
Benchmarkindexreturn
%TER
%
Trackingdifference
gross of TER%
Tax Securitieslending
Transactioncosts Sampling Other significant
drivers
Anticipatedtracking
error%
Realisedtracking
error%
iShares $ Treasury Bond 1-3yr UCITS ETF USD (Acc) B 4.32 4.37 0.07 0.02 √ √ √ Up to 0.150 0.03
iShares $ Treasury Bond 3-7yr UCITS ETF 8.92 8.96 0.07 0.03 √ √ √ Up to 0.150 0.03
iShares $ Treasury Bond 7-10yr UCITS ETF USD (Acc) 13.82 13.85 0.07 0.04 √ √ √ Up to 0.200 0.04
iShares € Govt Bond 1-3yr UCITS ETF EUR (Acc) (0.57) (0.37) 0.20 0.00 √ √ √ Up to 0.050 0.01
iShares € Govt Bond 3-7yr UCITS ETF 0.30 0.49 0.20 0.01 √ √ Up to 0.100 0.02
iShares € Govt Bond 7-10yr UCITS ETF EUR (Acc) 1.20 1.39 0.20 0.01 √ √ Up to 0.100 0.05
iShares Core EURO STOXX 50 UCITS ETF (6.13) (6.50) 0.10 0.47 √ √ √ Up to 0.350 0.24
iShares Core FTSE 100 UCITS ETF GBP (Acc) (19.30) (19.25) 0.07 0.02 √ √ √ √ Up to 0.100 0.07
iShares Core MSCI EMU UCITS ETF (6.75) (7.01) 0.12 0.38 √ √ √ √ Up to 0.250 0.21
iShares Core MSCI Pacific ex-Japan UCITS ETF (9.98) (9.86) 0.20 0.08 √ √ √ √ Up to 0.150 0.06
iShares Core S&P 500 UCITS ETF 11.57 11.29 0.07 0.35 √ √ √ Up to 0.100 0.03
iShares Dow Jones Industrial Average UCITS ETF 0.29 0.09 0.33 0.53 √ √ Up to 0.150 0.13
iShares FTSE Italia Mid-Small Cap UCITS ETF (9.16) (9.00) 0.33 0.17 √ √ √ Up to 0.400 0.20
iShares FTSE MIB UCITS ETF EUR (Acc) (9.19) (9.10) 0.33 0.24 √ √ √ a Up to 0.300 0.20
iSHARES VII PLC
INVESTMENT MANAGER’S REPORT (continued)
[11 ]
Performance summary, tracking difference and tracking error (continued)
Primary drivers impacting tracking difference
Fund name
Fundreturn
%
Benchmarkindexreturn
%TER
%
Trackingdifference
gross of TER%
Tax Securitieslending
Transactioncosts Sampling Other significant
drivers
Anticipatedtracking
error%
Realisedtracking
error%
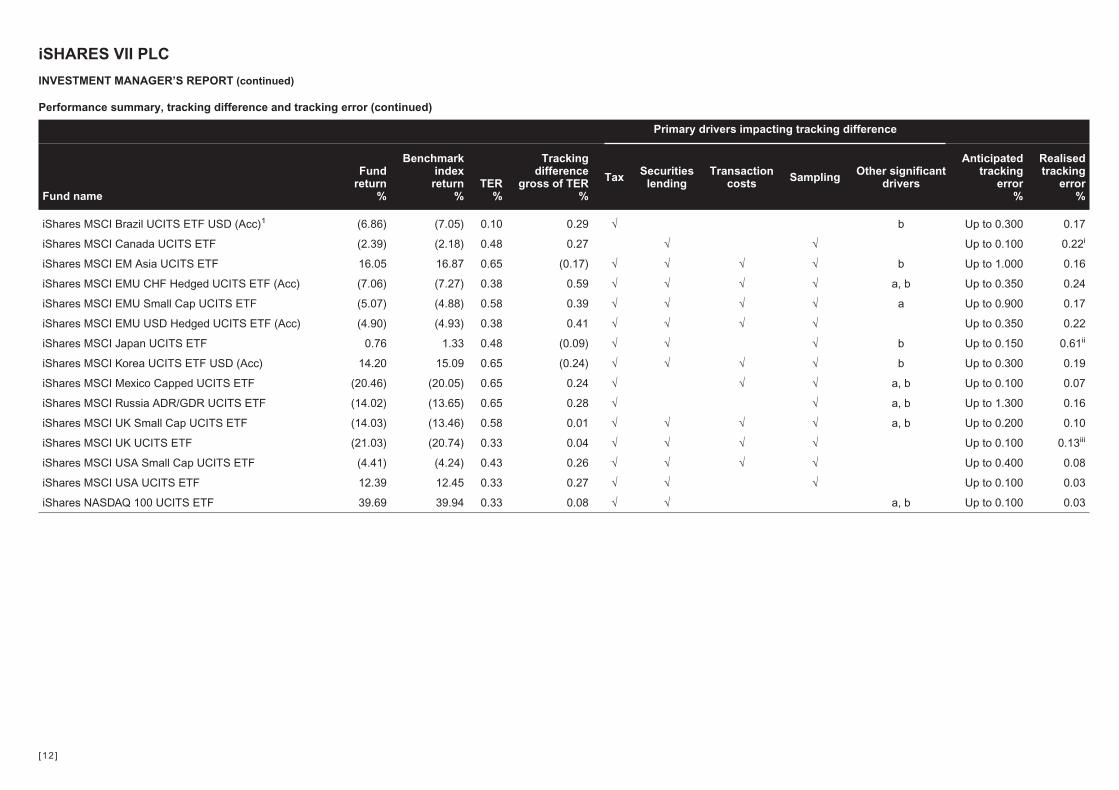
iShares MSCI Brazil UCITS ETF USD (Acc)1 (6.86) (7.05) 0.10 0.29 √ b Up to 0.300 0.17
iShares MSCI Canada UCITS ETF (2.39) (2.18) 0.48 0.27 √ √ Up to 0.100 0.22i
iShares MSCI EM Asia UCITS ETF 16.05 16.87 0.65 (0.17) √ √ √ √ b Up to 1.000 0.16
iShares MSCI EMU CHF Hedged UCITS ETF (Acc) (7.06) (7.27) 0.38 0.59 √ √ √ √ a, b Up to 0.350 0.24
iShares MSCI EMU Small Cap UCITS ETF (5.07) (4.88) 0.58 0.39 √ √ √ √ a Up to 0.900 0.17
iShares MSCI EMU USD Hedged UCITS ETF (Acc) (4.90) (4.93) 0.38 0.41 √ √ √ √ Up to 0.350 0.22
iShares MSCI Japan UCITS ETF 0.76 1.33 0.48 (0.09) √ √ √ b Up to 0.150 0.61ii
iShares MSCI Korea UCITS ETF USD (Acc) 14.20 15.09 0.65 (0.24) √ √ √ √ b Up to 0.300 0.19
iShares MSCI Mexico Capped UCITS ETF (20.46) (20.05) 0.65 0.24 √ √ √ a, b Up to 0.100 0.07
iShares MSCI Russia ADR/GDR UCITS ETF (14.02) (13.65) 0.65 0.28 √ √ a, b Up to 1.300 0.16
iShares MSCI UK Small Cap UCITS ETF (14.03) (13.46) 0.58 0.01 √ √ √ √ a, b Up to 0.200 0.10
iShares MSCI UK UCITS ETF (21.03) (20.74) 0.33 0.04 √ √ √ √ Up to 0.100 0.13iii
iShares MSCI USA Small Cap UCITS ETF (4.41) (4.24) 0.43 0.26 √ √ √ √ Up to 0.400 0.08
iShares MSCI USA UCITS ETF 12.39 12.45 0.33 0.27 √ √ √ Up to 0.100 0.03
iShares NASDAQ 100 UCITS ETF 39.69 39.94 0.33 0.08 √ √ a, b Up to 0.100 0.03
iSHARES VII PLC
INVESTMENT MANAGER’S REPORT (continued)
[12 ]
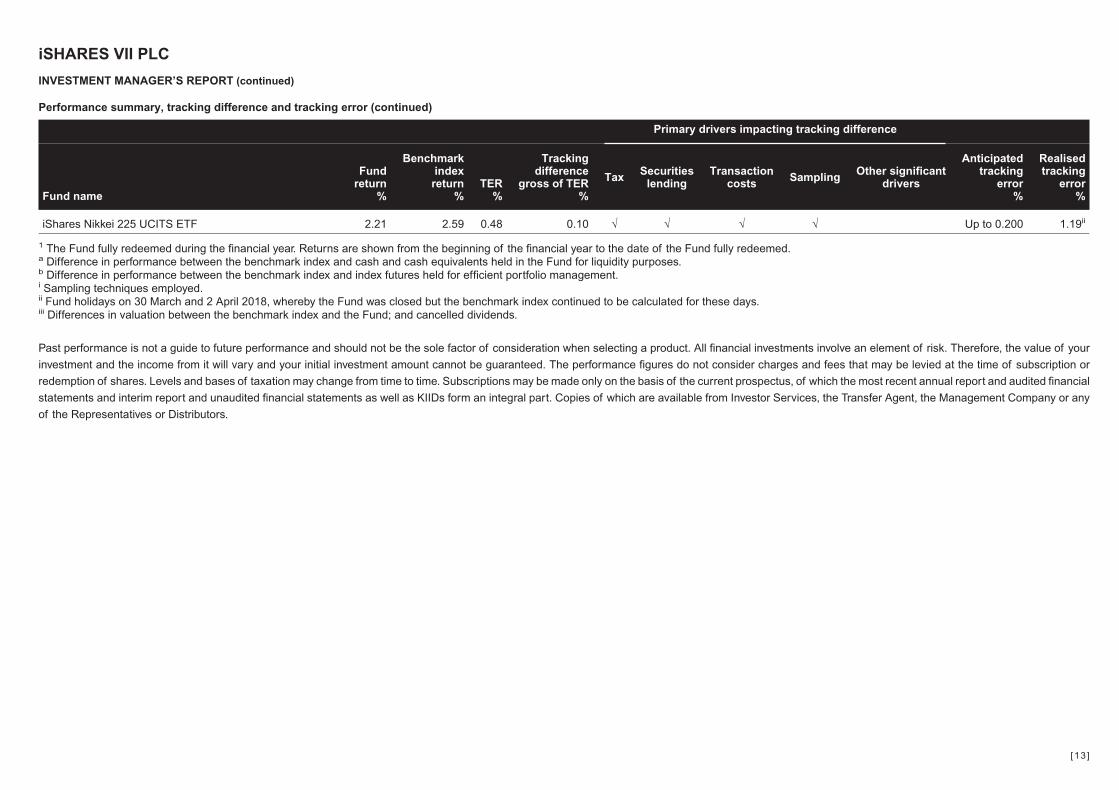
Performance summary, tracking difference and tracking error (continued)
Primary drivers impacting tracking difference
Fund name
Fundreturn
%
Benchmarkindexreturn
%TER
%
Trackingdifference
gross of TER%
Tax Securitieslending
Transactioncosts Sampling Other significant
drivers
Anticipatedtracking
error%
Realisedtracking
error%
iShares Nikkei 225 UCITS ETF 2.21 2.59 0.48 0.10 √ √ √ √ Up to 0.200 1.19ii
1 The Fund fully redeemed during the financial year. Returns are shown from the beginning of the financial year to the date of the Fund fully redeemed.a Difference in performance between the benchmark index and cash and cash equivalents held in the Fund for liquidity purposes.b Difference in performance between the benchmark index and index futures held for efficient portfolio management.i Sampling techniques employed.ii Fund holidays on 30 March and 2 April 2018, whereby the Fund was closed but the benchmark index continued to be calculated for these days.iii Differences in valuation between the benchmark index and the Fund; and cancelled dividends.
Past performance is not a guide to future performance and should not be the sole factor of consideration when selecting a product. All financial investments involve an element of risk. Therefore, the value of your
investment and the income from it will vary and your initial investment amount cannot be guaranteed. The performance figures do not consider charges and fees that may be levied at the time of subscription or
redemption of shares. Levels and bases of taxation may change from time to time. Subscriptions may be made only on the basis of the current prospectus, of which the most recent annual report and audited financial
statements and interim report and unaudited financial statements as well as KIIDs form an integral part. Copies of which are available from Investor Services, the Transfer Agent, the Management Company or any
of the Representatives or Distributors.
iSHARES VII PLC
INVESTMENT MANAGER’S REPORT (continued)
[13 ]
Global Economic Overview
Global equities, as represented by the MSCI All Country World Index (“ACWI”) (in USD terms), posted a return of 7.20% for the twelve months ended
31 July 2020. World stock markets gained for the first half of the reporting period, supported by solid, if slowing, economic growth and central bank
easing from the US Federal Reserve (the “Fed”) and several other central banks. The de-escalation of the trade conflict between the U.S. and China
- one of the chief economic uncertainties of the last several years - further boosted markets.
However, the spread of the coronavirus in early 2020 injected uncertainty into global markets, leading to steep declines for all classes of equities.
Countries around the globe instituted restrictions to slow the virus’ spread, resulting in a sharp economic downturn and a sudden rise in
unemployment. Turbulence in energy markets also impacted equities, as a rapid fall in oil prices threatened the viability of parts of the energy sector.
Beginning in April 2020, however, equities regained a significant proportion of their losses as aggressive monetary and fiscal policy, new virus
treatments and the loosening of restrictions in many countries raised hopes for a recovery. Nonetheless, a rise in coronavirus cases in the US and
several other countries late in the reporting period raised the prospect of prolonged disruption from coronavirus countermeasures.
The environment for global bond markets was positive for most of the reporting period prior to the coronavirus outbreak, as low inflation, risk
avoidance, and demand for yield led to higher bond prices despite yields near historic lows. However, as the coronavirus outbreak worsened in March
2020 and the impact to the global economy became apparent, many bond prices fell, particularly for riskier classes of bonds, before recovering
somewhat after central bank interventions. The demand for less risky assets drove the yield on the 10-year US Treasury, a benchmark lending rate
for the bond market, to an all-time low in March 2020.
Global government and corporate bonds posted solid returns, as falling interest rates and low inflation boosted most types of bonds. Corporate
bonds delivered positive returns overall, although solvency concerns amid deteriorating economic conditions meant that investment-grade bonds
advanced significantly more than high-yield bonds. Late in the reporting period, the Fed implemented an unprecedented corporate bond purchasing
facility, which provided significant support to US corporate bond prices.
Stocks in emerging markets advanced for the reporting period. These stocks were initially among the most affected by the coronavirus pandemic,
as lockdowns and factory closures in China weighed on Chinese markets as well as many of the emerging Asian economies that have significant
trade with China. However, stocks from emerging markets rebounded as infection rates slowed and economies reopened, and China reported
economic data indicating a strong recovery. Emerging market bond prices, which fell sharply in March 2020, recovered somewhat due to optimism
about the pace of economic recovery, although they returned less than other international bonds for the 12-month period.
In the commodities market, gold prices rose to an all-time high amid geopolitical tensions and a move towards less risky assets due to the outbreak
of the coronavirus. Negative yields in the bond market also increased the relative attractiveness of gold, a zero-yield, price-driven investment that
tends to perform well amid global uncertainty. Oil prices, already low throughout most of the reporting period, fell rapidly to a 21-year low in April
2020. The combination of weakened demand and increased supply following a dispute between Russia and Saudi Arabia (two of the world’s leading
oil producers) drove oil prices down sharply, although prices recovered somewhat throughout May and June 2020.
Looking at currencies, the US dollar declined against most global currencies, particularly late in the reporting period as US coronavirus infections
grew and economic conditions improved in Europe and Asia. The euro, the British pound, the Japanese yen and the Swiss franc all advanced against
the U.S. dollar.
Prior to the spread of the coronavirus, global economic growth was slow but resilient, with the US growing faster than most other developed
countries. However, the disruption caused by the pandemic led to a significant economic contraction, and the U.S. economy shrank by an annualized
5% in the first quarter of 2020 and a record 33% in the second quarter of 2020. The economies of the eurozone, Japan, and China also contracted,
although the Chinese economy returned to growth in the second quarter of 2020, raising hopes for recovery in the region.
iSHARES VII PLC
INVESTMENT MANAGER’S REPORT (continued)
[14 ]

Global Economic Overview (continued)
In an attempt to boost slowing growth, most central banks favoured more accommodative monetary policy in 2019, and the Fed, the ECB, and the
Bank of Japan all either lowered interest rates or increased monetary stimulus. After the coronavirus outbreak, the Fed instituted two emergency
rate cuts, and along with other influential central banks implemented major bond-buying programs to stabilize debt markets.
BlackRock Advisors (UK) Limited
2020
iSHARES VII PLC
INVESTMENT MANAGER’S REPORT (continued)
[15 ]

Paul McNaughton (Irish) Chairman of the Board, Independent
Non-Executive Director and Chairman of the Nominations
Committee (appointed 1 July 2013): Mr. McNaughton has over 30
years’ experience in the Banking/Finance, Fund Management and
Securities Processing Industries. In addition Mr. McNaughton spent 10
years with IDA (Ireland) both in Dublin and in the USA marketing Ireland
as a location for multinational investment. He went on to establish Bank
of Ireland’s IFSC Fund’s business before joining Deutsche Bank to
establish their funds business in Ireland. He was overall Head of
Deutsche Bank’s Offshore Funds business, including their hedge fund
administration businesses primarily based in Dublin and the Cayman
Islands, before assuming the role of Global Head of Deutsche’s Fund
Servicing business worldwide. Mr. McNaughton left Deutsche Bank in
August 2004 after leading the sale of Deutsche’s Global Custody and
Funds businesses to State Street Bank and now acts as an advisor and
non-executive director for several investment companies and other
financial entities in Ireland including several alternative/hedge fund
entities. Mr. McNaughton holds an Honours Economics Degree from
Trinity College Dublin. He was the founding Chairman of the Irish Funds
Industry Association (“IFIA”) and a member of the Irish Government
Task Force on Mutual Fund Administration. He was instrumental in the
growth of the funds business in Ireland both for traditional and
alternative asset classes.
Paul McGowan (Irish) – Chairman of the Audit Committee,
Independent Non-Executive Director, Senior Independent
Director and Member of the Nominations Committee (appointed
1 July 2013): Mr. McGowan was a financial services tax partner in
KPMG (Ireland) for more than 25 years and was Global Head of
Financial Services Tax for KPMG (International). He is a former
Chairman of both the IFIA and the IFSC Funds Working Group. Since
leaving KPMG he has held a number of non-executive directorships
including Chairman of AEGON Ireland Plc and Coronation Capital Ltd
and is a Director of Epoch Investments Fund Plc and CCA Life
Settlements Fund II ICA. He was appointed to the EU Arbitration Panel
on transfer pricing by the Irish Government. Mr. McGowan is a Fellow of
the Institute of Chartered Accountants in Ireland and holds a business
studies degree from Trinity College Dublin and a Diploma in Corporate
Financial Management from Harvard Business School.
Barry O’Dwyer (Irish), Non-Executive Director and member of the
Nominations Committee (appointed 1 July 2013): Mr. O’Dwyer is a
Managing Director at BlackRock. He is the Head of Funds Governance
for BlackRock’s European open-ended fund range and is the Chief
Operating Officer for BlackRock’s Regulated Irish business. He serves
as a Director on the boards of a number of BlackRock corporate, fund,
and management companies in Ireland, Luxembourg, Switzerland and
Germany and on the board of BlackRock’s UK Life company. He was
the chairman of the Irish Funds Industry Association 2014-2015 and
was a member of An Taoiseach’s Financial Services Industry Advisory
Committee 2015-2018.
He joined BlackRock Advisors (UK) Limited in 1999 as head of risk
management and moved to his present role in 2006. Prior to joining
BlackRock Advisors (UK) Limited, Mr. O’Dwyer worked as a risk
manager at Gartmore Investment Management and at
HypoVereinsbank and National Westminster Bank. Mr. O’Dwyer
graduated from Trinity College Dublin with a degree in Business Studies
and Economics in 1991. He holds a Chartered Association of Certified
Accountants qualification and an MBA from London City University
Business School.
Teresa O’Flynn (Irish), Non-Executive Director (originally
appointed 6 January 2016, resigned on 30 November 2018 and
re-appointed on 4 October 2019): Ms. O’Flynn is a Managing Director
at BlackRock and she is Global Head of Sustainable Investing Strategy
for BlackRock Alternatives Investors (BAI). BAI currently manages over
$175 billion in total assets and client commitments. Ms. O’Flynn is
responsible for instilling BlackRock’s firm-wide sustainable investing
strategy across our Real Estate, Infrastructure, Hedge Funds, Private
Equity and Credit businesses. This includes overseeing all aspects of
integrating sustainability considerations and risk factors across the
platform’s investment and asset management processes, developing
BAI-wide ESG reporting and contributing to BAI business and product
strategy.
Prior to assuming her current responsibilities in 2019, Ms. O’Flynn was
Global Head of Sustainable Investing for BlackRock Real Assets and a
senior Portfolio Manager with Global Renewable Power, having joined
the firm in 2011 to establish BlackRock’s renewables business. She
also serves on the board of BlackRock’s Irish domiciled ETF, cash and
real assets fund companies.
Ms. O’Flynn has over 16 years of international investment experience
having worked as a Senior Corporate Finance Executive at NTR Plc, a
private infrastructure developer, operator and business owner. Ms.
O’Flynn trained as a Chartered Accountant (FCA) and tax advisor (AITI)
with Arthur Andersen and KPMG. She earned a BComm with first class
honours and distinction, from University College Galway, Ireland.
iSHARES VII PLC
BOARD OF DIRECTORS
[16 ]
Jessica Irschick (British), Non-Executive Director (appointed
20 November 2017): Ms. Irschick is a Managing Director at BlackRock
and is the Global Head of Institutional Index business within ETF and
Index Investments. Ms. Irschick is responsible for the institutional
product offering, pricing, and investment strategy for Equity Indexing
and for coordinating with Global Fixed Income to have a globally
consistent institutional client strategy for Fixed Income Indexing. In
addition, she is the Global Head of Equity Index Product Strategy.
Ms. Irschick joined BlackRock in November 2016 from Bank of America
Merrill Lynch, where she was the Global Head of Sales Strategy of the
Equity Division, based in London. Previously, Ms. Irschick was the
Global Head of Treasury and Trading for Norges Bank Investment
Management (NBIM) where she was responsible for Fixed Income and
Equity trading, financing, securities lending and foreign exchange. Prior
to her role at NBIM she worked at UBS, Morgan Stanley and Goldman
Sachs for over 13 years in a variety of roles in equity trading, sales and
client relationship management. Before these roles, Ms. Irschick
worked as the Global Head of Equity and Fixed Income trading at Wells
Fargo Nikko Investment Advisors in San Francisco, one of the
predecessor organizations of BlackRock. Ms. Irschick started her
career at Salomon Brothers, where she worked in Tokyo developing
algorithms for the Fixed Income and Equity trading desks. Ms. Irschick
graduated from Cornell University in 1987 with a Bachelor’s degree in
Operations Research and Economics.
Ros O’Shea (Irish), Independent Non-Executive Director, Member
of the Audit Committee and Nominations Committee (appointed
3 May 2019): Ms.O’Shea is an Independent Non Executive Director
with a portfolio of board positions, including the Bank of Montreal
(Ireland) plc, the Food Safety Authority of Ireland and Pieta House. She
also chairs PwC’s Alumni Association in Ireland. Ros is a founding
partner of Acorn Governance Solutions, a consulting firm providing
advice in governance, culture, risk, compliance and business integrity
and lectures on these topics with UCD Smurfit Business School, the
Institute of Directors and the Institute of Banking. Previously, Ros
enjoyed a highly successful executive career with two of Ireland’s
largest companies: CRH plc, where she was Head of Group
Compliance & Ethics and Smurfit Kappa Group plc.
Ros has first class honours bachelor and masters degrees in business
from UCD, a Professional Diploma in Corporate Governance from UCD
Smurfit Business School and is an associate of the Institute of Tax and
a fellow of the Institute of Chartered Accountants, having trained with
PwC. She is also a graduate of the Value Creation through Effective
Boards programme at Harvard Business School and is a Certified Bank
Director. Furthermore, Ros is the author of the book, “Leading with
Integrity – a Practical Guide to Business Ethics” and is a regular
contributor to news and print media on related topics.
Deirdre Somers (Irish), Independent Non-Executive Director,
Member of the Audit Committee and Nominations Committee
(appointed 3 May 2019): Ms. Somers is an Independent Non Executive
Director and Member of the Audit Committee. She was the CEO and
Executive Director of the Irish Stock Exchange (ISE) from 2007 until its
sale to Euronext NV in early 2018, she served as CEO Euronext Dublin
and Group Head of Debt, Funds & ETFs until September 2018. Joining
the ISE in 1995, Ms. Somers held various management positions,
including Director of Listing (2000-2007) and Head of Policy
(1995-2000), building global positions in funds and fixed income
listings. She served as President of the Federation of European
Securities Exchanges (FESE) from 2015-2018 and was a Member of
The World Federation of Exchanges and FESE for over 20 years. Prior
to joining the ISE, she specialised in international tax in KPMG from
1987-1995. She served as member of the National Council of IBEC
from 2013-2018, Governor of University College Cork from 2008-2012,
and a Member of the Taoiseach’s Clearing House Group from
2007-2014. A Fellow of the Institute of Chartered Accountants in
Ireland, she graduated with a Bachelor of Commerce degree in 1987.
iSHARES VII PLC
BOARD OF DIRECTORS (continued)
[17 ]
Introduction
The Board is committed to maintaining the highest standards of corporate governance and is accountable to shareholders for the governance of
the Entity’s affairs. The Entity is subject to the United Kingdom Listing Authority Listing Rules (the “UKLA Listing Rules”) as they apply to overseas
open-ended investment funds under Chapter 16 of the UKLA Listing Rules, and applicable chapters of the Financial Conduct Authority (“FCA”)
Disclosure and Transparency Rules; available at http://www.fca.org.uk (the “DTR Rules”). The Entity is subject to the governance standards set out
in the UK Corporate Governance Code (the “Code”) issued by the Financial Reporting Council (“FRC”), which is applicable to accounting periods
beginning on or after 17 June 2016.
The Code is published by the FRC and is available to download from - http://www.frc.org.uk. The Entity has also voluntarily adopted the Irish Funds
Industry Association Corporate Governance Code for Collective Investment Schemes and Management Companies (Dec 2011) (the “IFIA Code”)
and, in addition, refers to this Code for the period under review. The IFIA Code can be obtained from the IFIA website at
https://files.irishfunds.ie/1432820468-corporate-governance-code-for-collective-investment-schemes-and-management-companies.pdf.
The Entity is also subject to corporate governance practices imposed by the UCITS Regulations which can be obtained from the CBI website at
http://www.centralbank.ie/regulation/industry-sectors/funds/ucits/Pages/default.aspx and are available for inspection at the registered office of the
Entity.
The Board has considered the principles and recommendations of the Code and has put in place a framework for corporate governance which it
believes both adheres to best practice and is appropriate for the Entity, given the nature of its structure as an Investment Entity.
The sole objective of the Entity is the collective investment in transferable securities and/or other liquid financial assets referred to in Regulation 68
of the UCITS Regulations of capital raised from the public and which operates on the principle of risk spreading. The Articles of Association of the
Entity provide that the Entity may offer separate classes of shares, each representing interests in a Fund comprising a distinct portfolio of
investments. The specific investment objectives and policies of each Fund are formulated by the Board at the time of the creation of the Fund and
any change to a Fund’s investment objective and/or material change to the investment policy of a Fund is subject to the prior consent of shareholders
evidenced by either a majority vote at a meeting of shareholders of a Fund or by written consent of all the shareholders.
This statement summarises the corporate governance structure and processes in place for the Entity for the year under review.
Compliance
The Board has made the appropriate disclosures in this report to ensure the Entity meets its continuing obligations pursuant to the Code. The Entity
has no employees and the Directors are all non-executive. The Board recognises that the shareholders of the Entity invest into a regulated
Investment Company and considers that the governance structure and operational processes in place for the Entity are suitable for an Investment
Entity.
The Board considers that the Entity has complied with the relevant provisions contained within the Code throughout this accounting period except,
as explained below, where departure from the Code is considered appropriate given the Entity’s position as an Investment Entity. This Corporate
Governance Statement, together with the Statement of Directors’ Responsibilities, describes how the main principles of the Code are applied to the
Entity.
iSHARES VII PLC
CORPORATE GOVERNANCE STATEMENT
[18 ]
Compliance (continued)
The Code includes provisions relating to:
(i) the appointment and role of the Chief Executive;
(ii) executive Directors’ remuneration;
(iii) the need for an internal audit function; and
(iv) the need to establish a Remuneration Committee;
(v) the need to assess and monitor culture and the approach to investing and rewarding the workforce; and
(vi) a method for “workforce” engagement.
Due to the nature of its structure as an Investment Entity, which has no workforce, the Board does not consider these provisions appropriate to the
Entity. Therefore the Entity was not compliant with these provisions during and post the year under review.
The Code also includes provisions for the re-election of Directors by shareholders with which the Entity was in compliance during the year under
review. Additionally the Articles of Association provide that retiring Directors are eligible for re-appointment by the other Directors every three years.
The Board considers that the Entity has been in full compliance with the IFIA Code during the year under review.
Board composition
The Board currently consists of seven non-executive Directors, four of whom are independent. The Board is committed to maintaining an
appropriate balance of skills, experience, independence and knowledge amongst its members.
In accordance with the Code, the Board has carried out an assessment based on the independence requirements set out therein and has determined
that, in its judgement the Chairman, Mr Paul McNaughton, Mr Paul McGowan, Ms Ros O’Shea and Ms Deirdre Somers are independent within the
meaning of those requirements. They are independent of the Manager, the Investment Manager and other third party service providers such as the
Administrator and Depositary. The Board has also considered and is satisfied that the presence of four non-executive independent Directors
(including the Chairman) is an appropriate balance for the Board. The Board has appointed Mr Paul McGowan as the senior independent Director.
The Directors’ biographies, collectively demonstrate a breadth of investment knowledge, business and financial skills which enables them to provide
effective strategic leadership, oversight and proper governance of the Entity.
Delegation of responsibilities
The Directors of the Entity have delegated the following areas of responsibility:
Management and Administration
The Directors of the Entity have delegated the investment management, distribution and administration of the Entity and its Funds to the Manager.
The Manager has delegated the management of the investment portfolio and distribution of the Entity’s shares to the Investment Manager. The
Investment Manager operates under guidelines determined by the Manager and as detailed in the Entity’s prospectus and the various
supplementary prospectuses relating to the Entity’s Funds. The Investment Manager has direct responsibility for the decisions relating to the
day-to-day running of the Entity’s Funds and is accountable to the Board of the Manager and the Entity for the investment performance of the Funds.
The Board has established a Nominations Committee and an Audit Committee. The Directors have delegated certain functions to these committees.
Please see the “Committees of the Board” section in this Corporate Governance Statement for further details.
Insurance
The Entity has maintained appropriate Directors’ and Officers’ liability insurance cover throughout the year.
iSHARES VII PLC
CORPORATE GOVERNANCE STATEMENT (continued)
[19 ]
Board’s responsibilities
The Board meets monthly and also on an ad hoc basis as required. All Directors are expected to attend each meeting and the attendance at Board
and committee meetings during the financial year is set out on the following pages. Directors are provided with relevant papers in advance of each
Board meeting. In addition, electronic copies of meeting papers and other relevant information are available to Directors. If a Director is unable to
attend a meeting, they will still receive the papers. During the financial year, ad hoc Board meetings were arranged at short notice and it was not
always possible for all Directors to attend.
The Board reserves to itself decisions relating to the determination of investment policy and objectives of the Funds and any change in investment
strategies of the Funds, the appointment and removal of the Company Secretary and entering into any material contracts. The Board also approves
the prospectus, circulars to shareholders, listing particulars and other relevant legal and fund documentation. A formal schedule of matters
specifically reserved for decision by the Board is maintained.
Any Director who resigns his/her position is obliged to confirm to the Board and the CBI that the resignation is not connected with any issues with
or claims against the Entity. Furthermore, any Director who has concerns about the running of the Entity or a proposed course of action may provide
a written statement to the Chairman outlining his/her concerns for circulation to the Board or alternatively may have his/her concerns formally
recorded in the minutes of a Board meeting.
The Board has responsibility for ensuring that the Entity keeps proper accounting records which disclose with reasonable accuracy at any time the
financial position of the Entity and which enable it to ensure that the financial statements comply with the Companies Act and relevant accounting
standards. It is the Board’s responsibility to present a balanced and understandable assessment of the Entity’s financial position, which extends to
interim financial statements and other reports made available to shareholders and the public. The Board is also responsible for safeguarding the
assets of the Entity and for taking reasonable steps in the prevention and detection of fraud and other irregularities.
The Directors have access to the advice and services of the Company Secretary, external counsel and the resources of the Investment Manager
should they be needed. Where necessary, in the furtherance of their duties, the Board and individual Directors may seek independent professional
advice.
Directors’ induction and training
Prior to his/her appointment, each new Director receives a full and formal tailored induction incorporating relevant information regarding the Entity
and his/her duties and responsibilities as a Director. In addition, a new Director is required to spend some time with representatives of the Investment
Manager so that the new Director will become familiar with the various processes which the Investment Manager considers necessary for the
performance of his/her duties and responsibilities to the Entity.
The Entity’s policy is to encourage Directors to keep up to date with developments relevant to the Entity. The Directors have attended and will
continue to attend updates and briefings run by the Investment Manager and which are relevant to the Entity. The Directors also receive regular
briefings from, amongst others, Deloitte external auditors, investment strategists, depositaries and legal advisors regarding any proposed product
developments or changes in laws or regulations that could affect the Entity. The Board is supplied with information in a timely manner and in a form
and of a quality appropriate to enable it to discharge its duties. The training needs of the Directors are evaluated as part of the annual performance
evaluation of the Board. Further information in respect of performance evaluation is provided below.
Performance evaluation
The Board formally reviews its performance on an annual basis and an appraisal system has been implemented for the Board, its supporting
Committees and the individual Directors, including the Chairman. This evaluation process assists in identifying individual Directors training and
development needs. The Board is satisfied with the robustness of the appraisal system and considers the current review and evaluation process
adequate. The Board evaluation for 2019 will be completed in 2020.
iSHARES VII PLC
CORPORATE GOVERNANCE STATEMENT (continued)
[20 ]
Diversity Report
The Nominations Committee, together with the Board, acknowledges the importance of diversity to enhance its operation. During the selection
process the Board and Nominations Committee are committed to selecting those with diversity of business skills, experience and gender and
candidates for appointment are considered based on these attributes. The Board’s principle is that each member of the Board must have the skills,
experience, knowledge and overall suitability that will enable each director to contribute individually, and as part of the board team, to the
effectiveness of the Board. Subject to that overriding principle, the Board believe that diversity of experience and approach, including educational
and professional background, gender, age and geographical provenance, amongst board members is of great value when considering overall board
balance in making new appointments to the Board. The Boards’ priority is to ensure that it continues to have strong leadership and the relevant skills
to deliver the business strategy. The implementation of the Boards diversity policy is monitored by the Nominations Committee which reviews the
balance of skills, knowledge, experience and diversity on the Board and leads succession planning for appointments to the Board. The Nominations
Committee will ensure that all selection decisions are based on merit and that recruitment is fair and non-discriminatory. The Board’s policy is to have
women make up at least 30% of the Boards’ membership, and currently has seven Board members, four of which are female. The current Board
composition reflects diverse age, gender, educational and professional backgrounds.
Committees of the Board
Nominations Committee
The Board has established a Nominations Committee comprising a majority of independent Directors. The Nominations Committee comprises of
Mr Paul McNaughton (Chairman), Mr Paul McGowan, Mr Barry O’Dwyer, Ms Deirdre Somers and Ms Ros O’Shea. The key objective of the
Nominations Committee is to ensure the Board comprises individuals with the appropriate balance of skills, experience, independence and
knowledge appropriate to the Entity to ensure that it is effective in discharging its responsibilities and oversight of all matters relating to corporate
governance.
The Nominations Committee is responsible for evaluating and nominating for the approval of the Board, candidates to fill Board vacancies as and
when they arise. Before a proposal is made to the Board, the Committee members will ensure that the capabilities required for a particular
appointment have been considered. They will also ensure that on appointment to the Board, Non-Executive Directors receive a formal letter of
appointment setting out clearly what is expected of them in terms of time commitment, committee service and involvement outside Board meetings.
The terms of reference of the Nominations Committee are available upon request.
The Nominations Committee met on 25 September 2019 and 27 November 2019 in order to review the Committee’s terms of reference and its own
performance and to review the structure, size and composition of the Board.
Audit Committee
The Entity has established an Audit Committee which reports directly to the Board and meets regularly throughout the financial year in order to
discharge its duties. Further information on how the Audit Committee carried out its duties during the financial year under review is contained in the
Audit Committee report.
The Board considered that all of the members of the Audit Committee were suitably qualified and had sufficient experience to discharge their
responsibilities effectively. Furthermore, Paul McGowan, Ros O’Shea and Deirdre Somers are qualified accountants with relevant experience in
financial matters as they pertain to investment companies.
iSHARES VII PLC
CORPORATE GOVERNANCE STATEMENT (continued)
[21 ]
Committees of the Board (continued)
Audit Committee (continued)
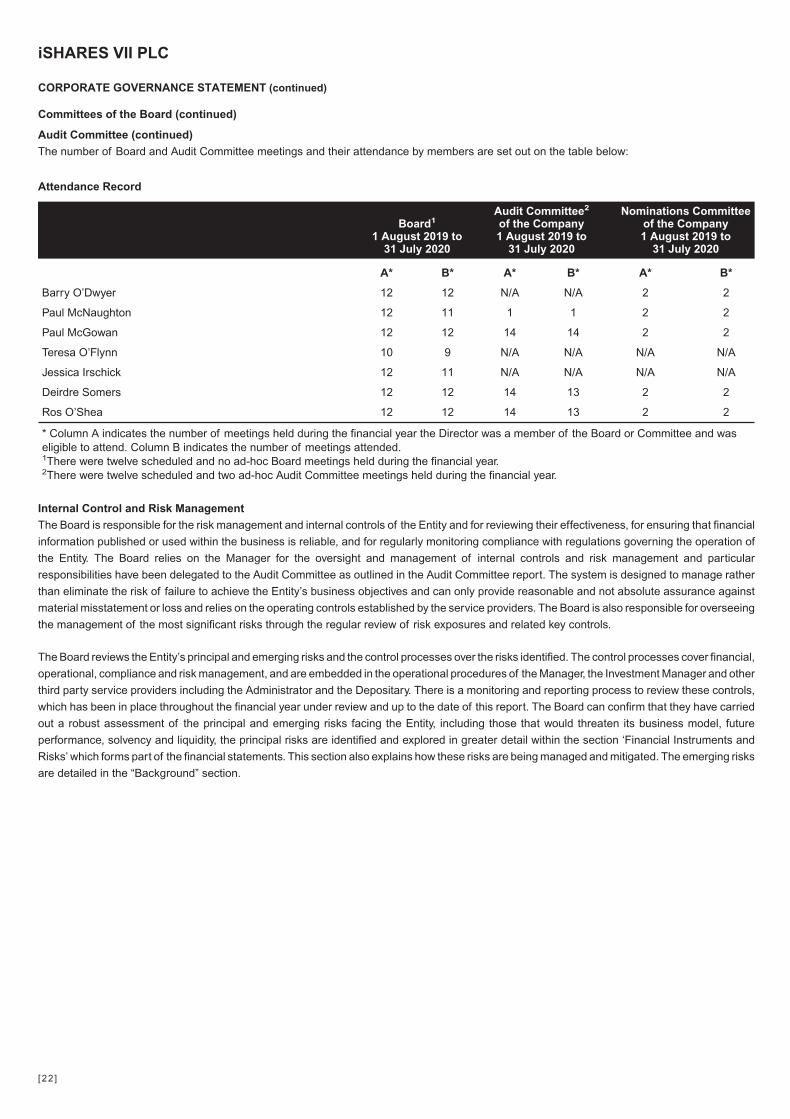
The number of Board and Audit Committee meetings and their attendance by members are set out on the table below:
Attendance Record
Board1
1 August 2019 to31 July 2020
Audit Committee2
of the Company1 August 2019 to
31 July 2020
Nominations Committeeof the Company1 August 2019 to
31 July 2020
A* B* A* B* A* B*
Barry O’Dwyer 12 12 N/A N/A 2 2
Paul McNaughton 12 11 1 1 2 2
Paul McGowan 12 12 14 14 2 2
Teresa O’Flynn 10 9 N/A N/A N/A N/A
Jessica Irschick 12 11 N/A N/A N/A N/A
Deirdre Somers 12 12 14 13 2 2
Ros O’Shea 12 12 14 13 2 2
* Column A indicates the number of meetings held during the financial year the Director was a member of the Board or Committee and waseligible to attend. Column B indicates the number of meetings attended.1There were twelve scheduled and no ad-hoc Board meetings held during the financial year.2There were twelve scheduled and two ad-hoc Audit Committee meetings held during the financial year.
Internal Control and Risk Management
The Board is responsible for the risk management and internal controls of the Entity and for reviewing their effectiveness, for ensuring that financial
information published or used within the business is reliable, and for regularly monitoring compliance with regulations governing the operation of
the Entity. The Board relies on the Manager for the oversight and management of internal controls and risk management and particular
responsibilities have been delegated to the Audit Committee as outlined in the Audit Committee report. The system is designed to manage rather
than eliminate the risk of failure to achieve the Entity’s business objectives and can only provide reasonable and not absolute assurance against
material misstatement or loss and relies on the operating controls established by the service providers. The Board is also responsible for overseeing
the management of the most significant risks through the regular review of risk exposures and related key controls.
The Board reviews the Entity’s principal and emerging risks and the control processes over the risks identified. The control processes cover financial,
operational, compliance and risk management, and are embedded in the operational procedures of the Manager, the Investment Manager and other
third party service providers including the Administrator and the Depositary. There is a monitoring and reporting process to review these controls,
which has been in place throughout the financial year under review and up to the date of this report. The Board can confirm that they have carried
out a robust assessment of the principal and emerging risks facing the Entity, including those that would threaten its business model, future
performance, solvency and liquidity, the principal risks are identified and explored in greater detail within the section ‘Financial Instruments and
Risks’ which forms part of the financial statements. This section also explains how these risks are being managed and mitigated. The emerging risks
are detailed in the “Background” section.
iSHARES VII PLC
CORPORATE GOVERNANCE STATEMENT (continued)
[22 ]
Internal Control and Risk Management (continued)
The Board is responsible for establishing and maintaining adequate internal control and risk management systems of the Entity in relation to the
financial reporting process. The Entity has procedures in place to ensure all relevant accounting records are properly maintained and are readily
available, including production of annual and half-yearly financial statements. These procedures include appointing the Administrator to maintain
the accounting records of the Entity independently of the Investment Manager and the Depositary. The annual and half-yearly financial statements
of the Entity are required to be approved by the Board and filed with the CBI and the London Stock Exchange. The financial statements are prepared
in accordance with accounting standards generally accepted in Ireland, the Companies Act and the UCITS Regulations. The accounting information
given in the annual report is required to be audited. The External Auditors’ report, including any qualifications, is reproduced in full in the annual
report of the Entity.
Monitoring and review activities
There are procedures designed for monitoring the system of internal control and risk management and to capture and evaluate any failings or
weaknesses. Should a case be categorised by the Board as significant, procedures exist to ensure that necessary action is taken to remedy the
failings.
During the financial year under review the Depositary reported to the Board on a quarterly basis.
The Depositary and the Administrator provides an annual Service Organisational Control Reports outlining an overview of the controls environment
adopted and applied by the Depositary and the Administrator to the Manager. The Manager reports annually on it to the Audit Committee of the Entity.
The Manager receives a report from the Administrator on the internal controls of the administrative operations of the Entity and the Administrator
reports to the Board on an annual basis.
Review of effectiveness
The Board has reviewed the effectiveness of the internal control and risk management systems (including financial, operational and compliance
controls) in accordance with the Code for the financial year under review and up to the date of approval of the financial statements. The Board is
not aware of any significant failings or weaknesses in internal control arising during this review. Had there been any such failings or weaknesses,
the Board confirms that necessary action would have been taken to remedy them.
Going Concern and Viability Statement
The going concern and viability statements are set out in the Directors’ Report.
Remuneration
The Entity is an Investment Company and has no employees or executive Directors. The Board believes that the principles of Section D of the Code
relating to remuneration do not apply to the Entity, except as outlined below, as the Entity has no executive Directors. No Director past or present
has any entitlement to pensions, and the Entity has not awarded any share options or long-term performance incentives to any of them. No element
of Directors’ remuneration is performance-related.
Those Directors who are also employees of the BlackRock group are not entitled to receive a Director’s fee. All other Directors have fees paid to
them which are set out in service contracts with the Entity. The Board believes that the level of remuneration for those Directors who take a fee
properly reflects the time commitment and responsibilities of their roles. The maximum amount of remuneration payable to the Directors is
determined by the Board and is set out in the prospectus of the Entity.
The terms of the aforementioned service contracts are for one financial year and include an assessment of the time commitment expected of each
Director. The Directors also have a continuing obligation to ensure they have sufficient time to discharge their duties. The detail of each Director’s,
including the Chairman’s, other appointments and commitments are made available to the Board for inspection and all new appointments or
significant commitments require the prior approval of the Investment Manager. The Directors, who are employees of the BlackRock group, have
executed letters of appointment which include an assessment of the time commitment expected. Extracts of the service contracts as they relate
to the Entity and letters of appointment are available for inspection on request and at each Annual General Meeting ("AGM").
iSHARES VII PLC
CORPORATE GOVERNANCE STATEMENT (continued)
[23 ]

Communication with Shareholders
The Entity is an Investment Company and the shareholders invest in its range of Funds in order to, inter alia, gain exposure to the expertise of the
Investment Manager and its investment strategies. Given the nature of the Entity, it is not necessary or desirable for the Chairman or any of the other
Directors to discuss investment strategy with shareholders. Furthermore, the Manager has appointed the Investment Manager as distributor and it
is this entity which is tasked with actively managing the relationship between the Entity and its shareholders.
The Board reviews monthly reports on shareholder communications and in addition, the Board reviews reports from the Manager’s compliance
function which include updates on shareholder complaints.
The Board is responsible for convening the AGM and all other general meetings of the Entity. All shareholders have the opportunity to attend and
vote at general meetings. Notice of general meetings is issued in accordance with the Companies Act and the Articles of Association of the Entity
and notice of the annual general meeting is sent out at least 20 working days in advance of the meeting, and any item not of an entirely routine nature
is explained in a covering circular. For all other general meetings the notice is sent at least 14 working days in advance. All substantive matters put
before a general meeting are dealt with by way of separate resolution, in accordance with the Articles of Association of the Entity.
Proxy voting figures are noted by the chairman of the general meeting and the results of each general meeting, including the number of votes
withheld, will be announced and made available on the iShares website shortly after the meeting. When it is the opinion of the Board that a significant
proportion of votes have been cast against a resolution at any general meeting, the Board will explain when announcing the results what actions
it intends to take to investigate and understand the reasoning behind the result.
General meetings are managed and run by the Company Secretary. Strategic issues and all operational matters of a material nature are determined
by the Board. If the shareholders wish to engage on matters relating to the management of the Entity, then invariably they will wish to discuss these
matters or meet with the Investment Manager.
However, the Board will accept requests to make individual Directors available to shareholders. One of the independent Directors is always available
to attend general meetings. The Chairman of the Audit and Nominations Committees will be available to attend general meetings and to answer
questions, if required, while the senior independent Director will be also available to liaise with shareholders, where required.
Every holder of participating shares present in person or by proxy who votes on a show of hands is entitled to one vote. On a poll, every holder of
participating shares present in person or by proxy is entitled to one vote in respect of each share held by him. The poll shall be taken in accordance
with the Articles of Association.
iSHARES VII PLC
CORPORATE GOVERNANCE STATEMENT (continued)
[24 ]
The Board has established an Audit Committee whose roles and responsibilities are detailed below.
Roles and Responsibilities
The main responsibilities of the Audit Committee include considering and recommending to the Board for approval the contents of the interim and
annual financial statements, and providing an opinion as to whether the annual financial statements, taken as a whole, are fair, balanced and
understandable and provide the information necessary for shareholders to assess the Entity’s performance, business model and strategy. The Audit
Committee also reviews related information presented within the financial statements, including statements concerning internal controls and risk
management. In addition, the Audit Committee is responsible for approving the audit fees of the External Auditor, conducting a review of the External
Auditors’ report on the annual financial statements and reviewing and forming an opinion on the effectiveness of the external audit process and audit
quality. Other duties include reviewing the appropriateness of the Entity’s accounting policies and reporting to the Board on how it has discharged
its responsibilities.
There are formal terms of reference in place for the Audit Committee. The terms of reference of the Audit Committee are available to shareholders
on request.
The Audit Committee has met fourteen times during the financial year. These meetings were to consider various items including updates in the
regulatory environment as they relate to the financial statements of the Entity, updates on the Entity’s accounting policies and progress reports on
the audit. The significant issues considered by the Audit Committee in relation to the financial statements are discussed below and overleaf.
Financial Statements
The Audit Committee reviewed the interim financial statements, annual financial statements and the audit findings presentation from the External
Auditors.
Significant issues considered in relation to the financial statements
During the financial year, the Audit Committee considered a number of significant issues and areas of key audit risk in respect of the Annual Report
and Financial Statements. The Committee reviewed the external audit plan at an early stage and concluded that the appropriate areas of audit risk
relevant to the Entity had been identified in the audit plan and that suitable audit procedures had been put in place to obtain reasonable assurance
that the financial statements as a whole would be free of material misstatements. Below sets out the key areas of risk identified and also explains
how these were addressed by the Committee.
1. Valuation
The Board has in place a hierarchical structure for the pricing of every asset class of the Entity which details the primary, secondary and tertiary
pricing sources (the “Pricing Hierarchy”). The Administrator has been appointed for the purposes of valuing each asset class of the Entity. The
Administrator follows the Pricing Hierarchy in this regard. During the year under review, monthly reporting was provided by the Investment Manager
in which any exceptions to this process were identified and investigated and referred to the Board. The Audit Committee considers that the
procedures that the Board has in place to monitor the Administrator and Investment Manager are adequate and appropriate. The Audit Committee
discussed with the external auditor the results of the year end audit procedures over the valuation of investments. No significant exceptions to
valuation of the assets were noted during the year under review.
2. Existence
In order to gain comfort on the existence of the assets of the Entity, a daily reconciliation of all asset classes is performed by the Administrator
between their records and the separate records held by counterparties, the Depositary and the Investment Manager. During the financial year under
review, any material exceptions identified by these reconciliations were reported on a monthly basis by the Investment Manager and quarterly by
the Administrator and Depositary. The Depositary also provided a report in relation to the oversight of its global sub-custodian and global custody
network and any exceptional items regarding existence of assets of the Entity were referred for consideration by the Audit Committee. The Audit
Committee considers that the procedures that the Board has in place to monitor the Administrator and Investment Manager are adequate and
appropriate. The Audit Committee discussed with the external auditor the results of the year end audit procedures over the existence of investments.
No material exceptions to the existence of the assets were noted during the financial year under review.
iSHARES VII PLC
AUDIT COMMITTEE REPORT
[25 ]
Roles and Responsibilities (continued)
Significant issues considered in relation to the financial statements (continued)
3. Risk of Management Override
The Depositary and Administrator provided reports to the Manager on an annual basis on the controls in place to minimise the risk of management
override. In addition to this, the Manager has reviewed the Statement on Service Organisational Control (the "SOC1") prepared by the Depositary
and Administrator to further ensure that the relevant control procedures were in place to minimise the risk of management override. The SOC1 of
the Investment Manager is also presented annually for review. Any exceptions noted were referred to the Audit Committee for further review. No
significant exceptions in respect of the risk of management override were noted during the financial year under review.
Fair, Balanced and Understandable
The production and audit of the financial statements is a comprehensive process requiring input from a number of different contributors. Following
the adoption of the Code by the Entity, the Board requested that the Audit Committee advises on whether it believes the financial statements, taken
as a whole, are fair, balanced and understandable and provide the information necessary for shareholders to assess the Entity’s position and
performance, business model and strategy. In doing so the Audit Committee has given consideration to the following:
● The comprehensive reviews that are undertaken at different levels in the production process of the financial statements, by the Manager and
the Administrator;
● The comprehensive review also undertaken during the production process by the Investment Manager;
● The comprehensive review undertaken by the Audit Committee to ensure consistency, overall balance and appropriate disclosure;
● The controls that are in place at the Investment Manager, the Administrator and Depositary, to ensure the completeness and accuracy of the
Entity’s financial records and the security of the Entity’s assets;
● The existence of satisfactory SOC1 control reports reviewing the effectiveness of the internal controls of the Investment Manager, the
Administrator and the Depositary; and
● The timely identification and resolution of any significant audit risks, process errors or control breaches that may have impacted the Entity’s NAV
and accounting records and how successfully any issues in respect of areas of accounting judgement were identified and resolved.
As a result of the work performed, the Audit Committee has concluded that the financial statements for the financial year ended 31 July 2020, taken
as a whole, are fair, balanced and understandable and provide the information necessary for shareholders to assess the Entity’s performance,
business model and strategy. The Audit Committee has reported on these findings to the Board and recommended the approval of the financial
statements to the Board. The Board’s conclusions in this respect are set out in the Statement of Directors’ Responsibilities.
External Auditor
To assess the effectiveness of the external audit, members of the Audit Committee work closely with the Investment Manager and the Manager to
obtain a good understanding of the progress and efficiency of the external audit.
In relation to the audit process, feedback on the role of the Investment Manager and the Manager, is sought from relevant parties involved, notably
the audit partner and audit team. The External Auditor is invited to attend the Audit Committee meetings at which the annual financial statements
are considered.
Deloitte Ireland LLP were appointed as independent auditors of the Entity in 31 December 2018 and the lead audit partner rotates every five years
to assure independence. To form a conclusion with regard to the independence of the External Auditor, the Audit Committee considers whether their
skills and experience make them a suitable supplier of non- audit services and whether there are safeguards in place to ensure that there is no threat
to their objectivity and independence in the conduct of the external audit resulting from the provision of such services. The external audit and
assurance services fees are disclosed in note 16 of the financial statements of the Entity.
iSHARES VII PLC
AUDIT COMMITTEE REPORT (continued)
[26 ]
External Auditor (continued)
On an annual basis, the External Auditor reviews the independence of its relationship with the Entity and reports this to the Board. The Audit
Committee also receives information about policies and processes for maintaining independence and monitoring compliance with relevant
requirements from the Entity’s External Auditors, including information on the rotation of external audit partners and staff, details of any relationships
between the external audit firm and its staff and the Entity as well as an overall confirmation from the External Auditors of their independence and
objectivity.
As a result of its review, the Audit Committee has concluded that Deloitte Ireland LLP, as External Auditor, is independent of the Entity. The Audit
Committee has conducted a review of independence of the External Auditor and has in place a pre-approval policy on the engagement of the
External Auditor to supply non-audit services.
Internal Audit
The Board considers it appropriate for the Entity not to have its own internal audit function as all of the management and administration of the Entity is
delegated to the Manager, Investment Manager, Administrator and Depositary.
Audit Committee Effectiveness
The performance of the Audit Committee is reviewed at least annually. The Audit Committee evaluation for 2019 will take place in 2020.
Paul McGowan
Chairman of the Audit Committee
28 October 2020
iSHARES VII PLC
AUDIT COMMITTEE REPORT (continued)
[27 ]
The Directors present the audited financial statements for the financial year from 1 August 2019 to 31 July 2020.
Statement of Directors’ responsibilities
The Directors are responsible for preparing the annual report and the audited financial statements in accordance with applicable Irish law and
Financial Reporting Standard 102 (“FRS 102”) “The Financial Reporting Standard applicable in the United Kingdom and Republic of Ireland” issued
by the Financial Reporting Council, and in compliance with the Irish Companies Act 2014 (as amended) and the European Communities
(Undertakings for Collective Investment in Transferable Securities) Regulations, 2011 (as amended) (the “UCITS Regulations”) and the Listing Rules
of the London Stock Exchange.
Under Irish law, the Directors shall not approve the audited financial statements unless they are satisfied that they give a true and fair view of the
Entity’s assets, liabilities and financial position as at the end of the financial year and the profit or loss of the Entity for the financial year.
In preparing these financial statements, the Directors are required to:
● select suitable accounting policies and then apply them consistently;
● make judgements and estimates that are reasonable and prudent;
● state whether the financial statements have been prepared in accordance with applicable accounting standards and identify the standards in
question, subject to any material departures from those standards being disclosed and explained in the notes to the financial statements; and
● prepare the financial statements on a going concern basis unless it is inappropriate to presume that the Entity will continue in business.
The Directors confirm that they have complied with the above requirements in preparing the audited financial statements.
The Directors are responsible for keeping adequate accounting records that are sufficient to:
● correctly record and explain the transactions of the Entity;
● enable, at any time, the assets, liabilities, financial position and profit or loss of the Entity to be determined with reasonable accuracy; and
● enable the Directors to ensure that the financial statements comply with the Companies Act 2014 (as amended) and enable those financial
statements to be audited.
The Directors have appointed State Street Fund Services (Ireland) Limited for the purpose of maintaining adequate accounting records. Accordingly,
the accounting records are kept at the following address on behalf of Administrator:
State Street Fund Services (Ireland) Limited
78 Sir John Rogerson’s Quay
Dublin 2
Ireland
The Directors are also responsible for safeguarding the assets of the Entity to prevent and detect fraud and other irregularities. The Directors have
entrusted the assets of the Entity to the Depositary for safekeeping in accordance with the Memorandum and Articles of Association of the Entity.
In this regard the Directors have appointed State Street Custodial Services (Ireland) Limited as Depositary pursuant to the terms of the Depositary
Agreement. The address at which this business is conducted is as follows:
State Street Custodial Services (Ireland) Limited
78 Sir John Rogerson’s Quay
Dublin 2
Ireland
Under applicable law and regulations, the Directors are also responsible for preparing a corporate governance statement that complies with that law
and those regulations.
iSHARES VII PLC
DIRECTORS’ REPORT
[28 ]
Statement of Directors’ responsibilities (continued)
The audited financial statements are published on the www.iShares.com website. The Directors, together with the Manager and the Investment
Manager are responsible for the maintenance and integrity of the financial information included on this website. Legislation in the Republic of Ireland
governing the presentation and dissemination of the financial statements may differ from legislation in other jurisdictions.
The Directors confirm to the best of their knowledge, that:
● The annual report and audited financial statements of the Entity and the Funds are prepared in accordance with accounting standards generally
accepted in Ireland, the Companies Act and the UCITS Regulations and disclose with reasonable accuracy the financial position of the Entity
and Funds and give a true and fair view of the assets, liabilities and financial position and profit or loss of the Entity and Funds for the financial
year;
● The annual report and audited financial statements of the Entity and the Funds include a fair review of the development and performance of the
business and the position of the Entity together with a description of the principal risks and uncertainties that it faces.
The Code also requires Directors to ensure that the annual report and audited financial statements are fair, balanced and understandable and
provide the information necessary for shareholder to assess the Entity’s position and performance, business model and strategy. In order to reach
a conclusion on this matter, the Directors have requested that the Audit Committee advise on whether they consider that the financial statements
fulfil these requirements. The process by which the Audit Committee has reached these conclusions is set out in the Audit Committee report. As a
result of a comprehensive review, the Directors have concluded that the financial statements for the financial year ended 31 July 2020, taken as a
whole, are fair, balanced and understandable and provide the information necessary for shareholder to assess the Entity’s performance, business
model and strategy.
Directors’ Compliance Statement
In accordance with Section 225 of the Companies Act 2014 (as amended), the acknowledge that they are responsible for securing the Entity’s
compliance with its relevant obligations and confirm that:
1. A compliance policy has been prepared setting out the Entity’s procedures (that, in the Directors’ opinion, are appropriate to the Entity) for
ensuring compliance by the Entity with its relevant obligations;
2. An adequate structure is in place, that in the Directors’ opinion, is designed to secure material compliance with the Entity’s relevant obligations;
and
3. An annual review procedure has been put in place to review the Entity’s relevant obligation and ensure a structure is in place to comply with these
obligations.
Results and dividends
The results and dividends for the financial year of the Entity are set out in the income statement on page 39.
The Manager has made a successful application for “Reporting Fund” status to apply to certain share classes under the Statutory Instrument
2009/3001 (The Offshore Funds (Tax) Regulations 2009) of the UK. A list of the share classes which currently have ‘reporting fund’ status is
available at https://www.gov.uk/government/publications/offshore-funds-list-of-reporting-funds.
Review of business and future developments
The specific investment objectives and policies, as set out in the Prospectus of the Entity are formulated by Directors at the time of the creation of
the Fund. Investors in a Fund are expected to be informed investors who have taken professional advice, are able to bear capital and income risk,
and should view investment in a Fund as a medium to long term investment. A description of the Fund, its performance review and a market review
can be found in the Background section and the Investment Manager’s report. The performance review encompasses tracking error and tracking
difference disclosures which are key metrics as to how well the Fund has been managed against their benchmark indices.
A review of the potential implications of Brexit and the COVID-19 outbreak which could impact the Entity’s business are included in the Background
section and Note 3.2.3.
iSHARES VII PLC
DIRECTORS’ REPORT (continued)
[29 ]
Risk management objectives and policies
The financial instruments and risks facing the Entity are set out on pages 63 to 128. The Entity’s corporate governance statement is set out on
pages 18 to 24.
Subsequent events after the financial year end
The significant events which have occurred since the balance sheet date are set out in note 18 of the notes to the financial statements of the Entity.
Directors’ and Company Secretary’s interest and transactions
The Directors and Company Secretary had no interests in the shares of the Entity during the year ended 31 July 2020 (2019: Nil) other than those
disclosed in the related party transactions note of the financial statements of the Entity.
The Directors and Company Secretary had no interests in the debentures of the Entity during or at the end of the financial year (2019: Nil).
Jessica Irschick and Barry O’Dwyer are non-executive Directors and also employees of the BlackRock Group. With effect from 4 October 2019,
Teresa O’Flynn, who is an employee of the BlackRock Group, was re-appointed as a non-executive Director.
No Director had at any time during the financial year, a material interest in any contract of significance, in relation to the business of the Entity
(2019: Nil).
Going concern
The financial statements of the Entity have been prepared on a going concern basis with the exception of iShares MSCI Brazil UCITS ETF USD
(Acc) which has been prepared on a non-going concern basis as this Fund closed during the financial year. The Entity is able to meet all of its
liabilities from its assets. The performance, marketability and risks of the Fund are reviewed on a regular basis throughout the financial year.
Therefore, the Directors believe that the Entity will continue in operational existence for the foreseeable future and is financially sound. The Directors
are satisfied that, at the time of approving the financial statements, it is appropriate to adopt the going concern basis in preparing the financial
statements of the Entity.
Viability statement
The Code includes a proposal for companies to include a “Viability Statement” addressed to shareholders with the intention of providing an improved
and broader assessment of long term solvency and liquidity. The Code does not define “long term” but expects the period to be longer than 12 months
with individual companies choosing a financial period appropriate to the nature of their own business. The Directors conducted this review for the
financial period up to the AGM in 2023, being a three year period from the date that this annual report will be approved by Shareholders. The reason
the Directors consider three years to be an appropriate financial period to review is that they do not expect there to be any significant change in the
Entity’s current principal risks and adequacy of the mitigating controls during that financial period. Furthermore, the Directors do not envisage any
change in the objective of the Entity, as disclosed in the Background section of the annual report and audited financial statements, or any other
events that would prevent the Entity from continuing to operate over that financial period as the Entity’s assets are sufficiently liquid and the Entity
intends to continue to operate as an Investment Entity. This financial period has been chosen, as a financial period longer than three years creates
a level of future uncertainty for which a Viability Statement cannot, in the Directors’ view, be made meaningfully. In making this assessment the Board
has considered the following factors:
● the Entity’s principal risks as set out in the Financial Risks section of the financial statements;
● the ongoing relevance of the Entity’s objective in the current environment; and
● the level of investor demand for the Fund offered by the Entity.
The Board has also considered a number of financial metrics in its assessment, including:
● the level of ongoing charges, both current and historic;
● the level of capital activity, both current and historic;
● the level of income generated; and
iSHARES VII PLC
DIRECTORS’ REPORT (continued)
[30 ]

Viability statement (continued)
● the liquidity, tracking error and tracking difference of each Fund.
The Board has concluded that the Entity would be able to meet its ongoing operating costs as they fall due as a consequence of:
● a diverse product offering that meets the needs of investors; and
● overheads which comprise a small percentage of net assets.
Based on the results of their analysis, the Directors have a reasonable expectation that the Entity will be able to continue in operation and meet its
liabilities as they fall due over the financial period of their assessment.
Independent auditor
The Board is not aware, of any relevant audit information that the Entity’s auditors are unaware of. The Directors have taken all the steps that should
have been taken as Directors in order to make themselves aware of any relevant audit information and to establish that the Entity’s auditors are
aware of that information.
The Directors recommend the re-appointment of the auditors, Deloitte Ireland LLP, in accordance with section 383 of the Companies Act.
On behalf of the Board of Directors
Deirdre Somers
Director
28 October 2020
Paul McGowan
Director
28 October 2020
iSHARES VII PLC
DIRECTORS’ REPORT (continued)
[31 ]
We have enquired into the conduct of iShares VII plc (the "Entity’) for the year ended 31 July 2020, in our capacity as Depositary to the Entity.
This report including the opinion has been prepared solely for the shareholders in the Entity, in accordance with Regulation 34, (1), (3) and (4) in
Part 5 of the UCITS Regulations, and for no other purpose. We do not, in giving this opinion, accept or assume responsibility for any other purpose
or to any other person to whom this report is shown.
Responsibilities of the Depositary
Our duties and responsibilities are outlined in Regulation 34, (1), (3) and (4) in Part 5 of the UCITS Regulations. One of those duties is to enquire
into the conduct of the Entity in each annual accounting period and report thereon to the shareholders.
Our report shall state whether, in our opinion, the Entity has been managed in that financial period in accordance with the provisions of the Entity’s
Constitution (the "Constitution") and the UCITS Regulations. It is the overall responsibility of the Entity to comply with these provisions. If the Entity
has not so complied, we as Depositary must state why this is the case and outline the steps which we have taken to rectify the situation.
Basis of Depositary opinion
The Depositary conducts such reviews as it, in its reasonable opinion, considers necessary in order to comply with its duties as outlined in Regulation
34, (1), (3) and (4) in Part 5 of the UCITS Regulations and to ensure that, in all material respects, the Entity has been managed:
(i) In accordance with the limitations imposed on its investment and borrowing powers by the provisions of the Entity’s Constitution and the
UCITS Regulations; and
(ii) Otherwise in accordance with the Entity’s constitutional documentation and the appropriate regulations.
Opinion
In our opinion, the Entity has been managed during the financial year, in all material respects:
(i) in accordance with the limitations imposed on the investment and borrowing powers of the Entity by the Constitution, the UCITS
Regulations and the Central Bank (Supervision and Enforcement) Act 2013 (Section 48(1)) (Undertakings for Collective Investment in
Transferable Securities) Regulations 2015 (‘the Central Bank UCITS Regulations’); and
(ii) otherwise in accordance with the provisions of the Constitution, the UCITS Regulations and the Central Bank UCITS Regulations.
For and on behalf of
State Street Custodial Services (Ireland) Limited
78 Sir John Rogerson’s Quay
Dublin 2
Ireland
28 October 2020
iSHARES VII PLC
DEPOSITARY’S REPORT TO THE SHAREHOLDERS
[32 ]
Deloitte Ireland LLP Chartered Accountants & Statutory Audit Firm
INDEPENDENT AUDITOR’S REPORT TO THE SHAREHOLDERS OF ISHARES VII PLC
Report on the audit of the financial statements
Opinion on the financial statements of iShares VII PLC (the ‘Company’)
In our opinion the financial statements:
• give a true and fair view of the assets, liabilities and financial position of the Company as at financial year ended 31 July 2020 and of the profit for the financial year then ended; and
• have been properly prepared in accordance with the relevant financial reporting framework, the applicable Regulations and, in particular, with the requirements of the Companies Act 2014.
The financial statements we have audited comprise:
• the Income statement; • the Statement of changes in net assets attributable to redeemable participating shareholders; • the Balance sheet; and • the related notes 1 to 19, including a summary of significant accounting policies as set out in note 2.
The relevant financial reporting framework that has been applied in their preparation is the Companies Act 2014 and FRS 102 “The Financial Reporting Standard applicable in the UK and Republic of Ireland” issued by the Financial Reporting Council (“the relevant financial reporting framework”). The applicable regulations that have been applied in their preparation is the European Communities (Undertakings for Collective Investment in Transferable Securities) Regulations, 2011 and Central Bank (Supervision and Enforcement) Act 2013 (Section 48(1)) (Undertakings for Collective Investment in Transferable Securities) Regulations, 2019 (as amended) (“the applicable Regulations”). Basis for opinion We conducted our audit in accordance with International Standards on Auditing (Ireland) (ISAs (Ireland)) and applicable law. Our responsibilities under those standards are described below in the “Auditor's responsibilities for the audit of the financial statements” section of our report. We are independent of the Company in accordance with the ethical requirements that are relevant to our audit of the financial statements in Ireland, including the Ethical Standard issued by the Irish Auditing and Accounting Supervisory Authority (IAASA), as applied to public interest entities, and we have fulfilled our other ethical responsibilities in accordance with these requirements. We believe that the audit evidence we have obtained is sufficient and appropriate to provide a basis for our opinion.
Summary of our audit approach
Key audit matters
The key audit matters that we identified in the current year were: • Valuation of financial assets and liabilities at fair value through profit or loss • Existence of financial assets and liabilities at fair value through profit or loss
Materiality The materiality that we used in the current year was 0.5% of the average net assets for each Fund.
Scope The Company is incorporated as an open-ended investment company with variable capital and is organised under the laws of Ireland as a public limited company pursuant to the Companies Act 2014 and engages BlackRock Asset Management Ireland Limited (the “Manager”) to manage certain duties and responsibilities with regards to the day-to-day management of the Company. Our audit is a risk based approach taking into account the structure of the Company, types of investments, the involvement of the third parties service providers, the accounting processes and controls in place and the industry in which the Company operates.
[33]

Conclusions relating to principal risks, going concern and viability statement We have nothing to report in respect of the following information in the annual report, in relation to which ISAs (Ireland) require us to report to you whether we have anything material to report, add or draw attention to:
• the Directors’ confirmation in the annual report on page 30 that they have carried out a robust assessment of the principal risks facing the Company, including those that would threaten its business model, future performance, solvency or liquidity;
• the disclosures on pages 63 to 128 to the annual report that describe those principal risks and explain how they are being managed or mitigated;
• the Directors’ statement on page 30 in the financial statements about whether the directors considered it appropriate to adopt the going concern basis of accounting in preparing the financial statements and the directors’ identification of any material uncertainties to the Company’s ability to continue to do so over a period of at least twelve months from the date of approval of the financial statements;
• whether the Directors’ statement relating to going concern required under the Listing Rules in accordance with Listing Rule 9.8.6R(3) is materially inconsistent with our knowledge obtained in the audit; or
• the Director's explanation on page 30 in the annual report as to how they have assessed the prospects of the Company, over what period they have done so and why they consider that period to be appropriate, and their statement as to whether they have a reasonable expectation that the Company will be able to continue in operation and meet its liabilities as they fall due over the period of their assessment, including any related disclosures drawing attention to any necessary qualifications or assumptions.
Key Audit Matters Key audit matters are those matters that, in our professional judgment, were of most significance in our audit of the financial statements of the current financial year and include the most significant assessed risks of material misstatement (whether or not due to fraud) we identified, including those which had the greatest effect on: the overall audit strategy, the allocation of resources in the audit; and directing the efforts of the engagement team. These matters were addressed in the context of our audit of the financial statements as a whole, and in forming our opinion thereon, and we do not provide a separate opinion on these matters. Valuation of Financial Assets and Liabilities at Fair Value Through Profit or Loss Key audit matter description
For the financial year ended, the financial assets and liabilities at fair value through profit or loss of the Company is €53,115m representing 99% of total net assets €53,345m. The valuation of financial assets and liabilities at fair value through profit or loss are considered a key audit matter as financial assets and liabilities at fair value through profit or loss represents a significant balance on the Balance Sheet. There is a risk that financial assets and liabilities at fair value through profit or loss are valued incorrectly, inappropriate valuation methodology applied and the use of inappropriate assumptions could result in the valuation being materially misstated. Refer also to note 3 and 4 in the financial statements.
How the scope of our audit responded to the key audit matter
We have performed the following procedures to address the key audit matter: • We obtained the State Street Administration Services (Ireland) Limited SOC 1 Report
in order to gain an understanding and evaluate the design, implementation and operating effectiveness of key controls over the valuation process for financial assets and liabilities at fair value through profit or loss;
• We independently valued equities, bonds, ETFs, rights, warrants and futures by using our own market feeds. We compared the prices published by independent pricing sources to the investment portfolio; and
• We independently valued forward currency contracts by obtaining forward rates from third party pricing vendors and comparing these rates to the forwards rates recorded in the investment portfolio. We investigated any differences identified.
Existence of Financial Assets and Liabilities at Fair Value Through Profit or Loss Key audit matter description
For the financial year ended the financial assets and liabilities at fair value through profit or loss of the Company is €53,115m representing 99% of total net assets €53,345m. The existence of financial assets and liabilities at fair value through profit or loss are considered a key audit matter as financial assets and liabilities at fair value through profit or loss represents a significant balance on the Balance Sheet. The existence of financial assets and liabilities at fair value through profit or loss is crucial to ensuring the financial statements are free from material misstatement. Refer also to note 3 and 4 in the financial statements.
[34]
How the scope of our audit responded to the key audit matter
We have performed the following procedures to address the key audit matter: • We obtained the State Street Administration Services (Ireland) Limited SOC 1 Report
in order to gain an understanding and evaluate the design, implementation and operating effectiveness of key controls over the reconciliation process for financial assets and liabilities at fair value through profit or loss;
• We obtained independent confirmations from the depositary and counterparties at the financial year end and agreed the amounts held to the investment portfolio; and
• We tested a sample of reconciling trades to ensure that they have been recorded in the correct period.
Our audit procedures relating to these matters were designed in the context of our audit of the financial statements as a whole, and not to express an opinion on individual accounts or disclosures. Our opinion on the financial statements is not modified with respect to any of the risks described above, and we do not express an opinion on these individual matters. Our application of materiality We define materiality as the magnitude of misstatement that makes it probable that the economic decisions of a reasonably knowledgeable person, relying on the financial statements, would be changed or influenced. We use materiality both in planning the scope of our audit work and in evaluating the results of our work. We determined materiality for each Fund to be 0.5% of average net assets. We have considered the average net assets to be the critical component for determining materiality because the main objective of each Fund is to provide investors with a total return. We have considered quantitative and qualitative factors such as understanding the Company and its environment, history of misstatements, complexity of the Company and reliability of control environment. We agreed with the Directors that we would report to the Directors any audit differences in excess of 10% of materiality, as well as differences below that threshold that, in our view, warranted reporting on qualitative grounds. We also report to the Directors on disclosure matters that we identified when assessing the overall presentation of the financial statements. An overview of the scope of our audit Our audit is a risk based approach taking into account the structure of the Company, types of investments, the involvement of the third parties service providers, the accounting processes and controls in place and the industry in which the Company operates. The Company is incorporated as an open-ended investment company with variable capital and is organised under the laws of Ireland as a public limited company pursuant to the Companies Act 2014. The Company is authorised by the Central Bank of Ireland (“the Central Bank”) as a UCITS (Undertakings for Collective Investment in Transferable Securities) pursuant to the European Communities (Undertakings for Collective Investment in Transferable Securities) Regulations, 2011. The Company is organised as an umbrella fund with segregated liability bewtween each Fund. We assess the the risks of each Fund separately. We have conducted our audit based on the books and records maintained by the administrator State Street Administration Services (Ireland) Limited 78 Sir John Rogerson's Quay, Grand Canal Dock, Dublin 2. Other information The Directors are responsible for the other information. The other information comprises the information included in the Annual report and audited financial statements, other than the financial statements and our auditor’s report thereon. Our opinion on the financial statements does not cover the other information and, except to the extent otherwise explicitly stated in our report, we do not express any form of assurance conclusion thereon. In connection with our audit of the financial statements, our responsibility is to read the other information and, in doing so, consider whether the other information is materially inconsistent with the financial statements or our knowledge obtained in the audit or otherwise appears to be materially misstated. If we identify such material inconsistencies or apparent material misstatements, we are required to determine whether there is a material misstatement in the financial statements or a material misstatement of the other information. If, based on the work we have performed, we conclude that there is a material misstatement of this other information, we are required to report that fact. We have nothing to report in this regard.
[35]
In this context, we also have nothing to report in regard to our responsibility to specifically address the following items in the other information and to report as uncorrected material misstatements of the other information where we conclude that those items meet the following conditions:
• Fair, balanced and understandable – the statement given by the directors that they consider the annual report and audited financial statements taken as a whole is fair, balanced and understandable and provides the information necessary for shareholders to assess the Company’s position and performance, business model and strategy, is materially inconsistent with our knowledge obtained in the audit; or
• Audit committee reporting – the section describing the work of the audit committee does not appropriately address matters communicated by us to the audit committee; or
• Directors’ statement of compliance with the UK Corporate Governance Code – the parts of the directors’
statement required under the Listing Rules relating to the company’s compliance with the UK Corporate Governance Code containing provisions specified for review by the auditor in accordance with Listing Rule 9.8.10R (2) do not properly disclose a departure from a relevant provision of the UK Corporate Governance Code.
Responsibilities of Directors As explained more fully in the Statement of Directors’ Responsibilities, the Directors are responsible for the preparation of the financial statements and for being satisfied that they give a true and fair view and otherwise comply with the Companies Act 2014, and for such internal control as the Directors determine is necessary to enable the preparation of financial statements that are free from material misstatement, whether due to fraud or error. In preparing the financial statements, the Directors are responsible for assessing the Company’s ability to continue as a going concern, disclosing, as applicable, matters related to going concern and using the going concern basis of accounting unless the Directors either intend to liquidate the Company or to cease operations, or have no realistic alternative but to do so. Auditor’s responsibilities for the audit of the financial statements Our objectives are to obtain reasonable assurance about whether the financial statements as a whole are free from material misstatement, whether due to fraud or error, and to issue an auditor's report that includes our opinion. Reasonable assurance is a high level of assurance, but is not a guarantee that an audit conducted in accordance with ISAs (Ireland) will always detect a material misstatement when it exists. Misstatements can arise from fraud or error and are considered material if, individually or in the aggregate, they could reasonably be expected to influence the economic decisions of users taken on the basis of these financial statements. As part of an audit in accordance with ISAs (Ireland), we exercise professional judgement and maintain professional scepticism throughout the audit. We also:
• Identify and assess the risks of material misstatement of the financial statements, whether due to fraud or error, design and perform audit procedures responsive to those risks, and obtain audit evidence that is sufficient and appropriate to provide a basis for our opinion. The risk of not detecting a material misstatement resulting from fraud is higher than for one resulting from error, as fraud may involve collusion, forgery, intentional omissions, misrepresentations, or the override of internal control.
• Obtain an understanding of internal control relevant to the audit in order to design audit procedures that are appropriate in the circumstances, but not for the purpose of expressing an opinion on the effectiveness of the Company’s internal control.
• Evaluate the appropriateness of accounting policies used and the reasonableness of accounting estimates and related disclosures made by the Directors.
• Conclude on the appropriateness of the Directors’ use of the going concern basis of accounting and, based on the audit evidence obtained, whether a material uncertainty exists related to events or conditions that may cast significant doubt on the Company’s ability to continue as a going concern. If we conclude that a material uncertainty exists, we are required to draw attention in our auditor’s report to the related disclosures in the financial statements or, if such disclosures are inadequate, to modify our opinion. Our conclusions are based on the audit evidence obtained up to the date of the auditor’s report. However, future events or conditions may cause the Company to cease to continue as a going concern.
[36]
• Evaluate the overall presentation, structure and content of the financial statements, including the disclosures, and whether the financial statements represent the underlying transactions and events in a manner that achieves fair presentation.
We communicate with those charged with governance regarding, among other matters, the planned scope and timing of the audit and significant audit findings, including any significant deficiencies in internal control that the auditor identifies during the audit. For listed entities and public interest entities, the auditor also provides those charged with governance with a statement that the auditor has complied with relevant ethical requirements regarding independence, including the Ethical Standard for Auditors (Ireland) 2016, and communicates with them all relationships and other matters that may be reasonably be thought to bear on the auditor’s independence, and where applicable, related safeguards. Where the auditor is required to report on key audit matters, from the matters communicated with those charged with governance, the auditor determines those matters that were of most significance in the audit of the financial statements of the current period and are therefore the key audit matters. The auditor describes these matters in the auditor’s report unless law or regulation precludes public disclosure about the matter or when, in extremely rare circumstances, the auditor determines that a matter should not be communicated in the auditor’s report because the adverse consequences of doing so would reasonably be expected to outweigh the public interest benefits of such communication. This report is made solely to the Company’s shareholders, as a body, in accordance with Section 391 of the Companies Act 2014. Our audit work has been undertaken so that we might state to the Company’s shareholders those matters we are required to state to them in an auditor’s report and for no other purpose. To the fullest extent permitted by law, we do not accept or assume responsibility to anyone other than the Company and the Company’s shareholders as a body, for our audit work, for this report, or for the opinions we have formed. Report on other legal and regulatory requirements Opinion on other matters prescribed by the Companies Act 2014 Based solely on the work undertaken in the course of the audit, we report that: • We have obtained all the information and explanations which we consider necessary for the purposes of our
audit. • In our opinion the accounting records of the Company were sufficient to permit the financial statements to
be readily and properly audited. • The financial statements are in agreement with the accounting records. • In our opinion the information given in the Directors’ report is consistent with the financial statements and
the Directors’ report has been prepared in accordance with the Companies Act 2014. Corporate Governance Statement We report, in relation to information given in the Corporate Governance Statement on pages 18 to 24 that:
• in our opinion the information given in the Corporate Governance Statement pursuant to subsections 2(c) and (d) of section 1373 Companies Act 2014 is consistent with the Company’s statutory financial statements in respect of the financial year concerned and such information has been prepared in accordance with section 1373 of the Companies Act 2014.
• Based on our knowledge and understanding of the Company and its environment obtained in the course of the audit, we have not identified any material misstatements in this information.
• In our opinion, based on the work undertaken during the course of the audit, the Corporate Governance Statement contains the information required by Regulation 6(2) of the European Union (Disclosure of Non-Financial and Diversity Information by certain large undertakings and groups) Regulations 2017 (as amended)
• In our opinion, based on the work undertaken during the course of the audit, the information required
pursuant to section 1373(2)(a),(b),(e) and (f) of the Companies Act 2014 is contained in the Corporate Governance Statement.
[37]
Matters on which we are required to report by exception Based on the knowledge and understanding of the Company and its environment obtained in the course of the audit, we have not identified material misstatements in the Directors' report. We have nothing to report in respect of the provisions in the Companies Act 2014 which require us to report to you if, in our opinion, the disclosures of Directors’ remuneration and transactions specified by law are not made. Other matters which we are required to address We were appointed by the Directors on 31 December 2018 to audit the financial statements for the financial period end date 31 July 2019 and subsequent financial periods. The period of total uninterrupted engagement including previous renewals and reappointments of the firm is 2 years, covering the years ending 31 July 2019 to 31 July 2020. The non-audit services prohibited by IAASA’s Ethical Standard were not provided and we remained independent of the Company in conducting the audit. Our audit opinion is consistent with the additional report to the Directors we are required to provide in accordance with ISA (Ireland) 260. Brian Jackson For and on behalf of Deloitte Ireland LLP Chartered Accountants and Statutory Audit Firm Deloitte & Touche House, Earlsfort Terrace, Dublin 2 Date: [38]
28th October 2020

Entity totaliShares $ Treasury Bond 1-3yr
UCITS ETF USD (Acc) BiShares $ Treasury Bond 3-7yr
UCITS ETFiShares $ Treasury Bond 7-10yr
UCITS ETF USD (Acc)Note 2020 2019 2020 2019 2020 2019 2020 2019
EUR’000 EUR’000 USD’000 USD’000 USD’000 USD’000 USD’000 USD’000
Operating income 5 1,103,534 1,071,999 6,587 5,130 44,406 41,648 9,021 6,110Net gains on financial instruments 7 3,271,657 1,468,047 9,789 3,066 162,677 76,826 60,271 16,742Total investment income 4,375,191 2,540,046 16,376 8,196 207,083 118,474 69,292 22,852Operating expenses 6 (72,708) (65,096) (253) (342) (1,599) (2,764) (358) (380)Negative yield on financial assets (2,455) (1,899) - - - - - -Net operating income 4,300,028 2,473,051 16,123 7,854 205,484 115,710 68,934 22,472
Finance costs:Interest expense (245) (304) (5) (3) (34) (2) (1) (6)Distributions to redeemable participatingshareholders 8 (32,872) (3,968) - - (2,612) 72 - -Total finance costs (33,117) (4,272) (5) (3) (2,646) 70 (1) (6)
Net profit before taxation 4,266,911 2,468,779 16,118 7,851 202,838 115,780 68,933 22,466
Taxation 9 (122,846) (121,065) - - - - - -Net profit after taxation 4,144,065 2,347,714 16,118 7,851 202,838 115,780 68,933 22,466
Increase in net assets attributable to redeemableshareholders 4,144,065 2,347,714 16,118 7,851 202,838 115,780 68,933 22,466
There are no recognised gains or losses arising in the financial year other than those dealt with in the income statement.The accompanying notes form an integral part of these financial statements.
iSHARES VII PLC
INCOME STATEMENTFor the financial year ended 31 July 2020
[39 ]
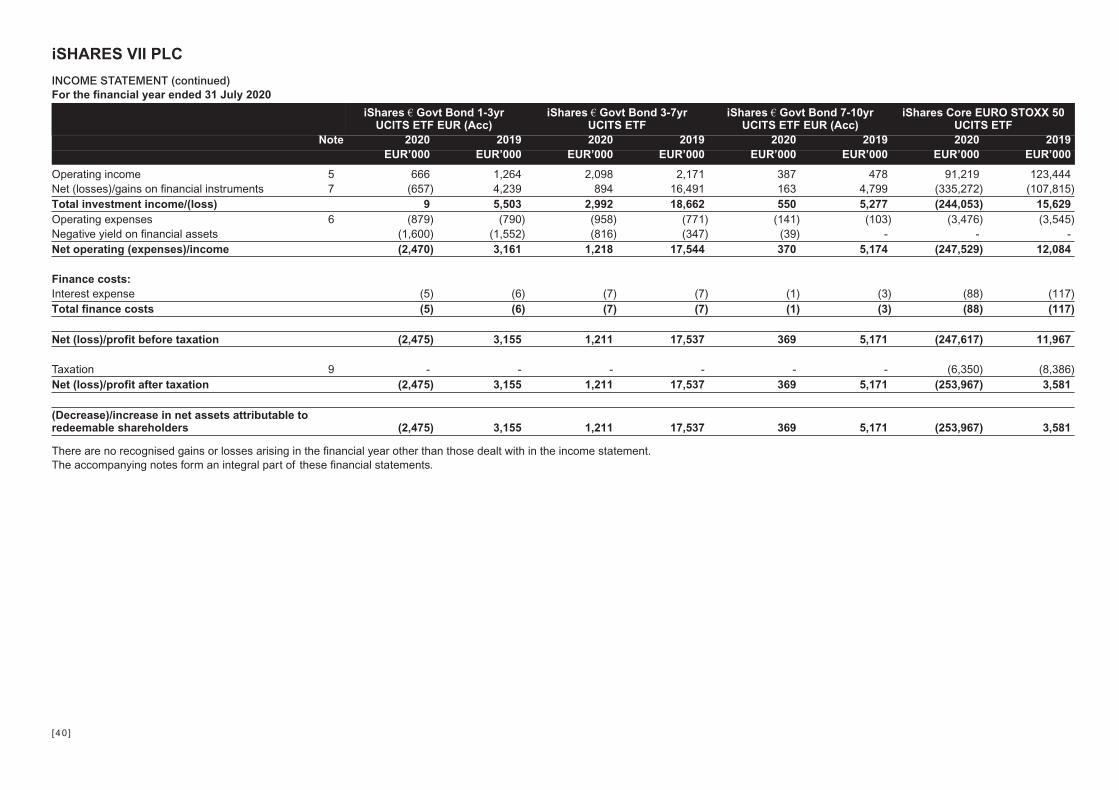
iShares € Govt Bond 1-3yrUCITS ETF EUR (Acc)
iShares € Govt Bond 3-7yrUCITS ETF
iShares € Govt Bond 7-10yrUCITS ETF EUR (Acc)
iShares Core EURO STOXX 50UCITS ETF
Note 2020 2019 2020 2019 2020 2019 2020 2019EUR’000 EUR’000 EUR’000 EUR’000 EUR’000 EUR’000 EUR’000 EUR’000
Operating income 5 666 1,264 2,098 2,171 387 478 91,219 123,444Net (losses)/gains on financial instruments 7 (657) 4,239 894 16,491 163 4,799 (335,272) (107,815)Total investment income/(loss) 9 5,503 2,992 18,662 550 5,277 (244,053) 15,629Operating expenses 6 (879) (790) (958) (771) (141) (103) (3,476) (3,545)Negative yield on financial assets (1,600) (1,552) (816) (347) (39) - - -Net operating (expenses)/income (2,470) 3,161 1,218 17,544 370 5,174 (247,529) 12,084
Finance costs:Interest expense (5) (6) (7) (7) (1) (3) (88) (117)Total finance costs (5) (6) (7) (7) (1) (3) (88) (117)
Net (loss)/profit before taxation (2,475) 3,155 1,211 17,537 369 5,171 (247,617) 11,967
Taxation 9 - - - - - - (6,350) (8,386)Net (loss)/profit after taxation (2,475) 3,155 1,211 17,537 369 5,171 (253,967) 3,581
(Decrease)/increase in net assets attributable toredeemable shareholders (2,475) 3,155 1,211 17,537 369 5,171 (253,967) 3,581
There are no recognised gains or losses arising in the financial year other than those dealt with in the income statement.The accompanying notes form an integral part of these financial statements.
iSHARES VII PLC
INCOME STATEMENT (continued)For the financial year ended 31 July 2020
[40 ]

iShares Core FTSE 100UCITS ETF GBP (Acc)
iShares Core MSCI EMUUCITS ETF
iShares Core MSCI Pacificex-Japan UCITS ETF
iShares Core S&P 500UCITS ETF
Note 2020 2019 2020 2019 2020 2019 2020 2019GBP’000 GBP’000 EUR’000 EUR’000 USD’000 USD’000 USD’000 USD’000
Operating income 5 23,312 21,532 51,522 68,998 69,753 74,237 725,795 647,876Net (losses)/gains on financial instruments 7 (142,525) (6,263) (218,024) (59,881) (281,732) 8,930 3,266,722 1,676,213Total investment (loss)/income (119,213) 15,269 (166,502) 9,117 (211,979) 83,167 3,992,517 2,324,089Operating expenses 6 (426) (332) (2,805) (2,152) (3,782) (3,358) (25,544) (22,642)Net operating (expenses)/income (119,639) 14,937 (169,307) 6,965 (215,761) 79,809 3,966,973 2,301,447
Finance costs:Interest expense (1) (1) (47) (75) (3) (5) (9) -Distributions to redeemable participatingshareholders 8 - - (8,938) (896) - - (23,906) (3,565)Total finance costs (1) (1) (8,985) (971) (3) (5) (23,915) (3,565)
Net (loss)/profit before taxation (119,640) 14,936 (178,292) 5,994 (215,764) 79,804 3,943,058 2,297,882
Taxation 9 (320) (296) (3,865) (4,855) (646) (948) (101,812) (95,419)Net (loss)/profit after taxation (119,960) 14,640 (182,157) 1,139 (216,410) 78,856 3,841,246 2,202,463
(Decrease)/increase in net assets attributable toredeemable shareholders (119,960) 14,640 (182,157) 1,139 (216,410) 78,856 3,841,246 2,202,463
There are no recognised gains or losses arising in the financial year other than those dealt with in the income statement.The accompanying notes form an integral part of these financial statements.
iSHARES VII PLC
INCOME STATEMENT (continued)For the financial year ended 31 July 2020
[41 ]
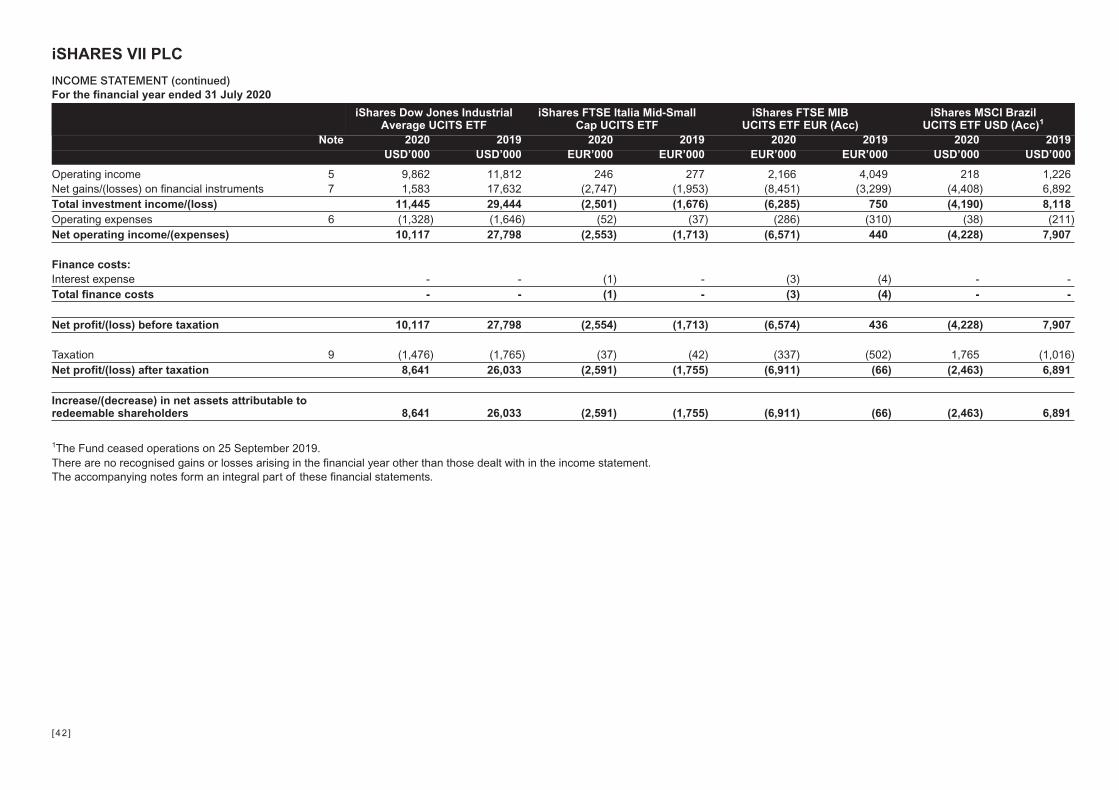
iShares Dow Jones IndustrialAverage UCITS ETF
iShares FTSE Italia Mid-SmallCap UCITS ETF
iShares FTSE MIBUCITS ETF EUR (Acc)
iShares MSCI BrazilUCITS ETF USD (Acc)1
Note 2020 2019 2020 2019 2020 2019 2020 2019USD’000 USD’000 EUR’000 EUR’000 EUR’000 EUR’000 USD’000 USD’000
Operating income 5 9,862 11,812 246 277 2,166 4,049 218 1,226Net gains/(losses) on financial instruments 7 1,583 17,632 (2,747) (1,953) (8,451) (3,299) (4,408) 6,892Total investment income/(loss) 11,445 29,444 (2,501) (1,676) (6,285) 750 (4,190) 8,118Operating expenses 6 (1,328) (1,646) (52) (37) (286) (310) (38) (211)Net operating income/(expenses) 10,117 27,798 (2,553) (1,713) (6,571) 440 (4,228) 7,907
Finance costs:Interest expense - - (1) - (3) (4) - -Total finance costs - - (1) - (3) (4) - -
Net profit/(loss) before taxation 10,117 27,798 (2,554) (1,713) (6,574) 436 (4,228) 7,907
Taxation 9 (1,476) (1,765) (37) (42) (337) (502) 1,765 (1,016)Net profit/(loss) after taxation 8,641 26,033 (2,591) (1,755) (6,911) (66) (2,463) 6,891
Increase/(decrease) in net assets attributable toredeemable shareholders 8,641 26,033 (2,591) (1,755) (6,911) (66) (2,463) 6,891
1The Fund ceased operations on 25 September 2019.There are no recognised gains or losses arising in the financial year other than those dealt with in the income statement.The accompanying notes form an integral part of these financial statements.
iSHARES VII PLC
INCOME STATEMENT (continued)For the financial year ended 31 July 2020
[42 ]
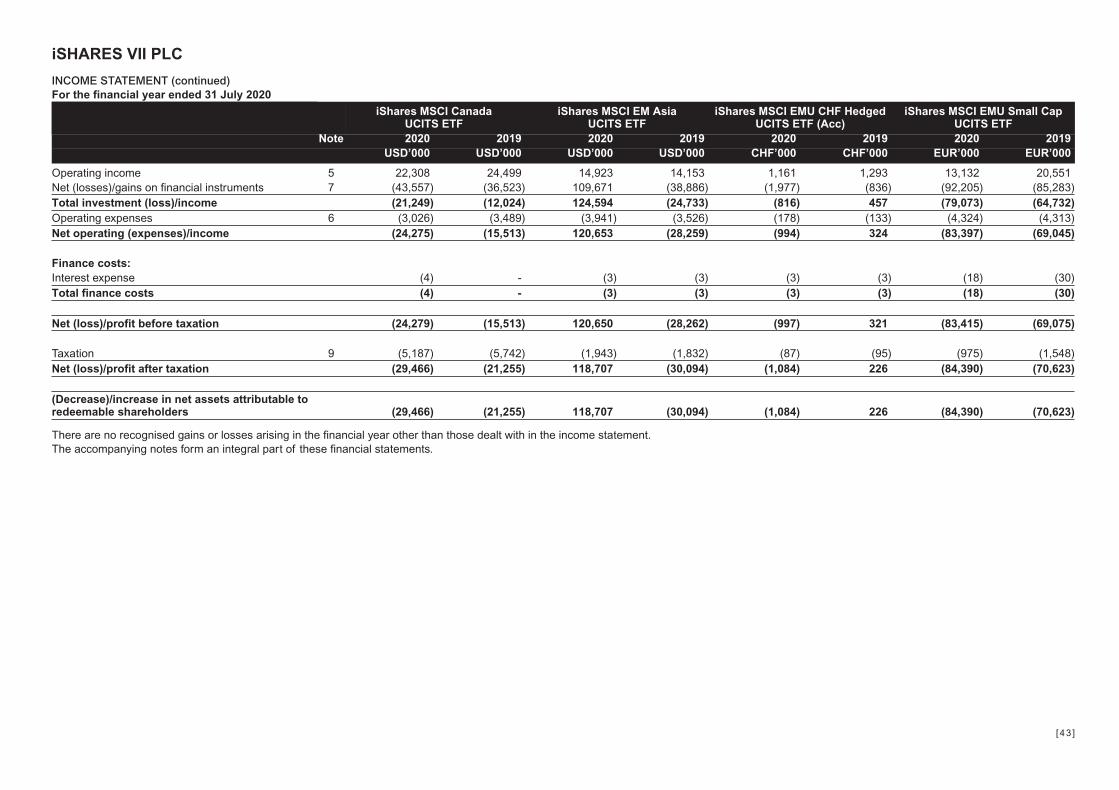
iShares MSCI CanadaUCITS ETF
iShares MSCI EM AsiaUCITS ETF
iShares MSCI EMU CHF HedgedUCITS ETF (Acc)
iShares MSCI EMU Small CapUCITS ETF
Note 2020 2019 2020 2019 2020 2019 2020 2019USD’000 USD’000 USD’000 USD’000 CHF’000 CHF’000 EUR’000 EUR’000
Operating income 5 22,308 24,499 14,923 14,153 1,161 1,293 13,132 20,551Net (losses)/gains on financial instruments 7 (43,557) (36,523) 109,671 (38,886) (1,977) (836) (92,205) (85,283)Total investment (loss)/income (21,249) (12,024) 124,594 (24,733) (816) 457 (79,073) (64,732)Operating expenses 6 (3,026) (3,489) (3,941) (3,526) (178) (133) (4,324) (4,313)Net operating (expenses)/income (24,275) (15,513) 120,653 (28,259) (994) 324 (83,397) (69,045)
Finance costs:Interest expense (4) - (3) (3) (3) (3) (18) (30)Total finance costs (4) - (3) (3) (3) (3) (18) (30)
Net (loss)/profit before taxation (24,279) (15,513) 120,650 (28,262) (997) 321 (83,415) (69,075)
Taxation 9 (5,187) (5,742) (1,943) (1,832) (87) (95) (975) (1,548)Net (loss)/profit after taxation (29,466) (21,255) 118,707 (30,094) (1,084) 226 (84,390) (70,623)
(Decrease)/increase in net assets attributable toredeemable shareholders (29,466) (21,255) 118,707 (30,094) (1,084) 226 (84,390) (70,623)
There are no recognised gains or losses arising in the financial year other than those dealt with in the income statement.The accompanying notes form an integral part of these financial statements.
iSHARES VII PLC
INCOME STATEMENT (continued)For the financial year ended 31 July 2020
[43 ]
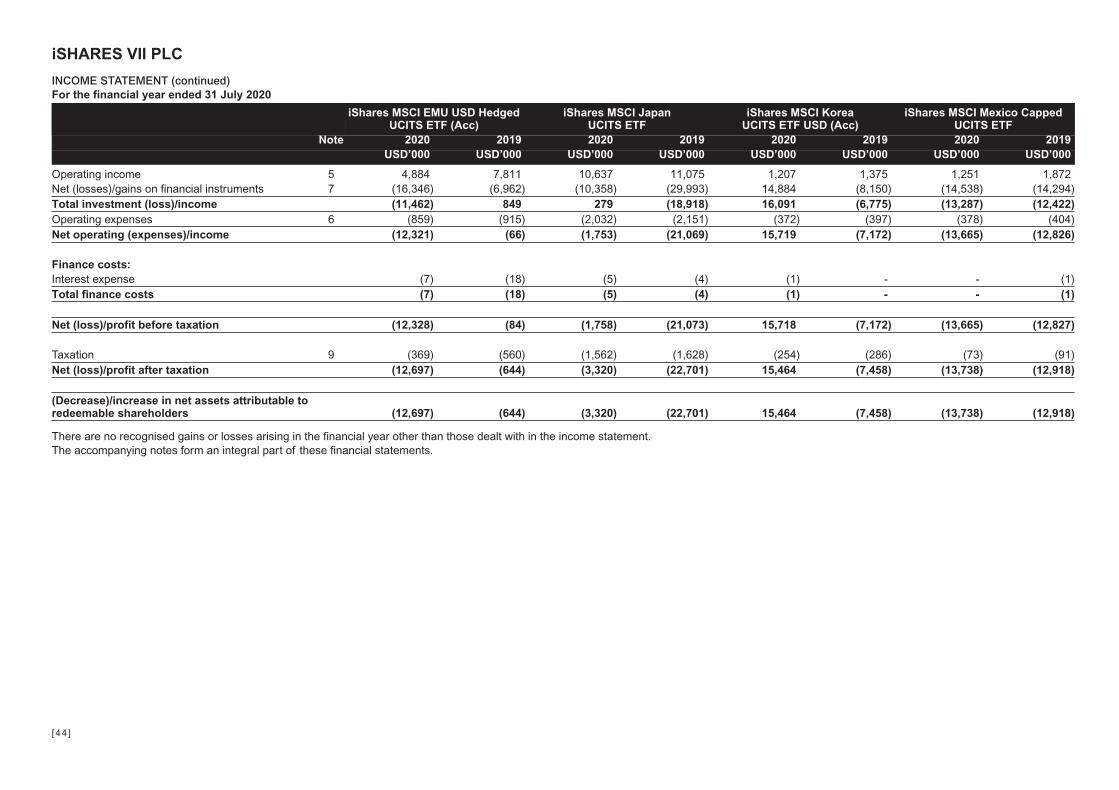
iShares MSCI EMU USD HedgedUCITS ETF (Acc)
iShares MSCI JapanUCITS ETF
iShares MSCI KoreaUCITS ETF USD (Acc)
iShares MSCI Mexico CappedUCITS ETF
Note 2020 2019 2020 2019 2020 2019 2020 2019USD’000 USD’000 USD’000 USD’000 USD’000 USD’000 USD’000 USD’000
Operating income 5 4,884 7,811 10,637 11,075 1,207 1,375 1,251 1,872Net (losses)/gains on financial instruments 7 (16,346) (6,962) (10,358) (29,993) 14,884 (8,150) (14,538) (14,294)Total investment (loss)/income (11,462) 849 279 (18,918) 16,091 (6,775) (13,287) (12,422)Operating expenses 6 (859) (915) (2,032) (2,151) (372) (397) (378) (404)Net operating (expenses)/income (12,321) (66) (1,753) (21,069) 15,719 (7,172) (13,665) (12,826)
Finance costs:Interest expense (7) (18) (5) (4) (1) - - (1)Total finance costs (7) (18) (5) (4) (1) - - (1)
Net (loss)/profit before taxation (12,328) (84) (1,758) (21,073) 15,718 (7,172) (13,665) (12,827)
Taxation 9 (369) (560) (1,562) (1,628) (254) (286) (73) (91)Net (loss)/profit after taxation (12,697) (644) (3,320) (22,701) 15,464 (7,458) (13,738) (12,918)
(Decrease)/increase in net assets attributable toredeemable shareholders (12,697) (644) (3,320) (22,701) 15,464 (7,458) (13,738) (12,918)
There are no recognised gains or losses arising in the financial year other than those dealt with in the income statement.The accompanying notes form an integral part of these financial statements.
iSHARES VII PLC
INCOME STATEMENT (continued)For the financial year ended 31 July 2020
[44 ]
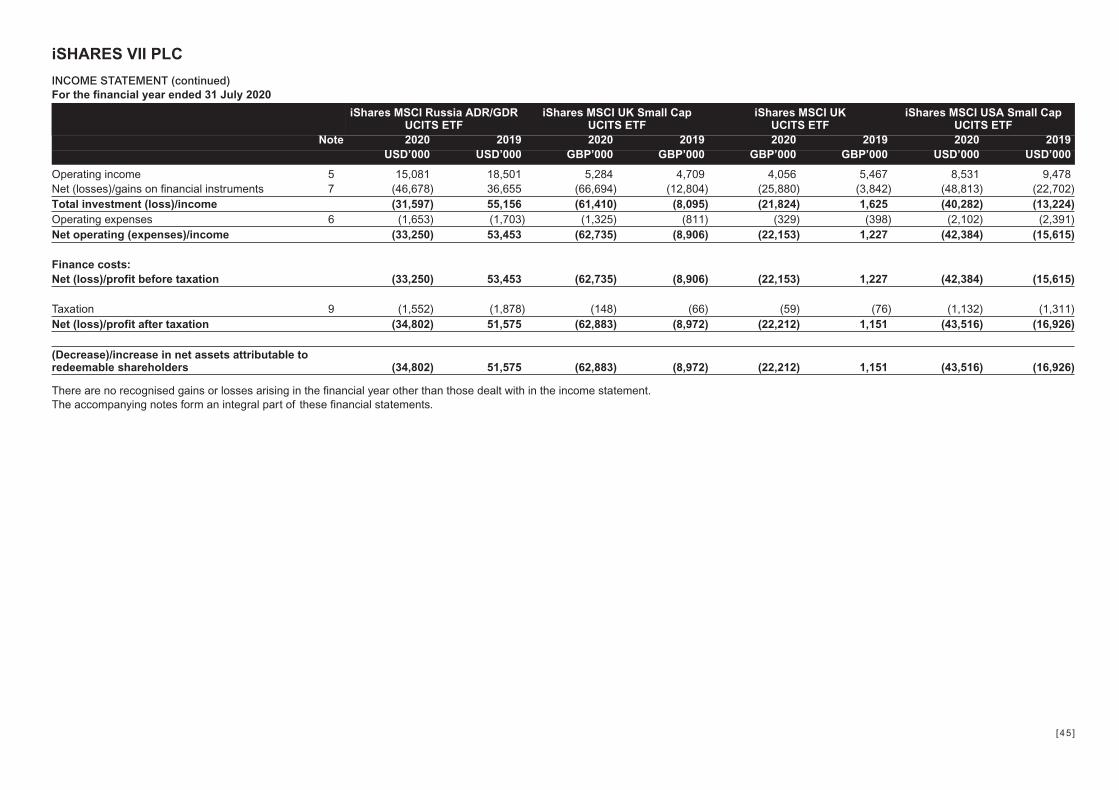
iShares MSCI Russia ADR/GDRUCITS ETF
iShares MSCI UK Small CapUCITS ETF
iShares MSCI UKUCITS ETF
iShares MSCI USA Small CapUCITS ETF
Note 2020 2019 2020 2019 2020 2019 2020 2019USD’000 USD’000 GBP’000 GBP’000 GBP’000 GBP’000 USD’000 USD’000
Operating income 5 15,081 18,501 5,284 4,709 4,056 5,467 8,531 9,478Net (losses)/gains on financial instruments 7 (46,678) 36,655 (66,694) (12,804) (25,880) (3,842) (48,813) (22,702)Total investment (loss)/income (31,597) 55,156 (61,410) (8,095) (21,824) 1,625 (40,282) (13,224)Operating expenses 6 (1,653) (1,703) (1,325) (811) (329) (398) (2,102) (2,391)Net operating (expenses)/income (33,250) 53,453 (62,735) (8,906) (22,153) 1,227 (42,384) (15,615)
Finance costs:Net (loss)/profit before taxation (33,250) 53,453 (62,735) (8,906) (22,153) 1,227 (42,384) (15,615)
Taxation 9 (1,552) (1,878) (148) (66) (59) (76) (1,132) (1,311)Net (loss)/profit after taxation (34,802) 51,575 (62,883) (8,972) (22,212) 1,151 (43,516) (16,926)
(Decrease)/increase in net assets attributable toredeemable shareholders (34,802) 51,575 (62,883) (8,972) (22,212) 1,151 (43,516) (16,926)
There are no recognised gains or losses arising in the financial year other than those dealt with in the income statement.The accompanying notes form an integral part of these financial statements.
iSHARES VII PLC
INCOME STATEMENT (continued)For the financial year ended 31 July 2020
[45 ]
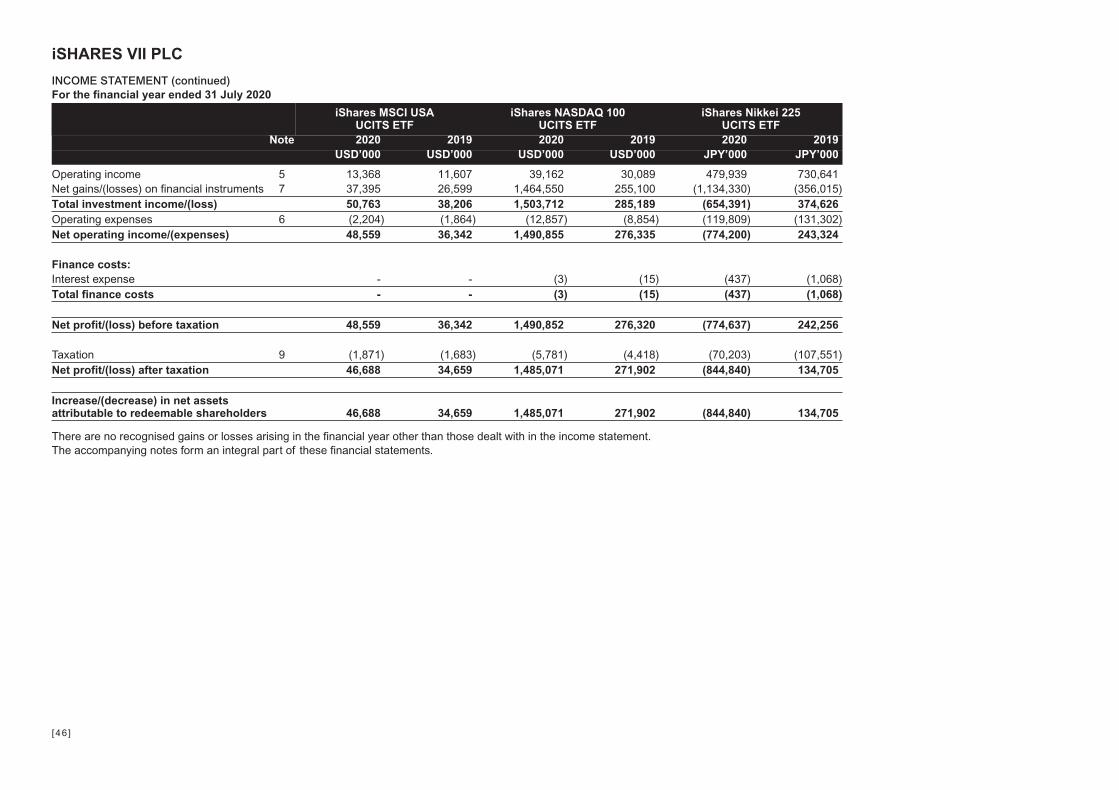
iShares MSCI USAUCITS ETF
iShares NASDAQ 100UCITS ETF
iShares Nikkei 225UCITS ETF
Note 2020 2019 2020 2019 2020 2019USD’000 USD’000 USD’000 USD’000 JPY’000 JPY’000
Operating income 5 13,368 11,607 39,162 30,089 479,939 730,641Net gains/(losses) on financial instruments 7 37,395 26,599 1,464,550 255,100 (1,134,330) (356,015)Total investment income/(loss) 50,763 38,206 1,503,712 285,189 (654,391) 374,626Operating expenses 6 (2,204) (1,864) (12,857) (8,854) (119,809) (131,302)Net operating income/(expenses) 48,559 36,342 1,490,855 276,335 (774,200) 243,324
Finance costs:Interest expense - - (3) (15) (437) (1,068)Total finance costs - - (3) (15) (437) (1,068)
Net profit/(loss) before taxation 48,559 36,342 1,490,852 276,320 (774,637) 242,256
Taxation 9 (1,871) (1,683) (5,781) (4,418) (70,203) (107,551)Net profit/(loss) after taxation 46,688 34,659 1,485,071 271,902 (844,840) 134,705
Increase/(decrease) in net assetsattributable to redeemable shareholders 46,688 34,659 1,485,071 271,902 (844,840) 134,705
There are no recognised gains or losses arising in the financial year other than those dealt with in the income statement.The accompanying notes form an integral part of these financial statements.
iSHARES VII PLC
INCOME STATEMENT (continued)For the financial year ended 31 July 2020
[46 ]

Entity totaliShares $ Treasury Bond 1-3yr
UCITS ETF USD (Acc) BiShares $ Treasury Bond 3-7yr
UCITS ETFiShares $ Treasury Bond 7-10yr
UCITS ETF USD (Acc)2020 2019 2020 2019 2020 2019 2020 2019
EUR’000 EUR’000 USD’000 USD’000 USD’000 USD’000 USD’000 USD’000
Net assets at the beginning of the financial year 50,634,060 43,097,567 311,734 135,410 1,889,898 1,373,782 256,034 218,093
Increase in net assets attributable to redeemable
shareholders 4,144,065 2,347,714 16,118 7,851 202,838 115,780 68,933 22,466
Share transactions:
Issue of redeemable shares 17,097,242 15,806,951 201,395 293,808 2,288,708 1,120,223 629,863 256,361
Redemption of redeemable shares (15,722,509) (12,494,770) (154,110) (125,335) (1,753,366) (719,887) (269,030) (240,886)
Increase in net assets resulting from share
transactions 1,374,733 3,312,181 47,285 168,473 535,342 400,336 360,833 15,475
Notional foreign exchange adjustment* (2,807,536) 1,876,598 - - - - - -
Net assets at the end of the financial year 53,345,322 50,634,060 375,137 311,734 2,628,078 1,889,898 685,800 256,034
*The notional foreign exchange adjustment arises from both the retranslation of the net assets at the beginning of the financial year using the exchange rate as at 31 July 2020 and the retranslation of theincome statement items and share transactions using the average rate exchange rate to the exchange rate as at 31 July 2020.The accompanying notes form an integral part of these financial statements.
iSHARES VII PLC
STATEMENT OF CHANGES IN NET ASSETS ATTRIBUTABLE TO REDEEMABLE SHAREHOLDERSFor the financial year ended 31 July 2020
[47 ]

iShares € Govt Bond 1-3yrUCITS ETF EUR (Acc)
iShares € Govt Bond 3-7yrUCITS ETF
iShares € Govt Bond 7-10yrUCITS ETF EUR (Acc)
iShares Core EURO STOXX 50UCITS ETF
2020 2019 2020 2019 2020 2019 2020 2019EUR’000 EUR’000 EUR’000 EUR’000 EUR’000 EUR’000 EUR’000 EUR’000
Net assets at the beginning of the financial year 488,797 267,797 460,043 343,630 67,115 40,175 3,370,260 3,961,343
(Decrease)/increase in net assets attributable to
redeemable shareholders (2,475) 3,155 1,211 17,537 369 5,171 (253,967) 3,581
Share transactions:
Issue of redeemable shares 198,156 405,569 199,215 288,027 32,799 91,493 727,404 230,033
Redemption of redeemable shares (273,163) (187,724) (182,750) (189,151) (27,934) (69,724) (415,837) (824,697)
(Decrease)/increase in net assets resulting from
share transactions (75,007) 217,845 16,465 98,876 4,865 21,769 311,567 (594,664)
Net assets at the end of the financial year 411,315 488,797 477,719 460,043 72,349 67,115 3,427,860 3,370,260
The accompanying notes form an integral part of these financial statements.
iSHARES VII PLC
STATEMENT OF CHANGES IN NET ASSETS ATTRIBUTABLE TO REDEEMABLE SHAREHOLDERS (continued)For the financial year ended 31 July 2020
[48 ]
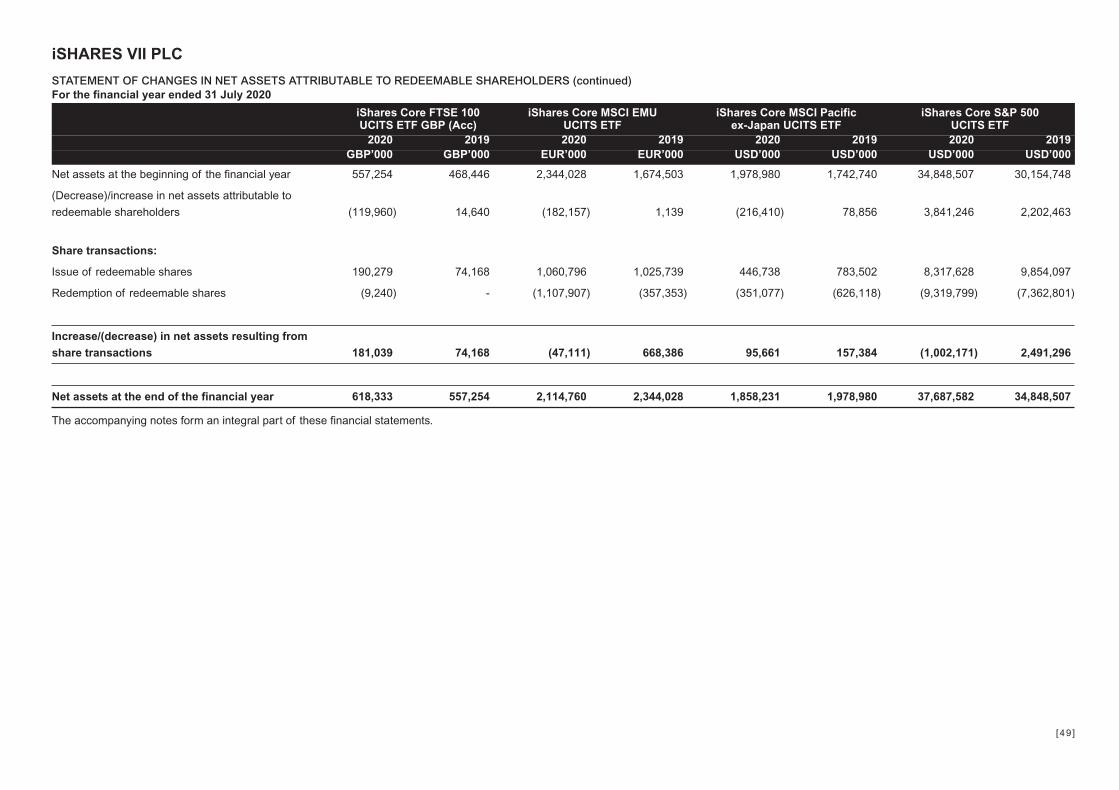
iShares Core FTSE 100UCITS ETF GBP (Acc)
iShares Core MSCI EMUUCITS ETF
iShares Core MSCI Pacificex-Japan UCITS ETF
iShares Core S&P 500UCITS ETF
2020 2019 2020 2019 2020 2019 2020 2019GBP’000 GBP’000 EUR’000 EUR’000 USD’000 USD’000 USD’000 USD’000
Net assets at the beginning of the financial year 557,254 468,446 2,344,028 1,674,503 1,978,980 1,742,740 34,848,507 30,154,748
(Decrease)/increase in net assets attributable to
redeemable shareholders (119,960) 14,640 (182,157) 1,139 (216,410) 78,856 3,841,246 2,202,463
Share transactions:
Issue of redeemable shares 190,279 74,168 1,060,796 1,025,739 446,738 783,502 8,317,628 9,854,097
Redemption of redeemable shares (9,240) - (1,107,907) (357,353) (351,077) (626,118) (9,319,799) (7,362,801)
Increase/(decrease) in net assets resulting from
share transactions 181,039 74,168 (47,111) 668,386 95,661 157,384 (1,002,171) 2,491,296
Net assets at the end of the financial year 618,333 557,254 2,114,760 2,344,028 1,858,231 1,978,980 37,687,582 34,848,507
The accompanying notes form an integral part of these financial statements.
iSHARES VII PLC
STATEMENT OF CHANGES IN NET ASSETS ATTRIBUTABLE TO REDEEMABLE SHAREHOLDERS (continued)For the financial year ended 31 July 2020
[49 ]
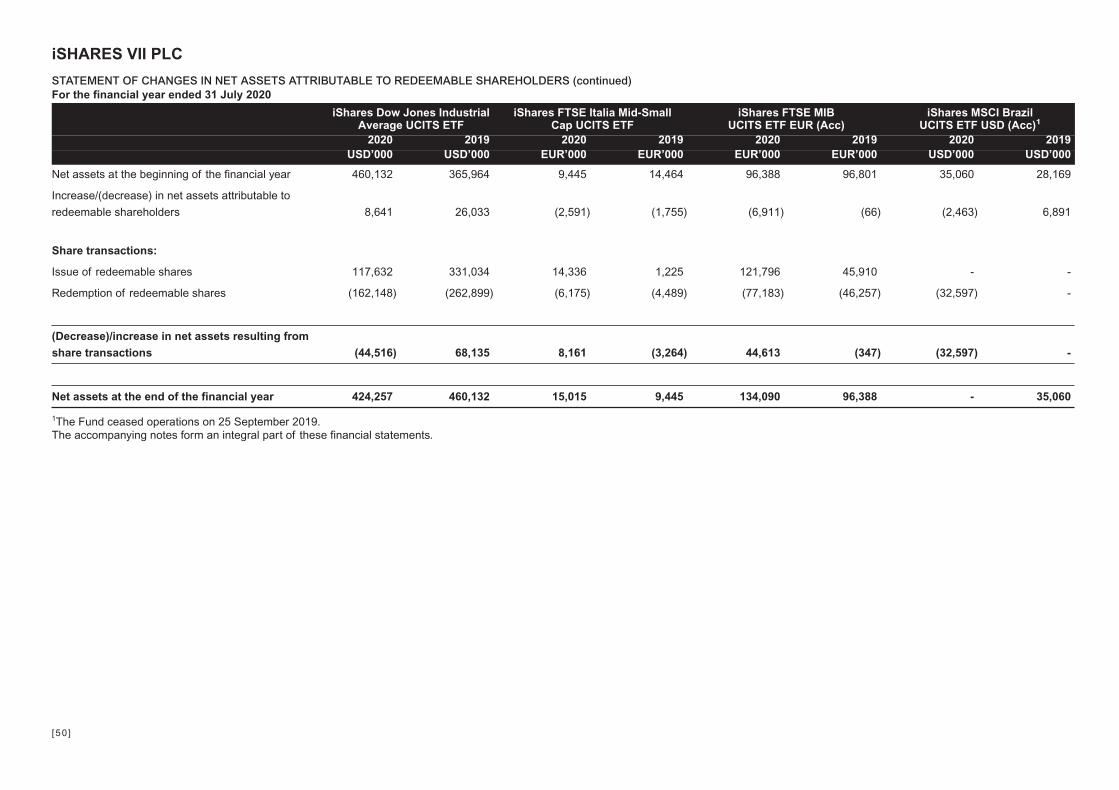
iShares Dow Jones IndustrialAverage UCITS ETF
iShares FTSE Italia Mid-SmallCap UCITS ETF
iShares FTSE MIBUCITS ETF EUR (Acc)
iShares MSCI BrazilUCITS ETF USD (Acc)1
2020 2019 2020 2019 2020 2019 2020 2019USD’000 USD’000 EUR’000 EUR’000 EUR’000 EUR’000 USD’000 USD’000
Net assets at the beginning of the financial year 460,132 365,964 9,445 14,464 96,388 96,801 35,060 28,169
Increase/(decrease) in net assets attributable to
redeemable shareholders 8,641 26,033 (2,591) (1,755) (6,911) (66) (2,463) 6,891
Share transactions:
Issue of redeemable shares 117,632 331,034 14,336 1,225 121,796 45,910 - -
Redemption of redeemable shares (162,148) (262,899) (6,175) (4,489) (77,183) (46,257) (32,597) -
(Decrease)/increase in net assets resulting from
share transactions (44,516) 68,135 8,161 (3,264) 44,613 (347) (32,597) -
Net assets at the end of the financial year 424,257 460,132 15,015 9,445 134,090 96,388 - 35,060
1The Fund ceased operations on 25 September 2019.The accompanying notes form an integral part of these financial statements.
iSHARES VII PLC
STATEMENT OF CHANGES IN NET ASSETS ATTRIBUTABLE TO REDEEMABLE SHAREHOLDERS (continued)For the financial year ended 31 July 2020
[50 ]
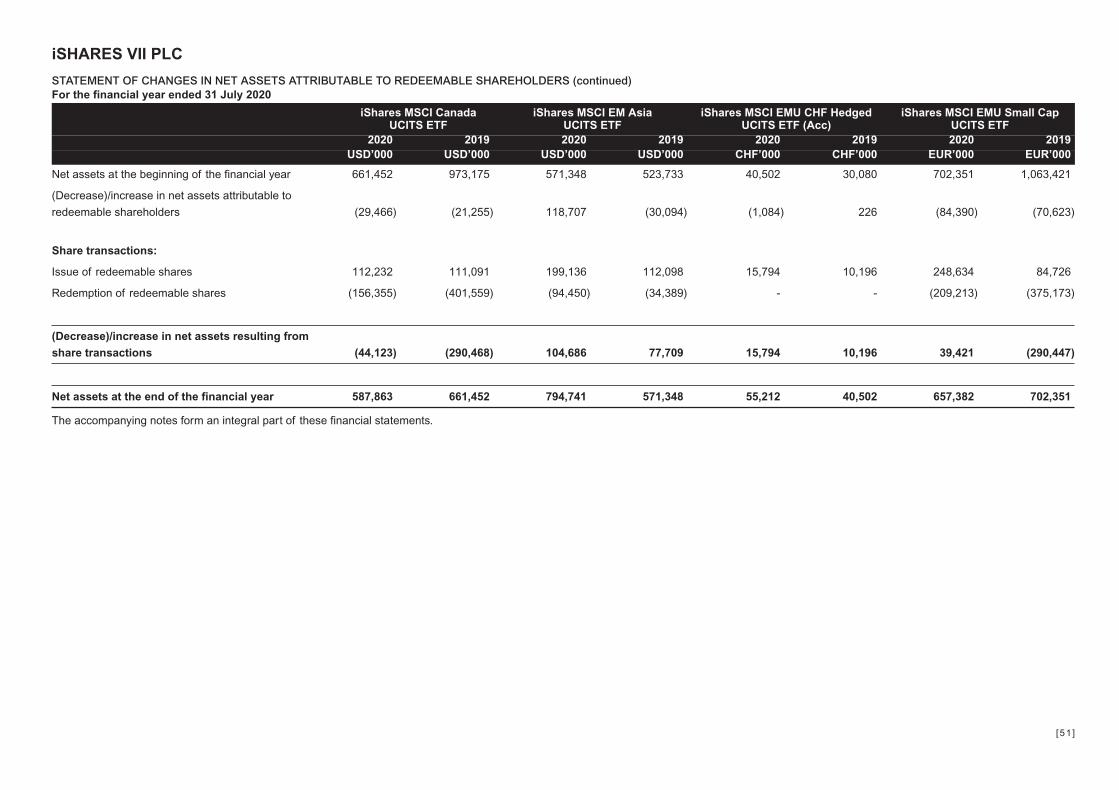
iShares MSCI CanadaUCITS ETF
iShares MSCI EM AsiaUCITS ETF
iShares MSCI EMU CHF HedgedUCITS ETF (Acc)
iShares MSCI EMU Small CapUCITS ETF
2020 2019 2020 2019 2020 2019 2020 2019USD’000 USD’000 USD’000 USD’000 CHF’000 CHF’000 EUR’000 EUR’000
Net assets at the beginning of the financial year 661,452 973,175 571,348 523,733 40,502 30,080 702,351 1,063,421
(Decrease)/increase in net assets attributable to
redeemable shareholders (29,466) (21,255) 118,707 (30,094) (1,084) 226 (84,390) (70,623)
Share transactions:
Issue of redeemable shares 112,232 111,091 199,136 112,098 15,794 10,196 248,634 84,726
Redemption of redeemable shares (156,355) (401,559) (94,450) (34,389) - - (209,213) (375,173)
(Decrease)/increase in net assets resulting from
share transactions (44,123) (290,468) 104,686 77,709 15,794 10,196 39,421 (290,447)
Net assets at the end of the financial year 587,863 661,452 794,741 571,348 55,212 40,502 657,382 702,351
The accompanying notes form an integral part of these financial statements.
iSHARES VII PLC
STATEMENT OF CHANGES IN NET ASSETS ATTRIBUTABLE TO REDEEMABLE SHAREHOLDERS (continued)For the financial year ended 31 July 2020
[51 ]

iShares MSCI EMU USD HedgedUCITS ETF (Acc)
iShares MSCI JapanUCITS ETF
iShares MSCI KoreaUCITS ETF USD (Acc)
iShares MSCI Mexico CappedUCITS ETF
2020 2019 2020 2019 2020 2019 2020 2019USD’000 USD’000 USD’000 USD’000 USD’000 USD’000 USD’000 USD’000
Net assets at the beginning of the financial year 224,525 280,798 438,969 522,204 62,103 48,564 66,489 69,103
(Decrease)/increase in net assets attributable to
redeemable shareholders (12,697) (644) (3,320) (22,701) 15,464 (7,458) (13,738) (12,918)
Share transactions:
Issue of redeemable shares 67,930 30,485 47,689 86,344 35,382 58,672 42,246 21,079
Redemption of redeemable shares (86,987) (86,114) (128,122) (146,878) (38,163) (37,675) (42,115) (10,775)
(Decrease)/increase in net assets resulting
from share transactions (19,057) (55,629) (80,433) (60,534) (2,781) 20,997 131 10,304
Net assets at the end of the financial year 192,771 224,525 355,216 438,969 74,786 62,103 52,882 66,489
The accompanying notes form an integral part of these financial statements.
iSHARES VII PLC
STATEMENT OF CHANGES IN NET ASSETS ATTRIBUTABLE TO REDEEMABLE SHAREHOLDERS (continued)For the financial year ended 31 July 2020
[52 ]
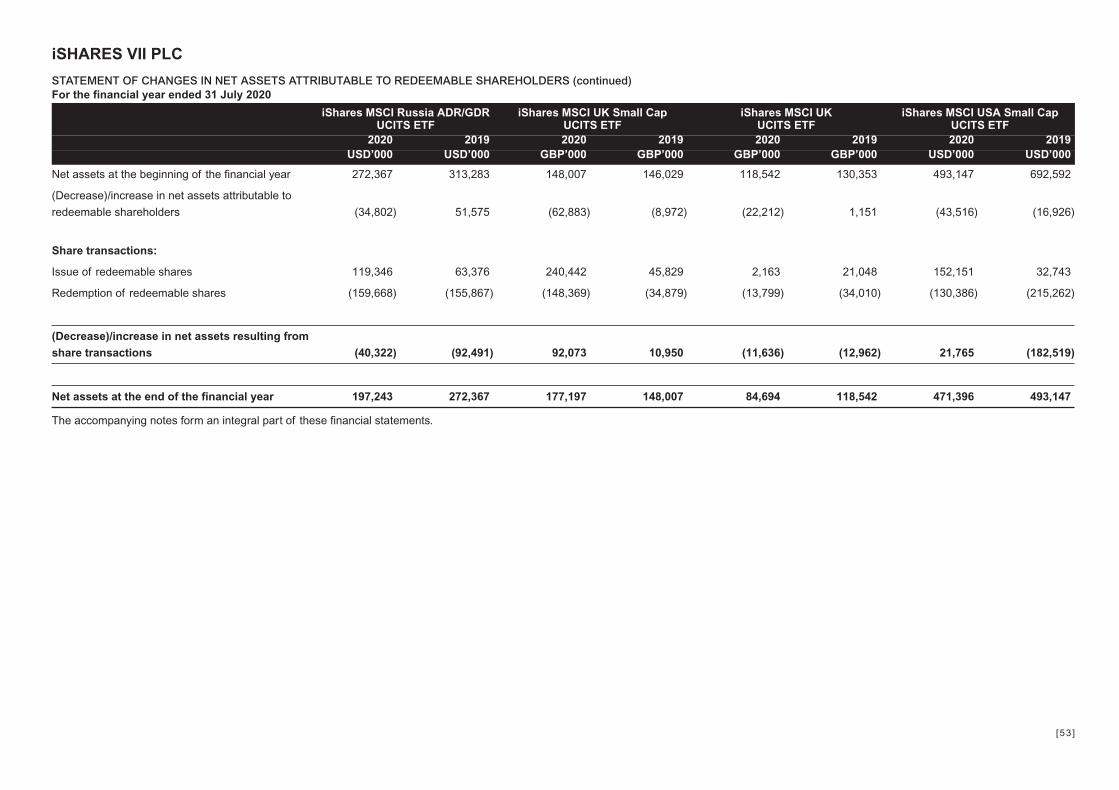
iShares MSCI Russia ADR/GDRUCITS ETF
iShares MSCI UK Small CapUCITS ETF
iShares MSCI UKUCITS ETF
iShares MSCI USA Small CapUCITS ETF
2020 2019 2020 2019 2020 2019 2020 2019USD’000 USD’000 GBP’000 GBP’000 GBP’000 GBP’000 USD’000 USD’000
Net assets at the beginning of the financial year 272,367 313,283 148,007 146,029 118,542 130,353 493,147 692,592
(Decrease)/increase in net assets attributable to
redeemable shareholders (34,802) 51,575 (62,883) (8,972) (22,212) 1,151 (43,516) (16,926)
Share transactions:
Issue of redeemable shares 119,346 63,376 240,442 45,829 2,163 21,048 152,151 32,743
Redemption of redeemable shares (159,668) (155,867) (148,369) (34,879) (13,799) (34,010) (130,386) (215,262)
(Decrease)/increase in net assets resulting from
share transactions (40,322) (92,491) 92,073 10,950 (11,636) (12,962) 21,765 (182,519)
Net assets at the end of the financial year 197,243 272,367 177,197 148,007 84,694 118,542 471,396 493,147
The accompanying notes form an integral part of these financial statements.
iSHARES VII PLC
STATEMENT OF CHANGES IN NET ASSETS ATTRIBUTABLE TO REDEEMABLE SHAREHOLDERS (continued)For the financial year ended 31 July 2020
[53 ]
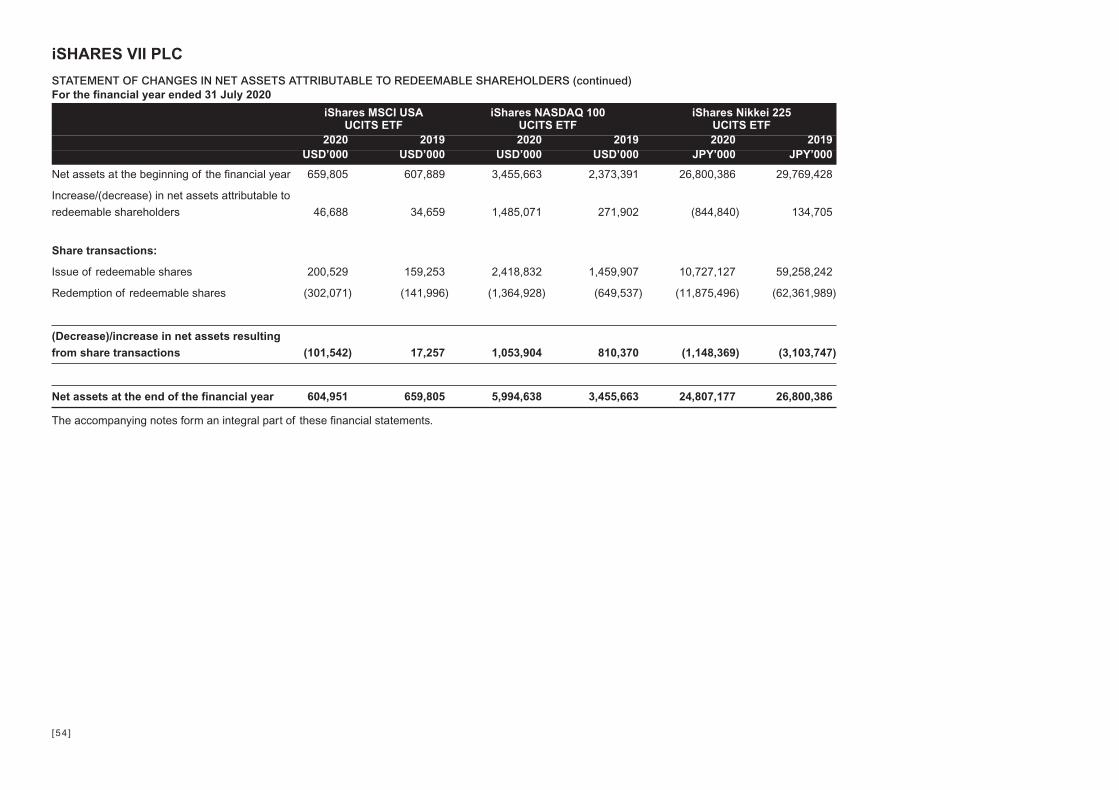
iShares MSCI USAUCITS ETF
iShares NASDAQ 100UCITS ETF
iShares Nikkei 225UCITS ETF
2020 2019 2020 2019 2020 2019USD’000 USD’000 USD’000 USD’000 JPY’000 JPY’000
Net assets at the beginning of the financial year 659,805 607,889 3,455,663 2,373,391 26,800,386 29,769,428
Increase/(decrease) in net assets attributable to
redeemable shareholders 46,688 34,659 1,485,071 271,902 (844,840) 134,705
Share transactions:
Issue of redeemable shares 200,529 159,253 2,418,832 1,459,907 10,727,127 59,258,242
Redemption of redeemable shares (302,071) (141,996) (1,364,928) (649,537) (11,875,496) (62,361,989)
(Decrease)/increase in net assets resulting
from share transactions (101,542) 17,257 1,053,904 810,370 (1,148,369) (3,103,747)
Net assets at the end of the financial year 604,951 659,805 5,994,638 3,455,663 24,807,177 26,800,386
The accompanying notes form an integral part of these financial statements.
iSHARES VII PLC
STATEMENT OF CHANGES IN NET ASSETS ATTRIBUTABLE TO REDEEMABLE SHAREHOLDERS (continued)For the financial year ended 31 July 2020
[54 ]
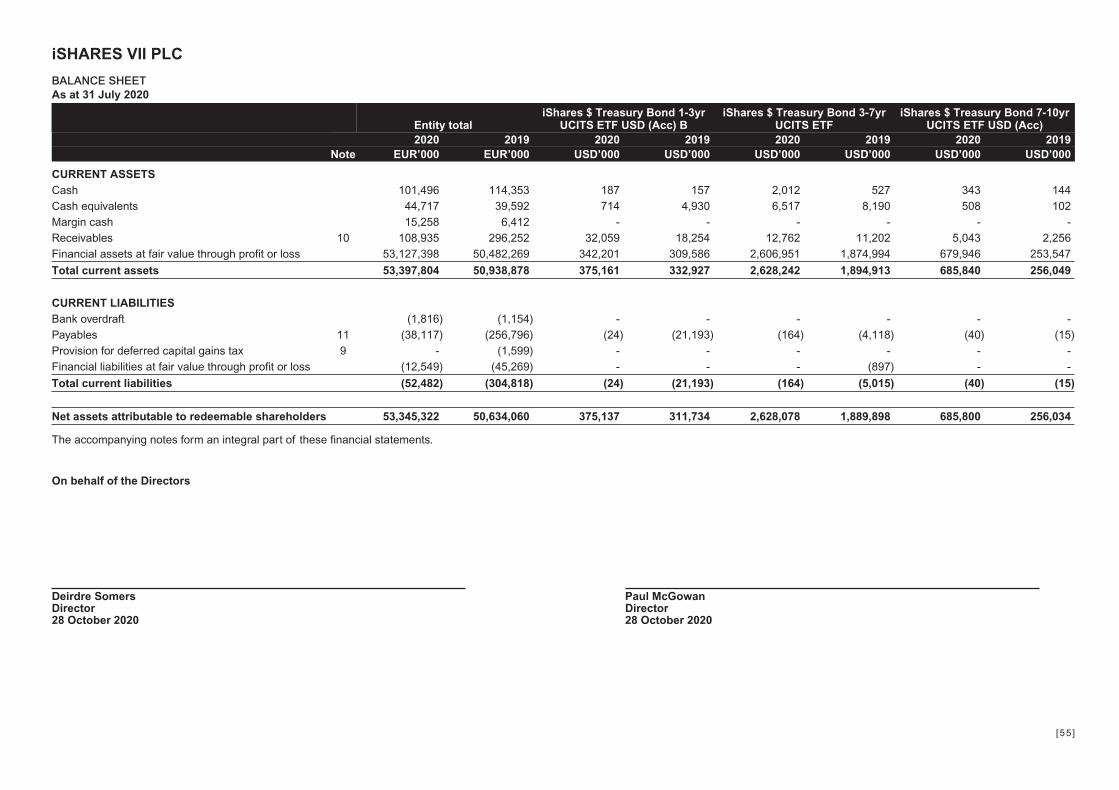
Entity totaliShares $ Treasury Bond 1-3yr
UCITS ETF USD (Acc) BiShares $ Treasury Bond 3-7yr
UCITS ETFiShares $ Treasury Bond 7-10yr
UCITS ETF USD (Acc)2020 2019 2020 2019 2020 2019 2020 2019
Note EUR’000 EUR’000 USD’000 USD’000 USD’000 USD’000 USD’000 USD’000
CURRENT ASSETSCash 101,496 114,353 187 157 2,012 527 343 144Cash equivalents 44,717 39,592 714 4,930 6,517 8,190 508 102Margin cash 15,258 6,412 - - - - - -Receivables 10 108,935 296,252 32,059 18,254 12,762 11,202 5,043 2,256Financial assets at fair value through profit or loss 53,127,398 50,482,269 342,201 309,586 2,606,951 1,874,994 679,946 253,547
Total current assets 53,397,804 50,938,878 375,161 332,927 2,628,242 1,894,913 685,840 256,049
CURRENT LIABILITIESBank overdraft (1,816) (1,154) - - - - - -Payables 11 (38,117) (256,796) (24) (21,193) (164) (4,118) (40) (15)Provision for deferred capital gains tax 9 - (1,599) - - - - - -Financial liabilities at fair value through profit or loss (12,549) (45,269) - - - (897) - -
Total current liabilities (52,482) (304,818) (24) (21,193) (164) (5,015) (40) (15)
Net assets attributable to redeemable shareholders 53,345,322 50,634,060 375,137 311,734 2,628,078 1,889,898 685,800 256,034
The accompanying notes form an integral part of these financial statements.
On behalf of the Directors
Deirdre Somers Paul McGowanDirector Director28 October 2020 28 October 2020
iSHARES VII PLC
BALANCE SHEETAs at 31 July 2020
[55 ]
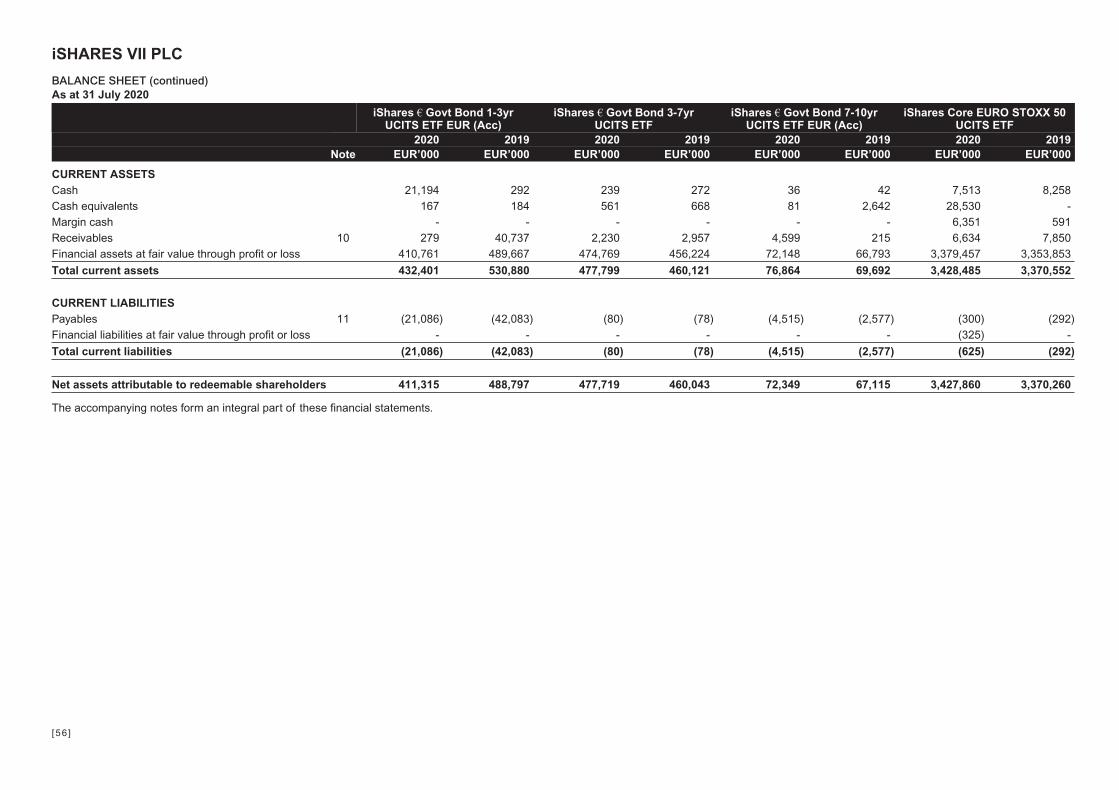
iShares € Govt Bond 1-3yrUCITS ETF EUR (Acc)
iShares € Govt Bond 3-7yrUCITS ETF
iShares € Govt Bond 7-10yrUCITS ETF EUR (Acc)
iShares Core EURO STOXX 50UCITS ETF
2020 2019 2020 2019 2020 2019 2020 2019Note EUR’000 EUR’000 EUR’000 EUR’000 EUR’000 EUR’000 EUR’000 EUR’000
CURRENT ASSETSCash 21,194 292 239 272 36 42 7,513 8,258Cash equivalents 167 184 561 668 81 2,642 28,530 -Margin cash - - - - - - 6,351 591Receivables 10 279 40,737 2,230 2,957 4,599 215 6,634 7,850Financial assets at fair value through profit or loss 410,761 489,667 474,769 456,224 72,148 66,793 3,379,457 3,353,853
Total current assets 432,401 530,880 477,799 460,121 76,864 69,692 3,428,485 3,370,552
CURRENT LIABILITIESPayables 11 (21,086) (42,083) (80) (78) (4,515) (2,577) (300) (292)Financial liabilities at fair value through profit or loss - - - - - - (325) -
Total current liabilities (21,086) (42,083) (80) (78) (4,515) (2,577) (625) (292)
Net assets attributable to redeemable shareholders 411,315 488,797 477,719 460,043 72,349 67,115 3,427,860 3,370,260
The accompanying notes form an integral part of these financial statements.
iSHARES VII PLC
BALANCE SHEET (continued)As at 31 July 2020
[56 ]
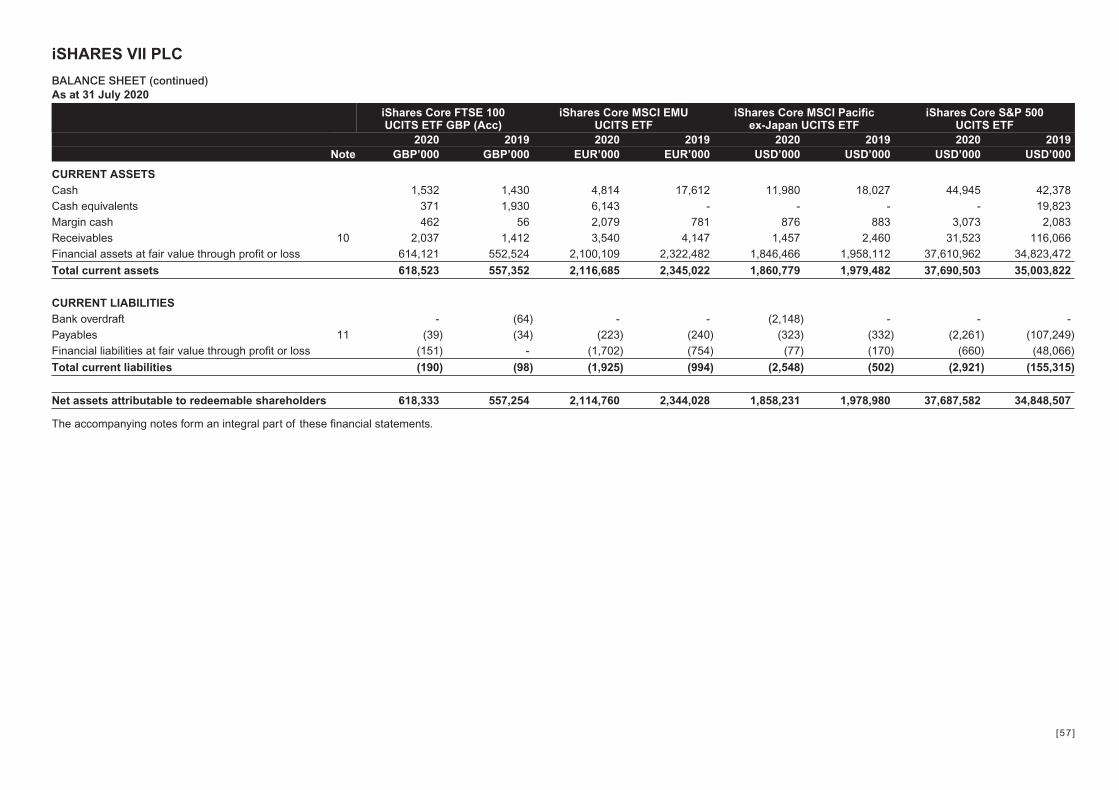
iShares Core FTSE 100UCITS ETF GBP (Acc)
iShares Core MSCI EMUUCITS ETF
iShares Core MSCI Pacificex-Japan UCITS ETF
iShares Core S&P 500UCITS ETF
2020 2019 2020 2019 2020 2019 2020 2019Note GBP’000 GBP’000 EUR’000 EUR’000 USD’000 USD’000 USD’000 USD’000
CURRENT ASSETSCash 1,532 1,430 4,814 17,612 11,980 18,027 44,945 42,378Cash equivalents 371 1,930 6,143 - - - - 19,823Margin cash 462 56 2,079 781 876 883 3,073 2,083Receivables 10 2,037 1,412 3,540 4,147 1,457 2,460 31,523 116,066Financial assets at fair value through profit or loss 614,121 552,524 2,100,109 2,322,482 1,846,466 1,958,112 37,610,962 34,823,472
Total current assets 618,523 557,352 2,116,685 2,345,022 1,860,779 1,979,482 37,690,503 35,003,822
CURRENT LIABILITIESBank overdraft - (64) - - (2,148) - - -Payables 11 (39) (34) (223) (240) (323) (332) (2,261) (107,249)Financial liabilities at fair value through profit or loss (151) - (1,702) (754) (77) (170) (660) (48,066)
Total current liabilities (190) (98) (1,925) (994) (2,548) (502) (2,921) (155,315)
Net assets attributable to redeemable shareholders 618,333 557,254 2,114,760 2,344,028 1,858,231 1,978,980 37,687,582 34,848,507
The accompanying notes form an integral part of these financial statements.
iSHARES VII PLC
BALANCE SHEET (continued)As at 31 July 2020
[57 ]

iShares Dow Jones IndustrialAverage UCITS ETF
iShares FTSE Italia Mid-SmallCap UCITS ETF
iShares FTSE MIBUCITS ETF EUR (Acc)
iShares MSCI BrazilUCITS ETF USD (Acc)1
2020 2019 2020 2019 2020 2019 2020 2019Note USD’000 USD’000 EUR’000 EUR’000 EUR’000 EUR’000 USD’000 USD’000
CURRENT ASSETSCash 961 1,053 73 29 360 - 112 9Cash equivalents 313 - - - 269 - - -Margin cash 139 13 9 2 122 30 - 3Receivables 10 301 272 - - 1,257 1,379 9 106Financial assets at fair value through profit or loss 422,674 458,924 14,988 9,417 133,194 95,955 - 36,744
Total current assets 424,388 460,262 15,070 9,448 135,202 97,364 121 36,862
CURRENT LIABILITIESBank overdraft - - - - - (949) - -Payables 11 (117) (130) (54) (3) (1,079) (27) (121) (21)Provision for deferred capital gains tax 9 - - - - - - - (1,780)Financial liabilities at fair value through profit or loss (14) - (1) - (33) - - (1)
Total current liabilities (131) (130) (55) (3) (1,112) (976) (121) (1,802)
Net assets attributable to redeemable shareholders 424,257 460,132 15,015 9,445 134,090 96,388 - 35,060
1The Fund ceased operations on 25 September 2019.The accompanying notes form an integral part of these financial statements.
iSHARES VII PLC
BALANCE SHEET (continued)As at 31 July 2020
[58 ]
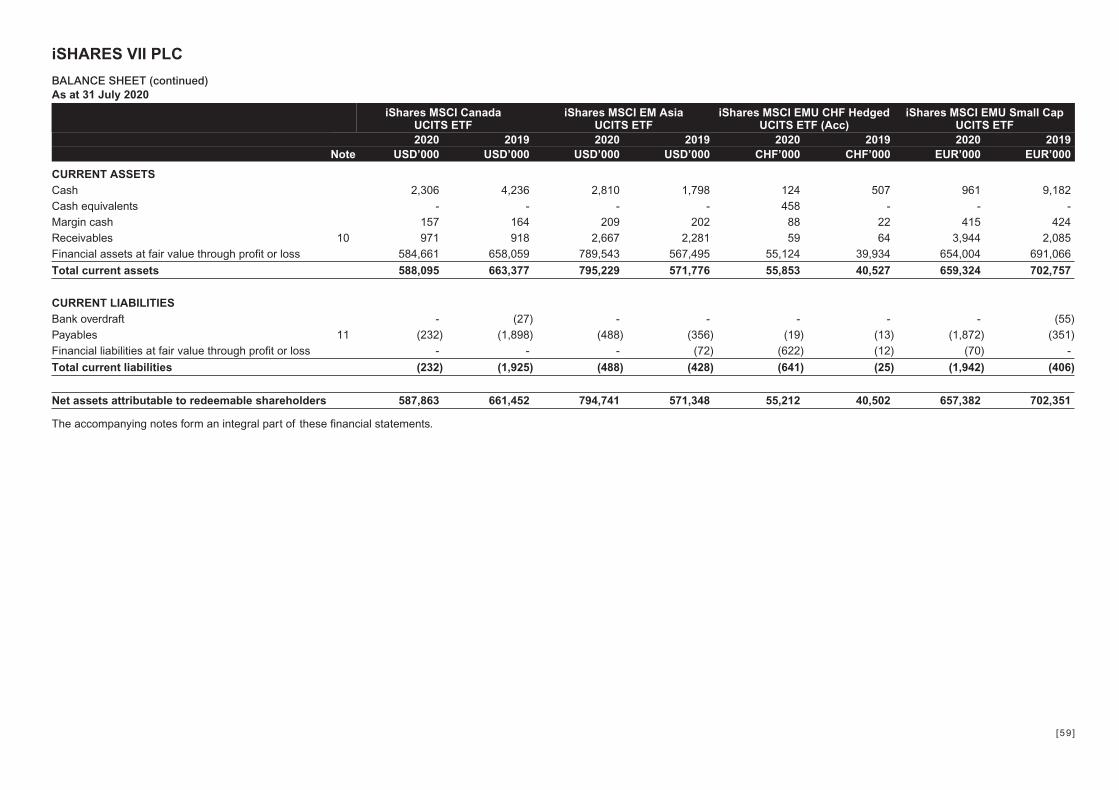
iShares MSCI CanadaUCITS ETF
iShares MSCI EM AsiaUCITS ETF
iShares MSCI EMU CHF HedgedUCITS ETF (Acc)
iShares MSCI EMU Small CapUCITS ETF
2020 2019 2020 2019 2020 2019 2020 2019Note USD’000 USD’000 USD’000 USD’000 CHF’000 CHF’000 EUR’000 EUR’000
CURRENT ASSETSCash 2,306 4,236 2,810 1,798 124 507 961 9,182Cash equivalents - - - - 458 - - -Margin cash 157 164 209 202 88 22 415 424Receivables 10 971 918 2,667 2,281 59 64 3,944 2,085Financial assets at fair value through profit or loss 584,661 658,059 789,543 567,495 55,124 39,934 654,004 691,066
Total current assets 588,095 663,377 795,229 571,776 55,853 40,527 659,324 702,757
CURRENT LIABILITIESBank overdraft - (27) - - - - - (55)Payables 11 (232) (1,898) (488) (356) (19) (13) (1,872) (351)Financial liabilities at fair value through profit or loss - - - (72) (622) (12) (70) -
Total current liabilities (232) (1,925) (488) (428) (641) (25) (1,942) (406)
Net assets attributable to redeemable shareholders 587,863 661,452 794,741 571,348 55,212 40,502 657,382 702,351
The accompanying notes form an integral part of these financial statements.
iSHARES VII PLC
BALANCE SHEET (continued)As at 31 July 2020
[59 ]
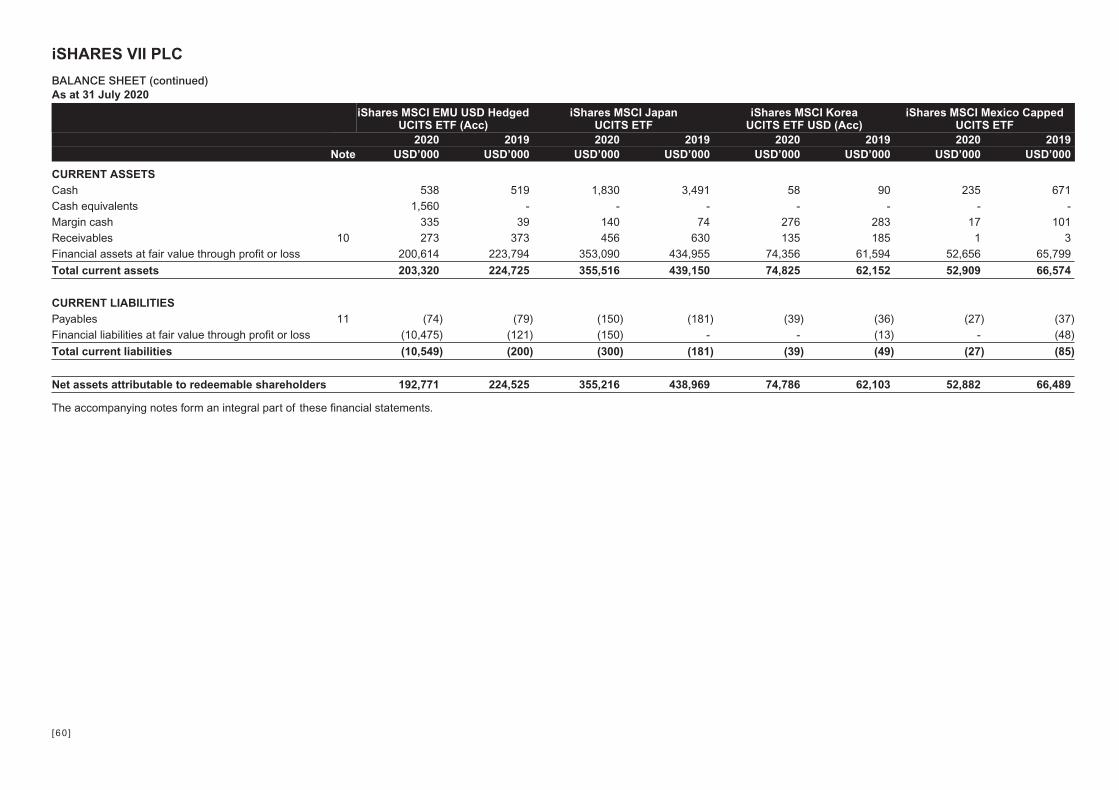
iShares MSCI EMU USD HedgedUCITS ETF (Acc)
iShares MSCI JapanUCITS ETF
iShares MSCI KoreaUCITS ETF USD (Acc)
iShares MSCI Mexico CappedUCITS ETF
2020 2019 2020 2019 2020 2019 2020 2019Note USD’000 USD’000 USD’000 USD’000 USD’000 USD’000 USD’000 USD’000
CURRENT ASSETSCash 538 519 1,830 3,491 58 90 235 671Cash equivalents 1,560 - - - - - - -Margin cash 335 39 140 74 276 283 17 101Receivables 10 273 373 456 630 135 185 1 3Financial assets at fair value through profit or loss 200,614 223,794 353,090 434,955 74,356 61,594 52,656 65,799
Total current assets 203,320 224,725 355,516 439,150 74,825 62,152 52,909 66,574
CURRENT LIABILITIESPayables 11 (74) (79) (150) (181) (39) (36) (27) (37)Financial liabilities at fair value through profit or loss (10,475) (121) (150) - - (13) - (48)
Total current liabilities (10,549) (200) (300) (181) (39) (49) (27) (85)
Net assets attributable to redeemable shareholders 192,771 224,525 355,216 438,969 74,786 62,103 52,882 66,489
The accompanying notes form an integral part of these financial statements.
iSHARES VII PLC
BALANCE SHEET (continued)As at 31 July 2020
[60 ]
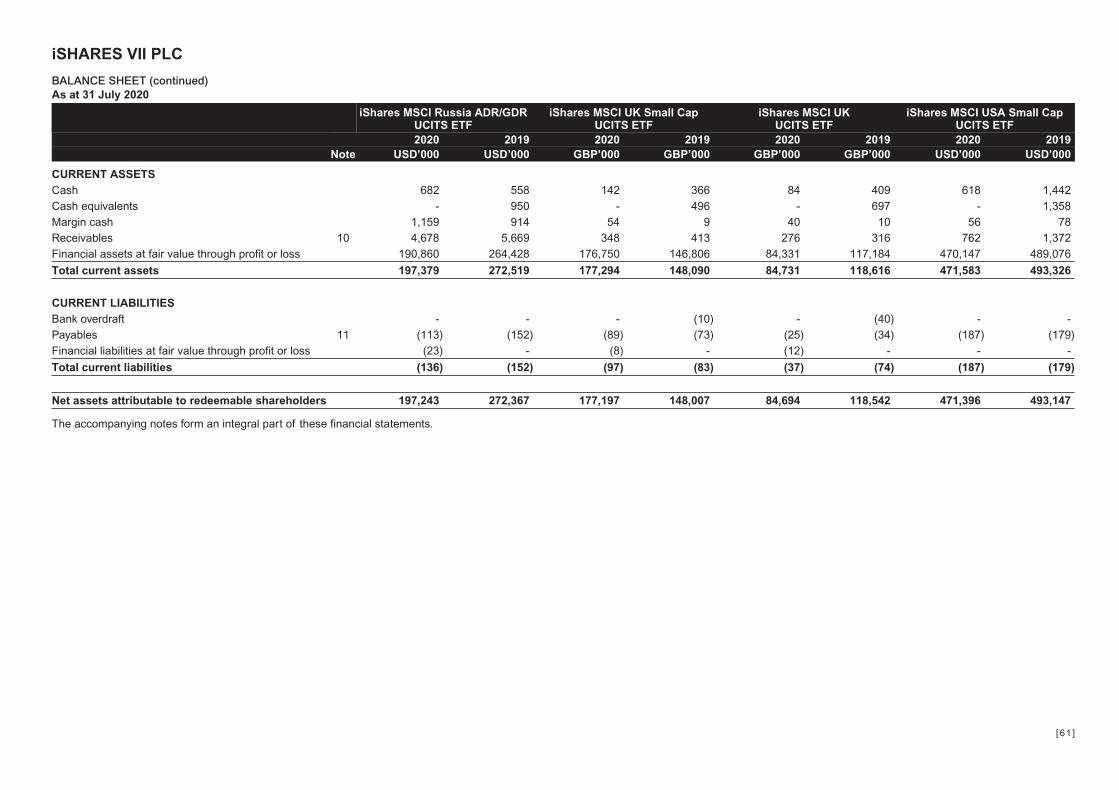
iShares MSCI Russia ADR/GDRUCITS ETF
iShares MSCI UK Small CapUCITS ETF
iShares MSCI UKUCITS ETF
iShares MSCI USA Small CapUCITS ETF
2020 2019 2020 2019 2020 2019 2020 2019Note USD’000 USD’000 GBP’000 GBP’000 GBP’000 GBP’000 USD’000 USD’000
CURRENT ASSETSCash 682 558 142 366 84 409 618 1,442Cash equivalents - 950 - 496 - 697 - 1,358Margin cash 1,159 914 54 9 40 10 56 78Receivables 10 4,678 5,669 348 413 276 316 762 1,372Financial assets at fair value through profit or loss 190,860 264,428 176,750 146,806 84,331 117,184 470,147 489,076
Total current assets 197,379 272,519 177,294 148,090 84,731 118,616 471,583 493,326
CURRENT LIABILITIESBank overdraft - - - (10) - (40) - -Payables 11 (113) (152) (89) (73) (25) (34) (187) (179)Financial liabilities at fair value through profit or loss (23) - (8) - (12) - - -
Total current liabilities (136) (152) (97) (83) (37) (74) (187) (179)
Net assets attributable to redeemable shareholders 197,243 272,367 177,197 148,007 84,694 118,542 471,396 493,147
The accompanying notes form an integral part of these financial statements.
iSHARES VII PLC
BALANCE SHEET (continued)As at 31 July 2020
[61 ]
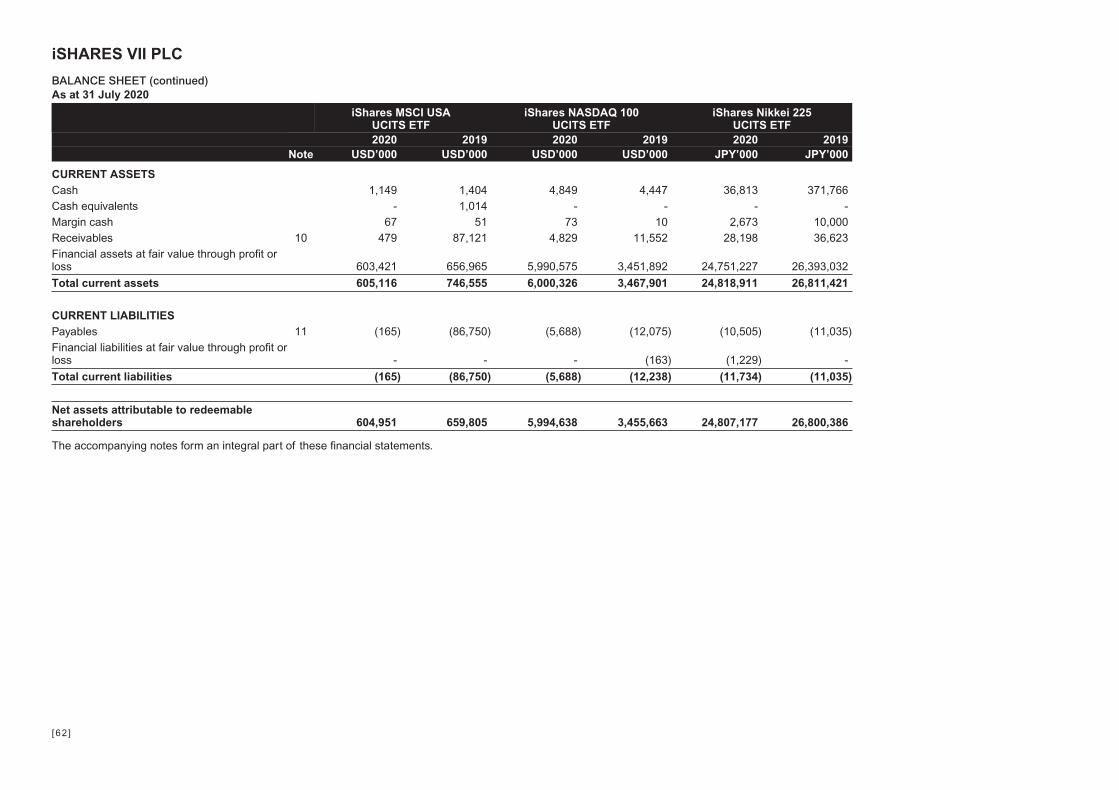
iShares MSCI USAUCITS ETF
iShares NASDAQ 100UCITS ETF
iShares Nikkei 225UCITS ETF
2020 2019 2020 2019 2020 2019Note USD’000 USD’000 USD’000 USD’000 JPY’000 JPY’000
CURRENT ASSETSCash 1,149 1,404 4,849 4,447 36,813 371,766Cash equivalents - 1,014 - - - -Margin cash 67 51 73 10 2,673 10,000Receivables 10 479 87,121 4,829 11,552 28,198 36,623Financial assets at fair value through profit orloss 603,421 656,965 5,990,575 3,451,892 24,751,227 26,393,032
Total current assets 605,116 746,555 6,000,326 3,467,901 24,818,911 26,811,421
CURRENT LIABILITIESPayables 11 (165) (86,750) (5,688) (12,075) (10,505) (11,035)Financial liabilities at fair value through profit orloss - - - (163) (1,229) -
Total current liabilities (165) (86,750) (5,688) (12,238) (11,734) (11,035)
Net assets attributable to redeemableshareholders 604,951 659,805 5,994,638 3,455,663 24,807,177 26,800,386
The accompanying notes form an integral part of these financial statements.
iSHARES VII PLC
BALANCE SHEET (continued)As at 31 July 2020
[62 ]
1. General information
The Entity is an open-ended investment company domiciled and incorporated under the laws of Ireland as a public limited company. The Entity is
authorised by the CBI and is governed by the provisions of the UCITS Regulations with its registered office at J.P Morgan, 200 Capital Dock, 79 Sir
John Rogerson’s Quay, Dublin 2, D02 RK57, Ireland.
2. Significant accounting policies2.1 Basis of preparation
The financial statements are prepared in accordance with Financial Reporting Standard 102 ("FRS 102"), "The Financial Reporting Standard
applicable in the United Kingdom and Republic of Ireland" issued by the Financial Reporting Council.
The financial statements are prepared on a going concern basis under the historical cost convention as modified by the revaluation of financial
assets and financial liabilities held at fair value through profit or loss. The financial statements of iShares MSCI Brazil UCITS ETF USD (Acc) have
been prepared on a non-going concern basis as this Fund closed during the financial year.
The Entity has availed of the exemption available to open-ended investment funds that hold a substantial proportion of highly liquid and fair valued
investments under Section 7 of FRS 102 and is not presenting a statement of cash flows.
The format and certain wordings of the financial statements have been adapted from those contained in Section 3 of FRS 102, so that, in the opinion
of Directors, they more appropriately reflect the nature of the Entity’s business as an investment fund.
All amounts are rounded to nearest thousand, unless otherwise indicated.
2.2 Financial instruments
The Entity has chosen to implement the recognition and measurement provisions of IAS 39 and only the disclosure requirements of Sections 11
and 12 FRS 102 as they relate to financial instruments.
2.2.1 Classification
The Entity classifies its investments in debt instruments, equity instruments and derivatives as financial assets or financial liabilities at fair value
through profit or loss. These financial assets and financial liabilities are classified as held for trading or designated by the Directors at fair value
through profit or loss at inception. All the derivatives investments are held for trading purposes. All other financial assets and financial liabilities
including cash, cash equivalents, receivables and payables are classified at amortised cost using the effective interest method.
2.2.2 Recognition and derecognition
The Entity recognises a financial asset or a financial liability when it becomes a party to the contractual provisions of the instrument. Purchases and
sales of investments are recognised on the day the trade takes place.
Realised gains and losses on disposals of financial instruments are calculated using the average cost method. For instruments held long, they
represent the difference between the initial carrying amount and disposal amount. For instruments held short, they represent the difference between
the proceeds received and the opening value. For derivative contracts, they represent the cash payments or receipts made on derivative contracts
(excluding those on collateral or margin accounts for such instruments).
Financial assets are derecognised when the rights to receive cash flows from the asset have expired or the risks and rewards of ownership have
all been substantially transferred. Financial liabilities are derecognised when the obligation under the liability is discharged, cancelled or expired.
2.2.3 Measurement
All financial instruments are initially recognised at fair value.
iSHARES VII PLC
NOTES TO THE FINANCIAL STATEMENTS
[63 ]

2. Significant accounting policies (continued)
2.2 Financial instruments (continued)2.2.3 Measurement (continued)Financial assets and financial liabilities at fair value through profit or loss are subsequently measured at fair value. Transaction costs on purchases
or sales of investments and gains and losses arising from changes in the fair value of financial assets or financial liabilities at fair value through profit
or loss are presented in the income statement within ‘Net gains/(losses) on financial instruments’’, in the period in which they arise.
Financial assets and financial liabilities, other than those classified as at fair value through profit or loss, are subsequently measured at amortised
cost.
2.2.4 Fair value estimation
Fair value is the amount for which an asset could be exchanged, a liability settled or an equity instrument granted could be exchanged, between
knowledgeable, willing parties in an arm’s length transaction. The estimation of fair value, after initial recognition, is determined as follows:
● Investments in debt and equity instruments and exchange traded derivatives which are quoted, listed, traded or dealt on a market or
exchange are valued based on quoted market prices which, for the purposes of the financial statements is in line with the valuation
methodology prescribed in the Entity’s prospectus. Depending on the nature of the underlying investment, the value taken could be either
at the closing price, closing mid-market price or bid price on the relevant market.
● Investments which are a unit of participation in an investee collective investment scheme (“CIS”) and ETFs are valued at the unaudited
NAV, and where available the independently audited NAV, on the valuation date of such unit of participation as calculated by the
administrator of the investee CIS/ETF and in accordance with the requirements of the scheme of which the relevant investment is a
share/unit of participation. The unaudited NAV of the underlying investee CIS/ETF is reflected gross of any redemption costs which may
potentially arise upon redemption from the underlying CIS/ETF.
● Investments in centrally cleared and over-the-counter (“OTC”) derivatives are valued using valuation techniques.
In the case of an investment which is not quoted, listed or dealt on a recognised market, or in respect of which a listed, traded or dealt price or
quotation is not available at the time of valuation, the fair value of such investment shall be estimated with care and in good faith by a competent
professional person, body, firm or corporation (appointed for such purpose by the Directors in consultation with the Investment Manager and
approved for the purpose by the Depositary), and such fair value shall be determined using valuation techniques. The Entity uses a variety of
methods and makes assumptions that are based on market conditions existing at each reporting date.
Valuation techniques used for non-standardised financial instruments such as OTC derivatives include those detailed in the fair value hierarchy note,
and those used by market participants making the maximum use of market inputs and relying as little as possible on entity-specific inputs.
2.2.5 Financial derivative and other specific instruments2.2.5.1 Futures contracts
A futures contract is a contract, traded on an exchange, to buy or sell a certain underlying instrument at a certain date in the future, at a specified
price.
Initial margin deposits are made to relevant brokers upon entering into futures contracts and are included in margin cash.
2.2.5.2 Forward currency contracts
A forward currency contract is an agreement, in the OTC market, between two parties to buy or sell a certain underlying currency at a certain date
in the future, at a specified price.
2.2.6 Cash and cash equivalents
Cash in the balance sheet includes cash deposits held on call with banks. Cash equivalents include short-term liquid investments that are readily
convertible to known amounts of cash and which are subject to an insignificant risk of changes in value.
iSHARES VII PLC
NOTES TO THE FINANCIAL STATEMENTS (continued)
[64 ]
2. Significant accounting policies (continued)
2.2 Financial instruments (continued)2.2.6 Cash and cash equivalents (continued)Bank overdrafts are classified as liabilities in the balance sheet.
2.2.7 Collateral and margin cash
Cash collateral provided by the Fund is identified as an asset on the balance sheet as ‘Cash collateral’ and is not included as a component of cash
and cash equivalents. For collateral other than cash provided by the Fund, if the party to whom the collateral is provided has the right by contract
to sell or re-pledge the collateral, the Fund classifies that asset on its balance sheet separately from other assets and identifies the asset as a pledged
investment. Where the party to whom the collateral is provided does not have the right to sell or re-pledge, a disclosure of the collateral provided
is made in the notes to the financial statements.
Cash balances held as margin with relevant brokers relating to investments in derivatives at the reporting date are identified on the balance sheet
as margin cash.
Cash collateral provided to the Fund by counterparties is identified on the balance sheet as ‘Cash collateral payable’. The Fund may reinvest this
cash collateral and the assets purchased are included as ‘Cash equivalents’ on the balance sheet.
2.2.8 Redeemable shares
Each Fund classifies redeemable shares issued as financial liabilities in accordance with the substance of the contractual terms of the instruments.
Redeemable shares are measured at the present value of redemption amounts.
The redeemable shares are redeemable at the option of the holders and meet the conditions set out in Section 22.4 of FRS 102, to be classified
as equity and as a result are classified as financial liabilities.
The redeemable shares are accounted for on the day the trade takes place. Subscriptions and redemptions of redeemable shares are accounted
for on the day the trade transaction takes place. Shares are subscribed and redeemed based upon the NAV per share as of the latest valuation point.
Where duties and charges are applied in the context of a subscription or redemption, they will have an impact on the value of an investment of a
subscribing or redeeming investor and as a result are reflected as part of the issue of redeemable shares or the redemption of redeemable shares
in the statement of changes in net assets attributable to redeemable share. Any potential duties and charges are at the discretion of the Directors.
2.3 Foreign currency
2.3.1 Functional and presentation currency
Foreign currency items included in each Fund’s financial statements are measured in each Fund’s functional currency which is shown for each Fund
in the headings of the financial statements.
The Directors consider that these currencies most accurately represent the economic effects of the underlying transactions, events and conditions
of each Fund. Each Fund’s’ presentation currency is the same as the functional currency.
The presentation currency of the Entity’s financial statements is Euro.
2.3.2 Transactions and balances
Transactions in foreign currencies are translated into the functional currency of each Fund at the foreign currency exchange rate in effect at the date
of the transaction.
Foreign currency assets and liabilities, including investments, are translated at the exchange rate prevailing at the reporting date.
iSHARES VII PLC
NOTES TO THE FINANCIAL STATEMENTS (continued)
[65 ]
2. Significant accounting policies (continued)
2.3 Foreign currency (continued)2.3.2 Transactions and balances (continued)The foreign exchange gain or loss based on the translation of the investments, as well as the gain or loss arising on the translation of other assets
and liabilities, is included in the income statement.
2.4 Critical accounting estimates and judgements
The preparation of the financial statements in conformity with FRS 102 requires the use of certain critical accounting estimates. It also requires the
Directors to exercise their judgement in the process of applying the Entity’s accounting policies. Changes in assumptions may have a significant
impact on the financial statements in the period the assumptions changed. The Directors believe that the underlying assumptions are appropriate
and that the Entity’s financial statements, therefore, present the Entity’s financial position and its results fairly. The estimates and underlying
assumptions are reviewed on an ongoing basis. Revisions to accounting estimates are recognised in the period in which the estimate is revised if
the revision affects only that period or in the period of the revision and future years if the revision affects both current and future years. The areas
involving a higher degree of judgement or complexity, or areas where assumptions and estimates are significant to the financial statements, are
disclosed below.
2.4.1 Assumptions and estimation uncertainties2.4.1.1 Fair value of OTC derivative financial instruments
OTC financial derivative instruments are valued using valuation techniques, as detailed in the fair value hierarchy note to the financial statements.
Where valuation techniques (for example, models) are used to determine fair values, they are validated and periodically reviewed and compared
to the price provided by an independent pricing service provider, where available.
2.4.1.2 Fair value of financial instruments not quoted in an active market
The fair value of such instruments not quoted in an active market may be determined by the Fund using reputable pricing sources or indicative prices
from bond/debt market makers. The Fund would exercise judgement and estimates on the quantity and quality of pricing sources used. Broker
quotes as obtained from the pricing sources may be indicative and not executable or binding.
2.4.1.3 Fair value of financial instruments with significant unobservable inputs
The fair value of such instruments is determined using valuation techniques including inputs not based on market data and where significant entity
determined adjustments or assumptions are applied, as detailed in the fair value hierarchy note to the financial statements.
2.4.2 Judgements2.4.2.1 Assessment as investment entities
The Directors are of the opinion that the Entity meets the definition of an investment entity. The following conditions exist:
a) The Entity has obtained funds for the purpose of providing investors with investment management services; and
b) The investments held by the Entity are measured and evaluated on a fair value basis and information about those investments are provided
to shareholders of a fair value basis through the Entity.
2.5 Dividend income
Dividend income is recognised in the income statement when the Fund’s right to receive the payment is established. For quoted equity securities,
this is usually the ex-dividend date. For unquoted equity securities, this is usually the date on which the share approve the payment of a dividend.
Dividend income is shown gross of any non-recoverable withholding taxes, which are presented separately in the income statement. CIS and ETF
income is recognised when the distributions are declared by the underlying CIS/ETF.
2.6 Interest income and interest expense
Interest income and expense for all interest-bearing financial instruments are recognised in the income statement using the effective interest
method.
iSHARES VII PLC
NOTES TO THE FINANCIAL STATEMENTS (continued)
[66 ]
2. Significant accounting policies (continued)
2.7 Securities lending income
Securities lending income is earned from lending securities owned by the Fund to third party borrowers. Securities lending income is recognised
in the income statement on an accruals method basis.
2.8 Management fee rebate
A management fee rebate is accrued on the portion of a Fund’s assets invested in another iShares Fund or BlackRock affiliate based on the
management fee rate charged by that Fund. The rebate is accounted for in the income statement.
The management fee rebate is calculated based on the amount invested by iShares MSCI EM Asia UCITS ETF in iShares MSCI China A UCITS
ETF (the “underlying fund”) multiplied by the management fee rate charged by the underlying fund.
2.9 Fees and expenses
Expenses are recognised in the income statement on an accruals basis except for transaction charges relating to the acquisition and realisation of
investments which are charged for as incurred.
Expenses directly attributable to a specific class of shares are borne directly by such class solely.
2.10 Negative yield on financial assets
Negative yield on financial assets relating to interest from a negative effective interest rate on a financial asset is accreted daily and is recognised
in the income statement over the life of the underlying instrument.
2.11 Distributions
Distributions are recognised in the income statement as finance costs where shares in the Fund do not meet the conditions to be classified as equity
and as a result are classified as financial liabilities.
The Directors may declare distributions on the shares of the class in respect of each financial period. Distributions may be paid out of the Fund’s
net income.
The Directors have implemented income equalisation arrangements to ensure that the level of income derived from investments is not affected by
the issue, conversion or redemption of shares during the financial period. As part of the distribution payment, the average amount of this equalisation
is returned to shareholders who subscribed to or redeemed from the Fund during the year. The equalisation element of the distribution is treated
as a repayment of capital.
Distributions will not be made to the shareholders of the accumulating unit classes. The income and other profits will be accumulated and reinvested
in the Fund on behalf of these shareholders.
2.12 Taxation
2.12.1 Current tax
Current tax is recognised for the amount of income tax payable in respect of the overseas taxable profit for the current or past reporting periods using
the tax rates and laws that that have been enacted or substantively enacted by the reporting date.
2.12.2 Deferred tax
A provision for deferred tax payable is recognised in respect of material timing differences that have originated but not reversed at the balance sheet
date. A deferred tax asset is not recognised to the extent that the transfer of economic benefits in the future is uncertain. Timing differences are
differences between the Fund’s overseas taxable profits and its results as stated in the financial statements that arise from the inclusion of income
and expenses in tax assessments in periods different from those in which they are recognised in the financial statements.
iSHARES VII PLC
NOTES TO THE FINANCIAL STATEMENTS (continued)
[67 ]
3. Financial risks
Each Fund’s investment activities expose them to the various types of risk which are associated with the financial instruments and markets in which
it invests. The following information is not intended to be a comprehensive summary of all risks and investors should refer to the prospectus for a
more detailed discussion of the risks inherent in investing in each Fund.
3.1 Risk management framework
The Directors review quarterly investment performance reports and receive semi-annual presentations from the Investment Manager covering the
Entity’s performance and risk profile during the financial year. The Directors have delegated certain duties and responsibilities to the Manager with
regard to the day-to-day management of the Entity. The Manager has in turn delegated the day-to-day administration of the investment programme
to the Investment Manager. The Investment Manager is also responsible for ensuring that the Entity is managed within the terms of its investment
guidelines and limits set out in the prospectus. The Directors reserve to themselves the investment performance, product risk monitoring and
oversight and the responsibility for the monitoring and oversight of regulatory and operational risk for the Entity. The Directors have appointed a risk
manager who has responsibility for the daily risk management process with assistance from key risk management personnel of the Investment
Manager, including members of the BlackRock Risk and Quantitative Analysis Group (“RQA Group”) which is a centralised group which performs
an independent risk management function. The RQA Group independently identifies, measures and monitors investment risk. The RQA Group
tracks the actual risk management practices being deployed across each Fund. By breaking down the components of the process, the RQA Group
has the ability to determine if the appropriate risk management processes are in place across each Fund. This captures the risk management tools
employed, how the levels of risk are controlled, ensuring risk/return is considered in portfolio construction and reviewing outcomes.
3.2 Market risk
Market risk arises mainly from uncertainty about future values of financial instruments influenced by currency, interest rate and price movements.
It represents the potential loss each Fund may suffer through holding market positions in the face of market movements.
The Funds are exposed to market risk by virtue of their investments in equities and derivatives.
A key metric used by the RQA Group to measure market risk is Value-at-Risk (“VaR”) which encompasses currency, interest rate and price risk. The
RQA Group is a centralised group which performs an independent risk management function. The group independently identifies, measures and
monitors investment risk.
VaR is a statistical risk measure that estimates the potential portfolio loss from adverse market movements in an ordinary market environment. VaR
analysis reflects the interdependencies between risk variables, unlike a traditional sensitivity analysis.
The VaR calculations are based on an adjusted historical simulation model with a confidence level of 99%, a holding period of one day and a
historical observation period of not less than one year (250 days). A VaR number is defined at a specified probability and a specified time horizon.
A 99% one day VaR means that the expectation is that 99% of the time over a one-day period each Fund will lose no more than this number in
percentage terms. Therefore, higher VaR numbers indicate higher risk.
It is noted that the use of VaR methodology has limitations, namely that the use of historical market data as a basis for estimating future events does
not encompass all possible scenarios, particularly those that are of an extreme nature and that the use of a specified confidence level (e.g. 99%)
does not take into account losses that occur beyond this level. There is some probability that the loss could be greater than the VaR amounts. These
limitations and the nature of the VaR measure mean that each Fund can neither guarantee that losses will not exceed the VaR amounts indicated,
nor that losses in excess of the VaR amounts will not occur more frequently.
iSHARES VII PLC
NOTES TO THE FINANCIAL STATEMENTS (continued)
[68 ]
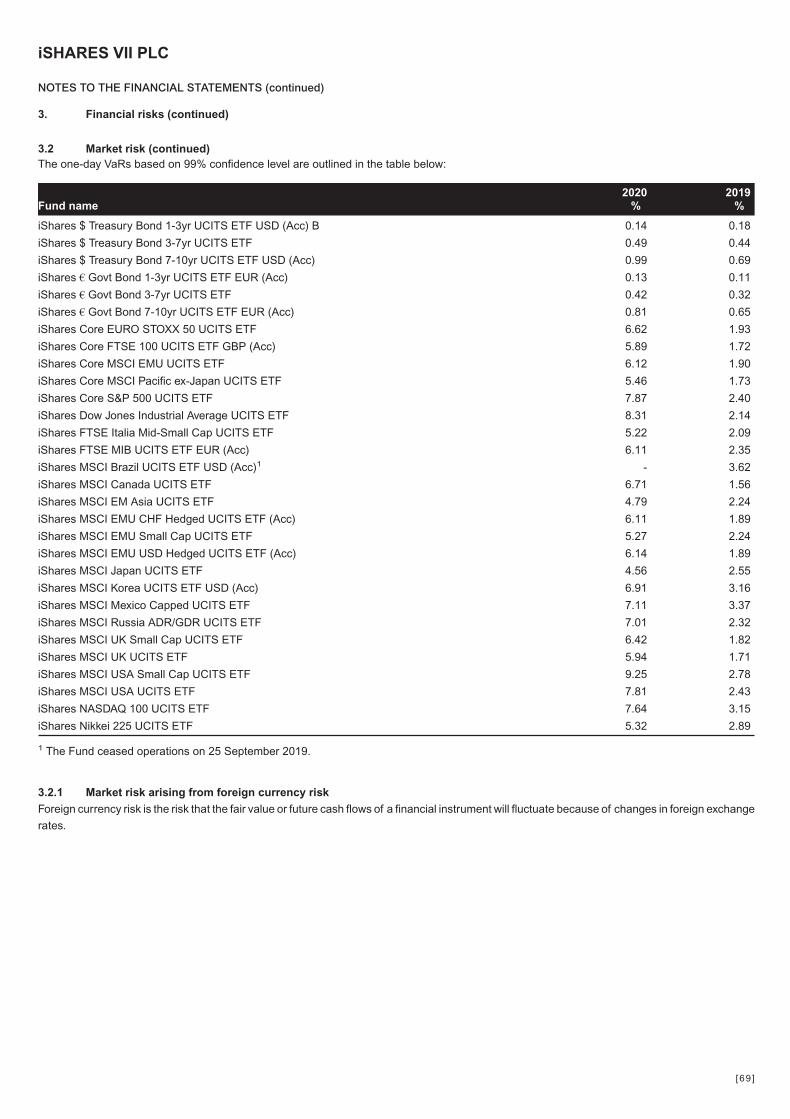
3. Financial risks (continued)
3.2 Market risk (continued)The one-day VaRs based on 99% confidence level are outlined in the table below:
2020 2019Fund name % %
iShares $ Treasury Bond 1-3yr UCITS ETF USD (Acc) B 0.14 0.18
iShares $ Treasury Bond 3-7yr UCITS ETF 0.49 0.44
iShares $ Treasury Bond 7-10yr UCITS ETF USD (Acc) 0.99 0.69
iShares € Govt Bond 1-3yr UCITS ETF EUR (Acc) 0.13 0.11
iShares € Govt Bond 3-7yr UCITS ETF 0.42 0.32
iShares € Govt Bond 7-10yr UCITS ETF EUR (Acc) 0.81 0.65
iShares Core EURO STOXX 50 UCITS ETF 6.62 1.93
iShares Core FTSE 100 UCITS ETF GBP (Acc) 5.89 1.72
iShares Core MSCI EMU UCITS ETF 6.12 1.90
iShares Core MSCI Pacific ex-Japan UCITS ETF 5.46 1.73
iShares Core S&P 500 UCITS ETF 7.87 2.40
iShares Dow Jones Industrial Average UCITS ETF 8.31 2.14
iShares FTSE Italia Mid-Small Cap UCITS ETF 5.22 2.09
iShares FTSE MIB UCITS ETF EUR (Acc) 6.11 2.35
iShares MSCI Brazil UCITS ETF USD (Acc)1 - 3.62
iShares MSCI Canada UCITS ETF 6.71 1.56
iShares MSCI EM Asia UCITS ETF 4.79 2.24
iShares MSCI EMU CHF Hedged UCITS ETF (Acc) 6.11 1.89
iShares MSCI EMU Small Cap UCITS ETF 5.27 2.24
iShares MSCI EMU USD Hedged UCITS ETF (Acc) 6.14 1.89
iShares MSCI Japan UCITS ETF 4.56 2.55
iShares MSCI Korea UCITS ETF USD (Acc) 6.91 3.16
iShares MSCI Mexico Capped UCITS ETF 7.11 3.37
iShares MSCI Russia ADR/GDR UCITS ETF 7.01 2.32
iShares MSCI UK Small Cap UCITS ETF 6.42 1.82
iShares MSCI UK UCITS ETF 5.94 1.71
iShares MSCI USA Small Cap UCITS ETF 9.25 2.78
iShares MSCI USA UCITS ETF 7.81 2.43
iShares NASDAQ 100 UCITS ETF 7.64 3.15
iShares Nikkei 225 UCITS ETF 5.32 2.89
1 The Fund ceased operations on 25 September 2019.
3.2.1 Market risk arising from foreign currency risk
Foreign currency risk is the risk that the fair value or future cash flows of a financial instrument will fluctuate because of changes in foreign exchange
rates.
iSHARES VII PLC
NOTES TO THE FINANCIAL STATEMENTS (continued)
[69 ]

3. Financial risks (continued)
3.2 Market risk (continued)3.2.1 Market risk arising from foreign currency risk (continued)Exposure to foreign currency risk
Each Fund may invest in financial instruments denominated in currencies other than its functional currency. Consequently, each Fund is exposed,
directly and/or indirectly, to risks that the exchange rate of its functional currency relative to other currencies may change in a manner which has
an adverse effect on the value of the portion of each Fund’s assets which are denominated in currencies other than its own currency.
The details of the open forward currency contracts in place to hedge foreign currency risk at the financial year end date are disclosed in the
schedules of investments.
In addition, each Fund issued share classes denominated in currencies other than the functional currency of the Fund.
Management of foreign currency risk
Each Fund engages in foreign currency hedging to minimise the effect of currency movements between the currencies of the investments held by
the Fund and the Fund’s functional currency and the Fund’s currency hedged share classes.
The Investment Manager monitors foreign currency risk exposure against pre-determined tolerances and determines when a currency hedge
should be reset and the gain or loss arising from such hedge reinvested or settled, while taking into consideration the frequency and associated
transaction and reinvestment costs of resetting the currency hedge.
3.2.2 Market risk arising from interest rate risk
Interest rate risk is the risk that the fair value or future cash flows of a financial instrument will fluctuate because of changes in market interest rates.
Exposure to interest rate risk
Each Fund is exposed to interest rate risk through its cash and cash equivalent holdings including margin cash held with brokers and through its
investments in interest bearing financial instruments which are disclosed in the schedules of investments.
Each Fund also has indirect exposure to interest rate risk through its investments into CIS, ETF, and interest rate financial derivative instruments
(”FDIs”), whereby the value of an underlying asset may fluctuate as a result of a change in interest rates.
Management of interest rate risk
Interest rate risk exposure is managed by constantly monitoring the position for deviations outside of a pre-determined tolerance level and, when
necessary, rebalancing back to the original desired parameters.
Cash and cash collateral is invested into money market funds to generate a return to protect the Fund against unfavourable movements in interest
rates.
3.2.3 Market risk arising from price risk
Price risk is the risk that the fair value of future cash flows of a financial instrument will fluctuate because of changes in market prices (other than
those arising from interest rate risk or currency risk), whether those changes are caused by factors specific to the individual financial instrument or
its issuer, or factors affecting similar financial instruments traded in the market. Local, regional or global events such as war, acts of terrorism, the
spread of infectious illness or other public health issue, recessions, or other events could have a significant impact on each Fund and the market
price of its investments.
iSHARES VII PLC
NOTES TO THE FINANCIAL STATEMENTS (continued)
[70 ]
3. Financial risks (continued)
3.2 Market risk (continued)3.2.3 Market risk arising from price risk (continued)An outbreak of an infectious respiratory illness caused by a novel coronavirus known as COVID-19 was first detected in China in December 2019
and has now developed into a global pandemic. This coronavirus has resulted in travel restrictions, closed international borders, enhanced health
screenings at ports of entry and elsewhere, disruption of and delays in healthcare service preparation and delivery, prolonged quarantines,
cancellations, supply chain disruptions, and lower consumer demand, as well as general concern and uncertainty. The impact of COVID-19 has
adversely affected the economies of many nations across the entire global economy, individual issuers and capital markets, and could continue to
extents that cannot necessarily be foreseen. In addition, the impact of infectious illnesses in emerging market countries may be greater due to
generally less established healthcare systems. Public health crises caused by the COVID-19 outbreak may exacerbate other pre-existing political,
social and economic risks in certain countries or globally. The duration of the COVID-19 outbreak and its effects cannot be determined with certainty.
Exposure to price risk
Each Fund is exposed to price risk arising from its investments in financial instruments. The exposure of each Fund to price risk is the fair value of
the investments held as shown in the schedules of investments of each Fund.
Management of price risk
By diversifying the portfolio, where this is appropriate and consistent with each Fund’s objectives, the risk that a price change of a particular
investment will have a material impact on the NAV of each Fund is minimised.
There is a risk that the valuation of each Fund may not fairly reflect the value of the investments held at a specific time due to events outside the
control of the Directors, which could result in significant losses or inaccurate pricing for each Fund. To mitigate this risk the Directors may temporarily
suspend the determination of the NAV of any Fund until a fair or reasonable valuation of the investments held can be determined.
The price risk inherent in the CIS holdings is monitored by the Investment Manager by understanding the investment objectives of the underlying
funds as well as their internal control policies and regular risk and performance reporting. The investments into other CIS are all investments into
related party funds. Such CIS are subject to the same control procedures the Investment Manager employs for each Fund.
3.3 Liquidity risk
Liquidity risk is the risk that each Fund will encounter difficulties in meeting obligations associated with financial liabilities.
Exposure to liquidity risk
Each Fund’s principal liquidity risks arise from the ability of investors to effect redemption requests and the liquidity of the underlying investments
each Fund has invested in.
Each Fund’s shareholders may redeem their shares on the close of any daily dealing deadline for cash equal to a proportionate share of each Funds’
NAV, excluding any duties and charges where applicable. Each Fund is therefore potentially exposed to the liquidity risk of meeting the shareholders’
redemptions and may need to sell assets at prevailing market prices to meet liquidity demands.
Each Fund may invest in CIS which can impose notice periods or other restrictions on redemptions and this may increase the liquidity risk of each
Fund. Each Fund is also exposed to liquidity risk associated with daily margin calls on FDIs.
All of the Fund’s financial liabilities, based on contractual maturities, fall due within three months. The expected settlement dates can be more than
three months based on the analysis of the remaining period at the reporting date to the maturity date and are outlined in the schedules of
investments.
iSHARES VII PLC
NOTES TO THE FINANCIAL STATEMENTS (continued)
[71 ]
3. Financial risks (continued)
3.3 Liquidity risk (continued)Management of liquidity risk
Liquidity risk is minimised by holding sufficient liquid investments which can be readily realised to meet liquidity demands. Asset disposals may also
be required to meet redemption requests. However, timely sale of trading positions can be impaired by many factors including trading volume and
increased price volatility. As a result, each Fund may experience difficulties in disposing of assets to satisfy liquidity demands.
Each Fund’s liquidity risk is managed by the Investment Manager in accordance with established policies and procedures in place. The portfolio
managers review daily forward-looking cash reports which project cash obligations. These reports allow them to manage their cash obligations. If
redemption requests from all holders of shares in a Fund exceed more than 10% of the NAV of each Fund on any particular dealing day, the Directors
shall be entitled, at their discretion, to refuse to redeem such excess numbers of shares in issue from each Fund. The shares which are not redeemed
at any given dealing day shall be redeemed on each subsequent dealing day on a pro-rata basis in priority to any requests received thereafter.
None of the assets of the Funds are subject to special liquidity arrangements.
3.4 Counterparty credit risk
Counterparty credit risk is the risk that one party to a financial instrument will cause a financial loss for the other party by failing to discharge an
obligation.
Exposure to counterparty credit risk
Each Fund is exposed to counterparty credit risk from the parties with which it trades and will bear the risk of settlement default.
Each Fund’s exposure is limited to the contracts in which it currently has a financial asset position reduced by any collateral received from the
counterparty, or to counterparties who have received collateral from each Fund. The carrying value of financial assets together with cash held with
counterparties best represents each Fund’s gross maximum exposure to counterparty credit risk at the reporting date, before including the effect
of any International Swaps and Derivatives Associations, Inc. Master Agreement (“ISDA Master Agreement”) or similar agreement, and netting,
which would reduce the overall counterparty credit risk exposure. Each Fund only transacts with counterparties that are regulated entities subject
to prudential supervision, or with high credit-ratings assigned by international credit-rating agencies. Cash held as security by the counterparty to
FDI contracts is subject to the credit risk of the counterparty.
All transactions in listed securities are settled/paid for upon delivery of securities, using approved brokers. Risk relating to unsettled transactions is
considered low due to the short settlement period involved and the high credit quality of the brokers used.
Management of counterparty credit risk
Counterparty credit risk is monitored and managed by BlackRock’s RQA Counterparty & Concentration Risk Team. The team is headed by
BlackRock’s Chief Counterparty Credit Officer who reports to the Global Head of RQA. Credit authority resides with the Chief Counterparty Credit
Officer and selected team members to whom specific credit authority has been delegated. As such, counterparty approvals may be granted by the
Chief Counterparty Credit Officer, or by identified RQA Credit Risk Officers who have been formally delegated authority by the Chief Counterparty
Credit Officer.
The BlackRock RQA Counterparty & Concentration Risk Team completes a formal review of each new counterparty, monitors and reviews all
approved counterparties on an ongoing basis and maintains an active oversight of counterparty exposures and the collateral management process.
There were no past due or impaired balances in relation to transactions with counterparties as at 31 July 2020 and 31 July 2019.
3.4.1 FDIs
Each Fund’s holdings in exchange traded and OTC FDIs expose the Fund to counterparty credit risk.
iSHARES VII PLC
NOTES TO THE FINANCIAL STATEMENTS (continued)
[72 ]
3. Financial risks (continued)
3.4 Counterparty credit risk (continued)3.4.1 FDIs (continued)3.4.1.0 Assessment as investment entities (continued)
3.4.1.1 Exchange traded FDIs
The exposure is limited by trading contracts through a clearing house. Each Fund’s exposure to credit risk on contracts in which it currently has a
gain position is reduced by such gains received in cash from the counterparty under the daily mark-to-market mechanism on exchange traded
contracts and centrally cleared swaps (variation margin). Each Fund’s exposure to credit risk on contracts in which it currently has a loss position
is equal to the amount of margin posted to the counterparty which has not been transferred to the exchange under the daily mark-to-market
mechanism.
3.4.1.2 OTC FDIs
The risk in relation to OTC FDIs arises from the failure of the counterparty to perform according to the terms of the contract as these FDI transactions
are traded bilaterally and not through a central clearing counterparty.
All OTC FDI transactions are entered into by each Fund under an ISDA Master Agreement or similar agreement. An ISDA Master Agreement is a
bilateral agreement between each Fund and a counterparty that governs OTC FDI transactions entered into by the parties.
The parties’ exposures under the ISDA Master Agreement are netted and collateralised together, therefore, any collateral disclosures provided are
in respect of all OTC FDI transactions entered into by each Fund under the ISDA Master Agreement. All cash collateral received/posted by each Fund
under the ISDA Master Agreement is transferred bilaterally under a title transfer arrangement.
Each Fund is the legal owner of inbound collateral and can sell the assets and withhold the cash in the case of default. If the counterparty fulfils
its obligations in relation to the investment, each Fund will return an equal amount of cash to the counterparty on maturity or sale of the investment.
When each Fund return securities collateral to the counterparty, it must be of the same type, nominal value, description and amount as the securities
that were transferred to each Fund. Trading in OTC FDIs which have not been collateralised give rise to counterparty exposure.
Each Fund’s maximum exposure to counterparty credit risk from holding forward currency contracts will be equal to the notional amount of the
currency contract and any net unrealised gains as disclosed in the relevant Fund’s schedule of investments.
Each Fund has the right to reinvest cash collateral received. Cash collateral pledged by each Fund is separately identified on the balance sheets
as cash collateral and is not included as a component of cash and cash equivalents. Inbound cash collateral received by each Fund is reflected on
the balance sheets as cash collateral payable. Each Fund is also exposed to counterparty risk of rehypothecation of pledged collateral. The value
of inbound cash collateral and cash collateral pledged is reflected on the balance sheets of each Fund.
3.4.2 Depositary
The majority of the investments are held by Depositary at financial year end. Investments are segregated from the assets of the Depositary, with
ownership rights remaining with the Fund. Bankruptcy or insolvency of the Depositary may cause the Funds’ rights with respect to its investments
held by the Depositary to be delayed or limited. The maximum exposure to this risk is the amount of long investments disclosed in the schedule of
investments, plus any unsettled trades.
The Depositary has appointed State Street Bank and Trust Company (the “Sub-Custodian”) as its global Sub-Custodian. Substantially all of the cash
of the Fund is held with the Sub-Custodian in its account together with its own cash balances and with those cash balances that are held on behalf
of other clients. The Fund’s cash balances are separately identifiable within the records of the Sub-Custodian.
iSHARES VII PLC
NOTES TO THE FINANCIAL STATEMENTS (continued)
[73 ]

3. Financial risks (continued)
3.4 Counterparty credit risk (continued)3.4.2 Depositary (continued)In respect of the cash held by the Sub-Custodian or other depositaries it appoints, the Funds will be exposed to counterparty credit risk of the
Sub-Custodian or those depositaries. In the event of the insolvency or bankruptcy of the Sub-Custodian or other depositaries, the Fund will be
treated as a general creditor of the Sub-Custodian or the depositaries.
To mitigate each Fund’s exposure to the Depositary, the Investment Manager employs specific procedures to ensure that the Depositary is a
reputable institution and that the counterparty credit risk is acceptable to each Fund. Each Fund only transacts with Depositary’s that are regulated
entities subject to prudential supervision, or with "high credit ratings" assigned by international credit rating agencies.
The long term credit rating of the parent company of the Depositary and Sub-Custodian, State Street Corporation, as at 31 July 2020 is A (31 July
2019: A) (Standard and Poor’s rating).
In order to further mitigate each Fund’s counterparty credit risk exposure to the Sub-Custodian or depositary banks, each Fund may enter into
additional arrangements such as the placing of residual cash in a money market fund.
3.4.3 Securities lending
Each Fund’s engagement in securities lending activities expose such Funds to counterparty credit risk. The maximum exposure to each Fund is
equal to the value of the securities loaned.
All securities lending transactions entered into by each Fund are subject to a written legal agreement between each Fund and the Securities Lending
Agent, BlackRock Advisors (UK) Limited, a related party to the Entity, and separately between the Securities Lending Agent and the approved
borrowing counterparty. Collateral received in exchange for securities lent is transferred under a title transfer arrangement and is delivered to and
held in an account with a tri-party collateral manager in the name of the Depositary on behalf of each Fund. Collateral received is segregated from
the assets belonging to each Funds’ Depositary or the Securities Lending Agent.
The collateral is registered and held in the name of Depositary on behalf of each Fund in any or all of the following central securities depositories;
Bank of NY Europe, Euroclear, J.P.Morgan Chase N.A., depending on the type of collateral the counterparty has to give in order to cover the required
value of exposure. The collateral provided by these counterparties consists of shares admitted to dealing on a regulated market.
The Funds outlined below engaged in securities lending activities during the financial year. The value of securities on loan and collateral held at the
financial year end are shown below:
Value ofsecurities
on loan
Value ofcollateralreceived
Value ofsecurities
on loan
Value ofcollateralreceived
31 July 2020 31 July 2019
Fund name Currency ’000 ’000 ’000 ’000
iShares $ Treasury Bond 1-3yr UCITS ETF USD (Acc) B USD 31,894 35,352 37,712 42,141
iShares $ Treasury Bond 3-7yr UCITS ETF USD 847,357 921,829 639,905 698,505
iShares $ Treasury Bond 7-10yr UCITS ETF USD (Acc) USD 333,539 365,408 162,809 178,673
iShares € Govt Bond 1-3yr UCITS ETF EUR (Acc) EUR 45,451 49,358 44,478 48,504
iShares € Govt Bond 3-7yr UCITS ETF EUR 94,705 102,665 98,881 108,482
iShares € Govt Bond 7-10yr UCITS ETF EUR (Acc) EUR 13,470 14,774 7,138 7,942
iSHARES VII PLC
NOTES TO THE FINANCIAL STATEMENTS (continued)
[74 ]
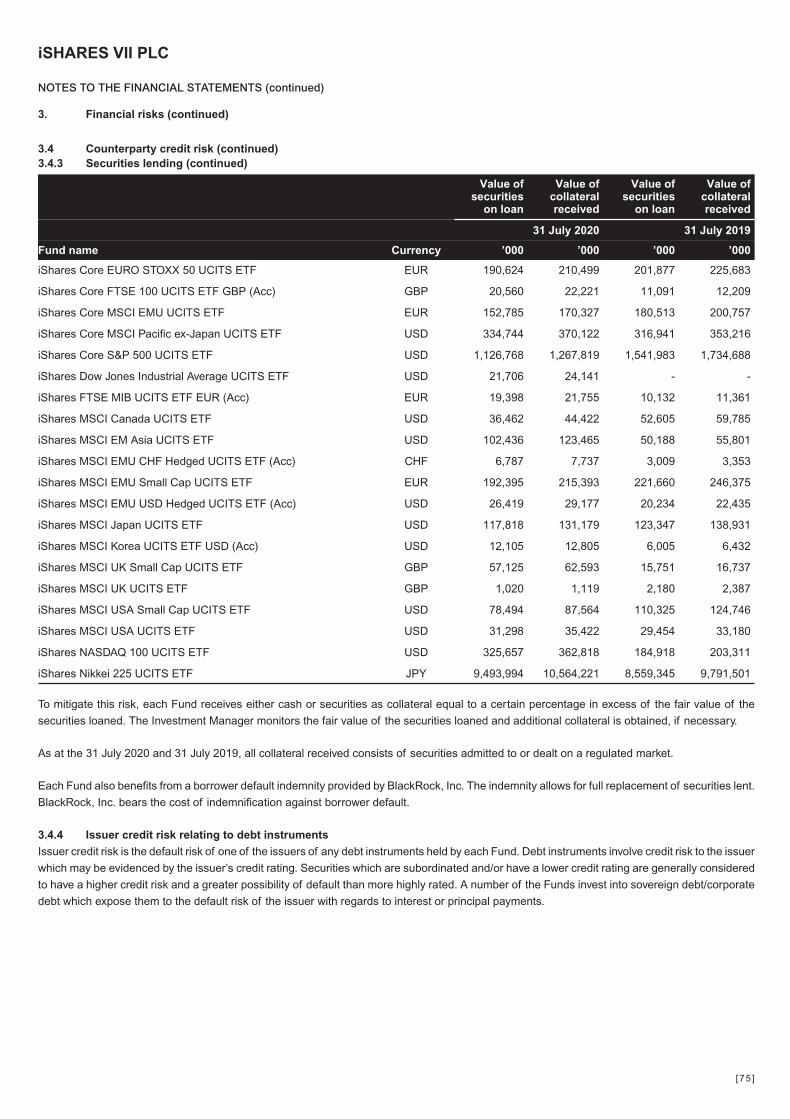
3. Financial risks (continued)
3.4 Counterparty credit risk (continued)3.4.3 Securities lending (continued)
Value ofsecurities
on loan
Value ofcollateralreceived
Value ofsecurities
on loan
Value ofcollateralreceived
31 July 2020 31 July 2019
Fund name Currency ’000 ’000 ’000 ’000
iShares Core EURO STOXX 50 UCITS ETF EUR 190,624 210,499 201,877 225,683
iShares Core FTSE 100 UCITS ETF GBP (Acc) GBP 20,560 22,221 11,091 12,209
iShares Core MSCI EMU UCITS ETF EUR 152,785 170,327 180,513 200,757
iShares Core MSCI Pacific ex-Japan UCITS ETF USD 334,744 370,122 316,941 353,216
iShares Core S&P 500 UCITS ETF USD 1,126,768 1,267,819 1,541,983 1,734,688
iShares Dow Jones Industrial Average UCITS ETF USD 21,706 24,141 - -
iShares FTSE MIB UCITS ETF EUR (Acc) EUR 19,398 21,755 10,132 11,361
iShares MSCI Canada UCITS ETF USD 36,462 44,422 52,605 59,785
iShares MSCI EM Asia UCITS ETF USD 102,436 123,465 50,188 55,801
iShares MSCI EMU CHF Hedged UCITS ETF (Acc) CHF 6,787 7,737 3,009 3,353
iShares MSCI EMU Small Cap UCITS ETF EUR 192,395 215,393 221,660 246,375
iShares MSCI EMU USD Hedged UCITS ETF (Acc) USD 26,419 29,177 20,234 22,435
iShares MSCI Japan UCITS ETF USD 117,818 131,179 123,347 138,931
iShares MSCI Korea UCITS ETF USD (Acc) USD 12,105 12,805 6,005 6,432
iShares MSCI UK Small Cap UCITS ETF GBP 57,125 62,593 15,751 16,737
iShares MSCI UK UCITS ETF GBP 1,020 1,119 2,180 2,387
iShares MSCI USA Small Cap UCITS ETF USD 78,494 87,564 110,325 124,746
iShares MSCI USA UCITS ETF USD 31,298 35,422 29,454 33,180
iShares NASDAQ 100 UCITS ETF USD 325,657 362,818 184,918 203,311
iShares Nikkei 225 UCITS ETF JPY 9,493,994 10,564,221 8,559,345 9,791,501
To mitigate this risk, each Fund receives either cash or securities as collateral equal to a certain percentage in excess of the fair value of the
securities loaned. The Investment Manager monitors the fair value of the securities loaned and additional collateral is obtained, if necessary.
As at the 31 July 2020 and 31 July 2019, all collateral received consists of securities admitted to or dealt on a regulated market.
Each Fund also benefits from a borrower default indemnity provided by BlackRock, Inc. The indemnity allows for full replacement of securities lent.
BlackRock, Inc. bears the cost of indemnification against borrower default.
3.4.4 Issuer credit risk relating to debt instruments
Issuer credit risk is the default risk of one of the issuers of any debt instruments held by each Fund. Debt instruments involve credit risk to the issuer
which may be evidenced by the issuer’s credit rating. Securities which are subordinated and/or have a lower credit rating are generally considered
to have a higher credit risk and a greater possibility of default than more highly rated. A number of the Funds invest into sovereign debt/corporate
debt which expose them to the default risk of the issuer with regards to interest or principal payments.
iSHARES VII PLC
NOTES TO THE FINANCIAL STATEMENTS (continued)
[75 ]
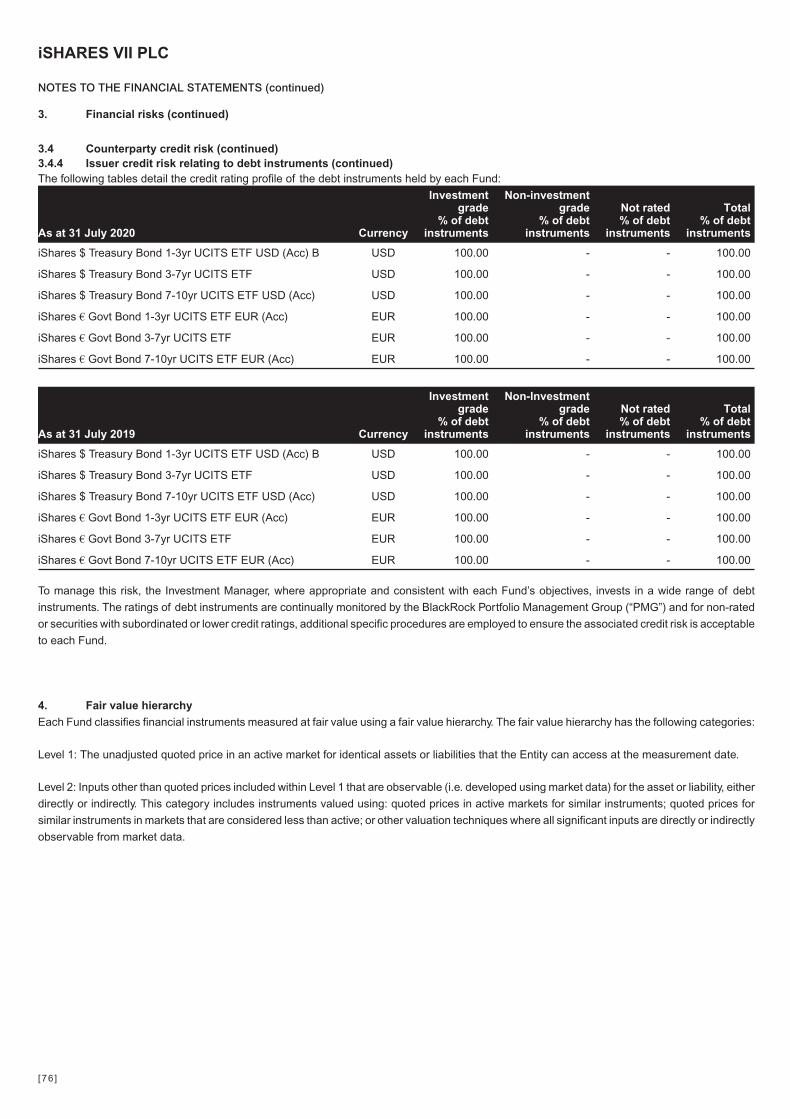
3. Financial risks (continued)
3.4 Counterparty credit risk (continued)3.4.4 Issuer credit risk relating to debt instruments (continued)The following tables detail the credit rating profile of the debt instruments held by each Fund:
As at 31 July 2020 Currency
Investmentgrade
% of debtinstruments
Non-investmentgrade
% of debtinstruments
Not rated% of debt
instruments
Total% of debt
instruments
iShares $ Treasury Bond 1-3yr UCITS ETF USD (Acc) B USD 100.00 - - 100.00
iShares $ Treasury Bond 3-7yr UCITS ETF USD 100.00 - - 100.00
iShares $ Treasury Bond 7-10yr UCITS ETF USD (Acc) USD 100.00 - - 100.00
iShares € Govt Bond 1-3yr UCITS ETF EUR (Acc) EUR 100.00 - - 100.00
iShares € Govt Bond 3-7yr UCITS ETF EUR 100.00 - - 100.00
iShares € Govt Bond 7-10yr UCITS ETF EUR (Acc) EUR 100.00 - - 100.00
As at 31 July 2019 Currency
Investmentgrade
% of debtinstruments
Non-Investmentgrade
% of debtinstruments
Not rated% of debt
instruments
Total% of debt
instruments
iShares $ Treasury Bond 1-3yr UCITS ETF USD (Acc) B USD 100.00 - - 100.00
iShares $ Treasury Bond 3-7yr UCITS ETF USD 100.00 - - 100.00
iShares $ Treasury Bond 7-10yr UCITS ETF USD (Acc) USD 100.00 - - 100.00
iShares € Govt Bond 1-3yr UCITS ETF EUR (Acc) EUR 100.00 - - 100.00
iShares € Govt Bond 3-7yr UCITS ETF EUR 100.00 - - 100.00
iShares € Govt Bond 7-10yr UCITS ETF EUR (Acc) EUR 100.00 - - 100.00
To manage this risk, the Investment Manager, where appropriate and consistent with each Fund’s objectives, invests in a wide range of debt
instruments. The ratings of debt instruments are continually monitored by the BlackRock Portfolio Management Group (“PMG”) and for non-rated
or securities with subordinated or lower credit ratings, additional specific procedures are employed to ensure the associated credit risk is acceptable
to each Fund.
4. Fair value hierarchy
Each Fund classifies financial instruments measured at fair value using a fair value hierarchy. The fair value hierarchy has the following categories:
Level 1: The unadjusted quoted price in an active market for identical assets or liabilities that the Entity can access at the measurement date.
Level 2: Inputs other than quoted prices included within Level 1 that are observable (i.e. developed using market data) for the asset or liability, either
directly or indirectly. This category includes instruments valued using: quoted prices in active markets for similar instruments; quoted prices for
similar instruments in markets that are considered less than active; or other valuation techniques where all significant inputs are directly or indirectly
observable from market data.
iSHARES VII PLC
NOTES TO THE FINANCIAL STATEMENTS (continued)
[76 ]
4. Fair value hierarchy (continued)
Level 3: Inputs are unobservable (i.e. for which market data is unavailable) for the asset or liability. This category includes all instruments where the
valuation techniques used include inputs not based on market data and these inputs could have a significant impact on the instrument’s valuation.
This category also includes instruments that are valued based on quoted prices for similar instruments where significant Entity determined
adjustments or assumptions are required to reflect differences between the instruments and instruments for which there is no active market.
Specific valuation techniques used to value financial instruments include:
(i) the use of quoted market prices or dealer quotes for similar instruments;
(ii) for interest rate swaps, the present value of the estimated future cash flows based on observable yield curves;
(iii) for foreign currency forwards, present value of future cash flows based on the forward exchange rates at the balance sheet date;
(iv) for foreign currency options, option pricing models; and
(v) for other financial instruments, discounted cash flow analysis.
All of the resulting fair value estimates are included in level 2 except for unlisted equity securities, a contingent consideration receivable and certain
derivative contracts, where the fair values have been determined based on present values and the discount rates used were adjusted for
counterparty or own credit risk.
The level in the fair value hierarchy within which the fair value measurement is categorised in its entirety is determined on the basis of the lowest
level input that is significant to the fair value measurement in its entirety. For this purpose, the significance of an input is assessed against the fair
value measurement in its entirety. If a fair value measurement uses observable inputs that require significant adjustment based on unobservable
inputs, that measurement is a level 3 measurement. Assessing the significance of a particular input to the fair value measurement in its entirety
requires judgement, considering factors specific to the asset or liability.
The determination of what constitutes ‘observable’ inputs requires significant judgement. The Directors consider observable inputs to be market
data that is readily available, regularly distributed or updated, reliable and verifiable, not proprietary, and provided by independent sources that are
actively involved in the relevant market.
The following tables provide an analysis of each Fund’s’ financial assets and financial liabilities measured at fair value as at 31 July 2020 and 31 July
2019:
iSHARES VII PLC
NOTES TO THE FINANCIAL STATEMENTS (continued)
[77 ]

4. Fair value hierarchy (continued)
31 July 2020
Fund name Level 1 Level 2 Level 3 Total
iShares $ Treasury Bond 1-3yr UCITS ETF USD (Acc) B USD’000 USD’000 USD’000 USD’000
Financial assets at fair value through profit or loss
- Bonds - 342,201 - 342,201
Total - 342,201 - 342,201
iShares $ Treasury Bond 3-7yr UCITS ETF USD’000 USD’000 USD’000 USD’000
Financial assets at fair value through profit or loss
- Bonds - 2,603,460 - 2,603,460
- Forward currency contracts - 3,491 - 3,491
Total - 2,606,951 - 2,606,951
Financial liabilities at fair value through profit or loss
- Forward currency contracts2 - - - -
Total - - - -
iShares $ Treasury Bond 7-10yr UCITS ETF USD (Acc) USD’000 USD’000 USD’000 USD’000
Financial assets at fair value through profit or loss
- Bonds - 679,946 - 679,946
Total - 679,946 - 679,946
iShares € Govt Bond 1-3yr UCITS ETF EUR (Acc) EUR’000 EUR’000 EUR’000 EUR’000
Financial assets at fair value through profit or loss
- Bonds - 410,761 - 410,761
Total - 410,761 - 410,761
iShares € Govt Bond 3-7yr UCITS ETF EUR’000 EUR’000 EUR’000 EUR’000
Financial assets at fair value through profit or loss
- Bonds - 474,769 - 474,769
Total - 474,769 - 474,769
iShares € Govt Bond 7-10yr UCITS ETF EUR (Acc) EUR’000 EUR’000 EUR’000 EUR’000
Financial assets at fair value through profit or loss
- Bonds - 72,148 - 72,148
Total - 72,148 - 72,148
iSHARES VII PLC
NOTES TO THE FINANCIAL STATEMENTS (continued)
[78 ]

4. Fair value hierarchy (continued)
31 July 2020 (continued)
Fund name Level 1 Level 2 Level 3 Total
iShares Core EURO STOXX 50 UCITS ETF EUR’000 EUR’000 EUR’000 EUR’000
Financial assets at fair value through profit or loss
- Equities 3,379,457 - - 3,379,457
Total 3,379,457 - - 3,379,457
Financial liabilities at fair value through profit or loss
- Futures contracts (325) - - (325)
Total (325) - - (325)
iShares Core FTSE 100 UCITS ETF GBP (Acc) GBP’000 GBP’000 GBP’000 GBP’000
Financial assets at fair value through profit or loss
- Equities 614,121 - - 614,121
Total 614,121 - - 614,121
Financial liabilities at fair value through profit or loss
- Futures contracts (151) - - (151)
Total (151) - - (151)
iShares Core MSCI EMU UCITS ETF EUR’000 EUR’000 EUR’000 EUR’000
Financial assets at fair value through profit or loss
- Equities 2,098,777 - - 2,098,777
- Rights 635 - - 635
- Forward currency contracts - 697 - 697
Total 2,099,412 697 - 2,100,109
Financial liabilities at fair value through profit or loss
- Futures contracts (286) - - (286)
- Forward currency contracts - (1,416) - (1,416)
Total (286) (1,416) - (1,702)
iShares Core MSCI Pacific ex-Japan UCITS ETF USD’000 USD’000 USD’000 USD’000
Financial assets at fair value through profit or loss
- Equities 1,846,366 - - 1,846,366
- Futures contracts 100 - - 100
Total 1,846,466 - - 1,846,466
Financial liabilities at fair value through profit or loss
- Futures contracts (77) - - (77)
Total (77) - - (77)
iSHARES VII PLC
NOTES TO THE FINANCIAL STATEMENTS (continued)
[79 ]
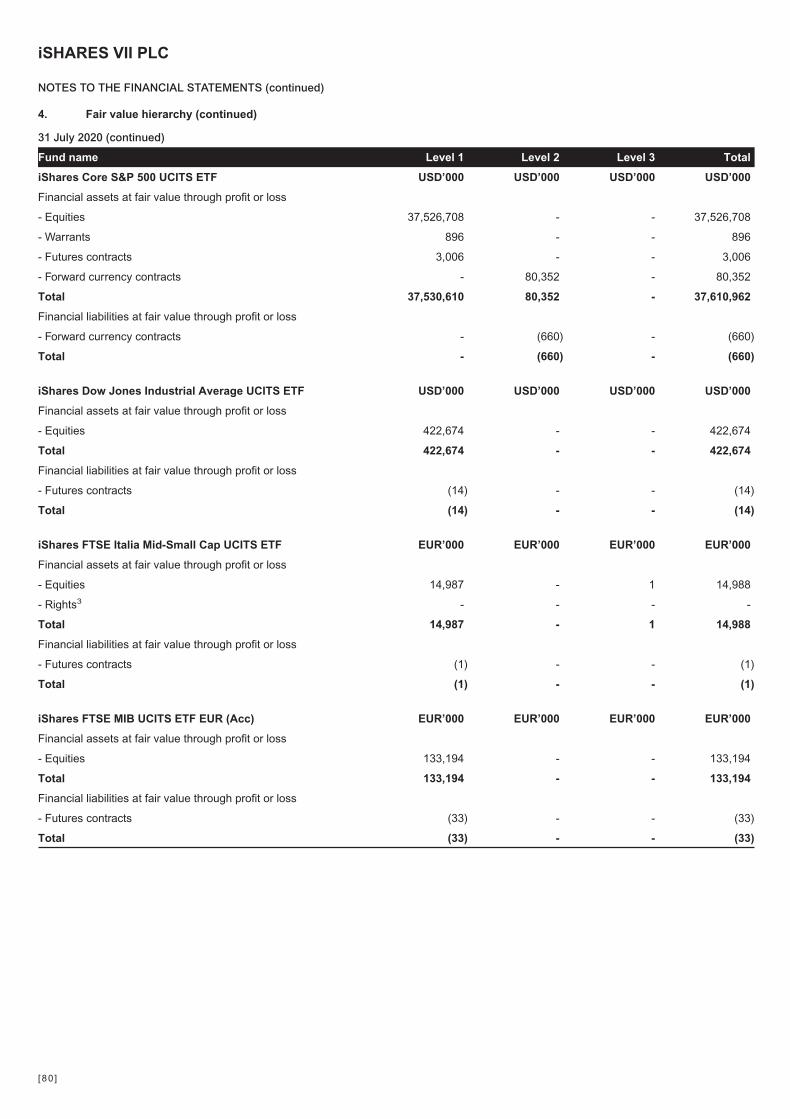
4. Fair value hierarchy (continued)
31 July 2020 (continued)
Fund name Level 1 Level 2 Level 3 Total
iShares Core S&P 500 UCITS ETF USD’000 USD’000 USD’000 USD’000
Financial assets at fair value through profit or loss
- Equities 37,526,708 - - 37,526,708
- Warrants 896 - - 896
- Futures contracts 3,006 - - 3,006
- Forward currency contracts - 80,352 - 80,352
Total 37,530,610 80,352 - 37,610,962
Financial liabilities at fair value through profit or loss
- Forward currency contracts - (660) - (660)
Total - (660) - (660)
iShares Dow Jones Industrial Average UCITS ETF USD’000 USD’000 USD’000 USD’000
Financial assets at fair value through profit or loss
- Equities 422,674 - - 422,674
Total 422,674 - - 422,674
Financial liabilities at fair value through profit or loss
- Futures contracts (14) - - (14)
Total (14) - - (14)
iShares FTSE Italia Mid-Small Cap UCITS ETF EUR’000 EUR’000 EUR’000 EUR’000
Financial assets at fair value through profit or loss
- Equities 14,987 - 1 14,988
- Rights3 - - - -
Total 14,987 - 1 14,988
Financial liabilities at fair value through profit or loss
- Futures contracts (1) - - (1)
Total (1) - - (1)
iShares FTSE MIB UCITS ETF EUR (Acc) EUR’000 EUR’000 EUR’000 EUR’000
Financial assets at fair value through profit or loss
- Equities 133,194 - - 133,194
Total 133,194 - - 133,194
Financial liabilities at fair value through profit or loss
- Futures contracts (33) - - (33)
Total (33) - - (33)
iSHARES VII PLC
NOTES TO THE FINANCIAL STATEMENTS (continued)
[80 ]
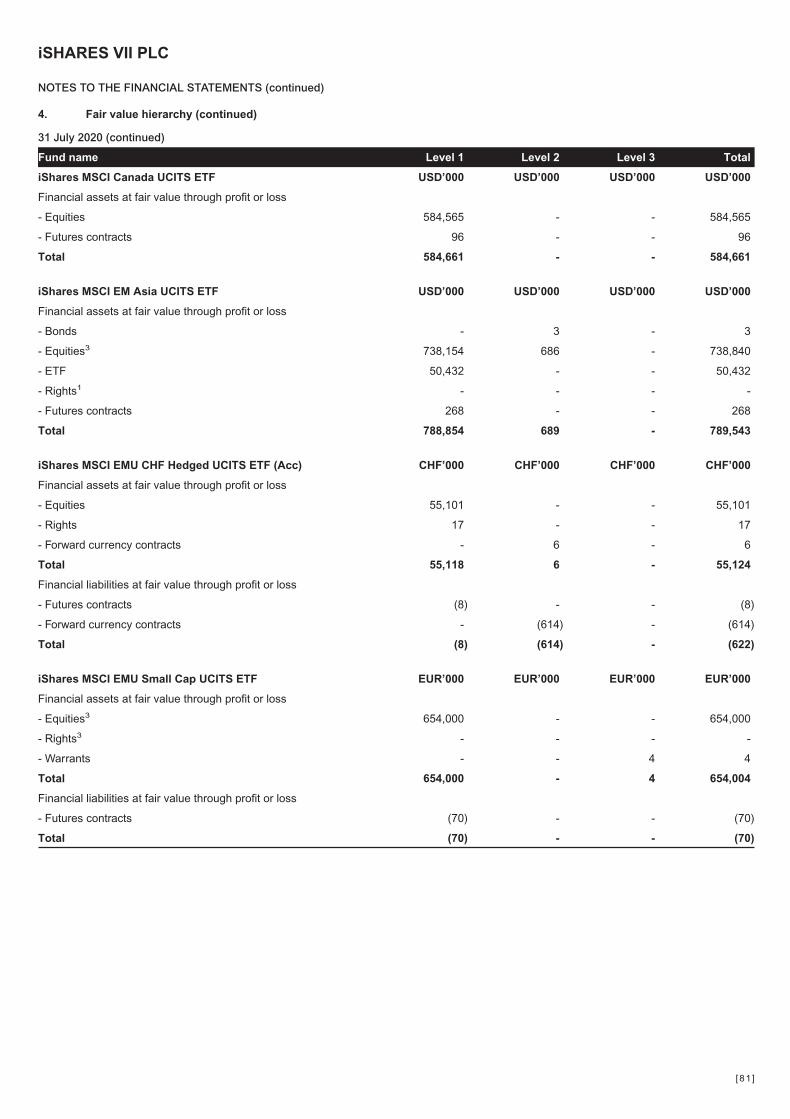
4. Fair value hierarchy (continued)
31 July 2020 (continued)
Fund name Level 1 Level 2 Level 3 Total
iShares MSCI Canada UCITS ETF USD’000 USD’000 USD’000 USD’000
Financial assets at fair value through profit or loss
- Equities 584,565 - - 584,565
- Futures contracts 96 - - 96
Total 584,661 - - 584,661
iShares MSCI EM Asia UCITS ETF USD’000 USD’000 USD’000 USD’000
Financial assets at fair value through profit or loss
- Bonds - 3 - 3
- Equities3 738,154 686 - 738,840
- ETF 50,432 - - 50,432
- Rights1 - - - -
- Futures contracts 268 - - 268
Total 788,854 689 - 789,543
iShares MSCI EMU CHF Hedged UCITS ETF (Acc) CHF’000 CHF’000 CHF’000 CHF’000
Financial assets at fair value through profit or loss
- Equities 55,101 - - 55,101
- Rights 17 - - 17
- Forward currency contracts - 6 - 6
Total 55,118 6 - 55,124
Financial liabilities at fair value through profit or loss
- Futures contracts (8) - - (8)
- Forward currency contracts - (614) - (614)
Total (8) (614) - (622)
iShares MSCI EMU Small Cap UCITS ETF EUR’000 EUR’000 EUR’000 EUR’000
Financial assets at fair value through profit or loss
- Equities3 654,000 - - 654,000
- Rights3 - - - -
- Warrants - - 4 4
Total 654,000 - 4 654,004
Financial liabilities at fair value through profit or loss
- Futures contracts (70) - - (70)
Total (70) - - (70)
iSHARES VII PLC
NOTES TO THE FINANCIAL STATEMENTS (continued)
[81 ]
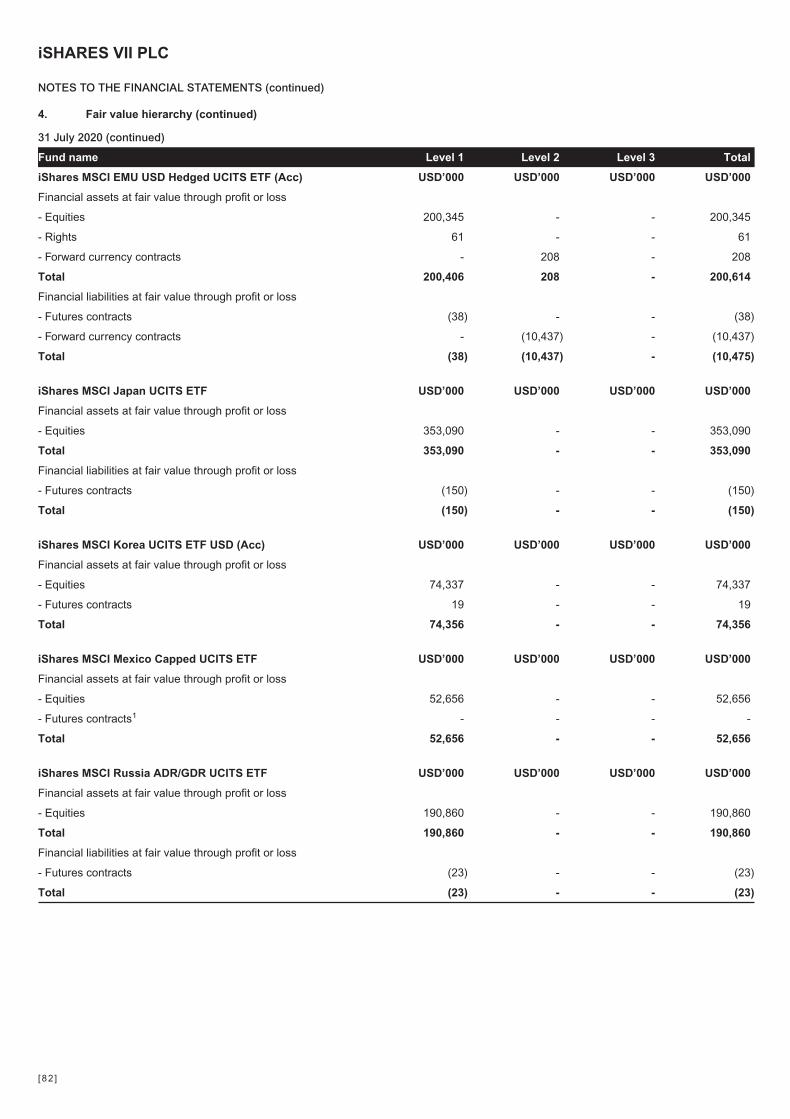
4. Fair value hierarchy (continued)
31 July 2020 (continued)
Fund name Level 1 Level 2 Level 3 Total
iShares MSCI EMU USD Hedged UCITS ETF (Acc) USD’000 USD’000 USD’000 USD’000
Financial assets at fair value through profit or loss
- Equities 200,345 - - 200,345
- Rights 61 - - 61
- Forward currency contracts - 208 - 208
Total 200,406 208 - 200,614
Financial liabilities at fair value through profit or loss
- Futures contracts (38) - - (38)
- Forward currency contracts - (10,437) - (10,437)
Total (38) (10,437) - (10,475)
iShares MSCI Japan UCITS ETF USD’000 USD’000 USD’000 USD’000
Financial assets at fair value through profit or loss
- Equities 353,090 - - 353,090
Total 353,090 - - 353,090
Financial liabilities at fair value through profit or loss
- Futures contracts (150) - - (150)
Total (150) - - (150)
iShares MSCI Korea UCITS ETF USD (Acc) USD’000 USD’000 USD’000 USD’000
Financial assets at fair value through profit or loss
- Equities 74,337 - - 74,337
- Futures contracts 19 - - 19
Total 74,356 - - 74,356
iShares MSCI Mexico Capped UCITS ETF USD’000 USD’000 USD’000 USD’000
Financial assets at fair value through profit or loss
- Equities 52,656 - - 52,656
- Futures contracts1 - - - -
Total 52,656 - - 52,656
iShares MSCI Russia ADR/GDR UCITS ETF USD’000 USD’000 USD’000 USD’000
Financial assets at fair value through profit or loss
- Equities 190,860 - - 190,860
Total 190,860 - - 190,860
Financial liabilities at fair value through profit or loss
- Futures contracts (23) - - (23)
Total (23) - - (23)
iSHARES VII PLC
NOTES TO THE FINANCIAL STATEMENTS (continued)
[82 ]
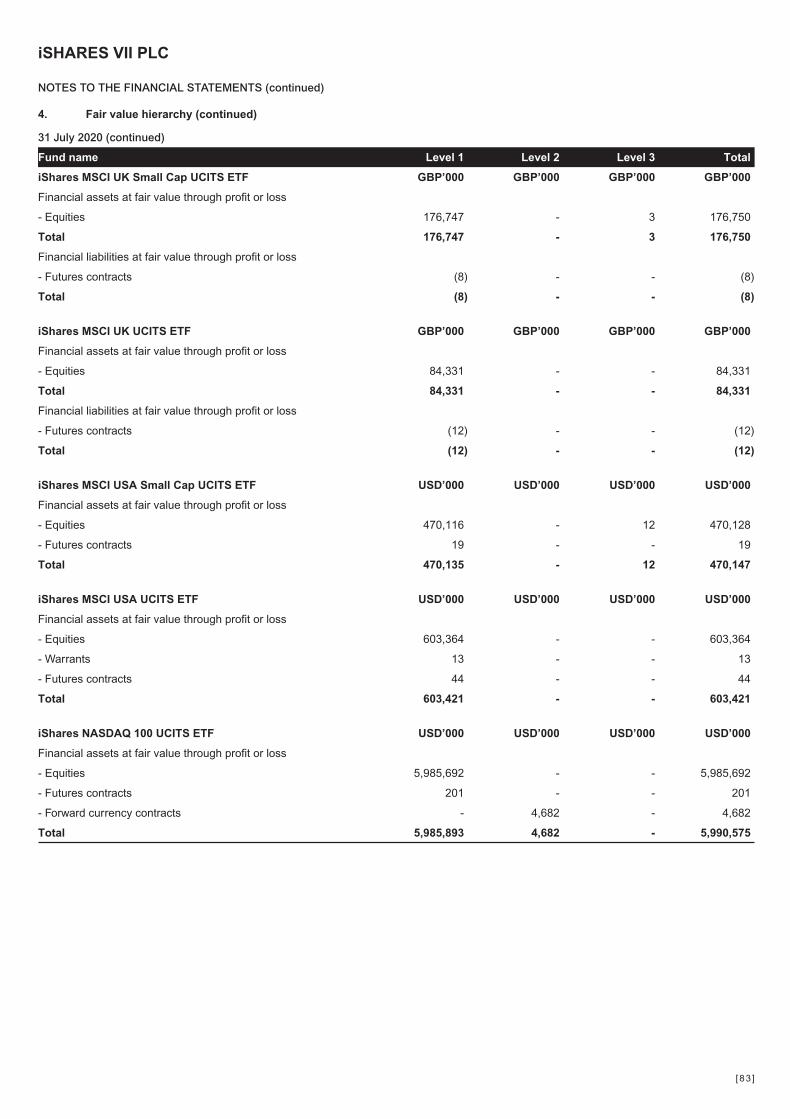
4. Fair value hierarchy (continued)
31 July 2020 (continued)
Fund name Level 1 Level 2 Level 3 Total
iShares MSCI UK Small Cap UCITS ETF GBP’000 GBP’000 GBP’000 GBP’000
Financial assets at fair value through profit or loss
- Equities 176,747 - 3 176,750
Total 176,747 - 3 176,750
Financial liabilities at fair value through profit or loss
- Futures contracts (8) - - (8)
Total (8) - - (8)
iShares MSCI UK UCITS ETF GBP’000 GBP’000 GBP’000 GBP’000
Financial assets at fair value through profit or loss
- Equities 84,331 - - 84,331
Total 84,331 - - 84,331
Financial liabilities at fair value through profit or loss
- Futures contracts (12) - - (12)
Total (12) - - (12)
iShares MSCI USA Small Cap UCITS ETF USD’000 USD’000 USD’000 USD’000
Financial assets at fair value through profit or loss
- Equities 470,116 - 12 470,128
- Futures contracts 19 - - 19
Total 470,135 - 12 470,147
iShares MSCI USA UCITS ETF USD’000 USD’000 USD’000 USD’000
Financial assets at fair value through profit or loss
- Equities 603,364 - - 603,364
- Warrants 13 - - 13
- Futures contracts 44 - - 44
Total 603,421 - - 603,421
iShares NASDAQ 100 UCITS ETF USD’000 USD’000 USD’000 USD’000
Financial assets at fair value through profit or loss
- Equities 5,985,692 - - 5,985,692
- Futures contracts 201 - - 201
- Forward currency contracts - 4,682 - 4,682
Total 5,985,893 4,682 - 5,990,575
iSHARES VII PLC
NOTES TO THE FINANCIAL STATEMENTS (continued)
[83 ]
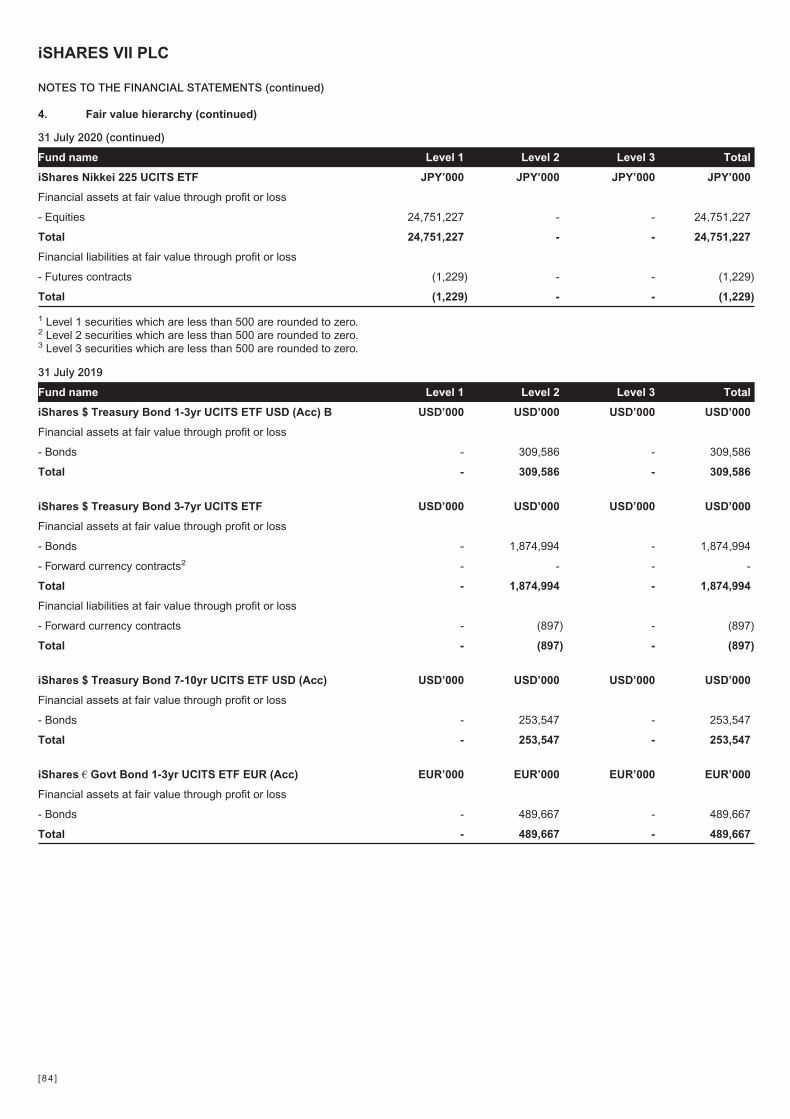
4. Fair value hierarchy (continued)
31 July 2020 (continued)
Fund name Level 1 Level 2 Level 3 Total
iShares Nikkei 225 UCITS ETF JPY’000 JPY’000 JPY’000 JPY’000
Financial assets at fair value through profit or loss
- Equities 24,751,227 - - 24,751,227
Total 24,751,227 - - 24,751,227
Financial liabilities at fair value through profit or loss
- Futures contracts (1,229) - - (1,229)
Total (1,229) - - (1,229)
1 Level 1 securities which are less than 500 are rounded to zero.2 Level 2 securities which are less than 500 are rounded to zero.3 Level 3 securities which are less than 500 are rounded to zero.
31 July 2019
Fund name Level 1 Level 2 Level 3 Total
iShares $ Treasury Bond 1-3yr UCITS ETF USD (Acc) B USD’000 USD’000 USD’000 USD’000
Financial assets at fair value through profit or loss
- Bonds - 309,586 - 309,586
Total - 309,586 - 309,586
iShares $ Treasury Bond 3-7yr UCITS ETF USD’000 USD’000 USD’000 USD’000
Financial assets at fair value through profit or loss
- Bonds - 1,874,994 - 1,874,994
- Forward currency contracts2 - - - -
Total - 1,874,994 - 1,874,994
Financial liabilities at fair value through profit or loss
- Forward currency contracts - (897) - (897)
Total - (897) - (897)
iShares $ Treasury Bond 7-10yr UCITS ETF USD (Acc) USD’000 USD’000 USD’000 USD’000
Financial assets at fair value through profit or loss
- Bonds - 253,547 - 253,547
Total - 253,547 - 253,547
iShares € Govt Bond 1-3yr UCITS ETF EUR (Acc) EUR’000 EUR’000 EUR’000 EUR’000
Financial assets at fair value through profit or loss
- Bonds - 489,667 - 489,667
Total - 489,667 - 489,667
iSHARES VII PLC
NOTES TO THE FINANCIAL STATEMENTS (continued)
[84 ]
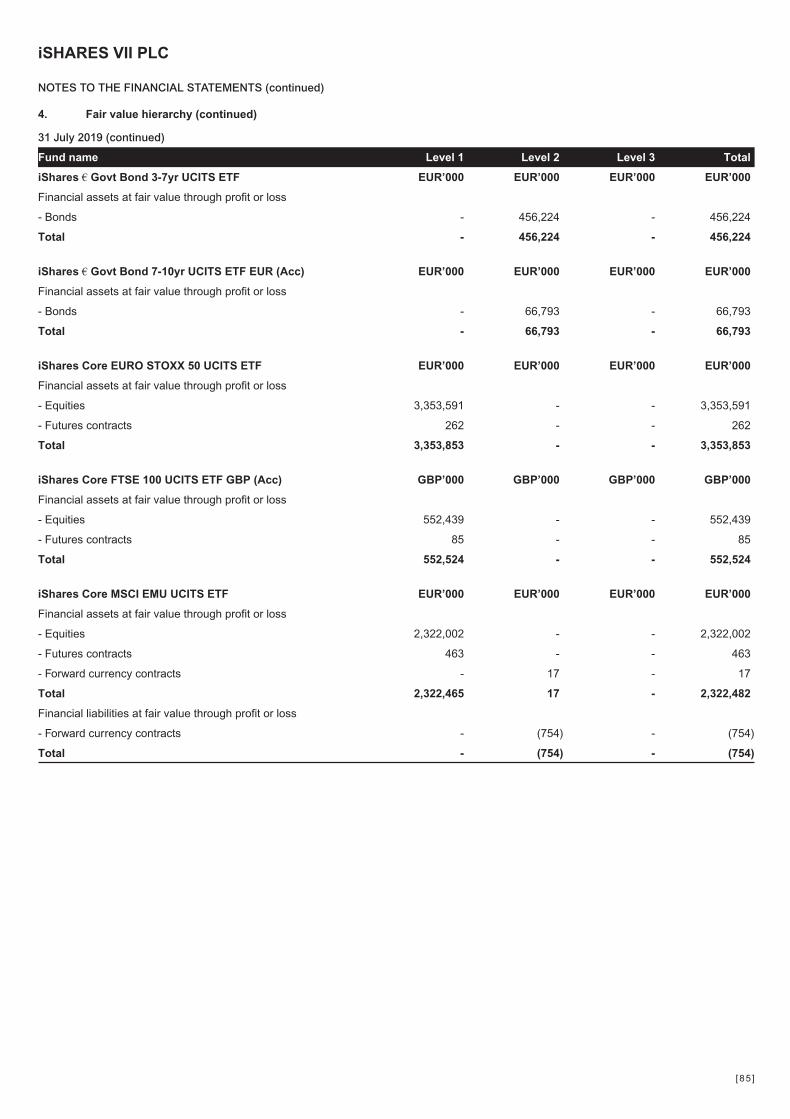
4. Fair value hierarchy (continued)
31 July 2019 (continued)
Fund name Level 1 Level 2 Level 3 Total
iShares € Govt Bond 3-7yr UCITS ETF EUR’000 EUR’000 EUR’000 EUR’000
Financial assets at fair value through profit or loss
- Bonds - 456,224 - 456,224
Total - 456,224 - 456,224
iShares € Govt Bond 7-10yr UCITS ETF EUR (Acc) EUR’000 EUR’000 EUR’000 EUR’000
Financial assets at fair value through profit or loss
- Bonds - 66,793 - 66,793
Total - 66,793 - 66,793
iShares Core EURO STOXX 50 UCITS ETF EUR’000 EUR’000 EUR’000 EUR’000
Financial assets at fair value through profit or loss
- Equities 3,353,591 - - 3,353,591
- Futures contracts 262 - - 262
Total 3,353,853 - - 3,353,853
iShares Core FTSE 100 UCITS ETF GBP (Acc) GBP’000 GBP’000 GBP’000 GBP’000
Financial assets at fair value through profit or loss
- Equities 552,439 - - 552,439
- Futures contracts 85 - - 85
Total 552,524 - - 552,524
iShares Core MSCI EMU UCITS ETF EUR’000 EUR’000 EUR’000 EUR’000
Financial assets at fair value through profit or loss
- Equities 2,322,002 - - 2,322,002
- Futures contracts 463 - - 463
- Forward currency contracts - 17 - 17
Total 2,322,465 17 - 2,322,482
Financial liabilities at fair value through profit or loss
- Forward currency contracts - (754) - (754)
Total - (754) - (754)
iSHARES VII PLC
NOTES TO THE FINANCIAL STATEMENTS (continued)
[85 ]

4. Fair value hierarchy (continued)
31 July 2019 (continued)
Fund name Level 1 Level 2 Level 3 Total
iShares Core MSCI Pacific ex-Japan UCITS ETF USD’000 USD’000 USD’000 USD’000
Financial assets at fair value through profit or loss
- Equities 1,957,697 - - 1,957,697
- Futures contracts 415 - - 415
Total 1,958,112 - - 1,958,112
Financial liabilities at fair value through profit or loss
- Futures contracts (170) - - (170)
Total (170) - - (170)
iShares Core S&P 500 UCITS ETF USD’000 USD’000 USD’000 USD’000
Financial assets at fair value through profit or loss
- Equities 34,823,178 - - 34,823,178
- Futures contracts 284 - - 284
- Forward currency contracts - 10 - 10
Total 34,823,462 10 - 34,823,472
Financial liabilities at fair value through profit or loss
- Forward currency contracts - (48,066) - (48,066)
Total - (48,066) - (48,066)
iShares Dow Jones Industrial Average UCITS ETF USD’000 USD’000 USD’000 USD’000
Financial assets at fair value through profit or loss
- Equities 458,901 - - 458,901
- Futures contracts 23 - - 23
Total 458,924 - - 458,924
iShares FTSE Italia Mid-Small Cap UCITS ETF EUR’000 EUR’000 EUR’000 EUR’000
Financial assets at fair value through profit or loss
- Equities3 9,416 - - 9,416
- Futures contracts 1 - - 1
Total 9,417 - - 9,417
iShares FTSE MIB UCITS ETF EUR (Acc) EUR’000 EUR’000 EUR’000 EUR’000
Financial assets at fair value through profit or loss
- Equities 95,948 - - 95,948
- Futures contracts 7 - - 7
Total 95,955 - - 95,955
iSHARES VII PLC
NOTES TO THE FINANCIAL STATEMENTS (continued)
[86 ]
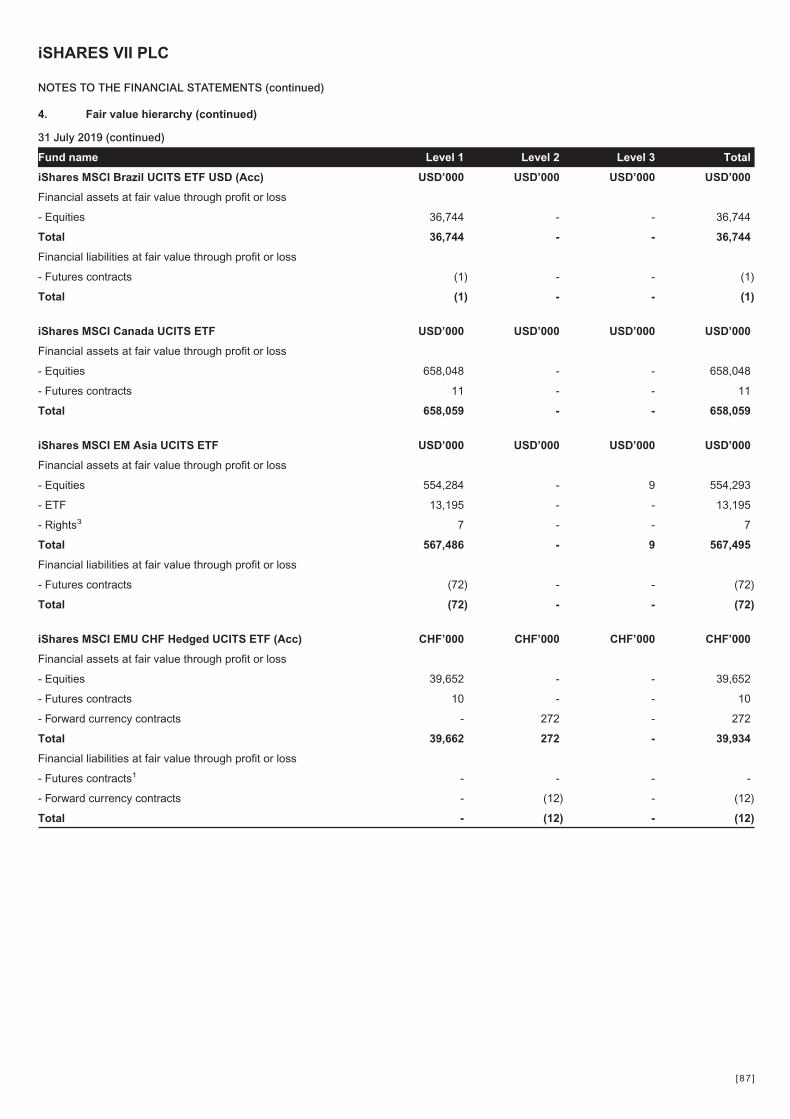
4. Fair value hierarchy (continued)
31 July 2019 (continued)
Fund name Level 1 Level 2 Level 3 Total
iShares MSCI Brazil UCITS ETF USD (Acc) USD’000 USD’000 USD’000 USD’000
Financial assets at fair value through profit or loss
- Equities 36,744 - - 36,744
Total 36,744 - - 36,744
Financial liabilities at fair value through profit or loss
- Futures contracts (1) - - (1)
Total (1) - - (1)
iShares MSCI Canada UCITS ETF USD’000 USD’000 USD’000 USD’000
Financial assets at fair value through profit or loss
- Equities 658,048 - - 658,048
- Futures contracts 11 - - 11
Total 658,059 - - 658,059
iShares MSCI EM Asia UCITS ETF USD’000 USD’000 USD’000 USD’000
Financial assets at fair value through profit or loss
- Equities 554,284 - 9 554,293
- ETF 13,195 - - 13,195
- Rights3 7 - - 7
Total 567,486 - 9 567,495
Financial liabilities at fair value through profit or loss
- Futures contracts (72) - - (72)
Total (72) - - (72)
iShares MSCI EMU CHF Hedged UCITS ETF (Acc) CHF’000 CHF’000 CHF’000 CHF’000
Financial assets at fair value through profit or loss
- Equities 39,652 - - 39,652
- Futures contracts 10 - - 10
- Forward currency contracts - 272 - 272
Total 39,662 272 - 39,934
Financial liabilities at fair value through profit or loss
- Futures contracts1 - - - -
- Forward currency contracts - (12) - (12)
Total - (12) - (12)
iSHARES VII PLC
NOTES TO THE FINANCIAL STATEMENTS (continued)
[87 ]
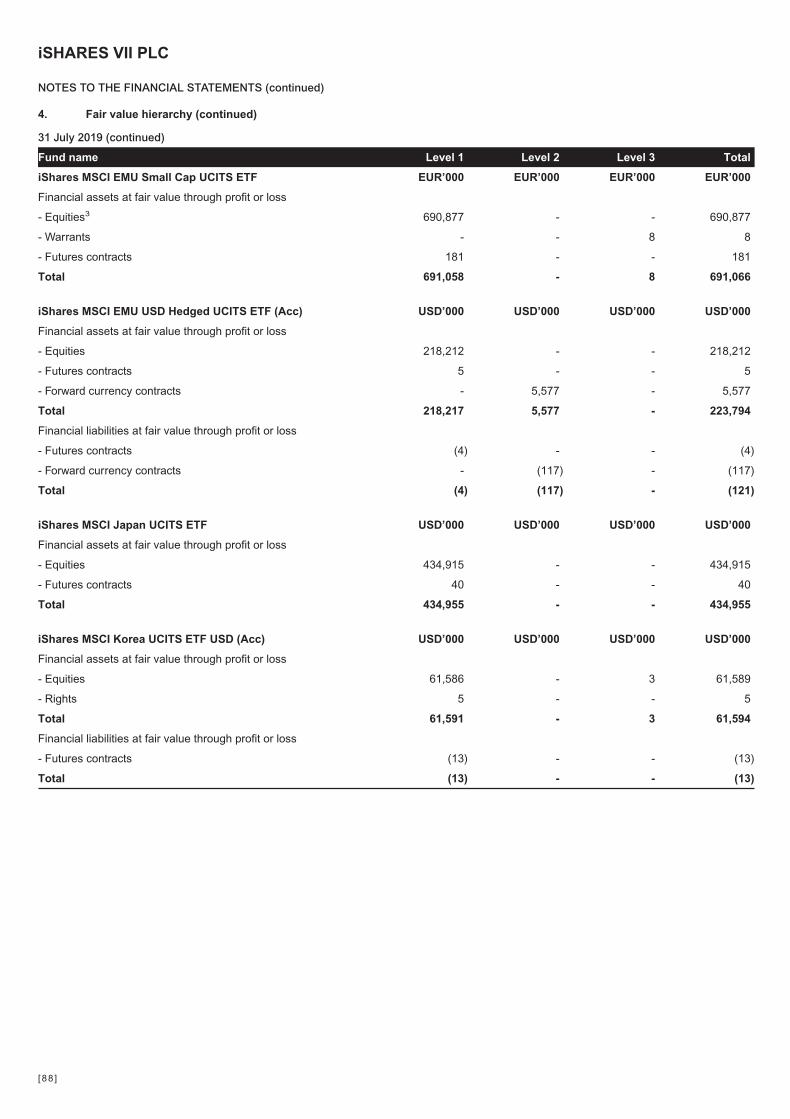
4. Fair value hierarchy (continued)
31 July 2019 (continued)
Fund name Level 1 Level 2 Level 3 Total
iShares MSCI EMU Small Cap UCITS ETF EUR’000 EUR’000 EUR’000 EUR’000
Financial assets at fair value through profit or loss
- Equities3 690,877 - - 690,877
- Warrants - - 8 8
- Futures contracts 181 - - 181
Total 691,058 - 8 691,066
iShares MSCI EMU USD Hedged UCITS ETF (Acc) USD’000 USD’000 USD’000 USD’000
Financial assets at fair value through profit or loss
- Equities 218,212 - - 218,212
- Futures contracts 5 - - 5
- Forward currency contracts - 5,577 - 5,577
Total 218,217 5,577 - 223,794
Financial liabilities at fair value through profit or loss
- Futures contracts (4) - - (4)
- Forward currency contracts - (117) - (117)
Total (4) (117) - (121)
iShares MSCI Japan UCITS ETF USD’000 USD’000 USD’000 USD’000
Financial assets at fair value through profit or loss
- Equities 434,915 - - 434,915
- Futures contracts 40 - - 40
Total 434,955 - - 434,955
iShares MSCI Korea UCITS ETF USD (Acc) USD’000 USD’000 USD’000 USD’000
Financial assets at fair value through profit or loss
- Equities 61,586 - 3 61,589
- Rights 5 - - 5
Total 61,591 - 3 61,594
Financial liabilities at fair value through profit or loss
- Futures contracts (13) - - (13)
Total (13) - - (13)
iSHARES VII PLC
NOTES TO THE FINANCIAL STATEMENTS (continued)
[88 ]
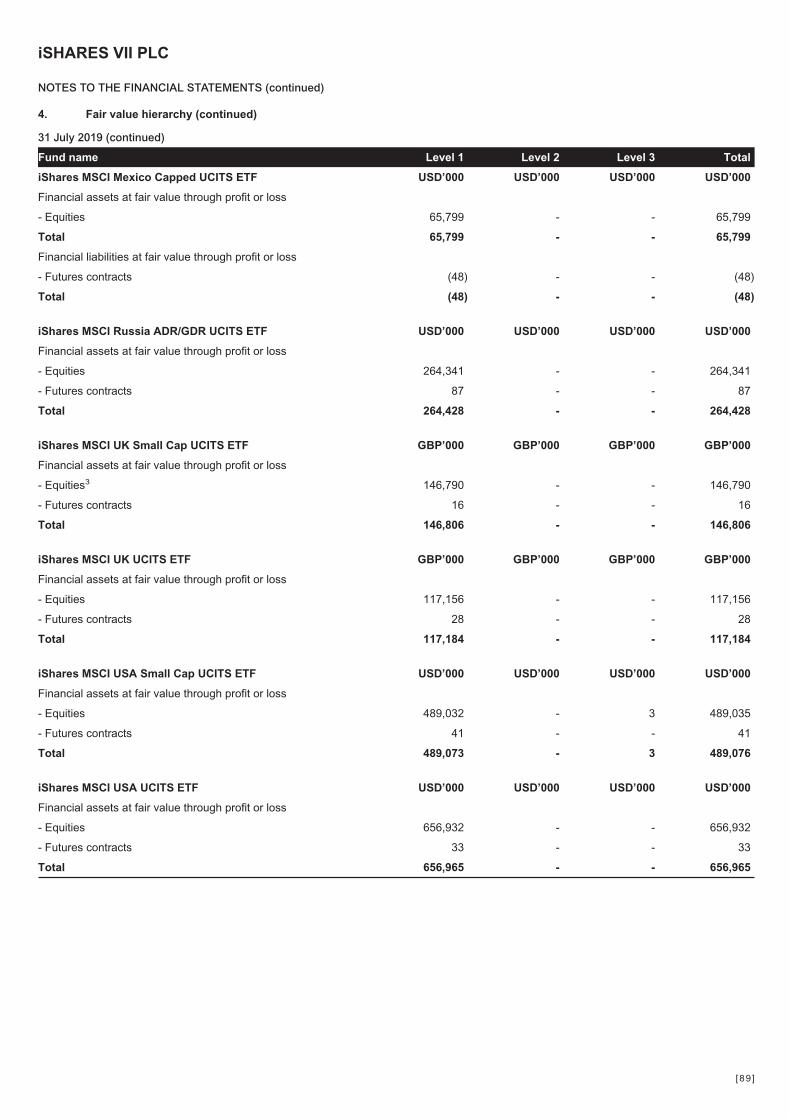
4. Fair value hierarchy (continued)
31 July 2019 (continued)
Fund name Level 1 Level 2 Level 3 Total
iShares MSCI Mexico Capped UCITS ETF USD’000 USD’000 USD’000 USD’000
Financial assets at fair value through profit or loss
- Equities 65,799 - - 65,799
Total 65,799 - - 65,799
Financial liabilities at fair value through profit or loss
- Futures contracts (48) - - (48)
Total (48) - - (48)
iShares MSCI Russia ADR/GDR UCITS ETF USD’000 USD’000 USD’000 USD’000
Financial assets at fair value through profit or loss
- Equities 264,341 - - 264,341
- Futures contracts 87 - - 87
Total 264,428 - - 264,428
iShares MSCI UK Small Cap UCITS ETF GBP’000 GBP’000 GBP’000 GBP’000
Financial assets at fair value through profit or loss
- Equities3 146,790 - - 146,790
- Futures contracts 16 - - 16
Total 146,806 - - 146,806
iShares MSCI UK UCITS ETF GBP’000 GBP’000 GBP’000 GBP’000
Financial assets at fair value through profit or loss
- Equities 117,156 - - 117,156
- Futures contracts 28 - - 28
Total 117,184 - - 117,184
iShares MSCI USA Small Cap UCITS ETF USD’000 USD’000 USD’000 USD’000
Financial assets at fair value through profit or loss
- Equities 489,032 - 3 489,035
- Futures contracts 41 - - 41
Total 489,073 - 3 489,076
iShares MSCI USA UCITS ETF USD’000 USD’000 USD’000 USD’000
Financial assets at fair value through profit or loss
- Equities 656,932 - - 656,932
- Futures contracts 33 - - 33
Total 656,965 - - 656,965
iSHARES VII PLC
NOTES TO THE FINANCIAL STATEMENTS (continued)
[89 ]
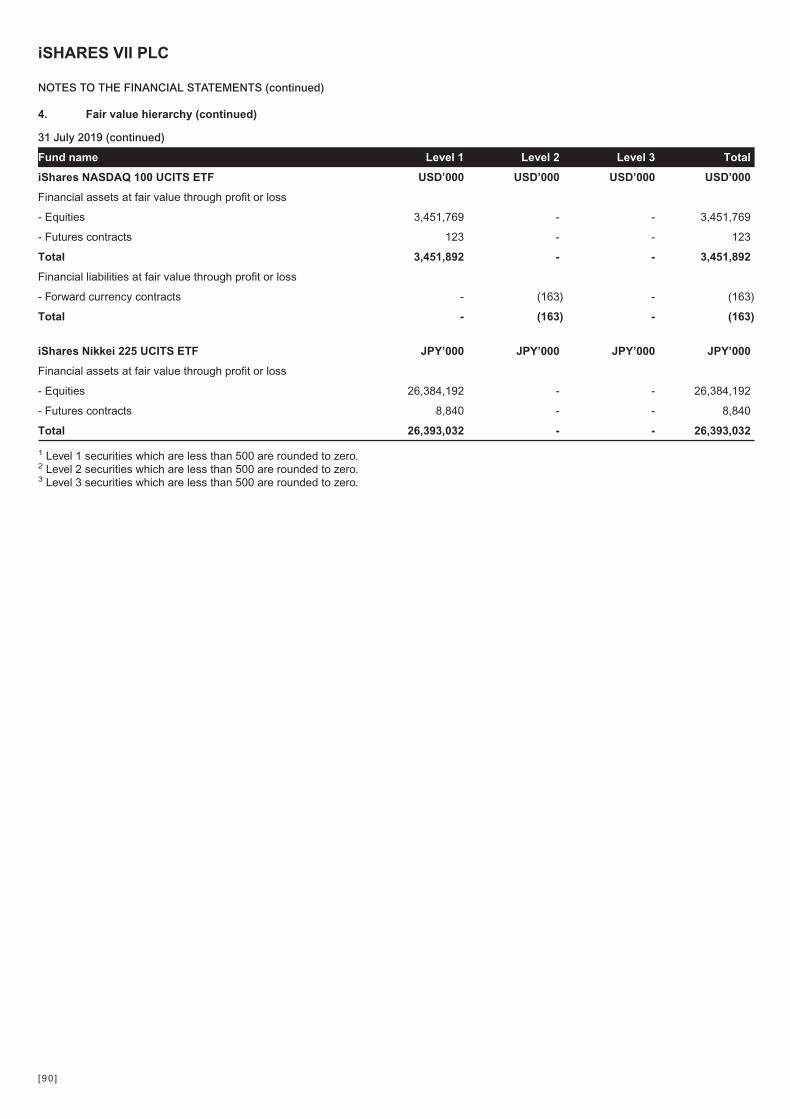
4. Fair value hierarchy (continued)
31 July 2019 (continued)
Fund name Level 1 Level 2 Level 3 Total
iShares NASDAQ 100 UCITS ETF USD’000 USD’000 USD’000 USD’000
Financial assets at fair value through profit or loss
- Equities 3,451,769 - - 3,451,769
- Futures contracts 123 - - 123
Total 3,451,892 - - 3,451,892
Financial liabilities at fair value through profit or loss
- Forward currency contracts - (163) - (163)
Total - (163) - (163)
iShares Nikkei 225 UCITS ETF JPY’000 JPY’000 JPY’000 JPY’000
Financial assets at fair value through profit or loss
- Equities 26,384,192 - - 26,384,192
- Futures contracts 8,840 - - 8,840
Total 26,393,032 - - 26,393,032
1 Level 1 securities which are less than 500 are rounded to zero.2 Level 2 securities which are less than 500 are rounded to zero.3 Level 3 securities which are less than 500 are rounded to zero.
iSHARES VII PLC
NOTES TO THE FINANCIAL STATEMENTS (continued)
[90 ]
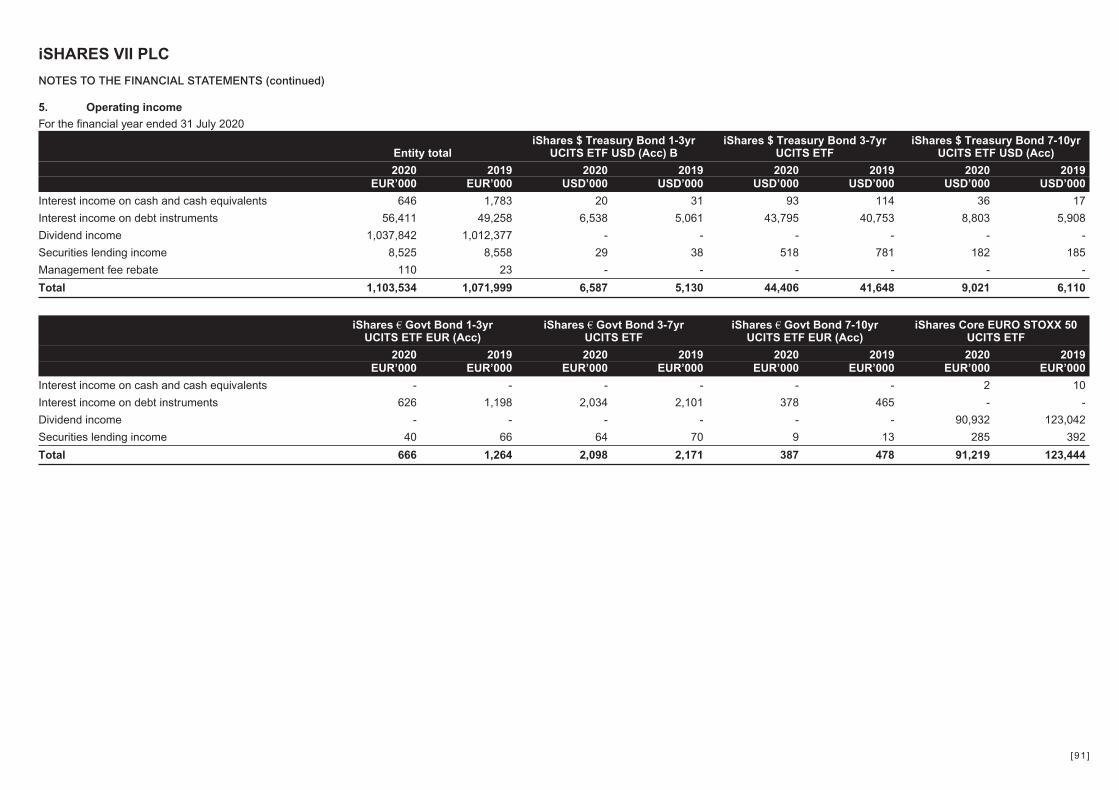
5. Operating income
For the financial year ended 31 July 2020
Entity totaliShares $ Treasury Bond 1-3yr
UCITS ETF USD (Acc) BiShares $ Treasury Bond 3-7yr
UCITS ETFiShares $ Treasury Bond 7-10yr
UCITS ETF USD (Acc)
2020 2019 2020 2019 2020 2019 2020 2019EUR’000 EUR’000 USD’000 USD’000 USD’000 USD’000 USD’000 USD’000
Interest income on cash and cash equivalents 646 1,783 20 31 93 114 36 17
Interest income on debt instruments 56,411 49,258 6,538 5,061 43,795 40,753 8,803 5,908
Dividend income 1,037,842 1,012,377 - - - - - -
Securities lending income 8,525 8,558 29 38 518 781 182 185
Management fee rebate 110 23 - - - - - -
Total 1,103,534 1,071,999 6,587 5,130 44,406 41,648 9,021 6,110
iShares € Govt Bond 1-3yrUCITS ETF EUR (Acc)
iShares € Govt Bond 3-7yrUCITS ETF
iShares € Govt Bond 7-10yrUCITS ETF EUR (Acc)
iShares Core EURO STOXX 50UCITS ETF
2020 2019 2020 2019 2020 2019 2020 2019EUR’000 EUR’000 EUR’000 EUR’000 EUR’000 EUR’000 EUR’000 EUR’000
Interest income on cash and cash equivalents - - - - - - 2 10
Interest income on debt instruments 626 1,198 2,034 2,101 378 465 - -
Dividend income - - - - - - 90,932 123,042
Securities lending income 40 66 64 70 9 13 285 392
Total 666 1,264 2,098 2,171 387 478 91,219 123,444
iSHARES VII PLC
NOTES TO THE FINANCIAL STATEMENTS (continued)
[91 ]

5. Operating income (continued)
For the financial year ended 31 July 2020 (continued)
iShares Core FTSE 100UCITS ETF GBP (Acc)
iShares Core MSCI EMUUCITS ETF
iShares Core MSCI Pacificex-Japan UCITS ETF
iShares Core S&P 500UCITS ETF
2020 2019 2020 2019 2020 2019 2020 2019GBP’000 GBP’000 EUR’000 EUR’000 USD’000 USD’000 USD’000 USD’000
Interest income on cash and cash equivalents 17 15 2 7 23 154 399 1,471
Dividend income 23,253 21,466 51,005 68,602 69,203 73,568 723,283 644,417
Securities lending income 42 51 515 389 527 515 2,113 1,988
Total 23,312 21,532 51,522 68,998 69,753 74,237 725,795 647,876
iShares Dow Jones IndustrialAverage UCITS ETF
iShares FTSE Italia Mid-SmallCap UCITS ETF
iShares FTSE MIBUCITS ETF EUR (Acc)
iShares MSCI BrazilUCITS ETF USD (Acc)1
2020 2019 2020 2019 2020 2019 2020 2019USD’000 USD’000 EUR’000 EUR’000 EUR’000 EUR’000 USD’000 USD’000
Interest income on cash and cash equivalents 7 35 - - - - 8 -
Dividend income 9,837 11,768 246 277 2,139 4,004 210 1,226
Securities lending income 18 9 - - 27 45 - -
Total 9,862 11,812 246 277 2,166 4,049 218 1,226
1 The Fund ceased operations on 25 September 2019.
iSHARES VII PLC
NOTES TO THE FINANCIAL STATEMENTS (continued)
[92 ]
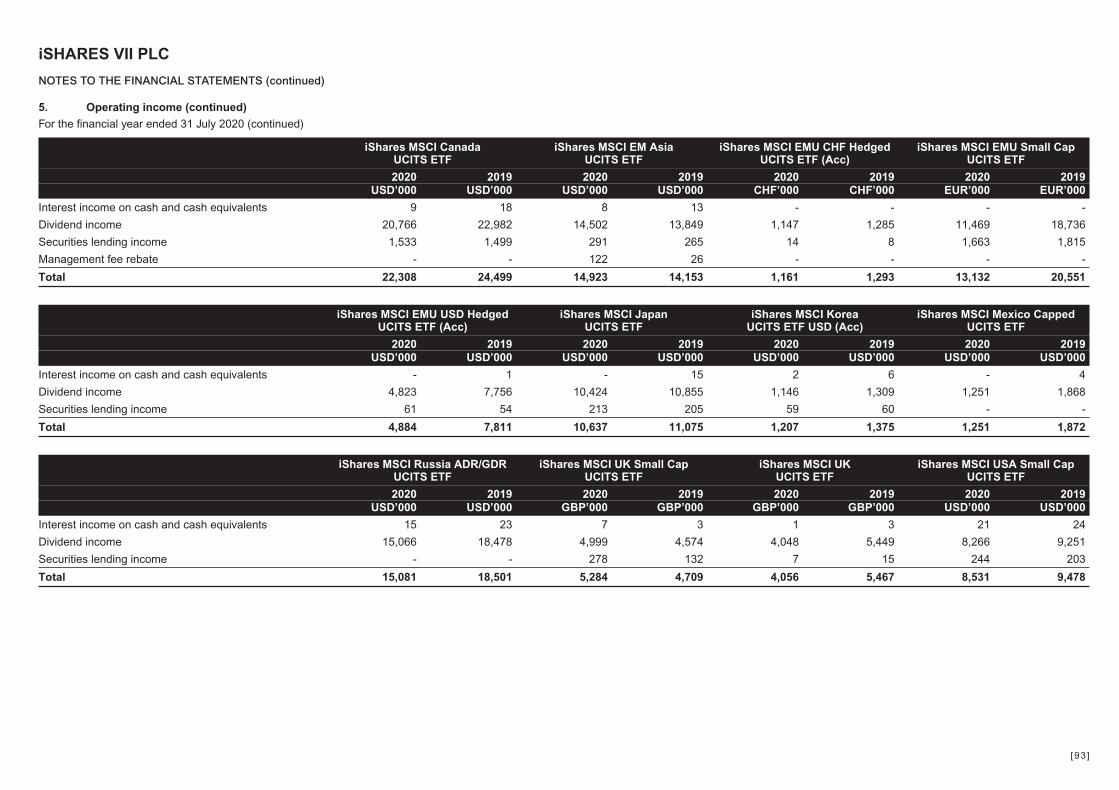
5. Operating income (continued)
For the financial year ended 31 July 2020 (continued)
iShares MSCI CanadaUCITS ETF
iShares MSCI EM AsiaUCITS ETF
iShares MSCI EMU CHF HedgedUCITS ETF (Acc)
iShares MSCI EMU Small CapUCITS ETF
2020 2019 2020 2019 2020 2019 2020 2019USD’000 USD’000 USD’000 USD’000 CHF’000 CHF’000 EUR’000 EUR’000
Interest income on cash and cash equivalents 9 18 8 13 - - - -
Dividend income 20,766 22,982 14,502 13,849 1,147 1,285 11,469 18,736
Securities lending income 1,533 1,499 291 265 14 8 1,663 1,815
Management fee rebate - - 122 26 - - - -
Total 22,308 24,499 14,923 14,153 1,161 1,293 13,132 20,551
iShares MSCI EMU USD HedgedUCITS ETF (Acc)
iShares MSCI JapanUCITS ETF
iShares MSCI KoreaUCITS ETF USD (Acc)
iShares MSCI Mexico CappedUCITS ETF
2020 2019 2020 2019 2020 2019 2020 2019USD’000 USD’000 USD’000 USD’000 USD’000 USD’000 USD’000 USD’000
Interest income on cash and cash equivalents - 1 - 15 2 6 - 4
Dividend income 4,823 7,756 10,424 10,855 1,146 1,309 1,251 1,868
Securities lending income 61 54 213 205 59 60 - -
Total 4,884 7,811 10,637 11,075 1,207 1,375 1,251 1,872
iShares MSCI Russia ADR/GDRUCITS ETF
iShares MSCI UK Small CapUCITS ETF
iShares MSCI UKUCITS ETF
iShares MSCI USA Small CapUCITS ETF
2020 2019 2020 2019 2020 2019 2020 2019USD’000 USD’000 GBP’000 GBP’000 GBP’000 GBP’000 USD’000 USD’000
Interest income on cash and cash equivalents 15 23 7 3 1 3 21 24
Dividend income 15,066 18,478 4,999 4,574 4,048 5,449 8,266 9,251
Securities lending income - - 278 132 7 15 244 203
Total 15,081 18,501 5,284 4,709 4,056 5,467 8,531 9,478
iSHARES VII PLC
NOTES TO THE FINANCIAL STATEMENTS (continued)
[93 ]
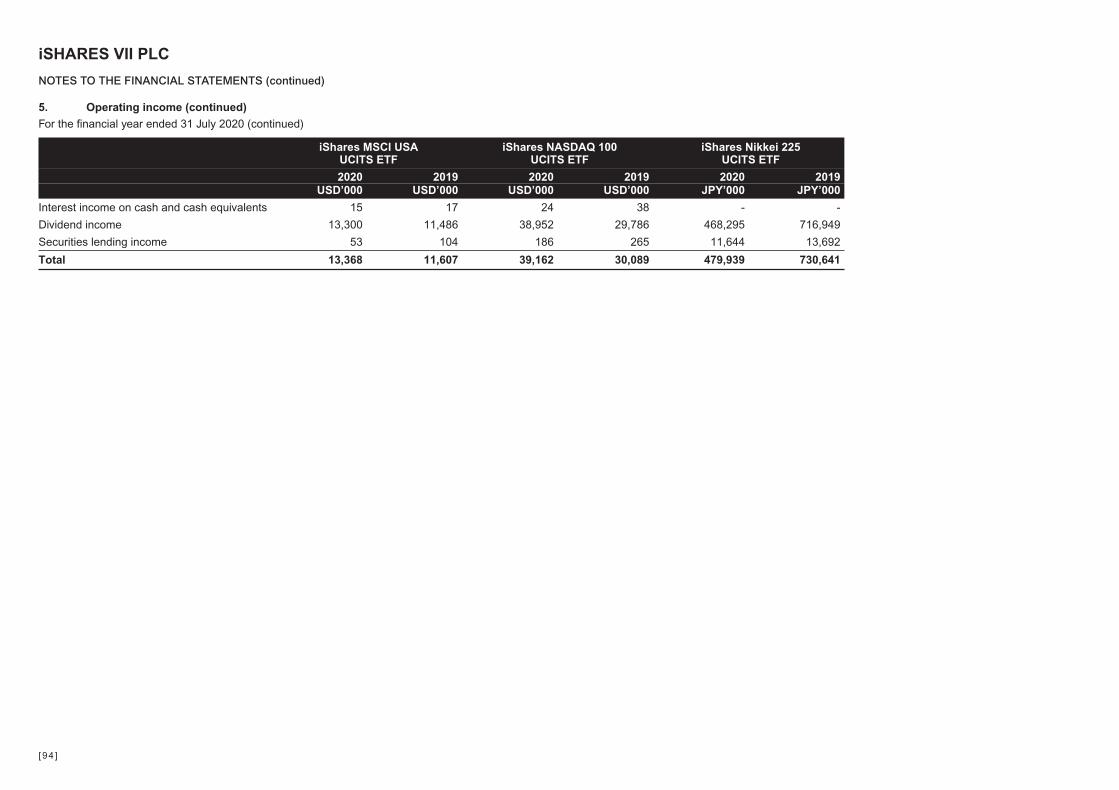
5. Operating income (continued)
For the financial year ended 31 July 2020 (continued)
iShares MSCI USAUCITS ETF
iShares NASDAQ 100UCITS ETF
iShares Nikkei 225UCITS ETF
2020 2019 2020 2019 2020 2019USD’000 USD’000 USD’000 USD’000 JPY’000 JPY’000
Interest income on cash and cash equivalents 15 17 24 38 - -
Dividend income 13,300 11,486 38,952 29,786 468,295 716,949
Securities lending income 53 104 186 265 11,644 13,692
Total 13,368 11,607 39,162 30,089 479,939 730,641
iSHARES VII PLC
NOTES TO THE FINANCIAL STATEMENTS (continued)
[94 ]
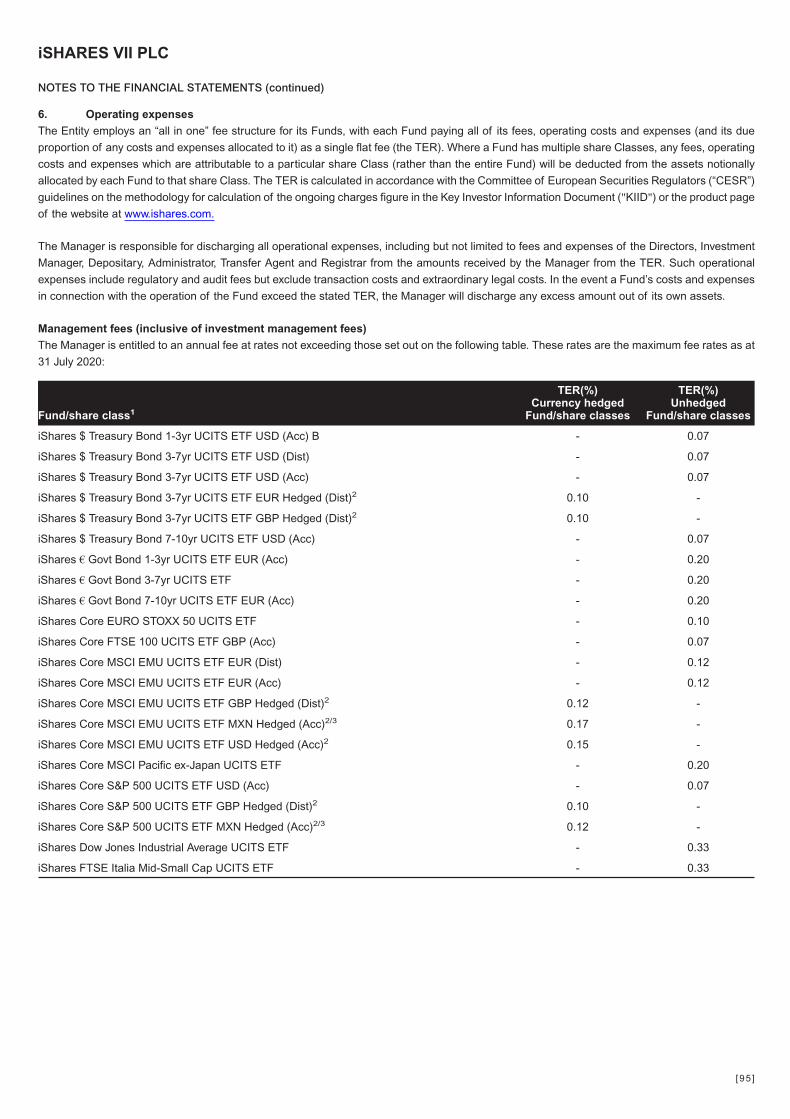
6. Operating expenses
The Entity employs an “all in one” fee structure for its Funds, with each Fund paying all of its fees, operating costs and expenses (and its due
proportion of any costs and expenses allocated to it) as a single flat fee (the TER). Where a Fund has multiple share Classes, any fees, operating
costs and expenses which are attributable to a particular share Class (rather than the entire Fund) will be deducted from the assets notionally
allocated by each Fund to that share Class. The TER is calculated in accordance with the Committee of European Securities Regulators (“CESR”)
guidelines on the methodology for calculation of the ongoing charges figure in the Key Investor Information Document ("KIID") or the product page
of the website at www.ishares.com.
The Manager is responsible for discharging all operational expenses, including but not limited to fees and expenses of the Directors, Investment
Manager, Depositary, Administrator, Transfer Agent and Registrar from the amounts received by the Manager from the TER. Such operational
expenses include regulatory and audit fees but exclude transaction costs and extraordinary legal costs. In the event a Fund’s costs and expenses
in connection with the operation of the Fund exceed the stated TER, the Manager will discharge any excess amount out of its own assets.
Management fees (inclusive of investment management fees)
The Manager is entitled to an annual fee at rates not exceeding those set out on the following table. These rates are the maximum fee rates as at
31 July 2020:
Fund/share class1
TER(%)Currency hedged
Fund/share classes
TER(%)Unhedged
Fund/share classes
iShares $ Treasury Bond 1-3yr UCITS ETF USD (Acc) B - 0.07
iShares $ Treasury Bond 3-7yr UCITS ETF USD (Dist) - 0.07
iShares $ Treasury Bond 3-7yr UCITS ETF USD (Acc) - 0.07
iShares $ Treasury Bond 3-7yr UCITS ETF EUR Hedged (Dist)2 0.10 -
iShares $ Treasury Bond 3-7yr UCITS ETF GBP Hedged (Dist)2 0.10 -
iShares $ Treasury Bond 7-10yr UCITS ETF USD (Acc) - 0.07
iShares € Govt Bond 1-3yr UCITS ETF EUR (Acc) - 0.20
iShares € Govt Bond 3-7yr UCITS ETF - 0.20
iShares € Govt Bond 7-10yr UCITS ETF EUR (Acc) - 0.20
iShares Core EURO STOXX 50 UCITS ETF - 0.10
iShares Core FTSE 100 UCITS ETF GBP (Acc) - 0.07
iShares Core MSCI EMU UCITS ETF EUR (Dist) - 0.12
iShares Core MSCI EMU UCITS ETF EUR (Acc) - 0.12
iShares Core MSCI EMU UCITS ETF GBP Hedged (Dist)2 0.12 -
iShares Core MSCI EMU UCITS ETF MXN Hedged (Acc)2/3 0.17 -
iShares Core MSCI EMU UCITS ETF USD Hedged (Acc)2 0.15 -
iShares Core MSCI Pacific ex-Japan UCITS ETF - 0.20
iShares Core S&P 500 UCITS ETF USD (Acc) - 0.07
iShares Core S&P 500 UCITS ETF GBP Hedged (Dist)2 0.10 -
iShares Core S&P 500 UCITS ETF MXN Hedged (Acc)2/3 0.12 -
iShares Dow Jones Industrial Average UCITS ETF - 0.33
iShares FTSE Italia Mid-Small Cap UCITS ETF - 0.33
iSHARES VII PLC
NOTES TO THE FINANCIAL STATEMENTS (continued)
[95 ]
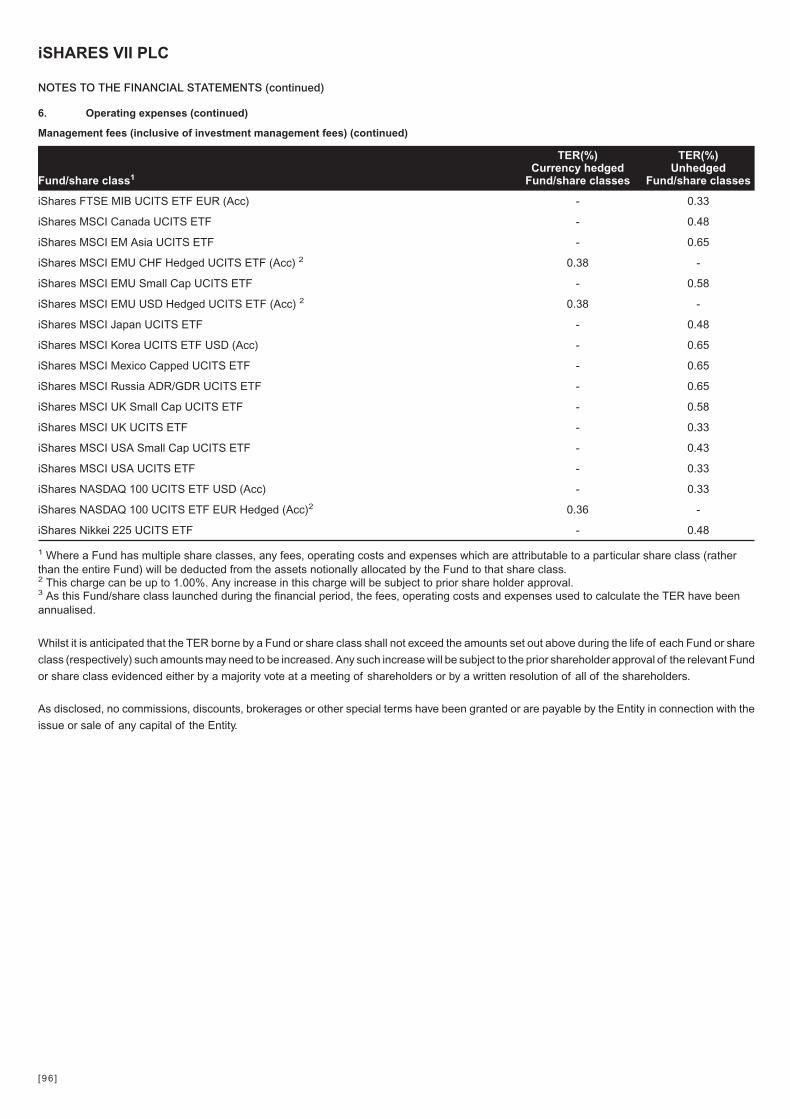
6. Operating expenses (continued)
Management fees (inclusive of investment management fees) (continued)
Fund/share class1
TER(%)Currency hedged
Fund/share classes
TER(%)Unhedged
Fund/share classes
iShares FTSE MIB UCITS ETF EUR (Acc) - 0.33
iShares MSCI Canada UCITS ETF - 0.48
iShares MSCI EM Asia UCITS ETF - 0.65
iShares MSCI EMU CHF Hedged UCITS ETF (Acc) 2 0.38 -
iShares MSCI EMU Small Cap UCITS ETF - 0.58
iShares MSCI EMU USD Hedged UCITS ETF (Acc) 2 0.38 -
iShares MSCI Japan UCITS ETF - 0.48
iShares MSCI Korea UCITS ETF USD (Acc) - 0.65
iShares MSCI Mexico Capped UCITS ETF - 0.65
iShares MSCI Russia ADR/GDR UCITS ETF - 0.65
iShares MSCI UK Small Cap UCITS ETF - 0.58
iShares MSCI UK UCITS ETF - 0.33
iShares MSCI USA Small Cap UCITS ETF - 0.43
iShares MSCI USA UCITS ETF - 0.33
iShares NASDAQ 100 UCITS ETF USD (Acc) - 0.33
iShares NASDAQ 100 UCITS ETF EUR Hedged (Acc)2 0.36 -
iShares Nikkei 225 UCITS ETF - 0.48
1 Where a Fund has multiple share classes, any fees, operating costs and expenses which are attributable to a particular share class (ratherthan the entire Fund) will be deducted from the assets notionally allocated by the Fund to that share class.2 This charge can be up to 1.00%. Any increase in this charge will be subject to prior share holder approval.3 As this Fund/share class launched during the financial period, the fees, operating costs and expenses used to calculate the TER have beenannualised.
Whilst it is anticipated that the TER borne by a Fund or share class shall not exceed the amounts set out above during the life of each Fund or share
class (respectively) such amounts may need to be increased. Any such increase will be subject to the prior shareholder approval of the relevant Fund
or share class evidenced either by a majority vote at a meeting of shareholders or by a written resolution of all of the shareholders.
As disclosed, no commissions, discounts, brokerages or other special terms have been granted or are payable by the Entity in connection with the
issue or sale of any capital of the Entity.
iSHARES VII PLC
NOTES TO THE FINANCIAL STATEMENTS (continued)
[96 ]

7. Net gains/(losses) on financial instruments
For the financial year ended 31 July 2020
Entity totaliShares $ Treasury Bond 1-3yr
UCITS ETF USD (Acc) BiShares $ Treasury Bond 3-7yr
UCITS ETFiShares $ Treasury Bond 7-10yr
UCITS ETF USD (Acc)
2020EUR’000
2019EUR’000
2020USD’000
2019USD’000
2020USD’000
2019USD’000
2020USD’000
2019USD’000
Net realised gains on investmentsin securities 1,398,369 1,279,087 5,043 129 82,038 5,862 28,587 1,196
Net realised gains/(losses) on financial derivativeinstruments 57,077 (28,409) - - 76 2 - -
Net change in unrealised gains oninvestments in securities 1,838,456 257,368 4,746 2,938 77,970 71,878 31,687 15,548
Net change in unrealised gains/(losses) onfinancial derivative instruments 124,014 (37,540) - - 4,388 (897) - -
Net losses on foreign exchange on otherinstruments (146,259) (2,459) - (1) (1,795) (19) (3) (2)
Total 3,271,657 1,468,047 9,789 3,066 162,677 76,826 60,271 16,742
iSHARES VII PLC
NOTES TO THE FINANCIAL STATEMENTS (continued)
[97 ]
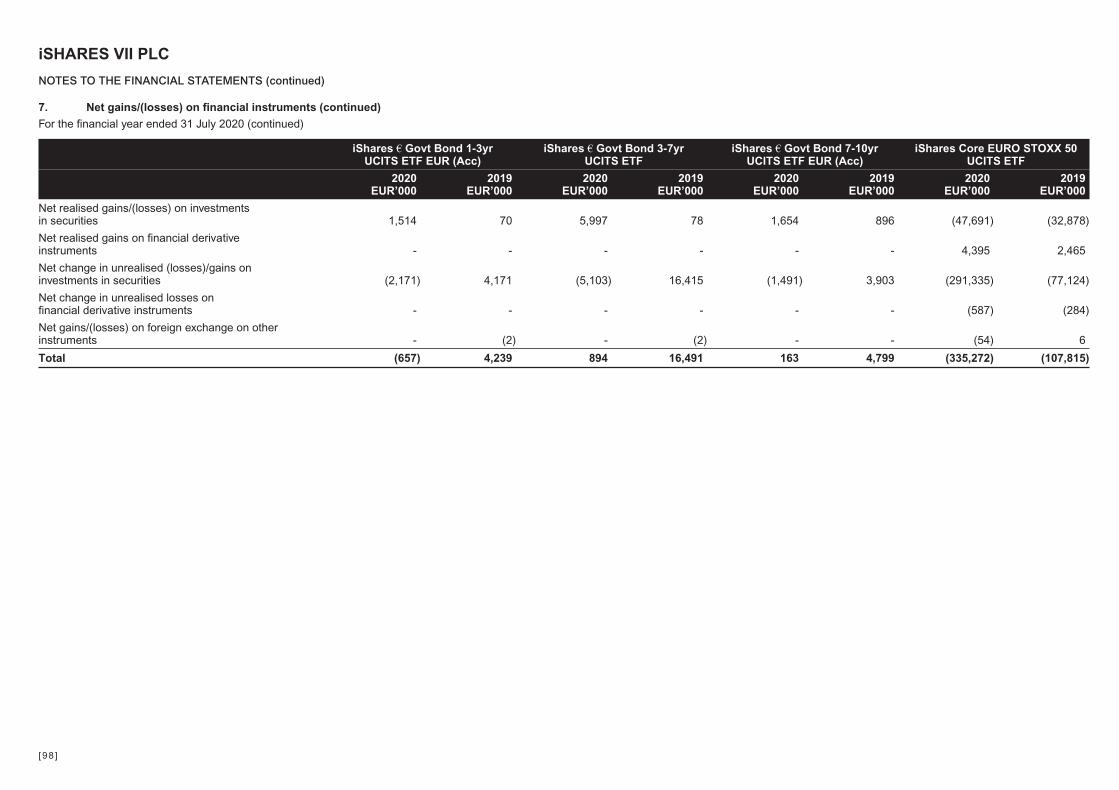
7. Net gains/(losses) on financial instruments (continued)
For the financial year ended 31 July 2020 (continued)
iShares € Govt Bond 1-3yrUCITS ETF EUR (Acc)
iShares € Govt Bond 3-7yrUCITS ETF
iShares € Govt Bond 7-10yrUCITS ETF EUR (Acc)
iShares Core EURO STOXX 50UCITS ETF
2020EUR’000
2019EUR’000
2020EUR’000
2019EUR’000
2020EUR’000
2019EUR’000
2020EUR’000
2019EUR’000
Net realised gains/(losses) on investmentsin securities 1,514 70 5,997 78 1,654 896 (47,691) (32,878)
Net realised gains on financial derivativeinstruments - - - - - - 4,395 2,465
Net change in unrealised (losses)/gains oninvestments in securities (2,171) 4,171 (5,103) 16,415 (1,491) 3,903 (291,335) (77,124)
Net change in unrealised losses onfinancial derivative instruments - - - - - - (587) (284)
Net gains/(losses) on foreign exchange on otherinstruments - (2) - (2) - - (54) 6
Total (657) 4,239 894 16,491 163 4,799 (335,272) (107,815)
iSHARES VII PLC
NOTES TO THE FINANCIAL STATEMENTS (continued)
[98 ]
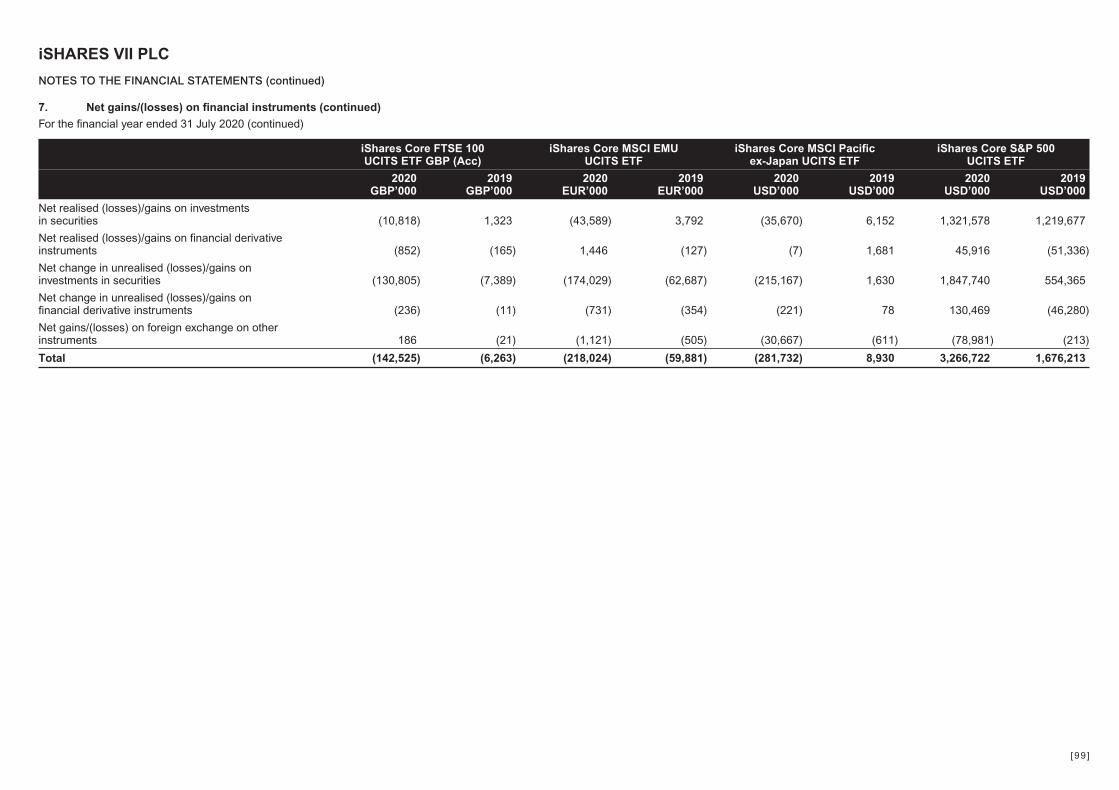
7. Net gains/(losses) on financial instruments (continued)
For the financial year ended 31 July 2020 (continued)
iShares Core FTSE 100UCITS ETF GBP (Acc)
iShares Core MSCI EMUUCITS ETF
iShares Core MSCI Pacificex-Japan UCITS ETF
iShares Core S&P 500UCITS ETF
2020GBP’000
2019GBP’000
2020EUR’000
2019EUR’000
2020USD’000
2019USD’000
2020USD’000
2019USD’000
Net realised (losses)/gains on investmentsin securities (10,818) 1,323 (43,589) 3,792 (35,670) 6,152 1,321,578 1,219,677
Net realised (losses)/gains on financial derivativeinstruments (852) (165) 1,446 (127) (7) 1,681 45,916 (51,336)
Net change in unrealised (losses)/gains oninvestments in securities (130,805) (7,389) (174,029) (62,687) (215,167) 1,630 1,847,740 554,365
Net change in unrealised (losses)/gains onfinancial derivative instruments (236) (11) (731) (354) (221) 78 130,469 (46,280)
Net gains/(losses) on foreign exchange on otherinstruments 186 (21) (1,121) (505) (30,667) (611) (78,981) (213)
Total (142,525) (6,263) (218,024) (59,881) (281,732) 8,930 3,266,722 1,676,213
iSHARES VII PLC
NOTES TO THE FINANCIAL STATEMENTS (continued)
[99 ]
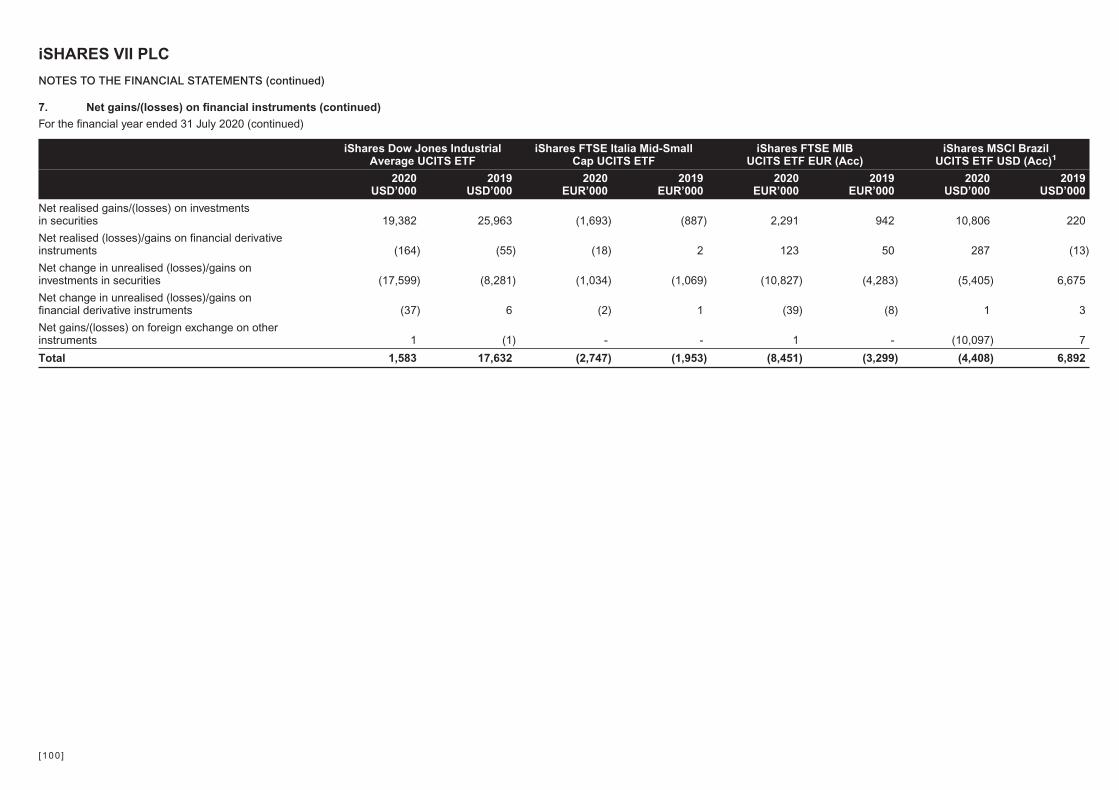
7. Net gains/(losses) on financial instruments (continued)
For the financial year ended 31 July 2020 (continued)
iShares Dow Jones IndustrialAverage UCITS ETF
iShares FTSE Italia Mid-SmallCap UCITS ETF
iShares FTSE MIBUCITS ETF EUR (Acc)
iShares MSCI BrazilUCITS ETF USD (Acc)1
2020USD’000
2019USD’000
2020EUR’000
2019EUR’000
2020EUR’000
2019EUR’000
2020USD’000
2019USD’000
Net realised gains/(losses) on investmentsin securities 19,382 25,963 (1,693) (887) 2,291 942 10,806 220
Net realised (losses)/gains on financial derivativeinstruments (164) (55) (18) 2 123 50 287 (13)
Net change in unrealised (losses)/gains oninvestments in securities (17,599) (8,281) (1,034) (1,069) (10,827) (4,283) (5,405) 6,675
Net change in unrealised (losses)/gains onfinancial derivative instruments (37) 6 (2) 1 (39) (8) 1 3
Net gains/(losses) on foreign exchange on otherinstruments 1 (1) - - 1 - (10,097) 7
Total 1,583 17,632 (2,747) (1,953) (8,451) (3,299) (4,408) 6,892
iSHARES VII PLC
NOTES TO THE FINANCIAL STATEMENTS (continued)
[100 ]
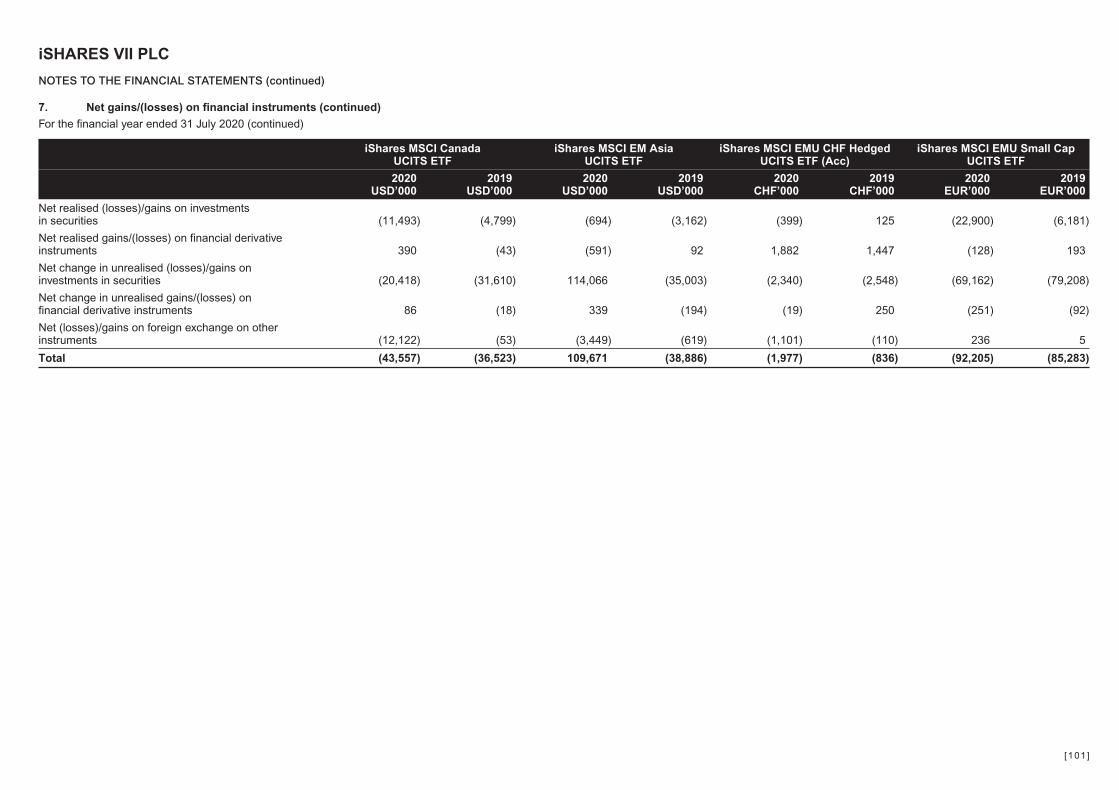
7. Net gains/(losses) on financial instruments (continued)
For the financial year ended 31 July 2020 (continued)
iShares MSCI CanadaUCITS ETF
iShares MSCI EM AsiaUCITS ETF
iShares MSCI EMU CHF HedgedUCITS ETF (Acc)
iShares MSCI EMU Small CapUCITS ETF
2020USD’000
2019USD’000
2020USD’000
2019USD’000
2020CHF’000
2019CHF’000
2020EUR’000
2019EUR’000
Net realised (losses)/gains on investmentsin securities (11,493) (4,799) (694) (3,162) (399) 125 (22,900) (6,181)
Net realised gains/(losses) on financial derivativeinstruments 390 (43) (591) 92 1,882 1,447 (128) 193
Net change in unrealised (losses)/gains oninvestments in securities (20,418) (31,610) 114,066 (35,003) (2,340) (2,548) (69,162) (79,208)
Net change in unrealised gains/(losses) onfinancial derivative instruments 86 (18) 339 (194) (19) 250 (251) (92)
Net (losses)/gains on foreign exchange on otherinstruments (12,122) (53) (3,449) (619) (1,101) (110) 236 5
Total (43,557) (36,523) 109,671 (38,886) (1,977) (836) (92,205) (85,283)
iSHARES VII PLC
NOTES TO THE FINANCIAL STATEMENTS (continued)
[101 ]
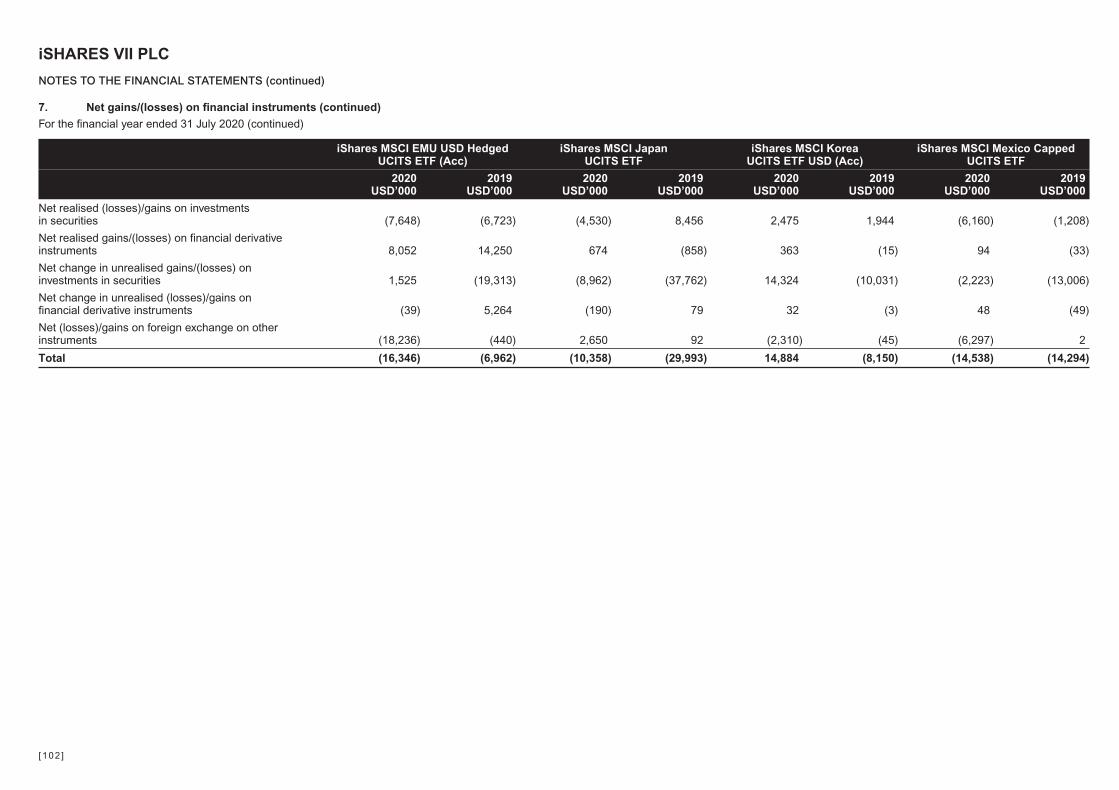
7. Net gains/(losses) on financial instruments (continued)
For the financial year ended 31 July 2020 (continued)
iShares MSCI EMU USD HedgedUCITS ETF (Acc)
iShares MSCI JapanUCITS ETF
iShares MSCI KoreaUCITS ETF USD (Acc)
iShares MSCI Mexico CappedUCITS ETF
2020USD’000
2019USD’000
2020USD’000
2019USD’000
2020USD’000
2019USD’000
2020USD’000
2019USD’000
Net realised (losses)/gains on investmentsin securities (7,648) (6,723) (4,530) 8,456 2,475 1,944 (6,160) (1,208)
Net realised gains/(losses) on financial derivativeinstruments 8,052 14,250 674 (858) 363 (15) 94 (33)
Net change in unrealised gains/(losses) oninvestments in securities 1,525 (19,313) (8,962) (37,762) 14,324 (10,031) (2,223) (13,006)
Net change in unrealised (losses)/gains onfinancial derivative instruments (39) 5,264 (190) 79 32 (3) 48 (49)
Net (losses)/gains on foreign exchange on otherinstruments (18,236) (440) 2,650 92 (2,310) (45) (6,297) 2
Total (16,346) (6,962) (10,358) (29,993) 14,884 (8,150) (14,538) (14,294)
iSHARES VII PLC
NOTES TO THE FINANCIAL STATEMENTS (continued)
[102 ]
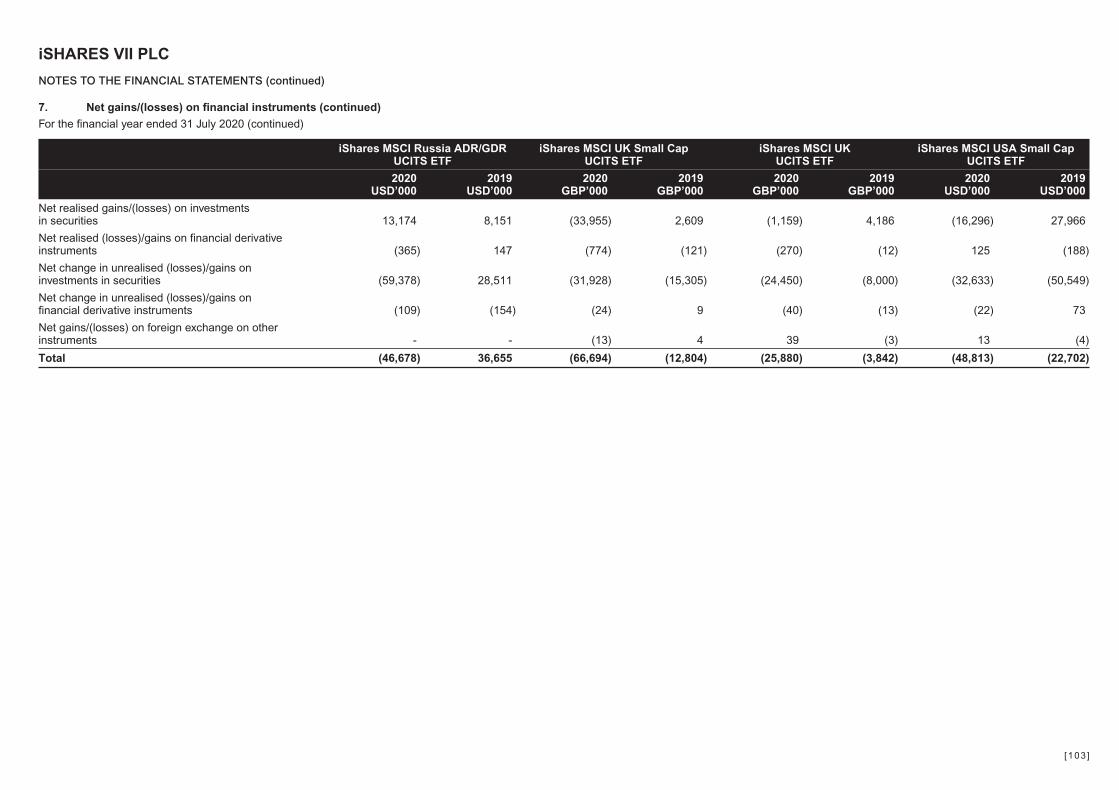
7. Net gains/(losses) on financial instruments (continued)
For the financial year ended 31 July 2020 (continued)
iShares MSCI Russia ADR/GDRUCITS ETF
iShares MSCI UK Small CapUCITS ETF
iShares MSCI UKUCITS ETF
iShares MSCI USA Small CapUCITS ETF
2020USD’000
2019USD’000
2020GBP’000
2019GBP’000
2020GBP’000
2019GBP’000
2020USD’000
2019USD’000
Net realised gains/(losses) on investmentsin securities 13,174 8,151 (33,955) 2,609 (1,159) 4,186 (16,296) 27,966
Net realised (losses)/gains on financial derivativeinstruments (365) 147 (774) (121) (270) (12) 125 (188)
Net change in unrealised (losses)/gains oninvestments in securities (59,378) 28,511 (31,928) (15,305) (24,450) (8,000) (32,633) (50,549)
Net change in unrealised (losses)/gains onfinancial derivative instruments (109) (154) (24) 9 (40) (13) (22) 73
Net gains/(losses) on foreign exchange on otherinstruments - - (13) 4 39 (3) 13 (4)
Total (46,678) 36,655 (66,694) (12,804) (25,880) (3,842) (48,813) (22,702)
iSHARES VII PLC
NOTES TO THE FINANCIAL STATEMENTS (continued)
[103 ]
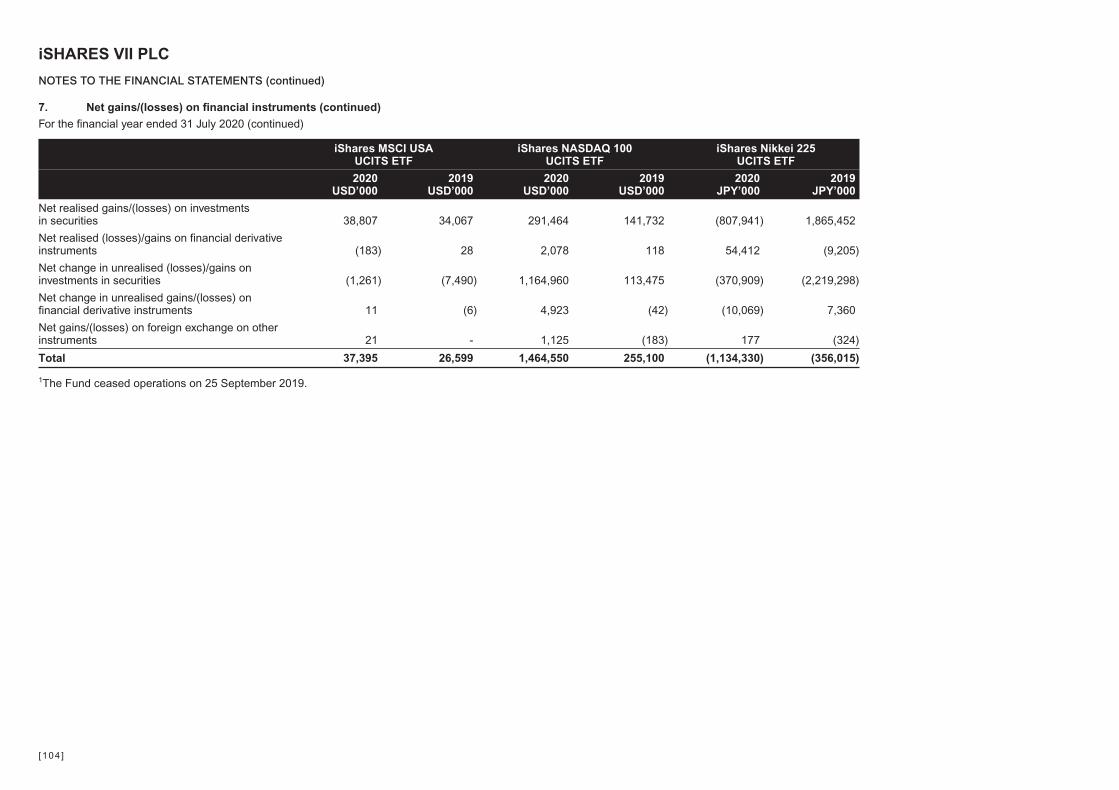
7. Net gains/(losses) on financial instruments (continued)
For the financial year ended 31 July 2020 (continued)
iShares MSCI USAUCITS ETF
iShares NASDAQ 100UCITS ETF
iShares Nikkei 225UCITS ETF
2020USD’000
2019USD’000
2020USD’000
2019USD’000
2020JPY’000
2019JPY’000
Net realised gains/(losses) on investmentsin securities 38,807 34,067 291,464 141,732 (807,941) 1,865,452
Net realised (losses)/gains on financial derivativeinstruments (183) 28 2,078 118 54,412 (9,205)
Net change in unrealised (losses)/gains oninvestments in securities (1,261) (7,490) 1,164,960 113,475 (370,909) (2,219,298)
Net change in unrealised gains/(losses) onfinancial derivative instruments 11 (6) 4,923 (42) (10,069) 7,360
Net gains/(losses) on foreign exchange on otherinstruments 21 - 1,125 (183) 177 (324)
Total 37,395 26,599 1,464,550 255,100 (1,134,330) (356,015)
1The Fund ceased operations on 25 September 2019.
iSHARES VII PLC
NOTES TO THE FINANCIAL STATEMENTS (continued)
[104 ]
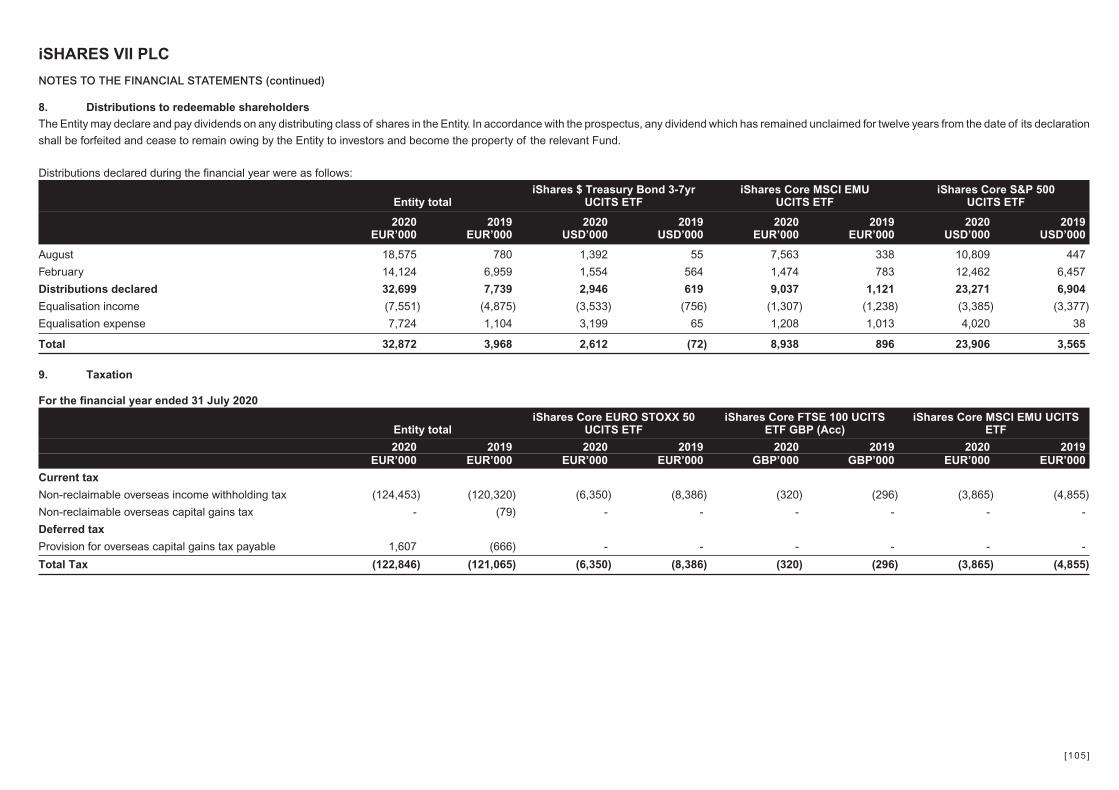
8. Distributions to redeemable shareholders
The Entity may declare and pay dividends on any distributing class of shares in the Entity. In accordance with the prospectus, any dividend which has remained unclaimed for twelve years from the date of its declaration
shall be forfeited and cease to remain owing by the Entity to investors and become the property of the relevant Fund.
Distributions declared during the financial year were as follows:
Entity totaliShares $ Treasury Bond 3-7yr
UCITS ETFiShares Core MSCI EMU
UCITS ETFiShares Core S&P 500
UCITS ETF
2020EUR’000
2019EUR’000
2020USD’000
2019USD’000
2020EUR’000
2019EUR’000
2020USD’000
2019USD’000
August 18,575 780 1,392 55 7,563 338 10,809 447
February 14,124 6,959 1,554 564 1,474 783 12,462 6,457
Distributions declared 32,699 7,739 2,946 619 9,037 1,121 23,271 6,904
Equalisation income (7,551) (4,875) (3,533) (756) (1,307) (1,238) (3,385) (3,377)
Equalisation expense 7,724 1,104 3,199 65 1,208 1,013 4,020 38
Total 32,872 3,968 2,612 (72) 8,938 896 23,906 3,565
9. Taxation
For the financial year ended 31 July 2020
Entity totaliShares Core EURO STOXX 50
UCITS ETFiShares Core FTSE 100 UCITS
ETF GBP (Acc)iShares Core MSCI EMU UCITS
ETF
2020 2019 2020 2019 2020 2019 2020 2019EUR’000 EUR’000 EUR’000 EUR’000 GBP’000 GBP’000 EUR’000 EUR’000
Current tax
Non-reclaimable overseas income withholding tax (124,453) (120,320) (6,350) (8,386) (320) (296) (3,865) (4,855)
Non-reclaimable overseas capital gains tax - (79) - - - - - -
Deferred tax
Provision for overseas capital gains tax payable 1,607 (666) - - - - - -
Total Tax (122,846) (121,065) (6,350) (8,386) (320) (296) (3,865) (4,855)
iSHARES VII PLC
NOTES TO THE FINANCIAL STATEMENTS (continued)
[105 ]
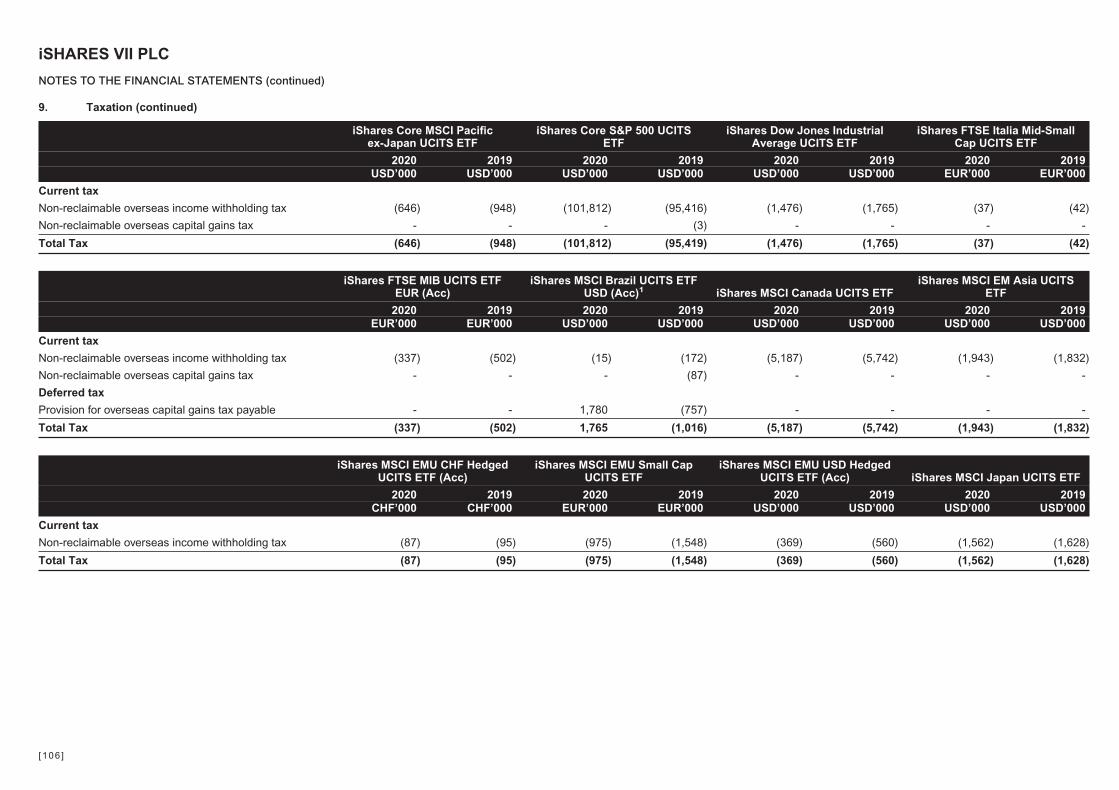
9. Taxation (continued)
iShares Core MSCI Pacificex-Japan UCITS ETF
iShares Core S&P 500 UCITSETF
iShares Dow Jones IndustrialAverage UCITS ETF
iShares FTSE Italia Mid-SmallCap UCITS ETF
2020 2019 2020 2019 2020 2019 2020 2019USD’000 USD’000 USD’000 USD’000 USD’000 USD’000 EUR’000 EUR’000
Current tax
Non-reclaimable overseas income withholding tax (646) (948) (101,812) (95,416) (1,476) (1,765) (37) (42)
Non-reclaimable overseas capital gains tax - - - (3) - - - -
Total Tax (646) (948) (101,812) (95,419) (1,476) (1,765) (37) (42)
iShares FTSE MIB UCITS ETFEUR (Acc)
iShares MSCI Brazil UCITS ETFUSD (Acc)1 iShares MSCI Canada UCITS ETF
iShares MSCI EM Asia UCITSETF
2020 2019 2020 2019 2020 2019 2020 2019EUR’000 EUR’000 USD’000 USD’000 USD’000 USD’000 USD’000 USD’000
Current tax
Non-reclaimable overseas income withholding tax (337) (502) (15) (172) (5,187) (5,742) (1,943) (1,832)
Non-reclaimable overseas capital gains tax - - - (87) - - - -
Deferred tax
Provision for overseas capital gains tax payable - - 1,780 (757) - - - -
Total Tax (337) (502) 1,765 (1,016) (5,187) (5,742) (1,943) (1,832)
iShares MSCI EMU CHF HedgedUCITS ETF (Acc)
iShares MSCI EMU Small CapUCITS ETF
iShares MSCI EMU USD HedgedUCITS ETF (Acc) iShares MSCI Japan UCITS ETF
2020 2019 2020 2019 2020 2019 2020 2019CHF’000 CHF’000 EUR’000 EUR’000 USD’000 USD’000 USD’000 USD’000
Current tax
Non-reclaimable overseas income withholding tax (87) (95) (975) (1,548) (369) (560) (1,562) (1,628)
Total Tax (87) (95) (975) (1,548) (369) (560) (1,562) (1,628)
iSHARES VII PLC
NOTES TO THE FINANCIAL STATEMENTS (continued)
[106 ]
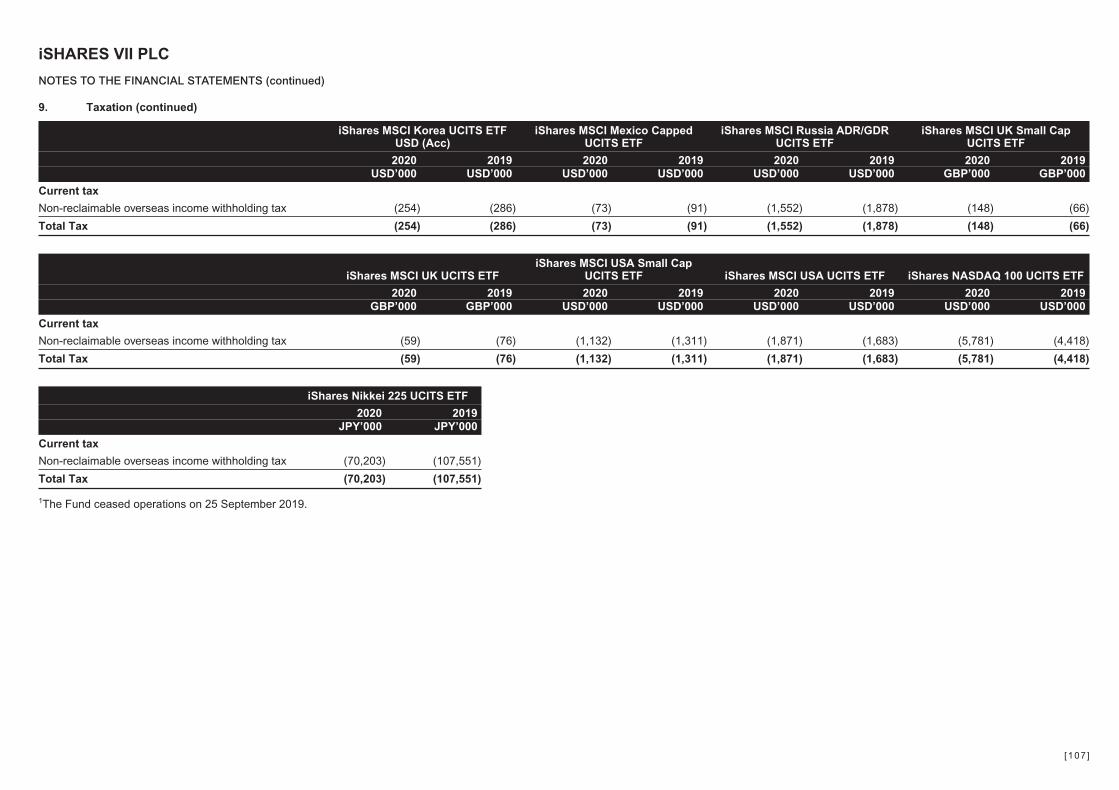
9. Taxation (continued)
iShares MSCI Korea UCITS ETFUSD (Acc)
iShares MSCI Mexico CappedUCITS ETF
iShares MSCI Russia ADR/GDRUCITS ETF
iShares MSCI UK Small CapUCITS ETF
2020 2019 2020 2019 2020 2019 2020 2019USD’000 USD’000 USD’000 USD’000 USD’000 USD’000 GBP’000 GBP’000
Current tax
Non-reclaimable overseas income withholding tax (254) (286) (73) (91) (1,552) (1,878) (148) (66)
Total Tax (254) (286) (73) (91) (1,552) (1,878) (148) (66)
iShares MSCI UK UCITS ETFiShares MSCI USA Small Cap
UCITS ETF iShares MSCI USA UCITS ETF iShares NASDAQ 100 UCITS ETF
2020 2019 2020 2019 2020 2019 2020 2019GBP’000 GBP’000 USD’000 USD’000 USD’000 USD’000 USD’000 USD’000
Current tax
Non-reclaimable overseas income withholding tax (59) (76) (1,132) (1,311) (1,871) (1,683) (5,781) (4,418)
Total Tax (59) (76) (1,132) (1,311) (1,871) (1,683) (5,781) (4,418)
iShares Nikkei 225 UCITS ETF
2020 2019JPY’000 JPY’000
Current tax
Non-reclaimable overseas income withholding tax (70,203) (107,551)
Total Tax (70,203) (107,551)
1The Fund ceased operations on 25 September 2019.
iSHARES VII PLC
NOTES TO THE FINANCIAL STATEMENTS (continued)
[107 ]
9. Taxation (continued)
Irish tax
Under current law and practice, the Entity qualifies as an investment undertaking as defined in Section 739B of the Taxes Consolidation Act, 1997,
as amended. On that basis it is not chargeable to Irish tax on its income or gains. However, Irish tax may arise on the occurrence of a "chargeable
event". A chargeable event includes any distribution payments to shareholders or any encashment, redemption, cancellation or transfer of shares
and the holding of shares at the end of each eight year period beginning with the acquisition of such shares.
No Irish tax will arise on the Entity in respect of chargeable events in respect of:
a) A shareholder who is neither Irish resident nor ordinarily resident in Ireland for tax purposes, at the time of the chargeable event, provided
appropriate valid declarations in accordance with the provisions of the Taxes Consolidation Act, 1997, as amended, are held by the Entity; or
the Entity has been authorised by the Irish Revenue to make gross payments in the absence of appropriate declarations; and
b) Certain exempted Irish tax resident shareholders who have provided the Entity with the necessary signed annual declarations; and
c) Any transaction (which might otherwise be a chargeable event) in relation to shares held in a recognised clearing system as designated by order
of the Irish Revenue Commissioners (such as CREST) will not constitute a chargeable event. It is the current intention of the Directors that all
the shares in the Entity will be held in CREST or another recognised clearing system.
Overseas tax
Dividends, interest and capital gains (if any) received on investments made by the Entity may be subject to withholding taxes imposed by the country
from which the investment income/gains are received and such taxes may not be recoverable by the Entity or its shareholders.
For financial reporting purposes, and in accordance with FRS 102, the Entity must recognise a provision for deferred tax payable arising from
material timing differences between the taxation of unrealised gains in the financial statements and actual realisable taxable profits.
iSHARES VII PLC
NOTES TO THE FINANCIAL STATEMENTS (continued)
[108 ]

10. Receivables
As at 31 July 2020
Entity totaliShares $ Treasury Bond 1-3yr
UCITS ETF USD (Acc) BiShares $ Treasury Bond 3-7yr
UCITS ETFiShares $ Treasury Bond 7-10yr
UCITS ETF USD (Acc)
2020 2019 2020 2019 2020 2019 2020 2019EUR’000 EUR’000 USD’000 USD’000 USD’000 USD’000 USD’000 USD’000
Dividend income receivable 41,525 40,756 - - - - - -
Interest income receivable from cash and cashequivalents
5 45 - - - - 5 -
Interest income receivable from debt instruments 19,109 16,928 1,626 1,549 12,713 11,156 5,020 2,241
Management fee rebate receivable 14 4 - - - - - -
Sale of securities awaiting settlement 33,773 57,391 30,431 16,701 - - - -
Securities lending income receivable 750 701 2 4 49 46 18 15
Subscription of shares awaiting settlement 3,458 168,364 - - - - - -
Withholding tax reclaim receivable 10,301 12,063 - - - - - -
Total 108,935 296,252 32,059 18,254 12,762 11,202 5,043 2,256
iShares € Govt Bond 1-3yr UCITSETF EUR (Acc)
iShares € Govt Bond 3-7yr UCITSETF
iShares € Govt Bond 7-10yrUCITS ETF EUR (Acc)
iShares Core EURO STOXX 50UCITS ETF
2020 2019 2020 2019 2020 2019 2020 2019EUR’000 EUR’000 EUR’000 EUR’000 EUR’000 EUR’000 EUR’000 EUR’000
Dividend income receivable - - - - - - 1,583 1,680
Interest income receivable from debt instruments 277 342 2,225 2,948 236 214 - -
Sale of securities awaiting settlement - 40,393 - - 4,362 - - -
Securities lending income receivable 2 2 5 9 1 1 96 13
Withholding tax reclaim receivable - - - - - - 4,955 6,157
Total 279 40,737 2,230 2,957 4,599 215 6,634 7,850
iSHARES VII PLC
NOTES TO THE FINANCIAL STATEMENTS (continued)
[109 ]

10. Receivables (continued)
As at 31 July 2020 (continued)
iShares Core FTSE 100 UCITSETF GBP (Acc)
iShares Core MSCI EMU UCITSETF
iShares Core MSCI Pacificex-Japan UCITS ETF
iShares Core S&P 500 UCITSETF
2020 2019 2020 2019 2020 2019 2020 2019GBP’000 GBP’000 EUR’000 EUR’000 USD’000 USD’000 USD’000 USD’000
Dividend income receivable 1,952 1,321 206 458 1,372 2,389 31,360 25,349
Interest income receivable from cash and cashequivalents
- 1 - - - 11 1 29
Sale of securities awaiting settlement - - - 4 44 - - -
Securities lending income receivable 7 5 61 46 41 36 161 147
Subscription of shares awaiting settlement - - - - - - - 90,540
Withholding tax reclaim receivable 78 85 3,273 3,639 - 24 1 1
Total 2,037 1,412 3,540 4,147 1,457 2,460 31,523 116,066
iShares Dow Jones IndustrialAverage UCITS ETF
iShares FTSE MIB UCITS ETFEUR (Acc)
iShares MSCI Brazil UCITS ETFUSD (Acc)1 iShares MSCI Canada UCITS ETF
2020 2019 2020 2019 2020 2019 2020 2019USD’000 USD’000 EUR’000 EUR’000 USD’000 USD’000 USD’000 USD’000
Dividend income receivable 299 272 2 1,360 9 106 867 781
Interest income receivable from cash and cashequivalents
- - - - - - - 1
Sale of securities awaiting settlement - - 1,235 - - - - -
Securities lending income receivable 2 - 2 1 - - 104 136
Withholding tax reclaim receivable - - 18 18 - - - -
Total 301 272 1,257 1,379 9 106 971 918
iSHARES VII PLC
NOTES TO THE FINANCIAL STATEMENTS (continued)
[110 ]
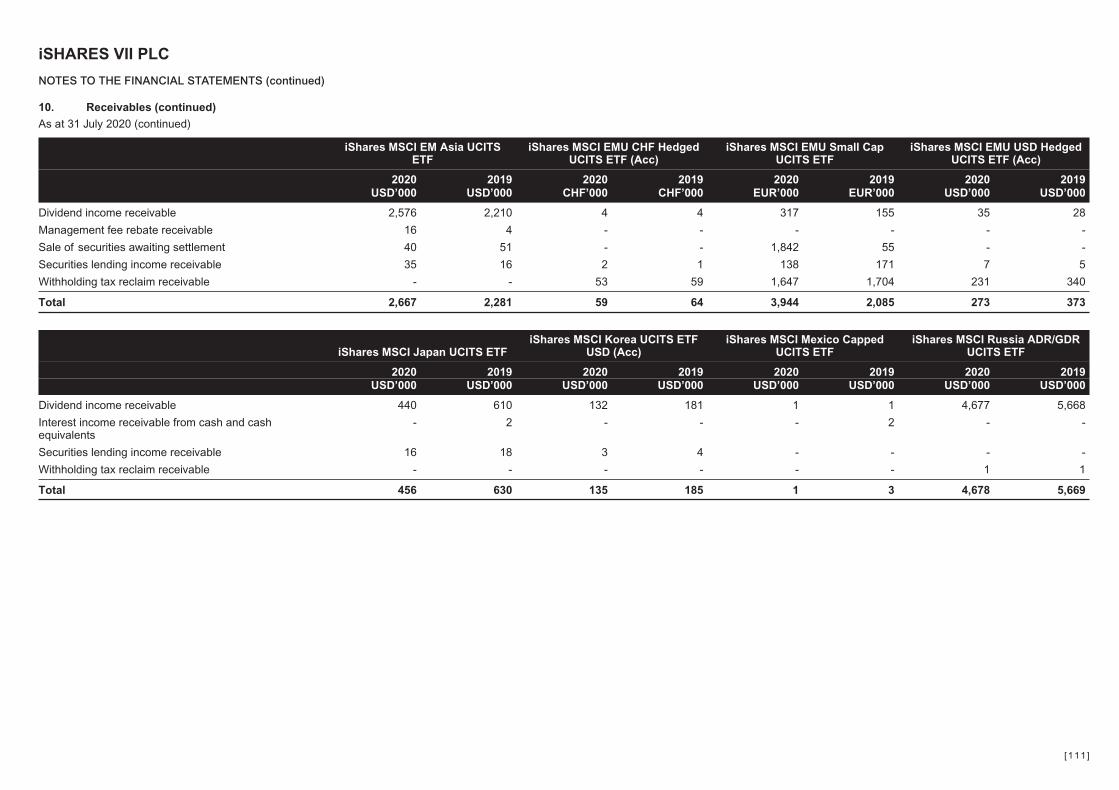
10. Receivables (continued)
As at 31 July 2020 (continued)
iShares MSCI EM Asia UCITSETF
iShares MSCI EMU CHF HedgedUCITS ETF (Acc)
iShares MSCI EMU Small CapUCITS ETF
iShares MSCI EMU USD HedgedUCITS ETF (Acc)
2020 2019 2020 2019 2020 2019 2020 2019USD’000 USD’000 CHF’000 CHF’000 EUR’000 EUR’000 USD’000 USD’000
Dividend income receivable 2,576 2,210 4 4 317 155 35 28
Management fee rebate receivable 16 4 - - - - - -
Sale of securities awaiting settlement 40 51 - - 1,842 55 - -
Securities lending income receivable 35 16 2 1 138 171 7 5
Withholding tax reclaim receivable - - 53 59 1,647 1,704 231 340
Total 2,667 2,281 59 64 3,944 2,085 273 373
iShares MSCI Japan UCITS ETFiShares MSCI Korea UCITS ETF
USD (Acc)iShares MSCI Mexico Capped
UCITS ETFiShares MSCI Russia ADR/GDR
UCITS ETF
2020 2019 2020 2019 2020 2019 2020 2019USD’000 USD’000 USD’000 USD’000 USD’000 USD’000 USD’000 USD’000
Dividend income receivable 440 610 132 181 1 1 4,677 5,668
Interest income receivable from cash and cashequivalents
- 2 - - - 2 - -
Securities lending income receivable 16 18 3 4 - - - -
Withholding tax reclaim receivable - - - - - - 1 1
Total 456 630 135 185 1 3 4,678 5,669
iSHARES VII PLC
NOTES TO THE FINANCIAL STATEMENTS (continued)
[111 ]
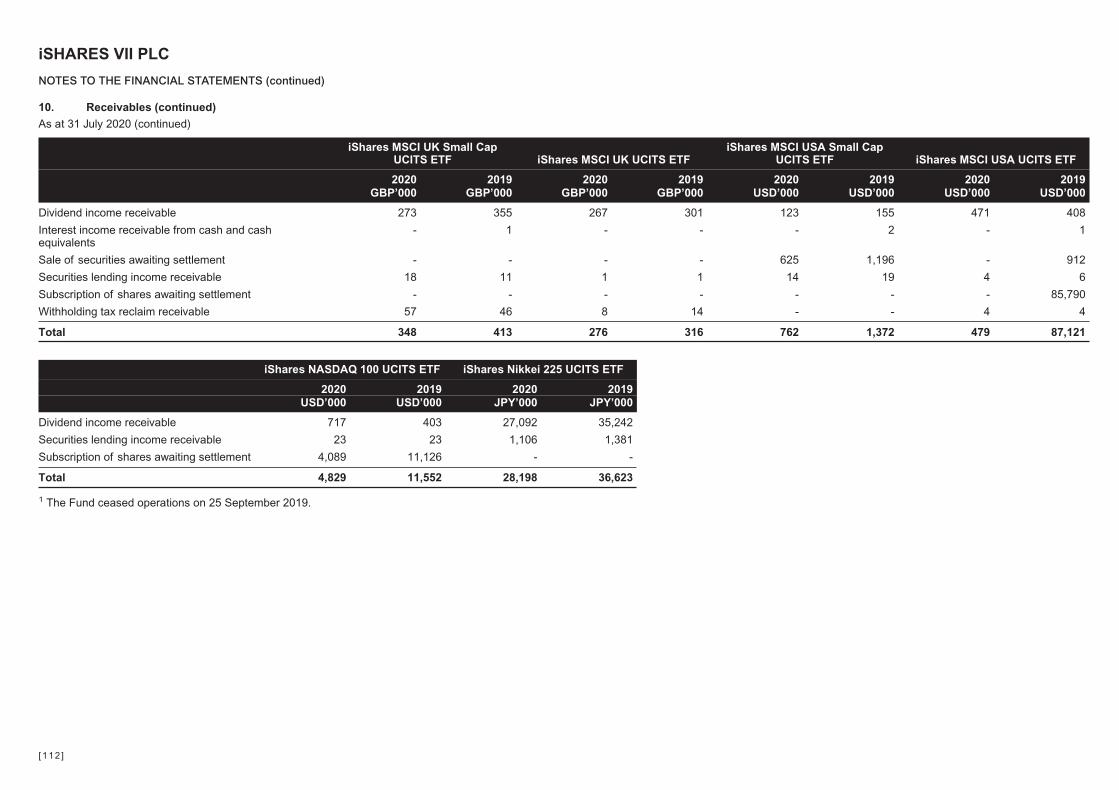
10. Receivables (continued)
As at 31 July 2020 (continued)
iShares MSCI UK Small CapUCITS ETF iShares MSCI UK UCITS ETF
iShares MSCI USA Small CapUCITS ETF iShares MSCI USA UCITS ETF
2020 2019 2020 2019 2020 2019 2020 2019GBP’000 GBP’000 GBP’000 GBP’000 USD’000 USD’000 USD’000 USD’000
Dividend income receivable 273 355 267 301 123 155 471 408
Interest income receivable from cash and cashequivalents
- 1 - - - 2 - 1
Sale of securities awaiting settlement - - - - 625 1,196 - 912
Securities lending income receivable 18 11 1 1 14 19 4 6
Subscription of shares awaiting settlement - - - - - - - 85,790
Withholding tax reclaim receivable 57 46 8 14 - - 4 4
Total 348 413 276 316 762 1,372 479 87,121
iShares NASDAQ 100 UCITS ETF iShares Nikkei 225 UCITS ETF
2020 2019 2020 2019USD’000 USD’000 JPY’000 JPY’000
Dividend income receivable 717 403 27,092 35,242
Securities lending income receivable 23 23 1,106 1,381
Subscription of shares awaiting settlement 4,089 11,126 - -
Total 4,829 11,552 28,198 36,623
1 The Fund ceased operations on 25 September 2019.
iSHARES VII PLC
NOTES TO THE FINANCIAL STATEMENTS (continued)
[112 ]
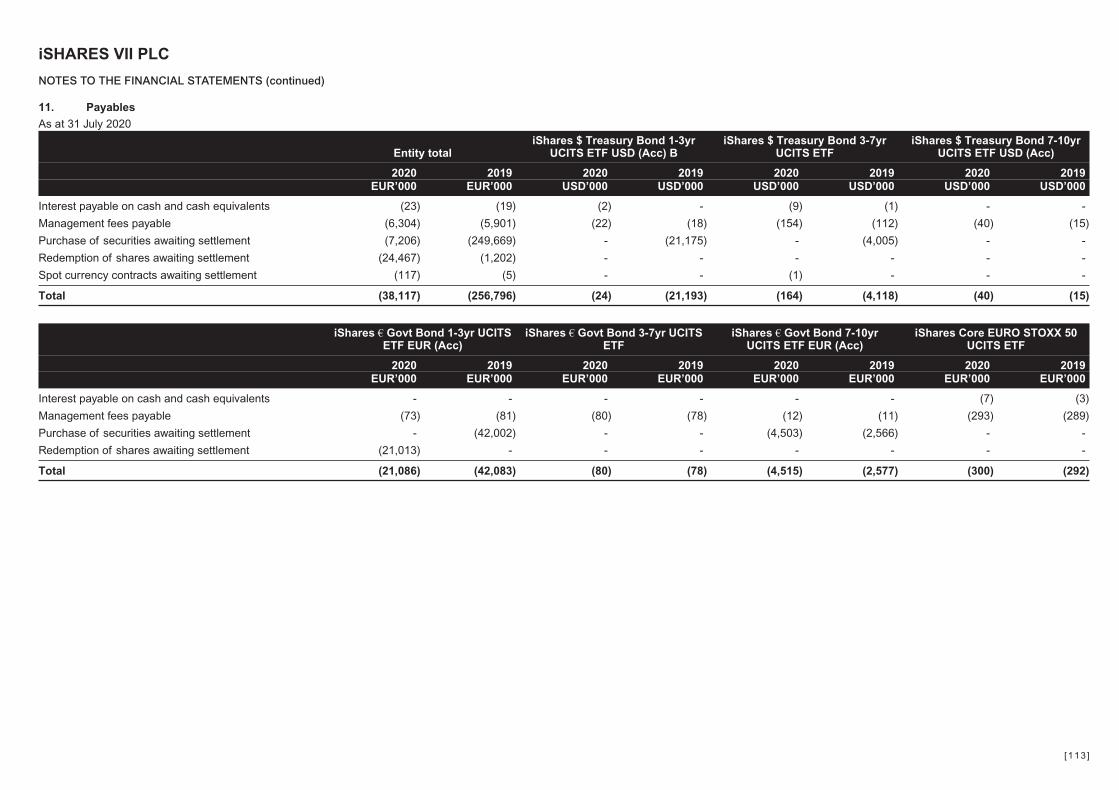
11. Payables
As at 31 July 2020
Entity totaliShares $ Treasury Bond 1-3yr
UCITS ETF USD (Acc) BiShares $ Treasury Bond 3-7yr
UCITS ETFiShares $ Treasury Bond 7-10yr
UCITS ETF USD (Acc)
2020 2019 2020 2019 2020 2019 2020 2019EUR’000 EUR’000 USD’000 USD’000 USD’000 USD’000 USD’000 USD’000
Interest payable on cash and cash equivalents (23) (19) (2) - (9) (1) - -
Management fees payable (6,304) (5,901) (22) (18) (154) (112) (40) (15)
Purchase of securities awaiting settlement (7,206) (249,669) - (21,175) - (4,005) - -
Redemption of shares awaiting settlement (24,467) (1,202) - - - - - -
Spot currency contracts awaiting settlement (117) (5) - - (1) - - -
Total (38,117) (256,796) (24) (21,193) (164) (4,118) (40) (15)
iShares € Govt Bond 1-3yr UCITSETF EUR (Acc)
iShares € Govt Bond 3-7yr UCITSETF
iShares € Govt Bond 7-10yrUCITS ETF EUR (Acc)
iShares Core EURO STOXX 50UCITS ETF
2020 2019 2020 2019 2020 2019 2020 2019EUR’000 EUR’000 EUR’000 EUR’000 EUR’000 EUR’000 EUR’000 EUR’000
Interest payable on cash and cash equivalents - - - - - - (7) (3)
Management fees payable (73) (81) (80) (78) (12) (11) (293) (289)
Purchase of securities awaiting settlement - (42,002) - - (4,503) (2,566) - -
Redemption of shares awaiting settlement (21,013) - - - - - - -
Total (21,086) (42,083) (80) (78) (4,515) (2,577) (300) (292)
iSHARES VII PLC
NOTES TO THE FINANCIAL STATEMENTS (continued)
[113 ]
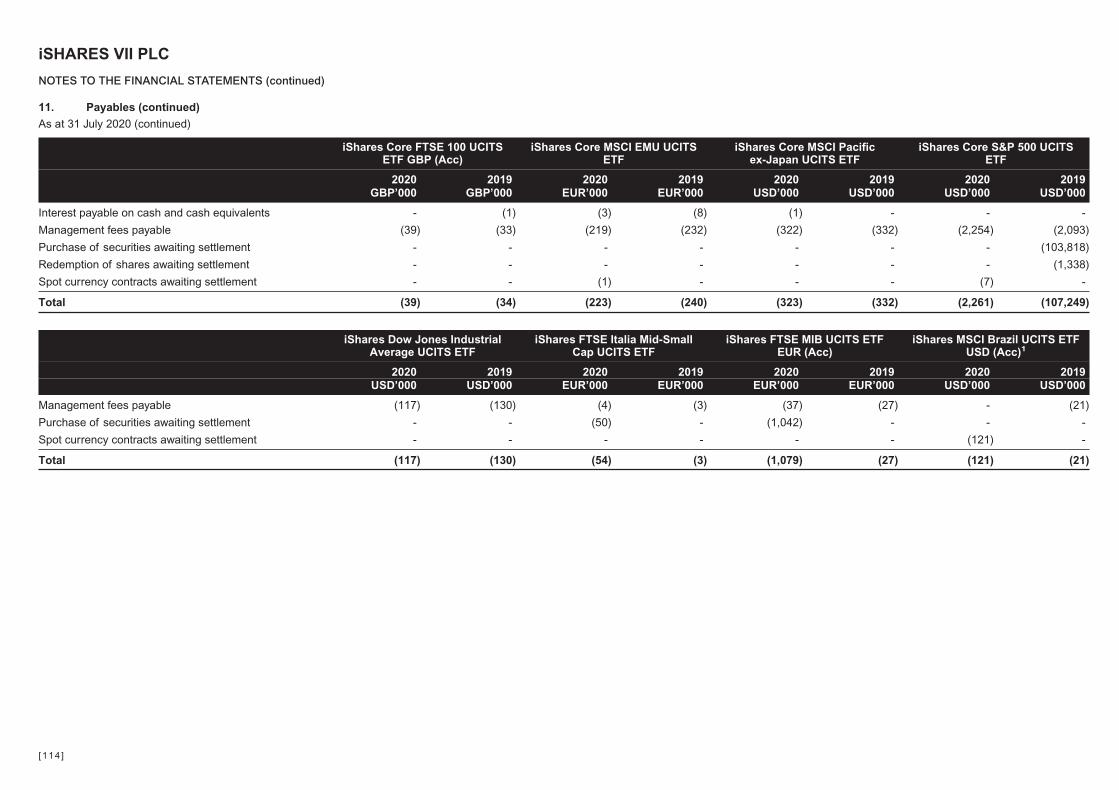
11. Payables (continued)
As at 31 July 2020 (continued)
iShares Core FTSE 100 UCITSETF GBP (Acc)
iShares Core MSCI EMU UCITSETF
iShares Core MSCI Pacificex-Japan UCITS ETF
iShares Core S&P 500 UCITSETF
2020 2019 2020 2019 2020 2019 2020 2019GBP’000 GBP’000 EUR’000 EUR’000 USD’000 USD’000 USD’000 USD’000
Interest payable on cash and cash equivalents - (1) (3) (8) (1) - - -
Management fees payable (39) (33) (219) (232) (322) (332) (2,254) (2,093)
Purchase of securities awaiting settlement - - - - - - - (103,818)
Redemption of shares awaiting settlement - - - - - - - (1,338)
Spot currency contracts awaiting settlement - - (1) - - - (7) -
Total (39) (34) (223) (240) (323) (332) (2,261) (107,249)
iShares Dow Jones IndustrialAverage UCITS ETF
iShares FTSE Italia Mid-SmallCap UCITS ETF
iShares FTSE MIB UCITS ETFEUR (Acc)
iShares MSCI Brazil UCITS ETFUSD (Acc)1
2020 2019 2020 2019 2020 2019 2020 2019USD’000 USD’000 EUR’000 EUR’000 EUR’000 EUR’000 USD’000 USD’000
Management fees payable (117) (130) (4) (3) (37) (27) - (21)
Purchase of securities awaiting settlement - - (50) - (1,042) - - -
Spot currency contracts awaiting settlement - - - - - - (121) -
Total (117) (130) (54) (3) (1,079) (27) (121) (21)
iSHARES VII PLC
NOTES TO THE FINANCIAL STATEMENTS (continued)
[114 ]
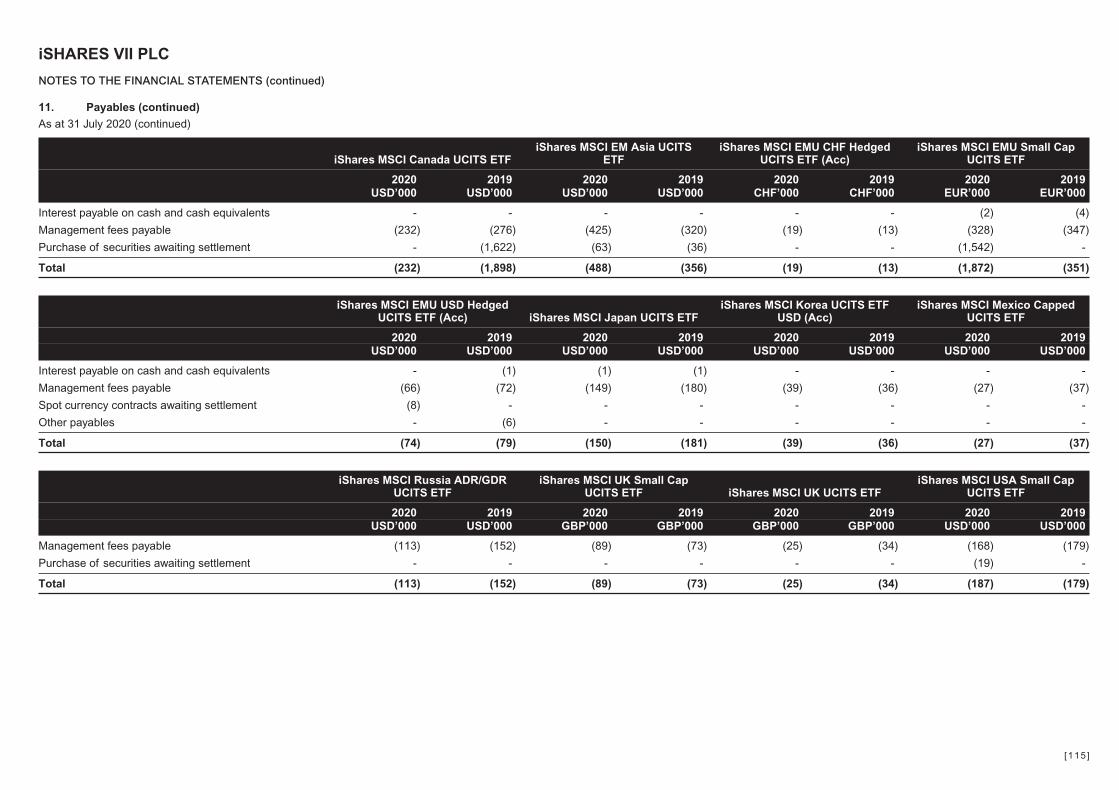
11. Payables (continued)
As at 31 July 2020 (continued)
iShares MSCI Canada UCITS ETFiShares MSCI EM Asia UCITS
ETFiShares MSCI EMU CHF Hedged
UCITS ETF (Acc)iShares MSCI EMU Small Cap
UCITS ETF
2020 2019 2020 2019 2020 2019 2020 2019USD’000 USD’000 USD’000 USD’000 CHF’000 CHF’000 EUR’000 EUR’000
Interest payable on cash and cash equivalents - - - - - - (2) (4)
Management fees payable (232) (276) (425) (320) (19) (13) (328) (347)
Purchase of securities awaiting settlement - (1,622) (63) (36) - - (1,542) -
Total (232) (1,898) (488) (356) (19) (13) (1,872) (351)
iShares MSCI EMU USD HedgedUCITS ETF (Acc) iShares MSCI Japan UCITS ETF
iShares MSCI Korea UCITS ETFUSD (Acc)
iShares MSCI Mexico CappedUCITS ETF
2020 2019 2020 2019 2020 2019 2020 2019USD’000 USD’000 USD’000 USD’000 USD’000 USD’000 USD’000 USD’000
Interest payable on cash and cash equivalents - (1) (1) (1) - - - -
Management fees payable (66) (72) (149) (180) (39) (36) (27) (37)
Spot currency contracts awaiting settlement (8) - - - - - - -
Other payables - (6) - - - - - -
Total (74) (79) (150) (181) (39) (36) (27) (37)
iShares MSCI Russia ADR/GDRUCITS ETF
iShares MSCI UK Small CapUCITS ETF iShares MSCI UK UCITS ETF
iShares MSCI USA Small CapUCITS ETF
2020 2019 2020 2019 2020 2019 2020 2019USD’000 USD’000 GBP’000 GBP’000 GBP’000 GBP’000 USD’000 USD’000
Management fees payable (113) (152) (89) (73) (25) (34) (168) (179)
Purchase of securities awaiting settlement - - - - - - (19) -
Total (113) (152) (89) (73) (25) (34) (187) (179)
iSHARES VII PLC
NOTES TO THE FINANCIAL STATEMENTS (continued)
[115 ]
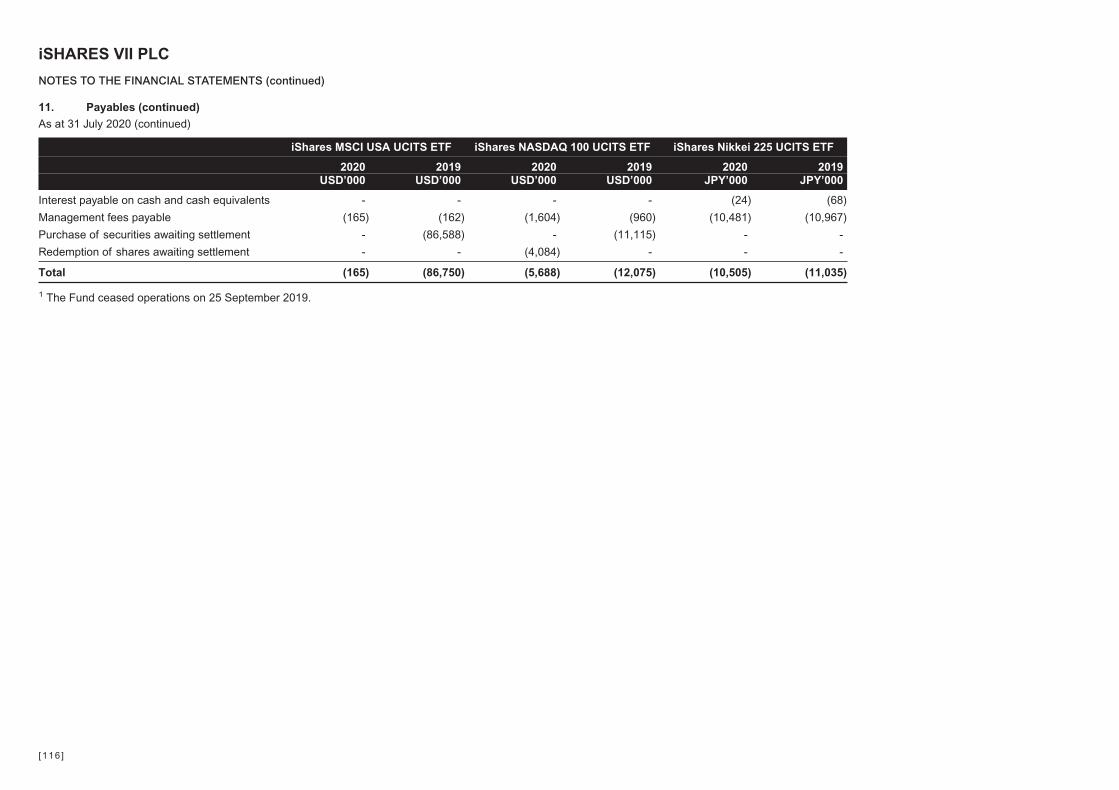
11. Payables (continued)
As at 31 July 2020 (continued)
iShares MSCI USA UCITS ETF iShares NASDAQ 100 UCITS ETF iShares Nikkei 225 UCITS ETF
2020 2019 2020 2019 2020 2019USD’000 USD’000 USD’000 USD’000 JPY’000 JPY’000
Interest payable on cash and cash equivalents - - - - (24) (68)
Management fees payable (165) (162) (1,604) (960) (10,481) (10,967)
Purchase of securities awaiting settlement - (86,588) - (11,115) - -
Redemption of shares awaiting settlement - - (4,084) - - -
Total (165) (86,750) (5,688) (12,075) (10,505) (11,035)
1 The Fund ceased operations on 25 September 2019.
iSHARES VII PLC
NOTES TO THE FINANCIAL STATEMENTS (continued)
[116 ]
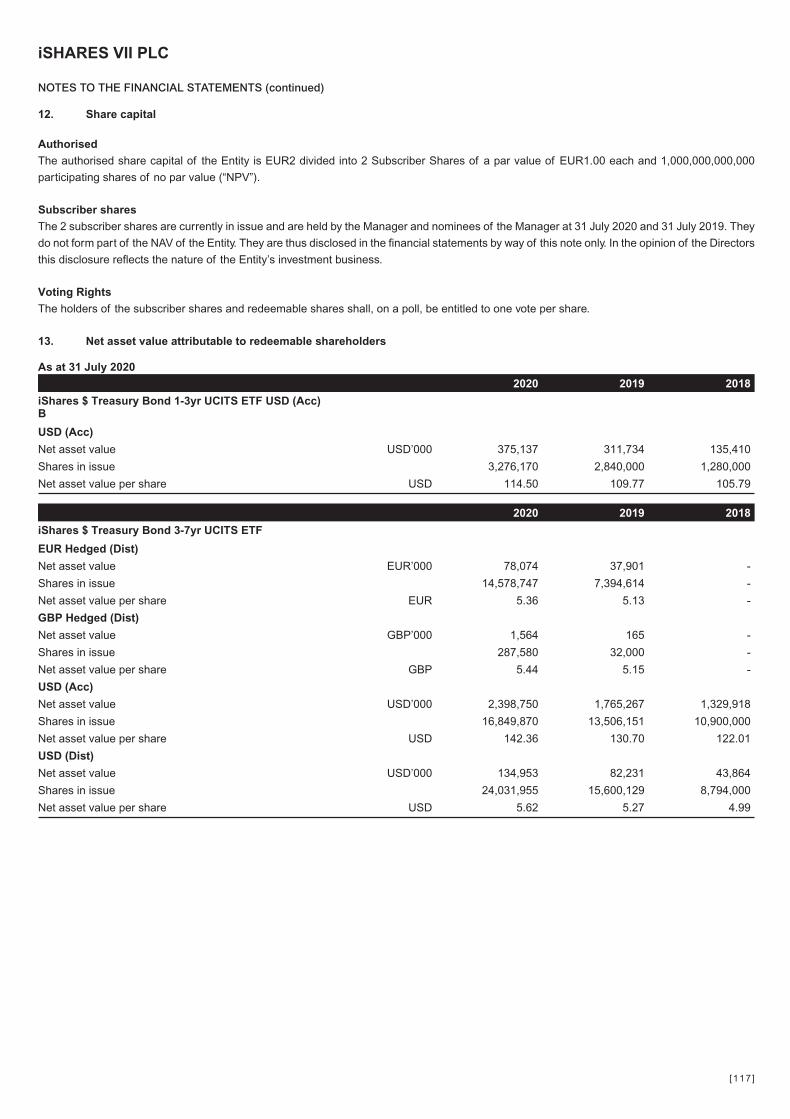
12. Share capital
Authorised
The authorised share capital of the Entity is EUR2 divided into 2 Subscriber Shares of a par value of EUR1.00 each and 1,000,000,000,000
participating shares of no par value (“NPV”).
Subscriber shares
The 2 subscriber shares are currently in issue and are held by the Manager and nominees of the Manager at 31 July 2020 and 31 July 2019. They
do not form part of the NAV of the Entity. They are thus disclosed in the financial statements by way of this note only. In the opinion of the Directors
this disclosure reflects the nature of the Entity’s investment business.
Voting Rights
The holders of the subscriber shares and redeemable shares shall, on a poll, be entitled to one vote per share.
13. Net asset value attributable to redeemable shareholders
As at 31 July 2020
2020 2019 2018
iShares $ Treasury Bond 1-3yr UCITS ETF USD (Acc)B
USD (Acc)
Net asset value USD’000 375,137 311,734 135,410
Shares in issue 3,276,170 2,840,000 1,280,000
Net asset value per share USD 114.50 109.77 105.79
2020 2019 2018
iShares $ Treasury Bond 3-7yr UCITS ETF
EUR Hedged (Dist)
Net asset value EUR’000 78,074 37,901 -
Shares in issue 14,578,747 7,394,614 -
Net asset value per share EUR 5.36 5.13 -
GBP Hedged (Dist)
Net asset value GBP’000 1,564 165 -
Shares in issue 287,580 32,000 -
Net asset value per share GBP 5.44 5.15 -
USD (Acc)
Net asset value USD’000 2,398,750 1,765,267 1,329,918
Shares in issue 16,849,870 13,506,151 10,900,000
Net asset value per share USD 142.36 130.70 122.01
USD (Dist)
Net asset value USD’000 134,953 82,231 43,864
Shares in issue 24,031,955 15,600,129 8,794,000
Net asset value per share USD 5.62 5.27 4.99
iSHARES VII PLC
NOTES TO THE FINANCIAL STATEMENTS (continued)
[117 ]

13. Net asset value attributable to redeemable shareholders (continued)
2020 2019 2018
iShares $ Treasury Bond 7-10yr UCITS ETF USD(Acc)
USD (Acc)
Net asset value USD’000 685,800 256,034 218,093
Shares in issue 4,000,540 1,700,000 1,600,000
Net asset value per share USD 171.43 150.61 136.31
2020 2019 2018
iShares € Govt Bond 1-3yr UCITS ETF EUR (Acc)
EUR (Acc)
Net asset value EUR’000 411,315 488,797 267,797
Shares in issue 3,681,450 4,350,000 2,400,000
Net asset value per share EUR 111.73 112.37 111.58
2020 2019 2018
iShares € Govt Bond 3-7yr UCITS ETF
EUR (Acc)
Net asset value EUR’000 477,719 460,043 343,630
Shares in issue 3,447,730 3,330,000 2,595,000
Net asset value per share EUR 138.56 138.15 132.42
2020 2019 2018
iShares € Govt Bond 7-10yr UCITS ETF EUR (Acc)
EUR (Acc)
Net asset value EUR’000 72,349 67,115 40,175
Shares in issue 415,430 390,000 255,000
Net asset value per share EUR 174.15 172.09 157.55
2020 2019 2018
iShares Core EURO STOXX 50 UCITS ETF
EUR (Acc)
Net asset value EUR’000 3,427,860 3,370,260 3,961,343
Shares in issue 32,774,637 30,249,637 36,124,637
Net asset value per share EUR 104.59 111.41 109.66
2020 2019 2018
iShares Core FTSE 100 UCITS ETF GBP (Acc)
GBP (Acc)
Net asset value GBP’000 618,333 557,254 468,446
Shares in issue 6,325,158 4,600,158 3,950,158
Net asset value per share GBP 97.76 121.14 118.59
iSHARES VII PLC
NOTES TO THE FINANCIAL STATEMENTS (continued)
[118 ]
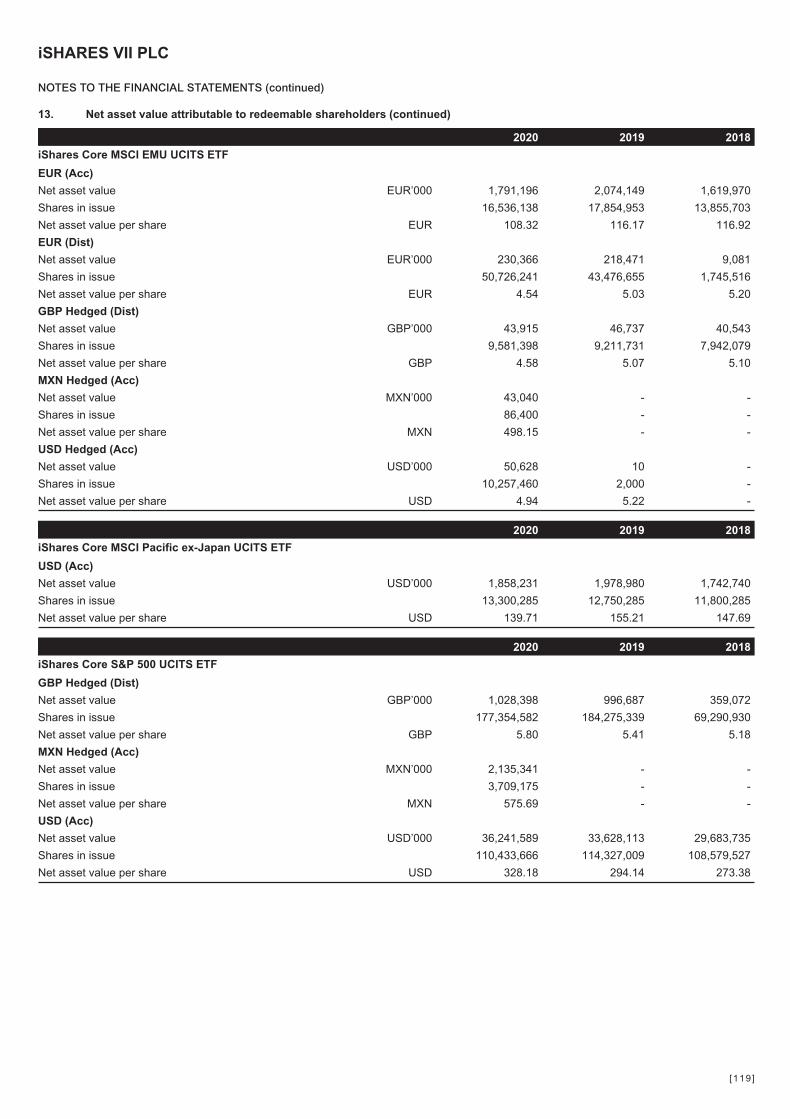
13. Net asset value attributable to redeemable shareholders (continued)
2020 2019 2018
iShares Core MSCI EMU UCITS ETF
EUR (Acc)
Net asset value EUR’000 1,791,196 2,074,149 1,619,970
Shares in issue 16,536,138 17,854,953 13,855,703
Net asset value per share EUR 108.32 116.17 116.92
EUR (Dist)
Net asset value EUR’000 230,366 218,471 9,081
Shares in issue 50,726,241 43,476,655 1,745,516
Net asset value per share EUR 4.54 5.03 5.20
GBP Hedged (Dist)
Net asset value GBP’000 43,915 46,737 40,543
Shares in issue 9,581,398 9,211,731 7,942,079
Net asset value per share GBP 4.58 5.07 5.10
MXN Hedged (Acc)
Net asset value MXN’000 43,040 - -
Shares in issue 86,400 - -
Net asset value per share MXN 498.15 - -
USD Hedged (Acc)
Net asset value USD’000 50,628 10 -
Shares in issue 10,257,460 2,000 -
Net asset value per share USD 4.94 5.22 -
2020 2019 2018
iShares Core MSCI Pacific ex-Japan UCITS ETF
USD (Acc)
Net asset value USD’000 1,858,231 1,978,980 1,742,740
Shares in issue 13,300,285 12,750,285 11,800,285
Net asset value per share USD 139.71 155.21 147.69
2020 2019 2018
iShares Core S&P 500 UCITS ETF
GBP Hedged (Dist)
Net asset value GBP’000 1,028,398 996,687 359,072
Shares in issue 177,354,582 184,275,339 69,290,930
Net asset value per share GBP 5.80 5.41 5.18
MXN Hedged (Acc)
Net asset value MXN’000 2,135,341 - -
Shares in issue 3,709,175 - -
Net asset value per share MXN 575.69 - -
USD (Acc)
Net asset value USD’000 36,241,589 33,628,113 29,683,735
Shares in issue 110,433,666 114,327,009 108,579,527
Net asset value per share USD 328.18 294.14 273.38
iSHARES VII PLC
NOTES TO THE FINANCIAL STATEMENTS (continued)
[119 ]
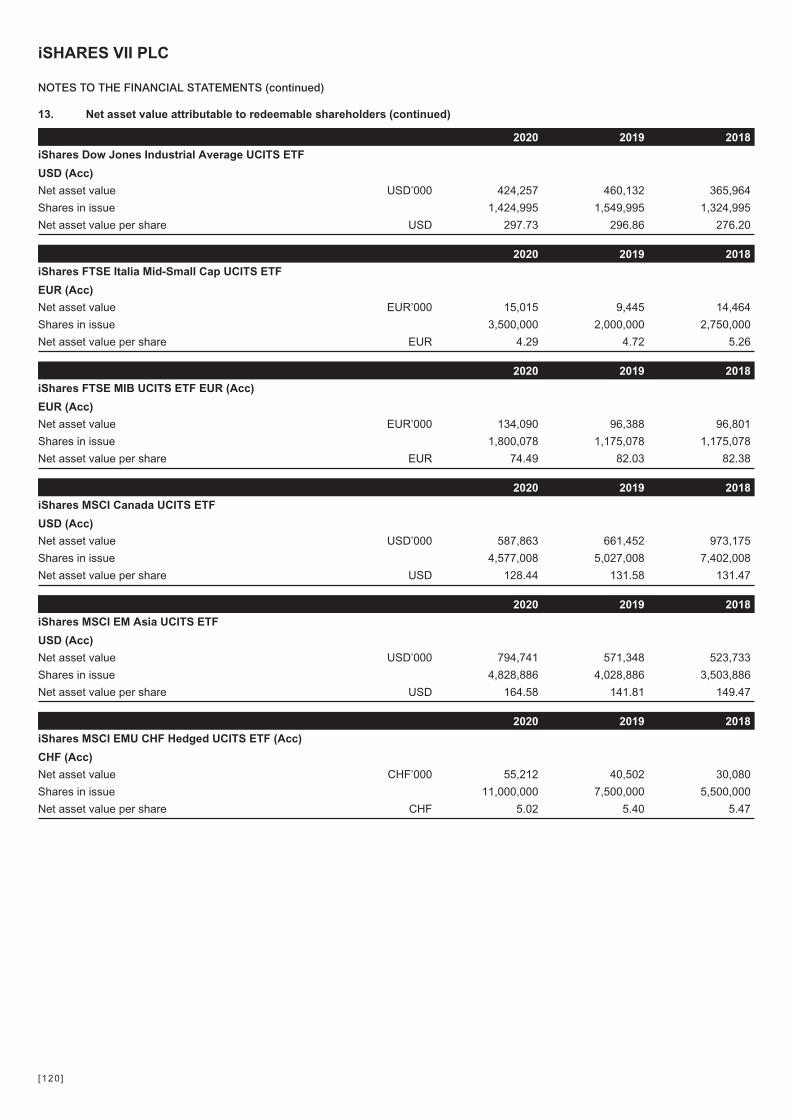
13. Net asset value attributable to redeemable shareholders (continued)
2020 2019 2018
iShares Dow Jones Industrial Average UCITS ETF
USD (Acc)
Net asset value USD’000 424,257 460,132 365,964
Shares in issue 1,424,995 1,549,995 1,324,995
Net asset value per share USD 297.73 296.86 276.20
2020 2019 2018
iShares FTSE Italia Mid-Small Cap UCITS ETF
EUR (Acc)
Net asset value EUR’000 15,015 9,445 14,464
Shares in issue 3,500,000 2,000,000 2,750,000
Net asset value per share EUR 4.29 4.72 5.26
2020 2019 2018
iShares FTSE MIB UCITS ETF EUR (Acc)
EUR (Acc)
Net asset value EUR’000 134,090 96,388 96,801
Shares in issue 1,800,078 1,175,078 1,175,078
Net asset value per share EUR 74.49 82.03 82.38
2020 2019 2018
iShares MSCI Canada UCITS ETF
USD (Acc)
Net asset value USD’000 587,863 661,452 973,175
Shares in issue 4,577,008 5,027,008 7,402,008
Net asset value per share USD 128.44 131.58 131.47
2020 2019 2018
iShares MSCI EM Asia UCITS ETF
USD (Acc)
Net asset value USD’000 794,741 571,348 523,733
Shares in issue 4,828,886 4,028,886 3,503,886
Net asset value per share USD 164.58 141.81 149.47
2020 2019 2018
iShares MSCI EMU CHF Hedged UCITS ETF (Acc)
CHF (Acc)
Net asset value CHF’000 55,212 40,502 30,080
Shares in issue 11,000,000 7,500,000 5,500,000
Net asset value per share CHF 5.02 5.40 5.47
iSHARES VII PLC
NOTES TO THE FINANCIAL STATEMENTS (continued)
[120 ]
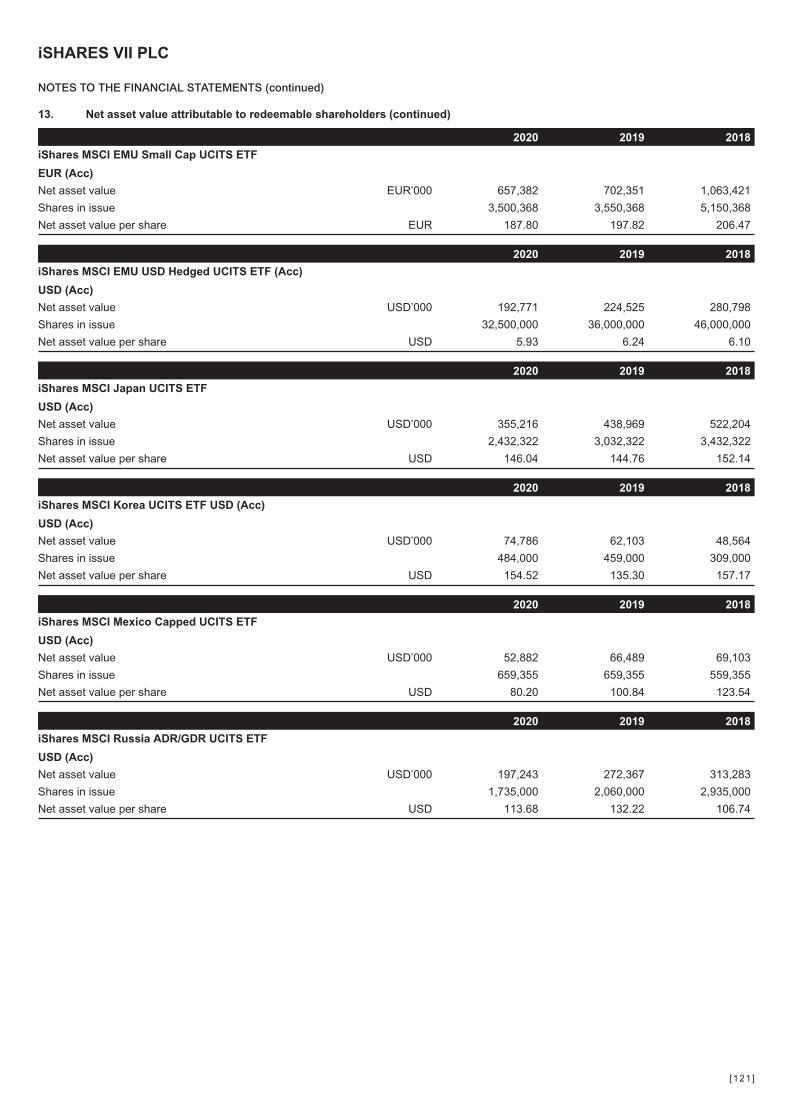
13. Net asset value attributable to redeemable shareholders (continued)
2020 2019 2018
iShares MSCI EMU Small Cap UCITS ETF
EUR (Acc)
Net asset value EUR’000 657,382 702,351 1,063,421
Shares in issue 3,500,368 3,550,368 5,150,368
Net asset value per share EUR 187.80 197.82 206.47
2020 2019 2018
iShares MSCI EMU USD Hedged UCITS ETF (Acc)
USD (Acc)
Net asset value USD’000 192,771 224,525 280,798
Shares in issue 32,500,000 36,000,000 46,000,000
Net asset value per share USD 5.93 6.24 6.10
2020 2019 2018
iShares MSCI Japan UCITS ETF
USD (Acc)
Net asset value USD’000 355,216 438,969 522,204
Shares in issue 2,432,322 3,032,322 3,432,322
Net asset value per share USD 146.04 144.76 152.14
2020 2019 2018
iShares MSCI Korea UCITS ETF USD (Acc)
USD (Acc)
Net asset value USD’000 74,786 62,103 48,564
Shares in issue 484,000 459,000 309,000
Net asset value per share USD 154.52 135.30 157.17
2020 2019 2018
iShares MSCI Mexico Capped UCITS ETF
USD (Acc)
Net asset value USD’000 52,882 66,489 69,103
Shares in issue 659,355 659,355 559,355
Net asset value per share USD 80.20 100.84 123.54
2020 2019 2018
iShares MSCI Russia ADR/GDR UCITS ETF
USD (Acc)
Net asset value USD’000 197,243 272,367 313,283
Shares in issue 1,735,000 2,060,000 2,935,000
Net asset value per share USD 113.68 132.22 106.74
iSHARES VII PLC
NOTES TO THE FINANCIAL STATEMENTS (continued)
[121 ]
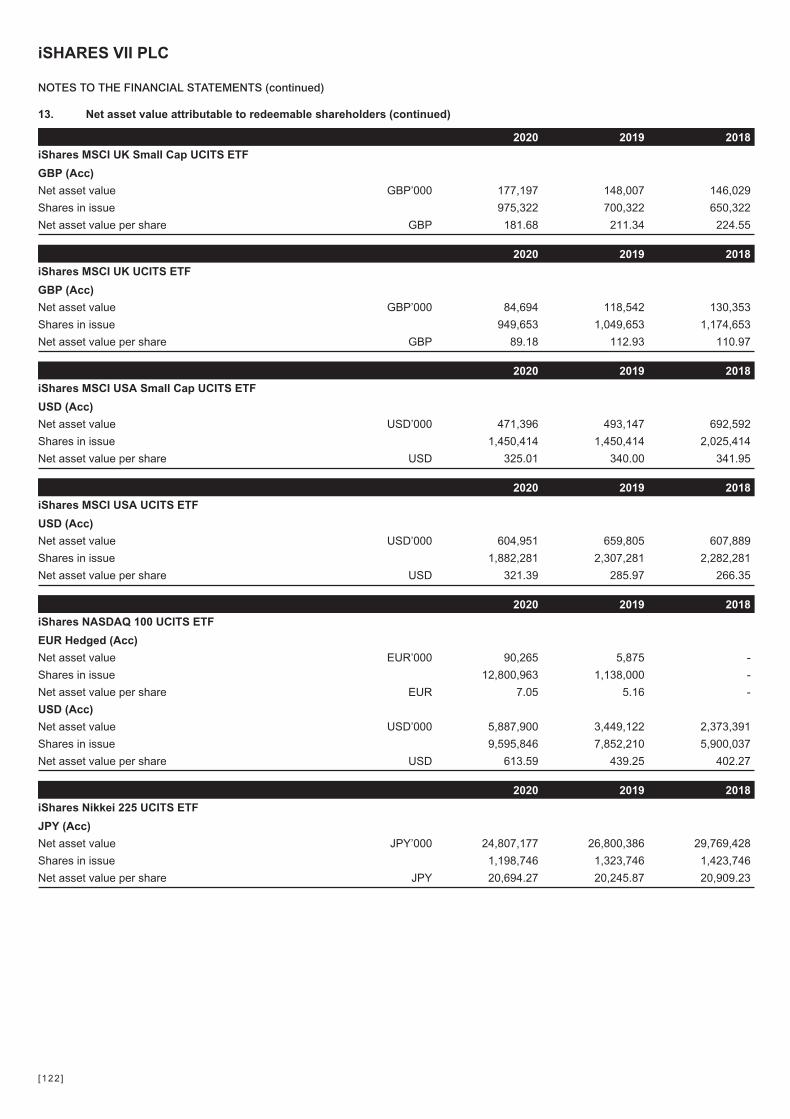
13. Net asset value attributable to redeemable shareholders (continued)
2020 2019 2018
iShares MSCI UK Small Cap UCITS ETF
GBP (Acc)
Net asset value GBP’000 177,197 148,007 146,029
Shares in issue 975,322 700,322 650,322
Net asset value per share GBP 181.68 211.34 224.55
2020 2019 2018
iShares MSCI UK UCITS ETF
GBP (Acc)
Net asset value GBP’000 84,694 118,542 130,353
Shares in issue 949,653 1,049,653 1,174,653
Net asset value per share GBP 89.18 112.93 110.97
2020 2019 2018
iShares MSCI USA Small Cap UCITS ETF
USD (Acc)
Net asset value USD’000 471,396 493,147 692,592
Shares in issue 1,450,414 1,450,414 2,025,414
Net asset value per share USD 325.01 340.00 341.95
2020 2019 2018
iShares MSCI USA UCITS ETF
USD (Acc)
Net asset value USD’000 604,951 659,805 607,889
Shares in issue 1,882,281 2,307,281 2,282,281
Net asset value per share USD 321.39 285.97 266.35
2020 2019 2018
iShares NASDAQ 100 UCITS ETF
EUR Hedged (Acc)
Net asset value EUR’000 90,265 5,875 -
Shares in issue 12,800,963 1,138,000 -
Net asset value per share EUR 7.05 5.16 -
USD (Acc)
Net asset value USD’000 5,887,900 3,449,122 2,373,391
Shares in issue 9,595,846 7,852,210 5,900,037
Net asset value per share USD 613.59 439.25 402.27
2020 2019 2018
iShares Nikkei 225 UCITS ETF
JPY (Acc)
Net asset value JPY’000 24,807,177 26,800,386 29,769,428
Shares in issue 1,198,746 1,323,746 1,423,746
Net asset value per share JPY 20,694.27 20,245.87 20,909.23
iSHARES VII PLC
NOTES TO THE FINANCIAL STATEMENTS (continued)
[122 ]
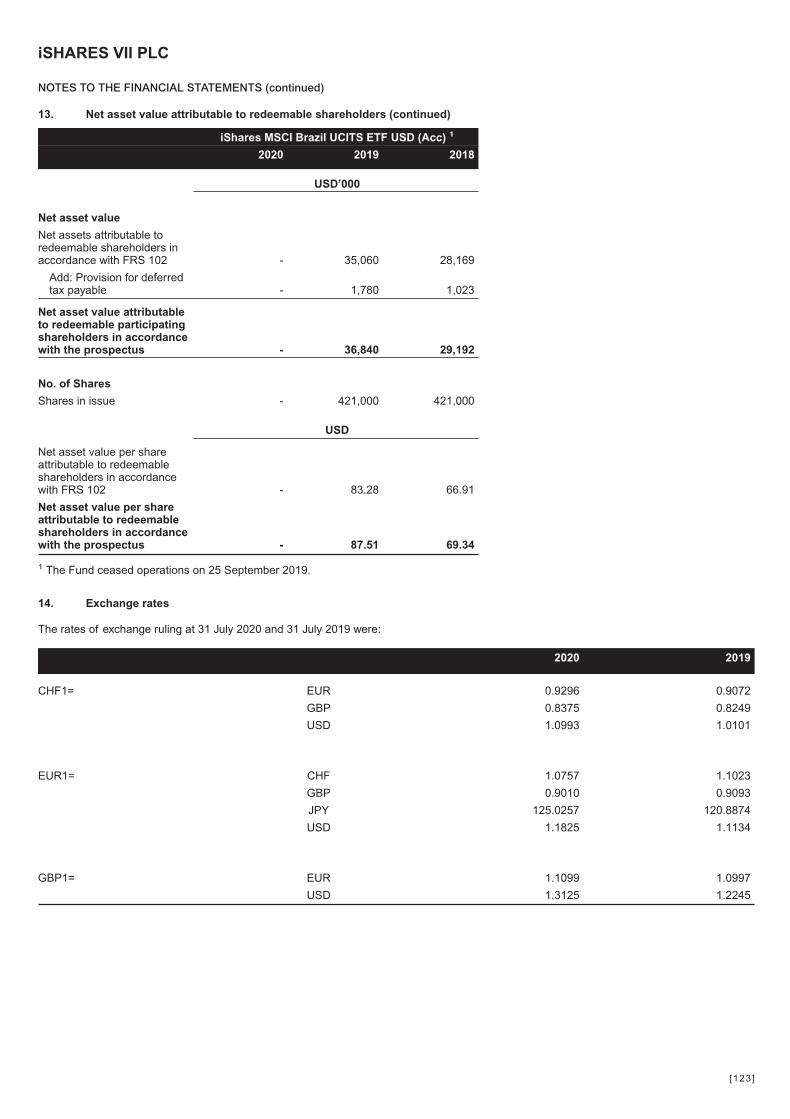
13. Net asset value attributable to redeemable shareholders (continued)
iShares MSCI Brazil UCITS ETF USD (Acc) 1
2020 2019 2018
USD’000
Net asset value
Net assets attributable toredeemable shareholders inaccordance with FRS 102 - 35,060 28,169
Add: Provision for deferredtax payable - 1,780 1,023
Net asset value attributableto redeemable participatingshareholders in accordancewith the prospectus - 36,840 29,192
No. of Shares
Shares in issue - 421,000 421,000
USD
Net asset value per shareattributable to redeemableshareholders in accordancewith FRS 102 - 83.28 66.91
Net asset value per shareattributable to redeemableshareholders in accordancewith the prospectus - 87.51 69.34
1 The Fund ceased operations on 25 September 2019.
14. Exchange rates
The rates of exchange ruling at 31 July 2020 and 31 July 2019 were:
2020 2019
CHF1= EUR 0.9296 0.9072
GBP 0.8375 0.8249
USD 1.0993 1.0101
EUR1= CHF 1.0757 1.1023
GBP 0.9010 0.9093
JPY 125.0257 120.8874
USD 1.1825 1.1134
GBP1= EUR 1.1099 1.0997
USD 1.3125 1.2245
iSHARES VII PLC
NOTES TO THE FINANCIAL STATEMENTS (continued)
[123 ]
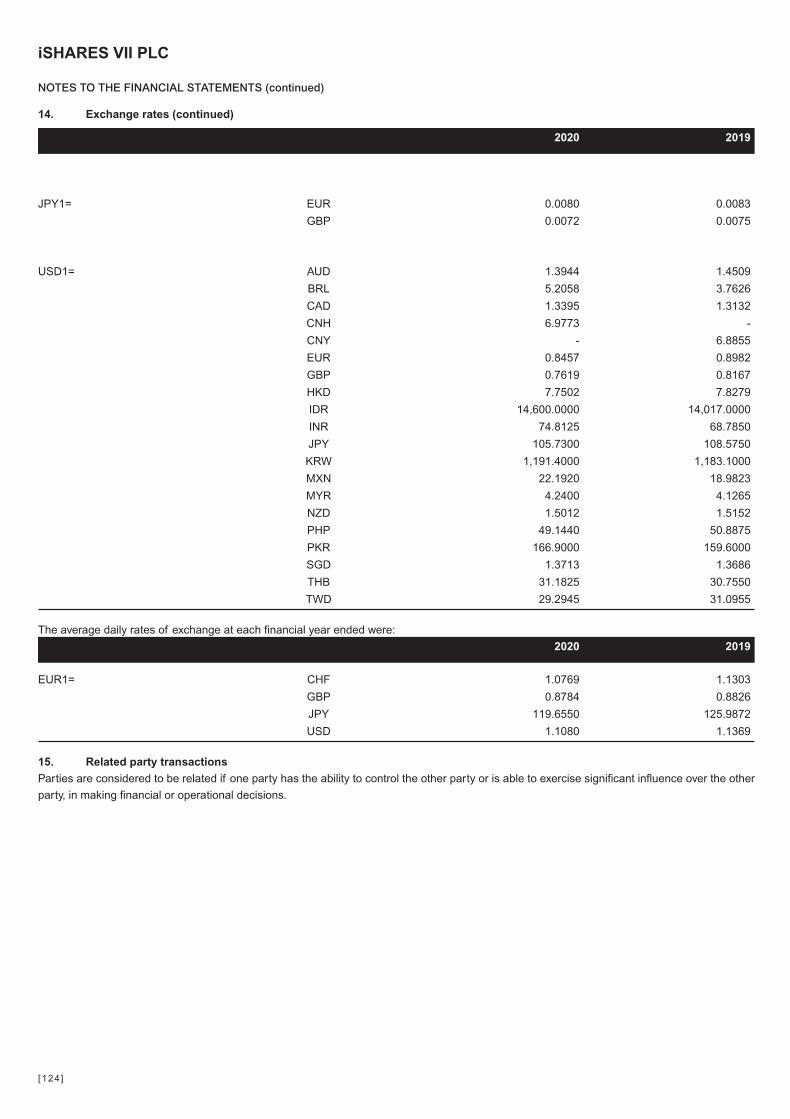
14. Exchange rates (continued)
2020 2019
JPY1= EUR 0.0080 0.0083
GBP 0.0072 0.0075
USD1= AUD 1.3944 1.4509
BRL 5.2058 3.7626
CAD 1.3395 1.3132
CNH 6.9773 -
CNY - 6.8855
EUR 0.8457 0.8982
GBP 0.7619 0.8167
HKD 7.7502 7.8279
IDR 14,600.0000 14,017.0000
INR 74.8125 68.7850
JPY 105.7300 108.5750
KRW 1,191.4000 1,183.1000
MXN 22.1920 18.9823
MYR 4.2400 4.1265
NZD 1.5012 1.5152
PHP 49.1440 50.8875
PKR 166.9000 159.6000
SGD 1.3713 1.3686
THB 31.1825 30.7550
TWD 29.2945 31.0955
The average daily rates of exchange at each financial year ended were:
2020 2019
EUR1= CHF 1.0769 1.1303
GBP 0.8784 0.8826
JPY 119.6550 125.9872
USD 1.1080 1.1369
15. Related party transactions
Parties are considered to be related if one party has the ability to control the other party or is able to exercise significant influence over the other
party, in making financial or operational decisions.
iSHARES VII PLC
NOTES TO THE FINANCIAL STATEMENTS (continued)
[124 ]
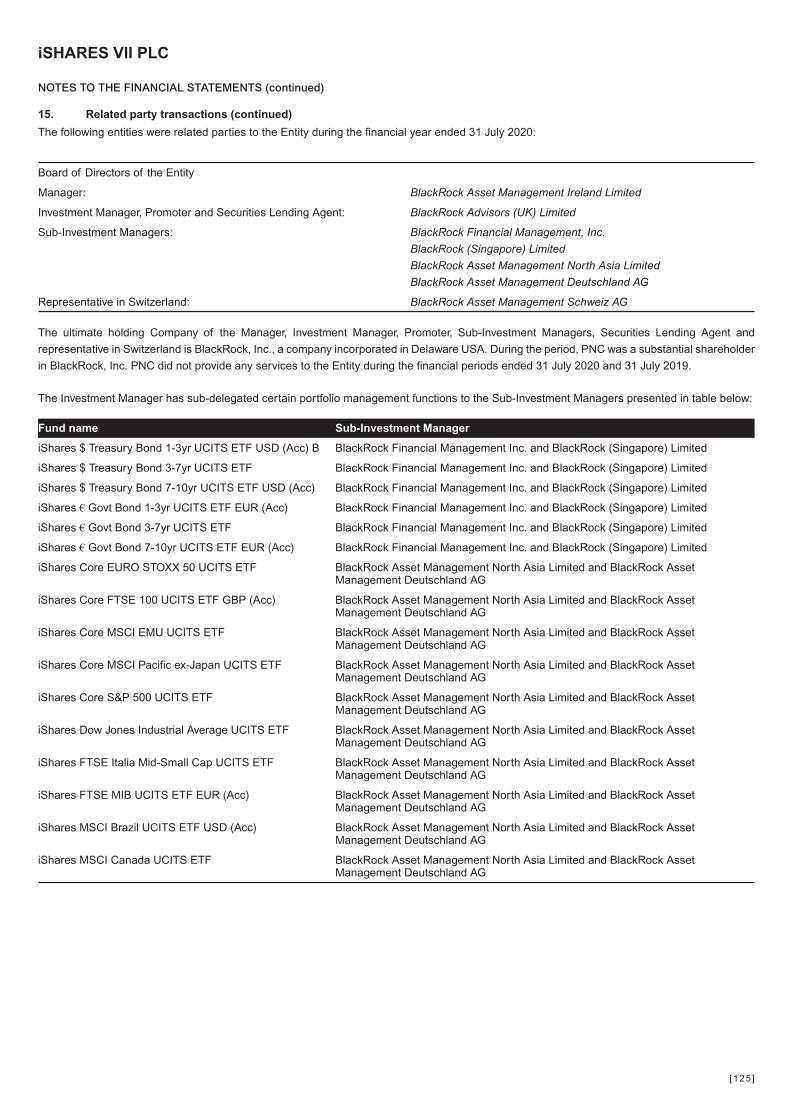
15. Related party transactions (continued)
The following entities were related parties to the Entity during the financial year ended 31 July 2020:
Board of Directors of the Entity
Manager: BlackRock Asset Management Ireland Limited
Investment Manager, Promoter and Securities Lending Agent: BlackRock Advisors (UK) Limited
Sub-Investment Managers: BlackRock Financial Management, Inc.
BlackRock (Singapore) Limited
BlackRock Asset Management North Asia Limited
BlackRock Asset Management Deutschland AG
Representative in Switzerland: BlackRock Asset Management Schweiz AG
The ultimate holding Company of the Manager, Investment Manager, Promoter, Sub-Investment Managers, Securities Lending Agent and
representative in Switzerland is BlackRock, Inc., a company incorporated in Delaware USA. During the period, PNC was a substantial shareholder
in BlackRock, Inc. PNC did not provide any services to the Entity during the financial periods ended 31 July 2020 and 31 July 2019.
The Investment Manager has sub-delegated certain portfolio management functions to the Sub-Investment Managers presented in table below:
Fund name Sub-Investment Manager
iShares $ Treasury Bond 1-3yr UCITS ETF USD (Acc) B BlackRock Financial Management Inc. and BlackRock (Singapore) Limited
iShares $ Treasury Bond 3-7yr UCITS ETF BlackRock Financial Management Inc. and BlackRock (Singapore) Limited
iShares $ Treasury Bond 7-10yr UCITS ETF USD (Acc) BlackRock Financial Management Inc. and BlackRock (Singapore) Limited
iShares € Govt Bond 1-3yr UCITS ETF EUR (Acc) BlackRock Financial Management Inc. and BlackRock (Singapore) Limited
iShares € Govt Bond 3-7yr UCITS ETF BlackRock Financial Management Inc. and BlackRock (Singapore) Limited
iShares € Govt Bond 7-10yr UCITS ETF EUR (Acc) BlackRock Financial Management Inc. and BlackRock (Singapore) Limited
iShares Core EURO STOXX 50 UCITS ETF BlackRock Asset Management North Asia Limited and BlackRock AssetManagement Deutschland AG
iShares Core FTSE 100 UCITS ETF GBP (Acc) BlackRock Asset Management North Asia Limited and BlackRock AssetManagement Deutschland AG
iShares Core MSCI EMU UCITS ETF BlackRock Asset Management North Asia Limited and BlackRock AssetManagement Deutschland AG
iShares Core MSCI Pacific ex-Japan UCITS ETF BlackRock Asset Management North Asia Limited and BlackRock AssetManagement Deutschland AG
iShares Core S&P 500 UCITS ETF BlackRock Asset Management North Asia Limited and BlackRock AssetManagement Deutschland AG
iShares Dow Jones Industrial Average UCITS ETF BlackRock Asset Management North Asia Limited and BlackRock AssetManagement Deutschland AG
iShares FTSE Italia Mid-Small Cap UCITS ETF BlackRock Asset Management North Asia Limited and BlackRock AssetManagement Deutschland AG
iShares FTSE MIB UCITS ETF EUR (Acc) BlackRock Asset Management North Asia Limited and BlackRock AssetManagement Deutschland AG
iShares MSCI Brazil UCITS ETF USD (Acc) BlackRock Asset Management North Asia Limited and BlackRock AssetManagement Deutschland AG
iShares MSCI Canada UCITS ETF BlackRock Asset Management North Asia Limited and BlackRock AssetManagement Deutschland AG
iSHARES VII PLC
NOTES TO THE FINANCIAL STATEMENTS (continued)
[125 ]
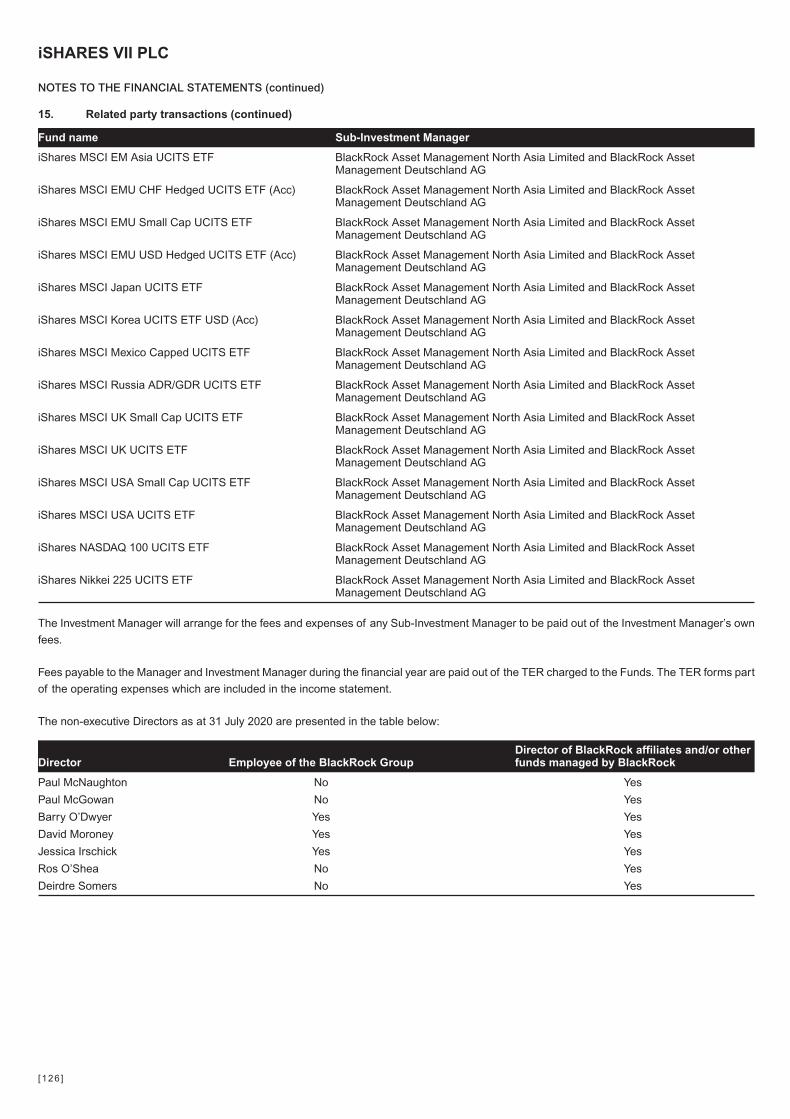
15. Related party transactions (continued)
Fund name Sub-Investment Manager
iShares MSCI EM Asia UCITS ETF BlackRock Asset Management North Asia Limited and BlackRock AssetManagement Deutschland AG
iShares MSCI EMU CHF Hedged UCITS ETF (Acc) BlackRock Asset Management North Asia Limited and BlackRock AssetManagement Deutschland AG
iShares MSCI EMU Small Cap UCITS ETF BlackRock Asset Management North Asia Limited and BlackRock AssetManagement Deutschland AG
iShares MSCI EMU USD Hedged UCITS ETF (Acc) BlackRock Asset Management North Asia Limited and BlackRock AssetManagement Deutschland AG
iShares MSCI Japan UCITS ETF BlackRock Asset Management North Asia Limited and BlackRock AssetManagement Deutschland AG
iShares MSCI Korea UCITS ETF USD (Acc) BlackRock Asset Management North Asia Limited and BlackRock AssetManagement Deutschland AG
iShares MSCI Mexico Capped UCITS ETF BlackRock Asset Management North Asia Limited and BlackRock AssetManagement Deutschland AG
iShares MSCI Russia ADR/GDR UCITS ETF BlackRock Asset Management North Asia Limited and BlackRock AssetManagement Deutschland AG
iShares MSCI UK Small Cap UCITS ETF BlackRock Asset Management North Asia Limited and BlackRock AssetManagement Deutschland AG
iShares MSCI UK UCITS ETF BlackRock Asset Management North Asia Limited and BlackRock AssetManagement Deutschland AG
iShares MSCI USA Small Cap UCITS ETF BlackRock Asset Management North Asia Limited and BlackRock AssetManagement Deutschland AG
iShares MSCI USA UCITS ETF BlackRock Asset Management North Asia Limited and BlackRock AssetManagement Deutschland AG
iShares NASDAQ 100 UCITS ETF BlackRock Asset Management North Asia Limited and BlackRock AssetManagement Deutschland AG
iShares Nikkei 225 UCITS ETF BlackRock Asset Management North Asia Limited and BlackRock AssetManagement Deutschland AG
The Investment Manager will arrange for the fees and expenses of any Sub-Investment Manager to be paid out of the Investment Manager’s own
fees.
Fees payable to the Manager and Investment Manager during the financial year are paid out of the TER charged to the Funds. The TER forms part
of the operating expenses which are included in the income statement.
The non-executive Directors as at 31 July 2020 are presented in the table below:
Director Employee of the BlackRock GroupDirector of BlackRock affiliates and/or otherfunds managed by BlackRock
Paul McNaughton No Yes
Paul McGowan No Yes
Barry O’Dwyer Yes Yes
David Moroney Yes Yes
Jessica Irschick Yes Yes
Ros O’Shea No Yes
Deirdre Somers No Yes
iSHARES VII PLC
NOTES TO THE FINANCIAL STATEMENTS (continued)
[126 ]
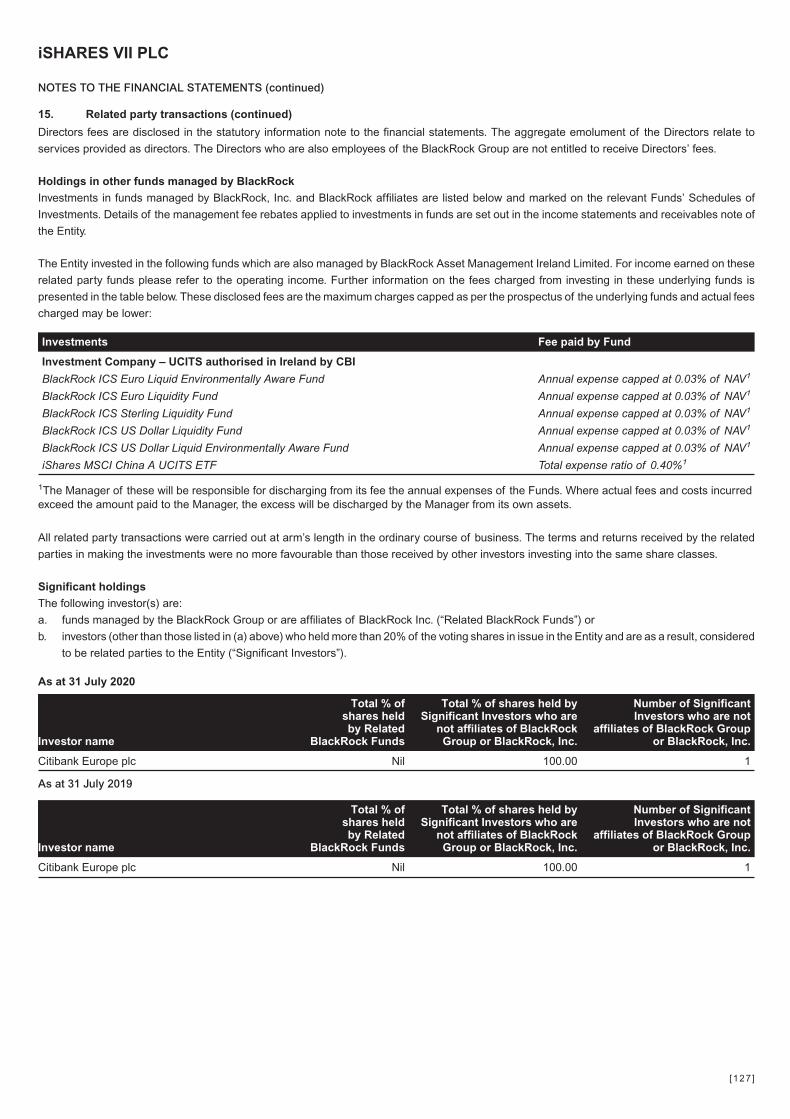
15. Related party transactions (continued)
Directors fees are disclosed in the statutory information note to the financial statements. The aggregate emolument of the Directors relate to
services provided as directors. The Directors who are also employees of the BlackRock Group are not entitled to receive Directors’ fees.
Holdings in other funds managed by BlackRock
Investments in funds managed by BlackRock, Inc. and BlackRock affiliates are listed below and marked on the relevant Funds’ Schedules of
Investments. Details of the management fee rebates applied to investments in funds are set out in the income statements and receivables note of
the Entity.
The Entity invested in the following funds which are also managed by BlackRock Asset Management Ireland Limited. For income earned on these
related party funds please refer to the operating income. Further information on the fees charged from investing in these underlying funds is
presented in the table below. These disclosed fees are the maximum charges capped as per the prospectus of the underlying funds and actual fees
charged may be lower:
Investments Fee paid by Fund
Investment Company – UCITS authorised in Ireland by CBI
BlackRock ICS Euro Liquid Environmentally Aware Fund Annual expense capped at 0.03% of NAV1
BlackRock ICS Euro Liquidity Fund Annual expense capped at 0.03% of NAV1
BlackRock ICS Sterling Liquidity Fund Annual expense capped at 0.03% of NAV1
BlackRock ICS US Dollar Liquidity Fund Annual expense capped at 0.03% of NAV1
BlackRock ICS US Dollar Liquid Environmentally Aware Fund Annual expense capped at 0.03% of NAV1
iShares MSCI China A UCITS ETF Total expense ratio of 0.40%1
1The Manager of these will be responsible for discharging from its fee the annual expenses of the Funds. Where actual fees and costs incurredexceed the amount paid to the Manager, the excess will be discharged by the Manager from its own assets.
All related party transactions were carried out at arm’s length in the ordinary course of business. The terms and returns received by the related
parties in making the investments were no more favourable than those received by other investors investing into the same share classes.
Significant holdings
The following investor(s) are:
a. funds managed by the BlackRock Group or are affiliates of BlackRock Inc. (“Related BlackRock Funds”) or
b. investors (other than those listed in (a) above) who held more than 20% of the voting shares in issue in the Entity and are as a result, considered
to be related parties to the Entity (“Significant Investors”).
As at 31 July 2020
Investor name
Total % ofshares heldby Related
BlackRock Funds
Total % of shares held bySignificant Investors who are
not affiliates of BlackRockGroup or BlackRock, Inc.
Number of SignificantInvestors who are not
affiliates of BlackRock Groupor BlackRock, Inc.
Citibank Europe plc Nil 100.00 1
As at 31 July 2019
Investor name
Total % ofshares heldby Related
BlackRock Funds
Total % of shares held bySignificant Investors who are
not affiliates of BlackRockGroup or BlackRock, Inc.
Number of SignificantInvestors who are not
affiliates of BlackRock Groupor BlackRock, Inc.
Citibank Europe plc Nil 100.00 1
iSHARES VII PLC
NOTES TO THE FINANCIAL STATEMENTS (continued)
[127 ]
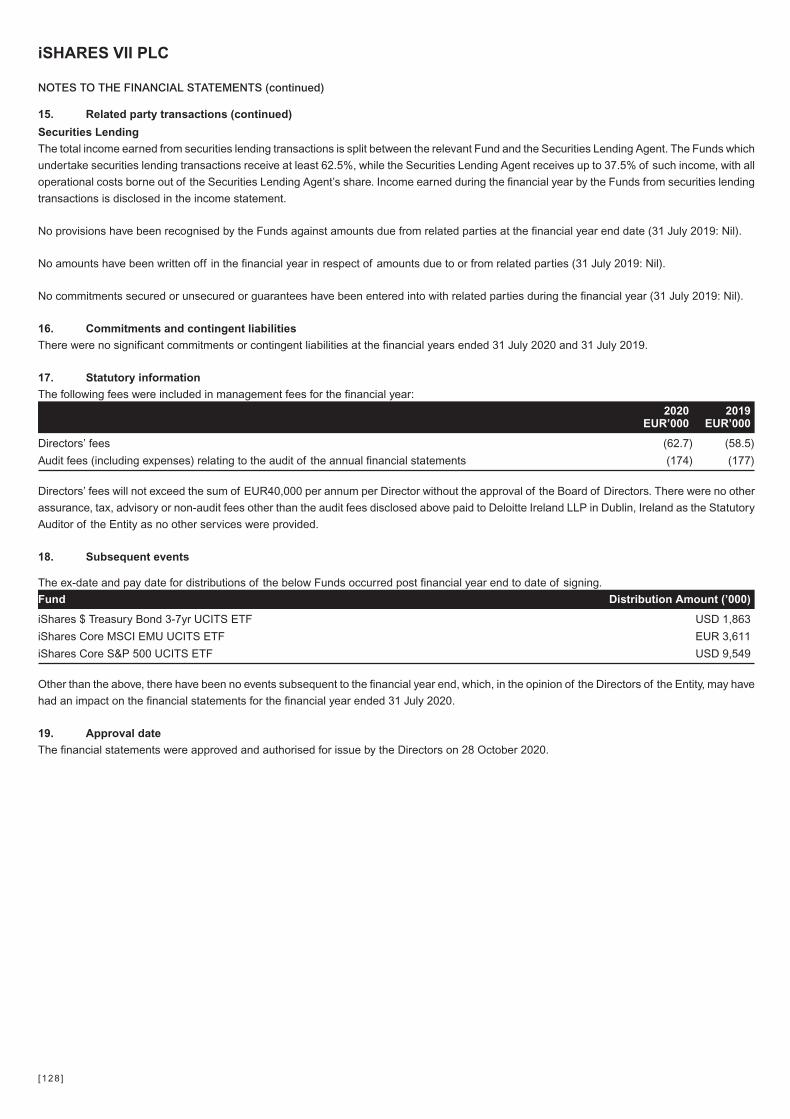
15. Related party transactions (continued)
Securities Lending
The total income earned from securities lending transactions is split between the relevant Fund and the Securities Lending Agent. The Funds which
undertake securities lending transactions receive at least 62.5%, while the Securities Lending Agent receives up to 37.5% of such income, with all
operational costs borne out of the Securities Lending Agent’s share. Income earned during the financial year by the Funds from securities lending
transactions is disclosed in the income statement.
No provisions have been recognised by the Funds against amounts due from related parties at the financial year end date (31 July 2019: Nil).
No amounts have been written off in the financial year in respect of amounts due to or from related parties (31 July 2019: Nil).
No commitments secured or unsecured or guarantees have been entered into with related parties during the financial year (31 July 2019: Nil).
16. Commitments and contingent liabilities
There were no significant commitments or contingent liabilities at the financial years ended 31 July 2020 and 31 July 2019.
17. Statutory information
The following fees were included in management fees for the financial year:
2020EUR’000
2019EUR’000
Directors’ fees (62.7) (58.5)
Audit fees (including expenses) relating to the audit of the annual financial statements (174) (177)
Directors’ fees will not exceed the sum of EUR40,000 per annum per Director without the approval of the Board of Directors. There were no other
assurance, tax, advisory or non-audit fees other than the audit fees disclosed above paid to Deloitte Ireland LLP in Dublin, Ireland as the Statutory
Auditor of the Entity as no other services were provided.
18. Subsequent events
The ex-date and pay date for distributions of the below Funds occurred post financial year end to date of signing.
Fund Distribution Amount (’000)
iShares $ Treasury Bond 3-7yr UCITS ETF USD 1,863
iShares Core MSCI EMU UCITS ETF EUR 3,611
iShares Core S&P 500 UCITS ETF USD 9,549
Other than the above, there have been no events subsequent to the financial year end, which, in the opinion of the Directors of the Entity, may have
had an impact on the financial statements for the financial year ended 31 July 2020.
19. Approval date
The financial statements were approved and authorised for issue by the Directors on 28 October 2020.
iSHARES VII PLC
NOTES TO THE FINANCIAL STATEMENTS (continued)
[128 ]
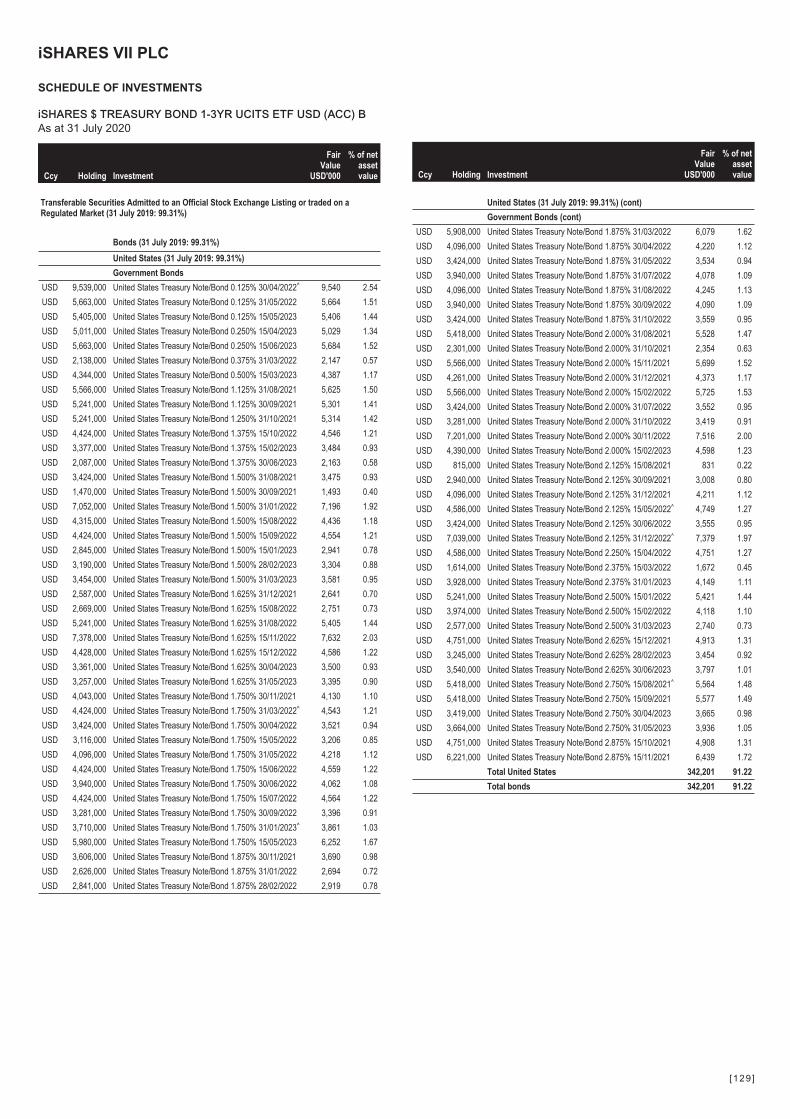
Ccy Holding Investment
FairValue
USD'000
% of netassetvalue
Transferable Securities Admitted to an Official Stock Exchange Listing or traded on aRegulated Market (31 July 2019: 99.31%)
Bonds (31 July 2019: 99.31%)
United States (31 July 2019: 99.31%)
Government Bonds
USD 9,539,000 United States Treasury Note/Bond 0.125% 30/04/2022^ 9,540 2.54
USD 5,663,000 United States Treasury Note/Bond 0.125% 31/05/2022 5,664 1.51
USD 5,405,000 United States Treasury Note/Bond 0.125% 15/05/2023 5,406 1.44
USD 5,011,000 United States Treasury Note/Bond 0.250% 15/04/2023 5,029 1.34
USD 5,663,000 United States Treasury Note/Bond 0.250% 15/06/2023 5,684 1.52
USD 2,138,000 United States Treasury Note/Bond 0.375% 31/03/2022 2,147 0.57
USD 4,344,000 United States Treasury Note/Bond 0.500% 15/03/2023 4,387 1.17
USD 5,566,000 United States Treasury Note/Bond 1.125% 31/08/2021 5,625 1.50
USD 5,241,000 United States Treasury Note/Bond 1.125% 30/09/2021 5,301 1.41
USD 5,241,000 United States Treasury Note/Bond 1.250% 31/10/2021 5,314 1.42
USD 4,424,000 United States Treasury Note/Bond 1.375% 15/10/2022 4,546 1.21
USD 3,377,000 United States Treasury Note/Bond 1.375% 15/02/2023 3,484 0.93
USD 2,087,000 United States Treasury Note/Bond 1.375% 30/06/2023 2,163 0.58
USD 3,424,000 United States Treasury Note/Bond 1.500% 31/08/2021 3,475 0.93
USD 1,470,000 United States Treasury Note/Bond 1.500% 30/09/2021 1,493 0.40
USD 7,052,000 United States Treasury Note/Bond 1.500% 31/01/2022 7,196 1.92
USD 4,315,000 United States Treasury Note/Bond 1.500% 15/08/2022 4,436 1.18
USD 4,424,000 United States Treasury Note/Bond 1.500% 15/09/2022 4,554 1.21
USD 2,845,000 United States Treasury Note/Bond 1.500% 15/01/2023 2,941 0.78
USD 3,190,000 United States Treasury Note/Bond 1.500% 28/02/2023 3,304 0.88
USD 3,454,000 United States Treasury Note/Bond 1.500% 31/03/2023 3,581 0.95
USD 2,587,000 United States Treasury Note/Bond 1.625% 31/12/2021 2,641 0.70
USD 2,669,000 United States Treasury Note/Bond 1.625% 15/08/2022 2,751 0.73
USD 5,241,000 United States Treasury Note/Bond 1.625% 31/08/2022 5,405 1.44
USD 7,378,000 United States Treasury Note/Bond 1.625% 15/11/2022 7,632 2.03
USD 4,428,000 United States Treasury Note/Bond 1.625% 15/12/2022 4,586 1.22
USD 3,361,000 United States Treasury Note/Bond 1.625% 30/04/2023 3,500 0.93
USD 3,257,000 United States Treasury Note/Bond 1.625% 31/05/2023 3,395 0.90
USD 4,043,000 United States Treasury Note/Bond 1.750% 30/11/2021 4,130 1.10
USD 4,424,000 United States Treasury Note/Bond 1.750% 31/03/2022^ 4,543 1.21
USD 3,424,000 United States Treasury Note/Bond 1.750% 30/04/2022 3,521 0.94
USD 3,116,000 United States Treasury Note/Bond 1.750% 15/05/2022 3,206 0.85
USD 4,096,000 United States Treasury Note/Bond 1.750% 31/05/2022 4,218 1.12
USD 4,424,000 United States Treasury Note/Bond 1.750% 15/06/2022 4,559 1.22
USD 3,940,000 United States Treasury Note/Bond 1.750% 30/06/2022 4,062 1.08
USD 4,424,000 United States Treasury Note/Bond 1.750% 15/07/2022 4,564 1.22
USD 3,281,000 United States Treasury Note/Bond 1.750% 30/09/2022 3,396 0.91
USD 3,710,000 United States Treasury Note/Bond 1.750% 31/01/2023^ 3,861 1.03
USD 5,980,000 United States Treasury Note/Bond 1.750% 15/05/2023 6,252 1.67
USD 3,606,000 United States Treasury Note/Bond 1.875% 30/11/2021 3,690 0.98
USD 2,626,000 United States Treasury Note/Bond 1.875% 31/01/2022 2,694 0.72
USD 2,841,000 United States Treasury Note/Bond 1.875% 28/02/2022 2,919 0.78
Ccy Holding Investment
FairValue
USD'000
% of netassetvalue
United States (31 July 2019: 99.31%) (cont)
Government Bonds (cont)
USD 5,908,000 United States Treasury Note/Bond 1.875% 31/03/2022 6,079 1.62
USD 4,096,000 United States Treasury Note/Bond 1.875% 30/04/2022 4,220 1.12
USD 3,424,000 United States Treasury Note/Bond 1.875% 31/05/2022 3,534 0.94
USD 3,940,000 United States Treasury Note/Bond 1.875% 31/07/2022 4,078 1.09
USD 4,096,000 United States Treasury Note/Bond 1.875% 31/08/2022 4,245 1.13
USD 3,940,000 United States Treasury Note/Bond 1.875% 30/09/2022 4,090 1.09
USD 3,424,000 United States Treasury Note/Bond 1.875% 31/10/2022 3,559 0.95
USD 5,418,000 United States Treasury Note/Bond 2.000% 31/08/2021 5,528 1.47
USD 2,301,000 United States Treasury Note/Bond 2.000% 31/10/2021 2,354 0.63
USD 5,566,000 United States Treasury Note/Bond 2.000% 15/11/2021 5,699 1.52
USD 4,261,000 United States Treasury Note/Bond 2.000% 31/12/2021 4,373 1.17
USD 5,566,000 United States Treasury Note/Bond 2.000% 15/02/2022 5,725 1.53
USD 3,424,000 United States Treasury Note/Bond 2.000% 31/07/2022 3,552 0.95
USD 3,281,000 United States Treasury Note/Bond 2.000% 31/10/2022 3,419 0.91
USD 7,201,000 United States Treasury Note/Bond 2.000% 30/11/2022 7,516 2.00
USD 4,390,000 United States Treasury Note/Bond 2.000% 15/02/2023 4,598 1.23
USD 815,000 United States Treasury Note/Bond 2.125% 15/08/2021 831 0.22
USD 2,940,000 United States Treasury Note/Bond 2.125% 30/09/2021 3,008 0.80
USD 4,096,000 United States Treasury Note/Bond 2.125% 31/12/2021 4,211 1.12
USD 4,586,000 United States Treasury Note/Bond 2.125% 15/05/2022^ 4,749 1.27
USD 3,424,000 United States Treasury Note/Bond 2.125% 30/06/2022 3,555 0.95
USD 7,039,000 United States Treasury Note/Bond 2.125% 31/12/2022^ 7,379 1.97
USD 4,586,000 United States Treasury Note/Bond 2.250% 15/04/2022 4,751 1.27
USD 1,614,000 United States Treasury Note/Bond 2.375% 15/03/2022 1,672 0.45
USD 3,928,000 United States Treasury Note/Bond 2.375% 31/01/2023 4,149 1.11
USD 5,241,000 United States Treasury Note/Bond 2.500% 15/01/2022 5,421 1.44
USD 3,974,000 United States Treasury Note/Bond 2.500% 15/02/2022 4,118 1.10
USD 2,577,000 United States Treasury Note/Bond 2.500% 31/03/2023 2,740 0.73
USD 4,751,000 United States Treasury Note/Bond 2.625% 15/12/2021 4,913 1.31
USD 3,245,000 United States Treasury Note/Bond 2.625% 28/02/2023 3,454 0.92
USD 3,540,000 United States Treasury Note/Bond 2.625% 30/06/2023 3,797 1.01
USD 5,418,000 United States Treasury Note/Bond 2.750% 15/08/2021^ 5,564 1.48
USD 5,418,000 United States Treasury Note/Bond 2.750% 15/09/2021 5,577 1.49
USD 3,419,000 United States Treasury Note/Bond 2.750% 30/04/2023 3,665 0.98
USD 3,664,000 United States Treasury Note/Bond 2.750% 31/05/2023 3,936 1.05
USD 4,751,000 United States Treasury Note/Bond 2.875% 15/10/2021 4,908 1.31
USD 6,221,000 United States Treasury Note/Bond 2.875% 15/11/2021 6,439 1.72
Total United States 342,201 91.22
Total bonds 342,201 91.22
iSHARES VII PLC
SCHEDULE OF INVESTMENTS
iSHARES $ TREASURY BOND 1-3YR UCITS ETF USD (ACC) BAs at 31 July 2020
[129 ]
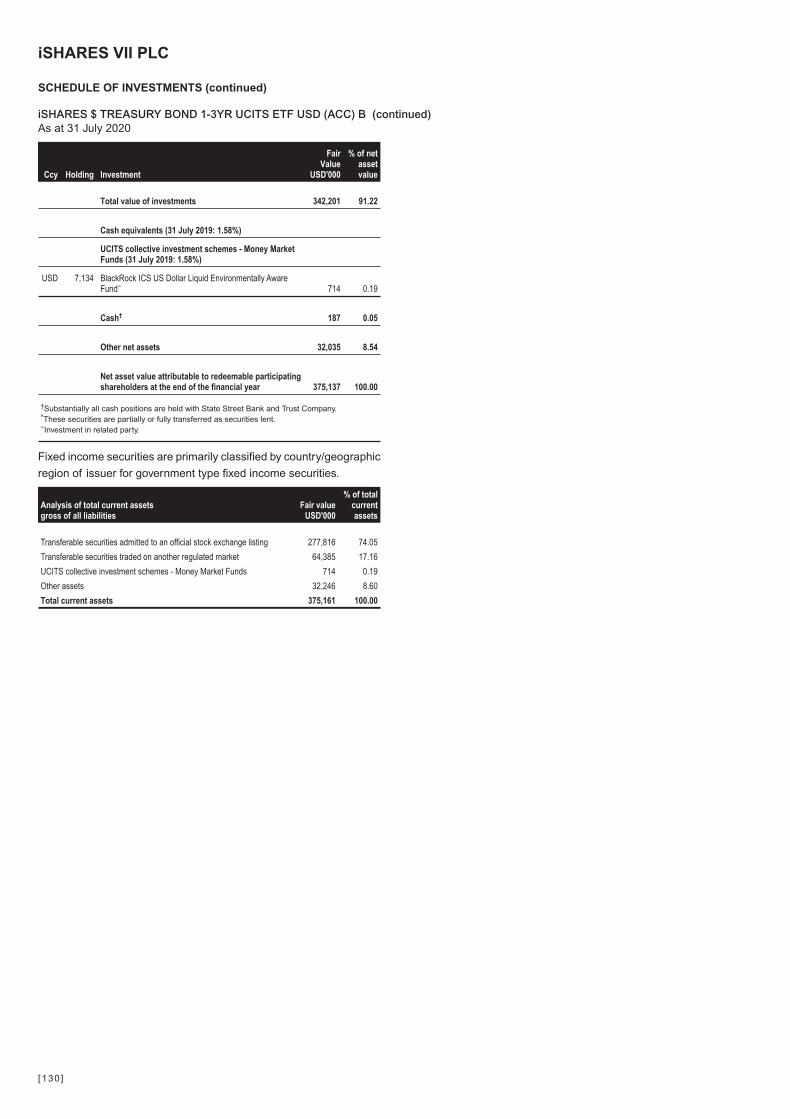
Ccy Holding Investment
FairValue
USD'000
% of netassetvalue
Total value of investments 342,201 91.22
Cash equivalents (31 July 2019: 1.58%)
UCITS collective investment schemes - Money MarketFunds (31 July 2019: 1.58%)
USD 7,134 BlackRock ICS US Dollar Liquid Environmentally AwareFund~ 714 0.19
Cash† 187 0.05
Other net assets 32,035 8.54
Net asset value attributable to redeemable participatingshareholders at the end of the financial year 375,137 100.00
†Substantially all cash positions are held with State Street Bank and Trust Company.^These securities are partially or fully transferred as securities lent.~Investment in related party.
Fixed income securities are primarily classified by country/geographic
region of issuer for government type fixed income securities.
Analysis of total current assetsgross of all liabilities
Fair valueUSD'000
% of totalcurrentassets
Transferable securities admitted to an official stock exchange listing 277,816 74.05
Transferable securities traded on another regulated market 64,385 17.16
UCITS collective investment schemes - Money Market Funds 714 0.19
Other assets 32,246 8.60
Total current assets 375,161 100.00
iSHARES VII PLC
SCHEDULE OF INVESTMENTS (continued)
iSHARES $ TREASURY BOND 1-3YR UCITS ETF USD (ACC) B (continued)As at 31 July 2020
[130 ]
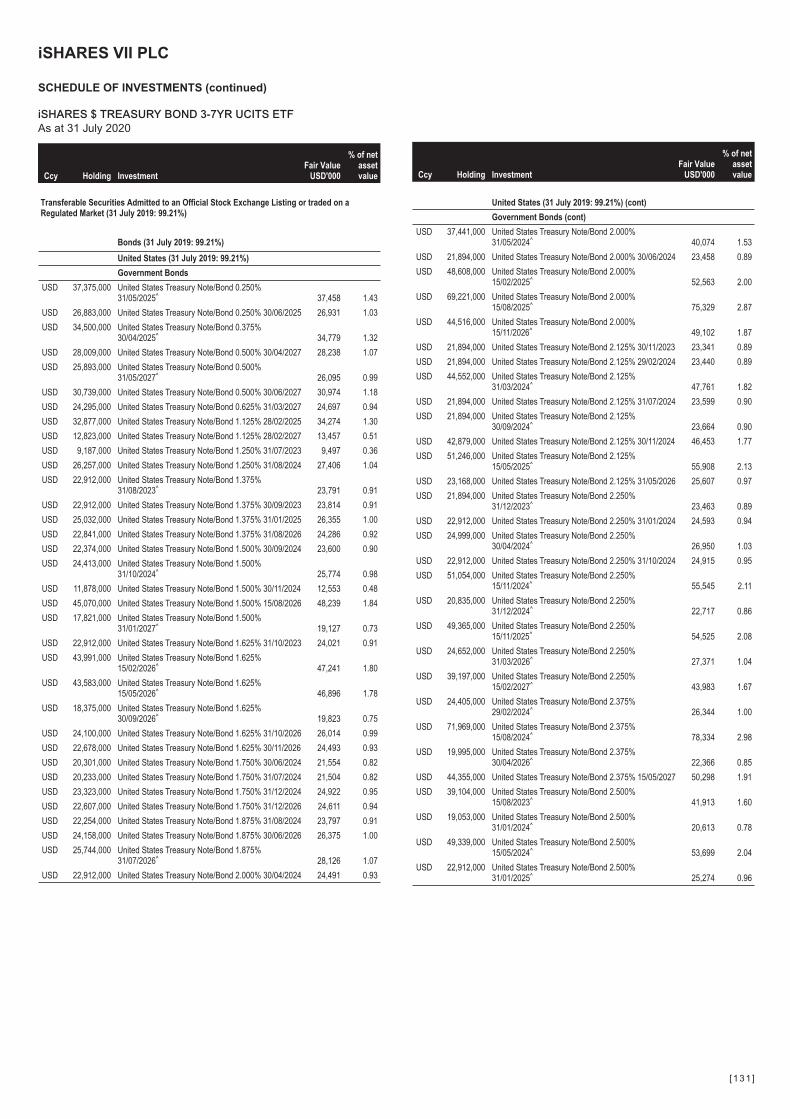
Ccy Holding InvestmentFair Value
USD'000
% of netassetvalue
Transferable Securities Admitted to an Official Stock Exchange Listing or traded on aRegulated Market (31 July 2019: 99.21%)
Bonds (31 July 2019: 99.21%)
United States (31 July 2019: 99.21%)
Government Bonds
USD 37,375,000 United States Treasury Note/Bond 0.250%31/05/2025^ 37,458 1.43
USD 26,883,000 United States Treasury Note/Bond 0.250% 30/06/2025 26,931 1.03
USD 34,500,000 United States Treasury Note/Bond 0.375%30/04/2025^ 34,779 1.32
USD 28,009,000 United States Treasury Note/Bond 0.500% 30/04/2027 28,238 1.07
USD 25,893,000 United States Treasury Note/Bond 0.500%31/05/2027^ 26,095 0.99
USD 30,739,000 United States Treasury Note/Bond 0.500% 30/06/2027 30,974 1.18
USD 24,295,000 United States Treasury Note/Bond 0.625% 31/03/2027 24,697 0.94
USD 32,877,000 United States Treasury Note/Bond 1.125% 28/02/2025 34,274 1.30
USD 12,823,000 United States Treasury Note/Bond 1.125% 28/02/2027 13,457 0.51
USD 9,187,000 United States Treasury Note/Bond 1.250% 31/07/2023 9,497 0.36
USD 26,257,000 United States Treasury Note/Bond 1.250% 31/08/2024 27,406 1.04
USD 22,912,000 United States Treasury Note/Bond 1.375%31/08/2023^ 23,791 0.91
USD 22,912,000 United States Treasury Note/Bond 1.375% 30/09/2023 23,814 0.91
USD 25,032,000 United States Treasury Note/Bond 1.375% 31/01/2025 26,355 1.00
USD 22,841,000 United States Treasury Note/Bond 1.375% 31/08/2026 24,286 0.92
USD 22,374,000 United States Treasury Note/Bond 1.500% 30/09/2024 23,600 0.90
USD 24,413,000 United States Treasury Note/Bond 1.500%31/10/2024^ 25,774 0.98
USD 11,878,000 United States Treasury Note/Bond 1.500% 30/11/2024 12,553 0.48
USD 45,070,000 United States Treasury Note/Bond 1.500% 15/08/2026 48,239 1.84
USD 17,821,000 United States Treasury Note/Bond 1.500%31/01/2027^ 19,127 0.73
USD 22,912,000 United States Treasury Note/Bond 1.625% 31/10/2023 24,021 0.91
USD 43,991,000 United States Treasury Note/Bond 1.625%15/02/2026^ 47,241 1.80
USD 43,583,000 United States Treasury Note/Bond 1.625%15/05/2026^ 46,896 1.78
USD 18,375,000 United States Treasury Note/Bond 1.625%30/09/2026^ 19,823 0.75
USD 24,100,000 United States Treasury Note/Bond 1.625% 31/10/2026 26,014 0.99
USD 22,678,000 United States Treasury Note/Bond 1.625% 30/11/2026 24,493 0.93
USD 20,301,000 United States Treasury Note/Bond 1.750% 30/06/2024 21,554 0.82
USD 20,233,000 United States Treasury Note/Bond 1.750% 31/07/2024 21,504 0.82
USD 23,323,000 United States Treasury Note/Bond 1.750% 31/12/2024 24,922 0.95
USD 22,607,000 United States Treasury Note/Bond 1.750% 31/12/2026 24,611 0.94
USD 22,254,000 United States Treasury Note/Bond 1.875% 31/08/2024 23,797 0.91
USD 24,158,000 United States Treasury Note/Bond 1.875% 30/06/2026 26,375 1.00
USD 25,744,000 United States Treasury Note/Bond 1.875%31/07/2026^ 28,126 1.07
USD 22,912,000 United States Treasury Note/Bond 2.000% 30/04/2024 24,491 0.93
Ccy Holding InvestmentFair Value
USD'000
% of netassetvalue
United States (31 July 2019: 99.21%) (cont)
Government Bonds (cont)
USD 37,441,000 United States Treasury Note/Bond 2.000%31/05/2024^ 40,074 1.53
USD 21,894,000 United States Treasury Note/Bond 2.000% 30/06/2024 23,458 0.89
USD 48,608,000 United States Treasury Note/Bond 2.000%15/02/2025^ 52,563 2.00
USD 69,221,000 United States Treasury Note/Bond 2.000%15/08/2025^ 75,329 2.87
USD 44,516,000 United States Treasury Note/Bond 2.000%15/11/2026^ 49,102 1.87
USD 21,894,000 United States Treasury Note/Bond 2.125% 30/11/2023 23,341 0.89
USD 21,894,000 United States Treasury Note/Bond 2.125% 29/02/2024 23,440 0.89
USD 44,552,000 United States Treasury Note/Bond 2.125%31/03/2024^ 47,761 1.82
USD 21,894,000 United States Treasury Note/Bond 2.125% 31/07/2024 23,599 0.90
USD 21,894,000 United States Treasury Note/Bond 2.125%30/09/2024^ 23,664 0.90
USD 42,879,000 United States Treasury Note/Bond 2.125% 30/11/2024 46,453 1.77
USD 51,246,000 United States Treasury Note/Bond 2.125%15/05/2025^ 55,908 2.13
USD 23,168,000 United States Treasury Note/Bond 2.125% 31/05/2026 25,607 0.97
USD 21,894,000 United States Treasury Note/Bond 2.250%31/12/2023^ 23,463 0.89
USD 22,912,000 United States Treasury Note/Bond 2.250% 31/01/2024 24,593 0.94
USD 24,999,000 United States Treasury Note/Bond 2.250%30/04/2024^ 26,950 1.03
USD 22,912,000 United States Treasury Note/Bond 2.250% 31/10/2024 24,915 0.95
USD 51,054,000 United States Treasury Note/Bond 2.250%15/11/2024^ 55,545 2.11
USD 20,835,000 United States Treasury Note/Bond 2.250%31/12/2024^ 22,717 0.86
USD 49,365,000 United States Treasury Note/Bond 2.250%15/11/2025^ 54,525 2.08
USD 24,652,000 United States Treasury Note/Bond 2.250%31/03/2026^ 27,371 1.04
USD 39,197,000 United States Treasury Note/Bond 2.250%15/02/2027^ 43,983 1.67
USD 24,405,000 United States Treasury Note/Bond 2.375%29/02/2024^ 26,344 1.00
USD 71,969,000 United States Treasury Note/Bond 2.375%15/08/2024^ 78,334 2.98
USD 19,995,000 United States Treasury Note/Bond 2.375%30/04/2026^ 22,366 0.85
USD 44,355,000 United States Treasury Note/Bond 2.375% 15/05/2027 50,298 1.91
USD 39,104,000 United States Treasury Note/Bond 2.500%15/08/2023^ 41,913 1.60
USD 19,053,000 United States Treasury Note/Bond 2.500%31/01/2024^ 20,613 0.78
USD 49,339,000 United States Treasury Note/Bond 2.500%15/05/2024^ 53,699 2.04
USD 22,912,000 United States Treasury Note/Bond 2.500%31/01/2025^ 25,274 0.96
iSHARES VII PLC
SCHEDULE OF INVESTMENTS (continued)
iSHARES $ TREASURY BOND 3-7YR UCITS ETFAs at 31 July 2020
[131 ]
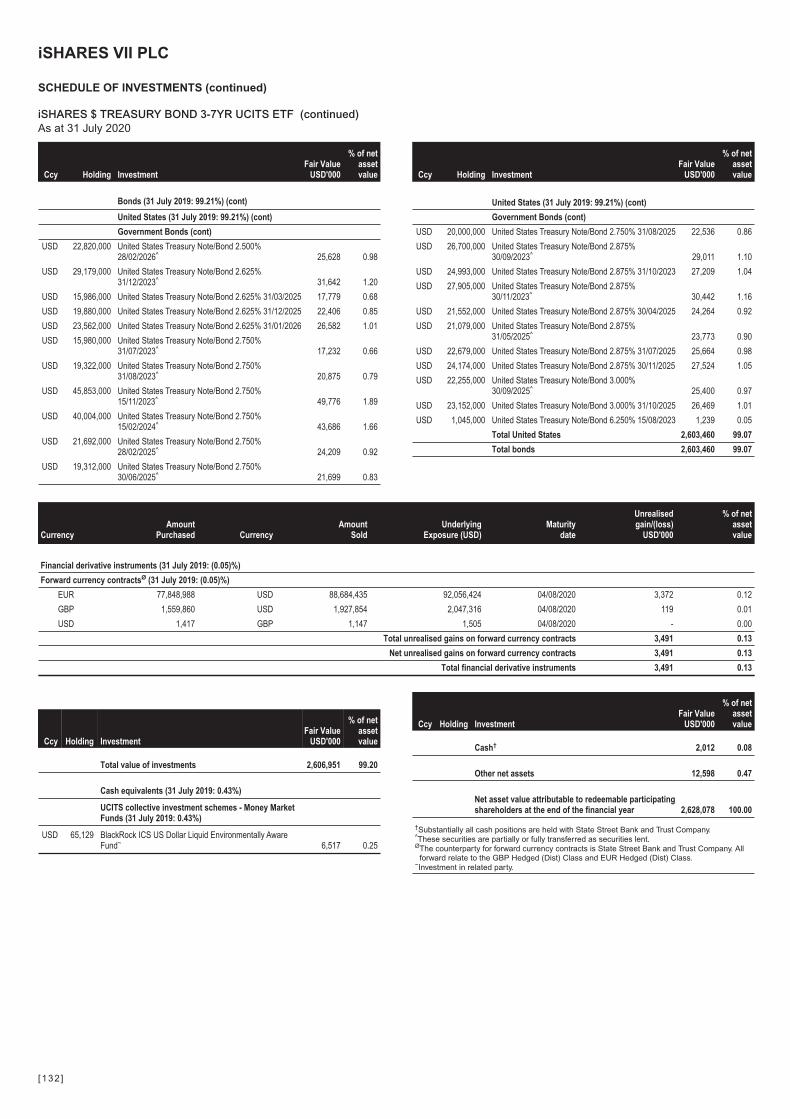
Ccy Holding InvestmentFair Value
USD'000
% of netassetvalue
Bonds (31 July 2019: 99.21%) (cont)
United States (31 July 2019: 99.21%) (cont)
Government Bonds (cont)
USD 22,820,000 United States Treasury Note/Bond 2.500%28/02/2026^ 25,628 0.98
USD 29,179,000 United States Treasury Note/Bond 2.625%31/12/2023^ 31,642 1.20
USD 15,986,000 United States Treasury Note/Bond 2.625% 31/03/2025 17,779 0.68
USD 19,880,000 United States Treasury Note/Bond 2.625% 31/12/2025 22,406 0.85
USD 23,562,000 United States Treasury Note/Bond 2.625% 31/01/2026 26,582 1.01
USD 15,980,000 United States Treasury Note/Bond 2.750%31/07/2023^ 17,232 0.66
USD 19,322,000 United States Treasury Note/Bond 2.750%31/08/2023^ 20,875 0.79
USD 45,853,000 United States Treasury Note/Bond 2.750%15/11/2023^ 49,776 1.89
USD 40,004,000 United States Treasury Note/Bond 2.750%15/02/2024^ 43,686 1.66
USD 21,692,000 United States Treasury Note/Bond 2.750%28/02/2025^ 24,209 0.92
USD 19,312,000 United States Treasury Note/Bond 2.750%30/06/2025^ 21,699 0.83
Ccy Holding InvestmentFair Value
USD'000
% of netassetvalue
United States (31 July 2019: 99.21%) (cont)
Government Bonds (cont)
USD 20,000,000 United States Treasury Note/Bond 2.750% 31/08/2025 22,536 0.86
USD 26,700,000 United States Treasury Note/Bond 2.875%30/09/2023^ 29,011 1.10
USD 24,993,000 United States Treasury Note/Bond 2.875% 31/10/2023 27,209 1.04
USD 27,905,000 United States Treasury Note/Bond 2.875%30/11/2023^ 30,442 1.16
USD 21,552,000 United States Treasury Note/Bond 2.875% 30/04/2025 24,264 0.92
USD 21,079,000 United States Treasury Note/Bond 2.875%31/05/2025^ 23,773 0.90
USD 22,679,000 United States Treasury Note/Bond 2.875% 31/07/2025 25,664 0.98
USD 24,174,000 United States Treasury Note/Bond 2.875% 30/11/2025 27,524 1.05
USD 22,255,000 United States Treasury Note/Bond 3.000%30/09/2025^ 25,400 0.97
USD 23,152,000 United States Treasury Note/Bond 3.000% 31/10/2025 26,469 1.01
USD 1,045,000 United States Treasury Note/Bond 6.250% 15/08/2023 1,239 0.05
Total United States 2,603,460 99.07
Total bonds 2,603,460 99.07
CurrencyAmount
Purchased CurrencyAmount
SoldUnderlying
Exposure (USD)Maturity
date
Unrealisedgain/(loss)
USD'000
% of netassetvalue
Financial derivative instruments (31 July 2019: (0.05)%)
Forward currency contractsØ (31 July 2019: (0.05)%)
EUR 77,848,988 USD 88,684,435 92,056,424 04/08/2020 3,372 0.12
GBP 1,559,860 USD 1,927,854 2,047,316 04/08/2020 119 0.01
USD 1,417 GBP 1,147 1,505 04/08/2020 - 0.00
Total unrealised gains on forward currency contracts 3,491 0.13
Net unrealised gains on forward currency contracts 3,491 0.13
Total financial derivative instruments 3,491 0.13
Ccy Holding InvestmentFair Value
USD'000
% of netassetvalue
Total value of investments 2,606,951 99.20
Cash equivalents (31 July 2019: 0.43%)
UCITS collective investment schemes - Money MarketFunds (31 July 2019: 0.43%)
USD 65,129 BlackRock ICS US Dollar Liquid Environmentally AwareFund~ 6,517 0.25
Ccy Holding InvestmentFair Value
USD'000
% of netassetvalue
Cash† 2,012 0.08
Other net assets 12,598 0.47
Net asset value attributable to redeemable participatingshareholders at the end of the financial year 2,628,078 100.00
†Substantially all cash positions are held with State Street Bank and Trust Company.^These securities are partially or fully transferred as securities lent.ØThe counterparty for forward currency contracts is State Street Bank and Trust Company. All
forward relate to the GBP Hedged (Dist) Class and EUR Hedged (Dist) Class.~Investment in related party.
iSHARES VII PLC
SCHEDULE OF INVESTMENTS (continued)
iSHARES $ TREASURY BOND 3-7YR UCITS ETF (continued)As at 31 July 2020
[132 ]
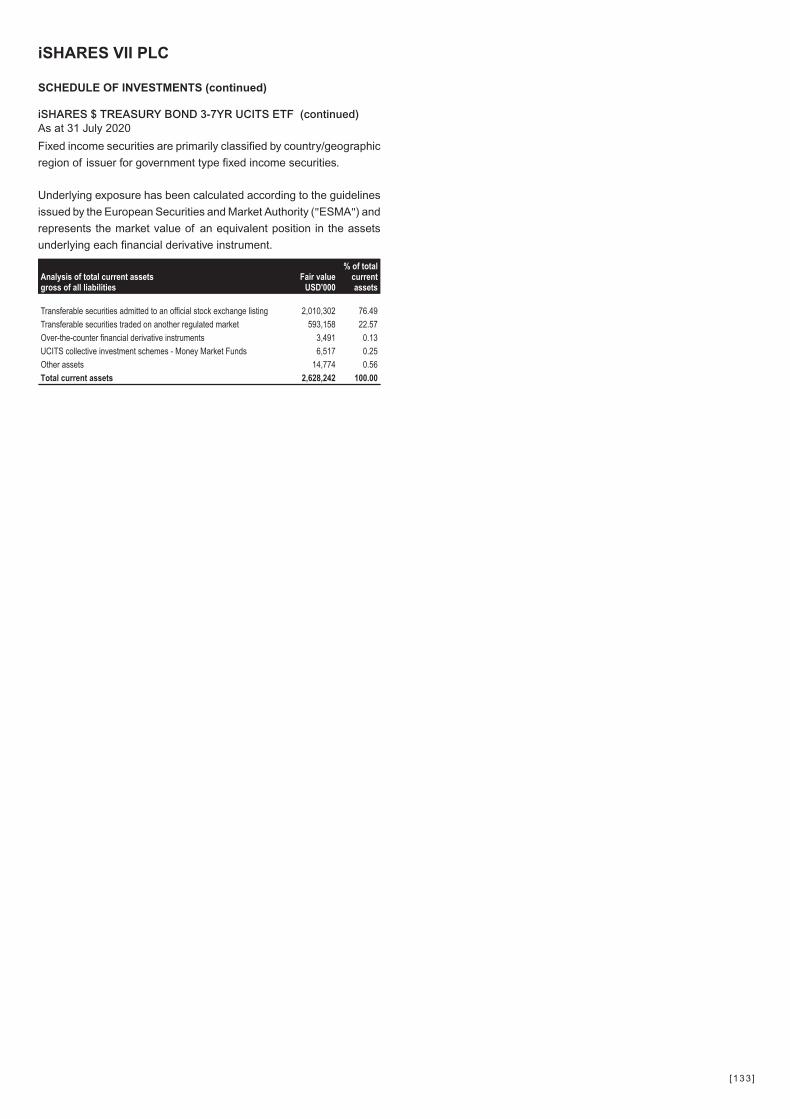
Fixed income securities are primarily classified by country/geographic
region of issuer for government type fixed income securities.
Underlying exposure has been calculated according to the guidelines
issued by the European Securities and Market Authority ("ESMA") and
represents the market value of an equivalent position in the assets
underlying each financial derivative instrument.
Analysis of total current assetsgross of all liabilities
Fair valueUSD'000
% of totalcurrentassets
Transferable securities admitted to an official stock exchange listing 2,010,302 76.49
Transferable securities traded on another regulated market 593,158 22.57
Over-the-counter financial derivative instruments 3,491 0.13
UCITS collective investment schemes - Money Market Funds 6,517 0.25
Other assets 14,774 0.56
Total current assets 2,628,242 100.00
iSHARES VII PLC
SCHEDULE OF INVESTMENTS (continued)
iSHARES $ TREASURY BOND 3-7YR UCITS ETF (continued)As at 31 July 2020
[133 ]
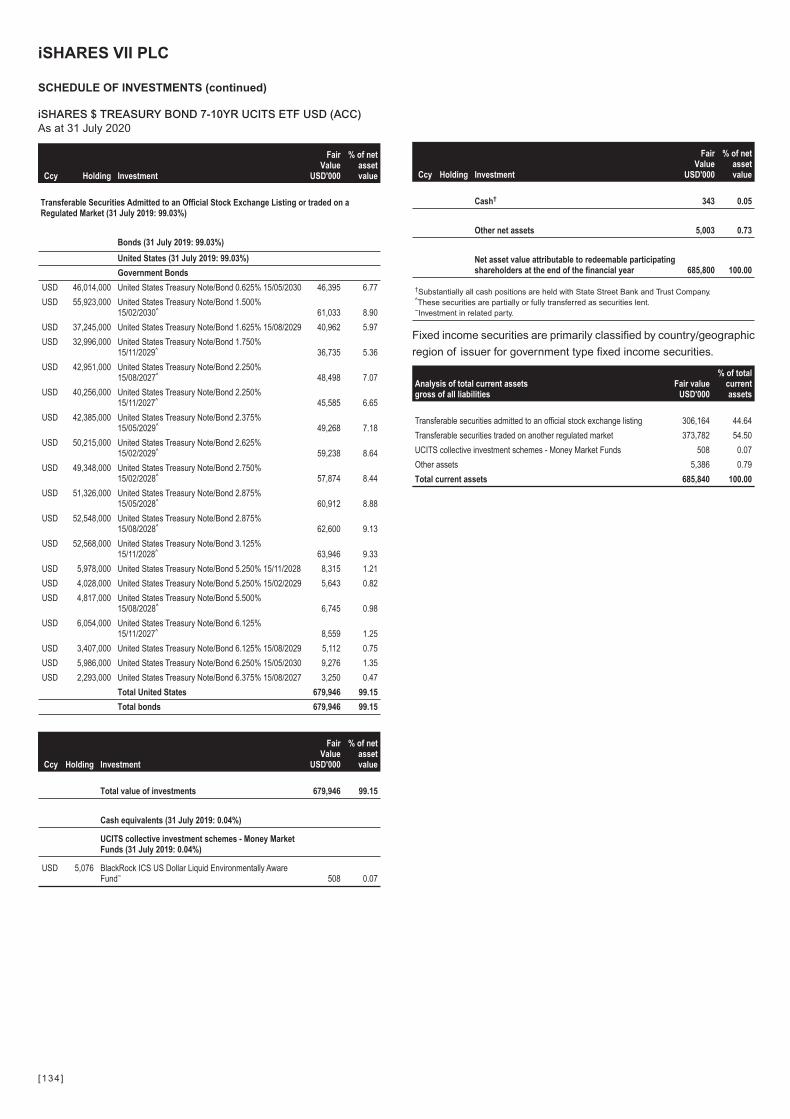
Ccy Holding Investment
FairValue
USD'000
% of netassetvalue
Transferable Securities Admitted to an Official Stock Exchange Listing or traded on aRegulated Market (31 July 2019: 99.03%)
Bonds (31 July 2019: 99.03%)
United States (31 July 2019: 99.03%)
Government Bonds
USD 46,014,000 United States Treasury Note/Bond 0.625% 15/05/2030 46,395 6.77
USD 55,923,000 United States Treasury Note/Bond 1.500%15/02/2030^ 61,033 8.90
USD 37,245,000 United States Treasury Note/Bond 1.625% 15/08/2029 40,962 5.97
USD 32,996,000 United States Treasury Note/Bond 1.750%15/11/2029^ 36,735 5.36
USD 42,951,000 United States Treasury Note/Bond 2.250%15/08/2027^ 48,498 7.07
USD 40,256,000 United States Treasury Note/Bond 2.250%15/11/2027^ 45,585 6.65
USD 42,385,000 United States Treasury Note/Bond 2.375%15/05/2029^ 49,268 7.18
USD 50,215,000 United States Treasury Note/Bond 2.625%15/02/2029^ 59,238 8.64
USD 49,348,000 United States Treasury Note/Bond 2.750%15/02/2028^ 57,874 8.44
USD 51,326,000 United States Treasury Note/Bond 2.875%15/05/2028^ 60,912 8.88
USD 52,548,000 United States Treasury Note/Bond 2.875%15/08/2028^ 62,600 9.13
USD 52,568,000 United States Treasury Note/Bond 3.125%15/11/2028^ 63,946 9.33
USD 5,978,000 United States Treasury Note/Bond 5.250% 15/11/2028 8,315 1.21
USD 4,028,000 United States Treasury Note/Bond 5.250% 15/02/2029 5,643 0.82
USD 4,817,000 United States Treasury Note/Bond 5.500%15/08/2028^ 6,745 0.98
USD 6,054,000 United States Treasury Note/Bond 6.125%15/11/2027^ 8,559 1.25
USD 3,407,000 United States Treasury Note/Bond 6.125% 15/08/2029 5,112 0.75
USD 5,986,000 United States Treasury Note/Bond 6.250% 15/05/2030 9,276 1.35
USD 2,293,000 United States Treasury Note/Bond 6.375% 15/08/2027 3,250 0.47
Total United States 679,946 99.15
Total bonds 679,946 99.15
Ccy Holding Investment
FairValue
USD'000
% of netassetvalue
Total value of investments 679,946 99.15
Cash equivalents (31 July 2019: 0.04%)
UCITS collective investment schemes - Money MarketFunds (31 July 2019: 0.04%)
USD 5,076 BlackRock ICS US Dollar Liquid Environmentally AwareFund~ 508 0.07
Ccy Holding Investment
FairValue
USD'000
% of netassetvalue
Cash† 343 0.05
Other net assets 5,003 0.73
Net asset value attributable to redeemable participatingshareholders at the end of the financial year 685,800 100.00
†Substantially all cash positions are held with State Street Bank and Trust Company.^These securities are partially or fully transferred as securities lent.~Investment in related party.
Fixed income securities are primarily classified by country/geographic
region of issuer for government type fixed income securities.
Analysis of total current assetsgross of all liabilities
Fair valueUSD'000
% of totalcurrentassets
Transferable securities admitted to an official stock exchange listing 306,164 44.64
Transferable securities traded on another regulated market 373,782 54.50
UCITS collective investment schemes - Money Market Funds 508 0.07
Other assets 5,386 0.79
Total current assets 685,840 100.00
iSHARES VII PLC
SCHEDULE OF INVESTMENTS (continued)
iSHARES $ TREASURY BOND 7-10YR UCITS ETF USD (ACC)As at 31 July 2020
[134 ]
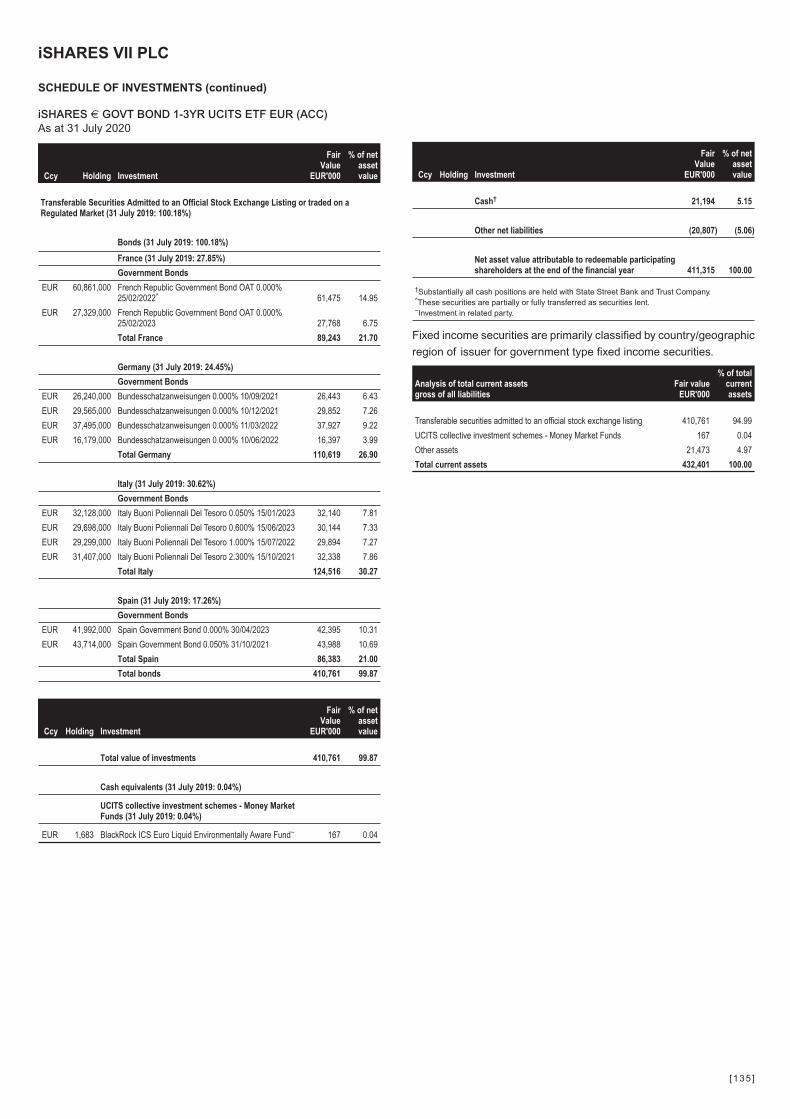
Ccy Holding Investment
FairValue
EUR'000
% of netassetvalue
Transferable Securities Admitted to an Official Stock Exchange Listing or traded on aRegulated Market (31 July 2019: 100.18%)
Bonds (31 July 2019: 100.18%)
France (31 July 2019: 27.85%)
Government Bonds
EUR 60,861,000 French Republic Government Bond OAT 0.000%25/02/2022^ 61,475 14.95
EUR 27,329,000 French Republic Government Bond OAT 0.000%25/02/2023 27,768 6.75
Total France 89,243 21.70
Germany (31 July 2019: 24.45%)
Government Bonds
EUR 26,240,000 Bundesschatzanweisungen 0.000% 10/09/2021 26,443 6.43
EUR 29,565,000 Bundesschatzanweisungen 0.000% 10/12/2021 29,852 7.26
EUR 37,495,000 Bundesschatzanweisungen 0.000% 11/03/2022 37,927 9.22
EUR 16,179,000 Bundesschatzanweisungen 0.000% 10/06/2022 16,397 3.99
Total Germany 110,619 26.90
Italy (31 July 2019: 30.62%)
Government Bonds
EUR 32,128,000 Italy Buoni Poliennali Del Tesoro 0.050% 15/01/2023 32,140 7.81
EUR 29,698,000 Italy Buoni Poliennali Del Tesoro 0.600% 15/06/2023 30,144 7.33
EUR 29,299,000 Italy Buoni Poliennali Del Tesoro 1.000% 15/07/2022 29,894 7.27
EUR 31,407,000 Italy Buoni Poliennali Del Tesoro 2.300% 15/10/2021 32,338 7.86
Total Italy 124,516 30.27
Spain (31 July 2019: 17.26%)
Government Bonds
EUR 41,992,000 Spain Government Bond 0.000% 30/04/2023 42,395 10.31
EUR 43,714,000 Spain Government Bond 0.050% 31/10/2021 43,988 10.69
Total Spain 86,383 21.00
Total bonds 410,761 99.87
Ccy Holding Investment
FairValue
EUR'000
% of netassetvalue
Total value of investments 410,761 99.87
Cash equivalents (31 July 2019: 0.04%)
UCITS collective investment schemes - Money MarketFunds (31 July 2019: 0.04%)
EUR 1,683 BlackRock ICS Euro Liquid Environmentally Aware Fund~ 167 0.04
Ccy Holding Investment
FairValue
EUR'000
% of netassetvalue
Cash† 21,194 5.15
Other net liabilities (20,807) (5.06)
Net asset value attributable to redeemable participatingshareholders at the end of the financial year 411,315 100.00
†Substantially all cash positions are held with State Street Bank and Trust Company.^These securities are partially or fully transferred as securities lent.~Investment in related party.
Fixed income securities are primarily classified by country/geographic
region of issuer for government type fixed income securities.
Analysis of total current assetsgross of all liabilities
Fair valueEUR'000
% of totalcurrentassets
Transferable securities admitted to an official stock exchange listing 410,761 94.99
UCITS collective investment schemes - Money Market Funds 167 0.04
Other assets 21,473 4.97
Total current assets 432,401 100.00
iSHARES VII PLC
SCHEDULE OF INVESTMENTS (continued)
iSHARES € GOVT BOND 1-3YR UCITS ETF EUR (ACC)As at 31 July 2020
[135 ]

Ccy Holding Investment
FairValue
EUR'000
% of netassetvalue
Transferable Securities Admitted to an Official Stock Exchange Listing or traded on aRegulated Market (31 July 2019: 99.17%)
Bonds (31 July 2019: 99.17%)
France (31 July 2019: 25.61%)
Government Bonds
EUR 10,767,000 French Republic Government Bond OAT 0.000%25/03/2024 11,011 2.30
EUR 12,278,000 French Republic Government Bond OAT 0.000%25/03/2025 12,615 2.64
EUR 2,999,000 French Republic Government Bond OAT 0.000%25/02/2026 3,086 0.64
EUR 12,827,000 French Republic Government Bond OAT 0.250%25/11/2026 13,444 2.81
EUR 13,170,000 French Republic Government Bond OAT 0.500%25/05/2025^ 13,871 2.90
EUR 12,730,000 French Republic Government Bond OAT 0.500%25/05/2026 13,507 2.83
EUR 12,229,000 French Republic Government Bond OAT 1.000%25/11/2025 13,262 2.78
EUR 11,527,000 French Republic Government Bond OAT 1.000%25/05/2027 12,691 2.66
EUR 13,626,000 French Republic Government Bond OAT 1.750%25/11/2024^ 15,033 3.15
EUR 12,712,000 French Republic Government Bond OAT 2.250%25/05/2024 14,122 2.96
Total France 122,642 25.67
Germany (31 July 2019: 23.03%)
Government Bonds
EUR 6,475,000 Bundesobligation 0.000% 13/10/2023^ 6,637 1.39
EUR 7,386,000 Bundesobligation 0.000% 05/04/2024 7,598 1.59
EUR 7,160,000 Bundesobligation 0.000% 18/10/2024 7,391 1.55
EUR 5,202,000 Bundesobligation 0.000% 11/04/2025^ 5,389 1.13
EUR 9,048,000 Bundesrepublik Deutschland Bundesanleihe 0.000%15/08/2026^ 9,459 1.98
EUR 11,448,000 Bundesrepublik Deutschland Bundesanleihe 0.250%15/02/2027^ 12,193 2.55
EUR 8,310,000 Bundesrepublik Deutschland Bundesanleihe 0.500%15/02/2025^ 8,797 1.84
EUR 11,447,000 Bundesrepublik Deutschland Bundesanleihe 0.500%15/02/2026^ 12,256 2.57
EUR 8,386,000 Bundesrepublik Deutschland Bundesanleihe 1.000%15/08/2024^ 8,993 1.88
EUR 8,649,000 Bundesrepublik Deutschland Bundesanleihe 1.000%15/08/2025^ 9,429 1.97
EUR 8,360,000 Bundesrepublik Deutschland Bundesanleihe 1.500%15/05/2024^ 9,089 1.90
EUR 7,731,000 Bundesrepublik Deutschland Bundesanleihe 1.750%15/02/2024^ 8,432 1.77
EUR 7,702,000 Bundesrepublik Deutschland Bundesanleihe 2.000%15/08/2023^ 8,358 1.75
Total Germany 114,021 23.87
Ccy Holding Investment
FairValue
EUR'000
% of netassetvalue
Italy (31 July 2019: 28.01%)
Government Bonds
EUR 7,010,000 Italy Buoni Poliennali Del Tesoro 0.350% 01/02/2025 6,995 1.46
EUR 5,956,000 Italy Buoni Poliennali Del Tesoro 0.650% 15/10/2023 6,054 1.27
EUR 4,597,000 Italy Buoni Poliennali Del Tesoro 0.850% 15/01/2027 4,648 0.97
EUR 6,508,000 Italy Buoni Poliennali Del Tesoro 1.250% 01/12/2026 6,759 1.41
EUR 5,064,000 Italy Buoni Poliennali Del Tesoro 1.450% 15/11/2024 5,299 1.11
EUR 5,308,000 Italy Buoni Poliennali Del Tesoro 1.450% 15/05/2025 5,556 1.16
EUR 8,310,000 Italy Buoni Poliennali Del Tesoro 1.500% 01/06/2025 8,723 1.83
EUR 6,078,000 Italy Buoni Poliennali Del Tesoro 1.600% 01/06/2026 6,434 1.35
EUR 6,466,000 Italy Buoni Poliennali Del Tesoro 1.750% 01/07/2024 6,826 1.43
EUR 5,774,000 Italy Buoni Poliennali Del Tesoro 1.850% 15/05/2024 6,114 1.28
EUR 1,222,000 Italy Buoni Poliennali Del Tesoro 1.850% 01/07/2025 1,302 0.27
EUR 6,696,000 Italy Buoni Poliennali Del Tesoro 2.000% 01/12/2025 7,218 1.51
EUR 5,992,000 Italy Buoni Poliennali Del Tesoro 2.100% 15/07/2026 6,509 1.36
EUR 6,658,000 Italy Buoni Poliennali Del Tesoro 2.200% 01/06/2027 7,313 1.53
EUR 4,583,000 Italy Buoni Poliennali Del Tesoro 2.450% 01/10/2023 4,915 1.03
EUR 7,608,000 Italy Buoni Poliennali Del Tesoro 2.500% 01/12/2024 8,294 1.74
EUR 6,697,000 Italy Buoni Poliennali Del Tesoro 2.500% 15/11/2025 7,385 1.55
EUR 6,926,000 Italy Buoni Poliennali Del Tesoro 3.750% 01/09/2024 7,872 1.65
EUR 7,160,000 Italy Buoni Poliennali Del Tesoro 4.500% 01/03/2024 8,239 1.72
Total Italy 122,455 25.63
Netherlands (31 July 2019: 6.27%)
Government Bonds
EUR 5,308,000 Netherlands Government Bond 0.000% 15/01/2024 5,431 1.14
EUR 1,689,000 Netherlands Government Bond 0.000% 15/01/2027 1,752 0.36
EUR 5,514,000 Netherlands Government Bond 0.250% 15/07/2025 5,766 1.21
EUR 5,458,000 Netherlands Government Bond 0.500% 15/07/2026 5,826 1.22
EUR 5,573,000 Netherlands Government Bond 1.750% 15/07/2023 5,978 1.25
EUR 5,272,000 Netherlands Government Bond 2.000% 15/07/2024 5,839 1.22
Total Netherlands 30,592 6.40
Spain (31 July 2019: 16.25%)
Government Bonds
EUR 3,336,000 Spain Government Bond 0.000% 31/01/2025 3,370 0.71
EUR 5,618,000 Spain Government Bond 0.250% 30/07/2024 5,742 1.20
EUR 6,428,000 Spain Government Bond 0.350% 30/07/2023 6,565 1.38
EUR 8,068,000 Spain Government Bond 1.300% 31/10/2026 8,776 1.84
EUR 7,318,000 Spain Government Bond 1.500% 30/04/2027 8,082 1.69
EUR 7,200,000 Spain Government Bond 1.600% 30/04/2025 7,827 1.64
EUR 7,590,000 Spain Government Bond 1.950% 30/04/2026 8,505 1.78
EUR 8,328,000 Spain Government Bond 2.150% 31/10/2025 9,349 1.96
EUR 8,770,000 Spain Government Bond 2.750% 31/10/2024 9,902 2.07
EUR 7,497,000 Spain Government Bond 3.800% 30/04/2024 8,657 1.81
EUR 7,171,000 Spain Government Bond 4.400% 31/10/2023 8,284 1.73
Total Spain 85,059 17.81
Total bonds 474,769 99.38
iSHARES VII PLC
SCHEDULE OF INVESTMENTS (continued)
iSHARES € GOVT BOND 3-7YR UCITS ETFAs at 31 July 2020
[136 ]
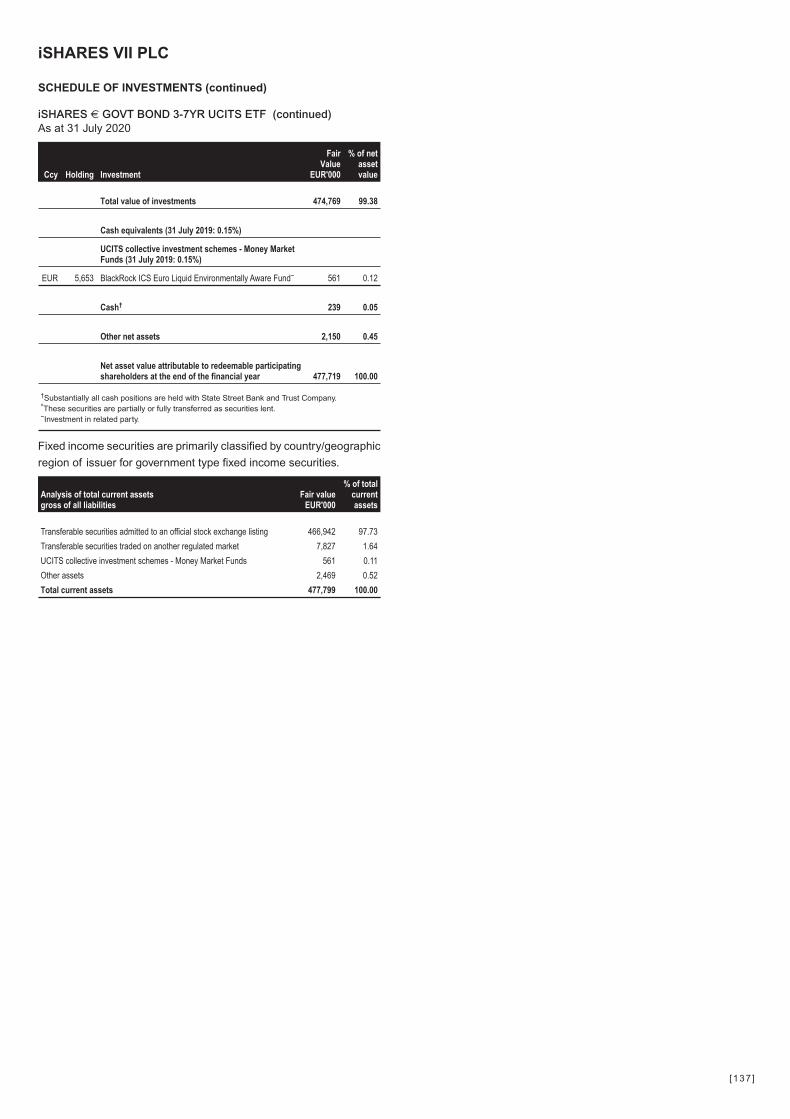
Ccy Holding Investment
FairValue
EUR'000
% of netassetvalue
Total value of investments 474,769 99.38
Cash equivalents (31 July 2019: 0.15%)
UCITS collective investment schemes - Money MarketFunds (31 July 2019: 0.15%)
EUR 5,653 BlackRock ICS Euro Liquid Environmentally Aware Fund~ 561 0.12
Cash† 239 0.05
Other net assets 2,150 0.45
Net asset value attributable to redeemable participatingshareholders at the end of the financial year 477,719 100.00
†Substantially all cash positions are held with State Street Bank and Trust Company.^These securities are partially or fully transferred as securities lent.~Investment in related party.
Fixed income securities are primarily classified by country/geographic
region of issuer for government type fixed income securities.
Analysis of total current assetsgross of all liabilities
Fair valueEUR'000
% of totalcurrentassets
Transferable securities admitted to an official stock exchange listing 466,942 97.73
Transferable securities traded on another regulated market 7,827 1.64
UCITS collective investment schemes - Money Market Funds 561 0.11
Other assets 2,469 0.52
Total current assets 477,799 100.00
iSHARES VII PLC
SCHEDULE OF INVESTMENTS (continued)
iSHARES € GOVT BOND 3-7YR UCITS ETF (continued)As at 31 July 2020
[137 ]
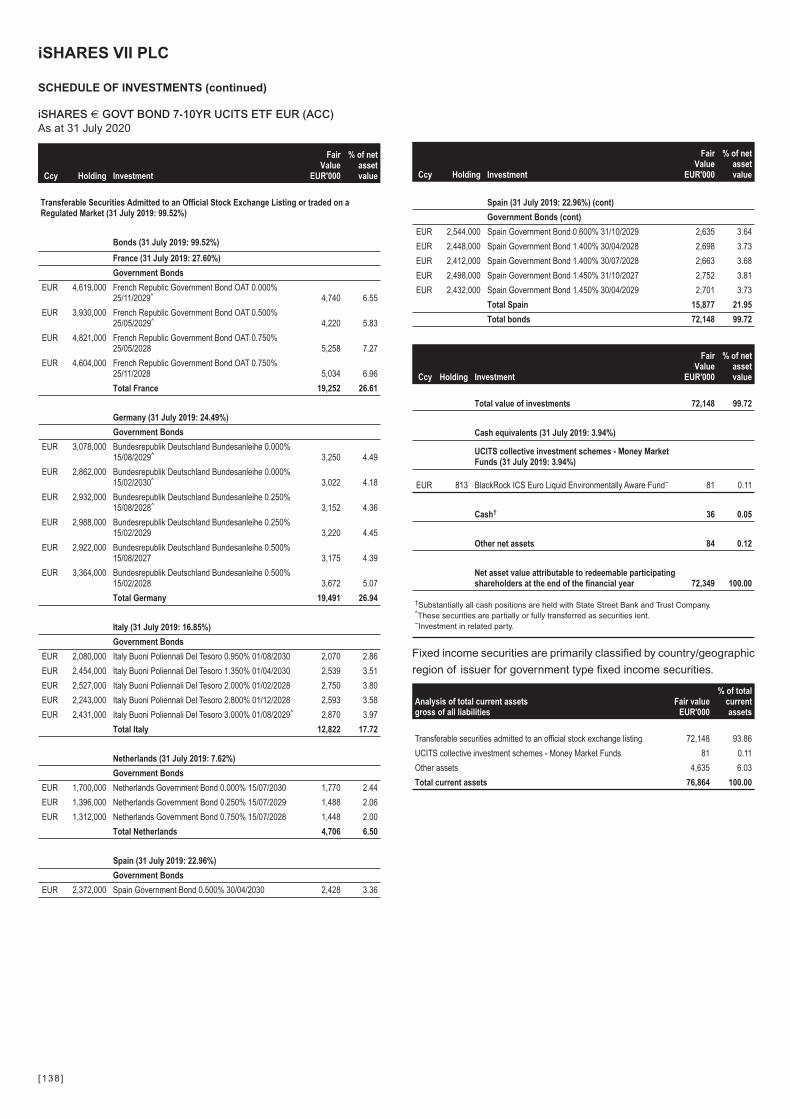
Ccy Holding Investment
FairValue
EUR'000
% of netassetvalue
Transferable Securities Admitted to an Official Stock Exchange Listing or traded on aRegulated Market (31 July 2019: 99.52%)
Bonds (31 July 2019: 99.52%)
France (31 July 2019: 27.60%)
Government Bonds
EUR 4,619,000 French Republic Government Bond OAT 0.000%25/11/2029^ 4,740 6.55
EUR 3,930,000 French Republic Government Bond OAT 0.500%25/05/2029^ 4,220 5.83
EUR 4,821,000 French Republic Government Bond OAT 0.750%25/05/2028 5,258 7.27
EUR 4,604,000 French Republic Government Bond OAT 0.750%25/11/2028 5,034 6.96
Total France 19,252 26.61
Germany (31 July 2019: 24.49%)
Government Bonds
EUR 3,078,000 Bundesrepublik Deutschland Bundesanleihe 0.000%15/08/2029^ 3,250 4.49
EUR 2,862,000 Bundesrepublik Deutschland Bundesanleihe 0.000%15/02/2030^ 3,022 4.18
EUR 2,932,000 Bundesrepublik Deutschland Bundesanleihe 0.250%15/08/2028^ 3,152 4.36
EUR 2,988,000 Bundesrepublik Deutschland Bundesanleihe 0.250%15/02/2029 3,220 4.45
EUR 2,922,000 Bundesrepublik Deutschland Bundesanleihe 0.500%15/08/2027 3,175 4.39
EUR 3,364,000 Bundesrepublik Deutschland Bundesanleihe 0.500%15/02/2028 3,672 5.07
Total Germany 19,491 26.94
Italy (31 July 2019: 16.85%)
Government Bonds
EUR 2,080,000 Italy Buoni Poliennali Del Tesoro 0.950% 01/08/2030 2,070 2.86
EUR 2,454,000 Italy Buoni Poliennali Del Tesoro 1.350% 01/04/2030 2,539 3.51
EUR 2,527,000 Italy Buoni Poliennali Del Tesoro 2.000% 01/02/2028 2,750 3.80
EUR 2,243,000 Italy Buoni Poliennali Del Tesoro 2.800% 01/12/2028 2,593 3.58
EUR 2,431,000 Italy Buoni Poliennali Del Tesoro 3.000% 01/08/2029^ 2,870 3.97
Total Italy 12,822 17.72
Netherlands (31 July 2019: 7.62%)
Government Bonds
EUR 1,700,000 Netherlands Government Bond 0.000% 15/07/2030 1,770 2.44
EUR 1,396,000 Netherlands Government Bond 0.250% 15/07/2029 1,488 2.06
EUR 1,312,000 Netherlands Government Bond 0.750% 15/07/2028 1,448 2.00
Total Netherlands 4,706 6.50
Spain (31 July 2019: 22.96%)
Government Bonds
EUR 2,372,000 Spain Government Bond 0.500% 30/04/2030 2,428 3.36
Ccy Holding Investment
FairValue
EUR'000
% of netassetvalue
Spain (31 July 2019: 22.96%) (cont)
Government Bonds (cont)
EUR 2,544,000 Spain Government Bond 0.600% 31/10/2029 2,635 3.64
EUR 2,448,000 Spain Government Bond 1.400% 30/04/2028 2,698 3.73
EUR 2,412,000 Spain Government Bond 1.400% 30/07/2028 2,663 3.68
EUR 2,498,000 Spain Government Bond 1.450% 31/10/2027 2,752 3.81
EUR 2,432,000 Spain Government Bond 1.450% 30/04/2029 2,701 3.73
Total Spain 15,877 21.95
Total bonds 72,148 99.72
Ccy Holding Investment
FairValue
EUR'000
% of netassetvalue
Total value of investments 72,148 99.72
Cash equivalents (31 July 2019: 3.94%)
UCITS collective investment schemes - Money MarketFunds (31 July 2019: 3.94%)
EUR 813 BlackRock ICS Euro Liquid Environmentally Aware Fund~ 81 0.11
Cash† 36 0.05
Other net assets 84 0.12
Net asset value attributable to redeemable participatingshareholders at the end of the financial year 72,349 100.00
†Substantially all cash positions are held with State Street Bank and Trust Company.^These securities are partially or fully transferred as securities lent.~Investment in related party.
Fixed income securities are primarily classified by country/geographic
region of issuer for government type fixed income securities.
Analysis of total current assetsgross of all liabilities
Fair valueEUR'000
% of totalcurrentassets
Transferable securities admitted to an official stock exchange listing 72,148 93.86
UCITS collective investment schemes - Money Market Funds 81 0.11
Other assets 4,635 6.03
Total current assets 76,864 100.00
iSHARES VII PLC
SCHEDULE OF INVESTMENTS (continued)
iSHARES € GOVT BOND 7-10YR UCITS ETF EUR (ACC)As at 31 July 2020
[138 ]
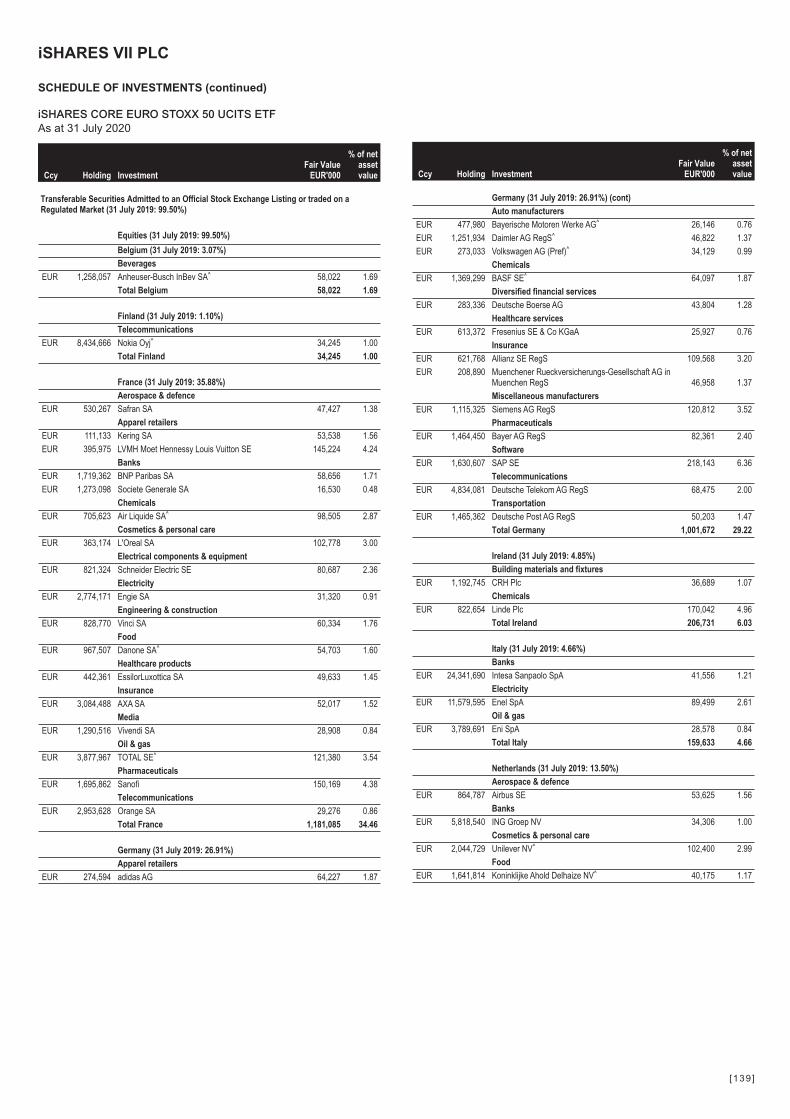
Ccy Holding InvestmentFair Value
EUR'000
% of netassetvalue
Transferable Securities Admitted to an Official Stock Exchange Listing or traded on aRegulated Market (31 July 2019: 99.50%)
Equities (31 July 2019: 99.50%)
Belgium (31 July 2019: 3.07%)
Beverages
EUR 1,258,057 Anheuser-Busch InBev SA^ 58,022 1.69
Total Belgium 58,022 1.69
Finland (31 July 2019: 1.10%)
Telecommunications
EUR 8,434,666 Nokia Oyj^ 34,245 1.00
Total Finland 34,245 1.00
France (31 July 2019: 35.88%)
Aerospace & defence
EUR 530,267 Safran SA 47,427 1.38
Apparel retailers
EUR 111,133 Kering SA 53,538 1.56
EUR 395,975 LVMH Moet Hennessy Louis Vuitton SE 145,224 4.24
Banks
EUR 1,719,362 BNP Paribas SA 58,656 1.71
EUR 1,273,098 Societe Generale SA 16,530 0.48
Chemicals
EUR 705,623 Air Liquide SA^ 98,505 2.87
Cosmetics & personal care
EUR 363,174 L'Oreal SA 102,778 3.00
Electrical components & equipment
EUR 821,324 Schneider Electric SE 80,687 2.36
Electricity
EUR 2,774,171 Engie SA 31,320 0.91
Engineering & construction
EUR 828,770 Vinci SA 60,334 1.76
Food
EUR 967,507 Danone SA^ 54,703 1.60
Healthcare products
EUR 442,361 EssilorLuxottica SA 49,633 1.45
Insurance
EUR 3,084,488 AXA SA 52,017 1.52
Media
EUR 1,290,516 Vivendi SA 28,908 0.84
Oil & gas
EUR 3,877,967 TOTAL SE^ 121,380 3.54
Pharmaceuticals
EUR 1,695,862 Sanofi 150,169 4.38
Telecommunications
EUR 2,953,628 Orange SA 29,276 0.86
Total France 1,181,085 34.46
Germany (31 July 2019: 26.91%)
Apparel retailers
EUR 274,594 adidas AG 64,227 1.87
Ccy Holding InvestmentFair Value
EUR'000
% of netassetvalue
Germany (31 July 2019: 26.91%) (cont)
Auto manufacturers
EUR 477,980 Bayerische Motoren Werke AG^ 26,146 0.76
EUR 1,251,934 Daimler AG RegS^ 46,822 1.37
EUR 273,033 Volkswagen AG (Pref)^ 34,129 0.99
Chemicals
EUR 1,369,299 BASF SE^ 64,097 1.87
Diversified financial services
EUR 283,336 Deutsche Boerse AG 43,804 1.28
Healthcare services
EUR 613,372 Fresenius SE & Co KGaA 25,927 0.76
Insurance
EUR 621,768 Allianz SE RegS 109,568 3.20
EUR 208,890 Muenchener Rueckversicherungs-Gesellschaft AG inMuenchen RegS 46,958 1.37
Miscellaneous manufacturers
EUR 1,115,325 Siemens AG RegS 120,812 3.52
Pharmaceuticals
EUR 1,464,450 Bayer AG RegS 82,361 2.40
Software
EUR 1,630,607 SAP SE 218,143 6.36
Telecommunications
EUR 4,834,081 Deutsche Telekom AG RegS 68,475 2.00
Transportation
EUR 1,465,362 Deutsche Post AG RegS 50,203 1.47
Total Germany 1,001,672 29.22
Ireland (31 July 2019: 4.85%)
Building materials and fixtures
EUR 1,192,745 CRH Plc 36,689 1.07
Chemicals
EUR 822,654 Linde Plc 170,042 4.96
Total Ireland 206,731 6.03
Italy (31 July 2019: 4.66%)
Banks
EUR 24,341,690 Intesa Sanpaolo SpA 41,556 1.21
Electricity
EUR 11,579,595 Enel SpA 89,499 2.61
Oil & gas
EUR 3,789,691 Eni SpA 28,578 0.84
Total Italy 159,633 4.66
Netherlands (31 July 2019: 13.50%)
Aerospace & defence
EUR 864,787 Airbus SE 53,625 1.56
Banks
EUR 5,818,540 ING Groep NV 34,306 1.00
Cosmetics & personal care
EUR 2,044,729 Unilever NV^ 102,400 2.99
Food
EUR 1,641,814 Koninklijke Ahold Delhaize NV^ 40,175 1.17
iSHARES VII PLC
SCHEDULE OF INVESTMENTS (continued)
iSHARES CORE EURO STOXX 50 UCITS ETFAs at 31 July 2020
[139 ]
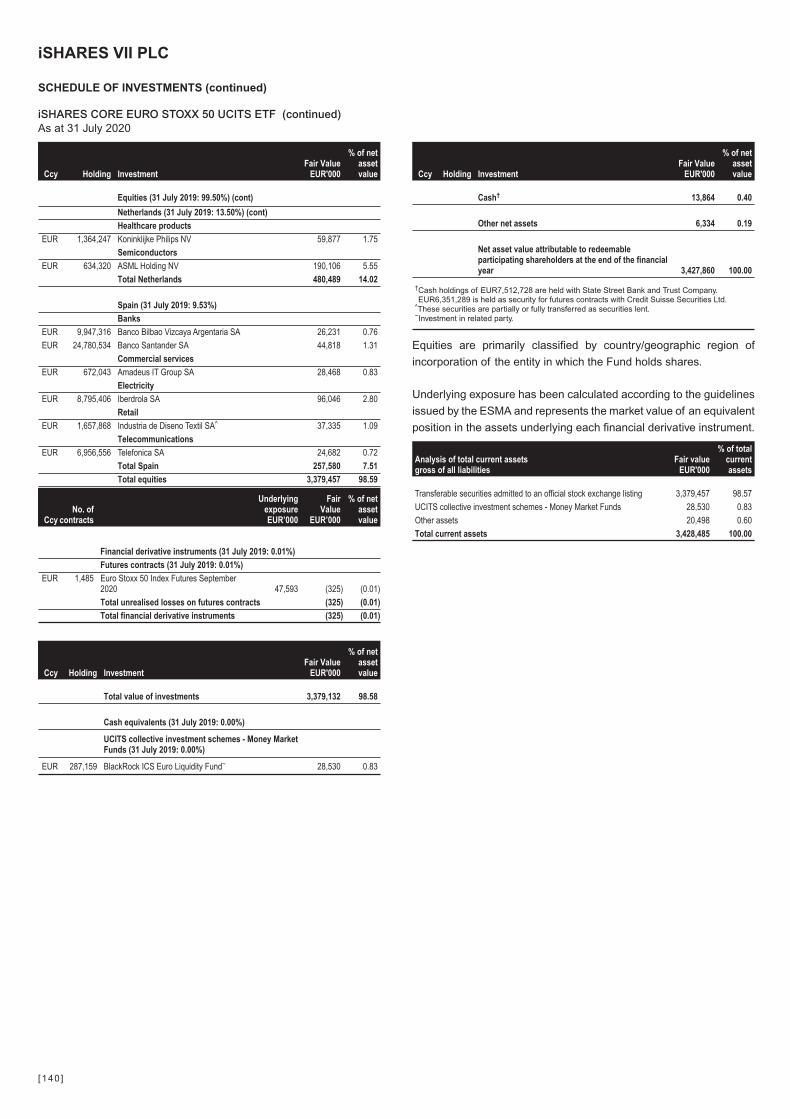
Ccy Holding InvestmentFair Value
EUR'000
% of netassetvalue
Equities (31 July 2019: 99.50%) (cont)
Netherlands (31 July 2019: 13.50%) (cont)
Healthcare products
EUR 1,364,247 Koninklijke Philips NV 59,877 1.75
Semiconductors
EUR 634,320 ASML Holding NV 190,106 5.55
Total Netherlands 480,489 14.02
Spain (31 July 2019: 9.53%)
Banks
EUR 9,947,316 Banco Bilbao Vizcaya Argentaria SA 26,231 0.76
EUR 24,780,534 Banco Santander SA 44,818 1.31
Commercial services
EUR 672,043 Amadeus IT Group SA 28,468 0.83
Electricity
EUR 8,795,406 Iberdrola SA 96,046 2.80
Retail
EUR 1,657,868 Industria de Diseno Textil SA^ 37,335 1.09
Telecommunications
EUR 6,956,556 Telefonica SA 24,682 0.72
Total Spain 257,580 7.51
Total equities 3,379,457 98.59
CcyNo. of
contracts
UnderlyingexposureEUR’000
FairValue
EUR’000
% of netassetvalue
Financial derivative instruments (31 July 2019: 0.01%)
Futures contracts (31 July 2019: 0.01%)
EUR 1,485 Euro Stoxx 50 Index Futures September2020 47,593 (325) (0.01)
Total unrealised losses on futures contracts (325) (0.01)
Total financial derivative instruments (325) (0.01)
Ccy Holding InvestmentFair Value
EUR'000
% of netassetvalue
Total value of investments 3,379,132 98.58
Cash equivalents (31 July 2019: 0.00%)
UCITS collective investment schemes - Money MarketFunds (31 July 2019: 0.00%)
EUR 287,159 BlackRock ICS Euro Liquidity Fund~ 28,530 0.83
Ccy Holding InvestmentFair Value
EUR'000
% of netassetvalue
Cash† 13,864 0.40
Other net assets 6,334 0.19
Net asset value attributable to redeemableparticipating shareholders at the end of the financialyear 3,427,860 100.00
†Cash holdings of EUR7,512,728 are held with State Street Bank and Trust Company.EUR6,351,289 is held as security for futures contracts with Credit Suisse Securities Ltd.
^These securities are partially or fully transferred as securities lent.~Investment in related party.
Equities are primarily classified by country/geographic region of
incorporation of the entity in which the Fund holds shares.
Underlying exposure has been calculated according to the guidelines
issued by the ESMA and represents the market value of an equivalent
position in the assets underlying each financial derivative instrument.
Analysis of total current assetsgross of all liabilities
Fair valueEUR'000
% of totalcurrentassets
Transferable securities admitted to an official stock exchange listing 3,379,457 98.57
UCITS collective investment schemes - Money Market Funds 28,530 0.83
Other assets 20,498 0.60
Total current assets 3,428,485 100.00
iSHARES VII PLC
SCHEDULE OF INVESTMENTS (continued)
iSHARES CORE EURO STOXX 50 UCITS ETF (continued)As at 31 July 2020
[140 ]
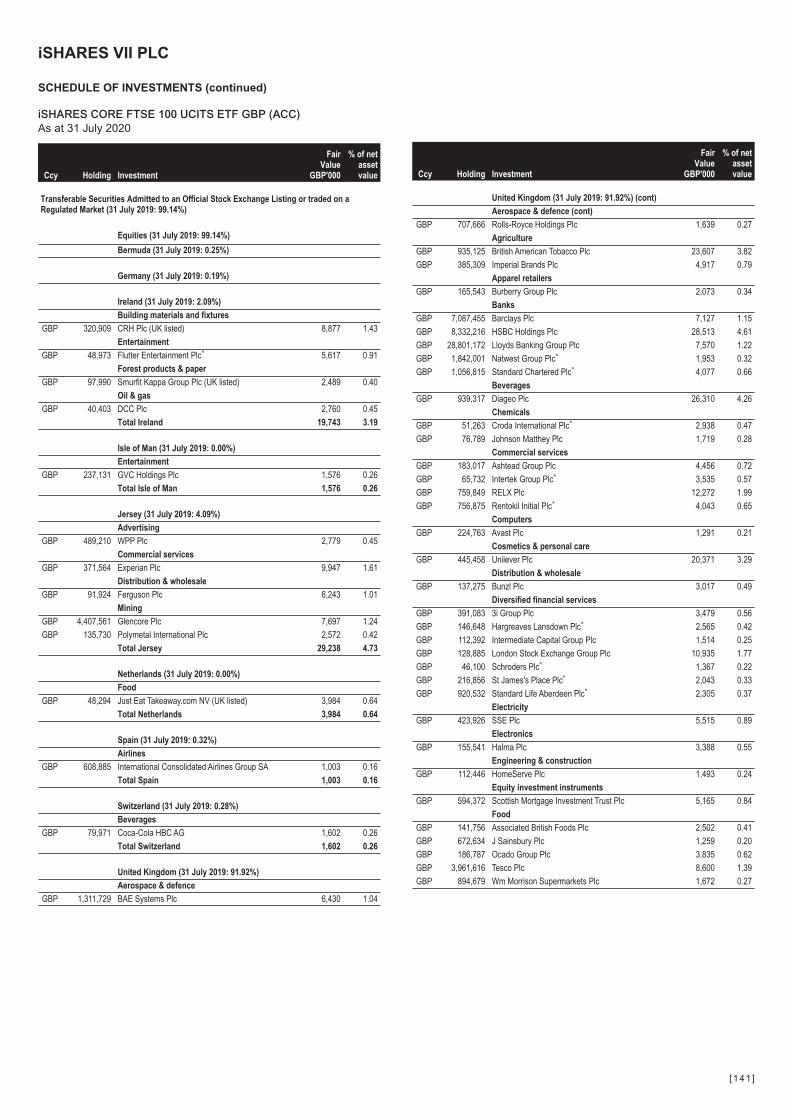
Ccy Holding Investment
FairValue
GBP'000
% of netassetvalue
Transferable Securities Admitted to an Official Stock Exchange Listing or traded on aRegulated Market (31 July 2019: 99.14%)
Equities (31 July 2019: 99.14%)
Bermuda (31 July 2019: 0.25%)
Germany (31 July 2019: 0.19%)
Ireland (31 July 2019: 2.09%)
Building materials and fixtures
GBP 320,909 CRH Plc (UK listed) 8,877 1.43
Entertainment
GBP 48,973 Flutter Entertainment Plc^ 5,617 0.91
Forest products & paper
GBP 97,990 Smurfit Kappa Group Plc (UK listed) 2,489 0.40
Oil & gas
GBP 40,403 DCC Plc 2,760 0.45
Total Ireland 19,743 3.19
Isle of Man (31 July 2019: 0.00%)
Entertainment
GBP 237,131 GVC Holdings Plc 1,576 0.26
Total Isle of Man 1,576 0.26
Jersey (31 July 2019: 4.09%)
Advertising
GBP 489,210 WPP Plc 2,779 0.45
Commercial services
GBP 371,564 Experian Plc 9,947 1.61
Distribution & wholesale
GBP 91,924 Ferguson Plc 6,243 1.01
Mining
GBP 4,407,561 Glencore Plc 7,697 1.24
GBP 135,730 Polymetal International Plc 2,572 0.42
Total Jersey 29,238 4.73
Netherlands (31 July 2019: 0.00%)
Food
GBP 48,294 Just Eat Takeaway.com NV (UK listed) 3,984 0.64
Total Netherlands 3,984 0.64
Spain (31 July 2019: 0.32%)
Airlines
GBP 608,885 International Consolidated Airlines Group SA 1,003 0.16
Total Spain 1,003 0.16
Switzerland (31 July 2019: 0.28%)
Beverages
GBP 79,971 Coca-Cola HBC AG 1,602 0.26
Total Switzerland 1,602 0.26
United Kingdom (31 July 2019: 91.92%)
Aerospace & defence
GBP 1,311,729 BAE Systems Plc 6,430 1.04
Ccy Holding Investment
FairValue
GBP'000
% of netassetvalue
United Kingdom (31 July 2019: 91.92%) (cont)
Aerospace & defence (cont)
GBP 707,666 Rolls-Royce Holdings Plc 1,639 0.27
Agriculture
GBP 935,125 British American Tobacco Plc 23,607 3.82
GBP 385,309 Imperial Brands Plc 4,917 0.79
Apparel retailers
GBP 165,543 Burberry Group Plc 2,073 0.34
Banks
GBP 7,087,455 Barclays Plc 7,127 1.15
GBP 8,332,216 HSBC Holdings Plc 28,513 4.61
GBP 28,801,172 Lloyds Banking Group Plc 7,570 1.22
GBP 1,842,001 Natwest Group Plc^ 1,953 0.32
GBP 1,056,815 Standard Chartered Plc^ 4,077 0.66
Beverages
GBP 939,317 Diageo Plc 26,310 4.26
Chemicals
GBP 51,263 Croda International Plc^ 2,938 0.47
GBP 76,789 Johnson Matthey Plc 1,719 0.28
Commercial services
GBP 183,017 Ashtead Group Plc 4,456 0.72
GBP 65,732 Intertek Group Plc^ 3,535 0.57
GBP 759,849 RELX Plc 12,272 1.99
GBP 756,875 Rentokil Initial Plc^ 4,043 0.65
Computers
GBP 224,763 Avast Plc 1,291 0.21
Cosmetics & personal care
GBP 445,458 Unilever Plc 20,371 3.29
Distribution & wholesale
GBP 137,275 Bunzl Plc 3,017 0.49
Diversified financial services
GBP 391,083 3i Group Plc 3,479 0.56
GBP 146,648 Hargreaves Lansdown Plc^ 2,565 0.42
GBP 112,392 Intermediate Capital Group Plc 1,514 0.25
GBP 128,885 London Stock Exchange Group Plc 10,935 1.77
GBP 46,100 Schroders Plc^ 1,367 0.22
GBP 216,856 St James's Place Plc^ 2,043 0.33
GBP 920,532 Standard Life Aberdeen Plc^ 2,305 0.37
Electricity
GBP 423,926 SSE Plc 5,515 0.89
Electronics
GBP 155,541 Halma Plc 3,388 0.55
Engineering & construction
GBP 112,446 HomeServe Plc 1,493 0.24
Equity investment instruments
GBP 594,372 Scottish Mortgage Investment Trust Plc 5,165 0.84
Food
GBP 141,756 Associated British Foods Plc 2,502 0.41
GBP 672,634 J Sainsbury Plc 1,259 0.20
GBP 186,787 Ocado Group Plc 3,835 0.62
GBP 3,961,616 Tesco Plc 8,600 1.39
GBP 894,679 Wm Morrison Supermarkets Plc 1,672 0.27
iSHARES VII PLC
SCHEDULE OF INVESTMENTS (continued)
iSHARES CORE FTSE 100 UCITS ETF GBP (ACC)As at 31 July 2020
[141 ]
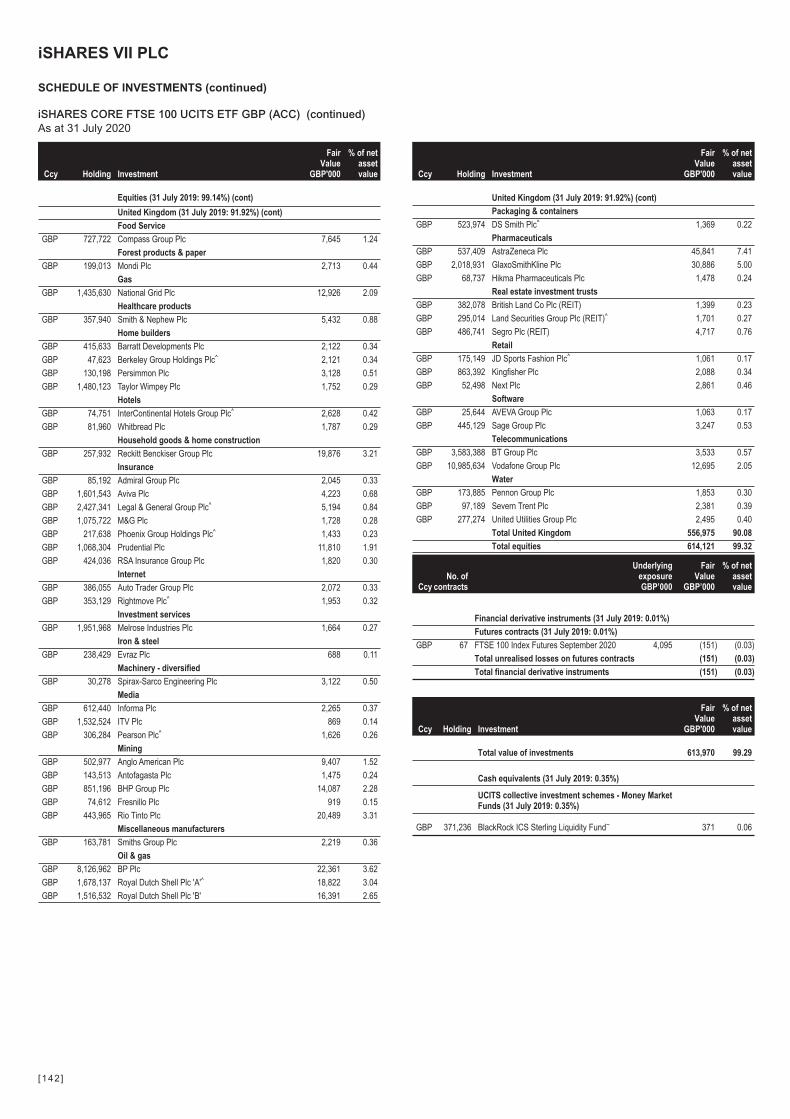
Ccy Holding Investment
FairValue
GBP'000
% of netassetvalue
Equities (31 July 2019: 99.14%) (cont)
United Kingdom (31 July 2019: 91.92%) (cont)
Food Service
GBP 727,722 Compass Group Plc 7,645 1.24
Forest products & paper
GBP 199,013 Mondi Plc 2,713 0.44
Gas
GBP 1,435,630 National Grid Plc 12,926 2.09
Healthcare products
GBP 357,940 Smith & Nephew Plc 5,432 0.88
Home builders
GBP 415,633 Barratt Developments Plc 2,122 0.34
GBP 47,623 Berkeley Group Holdings Plc^ 2,121 0.34
GBP 130,198 Persimmon Plc 3,128 0.51
GBP 1,480,123 Taylor Wimpey Plc 1,752 0.29
Hotels
GBP 74,751 InterContinental Hotels Group Plc^ 2,628 0.42
GBP 81,960 Whitbread Plc 1,787 0.29
Household goods & home construction
GBP 257,932 Reckitt Benckiser Group Plc 19,876 3.21
Insurance
GBP 85,192 Admiral Group Plc 2,045 0.33
GBP 1,601,543 Aviva Plc 4,223 0.68
GBP 2,427,341 Legal & General Group Plc^ 5,194 0.84
GBP 1,075,722 M&G Plc 1,728 0.28
GBP 217,638 Phoenix Group Holdings Plc^ 1,433 0.23
GBP 1,068,304 Prudential Plc 11,810 1.91
GBP 424,036 RSA Insurance Group Plc 1,820 0.30
Internet
GBP 386,055 Auto Trader Group Plc 2,072 0.33
GBP 353,129 Rightmove Plc^ 1,953 0.32
Investment services
GBP 1,951,968 Melrose Industries Plc 1,664 0.27
Iron & steel
GBP 238,429 Evraz Plc 688 0.11
Machinery - diversified
GBP 30,278 Spirax-Sarco Engineering Plc 3,122 0.50
Media
GBP 612,440 Informa Plc 2,265 0.37
GBP 1,532,524 ITV Plc 869 0.14
GBP 306,284 Pearson Plc^ 1,626 0.26
Mining
GBP 502,977 Anglo American Plc 9,407 1.52
GBP 143,513 Antofagasta Plc 1,475 0.24
GBP 851,196 BHP Group Plc 14,087 2.28
GBP 74,612 Fresnillo Plc 919 0.15
GBP 443,965 Rio Tinto Plc 20,489 3.31
Miscellaneous manufacturers
GBP 163,781 Smiths Group Plc 2,219 0.36
Oil & gas
GBP 8,126,962 BP Plc 22,361 3.62
GBP 1,678,137 Royal Dutch Shell Plc 'A'^ 18,822 3.04
GBP 1,516,532 Royal Dutch Shell Plc 'B' 16,391 2.65
Ccy Holding Investment
FairValue
GBP'000
% of netassetvalue
United Kingdom (31 July 2019: 91.92%) (cont)
Packaging & containers
GBP 523,974 DS Smith Plc^ 1,369 0.22
Pharmaceuticals
GBP 537,409 AstraZeneca Plc 45,841 7.41
GBP 2,018,931 GlaxoSmithKline Plc 30,886 5.00
GBP 68,737 Hikma Pharmaceuticals Plc 1,478 0.24
Real estate investment trusts
GBP 382,078 British Land Co Plc (REIT) 1,399 0.23
GBP 295,014 Land Securities Group Plc (REIT)^ 1,701 0.27
GBP 486,741 Segro Plc (REIT) 4,717 0.76
Retail
GBP 175,149 JD Sports Fashion Plc^ 1,061 0.17
GBP 863,392 Kingfisher Plc 2,088 0.34
GBP 52,498 Next Plc 2,861 0.46
Software
GBP 25,644 AVEVA Group Plc 1,063 0.17
GBP 445,129 Sage Group Plc 3,247 0.53
Telecommunications
GBP 3,583,388 BT Group Plc 3,533 0.57
GBP 10,985,634 Vodafone Group Plc 12,695 2.05
Water
GBP 173,885 Pennon Group Plc 1,853 0.30
GBP 97,189 Severn Trent Plc 2,381 0.39
GBP 277,274 United Utilities Group Plc 2,495 0.40
Total United Kingdom 556,975 90.08
Total equities 614,121 99.32
CcyNo. of
contracts
UnderlyingexposureGBP’000
FairValue
GBP’000
% of netassetvalue
Financial derivative instruments (31 July 2019: 0.01%)
Futures contracts (31 July 2019: 0.01%)
GBP 67 FTSE 100 Index Futures September 2020 4,095 (151) (0.03)
Total unrealised losses on futures contracts (151) (0.03)
Total financial derivative instruments (151) (0.03)
Ccy Holding Investment
FairValue
GBP'000
% of netassetvalue
Total value of investments 613,970 99.29
Cash equivalents (31 July 2019: 0.35%)
UCITS collective investment schemes - Money MarketFunds (31 July 2019: 0.35%)
GBP 371,236 BlackRock ICS Sterling Liquidity Fund~ 371 0.06
iSHARES VII PLC
SCHEDULE OF INVESTMENTS (continued)
iSHARES CORE FTSE 100 UCITS ETF GBP (ACC) (continued)As at 31 July 2020
[142 ]
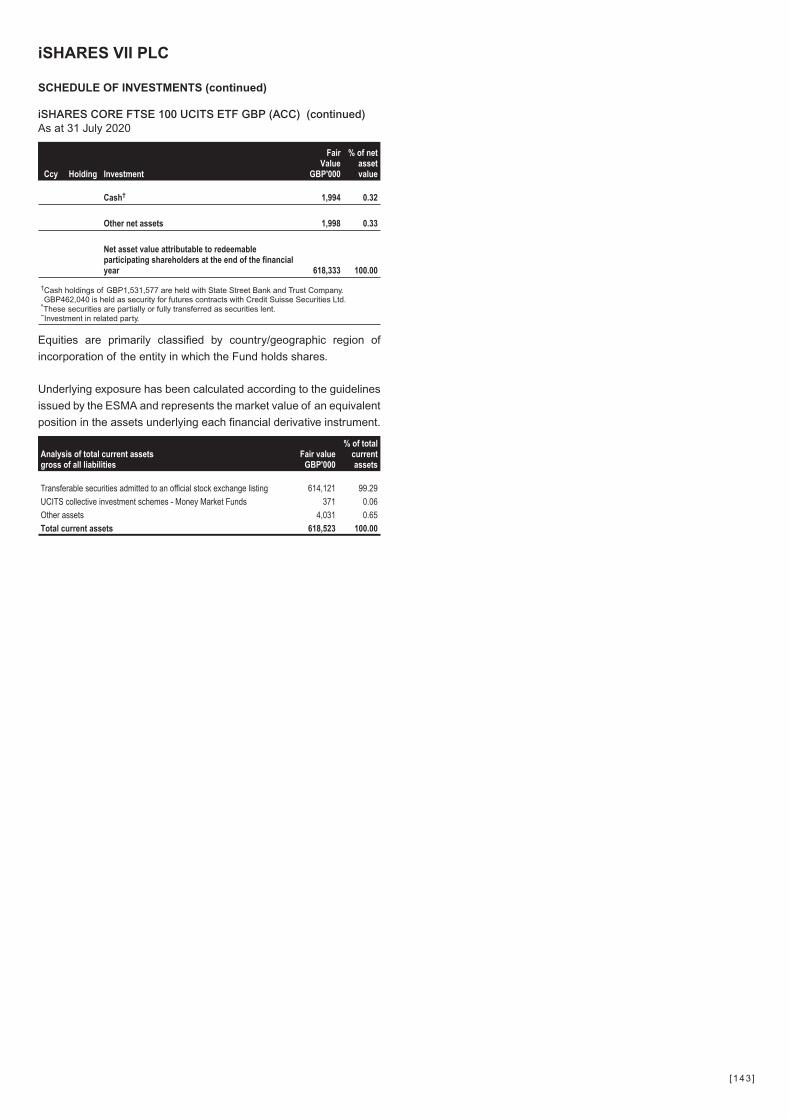
Ccy Holding Investment
FairValue
GBP'000
% of netassetvalue
Cash† 1,994 0.32
Other net assets 1,998 0.33
Net asset value attributable to redeemableparticipating shareholders at the end of the financialyear 618,333 100.00
†Cash holdings of GBP1,531,577 are held with State Street Bank and Trust Company.GBP462,040 is held as security for futures contracts with Credit Suisse Securities Ltd.
^These securities are partially or fully transferred as securities lent.~Investment in related party.
Equities are primarily classified by country/geographic region of
incorporation of the entity in which the Fund holds shares.
Underlying exposure has been calculated according to the guidelines
issued by the ESMA and represents the market value of an equivalent
position in the assets underlying each financial derivative instrument.
Analysis of total current assetsgross of all liabilities
Fair valueGBP'000
% of totalcurrentassets
Transferable securities admitted to an official stock exchange listing 614,121 99.29
UCITS collective investment schemes - Money Market Funds 371 0.06
Other assets 4,031 0.65
Total current assets 618,523 100.00
iSHARES VII PLC
SCHEDULE OF INVESTMENTS (continued)
iSHARES CORE FTSE 100 UCITS ETF GBP (ACC) (continued)As at 31 July 2020
[143 ]
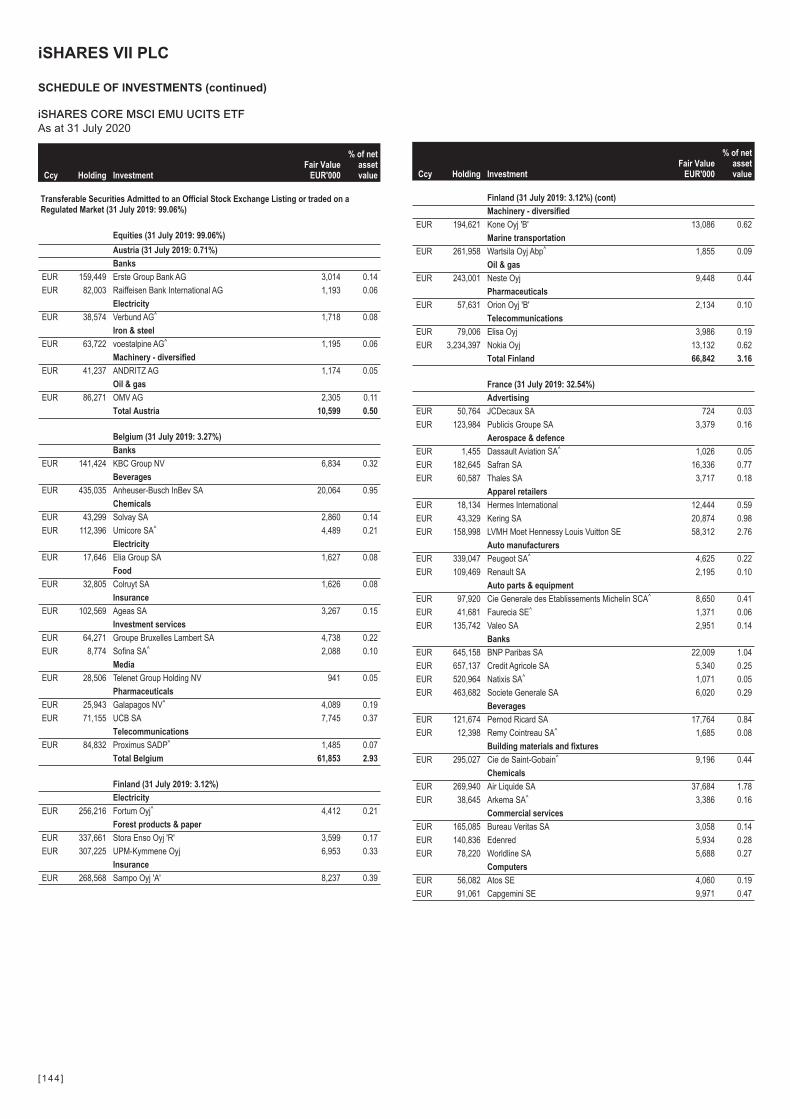
Ccy Holding InvestmentFair Value
EUR'000
% of netassetvalue
Transferable Securities Admitted to an Official Stock Exchange Listing or traded on aRegulated Market (31 July 2019: 99.06%)
Equities (31 July 2019: 99.06%)
Austria (31 July 2019: 0.71%)
Banks
EUR 159,449 Erste Group Bank AG 3,014 0.14
EUR 82,003 Raiffeisen Bank International AG 1,193 0.06
Electricity
EUR 38,574 Verbund AG^ 1,718 0.08
Iron & steel
EUR 63,722 voestalpine AG^ 1,195 0.06
Machinery - diversified
EUR 41,237 ANDRITZ AG 1,174 0.05
Oil & gas
EUR 86,271 OMV AG 2,305 0.11
Total Austria 10,599 0.50
Belgium (31 July 2019: 3.27%)
Banks
EUR 141,424 KBC Group NV 6,834 0.32
Beverages
EUR 435,035 Anheuser-Busch InBev SA 20,064 0.95
Chemicals
EUR 43,299 Solvay SA 2,860 0.14
EUR 112,396 Umicore SA^ 4,489 0.21
Electricity
EUR 17,646 Elia Group SA 1,627 0.08
Food
EUR 32,805 Colruyt SA 1,626 0.08
Insurance
EUR 102,569 Ageas SA 3,267 0.15
Investment services
EUR 64,271 Groupe Bruxelles Lambert SA 4,738 0.22
EUR 8,774 Sofina SA^ 2,088 0.10
Media
EUR 28,506 Telenet Group Holding NV 941 0.05
Pharmaceuticals
EUR 25,943 Galapagos NV^ 4,089 0.19
EUR 71,155 UCB SA 7,745 0.37
Telecommunications
EUR 84,832 Proximus SADP^ 1,485 0.07
Total Belgium 61,853 2.93
Finland (31 July 2019: 3.12%)
Electricity
EUR 256,216 Fortum Oyj^ 4,412 0.21
Forest products & paper
EUR 337,661 Stora Enso Oyj 'R' 3,599 0.17
EUR 307,225 UPM-Kymmene Oyj 6,953 0.33
Insurance
EUR 268,568 Sampo Oyj 'A' 8,237 0.39
Ccy Holding InvestmentFair Value
EUR'000
% of netassetvalue
Finland (31 July 2019: 3.12%) (cont)
Machinery - diversified
EUR 194,621 Kone Oyj 'B' 13,086 0.62
Marine transportation
EUR 261,958 Wartsila Oyj Abp^ 1,855 0.09
Oil & gas
EUR 243,001 Neste Oyj 9,448 0.44
Pharmaceuticals
EUR 57,631 Orion Oyj 'B' 2,134 0.10
Telecommunications
EUR 79,006 Elisa Oyj 3,986 0.19
EUR 3,234,397 Nokia Oyj 13,132 0.62
Total Finland 66,842 3.16
France (31 July 2019: 32.54%)
Advertising
EUR 50,764 JCDecaux SA 724 0.03
EUR 123,984 Publicis Groupe SA 3,379 0.16
Aerospace & defence
EUR 1,455 Dassault Aviation SA^ 1,026 0.05
EUR 182,645 Safran SA 16,336 0.77
EUR 60,587 Thales SA 3,717 0.18
Apparel retailers
EUR 18,134 Hermes International 12,444 0.59
EUR 43,329 Kering SA 20,874 0.98
EUR 158,998 LVMH Moet Hennessy Louis Vuitton SE 58,312 2.76
Auto manufacturers
EUR 339,047 Peugeot SA^ 4,625 0.22
EUR 109,469 Renault SA 2,195 0.10
Auto parts & equipment
EUR 97,920 Cie Generale des Etablissements Michelin SCA^ 8,650 0.41
EUR 41,681 Faurecia SE^ 1,371 0.06
EUR 135,742 Valeo SA 2,951 0.14
Banks
EUR 645,158 BNP Paribas SA 22,009 1.04
EUR 657,137 Credit Agricole SA 5,340 0.25
EUR 520,964 Natixis SA^ 1,071 0.05
EUR 463,682 Societe Generale SA 6,020 0.29
Beverages
EUR 121,674 Pernod Ricard SA 17,764 0.84
EUR 12,398 Remy Cointreau SA^ 1,685 0.08
Building materials and fixtures
EUR 295,027 Cie de Saint-Gobain^ 9,196 0.44
Chemicals
EUR 269,940 Air Liquide SA 37,684 1.78
EUR 38,645 Arkema SA^ 3,386 0.16
Commercial services
EUR 165,085 Bureau Veritas SA 3,058 0.14
EUR 140,836 Edenred 5,934 0.28
EUR 78,220 Worldline SA 5,688 0.27
Computers
EUR 56,082 Atos SE 4,060 0.19
EUR 91,061 Capgemini SE 9,971 0.47
iSHARES VII PLC
SCHEDULE OF INVESTMENTS (continued)
iSHARES CORE MSCI EMU UCITS ETFAs at 31 July 2020
[144 ]
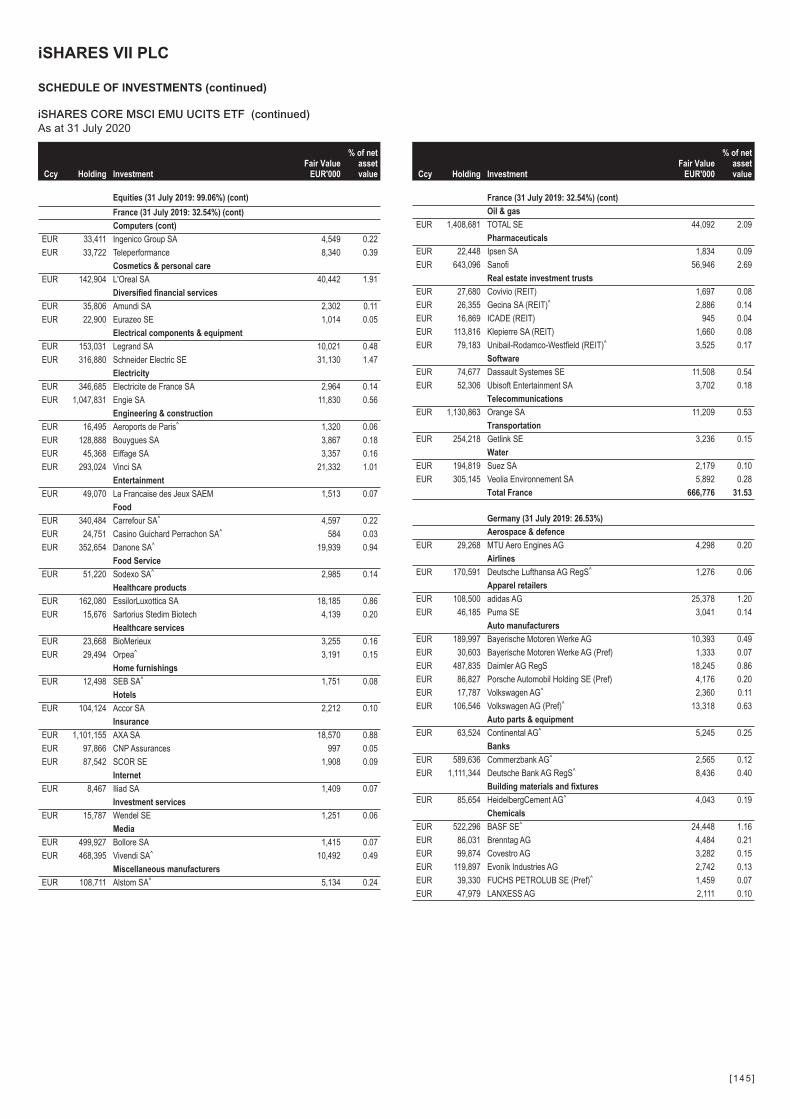
Ccy Holding InvestmentFair Value
EUR'000
% of netassetvalue
Equities (31 July 2019: 99.06%) (cont)
France (31 July 2019: 32.54%) (cont)
Computers (cont)
EUR 33,411 Ingenico Group SA 4,549 0.22
EUR 33,722 Teleperformance 8,340 0.39
Cosmetics & personal care
EUR 142,904 L'Oreal SA 40,442 1.91
Diversified financial services
EUR 35,806 Amundi SA 2,302 0.11
EUR 22,900 Eurazeo SE 1,014 0.05
Electrical components & equipment
EUR 153,031 Legrand SA 10,021 0.48
EUR 316,880 Schneider Electric SE 31,130 1.47
Electricity
EUR 346,685 Electricite de France SA 2,964 0.14
EUR 1,047,831 Engie SA 11,830 0.56
Engineering & construction
EUR 16,495 Aeroports de Paris^ 1,320 0.06
EUR 128,888 Bouygues SA 3,867 0.18
EUR 45,368 Eiffage SA 3,357 0.16
EUR 293,024 Vinci SA 21,332 1.01
Entertainment
EUR 49,070 La Francaise des Jeux SAEM 1,513 0.07
Food
EUR 340,484 Carrefour SA^ 4,597 0.22
EUR 24,751 Casino Guichard Perrachon SA^ 584 0.03
EUR 352,654 Danone SA^ 19,939 0.94
Food Service
EUR 51,220 Sodexo SA^ 2,985 0.14
Healthcare products
EUR 162,080 EssilorLuxottica SA 18,185 0.86
EUR 15,676 Sartorius Stedim Biotech 4,139 0.20
Healthcare services
EUR 23,668 BioMerieux 3,255 0.16
EUR 29,494 Orpea^ 3,191 0.15
Home furnishings
EUR 12,498 SEB SA^ 1,751 0.08
Hotels
EUR 104,124 Accor SA 2,212 0.10
Insurance
EUR 1,101,155 AXA SA 18,570 0.88
EUR 97,866 CNP Assurances 997 0.05
EUR 87,542 SCOR SE 1,908 0.09
Internet
EUR 8,467 Iliad SA 1,409 0.07
Investment services
EUR 15,787 Wendel SE 1,251 0.06
Media
EUR 499,927 Bollore SA 1,415 0.07
EUR 468,395 Vivendi SA^ 10,492 0.49
Miscellaneous manufacturers
EUR 108,711 Alstom SA^ 5,134 0.24
Ccy Holding InvestmentFair Value
EUR'000
% of netassetvalue
France (31 July 2019: 32.54%) (cont)
Oil & gas
EUR 1,408,681 TOTAL SE 44,092 2.09
Pharmaceuticals
EUR 22,448 Ipsen SA 1,834 0.09
EUR 643,096 Sanofi 56,946 2.69
Real estate investment trusts
EUR 27,680 Covivio (REIT) 1,697 0.08
EUR 26,355 Gecina SA (REIT)^ 2,886 0.14
EUR 16,869 ICADE (REIT) 945 0.04
EUR 113,816 Klepierre SA (REIT) 1,660 0.08
EUR 79,183 Unibail-Rodamco-Westfield (REIT)^ 3,525 0.17
Software
EUR 74,677 Dassault Systemes SE 11,508 0.54
EUR 52,306 Ubisoft Entertainment SA 3,702 0.18
Telecommunications
EUR 1,130,863 Orange SA 11,209 0.53
Transportation
EUR 254,218 Getlink SE 3,236 0.15
Water
EUR 194,819 Suez SA 2,179 0.10
EUR 305,145 Veolia Environnement SA 5,892 0.28
Total France 666,776 31.53
Germany (31 July 2019: 26.53%)
Aerospace & defence
EUR 29,268 MTU Aero Engines AG 4,298 0.20
Airlines
EUR 170,591 Deutsche Lufthansa AG RegS^ 1,276 0.06
Apparel retailers
EUR 108,500 adidas AG 25,378 1.20
EUR 46,185 Puma SE 3,041 0.14
Auto manufacturers
EUR 189,997 Bayerische Motoren Werke AG 10,393 0.49
EUR 30,603 Bayerische Motoren Werke AG (Pref) 1,333 0.07
EUR 487,835 Daimler AG RegS 18,245 0.86
EUR 86,827 Porsche Automobil Holding SE (Pref) 4,176 0.20
EUR 17,787 Volkswagen AG^ 2,360 0.11
EUR 106,546 Volkswagen AG (Pref)^ 13,318 0.63
Auto parts & equipment
EUR 63,524 Continental AG^ 5,245 0.25
Banks
EUR 589,636 Commerzbank AG^ 2,565 0.12
EUR 1,111,344 Deutsche Bank AG RegS^ 8,436 0.40
Building materials and fixtures
EUR 85,654 HeidelbergCement AG^ 4,043 0.19
Chemicals
EUR 522,296 BASF SE^ 24,448 1.16
EUR 86,031 Brenntag AG 4,484 0.21
EUR 99,874 Covestro AG 3,282 0.15
EUR 119,897 Evonik Industries AG 2,742 0.13
EUR 39,330 FUCHS PETROLUB SE (Pref)^ 1,459 0.07
EUR 47,979 LANXESS AG 2,111 0.10
iSHARES VII PLC
SCHEDULE OF INVESTMENTS (continued)
iSHARES CORE MSCI EMU UCITS ETF (continued)As at 31 July 2020
[145 ]

Ccy Holding InvestmentFair Value
EUR'000
% of netassetvalue
Equities (31 July 2019: 99.06%) (cont)
Germany (31 July 2019: 26.53%) (cont)
Chemicals (cont)
EUR 73,887 Symrise AG 7,836 0.37
Cosmetics & personal care
EUR 56,654 Beiersdorf AG^ 5,731 0.27
Diversified financial services
EUR 107,465 Deutsche Boerse AG 16,614 0.79
Electricity
EUR 1,285,559 E.ON SE 12,773 0.60
EUR 334,249 RWE AG 10,689 0.51
EUR 118,691 Uniper SE 3,485 0.16
Electronics
EUR 20,119 Sartorius AG (Pref) 6,547 0.31
Engineering & construction
EUR 22,802 Fraport AG Frankfurt Airport Services Worldwide^ 753 0.04
EUR 13,973 HOCHTIEF AG 964 0.04
Food
EUR 102,004 METRO AG^ 791 0.04
Healthcare products
EUR 23,042 Carl Zeiss Meditec AG 2,042 0.10
EUR 82,647 Siemens Healthineers AG^ 3,633 0.17
Healthcare services
EUR 122,404 Fresenius Medical Care AG & Co KGaA^ 9,134 0.43
EUR 239,512 Fresenius SE & Co KGaA 10,124 0.48
Household goods & home construction
EUR 57,763 Henkel AG & Co KGaA 4,254 0.20
EUR 101,362 Henkel AG & Co KGaA (Pref)^ 8,454 0.40
Insurance
EUR 237,296 Allianz SE RegS 41,816 1.98
EUR 34,741 Hannover Rueck SE 4,982 0.24
EUR 82,239 Muenchener Rueckversicherungs-Gesellschaft AG inMuenchen RegS 18,487 0.87
Internet
EUR 72,988 Delivery Hero SE^ 7,135 0.34
EUR 61,377 Scout24 AG^ 4,508 0.21
EUR 58,643 United Internet AG RegS 2,256 0.11
Iron & steel
EUR 224,344 thyssenkrupp AG^ 1,474 0.07
Machinery - diversified
EUR 90,216 GEA Group AG 2,763 0.13
EUR 39,247 KION Group AG^ 2,559 0.12
Miscellaneous manufacturers
EUR 27,776 Knorr-Bremse AG 2,761 0.13
EUR 436,742 Siemens AG RegS 47,308 2.24
Pharmaceuticals
EUR 559,892 Bayer AG RegS 31,488 1.49
EUR 74,506 Merck KGaA 8,051 0.38
Real estate investment & services
EUR 194,857 Deutsche Wohnen SE 8,028 0.38
EUR 39,365 LEG Immobilien AG 4,655 0.22
EUR 295,097 Vonovia SE 16,284 0.77
Ccy Holding InvestmentFair Value
EUR'000
% of netassetvalue
Germany (31 July 2019: 26.53%) (cont)
Retail
EUR 86,515 Zalando SE^ 5,298 0.25
Semiconductors
EUR 717,145 Infineon Technologies AG 15,153 0.72
Software
EUR 32,959 Nemetschek SE^ 2,057 0.10
EUR 595,082 SAP SE 79,610 3.76
EUR 74,189 TeamViewer AG 3,394 0.16
Telecommunications
EUR 1,903,371 Deutsche Telekom AG RegS 26,961 1.27
EUR 524,835 Telefonica Deutschland Holding AG 1,220 0.06
Transportation
EUR 566,689 Deutsche Post AG RegS 19,415 0.92
Total Germany 604,120 28.57
Ireland (31 July 2019: 1.67%)
Building materials and fixtures
EUR 444,903 CRH Plc 13,685 0.65
EUR 86,355 Kingspan Group Plc 5,246 0.25
Entertainment
EUR 88,002 Flutter Entertainment Plc 11,295 0.53
Food
EUR 91,135 Kerry Group Plc 'A' 10,207 0.48
Forest products & paper
EUR 124,909 Smurfit Kappa Group Plc 3,555 0.17
Total Ireland 43,988 2.08
Italy (31 July 2019: 5.89%)
Aerospace & defence
EUR 235,819 Leonardo SpA^ 1,276 0.06
Auto parts & equipment
EUR 222,477 Pirelli & C SpA^ 748 0.03
Banks
EUR 374,216 FinecoBank Banca Fineco SpA 4,593 0.22
EUR 8,446,094 Intesa Sanpaolo SpA 14,419 0.68
EUR 360,414 Mediobanca Banca di Credito Finanziario SpA^ 2,443 0.12
EUR 1,209,668 UniCredit SpA 9,340 0.44
Commercial services
EUR 284,514 Atlantia SpA 3,827 0.18
EUR 214,989 Nexi SpA 3,260 0.15
Electrical components & equipment
EUR 142,881 Prysmian SpA 3,090 0.15
Electricity
EUR 4,616,503 Enel SpA 35,681 1.69
EUR 809,837 Terna Rete Elettrica Nazionale SpA 5,107 0.24
Engineering & construction
EUR 136,986 Infrastrutture Wireless Italiane SpA 1,173 0.06
Gas
EUR 1,153,259 Snam SpA 5,190 0.25
Healthcare products
EUR 14,337 DiaSorin SpA 2,380 0.11
iSHARES VII PLC
SCHEDULE OF INVESTMENTS (continued)
iSHARES CORE MSCI EMU UCITS ETF (continued)As at 31 July 2020
[146 ]
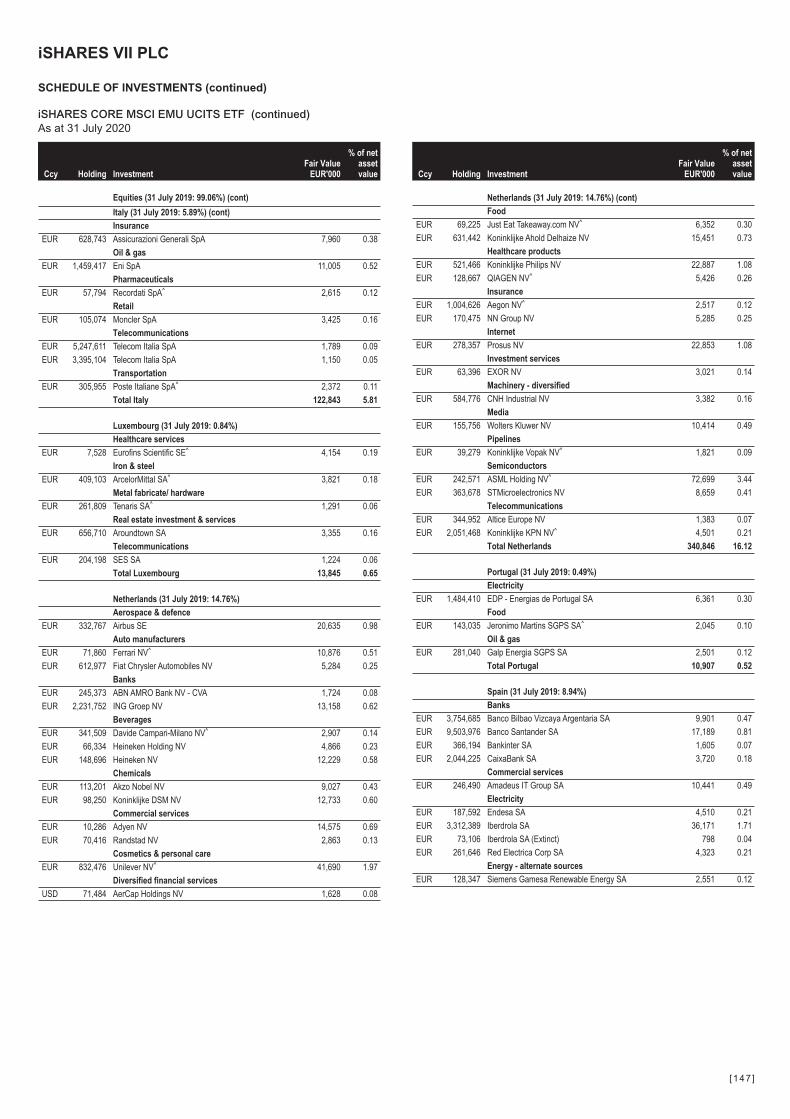
Ccy Holding InvestmentFair Value
EUR'000
% of netassetvalue
Equities (31 July 2019: 99.06%) (cont)
Italy (31 July 2019: 5.89%) (cont)
Insurance
EUR 628,743 Assicurazioni Generali SpA 7,960 0.38
Oil & gas
EUR 1,459,417 Eni SpA 11,005 0.52
Pharmaceuticals
EUR 57,794 Recordati SpA^ 2,615 0.12
Retail
EUR 105,074 Moncler SpA 3,425 0.16
Telecommunications
EUR 5,247,611 Telecom Italia SpA 1,789 0.09
EUR 3,395,104 Telecom Italia SpA 1,150 0.05
Transportation
EUR 305,955 Poste Italiane SpA^ 2,372 0.11
Total Italy 122,843 5.81
Luxembourg (31 July 2019: 0.84%)
Healthcare services
EUR 7,528 Eurofins Scientific SE^ 4,154 0.19
Iron & steel
EUR 409,103 ArcelorMittal SA^ 3,821 0.18
Metal fabricate/ hardware
EUR 261,809 Tenaris SA^ 1,291 0.06
Real estate investment & services
EUR 656,710 Aroundtown SA 3,355 0.16
Telecommunications
EUR 204,198 SES SA 1,224 0.06
Total Luxembourg 13,845 0.65
Netherlands (31 July 2019: 14.76%)
Aerospace & defence
EUR 332,767 Airbus SE 20,635 0.98
Auto manufacturers
EUR 71,860 Ferrari NV^ 10,876 0.51
EUR 612,977 Fiat Chrysler Automobiles NV 5,284 0.25
Banks
EUR 245,373 ABN AMRO Bank NV - CVA 1,724 0.08
EUR 2,231,752 ING Groep NV 13,158 0.62
Beverages
EUR 341,509 Davide Campari-Milano NV^ 2,907 0.14
EUR 66,334 Heineken Holding NV 4,866 0.23
EUR 148,696 Heineken NV 12,229 0.58
Chemicals
EUR 113,201 Akzo Nobel NV 9,027 0.43
EUR 98,250 Koninklijke DSM NV 12,733 0.60
Commercial services
EUR 10,286 Adyen NV 14,575 0.69
EUR 70,416 Randstad NV 2,863 0.13
Cosmetics & personal care
EUR 832,476 Unilever NV^ 41,690 1.97
Diversified financial services
USD 71,484 AerCap Holdings NV 1,628 0.08
Ccy Holding InvestmentFair Value
EUR'000
% of netassetvalue
Netherlands (31 July 2019: 14.76%) (cont)
Food
EUR 69,225 Just Eat Takeaway.com NV^ 6,352 0.30
EUR 631,442 Koninklijke Ahold Delhaize NV 15,451 0.73
Healthcare products
EUR 521,466 Koninklijke Philips NV 22,887 1.08
EUR 128,667 QIAGEN NV^ 5,426 0.26
Insurance
EUR 1,004,626 Aegon NV^ 2,517 0.12
EUR 170,475 NN Group NV 5,285 0.25
Internet
EUR 278,357 Prosus NV 22,853 1.08
Investment services
EUR 63,396 EXOR NV 3,021 0.14
Machinery - diversified
EUR 584,776 CNH Industrial NV 3,382 0.16
Media
EUR 155,756 Wolters Kluwer NV 10,414 0.49
Pipelines
EUR 39,279 Koninklijke Vopak NV^ 1,821 0.09
Semiconductors
EUR 242,571 ASML Holding NV^ 72,699 3.44
EUR 363,678 STMicroelectronics NV 8,659 0.41
Telecommunications
EUR 344,952 Altice Europe NV 1,383 0.07
EUR 2,051,468 Koninklijke KPN NV^ 4,501 0.21
Total Netherlands 340,846 16.12
Portugal (31 July 2019: 0.49%)
Electricity
EUR 1,484,410 EDP - Energias de Portugal SA 6,361 0.30
Food
EUR 143,035 Jeronimo Martins SGPS SA^ 2,045 0.10
Oil & gas
EUR 281,040 Galp Energia SGPS SA 2,501 0.12
Total Portugal 10,907 0.52
Spain (31 July 2019: 8.94%)
Banks
EUR 3,754,685 Banco Bilbao Vizcaya Argentaria SA 9,901 0.47
EUR 9,503,976 Banco Santander SA 17,189 0.81
EUR 366,194 Bankinter SA 1,605 0.07
EUR 2,044,225 CaixaBank SA 3,720 0.18
Commercial services
EUR 246,490 Amadeus IT Group SA 10,441 0.49
Electricity
EUR 187,592 Endesa SA 4,510 0.21
EUR 3,312,389 Iberdrola SA 36,171 1.71
EUR 73,106 Iberdrola SA (Extinct) 798 0.04
EUR 261,646 Red Electrica Corp SA 4,323 0.21
Energy - alternate sources
EUR 128,347 Siemens Gamesa Renewable Energy SA 2,551 0.12
iSHARES VII PLC
SCHEDULE OF INVESTMENTS (continued)
iSHARES CORE MSCI EMU UCITS ETF (continued)As at 31 July 2020
[147 ]
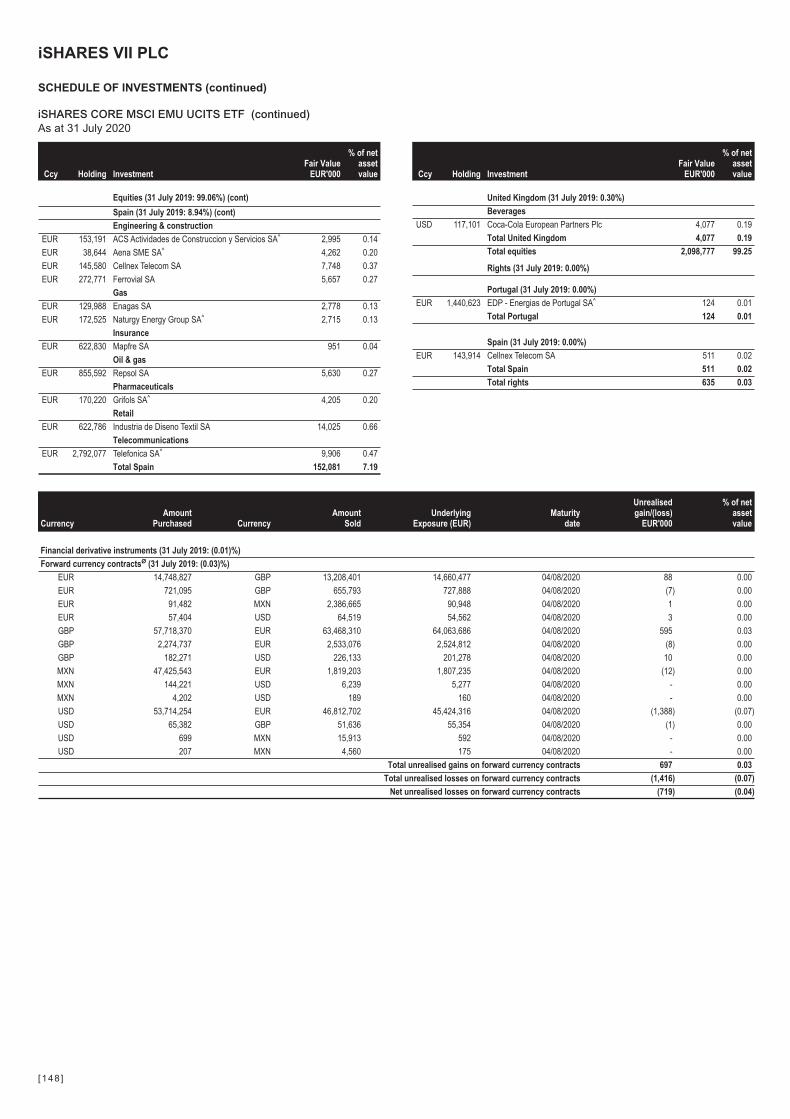
Ccy Holding InvestmentFair Value
EUR'000
% of netassetvalue
Equities (31 July 2019: 99.06%) (cont)
Spain (31 July 2019: 8.94%) (cont)
Engineering & construction
EUR 153,191 ACS Actividades de Construccion y Servicios SA^ 2,995 0.14
EUR 38,644 Aena SME SA^ 4,262 0.20
EUR 145,580 Cellnex Telecom SA 7,748 0.37
EUR 272,771 Ferrovial SA 5,657 0.27
Gas
EUR 129,988 Enagas SA 2,778 0.13
EUR 172,525 Naturgy Energy Group SA^ 2,715 0.13
Insurance
EUR 622,830 Mapfre SA 951 0.04
Oil & gas
EUR 855,592 Repsol SA 5,630 0.27
Pharmaceuticals
EUR 170,220 Grifols SA^ 4,205 0.20
Retail
EUR 622,786 Industria de Diseno Textil SA 14,025 0.66
Telecommunications
EUR 2,792,077 Telefonica SA^ 9,906 0.47
Total Spain 152,081 7.19
Ccy Holding InvestmentFair Value
EUR'000
% of netassetvalue
United Kingdom (31 July 2019: 0.30%)
Beverages
USD 117,101 Coca-Cola European Partners Plc 4,077 0.19
Total United Kingdom 4,077 0.19
Total equities 2,098,777 99.25
Rights (31 July 2019: 0.00%)
Portugal (31 July 2019: 0.00%)
EUR 1,440,623 EDP - Energias de Portugal SA^ 124 0.01
Total Portugal 124 0.01
Spain (31 July 2019: 0.00%)
EUR 143,914 Cellnex Telecom SA 511 0.02
Total Spain 511 0.02
Total rights 635 0.03
CurrencyAmount
Purchased CurrencyAmount
SoldUnderlying
Exposure (EUR)Maturity
date
Unrealisedgain/(loss)
EUR'000
% of netassetvalue
Financial derivative instruments (31 July 2019: (0.01)%)
Forward currency contractsØ (31 July 2019: (0.03)%)
EUR 14,748,827 GBP 13,208,401 14,660,477 04/08/2020 88 0.00
EUR 721,095 GBP 655,793 727,888 04/08/2020 (7) 0.00
EUR 91,482 MXN 2,386,665 90,948 04/08/2020 1 0.00
EUR 57,404 USD 64,519 54,562 04/08/2020 3 0.00
GBP 57,718,370 EUR 63,468,310 64,063,686 04/08/2020 595 0.03
GBP 2,274,737 EUR 2,533,076 2,524,812 04/08/2020 (8) 0.00
GBP 182,271 USD 226,133 201,278 04/08/2020 10 0.00
MXN 47,425,543 EUR 1,819,203 1,807,235 04/08/2020 (12) 0.00
MXN 144,221 USD 6,239 5,277 04/08/2020 - 0.00
MXN 4,202 USD 189 160 04/08/2020 - 0.00
USD 53,714,254 EUR 46,812,702 45,424,316 04/08/2020 (1,388) (0.07)
USD 65,382 GBP 51,636 55,354 04/08/2020 (1) 0.00
USD 699 MXN 15,913 592 04/08/2020 - 0.00
USD 207 MXN 4,560 175 04/08/2020 - 0.00
Total unrealised gains on forward currency contracts 697 0.03
Total unrealised losses on forward currency contracts (1,416) (0.07)
Net unrealised losses on forward currency contracts (719) (0.04)
iSHARES VII PLC
SCHEDULE OF INVESTMENTS (continued)
iSHARES CORE MSCI EMU UCITS ETF (continued)As at 31 July 2020
[148 ]
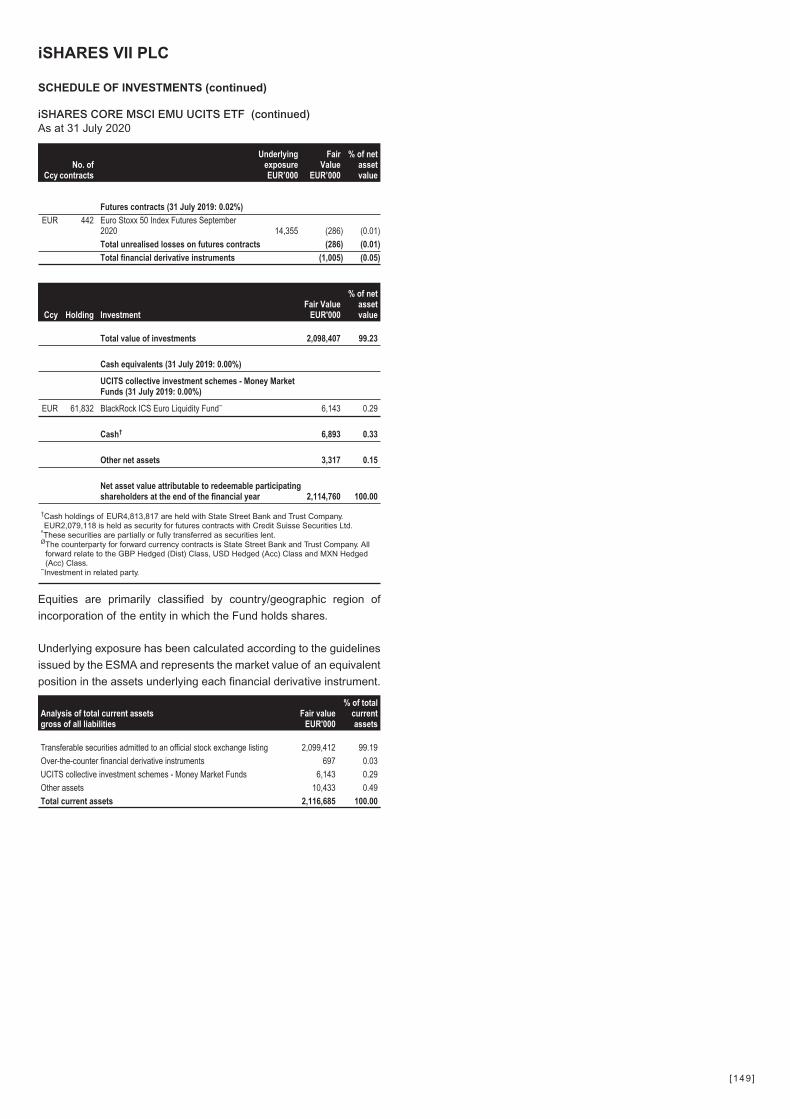
CcyNo. of
contracts
UnderlyingexposureEUR’000
FairValue
EUR’000
% of netassetvalue
Futures contracts (31 July 2019: 0.02%)
EUR 442 Euro Stoxx 50 Index Futures September2020 14,355 (286) (0.01)
Total unrealised losses on futures contracts (286) (0.01)
Total financial derivative instruments (1,005) (0.05)
Ccy Holding InvestmentFair Value
EUR'000
% of netassetvalue
Total value of investments 2,098,407 99.23
Cash equivalents (31 July 2019: 0.00%)
UCITS collective investment schemes - Money MarketFunds (31 July 2019: 0.00%)
EUR 61,832 BlackRock ICS Euro Liquidity Fund~ 6,143 0.29
Cash† 6,893 0.33
Other net assets 3,317 0.15
Net asset value attributable to redeemable participatingshareholders at the end of the financial year 2,114,760 100.00
†Cash holdings of EUR4,813,817 are held with State Street Bank and Trust Company.EUR2,079,118 is held as security for futures contracts with Credit Suisse Securities Ltd.
^These securities are partially or fully transferred as securities lent.ØThe counterparty for forward currency contracts is State Street Bank and Trust Company. All
forward relate to the GBP Hedged (Dist) Class, USD Hedged (Acc) Class and MXN Hedged(Acc) Class.
~Investment in related party.
Equities are primarily classified by country/geographic region of
incorporation of the entity in which the Fund holds shares.
Underlying exposure has been calculated according to the guidelines
issued by the ESMA and represents the market value of an equivalent
position in the assets underlying each financial derivative instrument.
Analysis of total current assetsgross of all liabilities
Fair valueEUR'000
% of totalcurrentassets
Transferable securities admitted to an official stock exchange listing 2,099,412 99.19
Over-the-counter financial derivative instruments 697 0.03
UCITS collective investment schemes - Money Market Funds 6,143 0.29
Other assets 10,433 0.49
Total current assets 2,116,685 100.00
iSHARES VII PLC
SCHEDULE OF INVESTMENTS (continued)
iSHARES CORE MSCI EMU UCITS ETF (continued)As at 31 July 2020
[149 ]
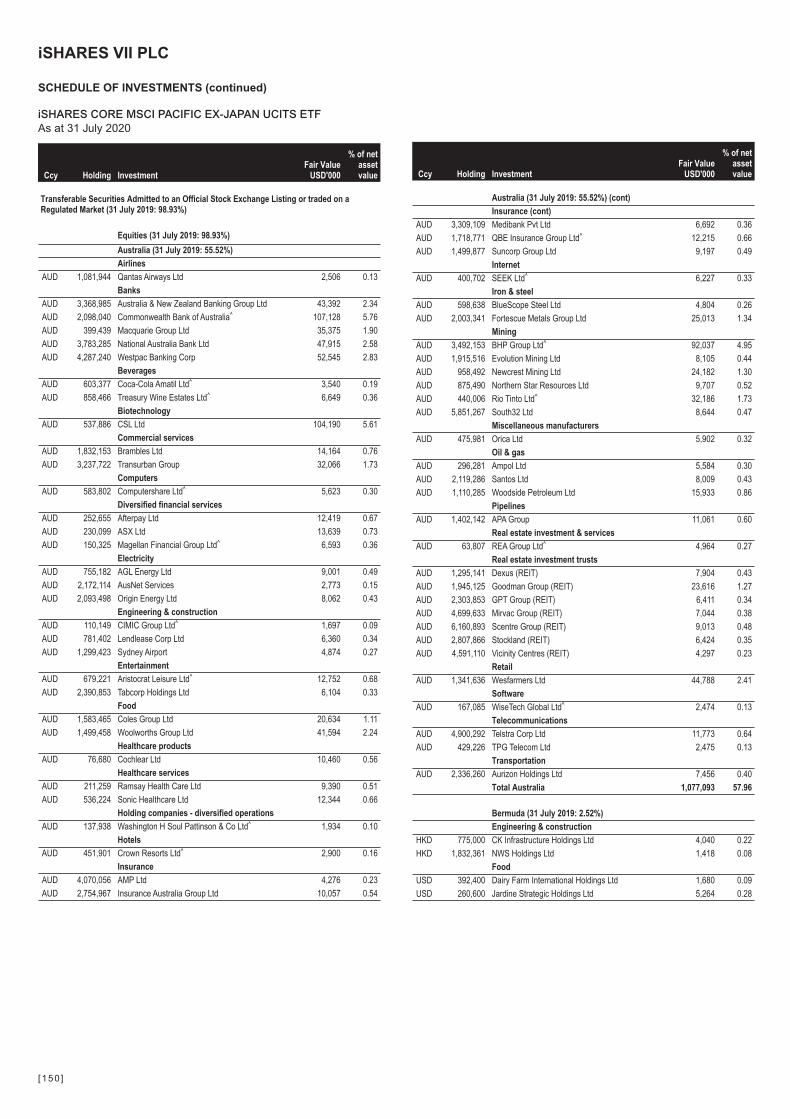
Ccy Holding InvestmentFair Value
USD'000
% of netassetvalue
Transferable Securities Admitted to an Official Stock Exchange Listing or traded on aRegulated Market (31 July 2019: 98.93%)
Equities (31 July 2019: 98.93%)
Australia (31 July 2019: 55.52%)
Airlines
AUD 1,081,944 Qantas Airways Ltd 2,506 0.13
Banks
AUD 3,368,985 Australia & New Zealand Banking Group Ltd 43,392 2.34
AUD 2,098,040 Commonwealth Bank of Australia^ 107,128 5.76
AUD 399,439 Macquarie Group Ltd 35,375 1.90
AUD 3,783,285 National Australia Bank Ltd 47,915 2.58
AUD 4,287,240 Westpac Banking Corp 52,545 2.83
Beverages
AUD 603,377 Coca-Cola Amatil Ltd^ 3,540 0.19
AUD 858,466 Treasury Wine Estates Ltd^ 6,649 0.36
Biotechnology
AUD 537,886 CSL Ltd 104,190 5.61
Commercial services
AUD 1,832,153 Brambles Ltd 14,164 0.76
AUD 3,237,722 Transurban Group 32,066 1.73
Computers
AUD 583,802 Computershare Ltd^ 5,623 0.30
Diversified financial services
AUD 252,655 Afterpay Ltd 12,419 0.67
AUD 230,099 ASX Ltd 13,639 0.73
AUD 150,325 Magellan Financial Group Ltd^ 6,593 0.36
Electricity
AUD 755,182 AGL Energy Ltd 9,001 0.49
AUD 2,172,114 AusNet Services 2,773 0.15
AUD 2,093,498 Origin Energy Ltd 8,062 0.43
Engineering & construction
AUD 110,149 CIMIC Group Ltd^ 1,697 0.09
AUD 781,402 Lendlease Corp Ltd 6,360 0.34
AUD 1,299,423 Sydney Airport 4,874 0.27
Entertainment
AUD 679,221 Aristocrat Leisure Ltd^ 12,752 0.68
AUD 2,390,853 Tabcorp Holdings Ltd 6,104 0.33
Food
AUD 1,583,465 Coles Group Ltd 20,634 1.11
AUD 1,499,458 Woolworths Group Ltd 41,594 2.24
Healthcare products
AUD 76,680 Cochlear Ltd 10,460 0.56
Healthcare services
AUD 211,259 Ramsay Health Care Ltd 9,390 0.51
AUD 536,224 Sonic Healthcare Ltd 12,344 0.66
Holding companies - diversified operations
AUD 137,938 Washington H Soul Pattinson & Co Ltd^ 1,934 0.10
Hotels
AUD 451,901 Crown Resorts Ltd^ 2,900 0.16
Insurance
AUD 4,070,056 AMP Ltd 4,276 0.23
AUD 2,754,967 Insurance Australia Group Ltd 10,057 0.54
Ccy Holding InvestmentFair Value
USD'000
% of netassetvalue
Australia (31 July 2019: 55.52%) (cont)
Insurance (cont)
AUD 3,309,109 Medibank Pvt Ltd 6,692 0.36
AUD 1,718,771 QBE Insurance Group Ltd^ 12,215 0.66
AUD 1,499,877 Suncorp Group Ltd 9,197 0.49
Internet
AUD 400,702 SEEK Ltd^ 6,227 0.33
Iron & steel
AUD 598,638 BlueScope Steel Ltd 4,804 0.26
AUD 2,003,341 Fortescue Metals Group Ltd 25,013 1.34
Mining
AUD 3,492,153 BHP Group Ltd^ 92,037 4.95
AUD 1,915,516 Evolution Mining Ltd 8,105 0.44
AUD 958,492 Newcrest Mining Ltd 24,182 1.30
AUD 875,490 Northern Star Resources Ltd 9,707 0.52
AUD 440,006 Rio Tinto Ltd^ 32,186 1.73
AUD 5,851,267 South32 Ltd 8,644 0.47
Miscellaneous manufacturers
AUD 475,981 Orica Ltd 5,902 0.32
Oil & gas
AUD 296,281 Ampol Ltd 5,584 0.30
AUD 2,119,286 Santos Ltd 8,009 0.43
AUD 1,110,285 Woodside Petroleum Ltd 15,933 0.86
Pipelines
AUD 1,402,142 APA Group 11,061 0.60
Real estate investment & services
AUD 63,807 REA Group Ltd^ 4,964 0.27
Real estate investment trusts
AUD 1,295,141 Dexus (REIT) 7,904 0.43
AUD 1,945,125 Goodman Group (REIT) 23,616 1.27
AUD 2,303,853 GPT Group (REIT) 6,411 0.34
AUD 4,699,633 Mirvac Group (REIT) 7,044 0.38
AUD 6,160,893 Scentre Group (REIT) 9,013 0.48
AUD 2,807,866 Stockland (REIT) 6,424 0.35
AUD 4,591,110 Vicinity Centres (REIT) 4,297 0.23
Retail
AUD 1,341,636 Wesfarmers Ltd 44,788 2.41
Software
AUD 167,085 WiseTech Global Ltd^ 2,474 0.13
Telecommunications
AUD 4,900,292 Telstra Corp Ltd 11,773 0.64
AUD 429,226 TPG Telecom Ltd 2,475 0.13
Transportation
AUD 2,336,260 Aurizon Holdings Ltd 7,456 0.40
Total Australia 1,077,093 57.96
Bermuda (31 July 2019: 2.52%)
Engineering & construction
HKD 775,000 CK Infrastructure Holdings Ltd 4,040 0.22
HKD 1,832,361 NWS Holdings Ltd 1,418 0.08
Food
USD 392,400 Dairy Farm International Holdings Ltd 1,680 0.09
USD 260,600 Jardine Strategic Holdings Ltd 5,264 0.28
iSHARES VII PLC
SCHEDULE OF INVESTMENTS (continued)
iSHARES CORE MSCI PACIFIC EX-JAPAN UCITS ETFAs at 31 July 2020
[150 ]
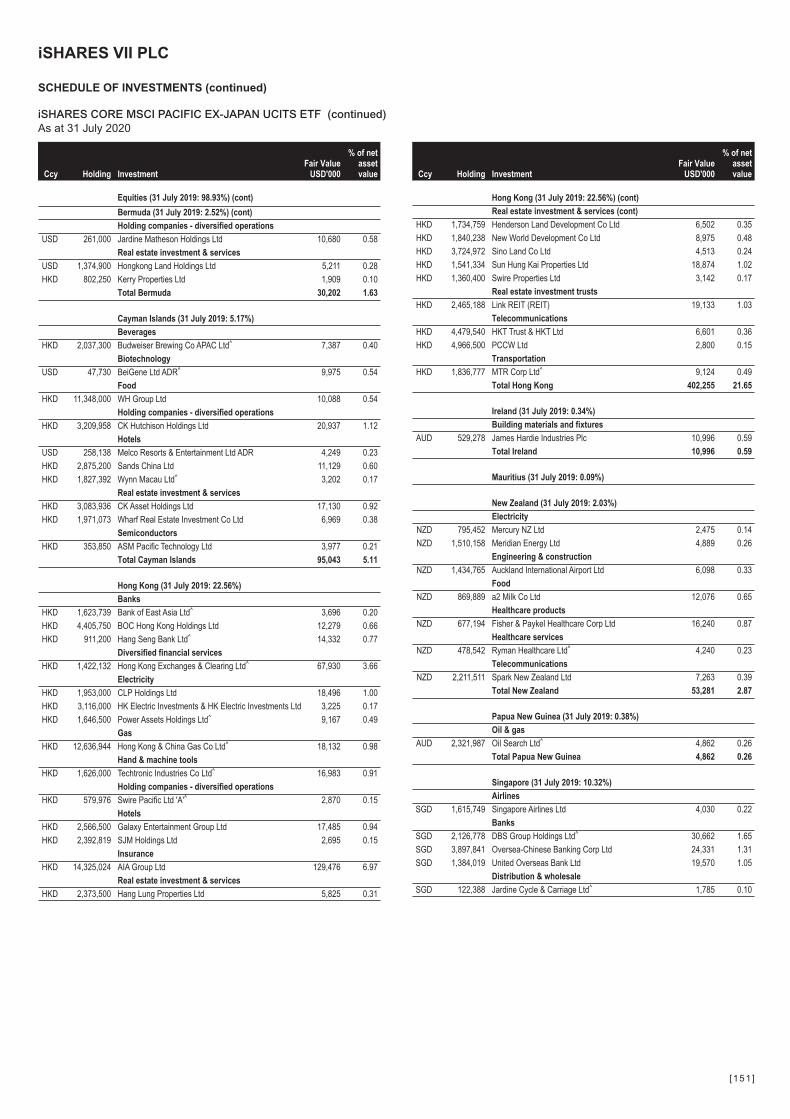
Ccy Holding InvestmentFair Value
USD'000
% of netassetvalue
Equities (31 July 2019: 98.93%) (cont)
Bermuda (31 July 2019: 2.52%) (cont)
Holding companies - diversified operations
USD 261,000 Jardine Matheson Holdings Ltd 10,680 0.58
Real estate investment & services
USD 1,374,900 Hongkong Land Holdings Ltd 5,211 0.28
HKD 802,250 Kerry Properties Ltd 1,909 0.10
Total Bermuda 30,202 1.63
Cayman Islands (31 July 2019: 5.17%)
Beverages
HKD 2,037,300 Budweiser Brewing Co APAC Ltd^ 7,387 0.40
Biotechnology
USD 47,730 BeiGene Ltd ADR^ 9,975 0.54
Food
HKD 11,348,000 WH Group Ltd 10,088 0.54
Holding companies - diversified operations
HKD 3,209,958 CK Hutchison Holdings Ltd 20,937 1.12
Hotels
USD 258,138 Melco Resorts & Entertainment Ltd ADR 4,249 0.23
HKD 2,875,200 Sands China Ltd 11,129 0.60
HKD 1,827,392 Wynn Macau Ltd^ 3,202 0.17
Real estate investment & services
HKD 3,083,936 CK Asset Holdings Ltd 17,130 0.92
HKD 1,971,073 Wharf Real Estate Investment Co Ltd 6,969 0.38
Semiconductors
HKD 353,850 ASM Pacific Technology Ltd 3,977 0.21
Total Cayman Islands 95,043 5.11
Hong Kong (31 July 2019: 22.56%)
Banks
HKD 1,623,739 Bank of East Asia Ltd^ 3,696 0.20
HKD 4,405,750 BOC Hong Kong Holdings Ltd 12,279 0.66
HKD 911,200 Hang Seng Bank Ltd^ 14,332 0.77
Diversified financial services
HKD 1,422,132 Hong Kong Exchanges & Clearing Ltd^ 67,930 3.66
Electricity
HKD 1,953,000 CLP Holdings Ltd 18,496 1.00
HKD 3,116,000 HK Electric Investments & HK Electric Investments Ltd 3,225 0.17
HKD 1,646,500 Power Assets Holdings Ltd^ 9,167 0.49
Gas
HKD 12,636,944 Hong Kong & China Gas Co Ltd^ 18,132 0.98
Hand & machine tools
HKD 1,626,000 Techtronic Industries Co Ltd^ 16,983 0.91
Holding companies - diversified operations
HKD 579,976 Swire Pacific Ltd 'A'^ 2,870 0.15
Hotels
HKD 2,566,500 Galaxy Entertainment Group Ltd 17,485 0.94
HKD 2,392,819 SJM Holdings Ltd 2,695 0.15
Insurance
HKD 14,325,024 AIA Group Ltd 129,476 6.97
Real estate investment & services
HKD 2,373,500 Hang Lung Properties Ltd 5,825 0.31
Ccy Holding InvestmentFair Value
USD'000
% of netassetvalue
Hong Kong (31 July 2019: 22.56%) (cont)
Real estate investment & services (cont)
HKD 1,734,759 Henderson Land Development Co Ltd 6,502 0.35
HKD 1,840,238 New World Development Co Ltd 8,975 0.48
HKD 3,724,972 Sino Land Co Ltd 4,513 0.24
HKD 1,541,334 Sun Hung Kai Properties Ltd 18,874 1.02
HKD 1,360,400 Swire Properties Ltd 3,142 0.17
Real estate investment trusts
HKD 2,465,188 Link REIT (REIT) 19,133 1.03
Telecommunications
HKD 4,479,540 HKT Trust & HKT Ltd 6,601 0.36
HKD 4,966,500 PCCW Ltd 2,800 0.15
Transportation
HKD 1,836,777 MTR Corp Ltd^ 9,124 0.49
Total Hong Kong 402,255 21.65
Ireland (31 July 2019: 0.34%)
Building materials and fixtures
AUD 529,278 James Hardie Industries Plc 10,996 0.59
Total Ireland 10,996 0.59
Mauritius (31 July 2019: 0.09%)
New Zealand (31 July 2019: 2.03%)
Electricity
NZD 795,452 Mercury NZ Ltd 2,475 0.14
NZD 1,510,158 Meridian Energy Ltd 4,889 0.26
Engineering & construction
NZD 1,434,765 Auckland International Airport Ltd 6,098 0.33
Food
NZD 869,889 a2 Milk Co Ltd 12,076 0.65
Healthcare products
NZD 677,194 Fisher & Paykel Healthcare Corp Ltd 16,240 0.87
Healthcare services
NZD 478,542 Ryman Healthcare Ltd^ 4,240 0.23
Telecommunications
NZD 2,211,511 Spark New Zealand Ltd 7,263 0.39
Total New Zealand 53,281 2.87
Papua New Guinea (31 July 2019: 0.38%)
Oil & gas
AUD 2,321,987 Oil Search Ltd^ 4,862 0.26
Total Papua New Guinea 4,862 0.26
Singapore (31 July 2019: 10.32%)
Airlines
SGD 1,615,749 Singapore Airlines Ltd 4,030 0.22
Banks
SGD 2,126,778 DBS Group Holdings Ltd^ 30,662 1.65
SGD 3,897,841 Oversea-Chinese Banking Corp Ltd 24,331 1.31
SGD 1,384,019 United Overseas Bank Ltd 19,570 1.05
Distribution & wholesale
SGD 122,388 Jardine Cycle & Carriage Ltd^ 1,785 0.10
iSHARES VII PLC
SCHEDULE OF INVESTMENTS (continued)
iSHARES CORE MSCI PACIFIC EX-JAPAN UCITS ETF (continued)As at 31 July 2020
[151 ]

Ccy Holding InvestmentFair Value
USD'000
% of netassetvalue
Equities (31 July 2019: 98.93%) (cont)
Singapore (31 July 2019: 10.32%) (cont)
Diversified financial services
SGD 936,500 Singapore Exchange Ltd^ 5,579 0.30
Electronics
SGD 335,100 Venture Corp Ltd^ 4,374 0.24
Engineering & construction
SGD 1,714,000 Keppel Corp Ltd^ 6,750 0.36
SGD 1,849,800 Singapore Technologies Engineering Ltd^ 4,411 0.24
Entertainment
SGD 7,272,100 Genting Singapore Ltd^ 3,898 0.21
Food
SGD 2,282,500 Wilmar International Ltd 7,690 0.41
Hotels
SGD 552,200 City Developments Ltd 3,294 0.18
Marine transportation
SGD 3,055,200 Yangzijiang Shipbuilding Holdings Ltd^ 2,039 0.11
Real estate investment & services
SGD 3,088,000 CapitaLand Ltd 6,215 0.33
SGD 567,714 UOL Group Ltd 2,741 0.15
Real estate investment trusts
SGD 3,638,010 Ascendas Real Estate Investment Trust (REIT) 9,391 0.51
SGD 3,166,900 CapitaLand Commercial Trust (REIT) 3,718 0.20
SGD 3,037,700 CapitaLand Mall Trust (REIT) 4,187 0.23
SGD 2,530,600 Mapletree Commercial Trust (REIT) 3,396 0.18
SGD 3,147,100 Mapletree Logistics Trust (REIT) 4,888 0.26
SGD 2,363,000 Suntec Real Estate Investment Trust (REIT) 2,309 0.12
Telecommunications
SGD 9,608,183 Singapore Telecommunications Ltd^ 17,376 0.93
Total Singapore 172,634 9.29
Total equities 1,846,366 99.36
CcyNo. of
contracts
UnderlyingexposureUSD’000
FairValue
USD’000
% of netassetvalue
Financial derivative instruments (31 July 2019: 0.01%)
Futures contracts (31 July 2019: 0.01%)
HKD 22 Hang Seng Index Futures August 2020 3,503 (17) 0.00
SGD 87 MSCI Singapore Index Futures August 2020 1,882 (60) 0.00
AUD 64 SPI 200 Index Futures September 2020 6,644 100 0.00
Total unrealised gains on futures contracts 100 0.00
Total unrealised losses on futures contracts (77) 0.00
Net unrealised gains on futures contracts 23 0.00
Total financial derivative instruments 23 0.00
Fair ValueUSD'000
% of netassetvalue
Total value of investments 1,846,389 99.36
Cash† 10,708 0.58
Other net assets 1,134 0.06
Net asset value attributable to redeemable participatingshareholders at the end of the financial year 1,858,231 100.00
†Cash holdings of USD9,831,784 are held with State Street Bank and Trust Company.USD876,340 is held as security for futures contracts with Credit Suisse Securities Ltd.
^These securities are partially or fully transferred as securities lent.
Equities are primarily classified by country/geographic region of
incorporation of the entity in which the Fund holds shares.
Underlying exposure has been calculated according to the guidelines
issued by the ESMA and represents the market value of an equivalent
position in the assets underlying each financial derivative instrument.
Analysis of total current assetsgross of all liabilities
Fair valueUSD'000
% of totalcurrentassets
Transferable securities admitted to an official stock exchange listing 1,846,366 99.23
Exchange traded financial derivative instruments 100 0.00
Other assets 14,313 0.77
Total current assets 1,860,779 100.00
iSHARES VII PLC
SCHEDULE OF INVESTMENTS (continued)
iSHARES CORE MSCI PACIFIC EX-JAPAN UCITS ETF (continued)As at 31 July 2020
[152 ]

Ccy Holding InvestmentFair Value
USD'000
% of netassetvalue
Transferable Securities Admitted to an Official Stock Exchange Listing or traded on aRegulated Market (31 July 2019: 99.93%)
Equities (31 July 2019: 99.93%)
Bermuda (31 July 2019: 0.21%)
Commercial services
USD 553,344 IHS Markit Ltd 44,672 0.12
Diversified financial services
USD 513,263 Invesco Ltd^ 5,153 0.01
Insurance
USD 55,990 Everest Re Group Ltd 12,250 0.03
Leisure time
USD 380,007 Norwegian Cruise Line Holdings Ltd^ 5,183 0.02
Total Bermuda 67,258 0.18
British Virgin Islands (31 July 2019: 0.02%)
Curacao (31 July 2019: 0.22%)
Oil & gas services
USD 1,925,539 Schlumberger Ltd 34,929 0.09
Total Curacao 34,929 0.09
Ireland (31 July 2019: 2.30%)
Building materials and fixtures
USD 1,032,084 Johnson Controls International Plc 39,715 0.11
Chemicals
USD 728,733 Linde Plc (US listed) 178,620 0.47
Computers
USD 883,730 Accenture Plc 'A' 198,645 0.52
USD 314,765 Seagate Technology Plc 14,233 0.04
Electronics
USD 127,691 Allegion Plc 12,700 0.03
Environmental control
USD 231,176 Pentair Plc 9,906 0.03
Healthcare products
USD 1,860,806 Medtronic Plc 179,530 0.48
USD 116,700 STERIS Plc 18,629 0.05
Insurance
USD 320,582 Aon Plc 'A' 65,790 0.17
USD 178,628 Willis Towers Watson Plc 37,514 0.10
Miscellaneous manufacturers
USD 554,927 Eaton Corp Plc 51,680 0.14
USD 330,849 Trane Technologies Plc 37,012 0.10
Pharmaceuticals
USD 187,583 Perrigo Co Plc 9,946 0.03
Total Ireland 853,920 2.27
Jersey (31 July 2019: 0.16%)
Auto parts & equipment
USD 371,870 Aptiv Plc^ 28,913 0.08
Packaging & containers
USD 2,184,525 Amcor Plc 22,500 0.06
Total Jersey 51,413 0.14
Ccy Holding InvestmentFair Value
USD'000
% of netassetvalue
Liberia (31 July 2019: 0.08%)
Leisure time
USD 236,661 Royal Caribbean Cruises Ltd^ 11,528 0.03
Total Liberia 11,528 0.03
Netherlands (31 July 2019: 0.14%)
Chemicals
USD 356,450 LyondellBasell Industries NV 'A' 22,285 0.06
Pharmaceuticals
USD 709,716 Mylan NV^ 11,434 0.03
Total Netherlands 33,719 0.09
Panama (31 July 2019: 0.08%)
Leisure time
USD 657,479 Carnival Corp^ 9,126 0.02
Total Panama 9,126 0.02
Switzerland (31 July 2019: 0.45%)
Electronics
USD 198,991 Garmin Ltd 19,618 0.05
USD 460,565 TE Connectivity Ltd 41,023 0.11
Insurance
USD 624,651 Chubb Ltd 79,481 0.21
Total Switzerland 140,122 0.37
United Kingdom (31 July 2019: 0.26%)
Commercial services
USD 488,874 Nielsen Holdings Plc 7,054 0.02
Oil & gas services
USD 579,766 TechnipFMC Plc^ 4,656 0.01
Total United Kingdom 11,710 0.03
United States (31 July 2019: 96.01%)
Advertising
USD 533,264 Interpublic Group of Cos Inc 9,625 0.03
USD 300,065 Omnicom Group Inc^ 16,123 0.04
Aerospace & defence
USD 743,771 Boeing Co 117,516 0.31
USD 322,551 General Dynamics Corp 47,331 0.13
USD 533,489 Howmet Aerospace Inc 7,885 0.02
USD 299,510 L3Harris Technologies Inc^ 50,416 0.13
USD 342,401 Lockheed Martin Corp 129,760 0.34
USD 214,982 Northrop Grumman Corp 69,871 0.19
USD 2,040,452 Raytheon Technologies Corp 115,653 0.31
USD 50,874 Teledyne Technologies Inc 15,603 0.04
USD 69,785 TransDigm Group Inc^ 30,118 0.08
Agriculture
USD 2,578,580 Altria Group Inc 106,109 0.28
USD 770,907 Archer-Daniels-Midland Co 33,018 0.09
USD 2,160,711 Philip Morris International Inc 165,964 0.44
Airlines
USD 169,788 Alaska Air Group Inc^ 5,848 0.02
USD 702,916 American Airlines Group Inc^ 7,816 0.02
iSHARES VII PLC
SCHEDULE OF INVESTMENTS (continued)
iSHARES CORE S&P 500 UCITS ETFAs at 31 July 2020
[153 ]
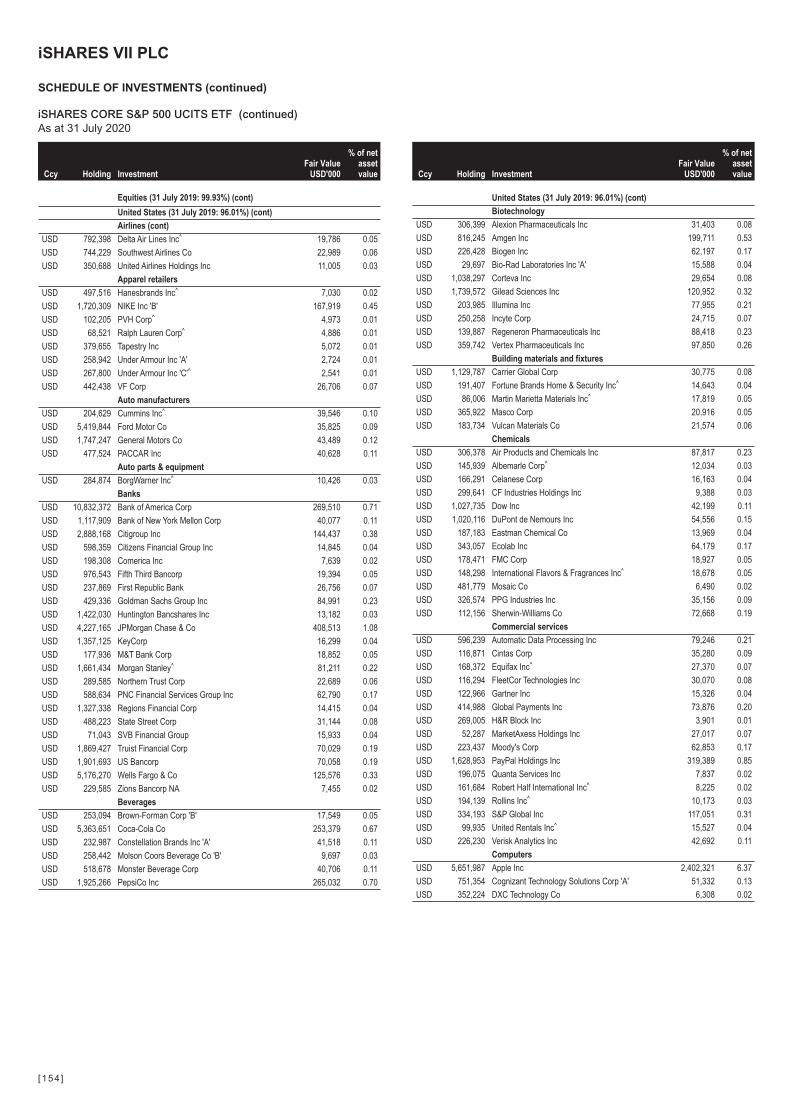
Ccy Holding InvestmentFair Value
USD'000
% of netassetvalue
Equities (31 July 2019: 99.93%) (cont)
United States (31 July 2019: 96.01%) (cont)
Airlines (cont)
USD 792,398 Delta Air Lines Inc^ 19,786 0.05
USD 744,229 Southwest Airlines Co 22,989 0.06
USD 350,688 United Airlines Holdings Inc 11,005 0.03
Apparel retailers
USD 497,516 Hanesbrands Inc^ 7,030 0.02
USD 1,720,309 NIKE Inc 'B' 167,919 0.45
USD 102,205 PVH Corp^ 4,973 0.01
USD 68,521 Ralph Lauren Corp^ 4,886 0.01
USD 379,655 Tapestry Inc 5,072 0.01
USD 258,942 Under Armour Inc 'A' 2,724 0.01
USD 267,800 Under Armour Inc 'C'^ 2,541 0.01
USD 442,438 VF Corp 26,706 0.07
Auto manufacturers
USD 204,629 Cummins Inc^ 39,546 0.10
USD 5,419,844 Ford Motor Co 35,825 0.09
USD 1,747,247 General Motors Co 43,489 0.12
USD 477,524 PACCAR Inc 40,628 0.11
Auto parts & equipment
USD 284,874 BorgWarner Inc^ 10,426 0.03
Banks
USD 10,832,372 Bank of America Corp 269,510 0.71
USD 1,117,909 Bank of New York Mellon Corp 40,077 0.11
USD 2,888,168 Citigroup Inc 144,437 0.38
USD 598,359 Citizens Financial Group Inc 14,845 0.04
USD 198,308 Comerica Inc 7,639 0.02
USD 976,543 Fifth Third Bancorp 19,394 0.05
USD 237,869 First Republic Bank 26,756 0.07
USD 429,336 Goldman Sachs Group Inc 84,991 0.23
USD 1,422,030 Huntington Bancshares Inc 13,182 0.03
USD 4,227,165 JPMorgan Chase & Co 408,513 1.08
USD 1,357,125 KeyCorp 16,299 0.04
USD 177,936 M&T Bank Corp 18,852 0.05
USD 1,661,434 Morgan Stanley^ 81,211 0.22
USD 289,585 Northern Trust Corp 22,689 0.06
USD 588,634 PNC Financial Services Group Inc 62,790 0.17
USD 1,327,338 Regions Financial Corp 14,415 0.04
USD 488,223 State Street Corp 31,144 0.08
USD 71,043 SVB Financial Group 15,933 0.04
USD 1,869,427 Truist Financial Corp 70,029 0.19
USD 1,901,693 US Bancorp 70,058 0.19
USD 5,176,270 Wells Fargo & Co 125,576 0.33
USD 229,585 Zions Bancorp NA 7,455 0.02
Beverages
USD 253,094 Brown-Forman Corp 'B' 17,549 0.05
USD 5,363,651 Coca-Cola Co 253,379 0.67
USD 232,987 Constellation Brands Inc 'A' 41,518 0.11
USD 258,442 Molson Coors Beverage Co 'B' 9,697 0.03
USD 518,678 Monster Beverage Corp 40,706 0.11
USD 1,925,266 PepsiCo Inc 265,032 0.70
Ccy Holding InvestmentFair Value
USD'000
% of netassetvalue
United States (31 July 2019: 96.01%) (cont)
Biotechnology
USD 306,399 Alexion Pharmaceuticals Inc 31,403 0.08
USD 816,245 Amgen Inc 199,711 0.53
USD 226,428 Biogen Inc 62,197 0.17
USD 29,697 Bio-Rad Laboratories Inc 'A' 15,588 0.04
USD 1,038,297 Corteva Inc 29,654 0.08
USD 1,739,572 Gilead Sciences Inc 120,952 0.32
USD 203,985 Illumina Inc 77,955 0.21
USD 250,258 Incyte Corp 24,715 0.07
USD 139,887 Regeneron Pharmaceuticals Inc 88,418 0.23
USD 359,742 Vertex Pharmaceuticals Inc 97,850 0.26
Building materials and fixtures
USD 1,129,787 Carrier Global Corp 30,775 0.08
USD 191,407 Fortune Brands Home & Security Inc^ 14,643 0.04
USD 86,006 Martin Marietta Materials Inc^ 17,819 0.05
USD 365,922 Masco Corp 20,916 0.05
USD 183,734 Vulcan Materials Co 21,574 0.06
Chemicals
USD 306,378 Air Products and Chemicals Inc 87,817 0.23
USD 145,939 Albemarle Corp^ 12,034 0.03
USD 166,291 Celanese Corp 16,163 0.04
USD 299,641 CF Industries Holdings Inc 9,388 0.03
USD 1,027,735 Dow Inc 42,199 0.11
USD 1,020,116 DuPont de Nemours Inc 54,556 0.15
USD 187,183 Eastman Chemical Co 13,969 0.04
USD 343,057 Ecolab Inc 64,179 0.17
USD 178,471 FMC Corp 18,927 0.05
USD 148,298 International Flavors & Fragrances Inc^ 18,678 0.05
USD 481,779 Mosaic Co 6,490 0.02
USD 326,574 PPG Industries Inc 35,156 0.09
USD 112,156 Sherwin-Williams Co 72,668 0.19
Commercial services
USD 596,239 Automatic Data Processing Inc 79,246 0.21
USD 116,871 Cintas Corp 35,280 0.09
USD 168,372 Equifax Inc^ 27,370 0.07
USD 116,294 FleetCor Technologies Inc 30,070 0.08
USD 122,966 Gartner Inc 15,326 0.04
USD 414,988 Global Payments Inc 73,876 0.20
USD 269,005 H&R Block Inc 3,901 0.01
USD 52,287 MarketAxess Holdings Inc 27,017 0.07
USD 223,437 Moody's Corp 62,853 0.17
USD 1,628,953 PayPal Holdings Inc 319,389 0.85
USD 196,075 Quanta Services Inc 7,837 0.02
USD 161,684 Robert Half International Inc^ 8,225 0.02
USD 194,139 Rollins Inc^ 10,173 0.03
USD 334,193 S&P Global Inc 117,051 0.31
USD 99,935 United Rentals Inc^ 15,527 0.04
USD 226,230 Verisk Analytics Inc 42,692 0.11
Computers
USD 5,651,987 Apple Inc 2,402,321 6.37
USD 751,354 Cognizant Technology Solutions Corp 'A' 51,332 0.13
USD 352,224 DXC Technology Co 6,308 0.02
iSHARES VII PLC
SCHEDULE OF INVESTMENTS (continued)
iSHARES CORE S&P 500 UCITS ETF (continued)As at 31 July 2020
[154 ]

Ccy Holding InvestmentFair Value
USD'000
% of netassetvalue
Equities (31 July 2019: 99.93%) (cont)
United States (31 July 2019: 96.01%) (cont)
Computers (cont)
USD 186,094 Fortinet Inc 25,737 0.07
USD 1,782,045 Hewlett Packard Enterprise Co 17,589 0.05
USD 1,983,990 HP Inc 34,879 0.09
USD 1,231,749 International Business Machines Corp^ 151,431 0.40
USD 183,186 Leidos Holdings Inc 17,432 0.05
USD 308,753 NetApp Inc 13,678 0.04
USD 415,778 Western Digital Corp 17,920 0.05
Cosmetics & personal care
USD 1,188,562 Colgate-Palmolive Co 91,757 0.24
USD 405,685 Coty Inc 'A' 1,505 0.01
USD 311,817 Estee Lauder Cos Inc 'A' 61,596 0.16
USD 3,435,108 Procter & Gamble Co 450,412 1.20
Distribution & wholesale
USD 286,577 Copart Inc 26,723 0.07
USD 794,963 Fastenal Co^ 37,395 0.10
USD 422,117 LKQ Corp 11,899 0.03
USD 60,099 WW Grainger Inc 20,526 0.06
Diversified financial services
USD 915,705 American Express Co 85,454 0.23
USD 169,721 Ameriprise Financial Inc 26,074 0.07
USD 213,978 BlackRock Inc~ 123,040 0.33
USD 631,634 Capital One Financial Corp 40,298 0.11
USD 152,793 Cboe Global Markets Inc 13,400 0.03
USD 1,589,645 Charles Schwab Corp^ 52,697 0.14
USD 497,420 CME Group Inc 82,661 0.22
USD 426,447 Discover Financial Services 21,079 0.06
USD 383,463 Franklin Resources Inc^ 8,072 0.02
USD 759,126 Intercontinental Exchange Inc 73,468 0.19
USD 1,226,156 Mastercard Inc 'A' 378,306 1.00
USD 157,926 Nasdaq Inc 20,737 0.05
USD 170,125 Raymond James Financial Inc 11,820 0.03
USD 745,103 Synchrony Financial 16,489 0.04
USD 315,667 T Rowe Price Group Inc^ 43,594 0.12
USD 2,340,498 Visa Inc 'A'^ 445,631 1.18
USD 576,358 Western Union Co^ 13,994 0.04
Electrical components & equipment
USD 318,338 AMETEK Inc 29,685 0.08
USD 828,862 Emerson Electric Co 51,398 0.13
Electricity
USD 914,392 AES Corp 13,926 0.04
USD 346,090 Alliant Energy Corp 18,637 0.05
USD 342,486 Ameren Corp 27,481 0.07
USD 687,523 American Electric Power Co Inc 59,732 0.16
USD 755,866 CenterPoint Energy Inc^ 14,369 0.04
USD 397,039 CMS Energy Corp 25,482 0.07
USD 463,523 Consolidated Edison Inc 35,613 0.10
USD 1,164,296 Dominion Energy Inc^ 94,343 0.25
USD 267,240 DTE Energy Co 30,901 0.08
USD 1,019,549 Duke Energy Corp 86,397 0.23
USD 524,455 Edison International 29,196 0.08
Ccy Holding InvestmentFair Value
USD'000
% of netassetvalue
United States (31 July 2019: 96.01%) (cont)
Electricity (cont)
USD 277,644 Entergy Corp 29,189 0.08
USD 314,981 Evergy Inc 20,420 0.05
USD 466,731 Eversource Energy 42,038 0.11
USD 1,351,889 Exelon Corp 52,196 0.14
USD 751,672 FirstEnergy Corp 21,799 0.06
USD 679,166 NextEra Energy Inc 190,642 0.51
USD 340,970 NRG Energy Inc 11,528 0.03
USD 154,677 Pinnacle West Capital Corp 12,851 0.03
USD 1,066,606 PPL Corp 28,393 0.08
USD 698,044 Public Service Enterprise Group Inc 39,049 0.10
USD 405,787 Sempra Energy 50,504 0.13
USD 1,464,891 Southern Co 79,998 0.21
USD 437,688 WEC Energy Group Inc^ 41,694 0.11
USD 728,365 Xcel Energy Inc 50,286 0.13
Electronics
USD 427,174 Agilent Technologies Inc 41,150 0.11
USD 408,179 Amphenol Corp 'A' 43,169 0.11
USD 184,414 FLIR Systems Inc 7,683 0.02
USD 411,215 Fortive Corp 28,863 0.08
USD 973,717 Honeywell International Inc 145,444 0.38
USD 258,236 Keysight Technologies Inc 25,795 0.07
USD 33,293 Mettler-Toledo International Inc^ 31,129 0.08
USD 153,159 PerkinElmer Inc 18,212 0.05
USD 144,791 Roper Technologies Inc 62,615 0.17
USD 85,861 Waters Corp^ 18,301 0.05
Engineering & construction
USD 180,529 Jacobs Engineering Group Inc 15,408 0.04
Entertainment
USD 193,872 Live Nation Entertainment Inc^ 9,075 0.02
Environmental control
USD 289,978 Republic Services Inc 25,301 0.07
USD 538,699 Waste Management Inc 59,041 0.15
Food
USD 232,610 Campbell Soup Co^ 11,530 0.03
USD 675,892 Conagra Brands Inc 25,312 0.07
USD 841,041 General Mills Inc 53,213 0.14
USD 204,714 Hershey Co 29,767 0.08
USD 388,812 Hormel Foods Corp^ 19,775 0.05
USD 157,064 J M Smucker Co^ 17,175 0.05
USD 347,004 Kellogg Co^ 23,940 0.06
USD 864,712 Kraft Heinz Co 29,729 0.08
USD 1,090,774 Kroger Co 37,948 0.10
USD 201,000 Lamb Weston Holdings Inc^ 12,076 0.03
USD 171,569 McCormick & Co Inc 33,439 0.09
USD 1,980,282 Mondelez International Inc 'A' 109,886 0.29
USD 702,639 Sysco Corp^ 37,134 0.10
USD 406,211 Tyson Foods Inc 'A' 24,962 0.07
Forest products & paper
USD 545,361 International Paper Co^ 18,973 0.05
Gas
USD 169,686 Atmos Energy Corp^ 17,985 0.05
iSHARES VII PLC
SCHEDULE OF INVESTMENTS (continued)
iSHARES CORE S&P 500 UCITS ETF (continued)As at 31 July 2020
[155 ]

Ccy Holding InvestmentFair Value
USD'000
% of netassetvalue
Equities (31 July 2019: 99.93%) (cont)
United States (31 July 2019: 96.01%) (cont)
Gas (cont)
USD 531,169 NiSource Inc 12,987 0.03
Hand & machine tools
USD 75,474 Snap-on Inc^ 11,009 0.03
USD 213,786 Stanley Black & Decker Inc 32,778 0.09
Healthcare products
USD 2,454,472 Abbott Laboratories 247,018 0.66
USD 62,095 ABIOMED Inc^ 18,625 0.05
USD 98,622 Align Technology Inc^ 28,977 0.08
USD 705,910 Baxter International Inc 60,976 0.16
USD 1,982,199 Boston Scientific Corp^ 76,453 0.20
USD 68,211 Cooper Cos Inc 19,299 0.05
USD 873,001 Danaher Corp 177,918 0.47
USD 306,362 DENTSPLY SIRONA Inc^ 13,664 0.04
USD 859,564 Edwards Lifesciences Corp 67,398 0.18
USD 201,656 Henry Schein Inc 13,860 0.04
USD 358,252 Hologic Inc 24,999 0.07
USD 118,394 IDEXX Laboratories Inc 47,091 0.12
USD 161,813 Intuitive Surgical Inc 110,913 0.29
USD 200,677 ResMed Inc 40,639 0.11
USD 447,157 Stryker Corp 86,435 0.23
USD 64,423 Teleflex Inc 24,036 0.06
USD 547,981 Thermo Fisher Scientific Inc 226,837 0.60
USD 125,270 Varian Medical Systems Inc 17,879 0.05
USD 102,085 West Pharmaceutical Services Inc 27,448 0.07
USD 286,857 Zimmer Biomet Holdings Inc 38,686 0.10
Healthcare services
USD 349,423 Anthem Inc 95,672 0.26
USD 804,779 Centene Corp 52,512 0.14
USD 118,267 DaVita Inc 10,335 0.03
USD 364,966 HCA Healthcare Inc 46,219 0.12
USD 183,411 Humana Inc 71,980 0.19
USD 246,912 IQVIA Holdings Inc^ 39,109 0.10
USD 133,703 Laboratory Corp of America Holdings 25,794 0.07
USD 185,570 Quest Diagnostics Inc 23,580 0.06
USD 1,315,586 UnitedHealth Group Inc 398,333 1.06
USD 108,506 Universal Health Services Inc 'B' 11,925 0.03
Home builders
USD 461,598 DR Horton Inc 30,539 0.08
USD 382,371 Lennar Corp 'A' 27,664 0.07
USD 4,785 NVR Inc 18,806 0.05
USD 350,384 PulteGroup Inc 15,277 0.04
Home furnishings
USD 181,350 Leggett & Platt Inc 7,270 0.02
USD 87,123 Whirlpool Corp 14,212 0.04
Hotels
USD 385,681 Hilton Worldwide Holdings Inc 28,945 0.08
USD 465,230 Las Vegas Sands Corp 20,303 0.05
USD 373,550 Marriott International Inc 'A'^ 31,313 0.08
USD 684,466 MGM Resorts International 11,013 0.03
USD 133,183 Wynn Resorts Ltd^ 9,646 0.03
Ccy Holding InvestmentFair Value
USD'000
% of netassetvalue
United States (31 July 2019: 96.01%) (cont)
Household goods & home construction
USD 115,013 Avery Dennison Corp 13,036 0.03
USD 341,207 Church & Dwight Co Inc 32,868 0.09
USD 173,177 Clorox Co^ 40,958 0.11
USD 472,544 Kimberly-Clark Corp 71,846 0.19
Household products
USD 524,165 Newell Brands Inc 8,596 0.02
Insurance
USD 995,526 Aflac Inc 35,411 0.09
USD 435,781 Allstate Corp 41,133 0.11
USD 1,197,584 American International Group Inc 38,490 0.10
USD 263,131 Arthur J Gallagher & Co 28,284 0.08
USD 83,370 Assurant Inc 8,960 0.02
USD 2,696,993 Berkshire Hathaway Inc 'B' 528,017 1.40
USD 209,095 Cincinnati Financial Corp 16,295 0.04
USD 137,220 Globe Life Inc 10,923 0.03
USD 495,629 Hartford Financial Services Group Inc 20,975 0.06
USD 273,093 Lincoln National Corp 10,178 0.03
USD 335,891 Loews Corp 12,230 0.03
USD 707,886 Marsh & McLennan Cos Inc 82,539 0.22
USD 1,076,305 MetLife Inc 40,738 0.11
USD 355,219 Principal Financial Group Inc 15,072 0.04
USD 812,000 Progressive Corp 73,356 0.20
USD 548,031 Prudential Financial Inc^ 34,729 0.09
USD 350,713 Travelers Cos Inc 40,129 0.11
USD 284,181 Unum Group^ 4,896 0.01
USD 195,834 W R Berkley Corp 12,093 0.03
Internet
USD 416,217 Alphabet Inc 'A' 619,310 1.64
USD 405,656 Alphabet Inc 'C' 601,572 1.60
USD 581,188 Amazon.com Inc 1,839,274 4.88
USD 56,822 Booking Holdings Inc 94,445 0.25
USD 197,797 CDW Corp 22,994 0.06
USD 311,113 E*TRADE Financial Corp^ 15,795 0.04
USD 916,351 eBay Inc 50,656 0.13
USD 187,924 Expedia Group Inc 15,224 0.04
USD 83,735 F5 Networks Inc 11,380 0.03
USD 3,335,647 Facebook Inc 'A' 846,154 2.25
USD 610,275 Netflix Inc 298,351 0.79
USD 752,008 NortonLifeLock Inc 16,130 0.04
USD 1,088,683 Twitter Inc 39,628 0.11
USD 141,405 VeriSign Inc 29,933 0.08
Iron & steel
USD 417,815 Nucor Corp 17,527 0.05
Machinery - diversified
USD 434,087 Deere & Co 76,534 0.20
USD 199,885 Dover Corp 20,574 0.06
USD 179,907 Flowserve Corp 5,014 0.01
USD 104,648 IDEX Corp 17,248 0.05
USD 475,855 Ingersoll Rand Inc^ 15,032 0.04
USD 564,885 Otis Worldwide Corp 35,441 0.09
USD 160,688 Rockwell Automation Inc^ 35,053 0.09
iSHARES VII PLC
SCHEDULE OF INVESTMENTS (continued)
iSHARES CORE S&P 500 UCITS ETF (continued)As at 31 July 2020
[156 ]
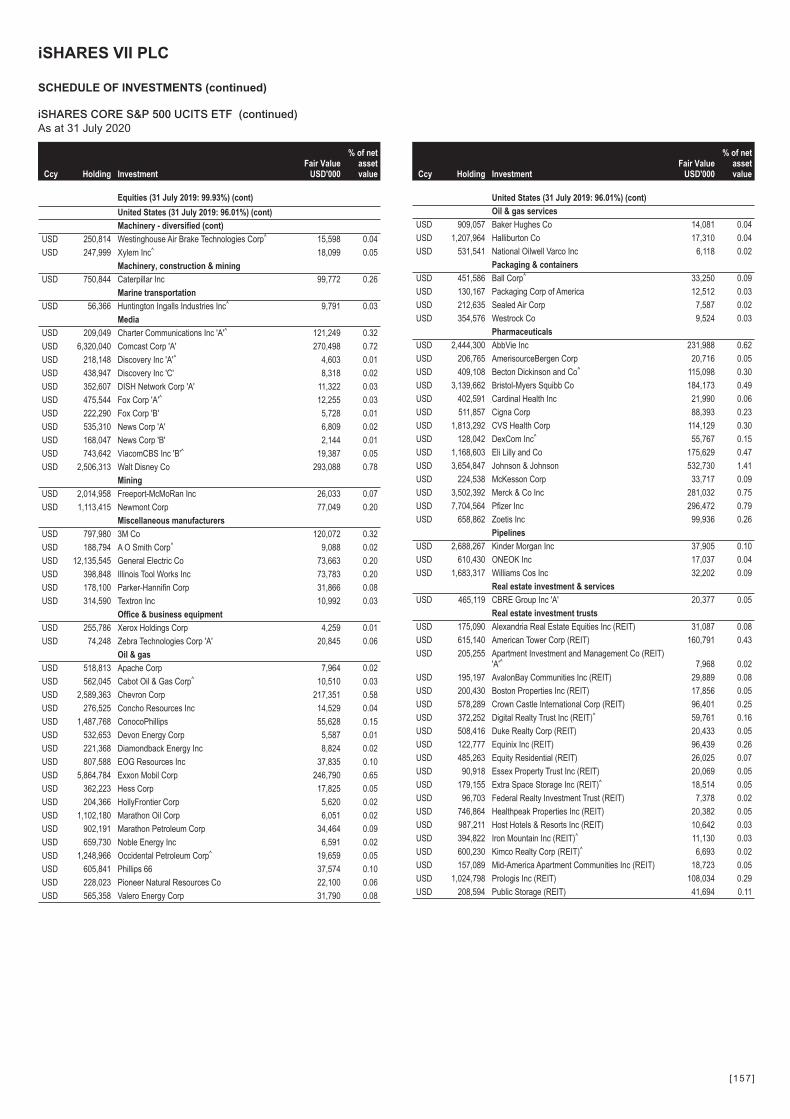
Ccy Holding InvestmentFair Value
USD'000
% of netassetvalue
Equities (31 July 2019: 99.93%) (cont)
United States (31 July 2019: 96.01%) (cont)
Machinery - diversified (cont)
USD 250,814 Westinghouse Air Brake Technologies Corp^ 15,598 0.04
USD 247,999 Xylem Inc^ 18,099 0.05
Machinery, construction & mining
USD 750,844 Caterpillar Inc 99,772 0.26
Marine transportation
USD 56,366 Huntington Ingalls Industries Inc^ 9,791 0.03
Media
USD 209,049 Charter Communications Inc 'A'^ 121,249 0.32
USD 6,320,040 Comcast Corp 'A' 270,498 0.72
USD 218,148 Discovery Inc 'A'^ 4,603 0.01
USD 438,947 Discovery Inc 'C' 8,318 0.02
USD 352,607 DISH Network Corp 'A' 11,322 0.03
USD 475,544 Fox Corp 'A'^ 12,255 0.03
USD 222,290 Fox Corp 'B' 5,728 0.01
USD 535,310 News Corp 'A' 6,809 0.02
USD 168,047 News Corp 'B' 2,144 0.01
USD 743,642 ViacomCBS Inc 'B'^ 19,387 0.05
USD 2,506,313 Walt Disney Co 293,088 0.78
Mining
USD 2,014,958 Freeport-McMoRan Inc 26,033 0.07
USD 1,113,415 Newmont Corp 77,049 0.20
Miscellaneous manufacturers
USD 797,980 3M Co 120,072 0.32
USD 188,794 A O Smith Corp^ 9,088 0.02
USD 12,135,545 General Electric Co 73,663 0.20
USD 398,848 Illinois Tool Works Inc 73,783 0.20
USD 178,100 Parker-Hannifin Corp 31,866 0.08
USD 314,590 Textron Inc 10,992 0.03
Office & business equipment
USD 255,786 Xerox Holdings Corp 4,259 0.01
USD 74,248 Zebra Technologies Corp 'A' 20,845 0.06
Oil & gas
USD 518,813 Apache Corp 7,964 0.02
USD 562,045 Cabot Oil & Gas Corp^ 10,510 0.03
USD 2,589,363 Chevron Corp 217,351 0.58
USD 276,525 Concho Resources Inc 14,529 0.04
USD 1,487,768 ConocoPhillips 55,628 0.15
USD 532,653 Devon Energy Corp 5,587 0.01
USD 221,368 Diamondback Energy Inc 8,824 0.02
USD 807,588 EOG Resources Inc 37,835 0.10
USD 5,864,784 Exxon Mobil Corp 246,790 0.65
USD 362,223 Hess Corp 17,825 0.05
USD 204,366 HollyFrontier Corp 5,620 0.02
USD 1,102,180 Marathon Oil Corp 6,051 0.02
USD 902,191 Marathon Petroleum Corp 34,464 0.09
USD 659,730 Noble Energy Inc 6,591 0.02
USD 1,248,966 Occidental Petroleum Corp^ 19,659 0.05
USD 605,841 Phillips 66 37,574 0.10
USD 228,023 Pioneer Natural Resources Co 22,100 0.06
USD 565,358 Valero Energy Corp 31,790 0.08
Ccy Holding InvestmentFair Value
USD'000
% of netassetvalue
United States (31 July 2019: 96.01%) (cont)
Oil & gas services
USD 909,057 Baker Hughes Co 14,081 0.04
USD 1,207,964 Halliburton Co 17,310 0.04
USD 531,541 National Oilwell Varco Inc 6,118 0.02
Packaging & containers
USD 451,586 Ball Corp^ 33,250 0.09
USD 130,167 Packaging Corp of America 12,512 0.03
USD 212,635 Sealed Air Corp 7,587 0.02
USD 354,576 Westrock Co 9,524 0.03
Pharmaceuticals
USD 2,444,300 AbbVie Inc 231,988 0.62
USD 206,765 AmerisourceBergen Corp 20,716 0.05
USD 409,108 Becton Dickinson and Co^ 115,098 0.30
USD 3,139,662 Bristol-Myers Squibb Co 184,173 0.49
USD 402,591 Cardinal Health Inc 21,990 0.06
USD 511,857 Cigna Corp 88,393 0.23
USD 1,813,292 CVS Health Corp 114,129 0.30
USD 128,042 DexCom Inc^ 55,767 0.15
USD 1,168,603 Eli Lilly and Co 175,629 0.47
USD 3,654,847 Johnson & Johnson 532,730 1.41
USD 224,538 McKesson Corp 33,717 0.09
USD 3,502,392 Merck & Co Inc 281,032 0.75
USD 7,704,564 Pfizer Inc 296,472 0.79
USD 658,862 Zoetis Inc 99,936 0.26
Pipelines
USD 2,688,267 Kinder Morgan Inc 37,905 0.10
USD 610,430 ONEOK Inc 17,037 0.04
USD 1,683,317 Williams Cos Inc 32,202 0.09
Real estate investment & services
USD 465,119 CBRE Group Inc 'A' 20,377 0.05
Real estate investment trusts
USD 175,090 Alexandria Real Estate Equities Inc (REIT) 31,087 0.08
USD 615,140 American Tower Corp (REIT) 160,791 0.43
USD 205,255 Apartment Investment and Management Co (REIT)'A'^ 7,968 0.02
USD 195,197 AvalonBay Communities Inc (REIT) 29,889 0.08
USD 200,430 Boston Properties Inc (REIT) 17,856 0.05
USD 578,289 Crown Castle International Corp (REIT) 96,401 0.25
USD 372,252 Digital Realty Trust Inc (REIT)^ 59,761 0.16
USD 508,416 Duke Realty Corp (REIT) 20,433 0.05
USD 122,777 Equinix Inc (REIT) 96,439 0.26
USD 485,263 Equity Residential (REIT) 26,025 0.07
USD 90,918 Essex Property Trust Inc (REIT) 20,069 0.05
USD 179,155 Extra Space Storage Inc (REIT)^ 18,514 0.05
USD 96,703 Federal Realty Investment Trust (REIT) 7,378 0.02
USD 746,864 Healthpeak Properties Inc (REIT) 20,382 0.05
USD 987,211 Host Hotels & Resorts Inc (REIT) 10,642 0.03
USD 394,822 Iron Mountain Inc (REIT)^ 11,130 0.03
USD 600,230 Kimco Realty Corp (REIT)^ 6,693 0.02
USD 157,089 Mid-America Apartment Communities Inc (REIT) 18,723 0.05
USD 1,024,798 Prologis Inc (REIT) 108,034 0.29
USD 208,594 Public Storage (REIT) 41,694 0.11
iSHARES VII PLC
SCHEDULE OF INVESTMENTS (continued)
iSHARES CORE S&P 500 UCITS ETF (continued)As at 31 July 2020
[157 ]

Ccy Holding InvestmentFair Value
USD'000
% of netassetvalue
Equities (31 July 2019: 99.93%) (cont)
United States (31 July 2019: 96.01%) (cont)
Real estate investment trusts (cont)
USD 476,424 Realty Income Corp (REIT) 28,609 0.08
USD 235,458 Regency Centers Corp (REIT) 9,661 0.02
USD 154,936 SBA Communications Corp (REIT) 48,269 0.13
USD 422,410 Simon Property Group Inc (REIT) 26,337 0.07
USD 107,664 SL Green Realty Corp (REIT)^ 5,006 0.01
USD 409,219 UDR Inc (REIT) 14,814 0.04
USD 513,581 Ventas Inc (REIT) 19,701 0.05
USD 218,017 Vornado Realty Trust (REIT)^ 7,526 0.02
USD 579,303 Welltower Inc (REIT) 31,028 0.08
USD 1,035,295 Weyerhaeuser Co (REIT) 28,792 0.08
Retail
USD 95,234 Advance Auto Parts Inc^ 14,298 0.04
USD 32,397 AutoZone Inc 39,117 0.10
USD 314,640 Best Buy Co Inc 31,335 0.08
USD 226,593 CarMax Inc 21,973 0.06
USD 35,575 Chipotle Mexican Grill Inc 41,095 0.11
USD 612,615 Costco Wholesale Corp 199,425 0.53
USD 179,770 Darden Restaurants Inc 13,644 0.04
USD 349,220 Dollar General Corp 66,491 0.18
USD 329,093 Dollar Tree Inc 30,721 0.08
USD 54,253 Domino's Pizza Inc 20,975 0.06
USD 293,349 Gap Inc^ 3,922 0.01
USD 200,022 Genuine Parts Co 18,032 0.05
USD 1,492,013 Home Depot Inc 396,114 1.05
USD 215,724 Kohl's Corp^ 4,107 0.01
USD 319,375 L Brands Inc 7,796 0.02
USD 1,047,388 Lowe's Cos Inc 155,967 0.41
USD 1,031,542 McDonald's Corp 200,408 0.53
USD 103,020 O'Reilly Automotive Inc 49,180 0.13
USD 492,986 Ross Stores Inc 44,206 0.12
USD 1,620,427 Starbucks Corp 124,011 0.33
USD 693,705 Target Corp 87,324 0.23
USD 151,516 Tiffany & Co 18,994 0.05
USD 1,661,738 TJX Cos Inc 86,394 0.23
USD 160,989 Tractor Supply Co 22,980 0.06
USD 78,661 Ulta Beauty Inc 15,181 0.04
USD 1,022,355 Walgreens Boots Alliance Inc 41,620 0.11
USD 1,964,741 Walmart Inc 254,237 0.67
USD 417,498 Yum! Brands Inc 38,013 0.10
Savings & loans
USD 595,704 People's United Financial Inc^ 6,428 0.02
Semiconductors
USD 1,624,940 Advanced Micro Devices Inc 125,819 0.33
USD 511,132 Analog Devices Inc 58,704 0.16
USD 1,271,539 Applied Materials Inc 81,798 0.22
USD 554,631 Broadcom Inc 175,679 0.47
USD 5,873,984 Intel Corp 280,365 0.74
USD 48,889 IPG Photonics Corp^ 8,752 0.02
USD 215,093 KLA Corp^ 42,982 0.11
USD 201,377 Lam Research Corp 75,951 0.20
Ccy Holding InvestmentFair Value
USD'000
% of netassetvalue
United States (31 July 2019: 96.01%) (cont)
Semiconductors (cont)
USD 372,715 Maxim Integrated Products Inc 25,378 0.07
USD 340,375 Microchip Technology Inc^ 34,626 0.09
USD 1,542,901 Micron Technology Inc 77,230 0.21
USD 853,396 NVIDIA Corp 362,343 0.96
USD 159,998 Qorvo Inc 20,504 0.05
USD 1,560,786 QUALCOMM Inc 164,835 0.44
USD 231,503 Skyworks Solutions Inc 33,702 0.09
USD 1,273,207 Texas Instruments Inc 162,398 0.43
USD 337,298 Xilinx Inc^ 36,209 0.10
Software
USD 1,068,928 Activision Blizzard Inc 88,325 0.23
USD 668,386 Adobe Inc 296,977 0.79
USD 225,180 Akamai Technologies Inc 25,319 0.07
USD 119,189 ANSYS Inc^ 37,020 0.10
USD 304,187 Autodesk Inc 71,919 0.19
USD 157,716 Broadridge Financial Solutions Inc 21,188 0.06
USD 387,367 Cadence Design Systems Inc 42,320 0.11
USD 422,257 Cerner Corp^ 29,326 0.08
USD 161,000 Citrix Systems Inc 22,984 0.06
USD 400,525 Electronic Arts Inc 56,722 0.15
USD 857,122 Fidelity National Information Services Inc 125,405 0.33
USD 780,193 Fiserv Inc^ 77,855 0.21
USD 361,761 Intuit Inc 110,833 0.29
USD 105,941 Jack Henry & Associates Inc^ 18,889 0.05
USD 10,520,031 Microsoft Corp 2,156,712 5.72
USD 117,915 MSCI Inc 44,334 0.12
USD 2,887,487 Oracle Corp 160,111 0.43
USD 442,869 Paychex Inc 31,851 0.08
USD 67,502 Paycom Software Inc 19,196 0.05
USD 1,249,930 salesforce.com Inc 243,549 0.65
USD 264,537 ServiceNow Inc 116,185 0.31
USD 209,155 Synopsys Inc 41,668 0.11
USD 158,121 Take-Two Interactive Software Inc 25,935 0.07
USD 55,165 Tyler Technologies Inc^ 19,708 0.05
Telecommunications
USD 74,758 Arista Networks Inc^ 19,420 0.05
USD 9,886,531 AT&T Inc 292,444 0.78
USD 1,371,012 CenturyLink Inc^ 13,230 0.03
USD 5,883,505 Cisco Systems Inc 277,113 0.73
USD 1,058,334 Corning Inc^ 32,808 0.09
USD 461,427 Juniper Networks Inc^ 11,711 0.03
USD 236,399 Motorola Solutions Inc 33,048 0.09
USD 807,170 T-Mobile US Inc 86,674 0.23
USD 5,741,715 Verizon Communications Inc 330,034 0.88
Textile
USD 81,565 Mohawk Industries Inc 6,513 0.02
Toys
USD 175,033 Hasbro Inc 12,735 0.03
Transportation
USD 186,110 CH Robinson Worldwide Inc^ 17,442 0.05
USD 1,061,901 CSX Corp 75,756 0.20
iSHARES VII PLC
SCHEDULE OF INVESTMENTS (continued)
iSHARES CORE S&P 500 UCITS ETF (continued)As at 31 July 2020
[158 ]

Ccy Holding InvestmentFair Value
USD'000
% of netassetvalue
Equities (31 July 2019: 99.93%) (cont)
United States (31 July 2019: 96.01%) (cont)
Transportation (cont)
USD 231,816 Expeditors International of Washington Inc 19,591 0.05
USD 333,413 FedEx Corp^ 56,147 0.15
USD 117,291 JB Hunt Transport Services Inc^ 15,177 0.04
USD 131,798 Kansas City Southern 22,650 0.06
USD 355,352 Norfolk Southern Corp 68,302 0.18
USD 131,834 Old Dominion Freight Line Inc^ 24,102 0.07
USD 941,416 Union Pacific Corp 163,194 0.43
USD 976,834 United Parcel Service Inc 'B' 139,453 0.37
Ccy Holding InvestmentFair Value
USD'000
% of netassetvalue
United States (31 July 2019: 96.01%) (cont)
Water
USD 251,164 American Water Works Co Inc 36,989 0.10
Total United States 36,312,983 96.35
Total equities 37,526,708 99.57
Warrants (31 July 2019: 0.00%)
United States (31 July 2019: 0.00%)
USD 160,018 Occidental Petroleum Corp 896 0.00
Total United States 896 0.00
Total warrants 896 0.00
CurrencyAmount
Purchased CurrencyAmount
SoldUnderlying
Exposure (USD)Maturity
date
Unrealisedgain/(loss)
USD'000
% of netassetvalue
Financial derivative instruments (31 July 2019: (0.14)%)
Forward currency contractsØ (31 July 2019: (0.14)%)
GBP 1,007,721,494 USD 1,246,560,260 1,322,634,048 04/08/2020 76,074 0.20
MXN 2,209,388,546 USD 95,280,419 99,557,884 04/08/2020 4,278 0.01
USD 8,907,304 GBP 7,139,753 9,370,922 04/08/2020 (464) 0.00
USD 5,796,881 MXN 132,984,622 5,992,458 04/08/2020 (196) 0.00
Total unrealised gains on forward currency contracts 80,352 0.21
Total unrealised losses on forward currency contracts (660) 0.00
Net unrealised gains on forward currency contracts 79,692 0.21
CcyNo. of
contracts
UnderlyingexposureUSD’000
FairValue
USD’000
% of netassetvalue
Futures contracts (31 July 2019: 0.00%)
USD 466 S&P 500 E Mini Index Futures September2020 73,034 3,006 0.01
Total unrealised gains on futures contracts 3,006 0.01
Total financial derivative instruments 82,698 0.22
Fair ValueUSD'000
% of netassetvalue
Total value of investments 37,610,302 99.79
Cash equivalents (31 July 2019: 0.06%)
Cash† 48,018 0.13
Other net assets 29,262 0.08
Net asset value attributable to redeemable participatingshareholders at the end of the financial year 37,687,582 100.00
†Cash holdings of USD44,945,424 are held with State Street Bank and Trust Company.USD3,072,963 is held as security for futures contracts with Credit Suisse Securities Ltd.
^These securities are partially or fully transferred as securities lent.~Investment in related party.ØThe counterparty for forward currency contracts is State Street Bank and Trust Company. All
forward relate to the GBP Hedged (Dist) Class and MXN Hedged (Acc) Class.
Equities are primarily classified by country/geographic region of
incorporation of the entity in which the Fund holds shares.
iSHARES VII PLC
SCHEDULE OF INVESTMENTS (continued)
iSHARES CORE S&P 500 UCITS ETF (continued)As at 31 July 2020
[159 ]

Underlying exposure has been calculated according to the guidelines
issued by the ESMA and represents the market value of an equivalent
position in the assets underlying each financial derivative instrument.
Analysis of total current assetsgross of all liabilities
Fair valueUSD'000
% of totalcurrentassets
Transferable securities admitted to an official stock exchange listing 37,527,604 99.57
Exchange traded financial derivative instruments 3,006 0.01
Over-the-counter financial derivative instruments 80,352 0.21
Other assets 79,541 0.21
Total current assets 37,690,503 100.00
iSHARES VII PLC
SCHEDULE OF INVESTMENTS (continued)
iSHARES CORE S&P 500 UCITS ETF (continued)As at 31 July 2020
[160 ]
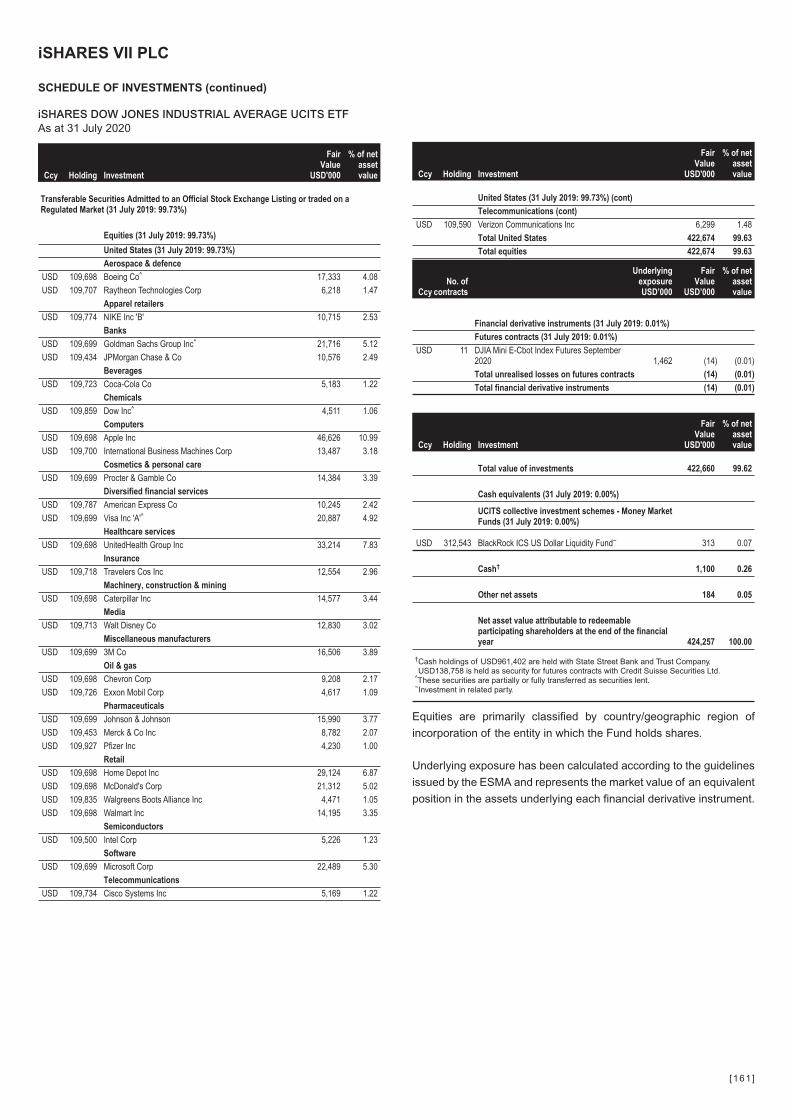
Ccy Holding Investment
FairValue
USD'000
% of netassetvalue
Transferable Securities Admitted to an Official Stock Exchange Listing or traded on aRegulated Market (31 July 2019: 99.73%)
Equities (31 July 2019: 99.73%)
United States (31 July 2019: 99.73%)
Aerospace & defence
USD 109,698 Boeing Co^ 17,333 4.08
USD 109,707 Raytheon Technologies Corp 6,218 1.47
Apparel retailers
USD 109,774 NIKE Inc 'B' 10,715 2.53
Banks
USD 109,699 Goldman Sachs Group Inc^ 21,716 5.12
USD 109,434 JPMorgan Chase & Co 10,576 2.49
Beverages
USD 109,723 Coca-Cola Co 5,183 1.22
Chemicals
USD 109,859 Dow Inc^ 4,511 1.06
Computers
USD 109,698 Apple Inc 46,626 10.99
USD 109,700 International Business Machines Corp 13,487 3.18
Cosmetics & personal care
USD 109,699 Procter & Gamble Co 14,384 3.39
Diversified financial services
USD 109,787 American Express Co 10,245 2.42
USD 109,699 Visa Inc 'A'^ 20,887 4.92
Healthcare services
USD 109,698 UnitedHealth Group Inc 33,214 7.83
Insurance
USD 109,718 Travelers Cos Inc 12,554 2.96
Machinery, construction & mining
USD 109,698 Caterpillar Inc 14,577 3.44
Media
USD 109,713 Walt Disney Co 12,830 3.02
Miscellaneous manufacturers
USD 109,699 3M Co 16,506 3.89
Oil & gas
USD 109,698 Chevron Corp 9,208 2.17
USD 109,726 Exxon Mobil Corp 4,617 1.09
Pharmaceuticals
USD 109,699 Johnson & Johnson 15,990 3.77
USD 109,453 Merck & Co Inc 8,782 2.07
USD 109,927 Pfizer Inc 4,230 1.00
Retail
USD 109,698 Home Depot Inc 29,124 6.87
USD 109,698 McDonald's Corp 21,312 5.02
USD 109,835 Walgreens Boots Alliance Inc 4,471 1.05
USD 109,698 Walmart Inc 14,195 3.35
Semiconductors
USD 109,500 Intel Corp 5,226 1.23
Software
USD 109,699 Microsoft Corp 22,489 5.30
Telecommunications
USD 109,734 Cisco Systems Inc 5,169 1.22
Ccy Holding Investment
FairValue
USD'000
% of netassetvalue
United States (31 July 2019: 99.73%) (cont)
Telecommunications (cont)
USD 109,590 Verizon Communications Inc 6,299 1.48
Total United States 422,674 99.63
Total equities 422,674 99.63
CcyNo. of
contracts
UnderlyingexposureUSD’000
FairValue
USD’000
% of netassetvalue
Financial derivative instruments (31 July 2019: 0.01%)
Futures contracts (31 July 2019: 0.01%)
USD 11 DJIA Mini E-Cbot Index Futures September2020 1,462 (14) (0.01)
Total unrealised losses on futures contracts (14) (0.01)
Total financial derivative instruments (14) (0.01)
Ccy Holding Investment
FairValue
USD'000
% of netassetvalue
Total value of investments 422,660 99.62
Cash equivalents (31 July 2019: 0.00%)
UCITS collective investment schemes - Money MarketFunds (31 July 2019: 0.00%)
USD 312,543 BlackRock ICS US Dollar Liquidity Fund~ 313 0.07
Cash† 1,100 0.26
Other net assets 184 0.05
Net asset value attributable to redeemableparticipating shareholders at the end of the financialyear 424,257 100.00
†Cash holdings of USD961,402 are held with State Street Bank and Trust Company.USD138,758 is held as security for futures contracts with Credit Suisse Securities Ltd.
^These securities are partially or fully transferred as securities lent.~Investment in related party.
Equities are primarily classified by country/geographic region of
incorporation of the entity in which the Fund holds shares.
Underlying exposure has been calculated according to the guidelines
issued by the ESMA and represents the market value of an equivalent
position in the assets underlying each financial derivative instrument.
iSHARES VII PLC
SCHEDULE OF INVESTMENTS (continued)
iSHARES DOW JONES INDUSTRIAL AVERAGE UCITS ETFAs at 31 July 2020
[161 ]
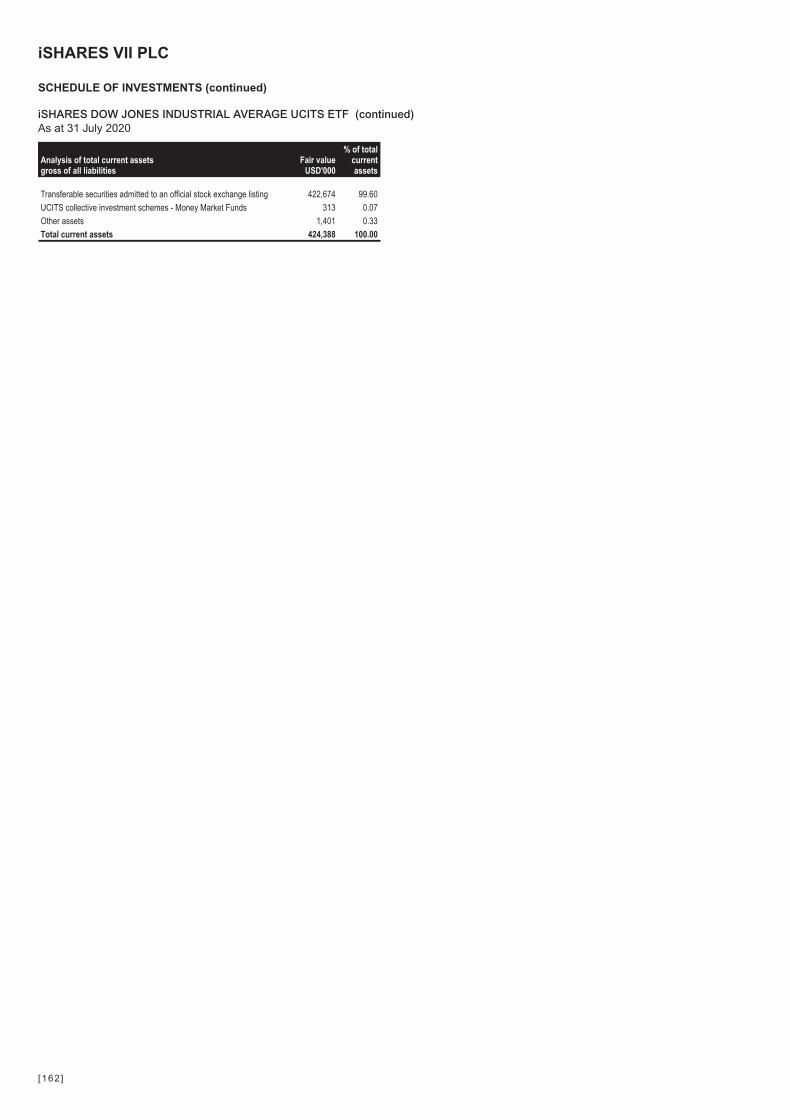
Analysis of total current assetsgross of all liabilities
Fair valueUSD'000
% of totalcurrentassets
Transferable securities admitted to an official stock exchange listing 422,674 99.60
UCITS collective investment schemes - Money Market Funds 313 0.07
Other assets 1,401 0.33
Total current assets 424,388 100.00
iSHARES VII PLC
SCHEDULE OF INVESTMENTS (continued)
iSHARES DOW JONES INDUSTRIAL AVERAGE UCITS ETF (continued)As at 31 July 2020
[162 ]
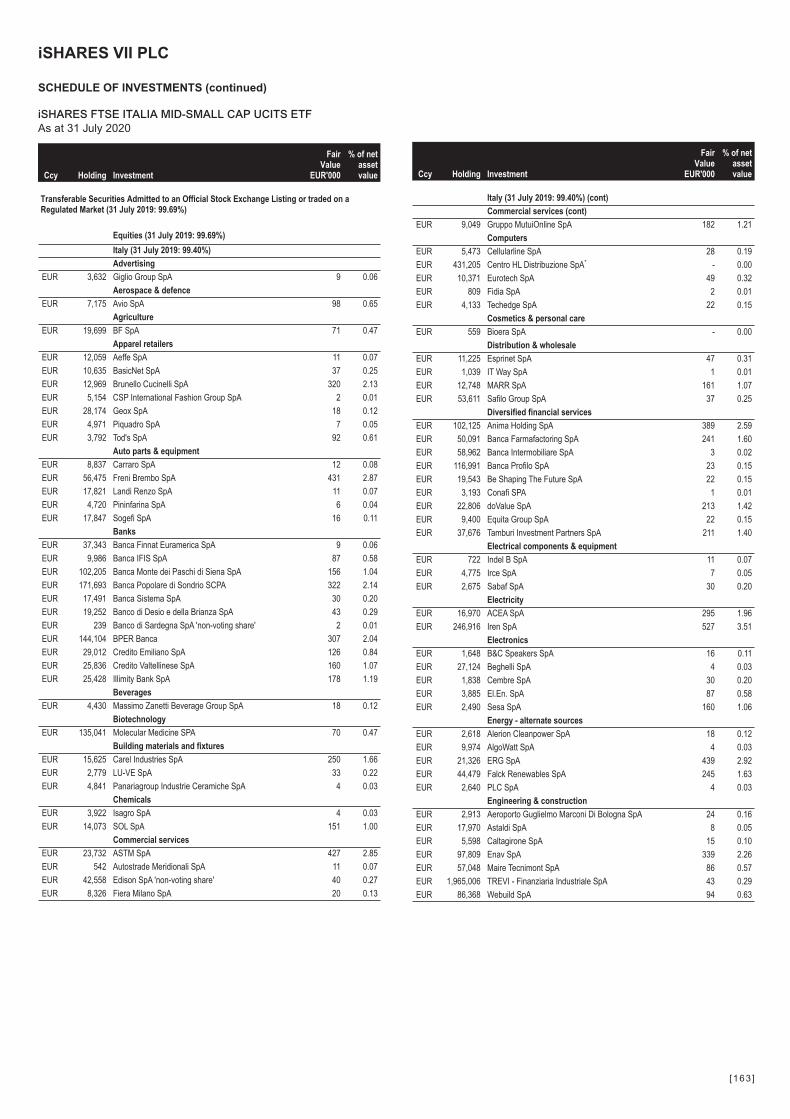
Ccy Holding Investment
FairValue
EUR'000
% of netassetvalue
Transferable Securities Admitted to an Official Stock Exchange Listing or traded on aRegulated Market (31 July 2019: 99.69%)
Equities (31 July 2019: 99.69%)
Italy (31 July 2019: 99.40%)
Advertising
EUR 3,632 Giglio Group SpA 9 0.06
Aerospace & defence
EUR 7,175 Avio SpA 98 0.65
Agriculture
EUR 19,699 BF SpA 71 0.47
Apparel retailers
EUR 12,059 Aeffe SpA 11 0.07
EUR 10,635 BasicNet SpA 37 0.25
EUR 12,969 Brunello Cucinelli SpA 320 2.13
EUR 5,154 CSP International Fashion Group SpA 2 0.01
EUR 28,174 Geox SpA 18 0.12
EUR 4,971 Piquadro SpA 7 0.05
EUR 3,792 Tod's SpA 92 0.61
Auto parts & equipment
EUR 8,837 Carraro SpA 12 0.08
EUR 56,475 Freni Brembo SpA 431 2.87
EUR 17,821 Landi Renzo SpA 11 0.07
EUR 4,720 Pininfarina SpA 6 0.04
EUR 17,847 Sogefi SpA 16 0.11
Banks
EUR 37,343 Banca Finnat Euramerica SpA 9 0.06
EUR 9,986 Banca IFIS SpA 87 0.58
EUR 102,205 Banca Monte dei Paschi di Siena SpA 156 1.04
EUR 171,693 Banca Popolare di Sondrio SCPA 322 2.14
EUR 17,491 Banca Sistema SpA 30 0.20
EUR 19,252 Banco di Desio e della Brianza SpA 43 0.29
EUR 239 Banco di Sardegna SpA 'non-voting share' 2 0.01
EUR 144,104 BPER Banca 307 2.04
EUR 29,012 Credito Emiliano SpA 126 0.84
EUR 25,836 Credito Valtellinese SpA 160 1.07
EUR 25,428 Illimity Bank SpA 178 1.19
Beverages
EUR 4,430 Massimo Zanetti Beverage Group SpA 18 0.12
Biotechnology
EUR 135,041 Molecular Medicine SPA 70 0.47
Building materials and fixtures
EUR 15,625 Carel Industries SpA 250 1.66
EUR 2,779 LU-VE SpA 33 0.22
EUR 4,841 Panariagroup Industrie Ceramiche SpA 4 0.03
Chemicals
EUR 3,922 Isagro SpA 4 0.03
EUR 14,073 SOL SpA 151 1.00
Commercial services
EUR 23,732 ASTM SpA 427 2.85
EUR 542 Autostrade Meridionali SpA 11 0.07
EUR 42,558 Edison SpA 'non-voting share' 40 0.27
EUR 8,326 Fiera Milano SpA 20 0.13
Ccy Holding Investment
FairValue
EUR'000
% of netassetvalue
Italy (31 July 2019: 99.40%) (cont)
Commercial services (cont)
EUR 9,049 Gruppo MutuiOnline SpA 182 1.21
Computers
EUR 5,473 Cellularline SpA 28 0.19
EUR 431,205 Centro HL Distribuzione SpA* - 0.00
EUR 10,371 Eurotech SpA 49 0.32
EUR 809 Fidia SpA 2 0.01
EUR 4,133 Techedge SpA 22 0.15
Cosmetics & personal care
EUR 559 Bioera SpA - 0.00
Distribution & wholesale
EUR 11,225 Esprinet SpA 47 0.31
EUR 1,039 IT Way SpA 1 0.01
EUR 12,748 MARR SpA 161 1.07
EUR 53,611 Safilo Group SpA 37 0.25
Diversified financial services
EUR 102,125 Anima Holding SpA 389 2.59
EUR 50,091 Banca Farmafactoring SpA 241 1.60
EUR 58,962 Banca Intermobiliare SpA 3 0.02
EUR 116,991 Banca Profilo SpA 23 0.15
EUR 19,543 Be Shaping The Future SpA 22 0.15
EUR 3,193 Conafi SPA 1 0.01
EUR 22,806 doValue SpA 213 1.42
EUR 9,400 Equita Group SpA 22 0.15
EUR 37,676 Tamburi Investment Partners SpA 211 1.40
Electrical components & equipment
EUR 722 Indel B SpA 11 0.07
EUR 4,775 Irce SpA 7 0.05
EUR 2,675 Sabaf SpA 30 0.20
Electricity
EUR 16,970 ACEA SpA 295 1.96
EUR 246,916 Iren SpA 527 3.51
Electronics
EUR 1,648 B&C Speakers SpA 16 0.11
EUR 27,124 Beghelli SpA 4 0.03
EUR 1,838 Cembre SpA 30 0.20
EUR 3,885 El.En. SpA 87 0.58
EUR 2,490 Sesa SpA 160 1.06
Energy - alternate sources
EUR 2,618 Alerion Cleanpower SpA 18 0.12
EUR 9,974 AlgoWatt SpA 4 0.03
EUR 21,326 ERG SpA 439 2.92
EUR 44,479 Falck Renewables SpA 245 1.63
EUR 2,640 PLC SpA 4 0.03
Engineering & construction
EUR 2,913 Aeroporto Guglielmo Marconi Di Bologna SpA 24 0.16
EUR 17,970 Astaldi SpA 8 0.05
EUR 5,598 Caltagirone SpA 15 0.10
EUR 97,809 Enav SpA 339 2.26
EUR 57,048 Maire Tecnimont SpA 86 0.57
EUR 1,965,006 TREVI - Finanziaria Industriale SpA 43 0.29
EUR 86,368 Webuild SpA 94 0.63
iSHARES VII PLC
SCHEDULE OF INVESTMENTS (continued)
iSHARES FTSE ITALIA MID-SMALL CAP UCITS ETFAs at 31 July 2020
[163 ]
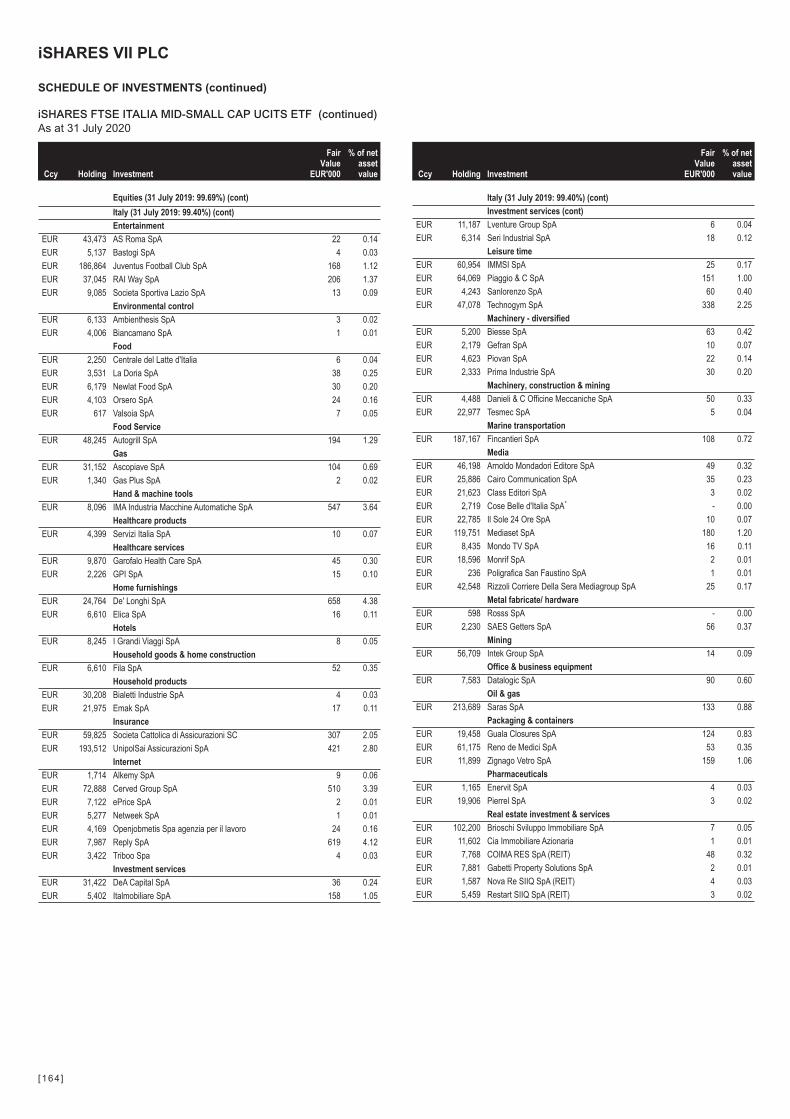
Ccy Holding Investment
FairValue
EUR'000
% of netassetvalue
Equities (31 July 2019: 99.69%) (cont)
Italy (31 July 2019: 99.40%) (cont)
Entertainment
EUR 43,473 AS Roma SpA 22 0.14
EUR 5,137 Bastogi SpA 4 0.03
EUR 186,864 Juventus Football Club SpA 168 1.12
EUR 37,045 RAI Way SpA 206 1.37
EUR 9,085 Societa Sportiva Lazio SpA 13 0.09
Environmental control
EUR 6,133 Ambienthesis SpA 3 0.02
EUR 4,006 Biancamano SpA 1 0.01
Food
EUR 2,250 Centrale del Latte d'Italia 6 0.04
EUR 3,531 La Doria SpA 38 0.25
EUR 6,179 Newlat Food SpA 30 0.20
EUR 4,103 Orsero SpA 24 0.16
EUR 617 Valsoia SpA 7 0.05
Food Service
EUR 48,245 Autogrill SpA 194 1.29
Gas
EUR 31,152 Ascopiave SpA 104 0.69
EUR 1,340 Gas Plus SpA 2 0.02
Hand & machine tools
EUR 8,096 IMA Industria Macchine Automatiche SpA 547 3.64
Healthcare products
EUR 4,399 Servizi Italia SpA 10 0.07
Healthcare services
EUR 9,870 Garofalo Health Care SpA 45 0.30
EUR 2,226 GPI SpA 15 0.10
Home furnishings
EUR 24,764 De' Longhi SpA 658 4.38
EUR 6,610 Elica SpA 16 0.11
Hotels
EUR 8,245 I Grandi Viaggi SpA 8 0.05
Household goods & home construction
EUR 6,610 Fila SpA 52 0.35
Household products
EUR 30,208 Bialetti Industrie SpA 4 0.03
EUR 21,975 Emak SpA 17 0.11
Insurance
EUR 59,825 Societa Cattolica di Assicurazioni SC 307 2.05
EUR 193,512 UnipolSai Assicurazioni SpA 421 2.80
Internet
EUR 1,714 Alkemy SpA 9 0.06
EUR 72,888 Cerved Group SpA 510 3.39
EUR 7,122 ePrice SpA 2 0.01
EUR 5,277 Netweek SpA 1 0.01
EUR 4,169 Openjobmetis Spa agenzia per il lavoro 24 0.16
EUR 7,987 Reply SpA 619 4.12
EUR 3,422 Triboo Spa 4 0.03
Investment services
EUR 31,422 DeA Capital SpA 36 0.24
EUR 5,402 Italmobiliare SpA 158 1.05
Ccy Holding Investment
FairValue
EUR'000
% of netassetvalue
Italy (31 July 2019: 99.40%) (cont)
Investment services (cont)
EUR 11,187 Lventure Group SpA 6 0.04
EUR 6,314 Seri Industrial SpA 18 0.12
Leisure time
EUR 60,954 IMMSI SpA 25 0.17
EUR 64,069 Piaggio & C SpA 151 1.00
EUR 4,243 Sanlorenzo SpA 60 0.40
EUR 47,078 Technogym SpA 338 2.25
Machinery - diversified
EUR 5,200 Biesse SpA 63 0.42
EUR 2,179 Gefran SpA 10 0.07
EUR 4,623 Piovan SpA 22 0.14
EUR 2,333 Prima Industrie SpA 30 0.20
Machinery, construction & mining
EUR 4,488 Danieli & C Officine Meccaniche SpA 50 0.33
EUR 22,977 Tesmec SpA 5 0.04
Marine transportation
EUR 187,167 Fincantieri SpA 108 0.72
Media
EUR 46,198 Arnoldo Mondadori Editore SpA 49 0.32
EUR 25,886 Cairo Communication SpA 35 0.23
EUR 21,623 Class Editori SpA 3 0.02
EUR 2,719 Cose Belle d'Italia SpA* - 0.00
EUR 22,785 Il Sole 24 Ore SpA 10 0.07
EUR 119,751 Mediaset SpA 180 1.20
EUR 8,435 Mondo TV SpA 16 0.11
EUR 18,596 Monrif SpA 2 0.01
EUR 236 Poligrafica San Faustino SpA 1 0.01
EUR 42,548 Rizzoli Corriere Della Sera Mediagroup SpA 25 0.17
Metal fabricate/ hardware
EUR 598 Rosss SpA - 0.00
EUR 2,230 SAES Getters SpA 56 0.37
Mining
EUR 56,709 Intek Group SpA 14 0.09
Office & business equipment
EUR 7,583 Datalogic SpA 90 0.60
Oil & gas
EUR 213,689 Saras SpA 133 0.88
Packaging & containers
EUR 19,458 Guala Closures SpA 124 0.83
EUR 61,175 Reno de Medici SpA 53 0.35
EUR 11,899 Zignago Vetro SpA 159 1.06
Pharmaceuticals
EUR 1,165 Enervit SpA 4 0.03
EUR 19,906 Pierrel SpA 3 0.02
Real estate investment & services
EUR 102,200 Brioschi Sviluppo Immobiliare SpA 7 0.05
EUR 11,602 Cia Immobiliare Azionaria 1 0.01
EUR 7,768 COIMA RES SpA (REIT) 48 0.32
EUR 7,881 Gabetti Property Solutions SpA 2 0.01
EUR 1,587 Nova Re SIIQ SpA (REIT) 4 0.03
EUR 5,459 Restart SIIQ SpA (REIT) 3 0.02
iSHARES VII PLC
SCHEDULE OF INVESTMENTS (continued)
iSHARES FTSE ITALIA MID-SMALL CAP UCITS ETF (continued)As at 31 July 2020
[164 ]
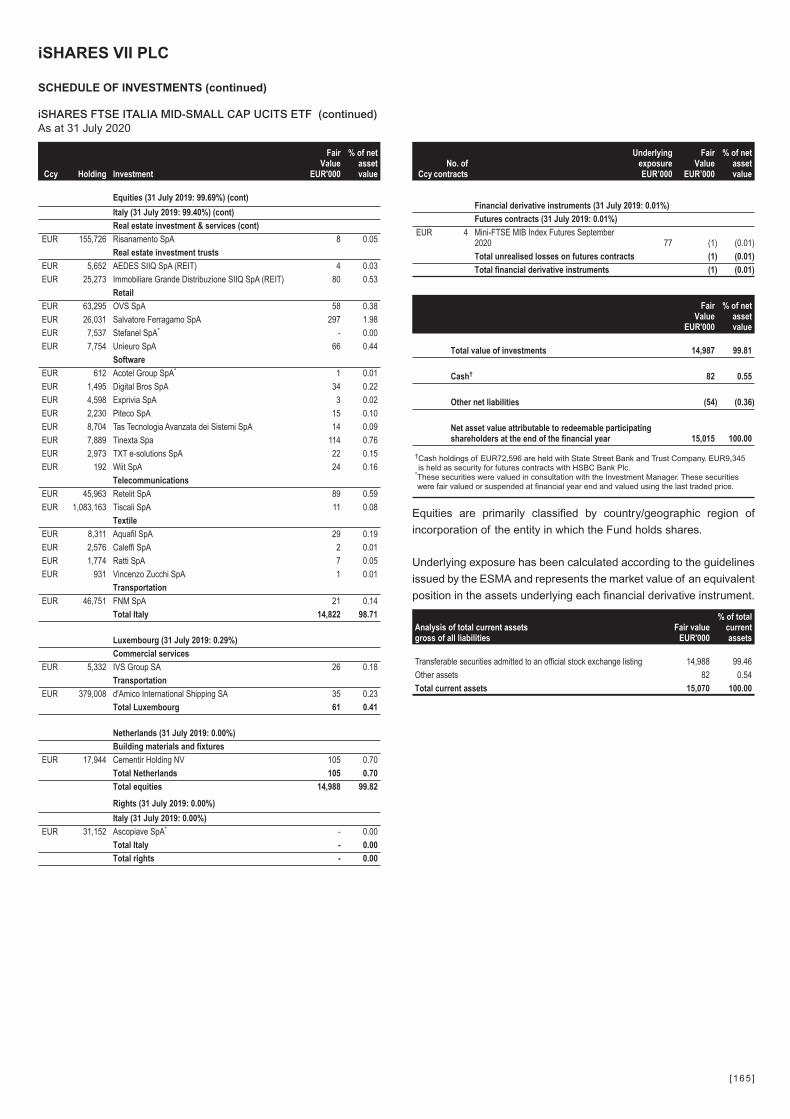
Ccy Holding Investment
FairValue
EUR'000
% of netassetvalue
Equities (31 July 2019: 99.69%) (cont)
Italy (31 July 2019: 99.40%) (cont)
Real estate investment & services (cont)
EUR 155,726 Risanamento SpA 8 0.05
Real estate investment trusts
EUR 5,652 AEDES SIIQ SpA (REIT) 4 0.03
EUR 25,273 Immobiliare Grande Distribuzione SIIQ SpA (REIT) 80 0.53
Retail
EUR 63,295 OVS SpA 58 0.38
EUR 26,031 Salvatore Ferragamo SpA 297 1.98
EUR 7,537 Stefanel SpA* - 0.00
EUR 7,754 Unieuro SpA 66 0.44
Software
EUR 612 Acotel Group SpA* 1 0.01
EUR 1,495 Digital Bros SpA 34 0.22
EUR 4,598 Exprivia SpA 3 0.02
EUR 2,230 Piteco SpA 15 0.10
EUR 8,704 Tas Tecnologia Avanzata dei Sistemi SpA 14 0.09
EUR 7,889 Tinexta Spa 114 0.76
EUR 2,973 TXT e-solutions SpA 22 0.15
EUR 192 Wiit SpA 24 0.16
Telecommunications
EUR 45,963 Retelit SpA 89 0.59
EUR 1,083,163 Tiscali SpA 11 0.08
Textile
EUR 8,311 Aquafil SpA 29 0.19
EUR 2,576 Caleffi SpA 2 0.01
EUR 1,774 Ratti SpA 7 0.05
EUR 931 Vincenzo Zucchi SpA 1 0.01
Transportation
EUR 46,751 FNM SpA 21 0.14
Total Italy 14,822 98.71
Luxembourg (31 July 2019: 0.29%)
Commercial services
EUR 5,332 IVS Group SA 26 0.18
Transportation
EUR 379,008 d'Amico International Shipping SA 35 0.23
Total Luxembourg 61 0.41
Netherlands (31 July 2019: 0.00%)
Building materials and fixtures
EUR 17,944 Cementir Holding NV 105 0.70
Total Netherlands 105 0.70
Total equities 14,988 99.82
Rights (31 July 2019: 0.00%)
Italy (31 July 2019: 0.00%)
EUR 31,152 Ascopiave SpA* - 0.00
Total Italy - 0.00
Total rights - 0.00
CcyNo. of
contracts
UnderlyingexposureEUR’000
FairValue
EUR’000
% of netassetvalue
Financial derivative instruments (31 July 2019: 0.01%)
Futures contracts (31 July 2019: 0.01%)
EUR 4 Mini-FTSE MIB Index Futures September2020 77 (1) (0.01)
Total unrealised losses on futures contracts (1) (0.01)
Total financial derivative instruments (1) (0.01)
FairValue
EUR'000
% of netassetvalue
Total value of investments 14,987 99.81
Cash† 82 0.55
Other net liabilities (54) (0.36)
Net asset value attributable to redeemable participatingshareholders at the end of the financial year 15,015 100.00
†Cash holdings of EUR72,596 are held with State Street Bank and Trust Company. EUR9,345is held as security for futures contracts with HSBC Bank Plc.
*These securities were valued in consultation with the Investment Manager. These securitieswere fair valued or suspended at financial year end and valued using the last traded price.
Equities are primarily classified by country/geographic region of
incorporation of the entity in which the Fund holds shares.
Underlying exposure has been calculated according to the guidelines
issued by the ESMA and represents the market value of an equivalent
position in the assets underlying each financial derivative instrument.
Analysis of total current assetsgross of all liabilities
Fair valueEUR'000
% of totalcurrentassets
Transferable securities admitted to an official stock exchange listing 14,988 99.46
Other assets 82 0.54
Total current assets 15,070 100.00
iSHARES VII PLC
SCHEDULE OF INVESTMENTS (continued)
iSHARES FTSE ITALIA MID-SMALL CAP UCITS ETF (continued)As at 31 July 2020
[165 ]
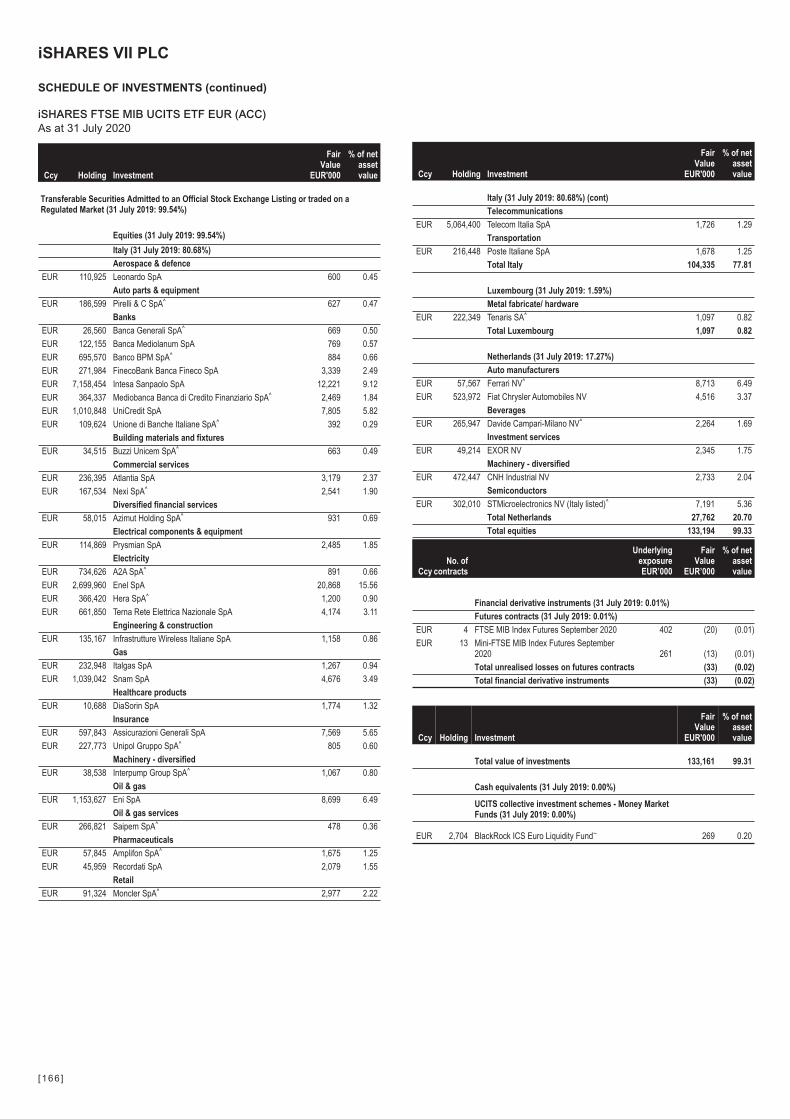
Ccy Holding Investment
FairValue
EUR'000
% of netassetvalue
Transferable Securities Admitted to an Official Stock Exchange Listing or traded on aRegulated Market (31 July 2019: 99.54%)
Equities (31 July 2019: 99.54%)
Italy (31 July 2019: 80.68%)
Aerospace & defence
EUR 110,925 Leonardo SpA 600 0.45
Auto parts & equipment
EUR 186,599 Pirelli & C SpA^ 627 0.47
Banks
EUR 26,560 Banca Generali SpA^ 669 0.50
EUR 122,155 Banca Mediolanum SpA 769 0.57
EUR 695,570 Banco BPM SpA^ 884 0.66
EUR 271,984 FinecoBank Banca Fineco SpA 3,339 2.49
EUR 7,158,454 Intesa Sanpaolo SpA 12,221 9.12
EUR 364,337 Mediobanca Banca di Credito Finanziario SpA^ 2,469 1.84
EUR 1,010,848 UniCredit SpA 7,805 5.82
EUR 109,624 Unione di Banche Italiane SpA^ 392 0.29
Building materials and fixtures
EUR 34,515 Buzzi Unicem SpA^ 663 0.49
Commercial services
EUR 236,395 Atlantia SpA 3,179 2.37
EUR 167,534 Nexi SpA^ 2,541 1.90
Diversified financial services
EUR 58,015 Azimut Holding SpA^ 931 0.69
Electrical components & equipment
EUR 114,869 Prysmian SpA 2,485 1.85
Electricity
EUR 734,626 A2A SpA^ 891 0.66
EUR 2,699,960 Enel SpA 20,868 15.56
EUR 366,420 Hera SpA^ 1,200 0.90
EUR 661,850 Terna Rete Elettrica Nazionale SpA 4,174 3.11
Engineering & construction
EUR 135,167 Infrastrutture Wireless Italiane SpA 1,158 0.86
Gas
EUR 232,948 Italgas SpA 1,267 0.94
EUR 1,039,042 Snam SpA 4,676 3.49
Healthcare products
EUR 10,688 DiaSorin SpA 1,774 1.32
Insurance
EUR 597,843 Assicurazioni Generali SpA 7,569 5.65
EUR 227,773 Unipol Gruppo SpA^ 805 0.60
Machinery - diversified
EUR 38,538 Interpump Group SpA^ 1,067 0.80
Oil & gas
EUR 1,153,627 Eni SpA 8,699 6.49
Oil & gas services
EUR 266,821 Saipem SpA^ 478 0.36
Pharmaceuticals
EUR 57,845 Amplifon SpA^ 1,675 1.25
EUR 45,959 Recordati SpA 2,079 1.55
Retail
EUR 91,324 Moncler SpA^ 2,977 2.22
Ccy Holding Investment
FairValue
EUR'000
% of netassetvalue
Italy (31 July 2019: 80.68%) (cont)
Telecommunications
EUR 5,064,400 Telecom Italia SpA 1,726 1.29
Transportation
EUR 216,448 Poste Italiane SpA 1,678 1.25
Total Italy 104,335 77.81
Luxembourg (31 July 2019: 1.59%)
Metal fabricate/ hardware
EUR 222,349 Tenaris SA^ 1,097 0.82
Total Luxembourg 1,097 0.82
Netherlands (31 July 2019: 17.27%)
Auto manufacturers
EUR 57,567 Ferrari NV^ 8,713 6.49
EUR 523,972 Fiat Chrysler Automobiles NV 4,516 3.37
Beverages
EUR 265,947 Davide Campari-Milano NV^ 2,264 1.69
Investment services
EUR 49,214 EXOR NV 2,345 1.75
Machinery - diversified
EUR 472,447 CNH Industrial NV 2,733 2.04
Semiconductors
EUR 302,010 STMicroelectronics NV (Italy listed)^ 7,191 5.36
Total Netherlands 27,762 20.70
Total equities 133,194 99.33
CcyNo. of
contracts
UnderlyingexposureEUR’000
FairValue
EUR’000
% of netassetvalue
Financial derivative instruments (31 July 2019: 0.01%)
Futures contracts (31 July 2019: 0.01%)
EUR 4 FTSE MIB Index Futures September 2020 402 (20) (0.01)
EUR 13 Mini-FTSE MIB Index Futures September2020 261 (13) (0.01)
Total unrealised losses on futures contracts (33) (0.02)
Total financial derivative instruments (33) (0.02)
Ccy Holding Investment
FairValue
EUR'000
% of netassetvalue
Total value of investments 133,161 99.31
Cash equivalents (31 July 2019: 0.00%)
UCITS collective investment schemes - Money MarketFunds (31 July 2019: 0.00%)
EUR 2,704 BlackRock ICS Euro Liquidity Fund~ 269 0.20
iSHARES VII PLC
SCHEDULE OF INVESTMENTS (continued)
iSHARES FTSE MIB UCITS ETF EUR (ACC)As at 31 July 2020
[166 ]

Ccy Holding Investment
FairValue
EUR'000
% of netassetvalue
Cash† 482 0.36
Other net assets 178 0.13
Net asset value attributable to redeemable participatingshareholders at the end of the financial year 134,090 100.00
†Cash holdings of EUR360,459 are held with State Street Bank and Trust Company.EUR122,027 is held as security for futures contracts with Credit Suisse Securities Ltd.
^These securities are partially or fully transferred as securities lent.~Investment in related party.
Equities are primarily classified by country/geographic region of
incorporation of the entity in which the Fund holds shares.
Underlying exposure has been calculated according to the guidelines
issued by the ESMA and represents the market value of an equivalent
position in the assets underlying each financial derivative instrument.
Analysis of total current assetsgross of all liabilities
Fair valueEUR'000
% of totalcurrentassets
Transferable securities admitted to an official stock exchange listing 133,194 98.51
UCITS collective investment schemes - Money Market Funds 269 0.20
Other assets 1,739 1.29
Total current assets 135,202 100.00
iSHARES VII PLC
SCHEDULE OF INVESTMENTS (continued)
iSHARES FTSE MIB UCITS ETF EUR (ACC) (continued)As at 31 July 2020
[167 ]

Ccy Holding Investment
FairValue
USD'000
% of netassetvalue
Transferable Securities Admitted to an Official Stock Exchange Listing or traded on aRegulated Market (31 July 2019: 99.49%)
Equities (31 July 2019: 99.49%)
Canada (31 July 2019: 99.49%)
Aerospace & defence
CAD 113,815 CAE Inc 1,698 0.29
Airlines
CAD 59,634 Air Canada^ 673 0.12
Apparel retailers
CAD 83,691 Gildan Activewear Inc 1,485 0.25
Auto parts & equipment
CAD 122,612 Magna International Inc 5,667 0.96
Banks
CAD 269,969 Bank of Montreal^ 14,769 2.51
CAD 511,802 Bank of Nova Scotia 21,018 3.58
CAD 187,994 Canadian Imperial Bank of Commerce 13,014 2.21
CAD 141,205 National Bank of Canada 6,667 1.13
CAD 600,411 Royal Bank of Canada 41,417 7.05
CAD 763,602 Toronto-Dominion Bank 33,788 5.75
Chemicals
CAD 241,188 Nutrien Ltd 7,854 1.34
Commercial services
CAD 46,227 Ritchie Bros Auctioneers Inc 2,137 0.36
Computers
CAD 101,741 CGI Inc 7,267 1.24
Diversified financial services
CAD 563,185 Brookfield Asset Management Inc 'A' 18,188 3.09
CAD 89,039 CI Financial Corp 1,224 0.21
CAD 35,941 IGM Financial Inc^ 884 0.15
CAD 36,315 Onex Corp 1,614 0.28
CAD 23,793 TMX Group Ltd 2,432 0.41
Electricity
CAD 247,059 Algonquin Power & Utilities Corp 3,408 0.58
CAD 32,340 Atco Ltd 'I' 1,006 0.17
CAD 54,762 Canadian Utilities Ltd 'A'^ 1,405 0.24
CAD 102,227 Emera Inc^ 4,255 0.72
CAD 195,630 Fortis Inc 7,967 1.36
CAD 138,411 Hydro One Ltd 2,949 0.50
Engineering & construction
CAD 47,548 WSP Global Inc^ 2,986 0.51
Food
CAD 72,097 Empire Co Ltd 'A' 1,852 0.32
CAD 32,688 George Weston Ltd 2,469 0.42
CAD 75,972 Loblaw Cos Ltd 3,941 0.67
CAD 106,588 Metro Inc 4,676 0.80
CAD 104,209 Saputo Inc 2,550 0.43
Household goods & home construction
CAD 86,447 Cronos Group Inc^ 567 0.10
Insurance
CAD 11,273 Fairfax Financial Holdings Ltd 3,532 0.60
CAD 117,515 Great-West Lifeco Inc 2,078 0.35
CAD 45,042 iA Financial Corp Inc 1,581 0.27
Ccy Holding Investment
FairValue
USD'000
% of netassetvalue
Canada (31 July 2019: 99.49%) (cont)
Insurance (cont)
CAD 60,363 Intact Financial Corp 6,590 1.12
CAD 821,011 Manulife Financial Corp 11,002 1.87
CAD 238,036 Power Corp of Canada^ 4,224 0.72
CAD 248,072 Sun Life Financial Inc 9,669 1.65
Internet
CAD 44,059 Shopify Inc 'A' 45,055 7.66
Media
CAD 74,856 Quebecor Inc 'B' 1,708 0.29
CAD 197,937 Shaw Communications Inc 'B' 3,620 0.61
CAD 73,850 Thomson Reuters Corp 5,153 0.88
Mining
CAD 100,829 Agnico Eagle Mines Ltd 8,007 1.36
CAD 437,473 B2Gold Corp 3,031 0.52
CAD 750,418 Barrick Gold Corp 21,686 3.69
CAD 167,342 Cameco Corp 1,701 0.29
CAD 247,131 First Quantum Minerals Ltd 2,088 0.36
CAD 79,594 Franco-Nevada Corp 12,722 2.16
CAD 531,146 Kinross Gold Corp 4,957 0.84
CAD 115,554 Kirkland Lake Gold Ltd 6,310 1.07
CAD 278,866 Lundin Mining Corp 1,561 0.27
CAD 88,607 Pan American Silver Corp 3,311 0.56
CAD 207,575 Teck Resources Ltd 'B' 2,103 0.36
CAD 188,691 Wheaton Precious Metals Corp 10,237 1.74
CAD 401,513 Yamana Gold Inc 2,608 0.44
Oil & gas
CAD 499,356 Canadian Natural Resources Ltd 8,809 1.50
CAD 438,151 Cenovus Energy Inc^ 1,949 0.33
CAD 109,119 Imperial Oil Ltd 1,707 0.29
CAD 63,451 Parkland Corp 1,671 0.28
CAD 645,583 Suncor Energy Inc 10,155 1.73
Packaging & containers
CAD 63,897 CCL Industries Inc 'B' 2,126 0.36
Pharmaceuticals
CAD 135,246 Bausch Health Cos Inc 2,473 0.42
CAD 97,487 Canopy Growth Corp^ 1,780 0.30
Pipelines
CAD 118,011 AltaGas Ltd^ 1,478 0.25
CAD 853,309 Enbridge Inc 27,310 4.65
CAD 179,293 Inter Pipeline Ltd^ 1,680 0.29
CAD 91,143 Keyera Corp^ 1,385 0.23
CAD 230,411 Pembina Pipeline Corp 5,599 0.95
CAD 396,333 TC Energy Corp 18,064 3.07
Real estate investment trusts
CAD 34,852 Canadian Apartment Properties REIT (REIT)^ 1,264 0.21
CAD 64,141 RioCan Real Estate Investment Trust (REIT)^ 716 0.12
CAD 29,829 SmartCentres Real Estate Investment Trust (REIT)^ 452 0.08
Retail
CAD 366,099 Alimentation Couche-Tard Inc 'B' 12,723 2.17
CAD 24,419 Canadian Tire Corp Ltd 'A'^ 2,251 0.38
CAD 124,378 Dollarama Inc 4,548 0.77
CAD 119,317 Restaurant Brands International Inc 6,738 1.15
iSHARES VII PLC
SCHEDULE OF INVESTMENTS (continued)
iSHARES MSCI CANADA UCITS ETFAs at 31 July 2020
[168 ]

Ccy Holding Investment
FairValue
USD'000
% of netassetvalue
Equities (31 July 2019: 99.49%) (cont)
Canada (31 July 2019: 99.49%) (cont)
Software
CAD 224,402 BlackBerry Ltd 1,064 0.18
CAD 8,499 Constellation Software Inc 10,052 1.71
CAD 113,929 Open Text Corp 5,128 0.87
Telecommunications
CAD 65,057 BCE Inc 2,728 0.47
CAD 149,570 Rogers Communications Inc 'B' 6,108 1.04
CAD 173,362 TELUS Corp 3,006 0.51
Transportation
CAD 300,660 Canadian National Railway Co 29,368 5.00
CAD 57,716 Canadian Pacific Railway Ltd 15,872 2.70
Total Canada 584,565 99.44
Total equities 584,565 99.44
CcyNo. of
contracts
UnderlyingexposureUSD’000
FairValue
USD’000
% of netassetvalue
Financial derivative instruments (31 July 2019: 0.00%)
Futures contracts (31 July 2019: 0.00%)
CAD 20 S&P TSX 60 Index Futures September 2020 2,786 96 0.02
Total unrealised gains on futures contracts 96 0.02
Total financial derivative instruments 96 0.02
FairValue
USD'000
% of netassetvalue
Total value of investments 584,661 99.46
Cash† 2,463 0.42
Other net assets 739 0.12
Net asset value attributable to redeemable participatingshareholders at the end of the financial year 587,863 100.00
†Cash holdings of USD2,306,223 are held with State Street Bank and Trust Company.USD157,242 is held as security for futures contracts with Credit Suisse Securities Ltd.
^These securities are partially or fully transferred as securities lent.
Equities are primarily classified by country/geographic region of
incorporation of the entity in which the Fund holds shares.
Underlying exposure has been calculated according to the guidelines
issued by the ESMA and represents the market value of an equivalent
position in the assets underlying each financial derivative instrument.
Analysis of total current assetsgross of all liabilities
Fair valueUSD'000
% of totalcurrentassets
Transferable securities admitted to an official stock exchange listing 584,565 99.40
Exchange traded financial derivative instruments 96 0.02
Other assets 3,434 0.58
Total current assets 588,095 100.00
iSHARES VII PLC
SCHEDULE OF INVESTMENTS (continued)
iSHARES MSCI CANADA UCITS ETF (continued)As at 31 July 2020
[169 ]
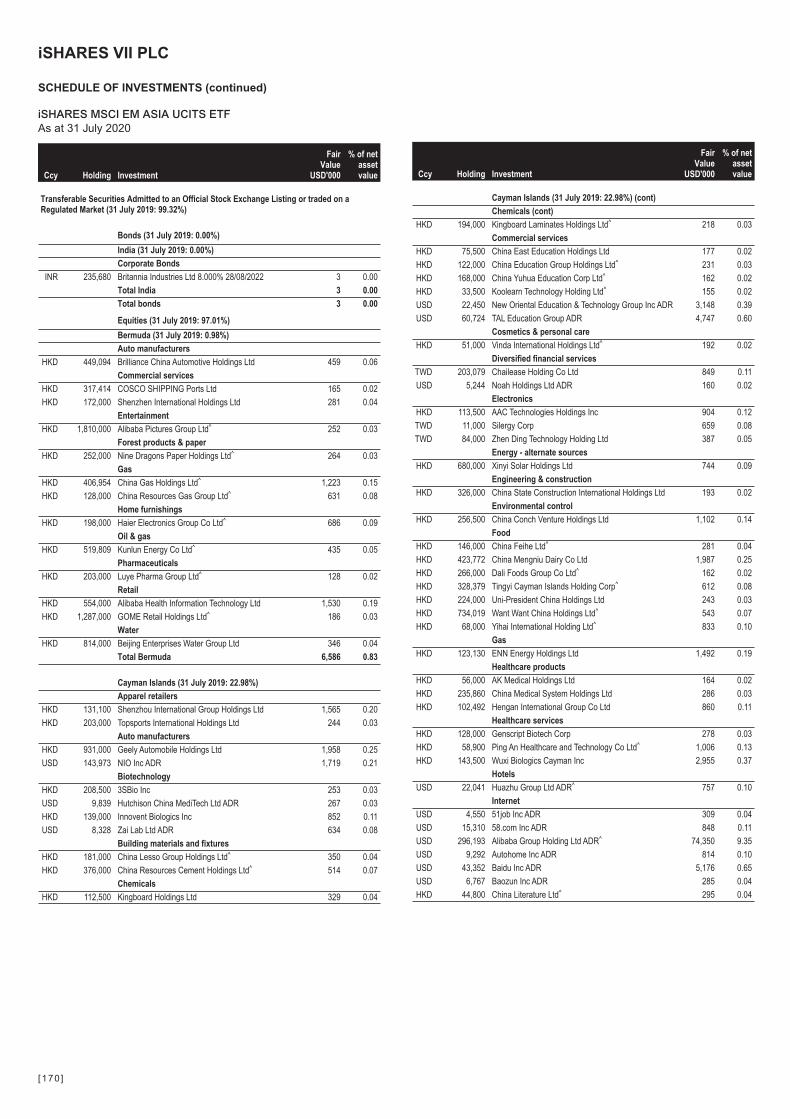
Ccy Holding Investment
FairValue
USD'000
% of netassetvalue
Transferable Securities Admitted to an Official Stock Exchange Listing or traded on aRegulated Market (31 July 2019: 99.32%)
Bonds (31 July 2019: 0.00%)
India (31 July 2019: 0.00%)
Corporate Bonds
INR 235,680 Britannia Industries Ltd 8.000% 28/08/2022 3 0.00
Total India 3 0.00
Total bonds 3 0.00
Equities (31 July 2019: 97.01%)
Bermuda (31 July 2019: 0.98%)
Auto manufacturers
HKD 449,094 Brilliance China Automotive Holdings Ltd 459 0.06
Commercial services
HKD 317,414 COSCO SHIPPING Ports Ltd 165 0.02
HKD 172,000 Shenzhen International Holdings Ltd 281 0.04
Entertainment
HKD 1,810,000 Alibaba Pictures Group Ltd^ 252 0.03
Forest products & paper
HKD 252,000 Nine Dragons Paper Holdings Ltd^ 264 0.03
Gas
HKD 406,954 China Gas Holdings Ltd^ 1,223 0.15
HKD 128,000 China Resources Gas Group Ltd^ 631 0.08
Home furnishings
HKD 198,000 Haier Electronics Group Co Ltd^ 686 0.09
Oil & gas
HKD 519,809 Kunlun Energy Co Ltd^ 435 0.05
Pharmaceuticals
HKD 203,000 Luye Pharma Group Ltd^ 128 0.02
Retail
HKD 554,000 Alibaba Health Information Technology Ltd 1,530 0.19
HKD 1,287,000 GOME Retail Holdings Ltd^ 186 0.03
Water
HKD 814,000 Beijing Enterprises Water Group Ltd 346 0.04
Total Bermuda 6,586 0.83
Cayman Islands (31 July 2019: 22.98%)
Apparel retailers
HKD 131,100 Shenzhou International Group Holdings Ltd 1,565 0.20
HKD 203,000 Topsports International Holdings Ltd 244 0.03
Auto manufacturers
HKD 931,000 Geely Automobile Holdings Ltd 1,958 0.25
USD 143,973 NIO Inc ADR 1,719 0.21
Biotechnology
HKD 208,500 3SBio Inc 253 0.03
USD 9,839 Hutchison China MediTech Ltd ADR 267 0.03
HKD 139,000 Innovent Biologics Inc 852 0.11
USD 8,328 Zai Lab Ltd ADR 634 0.08
Building materials and fixtures
HKD 181,000 China Lesso Group Holdings Ltd^ 350 0.04
HKD 376,000 China Resources Cement Holdings Ltd^ 514 0.07
Chemicals
HKD 112,500 Kingboard Holdings Ltd 329 0.04
Ccy Holding Investment
FairValue
USD'000
% of netassetvalue
Cayman Islands (31 July 2019: 22.98%) (cont)
Chemicals (cont)
HKD 194,000 Kingboard Laminates Holdings Ltd^ 218 0.03
Commercial services
HKD 75,500 China East Education Holdings Ltd 177 0.02
HKD 122,000 China Education Group Holdings Ltd^ 231 0.03
HKD 168,000 China Yuhua Education Corp Ltd^ 162 0.02
HKD 33,500 Koolearn Technology Holding Ltd^ 155 0.02
USD 22,450 New Oriental Education & Technology Group Inc ADR 3,148 0.39
USD 60,724 TAL Education Group ADR 4,747 0.60
Cosmetics & personal care
HKD 51,000 Vinda International Holdings Ltd^ 192 0.02
Diversified financial services
TWD 203,079 Chailease Holding Co Ltd 849 0.11
USD 5,244 Noah Holdings Ltd ADR 160 0.02
Electronics
HKD 113,500 AAC Technologies Holdings Inc 904 0.12
TWD 11,000 Silergy Corp 659 0.08
TWD 84,000 Zhen Ding Technology Holding Ltd 387 0.05
Energy - alternate sources
HKD 680,000 Xinyi Solar Holdings Ltd 744 0.09
Engineering & construction
HKD 326,000 China State Construction International Holdings Ltd 193 0.02
Environmental control
HKD 256,500 China Conch Venture Holdings Ltd 1,102 0.14
Food
HKD 146,000 China Feihe Ltd^ 281 0.04
HKD 423,772 China Mengniu Dairy Co Ltd 1,987 0.25
HKD 266,000 Dali Foods Group Co Ltd^ 162 0.02
HKD 328,379 Tingyi Cayman Islands Holding Corp^ 612 0.08
HKD 224,000 Uni-President China Holdings Ltd 243 0.03
HKD 734,019 Want Want China Holdings Ltd^ 543 0.07
HKD 68,000 Yihai International Holding Ltd^ 833 0.10
Gas
HKD 123,130 ENN Energy Holdings Ltd 1,492 0.19
Healthcare products
HKD 56,000 AK Medical Holdings Ltd 164 0.02
HKD 235,860 China Medical System Holdings Ltd 286 0.03
HKD 102,492 Hengan International Group Co Ltd 860 0.11
Healthcare services
HKD 128,000 Genscript Biotech Corp 278 0.03
HKD 58,900 Ping An Healthcare and Technology Co Ltd^ 1,006 0.13
HKD 143,500 Wuxi Biologics Cayman Inc 2,955 0.37
Hotels
USD 22,041 Huazhu Group Ltd ADR^ 757 0.10
Internet
USD 4,550 51job Inc ADR 309 0.04
USD 15,310 58.com Inc ADR 848 0.11
USD 296,193 Alibaba Group Holding Ltd ADR^ 74,350 9.35
USD 9,292 Autohome Inc ADR 814 0.10
USD 43,352 Baidu Inc ADR 5,176 0.65
USD 6,767 Baozun Inc ADR 285 0.04
HKD 44,800 China Literature Ltd^ 295 0.04
iSHARES VII PLC
SCHEDULE OF INVESTMENTS (continued)
iSHARES MSCI EM ASIA UCITS ETFAs at 31 July 2020
[170 ]
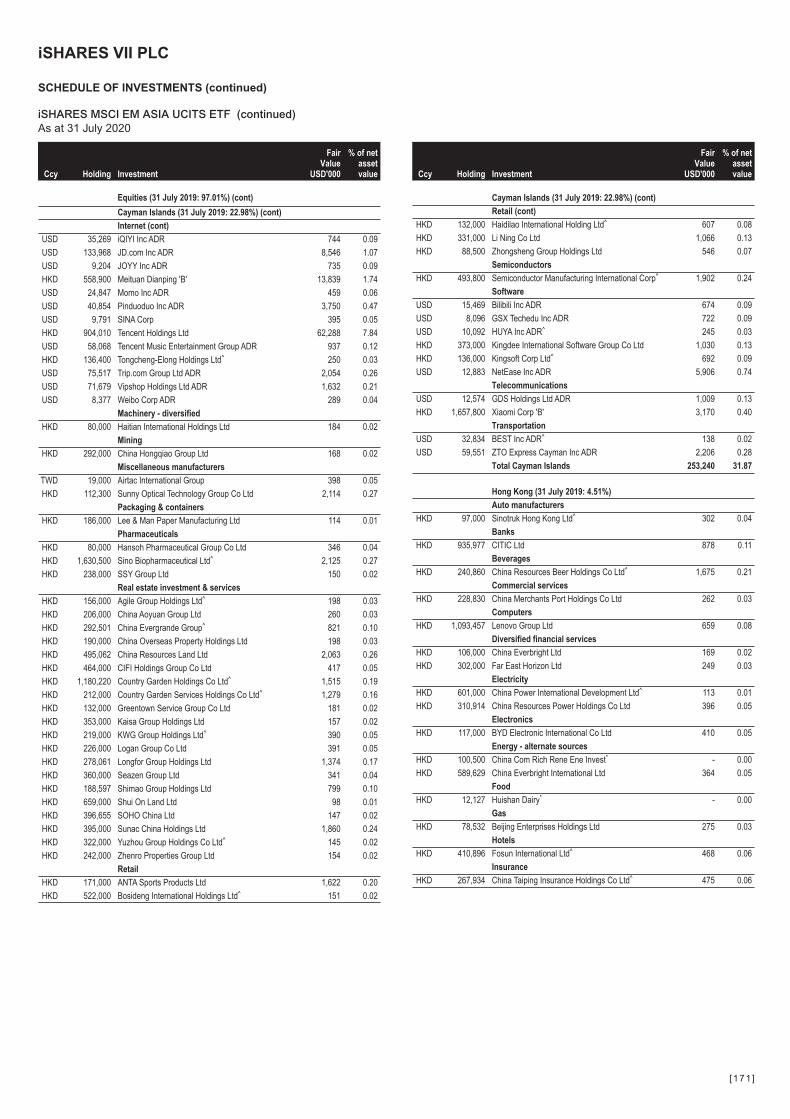
Ccy Holding Investment
FairValue
USD'000
% of netassetvalue
Equities (31 July 2019: 97.01%) (cont)
Cayman Islands (31 July 2019: 22.98%) (cont)
Internet (cont)
USD 35,269 iQIYI Inc ADR 744 0.09
USD 133,968 JD.com Inc ADR 8,546 1.07
USD 9,204 JOYY Inc ADR 735 0.09
HKD 558,900 Meituan Dianping 'B' 13,839 1.74
USD 24,847 Momo Inc ADR 459 0.06
USD 40,854 Pinduoduo Inc ADR 3,750 0.47
USD 9,791 SINA Corp 395 0.05
HKD 904,010 Tencent Holdings Ltd 62,288 7.84
USD 58,068 Tencent Music Entertainment Group ADR 937 0.12
HKD 136,400 Tongcheng-Elong Holdings Ltd^ 250 0.03
USD 75,517 Trip.com Group Ltd ADR 2,054 0.26
USD 71,679 Vipshop Holdings Ltd ADR 1,632 0.21
USD 8,377 Weibo Corp ADR 289 0.04
Machinery - diversified
HKD 80,000 Haitian International Holdings Ltd 184 0.02
Mining
HKD 292,000 China Hongqiao Group Ltd 168 0.02
Miscellaneous manufacturers
TWD 19,000 Airtac International Group 398 0.05
HKD 112,300 Sunny Optical Technology Group Co Ltd 2,114 0.27
Packaging & containers
HKD 186,000 Lee & Man Paper Manufacturing Ltd 114 0.01
Pharmaceuticals
HKD 80,000 Hansoh Pharmaceutical Group Co Ltd 346 0.04
HKD 1,630,500 Sino Biopharmaceutical Ltd^ 2,125 0.27
HKD 238,000 SSY Group Ltd 150 0.02
Real estate investment & services
HKD 156,000 Agile Group Holdings Ltd^ 198 0.03
HKD 206,000 China Aoyuan Group Ltd 260 0.03
HKD 292,501 China Evergrande Group^ 821 0.10
HKD 190,000 China Overseas Property Holdings Ltd 198 0.03
HKD 495,062 China Resources Land Ltd 2,063 0.26
HKD 464,000 CIFI Holdings Group Co Ltd 417 0.05
HKD 1,180,220 Country Garden Holdings Co Ltd^ 1,515 0.19
HKD 212,000 Country Garden Services Holdings Co Ltd^ 1,279 0.16
HKD 132,000 Greentown Service Group Co Ltd 181 0.02
HKD 353,000 Kaisa Group Holdings Ltd 157 0.02
HKD 219,000 KWG Group Holdings Ltd^ 390 0.05
HKD 226,000 Logan Group Co Ltd 391 0.05
HKD 278,061 Longfor Group Holdings Ltd 1,374 0.17
HKD 360,000 Seazen Group Ltd 341 0.04
HKD 188,597 Shimao Group Holdings Ltd 799 0.10
HKD 659,000 Shui On Land Ltd 98 0.01
HKD 396,655 SOHO China Ltd 147 0.02
HKD 395,000 Sunac China Holdings Ltd 1,860 0.24
HKD 322,000 Yuzhou Group Holdings Co Ltd^ 145 0.02
HKD 242,000 Zhenro Properties Group Ltd 154 0.02
Retail
HKD 171,000 ANTA Sports Products Ltd 1,622 0.20
HKD 522,000 Bosideng International Holdings Ltd^ 151 0.02
Ccy Holding Investment
FairValue
USD'000
% of netassetvalue
Cayman Islands (31 July 2019: 22.98%) (cont)
Retail (cont)
HKD 132,000 Haidilao International Holding Ltd^ 607 0.08
HKD 331,000 Li Ning Co Ltd 1,066 0.13
HKD 88,500 Zhongsheng Group Holdings Ltd 546 0.07
Semiconductors
HKD 493,800 Semiconductor Manufacturing International Corp^ 1,902 0.24
Software
USD 15,469 Bilibili Inc ADR 674 0.09
USD 8,096 GSX Techedu Inc ADR 722 0.09
USD 10,092 HUYA Inc ADR^ 245 0.03
HKD 373,000 Kingdee International Software Group Co Ltd 1,030 0.13
HKD 136,000 Kingsoft Corp Ltd^ 692 0.09
USD 12,883 NetEase Inc ADR 5,906 0.74
Telecommunications
USD 12,574 GDS Holdings Ltd ADR 1,009 0.13
HKD 1,657,800 Xiaomi Corp 'B' 3,170 0.40
Transportation
USD 32,834 BEST Inc ADR^ 138 0.02
USD 59,551 ZTO Express Cayman Inc ADR 2,206 0.28
Total Cayman Islands 253,240 31.87
Hong Kong (31 July 2019: 4.51%)
Auto manufacturers
HKD 97,000 Sinotruk Hong Kong Ltd^ 302 0.04
Banks
HKD 935,977 CITIC Ltd 878 0.11
Beverages
HKD 240,860 China Resources Beer Holdings Co Ltd^ 1,675 0.21
Commercial services
HKD 228,830 China Merchants Port Holdings Co Ltd 262 0.03
Computers
HKD 1,093,457 Lenovo Group Ltd 659 0.08
Diversified financial services
HKD 106,000 China Everbright Ltd 169 0.02
HKD 302,000 Far East Horizon Ltd 249 0.03
Electricity
HKD 601,000 China Power International Development Ltd^ 113 0.01
HKD 310,914 China Resources Power Holdings Co Ltd 396 0.05
Electronics
HKD 117,000 BYD Electronic International Co Ltd 410 0.05
Energy - alternate sources
HKD 100,500 China Com Rich Rene Ene Invest* - 0.00
HKD 589,629 China Everbright International Ltd 364 0.05
Food
HKD 12,127 Huishan Dairy* - 0.00
Gas
HKD 78,532 Beijing Enterprises Holdings Ltd 275 0.03
Hotels
HKD 410,896 Fosun International Ltd^ 468 0.06
Insurance
HKD 267,934 China Taiping Insurance Holdings Co Ltd^ 475 0.06
iSHARES VII PLC
SCHEDULE OF INVESTMENTS (continued)
iSHARES MSCI EM ASIA UCITS ETF (continued)As at 31 July 2020
[171 ]
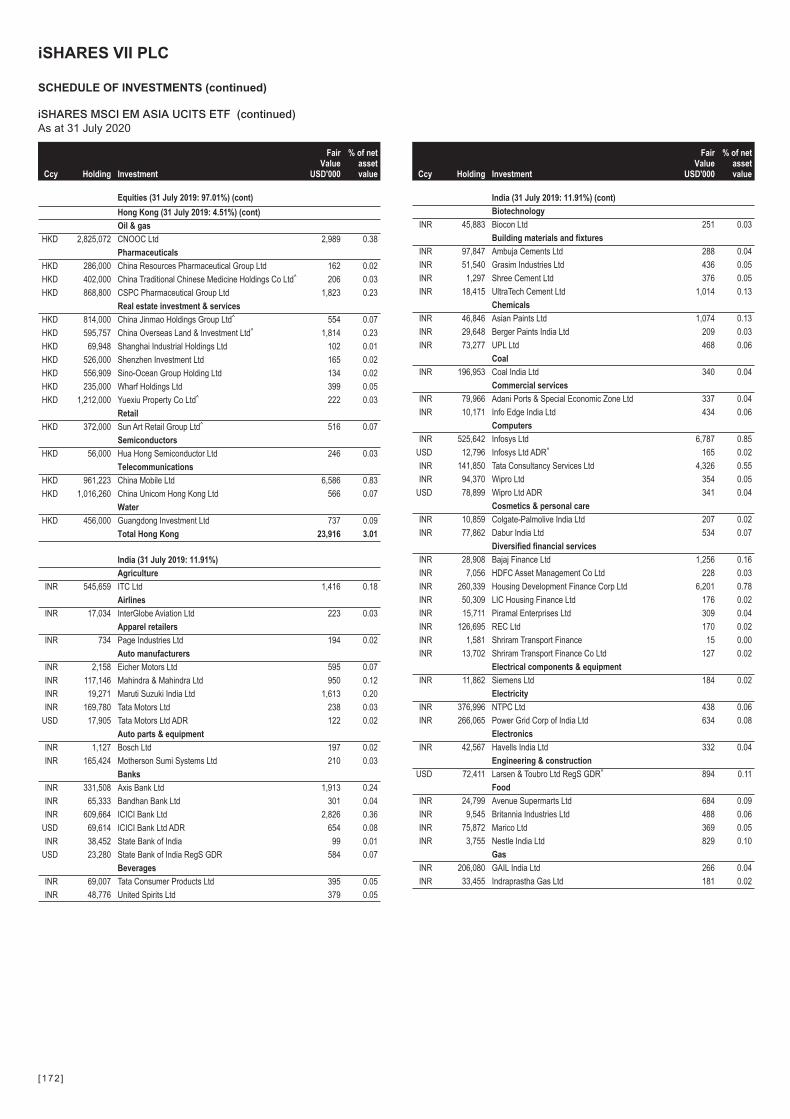
Ccy Holding Investment
FairValue
USD'000
% of netassetvalue
Equities (31 July 2019: 97.01%) (cont)
Hong Kong (31 July 2019: 4.51%) (cont)
Oil & gas
HKD 2,825,072 CNOOC Ltd 2,989 0.38
Pharmaceuticals
HKD 286,000 China Resources Pharmaceutical Group Ltd 162 0.02
HKD 402,000 China Traditional Chinese Medicine Holdings Co Ltd^ 206 0.03
HKD 868,800 CSPC Pharmaceutical Group Ltd 1,823 0.23
Real estate investment & services
HKD 814,000 China Jinmao Holdings Group Ltd^ 554 0.07
HKD 595,757 China Overseas Land & Investment Ltd^ 1,814 0.23
HKD 69,948 Shanghai Industrial Holdings Ltd 102 0.01
HKD 526,000 Shenzhen Investment Ltd 165 0.02
HKD 556,909 Sino-Ocean Group Holding Ltd 134 0.02
HKD 235,000 Wharf Holdings Ltd 399 0.05
HKD 1,212,000 Yuexiu Property Co Ltd^ 222 0.03
Retail
HKD 372,000 Sun Art Retail Group Ltd^ 516 0.07
Semiconductors
HKD 56,000 Hua Hong Semiconductor Ltd 246 0.03
Telecommunications
HKD 961,223 China Mobile Ltd 6,586 0.83
HKD 1,016,260 China Unicom Hong Kong Ltd 566 0.07
Water
HKD 456,000 Guangdong Investment Ltd 737 0.09
Total Hong Kong 23,916 3.01
India (31 July 2019: 11.91%)
Agriculture
INR 545,659 ITC Ltd 1,416 0.18
Airlines
INR 17,034 InterGlobe Aviation Ltd 223 0.03
Apparel retailers
INR 734 Page Industries Ltd 194 0.02
Auto manufacturers
INR 2,158 Eicher Motors Ltd 595 0.07
INR 117,146 Mahindra & Mahindra Ltd 950 0.12
INR 19,271 Maruti Suzuki India Ltd 1,613 0.20
INR 169,780 Tata Motors Ltd 238 0.03
USD 17,905 Tata Motors Ltd ADR 122 0.02
Auto parts & equipment
INR 1,127 Bosch Ltd 197 0.02
INR 165,424 Motherson Sumi Systems Ltd 210 0.03
Banks
INR 331,508 Axis Bank Ltd 1,913 0.24
INR 65,333 Bandhan Bank Ltd 301 0.04
INR 609,664 ICICI Bank Ltd 2,826 0.36
USD 69,614 ICICI Bank Ltd ADR 654 0.08
INR 38,452 State Bank of India 99 0.01
USD 23,280 State Bank of India RegS GDR 584 0.07
Beverages
INR 69,007 Tata Consumer Products Ltd 395 0.05
INR 48,776 United Spirits Ltd 379 0.05
Ccy Holding Investment
FairValue
USD'000
% of netassetvalue
India (31 July 2019: 11.91%) (cont)
Biotechnology
INR 45,883 Biocon Ltd 251 0.03
Building materials and fixtures
INR 97,847 Ambuja Cements Ltd 288 0.04
INR 51,540 Grasim Industries Ltd 436 0.05
INR 1,297 Shree Cement Ltd 376 0.05
INR 18,415 UltraTech Cement Ltd 1,014 0.13
Chemicals
INR 46,846 Asian Paints Ltd 1,074 0.13
INR 29,648 Berger Paints India Ltd 209 0.03
INR 73,277 UPL Ltd 468 0.06
Coal
INR 196,953 Coal India Ltd 340 0.04
Commercial services
INR 79,966 Adani Ports & Special Economic Zone Ltd 337 0.04
INR 10,171 Info Edge India Ltd 434 0.06
Computers
INR 525,642 Infosys Ltd 6,787 0.85
USD 12,796 Infosys Ltd ADR^ 165 0.02
INR 141,850 Tata Consultancy Services Ltd 4,326 0.55
INR 94,370 Wipro Ltd 354 0.05
USD 78,899 Wipro Ltd ADR 341 0.04
Cosmetics & personal care
INR 10,859 Colgate-Palmolive India Ltd 207 0.02
INR 77,862 Dabur India Ltd 534 0.07
Diversified financial services
INR 28,908 Bajaj Finance Ltd 1,256 0.16
INR 7,056 HDFC Asset Management Co Ltd 228 0.03
INR 260,339 Housing Development Finance Corp Ltd 6,201 0.78
INR 50,309 LIC Housing Finance Ltd 176 0.02
INR 15,711 Piramal Enterprises Ltd 309 0.04
INR 126,695 REC Ltd 170 0.02
INR 1,581 Shriram Transport Finance 15 0.00
INR 13,702 Shriram Transport Finance Co Ltd 127 0.02
Electrical components & equipment
INR 11,862 Siemens Ltd 184 0.02
Electricity
INR 376,996 NTPC Ltd 438 0.06
INR 266,065 Power Grid Corp of India Ltd 634 0.08
Electronics
INR 42,567 Havells India Ltd 332 0.04
Engineering & construction
USD 72,411 Larsen & Toubro Ltd RegS GDR^ 894 0.11
Food
INR 24,799 Avenue Supermarts Ltd 684 0.09
INR 9,545 Britannia Industries Ltd 488 0.06
INR 75,872 Marico Ltd 369 0.05
INR 3,755 Nestle India Ltd 829 0.10
Gas
INR 206,080 GAIL India Ltd 266 0.04
INR 33,455 Indraprastha Gas Ltd 181 0.02
iSHARES VII PLC
SCHEDULE OF INVESTMENTS (continued)
iSHARES MSCI EM ASIA UCITS ETF (continued)As at 31 July 2020
[172 ]
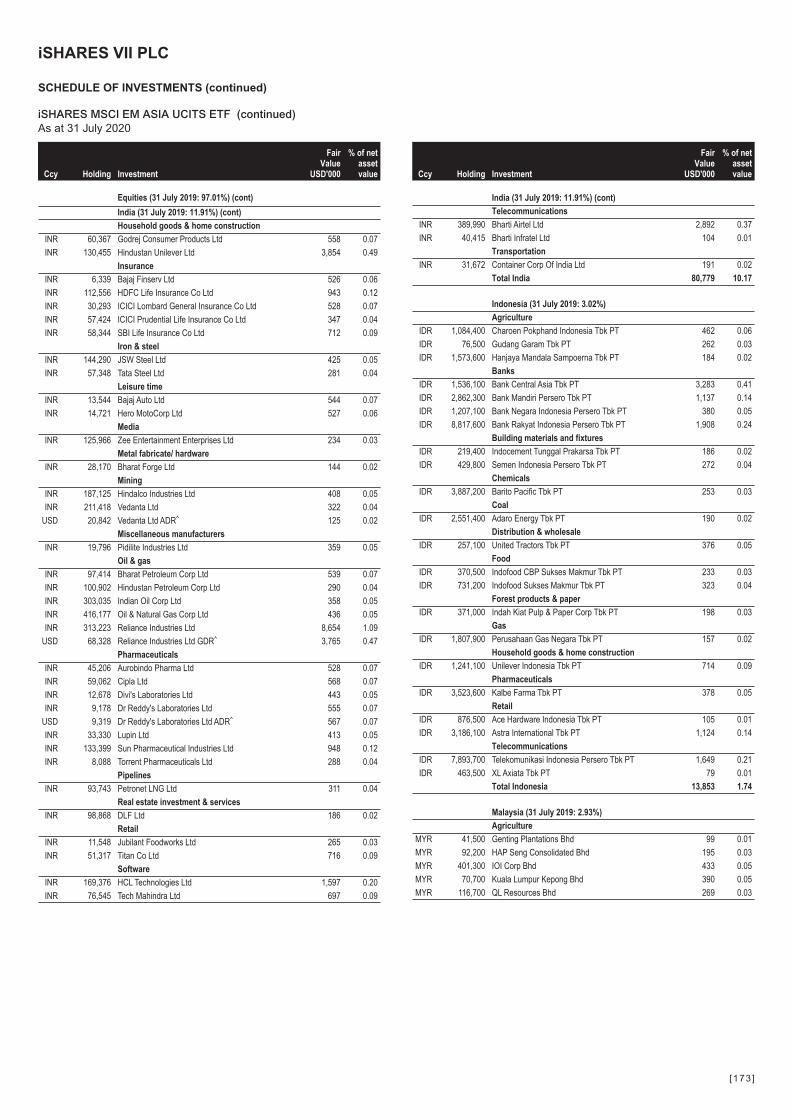
Ccy Holding Investment
FairValue
USD'000
% of netassetvalue
Equities (31 July 2019: 97.01%) (cont)
India (31 July 2019: 11.91%) (cont)
Household goods & home construction
INR 60,367 Godrej Consumer Products Ltd 558 0.07
INR 130,455 Hindustan Unilever Ltd 3,854 0.49
Insurance
INR 6,339 Bajaj Finserv Ltd 526 0.06
INR 112,556 HDFC Life Insurance Co Ltd 943 0.12
INR 30,293 ICICI Lombard General Insurance Co Ltd 528 0.07
INR 57,424 ICICI Prudential Life Insurance Co Ltd 347 0.04
INR 58,344 SBI Life Insurance Co Ltd 712 0.09
Iron & steel
INR 144,290 JSW Steel Ltd 425 0.05
INR 57,348 Tata Steel Ltd 281 0.04
Leisure time
INR 13,544 Bajaj Auto Ltd 544 0.07
INR 14,721 Hero MotoCorp Ltd 527 0.06
Media
INR 125,966 Zee Entertainment Enterprises Ltd 234 0.03
Metal fabricate/ hardware
INR 28,170 Bharat Forge Ltd 144 0.02
Mining
INR 187,125 Hindalco Industries Ltd 408 0.05
INR 211,418 Vedanta Ltd 322 0.04
USD 20,842 Vedanta Ltd ADR^ 125 0.02
Miscellaneous manufacturers
INR 19,796 Pidilite Industries Ltd 359 0.05
Oil & gas
INR 97,414 Bharat Petroleum Corp Ltd 539 0.07
INR 100,902 Hindustan Petroleum Corp Ltd 290 0.04
INR 303,035 Indian Oil Corp Ltd 358 0.05
INR 416,177 Oil & Natural Gas Corp Ltd 436 0.05
INR 313,223 Reliance Industries Ltd 8,654 1.09
USD 68,328 Reliance Industries Ltd GDR^ 3,765 0.47
Pharmaceuticals
INR 45,206 Aurobindo Pharma Ltd 528 0.07
INR 59,062 Cipla Ltd 568 0.07
INR 12,678 Divi's Laboratories Ltd 443 0.05
INR 9,178 Dr Reddy's Laboratories Ltd 555 0.07
USD 9,319 Dr Reddy's Laboratories Ltd ADR^ 567 0.07
INR 33,330 Lupin Ltd 413 0.05
INR 133,399 Sun Pharmaceutical Industries Ltd 948 0.12
INR 8,088 Torrent Pharmaceuticals Ltd 288 0.04
Pipelines
INR 93,743 Petronet LNG Ltd 311 0.04
Real estate investment & services
INR 98,868 DLF Ltd 186 0.02
Retail
INR 11,548 Jubilant Foodworks Ltd 265 0.03
INR 51,317 Titan Co Ltd 716 0.09
Software
INR 169,376 HCL Technologies Ltd 1,597 0.20
INR 76,545 Tech Mahindra Ltd 697 0.09
Ccy Holding Investment
FairValue
USD'000
% of netassetvalue
India (31 July 2019: 11.91%) (cont)
Telecommunications
INR 389,990 Bharti Airtel Ltd 2,892 0.37
INR 40,415 Bharti Infratel Ltd 104 0.01
Transportation
INR 31,672 Container Corp Of India Ltd 191 0.02
Total India 80,779 10.17
Indonesia (31 July 2019: 3.02%)
Agriculture
IDR 1,084,400 Charoen Pokphand Indonesia Tbk PT 462 0.06
IDR 76,500 Gudang Garam Tbk PT 262 0.03
IDR 1,573,600 Hanjaya Mandala Sampoerna Tbk PT 184 0.02
Banks
IDR 1,536,100 Bank Central Asia Tbk PT 3,283 0.41
IDR 2,862,300 Bank Mandiri Persero Tbk PT 1,137 0.14
IDR 1,207,100 Bank Negara Indonesia Persero Tbk PT 380 0.05
IDR 8,817,600 Bank Rakyat Indonesia Persero Tbk PT 1,908 0.24
Building materials and fixtures
IDR 219,400 Indocement Tunggal Prakarsa Tbk PT 186 0.02
IDR 429,800 Semen Indonesia Persero Tbk PT 272 0.04
Chemicals
IDR 3,887,200 Barito Pacific Tbk PT 253 0.03
Coal
IDR 2,551,400 Adaro Energy Tbk PT 190 0.02
Distribution & wholesale
IDR 257,100 United Tractors Tbk PT 376 0.05
Food
IDR 370,500 Indofood CBP Sukses Makmur Tbk PT 233 0.03
IDR 731,200 Indofood Sukses Makmur Tbk PT 323 0.04
Forest products & paper
IDR 371,000 Indah Kiat Pulp & Paper Corp Tbk PT 198 0.03
Gas
IDR 1,807,900 Perusahaan Gas Negara Tbk PT 157 0.02
Household goods & home construction
IDR 1,241,100 Unilever Indonesia Tbk PT 714 0.09
Pharmaceuticals
IDR 3,523,600 Kalbe Farma Tbk PT 378 0.05
Retail
IDR 876,500 Ace Hardware Indonesia Tbk PT 105 0.01
IDR 3,186,100 Astra International Tbk PT 1,124 0.14
Telecommunications
IDR 7,893,700 Telekomunikasi Indonesia Persero Tbk PT 1,649 0.21
IDR 463,500 XL Axiata Tbk PT 79 0.01
Total Indonesia 13,853 1.74
Malaysia (31 July 2019: 2.93%)
Agriculture
MYR 41,500 Genting Plantations Bhd 99 0.01
MYR 92,200 HAP Seng Consolidated Bhd 195 0.03
MYR 401,300 IOI Corp Bhd 433 0.05
MYR 70,700 Kuala Lumpur Kepong Bhd 390 0.05
MYR 116,700 QL Resources Bhd 269 0.03
iSHARES VII PLC
SCHEDULE OF INVESTMENTS (continued)
iSHARES MSCI EM ASIA UCITS ETF (continued)As at 31 July 2020
[173 ]
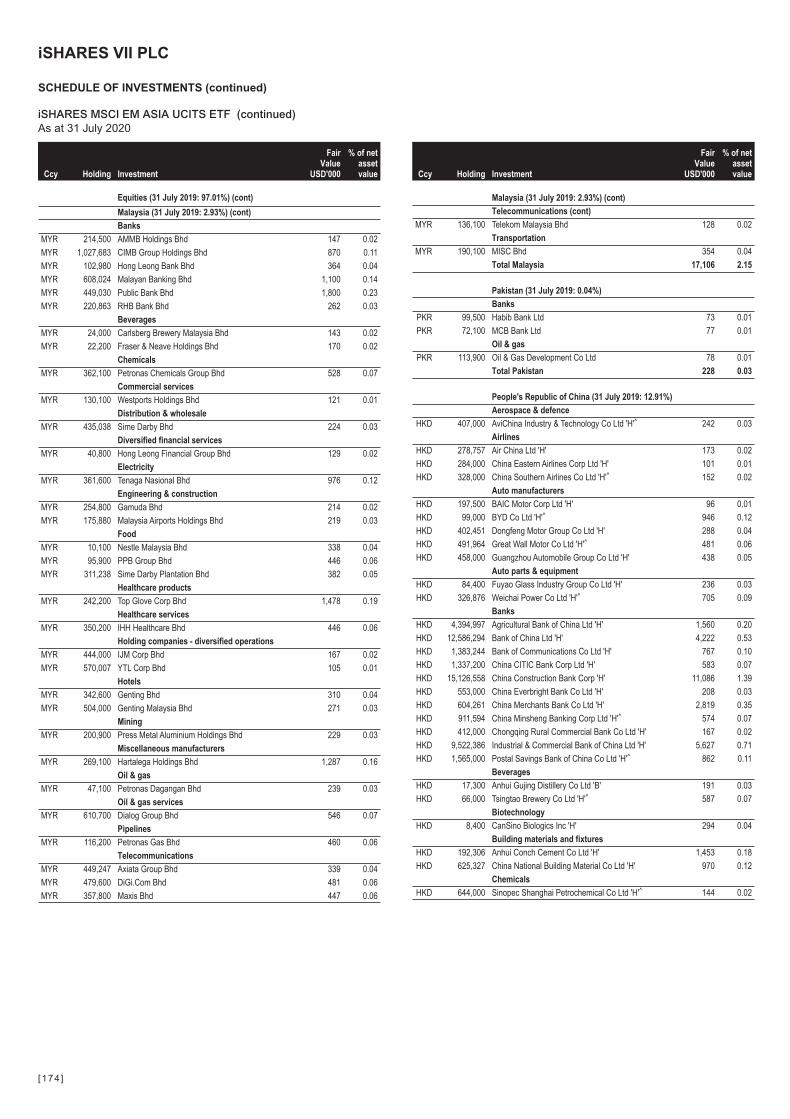
Ccy Holding Investment
FairValue
USD'000
% of netassetvalue
Equities (31 July 2019: 97.01%) (cont)
Malaysia (31 July 2019: 2.93%) (cont)
Banks
MYR 214,500 AMMB Holdings Bhd 147 0.02
MYR 1,027,683 CIMB Group Holdings Bhd 870 0.11
MYR 102,980 Hong Leong Bank Bhd 364 0.04
MYR 608,024 Malayan Banking Bhd 1,100 0.14
MYR 449,030 Public Bank Bhd 1,800 0.23
MYR 220,863 RHB Bank Bhd 262 0.03
Beverages
MYR 24,000 Carlsberg Brewery Malaysia Bhd 143 0.02
MYR 22,200 Fraser & Neave Holdings Bhd 170 0.02
Chemicals
MYR 362,100 Petronas Chemicals Group Bhd 528 0.07
Commercial services
MYR 130,100 Westports Holdings Bhd 121 0.01
Distribution & wholesale
MYR 435,038 Sime Darby Bhd 224 0.03
Diversified financial services
MYR 40,800 Hong Leong Financial Group Bhd 129 0.02
Electricity
MYR 361,600 Tenaga Nasional Bhd 976 0.12
Engineering & construction
MYR 254,800 Gamuda Bhd 214 0.02
MYR 175,880 Malaysia Airports Holdings Bhd 219 0.03
Food
MYR 10,100 Nestle Malaysia Bhd 338 0.04
MYR 95,900 PPB Group Bhd 446 0.06
MYR 311,238 Sime Darby Plantation Bhd 382 0.05
Healthcare products
MYR 242,200 Top Glove Corp Bhd 1,478 0.19
Healthcare services
MYR 350,200 IHH Healthcare Bhd 446 0.06
Holding companies - diversified operations
MYR 444,000 IJM Corp Bhd 167 0.02
MYR 570,007 YTL Corp Bhd 105 0.01
Hotels
MYR 342,600 Genting Bhd 310 0.04
MYR 504,000 Genting Malaysia Bhd 271 0.03
Mining
MYR 200,900 Press Metal Aluminium Holdings Bhd 229 0.03
Miscellaneous manufacturers
MYR 269,100 Hartalega Holdings Bhd 1,287 0.16
Oil & gas
MYR 47,100 Petronas Dagangan Bhd 239 0.03
Oil & gas services
MYR 610,700 Dialog Group Bhd 546 0.07
Pipelines
MYR 116,200 Petronas Gas Bhd 460 0.06
Telecommunications
MYR 449,247 Axiata Group Bhd 339 0.04
MYR 479,600 DiGi.Com Bhd 481 0.06
MYR 357,800 Maxis Bhd 447 0.06
Ccy Holding Investment
FairValue
USD'000
% of netassetvalue
Malaysia (31 July 2019: 2.93%) (cont)
Telecommunications (cont)
MYR 136,100 Telekom Malaysia Bhd 128 0.02
Transportation
MYR 190,100 MISC Bhd 354 0.04
Total Malaysia 17,106 2.15
Pakistan (31 July 2019: 0.04%)
Banks
PKR 99,500 Habib Bank Ltd 73 0.01
PKR 72,100 MCB Bank Ltd 77 0.01
Oil & gas
PKR 113,900 Oil & Gas Development Co Ltd 78 0.01
Total Pakistan 228 0.03
People's Republic of China (31 July 2019: 12.91%)
Aerospace & defence
HKD 407,000 AviChina Industry & Technology Co Ltd 'H'^ 242 0.03
Airlines
HKD 278,757 Air China Ltd 'H' 173 0.02
HKD 284,000 China Eastern Airlines Corp Ltd 'H' 101 0.01
HKD 328,000 China Southern Airlines Co Ltd 'H'^ 152 0.02
Auto manufacturers
HKD 197,500 BAIC Motor Corp Ltd 'H' 96 0.01
HKD 99,000 BYD Co Ltd 'H'^ 946 0.12
HKD 402,451 Dongfeng Motor Group Co Ltd 'H' 288 0.04
HKD 491,964 Great Wall Motor Co Ltd 'H'^ 481 0.06
HKD 458,000 Guangzhou Automobile Group Co Ltd 'H' 438 0.05
Auto parts & equipment
HKD 84,400 Fuyao Glass Industry Group Co Ltd 'H' 236 0.03
HKD 326,876 Weichai Power Co Ltd 'H'^ 705 0.09
Banks
HKD 4,394,997 Agricultural Bank of China Ltd 'H' 1,560 0.20
HKD 12,586,294 Bank of China Ltd 'H' 4,222 0.53
HKD 1,383,244 Bank of Communications Co Ltd 'H' 767 0.10
HKD 1,337,200 China CITIC Bank Corp Ltd 'H' 583 0.07
HKD 15,126,558 China Construction Bank Corp 'H' 11,086 1.39
HKD 553,000 China Everbright Bank Co Ltd 'H' 208 0.03
HKD 604,261 China Merchants Bank Co Ltd 'H' 2,819 0.35
HKD 911,594 China Minsheng Banking Corp Ltd 'H'^ 574 0.07
HKD 412,000 Chongqing Rural Commercial Bank Co Ltd 'H' 167 0.02
HKD 9,522,386 Industrial & Commercial Bank of China Ltd 'H' 5,627 0.71
HKD 1,565,000 Postal Savings Bank of China Co Ltd 'H'^ 862 0.11
Beverages
HKD 17,300 Anhui Gujing Distillery Co Ltd 'B' 191 0.03
HKD 66,000 Tsingtao Brewery Co Ltd 'H'^ 587 0.07
Biotechnology
HKD 8,400 CanSino Biologics Inc 'H' 294 0.04
Building materials and fixtures
HKD 192,306 Anhui Conch Cement Co Ltd 'H' 1,453 0.18
HKD 625,327 China National Building Material Co Ltd 'H' 970 0.12
Chemicals
HKD 644,000 Sinopec Shanghai Petrochemical Co Ltd 'H'^ 144 0.02
iSHARES VII PLC
SCHEDULE OF INVESTMENTS (continued)
iSHARES MSCI EM ASIA UCITS ETF (continued)As at 31 July 2020
[174 ]
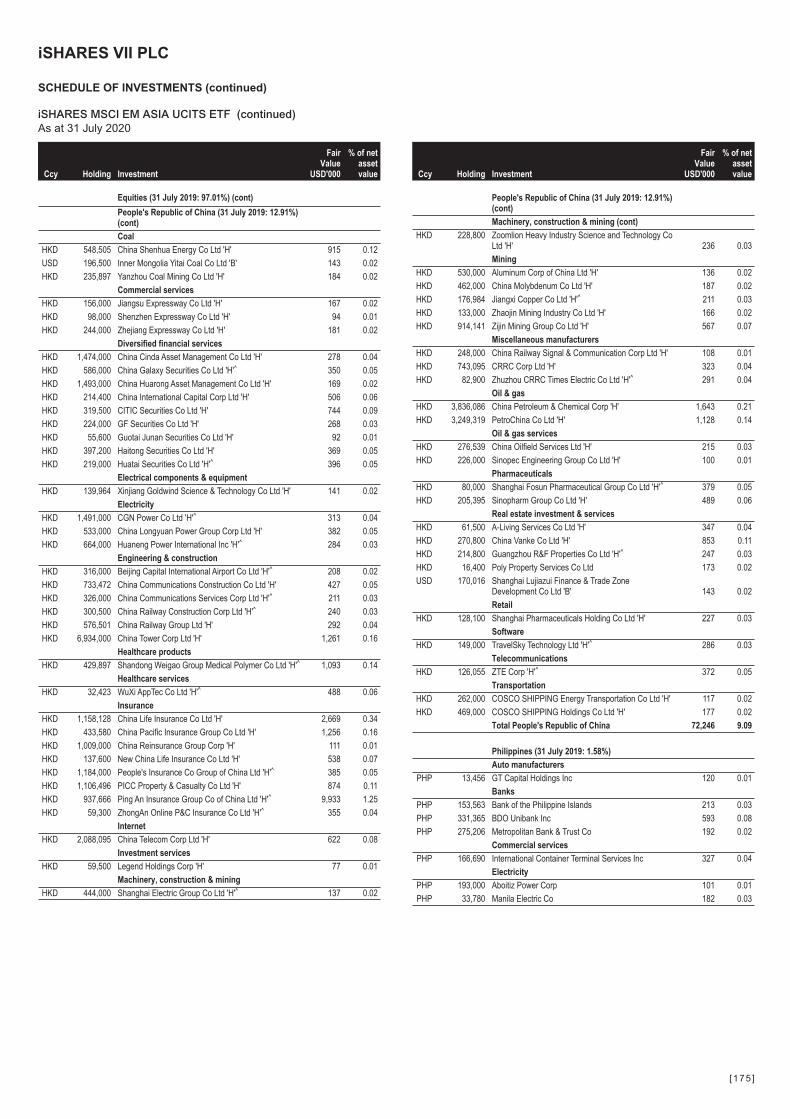
Ccy Holding Investment
FairValue
USD'000
% of netassetvalue
Equities (31 July 2019: 97.01%) (cont)
People's Republic of China (31 July 2019: 12.91%)(cont)
Coal
HKD 548,505 China Shenhua Energy Co Ltd 'H' 915 0.12
USD 196,500 Inner Mongolia Yitai Coal Co Ltd 'B' 143 0.02
HKD 235,897 Yanzhou Coal Mining Co Ltd 'H' 184 0.02
Commercial services
HKD 156,000 Jiangsu Expressway Co Ltd 'H' 167 0.02
HKD 98,000 Shenzhen Expressway Co Ltd 'H' 94 0.01
HKD 244,000 Zhejiang Expressway Co Ltd 'H' 181 0.02
Diversified financial services
HKD 1,474,000 China Cinda Asset Management Co Ltd 'H' 278 0.04
HKD 586,000 China Galaxy Securities Co Ltd 'H'^ 350 0.05
HKD 1,493,000 China Huarong Asset Management Co Ltd 'H' 169 0.02
HKD 214,400 China International Capital Corp Ltd 'H' 506 0.06
HKD 319,500 CITIC Securities Co Ltd 'H' 744 0.09
HKD 224,000 GF Securities Co Ltd 'H' 268 0.03
HKD 55,600 Guotai Junan Securities Co Ltd 'H' 92 0.01
HKD 397,200 Haitong Securities Co Ltd 'H' 369 0.05
HKD 219,000 Huatai Securities Co Ltd 'H'^ 396 0.05
Electrical components & equipment
HKD 139,964 Xinjiang Goldwind Science & Technology Co Ltd 'H' 141 0.02
Electricity
HKD 1,491,000 CGN Power Co Ltd 'H'^ 313 0.04
HKD 533,000 China Longyuan Power Group Corp Ltd 'H' 382 0.05
HKD 664,000 Huaneng Power International Inc 'H'^ 284 0.03
Engineering & construction
HKD 316,000 Beijing Capital International Airport Co Ltd 'H'^ 208 0.02
HKD 733,472 China Communications Construction Co Ltd 'H' 427 0.05
HKD 326,000 China Communications Services Corp Ltd 'H'^ 211 0.03
HKD 300,500 China Railway Construction Corp Ltd 'H'^ 240 0.03
HKD 576,501 China Railway Group Ltd 'H' 292 0.04
HKD 6,934,000 China Tower Corp Ltd 'H' 1,261 0.16
Healthcare products
HKD 429,897 Shandong Weigao Group Medical Polymer Co Ltd 'H'^ 1,093 0.14
Healthcare services
HKD 32,423 WuXi AppTec Co Ltd 'H'^ 488 0.06
Insurance
HKD 1,158,128 China Life Insurance Co Ltd 'H' 2,669 0.34
HKD 433,580 China Pacific Insurance Group Co Ltd 'H' 1,256 0.16
HKD 1,009,000 China Reinsurance Group Corp 'H' 111 0.01
HKD 137,600 New China Life Insurance Co Ltd 'H' 538 0.07
HKD 1,184,000 People's Insurance Co Group of China Ltd 'H'^ 385 0.05
HKD 1,106,496 PICC Property & Casualty Co Ltd 'H' 874 0.11
HKD 937,666 Ping An Insurance Group Co of China Ltd 'H'^ 9,933 1.25
HKD 59,300 ZhongAn Online P&C Insurance Co Ltd 'H'^ 355 0.04
Internet
HKD 2,088,095 China Telecom Corp Ltd 'H' 622 0.08
Investment services
HKD 59,500 Legend Holdings Corp 'H' 77 0.01
Machinery, construction & mining
HKD 444,000 Shanghai Electric Group Co Ltd 'H'^ 137 0.02
Ccy Holding Investment
FairValue
USD'000
% of netassetvalue
People's Republic of China (31 July 2019: 12.91%)(cont)
Machinery, construction & mining (cont)
HKD 228,800 Zoomlion Heavy Industry Science and Technology CoLtd 'H' 236 0.03
Mining
HKD 530,000 Aluminum Corp of China Ltd 'H' 136 0.02
HKD 462,000 China Molybdenum Co Ltd 'H' 187 0.02
HKD 176,984 Jiangxi Copper Co Ltd 'H'^ 211 0.03
HKD 133,000 Zhaojin Mining Industry Co Ltd 'H' 166 0.02
HKD 914,141 Zijin Mining Group Co Ltd 'H' 567 0.07
Miscellaneous manufacturers
HKD 248,000 China Railway Signal & Communication Corp Ltd 'H' 108 0.01
HKD 743,095 CRRC Corp Ltd 'H' 323 0.04
HKD 82,900 Zhuzhou CRRC Times Electric Co Ltd 'H'^ 291 0.04
Oil & gas
HKD 3,836,086 China Petroleum & Chemical Corp 'H' 1,643 0.21
HKD 3,249,319 PetroChina Co Ltd 'H' 1,128 0.14
Oil & gas services
HKD 276,539 China Oilfield Services Ltd 'H' 215 0.03
HKD 226,000 Sinopec Engineering Group Co Ltd 'H' 100 0.01
Pharmaceuticals
HKD 80,000 Shanghai Fosun Pharmaceutical Group Co Ltd 'H'^ 379 0.05
HKD 205,395 Sinopharm Group Co Ltd 'H' 489 0.06
Real estate investment & services
HKD 61,500 A-Living Services Co Ltd 'H' 347 0.04
HKD 270,800 China Vanke Co Ltd 'H' 853 0.11
HKD 214,800 Guangzhou R&F Properties Co Ltd 'H'^ 247 0.03
HKD 16,400 Poly Property Services Co Ltd 173 0.02
USD 170,016 Shanghai Lujiazui Finance & Trade ZoneDevelopment Co Ltd 'B' 143 0.02
Retail
HKD 128,100 Shanghai Pharmaceuticals Holding Co Ltd 'H' 227 0.03
Software
HKD 149,000 TravelSky Technology Ltd 'H'^ 286 0.03
Telecommunications
HKD 126,055 ZTE Corp 'H'^ 372 0.05
Transportation
HKD 262,000 COSCO SHIPPING Energy Transportation Co Ltd 'H' 117 0.02
HKD 469,000 COSCO SHIPPING Holdings Co Ltd 'H' 177 0.02
Total People's Republic of China 72,246 9.09
Philippines (31 July 2019: 1.58%)
Auto manufacturers
PHP 13,456 GT Capital Holdings Inc 120 0.01
Banks
PHP 153,563 Bank of the Philippine Islands 213 0.03
PHP 331,365 BDO Unibank Inc 593 0.08
PHP 275,206 Metropolitan Bank & Trust Co 192 0.02
Commercial services
PHP 166,690 International Container Terminal Services Inc 327 0.04
Electricity
PHP 193,000 Aboitiz Power Corp 101 0.01
PHP 33,780 Manila Electric Co 182 0.03
iSHARES VII PLC
SCHEDULE OF INVESTMENTS (continued)
iSHARES MSCI EM ASIA UCITS ETF (continued)As at 31 July 2020
[175 ]
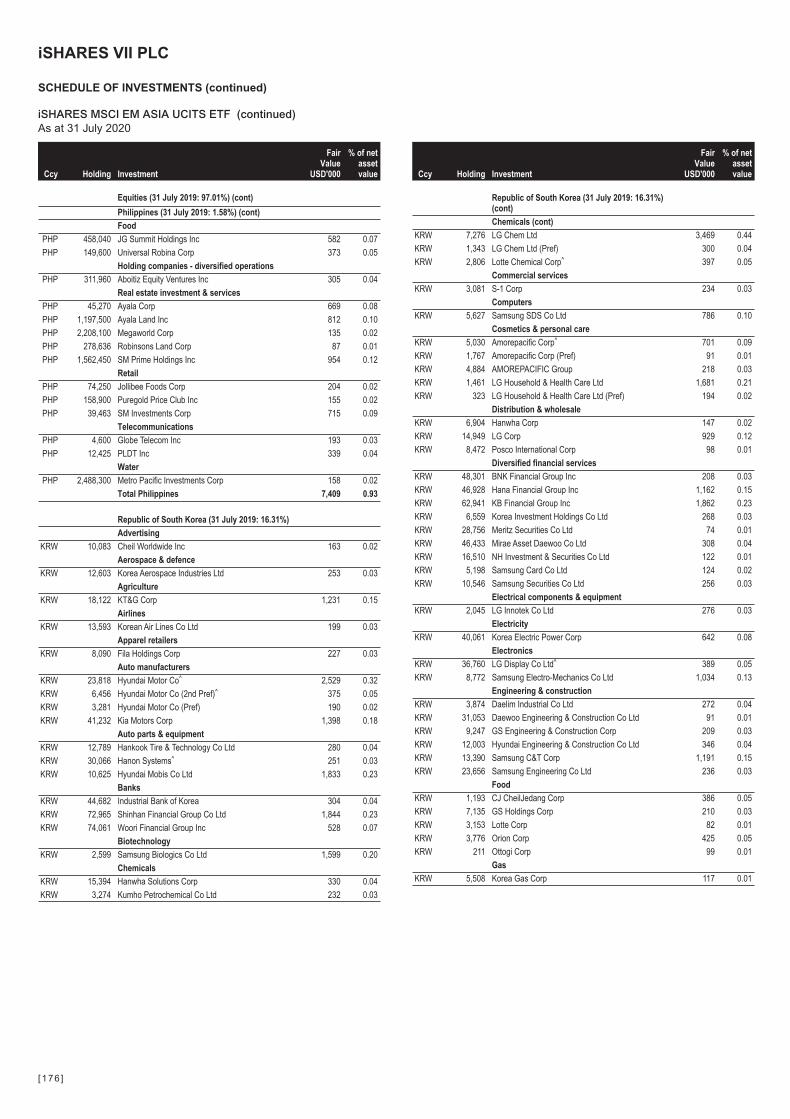
Ccy Holding Investment
FairValue
USD'000
% of netassetvalue
Equities (31 July 2019: 97.01%) (cont)
Philippines (31 July 2019: 1.58%) (cont)
Food
PHP 458,040 JG Summit Holdings Inc 582 0.07
PHP 149,600 Universal Robina Corp 373 0.05
Holding companies - diversified operations
PHP 311,960 Aboitiz Equity Ventures Inc 305 0.04
Real estate investment & services
PHP 45,270 Ayala Corp 669 0.08
PHP 1,197,500 Ayala Land Inc 812 0.10
PHP 2,208,100 Megaworld Corp 135 0.02
PHP 278,636 Robinsons Land Corp 87 0.01
PHP 1,562,450 SM Prime Holdings Inc 954 0.12
Retail
PHP 74,250 Jollibee Foods Corp 204 0.02
PHP 158,900 Puregold Price Club Inc 155 0.02
PHP 39,463 SM Investments Corp 715 0.09
Telecommunications
PHP 4,600 Globe Telecom Inc 193 0.03
PHP 12,425 PLDT Inc 339 0.04
Water
PHP 2,488,300 Metro Pacific Investments Corp 158 0.02
Total Philippines 7,409 0.93
Republic of South Korea (31 July 2019: 16.31%)
Advertising
KRW 10,083 Cheil Worldwide Inc 163 0.02
Aerospace & defence
KRW 12,603 Korea Aerospace Industries Ltd 253 0.03
Agriculture
KRW 18,122 KT&G Corp 1,231 0.15
Airlines
KRW 13,593 Korean Air Lines Co Ltd 199 0.03
Apparel retailers
KRW 8,090 Fila Holdings Corp 227 0.03
Auto manufacturers
KRW 23,818 Hyundai Motor Co^ 2,529 0.32
KRW 6,456 Hyundai Motor Co (2nd Pref)^ 375 0.05
KRW 3,281 Hyundai Motor Co (Pref) 190 0.02
KRW 41,232 Kia Motors Corp 1,398 0.18
Auto parts & equipment
KRW 12,789 Hankook Tire & Technology Co Ltd 280 0.04
KRW 30,066 Hanon Systems^ 251 0.03
KRW 10,625 Hyundai Mobis Co Ltd 1,833 0.23
Banks
KRW 44,682 Industrial Bank of Korea 304 0.04
KRW 72,965 Shinhan Financial Group Co Ltd 1,844 0.23
KRW 74,061 Woori Financial Group Inc 528 0.07
Biotechnology
KRW 2,599 Samsung Biologics Co Ltd 1,599 0.20
Chemicals
KRW 15,394 Hanwha Solutions Corp 330 0.04
KRW 3,274 Kumho Petrochemical Co Ltd 232 0.03
Ccy Holding Investment
FairValue
USD'000
% of netassetvalue
Republic of South Korea (31 July 2019: 16.31%)(cont)
Chemicals (cont)
KRW 7,276 LG Chem Ltd 3,469 0.44
KRW 1,343 LG Chem Ltd (Pref) 300 0.04
KRW 2,806 Lotte Chemical Corp^ 397 0.05
Commercial services
KRW 3,081 S-1 Corp 234 0.03
Computers
KRW 5,627 Samsung SDS Co Ltd 786 0.10
Cosmetics & personal care
KRW 5,030 Amorepacific Corp^ 701 0.09
KRW 1,767 Amorepacific Corp (Pref) 91 0.01
KRW 4,884 AMOREPACIFIC Group 218 0.03
KRW 1,461 LG Household & Health Care Ltd 1,681 0.21
KRW 323 LG Household & Health Care Ltd (Pref) 194 0.02
Distribution & wholesale
KRW 6,904 Hanwha Corp 147 0.02
KRW 14,949 LG Corp 929 0.12
KRW 8,472 Posco International Corp 98 0.01
Diversified financial services
KRW 48,301 BNK Financial Group Inc 208 0.03
KRW 46,928 Hana Financial Group Inc 1,162 0.15
KRW 62,941 KB Financial Group Inc 1,862 0.23
KRW 6,559 Korea Investment Holdings Co Ltd 268 0.03
KRW 28,756 Meritz Securities Co Ltd 74 0.01
KRW 46,433 Mirae Asset Daewoo Co Ltd 308 0.04
KRW 16,510 NH Investment & Securities Co Ltd 122 0.01
KRW 5,198 Samsung Card Co Ltd 124 0.02
KRW 10,546 Samsung Securities Co Ltd 256 0.03
Electrical components & equipment
KRW 2,045 LG Innotek Co Ltd 276 0.03
Electricity
KRW 40,061 Korea Electric Power Corp 642 0.08
Electronics
KRW 36,760 LG Display Co Ltd^ 389 0.05
KRW 8,772 Samsung Electro-Mechanics Co Ltd 1,034 0.13
Engineering & construction
KRW 3,874 Daelim Industrial Co Ltd 272 0.04
KRW 31,053 Daewoo Engineering & Construction Co Ltd 91 0.01
KRW 9,247 GS Engineering & Construction Corp 209 0.03
KRW 12,003 Hyundai Engineering & Construction Co Ltd 346 0.04
KRW 13,390 Samsung C&T Corp 1,191 0.15
KRW 23,656 Samsung Engineering Co Ltd 236 0.03
Food
KRW 1,193 CJ CheilJedang Corp 386 0.05
KRW 7,135 GS Holdings Corp 210 0.03
KRW 3,153 Lotte Corp 82 0.01
KRW 3,776 Orion Corp 425 0.05
KRW 211 Ottogi Corp 99 0.01
Gas
KRW 5,508 Korea Gas Corp 117 0.01
iSHARES VII PLC
SCHEDULE OF INVESTMENTS (continued)
iSHARES MSCI EM ASIA UCITS ETF (continued)As at 31 July 2020
[176 ]
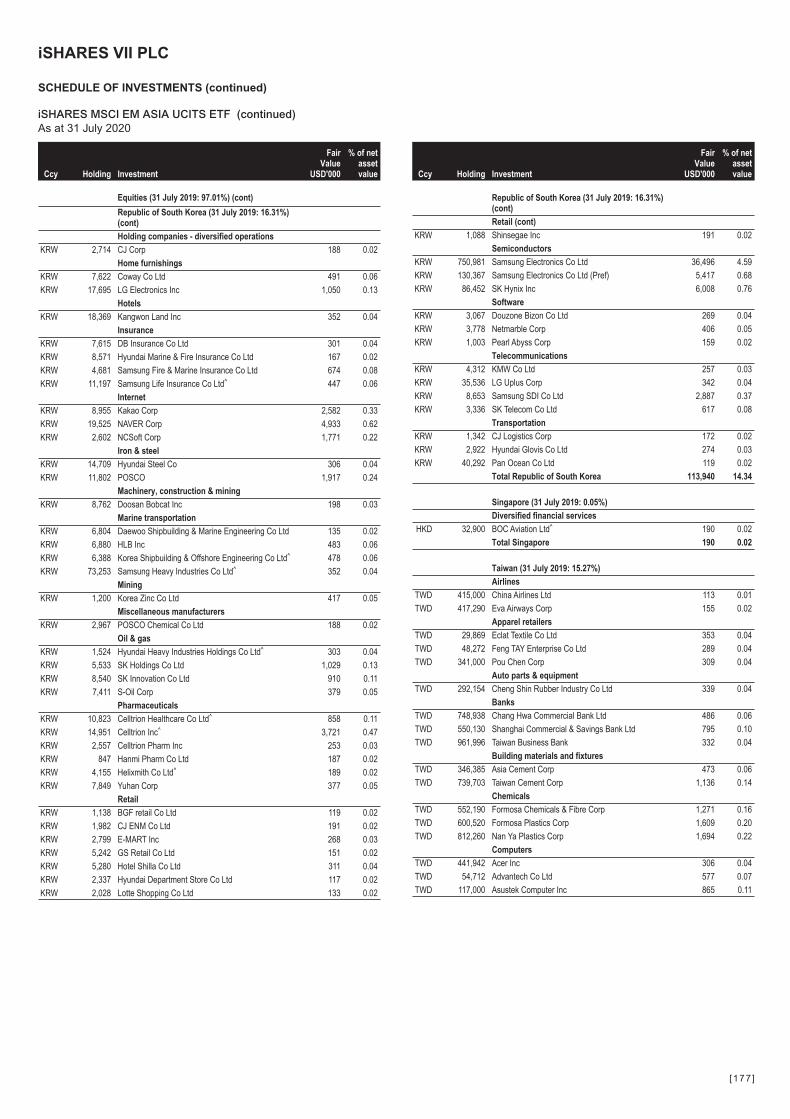
Ccy Holding Investment
FairValue
USD'000
% of netassetvalue
Equities (31 July 2019: 97.01%) (cont)
Republic of South Korea (31 July 2019: 16.31%)(cont)
Holding companies - diversified operations
KRW 2,714 CJ Corp 188 0.02
Home furnishings
KRW 7,622 Coway Co Ltd 491 0.06
KRW 17,695 LG Electronics Inc 1,050 0.13
Hotels
KRW 18,369 Kangwon Land Inc 352 0.04
Insurance
KRW 7,615 DB Insurance Co Ltd 301 0.04
KRW 8,571 Hyundai Marine & Fire Insurance Co Ltd 167 0.02
KRW 4,681 Samsung Fire & Marine Insurance Co Ltd 674 0.08
KRW 11,197 Samsung Life Insurance Co Ltd^ 447 0.06
Internet
KRW 8,955 Kakao Corp 2,582 0.33
KRW 19,525 NAVER Corp 4,933 0.62
KRW 2,602 NCSoft Corp 1,771 0.22
Iron & steel
KRW 14,709 Hyundai Steel Co 306 0.04
KRW 11,802 POSCO 1,917 0.24
Machinery, construction & mining
KRW 8,762 Doosan Bobcat Inc 198 0.03
Marine transportation
KRW 6,804 Daewoo Shipbuilding & Marine Engineering Co Ltd 135 0.02
KRW 6,880 HLB Inc 483 0.06
KRW 6,388 Korea Shipbuilding & Offshore Engineering Co Ltd^ 478 0.06
KRW 73,253 Samsung Heavy Industries Co Ltd^ 352 0.04
Mining
KRW 1,200 Korea Zinc Co Ltd 417 0.05
Miscellaneous manufacturers
KRW 2,967 POSCO Chemical Co Ltd 188 0.02
Oil & gas
KRW 1,524 Hyundai Heavy Industries Holdings Co Ltd^ 303 0.04
KRW 5,533 SK Holdings Co Ltd 1,029 0.13
KRW 8,540 SK Innovation Co Ltd 910 0.11
KRW 7,411 S-Oil Corp 379 0.05
Pharmaceuticals
KRW 10,823 Celltrion Healthcare Co Ltd^ 858 0.11
KRW 14,951 Celltrion Inc^ 3,721 0.47
KRW 2,557 Celltrion Pharm Inc 253 0.03
KRW 847 Hanmi Pharm Co Ltd 187 0.02
KRW 4,155 Helixmith Co Ltd^ 189 0.02
KRW 7,849 Yuhan Corp 377 0.05
Retail
KRW 1,138 BGF retail Co Ltd 119 0.02
KRW 1,982 CJ ENM Co Ltd 191 0.02
KRW 2,799 E-MART Inc 268 0.03
KRW 5,242 GS Retail Co Ltd 151 0.02
KRW 5,280 Hotel Shilla Co Ltd 311 0.04
KRW 2,337 Hyundai Department Store Co Ltd 117 0.02
KRW 2,028 Lotte Shopping Co Ltd 133 0.02
Ccy Holding Investment
FairValue
USD'000
% of netassetvalue
Republic of South Korea (31 July 2019: 16.31%)(cont)
Retail (cont)
KRW 1,088 Shinsegae Inc 191 0.02
Semiconductors
KRW 750,981 Samsung Electronics Co Ltd 36,496 4.59
KRW 130,367 Samsung Electronics Co Ltd (Pref) 5,417 0.68
KRW 86,452 SK Hynix Inc 6,008 0.76
Software
KRW 3,067 Douzone Bizon Co Ltd 269 0.04
KRW 3,778 Netmarble Corp 406 0.05
KRW 1,003 Pearl Abyss Corp 159 0.02
Telecommunications
KRW 4,312 KMW Co Ltd 257 0.03
KRW 35,536 LG Uplus Corp 342 0.04
KRW 8,653 Samsung SDI Co Ltd 2,887 0.37
KRW 3,336 SK Telecom Co Ltd 617 0.08
Transportation
KRW 1,342 CJ Logistics Corp 172 0.02
KRW 2,922 Hyundai Glovis Co Ltd 274 0.03
KRW 40,292 Pan Ocean Co Ltd 119 0.02
Total Republic of South Korea 113,940 14.34
Singapore (31 July 2019: 0.05%)
Diversified financial services
HKD 32,900 BOC Aviation Ltd^ 190 0.02
Total Singapore 190 0.02
Taiwan (31 July 2019: 15.27%)
Airlines
TWD 415,000 China Airlines Ltd 113 0.01
TWD 417,290 Eva Airways Corp 155 0.02
Apparel retailers
TWD 29,869 Eclat Textile Co Ltd 353 0.04
TWD 48,272 Feng TAY Enterprise Co Ltd 289 0.04
TWD 341,000 Pou Chen Corp 309 0.04
Auto parts & equipment
TWD 292,154 Cheng Shin Rubber Industry Co Ltd 339 0.04
Banks
TWD 748,938 Chang Hwa Commercial Bank Ltd 486 0.06
TWD 550,130 Shanghai Commercial & Savings Bank Ltd 795 0.10
TWD 961,996 Taiwan Business Bank 332 0.04
Building materials and fixtures
TWD 346,385 Asia Cement Corp 473 0.06
TWD 739,703 Taiwan Cement Corp 1,136 0.14
Chemicals
TWD 552,190 Formosa Chemicals & Fibre Corp 1,271 0.16
TWD 600,520 Formosa Plastics Corp 1,609 0.20
TWD 812,260 Nan Ya Plastics Corp 1,694 0.22
Computers
TWD 441,942 Acer Inc 306 0.04
TWD 54,712 Advantech Co Ltd 577 0.07
TWD 117,000 Asustek Computer Inc 865 0.11
iSHARES VII PLC
SCHEDULE OF INVESTMENTS (continued)
iSHARES MSCI EM ASIA UCITS ETF (continued)As at 31 July 2020
[177 ]
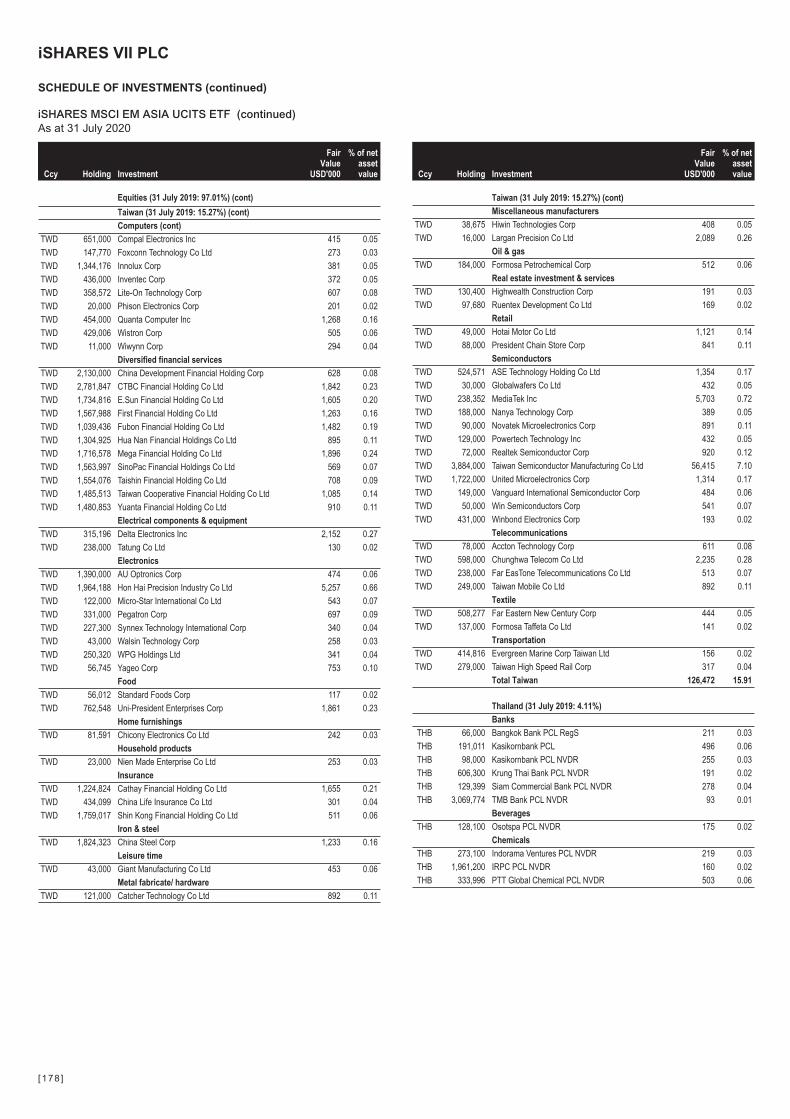
Ccy Holding Investment
FairValue
USD'000
% of netassetvalue
Equities (31 July 2019: 97.01%) (cont)
Taiwan (31 July 2019: 15.27%) (cont)
Computers (cont)
TWD 651,000 Compal Electronics Inc 415 0.05
TWD 147,770 Foxconn Technology Co Ltd 273 0.03
TWD 1,344,176 Innolux Corp 381 0.05
TWD 436,000 Inventec Corp 372 0.05
TWD 358,572 Lite-On Technology Corp 607 0.08
TWD 20,000 Phison Electronics Corp 201 0.02
TWD 454,000 Quanta Computer Inc 1,268 0.16
TWD 429,006 Wistron Corp 505 0.06
TWD 11,000 Wiwynn Corp 294 0.04
Diversified financial services
TWD 2,130,000 China Development Financial Holding Corp 628 0.08
TWD 2,781,847 CTBC Financial Holding Co Ltd 1,842 0.23
TWD 1,734,816 E.Sun Financial Holding Co Ltd 1,605 0.20
TWD 1,567,988 First Financial Holding Co Ltd 1,263 0.16
TWD 1,039,436 Fubon Financial Holding Co Ltd 1,482 0.19
TWD 1,304,925 Hua Nan Financial Holdings Co Ltd 895 0.11
TWD 1,716,578 Mega Financial Holding Co Ltd 1,896 0.24
TWD 1,563,997 SinoPac Financial Holdings Co Ltd 569 0.07
TWD 1,554,076 Taishin Financial Holding Co Ltd 708 0.09
TWD 1,485,513 Taiwan Cooperative Financial Holding Co Ltd 1,085 0.14
TWD 1,480,853 Yuanta Financial Holding Co Ltd 910 0.11
Electrical components & equipment
TWD 315,196 Delta Electronics Inc 2,152 0.27
TWD 238,000 Tatung Co Ltd 130 0.02
Electronics
TWD 1,390,000 AU Optronics Corp 474 0.06
TWD 1,964,188 Hon Hai Precision Industry Co Ltd 5,257 0.66
TWD 122,000 Micro-Star International Co Ltd 543 0.07
TWD 331,000 Pegatron Corp 697 0.09
TWD 227,300 Synnex Technology International Corp 340 0.04
TWD 43,000 Walsin Technology Corp 258 0.03
TWD 250,320 WPG Holdings Ltd 341 0.04
TWD 56,745 Yageo Corp 753 0.10
Food
TWD 56,012 Standard Foods Corp 117 0.02
TWD 762,548 Uni-President Enterprises Corp 1,861 0.23
Home furnishings
TWD 81,591 Chicony Electronics Co Ltd 242 0.03
Household products
TWD 23,000 Nien Made Enterprise Co Ltd 253 0.03
Insurance
TWD 1,224,824 Cathay Financial Holding Co Ltd 1,655 0.21
TWD 434,099 China Life Insurance Co Ltd 301 0.04
TWD 1,759,017 Shin Kong Financial Holding Co Ltd 511 0.06
Iron & steel
TWD 1,824,323 China Steel Corp 1,233 0.16
Leisure time
TWD 43,000 Giant Manufacturing Co Ltd 453 0.06
Metal fabricate/ hardware
TWD 121,000 Catcher Technology Co Ltd 892 0.11
Ccy Holding Investment
FairValue
USD'000
% of netassetvalue
Taiwan (31 July 2019: 15.27%) (cont)
Miscellaneous manufacturers
TWD 38,675 Hiwin Technologies Corp 408 0.05
TWD 16,000 Largan Precision Co Ltd 2,089 0.26
Oil & gas
TWD 184,000 Formosa Petrochemical Corp 512 0.06
Real estate investment & services
TWD 130,400 Highwealth Construction Corp 191 0.03
TWD 97,680 Ruentex Development Co Ltd 169 0.02
Retail
TWD 49,000 Hotai Motor Co Ltd 1,121 0.14
TWD 88,000 President Chain Store Corp 841 0.11
Semiconductors
TWD 524,571 ASE Technology Holding Co Ltd 1,354 0.17
TWD 30,000 Globalwafers Co Ltd 432 0.05
TWD 238,352 MediaTek Inc 5,703 0.72
TWD 188,000 Nanya Technology Corp 389 0.05
TWD 90,000 Novatek Microelectronics Corp 891 0.11
TWD 129,000 Powertech Technology Inc 432 0.05
TWD 72,000 Realtek Semiconductor Corp 920 0.12
TWD 3,884,000 Taiwan Semiconductor Manufacturing Co Ltd 56,415 7.10
TWD 1,722,000 United Microelectronics Corp 1,314 0.17
TWD 149,000 Vanguard International Semiconductor Corp 484 0.06
TWD 50,000 Win Semiconductors Corp 541 0.07
TWD 431,000 Winbond Electronics Corp 193 0.02
Telecommunications
TWD 78,000 Accton Technology Corp 611 0.08
TWD 598,000 Chunghwa Telecom Co Ltd 2,235 0.28
TWD 238,000 Far EasTone Telecommunications Co Ltd 513 0.07
TWD 249,000 Taiwan Mobile Co Ltd 892 0.11
Textile
TWD 508,277 Far Eastern New Century Corp 444 0.05
TWD 137,000 Formosa Taffeta Co Ltd 141 0.02
Transportation
TWD 414,816 Evergreen Marine Corp Taiwan Ltd 156 0.02
TWD 279,000 Taiwan High Speed Rail Corp 317 0.04
Total Taiwan 126,472 15.91
Thailand (31 July 2019: 4.11%)
Banks
THB 66,000 Bangkok Bank PCL RegS 211 0.03
THB 191,011 Kasikornbank PCL 496 0.06
THB 98,000 Kasikornbank PCL NVDR 255 0.03
THB 606,300 Krung Thai Bank PCL NVDR 191 0.02
THB 129,399 Siam Commercial Bank PCL NVDR 278 0.04
THB 3,069,774 TMB Bank PCL NVDR 93 0.01
Beverages
THB 128,100 Osotspa PCL NVDR 175 0.02
Chemicals
THB 273,100 Indorama Ventures PCL NVDR 219 0.03
THB 1,961,200 IRPC PCL NVDR 160 0.02
THB 333,996 PTT Global Chemical PCL NVDR 503 0.06
iSHARES VII PLC
SCHEDULE OF INVESTMENTS (continued)
iSHARES MSCI EM ASIA UCITS ETF (continued)As at 31 July 2020
[178 ]
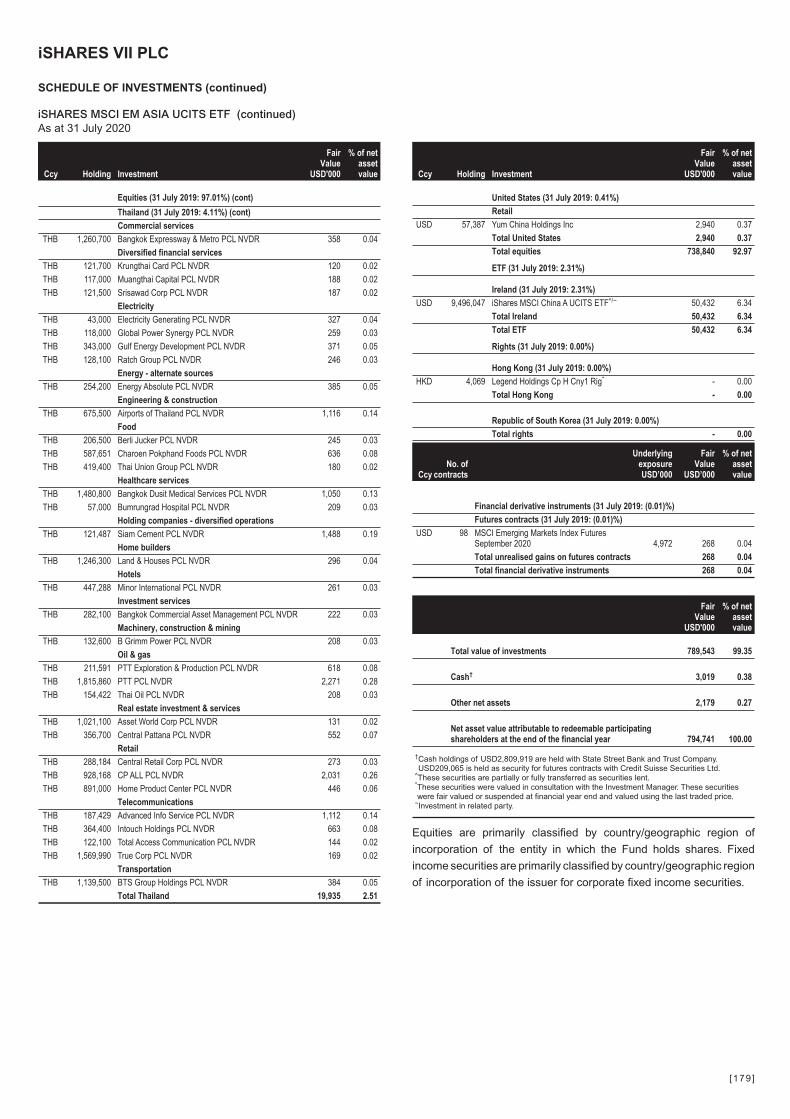
Ccy Holding Investment
FairValue
USD'000
% of netassetvalue
Equities (31 July 2019: 97.01%) (cont)
Thailand (31 July 2019: 4.11%) (cont)
Commercial services
THB 1,260,700 Bangkok Expressway & Metro PCL NVDR 358 0.04
Diversified financial services
THB 121,700 Krungthai Card PCL NVDR 120 0.02
THB 117,000 Muangthai Capital PCL NVDR 188 0.02
THB 121,500 Srisawad Corp PCL NVDR 187 0.02
Electricity
THB 43,000 Electricity Generating PCL NVDR 327 0.04
THB 118,000 Global Power Synergy PCL NVDR 259 0.03
THB 343,000 Gulf Energy Development PCL NVDR 371 0.05
THB 128,100 Ratch Group PCL NVDR 246 0.03
Energy - alternate sources
THB 254,200 Energy Absolute PCL NVDR 385 0.05
Engineering & construction
THB 675,500 Airports of Thailand PCL NVDR 1,116 0.14
Food
THB 206,500 Berli Jucker PCL NVDR 245 0.03
THB 587,651 Charoen Pokphand Foods PCL NVDR 636 0.08
THB 419,400 Thai Union Group PCL NVDR 180 0.02
Healthcare services
THB 1,480,800 Bangkok Dusit Medical Services PCL NVDR 1,050 0.13
THB 57,000 Bumrungrad Hospital PCL NVDR 209 0.03
Holding companies - diversified operations
THB 121,487 Siam Cement PCL NVDR 1,488 0.19
Home builders
THB 1,246,300 Land & Houses PCL NVDR 296 0.04
Hotels
THB 447,288 Minor International PCL NVDR 261 0.03
Investment services
THB 282,100 Bangkok Commercial Asset Management PCL NVDR 222 0.03
Machinery, construction & mining
THB 132,600 B Grimm Power PCL NVDR 208 0.03
Oil & gas
THB 211,591 PTT Exploration & Production PCL NVDR 618 0.08
THB 1,815,860 PTT PCL NVDR 2,271 0.28
THB 154,422 Thai Oil PCL NVDR 208 0.03
Real estate investment & services
THB 1,021,100 Asset World Corp PCL NVDR 131 0.02
THB 356,700 Central Pattana PCL NVDR 552 0.07
Retail
THB 288,184 Central Retail Corp PCL NVDR 273 0.03
THB 928,168 CP ALL PCL NVDR 2,031 0.26
THB 891,000 Home Product Center PCL NVDR 446 0.06
Telecommunications
THB 187,429 Advanced Info Service PCL NVDR 1,112 0.14
THB 364,400 Intouch Holdings PCL NVDR 663 0.08
THB 122,100 Total Access Communication PCL NVDR 144 0.02
THB 1,569,990 True Corp PCL NVDR 169 0.02
Transportation
THB 1,139,500 BTS Group Holdings PCL NVDR 384 0.05
Total Thailand 19,935 2.51
Ccy Holding Investment
FairValue
USD'000
% of netassetvalue
United States (31 July 2019: 0.41%)
Retail
USD 57,387 Yum China Holdings Inc 2,940 0.37
Total United States 2,940 0.37
Total equities 738,840 92.97
ETF (31 July 2019: 2.31%)
Ireland (31 July 2019: 2.31%)
USD 9,496,047 iShares MSCI China A UCITS ETF^/~ 50,432 6.34
Total Ireland 50,432 6.34
Total ETF 50,432 6.34
Rights (31 July 2019: 0.00%)
Hong Kong (31 July 2019: 0.00%)
HKD 4,069 Legend Holdings Cp H Cny1 Rig* - 0.00
Total Hong Kong - 0.00
Republic of South Korea (31 July 2019: 0.00%)
Total rights - 0.00
CcyNo. of
contracts
UnderlyingexposureUSD’000
FairValue
USD’000
% of netassetvalue
Financial derivative instruments (31 July 2019: (0.01)%)
Futures contracts (31 July 2019: (0.01)%)
USD 98 MSCI Emerging Markets Index FuturesSeptember 2020 4,972 268 0.04
Total unrealised gains on futures contracts 268 0.04
Total financial derivative instruments 268 0.04
FairValue
USD'000
% of netassetvalue
Total value of investments 789,543 99.35
Cash† 3,019 0.38
Other net assets 2,179 0.27
Net asset value attributable to redeemable participatingshareholders at the end of the financial year 794,741 100.00
†Cash holdings of USD2,809,919 are held with State Street Bank and Trust Company.USD209,065 is held as security for futures contracts with Credit Suisse Securities Ltd.
^These securities are partially or fully transferred as securities lent.*These securities were valued in consultation with the Investment Manager. These securitieswere fair valued or suspended at financial year end and valued using the last traded price.
~Investment in related party.
Equities are primarily classified by country/geographic region of
incorporation of the entity in which the Fund holds shares. Fixed
income securities are primarily classified by country/geographic region
of incorporation of the issuer for corporate fixed income securities.
iSHARES VII PLC
SCHEDULE OF INVESTMENTS (continued)
iSHARES MSCI EM ASIA UCITS ETF (continued)As at 31 July 2020
[179 ]
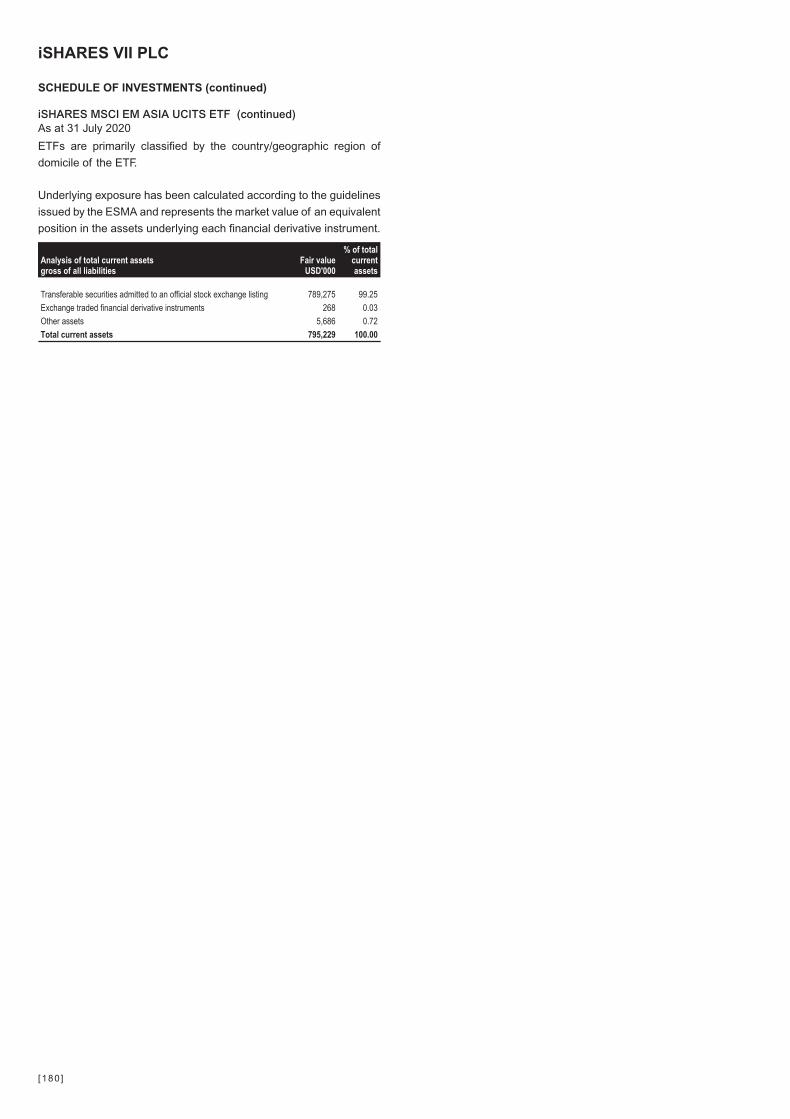
ETFs are primarily classified by the country/geographic region of
domicile of the ETF.
Underlying exposure has been calculated according to the guidelines
issued by the ESMA and represents the market value of an equivalent
position in the assets underlying each financial derivative instrument.
Analysis of total current assetsgross of all liabilities
Fair valueUSD'000
% of totalcurrentassets
Transferable securities admitted to an official stock exchange listing 789,275 99.25
Exchange traded financial derivative instruments 268 0.03
Other assets 5,686 0.72
Total current assets 795,229 100.00
iSHARES VII PLC
SCHEDULE OF INVESTMENTS (continued)
iSHARES MSCI EM ASIA UCITS ETF (continued)As at 31 July 2020
[180 ]
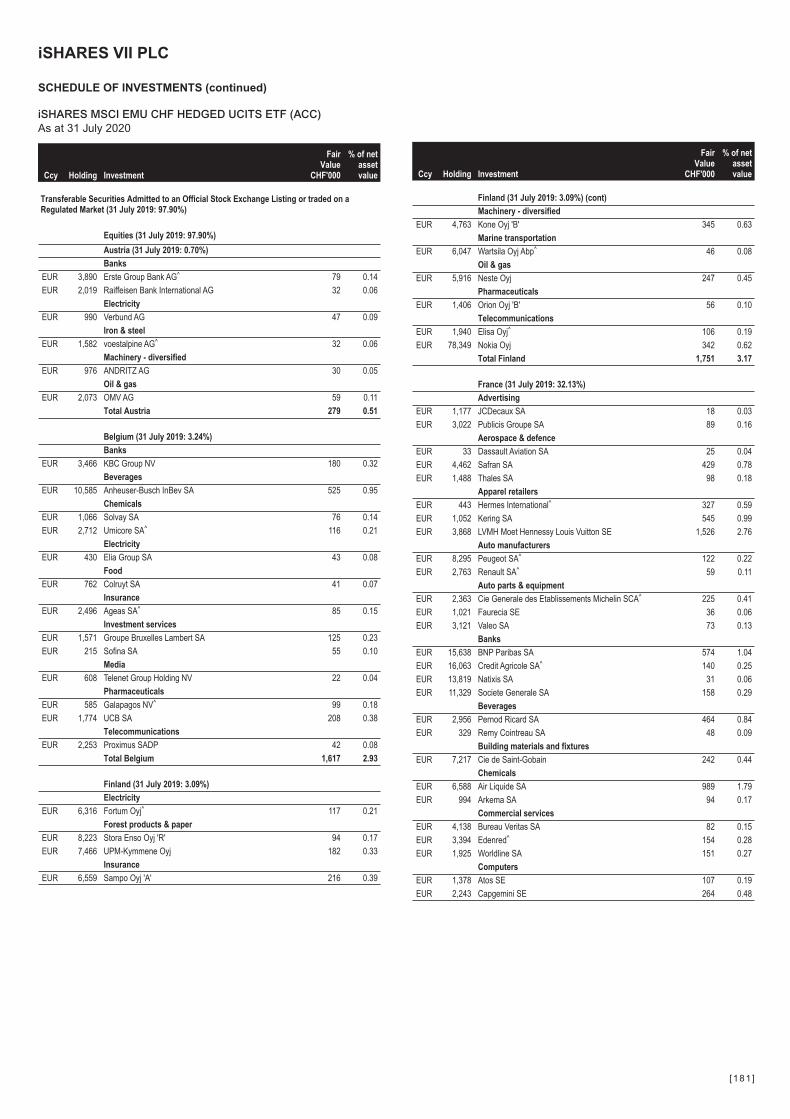
Ccy Holding Investment
FairValue
CHF'000
% of netassetvalue
Transferable Securities Admitted to an Official Stock Exchange Listing or traded on aRegulated Market (31 July 2019: 97.90%)
Equities (31 July 2019: 97.90%)
Austria (31 July 2019: 0.70%)
Banks
EUR 3,890 Erste Group Bank AG^ 79 0.14
EUR 2,019 Raiffeisen Bank International AG 32 0.06
Electricity
EUR 990 Verbund AG 47 0.09
Iron & steel
EUR 1,582 voestalpine AG^ 32 0.06
Machinery - diversified
EUR 976 ANDRITZ AG 30 0.05
Oil & gas
EUR 2,073 OMV AG 59 0.11
Total Austria 279 0.51
Belgium (31 July 2019: 3.24%)
Banks
EUR 3,466 KBC Group NV 180 0.32
Beverages
EUR 10,585 Anheuser-Busch InBev SA 525 0.95
Chemicals
EUR 1,066 Solvay SA 76 0.14
EUR 2,712 Umicore SA^ 116 0.21
Electricity
EUR 430 Elia Group SA 43 0.08
Food
EUR 762 Colruyt SA 41 0.07
Insurance
EUR 2,496 Ageas SA^ 85 0.15
Investment services
EUR 1,571 Groupe Bruxelles Lambert SA 125 0.23
EUR 215 Sofina SA 55 0.10
Media
EUR 608 Telenet Group Holding NV 22 0.04
Pharmaceuticals
EUR 585 Galapagos NV^ 99 0.18
EUR 1,774 UCB SA 208 0.38
Telecommunications
EUR 2,253 Proximus SADP 42 0.08
Total Belgium 1,617 2.93
Finland (31 July 2019: 3.09%)
Electricity
EUR 6,316 Fortum Oyj^ 117 0.21
Forest products & paper
EUR 8,223 Stora Enso Oyj 'R' 94 0.17
EUR 7,466 UPM-Kymmene Oyj 182 0.33
Insurance
EUR 6,559 Sampo Oyj 'A' 216 0.39
Ccy Holding Investment
FairValue
CHF'000
% of netassetvalue
Finland (31 July 2019: 3.09%) (cont)
Machinery - diversified
EUR 4,763 Kone Oyj 'B' 345 0.63
Marine transportation
EUR 6,047 Wartsila Oyj Abp^ 46 0.08
Oil & gas
EUR 5,916 Neste Oyj 247 0.45
Pharmaceuticals
EUR 1,406 Orion Oyj 'B' 56 0.10
Telecommunications
EUR 1,940 Elisa Oyj^ 106 0.19
EUR 78,349 Nokia Oyj 342 0.62
Total Finland 1,751 3.17
France (31 July 2019: 32.13%)
Advertising
EUR 1,177 JCDecaux SA 18 0.03
EUR 3,022 Publicis Groupe SA 89 0.16
Aerospace & defence
EUR 33 Dassault Aviation SA 25 0.04
EUR 4,462 Safran SA 429 0.78
EUR 1,488 Thales SA 98 0.18
Apparel retailers
EUR 443 Hermes International^ 327 0.59
EUR 1,052 Kering SA 545 0.99
EUR 3,868 LVMH Moet Hennessy Louis Vuitton SE 1,526 2.76
Auto manufacturers
EUR 8,295 Peugeot SA^ 122 0.22
EUR 2,763 Renault SA^ 59 0.11
Auto parts & equipment
EUR 2,363 Cie Generale des Etablissements Michelin SCA^ 225 0.41
EUR 1,021 Faurecia SE 36 0.06
EUR 3,121 Valeo SA 73 0.13
Banks
EUR 15,638 BNP Paribas SA 574 1.04
EUR 16,063 Credit Agricole SA^ 140 0.25
EUR 13,819 Natixis SA 31 0.06
EUR 11,329 Societe Generale SA 158 0.29
Beverages
EUR 2,956 Pernod Ricard SA 464 0.84
EUR 329 Remy Cointreau SA 48 0.09
Building materials and fixtures
EUR 7,217 Cie de Saint-Gobain 242 0.44
Chemicals
EUR 6,588 Air Liquide SA 989 1.79
EUR 994 Arkema SA 94 0.17
Commercial services
EUR 4,138 Bureau Veritas SA 82 0.15
EUR 3,394 Edenred^ 154 0.28
EUR 1,925 Worldline SA 151 0.27
Computers
EUR 1,378 Atos SE 107 0.19
EUR 2,243 Capgemini SE 264 0.48
iSHARES VII PLC
SCHEDULE OF INVESTMENTS (continued)
iSHARES MSCI EMU CHF HEDGED UCITS ETF (ACC)As at 31 July 2020
[181 ]

Ccy Holding Investment
FairValue
CHF'000
% of netassetvalue
Equities (31 July 2019: 97.90%) (cont)
France (31 July 2019: 32.13%) (cont)
Computers (cont)
EUR 825 Ingenico Group SA^ 121 0.22
EUR 812 Teleperformance 216 0.39
Cosmetics & personal care
EUR 3,497 L'Oreal SA 1,065 1.93
Diversified financial services
EUR 865 Amundi SA 60 0.11
EUR 530 Eurazeo SE 25 0.04
Electrical components & equipment
EUR 3,725 Legrand SA 262 0.48
EUR 7,699 Schneider Electric SE 814 1.47
Electricity
EUR 8,696 Electricite de France SA 80 0.14
EUR 25,461 Engie SA 309 0.56
Engineering & construction
EUR 439 Aeroports de Paris^ 38 0.07
EUR 3,187 Bouygues SA 103 0.19
EUR 1,119 Eiffage SA 89 0.16
EUR 7,145 Vinci SA 559 1.01
Entertainment
EUR 1,197 La Francaise des Jeux SAEM 40 0.07
Food
EUR 8,434 Carrefour SA 123 0.22
EUR 554 Casino Guichard Perrachon SA 14 0.03
EUR 8,600 Danone SA 523 0.95
Food Service
EUR 1,250 Sodexo SA 78 0.14
Healthcare products
EUR 3,945 EssilorLuxottica SA 476 0.86
EUR 394 Sartorius Stedim Biotech 112 0.21
Healthcare services
EUR 560 BioMerieux 83 0.15
EUR 720 Orpea 84 0.15
Home furnishings
EUR 305 SEB SA 46 0.08
Hotels
EUR 2,643 Accor SA 60 0.11
Insurance
EUR 26,872 AXA SA 487 0.88
EUR 2,520 CNP Assurances 28 0.05
EUR 2,228 SCOR SE 52 0.10
Internet
EUR 204 Iliad SA 36 0.07
Investment services
EUR 371 Wendel SE 32 0.06
Media
EUR 11,508 Bollore SA 35 0.06
EUR 11,556 Vivendi SA^ 278 0.51
Miscellaneous manufacturers
EUR 2,617 Alstom SA 133 0.24
Ccy Holding Investment
FairValue
CHF'000
% of netassetvalue
France (31 July 2019: 32.13%) (cont)
Oil & gas
EUR 34,421 TOTAL SE 1,159 2.10
Pharmaceuticals
EUR 513 Ipsen SA 45 0.08
EUR 15,713 Sanofi 1,497 2.71
Real estate investment trusts
EUR 679 Covivio (REIT) 45 0.08
EUR 653 Gecina SA (REIT) 77 0.14
EUR 393 ICADE (REIT) 24 0.04
EUR 2,835 Klepierre SA (REIT) 44 0.08
EUR 1,936 Unibail-Rodamco-Westfield (REIT)^ 93 0.17
Software
EUR 1,816 Dassault Systemes SE 301 0.54
EUR 1,270 Ubisoft Entertainment SA 97 0.18
Telecommunications
EUR 27,738 Orange SA 296 0.54
Transportation
EUR 6,113 Getlink SE 84 0.15
Water
EUR 4,784 Suez SA 57 0.11
EUR 7,492 Veolia Environnement SA^ 156 0.28
Total France 17,506 31.71
Germany (31 July 2019: 26.24%)
Aerospace & defence
EUR 723 MTU Aero Engines AG^ 114 0.21
Airlines
EUR 4,159 Deutsche Lufthansa AG RegS^ 34 0.06
Apparel retailers
EUR 2,651 adidas AG 667 1.21
EUR 1,119 Puma SE 79 0.14
Auto manufacturers
EUR 4,626 Bayerische Motoren Werke AG 272 0.49
EUR 754 Bayerische Motoren Werke AG (Pref) 35 0.06
EUR 11,917 Daimler AG RegS 480 0.87
EUR 2,172 Porsche Automobil Holding SE (Pref) 112 0.20
EUR 443 Volkswagen AG 63 0.12
EUR 2,584 Volkswagen AG (Pref)^ 348 0.63
Auto parts & equipment
EUR 1,534 Continental AG^ 136 0.25
Banks
EUR 13,293 Commerzbank AG 62 0.11
EUR 27,306 Deutsche Bank AG RegS^ 223 0.41
Building materials and fixtures
EUR 2,115 HeidelbergCement AG 107 0.19
Chemicals
EUR 12,788 BASF SE^ 644 1.17
EUR 2,133 Brenntag AG 120 0.22
EUR 2,364 Covestro AG 83 0.15
EUR 2,943 Evonik Industries AG 72 0.13
EUR 947 FUCHS PETROLUB SE (Pref)^ 38 0.07
EUR 1,183 LANXESS AG 56 0.10
iSHARES VII PLC
SCHEDULE OF INVESTMENTS (continued)
iSHARES MSCI EMU CHF HEDGED UCITS ETF (ACC) (continued)As at 31 July 2020
[182 ]
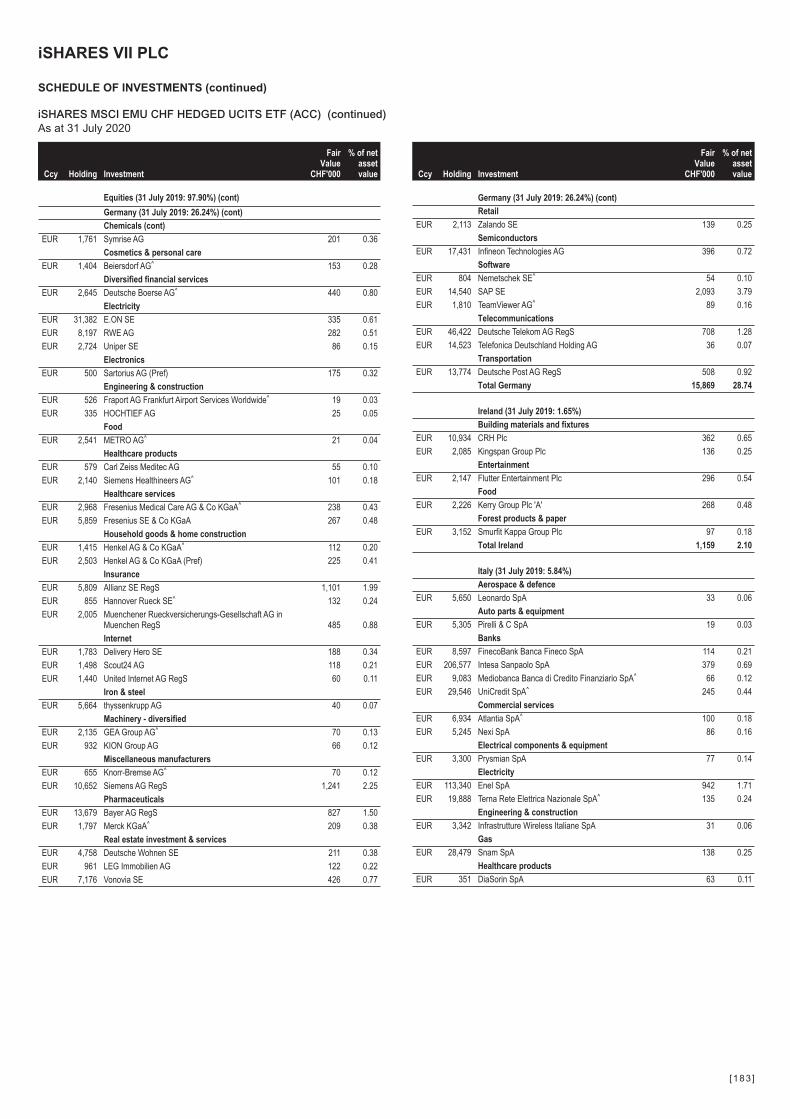
Ccy Holding Investment
FairValue
CHF'000
% of netassetvalue
Equities (31 July 2019: 97.90%) (cont)
Germany (31 July 2019: 26.24%) (cont)
Chemicals (cont)
EUR 1,761 Symrise AG 201 0.36
Cosmetics & personal care
EUR 1,404 Beiersdorf AG^ 153 0.28
Diversified financial services
EUR 2,645 Deutsche Boerse AG^ 440 0.80
Electricity
EUR 31,382 E.ON SE 335 0.61
EUR 8,197 RWE AG 282 0.51
EUR 2,724 Uniper SE 86 0.15
Electronics
EUR 500 Sartorius AG (Pref) 175 0.32
Engineering & construction
EUR 526 Fraport AG Frankfurt Airport Services Worldwide^ 19 0.03
EUR 335 HOCHTIEF AG 25 0.05
Food
EUR 2,541 METRO AG^ 21 0.04
Healthcare products
EUR 579 Carl Zeiss Meditec AG 55 0.10
EUR 2,140 Siemens Healthineers AG^ 101 0.18
Healthcare services
EUR 2,968 Fresenius Medical Care AG & Co KGaA^ 238 0.43
EUR 5,859 Fresenius SE & Co KGaA 267 0.48
Household goods & home construction
EUR 1,415 Henkel AG & Co KGaA^ 112 0.20
EUR 2,503 Henkel AG & Co KGaA (Pref) 225 0.41
Insurance
EUR 5,809 Allianz SE RegS 1,101 1.99
EUR 855 Hannover Rueck SE^ 132 0.24
EUR 2,005 Muenchener Rueckversicherungs-Gesellschaft AG inMuenchen RegS 485 0.88
Internet
EUR 1,783 Delivery Hero SE 188 0.34
EUR 1,498 Scout24 AG 118 0.21
EUR 1,440 United Internet AG RegS 60 0.11
Iron & steel
EUR 5,664 thyssenkrupp AG 40 0.07
Machinery - diversified
EUR 2,135 GEA Group AG^ 70 0.13
EUR 932 KION Group AG 66 0.12
Miscellaneous manufacturers
EUR 655 Knorr-Bremse AG^ 70 0.12
EUR 10,652 Siemens AG RegS 1,241 2.25
Pharmaceuticals
EUR 13,679 Bayer AG RegS 827 1.50
EUR 1,797 Merck KGaA^ 209 0.38
Real estate investment & services
EUR 4,758 Deutsche Wohnen SE 211 0.38
EUR 961 LEG Immobilien AG 122 0.22
EUR 7,176 Vonovia SE 426 0.77
Ccy Holding Investment
FairValue
CHF'000
% of netassetvalue
Germany (31 July 2019: 26.24%) (cont)
Retail
EUR 2,113 Zalando SE 139 0.25
Semiconductors
EUR 17,431 Infineon Technologies AG 396 0.72
Software
EUR 804 Nemetschek SE^ 54 0.10
EUR 14,540 SAP SE 2,093 3.79
EUR 1,810 TeamViewer AG^ 89 0.16
Telecommunications
EUR 46,422 Deutsche Telekom AG RegS 708 1.28
EUR 14,523 Telefonica Deutschland Holding AG 36 0.07
Transportation
EUR 13,774 Deutsche Post AG RegS 508 0.92
Total Germany 15,869 28.74
Ireland (31 July 2019: 1.65%)
Building materials and fixtures
EUR 10,934 CRH Plc 362 0.65
EUR 2,085 Kingspan Group Plc 136 0.25
Entertainment
EUR 2,147 Flutter Entertainment Plc 296 0.54
Food
EUR 2,226 Kerry Group Plc 'A' 268 0.48
Forest products & paper
EUR 3,152 Smurfit Kappa Group Plc 97 0.18
Total Ireland 1,159 2.10
Italy (31 July 2019: 5.84%)
Aerospace & defence
EUR 5,650 Leonardo SpA 33 0.06
Auto parts & equipment
EUR 5,305 Pirelli & C SpA 19 0.03
Banks
EUR 8,597 FinecoBank Banca Fineco SpA 114 0.21
EUR 206,577 Intesa Sanpaolo SpA 379 0.69
EUR 9,083 Mediobanca Banca di Credito Finanziario SpA^ 66 0.12
EUR 29,546 UniCredit SpA^ 245 0.44
Commercial services
EUR 6,934 Atlantia SpA^ 100 0.18
EUR 5,245 Nexi SpA 86 0.16
Electrical components & equipment
EUR 3,300 Prysmian SpA 77 0.14
Electricity
EUR 113,340 Enel SpA 942 1.71
EUR 19,888 Terna Rete Elettrica Nazionale SpA^ 135 0.24
Engineering & construction
EUR 3,342 Infrastrutture Wireless Italiane SpA 31 0.06
Gas
EUR 28,479 Snam SpA 138 0.25
Healthcare products
EUR 351 DiaSorin SpA 63 0.11
iSHARES VII PLC
SCHEDULE OF INVESTMENTS (continued)
iSHARES MSCI EMU CHF HEDGED UCITS ETF (ACC) (continued)As at 31 July 2020
[183 ]

Ccy Holding Investment
FairValue
CHF'000
% of netassetvalue
Equities (31 July 2019: 97.90%) (cont)
Italy (31 July 2019: 5.84%) (cont)
Insurance
EUR 15,406 Assicurazioni Generali SpA 210 0.38
Oil & gas
EUR 35,338 Eni SpA^ 287 0.52
Pharmaceuticals
EUR 1,455 Recordati SpA 71 0.13
Retail
EUR 2,702 Moncler SpA 95 0.17
Telecommunications
EUR 116,523 Telecom Italia SpA^ 43 0.08
EUR 92,181 Telecom Italia SpA 33 0.06
Transportation
EUR 7,617 Poste Italiane SpA 63 0.11
Total Italy 3,230 5.85
Luxembourg (31 July 2019: 0.80%)
Healthcare services
EUR 176 Eurofins Scientific SE 105 0.19
Iron & steel
EUR 9,994 ArcelorMittal SA 100 0.18
Metal fabricate/ hardware
EUR 6,437 Tenaris SA 34 0.06
Real estate investment & services
EUR 16,056 Aroundtown SA 88 0.16
Telecommunications
EUR 4,971 SES SA 32 0.06
Total Luxembourg 359 0.65
Netherlands (31 July 2019: 14.58%)
Aerospace & defence
EUR 8,174 Airbus SE 545 0.99
Auto manufacturers
EUR 1,755 Ferrari NV 286 0.52
EUR 15,573 Fiat Chrysler Automobiles NV 144 0.26
Banks
EUR 5,790 ABN AMRO Bank NV - CVA 44 0.08
EUR 54,097 ING Groep NV 343 0.62
Beverages
EUR 7,908 Davide Campari-Milano NV 72 0.13
EUR 1,616 Heineken Holding NV 128 0.23
EUR 3,608 Heineken NV^ 319 0.58
Chemicals
EUR 2,756 Akzo Nobel NV 236 0.43
EUR 2,400 Koninklijke DSM NV 335 0.60
Commercial services
EUR 251 Adyen NV 383 0.69
EUR 1,727 Randstad NV^ 75 0.14
Cosmetics & personal care
EUR 20,339 Unilever NV 1,096 1.98
Diversified financial services
USD 1,695 AerCap Holdings NV^ 42 0.08
Ccy Holding Investment
FairValue
CHF'000
% of netassetvalue
Netherlands (31 July 2019: 14.58%) (cont)
Food
EUR 1,692 Just Eat Takeaway.com NV^ 167 0.30
EUR 15,323 Koninklijke Ahold Delhaize NV 403 0.73
Healthcare products
EUR 12,739 Koninklijke Philips NV 602 1.09
EUR 3,114 QIAGEN NV 141 0.26
Insurance
EUR 24,523 Aegon NV^ 66 0.12
EUR 4,066 NN Group NV 136 0.25
Internet
EUR 6,787 Prosus NV 599 1.08
Investment services
EUR 1,537 EXOR NV 79 0.14
Machinery - diversified
EUR 14,019 CNH Industrial NV 87 0.16
Media
EUR 3,804 Wolters Kluwer NV 274 0.50
Pipelines
EUR 977 Koninklijke Vopak NV^ 49 0.09
Semiconductors
EUR 5,927 ASML Holding NV 1,911 3.46
EUR 8,881 STMicroelectronics NV^ 227 0.41
Telecommunications
EUR 9,276 Altice Europe NV 40 0.07
EUR 50,449 Koninklijke KPN NV^ 119 0.22
Total Netherlands 8,948 16.21
Portugal (31 July 2019: 0.48%)
Electricity
EUR 36,216 EDP - Energias de Portugal SA 167 0.30
Food
EUR 3,379 Jeronimo Martins SGPS SA^ 52 0.09
Oil & gas
EUR 6,788 Galp Energia SGPS SA 65 0.12
Total Portugal 284 0.51
Spain (31 July 2019: 8.86%)
Banks
EUR 94,092 Banco Bilbao Vizcaya Argentaria SA 267 0.49
EUR 231,076 Banco Santander SA 449 0.81
EUR 10,180 Bankinter SA 48 0.09
EUR 51,419 CaixaBank SA^ 101 0.18
Commercial services
EUR 5,996 Amadeus IT Group SA 273 0.49
Electricity
EUR 4,506 Endesa SA 116 0.21
EUR 80,751 Iberdrola SA 949 1.72
EUR 1,835 Iberdrola SA (Extinct) 22 0.04
EUR 5,846 Red Electrica Corp SA 104 0.19
Energy - alternate sources
EUR 3,619 Siemens Gamesa Renewable Energy SA 77 0.14
iSHARES VII PLC
SCHEDULE OF INVESTMENTS (continued)
iSHARES MSCI EMU CHF HEDGED UCITS ETF (ACC) (continued)As at 31 July 2020
[184 ]
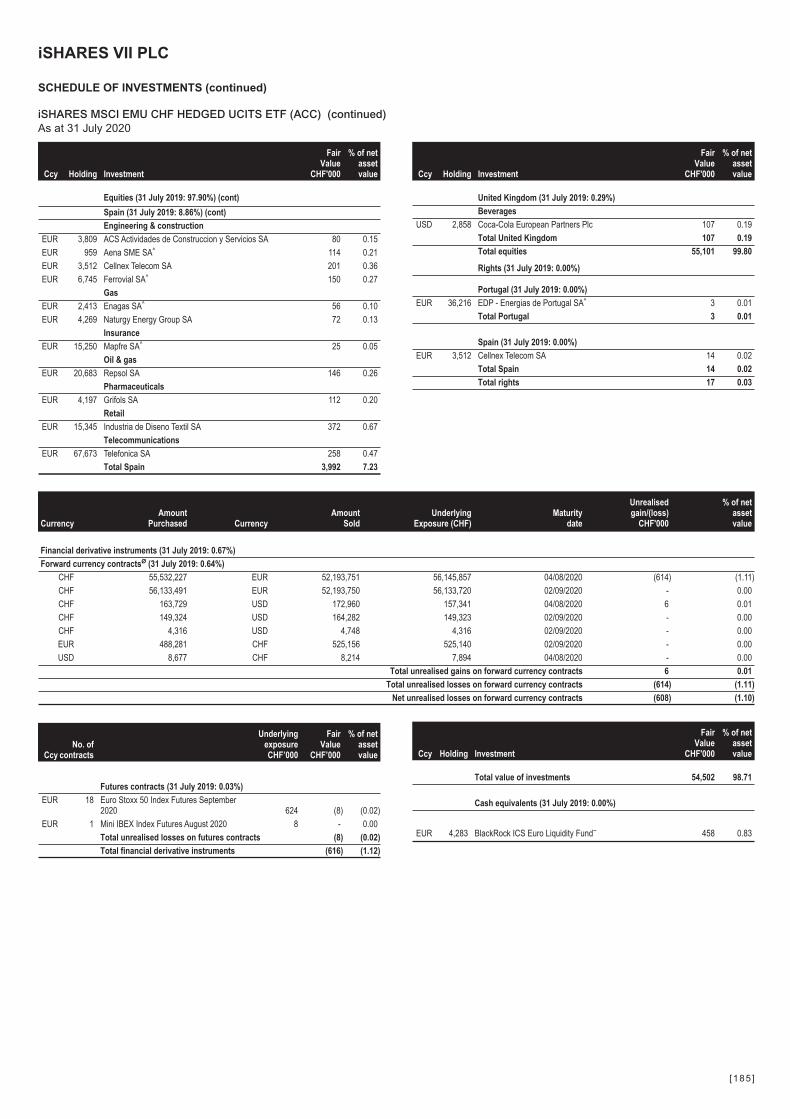
Ccy Holding Investment
FairValue
CHF'000
% of netassetvalue
Equities (31 July 2019: 97.90%) (cont)
Spain (31 July 2019: 8.86%) (cont)
Engineering & construction
EUR 3,809 ACS Actividades de Construccion y Servicios SA 80 0.15
EUR 959 Aena SME SA^ 114 0.21
EUR 3,512 Cellnex Telecom SA 201 0.36
EUR 6,745 Ferrovial SA^ 150 0.27
Gas
EUR 2,413 Enagas SA^ 56 0.10
EUR 4,269 Naturgy Energy Group SA 72 0.13
Insurance
EUR 15,250 Mapfre SA^ 25 0.05
Oil & gas
EUR 20,683 Repsol SA 146 0.26
Pharmaceuticals
EUR 4,197 Grifols SA 112 0.20
Retail
EUR 15,345 Industria de Diseno Textil SA 372 0.67
Telecommunications
EUR 67,673 Telefonica SA 258 0.47
Total Spain 3,992 7.23
Ccy Holding Investment
FairValue
CHF'000
% of netassetvalue
United Kingdom (31 July 2019: 0.29%)
Beverages
USD 2,858 Coca-Cola European Partners Plc 107 0.19
Total United Kingdom 107 0.19
Total equities 55,101 99.80
Rights (31 July 2019: 0.00%)
Portugal (31 July 2019: 0.00%)
EUR 36,216 EDP - Energias de Portugal SA^ 3 0.01
Total Portugal 3 0.01
Spain (31 July 2019: 0.00%)
EUR 3,512 Cellnex Telecom SA 14 0.02
Total Spain 14 0.02
Total rights 17 0.03
CurrencyAmount
Purchased CurrencyAmount
SoldUnderlying
Exposure (CHF)Maturity
date
Unrealisedgain/(loss)
CHF'000
% of netassetvalue
Financial derivative instruments (31 July 2019: 0.67%)
Forward currency contractsØ (31 July 2019: 0.64%)
CHF 55,532,227 EUR 52,193,751 56,145,857 04/08/2020 (614) (1.11)
CHF 56,133,491 EUR 52,193,750 56,133,720 02/09/2020 - 0.00
CHF 163,729 USD 172,960 157,341 04/08/2020 6 0.01
CHF 149,324 USD 164,282 149,323 02/09/2020 - 0.00
CHF 4,316 USD 4,748 4,316 02/09/2020 - 0.00
EUR 488,281 CHF 525,156 525,140 02/09/2020 - 0.00
USD 8,677 CHF 8,214 7,894 04/08/2020 - 0.00
Total unrealised gains on forward currency contracts 6 0.01
Total unrealised losses on forward currency contracts (614) (1.11)
Net unrealised losses on forward currency contracts (608) (1.10)
CcyNo. of
contracts
UnderlyingexposureCHF’000
FairValue
CHF’000
% of netassetvalue
Futures contracts (31 July 2019: 0.03%)
EUR 18 Euro Stoxx 50 Index Futures September2020 624 (8) (0.02)
EUR 1 Mini IBEX Index Futures August 2020 8 - 0.00
Total unrealised losses on futures contracts (8) (0.02)
Total financial derivative instruments (616) (1.12)
Ccy Holding Investment
FairValue
CHF'000
% of netassetvalue
Total value of investments 54,502 98.71
Cash equivalents (31 July 2019: 0.00%)
EUR 4,283 BlackRock ICS Euro Liquidity Fund~ 458 0.83
iSHARES VII PLC
SCHEDULE OF INVESTMENTS (continued)
iSHARES MSCI EMU CHF HEDGED UCITS ETF (ACC) (continued)As at 31 July 2020
[185 ]

Ccy Holding Investment
FairValue
CHF'000
% of netassetvalue
Cash† 212 0.38
Other net assets 40 0.08
Net asset value attributable to redeemable participatingshareholders at the end of the financial year 55,212 100.00
†Cash holdings of CHF123,654 are held with State Street Bank and Trust Company.CHF88,244 is held as security for futures contracts with Morgan Stanley.
^These securities are partially or fully transferred as securities lent.~Investment in related party.ØThe counterparty for forward currency contracts is State Street Bank and Trust Company.
Equities are primarily classified by country/geographic region of
incorporation of the entity in which the Fund holds shares.
Underlying exposure has been calculated according to the guidelines
issued by the ESMA and represents the market value of an equivalent
position in the assets underlying each financial derivative instrument.
Analysis of total current assetsgross of all liabilities
Fair valueCHF'000
% of totalcurrentassets
Transferable securities admitted to an official stock exchange listing 55,118 98.68
Over-the-counter financial derivative instruments 6 0.01
UCITS collective investment schemes - Money Market Funds 458 0.82
Other assets 271 0.49
Total current assets 55,853 100.00
iSHARES VII PLC
SCHEDULE OF INVESTMENTS (continued)
iSHARES MSCI EMU CHF HEDGED UCITS ETF (ACC) (continued)As at 31 July 2020
[186 ]
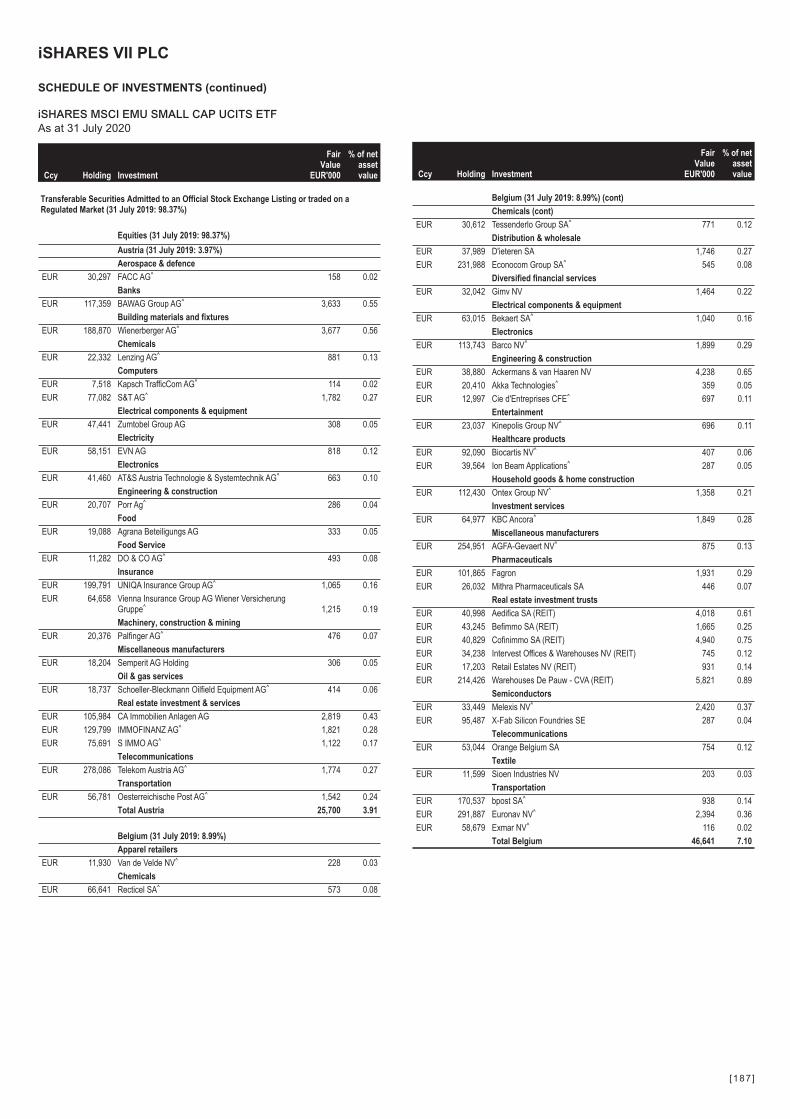
Ccy Holding Investment
FairValue
EUR'000
% of netassetvalue
Transferable Securities Admitted to an Official Stock Exchange Listing or traded on aRegulated Market (31 July 2019: 98.37%)
Equities (31 July 2019: 98.37%)
Austria (31 July 2019: 3.97%)
Aerospace & defence
EUR 30,297 FACC AG^ 158 0.02
Banks
EUR 117,359 BAWAG Group AG^ 3,633 0.55
Building materials and fixtures
EUR 188,870 Wienerberger AG^ 3,677 0.56
Chemicals
EUR 22,332 Lenzing AG^ 881 0.13
Computers
EUR 7,518 Kapsch TrafficCom AG^ 114 0.02
EUR 77,082 S&T AG^ 1,782 0.27
Electrical components & equipment
EUR 47,441 Zumtobel Group AG 308 0.05
Electricity
EUR 58,151 EVN AG 818 0.12
Electronics
EUR 41,460 AT&S Austria Technologie & Systemtechnik AG^ 663 0.10
Engineering & construction
EUR 20,707 Porr Ag^ 286 0.04
Food
EUR 19,088 Agrana Beteiligungs AG 333 0.05
Food Service
EUR 11,282 DO & CO AG^ 493 0.08
Insurance
EUR 199,791 UNIQA Insurance Group AG^ 1,065 0.16
EUR 64,658 Vienna Insurance Group AG Wiener VersicherungGruppe^ 1,215 0.19
Machinery, construction & mining
EUR 20,376 Palfinger AG^ 476 0.07
Miscellaneous manufacturers
EUR 18,204 Semperit AG Holding 306 0.05
Oil & gas services
EUR 18,737 Schoeller-Bleckmann Oilfield Equipment AG^ 414 0.06
Real estate investment & services
EUR 105,984 CA Immobilien Anlagen AG 2,819 0.43
EUR 129,799 IMMOFINANZ AG^ 1,821 0.28
EUR 75,691 S IMMO AG^ 1,122 0.17
Telecommunications
EUR 278,086 Telekom Austria AG^ 1,774 0.27
Transportation
EUR 56,781 Oesterreichische Post AG^ 1,542 0.24
Total Austria 25,700 3.91
Belgium (31 July 2019: 8.99%)
Apparel retailers
EUR 11,930 Van de Velde NV^ 228 0.03
Chemicals
EUR 66,641 Recticel SA^ 573 0.08
Ccy Holding Investment
FairValue
EUR'000
% of netassetvalue
Belgium (31 July 2019: 8.99%) (cont)
Chemicals (cont)
EUR 30,612 Tessenderlo Group SA^ 771 0.12
Distribution & wholesale
EUR 37,989 D'ieteren SA 1,746 0.27
EUR 231,988 Econocom Group SA^ 545 0.08
Diversified financial services
EUR 32,042 Gimv NV 1,464 0.22
Electrical components & equipment
EUR 63,015 Bekaert SA^ 1,040 0.16
Electronics
EUR 113,743 Barco NV^ 1,899 0.29
Engineering & construction
EUR 38,880 Ackermans & van Haaren NV 4,238 0.65
EUR 20,410 Akka Technologies^ 359 0.05
EUR 12,997 Cie d'Entreprises CFE^ 697 0.11
Entertainment
EUR 23,037 Kinepolis Group NV^ 696 0.11
Healthcare products
EUR 92,090 Biocartis NV^ 407 0.06
EUR 39,564 Ion Beam Applications^ 287 0.05
Household goods & home construction
EUR 112,430 Ontex Group NV^ 1,358 0.21
Investment services
EUR 64,977 KBC Ancora^ 1,849 0.28
Miscellaneous manufacturers
EUR 254,951 AGFA-Gevaert NV^ 875 0.13
Pharmaceuticals
EUR 101,865 Fagron 1,931 0.29
EUR 26,032 Mithra Pharmaceuticals SA 446 0.07
Real estate investment trusts
EUR 40,998 Aedifica SA (REIT) 4,018 0.61
EUR 43,245 Befimmo SA (REIT) 1,665 0.25
EUR 40,829 Cofinimmo SA (REIT) 4,940 0.75
EUR 34,238 Intervest Offices & Warehouses NV (REIT) 745 0.12
EUR 17,203 Retail Estates NV (REIT) 931 0.14
EUR 214,426 Warehouses De Pauw - CVA (REIT) 5,821 0.89
Semiconductors
EUR 33,449 Melexis NV^ 2,420 0.37
EUR 95,487 X-Fab Silicon Foundries SE 287 0.04
Telecommunications
EUR 53,044 Orange Belgium SA 754 0.12
Textile
EUR 11,599 Sioen Industries NV 203 0.03
Transportation
EUR 170,537 bpost SA^ 938 0.14
EUR 291,887 Euronav NV^ 2,394 0.36
EUR 58,679 Exmar NV^ 116 0.02
Total Belgium 46,641 7.10
iSHARES VII PLC
SCHEDULE OF INVESTMENTS (continued)
iSHARES MSCI EMU SMALL CAP UCITS ETFAs at 31 July 2020
[187 ]
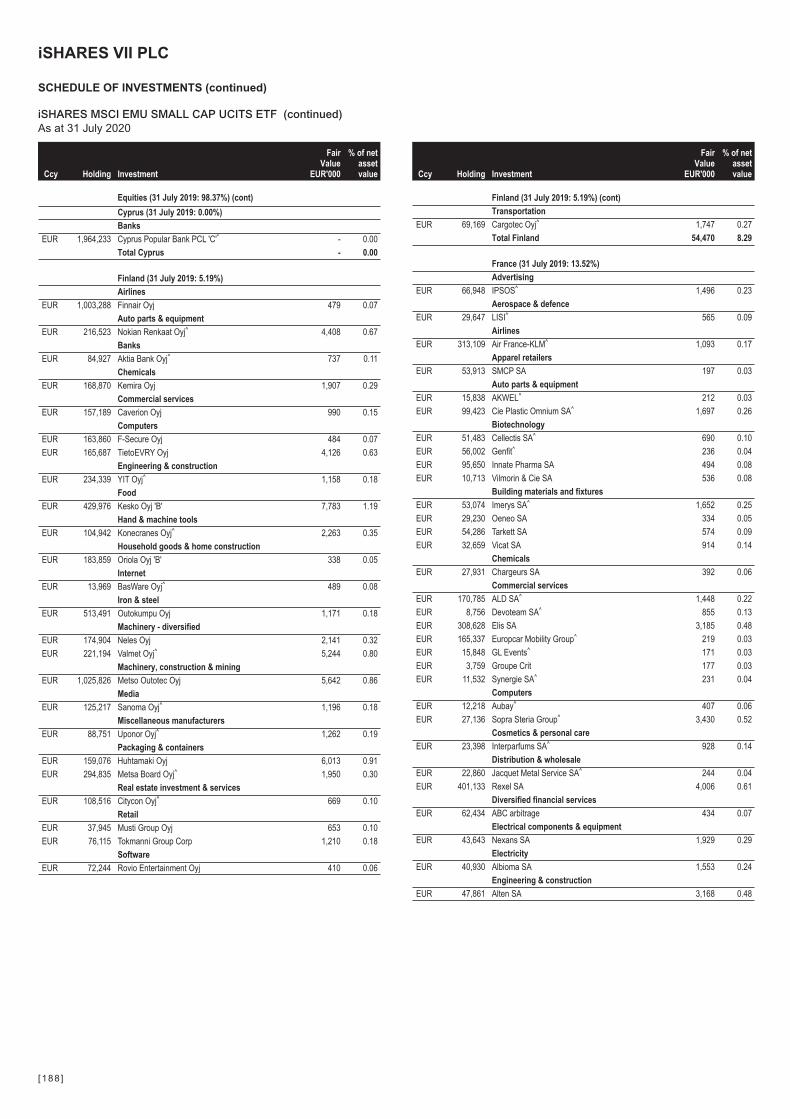
Ccy Holding Investment
FairValue
EUR'000
% of netassetvalue
Equities (31 July 2019: 98.37%) (cont)
Cyprus (31 July 2019: 0.00%)
Banks
EUR 1,964,233 Cyprus Popular Bank PCL 'C'* - 0.00
Total Cyprus - 0.00
Finland (31 July 2019: 5.19%)
Airlines
EUR 1,003,288 Finnair Oyj 479 0.07
Auto parts & equipment
EUR 216,523 Nokian Renkaat Oyj^ 4,408 0.67
Banks
EUR 84,927 Aktia Bank Oyj^ 737 0.11
Chemicals
EUR 168,870 Kemira Oyj 1,907 0.29
Commercial services
EUR 157,189 Caverion Oyj 990 0.15
Computers
EUR 163,860 F-Secure Oyj 484 0.07
EUR 165,687 TietoEVRY Oyj 4,126 0.63
Engineering & construction
EUR 234,339 YIT Oyj^ 1,158 0.18
Food
EUR 429,976 Kesko Oyj 'B' 7,783 1.19
Hand & machine tools
EUR 104,942 Konecranes Oyj^ 2,263 0.35
Household goods & home construction
EUR 183,859 Oriola Oyj 'B' 338 0.05
Internet
EUR 13,969 BasWare Oyj^ 489 0.08
Iron & steel
EUR 513,491 Outokumpu Oyj 1,171 0.18
Machinery - diversified
EUR 174,904 Neles Oyj 2,141 0.32
EUR 221,194 Valmet Oyj^ 5,244 0.80
Machinery, construction & mining
EUR 1,025,826 Metso Outotec Oyj 5,642 0.86
Media
EUR 125,217 Sanoma Oyj^ 1,196 0.18
Miscellaneous manufacturers
EUR 88,751 Uponor Oyj^ 1,262 0.19
Packaging & containers
EUR 159,076 Huhtamaki Oyj 6,013 0.91
EUR 294,835 Metsa Board Oyj^ 1,950 0.30
Real estate investment & services
EUR 108,516 Citycon Oyj^ 669 0.10
Retail
EUR 37,945 Musti Group Oyj 653 0.10
EUR 76,115 Tokmanni Group Corp 1,210 0.18
Software
EUR 72,244 Rovio Entertainment Oyj 410 0.06
Ccy Holding Investment
FairValue
EUR'000
% of netassetvalue
Finland (31 July 2019: 5.19%) (cont)
Transportation
EUR 69,169 Cargotec Oyj^ 1,747 0.27
Total Finland 54,470 8.29
France (31 July 2019: 13.52%)
Advertising
EUR 66,948 IPSOS^ 1,496 0.23
Aerospace & defence
EUR 29,647 LISI^ 565 0.09
Airlines
EUR 313,109 Air France-KLM^ 1,093 0.17
Apparel retailers
EUR 53,913 SMCP SA 197 0.03
Auto parts & equipment
EUR 15,838 AKWEL^ 212 0.03
EUR 99,423 Cie Plastic Omnium SA^ 1,697 0.26
Biotechnology
EUR 51,483 Cellectis SA^ 690 0.10
EUR 56,002 Genfit^ 236 0.04
EUR 95,650 Innate Pharma SA 494 0.08
EUR 10,713 Vilmorin & Cie SA 536 0.08
Building materials and fixtures
EUR 53,074 Imerys SA^ 1,652 0.25
EUR 29,230 Oeneo SA 334 0.05
EUR 54,286 Tarkett SA 574 0.09
EUR 32,659 Vicat SA 914 0.14
Chemicals
EUR 27,931 Chargeurs SA 392 0.06
Commercial services
EUR 170,785 ALD SA^ 1,448 0.22
EUR 8,756 Devoteam SA^ 855 0.13
EUR 308,628 Elis SA 3,185 0.48
EUR 165,337 Europcar Mobility Group^ 219 0.03
EUR 15,848 GL Events^ 171 0.03
EUR 3,759 Groupe Crit 177 0.03
EUR 11,532 Synergie SA^ 231 0.04
Computers
EUR 12,218 Aubay^ 407 0.06
EUR 27,136 Sopra Steria Group^ 3,430 0.52
Cosmetics & personal care
EUR 23,398 Interparfums SA^ 928 0.14
Distribution & wholesale
EUR 22,860 Jacquet Metal Service SA^ 244 0.04
EUR 401,133 Rexel SA 4,006 0.61
Diversified financial services
EUR 62,434 ABC arbitrage 434 0.07
Electrical components & equipment
EUR 43,643 Nexans SA 1,929 0.29
Electricity
EUR 40,930 Albioma SA 1,553 0.24
Engineering & construction
EUR 47,861 Alten SA 3,168 0.48
iSHARES VII PLC
SCHEDULE OF INVESTMENTS (continued)
iSHARES MSCI EMU SMALL CAP UCITS ETF (continued)As at 31 July 2020
[188 ]

Ccy Holding Investment
FairValue
EUR'000
% of netassetvalue
Equities (31 July 2019: 98.37%) (cont)
France (31 July 2019: 13.52%) (cont)
Engineering & construction (cont)
EUR 36,834 Gaztransport Et Technigaz SA 2,882 0.44
EUR 195,968 SPIE SA^ 2,695 0.41
Entertainment
EUR 16,554 Cie des Alpes 248 0.04
Environmental control
EUR 167,544 Derichebourg SA^ 411 0.06
Food
EUR 26,298 Bonduelle SCA 537 0.08
EUR 33,739 Rallye SA 197 0.03
Food Service
EUR 157,549 Elior Group SA^ 739 0.11
Gas
EUR 149,147 Rubis SCA 5,960 0.91
Healthcare products
EUR 9,695 Guerbet 292 0.04
Healthcare services
EUR 88,993 Korian SA^ 3,093 0.47
EUR 7,752 LNA Sante SA^ 397 0.06
Home builders
EUR 28,563 Kaufman & Broad SA^ 1,040 0.16
Household goods & home construction
EUR 40,744 Societe BIC SA^ 2,043 0.31
Insurance
EUR 149,904 Coface SA^ 1,004 0.15
Investment services
EUR 8,313 FFP^ 548 0.08
Leisure time
EUR 61,330 Beneteau SA^ 375 0.05
EUR 14,787 Trigano SA^ 1,432 0.22
Machinery, construction & mining
EUR 16,143 Manitou BF SA^ 253 0.04
Media
EUR 85,609 Lagardere SCA^ 1,100 0.16
EUR 45,001 Metropole Television SA 461 0.07
EUR 65,372 Television Francaise 1^ 318 0.05
Metal fabricate/ hardware
EUR 13,565 Vallourec SA 379 0.06
Mining
EUR 14,551 Eramet^ 336 0.05
Miscellaneous manufacturers
EUR 26,971 Mersen SA^ 611 0.09
Office & business equipment
EUR 56,567 Quadient 707 0.11
Oil & gas
EUR 96,132 Etablissements Maurel et Prom SA 160 0.02
Oil & gas services
EUR 1,147,599 CGG SA^ 824 0.12
Packaging & containers
EUR 10,962 Groupe Guillin^ 230 0.03
EUR 49,901 Verallia SA^ 1,417 0.22
Ccy Holding Investment
FairValue
EUR'000
% of netassetvalue
France (31 July 2019: 13.52%) (cont)
Pharmaceuticals
EUR 46,838 AB Science SA^ 413 0.06
EUR 6,504 Boiron SA^ 217 0.03
EUR 62,589 DBV Technologies SA^ 436 0.07
EUR 6,974 Virbac SA^ 1,287 0.20
Real estate investment & services
EUR 70,318 Nexity SA^ 2,029 0.31
Real estate investment trusts
EUR 78,825 Carmila SA (REIT) 788 0.12
EUR 103,089 Mercialys SA (REIT)^ 659 0.10
Retail
EUR 28,123 Fnac Darty SA^ 941 0.14
EUR 73,129 Maisons du Monde SA^ 943 0.15
Semiconductors
EUR 35,003 SOITEC^ 3,486 0.53
Storage & warehousing
EUR 4,137 ID Logistics Group 765 0.12
Telecommunications
EUR 288,629 Eutelsat Communications SA 2,474 0.38
Total France 78,594 11.96
Germany (31 July 2019: 23.15%)
Advertising
EUR 46,513 Stroeer SE & Co KGaA^ 2,700 0.41
Aerospace & defence
EUR 8,387 OHB SE 340 0.05
Agriculture
EUR 25,661 BayWa AG^ 686 0.10
Auto parts & equipment
EUR 8,397 Bertrandt AG^ 264 0.04
EUR 43,060 ElringKlinger AG^ 222 0.03
EUR 22,614 JOST Werke AG^ 702 0.11
EUR 3,488 MBB SE^ 213 0.03
EUR 71,925 Rheinmetall AG^ 5,771 0.88
Banks
EUR 226,194 Deutsche Pfandbriefbank AG 1,218 0.19
Biotechnology
EUR 22,524 Eckert & Ziegler Strahlen- und Medizintechnik AG^ 1,016 0.16
EUR 52,387 MorphoSys AG^ 5,658 0.86
Building materials and fixtures
EUR 3,904 STO SE & Co KGaA (Pref)^ 379 0.06
Chemicals
EUR 317,901 K+S AG RegS 1,785 0.27
EUR 19,454 KWS Saat SE & Co KGaA^ 1,278 0.19
EUR 93,647 SGL Carbon SE^ 293 0.05
EUR 26,152 Wacker Chemie AG 2,002 0.30
Commercial services
EUR 8,485 Amadeus Fire AG^ 836 0.13
EUR 40,509 Hamburger Hafen und Logistik AG^ 594 0.09
EUR 5,900 Hypoport SE^ 2,357 0.36
EUR 22,090 Sixt SE^ 1,403 0.21
EUR 26,793 Sixt SE (Pref) 1,148 0.17
iSHARES VII PLC
SCHEDULE OF INVESTMENTS (continued)
iSHARES MSCI EMU SMALL CAP UCITS ETF (continued)As at 31 July 2020
[189 ]
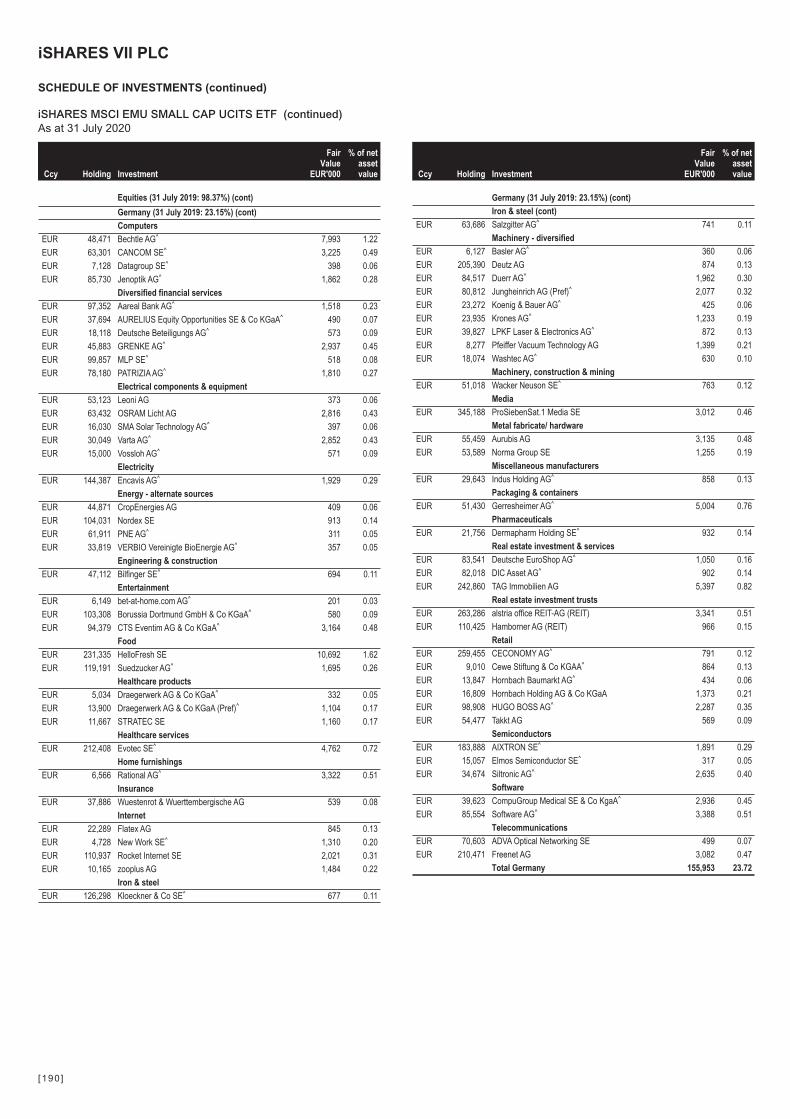
Ccy Holding Investment
FairValue
EUR'000
% of netassetvalue
Equities (31 July 2019: 98.37%) (cont)
Germany (31 July 2019: 23.15%) (cont)
Computers
EUR 48,471 Bechtle AG^ 7,993 1.22
EUR 63,301 CANCOM SE^ 3,225 0.49
EUR 7,128 Datagroup SE^ 398 0.06
EUR 85,730 Jenoptik AG^ 1,862 0.28
Diversified financial services
EUR 97,352 Aareal Bank AG^ 1,518 0.23
EUR 37,694 AURELIUS Equity Opportunities SE & Co KGaA^ 490 0.07
EUR 18,118 Deutsche Beteiligungs AG^ 573 0.09
EUR 45,883 GRENKE AG^ 2,937 0.45
EUR 99,857 MLP SE^ 518 0.08
EUR 78,180 PATRIZIA AG^ 1,810 0.27
Electrical components & equipment
EUR 53,123 Leoni AG 373 0.06
EUR 63,432 OSRAM Licht AG 2,816 0.43
EUR 16,030 SMA Solar Technology AG^ 397 0.06
EUR 30,049 Varta AG^ 2,852 0.43
EUR 15,000 Vossloh AG^ 571 0.09
Electricity
EUR 144,387 Encavis AG^ 1,929 0.29
Energy - alternate sources
EUR 44,871 CropEnergies AG 409 0.06
EUR 104,031 Nordex SE 913 0.14
EUR 61,911 PNE AG^ 311 0.05
EUR 33,819 VERBIO Vereinigte BioEnergie AG^ 357 0.05
Engineering & construction
EUR 47,112 Bilfinger SE^ 694 0.11
Entertainment
EUR 6,149 bet-at-home.com AG^ 201 0.03
EUR 103,308 Borussia Dortmund GmbH & Co KGaA^ 580 0.09
EUR 94,379 CTS Eventim AG & Co KGaA^ 3,164 0.48
Food
EUR 231,335 HelloFresh SE 10,692 1.62
EUR 119,191 Suedzucker AG^ 1,695 0.26
Healthcare products
EUR 5,034 Draegerwerk AG & Co KGaA^ 332 0.05
EUR 13,900 Draegerwerk AG & Co KGaA (Pref)^ 1,104 0.17
EUR 11,667 STRATEC SE 1,160 0.17
Healthcare services
EUR 212,408 Evotec SE^ 4,762 0.72
Home furnishings
EUR 6,566 Rational AG^ 3,322 0.51
Insurance
EUR 37,886 Wuestenrot & Wuerttembergische AG 539 0.08
Internet
EUR 22,289 Flatex AG 845 0.13
EUR 4,728 New Work SE^ 1,310 0.20
EUR 110,937 Rocket Internet SE 2,021 0.31
EUR 10,165 zooplus AG 1,484 0.22
Iron & steel
EUR 126,298 Kloeckner & Co SE^ 677 0.11
Ccy Holding Investment
FairValue
EUR'000
% of netassetvalue
Germany (31 July 2019: 23.15%) (cont)
Iron & steel (cont)
EUR 63,686 Salzgitter AG^ 741 0.11
Machinery - diversified
EUR 6,127 Basler AG^ 360 0.06
EUR 205,390 Deutz AG 874 0.13
EUR 84,517 Duerr AG^ 1,962 0.30
EUR 80,812 Jungheinrich AG (Pref)^ 2,077 0.32
EUR 23,272 Koenig & Bauer AG^ 425 0.06
EUR 23,935 Krones AG^ 1,233 0.19
EUR 39,827 LPKF Laser & Electronics AG^ 872 0.13
EUR 8,277 Pfeiffer Vacuum Technology AG 1,399 0.21
EUR 18,074 Washtec AG^ 630 0.10
Machinery, construction & mining
EUR 51,018 Wacker Neuson SE^ 763 0.12
Media
EUR 345,188 ProSiebenSat.1 Media SE 3,012 0.46
Metal fabricate/ hardware
EUR 55,459 Aurubis AG 3,135 0.48
EUR 53,589 Norma Group SE 1,255 0.19
Miscellaneous manufacturers
EUR 29,643 Indus Holding AG^ 858 0.13
Packaging & containers
EUR 51,430 Gerresheimer AG^ 5,004 0.76
Pharmaceuticals
EUR 21,756 Dermapharm Holding SE^ 932 0.14
Real estate investment & services
EUR 83,541 Deutsche EuroShop AG^ 1,050 0.16
EUR 82,018 DIC Asset AG^ 902 0.14
EUR 242,860 TAG Immobilien AG 5,397 0.82
Real estate investment trusts
EUR 263,286 alstria office REIT-AG (REIT) 3,341 0.51
EUR 110,425 Hamborner AG (REIT) 966 0.15
Retail
EUR 259,455 CECONOMY AG^ 791 0.12
EUR 9,010 Cewe Stiftung & Co KGAA^ 864 0.13
EUR 13,847 Hornbach Baumarkt AG^ 434 0.06
EUR 16,809 Hornbach Holding AG & Co KGaA 1,373 0.21
EUR 98,908 HUGO BOSS AG^ 2,287 0.35
EUR 54,477 Takkt AG 569 0.09
Semiconductors
EUR 183,888 AIXTRON SE^ 1,891 0.29
EUR 15,057 Elmos Semiconductor SE^ 317 0.05
EUR 34,674 Siltronic AG^ 2,635 0.40
Software
EUR 39,623 CompuGroup Medical SE & Co KgaA^ 2,936 0.45
EUR 85,554 Software AG^ 3,388 0.51
Telecommunications
EUR 70,603 ADVA Optical Networking SE 499 0.07
EUR 210,471 Freenet AG 3,082 0.47
Total Germany 155,953 23.72
iSHARES VII PLC
SCHEDULE OF INVESTMENTS (continued)
iSHARES MSCI EMU SMALL CAP UCITS ETF (continued)As at 31 July 2020
[190 ]
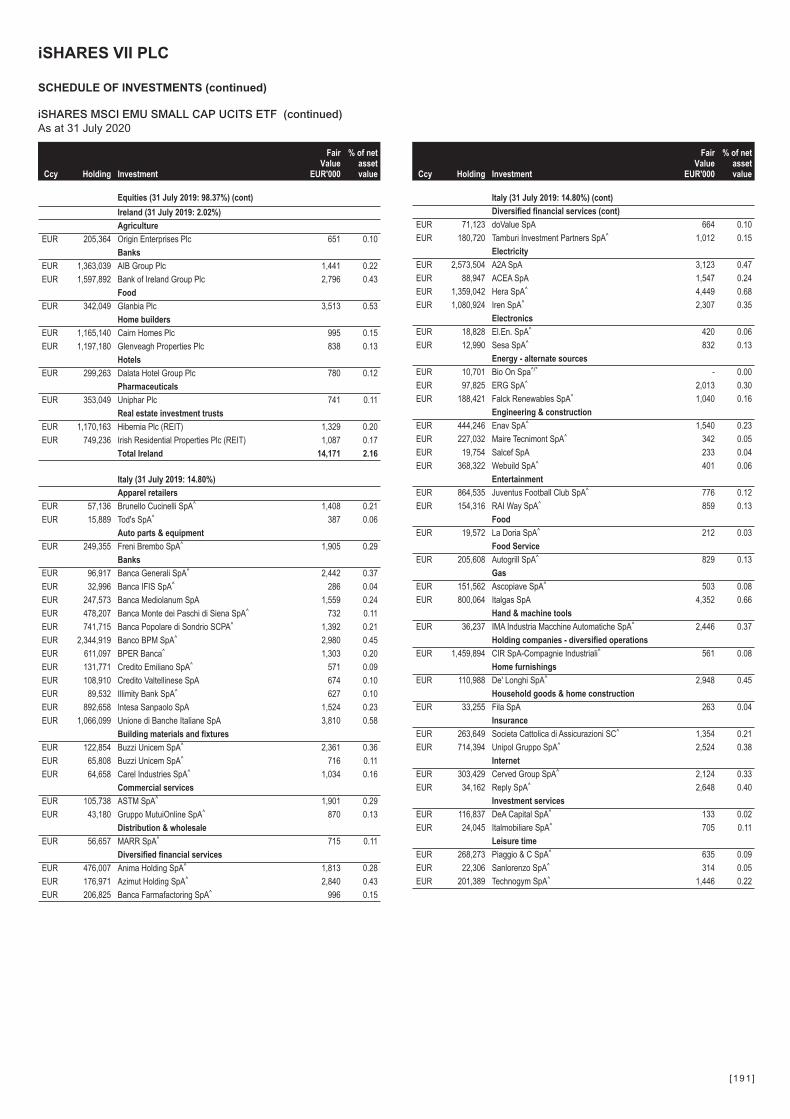
Ccy Holding Investment
FairValue
EUR'000
% of netassetvalue
Equities (31 July 2019: 98.37%) (cont)
Ireland (31 July 2019: 2.02%)
Agriculture
EUR 205,364 Origin Enterprises Plc 651 0.10
Banks
EUR 1,363,039 AIB Group Plc 1,441 0.22
EUR 1,597,892 Bank of Ireland Group Plc 2,796 0.43
Food
EUR 342,049 Glanbia Plc 3,513 0.53
Home builders
EUR 1,165,140 Cairn Homes Plc 995 0.15
EUR 1,197,180 Glenveagh Properties Plc 838 0.13
Hotels
EUR 299,263 Dalata Hotel Group Plc 780 0.12
Pharmaceuticals
EUR 353,049 Uniphar Plc 741 0.11
Real estate investment trusts
EUR 1,170,163 Hibernia Plc (REIT) 1,329 0.20
EUR 749,236 Irish Residential Properties Plc (REIT) 1,087 0.17
Total Ireland 14,171 2.16
Italy (31 July 2019: 14.80%)
Apparel retailers
EUR 57,136 Brunello Cucinelli SpA^ 1,408 0.21
EUR 15,889 Tod's SpA^ 387 0.06
Auto parts & equipment
EUR 249,355 Freni Brembo SpA^ 1,905 0.29
Banks
EUR 96,917 Banca Generali SpA^ 2,442 0.37
EUR 32,996 Banca IFIS SpA^ 286 0.04
EUR 247,573 Banca Mediolanum SpA 1,559 0.24
EUR 478,207 Banca Monte dei Paschi di Siena SpA^ 732 0.11
EUR 741,715 Banca Popolare di Sondrio SCPA^ 1,392 0.21
EUR 2,344,919 Banco BPM SpA^ 2,980 0.45
EUR 611,097 BPER Banca^ 1,303 0.20
EUR 131,771 Credito Emiliano SpA^ 571 0.09
EUR 108,910 Credito Valtellinese SpA 674 0.10
EUR 89,532 Illimity Bank SpA^ 627 0.10
EUR 892,658 Intesa Sanpaolo SpA 1,524 0.23
EUR 1,066,099 Unione di Banche Italiane SpA 3,810 0.58
Building materials and fixtures
EUR 122,854 Buzzi Unicem SpA^ 2,361 0.36
EUR 65,808 Buzzi Unicem SpA^ 716 0.11
EUR 64,658 Carel Industries SpA^ 1,034 0.16
Commercial services
EUR 105,738 ASTM SpA^ 1,901 0.29
EUR 43,180 Gruppo MutuiOnline SpA^ 870 0.13
Distribution & wholesale
EUR 56,657 MARR SpA^ 715 0.11
Diversified financial services
EUR 476,007 Anima Holding SpA^ 1,813 0.28
EUR 176,971 Azimut Holding SpA^ 2,840 0.43
EUR 206,825 Banca Farmafactoring SpA^ 996 0.15
Ccy Holding Investment
FairValue
EUR'000
% of netassetvalue
Italy (31 July 2019: 14.80%) (cont)
Diversified financial services (cont)
EUR 71,123 doValue SpA 664 0.10
EUR 180,720 Tamburi Investment Partners SpA^ 1,012 0.15
Electricity
EUR 2,573,504 A2A SpA 3,123 0.47
EUR 88,947 ACEA SpA 1,547 0.24
EUR 1,359,042 Hera SpA^ 4,449 0.68
EUR 1,080,924 Iren SpA^ 2,307 0.35
Electronics
EUR 18,828 El.En. SpA^ 420 0.06
EUR 12,990 Sesa SpA^ 832 0.13
Energy - alternate sources
EUR 10,701 Bio On Spa^/* - 0.00
EUR 97,825 ERG SpA^ 2,013 0.30
EUR 188,421 Falck Renewables SpA^ 1,040 0.16
Engineering & construction
EUR 444,246 Enav SpA^ 1,540 0.23
EUR 227,032 Maire Tecnimont SpA^ 342 0.05
EUR 19,754 Salcef SpA 233 0.04
EUR 368,322 Webuild SpA^ 401 0.06
Entertainment
EUR 864,535 Juventus Football Club SpA^ 776 0.12
EUR 154,316 RAI Way SpA^ 859 0.13
Food
EUR 19,572 La Doria SpA^ 212 0.03
Food Service
EUR 205,608 Autogrill SpA^ 829 0.13
Gas
EUR 151,562 Ascopiave SpA^ 503 0.08
EUR 800,064 Italgas SpA 4,352 0.66
Hand & machine tools
EUR 36,237 IMA Industria Macchine Automatiche SpA^ 2,446 0.37
Holding companies - diversified operations
EUR 1,459,894 CIR SpA-Compagnie Industriali^ 561 0.08
Home furnishings
EUR 110,988 De' Longhi SpA^ 2,948 0.45
Household goods & home construction
EUR 33,255 Fila SpA 263 0.04
Insurance
EUR 263,649 Societa Cattolica di Assicurazioni SC^ 1,354 0.21
EUR 714,394 Unipol Gruppo SpA^ 2,524 0.38
Internet
EUR 303,429 Cerved Group SpA^ 2,124 0.33
EUR 34,162 Reply SpA^ 2,648 0.40
Investment services
EUR 116,837 DeA Capital SpA^ 133 0.02
EUR 24,045 Italmobiliare SpA^ 705 0.11
Leisure time
EUR 268,273 Piaggio & C SpA^ 635 0.09
EUR 22,306 Sanlorenzo SpA^ 314 0.05
EUR 201,389 Technogym SpA^ 1,446 0.22
iSHARES VII PLC
SCHEDULE OF INVESTMENTS (continued)
iSHARES MSCI EMU SMALL CAP UCITS ETF (continued)As at 31 July 2020
[191 ]
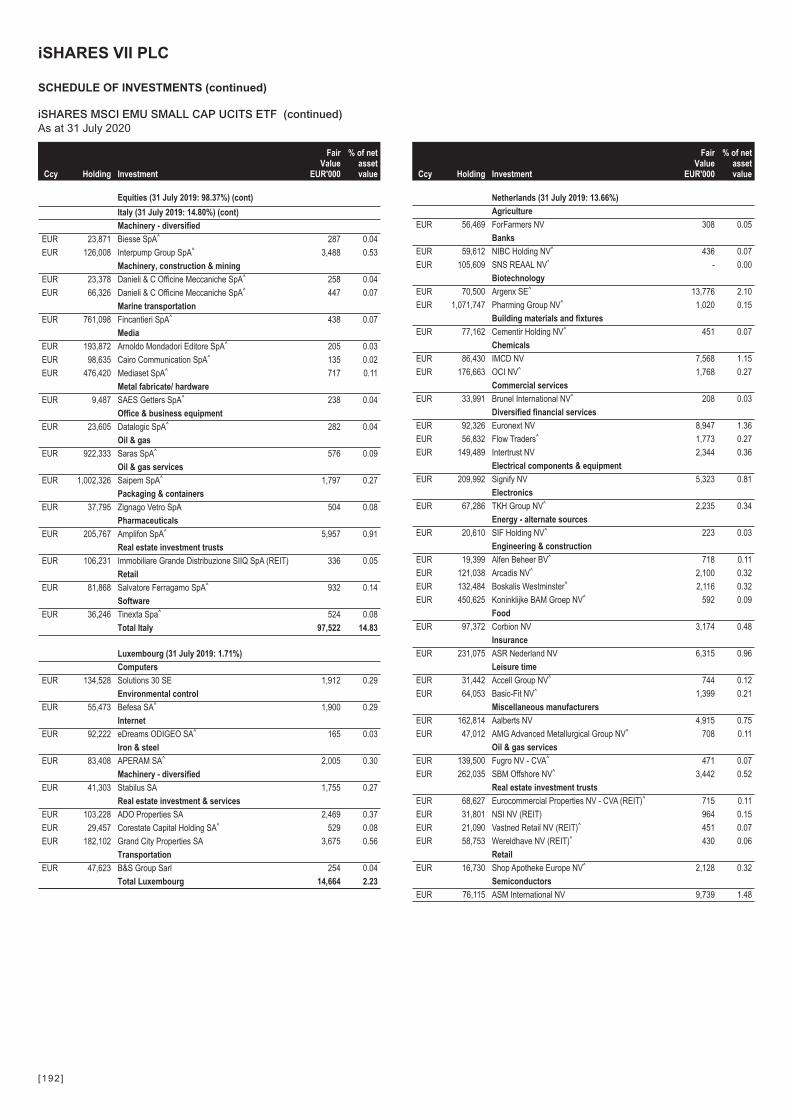
Ccy Holding Investment
FairValue
EUR'000
% of netassetvalue
Equities (31 July 2019: 98.37%) (cont)
Italy (31 July 2019: 14.80%) (cont)
Machinery - diversified
EUR 23,871 Biesse SpA^ 287 0.04
EUR 126,008 Interpump Group SpA^ 3,488 0.53
Machinery, construction & mining
EUR 23,378 Danieli & C Officine Meccaniche SpA^ 258 0.04
EUR 66,326 Danieli & C Officine Meccaniche SpA^ 447 0.07
Marine transportation
EUR 761,098 Fincantieri SpA^ 438 0.07
Media
EUR 193,872 Arnoldo Mondadori Editore SpA^ 205 0.03
EUR 98,635 Cairo Communication SpA^ 135 0.02
EUR 476,420 Mediaset SpA^ 717 0.11
Metal fabricate/ hardware
EUR 9,487 SAES Getters SpA^ 238 0.04
Office & business equipment
EUR 23,605 Datalogic SpA^ 282 0.04
Oil & gas
EUR 922,333 Saras SpA^ 576 0.09
Oil & gas services
EUR 1,002,326 Saipem SpA^ 1,797 0.27
Packaging & containers
EUR 37,795 Zignago Vetro SpA 504 0.08
Pharmaceuticals
EUR 205,767 Amplifon SpA^ 5,957 0.91
Real estate investment trusts
EUR 106,231 Immobiliare Grande Distribuzione SIIQ SpA (REIT) 336 0.05
Retail
EUR 81,868 Salvatore Ferragamo SpA^ 932 0.14
Software
EUR 36,246 Tinexta Spa^ 524 0.08
Total Italy 97,522 14.83
Luxembourg (31 July 2019: 1.71%)
Computers
EUR 134,528 Solutions 30 SE 1,912 0.29
Environmental control
EUR 55,473 Befesa SA^ 1,900 0.29
Internet
EUR 92,222 eDreams ODIGEO SA^ 165 0.03
Iron & steel
EUR 83,408 APERAM SA^ 2,005 0.30
Machinery - diversified
EUR 41,303 Stabilus SA 1,755 0.27
Real estate investment & services
EUR 103,228 ADO Properties SA 2,469 0.37
EUR 29,457 Corestate Capital Holding SA^ 529 0.08
EUR 182,102 Grand City Properties SA 3,675 0.56
Transportation
EUR 47,623 B&S Group Sarl 254 0.04
Total Luxembourg 14,664 2.23
Ccy Holding Investment
FairValue
EUR'000
% of netassetvalue
Netherlands (31 July 2019: 13.66%)
Agriculture
EUR 56,469 ForFarmers NV 308 0.05
Banks
EUR 59,612 NIBC Holding NV^ 436 0.07
EUR 105,609 SNS REAAL NV* - 0.00
Biotechnology
EUR 70,500 Argenx SE^ 13,776 2.10
EUR 1,071,747 Pharming Group NV^ 1,020 0.15
Building materials and fixtures
EUR 77,162 Cementir Holding NV^ 451 0.07
Chemicals
EUR 86,430 IMCD NV 7,568 1.15
EUR 176,663 OCI NV^ 1,768 0.27
Commercial services
EUR 33,991 Brunel International NV^ 208 0.03
Diversified financial services
EUR 92,326 Euronext NV 8,947 1.36
EUR 56,832 Flow Traders^ 1,773 0.27
EUR 149,489 Intertrust NV 2,344 0.36
Electrical components & equipment
EUR 209,992 Signify NV 5,323 0.81
Electronics
EUR 67,286 TKH Group NV^ 2,235 0.34
Energy - alternate sources
EUR 20,610 SIF Holding NV^ 223 0.03
Engineering & construction
EUR 19,399 Alfen Beheer BV^ 718 0.11
EUR 121,038 Arcadis NV^ 2,100 0.32
EUR 132,484 Boskalis Westminster^ 2,116 0.32
EUR 450,625 Koninklijke BAM Groep NV^ 592 0.09
Food
EUR 97,372 Corbion NV 3,174 0.48
Insurance
EUR 231,075 ASR Nederland NV 6,315 0.96
Leisure time
EUR 31,442 Accell Group NV^ 744 0.12
EUR 64,053 Basic-Fit NV^ 1,399 0.21
Miscellaneous manufacturers
EUR 162,814 Aalberts NV 4,915 0.75
EUR 47,012 AMG Advanced Metallurgical Group NV^ 708 0.11
Oil & gas services
EUR 139,500 Fugro NV - CVA^ 471 0.07
EUR 262,035 SBM Offshore NV^ 3,442 0.52
Real estate investment trusts
EUR 68,627 Eurocommercial Properties NV - CVA (REIT)^ 715 0.11
EUR 31,801 NSI NV (REIT) 964 0.15
EUR 21,090 Vastned Retail NV (REIT)^ 451 0.07
EUR 58,753 Wereldhave NV (REIT)^ 430 0.06
Retail
EUR 16,730 Shop Apotheke Europe NV^ 2,128 0.32
Semiconductors
EUR 76,115 ASM International NV 9,739 1.48
iSHARES VII PLC
SCHEDULE OF INVESTMENTS (continued)
iSHARES MSCI EMU SMALL CAP UCITS ETF (continued)As at 31 July 2020
[192 ]

Ccy Holding Investment
FairValue
EUR'000
% of netassetvalue
Equities (31 July 2019: 98.37%) (cont)
Netherlands (31 July 2019: 13.66%) (cont)
Semiconductors (cont)
EUR 118,805 BE Semiconductor Industries NV^ 4,446 0.68
Software
EUR 112,124 TomTom NV^ 758 0.11
Transportation
EUR 792,028 PostNL NV 1,632 0.25
Total Netherlands 94,337 14.35
Portugal (31 July 2019: 1.50%)
Banks
EUR 13,890,199 Banco Comercial Portugues SA 'R'^ 1,364 0.21
Commercial services
EUR 211,015 CTT-Correios de Portugal SA^ 480 0.07
Electricity
EUR 669,054 REN - Redes Energeticas Nacionais SGPS SA 1,639 0.25
Engineering & construction
EUR 119,881 Mota-Engil SGPS SA^ 140 0.02
Food
EUR 1,293,143 Sonae SGPS SA^ 768 0.12
Forest products & paper
EUR 111,015 Altri SGPS SA^ 466 0.07
EUR 66,011 Corticeira Amorim SGPS SA 651 0.10
EUR 347,936 Navigator Co SA^ 736 0.11
EUR 36,988 Semapa-Sociedade de Investimento e Gestao^ 283 0.04
Media
EUR 429,853 NOS SGPS SA^ 1,611 0.25
Total Portugal 8,138 1.24
Spain (31 July 2019: 9.18%)
Auto parts & equipment
EUR 118,873 CIE Automotive SA^ 1,604 0.24
EUR 280,009 Gestamp Automocion SA^ 571 0.09
Banks
EUR 9,251,548 Banco de Sabadell SA 2,674 0.41
EUR 1,985,138 Bankia SA 2,126 0.32
EUR 3,206,667 Liberbank SA^ 521 0.08
EUR 1,301,468 Unicaja Banco SA^ 612 0.09
Biotechnology
EUR 24,170 Pharma Mar SA 2,152 0.33
Commercial services
EUR 238,629 Applus Services SA 1,565 0.24
EUR 167,332 Global Dominion Access SA^ 467 0.07
EUR 737,177 Prosegur Cash SA^ 514 0.08
EUR 403,842 Prosegur Cia de Seguridad SA 901 0.13
Computers
EUR 214,163 Indra Sistemas SA^ 1,364 0.21
Energy - alternate sources
EUR 106,331 Solaria Energia y Medio Ambiente SA^ 1,364 0.21
Engineering & construction
EUR 36,176 Acciona SA^ 3,393 0.51
EUR 132,208 Fomento de Construcciones y Contratas SA 967 0.15
Ccy Holding Investment
FairValue
EUR'000
% of netassetvalue
Spain (31 July 2019: 9.18%) (cont)
Engineering & construction (cont)
EUR 32,822 Grupo Empresarial San Jose SA^ 144 0.02
EUR 584,990 Sacyr SA^ 1,117 0.17
EUR 54,789 Tecnicas Reunidas SA^ 579 0.09
Environmental control
EUR 79,221 Fluidra SA^ 1,112 0.17
Food
EUR 2,697,324 Distribuidora Internacional de Alimentacion SA^ 302 0.05
EUR 114,811 Ebro Foods SA^ 2,181 0.33
EUR 65,018 Viscofan SA 4,047 0.61
Forest products & paper
EUR 238,849 Ence Energia y Celulosa SA^ 610 0.09
EUR 32,826 Miquel y Costas & Miquel SA 387 0.06
Hotels
EUR 185,647 Melia Hotels International SA^ 584 0.09
Insurance
EUR 70,551 Grupo Catalana Occidente SA 1,411 0.21
Internet
EUR 117,967 Masmovil Ibercom SA 2,675 0.41
Investment services
EUR 28,243 Corp Financiera Alba SA 978 0.15
Iron & steel
EUR 271,313 Acerinox SA 1,963 0.30
Machinery - diversified
EUR 122,309 Talgo SA^ 480 0.07
EUR 315,170 Zardoya Otis SA 1,771 0.27
Media
EUR 150,768 Atresmedia Corp de Medios de Comunicacion SA^ 349 0.05
EUR 129,919 Euskaltel SA^ 1,034 0.16
EUR 266,562 Mediaset Espana Comunicacion SA^ 741 0.11
EUR 355,365 Promotora de Informaciones SA 'A'^ 153 0.03
Pharmaceuticals
EUR 112,862 Almirall SA^ 1,063 0.16
EUR 474,837 Faes Farma SA^ 1,695 0.26
Real estate investment & services
EUR 38,326 Aedas Homes SA^ 689 0.11
EUR 81,755 Metrovacesa SA^ 483 0.07
EUR 89,387 Neinor Homes SA^ 908 0.14
Real estate investment trusts
EUR 466,772 Inmobiliaria Colonial Socimi SA (REIT) 3,372 0.51
EUR 110,793 Lar Espana Real Estate Socimi SA (REIT) 493 0.08
EUR 622,870 Merlin Properties Socimi SA (REIT)^ 4,354 0.66
Telecommunications
EUR 38,771 Let's GOWEX SA^/* - 0.00
Transportation
EUR 111,217 Cia de Distribucion Integral Logista Holdings SA 1,751 0.26
EUR 33,246 Construcciones y Auxiliar de Ferrocarriles SA^ 969 0.15
Total Spain 59,190 9.00
Switzerland (31 July 2019: 0.02%)
iSHARES VII PLC
SCHEDULE OF INVESTMENTS (continued)
iSHARES MSCI EMU SMALL CAP UCITS ETF (continued)As at 31 July 2020
[193 ]
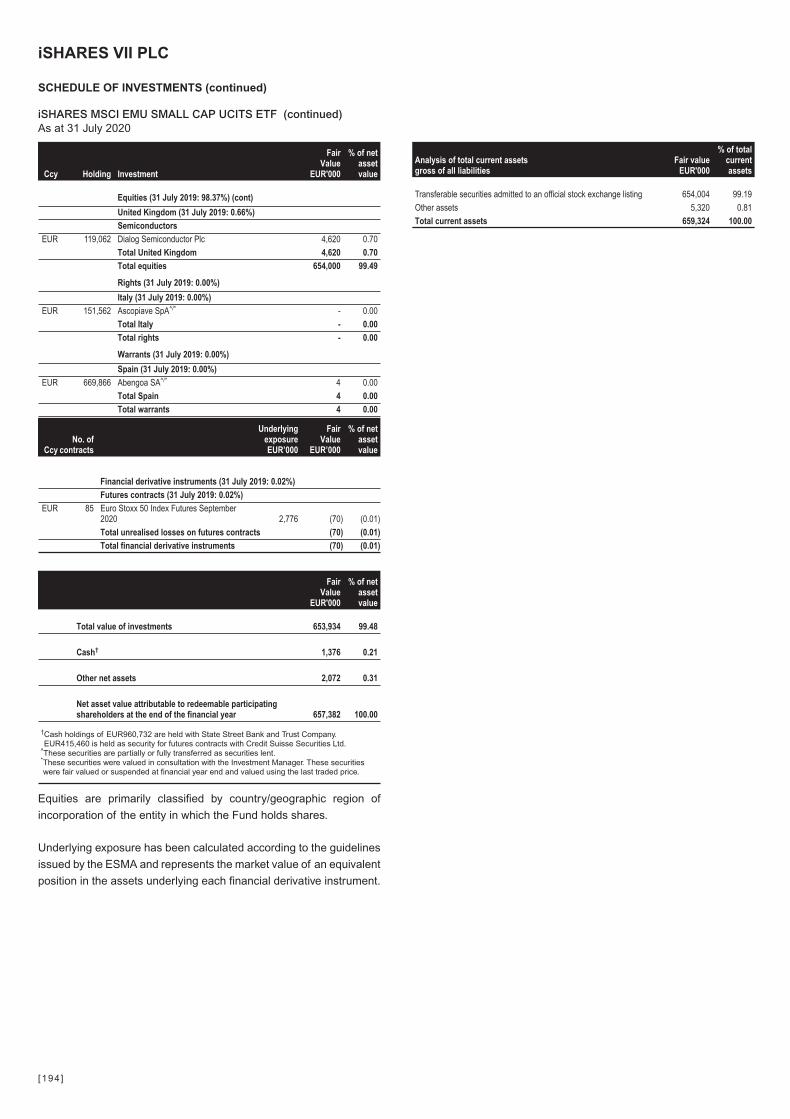
Ccy Holding Investment
FairValue
EUR'000
% of netassetvalue
Equities (31 July 2019: 98.37%) (cont)
United Kingdom (31 July 2019: 0.66%)
Semiconductors
EUR 119,062 Dialog Semiconductor Plc 4,620 0.70
Total United Kingdom 4,620 0.70
Total equities 654,000 99.49
Rights (31 July 2019: 0.00%)
Italy (31 July 2019: 0.00%)
EUR 151,562 Ascopiave SpA^/* - 0.00
Total Italy - 0.00
Total rights - 0.00
Warrants (31 July 2019: 0.00%)
Spain (31 July 2019: 0.00%)
EUR 669,866 Abengoa SA^/* 4 0.00
Total Spain 4 0.00
Total warrants 4 0.00
CcyNo. of
contracts
UnderlyingexposureEUR’000
FairValue
EUR’000
% of netassetvalue
Financial derivative instruments (31 July 2019: 0.02%)
Futures contracts (31 July 2019: 0.02%)
EUR 85 Euro Stoxx 50 Index Futures September2020 2,776 (70) (0.01)
Total unrealised losses on futures contracts (70) (0.01)
Total financial derivative instruments (70) (0.01)
FairValue
EUR'000
% of netassetvalue
Total value of investments 653,934 99.48
Cash† 1,376 0.21
Other net assets 2,072 0.31
Net asset value attributable to redeemable participatingshareholders at the end of the financial year 657,382 100.00
†Cash holdings of EUR960,732 are held with State Street Bank and Trust Company.EUR415,460 is held as security for futures contracts with Credit Suisse Securities Ltd.
^These securities are partially or fully transferred as securities lent.*These securities were valued in consultation with the Investment Manager. These securitieswere fair valued or suspended at financial year end and valued using the last traded price.
Equities are primarily classified by country/geographic region of
incorporation of the entity in which the Fund holds shares.
Underlying exposure has been calculated according to the guidelines
issued by the ESMA and represents the market value of an equivalent
position in the assets underlying each financial derivative instrument.
Analysis of total current assetsgross of all liabilities
Fair valueEUR'000
% of totalcurrentassets
Transferable securities admitted to an official stock exchange listing 654,004 99.19
Other assets 5,320 0.81
Total current assets 659,324 100.00
iSHARES VII PLC
SCHEDULE OF INVESTMENTS (continued)
iSHARES MSCI EMU SMALL CAP UCITS ETF (continued)As at 31 July 2020
[194 ]

Ccy Holding Investment
FairValue
USD'000
% of netassetvalue
Transferable Securities Admitted to an Official Stock Exchange Listing or traded on aRegulated Market (31 July 2019: 97.19%)
Equities (31 July 2019: 97.19%)
Austria (31 July 2019: 0.69%)
Banks
EUR 13,111 Erste Group Bank AG 293 0.15
EUR 6,434 Raiffeisen Bank International AG 111 0.06
Electricity
EUR 3,257 Verbund AG 171 0.09
Iron & steel
EUR 5,308 voestalpine AG^ 118 0.06
Machinery - diversified
EUR 3,213 ANDRITZ AG 108 0.06
Oil & gas
EUR 6,983 OMV AG 221 0.11
Total Austria 1,022 0.53
Belgium (31 July 2019: 3.21%)
Banks
EUR 11,388 KBC Group NV 651 0.34
Beverages
EUR 35,089 Anheuser-Busch InBev SA 1,914 0.99
Chemicals
EUR 3,464 Solvay SA 270 0.14
EUR 9,143 Umicore SA^ 432 0.23
Electricity
EUR 1,452 Elia Group SA 158 0.08
Food
EUR 2,397 Colruyt SA 140 0.07
Insurance
EUR 8,349 Ageas SA 314 0.16
Investment services
EUR 5,261 Groupe Bruxelles Lambert SA 459 0.24
EUR 725 Sofina SA 204 0.11
Media
EUR 2,111 Telenet Group Holding NV 82 0.04
Pharmaceuticals
EUR 1,897 Galapagos NV 354 0.18
EUR 5,811 UCB SA^ 748 0.39
Telecommunications
EUR 7,099 Proximus SADP 147 0.08
Total Belgium 5,873 3.05
Finland (31 July 2019: 3.07%)
Electricity
EUR 20,844 Fortum Oyj^ 425 0.22
Forest products & paper
EUR 26,388 Stora Enso Oyj 'R' 333 0.17
EUR 24,575 UPM-Kymmene Oyj 657 0.34
Insurance
EUR 21,639 Sampo Oyj 'A' 785 0.41
Ccy Holding Investment
FairValue
USD'000
% of netassetvalue
Finland (31 July 2019: 3.07%) (cont)
Machinery - diversified
EUR 15,651 Kone Oyj 'B' 1,244 0.64
Marine transportation
EUR 20,053 Wartsila Oyj Abp^ 168 0.09
Oil & gas
EUR 19,337 Neste Oyj 889 0.46
Pharmaceuticals
EUR 4,713 Orion Oyj 'B' 206 0.11
Telecommunications
EUR 6,697 Elisa Oyj 400 0.21
EUR 260,371 Nokia Oyj^ 1,250 0.65
Total Finland 6,357 3.30
France (31 July 2019: 31.93%)
Advertising
EUR 3,702 JCDecaux SA 62 0.03
EUR 10,237 Publicis Groupe SA 330 0.17
Aerospace & defence
EUR 109 Dassault Aviation SA 91 0.05
EUR 14,707 Safran SA 1,556 0.81
EUR 4,952 Thales SA 359 0.18
Apparel retailers
EUR 1,459 Hermes International 1,184 0.61
EUR 3,490 Kering SA^ 1,988 1.03
EUR 12,794 LVMH Moet Hennessy Louis Vuitton SE 5,549 2.88
Auto manufacturers
EUR 26,941 Peugeot SA^ 435 0.23
EUR 8,946 Renault SA 212 0.11
Auto parts & equipment
EUR 7,889 Cie Generale des Etablissements Michelin SCA^ 824 0.43
EUR 3,519 Faurecia SE 137 0.07
EUR 10,412 Valeo SA 268 0.14
Banks
EUR 51,806 BNP Paribas SA^ 2,090 1.08
EUR 53,894 Credit Agricole SA^ 518 0.27
EUR 46,272 Natixis SA 112 0.06
EUR 37,700 Societe Generale SA^ 579 0.30
Beverages
EUR 9,747 Pernod Ricard SA 1,683 0.88
EUR 991 Remy Cointreau SA 159 0.08
Building materials and fixtures
EUR 23,829 Cie de Saint-Gobain 878 0.46
Chemicals
EUR 21,792 Air Liquide SA 3,598 1.86
EUR 3,140 Arkema SA 325 0.17
Commercial services
EUR 13,432 Bureau Veritas SA 294 0.15
EUR 10,948 Edenred^ 546 0.29
EUR 6,314 Worldline SA 543 0.28
Computers
EUR 4,581 Atos SE 392 0.20
EUR 7,409 Capgemini SE 960 0.50
iSHARES VII PLC
SCHEDULE OF INVESTMENTS (continued)
iSHARES MSCI EMU USD HEDGED UCITS ETF (ACC)As at 31 July 2020
[195 ]
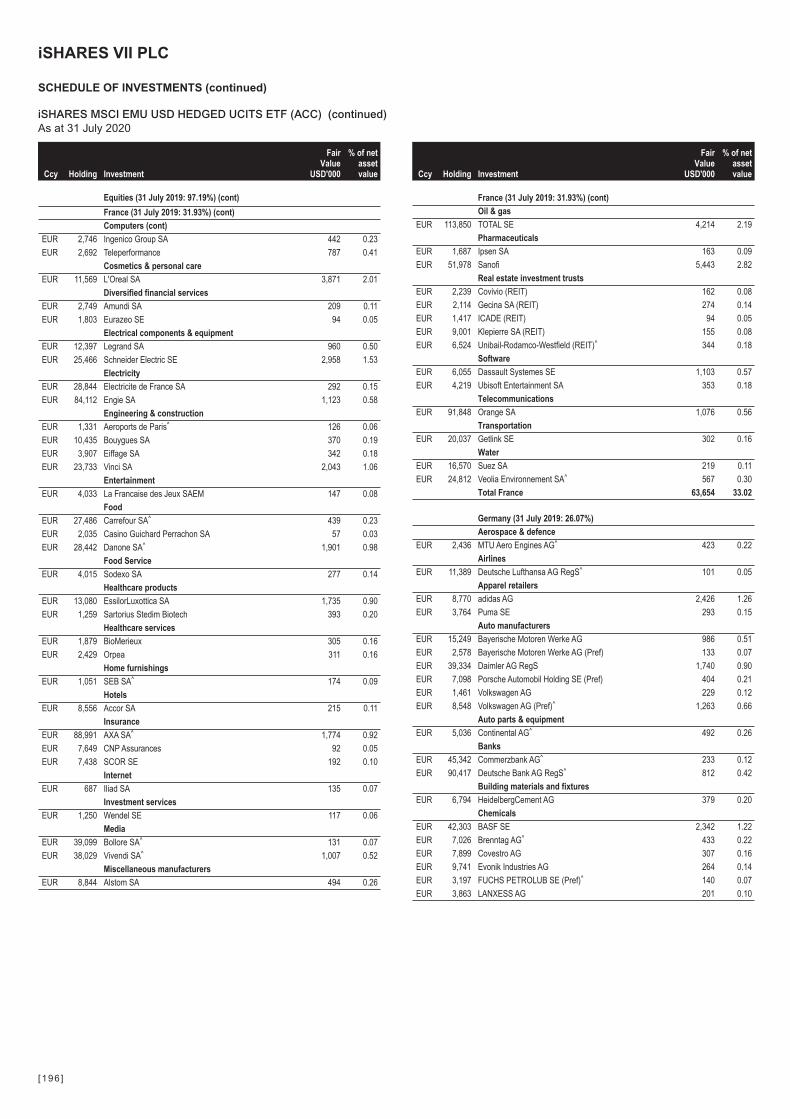
Ccy Holding Investment
FairValue
USD'000
% of netassetvalue
Equities (31 July 2019: 97.19%) (cont)
France (31 July 2019: 31.93%) (cont)
Computers (cont)
EUR 2,746 Ingenico Group SA 442 0.23
EUR 2,692 Teleperformance 787 0.41
Cosmetics & personal care
EUR 11,569 L'Oreal SA 3,871 2.01
Diversified financial services
EUR 2,749 Amundi SA 209 0.11
EUR 1,803 Eurazeo SE 94 0.05
Electrical components & equipment
EUR 12,397 Legrand SA 960 0.50
EUR 25,466 Schneider Electric SE 2,958 1.53
Electricity
EUR 28,844 Electricite de France SA 292 0.15
EUR 84,112 Engie SA 1,123 0.58
Engineering & construction
EUR 1,331 Aeroports de Paris^ 126 0.06
EUR 10,435 Bouygues SA 370 0.19
EUR 3,907 Eiffage SA 342 0.18
EUR 23,733 Vinci SA 2,043 1.06
Entertainment
EUR 4,033 La Francaise des Jeux SAEM 147 0.08
Food
EUR 27,486 Carrefour SA^ 439 0.23
EUR 2,035 Casino Guichard Perrachon SA 57 0.03
EUR 28,442 Danone SA^ 1,901 0.98
Food Service
EUR 4,015 Sodexo SA 277 0.14
Healthcare products
EUR 13,080 EssilorLuxottica SA 1,735 0.90
EUR 1,259 Sartorius Stedim Biotech 393 0.20
Healthcare services
EUR 1,879 BioMerieux 305 0.16
EUR 2,429 Orpea 311 0.16
Home furnishings
EUR 1,051 SEB SA^ 174 0.09
Hotels
EUR 8,556 Accor SA 215 0.11
Insurance
EUR 88,991 AXA SA^ 1,774 0.92
EUR 7,649 CNP Assurances 92 0.05
EUR 7,438 SCOR SE 192 0.10
Internet
EUR 687 Iliad SA 135 0.07
Investment services
EUR 1,250 Wendel SE 117 0.06
Media
EUR 39,099 Bollore SA^ 131 0.07
EUR 38,029 Vivendi SA^ 1,007 0.52
Miscellaneous manufacturers
EUR 8,844 Alstom SA 494 0.26
Ccy Holding Investment
FairValue
USD'000
% of netassetvalue
France (31 July 2019: 31.93%) (cont)
Oil & gas
EUR 113,850 TOTAL SE 4,214 2.19
Pharmaceuticals
EUR 1,687 Ipsen SA 163 0.09
EUR 51,978 Sanofi 5,443 2.82
Real estate investment trusts
EUR 2,239 Covivio (REIT) 162 0.08
EUR 2,114 Gecina SA (REIT) 274 0.14
EUR 1,417 ICADE (REIT) 94 0.05
EUR 9,001 Klepierre SA (REIT) 155 0.08
EUR 6,524 Unibail-Rodamco-Westfield (REIT)^ 344 0.18
Software
EUR 6,055 Dassault Systemes SE 1,103 0.57
EUR 4,219 Ubisoft Entertainment SA 353 0.18
Telecommunications
EUR 91,848 Orange SA 1,076 0.56
Transportation
EUR 20,037 Getlink SE 302 0.16
Water
EUR 16,570 Suez SA 219 0.11
EUR 24,812 Veolia Environnement SA^ 567 0.30
Total France 63,654 33.02
Germany (31 July 2019: 26.07%)
Aerospace & defence
EUR 2,436 MTU Aero Engines AG^ 423 0.22
Airlines
EUR 11,389 Deutsche Lufthansa AG RegS^ 101 0.05
Apparel retailers
EUR 8,770 adidas AG 2,426 1.26
EUR 3,764 Puma SE 293 0.15
Auto manufacturers
EUR 15,249 Bayerische Motoren Werke AG 986 0.51
EUR 2,578 Bayerische Motoren Werke AG (Pref) 133 0.07
EUR 39,334 Daimler AG RegS 1,740 0.90
EUR 7,098 Porsche Automobil Holding SE (Pref) 404 0.21
EUR 1,461 Volkswagen AG 229 0.12
EUR 8,548 Volkswagen AG (Pref)^ 1,263 0.66
Auto parts & equipment
EUR 5,036 Continental AG^ 492 0.26
Banks
EUR 45,342 Commerzbank AG^ 233 0.12
EUR 90,417 Deutsche Bank AG RegS^ 812 0.42
Building materials and fixtures
EUR 6,794 HeidelbergCement AG 379 0.20
Chemicals
EUR 42,303 BASF SE 2,342 1.22
EUR 7,026 Brenntag AG^ 433 0.22
EUR 7,899 Covestro AG 307 0.16
EUR 9,741 Evonik Industries AG 264 0.14
EUR 3,197 FUCHS PETROLUB SE (Pref)^ 140 0.07
EUR 3,863 LANXESS AG 201 0.10
iSHARES VII PLC
SCHEDULE OF INVESTMENTS (continued)
iSHARES MSCI EMU USD HEDGED UCITS ETF (ACC) (continued)As at 31 July 2020
[196 ]
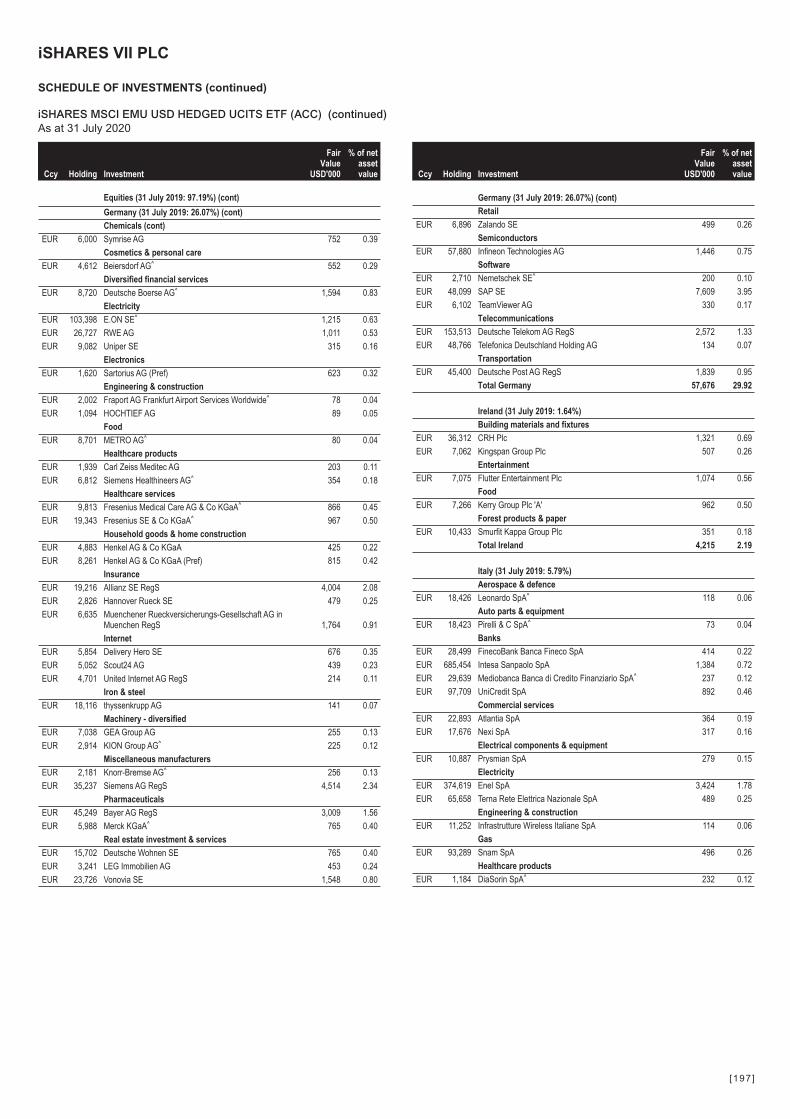
Ccy Holding Investment
FairValue
USD'000
% of netassetvalue
Equities (31 July 2019: 97.19%) (cont)
Germany (31 July 2019: 26.07%) (cont)
Chemicals (cont)
EUR 6,000 Symrise AG 752 0.39
Cosmetics & personal care
EUR 4,612 Beiersdorf AG^ 552 0.29
Diversified financial services
EUR 8,720 Deutsche Boerse AG^ 1,594 0.83
Electricity
EUR 103,398 E.ON SE^ 1,215 0.63
EUR 26,727 RWE AG 1,011 0.53
EUR 9,082 Uniper SE 315 0.16
Electronics
EUR 1,620 Sartorius AG (Pref) 623 0.32
Engineering & construction
EUR 2,002 Fraport AG Frankfurt Airport Services Worldwide^ 78 0.04
EUR 1,094 HOCHTIEF AG 89 0.05
Food
EUR 8,701 METRO AG^ 80 0.04
Healthcare products
EUR 1,939 Carl Zeiss Meditec AG 203 0.11
EUR 6,812 Siemens Healthineers AG^ 354 0.18
Healthcare services
EUR 9,813 Fresenius Medical Care AG & Co KGaA^ 866 0.45
EUR 19,343 Fresenius SE & Co KGaA^ 967 0.50
Household goods & home construction
EUR 4,883 Henkel AG & Co KGaA 425 0.22
EUR 8,261 Henkel AG & Co KGaA (Pref) 815 0.42
Insurance
EUR 19,216 Allianz SE RegS 4,004 2.08
EUR 2,826 Hannover Rueck SE 479 0.25
EUR 6,635 Muenchener Rueckversicherungs-Gesellschaft AG inMuenchen RegS 1,764 0.91
Internet
EUR 5,854 Delivery Hero SE 676 0.35
EUR 5,052 Scout24 AG 439 0.23
EUR 4,701 United Internet AG RegS 214 0.11
Iron & steel
EUR 18,116 thyssenkrupp AG 141 0.07
Machinery - diversified
EUR 7,038 GEA Group AG 255 0.13
EUR 2,914 KION Group AG^ 225 0.12
Miscellaneous manufacturers
EUR 2,181 Knorr-Bremse AG^ 256 0.13
EUR 35,237 Siemens AG RegS 4,514 2.34
Pharmaceuticals
EUR 45,249 Bayer AG RegS 3,009 1.56
EUR 5,988 Merck KGaA^ 765 0.40
Real estate investment & services
EUR 15,702 Deutsche Wohnen SE 765 0.40
EUR 3,241 LEG Immobilien AG 453 0.24
EUR 23,726 Vonovia SE 1,548 0.80
Ccy Holding Investment
FairValue
USD'000
% of netassetvalue
Germany (31 July 2019: 26.07%) (cont)
Retail
EUR 6,896 Zalando SE 499 0.26
Semiconductors
EUR 57,880 Infineon Technologies AG 1,446 0.75
Software
EUR 2,710 Nemetschek SE^ 200 0.10
EUR 48,099 SAP SE 7,609 3.95
EUR 6,102 TeamViewer AG 330 0.17
Telecommunications
EUR 153,513 Deutsche Telekom AG RegS 2,572 1.33
EUR 48,766 Telefonica Deutschland Holding AG 134 0.07
Transportation
EUR 45,400 Deutsche Post AG RegS 1,839 0.95
Total Germany 57,676 29.92
Ireland (31 July 2019: 1.64%)
Building materials and fixtures
EUR 36,312 CRH Plc 1,321 0.69
EUR 7,062 Kingspan Group Plc 507 0.26
Entertainment
EUR 7,075 Flutter Entertainment Plc 1,074 0.56
Food
EUR 7,266 Kerry Group Plc 'A' 962 0.50
Forest products & paper
EUR 10,433 Smurfit Kappa Group Plc 351 0.18
Total Ireland 4,215 2.19
Italy (31 July 2019: 5.79%)
Aerospace & defence
EUR 18,426 Leonardo SpA^ 118 0.06
Auto parts & equipment
EUR 18,423 Pirelli & C SpA^ 73 0.04
Banks
EUR 28,499 FinecoBank Banca Fineco SpA 414 0.22
EUR 685,454 Intesa Sanpaolo SpA 1,384 0.72
EUR 29,639 Mediobanca Banca di Credito Finanziario SpA^ 237 0.12
EUR 97,709 UniCredit SpA 892 0.46
Commercial services
EUR 22,893 Atlantia SpA 364 0.19
EUR 17,676 Nexi SpA 317 0.16
Electrical components & equipment
EUR 10,887 Prysmian SpA 279 0.15
Electricity
EUR 374,619 Enel SpA 3,424 1.78
EUR 65,658 Terna Rete Elettrica Nazionale SpA 489 0.25
Engineering & construction
EUR 11,252 Infrastrutture Wireless Italiane SpA 114 0.06
Gas
EUR 93,289 Snam SpA 496 0.26
Healthcare products
EUR 1,184 DiaSorin SpA^ 232 0.12
iSHARES VII PLC
SCHEDULE OF INVESTMENTS (continued)
iSHARES MSCI EMU USD HEDGED UCITS ETF (ACC) (continued)As at 31 July 2020
[197 ]
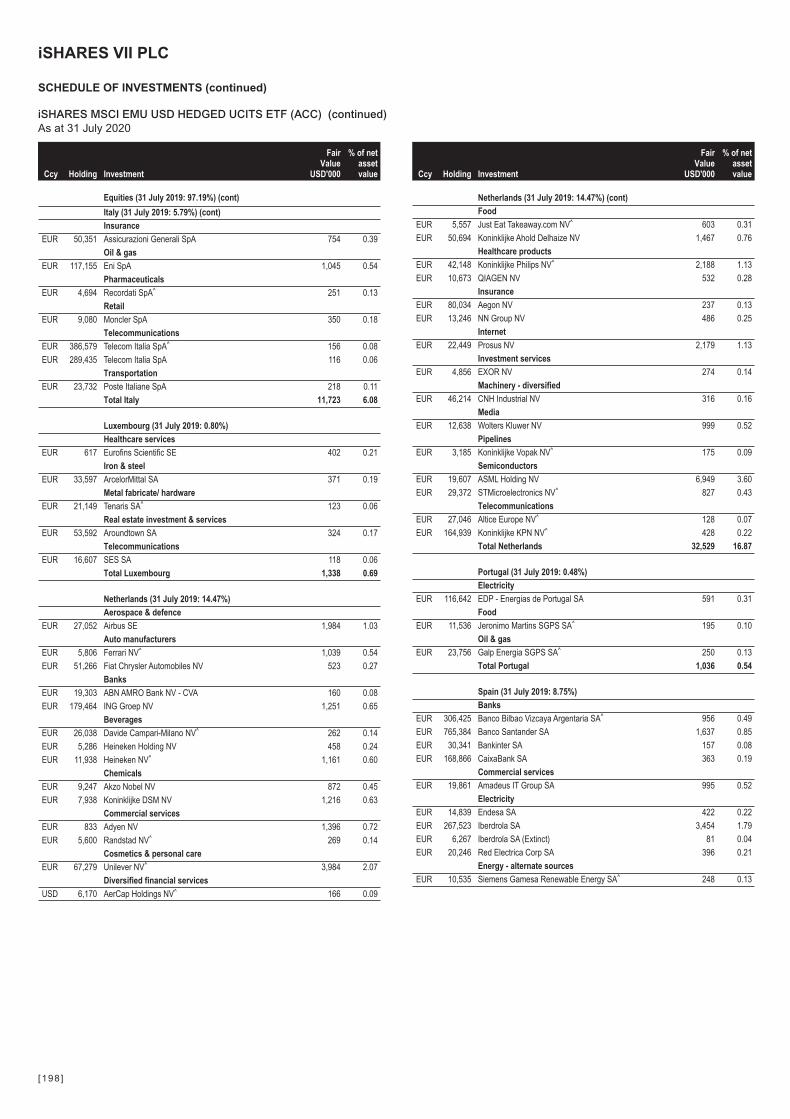
Ccy Holding Investment
FairValue
USD'000
% of netassetvalue
Equities (31 July 2019: 97.19%) (cont)
Italy (31 July 2019: 5.79%) (cont)
Insurance
EUR 50,351 Assicurazioni Generali SpA 754 0.39
Oil & gas
EUR 117,155 Eni SpA 1,045 0.54
Pharmaceuticals
EUR 4,694 Recordati SpA^ 251 0.13
Retail
EUR 9,080 Moncler SpA 350 0.18
Telecommunications
EUR 386,579 Telecom Italia SpA^ 156 0.08
EUR 289,435 Telecom Italia SpA 116 0.06
Transportation
EUR 23,732 Poste Italiane SpA 218 0.11
Total Italy 11,723 6.08
Luxembourg (31 July 2019: 0.80%)
Healthcare services
EUR 617 Eurofins Scientific SE 402 0.21
Iron & steel
EUR 33,597 ArcelorMittal SA 371 0.19
Metal fabricate/ hardware
EUR 21,149 Tenaris SA^ 123 0.06
Real estate investment & services
EUR 53,592 Aroundtown SA 324 0.17
Telecommunications
EUR 16,607 SES SA 118 0.06
Total Luxembourg 1,338 0.69
Netherlands (31 July 2019: 14.47%)
Aerospace & defence
EUR 27,052 Airbus SE 1,984 1.03
Auto manufacturers
EUR 5,806 Ferrari NV^ 1,039 0.54
EUR 51,266 Fiat Chrysler Automobiles NV 523 0.27
Banks
EUR 19,303 ABN AMRO Bank NV - CVA 160 0.08
EUR 179,464 ING Groep NV 1,251 0.65
Beverages
EUR 26,038 Davide Campari-Milano NV^ 262 0.14
EUR 5,286 Heineken Holding NV 458 0.24
EUR 11,938 Heineken NV^ 1,161 0.60
Chemicals
EUR 9,247 Akzo Nobel NV 872 0.45
EUR 7,938 Koninklijke DSM NV 1,216 0.63
Commercial services
EUR 833 Adyen NV 1,396 0.72
EUR 5,600 Randstad NV^ 269 0.14
Cosmetics & personal care
EUR 67,279 Unilever NV^ 3,984 2.07
Diversified financial services
USD 6,170 AerCap Holdings NV^ 166 0.09
Ccy Holding Investment
FairValue
USD'000
% of netassetvalue
Netherlands (31 July 2019: 14.47%) (cont)
Food
EUR 5,557 Just Eat Takeaway.com NV^ 603 0.31
EUR 50,694 Koninklijke Ahold Delhaize NV 1,467 0.76
Healthcare products
EUR 42,148 Koninklijke Philips NV^ 2,188 1.13
EUR 10,673 QIAGEN NV 532 0.28
Insurance
EUR 80,034 Aegon NV 237 0.13
EUR 13,246 NN Group NV 486 0.25
Internet
EUR 22,449 Prosus NV 2,179 1.13
Investment services
EUR 4,856 EXOR NV 274 0.14
Machinery - diversified
EUR 46,214 CNH Industrial NV 316 0.16
Media
EUR 12,638 Wolters Kluwer NV 999 0.52
Pipelines
EUR 3,185 Koninklijke Vopak NV^ 175 0.09
Semiconductors
EUR 19,607 ASML Holding NV 6,949 3.60
EUR 29,372 STMicroelectronics NV^ 827 0.43
Telecommunications
EUR 27,046 Altice Europe NV^ 128 0.07
EUR 164,939 Koninklijke KPN NV^ 428 0.22
Total Netherlands 32,529 16.87
Portugal (31 July 2019: 0.48%)
Electricity
EUR 116,642 EDP - Energias de Portugal SA 591 0.31
Food
EUR 11,536 Jeronimo Martins SGPS SA^ 195 0.10
Oil & gas
EUR 23,756 Galp Energia SGPS SA^ 250 0.13
Total Portugal 1,036 0.54
Spain (31 July 2019: 8.75%)
Banks
EUR 306,425 Banco Bilbao Vizcaya Argentaria SA^ 956 0.49
EUR 765,384 Banco Santander SA 1,637 0.85
EUR 30,341 Bankinter SA 157 0.08
EUR 168,866 CaixaBank SA 363 0.19
Commercial services
EUR 19,861 Amadeus IT Group SA 995 0.52
Electricity
EUR 14,839 Endesa SA 422 0.22
EUR 267,523 Iberdrola SA 3,454 1.79
EUR 6,267 Iberdrola SA (Extinct) 81 0.04
EUR 20,246 Red Electrica Corp SA 396 0.21
Energy - alternate sources
EUR 10,535 Siemens Gamesa Renewable Energy SA^ 248 0.13
iSHARES VII PLC
SCHEDULE OF INVESTMENTS (continued)
iSHARES MSCI EMU USD HEDGED UCITS ETF (ACC) (continued)As at 31 July 2020
[198 ]
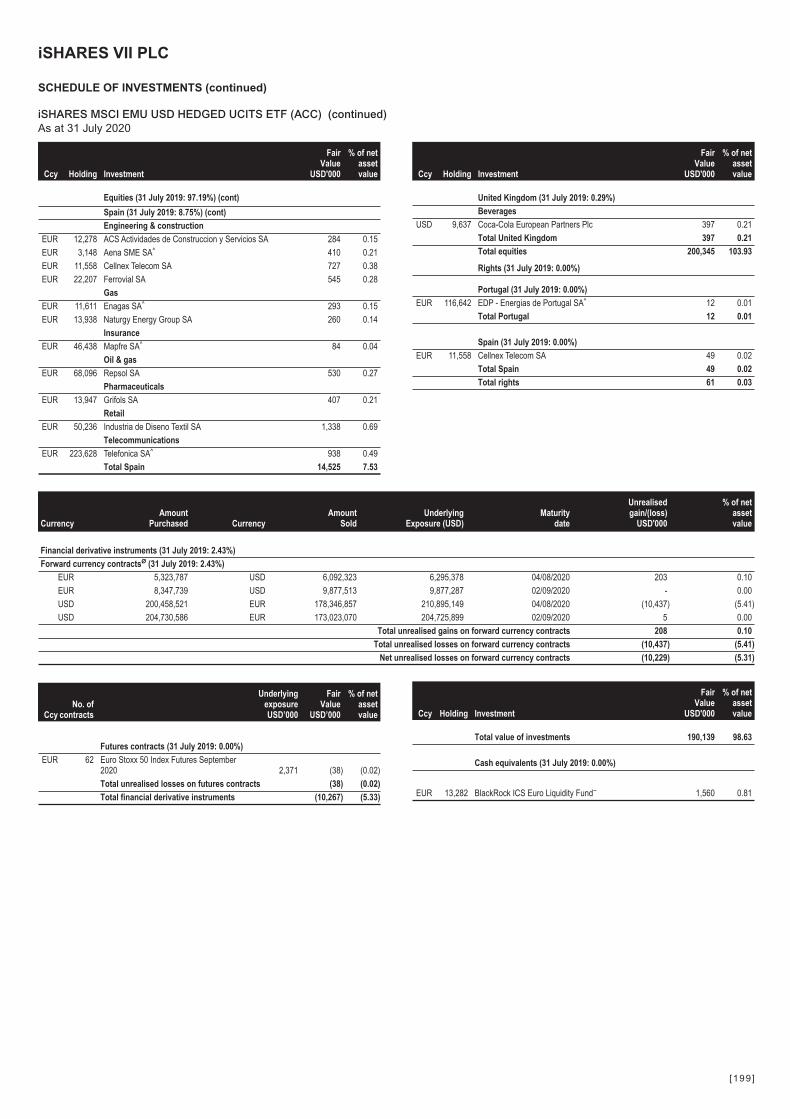
Ccy Holding Investment
FairValue
USD'000
% of netassetvalue
Equities (31 July 2019: 97.19%) (cont)
Spain (31 July 2019: 8.75%) (cont)
Engineering & construction
EUR 12,278 ACS Actividades de Construccion y Servicios SA 284 0.15
EUR 3,148 Aena SME SA^ 410 0.21
EUR 11,558 Cellnex Telecom SA 727 0.38
EUR 22,207 Ferrovial SA 545 0.28
Gas
EUR 11,611 Enagas SA^ 293 0.15
EUR 13,938 Naturgy Energy Group SA 260 0.14
Insurance
EUR 46,438 Mapfre SA^ 84 0.04
Oil & gas
EUR 68,096 Repsol SA 530 0.27
Pharmaceuticals
EUR 13,947 Grifols SA 407 0.21
Retail
EUR 50,236 Industria de Diseno Textil SA 1,338 0.69
Telecommunications
EUR 223,628 Telefonica SA^ 938 0.49
Total Spain 14,525 7.53
Ccy Holding Investment
FairValue
USD'000
% of netassetvalue
United Kingdom (31 July 2019: 0.29%)
Beverages
USD 9,637 Coca-Cola European Partners Plc 397 0.21
Total United Kingdom 397 0.21
Total equities 200,345 103.93
Rights (31 July 2019: 0.00%)
Portugal (31 July 2019: 0.00%)
EUR 116,642 EDP - Energias de Portugal SA^ 12 0.01
Total Portugal 12 0.01
Spain (31 July 2019: 0.00%)
EUR 11,558 Cellnex Telecom SA 49 0.02
Total Spain 49 0.02
Total rights 61 0.03
CurrencyAmount
Purchased CurrencyAmount
SoldUnderlying
Exposure (USD)Maturity
date
Unrealisedgain/(loss)
USD'000
% of netassetvalue
Financial derivative instruments (31 July 2019: 2.43%)
Forward currency contractsØ (31 July 2019: 2.43%)
EUR 5,323,787 USD 6,092,323 6,295,378 04/08/2020 203 0.10
EUR 8,347,739 USD 9,877,513 9,877,287 02/09/2020 - 0.00
USD 200,458,521 EUR 178,346,857 210,895,149 04/08/2020 (10,437) (5.41)
USD 204,730,586 EUR 173,023,070 204,725,899 02/09/2020 5 0.00
Total unrealised gains on forward currency contracts 208 0.10
Total unrealised losses on forward currency contracts (10,437) (5.41)
Net unrealised losses on forward currency contracts (10,229) (5.31)
CcyNo. of
contracts
UnderlyingexposureUSD’000
FairValue
USD’000
% of netassetvalue
Futures contracts (31 July 2019: 0.00%)
EUR 62 Euro Stoxx 50 Index Futures September2020 2,371 (38) (0.02)
Total unrealised losses on futures contracts (38) (0.02)
Total financial derivative instruments (10,267) (5.33)
Ccy Holding Investment
FairValue
USD'000
% of netassetvalue
Total value of investments 190,139 98.63
Cash equivalents (31 July 2019: 0.00%)
EUR 13,282 BlackRock ICS Euro Liquidity Fund~ 1,560 0.81
iSHARES VII PLC
SCHEDULE OF INVESTMENTS (continued)
iSHARES MSCI EMU USD HEDGED UCITS ETF (ACC) (continued)As at 31 July 2020
[199 ]
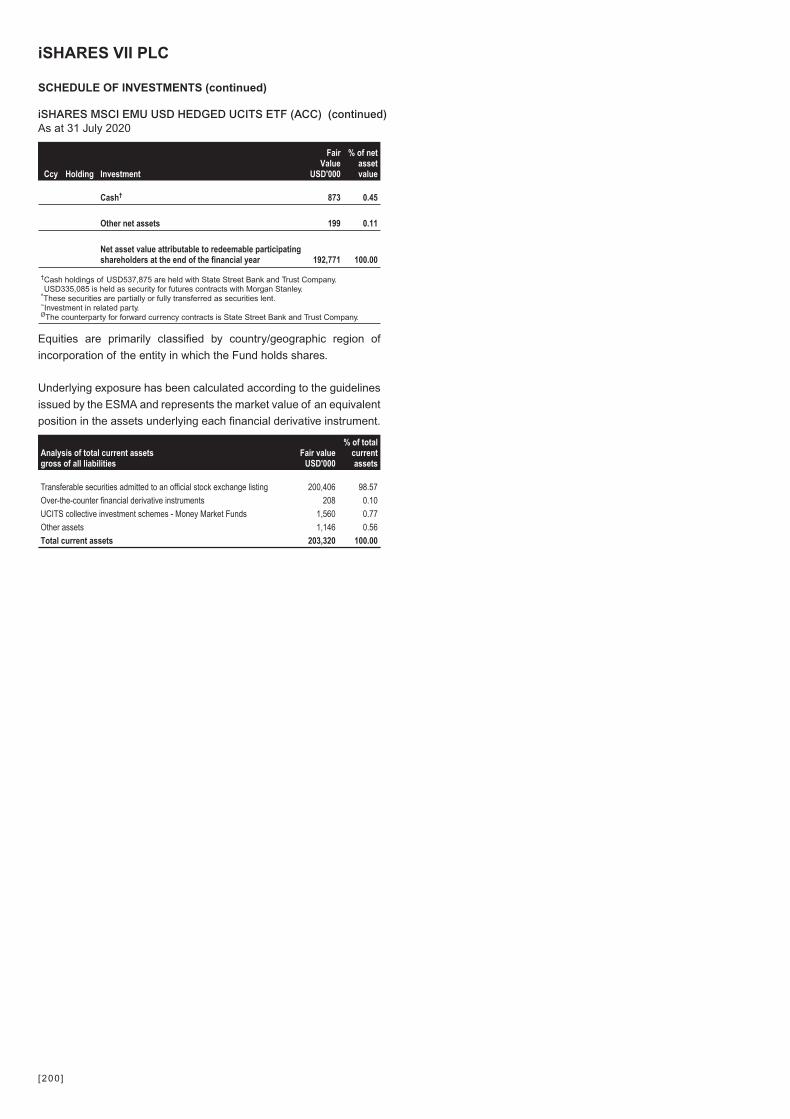
Ccy Holding Investment
FairValue
USD'000
% of netassetvalue
Cash† 873 0.45
Other net assets 199 0.11
Net asset value attributable to redeemable participatingshareholders at the end of the financial year 192,771 100.00
†Cash holdings of USD537,875 are held with State Street Bank and Trust Company.USD335,085 is held as security for futures contracts with Morgan Stanley.
^These securities are partially or fully transferred as securities lent.~Investment in related party.ØThe counterparty for forward currency contracts is State Street Bank and Trust Company.
Equities are primarily classified by country/geographic region of
incorporation of the entity in which the Fund holds shares.
Underlying exposure has been calculated according to the guidelines
issued by the ESMA and represents the market value of an equivalent
position in the assets underlying each financial derivative instrument.
Analysis of total current assetsgross of all liabilities
Fair valueUSD'000
% of totalcurrentassets
Transferable securities admitted to an official stock exchange listing 200,406 98.57
Over-the-counter financial derivative instruments 208 0.10
UCITS collective investment schemes - Money Market Funds 1,560 0.77
Other assets 1,146 0.56
Total current assets 203,320 100.00
iSHARES VII PLC
SCHEDULE OF INVESTMENTS (continued)
iSHARES MSCI EMU USD HEDGED UCITS ETF (ACC) (continued)As at 31 July 2020
[200 ]
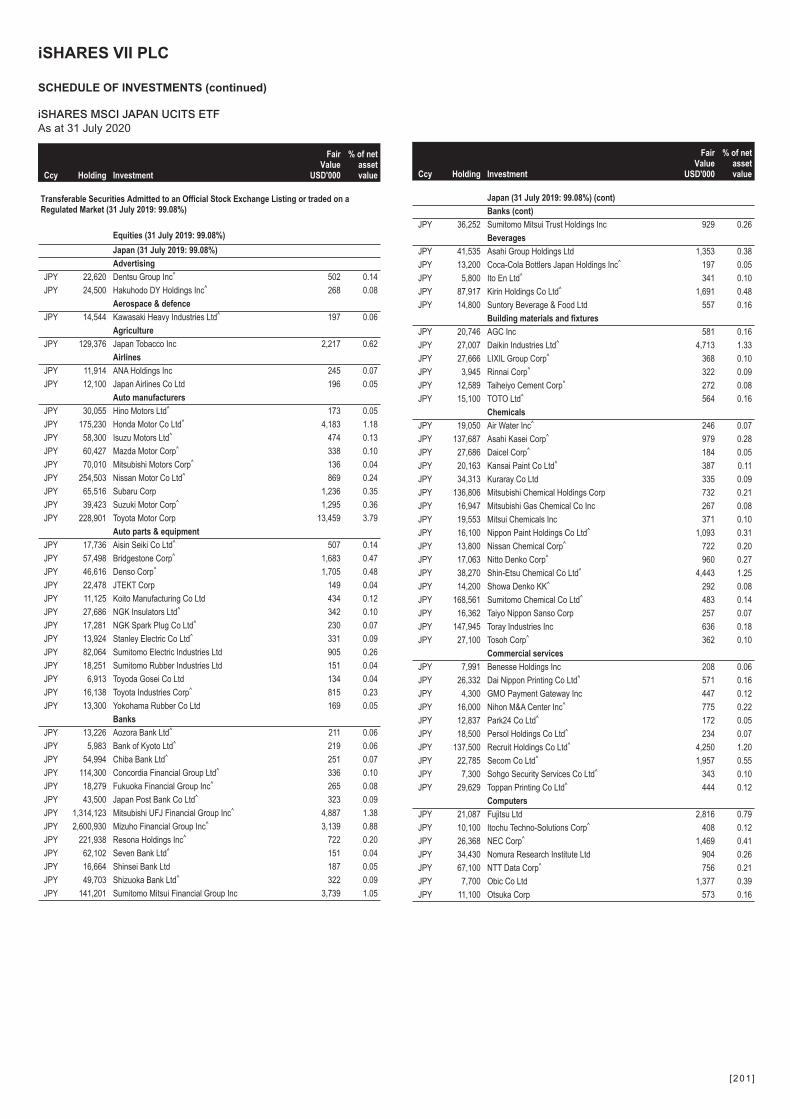
Ccy Holding Investment
FairValue
USD'000
% of netassetvalue
Transferable Securities Admitted to an Official Stock Exchange Listing or traded on aRegulated Market (31 July 2019: 99.08%)
Equities (31 July 2019: 99.08%)
Japan (31 July 2019: 99.08%)
Advertising
JPY 22,620 Dentsu Group Inc^ 502 0.14
JPY 24,500 Hakuhodo DY Holdings Inc^ 268 0.08
Aerospace & defence
JPY 14,544 Kawasaki Heavy Industries Ltd^ 197 0.06
Agriculture
JPY 129,376 Japan Tobacco Inc 2,217 0.62
Airlines
JPY 11,914 ANA Holdings Inc 245 0.07
JPY 12,100 Japan Airlines Co Ltd 196 0.05
Auto manufacturers
JPY 30,055 Hino Motors Ltd^ 173 0.05
JPY 175,230 Honda Motor Co Ltd^ 4,183 1.18
JPY 58,300 Isuzu Motors Ltd^ 474 0.13
JPY 60,427 Mazda Motor Corp^ 338 0.10
JPY 70,010 Mitsubishi Motors Corp^ 136 0.04
JPY 254,503 Nissan Motor Co Ltd^ 869 0.24
JPY 65,516 Subaru Corp 1,236 0.35
JPY 39,423 Suzuki Motor Corp^ 1,295 0.36
JPY 228,901 Toyota Motor Corp 13,459 3.79
Auto parts & equipment
JPY 17,736 Aisin Seiki Co Ltd^ 507 0.14
JPY 57,498 Bridgestone Corp^ 1,683 0.47
JPY 46,616 Denso Corp^ 1,705 0.48
JPY 22,478 JTEKT Corp 149 0.04
JPY 11,125 Koito Manufacturing Co Ltd 434 0.12
JPY 27,686 NGK Insulators Ltd^ 342 0.10
JPY 17,281 NGK Spark Plug Co Ltd^ 230 0.07
JPY 13,924 Stanley Electric Co Ltd^ 331 0.09
JPY 82,064 Sumitomo Electric Industries Ltd 905 0.26
JPY 18,251 Sumitomo Rubber Industries Ltd 151 0.04
JPY 6,913 Toyoda Gosei Co Ltd 134 0.04
JPY 16,138 Toyota Industries Corp^ 815 0.23
JPY 13,300 Yokohama Rubber Co Ltd 169 0.05
Banks
JPY 13,226 Aozora Bank Ltd^ 211 0.06
JPY 5,983 Bank of Kyoto Ltd^ 219 0.06
JPY 54,994 Chiba Bank Ltd^ 251 0.07
JPY 114,300 Concordia Financial Group Ltd^ 336 0.10
JPY 18,279 Fukuoka Financial Group Inc^ 265 0.08
JPY 43,500 Japan Post Bank Co Ltd^ 323 0.09
JPY 1,314,123 Mitsubishi UFJ Financial Group Inc^ 4,887 1.38
JPY 2,600,930 Mizuho Financial Group Inc^ 3,139 0.88
JPY 221,938 Resona Holdings Inc^ 722 0.20
JPY 62,102 Seven Bank Ltd^ 151 0.04
JPY 16,664 Shinsei Bank Ltd 187 0.05
JPY 49,703 Shizuoka Bank Ltd^ 322 0.09
JPY 141,201 Sumitomo Mitsui Financial Group Inc 3,739 1.05
Ccy Holding Investment
FairValue
USD'000
% of netassetvalue
Japan (31 July 2019: 99.08%) (cont)
Banks (cont)
JPY 36,252 Sumitomo Mitsui Trust Holdings Inc 929 0.26
Beverages
JPY 41,535 Asahi Group Holdings Ltd 1,353 0.38
JPY 13,200 Coca-Cola Bottlers Japan Holdings Inc^ 197 0.05
JPY 5,800 Ito En Ltd^ 341 0.10
JPY 87,917 Kirin Holdings Co Ltd^ 1,691 0.48
JPY 14,800 Suntory Beverage & Food Ltd 557 0.16
Building materials and fixtures
JPY 20,746 AGC Inc 581 0.16
JPY 27,007 Daikin Industries Ltd^ 4,713 1.33
JPY 27,666 LIXIL Group Corp^ 368 0.10
JPY 3,945 Rinnai Corp^ 322 0.09
JPY 12,589 Taiheiyo Cement Corp^ 272 0.08
JPY 15,100 TOTO Ltd^ 564 0.16
Chemicals
JPY 19,050 Air Water Inc^ 246 0.07
JPY 137,687 Asahi Kasei Corp^ 979 0.28
JPY 27,686 Daicel Corp^ 184 0.05
JPY 20,163 Kansai Paint Co Ltd^ 387 0.11
JPY 34,313 Kuraray Co Ltd 335 0.09
JPY 136,806 Mitsubishi Chemical Holdings Corp 732 0.21
JPY 16,947 Mitsubishi Gas Chemical Co Inc 267 0.08
JPY 19,553 Mitsui Chemicals Inc 371 0.10
JPY 16,100 Nippon Paint Holdings Co Ltd^ 1,093 0.31
JPY 13,800 Nissan Chemical Corp^ 722 0.20
JPY 17,063 Nitto Denko Corp^ 960 0.27
JPY 38,270 Shin-Etsu Chemical Co Ltd^ 4,443 1.25
JPY 14,200 Showa Denko KK^ 292 0.08
JPY 168,561 Sumitomo Chemical Co Ltd^ 483 0.14
JPY 16,362 Taiyo Nippon Sanso Corp 257 0.07
JPY 147,945 Toray Industries Inc 636 0.18
JPY 27,100 Tosoh Corp^ 362 0.10
Commercial services
JPY 7,991 Benesse Holdings Inc 208 0.06
JPY 26,332 Dai Nippon Printing Co Ltd^ 571 0.16
JPY 4,300 GMO Payment Gateway Inc 447 0.12
JPY 16,000 Nihon M&A Center Inc^ 775 0.22
JPY 12,837 Park24 Co Ltd^ 172 0.05
JPY 18,500 Persol Holdings Co Ltd^ 234 0.07
JPY 137,500 Recruit Holdings Co Ltd^ 4,250 1.20
JPY 22,785 Secom Co Ltd^ 1,957 0.55
JPY 7,300 Sohgo Security Services Co Ltd^ 343 0.10
JPY 29,629 Toppan Printing Co Ltd^ 444 0.12
Computers
JPY 21,087 Fujitsu Ltd 2,816 0.79
JPY 10,100 Itochu Techno-Solutions Corp^ 408 0.12
JPY 26,368 NEC Corp^ 1,469 0.41
JPY 34,430 Nomura Research Institute Ltd 904 0.26
JPY 67,100 NTT Data Corp^ 756 0.21
JPY 7,700 Obic Co Ltd 1,377 0.39
JPY 11,100 Otsuka Corp 573 0.16
iSHARES VII PLC
SCHEDULE OF INVESTMENTS (continued)
iSHARES MSCI JAPAN UCITS ETFAs at 31 July 2020
[201 ]
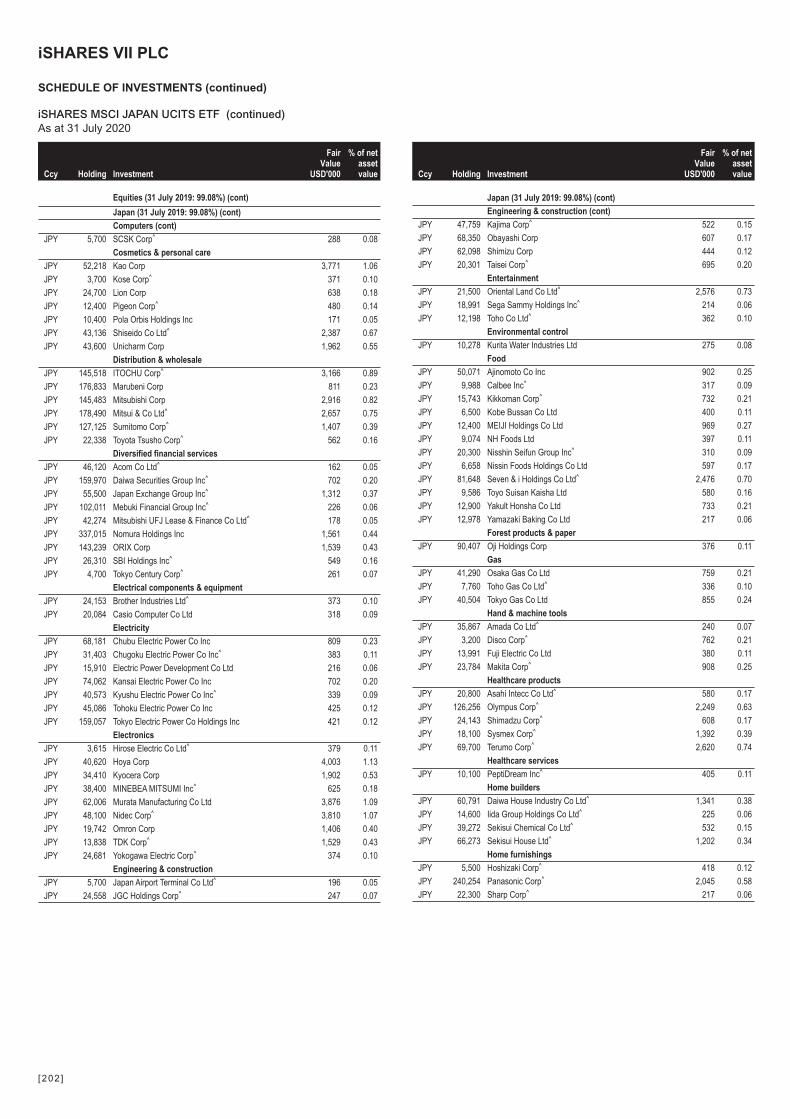
Ccy Holding Investment
FairValue
USD'000
% of netassetvalue
Equities (31 July 2019: 99.08%) (cont)
Japan (31 July 2019: 99.08%) (cont)
Computers (cont)
JPY 5,700 SCSK Corp^ 288 0.08
Cosmetics & personal care
JPY 52,218 Kao Corp 3,771 1.06
JPY 3,700 Kose Corp^ 371 0.10
JPY 24,700 Lion Corp 638 0.18
JPY 12,400 Pigeon Corp^ 480 0.14
JPY 10,400 Pola Orbis Holdings Inc 171 0.05
JPY 43,136 Shiseido Co Ltd^ 2,387 0.67
JPY 43,600 Unicharm Corp 1,962 0.55
Distribution & wholesale
JPY 145,518 ITOCHU Corp^ 3,166 0.89
JPY 176,833 Marubeni Corp 811 0.23
JPY 145,483 Mitsubishi Corp 2,916 0.82
JPY 178,490 Mitsui & Co Ltd^ 2,657 0.75
JPY 127,125 Sumitomo Corp^ 1,407 0.39
JPY 22,338 Toyota Tsusho Corp^ 562 0.16
Diversified financial services
JPY 46,120 Acom Co Ltd^ 162 0.05
JPY 159,970 Daiwa Securities Group Inc^ 702 0.20
JPY 55,500 Japan Exchange Group Inc^ 1,312 0.37
JPY 102,011 Mebuki Financial Group Inc^ 226 0.06
JPY 42,274 Mitsubishi UFJ Lease & Finance Co Ltd^ 178 0.05
JPY 337,015 Nomura Holdings Inc 1,561 0.44
JPY 143,239 ORIX Corp 1,539 0.43
JPY 26,310 SBI Holdings Inc^ 549 0.16
JPY 4,700 Tokyo Century Corp^ 261 0.07
Electrical components & equipment
JPY 24,153 Brother Industries Ltd^ 373 0.10
JPY 20,084 Casio Computer Co Ltd 318 0.09
Electricity
JPY 68,181 Chubu Electric Power Co Inc 809 0.23
JPY 31,403 Chugoku Electric Power Co Inc^ 383 0.11
JPY 15,910 Electric Power Development Co Ltd 216 0.06
JPY 74,062 Kansai Electric Power Co Inc 702 0.20
JPY 40,573 Kyushu Electric Power Co Inc^ 339 0.09
JPY 45,086 Tohoku Electric Power Co Inc 425 0.12
JPY 159,057 Tokyo Electric Power Co Holdings Inc 421 0.12
Electronics
JPY 3,615 Hirose Electric Co Ltd^ 379 0.11
JPY 40,620 Hoya Corp 4,003 1.13
JPY 34,410 Kyocera Corp 1,902 0.53
JPY 38,400 MINEBEA MITSUMI Inc^ 625 0.18
JPY 62,006 Murata Manufacturing Co Ltd 3,876 1.09
JPY 48,100 Nidec Corp^ 3,810 1.07
JPY 19,742 Omron Corp 1,406 0.40
JPY 13,838 TDK Corp^ 1,529 0.43
JPY 24,681 Yokogawa Electric Corp^ 374 0.10
Engineering & construction
JPY 5,700 Japan Airport Terminal Co Ltd^ 196 0.05
JPY 24,558 JGC Holdings Corp^ 247 0.07
Ccy Holding Investment
FairValue
USD'000
% of netassetvalue
Japan (31 July 2019: 99.08%) (cont)
Engineering & construction (cont)
JPY 47,759 Kajima Corp^ 522 0.15
JPY 68,350 Obayashi Corp 607 0.17
JPY 62,098 Shimizu Corp 444 0.12
JPY 20,301 Taisei Corp^ 695 0.20
Entertainment
JPY 21,500 Oriental Land Co Ltd^ 2,576 0.73
JPY 18,991 Sega Sammy Holdings Inc^ 214 0.06
JPY 12,198 Toho Co Ltd^ 362 0.10
Environmental control
JPY 10,278 Kurita Water Industries Ltd 275 0.08
Food
JPY 50,071 Ajinomoto Co Inc 902 0.25
JPY 9,988 Calbee Inc^ 317 0.09
JPY 15,743 Kikkoman Corp^ 732 0.21
JPY 6,500 Kobe Bussan Co Ltd 400 0.11
JPY 12,400 MEIJI Holdings Co Ltd 969 0.27
JPY 9,074 NH Foods Ltd 397 0.11
JPY 20,300 Nisshin Seifun Group Inc^ 310 0.09
JPY 6,658 Nissin Foods Holdings Co Ltd 597 0.17
JPY 81,648 Seven & i Holdings Co Ltd^ 2,476 0.70
JPY 9,586 Toyo Suisan Kaisha Ltd 580 0.16
JPY 12,900 Yakult Honsha Co Ltd 733 0.21
JPY 12,978 Yamazaki Baking Co Ltd 217 0.06
Forest products & paper
JPY 90,407 Oji Holdings Corp 376 0.11
Gas
JPY 41,290 Osaka Gas Co Ltd 759 0.21
JPY 7,760 Toho Gas Co Ltd^ 336 0.10
JPY 40,504 Tokyo Gas Co Ltd 855 0.24
Hand & machine tools
JPY 35,867 Amada Co Ltd^ 240 0.07
JPY 3,200 Disco Corp^ 762 0.21
JPY 13,991 Fuji Electric Co Ltd 380 0.11
JPY 23,784 Makita Corp^ 908 0.25
Healthcare products
JPY 20,800 Asahi Intecc Co Ltd^ 580 0.17
JPY 126,256 Olympus Corp^ 2,249 0.63
JPY 24,143 Shimadzu Corp^ 608 0.17
JPY 18,100 Sysmex Corp^ 1,392 0.39
JPY 69,700 Terumo Corp^ 2,620 0.74
Healthcare services
JPY 10,100 PeptiDream Inc^ 405 0.11
Home builders
JPY 60,791 Daiwa House Industry Co Ltd^ 1,341 0.38
JPY 14,600 Iida Group Holdings Co Ltd^ 225 0.06
JPY 39,272 Sekisui Chemical Co Ltd^ 532 0.15
JPY 66,273 Sekisui House Ltd^ 1,202 0.34
Home furnishings
JPY 5,500 Hoshizaki Corp^ 418 0.12
JPY 240,254 Panasonic Corp^ 2,045 0.58
JPY 22,300 Sharp Corp^ 217 0.06
iSHARES VII PLC
SCHEDULE OF INVESTMENTS (continued)
iSHARES MSCI JAPAN UCITS ETF (continued)As at 31 July 2020
[202 ]

Ccy Holding Investment
FairValue
USD'000
% of netassetvalue
Equities (31 July 2019: 99.08%) (cont)
Japan (31 July 2019: 99.08%) (cont)
Home furnishings (cont)
JPY 137,397 Sony Corp 10,495 2.95
Insurance
JPY 115,400 Dai-ichi Life Holdings Inc^ 1,342 0.38
JPY 167,600 Japan Post Holdings Co Ltd 1,137 0.32
JPY 23,700 Japan Post Insurance Co Ltd^ 313 0.09
JPY 47,717 MS&AD Insurance Group Holdings Inc 1,190 0.34
JPY 36,234 Sompo Holdings Inc^ 1,184 0.33
JPY 58,547 T&D Holdings Inc^ 478 0.13
JPY 69,215 Tokio Marine Holdings Inc^ 2,904 0.82
Internet
JPY 10,600 CyberAgent Inc^ 596 0.17
JPY 14,800 Kakaku.com Inc 356 0.10
JPY 6,900 LINE Corp 365 0.10
JPY 47,400 M3 Inc^ 2,412 0.68
JPY 9,100 Mercari Inc 380 0.11
JPY 13,700 MonotaRO Co Ltd^ 584 0.16
JPY 90,762 Rakuten Inc^ 828 0.23
JPY 14,264 Trend Micro Inc^ 830 0.23
JPY 287,500 Z Holdings Corp 1,515 0.43
JPY 12,700 ZOZO Inc 344 0.10
Iron & steel
JPY 23,127 Hitachi Metals Ltd^ 300 0.08
JPY 52,749 JFE Holdings Inc 341 0.10
JPY 85,800 Nippon Steel Corp 696 0.20
Leisure time
JPY 8,086 Shimano Inc^ 1,759 0.50
JPY 14,891 Yamaha Corp^ 683 0.19
JPY 30,126 Yamaha Motor Co Ltd^ 437 0.12
Machinery - diversified
JPY 11,200 Daifuku Co Ltd^ 1,006 0.28
JPY 20,883 FANUC Corp^ 3,497 0.99
JPY 19,720 Keyence Corp 8,248 2.32
JPY 112,751 Kubota Corp^ 1,603 0.45
JPY 9,500 Miura Co Ltd 356 0.10
JPY 12,049 Nabtesco Corp^ 361 0.10
JPY 6,224 SMC Corp^ 3,242 0.91
JPY 11,286 Sumitomo Heavy Industries Ltd 219 0.06
JPY 13,624 THK Co Ltd 317 0.09
JPY 26,240 Yaskawa Electric Corp^ 865 0.25
Machinery, construction & mining
JPY 11,372 Hitachi Construction Machinery Co Ltd^ 325 0.09
JPY 104,547 Hitachi Ltd^ 3,093 0.87
JPY 93,914 Komatsu Ltd^ 1,835 0.52
JPY 197,546 Mitsubishi Electric Corp 2,561 0.72
JPY 34,451 Mitsubishi Heavy Industries Ltd^ 797 0.22
Metal fabricate/ hardware
JPY 6,109 Maruichi Steel Tube Ltd^ 144 0.04
JPY 30,400 MISUMI Group Inc^ 717 0.20
JPY 36,669 NSK Ltd 243 0.07
Ccy Holding Investment
FairValue
USD'000
% of netassetvalue
Japan (31 July 2019: 99.08%) (cont)
Mining
JPY 12,190 Mitsubishi Materials Corp^ 248 0.07
JPY 24,629 Sumitomo Metal Mining Co Ltd^ 730 0.21
Miscellaneous manufacturers
JPY 21,932 JSR Corp^ 471 0.13
JPY 34,320 Nikon Corp^ 238 0.07
JPY 41,596 Toshiba Corp 1,259 0.35
Office & business equipment
JPY 108,784 Canon Inc^ 1,724 0.49
JPY 38,548 FUJIFILM Holdings Corp^ 1,720 0.48
JPY 74,732 Ricoh Co Ltd^ 477 0.13
JPY 29,400 Seiko Epson Corp^ 309 0.09
Oil & gas
JPY 335,333 ENEOS Holdings Inc 1,164 0.33
JPY 20,935 Idemitsu Kosan Co Ltd^ 432 0.12
JPY 111,900 Inpex Corp 634 0.18
Pharmaceuticals
JPY 21,000 Alfresa Holdings Corp 429 0.12
JPY 201,800 Astellas Pharma Inc 3,149 0.89
JPY 72,318 Chugai Pharmaceutical Co Ltd 3,239 0.91
JPY 61,083 Daiichi Sankyo Co Ltd 5,349 1.51
JPY 27,168 Eisai Co Ltd^ 2,181 0.61
JPY 5,427 Hisamitsu Pharmaceutical Co Inc^ 236 0.07
JPY 5,500 Kobayashi Pharmaceutical Co Ltd^ 487 0.14
JPY 29,007 Kyowa Kirin Co Ltd 713 0.20
JPY 19,548 Medipal Holdings Corp 359 0.10
JPY 5,000 Nippon Shinyaku Co Ltd^ 385 0.11
JPY 40,300 Ono Pharmaceutical Co Ltd 1,130 0.32
JPY 42,062 Otsuka Holdings Co Ltd^ 1,739 0.49
JPY 38,400 Santen Pharmaceutical Co Ltd^ 647 0.18
JPY 29,055 Shionogi & Co Ltd^ 1,720 0.48
JPY 19,197 Sumitomo Dainippon Pharma Co Ltd^ 239 0.07
JPY 7,400 Suzuken Co Ltd^ 262 0.07
JPY 3,777 Taisho Pharmaceutical Holdings Co Ltd^ 213 0.06
JPY 170,135 Takeda Pharmaceutical Co Ltd 6,044 1.70
Real estate investment & services
JPY 10,268 Aeon Mall Co Ltd 122 0.03
JPY 6,864 Daito Trust Construction Co Ltd^ 537 0.15
JPY 32,118 Hulic Co Ltd^ 275 0.08
JPY 126,587 Mitsubishi Estate Co Ltd 1,819 0.51
JPY 99,716 Mitsui Fudosan Co Ltd 1,554 0.44
JPY 14,023 Nomura Real Estate Holdings Inc 232 0.06
JPY 33,232 Sumitomo Realty & Development Co Ltd 845 0.24
JPY 64,114 Tokyu Fudosan Holdings Corp^ 245 0.07
Real estate investment trusts
JPY 213 Daiwa House Investment Corp (REIT)^ 553 0.16
JPY 390 GLP J-Reit (REIT)^ 648 0.18
JPY 85 Japan Prime Realty Investment Corp (REIT) 224 0.06
JPY 142 Japan Real Estate Investment Corp (REIT) 725 0.20
JPY 286 Japan Retail Fund Investment Corp (REIT) 343 0.10
JPY 142 Nippon Building Fund Inc (REIT)^ 795 0.22
JPY 224 Nippon Prologis Inc (REIT) 772 0.22
iSHARES VII PLC
SCHEDULE OF INVESTMENTS (continued)
iSHARES MSCI JAPAN UCITS ETF (continued)As at 31 July 2020
[203 ]
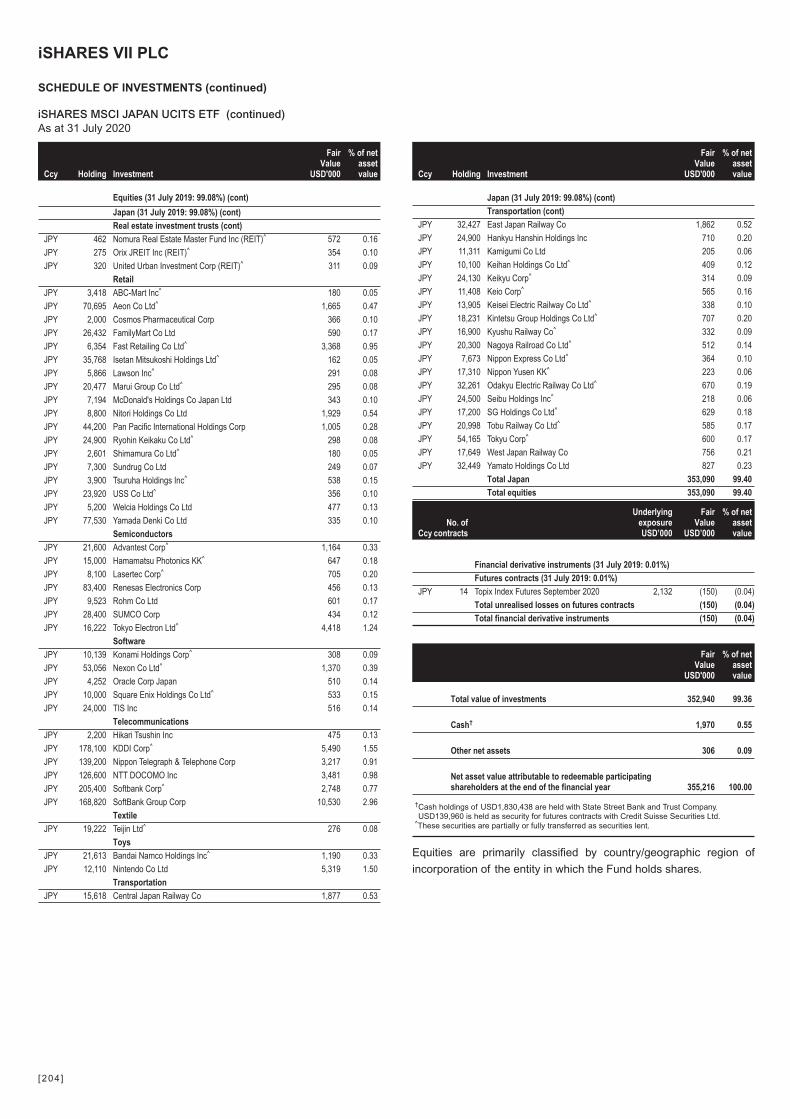
Ccy Holding Investment
FairValue
USD'000
% of netassetvalue
Equities (31 July 2019: 99.08%) (cont)
Japan (31 July 2019: 99.08%) (cont)
Real estate investment trusts (cont)
JPY 462 Nomura Real Estate Master Fund Inc (REIT)^ 572 0.16
JPY 275 Orix JREIT Inc (REIT)^ 354 0.10
JPY 320 United Urban Investment Corp (REIT)^ 311 0.09
Retail
JPY 3,418 ABC-Mart Inc^ 180 0.05
JPY 70,695 Aeon Co Ltd^ 1,665 0.47
JPY 2,000 Cosmos Pharmaceutical Corp 366 0.10
JPY 26,432 FamilyMart Co Ltd 590 0.17
JPY 6,354 Fast Retailing Co Ltd^ 3,368 0.95
JPY 35,768 Isetan Mitsukoshi Holdings Ltd^ 162 0.05
JPY 5,866 Lawson Inc^ 291 0.08
JPY 20,477 Marui Group Co Ltd^ 295 0.08
JPY 7,194 McDonald's Holdings Co Japan Ltd 343 0.10
JPY 8,800 Nitori Holdings Co Ltd 1,929 0.54
JPY 44,200 Pan Pacific International Holdings Corp 1,005 0.28
JPY 24,900 Ryohin Keikaku Co Ltd^ 298 0.08
JPY 2,601 Shimamura Co Ltd^ 180 0.05
JPY 7,300 Sundrug Co Ltd 249 0.07
JPY 3,900 Tsuruha Holdings Inc^ 538 0.15
JPY 23,920 USS Co Ltd^ 356 0.10
JPY 5,200 Welcia Holdings Co Ltd 477 0.13
JPY 77,530 Yamada Denki Co Ltd 335 0.10
Semiconductors
JPY 21,600 Advantest Corp^ 1,164 0.33
JPY 15,000 Hamamatsu Photonics KK^ 647 0.18
JPY 8,100 Lasertec Corp^ 705 0.20
JPY 83,400 Renesas Electronics Corp 456 0.13
JPY 9,523 Rohm Co Ltd 601 0.17
JPY 28,400 SUMCO Corp 434 0.12
JPY 16,222 Tokyo Electron Ltd^ 4,418 1.24
Software
JPY 10,139 Konami Holdings Corp^ 308 0.09
JPY 53,056 Nexon Co Ltd^ 1,370 0.39
JPY 4,252 Oracle Corp Japan 510 0.14
JPY 10,000 Square Enix Holdings Co Ltd^ 533 0.15
JPY 24,000 TIS Inc 516 0.14
Telecommunications
JPY 2,200 Hikari Tsushin Inc 475 0.13
JPY 178,100 KDDI Corp^ 5,490 1.55
JPY 139,200 Nippon Telegraph & Telephone Corp 3,217 0.91
JPY 126,600 NTT DOCOMO Inc 3,481 0.98
JPY 205,400 Softbank Corp^ 2,748 0.77
JPY 168,820 SoftBank Group Corp 10,530 2.96
Textile
JPY 19,222 Teijin Ltd^ 276 0.08
Toys
JPY 21,613 Bandai Namco Holdings Inc^ 1,190 0.33
JPY 12,110 Nintendo Co Ltd 5,319 1.50
Transportation
JPY 15,618 Central Japan Railway Co 1,877 0.53
Ccy Holding Investment
FairValue
USD'000
% of netassetvalue
Japan (31 July 2019: 99.08%) (cont)
Transportation (cont)
JPY 32,427 East Japan Railway Co 1,862 0.52
JPY 24,900 Hankyu Hanshin Holdings Inc 710 0.20
JPY 11,311 Kamigumi Co Ltd 205 0.06
JPY 10,100 Keihan Holdings Co Ltd^ 409 0.12
JPY 24,130 Keikyu Corp^ 314 0.09
JPY 11,408 Keio Corp^ 565 0.16
JPY 13,905 Keisei Electric Railway Co Ltd^ 338 0.10
JPY 18,231 Kintetsu Group Holdings Co Ltd^ 707 0.20
JPY 16,900 Kyushu Railway Co^ 332 0.09
JPY 20,300 Nagoya Railroad Co Ltd^ 512 0.14
JPY 7,673 Nippon Express Co Ltd^ 364 0.10
JPY 17,310 Nippon Yusen KK^ 223 0.06
JPY 32,261 Odakyu Electric Railway Co Ltd^ 670 0.19
JPY 24,500 Seibu Holdings Inc^ 218 0.06
JPY 17,200 SG Holdings Co Ltd^ 629 0.18
JPY 20,998 Tobu Railway Co Ltd^ 585 0.17
JPY 54,165 Tokyu Corp^ 600 0.17
JPY 17,649 West Japan Railway Co 756 0.21
JPY 32,449 Yamato Holdings Co Ltd 827 0.23
Total Japan 353,090 99.40
Total equities 353,090 99.40
CcyNo. of
contracts
UnderlyingexposureUSD’000
FairValue
USD’000
% of netassetvalue
Financial derivative instruments (31 July 2019: 0.01%)
Futures contracts (31 July 2019: 0.01%)
JPY 14 Topix Index Futures September 2020 2,132 (150) (0.04)
Total unrealised losses on futures contracts (150) (0.04)
Total financial derivative instruments (150) (0.04)
FairValue
USD'000
% of netassetvalue
Total value of investments 352,940 99.36
Cash† 1,970 0.55
Other net assets 306 0.09
Net asset value attributable to redeemable participatingshareholders at the end of the financial year 355,216 100.00
†Cash holdings of USD1,830,438 are held with State Street Bank and Trust Company.USD139,960 is held as security for futures contracts with Credit Suisse Securities Ltd.
^These securities are partially or fully transferred as securities lent.
Equities are primarily classified by country/geographic region of
incorporation of the entity in which the Fund holds shares.
iSHARES VII PLC
SCHEDULE OF INVESTMENTS (continued)
iSHARES MSCI JAPAN UCITS ETF (continued)As at 31 July 2020
[204 ]

Underlying exposure has been calculated according to the guidelines
issued by the ESMA and represents the market value of an equivalent
position in the assets underlying each financial derivative instrument.
Analysis of total current assetsgross of all liabilities
Fair valueUSD'000
% of totalcurrentassets
Transferable securities admitted to an official stock exchange listing 353,090 99.32
Other assets 2,426 0.68
Total current assets 355,516 100.00
iSHARES VII PLC
SCHEDULE OF INVESTMENTS (continued)
iSHARES MSCI JAPAN UCITS ETF (continued)As at 31 July 2020
[205 ]
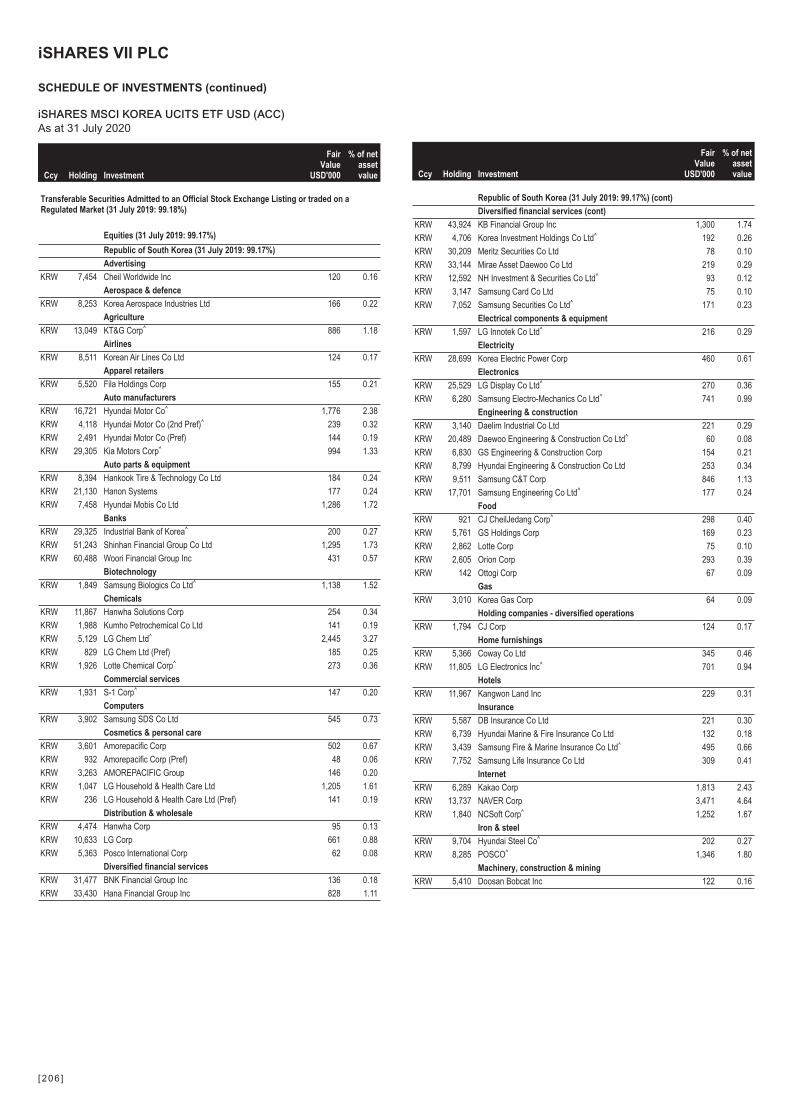
Ccy Holding Investment
FairValue
USD'000
% of netassetvalue
Transferable Securities Admitted to an Official Stock Exchange Listing or traded on aRegulated Market (31 July 2019: 99.18%)
Equities (31 July 2019: 99.17%)
Republic of South Korea (31 July 2019: 99.17%)
Advertising
KRW 7,454 Cheil Worldwide Inc 120 0.16
Aerospace & defence
KRW 8,253 Korea Aerospace Industries Ltd 166 0.22
Agriculture
KRW 13,049 KT&G Corp^ 886 1.18
Airlines
KRW 8,511 Korean Air Lines Co Ltd 124 0.17
Apparel retailers
KRW 5,520 Fila Holdings Corp 155 0.21
Auto manufacturers
KRW 16,721 Hyundai Motor Co^ 1,776 2.38
KRW 4,118 Hyundai Motor Co (2nd Pref)^ 239 0.32
KRW 2,491 Hyundai Motor Co (Pref) 144 0.19
KRW 29,305 Kia Motors Corp^ 994 1.33
Auto parts & equipment
KRW 8,394 Hankook Tire & Technology Co Ltd 184 0.24
KRW 21,130 Hanon Systems 177 0.24
KRW 7,458 Hyundai Mobis Co Ltd 1,286 1.72
Banks
KRW 29,325 Industrial Bank of Korea^ 200 0.27
KRW 51,243 Shinhan Financial Group Co Ltd 1,295 1.73
KRW 60,488 Woori Financial Group Inc 431 0.57
Biotechnology
KRW 1,849 Samsung Biologics Co Ltd^ 1,138 1.52
Chemicals
KRW 11,867 Hanwha Solutions Corp 254 0.34
KRW 1,988 Kumho Petrochemical Co Ltd 141 0.19
KRW 5,129 LG Chem Ltd^ 2,445 3.27
KRW 829 LG Chem Ltd (Pref) 185 0.25
KRW 1,926 Lotte Chemical Corp^ 273 0.36
Commercial services
KRW 1,931 S-1 Corp^ 147 0.20
Computers
KRW 3,902 Samsung SDS Co Ltd 545 0.73
Cosmetics & personal care
KRW 3,601 Amorepacific Corp 502 0.67
KRW 932 Amorepacific Corp (Pref) 48 0.06
KRW 3,263 AMOREPACIFIC Group 146 0.20
KRW 1,047 LG Household & Health Care Ltd 1,205 1.61
KRW 236 LG Household & Health Care Ltd (Pref) 141 0.19
Distribution & wholesale
KRW 4,474 Hanwha Corp 95 0.13
KRW 10,633 LG Corp 661 0.88
KRW 5,363 Posco International Corp 62 0.08
Diversified financial services
KRW 31,477 BNK Financial Group Inc 136 0.18
KRW 33,430 Hana Financial Group Inc 828 1.11
Ccy Holding Investment
FairValue
USD'000
% of netassetvalue
Republic of South Korea (31 July 2019: 99.17%) (cont)
Diversified financial services (cont)
KRW 43,924 KB Financial Group Inc 1,300 1.74
KRW 4,706 Korea Investment Holdings Co Ltd^ 192 0.26
KRW 30,209 Meritz Securities Co Ltd 78 0.10
KRW 33,144 Mirae Asset Daewoo Co Ltd 219 0.29
KRW 12,592 NH Investment & Securities Co Ltd^ 93 0.12
KRW 3,147 Samsung Card Co Ltd 75 0.10
KRW 7,052 Samsung Securities Co Ltd^ 171 0.23
Electrical components & equipment
KRW 1,597 LG Innotek Co Ltd^ 216 0.29
Electricity
KRW 28,699 Korea Electric Power Corp 460 0.61
Electronics
KRW 25,529 LG Display Co Ltd^ 270 0.36
KRW 6,280 Samsung Electro-Mechanics Co Ltd^ 741 0.99
Engineering & construction
KRW 3,140 Daelim Industrial Co Ltd 221 0.29
KRW 20,489 Daewoo Engineering & Construction Co Ltd^ 60 0.08
KRW 6,830 GS Engineering & Construction Corp 154 0.21
KRW 8,799 Hyundai Engineering & Construction Co Ltd 253 0.34
KRW 9,511 Samsung C&T Corp 846 1.13
KRW 17,701 Samsung Engineering Co Ltd^ 177 0.24
Food
KRW 921 CJ CheilJedang Corp^ 298 0.40
KRW 5,761 GS Holdings Corp 169 0.23
KRW 2,862 Lotte Corp 75 0.10
KRW 2,605 Orion Corp 293 0.39
KRW 142 Ottogi Corp 67 0.09
Gas
KRW 3,010 Korea Gas Corp 64 0.09
Holding companies - diversified operations
KRW 1,794 CJ Corp 124 0.17
Home furnishings
KRW 5,366 Coway Co Ltd 345 0.46
KRW 11,805 LG Electronics Inc^ 701 0.94
Hotels
KRW 11,967 Kangwon Land Inc 229 0.31
Insurance
KRW 5,587 DB Insurance Co Ltd 221 0.30
KRW 6,739 Hyundai Marine & Fire Insurance Co Ltd 132 0.18
KRW 3,439 Samsung Fire & Marine Insurance Co Ltd^ 495 0.66
KRW 7,752 Samsung Life Insurance Co Ltd 309 0.41
Internet
KRW 6,289 Kakao Corp 1,813 2.43
KRW 13,737 NAVER Corp 3,471 4.64
KRW 1,840 NCSoft Corp^ 1,252 1.67
Iron & steel
KRW 9,704 Hyundai Steel Co^ 202 0.27
KRW 8,285 POSCO^ 1,346 1.80
Machinery, construction & mining
KRW 5,410 Doosan Bobcat Inc 122 0.16
iSHARES VII PLC
SCHEDULE OF INVESTMENTS (continued)
iSHARES MSCI KOREA UCITS ETF USD (ACC)As at 31 July 2020
[206 ]
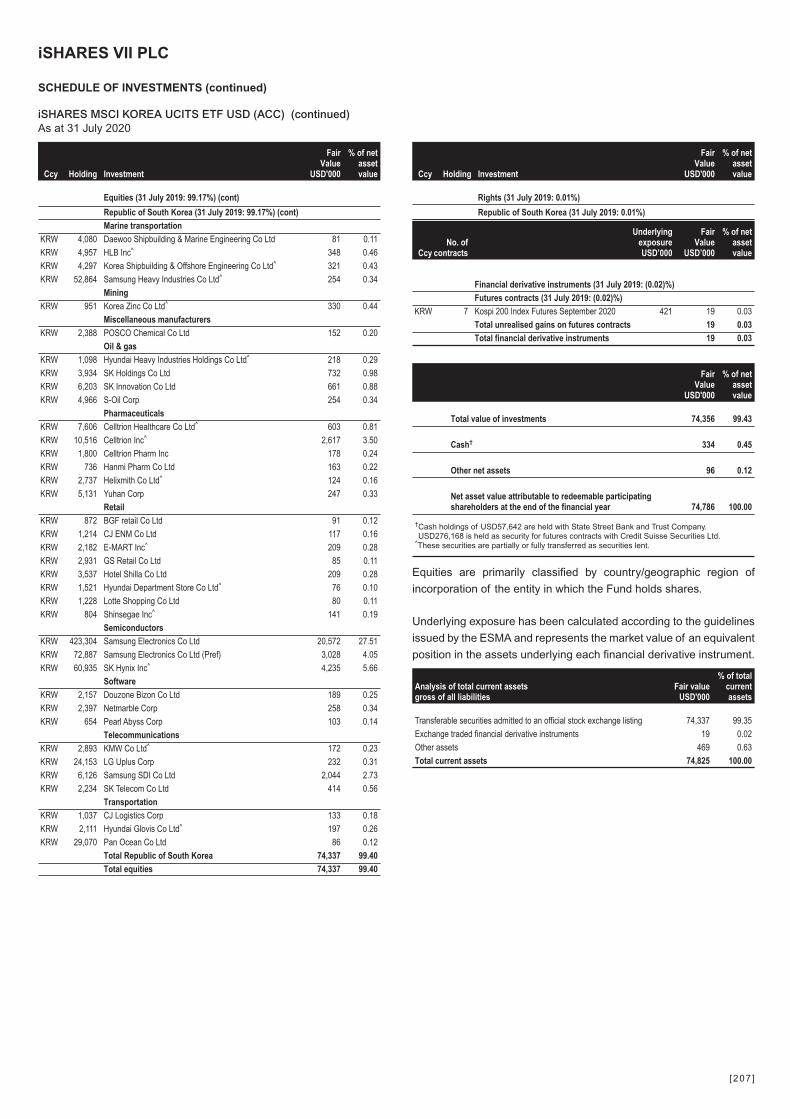
Ccy Holding Investment
FairValue
USD'000
% of netassetvalue
Equities (31 July 2019: 99.17%) (cont)
Republic of South Korea (31 July 2019: 99.17%) (cont)
Marine transportation
KRW 4,080 Daewoo Shipbuilding & Marine Engineering Co Ltd 81 0.11
KRW 4,957 HLB Inc^ 348 0.46
KRW 4,297 Korea Shipbuilding & Offshore Engineering Co Ltd^ 321 0.43
KRW 52,864 Samsung Heavy Industries Co Ltd^ 254 0.34
Mining
KRW 951 Korea Zinc Co Ltd^ 330 0.44
Miscellaneous manufacturers
KRW 2,388 POSCO Chemical Co Ltd 152 0.20
Oil & gas
KRW 1,098 Hyundai Heavy Industries Holdings Co Ltd^ 218 0.29
KRW 3,934 SK Holdings Co Ltd 732 0.98
KRW 6,203 SK Innovation Co Ltd 661 0.88
KRW 4,966 S-Oil Corp 254 0.34
Pharmaceuticals
KRW 7,606 Celltrion Healthcare Co Ltd^ 603 0.81
KRW 10,516 Celltrion Inc^ 2,617 3.50
KRW 1,800 Celltrion Pharm Inc 178 0.24
KRW 736 Hanmi Pharm Co Ltd 163 0.22
KRW 2,737 Helixmith Co Ltd^ 124 0.16
KRW 5,131 Yuhan Corp 247 0.33
Retail
KRW 872 BGF retail Co Ltd 91 0.12
KRW 1,214 CJ ENM Co Ltd 117 0.16
KRW 2,182 E-MART Inc^ 209 0.28
KRW 2,931 GS Retail Co Ltd 85 0.11
KRW 3,537 Hotel Shilla Co Ltd 209 0.28
KRW 1,521 Hyundai Department Store Co Ltd^ 76 0.10
KRW 1,228 Lotte Shopping Co Ltd 80 0.11
KRW 804 Shinsegae Inc^ 141 0.19
Semiconductors
KRW 423,304 Samsung Electronics Co Ltd 20,572 27.51
KRW 72,887 Samsung Electronics Co Ltd (Pref) 3,028 4.05
KRW 60,935 SK Hynix Inc^ 4,235 5.66
Software
KRW 2,157 Douzone Bizon Co Ltd 189 0.25
KRW 2,397 Netmarble Corp 258 0.34
KRW 654 Pearl Abyss Corp 103 0.14
Telecommunications
KRW 2,893 KMW Co Ltd^ 172 0.23
KRW 24,153 LG Uplus Corp 232 0.31
KRW 6,126 Samsung SDI Co Ltd 2,044 2.73
KRW 2,234 SK Telecom Co Ltd 414 0.56
Transportation
KRW 1,037 CJ Logistics Corp 133 0.18
KRW 2,111 Hyundai Glovis Co Ltd^ 197 0.26
KRW 29,070 Pan Ocean Co Ltd 86 0.12
Total Republic of South Korea 74,337 99.40
Total equities 74,337 99.40
Ccy Holding Investment
FairValue
USD'000
% of netassetvalue
Rights (31 July 2019: 0.01%)
Republic of South Korea (31 July 2019: 0.01%)
CcyNo. of
contracts
UnderlyingexposureUSD’000
FairValue
USD’000
% of netassetvalue
Financial derivative instruments (31 July 2019: (0.02)%)
Futures contracts (31 July 2019: (0.02)%)
KRW 7 Kospi 200 Index Futures September 2020 421 19 0.03
Total unrealised gains on futures contracts 19 0.03
Total financial derivative instruments 19 0.03
FairValue
USD'000
% of netassetvalue
Total value of investments 74,356 99.43
Cash† 334 0.45
Other net assets 96 0.12
Net asset value attributable to redeemable participatingshareholders at the end of the financial year 74,786 100.00
†Cash holdings of USD57,642 are held with State Street Bank and Trust Company.USD276,168 is held as security for futures contracts with Credit Suisse Securities Ltd.
^These securities are partially or fully transferred as securities lent.
Equities are primarily classified by country/geographic region of
incorporation of the entity in which the Fund holds shares.
Underlying exposure has been calculated according to the guidelines
issued by the ESMA and represents the market value of an equivalent
position in the assets underlying each financial derivative instrument.
Analysis of total current assetsgross of all liabilities
Fair valueUSD'000
% of totalcurrentassets
Transferable securities admitted to an official stock exchange listing 74,337 99.35
Exchange traded financial derivative instruments 19 0.02
Other assets 469 0.63
Total current assets 74,825 100.00
iSHARES VII PLC
SCHEDULE OF INVESTMENTS (continued)
iSHARES MSCI KOREA UCITS ETF USD (ACC) (continued)As at 31 July 2020
[207 ]
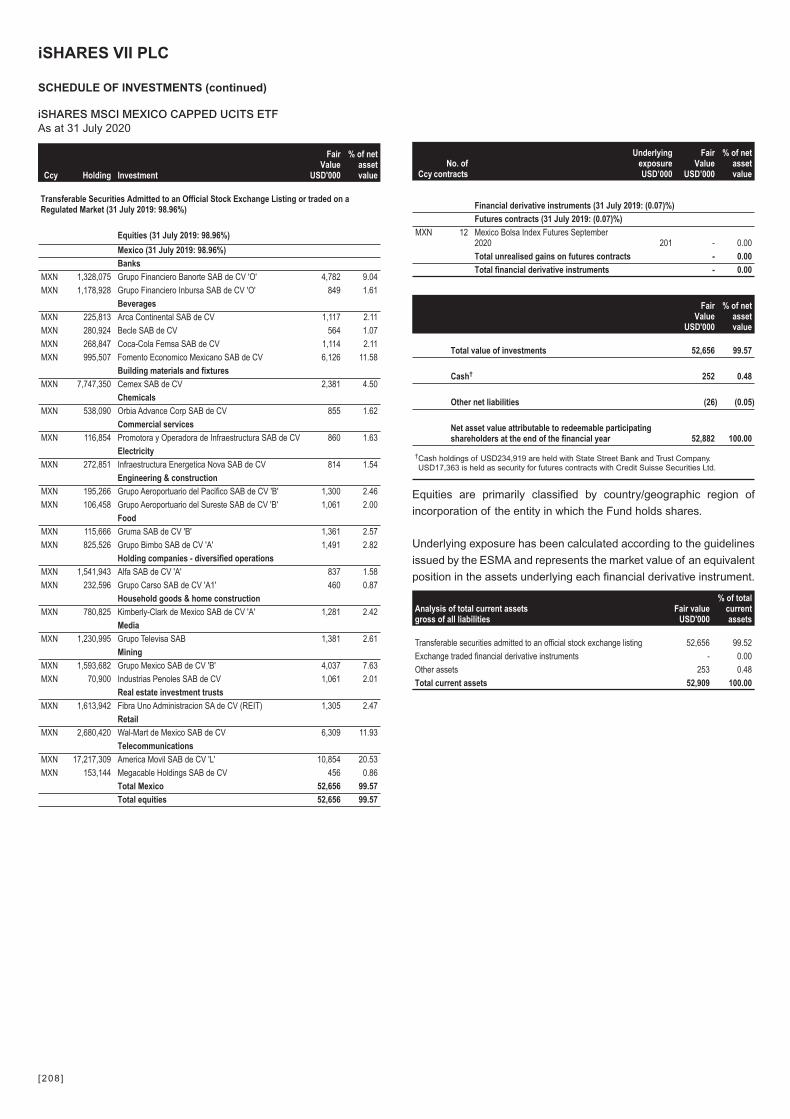
Ccy Holding Investment
FairValue
USD'000
% of netassetvalue
Transferable Securities Admitted to an Official Stock Exchange Listing or traded on aRegulated Market (31 July 2019: 98.96%)
Equities (31 July 2019: 98.96%)
Mexico (31 July 2019: 98.96%)
Banks
MXN 1,328,075 Grupo Financiero Banorte SAB de CV 'O' 4,782 9.04
MXN 1,178,928 Grupo Financiero Inbursa SAB de CV 'O' 849 1.61
Beverages
MXN 225,813 Arca Continental SAB de CV 1,117 2.11
MXN 280,924 Becle SAB de CV 564 1.07
MXN 268,847 Coca-Cola Femsa SAB de CV 1,114 2.11
MXN 995,507 Fomento Economico Mexicano SAB de CV 6,126 11.58
Building materials and fixtures
MXN 7,747,350 Cemex SAB de CV 2,381 4.50
Chemicals
MXN 538,090 Orbia Advance Corp SAB de CV 855 1.62
Commercial services
MXN 116,854 Promotora y Operadora de Infraestructura SAB de CV 860 1.63
Electricity
MXN 272,851 Infraestructura Energetica Nova SAB de CV 814 1.54
Engineering & construction
MXN 195,266 Grupo Aeroportuario del Pacifico SAB de CV 'B' 1,300 2.46
MXN 106,458 Grupo Aeroportuario del Sureste SAB de CV 'B' 1,061 2.00
Food
MXN 115,666 Gruma SAB de CV 'B' 1,361 2.57
MXN 825,526 Grupo Bimbo SAB de CV 'A' 1,491 2.82
Holding companies - diversified operations
MXN 1,541,943 Alfa SAB de CV 'A' 837 1.58
MXN 232,596 Grupo Carso SAB de CV 'A1' 460 0.87
Household goods & home construction
MXN 780,825 Kimberly-Clark de Mexico SAB de CV 'A' 1,281 2.42
Media
MXN 1,230,995 Grupo Televisa SAB 1,381 2.61
Mining
MXN 1,593,682 Grupo Mexico SAB de CV 'B' 4,037 7.63
MXN 70,900 Industrias Penoles SAB de CV 1,061 2.01
Real estate investment trusts
MXN 1,613,942 Fibra Uno Administracion SA de CV (REIT) 1,305 2.47
Retail
MXN 2,680,420 Wal-Mart de Mexico SAB de CV 6,309 11.93
Telecommunications
MXN 17,217,309 America Movil SAB de CV 'L' 10,854 20.53
MXN 153,144 Megacable Holdings SAB de CV 456 0.86
Total Mexico 52,656 99.57
Total equities 52,656 99.57
CcyNo. of
contracts
UnderlyingexposureUSD’000
FairValue
USD’000
% of netassetvalue
Financial derivative instruments (31 July 2019: (0.07)%)
Futures contracts (31 July 2019: (0.07)%)
MXN 12 Mexico Bolsa Index Futures September2020 201 - 0.00
Total unrealised gains on futures contracts - 0.00
Total financial derivative instruments - 0.00
FairValue
USD'000
% of netassetvalue
Total value of investments 52,656 99.57
Cash† 252 0.48
Other net liabilities (26) (0.05)
Net asset value attributable to redeemable participatingshareholders at the end of the financial year 52,882 100.00
†Cash holdings of USD234,919 are held with State Street Bank and Trust Company.USD17,363 is held as security for futures contracts with Credit Suisse Securities Ltd.
Equities are primarily classified by country/geographic region of
incorporation of the entity in which the Fund holds shares.
Underlying exposure has been calculated according to the guidelines
issued by the ESMA and represents the market value of an equivalent
position in the assets underlying each financial derivative instrument.
Analysis of total current assetsgross of all liabilities
Fair valueUSD'000
% of totalcurrentassets
Transferable securities admitted to an official stock exchange listing 52,656 99.52
Exchange traded financial derivative instruments - 0.00
Other assets 253 0.48
Total current assets 52,909 100.00
iSHARES VII PLC
SCHEDULE OF INVESTMENTS (continued)
iSHARES MSCI MEXICO CAPPED UCITS ETFAs at 31 July 2020
[208 ]
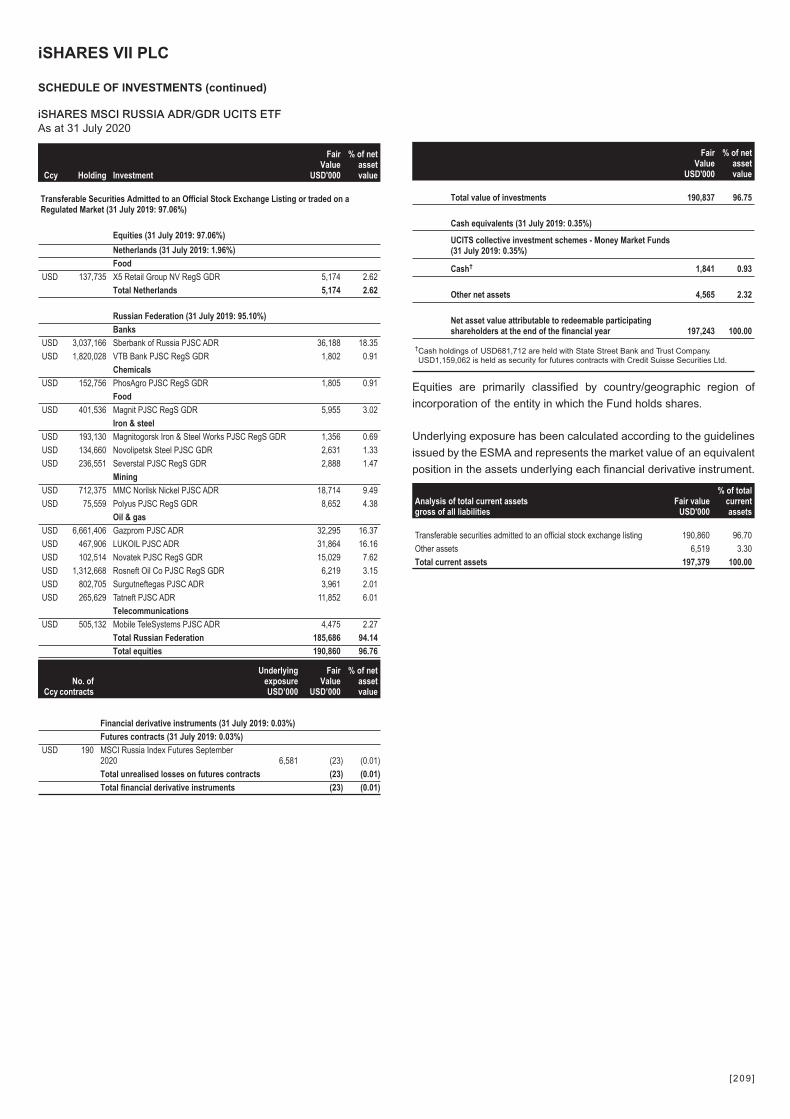
Ccy Holding Investment
FairValue
USD'000
% of netassetvalue
Transferable Securities Admitted to an Official Stock Exchange Listing or traded on aRegulated Market (31 July 2019: 97.06%)
Equities (31 July 2019: 97.06%)
Netherlands (31 July 2019: 1.96%)
Food
USD 137,735 X5 Retail Group NV RegS GDR 5,174 2.62
Total Netherlands 5,174 2.62
Russian Federation (31 July 2019: 95.10%)
Banks
USD 3,037,166 Sberbank of Russia PJSC ADR 36,188 18.35
USD 1,820,028 VTB Bank PJSC RegS GDR 1,802 0.91
Chemicals
USD 152,756 PhosAgro PJSC RegS GDR 1,805 0.91
Food
USD 401,536 Magnit PJSC RegS GDR 5,955 3.02
Iron & steel
USD 193,130 Magnitogorsk Iron & Steel Works PJSC RegS GDR 1,356 0.69
USD 134,660 Novolipetsk Steel PJSC GDR 2,631 1.33
USD 236,551 Severstal PJSC RegS GDR 2,888 1.47
Mining
USD 712,375 MMC Norilsk Nickel PJSC ADR 18,714 9.49
USD 75,559 Polyus PJSC RegS GDR 8,652 4.38
Oil & gas
USD 6,661,406 Gazprom PJSC ADR 32,295 16.37
USD 467,906 LUKOIL PJSC ADR 31,864 16.16
USD 102,514 Novatek PJSC RegS GDR 15,029 7.62
USD 1,312,668 Rosneft Oil Co PJSC RegS GDR 6,219 3.15
USD 802,705 Surgutneftegas PJSC ADR 3,961 2.01
USD 265,629 Tatneft PJSC ADR 11,852 6.01
Telecommunications
USD 505,132 Mobile TeleSystems PJSC ADR 4,475 2.27
Total Russian Federation 185,686 94.14
Total equities 190,860 96.76
CcyNo. of
contracts
UnderlyingexposureUSD’000
FairValue
USD’000
% of netassetvalue
Financial derivative instruments (31 July 2019: 0.03%)
Futures contracts (31 July 2019: 0.03%)
USD 190 MSCI Russia Index Futures September2020 6,581 (23) (0.01)
Total unrealised losses on futures contracts (23) (0.01)
Total financial derivative instruments (23) (0.01)
FairValue
USD'000
% of netassetvalue
Total value of investments 190,837 96.75
Cash equivalents (31 July 2019: 0.35%)
UCITS collective investment schemes - Money Market Funds(31 July 2019: 0.35%)
Cash† 1,841 0.93
Other net assets 4,565 2.32
Net asset value attributable to redeemable participatingshareholders at the end of the financial year 197,243 100.00
†Cash holdings of USD681,712 are held with State Street Bank and Trust Company.USD1,159,062 is held as security for futures contracts with Credit Suisse Securities Ltd.
Equities are primarily classified by country/geographic region of
incorporation of the entity in which the Fund holds shares.
Underlying exposure has been calculated according to the guidelines
issued by the ESMA and represents the market value of an equivalent
position in the assets underlying each financial derivative instrument.
Analysis of total current assetsgross of all liabilities
Fair valueUSD'000
% of totalcurrentassets
Transferable securities admitted to an official stock exchange listing 190,860 96.70
Other assets 6,519 3.30
Total current assets 197,379 100.00
iSHARES VII PLC
SCHEDULE OF INVESTMENTS (continued)
iSHARES MSCI RUSSIA ADR/GDR UCITS ETFAs at 31 July 2020
[209 ]
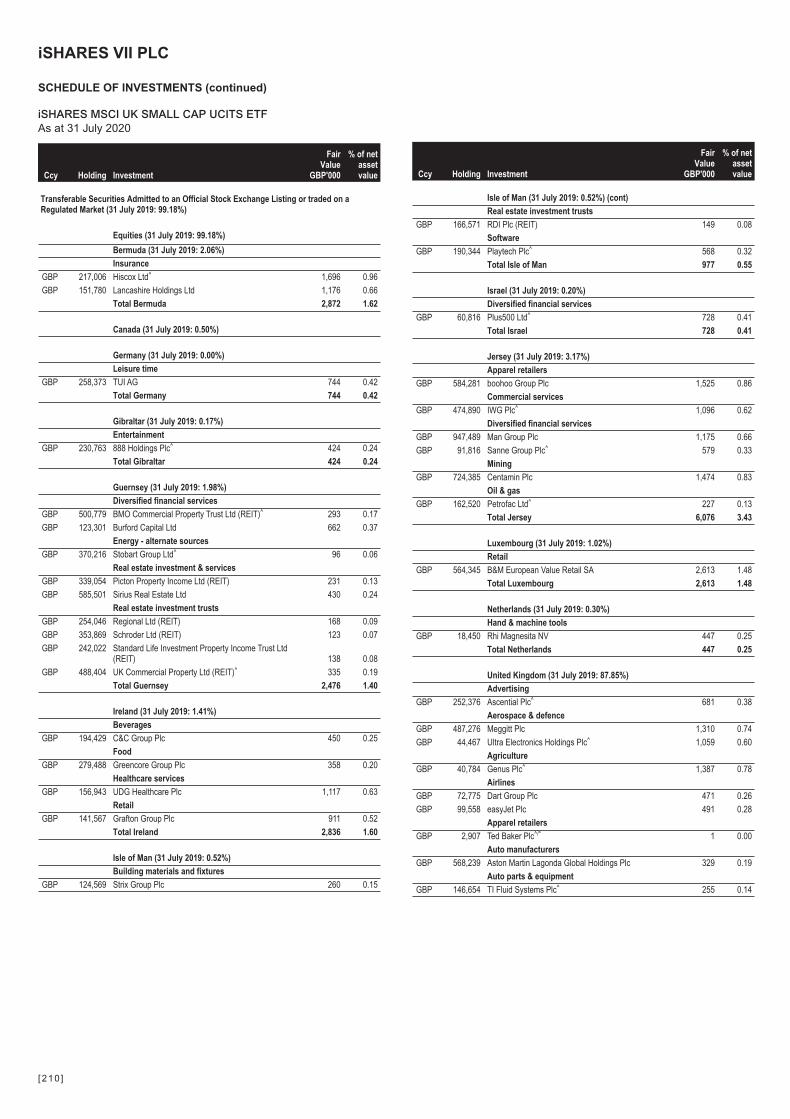
Ccy Holding Investment
FairValue
GBP'000
% of netassetvalue
Transferable Securities Admitted to an Official Stock Exchange Listing or traded on aRegulated Market (31 July 2019: 99.18%)
Equities (31 July 2019: 99.18%)
Bermuda (31 July 2019: 2.06%)
Insurance
GBP 217,006 Hiscox Ltd^ 1,696 0.96
GBP 151,780 Lancashire Holdings Ltd 1,176 0.66
Total Bermuda 2,872 1.62
Canada (31 July 2019: 0.50%)
Germany (31 July 2019: 0.00%)
Leisure time
GBP 258,373 TUI AG 744 0.42
Total Germany 744 0.42
Gibraltar (31 July 2019: 0.17%)
Entertainment
GBP 230,763 888 Holdings Plc^ 424 0.24
Total Gibraltar 424 0.24
Guernsey (31 July 2019: 1.98%)
Diversified financial services
GBP 500,779 BMO Commercial Property Trust Ltd (REIT)^ 293 0.17
GBP 123,301 Burford Capital Ltd 662 0.37
Energy - alternate sources
GBP 370,216 Stobart Group Ltd^ 96 0.06
Real estate investment & services
GBP 339,054 Picton Property Income Ltd (REIT) 231 0.13
GBP 585,501 Sirius Real Estate Ltd 430 0.24
Real estate investment trusts
GBP 254,046 Regional Ltd (REIT) 168 0.09
GBP 353,869 Schroder Ltd (REIT) 123 0.07
GBP 242,022 Standard Life Investment Property Income Trust Ltd(REIT) 138 0.08
GBP 488,404 UK Commercial Property Ltd (REIT)^ 335 0.19
Total Guernsey 2,476 1.40
Ireland (31 July 2019: 1.41%)
Beverages
GBP 194,429 C&C Group Plc 450 0.25
Food
GBP 279,488 Greencore Group Plc 358 0.20
Healthcare services
GBP 156,943 UDG Healthcare Plc 1,117 0.63
Retail
GBP 141,567 Grafton Group Plc 911 0.52
Total Ireland 2,836 1.60
Isle of Man (31 July 2019: 0.52%)
Building materials and fixtures
GBP 124,569 Strix Group Plc 260 0.15
Ccy Holding Investment
FairValue
GBP'000
% of netassetvalue
Isle of Man (31 July 2019: 0.52%) (cont)
Real estate investment trusts
GBP 166,571 RDI Plc (REIT) 149 0.08
Software
GBP 190,344 Playtech Plc^ 568 0.32
Total Isle of Man 977 0.55
Israel (31 July 2019: 0.20%)
Diversified financial services
GBP 60,816 Plus500 Ltd^ 728 0.41
Total Israel 728 0.41
Jersey (31 July 2019: 3.17%)
Apparel retailers
GBP 584,281 boohoo Group Plc 1,525 0.86
Commercial services
GBP 474,890 IWG Plc^ 1,096 0.62
Diversified financial services
GBP 947,489 Man Group Plc 1,175 0.66
GBP 91,816 Sanne Group Plc^ 579 0.33
Mining
GBP 724,385 Centamin Plc 1,474 0.83
Oil & gas
GBP 162,520 Petrofac Ltd^ 227 0.13
Total Jersey 6,076 3.43
Luxembourg (31 July 2019: 1.02%)
Retail
GBP 564,345 B&M European Value Retail SA 2,613 1.48
Total Luxembourg 2,613 1.48
Netherlands (31 July 2019: 0.30%)
Hand & machine tools
GBP 18,450 Rhi Magnesita NV 447 0.25
Total Netherlands 447 0.25
United Kingdom (31 July 2019: 87.85%)
Advertising
GBP 252,376 Ascential Plc^ 681 0.38
Aerospace & defence
GBP 487,276 Meggitt Plc 1,310 0.74
GBP 44,467 Ultra Electronics Holdings Plc^ 1,059 0.60
Agriculture
GBP 40,784 Genus Plc^ 1,387 0.78
Airlines
GBP 72,775 Dart Group Plc 471 0.26
GBP 99,558 easyJet Plc 491 0.28
Apparel retailers
GBP 2,907 Ted Baker Plc^/* 1 0.00
Auto manufacturers
GBP 568,239 Aston Martin Lagonda Global Holdings Plc 329 0.19
Auto parts & equipment
GBP 146,654 TI Fluid Systems Plc^ 255 0.14
iSHARES VII PLC
SCHEDULE OF INVESTMENTS (continued)
iSHARES MSCI UK SMALL CAP UCITS ETFAs at 31 July 2020
[210 ]
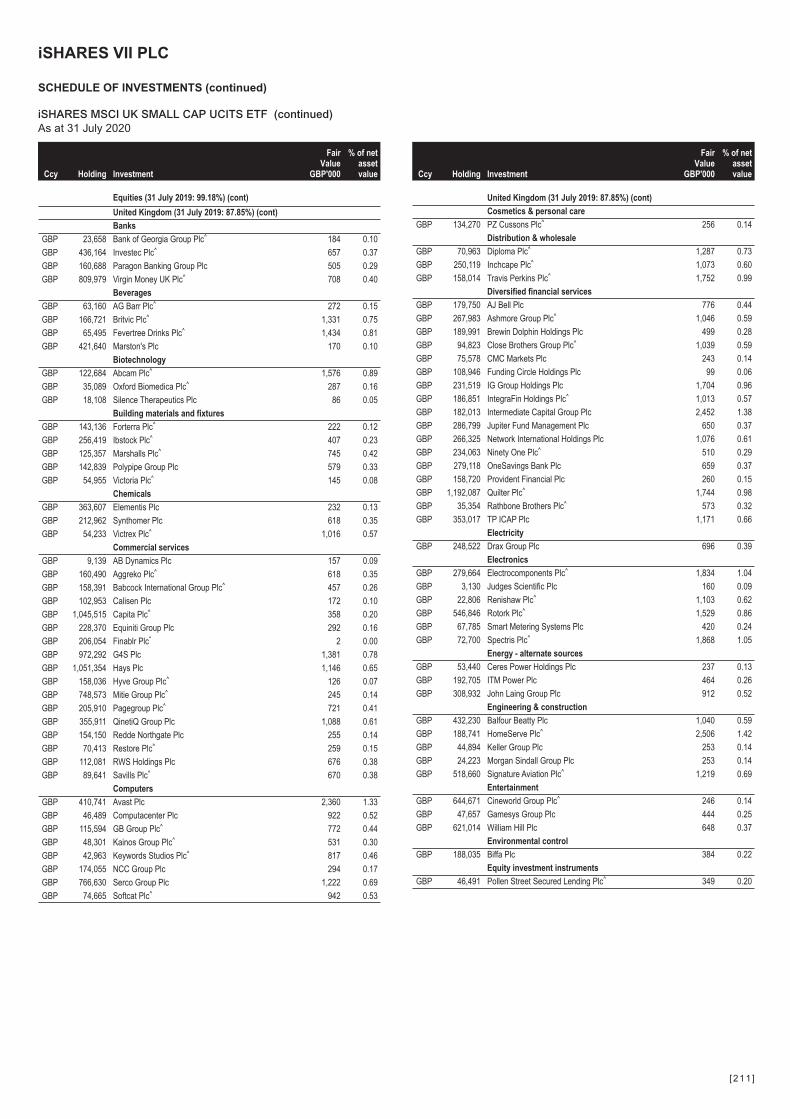
Ccy Holding Investment
FairValue
GBP'000
% of netassetvalue
Equities (31 July 2019: 99.18%) (cont)
United Kingdom (31 July 2019: 87.85%) (cont)
Banks
GBP 23,658 Bank of Georgia Group Plc^ 184 0.10
GBP 436,164 Investec Plc^ 657 0.37
GBP 160,688 Paragon Banking Group Plc 505 0.29
GBP 809,979 Virgin Money UK Plc^ 708 0.40
Beverages
GBP 63,160 AG Barr Plc^ 272 0.15
GBP 166,721 Britvic Plc^ 1,331 0.75
GBP 65,495 Fevertree Drinks Plc^ 1,434 0.81
GBP 421,640 Marston's Plc 170 0.10
Biotechnology
GBP 122,684 Abcam Plc^ 1,576 0.89
GBP 35,089 Oxford Biomedica Plc^ 287 0.16
GBP 18,108 Silence Therapeutics Plc 86 0.05
Building materials and fixtures
GBP 143,136 Forterra Plc^ 222 0.12
GBP 256,419 Ibstock Plc^ 407 0.23
GBP 125,357 Marshalls Plc^ 745 0.42
GBP 142,839 Polypipe Group Plc 579 0.33
GBP 54,955 Victoria Plc^ 145 0.08
Chemicals
GBP 363,607 Elementis Plc 232 0.13
GBP 212,962 Synthomer Plc 618 0.35
GBP 54,233 Victrex Plc^ 1,016 0.57
Commercial services
GBP 9,139 AB Dynamics Plc 157 0.09
GBP 160,490 Aggreko Plc^ 618 0.35
GBP 158,391 Babcock International Group Plc^ 457 0.26
GBP 102,953 Calisen Plc 172 0.10
GBP 1,045,515 Capita Plc^ 358 0.20
GBP 228,370 Equiniti Group Plc 292 0.16
GBP 206,054 Finablr Plc* 2 0.00
GBP 972,292 G4S Plc 1,381 0.78
GBP 1,051,354 Hays Plc 1,146 0.65
GBP 158,036 Hyve Group Plc^ 126 0.07
GBP 748,573 Mitie Group Plc^ 245 0.14
GBP 205,910 Pagegroup Plc^ 721 0.41
GBP 355,911 QinetiQ Group Plc 1,088 0.61
GBP 154,150 Redde Northgate Plc 255 0.14
GBP 70,413 Restore Plc^ 259 0.15
GBP 112,081 RWS Holdings Plc 676 0.38
GBP 89,641 Savills Plc^ 670 0.38
Computers
GBP 410,741 Avast Plc 2,360 1.33
GBP 46,489 Computacenter Plc 922 0.52
GBP 115,594 GB Group Plc^ 772 0.44
GBP 48,301 Kainos Group Plc^ 531 0.30
GBP 42,963 Keywords Studios Plc^ 817 0.46
GBP 174,055 NCC Group Plc 294 0.17
GBP 766,630 Serco Group Plc 1,222 0.69
GBP 74,665 Softcat Plc^ 942 0.53
Ccy Holding Investment
FairValue
GBP'000
% of netassetvalue
United Kingdom (31 July 2019: 87.85%) (cont)
Cosmetics & personal care
GBP 134,270 PZ Cussons Plc^ 256 0.14
Distribution & wholesale
GBP 70,963 Diploma Plc^ 1,287 0.73
GBP 250,119 Inchcape Plc^ 1,073 0.60
GBP 158,014 Travis Perkins Plc^ 1,752 0.99
Diversified financial services
GBP 179,750 AJ Bell Plc 776 0.44
GBP 267,983 Ashmore Group Plc^ 1,046 0.59
GBP 189,991 Brewin Dolphin Holdings Plc 499 0.28
GBP 94,823 Close Brothers Group Plc^ 1,039 0.59
GBP 75,578 CMC Markets Plc 243 0.14
GBP 108,946 Funding Circle Holdings Plc 99 0.06
GBP 231,519 IG Group Holdings Plc 1,704 0.96
GBP 186,851 IntegraFin Holdings Plc^ 1,013 0.57
GBP 182,013 Intermediate Capital Group Plc 2,452 1.38
GBP 286,799 Jupiter Fund Management Plc 650 0.37
GBP 266,325 Network International Holdings Plc 1,076 0.61
GBP 234,063 Ninety One Plc^ 510 0.29
GBP 279,118 OneSavings Bank Plc 659 0.37
GBP 158,720 Provident Financial Plc 260 0.15
GBP 1,192,087 Quilter Plc^ 1,744 0.98
GBP 35,354 Rathbone Brothers Plc^ 573 0.32
GBP 353,017 TP ICAP Plc 1,171 0.66
Electricity
GBP 248,522 Drax Group Plc 696 0.39
Electronics
GBP 279,664 Electrocomponents Plc^ 1,834 1.04
GBP 3,130 Judges Scientific Plc 160 0.09
GBP 22,806 Renishaw Plc^ 1,103 0.62
GBP 546,846 Rotork Plc^ 1,529 0.86
GBP 67,785 Smart Metering Systems Plc 420 0.24
GBP 72,700 Spectris Plc^ 1,868 1.05
Energy - alternate sources
GBP 53,440 Ceres Power Holdings Plc 237 0.13
GBP 192,705 ITM Power Plc 464 0.26
GBP 308,932 John Laing Group Plc 912 0.52
Engineering & construction
GBP 432,230 Balfour Beatty Plc 1,040 0.59
GBP 188,741 HomeServe Plc^ 2,506 1.42
GBP 44,894 Keller Group Plc 253 0.14
GBP 24,223 Morgan Sindall Group Plc 253 0.14
GBP 518,660 Signature Aviation Plc^ 1,219 0.69
Entertainment
GBP 644,671 Cineworld Group Plc^ 246 0.14
GBP 47,657 Gamesys Group Plc 444 0.25
GBP 621,014 William Hill Plc 648 0.37
Environmental control
GBP 188,035 Biffa Plc 384 0.22
Equity investment instruments
GBP 46,491 Pollen Street Secured Lending Plc^ 349 0.20
iSHARES VII PLC
SCHEDULE OF INVESTMENTS (continued)
iSHARES MSCI UK SMALL CAP UCITS ETF (continued)As at 31 July 2020
[211 ]
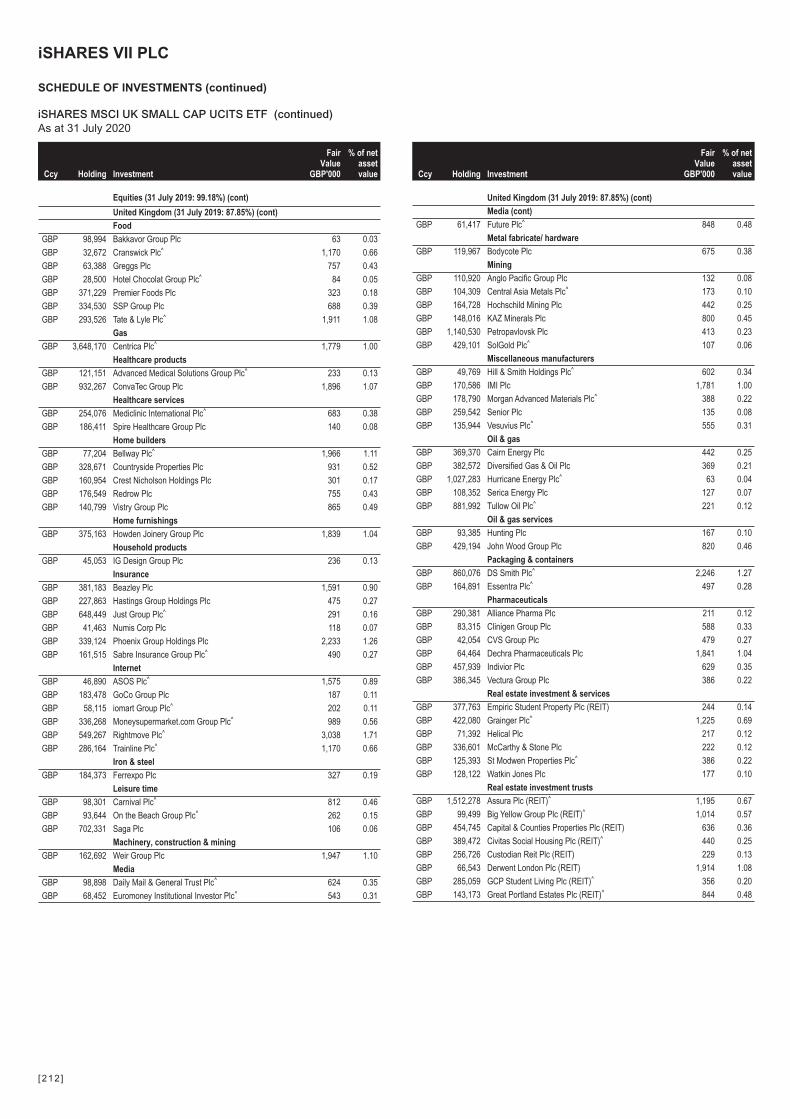
Ccy Holding Investment
FairValue
GBP'000
% of netassetvalue
Equities (31 July 2019: 99.18%) (cont)
United Kingdom (31 July 2019: 87.85%) (cont)
Food
GBP 98,994 Bakkavor Group Plc 63 0.03
GBP 32,672 Cranswick Plc^ 1,170 0.66
GBP 63,388 Greggs Plc 757 0.43
GBP 28,500 Hotel Chocolat Group Plc^ 84 0.05
GBP 371,229 Premier Foods Plc 323 0.18
GBP 334,530 SSP Group Plc 688 0.39
GBP 293,526 Tate & Lyle Plc^ 1,911 1.08
Gas
GBP 3,648,170 Centrica Plc^ 1,779 1.00
Healthcare products
GBP 121,151 Advanced Medical Solutions Group Plc^ 233 0.13
GBP 932,267 ConvaTec Group Plc 1,896 1.07
Healthcare services
GBP 254,076 Mediclinic International Plc^ 683 0.38
GBP 186,411 Spire Healthcare Group Plc 140 0.08
Home builders
GBP 77,204 Bellway Plc^ 1,966 1.11
GBP 328,671 Countryside Properties Plc 931 0.52
GBP 160,954 Crest Nicholson Holdings Plc 301 0.17
GBP 176,549 Redrow Plc 755 0.43
GBP 140,799 Vistry Group Plc 865 0.49
Home furnishings
GBP 375,163 Howden Joinery Group Plc 1,839 1.04
Household products
GBP 45,053 IG Design Group Plc 236 0.13
Insurance
GBP 381,183 Beazley Plc 1,591 0.90
GBP 227,863 Hastings Group Holdings Plc 475 0.27
GBP 648,449 Just Group Plc^ 291 0.16
GBP 41,463 Numis Corp Plc 118 0.07
GBP 339,124 Phoenix Group Holdings Plc 2,233 1.26
GBP 161,515 Sabre Insurance Group Plc^ 490 0.27
Internet
GBP 46,890 ASOS Plc^ 1,575 0.89
GBP 183,478 GoCo Group Plc 187 0.11
GBP 58,115 iomart Group Plc^ 202 0.11
GBP 336,268 Moneysupermarket.com Group Plc^ 989 0.56
GBP 549,267 Rightmove Plc^ 3,038 1.71
GBP 286,164 Trainline Plc^ 1,170 0.66
Iron & steel
GBP 184,373 Ferrexpo Plc 327 0.19
Leisure time
GBP 98,301 Carnival Plc^ 812 0.46
GBP 93,644 On the Beach Group Plc^ 262 0.15
GBP 702,331 Saga Plc 106 0.06
Machinery, construction & mining
GBP 162,692 Weir Group Plc 1,947 1.10
Media
GBP 98,898 Daily Mail & General Trust Plc^ 624 0.35
GBP 68,452 Euromoney Institutional Investor Plc^ 543 0.31
Ccy Holding Investment
FairValue
GBP'000
% of netassetvalue
United Kingdom (31 July 2019: 87.85%) (cont)
Media (cont)
GBP 61,417 Future Plc^ 848 0.48
Metal fabricate/ hardware
GBP 119,967 Bodycote Plc 675 0.38
Mining
GBP 110,920 Anglo Pacific Group Plc 132 0.08
GBP 104,309 Central Asia Metals Plc^ 173 0.10
GBP 164,728 Hochschild Mining Plc 442 0.25
GBP 148,016 KAZ Minerals Plc 800 0.45
GBP 1,140,530 Petropavlovsk Plc 413 0.23
GBP 429,101 SolGold Plc^ 107 0.06
Miscellaneous manufacturers
GBP 49,769 Hill & Smith Holdings Plc^ 602 0.34
GBP 170,586 IMI Plc 1,781 1.00
GBP 178,790 Morgan Advanced Materials Plc^ 388 0.22
GBP 259,542 Senior Plc 135 0.08
GBP 135,944 Vesuvius Plc^ 555 0.31
Oil & gas
GBP 369,370 Cairn Energy Plc 442 0.25
GBP 382,572 Diversified Gas & Oil Plc 369 0.21
GBP 1,027,283 Hurricane Energy Plc^ 63 0.04
GBP 108,352 Serica Energy Plc 127 0.07
GBP 881,992 Tullow Oil Plc^ 221 0.12
Oil & gas services
GBP 93,385 Hunting Plc 167 0.10
GBP 429,194 John Wood Group Plc 820 0.46
Packaging & containers
GBP 860,076 DS Smith Plc^ 2,246 1.27
GBP 164,891 Essentra Plc^ 497 0.28
Pharmaceuticals
GBP 290,381 Alliance Pharma Plc 211 0.12
GBP 83,315 Clinigen Group Plc 588 0.33
GBP 42,054 CVS Group Plc 479 0.27
GBP 64,464 Dechra Pharmaceuticals Plc 1,841 1.04
GBP 457,939 Indivior Plc 629 0.35
GBP 386,345 Vectura Group Plc 386 0.22
Real estate investment & services
GBP 377,763 Empiric Student Property Plc (REIT) 244 0.14
GBP 422,080 Grainger Plc^ 1,225 0.69
GBP 71,392 Helical Plc 217 0.12
GBP 336,601 McCarthy & Stone Plc 222 0.12
GBP 125,393 St Modwen Properties Plc^ 386 0.22
GBP 128,122 Watkin Jones Plc 177 0.10
Real estate investment trusts
GBP 1,512,278 Assura Plc (REIT)^ 1,195 0.67
GBP 99,499 Big Yellow Group Plc (REIT)^ 1,014 0.57
GBP 454,745 Capital & Counties Properties Plc (REIT) 636 0.36
GBP 389,472 Civitas Social Housing Plc (REIT)^ 440 0.25
GBP 256,726 Custodian Reit Plc (REIT) 229 0.13
GBP 66,543 Derwent London Plc (REIT) 1,914 1.08
GBP 285,059 GCP Student Living Plc (REIT)^ 356 0.20
GBP 143,173 Great Portland Estates Plc (REIT)^ 844 0.48
iSHARES VII PLC
SCHEDULE OF INVESTMENTS (continued)
iSHARES MSCI UK SMALL CAP UCITS ETF (continued)As at 31 July 2020
[212 ]
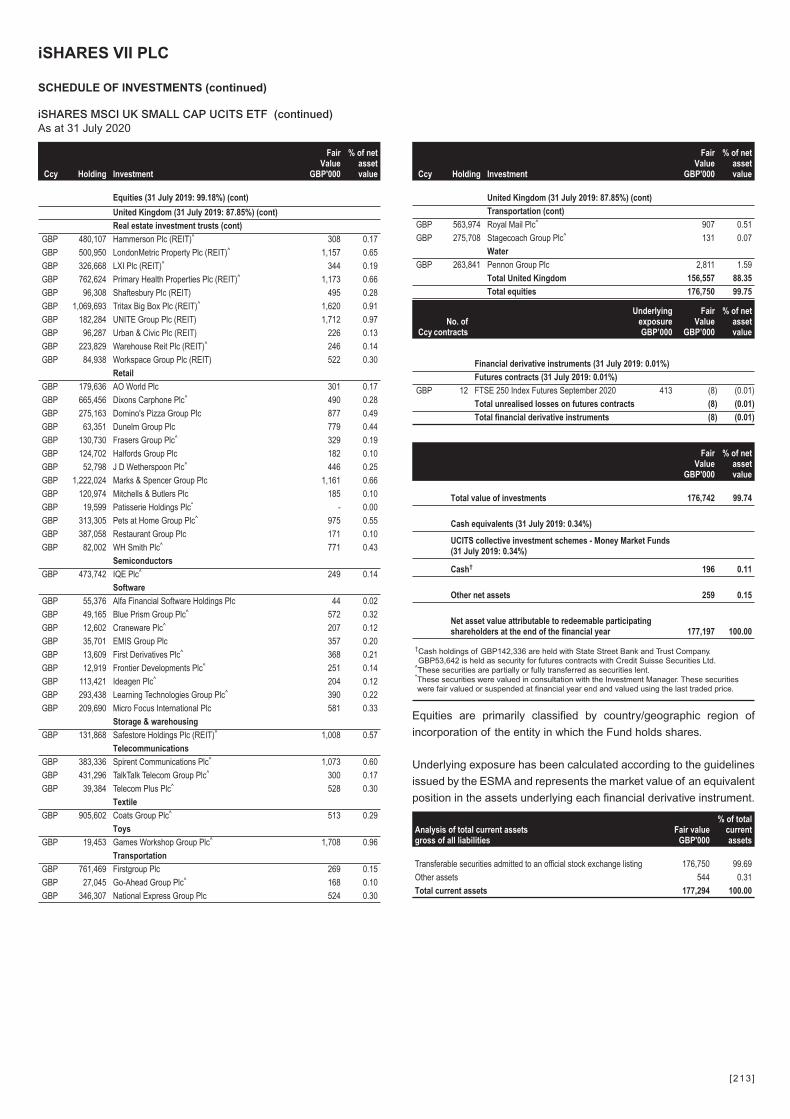
Ccy Holding Investment
FairValue
GBP'000
% of netassetvalue
Equities (31 July 2019: 99.18%) (cont)
United Kingdom (31 July 2019: 87.85%) (cont)
Real estate investment trusts (cont)
GBP 480,107 Hammerson Plc (REIT)^ 308 0.17
GBP 500,950 LondonMetric Property Plc (REIT)^ 1,157 0.65
GBP 326,668 LXI Plc (REIT)^ 344 0.19
GBP 762,624 Primary Health Properties Plc (REIT)^ 1,173 0.66
GBP 96,308 Shaftesbury Plc (REIT) 495 0.28
GBP 1,069,693 Tritax Big Box Plc (REIT)^ 1,620 0.91
GBP 182,284 UNITE Group Plc (REIT) 1,712 0.97
GBP 96,287 Urban & Civic Plc (REIT) 226 0.13
GBP 223,829 Warehouse Reit Plc (REIT)^ 246 0.14
GBP 84,938 Workspace Group Plc (REIT) 522 0.30
Retail
GBP 179,636 AO World Plc 301 0.17
GBP 665,456 Dixons Carphone Plc^ 490 0.28
GBP 275,163 Domino's Pizza Group Plc 877 0.49
GBP 63,351 Dunelm Group Plc 779 0.44
GBP 130,730 Frasers Group Plc^ 329 0.19
GBP 124,702 Halfords Group Plc 182 0.10
GBP 52,798 J D Wetherspoon Plc^ 446 0.25
GBP 1,222,024 Marks & Spencer Group Plc 1,161 0.66
GBP 120,974 Mitchells & Butlers Plc 185 0.10
GBP 19,599 Patisserie Holdings Plc* - 0.00
GBP 313,305 Pets at Home Group Plc^ 975 0.55
GBP 387,058 Restaurant Group Plc 171 0.10
GBP 82,002 WH Smith Plc^ 771 0.43
Semiconductors
GBP 473,742 IQE Plc^ 249 0.14
Software
GBP 55,376 Alfa Financial Software Holdings Plc 44 0.02
GBP 49,165 Blue Prism Group Plc^ 572 0.32
GBP 12,602 Craneware Plc^ 207 0.12
GBP 35,701 EMIS Group Plc 357 0.20
GBP 13,609 First Derivatives Plc^ 368 0.21
GBP 12,919 Frontier Developments Plc^ 251 0.14
GBP 113,421 Ideagen Plc^ 204 0.12
GBP 293,438 Learning Technologies Group Plc^ 390 0.22
GBP 209,690 Micro Focus International Plc 581 0.33
Storage & warehousing
GBP 131,868 Safestore Holdings Plc (REIT)^ 1,008 0.57
Telecommunications
GBP 383,336 Spirent Communications Plc^ 1,073 0.60
GBP 431,296 TalkTalk Telecom Group Plc^ 300 0.17
GBP 39,384 Telecom Plus Plc^ 528 0.30
Textile
GBP 905,602 Coats Group Plc^ 513 0.29
Toys
GBP 19,453 Games Workshop Group Plc^ 1,708 0.96
Transportation
GBP 761,469 Firstgroup Plc 269 0.15
GBP 27,045 Go-Ahead Group Plc^ 168 0.10
GBP 346,307 National Express Group Plc 524 0.30
Ccy Holding Investment
FairValue
GBP'000
% of netassetvalue
United Kingdom (31 July 2019: 87.85%) (cont)
Transportation (cont)
GBP 563,974 Royal Mail Plc^ 907 0.51
GBP 275,708 Stagecoach Group Plc^ 131 0.07
Water
GBP 263,841 Pennon Group Plc 2,811 1.59
Total United Kingdom 156,557 88.35
Total equities 176,750 99.75
CcyNo. of
contracts
UnderlyingexposureGBP’000
FairValue
GBP’000
% of netassetvalue
Financial derivative instruments (31 July 2019: 0.01%)
Futures contracts (31 July 2019: 0.01%)
GBP 12 FTSE 250 Index Futures September 2020 413 (8) (0.01)
Total unrealised losses on futures contracts (8) (0.01)
Total financial derivative instruments (8) (0.01)
FairValue
GBP'000
% of netassetvalue
Total value of investments 176,742 99.74
Cash equivalents (31 July 2019: 0.34%)
UCITS collective investment schemes - Money Market Funds(31 July 2019: 0.34%)
Cash† 196 0.11
Other net assets 259 0.15
Net asset value attributable to redeemable participatingshareholders at the end of the financial year 177,197 100.00
†Cash holdings of GBP142,336 are held with State Street Bank and Trust Company.GBP53,642 is held as security for futures contracts with Credit Suisse Securities Ltd.
^These securities are partially or fully transferred as securities lent.*These securities were valued in consultation with the Investment Manager. These securitieswere fair valued or suspended at financial year end and valued using the last traded price.
Equities are primarily classified by country/geographic region of
incorporation of the entity in which the Fund holds shares.
Underlying exposure has been calculated according to the guidelines
issued by the ESMA and represents the market value of an equivalent
position in the assets underlying each financial derivative instrument.
Analysis of total current assetsgross of all liabilities
Fair valueGBP'000
% of totalcurrentassets
Transferable securities admitted to an official stock exchange listing 176,750 99.69
Other assets 544 0.31
Total current assets 177,294 100.00
iSHARES VII PLC
SCHEDULE OF INVESTMENTS (continued)
iSHARES MSCI UK SMALL CAP UCITS ETF (continued)As at 31 July 2020
[213 ]
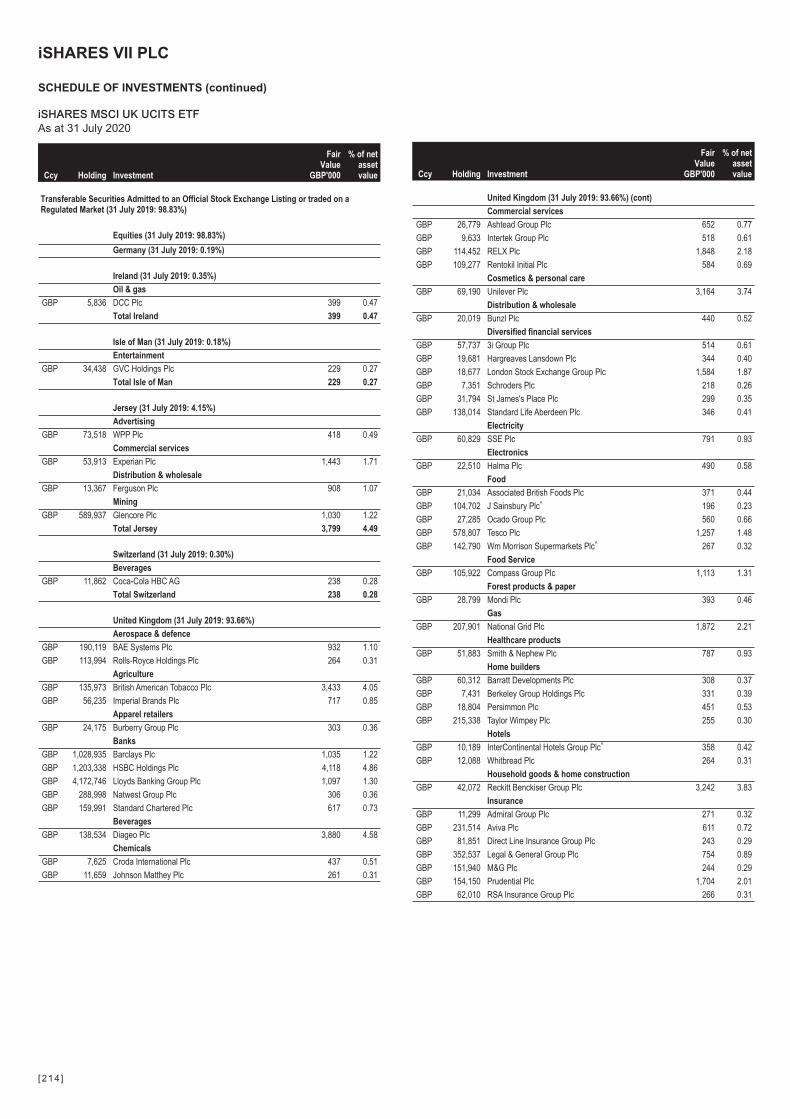
Ccy Holding Investment
FairValue
GBP'000
% of netassetvalue
Transferable Securities Admitted to an Official Stock Exchange Listing or traded on aRegulated Market (31 July 2019: 98.83%)
Equities (31 July 2019: 98.83%)
Germany (31 July 2019: 0.19%)
Ireland (31 July 2019: 0.35%)
Oil & gas
GBP 5,836 DCC Plc 399 0.47
Total Ireland 399 0.47
Isle of Man (31 July 2019: 0.18%)
Entertainment
GBP 34,438 GVC Holdings Plc 229 0.27
Total Isle of Man 229 0.27
Jersey (31 July 2019: 4.15%)
Advertising
GBP 73,518 WPP Plc 418 0.49
Commercial services
GBP 53,913 Experian Plc 1,443 1.71
Distribution & wholesale
GBP 13,367 Ferguson Plc 908 1.07
Mining
GBP 589,937 Glencore Plc 1,030 1.22
Total Jersey 3,799 4.49
Switzerland (31 July 2019: 0.30%)
Beverages
GBP 11,862 Coca-Cola HBC AG 238 0.28
Total Switzerland 238 0.28
United Kingdom (31 July 2019: 93.66%)
Aerospace & defence
GBP 190,119 BAE Systems Plc 932 1.10
GBP 113,994 Rolls-Royce Holdings Plc 264 0.31
Agriculture
GBP 135,973 British American Tobacco Plc 3,433 4.05
GBP 56,235 Imperial Brands Plc 717 0.85
Apparel retailers
GBP 24,175 Burberry Group Plc 303 0.36
Banks
GBP 1,028,935 Barclays Plc 1,035 1.22
GBP 1,203,338 HSBC Holdings Plc 4,118 4.86
GBP 4,172,746 Lloyds Banking Group Plc 1,097 1.30
GBP 288,998 Natwest Group Plc 306 0.36
GBP 159,991 Standard Chartered Plc 617 0.73
Beverages
GBP 138,534 Diageo Plc 3,880 4.58
Chemicals
GBP 7,625 Croda International Plc 437 0.51
GBP 11,659 Johnson Matthey Plc 261 0.31
Ccy Holding Investment
FairValue
GBP'000
% of netassetvalue
United Kingdom (31 July 2019: 93.66%) (cont)
Commercial services
GBP 26,779 Ashtead Group Plc 652 0.77
GBP 9,633 Intertek Group Plc 518 0.61
GBP 114,452 RELX Plc 1,848 2.18
GBP 109,277 Rentokil Initial Plc 584 0.69
Cosmetics & personal care
GBP 69,190 Unilever Plc 3,164 3.74
Distribution & wholesale
GBP 20,019 Bunzl Plc 440 0.52
Diversified financial services
GBP 57,737 3i Group Plc 514 0.61
GBP 19,681 Hargreaves Lansdown Plc 344 0.40
GBP 18,677 London Stock Exchange Group Plc 1,584 1.87
GBP 7,351 Schroders Plc 218 0.26
GBP 31,794 St James's Place Plc 299 0.35
GBP 138,014 Standard Life Aberdeen Plc 346 0.41
Electricity
GBP 60,829 SSE Plc 791 0.93
Electronics
GBP 22,510 Halma Plc 490 0.58
Food
GBP 21,034 Associated British Foods Plc 371 0.44
GBP 104,702 J Sainsbury Plc^ 196 0.23
GBP 27,285 Ocado Group Plc 560 0.66
GBP 578,807 Tesco Plc 1,257 1.48
GBP 142,790 Wm Morrison Supermarkets Plc^ 267 0.32
Food Service
GBP 105,922 Compass Group Plc 1,113 1.31
Forest products & paper
GBP 28,799 Mondi Plc 393 0.46
Gas
GBP 207,901 National Grid Plc 1,872 2.21
Healthcare products
GBP 51,883 Smith & Nephew Plc 787 0.93
Home builders
GBP 60,312 Barratt Developments Plc 308 0.37
GBP 7,431 Berkeley Group Holdings Plc 331 0.39
GBP 18,804 Persimmon Plc 451 0.53
GBP 215,338 Taylor Wimpey Plc 255 0.30
Hotels
GBP 10,189 InterContinental Hotels Group Plc^ 358 0.42
GBP 12,088 Whitbread Plc 264 0.31
Household goods & home construction
GBP 42,072 Reckitt Benckiser Group Plc 3,242 3.83
Insurance
GBP 11,299 Admiral Group Plc 271 0.32
GBP 231,514 Aviva Plc 611 0.72
GBP 81,851 Direct Line Insurance Group Plc 243 0.29
GBP 352,537 Legal & General Group Plc 754 0.89
GBP 151,940 M&G Plc 244 0.29
GBP 154,150 Prudential Plc 1,704 2.01
GBP 62,010 RSA Insurance Group Plc 266 0.31
iSHARES VII PLC
SCHEDULE OF INVESTMENTS (continued)
iSHARES MSCI UK UCITS ETFAs at 31 July 2020
[214 ]

Ccy Holding Investment
FairValue
GBP'000
% of netassetvalue
Equities (31 July 2019: 98.83%) (cont)
United Kingdom (31 July 2019: 93.66%) (cont)
Internet
GBP 56,996 Auto Trader Group Plc 306 0.36
Investment services
GBP 285,234 Melrose Industries Plc 243 0.29
Iron & steel
GBP 30,710 Evraz Plc 89 0.11
Machinery - diversified
GBP 4,344 Spirax-Sarco Engineering Plc 448 0.53
Media
GBP 89,844 Informa Plc 332 0.39
GBP 213,171 ITV Plc 121 0.15
GBP 44,928 Pearson Plc^ 239 0.28
Mining
GBP 72,877 Anglo American Plc 1,363 1.61
GBP 23,204 Antofagasta Plc 238 0.28
GBP 125,093 BHP Group Plc 2,070 2.44
GBP 66,534 Rio Tinto Plc 3,071 3.63
Miscellaneous manufacturers
GBP 23,488 Smiths Group Plc 318 0.38
Oil & gas
GBP 1,200,530 BP Plc 3,303 3.90
GBP 244,170 Royal Dutch Shell Plc 'A' 2,739 3.23
GBP 220,755 Royal Dutch Shell Plc 'B' 2,386 2.82
Pharmaceuticals
GBP 77,775 AstraZeneca Plc 6,634 7.83
GBP 297,128 GlaxoSmithKline Plc 4,545 5.37
GBP 10,213 Hikma Pharmaceuticals Plc 220 0.26
Real estate investment trusts
GBP 51,379 British Land Co Plc (REIT) 188 0.22
GBP 41,655 Land Securities Group Plc (REIT) 240 0.28
GBP 69,591 Segro Plc (REIT) 675 0.80
Retail
GBP 26,491 JD Sports Fashion Plc 160 0.19
GBP 124,883 Kingfisher Plc 302 0.35
GBP 7,880 Next Plc 430 0.51
Software
GBP 3,913 AVEVA Group Plc 162 0.19
GBP 64,388 Sage Group Plc 470 0.56
Telecommunications
GBP 525,045 BT Group Plc 517 0.61
GBP 1,585,915 Vodafone Group Plc 1,833 2.17
Water
GBP 14,232 Severn Trent Plc 349 0.41
GBP 40,553 United Utilities Group Plc 365 0.43
Total United Kingdom 79,666 94.06
Total equities 84,331 99.57
CcyNo. of
contracts
UnderlyingexposureGBP’000
FairValue
GBP’000
% of netassetvalue
Financial derivative instruments (31 July 2019: 0.02%)
Futures contracts (31 July 2019: 0.02%)
GBP 6 FTSE 100 Index Futures September 2020 365 (12) (0.01)
Total unrealised losses on futures contracts (12) (0.01)
Total financial derivative instruments (12) (0.01)
FairValue
GBP'000
% of netassetvalue
Total value of investments 84,319 99.56
Cash equivalents (31 July 2019: 0.59%)
UCITS collective investment schemes - Money Market Funds(31 July 2019: 0.59%)
Cash† 124 0.15
Other net assets 251 0.29
Net asset value attributable to redeemable participatingshareholders at the end of the financial year 84,694 100.00
†Cash holdings of GBP84,428 are held with State Street Bank and Trust Company. GBP39,935is held as security for futures contracts with Credit Suisse Securities Ltd.
^These securities are partially or fully transferred as securities lent.
Equities are primarily classified by country/geographic region of
incorporation of the entity in which the Fund holds shares.
Underlying exposure has been calculated according to the guidelines
issued by the ESMA and represents the market value of an equivalent
position in the assets underlying each financial derivative instrument.
Analysis of total current assetsgross of all liabilities
Fair valueGBP'000
% of totalcurrentassets
Transferable securities admitted to an official stock exchange listing 84,331 99.53
Other assets 400 0.47
Total current assets 84,731 100.00
iSHARES VII PLC
SCHEDULE OF INVESTMENTS (continued)
iSHARES MSCI UK UCITS ETF (continued)As at 31 July 2020
[215 ]

Ccy Holding Investment
FairValue
USD'000
% of netassetvalue
Transferable Securities Admitted to an Official Stock Exchange Listing or traded on aRegulated Market (31 July 2019: 99.16%)
Equities (31 July 2019: 99.16%)
Bahamas (31 July 2019: 0.00%)
Leisure time
USD 6,621 OneSpaWorld Holdings Ltd 37 0.01
Total Bahamas 37 0.01
Bermuda (31 July 2019: 1.04%)
Biotechnology
USD 2,469 Kiniksa Pharmaceuticals Ltd 'A' 48 0.01
Distribution & wholesale
USD 7,699 Triton International Ltd 242 0.05
Household goods & home construction
USD 3,686 Helen of Troy Ltd^ 694 0.15
Insurance
USD 5,469 Argo Group International Holdings Ltd 183 0.04
USD 13,669 Assured Guaranty Ltd 298 0.06
USD 12,007 Axis Capital Holdings Ltd^ 482 0.10
USD 1,728 Enstar Group Ltd 290 0.06
USD 15,898 Essent Group Ltd^ 570 0.12
USD 4,641 James River Group Holdings Ltd 215 0.05
USD 11,135 Third Point Reinsurance Ltd 87 0.02
USD 2,951 Watford Holdings Ltd 49 0.01
USD 464 White Mountains Insurance Group Ltd 408 0.09
Leisure time
USD 35,650 Norwegian Cruise Line Holdings Ltd 486 0.10
Media
USD 6,121 Liberty Latin America Ltd 'A'^ 63 0.01
USD 17,989 Liberty Latin America Ltd 'C' 184 0.04
Pharmaceuticals
USD 5,947 Myovant Sciences Ltd 91 0.02
Retail
USD 7,562 Signet Jewelers Ltd 81 0.02
Total Bermuda 4,471 0.95
British Virgin Islands (31 July 2019: 0.06%)
Apparel retailers
USD 20,270 Capri Holdings Ltd^ 304 0.06
Biotechnology
USD 7,076 Biohaven Pharmaceutical Holding Co Ltd 453 0.10
Total British Virgin Islands 757 0.16
Canada (31 July 2019: 0.22%)
Biotechnology
USD 3,995 Xenon Pharmaceuticals Inc 44 0.01
USD 4,877 Zymeworks Inc 149 0.03
Building materials and fixtures
USD 3,214 Masonite International Corp 271 0.06
Electrical components & equipment
USD 4,890 Novanta Inc^ 507 0.11
Ccy Holding Investment
FairValue
USD'000
% of netassetvalue
Canada (31 July 2019: 0.22%) (cont)
Entertainment
USD 7,081 IMAX Corp 80 0.02
USD 7,076 Lions Gate Entertainment Corp 'A' 54 0.01
USD 16,782 Lions Gate Entertainment Corp 'B' 119 0.02
Total Canada 1,224 0.26
Cayman Islands (31 July 2019: 0.38%)
Agriculture
USD 4,779 Fresh Del Monte Produce Inc 108 0.02
Biotechnology
USD 1,938 MeiraGTx Holdings Plc 25 0.00
USD 6,442 Theravance Biopharma Inc 125 0.03
Electronics
USD 2,272 SMART Global Holdings Inc^ 63 0.01
Insurance
USD 1,104 Global Indemnity Ltd 25 0.01
USD 3,832 Greenlight Capital Re Ltd 'A' 25 0.00
Machinery - diversified
USD 3,763 Ichor Holdings Ltd 123 0.03
Miscellaneous manufacturers
USD 5,066 Fabrinet 368 0.08
Pharmaceuticals
USD 13,699 Herbalife Nutrition Ltd 702 0.15
Semiconductors
USD 5,047 Ambarella Inc 229 0.05
Total Cayman Islands 1,793 0.38
Ireland (31 July 2019: 0.32%)
Auto parts & equipment
USD 13,109 Adient Plc 218 0.05
Biotechnology
USD 4,767 Prothena Corp Plc 58 0.01
Commercial services
USD 2,809 Cimpress Plc 281 0.06
Electronics
USD 22,979 nVent Electric Plc 417 0.09
Pharmaceuticals
USD 22,686 Alkermes Plc 409 0.08
USD 26,376 Endo International Plc 92 0.02
USD 27,693 Horizon Therapeutics Plc 1,694 0.36
Total Ireland 3,169 0.67
Israel (31 July 2019: 0.15%)
Jersey (31 July 2019: 0.40%)
Auto parts & equipment
USD 12,961 Delphi Technologies Plc 194 0.04
Diversified financial services
USD 23,777 Janus Henderson Group Plc 497 0.11
Healthcare products
USD 11,978 Novocure Ltd 908 0.19
USD 7,194 Quotient Ltd 56 0.01
iSHARES VII PLC
SCHEDULE OF INVESTMENTS (continued)
iSHARES MSCI USA SMALL CAP UCITS ETFAs at 31 July 2020
[216 ]

Ccy Holding Investment
FairValue
USD'000
% of netassetvalue
Equities (31 July 2019: 99.16%) (cont)
Jersey (31 July 2019: 0.40%) (cont)
Internet
USD 8,109 Mimecast Ltd^ 381 0.08
Total Jersey 2,036 0.43
Luxembourg (31 July 2019: 0.05%)
Chemicals
USD 8,712 Orion Engineered Carbons SA 89 0.02
Miscellaneous manufacturers
USD 3,952 Trinseo SA 86 0.02
Total Luxembourg 175 0.04
Marshall Islands (31 July 2019: 0.01%)
Transportation
USD 3,515 Diamond S Shipping Inc 31 0.01
USD 5,766 Dorian LPG Ltd 49 0.01
USD 3,975 Genco Shipping & Trading Ltd 27 0.00
USD 3,405 International Seaways Inc 59 0.01
Total Marshall Islands 166 0.03
Netherlands (31 July 2019: 0.38%)
Healthcare products
USD 18,735 Wright Medical Group NV 562 0.12
Hotels
USD 8,020 Playa Hotels & Resorts NV 29 0.01
Oil & gas services
USD 6,689 Core Laboratories NV 143 0.03
USD 12,803 Frank's International NV 29 0.01
Pharmaceuticals
USD 3,207 Merus NV 44 0.01
USD 4,931 uniQure NV 206 0.04
Software
USD 7,572 Elastic NV 728 0.15
Total Netherlands 1,741 0.37
Panama (31 July 2019: 0.03%)
Puerto Rico (31 July 2019: 0.35%)
Banks
USD 31,096 First BanCorp 169 0.04
USD 6,297 OFG Bancorp 82 0.02
USD 13,278 Popular Inc 493 0.10
Commercial services
USD 8,984 EVERTEC Inc 279 0.06
Healthcare services
USD 2,452 Triple-S Management Corp 'B' 48 0.01
Total Puerto Rico 1,071 0.23
Singapore (31 July 2019: 0.01%)
Biotechnology
USD 2,928 WaVe Life Sciences Ltd 26 0.01
Ccy Holding Investment
FairValue
USD'000
% of netassetvalue
Singapore (31 July 2019: 0.01%) (cont)
Electronics
USD 71,992 Flex Ltd 827 0.17
Total Singapore 853 0.18
Switzerland (31 July 2019: 0.13%)
Biotechnology
USD 7,342 CRISPR Therapeutics AG 627 0.13
Oil & gas
USD 76,420 Transocean Ltd 156 0.04
Total Switzerland 783 0.17
United Kingdom (31 July 2019: 0.30%)
Chemicals
USD 11,860 Tronox Holdings Plc 'A' 90 0.02
Commercial services
USD 5,237 Cardtronics Plc 'A' 117 0.02
Hand & machine tools
USD 3,954 Luxfer Holdings Plc 50 0.01
Healthcare products
USD 6,861 LivaNova Plc^ 319 0.07
Machinery - diversified
USD 7,661 Gates Industrial Corp Plc 81 0.02
Oil & gas services
USD 60,725 TechnipFMC Plc 488 0.10
Real estate investment & services
USD 13,687 Cushman & Wakefield Plc 147 0.03
Total United Kingdom 1,292 0.27
United States (31 July 2019: 95.33%)
Advertising
USD 1,871 Boston Omaha Corp 'A' 30 0.01
USD 52,667 Clear Channel Outdoor Holdings Inc 48 0.01
USD 13,038 National CineMedia Inc 32 0.01
USD 13,695 Quotient Technology Inc 110 0.02
Aerospace & defence
USD 5,424 AAR Corp 93 0.02
USD 9,557 Aerojet Rocketdyne Holdings Inc 394 0.08
USD 3,180 AeroVironment Inc 243 0.05
USD 2,729 Astronics Corp 24 0.01
USD 406 Astronics Corp 'B' 4 0.00
USD 6,700 Barnes Group Inc 247 0.05
USD 1,524 Ducommun Inc 55 0.01
USD 12,301 Hexcel Corp 459 0.10
USD 3,446 Kaman Corp 136 0.03
USD 17,238 Kratos Defense & Security Solutions Inc 310 0.07
USD 7,843 Mercury Systems Inc 607 0.13
USD 4,650 Moog Inc 'A' 250 0.05
USD 712 National Presto Industries Inc 61 0.01
USD 2,479 Park Aerospace Corp^ 27 0.01
USD 14,963 Spirit AeroSystems Holdings Inc 'A' 293 0.06
USD 7,272 Triumph Group Inc 49 0.01
iSHARES VII PLC
SCHEDULE OF INVESTMENTS (continued)
iSHARES MSCI USA SMALL CAP UCITS ETF (continued)As at 31 July 2020
[217 ]
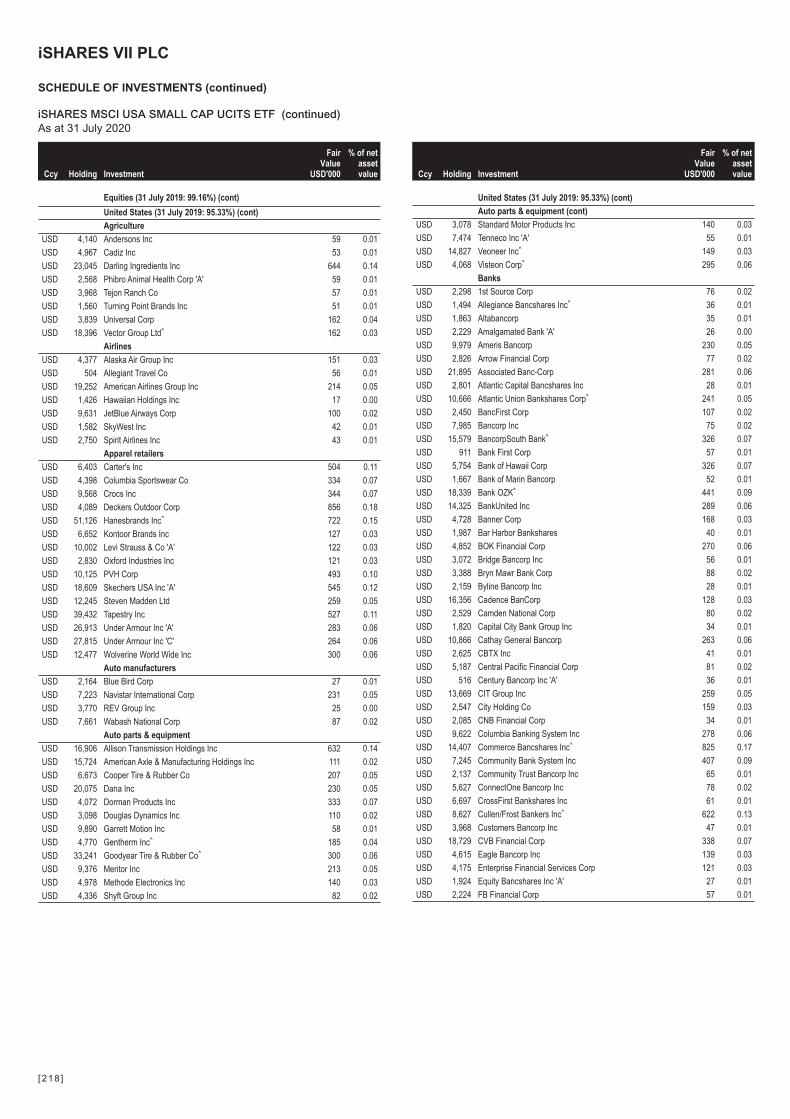
Ccy Holding Investment
FairValue
USD'000
% of netassetvalue
Equities (31 July 2019: 99.16%) (cont)
United States (31 July 2019: 95.33%) (cont)
Agriculture
USD 4,140 Andersons Inc 59 0.01
USD 4,967 Cadiz Inc 53 0.01
USD 23,045 Darling Ingredients Inc 644 0.14
USD 2,568 Phibro Animal Health Corp 'A' 59 0.01
USD 3,968 Tejon Ranch Co 57 0.01
USD 1,560 Turning Point Brands Inc 51 0.01
USD 3,839 Universal Corp 162 0.04
USD 18,396 Vector Group Ltd^ 162 0.03
Airlines
USD 4,377 Alaska Air Group Inc 151 0.03
USD 504 Allegiant Travel Co 56 0.01
USD 19,252 American Airlines Group Inc 214 0.05
USD 1,426 Hawaiian Holdings Inc 17 0.00
USD 9,631 JetBlue Airways Corp 100 0.02
USD 1,582 SkyWest Inc 42 0.01
USD 2,750 Spirit Airlines Inc 43 0.01
Apparel retailers
USD 6,403 Carter's Inc 504 0.11
USD 4,398 Columbia Sportswear Co 334 0.07
USD 9,568 Crocs Inc 344 0.07
USD 4,089 Deckers Outdoor Corp 856 0.18
USD 51,126 Hanesbrands Inc^ 722 0.15
USD 6,652 Kontoor Brands Inc 127 0.03
USD 10,002 Levi Strauss & Co 'A' 122 0.03
USD 2,830 Oxford Industries Inc 121 0.03
USD 10,125 PVH Corp 493 0.10
USD 18,609 Skechers USA Inc 'A' 545 0.12
USD 12,245 Steven Madden Ltd 259 0.05
USD 39,432 Tapestry Inc 527 0.11
USD 26,913 Under Armour Inc 'A' 283 0.06
USD 27,815 Under Armour Inc 'C' 264 0.06
USD 12,477 Wolverine World Wide Inc 300 0.06
Auto manufacturers
USD 2,164 Blue Bird Corp 27 0.01
USD 7,223 Navistar International Corp 231 0.05
USD 3,770 REV Group Inc 25 0.00
USD 7,661 Wabash National Corp 87 0.02
Auto parts & equipment
USD 16,906 Allison Transmission Holdings Inc 632 0.14
USD 15,724 American Axle & Manufacturing Holdings Inc 111 0.02
USD 6,673 Cooper Tire & Rubber Co 207 0.05
USD 20,075 Dana Inc 230 0.05
USD 4,072 Dorman Products Inc 333 0.07
USD 3,098 Douglas Dynamics Inc 110 0.02
USD 9,890 Garrett Motion Inc 58 0.01
USD 4,770 Gentherm Inc^ 185 0.04
USD 33,241 Goodyear Tire & Rubber Co^ 300 0.06
USD 9,376 Meritor Inc 213 0.05
USD 4,978 Methode Electronics Inc 140 0.03
USD 4,336 Shyft Group Inc 82 0.02
Ccy Holding Investment
FairValue
USD'000
% of netassetvalue
United States (31 July 2019: 95.33%) (cont)
Auto parts & equipment (cont)
USD 3,078 Standard Motor Products Inc 140 0.03
USD 7,474 Tenneco Inc 'A' 55 0.01
USD 14,827 Veoneer Inc^ 149 0.03
USD 4,068 Visteon Corp^ 295 0.06
Banks
USD 2,298 1st Source Corp 76 0.02
USD 1,494 Allegiance Bancshares Inc^ 36 0.01
USD 1,863 Altabancorp 35 0.01
USD 2,229 Amalgamated Bank 'A' 26 0.00
USD 9,979 Ameris Bancorp 230 0.05
USD 2,826 Arrow Financial Corp 77 0.02
USD 21,895 Associated Banc-Corp 281 0.06
USD 2,801 Atlantic Capital Bancshares Inc 28 0.01
USD 10,666 Atlantic Union Bankshares Corp^ 241 0.05
USD 2,450 BancFirst Corp 107 0.02
USD 7,985 Bancorp Inc 75 0.02
USD 15,579 BancorpSouth Bank^ 326 0.07
USD 911 Bank First Corp 57 0.01
USD 5,754 Bank of Hawaii Corp 326 0.07
USD 1,667 Bank of Marin Bancorp 52 0.01
USD 18,339 Bank OZK^ 441 0.09
USD 14,325 BankUnited Inc 289 0.06
USD 4,728 Banner Corp 168 0.03
USD 1,987 Bar Harbor Bankshares 40 0.01
USD 4,852 BOK Financial Corp 270 0.06
USD 3,072 Bridge Bancorp Inc 56 0.01
USD 3,388 Bryn Mawr Bank Corp 88 0.02
USD 2,159 Byline Bancorp Inc 28 0.01
USD 16,356 Cadence BanCorp 128 0.03
USD 2,529 Camden National Corp 80 0.02
USD 1,820 Capital City Bank Group Inc 34 0.01
USD 10,866 Cathay General Bancorp 263 0.06
USD 2,625 CBTX Inc 41 0.01
USD 5,187 Central Pacific Financial Corp 81 0.02
USD 516 Century Bancorp Inc 'A' 36 0.01
USD 13,669 CIT Group Inc 259 0.05
USD 2,547 City Holding Co 159 0.03
USD 2,085 CNB Financial Corp 34 0.01
USD 9,622 Columbia Banking System Inc 278 0.06
USD 14,407 Commerce Bancshares Inc^ 825 0.17
USD 7,245 Community Bank System Inc 407 0.09
USD 2,137 Community Trust Bancorp Inc 65 0.01
USD 5,627 ConnectOne Bancorp Inc 78 0.02
USD 6,697 CrossFirst Bankshares Inc 61 0.01
USD 8,627 Cullen/Frost Bankers Inc^ 622 0.13
USD 3,968 Customers Bancorp Inc 47 0.01
USD 18,729 CVB Financial Corp 338 0.07
USD 4,615 Eagle Bancorp Inc 139 0.03
USD 4,175 Enterprise Financial Services Corp 121 0.03
USD 1,924 Equity Bancshares Inc 'A' 27 0.01
USD 2,224 FB Financial Corp 57 0.01
iSHARES VII PLC
SCHEDULE OF INVESTMENTS (continued)
iSHARES MSCI USA SMALL CAP UCITS ETF (continued)As at 31 July 2020
[218 ]

Ccy Holding Investment
FairValue
USD'000
% of netassetvalue
Equities (31 July 2019: 99.16%) (cont)
United States (31 July 2019: 95.33%) (cont)
Banks (cont)
USD 2,776 Financial Institutions Inc 41 0.01
USD 4,430 First Bancorp/Southern Pines NC 92 0.02
USD 2,872 First Bancshares Inc 57 0.01
USD 7,408 First Busey Corp 127 0.03
USD 746 First Citizens BancShares Inc 'A' 318 0.07
USD 12,937 First Commonwealth Financial Corp 102 0.02
USD 1,834 First Community Bankshares Inc 36 0.01
USD 13,242 First Financial Bancorp 184 0.04
USD 18,685 First Financial Bankshares Inc^ 559 0.12
USD 1,972 First Financial Corp 66 0.01
USD 7,082 First Foundation Inc 109 0.02
USD 17,285 First Hawaiian Inc 300 0.06
USD 77,064 First Horizon National Corp^ 714 0.15
USD 5,975 First Interstate BancSystem Inc 'A' 174 0.04
USD 8,113 First Merchants Corp 198 0.04
USD 2,545 First Mid Bancshares Inc 62 0.01
USD 14,871 First Midwest Bancorp Inc 180 0.04
USD 4,856 First of Long Island Corp 72 0.01
USD 5,351 Flagstar Bancorp Inc 168 0.03
USD 46,448 FNB Corp^ 344 0.07
USD 1,605 Franklin Financial Network Inc 42 0.01
USD 23,150 Fulton Financial Corp 225 0.05
USD 3,794 German American Bancorp Inc 108 0.02
USD 13,514 Glacier Bancorp Inc^ 477 0.10
USD 2,074 Great Southern Bancorp Inc 75 0.02
USD 7,343 Great Western Bancorp Inc 95 0.02
USD 13,209 Hancock Whitney Corp 252 0.05
USD 4,942 Hanmi Financial Corp 46 0.01
USD 8,771 HarborOne Bancorp Inc 76 0.02
USD 5,426 Heartland Financial USA Inc 170 0.04
USD 7,991 Heritage Commerce Corp 54 0.01
USD 5,470 Heritage Financial Corp 103 0.02
USD 9,711 Hilltop Holdings Inc 189 0.04
USD 22,764 Home BancShares Inc^ 372 0.08
USD 3,492 HomeStreet Inc 92 0.02
USD 17,126 Hope Bancorp Inc 144 0.03
USD 6,863 Horizon Bancorp Inc 69 0.01
USD 2,767 Independent Bank Corp 39 0.01
USD 4,836 Independent Bank Corp of Rockland Massachusetts 312 0.07
USD 4,754 Independent Bank Group Inc^ 209 0.04
USD 8,383 International Bancshares Corp 255 0.05
USD 13,666 Kearny Financial Corp 110 0.02
USD 6,179 Lakeland Bancorp Inc 63 0.01
USD 3,802 Lakeland Financial Corp 168 0.04
USD 4,040 Live Oak Bancshares Inc 69 0.01
USD 3,877 Luther Burbank Corp 37 0.01
USD 3,046 Mercantile Bank Corp 65 0.01
USD 1,824 Merchants Bancorp 34 0.01
USD 3,975 Meta Financial Group Inc 74 0.02
USD 2,981 Midland States Bancorp Inc 42 0.01
Ccy Holding Investment
FairValue
USD'000
% of netassetvalue
United States (31 July 2019: 95.33%) (cont)
Banks (cont)
USD 2,110 MidWestOne Financial Group Inc 38 0.01
USD 4,891 National Bank Holdings Corp 'A' 136 0.03
USD 5,735 NBT Bancorp Inc 171 0.04
USD 1,193 Nicolet Bankshares Inc 67 0.01
USD 23,516 Old National Bancorp^ 329 0.07
USD 2,380 Origin Bancorp Inc 56 0.01
USD 16,710 PacWest Bancorp 305 0.06
USD 2,330 Park National Corp 200 0.04
USD 1,940 Peapack-Gladstone Financial Corp 32 0.01
USD 3,800 Peoples Bancorp Inc 76 0.02
USD 10,752 Pinnacle Financial Partners Inc 426 0.09
USD 2,612 Preferred Bank 97 0.02
USD 13,427 Prosperity Bancshares Inc^ 746 0.16
USD 2,572 QCR Holdings Inc 77 0.02
USD 7,647 Renasant Corp 178 0.04
USD 1,297 Republic Bancorp Inc 'A' 39 0.01
USD 6,122 S&T Bancorp Inc 132 0.03
USD 5,541 Sandy Spring Bancorp Inc 128 0.03
USD 7,397 Seacoast Banking Corp of Florida 140 0.03
USD 6,894 ServisFirst Bancshares Inc 252 0.05
USD 15,989 Simmons First National Corp 'A' 265 0.06
USD 9,858 South State Corp 470 0.10
USD 4,918 Southside Bancshares Inc 136 0.03
USD 2,648 Stock Yards Bancorp Inc 104 0.02
USD 20,266 Synovus Financial Corp 408 0.09
USD 21,716 TCF Financial Corp^ 597 0.13
USD 7,671 Texas Capital Bancshares Inc 255 0.05
USD 1,940 Tompkins Financial Corp 125 0.03
USD 10,155 Towne Bank 179 0.04
USD 4,148 TriCo Bancshares 116 0.02
USD 2,772 TriState Capital Holdings Inc 37 0.01
USD 3,498 Triumph Bancorp Inc 92 0.02
USD 15,647 TrustCo Bank Corp 91 0.02
USD 9,029 Trustmark Corp 203 0.04
USD 6,687 UMB Financial Corp 333 0.07
USD 31,313 Umpqua Holdings Corp 340 0.07
USD 18,379 United Bankshares Inc 484 0.10
USD 10,961 United Community Banks Inc 197 0.04
USD 4,763 Univest Financial Corp 73 0.01
USD 52,713 Valley National Bancorp 394 0.08
USD 6,575 Veritex Holdings Inc 110 0.02
USD 4,446 Walker & Dunlop Inc 224 0.05
USD 2,654 Washington Trust Bancorp Inc 88 0.02
USD 13,621 Webster Financial Corp 371 0.08
USD 9,559 WesBanco Inc 190 0.04
USD 3,508 Westamerica BanCorp 212 0.04
USD 13,415 Western Alliance Bancorp 482 0.10
USD 8,557 Wintrust Financial Corp 366 0.08
Beverages
USD 1,322 Boston Beer Co Inc 'A' 1,072 0.23
USD 790 Coca-Cola Consolidated Inc 181 0.04
iSHARES VII PLC
SCHEDULE OF INVESTMENTS (continued)
iSHARES MSCI USA SMALL CAP UCITS ETF (continued)As at 31 July 2020
[219 ]
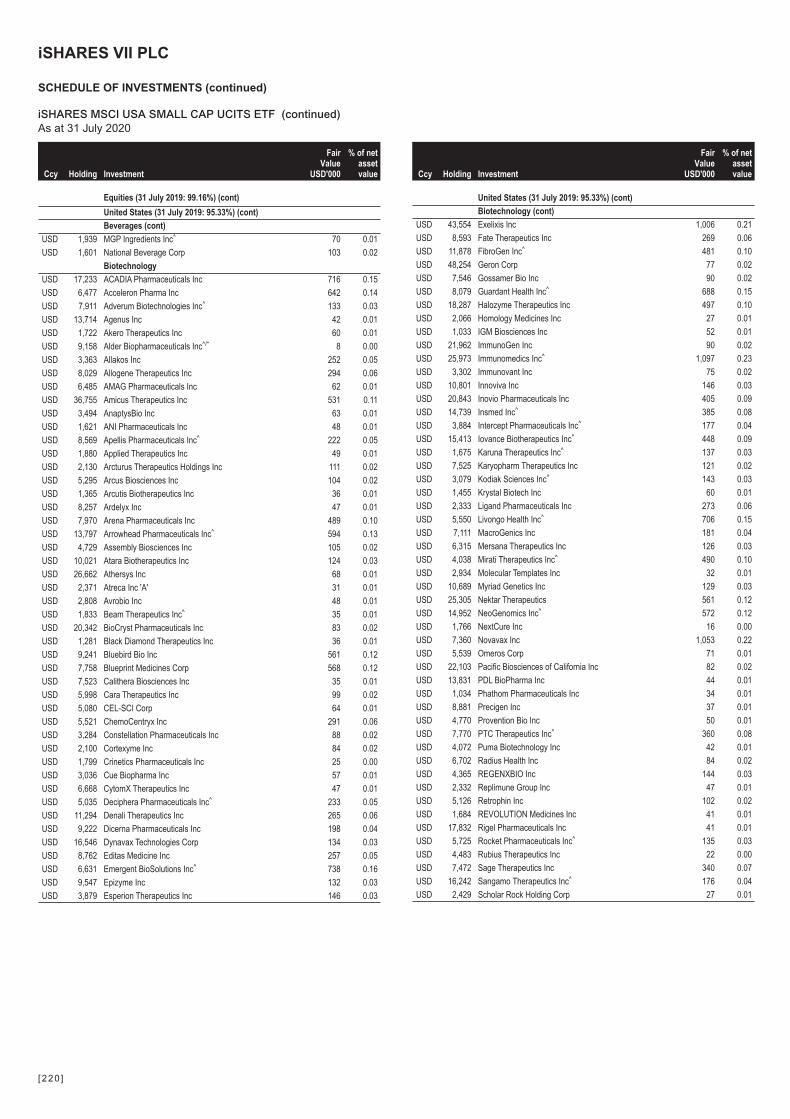
Ccy Holding Investment
FairValue
USD'000
% of netassetvalue
Equities (31 July 2019: 99.16%) (cont)
United States (31 July 2019: 95.33%) (cont)
Beverages (cont)
USD 1,939 MGP Ingredients Inc^ 70 0.01
USD 1,601 National Beverage Corp 103 0.02
Biotechnology
USD 17,233 ACADIA Pharmaceuticals Inc 716 0.15
USD 6,477 Acceleron Pharma Inc 642 0.14
USD 7,911 Adverum Biotechnologies Inc^ 133 0.03
USD 13,714 Agenus Inc 42 0.01
USD 1,722 Akero Therapeutics Inc 60 0.01
USD 9,158 Alder Biopharmaceuticals Inc^/* 8 0.00
USD 3,363 Allakos Inc 252 0.05
USD 8,029 Allogene Therapeutics Inc 294 0.06
USD 6,485 AMAG Pharmaceuticals Inc 62 0.01
USD 36,755 Amicus Therapeutics Inc 531 0.11
USD 3,494 AnaptysBio Inc 63 0.01
USD 1,621 ANI Pharmaceuticals Inc 48 0.01
USD 8,569 Apellis Pharmaceuticals Inc^ 222 0.05
USD 1,880 Applied Therapeutics Inc 49 0.01
USD 2,130 Arcturus Therapeutics Holdings Inc 111 0.02
USD 5,295 Arcus Biosciences Inc 104 0.02
USD 1,365 Arcutis Biotherapeutics Inc 36 0.01
USD 8,257 Ardelyx Inc 47 0.01
USD 7,970 Arena Pharmaceuticals Inc 489 0.10
USD 13,797 Arrowhead Pharmaceuticals Inc^ 594 0.13
USD 4,729 Assembly Biosciences Inc 105 0.02
USD 10,021 Atara Biotherapeutics Inc 124 0.03
USD 26,662 Athersys Inc 68 0.01
USD 2,371 Atreca Inc 'A' 31 0.01
USD 2,808 Avrobio Inc 48 0.01
USD 1,833 Beam Therapeutics Inc^ 35 0.01
USD 20,342 BioCryst Pharmaceuticals Inc 83 0.02
USD 1,281 Black Diamond Therapeutics Inc 36 0.01
USD 9,241 Bluebird Bio Inc 561 0.12
USD 7,758 Blueprint Medicines Corp 568 0.12
USD 7,523 Calithera Biosciences Inc 35 0.01
USD 5,998 Cara Therapeutics Inc 99 0.02
USD 5,080 CEL-SCI Corp 64 0.01
USD 5,521 ChemoCentryx Inc 291 0.06
USD 3,284 Constellation Pharmaceuticals Inc 88 0.02
USD 2,100 Cortexyme Inc 84 0.02
USD 1,799 Crinetics Pharmaceuticals Inc 25 0.00
USD 3,036 Cue Biopharma Inc 57 0.01
USD 6,668 CytomX Therapeutics Inc 47 0.01
USD 5,035 Deciphera Pharmaceuticals Inc^ 233 0.05
USD 11,294 Denali Therapeutics Inc 265 0.06
USD 9,222 Dicerna Pharmaceuticals Inc 198 0.04
USD 16,546 Dynavax Technologies Corp 134 0.03
USD 8,762 Editas Medicine Inc 257 0.05
USD 6,631 Emergent BioSolutions Inc^ 738 0.16
USD 9,547 Epizyme Inc 132 0.03
USD 3,879 Esperion Therapeutics Inc 146 0.03
Ccy Holding Investment
FairValue
USD'000
% of netassetvalue
United States (31 July 2019: 95.33%) (cont)
Biotechnology (cont)
USD 43,554 Exelixis Inc 1,006 0.21
USD 8,593 Fate Therapeutics Inc 269 0.06
USD 11,878 FibroGen Inc^ 481 0.10
USD 48,254 Geron Corp 77 0.02
USD 7,546 Gossamer Bio Inc 90 0.02
USD 8,079 Guardant Health Inc^ 688 0.15
USD 18,287 Halozyme Therapeutics Inc 497 0.10
USD 2,066 Homology Medicines Inc 27 0.01
USD 1,033 IGM Biosciences Inc 52 0.01
USD 21,962 ImmunoGen Inc 90 0.02
USD 25,973 Immunomedics Inc^ 1,097 0.23
USD 3,302 Immunovant Inc 75 0.02
USD 10,801 Innoviva Inc 146 0.03
USD 20,843 Inovio Pharmaceuticals Inc 405 0.09
USD 14,739 Insmed Inc^ 385 0.08
USD 3,884 Intercept Pharmaceuticals Inc^ 177 0.04
USD 15,413 Iovance Biotherapeutics Inc^ 448 0.09
USD 1,675 Karuna Therapeutics Inc^ 137 0.03
USD 7,525 Karyopharm Therapeutics Inc 121 0.02
USD 3,079 Kodiak Sciences Inc^ 143 0.03
USD 1,455 Krystal Biotech Inc 60 0.01
USD 2,333 Ligand Pharmaceuticals Inc 273 0.06
USD 5,550 Livongo Health Inc^ 706 0.15
USD 7,111 MacroGenics Inc 181 0.04
USD 6,315 Mersana Therapeutics Inc 126 0.03
USD 4,038 Mirati Therapeutics Inc^ 490 0.10
USD 2,934 Molecular Templates Inc 32 0.01
USD 10,689 Myriad Genetics Inc 129 0.03
USD 25,305 Nektar Therapeutics 561 0.12
USD 14,952 NeoGenomics Inc^ 572 0.12
USD 1,766 NextCure Inc 16 0.00
USD 7,360 Novavax Inc 1,053 0.22
USD 5,539 Omeros Corp 71 0.01
USD 22,103 Pacific Biosciences of California Inc 82 0.02
USD 13,831 PDL BioPharma Inc 44 0.01
USD 1,034 Phathom Pharmaceuticals Inc 34 0.01
USD 8,881 Precigen Inc 37 0.01
USD 4,770 Provention Bio Inc 50 0.01
USD 7,770 PTC Therapeutics Inc^ 360 0.08
USD 4,072 Puma Biotechnology Inc 42 0.01
USD 6,702 Radius Health Inc 84 0.02
USD 4,365 REGENXBIO Inc 144 0.03
USD 2,332 Replimune Group Inc 47 0.01
USD 5,126 Retrophin Inc 102 0.02
USD 1,684 REVOLUTION Medicines Inc 41 0.01
USD 17,832 Rigel Pharmaceuticals Inc 41 0.01
USD 5,725 Rocket Pharmaceuticals Inc^ 135 0.03
USD 4,483 Rubius Therapeutics Inc 22 0.00
USD 7,472 Sage Therapeutics Inc 340 0.07
USD 16,242 Sangamo Therapeutics Inc^ 176 0.04
USD 2,429 Scholar Rock Holding Corp 27 0.01
iSHARES VII PLC
SCHEDULE OF INVESTMENTS (continued)
iSHARES MSCI USA SMALL CAP UCITS ETF (continued)As at 31 July 2020
[220 ]
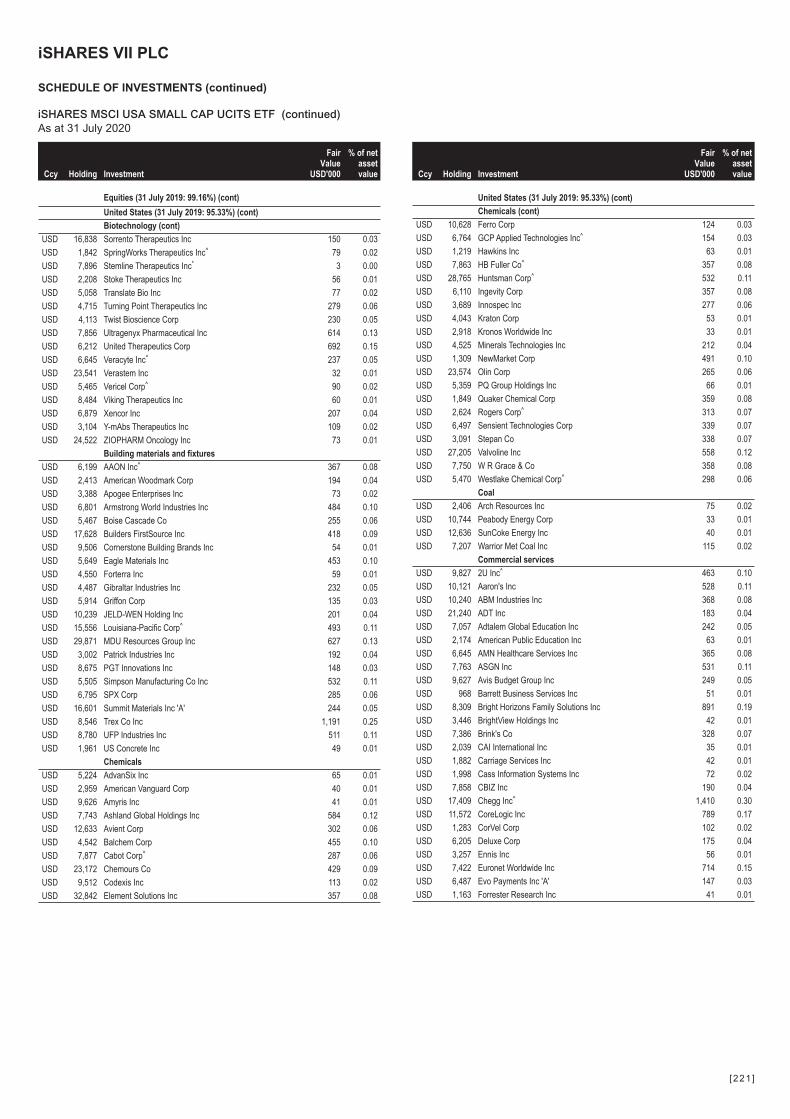
Ccy Holding Investment
FairValue
USD'000
% of netassetvalue
Equities (31 July 2019: 99.16%) (cont)
United States (31 July 2019: 95.33%) (cont)
Biotechnology (cont)
USD 16,838 Sorrento Therapeutics Inc 150 0.03
USD 1,842 SpringWorks Therapeutics Inc^ 79 0.02
USD 7,896 Stemline Therapeutics Inc* 3 0.00
USD 2,208 Stoke Therapeutics Inc 56 0.01
USD 5,058 Translate Bio Inc 77 0.02
USD 4,715 Turning Point Therapeutics Inc 279 0.06
USD 4,113 Twist Bioscience Corp 230 0.05
USD 7,856 Ultragenyx Pharmaceutical Inc 614 0.13
USD 6,212 United Therapeutics Corp 692 0.15
USD 6,645 Veracyte Inc^ 237 0.05
USD 23,541 Verastem Inc 32 0.01
USD 5,465 Vericel Corp^ 90 0.02
USD 8,484 Viking Therapeutics Inc 60 0.01
USD 6,879 Xencor Inc 207 0.04
USD 3,104 Y-mAbs Therapeutics Inc 109 0.02
USD 24,522 ZIOPHARM Oncology Inc 73 0.01
Building materials and fixtures
USD 6,199 AAON Inc^ 367 0.08
USD 2,413 American Woodmark Corp 194 0.04
USD 3,388 Apogee Enterprises Inc 73 0.02
USD 6,801 Armstrong World Industries Inc 484 0.10
USD 5,467 Boise Cascade Co 255 0.06
USD 17,628 Builders FirstSource Inc 418 0.09
USD 9,506 Cornerstone Building Brands Inc 54 0.01
USD 5,649 Eagle Materials Inc 453 0.10
USD 4,550 Forterra Inc 59 0.01
USD 4,487 Gibraltar Industries Inc 232 0.05
USD 5,914 Griffon Corp 135 0.03
USD 10,239 JELD-WEN Holding Inc 201 0.04
USD 15,556 Louisiana-Pacific Corp^ 493 0.11
USD 29,871 MDU Resources Group Inc 627 0.13
USD 3,002 Patrick Industries Inc 192 0.04
USD 8,675 PGT Innovations Inc 148 0.03
USD 5,505 Simpson Manufacturing Co Inc 532 0.11
USD 6,795 SPX Corp 285 0.06
USD 16,601 Summit Materials Inc 'A' 244 0.05
USD 8,546 Trex Co Inc 1,191 0.25
USD 8,780 UFP Industries Inc 511 0.11
USD 1,961 US Concrete Inc 49 0.01
Chemicals
USD 5,224 AdvanSix Inc 65 0.01
USD 2,959 American Vanguard Corp 40 0.01
USD 9,626 Amyris Inc 41 0.01
USD 7,743 Ashland Global Holdings Inc 584 0.12
USD 12,633 Avient Corp 302 0.06
USD 4,542 Balchem Corp 455 0.10
USD 7,877 Cabot Corp^ 287 0.06
USD 23,172 Chemours Co 429 0.09
USD 9,512 Codexis Inc 113 0.02
USD 32,842 Element Solutions Inc 357 0.08
Ccy Holding Investment
FairValue
USD'000
% of netassetvalue
United States (31 July 2019: 95.33%) (cont)
Chemicals (cont)
USD 10,628 Ferro Corp 124 0.03
USD 6,764 GCP Applied Technologies Inc^ 154 0.03
USD 1,219 Hawkins Inc 63 0.01
USD 7,863 HB Fuller Co^ 357 0.08
USD 28,765 Huntsman Corp^ 532 0.11
USD 6,110 Ingevity Corp 357 0.08
USD 3,689 Innospec Inc 277 0.06
USD 4,043 Kraton Corp 53 0.01
USD 2,918 Kronos Worldwide Inc 33 0.01
USD 4,525 Minerals Technologies Inc 212 0.04
USD 1,309 NewMarket Corp 491 0.10
USD 23,574 Olin Corp 265 0.06
USD 5,359 PQ Group Holdings Inc 66 0.01
USD 1,849 Quaker Chemical Corp 359 0.08
USD 2,624 Rogers Corp^ 313 0.07
USD 6,497 Sensient Technologies Corp 339 0.07
USD 3,091 Stepan Co 338 0.07
USD 27,205 Valvoline Inc 558 0.12
USD 7,750 W R Grace & Co 358 0.08
USD 5,470 Westlake Chemical Corp^ 298 0.06
Coal
USD 2,406 Arch Resources Inc 75 0.02
USD 10,744 Peabody Energy Corp 33 0.01
USD 12,636 SunCoke Energy Inc 40 0.01
USD 7,207 Warrior Met Coal Inc 115 0.02
Commercial services
USD 9,827 2U Inc^ 463 0.10
USD 10,121 Aaron's Inc 528 0.11
USD 10,240 ABM Industries Inc 368 0.08
USD 21,240 ADT Inc 183 0.04
USD 7,057 Adtalem Global Education Inc 242 0.05
USD 2,174 American Public Education Inc 63 0.01
USD 6,645 AMN Healthcare Services Inc 365 0.08
USD 7,763 ASGN Inc 531 0.11
USD 9,627 Avis Budget Group Inc 249 0.05
USD 968 Barrett Business Services Inc 51 0.01
USD 8,309 Bright Horizons Family Solutions Inc 891 0.19
USD 3,446 BrightView Holdings Inc 42 0.01
USD 7,386 Brink's Co 328 0.07
USD 2,039 CAI International Inc 35 0.01
USD 1,882 Carriage Services Inc 42 0.01
USD 1,998 Cass Information Systems Inc 72 0.02
USD 7,858 CBIZ Inc 190 0.04
USD 17,409 Chegg Inc^ 1,410 0.30
USD 11,572 CoreLogic Inc 789 0.17
USD 1,283 CorVel Corp 102 0.02
USD 6,205 Deluxe Corp 175 0.04
USD 3,257 Ennis Inc 56 0.01
USD 7,422 Euronet Worldwide Inc 714 0.15
USD 6,487 Evo Payments Inc 'A' 147 0.03
USD 1,163 Forrester Research Inc 41 0.01
iSHARES VII PLC
SCHEDULE OF INVESTMENTS (continued)
iSHARES MSCI USA SMALL CAP UCITS ETF (continued)As at 31 July 2020
[221 ]
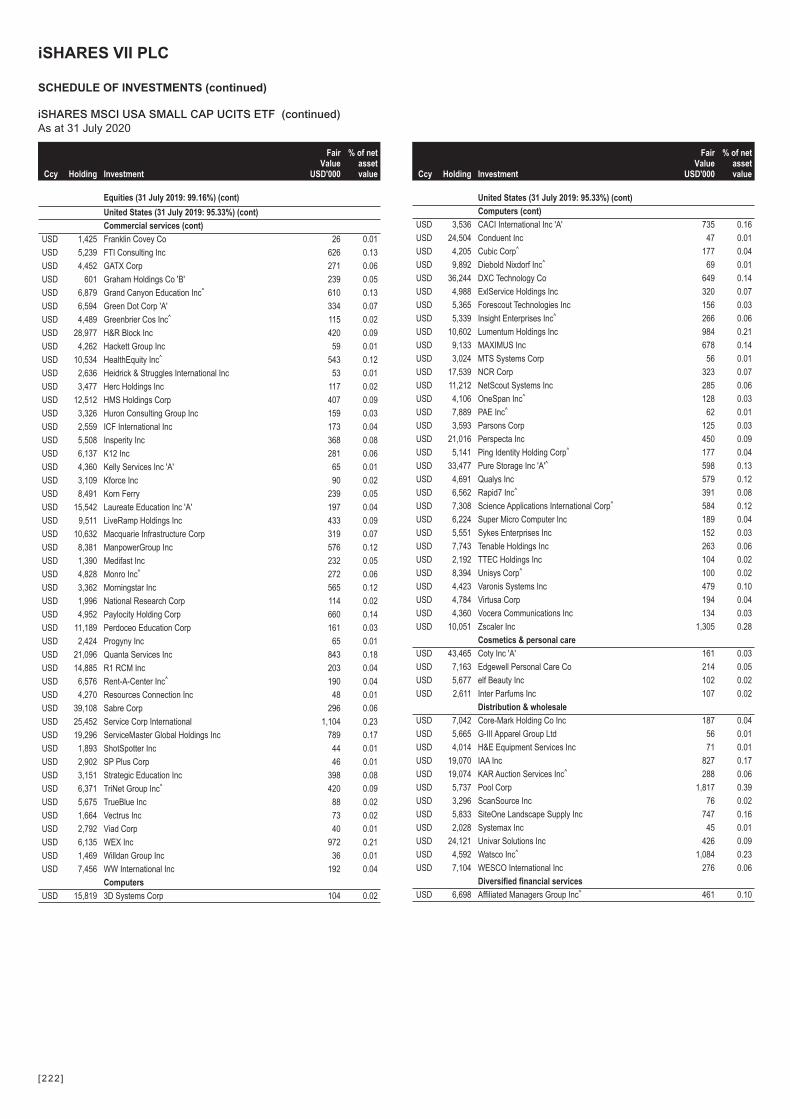
Ccy Holding Investment
FairValue
USD'000
% of netassetvalue
Equities (31 July 2019: 99.16%) (cont)
United States (31 July 2019: 95.33%) (cont)
Commercial services (cont)
USD 1,425 Franklin Covey Co 26 0.01
USD 5,239 FTI Consulting Inc 626 0.13
USD 4,452 GATX Corp 271 0.06
USD 601 Graham Holdings Co 'B' 239 0.05
USD 6,879 Grand Canyon Education Inc^ 610 0.13
USD 6,594 Green Dot Corp 'A' 334 0.07
USD 4,489 Greenbrier Cos Inc^ 115 0.02
USD 28,977 H&R Block Inc 420 0.09
USD 4,262 Hackett Group Inc 59 0.01
USD 10,534 HealthEquity Inc^ 543 0.12
USD 2,636 Heidrick & Struggles International Inc 53 0.01
USD 3,477 Herc Holdings Inc 117 0.02
USD 12,512 HMS Holdings Corp 407 0.09
USD 3,326 Huron Consulting Group Inc 159 0.03
USD 2,559 ICF International Inc 173 0.04
USD 5,508 Insperity Inc 368 0.08
USD 6,137 K12 Inc 281 0.06
USD 4,360 Kelly Services Inc 'A' 65 0.01
USD 3,109 Kforce Inc 90 0.02
USD 8,491 Korn Ferry 239 0.05
USD 15,542 Laureate Education Inc 'A' 197 0.04
USD 9,511 LiveRamp Holdings Inc 433 0.09
USD 10,632 Macquarie Infrastructure Corp 319 0.07
USD 8,381 ManpowerGroup Inc 576 0.12
USD 1,390 Medifast Inc 232 0.05
USD 4,828 Monro Inc^ 272 0.06
USD 3,362 Morningstar Inc 565 0.12
USD 1,996 National Research Corp 114 0.02
USD 4,952 Paylocity Holding Corp 660 0.14
USD 11,189 Perdoceo Education Corp 161 0.03
USD 2,424 Progyny Inc 65 0.01
USD 21,096 Quanta Services Inc 843 0.18
USD 14,885 R1 RCM Inc 203 0.04
USD 6,576 Rent-A-Center Inc^ 190 0.04
USD 4,270 Resources Connection Inc 48 0.01
USD 39,108 Sabre Corp 296 0.06
USD 25,452 Service Corp International 1,104 0.23
USD 19,296 ServiceMaster Global Holdings Inc 789 0.17
USD 1,893 ShotSpotter Inc 44 0.01
USD 2,902 SP Plus Corp 46 0.01
USD 3,151 Strategic Education Inc 398 0.08
USD 6,371 TriNet Group Inc^ 420 0.09
USD 5,675 TrueBlue Inc 88 0.02
USD 1,664 Vectrus Inc 73 0.02
USD 2,792 Viad Corp 40 0.01
USD 6,135 WEX Inc 972 0.21
USD 1,469 Willdan Group Inc 36 0.01
USD 7,456 WW International Inc 192 0.04
Computers
USD 15,819 3D Systems Corp 104 0.02
Ccy Holding Investment
FairValue
USD'000
% of netassetvalue
United States (31 July 2019: 95.33%) (cont)
Computers (cont)
USD 3,536 CACI International Inc 'A' 735 0.16
USD 24,504 Conduent Inc 47 0.01
USD 4,205 Cubic Corp^ 177 0.04
USD 9,892 Diebold Nixdorf Inc^ 69 0.01
USD 36,244 DXC Technology Co 649 0.14
USD 4,988 ExlService Holdings Inc 320 0.07
USD 5,365 Forescout Technologies Inc 156 0.03
USD 5,339 Insight Enterprises Inc^ 266 0.06
USD 10,602 Lumentum Holdings Inc 984 0.21
USD 9,133 MAXIMUS Inc 678 0.14
USD 3,024 MTS Systems Corp 56 0.01
USD 17,539 NCR Corp 323 0.07
USD 11,212 NetScout Systems Inc 285 0.06
USD 4,106 OneSpan Inc^ 128 0.03
USD 7,889 PAE Inc^ 62 0.01
USD 3,593 Parsons Corp 125 0.03
USD 21,016 Perspecta Inc 450 0.09
USD 5,141 Ping Identity Holding Corp^ 177 0.04
USD 33,477 Pure Storage Inc 'A'^ 598 0.13
USD 4,691 Qualys Inc 579 0.12
USD 6,562 Rapid7 Inc^ 391 0.08
USD 7,308 Science Applications International Corp^ 584 0.12
USD 6,224 Super Micro Computer Inc 189 0.04
USD 5,551 Sykes Enterprises Inc 152 0.03
USD 7,743 Tenable Holdings Inc 263 0.06
USD 2,192 TTEC Holdings Inc 104 0.02
USD 8,394 Unisys Corp^ 100 0.02
USD 4,423 Varonis Systems Inc 479 0.10
USD 4,784 Virtusa Corp 194 0.04
USD 4,360 Vocera Communications Inc 134 0.03
USD 10,051 Zscaler Inc 1,305 0.28
Cosmetics & personal care
USD 43,465 Coty Inc 'A' 161 0.03
USD 7,163 Edgewell Personal Care Co 214 0.05
USD 5,677 elf Beauty Inc 102 0.02
USD 2,611 Inter Parfums Inc 107 0.02
Distribution & wholesale
USD 7,042 Core-Mark Holding Co Inc 187 0.04
USD 5,665 G-III Apparel Group Ltd 56 0.01
USD 4,014 H&E Equipment Services Inc 71 0.01
USD 19,070 IAA Inc 827 0.17
USD 19,074 KAR Auction Services Inc^ 288 0.06
USD 5,737 Pool Corp 1,817 0.39
USD 3,296 ScanSource Inc 76 0.02
USD 5,833 SiteOne Landscape Supply Inc 747 0.16
USD 2,028 Systemax Inc 45 0.01
USD 24,121 Univar Solutions Inc 426 0.09
USD 4,592 Watsco Inc^ 1,084 0.23
USD 7,104 WESCO International Inc 276 0.06
Diversified financial services
USD 6,698 Affiliated Managers Group Inc^ 461 0.10
iSHARES VII PLC
SCHEDULE OF INVESTMENTS (continued)
iSHARES MSCI USA SMALL CAP UCITS ETF (continued)As at 31 July 2020
[222 ]
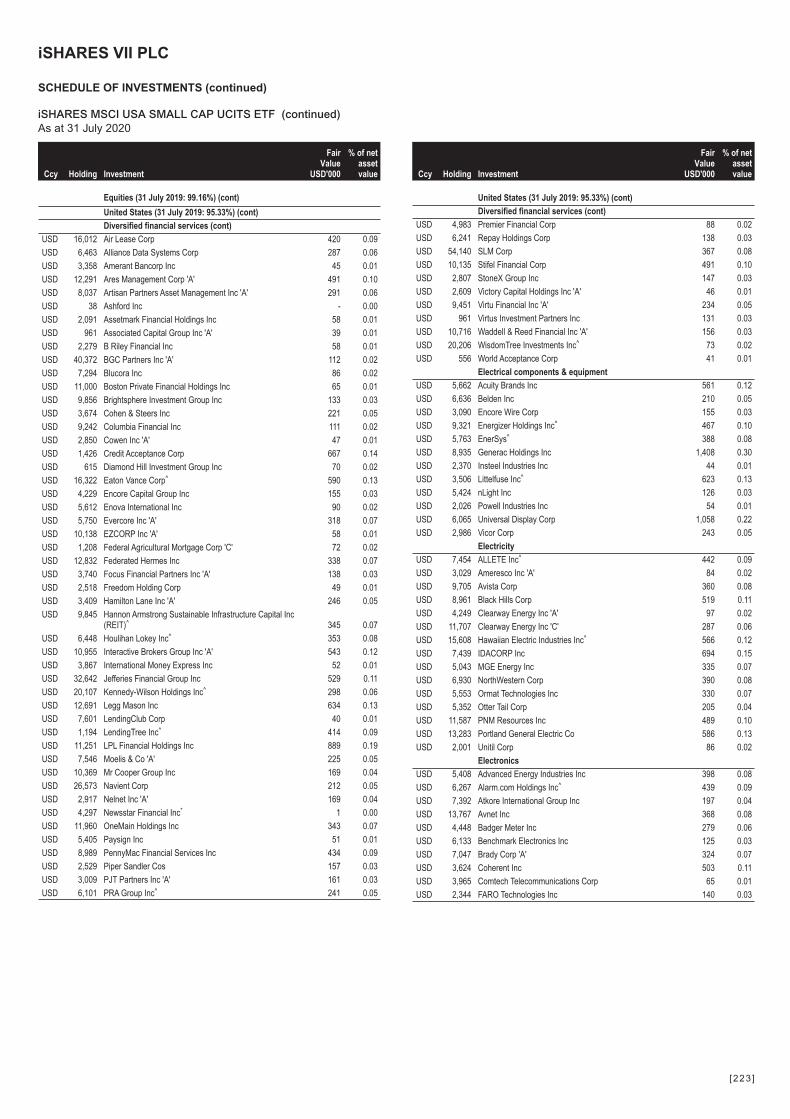
Ccy Holding Investment
FairValue
USD'000
% of netassetvalue
Equities (31 July 2019: 99.16%) (cont)
United States (31 July 2019: 95.33%) (cont)
Diversified financial services (cont)
USD 16,012 Air Lease Corp 420 0.09
USD 6,463 Alliance Data Systems Corp 287 0.06
USD 3,358 Amerant Bancorp Inc 45 0.01
USD 12,291 Ares Management Corp 'A' 491 0.10
USD 8,037 Artisan Partners Asset Management Inc 'A' 291 0.06
USD 38 Ashford Inc - 0.00
USD 2,091 Assetmark Financial Holdings Inc 58 0.01
USD 961 Associated Capital Group Inc 'A' 39 0.01
USD 2,279 B Riley Financial Inc 58 0.01
USD 40,372 BGC Partners Inc 'A' 112 0.02
USD 7,294 Blucora Inc 86 0.02
USD 11,000 Boston Private Financial Holdings Inc 65 0.01
USD 9,856 Brightsphere Investment Group Inc 133 0.03
USD 3,674 Cohen & Steers Inc 221 0.05
USD 9,242 Columbia Financial Inc 111 0.02
USD 2,850 Cowen Inc 'A' 47 0.01
USD 1,426 Credit Acceptance Corp 667 0.14
USD 615 Diamond Hill Investment Group Inc 70 0.02
USD 16,322 Eaton Vance Corp^ 590 0.13
USD 4,229 Encore Capital Group Inc 155 0.03
USD 5,612 Enova International Inc 90 0.02
USD 5,750 Evercore Inc 'A' 318 0.07
USD 10,138 EZCORP Inc 'A' 58 0.01
USD 1,208 Federal Agricultural Mortgage Corp 'C' 72 0.02
USD 12,832 Federated Hermes Inc 338 0.07
USD 3,740 Focus Financial Partners Inc 'A' 138 0.03
USD 2,518 Freedom Holding Corp 49 0.01
USD 3,409 Hamilton Lane Inc 'A' 246 0.05
USD 9,845 Hannon Armstrong Sustainable Infrastructure Capital Inc(REIT)^ 345 0.07
USD 6,448 Houlihan Lokey Inc^ 353 0.08
USD 10,955 Interactive Brokers Group Inc 'A' 543 0.12
USD 3,867 International Money Express Inc 52 0.01
USD 32,642 Jefferies Financial Group Inc 529 0.11
USD 20,107 Kennedy-Wilson Holdings Inc^ 298 0.06
USD 12,691 Legg Mason Inc 634 0.13
USD 7,601 LendingClub Corp 40 0.01
USD 1,194 LendingTree Inc^ 414 0.09
USD 11,251 LPL Financial Holdings Inc 889 0.19
USD 7,546 Moelis & Co 'A' 225 0.05
USD 10,369 Mr Cooper Group Inc 169 0.04
USD 26,573 Navient Corp 212 0.05
USD 2,917 Nelnet Inc 'A' 169 0.04
USD 4,297 Newsstar Financial Inc* 1 0.00
USD 11,960 OneMain Holdings Inc 343 0.07
USD 5,405 Paysign Inc 51 0.01
USD 8,989 PennyMac Financial Services Inc 434 0.09
USD 2,529 Piper Sandler Cos 157 0.03
USD 3,009 PJT Partners Inc 'A' 161 0.03
USD 6,101 PRA Group Inc^ 241 0.05
Ccy Holding Investment
FairValue
USD'000
% of netassetvalue
United States (31 July 2019: 95.33%) (cont)
Diversified financial services (cont)
USD 4,983 Premier Financial Corp 88 0.02
USD 6,241 Repay Holdings Corp 138 0.03
USD 54,140 SLM Corp 367 0.08
USD 10,135 Stifel Financial Corp 491 0.10
USD 2,807 StoneX Group Inc 147 0.03
USD 2,609 Victory Capital Holdings Inc 'A' 46 0.01
USD 9,451 Virtu Financial Inc 'A' 234 0.05
USD 961 Virtus Investment Partners Inc 131 0.03
USD 10,716 Waddell & Reed Financial Inc 'A' 156 0.03
USD 20,206 WisdomTree Investments Inc^ 73 0.02
USD 556 World Acceptance Corp 41 0.01
Electrical components & equipment
USD 5,662 Acuity Brands Inc 561 0.12
USD 6,636 Belden Inc 210 0.05
USD 3,090 Encore Wire Corp 155 0.03
USD 9,321 Energizer Holdings Inc^ 467 0.10
USD 5,763 EnerSys^ 388 0.08
USD 8,935 Generac Holdings Inc 1,408 0.30
USD 2,370 Insteel Industries Inc 44 0.01
USD 3,506 Littelfuse Inc^ 623 0.13
USD 5,424 nLight Inc 126 0.03
USD 2,026 Powell Industries Inc 54 0.01
USD 6,065 Universal Display Corp 1,058 0.22
USD 2,986 Vicor Corp 243 0.05
Electricity
USD 7,454 ALLETE Inc^ 442 0.09
USD 3,029 Ameresco Inc 'A' 84 0.02
USD 9,705 Avista Corp 360 0.08
USD 8,961 Black Hills Corp 519 0.11
USD 4,249 Clearway Energy Inc 'A' 97 0.02
USD 11,707 Clearway Energy Inc 'C' 287 0.06
USD 15,608 Hawaiian Electric Industries Inc^ 566 0.12
USD 7,439 IDACORP Inc 694 0.15
USD 5,043 MGE Energy Inc 335 0.07
USD 6,930 NorthWestern Corp 390 0.08
USD 5,553 Ormat Technologies Inc 330 0.07
USD 5,352 Otter Tail Corp 205 0.04
USD 11,587 PNM Resources Inc 489 0.10
USD 13,283 Portland General Electric Co 586 0.13
USD 2,001 Unitil Corp 86 0.02
Electronics
USD 5,408 Advanced Energy Industries Inc 398 0.08
USD 6,267 Alarm.com Holdings Inc^ 439 0.09
USD 7,392 Atkore International Group Inc 197 0.04
USD 13,767 Avnet Inc 368 0.08
USD 4,448 Badger Meter Inc 279 0.06
USD 6,133 Benchmark Electronics Inc 125 0.03
USD 7,047 Brady Corp 'A' 324 0.07
USD 3,624 Coherent Inc 503 0.11
USD 3,965 Comtech Telecommunications Corp 65 0.01
USD 2,344 FARO Technologies Inc 140 0.03
iSHARES VII PLC
SCHEDULE OF INVESTMENTS (continued)
iSHARES MSCI USA SMALL CAP UCITS ETF (continued)As at 31 July 2020
[223 ]
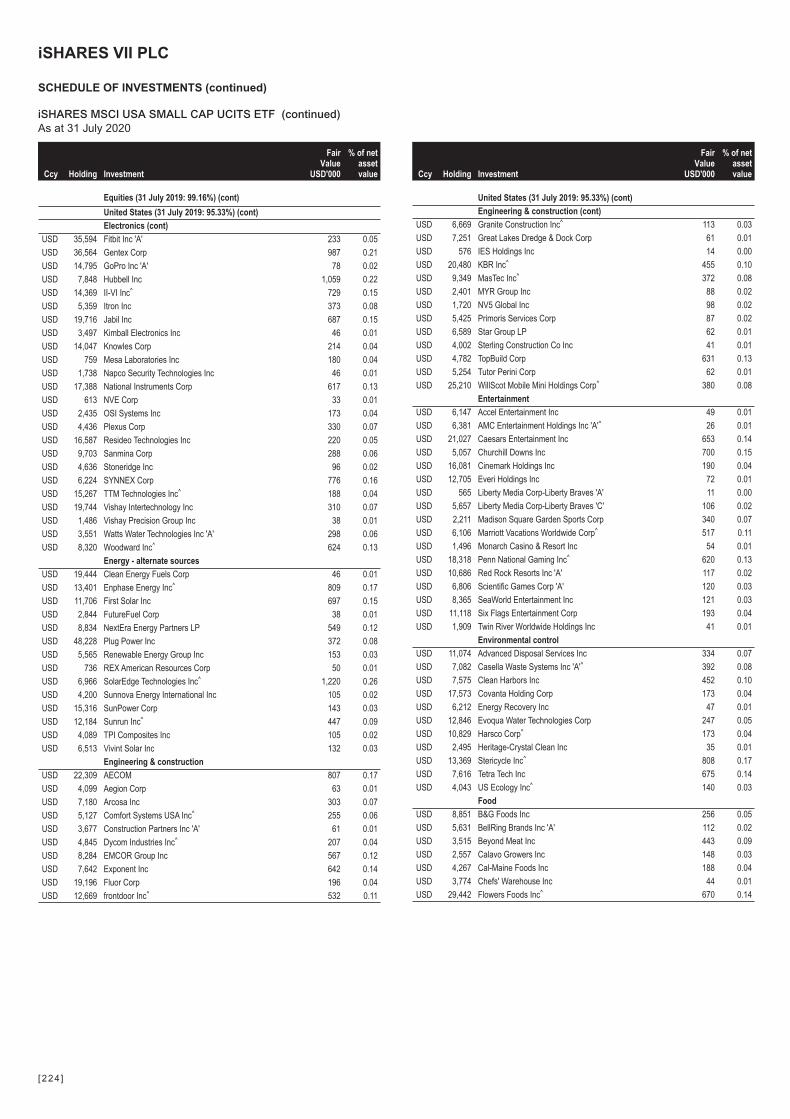
Ccy Holding Investment
FairValue
USD'000
% of netassetvalue
Equities (31 July 2019: 99.16%) (cont)
United States (31 July 2019: 95.33%) (cont)
Electronics (cont)
USD 35,594 Fitbit Inc 'A' 233 0.05
USD 36,564 Gentex Corp 987 0.21
USD 14,795 GoPro Inc 'A' 78 0.02
USD 7,848 Hubbell Inc 1,059 0.22
USD 14,369 II-VI Inc^ 729 0.15
USD 5,359 Itron Inc 373 0.08
USD 19,716 Jabil Inc 687 0.15
USD 3,497 Kimball Electronics Inc 46 0.01
USD 14,047 Knowles Corp 214 0.04
USD 759 Mesa Laboratories Inc 180 0.04
USD 1,738 Napco Security Technologies Inc 46 0.01
USD 17,388 National Instruments Corp 617 0.13
USD 613 NVE Corp 33 0.01
USD 2,435 OSI Systems Inc 173 0.04
USD 4,436 Plexus Corp 330 0.07
USD 16,587 Resideo Technologies Inc 220 0.05
USD 9,703 Sanmina Corp 288 0.06
USD 4,636 Stoneridge Inc 96 0.02
USD 6,224 SYNNEX Corp 776 0.16
USD 15,267 TTM Technologies Inc^ 188 0.04
USD 19,744 Vishay Intertechnology Inc 310 0.07
USD 1,486 Vishay Precision Group Inc 38 0.01
USD 3,551 Watts Water Technologies Inc 'A' 298 0.06
USD 8,320 Woodward Inc^ 624 0.13
Energy - alternate sources
USD 19,444 Clean Energy Fuels Corp 46 0.01
USD 13,401 Enphase Energy Inc^ 809 0.17
USD 11,706 First Solar Inc 697 0.15
USD 2,844 FutureFuel Corp 38 0.01
USD 8,834 NextEra Energy Partners LP 549 0.12
USD 48,228 Plug Power Inc 372 0.08
USD 5,565 Renewable Energy Group Inc 153 0.03
USD 736 REX American Resources Corp 50 0.01
USD 6,966 SolarEdge Technologies Inc^ 1,220 0.26
USD 4,200 Sunnova Energy International Inc 105 0.02
USD 15,316 SunPower Corp 143 0.03
USD 12,184 Sunrun Inc^ 447 0.09
USD 4,089 TPI Composites Inc 105 0.02
USD 6,513 Vivint Solar Inc 132 0.03
Engineering & construction
USD 22,309 AECOM 807 0.17
USD 4,099 Aegion Corp 63 0.01
USD 7,180 Arcosa Inc 303 0.07
USD 5,127 Comfort Systems USA Inc^ 255 0.06
USD 3,677 Construction Partners Inc 'A' 61 0.01
USD 4,845 Dycom Industries Inc^ 207 0.04
USD 8,284 EMCOR Group Inc 567 0.12
USD 7,642 Exponent Inc 642 0.14
USD 19,196 Fluor Corp 196 0.04
USD 12,669 frontdoor Inc^ 532 0.11
Ccy Holding Investment
FairValue
USD'000
% of netassetvalue
United States (31 July 2019: 95.33%) (cont)
Engineering & construction (cont)
USD 6,669 Granite Construction Inc^ 113 0.03
USD 7,251 Great Lakes Dredge & Dock Corp 61 0.01
USD 576 IES Holdings Inc 14 0.00
USD 20,480 KBR Inc^ 455 0.10
USD 9,349 MasTec Inc^ 372 0.08
USD 2,401 MYR Group Inc 88 0.02
USD 1,720 NV5 Global Inc 98 0.02
USD 5,425 Primoris Services Corp 87 0.02
USD 6,589 Star Group LP 62 0.01
USD 4,002 Sterling Construction Co Inc 41 0.01
USD 4,782 TopBuild Corp 631 0.13
USD 5,254 Tutor Perini Corp 62 0.01
USD 25,210 WillScot Mobile Mini Holdings Corp^ 380 0.08
Entertainment
USD 6,147 Accel Entertainment Inc 49 0.01
USD 6,381 AMC Entertainment Holdings Inc 'A'^ 26 0.01
USD 21,027 Caesars Entertainment Inc 653 0.14
USD 5,057 Churchill Downs Inc 700 0.15
USD 16,081 Cinemark Holdings Inc 190 0.04
USD 12,705 Everi Holdings Inc 72 0.01
USD 565 Liberty Media Corp-Liberty Braves 'A' 11 0.00
USD 5,657 Liberty Media Corp-Liberty Braves 'C' 106 0.02
USD 2,211 Madison Square Garden Sports Corp 340 0.07
USD 6,106 Marriott Vacations Worldwide Corp^ 517 0.11
USD 1,496 Monarch Casino & Resort Inc 54 0.01
USD 18,318 Penn National Gaming Inc^ 620 0.13
USD 10,686 Red Rock Resorts Inc 'A' 117 0.02
USD 6,806 Scientific Games Corp 'A' 120 0.03
USD 8,365 SeaWorld Entertainment Inc 121 0.03
USD 11,118 Six Flags Entertainment Corp 193 0.04
USD 1,909 Twin River Worldwide Holdings Inc 41 0.01
Environmental control
USD 11,074 Advanced Disposal Services Inc 334 0.07
USD 7,082 Casella Waste Systems Inc 'A'^ 392 0.08
USD 7,575 Clean Harbors Inc 452 0.10
USD 17,573 Covanta Holding Corp 173 0.04
USD 6,212 Energy Recovery Inc 47 0.01
USD 12,846 Evoqua Water Technologies Corp 247 0.05
USD 10,829 Harsco Corp^ 173 0.04
USD 2,495 Heritage-Crystal Clean Inc 35 0.01
USD 13,369 Stericycle Inc^ 808 0.17
USD 7,616 Tetra Tech Inc 675 0.14
USD 4,043 US Ecology Inc^ 140 0.03
Food
USD 8,851 B&G Foods Inc 256 0.05
USD 5,631 BellRing Brands Inc 'A' 112 0.02
USD 3,515 Beyond Meat Inc 443 0.09
USD 2,557 Calavo Growers Inc 148 0.03
USD 4,267 Cal-Maine Foods Inc 188 0.04
USD 3,774 Chefs' Warehouse Inc 44 0.01
USD 29,442 Flowers Foods Inc^ 670 0.14
iSHARES VII PLC
SCHEDULE OF INVESTMENTS (continued)
iSHARES MSCI USA SMALL CAP UCITS ETF (continued)As at 31 July 2020
[224 ]

Ccy Holding Investment
FairValue
USD'000
% of netassetvalue
Equities (31 July 2019: 99.16%) (cont)
United States (31 July 2019: 95.33%) (cont)
Food (cont)
USD 10,028 Grocery Outlet Holding Corp^ 441 0.09
USD 11,595 Hain Celestial Group Inc 394 0.08
USD 17,051 Hostess Brands Inc 216 0.05
USD 2,181 Ingles Markets Inc 'A' 88 0.02
USD 2,152 J & J Snack Foods Corp 265 0.06
USD 1,498 John B Sanfilippo & Son Inc 132 0.03
USD 2,680 Lancaster Colony Corp^ 425 0.09
USD 2,982 Landec Corp 28 0.01
USD 18,577 Performance Food Group Co 521 0.11
USD 8,364 Pilgrim's Pride Corp 128 0.03
USD 9,352 Post Holdings Inc 830 0.18
USD 2,926 Sanderson Farms Inc^ 326 0.07
USD 40 Seaboard Corp 108 0.02
USD 12,157 Simply Good Foods Co^ 292 0.06
USD 4,727 SpartanNash Co 99 0.02
USD 17,371 Sprouts Farmers Market Inc^ 458 0.10
USD 2,551 Tootsie Roll Industries Inc 81 0.02
USD 8,311 TreeHouse Foods Inc^ 364 0.08
USD 7,265 United Natural Foods Inc 144 0.03
USD 32,203 US Foods Holding Corp 654 0.14
USD 925 Village Super Market Inc 'A' 23 0.01
USD 2,295 Weis Markets Inc^ 114 0.02
Food Service
USD 10,936 Healthcare Services Group Inc 286 0.06
Forest products & paper
USD 2,201 Clearwater Paper Corp 81 0.02
USD 8,817 Domtar Corp^ 185 0.04
USD 5,533 Mercer International Inc 41 0.01
USD 2,217 Neenah Inc 99 0.02
USD 7,681 P H Glatfelter Co 123 0.03
USD 4,995 Schweitzer-Mauduit International Inc 163 0.03
USD 4,527 Verso Corp 'A' 55 0.01
Gas
USD 2,547 Chesapeake Utilities Corp 215 0.05
USD 10,885 National Fuel Gas Co^ 442 0.09
USD 13,745 New Jersey Resources Corp 427 0.09
USD 4,108 Northwest Natural Holding Co 220 0.05
USD 7,635 ONE Gas Inc 578 0.12
USD 13,208 South Jersey Industries Inc^ 308 0.07
USD 8,050 Southwest Gas Holdings Inc 560 0.12
USD 7,050 Spire Inc 435 0.09
Hand & machine tools
USD 13,482 Colfax Corp^ 392 0.09
USD 5,326 Franklin Electric Co Inc 288 0.06
USD 12,216 Kennametal Inc^ 329 0.07
USD 8,498 Lincoln Electric Holdings Inc^ 768 0.16
USD 5,124 MSA Safety Inc 607 0.13
USD 5,618 Regal Beloit Corp 517 0.11
Healthcare products
USD 3,876 Accelerate Diagnostics Inc^ 56 0.01
Ccy Holding Investment
FairValue
USD'000
% of netassetvalue
United States (31 July 2019: 95.33%) (cont)
Healthcare products (cont)
USD 10,826 Adaptive Biotechnologies Corp 404 0.09
USD 6,254 AngioDynamics Inc 52 0.01
USD 6,275 AtriCure Inc 256 0.05
USD 229 Atrion Corp 142 0.03
USD 7,199 Avanos Medical Inc^ 221 0.05
USD 5,964 Axogen Inc 68 0.01
USD 2,878 Axonics Modulation Technologies Inc 122 0.03
USD 5,476 Bio-Techne Corp 1,507 0.32
USD 4,927 BioTelemetry Inc 210 0.04
USD 15,733 Bruker Corp 702 0.15
USD 5,268 Cantel Medical Corp^ 249 0.05
USD 5,489 Cardiovascular Systems Inc 167 0.04
USD 6,229 CareDx Inc 208 0.04
USD 1,657 Castle Biosciences Inc 64 0.01
USD 23,117 Cerus Corp 165 0.03
USD 3,527 Co-Diagnostics Inc 85 0.02
USD 4,126 CONMED Corp^ 340 0.07
USD 5,097 CryoLife Inc^ 99 0.02
USD 22,081 Envista Holdings Corp 483 0.10
USD 9,295 GenMark Diagnostics Inc 166 0.04
USD 5,585 Glaukos Corp^ 244 0.05
USD 11,133 Globus Medical Inc 'A' 536 0.11
USD 7,185 Haemonetics Corp 630 0.13
USD 4,706 Hanger Inc 82 0.02
USD 9,568 Hill-Rom Holdings Inc 930 0.20
USD 2,774 ICU Medical Inc 510 0.11
USD 2,666 Inogen Inc 82 0.02
USD 3,100 Inspire Medical Systems Inc 308 0.07
USD 4,564 Integer Holdings Corp 300 0.06
USD 10,532 Integra LifeSciences Holdings Corp^ 503 0.11
USD 4,701 Intersect ENT Inc 81 0.02
USD 3,991 iRhythm Technologies Inc^ 497 0.11
USD 10,452 Lantheus Holdings Inc 141 0.03
USD 1,939 LeMaitre Vascular Inc 57 0.01
USD 6,830 Luminex Corp 249 0.05
USD 5,927 Meridian Bioscience Inc 145 0.03
USD 7,097 Merit Medical Systems Inc^ 317 0.07
USD 5,780 NanoString Technologies Inc^ 209 0.04
USD 9,470 Natera Inc 455 0.10
USD 4,728 Natus Medical Inc 88 0.02
USD 4,317 Nevro Corp 574 0.12
USD 7,448 NuVasive Inc^ 426 0.09
USD 10,243 OraSure Technologies Inc^ 186 0.04
USD 3,035 Orthofix Medical Inc 93 0.02
USD 1,236 OrthoPediatrics Corp 52 0.01
USD 11,649 Patterson Cos Inc 309 0.07
USD 4,822 Penumbra Inc^ 1,070 0.23
USD 6,247 Precision BioSciences Inc 40 0.01
USD 2,096 Quanterix Corp 68 0.01
USD 5,383 Quidel Corp^ 1,520 0.32
USD 7,090 Repligen Corp 1,070 0.23
iSHARES VII PLC
SCHEDULE OF INVESTMENTS (continued)
iSHARES MSCI USA SMALL CAP UCITS ETF (continued)As at 31 July 2020
[225 ]
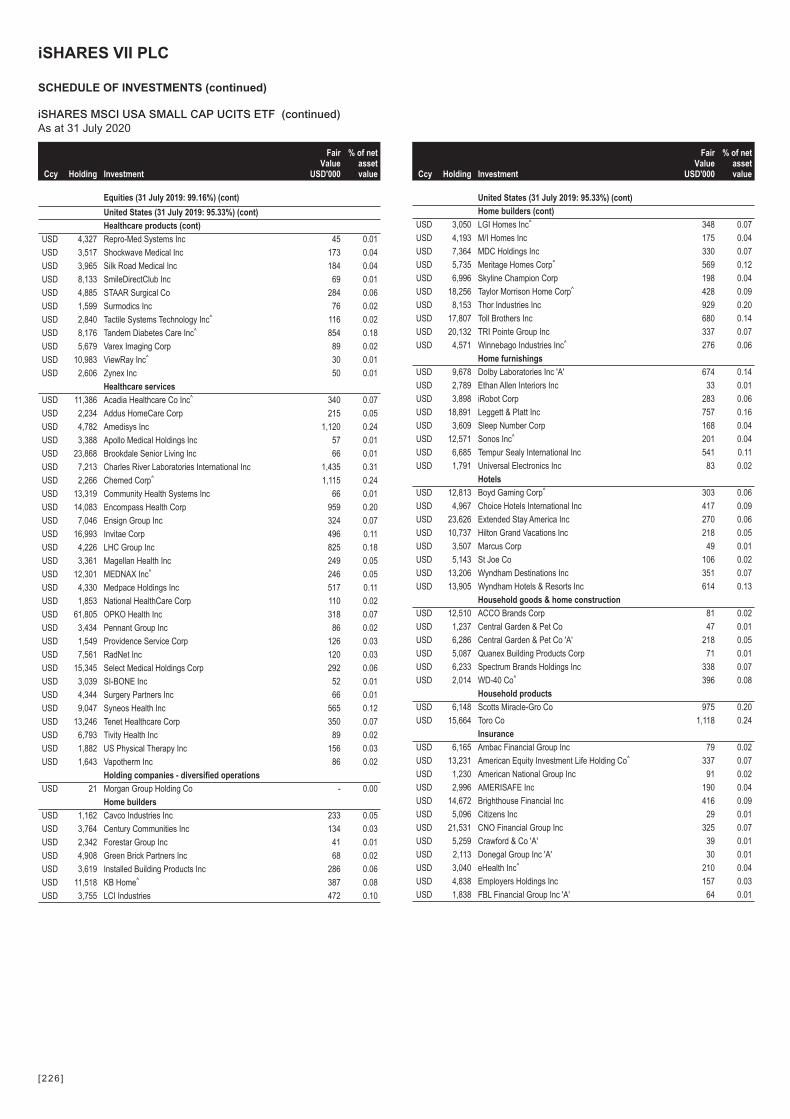
Ccy Holding Investment
FairValue
USD'000
% of netassetvalue
Equities (31 July 2019: 99.16%) (cont)
United States (31 July 2019: 95.33%) (cont)
Healthcare products (cont)
USD 4,327 Repro-Med Systems Inc 45 0.01
USD 3,517 Shockwave Medical Inc 173 0.04
USD 3,965 Silk Road Medical Inc 184 0.04
USD 8,133 SmileDirectClub Inc 69 0.01
USD 4,885 STAAR Surgical Co 284 0.06
USD 1,599 Surmodics Inc 76 0.02
USD 2,840 Tactile Systems Technology Inc^ 116 0.02
USD 8,176 Tandem Diabetes Care Inc^ 854 0.18
USD 5,679 Varex Imaging Corp 89 0.02
USD 10,983 ViewRay Inc^ 30 0.01
USD 2,606 Zynex Inc 50 0.01
Healthcare services
USD 11,386 Acadia Healthcare Co Inc^ 340 0.07
USD 2,234 Addus HomeCare Corp 215 0.05
USD 4,782 Amedisys Inc 1,120 0.24
USD 3,388 Apollo Medical Holdings Inc 57 0.01
USD 23,868 Brookdale Senior Living Inc 66 0.01
USD 7,213 Charles River Laboratories International Inc 1,435 0.31
USD 2,266 Chemed Corp^ 1,115 0.24
USD 13,319 Community Health Systems Inc 66 0.01
USD 14,083 Encompass Health Corp 959 0.20
USD 7,046 Ensign Group Inc 324 0.07
USD 16,993 Invitae Corp 496 0.11
USD 4,226 LHC Group Inc 825 0.18
USD 3,361 Magellan Health Inc 249 0.05
USD 12,301 MEDNAX Inc^ 246 0.05
USD 4,330 Medpace Holdings Inc 517 0.11
USD 1,853 National HealthCare Corp 110 0.02
USD 61,805 OPKO Health Inc 318 0.07
USD 3,434 Pennant Group Inc 86 0.02
USD 1,549 Providence Service Corp 126 0.03
USD 7,561 RadNet Inc 120 0.03
USD 15,345 Select Medical Holdings Corp 292 0.06
USD 3,039 SI-BONE Inc 52 0.01
USD 4,344 Surgery Partners Inc 66 0.01
USD 9,047 Syneos Health Inc 565 0.12
USD 13,246 Tenet Healthcare Corp 350 0.07
USD 6,793 Tivity Health Inc 89 0.02
USD 1,882 US Physical Therapy Inc 156 0.03
USD 1,643 Vapotherm Inc 86 0.02
Holding companies - diversified operations
USD 21 Morgan Group Holding Co - 0.00
Home builders
USD 1,162 Cavco Industries Inc 233 0.05
USD 3,764 Century Communities Inc 134 0.03
USD 2,342 Forestar Group Inc 41 0.01
USD 4,908 Green Brick Partners Inc 68 0.02
USD 3,619 Installed Building Products Inc 286 0.06
USD 11,518 KB Home^ 387 0.08
USD 3,755 LCI Industries 472 0.10
Ccy Holding Investment
FairValue
USD'000
% of netassetvalue
United States (31 July 2019: 95.33%) (cont)
Home builders (cont)
USD 3,050 LGI Homes Inc^ 348 0.07
USD 4,193 M/I Homes Inc 175 0.04
USD 7,364 MDC Holdings Inc 330 0.07
USD 5,735 Meritage Homes Corp^ 569 0.12
USD 6,996 Skyline Champion Corp 198 0.04
USD 18,256 Taylor Morrison Home Corp^ 428 0.09
USD 8,153 Thor Industries Inc 929 0.20
USD 17,807 Toll Brothers Inc 680 0.14
USD 20,132 TRI Pointe Group Inc 337 0.07
USD 4,571 Winnebago Industries Inc^ 276 0.06
Home furnishings
USD 9,678 Dolby Laboratories Inc 'A' 674 0.14
USD 2,789 Ethan Allen Interiors Inc 33 0.01
USD 3,898 iRobot Corp 283 0.06
USD 18,891 Leggett & Platt Inc 757 0.16
USD 3,609 Sleep Number Corp 168 0.04
USD 12,571 Sonos Inc^ 201 0.04
USD 6,685 Tempur Sealy International Inc 541 0.11
USD 1,791 Universal Electronics Inc 83 0.02
Hotels
USD 12,813 Boyd Gaming Corp^ 303 0.06
USD 4,967 Choice Hotels International Inc 417 0.09
USD 23,626 Extended Stay America Inc 270 0.06
USD 10,737 Hilton Grand Vacations Inc 218 0.05
USD 3,507 Marcus Corp 49 0.01
USD 5,143 St Joe Co 106 0.02
USD 13,206 Wyndham Destinations Inc 351 0.07
USD 13,905 Wyndham Hotels & Resorts Inc 614 0.13
Household goods & home construction
USD 12,510 ACCO Brands Corp 81 0.02
USD 1,237 Central Garden & Pet Co 47 0.01
USD 6,286 Central Garden & Pet Co 'A' 218 0.05
USD 5,087 Quanex Building Products Corp 71 0.01
USD 6,233 Spectrum Brands Holdings Inc 338 0.07
USD 2,014 WD-40 Co^ 396 0.08
Household products
USD 6,148 Scotts Miracle-Gro Co 975 0.20
USD 15,664 Toro Co 1,118 0.24
Insurance
USD 6,165 Ambac Financial Group Inc 79 0.02
USD 13,231 American Equity Investment Life Holding Co^ 337 0.07
USD 1,230 American National Group Inc 91 0.02
USD 2,996 AMERISAFE Inc 190 0.04
USD 14,672 Brighthouse Financial Inc 416 0.09
USD 5,096 Citizens Inc 29 0.01
USD 21,531 CNO Financial Group Inc 325 0.07
USD 5,259 Crawford & Co 'A' 39 0.01
USD 2,113 Donegal Group Inc 'A' 30 0.01
USD 3,040 eHealth Inc^ 210 0.04
USD 4,838 Employers Holdings Inc 157 0.03
USD 1,838 FBL Financial Group Inc 'A' 64 0.01
iSHARES VII PLC
SCHEDULE OF INVESTMENTS (continued)
iSHARES MSCI USA SMALL CAP UCITS ETF (continued)As at 31 July 2020
[226 ]
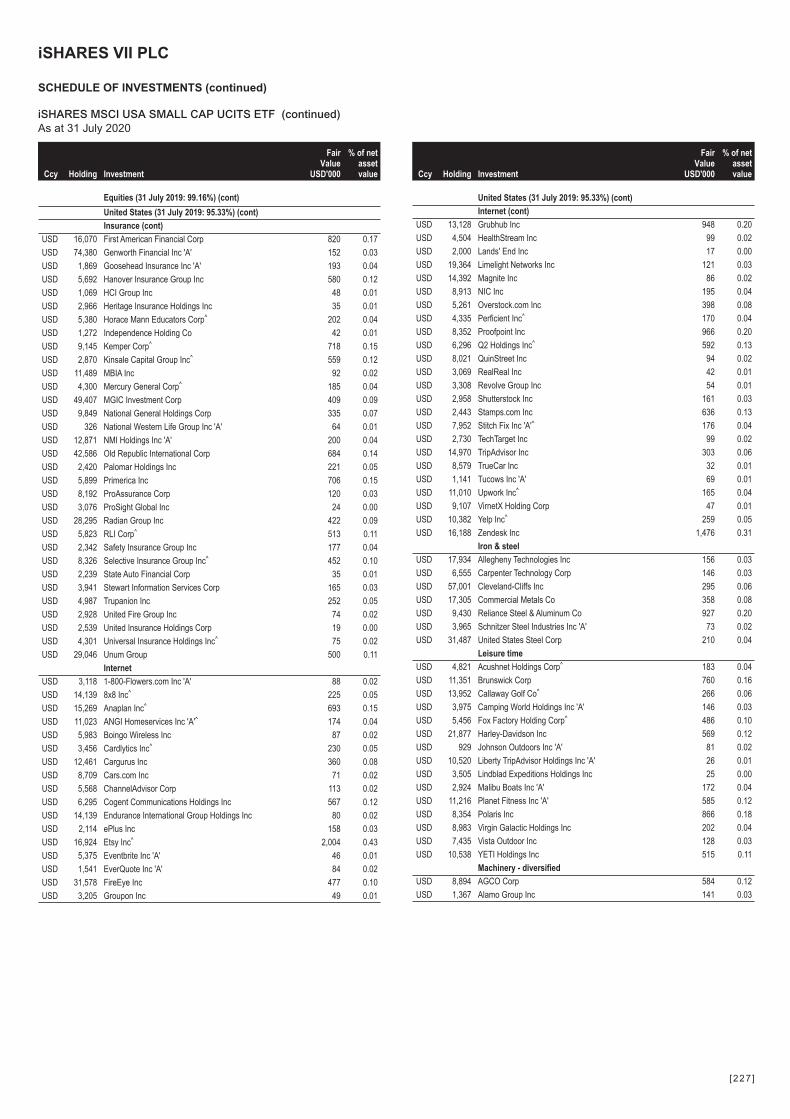
Ccy Holding Investment
FairValue
USD'000
% of netassetvalue
Equities (31 July 2019: 99.16%) (cont)
United States (31 July 2019: 95.33%) (cont)
Insurance (cont)
USD 16,070 First American Financial Corp 820 0.17
USD 74,380 Genworth Financial Inc 'A' 152 0.03
USD 1,869 Goosehead Insurance Inc 'A' 193 0.04
USD 5,692 Hanover Insurance Group Inc 580 0.12
USD 1,069 HCI Group Inc 48 0.01
USD 2,966 Heritage Insurance Holdings Inc 35 0.01
USD 5,380 Horace Mann Educators Corp^ 202 0.04
USD 1,272 Independence Holding Co 42 0.01
USD 9,145 Kemper Corp^ 718 0.15
USD 2,870 Kinsale Capital Group Inc^ 559 0.12
USD 11,489 MBIA Inc 92 0.02
USD 4,300 Mercury General Corp^ 185 0.04
USD 49,407 MGIC Investment Corp 409 0.09
USD 9,849 National General Holdings Corp 335 0.07
USD 326 National Western Life Group Inc 'A' 64 0.01
USD 12,871 NMI Holdings Inc 'A' 200 0.04
USD 42,586 Old Republic International Corp 684 0.14
USD 2,420 Palomar Holdings Inc 221 0.05
USD 5,899 Primerica Inc 706 0.15
USD 8,192 ProAssurance Corp 120 0.03
USD 3,076 ProSight Global Inc 24 0.00
USD 28,295 Radian Group Inc 422 0.09
USD 5,823 RLI Corp^ 513 0.11
USD 2,342 Safety Insurance Group Inc 177 0.04
USD 8,326 Selective Insurance Group Inc^ 452 0.10
USD 2,239 State Auto Financial Corp 35 0.01
USD 3,941 Stewart Information Services Corp 165 0.03
USD 4,987 Trupanion Inc 252 0.05
USD 2,928 United Fire Group Inc 74 0.02
USD 2,539 United Insurance Holdings Corp 19 0.00
USD 4,301 Universal Insurance Holdings Inc^ 75 0.02
USD 29,046 Unum Group 500 0.11
Internet
USD 3,118 1-800-Flowers.com Inc 'A' 88 0.02
USD 14,139 8x8 Inc^ 225 0.05
USD 15,269 Anaplan Inc^ 693 0.15
USD 11,023 ANGI Homeservices Inc 'A'^ 174 0.04
USD 5,983 Boingo Wireless Inc 87 0.02
USD 3,456 Cardlytics Inc^ 230 0.05
USD 12,461 Cargurus Inc 360 0.08
USD 8,709 Cars.com Inc 71 0.02
USD 5,568 ChannelAdvisor Corp 113 0.02
USD 6,295 Cogent Communications Holdings Inc 567 0.12
USD 14,139 Endurance International Group Holdings Inc 80 0.02
USD 2,114 ePlus Inc 158 0.03
USD 16,924 Etsy Inc^ 2,004 0.43
USD 5,375 Eventbrite Inc 'A' 46 0.01
USD 1,541 EverQuote Inc 'A' 84 0.02
USD 31,578 FireEye Inc 477 0.10
USD 3,205 Groupon Inc 49 0.01
Ccy Holding Investment
FairValue
USD'000
% of netassetvalue
United States (31 July 2019: 95.33%) (cont)
Internet (cont)
USD 13,128 Grubhub Inc 948 0.20
USD 4,504 HealthStream Inc 99 0.02
USD 2,000 Lands' End Inc 17 0.00
USD 19,364 Limelight Networks Inc 121 0.03
USD 14,392 Magnite Inc 86 0.02
USD 8,913 NIC Inc 195 0.04
USD 5,261 Overstock.com Inc 398 0.08
USD 4,335 Perficient Inc^ 170 0.04
USD 8,352 Proofpoint Inc 966 0.20
USD 6,296 Q2 Holdings Inc^ 592 0.13
USD 8,021 QuinStreet Inc 94 0.02
USD 3,069 RealReal Inc 42 0.01
USD 3,308 Revolve Group Inc 54 0.01
USD 2,958 Shutterstock Inc 161 0.03
USD 2,443 Stamps.com Inc 636 0.13
USD 7,952 Stitch Fix Inc 'A'^ 176 0.04
USD 2,730 TechTarget Inc 99 0.02
USD 14,970 TripAdvisor Inc 303 0.06
USD 8,579 TrueCar Inc 32 0.01
USD 1,141 Tucows Inc 'A' 69 0.01
USD 11,010 Upwork Inc^ 165 0.04
USD 9,107 VirnetX Holding Corp 47 0.01
USD 10,382 Yelp Inc^ 259 0.05
USD 16,188 Zendesk Inc 1,476 0.31
Iron & steel
USD 17,934 Allegheny Technologies Inc 156 0.03
USD 6,555 Carpenter Technology Corp 146 0.03
USD 57,001 Cleveland-Cliffs Inc 295 0.06
USD 17,305 Commercial Metals Co 358 0.08
USD 9,430 Reliance Steel & Aluminum Co 927 0.20
USD 3,965 Schnitzer Steel Industries Inc 'A' 73 0.02
USD 31,487 United States Steel Corp 210 0.04
Leisure time
USD 4,821 Acushnet Holdings Corp^ 183 0.04
USD 11,351 Brunswick Corp 760 0.16
USD 13,952 Callaway Golf Co^ 266 0.06
USD 3,975 Camping World Holdings Inc 'A' 146 0.03
USD 5,456 Fox Factory Holding Corp^ 486 0.10
USD 21,877 Harley-Davidson Inc 569 0.12
USD 929 Johnson Outdoors Inc 'A' 81 0.02
USD 10,520 Liberty TripAdvisor Holdings Inc 'A' 26 0.01
USD 3,505 Lindblad Expeditions Holdings Inc 25 0.00
USD 2,924 Malibu Boats Inc 'A' 172 0.04
USD 11,216 Planet Fitness Inc 'A' 585 0.12
USD 8,354 Polaris Inc 866 0.18
USD 8,983 Virgin Galactic Holdings Inc 202 0.04
USD 7,435 Vista Outdoor Inc 128 0.03
USD 10,538 YETI Holdings Inc 515 0.11
Machinery - diversified
USD 8,894 AGCO Corp 584 0.12
USD 1,367 Alamo Group Inc 141 0.03
iSHARES VII PLC
SCHEDULE OF INVESTMENTS (continued)
iSHARES MSCI USA SMALL CAP UCITS ETF (continued)As at 31 July 2020
[227 ]
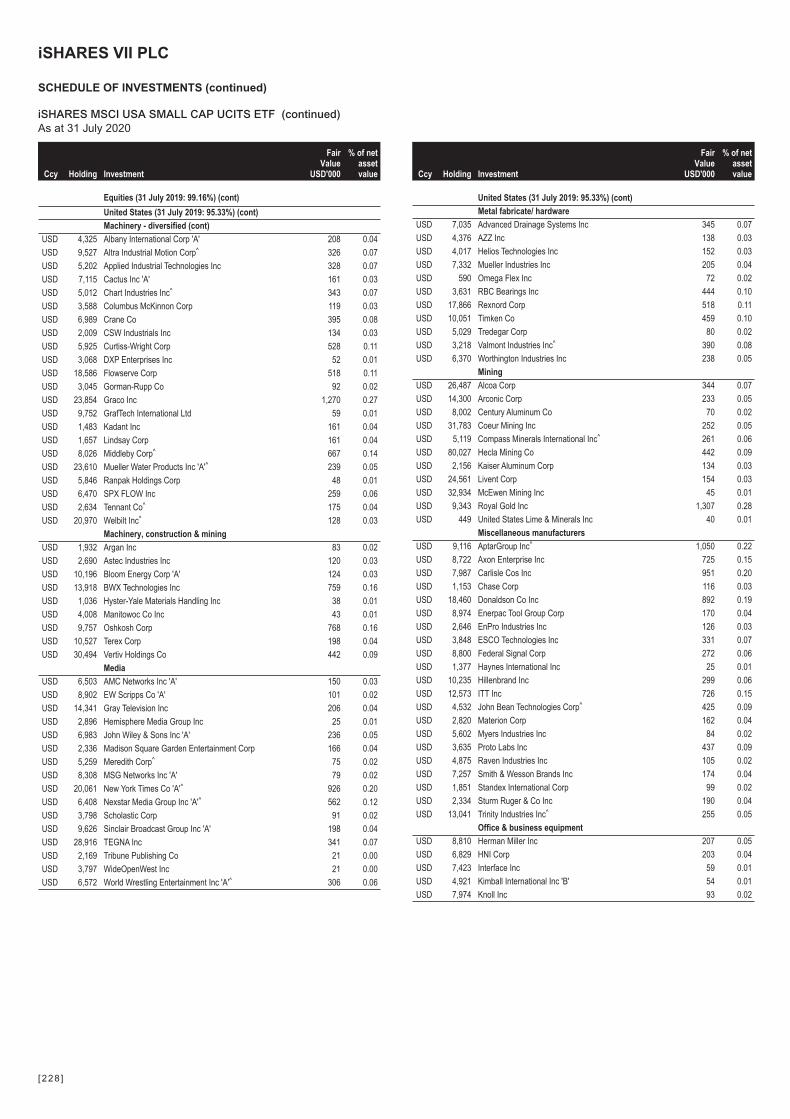
Ccy Holding Investment
FairValue
USD'000
% of netassetvalue
Equities (31 July 2019: 99.16%) (cont)
United States (31 July 2019: 95.33%) (cont)
Machinery - diversified (cont)
USD 4,325 Albany International Corp 'A' 208 0.04
USD 9,527 Altra Industrial Motion Corp^ 326 0.07
USD 5,202 Applied Industrial Technologies Inc 328 0.07
USD 7,115 Cactus Inc 'A' 161 0.03
USD 5,012 Chart Industries Inc^ 343 0.07
USD 3,588 Columbus McKinnon Corp 119 0.03
USD 6,989 Crane Co 395 0.08
USD 2,009 CSW Industrials Inc 134 0.03
USD 5,925 Curtiss-Wright Corp 528 0.11
USD 3,068 DXP Enterprises Inc 52 0.01
USD 18,586 Flowserve Corp 518 0.11
USD 3,045 Gorman-Rupp Co 92 0.02
USD 23,854 Graco Inc 1,270 0.27
USD 9,752 GrafTech International Ltd 59 0.01
USD 1,483 Kadant Inc 161 0.04
USD 1,657 Lindsay Corp 161 0.04
USD 8,026 Middleby Corp^ 667 0.14
USD 23,610 Mueller Water Products Inc 'A'^ 239 0.05
USD 5,846 Ranpak Holdings Corp 48 0.01
USD 6,470 SPX FLOW Inc 259 0.06
USD 2,634 Tennant Co^ 175 0.04
USD 20,970 Welbilt Inc^ 128 0.03
Machinery, construction & mining
USD 1,932 Argan Inc 83 0.02
USD 2,690 Astec Industries Inc 120 0.03
USD 10,196 Bloom Energy Corp 'A' 124 0.03
USD 13,918 BWX Technologies Inc 759 0.16
USD 1,036 Hyster-Yale Materials Handling Inc 38 0.01
USD 4,008 Manitowoc Co Inc 43 0.01
USD 9,757 Oshkosh Corp 768 0.16
USD 10,527 Terex Corp 198 0.04
USD 30,494 Vertiv Holdings Co 442 0.09
Media
USD 6,503 AMC Networks Inc 'A' 150 0.03
USD 8,902 EW Scripps Co 'A' 101 0.02
USD 14,341 Gray Television Inc 206 0.04
USD 2,896 Hemisphere Media Group Inc 25 0.01
USD 6,983 John Wiley & Sons Inc 'A' 236 0.05
USD 2,336 Madison Square Garden Entertainment Corp 166 0.04
USD 5,259 Meredith Corp^ 75 0.02
USD 8,308 MSG Networks Inc 'A' 79 0.02
USD 20,061 New York Times Co 'A'^ 926 0.20
USD 6,408 Nexstar Media Group Inc 'A'^ 562 0.12
USD 3,798 Scholastic Corp 91 0.02
USD 9,626 Sinclair Broadcast Group Inc 'A' 198 0.04
USD 28,916 TEGNA Inc 341 0.07
USD 2,169 Tribune Publishing Co 21 0.00
USD 3,797 WideOpenWest Inc 21 0.00
USD 6,572 World Wrestling Entertainment Inc 'A'^ 306 0.06
Ccy Holding Investment
FairValue
USD'000
% of netassetvalue
United States (31 July 2019: 95.33%) (cont)
Metal fabricate/ hardware
USD 7,035 Advanced Drainage Systems Inc 345 0.07
USD 4,376 AZZ Inc 138 0.03
USD 4,017 Helios Technologies Inc 152 0.03
USD 7,332 Mueller Industries Inc 205 0.04
USD 590 Omega Flex Inc 72 0.02
USD 3,631 RBC Bearings Inc 444 0.10
USD 17,866 Rexnord Corp 518 0.11
USD 10,051 Timken Co 459 0.10
USD 5,029 Tredegar Corp 80 0.02
USD 3,218 Valmont Industries Inc^ 390 0.08
USD 6,370 Worthington Industries Inc 238 0.05
Mining
USD 26,487 Alcoa Corp 344 0.07
USD 14,300 Arconic Corp 233 0.05
USD 8,002 Century Aluminum Co 70 0.02
USD 31,783 Coeur Mining Inc 252 0.05
USD 5,119 Compass Minerals International Inc^ 261 0.06
USD 80,027 Hecla Mining Co 442 0.09
USD 2,156 Kaiser Aluminum Corp 134 0.03
USD 24,561 Livent Corp 154 0.03
USD 32,934 McEwen Mining Inc 45 0.01
USD 9,343 Royal Gold Inc 1,307 0.28
USD 449 United States Lime & Minerals Inc 40 0.01
Miscellaneous manufacturers
USD 9,116 AptarGroup Inc^ 1,050 0.22
USD 8,722 Axon Enterprise Inc 725 0.15
USD 7,987 Carlisle Cos Inc 951 0.20
USD 1,153 Chase Corp 116 0.03
USD 18,460 Donaldson Co Inc 892 0.19
USD 8,974 Enerpac Tool Group Corp 170 0.04
USD 2,646 EnPro Industries Inc 126 0.03
USD 3,848 ESCO Technologies Inc 331 0.07
USD 8,800 Federal Signal Corp 272 0.06
USD 1,377 Haynes International Inc 25 0.01
USD 10,235 Hillenbrand Inc 299 0.06
USD 12,573 ITT Inc 726 0.15
USD 4,532 John Bean Technologies Corp^ 425 0.09
USD 2,820 Materion Corp 162 0.04
USD 5,602 Myers Industries Inc 84 0.02
USD 3,635 Proto Labs Inc 437 0.09
USD 4,875 Raven Industries Inc 105 0.02
USD 7,257 Smith & Wesson Brands Inc 174 0.04
USD 1,851 Standex International Corp 99 0.02
USD 2,334 Sturm Ruger & Co Inc 190 0.04
USD 13,041 Trinity Industries Inc^ 255 0.05
Office & business equipment
USD 8,810 Herman Miller Inc 207 0.05
USD 6,829 HNI Corp 203 0.04
USD 7,423 Interface Inc 59 0.01
USD 4,921 Kimball International Inc 'B' 54 0.01
USD 7,974 Knoll Inc 93 0.02
iSHARES VII PLC
SCHEDULE OF INVESTMENTS (continued)
iSHARES MSCI USA SMALL CAP UCITS ETF (continued)As at 31 July 2020
[228 ]

Ccy Holding Investment
FairValue
USD'000
% of netassetvalue
Equities (31 July 2019: 99.16%) (cont)
United States (31 July 2019: 95.33%) (cont)
Office & business equipment (cont)
USD 24,142 Pitney Bowes Inc 81 0.02
USD 13,239 Steelcase Inc 'A' 142 0.03
USD 25,843 Xerox Holdings Corp 430 0.09
Oil & gas
USD 38,414 Antero Resources Corp^ 114 0.02
USD 53,911 Apache Corp 828 0.18
USD 2,291 Bonanza Creek Energy Inc 42 0.01
USD 4,988 Brigham Minerals Inc 'A' 55 0.01
USD 14,589 Cimarex Energy Co 357 0.08
USD 25,524 CNX Resources Corp^ 246 0.05
USD 13,039 Continental Resources Inc 225 0.05
USD 4,562 CVR Energy Inc 88 0.02
USD 9,693 Delek US Energy Inc 169 0.04
USD 54,892 Devon Energy Corp 576 0.12
USD 39,216 EQT Corp^ 569 0.12
USD 19,675 Gulfport Energy Corp 20 0.00
USD 15,752 Helmerich & Payne Inc 281 0.06
USD 64,538 Kosmos Energy Ltd 104 0.02
USD 19,677 Magnolia Oil & Gas Corp 'A' 118 0.03
USD 112,905 Marathon Oil Corp 620 0.13
USD 16,877 Matador Resources Co 147 0.03
USD 19,760 Murphy Oil Corp^ 261 0.06
USD 4,248 Murphy USA Inc 562 0.12
USD 69,287 Noble Energy Inc 692 0.15
USD 39,744 Northern Oil and Gas Inc^ 32 0.01
USD 37,117 Ovintiv Inc 360 0.08
USD 5,375 Par Pacific Holdings Inc 40 0.01
USD 43,742 Parsley Energy Inc 'A'^ 480 0.10
USD 31,338 Patterson-UTI Energy Inc 121 0.03
USD 16,694 PBF Energy Inc 'A' 145 0.03
USD 14,813 PDC Energy Inc 211 0.04
USD 12,273 ProPetro Holding Corp 66 0.01
USD 32,821 Range Resources Corp 212 0.04
USD 81,968 Southwestern Energy Co^ 199 0.04
USD 2,643 Talos Energy Inc 18 0.00
USD 12,907 Tellurian Inc 12 0.00
USD 817 Texas Pacific Land Trust 435 0.09
USD 12,858 W&T Offshore Inc 29 0.01
USD 61,377 WPX Energy Inc^ 366 0.08
Oil & gas services
USD 17,272 Archrock Inc 115 0.02
USD 26,017 ChampionX Corp 247 0.05
USD 1,996 DMC Global Inc 59 0.01
USD 5,242 Dril-Quip Inc 174 0.04
USD 23,292 Helix Energy Solutions Group Inc^ 98 0.02
USD 8,979 Liberty Oilfield Services Inc 'A' 51 0.01
USD 5,389 Matrix Service Co 47 0.01
USD 12,665 MRC Global Inc 75 0.02
USD 26,608 NexTier Oilfield Solutions Inc 67 0.01
USD 16,921 NOW Inc 133 0.03
Ccy Holding Investment
FairValue
USD'000
% of netassetvalue
United States (31 July 2019: 95.33%) (cont)
Oil & gas services (cont)
USD 13,833 Oceaneering International Inc 78 0.02
USD 8,326 RPC Inc 25 0.00
USD 6,905 Select Energy Services Inc 'A' 31 0.01
USD 5,619 Thermon Group Holdings Inc 76 0.02
Packaging & containers
USD 19,258 Berry Global Group Inc 963 0.20
USD 42,332 Graphic Packaging Holding Co 590 0.13
USD 4,245 Greif Inc 'A' 148 0.03
USD 570 Greif Inc 'B' 22 0.00
USD 4,245 Matthews International Corp 'A' 92 0.02
USD 22,599 O-I Glass Inc 236 0.05
USD 10,708 Silgan Holdings Inc 410 0.09
USD 14,480 Sonoco Products Co^ 749 0.16
USD 6,209 TriMas Corp 145 0.03
Pharmaceuticals
USD 5,927 Aerie Pharmaceuticals Inc 69 0.01
USD 8,709 Agios Pharmaceuticals Inc 395 0.08
USD 4,870 Aimmune Therapeutics Inc 64 0.01
USD 2,228 Akcea Therapeutics Inc 24 0.01
USD 16,142 Akebia Therapeutics Inc^ 180 0.04
USD 6,206 Alector Inc 97 0.02
USD 12,602 Amneal Pharmaceuticals Inc 55 0.01
USD 5,612 Amphastar Pharmaceuticals Inc 112 0.02
USD 2,040 Anika Therapeutics Inc 74 0.02
USD 19,037 Antares Pharma Inc 50 0.01
USD 2,503 Arvinas Inc 79 0.02
USD 7,557 Athenex Inc 80 0.02
USD 3,773 Axsome Therapeutics Inc 269 0.06
USD 11,632 BioDelivery Sciences International Inc 49 0.01
USD 787 BioSpecifics Technologies Corp 49 0.01
USD 1,440 Bioxcel Therapeutics Inc 65 0.01
USD 13,338 Catalyst Pharmaceuticals Inc 57 0.01
USD 11,942 Clovis Oncology Inc 69 0.01
USD 8,113 Coherus Biosciences Inc^ 143 0.03
USD 4,758 Collegium Pharmaceutical Inc 75 0.02
USD 9,319 Corbus Pharmaceuticals Holdings Inc 58 0.01
USD 16,422 Corcept Therapeutics Inc 246 0.05
USD 14,049 Covetrus Inc^ 311 0.07
USD 7,978 Cytokinetics Inc^ 173 0.04
USD 27,974 Durect Corp 55 0.01
USD 1,606 Eagle Pharmaceuticals Inc 75 0.02
USD 1,707 Eidos Therapeutics Inc 69 0.01
USD 2,035 Enanta Pharmaceuticals Inc 93 0.02
USD 7,425 Flexion Therapeutics Inc 101 0.02
USD 3,295 G1 Therapeutics Inc 48 0.01
USD 7,822 Global Blood Therapeutics Inc 528 0.11
USD 11,490 Heron Therapeutics Inc^ 187 0.04
USD 1,367 Heska Corp^ 132 0.03
USD 6,643 Intellia Therapeutics Inc 118 0.03
USD 8,905 Intra-Cellular Therapies Inc 177 0.04
USD 20,547 Ironwood Pharmaceuticals Inc^ 188 0.04
iSHARES VII PLC
SCHEDULE OF INVESTMENTS (continued)
iSHARES MSCI USA SMALL CAP UCITS ETF (continued)As at 31 July 2020
[229 ]
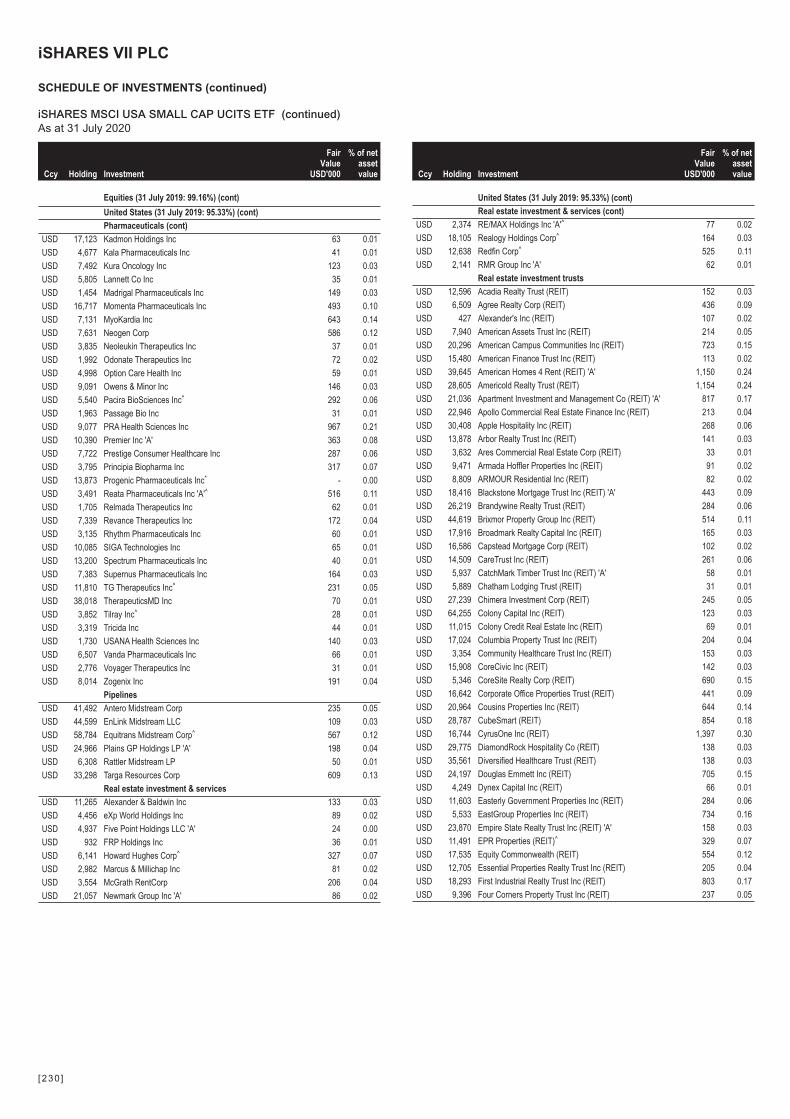
Ccy Holding Investment
FairValue
USD'000
% of netassetvalue
Equities (31 July 2019: 99.16%) (cont)
United States (31 July 2019: 95.33%) (cont)
Pharmaceuticals (cont)
USD 17,123 Kadmon Holdings Inc 63 0.01
USD 4,677 Kala Pharmaceuticals Inc 41 0.01
USD 7,492 Kura Oncology Inc 123 0.03
USD 5,805 Lannett Co Inc 35 0.01
USD 1,454 Madrigal Pharmaceuticals Inc 149 0.03
USD 16,717 Momenta Pharmaceuticals Inc 493 0.10
USD 7,131 MyoKardia Inc 643 0.14
USD 7,631 Neogen Corp 586 0.12
USD 3,835 Neoleukin Therapeutics Inc 37 0.01
USD 1,992 Odonate Therapeutics Inc 72 0.02
USD 4,998 Option Care Health Inc 59 0.01
USD 9,091 Owens & Minor Inc 146 0.03
USD 5,540 Pacira BioSciences Inc^ 292 0.06
USD 1,963 Passage Bio Inc 31 0.01
USD 9,077 PRA Health Sciences Inc 967 0.21
USD 10,390 Premier Inc 'A' 363 0.08
USD 7,722 Prestige Consumer Healthcare Inc 287 0.06
USD 3,795 Principia Biopharma Inc 317 0.07
USD 13,873 Progenic Pharmaceuticals Inc* - 0.00
USD 3,491 Reata Pharmaceuticals Inc 'A'^ 516 0.11
USD 1,705 Relmada Therapeutics Inc 62 0.01
USD 7,339 Revance Therapeutics Inc 172 0.04
USD 3,135 Rhythm Pharmaceuticals Inc 60 0.01
USD 10,085 SIGA Technologies Inc 65 0.01
USD 13,200 Spectrum Pharmaceuticals Inc 40 0.01
USD 7,383 Supernus Pharmaceuticals Inc 164 0.03
USD 11,810 TG Therapeutics Inc^ 231 0.05
USD 38,018 TherapeuticsMD Inc 70 0.01
USD 3,852 Tilray Inc^ 28 0.01
USD 3,319 Tricida Inc 44 0.01
USD 1,730 USANA Health Sciences Inc 140 0.03
USD 6,507 Vanda Pharmaceuticals Inc 66 0.01
USD 2,776 Voyager Therapeutics Inc 31 0.01
USD 8,014 Zogenix Inc 191 0.04
Pipelines
USD 41,492 Antero Midstream Corp 235 0.05
USD 44,599 EnLink Midstream LLC 109 0.03
USD 58,784 Equitrans Midstream Corp^ 567 0.12
USD 24,966 Plains GP Holdings LP 'A' 198 0.04
USD 6,308 Rattler Midstream LP 50 0.01
USD 33,298 Targa Resources Corp 609 0.13
Real estate investment & services
USD 11,265 Alexander & Baldwin Inc 133 0.03
USD 4,456 eXp World Holdings Inc 89 0.02
USD 4,937 Five Point Holdings LLC 'A' 24 0.00
USD 932 FRP Holdings Inc 36 0.01
USD 6,141 Howard Hughes Corp^ 327 0.07
USD 2,982 Marcus & Millichap Inc 81 0.02
USD 3,554 McGrath RentCorp 206 0.04
USD 21,057 Newmark Group Inc 'A' 86 0.02
Ccy Holding Investment
FairValue
USD'000
% of netassetvalue
United States (31 July 2019: 95.33%) (cont)
Real estate investment & services (cont)
USD 2,374 RE/MAX Holdings Inc 'A'^ 77 0.02
USD 18,105 Realogy Holdings Corp^ 164 0.03
USD 12,638 Redfin Corp^ 525 0.11
USD 2,141 RMR Group Inc 'A' 62 0.01
Real estate investment trusts
USD 12,596 Acadia Realty Trust (REIT) 152 0.03
USD 6,509 Agree Realty Corp (REIT) 436 0.09
USD 427 Alexander's Inc (REIT) 107 0.02
USD 7,940 American Assets Trust Inc (REIT) 214 0.05
USD 20,296 American Campus Communities Inc (REIT) 723 0.15
USD 15,480 American Finance Trust Inc (REIT) 113 0.02
USD 39,645 American Homes 4 Rent (REIT) 'A' 1,150 0.24
USD 28,605 Americold Realty Trust (REIT) 1,154 0.24
USD 21,036 Apartment Investment and Management Co (REIT) 'A' 817 0.17
USD 22,946 Apollo Commercial Real Estate Finance Inc (REIT) 213 0.04
USD 30,408 Apple Hospitality Inc (REIT) 268 0.06
USD 13,878 Arbor Realty Trust Inc (REIT) 141 0.03
USD 3,632 Ares Commercial Real Estate Corp (REIT) 33 0.01
USD 9,471 Armada Hoffler Properties Inc (REIT) 91 0.02
USD 8,809 ARMOUR Residential Inc (REIT) 82 0.02
USD 18,416 Blackstone Mortgage Trust Inc (REIT) 'A' 443 0.09
USD 26,219 Brandywine Realty Trust (REIT) 284 0.06
USD 44,619 Brixmor Property Group Inc (REIT) 514 0.11
USD 17,916 Broadmark Realty Capital Inc (REIT) 165 0.03
USD 16,586 Capstead Mortgage Corp (REIT) 102 0.02
USD 14,509 CareTrust Inc (REIT) 261 0.06
USD 5,937 CatchMark Timber Trust Inc (REIT) 'A' 58 0.01
USD 5,889 Chatham Lodging Trust (REIT) 31 0.01
USD 27,239 Chimera Investment Corp (REIT) 245 0.05
USD 64,255 Colony Capital Inc (REIT) 123 0.03
USD 11,015 Colony Credit Real Estate Inc (REIT) 69 0.01
USD 17,024 Columbia Property Trust Inc (REIT) 204 0.04
USD 3,354 Community Healthcare Trust Inc (REIT) 153 0.03
USD 15,908 CoreCivic Inc (REIT) 142 0.03
USD 5,346 CoreSite Realty Corp (REIT) 690 0.15
USD 16,642 Corporate Office Properties Trust (REIT) 441 0.09
USD 20,964 Cousins Properties Inc (REIT) 644 0.14
USD 28,787 CubeSmart (REIT) 854 0.18
USD 16,744 CyrusOne Inc (REIT) 1,397 0.30
USD 29,775 DiamondRock Hospitality Co (REIT) 138 0.03
USD 35,561 Diversified Healthcare Trust (REIT) 138 0.03
USD 24,197 Douglas Emmett Inc (REIT) 705 0.15
USD 4,249 Dynex Capital Inc (REIT) 66 0.01
USD 11,603 Easterly Government Properties Inc (REIT) 284 0.06
USD 5,533 EastGroup Properties Inc (REIT) 734 0.16
USD 23,870 Empire State Realty Trust Inc (REIT) 'A' 158 0.03
USD 11,491 EPR Properties (REIT)^ 329 0.07
USD 17,535 Equity Commonwealth (REIT) 554 0.12
USD 12,705 Essential Properties Realty Trust Inc (REIT) 205 0.04
USD 18,293 First Industrial Realty Trust Inc (REIT) 803 0.17
USD 9,396 Four Corners Property Trust Inc (REIT) 237 0.05
iSHARES VII PLC
SCHEDULE OF INVESTMENTS (continued)
iSHARES MSCI USA SMALL CAP UCITS ETF (continued)As at 31 July 2020
[230 ]
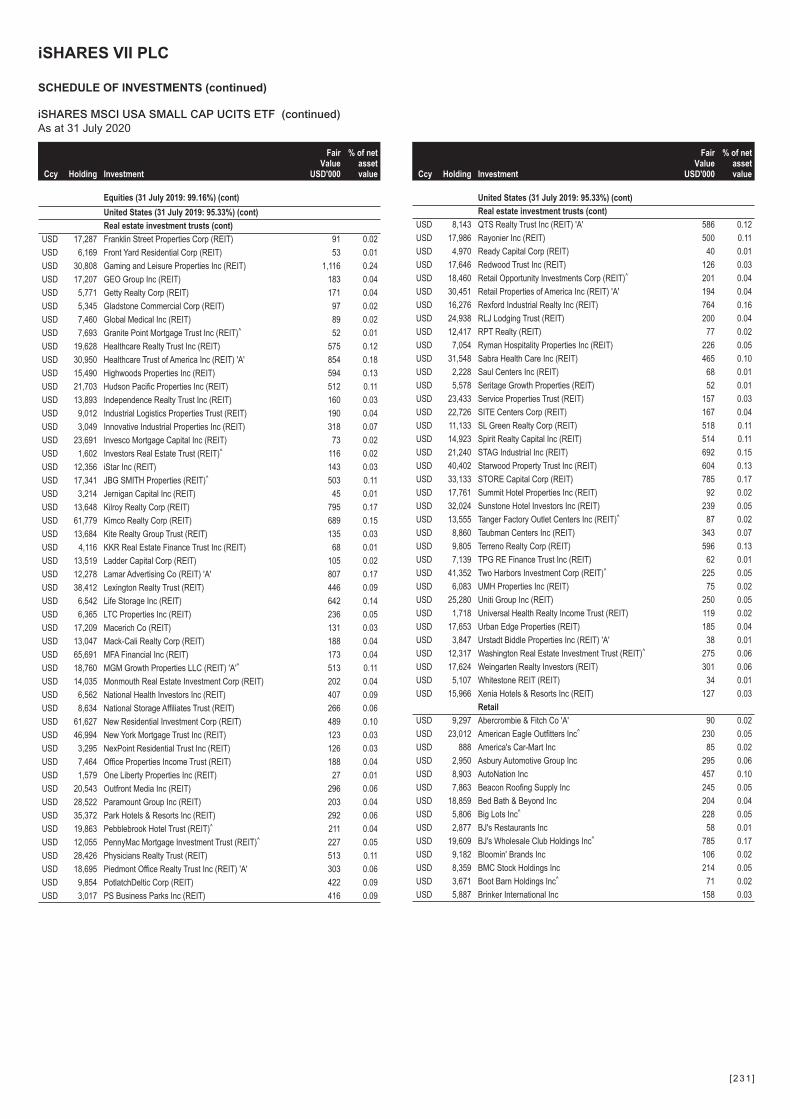
Ccy Holding Investment
FairValue
USD'000
% of netassetvalue
Equities (31 July 2019: 99.16%) (cont)
United States (31 July 2019: 95.33%) (cont)
Real estate investment trusts (cont)
USD 17,287 Franklin Street Properties Corp (REIT) 91 0.02
USD 6,169 Front Yard Residential Corp (REIT) 53 0.01
USD 30,808 Gaming and Leisure Properties Inc (REIT) 1,116 0.24
USD 17,207 GEO Group Inc (REIT) 183 0.04
USD 5,771 Getty Realty Corp (REIT) 171 0.04
USD 5,345 Gladstone Commercial Corp (REIT) 97 0.02
USD 7,460 Global Medical Inc (REIT) 89 0.02
USD 7,693 Granite Point Mortgage Trust Inc (REIT)^ 52 0.01
USD 19,628 Healthcare Realty Trust Inc (REIT) 575 0.12
USD 30,950 Healthcare Trust of America Inc (REIT) 'A' 854 0.18
USD 15,490 Highwoods Properties Inc (REIT) 594 0.13
USD 21,703 Hudson Pacific Properties Inc (REIT) 512 0.11
USD 13,893 Independence Realty Trust Inc (REIT) 160 0.03
USD 9,012 Industrial Logistics Properties Trust (REIT) 190 0.04
USD 3,049 Innovative Industrial Properties Inc (REIT) 318 0.07
USD 23,691 Invesco Mortgage Capital Inc (REIT) 73 0.02
USD 1,602 Investors Real Estate Trust (REIT)^ 116 0.02
USD 12,356 iStar Inc (REIT) 143 0.03
USD 17,341 JBG SMITH Properties (REIT)^ 503 0.11
USD 3,214 Jernigan Capital Inc (REIT) 45 0.01
USD 13,648 Kilroy Realty Corp (REIT) 795 0.17
USD 61,779 Kimco Realty Corp (REIT) 689 0.15
USD 13,684 Kite Realty Group Trust (REIT) 135 0.03
USD 4,116 KKR Real Estate Finance Trust Inc (REIT) 68 0.01
USD 13,519 Ladder Capital Corp (REIT) 105 0.02
USD 12,278 Lamar Advertising Co (REIT) 'A' 807 0.17
USD 38,412 Lexington Realty Trust (REIT) 446 0.09
USD 6,542 Life Storage Inc (REIT) 642 0.14
USD 6,365 LTC Properties Inc (REIT) 236 0.05
USD 17,209 Macerich Co (REIT) 131 0.03
USD 13,047 Mack-Cali Realty Corp (REIT) 188 0.04
USD 65,691 MFA Financial Inc (REIT) 173 0.04
USD 18,760 MGM Growth Properties LLC (REIT) 'A'^ 513 0.11
USD 14,035 Monmouth Real Estate Investment Corp (REIT) 202 0.04
USD 6,562 National Health Investors Inc (REIT) 407 0.09
USD 8,634 National Storage Affiliates Trust (REIT) 266 0.06
USD 61,627 New Residential Investment Corp (REIT) 489 0.10
USD 46,994 New York Mortgage Trust Inc (REIT) 123 0.03
USD 3,295 NexPoint Residential Trust Inc (REIT) 126 0.03
USD 7,464 Office Properties Income Trust (REIT) 188 0.04
USD 1,579 One Liberty Properties Inc (REIT) 27 0.01
USD 20,543 Outfront Media Inc (REIT) 296 0.06
USD 28,522 Paramount Group Inc (REIT) 203 0.04
USD 35,372 Park Hotels & Resorts Inc (REIT) 292 0.06
USD 19,863 Pebblebrook Hotel Trust (REIT)^ 211 0.04
USD 12,055 PennyMac Mortgage Investment Trust (REIT)^ 227 0.05
USD 28,426 Physicians Realty Trust (REIT) 513 0.11
USD 18,695 Piedmont Office Realty Trust Inc (REIT) 'A' 303 0.06
USD 9,854 PotlatchDeltic Corp (REIT) 422 0.09
USD 3,017 PS Business Parks Inc (REIT) 416 0.09
Ccy Holding Investment
FairValue
USD'000
% of netassetvalue
United States (31 July 2019: 95.33%) (cont)
Real estate investment trusts (cont)
USD 8,143 QTS Realty Trust Inc (REIT) 'A' 586 0.12
USD 17,986 Rayonier Inc (REIT) 500 0.11
USD 4,970 Ready Capital Corp (REIT) 40 0.01
USD 17,646 Redwood Trust Inc (REIT) 126 0.03
USD 18,460 Retail Opportunity Investments Corp (REIT)^ 201 0.04
USD 30,451 Retail Properties of America Inc (REIT) 'A' 194 0.04
USD 16,276 Rexford Industrial Realty Inc (REIT) 764 0.16
USD 24,938 RLJ Lodging Trust (REIT) 200 0.04
USD 12,417 RPT Realty (REIT) 77 0.02
USD 7,054 Ryman Hospitality Properties Inc (REIT) 226 0.05
USD 31,548 Sabra Health Care Inc (REIT) 465 0.10
USD 2,228 Saul Centers Inc (REIT) 68 0.01
USD 5,578 Seritage Growth Properties (REIT) 52 0.01
USD 23,433 Service Properties Trust (REIT) 157 0.03
USD 22,726 SITE Centers Corp (REIT) 167 0.04
USD 11,133 SL Green Realty Corp (REIT) 518 0.11
USD 14,923 Spirit Realty Capital Inc (REIT) 514 0.11
USD 21,240 STAG Industrial Inc (REIT) 692 0.15
USD 40,402 Starwood Property Trust Inc (REIT) 604 0.13
USD 33,133 STORE Capital Corp (REIT) 785 0.17
USD 17,761 Summit Hotel Properties Inc (REIT) 92 0.02
USD 32,024 Sunstone Hotel Investors Inc (REIT) 239 0.05
USD 13,555 Tanger Factory Outlet Centers Inc (REIT)^ 87 0.02
USD 8,860 Taubman Centers Inc (REIT) 343 0.07
USD 9,805 Terreno Realty Corp (REIT) 596 0.13
USD 7,139 TPG RE Finance Trust Inc (REIT) 62 0.01
USD 41,352 Two Harbors Investment Corp (REIT)^ 225 0.05
USD 6,083 UMH Properties Inc (REIT) 75 0.02
USD 25,280 Uniti Group Inc (REIT) 250 0.05
USD 1,718 Universal Health Realty Income Trust (REIT) 119 0.02
USD 17,653 Urban Edge Properties (REIT) 185 0.04
USD 3,847 Urstadt Biddle Properties Inc (REIT) 'A' 38 0.01
USD 12,317 Washington Real Estate Investment Trust (REIT)^ 275 0.06
USD 17,624 Weingarten Realty Investors (REIT) 301 0.06
USD 5,107 Whitestone REIT (REIT) 34 0.01
USD 15,966 Xenia Hotels & Resorts Inc (REIT) 127 0.03
Retail
USD 9,297 Abercrombie & Fitch Co 'A' 90 0.02
USD 23,012 American Eagle Outfitters Inc^ 230 0.05
USD 888 America's Car-Mart Inc 85 0.02
USD 2,950 Asbury Automotive Group Inc 295 0.06
USD 8,903 AutoNation Inc 457 0.10
USD 7,863 Beacon Roofing Supply Inc 245 0.05
USD 18,859 Bed Bath & Beyond Inc 204 0.04
USD 5,806 Big Lots Inc^ 228 0.05
USD 2,877 BJ's Restaurants Inc 58 0.01
USD 19,609 BJ's Wholesale Club Holdings Inc^ 785 0.17
USD 9,182 Bloomin' Brands Inc 106 0.02
USD 8,359 BMC Stock Holdings Inc 214 0.05
USD 3,671 Boot Barn Holdings Inc^ 71 0.02
USD 5,887 Brinker International Inc 158 0.03
iSHARES VII PLC
SCHEDULE OF INVESTMENTS (continued)
iSHARES MSCI USA SMALL CAP UCITS ETF (continued)As at 31 July 2020
[231 ]
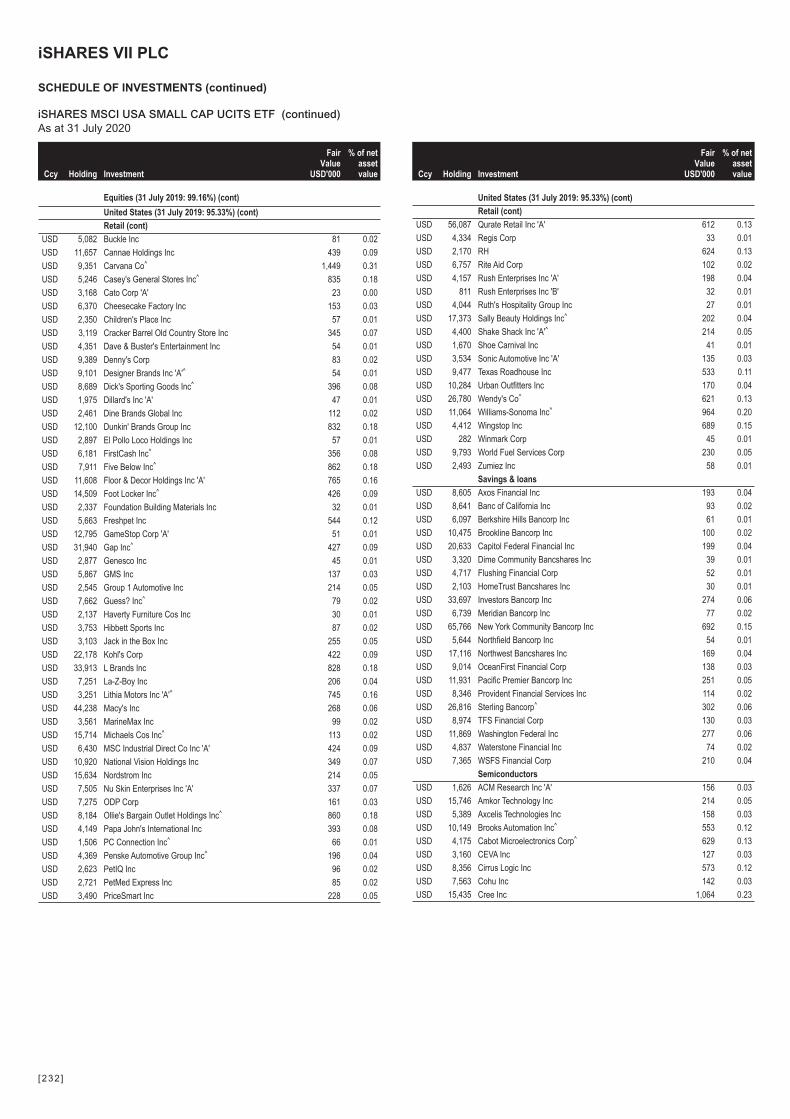
Ccy Holding Investment
FairValue
USD'000
% of netassetvalue
Equities (31 July 2019: 99.16%) (cont)
United States (31 July 2019: 95.33%) (cont)
Retail (cont)
USD 5,082 Buckle Inc 81 0.02
USD 11,657 Cannae Holdings Inc 439 0.09
USD 9,351 Carvana Co^ 1,449 0.31
USD 5,246 Casey's General Stores Inc^ 835 0.18
USD 3,168 Cato Corp 'A' 23 0.00
USD 6,370 Cheesecake Factory Inc 153 0.03
USD 2,350 Children's Place Inc 57 0.01
USD 3,119 Cracker Barrel Old Country Store Inc 345 0.07
USD 4,351 Dave & Buster's Entertainment Inc 54 0.01
USD 9,389 Denny's Corp 83 0.02
USD 9,101 Designer Brands Inc 'A'^ 54 0.01
USD 8,689 Dick's Sporting Goods Inc^ 396 0.08
USD 1,975 Dillard's Inc 'A' 47 0.01
USD 2,461 Dine Brands Global Inc 112 0.02
USD 12,100 Dunkin' Brands Group Inc 832 0.18
USD 2,897 El Pollo Loco Holdings Inc 57 0.01
USD 6,181 FirstCash Inc^ 356 0.08
USD 7,911 Five Below Inc^ 862 0.18
USD 11,608 Floor & Decor Holdings Inc 'A' 765 0.16
USD 14,509 Foot Locker Inc^ 426 0.09
USD 2,337 Foundation Building Materials Inc 32 0.01
USD 5,663 Freshpet Inc 544 0.12
USD 12,795 GameStop Corp 'A' 51 0.01
USD 31,940 Gap Inc^ 427 0.09
USD 2,877 Genesco Inc 45 0.01
USD 5,867 GMS Inc 137 0.03
USD 2,545 Group 1 Automotive Inc 214 0.05
USD 7,662 Guess? Inc^ 79 0.02
USD 2,137 Haverty Furniture Cos Inc 30 0.01
USD 3,753 Hibbett Sports Inc 87 0.02
USD 3,103 Jack in the Box Inc 255 0.05
USD 22,178 Kohl's Corp 422 0.09
USD 33,913 L Brands Inc 828 0.18
USD 7,251 La-Z-Boy Inc 206 0.04
USD 3,251 Lithia Motors Inc 'A'^ 745 0.16
USD 44,238 Macy's Inc 268 0.06
USD 3,561 MarineMax Inc 99 0.02
USD 15,714 Michaels Cos Inc^ 113 0.02
USD 6,430 MSC Industrial Direct Co Inc 'A' 424 0.09
USD 10,920 National Vision Holdings Inc 349 0.07
USD 15,634 Nordstrom Inc 214 0.05
USD 7,505 Nu Skin Enterprises Inc 'A' 337 0.07
USD 7,275 ODP Corp 161 0.03
USD 8,184 Ollie's Bargain Outlet Holdings Inc^ 860 0.18
USD 4,149 Papa John's International Inc 393 0.08
USD 1,506 PC Connection Inc^ 66 0.01
USD 4,369 Penske Automotive Group Inc^ 196 0.04
USD 2,623 PetIQ Inc 96 0.02
USD 2,721 PetMed Express Inc 85 0.02
USD 3,490 PriceSmart Inc 228 0.05
Ccy Holding Investment
FairValue
USD'000
% of netassetvalue
United States (31 July 2019: 95.33%) (cont)
Retail (cont)
USD 56,087 Qurate Retail Inc 'A' 612 0.13
USD 4,334 Regis Corp 33 0.01
USD 2,170 RH 624 0.13
USD 6,757 Rite Aid Corp 102 0.02
USD 4,157 Rush Enterprises Inc 'A' 198 0.04
USD 811 Rush Enterprises Inc 'B' 32 0.01
USD 4,044 Ruth's Hospitality Group Inc 27 0.01
USD 17,373 Sally Beauty Holdings Inc^ 202 0.04
USD 4,400 Shake Shack Inc 'A'^ 214 0.05
USD 1,670 Shoe Carnival Inc 41 0.01
USD 3,534 Sonic Automotive Inc 'A' 135 0.03
USD 9,477 Texas Roadhouse Inc 533 0.11
USD 10,284 Urban Outfitters Inc 170 0.04
USD 26,780 Wendy's Co^ 621 0.13
USD 11,064 Williams-Sonoma Inc^ 964 0.20
USD 4,412 Wingstop Inc 689 0.15
USD 282 Winmark Corp 45 0.01
USD 9,793 World Fuel Services Corp 230 0.05
USD 2,493 Zumiez Inc 58 0.01
Savings & loans
USD 8,605 Axos Financial Inc 193 0.04
USD 8,641 Banc of California Inc 93 0.02
USD 6,097 Berkshire Hills Bancorp Inc 61 0.01
USD 10,475 Brookline Bancorp Inc 100 0.02
USD 20,633 Capitol Federal Financial Inc 199 0.04
USD 3,320 Dime Community Bancshares Inc 39 0.01
USD 4,717 Flushing Financial Corp 52 0.01
USD 2,103 HomeTrust Bancshares Inc 30 0.01
USD 33,697 Investors Bancorp Inc 274 0.06
USD 6,739 Meridian Bancorp Inc 77 0.02
USD 65,766 New York Community Bancorp Inc 692 0.15
USD 5,644 Northfield Bancorp Inc 54 0.01
USD 17,116 Northwest Bancshares Inc 169 0.04
USD 9,014 OceanFirst Financial Corp 138 0.03
USD 11,931 Pacific Premier Bancorp Inc 251 0.05
USD 8,346 Provident Financial Services Inc 114 0.02
USD 26,816 Sterling Bancorp^ 302 0.06
USD 8,974 TFS Financial Corp 130 0.03
USD 11,869 Washington Federal Inc 277 0.06
USD 4,837 Waterstone Financial Inc 74 0.02
USD 7,365 WSFS Financial Corp 210 0.04
Semiconductors
USD 1,626 ACM Research Inc 'A' 156 0.03
USD 15,746 Amkor Technology Inc 214 0.05
USD 5,389 Axcelis Technologies Inc 158 0.03
USD 10,149 Brooks Automation Inc^ 553 0.12
USD 4,175 Cabot Microelectronics Corp^ 629 0.13
USD 3,160 CEVA Inc 127 0.03
USD 8,356 Cirrus Logic Inc 573 0.12
USD 7,563 Cohu Inc 142 0.03
USD 15,435 Cree Inc 1,064 0.23
iSHARES VII PLC
SCHEDULE OF INVESTMENTS (continued)
iSHARES MSCI USA SMALL CAP UCITS ETF (continued)As at 31 July 2020
[232 ]
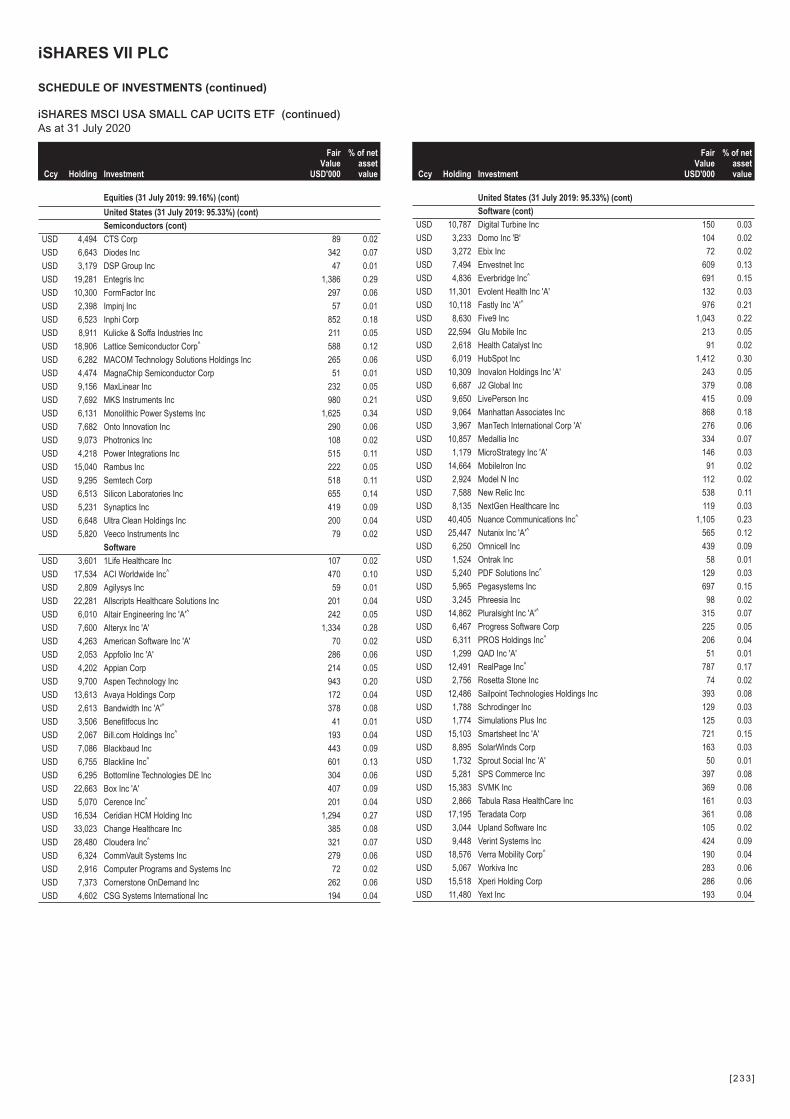
Ccy Holding Investment
FairValue
USD'000
% of netassetvalue
Equities (31 July 2019: 99.16%) (cont)
United States (31 July 2019: 95.33%) (cont)
Semiconductors (cont)
USD 4,494 CTS Corp 89 0.02
USD 6,643 Diodes Inc 342 0.07
USD 3,179 DSP Group Inc 47 0.01
USD 19,281 Entegris Inc 1,386 0.29
USD 10,300 FormFactor Inc 297 0.06
USD 2,398 Impinj Inc 57 0.01
USD 6,523 Inphi Corp 852 0.18
USD 8,911 Kulicke & Soffa Industries Inc 211 0.05
USD 18,906 Lattice Semiconductor Corp^ 588 0.12
USD 6,282 MACOM Technology Solutions Holdings Inc 265 0.06
USD 4,474 MagnaChip Semiconductor Corp 51 0.01
USD 9,156 MaxLinear Inc 232 0.05
USD 7,692 MKS Instruments Inc 980 0.21
USD 6,131 Monolithic Power Systems Inc 1,625 0.34
USD 7,682 Onto Innovation Inc 290 0.06
USD 9,073 Photronics Inc 108 0.02
USD 4,218 Power Integrations Inc 515 0.11
USD 15,040 Rambus Inc 222 0.05
USD 9,295 Semtech Corp 518 0.11
USD 6,513 Silicon Laboratories Inc 655 0.14
USD 5,231 Synaptics Inc 419 0.09
USD 6,648 Ultra Clean Holdings Inc 200 0.04
USD 5,820 Veeco Instruments Inc 79 0.02
Software
USD 3,601 1Life Healthcare Inc 107 0.02
USD 17,534 ACI Worldwide Inc^ 470 0.10
USD 2,809 Agilysys Inc 59 0.01
USD 22,281 Allscripts Healthcare Solutions Inc 201 0.04
USD 6,010 Altair Engineering Inc 'A'^ 242 0.05
USD 7,600 Alteryx Inc 'A' 1,334 0.28
USD 4,263 American Software Inc 'A' 70 0.02
USD 2,053 Appfolio Inc 'A' 286 0.06
USD 4,202 Appian Corp 214 0.05
USD 9,700 Aspen Technology Inc 943 0.20
USD 13,613 Avaya Holdings Corp 172 0.04
USD 2,613 Bandwidth Inc 'A'^ 378 0.08
USD 3,506 Benefitfocus Inc 41 0.01
USD 2,067 Bill.com Holdings Inc^ 193 0.04
USD 7,086 Blackbaud Inc 443 0.09
USD 6,755 Blackline Inc^ 601 0.13
USD 6,295 Bottomline Technologies DE Inc 304 0.06
USD 22,663 Box Inc 'A' 407 0.09
USD 5,070 Cerence Inc^ 201 0.04
USD 16,534 Ceridian HCM Holding Inc 1,294 0.27
USD 33,023 Change Healthcare Inc 385 0.08
USD 28,480 Cloudera Inc^ 321 0.07
USD 6,324 CommVault Systems Inc 279 0.06
USD 2,916 Computer Programs and Systems Inc 72 0.02
USD 7,373 Cornerstone OnDemand Inc 262 0.06
USD 4,602 CSG Systems International Inc 194 0.04
Ccy Holding Investment
FairValue
USD'000
% of netassetvalue
United States (31 July 2019: 95.33%) (cont)
Software (cont)
USD 10,787 Digital Turbine Inc 150 0.03
USD 3,233 Domo Inc 'B' 104 0.02
USD 3,272 Ebix Inc 72 0.02
USD 7,494 Envestnet Inc 609 0.13
USD 4,836 Everbridge Inc^ 691 0.15
USD 11,301 Evolent Health Inc 'A' 132 0.03
USD 10,118 Fastly Inc 'A'^ 976 0.21
USD 8,630 Five9 Inc 1,043 0.22
USD 22,594 Glu Mobile Inc 213 0.05
USD 2,618 Health Catalyst Inc 91 0.02
USD 6,019 HubSpot Inc 1,412 0.30
USD 10,309 Inovalon Holdings Inc 'A' 243 0.05
USD 6,687 J2 Global Inc 379 0.08
USD 9,650 LivePerson Inc 415 0.09
USD 9,064 Manhattan Associates Inc 868 0.18
USD 3,967 ManTech International Corp 'A' 276 0.06
USD 10,857 Medallia Inc 334 0.07
USD 1,179 MicroStrategy Inc 'A' 146 0.03
USD 14,664 MobileIron Inc 91 0.02
USD 2,924 Model N Inc 112 0.02
USD 7,588 New Relic Inc 538 0.11
USD 8,135 NextGen Healthcare Inc 119 0.03
USD 40,405 Nuance Communications Inc^ 1,105 0.23
USD 25,447 Nutanix Inc 'A'^ 565 0.12
USD 6,250 Omnicell Inc 439 0.09
USD 1,524 Ontrak Inc 58 0.01
USD 5,240 PDF Solutions Inc^ 129 0.03
USD 5,965 Pegasystems Inc 697 0.15
USD 3,245 Phreesia Inc 98 0.02
USD 14,862 Pluralsight Inc 'A'^ 315 0.07
USD 6,467 Progress Software Corp 225 0.05
USD 6,311 PROS Holdings Inc^ 206 0.04
USD 1,299 QAD Inc 'A' 51 0.01
USD 12,491 RealPage Inc^ 787 0.17
USD 2,756 Rosetta Stone Inc 74 0.02
USD 12,486 Sailpoint Technologies Holdings Inc 393 0.08
USD 1,788 Schrodinger Inc 129 0.03
USD 1,774 Simulations Plus Inc 125 0.03
USD 15,103 Smartsheet Inc 'A' 721 0.15
USD 8,895 SolarWinds Corp 163 0.03
USD 1,732 Sprout Social Inc 'A' 50 0.01
USD 5,281 SPS Commerce Inc 397 0.08
USD 15,383 SVMK Inc 369 0.08
USD 2,866 Tabula Rasa HealthCare Inc 161 0.03
USD 17,195 Teradata Corp 361 0.08
USD 3,044 Upland Software Inc 105 0.02
USD 9,448 Verint Systems Inc 424 0.09
USD 18,576 Verra Mobility Corp^ 190 0.04
USD 5,067 Workiva Inc 283 0.06
USD 15,518 Xperi Holding Corp 286 0.06
USD 11,480 Yext Inc 193 0.04
iSHARES VII PLC
SCHEDULE OF INVESTMENTS (continued)
iSHARES MSCI USA SMALL CAP UCITS ETF (continued)As at 31 July 2020
[233 ]

Ccy Holding Investment
FairValue
USD'000
% of netassetvalue
Equities (31 July 2019: 99.16%) (cont)
United States (31 July 2019: 95.33%) (cont)
Software (cont)
USD 15,562 Zuora Inc 'A' 181 0.04
USD 133,484 Zynga Inc 'A'^ 1,312 0.28
Telecommunications
USD 8,311 A10 Networks Inc 67 0.01
USD 5,638 Acacia Communications Inc 383 0.08
USD 6,060 ADTRAN Inc 75 0.02
USD 1,450 Anterix Inc 63 0.01
USD 1,407 ATN International Inc 81 0.02
USD 7,279 Calix Inc 149 0.03
USD 4,065 Casa Systems Inc 23 0.00
USD 21,923 Ciena Corp 1,305 0.28
USD 6,255 Cincinnati Bell Inc 94 0.02
USD 27,358 CommScope Holding Co Inc 254 0.05
USD 8,999 Consolidated Communications Holdings Inc^ 66 0.01
USD 7,252 EchoStar Corp 'A'^ 198 0.04
USD 20,024 Extreme Networks Inc 91 0.02
USD 13,678 GCI Liberty Inc 'A' 1,072 0.23
USD 63,221 Globalstar Inc 25 0.01
USD 5,572 GTT Communications Inc 35 0.01
USD 11,550 Harmonic Inc^ 64 0.01
USD 8,283 Iheartmedia Inc 'A' 69 0.01
USD 27,828 Infinera Corp^ 220 0.05
USD 8,925 Inseego Corp^ 120 0.03
USD 4,090 InterDigital Inc 246 0.05
USD 16,525 Iridium Communications Inc^ 453 0.10
USD 7,061 LogMeIn Inc 606 0.13
USD 1,605 Loral Space & Communications Inc 29 0.01
USD 8,607 Maxar Technologies Inc 153 0.03
USD 6,601 NeoPhotonics Corp 60 0.01
USD 3,907 NETGEAR Inc 120 0.03
USD 3,852 PagerDuty Inc 117 0.02
USD 4,548 Plantronics Inc 91 0.02
USD 9,105 Ribbon Communications Inc 40 0.01
USD 6,644 Shenandoah Telecommunications Co 334 0.07
USD 7,166 Switch Inc 'A'^ 129 0.03
USD 14,480 Telephone and Data Systems Inc 281 0.06
USD 1,742 United States Cellular Corp 52 0.01
USD 6,823 ViaSat Inc^ 259 0.06
USD 32,094 Viavi Solutions Inc^ 444 0.09
USD 31,545 Vonage Holdings Corp 377 0.08
Textile
USD 2,274 UniFirst Corp 424 0.09
Toys
USD 52,161 Mattel Inc^ 579 0.12
Transportation
USD 1,938 Air Transport Services Group Inc^ 47 0.01
USD 3,064 ArcBest Corp 93 0.02
USD 787 Atlas Air Worldwide Holdings Inc 41 0.01
USD 5,138 CryoPort Inc 170 0.03
USD 3,317 Echo Global Logistics Inc 83 0.02
Ccy Holding Investment
FairValue
USD'000
% of netassetvalue
United States (31 July 2019: 95.33%) (cont)
Transportation (cont)
USD 3,570 Forward Air Corp 186 0.04
USD 5,887 Heartland Express Inc 119 0.02
USD 5,099 Hub Group Inc 'A' 270 0.06
USD 2,181 Kirby Corp^ 101 0.02
USD 5,709 Landstar System Inc^ 695 0.15
USD 6,802 Marten Transport Ltd 181 0.04
USD 2,344 Matson Inc^ 85 0.02
USD 7,629 Ryder System Inc^ 280 0.06
USD 3,806 Saia Inc 455 0.10
USD 7,309 Schneider National Inc 'B' 184 0.04
USD 2,487 SEACOR Holdings Inc 72 0.01
USD 8,922 Werner Enterprises Inc 393 0.08
Water
USD 5,450 American States Water Co 419 0.09
USD 7,076 California Water Service Group 332 0.07
USD 2,691 Middlesex Water Co^ 172 0.03
USD 3,853 SJW Group 241 0.05
USD 1,790 York Water Co 83 0.02
Total United States 450,560 95.58
Total equities 470,128 99.73
CcyNo. of
contracts
UnderlyingexposureUSD’000
FairValue
USD’000
% of netassetvalue
Financial derivative instruments (31 July 2019: 0.01%)
Futures contracts (31 July 2019: 0.01%)
USD 18 E-mini Russell 2000 September 2020 1,311 19 0.01
Total unrealised gains on futures contracts 19 0.01
Total financial derivative instruments 19 0.01
FairValue
USD'000
% of netassetvalue
Total value of investments 470,147 99.74
Cash equivalents (31 July 2019: 0.28%)
UCITS collective investment schemes - Money Market Funds(31 July 2019: 0.28%)
Cash† 674 0.14
Other net assets 575 0.12
Net asset value attributable to redeemable participatingshareholders at the end of the financial year 471,396 100.00
†Cash holdings of USD618,140 are held with State Street Bank and Trust Company.USD56,072 is held as security for futures contracts with Credit Suisse Securities Ltd.
^These securities are partially or fully transferred as securities lent.*These securities were valued in consultation with the Investment Manager. These securitieswere fair valued or suspended at financial year end and valued using the last traded price.
iSHARES VII PLC
SCHEDULE OF INVESTMENTS (continued)
iSHARES MSCI USA SMALL CAP UCITS ETF (continued)As at 31 July 2020
[234 ]

Equities are primarily classified by country/geographic region of
incorporation of the entity in which the Fund holds shares.
Underlying exposure has been calculated according to the guidelines
issued by the ESMA and represents the market value of an equivalent
position in the assets underlying each financial derivative instrument.
Analysis of total current assetsgross of all liabilities
Fair valueUSD'000
% of totalcurrentassets
Transferable securities admitted to an official stock exchange listing 470,128 99.69
Exchange traded financial derivative instruments 19 0.01
Other assets 1,436 0.30
Total current assets 471,583 100.00
iSHARES VII PLC
SCHEDULE OF INVESTMENTS (continued)
iSHARES MSCI USA SMALL CAP UCITS ETF (continued)As at 31 July 2020
[235 ]

Ccy Holding Investment
FairValue
USD'000
% of netassetvalue
Transferable Securities Admitted to an Official Stock Exchange Listing or traded on aRegulated Market (31 July 2019: 99.56%)
Equities (31 July 2019: 99.56%)
Bermuda (31 July 2019: 0.43%)
Agriculture
USD 2,598 Bunge Ltd 113 0.02
Chemicals
USD 4,096 Axalta Coating Systems Ltd 91 0.01
Commercial services
USD 8,092 IHS Markit Ltd 653 0.11
Diversified financial services
USD 8,046 Invesco Ltd 81 0.01
Insurance
USD 8,133 Arch Capital Group Ltd 250 0.04
USD 3,202 Athene Holding Ltd 'A' 103 0.02
USD 864 Everest Re Group Ltd 189 0.03
USD 893 RenaissanceRe Holdings Ltd 161 0.03
Semiconductors
USD 14,217 Marvell Technology Group Ltd^ 519 0.09
Total Bermuda 2,160 0.36
British Virgin Islands (31 July 2019: 0.02%)
Canada (31 July 2019: 0.09%)
Environmental control
USD 5,483 Waste Connections Inc 561 0.09
Total Canada 561 0.09
Curacao (31 July 2019: 0.21%)
Oil & gas services
USD 27,898 Schlumberger Ltd 506 0.08
Total Curacao 506 0.08
Ireland (31 July 2019: 2.29%)
Building materials and fixtures
USD 16,296 Johnson Controls International Plc 627 0.10
Chemicals
USD 11,026 Linde Plc (US listed) 2,703 0.45
Computers
USD 13,191 Accenture Plc 'A' 2,965 0.49
USD 4,924 Seagate Technology Plc 223 0.04
Electronics
USD 1,845 Allegion Plc 184 0.03
Environmental control
USD 3,224 Pentair Plc 138 0.02
Healthcare products
USD 27,894 Medtronic Plc 2,691 0.44
USD 1,728 STERIS Plc 276 0.05
Insurance
USD 4,932 Aon Plc 'A' 1,012 0.17
USD 2,785 Willis Towers Watson Plc 585 0.10
Ccy Holding Investment
FairValue
USD'000
% of netassetvalue
Ireland (31 July 2019: 2.29%) (cont)
Miscellaneous manufacturers
USD 8,659 Eaton Corp Plc 806 0.13
USD 4,835 Trane Technologies Plc 541 0.09
Pharmaceuticals
USD 1,096 Jazz Pharmaceuticals Plc 119 0.02
USD 2,664 Perrigo Co Plc 141 0.02
Total Ireland 13,011 2.15
Jersey (31 July 2019: 0.15%)
Auto parts & equipment
USD 5,231 Aptiv Plc 407 0.07
Packaging & containers
USD 33,219 Amcor Plc 342 0.05
Total Jersey 749 0.12
Liberia (31 July 2019: 0.08%)
Leisure time
USD 3,514 Royal Caribbean Cruises Ltd^ 171 0.03
Total Liberia 171 0.03
Netherlands (31 July 2019: 0.12%)
Chemicals
USD 5,517 LyondellBasell Industries NV 'A' 345 0.06
Pharmaceuticals
USD 10,187 Mylan NV 164 0.03
Semiconductors
USD 5,803 NXP Semiconductors NV 682 0.11
Total Netherlands 1,191 0.20
Panama (31 July 2019: 0.07%)
Leisure time
USD 8,451 Carnival Corp^ 118 0.02
Total Panama 118 0.02
Singapore (31 July 2019: 0.02%)
Switzerland (31 July 2019: 0.43%)
Electronics
USD 2,683 Garmin Ltd 265 0.05
USD 6,964 TE Connectivity Ltd 620 0.10
Insurance
USD 9,449 Chubb Ltd 1,202 0.20
Total Switzerland 2,087 0.35
United Kingdom (31 July 2019: 0.35%)
Commercial services
USD 6,794 Nielsen Holdings Plc 98 0.02
Electronics
USD 3,244 Sensata Technologies Holding Plc 123 0.02
Media
USD 4,266 Liberty Global Plc 'A' 100 0.02
iSHARES VII PLC
SCHEDULE OF INVESTMENTS (continued)
iSHARES MSCI USA UCITS ETFAs at 31 July 2020
[236 ]
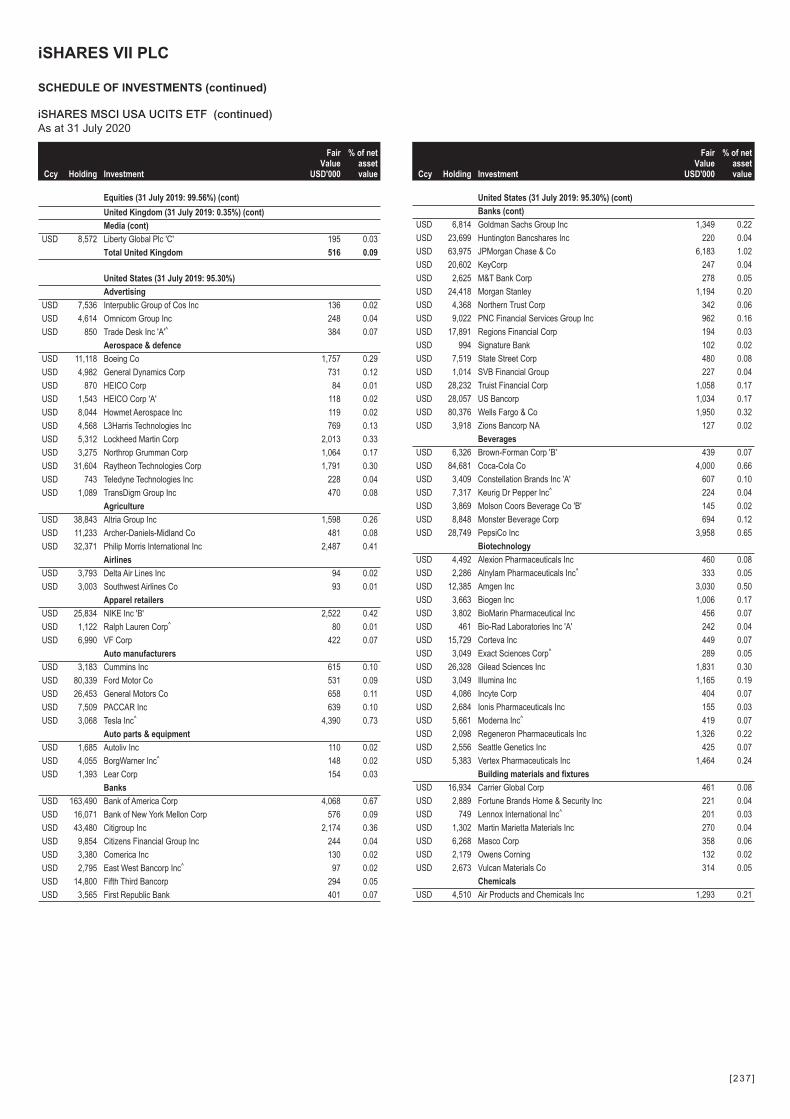
Ccy Holding Investment
FairValue
USD'000
% of netassetvalue
Equities (31 July 2019: 99.56%) (cont)
United Kingdom (31 July 2019: 0.35%) (cont)
Media (cont)
USD 8,572 Liberty Global Plc 'C' 195 0.03
Total United Kingdom 516 0.09
United States (31 July 2019: 95.30%)
Advertising
USD 7,536 Interpublic Group of Cos Inc 136 0.02
USD 4,614 Omnicom Group Inc 248 0.04
USD 850 Trade Desk Inc 'A'^ 384 0.07
Aerospace & defence
USD 11,118 Boeing Co 1,757 0.29
USD 4,982 General Dynamics Corp 731 0.12
USD 870 HEICO Corp 84 0.01
USD 1,543 HEICO Corp 'A' 118 0.02
USD 8,044 Howmet Aerospace Inc 119 0.02
USD 4,568 L3Harris Technologies Inc 769 0.13
USD 5,312 Lockheed Martin Corp 2,013 0.33
USD 3,275 Northrop Grumman Corp 1,064 0.17
USD 31,604 Raytheon Technologies Corp 1,791 0.30
USD 743 Teledyne Technologies Inc 228 0.04
USD 1,089 TransDigm Group Inc 470 0.08
Agriculture
USD 38,843 Altria Group Inc 1,598 0.26
USD 11,233 Archer-Daniels-Midland Co 481 0.08
USD 32,371 Philip Morris International Inc 2,487 0.41
Airlines
USD 3,793 Delta Air Lines Inc 94 0.02
USD 3,003 Southwest Airlines Co 93 0.01
Apparel retailers
USD 25,834 NIKE Inc 'B' 2,522 0.42
USD 1,122 Ralph Lauren Corp^ 80 0.01
USD 6,990 VF Corp 422 0.07
Auto manufacturers
USD 3,183 Cummins Inc 615 0.10
USD 80,339 Ford Motor Co 531 0.09
USD 26,453 General Motors Co 658 0.11
USD 7,509 PACCAR Inc 639 0.10
USD 3,068 Tesla Inc^ 4,390 0.73
Auto parts & equipment
USD 1,685 Autoliv Inc 110 0.02
USD 4,055 BorgWarner Inc^ 148 0.02
USD 1,393 Lear Corp 154 0.03
Banks
USD 163,490 Bank of America Corp 4,068 0.67
USD 16,071 Bank of New York Mellon Corp 576 0.09
USD 43,480 Citigroup Inc 2,174 0.36
USD 9,854 Citizens Financial Group Inc 244 0.04
USD 3,380 Comerica Inc 130 0.02
USD 2,795 East West Bancorp Inc^ 97 0.02
USD 14,800 Fifth Third Bancorp 294 0.05
USD 3,565 First Republic Bank 401 0.07
Ccy Holding Investment
FairValue
USD'000
% of netassetvalue
United States (31 July 2019: 95.30%) (cont)
Banks (cont)
USD 6,814 Goldman Sachs Group Inc 1,349 0.22
USD 23,699 Huntington Bancshares Inc 220 0.04
USD 63,975 JPMorgan Chase & Co 6,183 1.02
USD 20,602 KeyCorp 247 0.04
USD 2,625 M&T Bank Corp 278 0.05
USD 24,418 Morgan Stanley 1,194 0.20
USD 4,368 Northern Trust Corp 342 0.06
USD 9,022 PNC Financial Services Group Inc 962 0.16
USD 17,891 Regions Financial Corp 194 0.03
USD 994 Signature Bank 102 0.02
USD 7,519 State Street Corp 480 0.08
USD 1,014 SVB Financial Group 227 0.04
USD 28,232 Truist Financial Corp 1,058 0.17
USD 28,057 US Bancorp 1,034 0.17
USD 80,376 Wells Fargo & Co 1,950 0.32
USD 3,918 Zions Bancorp NA 127 0.02
Beverages
USD 6,326 Brown-Forman Corp 'B' 439 0.07
USD 84,681 Coca-Cola Co 4,000 0.66
USD 3,409 Constellation Brands Inc 'A' 607 0.10
USD 7,317 Keurig Dr Pepper Inc^ 224 0.04
USD 3,869 Molson Coors Beverage Co 'B' 145 0.02
USD 8,848 Monster Beverage Corp 694 0.12
USD 28,749 PepsiCo Inc 3,958 0.65
Biotechnology
USD 4,492 Alexion Pharmaceuticals Inc 460 0.08
USD 2,286 Alnylam Pharmaceuticals Inc^ 333 0.05
USD 12,385 Amgen Inc 3,030 0.50
USD 3,663 Biogen Inc 1,006 0.17
USD 3,802 BioMarin Pharmaceutical Inc 456 0.07
USD 461 Bio-Rad Laboratories Inc 'A' 242 0.04
USD 15,729 Corteva Inc 449 0.07
USD 3,049 Exact Sciences Corp^ 289 0.05
USD 26,328 Gilead Sciences Inc 1,831 0.30
USD 3,049 Illumina Inc 1,165 0.19
USD 4,086 Incyte Corp 404 0.07
USD 2,684 Ionis Pharmaceuticals Inc 155 0.03
USD 5,661 Moderna Inc^ 419 0.07
USD 2,098 Regeneron Pharmaceuticals Inc 1,326 0.22
USD 2,556 Seattle Genetics Inc 425 0.07
USD 5,383 Vertex Pharmaceuticals Inc 1,464 0.24
Building materials and fixtures
USD 16,934 Carrier Global Corp 461 0.08
USD 2,889 Fortune Brands Home & Security Inc 221 0.04
USD 749 Lennox International Inc^ 201 0.03
USD 1,302 Martin Marietta Materials Inc 270 0.04
USD 6,268 Masco Corp 358 0.06
USD 2,179 Owens Corning 132 0.02
USD 2,673 Vulcan Materials Co 314 0.05
Chemicals
USD 4,510 Air Products and Chemicals Inc 1,293 0.21
iSHARES VII PLC
SCHEDULE OF INVESTMENTS (continued)
iSHARES MSCI USA UCITS ETF (continued)As at 31 July 2020
[237 ]
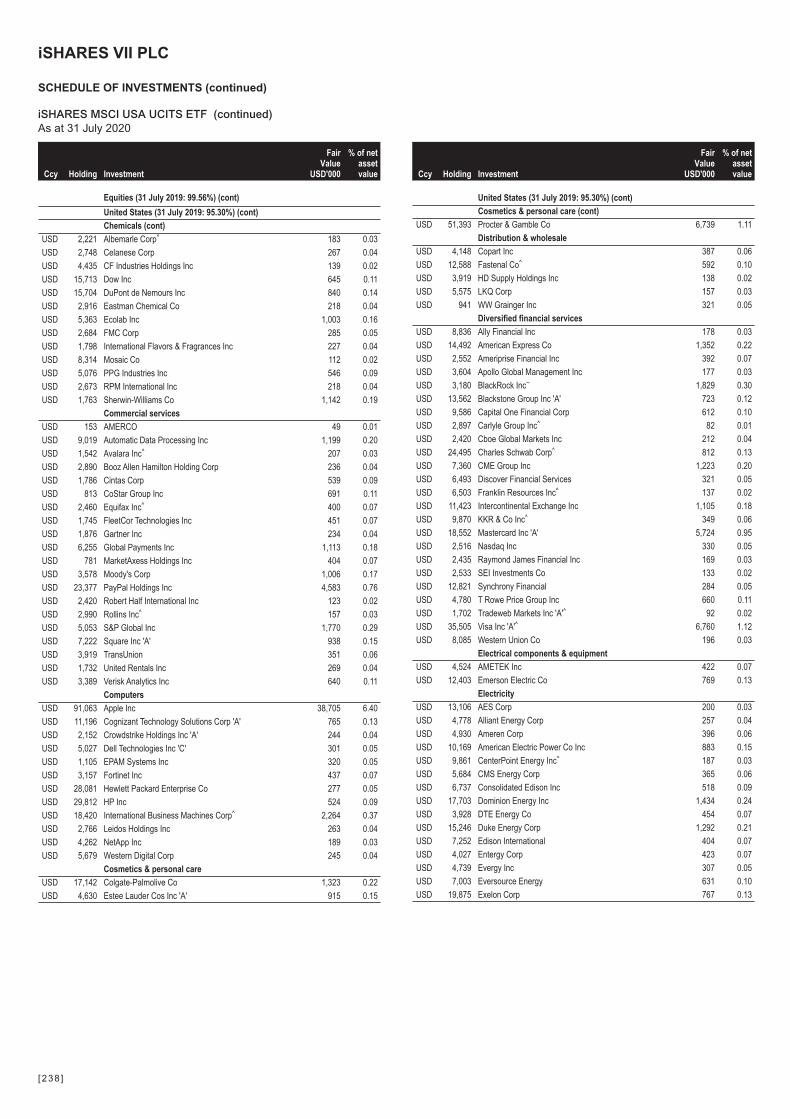
Ccy Holding Investment
FairValue
USD'000
% of netassetvalue
Equities (31 July 2019: 99.56%) (cont)
United States (31 July 2019: 95.30%) (cont)
Chemicals (cont)
USD 2,221 Albemarle Corp^ 183 0.03
USD 2,748 Celanese Corp 267 0.04
USD 4,435 CF Industries Holdings Inc 139 0.02
USD 15,713 Dow Inc 645 0.11
USD 15,704 DuPont de Nemours Inc 840 0.14
USD 2,916 Eastman Chemical Co 218 0.04
USD 5,363 Ecolab Inc 1,003 0.16
USD 2,684 FMC Corp 285 0.05
USD 1,798 International Flavors & Fragrances Inc 227 0.04
USD 8,314 Mosaic Co 112 0.02
USD 5,076 PPG Industries Inc 546 0.09
USD 2,673 RPM International Inc 218 0.04
USD 1,763 Sherwin-Williams Co 1,142 0.19
Commercial services
USD 153 AMERCO 49 0.01
USD 9,019 Automatic Data Processing Inc 1,199 0.20
USD 1,542 Avalara Inc^ 207 0.03
USD 2,890 Booz Allen Hamilton Holding Corp 236 0.04
USD 1,786 Cintas Corp 539 0.09
USD 813 CoStar Group Inc 691 0.11
USD 2,460 Equifax Inc^ 400 0.07
USD 1,745 FleetCor Technologies Inc 451 0.07
USD 1,876 Gartner Inc 234 0.04
USD 6,255 Global Payments Inc 1,113 0.18
USD 781 MarketAxess Holdings Inc 404 0.07
USD 3,578 Moody's Corp 1,006 0.17
USD 23,377 PayPal Holdings Inc 4,583 0.76
USD 2,420 Robert Half International Inc 123 0.02
USD 2,990 Rollins Inc^ 157 0.03
USD 5,053 S&P Global Inc 1,770 0.29
USD 7,222 Square Inc 'A' 938 0.15
USD 3,919 TransUnion 351 0.06
USD 1,732 United Rentals Inc 269 0.04
USD 3,389 Verisk Analytics Inc 640 0.11
Computers
USD 91,063 Apple Inc 38,705 6.40
USD 11,196 Cognizant Technology Solutions Corp 'A' 765 0.13
USD 2,152 Crowdstrike Holdings Inc 'A' 244 0.04
USD 5,027 Dell Technologies Inc 'C' 301 0.05
USD 1,105 EPAM Systems Inc 320 0.05
USD 3,157 Fortinet Inc 437 0.07
USD 28,081 Hewlett Packard Enterprise Co 277 0.05
USD 29,812 HP Inc 524 0.09
USD 18,420 International Business Machines Corp^ 2,264 0.37
USD 2,766 Leidos Holdings Inc 263 0.04
USD 4,262 NetApp Inc 189 0.03
USD 5,679 Western Digital Corp 245 0.04
Cosmetics & personal care
USD 17,142 Colgate-Palmolive Co 1,323 0.22
USD 4,630 Estee Lauder Cos Inc 'A' 915 0.15
Ccy Holding Investment
FairValue
USD'000
% of netassetvalue
United States (31 July 2019: 95.30%) (cont)
Cosmetics & personal care (cont)
USD 51,393 Procter & Gamble Co 6,739 1.11
Distribution & wholesale
USD 4,148 Copart Inc 387 0.06
USD 12,588 Fastenal Co^ 592 0.10
USD 3,919 HD Supply Holdings Inc 138 0.02
USD 5,575 LKQ Corp 157 0.03
USD 941 WW Grainger Inc 321 0.05
Diversified financial services
USD 8,836 Ally Financial Inc 178 0.03
USD 14,492 American Express Co 1,352 0.22
USD 2,552 Ameriprise Financial Inc 392 0.07
USD 3,604 Apollo Global Management Inc 177 0.03
USD 3,180 BlackRock Inc~ 1,829 0.30
USD 13,562 Blackstone Group Inc 'A' 723 0.12
USD 9,586 Capital One Financial Corp 612 0.10
USD 2,897 Carlyle Group Inc^ 82 0.01
USD 2,420 Cboe Global Markets Inc 212 0.04
USD 24,495 Charles Schwab Corp^ 812 0.13
USD 7,360 CME Group Inc 1,223 0.20
USD 6,493 Discover Financial Services 321 0.05
USD 6,503 Franklin Resources Inc^ 137 0.02
USD 11,423 Intercontinental Exchange Inc 1,105 0.18
USD 9,870 KKR & Co Inc^ 349 0.06
USD 18,552 Mastercard Inc 'A' 5,724 0.95
USD 2,516 Nasdaq Inc 330 0.05
USD 2,435 Raymond James Financial Inc 169 0.03
USD 2,533 SEI Investments Co 133 0.02
USD 12,821 Synchrony Financial 284 0.05
USD 4,780 T Rowe Price Group Inc 660 0.11
USD 1,702 Tradeweb Markets Inc 'A'^ 92 0.02
USD 35,505 Visa Inc 'A'^ 6,760 1.12
USD 8,085 Western Union Co 196 0.03
Electrical components & equipment
USD 4,524 AMETEK Inc 422 0.07
USD 12,403 Emerson Electric Co 769 0.13
Electricity
USD 13,106 AES Corp 200 0.03
USD 4,778 Alliant Energy Corp 257 0.04
USD 4,930 Ameren Corp 396 0.06
USD 10,169 American Electric Power Co Inc 883 0.15
USD 9,861 CenterPoint Energy Inc^ 187 0.03
USD 5,684 CMS Energy Corp 365 0.06
USD 6,737 Consolidated Edison Inc 518 0.09
USD 17,703 Dominion Energy Inc 1,434 0.24
USD 3,928 DTE Energy Co 454 0.07
USD 15,246 Duke Energy Corp 1,292 0.21
USD 7,252 Edison International 404 0.07
USD 4,027 Entergy Corp 423 0.07
USD 4,739 Evergy Inc 307 0.05
USD 7,003 Eversource Energy 631 0.10
USD 19,875 Exelon Corp 767 0.13
iSHARES VII PLC
SCHEDULE OF INVESTMENTS (continued)
iSHARES MSCI USA UCITS ETF (continued)As at 31 July 2020
[238 ]
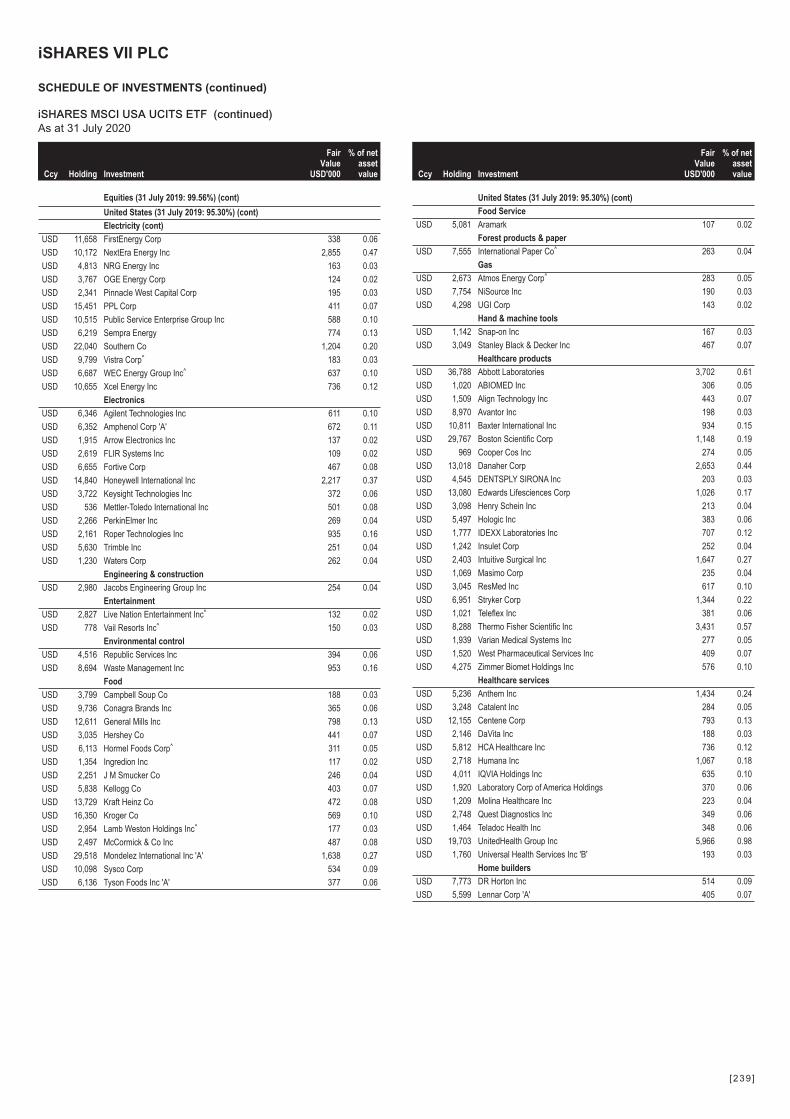
Ccy Holding Investment
FairValue
USD'000
% of netassetvalue
Equities (31 July 2019: 99.56%) (cont)
United States (31 July 2019: 95.30%) (cont)
Electricity (cont)
USD 11,658 FirstEnergy Corp 338 0.06
USD 10,172 NextEra Energy Inc 2,855 0.47
USD 4,813 NRG Energy Inc 163 0.03
USD 3,767 OGE Energy Corp 124 0.02
USD 2,341 Pinnacle West Capital Corp 195 0.03
USD 15,451 PPL Corp 411 0.07
USD 10,515 Public Service Enterprise Group Inc 588 0.10
USD 6,219 Sempra Energy 774 0.13
USD 22,040 Southern Co 1,204 0.20
USD 9,799 Vistra Corp^ 183 0.03
USD 6,687 WEC Energy Group Inc^ 637 0.10
USD 10,655 Xcel Energy Inc 736 0.12
Electronics
USD 6,346 Agilent Technologies Inc 611 0.10
USD 6,352 Amphenol Corp 'A' 672 0.11
USD 1,915 Arrow Electronics Inc 137 0.02
USD 2,619 FLIR Systems Inc 109 0.02
USD 6,655 Fortive Corp 467 0.08
USD 14,840 Honeywell International Inc 2,217 0.37
USD 3,722 Keysight Technologies Inc 372 0.06
USD 536 Mettler-Toledo International Inc 501 0.08
USD 2,266 PerkinElmer Inc 269 0.04
USD 2,161 Roper Technologies Inc 935 0.16
USD 5,630 Trimble Inc 251 0.04
USD 1,230 Waters Corp 262 0.04
Engineering & construction
USD 2,980 Jacobs Engineering Group Inc 254 0.04
Entertainment
USD 2,827 Live Nation Entertainment Inc^ 132 0.02
USD 778 Vail Resorts Inc^ 150 0.03
Environmental control
USD 4,516 Republic Services Inc 394 0.06
USD 8,694 Waste Management Inc 953 0.16
Food
USD 3,799 Campbell Soup Co 188 0.03
USD 9,736 Conagra Brands Inc 365 0.06
USD 12,611 General Mills Inc 798 0.13
USD 3,035 Hershey Co 441 0.07
USD 6,113 Hormel Foods Corp^ 311 0.05
USD 1,354 Ingredion Inc 117 0.02
USD 2,251 J M Smucker Co 246 0.04
USD 5,838 Kellogg Co 403 0.07
USD 13,729 Kraft Heinz Co 472 0.08
USD 16,350 Kroger Co 569 0.10
USD 2,954 Lamb Weston Holdings Inc^ 177 0.03
USD 2,497 McCormick & Co Inc 487 0.08
USD 29,518 Mondelez International Inc 'A' 1,638 0.27
USD 10,098 Sysco Corp 534 0.09
USD 6,136 Tyson Foods Inc 'A' 377 0.06
Ccy Holding Investment
FairValue
USD'000
% of netassetvalue
United States (31 July 2019: 95.30%) (cont)
Food Service
USD 5,081 Aramark 107 0.02
Forest products & paper
USD 7,555 International Paper Co^ 263 0.04
Gas
USD 2,673 Atmos Energy Corp^ 283 0.05
USD 7,754 NiSource Inc 190 0.03
USD 4,298 UGI Corp 143 0.02
Hand & machine tools
USD 1,142 Snap-on Inc 167 0.03
USD 3,049 Stanley Black & Decker Inc 467 0.07
Healthcare products
USD 36,788 Abbott Laboratories 3,702 0.61
USD 1,020 ABIOMED Inc 306 0.05
USD 1,509 Align Technology Inc 443 0.07
USD 8,970 Avantor Inc 198 0.03
USD 10,811 Baxter International Inc 934 0.15
USD 29,767 Boston Scientific Corp 1,148 0.19
USD 969 Cooper Cos Inc 274 0.05
USD 13,018 Danaher Corp 2,653 0.44
USD 4,545 DENTSPLY SIRONA Inc 203 0.03
USD 13,080 Edwards Lifesciences Corp 1,026 0.17
USD 3,098 Henry Schein Inc 213 0.04
USD 5,497 Hologic Inc 383 0.06
USD 1,777 IDEXX Laboratories Inc 707 0.12
USD 1,242 Insulet Corp 252 0.04
USD 2,403 Intuitive Surgical Inc 1,647 0.27
USD 1,069 Masimo Corp 235 0.04
USD 3,045 ResMed Inc 617 0.10
USD 6,951 Stryker Corp 1,344 0.22
USD 1,021 Teleflex Inc 381 0.06
USD 8,288 Thermo Fisher Scientific Inc 3,431 0.57
USD 1,939 Varian Medical Systems Inc 277 0.05
USD 1,520 West Pharmaceutical Services Inc 409 0.07
USD 4,275 Zimmer Biomet Holdings Inc 576 0.10
Healthcare services
USD 5,236 Anthem Inc 1,434 0.24
USD 3,248 Catalent Inc 284 0.05
USD 12,155 Centene Corp 793 0.13
USD 2,146 DaVita Inc 188 0.03
USD 5,812 HCA Healthcare Inc 736 0.12
USD 2,718 Humana Inc 1,067 0.18
USD 4,011 IQVIA Holdings Inc 635 0.10
USD 1,920 Laboratory Corp of America Holdings 370 0.06
USD 1,209 Molina Healthcare Inc 223 0.04
USD 2,748 Quest Diagnostics Inc 349 0.06
USD 1,464 Teladoc Health Inc 348 0.06
USD 19,703 UnitedHealth Group Inc 5,966 0.98
USD 1,760 Universal Health Services Inc 'B' 193 0.03
Home builders
USD 7,773 DR Horton Inc 514 0.09
USD 5,599 Lennar Corp 'A' 405 0.07
iSHARES VII PLC
SCHEDULE OF INVESTMENTS (continued)
iSHARES MSCI USA UCITS ETF (continued)As at 31 July 2020
[239 ]
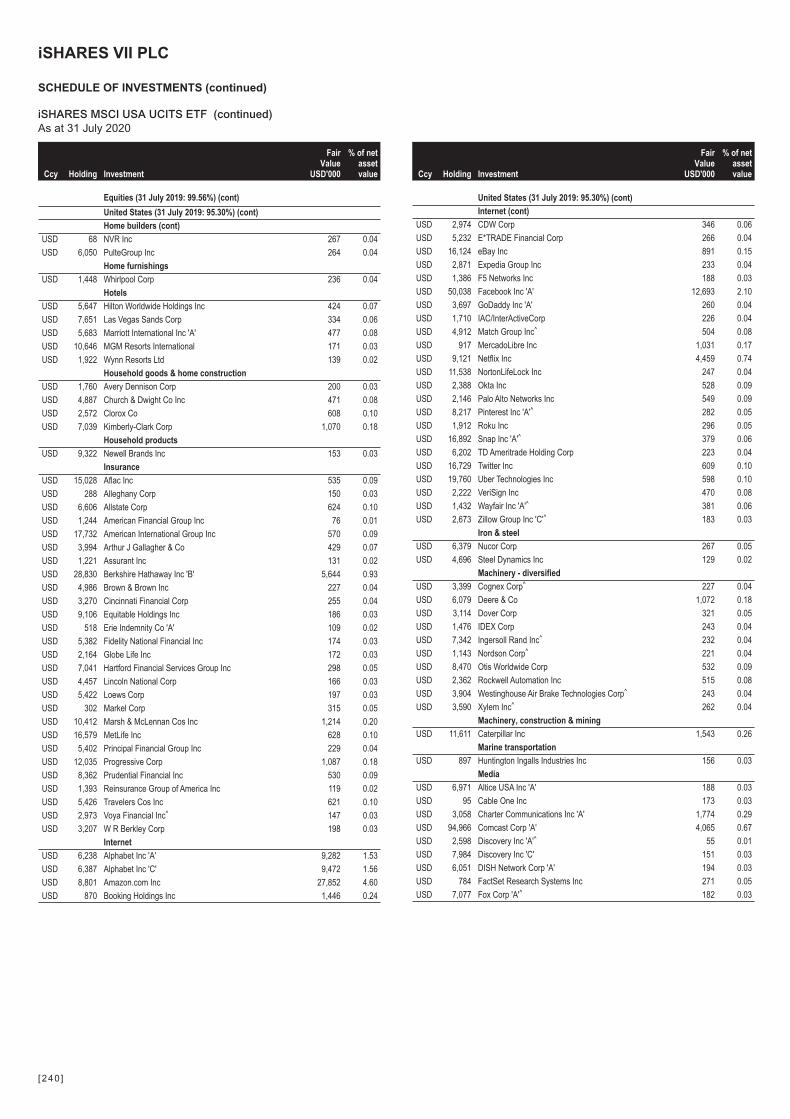
Ccy Holding Investment
FairValue
USD'000
% of netassetvalue
Equities (31 July 2019: 99.56%) (cont)
United States (31 July 2019: 95.30%) (cont)
Home builders (cont)
USD 68 NVR Inc 267 0.04
USD 6,050 PulteGroup Inc 264 0.04
Home furnishings
USD 1,448 Whirlpool Corp 236 0.04
Hotels
USD 5,647 Hilton Worldwide Holdings Inc 424 0.07
USD 7,651 Las Vegas Sands Corp 334 0.06
USD 5,683 Marriott International Inc 'A' 477 0.08
USD 10,646 MGM Resorts International 171 0.03
USD 1,922 Wynn Resorts Ltd 139 0.02
Household goods & home construction
USD 1,760 Avery Dennison Corp 200 0.03
USD 4,887 Church & Dwight Co Inc 471 0.08
USD 2,572 Clorox Co 608 0.10
USD 7,039 Kimberly-Clark Corp 1,070 0.18
Household products
USD 9,322 Newell Brands Inc 153 0.03
Insurance
USD 15,028 Aflac Inc 535 0.09
USD 288 Alleghany Corp 150 0.03
USD 6,606 Allstate Corp 624 0.10
USD 1,244 American Financial Group Inc 76 0.01
USD 17,732 American International Group Inc 570 0.09
USD 3,994 Arthur J Gallagher & Co 429 0.07
USD 1,221 Assurant Inc 131 0.02
USD 28,830 Berkshire Hathaway Inc 'B' 5,644 0.93
USD 4,986 Brown & Brown Inc 227 0.04
USD 3,270 Cincinnati Financial Corp 255 0.04
USD 9,106 Equitable Holdings Inc 186 0.03
USD 518 Erie Indemnity Co 'A' 109 0.02
USD 5,382 Fidelity National Financial Inc 174 0.03
USD 2,164 Globe Life Inc 172 0.03
USD 7,041 Hartford Financial Services Group Inc 298 0.05
USD 4,457 Lincoln National Corp 166 0.03
USD 5,422 Loews Corp 197 0.03
USD 302 Markel Corp 315 0.05
USD 10,412 Marsh & McLennan Cos Inc 1,214 0.20
USD 16,579 MetLife Inc 628 0.10
USD 5,402 Principal Financial Group Inc 229 0.04
USD 12,035 Progressive Corp 1,087 0.18
USD 8,362 Prudential Financial Inc 530 0.09
USD 1,393 Reinsurance Group of America Inc 119 0.02
USD 5,426 Travelers Cos Inc 621 0.10
USD 2,973 Voya Financial Inc^ 147 0.03
USD 3,207 W R Berkley Corp 198 0.03
Internet
USD 6,238 Alphabet Inc 'A' 9,282 1.53
USD 6,387 Alphabet Inc 'C' 9,472 1.56
USD 8,801 Amazon.com Inc 27,852 4.60
USD 870 Booking Holdings Inc 1,446 0.24
Ccy Holding Investment
FairValue
USD'000
% of netassetvalue
United States (31 July 2019: 95.30%) (cont)
Internet (cont)
USD 2,974 CDW Corp 346 0.06
USD 5,232 E*TRADE Financial Corp 266 0.04
USD 16,124 eBay Inc 891 0.15
USD 2,871 Expedia Group Inc 233 0.04
USD 1,386 F5 Networks Inc 188 0.03
USD 50,038 Facebook Inc 'A' 12,693 2.10
USD 3,697 GoDaddy Inc 'A' 260 0.04
USD 1,710 IAC/InterActiveCorp 226 0.04
USD 4,912 Match Group Inc^ 504 0.08
USD 917 MercadoLibre Inc 1,031 0.17
USD 9,121 Netflix Inc 4,459 0.74
USD 11,538 NortonLifeLock Inc 247 0.04
USD 2,388 Okta Inc 528 0.09
USD 2,146 Palo Alto Networks Inc 549 0.09
USD 8,217 Pinterest Inc 'A'^ 282 0.05
USD 1,912 Roku Inc 296 0.05
USD 16,892 Snap Inc 'A'^ 379 0.06
USD 6,202 TD Ameritrade Holding Corp 223 0.04
USD 16,729 Twitter Inc 609 0.10
USD 19,760 Uber Technologies Inc 598 0.10
USD 2,222 VeriSign Inc 470 0.08
USD 1,432 Wayfair Inc 'A'^ 381 0.06
USD 2,673 Zillow Group Inc 'C'^ 183 0.03
Iron & steel
USD 6,379 Nucor Corp 267 0.05
USD 4,696 Steel Dynamics Inc 129 0.02
Machinery - diversified
USD 3,399 Cognex Corp^ 227 0.04
USD 6,079 Deere & Co 1,072 0.18
USD 3,114 Dover Corp 321 0.05
USD 1,476 IDEX Corp 243 0.04
USD 7,342 Ingersoll Rand Inc^ 232 0.04
USD 1,143 Nordson Corp^ 221 0.04
USD 8,470 Otis Worldwide Corp 532 0.09
USD 2,362 Rockwell Automation Inc 515 0.08
USD 3,904 Westinghouse Air Brake Technologies Corp^ 243 0.04
USD 3,590 Xylem Inc^ 262 0.04
Machinery, construction & mining
USD 11,611 Caterpillar Inc 1,543 0.26
Marine transportation
USD 897 Huntington Ingalls Industries Inc 156 0.03
Media
USD 6,971 Altice USA Inc 'A' 188 0.03
USD 95 Cable One Inc 173 0.03
USD 3,058 Charter Communications Inc 'A' 1,774 0.29
USD 94,966 Comcast Corp 'A' 4,065 0.67
USD 2,598 Discovery Inc 'A'^ 55 0.01
USD 7,984 Discovery Inc 'C' 151 0.03
USD 6,051 DISH Network Corp 'A' 194 0.03
USD 784 FactSet Research Systems Inc 271 0.05
USD 7,077 Fox Corp 'A'^ 182 0.03
iSHARES VII PLC
SCHEDULE OF INVESTMENTS (continued)
iSHARES MSCI USA UCITS ETF (continued)As at 31 July 2020
[240 ]
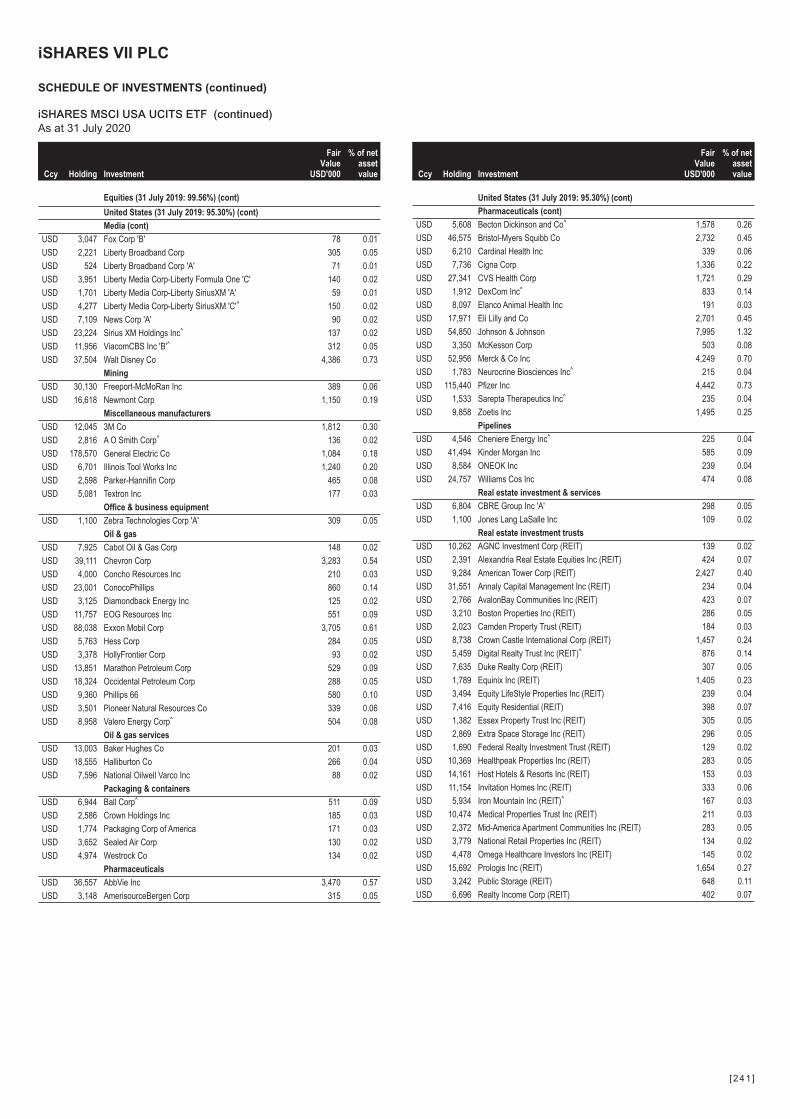
Ccy Holding Investment
FairValue
USD'000
% of netassetvalue
Equities (31 July 2019: 99.56%) (cont)
United States (31 July 2019: 95.30%) (cont)
Media (cont)
USD 3,047 Fox Corp 'B' 78 0.01
USD 2,221 Liberty Broadband Corp 305 0.05
USD 524 Liberty Broadband Corp 'A' 71 0.01
USD 3,951 Liberty Media Corp-Liberty Formula One 'C' 140 0.02
USD 1,701 Liberty Media Corp-Liberty SiriusXM 'A' 59 0.01
USD 4,277 Liberty Media Corp-Liberty SiriusXM 'C'^ 150 0.02
USD 7,109 News Corp 'A' 90 0.02
USD 23,224 Sirius XM Holdings Inc^ 137 0.02
USD 11,956 ViacomCBS Inc 'B'^ 312 0.05
USD 37,504 Walt Disney Co 4,386 0.73
Mining
USD 30,130 Freeport-McMoRan Inc 389 0.06
USD 16,618 Newmont Corp 1,150 0.19
Miscellaneous manufacturers
USD 12,045 3M Co 1,812 0.30
USD 2,816 A O Smith Corp^ 136 0.02
USD 178,570 General Electric Co 1,084 0.18
USD 6,701 Illinois Tool Works Inc 1,240 0.20
USD 2,598 Parker-Hannifin Corp 465 0.08
USD 5,081 Textron Inc 177 0.03
Office & business equipment
USD 1,100 Zebra Technologies Corp 'A' 309 0.05
Oil & gas
USD 7,925 Cabot Oil & Gas Corp 148 0.02
USD 39,111 Chevron Corp 3,283 0.54
USD 4,000 Concho Resources Inc 210 0.03
USD 23,001 ConocoPhillips 860 0.14
USD 3,125 Diamondback Energy Inc 125 0.02
USD 11,757 EOG Resources Inc 551 0.09
USD 88,038 Exxon Mobil Corp 3,705 0.61
USD 5,763 Hess Corp 284 0.05
USD 3,378 HollyFrontier Corp 93 0.02
USD 13,851 Marathon Petroleum Corp 529 0.09
USD 18,324 Occidental Petroleum Corp 288 0.05
USD 9,360 Phillips 66 580 0.10
USD 3,501 Pioneer Natural Resources Co 339 0.06
USD 8,958 Valero Energy Corp^ 504 0.08
Oil & gas services
USD 13,003 Baker Hughes Co 201 0.03
USD 18,555 Halliburton Co 266 0.04
USD 7,596 National Oilwell Varco Inc 88 0.02
Packaging & containers
USD 6,944 Ball Corp^ 511 0.09
USD 2,586 Crown Holdings Inc 185 0.03
USD 1,774 Packaging Corp of America 171 0.03
USD 3,652 Sealed Air Corp 130 0.02
USD 4,974 Westrock Co 134 0.02
Pharmaceuticals
USD 36,557 AbbVie Inc 3,470 0.57
USD 3,148 AmerisourceBergen Corp 315 0.05
Ccy Holding Investment
FairValue
USD'000
% of netassetvalue
United States (31 July 2019: 95.30%) (cont)
Pharmaceuticals (cont)
USD 5,608 Becton Dickinson and Co^ 1,578 0.26
USD 46,575 Bristol-Myers Squibb Co 2,732 0.45
USD 6,210 Cardinal Health Inc 339 0.06
USD 7,736 Cigna Corp 1,336 0.22
USD 27,341 CVS Health Corp 1,721 0.29
USD 1,912 DexCom Inc^ 833 0.14
USD 8,097 Elanco Animal Health Inc 191 0.03
USD 17,971 Eli Lilly and Co 2,701 0.45
USD 54,850 Johnson & Johnson 7,995 1.32
USD 3,350 McKesson Corp 503 0.08
USD 52,956 Merck & Co Inc 4,249 0.70
USD 1,783 Neurocrine Biosciences Inc^ 215 0.04
USD 115,440 Pfizer Inc 4,442 0.73
USD 1,533 Sarepta Therapeutics Inc^ 235 0.04
USD 9,858 Zoetis Inc 1,495 0.25
Pipelines
USD 4,546 Cheniere Energy Inc^ 225 0.04
USD 41,494 Kinder Morgan Inc 585 0.09
USD 8,584 ONEOK Inc 239 0.04
USD 24,757 Williams Cos Inc 474 0.08
Real estate investment & services
USD 6,804 CBRE Group Inc 'A' 298 0.05
USD 1,100 Jones Lang LaSalle Inc 109 0.02
Real estate investment trusts
USD 10,262 AGNC Investment Corp (REIT) 139 0.02
USD 2,391 Alexandria Real Estate Equities Inc (REIT) 424 0.07
USD 9,284 American Tower Corp (REIT) 2,427 0.40
USD 31,551 Annaly Capital Management Inc (REIT) 234 0.04
USD 2,766 AvalonBay Communities Inc (REIT) 423 0.07
USD 3,210 Boston Properties Inc (REIT) 286 0.05
USD 2,023 Camden Property Trust (REIT) 184 0.03
USD 8,738 Crown Castle International Corp (REIT) 1,457 0.24
USD 5,459 Digital Realty Trust Inc (REIT)^ 876 0.14
USD 7,635 Duke Realty Corp (REIT) 307 0.05
USD 1,789 Equinix Inc (REIT) 1,405 0.23
USD 3,494 Equity LifeStyle Properties Inc (REIT) 239 0.04
USD 7,416 Equity Residential (REIT) 398 0.07
USD 1,382 Essex Property Trust Inc (REIT) 305 0.05
USD 2,869 Extra Space Storage Inc (REIT) 296 0.05
USD 1,690 Federal Realty Investment Trust (REIT) 129 0.02
USD 10,369 Healthpeak Properties Inc (REIT) 283 0.05
USD 14,161 Host Hotels & Resorts Inc (REIT) 153 0.03
USD 11,154 Invitation Homes Inc (REIT) 333 0.06
USD 5,934 Iron Mountain Inc (REIT)^ 167 0.03
USD 10,474 Medical Properties Trust Inc (REIT) 211 0.03
USD 2,372 Mid-America Apartment Communities Inc (REIT) 283 0.05
USD 3,779 National Retail Properties Inc (REIT) 134 0.02
USD 4,478 Omega Healthcare Investors Inc (REIT) 145 0.02
USD 15,692 Prologis Inc (REIT) 1,654 0.27
USD 3,242 Public Storage (REIT) 648 0.11
USD 6,696 Realty Income Corp (REIT) 402 0.07
iSHARES VII PLC
SCHEDULE OF INVESTMENTS (continued)
iSHARES MSCI USA UCITS ETF (continued)As at 31 July 2020
[241 ]
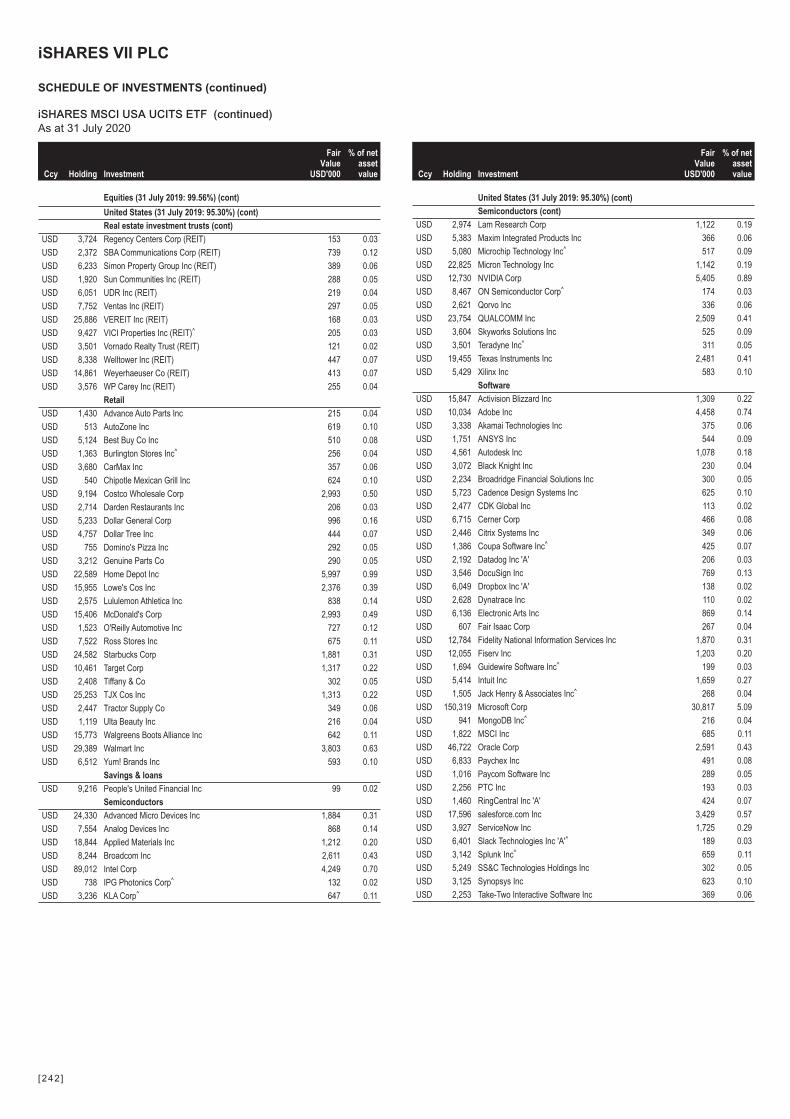
Ccy Holding Investment
FairValue
USD'000
% of netassetvalue
Equities (31 July 2019: 99.56%) (cont)
United States (31 July 2019: 95.30%) (cont)
Real estate investment trusts (cont)
USD 3,724 Regency Centers Corp (REIT) 153 0.03
USD 2,372 SBA Communications Corp (REIT) 739 0.12
USD 6,233 Simon Property Group Inc (REIT) 389 0.06
USD 1,920 Sun Communities Inc (REIT) 288 0.05
USD 6,051 UDR Inc (REIT) 219 0.04
USD 7,752 Ventas Inc (REIT) 297 0.05
USD 25,886 VEREIT Inc (REIT) 168 0.03
USD 9,427 VICI Properties Inc (REIT)^ 205 0.03
USD 3,501 Vornado Realty Trust (REIT) 121 0.02
USD 8,338 Welltower Inc (REIT) 447 0.07
USD 14,861 Weyerhaeuser Co (REIT) 413 0.07
USD 3,576 WP Carey Inc (REIT) 255 0.04
Retail
USD 1,430 Advance Auto Parts Inc 215 0.04
USD 513 AutoZone Inc 619 0.10
USD 5,124 Best Buy Co Inc 510 0.08
USD 1,363 Burlington Stores Inc^ 256 0.04
USD 3,680 CarMax Inc 357 0.06
USD 540 Chipotle Mexican Grill Inc 624 0.10
USD 9,194 Costco Wholesale Corp 2,993 0.50
USD 2,714 Darden Restaurants Inc 206 0.03
USD 5,233 Dollar General Corp 996 0.16
USD 4,757 Dollar Tree Inc 444 0.07
USD 755 Domino's Pizza Inc 292 0.05
USD 3,212 Genuine Parts Co 290 0.05
USD 22,589 Home Depot Inc 5,997 0.99
USD 15,955 Lowe's Cos Inc 2,376 0.39
USD 2,575 Lululemon Athletica Inc 838 0.14
USD 15,406 McDonald's Corp 2,993 0.49
USD 1,523 O'Reilly Automotive Inc 727 0.12
USD 7,522 Ross Stores Inc 675 0.11
USD 24,582 Starbucks Corp 1,881 0.31
USD 10,461 Target Corp 1,317 0.22
USD 2,408 Tiffany & Co 302 0.05
USD 25,253 TJX Cos Inc 1,313 0.22
USD 2,447 Tractor Supply Co 349 0.06
USD 1,119 Ulta Beauty Inc 216 0.04
USD 15,773 Walgreens Boots Alliance Inc 642 0.11
USD 29,389 Walmart Inc 3,803 0.63
USD 6,512 Yum! Brands Inc 593 0.10
Savings & loans
USD 9,216 People's United Financial Inc 99 0.02
Semiconductors
USD 24,330 Advanced Micro Devices Inc 1,884 0.31
USD 7,554 Analog Devices Inc 868 0.14
USD 18,844 Applied Materials Inc 1,212 0.20
USD 8,244 Broadcom Inc 2,611 0.43
USD 89,012 Intel Corp 4,249 0.70
USD 738 IPG Photonics Corp^ 132 0.02
USD 3,236 KLA Corp^ 647 0.11
Ccy Holding Investment
FairValue
USD'000
% of netassetvalue
United States (31 July 2019: 95.30%) (cont)
Semiconductors (cont)
USD 2,974 Lam Research Corp 1,122 0.19
USD 5,383 Maxim Integrated Products Inc 366 0.06
USD 5,080 Microchip Technology Inc^ 517 0.09
USD 22,825 Micron Technology Inc 1,142 0.19
USD 12,730 NVIDIA Corp 5,405 0.89
USD 8,467 ON Semiconductor Corp^ 174 0.03
USD 2,621 Qorvo Inc 336 0.06
USD 23,754 QUALCOMM Inc 2,509 0.41
USD 3,604 Skyworks Solutions Inc 525 0.09
USD 3,501 Teradyne Inc^ 311 0.05
USD 19,455 Texas Instruments Inc 2,481 0.41
USD 5,429 Xilinx Inc 583 0.10
Software
USD 15,847 Activision Blizzard Inc 1,309 0.22
USD 10,034 Adobe Inc 4,458 0.74
USD 3,338 Akamai Technologies Inc 375 0.06
USD 1,751 ANSYS Inc 544 0.09
USD 4,561 Autodesk Inc 1,078 0.18
USD 3,072 Black Knight Inc 230 0.04
USD 2,234 Broadridge Financial Solutions Inc 300 0.05
USD 5,723 Cadence Design Systems Inc 625 0.10
USD 2,477 CDK Global Inc 113 0.02
USD 6,715 Cerner Corp 466 0.08
USD 2,446 Citrix Systems Inc 349 0.06
USD 1,386 Coupa Software Inc^ 425 0.07
USD 2,192 Datadog Inc 'A' 206 0.03
USD 3,546 DocuSign Inc 769 0.13
USD 6,049 Dropbox Inc 'A' 138 0.02
USD 2,628 Dynatrace Inc 110 0.02
USD 6,136 Electronic Arts Inc 869 0.14
USD 607 Fair Isaac Corp 267 0.04
USD 12,784 Fidelity National Information Services Inc 1,870 0.31
USD 12,055 Fiserv Inc 1,203 0.20
USD 1,694 Guidewire Software Inc^ 199 0.03
USD 5,414 Intuit Inc 1,659 0.27
USD 1,505 Jack Henry & Associates Inc^ 268 0.04
USD 150,319 Microsoft Corp 30,817 5.09
USD 941 MongoDB Inc^ 216 0.04
USD 1,822 MSCI Inc 685 0.11
USD 46,722 Oracle Corp 2,591 0.43
USD 6,833 Paychex Inc 491 0.08
USD 1,016 Paycom Software Inc 289 0.05
USD 2,256 PTC Inc 193 0.03
USD 1,460 RingCentral Inc 'A' 424 0.07
USD 17,596 salesforce.com Inc 3,429 0.57
USD 3,927 ServiceNow Inc 1,725 0.29
USD 6,401 Slack Technologies Inc 'A'^ 189 0.03
USD 3,142 Splunk Inc^ 659 0.11
USD 5,249 SS&C Technologies Holdings Inc 302 0.05
USD 3,125 Synopsys Inc 623 0.10
USD 2,253 Take-Two Interactive Software Inc 369 0.06
iSHARES VII PLC
SCHEDULE OF INVESTMENTS (continued)
iSHARES MSCI USA UCITS ETF (continued)As at 31 July 2020
[242 ]
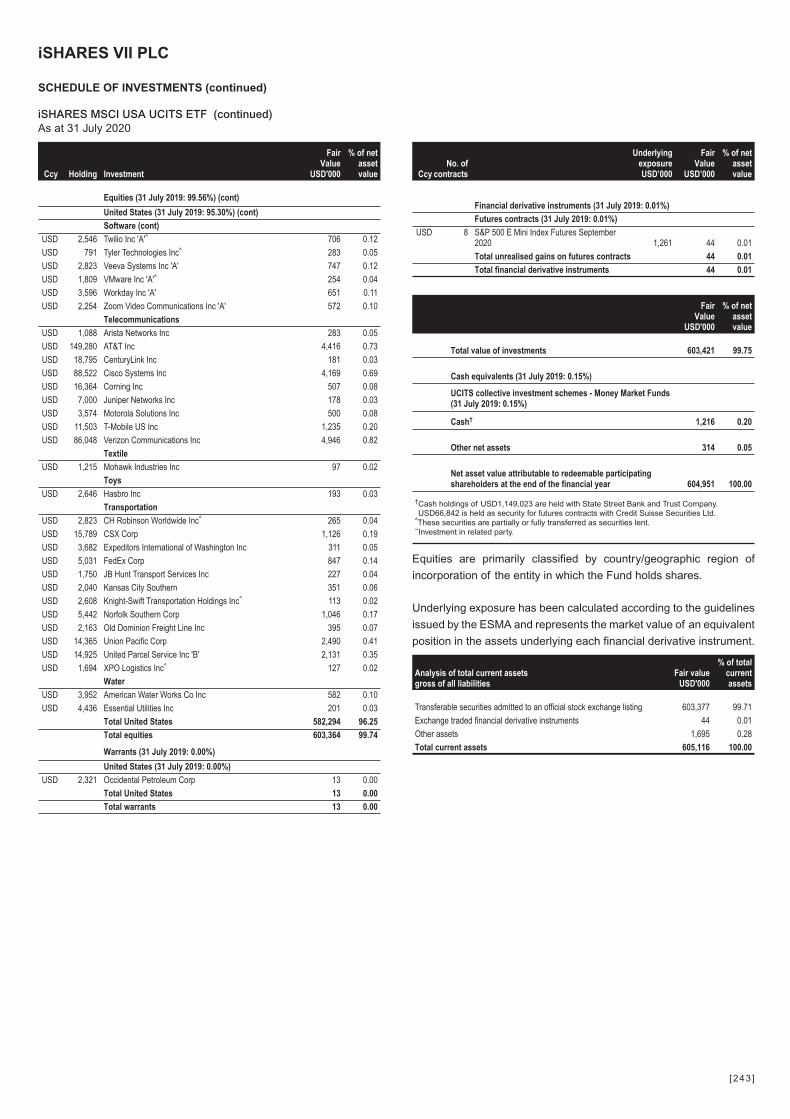
Ccy Holding Investment
FairValue
USD'000
% of netassetvalue
Equities (31 July 2019: 99.56%) (cont)
United States (31 July 2019: 95.30%) (cont)
Software (cont)
USD 2,546 Twilio Inc 'A'^ 706 0.12
USD 791 Tyler Technologies Inc^ 283 0.05
USD 2,823 Veeva Systems Inc 'A' 747 0.12
USD 1,809 VMware Inc 'A'^ 254 0.04
USD 3,596 Workday Inc 'A' 651 0.11
USD 2,254 Zoom Video Communications Inc 'A' 572 0.10
Telecommunications
USD 1,088 Arista Networks Inc 283 0.05
USD 149,280 AT&T Inc 4,416 0.73
USD 18,795 CenturyLink Inc 181 0.03
USD 88,522 Cisco Systems Inc 4,169 0.69
USD 16,364 Corning Inc 507 0.08
USD 7,000 Juniper Networks Inc 178 0.03
USD 3,574 Motorola Solutions Inc 500 0.08
USD 11,503 T-Mobile US Inc 1,235 0.20
USD 86,048 Verizon Communications Inc 4,946 0.82
Textile
USD 1,215 Mohawk Industries Inc 97 0.02
Toys
USD 2,646 Hasbro Inc 193 0.03
Transportation
USD 2,823 CH Robinson Worldwide Inc^ 265 0.04
USD 15,789 CSX Corp 1,126 0.19
USD 3,682 Expeditors International of Washington Inc 311 0.05
USD 5,031 FedEx Corp 847 0.14
USD 1,750 JB Hunt Transport Services Inc 227 0.04
USD 2,040 Kansas City Southern 351 0.06
USD 2,608 Knight-Swift Transportation Holdings Inc^ 113 0.02
USD 5,442 Norfolk Southern Corp 1,046 0.17
USD 2,163 Old Dominion Freight Line Inc 395 0.07
USD 14,365 Union Pacific Corp 2,490 0.41
USD 14,925 United Parcel Service Inc 'B' 2,131 0.35
USD 1,694 XPO Logistics Inc^ 127 0.02
Water
USD 3,952 American Water Works Co Inc 582 0.10
USD 4,436 Essential Utilities Inc 201 0.03
Total United States 582,294 96.25
Total equities 603,364 99.74
Warrants (31 July 2019: 0.00%)
United States (31 July 2019: 0.00%)
USD 2,321 Occidental Petroleum Corp 13 0.00
Total United States 13 0.00
Total warrants 13 0.00
CcyNo. of
contracts
UnderlyingexposureUSD’000
FairValue
USD’000
% of netassetvalue
Financial derivative instruments (31 July 2019: 0.01%)
Futures contracts (31 July 2019: 0.01%)
USD 8 S&P 500 E Mini Index Futures September2020 1,261 44 0.01
Total unrealised gains on futures contracts 44 0.01
Total financial derivative instruments 44 0.01
FairValue
USD'000
% of netassetvalue
Total value of investments 603,421 99.75
Cash equivalents (31 July 2019: 0.15%)
UCITS collective investment schemes - Money Market Funds(31 July 2019: 0.15%)
Cash† 1,216 0.20
Other net assets 314 0.05
Net asset value attributable to redeemable participatingshareholders at the end of the financial year 604,951 100.00
†Cash holdings of USD1,149,023 are held with State Street Bank and Trust Company.USD66,842 is held as security for futures contracts with Credit Suisse Securities Ltd.
^These securities are partially or fully transferred as securities lent.~Investment in related party.
Equities are primarily classified by country/geographic region of
incorporation of the entity in which the Fund holds shares.
Underlying exposure has been calculated according to the guidelines
issued by the ESMA and represents the market value of an equivalent
position in the assets underlying each financial derivative instrument.
Analysis of total current assetsgross of all liabilities
Fair valueUSD'000
% of totalcurrentassets
Transferable securities admitted to an official stock exchange listing 603,377 99.71
Exchange traded financial derivative instruments 44 0.01
Other assets 1,695 0.28
Total current assets 605,116 100.00
iSHARES VII PLC
SCHEDULE OF INVESTMENTS (continued)
iSHARES MSCI USA UCITS ETF (continued)As at 31 July 2020
[243 ]
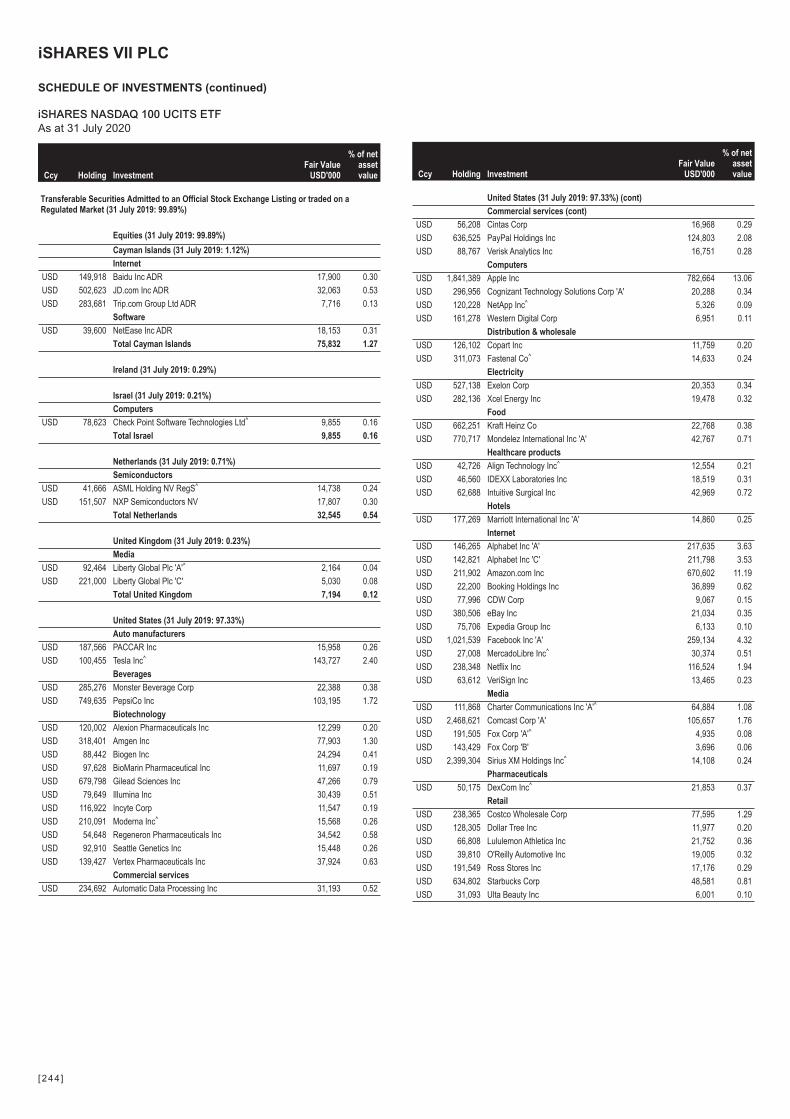
Ccy Holding InvestmentFair Value
USD'000
% of netassetvalue
Transferable Securities Admitted to an Official Stock Exchange Listing or traded on aRegulated Market (31 July 2019: 99.89%)
Equities (31 July 2019: 99.89%)
Cayman Islands (31 July 2019: 1.12%)
Internet
USD 149,918 Baidu Inc ADR 17,900 0.30
USD 502,623 JD.com Inc ADR 32,063 0.53
USD 283,681 Trip.com Group Ltd ADR 7,716 0.13
Software
USD 39,600 NetEase Inc ADR 18,153 0.31
Total Cayman Islands 75,832 1.27
Ireland (31 July 2019: 0.29%)
Israel (31 July 2019: 0.21%)
Computers
USD 78,623 Check Point Software Technologies Ltd^ 9,855 0.16
Total Israel 9,855 0.16
Netherlands (31 July 2019: 0.71%)
Semiconductors
USD 41,666 ASML Holding NV RegS^ 14,738 0.24
USD 151,507 NXP Semiconductors NV 17,807 0.30
Total Netherlands 32,545 0.54
United Kingdom (31 July 2019: 0.23%)
Media
USD 92,464 Liberty Global Plc 'A'^ 2,164 0.04
USD 221,000 Liberty Global Plc 'C' 5,030 0.08
Total United Kingdom 7,194 0.12
United States (31 July 2019: 97.33%)
Auto manufacturers
USD 187,566 PACCAR Inc 15,958 0.26
USD 100,455 Tesla Inc^ 143,727 2.40
Beverages
USD 285,276 Monster Beverage Corp 22,388 0.38
USD 749,635 PepsiCo Inc 103,195 1.72
Biotechnology
USD 120,002 Alexion Pharmaceuticals Inc 12,299 0.20
USD 318,401 Amgen Inc 77,903 1.30
USD 88,442 Biogen Inc 24,294 0.41
USD 97,628 BioMarin Pharmaceutical Inc 11,697 0.19
USD 679,798 Gilead Sciences Inc 47,266 0.79
USD 79,649 Illumina Inc 30,439 0.51
USD 116,922 Incyte Corp 11,547 0.19
USD 210,091 Moderna Inc^ 15,568 0.26
USD 54,648 Regeneron Pharmaceuticals Inc 34,542 0.58
USD 92,910 Seattle Genetics Inc 15,448 0.26
USD 139,427 Vertex Pharmaceuticals Inc 37,924 0.63
Commercial services
USD 234,692 Automatic Data Processing Inc 31,193 0.52
Ccy Holding InvestmentFair Value
USD'000
% of netassetvalue
United States (31 July 2019: 97.33%) (cont)
Commercial services (cont)
USD 56,208 Cintas Corp 16,968 0.29
USD 636,525 PayPal Holdings Inc 124,803 2.08
USD 88,767 Verisk Analytics Inc 16,751 0.28
Computers
USD 1,841,389 Apple Inc 782,664 13.06
USD 296,956 Cognizant Technology Solutions Corp 'A' 20,288 0.34
USD 120,228 NetApp Inc^ 5,326 0.09
USD 161,278 Western Digital Corp 6,951 0.11
Distribution & wholesale
USD 126,102 Copart Inc 11,759 0.20
USD 311,073 Fastenal Co^ 14,633 0.24
Electricity
USD 527,138 Exelon Corp 20,353 0.34
USD 282,136 Xcel Energy Inc 19,478 0.32
Food
USD 662,251 Kraft Heinz Co 22,768 0.38
USD 770,717 Mondelez International Inc 'A' 42,767 0.71
Healthcare products
USD 42,726 Align Technology Inc^ 12,554 0.21
USD 46,560 IDEXX Laboratories Inc 18,519 0.31
USD 62,688 Intuitive Surgical Inc 42,969 0.72
Hotels
USD 177,269 Marriott International Inc 'A' 14,860 0.25
Internet
USD 146,265 Alphabet Inc 'A' 217,635 3.63
USD 142,821 Alphabet Inc 'C' 211,798 3.53
USD 211,902 Amazon.com Inc 670,602 11.19
USD 22,200 Booking Holdings Inc 36,899 0.62
USD 77,996 CDW Corp 9,067 0.15
USD 380,506 eBay Inc 21,034 0.35
USD 75,706 Expedia Group Inc 6,133 0.10
USD 1,021,539 Facebook Inc 'A' 259,134 4.32
USD 27,008 MercadoLibre Inc^ 30,374 0.51
USD 238,348 Netflix Inc 116,524 1.94
USD 63,612 VeriSign Inc 13,465 0.23
Media
USD 111,868 Charter Communications Inc 'A'^ 64,884 1.08
USD 2,468,621 Comcast Corp 'A' 105,657 1.76
USD 191,505 Fox Corp 'A'^ 4,935 0.08
USD 143,429 Fox Corp 'B' 3,696 0.06
USD 2,399,304 Sirius XM Holdings Inc^ 14,108 0.24
Pharmaceuticals
USD 50,175 DexCom Inc^ 21,853 0.37
Retail
USD 238,365 Costco Wholesale Corp 77,595 1.29
USD 128,305 Dollar Tree Inc 11,977 0.20
USD 66,808 Lululemon Athletica Inc 21,752 0.36
USD 39,810 O'Reilly Automotive Inc 19,005 0.32
USD 191,549 Ross Stores Inc 17,176 0.29
USD 634,802 Starbucks Corp 48,581 0.81
USD 31,093 Ulta Beauty Inc 6,001 0.10
iSHARES VII PLC
SCHEDULE OF INVESTMENTS (continued)
iSHARES NASDAQ 100 UCITS ETFAs at 31 July 2020
[244 ]

Ccy Holding InvestmentFair Value
USD'000
% of netassetvalue
Equities (31 July 2019: 99.89%) (cont)
United States (31 July 2019: 97.33%) (cont)
Retail (cont)
USD 473,616 Walgreens Boots Alliance Inc 19,281 0.32
Semiconductors
USD 635,547 Advanced Micro Devices Inc 49,210 0.82
USD 199,606 Analog Devices Inc 22,925 0.38
USD 501,015 Applied Materials Inc 32,230 0.54
USD 216,668 Broadcom Inc 68,630 1.14
USD 2,294,523 Intel Corp 109,518 1.83
USD 83,357 KLA Corp^ 16,657 0.28
USD 78,687 Lam Research Corp 29,678 0.49
USD 146,871 Maxim Integrated Products Inc 10,000 0.17
USD 133,810 Microchip Technology Inc^ 13,613 0.23
USD 600,305 Micron Technology Inc 30,048 0.50
USD 333,285 NVIDIA Corp 141,509 2.36
USD 609,633 QUALCOMM Inc 64,383 1.07
USD 92,508 Skyworks Solutions Inc 13,467 0.22
USD 497,371 Texas Instruments Inc 63,440 1.06
USD 131,771 Xilinx Inc 14,146 0.24
Software
USD 416,641 Activision Blizzard Inc 34,427 0.57
USD 261,376 Adobe Inc 116,135 1.94
USD 45,610 ANSYS Inc 14,166 0.24
Ccy Holding InvestmentFair Value
USD'000
% of netassetvalue
United States (31 July 2019: 97.33%) (cont)
Software (cont)
USD 119,104 Autodesk Inc 28,160 0.47
USD 152,153 Cadence Design Systems Inc 16,623 0.28
USD 164,005 Cerner Corp 11,390 0.19
USD 66,140 Citrix Systems Inc 9,442 0.16
USD 99,229 DocuSign Inc 21,516 0.36
USD 158,352 Electronic Arts Inc 22,426 0.37
USD 362,816 Fiserv Inc 36,205 0.60
USD 141,112 Intuit Inc 43,233 0.72
USD 3,222,803 Microsoft Corp 660,707 11.02
USD 194,216 Paychex Inc 13,968 0.23
USD 84,383 Splunk Inc^ 17,705 0.30
USD 81,516 Synopsys Inc 16,240 0.27
USD 61,475 Take-Two Interactive Software Inc 10,083 0.17
USD 94,286 Workday Inc 'A'^ 17,058 0.28
USD 89,659 Zoom Video Communications Inc 'A'^ 22,765 0.38
Telecommunications
USD 2,292,184 Cisco Systems Inc 107,962 1.80
USD 669,973 T-Mobile US Inc 71,942 1.20
Transportation
USD 416,237 CSX Corp 29,694 0.50
Total United States 5,860,266 97.76
Total equities 5,985,692 99.85
CurrencyAmount
Purchased CurrencyAmount
SoldUnderlying
Exposure (USD)Maturity
date
Unrealisedgain/(loss)
USD'000
% of netassetvalue
Financial derivative instruments (31 July 2019: (0.00)%)
Forward currency contractsØ (31 July 2019: (0.00)%)
EUR 88,260,264 USD 99,686,186 104,367,757 04/08/2020 4,682 0.08
Total unrealised gains on forward currency contracts 4,682 0.08
CcyNo. of
contracts
UnderlyingexposureUSD’000
FairValue
USD’000
% of netassetvalue
Futures contracts (31 July 2019: 0.00%)
USD 13 NASDAQ 100 E Mini Index FutureSeptember 2020 2,630 201 0.00
Total unrealised gains on futures contracts 201 0.00
Total financial derivative instruments 4,883 0.08
Fair ValueUSD'000
% of netassetvalue
Total value of investments 5,990,575 99.93
Cash† 4,922 0.08
Other net liabilities (859) (0.01)
Net asset value attributable to redeemable participatingshareholders at the end of the financial year 5,994,638 100.00
†Cash holdings of USD4,848,781 are held with State Street Bank and Trust Company.USD72,900 is held as security for futures contracts with Credit Suisse Securities Ltd.
^These securities are partially or fully transferred as securities lent.ØThe counterparty for forward currency contracts is State Street Bank and Trust Company. All
forward relate to the EUR Hedged (Acc) Class.
Equities are primarily classified by country/geographic region of
incorporation of the entity in which the Fund holds shares.
iSHARES VII PLC
SCHEDULE OF INVESTMENTS (continued)
iSHARES NASDAQ 100 UCITS ETF (continued)As at 31 July 2020
[245 ]
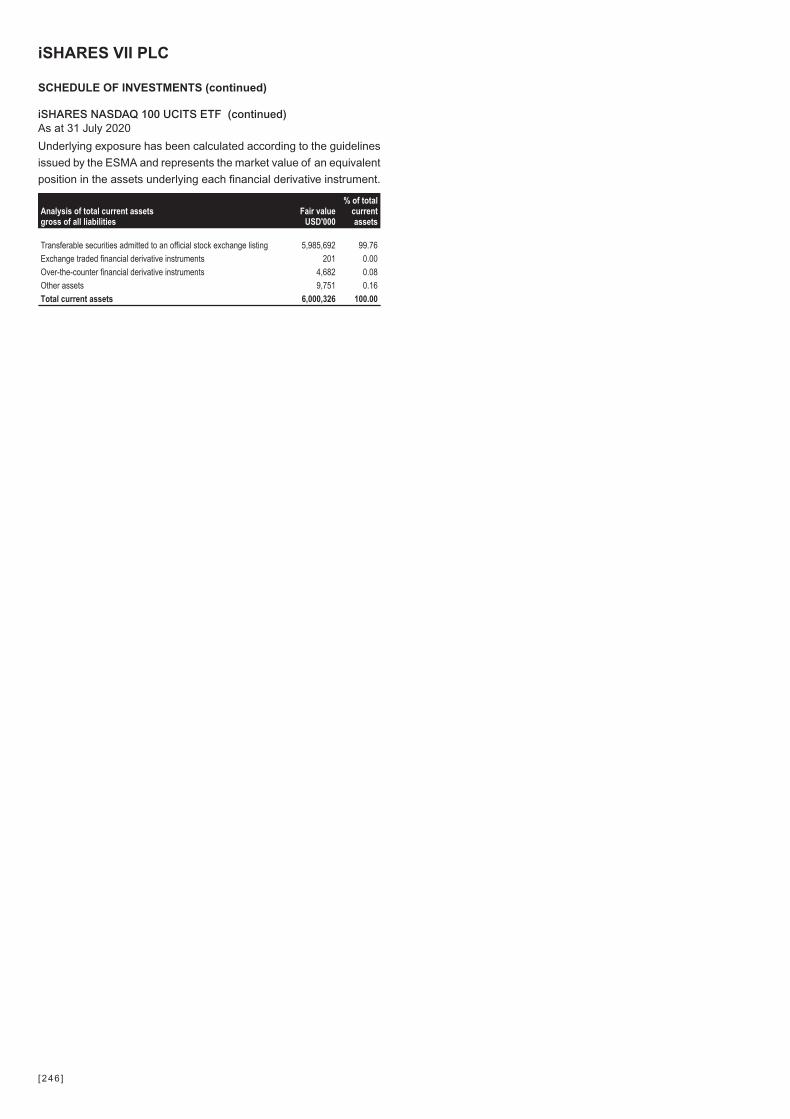
Underlying exposure has been calculated according to the guidelines
issued by the ESMA and represents the market value of an equivalent
position in the assets underlying each financial derivative instrument.
Analysis of total current assetsgross of all liabilities
Fair valueUSD'000
% of totalcurrentassets
Transferable securities admitted to an official stock exchange listing 5,985,692 99.76
Exchange traded financial derivative instruments 201 0.00
Over-the-counter financial derivative instruments 4,682 0.08
Other assets 9,751 0.16
Total current assets 6,000,326 100.00
iSHARES VII PLC
SCHEDULE OF INVESTMENTS (continued)
iSHARES NASDAQ 100 UCITS ETF (continued)As at 31 July 2020
[246 ]
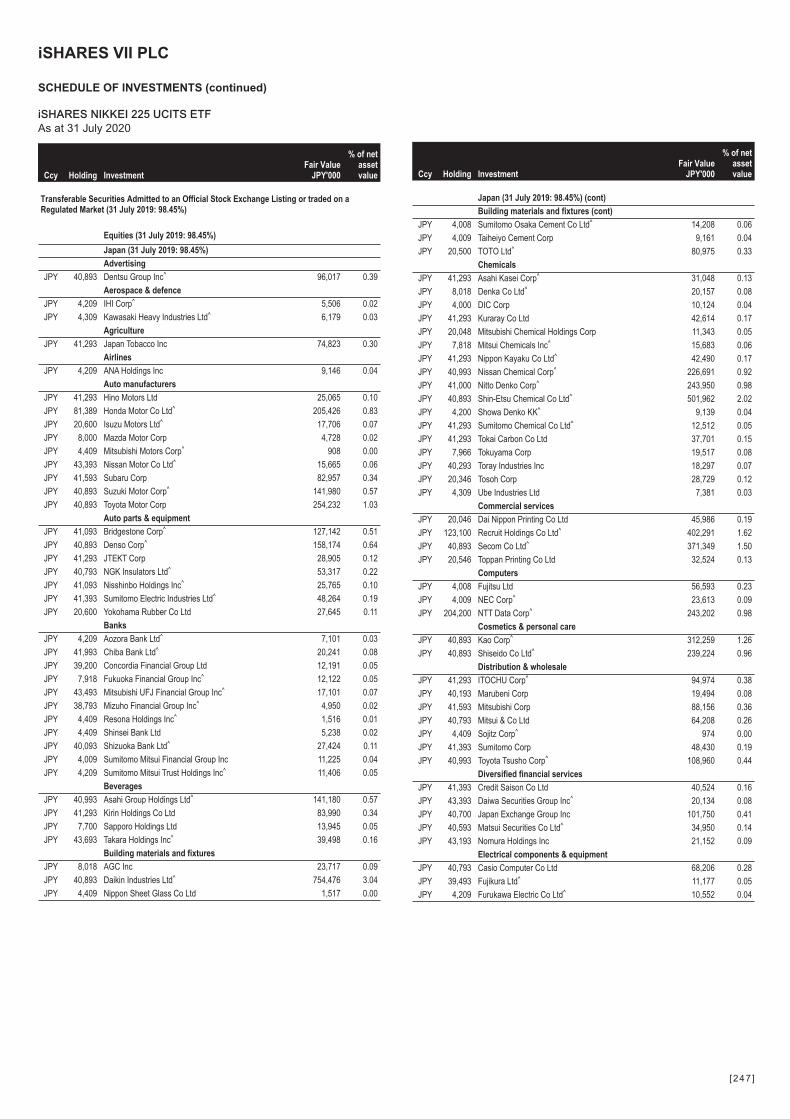
Ccy Holding InvestmentFair Value
JPY'000
% of netassetvalue
Transferable Securities Admitted to an Official Stock Exchange Listing or traded on aRegulated Market (31 July 2019: 98.45%)
Equities (31 July 2019: 98.45%)
Japan (31 July 2019: 98.45%)
Advertising
JPY 40,893 Dentsu Group Inc^ 96,017 0.39
Aerospace & defence
JPY 4,209 IHI Corp^ 5,506 0.02
JPY 4,309 Kawasaki Heavy Industries Ltd^ 6,179 0.03
Agriculture
JPY 41,293 Japan Tobacco Inc 74,823 0.30
Airlines
JPY 4,209 ANA Holdings Inc 9,146 0.04
Auto manufacturers
JPY 41,293 Hino Motors Ltd 25,065 0.10
JPY 81,389 Honda Motor Co Ltd^ 205,426 0.83
JPY 20,600 Isuzu Motors Ltd^ 17,706 0.07
JPY 8,000 Mazda Motor Corp 4,728 0.02
JPY 4,409 Mitsubishi Motors Corp^ 908 0.00
JPY 43,393 Nissan Motor Co Ltd^ 15,665 0.06
JPY 41,593 Subaru Corp 82,957 0.34
JPY 40,893 Suzuki Motor Corp^ 141,980 0.57
JPY 40,893 Toyota Motor Corp 254,232 1.03
Auto parts & equipment
JPY 41,093 Bridgestone Corp^ 127,142 0.51
JPY 40,893 Denso Corp^ 158,174 0.64
JPY 41,293 JTEKT Corp 28,905 0.12
JPY 40,793 NGK Insulators Ltd^ 53,317 0.22
JPY 41,093 Nisshinbo Holdings Inc^ 25,765 0.10
JPY 41,393 Sumitomo Electric Industries Ltd^ 48,264 0.19
JPY 20,600 Yokohama Rubber Co Ltd 27,645 0.11
Banks
JPY 4,209 Aozora Bank Ltd^ 7,101 0.03
JPY 41,993 Chiba Bank Ltd^ 20,241 0.08
JPY 39,200 Concordia Financial Group Ltd 12,191 0.05
JPY 7,918 Fukuoka Financial Group Inc^ 12,122 0.05
JPY 43,493 Mitsubishi UFJ Financial Group Inc^ 17,101 0.07
JPY 38,793 Mizuho Financial Group Inc^ 4,950 0.02
JPY 4,409 Resona Holdings Inc^ 1,516 0.01
JPY 4,409 Shinsei Bank Ltd 5,238 0.02
JPY 40,093 Shizuoka Bank Ltd^ 27,424 0.11
JPY 4,009 Sumitomo Mitsui Financial Group Inc 11,225 0.04
JPY 4,209 Sumitomo Mitsui Trust Holdings Inc^ 11,406 0.05
Beverages
JPY 40,993 Asahi Group Holdings Ltd^ 141,180 0.57
JPY 41,293 Kirin Holdings Co Ltd 83,990 0.34
JPY 7,700 Sapporo Holdings Ltd 13,945 0.05
JPY 43,693 Takara Holdings Inc^ 39,498 0.16
Building materials and fixtures
JPY 8,018 AGC Inc 23,717 0.09
JPY 40,893 Daikin Industries Ltd^ 754,476 3.04
JPY 4,409 Nippon Sheet Glass Co Ltd 1,517 0.00
Ccy Holding InvestmentFair Value
JPY'000
% of netassetvalue
Japan (31 July 2019: 98.45%) (cont)
Building materials and fixtures (cont)
JPY 4,008 Sumitomo Osaka Cement Co Ltd^ 14,208 0.06
JPY 4,009 Taiheiyo Cement Corp 9,161 0.04
JPY 20,500 TOTO Ltd^ 80,975 0.33
Chemicals
JPY 41,293 Asahi Kasei Corp^ 31,048 0.13
JPY 8,018 Denka Co Ltd^ 20,157 0.08
JPY 4,000 DIC Corp 10,124 0.04
JPY 41,293 Kuraray Co Ltd 42,614 0.17
JPY 20,048 Mitsubishi Chemical Holdings Corp 11,343 0.05
JPY 7,818 Mitsui Chemicals Inc^ 15,683 0.06
JPY 41,293 Nippon Kayaku Co Ltd^ 42,490 0.17
JPY 40,993 Nissan Chemical Corp^ 226,691 0.92
JPY 41,000 Nitto Denko Corp^ 243,950 0.98
JPY 40,893 Shin-Etsu Chemical Co Ltd^ 501,962 2.02
JPY 4,200 Showa Denko KK^ 9,139 0.04
JPY 41,293 Sumitomo Chemical Co Ltd^ 12,512 0.05
JPY 41,293 Tokai Carbon Co Ltd 37,701 0.15
JPY 7,966 Tokuyama Corp 19,517 0.08
JPY 40,293 Toray Industries Inc 18,297 0.07
JPY 20,346 Tosoh Corp 28,729 0.12
JPY 4,309 Ube Industries Ltd 7,381 0.03
Commercial services
JPY 20,046 Dai Nippon Printing Co Ltd 45,986 0.19
JPY 123,100 Recruit Holdings Co Ltd^ 402,291 1.62
JPY 40,893 Secom Co Ltd^ 371,349 1.50
JPY 20,546 Toppan Printing Co Ltd 32,524 0.13
Computers
JPY 4,008 Fujitsu Ltd 56,593 0.23
JPY 4,009 NEC Corp^ 23,613 0.09
JPY 204,200 NTT Data Corp^ 243,202 0.98
Cosmetics & personal care
JPY 40,893 Kao Corp^ 312,259 1.26
JPY 40,893 Shiseido Co Ltd^ 239,224 0.96
Distribution & wholesale
JPY 41,293 ITOCHU Corp^ 94,974 0.38
JPY 40,193 Marubeni Corp 19,494 0.08
JPY 41,593 Mitsubishi Corp 88,156 0.36
JPY 40,793 Mitsui & Co Ltd 64,208 0.26
JPY 4,409 Sojitz Corp^ 974 0.00
JPY 41,393 Sumitomo Corp 48,430 0.19
JPY 40,993 Toyota Tsusho Corp^ 108,960 0.44
Diversified financial services
JPY 41,393 Credit Saison Co Ltd 40,524 0.16
JPY 43,393 Daiwa Securities Group Inc^ 20,134 0.08
JPY 40,700 Japan Exchange Group Inc 101,750 0.41
JPY 40,593 Matsui Securities Co Ltd^ 34,950 0.14
JPY 43,193 Nomura Holdings Inc 21,152 0.09
Electrical components & equipment
JPY 40,793 Casio Computer Co Ltd 68,206 0.28
JPY 39,493 Fujikura Ltd^ 11,177 0.05
JPY 4,209 Furukawa Electric Co Ltd^ 10,552 0.04
iSHARES VII PLC
SCHEDULE OF INVESTMENTS (continued)
iSHARES NIKKEI 225 UCITS ETFAs at 31 July 2020
[247 ]
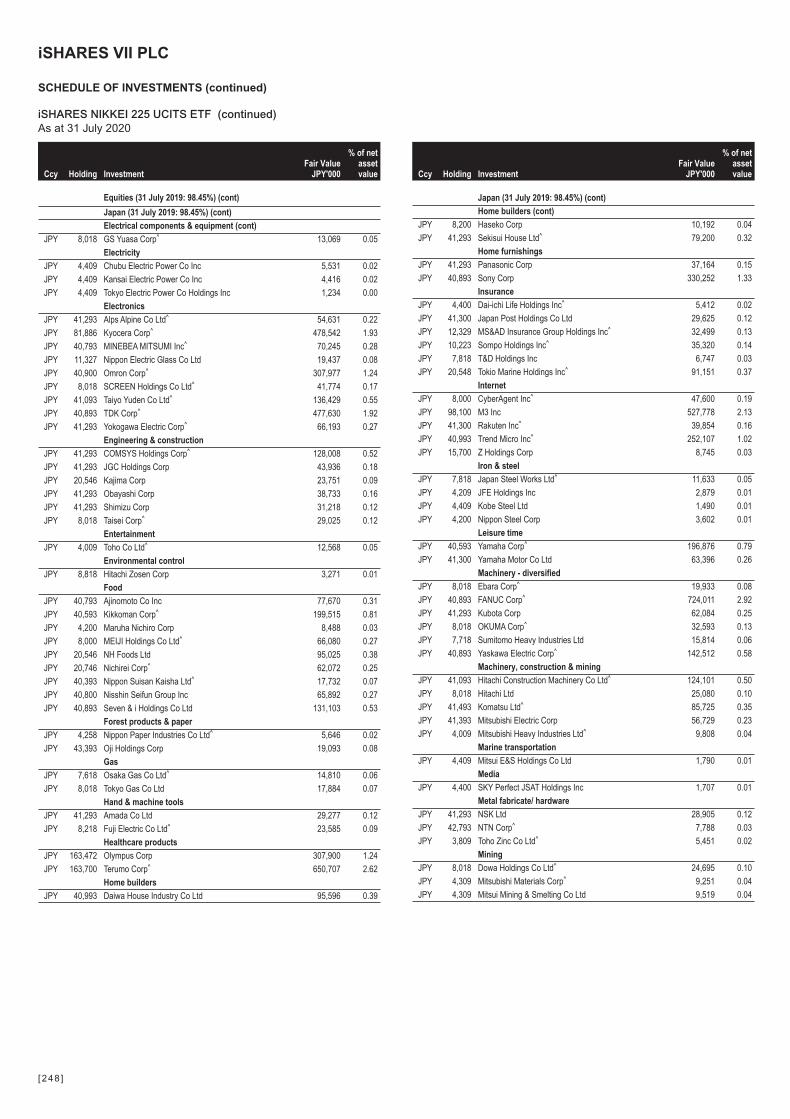
Ccy Holding InvestmentFair Value
JPY'000
% of netassetvalue
Equities (31 July 2019: 98.45%) (cont)
Japan (31 July 2019: 98.45%) (cont)
Electrical components & equipment (cont)
JPY 8,018 GS Yuasa Corp^ 13,069 0.05
Electricity
JPY 4,409 Chubu Electric Power Co Inc 5,531 0.02
JPY 4,409 Kansai Electric Power Co Inc 4,416 0.02
JPY 4,409 Tokyo Electric Power Co Holdings Inc 1,234 0.00
Electronics
JPY 41,293 Alps Alpine Co Ltd^ 54,631 0.22
JPY 81,886 Kyocera Corp^ 478,542 1.93
JPY 40,793 MINEBEA MITSUMI Inc^ 70,245 0.28
JPY 11,327 Nippon Electric Glass Co Ltd 19,437 0.08
JPY 40,900 Omron Corp^ 307,977 1.24
JPY 8,018 SCREEN Holdings Co Ltd^ 41,774 0.17
JPY 41,093 Taiyo Yuden Co Ltd^ 136,429 0.55
JPY 40,893 TDK Corp^ 477,630 1.92
JPY 41,293 Yokogawa Electric Corp^ 66,193 0.27
Engineering & construction
JPY 41,293 COMSYS Holdings Corp^ 128,008 0.52
JPY 41,293 JGC Holdings Corp 43,936 0.18
JPY 20,546 Kajima Corp 23,751 0.09
JPY 41,293 Obayashi Corp 38,733 0.16
JPY 41,293 Shimizu Corp 31,218 0.12
JPY 8,018 Taisei Corp^ 29,025 0.12
Entertainment
JPY 4,009 Toho Co Ltd^ 12,568 0.05
Environmental control
JPY 8,818 Hitachi Zosen Corp 3,271 0.01
Food
JPY 40,793 Ajinomoto Co Inc 77,670 0.31
JPY 40,593 Kikkoman Corp^ 199,515 0.81
JPY 4,200 Maruha Nichiro Corp 8,488 0.03
JPY 8,000 MEIJI Holdings Co Ltd^ 66,080 0.27
JPY 20,546 NH Foods Ltd 95,025 0.38
JPY 20,746 Nichirei Corp^ 62,072 0.25
JPY 40,393 Nippon Suisan Kaisha Ltd^ 17,732 0.07
JPY 40,800 Nisshin Seifun Group Inc 65,892 0.27
JPY 40,893 Seven & i Holdings Co Ltd 131,103 0.53
Forest products & paper
JPY 4,258 Nippon Paper Industries Co Ltd^ 5,646 0.02
JPY 43,393 Oji Holdings Corp 19,093 0.08
Gas
JPY 7,618 Osaka Gas Co Ltd^ 14,810 0.06
JPY 8,018 Tokyo Gas Co Ltd 17,884 0.07
Hand & machine tools
JPY 41,293 Amada Co Ltd 29,277 0.12
JPY 8,218 Fuji Electric Co Ltd^ 23,585 0.09
Healthcare products
JPY 163,472 Olympus Corp 307,900 1.24
JPY 163,700 Terumo Corp^ 650,707 2.62
Home builders
JPY 40,993 Daiwa House Industry Co Ltd 95,596 0.39
Ccy Holding InvestmentFair Value
JPY'000
% of netassetvalue
Japan (31 July 2019: 98.45%) (cont)
Home builders (cont)
JPY 8,200 Haseko Corp 10,192 0.04
JPY 41,293 Sekisui House Ltd^ 79,200 0.32
Home furnishings
JPY 41,293 Panasonic Corp 37,164 0.15
JPY 40,893 Sony Corp 330,252 1.33
Insurance
JPY 4,400 Dai-ichi Life Holdings Inc^ 5,412 0.02
JPY 41,300 Japan Post Holdings Co Ltd 29,625 0.12
JPY 12,329 MS&AD Insurance Group Holdings Inc^ 32,499 0.13
JPY 10,223 Sompo Holdings Inc^ 35,320 0.14
JPY 7,818 T&D Holdings Inc 6,747 0.03
JPY 20,548 Tokio Marine Holdings Inc^ 91,151 0.37
Internet
JPY 8,000 CyberAgent Inc^ 47,600 0.19
JPY 98,100 M3 Inc 527,778 2.13
JPY 41,300 Rakuten Inc^ 39,854 0.16
JPY 40,993 Trend Micro Inc^ 252,107 1.02
JPY 15,700 Z Holdings Corp 8,745 0.03
Iron & steel
JPY 7,818 Japan Steel Works Ltd^ 11,633 0.05
JPY 4,209 JFE Holdings Inc 2,879 0.01
JPY 4,409 Kobe Steel Ltd 1,490 0.01
JPY 4,200 Nippon Steel Corp 3,602 0.01
Leisure time
JPY 40,593 Yamaha Corp^ 196,876 0.79
JPY 41,300 Yamaha Motor Co Ltd 63,396 0.26
Machinery - diversified
JPY 8,018 Ebara Corp^ 19,933 0.08
JPY 40,893 FANUC Corp^ 724,011 2.92
JPY 41,293 Kubota Corp 62,084 0.25
JPY 8,018 OKUMA Corp^ 32,593 0.13
JPY 7,718 Sumitomo Heavy Industries Ltd 15,814 0.06
JPY 40,893 Yaskawa Electric Corp^ 142,512 0.58
Machinery, construction & mining
JPY 41,093 Hitachi Construction Machinery Co Ltd^ 124,101 0.50
JPY 8,018 Hitachi Ltd 25,080 0.10
JPY 41,493 Komatsu Ltd^ 85,725 0.35
JPY 41,393 Mitsubishi Electric Corp 56,729 0.23
JPY 4,009 Mitsubishi Heavy Industries Ltd^ 9,808 0.04
Marine transportation
JPY 4,409 Mitsui E&S Holdings Co Ltd 1,790 0.01
Media
JPY 4,400 SKY Perfect JSAT Holdings Inc 1,707 0.01
Metal fabricate/ hardware
JPY 41,293 NSK Ltd 28,905 0.12
JPY 42,793 NTN Corp^ 7,788 0.03
JPY 3,809 Toho Zinc Co Ltd^ 5,451 0.02
Mining
JPY 8,018 Dowa Holdings Co Ltd^ 24,695 0.10
JPY 4,309 Mitsubishi Materials Corp^ 9,251 0.04
JPY 4,309 Mitsui Mining & Smelting Co Ltd 9,519 0.04
iSHARES VII PLC
SCHEDULE OF INVESTMENTS (continued)
iSHARES NIKKEI 225 UCITS ETF (continued)As at 31 July 2020
[248 ]
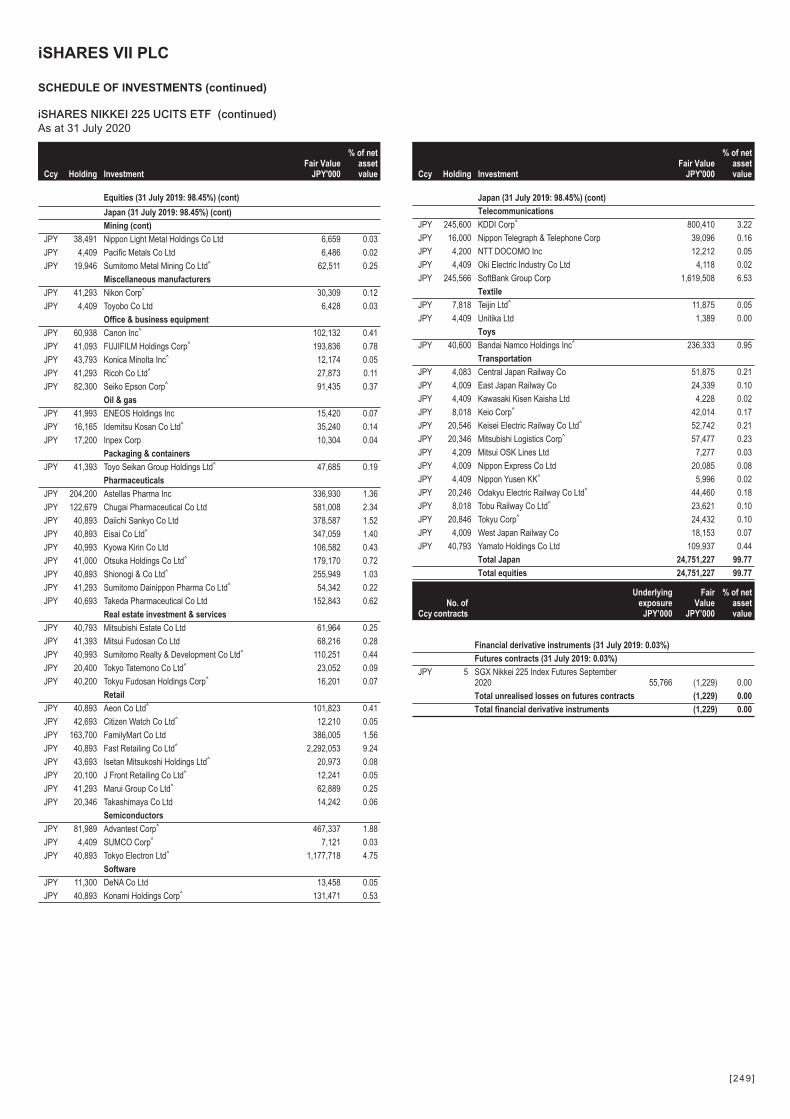
Ccy Holding InvestmentFair Value
JPY'000
% of netassetvalue
Equities (31 July 2019: 98.45%) (cont)
Japan (31 July 2019: 98.45%) (cont)
Mining (cont)
JPY 38,491 Nippon Light Metal Holdings Co Ltd 6,659 0.03
JPY 4,409 Pacific Metals Co Ltd 6,486 0.02
JPY 19,946 Sumitomo Metal Mining Co Ltd^ 62,511 0.25
Miscellaneous manufacturers
JPY 41,293 Nikon Corp^ 30,309 0.12
JPY 4,409 Toyobo Co Ltd 6,428 0.03
Office & business equipment
JPY 60,938 Canon Inc^ 102,132 0.41
JPY 41,093 FUJIFILM Holdings Corp^ 193,836 0.78
JPY 43,793 Konica Minolta Inc^ 12,174 0.05
JPY 41,293 Ricoh Co Ltd^ 27,873 0.11
JPY 82,300 Seiko Epson Corp^ 91,435 0.37
Oil & gas
JPY 41,993 ENEOS Holdings Inc 15,420 0.07
JPY 16,165 Idemitsu Kosan Co Ltd^ 35,240 0.14
JPY 17,200 Inpex Corp 10,304 0.04
Packaging & containers
JPY 41,393 Toyo Seikan Group Holdings Ltd^ 47,685 0.19
Pharmaceuticals
JPY 204,200 Astellas Pharma Inc 336,930 1.36
JPY 122,679 Chugai Pharmaceutical Co Ltd 581,008 2.34
JPY 40,893 Daiichi Sankyo Co Ltd 378,587 1.52
JPY 40,893 Eisai Co Ltd^ 347,059 1.40
JPY 40,993 Kyowa Kirin Co Ltd 106,582 0.43
JPY 41,000 Otsuka Holdings Co Ltd^ 179,170 0.72
JPY 40,893 Shionogi & Co Ltd^ 255,949 1.03
JPY 41,293 Sumitomo Dainippon Pharma Co Ltd^ 54,342 0.22
JPY 40,693 Takeda Pharmaceutical Co Ltd 152,843 0.62
Real estate investment & services
JPY 40,793 Mitsubishi Estate Co Ltd 61,964 0.25
JPY 41,393 Mitsui Fudosan Co Ltd 68,216 0.28
JPY 40,993 Sumitomo Realty & Development Co Ltd^ 110,251 0.44
JPY 20,400 Tokyo Tatemono Co Ltd^ 23,052 0.09
JPY 40,200 Tokyu Fudosan Holdings Corp^ 16,201 0.07
Retail
JPY 40,893 Aeon Co Ltd^ 101,823 0.41
JPY 42,693 Citizen Watch Co Ltd^ 12,210 0.05
JPY 163,700 FamilyMart Co Ltd 386,005 1.56
JPY 40,893 Fast Retailing Co Ltd^ 2,292,053 9.24
JPY 43,693 Isetan Mitsukoshi Holdings Ltd^ 20,973 0.08
JPY 20,100 J Front Retailing Co Ltd^ 12,241 0.05
JPY 41,293 Marui Group Co Ltd^ 62,889 0.25
JPY 20,346 Takashimaya Co Ltd 14,242 0.06
Semiconductors
JPY 81,989 Advantest Corp^ 467,337 1.88
JPY 4,409 SUMCO Corp^ 7,121 0.03
JPY 40,893 Tokyo Electron Ltd^ 1,177,718 4.75
Software
JPY 11,300 DeNA Co Ltd 13,458 0.05
JPY 40,893 Konami Holdings Corp^ 131,471 0.53
Ccy Holding InvestmentFair Value
JPY'000
% of netassetvalue
Japan (31 July 2019: 98.45%) (cont)
Telecommunications
JPY 245,600 KDDI Corp^ 800,410 3.22
JPY 16,000 Nippon Telegraph & Telephone Corp 39,096 0.16
JPY 4,200 NTT DOCOMO Inc 12,212 0.05
JPY 4,409 Oki Electric Industry Co Ltd 4,118 0.02
JPY 245,566 SoftBank Group Corp 1,619,508 6.53
Textile
JPY 7,818 Teijin Ltd^ 11,875 0.05
JPY 4,409 Unitika Ltd 1,389 0.00
Toys
JPY 40,600 Bandai Namco Holdings Inc^ 236,333 0.95
Transportation
JPY 4,083 Central Japan Railway Co 51,875 0.21
JPY 4,009 East Japan Railway Co 24,339 0.10
JPY 4,409 Kawasaki Kisen Kaisha Ltd 4,228 0.02
JPY 8,018 Keio Corp^ 42,014 0.17
JPY 20,546 Keisei Electric Railway Co Ltd^ 52,742 0.21
JPY 20,346 Mitsubishi Logistics Corp^ 57,477 0.23
JPY 4,209 Mitsui OSK Lines Ltd 7,277 0.03
JPY 4,009 Nippon Express Co Ltd 20,085 0.08
JPY 4,409 Nippon Yusen KK^ 5,996 0.02
JPY 20,246 Odakyu Electric Railway Co Ltd^ 44,460 0.18
JPY 8,018 Tobu Railway Co Ltd^ 23,621 0.10
JPY 20,846 Tokyu Corp^ 24,432 0.10
JPY 4,009 West Japan Railway Co 18,153 0.07
JPY 40,793 Yamato Holdings Co Ltd 109,937 0.44
Total Japan 24,751,227 99.77
Total equities 24,751,227 99.77
CcyNo. of
contracts
Underlyingexposure
JPY’000
FairValue
JPY’000
% of netassetvalue
Financial derivative instruments (31 July 2019: 0.03%)
Futures contracts (31 July 2019: 0.03%)
JPY 5 SGX Nikkei 225 Index Futures September2020 55,766 (1,229) 0.00
Total unrealised losses on futures contracts (1,229) 0.00
Total financial derivative instruments (1,229) 0.00
iSHARES VII PLC
SCHEDULE OF INVESTMENTS (continued)
iSHARES NIKKEI 225 UCITS ETF (continued)As at 31 July 2020
[249 ]
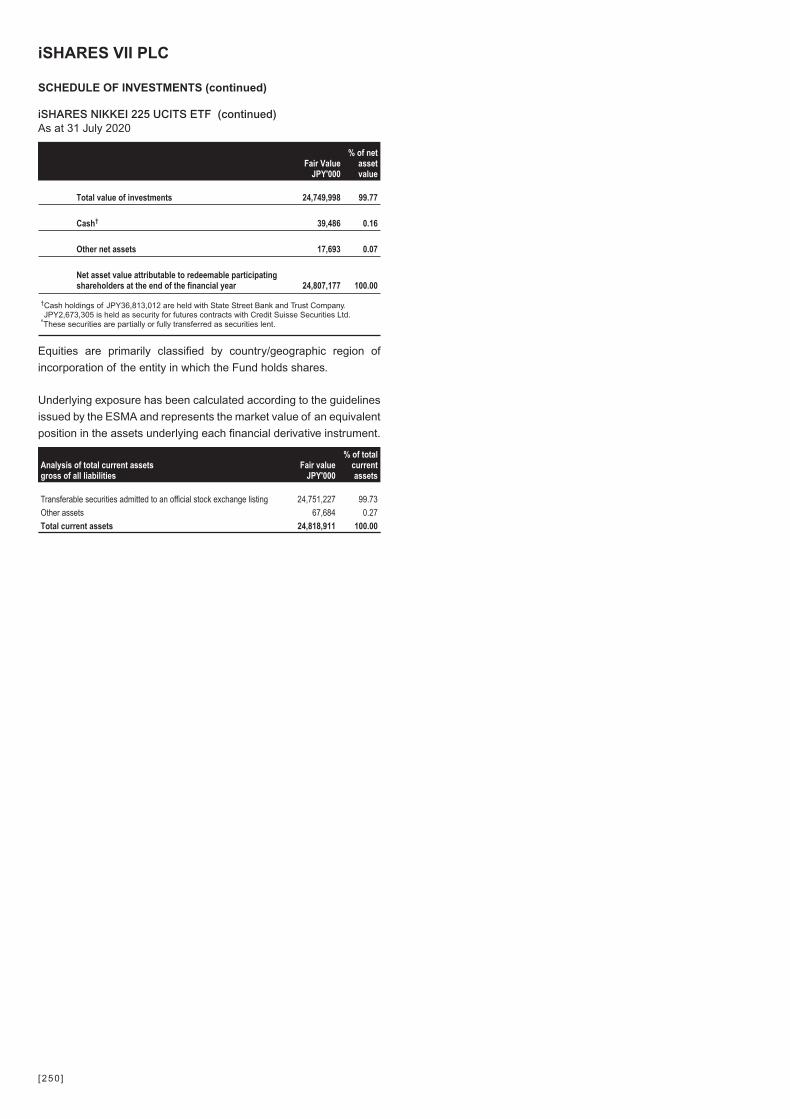
Fair ValueJPY'000
% of netassetvalue
Total value of investments 24,749,998 99.77
Cash† 39,486 0.16
Other net assets 17,693 0.07
Net asset value attributable to redeemable participatingshareholders at the end of the financial year 24,807,177 100.00
†Cash holdings of JPY36,813,012 are held with State Street Bank and Trust Company.JPY2,673,305 is held as security for futures contracts with Credit Suisse Securities Ltd.
^These securities are partially or fully transferred as securities lent.
Equities are primarily classified by country/geographic region of
incorporation of the entity in which the Fund holds shares.
Underlying exposure has been calculated according to the guidelines
issued by the ESMA and represents the market value of an equivalent
position in the assets underlying each financial derivative instrument.
Analysis of total current assetsgross of all liabilities
Fair valueJPY'000
% of totalcurrentassets
Transferable securities admitted to an official stock exchange listing 24,751,227 99.73
Other assets 67,684 0.27
Total current assets 24,818,911 100.00
iSHARES VII PLC
SCHEDULE OF INVESTMENTS (continued)
iSHARES NIKKEI 225 UCITS ETF (continued)As at 31 July 2020
[250 ]
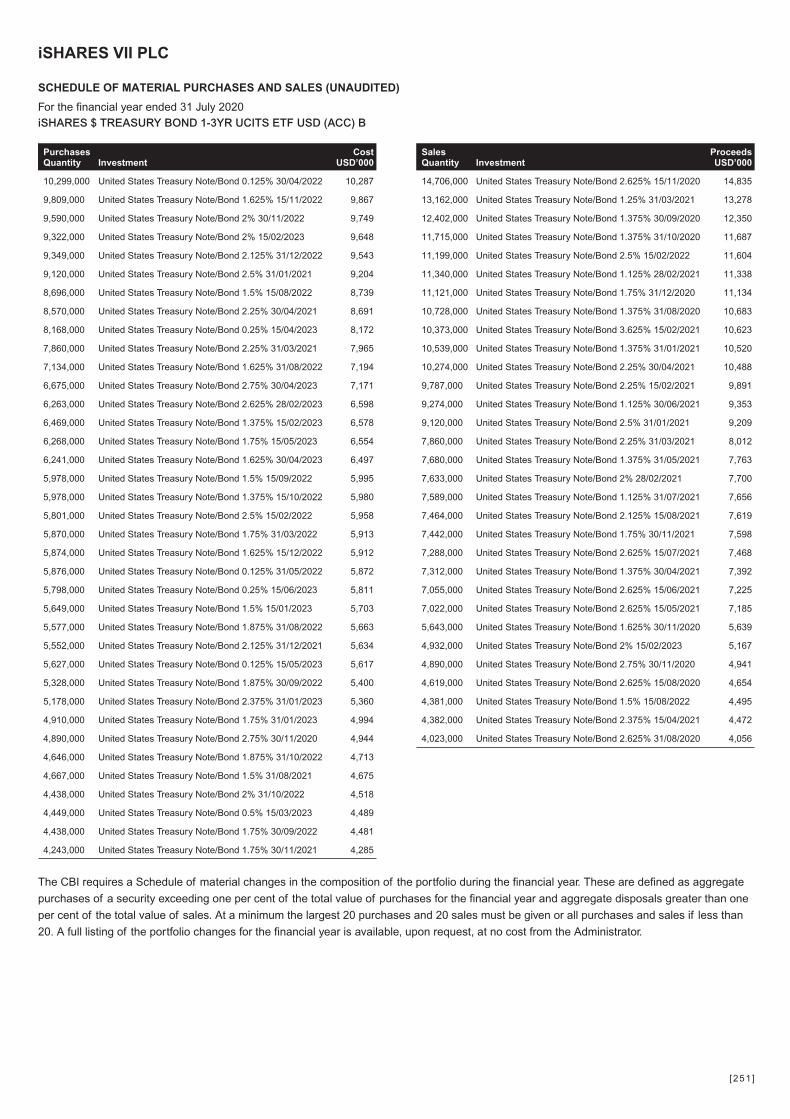
SalesQuantity Investment
ProceedsUSD’000
14,706,000 United States Treasury Note/Bond 2.625% 15/11/2020 14,835
13,162,000 United States Treasury Note/Bond 1.25% 31/03/2021 13,278
12,402,000 United States Treasury Note/Bond 1.375% 30/09/2020 12,350
11,715,000 United States Treasury Note/Bond 1.375% 31/10/2020 11,687
11,199,000 United States Treasury Note/Bond 2.5% 15/02/2022 11,604
11,340,000 United States Treasury Note/Bond 1.125% 28/02/2021 11,338
11,121,000 United States Treasury Note/Bond 1.75% 31/12/2020 11,134
10,728,000 United States Treasury Note/Bond 1.375% 31/08/2020 10,683
10,373,000 United States Treasury Note/Bond 3.625% 15/02/2021 10,623
10,539,000 United States Treasury Note/Bond 1.375% 31/01/2021 10,520
10,274,000 United States Treasury Note/Bond 2.25% 30/04/2021 10,488
9,787,000 United States Treasury Note/Bond 2.25% 15/02/2021 9,891
9,274,000 United States Treasury Note/Bond 1.125% 30/06/2021 9,353
9,120,000 United States Treasury Note/Bond 2.5% 31/01/2021 9,209
7,860,000 United States Treasury Note/Bond 2.25% 31/03/2021 8,012
7,680,000 United States Treasury Note/Bond 1.375% 31/05/2021 7,763
7,633,000 United States Treasury Note/Bond 2% 28/02/2021 7,700
7,589,000 United States Treasury Note/Bond 1.125% 31/07/2021 7,656
7,464,000 United States Treasury Note/Bond 2.125% 15/08/2021 7,619
7,442,000 United States Treasury Note/Bond 1.75% 30/11/2021 7,598
7,288,000 United States Treasury Note/Bond 2.625% 15/07/2021 7,468
7,312,000 United States Treasury Note/Bond 1.375% 30/04/2021 7,392
7,055,000 United States Treasury Note/Bond 2.625% 15/06/2021 7,225
7,022,000 United States Treasury Note/Bond 2.625% 15/05/2021 7,185
5,643,000 United States Treasury Note/Bond 1.625% 30/11/2020 5,639
4,932,000 United States Treasury Note/Bond 2% 15/02/2023 5,167
4,890,000 United States Treasury Note/Bond 2.75% 30/11/2020 4,941
4,619,000 United States Treasury Note/Bond 2.625% 15/08/2020 4,654
4,381,000 United States Treasury Note/Bond 1.5% 15/08/2022 4,495
4,382,000 United States Treasury Note/Bond 2.375% 15/04/2021 4,472
4,023,000 United States Treasury Note/Bond 2.625% 31/08/2020 4,056
The CBI requires a Schedule of material changes in the composition of the portfolio during the financial year. These are defined as aggregate
purchases of a security exceeding one per cent of the total value of purchases for the financial year and aggregate disposals greater than one
per cent of the total value of sales. At a minimum the largest 20 purchases and 20 sales must be given or all purchases and sales if less than
20. A full listing of the portfolio changes for the financial year is available, upon request, at no cost from the Administrator.
PurchasesQuantity Investment
CostUSD’000
10,299,000 United States Treasury Note/Bond 0.125% 30/04/2022 10,287
9,809,000 United States Treasury Note/Bond 1.625% 15/11/2022 9,867
9,590,000 United States Treasury Note/Bond 2% 30/11/2022 9,749
9,322,000 United States Treasury Note/Bond 2% 15/02/2023 9,648
9,349,000 United States Treasury Note/Bond 2.125% 31/12/2022 9,543
9,120,000 United States Treasury Note/Bond 2.5% 31/01/2021 9,204
8,696,000 United States Treasury Note/Bond 1.5% 15/08/2022 8,739
8,570,000 United States Treasury Note/Bond 2.25% 30/04/2021 8,691
8,168,000 United States Treasury Note/Bond 0.25% 15/04/2023 8,172
7,860,000 United States Treasury Note/Bond 2.25% 31/03/2021 7,965
7,134,000 United States Treasury Note/Bond 1.625% 31/08/2022 7,194
6,675,000 United States Treasury Note/Bond 2.75% 30/04/2023 7,171
6,263,000 United States Treasury Note/Bond 2.625% 28/02/2023 6,598
6,469,000 United States Treasury Note/Bond 1.375% 15/02/2023 6,578
6,268,000 United States Treasury Note/Bond 1.75% 15/05/2023 6,554
6,241,000 United States Treasury Note/Bond 1.625% 30/04/2023 6,497
5,978,000 United States Treasury Note/Bond 1.5% 15/09/2022 5,995
5,978,000 United States Treasury Note/Bond 1.375% 15/10/2022 5,980
5,801,000 United States Treasury Note/Bond 2.5% 15/02/2022 5,958
5,870,000 United States Treasury Note/Bond 1.75% 31/03/2022 5,913
5,874,000 United States Treasury Note/Bond 1.625% 15/12/2022 5,912
5,876,000 United States Treasury Note/Bond 0.125% 31/05/2022 5,872
5,798,000 United States Treasury Note/Bond 0.25% 15/06/2023 5,811
5,649,000 United States Treasury Note/Bond 1.5% 15/01/2023 5,703
5,577,000 United States Treasury Note/Bond 1.875% 31/08/2022 5,663
5,552,000 United States Treasury Note/Bond 2.125% 31/12/2021 5,634
5,627,000 United States Treasury Note/Bond 0.125% 15/05/2023 5,617
5,328,000 United States Treasury Note/Bond 1.875% 30/09/2022 5,400
5,178,000 United States Treasury Note/Bond 2.375% 31/01/2023 5,360
4,910,000 United States Treasury Note/Bond 1.75% 31/01/2023 4,994
4,890,000 United States Treasury Note/Bond 2.75% 30/11/2020 4,944
4,646,000 United States Treasury Note/Bond 1.875% 31/10/2022 4,713
4,667,000 United States Treasury Note/Bond 1.5% 31/08/2021 4,675
4,438,000 United States Treasury Note/Bond 2% 31/10/2022 4,518
4,449,000 United States Treasury Note/Bond 0.5% 15/03/2023 4,489
4,438,000 United States Treasury Note/Bond 1.75% 30/09/2022 4,481
4,243,000 United States Treasury Note/Bond 1.75% 30/11/2021 4,285
iSHARES VII PLC
SCHEDULE OF MATERIAL PURCHASES AND SALES (UNAUDITED)
For the financial year ended 31 July 2020iSHARES $ TREASURY BOND 1-3YR UCITS ETF USD (ACC) B
[251 ]
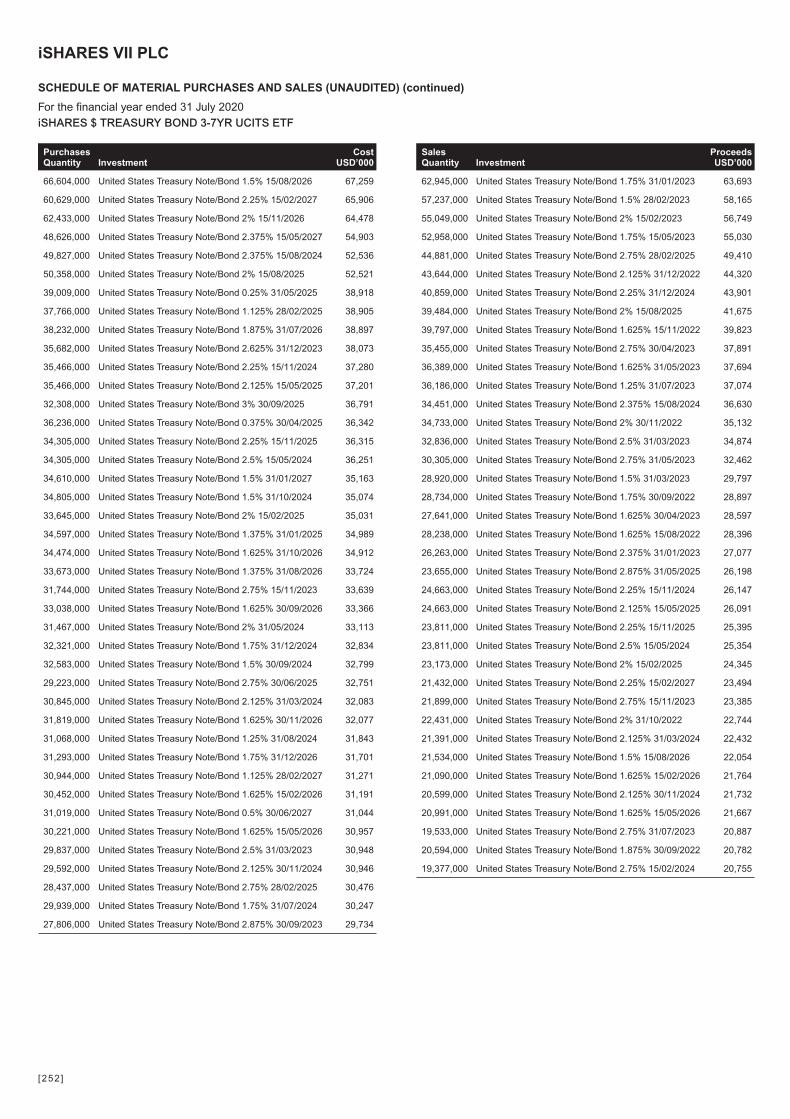
SalesQuantity Investment
ProceedsUSD’000
62,945,000 United States Treasury Note/Bond 1.75% 31/01/2023 63,693
57,237,000 United States Treasury Note/Bond 1.5% 28/02/2023 58,165
55,049,000 United States Treasury Note/Bond 2% 15/02/2023 56,749
52,958,000 United States Treasury Note/Bond 1.75% 15/05/2023 55,030
44,881,000 United States Treasury Note/Bond 2.75% 28/02/2025 49,410
43,644,000 United States Treasury Note/Bond 2.125% 31/12/2022 44,320
40,859,000 United States Treasury Note/Bond 2.25% 31/12/2024 43,901
39,484,000 United States Treasury Note/Bond 2% 15/08/2025 41,675
39,797,000 United States Treasury Note/Bond 1.625% 15/11/2022 39,823
35,455,000 United States Treasury Note/Bond 2.75% 30/04/2023 37,891
36,389,000 United States Treasury Note/Bond 1.625% 31/05/2023 37,694
36,186,000 United States Treasury Note/Bond 1.25% 31/07/2023 37,074
34,451,000 United States Treasury Note/Bond 2.375% 15/08/2024 36,630
34,733,000 United States Treasury Note/Bond 2% 30/11/2022 35,132
32,836,000 United States Treasury Note/Bond 2.5% 31/03/2023 34,874
30,305,000 United States Treasury Note/Bond 2.75% 31/05/2023 32,462
28,920,000 United States Treasury Note/Bond 1.5% 31/03/2023 29,797
28,734,000 United States Treasury Note/Bond 1.75% 30/09/2022 28,897
27,641,000 United States Treasury Note/Bond 1.625% 30/04/2023 28,597
28,238,000 United States Treasury Note/Bond 1.625% 15/08/2022 28,396
26,263,000 United States Treasury Note/Bond 2.375% 31/01/2023 27,077
23,655,000 United States Treasury Note/Bond 2.875% 31/05/2025 26,198
24,663,000 United States Treasury Note/Bond 2.25% 15/11/2024 26,147
24,663,000 United States Treasury Note/Bond 2.125% 15/05/2025 26,091
23,811,000 United States Treasury Note/Bond 2.25% 15/11/2025 25,395
23,811,000 United States Treasury Note/Bond 2.5% 15/05/2024 25,354
23,173,000 United States Treasury Note/Bond 2% 15/02/2025 24,345
21,432,000 United States Treasury Note/Bond 2.25% 15/02/2027 23,494
21,899,000 United States Treasury Note/Bond 2.75% 15/11/2023 23,385
22,431,000 United States Treasury Note/Bond 2% 31/10/2022 22,744
21,391,000 United States Treasury Note/Bond 2.125% 31/03/2024 22,432
21,534,000 United States Treasury Note/Bond 1.5% 15/08/2026 22,054
21,090,000 United States Treasury Note/Bond 1.625% 15/02/2026 21,764
20,599,000 United States Treasury Note/Bond 2.125% 30/11/2024 21,732
20,991,000 United States Treasury Note/Bond 1.625% 15/05/2026 21,667
19,533,000 United States Treasury Note/Bond 2.75% 31/07/2023 20,887
20,594,000 United States Treasury Note/Bond 1.875% 30/09/2022 20,782
19,377,000 United States Treasury Note/Bond 2.75% 15/02/2024 20,755
PurchasesQuantity Investment
CostUSD’000
66,604,000 United States Treasury Note/Bond 1.5% 15/08/2026 67,259
60,629,000 United States Treasury Note/Bond 2.25% 15/02/2027 65,906
62,433,000 United States Treasury Note/Bond 2% 15/11/2026 64,478
48,626,000 United States Treasury Note/Bond 2.375% 15/05/2027 54,903
49,827,000 United States Treasury Note/Bond 2.375% 15/08/2024 52,536
50,358,000 United States Treasury Note/Bond 2% 15/08/2025 52,521
39,009,000 United States Treasury Note/Bond 0.25% 31/05/2025 38,918
37,766,000 United States Treasury Note/Bond 1.125% 28/02/2025 38,905
38,232,000 United States Treasury Note/Bond 1.875% 31/07/2026 38,897
35,682,000 United States Treasury Note/Bond 2.625% 31/12/2023 38,073
35,466,000 United States Treasury Note/Bond 2.25% 15/11/2024 37,280
35,466,000 United States Treasury Note/Bond 2.125% 15/05/2025 37,201
32,308,000 United States Treasury Note/Bond 3% 30/09/2025 36,791
36,236,000 United States Treasury Note/Bond 0.375% 30/04/2025 36,342
34,305,000 United States Treasury Note/Bond 2.25% 15/11/2025 36,315
34,305,000 United States Treasury Note/Bond 2.5% 15/05/2024 36,251
34,610,000 United States Treasury Note/Bond 1.5% 31/01/2027 35,163
34,805,000 United States Treasury Note/Bond 1.5% 31/10/2024 35,074
33,645,000 United States Treasury Note/Bond 2% 15/02/2025 35,031
34,597,000 United States Treasury Note/Bond 1.375% 31/01/2025 34,989
34,474,000 United States Treasury Note/Bond 1.625% 31/10/2026 34,912
33,673,000 United States Treasury Note/Bond 1.375% 31/08/2026 33,724
31,744,000 United States Treasury Note/Bond 2.75% 15/11/2023 33,639
33,038,000 United States Treasury Note/Bond 1.625% 30/09/2026 33,366
31,467,000 United States Treasury Note/Bond 2% 31/05/2024 33,113
32,321,000 United States Treasury Note/Bond 1.75% 31/12/2024 32,834
32,583,000 United States Treasury Note/Bond 1.5% 30/09/2024 32,799
29,223,000 United States Treasury Note/Bond 2.75% 30/06/2025 32,751
30,845,000 United States Treasury Note/Bond 2.125% 31/03/2024 32,083
31,819,000 United States Treasury Note/Bond 1.625% 30/11/2026 32,077
31,068,000 United States Treasury Note/Bond 1.25% 31/08/2024 31,843
31,293,000 United States Treasury Note/Bond 1.75% 31/12/2026 31,701
30,944,000 United States Treasury Note/Bond 1.125% 28/02/2027 31,271
30,452,000 United States Treasury Note/Bond 1.625% 15/02/2026 31,191
31,019,000 United States Treasury Note/Bond 0.5% 30/06/2027 31,044
30,221,000 United States Treasury Note/Bond 1.625% 15/05/2026 30,957
29,837,000 United States Treasury Note/Bond 2.5% 31/03/2023 30,948
29,592,000 United States Treasury Note/Bond 2.125% 30/11/2024 30,946
28,437,000 United States Treasury Note/Bond 2.75% 28/02/2025 30,476
29,939,000 United States Treasury Note/Bond 1.75% 31/07/2024 30,247
27,806,000 United States Treasury Note/Bond 2.875% 30/09/2023 29,734
iSHARES VII PLC
SCHEDULE OF MATERIAL PURCHASES AND SALES (UNAUDITED) (continued)
For the financial year ended 31 July 2020iSHARES $ TREASURY BOND 3-7YR UCITS ETF
[252 ]
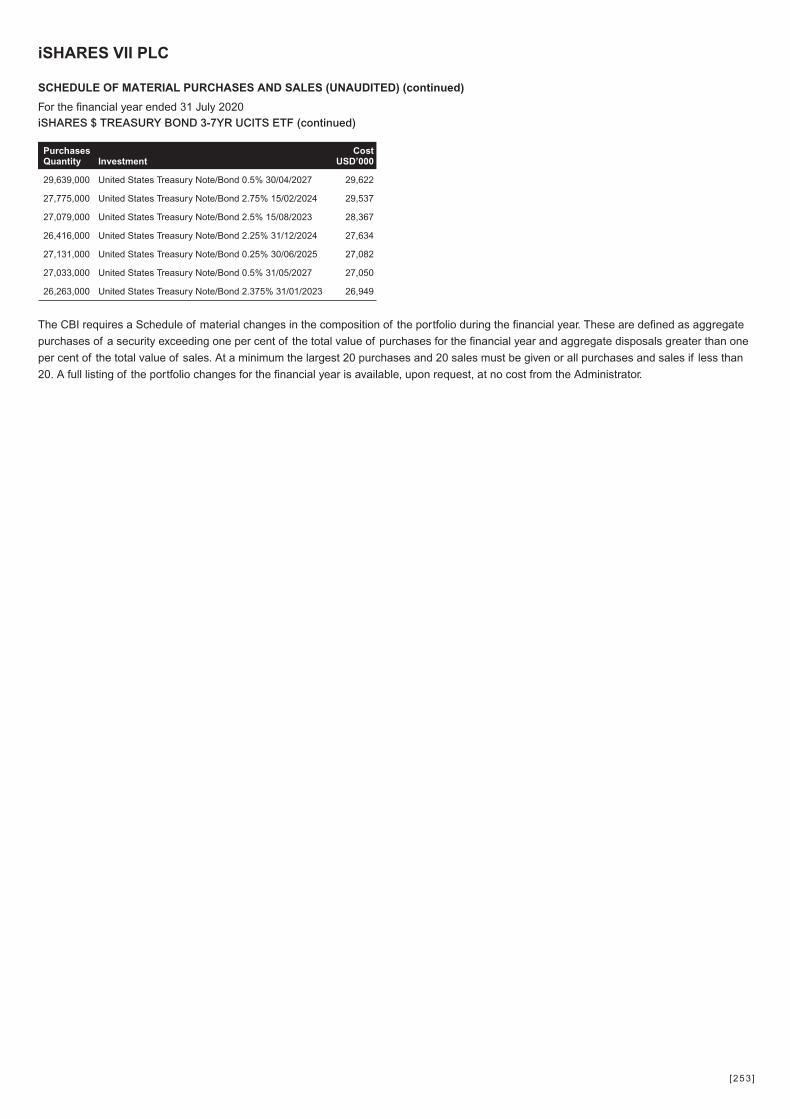
The CBI requires a Schedule of material changes in the composition of the portfolio during the financial year. These are defined as aggregate
purchases of a security exceeding one per cent of the total value of purchases for the financial year and aggregate disposals greater than one
per cent of the total value of sales. At a minimum the largest 20 purchases and 20 sales must be given or all purchases and sales if less than
20. A full listing of the portfolio changes for the financial year is available, upon request, at no cost from the Administrator.
PurchasesQuantity Investment
CostUSD’000
29,639,000 United States Treasury Note/Bond 0.5% 30/04/2027 29,622
27,775,000 United States Treasury Note/Bond 2.75% 15/02/2024 29,537
27,079,000 United States Treasury Note/Bond 2.5% 15/08/2023 28,367
26,416,000 United States Treasury Note/Bond 2.25% 31/12/2024 27,634
27,131,000 United States Treasury Note/Bond 0.25% 30/06/2025 27,082
27,033,000 United States Treasury Note/Bond 0.5% 31/05/2027 27,050
26,263,000 United States Treasury Note/Bond 2.375% 31/01/2023 26,949
iSHARES VII PLC
SCHEDULE OF MATERIAL PURCHASES AND SALES (UNAUDITED) (continued)
For the financial year ended 31 July 2020iSHARES $ TREASURY BOND 3-7YR UCITS ETF (continued)
[253 ]

SalesQuantity Investment
ProceedsUSD’000
62,441,000 United States Treasury Note/Bond 2.375% 15/05/2027 69,558
47,720,000 United States Treasury Note/Bond 2.25% 15/02/2027 51,213
36,520,000 United States Treasury Note/Bond 1.625% 15/08/2029 38,868
35,240,000 United States Treasury Note/Bond 1.75% 15/11/2029 38,386
31,652,000 United States Treasury Note/Bond 2.375% 15/05/2029 35,481
33,067,000 United States Treasury Note/Bond 2% 15/11/2026 33,698
27,261,000 United States Treasury Note/Bond 3.125% 15/11/2028 31,773
25,719,000 United States Treasury Note/Bond 2.875% 15/08/2028 29,268
24,269,000 United States Treasury Note/Bond 2.75% 15/02/2028 27,190
23,216,000 United States Treasury Note/Bond 2.875% 15/05/2028 26,477
24,072,000 United States Treasury Note/Bond 2.25% 15/11/2027 26,186
23,313,000 United States Treasury Note/Bond 2.625% 15/02/2029 26,183
23,466,000 United States Treasury Note/Bond 2.25% 15/08/2027 25,451
21,632,000 United States Treasury Note/Bond 1.5% 15/08/2026 21,692
11,973,000 United States Treasury Note/Bond 1.5% 15/02/2030 12,852
4,700,000 United States Treasury Note/Bond 6.125% 15/11/2027 6,485
2,600,000 United States Treasury Note/Bond 6.625% 15/02/2027 3,526
2,462,000 United States Treasury Note/Bond 5.25% 15/11/2028 3,324
2,358,000 United States Treasury Note/Bond 6.5% 15/11/2026 3,109
1,956,000 United States Treasury Note/Bond 5.5% 15/08/2028 2,662
The CBI requires a Schedule of material changes in the composition of the portfolio during the financial year. These are defined as aggregate
purchases of a security exceeding one per cent of the total value of purchases for the financial year and aggregate disposals greater than one
per cent of the total value of sales. At a minimum the largest 20 purchases and 20 sales must be given or all purchases and sales if less than
20. A full listing of the portfolio changes for the financial year is available, upon request, at no cost from the Administrator.
PurchasesQuantity Investment
CostUSD’000
73,765,000 United States Treasury Note/Bond 1.625% 15/08/2029 74,939
67,896,000 United States Treasury Note/Bond 1.5% 15/02/2030 72,475
68,236,000 United States Treasury Note/Bond 1.75% 15/11/2029 70,059
61,712,000 United States Treasury Note/Bond 2.375% 15/05/2029 66,694
57,219,000 United States Treasury Note/Bond 3.125% 15/11/2028 65,866
56,847,000 United States Treasury Note/Bond 2.875% 15/08/2028 64,084
54,312,000 United States Treasury Note/Bond 2.875% 15/05/2028 61,221
54,237,000 United States Treasury Note/Bond 2.75% 15/02/2028 60,352
51,173,000 United States Treasury Note/Bond 2.625% 15/02/2029 56,692
48,227,000 United States Treasury Note/Bond 2.25% 15/08/2027 51,591
45,883,000 United States Treasury Note/Bond 2.25% 15/11/2027 49,123
44,251,000 United States Treasury Note/Bond 2.375% 15/05/2027 47,529
46,553,000 United States Treasury Note/Bond 0.625% 15/05/2030 46,418
29,615,000 United States Treasury Note/Bond 2.25% 15/02/2027 30,844
15,727,000 United States Treasury Note/Bond 2% 15/11/2026 16,141
7,864,000 United States Treasury Note/Bond 6.125% 15/11/2027 10,722
6,090,000 United States Treasury Note/Bond 6.25% 15/05/2030 9,408
5,890,000 United States Treasury Note/Bond 5.25% 15/11/2028 7,809
4,797,000 United States Treasury Note/Bond 6.125% 15/08/2029 6,855
4,733,000 United States Treasury Note/Bond 5.5% 15/08/2028 6,333
iSHARES VII PLC
SCHEDULE OF MATERIAL PURCHASES AND SALES (UNAUDITED) (continued)
For the financial year ended 31 July 2020iSHARES $ TREASURY BOND 7-10YR UCITS ETF USD (ACC)
[254 ]

SalesQuantity Investment
ProceedsEUR’000
96,601,000 French Republic Government Bond OAT 0%
25/02/2021 97,283
55,681,000 Spain Government Bond 0.05% 31/01/2021 56,004
52,948,000 Bundesschatzanweisungen 0% 11/06/2021 53,360
50,988,000 French Republic Government Bond OAT 0%
25/02/2022 51,675
43,351,000 Bundesschatzanweisungen 0% 12/03/2021 43,653
42,331,000 Italy Buoni Poliennali Del Tesoro 0.2% 15/10/2020 42,514
37,674,000 Italy Buoni Poliennali Del Tesoro 2.3% 15/10/2021 39,019
35,890,000 Spain Government Bond 0.05% 31/10/2021 36,178
33,845,000 Bundesschatzanweisungen 0% 11/12/2020 34,083
31,075,000 Italy Buoni Poliennali Del Tesoro 0.05% 15/04/2021 31,019
29,680,000 Bundesschatzanweisungen 0% 11/09/2020 29,891
28,969,000 Italy Buoni Poliennali Del Tesoro 1% 15/07/2022 29,491
19,016,000 Bundesschatzanweisungen 0% 10/09/2021 19,193
16,027,000 Italy Buoni Poliennali Del Tesoro 0.05% 15/04/2021 16,044
10,294,000 Bundesschatzanweisungen 0% 10/12/2021 10,410
10,067,000 Italy Buoni Poliennali Del Tesoro 0.05% 15/01/2023 10,008
7,247,000 Italy Buoni Poliennali Del Tesoro 0.05% 15/01/2023 7,156
5,901,000 Bundesschatzanweisungen 0% 11/03/2022 5,972
5,533,000 French Republic Government Bond OAT 0%
25/02/2023 5,609
4,376,000 Spain Government Bond 0% 30/04/2023 4,412
The CBI requires a Schedule of material changes in the composition of the portfolio during the financial year. These are defined as aggregate
purchases of a security exceeding one per cent of the total value of purchases for the financial year and aggregate disposals greater than one
per cent of the total value of sales. At a minimum the largest 20 purchases and 20 sales must be given or all purchases and sales if less than
20. A full listing of the portfolio changes for the financial year is available, upon request, at no cost from the Administrator.
PurchasesQuantity Investment
CostEUR’000
49,866,000 French Republic Government Bond OAT 0%
25/02/2022 50,546
46,368,000 Spain Government Bond 0% 30/04/2023 46,590
45,256,000 Bundesschatzanweisungen 0% 10/09/2021 45,883
43,396,000 Bundesschatzanweisungen 0% 11/03/2022 44,033
40,709,000 Italy Buoni Poliennali Del Tesoro 0.05% 15/01/2023 40,721
39,859,000 Bundesschatzanweisungen 0% 10/12/2021 40,361
39,155,000 Spain Government Bond 0.05% 31/10/2021 39,462
32,706,000 Italy Buoni Poliennali Del Tesoro 2.3% 15/10/2021 33,980
32,862,000 French Republic Government Bond OAT 0%
25/02/2023 33,461
31,434,000 Italy Buoni Poliennali Del Tesoro 0.6% 15/06/2023 31,765
24,433,000 French Republic Government Bond OAT 0%
25/02/2021 24,643
24,139,000 Bundesschatzanweisungen 0% 11/06/2021 24,371
18,692,000 Italy Buoni Poliennali Del Tesoro 1% 15/07/2022 19,069
17,595,000 Bundesschatzanweisungen 0% 10/06/2022 17,837
12,613,000 Spain Government Bond 0.05% 31/01/2021 12,699
11,309,000 Italy Buoni Poliennali Del Tesoro 0.05% 15/04/2021 11,329
10,177,000 Bundesschatzanweisungen 0% 12/03/2021 10,269
8,733,000 Italy Buoni Poliennali Del Tesoro 0.05% 15/01/2023 8,580
7,120,000 Italy Buoni Poliennali Del Tesoro 0.2% 15/10/2020 7,155
5,327,000 Bundesschatzanweisungen 0% 11/12/2020 5,373
iSHARES VII PLC
SCHEDULE OF MATERIAL PURCHASES AND SALES (UNAUDITED) (continued)
For the financial year ended 31 July 2020iSHARES € GOVT BOND 1-3YR UCITS ETF EUR (ACC)
[255 ]

SalesQuantity Investment
ProceedsEUR’000
21,233,000 French Republic Government Bond OAT 1.75%
25/05/2023 22,771
14,970,000 French Republic Government Bond OAT 0%
25/03/2023 15,221
13,674,000 French Republic Government Bond OAT 2.25%
25/10/2022 14,866
9,512,000 Italy Buoni Poliennali Del Tesoro 5.5% 01/11/2022 11,073
9,349,000 Spain Government Bond 5.4% 31/01/2023 10,982
9,543,000 Italy Buoni Poliennali Del Tesoro 4.5% 01/05/2023 10,644
9,647,000 Bundesrepublik Deutschland Bundesanleihe 1.5%
15/05/2023 10,296
8,713,000 French Republic Government Bond OAT 0.5%
25/05/2025 9,145
7,568,000 Bundesrepublik Deutschland Bundesanleihe 1.5%
15/02/2023 8,092
6,583,000 Italy Buoni Poliennali Del Tesoro 5.5% 01/09/2022 7,648
7,356,000 Italy Buoni Poliennali Del Tesoro 0.95% 15/03/2023 7,470
6,942,000 Bundesrepublik Deutschland Bundesanleihe 1.5%
04/09/2022 7,426
6,882,000 Bundesrepublik Deutschland Bundesanleihe 1.75%
04/07/2022 7,405
7,079,000 Bundesobligation 0% 14/04/2023 7,252
6,904,000 Spain Government Bond 0.45% 31/10/2022 7,082
6,650,000 Italy Buoni Poliennali Del Tesoro 1.45% 15/09/2022 6,948
6,691,000 Bundesobligation 0% 07/10/2022 6,833
6,494,000 Italy Buoni Poliennali Del Tesoro 0.95% 01/03/2023 6,642
5,374,000 French Republic Government Bond OAT 1%
25/11/2025 5,831
5,517,000 French Republic Government Bond OAT 0.5%
25/05/2026 5,820
5,142,000 French Republic Government Bond OAT 1.75%
25/11/2024 5,702
4,819,000 Italy Buoni Poliennali Del Tesoro 4.5% 01/03/2024 5,601
5,106,000 Netherlands Government Bond 2.25% 15/07/2022 5,572
4,784,000 French Republic Government Bond OAT 2.25%
25/05/2024 5,362
4,581,000 Spain Government Bond 3.8% 30/04/2024 5,329
4,704,000 Italy Buoni Poliennali Del Tesoro 2.45% 01/10/2023 5,009
4,643,000 French Republic Government Bond OAT 0.25%
25/11/2026 4,820
4,421,000 Bundesrepublik Deutschland Bundesanleihe 0.5%
15/02/2026 4,740
PurchasesQuantity Investment
CostEUR’000
17,470,000 French Republic Government Bond OAT 0.25%
25/11/2026 18,143
13,539,000 Bundesrepublik Deutschland Bundesanleihe 0.25%
15/02/2027 14,475
13,483,000 French Republic Government Bond OAT 0%
25/03/2025 13,825
12,621,000 Bundesrepublik Deutschland Bundesanleihe 0%
15/08/2026 13,338
12,184,000 French Republic Government Bond OAT 1%
25/05/2027 13,272
11,151,000 Spain Government Bond 1.3% 31/10/2026 12,132
9,673,000 French Republic Government Bond OAT 0.5%
25/05/2025 10,186
9,670,000 Bundesobligation 0% 18/10/2024 10,041
9,212,000 Italy Buoni Poliennali Del Tesoro 2.1% 15/07/2026 9,951
8,185,000 Netherlands Government Bond 0.5% 15/07/2026 8,769
8,476,000 Italy Buoni Poliennali Del Tesoro 1.25% 01/12/2026 8,658
7,732,000 Spain Government Bond 1.5% 30/04/2027 8,319
8,395,000 Italy Buoni Poliennali Del Tesoro 0.35% 01/02/2025 8,296
7,036,000 Italy Buoni Poliennali Del Tesoro 2.2% 01/06/2027 7,478
6,481,000 French Republic Government Bond OAT 0.5%
25/05/2026 6,855
6,322,000 Bundesrepublik Deutschland Bundesanleihe 0.5%
15/02/2026 6,785
6,534,000 French Republic Government Bond OAT 0%
25/03/2023 6,692
5,640,000 Spain Government Bond 3.8% 30/04/2024 6,619
5,892,000 French Republic Government Bond OAT 1.75%
25/11/2024 6,545
6,214,000 French Republic Government Bond OAT 0%
25/03/2024 6,358
5,972,000 Bundesobligation 0% 11/04/2025 6,191
5,693,000 French Republic Government Bond OAT 1.75%
25/05/2023 6,158
5,865,000 Bundesobligation 0% 05/04/2024 6,046
5,286,000 French Republic Government Bond OAT 2.25%
25/05/2024 5,936
5,409,000 Bundesrepublik Deutschland Bundesanleihe 1%
15/08/2025 5,920
5,576,000 Spain Government Bond 0.25% 30/07/2024 5,698
5,045,000 Spain Government Bond 2.15% 31/10/2025 5,690
iSHARES VII PLC
SCHEDULE OF MATERIAL PURCHASES AND SALES (UNAUDITED) (continued)
For the financial year ended 31 July 2020iSHARES € GOVT BOND 3-7YR UCITS ETF
[256 ]
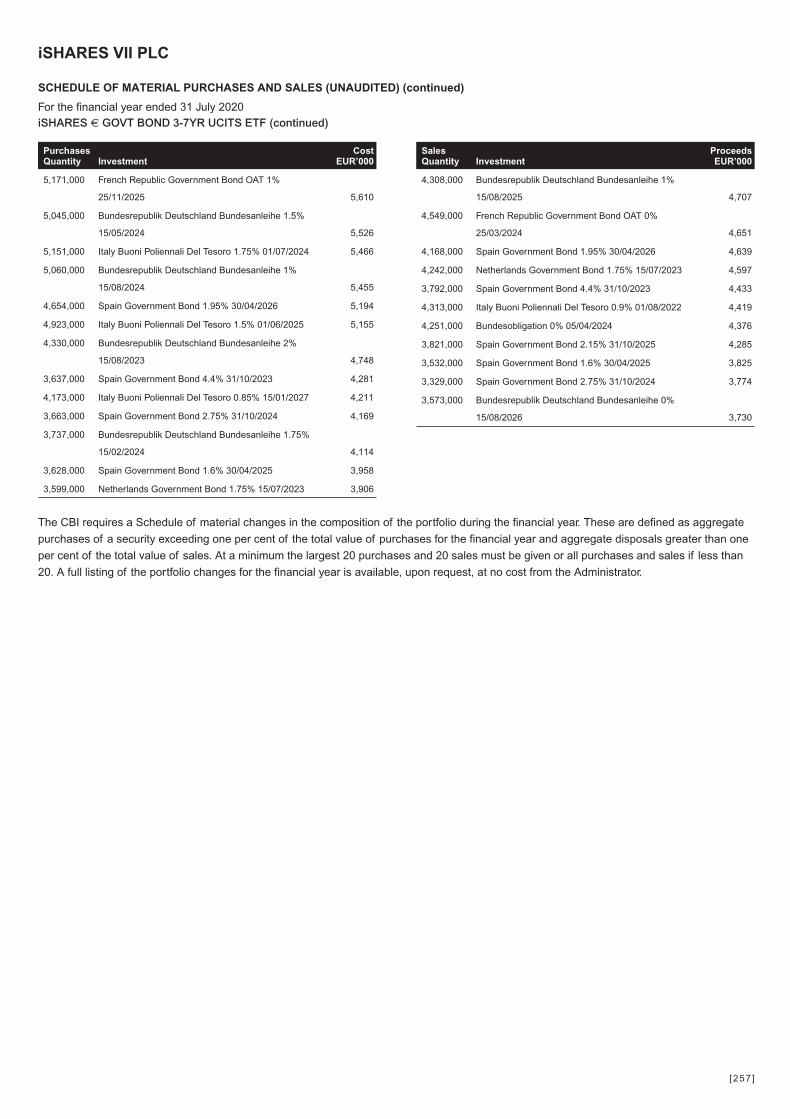
SalesQuantity Investment
ProceedsEUR’000
4,308,000 Bundesrepublik Deutschland Bundesanleihe 1%
15/08/2025 4,707
4,549,000 French Republic Government Bond OAT 0%
25/03/2024 4,651
4,168,000 Spain Government Bond 1.95% 30/04/2026 4,639
4,242,000 Netherlands Government Bond 1.75% 15/07/2023 4,597
3,792,000 Spain Government Bond 4.4% 31/10/2023 4,433
4,313,000 Italy Buoni Poliennali Del Tesoro 0.9% 01/08/2022 4,419
4,251,000 Bundesobligation 0% 05/04/2024 4,376
3,821,000 Spain Government Bond 2.15% 31/10/2025 4,285
3,532,000 Spain Government Bond 1.6% 30/04/2025 3,825
3,329,000 Spain Government Bond 2.75% 31/10/2024 3,774
3,573,000 Bundesrepublik Deutschland Bundesanleihe 0%
15/08/2026 3,730
The CBI requires a Schedule of material changes in the composition of the portfolio during the financial year. These are defined as aggregate
purchases of a security exceeding one per cent of the total value of purchases for the financial year and aggregate disposals greater than one
per cent of the total value of sales. At a minimum the largest 20 purchases and 20 sales must be given or all purchases and sales if less than
20. A full listing of the portfolio changes for the financial year is available, upon request, at no cost from the Administrator.
PurchasesQuantity Investment
CostEUR’000
5,171,000 French Republic Government Bond OAT 1%
25/11/2025 5,610
5,045,000 Bundesrepublik Deutschland Bundesanleihe 1.5%
15/05/2024 5,526
5,151,000 Italy Buoni Poliennali Del Tesoro 1.75% 01/07/2024 5,466
5,060,000 Bundesrepublik Deutschland Bundesanleihe 1%
15/08/2024 5,455
4,654,000 Spain Government Bond 1.95% 30/04/2026 5,194
4,923,000 Italy Buoni Poliennali Del Tesoro 1.5% 01/06/2025 5,155
4,330,000 Bundesrepublik Deutschland Bundesanleihe 2%
15/08/2023 4,748
3,637,000 Spain Government Bond 4.4% 31/10/2023 4,281
4,173,000 Italy Buoni Poliennali Del Tesoro 0.85% 15/01/2027 4,211
3,663,000 Spain Government Bond 2.75% 31/10/2024 4,169
3,737,000 Bundesrepublik Deutschland Bundesanleihe 1.75%
15/02/2024 4,114
3,628,000 Spain Government Bond 1.6% 30/04/2025 3,958
3,599,000 Netherlands Government Bond 1.75% 15/07/2023 3,906
iSHARES VII PLC
SCHEDULE OF MATERIAL PURCHASES AND SALES (UNAUDITED) (continued)
For the financial year ended 31 July 2020iSHARES € GOVT BOND 3-7YR UCITS ETF (continued)
[257 ]
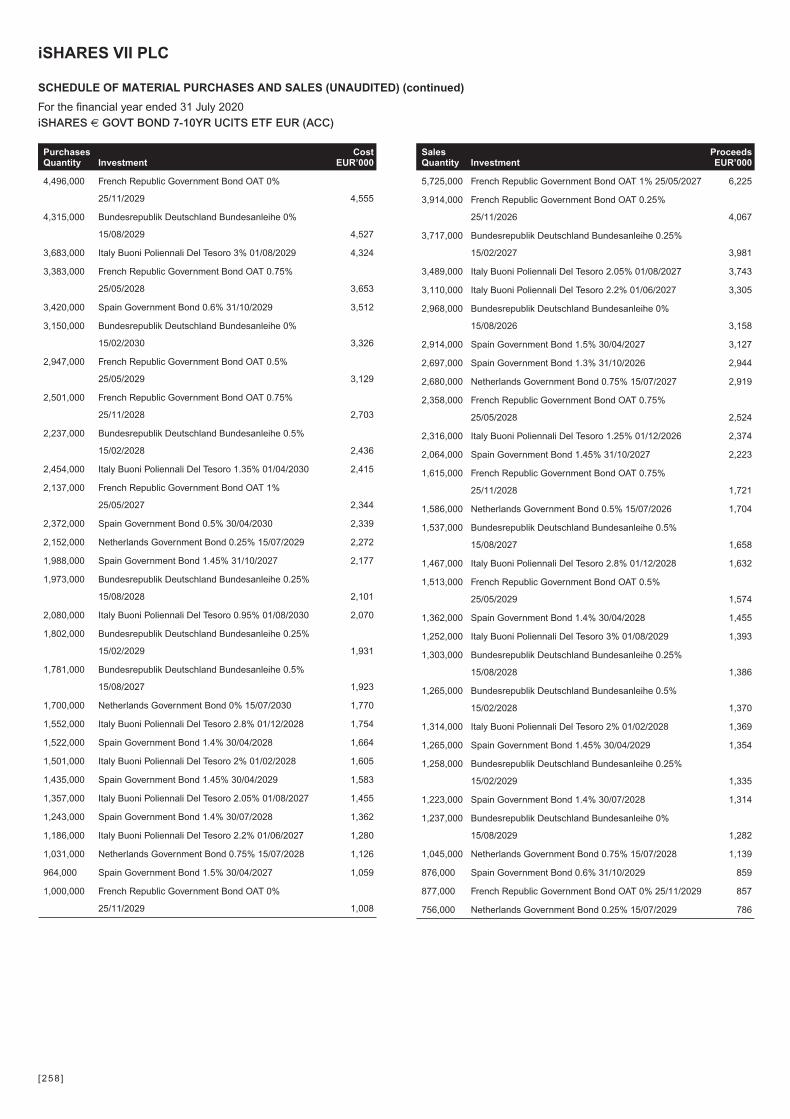
SalesQuantity Investment
ProceedsEUR’000
5,725,000 French Republic Government Bond OAT 1% 25/05/2027 6,225
3,914,000 French Republic Government Bond OAT 0.25%
25/11/2026 4,067
3,717,000 Bundesrepublik Deutschland Bundesanleihe 0.25%
15/02/2027 3,981
3,489,000 Italy Buoni Poliennali Del Tesoro 2.05% 01/08/2027 3,743
3,110,000 Italy Buoni Poliennali Del Tesoro 2.2% 01/06/2027 3,305
2,968,000 Bundesrepublik Deutschland Bundesanleihe 0%
15/08/2026 3,158
2,914,000 Spain Government Bond 1.5% 30/04/2027 3,127
2,697,000 Spain Government Bond 1.3% 31/10/2026 2,944
2,680,000 Netherlands Government Bond 0.75% 15/07/2027 2,919
2,358,000 French Republic Government Bond OAT 0.75%
25/05/2028 2,524
2,316,000 Italy Buoni Poliennali Del Tesoro 1.25% 01/12/2026 2,374
2,064,000 Spain Government Bond 1.45% 31/10/2027 2,223
1,615,000 French Republic Government Bond OAT 0.75%
25/11/2028 1,721
1,586,000 Netherlands Government Bond 0.5% 15/07/2026 1,704
1,537,000 Bundesrepublik Deutschland Bundesanleihe 0.5%
15/08/2027 1,658
1,467,000 Italy Buoni Poliennali Del Tesoro 2.8% 01/12/2028 1,632
1,513,000 French Republic Government Bond OAT 0.5%
25/05/2029 1,574
1,362,000 Spain Government Bond 1.4% 30/04/2028 1,455
1,252,000 Italy Buoni Poliennali Del Tesoro 3% 01/08/2029 1,393
1,303,000 Bundesrepublik Deutschland Bundesanleihe 0.25%
15/08/2028 1,386
1,265,000 Bundesrepublik Deutschland Bundesanleihe 0.5%
15/02/2028 1,370
1,314,000 Italy Buoni Poliennali Del Tesoro 2% 01/02/2028 1,369
1,265,000 Spain Government Bond 1.45% 30/04/2029 1,354
1,258,000 Bundesrepublik Deutschland Bundesanleihe 0.25%
15/02/2029 1,335
1,223,000 Spain Government Bond 1.4% 30/07/2028 1,314
1,237,000 Bundesrepublik Deutschland Bundesanleihe 0%
15/08/2029 1,282
1,045,000 Netherlands Government Bond 0.75% 15/07/2028 1,139
876,000 Spain Government Bond 0.6% 31/10/2029 859
877,000 French Republic Government Bond OAT 0% 25/11/2029 857
756,000 Netherlands Government Bond 0.25% 15/07/2029 786
PurchasesQuantity Investment
CostEUR’000
4,496,000 French Republic Government Bond OAT 0%
25/11/2029 4,555
4,315,000 Bundesrepublik Deutschland Bundesanleihe 0%
15/08/2029 4,527
3,683,000 Italy Buoni Poliennali Del Tesoro 3% 01/08/2029 4,324
3,383,000 French Republic Government Bond OAT 0.75%
25/05/2028 3,653
3,420,000 Spain Government Bond 0.6% 31/10/2029 3,512
3,150,000 Bundesrepublik Deutschland Bundesanleihe 0%
15/02/2030 3,326
2,947,000 French Republic Government Bond OAT 0.5%
25/05/2029 3,129
2,501,000 French Republic Government Bond OAT 0.75%
25/11/2028 2,703
2,237,000 Bundesrepublik Deutschland Bundesanleihe 0.5%
15/02/2028 2,436
2,454,000 Italy Buoni Poliennali Del Tesoro 1.35% 01/04/2030 2,415
2,137,000 French Republic Government Bond OAT 1%
25/05/2027 2,344
2,372,000 Spain Government Bond 0.5% 30/04/2030 2,339
2,152,000 Netherlands Government Bond 0.25% 15/07/2029 2,272
1,988,000 Spain Government Bond 1.45% 31/10/2027 2,177
1,973,000 Bundesrepublik Deutschland Bundesanleihe 0.25%
15/08/2028 2,101
2,080,000 Italy Buoni Poliennali Del Tesoro 0.95% 01/08/2030 2,070
1,802,000 Bundesrepublik Deutschland Bundesanleihe 0.25%
15/02/2029 1,931
1,781,000 Bundesrepublik Deutschland Bundesanleihe 0.5%
15/08/2027 1,923
1,700,000 Netherlands Government Bond 0% 15/07/2030 1,770
1,552,000 Italy Buoni Poliennali Del Tesoro 2.8% 01/12/2028 1,754
1,522,000 Spain Government Bond 1.4% 30/04/2028 1,664
1,501,000 Italy Buoni Poliennali Del Tesoro 2% 01/02/2028 1,605
1,435,000 Spain Government Bond 1.45% 30/04/2029 1,583
1,357,000 Italy Buoni Poliennali Del Tesoro 2.05% 01/08/2027 1,455
1,243,000 Spain Government Bond 1.4% 30/07/2028 1,362
1,186,000 Italy Buoni Poliennali Del Tesoro 2.2% 01/06/2027 1,280
1,031,000 Netherlands Government Bond 0.75% 15/07/2028 1,126
964,000 Spain Government Bond 1.5% 30/04/2027 1,059
1,000,000 French Republic Government Bond OAT 0%
25/11/2029 1,008
iSHARES VII PLC
SCHEDULE OF MATERIAL PURCHASES AND SALES (UNAUDITED) (continued)
For the financial year ended 31 July 2020iSHARES € GOVT BOND 7-10YR UCITS ETF EUR (ACC)
[258 ]

The CBI requires a Schedule of material changes in the composition of the portfolio during the financial year. These are defined as aggregate
purchases of a security exceeding one per cent of the total value of purchases for the financial year and aggregate disposals greater than one
per cent of the total value of sales. At a minimum the largest 20 purchases and 20 sales must be given or all purchases and sales if less than
20. A full listing of the portfolio changes for the financial year is available, upon request, at no cost from the Administrator.
PurchasesQuantity Investment
CostEUR’000
912,000 Netherlands Government Bond 0.75% 15/07/2027 993
935,000 Bundesrepublik Deutschland Bundesanleihe 0.25%
15/02/2027 989
iSHARES VII PLC
SCHEDULE OF MATERIAL PURCHASES AND SALES (UNAUDITED) (continued)
For the financial year ended 31 July 2020iSHARES € GOVT BOND 7-10YR UCITS ETF EUR (ACC) (continued)
[259 ]
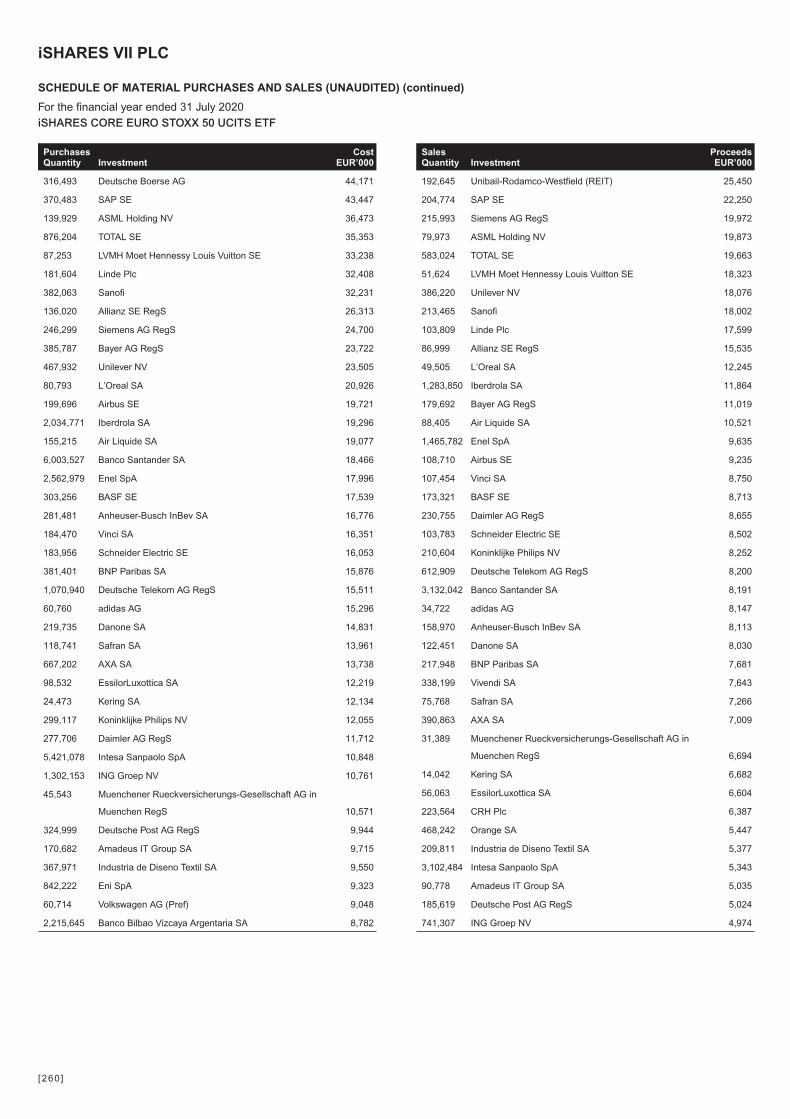
SalesQuantity Investment
ProceedsEUR’000
192,645 Unibail-Rodamco-Westfield (REIT) 25,450
204,774 SAP SE 22,250
215,993 Siemens AG RegS 19,972
79,973 ASML Holding NV 19,873
583,024 TOTAL SE 19,663
51,624 LVMH Moet Hennessy Louis Vuitton SE 18,323
386,220 Unilever NV 18,076
213,465 Sanofi 18,002
103,809 Linde Plc 17,599
86,999 Allianz SE RegS 15,535
49,505 L’Oreal SA 12,245
1,283,850 Iberdrola SA 11,864
179,692 Bayer AG RegS 11,019
88,405 Air Liquide SA 10,521
1,465,782 Enel SpA 9,635
108,710 Airbus SE 9,235
107,454 Vinci SA 8,750
173,321 BASF SE 8,713
230,755 Daimler AG RegS 8,655
103,783 Schneider Electric SE 8,502
210,604 Koninklijke Philips NV 8,252
612,909 Deutsche Telekom AG RegS 8,200
3,132,042 Banco Santander SA 8,191
34,722 adidas AG 8,147
158,970 Anheuser-Busch InBev SA 8,113
122,451 Danone SA 8,030
217,948 BNP Paribas SA 7,681
338,199 Vivendi SA 7,643
75,768 Safran SA 7,266
390,863 AXA SA 7,009
31,389 Muenchener Rueckversicherungs-Gesellschaft AG in
Muenchen RegS 6,694
14,042 Kering SA 6,682
56,063 EssilorLuxottica SA 6,604
223,564 CRH Plc 6,387
468,242 Orange SA 5,447
209,811 Industria de Diseno Textil SA 5,377
3,102,484 Intesa Sanpaolo SpA 5,343
90,778 Amadeus IT Group SA 5,035
185,619 Deutsche Post AG RegS 5,024
741,307 ING Groep NV 4,974
PurchasesQuantity Investment
CostEUR’000
316,493 Deutsche Boerse AG 44,171
370,483 SAP SE 43,447
139,929 ASML Holding NV 36,473
876,204 TOTAL SE 35,353
87,253 LVMH Moet Hennessy Louis Vuitton SE 33,238
181,604 Linde Plc 32,408
382,063 Sanofi 32,231
136,020 Allianz SE RegS 26,313
246,299 Siemens AG RegS 24,700
385,787 Bayer AG RegS 23,722
467,932 Unilever NV 23,505
80,793 L’Oreal SA 20,926
199,696 Airbus SE 19,721
2,034,771 Iberdrola SA 19,296
155,215 Air Liquide SA 19,077
6,003,527 Banco Santander SA 18,466
2,562,979 Enel SpA 17,996
303,256 BASF SE 17,539
281,481 Anheuser-Busch InBev SA 16,776
184,470 Vinci SA 16,351
183,956 Schneider Electric SE 16,053
381,401 BNP Paribas SA 15,876
1,070,940 Deutsche Telekom AG RegS 15,511
60,760 adidas AG 15,296
219,735 Danone SA 14,831
118,741 Safran SA 13,961
667,202 AXA SA 13,738
98,532 EssilorLuxottica SA 12,219
24,473 Kering SA 12,134
299,117 Koninklijke Philips NV 12,055
277,706 Daimler AG RegS 11,712
5,421,078 Intesa Sanpaolo SpA 10,848
1,302,153 ING Groep NV 10,761
45,543 Muenchener Rueckversicherungs-Gesellschaft AG in
Muenchen RegS 10,571
324,999 Deutsche Post AG RegS 9,944
170,682 Amadeus IT Group SA 9,715
367,971 Industria de Diseno Textil SA 9,550
842,222 Eni SpA 9,323
60,714 Volkswagen AG (Pref) 9,048
2,215,645 Banco Bilbao Vizcaya Argentaria SA 8,782
iSHARES VII PLC
SCHEDULE OF MATERIAL PURCHASES AND SALES (UNAUDITED) (continued)
For the financial year ended 31 July 2020iSHARES CORE EURO STOXX 50 UCITS ETF
[260 ]
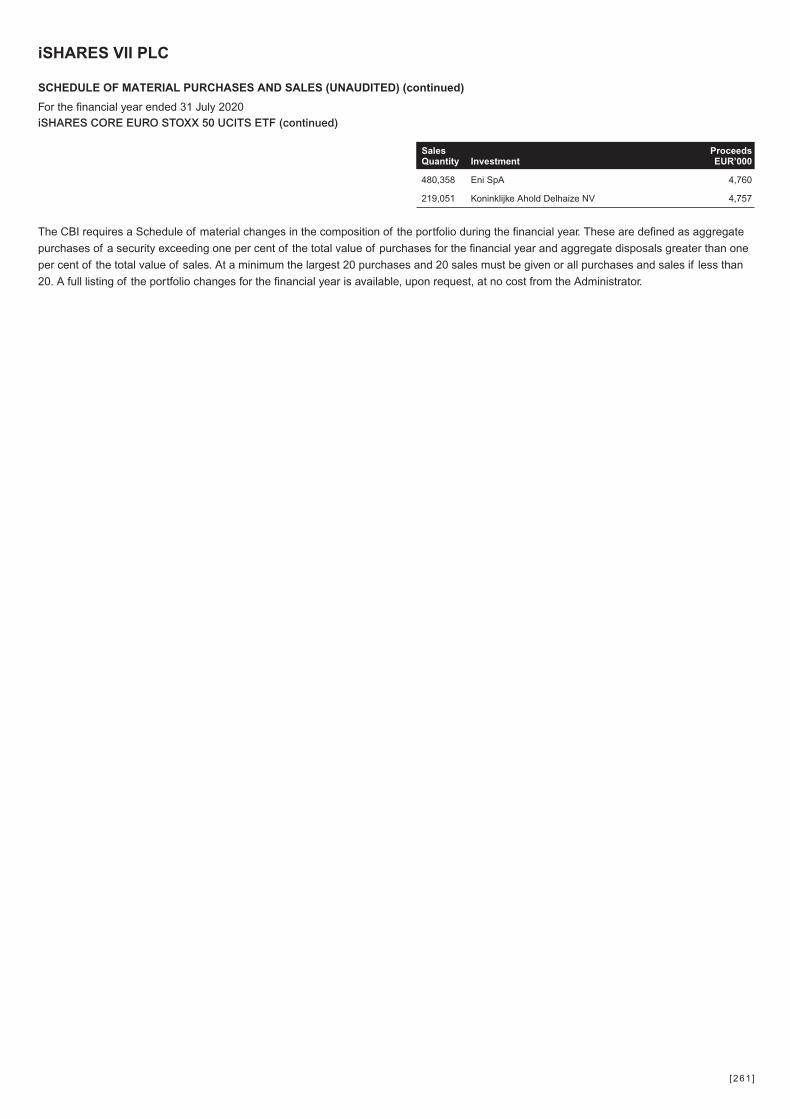
SalesQuantity Investment
ProceedsEUR’000
480,358 Eni SpA 4,760
219,051 Koninklijke Ahold Delhaize NV 4,757
The CBI requires a Schedule of material changes in the composition of the portfolio during the financial year. These are defined as aggregate
purchases of a security exceeding one per cent of the total value of purchases for the financial year and aggregate disposals greater than one
per cent of the total value of sales. At a minimum the largest 20 purchases and 20 sales must be given or all purchases and sales if less than
20. A full listing of the portfolio changes for the financial year is available, upon request, at no cost from the Administrator.
iSHARES VII PLC
SCHEDULE OF MATERIAL PURCHASES AND SALES (UNAUDITED) (continued)
For the financial year ended 31 July 2020iSHARES CORE EURO STOXX 50 UCITS ETF (continued)
[261 ]
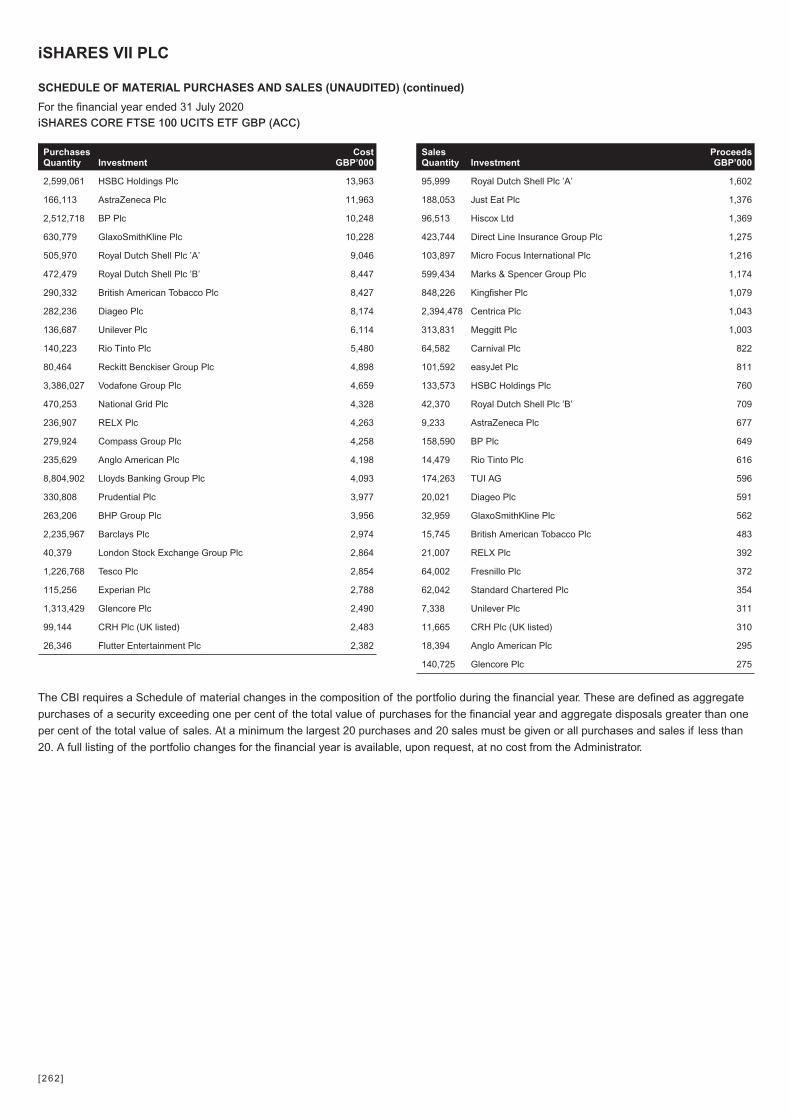
SalesQuantity Investment
ProceedsGBP’000
95,999 Royal Dutch Shell Plc ’A’ 1,602
188,053 Just Eat Plc 1,376
96,513 Hiscox Ltd 1,369
423,744 Direct Line Insurance Group Plc 1,275
103,897 Micro Focus International Plc 1,216
599,434 Marks & Spencer Group Plc 1,174
848,226 Kingfisher Plc 1,079
2,394,478 Centrica Plc 1,043
313,831 Meggitt Plc 1,003
64,582 Carnival Plc 822
101,592 easyJet Plc 811
133,573 HSBC Holdings Plc 760
42,370 Royal Dutch Shell Plc ’B’ 709
9,233 AstraZeneca Plc 677
158,590 BP Plc 649
14,479 Rio Tinto Plc 616
174,263 TUI AG 596
20,021 Diageo Plc 591
32,959 GlaxoSmithKline Plc 562
15,745 British American Tobacco Plc 483
21,007 RELX Plc 392
64,002 Fresnillo Plc 372
62,042 Standard Chartered Plc 354
7,338 Unilever Plc 311
11,665 CRH Plc (UK listed) 310
18,394 Anglo American Plc 295
140,725 Glencore Plc 275
The CBI requires a Schedule of material changes in the composition of the portfolio during the financial year. These are defined as aggregate
purchases of a security exceeding one per cent of the total value of purchases for the financial year and aggregate disposals greater than one
per cent of the total value of sales. At a minimum the largest 20 purchases and 20 sales must be given or all purchases and sales if less than
20. A full listing of the portfolio changes for the financial year is available, upon request, at no cost from the Administrator.
PurchasesQuantity Investment
CostGBP’000
2,599,061 HSBC Holdings Plc 13,963
166,113 AstraZeneca Plc 11,963
2,512,718 BP Plc 10,248
630,779 GlaxoSmithKline Plc 10,228
505,970 Royal Dutch Shell Plc ’A’ 9,046
472,479 Royal Dutch Shell Plc ’B’ 8,447
290,332 British American Tobacco Plc 8,427
282,236 Diageo Plc 8,174
136,687 Unilever Plc 6,114
140,223 Rio Tinto Plc 5,480
80,464 Reckitt Benckiser Group Plc 4,898
3,386,027 Vodafone Group Plc 4,659
470,253 National Grid Plc 4,328
236,907 RELX Plc 4,263
279,924 Compass Group Plc 4,258
235,629 Anglo American Plc 4,198
8,804,902 Lloyds Banking Group Plc 4,093
330,808 Prudential Plc 3,977
263,206 BHP Group Plc 3,956
2,235,967 Barclays Plc 2,974
40,379 London Stock Exchange Group Plc 2,864
1,226,768 Tesco Plc 2,854
115,256 Experian Plc 2,788
1,313,429 Glencore Plc 2,490
99,144 CRH Plc (UK listed) 2,483
26,346 Flutter Entertainment Plc 2,382
iSHARES VII PLC
SCHEDULE OF MATERIAL PURCHASES AND SALES (UNAUDITED) (continued)
For the financial year ended 31 July 2020iSHARES CORE FTSE 100 UCITS ETF GBP (ACC)
[262 ]
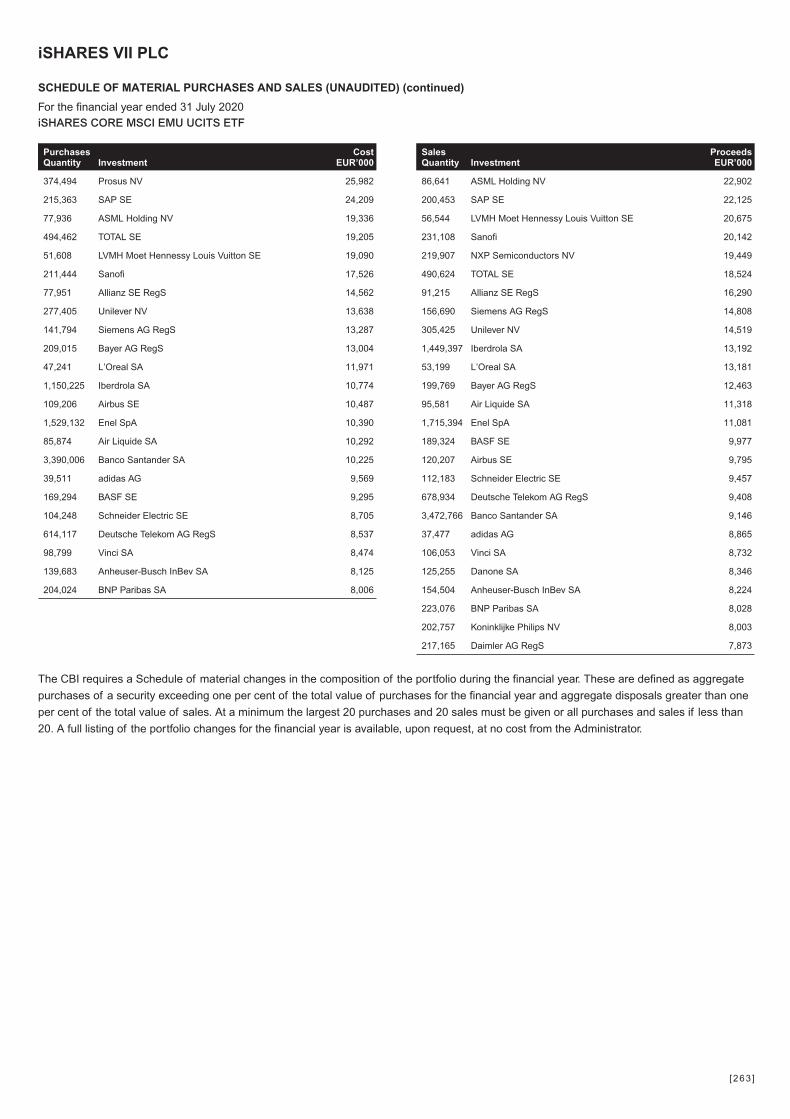
SalesQuantity Investment
ProceedsEUR’000
86,641 ASML Holding NV 22,902
200,453 SAP SE 22,125
56,544 LVMH Moet Hennessy Louis Vuitton SE 20,675
231,108 Sanofi 20,142
219,907 NXP Semiconductors NV 19,449
490,624 TOTAL SE 18,524
91,215 Allianz SE RegS 16,290
156,690 Siemens AG RegS 14,808
305,425 Unilever NV 14,519
1,449,397 Iberdrola SA 13,192
53,199 L’Oreal SA 13,181
199,769 Bayer AG RegS 12,463
95,581 Air Liquide SA 11,318
1,715,394 Enel SpA 11,081
189,324 BASF SE 9,977
120,207 Airbus SE 9,795
112,183 Schneider Electric SE 9,457
678,934 Deutsche Telekom AG RegS 9,408
3,472,766 Banco Santander SA 9,146
37,477 adidas AG 8,865
106,053 Vinci SA 8,732
125,255 Danone SA 8,346
154,504 Anheuser-Busch InBev SA 8,224
223,076 BNP Paribas SA 8,028
202,757 Koninklijke Philips NV 8,003
217,165 Daimler AG RegS 7,873
The CBI requires a Schedule of material changes in the composition of the portfolio during the financial year. These are defined as aggregate
purchases of a security exceeding one per cent of the total value of purchases for the financial year and aggregate disposals greater than one
per cent of the total value of sales. At a minimum the largest 20 purchases and 20 sales must be given or all purchases and sales if less than
20. A full listing of the portfolio changes for the financial year is available, upon request, at no cost from the Administrator.
PurchasesQuantity Investment
CostEUR’000
374,494 Prosus NV 25,982
215,363 SAP SE 24,209
77,936 ASML Holding NV 19,336
494,462 TOTAL SE 19,205
51,608 LVMH Moet Hennessy Louis Vuitton SE 19,090
211,444 Sanofi 17,526
77,951 Allianz SE RegS 14,562
277,405 Unilever NV 13,638
141,794 Siemens AG RegS 13,287
209,015 Bayer AG RegS 13,004
47,241 L’Oreal SA 11,971
1,150,225 Iberdrola SA 10,774
109,206 Airbus SE 10,487
1,529,132 Enel SpA 10,390
85,874 Air Liquide SA 10,292
3,390,006 Banco Santander SA 10,225
39,511 adidas AG 9,569
169,294 BASF SE 9,295
104,248 Schneider Electric SE 8,705
614,117 Deutsche Telekom AG RegS 8,537
98,799 Vinci SA 8,474
139,683 Anheuser-Busch InBev SA 8,125
204,024 BNP Paribas SA 8,006
iSHARES VII PLC
SCHEDULE OF MATERIAL PURCHASES AND SALES (UNAUDITED) (continued)
For the financial year ended 31 July 2020iSHARES CORE MSCI EMU UCITS ETF
[263 ]
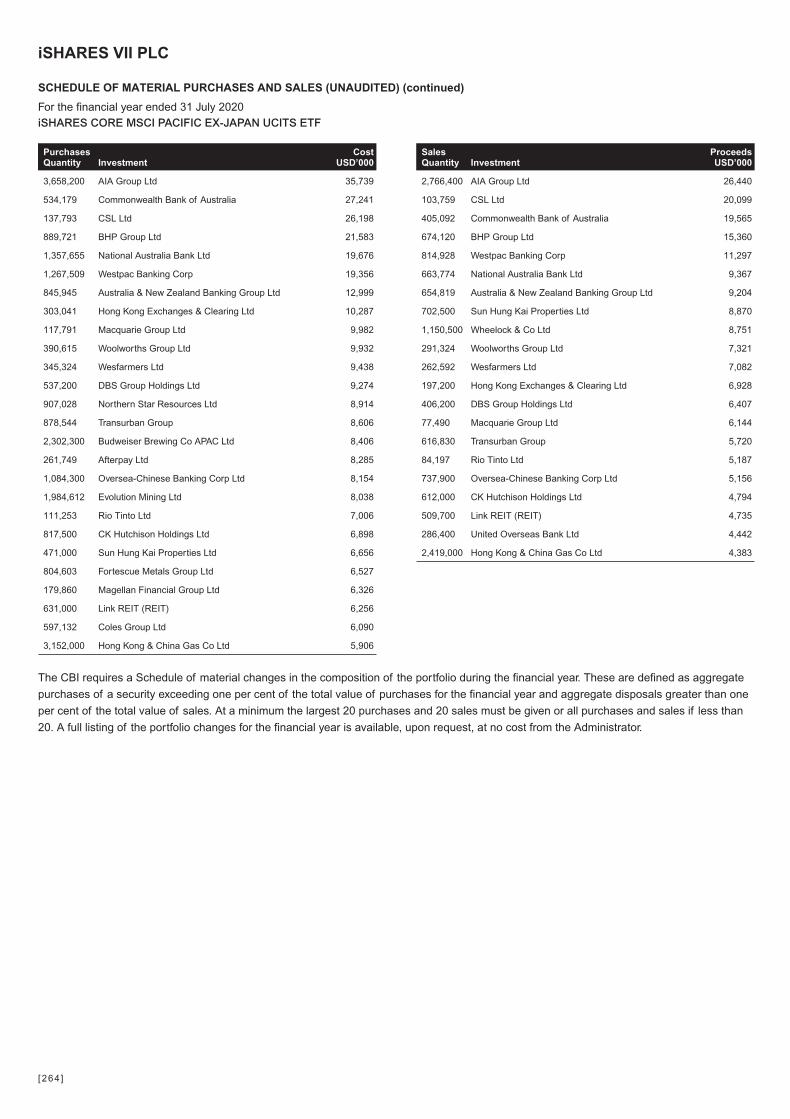
SalesQuantity Investment
ProceedsUSD’000
2,766,400 AIA Group Ltd 26,440
103,759 CSL Ltd 20,099
405,092 Commonwealth Bank of Australia 19,565
674,120 BHP Group Ltd 15,360
814,928 Westpac Banking Corp 11,297
663,774 National Australia Bank Ltd 9,367
654,819 Australia & New Zealand Banking Group Ltd 9,204
702,500 Sun Hung Kai Properties Ltd 8,870
1,150,500 Wheelock & Co Ltd 8,751
291,324 Woolworths Group Ltd 7,321
262,592 Wesfarmers Ltd 7,082
197,200 Hong Kong Exchanges & Clearing Ltd 6,928
406,200 DBS Group Holdings Ltd 6,407
77,490 Macquarie Group Ltd 6,144
616,830 Transurban Group 5,720
84,197 Rio Tinto Ltd 5,187
737,900 Oversea-Chinese Banking Corp Ltd 5,156
612,000 CK Hutchison Holdings Ltd 4,794
509,700 Link REIT (REIT) 4,735
286,400 United Overseas Bank Ltd 4,442
2,419,000 Hong Kong & China Gas Co Ltd 4,383
The CBI requires a Schedule of material changes in the composition of the portfolio during the financial year. These are defined as aggregate
purchases of a security exceeding one per cent of the total value of purchases for the financial year and aggregate disposals greater than one
per cent of the total value of sales. At a minimum the largest 20 purchases and 20 sales must be given or all purchases and sales if less than
20. A full listing of the portfolio changes for the financial year is available, upon request, at no cost from the Administrator.
PurchasesQuantity Investment
CostUSD’000
3,658,200 AIA Group Ltd 35,739
534,179 Commonwealth Bank of Australia 27,241
137,793 CSL Ltd 26,198
889,721 BHP Group Ltd 21,583
1,357,655 National Australia Bank Ltd 19,676
1,267,509 Westpac Banking Corp 19,356
845,945 Australia & New Zealand Banking Group Ltd 12,999
303,041 Hong Kong Exchanges & Clearing Ltd 10,287
117,791 Macquarie Group Ltd 9,982
390,615 Woolworths Group Ltd 9,932
345,324 Wesfarmers Ltd 9,438
537,200 DBS Group Holdings Ltd 9,274
907,028 Northern Star Resources Ltd 8,914
878,544 Transurban Group 8,606
2,302,300 Budweiser Brewing Co APAC Ltd 8,406
261,749 Afterpay Ltd 8,285
1,084,300 Oversea-Chinese Banking Corp Ltd 8,154
1,984,612 Evolution Mining Ltd 8,038
111,253 Rio Tinto Ltd 7,006
817,500 CK Hutchison Holdings Ltd 6,898
471,000 Sun Hung Kai Properties Ltd 6,656
804,603 Fortescue Metals Group Ltd 6,527
179,860 Magellan Financial Group Ltd 6,326
631,000 Link REIT (REIT) 6,256
597,132 Coles Group Ltd 6,090
3,152,000 Hong Kong & China Gas Co Ltd 5,906
iSHARES VII PLC
SCHEDULE OF MATERIAL PURCHASES AND SALES (UNAUDITED) (continued)
For the financial year ended 31 July 2020iSHARES CORE MSCI PACIFIC EX-JAPAN UCITS ETF
[264 ]
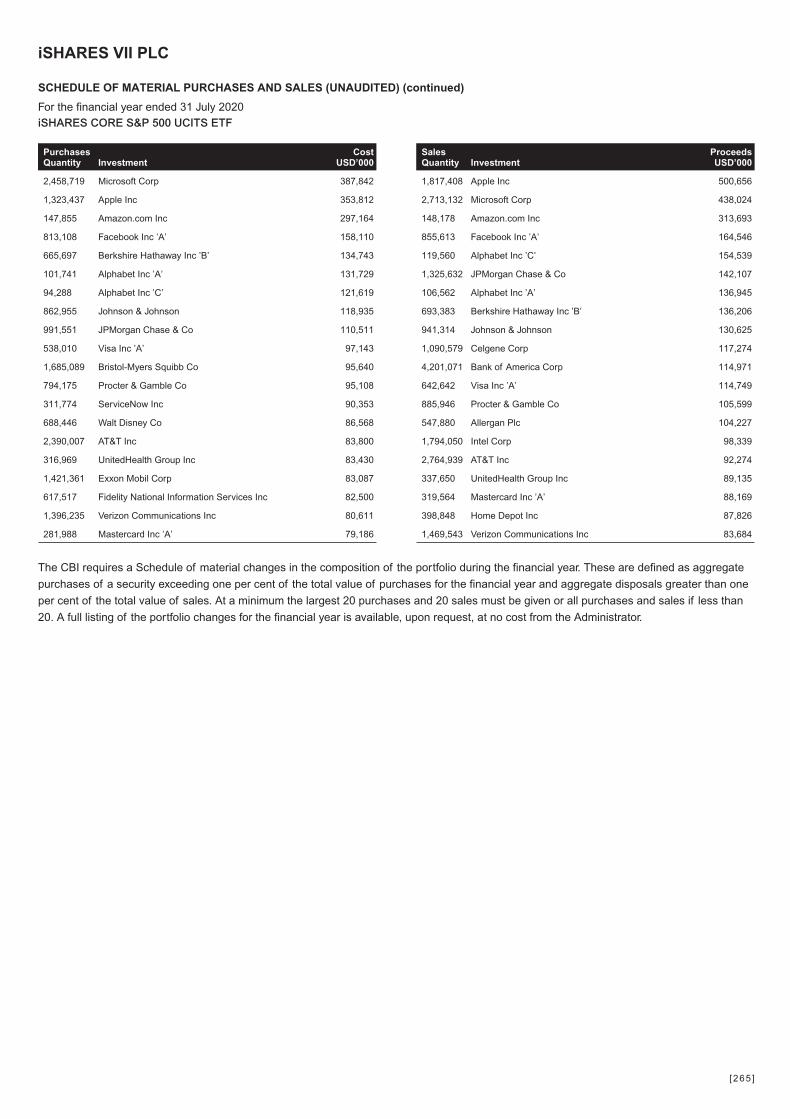
SalesQuantity Investment
ProceedsUSD’000
1,817,408 Apple Inc 500,656
2,713,132 Microsoft Corp 438,024
148,178 Amazon.com Inc 313,693
855,613 Facebook Inc ’A’ 164,546
119,560 Alphabet Inc ’C’ 154,539
1,325,632 JPMorgan Chase & Co 142,107
106,562 Alphabet Inc ’A’ 136,945
693,383 Berkshire Hathaway Inc ’B’ 136,206
941,314 Johnson & Johnson 130,625
1,090,579 Celgene Corp 117,274
4,201,071 Bank of America Corp 114,971
642,642 Visa Inc ’A’ 114,749
885,946 Procter & Gamble Co 105,599
547,880 Allergan Plc 104,227
1,794,050 Intel Corp 98,339
2,764,939 AT&T Inc 92,274
337,650 UnitedHealth Group Inc 89,135
319,564 Mastercard Inc ’A’ 88,169
398,848 Home Depot Inc 87,826
1,469,543 Verizon Communications Inc 83,684
The CBI requires a Schedule of material changes in the composition of the portfolio during the financial year. These are defined as aggregate
purchases of a security exceeding one per cent of the total value of purchases for the financial year and aggregate disposals greater than one
per cent of the total value of sales. At a minimum the largest 20 purchases and 20 sales must be given or all purchases and sales if less than
20. A full listing of the portfolio changes for the financial year is available, upon request, at no cost from the Administrator.
PurchasesQuantity Investment
CostUSD’000
2,458,719 Microsoft Corp 387,842
1,323,437 Apple Inc 353,812
147,855 Amazon.com Inc 297,164
813,108 Facebook Inc ’A’ 158,110
665,697 Berkshire Hathaway Inc ’B’ 134,743
101,741 Alphabet Inc ’A’ 131,729
94,288 Alphabet Inc ’C’ 121,619
862,955 Johnson & Johnson 118,935
991,551 JPMorgan Chase & Co 110,511
538,010 Visa Inc ’A’ 97,143
1,685,089 Bristol-Myers Squibb Co 95,640
794,175 Procter & Gamble Co 95,108
311,774 ServiceNow Inc 90,353
688,446 Walt Disney Co 86,568
2,390,007 AT&T Inc 83,800
316,969 UnitedHealth Group Inc 83,430
1,421,361 Exxon Mobil Corp 83,087
617,517 Fidelity National Information Services Inc 82,500
1,396,235 Verizon Communications Inc 80,611
281,988 Mastercard Inc ’A’ 79,186
iSHARES VII PLC
SCHEDULE OF MATERIAL PURCHASES AND SALES (UNAUDITED) (continued)
For the financial year ended 31 July 2020iSHARES CORE S&P 500 UCITS ETF
[265 ]
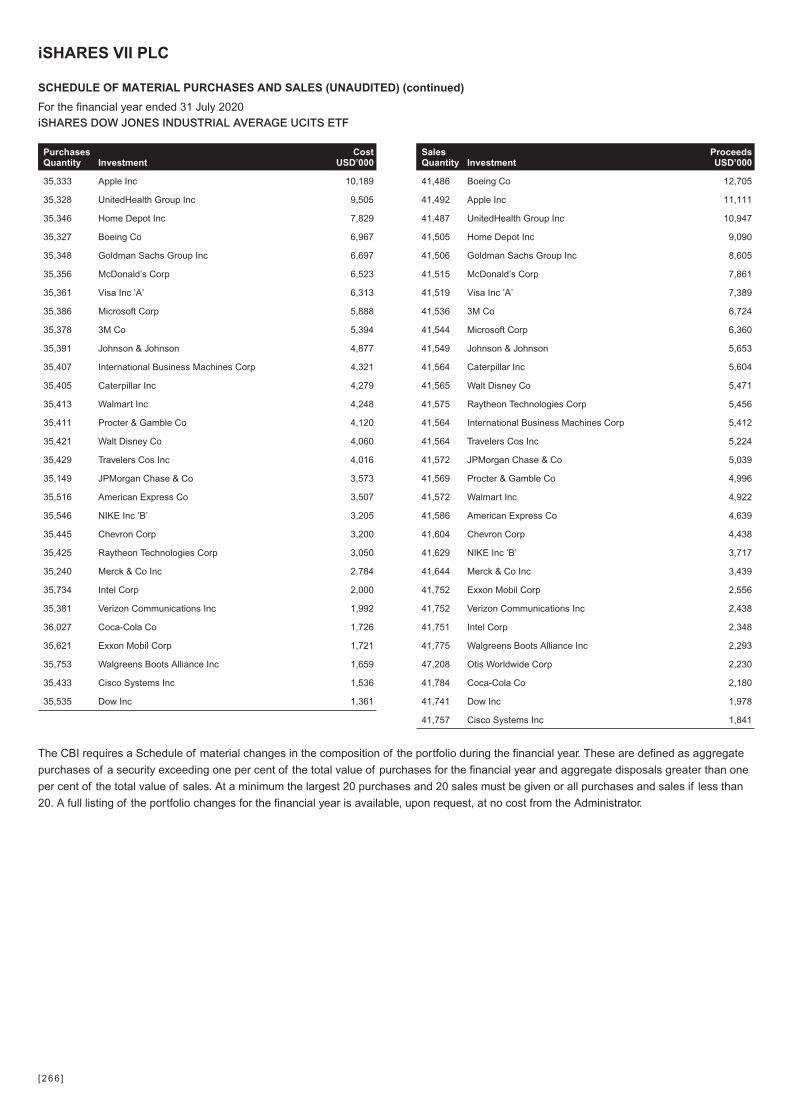
SalesQuantity Investment
ProceedsUSD’000
41,486 Boeing Co 12,705
41,492 Apple Inc 11,111
41,487 UnitedHealth Group Inc 10,947
41,505 Home Depot Inc 9,090
41,506 Goldman Sachs Group Inc 8,605
41,515 McDonald’s Corp 7,861
41,519 Visa Inc ’A’ 7,389
41,536 3M Co 6,724
41,544 Microsoft Corp 6,360
41,549 Johnson & Johnson 5,653
41,564 Caterpillar Inc 5,604
41,565 Walt Disney Co 5,471
41,575 Raytheon Technologies Corp 5,456
41,564 International Business Machines Corp 5,412
41,564 Travelers Cos Inc 5,224
41,572 JPMorgan Chase & Co 5,039
41,569 Procter & Gamble Co 4,996
41,572 Walmart Inc 4,922
41,586 American Express Co 4,639
41,604 Chevron Corp 4,438
41,629 NIKE Inc ’B’ 3,717
41,644 Merck & Co Inc 3,439
41,752 Exxon Mobil Corp 2,556
41,752 Verizon Communications Inc 2,438
41,751 Intel Corp 2,348
41,775 Walgreens Boots Alliance Inc 2,293
47,208 Otis Worldwide Corp 2,230
41,784 Coca-Cola Co 2,180
41,741 Dow Inc 1,978
41,757 Cisco Systems Inc 1,841
The CBI requires a Schedule of material changes in the composition of the portfolio during the financial year. These are defined as aggregate
purchases of a security exceeding one per cent of the total value of purchases for the financial year and aggregate disposals greater than one
per cent of the total value of sales. At a minimum the largest 20 purchases and 20 sales must be given or all purchases and sales if less than
20. A full listing of the portfolio changes for the financial year is available, upon request, at no cost from the Administrator.
PurchasesQuantity Investment
CostUSD’000
35,333 Apple Inc 10,189
35,328 UnitedHealth Group Inc 9,505
35,346 Home Depot Inc 7,829
35,327 Boeing Co 6,967
35,348 Goldman Sachs Group Inc 6,697
35,356 McDonald’s Corp 6,523
35,361 Visa Inc ’A’ 6,313
35,386 Microsoft Corp 5,888
35,378 3M Co 5,394
35,391 Johnson & Johnson 4,877
35,407 International Business Machines Corp 4,321
35,405 Caterpillar Inc 4,279
35,413 Walmart Inc 4,248
35,411 Procter & Gamble Co 4,120
35,421 Walt Disney Co 4,060
35,429 Travelers Cos Inc 4,016
35,149 JPMorgan Chase & Co 3,573
35,516 American Express Co 3,507
35,546 NIKE Inc ’B’ 3,205
35,445 Chevron Corp 3,200
35,425 Raytheon Technologies Corp 3,050
35,240 Merck & Co Inc 2,784
35,734 Intel Corp 2,000
35,381 Verizon Communications Inc 1,992
36,027 Coca-Cola Co 1,726
35,621 Exxon Mobil Corp 1,721
35,753 Walgreens Boots Alliance Inc 1,659
35,433 Cisco Systems Inc 1,536
35,535 Dow Inc 1,361
iSHARES VII PLC
SCHEDULE OF MATERIAL PURCHASES AND SALES (UNAUDITED) (continued)
For the financial year ended 31 July 2020iSHARES DOW JONES INDUSTRIAL AVERAGE UCITS ETF
[266 ]
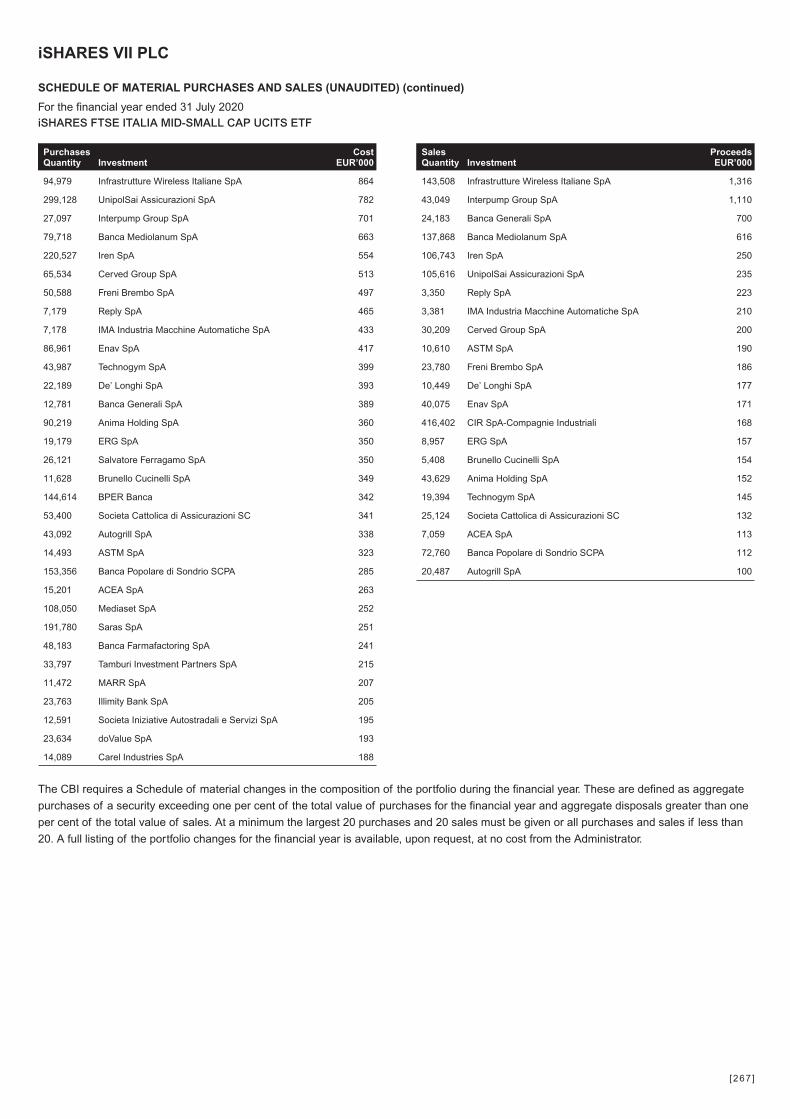
SalesQuantity Investment
ProceedsEUR’000
143,508 Infrastrutture Wireless Italiane SpA 1,316
43,049 Interpump Group SpA 1,110
24,183 Banca Generali SpA 700
137,868 Banca Mediolanum SpA 616
106,743 Iren SpA 250
105,616 UnipolSai Assicurazioni SpA 235
3,350 Reply SpA 223
3,381 IMA Industria Macchine Automatiche SpA 210
30,209 Cerved Group SpA 200
10,610 ASTM SpA 190
23,780 Freni Brembo SpA 186
10,449 De’ Longhi SpA 177
40,075 Enav SpA 171
416,402 CIR SpA-Compagnie Industriali 168
8,957 ERG SpA 157
5,408 Brunello Cucinelli SpA 154
43,629 Anima Holding SpA 152
19,394 Technogym SpA 145
25,124 Societa Cattolica di Assicurazioni SC 132
7,059 ACEA SpA 113
72,760 Banca Popolare di Sondrio SCPA 112
20,487 Autogrill SpA 100
The CBI requires a Schedule of material changes in the composition of the portfolio during the financial year. These are defined as aggregate
purchases of a security exceeding one per cent of the total value of purchases for the financial year and aggregate disposals greater than one
per cent of the total value of sales. At a minimum the largest 20 purchases and 20 sales must be given or all purchases and sales if less than
20. A full listing of the portfolio changes for the financial year is available, upon request, at no cost from the Administrator.
PurchasesQuantity Investment
CostEUR’000
94,979 Infrastrutture Wireless Italiane SpA 864
299,128 UnipolSai Assicurazioni SpA 782
27,097 Interpump Group SpA 701
79,718 Banca Mediolanum SpA 663
220,527 Iren SpA 554
65,534 Cerved Group SpA 513
50,588 Freni Brembo SpA 497
7,179 Reply SpA 465
7,178 IMA Industria Macchine Automatiche SpA 433
86,961 Enav SpA 417
43,987 Technogym SpA 399
22,189 De’ Longhi SpA 393
12,781 Banca Generali SpA 389
90,219 Anima Holding SpA 360
19,179 ERG SpA 350
26,121 Salvatore Ferragamo SpA 350
11,628 Brunello Cucinelli SpA 349
144,614 BPER Banca 342
53,400 Societa Cattolica di Assicurazioni SC 341
43,092 Autogrill SpA 338
14,493 ASTM SpA 323
153,356 Banca Popolare di Sondrio SCPA 285
15,201 ACEA SpA 263
108,050 Mediaset SpA 252
191,780 Saras SpA 251
48,183 Banca Farmafactoring SpA 241
33,797 Tamburi Investment Partners SpA 215
11,472 MARR SpA 207
23,763 Illimity Bank SpA 205
12,591 Societa Iniziative Autostradali e Servizi SpA 195
23,634 doValue SpA 193
14,089 Carel Industries SpA 188
iSHARES VII PLC
SCHEDULE OF MATERIAL PURCHASES AND SALES (UNAUDITED) (continued)
For the financial year ended 31 July 2020iSHARES FTSE ITALIA MID-SMALL CAP UCITS ETF
[267 ]

SalesQuantity Investment
ProceedsEUR’000
2,195,157 Enel SpA 14,986
3,817,787 Intesa Sanpaolo SpA 7,517
603,090 Eni SpA 7,205
558,303 UniCredit SpA 5,603
318,002 Assicurazioni Generali SpA 5,116
30,321 Ferrari NV 4,439
157,588 STMicroelectronics NV (Italy listed) 3,359
272,481 Fiat Chrysler Automobiles NV 3,047
139,483 Atlantia SpA 2,764
575,603 Snam SpA 2,570
258,116 CNH Industrial NV 2,106
346,519 Terna Rete Elettrica Nazionale SpA 2,020
204,332 Mediobanca Banca di Credito Finanziario SpA 1,722
28,031 EXOR NV 1,686
45,755 Moncler SpA 1,606
67,093 Prysmian SpA 1,329
2,639,192 Telecom Italia SpA 1,205
115,758 Poste Italiane SpA 1,089
114,079 Tenaris SA 977
120,314 Davide Campari-Milano SpA 958
80,658 Nexi SpA 956
23,266 Recordati SpA 922
The CBI requires a Schedule of material changes in the composition of the portfolio during the financial year. These are defined as aggregate
purchases of a security exceeding one per cent of the total value of purchases for the financial year and aggregate disposals greater than one
per cent of the total value of sales. At a minimum the largest 20 purchases and 20 sales must be given or all purchases and sales if less than
20. A full listing of the portfolio changes for the financial year is available, upon request, at no cost from the Administrator.
PurchasesQuantity Investment
CostEUR’000
2,656,519 Enel SpA 19,267
6,093,334 Intesa Sanpaolo SpA 11,159
1,036,346 Eni SpA 10,211
925,478 UniCredit SpA 8,556
546,102 Assicurazioni Generali SpA 7,880
52,054 Ferrari NV 7,724
274,292 STMicroelectronics NV (Italy listed) 6,155
478,806 Fiat Chrysler Automobiles NV 4,383
956,583 Snam SpA 4,183
601,192 Terna Rete Elettrica Nazionale SpA 3,624
222,699 Atlantia SpA 3,583
445,633 CNH Industrial NV 3,066
84,417 Moncler SpA 2,866
358,690 Mediobanca Banca di Credito Finanziario SpA 2,672
47,207 EXOR NV 2,492
167,656 Nexi SpA 2,321
106,474 Prysmian SpA 2,119
170,791 FinecoBank Banca Fineco SpA 1,988
4,631,758 Telecom Italia SpA 1,892
41,915 Recordati SpA 1,741
200,510 Poste Italiane SpA 1,738
214,435 Davide Campari-Milano SpA 1,617
9,736 DiaSorin SpA 1,433
201,558 Tenaris SA 1,368
142,815 Infrastrutture Wireless Italiane SpA 1,309
iSHARES VII PLC
SCHEDULE OF MATERIAL PURCHASES AND SALES (UNAUDITED) (continued)
For the financial year ended 31 July 2020iSHARES FTSE MIB UCITS ETF EUR (ACC)
[268 ]

SalesQuantity Investment
ProceedsUSD’000
409,093 Itau Unibanco Holding SA (Pref) 3,423
267,436 Vale SA 3,120
340,118 Banco Bradesco SA (Pref) 2,758
354,583 Petroleo Brasileiro SA (Pref) 2,336
173,823 B3 SA - Brasil Bolsa Balcao 1,870
398,227 Ambev SA 1,860
251,313 Petroleo Brasileiro SA 1,834
372,143 Itausa SA 1,175
72,478 Banco do Brasil SA 818
66,885 Lojas Renner SA 818
102,029 Banco Bradesco SA 761
91,978 JBS SA 658
48,691 Localiza Rent a Car SA 539
19,716 IRB Brasil Resseguros S/A 534
91,952 Rumo SA 522
37,992 Telefonica Brasil SA (Pref) 498
59,411 BB Seguridade Participacoes SA 493
51,389 Magazine Luiza SA 444
19,467 Raia Drogasil SA 437
47,899 BRF SA 436
101,859 CCR SA 426
70,704 WEG SA 404
58,897 Petrobras Distribuidora SA 382
28,970 Notre Dame Intermedica Participacoes SA 375
34,737 Banco Santander Brasil SA 371
45,836 Suzano SA 365
14,478 Equatorial Energia SA 357
28,770 Cia de Saneamento Basico do Estado de Sao Paulo 353
The CBI requires a Schedule of material changes in the composition of the portfolio during the financial year. These are defined as aggregate
purchases of a security exceeding one per cent of the total value of purchases for the financial year and aggregate disposals greater than one
per cent of the total value of sales. At a minimum the largest 20 purchases and 20 sales must be given or all purchases and sales if less than
20. A full listing of the portfolio changes for the financial year is available, upon request, at no cost from the Administrator.
PurchasesQuantity Investment
CostUSD’000
2,149 B2W Cia Digital 22
1,840 Itau Unibanco Holding SA (Pref) 15
966 Vale SA 10
1,269 Banco Bradesco SA (Pref) 10
1,479 Petroleo Brasileiro SA (Pref) 9
1,832 Ambev SA 8
770 B3 SA - Brasil Bolsa Balcao 8
1,122 Petroleo Brasileiro SA 7
322 Lojas Renner SA 4
326 Centrais Eletricas Brasileiras SA (Pref) ’B’ 3
468 Petrobras Distribuidora SA 3
206 Natura Cosmeticos SA 3
373 Magazine Luiza SA 3
369 BB Seguridade Participacoes SA 3
957 Itausa SA 3
250 Localiza Rent a Car SA 3
214 Telefonica Brasil SA (Pref) 3
110 IRB Brasil Resseguros S/A 3
499 Rumo SA 3
374 Banco Bradesco SA 3
227 Energisa SA 3
773 BR Malls Participacoes SA 3
378 JBS SA 3
244 Engie Brasil Energia SA 3
593 Embraer SA 3
234 Banco do Brasil SA 2
1,063 Cogna Educacao SA 2
112 Equatorial Energia SA 2
214 Sul America SA 2
872 Gerdau SA 2
239 Centrais Eletricas Brasileiras SA 2
iSHARES VII PLC
SCHEDULE OF MATERIAL PURCHASES AND SALES (UNAUDITED) (continued)
For the financial year ended 31 July 2020iSHARES MSCI BRAZIL UCITS ETF USD (ACC)
[269 ]

SalesQuantity Investment
ProceedsUSD’000
187,574 Royal Bank of Canada 12,716
239,423 Toronto-Dominion Bank 11,109
258,543 Enbridge Inc 8,425
96,297 Canadian National Railway Co 8,124
160,056 Bank of Nova Scotia 7,112
12,664 Shopify Inc ’A’ 6,969
145,990 Brookfield Asset Management Inc ’A’ 5,838
115,755 TC Energy Corp 5,453
228,089 Barrick Gold Corp 5,039
218,972 Suncor Energy Inc 4,689
80,412 Bank of Montreal 4,561
18,866 Canadian Pacific Railway Ltd 4,411
56,358 Canadian Imperial Bank of Commerce 3,779
254,135 Manulife Financial Corp 3,626
88,161 Nutrien Ltd 3,476
110,025 Alimentation Couche-Tard Inc ’B’ 3,357
121,329 Stars Group Inc 3,161
158,426 Canadian Natural Resources Ltd 3,030
79,576 Sun Life Financial Inc 2,987
23,713 Franco-Nevada Corp 2,836
2,586 Constellation Software Inc 2,611
36,331 Thomson Reuters Corp 2,498
50,555 Magna International Inc 2,250
32,959 CGI Inc 2,245
49,633 Rogers Communications Inc ’B’ 2,194
54,906 Fortis Inc 2,161
56,594 Wheaton Precious Metals Corp 1,950
34,977 Restaurant Brands International Inc 1,869
42,718 National Bank of Canada 1,864
69,103 Pembina Pipeline Corp 1,825
The CBI requires a Schedule of material changes in the composition of the portfolio during the financial year. These are defined as aggregate
purchases of a security exceeding one per cent of the total value of purchases for the financial year and aggregate disposals greater than one
per cent of the total value of sales. At a minimum the largest 20 purchases and 20 sales must be given or all purchases and sales if less than
20. A full listing of the portfolio changes for the financial year is available, upon request, at no cost from the Administrator.
PurchasesQuantity Investment
CostUSD’000
121,453 Royal Bank of Canada 9,021
153,001 Toronto-Dominion Bank 7,867
172,750 Enbridge Inc 6,046
11,036 Shopify Inc ’A’ 5,552
60,857 Canadian National Railway Co 5,334
102,799 Bank of Nova Scotia 5,176
106,796 Brookfield Asset Management Inc ’A’ 5,174
104,013 Emera Inc 4,410
302,148 Algonquin Power & Utilities Corp 4,163
84,012 TC Energy Corp 4,128
54,415 Bank of Montreal 3,620
131,025 Suncor Energy Inc 3,377
165,077 Barrick Gold Corp 3,286
38,199 Canadian Imperial Bank of Commerce 2,898
11,544 Canadian Pacific Railway Ltd 2,781
94,112 Pan American Silver Corp 2,758
163,398 Manulife Financial Corp 2,750
43,694 Restaurant Brands International Inc 2,688
76,335 Parkland Fuel Corp 2,671
464,721 B2Gold Corp 2,552
25,271 TMX Group Ltd 2,522
100,110 Canadian Natural Resources Ltd 2,359
75,916 Air Canada 2,303
426,620 Yamana Gold Inc 2,299
55,725 Kirkland Lake Gold Ltd 2,294
69,511 Alimentation Couche-Tard Inc ’B’ 2,232
49,123 Ritchie Bros Auctioneers Inc 2,115
64,075 Pembina Pipeline Corp 2,114
49,159 Nutrien Ltd 2,087
51,968 Fortis Inc 2,074
50,027 Sun Life Financial Inc 2,074
45,129 Canadian Apartment Properties REIT (REIT) 1,844
16,577 Franco-Nevada Corp 1,838
1,718 Constellation Software Inc 1,761
iSHARES VII PLC
SCHEDULE OF MATERIAL PURCHASES AND SALES (UNAUDITED) (continued)
For the financial year ended 31 July 2020iSHARES MSCI CANADA UCITS ETF
[270 ]
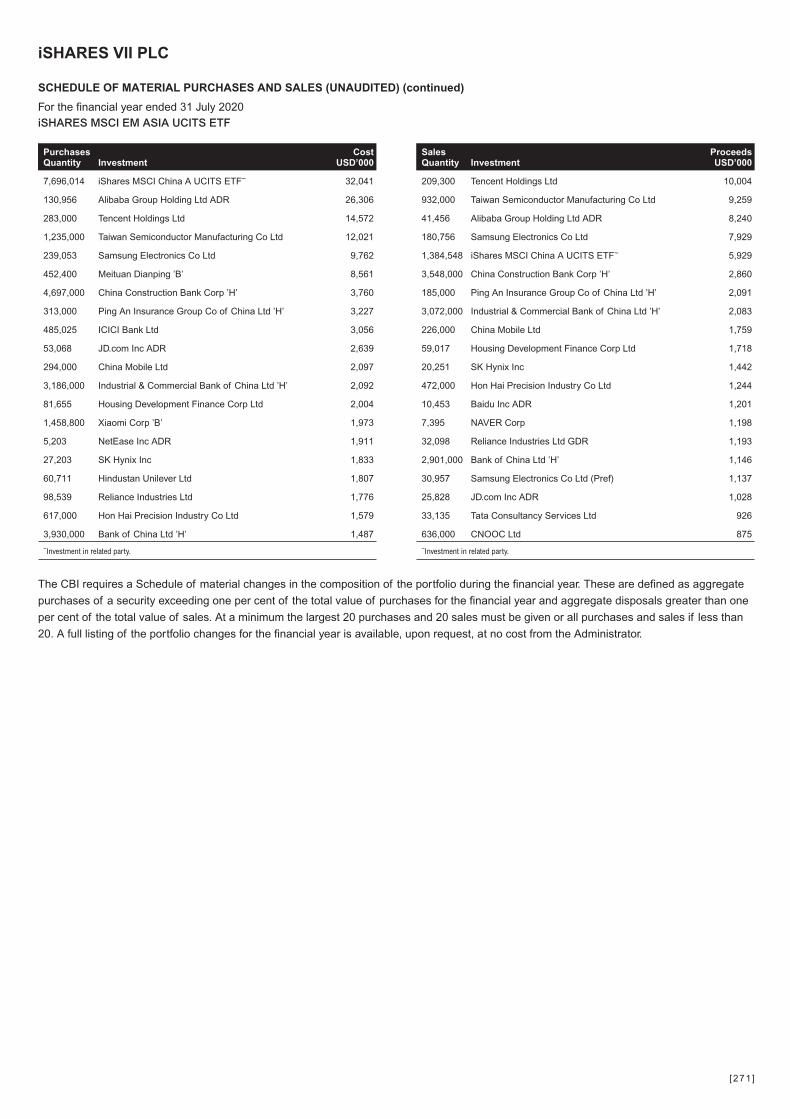
SalesQuantity Investment
ProceedsUSD’000
209,300 Tencent Holdings Ltd 10,004
932,000 Taiwan Semiconductor Manufacturing Co Ltd 9,259
41,456 Alibaba Group Holding Ltd ADR 8,240
180,756 Samsung Electronics Co Ltd 7,929
1,384,548 iShares MSCI China A UCITS ETF~ 5,929
3,548,000 China Construction Bank Corp ’H’ 2,860
185,000 Ping An Insurance Group Co of China Ltd ’H’ 2,091
3,072,000 Industrial & Commercial Bank of China Ltd ’H’ 2,083
226,000 China Mobile Ltd 1,759
59,017 Housing Development Finance Corp Ltd 1,718
20,251 SK Hynix Inc 1,442
472,000 Hon Hai Precision Industry Co Ltd 1,244
10,453 Baidu Inc ADR 1,201
7,395 NAVER Corp 1,198
32,098 Reliance Industries Ltd GDR 1,193
2,901,000 Bank of China Ltd ’H’ 1,146
30,957 Samsung Electronics Co Ltd (Pref) 1,137
25,828 JD.com Inc ADR 1,028
33,135 Tata Consultancy Services Ltd 926
636,000 CNOOC Ltd 875
~Investment in related party.
The CBI requires a Schedule of material changes in the composition of the portfolio during the financial year. These are defined as aggregate
purchases of a security exceeding one per cent of the total value of purchases for the financial year and aggregate disposals greater than one
per cent of the total value of sales. At a minimum the largest 20 purchases and 20 sales must be given or all purchases and sales if less than
20. A full listing of the portfolio changes for the financial year is available, upon request, at no cost from the Administrator.
PurchasesQuantity Investment
CostUSD’000
7,696,014 iShares MSCI China A UCITS ETF~ 32,041
130,956 Alibaba Group Holding Ltd ADR 26,306
283,000 Tencent Holdings Ltd 14,572
1,235,000 Taiwan Semiconductor Manufacturing Co Ltd 12,021
239,053 Samsung Electronics Co Ltd 9,762
452,400 Meituan Dianping ’B’ 8,561
4,697,000 China Construction Bank Corp ’H’ 3,760
313,000 Ping An Insurance Group Co of China Ltd ’H’ 3,227
485,025 ICICI Bank Ltd 3,056
53,068 JD.com Inc ADR 2,639
294,000 China Mobile Ltd 2,097
3,186,000 Industrial & Commercial Bank of China Ltd ’H’ 2,092
81,655 Housing Development Finance Corp Ltd 2,004
1,458,800 Xiaomi Corp ’B’ 1,973
5,203 NetEase Inc ADR 1,911
27,203 SK Hynix Inc 1,833
60,711 Hindustan Unilever Ltd 1,807
98,539 Reliance Industries Ltd 1,776
617,000 Hon Hai Precision Industry Co Ltd 1,579
3,930,000 Bank of China Ltd ’H’ 1,487
~Investment in related party.
iSHARES VII PLC
SCHEDULE OF MATERIAL PURCHASES AND SALES (UNAUDITED) (continued)
For the financial year ended 31 July 2020iSHARES MSCI EM ASIA UCITS ETF
[271 ]
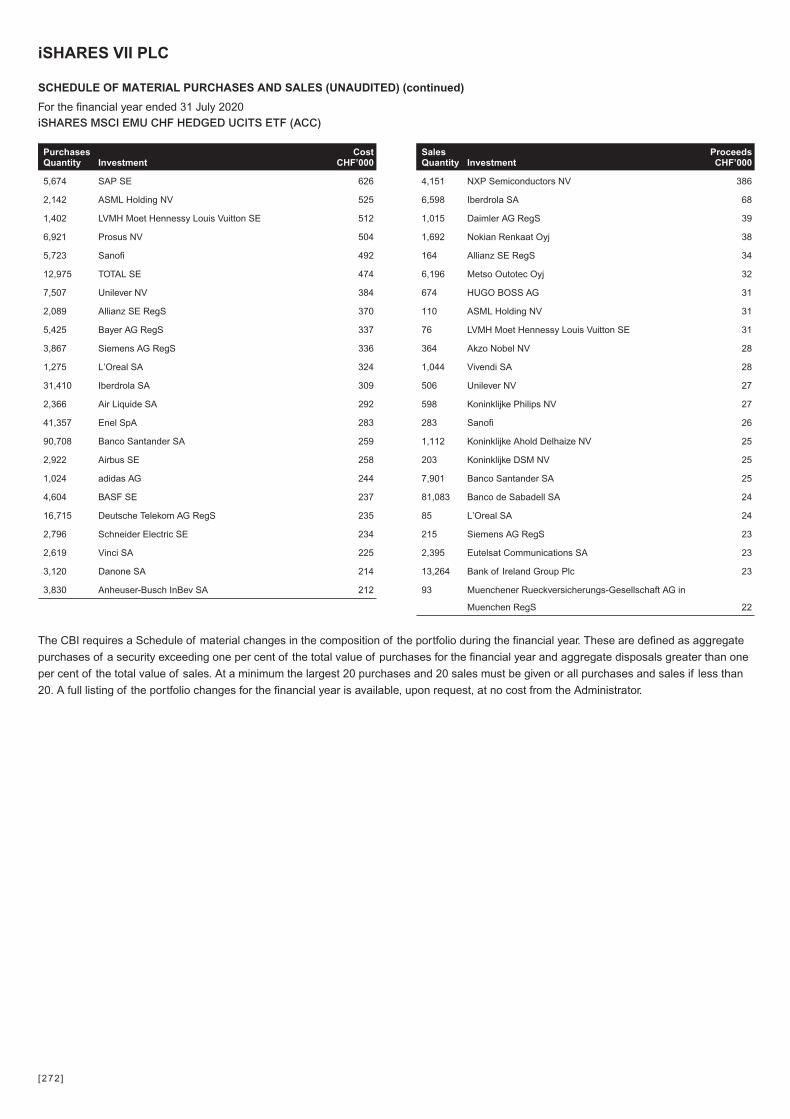
SalesQuantity Investment
ProceedsCHF’000
4,151 NXP Semiconductors NV 386
6,598 Iberdrola SA 68
1,015 Daimler AG RegS 39
1,692 Nokian Renkaat Oyj 38
164 Allianz SE RegS 34
6,196 Metso Outotec Oyj 32
674 HUGO BOSS AG 31
110 ASML Holding NV 31
76 LVMH Moet Hennessy Louis Vuitton SE 31
364 Akzo Nobel NV 28
1,044 Vivendi SA 28
506 Unilever NV 27
598 Koninklijke Philips NV 27
283 Sanofi 26
1,112 Koninklijke Ahold Delhaize NV 25
203 Koninklijke DSM NV 25
7,901 Banco Santander SA 25
81,083 Banco de Sabadell SA 24
85 L’Oreal SA 24
215 Siemens AG RegS 23
2,395 Eutelsat Communications SA 23
13,264 Bank of Ireland Group Plc 23
93 Muenchener Rueckversicherungs-Gesellschaft AG in
Muenchen RegS 22
The CBI requires a Schedule of material changes in the composition of the portfolio during the financial year. These are defined as aggregate
purchases of a security exceeding one per cent of the total value of purchases for the financial year and aggregate disposals greater than one
per cent of the total value of sales. At a minimum the largest 20 purchases and 20 sales must be given or all purchases and sales if less than
20. A full listing of the portfolio changes for the financial year is available, upon request, at no cost from the Administrator.
PurchasesQuantity Investment
CostCHF’000
5,674 SAP SE 626
2,142 ASML Holding NV 525
1,402 LVMH Moet Hennessy Louis Vuitton SE 512
6,921 Prosus NV 504
5,723 Sanofi 492
12,975 TOTAL SE 474
7,507 Unilever NV 384
2,089 Allianz SE RegS 370
5,425 Bayer AG RegS 337
3,867 Siemens AG RegS 336
1,275 L’Oreal SA 324
31,410 Iberdrola SA 309
2,366 Air Liquide SA 292
41,357 Enel SpA 283
90,708 Banco Santander SA 259
2,922 Airbus SE 258
1,024 adidas AG 244
4,604 BASF SE 237
16,715 Deutsche Telekom AG RegS 235
2,796 Schneider Electric SE 234
2,619 Vinci SA 225
3,120 Danone SA 214
3,830 Anheuser-Busch InBev SA 212
iSHARES VII PLC
SCHEDULE OF MATERIAL PURCHASES AND SALES (UNAUDITED) (continued)
For the financial year ended 31 July 2020iSHARES MSCI EMU CHF HEDGED UCITS ETF (ACC)
[272 ]

SalesQuantity Investment
ProceedsEUR’000
141,424 LEG Immobilien AG 15,395
221,820 Scout24 AG 14,340
77,000 Galapagos NV 13,280
148,923 InterXion Holding NV 10,097
92,629 Orpea 9,510
51,547 DiaSorin SpA 8,710
118,273 Nemetschek SE 7,636
31,790 Sofina SA 7,359
65,125 Just Eat Takeaway.com NV 5,988
149,133 OSRAM Licht AG 5,816
56,746 Elia Group SA 5,768
991,263 Altice Europe NV 5,248
504,018 Infrastrutture Wireless Italiane SpA 4,652
143,892 TLG Immobilien AG 4,317
24,270 Argenx SE 3,043
31,705 ASM International NV 2,927
31,472 Euronext NV 2,372
51,877 Rubis SCA 2,191
80,172 HelloFresh SE 2,110
30,323 IMCD NV 2,001
The CBI requires a Schedule of material changes in the composition of the portfolio during the financial year. These are defined as aggregate
purchases of a security exceeding one per cent of the total value of purchases for the financial year and aggregate disposals greater than one
per cent of the total value of sales. At a minimum the largest 20 purchases and 20 sales must be given or all purchases and sales if less than
20. A full listing of the portfolio changes for the financial year is available, upon request, at no cost from the Administrator.
PurchasesQuantity Investment
CostEUR’000
50,193 Argenx SE 6,775
135,746 HUGO BOSS AG 5,559
48,463 LEG Immobilien AG 5,100
219,129 Nokian Renkaat Oyj 4,576
884,465 Metso Outotec Oyj 4,399
37,823 ASM International NV 3,835
64,429 Scout24 AG 3,636
73,576 Rubis SCA 3,617
43,270 InterXion Holding NV 3,399
55,803 Societe BIC SA 3,391
131,730 Signify NV 3,296
129,396 TietoEVRY Oyj 3,279
92,379 BAWAG Group AG 3,240
106,024 ASR Nederland NV 3,233
301,430 Merlin Properties Socimi SA (REIT) 3,226
41,884 Euronext NV 3,197
23,411 Cofinimmo SA (REIT) 3,123
32,692 Rheinmetall AG 3,022
86,944 Kesko Oyj ’B’ 3,015
39,823 IMCD NV 2,963
iSHARES VII PLC
SCHEDULE OF MATERIAL PURCHASES AND SALES (UNAUDITED) (continued)
For the financial year ended 31 July 2020iSHARES MSCI EMU SMALL CAP UCITS ETF
[273 ]

SalesQuantity Investment
ProceedsUSD’000
9,972 ASML Holding NV 3,002
22,920 SAP SE 2,917
6,529 LVMH Moet Hennessy Louis Vuitton SE 2,760
26,438 Sanofi 2,560
55,121 TOTAL SE 2,388
10,197 Allianz SE RegS 2,138
19,963 NXP Semiconductors NV 1,998
18,083 Siemens AG RegS 1,997
34,862 Unilever NV 1,860
158,384 Iberdrola SA 1,674
5,837 L’Oreal SA 1,652
22,937 Bayer AG RegS 1,634
11,154 Air Liquide SA 1,517
192,813 Enel SpA 1,494
13,677 Airbus SE 1,399
21,699 BASF SE 1,318
404,504 Banco Santander SA 1,279
12,976 Schneider Electric SE 1,274
79,344 Deutsche Telekom AG RegS 1,243
26,836 BNP Paribas SA 1,192
4,235 adidas AG 1,170
11,972 Vinci SA 1,149
17,962 Anheuser-Busch InBev SA 1,091
14,467 Danone SA 1,045
23,067 Koninklijke Philips NV 1,038
The CBI requires a Schedule of material changes in the composition of the portfolio during the financial year. These are defined as aggregate
purchases of a security exceeding one per cent of the total value of purchases for the financial year and aggregate disposals greater than one
per cent of the total value of sales. At a minimum the largest 20 purchases and 20 sales must be given or all purchases and sales if less than
20. A full listing of the portfolio changes for the financial year is available, upon request, at no cost from the Administrator.
PurchasesQuantity Investment
CostUSD’000
21,982 SAP SE 2,760
33,701 Prosus NV 2,558
50,339 TOTAL SE 2,301
5,462 LVMH Moet Hennessy Louis Vuitton SE 2,260
8,341 ASML Holding NV 2,235
22,401 Sanofi 2,071
8,234 Allianz SE RegS 1,792
29,403 Unilever NV 1,658
15,150 Siemens AG RegS 1,650
21,657 Bayer AG RegS 1,562
11,678 Airbus SE 1,426
4,825 L’Oreal SA 1,343
362,829 Banco Santander SA 1,298
121,583 Iberdrola SA 1,255
9,239 Air Liquide SA 1,253
161,622 Enel SpA 1,228
18,175 BASF SE 1,169
4,005 adidas AG 1,131
15,033 Anheuser-Busch InBev SA 1,083
22,519 BNP Paribas SA 1,068
66,556 Deutsche Telekom AG RegS 1,061
10,333 Vinci SA 1,043
10,999 Schneider Electric SE 1,033
12,146 Danone SA 955
iSHARES VII PLC
SCHEDULE OF MATERIAL PURCHASES AND SALES (UNAUDITED) (continued)
For the financial year ended 31 July 2020iSHARES MSCI EMU USD HEDGED UCITS ETF (ACC)
[274 ]

SalesQuantity Investment
ProceedsUSD’000
108,600 Toyota Motor Corp 6,899
51,300 Sony Corp 3,172
73,400 SoftBank Group Corp 3,095
6,800 Keyence Corp 2,644
83,600 KDDI Corp 2,377
497,000 Mitsubishi UFJ Financial Group Inc 2,173
59,100 Takeda Pharmaceutical Co Ltd 2,074
61,500 Recruit Holdings Co Ltd 2,002
70,200 NTT DOCOMO Inc 1,925
4,800 Nintendo Co Ltd 1,845
65,700 Honda Motor Co Ltd 1,649
14,900 Shin-Etsu Chemical Co Ltd 1,624
3,100 Fast Retailing Co Ltd 1,616
20,800 Kao Corp 1,605
53,600 Sumitomo Mitsui Financial Group Inc 1,594
22,500 Daiichi Sankyo Co Ltd 1,573
7,100 Tokyo Electron Ltd 1,413
10,400 Daikin Industries Ltd 1,404
15,400 Hoya Corp 1,346
55,800 Mitsubishi Corp 1,310
The CBI requires a Schedule of material changes in the composition of the portfolio during the financial year. These are defined as aggregate
purchases of a security exceeding one per cent of the total value of purchases for the financial year and aggregate disposals greater than one
per cent of the total value of sales. At a minimum the largest 20 purchases and 20 sales must be given or all purchases and sales if less than
20. A full listing of the portfolio changes for the financial year is available, upon request, at no cost from the Administrator.
PurchasesQuantity Investment
CostUSD’000
37,600 Toyota Motor Corp 2,621
43,500 Recruit Holdings Co Ltd 1,480
22,100 Sony Corp 1,475
34,000 Takeda Pharmaceutical Co Ltd 1,330
3,100 Keyence Corp 1,207
25,300 SoftBank Group Corp 1,096
199,900 Mitsubishi UFJ Financial Group Inc 1,052
1,800 Fast Retailing Co Ltd 1,009
29,500 KDDI Corp 876
360 Orix JREIT Inc (REIT) 795
2,000 Nintendo Co Ltd 782
26,500 Honda Motor Co Ltd 727
20,100 Sumitomo Mitsui Financial Group Inc 718
8,700 Kao Corp 700
8,500 Lasertec Corp 698
52,300 Softbank Corp 683
4,800 Daikin Industries Ltd 677
16,800 Nihon M&A Center Inc 676
1,400 SMC Corp 656
16,200 Hitachi Ltd 640
iSHARES VII PLC
SCHEDULE OF MATERIAL PURCHASES AND SALES (UNAUDITED) (continued)
For the financial year ended 31 July 2020iSHARES MSCI JAPAN UCITS ETF
[275 ]
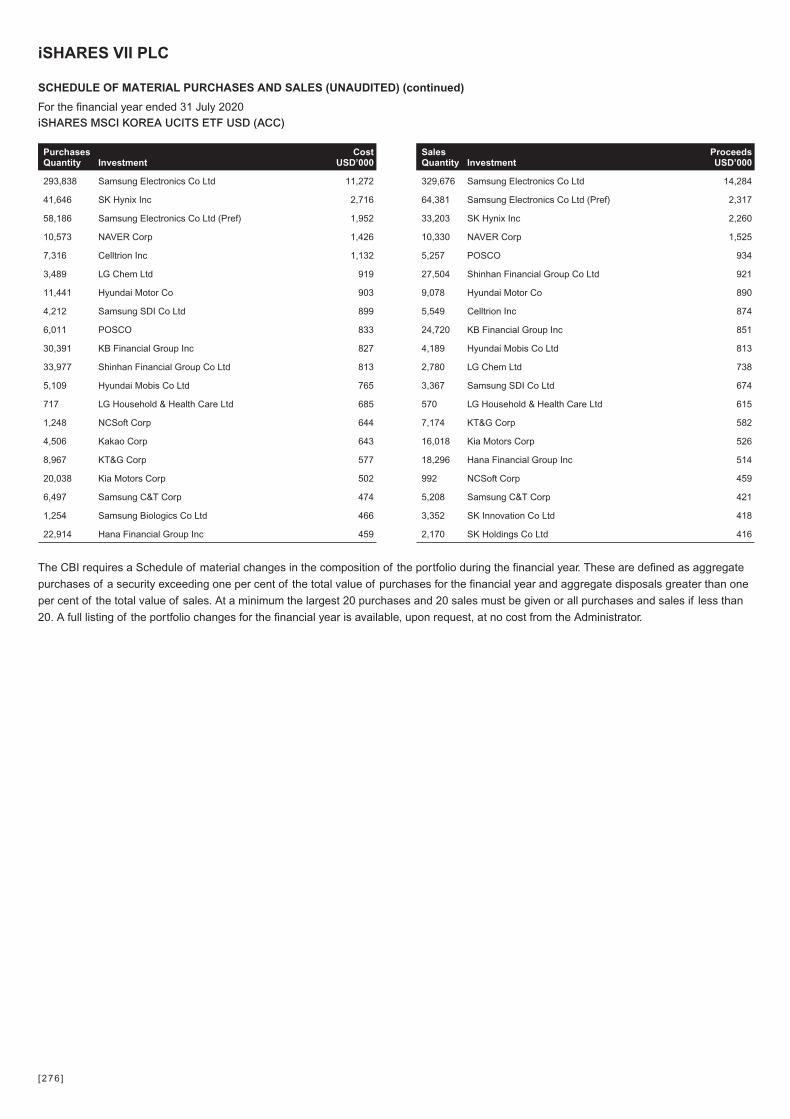
SalesQuantity Investment
ProceedsUSD’000
329,676 Samsung Electronics Co Ltd 14,284
64,381 Samsung Electronics Co Ltd (Pref) 2,317
33,203 SK Hynix Inc 2,260
10,330 NAVER Corp 1,525
5,257 POSCO 934
27,504 Shinhan Financial Group Co Ltd 921
9,078 Hyundai Motor Co 890
5,549 Celltrion Inc 874
24,720 KB Financial Group Inc 851
4,189 Hyundai Mobis Co Ltd 813
2,780 LG Chem Ltd 738
3,367 Samsung SDI Co Ltd 674
570 LG Household & Health Care Ltd 615
7,174 KT&G Corp 582
16,018 Kia Motors Corp 526
18,296 Hana Financial Group Inc 514
992 NCSoft Corp 459
5,208 Samsung C&T Corp 421
3,352 SK Innovation Co Ltd 418
2,170 SK Holdings Co Ltd 416
The CBI requires a Schedule of material changes in the composition of the portfolio during the financial year. These are defined as aggregate
purchases of a security exceeding one per cent of the total value of purchases for the financial year and aggregate disposals greater than one
per cent of the total value of sales. At a minimum the largest 20 purchases and 20 sales must be given or all purchases and sales if less than
20. A full listing of the portfolio changes for the financial year is available, upon request, at no cost from the Administrator.
PurchasesQuantity Investment
CostUSD’000
293,838 Samsung Electronics Co Ltd 11,272
41,646 SK Hynix Inc 2,716
58,186 Samsung Electronics Co Ltd (Pref) 1,952
10,573 NAVER Corp 1,426
7,316 Celltrion Inc 1,132
3,489 LG Chem Ltd 919
11,441 Hyundai Motor Co 903
4,212 Samsung SDI Co Ltd 899
6,011 POSCO 833
30,391 KB Financial Group Inc 827
33,977 Shinhan Financial Group Co Ltd 813
5,109 Hyundai Mobis Co Ltd 765
717 LG Household & Health Care Ltd 685
1,248 NCSoft Corp 644
4,506 Kakao Corp 643
8,967 KT&G Corp 577
20,038 Kia Motors Corp 502
6,497 Samsung C&T Corp 474
1,254 Samsung Biologics Co Ltd 466
22,914 Hana Financial Group Inc 459
iSHARES VII PLC
SCHEDULE OF MATERIAL PURCHASES AND SALES (UNAUDITED) (continued)
For the financial year ended 31 July 2020iSHARES MSCI KOREA UCITS ETF USD (ACC)
[276 ]
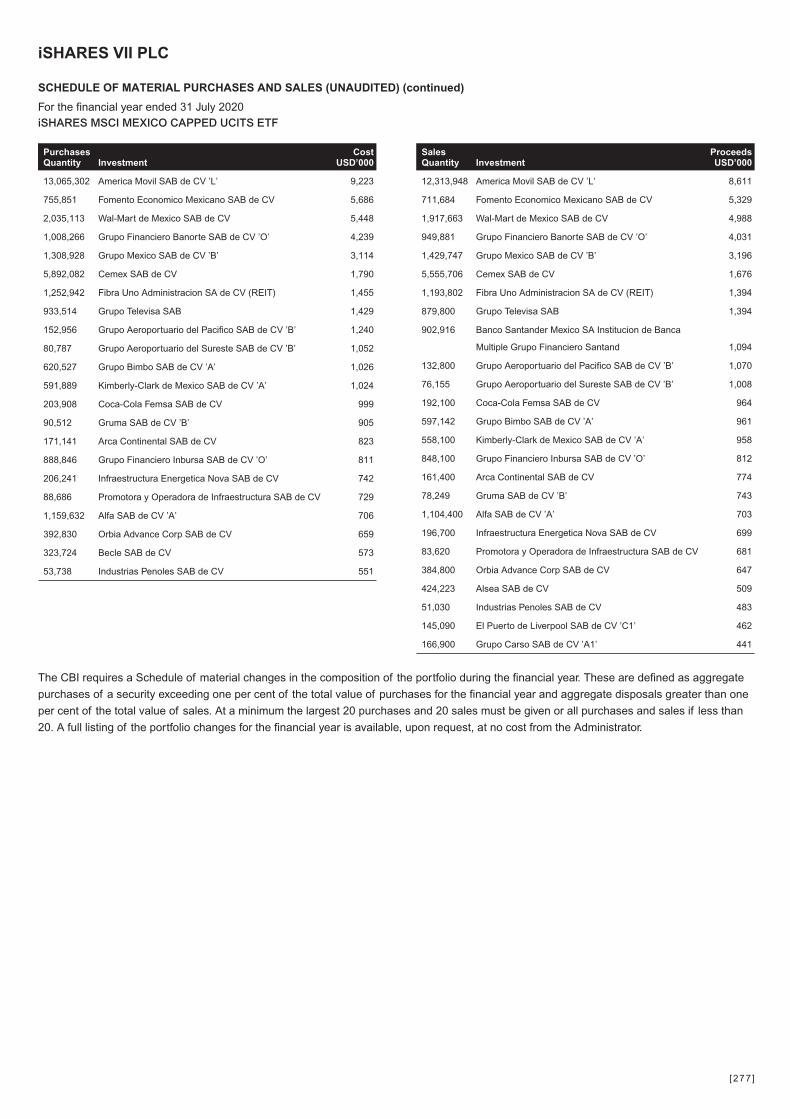
SalesQuantity Investment
ProceedsUSD’000
12,313,948 America Movil SAB de CV ’L’ 8,611
711,684 Fomento Economico Mexicano SAB de CV 5,329
1,917,663 Wal-Mart de Mexico SAB de CV 4,988
949,881 Grupo Financiero Banorte SAB de CV ’O’ 4,031
1,429,747 Grupo Mexico SAB de CV ’B’ 3,196
5,555,706 Cemex SAB de CV 1,676
1,193,802 Fibra Uno Administracion SA de CV (REIT) 1,394
879,800 Grupo Televisa SAB 1,394
902,916 Banco Santander Mexico SA Institucion de Banca
Multiple Grupo Financiero Santand 1,094
132,800 Grupo Aeroportuario del Pacifico SAB de CV ’B’ 1,070
76,155 Grupo Aeroportuario del Sureste SAB de CV ’B’ 1,008
192,100 Coca-Cola Femsa SAB de CV 964
597,142 Grupo Bimbo SAB de CV ’A’ 961
558,100 Kimberly-Clark de Mexico SAB de CV ’A’ 958
848,100 Grupo Financiero Inbursa SAB de CV ’O’ 812
161,400 Arca Continental SAB de CV 774
78,249 Gruma SAB de CV ’B’ 743
1,104,400 Alfa SAB de CV ’A’ 703
196,700 Infraestructura Energetica Nova SAB de CV 699
83,620 Promotora y Operadora de Infraestructura SAB de CV 681
384,800 Orbia Advance Corp SAB de CV 647
424,223 Alsea SAB de CV 509
51,030 Industrias Penoles SAB de CV 483
145,090 El Puerto de Liverpool SAB de CV ’C1’ 462
166,900 Grupo Carso SAB de CV ’A1’ 441
The CBI requires a Schedule of material changes in the composition of the portfolio during the financial year. These are defined as aggregate
purchases of a security exceeding one per cent of the total value of purchases for the financial year and aggregate disposals greater than one
per cent of the total value of sales. At a minimum the largest 20 purchases and 20 sales must be given or all purchases and sales if less than
20. A full listing of the portfolio changes for the financial year is available, upon request, at no cost from the Administrator.
PurchasesQuantity Investment
CostUSD’000
13,065,302 America Movil SAB de CV ’L’ 9,223
755,851 Fomento Economico Mexicano SAB de CV 5,686
2,035,113 Wal-Mart de Mexico SAB de CV 5,448
1,008,266 Grupo Financiero Banorte SAB de CV ’O’ 4,239
1,308,928 Grupo Mexico SAB de CV ’B’ 3,114
5,892,082 Cemex SAB de CV 1,790
1,252,942 Fibra Uno Administracion SA de CV (REIT) 1,455
933,514 Grupo Televisa SAB 1,429
152,956 Grupo Aeroportuario del Pacifico SAB de CV ’B’ 1,240
80,787 Grupo Aeroportuario del Sureste SAB de CV ’B’ 1,052
620,527 Grupo Bimbo SAB de CV ’A’ 1,026
591,889 Kimberly-Clark de Mexico SAB de CV ’A’ 1,024
203,908 Coca-Cola Femsa SAB de CV 999
90,512 Gruma SAB de CV ’B’ 905
171,141 Arca Continental SAB de CV 823
888,846 Grupo Financiero Inbursa SAB de CV ’O’ 811
206,241 Infraestructura Energetica Nova SAB de CV 742
88,686 Promotora y Operadora de Infraestructura SAB de CV 729
1,159,632 Alfa SAB de CV ’A’ 706
392,830 Orbia Advance Corp SAB de CV 659
323,724 Becle SAB de CV 573
53,738 Industrias Penoles SAB de CV 551
iSHARES VII PLC
SCHEDULE OF MATERIAL PURCHASES AND SALES (UNAUDITED) (continued)
For the financial year ended 31 July 2020iSHARES MSCI MEXICO CAPPED UCITS ETF
[277 ]
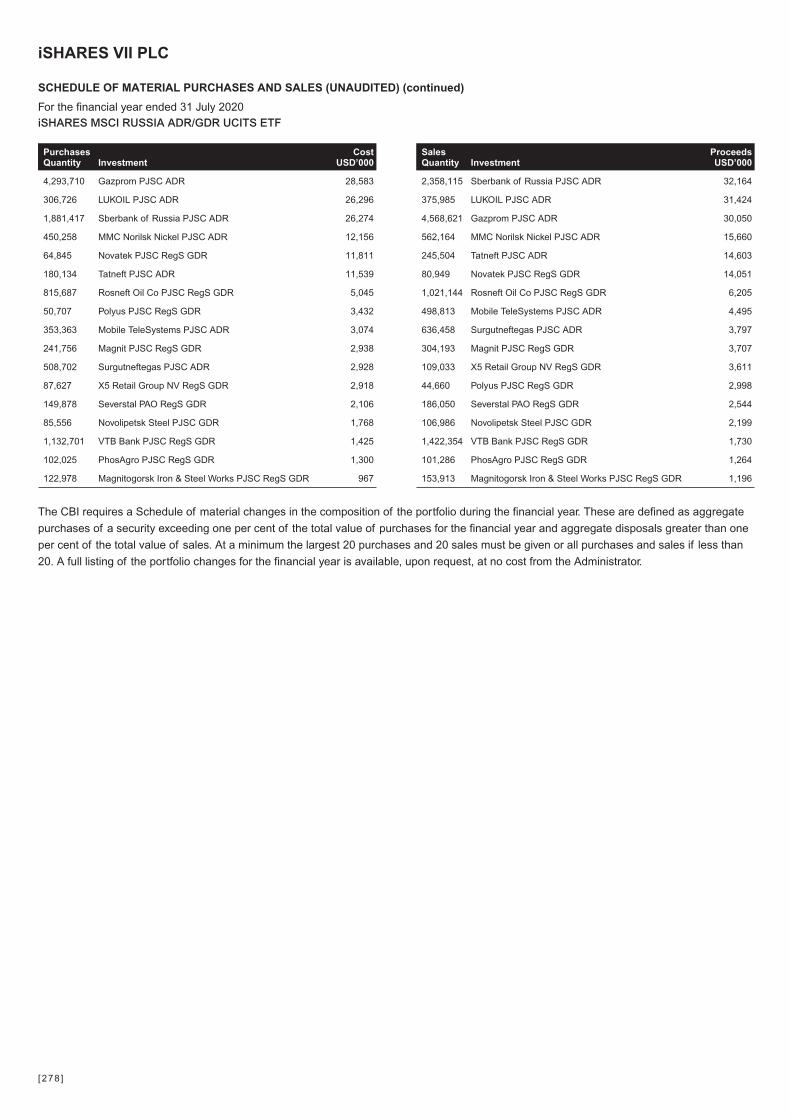
SalesQuantity Investment
ProceedsUSD’000
2,358,115 Sberbank of Russia PJSC ADR 32,164
375,985 LUKOIL PJSC ADR 31,424
4,568,621 Gazprom PJSC ADR 30,050
562,164 MMC Norilsk Nickel PJSC ADR 15,660
245,504 Tatneft PJSC ADR 14,603
80,949 Novatek PJSC RegS GDR 14,051
1,021,144 Rosneft Oil Co PJSC RegS GDR 6,205
498,813 Mobile TeleSystems PJSC ADR 4,495
636,458 Surgutneftegas PJSC ADR 3,797
304,193 Magnit PJSC RegS GDR 3,707
109,033 X5 Retail Group NV RegS GDR 3,611
44,660 Polyus PJSC RegS GDR 2,998
186,050 Severstal PAO RegS GDR 2,544
106,986 Novolipetsk Steel PJSC GDR 2,199
1,422,354 VTB Bank PJSC RegS GDR 1,730
101,286 PhosAgro PJSC RegS GDR 1,264
153,913 Magnitogorsk Iron & Steel Works PJSC RegS GDR 1,196
The CBI requires a Schedule of material changes in the composition of the portfolio during the financial year. These are defined as aggregate
purchases of a security exceeding one per cent of the total value of purchases for the financial year and aggregate disposals greater than one
per cent of the total value of sales. At a minimum the largest 20 purchases and 20 sales must be given or all purchases and sales if less than
20. A full listing of the portfolio changes for the financial year is available, upon request, at no cost from the Administrator.
PurchasesQuantity Investment
CostUSD’000
4,293,710 Gazprom PJSC ADR 28,583
306,726 LUKOIL PJSC ADR 26,296
1,881,417 Sberbank of Russia PJSC ADR 26,274
450,258 MMC Norilsk Nickel PJSC ADR 12,156
64,845 Novatek PJSC RegS GDR 11,811
180,134 Tatneft PJSC ADR 11,539
815,687 Rosneft Oil Co PJSC RegS GDR 5,045
50,707 Polyus PJSC RegS GDR 3,432
353,363 Mobile TeleSystems PJSC ADR 3,074
241,756 Magnit PJSC RegS GDR 2,938
508,702 Surgutneftegas PJSC ADR 2,928
87,627 X5 Retail Group NV RegS GDR 2,918
149,878 Severstal PAO RegS GDR 2,106
85,556 Novolipetsk Steel PJSC GDR 1,768
1,132,701 VTB Bank PJSC RegS GDR 1,425
102,025 PhosAgro PJSC RegS GDR 1,300
122,978 Magnitogorsk Iron & Steel Works PJSC RegS GDR 967
iSHARES VII PLC
SCHEDULE OF MATERIAL PURCHASES AND SALES (UNAUDITED) (continued)
For the financial year ended 31 July 2020iSHARES MSCI RUSSIA ADR/GDR UCITS ETF
[278 ]
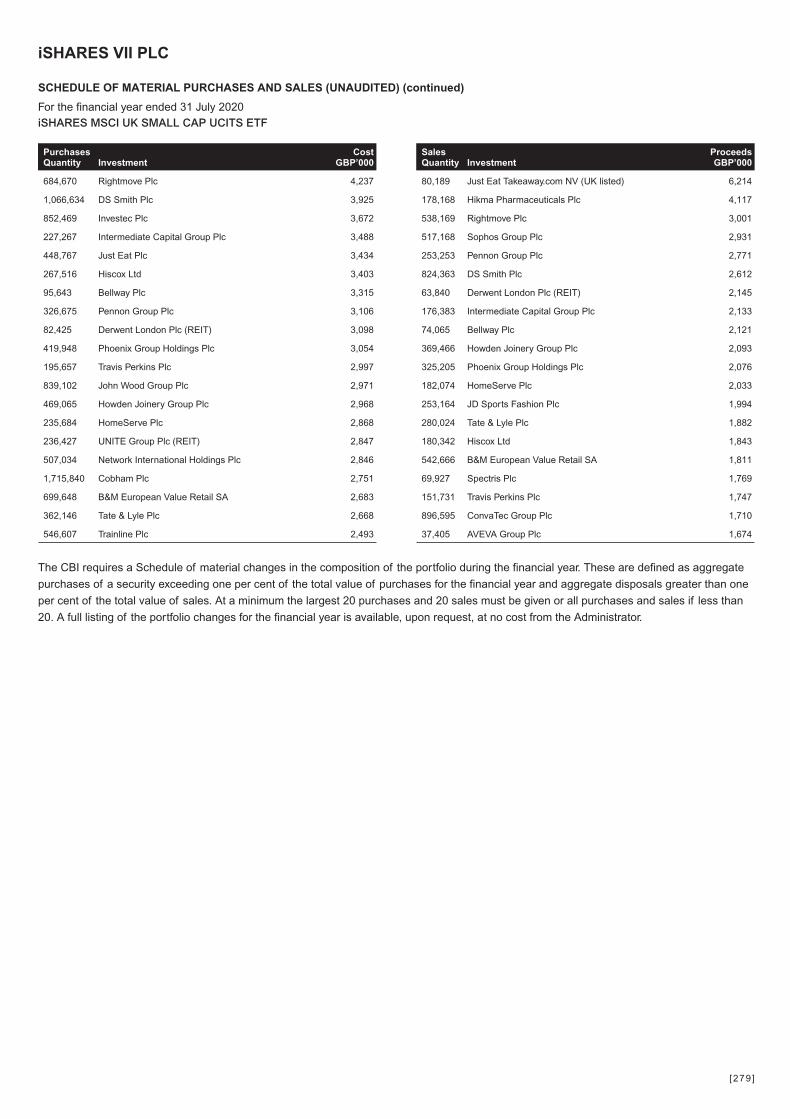
SalesQuantity Investment
ProceedsGBP’000
80,189 Just Eat Takeaway.com NV (UK listed) 6,214
178,168 Hikma Pharmaceuticals Plc 4,117
538,169 Rightmove Plc 3,001
517,168 Sophos Group Plc 2,931
253,253 Pennon Group Plc 2,771
824,363 DS Smith Plc 2,612
63,840 Derwent London Plc (REIT) 2,145
176,383 Intermediate Capital Group Plc 2,133
74,065 Bellway Plc 2,121
369,466 Howden Joinery Group Plc 2,093
325,205 Phoenix Group Holdings Plc 2,076
182,074 HomeServe Plc 2,033
253,164 JD Sports Fashion Plc 1,994
280,024 Tate & Lyle Plc 1,882
180,342 Hiscox Ltd 1,843
542,666 B&M European Value Retail SA 1,811
69,927 Spectris Plc 1,769
151,731 Travis Perkins Plc 1,747
896,595 ConvaTec Group Plc 1,710
37,405 AVEVA Group Plc 1,674
The CBI requires a Schedule of material changes in the composition of the portfolio during the financial year. These are defined as aggregate
purchases of a security exceeding one per cent of the total value of purchases for the financial year and aggregate disposals greater than one
per cent of the total value of sales. At a minimum the largest 20 purchases and 20 sales must be given or all purchases and sales if less than
20. A full listing of the portfolio changes for the financial year is available, upon request, at no cost from the Administrator.
PurchasesQuantity Investment
CostGBP’000
684,670 Rightmove Plc 4,237
1,066,634 DS Smith Plc 3,925
852,469 Investec Plc 3,672
227,267 Intermediate Capital Group Plc 3,488
448,767 Just Eat Plc 3,434
267,516 Hiscox Ltd 3,403
95,643 Bellway Plc 3,315
326,675 Pennon Group Plc 3,106
82,425 Derwent London Plc (REIT) 3,098
419,948 Phoenix Group Holdings Plc 3,054
195,657 Travis Perkins Plc 2,997
839,102 John Wood Group Plc 2,971
469,065 Howden Joinery Group Plc 2,968
235,684 HomeServe Plc 2,868
236,427 UNITE Group Plc (REIT) 2,847
507,034 Network International Holdings Plc 2,846
1,715,840 Cobham Plc 2,751
699,648 B&M European Value Retail SA 2,683
362,146 Tate & Lyle Plc 2,668
546,607 Trainline Plc 2,493
iSHARES VII PLC
SCHEDULE OF MATERIAL PURCHASES AND SALES (UNAUDITED) (continued)
For the financial year ended 31 July 2020iSHARES MSCI UK SMALL CAP UCITS ETF
[279 ]

SalesQuantity Investment
ProceedsGBP’000
45,297 Royal Dutch Shell Plc ’A’ 933
158,827 HSBC Holdings Plc 919
160,123 BP Plc 750
10,320 AstraZeneca Plc 738
39,246 GlaxoSmithKline Plc 671
29,152 Royal Dutch Shell Plc ’B’ 626
20,143 Diageo Plc 625
18,020 British American Tobacco Plc 545
8,672 Unilever Plc 400
8,845 Rio Tinto Plc 379
567,432 Lloyds Banking Group Plc 345
5,528 Reckitt Benckiser Group Plc 336
209,765 Vodafone Group Plc 308
16,739 BHP Group Plc 287
20,458 Prudential Plc 282
15,236 RELX Plc 277
125,726 Glencore Plc 260
27,193 National Grid Plc 245
138,254 Barclays Plc 234
12,162 Compass Group Plc 227
77,553 Tesco Plc 190
42,339 Investec Plc 183
8,941 Anglo American Plc 182
2,498 London Stock Exchange Group Plc 177
7,249 Experian Plc 177
16,944 Weir Group Plc 175
52,678 Meggitt Plc 173
23,657 Standard Chartered Plc 165
386,363 Centrica Plc 165
The CBI requires a Schedule of material changes in the composition of the portfolio during the financial year. These are defined as aggregate
purchases of a security exceeding one per cent of the total value of purchases for the financial year and aggregate disposals greater than one
per cent of the total value of sales. At a minimum the largest 20 purchases and 20 sales must be given or all purchases and sales if less than
20. A full listing of the portfolio changes for the financial year is available, upon request, at no cost from the Administrator.
PurchasesQuantity Investment
CostGBP’000
9,009 AstraZeneca Plc 665
110,948 HSBC Holdings Plc 552
26,720 GlaxoSmithKline Plc 438
95,383 BP Plc 384
8,633 Unilever Plc 382
10,873 British American Tobacco Plc 321
16,409 Royal Dutch Shell Plc ’B’ 292
15,907 Anglo American Plc 267
10,213 Hikma Pharmaceuticals Plc 259
19,080 Compass Group Plc 255
29,237 JD Sports Fashion Plc 228
7,895 Diageo Plc 223
13,147 Royal Dutch Shell Plc ’A’ 216
3,378 Reckitt Benckiser Group Plc 213
22,505 National Grid Plc 202
4,317 AVEVA Group Plc 193
128,933 Vodafone Group Plc 173
4,235 Rio Tinto Plc 168
12,953 Prudential Plc 156
10,122 BHP Group Plc 152
7,402 RELX Plc 134
1,718 London Stock Exchange Group Plc 126
97,404 Barclays Plc 119
291,873 Lloyds Banking Group Plc 108
21,745 Informa Plc 106
4,249 Experian Plc 104
44,278 Tesco Plc 102
iSHARES VII PLC
SCHEDULE OF MATERIAL PURCHASES AND SALES (UNAUDITED) (continued)
For the financial year ended 31 July 2020iSHARES MSCI UK UCITS ETF
[280 ]
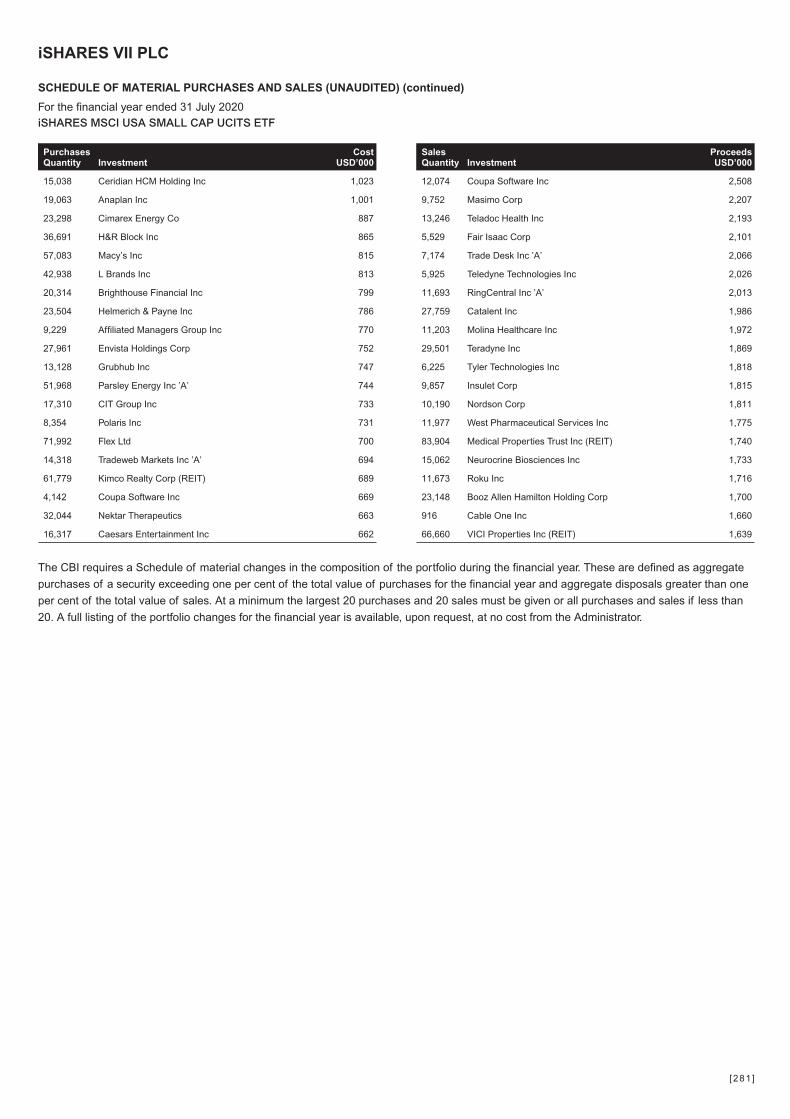
SalesQuantity Investment
ProceedsUSD’000
12,074 Coupa Software Inc 2,508
9,752 Masimo Corp 2,207
13,246 Teladoc Health Inc 2,193
5,529 Fair Isaac Corp 2,101
7,174 Trade Desk Inc ’A’ 2,066
5,925 Teledyne Technologies Inc 2,026
11,693 RingCentral Inc ’A’ 2,013
27,759 Catalent Inc 1,986
11,203 Molina Healthcare Inc 1,972
29,501 Teradyne Inc 1,869
6,225 Tyler Technologies Inc 1,818
9,857 Insulet Corp 1,815
10,190 Nordson Corp 1,811
11,977 West Pharmaceutical Services Inc 1,775
83,904 Medical Properties Trust Inc (REIT) 1,740
15,062 Neurocrine Biosciences Inc 1,733
11,673 Roku Inc 1,716
23,148 Booz Allen Hamilton Holding Corp 1,700
916 Cable One Inc 1,660
66,660 VICI Properties Inc (REIT) 1,639
The CBI requires a Schedule of material changes in the composition of the portfolio during the financial year. These are defined as aggregate
purchases of a security exceeding one per cent of the total value of purchases for the financial year and aggregate disposals greater than one
per cent of the total value of sales. At a minimum the largest 20 purchases and 20 sales must be given or all purchases and sales if less than
20. A full listing of the portfolio changes for the financial year is available, upon request, at no cost from the Administrator.
PurchasesQuantity Investment
CostUSD’000
15,038 Ceridian HCM Holding Inc 1,023
19,063 Anaplan Inc 1,001
23,298 Cimarex Energy Co 887
36,691 H&R Block Inc 865
57,083 Macy’s Inc 815
42,938 L Brands Inc 813
20,314 Brighthouse Financial Inc 799
23,504 Helmerich & Payne Inc 786
9,229 Affiliated Managers Group Inc 770
27,961 Envista Holdings Corp 752
13,128 Grubhub Inc 747
51,968 Parsley Energy Inc ’A’ 744
17,310 CIT Group Inc 733
8,354 Polaris Inc 731
71,992 Flex Ltd 700
14,318 Tradeweb Markets Inc ’A’ 694
61,779 Kimco Realty Corp (REIT) 689
4,142 Coupa Software Inc 669
32,044 Nektar Therapeutics 663
16,317 Caesars Entertainment Inc 662
iSHARES VII PLC
SCHEDULE OF MATERIAL PURCHASES AND SALES (UNAUDITED) (continued)
For the financial year ended 31 July 2020iSHARES MSCI USA SMALL CAP UCITS ETF
[281 ]

SalesQuantity Investment
ProceedsUSD’000
61,408 Apple Inc 16,779
89,284 Microsoft Corp 14,437
5,104 Amazon.com Inc 10,200
29,479 Facebook Inc ’A’ 5,405
3,870 Alphabet Inc ’C’ 4,875
3,688 Alphabet Inc ’A’ 4,629
31,976 Johnson & Johnson 4,433
41,967 JPMorgan Chase & Co 4,416
21,594 Visa Inc ’A’ 3,773
31,238 Procter & Gamble Co 3,626
130,826 Bank of America Corp 3,403
57,217 Intel Corp 3,227
15,975 Berkshire Hathaway Inc ’B’ 3,129
11,711 UnitedHealth Group Inc 3,116
11,136 Mastercard Inc ’A’ 3,019
91,276 AT&T Inc 2,992
14,036 Home Depot Inc 2,908
50,183 Verizon Communications Inc 2,846
30,945 Merck & Co Inc 2,504
51,343 Exxon Mobil Corp 2,481
The CBI requires a Schedule of material changes in the composition of the portfolio during the financial year. These are defined as aggregate
purchases of a security exceeding one per cent of the total value of purchases for the financial year and aggregate disposals greater than one
per cent of the total value of sales. At a minimum the largest 20 purchases and 20 sales must be given or all purchases and sales if less than
20. A full listing of the portfolio changes for the financial year is available, upon request, at no cost from the Administrator.
PurchasesQuantity Investment
CostUSD’000
34,370 Apple Inc 9,436
57,191 Microsoft Corp 8,878
3,451 Amazon.com Inc 6,479
19,921 Facebook Inc ’A’ 3,931
2,385 Alphabet Inc ’A’ 3,170
2,359 Alphabet Inc ’C’ 3,139
23,667 JPMorgan Chase & Co 2,886
19,915 Johnson & Johnson 2,767
12,116 Berkshire Hathaway Inc ’B’ 2,546
13,431 Visa Inc ’A’ 2,510
19,977 Procter & Gamble Co 2,426
57,507 AT&T Inc 2,141
33,162 Exxon Mobil Corp 2,079
35,991 Bristol-Myers Squibb Co 2,072
7,459 UnitedHealth Group Inc 2,029
6,909 Mastercard Inc ’A’ 2,006
65,315 Bank of America Corp 1,991
32,848 Verizon Communications Inc 1,932
33,997 Intel Corp 1,917
8,340 Home Depot Inc 1,909
iSHARES VII PLC
SCHEDULE OF MATERIAL PURCHASES AND SALES (UNAUDITED) (continued)
For the financial year ended 31 July 2020iSHARES MSCI USA UCITS ETF
[282 ]
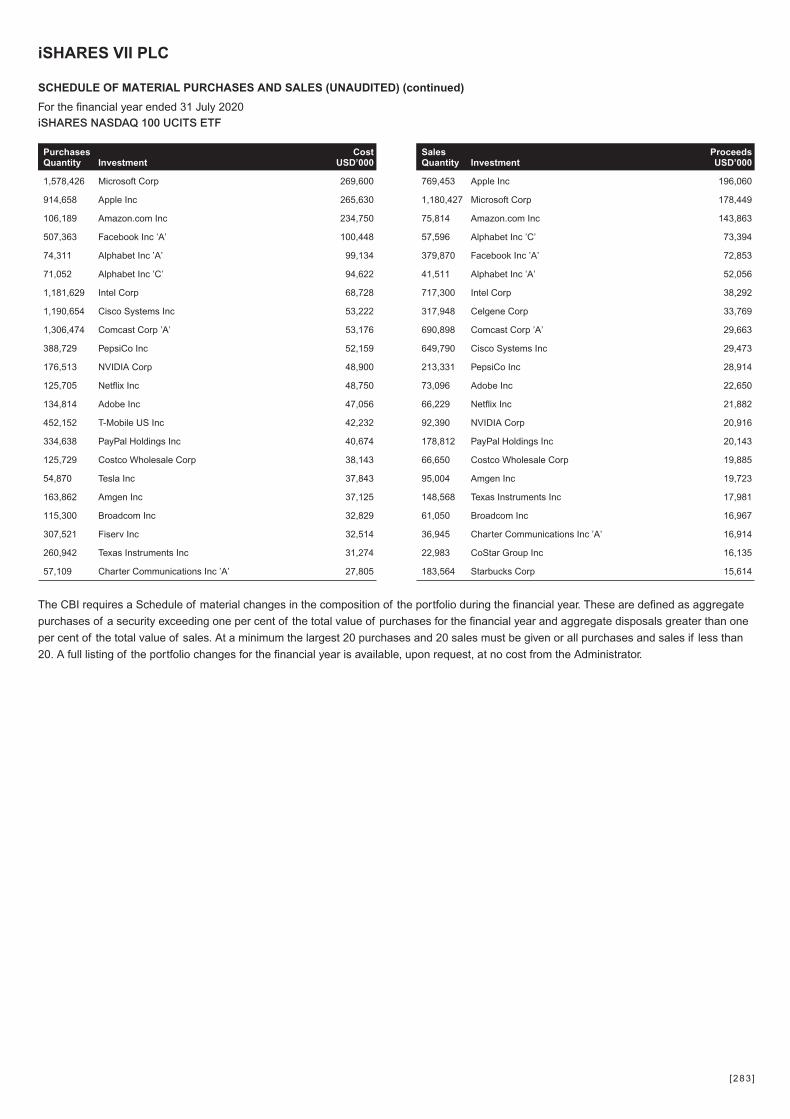
SalesQuantity Investment
ProceedsUSD’000
769,453 Apple Inc 196,060
1,180,427 Microsoft Corp 178,449
75,814 Amazon.com Inc 143,863
57,596 Alphabet Inc ’C’ 73,394
379,870 Facebook Inc ’A’ 72,853
41,511 Alphabet Inc ’A’ 52,056
717,300 Intel Corp 38,292
317,948 Celgene Corp 33,769
690,898 Comcast Corp ’A’ 29,663
649,790 Cisco Systems Inc 29,473
213,331 PepsiCo Inc 28,914
73,096 Adobe Inc 22,650
66,229 Netflix Inc 21,882
92,390 NVIDIA Corp 20,916
178,812 PayPal Holdings Inc 20,143
66,650 Costco Wholesale Corp 19,885
95,004 Amgen Inc 19,723
148,568 Texas Instruments Inc 17,981
61,050 Broadcom Inc 16,967
36,945 Charter Communications Inc ’A’ 16,914
22,983 CoStar Group Inc 16,135
183,564 Starbucks Corp 15,614
The CBI requires a Schedule of material changes in the composition of the portfolio during the financial year. These are defined as aggregate
purchases of a security exceeding one per cent of the total value of purchases for the financial year and aggregate disposals greater than one
per cent of the total value of sales. At a minimum the largest 20 purchases and 20 sales must be given or all purchases and sales if less than
20. A full listing of the portfolio changes for the financial year is available, upon request, at no cost from the Administrator.
PurchasesQuantity Investment
CostUSD’000
1,578,426 Microsoft Corp 269,600
914,658 Apple Inc 265,630
106,189 Amazon.com Inc 234,750
507,363 Facebook Inc ’A’ 100,448
74,311 Alphabet Inc ’A’ 99,134
71,052 Alphabet Inc ’C’ 94,622
1,181,629 Intel Corp 68,728
1,190,654 Cisco Systems Inc 53,222
1,306,474 Comcast Corp ’A’ 53,176
388,729 PepsiCo Inc 52,159
176,513 NVIDIA Corp 48,900
125,705 Netflix Inc 48,750
134,814 Adobe Inc 47,056
452,152 T-Mobile US Inc 42,232
334,638 PayPal Holdings Inc 40,674
125,729 Costco Wholesale Corp 38,143
54,870 Tesla Inc 37,843
163,862 Amgen Inc 37,125
115,300 Broadcom Inc 32,829
307,521 Fiserv Inc 32,514
260,942 Texas Instruments Inc 31,274
57,109 Charter Communications Inc ’A’ 27,805
iSHARES VII PLC
SCHEDULE OF MATERIAL PURCHASES AND SALES (UNAUDITED) (continued)
For the financial year ended 31 July 2020iSHARES NASDAQ 100 UCITS ETF
[283 ]
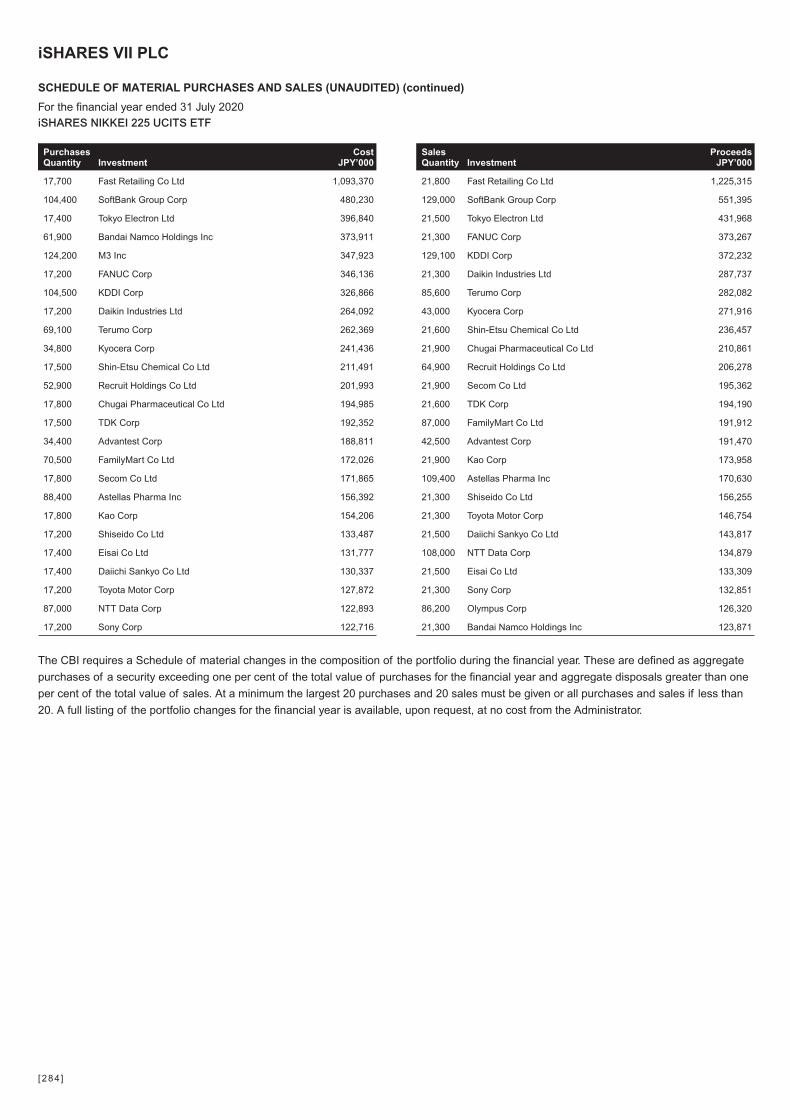
SalesQuantity Investment
ProceedsJPY’000
21,800 Fast Retailing Co Ltd 1,225,315
129,000 SoftBank Group Corp 551,395
21,500 Tokyo Electron Ltd 431,968
21,300 FANUC Corp 373,267
129,100 KDDI Corp 372,232
21,300 Daikin Industries Ltd 287,737
85,600 Terumo Corp 282,082
43,000 Kyocera Corp 271,916
21,600 Shin-Etsu Chemical Co Ltd 236,457
21,900 Chugai Pharmaceutical Co Ltd 210,861
64,900 Recruit Holdings Co Ltd 206,278
21,900 Secom Co Ltd 195,362
21,600 TDK Corp 194,190
87,000 FamilyMart Co Ltd 191,912
42,500 Advantest Corp 191,470
21,900 Kao Corp 173,958
109,400 Astellas Pharma Inc 170,630
21,300 Shiseido Co Ltd 156,255
21,300 Toyota Motor Corp 146,754
21,500 Daiichi Sankyo Co Ltd 143,817
108,000 NTT Data Corp 134,879
21,500 Eisai Co Ltd 133,309
21,300 Sony Corp 132,851
86,200 Olympus Corp 126,320
21,300 Bandai Namco Holdings Inc 123,871
The CBI requires a Schedule of material changes in the composition of the portfolio during the financial year. These are defined as aggregate
purchases of a security exceeding one per cent of the total value of purchases for the financial year and aggregate disposals greater than one
per cent of the total value of sales. At a minimum the largest 20 purchases and 20 sales must be given or all purchases and sales if less than
20. A full listing of the portfolio changes for the financial year is available, upon request, at no cost from the Administrator.
PurchasesQuantity Investment
CostJPY’000
17,700 Fast Retailing Co Ltd 1,093,370
104,400 SoftBank Group Corp 480,230
17,400 Tokyo Electron Ltd 396,840
61,900 Bandai Namco Holdings Inc 373,911
124,200 M3 Inc 347,923
17,200 FANUC Corp 346,136
104,500 KDDI Corp 326,866
17,200 Daikin Industries Ltd 264,092
69,100 Terumo Corp 262,369
34,800 Kyocera Corp 241,436
17,500 Shin-Etsu Chemical Co Ltd 211,491
52,900 Recruit Holdings Co Ltd 201,993
17,800 Chugai Pharmaceutical Co Ltd 194,985
17,500 TDK Corp 192,352
34,400 Advantest Corp 188,811
70,500 FamilyMart Co Ltd 172,026
17,800 Secom Co Ltd 171,865
88,400 Astellas Pharma Inc 156,392
17,800 Kao Corp 154,206
17,200 Shiseido Co Ltd 133,487
17,400 Eisai Co Ltd 131,777
17,400 Daiichi Sankyo Co Ltd 130,337
17,200 Toyota Motor Corp 127,872
87,000 NTT Data Corp 122,893
17,200 Sony Corp 122,716
iSHARES VII PLC
SCHEDULE OF MATERIAL PURCHASES AND SALES (UNAUDITED) (continued)
For the financial year ended 31 July 2020iSHARES NIKKEI 225 UCITS ETF
[284 ]

The following table summarises the performance on a calendar year basis for each Fund registered for distribution in Switzerland.
The Fund performance figures are based on the NAV calculated in accordance with the prospectus for the calendar year under review with any
dividends reinvested. Due to FRS 102 requirements which apply to the financial statements, there may be differences between the NAV per share
as recorded in the financial statements and the NAV per share calculated in accordance with the prospectus.
The returns disclosed are the performance returns for the primary share class for each Fund, net of fees, which has been selected as a
representative share class. The primary share class represents the class of share invested in by the majority of investors in the Fund and also takes
into account other relevant factors such as the Fund’s base currency. Performance returns for any other share class can be made available on
request.
2019 2018 2017
Fund nameLaunch
Date
Fundreturn
%
Benchmarkindexreturn
%
Fundreturn
%
Benchmarkindexreturn
%
Fundreturn
%
Benchmarkindexreturn
%
iShares $ Treasury Bond 1-3yr UCITS ETF USD (Acc) B Jun-09 3.50 3.60 1.39 1.56 0.25 0.42
iShares $ Treasury Bond 3-7yr UCITS ETF Jun-09 5.81 5.89 1.34 1.47 1.18 1.30
iShares $ Treasury Bond 7-10yr UCITS ETF USD (Acc) Jun-09 8.45 8.50 0.80 0.90 2.46 2.57
iShares € Govt Bond 1-3yr UCITS ETF EUR (Acc) Jun-09 0.17 0.35 (0.32) (0.09) 0.05 0.24
iShares € Govt Bond 3-7yr UCITS ETF Jun-09 2.84 3.00 0.11 0.31 0.20 0.39
iShares € Govt Bond 7-10yr UCITS ETF EUR (Acc) Jun-09 6.63 6.76 1.14 1.33 1.04 1.18
iShares Core EURO STOXX 50 UCITS ETF Jan-10 28.86 28.20 (11.56) (12.03) 9.70 9.15
iShares Core FTSE 100 UCITS ETF GBP (Acc) Jan-10 17.16 17.28 (8.84) (8.77) 11.88 11.95
iShares Core MSCI EMU UCITS ETF Jan-10 26.22 25.47 (12.40) (12.71) 12.75 12.49
iShares Core MSCI Pacific ex-Japan UCITS ETF Jan-10 18.19 18.36 (10.43) (10.30) 25.84 25.88
iShares Core S&P 500 UCITS ETF May-10 31.05 30.70 (4.72) (4.94) 21.40 21.10
iShares Dow Jones Industrial Average UCITS ETF Jan-10 24.47 24.43 (4.13) (4.13) 27.27 27.19
iShares FTSE MIB UCITS ETF EUR (Acc) Jan-10 32.58 32.43 (13.90) (13.99) 16.47 16.33
iShares MSCI Canada UCITS ETF Jan-10 26.97 27.50 (17.28) (17.20) 15.76 16.07
iShares MSCI EM Asia UCITS ETF Aug-10 18.47 19.24 (15.99) (15.45) 41.88 42.83
iShares MSCI EMU CHF Hedged UCITS ETF (Acc) Jun-15 25.43 25.20 (12.97) (13.09) 12.37 12.13
iShares MSCI EMU Small Cap UCITS ETF Jul-09 28.29 28.21 (17.29) (17.40) 24.12 24.19
iShares MSCI EMU USD Hedged UCITS ETF (Acc) Jul-15 29.47 29.21 (9.95) (10.05) 14.86 14.69
iShares MSCI Japan UCITS ETF Jan-10 18.97 19.61 (13.27) (12.88) 23.44 23.99
iShares MSCI Korea UCITS ETF USD (Acc) Aug-10 11.84 12.50 (21.41) (20.94) 46.36 47.30
iShares MSCI Mexico Capped UCITS ETF Aug-10 10.86 11.37 (15.95) (15.53) 15.47 15.97
iShares MSCI Russia ADR/GDR UCITS ETF Aug-10 51.26 51.76 (2.04) (1.63) 7.49 7.97
iShares MSCI UK Small Cap UCITS ETF Jul-09 29.22 30.02 (15.47) (15.03) 20.33 20.98
iShares MSCI UK UCITS ETF Jan-10 15.96 16.37 (9.16) (8.82) 11.38 11.71
iShares MSCI USA Small Cap UCITS ETF Jul-09 26.56 26.74 (10.49) (10.40) 16.49 16.75
iShares MSCI USA UCITS ETF Jan-10 30.84 30.88 (5.10) (5.04) 21.15 21.19
iShares NASDAQ 100 UCITS ETF Jan-10 38.77 38.99 (0.44) (0.29) 32.34 32.53
iShares Nikkei 225 UCITS ETF Jan-10 19.85 20.20 (3.17) (2.94) 20.40 20.88
Past performance is not a guide to future performance and should not be the sole factor of consideration when selecting a product. All financial
investments involve an element of risk. Therefore, the value of your investment and the income from it will vary and your initial investment amount
cannot be guaranteed. The performance figures do not consider charges and fees that may be levied at the time of subscription or redemption of
shares. Levels and bases of taxation may change from time to time.
iSHARES VII PLC
CALENDAR YEAR PERFORMANCE (UNAUDITED)
[285 ]
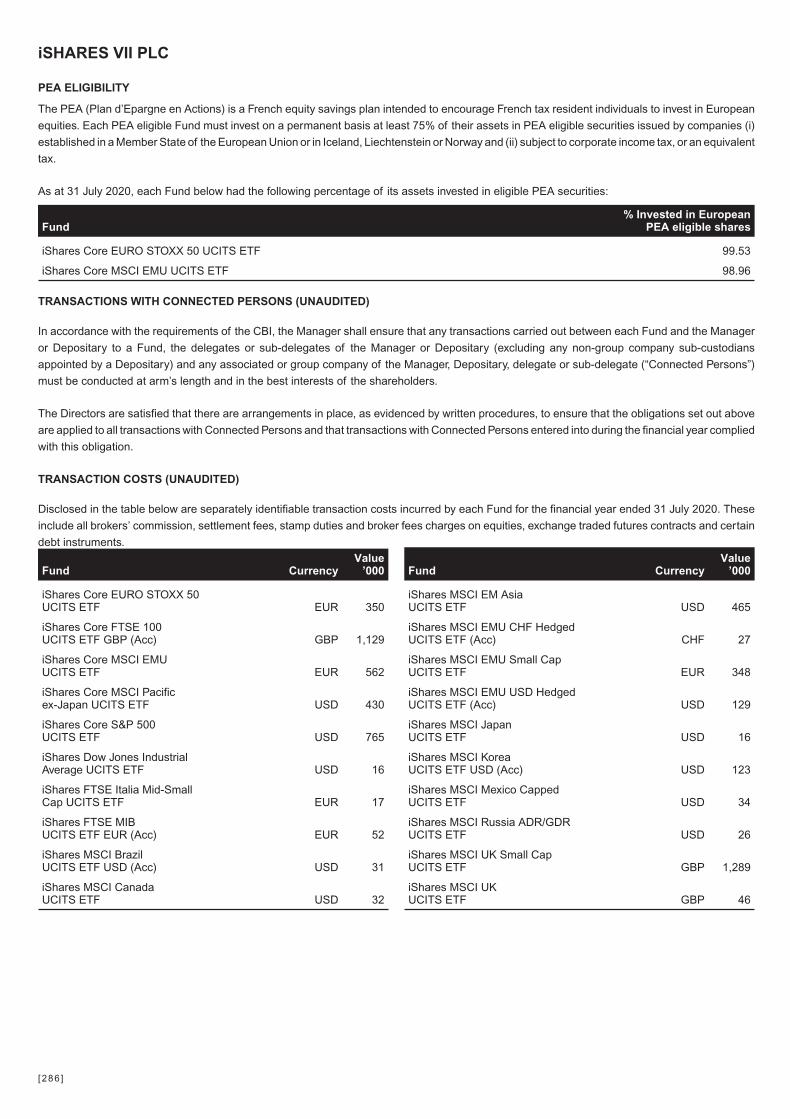
The PEA (Plan d’Epargne en Actions) is a French equity savings plan intended to encourage French tax resident individuals to invest in European
equities. Each PEA eligible Fund must invest on a permanent basis at least 75% of their assets in PEA eligible securities issued by companies (i)
established in a Member State of the European Union or in Iceland, Liechtenstein or Norway and (ii) subject to corporate income tax, or an equivalent
tax.
As at 31 July 2020, each Fund below had the following percentage of its assets invested in eligible PEA securities:
Fund% Invested in European
PEA eligible shares
iShares Core EURO STOXX 50 UCITS ETF 99.53
iShares Core MSCI EMU UCITS ETF 98.96
TRANSACTIONS WITH CONNECTED PERSONS (UNAUDITED)
In accordance with the requirements of the CBI, the Manager shall ensure that any transactions carried out between each Fund and the Manager
or Depositary to a Fund, the delegates or sub-delegates of the Manager or Depositary (excluding any non-group company sub-custodians
appointed by a Depositary) and any associated or group company of the Manager, Depositary, delegate or sub-delegate (“Connected Persons”)
must be conducted at arm’s length and in the best interests of the shareholders.
The Directors are satisfied that there are arrangements in place, as evidenced by written procedures, to ensure that the obligations set out above
are applied to all transactions with Connected Persons and that transactions with Connected Persons entered into during the financial year complied
with this obligation.
TRANSACTION COSTS (UNAUDITED)
Disclosed in the table below are separately identifiable transaction costs incurred by each Fund for the financial year ended 31 July 2020. These
include all brokers’ commission, settlement fees, stamp duties and broker fees charges on equities, exchange traded futures contracts and certain
debt instruments.
Fund CurrencyValue
’000
iShares Core EURO STOXX 50UCITS ETF EUR 350
iShares Core FTSE 100UCITS ETF GBP (Acc) GBP 1,129
iShares Core MSCI EMUUCITS ETF EUR 562
iShares Core MSCI Pacificex-Japan UCITS ETF USD 430
iShares Core S&P 500UCITS ETF USD 765
iShares Dow Jones IndustrialAverage UCITS ETF USD 16
iShares FTSE Italia Mid-SmallCap UCITS ETF EUR 17
iShares FTSE MIBUCITS ETF EUR (Acc) EUR 52
iShares MSCI BrazilUCITS ETF USD (Acc) USD 31
iShares MSCI CanadaUCITS ETF USD 32
Fund CurrencyValue
’000
iShares MSCI EM AsiaUCITS ETF USD 465
iShares MSCI EMU CHF HedgedUCITS ETF (Acc) CHF 27
iShares MSCI EMU Small CapUCITS ETF EUR 348
iShares MSCI EMU USD HedgedUCITS ETF (Acc) USD 129
iShares MSCI JapanUCITS ETF USD 16
iShares MSCI KoreaUCITS ETF USD (Acc) USD 123
iShares MSCI Mexico CappedUCITS ETF USD 34
iShares MSCI Russia ADR/GDRUCITS ETF USD 26
iShares MSCI UK Small CapUCITS ETF GBP 1,289
iShares MSCI UKUCITS ETF GBP 46
iSHARES VII PLC
PEA ELIGIBILITY
[286 ]
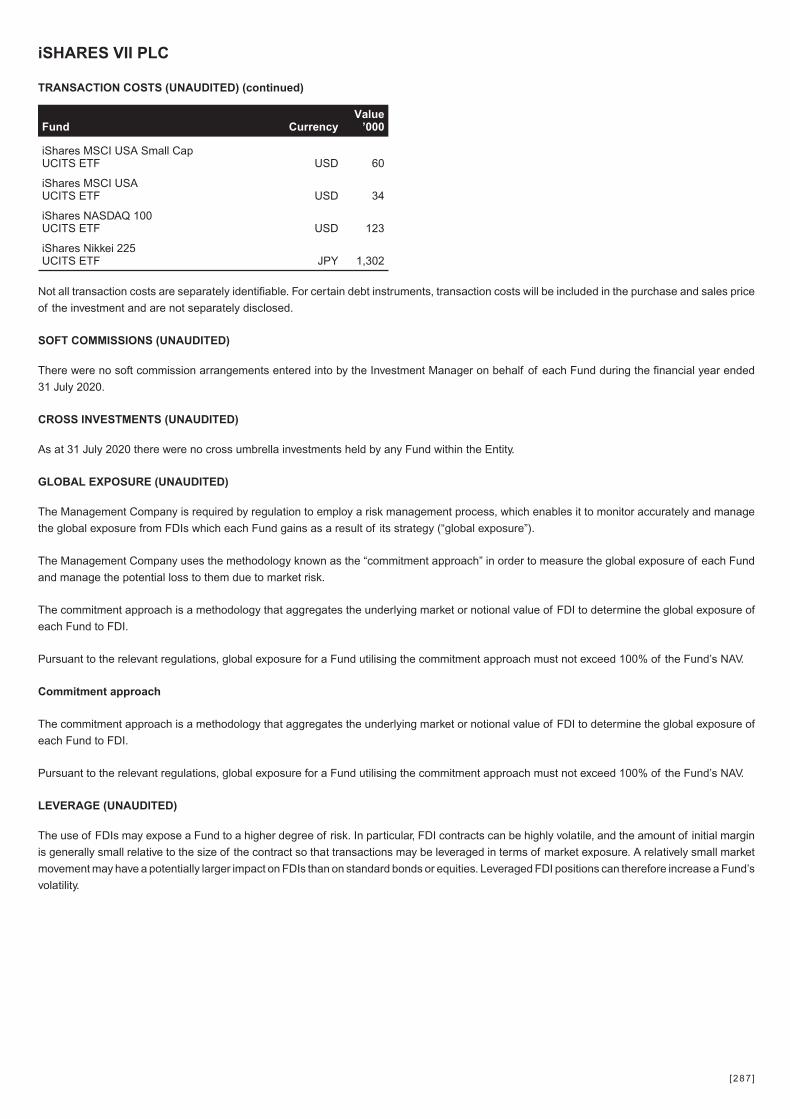
Fund CurrencyValue
’000
iShares MSCI USA Small CapUCITS ETF USD 60
iShares MSCI USAUCITS ETF USD 34
iShares NASDAQ 100UCITS ETF USD 123
iShares Nikkei 225UCITS ETF JPY 1,302
Not all transaction costs are separately identifiable. For certain debt instruments, transaction costs will be included in the purchase and sales price
of the investment and are not separately disclosed.
SOFT COMMISSIONS (UNAUDITED)
There were no soft commission arrangements entered into by the Investment Manager on behalf of each Fund during the financial year ended
31 July 2020.
CROSS INVESTMENTS (UNAUDITED)
As at 31 July 2020 there were no cross umbrella investments held by any Fund within the Entity.
GLOBAL EXPOSURE (UNAUDITED)
The Management Company is required by regulation to employ a risk management process, which enables it to monitor accurately and manage
the global exposure from FDIs which each Fund gains as a result of its strategy (“global exposure”).
The Management Company uses the methodology known as the “commitment approach” in order to measure the global exposure of each Fund
and manage the potential loss to them due to market risk.
The commitment approach is a methodology that aggregates the underlying market or notional value of FDI to determine the global exposure of
each Fund to FDI.
Pursuant to the relevant regulations, global exposure for a Fund utilising the commitment approach must not exceed 100% of the Fund’s NAV.
Commitment approach
The commitment approach is a methodology that aggregates the underlying market or notional value of FDI to determine the global exposure of
each Fund to FDI.
Pursuant to the relevant regulations, global exposure for a Fund utilising the commitment approach must not exceed 100% of the Fund’s NAV.
LEVERAGE (UNAUDITED)
The use of FDIs may expose a Fund to a higher degree of risk. In particular, FDI contracts can be highly volatile, and the amount of initial margin
is generally small relative to the size of the contract so that transactions may be leveraged in terms of market exposure. A relatively small market
movement may have a potentially larger impact on FDIs than on standard bonds or equities. Leveraged FDI positions can therefore increase a Fund’s
volatility.
iSHARES VII PLC
TRANSACTION COSTS (UNAUDITED) (continued)
[287 ]
The below disclosures are made in respect of the remuneration policies of the BlackRock group ("BlackRock"), as they apply to BlackRock Asset
Management Ireland Limited (the "Manager"). The disclosures are made in accordance with the Directive 2009/65/EC on the coordination of laws,
regulations and administrative provisions relating to undertakings for collective investment in transferable securities (“UCITS”), as amended,
including in particular by Directive 2014/91/EU of the European Parliament and of the council of 23 July 2014, (the “Directive”), and the "Guidelines
on sound remuneration policies under the UCITS Directive and AIFMD" issued by the European Securities and Markets Authority.
BlackRock’s UCITS Remuneration Policy (the “UCITS Remuneration Policy”) will apply to the EEA entities within the BlackRock group authorised
as a manager of UCITS funds in accordance with the Directive, and will ensure compliance with the requirements of Article 14b of the Directive.
The Manager has adopted the UCITS Remuneration Policy, a summary of which is set out below.
Remuneration Governance
BlackRock’s remuneration governance in EMEA operates as a tiered structure which includes: (a) the Management Development and
Compensation Committee (“MDCC”) (which is the global, independent remuneration committee for BlackRock, Inc. and all of its subsidiaries,
including the Manager); and (b) the Manager’s board of directors (the “Manager’s Board”). These bodies are responsible for the determination of
BlackRock’s remuneration policies.
a) MDCC
The MDCC’s purposes include:
● providing oversight of:
○ BlackRock’s executive compensation programmes;
○ BlackRock’s employee benefit plans; and
○ such other compensation plans as may be established by BlackRock from time to time for which the MDCC is deemed as
administrator;
● reviewing and discussing the compensation discussion and analysis included in the BlackRock, Inc. annual proxy statement with management
and approving the MDCC’s report for inclusion in the proxy statement;
● reviewing, assessing and making reports and recommendations to the BlackRock, Inc. board of directors (the “BlackRock, Inc. Board”) as
appropriate on BlackRock’s talent development and succession planning, with the emphasis on performance and succession at the highest
management levels; and
● supporting the boards of the Entity’s EMEA regulated entities in meeting their remuneration-related obligations by overseeing the design and
implementation of EMEA remuneration policy in accordance with applicable regulation.The MDCC directly retains its own independent
compensation consultant, Semler Brossy Consulting Group LLC, who has no relationship with BlackRock, Inc. or the BlackRock, Inc. Board that
would interfere with its ability to provide independent advice to the MDCC on compensation matters.
The MDCC directly retains its own independent compensation consultant, Semler Brossy Consulting Group LLC, who has no relationship with
BlackRock, Inc. or the BlackRock, Inc. Board that would interfere with its ability to provide independent advice to the MDCC on compensation
matters.
The BlackRock, Inc. Board has determined that all of the members of the MDCC are “independent” within the meaning of the listing standards of
the New York Stock Exchange (NYSE), which requires each meet a “non-employee director” standard.
The MDCC held 8 meetings during 2019. The MDCC charter is available on BlackRock, Inc.’s website (www.blackrock.com).
Through its regular reviews, the MDCC continues to be satisfied with the principles of BlackRock’s compensation policy and approach.
iSHARES VII PLC
REPORT ON REMUNERATION (UNAUDITED)
[288 ]
b) The Manager’s Board
The Manager’s Board has the task of supervising and providing oversight of the UCITS Remuneration Policy as it applies to the Manager and its
Identified Staff.
The Manager’s Board (through independent review by the relevant control functions) remains satisfied with the implementation of the UCITS
Remuneration Policy as it applies to the Manager and its Identified Staff.
Decision making process
Remuneration decisions for employees are made once annually in January following the end of the performance year. This timing allows full-year
financial results to be considered along with other non-financial goals and objectives. Although the framework for remuneration decision-making is
tied to financial performance, significant discretion is used to determine individual variable remuneration based on achievement of strategic and
operating results and other considerations such as management and leadership capabilities.
No set formulas are established, and no fixed benchmarks are used in determining annual incentive awards. In determining specific individual
remuneration amounts, a number of factors are considered including non-financial goals and objectives and overall financial and investment
performance. These results are viewed in the aggregate without any specific weighting, and there is no direct correlation between any particular
performance measure and the resulting annual incentive award. The variable remuneration awarded to any individual(s) for a particular performance
year may also be zero.
Annual incentive awards are paid from a bonus pool.
The size of the projected bonus pool, including cash and equity awards, is reviewed throughout the year by the MDCC and the final total bonus pool
is approved after year-end. As part of this review, the MDCC receives actual and projected financial information over the course of the year as well
as final year-end information. The financial information that the MDCC receives and considers includes the current year projected income statement
and other financial measures compared with prior year results and the current year budget. The MDCC additionally reviews other metrics of
BlackRock’s financial performance (e.g., net inflows of AUM and investment performance) as well as information regarding market conditions and
competitive compensation levels.
The MDCC regularly considers management’s recommendation as to the percentage of preincentive operating income that will be accrued and
reflected as a compensation expense throughout the year for the cash portion of the total annual bonus pool (the “accrual rate”). The accrual rate
of the cash portion of the total annual bonus pool may be modified by the MDCC during the year based on its review of the financial information
described above. The MDCC does not apply any particular weighting or formula to the information it considers when determining the size of the total
bonus pool or the accruals made for the cash portion of the total bonus pool.
Following the end of the performance year, the MDCC approves the final bonus pool amount.
As part of the year-end review process the Enterprise Risk and Regulatory Compliance departments report to the MDCC on any activities, incidents
or events that warrant consideration in making compensation decisions.
Individuals are not involved in setting their own remuneration.
Control functions
Each of the control functions (Enterprise Risk, Legal & Compliance, and Internal Audit) has its own organisational structure which is independent
of the business units. The head of each control function is either a member of the Global Executive Committee (“GEC”), the global management
committee, or has a reporting obligation to the board of directors of BlackRock Group Limited, the parent company of all of BlackRock’s EMEA
regulated entities, including the Manager.
iSHARES VII PLC
REPORT ON REMUNERATION (UNAUDITED) (continued)
[289 ]

Control functions (continued)
Functional bonus pools are determined with reference to the performance of each individual function. The remuneration of the senior members of
control functions is directly overseen by the MDCC.
Link between pay and performance
There is a clear and well defined pay-for-performance philosophy and compensation programmes which are designed to meet the following key
objectives as detailed below:
● appropriately balance BlackRock’s financial results between shareholders and employees;
● attract, retain and motivate employees capable of making significant contributions to the long-term success of the business;
● align the interests of senior employees with those of shareholders by awarding BlackRock Inc.’s stock as a significant part of both annual and
long-term incentive awards;
● control fixed costs by ensuring that compensation expense varies with profitability;
● link a significant portion of an employee’s total compensation to the financial and operational performance of the business as well as its common
stock performance;
● discourage excessive risk-taking; and
● ensure that client interests are not negatively impacted by remuneration awarded on a short-term, mid-term and/or long-term basis.
Driving a high-performance culture is dependent on the ability to measure performance against objectives, values and behaviours in a clear and
consistent way. Managers use a 5-point rating scale to provide an overall assessment of an employee’s performance, and employees also provide
a self-evaluation. The overall, final rating is reconciled during each employee’s performance appraisal. Employees are assessed on the manner in
which performance is attained as well as the absolute performance itself.
In keeping with the pay-for-performance philosophy, ratings are used to differentiate and reward individual performance – but don’t pre-determine
compensation outcomes. Compensation decisions remain discretionary and are made as part of the year-end compensation process.
When setting remuneration levels other factors are considered, as well as individual performance, which may include:
● the performance of the Manager, the funds managed by the Manager and/or the relevant functional department;
● factors relevant to an employee individually; relationships with clients and colleagues; teamwork; skills; any conduct issues; and, subject to any
applicable policy, the impact that any relevant leave of absence may have on contribution to the business);
● the management of risk within the risk profiles appropriate for BlackRock’s clients;
● strategic business needs, including intentions regarding retention;
● market intelligence; and
● criticality to business.
A primary product tool is risk management and, while employees are compensated for strong performance in their management of client assets,
they are required to manage risk within the risk profiles appropriate for their clients. Therefore, employees are not rewarded for engaging in high-risk
transactions outside of established parameters. Remuneration practices do not provide undue incentives for short-term planning or short-term
financial rewards, do not reward unreasonable risk and provide a reasonable balance between the many and substantial risks inherent within the
business of investment management, risk management and advisory services.
BlackRock operates a total compensation model for remuneration which includes a base salary, which is contractual, and a discretionary bonus
scheme.
iSHARES VII PLC
REPORT ON REMUNERATION (UNAUDITED) (continued)
[290 ]
Link between pay and performance (continued)
BlackRock operates an annual discretionary bonus scheme. Although all employees are eligible to be considered for a discretionary bonus, there
is no contractual obligation to make any award to an employee under its discretionary bonus scheme. In exercising discretion to award a
discretionary bonus, the factors listed above (under the heading “Link between pay and performance”) may be taken into account in addition to any
other matters which become relevant to the exercise of discretion in the course of the performance year.
Discretionary bonus awards for all employees, including executive officers, are subject to a guideline that determines the portion paid in cash and
the portion paid in BlackRock, Inc. stock and subject to additional vesting/clawback conditions. Stock awards are subject to further performance
adjustment through variation in BlackRock, Inc.’s share price over the vesting period. As total annual compensation increases, a greater portion is
deferred into stock. The MDCC adopted this approach in 2006 to substantially increase the retention value and shareholder alignment of the
compensation package for eligible employees, including the executive officers. The portion deferred into stock vests into three equal instalments
over the three years following grant.
Supplementary to the annual discretionary bonus as described above, equity awards may be made to select individuals to provide greater linkage
with future business results. These long-term incentive awards have been established individually to provide meaningful incentive for continued
performance over a multi-year period recognising the scope of the individual’s role, business expertise and leadership skills.
Selected senior leaders are eligible to receive performance-adjusted equity-based awards from the “BlackRock Performance Incentive Plan”
(“BPIP”). Awards made from the BPIP have a three-year performance period based on a measurement of As Adjusted Operating Margin1 and
Organic Revenue Growth2 .Determination of pay-out will be made based on the firm’s achievement relative to target financial results at the
conclusion of the performance period. The maximum number of shares that can be earned is 165% of the award in those situations where both
metrics achieve pre-determined financial targets. No shares will be earned where the firm’s financial performance in both of the above metrics is
below a pre-determined performance threshold. These metrics have been selected as key measures of shareholder value which endure across
market cycles.
A limited number of investment professionals have a portion of their annual discretionary bonus (as described above) awarded as deferred cash
that notionally tracks investment in selected products managed by the employee. The intention of these awards is to align investment professionals
with the investment returns of the products they manage through the deferral of compensation into those products. Clients and external evaluators
have increasingly viewed more favourably those products where key investors have “skin in the game” through significant personal investments.
Identified Staff
The UCITS Remuneration Policy sets out the process that will be applied to identify staff as Identified Staff, being categories of staff of the Manager,
including senior management, risk takers, control functions and any employee receiving total remuneration that takes them into the same
remuneration bracket as senior management and risk takers, whose professional activities have a material impact on the risk profiles of the Manager
or of the funds it manages.
The list of Identified Staff will be subject to regular review, being formally reviewed in the event of, but not limited to:
● organisational changes;
● new business initiatives;
● changes in significant influence function lists;
● changes in role responsibilities; and
● revised regulatory direction.
1As Adjusted Operating Margin: As reported in BlackRock’s external filings, reflects adjusted Operating Income divided by Total Revenue net of distribution and servicing expenses and amortisation of deferred sales commissions.2Organic Revenue Growth: Equal to net new base fees plus net new Aladdin revenue generated in the year (in Dollars).
iSHARES VII PLC
REPORT ON REMUNERATION (UNAUDITED) (continued)
[291 ]

Quantitative Remuneration Disclosure
The Manager is required under UCITS to make quantitative disclosures of remuneration. These disclosures are made in line with BlackRock’s
interpretation of currently available regulatory guidance on quantitative remuneration disclosures. As market or regulatory practice develops
BlackRock may consider it appropriate to make changes to the way in which quantitative remuneration disclosures are calculated. Where such
changes are made, this may result in disclosures in relation to a fund not being comparable to the disclosures made in the prior year, or in relation
to other BlackRock fund disclosures in that same year.
Disclosures are provided in relation to (a) the staff of the Manager; (b) staff who are senior management; and (c) staff who have the ability to
materially affect the risk profile of the Fund, including individuals who, although not directly employed by the Manager, are assigned by their employer
to carry out services directly for the Manager.
All individuals included in the aggregated figures disclosed are rewarded in line with BlackRock’s remuneration policy for their responsibilities across
the relevant BlackRock business area. As all individuals have a number of areas of responsibilities, only the portion of remuneration for those
individuals’ services attributable to the Fund is included in the aggregate figures disclosed.
Members of staff and senior management of the Manager typically provide both UCITS and non-UCITS related services in respect of multiple funds,
clients and functions of the Manager and across the broader BlackRock group. Therefore, the figures disclosed are a sum of each individual’s
portion of remuneration attributable to the Manager according to an objective apportionment methodology which acknowledges the multiple-service
nature of the Manager. Accordingly, the figures are not representative of any individual’s actual remuneration or their remuneration structure.
The amount of the total remuneration awarded by the Manager to its staff which has been attributed to the Manager’s UCITS-related business in
respect of the Manager’s financial year ending 31 December 2019 is EUR 7.7 million. This figure is comprised of fixed remuneration of EUR
3.4 million and variable remuneration of EUR 4.3 million. There was a total of 67 beneficiaries of the remuneration described above.
The amount of the aggregate remuneration awarded by the Manager, which has been attributed to the Manager’s UCITS-related business in respect
of the Manager’s financial year ending 31 December 2019, to its senior management was EUR 0.6 million, and to other members of its staff whose
actions have a material impact on the risk profile of the Fund was EUR 7.1 million.
iSHARES VII PLC
REPORT ON REMUNERATION (UNAUDITED) (continued)
[292 ]
Efficient Portfolio Management Techniques
The Entity may, on behalf of each Fund and subject to the conditions and within the limits laid down by the CBI, employ techniques and instruments
relating to transferable securities for efficient portfolio management purposes. Transactions for the purposes of efficient portfolio management may
be undertaken with a view to achieving a reduction in risk, a reduction in costs or the generation of additional capital or income for the Fund with
an appropriate level of risk, taking into account the risk profile of the relevant Fund and the general provisions of the Directive. These techniques
and instruments may include investments in FDI such as interest rate and bond futures (which may be used to manage interest rate risk), index
futures (which may be used to manage cash flows on a short term basis), options (which may be used to achieve cost efficiencies, for example where
the acquisition of the option is more cost effective than purchasing of the underlying asset), swaps (which may be used to manage currency risk)
and investments in money market instruments and/or money market collective investment schemes. New techniques and instruments may be
developed which may be suitable for use by the Entity and the Entity (subject to the Central Bank’s requirements) may employ such techniques and
instruments.
A Fund may enter into securities lending, repurchase and/or reverse repurchase agreements for the purposes of efficient portfolio management
subject to the conditions and limits set out in the Central Bank UCITS Regulations and in accordance with the requirements of the Central Bank.
The underlying exposure obtained through FDI and at the identity of the counterparties to these FDIs at the financial period end are disclosed on
the relevant Fund’s schedule of investments.
Securities Lending
All securities lending transactions entered into by each Fund are subject to a written legal agreement between each Fund and the securities lending
agent, BlackRock Advisors (UK) Limited, a related party to the Entity, and separately between the securities lending agent and the approved
borrowing counterparty. Collateral received in exchange for securities lent is transferred under a title transfer arrangement and is delivered to and
held in an account with a tri-party collateral manager in the name of the Depositary on behalf of each Fund. Collateral received is segregated from
the assets belonging to each Fund’s Depositary or the securities lending agent.
All collateral received/posted by each Fund under the ISDA Master Agreement is transferred bilaterally under a title transfer arrangement.
The following table details the value of securities on loan as a proportion of each Fund’s total lendable assets and NAV, as at 31 July 2020. Total
lendable assets represent the aggregate value of assets forming part of a Fund’s securities lending programme. This excludes any assets held by
the Fund that are not considered lendable due to any market, regulatory, investment or other restriction.
Securities on loan
Fund Currency
% oflendable
assets% ofNAV
iShares $ Treasury Bond 1-3yr UCITS ETF USD (Acc) B USD 9.77 8.50
iShares $ Treasury Bond 3-7yr UCITS ETF USD 34.76 32.24
iShares $ Treasury Bond 7-10yr UCITS ETF USD (Acc) USD 52.98 48.64
iShares € Govt Bond 1-3yr UCITS ETF EUR (Acc) EUR 11.94 11.05
iShares € Govt Bond 3-7yr UCITS ETF EUR 21.81 19.82
iShares € Govt Bond 7-10yr UCITS ETF EUR (Acc) EUR 20.88 18.62
iShares Core EURO STOXX 50 UCITS ETF EUR 5.87 5.56
iShares Core FTSE 100 UCITS ETF GBP (Acc) GBP 3.49 3.33
iShares Core MSCI EMU UCITS ETF EUR 8.01 7.22
iShares Core MSCI Pacific ex-Japan UCITS ETF USD 18.83 18.01
iShares Core S&P 500 UCITS ETF USD 3.19 2.99
iShares Dow Jones Industrial Average UCITS ETF USD 5.43 5.12
iSHARES VII PLC
EFFICIENT PORTFOLIO MANAGEMENT AND SECURITIES FINANCING TRANSACTIONS
[293 ]

Securities Lending (continued)
Securities on loan
Fund Currency
% oflendable
assets% ofNAV
iShares FTSE MIB UCITS ETF EUR (Acc) EUR 15.22 14.47
iShares MSCI Canada UCITS ETF USD 6.51 6.20
iShares MSCI EM Asia UCITS ETF USD 19.71 12.89
iShares MSCI EMU CHF Hedged UCITS ETF (Acc) CHF 12.88 12.29
iShares MSCI EMU Small Cap UCITS ETF EUR 31.02 29.27
iShares MSCI EMU USD Hedged UCITS ETF (Acc) USD 14.37 13.70
iShares MSCI Japan UCITS ETF USD 33.83 33.17
iShares MSCI Korea UCITS ETF USD (Acc) USD 17.01 16.19
iShares MSCI UK Small Cap UCITS ETF GBP 34.02 32.24
iShares MSCI UK UCITS ETF GBP 1.25 1.20
iShares MSCI USA Small Cap UCITS ETF USD 17.47 16.65
iShares MSCI USA UCITS ETF USD 5.50 5.17
iShares NASDAQ 100 UCITS ETF USD 5.86 5.43
iShares Nikkei 225 UCITS ETF JPY 38.84 38.27
The total income earned from securities lending transactions is split between the relevant Fund and the Securities Lending Agent. Each Fund
receives 62.5% while securities lending agent receives 37.5% of such income with all operational costs borne out of the securities lending agent’s
share.
The following tables detail the value of securities on loan (individually identified in the relevant Fund’s Schedule of Investments), analysed by
counterparty as at 31 July 2020.
CounterpartyAmounton loan
Collateralreceived
iShares $ Treasury Bond 1-3yr UCITS ETF USD (Acc) B USD’000 USD’000
The Bank of Nova Scotia 19,054 21,203
UBS AG 8,703 9,662
BNP Paribas Arbitrage SNC 4,137 4,487
Total 31,894 35,352
CounterpartyAmounton loan
Collateralreceived
iShares $ Treasury Bond 3-7yr UCITS ETF USD’000 USD’000
Societe Generale SA 486,083 528,921
BNP Paribas Arbitrage SNC 319,531 346,565
UBS AG 41,743 46,343
Total 847,357 921,829
iSHARES VII PLC
EFFICIENT PORTFOLIO MANAGEMENT AND SECURITIES FINANCING TRANSACTIONS (continued)
[294 ]
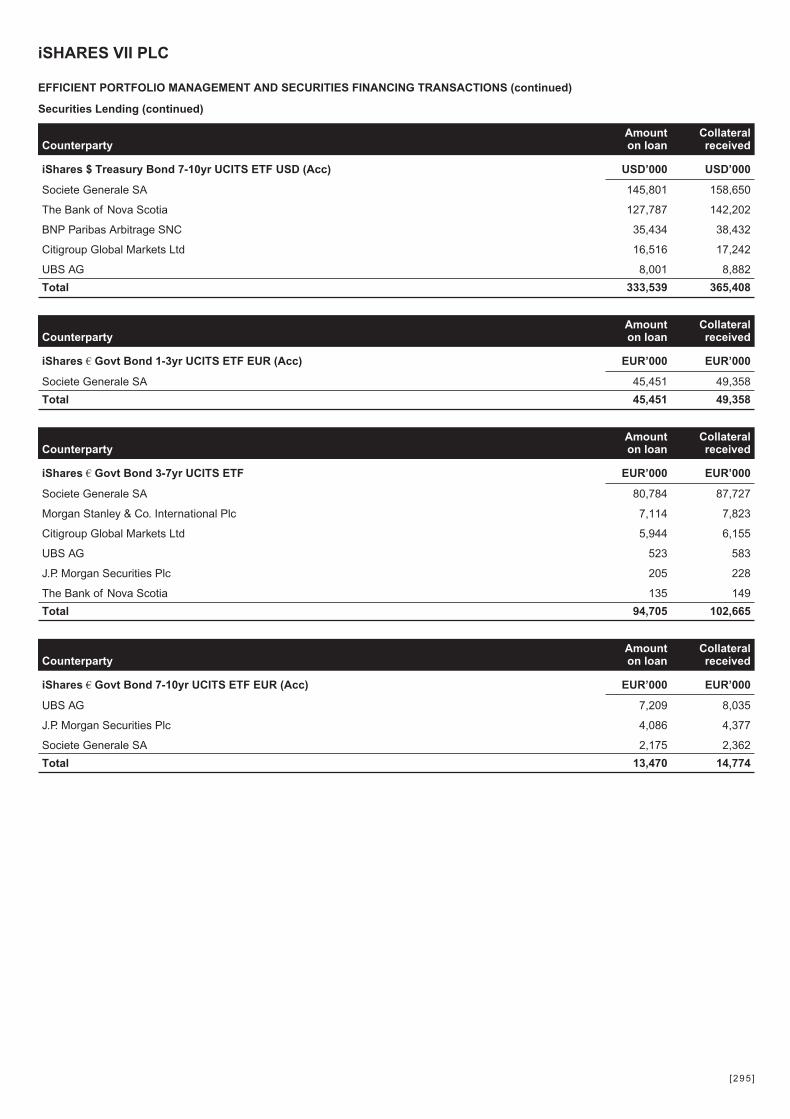
Securities Lending (continued)
CounterpartyAmounton loan
Collateralreceived
iShares $ Treasury Bond 7-10yr UCITS ETF USD (Acc) USD’000 USD’000
Societe Generale SA 145,801 158,650
The Bank of Nova Scotia 127,787 142,202
BNP Paribas Arbitrage SNC 35,434 38,432
Citigroup Global Markets Ltd 16,516 17,242
UBS AG 8,001 8,882
Total 333,539 365,408
CounterpartyAmounton loan
Collateralreceived
iShares € Govt Bond 1-3yr UCITS ETF EUR (Acc) EUR’000 EUR’000
Societe Generale SA 45,451 49,358
Total 45,451 49,358
CounterpartyAmounton loan
Collateralreceived
iShares € Govt Bond 3-7yr UCITS ETF EUR’000 EUR’000
Societe Generale SA 80,784 87,727
Morgan Stanley & Co. International Plc 7,114 7,823
Citigroup Global Markets Ltd 5,944 6,155
UBS AG 523 583
J.P. Morgan Securities Plc 205 228
The Bank of Nova Scotia 135 149
Total 94,705 102,665
CounterpartyAmounton loan
Collateralreceived
iShares € Govt Bond 7-10yr UCITS ETF EUR (Acc) EUR’000 EUR’000
UBS AG 7,209 8,035
J.P. Morgan Securities Plc 4,086 4,377
Societe Generale SA 2,175 2,362
Total 13,470 14,774
iSHARES VII PLC
EFFICIENT PORTFOLIO MANAGEMENT AND SECURITIES FINANCING TRANSACTIONS (continued)
[295 ]
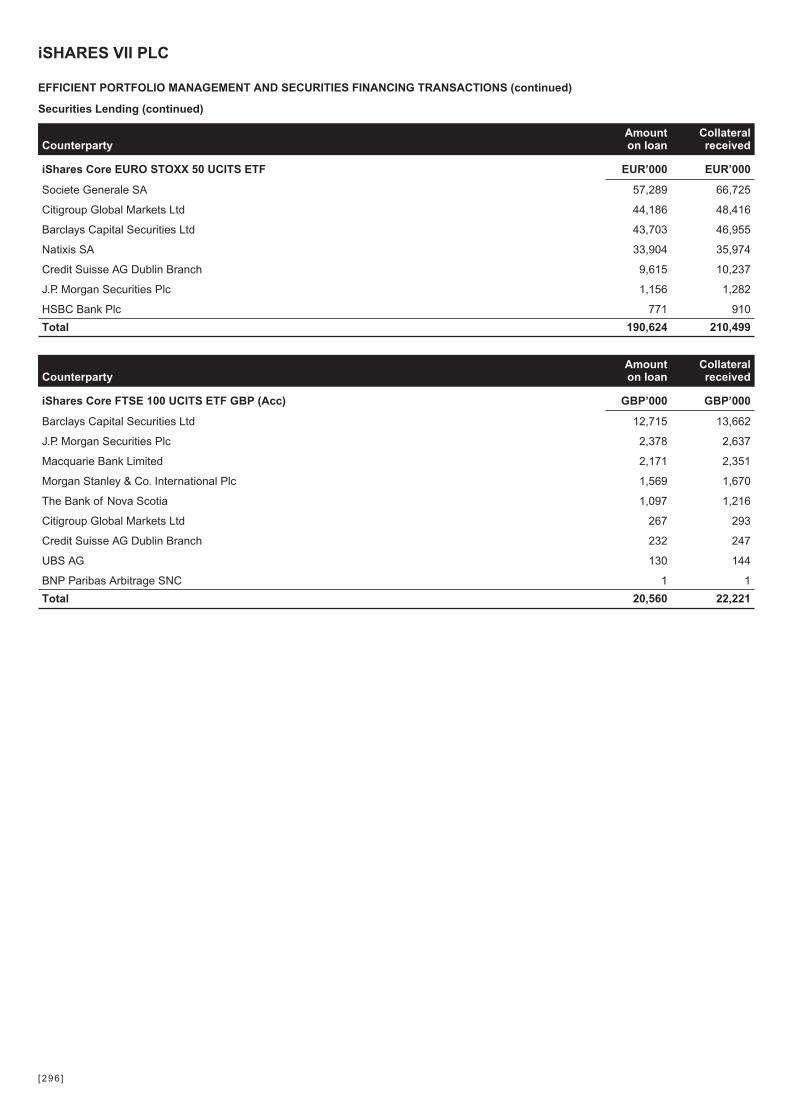
Securities Lending (continued)
CounterpartyAmounton loan
Collateralreceived
iShares Core EURO STOXX 50 UCITS ETF EUR’000 EUR’000
Societe Generale SA 57,289 66,725
Citigroup Global Markets Ltd 44,186 48,416
Barclays Capital Securities Ltd 43,703 46,955
Natixis SA 33,904 35,974
Credit Suisse AG Dublin Branch 9,615 10,237
J.P. Morgan Securities Plc 1,156 1,282
HSBC Bank Plc 771 910
Total 190,624 210,499
CounterpartyAmounton loan
Collateralreceived
iShares Core FTSE 100 UCITS ETF GBP (Acc) GBP’000 GBP’000
Barclays Capital Securities Ltd 12,715 13,662
J.P. Morgan Securities Plc 2,378 2,637
Macquarie Bank Limited 2,171 2,351
Morgan Stanley & Co. International Plc 1,569 1,670
The Bank of Nova Scotia 1,097 1,216
Citigroup Global Markets Ltd 267 293
Credit Suisse AG Dublin Branch 232 247
UBS AG 130 144
BNP Paribas Arbitrage SNC 1 1
Total 20,560 22,221
iSHARES VII PLC
EFFICIENT PORTFOLIO MANAGEMENT AND SECURITIES FINANCING TRANSACTIONS (continued)
[296 ]

Securities Lending (continued)
CounterpartyAmounton loan
Collateralreceived
iShares Core MSCI EMU UCITS ETF EUR’000 EUR’000
Citigroup Global Markets Ltd 33,603 36,817
Societe Generale SA 28,158 32,795
J.P. Morgan Securities Plc 17,322 19,211
Barclays Capital Securities Ltd 17,202 18,482
BNP Paribas Arbitrage SNC 17,166 19,010
Morgan Stanley & Co. International Plc 11,413 12,147
HSBC Bank Plc 9,368 11,056
Natixis SA 5,955 6,319
UBS AG 4,958 5,496
Macquarie Bank Limited 3,217 3,484
Other 4,423 5,510
Total 152,785 170,327
CounterpartyAmounton loan
Collateralreceived
iShares Core MSCI Pacific ex-Japan UCITS ETF USD’000 USD’000
J.P. Morgan Securities Plc 93,842 104,075
Morgan Stanley & Co. International Plc 71,558 76,160
Societe Generale SA 70,028 81,561
Barclays Capital Securities Ltd 52,877 56,812
Macquarie Bank Limited 30,164 32,664
UBS AG 9,338 10,350
HSBC Bank Plc 4,643 5,480
Goldman Sachs International 1,698 2,366
Citigroup Global Markets Ltd 596 654
Total 334,744 370,122
iSHARES VII PLC
EFFICIENT PORTFOLIO MANAGEMENT AND SECURITIES FINANCING TRANSACTIONS (continued)
[297 ]
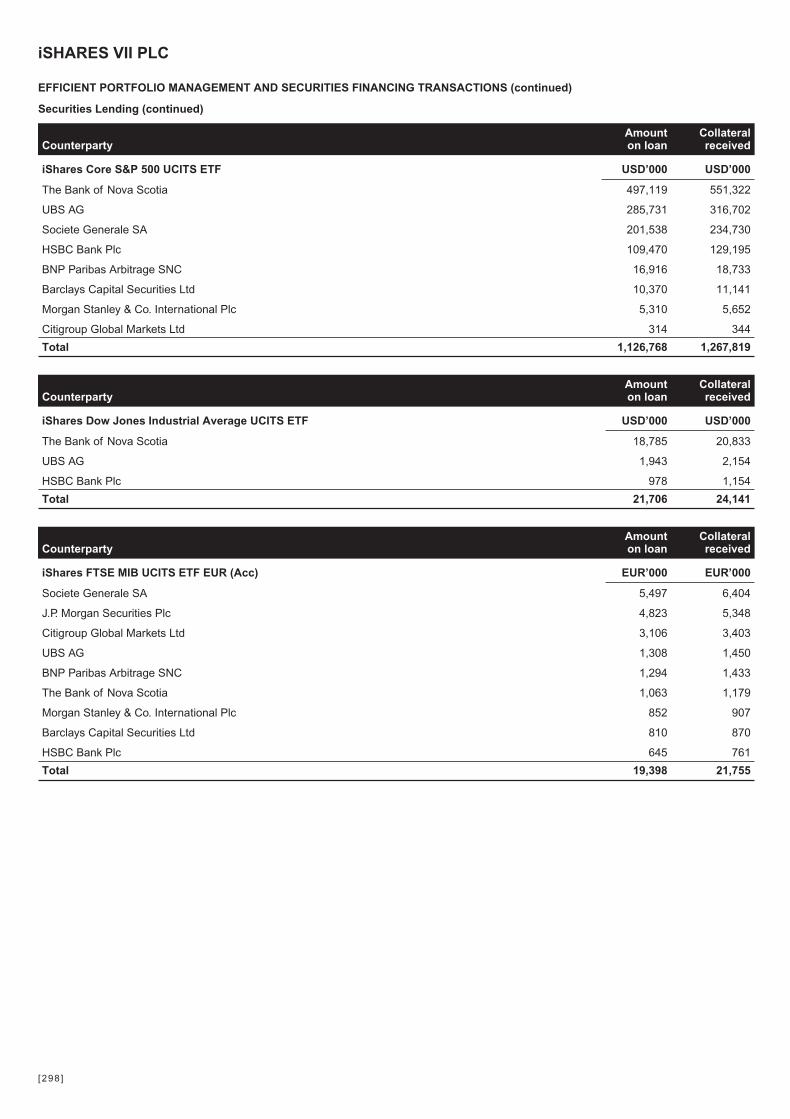
Securities Lending (continued)
CounterpartyAmounton loan
Collateralreceived
iShares Core S&P 500 UCITS ETF USD’000 USD’000
The Bank of Nova Scotia 497,119 551,322
UBS AG 285,731 316,702
Societe Generale SA 201,538 234,730
HSBC Bank Plc 109,470 129,195
BNP Paribas Arbitrage SNC 16,916 18,733
Barclays Capital Securities Ltd 10,370 11,141
Morgan Stanley & Co. International Plc 5,310 5,652
Citigroup Global Markets Ltd 314 344
Total 1,126,768 1,267,819
CounterpartyAmounton loan
Collateralreceived
iShares Dow Jones Industrial Average UCITS ETF USD’000 USD’000
The Bank of Nova Scotia 18,785 20,833
UBS AG 1,943 2,154
HSBC Bank Plc 978 1,154
Total 21,706 24,141
CounterpartyAmounton loan
Collateralreceived
iShares FTSE MIB UCITS ETF EUR (Acc) EUR’000 EUR’000
Societe Generale SA 5,497 6,404
J.P. Morgan Securities Plc 4,823 5,348
Citigroup Global Markets Ltd 3,106 3,403
UBS AG 1,308 1,450
BNP Paribas Arbitrage SNC 1,294 1,433
The Bank of Nova Scotia 1,063 1,179
Morgan Stanley & Co. International Plc 852 907
Barclays Capital Securities Ltd 810 870
HSBC Bank Plc 645 761
Total 19,398 21,755
iSHARES VII PLC
EFFICIENT PORTFOLIO MANAGEMENT AND SECURITIES FINANCING TRANSACTIONS (continued)
[298 ]
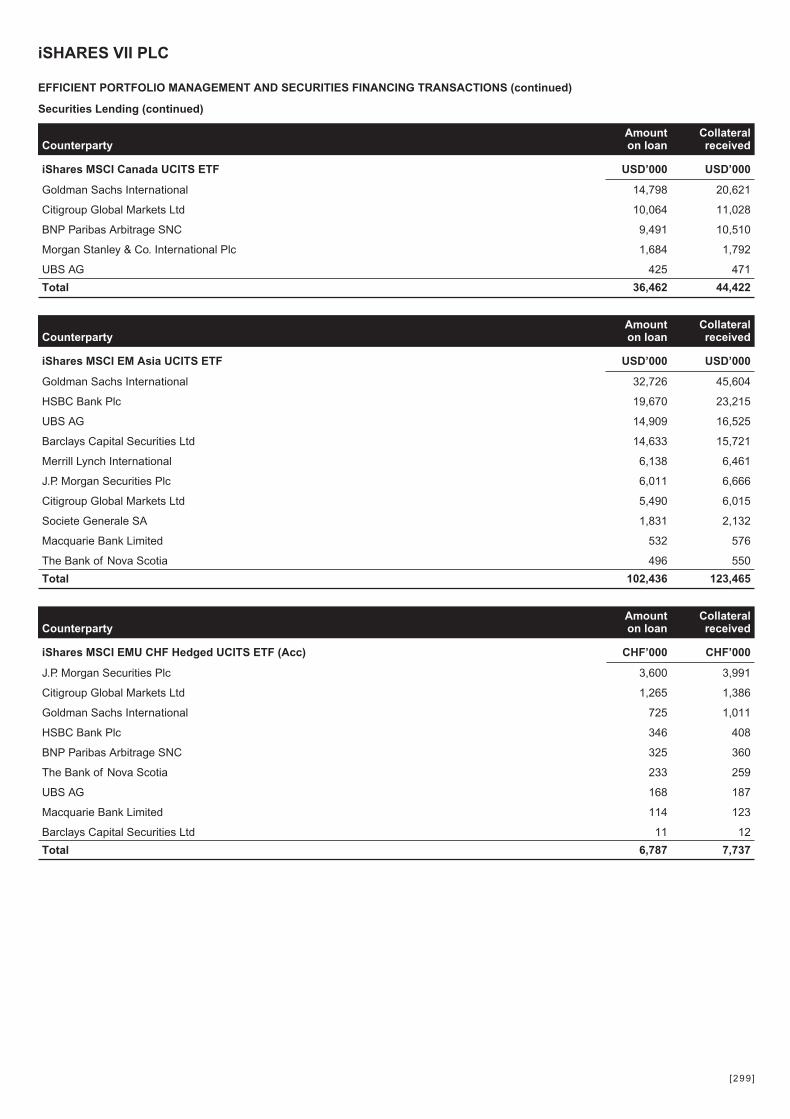
Securities Lending (continued)
CounterpartyAmounton loan
Collateralreceived
iShares MSCI Canada UCITS ETF USD’000 USD’000
Goldman Sachs International 14,798 20,621
Citigroup Global Markets Ltd 10,064 11,028
BNP Paribas Arbitrage SNC 9,491 10,510
Morgan Stanley & Co. International Plc 1,684 1,792
UBS AG 425 471
Total 36,462 44,422
CounterpartyAmounton loan
Collateralreceived
iShares MSCI EM Asia UCITS ETF USD’000 USD’000
Goldman Sachs International 32,726 45,604
HSBC Bank Plc 19,670 23,215
UBS AG 14,909 16,525
Barclays Capital Securities Ltd 14,633 15,721
Merrill Lynch International 6,138 6,461
J.P. Morgan Securities Plc 6,011 6,666
Citigroup Global Markets Ltd 5,490 6,015
Societe Generale SA 1,831 2,132
Macquarie Bank Limited 532 576
The Bank of Nova Scotia 496 550
Total 102,436 123,465
CounterpartyAmounton loan
Collateralreceived
iShares MSCI EMU CHF Hedged UCITS ETF (Acc) CHF’000 CHF’000
J.P. Morgan Securities Plc 3,600 3,991
Citigroup Global Markets Ltd 1,265 1,386
Goldman Sachs International 725 1,011
HSBC Bank Plc 346 408
BNP Paribas Arbitrage SNC 325 360
The Bank of Nova Scotia 233 259
UBS AG 168 187
Macquarie Bank Limited 114 123
Barclays Capital Securities Ltd 11 12
Total 6,787 7,737
iSHARES VII PLC
EFFICIENT PORTFOLIO MANAGEMENT AND SECURITIES FINANCING TRANSACTIONS (continued)
[299 ]
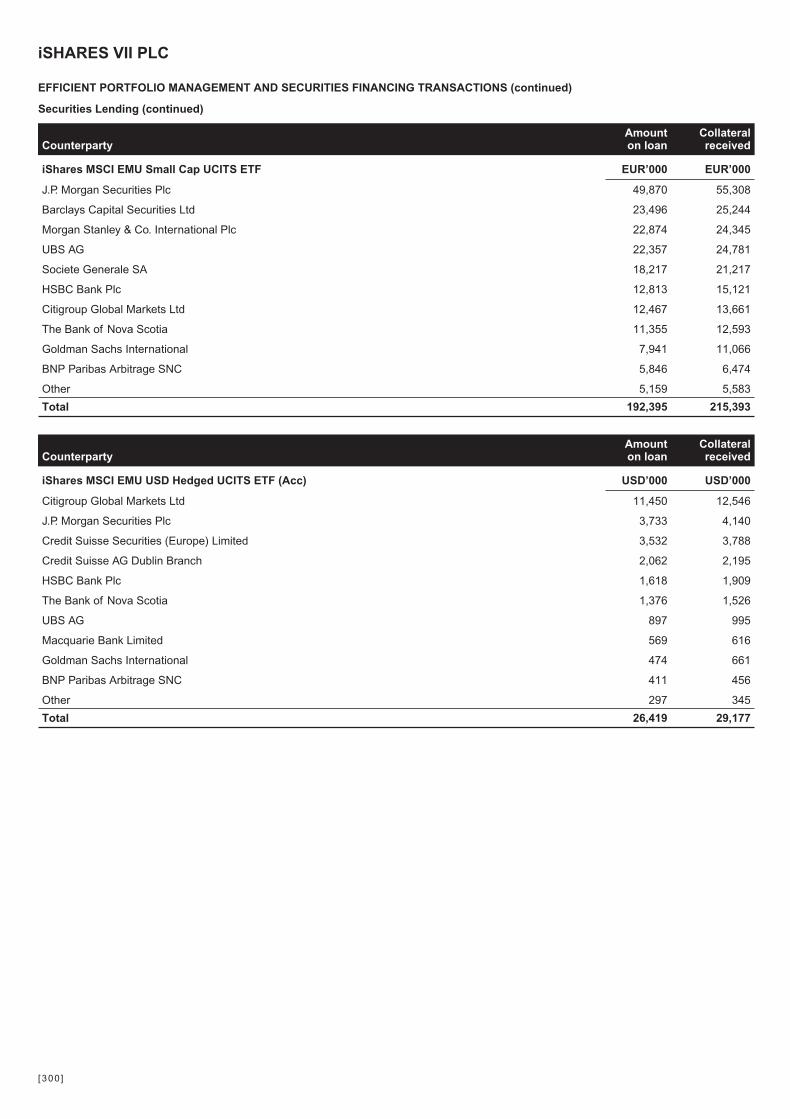
Securities Lending (continued)
CounterpartyAmounton loan
Collateralreceived
iShares MSCI EMU Small Cap UCITS ETF EUR’000 EUR’000
J.P. Morgan Securities Plc 49,870 55,308
Barclays Capital Securities Ltd 23,496 25,244
Morgan Stanley & Co. International Plc 22,874 24,345
UBS AG 22,357 24,781
Societe Generale SA 18,217 21,217
HSBC Bank Plc 12,813 15,121
Citigroup Global Markets Ltd 12,467 13,661
The Bank of Nova Scotia 11,355 12,593
Goldman Sachs International 7,941 11,066
BNP Paribas Arbitrage SNC 5,846 6,474
Other 5,159 5,583
Total 192,395 215,393
CounterpartyAmounton loan
Collateralreceived
iShares MSCI EMU USD Hedged UCITS ETF (Acc) USD’000 USD’000
Citigroup Global Markets Ltd 11,450 12,546
J.P. Morgan Securities Plc 3,733 4,140
Credit Suisse Securities (Europe) Limited 3,532 3,788
Credit Suisse AG Dublin Branch 2,062 2,195
HSBC Bank Plc 1,618 1,909
The Bank of Nova Scotia 1,376 1,526
UBS AG 897 995
Macquarie Bank Limited 569 616
Goldman Sachs International 474 661
BNP Paribas Arbitrage SNC 411 456
Other 297 345
Total 26,419 29,177
iSHARES VII PLC
EFFICIENT PORTFOLIO MANAGEMENT AND SECURITIES FINANCING TRANSACTIONS (continued)
[300 ]
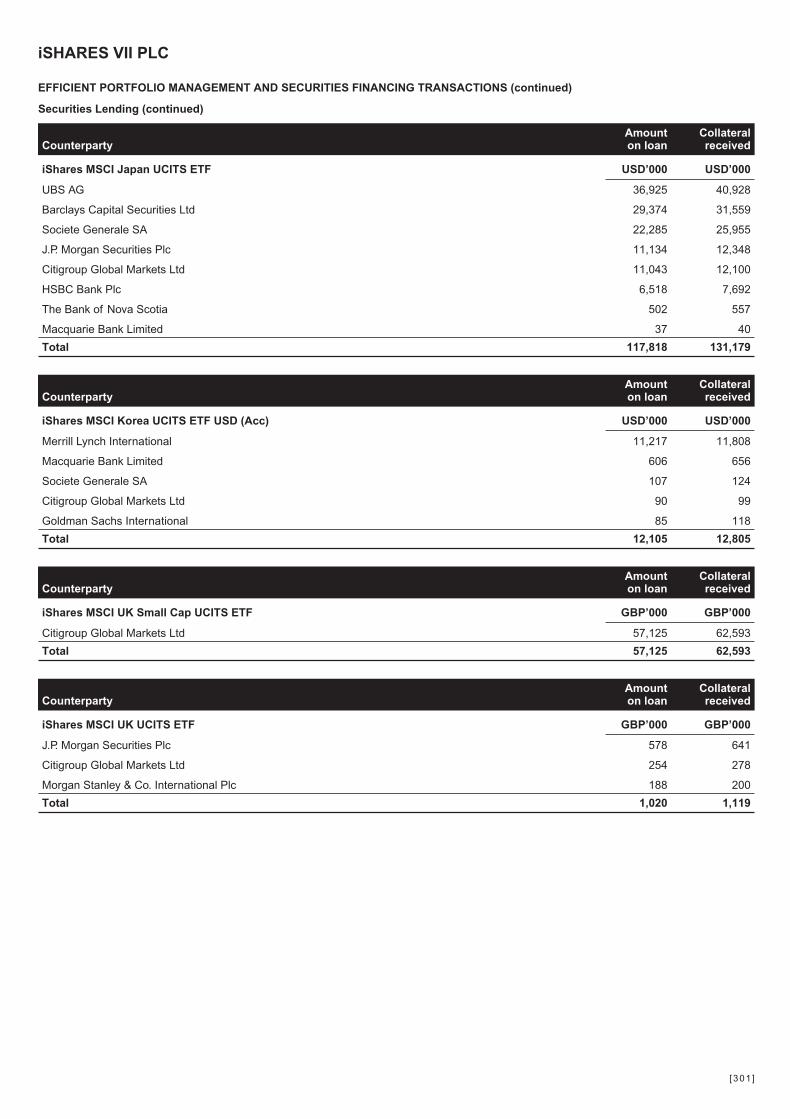
Securities Lending (continued)
CounterpartyAmounton loan
Collateralreceived
iShares MSCI Japan UCITS ETF USD’000 USD’000
UBS AG 36,925 40,928
Barclays Capital Securities Ltd 29,374 31,559
Societe Generale SA 22,285 25,955
J.P. Morgan Securities Plc 11,134 12,348
Citigroup Global Markets Ltd 11,043 12,100
HSBC Bank Plc 6,518 7,692
The Bank of Nova Scotia 502 557
Macquarie Bank Limited 37 40
Total 117,818 131,179
CounterpartyAmounton loan
Collateralreceived
iShares MSCI Korea UCITS ETF USD (Acc) USD’000 USD’000
Merrill Lynch International 11,217 11,808
Macquarie Bank Limited 606 656
Societe Generale SA 107 124
Citigroup Global Markets Ltd 90 99
Goldman Sachs International 85 118
Total 12,105 12,805
CounterpartyAmounton loan
Collateralreceived
iShares MSCI UK Small Cap UCITS ETF GBP’000 GBP’000
Citigroup Global Markets Ltd 57,125 62,593
Total 57,125 62,593
CounterpartyAmounton loan
Collateralreceived
iShares MSCI UK UCITS ETF GBP’000 GBP’000
J.P. Morgan Securities Plc 578 641
Citigroup Global Markets Ltd 254 278
Morgan Stanley & Co. International Plc 188 200
Total 1,020 1,119
iSHARES VII PLC
EFFICIENT PORTFOLIO MANAGEMENT AND SECURITIES FINANCING TRANSACTIONS (continued)
[301 ]

Securities Lending (continued)
CounterpartyAmounton loan
Collateralreceived
iShares MSCI USA Small Cap UCITS ETF USD’000 USD’000
UBS AG 38,020 42,143
The Bank of Nova Scotia 32,783 36,357
HSBC Bank Plc 6,729 7,941
Societe Generale SA 433 504
Barclays Capital Securities Ltd 213 229
Goldman Sachs International 152 212
Citigroup Global Markets Ltd 111 122
Morgan Stanley & Co. International Plc 53 56
Total 78,494 87,564
CounterpartyAmounton loan
Collateralreceived
iShares MSCI USA UCITS ETF USD’000 USD’000
UBS AG 11,041 12,237
HSBC Bank Plc 10,124 11,949
The Bank of Nova Scotia 10,032 11,126
Citigroup Global Markets Ltd 101 110
Total 31,298 35,422
CounterpartyAmounton loan
Collateralreceived
iShares NASDAQ 100 UCITS ETF USD’000 USD’000
UBS AG 166,401 184,439
Credit Suisse AG Dublin Branch 63,969 68,112
Societe Generale SA 62,567 72,871
The Bank of Nova Scotia 17,139 19,008
HSBC Bank Plc 15,581 18,388
Total 325,657 362,818
iSHARES VII PLC
EFFICIENT PORTFOLIO MANAGEMENT AND SECURITIES FINANCING TRANSACTIONS (continued)
[302 ]
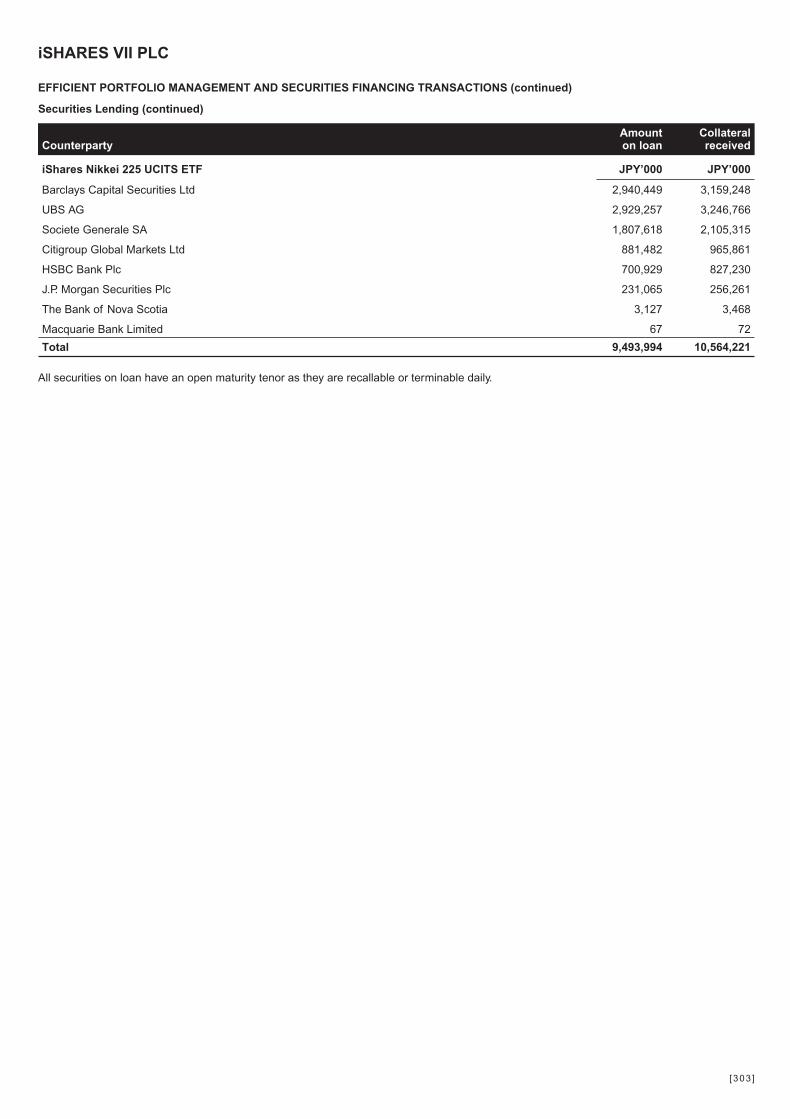
Securities Lending (continued)
CounterpartyAmounton loan
Collateralreceived
iShares Nikkei 225 UCITS ETF JPY’000 JPY’000
Barclays Capital Securities Ltd 2,940,449 3,159,248
UBS AG 2,929,257 3,246,766
Societe Generale SA 1,807,618 2,105,315
Citigroup Global Markets Ltd 881,482 965,861
HSBC Bank Plc 700,929 827,230
J.P. Morgan Securities Plc 231,065 256,261
The Bank of Nova Scotia 3,127 3,468
Macquarie Bank Limited 67 72
Total 9,493,994 10,564,221
All securities on loan have an open maturity tenor as they are recallable or terminable daily.
iSHARES VII PLC
EFFICIENT PORTFOLIO MANAGEMENT AND SECURITIES FINANCING TRANSACTIONS (continued)
[303 ]
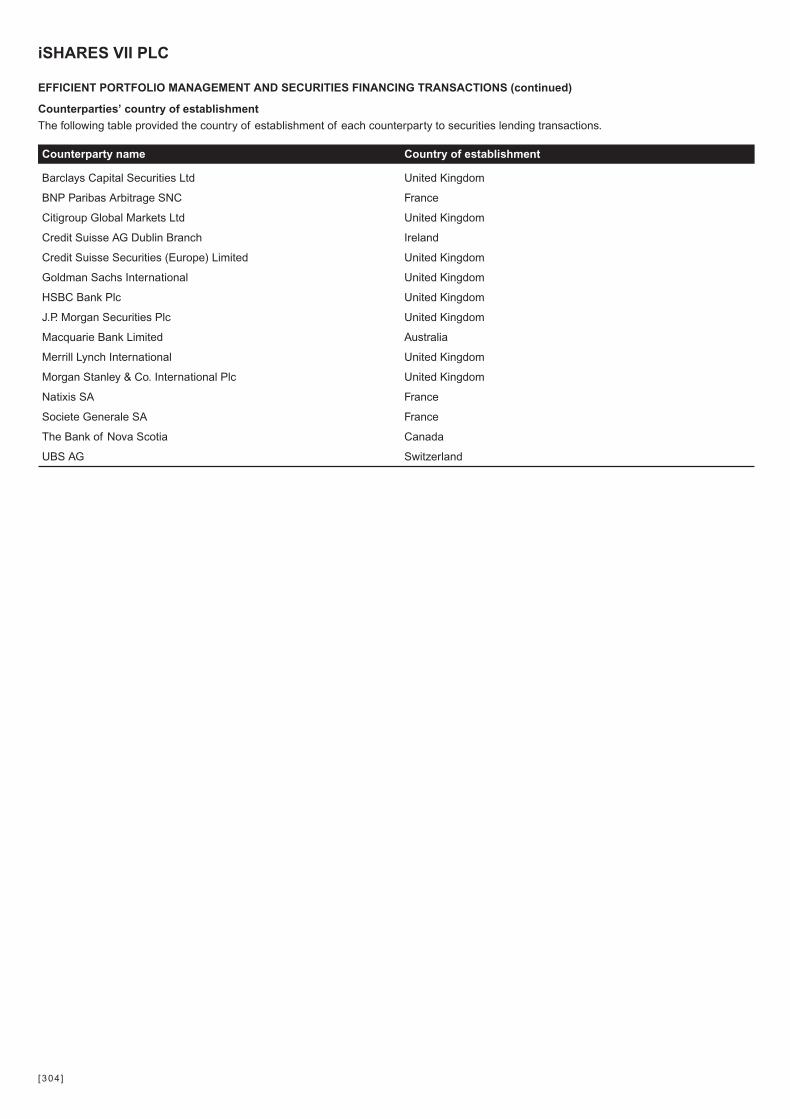
Counterparties’ country of establishment
The following table provided the country of establishment of each counterparty to securities lending transactions.
Counterparty name Country of establishment
Barclays Capital Securities Ltd United Kingdom
BNP Paribas Arbitrage SNC France
Citigroup Global Markets Ltd United Kingdom
Credit Suisse AG Dublin Branch Ireland
Credit Suisse Securities (Europe) Limited United Kingdom
Goldman Sachs International United Kingdom
HSBC Bank Plc United Kingdom
J.P. Morgan Securities Plc United Kingdom
Macquarie Bank Limited Australia
Merrill Lynch International United Kingdom
Morgan Stanley & Co. International Plc United Kingdom
Natixis SA France
Societe Generale SA France
The Bank of Nova Scotia Canada
UBS AG Switzerland
iSHARES VII PLC
EFFICIENT PORTFOLIO MANAGEMENT AND SECURITIES FINANCING TRANSACTIONS (continued)
[304 ]
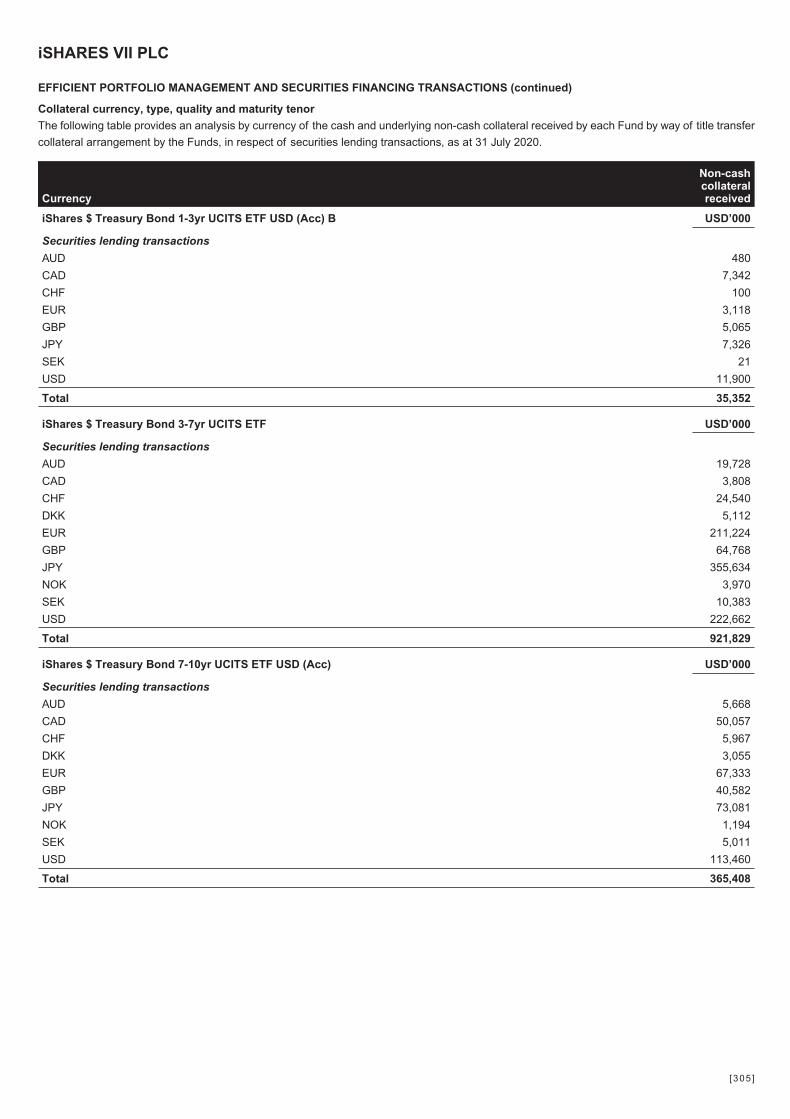
Collateral currency, type, quality and maturity tenor
The following table provides an analysis by currency of the cash and underlying non-cash collateral received by each Fund by way of title transfer
collateral arrangement by the Funds, in respect of securities lending transactions, as at 31 July 2020.
Currency
Non-cashcollateralreceived
iShares $ Treasury Bond 1-3yr UCITS ETF USD (Acc) B USD’000
Securities lending transactions
AUD 480
CAD 7,342
CHF 100
EUR 3,118
GBP 5,065
JPY 7,326
SEK 21
USD 11,900
Total 35,352
iShares $ Treasury Bond 3-7yr UCITS ETF USD’000
Securities lending transactions
AUD 19,728
CAD 3,808
CHF 24,540
DKK 5,112
EUR 211,224
GBP 64,768
JPY 355,634
NOK 3,970
SEK 10,383
USD 222,662
Total 921,829
iShares $ Treasury Bond 7-10yr UCITS ETF USD (Acc) USD’000
Securities lending transactions
AUD 5,668
CAD 50,057
CHF 5,967
DKK 3,055
EUR 67,333
GBP 40,582
JPY 73,081
NOK 1,194
SEK 5,011
USD 113,460
Total 365,408
iSHARES VII PLC
EFFICIENT PORTFOLIO MANAGEMENT AND SECURITIES FINANCING TRANSACTIONS (continued)
[305 ]
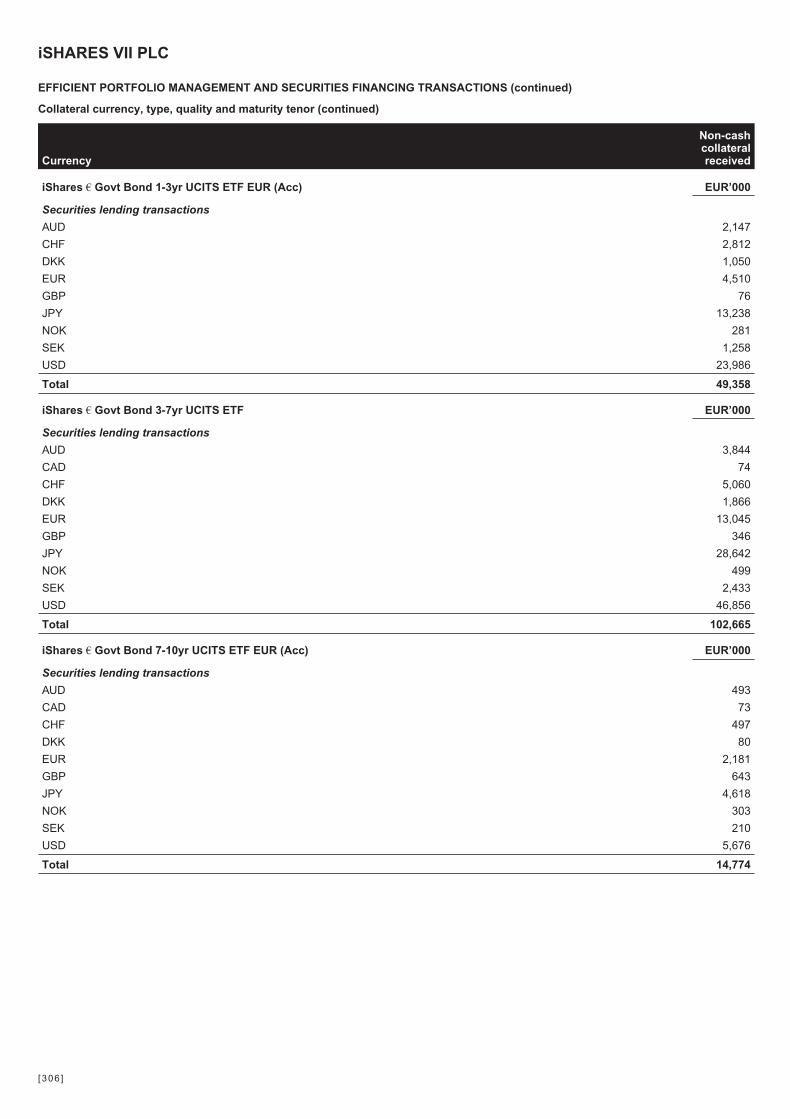
Collateral currency, type, quality and maturity tenor (continued)
Currency
Non-cashcollateralreceived
iShares € Govt Bond 1-3yr UCITS ETF EUR (Acc) EUR’000
Securities lending transactions
AUD 2,147
CHF 2,812
DKK 1,050
EUR 4,510
GBP 76
JPY 13,238
NOK 281
SEK 1,258
USD 23,986
Total 49,358
iShares € Govt Bond 3-7yr UCITS ETF EUR’000
Securities lending transactions
AUD 3,844
CAD 74
CHF 5,060
DKK 1,866
EUR 13,045
GBP 346
JPY 28,642
NOK 499
SEK 2,433
USD 46,856
Total 102,665
iShares € Govt Bond 7-10yr UCITS ETF EUR (Acc) EUR’000
Securities lending transactions
AUD 493
CAD 73
CHF 497
DKK 80
EUR 2,181
GBP 643
JPY 4,618
NOK 303
SEK 210
USD 5,676
Total 14,774
iSHARES VII PLC
EFFICIENT PORTFOLIO MANAGEMENT AND SECURITIES FINANCING TRANSACTIONS (continued)
[306 ]
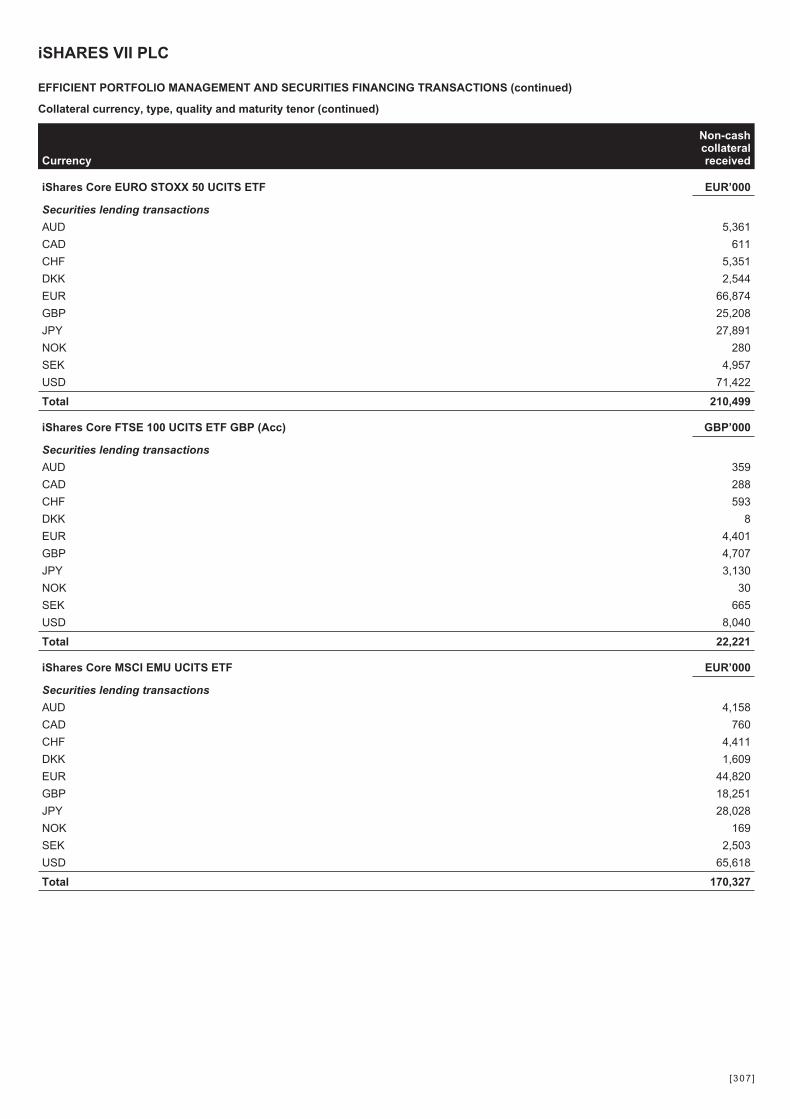
Collateral currency, type, quality and maturity tenor (continued)
Currency
Non-cashcollateralreceived
iShares Core EURO STOXX 50 UCITS ETF EUR’000
Securities lending transactions
AUD 5,361
CAD 611
CHF 5,351
DKK 2,544
EUR 66,874
GBP 25,208
JPY 27,891
NOK 280
SEK 4,957
USD 71,422
Total 210,499
iShares Core FTSE 100 UCITS ETF GBP (Acc) GBP’000
Securities lending transactions
AUD 359
CAD 288
CHF 593
DKK 8
EUR 4,401
GBP 4,707
JPY 3,130
NOK 30
SEK 665
USD 8,040
Total 22,221
iShares Core MSCI EMU UCITS ETF EUR’000
Securities lending transactions
AUD 4,158
CAD 760
CHF 4,411
DKK 1,609
EUR 44,820
GBP 18,251
JPY 28,028
NOK 169
SEK 2,503
USD 65,618
Total 170,327
iSHARES VII PLC
EFFICIENT PORTFOLIO MANAGEMENT AND SECURITIES FINANCING TRANSACTIONS (continued)
[307 ]
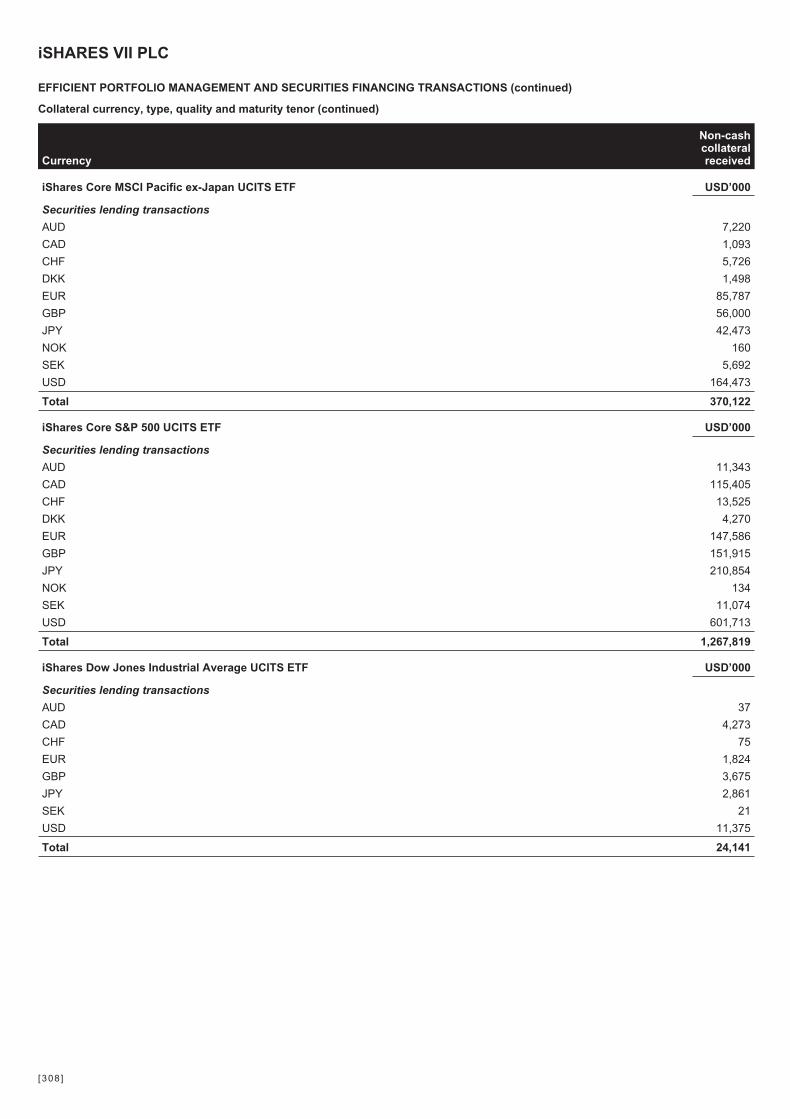
Collateral currency, type, quality and maturity tenor (continued)
Currency
Non-cashcollateralreceived
iShares Core MSCI Pacific ex-Japan UCITS ETF USD’000
Securities lending transactions
AUD 7,220
CAD 1,093
CHF 5,726
DKK 1,498
EUR 85,787
GBP 56,000
JPY 42,473
NOK 160
SEK 5,692
USD 164,473
Total 370,122
iShares Core S&P 500 UCITS ETF USD’000
Securities lending transactions
AUD 11,343
CAD 115,405
CHF 13,525
DKK 4,270
EUR 147,586
GBP 151,915
JPY 210,854
NOK 134
SEK 11,074
USD 601,713
Total 1,267,819
iShares Dow Jones Industrial Average UCITS ETF USD’000
Securities lending transactions
AUD 37
CAD 4,273
CHF 75
EUR 1,824
GBP 3,675
JPY 2,861
SEK 21
USD 11,375
Total 24,141
iSHARES VII PLC
EFFICIENT PORTFOLIO MANAGEMENT AND SECURITIES FINANCING TRANSACTIONS (continued)
[308 ]
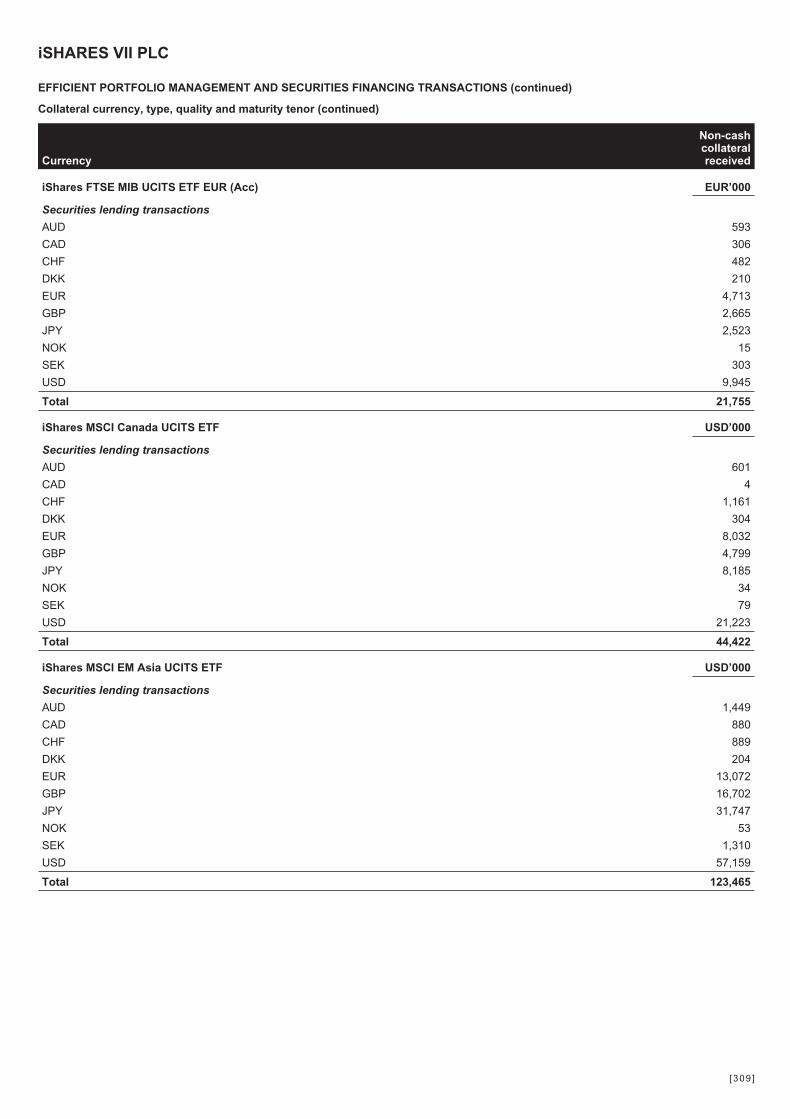
Collateral currency, type, quality and maturity tenor (continued)
Currency
Non-cashcollateralreceived
iShares FTSE MIB UCITS ETF EUR (Acc) EUR’000
Securities lending transactions
AUD 593
CAD 306
CHF 482
DKK 210
EUR 4,713
GBP 2,665
JPY 2,523
NOK 15
SEK 303
USD 9,945
Total 21,755
iShares MSCI Canada UCITS ETF USD’000
Securities lending transactions
AUD 601
CAD 4
CHF 1,161
DKK 304
EUR 8,032
GBP 4,799
JPY 8,185
NOK 34
SEK 79
USD 21,223
Total 44,422
iShares MSCI EM Asia UCITS ETF USD’000
Securities lending transactions
AUD 1,449
CAD 880
CHF 889
DKK 204
EUR 13,072
GBP 16,702
JPY 31,747
NOK 53
SEK 1,310
USD 57,159
Total 123,465
iSHARES VII PLC
EFFICIENT PORTFOLIO MANAGEMENT AND SECURITIES FINANCING TRANSACTIONS (continued)
[309 ]

Collateral currency, type, quality and maturity tenor (continued)
Currency
Non-cashcollateralreceived
iShares MSCI EMU CHF Hedged UCITS ETF (Acc) CHF’000
Securities lending transactions
AUD 228
CAD 92
CHF 68
DKK 38
EUR 869
GBP 1,254
JPY 1,011
NOK 4
SEK 18
USD 4,155
Total 7,737
iShares MSCI EMU Small Cap UCITS ETF EUR’000
Securities lending transactions
AUD 4,229
CAD 3,311
CHF 2,933
DKK 761
EUR 37,828
GBP 31,923
JPY 35,095
NOK 105
SEK 2,339
USD 96,869
Total 215,393
iShares MSCI EMU USD Hedged UCITS ETF (Acc) USD’000
Securities lending transactions
AUD 881
CAD 482
CHF 477
DKK 352
EUR 8,953
GBP 2,683
JPY 3,086
NOK 39
SEK 137
USD 12,087
Total 29,177
iSHARES VII PLC
EFFICIENT PORTFOLIO MANAGEMENT AND SECURITIES FINANCING TRANSACTIONS (continued)
[310 ]
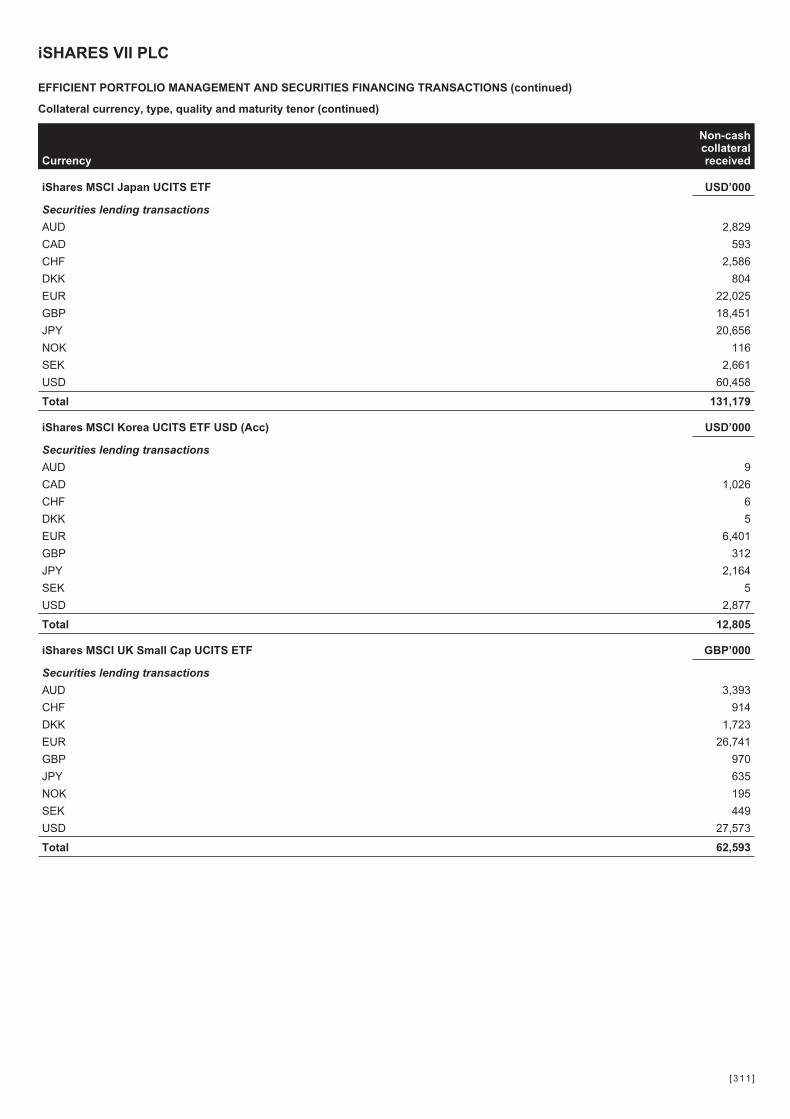
Collateral currency, type, quality and maturity tenor (continued)
Currency
Non-cashcollateralreceived
iShares MSCI Japan UCITS ETF USD’000
Securities lending transactions
AUD 2,829
CAD 593
CHF 2,586
DKK 804
EUR 22,025
GBP 18,451
JPY 20,656
NOK 116
SEK 2,661
USD 60,458
Total 131,179
iShares MSCI Korea UCITS ETF USD (Acc) USD’000
Securities lending transactions
AUD 9
CAD 1,026
CHF 6
DKK 5
EUR 6,401
GBP 312
JPY 2,164
SEK 5
USD 2,877
Total 12,805
iShares MSCI UK Small Cap UCITS ETF GBP’000
Securities lending transactions
AUD 3,393
CHF 914
DKK 1,723
EUR 26,741
GBP 970
JPY 635
NOK 195
SEK 449
USD 27,573
Total 62,593
iSHARES VII PLC
EFFICIENT PORTFOLIO MANAGEMENT AND SECURITIES FINANCING TRANSACTIONS (continued)
[311 ]
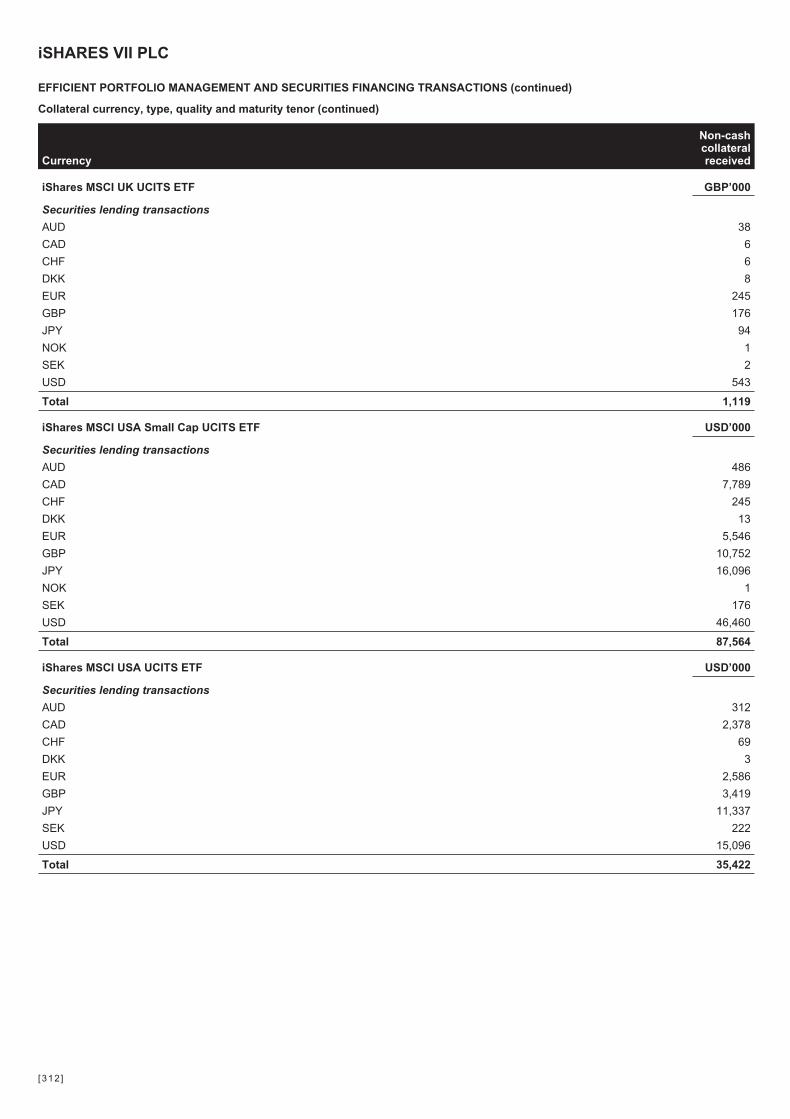
Collateral currency, type, quality and maturity tenor (continued)
Currency
Non-cashcollateralreceived
iShares MSCI UK UCITS ETF GBP’000
Securities lending transactions
AUD 38
CAD 6
CHF 6
DKK 8
EUR 245
GBP 176
JPY 94
NOK 1
SEK 2
USD 543
Total 1,119
iShares MSCI USA Small Cap UCITS ETF USD’000
Securities lending transactions
AUD 486
CAD 7,789
CHF 245
DKK 13
EUR 5,546
GBP 10,752
JPY 16,096
NOK 1
SEK 176
USD 46,460
Total 87,564
iShares MSCI USA UCITS ETF USD’000
Securities lending transactions
AUD 312
CAD 2,378
CHF 69
DKK 3
EUR 2,586
GBP 3,419
JPY 11,337
SEK 222
USD 15,096
Total 35,422
iSHARES VII PLC
EFFICIENT PORTFOLIO MANAGEMENT AND SECURITIES FINANCING TRANSACTIONS (continued)
[312 ]
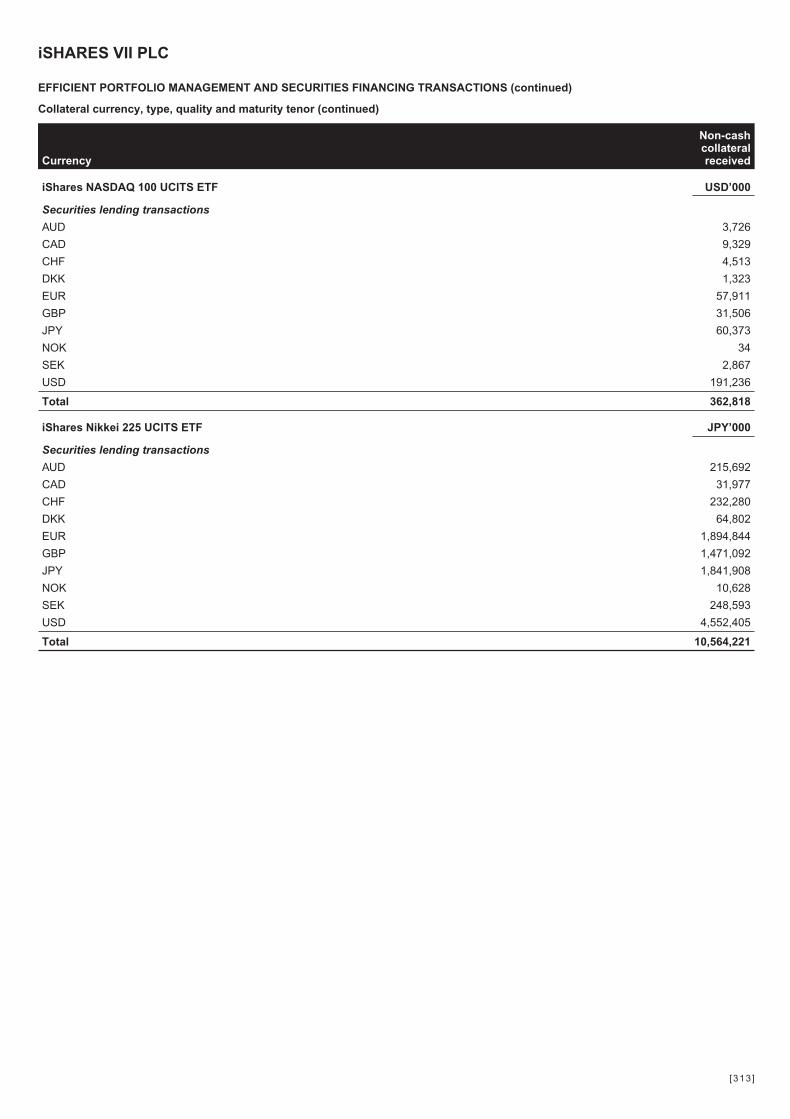
Collateral currency, type, quality and maturity tenor (continued)
Currency
Non-cashcollateralreceived
iShares NASDAQ 100 UCITS ETF USD’000
Securities lending transactions
AUD 3,726
CAD 9,329
CHF 4,513
DKK 1,323
EUR 57,911
GBP 31,506
JPY 60,373
NOK 34
SEK 2,867
USD 191,236
Total 362,818
iShares Nikkei 225 UCITS ETF JPY’000
Securities lending transactions
AUD 215,692
CAD 31,977
CHF 232,280
DKK 64,802
EUR 1,894,844
GBP 1,471,092
JPY 1,841,908
NOK 10,628
SEK 248,593
USD 4,552,405
Total 10,564,221
iSHARES VII PLC
EFFICIENT PORTFOLIO MANAGEMENT AND SECURITIES FINANCING TRANSACTIONS (continued)
[313 ]
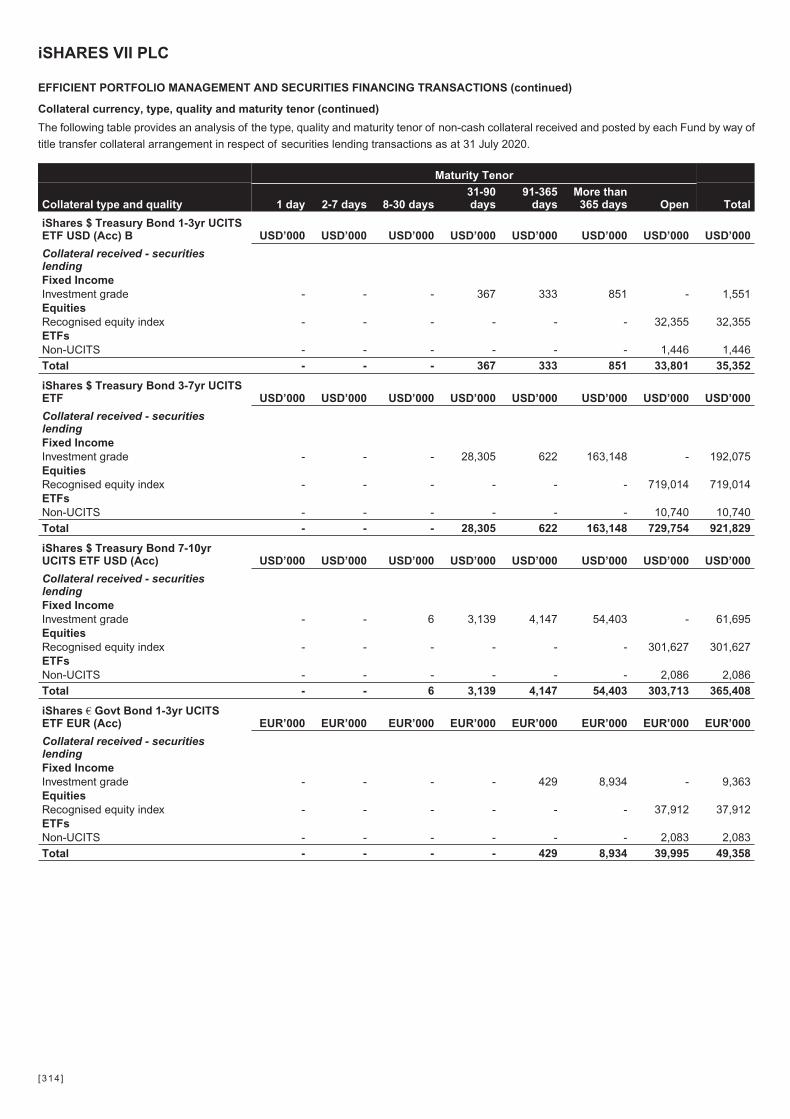
Collateral currency, type, quality and maturity tenor (continued)
The following table provides an analysis of the type, quality and maturity tenor of non-cash collateral received and posted by each Fund by way of
title transfer collateral arrangement in respect of securities lending transactions as at 31 July 2020.
Maturity Tenor
Collateral type and quality 1 day 2-7 days 8-30 days31-90days
91-365days
More than365 days Open Total
iShares $ Treasury Bond 1-3yr UCITSETF USD (Acc) B USD’000 USD’000 USD’000 USD’000 USD’000 USD’000 USD’000 USD’000
Collateral received - securitieslendingFixed IncomeInvestment grade - - - 367 333 851 - 1,551EquitiesRecognised equity index - - - - - - 32,355 32,355ETFsNon-UCITS - - - - - - 1,446 1,446Total - - - 367 333 851 33,801 35,352
iShares $ Treasury Bond 3-7yr UCITSETF USD’000 USD’000 USD’000 USD’000 USD’000 USD’000 USD’000 USD’000
Collateral received - securitieslendingFixed IncomeInvestment grade - - - 28,305 622 163,148 - 192,075EquitiesRecognised equity index - - - - - - 719,014 719,014ETFsNon-UCITS - - - - - - 10,740 10,740Total - - - 28,305 622 163,148 729,754 921,829
iShares $ Treasury Bond 7-10yrUCITS ETF USD (Acc) USD’000 USD’000 USD’000 USD’000 USD’000 USD’000 USD’000 USD’000
Collateral received - securitieslendingFixed IncomeInvestment grade - - 6 3,139 4,147 54,403 - 61,695EquitiesRecognised equity index - - - - - - 301,627 301,627ETFsNon-UCITS - - - - - - 2,086 2,086Total - - 6 3,139 4,147 54,403 303,713 365,408
iShares € Govt Bond 1-3yr UCITSETF EUR (Acc) EUR’000 EUR’000 EUR’000 EUR’000 EUR’000 EUR’000 EUR’000 EUR’000
Collateral received - securitieslendingFixed IncomeInvestment grade - - - - 429 8,934 - 9,363EquitiesRecognised equity index - - - - - - 37,912 37,912ETFsNon-UCITS - - - - - - 2,083 2,083Total - - - - 429 8,934 39,995 49,358
iSHARES VII PLC
EFFICIENT PORTFOLIO MANAGEMENT AND SECURITIES FINANCING TRANSACTIONS (continued)
[314 ]
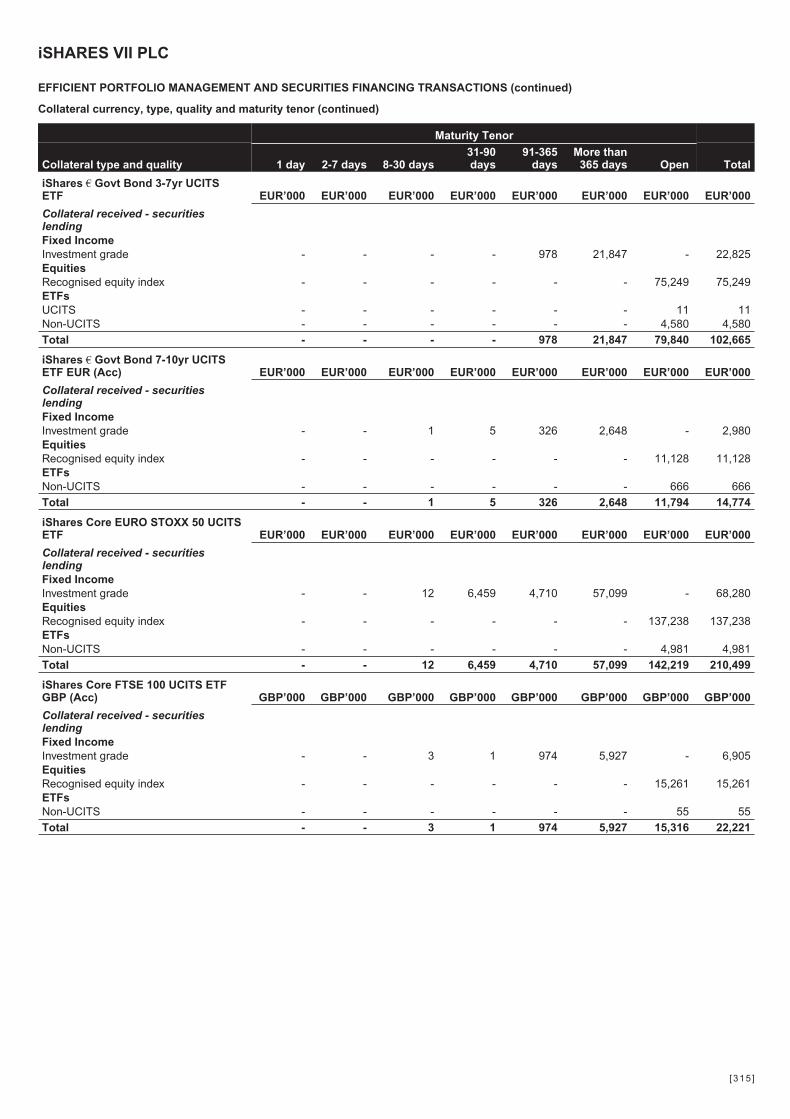
Collateral currency, type, quality and maturity tenor (continued)
Maturity Tenor
Collateral type and quality 1 day 2-7 days 8-30 days31-90days
91-365days
More than365 days Open Total
iShares € Govt Bond 3-7yr UCITSETF EUR’000 EUR’000 EUR’000 EUR’000 EUR’000 EUR’000 EUR’000 EUR’000
Collateral received - securitieslendingFixed IncomeInvestment grade - - - - 978 21,847 - 22,825EquitiesRecognised equity index - - - - - - 75,249 75,249ETFsUCITS - - - - - - 11 11Non-UCITS - - - - - - 4,580 4,580Total - - - - 978 21,847 79,840 102,665
iShares € Govt Bond 7-10yr UCITSETF EUR (Acc) EUR’000 EUR’000 EUR’000 EUR’000 EUR’000 EUR’000 EUR’000 EUR’000
Collateral received - securitieslendingFixed IncomeInvestment grade - - 1 5 326 2,648 - 2,980EquitiesRecognised equity index - - - - - - 11,128 11,128ETFsNon-UCITS - - - - - - 666 666Total - - 1 5 326 2,648 11,794 14,774
iShares Core EURO STOXX 50 UCITSETF EUR’000 EUR’000 EUR’000 EUR’000 EUR’000 EUR’000 EUR’000 EUR’000
Collateral received - securitieslendingFixed IncomeInvestment grade - - 12 6,459 4,710 57,099 - 68,280EquitiesRecognised equity index - - - - - - 137,238 137,238ETFsNon-UCITS - - - - - - 4,981 4,981Total - - 12 6,459 4,710 57,099 142,219 210,499
iShares Core FTSE 100 UCITS ETFGBP (Acc) GBP’000 GBP’000 GBP’000 GBP’000 GBP’000 GBP’000 GBP’000 GBP’000
Collateral received - securitieslendingFixed IncomeInvestment grade - - 3 1 974 5,927 - 6,905EquitiesRecognised equity index - - - - - - 15,261 15,261ETFsNon-UCITS - - - - - - 55 55Total - - 3 1 974 5,927 15,316 22,221
iSHARES VII PLC
EFFICIENT PORTFOLIO MANAGEMENT AND SECURITIES FINANCING TRANSACTIONS (continued)
[315 ]

Collateral currency, type, quality and maturity tenor (continued)
Maturity Tenor
Collateral type and quality 1 day 2-7 days 8-30 days31-90days
91-365days
More than365 days Open Total
iShares Core MSCI EMU UCITS ETF EUR’000 EUR’000 EUR’000 EUR’000 EUR’000 EUR’000 EUR’000 EUR’000
Collateral received - securitieslendingFixed IncomeInvestment grade - - 5 1,133 2,065 44,155 - 47,358EquitiesRecognised equity index - - - - - - 121,192 121,192ETFsNon-UCITS - - - - - - 1,777 1,777Total - - 5 1,133 2,065 44,155 122,969 170,327
iShares Core MSCI Pacific ex-JapanUCITS ETF USD’000 USD’000 USD’000 USD’000 USD’000 USD’000 USD’000 USD’000
Collateral received - securitieslendingFixed IncomeInvestment grade - - 14 3 3,924 96,035 - 99,976EquitiesRecognised equity index - - - - - - 268,466 268,466ETFsNon-UCITS - - - - - - 1,680 1,680Total - - 14 3 3,924 96,035 270,146 370,122
iShares Core S&P 500 UCITS ETF USD’000 USD’000 USD’000 USD’000 USD’000 USD’000 USD’000 USD’000
Collateral received - securitieslendingFixed IncomeInvestment grade - - 3 - 8,418 47,372 - 55,793EquitiesRecognised equity index - - - - - - 1,183,021 1,183,021ETFsNon-UCITS - - - - - - 29,005 29,005Total - - 3 - 8,418 47,372 1,212,026 1,267,819
iShares Dow Jones IndustrialAverage UCITS ETF USD’000 USD’000 USD’000 USD’000 USD’000 USD’000 USD’000 USD’000
Collateral received - securitieslendingFixed IncomeInvestment grade - - - - 289 535 - 824EquitiesRecognised equity index - - - - - - 23,125 23,125ETFsNon-UCITS - - - - - - 192 192Total - - - - 289 535 23,317 24,141
iSHARES VII PLC
EFFICIENT PORTFOLIO MANAGEMENT AND SECURITIES FINANCING TRANSACTIONS (continued)
[316 ]
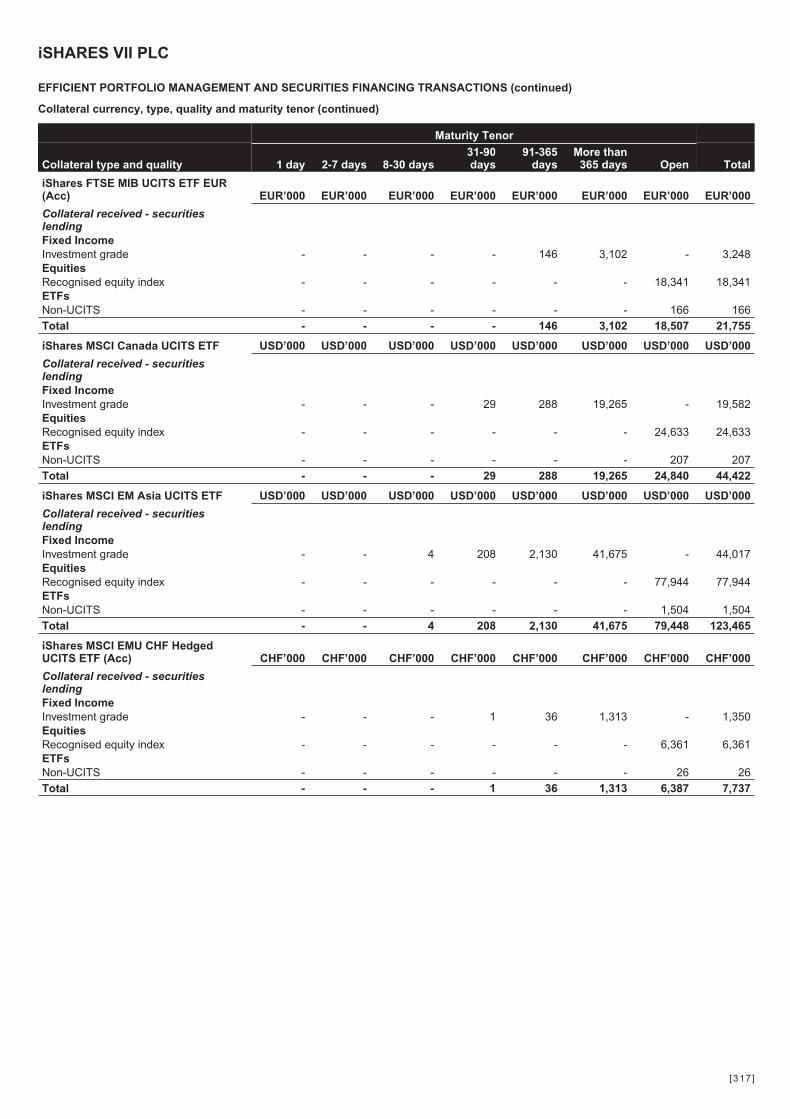
Collateral currency, type, quality and maturity tenor (continued)
Maturity Tenor
Collateral type and quality 1 day 2-7 days 8-30 days31-90days
91-365days
More than365 days Open Total
iShares FTSE MIB UCITS ETF EUR(Acc) EUR’000 EUR’000 EUR’000 EUR’000 EUR’000 EUR’000 EUR’000 EUR’000
Collateral received - securitieslendingFixed IncomeInvestment grade - - - - 146 3,102 - 3,248EquitiesRecognised equity index - - - - - - 18,341 18,341ETFsNon-UCITS - - - - - - 166 166Total - - - - 146 3,102 18,507 21,755
iShares MSCI Canada UCITS ETF USD’000 USD’000 USD’000 USD’000 USD’000 USD’000 USD’000 USD’000
Collateral received - securitieslendingFixed IncomeInvestment grade - - - 29 288 19,265 - 19,582EquitiesRecognised equity index - - - - - - 24,633 24,633ETFsNon-UCITS - - - - - - 207 207Total - - - 29 288 19,265 24,840 44,422
iShares MSCI EM Asia UCITS ETF USD’000 USD’000 USD’000 USD’000 USD’000 USD’000 USD’000 USD’000
Collateral received - securitieslendingFixed IncomeInvestment grade - - 4 208 2,130 41,675 - 44,017EquitiesRecognised equity index - - - - - - 77,944 77,944ETFsNon-UCITS - - - - - - 1,504 1,504Total - - 4 208 2,130 41,675 79,448 123,465
iShares MSCI EMU CHF HedgedUCITS ETF (Acc) CHF’000 CHF’000 CHF’000 CHF’000 CHF’000 CHF’000 CHF’000 CHF’000
Collateral received - securitieslendingFixed IncomeInvestment grade - - - 1 36 1,313 - 1,350EquitiesRecognised equity index - - - - - - 6,361 6,361ETFsNon-UCITS - - - - - - 26 26Total - - - 1 36 1,313 6,387 7,737
iSHARES VII PLC
EFFICIENT PORTFOLIO MANAGEMENT AND SECURITIES FINANCING TRANSACTIONS (continued)
[317 ]
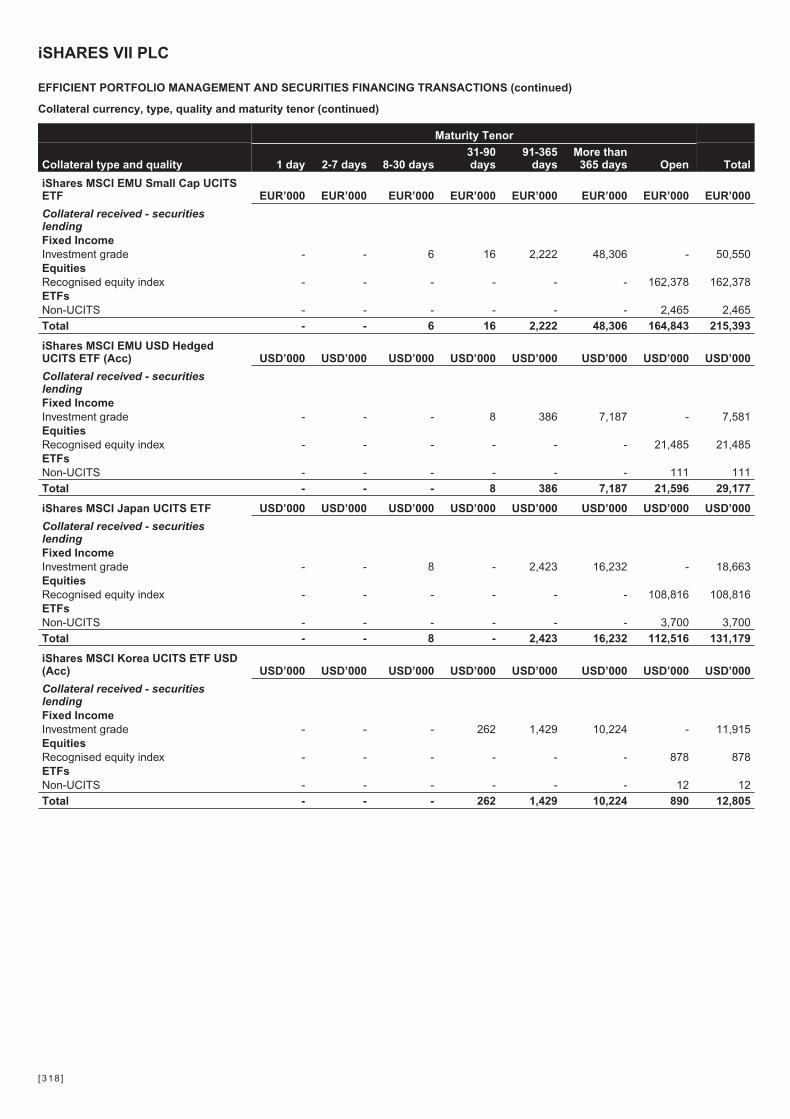
Collateral currency, type, quality and maturity tenor (continued)
Maturity Tenor
Collateral type and quality 1 day 2-7 days 8-30 days31-90days
91-365days
More than365 days Open Total
iShares MSCI EMU Small Cap UCITSETF EUR’000 EUR’000 EUR’000 EUR’000 EUR’000 EUR’000 EUR’000 EUR’000
Collateral received - securitieslendingFixed IncomeInvestment grade - - 6 16 2,222 48,306 - 50,550EquitiesRecognised equity index - - - - - - 162,378 162,378ETFsNon-UCITS - - - - - - 2,465 2,465Total - - 6 16 2,222 48,306 164,843 215,393
iShares MSCI EMU USD HedgedUCITS ETF (Acc) USD’000 USD’000 USD’000 USD’000 USD’000 USD’000 USD’000 USD’000
Collateral received - securitieslendingFixed IncomeInvestment grade - - - 8 386 7,187 - 7,581EquitiesRecognised equity index - - - - - - 21,485 21,485ETFsNon-UCITS - - - - - - 111 111Total - - - 8 386 7,187 21,596 29,177
iShares MSCI Japan UCITS ETF USD’000 USD’000 USD’000 USD’000 USD’000 USD’000 USD’000 USD’000
Collateral received - securitieslendingFixed IncomeInvestment grade - - 8 - 2,423 16,232 - 18,663EquitiesRecognised equity index - - - - - - 108,816 108,816ETFsNon-UCITS - - - - - - 3,700 3,700Total - - 8 - 2,423 16,232 112,516 131,179
iShares MSCI Korea UCITS ETF USD(Acc) USD’000 USD’000 USD’000 USD’000 USD’000 USD’000 USD’000 USD’000
Collateral received - securitieslendingFixed IncomeInvestment grade - - - 262 1,429 10,224 - 11,915EquitiesRecognised equity index - - - - - - 878 878ETFsNon-UCITS - - - - - - 12 12Total - - - 262 1,429 10,224 890 12,805
iSHARES VII PLC
EFFICIENT PORTFOLIO MANAGEMENT AND SECURITIES FINANCING TRANSACTIONS (continued)
[318 ]
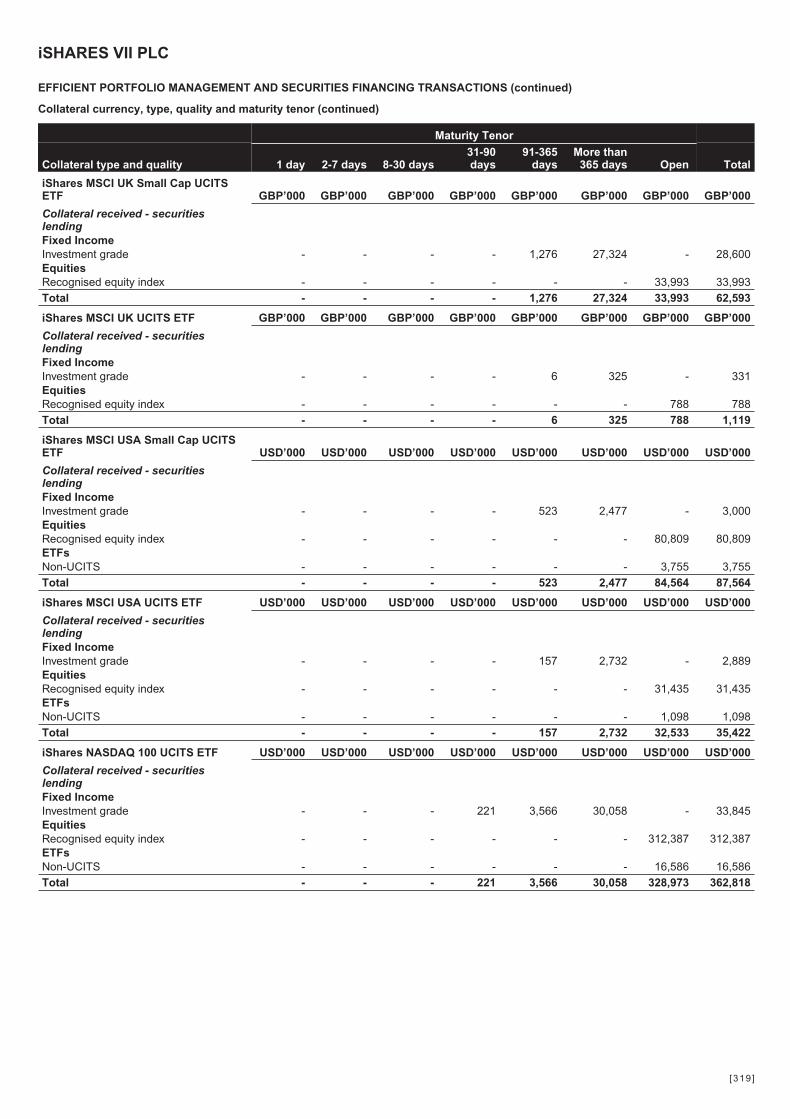
Collateral currency, type, quality and maturity tenor (continued)
Maturity Tenor
Collateral type and quality 1 day 2-7 days 8-30 days31-90days
91-365days
More than365 days Open Total
iShares MSCI UK Small Cap UCITSETF GBP’000 GBP’000 GBP’000 GBP’000 GBP’000 GBP’000 GBP’000 GBP’000
Collateral received - securitieslendingFixed IncomeInvestment grade - - - - 1,276 27,324 - 28,600EquitiesRecognised equity index - - - - - - 33,993 33,993Total - - - - 1,276 27,324 33,993 62,593
iShares MSCI UK UCITS ETF GBP’000 GBP’000 GBP’000 GBP’000 GBP’000 GBP’000 GBP’000 GBP’000
Collateral received - securitieslendingFixed IncomeInvestment grade - - - - 6 325 - 331EquitiesRecognised equity index - - - - - - 788 788Total - - - - 6 325 788 1,119
iShares MSCI USA Small Cap UCITSETF USD’000 USD’000 USD’000 USD’000 USD’000 USD’000 USD’000 USD’000
Collateral received - securitieslendingFixed IncomeInvestment grade - - - - 523 2,477 - 3,000EquitiesRecognised equity index - - - - - - 80,809 80,809ETFsNon-UCITS - - - - - - 3,755 3,755Total - - - - 523 2,477 84,564 87,564
iShares MSCI USA UCITS ETF USD’000 USD’000 USD’000 USD’000 USD’000 USD’000 USD’000 USD’000
Collateral received - securitieslendingFixed IncomeInvestment grade - - - - 157 2,732 - 2,889EquitiesRecognised equity index - - - - - - 31,435 31,435ETFsNon-UCITS - - - - - - 1,098 1,098Total - - - - 157 2,732 32,533 35,422
iShares NASDAQ 100 UCITS ETF USD’000 USD’000 USD’000 USD’000 USD’000 USD’000 USD’000 USD’000
Collateral received - securitieslendingFixed IncomeInvestment grade - - - 221 3,566 30,058 - 33,845EquitiesRecognised equity index - - - - - - 312,387 312,387ETFsNon-UCITS - - - - - - 16,586 16,586Total - - - 221 3,566 30,058 328,973 362,818
iSHARES VII PLC
EFFICIENT PORTFOLIO MANAGEMENT AND SECURITIES FINANCING TRANSACTIONS (continued)
[319 ]

Collateral currency, type, quality and maturity tenor (continued)
Maturity Tenor
Collateral type and quality 1 day 2-7 days 8-30 days31-90days
91-365days
More than365 days Open Total
iShares Nikkei 225 UCITS ETF JPY’000 JPY’000 JPY’000 JPY’000 JPY’000 JPY’000 JPY’000 JPY’000
Collateral received - securitieslendingFixed IncomeInvestment grade - - 800 - 236,824 1,524,141 - 1,761,765EquitiesRecognised equity index - - - - - - 8,508,993 8,508,993ETFsNon-UCITS - - - - - - 293,463 293,463Total - - 800 - 236,824 1,524,141 8,802,456 10,564,221
Investment grade securities are those issued by an entity with a minimum investment grade credit rating from at least one globally recognised credit
rating agency; Standard & Poor’s, Moody’s or Fitch.
A recognised equity index contains at least 20 equities where no single equity represents more than 20% of the total index and no five equities
combined represent more than 60% of the total index.
The maturity tenor analysis for fixed income securities received or posted as collateral is based on the respective contractual maturity date, while
for equity securities, ETFs and money market funds received or posted as collateral are presented as open transactions as they are not subject to
a contractual maturity date.
All cash received or posted as collateral has an open maturity tenor as it’s not subject to a contractual maturity date.
Reuse of collateral received
Non-cash collateral received by way of title transfer collateral arrangement in relation to securities lending cannot be sold, re-invested or pledged.
Safekeeping of collateral received
The following table provides an analysis of the amounts of non-cash collateral received by each Fund in respect of securities lending transactions
and held by the Funds’ Depositary (or through its delegates) or through a securities settlement system, as at 31 July 2020.
Non-cash collateralreceived
Custodian Securities lending
iShares $ Treasury Bond 7-10yr UCITS ETF USD (Acc) USD’000
Euroclear SA/NV 17,242
Total 17,242
iShares € Govt Bond 3-7yr UCITS ETF EUR’000
Euroclear SA/NV 6,155
Total 6,155
iShares € Govt Bond 7-10yr UCITS ETF EUR (Acc) EUR’000
Euroclear SA/NV 2,532
Total 2,532
iSHARES VII PLC
EFFICIENT PORTFOLIO MANAGEMENT AND SECURITIES FINANCING TRANSACTIONS (continued)
[320 ]

Concentration of collateral received
The following table lists the ten largest issuers by value of non-cash collateral received by each Fund by way of title transfer collateral arrangement
across securities lending transactions as at 31 July 2020.
Issuer Value
iShares $ Treasury Bond 1-3yr UCITS ETF USD (Acc)B USD’000
Amazon.com Inc 1,219
Toyota Motor Corp 1,183
State of Japan 1,162
SPDR Gold Shares 956
BHP Group Plc 837
Kinross Gold Corp 801
Shopify Inc 753
Sun Life Financial Inc 705
Lloyds Banking Group Plc 694
Diageo Plc 674
Issuer Value
iShares $ Treasury Bond 3-7yr UCITS ETF USD’000
State of Japan 151,075
Apple Inc 34,828
Fast Retailing Co Ltd 22,694
United Kingdom 16,303
Royal Dutch Shell Plc 12,432
J.P Morgan Chase & Co 11,502
Total SE 11,470
Unilever NV 11,199
ING Groep NV 10,651
LVMH Moet Hennessy Louis Vuitton SE 10,638
Issuer Value
iShares $ Treasury Bond 7-10yr UCITS ETF USD(Acc) USD’000
State of Japan 36,357
Apple Inc 10,453
Amazon.com Inc 8,173
Facebook Inc 5,727
BHP Group Plc 5,628
Diageo Plc 5,494
Kinross Gold Corp 5,370
Shopify Inc 5,245
United Kingdom 4,953
Sun Life Financial Inc 4,727
Issuer Value
iShares € Govt Bond 1-3yr UCITS ETF EUR (Acc) EUR’000
State of Japan 8,614
Facebook Inc 4,534
Boeing Co 3,975
Trip.com Group Ltd 2,291
Keyence Corp 2,266
Technology Select Sector SPDR Fund 2,083
Westpac Banking Corp 2,013
Republic Services Inc 1,654
Lafargeholcim Ltd 1,296
Cie Financiere Richemont SA 1,289
Issuer Value
iShares € Govt Bond 3-7yr UCITS ETF EUR’000
State of Japan 15,327
Facebook Inc 8,062
Boeing Co 7,066
Trip.com Group Ltd 4,072
Keyence Corp 4,027
Technology Select Sector SPDR Fund 3,702
Westpac Banking Corp 3,579
Republic Services Inc 2,940
Lafargeholcim Ltd 2,304
Cie Financiere Richemont SA 2,290
Issuer Value
iShares € Govt Bond 7-10yr UCITS ETF EUR (Acc) EUR’000
Mitsubishi Corp 775
Kirin Holdings Co Ltd 729
Inpex Corp 671
iShares MSCI EAFE ETF 566
French Republic 517
Republic of Germany 479
Ono Pharmaceutical Co Ltd 424
State of Japan 412
Kingdom of Belgium 388
VAT Group AG 362
iSHARES VII PLC
EFFICIENT PORTFOLIO MANAGEMENT AND SECURITIES FINANCING TRANSACTIONS (continued)
[321 ]

Concentration of collateral received (continued)
Issuer Value
iShares Core EURO STOXX 50 UCITS ETF EUR’000
United States Treasury 16,942
French Republic 15,567
State of Japan 15,133
Republic of Germany 7,585
Apple Inc 6,230
Republic of Austria 6,009
United Kingdom 5,768
Zoetis Inc 3,848
iShares 7-10 Year Treasury Bond ETF 3,382
Microsoft Corp 3,217
Issuer Value
iShares Core FTSE 100 UCITS ETF GBP (Acc) GBP’000
State of Japan 2,722
United States Treasury 2,700
Total SE 672
Rio Tinto Plc 559
Glaxosmithkline Plc 431
Royal Dutch Shell Plc 414
French Republic 368
BHP Group Plc 349
Reckitt Benckiser Group Plc 338
Republic of Germany 318
Issuer Value
iShares Core MSCI EMU UCITS ETF EUR’000
United States Treasury 13,406
State of Japan 10,390
French Republic 10,324
Republic of Germany 4,113
Republic of Austria 3,643
Apple Inc 3,033
Zoetis Inc 2,987
United Kingdom 2,680
Alibaba Group Holding Ltd 2,418
Kingdom of the Netherlands 2,251
Issuer Value
iShares Core MSCI Pacific ex-Japan UCITS ETF USD’000
United States Treasury 24,388
State of Japan 24,108
French Republic 14,147
Kingdom of the Netherlands 14,069
Republic of Germany 13,933
United Kingdom 7,915
Apple Inc 7,414
Alibaba Group Holding Ltd 6,034
Astrazeneca Plc 5,961
Royal Dutch Shell Plc 4,522
Issuer Value
iShares Core S&P 500 UCITS ETF USD’000
Toronto-Dominion Bank 35,410
Apple Inc 32,683
Microsoft Corp 29,841
Alibaba Group Holding Ltd 27,946
SPDR Gold Shares 26,860
United States Treasury 21,930
Walt Disney Co 17,576
Mitsubishi UFJ Financial Group Inc 17,080
J.P Morgan Chase & Co 16,641
Alphabet Inc 16,608
Issuer Value
iShares Dow Jones Industrial Average UCITS ETF USD’000
Toronto-Dominion Bank 1,338
Microsoft Corp 701
Royal Bank of Canada 625
J.P Morgan Chase & Co 570
Alphabet Inc 549
Mastercard Inc 539
Bank of America Corp 502
BCE Inc 466
Apple Inc 429
Royal Dutch Shell Plc 418
iSHARES VII PLC
EFFICIENT PORTFOLIO MANAGEMENT AND SECURITIES FINANCING TRANSACTIONS (continued)
[322 ]
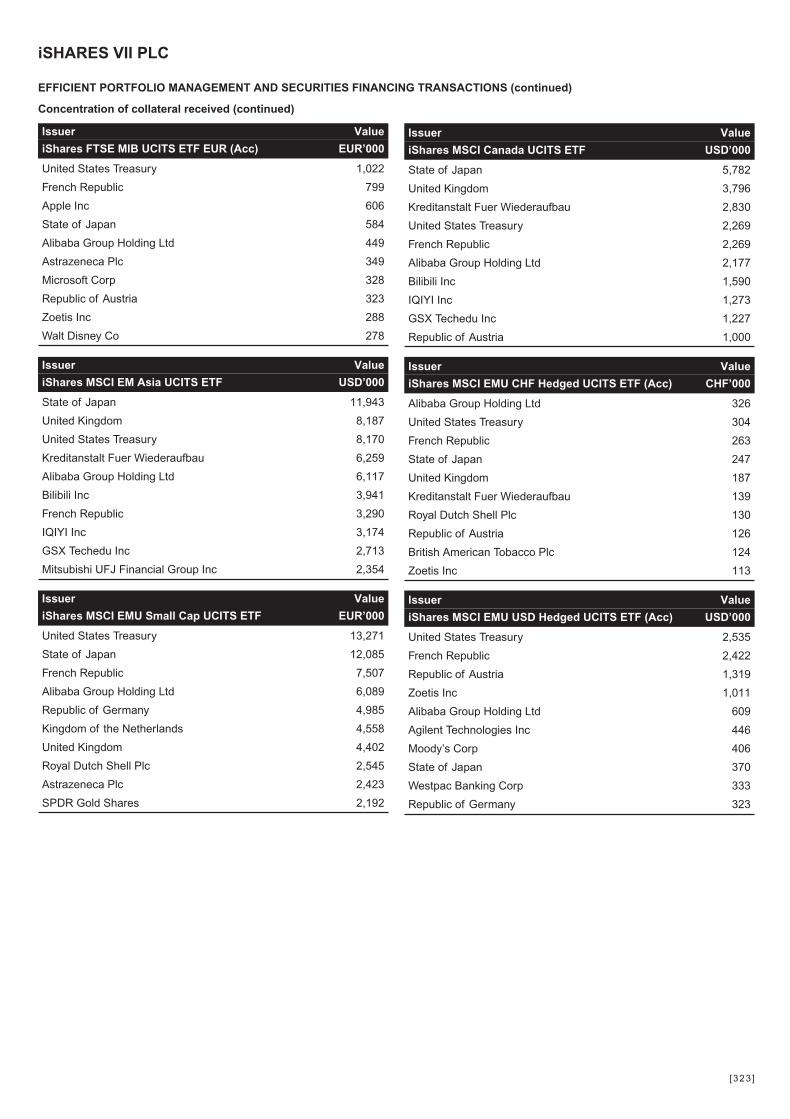
Concentration of collateral received (continued)
Issuer Value
iShares FTSE MIB UCITS ETF EUR (Acc) EUR’000
United States Treasury 1,022
French Republic 799
Apple Inc 606
State of Japan 584
Alibaba Group Holding Ltd 449
Astrazeneca Plc 349
Microsoft Corp 328
Republic of Austria 323
Zoetis Inc 288
Walt Disney Co 278
Issuer Value
iShares MSCI Canada UCITS ETF USD’000
State of Japan 5,782
United Kingdom 3,796
Kreditanstalt Fuer Wiederaufbau 2,830
United States Treasury 2,269
French Republic 2,269
Alibaba Group Holding Ltd 2,177
Bilibili Inc 1,590
IQIYI Inc 1,273
GSX Techedu Inc 1,227
Republic of Austria 1,000
Issuer Value
iShares MSCI EM Asia UCITS ETF USD’000
State of Japan 11,943
United Kingdom 8,187
United States Treasury 8,170
Kreditanstalt Fuer Wiederaufbau 6,259
Alibaba Group Holding Ltd 6,117
Bilibili Inc 3,941
French Republic 3,290
IQIYI Inc 3,174
GSX Techedu Inc 2,713
Mitsubishi UFJ Financial Group Inc 2,354
Issuer Value
iShares MSCI EMU CHF Hedged UCITS ETF (Acc) CHF’000
Alibaba Group Holding Ltd 326
United States Treasury 304
French Republic 263
State of Japan 247
United Kingdom 187
Kreditanstalt Fuer Wiederaufbau 139
Royal Dutch Shell Plc 130
Republic of Austria 126
British American Tobacco Plc 124
Zoetis Inc 113
Issuer Value
iShares MSCI EMU Small Cap UCITS ETF EUR’000
United States Treasury 13,271
State of Japan 12,085
French Republic 7,507
Alibaba Group Holding Ltd 6,089
Republic of Germany 4,985
Kingdom of the Netherlands 4,558
United Kingdom 4,402
Royal Dutch Shell Plc 2,545
Astrazeneca Plc 2,423
SPDR Gold Shares 2,192
Issuer Value
iShares MSCI EMU USD Hedged UCITS ETF (Acc) USD’000
United States Treasury 2,535
French Republic 2,422
Republic of Austria 1,319
Zoetis Inc 1,011
Alibaba Group Holding Ltd 609
Agilent Technologies Inc 446
Moody’s Corp 406
State of Japan 370
Westpac Banking Corp 333
Republic of Germany 323
iSHARES VII PLC
EFFICIENT PORTFOLIO MANAGEMENT AND SECURITIES FINANCING TRANSACTIONS (continued)
[323 ]
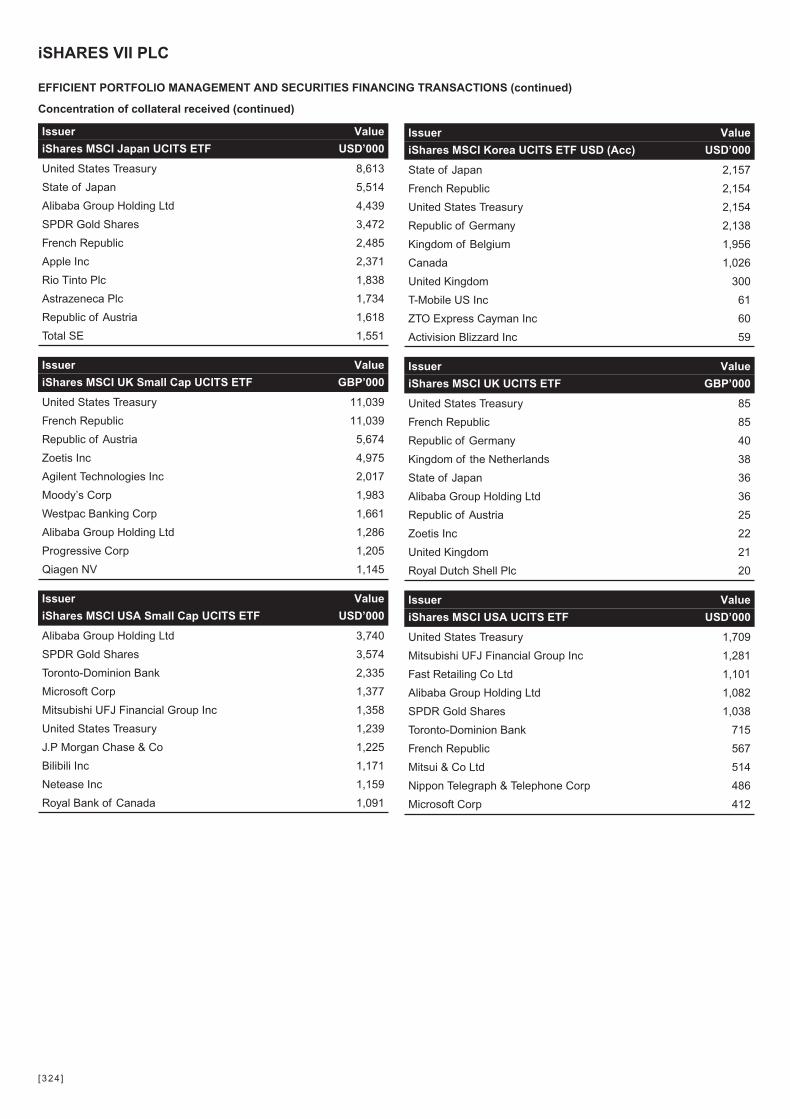
Concentration of collateral received (continued)
Issuer Value
iShares MSCI Japan UCITS ETF USD’000
United States Treasury 8,613
State of Japan 5,514
Alibaba Group Holding Ltd 4,439
SPDR Gold Shares 3,472
French Republic 2,485
Apple Inc 2,371
Rio Tinto Plc 1,838
Astrazeneca Plc 1,734
Republic of Austria 1,618
Total SE 1,551
Issuer Value
iShares MSCI Korea UCITS ETF USD (Acc) USD’000
State of Japan 2,157
French Republic 2,154
United States Treasury 2,154
Republic of Germany 2,138
Kingdom of Belgium 1,956
Canada 1,026
United Kingdom 300
T-Mobile US Inc 61
ZTO Express Cayman Inc 60
Activision Blizzard Inc 59
Issuer Value
iShares MSCI UK Small Cap UCITS ETF GBP’000
United States Treasury 11,039
French Republic 11,039
Republic of Austria 5,674
Zoetis Inc 4,975
Agilent Technologies Inc 2,017
Moody’s Corp 1,983
Westpac Banking Corp 1,661
Alibaba Group Holding Ltd 1,286
Progressive Corp 1,205
Qiagen NV 1,145
Issuer Value
iShares MSCI UK UCITS ETF GBP’000
United States Treasury 85
French Republic 85
Republic of Germany 40
Kingdom of the Netherlands 38
State of Japan 36
Alibaba Group Holding Ltd 36
Republic of Austria 25
Zoetis Inc 22
United Kingdom 21
Royal Dutch Shell Plc 20
Issuer Value
iShares MSCI USA Small Cap UCITS ETF USD’000
Alibaba Group Holding Ltd 3,740
SPDR Gold Shares 3,574
Toronto-Dominion Bank 2,335
Microsoft Corp 1,377
Mitsubishi UFJ Financial Group Inc 1,358
United States Treasury 1,239
J.P Morgan Chase & Co 1,225
Bilibili Inc 1,171
Netease Inc 1,159
Royal Bank of Canada 1,091
Issuer Value
iShares MSCI USA UCITS ETF USD’000
United States Treasury 1,709
Mitsubishi UFJ Financial Group Inc 1,281
Fast Retailing Co Ltd 1,101
Alibaba Group Holding Ltd 1,082
SPDR Gold Shares 1,038
Toronto-Dominion Bank 715
French Republic 567
Mitsui & Co Ltd 514
Nippon Telegraph & Telephone Corp 486
Microsoft Corp 412
iSHARES VII PLC
EFFICIENT PORTFOLIO MANAGEMENT AND SECURITIES FINANCING TRANSACTIONS (continued)
[324 ]
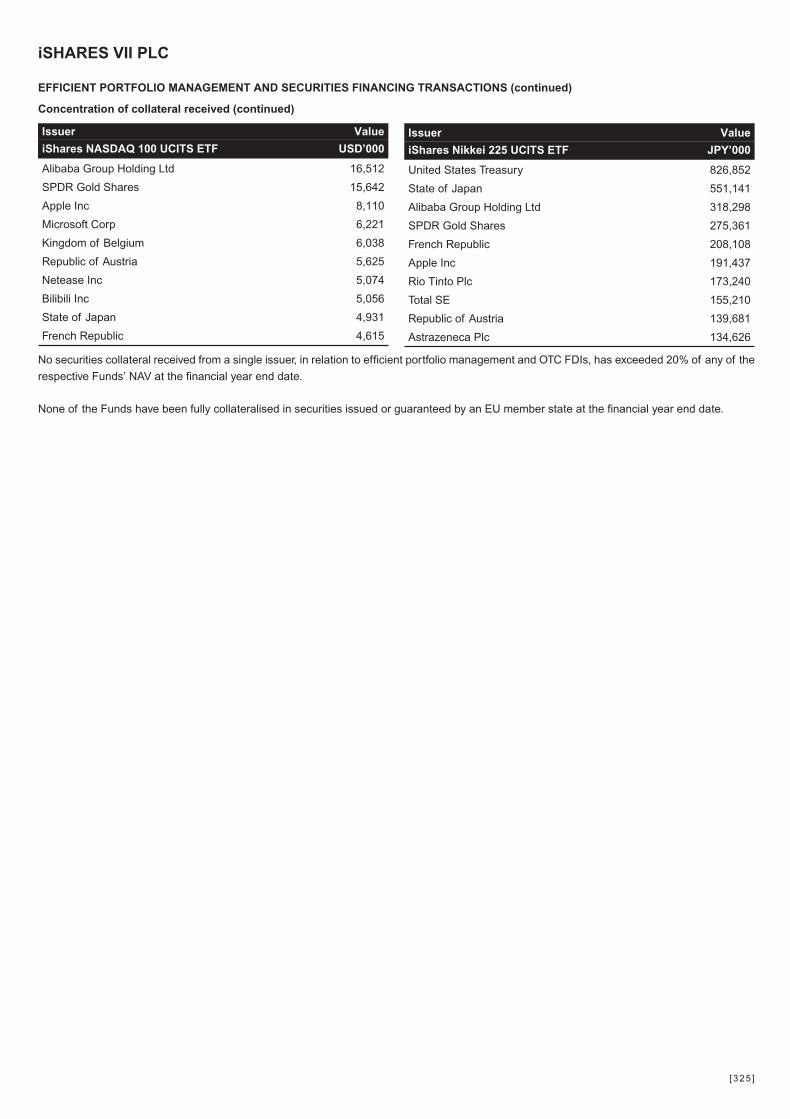
Concentration of collateral received (continued)
Issuer Value
iShares NASDAQ 100 UCITS ETF USD’000
Alibaba Group Holding Ltd 16,512
SPDR Gold Shares 15,642
Apple Inc 8,110
Microsoft Corp 6,221
Kingdom of Belgium 6,038
Republic of Austria 5,625
Netease Inc 5,074
Bilibili Inc 5,056
State of Japan 4,931
French Republic 4,615
Issuer Value
iShares Nikkei 225 UCITS ETF JPY’000
United States Treasury 826,852
State of Japan 551,141
Alibaba Group Holding Ltd 318,298
SPDR Gold Shares 275,361
French Republic 208,108
Apple Inc 191,437
Rio Tinto Plc 173,240
Total SE 155,210
Republic of Austria 139,681
Astrazeneca Plc 134,626
No securities collateral received from a single issuer, in relation to efficient portfolio management and OTC FDIs, has exceeded 20% of any of the
respective Funds’ NAV at the financial year end date.
None of the Funds have been fully collateralised in securities issued or guaranteed by an EU member state at the financial year end date.
iSHARES VII PLC
EFFICIENT PORTFOLIO MANAGEMENT AND SECURITIES FINANCING TRANSACTIONS (continued)
[325 ]
Regulatory Information
Issued by BlackRock Advisors (UK) Limited, which is authorised and regulated by the Financial Conduct Authority. Registered office: 12
Throgmorton Avenue, London, EC2N 2DL, Tel: +44 (0)20 7743 3000. Registered in England and Wales No. 00796793. For your protection, calls are
usually recorded. Please refer to the Financial Conduct Authority website for a list of authorised activities conducted by BlackRock.
iShares plc, iShares II plc, iShares III plc, iShares IV plc, iShares V plc, iShares VI plc and iShares VII plc (together ’the Companies’) are open-ended
investment companies with variable capital having segregated liability between their funds organised under the laws of Ireland and authorised by
the Central Bank of Ireland.
Further information about the Fund and the Share Class, such as details of the key underlying investments of the Share Class and share prices,
is available on the iShares website at www.ishares.com or by calling +44 (0)845 357 7000 or from your broker or financial adviser. The indicative
intra-day net asset value of the Share Class is available at http://deutsche-boerse.com and/or http://www.reuters.com. A UCITS ETF’s units / shares
that have been acquired on the secondary market cannot usually be sold directly back to the UCITS ETF itself. Investors who are not Authorised
Participants must buy and sell shares on a secondary market with the assistance of an intermediary (e.g. a stockbroker) and may incur fees and
additional taxes in doing so. In addition, as the market price at which the Shares are traded on the secondary market may differ from the Net Asset
Value per Share, investors may pay more than the then current Net Asset Value per Share when buying shares and may receive less than the current
Net Asset Value per Share when selling them.
For investors in the UK
Any decision to invest must be based solely on the information contained in the Entity’s Prospectus, Key Investor Information Document and the
latest half-yearly report and unaudited accounts and/or annual report and audited accounts. Investors should read the fund specific risks in the Key
Investor Information Document and the Entity’s Prospectus.
Restricted Investors
This document is not, and under no circumstances is to be construed as an advertisement or any other step in furtherance of a public offering of
shares in the United States or Canada. This document is not aimed at persons who are resident in the United States, Canada or any province or
territory thereof, where the companies/securities are not authorised or registered for distribution and where no prospectus has been filed with any
securities commission or regulatory authority. The companies/securities may not be acquired or owned by, or acquired with the assets of, an ERISA
Plan.
Index Disclaimers
Bloomberg® is a trademark and service mark of Bloomberg Finance L.P. (collectively with its affiliates, “Bloomberg”). Barclays® is a trademark and
service mark of Barclays Bank Plc (collectively with its affiliates, “Barclays”), used under license. Bloomberg or Bloomberg’s licensors, including
Barclays, own all proprietary rights in the Bloomberg Barclays Indices. Neither Bloomberg nor Barclays are affiliated with BlackRock Fund Advisors
or its affiliates, and neither Bloomberg nor Barclays approves, endorses, reviews, or recommends the iShares ETFs. Neither Bloomberg nor
Barclays guarantees the timeliness, accurateness, or completeness of any data or information relating to ’Bloomberg Barclays Euro Government
Bond 1-3 Year Term Index’, ’Bloomberg Barclays Euro Government Bond 3-7 Year Term Index’ and ’Bloomberg Barclays Euro Government Bond
10 Year Term Index’. Neither Bloomberg nor Barclays shall be liable in any way to the BlackRock Fund Advisors or its affiliates, investors in the
iShares ETFs or to other third parties in respect of the use or accuracy of the ’Bloomberg Barclays Euro Government Bond 1-3 Year Term Index’,
’Bloomberg Barclays Euro Government Bond 3-7 Year Term Index’ and ’Bloomberg Barclays Euro Government Bond 10 Year Term Index’ or any
data included therein.
S&P® is a registered trademark of Standard & Poor’s Financial Services LLC (“S&P”) and “Dow Jones®” is a registered trademark of Dow Jones
Trademark Holdings LLC (“Dow Jones”) and have been licensed for use by S&P Dow Jones Indices LLC and its affiliates and sublicensed for certain
purposes by BlackRock Fund Advisors or its affiliates (“BlackRock”). The Dow Jones Industrial Average Index is a product of S&P Dow Jones
Indices LLC or its affiliates, and has been licensed for use by BlackRock. The iShares ETF (the “Fund”) is not sponsored, endorsed, sold or promoted
by S&P Dow Jones Indices LLC, Dow Jones, S&P, their respective affiliates, and none of S&P Dow Jones Indices LLC, Dow Jones, S&P nor their
respective affiliates makes any representation regarding the advisability of investing in the Fund. BlackRock is not affiliated with the companies listed
above. Index data source: S&P Dow Jones Indices LLC.
iSHARES VII PLC
DISCLAIMERS
[326 ]
Index Disclaimers (continued)
’FTSE®’ is a trade mark jointly owned by the London Stock Exchange plc and the Financial Times Limited (the ’FT’) and is used by FTSE
International Limited (’FTSE’) under licence. The FTSE 100 Index and FTSE Italia Mid-Small Cap PIR Index are calculated by or on behalf of FTSE
International Limited (’FTSE’). None of the Exchange, the FT nor FTSE sponsors, endorses or promotes the iShares ETFs nor is in any way
connected to the funds or accepts any liability in relation to their issue, operation and trading. All copyright and database rights within the index values
and constituent list vest in FTSE. BlackRock has obtained full licence from FTSE to use such copyright and database rights in the creation of these
products.
’FTSE®’ is a trade mark of the London Stock Exchange plc and the Financial Times Limited, ’MIB’ is a trade mark of Borsa Italiana SpA (’Borsa
Italiana’) and both are used by FTSE International Limited (’FTSE’) under licence. The FTSE MIB Index is calculated by FTSE with the assistance
of Borsa Italiana. Neither FTSE nor its licensors nor Borsa Italiana sponsor, endorse or promote the iShares ETF and are not in any way connected
to it and do not accept any liability in relation to its issue, operation and trading. All copyright in the index values and constituent list vest in FTSE.
BlackRock has obtained full licence from FTSE to use such copyright in the creation of this product.
The ICE Index mentioned in this document is a service mark of Interactive Data Pricing and Reference Data, LLC or its affiliates (“Interactive Data”)
and has been licensed for use by BlackRock, Inc. in connection with the fund. Neither BlackRock, Inc. nor the fund is sponsored, endorsed, sold
or promoted by Interactive Data. Interactive Data makes no representations or warranties regarding BlackRock, Inc. or the fund or the ability of the
fund to track the applicable Index. INTERACTIVE DATA MAKES NO EXPRESS OR IMPLIED WARRANTIES, AND HEREBY EXPRESSLY
DISCLAIMS ALL WARRANTIES OF MERCHANTABILITY OR FITNESS FOR A PARTICULAR PURPOSE WITH RESPECT TO THE ICE INDEX
OR ANY DATA INCLUDED THEREIN. IN NO EVENT SHALL INTERACTIVE DATA HAVE ANY LIABILITY FOR ANY SPECIAL, PUNITIVE, DIRECT,
INDIRECT, OR CONSEQUENTIAL DAMAGES (INCLUDING LOST PROFITS) EVEN IF NOTIFIED OF THE POSSIBILITY OF SUCH DAMAGES.
iShares funds are not sponsored, endorsed, or promoted by MSCI, and MSCI bears no liability with respect to any such funds or
any index on which such funds are based. The Prospectus contains a more detailed description of the limited relationship that MSCI has with
BlackRock and any related funds.
Nasdaq®, NASDAQ 100 Index are registered trademarks of the NASDAQ, Inc. (referred to below as “corporation” jointly with its affiliates) and are
licensed for use by BlackRock Asset Management Ireland Limited. The corporation bears no liability for the legality or suitability of the products. The
products are not issued, subscribed, sold or promoted by the corporation. The corporation makes no warranties and bears no liability with respect
to the products.
Nikkei 225 is protected by a copyright and is calculated according to criteria independently developed and created by Nikkei Inc. Nikkei Inc. is the
only and exclusive owner of the copyrights and other intellectual property rights on Nikkei 225 and on the relevant calculation criteria. Nikkei Digital
Media Inc., upon authorization of Nikkei Inc., licensed the use of Nikkei 225 as index for the fund to the licensee. The intellectual property and any
other right related to the trademarks connected with Nikkei and Nikkei 225 are granted to Nikkei Inc. Nikkei Inc. and/or Nikkei Digital Media, Inc. do
not sponsor, support, sell or advertise the fund. Nikkei Inc. and/or Nikkei Digital Media, Inc. are not connected in any way with the fund and license
the use of certain trademarks and of Nikkei 225 for the fund itself to the licensee. The licence agreement between Nikkei Digital Media, Inc. and
the licensee grants no right to any third party. The fund is managed at the licensee’s exclusive risk; Nikkei Inc. and/or Nikkei Digital Media, Inc.
assume no obligation or liability with respect to the management and transactions of the fund. Nikkei Inc. and/or Nikkei Digital Media, Inc. bear no
liability for the correctness of the fund’s calculations or relevant data. Nikkei Inc. and/or Nikkei Digital Media, Inc. have no obligation to continue to
publish the Nikkei 225 and are not responsible for any errors, delays, interruptions, suspensions or termination of the relevant publication; Nikkei Inc.
and Nikkei Digital Media, Inc. are authorized to change the description of securities, calculation criteria or any other detail of Nikkei 225 and have
the right to interrupt or stop the announcement of Nikkei 225 with no responsibility towards the licensor or any third party.
The Index is a product of S&P Dow Jones Indices LLC, a division of S&P Global, or its affiliates (“SPDJI”) and has been licensed for use by
BlackRock. Standard & Poor’s® and S&P® are registered trademarks of Standard & Poor’s Financial Services LLC, a division of S&P Global
(“S&P”); Dow Jones® is a registered trademark of Dow Jones Trademark Holdings LLC (“Dow Jones”); and these trademarks have been licensed
for use by SPDJI and sublicensed for certain purposes by BlackRock. The iShares ETFs are not sponsored, endorsed, sold or promoted by SPDJI,
iSHARES VII PLC
DISCLAIMERS (continued)
[327 ]
Index Disclaimers (continued)
Dow Jones, S&P, their respective affiliates, and none of such parties make any representation regarding the advisability of investing in such
product(s) nor do they have any liability for any errors, omissions, or interruptions of the Index.
EURO STOXX 50® is the intellectual property (including registered trademarks) of STOXX Limited, Zurich, Switzerland (“STOXX”), Deutsche Börse
Group or their licensors, which is used under license. The iShares ETF is neither sponsored nor promoted, distributed or in any other manner
supported by STOXX, Deutsche Börse Group or their licensors, research partners or data providers and STOXX, Deutsche Börse Group and their
licensors, research partners or data providers do not give any warranty, and exclude any liability (whether in negligence or otherwise) with respect
thereto generally or specifically in relation to any errors, omissions or interruptions in the relevant index or its data.
Any research in this document has been procured and may have been acted on by BlackRock for its own purpose. The results of such research are
being made available only incidentally. The views expressed do not constitute investment or any other advice and are subject to change. They do
not necessarily reflect the views of any company in the BlackRock Group or any part thereof and no assurances are made as to their accuracy.
© 2020 BlackRock, Inc. All Rights reserved. BLACKROCK, BLACKROCK SOLUTIONS, iSHARES, BUILD ON BLACKROCK and SO WHAT DO I
DO WITH MY MONEY are registered and unregistered trademarks of BlackRock, Inc. or its subsidiaries in the United States and elsewhere. All other
trademarks are those of their respective owners.
iSHARES VII PLC
DISCLAIMERS (continued)
[328 ]
Want to know more?iShares.com | +44 (0)800 917 1770
© 2020 BlackRock, Inc. All Rights reserved. BLACKROCK, BLACKROCK SOLUTIONS, iSHARES, SO WHAT DO I DO WITH MYMONEY, INVESTING FOR A NEW WORLD, and BUILT FOR THESE TIMES are registered and unregistered trademarks ofBlackRock, Inc. or its subsidiaries in the United States and elsewhere. All other trademarks are those of their respective owners.